
| 2023-12-31 | 2023-09-30 | 2023-06-30 | 2023-03-31 | 2022-12-31 | 2022-09-30 | 2022-06-30 | 2022-03-31 | 2021-12-31 | 2021-09-30 | 2021-06-30 | 2021-03-31 | 2020-12-31 | 2020-09-30 | 2020-06-30 | 2020-03-31 | 2019-12-31 | 2019-09-30 | 2019-06-30 | 2019-03-31 | 2018-12-31 | 2018-09-30 | 2018-06-30 | 2018-03-31 | 2017-12-31 | 2017-09-30 | 2017-06-30 | 2017-03-31 | 2016-12-31 | 2016-09-30 | 2016-06-30 | 2016-03-31 | 2015-12-31 | ||
|---|---|---|---|---|---|---|---|---|---|---|---|---|---|---|---|---|---|---|---|---|---|---|---|---|---|---|---|---|---|---|---|---|---|---|
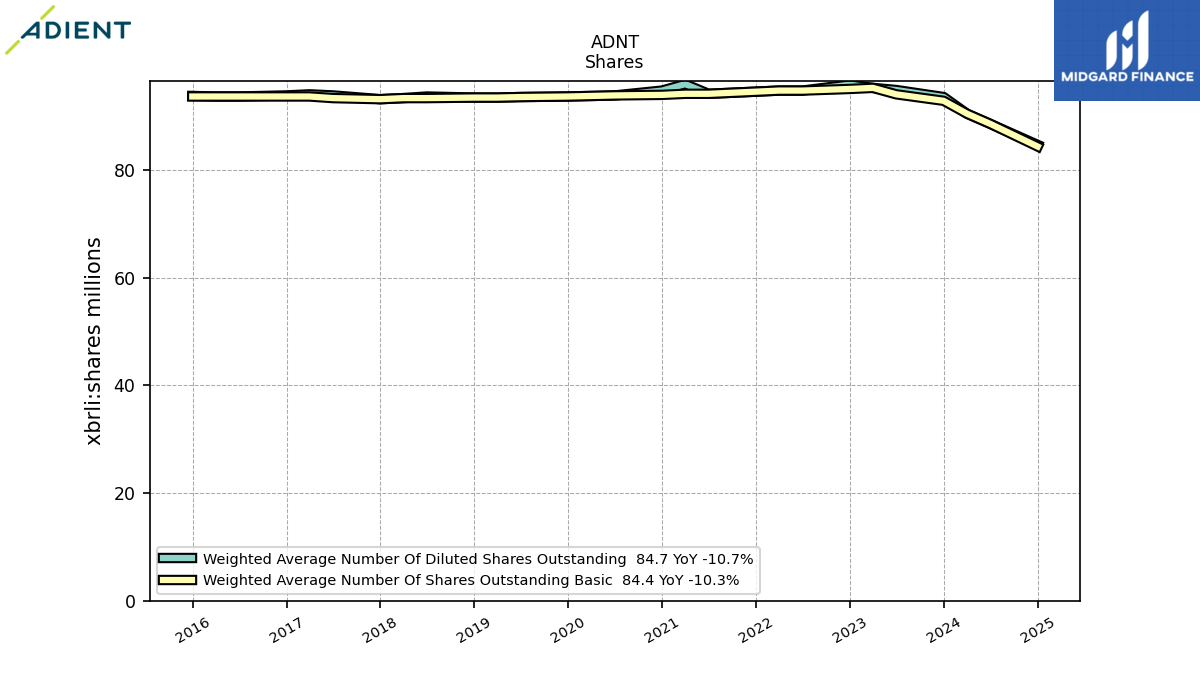
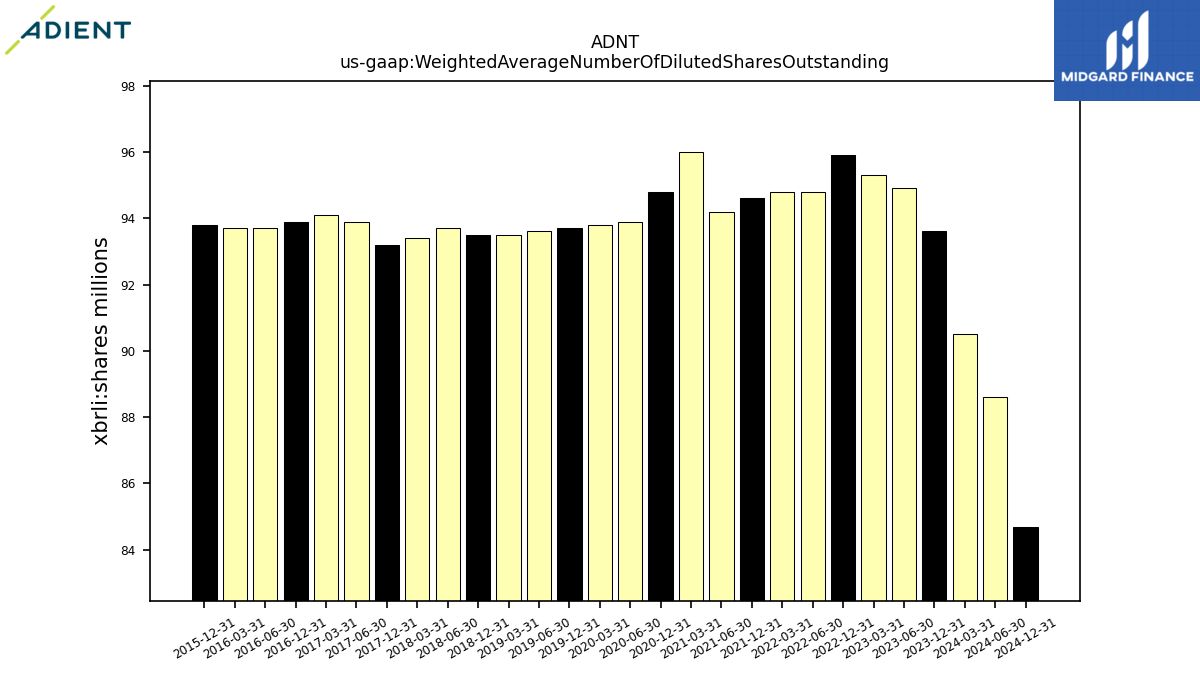
| Weighted Average Number Of Diluted Shares Outstanding | 93.60 | NA | 94.90 | 95.30 | 95.90 | NA | 94.80 | 94.80 | 94.60 | NA | 94.20 | 96.00 | 94.80 | NA | 93.90 | 93.80 | 93.70 | NA | 93.60 | 93.50 | 93.50 | NA | 93.70 | 93.40 | 93.20 | NA | 93.90 | 94.10 | 93.90 | NA | 93.70 | 93.70 | 93.80 | |
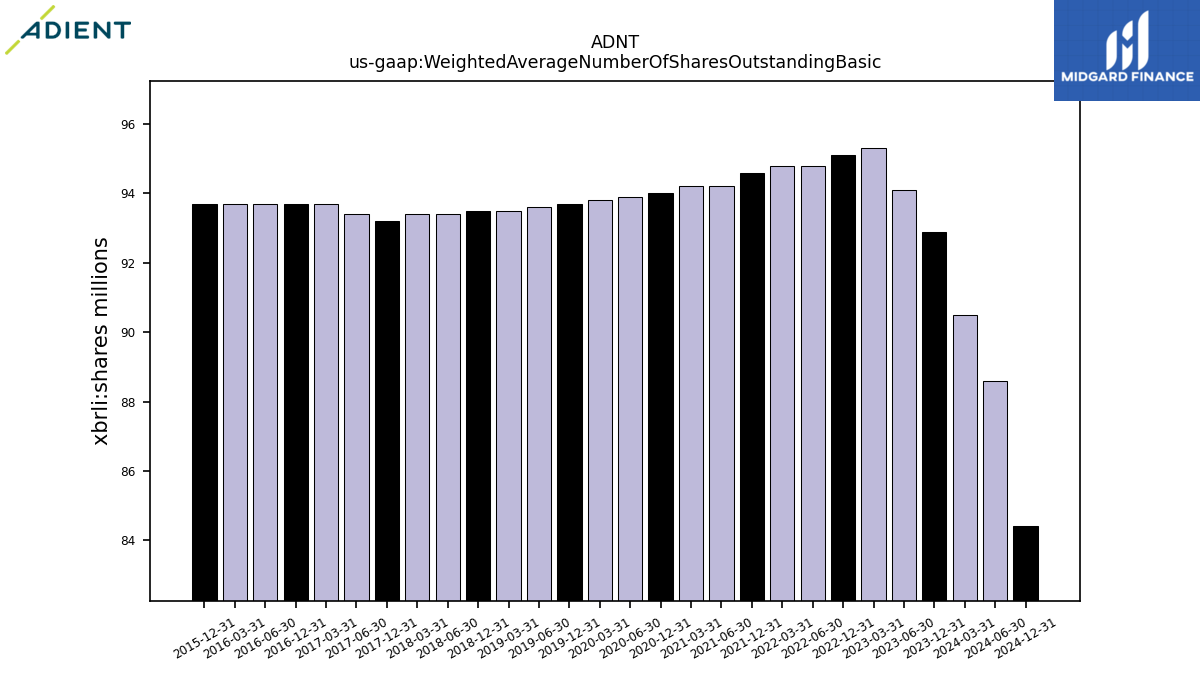
| Weighted Average Number Of Shares Outstanding Basic | 92.90 | NA | 94.10 | 95.30 | 95.10 | NA | 94.80 | 94.80 | 94.60 | NA | 94.20 | 94.20 | 94.00 | NA | 93.90 | 93.80 | 93.70 | NA | 93.60 | 93.50 | 93.50 | NA | 93.40 | 93.40 | 93.20 | NA | 93.40 | 93.70 | 93.70 | NA | 93.70 | 93.70 | 93.70 | |
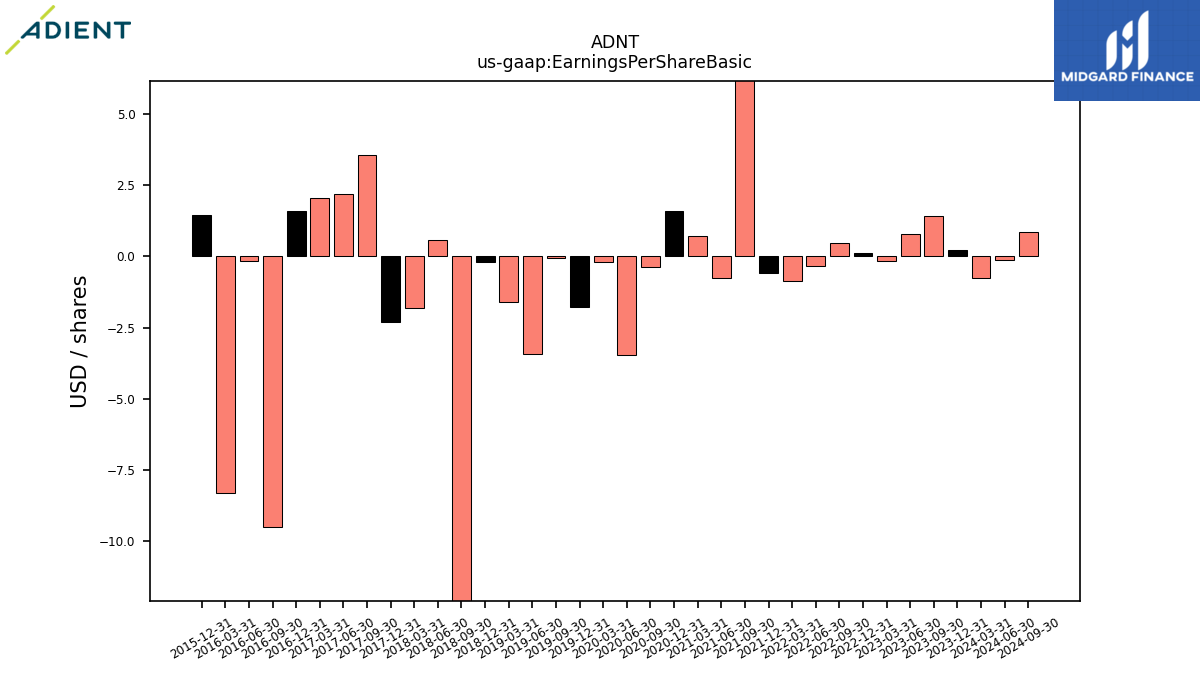
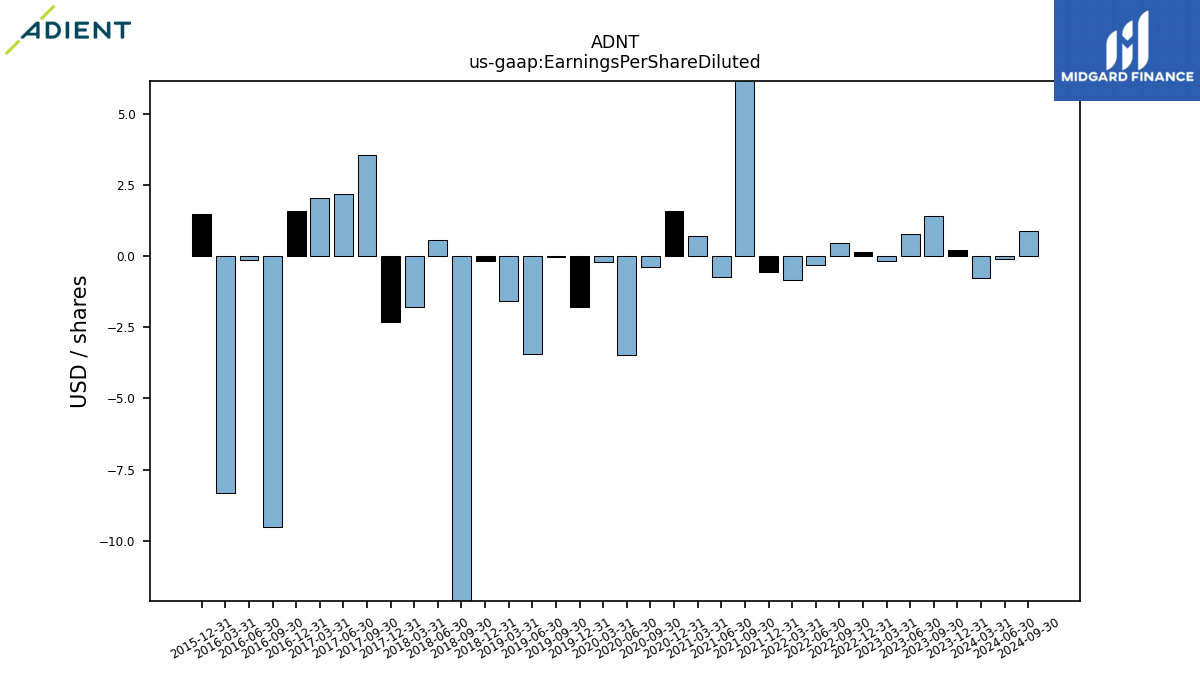
| Earnings Per Share Basic | 0.22 | 1.43 | 0.78 | -0.16 | 0.13 | 0.47 | -0.32 | -0.85 | -0.57 | 10.19 | -0.75 | 0.73 | 1.60 | -0.38 | -3.46 | -0.20 | -1.78 | -0.04 | -3.43 | -1.59 | -0.18 | -14.52 | 0.58 | -1.80 | -2.32 | 3.56 | 2.18 | 2.05 | 1.59 | -9.50 | -0.15 | -8.31 | 1.46 | |
| Earnings Per Share Diluted | 0.21 | 1.42 | 0.77 | -0.16 | 0.13 | 0.47 | -0.32 | -0.85 | -0.57 | 10.03 | -0.75 | 0.72 | 1.58 | -0.38 | -3.46 | -0.20 | -1.78 | -0.04 | -3.43 | -1.59 | -0.18 | -14.52 | 0.58 | -1.80 | -2.32 | 3.54 | 2.17 | 2.04 | 1.59 | -9.50 | -0.15 | -8.31 | 1.46 |
| 2023-12-31 | 2023-09-30 | 2023-06-30 | 2023-03-31 | 2022-12-31 | 2022-09-30 | 2022-06-30 | 2022-03-31 | 2021-12-31 | 2021-09-30 | 2021-06-30 | 2021-03-31 | 2020-12-31 | 2020-09-30 | 2020-06-30 | 2020-03-31 | 2019-12-31 | 2019-09-30 | 2019-06-30 | 2019-03-31 | 2018-12-31 | 2018-09-30 | 2018-06-30 | 2018-03-31 | 2017-12-31 | 2017-09-30 | 2017-06-30 | 2017-03-31 | 2016-12-31 | 2016-09-30 | 2016-06-30 | 2016-03-31 | 2015-12-31 | ||
|---|---|---|---|---|---|---|---|---|---|---|---|---|---|---|---|---|---|---|---|---|---|---|---|---|---|---|---|---|---|---|---|---|---|---|
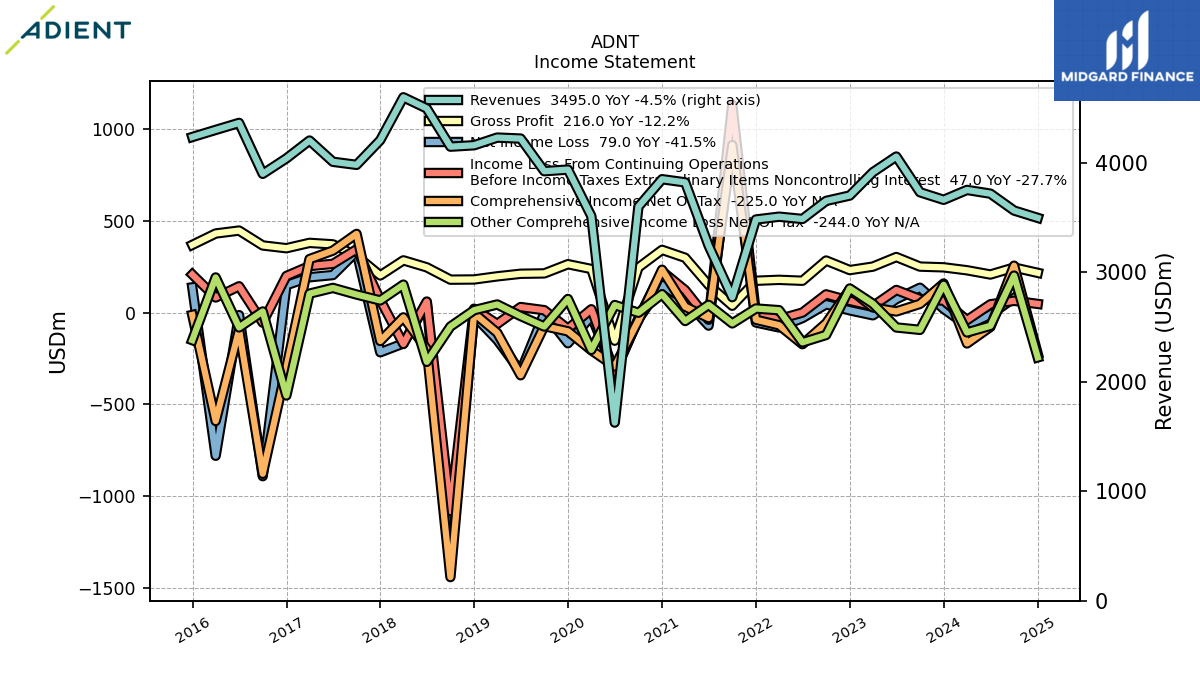
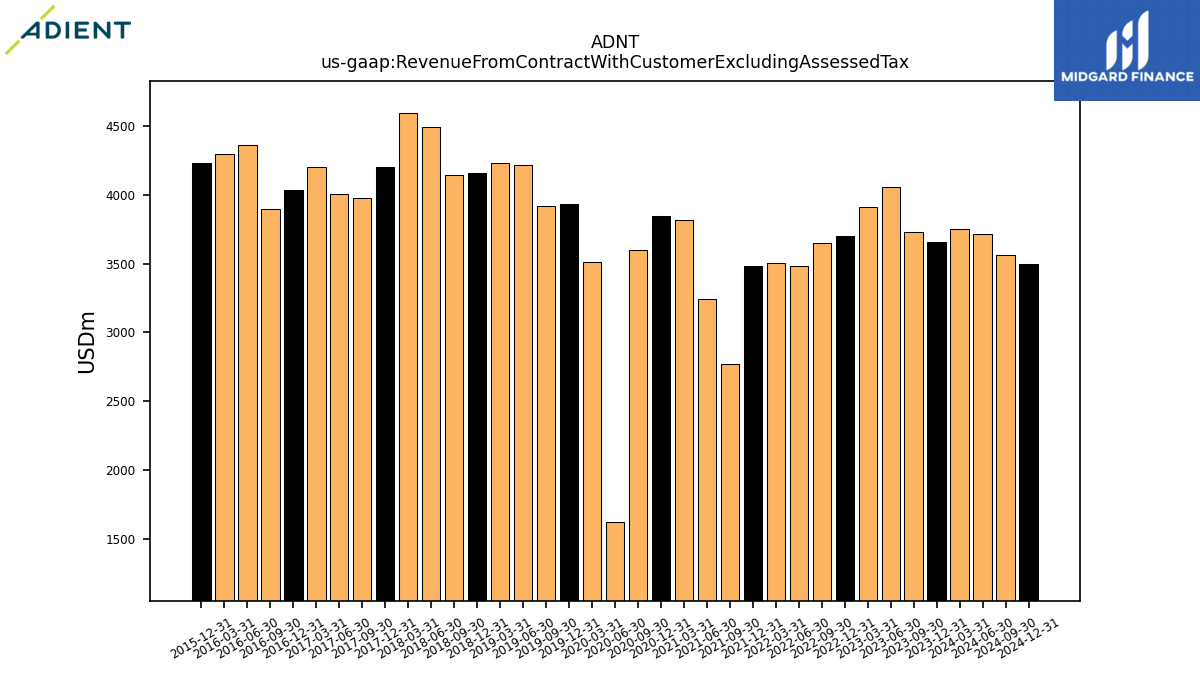
| Revenue From Contract With Customer Excluding Assessed Tax | 3660.00 | 3729.00 | 4055.00 | 3912.00 | 3699.00 | 3650.00 | 3485.00 | 3506.00 | 3480.00 | 2771.00 | 3242.00 | 3819.00 | 3848.00 | 3597.00 | 1626.00 | 3511.00 | 3936.00 | 3921.00 | 4219.00 | 4228.00 | 4158.00 | 4145.00 | 4494.00 | 4596.00 | 4204.00 | 3979.00 | 4007.00 | 4201.00 | 4038.00 | 3897.00 | 4362.00 | 4298.00 | 4233.00 | |
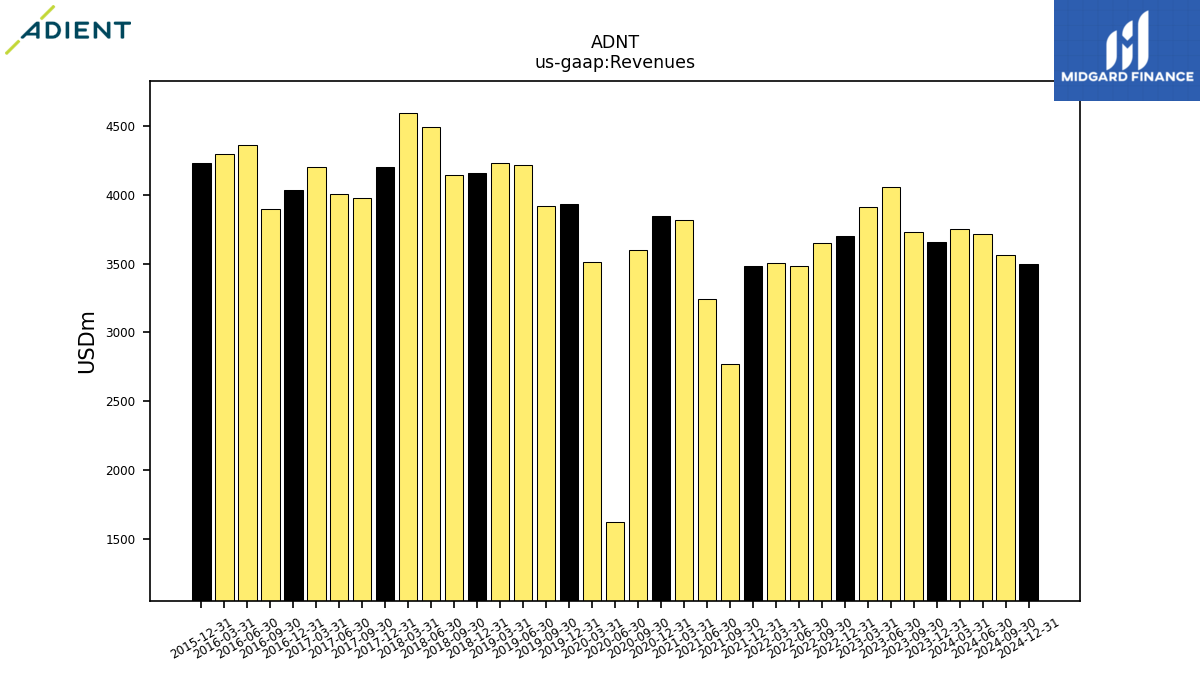
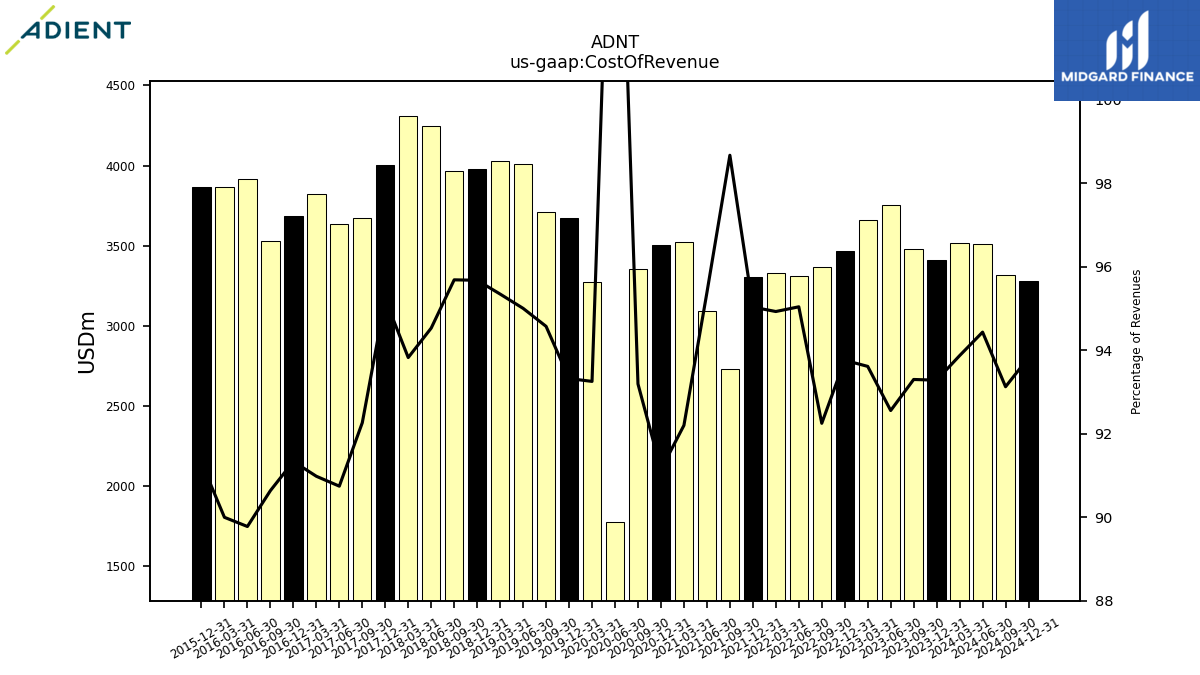
| Revenues | 3660.00 | 3729.00 | 4055.00 | 3912.00 | 3699.00 | 3650.00 | 3485.00 | 3506.00 | 3480.00 | 2771.00 | 3242.00 | 3819.00 | 3848.00 | 3597.00 | 1626.00 | 3511.00 | 3936.00 | 3921.00 | 4219.00 | 4228.00 | 4158.00 | 4145.00 | 4494.00 | 4596.00 | 4204.00 | 3979.00 | 4007.00 | 4201.00 | 4038.00 | 3897.00 | 4362.00 | 4298.00 | 4233.00 | |
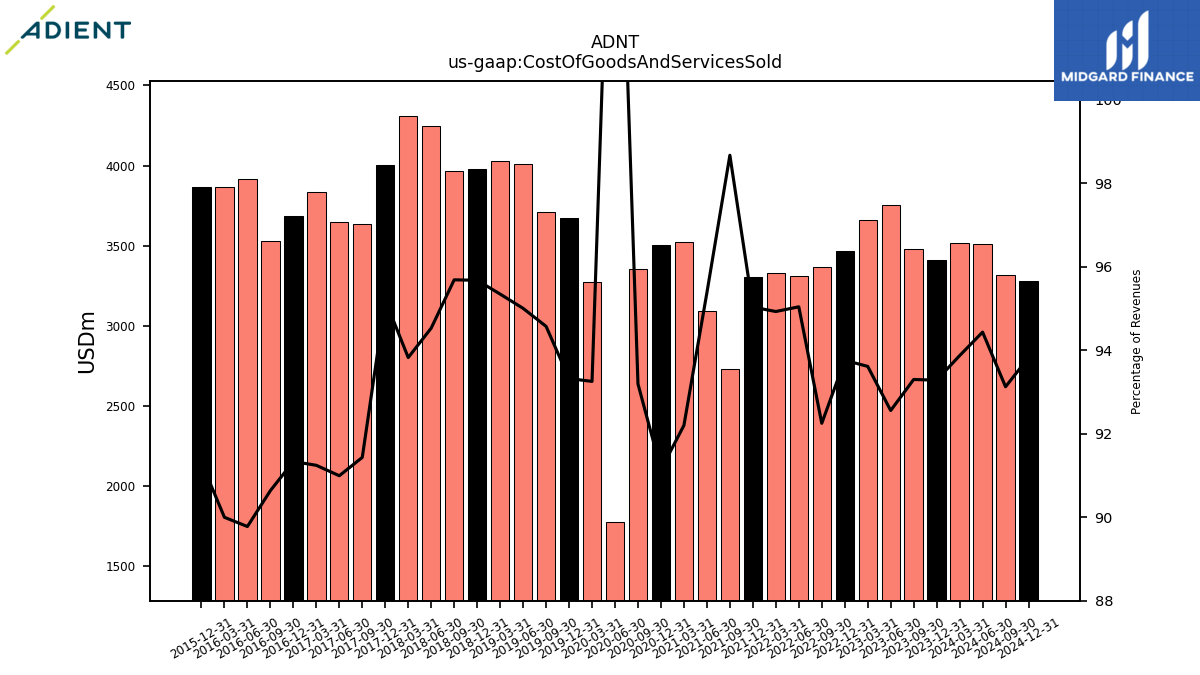
| Cost Of Revenue | 3414.00 | 3479.00 | 3753.00 | 3662.00 | 3468.00 | 3367.00 | 3312.00 | 3328.00 | 3307.00 | 2734.00 | 3092.00 | 3521.00 | 3507.00 | 3352.00 | 1779.00 | 3274.00 | 3673.00 | 3708.00 | 4008.00 | 4031.00 | 3978.00 | 3966.00 | 4248.00 | 4312.00 | 4003.00 | 3671.00 | 3636.00 | 3822.00 | 3688.00 | 3532.00 | 3916.00 | 3868.00 | 3865.00 | |
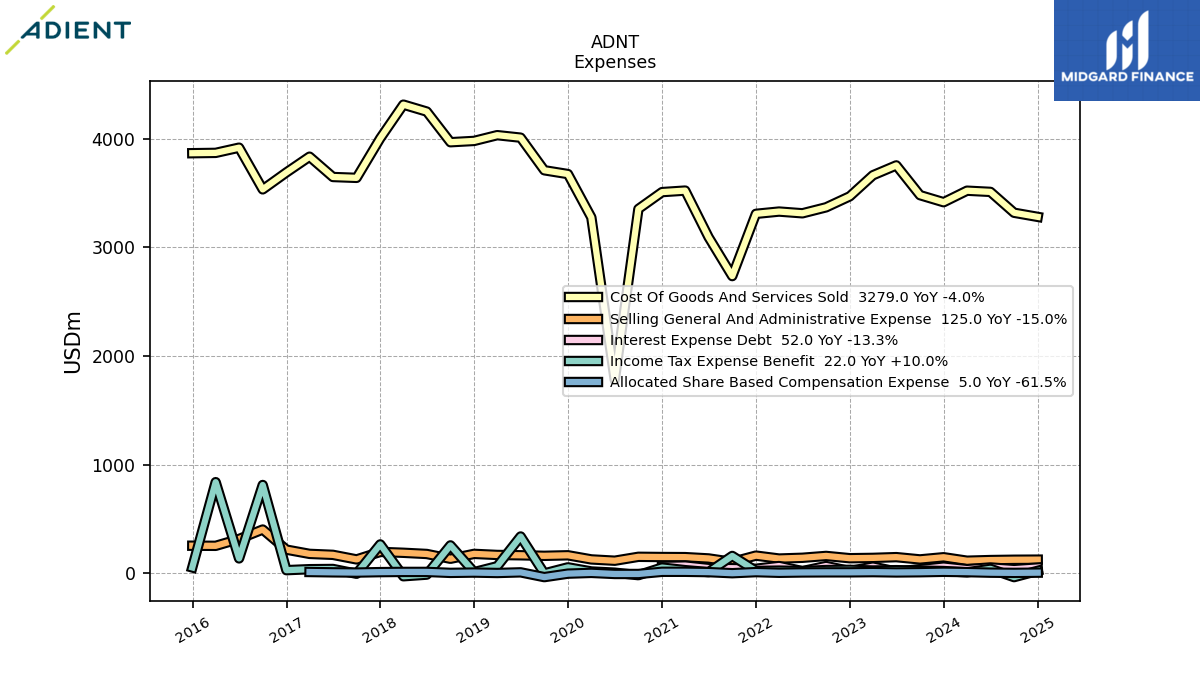
| Cost Of Goods And Services Sold | 3414.00 | 3479.00 | 3753.00 | 3662.00 | 3468.00 | 3367.00 | 3312.00 | 3328.00 | 3307.00 | 2734.00 | 3092.00 | 3521.00 | 3507.00 | 3352.00 | 1779.00 | 3274.00 | 3673.00 | 3708.00 | 4008.00 | 4031.00 | 3978.00 | 3966.00 | 4248.00 | 4312.00 | 4002.00 | 3638.00 | 3646.00 | 3833.00 | 3688.00 | 3532.00 | 3916.00 | 3868.00 | 3865.00 | |
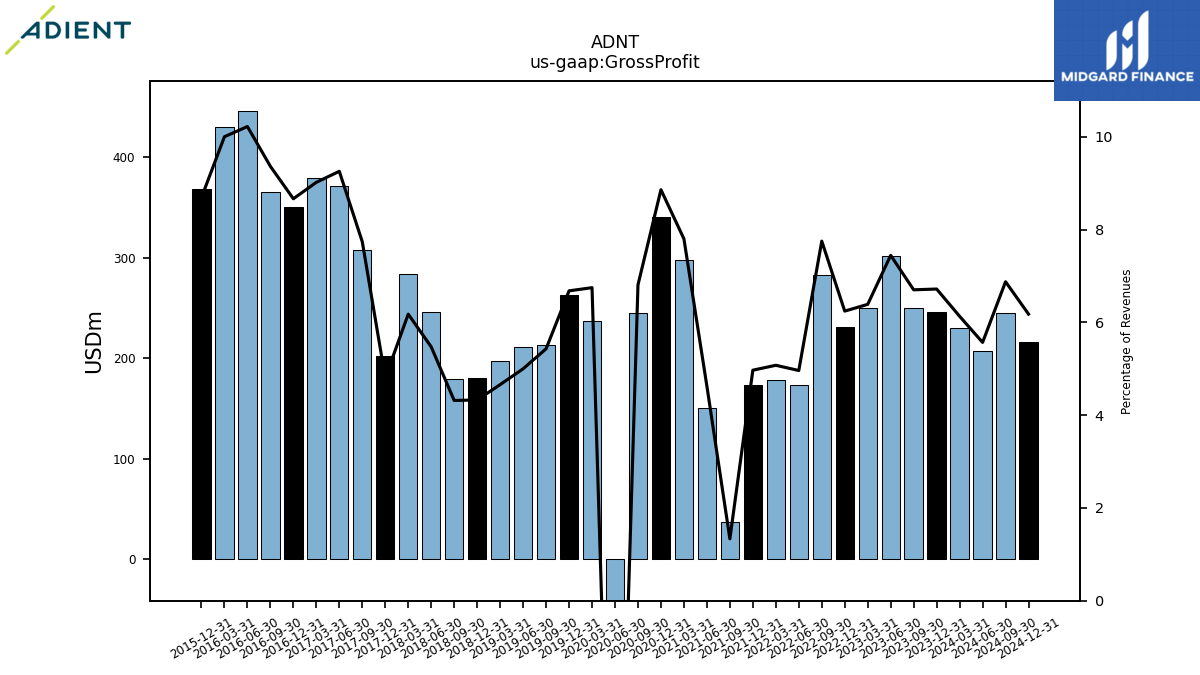
| Gross Profit | 246.00 | 250.00 | 302.00 | 250.00 | 231.00 | 283.00 | 173.00 | 178.00 | 173.00 | 37.00 | 150.00 | 298.00 | 341.00 | 245.00 | -153.00 | 237.00 | 263.00 | 213.00 | 211.00 | 197.00 | 180.00 | 179.00 | 246.00 | 284.00 | 202.00 | 308.00 | 371.00 | 379.00 | 350.00 | 365.00 | 446.00 | 430.00 | 368.00 | |
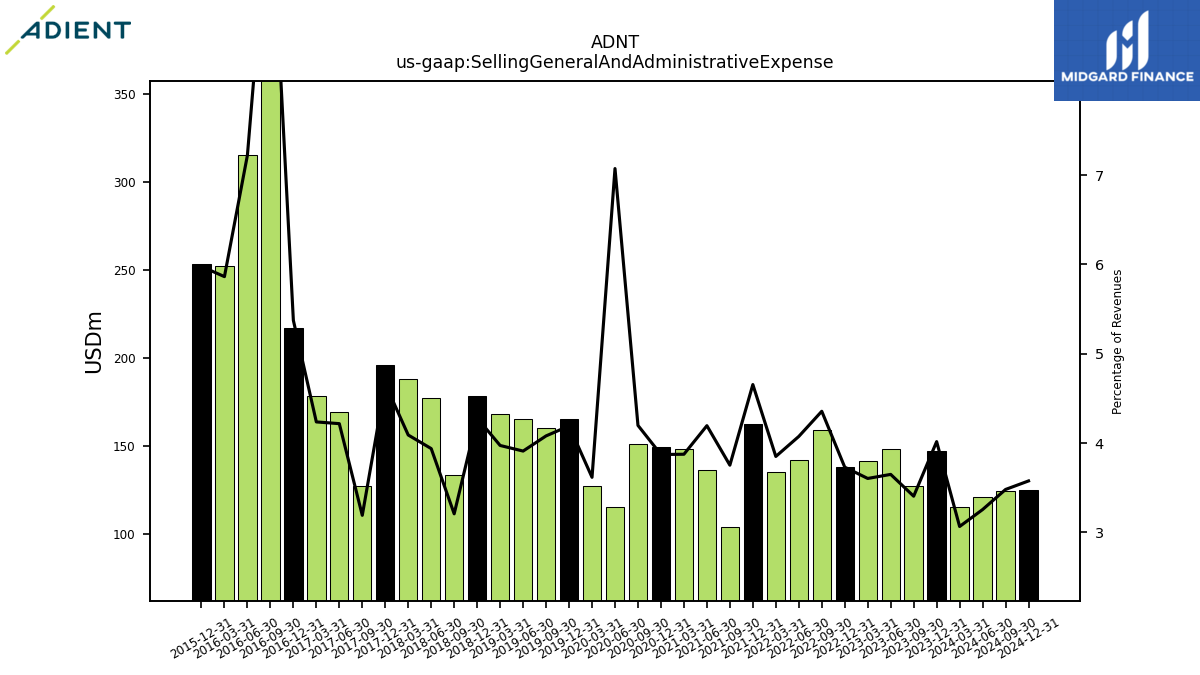
| Selling General And Administrative Expense | 147.00 | 127.00 | 148.00 | 141.00 | 138.00 | 159.00 | 142.00 | 135.00 | 162.00 | 104.00 | 136.00 | 148.00 | 149.00 | 151.00 | 115.00 | 127.00 | 165.00 | 160.00 | 165.00 | 168.00 | 178.00 | 133.00 | 177.00 | 188.00 | 196.00 | 127.00 | 169.00 | 178.00 | 217.00 | 402.00 | 315.00 | 252.00 | 253.00 | |
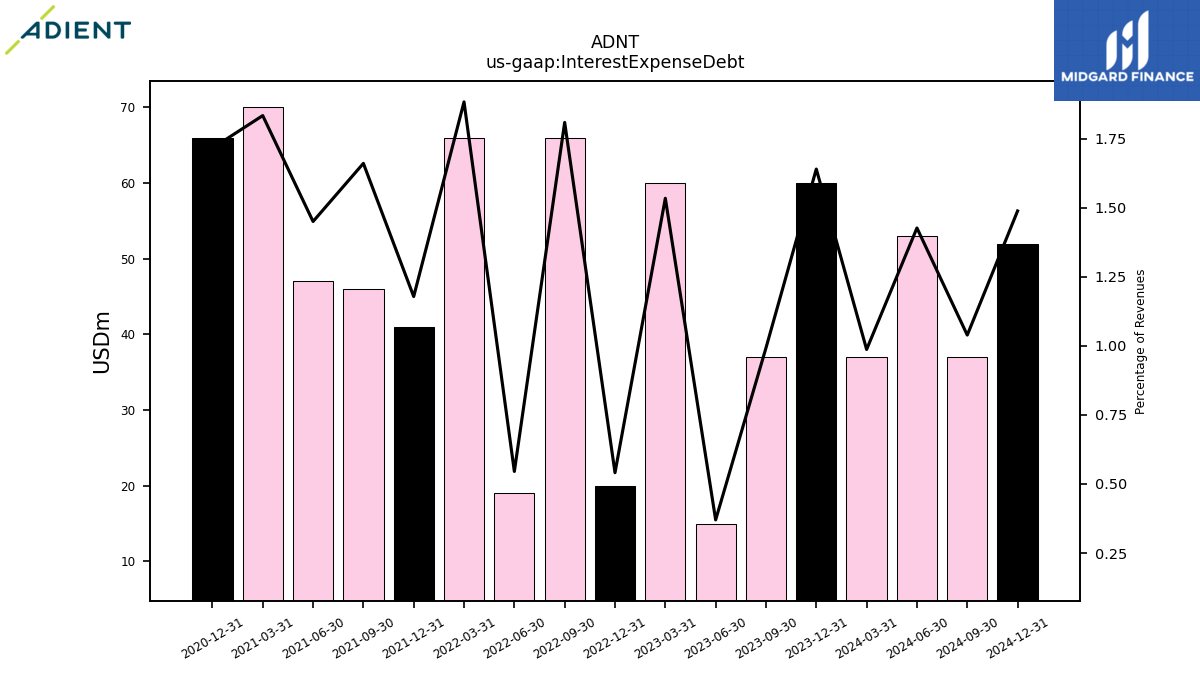
| Interest Expense Debt | 60.00 | 37.00 | 15.00 | 60.00 | 20.00 | 66.00 | 19.00 | 66.00 | 41.00 | 46.00 | 47.00 | 70.00 | 66.00 | NA | NA | NA | NA | NA | NA | NA | NA | NA | NA | NA | NA | NA | NA | NA | NA | NA | NA | NA | NA | |
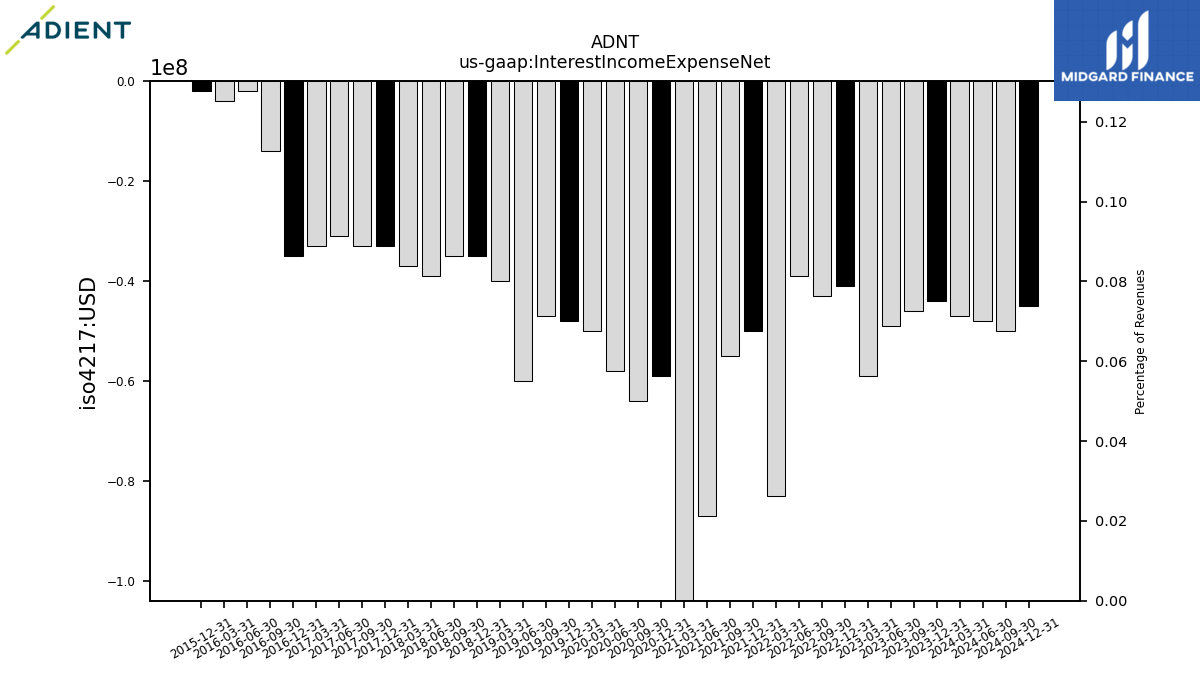
| Interest Income Expense Net | -44.00 | -46.00 | -49.00 | -59.00 | -41.00 | -43.00 | -39.00 | -83.00 | -50.00 | -55.00 | -87.00 | -110.00 | -59.00 | -64.00 | -58.00 | -50.00 | -48.00 | -47.00 | -60.00 | -40.00 | -35.00 | -35.00 | -39.00 | -37.00 | -33.00 | -33.00 | -31.00 | -33.00 | -35.00 | -14.00 | -2.00 | -4.00 | -2.00 | |
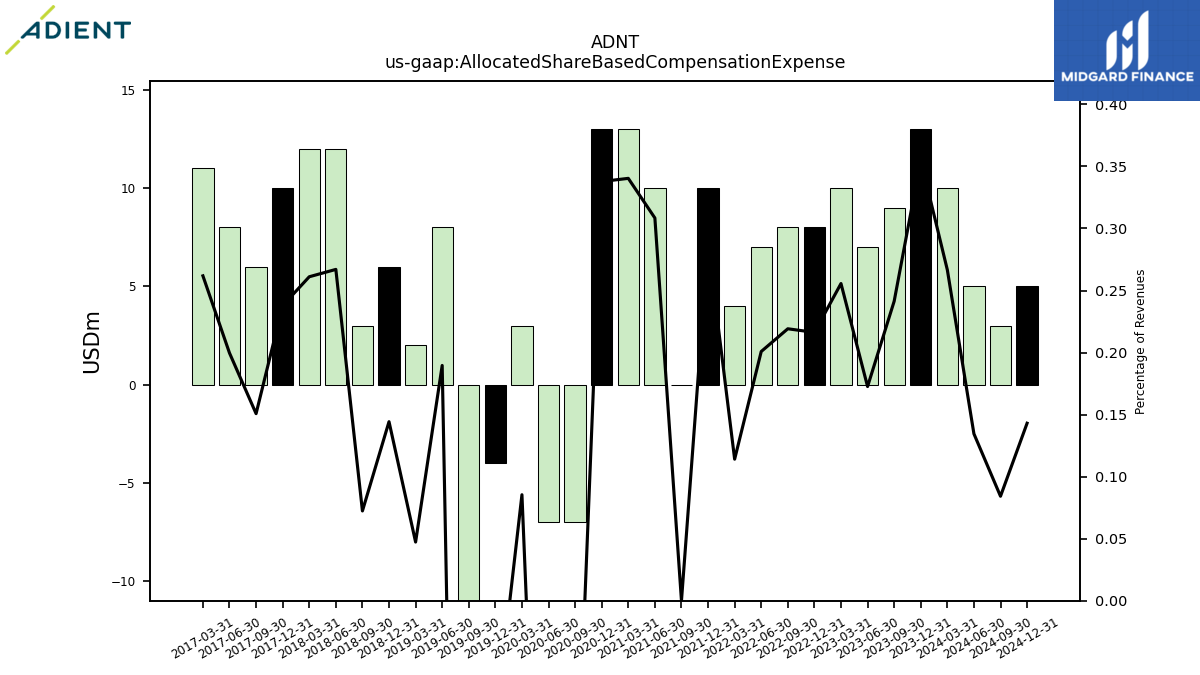
| Allocated Share Based Compensation Expense | 13.00 | 9.00 | 7.00 | 10.00 | 8.00 | 8.00 | 7.00 | 4.00 | 10.00 | 0.00 | 10.00 | 13.00 | 13.00 | -7.00 | -7.00 | 3.00 | -4.00 | -36.00 | 8.00 | 2.00 | 6.00 | 3.00 | 12.00 | 12.00 | 10.00 | 6.00 | 8.00 | 11.00 | NA | NA | NA | NA | NA | |
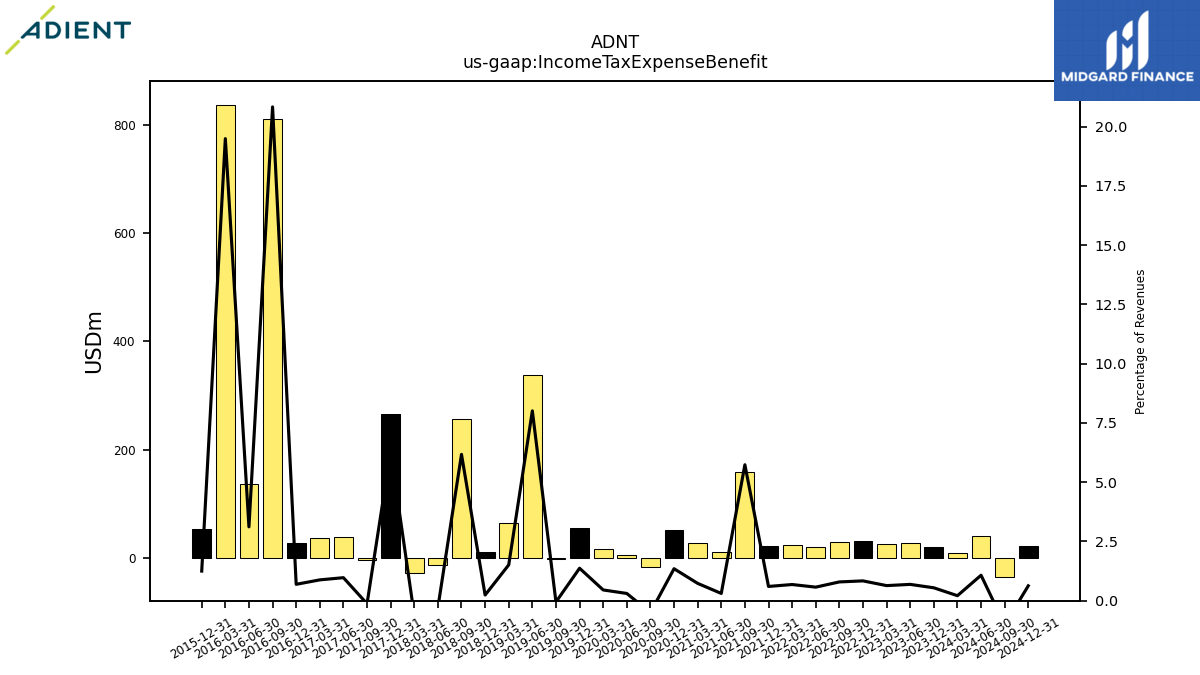
| Income Tax Expense Benefit | 20.00 | NA | 28.00 | 25.00 | 31.00 | 29.00 | 20.00 | 24.00 | 21.00 | 159.00 | 10.00 | 28.00 | 52.00 | -18.00 | 5.00 | 16.00 | 54.00 | -2.00 | 338.00 | 64.00 | 10.00 | 256.00 | -13.00 | -28.00 | 265.00 | -5.00 | 39.00 | 37.00 | 28.00 | 812.00 | 136.00 | 838.00 | 53.00 | |
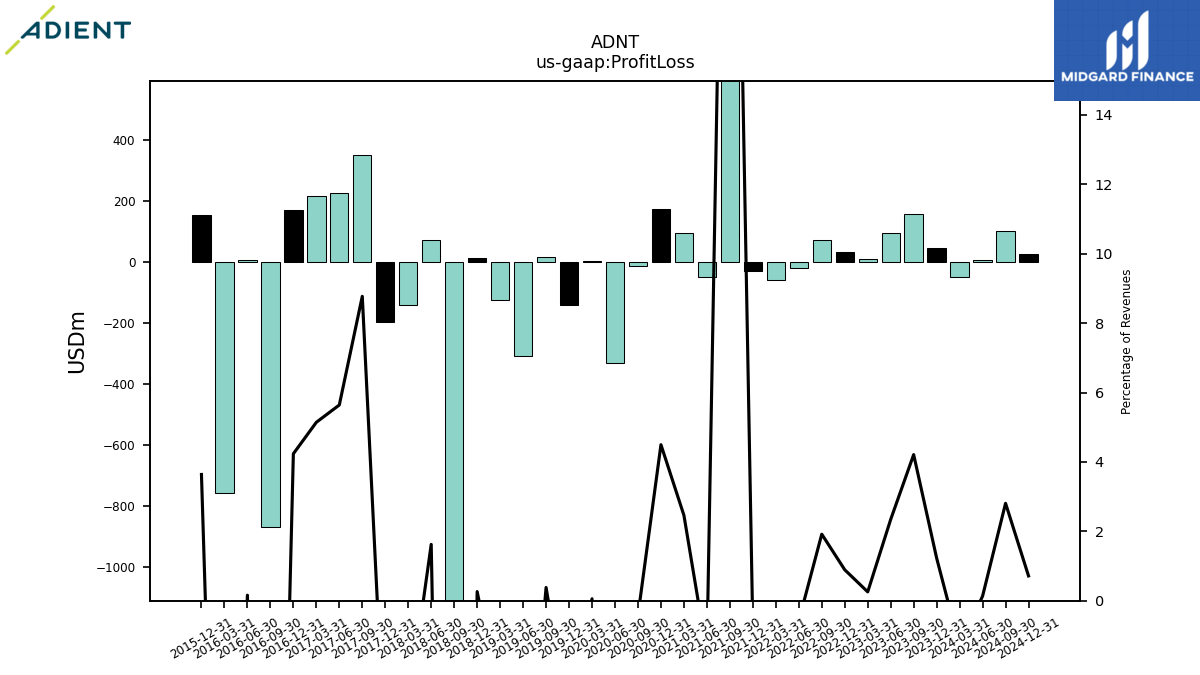
| Profit Loss | 45.00 | 157.00 | 95.00 | 10.00 | 33.00 | 70.00 | -20.00 | -60.00 | -30.00 | 972.00 | -49.00 | 94.00 | 173.00 | -15.00 | -331.00 | 2.00 | -142.00 | 15.00 | -308.00 | -126.00 | 11.00 | -1335.00 | 73.00 | -143.00 | -196.00 | 349.00 | 226.00 | 216.00 | 171.00 | -867.00 | 7.00 | -756.00 | 154.00 | |
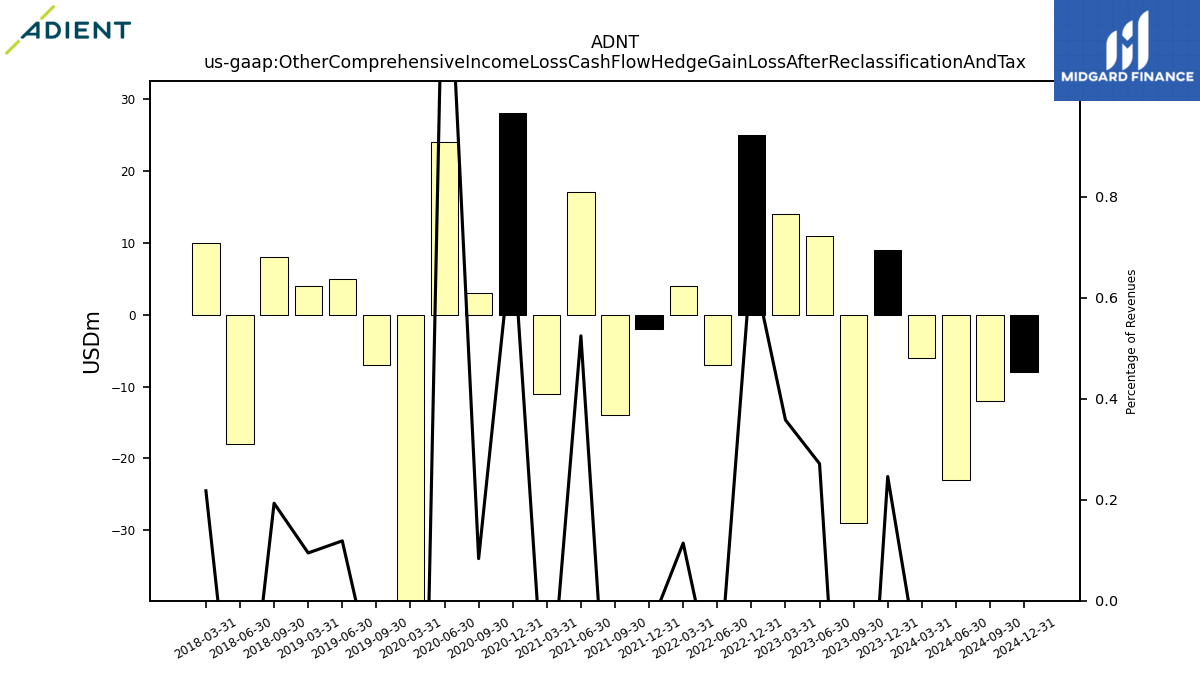
| Other Comprehensive Income Loss Cash Flow Hedge Gain Loss After Reclassification And Tax | 9.00 | -29.00 | 11.00 | 14.00 | 25.00 | NA | -7.00 | 4.00 | -2.00 | -14.00 | 17.00 | -11.00 | 28.00 | 3.00 | 24.00 | -62.00 | NA | -7.00 | 5.00 | 4.00 | NA | 8.00 | -18.00 | 10.00 | NA | NA | NA | NA | NA | NA | NA | NA | NA | |
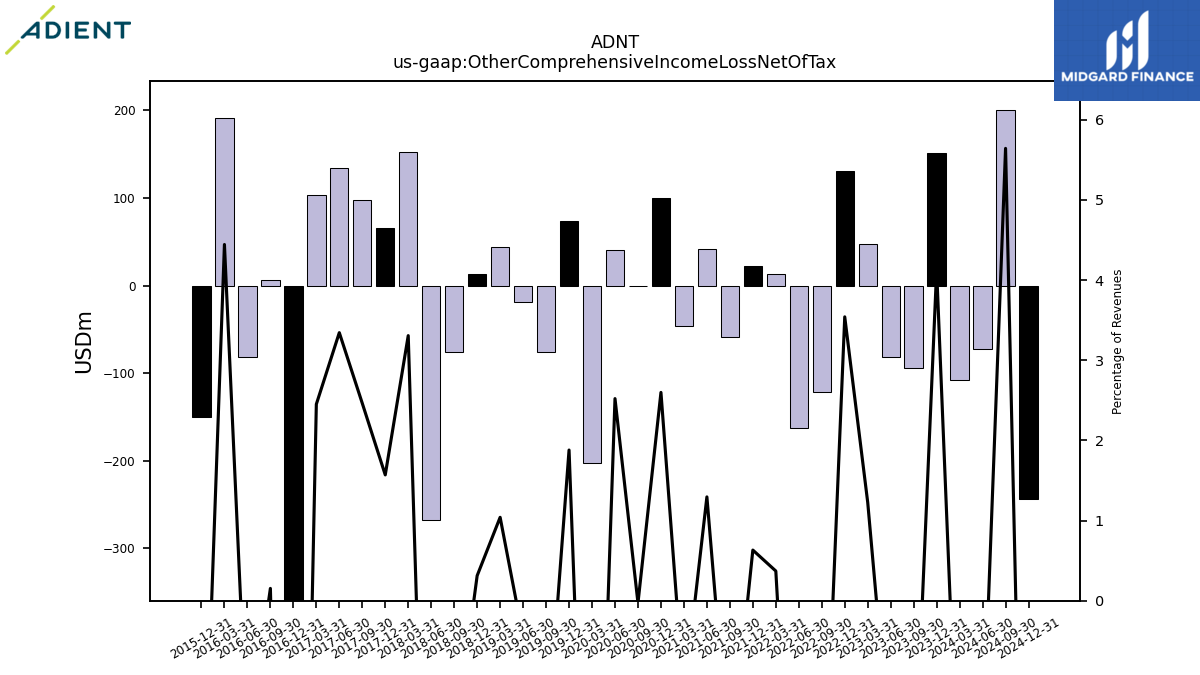
| Other Comprehensive Income Loss Net Of Tax | 151.00 | -94.00 | -81.00 | 48.00 | 131.00 | -122.00 | -162.00 | 13.00 | 22.00 | -59.00 | 42.00 | -46.00 | 100.00 | -1.00 | 41.00 | -203.00 | 74.00 | -76.00 | -19.00 | 44.00 | 13.00 | -76.00 | -268.00 | 152.00 | 66.00 | 98.00 | 134.00 | 103.00 | -451.00 | 6.00 | -81.00 | 191.00 | -150.00 | |
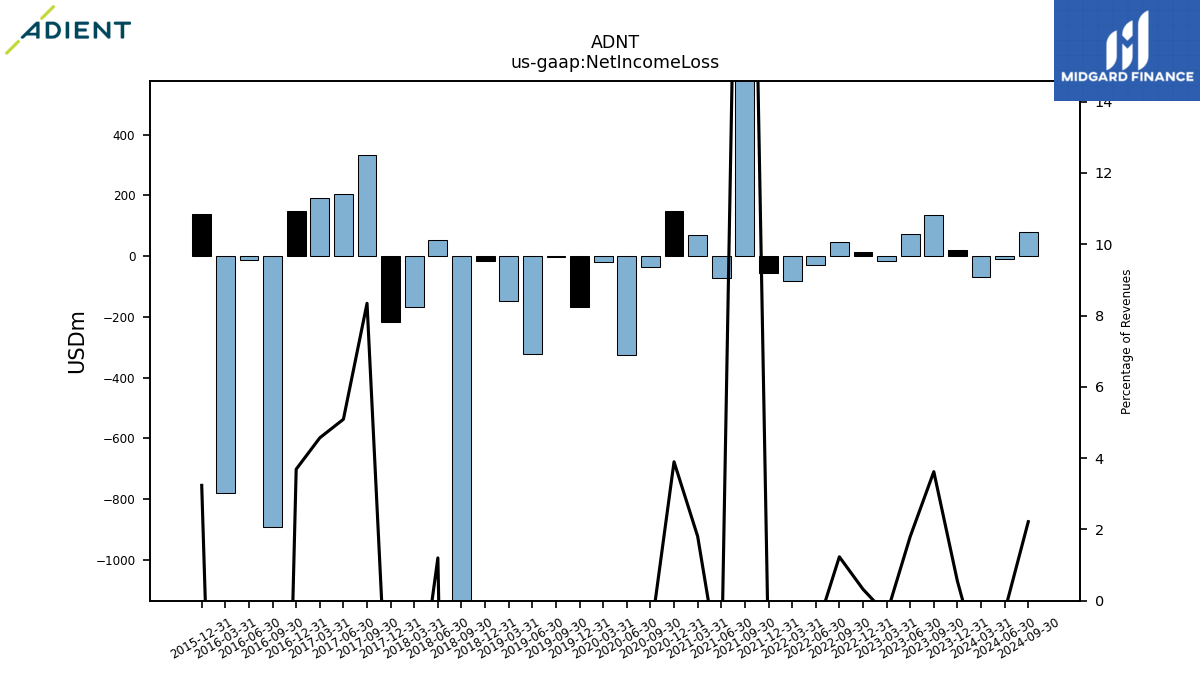
| Net Income Loss | 20.00 | 135.00 | 73.00 | -15.00 | 12.00 | 45.00 | -30.00 | -81.00 | -54.00 | 960.00 | -71.00 | 69.00 | 150.00 | -36.00 | -325.00 | -19.00 | -167.00 | -4.00 | -321.00 | -149.00 | -17.00 | -1355.00 | 54.00 | -168.00 | -216.00 | 332.00 | 204.00 | 192.00 | 149.00 | -890.00 | -14.00 | -779.00 | 137.00 | |
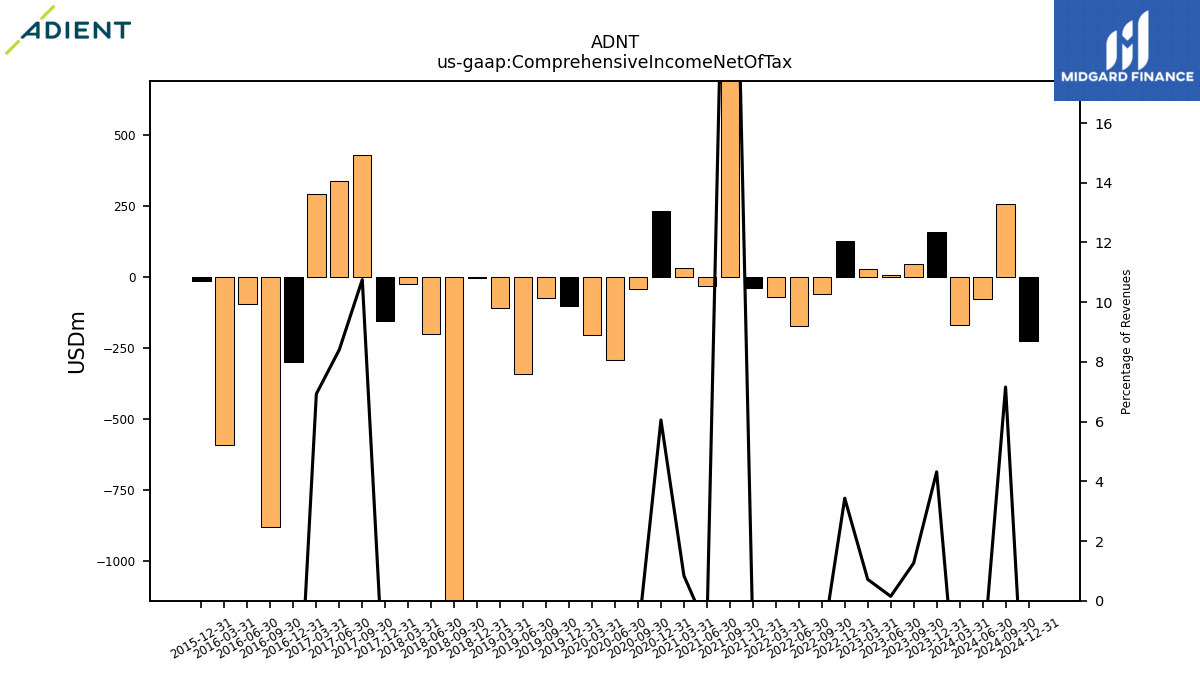
| Comprehensive Income Net Of Tax | 158.00 | 47.00 | 6.00 | 28.00 | 127.00 | -58.00 | -172.00 | -69.00 | -39.00 | 911.00 | -30.00 | 32.00 | 233.00 | -43.00 | -293.00 | -205.00 | -102.00 | -74.00 | -341.00 | -110.00 | -4.00 | -1439.00 | -199.00 | -26.00 | -155.00 | 428.00 | 337.00 | 291.00 | -300.00 | -877.00 | -95.00 | -590.00 | -13.00 |
| 2023-12-31 | 2023-09-30 | 2023-06-30 | 2023-03-31 | 2022-12-31 | 2022-09-30 | 2022-06-30 | 2022-03-31 | 2021-12-31 | 2021-09-30 | 2021-06-30 | 2021-03-31 | 2020-12-31 | 2020-09-30 | 2020-06-30 | 2020-03-31 | 2019-12-31 | 2019-09-30 | 2019-06-30 | 2019-03-31 | 2018-12-31 | 2018-09-30 | 2018-06-30 | 2018-03-31 | 2017-12-31 | 2017-09-30 | 2017-06-30 | 2017-03-31 | 2016-12-31 | 2016-09-30 | 2016-06-30 | 2016-03-31 | 2015-12-31 | ||
|---|---|---|---|---|---|---|---|---|---|---|---|---|---|---|---|---|---|---|---|---|---|---|---|---|---|---|---|---|---|---|---|---|---|---|
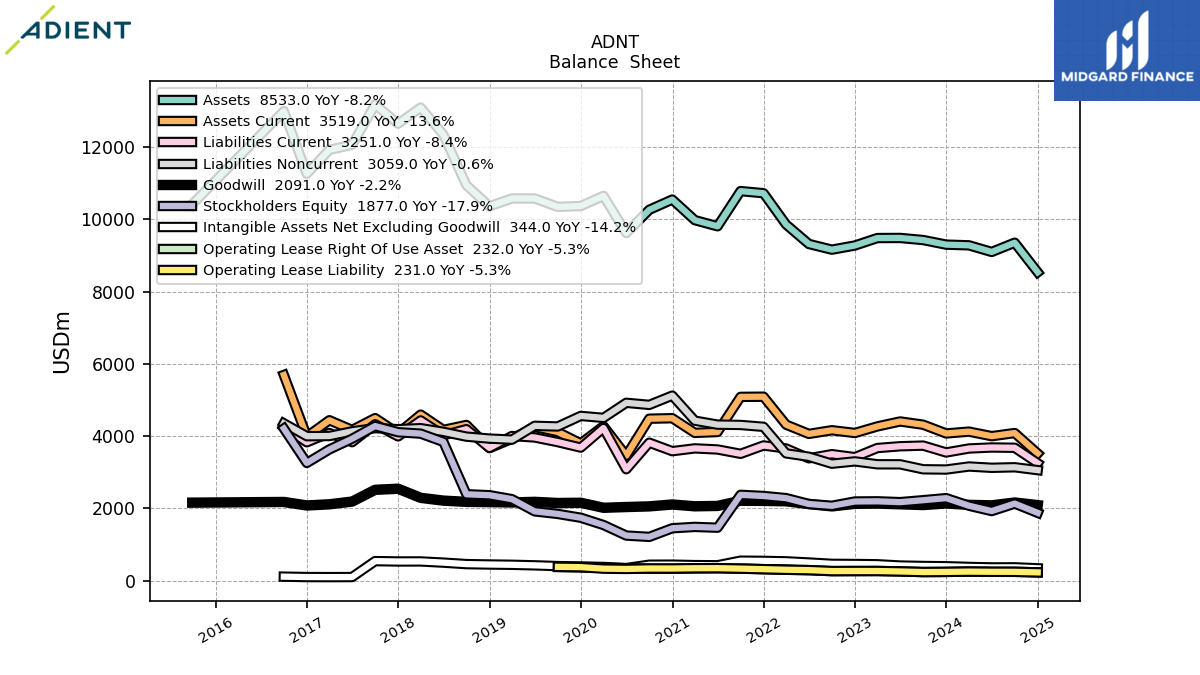
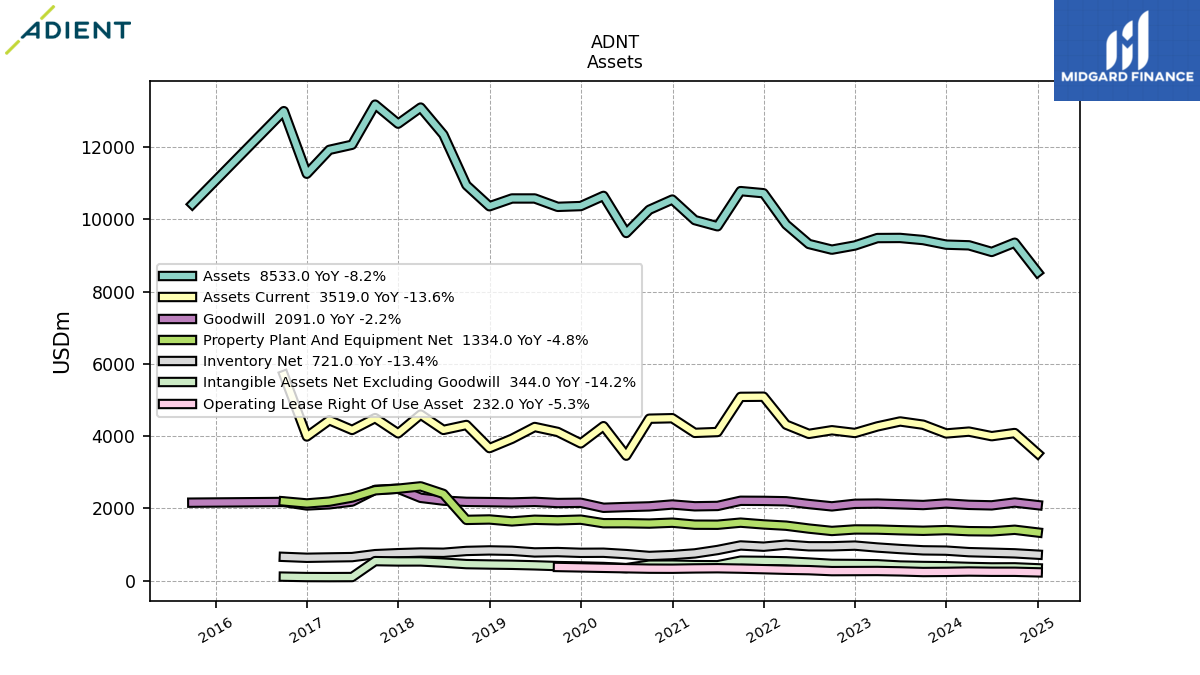
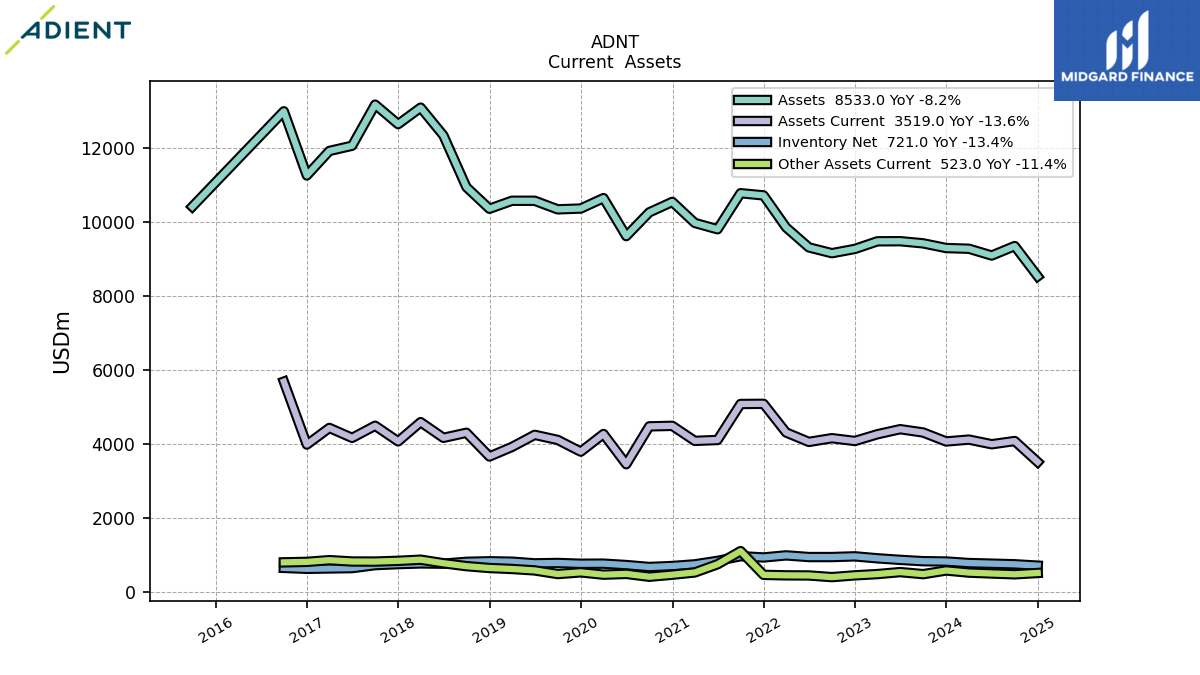
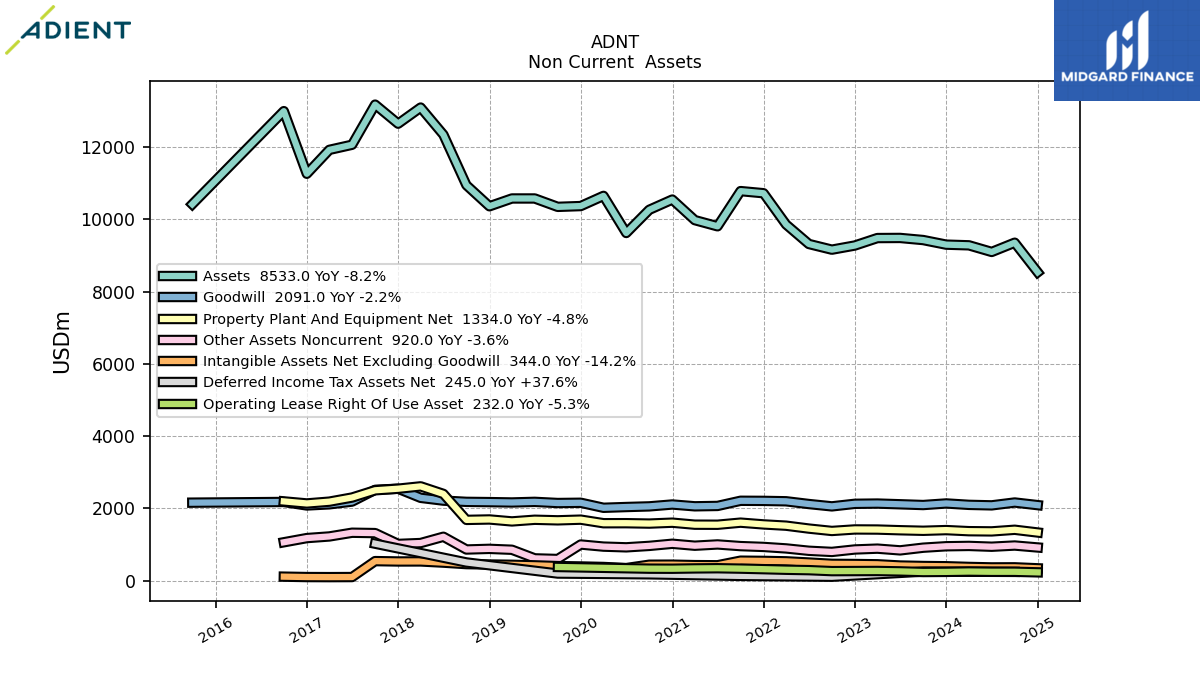
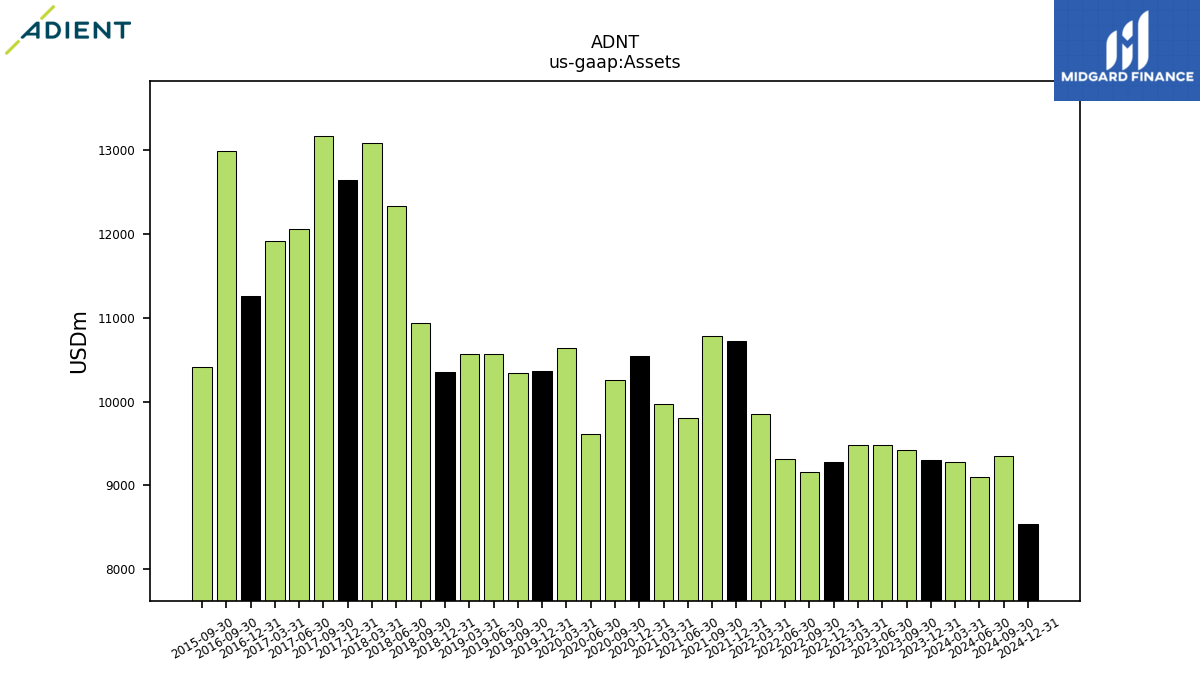
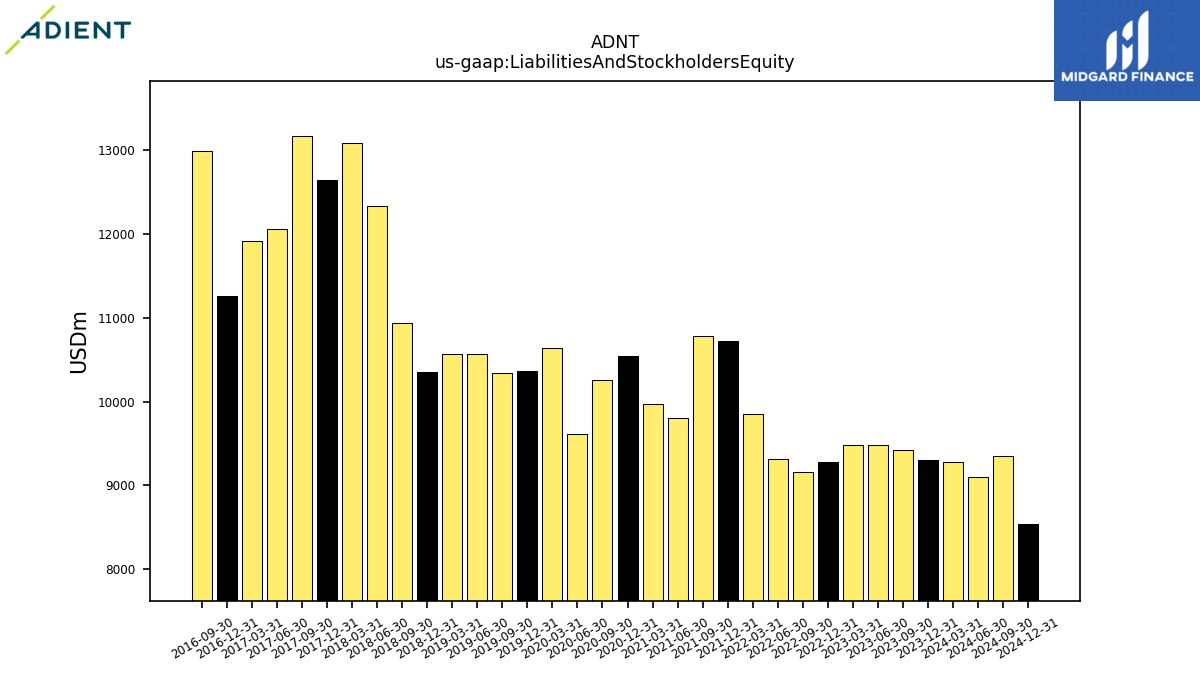
| Assets | 9297.00 | 9424.00 | 9482.00 | 9479.00 | 9273.00 | 9158.00 | 9315.00 | 9854.00 | 10719.00 | 10778.00 | 9804.00 | 9975.00 | 10544.00 | 10261.00 | 9619.00 | 10646.00 | 10364.00 | 10342.00 | 10574.00 | 10574.00 | 10358.00 | 10942.00 | 12338.00 | 13089.00 | 12643.00 | 13170.00 | 12060.00 | 11919.00 | 11257.00 | 12990.00 | NA | NA | NA | |
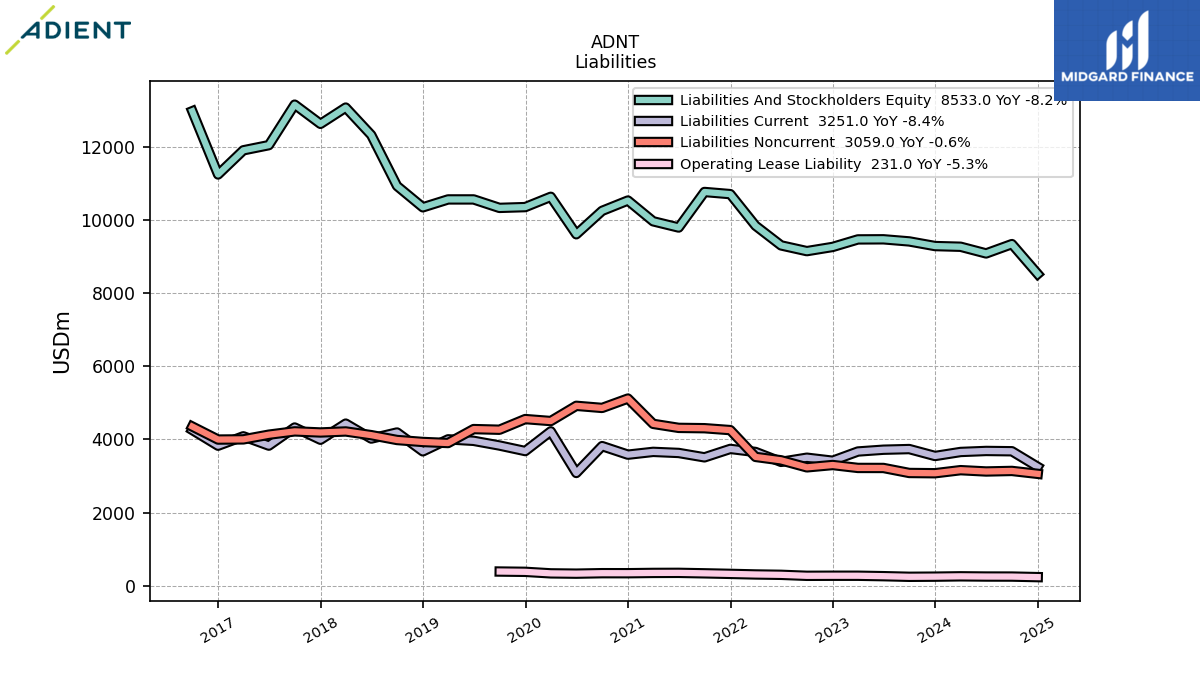
| Liabilities And Stockholders Equity | 9297.00 | 9424.00 | 9482.00 | 9479.00 | 9273.00 | 9158.00 | 9315.00 | 9854.00 | 10719.00 | 10778.00 | 9804.00 | 9975.00 | 10544.00 | 10261.00 | 9619.00 | 10646.00 | 10364.00 | 10342.00 | 10574.00 | 10574.00 | 10358.00 | 10942.00 | 12338.00 | 13089.00 | 12643.00 | 13170.00 | 12060.00 | 11919.00 | 11257.00 | 12990.00 | NA | NA | NA | |
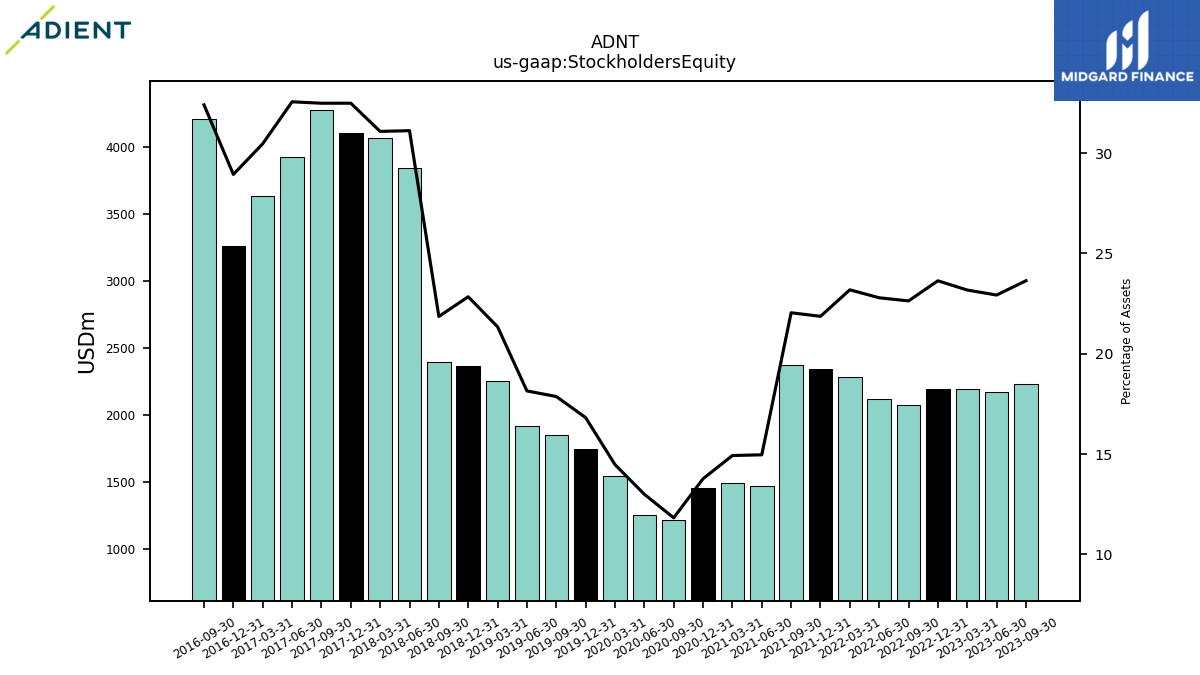
| Stockholders Equity | 2285.00 | 2228.00 | 2174.00 | 2197.00 | 2192.00 | 2073.00 | 2123.00 | 2285.00 | 2344.00 | 2376.00 | 1467.00 | 1489.00 | 1452.00 | 1213.00 | 1250.00 | 1541.00 | 1743.00 | 1848.00 | 1919.00 | 2257.00 | 2366.00 | 2392.00 | 3840.00 | 4069.00 | 4108.00 | 4279.00 | 3927.00 | 3632.00 | 3258.00 | 4210.00 | NA | NA | NA |
| 2023-12-31 | 2023-09-30 | 2023-06-30 | 2023-03-31 | 2022-12-31 | 2022-09-30 | 2022-06-30 | 2022-03-31 | 2021-12-31 | 2021-09-30 | 2021-06-30 | 2021-03-31 | 2020-12-31 | 2020-09-30 | 2020-06-30 | 2020-03-31 | 2019-12-31 | 2019-09-30 | 2019-06-30 | 2019-03-31 | 2018-12-31 | 2018-09-30 | 2018-06-30 | 2018-03-31 | 2017-12-31 | 2017-09-30 | 2017-06-30 | 2017-03-31 | 2016-12-31 | 2016-09-30 | 2016-06-30 | 2016-03-31 | 2015-12-31 | ||
|---|---|---|---|---|---|---|---|---|---|---|---|---|---|---|---|---|---|---|---|---|---|---|---|---|---|---|---|---|---|---|---|---|---|---|
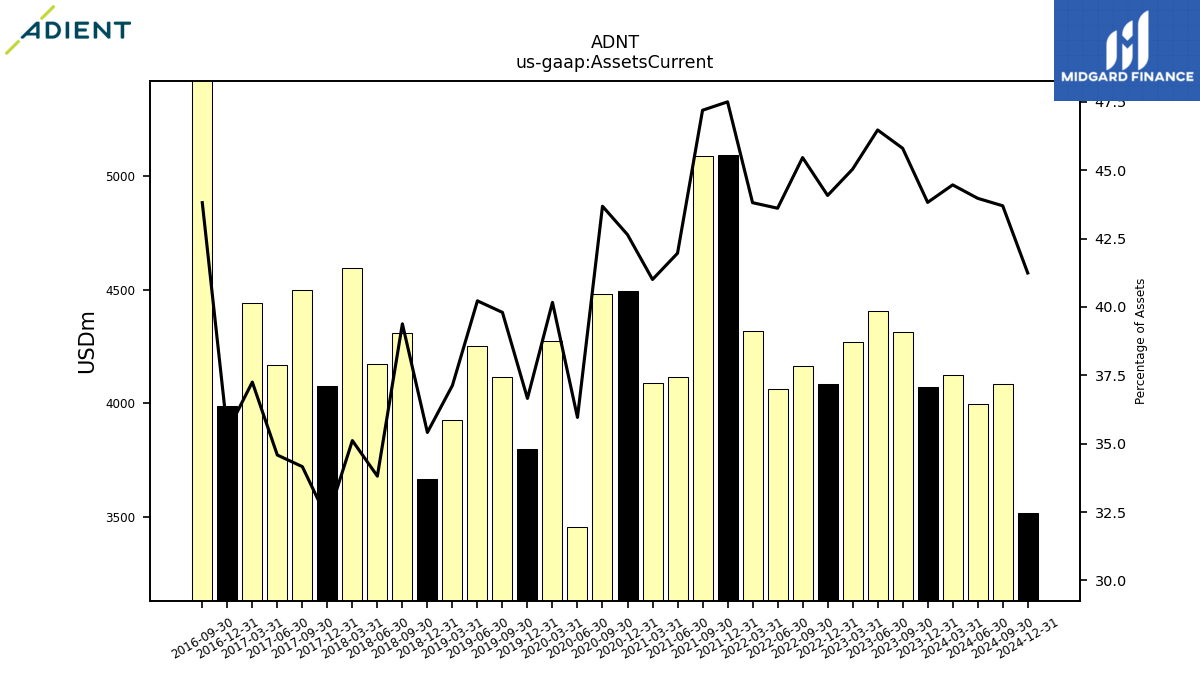
| Assets Current | 4074.00 | 4316.00 | 4406.00 | 4269.00 | 4087.00 | 4163.00 | 4062.00 | 4317.00 | 5091.00 | 5086.00 | 4114.00 | 4090.00 | 4496.00 | 4482.00 | 3459.00 | 4276.00 | 3799.00 | 4116.00 | 4253.00 | 3926.00 | 3668.00 | 4309.00 | 4172.00 | 4596.00 | 4077.00 | 4499.00 | 4171.00 | 4440.00 | 3990.00 | 5691.00 | NA | NA | NA | |
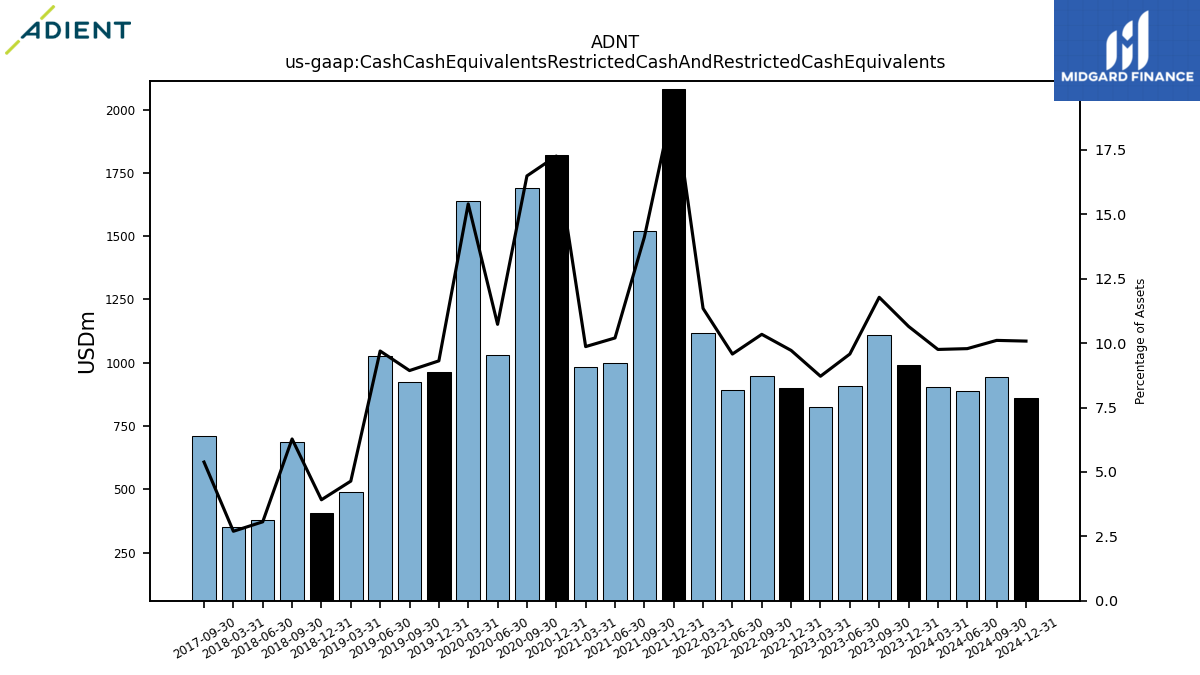
| Cash Cash Equivalents Restricted Cash And Restricted Cash Equivalents | 990.00 | 1110.00 | 908.00 | 826.00 | 901.00 | 947.00 | 892.00 | 1118.00 | 2080.00 | 1521.00 | 1000.00 | 984.00 | 1820.00 | 1692.00 | 1032.00 | 1640.00 | 965.00 | 924.00 | 1025.00 | 491.00 | 406.00 | 687.00 | 378.00 | 353.00 | NA | 709.00 | NA | NA | NA | NA | NA | NA | NA | |
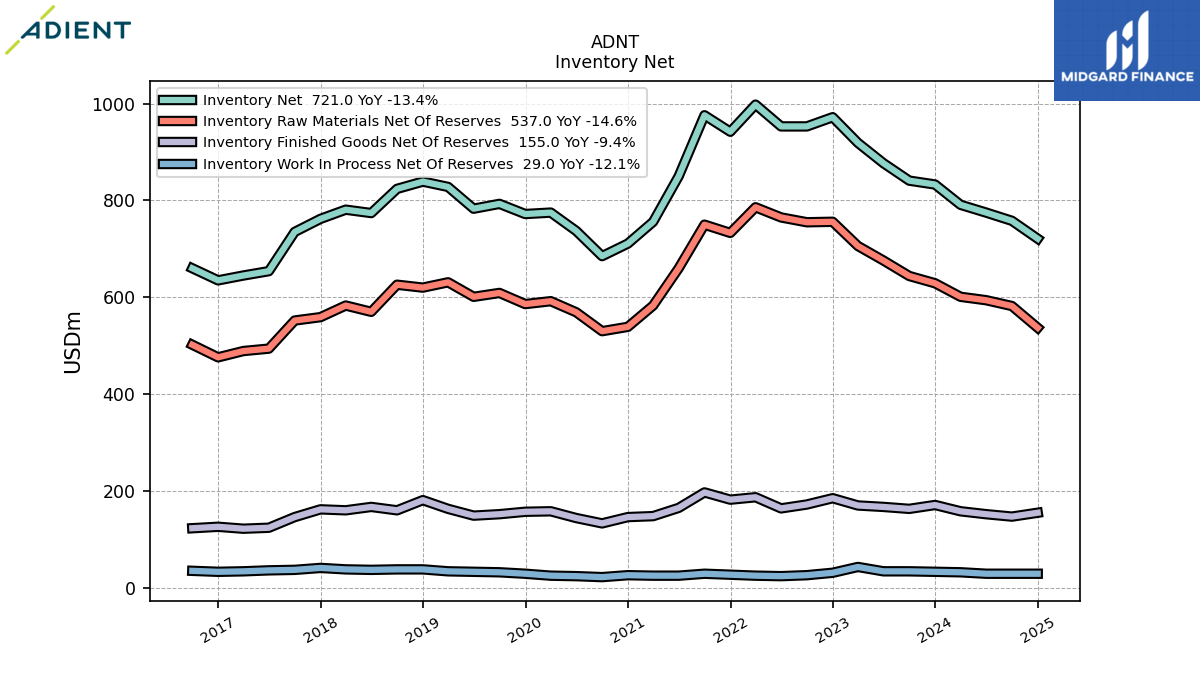
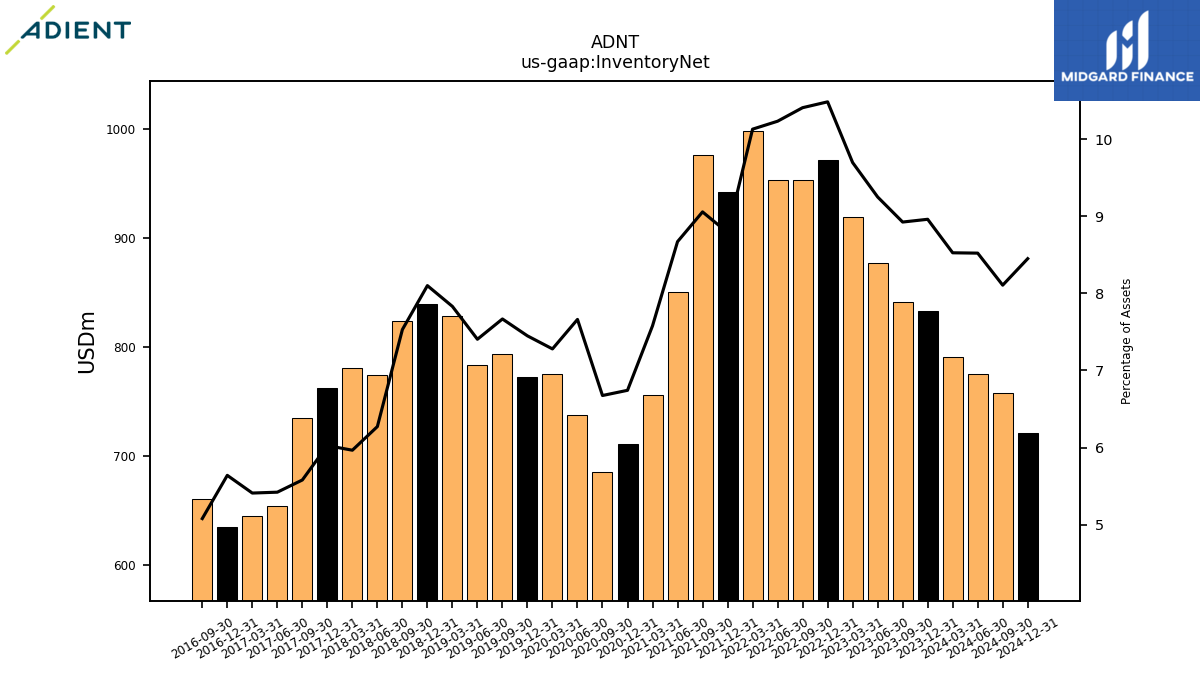
| Inventory Net | 833.00 | 841.00 | 877.00 | 919.00 | 972.00 | 953.00 | 953.00 | 998.00 | 942.00 | 976.00 | 850.00 | 756.00 | 711.00 | 685.00 | 737.00 | 775.00 | 772.00 | 793.00 | 783.00 | 828.00 | 839.00 | 824.00 | 774.00 | 781.00 | 762.00 | 735.00 | 654.00 | 645.00 | 635.00 | 660.00 | NA | NA | NA | |
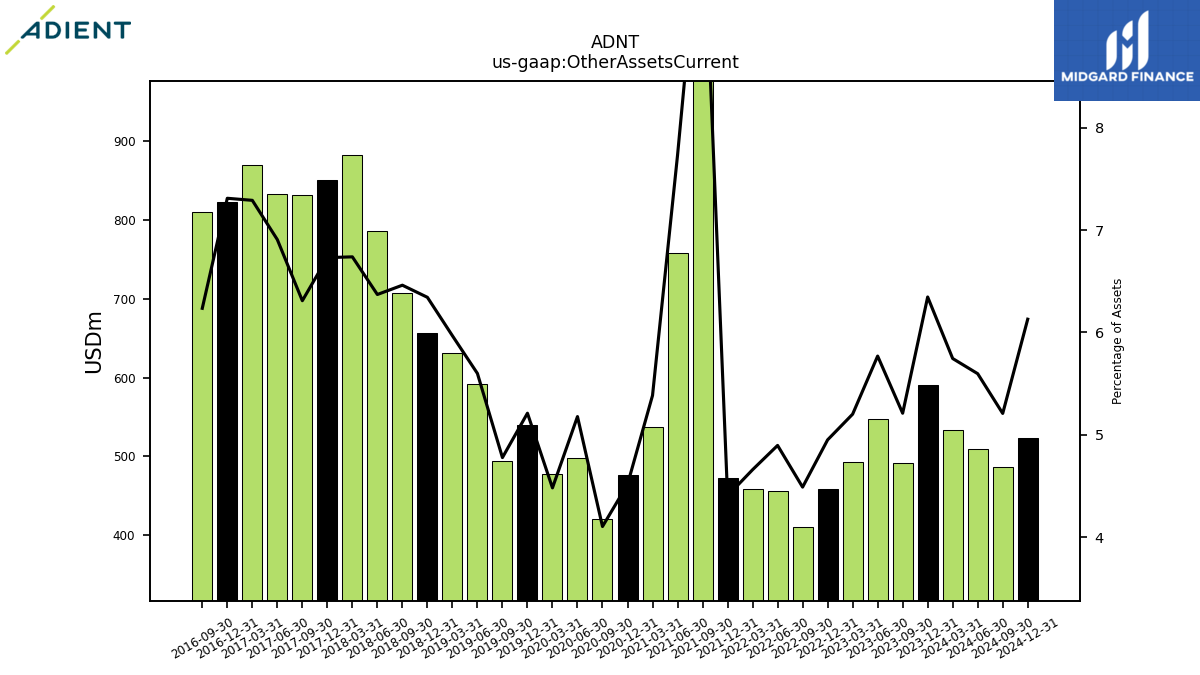
| Other Assets Current | 590.00 | 491.00 | 547.00 | 493.00 | 459.00 | 411.00 | 456.00 | 459.00 | 472.00 | 1114.00 | 758.00 | 537.00 | 476.00 | 421.00 | 498.00 | 477.00 | 540.00 | 494.00 | 592.00 | 631.00 | 657.00 | 707.00 | 786.00 | 882.00 | 851.00 | 831.00 | 833.00 | 869.00 | 823.00 | 810.00 | NA | NA | NA |
| 2023-12-31 | 2023-09-30 | 2023-06-30 | 2023-03-31 | 2022-12-31 | 2022-09-30 | 2022-06-30 | 2022-03-31 | 2021-12-31 | 2021-09-30 | 2021-06-30 | 2021-03-31 | 2020-12-31 | 2020-09-30 | 2020-06-30 | 2020-03-31 | 2019-12-31 | 2019-09-30 | 2019-06-30 | 2019-03-31 | 2018-12-31 | 2018-09-30 | 2018-06-30 | 2018-03-31 | 2017-12-31 | 2017-09-30 | 2017-06-30 | 2017-03-31 | 2016-12-31 | 2016-09-30 | 2016-06-30 | 2016-03-31 | 2015-12-31 | ||
|---|---|---|---|---|---|---|---|---|---|---|---|---|---|---|---|---|---|---|---|---|---|---|---|---|---|---|---|---|---|---|---|---|---|---|
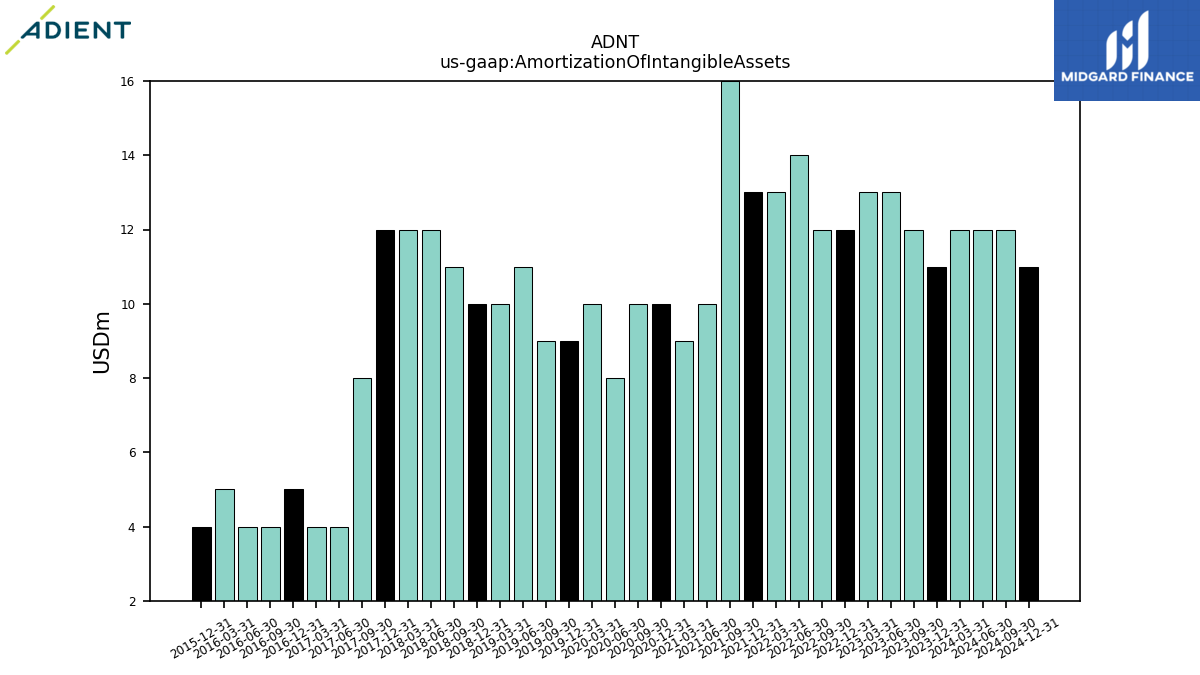
| Amortization Of Intangible Assets | 11.00 | 12.00 | 13.00 | 13.00 | 12.00 | 12.00 | 14.00 | 13.00 | 13.00 | 16.00 | 10.00 | 9.00 | 10.00 | 10.00 | 8.00 | 10.00 | 9.00 | 9.00 | 11.00 | 10.00 | 10.00 | 11.00 | 12.00 | 12.00 | 12.00 | 8.00 | 4.00 | 4.00 | 5.00 | 4.00 | 4.00 | 5.00 | 4.00 | |
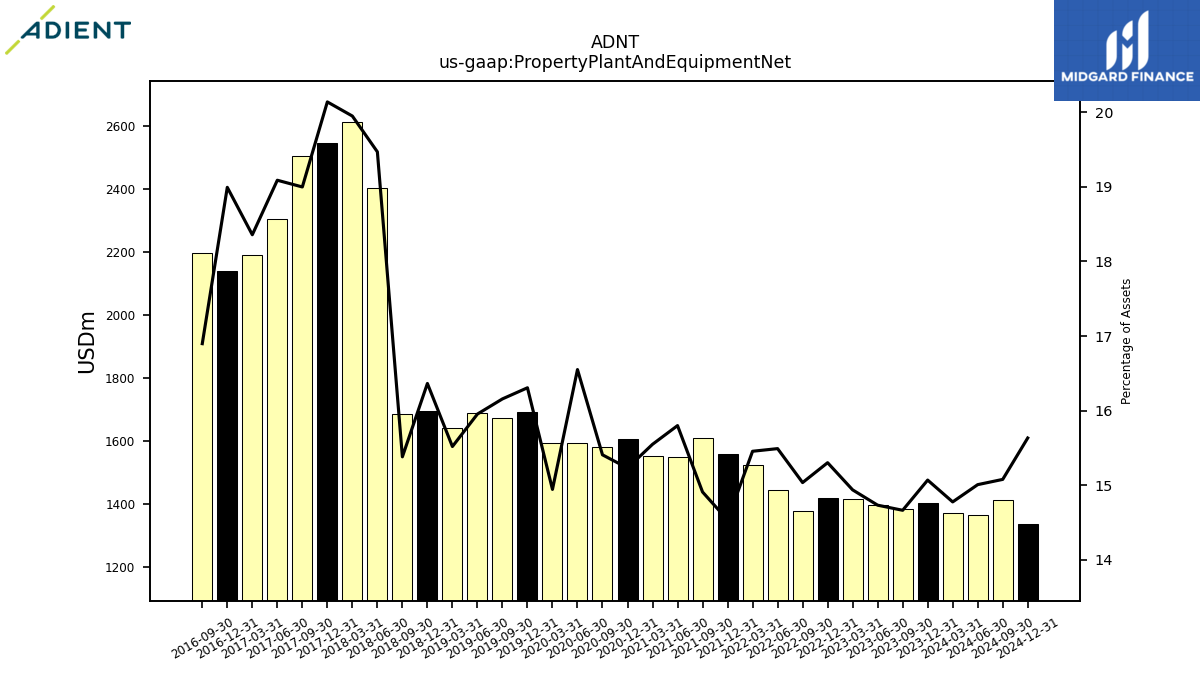
| Property Plant And Equipment Net | 1401.00 | 1382.00 | 1397.00 | 1416.00 | 1419.00 | 1377.00 | 1443.00 | 1523.00 | 1558.00 | 1607.00 | 1549.00 | 1551.00 | 1606.00 | 1581.00 | 1592.00 | 1591.00 | 1690.00 | 1671.00 | 1687.00 | 1641.00 | 1695.00 | 1683.00 | 2402.00 | 2611.00 | 2546.00 | 2502.00 | 2302.00 | 2188.00 | 2138.00 | 2195.00 | NA | NA | NA | |
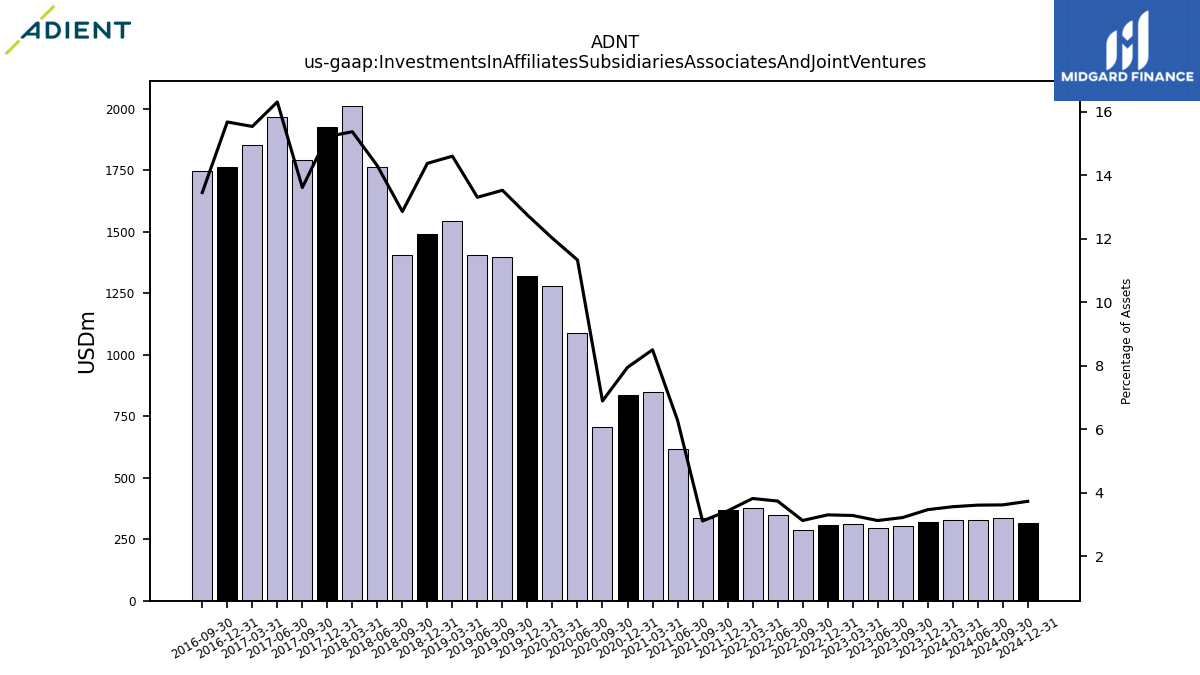
| Investments In Affiliates Subsidiaries Associates And Joint Ventures | 322.00 | 303.00 | 296.00 | 311.00 | 306.00 | 286.00 | 348.00 | 376.00 | 367.00 | 335.00 | 616.00 | 848.00 | 838.00 | 707.00 | 1090.00 | 1279.00 | 1321.00 | 1399.00 | 1407.00 | 1544.00 | 1489.00 | 1407.00 | 1764.00 | 2012.00 | 1924.00 | 1793.00 | 1967.00 | 1852.00 | 1765.00 | 1748.00 | NA | NA | NA | |
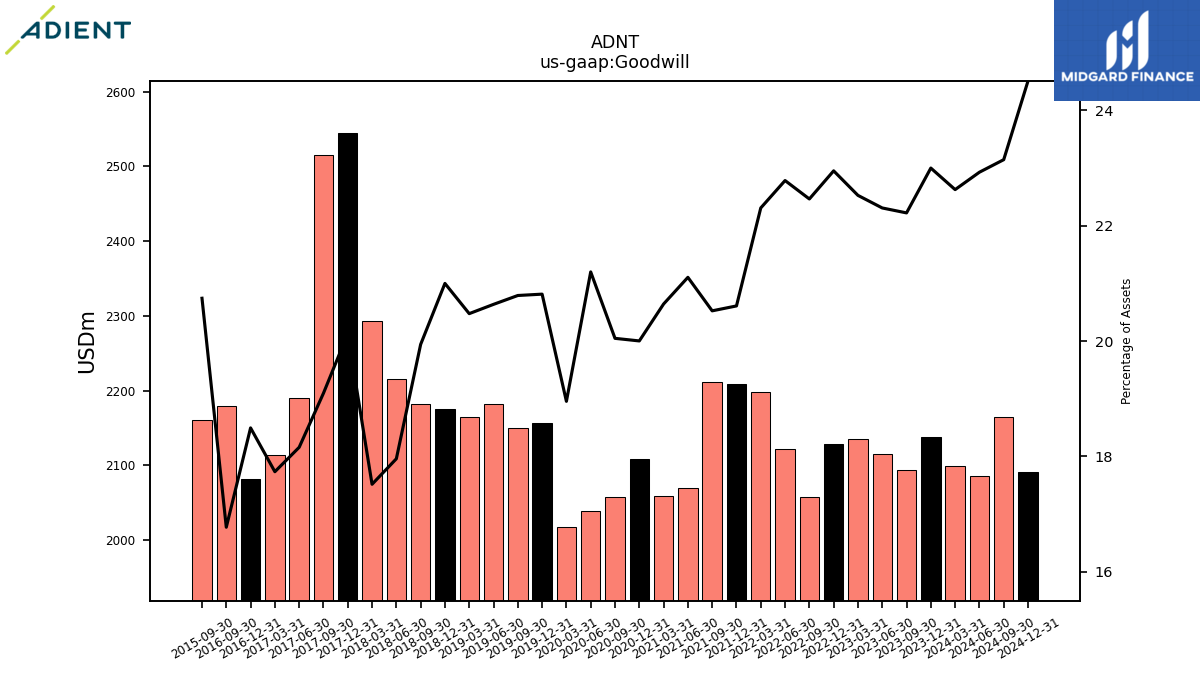
| Goodwill | 2138.00 | 2094.00 | 2115.00 | 2135.00 | 2128.00 | 2057.00 | 2122.00 | 2198.00 | 2209.00 | 2212.00 | 2069.00 | 2059.00 | 2109.00 | 2057.00 | 2039.00 | 2018.00 | 2157.00 | 2150.00 | 2182.00 | 2165.00 | 2175.00 | 2182.00 | 2216.00 | 2293.00 | 2545.00 | 2515.00 | 2190.00 | 2114.00 | 2082.00 | 2179.00 | NA | NA | NA | |
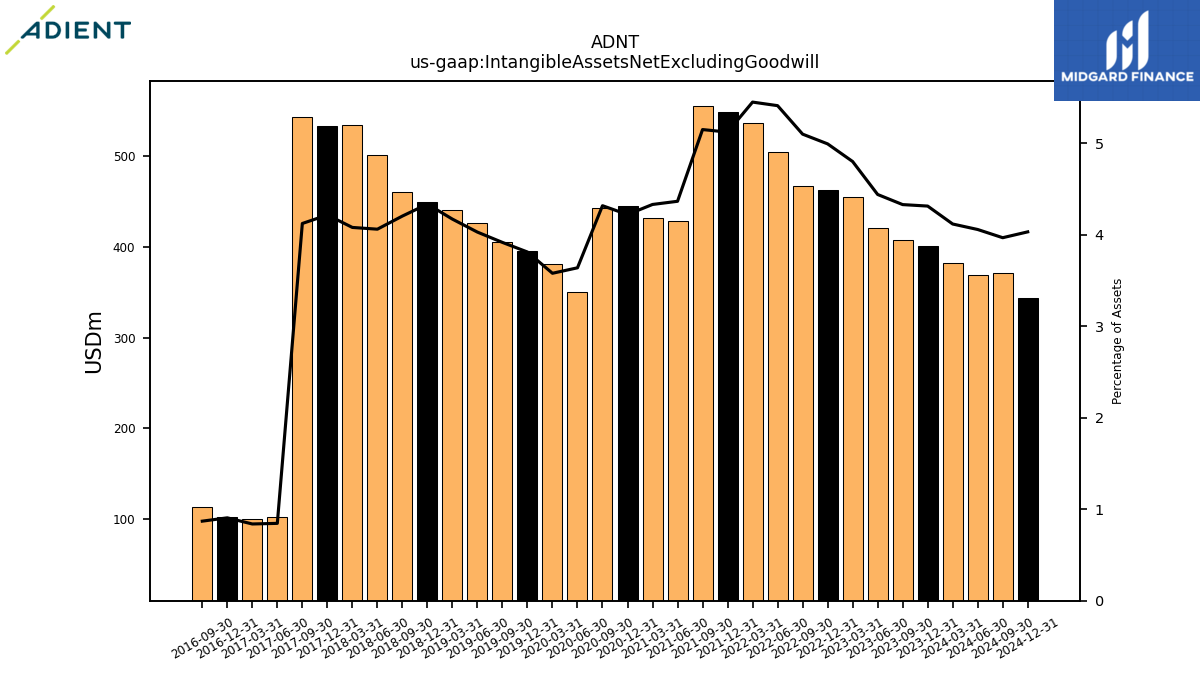
| Intangible Assets Net Excluding Goodwill | 401.00 | 408.00 | 421.00 | 455.00 | 463.00 | 467.00 | 504.00 | 537.00 | 549.00 | 555.00 | 428.00 | 432.00 | 445.00 | 443.00 | 350.00 | 381.00 | 395.00 | 405.00 | 426.00 | 441.00 | 449.00 | 460.00 | 501.00 | 534.00 | 533.00 | 543.00 | 102.00 | 100.00 | 102.00 | 113.00 | NA | NA | NA | |
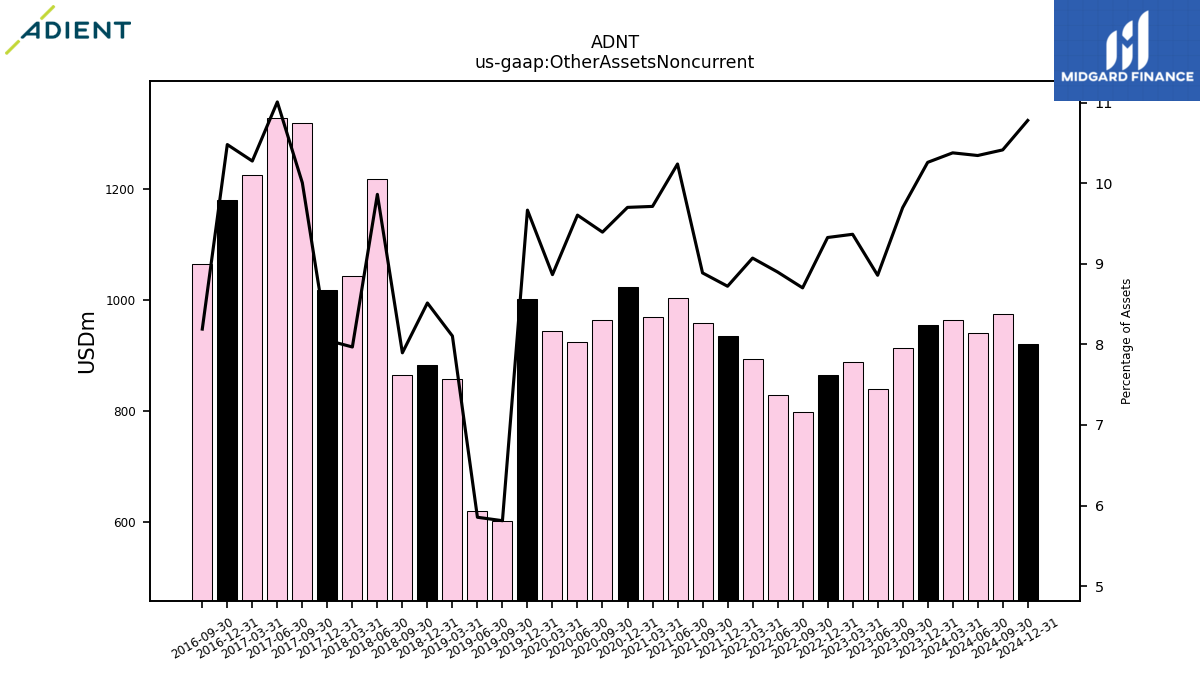
| Other Assets Noncurrent | 954.00 | 914.00 | 840.00 | 888.00 | 865.00 | 797.00 | 829.00 | 894.00 | 935.00 | 958.00 | 1004.00 | 969.00 | 1023.00 | 964.00 | 924.00 | 944.00 | 1002.00 | 601.00 | 619.00 | 857.00 | 882.00 | 864.00 | 1217.00 | 1043.00 | 1018.00 | 1318.00 | 1328.00 | 1225.00 | 1180.00 | 1064.00 | NA | NA | NA |
| 2023-12-31 | 2023-09-30 | 2023-06-30 | 2023-03-31 | 2022-12-31 | 2022-09-30 | 2022-06-30 | 2022-03-31 | 2021-12-31 | 2021-09-30 | 2021-06-30 | 2021-03-31 | 2020-12-31 | 2020-09-30 | 2020-06-30 | 2020-03-31 | 2019-12-31 | 2019-09-30 | 2019-06-30 | 2019-03-31 | 2018-12-31 | 2018-09-30 | 2018-06-30 | 2018-03-31 | 2017-12-31 | 2017-09-30 | 2017-06-30 | 2017-03-31 | 2016-12-31 | 2016-09-30 | 2016-06-30 | 2016-03-31 | 2015-12-31 | ||
|---|---|---|---|---|---|---|---|---|---|---|---|---|---|---|---|---|---|---|---|---|---|---|---|---|---|---|---|---|---|---|---|---|---|---|
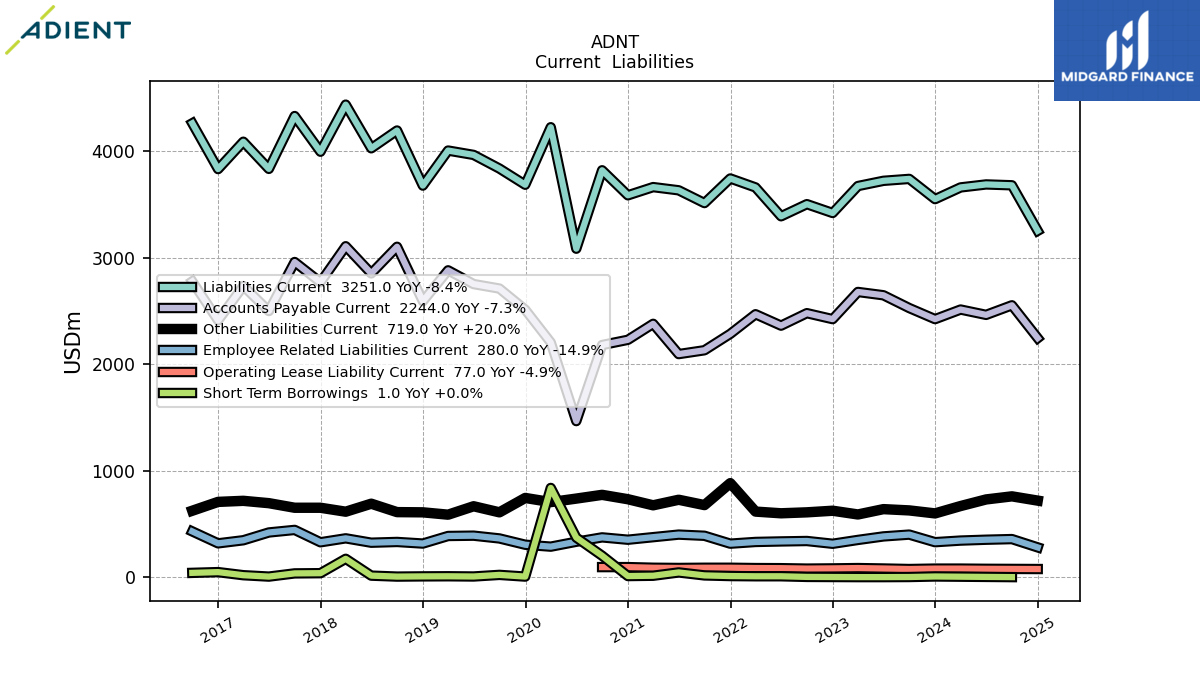
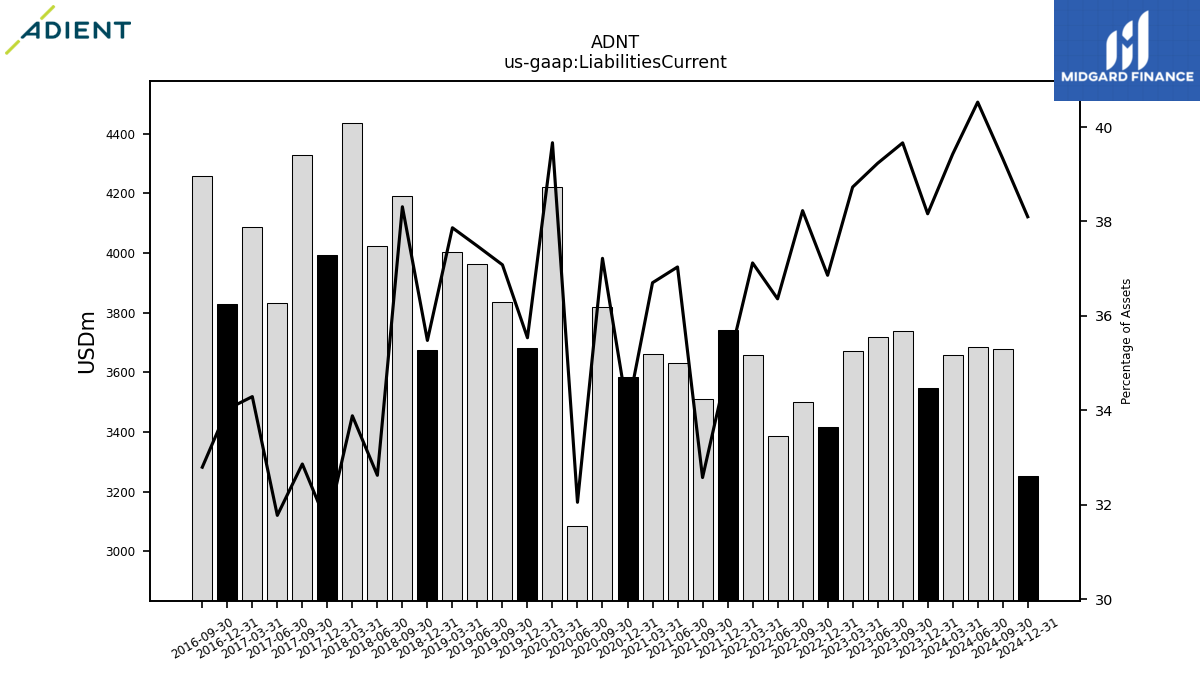
| Liabilities Current | 3548.00 | 3738.00 | 3720.00 | 3671.00 | 3418.00 | 3501.00 | 3387.00 | 3658.00 | 3742.00 | 3511.00 | 3631.00 | 3661.00 | 3584.00 | 3819.00 | 3083.00 | 4223.00 | 3683.00 | 3835.00 | 3963.00 | 4004.00 | 3675.00 | 4192.00 | 4025.00 | 4435.00 | 3993.00 | 4328.00 | 3832.00 | 4087.00 | 3830.00 | 4260.00 | NA | NA | NA | |
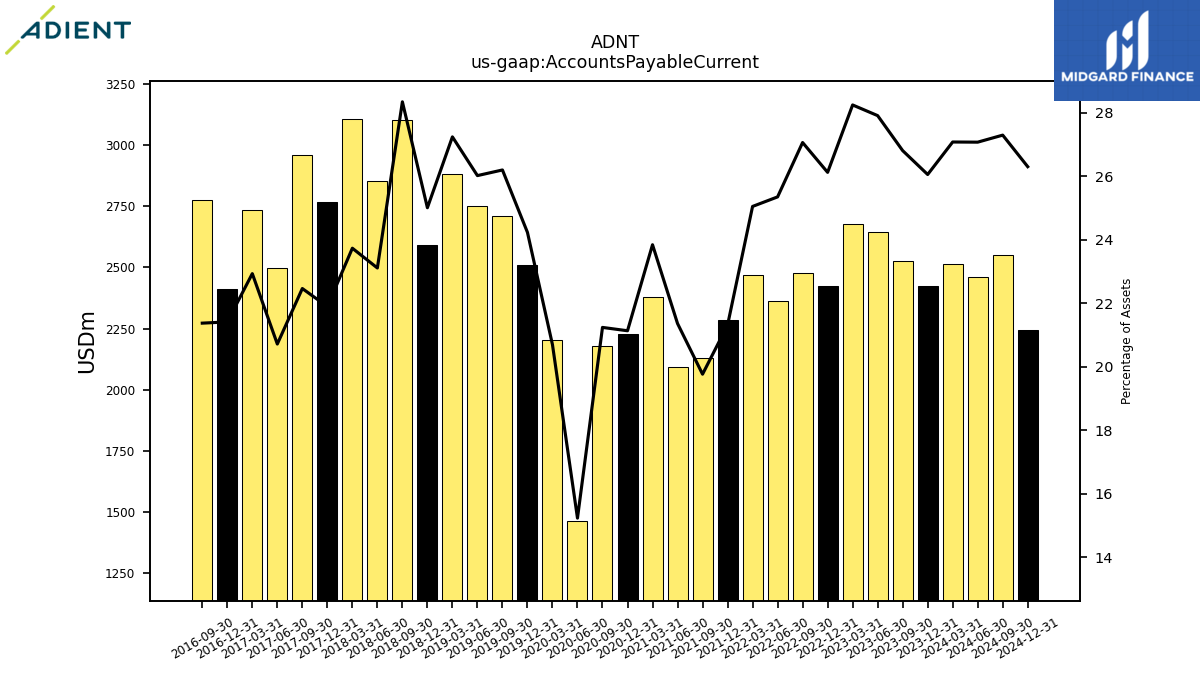
| Accounts Payable Current | 2422.00 | 2526.00 | 2646.00 | 2677.00 | 2422.00 | 2478.00 | 2361.00 | 2468.00 | 2284.00 | 2130.00 | 2094.00 | 2378.00 | 2228.00 | 2179.00 | 1465.00 | 2203.00 | 2511.00 | 2709.00 | 2751.00 | 2880.00 | 2590.00 | 3101.00 | 2851.00 | 3106.00 | 2768.00 | 2958.00 | 2498.00 | 2733.00 | 2410.00 | 2776.00 | NA | NA | NA | |
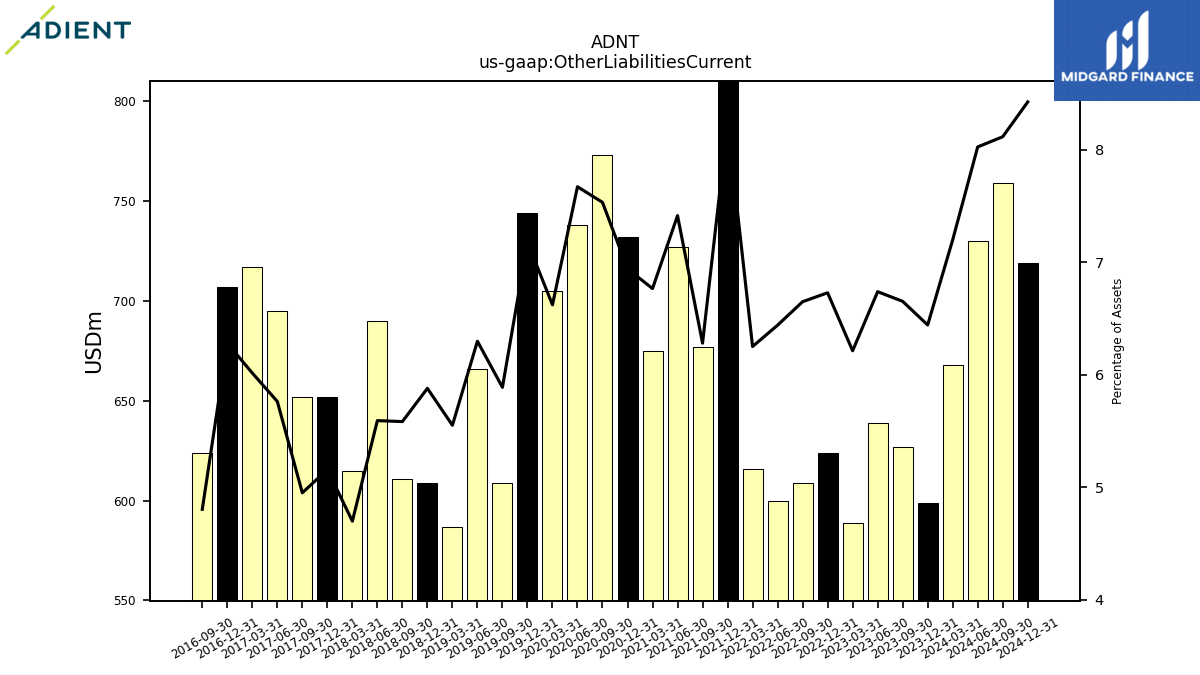
| Other Liabilities Current | 599.00 | 627.00 | 639.00 | 589.00 | 624.00 | 609.00 | 600.00 | 616.00 | 883.00 | 677.00 | 727.00 | 675.00 | 732.00 | 773.00 | 738.00 | 705.00 | 744.00 | 609.00 | 666.00 | 587.00 | 609.00 | 611.00 | 690.00 | 615.00 | 652.00 | 652.00 | 695.00 | 717.00 | 707.00 | 624.00 | NA | NA | NA |
| 2023-12-31 | 2023-09-30 | 2023-06-30 | 2023-03-31 | 2022-12-31 | 2022-09-30 | 2022-06-30 | 2022-03-31 | 2021-12-31 | 2021-09-30 | 2021-06-30 | 2021-03-31 | 2020-12-31 | 2020-09-30 | 2020-06-30 | 2020-03-31 | 2019-12-31 | 2019-09-30 | 2019-06-30 | 2019-03-31 | 2018-12-31 | 2018-09-30 | 2018-06-30 | 2018-03-31 | 2017-12-31 | 2017-09-30 | 2017-06-30 | 2017-03-31 | 2016-12-31 | 2016-09-30 | 2016-06-30 | 2016-03-31 | 2015-12-31 | ||
|---|---|---|---|---|---|---|---|---|---|---|---|---|---|---|---|---|---|---|---|---|---|---|---|---|---|---|---|---|---|---|---|---|---|---|
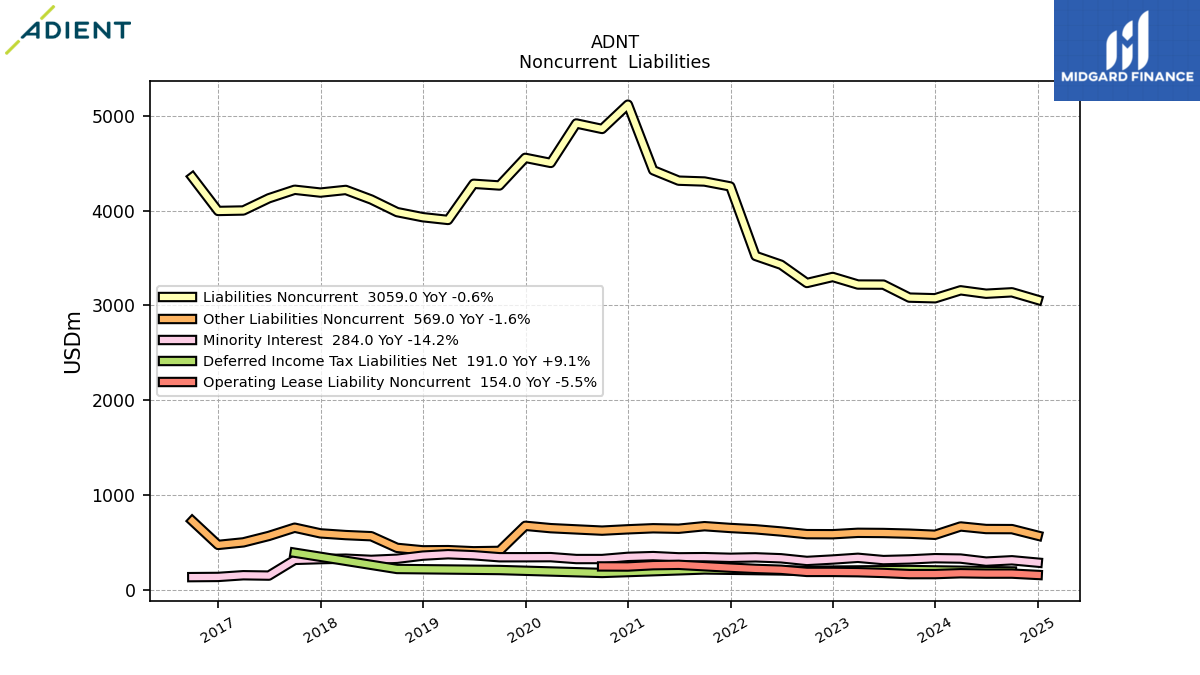
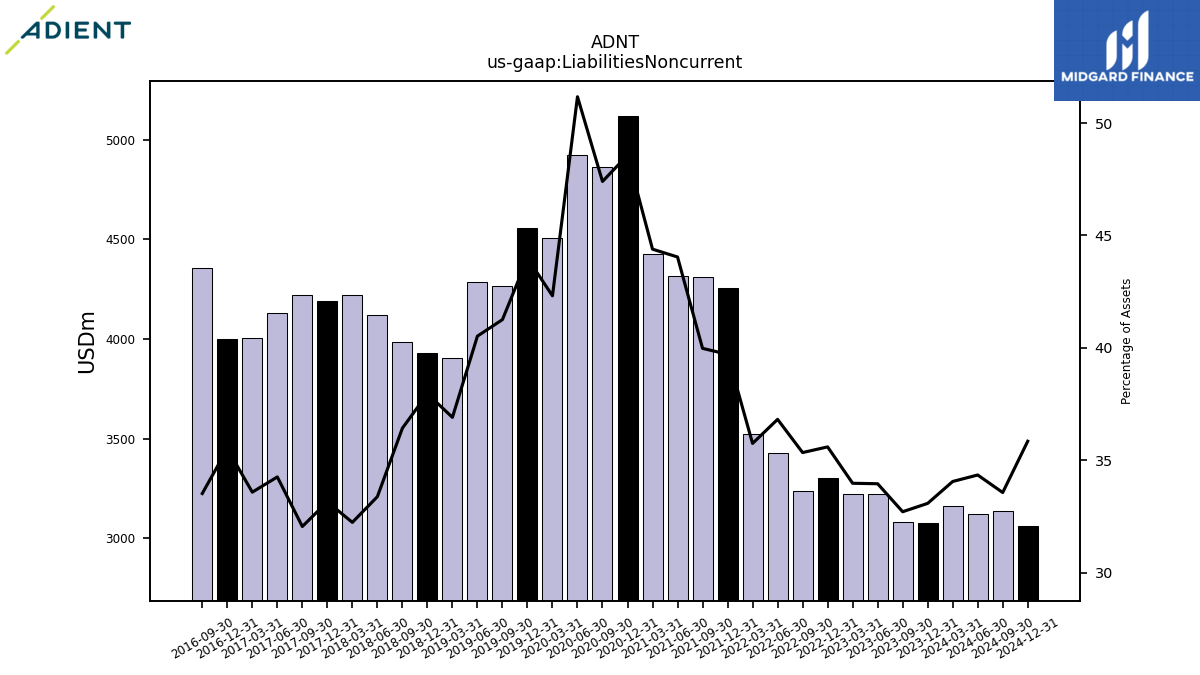
| Liabilities Noncurrent | 3076.00 | 3083.00 | 3220.00 | 3221.00 | 3301.00 | 3237.00 | 3430.00 | 3523.00 | 4257.00 | 4309.00 | 4318.00 | 4428.00 | 5121.00 | 4864.00 | 4922.00 | 4505.00 | 4559.00 | 4267.00 | 4285.00 | 3903.00 | 3932.00 | 3986.00 | 4119.00 | 4220.00 | 4192.00 | 4222.00 | 4132.00 | 4003.00 | 3998.00 | 4355.00 | NA | NA | NA | |
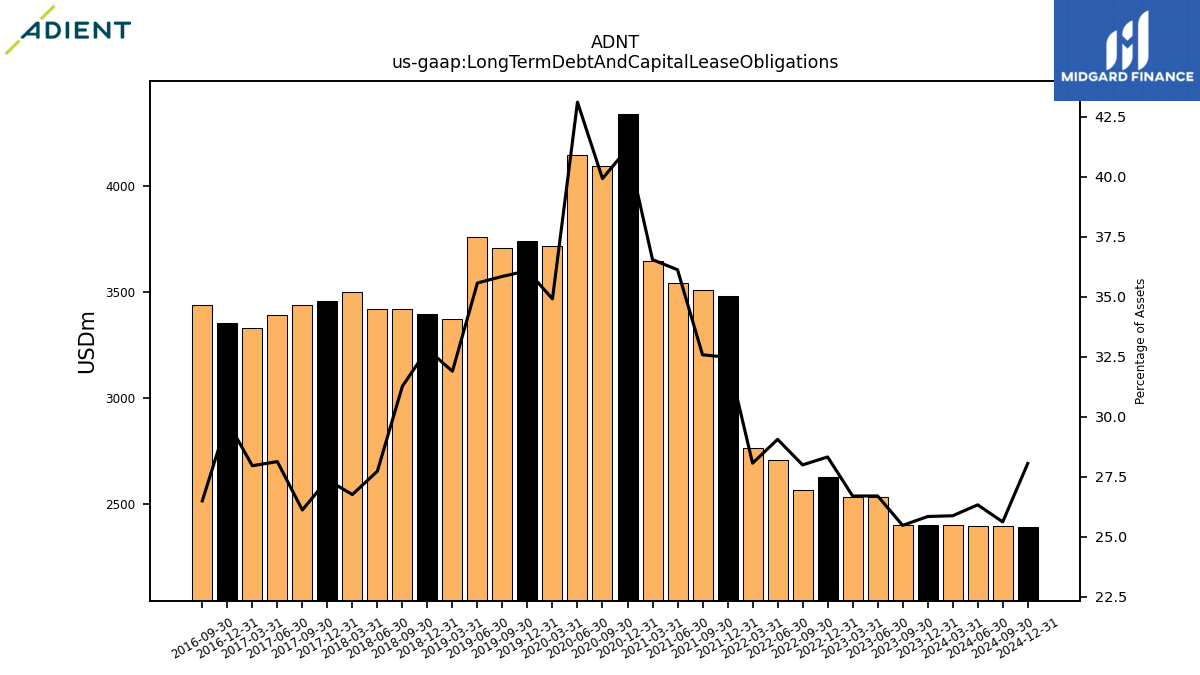
| Long Term Debt And Capital Lease Obligations | 2403.00 | 2401.00 | 2532.00 | 2531.00 | 2627.00 | 2564.00 | 2707.00 | 2766.00 | 3482.00 | 3512.00 | 3542.00 | 3646.00 | 4342.00 | 4097.00 | 4147.00 | 3717.00 | 3740.00 | 3708.00 | 3762.00 | 3373.00 | 3399.00 | 3422.00 | 3422.00 | 3503.00 | 3461.00 | 3440.00 | 3393.00 | 3333.00 | 3357.00 | 3442.00 | NA | NA | NA | |
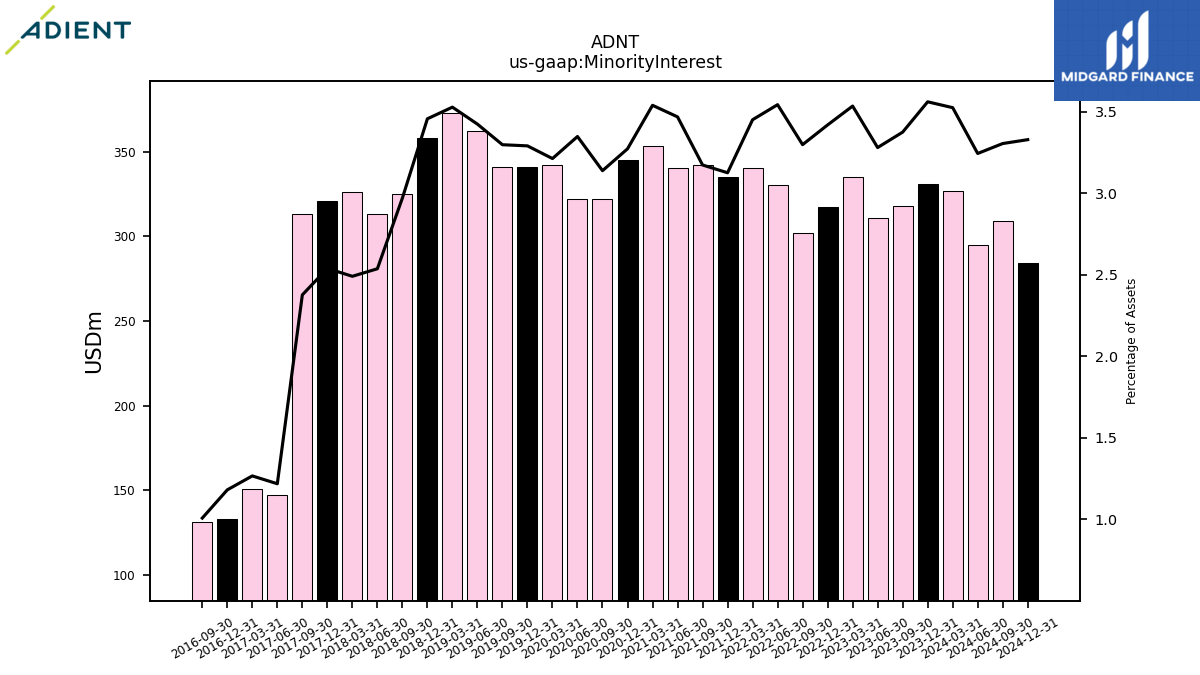
| Minority Interest | 331.00 | 318.00 | 311.00 | 335.00 | 317.00 | 302.00 | 330.00 | 340.00 | 335.00 | 342.00 | 340.00 | 353.00 | 345.00 | 322.00 | 322.00 | 342.00 | 341.00 | 341.00 | 362.00 | 373.00 | 358.00 | 325.00 | 313.00 | 326.00 | 321.00 | 313.00 | 147.00 | 151.00 | 133.00 | 131.00 | NA | NA | NA | |
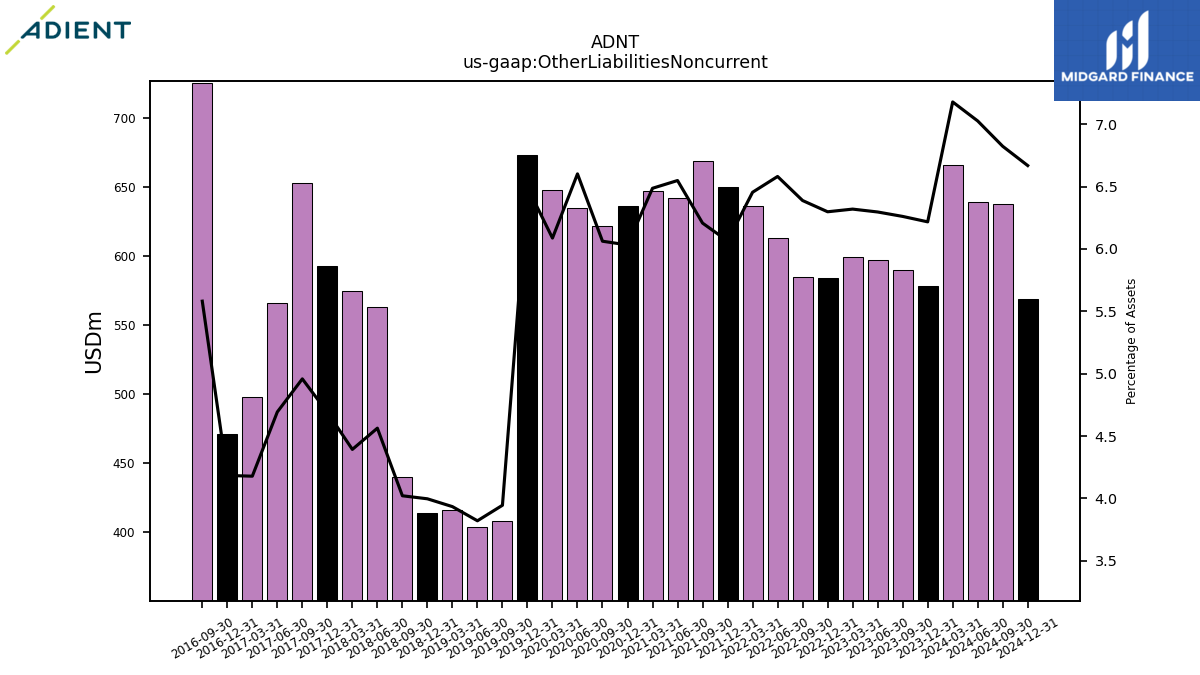
| Other Liabilities Noncurrent | 578.00 | 590.00 | 597.00 | 599.00 | 584.00 | 585.00 | 613.00 | 636.00 | 650.00 | 669.00 | 642.00 | 647.00 | 636.00 | 622.00 | 635.00 | 648.00 | 673.00 | 408.00 | 404.00 | 416.00 | 414.00 | 440.00 | 563.00 | 575.00 | 593.00 | 653.00 | 566.00 | 498.00 | 471.00 | 725.00 | NA | NA | NA | |
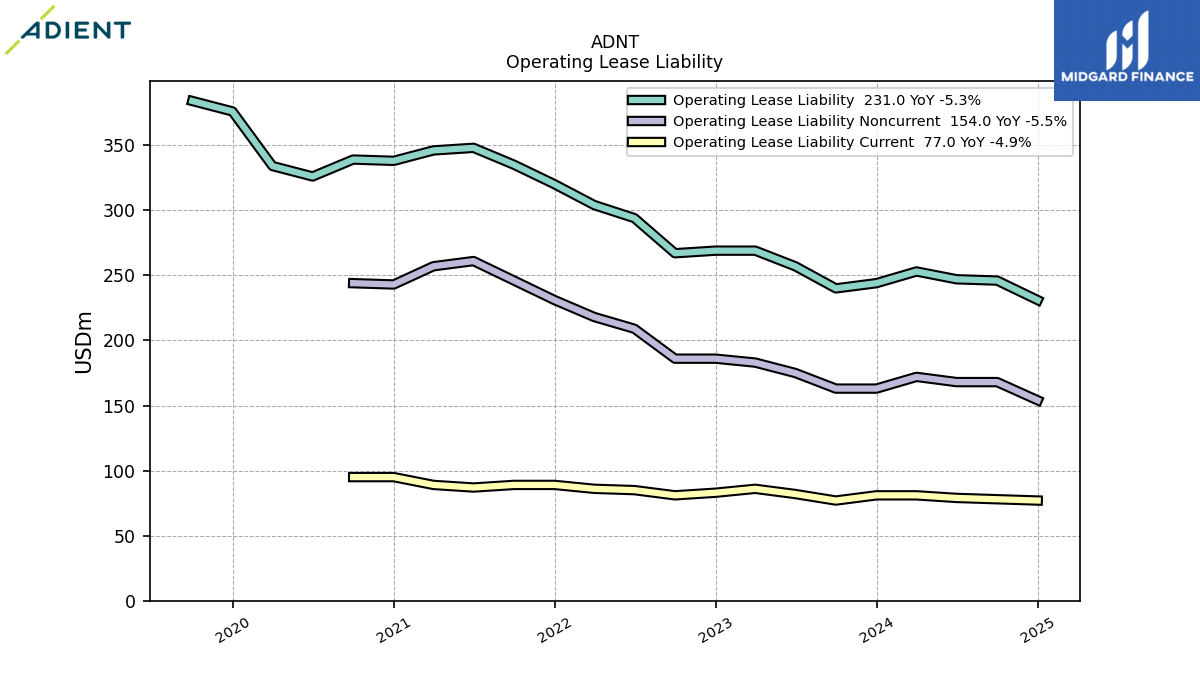
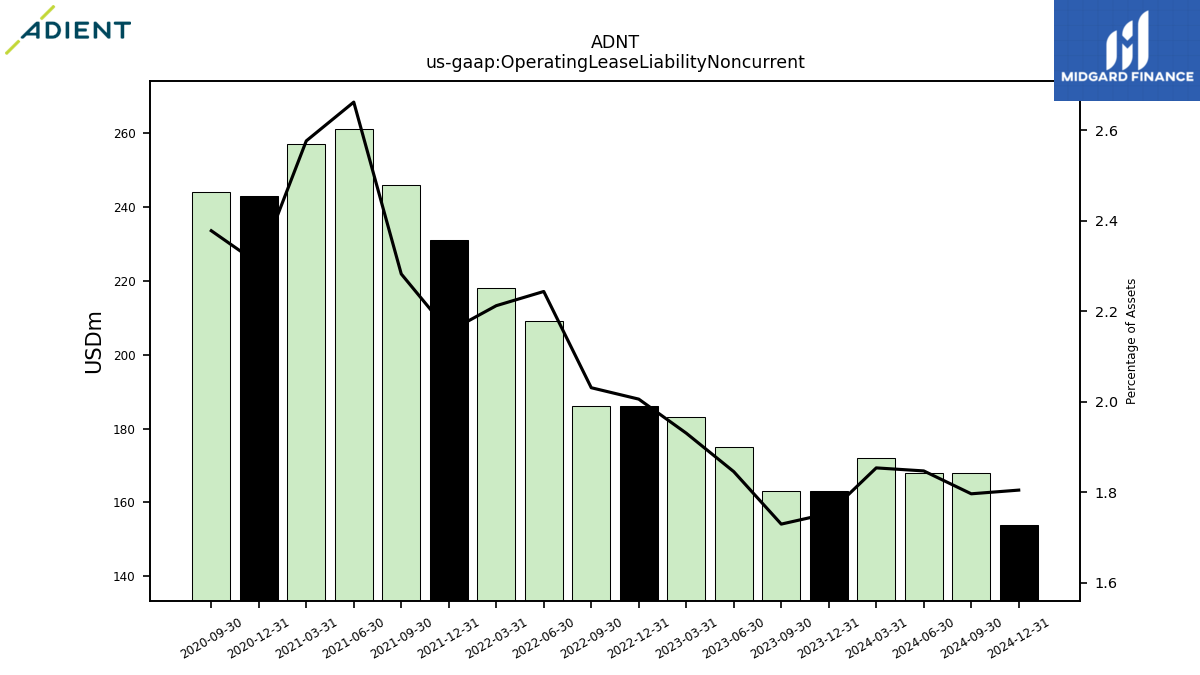
| Operating Lease Liability Noncurrent | 163.00 | 163.00 | 175.00 | 183.00 | 186.00 | 186.00 | 209.00 | 218.00 | 231.00 | 246.00 | 261.00 | 257.00 | 243.00 | 244.00 | NA | NA | NA | NA | NA | NA | NA | NA | NA | NA | NA | NA | NA | NA | NA | NA | NA | NA | NA |
| 2023-12-31 | 2023-09-30 | 2023-06-30 | 2023-03-31 | 2022-12-31 | 2022-09-30 | 2022-06-30 | 2022-03-31 | 2021-12-31 | 2021-09-30 | 2021-06-30 | 2021-03-31 | 2020-12-31 | 2020-09-30 | 2020-06-30 | 2020-03-31 | 2019-12-31 | 2019-09-30 | 2019-06-30 | 2019-03-31 | 2018-12-31 | 2018-09-30 | 2018-06-30 | 2018-03-31 | 2017-12-31 | 2017-09-30 | 2017-06-30 | 2017-03-31 | 2016-12-31 | 2016-09-30 | 2016-06-30 | 2016-03-31 | 2015-12-31 | ||
|---|---|---|---|---|---|---|---|---|---|---|---|---|---|---|---|---|---|---|---|---|---|---|---|---|---|---|---|---|---|---|---|---|---|---|
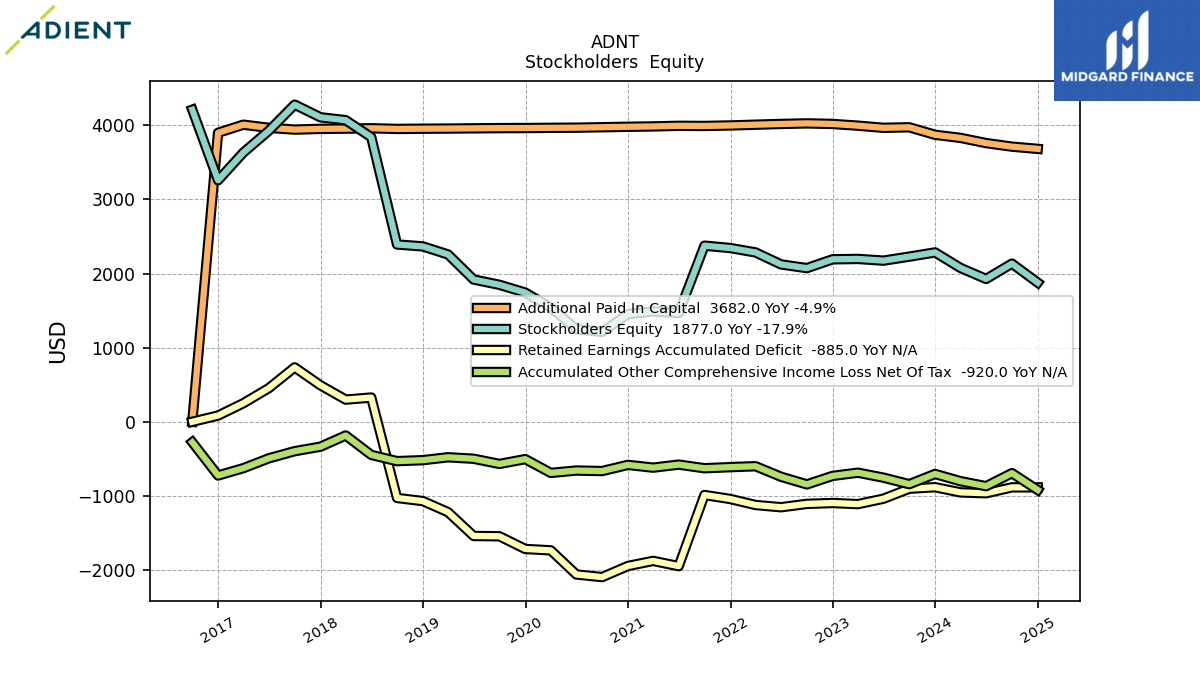
| Stockholders Equity | 2285.00 | 2228.00 | 2174.00 | 2197.00 | 2192.00 | 2073.00 | 2123.00 | 2285.00 | 2344.00 | 2376.00 | 1467.00 | 1489.00 | 1452.00 | 1213.00 | 1250.00 | 1541.00 | 1743.00 | 1848.00 | 1919.00 | 2257.00 | 2366.00 | 2392.00 | 3840.00 | 4069.00 | 4108.00 | 4279.00 | 3927.00 | 3632.00 | 3258.00 | 4210.00 | NA | NA | NA | |
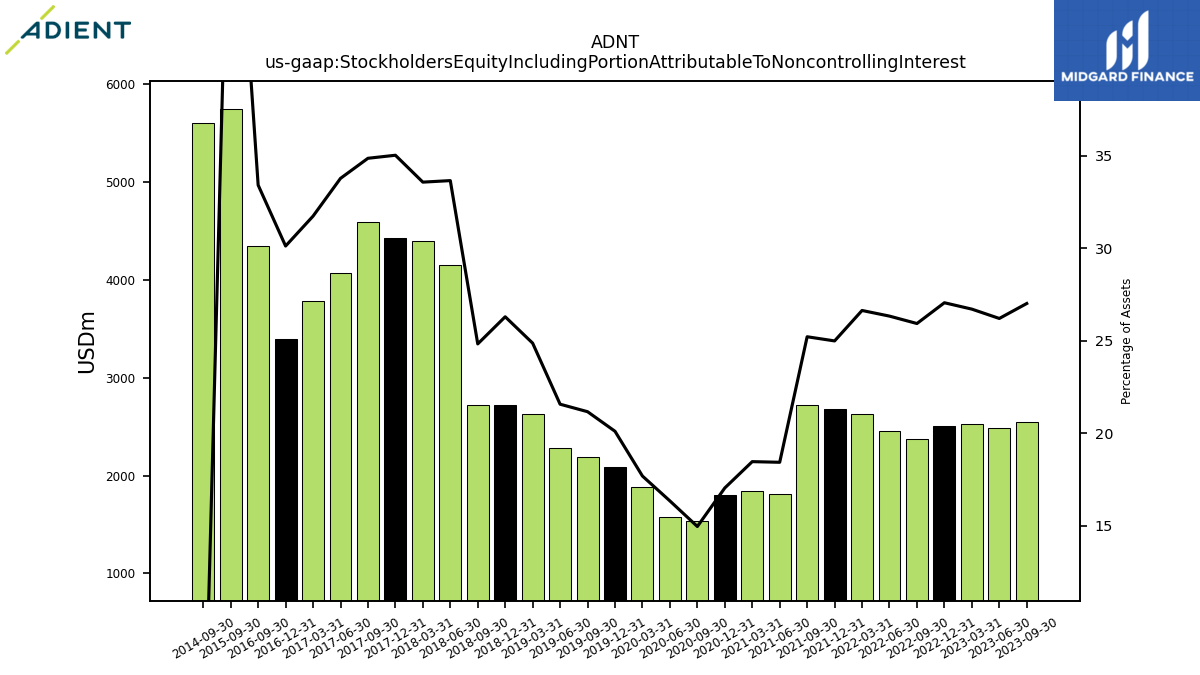
| Stockholders Equity Including Portion Attributable To Noncontrolling Interest | 2616.00 | 2546.00 | 2485.00 | 2532.00 | 2509.00 | 2375.00 | 2453.00 | 2625.00 | 2679.00 | 2718.00 | 1807.00 | 1842.00 | 1797.00 | 1535.00 | 1572.00 | 1883.00 | 2084.00 | 2189.00 | 2281.00 | 2630.00 | 2724.00 | 2717.00 | 4153.00 | 4395.00 | 4429.00 | 4592.00 | 4074.00 | 3783.00 | 3391.00 | 4341.00 | NA | NA | NA | |
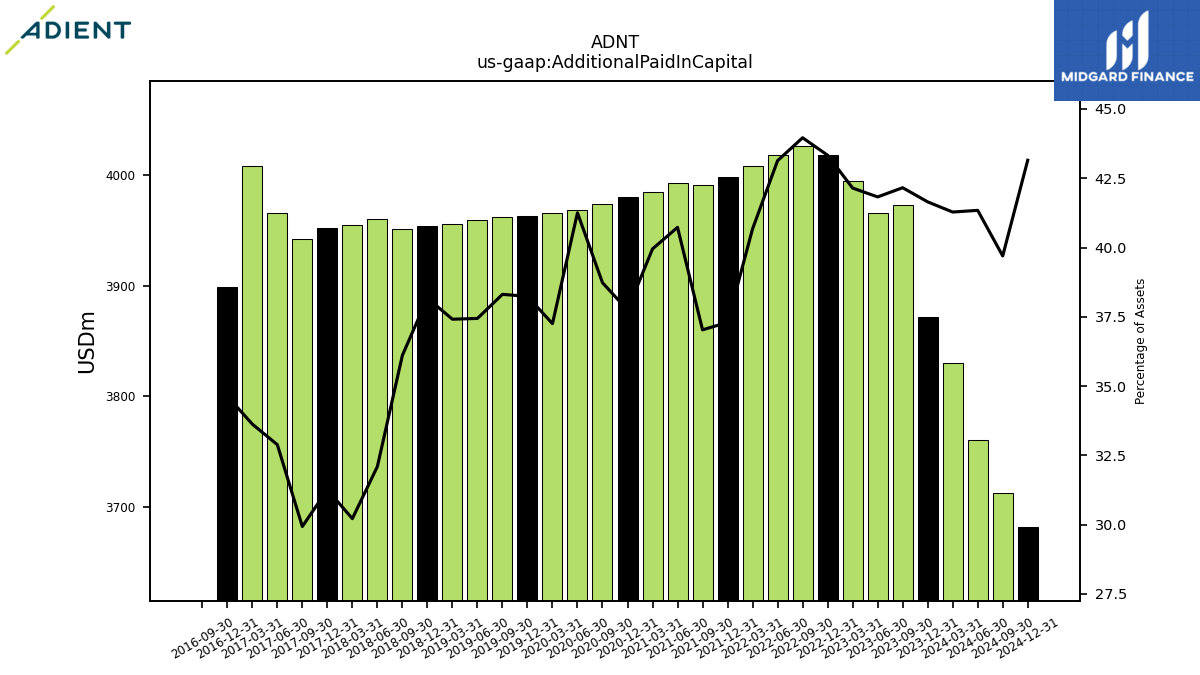
| Additional Paid In Capital | 3872.00 | 3973.00 | 3966.00 | 3995.00 | 4018.00 | 4026.00 | 4018.00 | 4008.00 | 3998.00 | 3991.00 | 3993.00 | 3985.00 | 3980.00 | 3974.00 | 3968.00 | 3966.00 | 3963.00 | 3962.00 | 3959.00 | 3956.00 | 3954.00 | 3951.00 | 3960.00 | 3955.00 | 3952.00 | 3942.00 | 3966.00 | 4008.00 | 3899.00 | 0.00 | NA | NA | NA | |
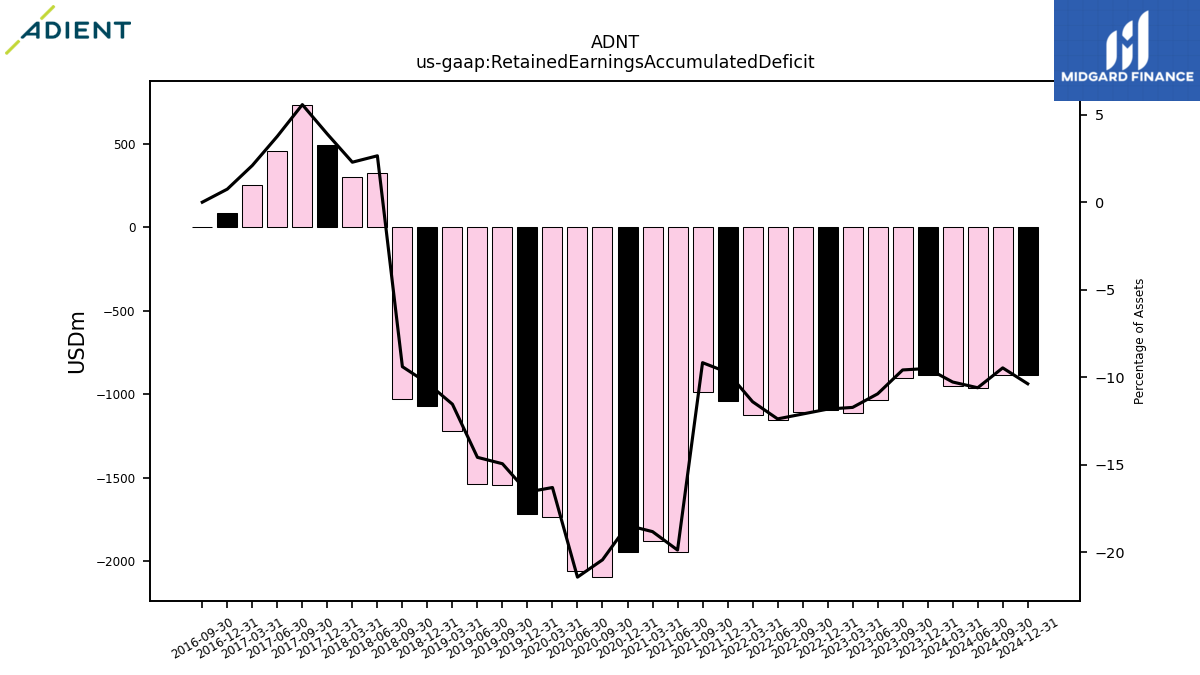
| Retained Earnings Accumulated Deficit | -883.00 | -903.00 | -1038.00 | -1111.00 | -1096.00 | -1108.00 | -1153.00 | -1123.00 | -1042.00 | -988.00 | -1948.00 | -1877.00 | -1946.00 | -2096.00 | -2060.00 | -1735.00 | -1716.00 | -1545.00 | -1541.00 | -1220.00 | -1070.00 | -1028.00 | 327.00 | 299.00 | 492.00 | 734.00 | 454.00 | 250.00 | 84.00 | 0.00 | NA | NA | NA | |
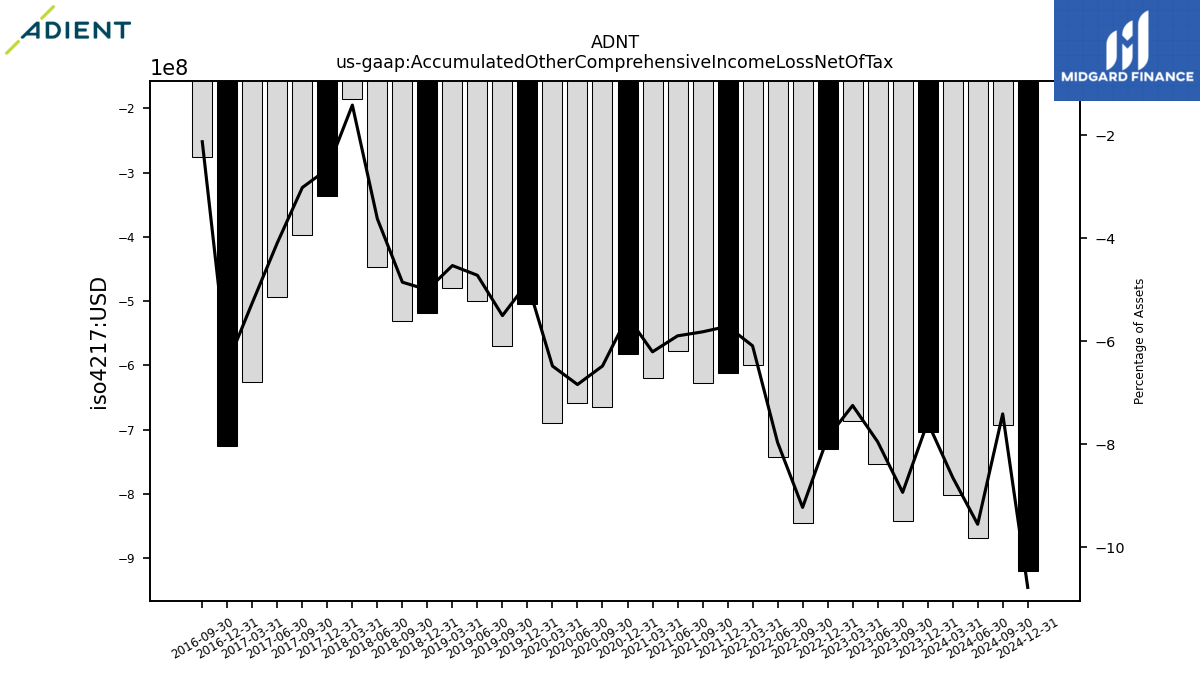
| Accumulated Other Comprehensive Income Loss Net Of Tax | -704.00 | -842.00 | -754.00 | -687.00 | -730.00 | -845.00 | -742.00 | -600.00 | -612.00 | -627.00 | -578.00 | -619.00 | -582.00 | -665.00 | -658.00 | -690.00 | -504.00 | -569.00 | -499.00 | -479.00 | -518.00 | -531.00 | -447.00 | -185.00 | -336.00 | -397.00 | -493.00 | -626.00 | -725.00 | -276.00 | NA | NA | NA | |
| Minority Interest | 331.00 | 318.00 | 311.00 | 335.00 | 317.00 | 302.00 | 330.00 | 340.00 | 335.00 | 342.00 | 340.00 | 353.00 | 345.00 | 322.00 | 322.00 | 342.00 | 341.00 | 341.00 | 362.00 | 373.00 | 358.00 | 325.00 | 313.00 | 326.00 | 321.00 | 313.00 | 147.00 | 151.00 | 133.00 | 131.00 | NA | NA | NA | |
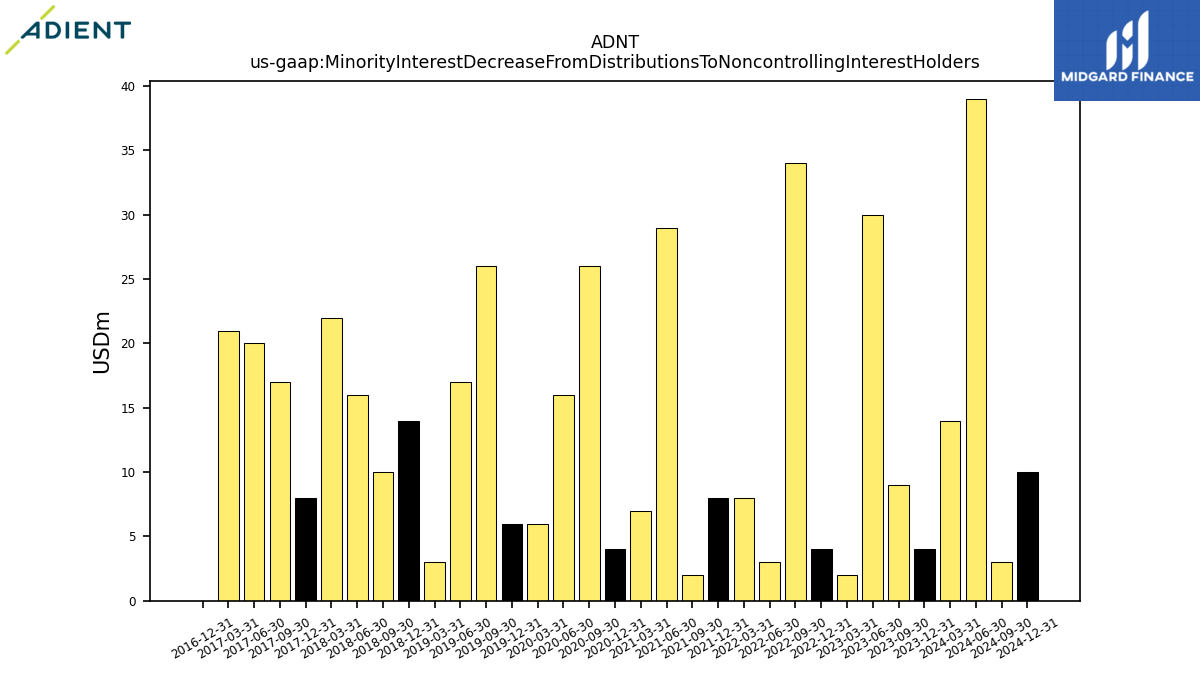
| Minority Interest Decrease From Distributions To Noncontrolling Interest Holders | 4.00 | 9.00 | 30.00 | 2.00 | 4.00 | 34.00 | 3.00 | 8.00 | 8.00 | 2.00 | 29.00 | 7.00 | 4.00 | 26.00 | 16.00 | 6.00 | 6.00 | 26.00 | 17.00 | 3.00 | 14.00 | 10.00 | 16.00 | 22.00 | 8.00 | 17.00 | 20.00 | 21.00 | 0.00 | NA | NA | NA | NA |
| 2023-12-31 | 2023-09-30 | 2023-06-30 | 2023-03-31 | 2022-12-31 | 2022-09-30 | 2022-06-30 | 2022-03-31 | 2021-12-31 | 2021-09-30 | 2021-06-30 | 2021-03-31 | 2020-12-31 | 2020-09-30 | 2020-06-30 | 2020-03-31 | 2019-12-31 | 2019-09-30 | 2019-06-30 | 2019-03-31 | 2018-12-31 | 2018-09-30 | 2018-06-30 | 2018-03-31 | 2017-12-31 | 2017-09-30 | 2017-06-30 | 2017-03-31 | 2016-12-31 | 2016-09-30 | 2016-06-30 | 2016-03-31 | 2015-12-31 | ||
|---|---|---|---|---|---|---|---|---|---|---|---|---|---|---|---|---|---|---|---|---|---|---|---|---|---|---|---|---|---|---|---|---|---|---|
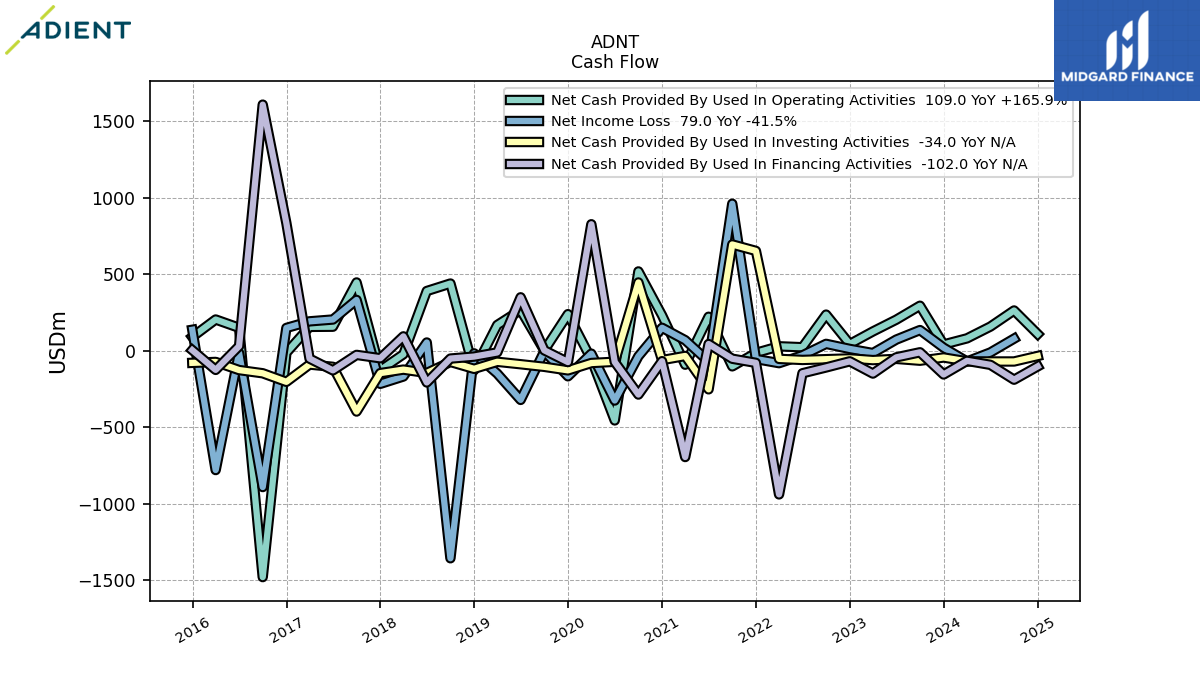
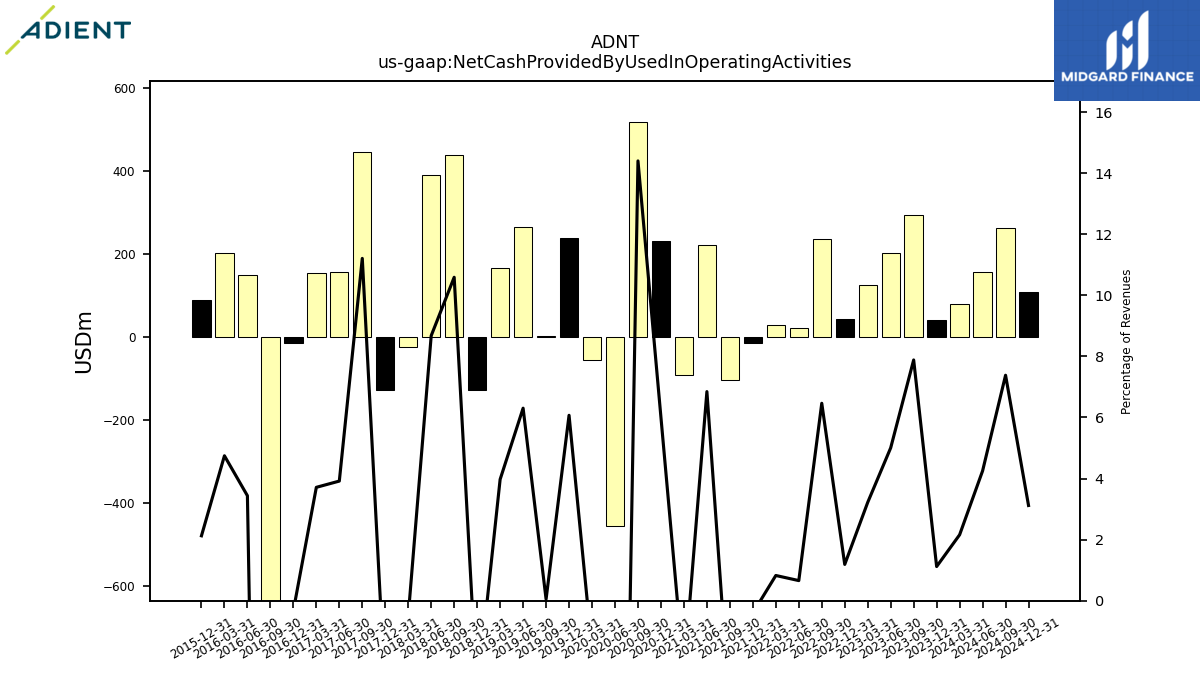
| Net Cash Provided By Used In Operating Activities | 41.00 | 294.00 | 203.00 | 126.00 | 44.00 | 236.00 | 23.00 | 29.00 | -14.00 | -102.00 | 222.00 | -91.00 | 231.00 | 518.00 | -455.00 | -56.00 | 239.00 | 2.00 | 266.00 | 168.00 | -128.00 | 439.00 | 390.00 | -23.00 | -127.00 | 446.00 | 157.00 | 156.00 | -13.00 | -1478.00 | 150.00 | 204.00 | 90.00 | |
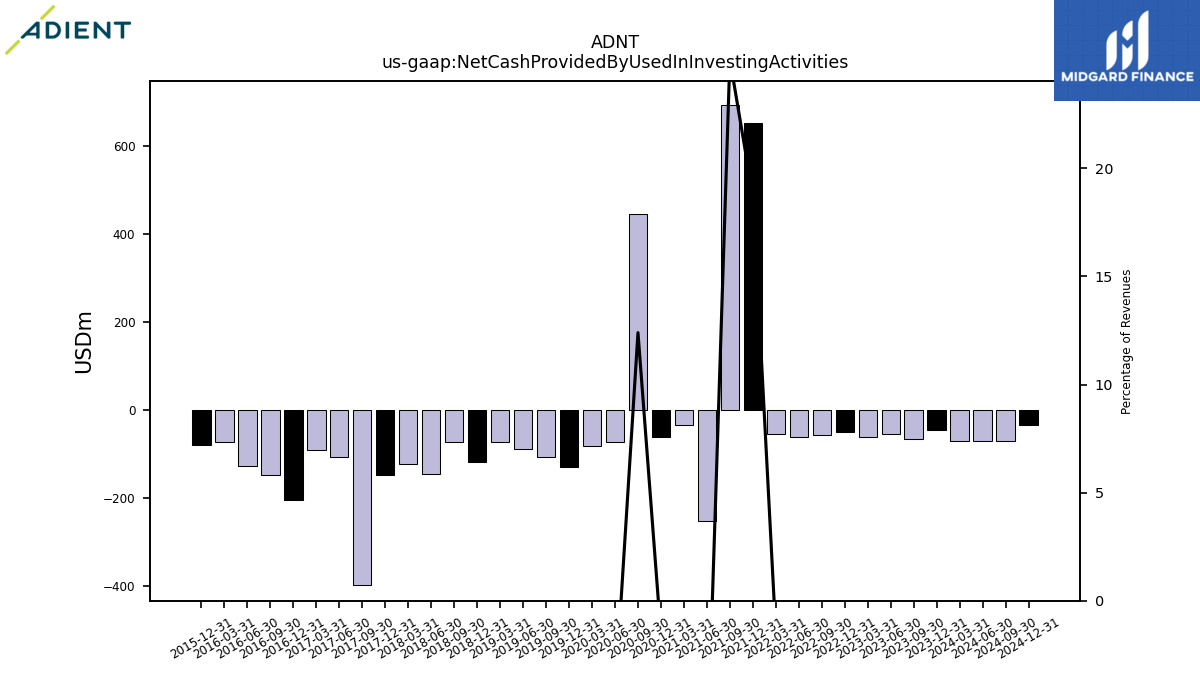
| Net Cash Provided By Used In Investing Activities | -44.00 | -65.00 | -53.00 | -61.00 | -50.00 | -55.00 | -60.00 | -53.00 | 652.00 | 694.00 | -252.00 | -34.00 | -61.00 | 446.00 | -72.00 | -80.00 | -128.00 | -105.00 | -88.00 | -72.00 | -118.00 | -73.00 | -145.00 | -123.00 | -146.00 | -397.00 | -105.00 | -90.00 | -203.00 | -147.00 | -126.00 | -73.00 | -79.00 | |
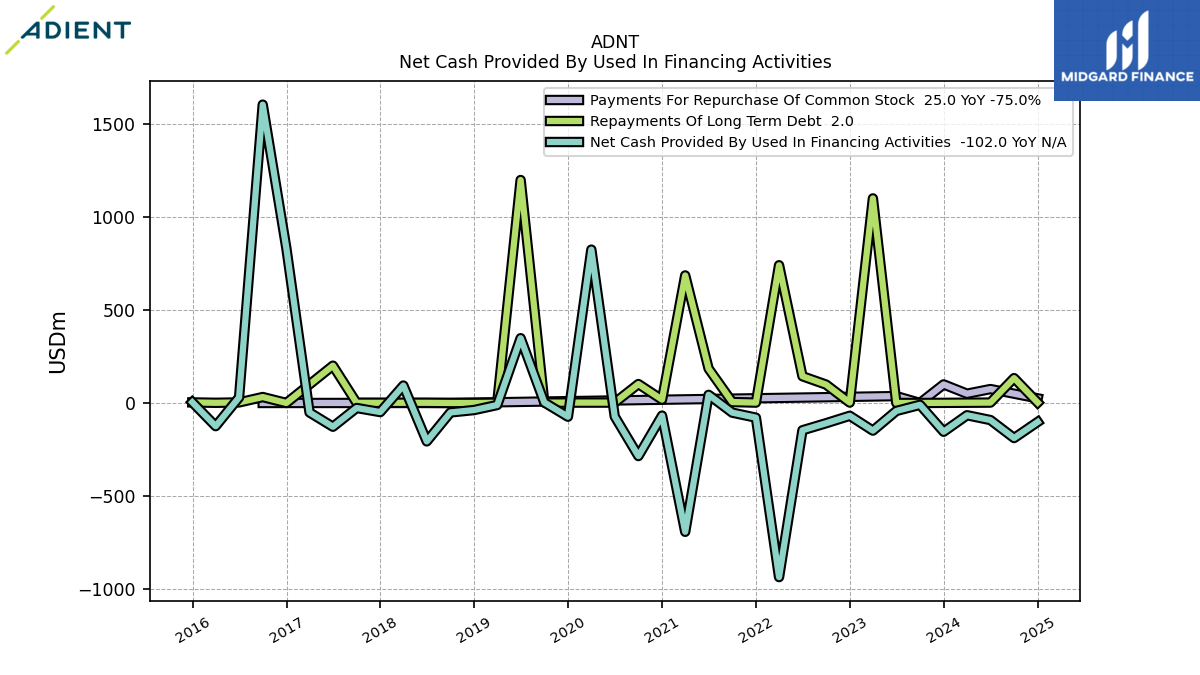
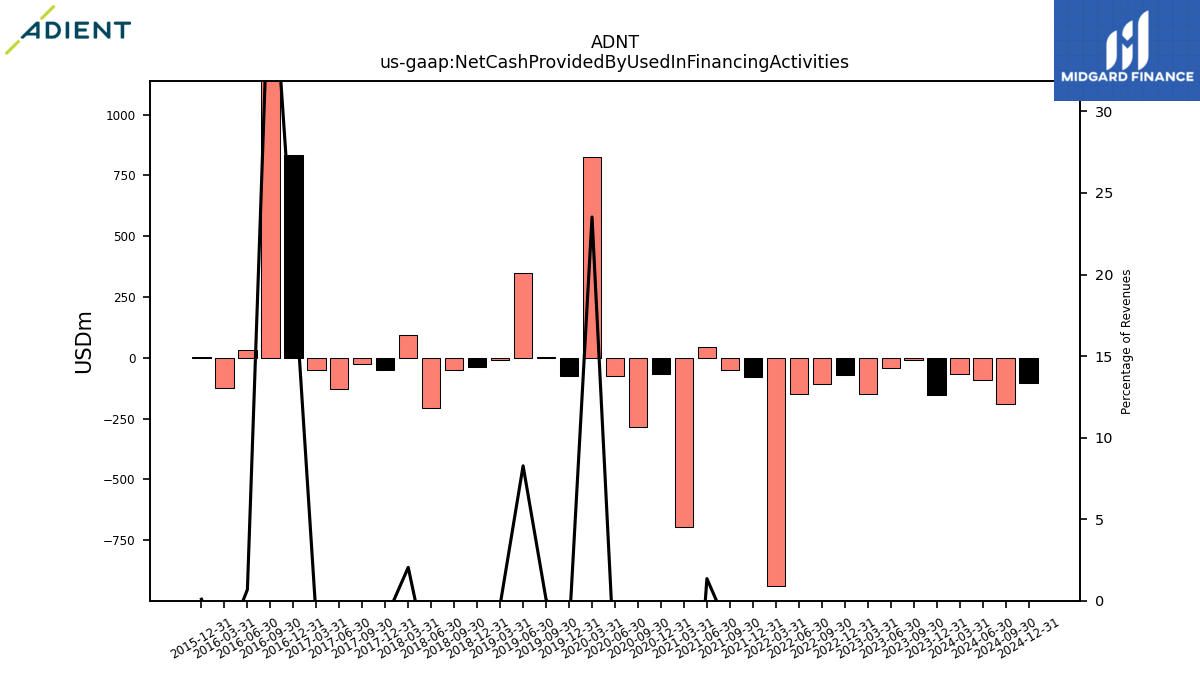
| Net Cash Provided By Used In Financing Activities | -155.00 | -10.00 | -43.00 | -149.00 | -69.00 | -109.00 | -147.00 | -938.00 | -79.00 | -52.00 | 44.00 | -694.00 | -68.00 | -286.00 | -73.00 | 826.00 | -74.00 | 3.00 | 349.00 | -11.00 | -38.00 | -51.00 | -207.00 | 94.00 | -49.00 | -27.00 | -128.00 | -51.00 | 833.00 | 1607.00 | 30.00 | -125.00 | 4.00 |
| 2023-12-31 | 2023-09-30 | 2023-06-30 | 2023-03-31 | 2022-12-31 | 2022-09-30 | 2022-06-30 | 2022-03-31 | 2021-12-31 | 2021-09-30 | 2021-06-30 | 2021-03-31 | 2020-12-31 | 2020-09-30 | 2020-06-30 | 2020-03-31 | 2019-12-31 | 2019-09-30 | 2019-06-30 | 2019-03-31 | 2018-12-31 | 2018-09-30 | 2018-06-30 | 2018-03-31 | 2017-12-31 | 2017-09-30 | 2017-06-30 | 2017-03-31 | 2016-12-31 | 2016-09-30 | 2016-06-30 | 2016-03-31 | 2015-12-31 | ||
|---|---|---|---|---|---|---|---|---|---|---|---|---|---|---|---|---|---|---|---|---|---|---|---|---|---|---|---|---|---|---|---|---|---|---|
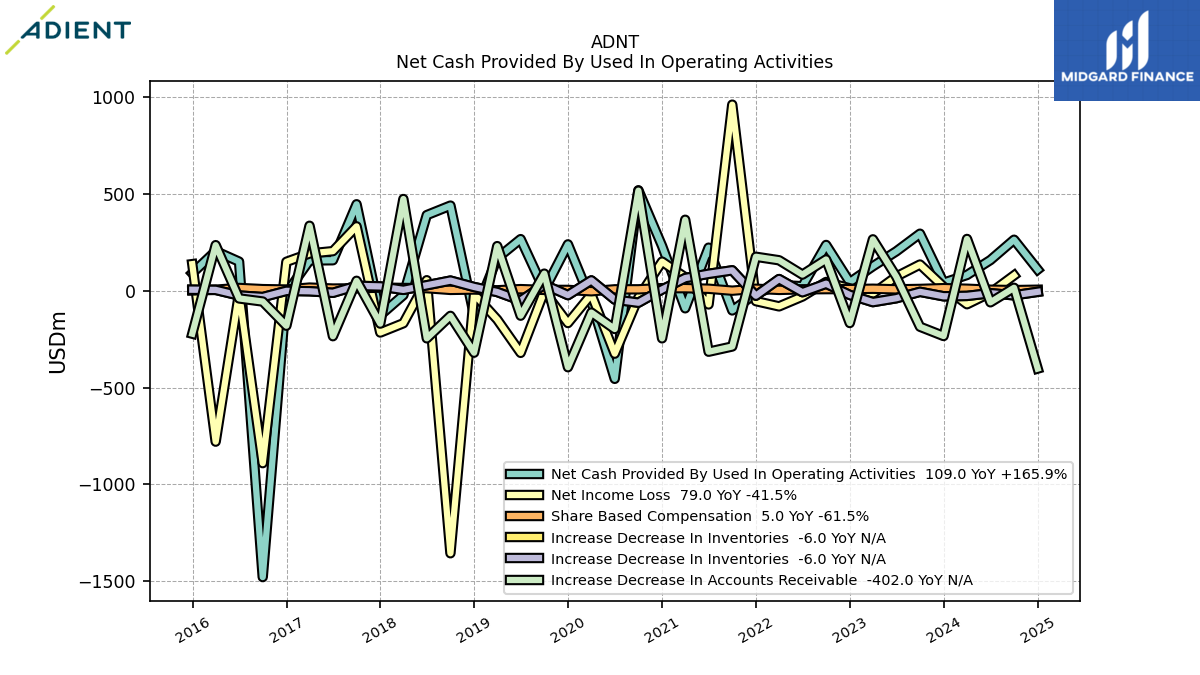
| Net Cash Provided By Used In Operating Activities | 41.00 | 294.00 | 203.00 | 126.00 | 44.00 | 236.00 | 23.00 | 29.00 | -14.00 | -102.00 | 222.00 | -91.00 | 231.00 | 518.00 | -455.00 | -56.00 | 239.00 | 2.00 | 266.00 | 168.00 | -128.00 | 439.00 | 390.00 | -23.00 | -127.00 | 446.00 | 157.00 | 156.00 | -13.00 | -1478.00 | 150.00 | 204.00 | 90.00 | |
| Net Income Loss | 20.00 | 135.00 | 73.00 | -15.00 | 12.00 | 45.00 | -30.00 | -81.00 | -54.00 | 960.00 | -71.00 | 69.00 | 150.00 | -36.00 | -325.00 | -19.00 | -167.00 | -4.00 | -321.00 | -149.00 | -17.00 | -1355.00 | 54.00 | -168.00 | -216.00 | 332.00 | 204.00 | 192.00 | 149.00 | -890.00 | -14.00 | -779.00 | 137.00 | |
| Profit Loss | 45.00 | 157.00 | 95.00 | 10.00 | 33.00 | 70.00 | -20.00 | -60.00 | -30.00 | 972.00 | -49.00 | 94.00 | 173.00 | -15.00 | -331.00 | 2.00 | -142.00 | 15.00 | -308.00 | -126.00 | 11.00 | -1335.00 | 73.00 | -143.00 | -196.00 | 349.00 | 226.00 | 216.00 | 171.00 | -867.00 | 7.00 | -756.00 | 154.00 | |
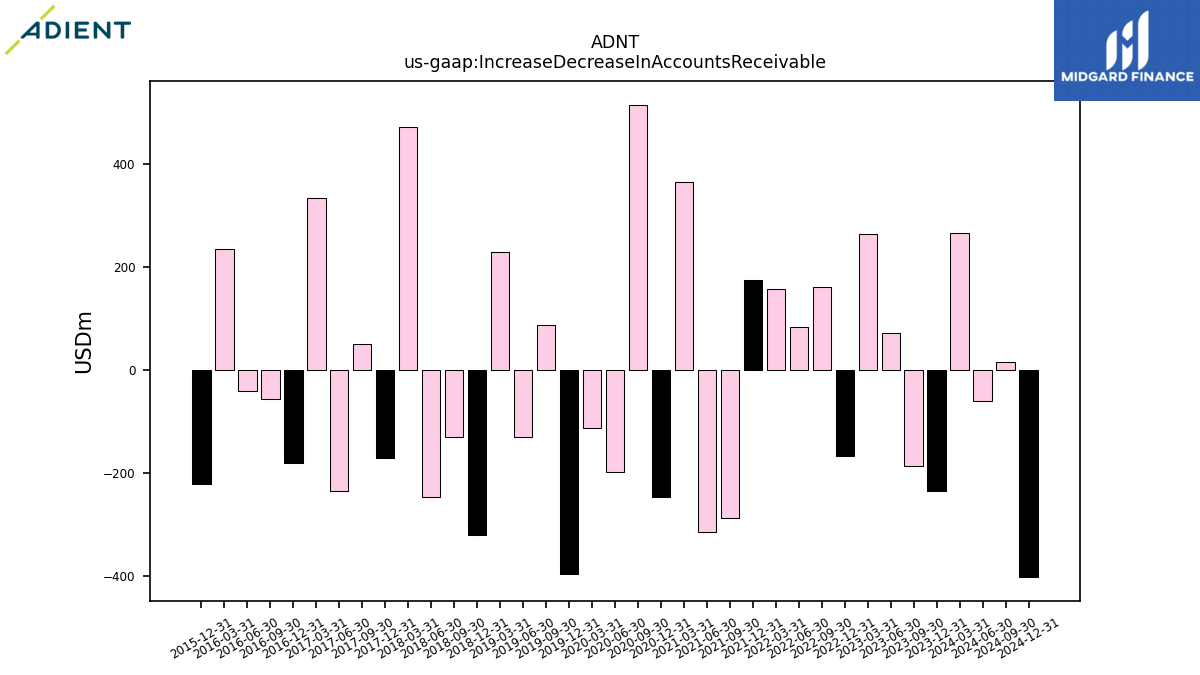
| Increase Decrease In Accounts Receivable | -234.00 | -186.00 | 72.00 | 265.00 | -167.00 | 161.00 | 83.00 | 157.00 | 175.00 | -288.00 | -315.00 | 366.00 | -246.00 | 516.00 | -198.00 | -113.00 | -395.00 | 88.00 | -129.00 | 230.00 | -320.00 | -130.00 | -246.00 | 473.00 | -170.00 | 51.00 | -235.00 | 335.00 | -181.00 | -56.00 | -40.00 | 235.00 | -222.00 | |
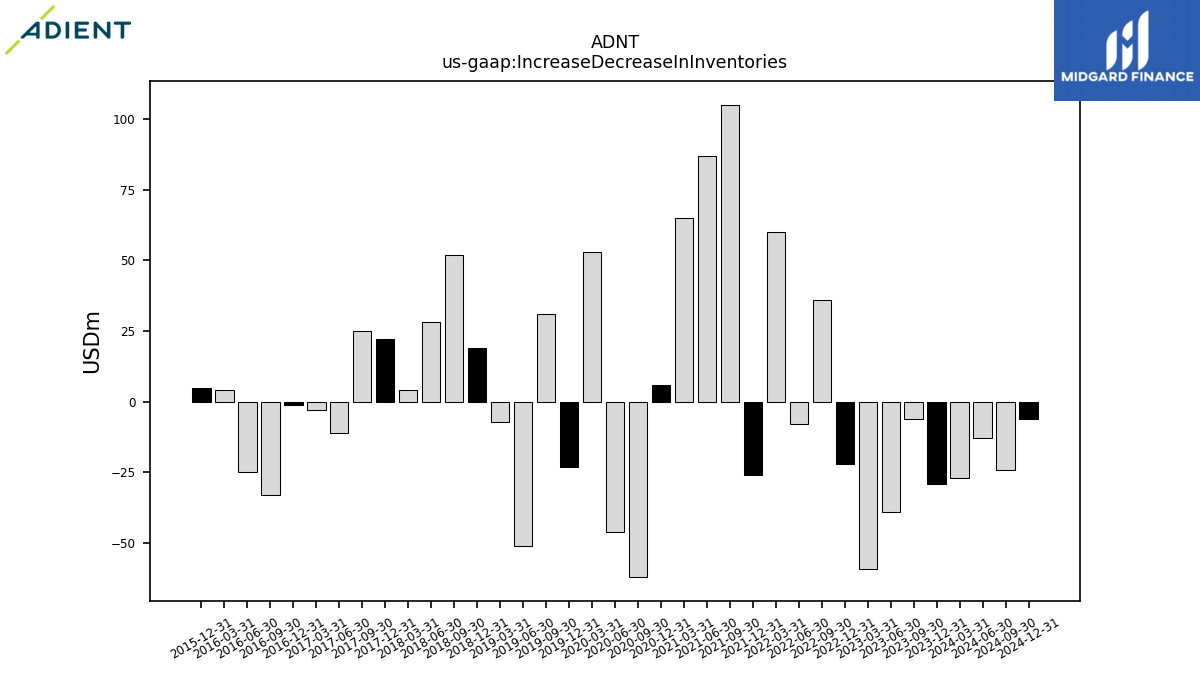
| Increase Decrease In Inventories | -29.00 | -6.00 | -39.00 | -59.00 | -22.00 | 36.00 | -8.00 | 60.00 | -26.00 | 105.00 | 87.00 | 65.00 | 6.00 | -62.00 | -46.00 | 53.00 | -23.00 | 31.00 | -51.00 | -7.00 | 19.00 | 52.00 | 28.00 | 4.00 | 22.00 | 25.00 | -11.00 | -3.00 | -1.00 | -33.00 | -25.00 | 4.00 | 5.00 | |
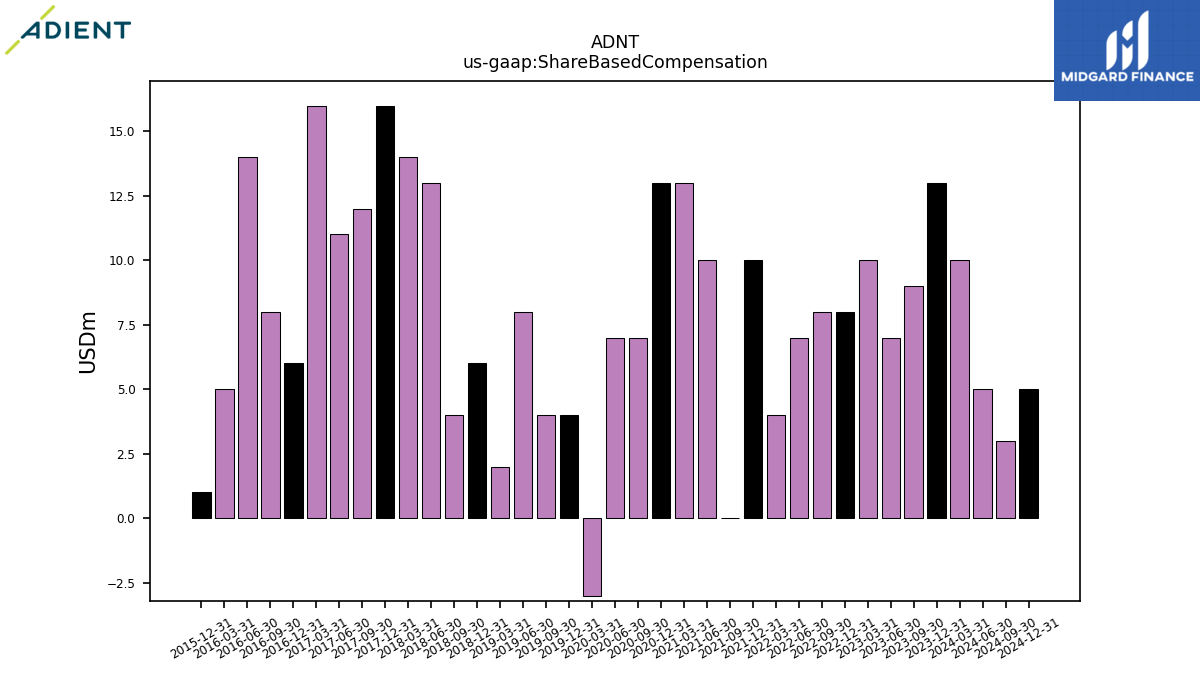
| Share Based Compensation | 13.00 | 9.00 | 7.00 | 10.00 | 8.00 | 8.00 | 7.00 | 4.00 | 10.00 | 0.00 | 10.00 | 13.00 | 13.00 | 7.00 | 7.00 | -3.00 | 4.00 | 4.00 | 8.00 | 2.00 | 6.00 | 4.00 | 13.00 | 14.00 | 16.00 | 12.00 | 11.00 | 16.00 | 6.00 | 8.00 | 14.00 | 5.00 | 1.00 | |
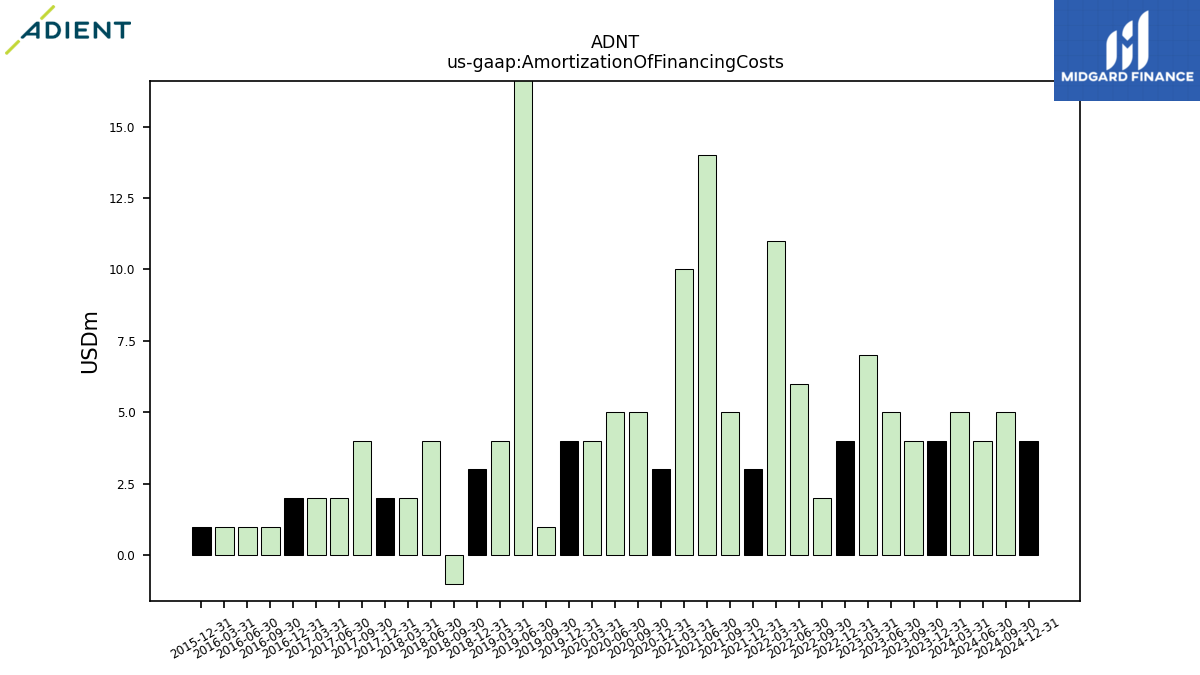
| Amortization Of Financing Costs | 4.00 | 4.00 | 5.00 | 7.00 | 4.00 | 2.00 | 6.00 | 11.00 | 3.00 | 5.00 | 14.00 | 10.00 | 3.00 | 5.00 | 5.00 | 4.00 | 4.00 | 1.00 | 18.00 | 4.00 | 3.00 | -1.00 | 4.00 | 2.00 | 2.00 | 4.00 | 2.00 | 2.00 | 2.00 | 1.00 | 1.00 | 1.00 | 1.00 |
| 2023-12-31 | 2023-09-30 | 2023-06-30 | 2023-03-31 | 2022-12-31 | 2022-09-30 | 2022-06-30 | 2022-03-31 | 2021-12-31 | 2021-09-30 | 2021-06-30 | 2021-03-31 | 2020-12-31 | 2020-09-30 | 2020-06-30 | 2020-03-31 | 2019-12-31 | 2019-09-30 | 2019-06-30 | 2019-03-31 | 2018-12-31 | 2018-09-30 | 2018-06-30 | 2018-03-31 | 2017-12-31 | 2017-09-30 | 2017-06-30 | 2017-03-31 | 2016-12-31 | 2016-09-30 | 2016-06-30 | 2016-03-31 | 2015-12-31 | ||
|---|---|---|---|---|---|---|---|---|---|---|---|---|---|---|---|---|---|---|---|---|---|---|---|---|---|---|---|---|---|---|---|---|---|---|
| Net Cash Provided By Used In Investing Activities | -44.00 | -65.00 | -53.00 | -61.00 | -50.00 | -55.00 | -60.00 | -53.00 | 652.00 | 694.00 | -252.00 | -34.00 | -61.00 | 446.00 | -72.00 | -80.00 | -128.00 | -105.00 | -88.00 | -72.00 | -118.00 | -73.00 | -145.00 | -123.00 | -146.00 | -397.00 | -105.00 | -90.00 | -203.00 | -147.00 | -126.00 | -73.00 | -79.00 | |
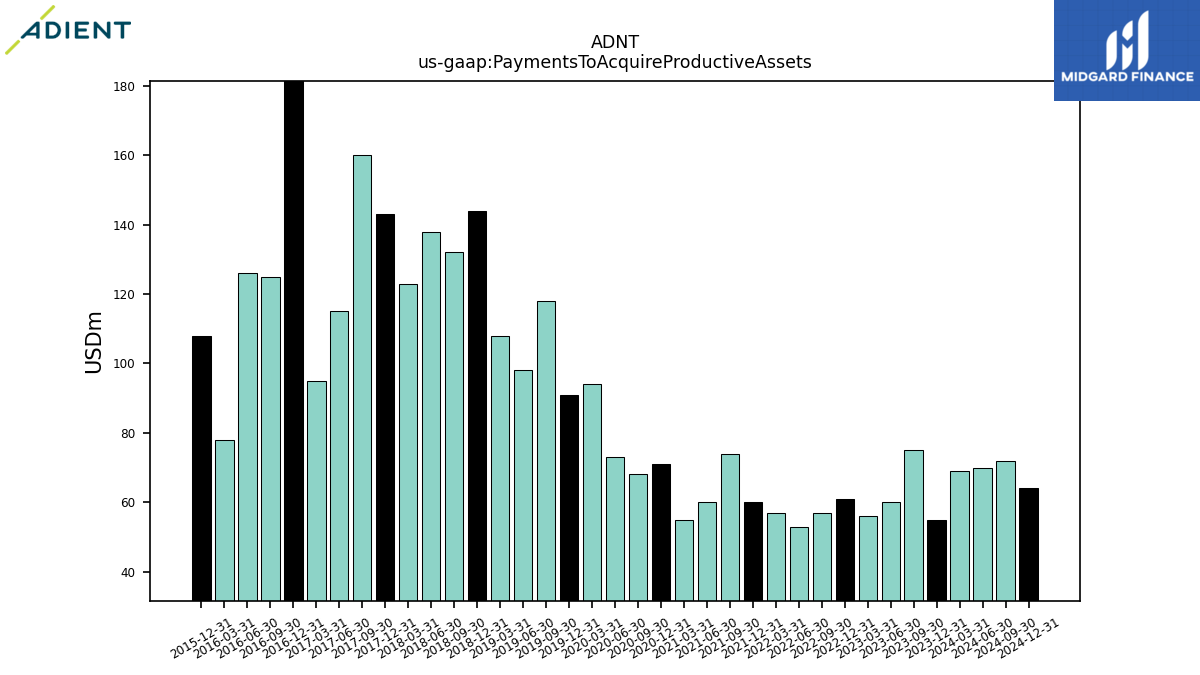
| Payments To Acquire Productive Assets | 55.00 | 75.00 | 60.00 | 56.00 | 61.00 | 57.00 | 53.00 | 57.00 | 60.00 | 74.00 | 60.00 | 55.00 | 71.00 | 68.00 | 73.00 | 94.00 | 91.00 | 118.00 | 98.00 | 108.00 | 144.00 | 132.00 | 138.00 | 123.00 | 143.00 | 160.00 | 115.00 | 95.00 | 207.00 | 125.00 | 126.00 | 78.00 | 108.00 |
| 2023-12-31 | 2023-09-30 | 2023-06-30 | 2023-03-31 | 2022-12-31 | 2022-09-30 | 2022-06-30 | 2022-03-31 | 2021-12-31 | 2021-09-30 | 2021-06-30 | 2021-03-31 | 2020-12-31 | 2020-09-30 | 2020-06-30 | 2020-03-31 | 2019-12-31 | 2019-09-30 | 2019-06-30 | 2019-03-31 | 2018-12-31 | 2018-09-30 | 2018-06-30 | 2018-03-31 | 2017-12-31 | 2017-09-30 | 2017-06-30 | 2017-03-31 | 2016-12-31 | 2016-09-30 | 2016-06-30 | 2016-03-31 | 2015-12-31 | ||
|---|---|---|---|---|---|---|---|---|---|---|---|---|---|---|---|---|---|---|---|---|---|---|---|---|---|---|---|---|---|---|---|---|---|---|
| Net Cash Provided By Used In Financing Activities | -155.00 | -10.00 | -43.00 | -149.00 | -69.00 | -109.00 | -147.00 | -938.00 | -79.00 | -52.00 | 44.00 | -694.00 | -68.00 | -286.00 | -73.00 | 826.00 | -74.00 | 3.00 | 349.00 | -11.00 | -38.00 | -51.00 | -207.00 | 94.00 | -49.00 | -27.00 | -128.00 | -51.00 | 833.00 | 1607.00 | 30.00 | -125.00 | 4.00 | |
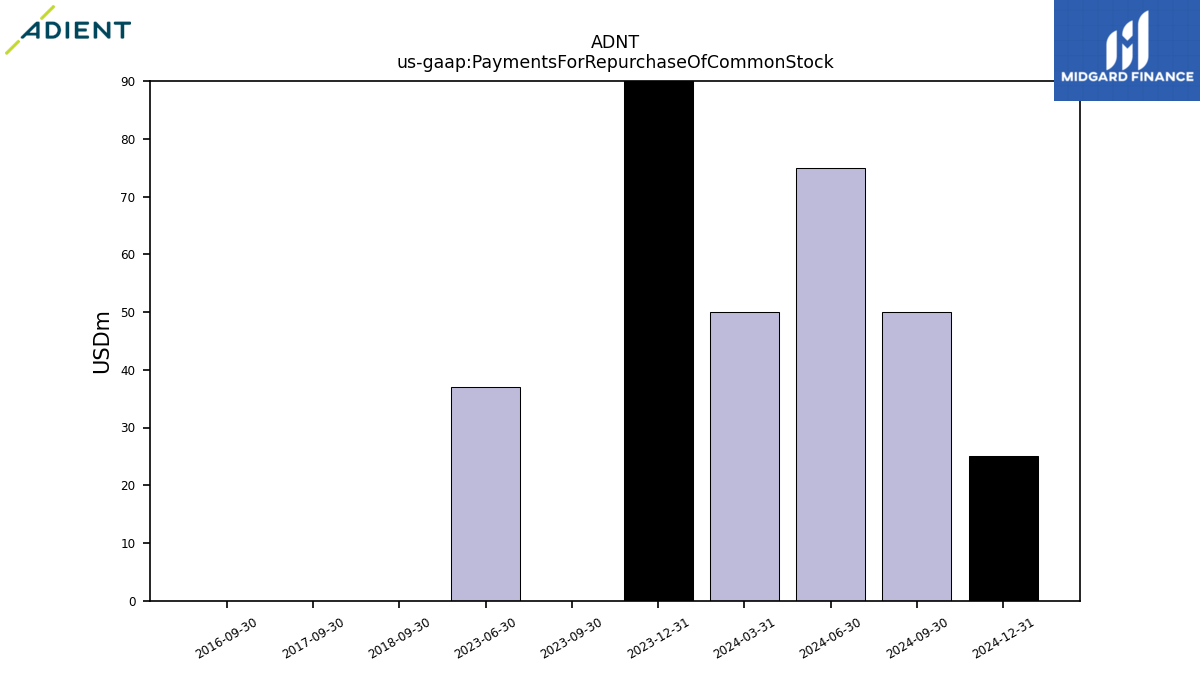
| Payments For Repurchase Of Common Stock | 100.00 | 0.00 | 37.00 | NA | NA | NA | NA | NA | NA | NA | NA | NA | NA | NA | NA | NA | NA | NA | NA | NA | NA | 0.00 | NA | NA | NA | 0.00 | NA | NA | NA | 0.00 | NA | NA | NA |
| 2023-12-31 | 2023-09-30 | 2023-06-30 | 2023-03-31 | 2022-12-31 | 2022-09-30 | 2022-06-30 | 2022-03-31 | 2021-12-31 | 2021-09-30 | 2021-06-30 | 2021-03-31 | 2020-12-31 | 2020-09-30 | 2020-06-30 | 2020-03-31 | 2019-12-31 | 2019-09-30 | 2019-06-30 | 2019-03-31 | 2018-12-31 | 2018-09-30 | 2018-06-30 | 2018-03-31 | 2017-12-31 | 2017-09-30 | 2017-06-30 | 2017-03-31 | 2016-12-31 | 2016-09-30 | 2016-06-30 | 2016-03-31 | 2015-12-31 | ||
|---|---|---|---|---|---|---|---|---|---|---|---|---|---|---|---|---|---|---|---|---|---|---|---|---|---|---|---|---|---|---|---|---|---|---|
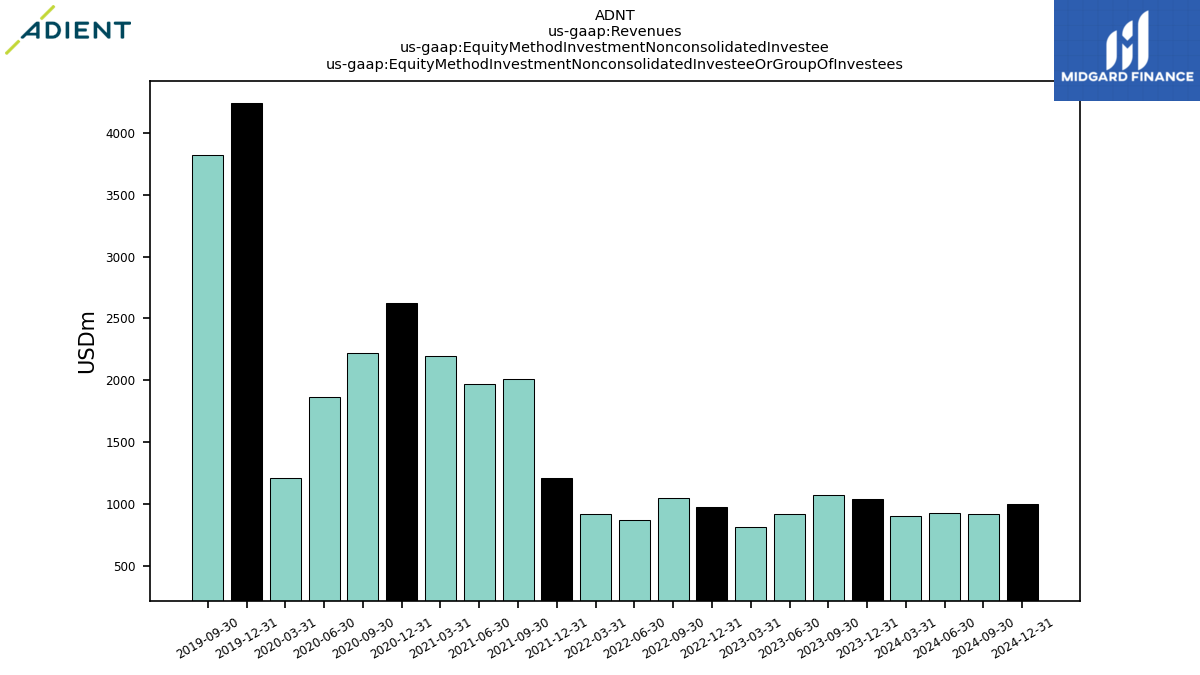
| Revenues | 3660.00 | 3729.00 | 4055.00 | 3912.00 | 3699.00 | 3650.00 | 3485.00 | 3506.00 | 3480.00 | 2771.00 | 3242.00 | 3819.00 | 3848.00 | 3597.00 | 1626.00 | 3511.00 | 3936.00 | 3921.00 | 4219.00 | 4228.00 | 4158.00 | 4145.00 | 4494.00 | 4596.00 | 4204.00 | 3979.00 | 4007.00 | 4201.00 | 4038.00 | 3897.00 | 4362.00 | 4298.00 | 4233.00 | |
| Equity Method Investment Nonconsolidated Investee Or Group Of Investees | 1037.00 | 1076.00 | 921.00 | 818.00 | 976.00 | 1046.00 | 869.00 | 916.00 | 1208.00 | 2014.00 | 1973.00 | 2197.00 | 2625.00 | 2219.00 | 1862.00 | 1214.00 | 4243.00 | 3819.00 | NA | NA | NA | NA | NA | NA | NA | NA | NA | NA | NA | NA | NA | NA | NA | |
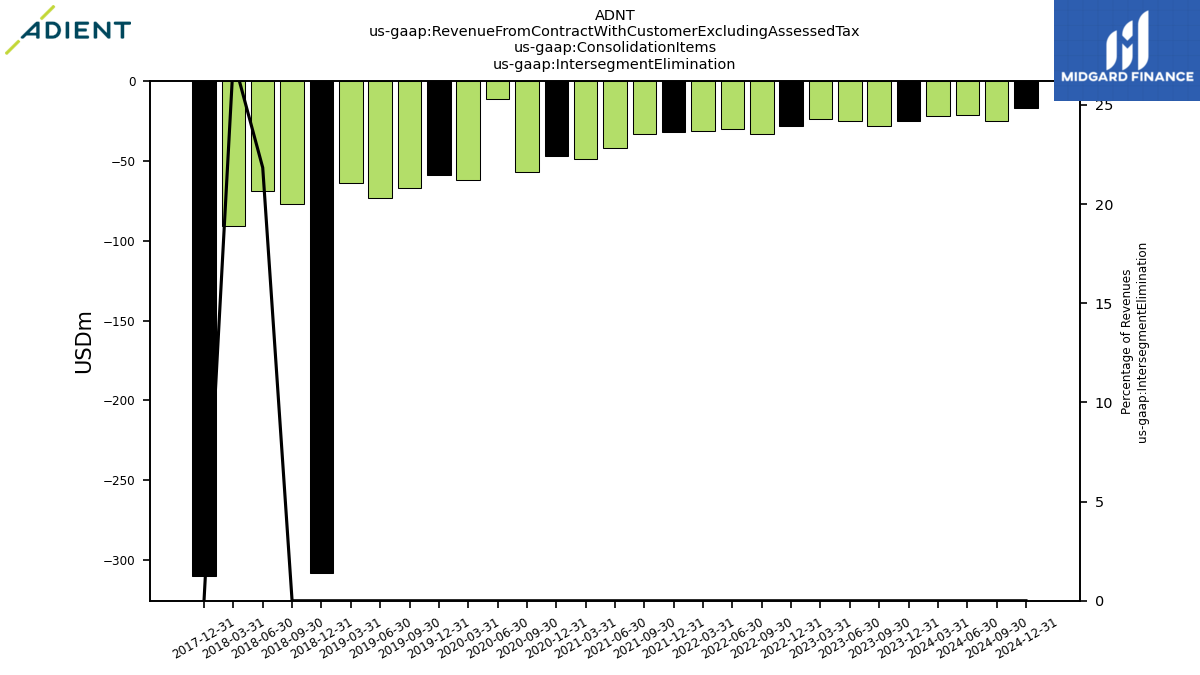
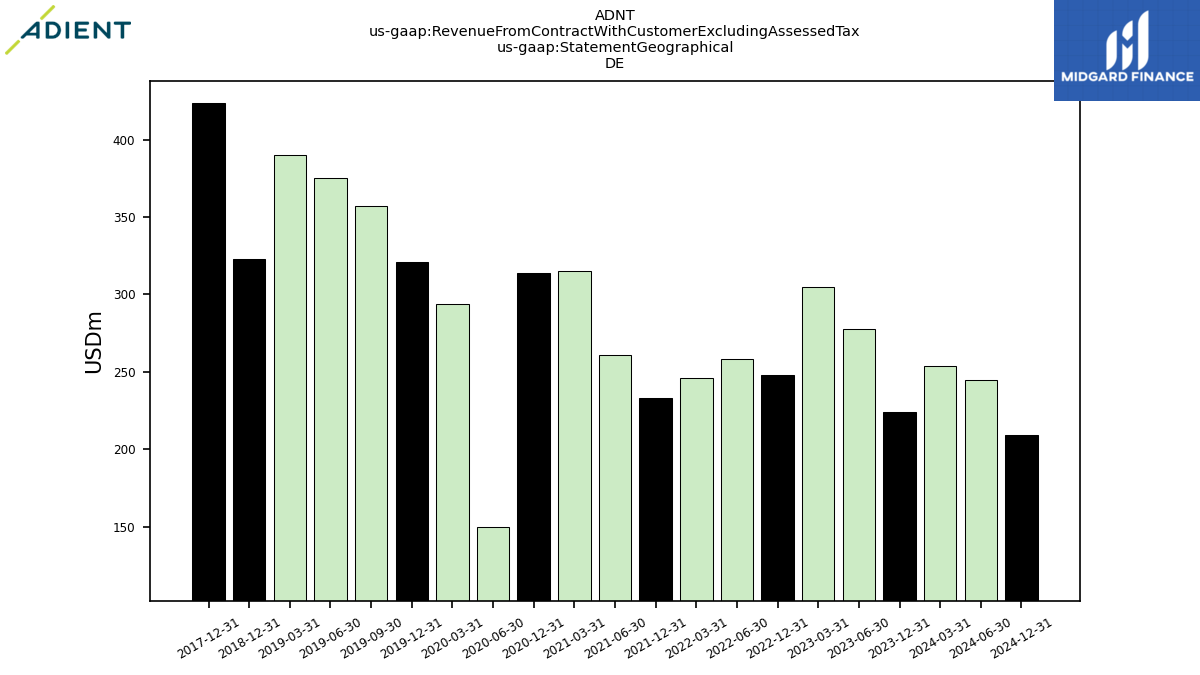
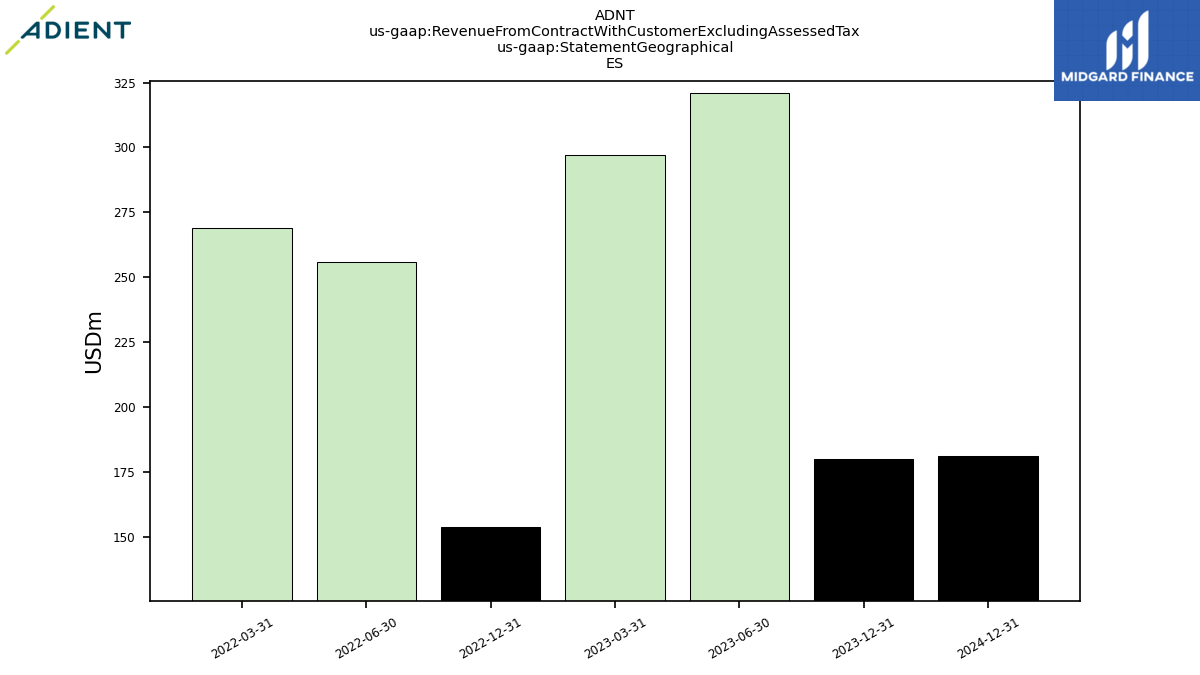
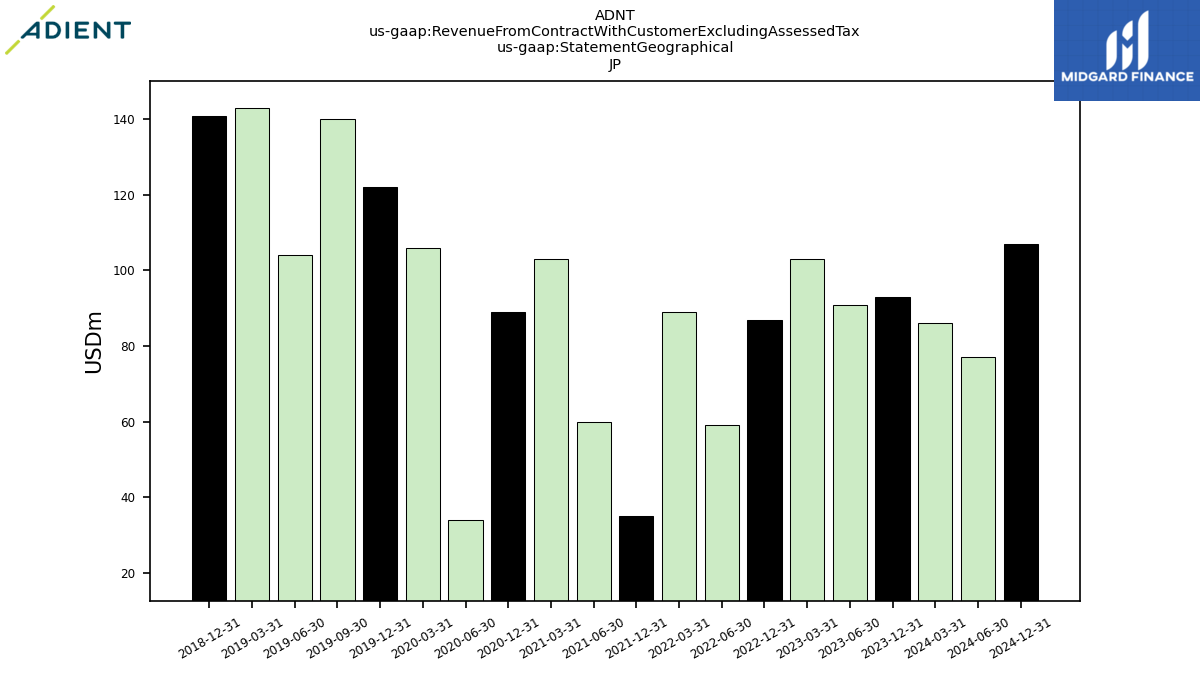
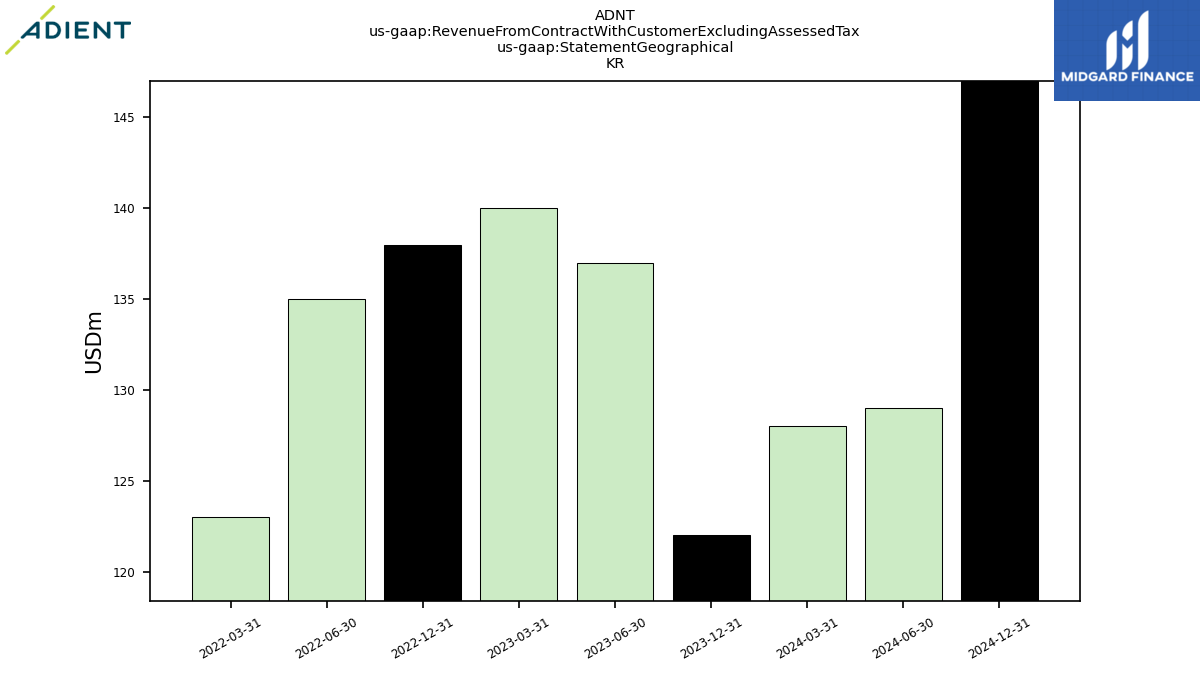
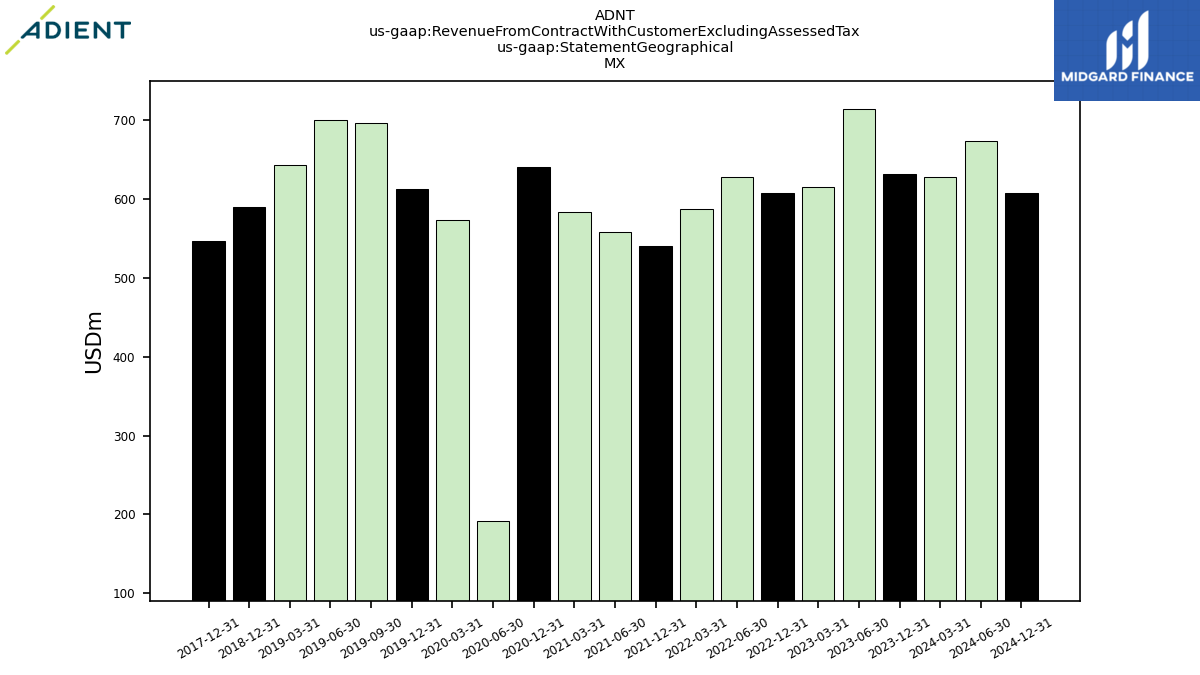
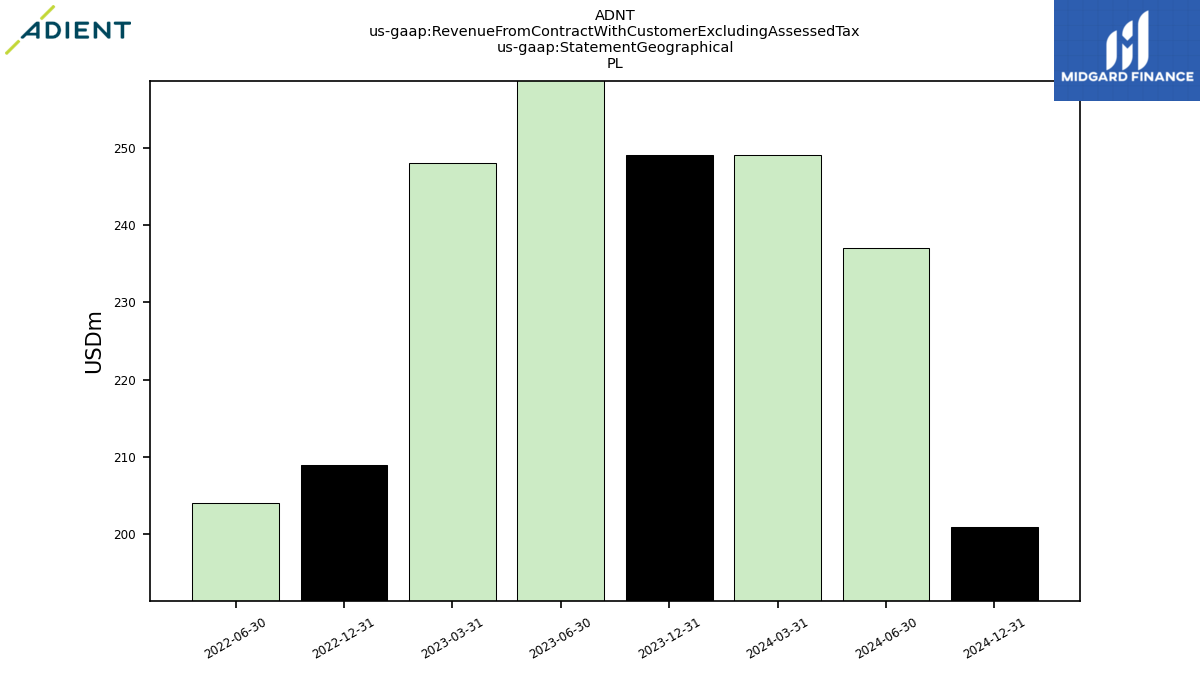
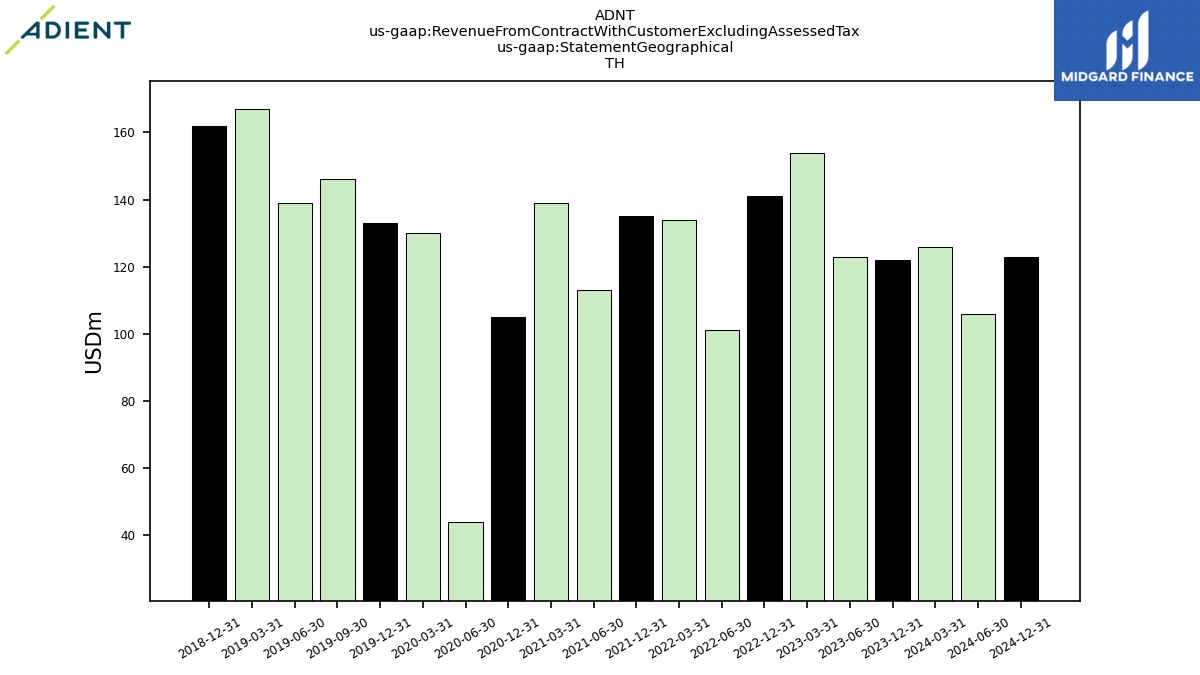
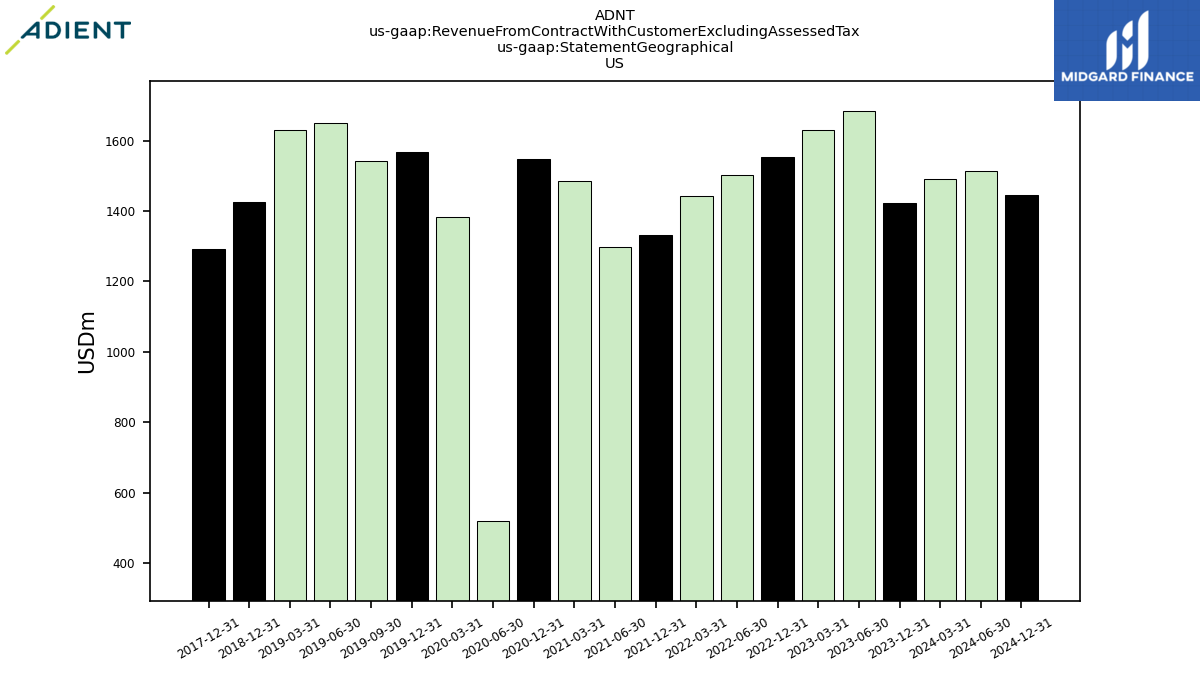
| Revenue From Contract With Customer Excluding Assessed Tax | 3660.00 | 3729.00 | 4055.00 | 3912.00 | 3699.00 | 3650.00 | 3485.00 | 3506.00 | 3480.00 | 2771.00 | 3242.00 | 3819.00 | 3848.00 | 3597.00 | 1626.00 | 3511.00 | 3936.00 | 3921.00 | 4219.00 | 4228.00 | 4158.00 | 4145.00 | 4494.00 | 4596.00 | 4204.00 | 3979.00 | 4007.00 | 4201.00 | 4038.00 | 3897.00 | 4362.00 | 4298.00 | 4233.00 | |
| Intersegment Elimination | -25.00 | -28.00 | -25.00 | -24.00 | -28.00 | -33.00 | -30.00 | -31.00 | -32.00 | -33.00 | -42.00 | -49.00 | -47.00 | -57.00 | -11.00 | -62.00 | -59.00 | -67.00 | -73.00 | -64.00 | -308.00 | -77.00 | -69.00 | -91.00 | -310.00 | NA | NA | NA | NA | NA | NA | NA | NA | |
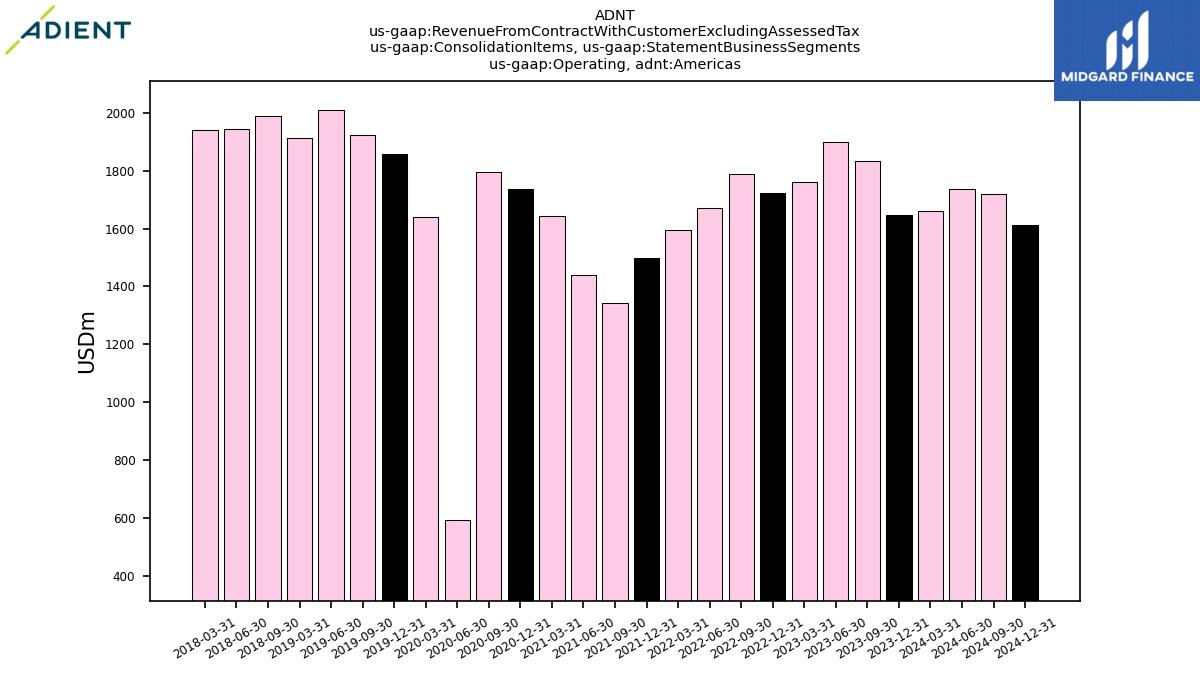
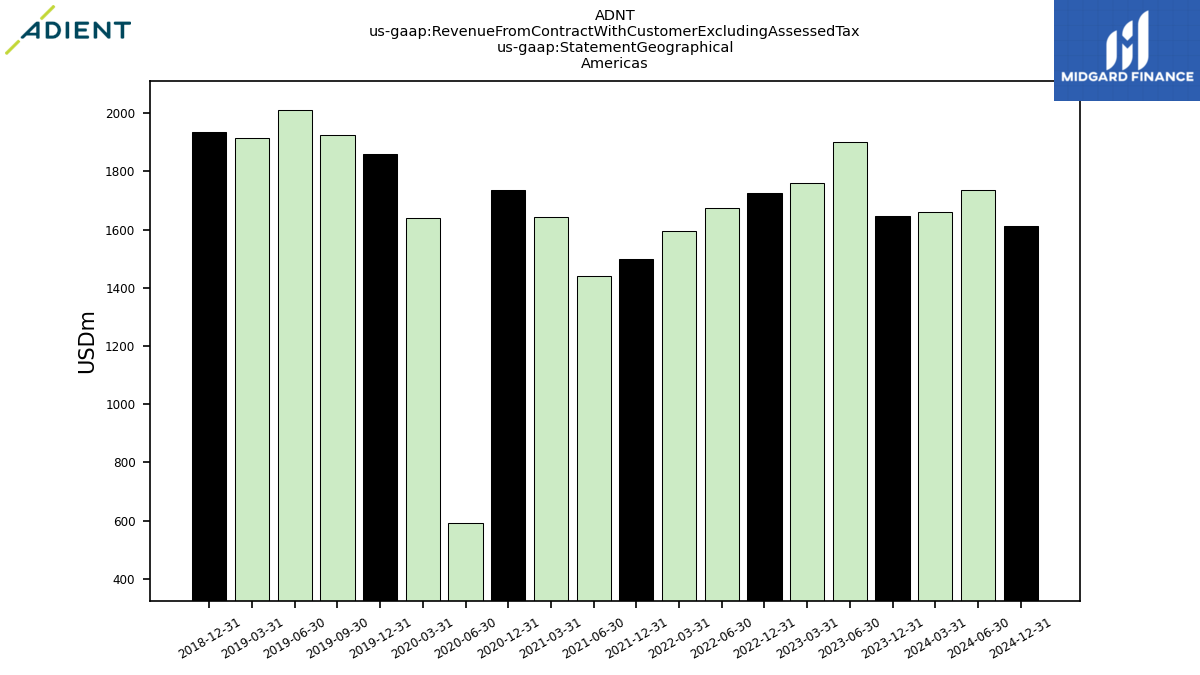
| Operating, Americas | 1647.00 | 1835.00 | 1900.00 | 1761.00 | 1724.00 | 1790.00 | 1673.00 | 1596.00 | 1498.00 | 1343.00 | 1440.00 | 1644.00 | 1737.00 | 1796.00 | 593.00 | 1641.00 | 1859.00 | 1925.00 | 2010.00 | 1915.00 | NA | 1991.00 | 1946.00 | 1941.00 | NA | NA | NA | NA | NA | NA | NA | NA | NA | |
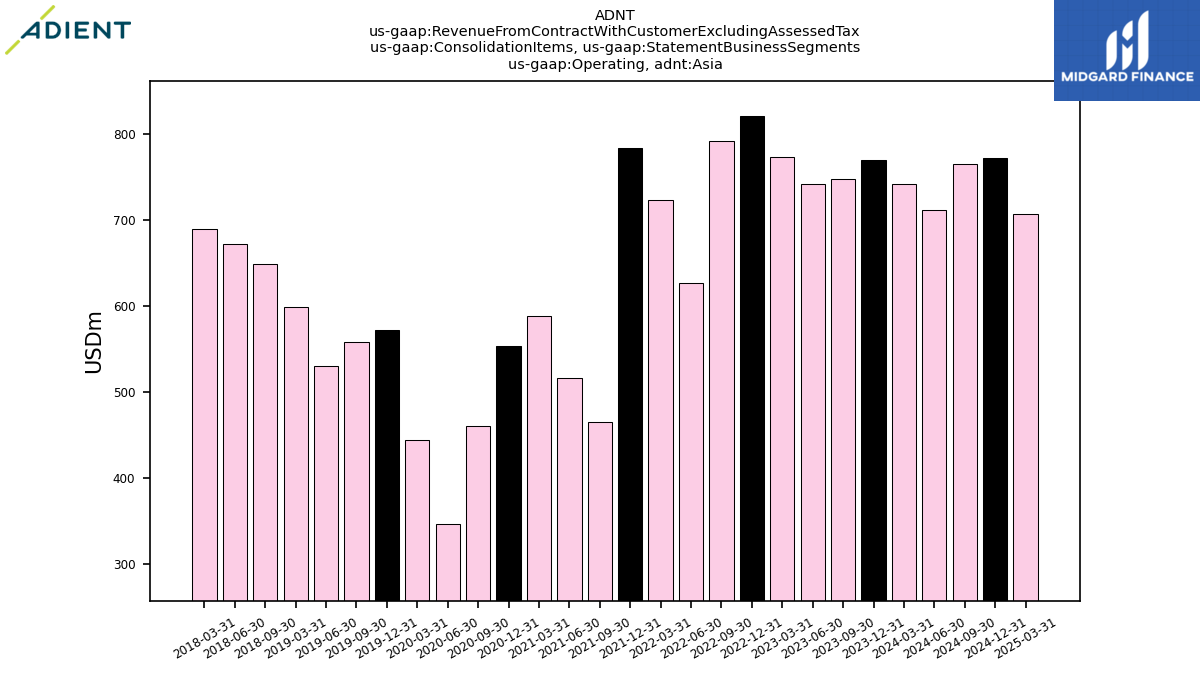
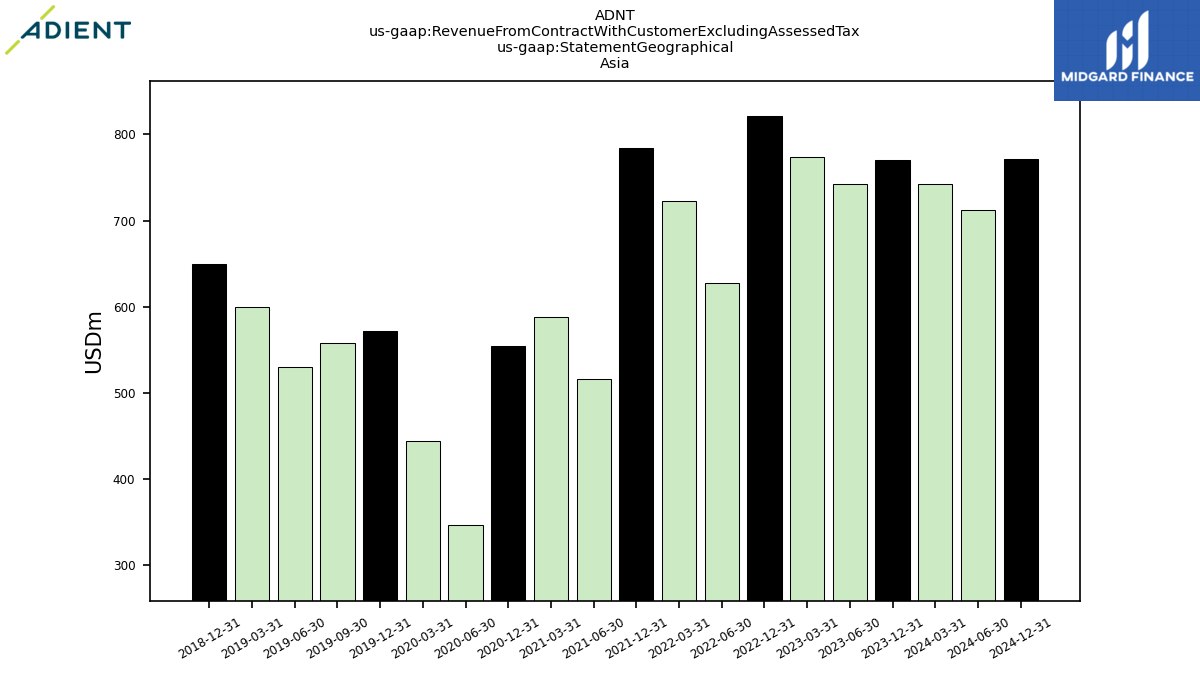
| Operating, Asia | 770.00 | 748.00 | 742.00 | 774.00 | 821.00 | 792.00 | 627.00 | 723.00 | 784.00 | 465.00 | 516.00 | 588.00 | 554.00 | 460.00 | 346.00 | 444.00 | 572.00 | 558.00 | 530.00 | 599.00 | NA | 649.00 | 672.00 | 690.00 | NA | NA | NA | NA | NA | NA | NA | NA | NA | |
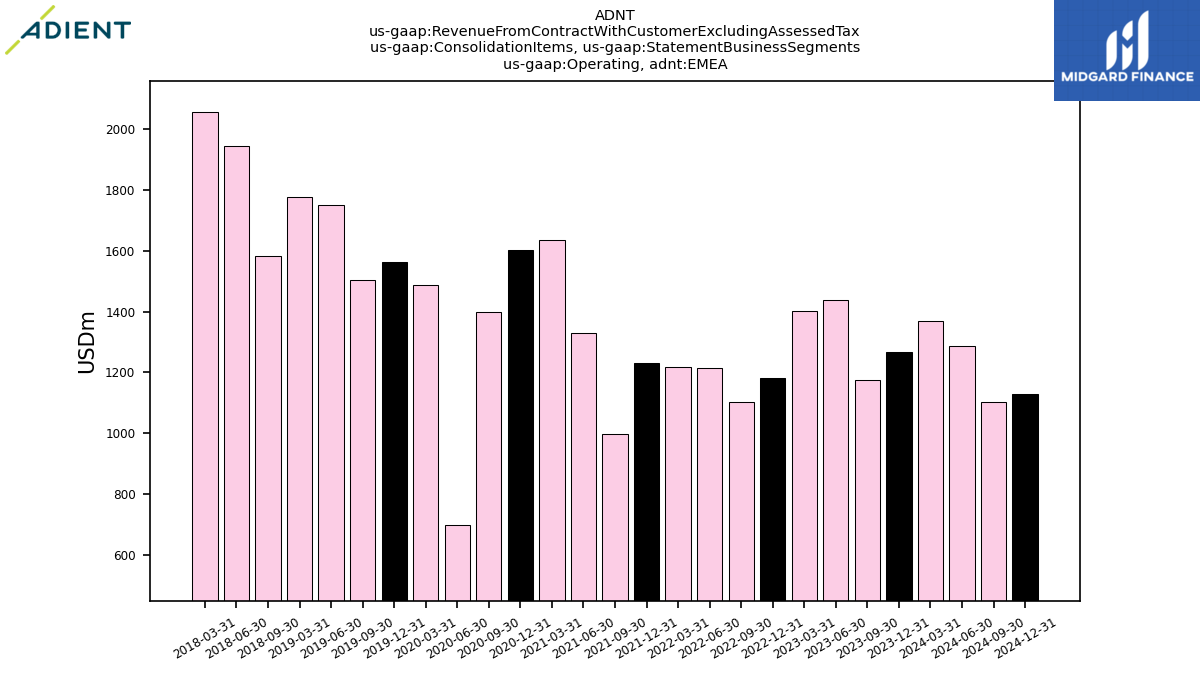
| Operating,EMEA | 1268.00 | 1174.00 | 1438.00 | 1401.00 | 1182.00 | 1101.00 | 1215.00 | 1218.00 | 1230.00 | 996.00 | 1328.00 | 1636.00 | 1604.00 | 1398.00 | 698.00 | 1488.00 | 1564.00 | 1505.00 | 1752.00 | 1778.00 | NA | 1582.00 | 1945.00 | 2056.00 | NA | NA | NA | NA | NA | NA | NA | NA | NA | |
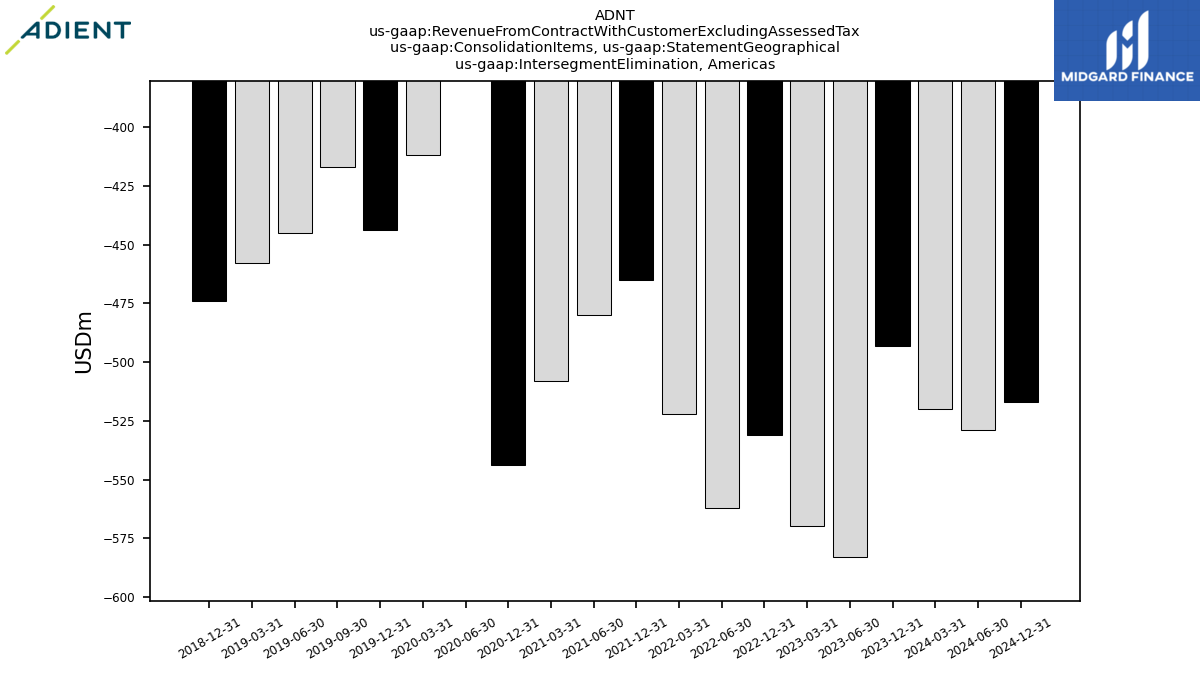
| Intersegment Elimination, | -493.00 | NA | -583.00 | -570.00 | -531.00 | NA | -562.00 | -522.00 | -465.00 | NA | -480.00 | -508.00 | -544.00 | NA | -135.00 | -412.00 | -444.00 | -417.00 | -445.00 | -458.00 | -474.00 | NA | NA | NA | NA | NA | NA | NA | NA | NA | NA | NA | NA | |
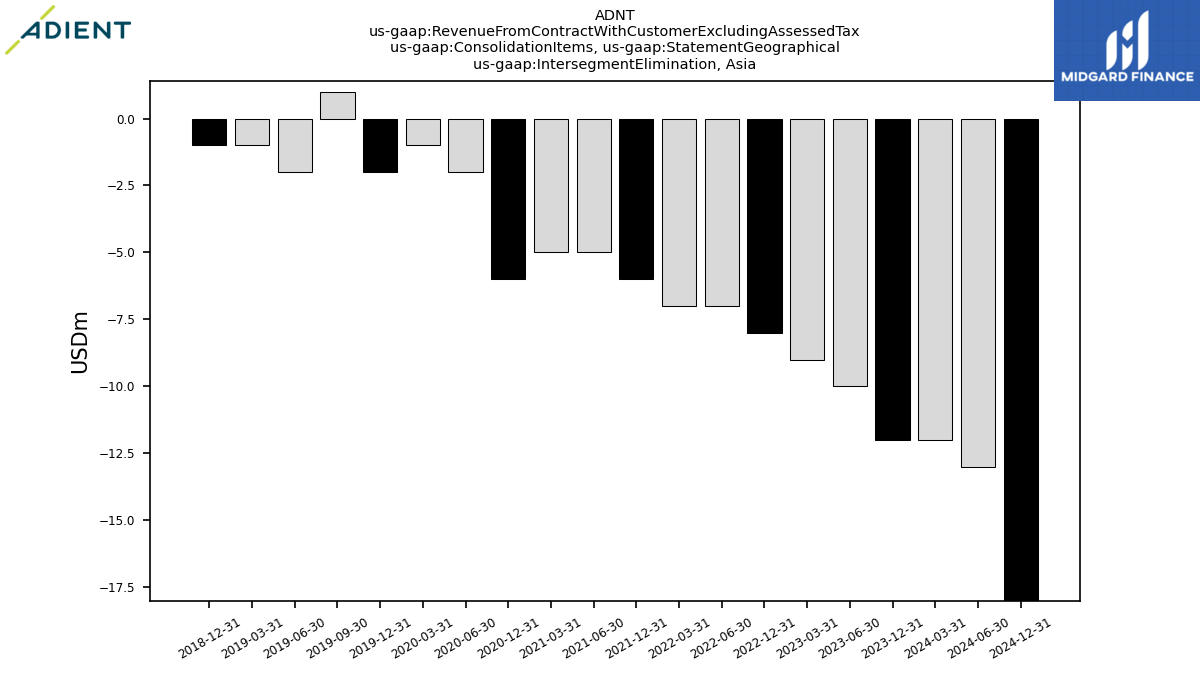
| Intersegment Elimination, | -12.00 | NA | -10.00 | -9.00 | -8.00 | NA | -7.00 | -7.00 | -6.00 | NA | -5.00 | -5.00 | -6.00 | NA | -2.00 | -1.00 | -2.00 | 1.00 | -2.00 | -1.00 | -1.00 | NA | NA | NA | NA | NA | NA | NA | NA | NA | NA | NA | NA | |
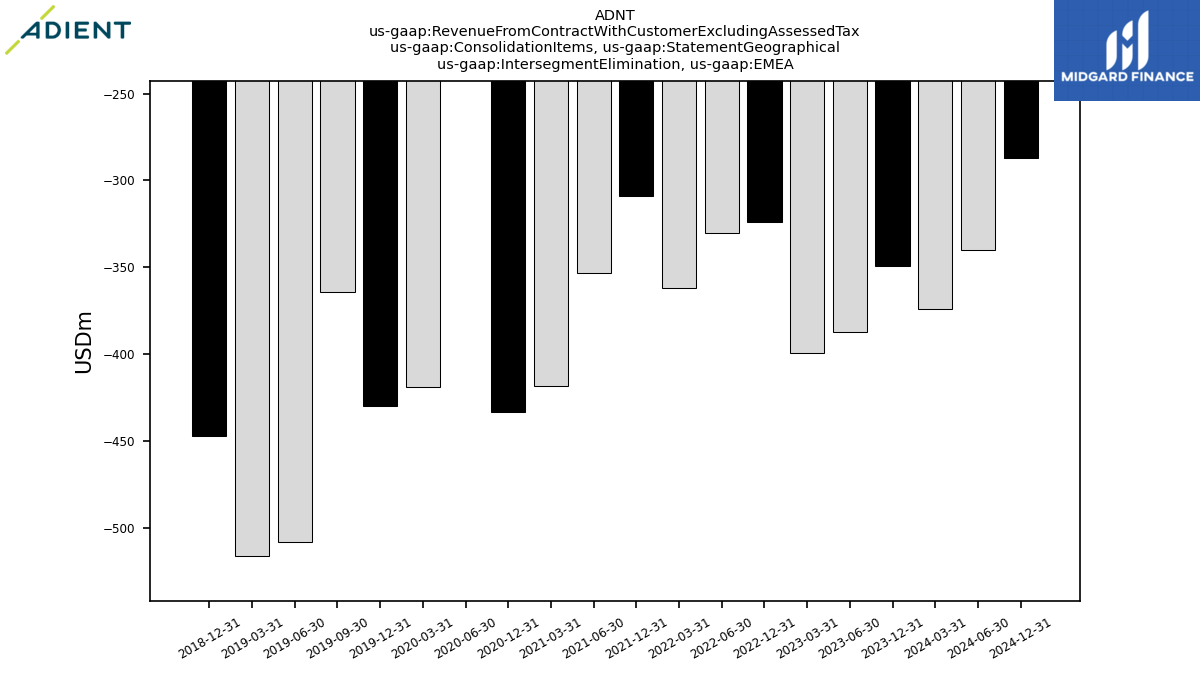
| Intersegment Elimination,EMEA | -349.00 | NA | -387.00 | -399.00 | -324.00 | NA | -330.00 | -362.00 | -309.00 | NA | -353.00 | -418.00 | -433.00 | NA | -189.00 | -419.00 | -430.00 | -364.00 | -508.00 | -516.00 | -447.00 | NA | NA | NA | NA | NA | NA | NA | NA | NA | NA | NA | NA | |
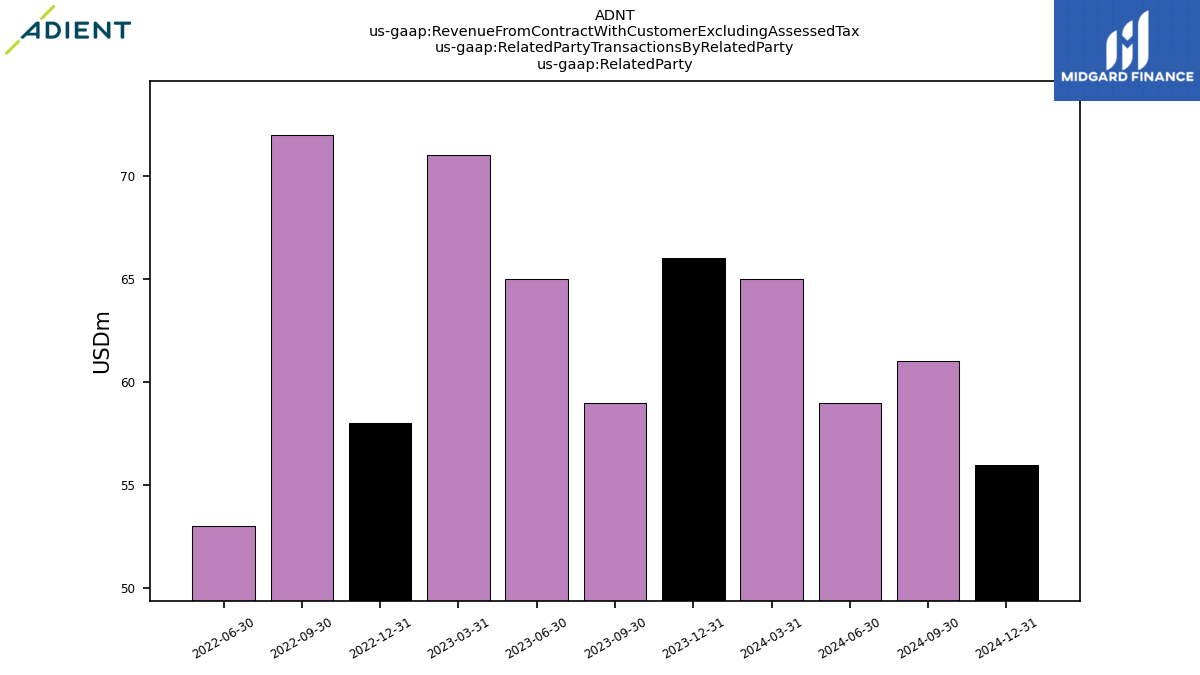
| Related Party | 66.00 | 59.00 | 65.00 | NA | 58.00 | 72.00 | 53.00 | NA | NA | NA | NA | NA | NA | NA | NA | NA | NA | NA | NA | NA | NA | NA | NA | NA | NA | NA | NA | NA | NA | NA | NA | NA | NA | |
| 1647.00 | NA | 1900.00 | 1761.00 | 1724.00 | NA | 1673.00 | 1596.00 | 1498.00 | NA | 1440.00 | 1644.00 | 1737.00 | NA | 593.00 | 1641.00 | 1859.00 | 1925.00 | 2010.00 | 1915.00 | 1935.00 | NA | NA | NA | NA | NA | NA | NA | NA | NA | NA | NA | NA | ||
| 770.00 | NA | 743.00 | 774.00 | 821.00 | NA | 627.00 | 723.00 | 784.00 | NA | 516.00 | 588.00 | 554.00 | NA | 346.00 | 444.00 | 572.00 | 558.00 | 530.00 | 599.00 | 650.00 | NA | NA | NA | NA | NA | NA | NA | NA | NA | NA | NA | NA | ||
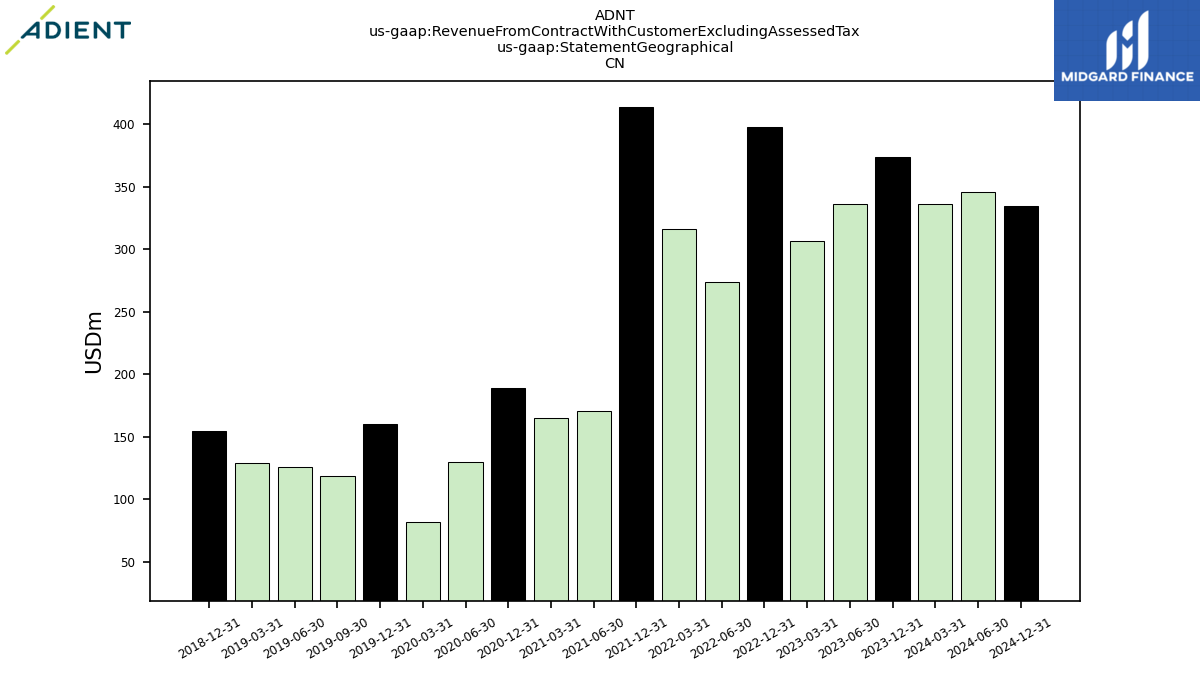
| 374.00 | NA | 336.00 | 307.00 | 398.00 | NA | 274.00 | 316.00 | 414.00 | NA | 171.00 | 165.00 | 189.00 | NA | 130.00 | 82.00 | 160.00 | 119.00 | 126.00 | 129.00 | 155.00 | NA | NA | NA | NA | NA | NA | NA | NA | NA | NA | NA | NA | ||
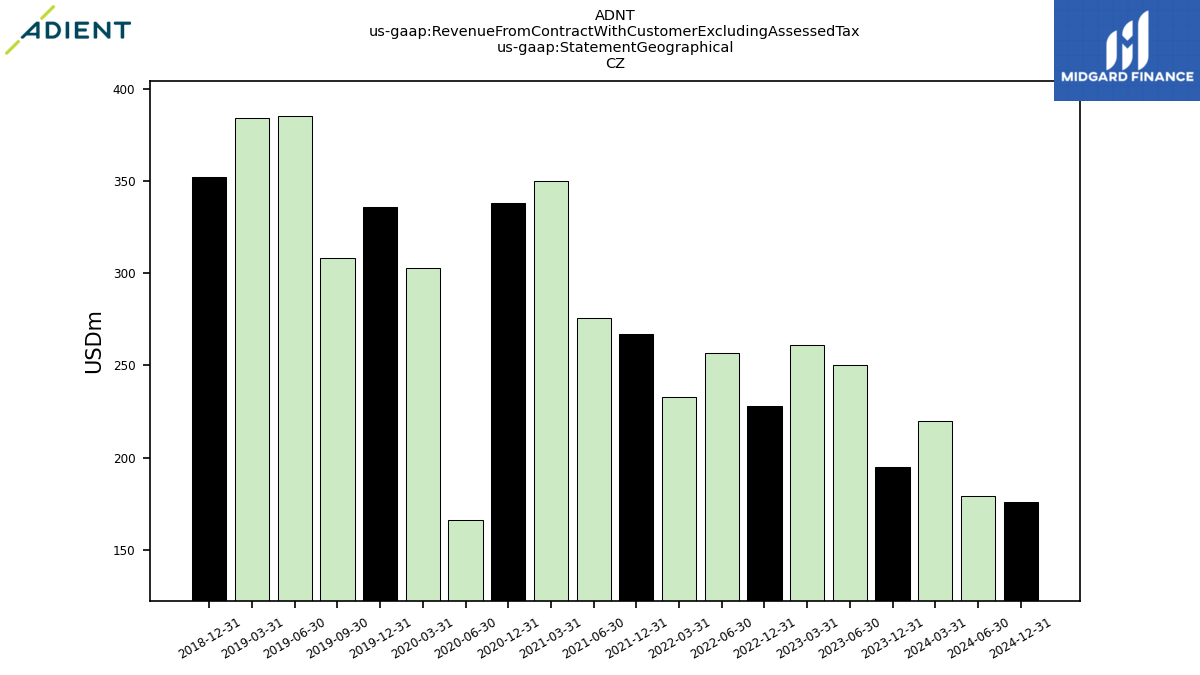
| 195.00 | NA | 250.00 | 261.00 | 228.00 | NA | 257.00 | 233.00 | 267.00 | NA | 276.00 | 350.00 | 338.00 | NA | 166.00 | 303.00 | 336.00 | 308.00 | 385.00 | 384.00 | 352.00 | NA | NA | NA | NA | NA | NA | NA | NA | NA | NA | NA | NA | ||
| 224.00 | NA | 278.00 | 305.00 | 248.00 | NA | 258.00 | 246.00 | 233.00 | NA | 261.00 | 315.00 | 314.00 | NA | 150.00 | 294.00 | 321.00 | 357.00 | 375.00 | 390.00 | 323.00 | NA | NA | NA | 424.00 | NA | NA | NA | NA | NA | NA | NA | NA | ||
| 180.00 | NA | 321.00 | 297.00 | 154.00 | NA | 256.00 | 269.00 | NA | NA | NA | NA | NA | NA | NA | NA | NA | NA | NA | NA | NA | NA | NA | NA | NA | NA | NA | NA | NA | NA | NA | NA | NA | ||
| 93.00 | NA | 91.00 | 103.00 | 87.00 | NA | 59.00 | 89.00 | 35.00 | NA | 60.00 | 103.00 | 89.00 | NA | 34.00 | 106.00 | 122.00 | 140.00 | 104.00 | 143.00 | 141.00 | NA | NA | NA | NA | NA | NA | NA | NA | NA | NA | NA | NA | ||
| 122.00 | NA | 137.00 | 140.00 | 138.00 | NA | 135.00 | 123.00 | NA | NA | NA | NA | NA | NA | NA | NA | NA | NA | NA | NA | NA | NA | NA | NA | NA | NA | NA | NA | NA | NA | NA | NA | NA | ||
| 632.00 | NA | 714.00 | 615.00 | 607.00 | NA | 628.00 | 587.00 | 541.00 | NA | 558.00 | 584.00 | 641.00 | NA | 192.00 | 574.00 | 613.00 | 696.00 | 700.00 | 643.00 | 590.00 | NA | NA | NA | 547.00 | NA | NA | NA | NA | NA | NA | NA | NA | ||
| 249.00 | NA | 268.00 | NA | 209.00 | NA | 204.00 | NA | NA | NA | NA | NA | NA | NA | NA | NA | NA | NA | NA | NA | NA | NA | NA | NA | NA | NA | NA | NA | NA | NA | NA | NA | NA | ||
| 122.00 | NA | 123.00 | 154.00 | 141.00 | NA | 101.00 | 134.00 | 135.00 | NA | 113.00 | 139.00 | 105.00 | NA | 44.00 | 130.00 | 133.00 | 146.00 | 139.00 | 167.00 | 162.00 | NA | NA | NA | NA | NA | NA | NA | NA | NA | NA | NA | NA | ||
| US | 1422.00 | NA | 1685.00 | 1629.00 | 1553.00 | NA | 1501.00 | 1444.00 | 1331.00 | NA | 1298.00 | 1486.00 | 1548.00 | NA | 519.00 | 1383.00 | 1567.00 | 1541.00 | 1649.00 | 1630.00 | 1425.00 | NA | NA | NA | 1293.00 | NA | NA | NA | NA | NA | NA | NA | NA | |
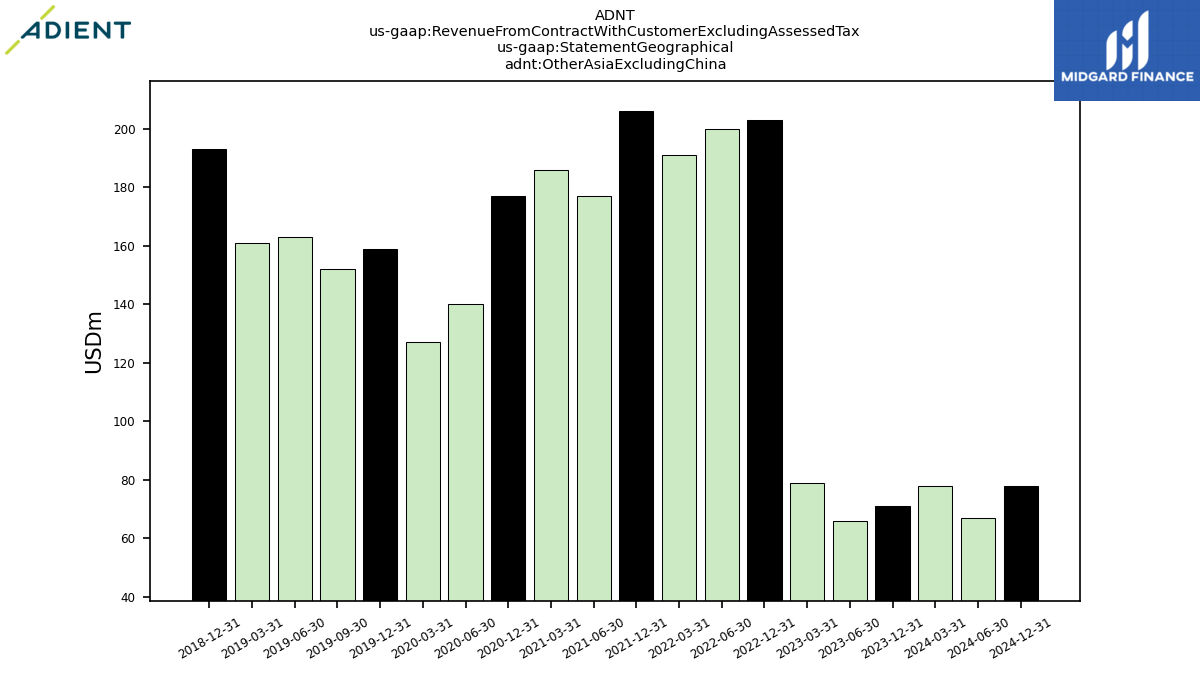
| Other Asia Excluding China | 71.00 | NA | 66.00 | 79.00 | 203.00 | NA | 200.00 | 191.00 | 206.00 | NA | 177.00 | 186.00 | 177.00 | NA | 140.00 | 127.00 | 159.00 | 152.00 | 163.00 | 161.00 | 193.00 | NA | NA | NA | NA | NA | NA | NA | NA | NA | NA | NA | NA | |
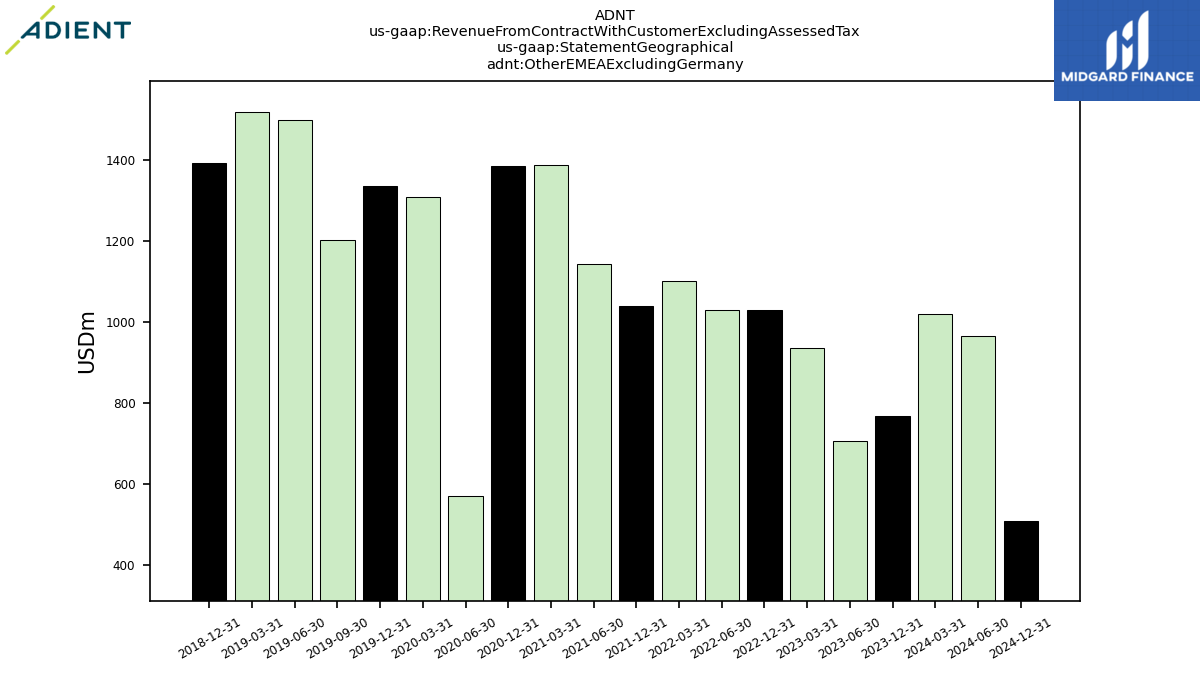
| Other E M E A Excluding Germany | 769.00 | NA | 707.00 | 937.00 | 1030.00 | NA | 1030.00 | 1101.00 | 1039.00 | NA | 1144.00 | 1389.00 | 1385.00 | NA | 571.00 | 1310.00 | 1337.00 | 1204.00 | 1500.00 | 1520.00 | 1394.00 | NA | NA | NA | NA | NA | NA | NA | NA | NA | NA | NA | NA | |
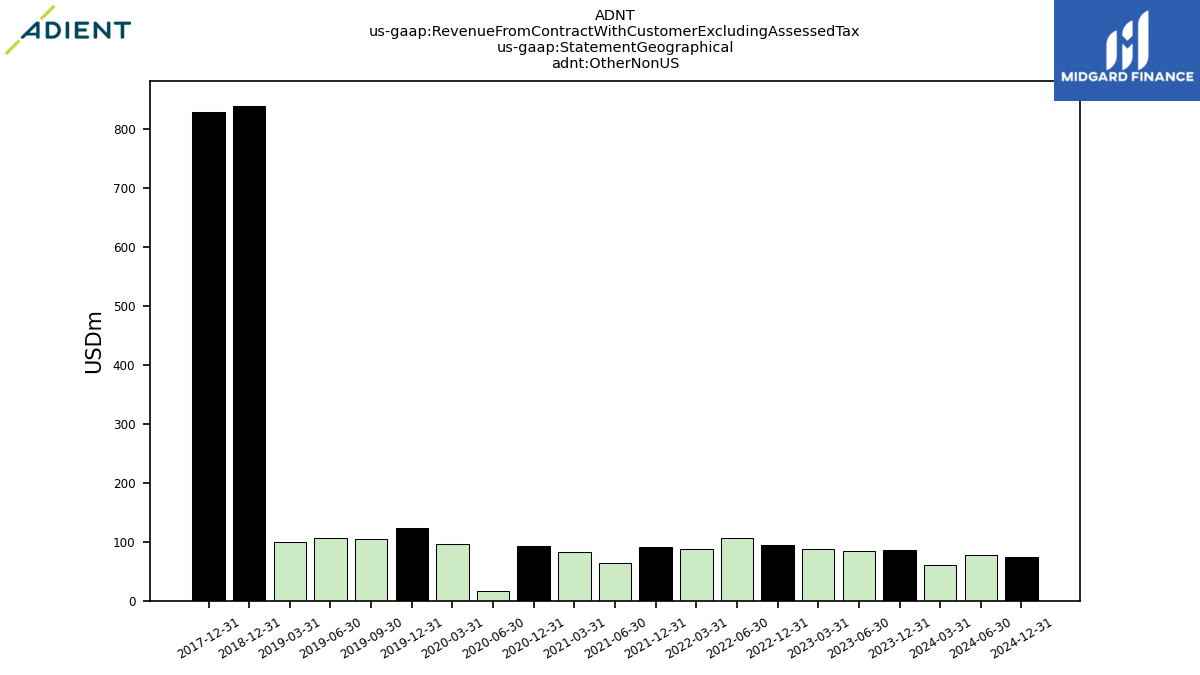
| Other Non U S | 86.00 | NA | 84.00 | 87.00 | 95.00 | NA | 106.00 | 87.00 | 91.00 | NA | 64.00 | 82.00 | 92.00 | NA | 17.00 | 96.00 | 123.00 | 105.00 | 106.00 | 100.00 | 839.00 | NA | NA | NA | 828.00 | NA | NA | NA | NA | NA | NA | NA | NA | |
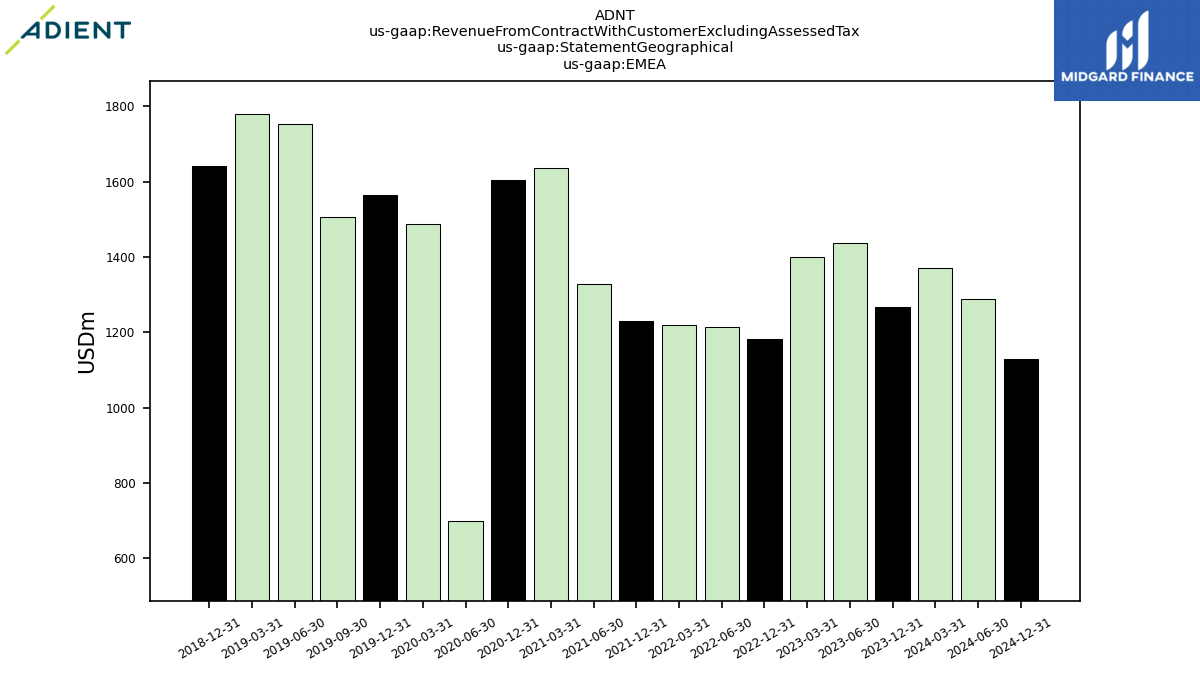
| EMEA | 1268.00 | NA | 1437.00 | 1401.00 | 1182.00 | NA | 1215.00 | 1218.00 | 1230.00 | NA | 1328.00 | 1636.00 | 1604.00 | NA | 698.00 | 1488.00 | 1564.00 | 1505.00 | 1752.00 | 1778.00 | 1640.00 | NA | NA | NA | NA | NA | NA | NA | NA | NA | NA | NA | NA |