
| 2023-12-31 | 2023-09-30 | 2023-06-30 | 2023-03-31 | 2022-12-31 | 2022-09-30 | 2022-06-30 | 2022-03-31 | 2021-12-31 | 2021-09-30 | 2021-06-30 | 2021-03-31 | 2020-12-31 | 2020-09-30 | 2020-06-30 | 2020-03-31 | ||
|---|---|---|---|---|---|---|---|---|---|---|---|---|---|---|---|---|---|
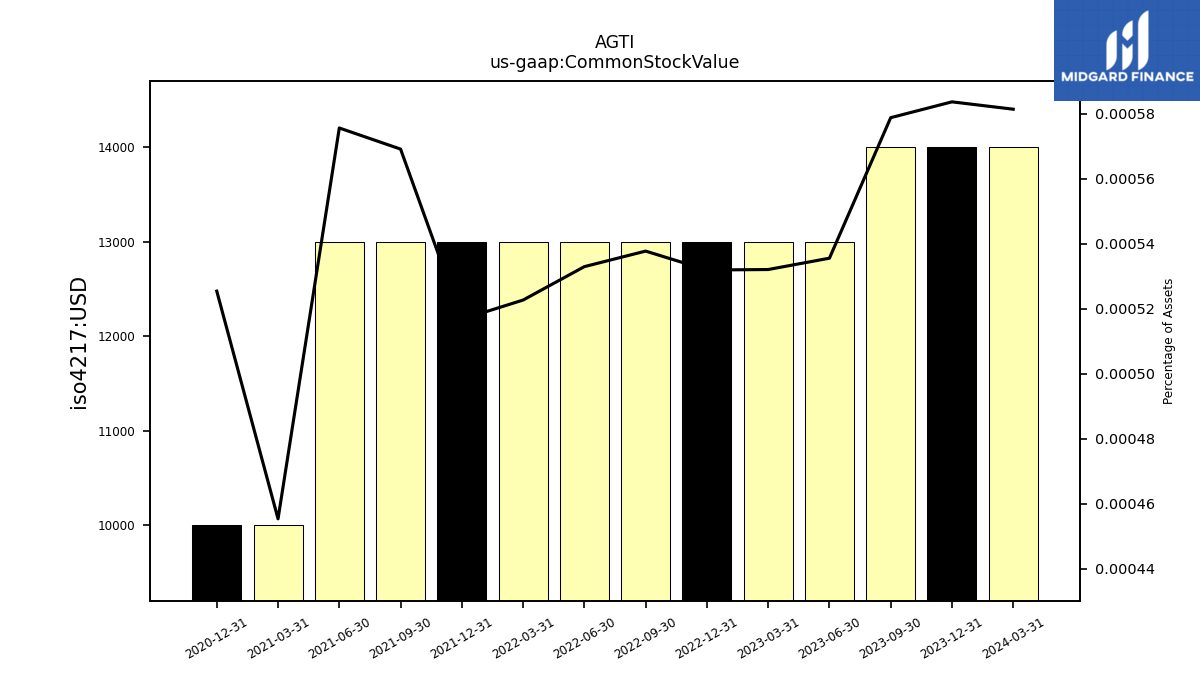
| Common Stock Value | 0.01 | 0.01 | 0.01 | 0.01 | 0.01 | 0.01 | 0.01 | 0.01 | 0.01 | 0.01 | 0.01 | 0.01 | 0.01 | NA | NA | NA | |
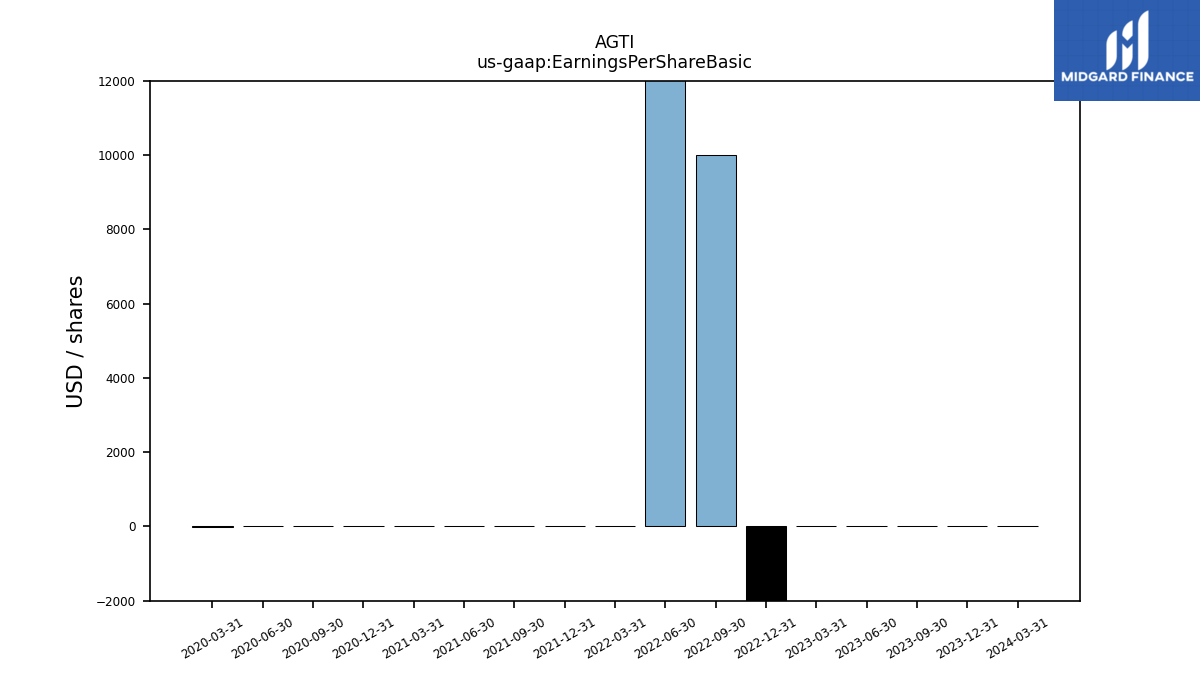
| Earnings Per Share Basic | -0.04 | -0.09 | -0.03 | 0.02 | -199999.77 | 10000.00 | 40000.00 | 0.15 | 0.08 | 0.07 | -0.04 | 0.10 | -0.01 | -0.10 | 0.01 | -0.13 | |
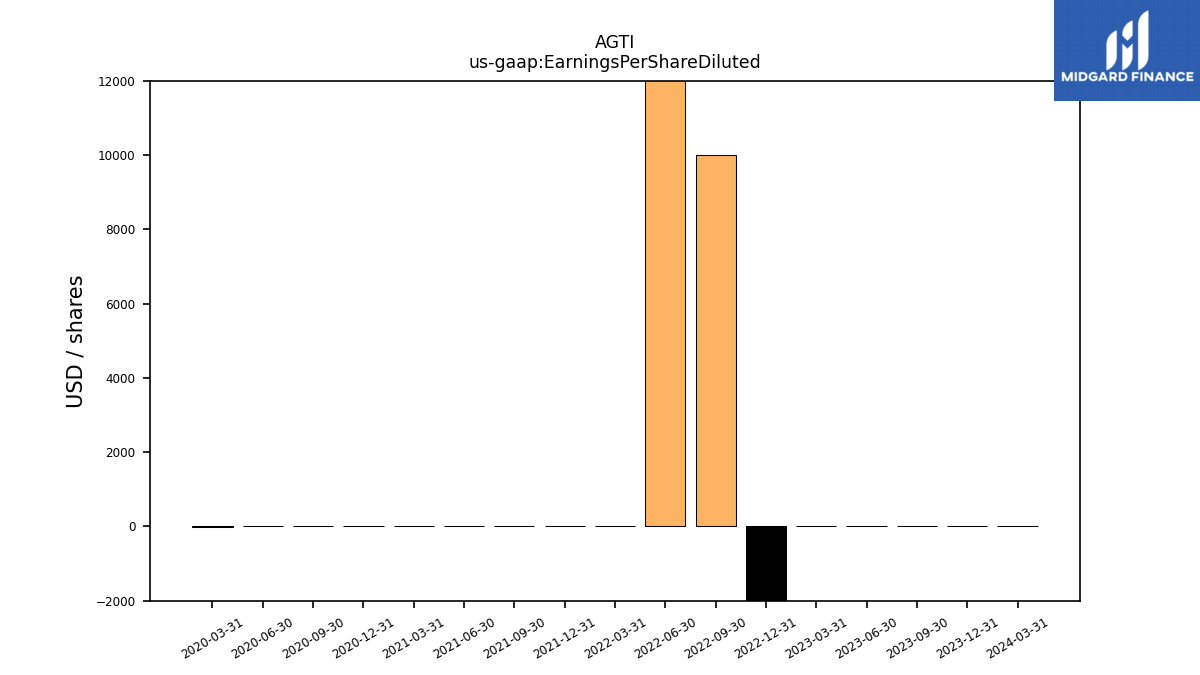
| Earnings Per Share Diluted | -0.04 | -0.09 | -0.03 | 0.02 | -189999.78 | 10000.00 | 40000.00 | 0.14 | 0.08 | 0.07 | -0.04 | 0.09 | -0.01 | -0.10 | 0.01 | -0.13 |
| 2023-12-31 | 2023-09-30 | 2023-06-30 | 2023-03-31 | 2022-12-31 | 2022-09-30 | 2022-06-30 | 2022-03-31 | 2021-12-31 | 2021-09-30 | 2021-06-30 | 2021-03-31 | 2020-12-31 | 2020-09-30 | 2020-06-30 | 2020-03-31 | ||
|---|---|---|---|---|---|---|---|---|---|---|---|---|---|---|---|---|---|
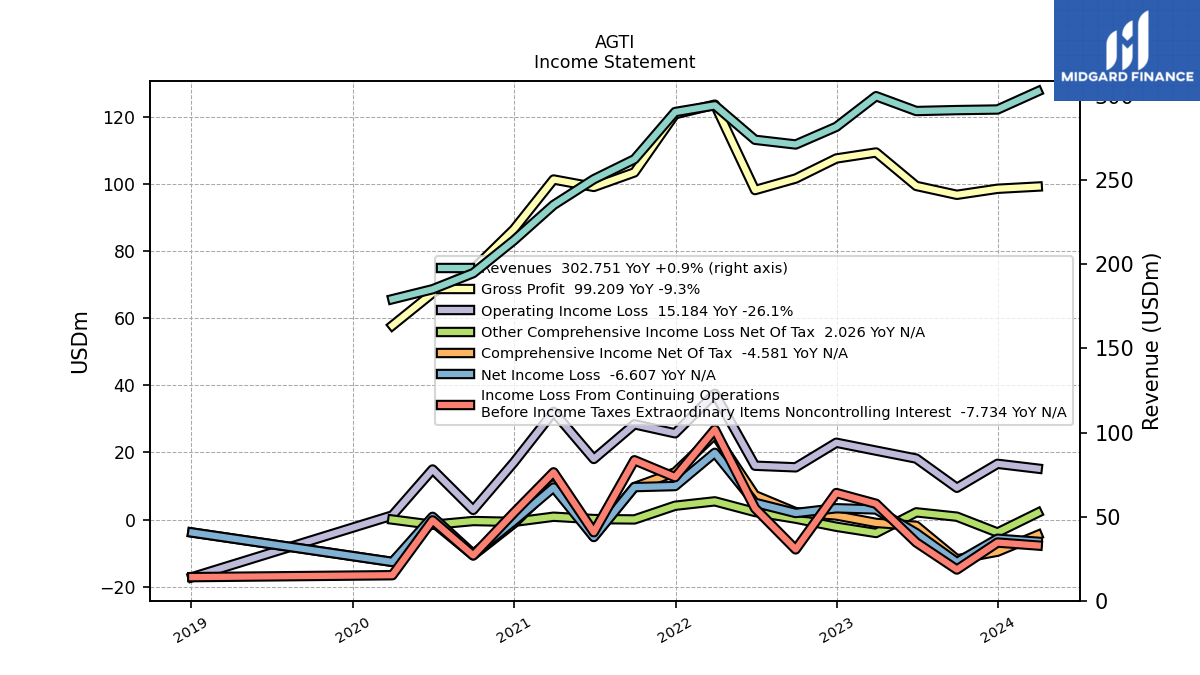
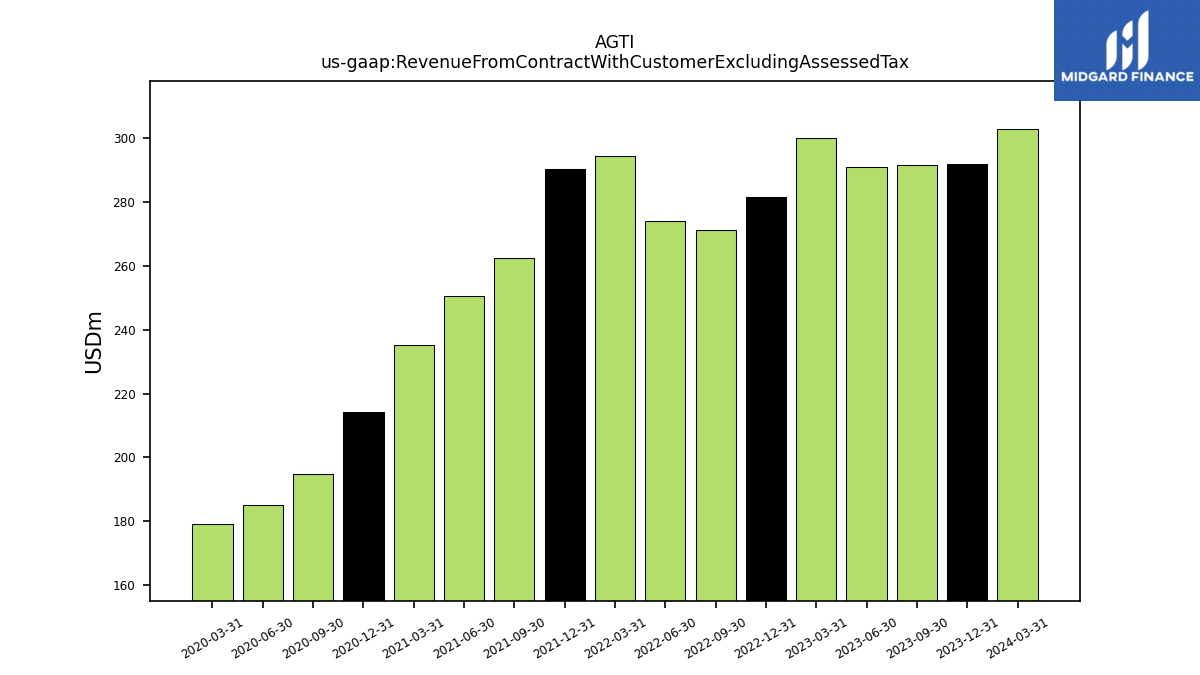
| Revenue From Contract With Customer Excluding Assessed Tax | 291.99 | 291.63 | 291.08 | 299.90 | 281.68 | 271.19 | 273.98 | 294.44 | 290.48 | 262.42 | 250.54 | 235.25 | 214.19 | 194.72 | 185.16 | 179.24 | |
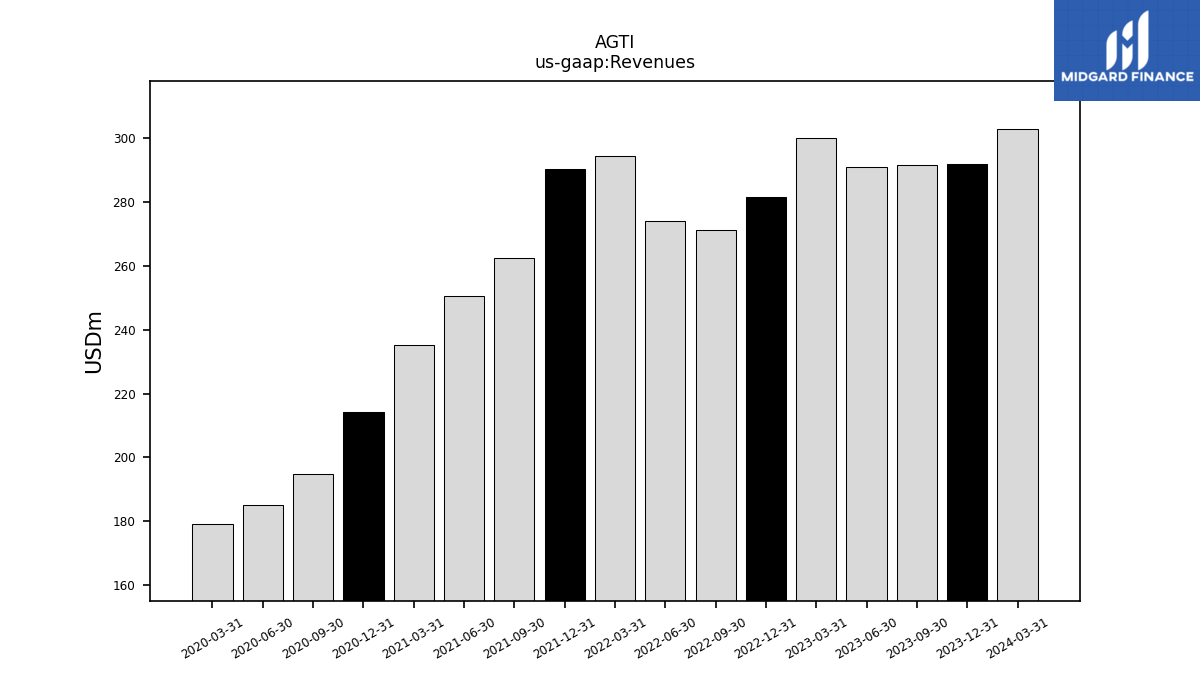
| Revenues | 291.99 | 291.63 | 291.08 | 299.90 | 281.68 | 271.19 | 273.98 | 294.44 | 290.48 | 262.42 | 250.54 | 235.25 | 214.19 | 194.72 | 185.16 | 179.24 | |
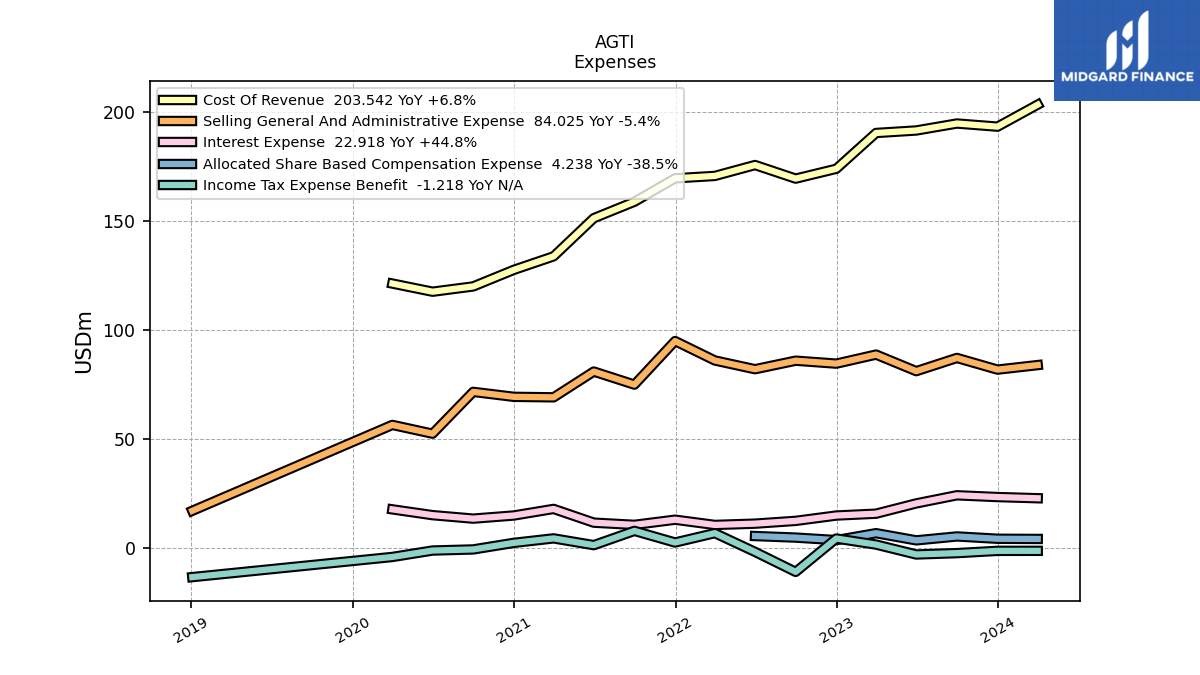
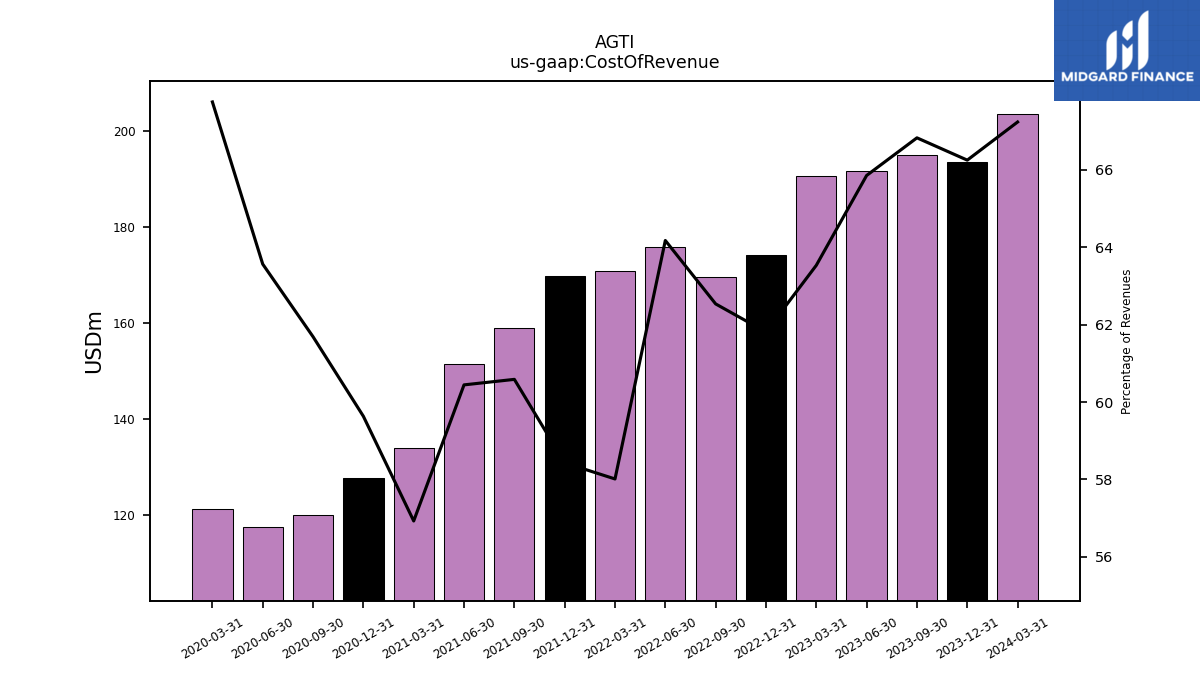
| Cost Of Revenue | 193.43 | 194.88 | 191.68 | 190.53 | 174.10 | 169.58 | 175.82 | 170.82 | 169.73 | 158.99 | 151.44 | 133.92 | 127.73 | 120.11 | 117.69 | 121.43 | |
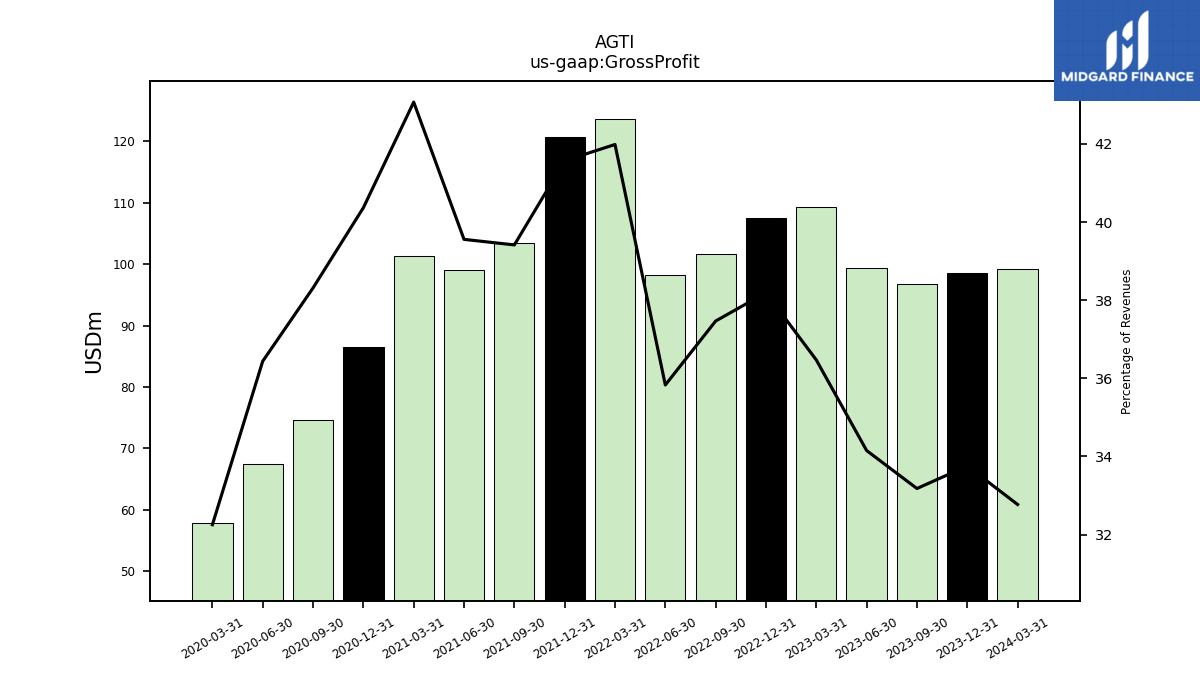
| Gross Profit | 98.56 | 96.76 | 99.40 | 109.37 | 107.58 | 101.60 | 98.17 | 123.63 | 120.75 | 103.43 | 99.11 | 101.32 | 86.47 | 74.61 | 67.47 | 57.81 | |
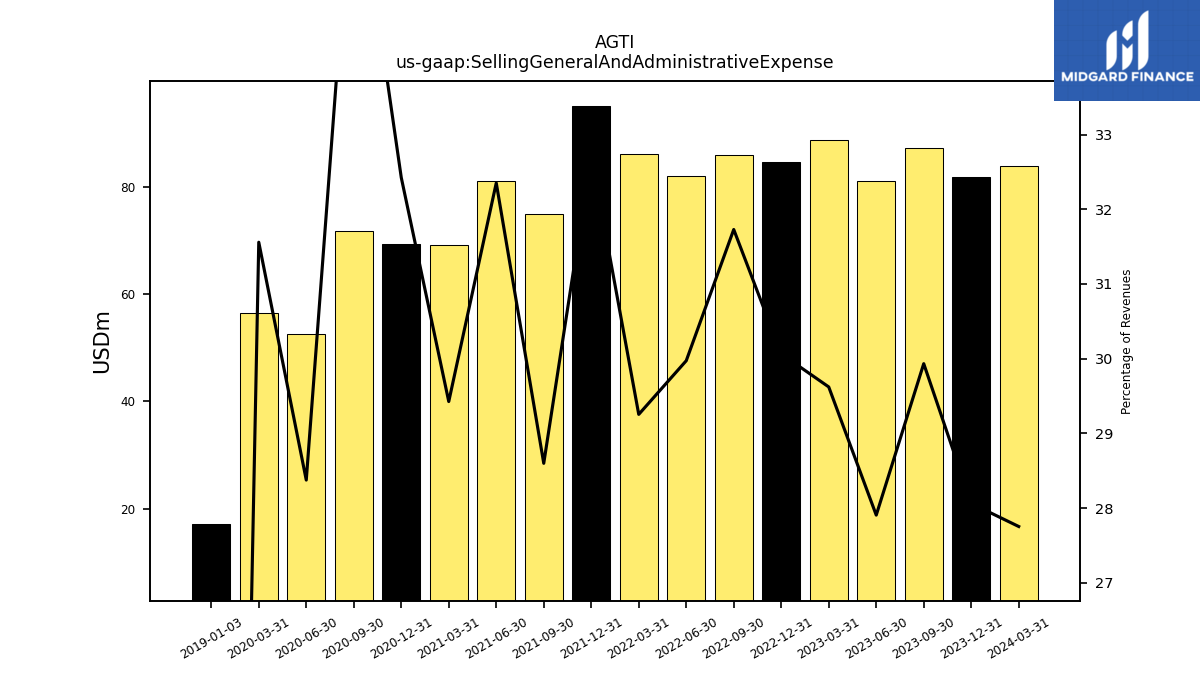
| Selling General And Administrative Expense | 81.94 | 87.30 | 81.23 | 88.84 | 84.69 | 86.04 | 82.12 | 86.14 | 95.05 | 75.05 | 81.06 | 69.22 | 69.45 | 71.73 | 52.54 | 56.57 | |
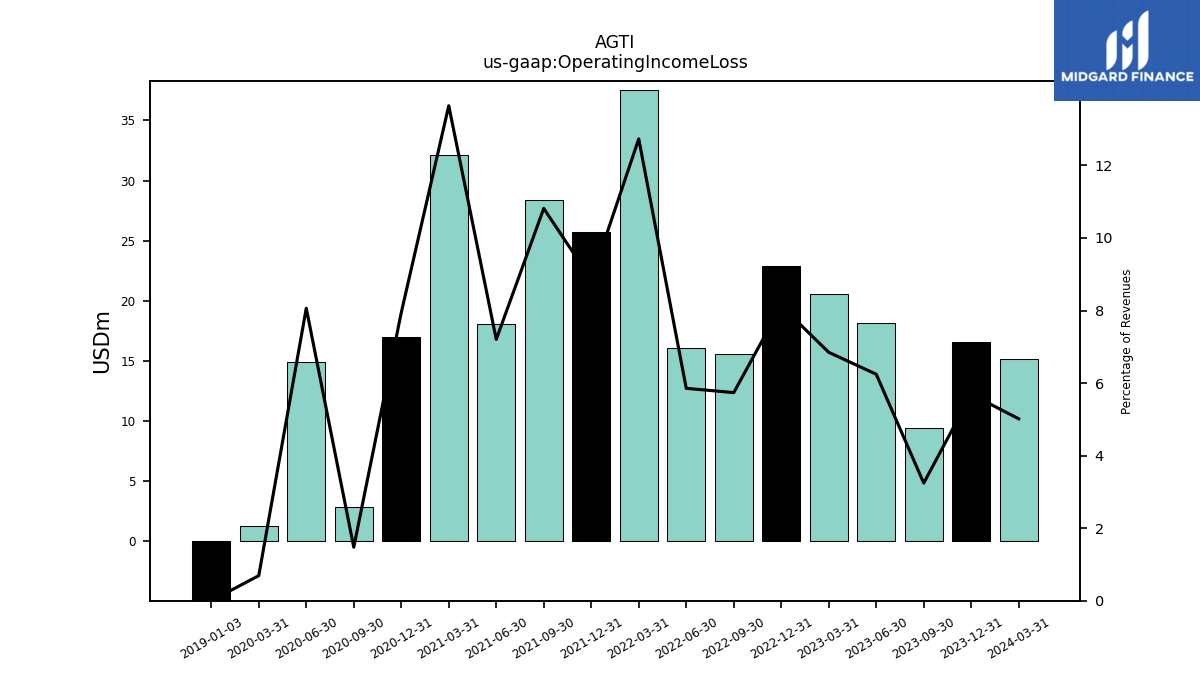
| Operating Income Loss | 16.62 | 9.46 | 18.17 | 20.54 | 22.89 | 15.56 | 16.04 | 37.49 | 25.70 | 28.38 | 18.05 | 32.10 | 17.01 | 2.87 | 14.93 | 1.24 | |
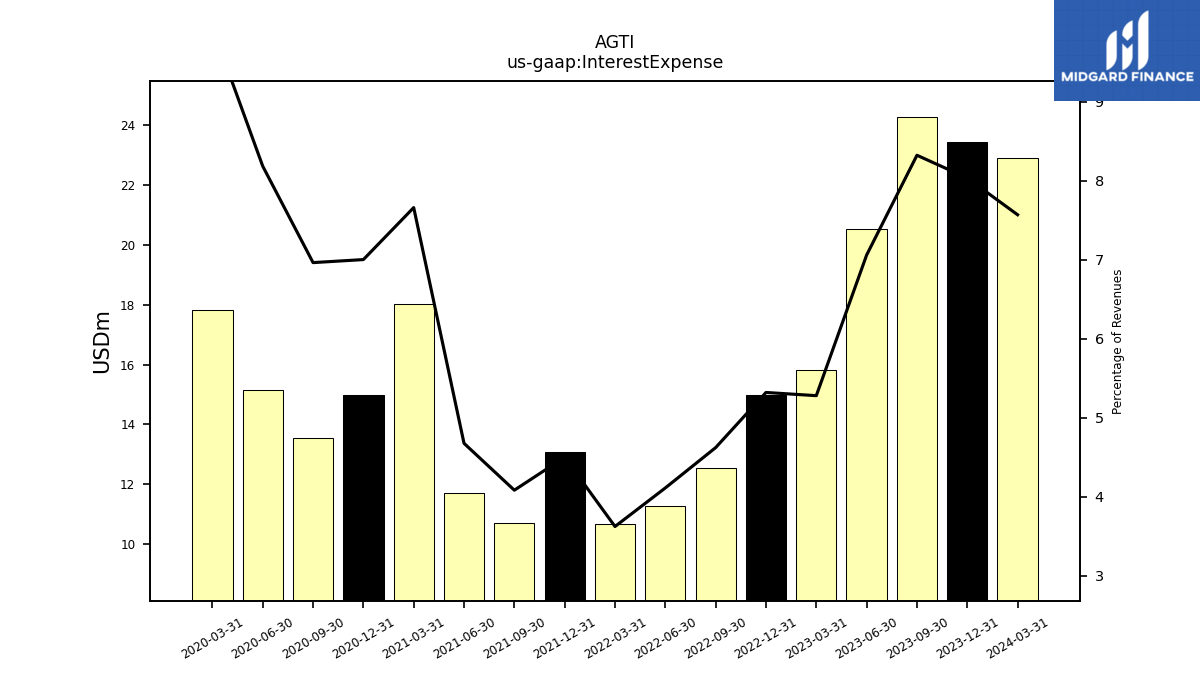
| Interest Expense | 23.46 | 24.27 | 20.55 | 15.83 | 14.98 | 12.53 | 11.26 | 10.66 | 13.07 | 10.71 | 11.71 | 18.02 | 15.00 | 13.56 | 15.16 | 17.82 | |
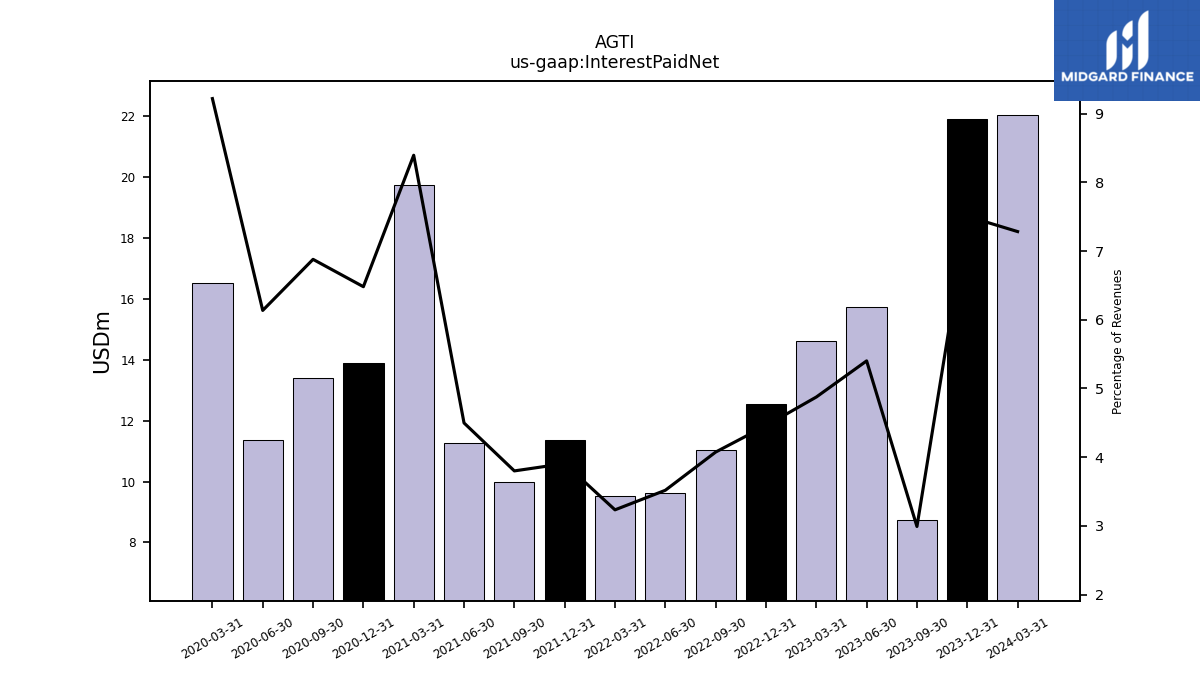
| Interest Paid Net | 21.91 | 8.72 | 15.72 | 14.62 | 12.56 | 11.05 | 9.64 | 9.52 | 11.35 | 9.97 | 11.27 | 19.75 | 13.88 | 13.39 | 11.36 | 16.52 | |
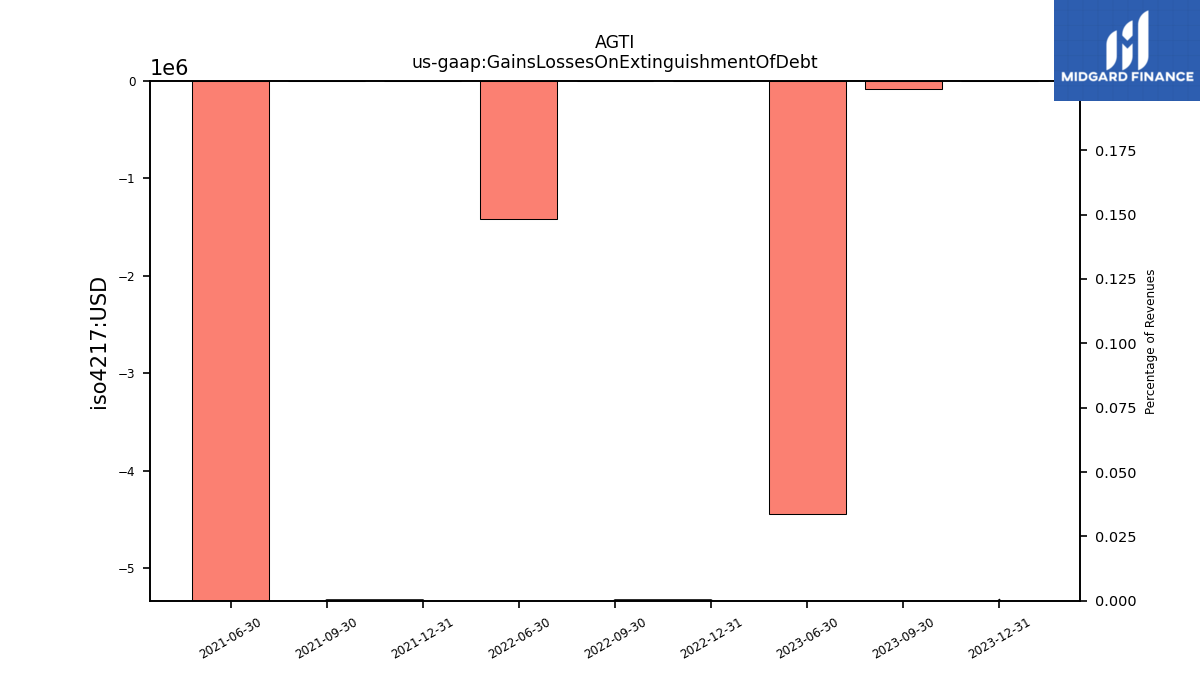
| Gains Losses On Extinguishment Of Debt | 0.00 | -0.08 | -4.45 | NA | 0.00 | 0.00 | -1.42 | NA | 0.00 | 0.00 | -10.12 | NA | NA | NA | NA | NA | |
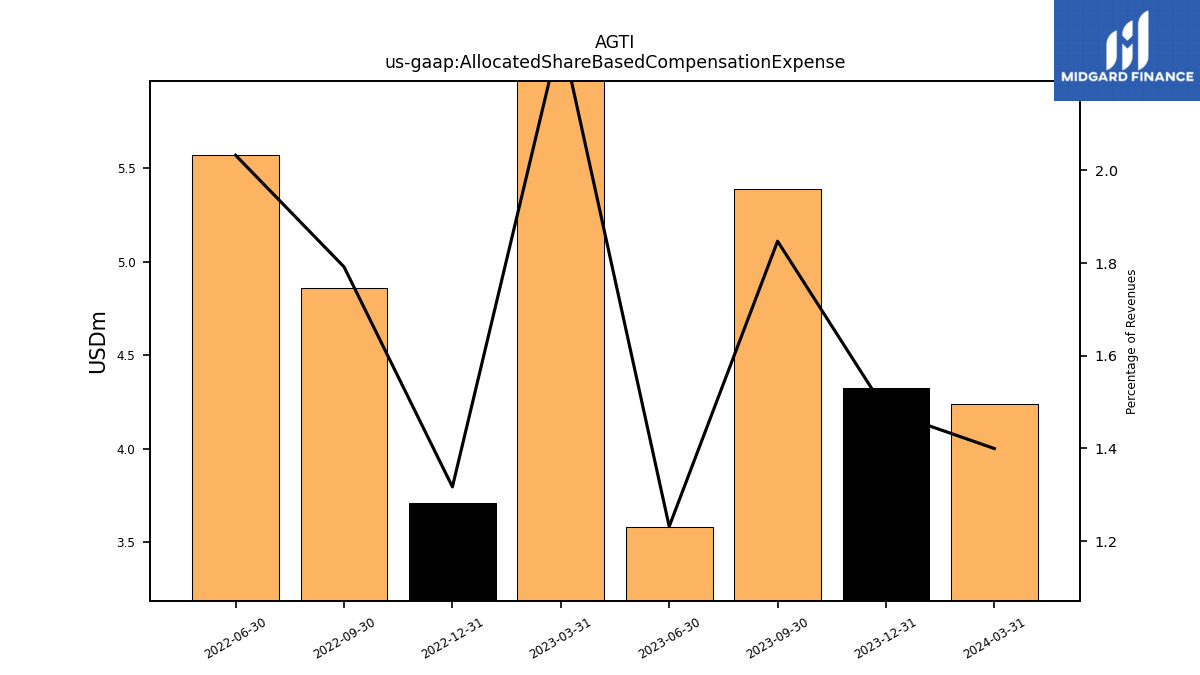
| Allocated Share Based Compensation Expense | 4.33 | 5.39 | 3.58 | NA | 3.71 | 4.86 | 5.57 | NA | NA | NA | NA | NA | NA | NA | NA | NA | |
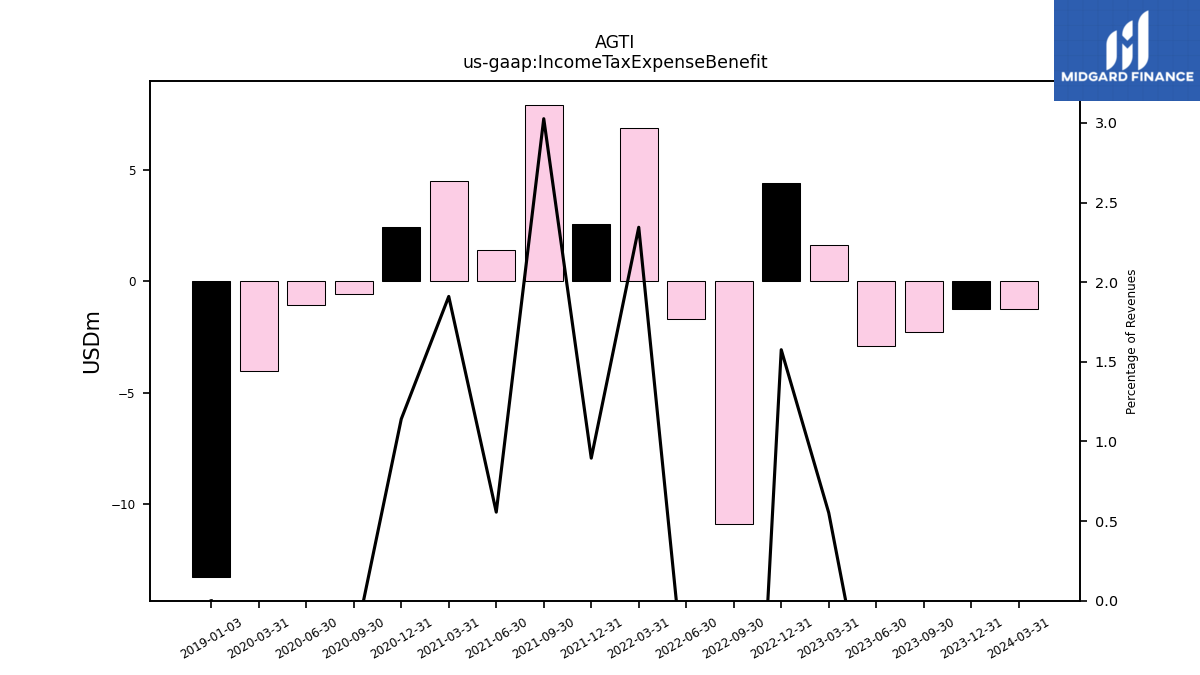
| Income Tax Expense Benefit | -1.23 | -2.27 | -2.89 | 1.66 | 4.44 | -10.88 | -1.70 | 6.91 | 2.60 | 7.94 | 1.39 | 4.50 | 2.44 | -0.57 | -1.08 | -4.03 | |
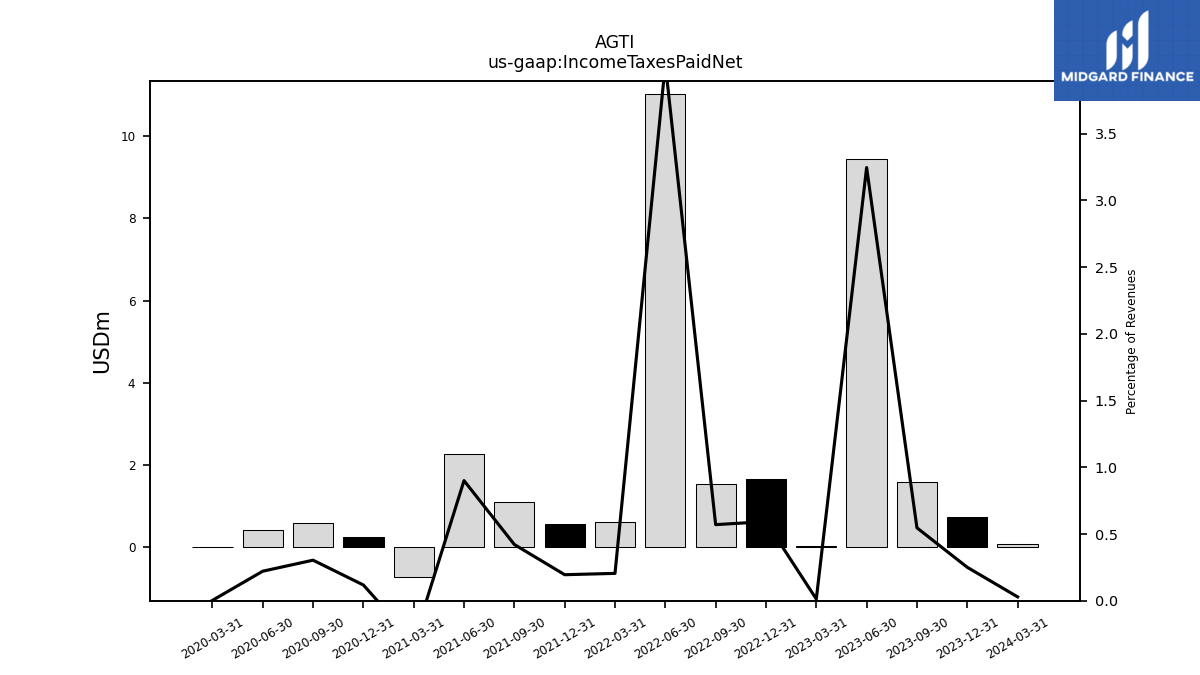
| Income Taxes Paid Net | 0.73 | 1.59 | 9.45 | 0.04 | 1.67 | 1.55 | 11.02 | 0.60 | 0.57 | 1.11 | 2.26 | -0.71 | 0.25 | 0.59 | 0.41 | 0.01 | |
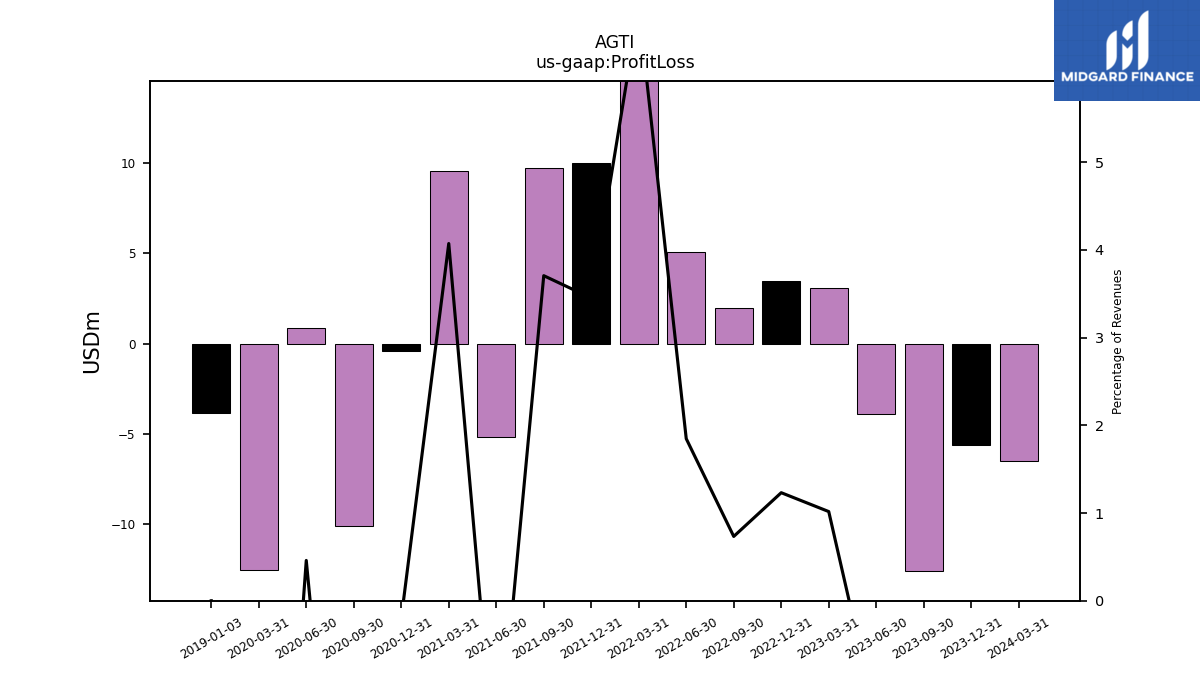
| Profit Loss | -5.62 | -12.62 | -3.93 | 3.05 | 3.47 | 1.99 | 5.06 | 19.92 | 10.03 | 9.73 | -5.17 | 9.58 | -0.43 | -10.11 | 0.85 | -12.55 | |
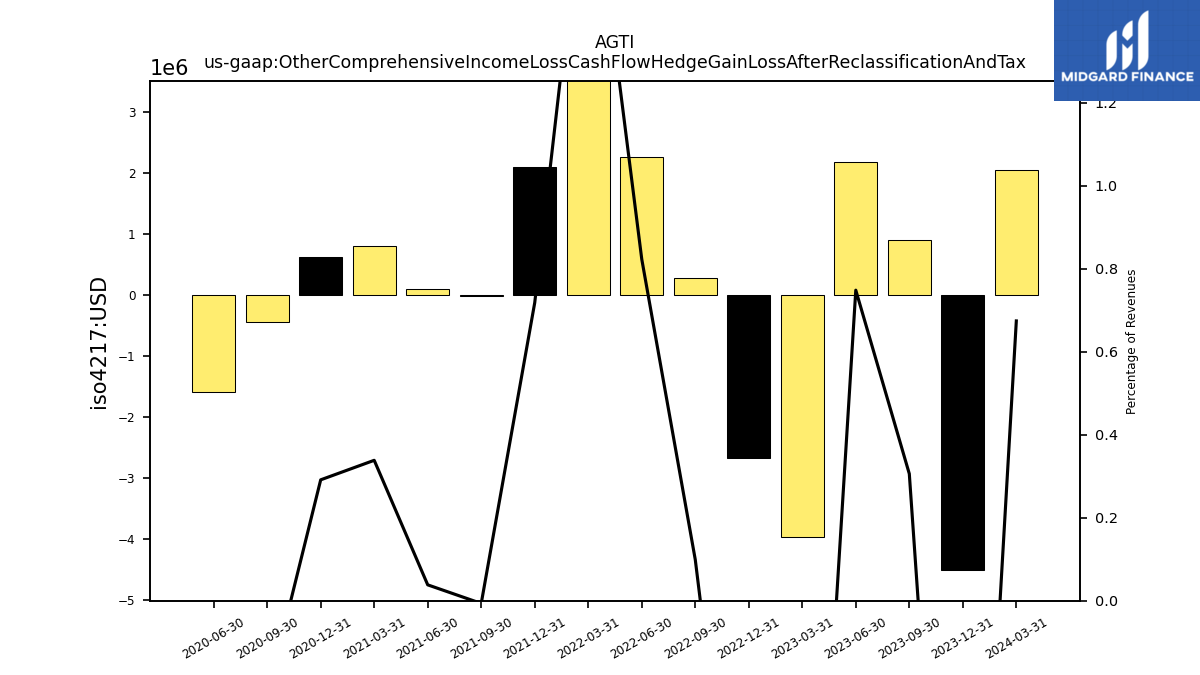
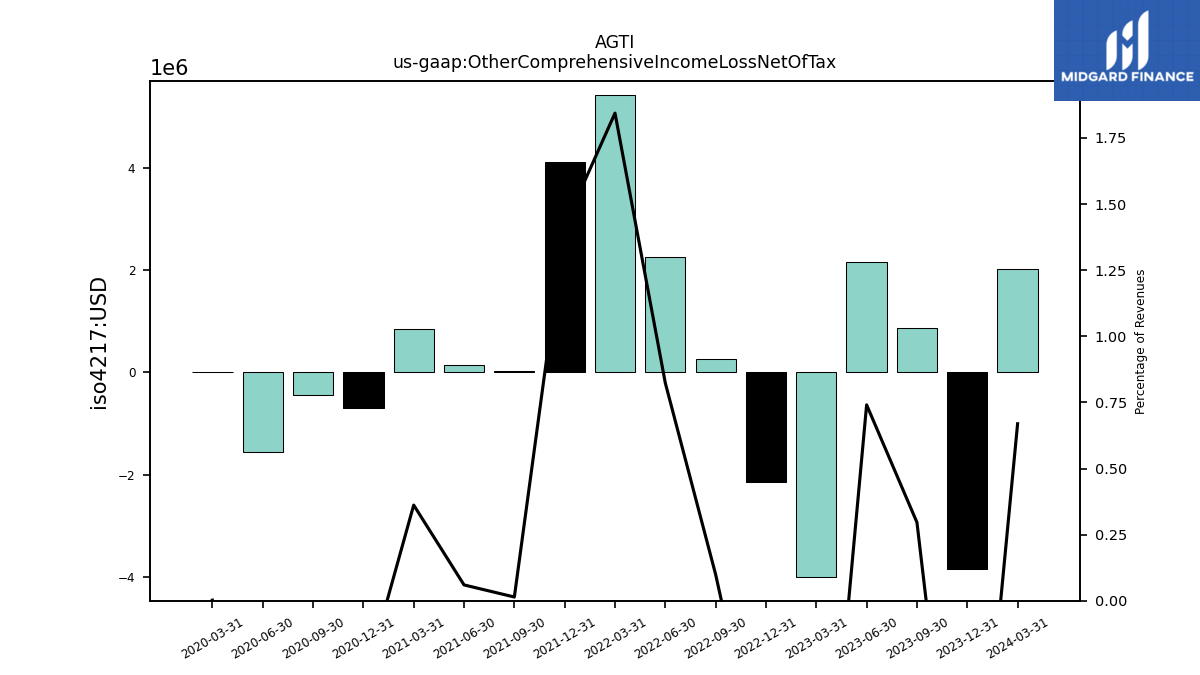
| Other Comprehensive Income Loss Cash Flow Hedge Gain Loss After Reclassification And Tax | -4.51 | 0.89 | 2.18 | -3.97 | -2.67 | 0.27 | 2.25 | 5.43 | 2.09 | -0.02 | 0.10 | 0.80 | 0.62 | -0.45 | -1.58 | NA | |
| Other Comprehensive Income Loss Net Of Tax | -3.86 | 0.86 | 2.16 | -4.00 | -2.15 | 0.27 | 2.25 | 5.43 | 4.12 | 0.04 | 0.15 | 0.85 | -0.69 | -0.43 | -1.56 | 0.00 | |
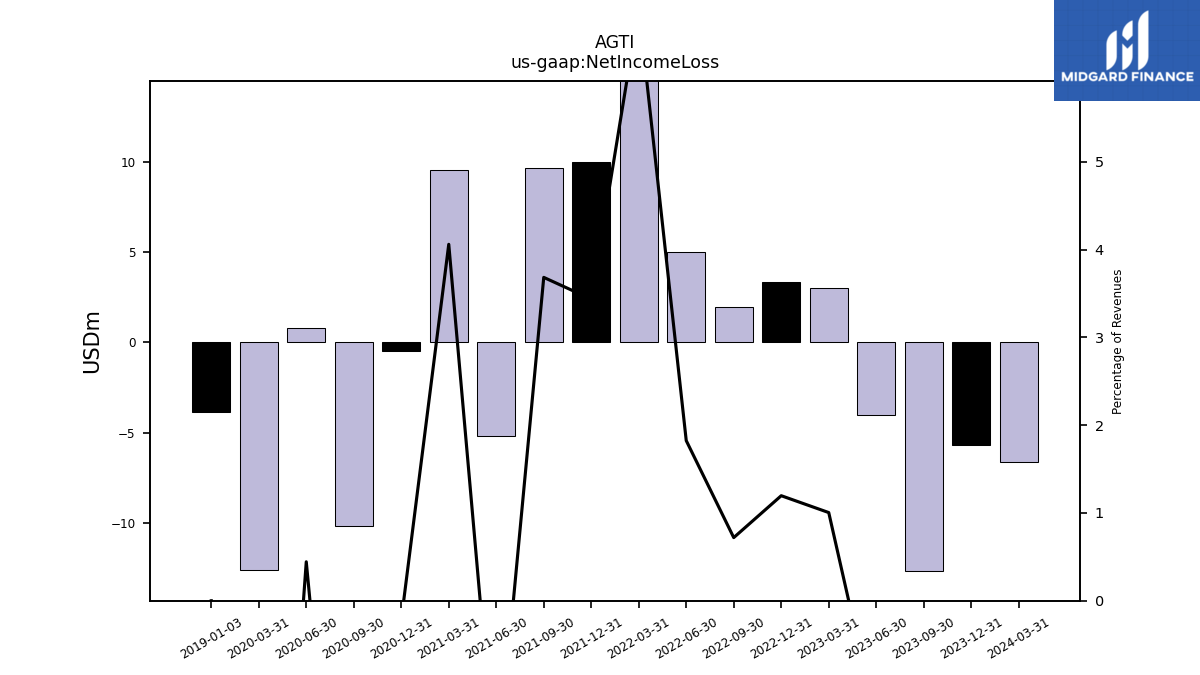
| Net Income Loss | -5.71 | -12.70 | -4.03 | 3.01 | 3.37 | 1.95 | 5.00 | 19.89 | 9.98 | 9.67 | -5.20 | 9.55 | -0.47 | -10.21 | 0.82 | -12.62 | |
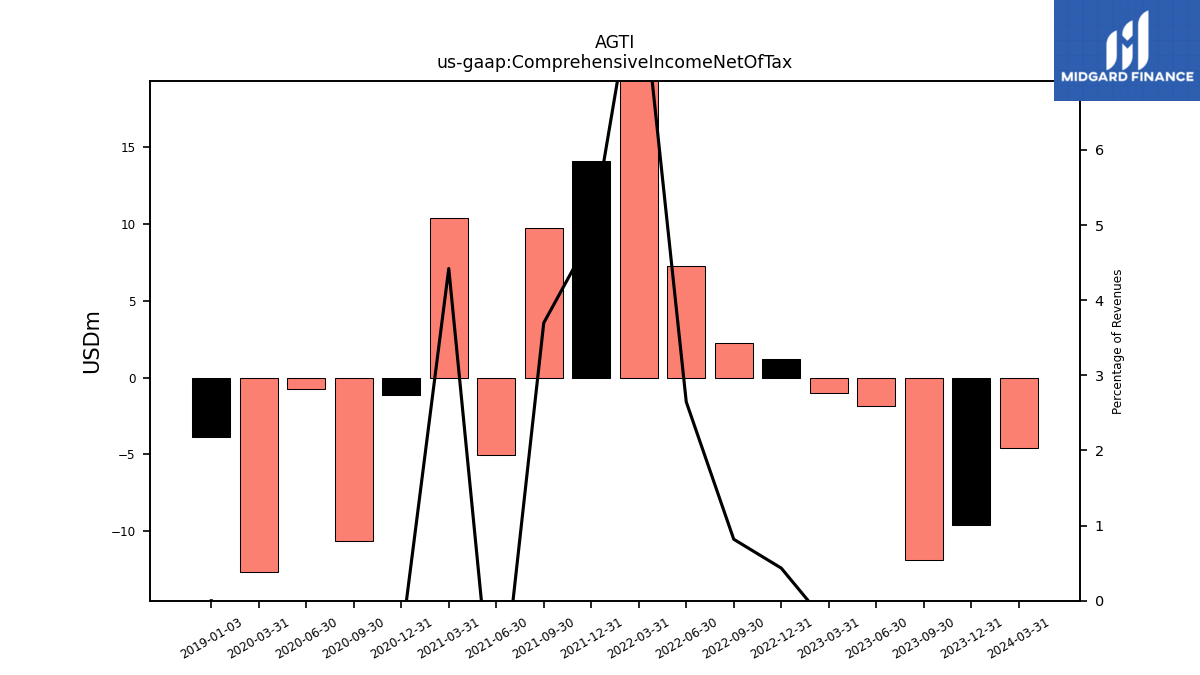
| Comprehensive Income Net Of Tax | -9.57 | -11.84 | -1.87 | -0.99 | 1.22 | 2.22 | 7.25 | 25.32 | 14.10 | 9.71 | -5.05 | 10.40 | -1.16 | -10.64 | -0.74 | -12.62 |
| 2023-12-31 | 2023-09-30 | 2023-06-30 | 2023-03-31 | 2022-12-31 | 2022-09-30 | 2022-06-30 | 2022-03-31 | 2021-12-31 | 2021-09-30 | 2021-06-30 | 2021-03-31 | 2020-12-31 | 2020-09-30 | 2020-06-30 | 2020-03-31 | ||
|---|---|---|---|---|---|---|---|---|---|---|---|---|---|---|---|---|---|
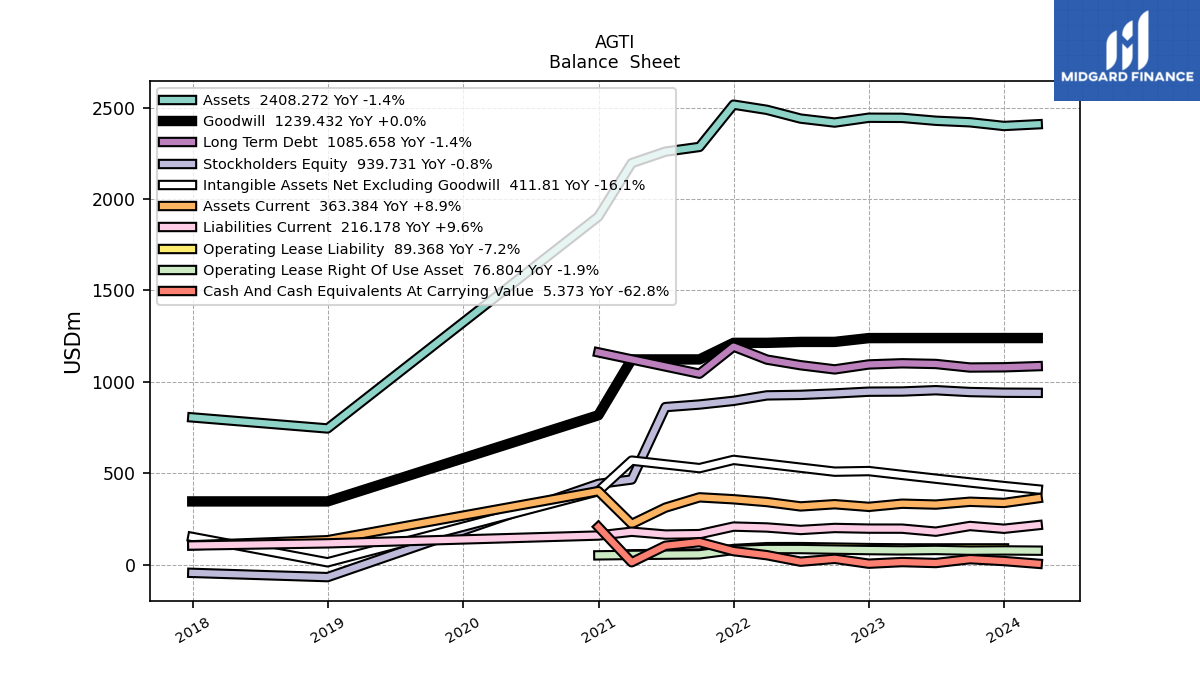
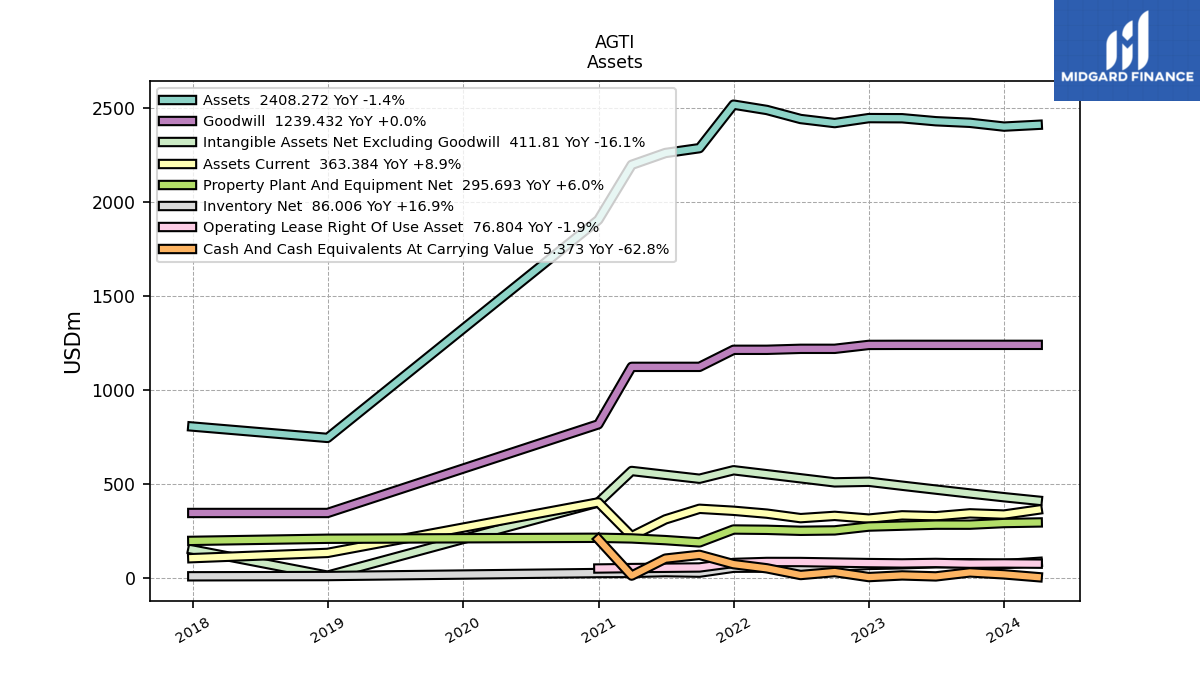
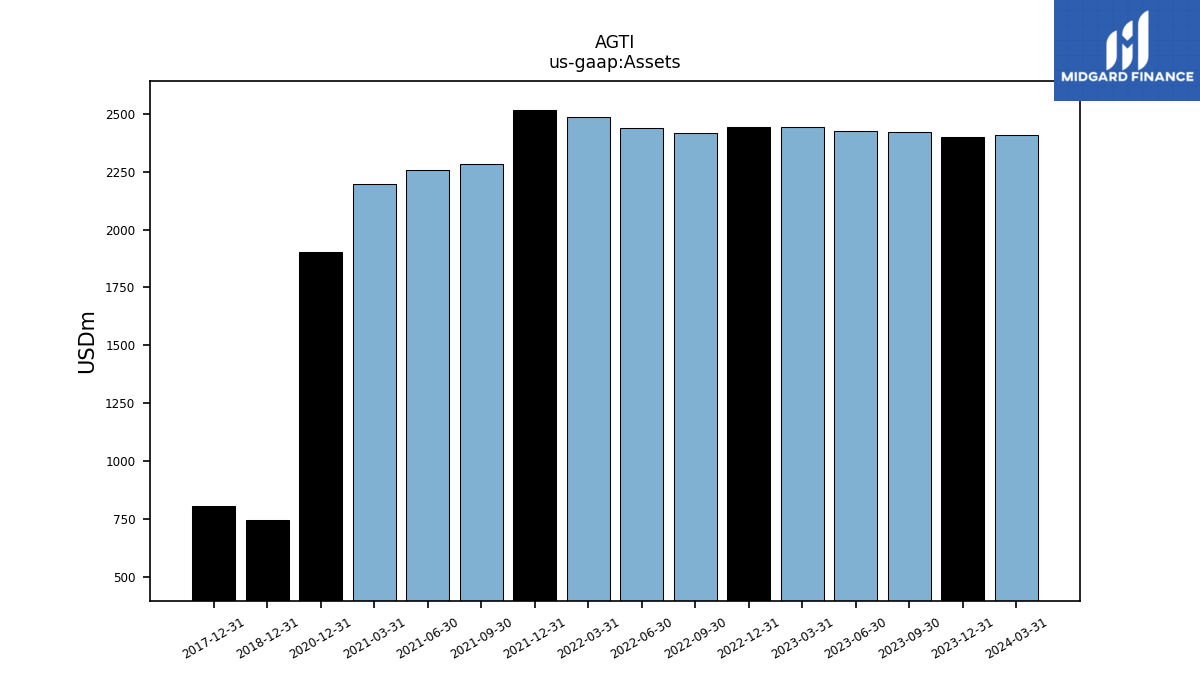
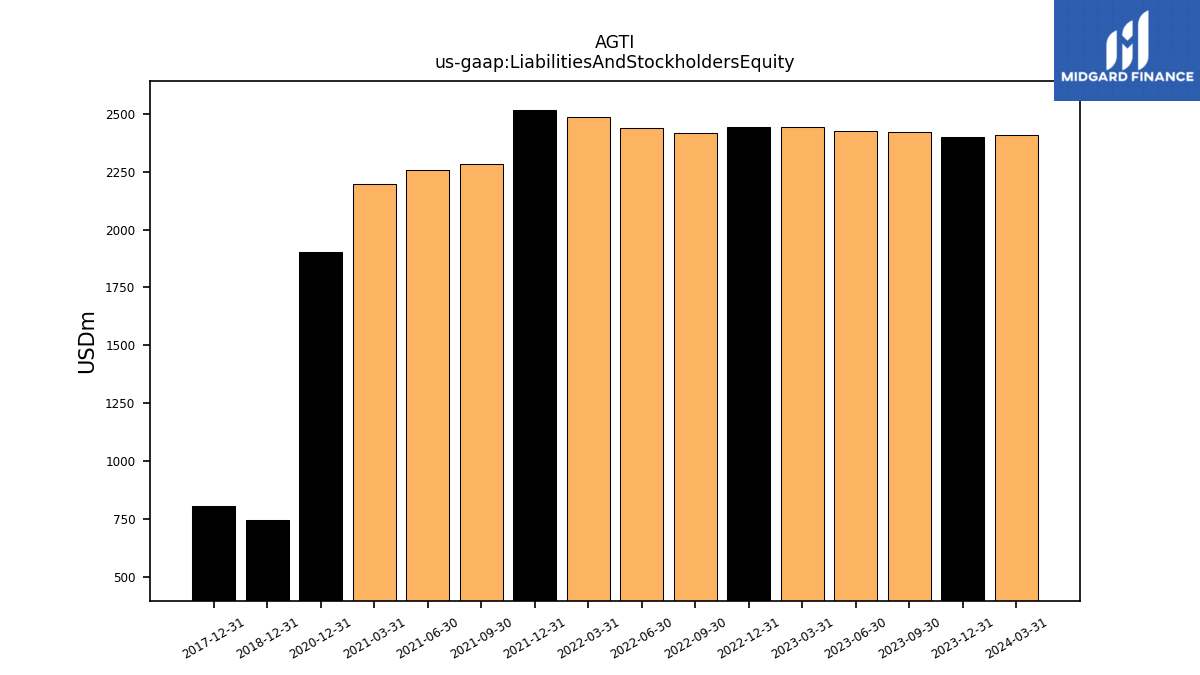
| Assets | 2398.94 | 2419.12 | 2427.51 | 2443.41 | 2444.11 | 2417.66 | 2439.34 | 2487.26 | 2515.75 | 2284.45 | 2258.69 | 2195.84 | 1903.36 | NA | NA | NA | |
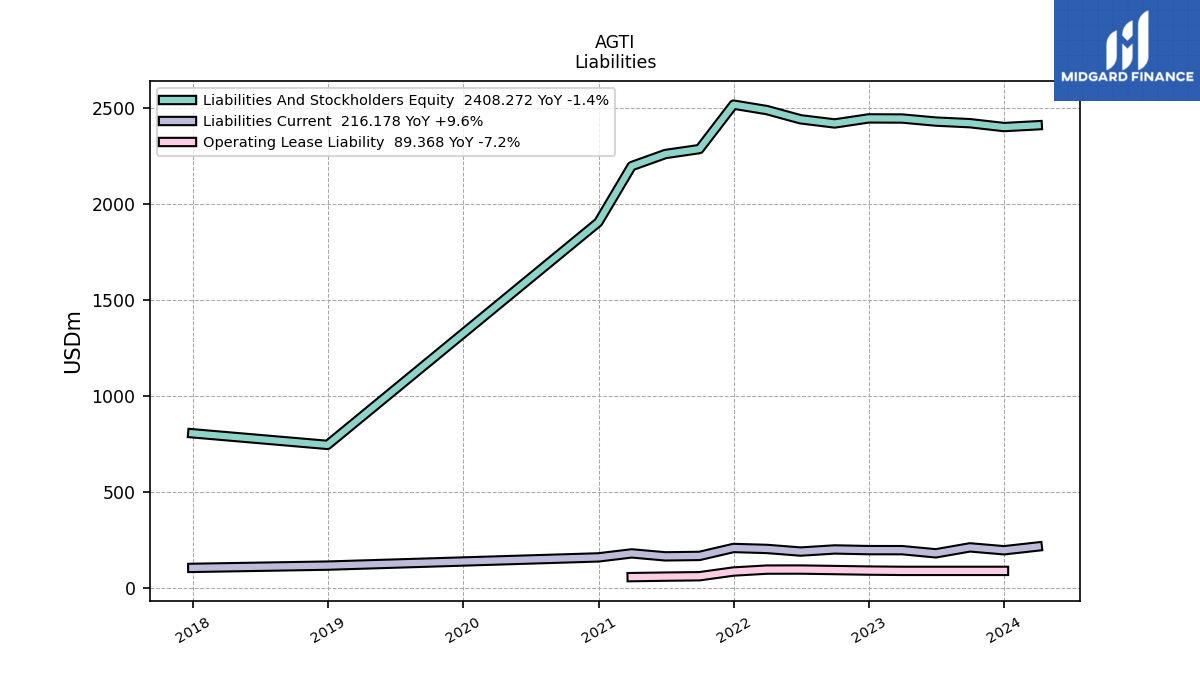
| Liabilities And Stockholders Equity | 2398.94 | 2419.12 | 2427.51 | 2443.41 | 2444.11 | 2417.66 | 2439.34 | 2487.26 | 2515.75 | 2284.45 | 2258.69 | 2195.84 | 1903.36 | NA | NA | NA | |
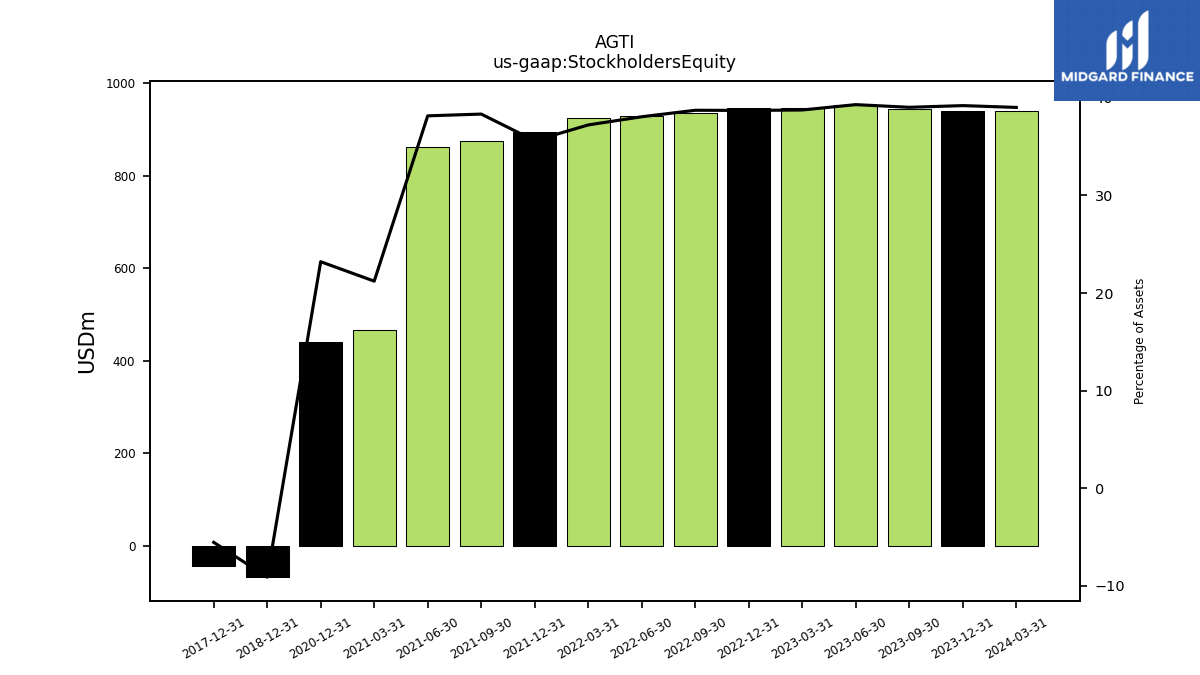
| Stockholders Equity | 940.56 | 944.24 | 954.19 | 947.02 | 946.13 | 936.34 | 928.54 | 925.90 | 895.95 | 875.83 | 861.88 | 465.93 | 441.80 | NA | NA | NA |
| 2023-12-31 | 2023-09-30 | 2023-06-30 | 2023-03-31 | 2022-12-31 | 2022-09-30 | 2022-06-30 | 2022-03-31 | 2021-12-31 | 2021-09-30 | 2021-06-30 | 2021-03-31 | 2020-12-31 | 2020-09-30 | 2020-06-30 | 2020-03-31 | ||
|---|---|---|---|---|---|---|---|---|---|---|---|---|---|---|---|---|---|
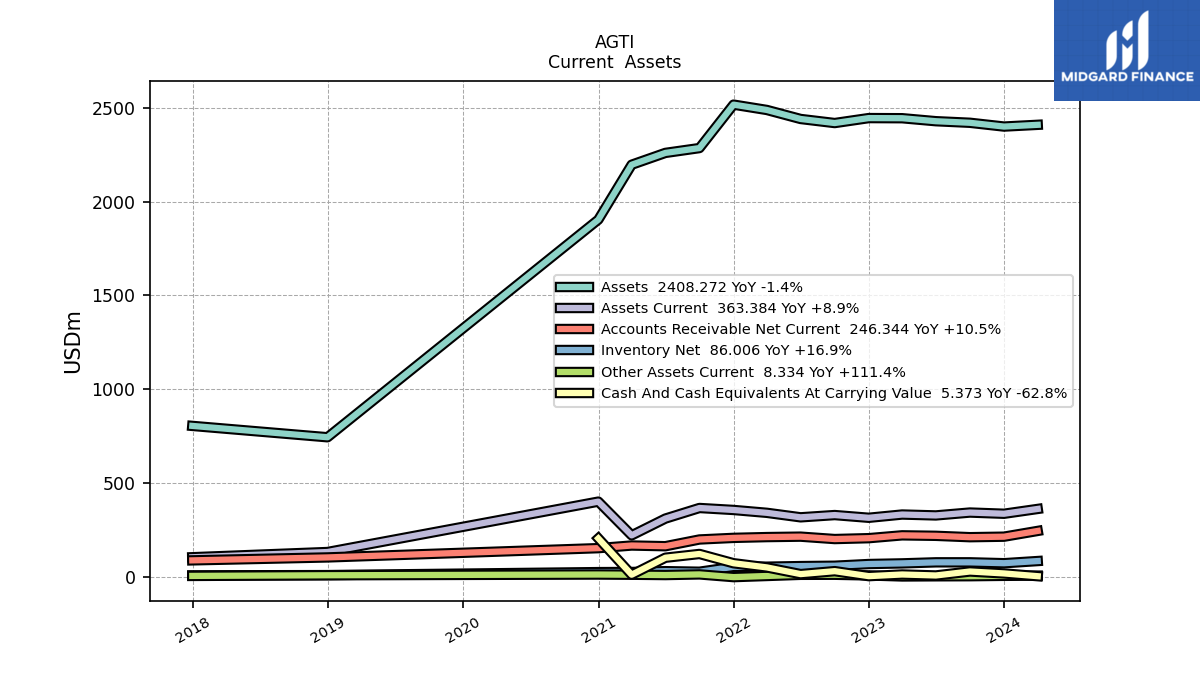
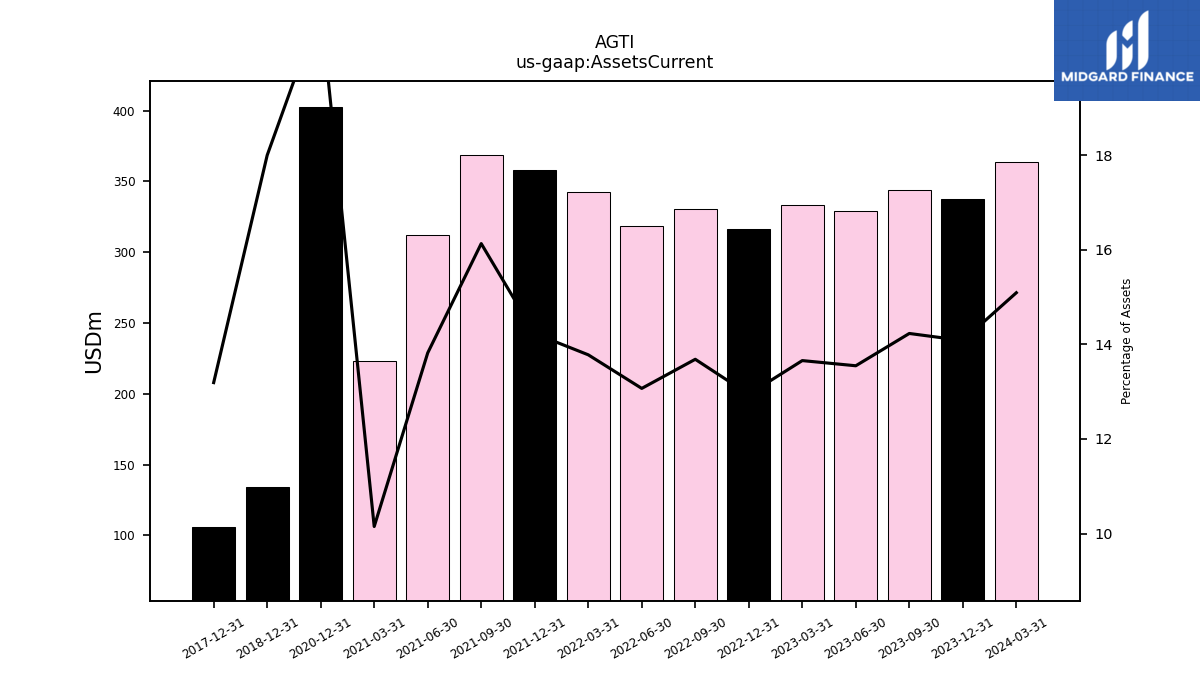
| Assets Current | 337.74 | 344.20 | 328.82 | 333.64 | 316.31 | 330.79 | 318.75 | 342.67 | 357.88 | 368.43 | 312.08 | 222.84 | 402.37 | NA | NA | NA | |
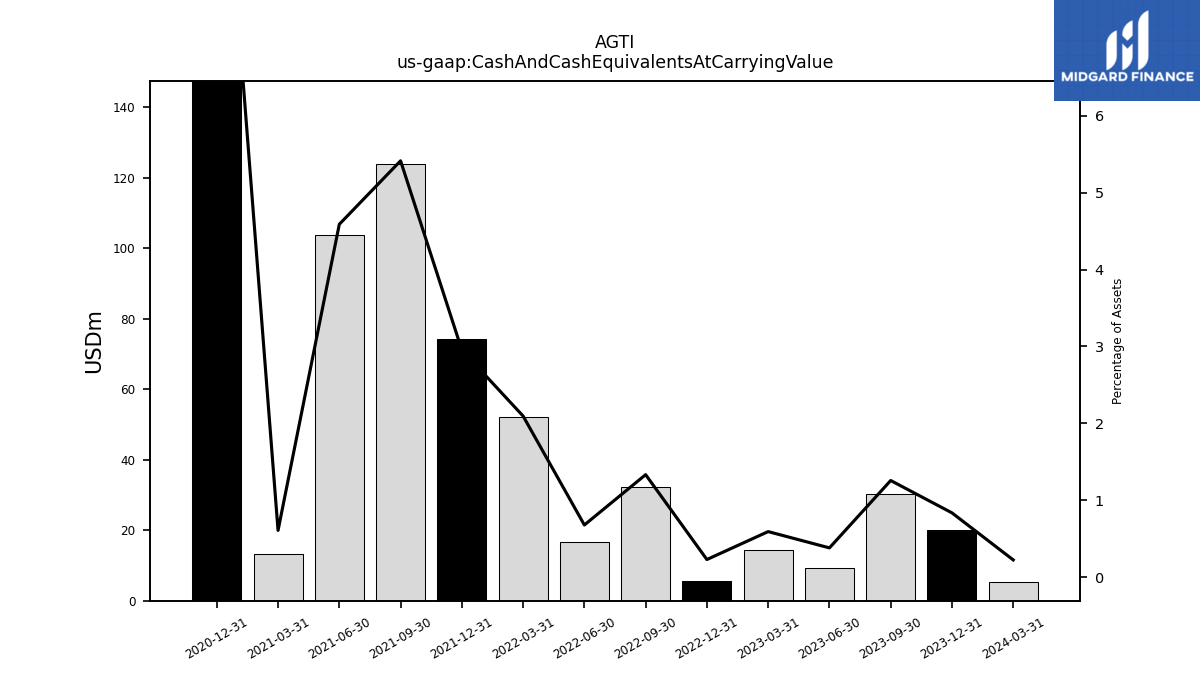
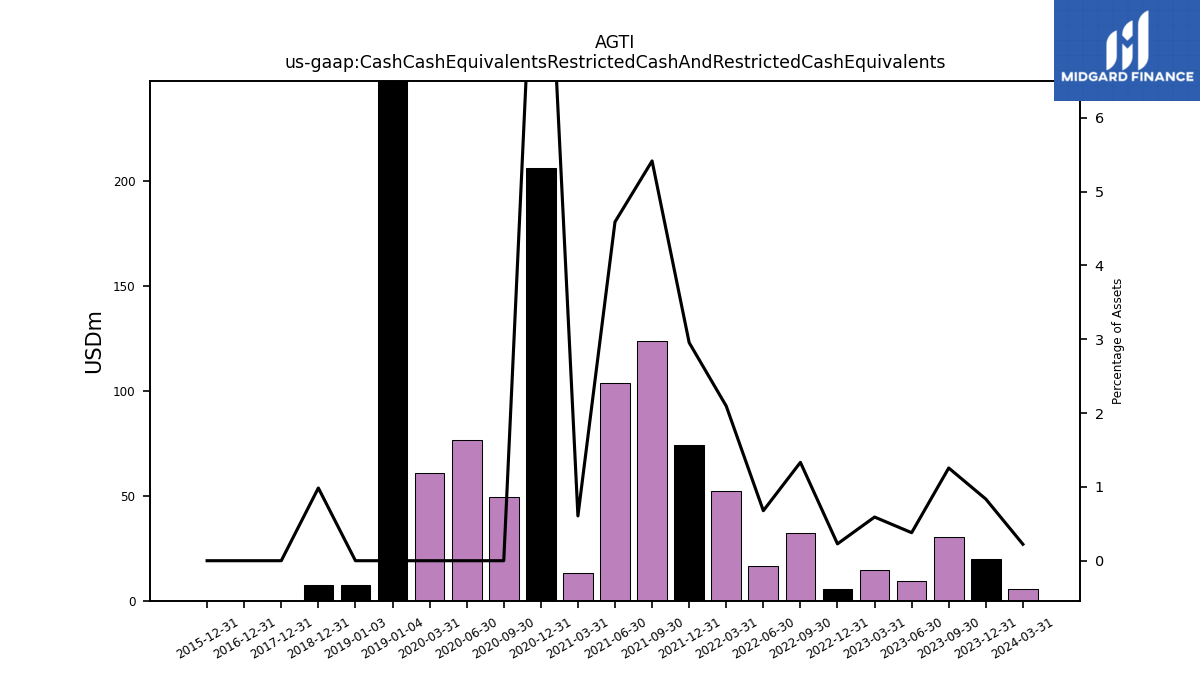
| Cash And Cash Equivalents At Carrying Value | 20.04 | 30.39 | 9.21 | 14.45 | 5.58 | 32.21 | 16.52 | 52.10 | 74.33 | 123.71 | 103.67 | 13.33 | 206.50 | NA | NA | NA | |
| Cash Cash Equivalents Restricted Cash And Restricted Cash Equivalents | 20.04 | 30.39 | 9.21 | 14.45 | 5.58 | 32.21 | 16.52 | 52.10 | 74.33 | 123.71 | 103.67 | 13.33 | 206.50 | 49.47 | 76.83 | 61.02 | |
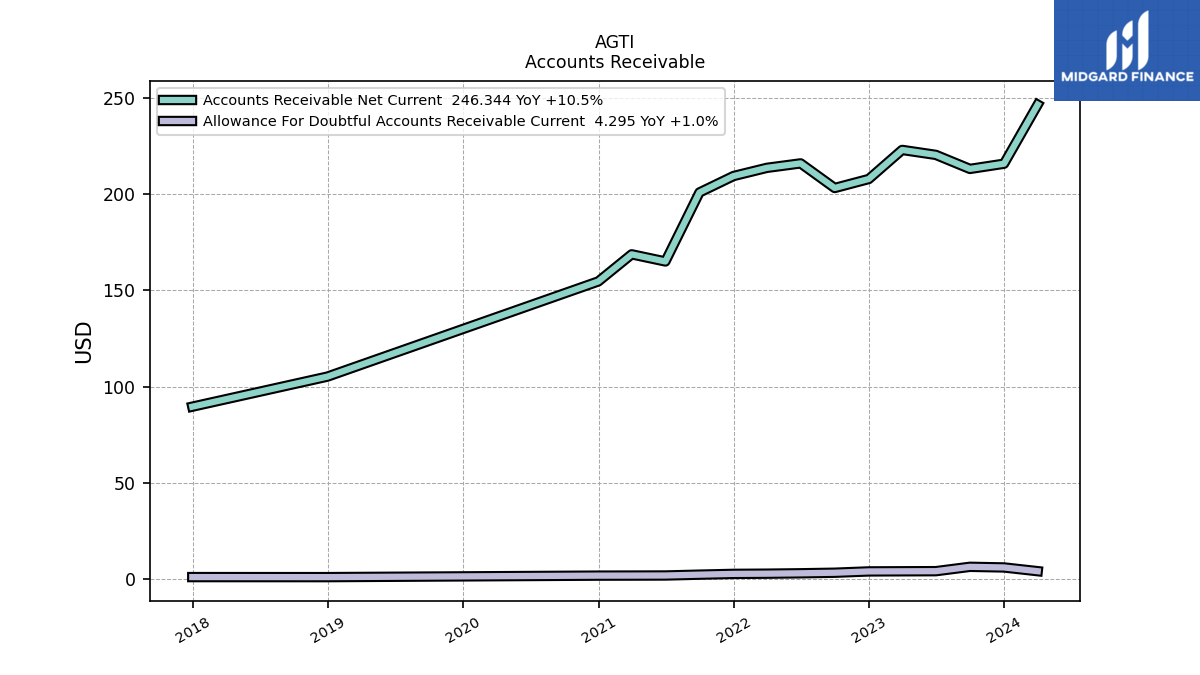
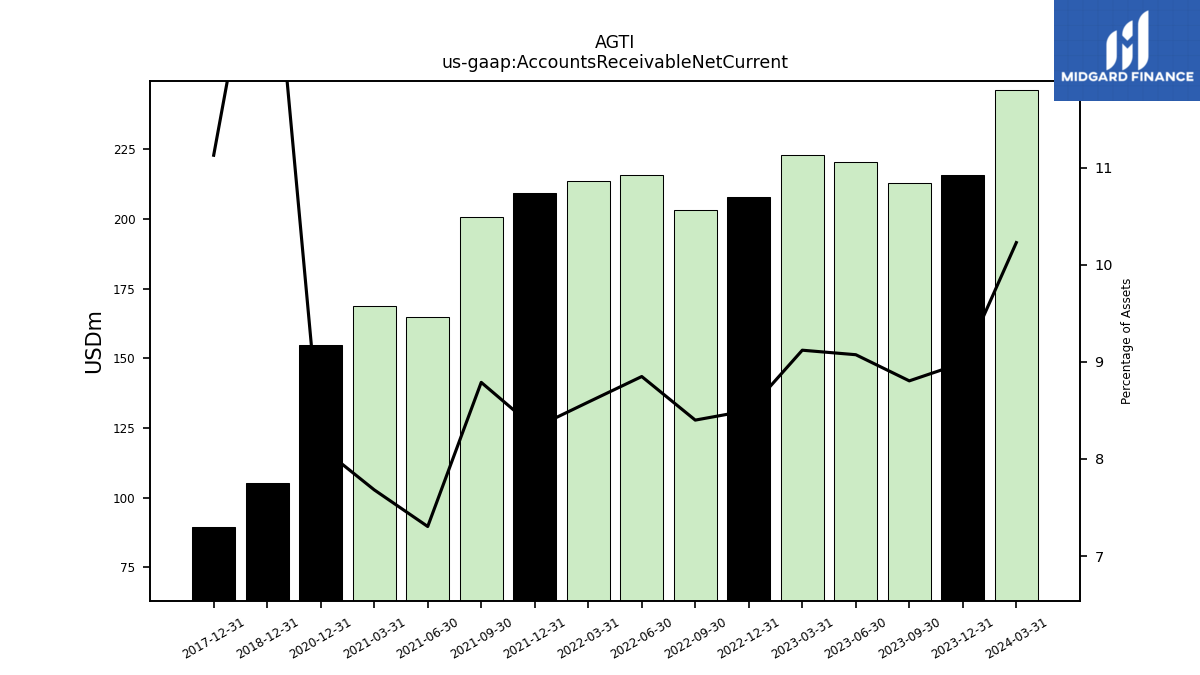
| Accounts Receivable Net Current | 215.68 | 212.99 | 220.27 | 222.85 | 207.75 | 203.09 | 215.86 | 213.55 | 209.31 | 200.78 | 164.97 | 168.68 | 154.62 | NA | NA | NA | |
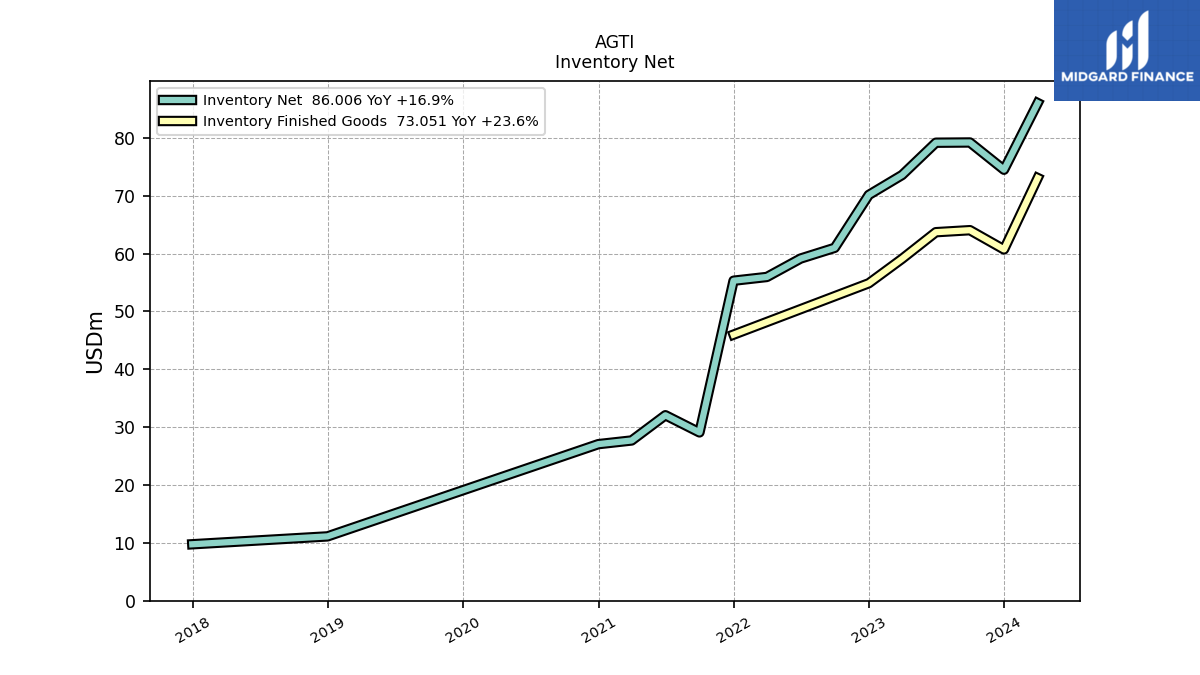
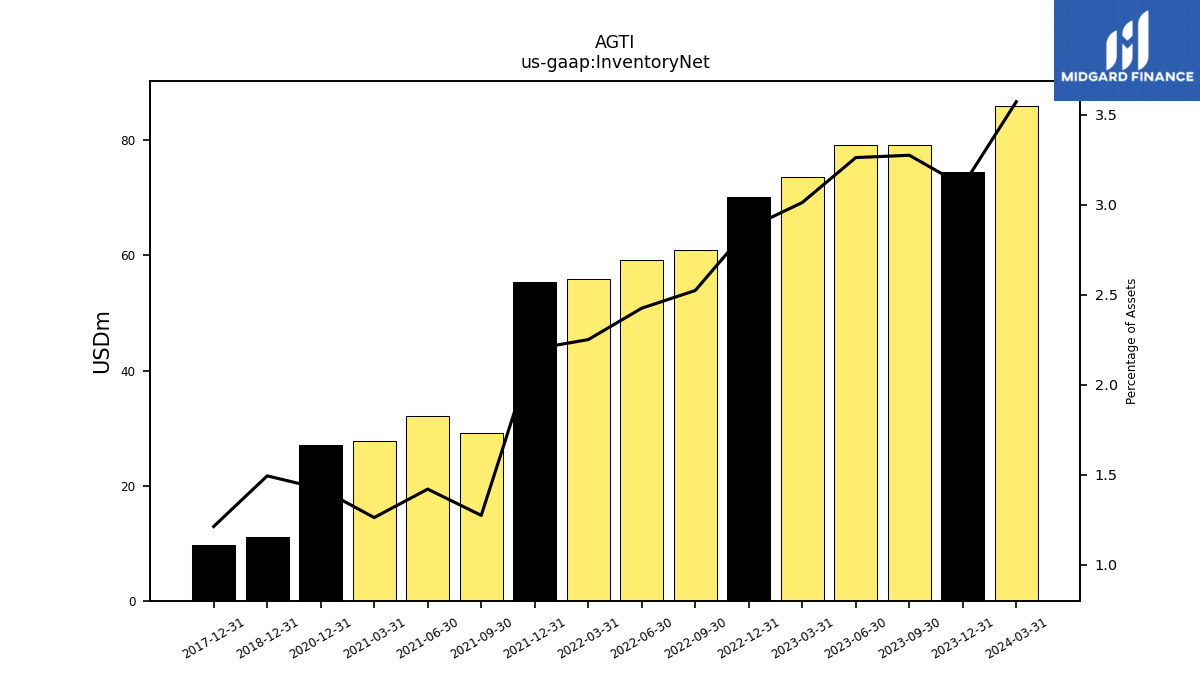
| Inventory Net | 74.48 | 79.19 | 79.15 | 73.58 | 70.13 | 60.99 | 59.14 | 55.95 | 55.31 | 29.09 | 32.06 | 27.70 | 27.06 | NA | NA | NA | |
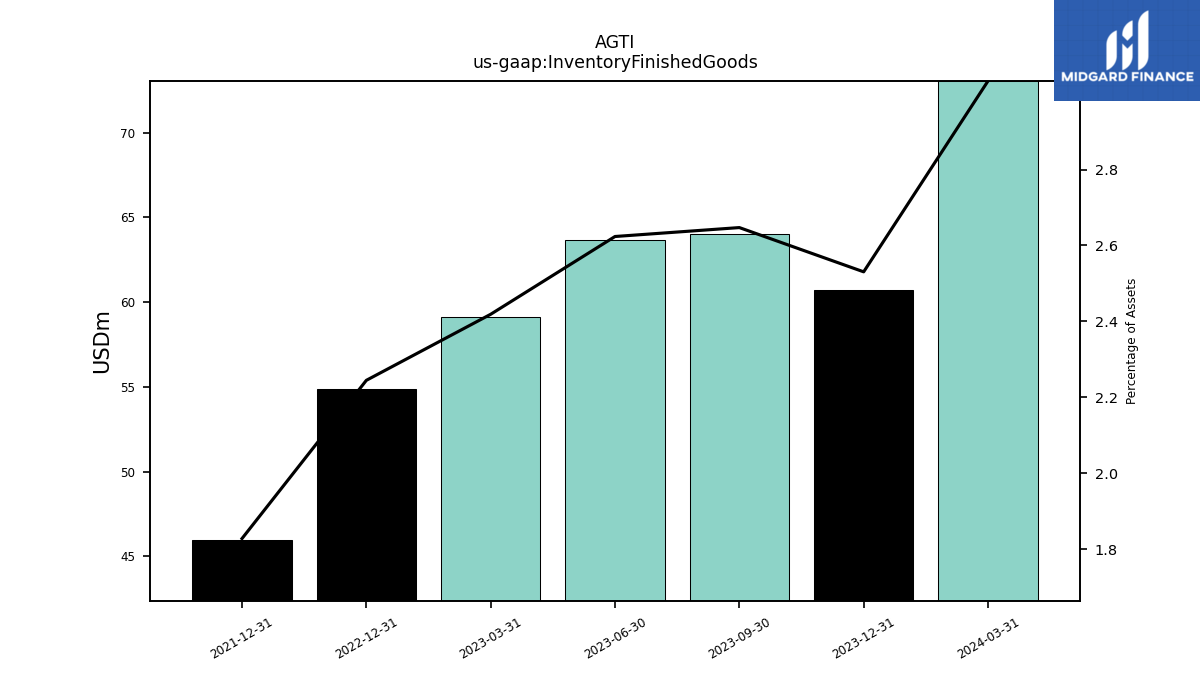
| Inventory Finished Goods | 60.71 | 64.04 | 63.69 | 59.10 | 54.87 | NA | NA | NA | 45.99 | NA | NA | NA | NA | NA | NA | NA | |
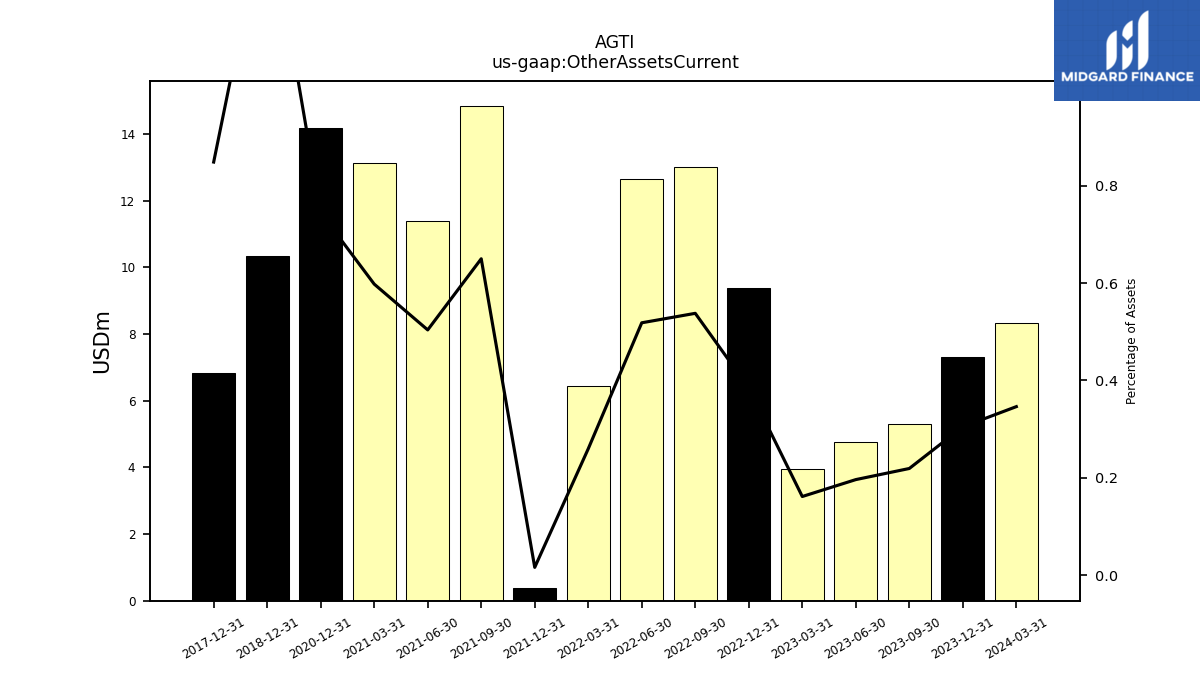
| Other Assets Current | 7.31 | 5.30 | 4.76 | 3.94 | 9.39 | 13.00 | 12.64 | 6.45 | 0.40 | 14.85 | 11.38 | 13.13 | 14.18 | NA | NA | NA |
| 2023-12-31 | 2023-09-30 | 2023-06-30 | 2023-03-31 | 2022-12-31 | 2022-09-30 | 2022-06-30 | 2022-03-31 | 2021-12-31 | 2021-09-30 | 2021-06-30 | 2021-03-31 | 2020-12-31 | 2020-09-30 | 2020-06-30 | 2020-03-31 | ||
|---|---|---|---|---|---|---|---|---|---|---|---|---|---|---|---|---|---|
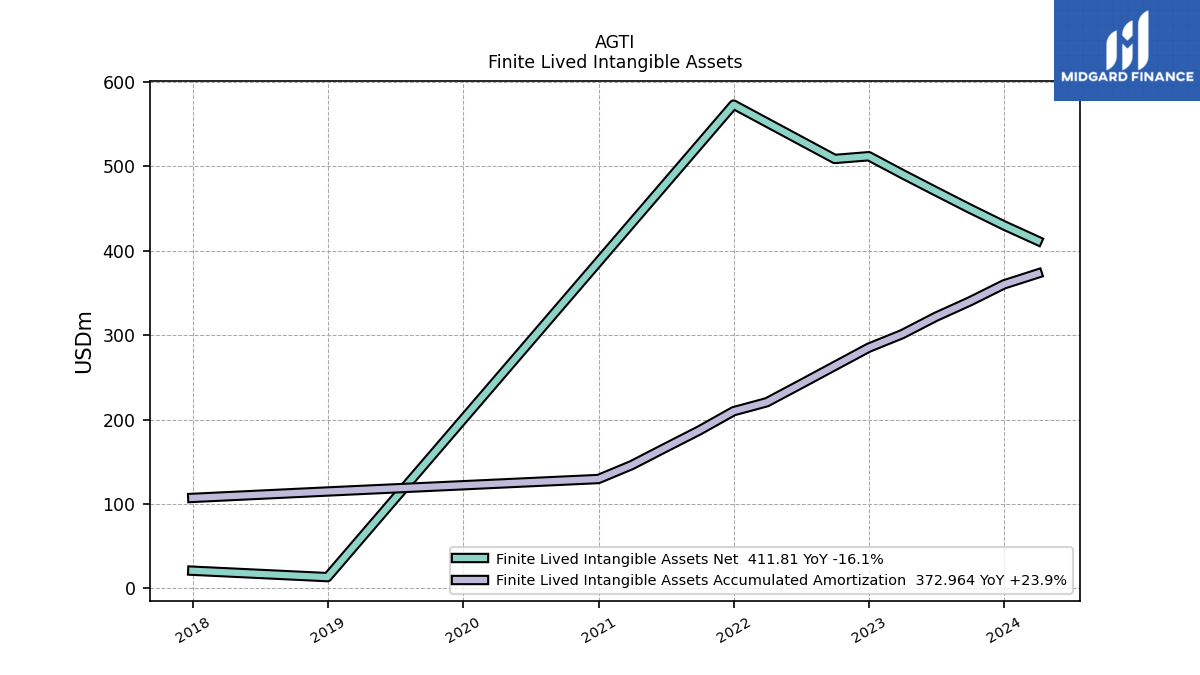
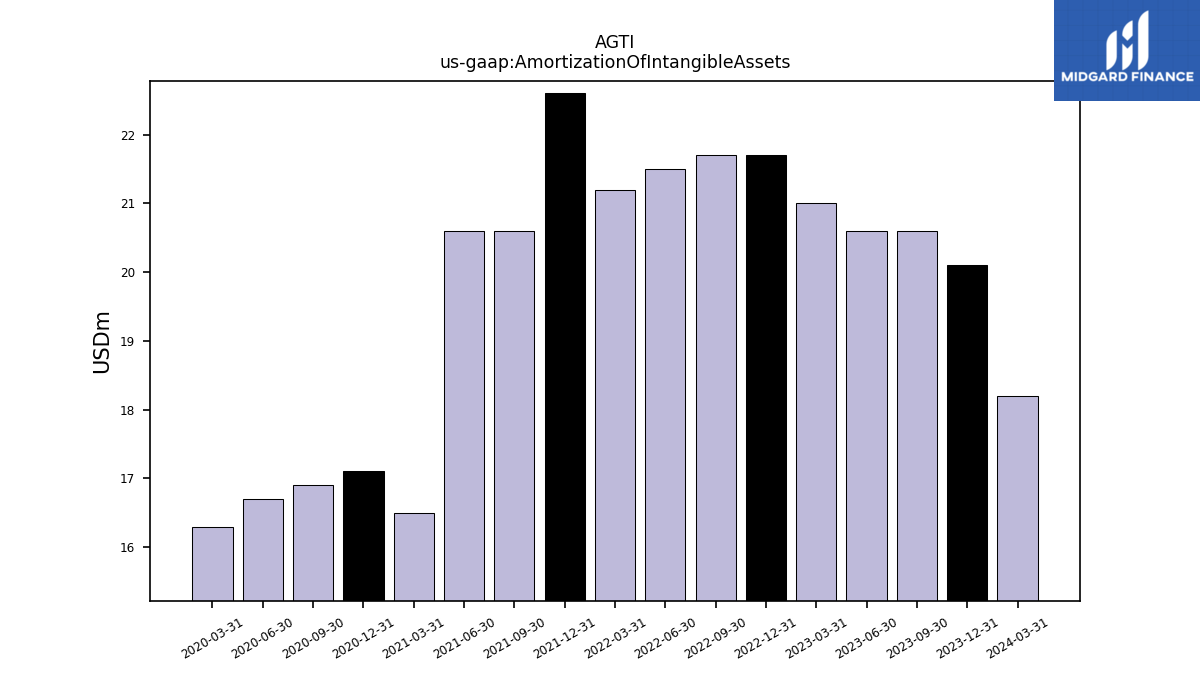
| Amortization Of Intangible Assets | 20.10 | 20.60 | 20.60 | 21.00 | 21.70 | 21.70 | 21.50 | 21.20 | 22.60 | 20.60 | 20.60 | 16.50 | 17.10 | 16.90 | 16.70 | 16.30 | |
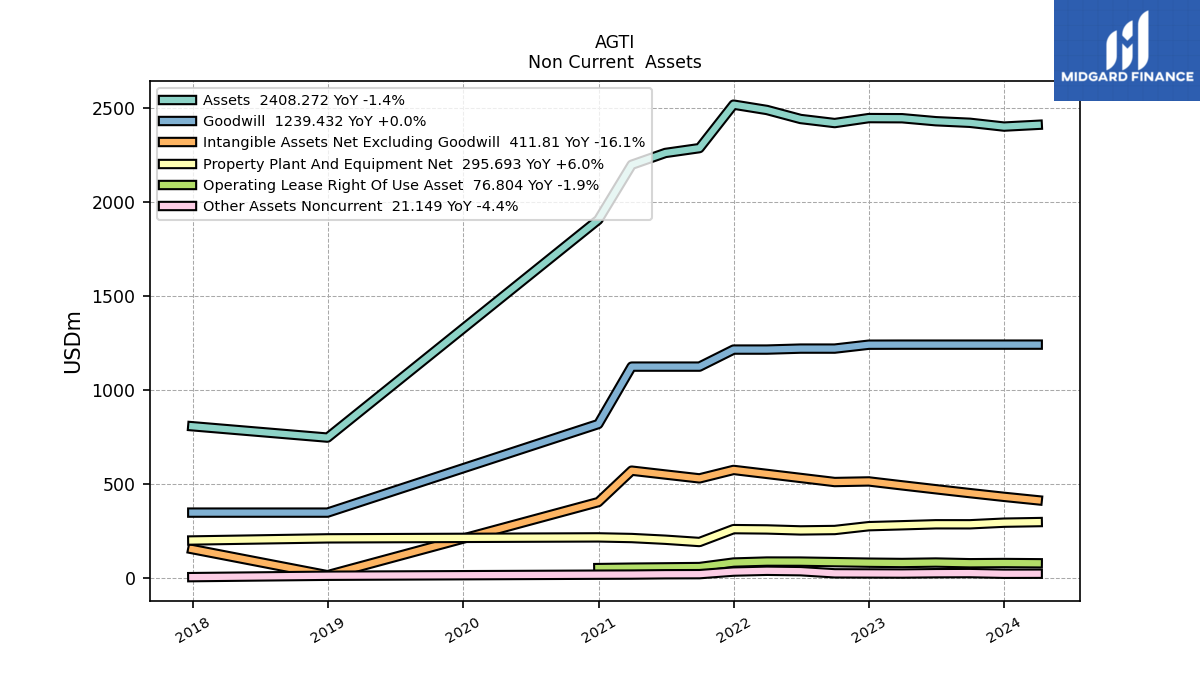
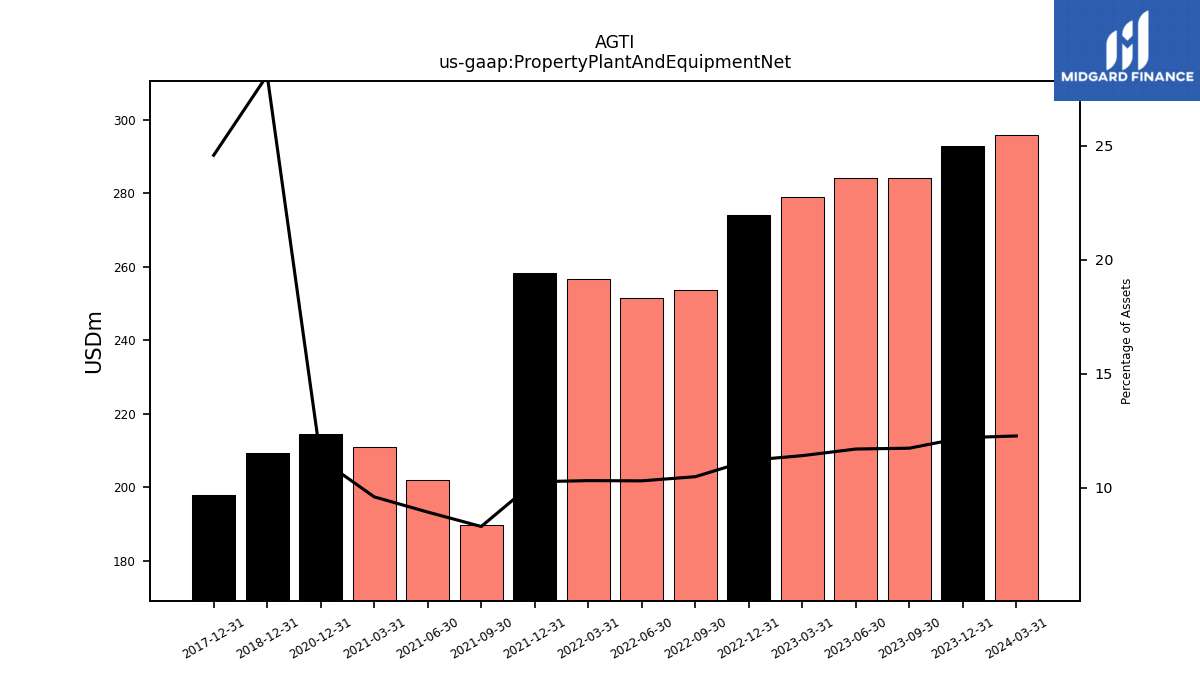
| Property Plant And Equipment Net | 292.68 | 284.04 | 284.13 | 278.89 | 273.96 | 253.64 | 251.49 | 256.67 | 258.37 | 189.80 | 201.95 | 210.97 | 214.42 | NA | NA | NA | |
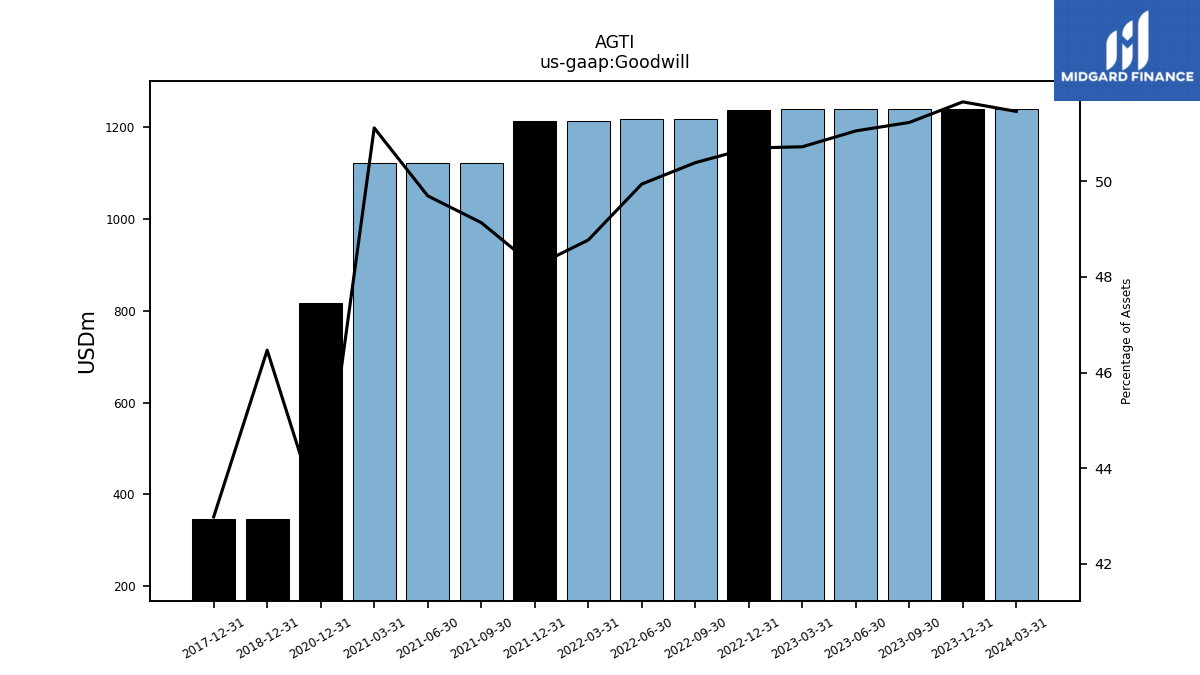
| Goodwill | 1239.43 | 1239.43 | 1239.43 | 1239.43 | 1239.11 | 1218.33 | 1218.33 | 1213.12 | 1213.12 | 1122.53 | 1122.53 | 1122.53 | 817.11 | NA | NA | NA | |
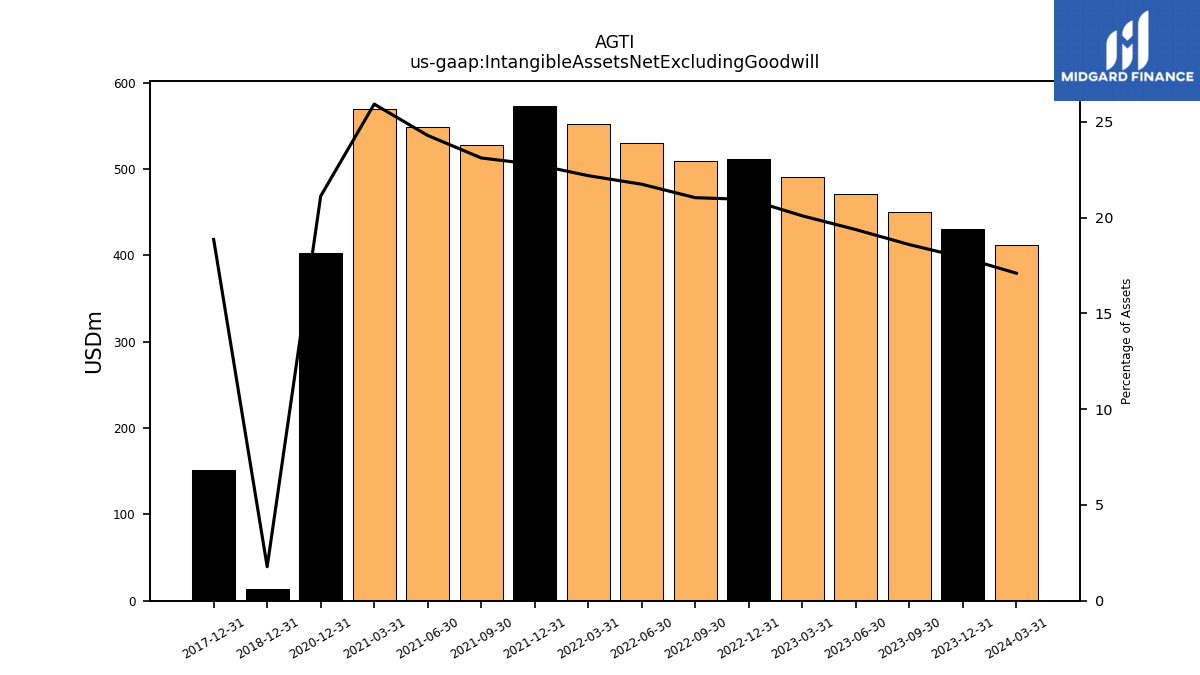
| Intangible Assets Net Excluding Goodwill | 430.00 | 449.83 | 470.42 | 491.04 | 512.02 | 508.77 | 530.47 | 552.00 | 573.16 | 528.12 | 548.72 | 569.34 | 402.10 | NA | NA | NA | |
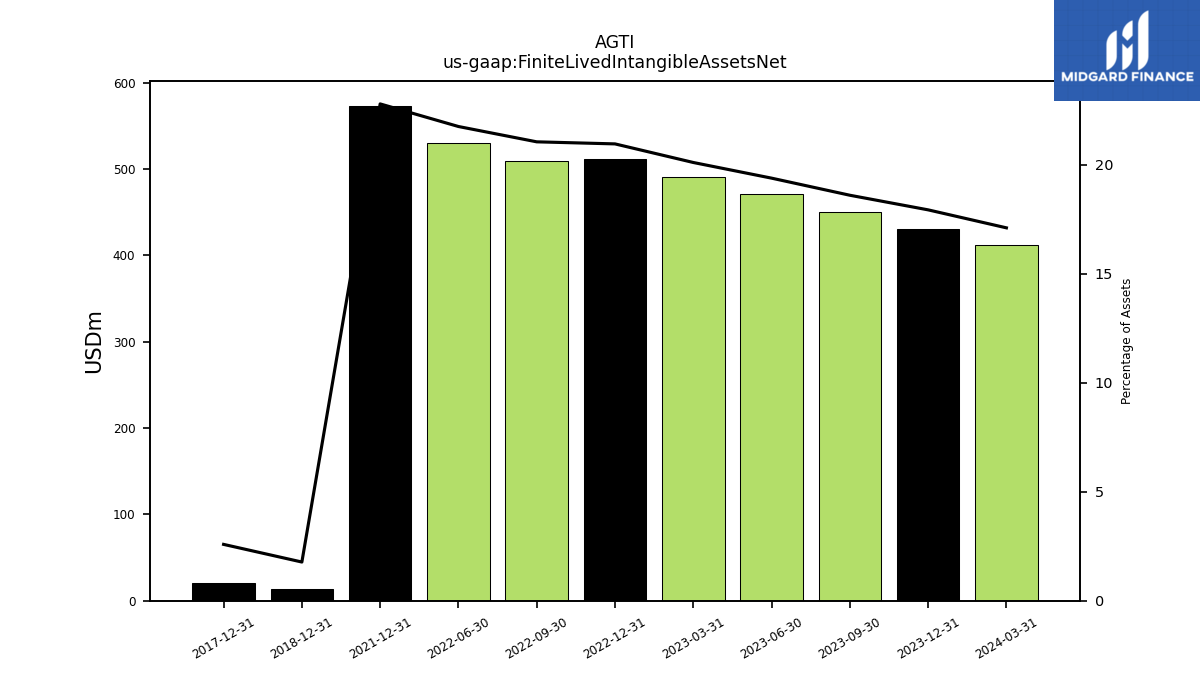
| Finite Lived Intangible Assets Net | 430.00 | 449.83 | 470.42 | 491.04 | 512.02 | 508.77 | 530.47 | NA | 573.16 | NA | NA | NA | NA | NA | NA | NA | |
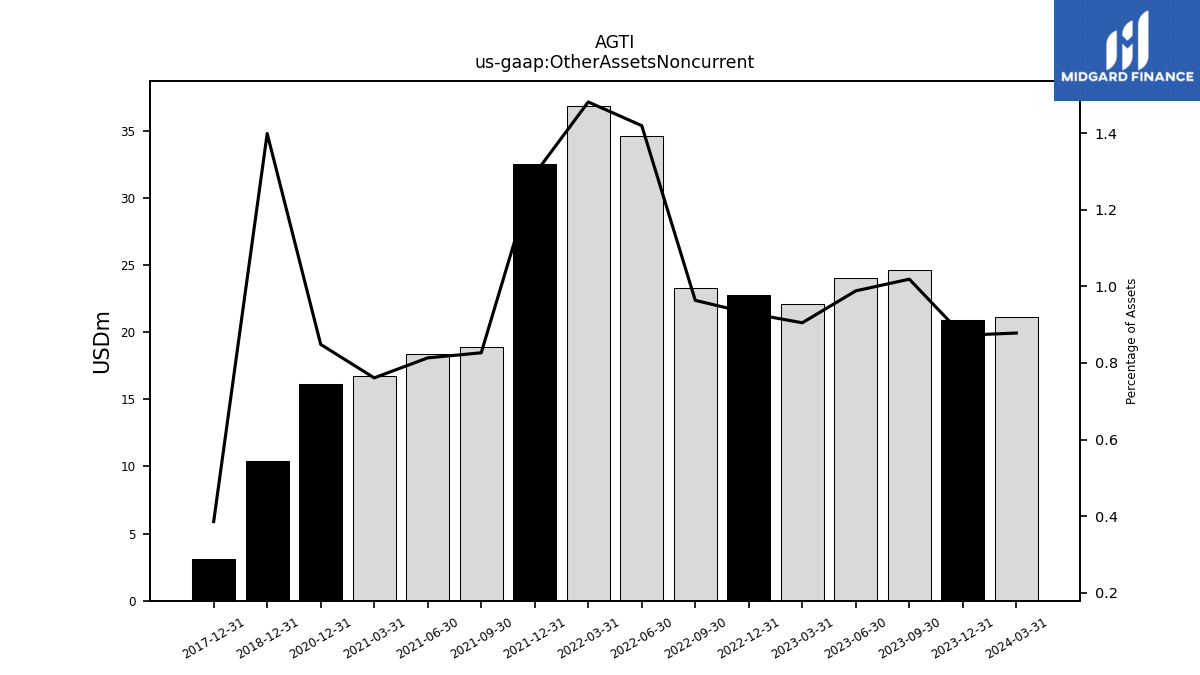
| Other Assets Noncurrent | 20.93 | 24.65 | 23.99 | 22.11 | 22.73 | 23.30 | 34.63 | 36.85 | 32.54 | 18.88 | 18.37 | 16.71 | 16.15 | NA | NA | NA |
| 2023-12-31 | 2023-09-30 | 2023-06-30 | 2023-03-31 | 2022-12-31 | 2022-09-30 | 2022-06-30 | 2022-03-31 | 2021-12-31 | 2021-09-30 | 2021-06-30 | 2021-03-31 | 2020-12-31 | 2020-09-30 | 2020-06-30 | 2020-03-31 | ||
|---|---|---|---|---|---|---|---|---|---|---|---|---|---|---|---|---|---|
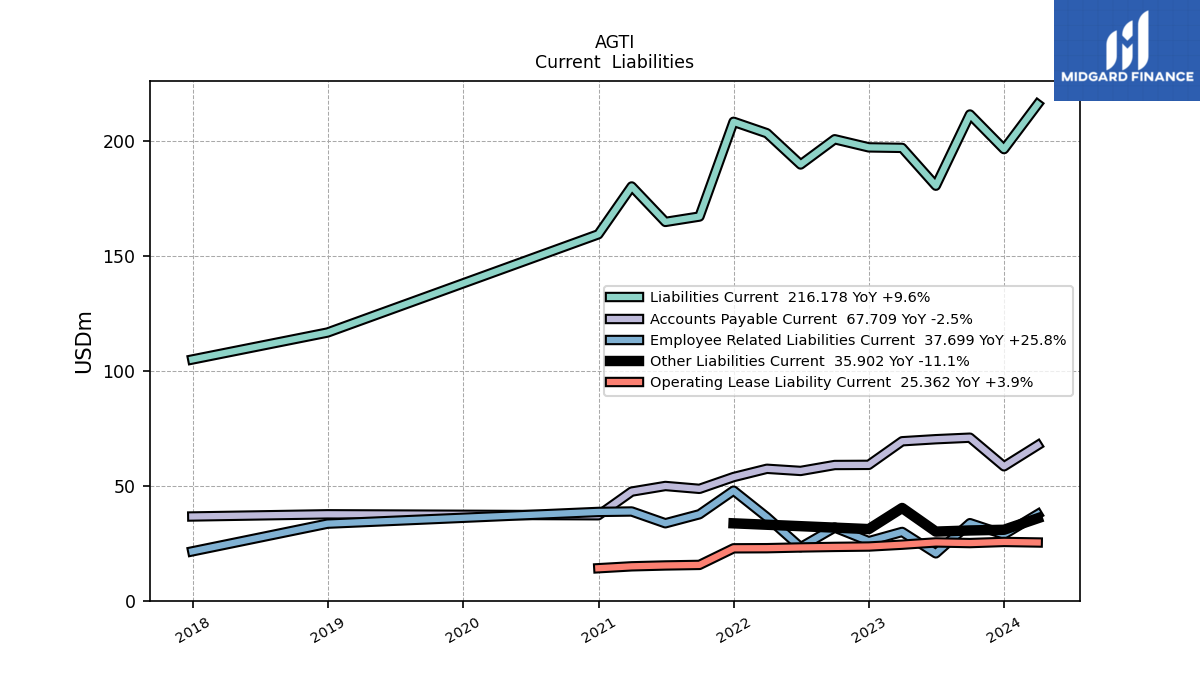
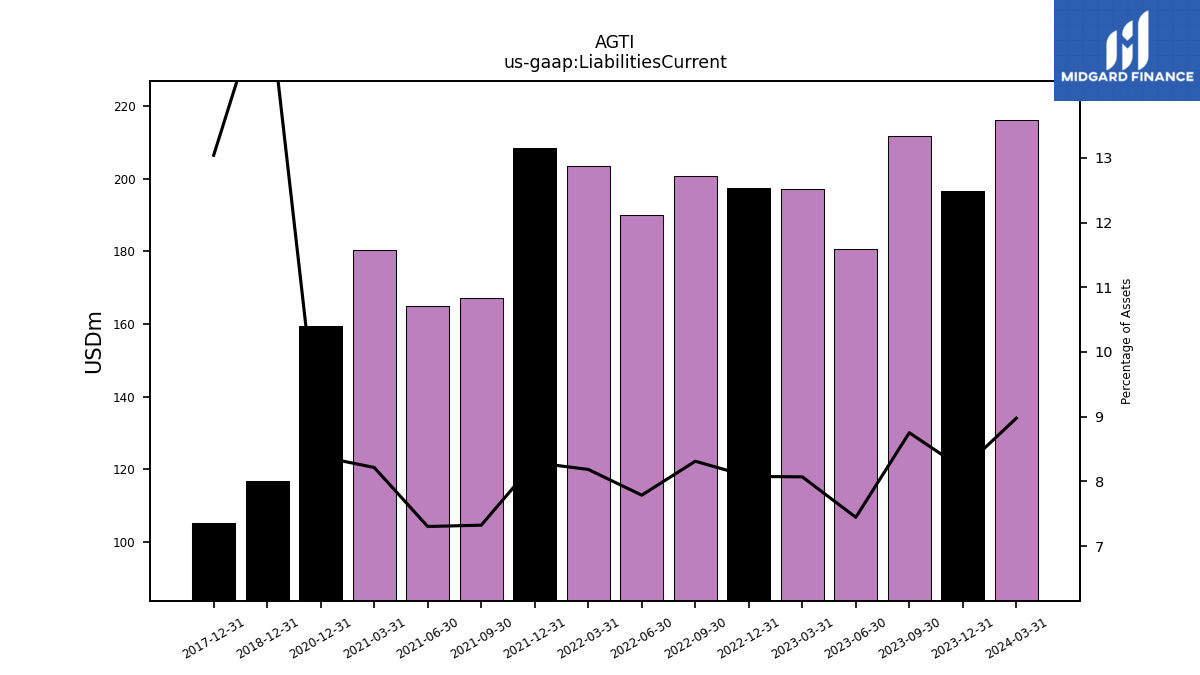
| Liabilities Current | 196.61 | 211.70 | 180.69 | 197.16 | 197.38 | 200.92 | 189.93 | 203.55 | 208.53 | 167.27 | 164.92 | 180.37 | 159.53 | NA | NA | NA | |
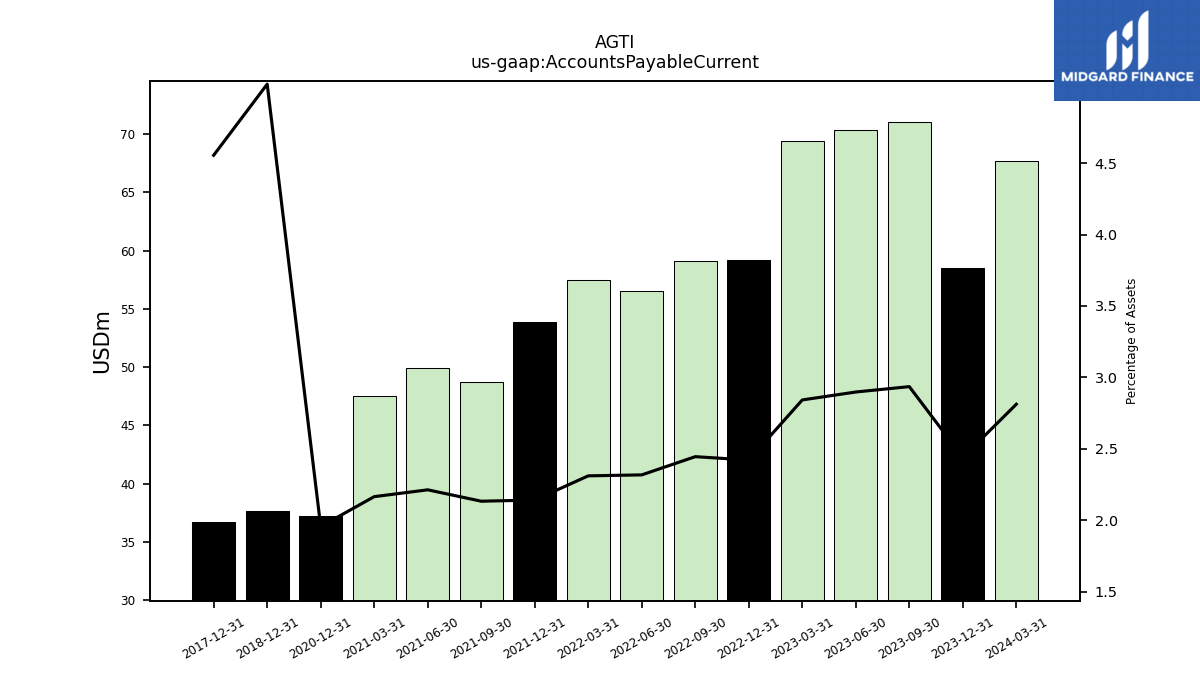
| Accounts Payable Current | 58.52 | 71.00 | 70.33 | 69.43 | 59.16 | 59.09 | 56.51 | 57.45 | 53.85 | 48.71 | 49.97 | 47.52 | 37.22 | NA | NA | NA | |
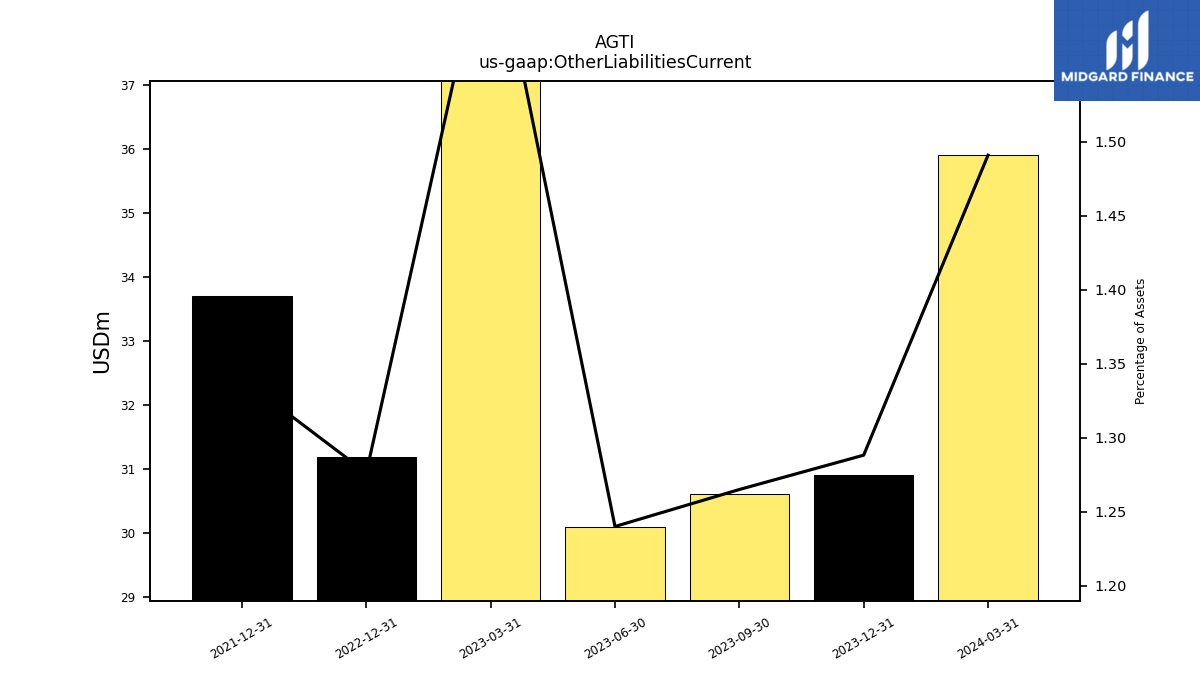
| Other Liabilities Current | 30.91 | 30.61 | 30.11 | 40.40 | 31.20 | NA | NA | NA | 33.71 | NA | NA | NA | NA | NA | NA | NA |
| 2023-12-31 | 2023-09-30 | 2023-06-30 | 2023-03-31 | 2022-12-31 | 2022-09-30 | 2022-06-30 | 2022-03-31 | 2021-12-31 | 2021-09-30 | 2021-06-30 | 2021-03-31 | 2020-12-31 | 2020-09-30 | 2020-06-30 | 2020-03-31 | ||
|---|---|---|---|---|---|---|---|---|---|---|---|---|---|---|---|---|---|
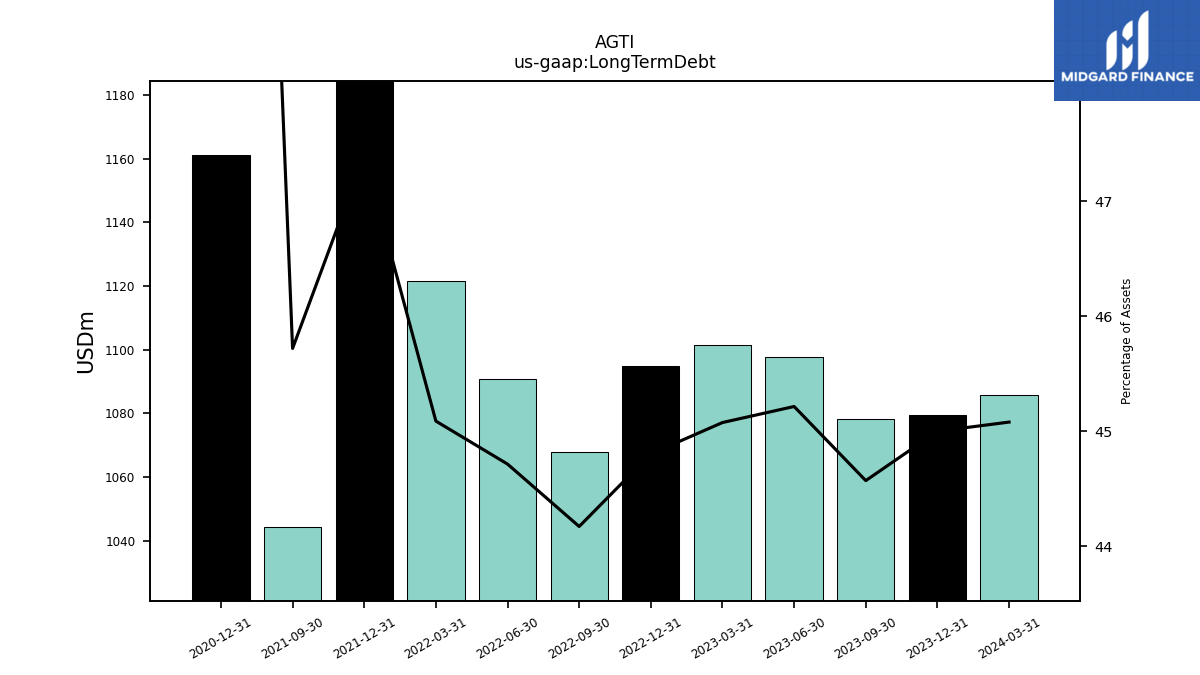
| Long Term Debt | 1079.53 | 1078.23 | 1097.62 | 1101.40 | 1095.05 | 1067.93 | 1090.75 | 1121.48 | 1192.50 | 1044.47 | NA | NA | 1161.10 | NA | NA | NA | |
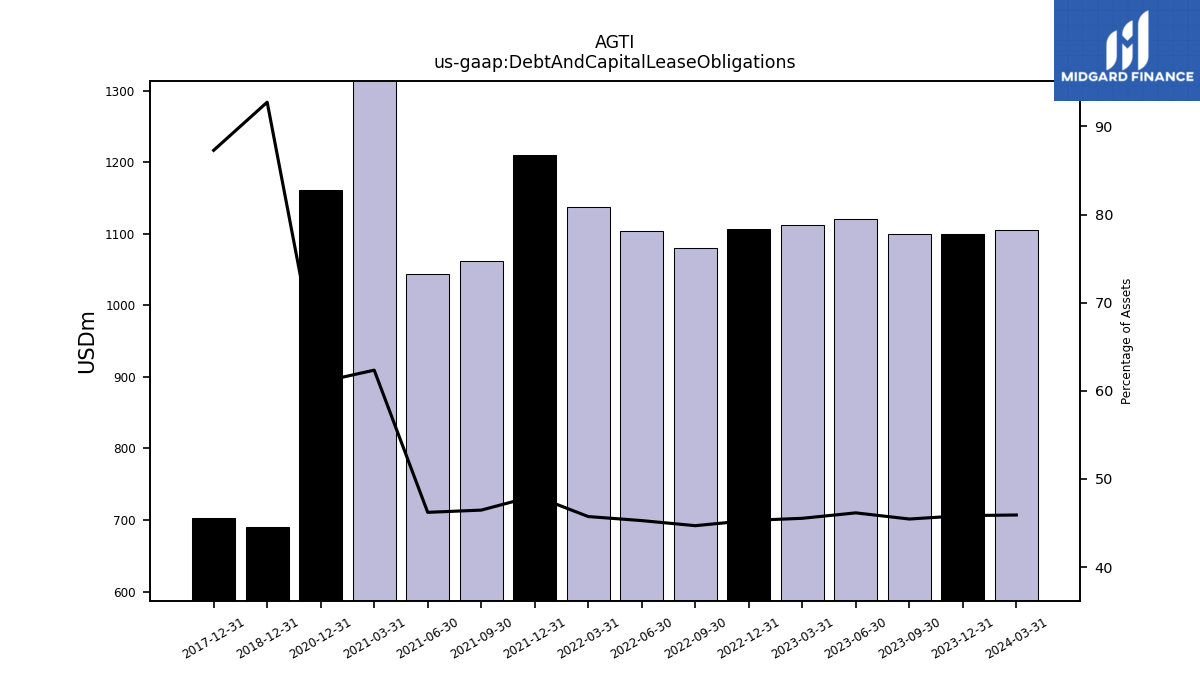
| Debt And Capital Lease Obligations | 1099.69 | 1099.69 | 1120.48 | 1112.74 | 1106.94 | 1080.77 | 1104.53 | 1137.64 | 1209.69 | 1061.57 | 1043.92 | 1369.10 | 1161.10 | NA | NA | NA | |
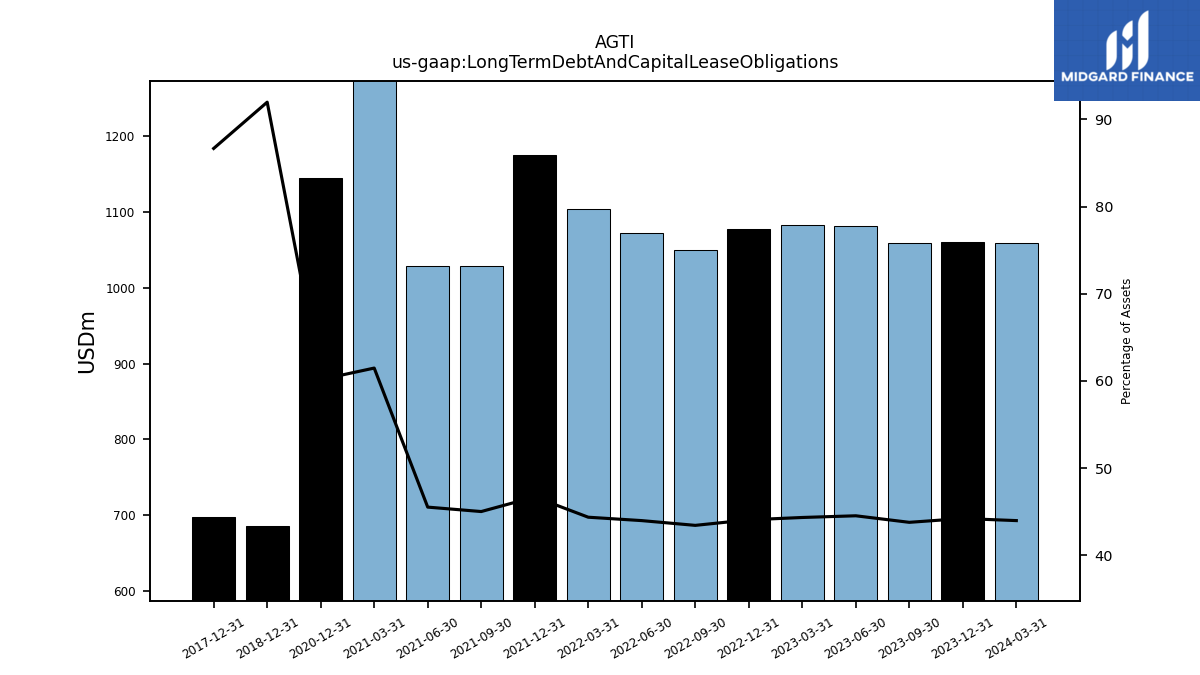
| Long Term Debt And Capital Lease Obligations | 1061.06 | 1059.35 | 1081.25 | 1083.57 | 1077.29 | 1050.29 | 1073.02 | 1103.79 | 1174.97 | 1028.63 | 1028.50 | 1350.04 | 1145.06 | NA | NA | NA | |
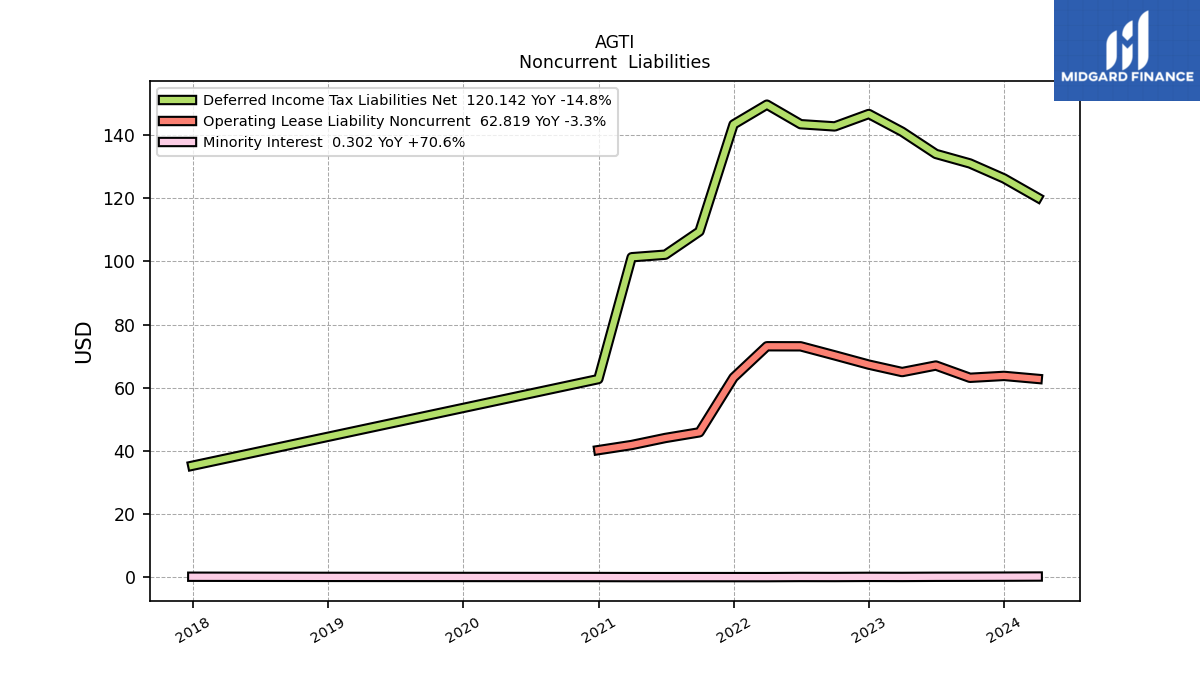
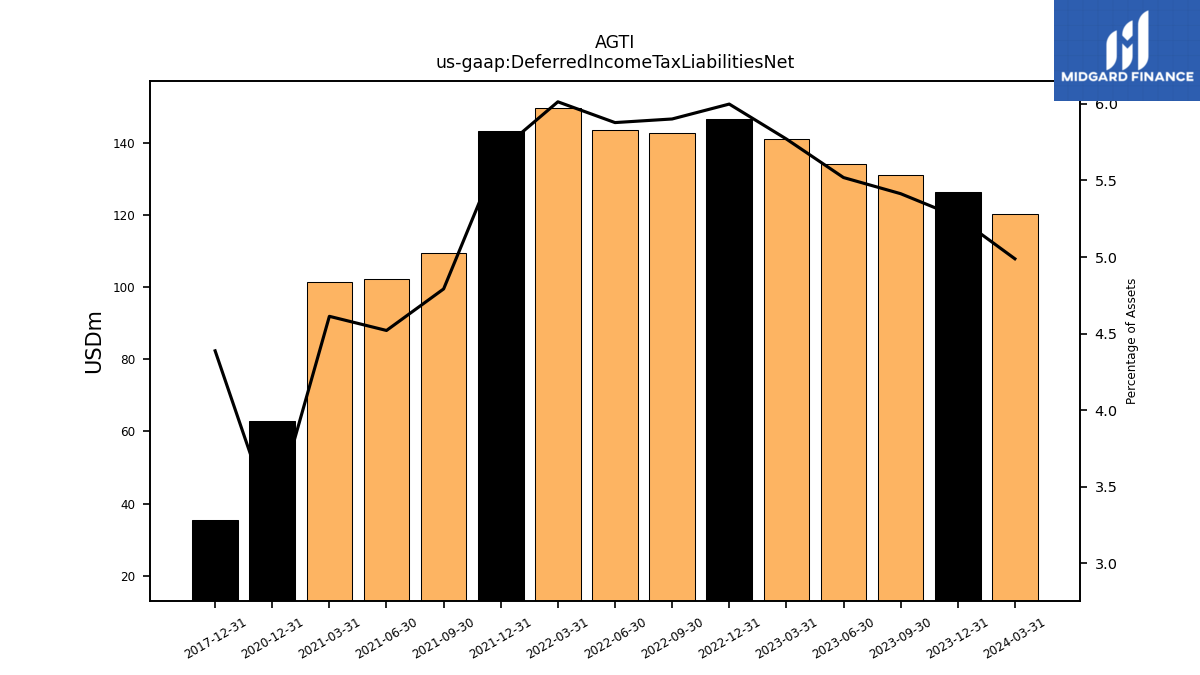
| Deferred Income Tax Liabilities Net | 126.22 | 130.96 | 133.98 | 141.00 | 146.62 | 142.68 | 143.38 | 149.57 | 143.31 | 109.47 | 102.11 | 101.30 | 62.75 | NA | NA | NA | |
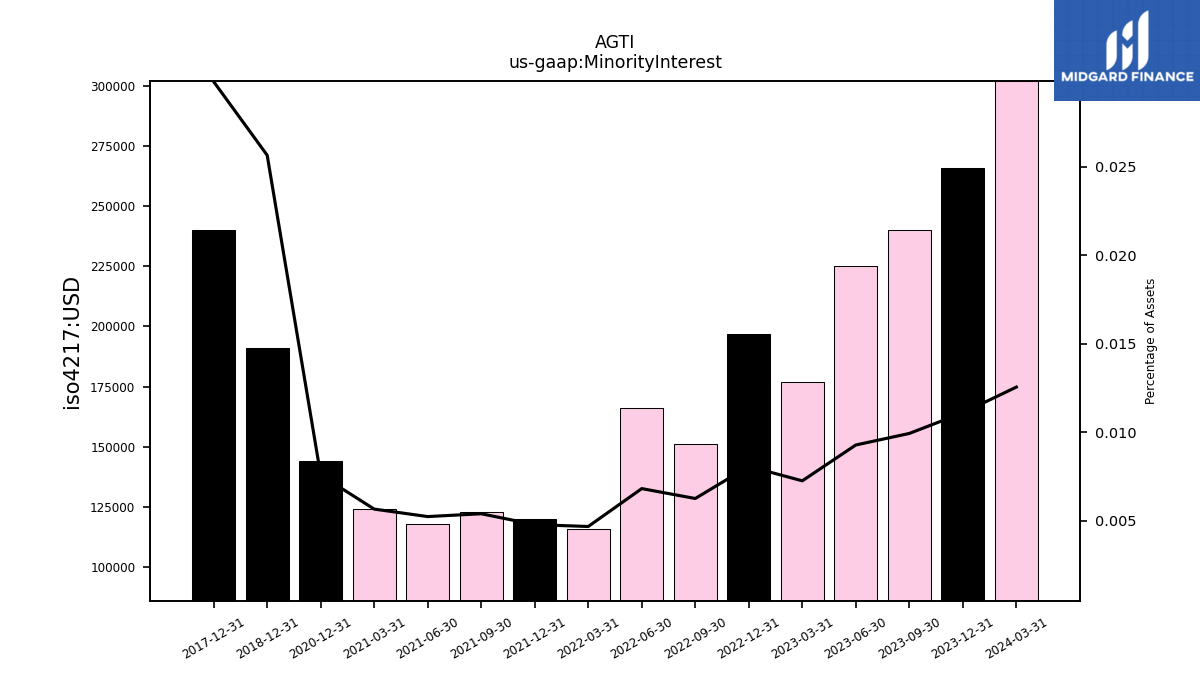
| Minority Interest | 0.27 | 0.24 | 0.23 | 0.18 | 0.20 | 0.15 | 0.17 | 0.12 | 0.12 | 0.12 | 0.12 | 0.12 | 0.14 | NA | NA | NA | |
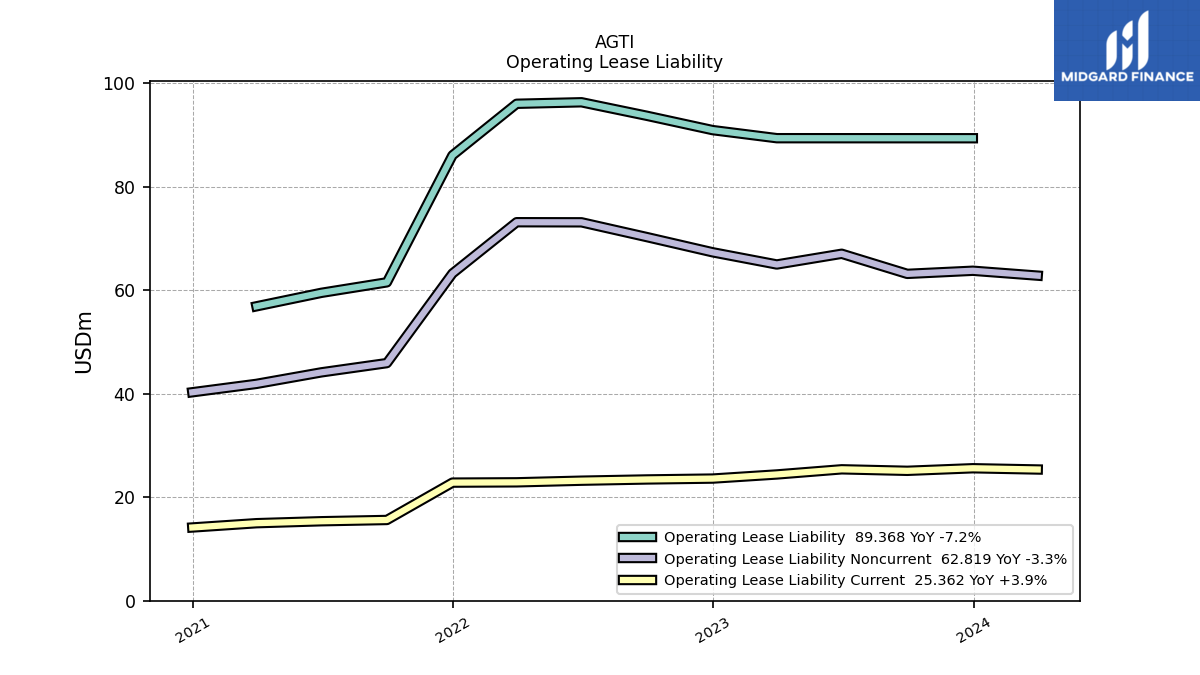
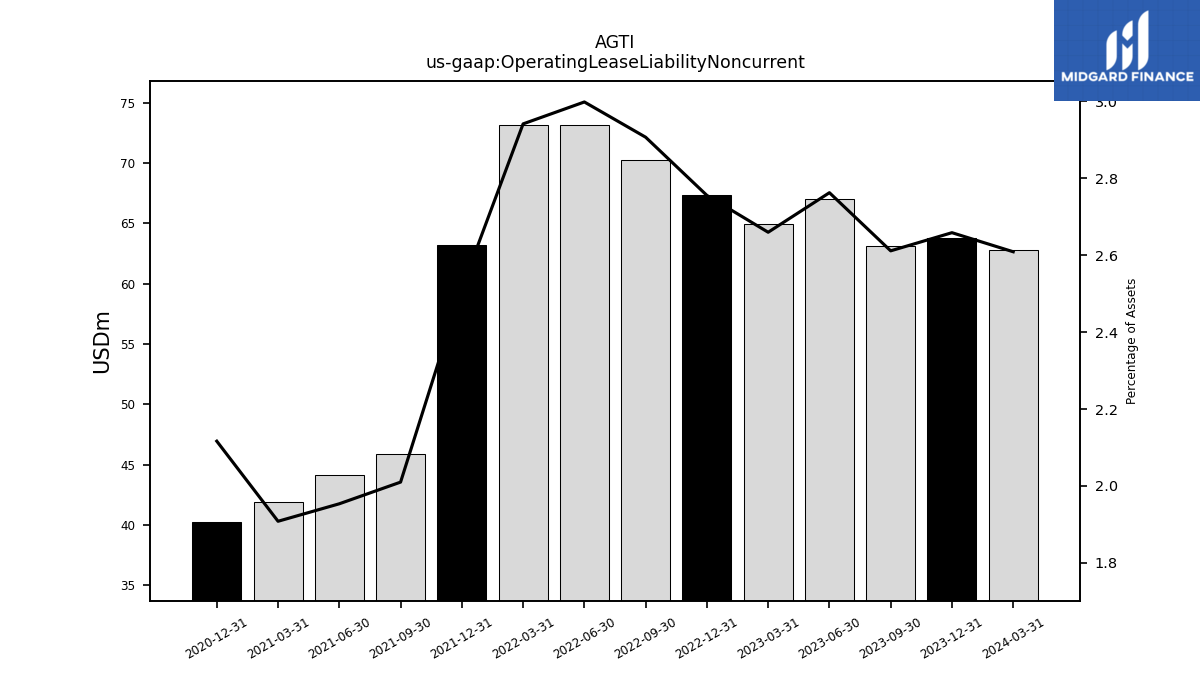
| Operating Lease Liability Noncurrent | 63.77 | 63.16 | 67.05 | 64.97 | 67.33 | 70.26 | 73.12 | 73.14 | 63.24 | 45.92 | 44.13 | 41.90 | 40.28 | NA | NA | NA |
| 2023-12-31 | 2023-09-30 | 2023-06-30 | 2023-03-31 | 2022-12-31 | 2022-09-30 | 2022-06-30 | 2022-03-31 | 2021-12-31 | 2021-09-30 | 2021-06-30 | 2021-03-31 | 2020-12-31 | 2020-09-30 | 2020-06-30 | 2020-03-31 | ||
|---|---|---|---|---|---|---|---|---|---|---|---|---|---|---|---|---|---|
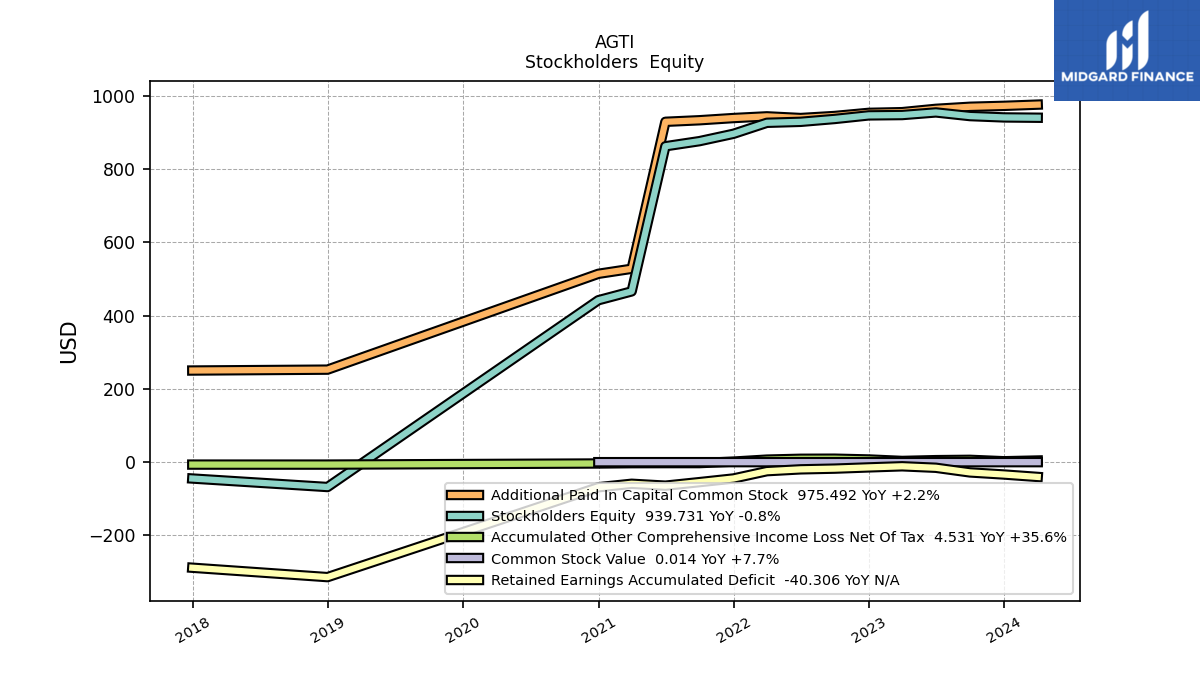
| Stockholders Equity | 940.56 | 944.24 | 954.19 | 947.02 | 946.13 | 936.34 | 928.54 | 925.90 | 895.95 | 875.83 | 861.88 | 465.93 | 441.80 | NA | NA | NA | |
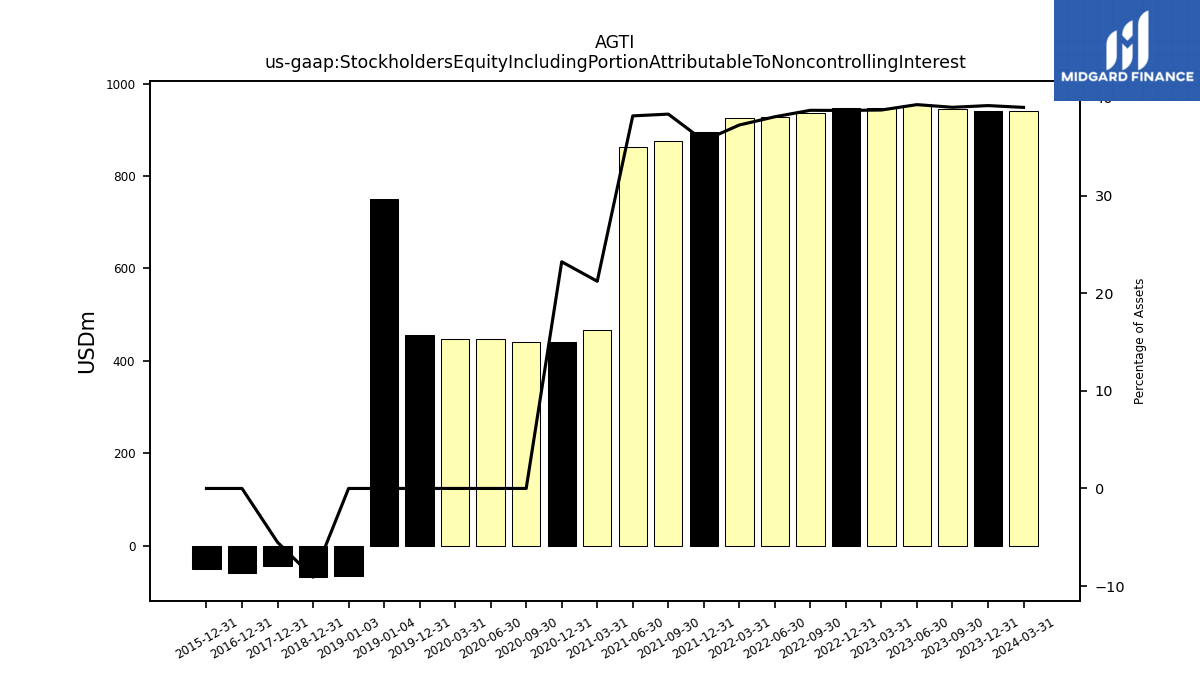
| Stockholders Equity Including Portion Attributable To Noncontrolling Interest | 940.82 | 944.48 | 954.41 | 947.20 | 946.33 | 936.49 | 928.71 | 926.02 | 896.07 | 875.95 | 862.00 | 466.05 | 441.94 | 440.60 | 448.05 | 446.71 | |
| Common Stock Value | 0.01 | 0.01 | 0.01 | 0.01 | 0.01 | 0.01 | 0.01 | 0.01 | 0.01 | 0.01 | 0.01 | 0.01 | 0.01 | NA | NA | NA | |
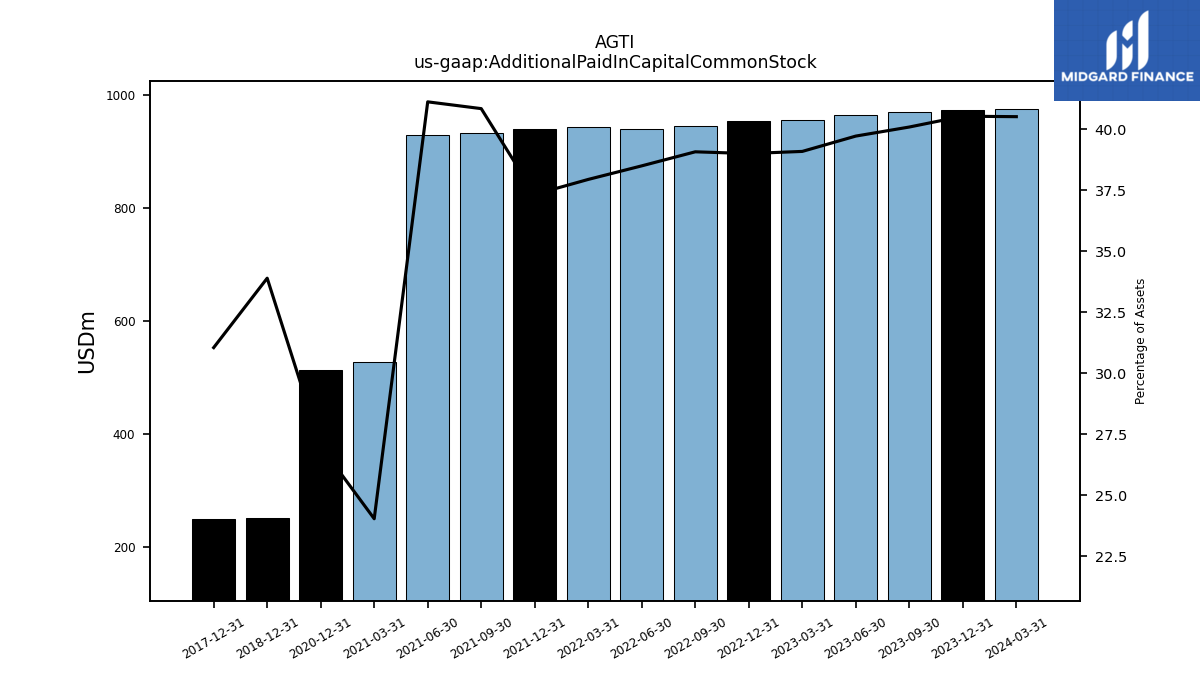
| Additional Paid In Capital Common Stock | 972.16 | 969.62 | 963.97 | 954.93 | 953.05 | 944.48 | 938.91 | 943.52 | 938.89 | 932.87 | 928.62 | 527.63 | 513.90 | NA | NA | NA | |
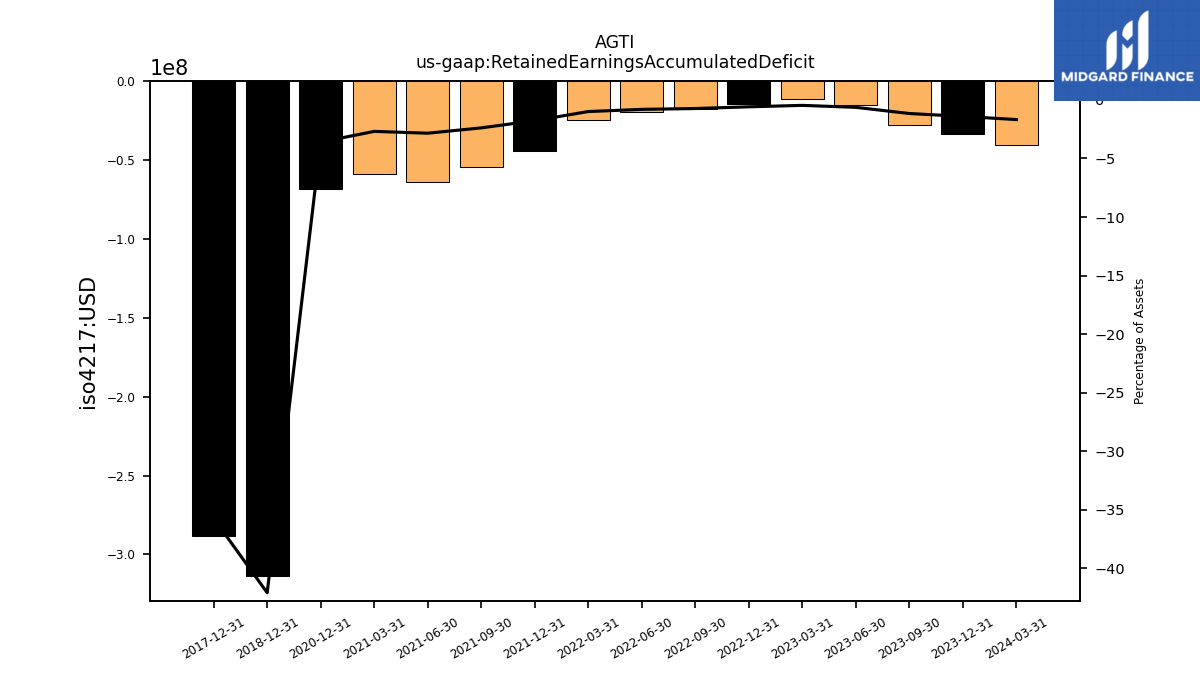
| Retained Earnings Accumulated Deficit | -33.70 | -27.99 | -15.29 | -11.26 | -14.27 | -17.64 | -19.60 | -24.59 | -44.49 | -54.47 | -64.14 | -58.94 | -68.49 | NA | NA | NA | |
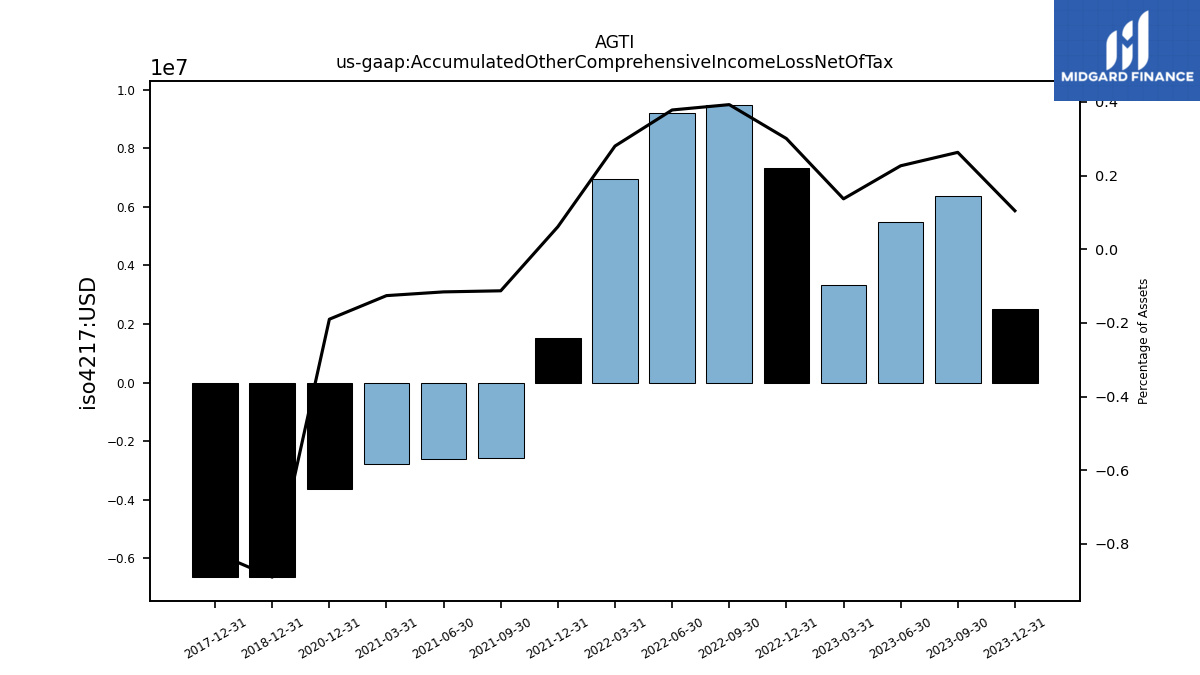
| Accumulated Other Comprehensive Income Loss Net Of Tax | 2.50 | 6.36 | 5.50 | 3.34 | 7.34 | 9.49 | 9.22 | 6.97 | 1.54 | -2.58 | -2.62 | -2.77 | -3.62 | NA | NA | NA | |
| Minority Interest | 0.27 | 0.24 | 0.23 | 0.18 | 0.20 | 0.15 | 0.17 | 0.12 | 0.12 | 0.12 | 0.12 | 0.12 | 0.14 | NA | NA | NA | |
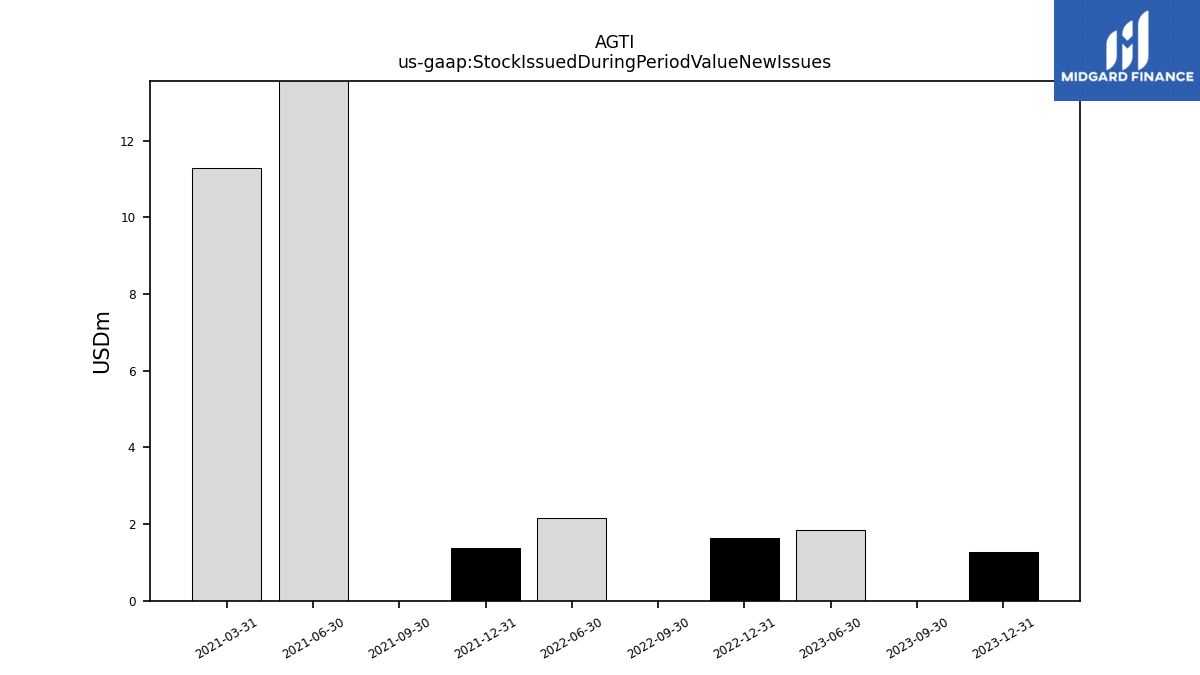
| Stock Issued During Period Value New Issues | 1.28 | 0.00 | 1.86 | NA | 1.65 | 0.00 | 2.16 | NA | 1.37 | 0.00 | 401.44 | 11.30 | NA | NA | NA | NA | |
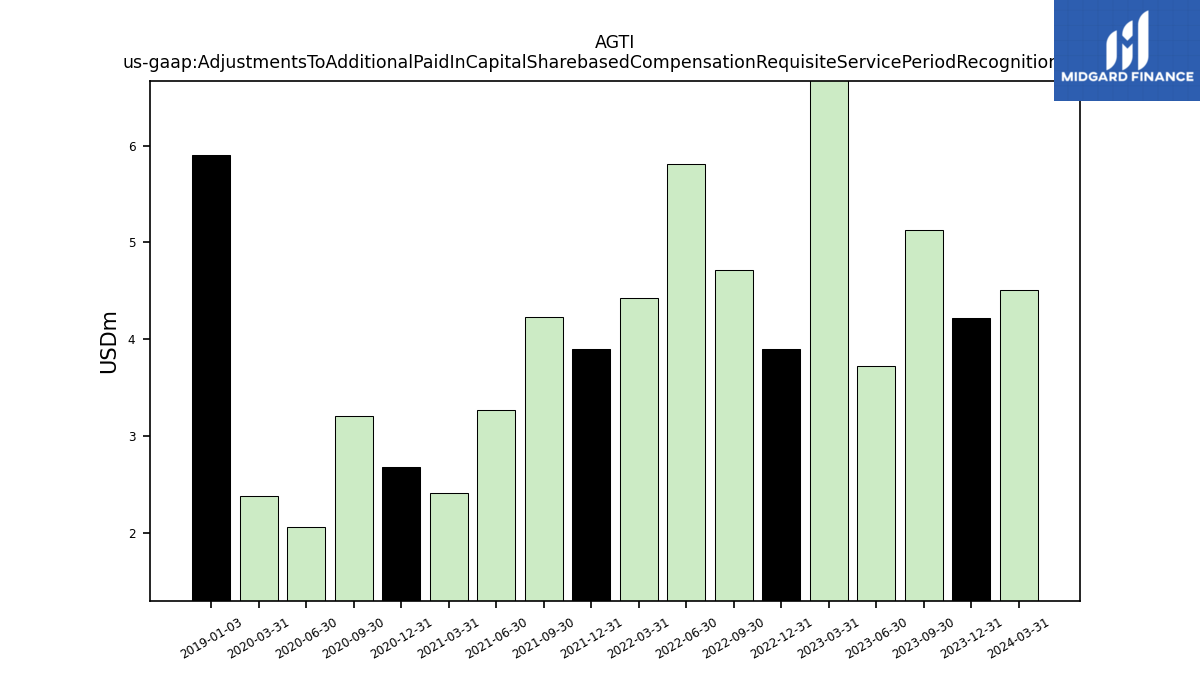
| Adjustments To Additional Paid In Capital Sharebased Compensation Requisite Service Period Recognition Value | 4.22 | 5.13 | 3.73 | 6.73 | 3.90 | 4.71 | 5.81 | 4.42 | 3.90 | 4.24 | 3.27 | 2.41 | 2.68 | 3.21 | 2.07 | 2.38 | |
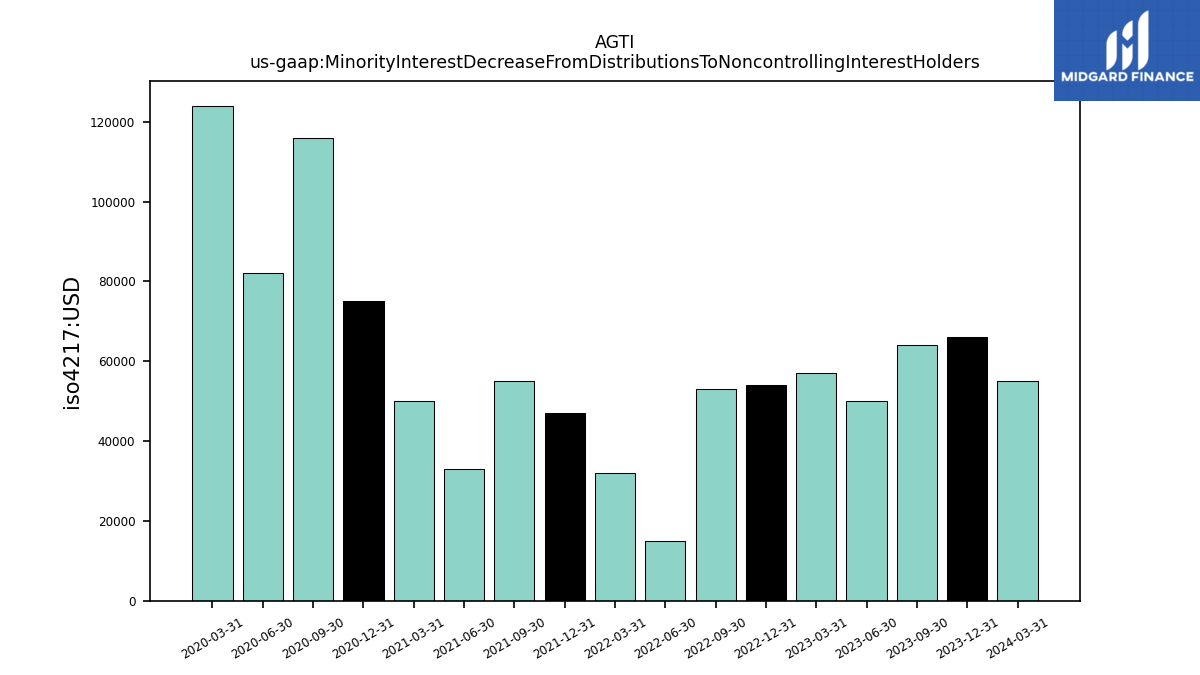
| Minority Interest Decrease From Distributions To Noncontrolling Interest Holders | 0.07 | 0.06 | 0.05 | 0.06 | 0.05 | 0.05 | 0.01 | 0.03 | 0.05 | 0.06 | 0.03 | 0.05 | 0.07 | 0.12 | 0.08 | 0.12 |
| 2023-12-31 | 2023-09-30 | 2023-06-30 | 2023-03-31 | 2022-12-31 | 2022-09-30 | 2022-06-30 | 2022-03-31 | 2021-12-31 | 2021-09-30 | 2021-06-30 | 2021-03-31 | 2020-12-31 | 2020-09-30 | 2020-06-30 | 2020-03-31 | ||
|---|---|---|---|---|---|---|---|---|---|---|---|---|---|---|---|---|---|
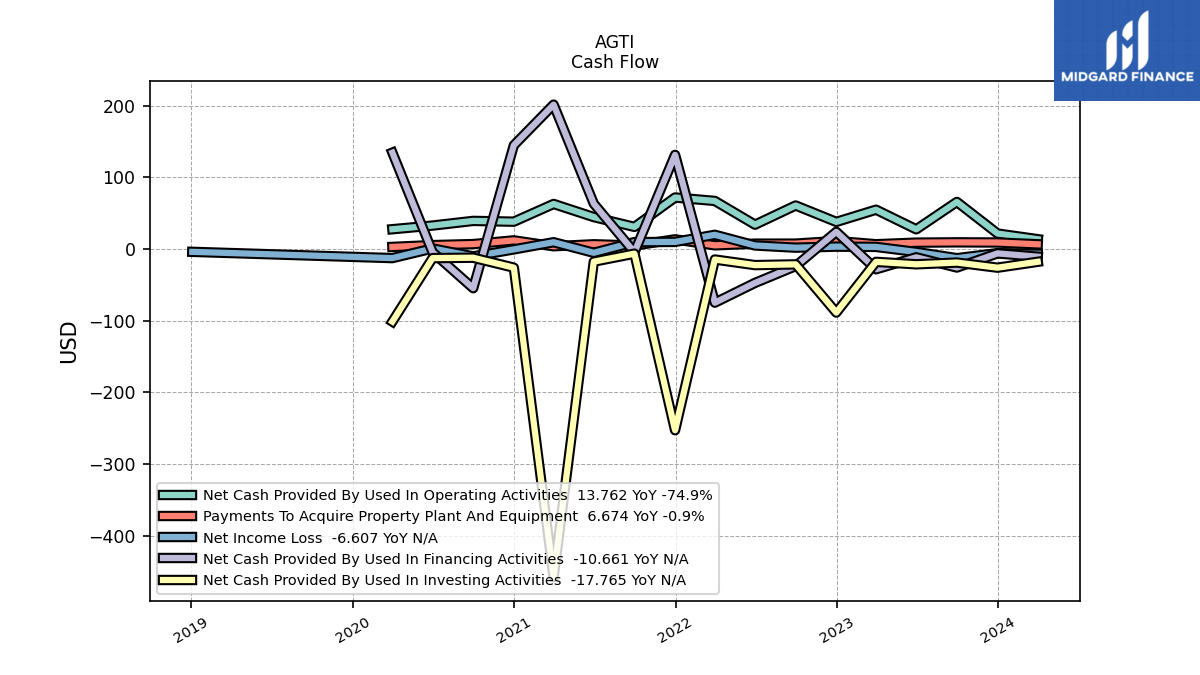
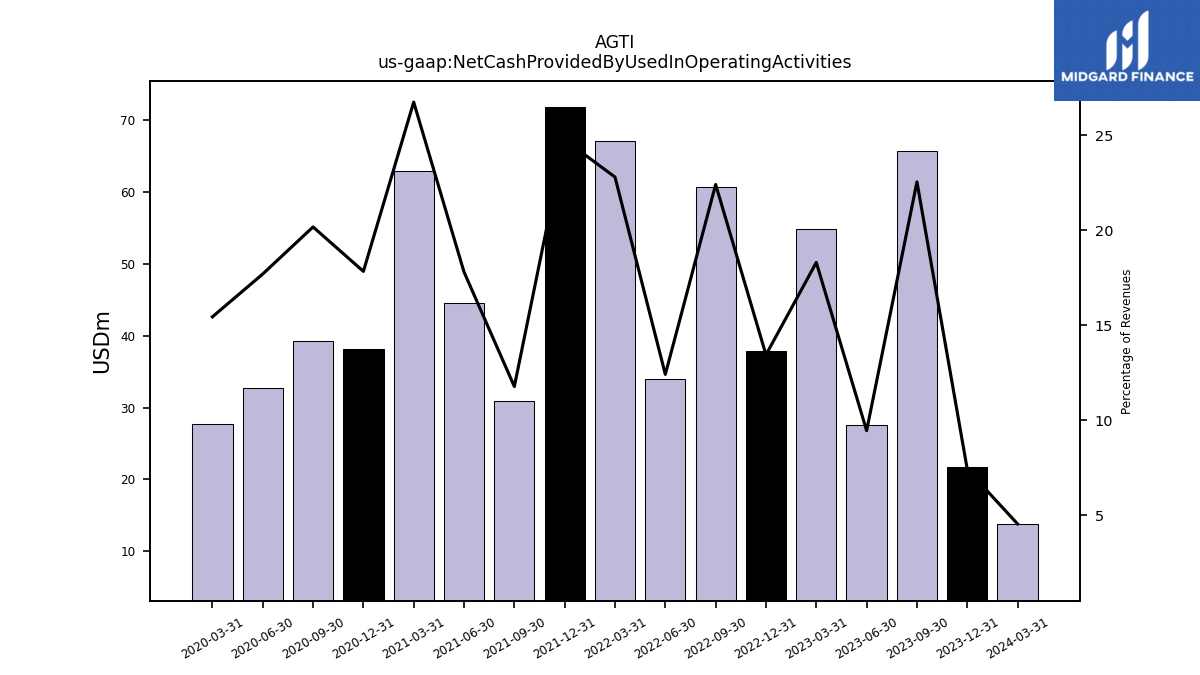
| Net Cash Provided By Used In Operating Activities | 21.66 | 65.74 | 27.52 | 54.90 | 37.88 | 60.76 | 34.01 | 67.12 | 71.90 | 30.91 | 44.60 | 62.91 | 38.20 | 39.28 | 32.77 | 27.68 | |
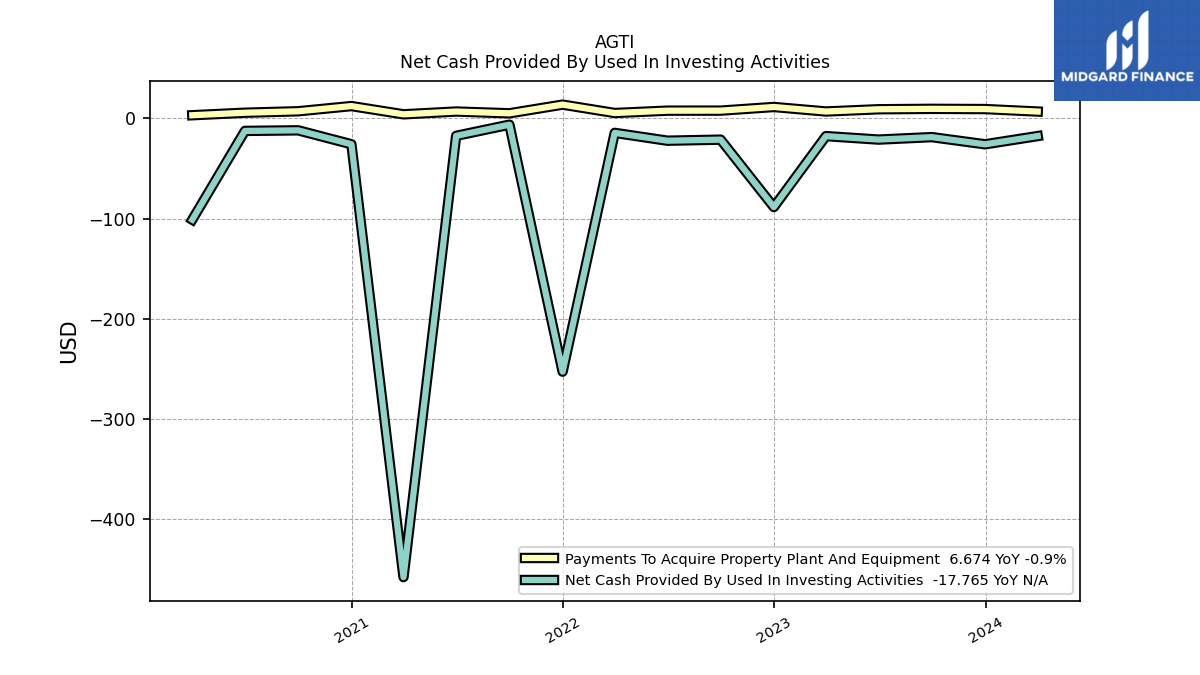
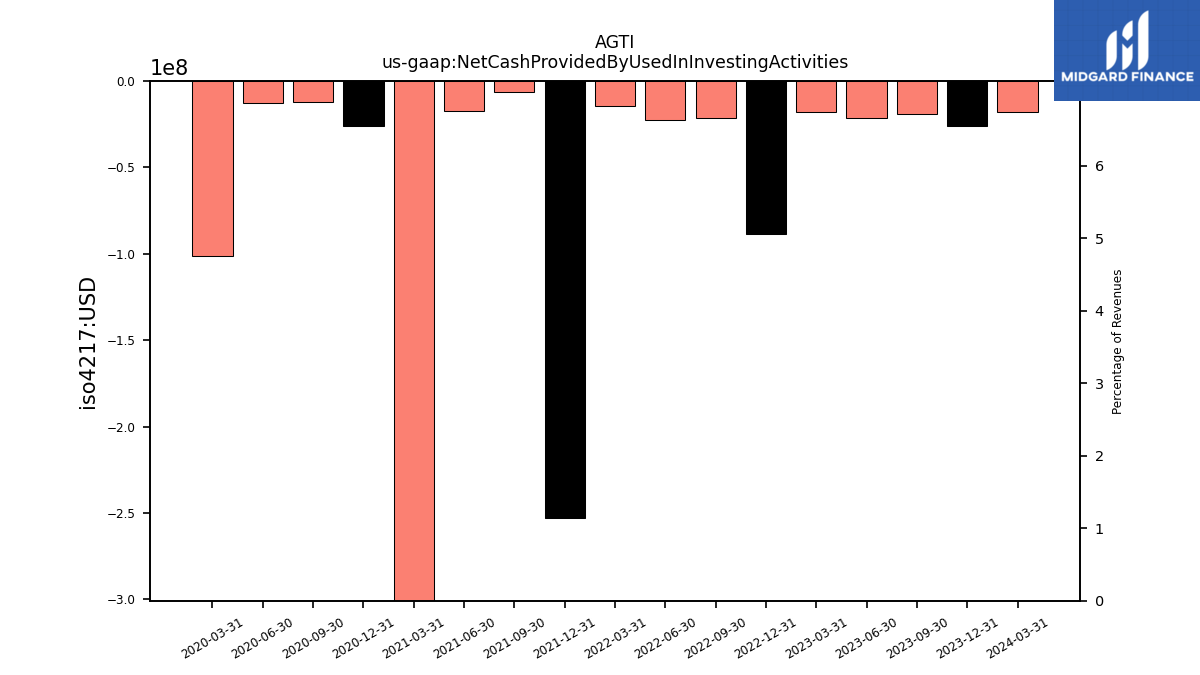
| Net Cash Provided By Used In Investing Activities | -25.97 | -18.82 | -21.27 | -17.83 | -88.56 | -21.34 | -22.39 | -14.58 | -252.67 | -6.40 | -17.54 | -457.52 | -25.91 | -12.06 | -12.62 | -101.14 | |
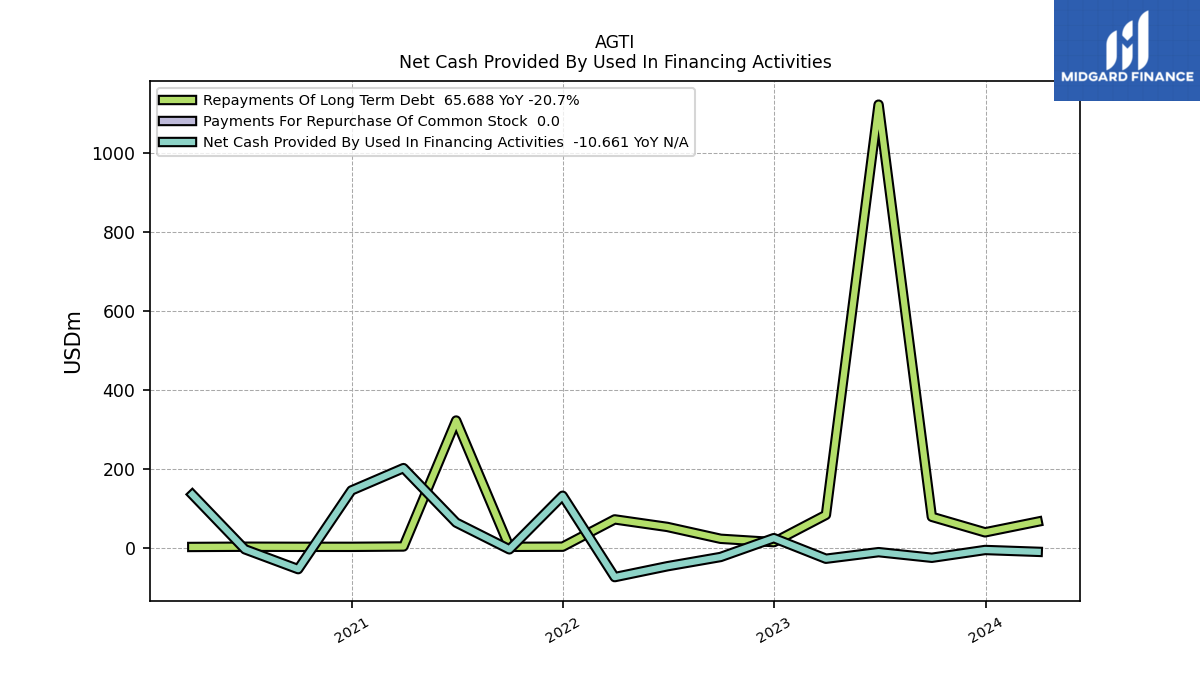
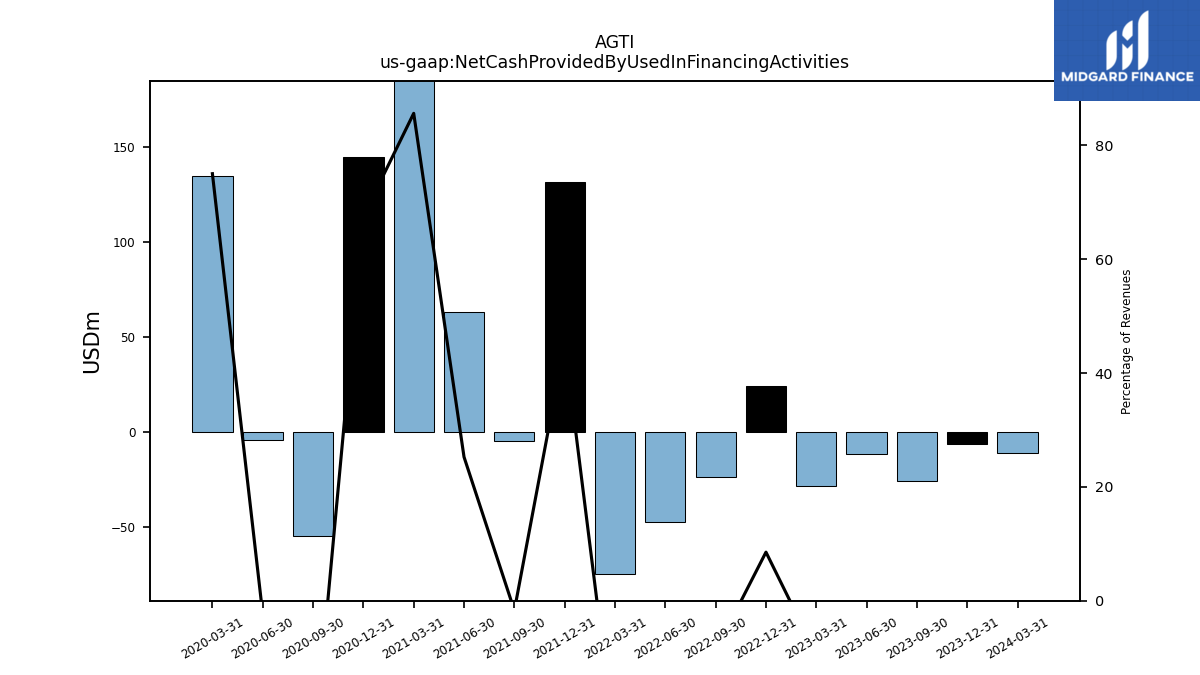
| Net Cash Provided By Used In Financing Activities | -6.04 | -25.75 | -11.49 | -28.19 | 24.05 | -23.74 | -47.21 | -74.77 | 131.38 | -4.47 | 63.28 | 201.44 | 144.75 | -54.59 | -4.33 | 134.48 |
| 2023-12-31 | 2023-09-30 | 2023-06-30 | 2023-03-31 | 2022-12-31 | 2022-09-30 | 2022-06-30 | 2022-03-31 | 2021-12-31 | 2021-09-30 | 2021-06-30 | 2021-03-31 | 2020-12-31 | 2020-09-30 | 2020-06-30 | 2020-03-31 | ||
|---|---|---|---|---|---|---|---|---|---|---|---|---|---|---|---|---|---|
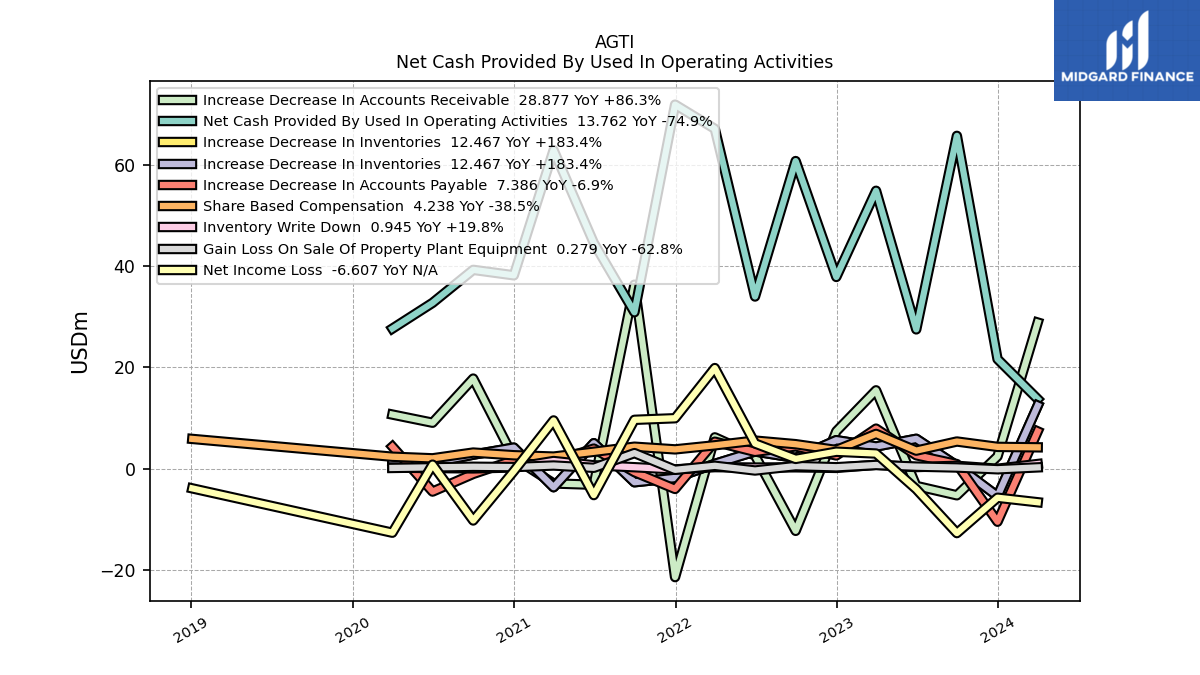
| Net Cash Provided By Used In Operating Activities | 21.66 | 65.74 | 27.52 | 54.90 | 37.88 | 60.76 | 34.01 | 67.12 | 71.90 | 30.91 | 44.60 | 62.91 | 38.20 | 39.28 | 32.77 | 27.68 | |
| Net Income Loss | -5.71 | -12.70 | -4.03 | 3.01 | 3.37 | 1.95 | 5.00 | 19.89 | 9.98 | 9.67 | -5.20 | 9.55 | -0.47 | -10.21 | 0.82 | -12.62 | |
| Profit Loss | -5.62 | -12.62 | -3.93 | 3.05 | 3.47 | 1.99 | 5.06 | 19.92 | 10.03 | 9.73 | -5.17 | 9.58 | -0.43 | -10.11 | 0.85 | -12.55 | |
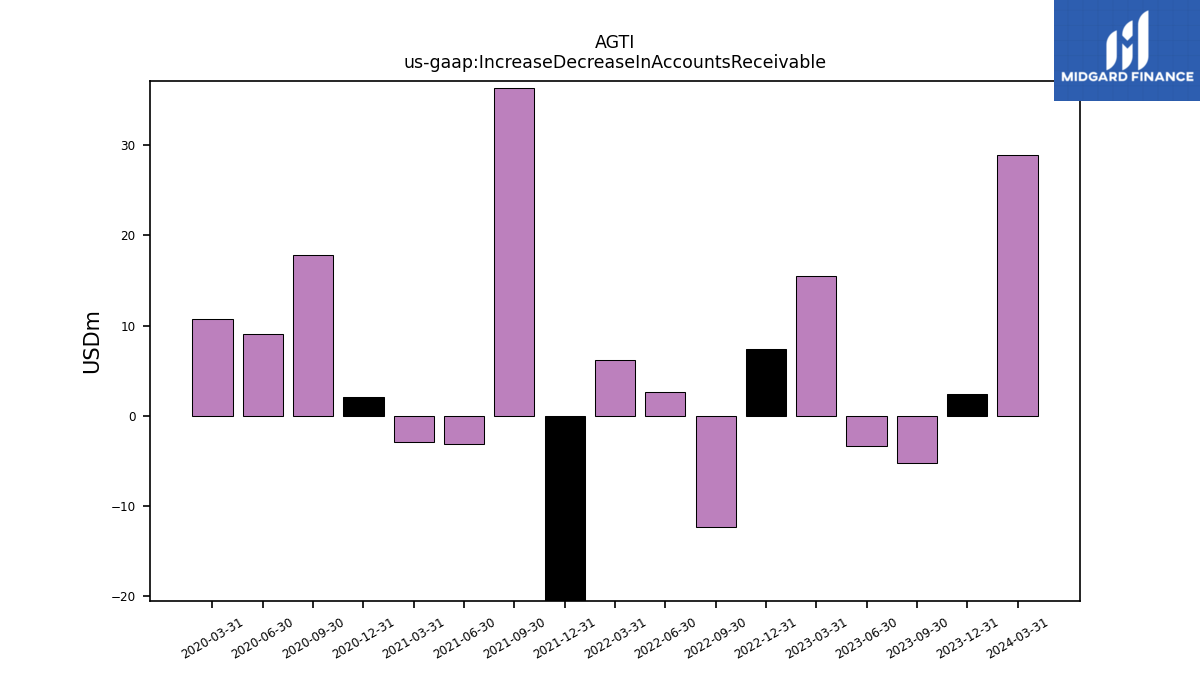
| Increase Decrease In Accounts Receivable | 2.45 | -5.23 | -3.38 | 15.50 | 7.40 | -12.25 | 2.62 | 6.21 | -21.39 | 36.35 | -3.15 | -2.90 | 2.15 | 17.81 | 9.10 | 10.71 | |
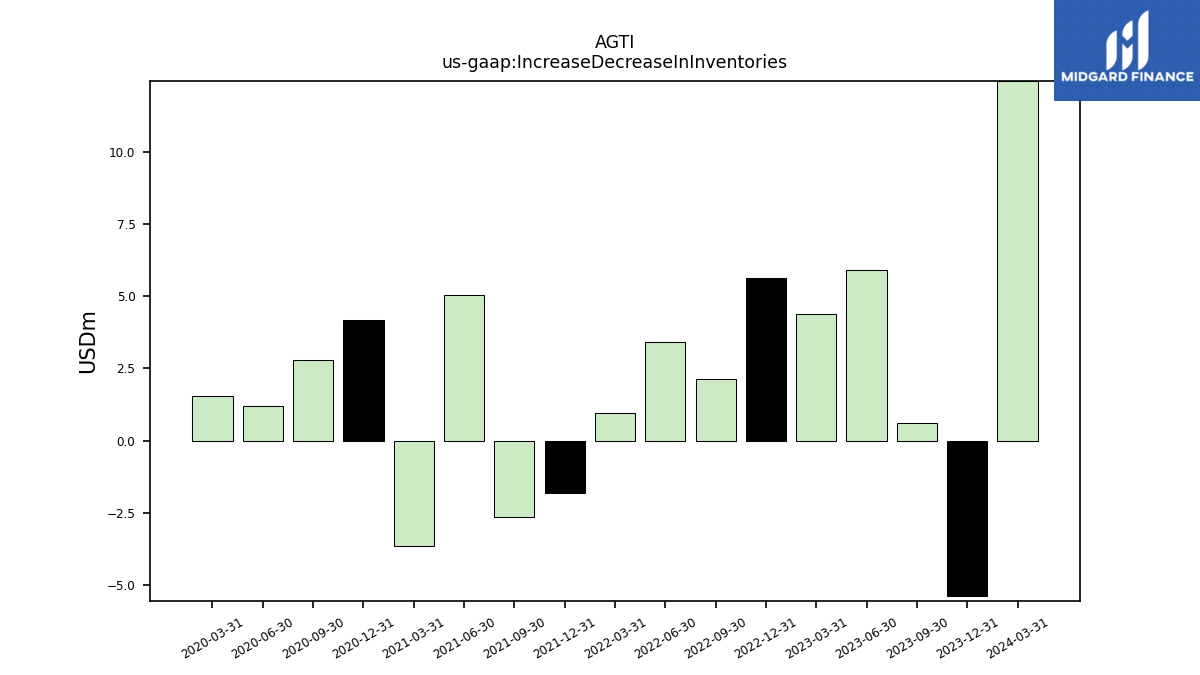
| Increase Decrease In Inventories | -5.39 | 0.62 | 5.92 | 4.40 | 5.65 | 2.14 | 3.43 | 0.97 | -1.81 | -2.65 | 5.05 | -3.64 | 4.18 | 2.79 | 1.21 | 1.54 | |
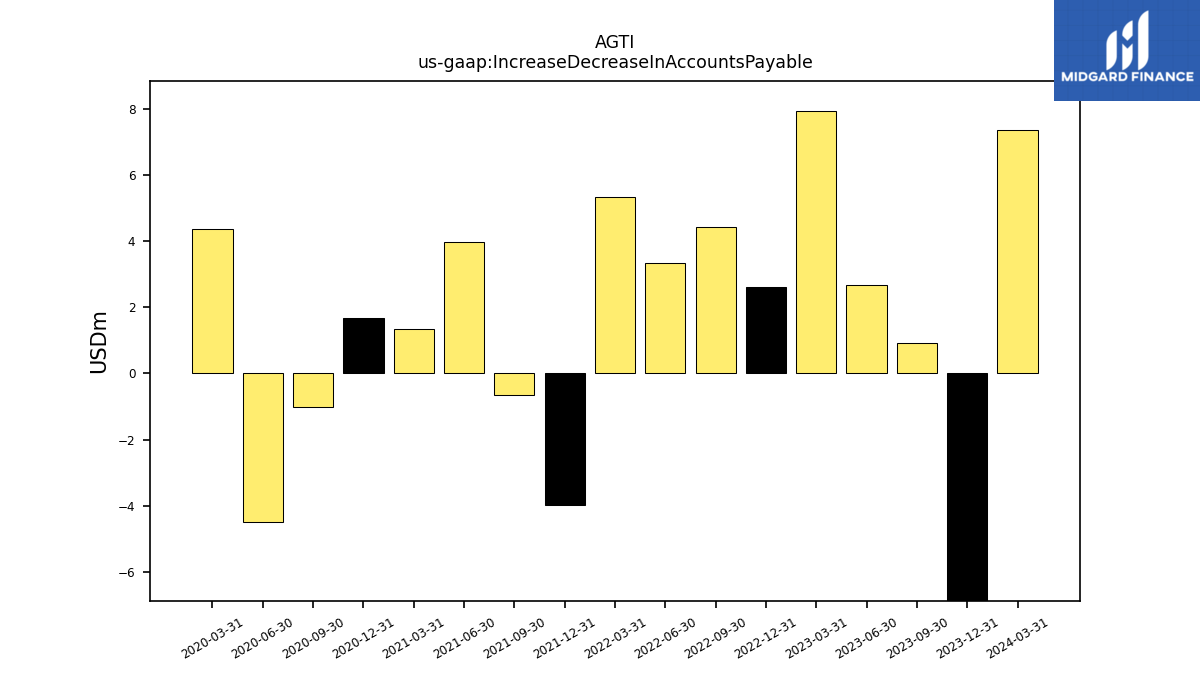
| Increase Decrease In Accounts Payable | -10.46 | 0.93 | 2.67 | 7.93 | 2.63 | 4.42 | 3.35 | 5.35 | -3.98 | -0.65 | 3.99 | 1.36 | 1.69 | -1.01 | -4.50 | 4.38 | |
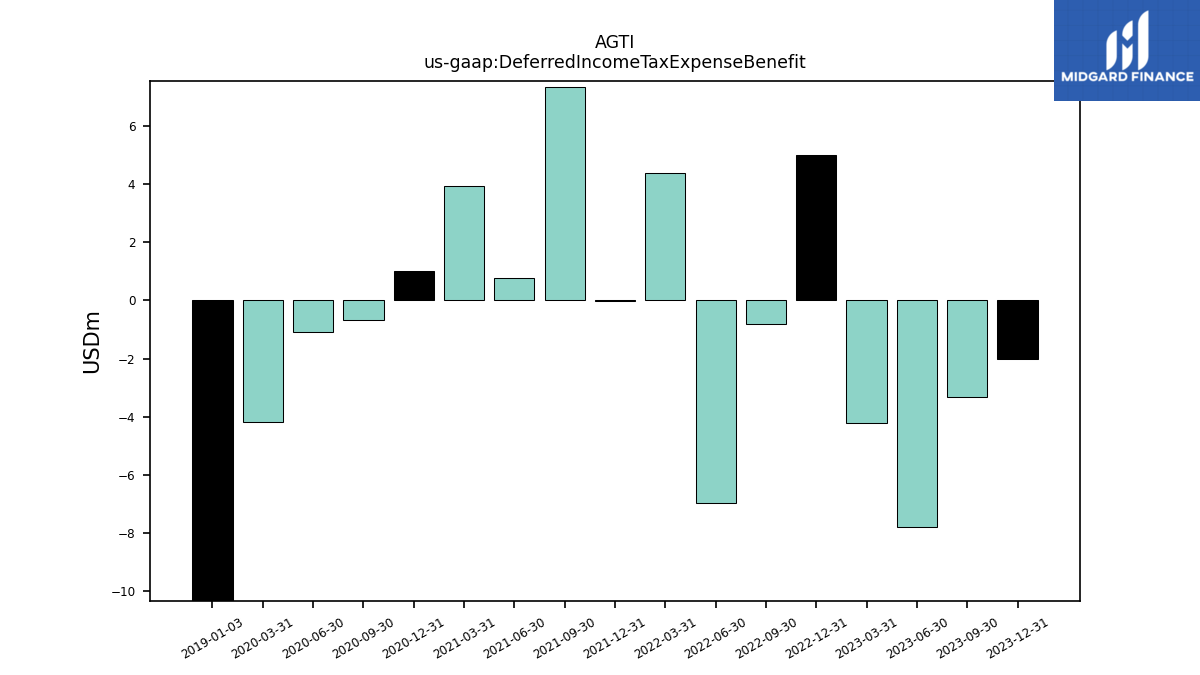
| Deferred Income Tax Expense Benefit | -2.01 | -3.31 | -7.77 | -4.23 | 4.99 | -0.80 | -6.96 | 4.40 | -0.04 | 7.35 | 0.76 | 3.93 | 1.02 | -0.67 | -1.10 | -4.20 | |
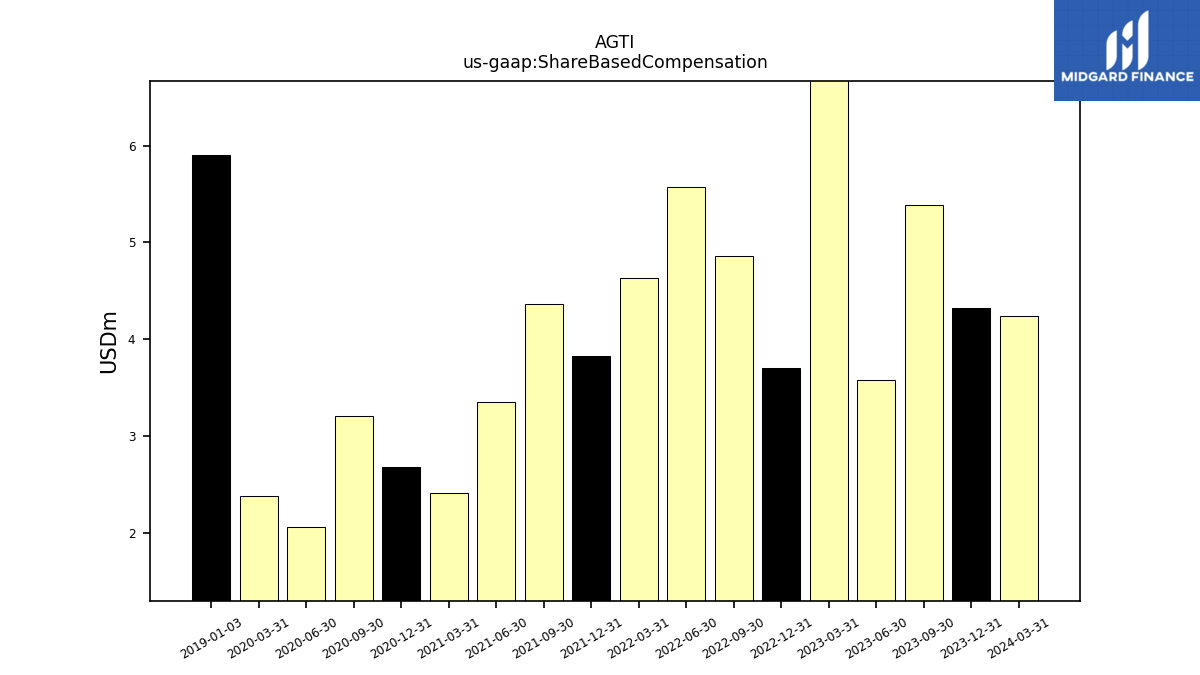
| Share Based Compensation | 4.33 | 5.39 | 3.58 | 6.89 | 3.71 | 4.86 | 5.57 | 4.64 | 3.83 | 4.36 | 3.35 | 2.41 | 2.68 | 3.21 | 2.07 | 2.38 |
| 2023-12-31 | 2023-09-30 | 2023-06-30 | 2023-03-31 | 2022-12-31 | 2022-09-30 | 2022-06-30 | 2022-03-31 | 2021-12-31 | 2021-09-30 | 2021-06-30 | 2021-03-31 | 2020-12-31 | 2020-09-30 | 2020-06-30 | 2020-03-31 | ||
|---|---|---|---|---|---|---|---|---|---|---|---|---|---|---|---|---|---|
| Net Cash Provided By Used In Investing Activities | -25.97 | -18.82 | -21.27 | -17.83 | -88.56 | -21.34 | -22.39 | -14.58 | -252.67 | -6.40 | -17.54 | -457.52 | -25.91 | -12.06 | -12.62 | -101.14 | |
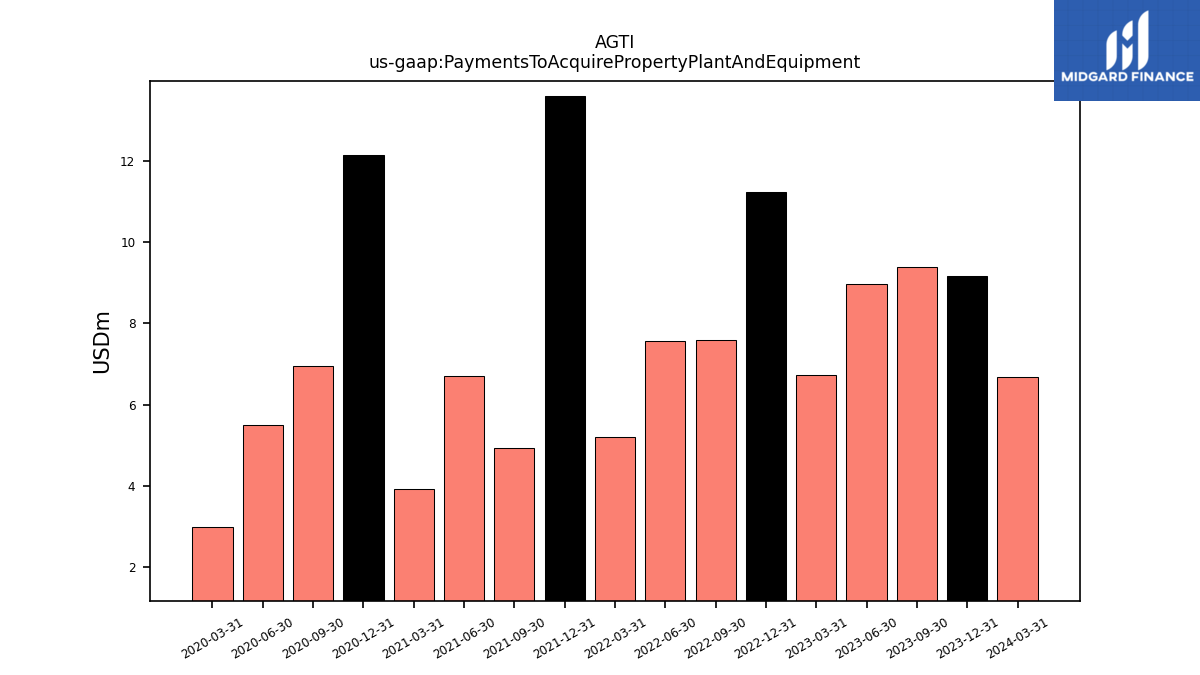
| Payments To Acquire Property Plant And Equipment | 9.15 | 9.38 | 8.97 | 6.73 | 11.23 | 7.60 | 7.56 | 5.21 | 13.58 | 4.93 | 6.70 | 3.92 | 12.13 | 6.95 | 5.51 | 3.00 |
| 2023-12-31 | 2023-09-30 | 2023-06-30 | 2023-03-31 | 2022-12-31 | 2022-09-30 | 2022-06-30 | 2022-03-31 | 2021-12-31 | 2021-09-30 | 2021-06-30 | 2021-03-31 | 2020-12-31 | 2020-09-30 | 2020-06-30 | 2020-03-31 | ||
|---|---|---|---|---|---|---|---|---|---|---|---|---|---|---|---|---|---|
| Net Cash Provided By Used In Financing Activities | -6.04 | -25.75 | -11.49 | -28.19 | 24.05 | -23.74 | -47.21 | -74.77 | 131.38 | -4.47 | 63.28 | 201.44 | 144.75 | -54.59 | -4.33 | 134.48 | |
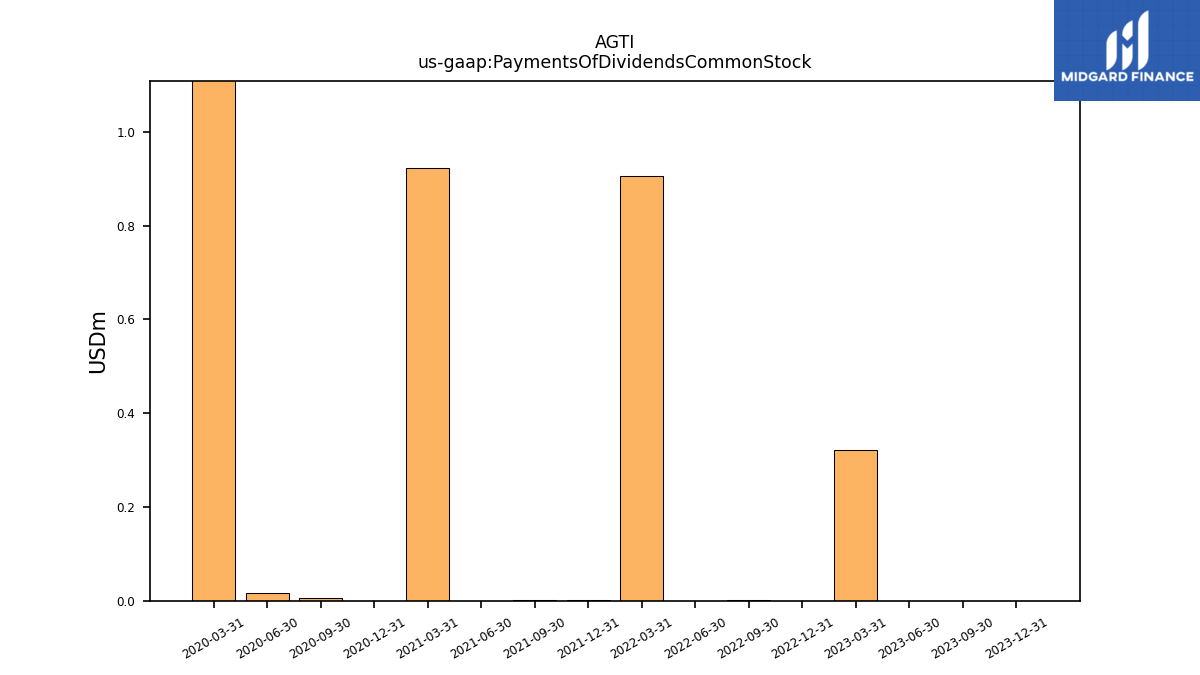
| Payments Of Dividends Common Stock | 0.00 | 0.00 | 0.00 | 0.32 | 0.00 | 0.00 | 0.00 | 0.91 | 0.00 | 0.00 | 0.00 | 0.92 | 0.00 | 0.01 | 0.02 | 1.11 | |
| Payments For Repurchase Of Common Stock | 0.00 | NA | NA | NA | NA | NA | NA | NA | NA | NA | NA | NA | NA | NA | NA | NA |
| 2023-12-31 | 2023-09-30 | 2023-06-30 | 2023-03-31 | 2022-12-31 | 2022-09-30 | 2022-06-30 | 2022-03-31 | 2021-12-31 | 2021-09-30 | 2021-06-30 | 2021-03-31 | 2020-12-31 | 2020-09-30 | 2020-06-30 | 2020-03-31 | ||
|---|---|---|---|---|---|---|---|---|---|---|---|---|---|---|---|---|---|
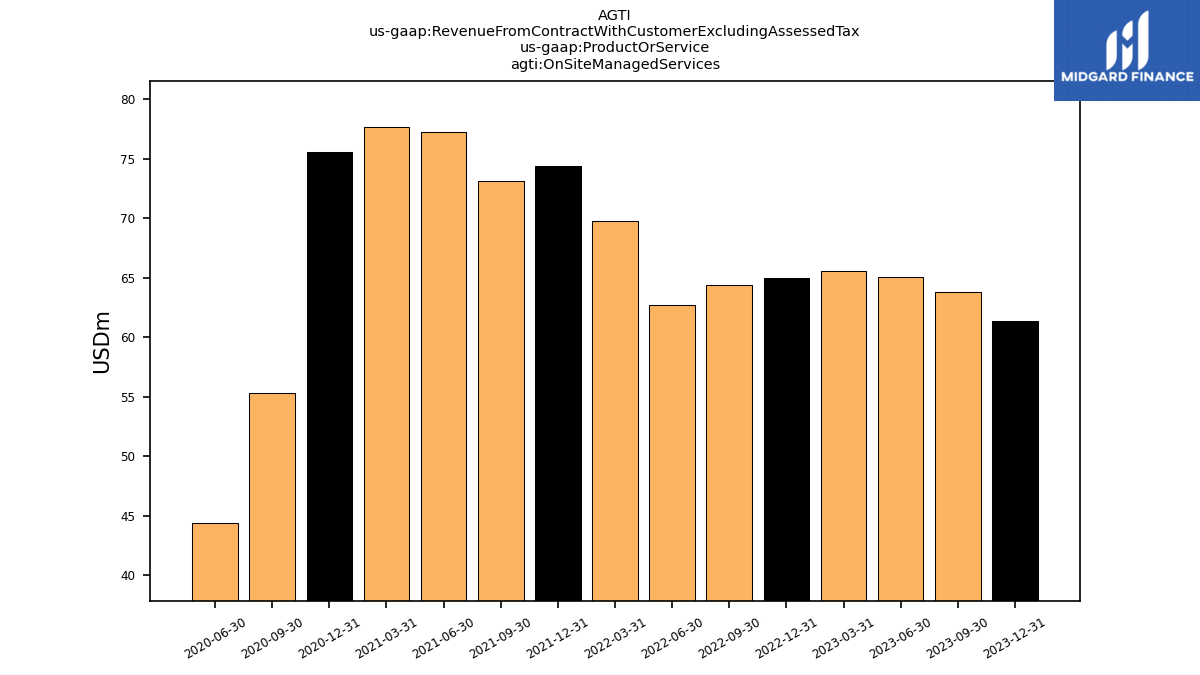
| Revenues | 291.99 | 291.63 | 291.08 | 299.90 | 281.68 | 271.19 | 273.98 | 294.44 | 290.48 | 262.42 | 250.54 | 235.25 | 214.19 | 194.72 | 185.16 | 179.24 | |
| Revenue From Contract With Customer Excluding Assessed Tax | 291.99 | 291.63 | 291.08 | 299.90 | 281.68 | 271.19 | 273.98 | 294.44 | 290.48 | 262.42 | 250.54 | 235.25 | 214.19 | 194.72 | 185.16 | 179.24 | |
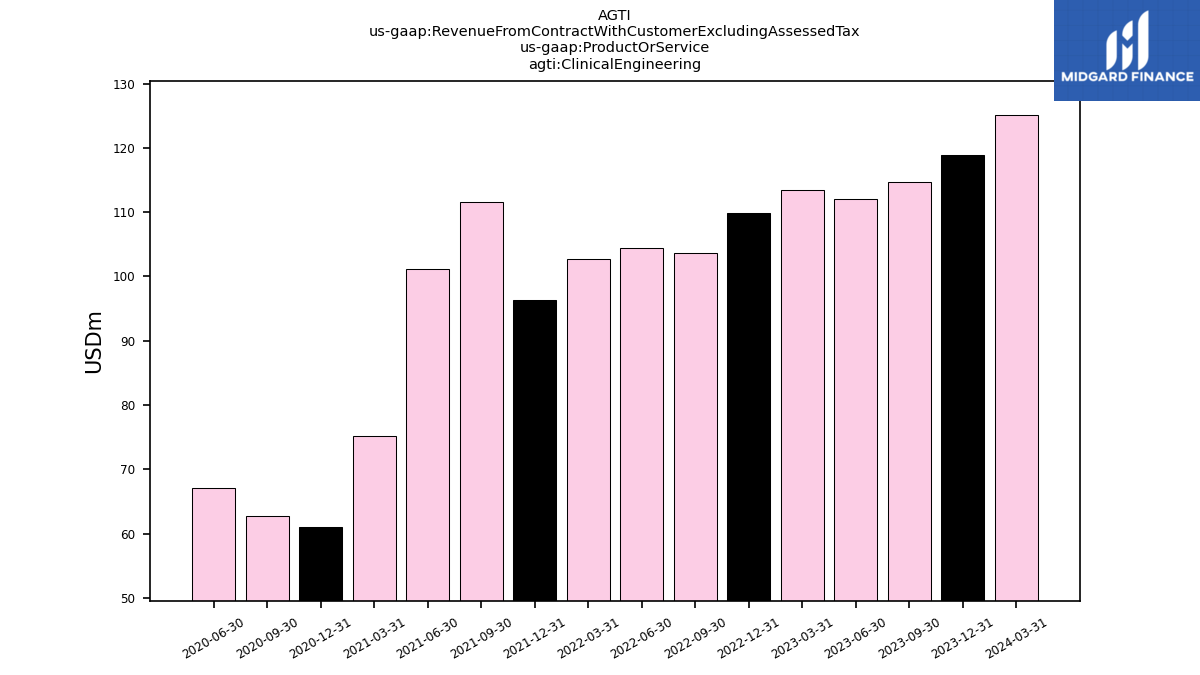
| Clinical Engineering | 118.87 | 114.64 | 112.03 | 113.47 | 109.83 | 103.64 | 104.41 | 102.80 | 96.29 | 111.61 | 101.14 | 75.11 | 61.09 | 62.74 | 67.03 | NA | |
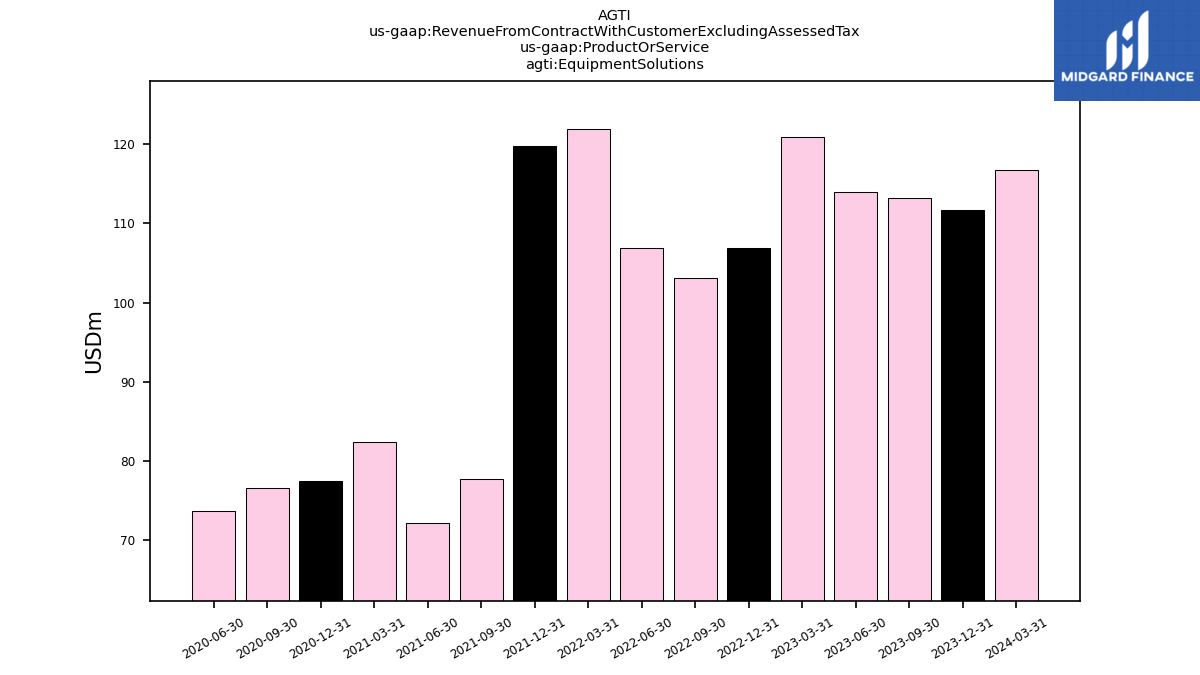
| Equipment Solutions | 111.72 | 113.20 | 114.01 | 120.87 | 106.87 | 103.10 | 106.85 | 121.86 | 119.78 | 77.71 | 72.14 | 82.47 | 77.52 | 76.63 | 73.71 | NA | |
| On Site Managed Services | 61.40 | 63.79 | 65.05 | 65.56 | 64.97 | 64.44 | 62.72 | 69.79 | 74.42 | 73.10 | 77.26 | 77.67 | 75.57 | 55.35 | 44.42 | NA |