
| 2023-12-31 | 2023-09-30 | 2023-06-30 | 2023-03-31 | 2022-12-31 | 2022-09-30 | 2022-06-30 | 2022-03-31 | 2021-12-31 | 2021-09-30 | 2021-06-30 | 2021-03-31 | 2020-12-31 | 2020-09-30 | 2020-06-30 | 2020-03-31 | 2019-12-31 | 2019-09-30 | 2019-06-30 | 2019-03-31 | ||
|---|---|---|---|---|---|---|---|---|---|---|---|---|---|---|---|---|---|---|---|---|---|
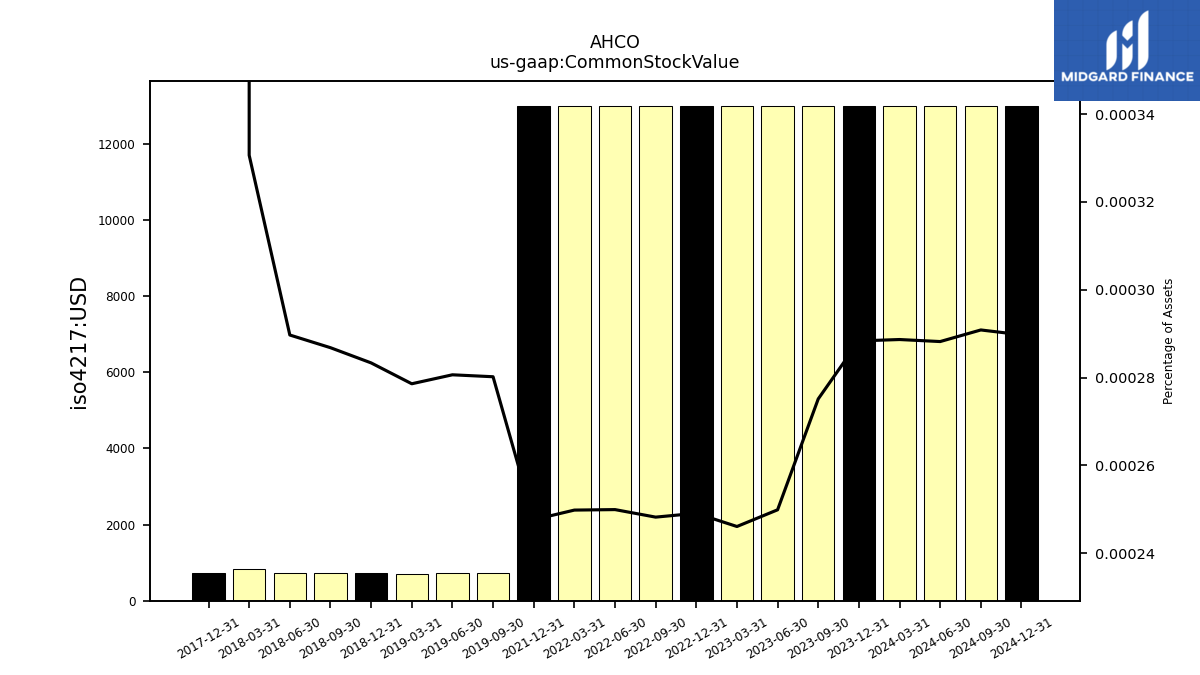
| Common Stock Value | 0.01 | 0.01 | 0.01 | 0.01 | 0.01 | 0.01 | 0.01 | 0.01 | 0.01 | NA | NA | NA | NA | NA | NA | NA | NA | 0.00 | 0.00 | 0.00 | |
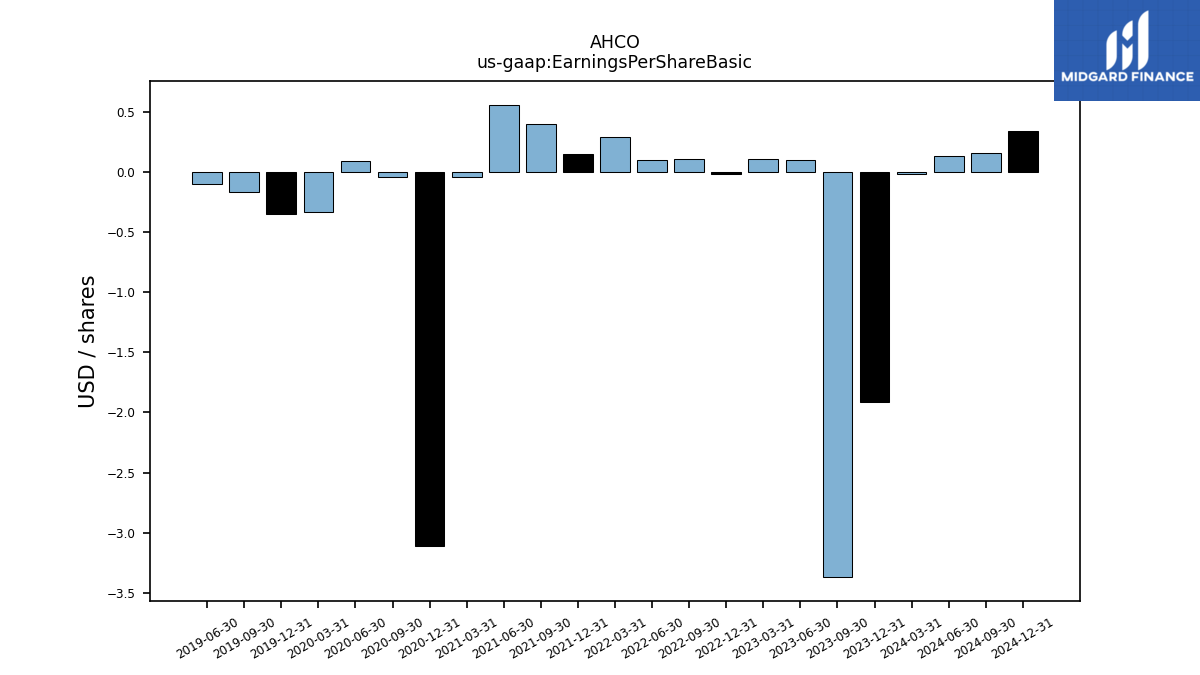
| Earnings Per Share Basic | -1.91 | -3.37 | 0.10 | 0.11 | -0.02 | 0.11 | 0.10 | 0.29 | 0.15 | 0.40 | 0.56 | -0.04 | -3.11 | -0.04 | 0.09 | -0.33 | -0.35 | -0.17 | -0.10 | NA | |
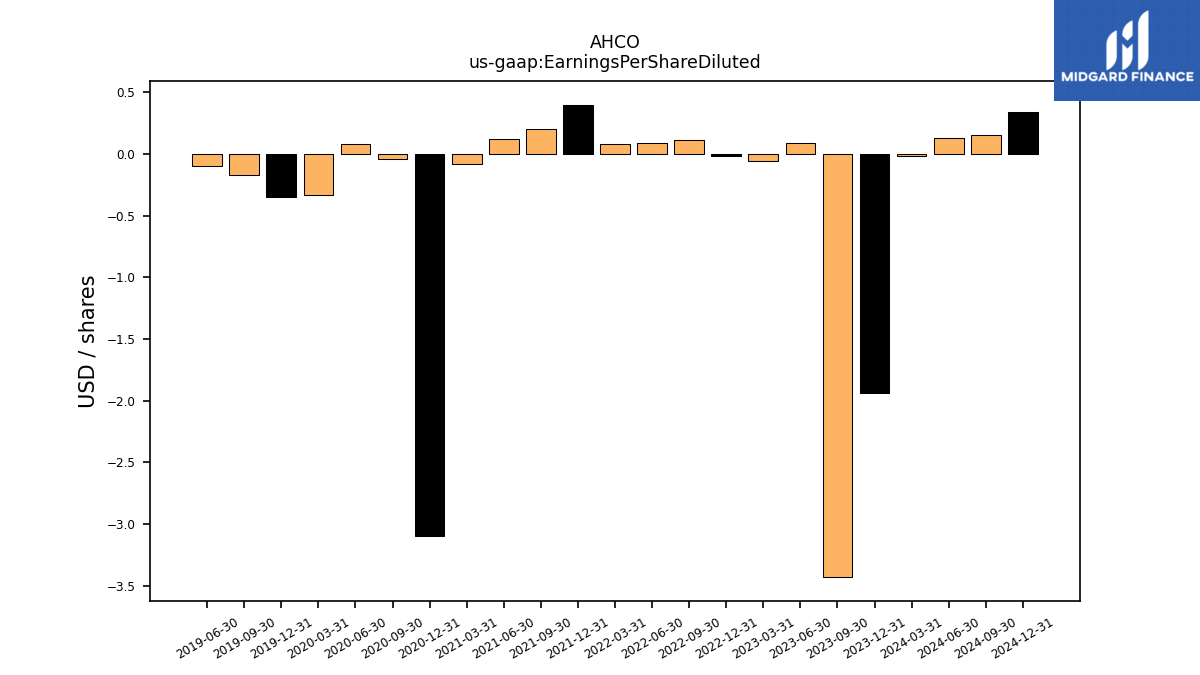
| Earnings Per Share Diluted | -1.94 | -3.43 | 0.09 | -0.06 | -0.02 | 0.11 | 0.09 | 0.08 | 0.40 | 0.20 | 0.12 | -0.08 | -3.10 | -0.04 | 0.08 | -0.33 | -0.35 | -0.17 | -0.10 | NA |
| 2023-12-31 | 2023-09-30 | 2023-06-30 | 2023-03-31 | 2022-12-31 | 2022-09-30 | 2022-06-30 | 2022-03-31 | 2021-12-31 | 2021-09-30 | 2021-06-30 | 2021-03-31 | 2020-12-31 | 2020-09-30 | 2020-06-30 | 2020-03-31 | 2019-12-31 | 2019-09-30 | 2019-06-30 | 2019-03-31 | ||
|---|---|---|---|---|---|---|---|---|---|---|---|---|---|---|---|---|---|---|---|---|---|
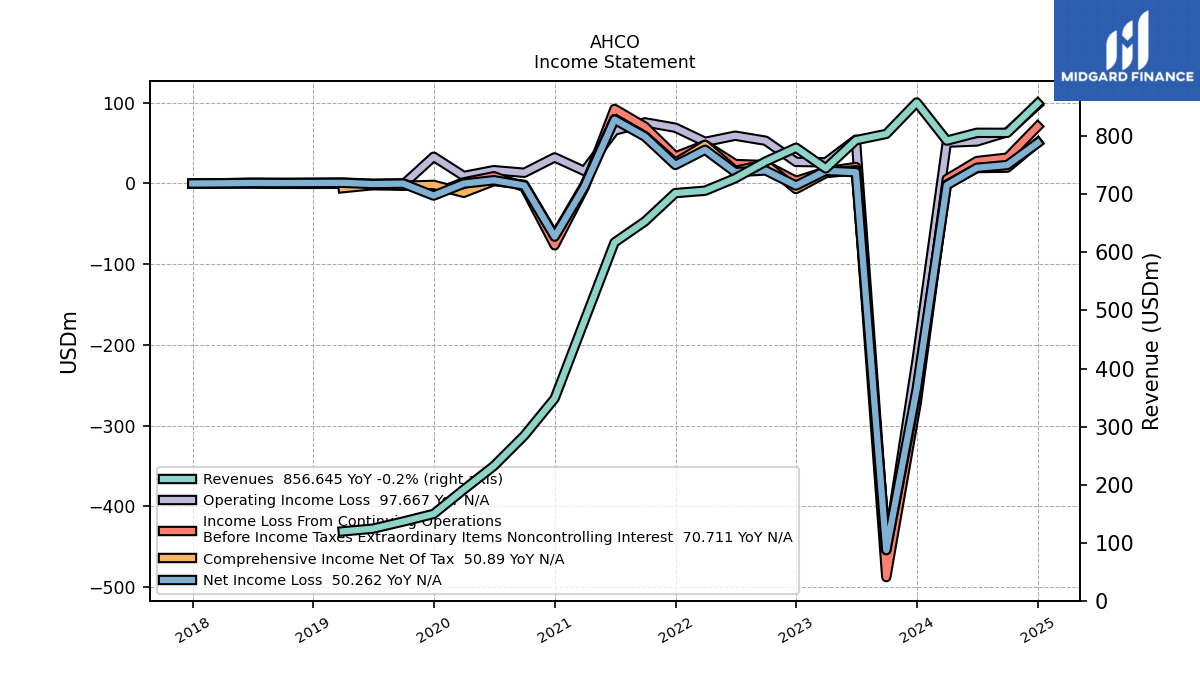
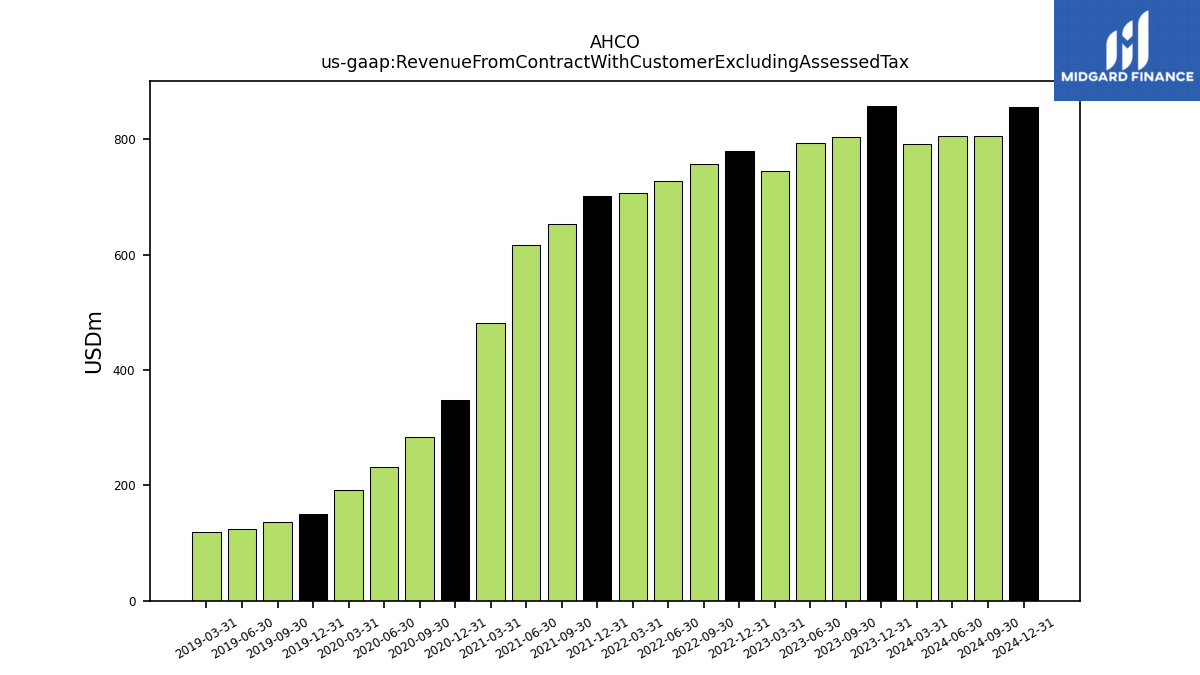
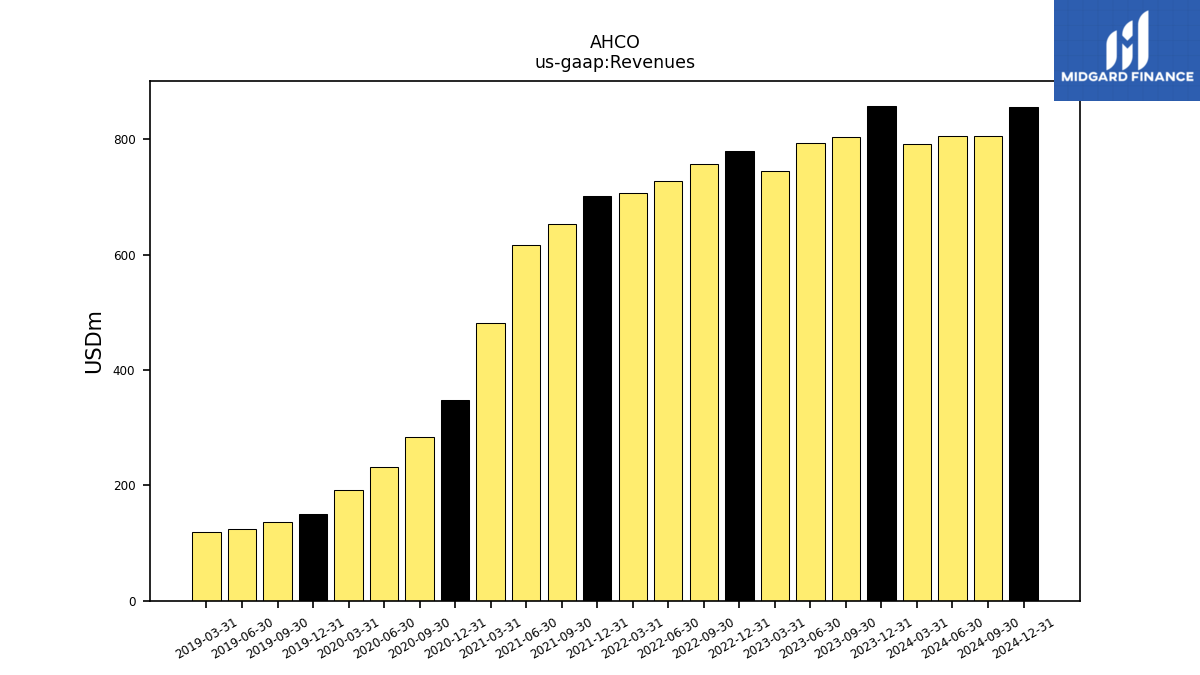
| Revenue From Contract With Customer Excluding Assessed Tax | 858.23 | 804.03 | 793.29 | 744.63 | 780.28 | 756.50 | 727.61 | 706.20 | 702.11 | 653.29 | 617.02 | 482.12 | 348.43 | 284.40 | 232.12 | 191.44 | 149.54 | 136.45 | 124.15 | 119.50 | |
| Revenues | 858.23 | 804.03 | 793.29 | 744.63 | 780.28 | 756.50 | 727.61 | 706.20 | 702.11 | 653.29 | 617.02 | 482.12 | 348.43 | 284.40 | 232.12 | 191.44 | 149.54 | 136.45 | 124.15 | 119.50 | |
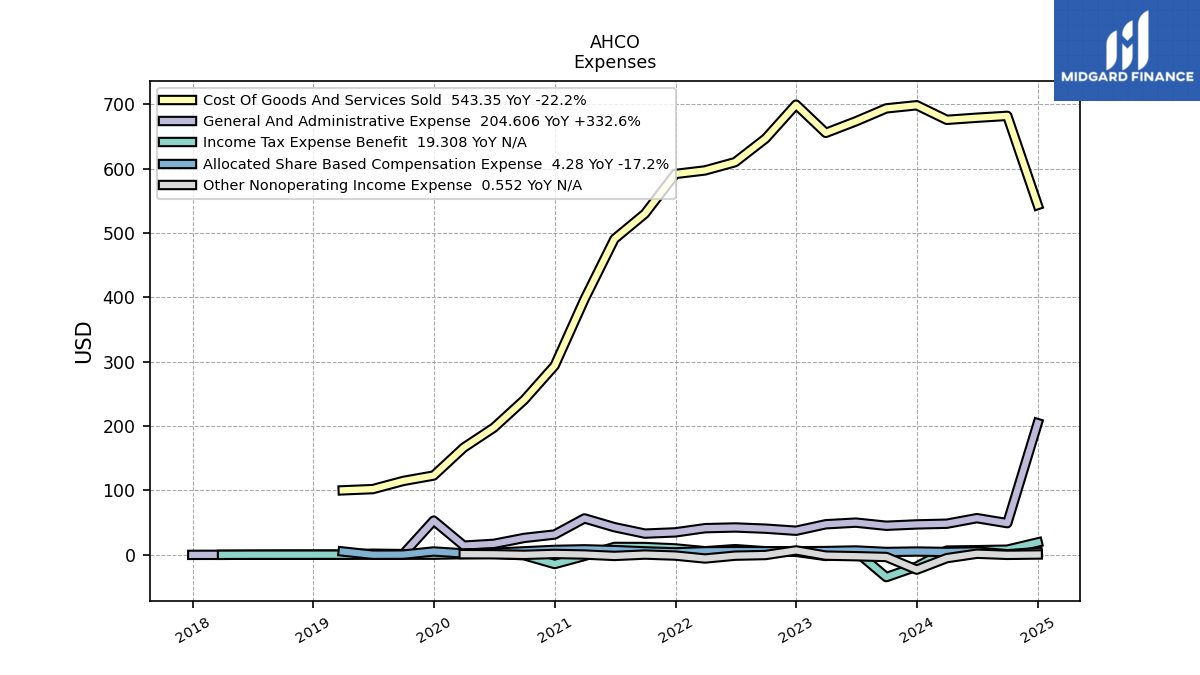
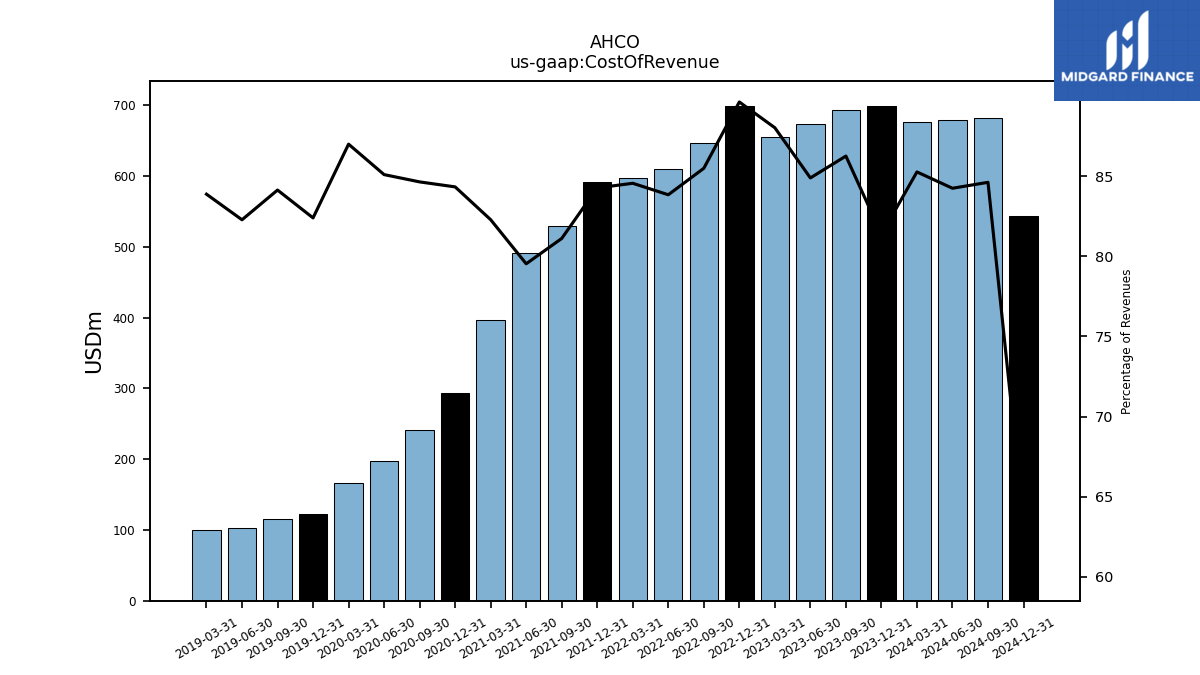
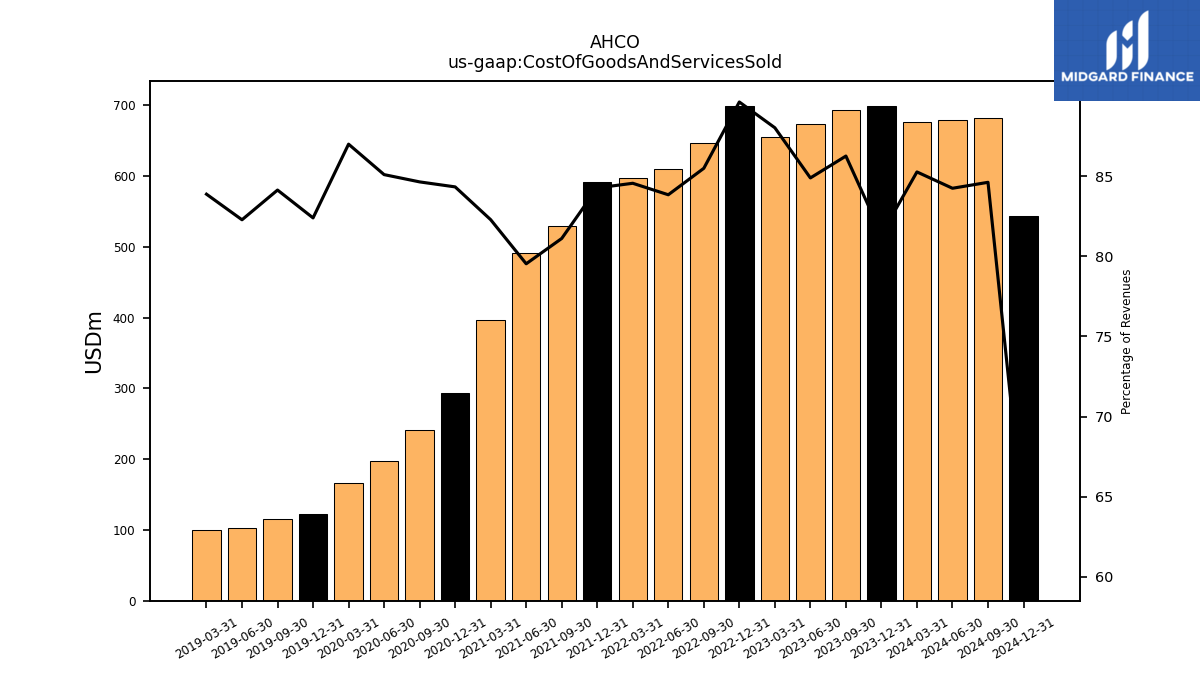
| Cost Of Revenue | 698.33 | 693.49 | 673.40 | 655.40 | 699.32 | 646.71 | 610.01 | 597.12 | 591.62 | 529.89 | 490.72 | 396.70 | 293.82 | 240.72 | 197.52 | 166.54 | 123.21 | 114.80 | 102.15 | 100.23 | |
| Cost Of Goods And Services Sold | 698.33 | 693.49 | 673.40 | 655.40 | 699.32 | 646.71 | 610.01 | 597.12 | 591.62 | 529.89 | 490.72 | 396.70 | 293.82 | 240.72 | 197.52 | 166.54 | 123.21 | 114.80 | 102.15 | 100.23 | |
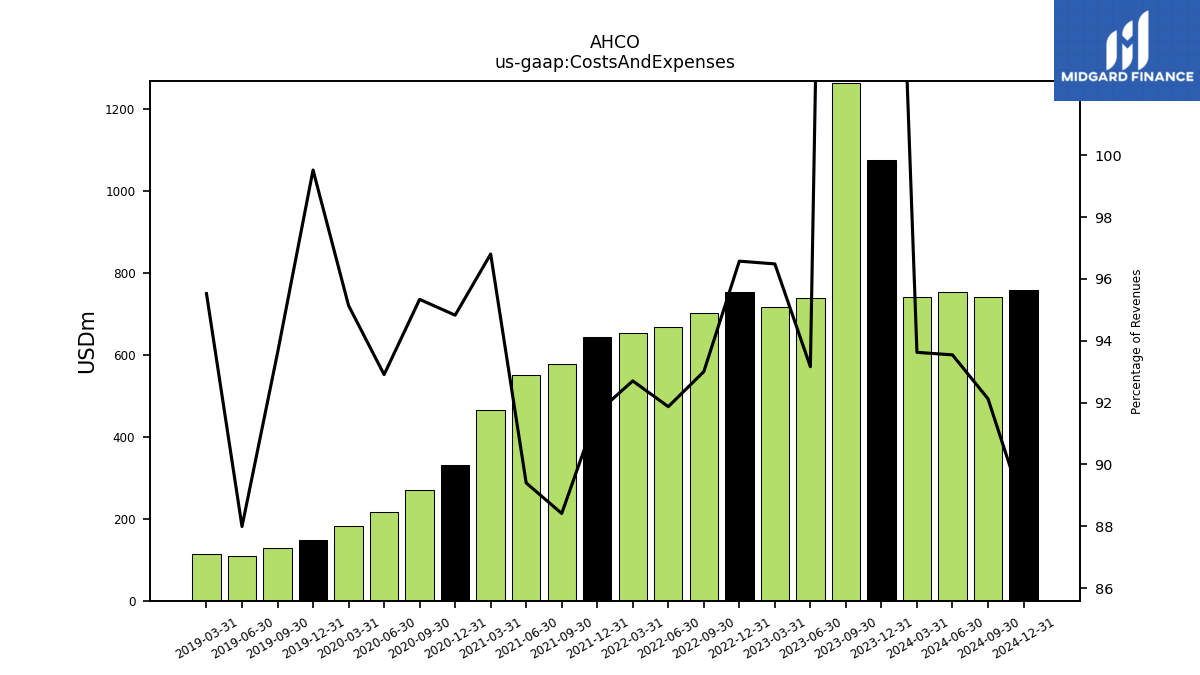
| Costs And Expenses | 1076.04 | 1265.07 | 739.02 | 718.45 | 753.55 | 703.55 | 668.44 | 654.65 | 643.62 | 577.58 | 551.61 | 466.71 | 330.40 | 271.15 | 215.65 | 182.13 | 148.83 | 127.73 | 109.24 | 114.15 | |
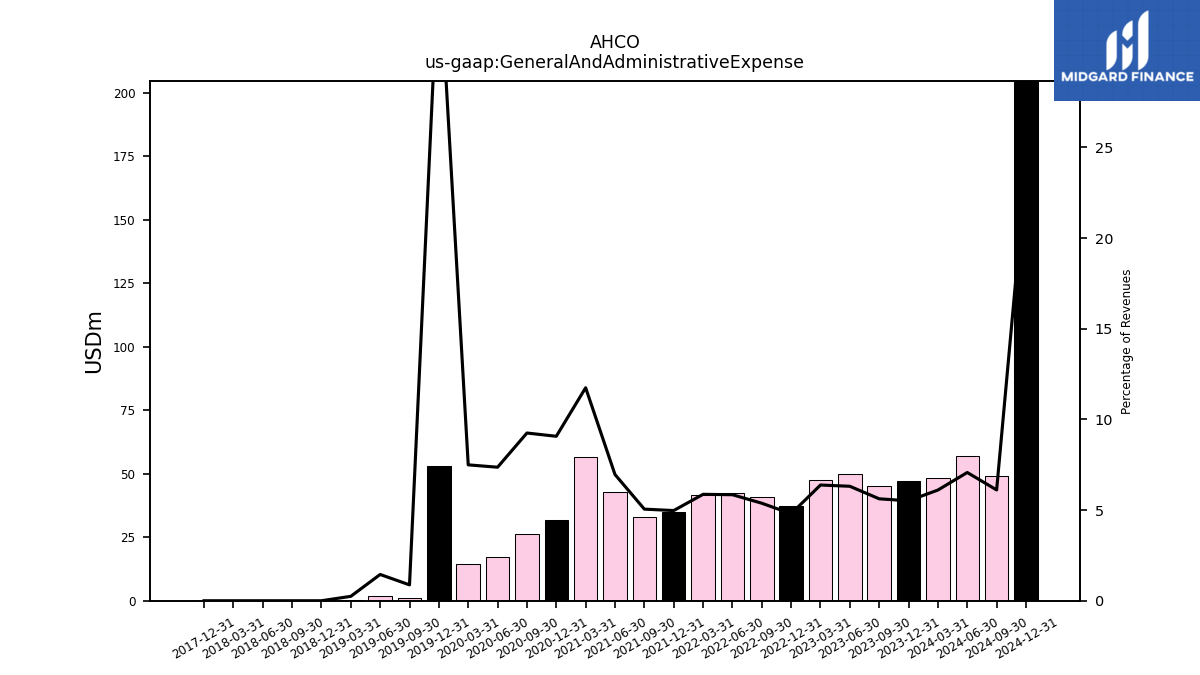
| General And Administrative Expense | 47.29 | 45.20 | 50.08 | 47.52 | 37.45 | 40.68 | 42.55 | 41.44 | 34.92 | 33.01 | 42.95 | 56.63 | 31.60 | 26.31 | 17.09 | 14.35 | 53.21 | 1.20 | 1.80 | 0.29 | |
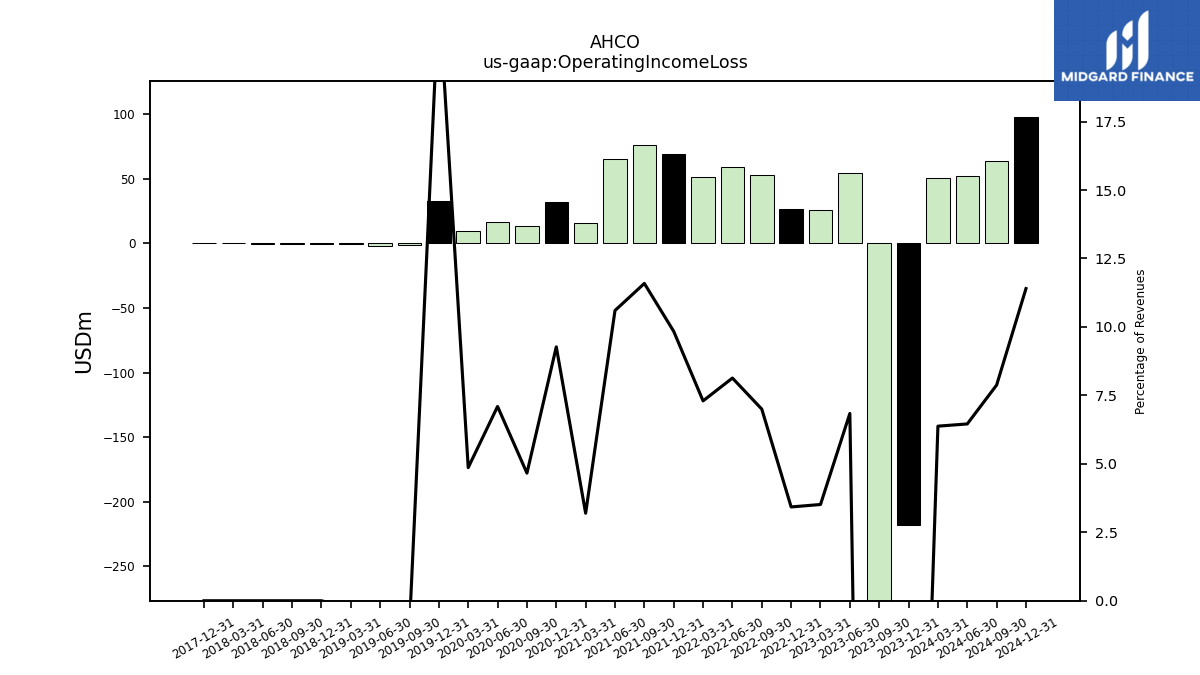
| Operating Income Loss | -217.80 | -461.04 | 54.26 | 26.18 | 26.73 | 52.95 | 59.18 | 51.55 | 69.08 | 75.71 | 65.41 | 15.41 | 32.31 | 13.26 | 16.47 | 9.31 | 33.13 | -1.25 | -1.85 | -0.34 | |
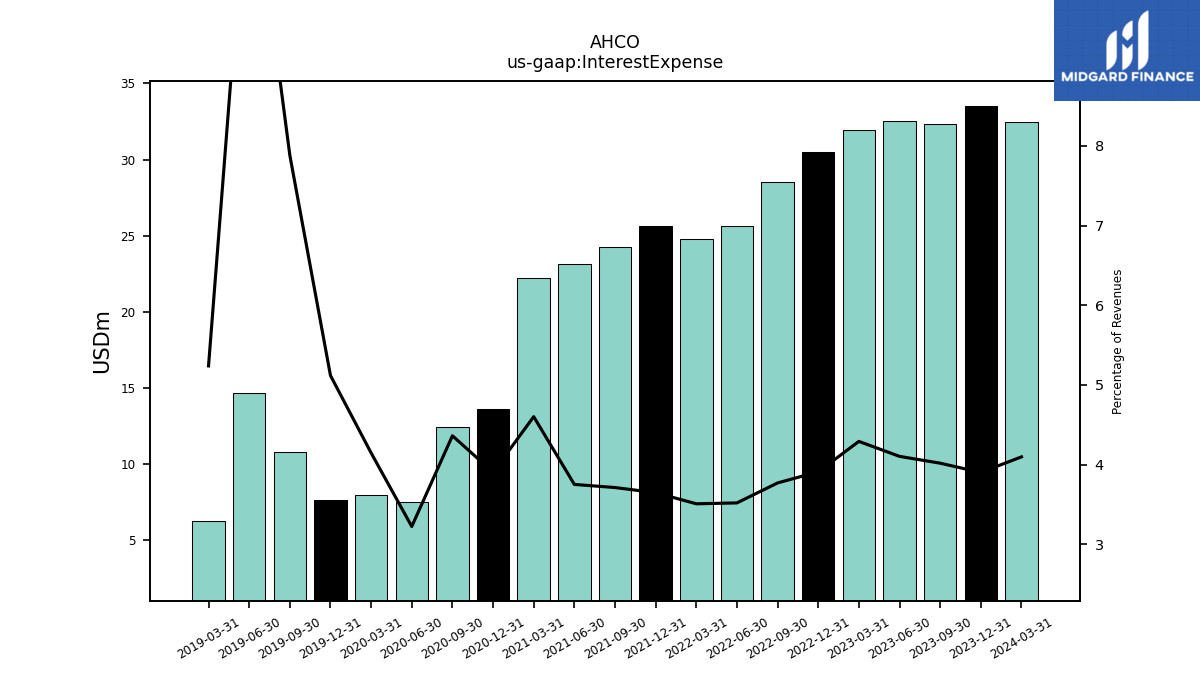
| Interest Expense | 33.49 | 32.31 | 32.55 | 31.95 | 30.51 | 28.52 | 25.61 | 24.78 | 25.61 | 24.25 | 23.15 | 22.18 | 13.60 | 12.41 | 7.48 | 7.94 | 7.65 | 10.76 | 14.63 | 6.26 | |
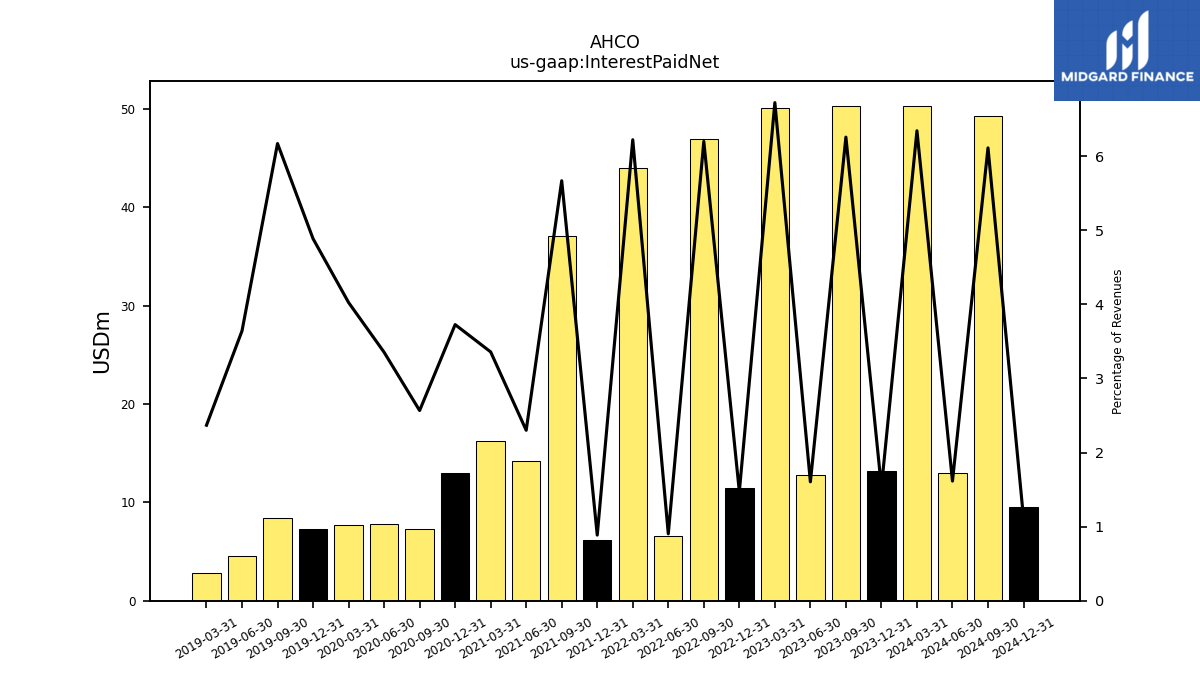
| Interest Paid Net | 13.14 | 50.30 | 12.73 | 50.05 | 11.50 | 46.89 | 6.57 | 43.93 | 6.22 | 37.03 | 14.19 | 16.19 | 12.98 | 7.30 | 7.78 | 7.70 | 7.31 | 8.42 | 4.52 | 2.83 | |
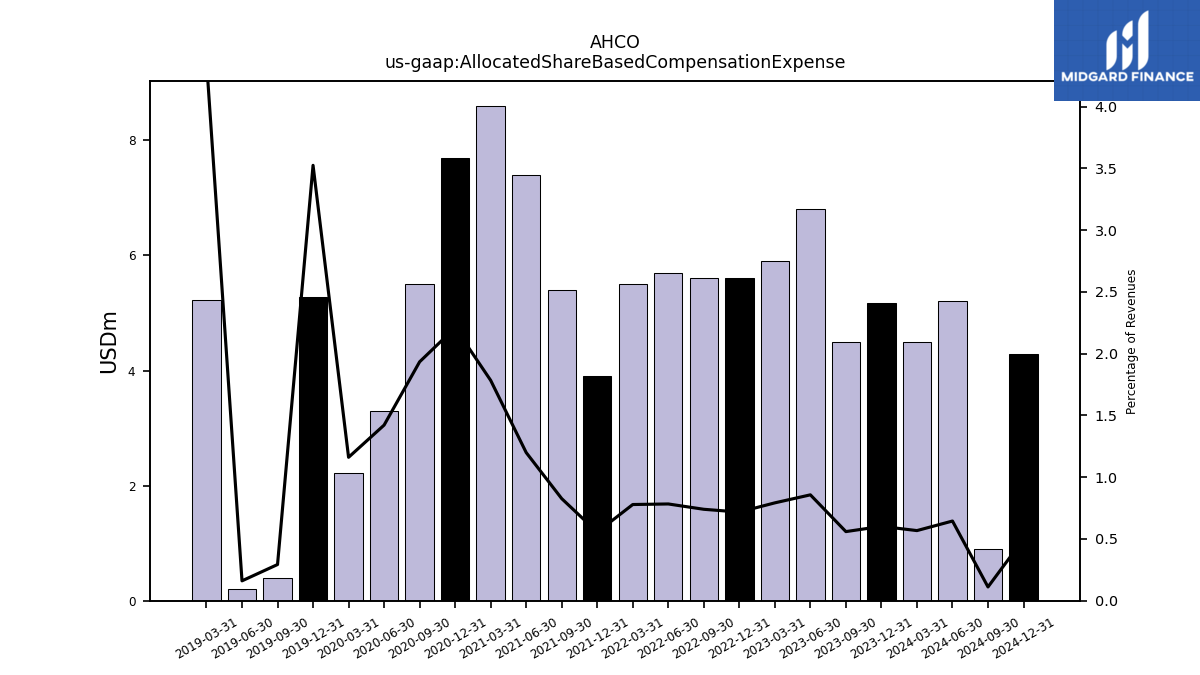
| Allocated Share Based Compensation Expense | 5.17 | 4.50 | 6.80 | 5.90 | 5.60 | 5.60 | 5.70 | 5.50 | 3.90 | 5.40 | 7.40 | 8.60 | 7.70 | 5.50 | 3.30 | 2.22 | 5.27 | 0.40 | 0.20 | 5.22 | |
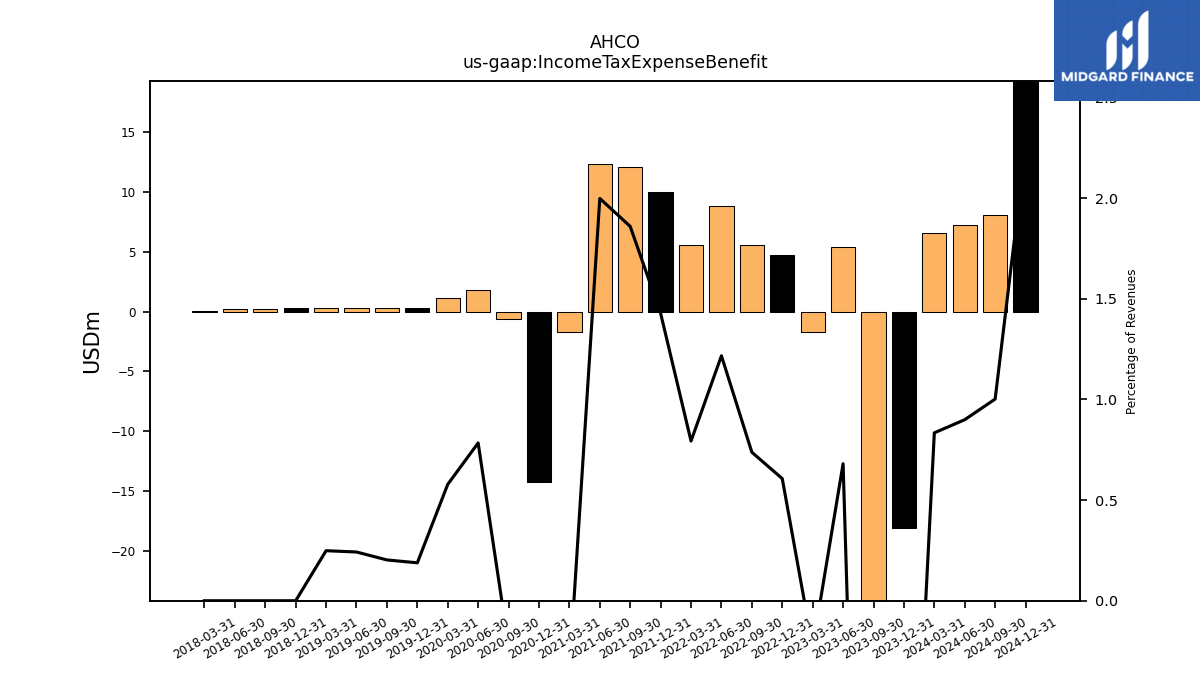
| Income Tax Expense Benefit | -18.11 | -34.58 | 5.40 | -1.71 | 4.73 | 5.58 | 8.85 | 5.60 | 10.02 | 12.15 | 12.33 | -1.70 | -14.24 | -0.64 | 1.82 | 1.11 | 0.28 | 0.28 | 0.30 | 0.30 | |
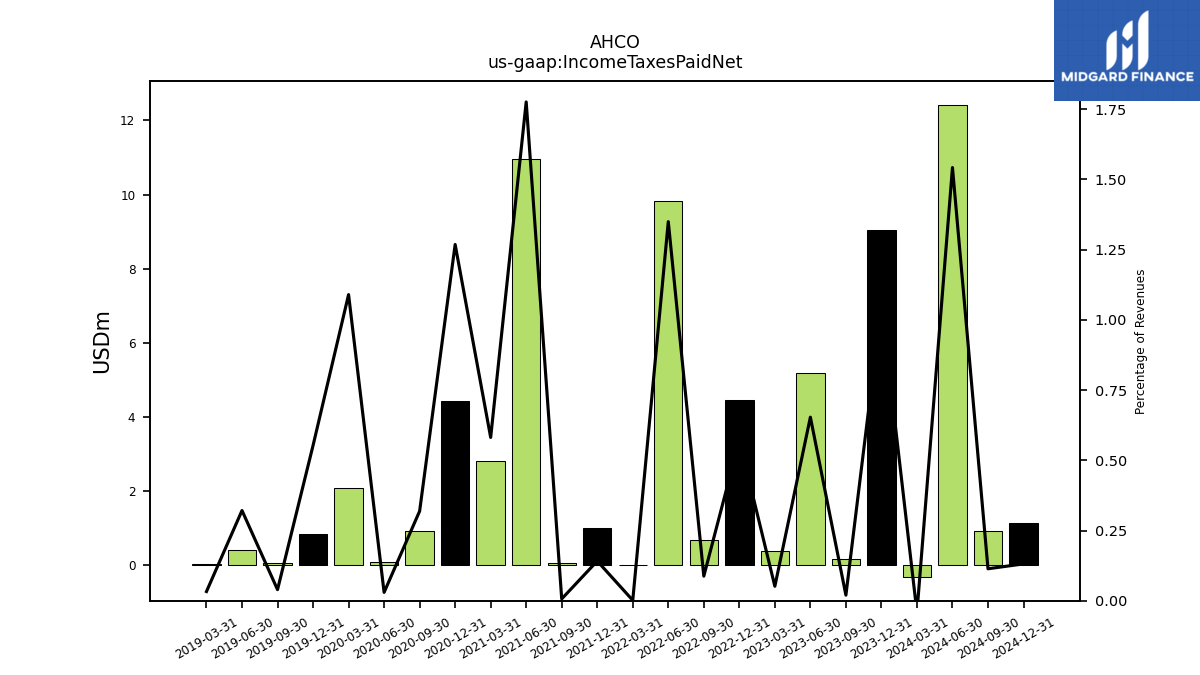
| Income Taxes Paid Net | 9.03 | 0.16 | 5.18 | 0.38 | 4.46 | 0.66 | 9.82 | 0.01 | 0.99 | 0.04 | 10.95 | 2.80 | 4.42 | 0.91 | 0.07 | 2.09 | 0.83 | 0.05 | 0.40 | 0.04 | |
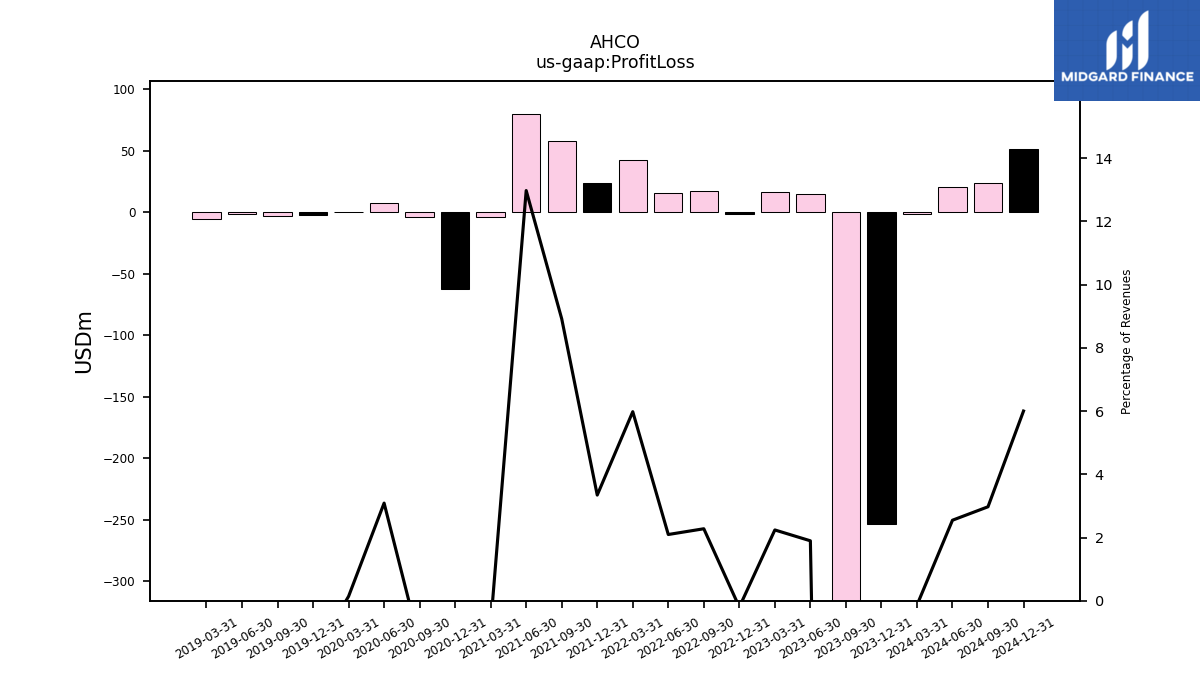
| Profit Loss | -253.57 | -452.92 | 15.04 | 16.68 | -1.57 | 17.23 | 15.25 | 42.23 | 23.47 | 58.27 | 80.06 | -3.64 | -62.33 | -3.83 | 7.17 | 0.27 | -2.65 | -3.06 | -1.72 | -5.45 | |
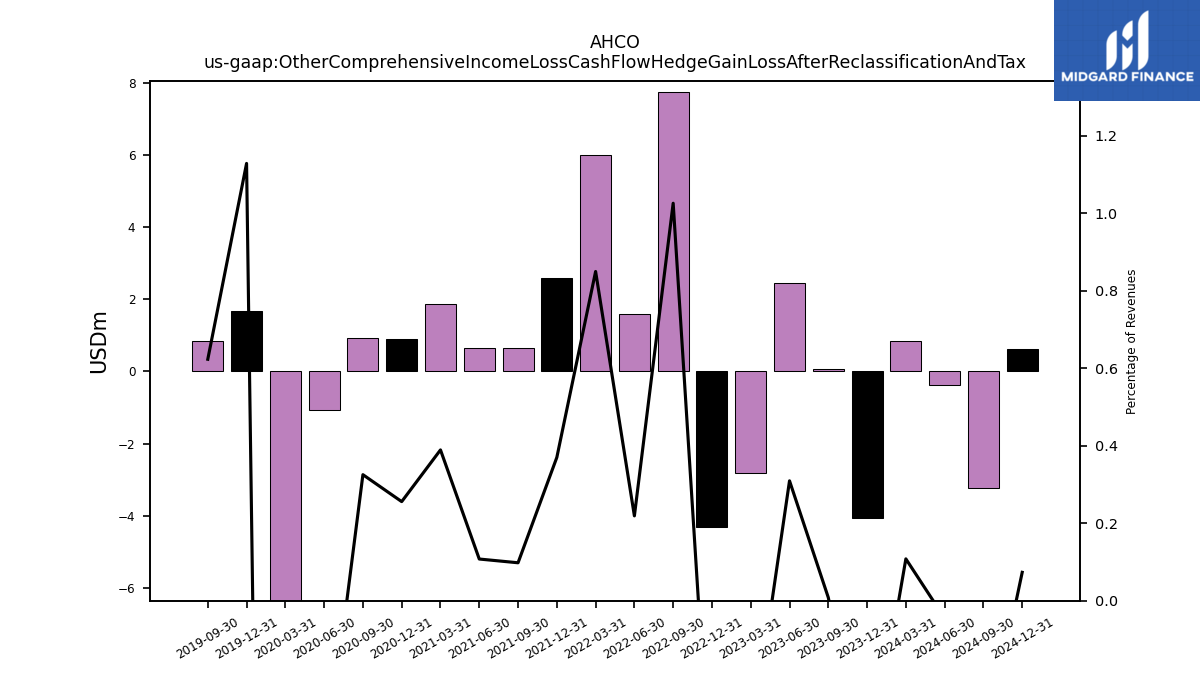
| Other Comprehensive Income Loss Cash Flow Hedge Gain Loss After Reclassification And Tax | -4.05 | 0.07 | 2.45 | -2.81 | -4.30 | 7.76 | 1.59 | 6.00 | 2.60 | 0.64 | 0.66 | 1.88 | 0.89 | 0.93 | -1.07 | -11.42 | 1.69 | 0.85 | NA | NA | |
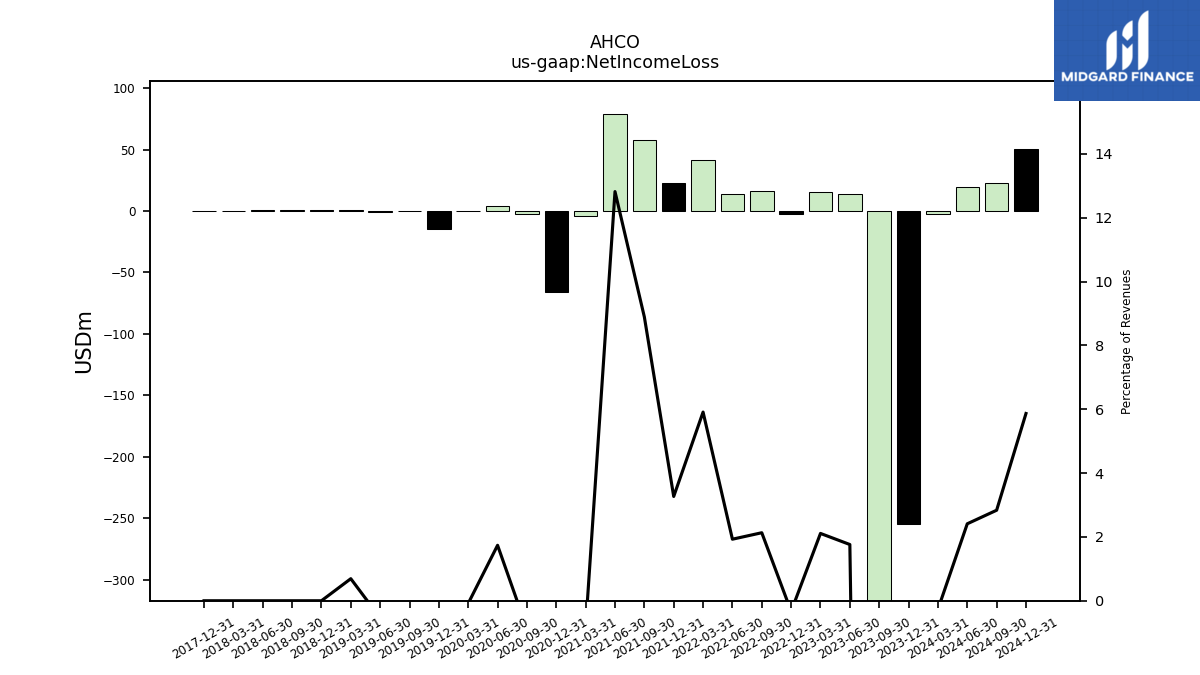
| Net Income Loss | -254.50 | -454.08 | 13.98 | 15.71 | -2.59 | 16.12 | 14.03 | 41.75 | 22.94 | 58.09 | 79.11 | -3.97 | -65.87 | -2.49 | 4.03 | -0.16 | -15.00 | -0.15 | -0.67 | 0.83 | |
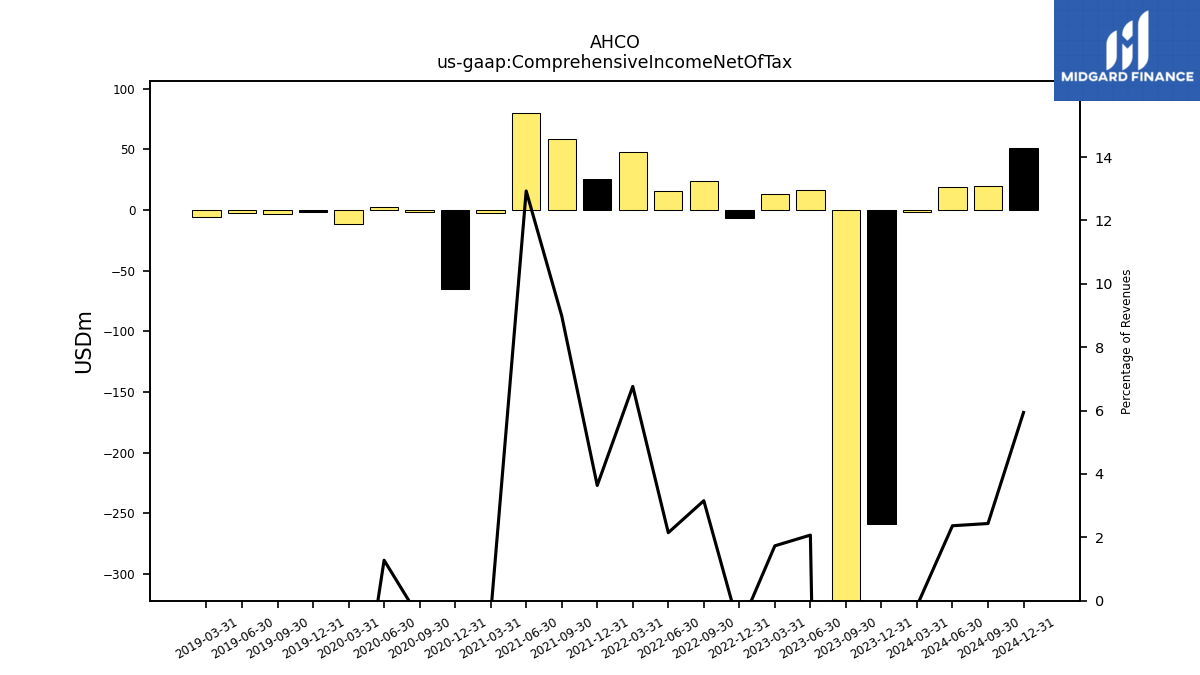
| Comprehensive Income Net Of Tax | -258.56 | -454.01 | 16.43 | 12.90 | -6.89 | 23.88 | 15.62 | 47.75 | 25.54 | 58.73 | 79.77 | -2.09 | -64.98 | -1.56 | 2.97 | -11.58 | -1.74 | -2.84 | -2.08 | -5.80 | |
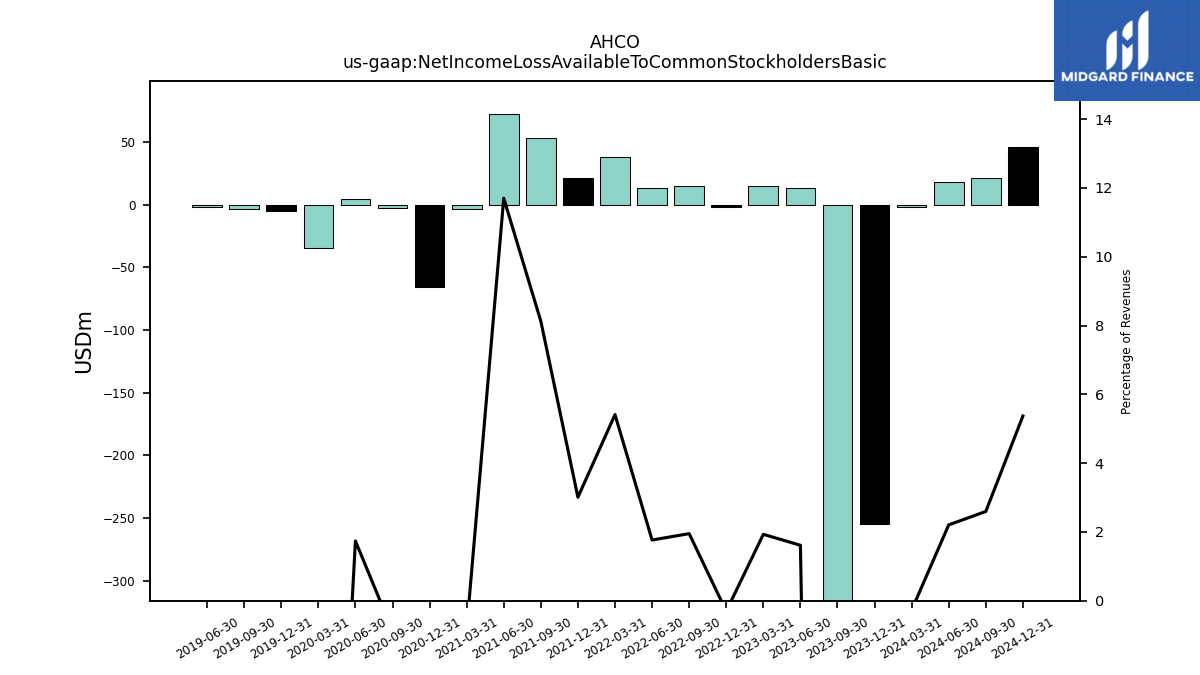
| Net Income Loss Available To Common Stockholders Basic | -254.50 | -454.08 | 12.79 | 14.38 | -2.38 | 14.76 | 12.85 | 38.21 | 21.14 | 53.09 | 72.20 | -3.97 | -65.68 | -2.49 | 4.03 | -34.55 | -5.49 | -3.69 | -2.08 | NA | |
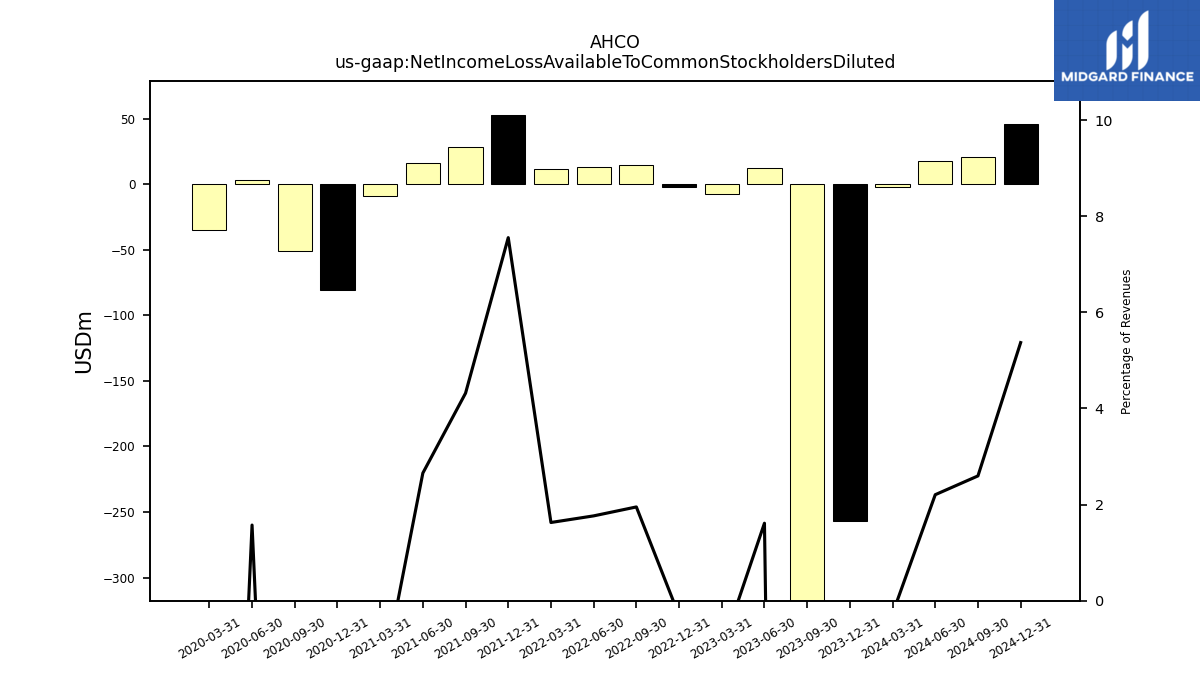
| Net Income Loss Available To Common Stockholders Diluted | -257.10 | -463.24 | 12.79 | -7.53 | -2.39 | 14.76 | 12.85 | 11.50 | 53.03 | 28.21 | 16.39 | -9.10 | -80.52 | -51.03 | 3.65 | -34.55 | NA | NA | NA | NA | |
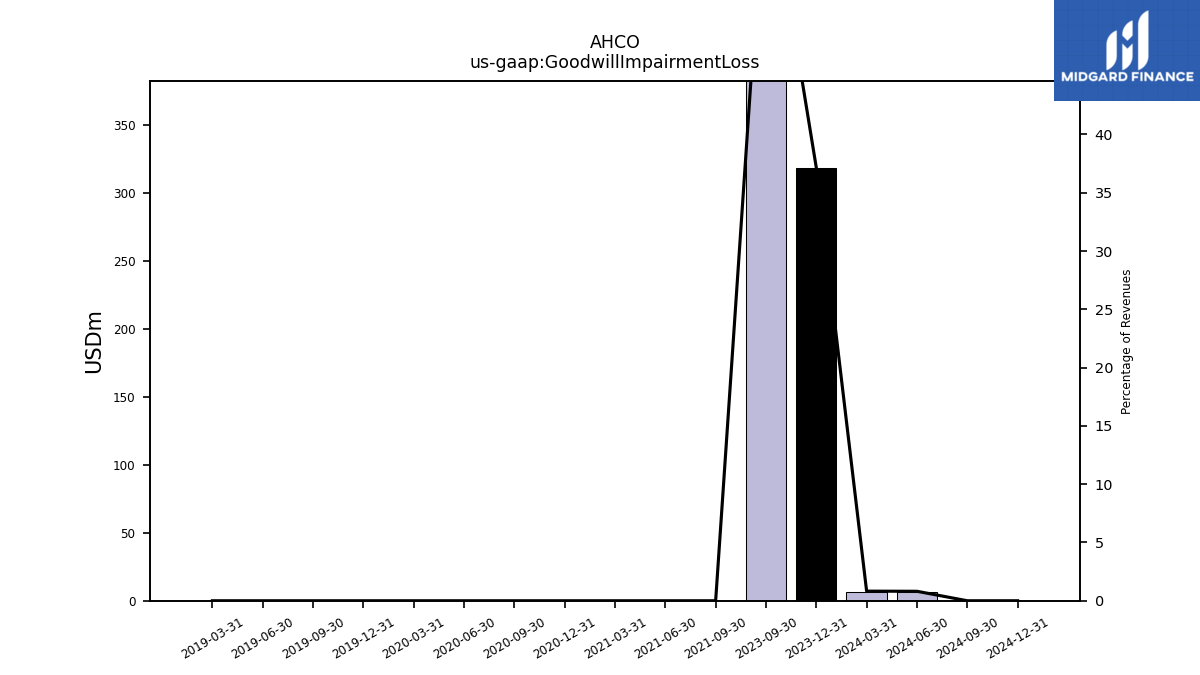
| Goodwill Impairment Loss | 318.90 | 511.87 | NA | NA | NA | NA | NA | NA | NA | 0.00 | 0.00 | 0.00 | 0.00 | 0.00 | 0.00 | 0.00 | 0.00 | 0.00 | 0.00 | 0.00 |
| 2023-12-31 | 2023-09-30 | 2023-06-30 | 2023-03-31 | 2022-12-31 | 2022-09-30 | 2022-06-30 | 2022-03-31 | 2021-12-31 | 2021-09-30 | 2021-06-30 | 2021-03-31 | 2020-12-31 | 2020-09-30 | 2020-06-30 | 2020-03-31 | 2019-12-31 | 2019-09-30 | 2019-06-30 | 2019-03-31 | ||
|---|---|---|---|---|---|---|---|---|---|---|---|---|---|---|---|---|---|---|---|---|---|
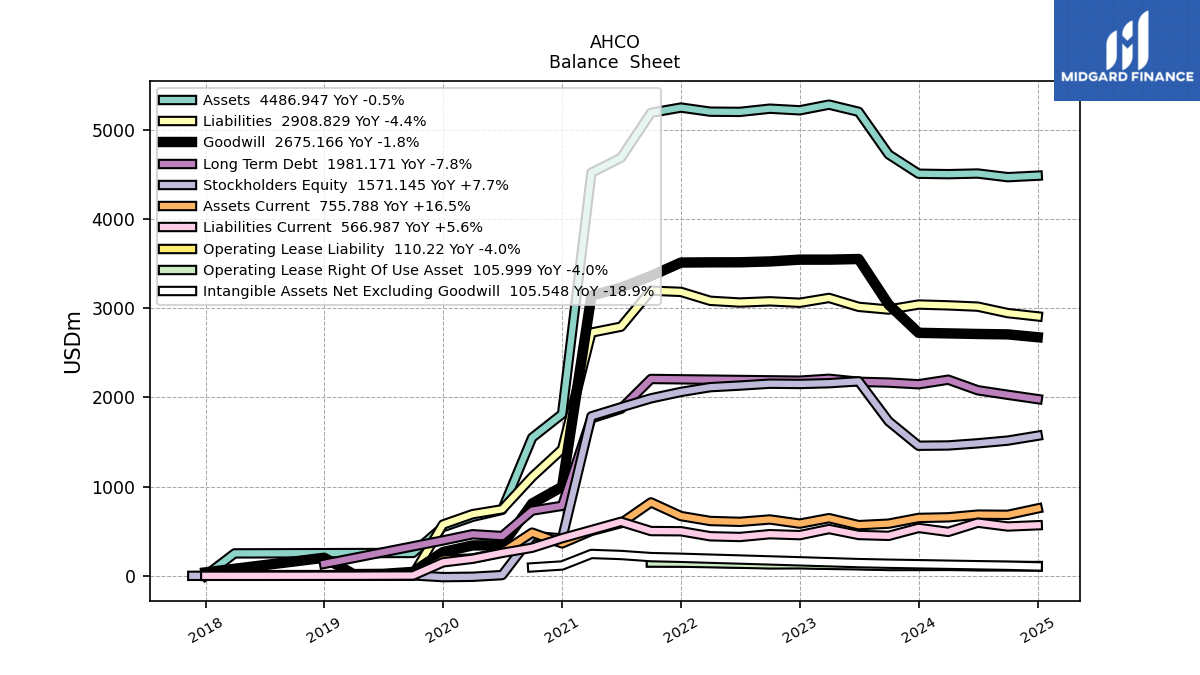
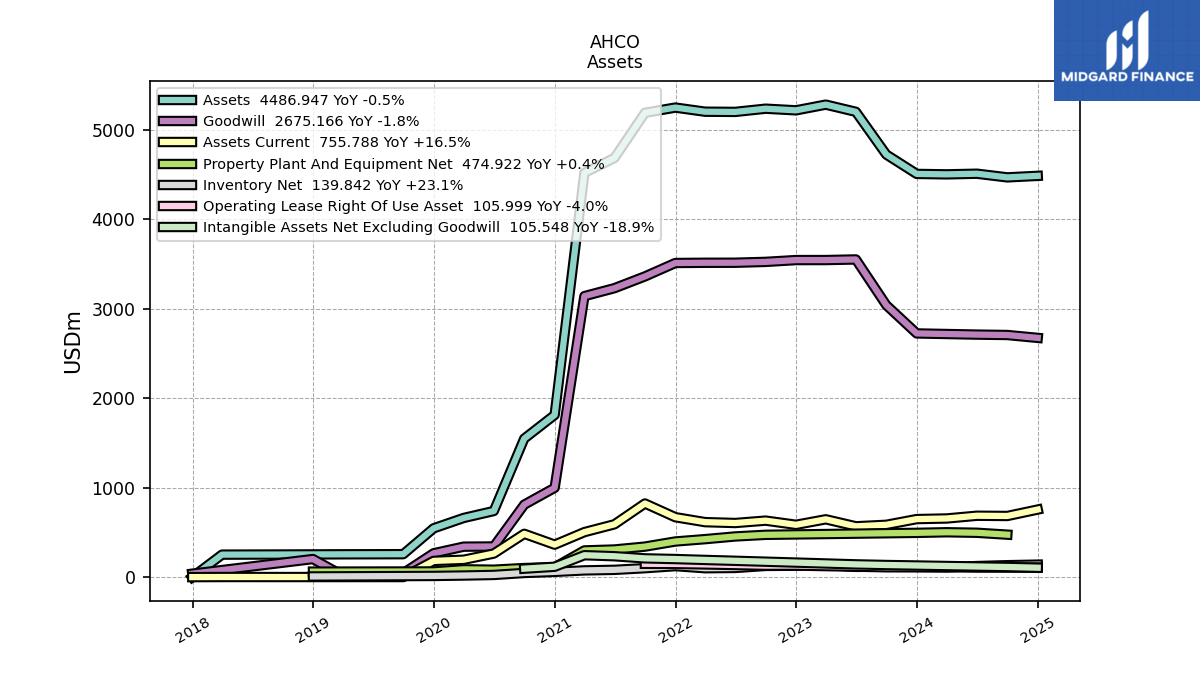
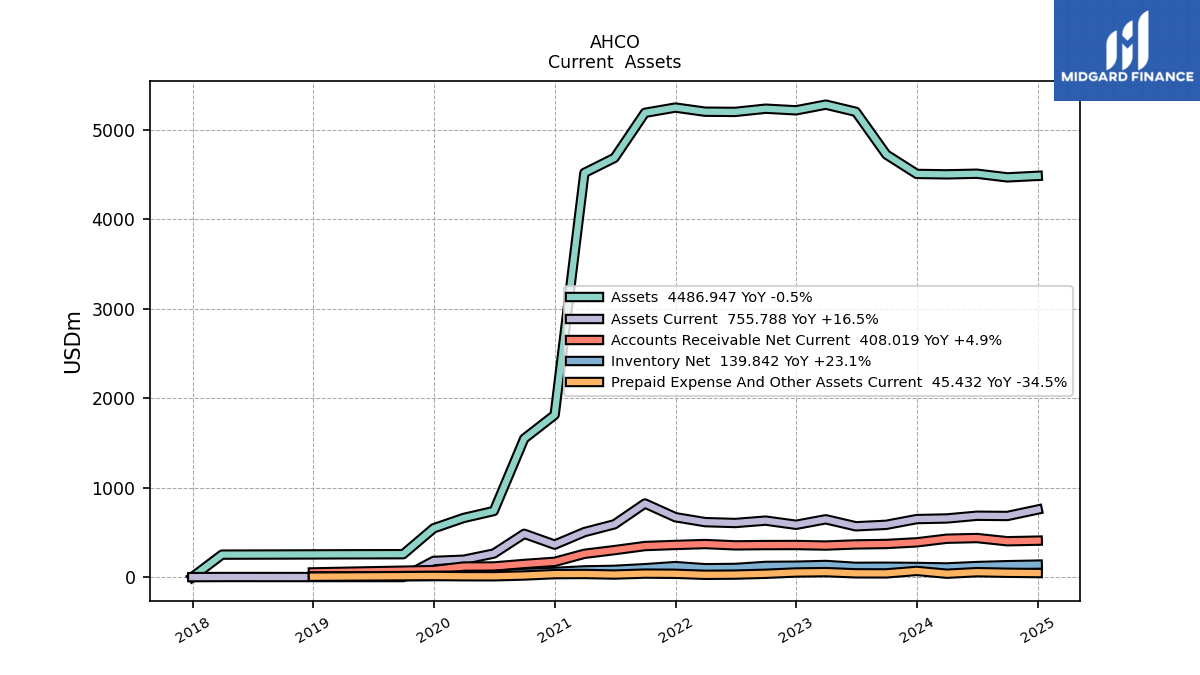
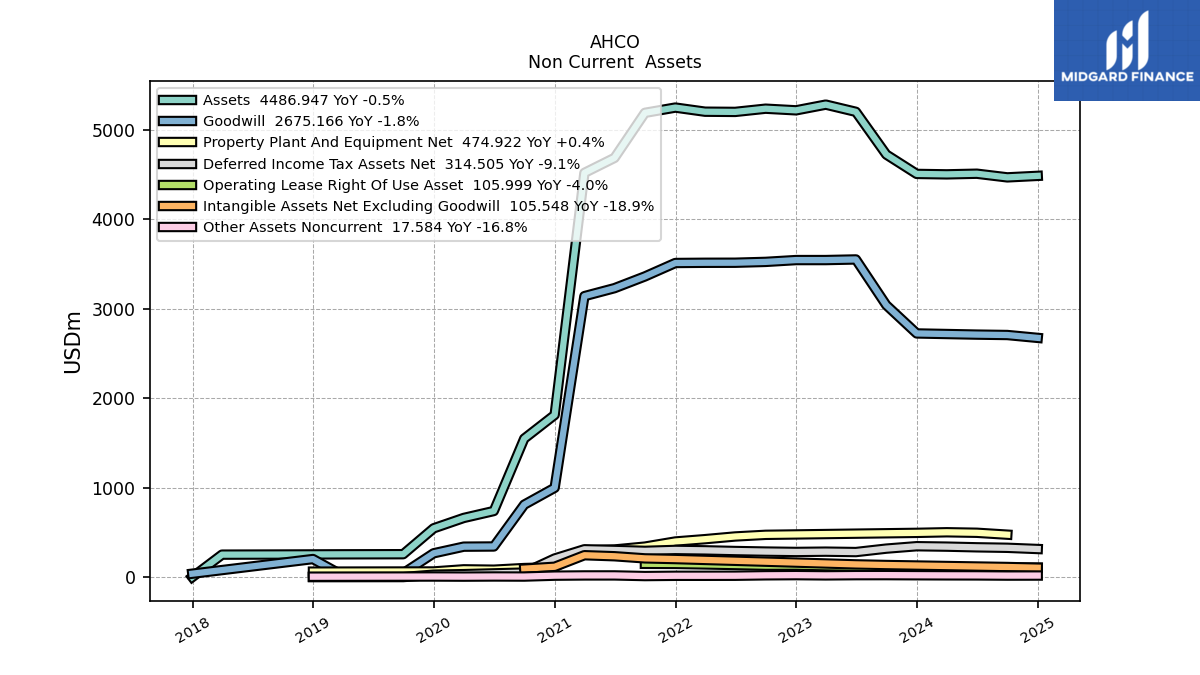
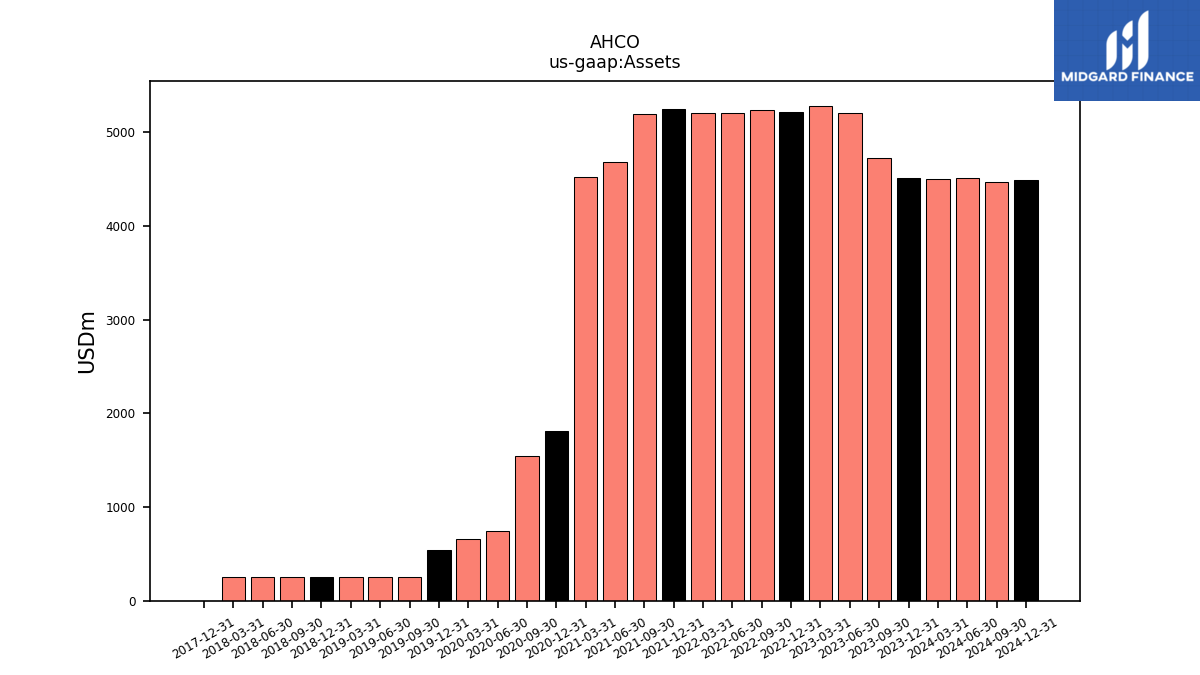
| Assets | 4508.65 | 4725.25 | 5203.01 | 5283.44 | 5219.59 | 5237.98 | 5202.01 | 5204.34 | 5250.48 | 5191.72 | 4687.66 | 4520.07 | 1813.47 | 1548.83 | 739.31 | 661.84 | 546.12 | 256.63 | 255.87 | 255.23 | |
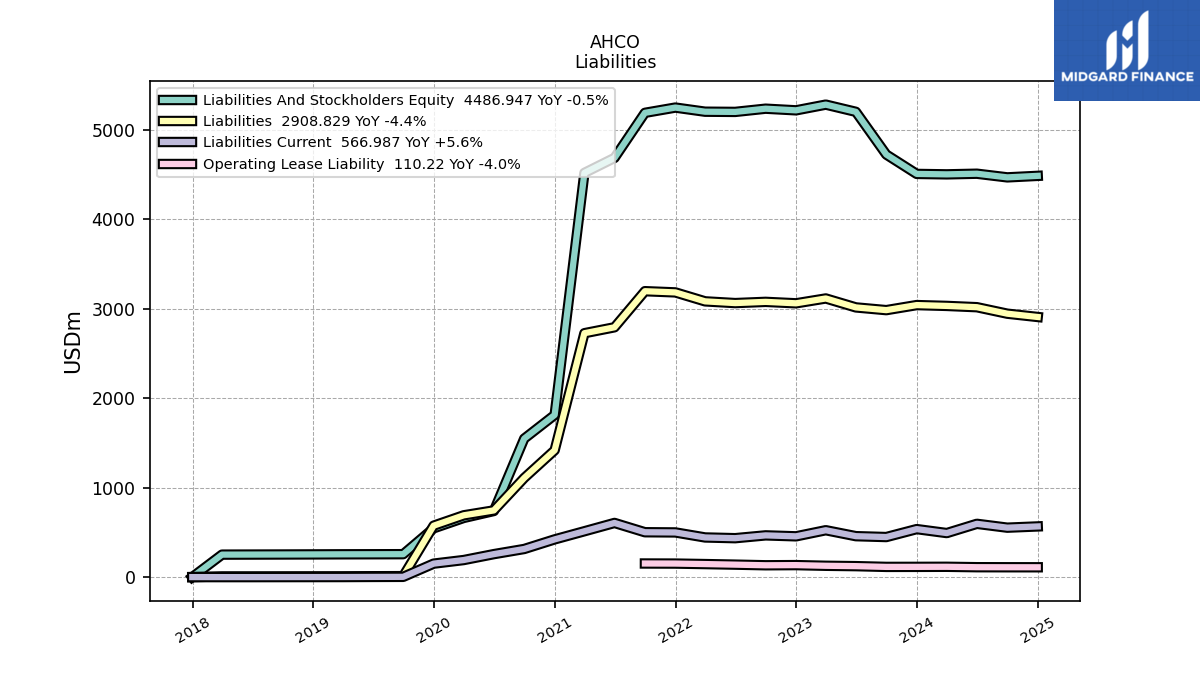
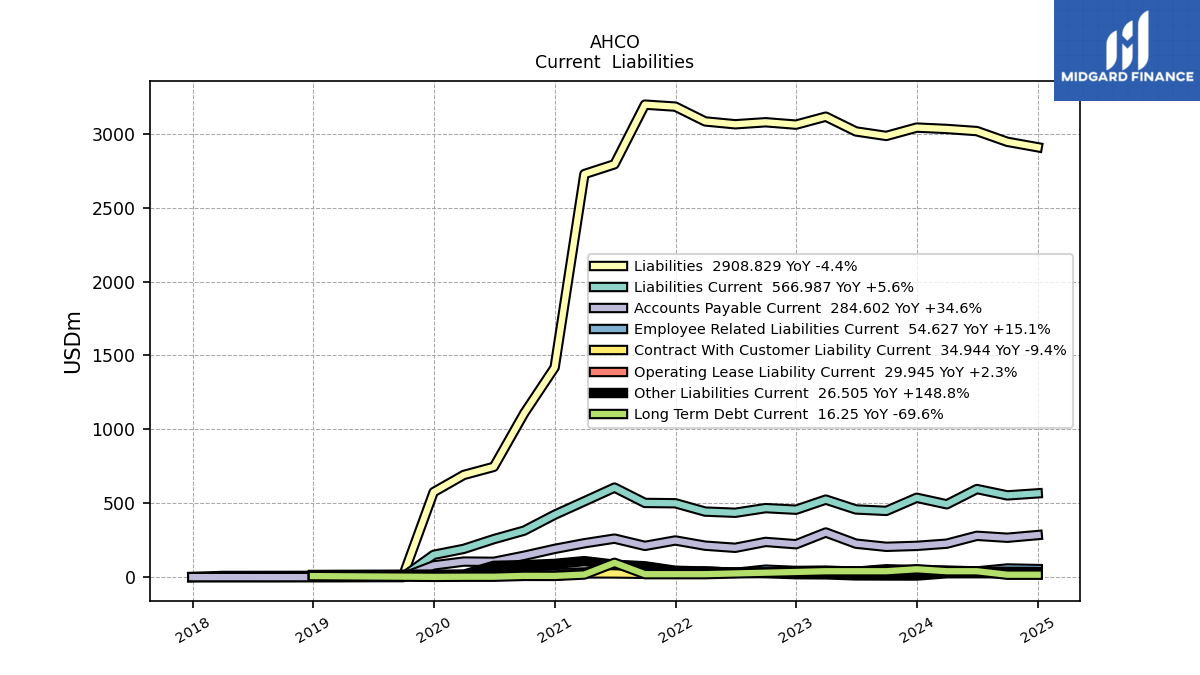
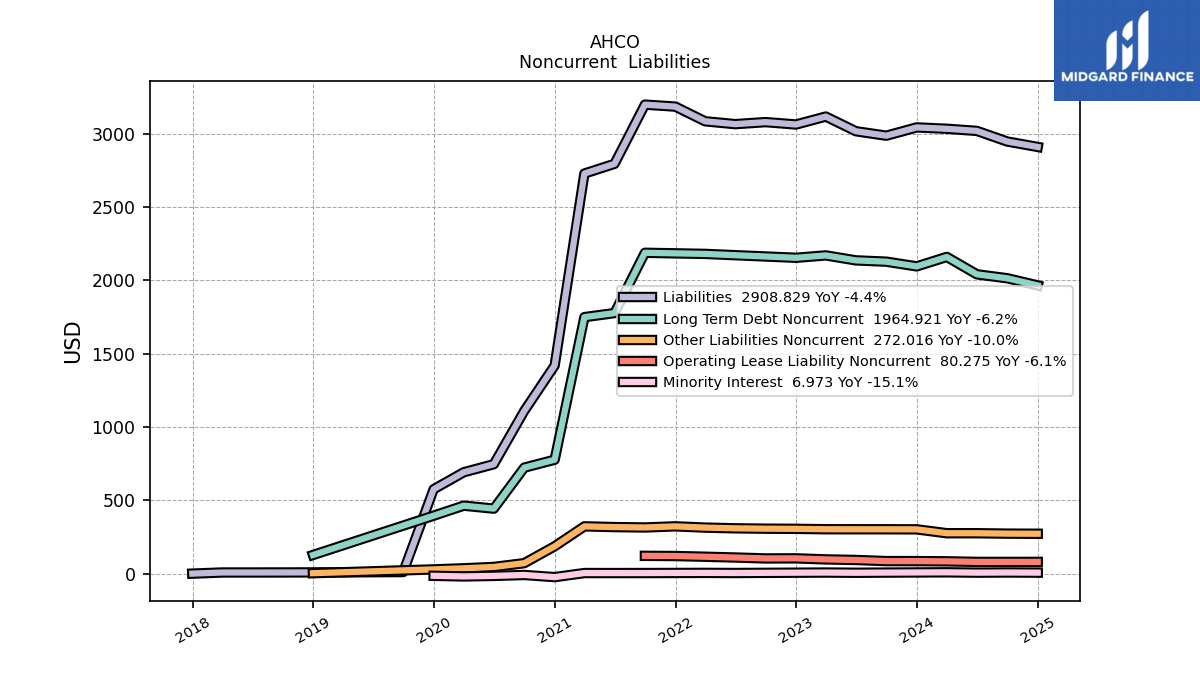
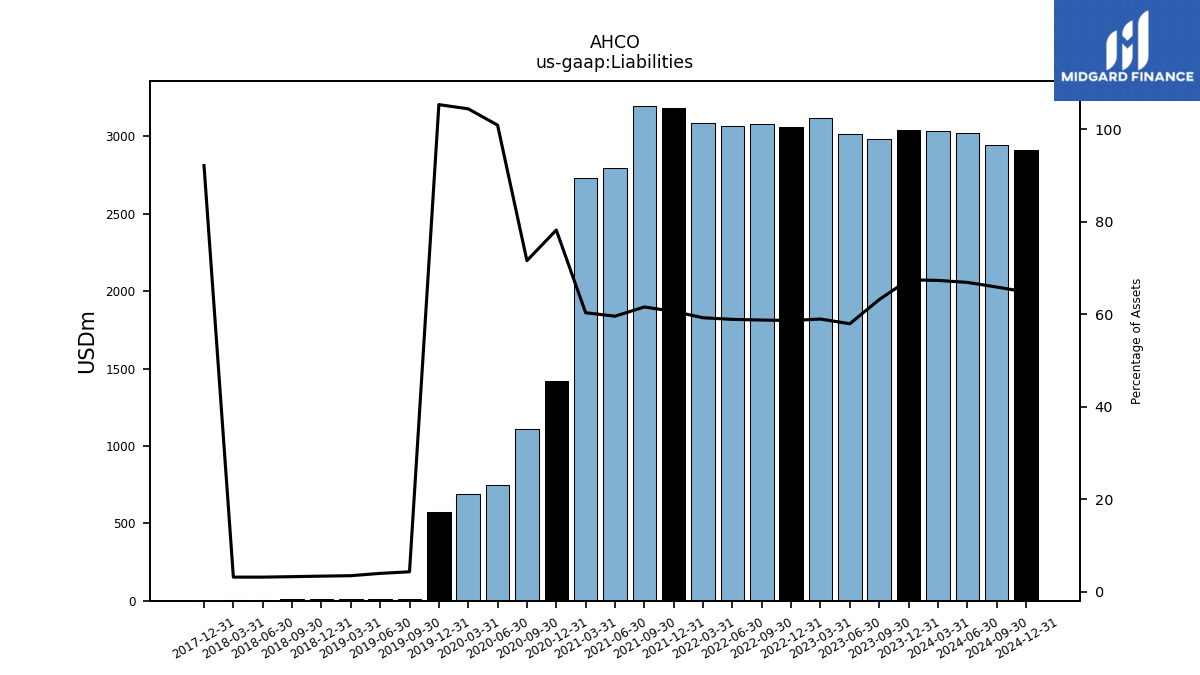
| Liabilities | 3041.98 | 2985.48 | 3015.94 | 3115.98 | 3061.83 | 3078.03 | 3064.32 | 3083.72 | 3183.80 | 3197.35 | 2793.62 | 2727.59 | 1418.72 | 1109.11 | 746.10 | 691.29 | 575.37 | 11.07 | 10.16 | 8.86 | |
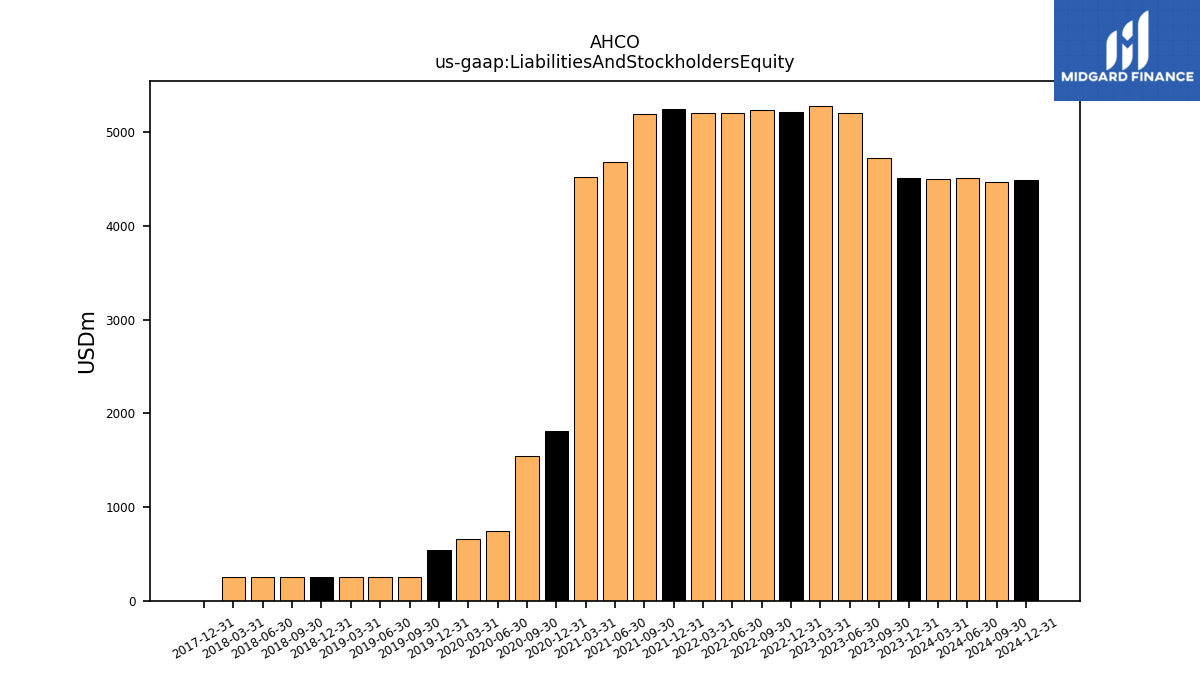
| Liabilities And Stockholders Equity | 4508.65 | 4725.25 | 5203.01 | 5283.44 | 5219.59 | 5237.98 | 5202.01 | 5204.34 | 5250.48 | 5191.72 | 4687.66 | 4520.07 | 1813.47 | 1548.83 | 739.31 | 661.84 | 546.12 | 256.63 | 255.87 | 255.23 | |
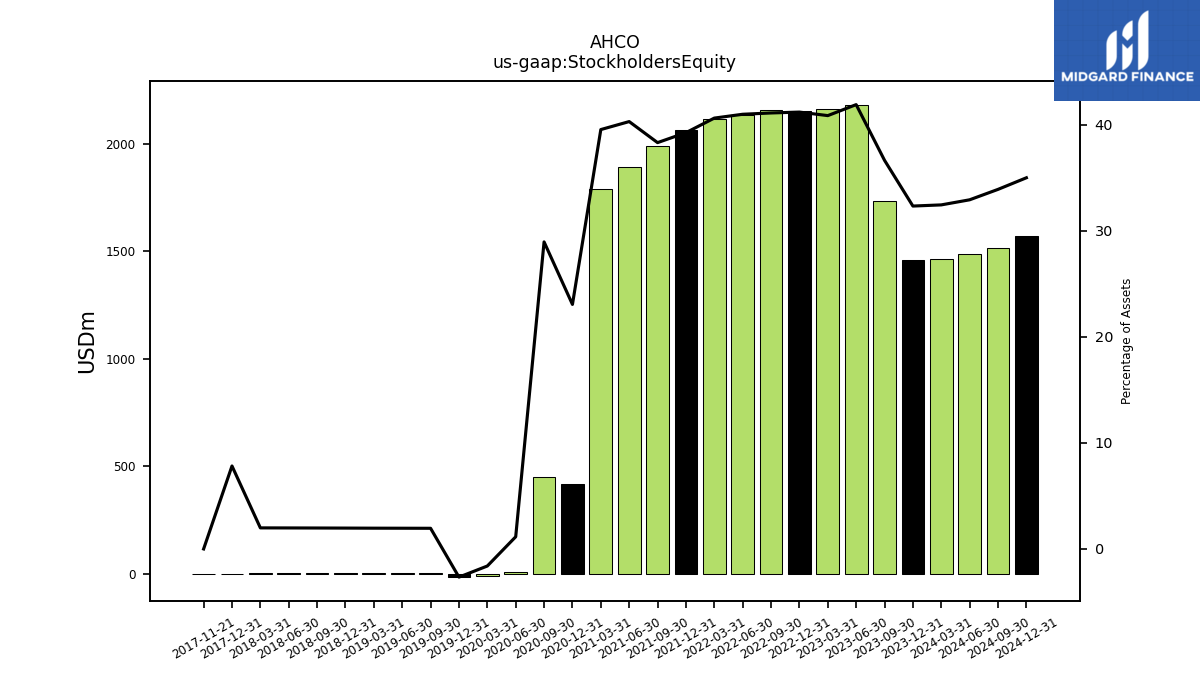
| Stockholders Equity | 1458.45 | 1732.48 | 2180.94 | 2159.89 | 2151.16 | 2154.37 | 2133.22 | 2115.36 | 2061.91 | 1990.11 | 1889.96 | 1788.28 | 418.34 | 448.63 | 8.49 | -10.66 | -14.52 | 5.00 | 5.00 | 5.00 |
| 2023-12-31 | 2023-09-30 | 2023-06-30 | 2023-03-31 | 2022-12-31 | 2022-09-30 | 2022-06-30 | 2022-03-31 | 2021-12-31 | 2021-09-30 | 2021-06-30 | 2021-03-31 | 2020-12-31 | 2020-09-30 | 2020-06-30 | 2020-03-31 | 2019-12-31 | 2019-09-30 | 2019-06-30 | 2019-03-31 | ||
|---|---|---|---|---|---|---|---|---|---|---|---|---|---|---|---|---|---|---|---|---|---|
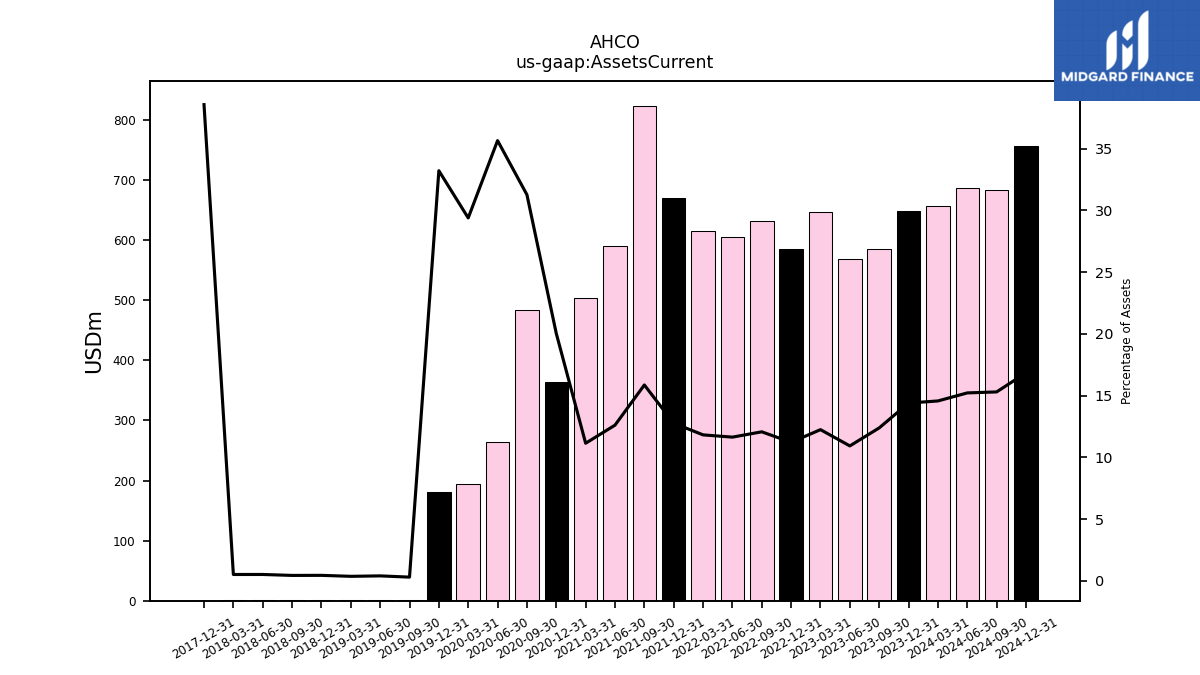
| Assets Current | 649.02 | 585.07 | 568.29 | 646.73 | 585.31 | 631.93 | 605.22 | 614.99 | 670.06 | 823.44 | 590.87 | 503.50 | 363.25 | 484.38 | 263.64 | 194.54 | 181.41 | 0.75 | 1.00 | 0.91 | |
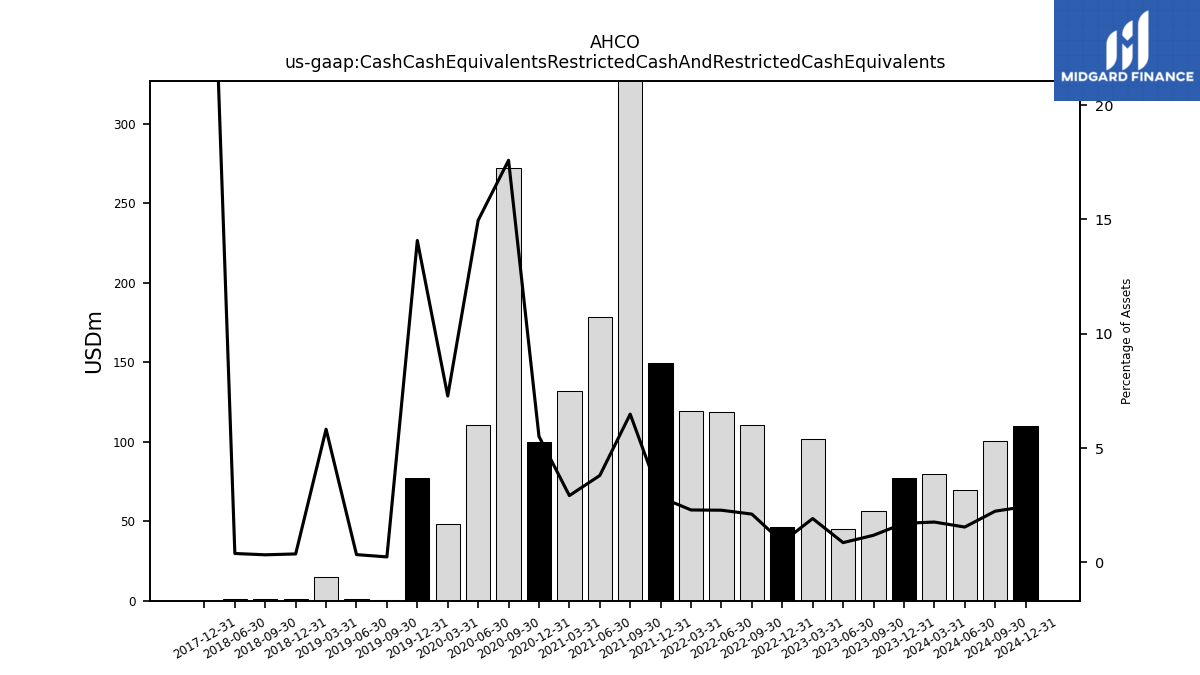
| Cash Cash Equivalents Restricted Cash And Restricted Cash Equivalents | 77.13 | 56.14 | 45.13 | 101.40 | 46.27 | 110.74 | 118.81 | 119.43 | 149.63 | 336.65 | 178.19 | 132.14 | 99.96 | 272.32 | 110.59 | 48.16 | 76.88 | 0.62 | 0.88 | 14.87 | |
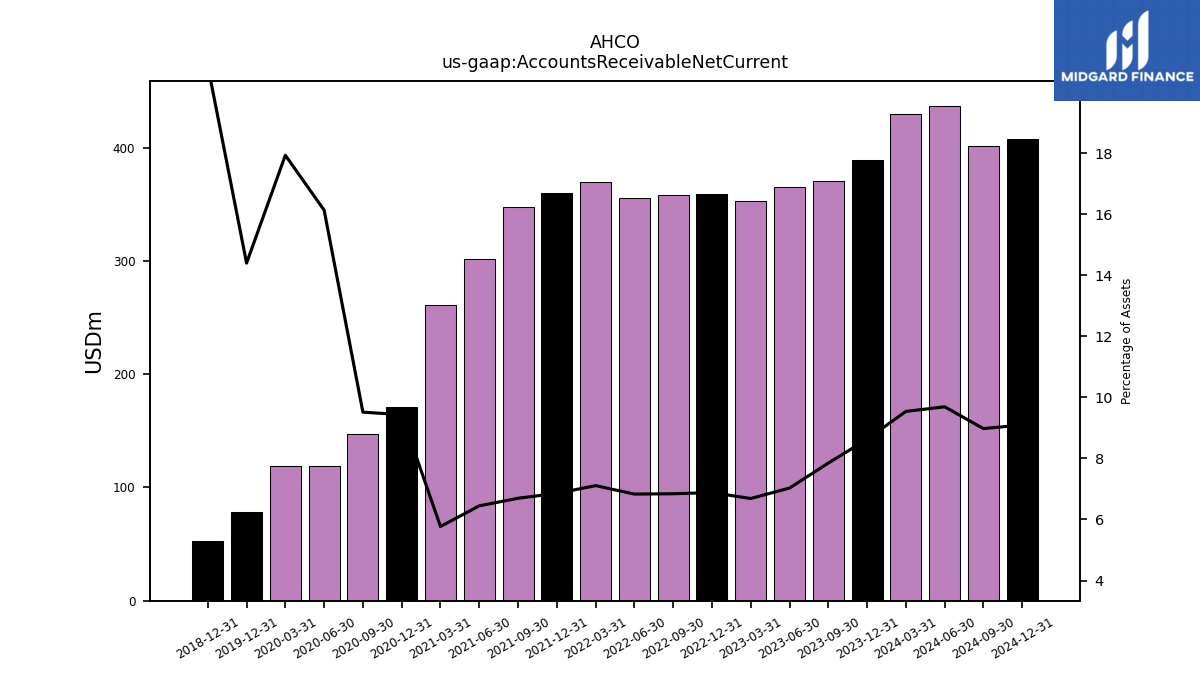
| Accounts Receivable Net Current | 388.91 | 370.74 | 365.71 | 353.23 | 359.15 | 358.34 | 355.35 | 369.90 | 359.90 | 347.51 | 302.13 | 260.76 | 171.06 | 147.34 | 119.24 | 118.65 | 78.62 | NA | NA | NA | |
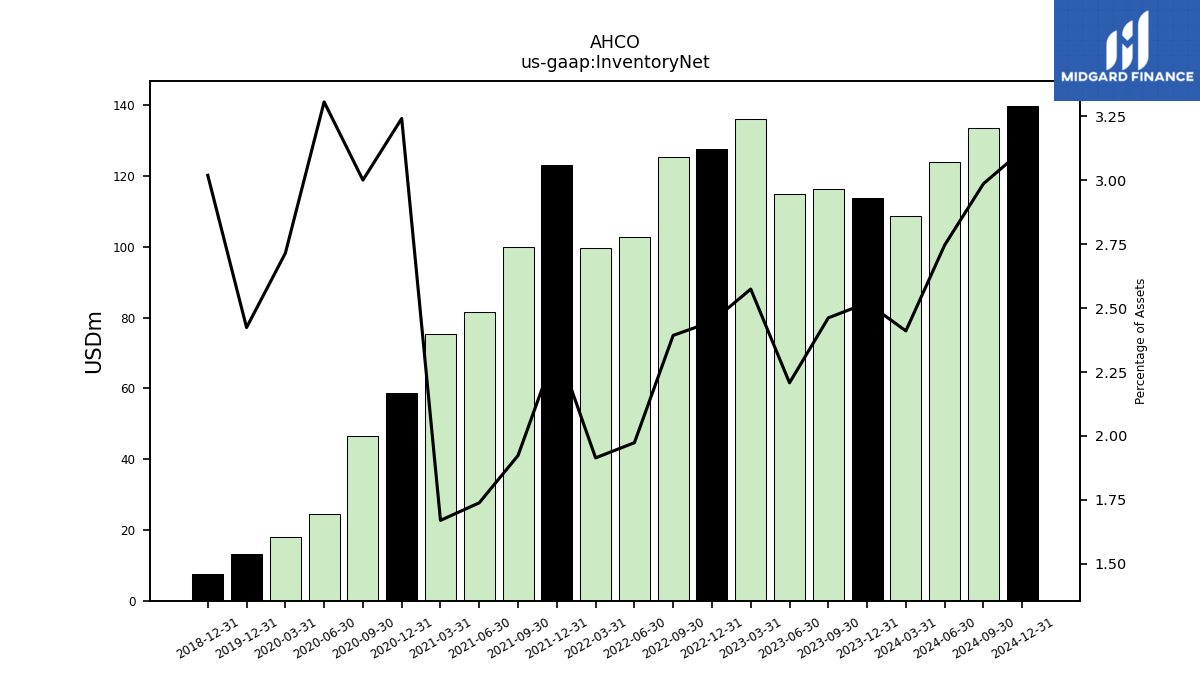
| Inventory Net | 113.64 | 116.33 | 114.88 | 136.02 | 127.75 | 125.36 | 102.67 | 99.64 | 123.09 | 99.88 | 81.51 | 75.49 | 58.78 | 46.48 | 24.44 | 17.97 | 13.24 | NA | NA | NA | |
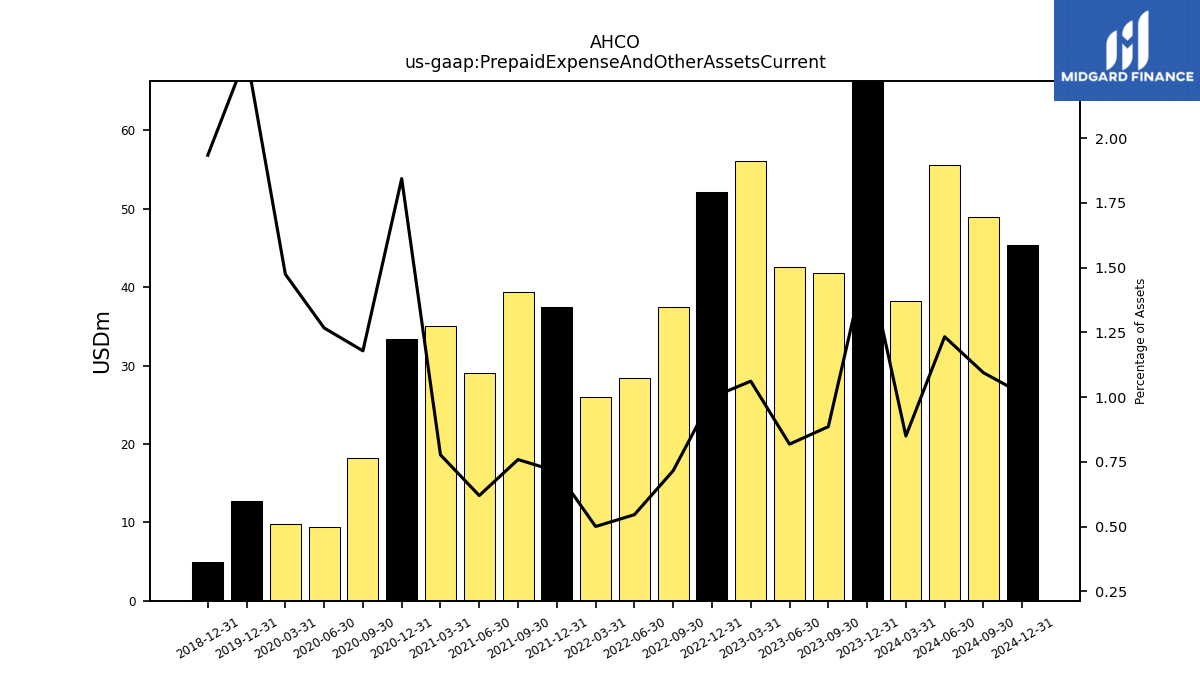
| Prepaid Expense And Other Assets Current | 69.34 | 41.85 | 42.57 | 56.08 | 52.14 | 37.49 | 28.39 | 26.03 | 37.44 | 39.39 | 29.05 | 35.12 | 33.44 | 18.25 | 9.37 | 9.76 | 12.68 | NA | NA | NA |
| 2023-12-31 | 2023-09-30 | 2023-06-30 | 2023-03-31 | 2022-12-31 | 2022-09-30 | 2022-06-30 | 2022-03-31 | 2021-12-31 | 2021-09-30 | 2021-06-30 | 2021-03-31 | 2020-12-31 | 2020-09-30 | 2020-06-30 | 2020-03-31 | 2019-12-31 | 2019-09-30 | 2019-06-30 | 2019-03-31 | ||
|---|---|---|---|---|---|---|---|---|---|---|---|---|---|---|---|---|---|---|---|---|---|
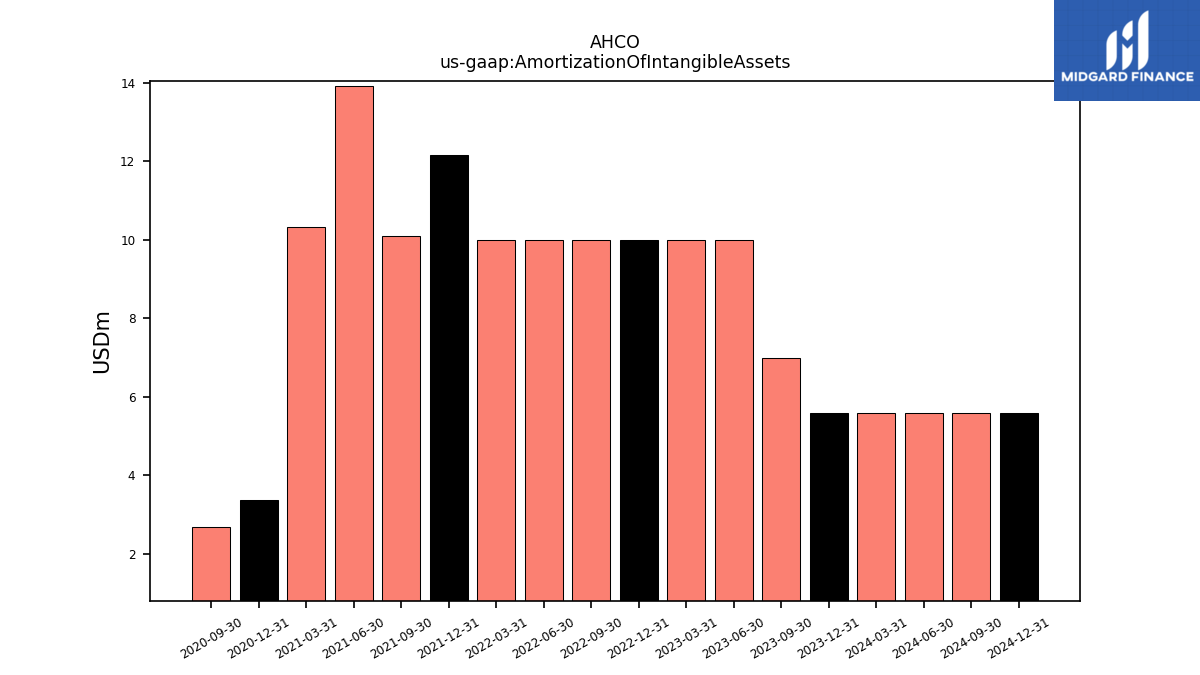
| Amortization Of Intangible Assets | 5.60 | 7.00 | 10.00 | 10.00 | 10.00 | 10.00 | 10.00 | 10.00 | 12.15 | 10.10 | 13.90 | 10.32 | 3.36 | 2.70 | NA | NA | NA | NA | NA | NA | |
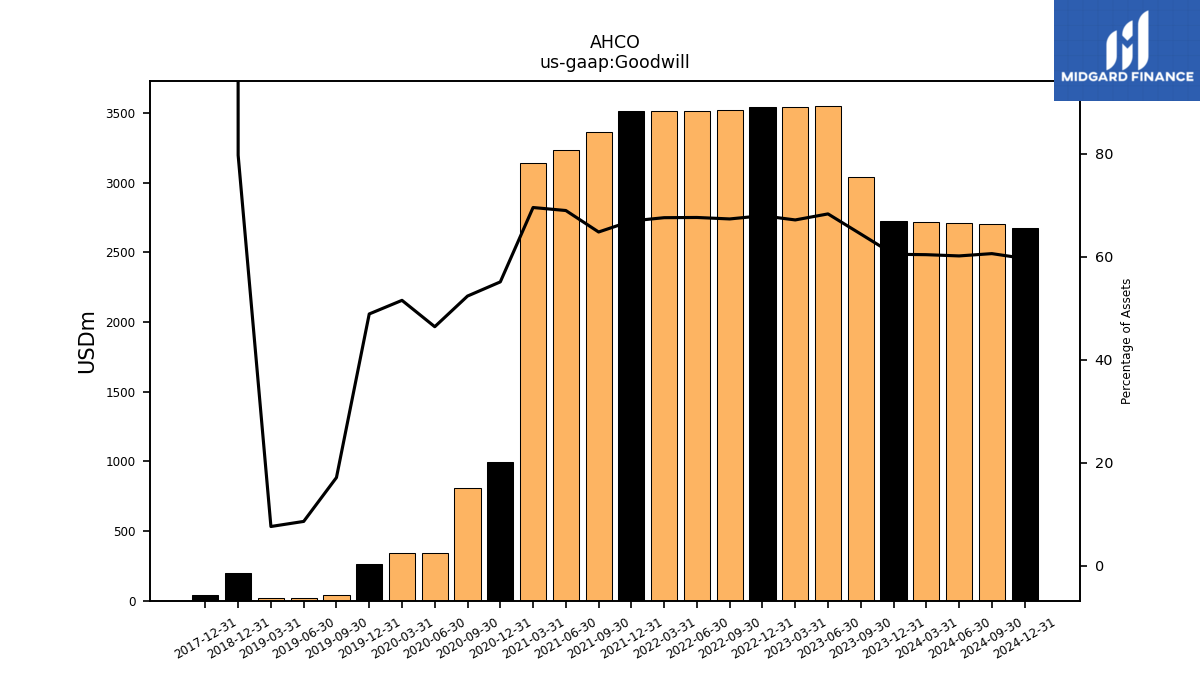
| Goodwill | 2724.96 | 3041.45 | 3552.31 | 3545.36 | 3545.30 | 3525.00 | 3515.61 | 3515.07 | 3512.57 | 3362.27 | 3231.20 | 3142.08 | 998.81 | 810.48 | 342.85 | 340.81 | 266.79 | 43.88 | 21.95 | 19.38 | |
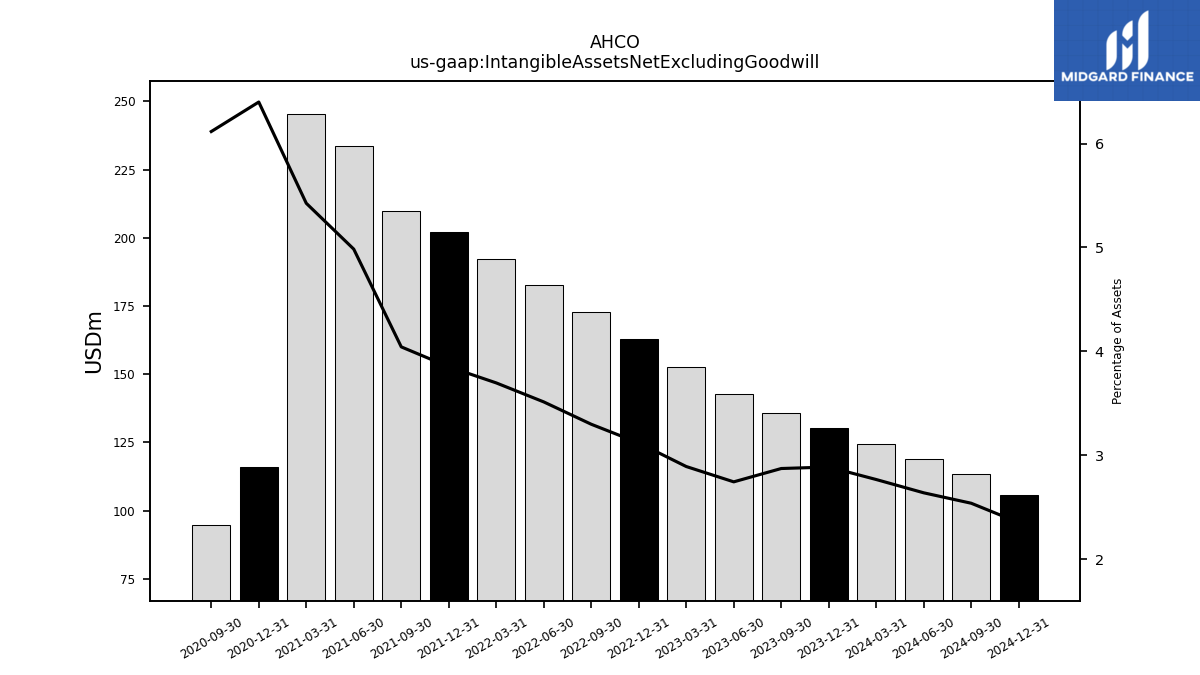
| Intangible Assets Net Excluding Goodwill | 130.16 | 135.73 | 142.77 | 152.77 | 162.77 | 172.77 | 182.77 | 192.37 | 202.23 | 209.91 | 233.63 | 245.24 | 116.06 | 94.72 | NA | NA | NA | NA | NA | NA | |
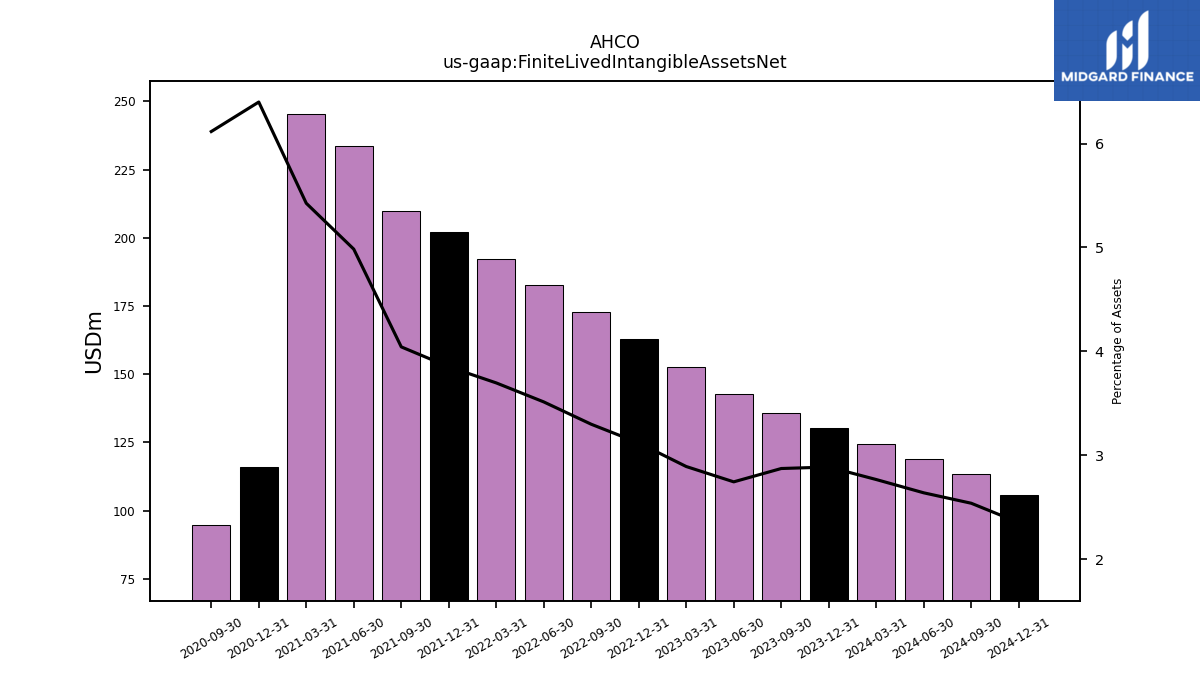
| Finite Lived Intangible Assets Net | 130.16 | 135.73 | 142.77 | 152.77 | 162.77 | 172.77 | 182.77 | 192.37 | 202.23 | 209.91 | 233.63 | 245.24 | 116.06 | 94.72 | NA | NA | NA | NA | NA | NA | |
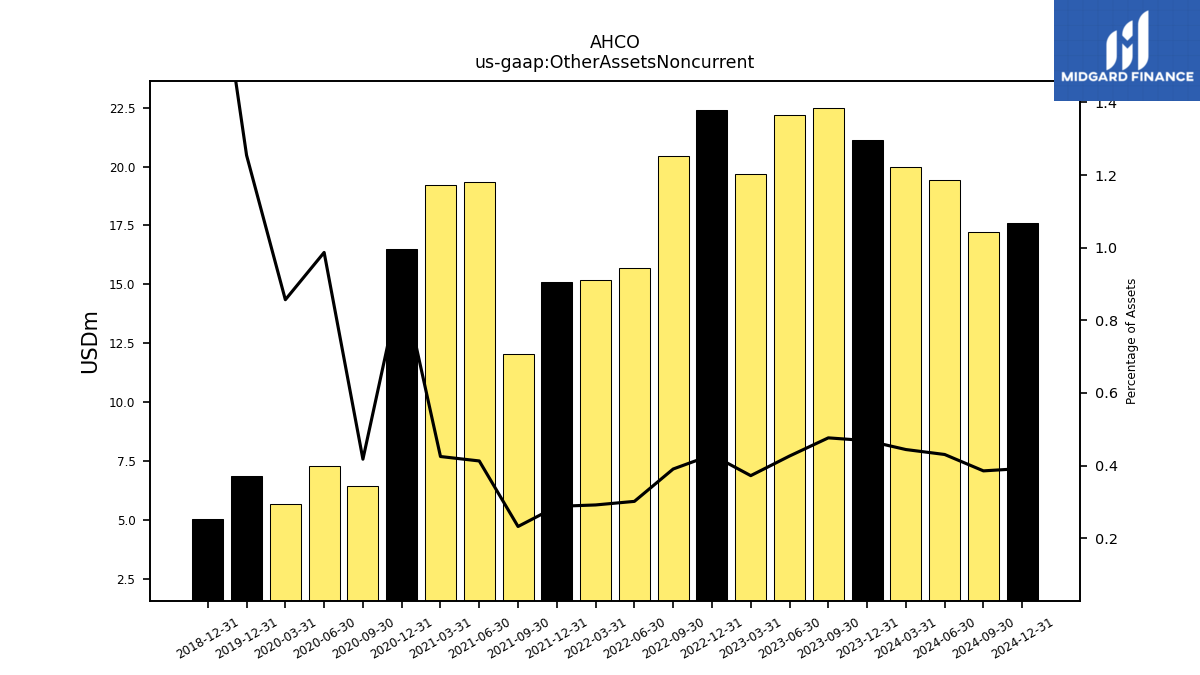
| Other Assets Noncurrent | 21.13 | 22.50 | 22.18 | 19.66 | 22.41 | 20.45 | 15.67 | 15.17 | 15.10 | 12.05 | 19.34 | 19.20 | 16.48 | 6.47 | 7.30 | 5.67 | 6.85 | NA | NA | NA |
| 2023-12-31 | 2023-09-30 | 2023-06-30 | 2023-03-31 | 2022-12-31 | 2022-09-30 | 2022-06-30 | 2022-03-31 | 2021-12-31 | 2021-09-30 | 2021-06-30 | 2021-03-31 | 2020-12-31 | 2020-09-30 | 2020-06-30 | 2020-03-31 | 2019-12-31 | 2019-09-30 | 2019-06-30 | 2019-03-31 | ||
|---|---|---|---|---|---|---|---|---|---|---|---|---|---|---|---|---|---|---|---|---|---|
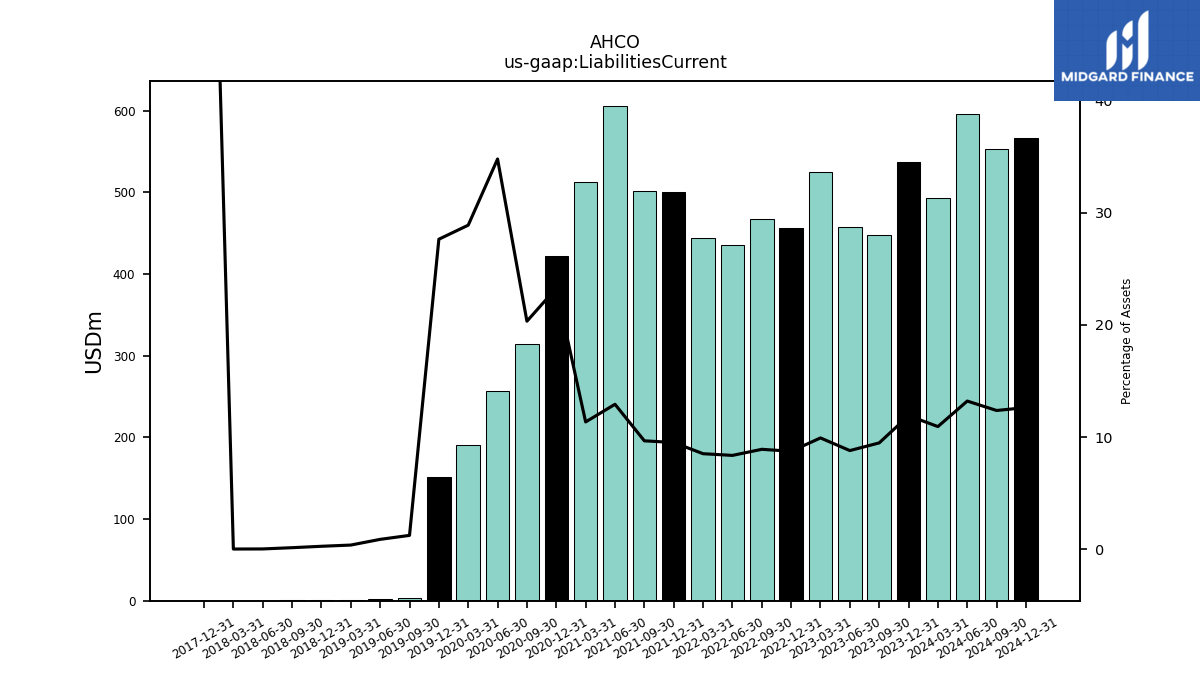
| Liabilities Current | 537.00 | 448.19 | 457.98 | 524.48 | 456.21 | 466.93 | 435.46 | 443.56 | 499.81 | 502.06 | 605.87 | 513.14 | 422.05 | 314.81 | 257.11 | 191.15 | 150.89 | 3.20 | 2.28 | 0.98 | |
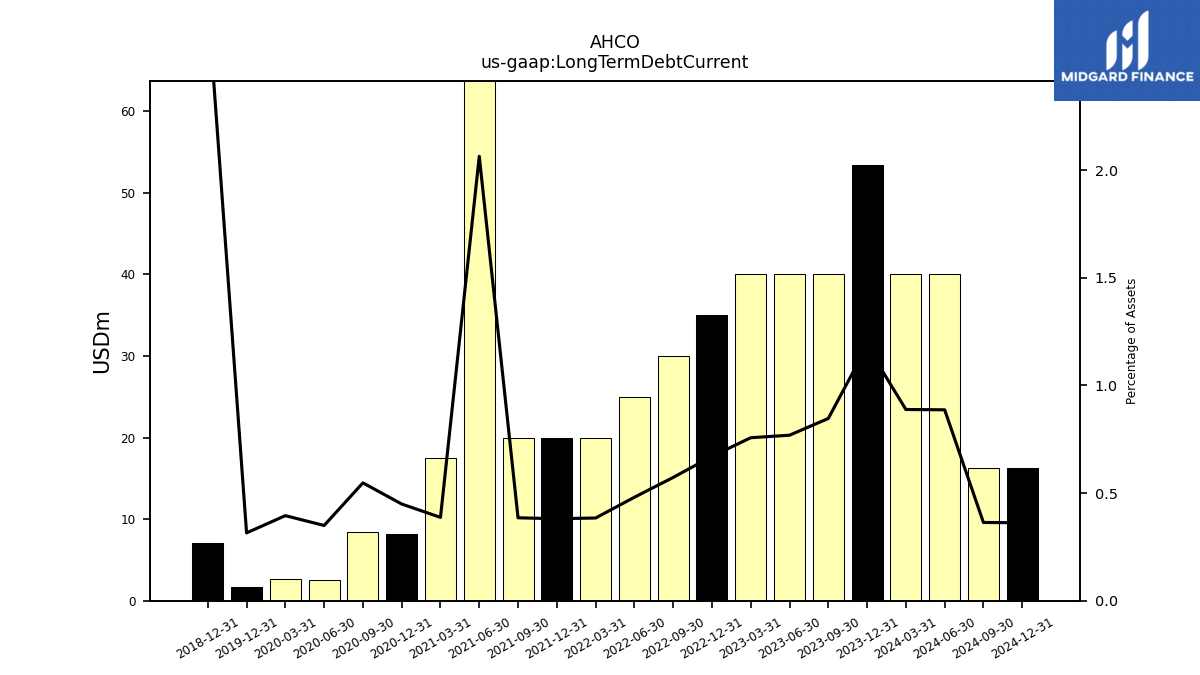
| Long Term Debt Current | 53.37 | 40.00 | 40.00 | 40.00 | 35.00 | 30.00 | 25.00 | 20.00 | 20.00 | 20.00 | 96.75 | 17.50 | 8.15 | 8.48 | 2.58 | 2.62 | 1.72 | NA | NA | NA | |
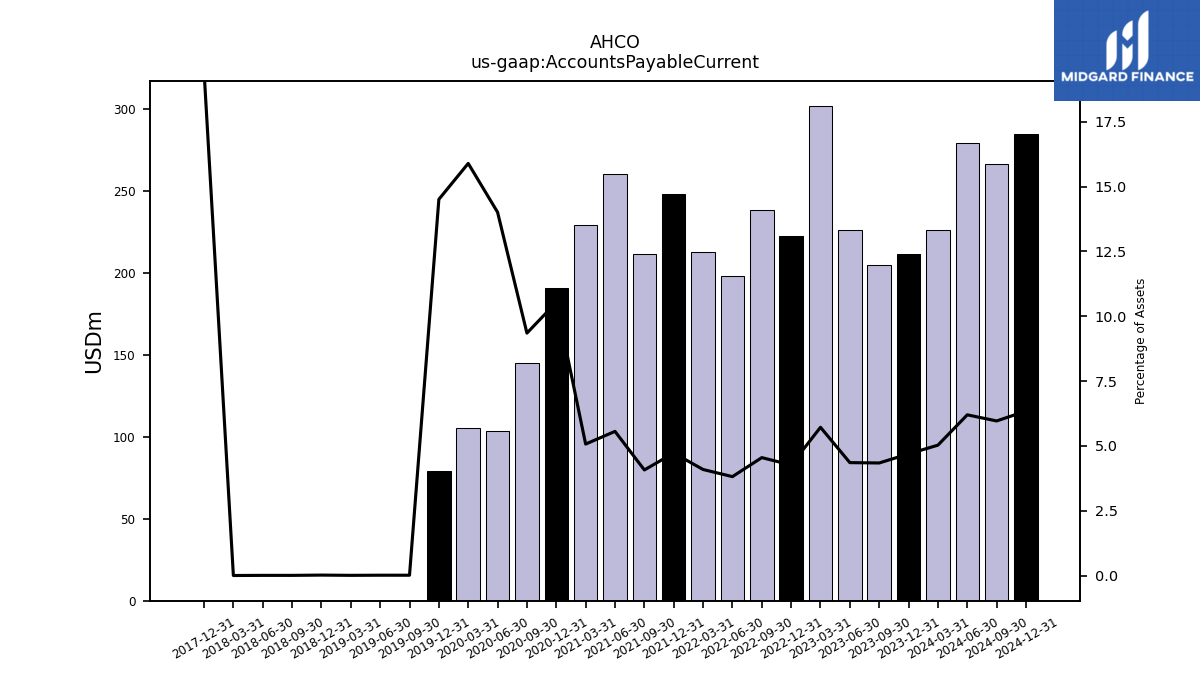
| Accounts Payable Current | 211.50 | 205.10 | 226.53 | 302.05 | 222.50 | 238.20 | 198.41 | 212.82 | 248.03 | 211.37 | 260.58 | 229.15 | 191.04 | 144.80 | 103.59 | 105.19 | 79.24 | 0.03 | 0.03 | 0.02 | |
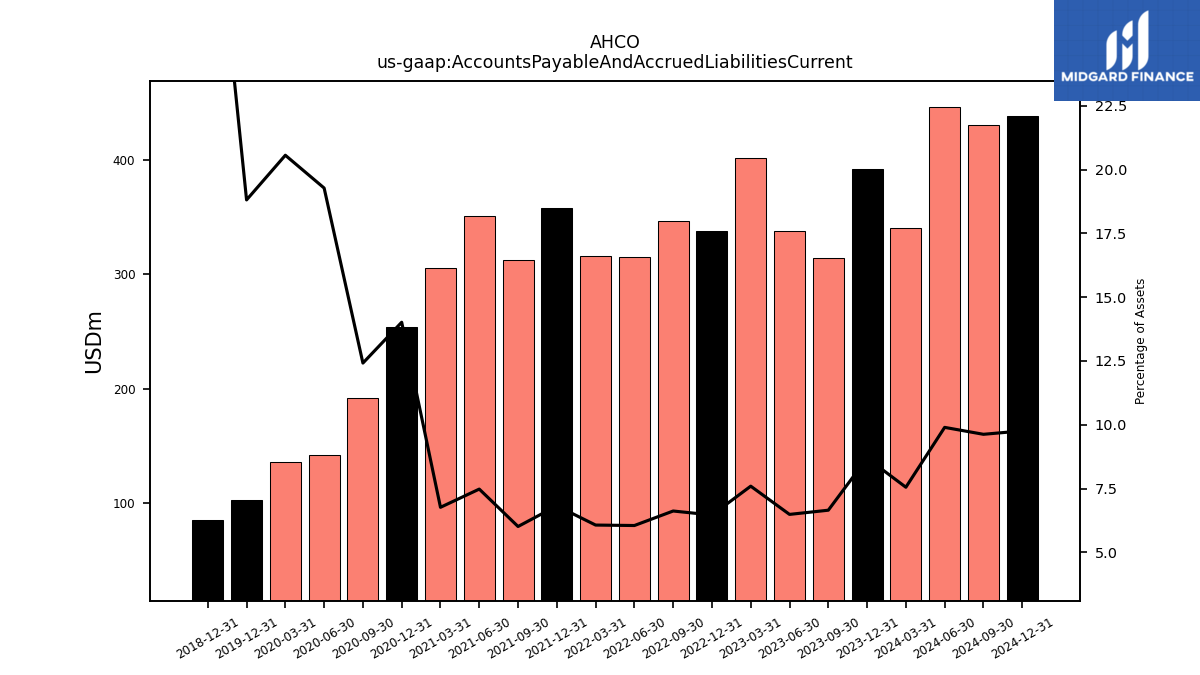
| Accounts Payable And Accrued Liabilities Current | 391.99 | 314.45 | 337.70 | 401.35 | 337.50 | 346.92 | 314.97 | 316.05 | 358.38 | 312.36 | 350.71 | 305.93 | 254.21 | 192.34 | 142.50 | 136.07 | 102.73 | NA | NA | NA | |
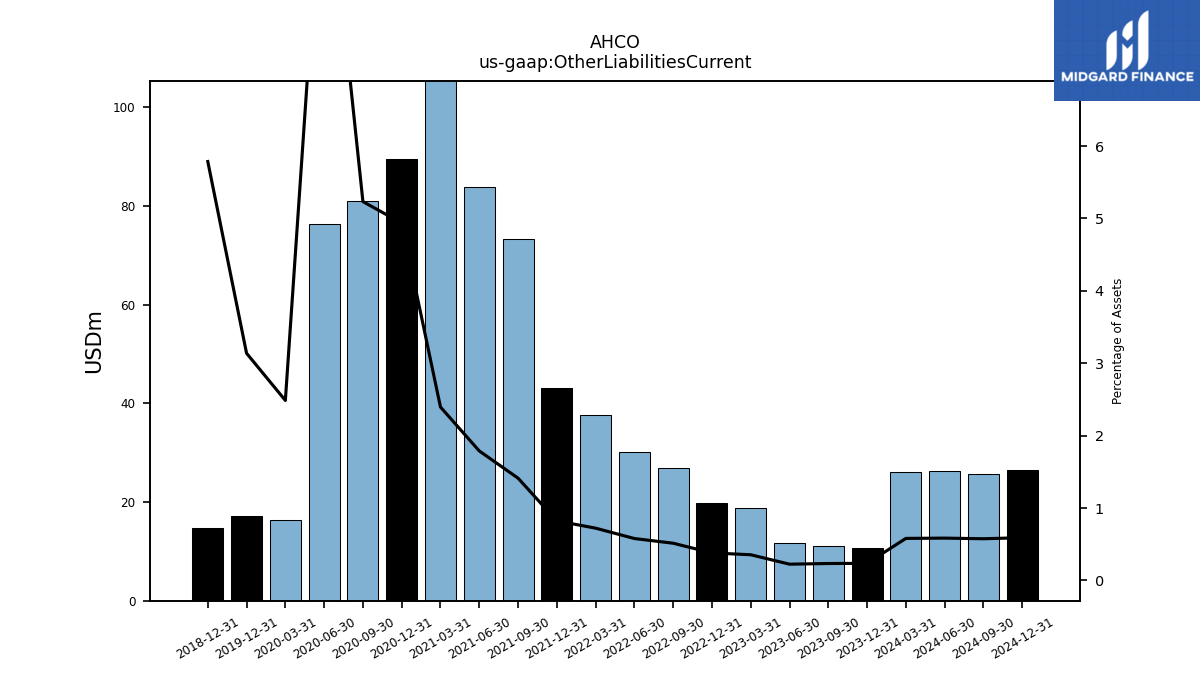
| Other Liabilities Current | 10.65 | 11.07 | 11.71 | 18.76 | 19.86 | 26.94 | 30.13 | 37.60 | 43.19 | 73.37 | 83.86 | 108.28 | 89.52 | 81.06 | 76.36 | 16.46 | 17.14 | NA | NA | NA | |
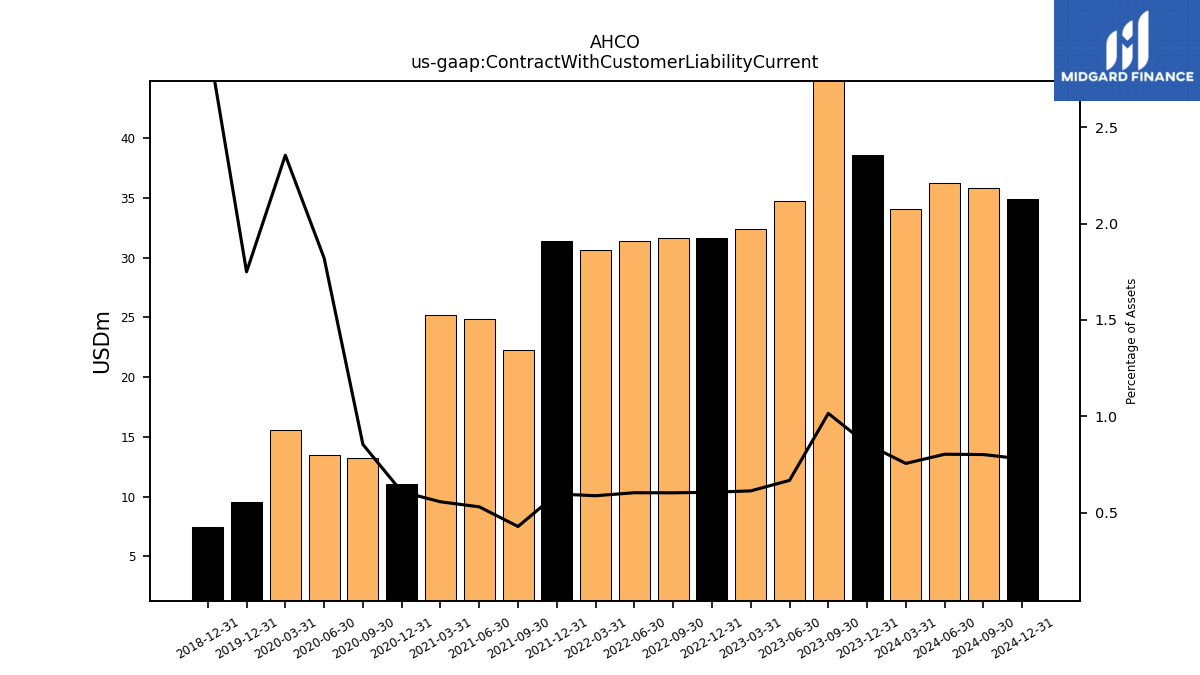
| Contract With Customer Liability Current | 38.57 | 47.98 | 34.75 | 32.41 | 31.64 | 31.61 | 31.41 | 30.61 | 31.37 | 22.25 | 24.87 | 25.17 | 11.04 | 13.23 | 13.46 | 15.58 | 9.56 | NA | NA | NA |
| 2023-12-31 | 2023-09-30 | 2023-06-30 | 2023-03-31 | 2022-12-31 | 2022-09-30 | 2022-06-30 | 2022-03-31 | 2021-12-31 | 2021-09-30 | 2021-06-30 | 2021-03-31 | 2020-12-31 | 2020-09-30 | 2020-06-30 | 2020-03-31 | 2019-12-31 | 2019-09-30 | 2019-06-30 | 2019-03-31 | ||
|---|---|---|---|---|---|---|---|---|---|---|---|---|---|---|---|---|---|---|---|---|---|
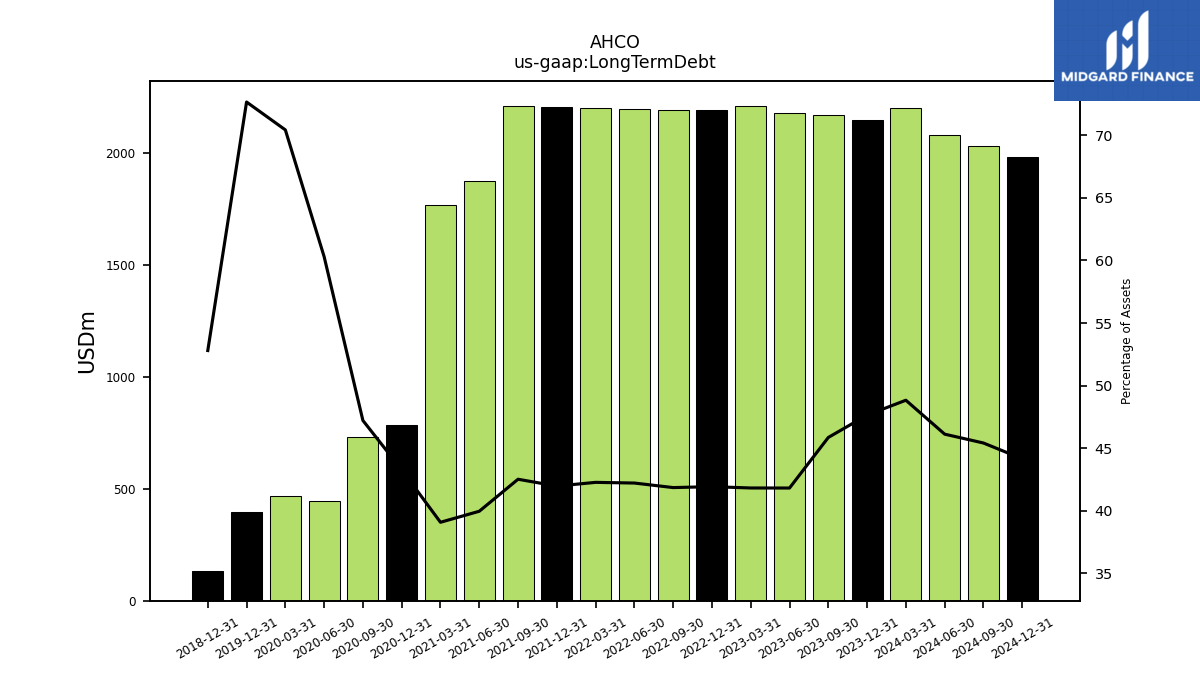
| Long Term Debt | 2147.98 | 2166.80 | 2175.62 | 2209.45 | 2188.27 | 2192.09 | 2195.91 | 2199.73 | 2203.55 | 2207.37 | 1873.08 | 1766.33 | 784.71 | 731.21 | 445.83 | 466.17 | 396.83 | NA | NA | NA | |
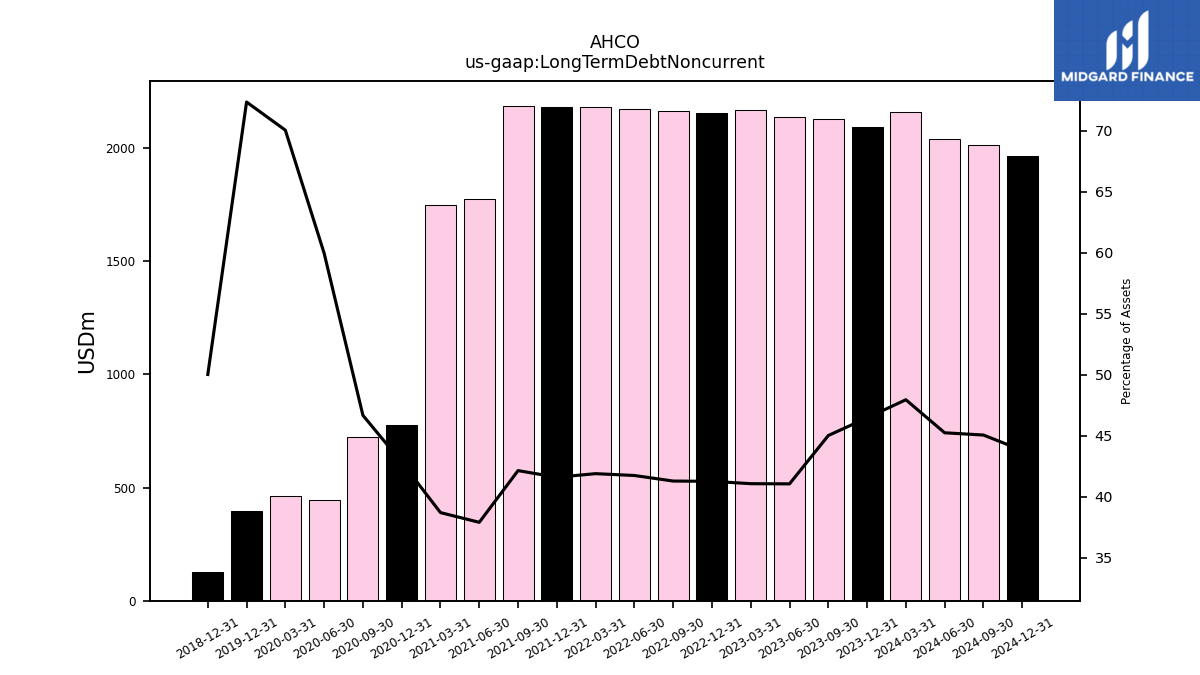
| Long Term Debt Noncurrent | 2094.61 | 2126.80 | 2135.62 | 2169.45 | 2153.27 | 2162.09 | 2170.91 | 2179.73 | 2183.55 | 2187.37 | 1776.33 | 1748.83 | 776.57 | 722.73 | 443.25 | 463.55 | 395.11 | NA | NA | NA | |
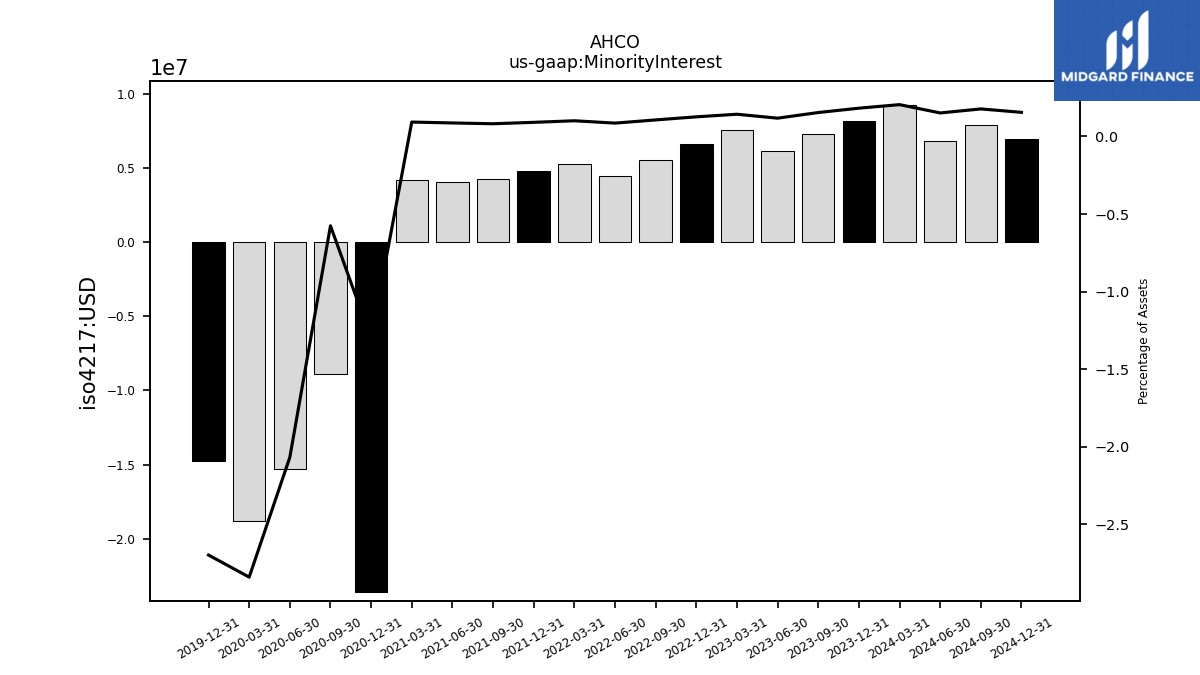
| Minority Interest | 8.21 | 7.29 | 6.13 | 7.57 | 6.60 | 5.58 | 4.48 | 5.26 | 4.78 | 4.25 | 4.08 | 4.20 | -23.59 | -8.91 | -15.29 | -18.79 | -14.73 | NA | NA | NA | |
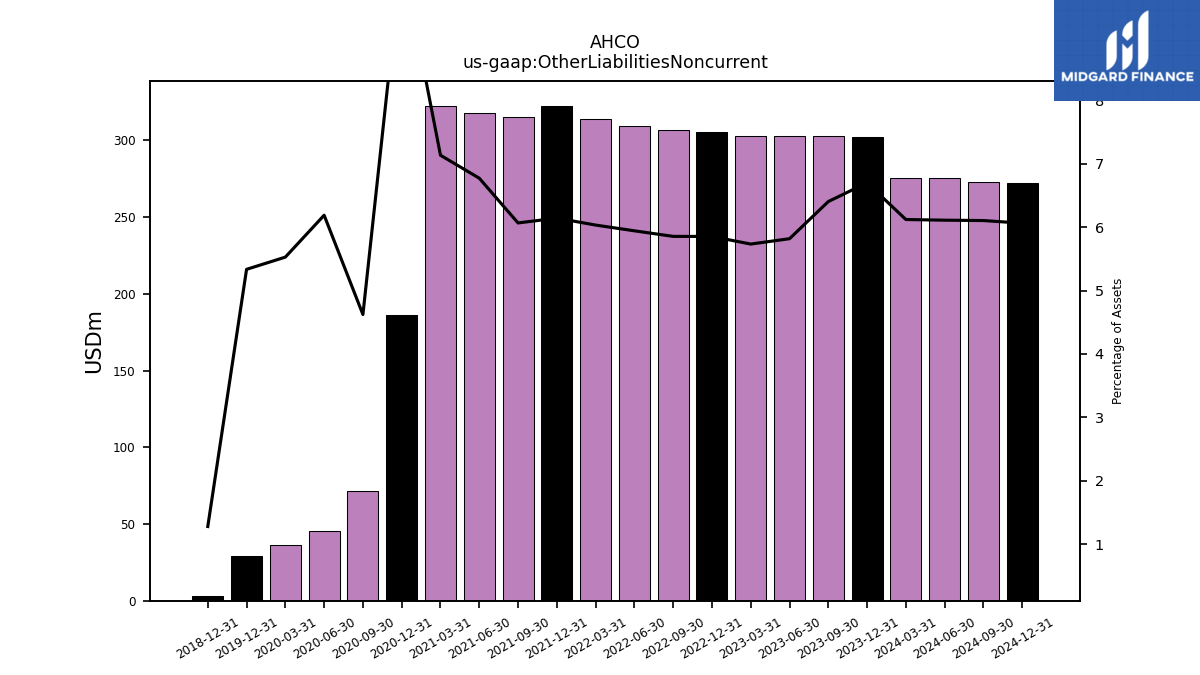
| Other Liabilities Noncurrent | 302.09 | 302.59 | 302.68 | 302.89 | 305.50 | 306.64 | 309.10 | 313.96 | 322.49 | 314.93 | 317.46 | 322.48 | 186.47 | 71.58 | 45.75 | 36.58 | 29.13 | NA | NA | NA | |
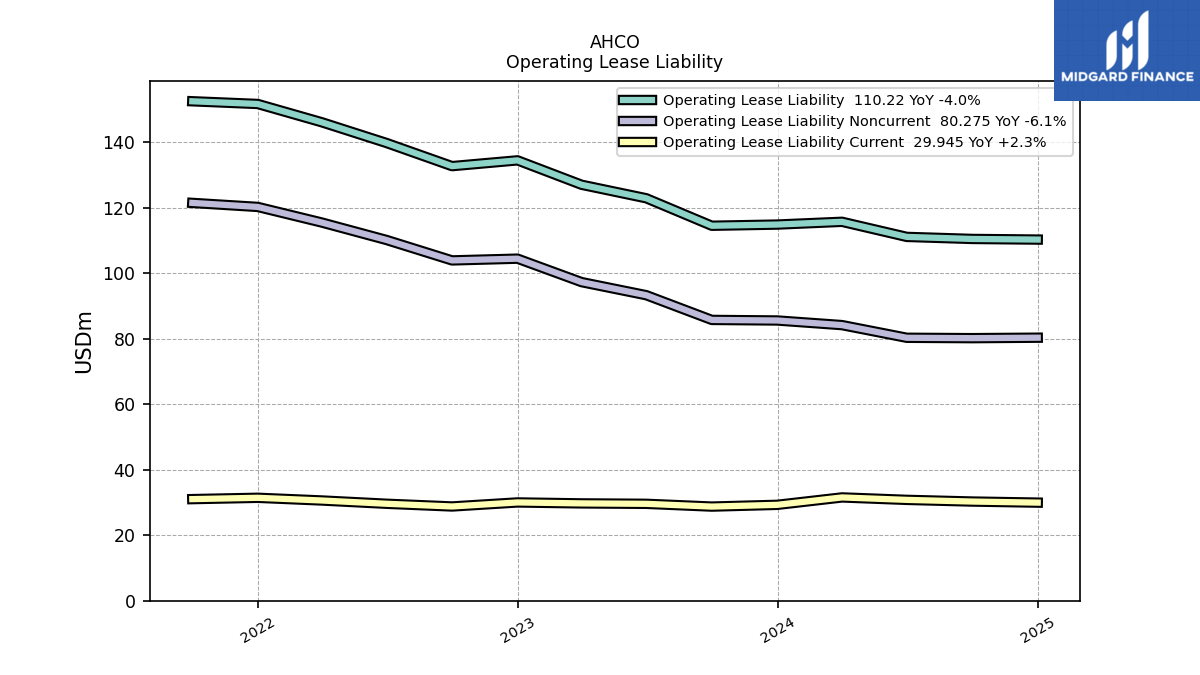
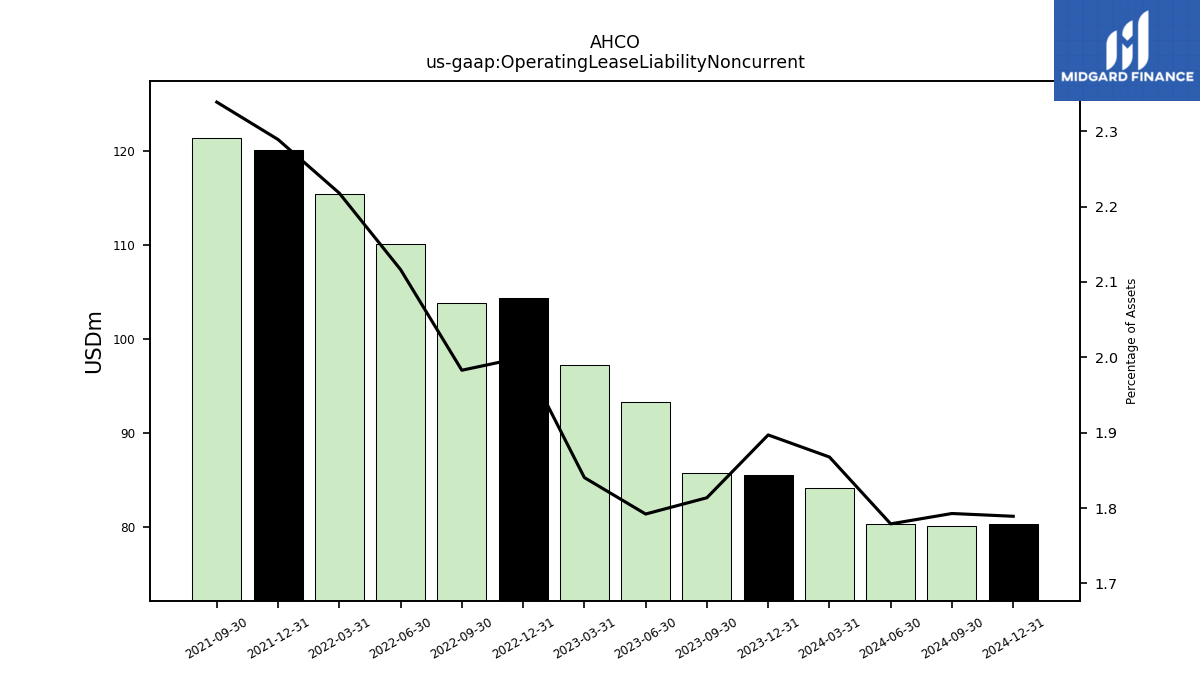
| Operating Lease Liability Noncurrent | 85.53 | 85.70 | 93.24 | 97.24 | 104.39 | 103.86 | 110.09 | 115.42 | 120.18 | 121.41 | NA | NA | NA | NA | NA | NA | NA | NA | NA | NA |
| 2023-12-31 | 2023-09-30 | 2023-06-30 | 2023-03-31 | 2022-12-31 | 2022-09-30 | 2022-06-30 | 2022-03-31 | 2021-12-31 | 2021-09-30 | 2021-06-30 | 2021-03-31 | 2020-12-31 | 2020-09-30 | 2020-06-30 | 2020-03-31 | 2019-12-31 | 2019-09-30 | 2019-06-30 | 2019-03-31 | ||
|---|---|---|---|---|---|---|---|---|---|---|---|---|---|---|---|---|---|---|---|---|---|
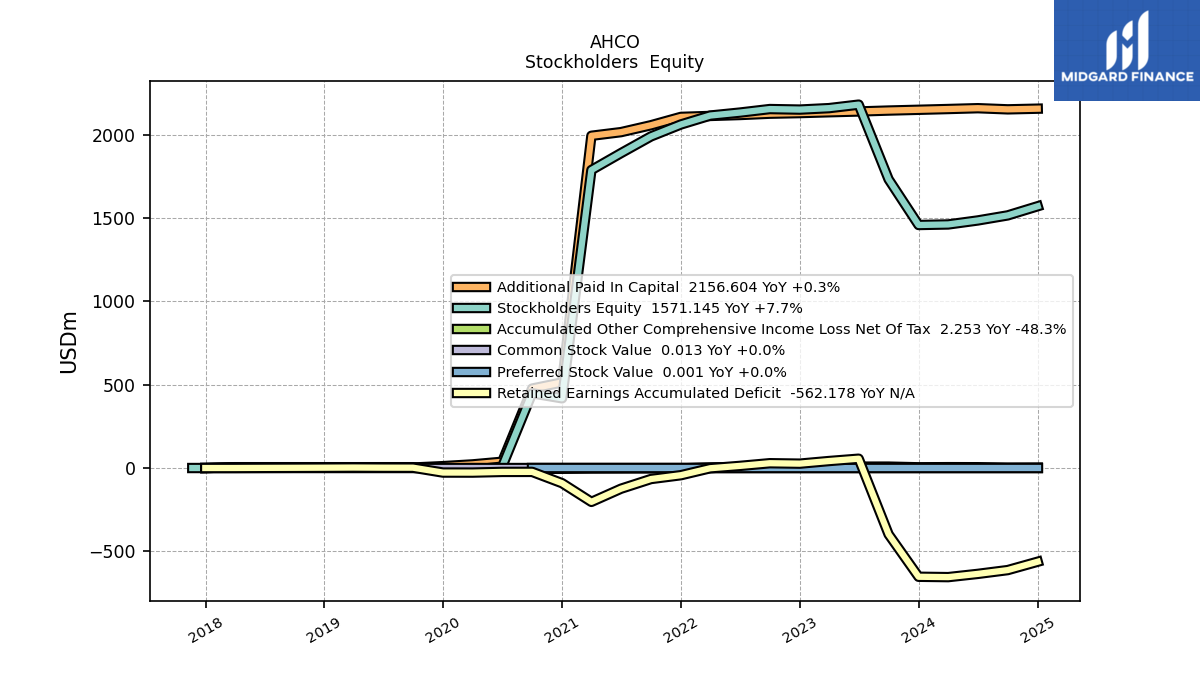
| Stockholders Equity | 1458.45 | 1732.48 | 2180.94 | 2159.89 | 2151.16 | 2154.37 | 2133.22 | 2115.36 | 2061.91 | 1990.11 | 1889.96 | 1788.28 | 418.34 | 448.63 | 8.49 | -10.66 | -14.52 | 5.00 | 5.00 | 5.00 | |
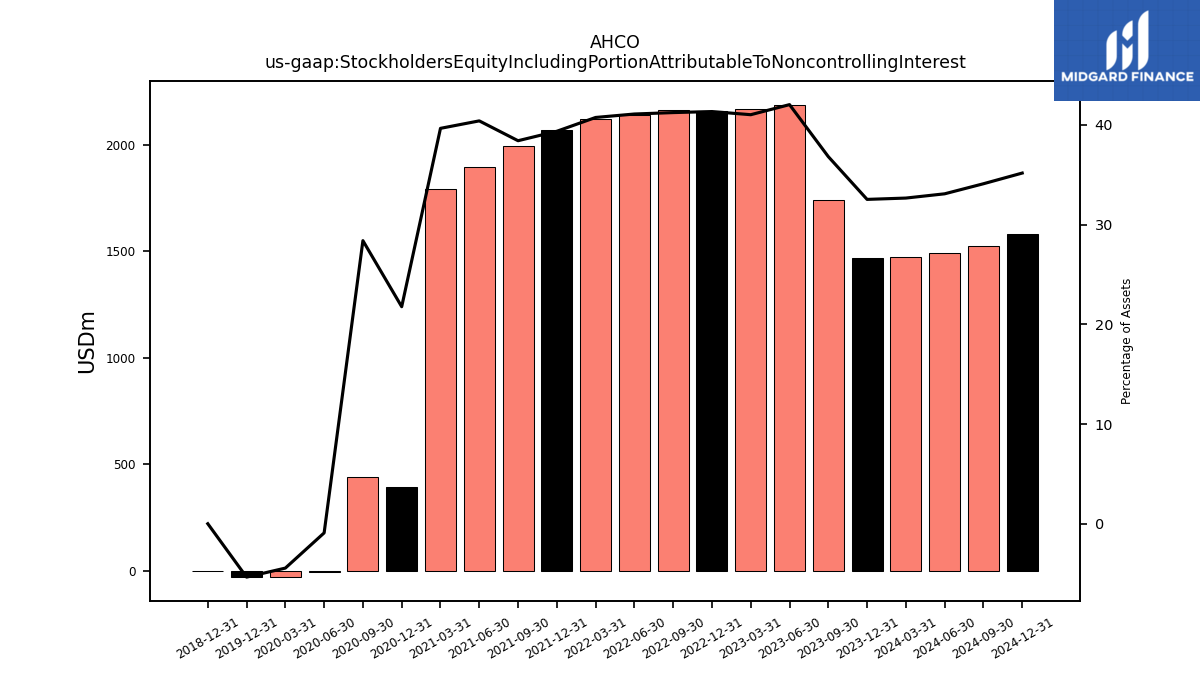
| Stockholders Equity Including Portion Attributable To Noncontrolling Interest | 1466.67 | 1739.77 | 2187.07 | 2167.46 | 2157.76 | 2159.95 | 2137.69 | 2120.63 | 2066.69 | 1994.36 | 1894.04 | 1792.48 | 394.75 | 439.71 | -6.79 | -29.45 | -29.25 | NA | NA | NA | |
| Common Stock Value | 0.01 | 0.01 | 0.01 | 0.01 | 0.01 | 0.01 | 0.01 | 0.01 | 0.01 | NA | NA | NA | NA | NA | NA | NA | NA | 0.00 | 0.00 | 0.00 | |
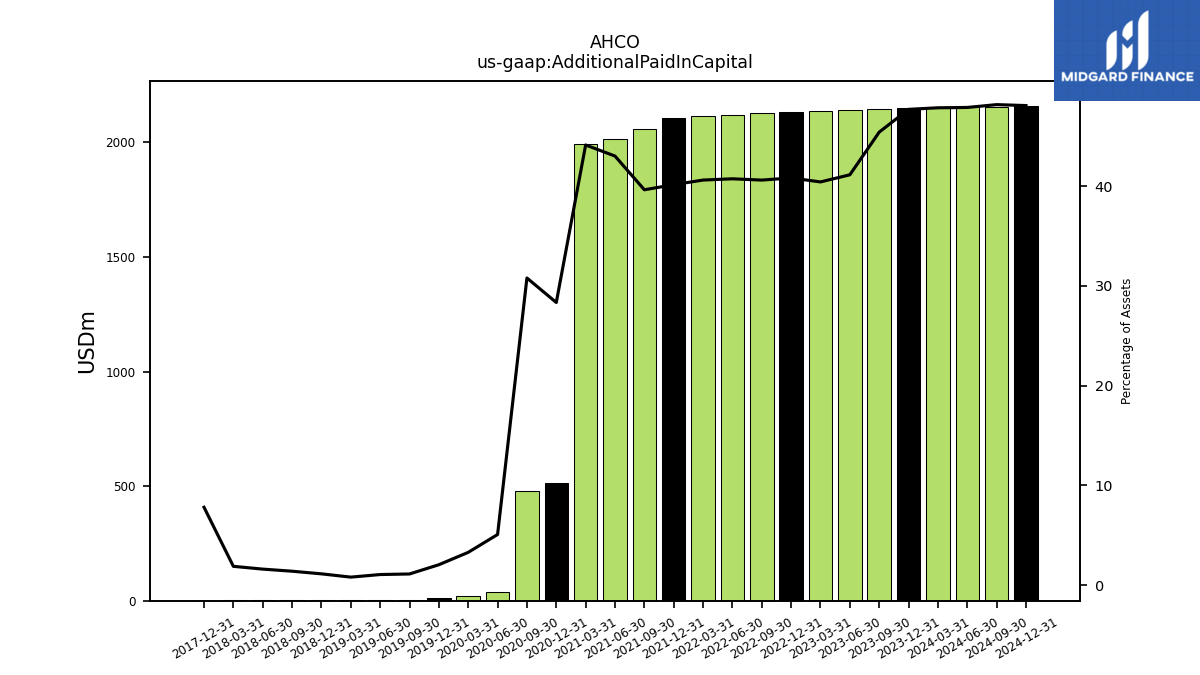
| Additional Paid In Capital | 2149.95 | 2145.38 | 2139.82 | 2135.20 | 2130.15 | 2126.47 | 2118.58 | 2112.98 | 2107.27 | 2057.29 | 2015.88 | 1993.96 | 513.81 | 476.86 | 37.61 | 21.84 | 11.25 | 2.91 | 2.76 | 2.09 | |
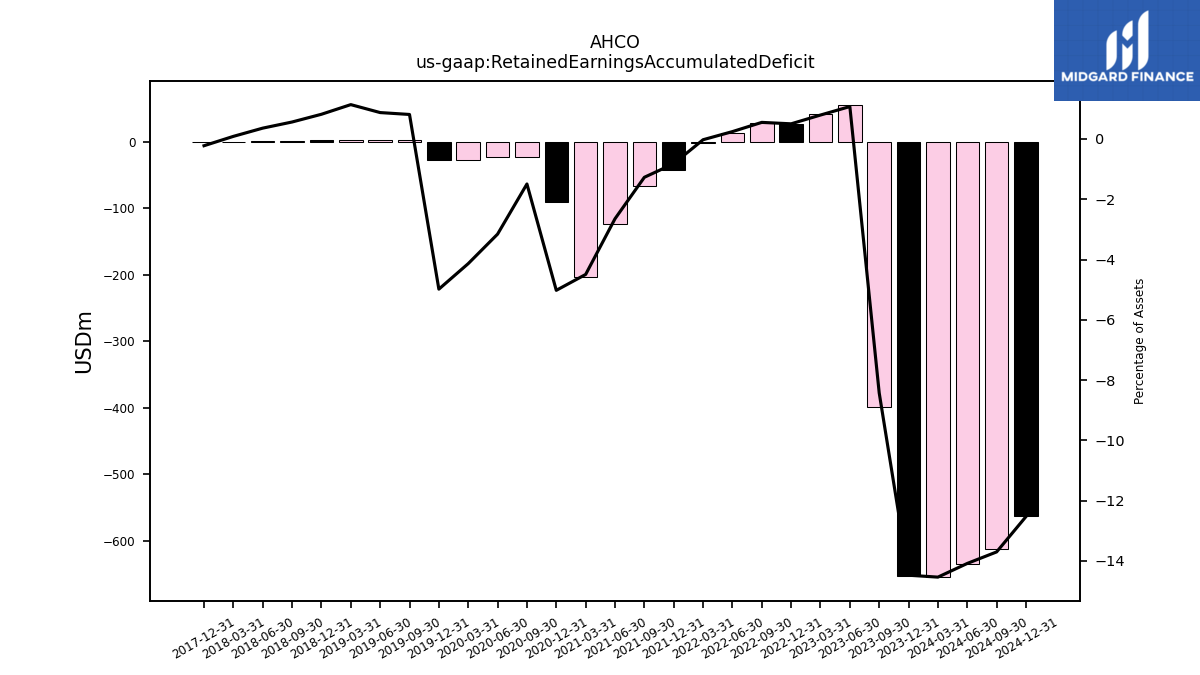
| Retained Earnings Accumulated Deficit | -652.60 | -398.10 | 55.98 | 42.00 | 26.30 | 28.88 | 12.76 | -1.27 | -43.02 | -65.96 | -124.06 | -203.16 | -91.06 | -23.13 | -23.34 | -27.37 | -27.21 | 2.09 | 2.24 | 2.91 | |
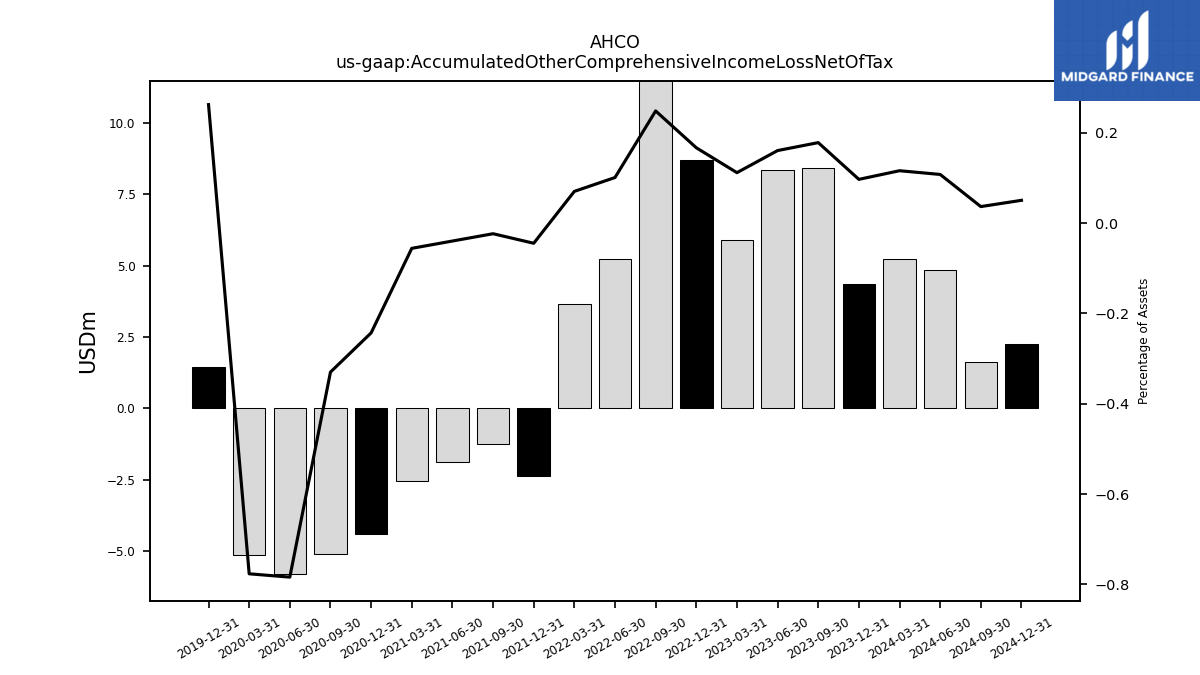
| Accumulated Other Comprehensive Income Loss Net Of Tax | 4.36 | 8.41 | 8.34 | 5.89 | 8.69 | 12.99 | 5.24 | 3.64 | -2.35 | -1.23 | -1.87 | -2.54 | -4.41 | -5.11 | -5.79 | -5.14 | 1.43 | NA | NA | NA | |
| Minority Interest | 8.21 | 7.29 | 6.13 | 7.57 | 6.60 | 5.58 | 4.48 | 5.26 | 4.78 | 4.25 | 4.08 | 4.20 | -23.59 | -8.91 | -15.29 | -18.79 | -14.73 | NA | NA | NA |
| 2023-12-31 | 2023-09-30 | 2023-06-30 | 2023-03-31 | 2022-12-31 | 2022-09-30 | 2022-06-30 | 2022-03-31 | 2021-12-31 | 2021-09-30 | 2021-06-30 | 2021-03-31 | 2020-12-31 | 2020-09-30 | 2020-06-30 | 2020-03-31 | 2019-12-31 | 2019-09-30 | 2019-06-30 | 2019-03-31 | ||
|---|---|---|---|---|---|---|---|---|---|---|---|---|---|---|---|---|---|---|---|---|---|
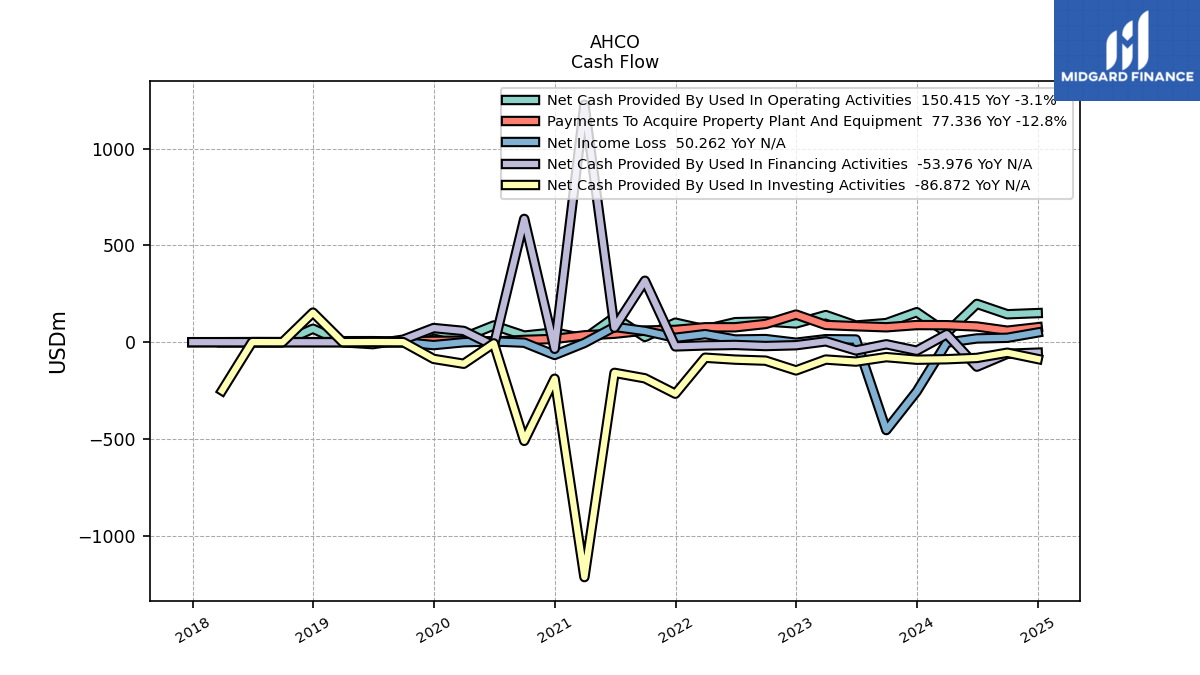
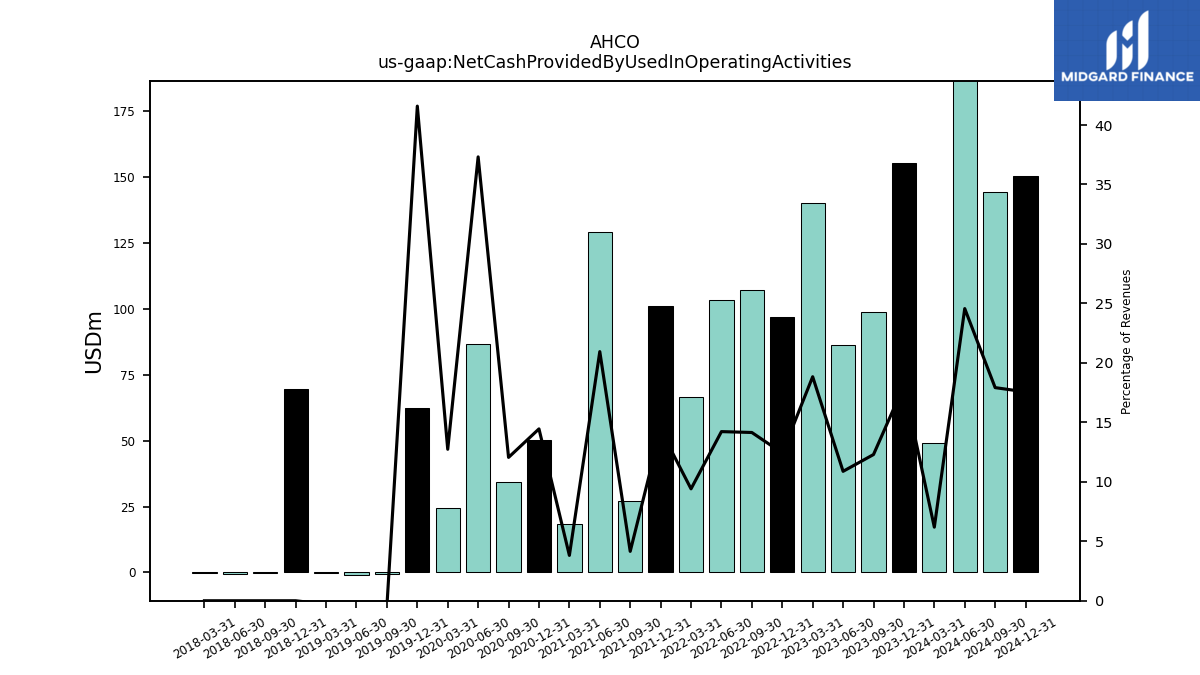
| Net Cash Provided By Used In Operating Activities | 155.27 | 98.83 | 86.32 | 140.25 | 96.92 | 107.02 | 103.47 | 66.45 | 100.93 | 27.13 | 129.24 | 18.38 | 50.35 | 34.28 | 86.63 | 24.38 | 62.19 | -0.61 | -0.81 | -0.36 | |
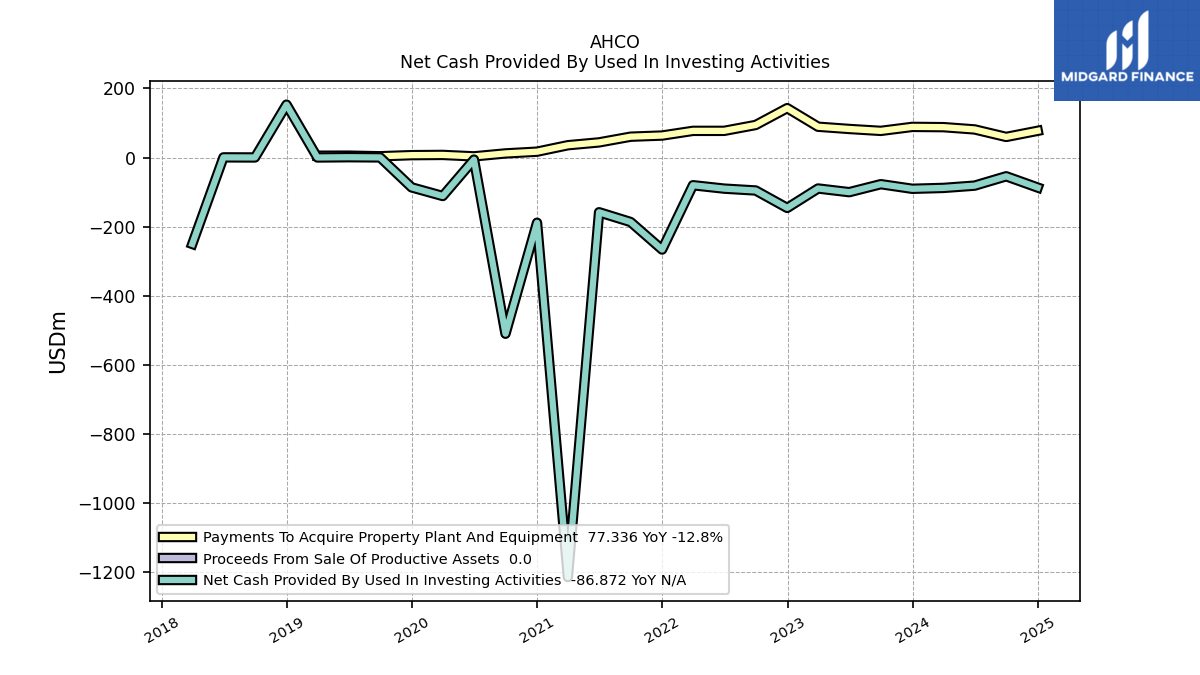
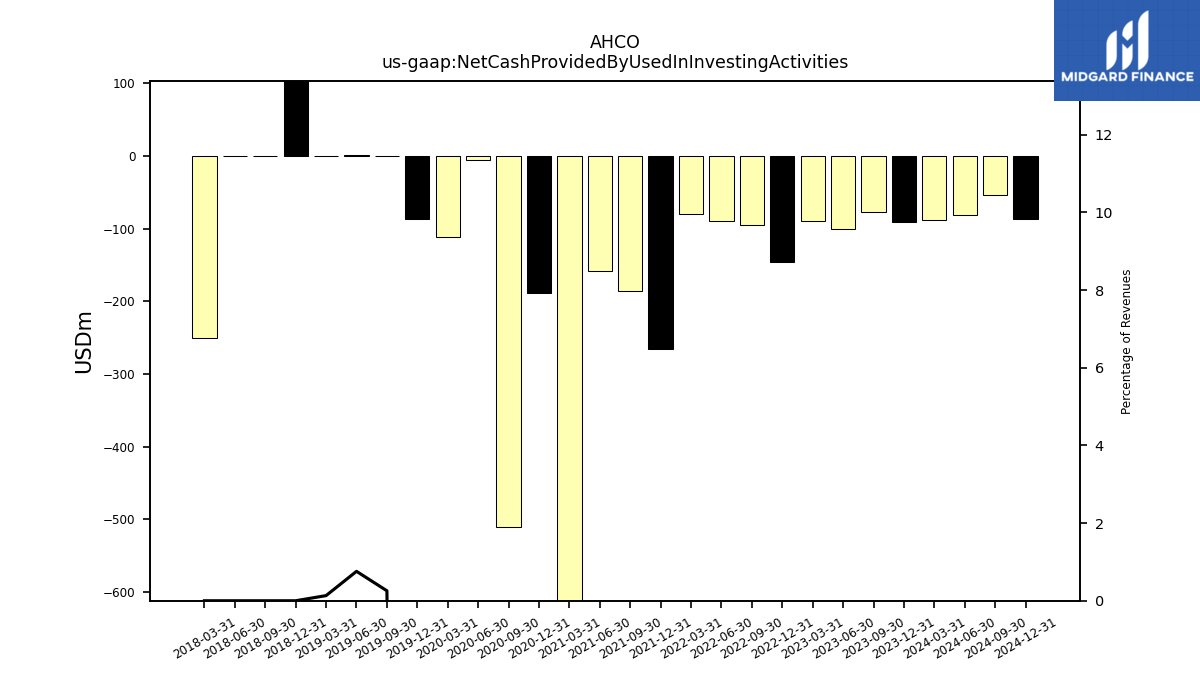
| Net Cash Provided By Used In Investing Activities | -90.42 | -77.10 | -100.20 | -89.57 | -145.79 | -95.34 | -89.93 | -80.10 | -266.25 | -186.48 | -158.26 | -1213.76 | -188.61 | -509.76 | -6.00 | -111.33 | -86.32 | 0.35 | 0.94 | 0.16 | |
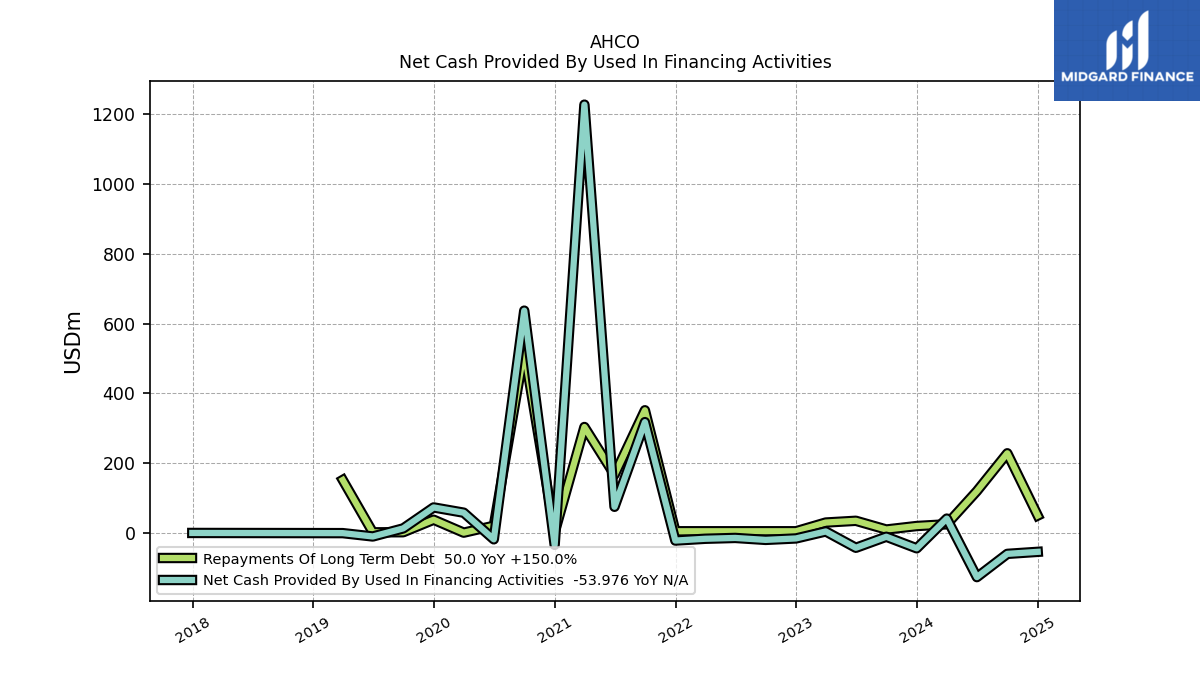
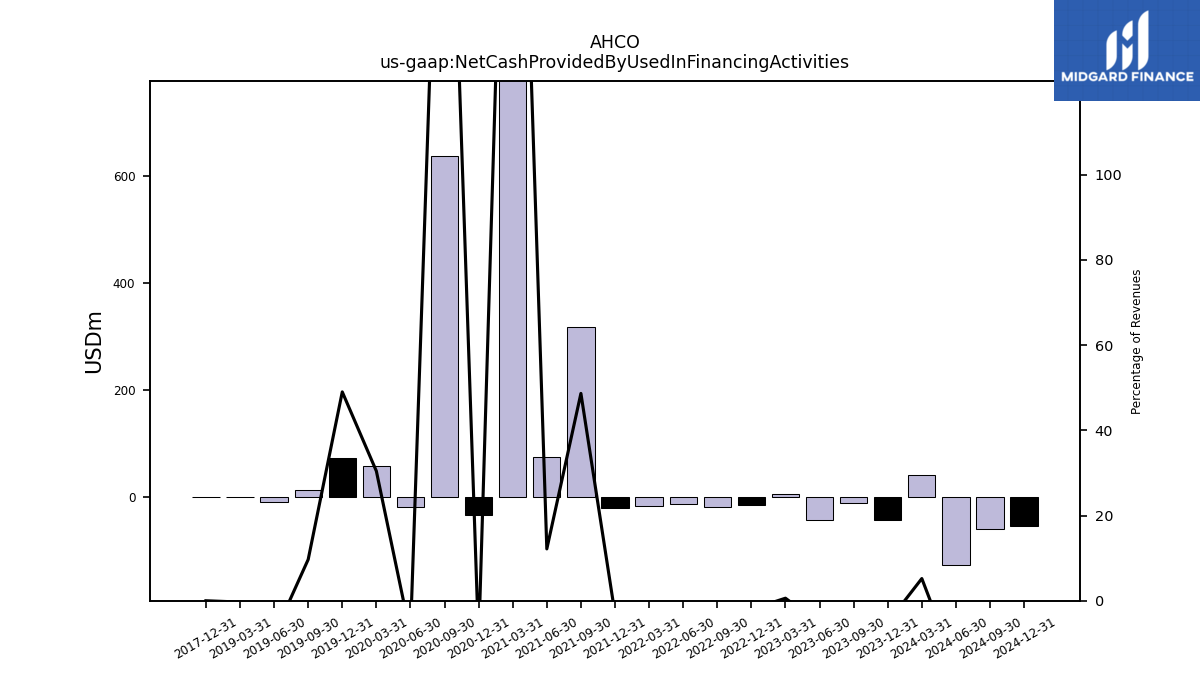
| Net Cash Provided By Used In Financing Activities | -43.86 | -10.72 | -42.40 | 4.45 | -15.59 | -19.75 | -14.16 | -16.55 | -21.71 | 317.82 | 75.07 | 1227.56 | -34.10 | 637.22 | -18.20 | 58.23 | 73.28 | 13.21 | -9.98 | -0.37 |
| 2023-12-31 | 2023-09-30 | 2023-06-30 | 2023-03-31 | 2022-12-31 | 2022-09-30 | 2022-06-30 | 2022-03-31 | 2021-12-31 | 2021-09-30 | 2021-06-30 | 2021-03-31 | 2020-12-31 | 2020-09-30 | 2020-06-30 | 2020-03-31 | 2019-12-31 | 2019-09-30 | 2019-06-30 | 2019-03-31 | ||
|---|---|---|---|---|---|---|---|---|---|---|---|---|---|---|---|---|---|---|---|---|---|
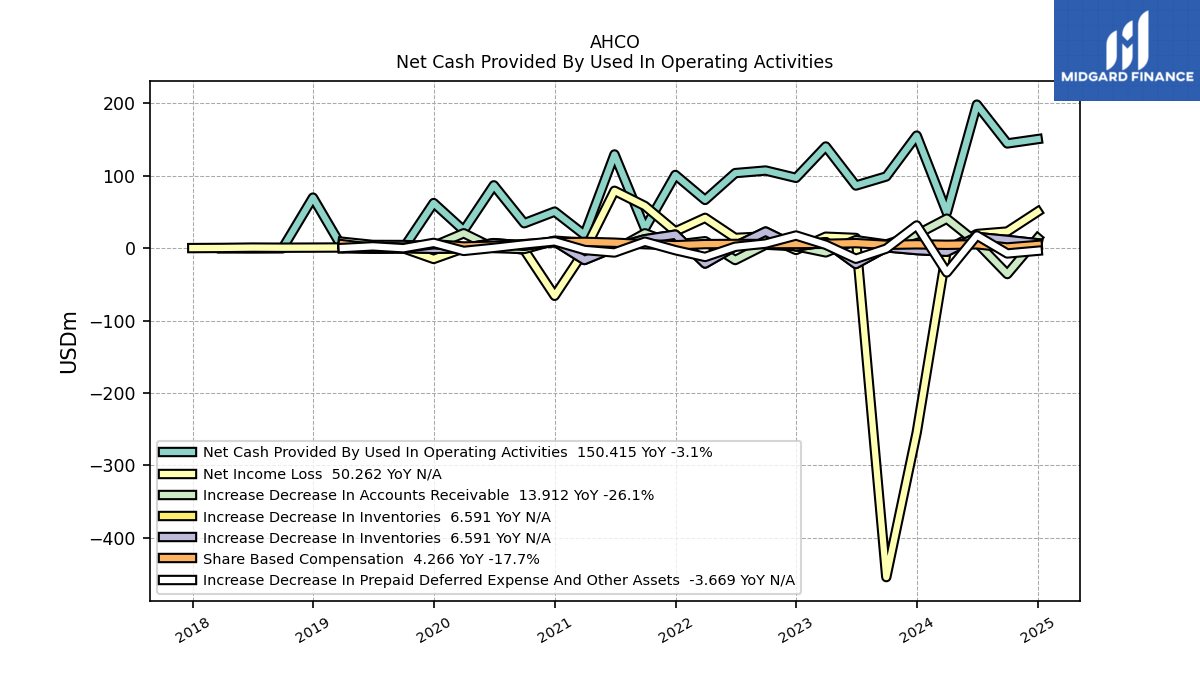
| Net Cash Provided By Used In Operating Activities | 155.27 | 98.83 | 86.32 | 140.25 | 96.92 | 107.02 | 103.47 | 66.45 | 100.93 | 27.13 | 129.24 | 18.38 | 50.35 | 34.28 | 86.63 | 24.38 | 62.19 | -0.61 | -0.81 | -0.36 | |
| Net Income Loss | -254.50 | -454.08 | 13.98 | 15.71 | -2.59 | 16.12 | 14.03 | 41.75 | 22.94 | 58.09 | 79.11 | -3.97 | -65.87 | -2.49 | 4.03 | -0.16 | -15.00 | -0.15 | -0.67 | 0.83 | |
| Profit Loss | -253.57 | -452.92 | 15.04 | 16.68 | -1.57 | 17.23 | 15.25 | 42.23 | 23.47 | 58.27 | 80.06 | -3.64 | -62.33 | -3.83 | 7.17 | 0.27 | -2.65 | -3.06 | -1.72 | -5.45 | |
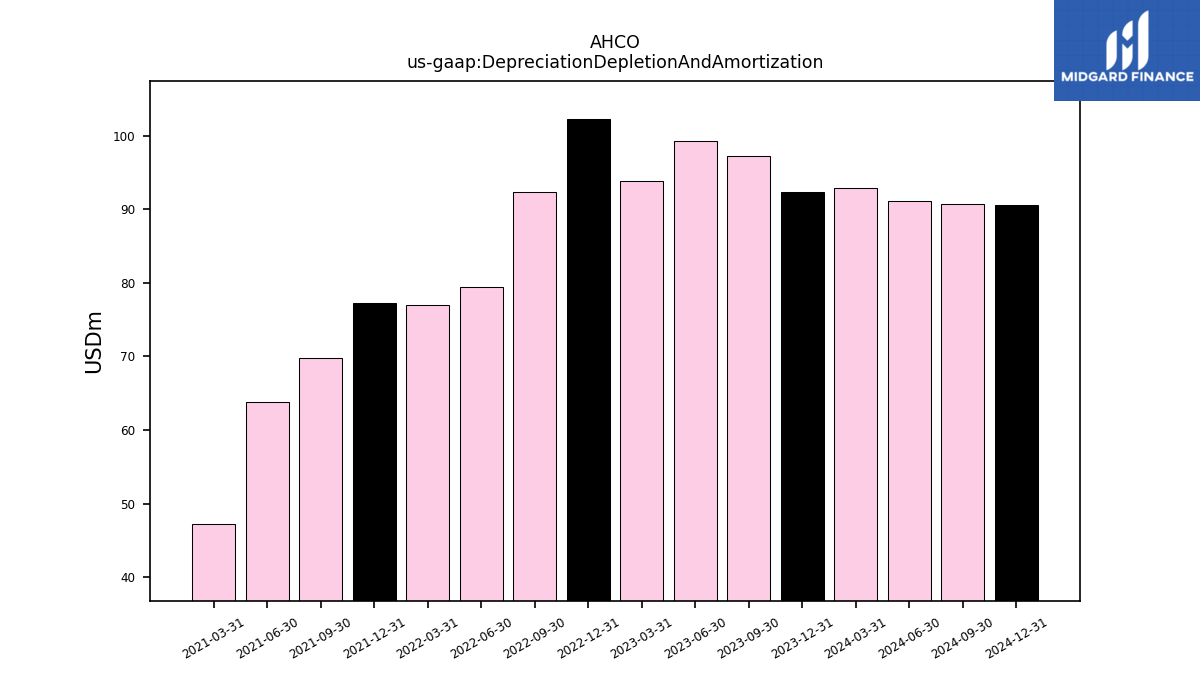
| Depreciation Depletion And Amortization | 92.36 | 97.31 | 99.30 | 93.81 | 102.34 | 92.33 | 79.47 | 77.03 | 77.23 | 69.83 | 63.79 | 47.21 | NA | NA | NA | NA | NA | NA | NA | NA | |
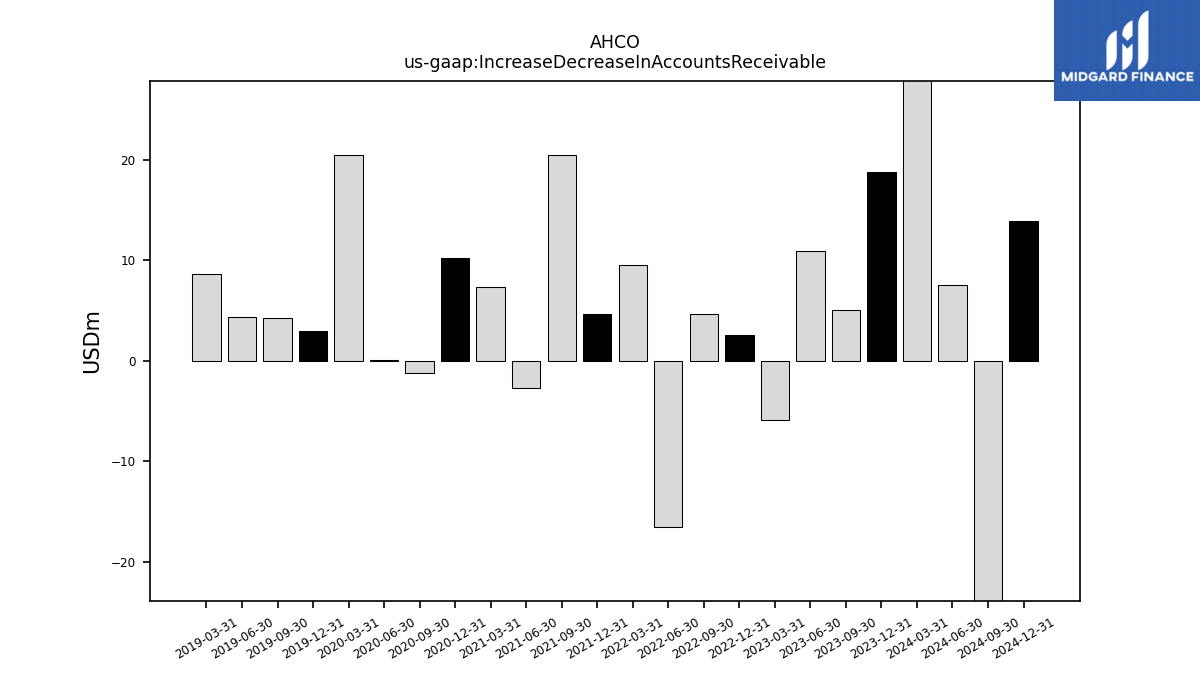
| Increase Decrease In Accounts Receivable | 18.82 | 5.03 | 10.93 | -5.92 | 2.57 | 4.67 | -16.51 | 9.48 | 4.65 | 20.44 | -2.74 | 7.34 | 10.27 | -1.25 | 0.05 | 20.46 | 2.95 | 4.26 | 4.35 | 8.64 | |
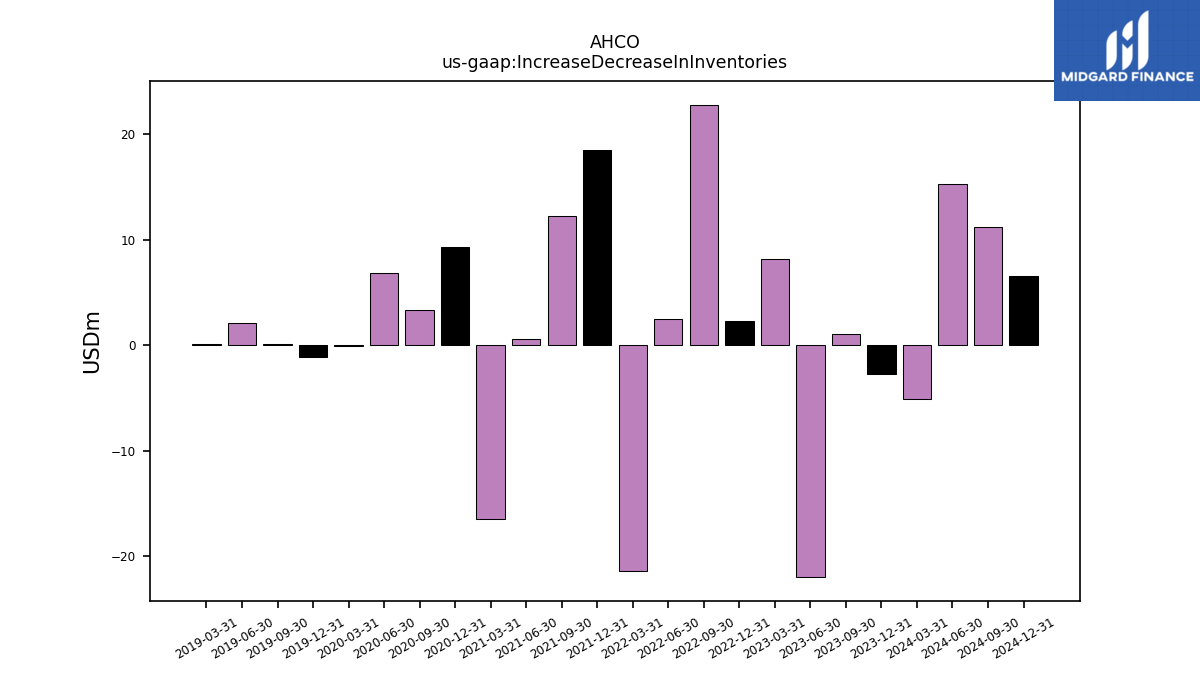
| Increase Decrease In Inventories | -2.76 | 1.04 | -21.96 | 8.15 | 2.31 | 22.80 | 2.52 | -21.33 | 18.55 | 12.21 | 0.60 | -16.44 | 9.27 | 3.37 | 6.84 | -0.05 | -1.08 | 0.14 | 2.08 | 0.16 | |
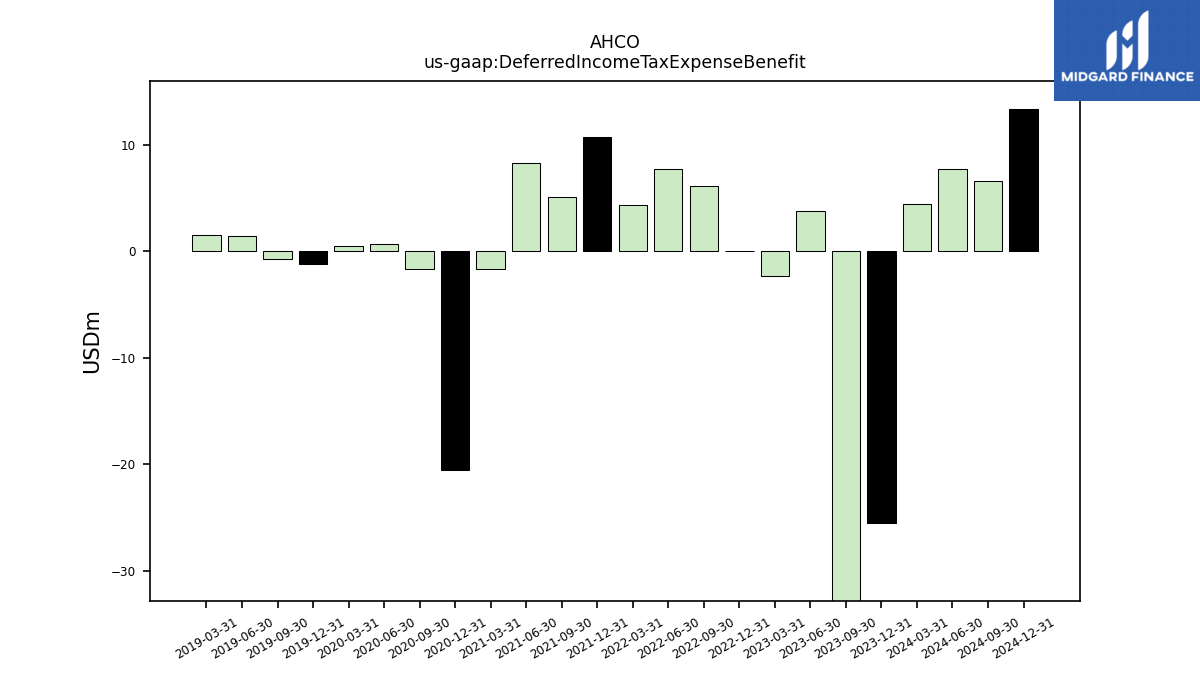
| Deferred Income Tax Expense Benefit | -25.56 | -38.45 | 3.74 | -2.33 | -0.02 | 6.08 | 7.67 | 4.30 | 10.71 | 5.12 | 8.24 | -1.70 | -20.54 | -1.69 | 0.65 | 0.48 | -1.22 | -0.76 | 1.39 | 1.48 | |
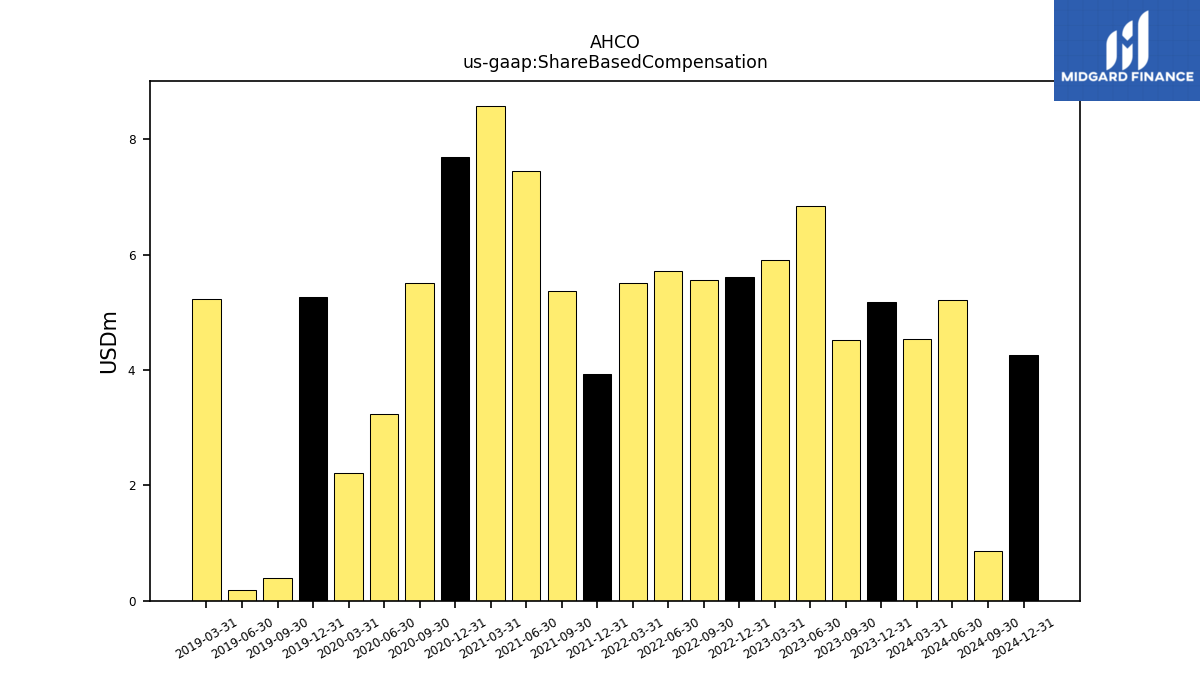
| Share Based Compensation | 5.18 | 4.52 | 6.85 | 5.92 | 5.61 | 5.56 | 5.72 | 5.50 | 3.93 | 5.37 | 7.45 | 8.58 | 7.70 | 5.50 | 3.24 | 2.22 | 5.26 | 0.40 | 0.18 | 5.22 | |
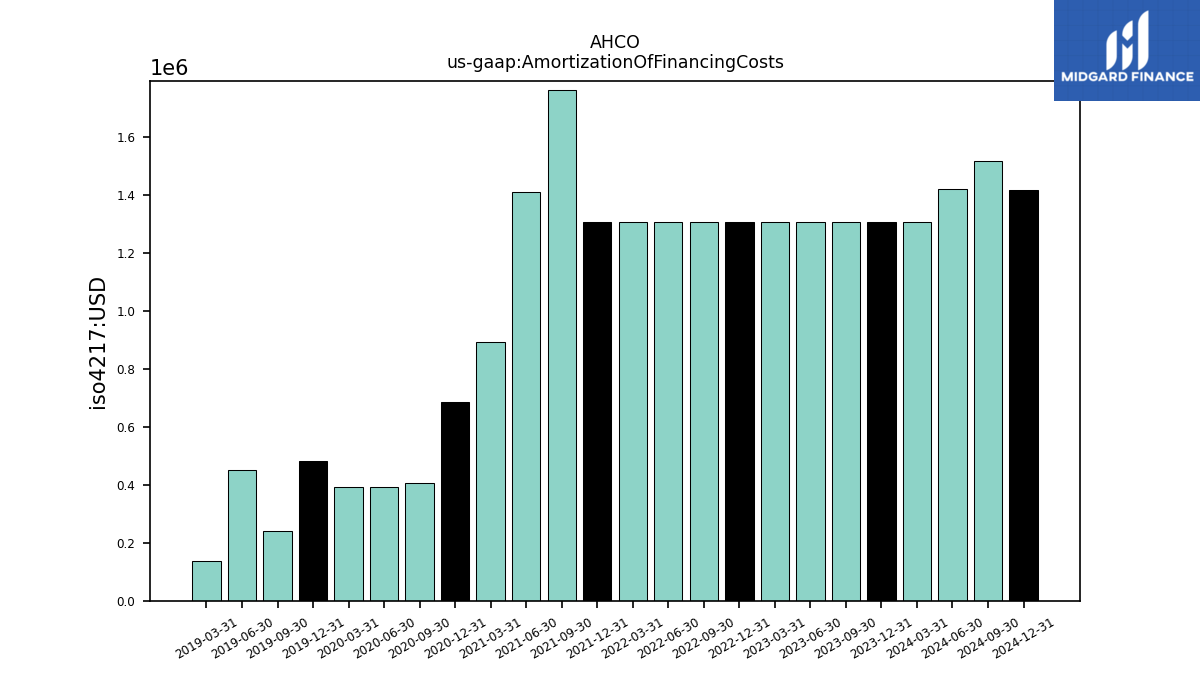
| Amortization Of Financing Costs | 1.31 | 1.31 | 1.31 | 1.31 | 1.31 | 1.31 | 1.31 | 1.31 | 1.31 | 1.76 | 1.41 | 0.89 | 0.69 | 0.41 | 0.39 | 0.39 | 0.48 | 0.24 | 0.45 | 0.14 |
| 2023-12-31 | 2023-09-30 | 2023-06-30 | 2023-03-31 | 2022-12-31 | 2022-09-30 | 2022-06-30 | 2022-03-31 | 2021-12-31 | 2021-09-30 | 2021-06-30 | 2021-03-31 | 2020-12-31 | 2020-09-30 | 2020-06-30 | 2020-03-31 | 2019-12-31 | 2019-09-30 | 2019-06-30 | 2019-03-31 | ||
|---|---|---|---|---|---|---|---|---|---|---|---|---|---|---|---|---|---|---|---|---|---|
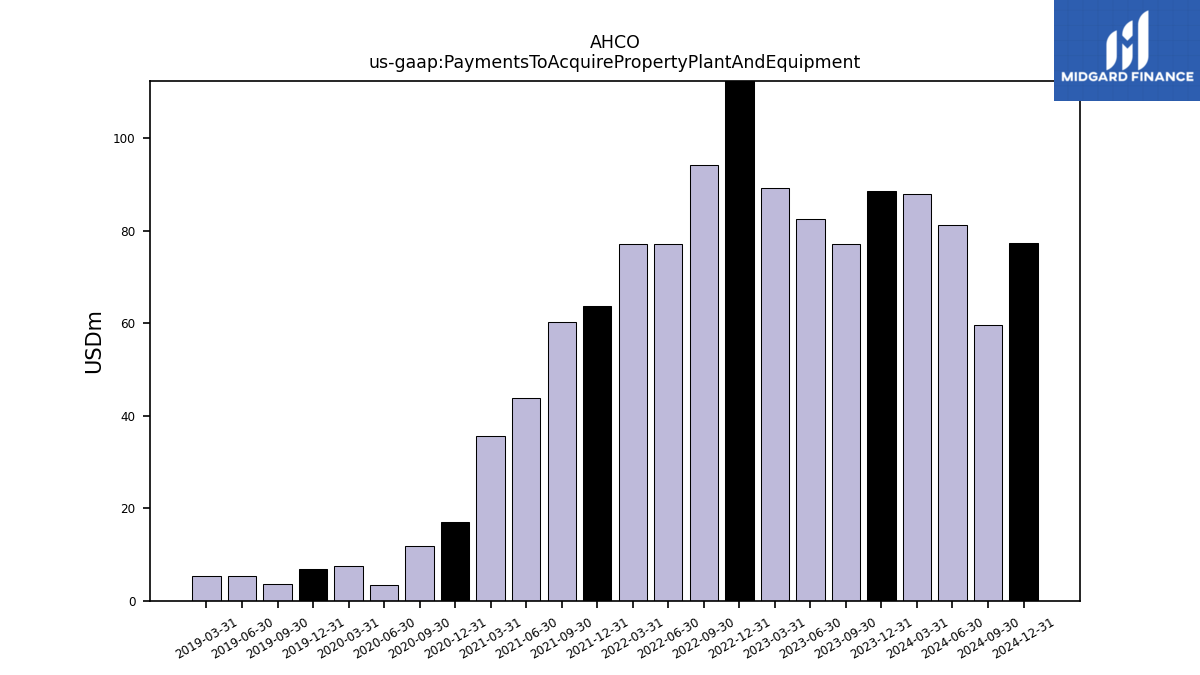
| Net Cash Provided By Used In Investing Activities | -90.42 | -77.10 | -100.20 | -89.57 | -145.79 | -95.34 | -89.93 | -80.10 | -266.25 | -186.48 | -158.26 | -1213.76 | -188.61 | -509.76 | -6.00 | -111.33 | -86.32 | 0.35 | 0.94 | 0.16 | |
| Payments To Acquire Property Plant And Equipment | 88.65 | 77.09 | 82.61 | 89.12 | 142.91 | 94.17 | 77.17 | 77.17 | 63.62 | 60.29 | 43.80 | 35.60 | 16.92 | 11.92 | 3.38 | 7.53 | 6.88 | 3.71 | 5.44 | 5.30 |
| 2023-12-31 | 2023-09-30 | 2023-06-30 | 2023-03-31 | 2022-12-31 | 2022-09-30 | 2022-06-30 | 2022-03-31 | 2021-12-31 | 2021-09-30 | 2021-06-30 | 2021-03-31 | 2020-12-31 | 2020-09-30 | 2020-06-30 | 2020-03-31 | 2019-12-31 | 2019-09-30 | 2019-06-30 | 2019-03-31 | ||
|---|---|---|---|---|---|---|---|---|---|---|---|---|---|---|---|---|---|---|---|---|---|
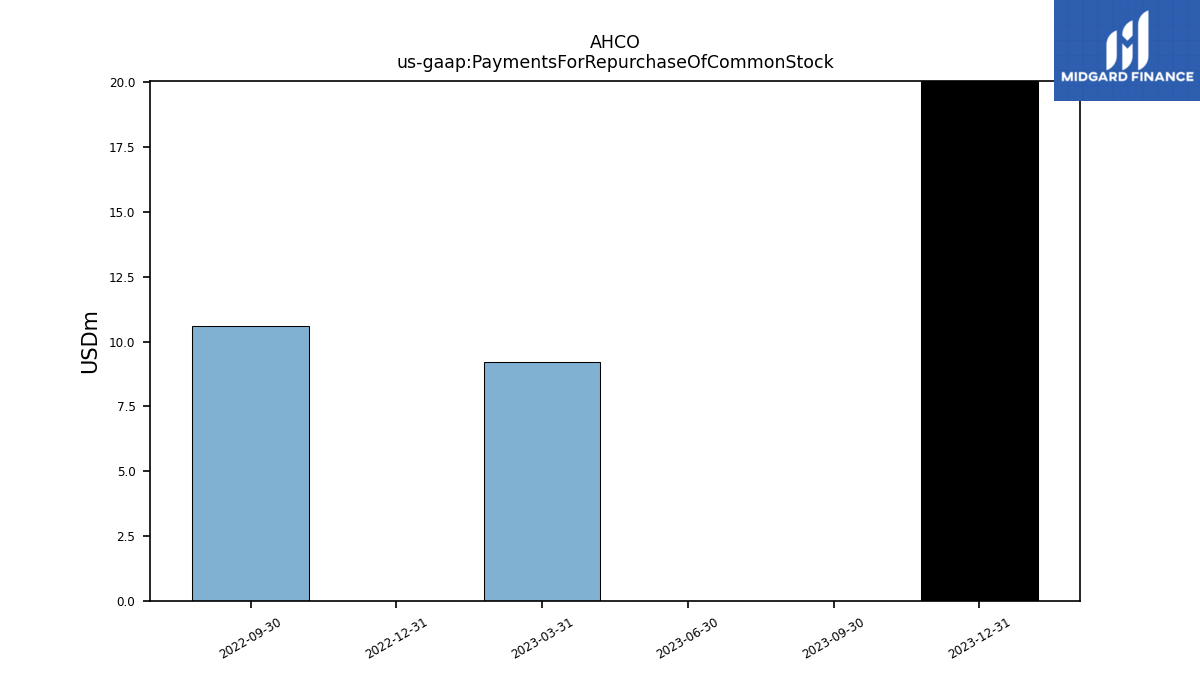
| Net Cash Provided By Used In Financing Activities | -43.86 | -10.72 | -42.40 | 4.45 | -15.59 | -19.75 | -14.16 | -16.55 | -21.71 | 317.82 | 75.07 | 1227.56 | -34.10 | 637.22 | -18.20 | 58.23 | 73.28 | 13.21 | -9.98 | -0.37 | |
| Payments For Repurchase Of Common Stock | 20.05 | 0.00 | 0.00 | 9.22 | 0.00 | 10.62 | NA | NA | NA | NA | NA | NA | NA | NA | NA | NA | NA | NA | NA | NA |
| 2023-12-31 | 2023-09-30 | 2023-06-30 | 2023-03-31 | 2022-12-31 | 2022-09-30 | 2022-06-30 | 2022-03-31 | 2021-12-31 | 2021-09-30 | 2021-06-30 | 2021-03-31 | 2020-12-31 | 2020-09-30 | 2020-06-30 | 2020-03-31 | 2019-12-31 | 2019-09-30 | 2019-06-30 | 2019-03-31 | ||
|---|---|---|---|---|---|---|---|---|---|---|---|---|---|---|---|---|---|---|---|---|---|
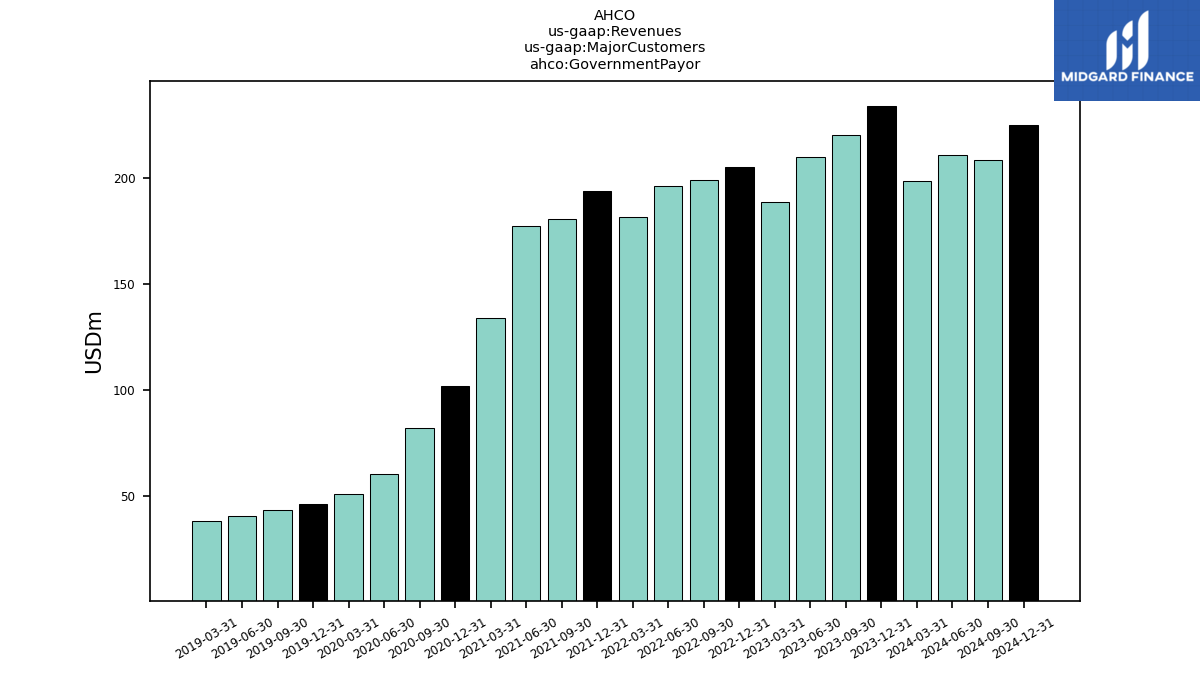
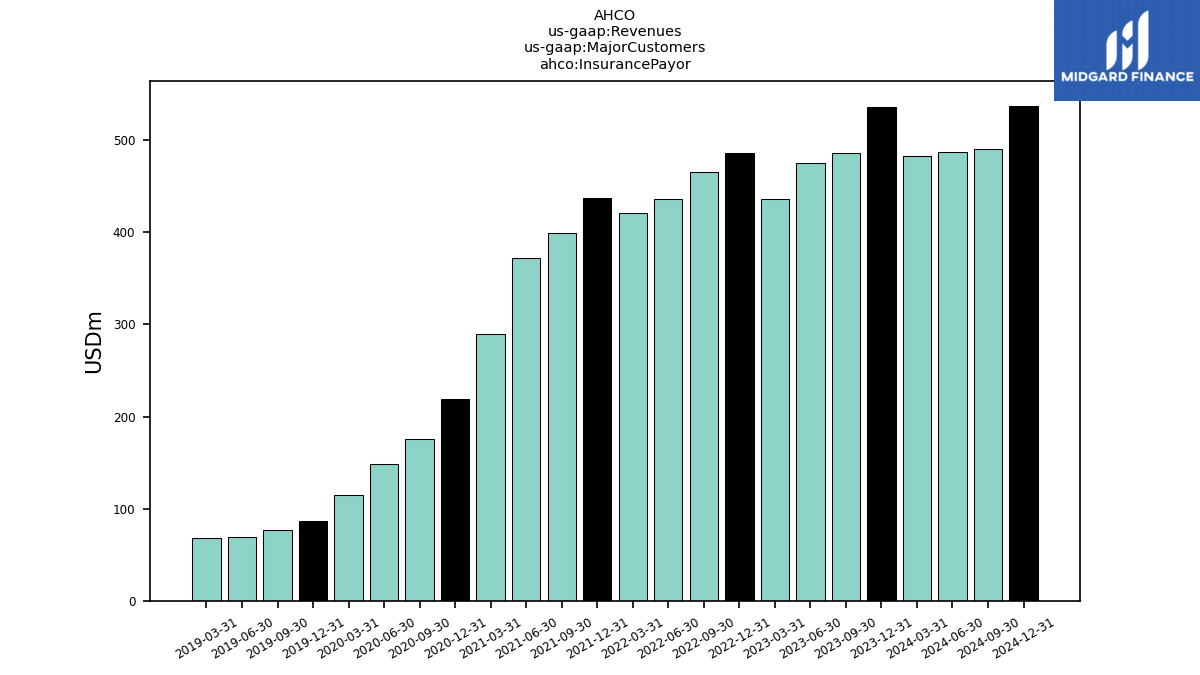
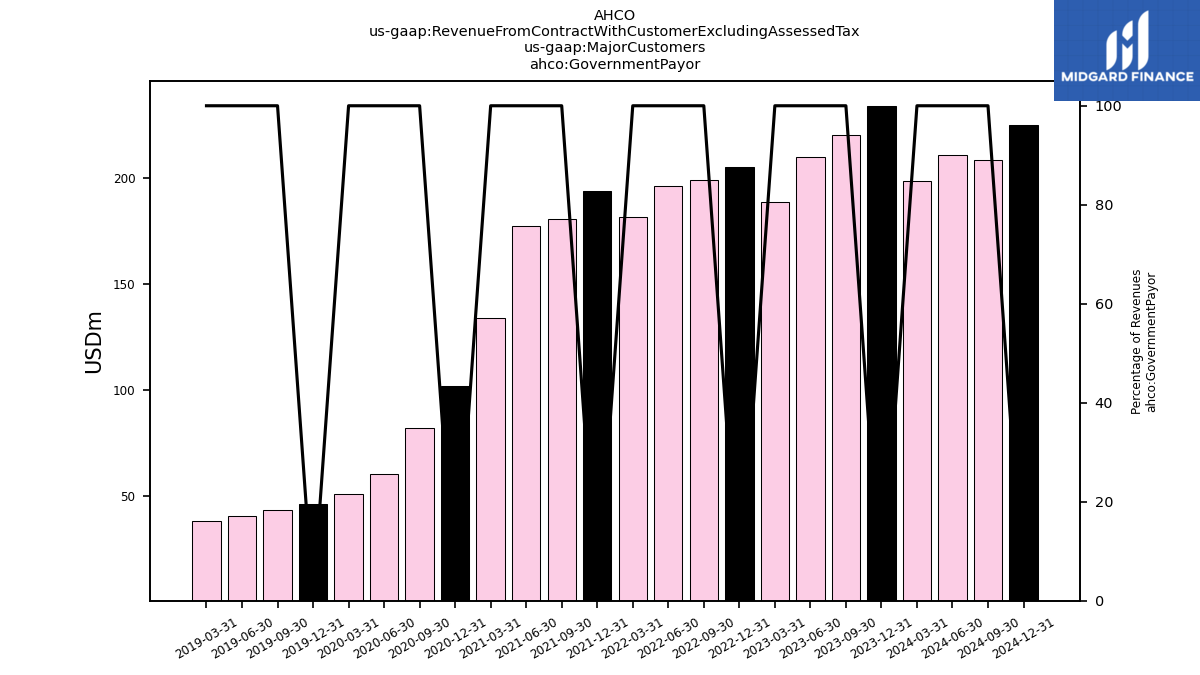
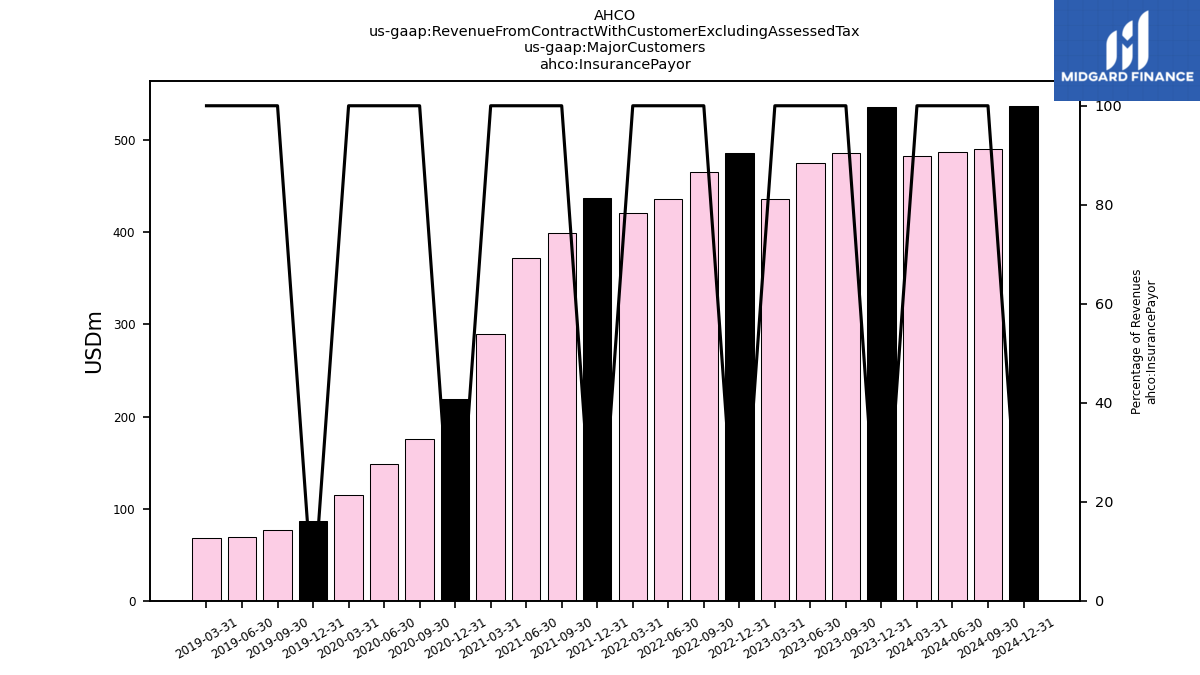
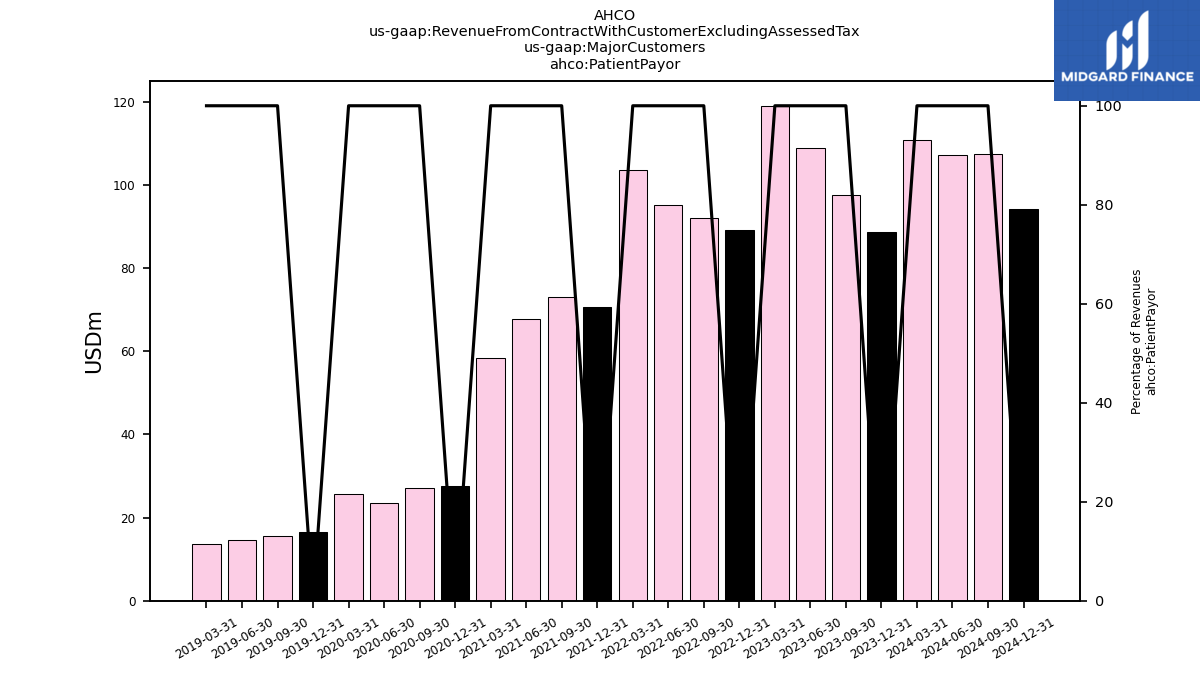
| Revenues | 858.23 | 804.03 | 793.29 | 744.63 | 780.28 | 756.50 | 727.61 | 706.20 | 702.11 | 653.29 | 617.02 | 482.12 | 348.43 | 284.40 | 232.12 | 191.44 | 149.54 | 136.45 | 124.15 | 119.50 | |
| Government Payor | 233.93 | 220.35 | 209.66 | 188.85 | 205.15 | 198.84 | 196.34 | 181.65 | 193.95 | 180.51 | 177.32 | 133.73 | 101.93 | 81.97 | 60.51 | 51.24 | 46.33 | 43.68 | 40.58 | 38.10 | |
| Insurance Payor | 535.69 | 486.14 | 474.83 | 436.78 | 485.94 | 465.62 | 436.18 | 420.89 | 437.53 | 399.75 | 371.87 | 290.01 | 219.00 | 175.42 | 148.16 | 114.45 | 86.60 | 77.14 | 68.91 | 67.72 | |
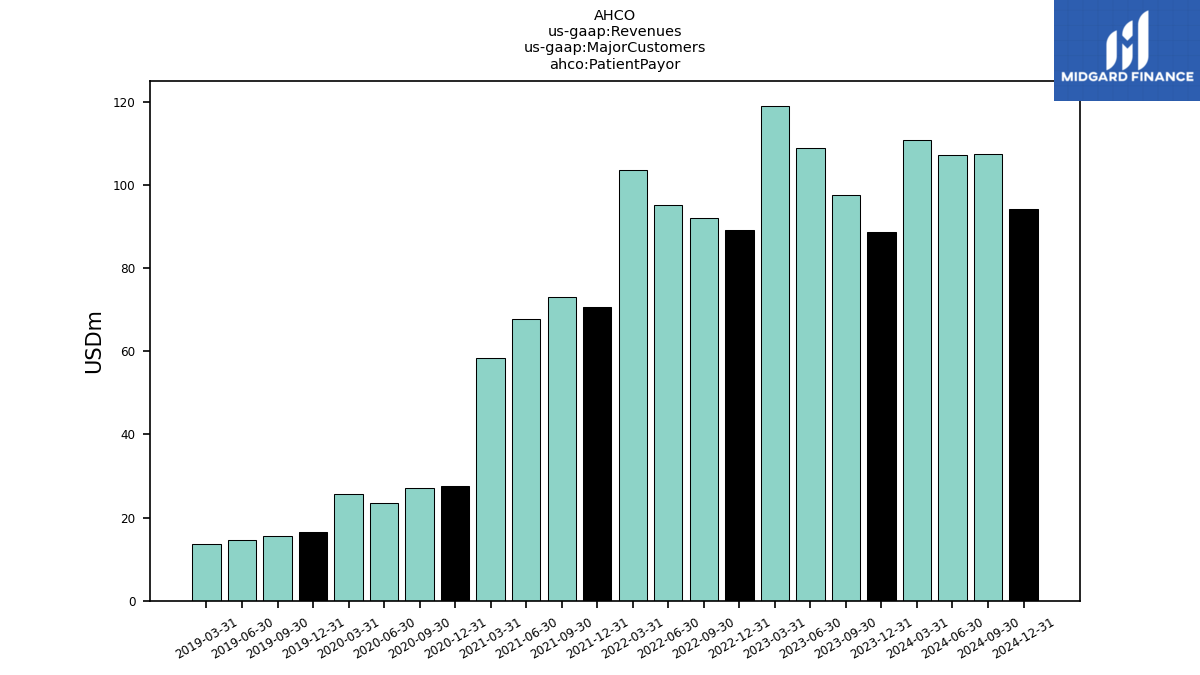
| Patient Payor | 88.61 | 97.54 | 108.80 | 119.00 | 89.20 | 92.03 | 95.10 | 103.66 | 70.63 | 73.03 | 67.83 | 58.38 | 27.50 | 27.02 | 23.44 | 25.74 | 16.61 | 15.64 | 14.67 | 13.68 | |
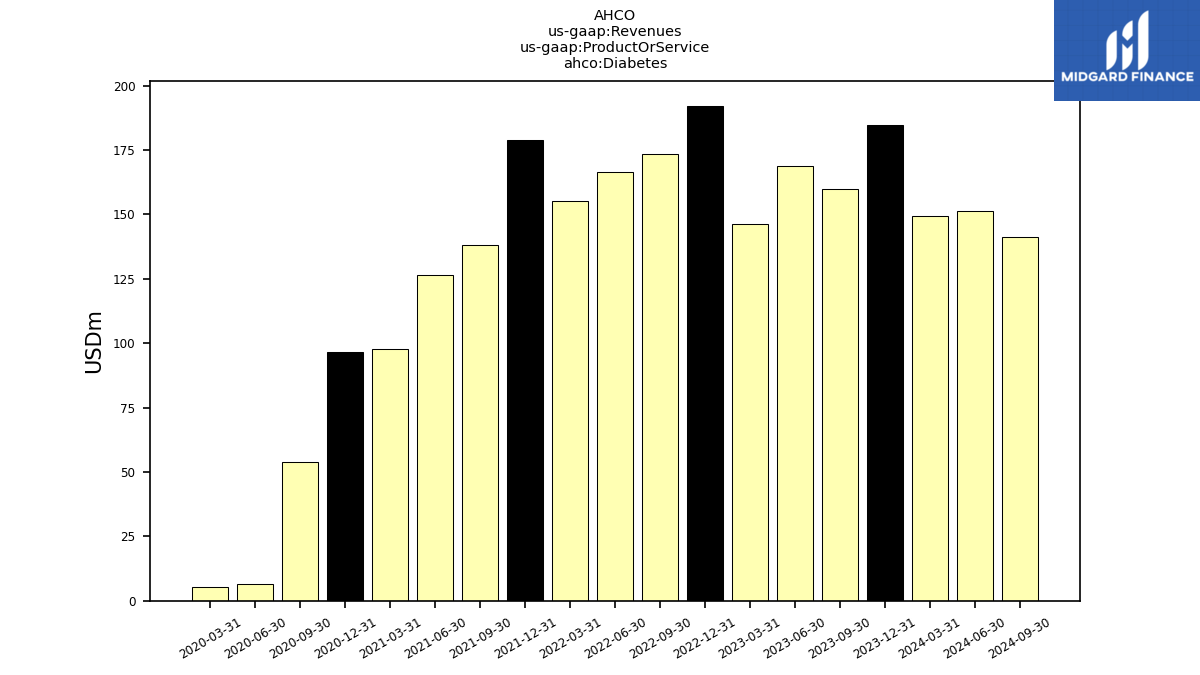
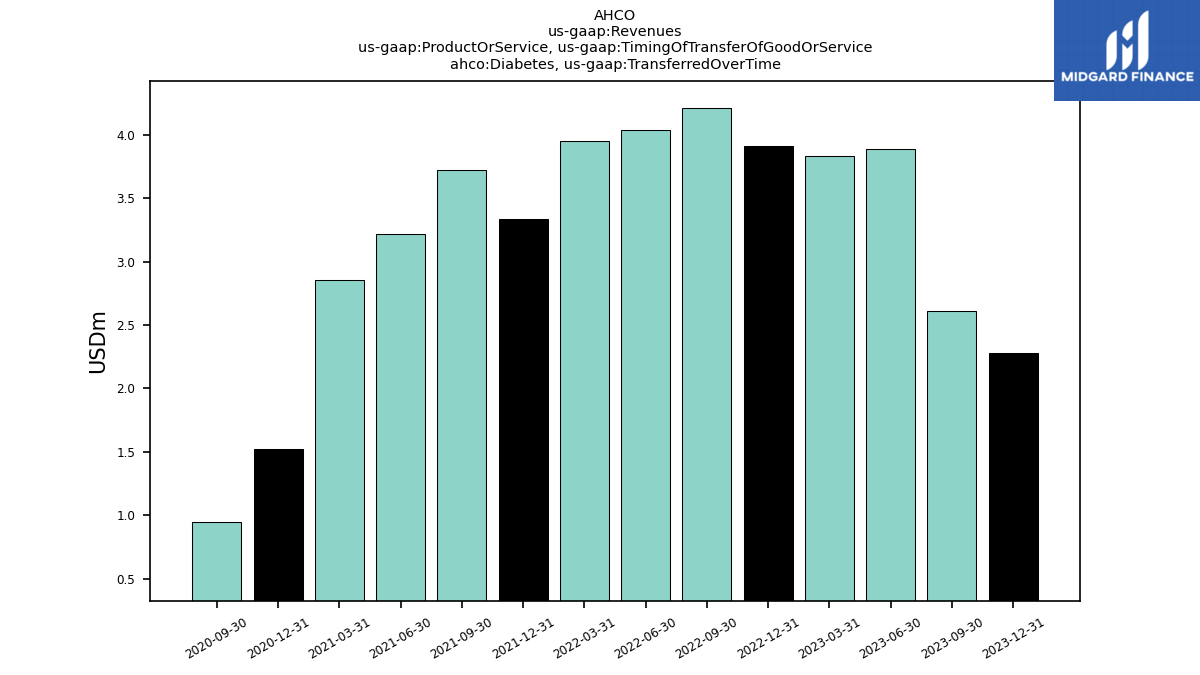
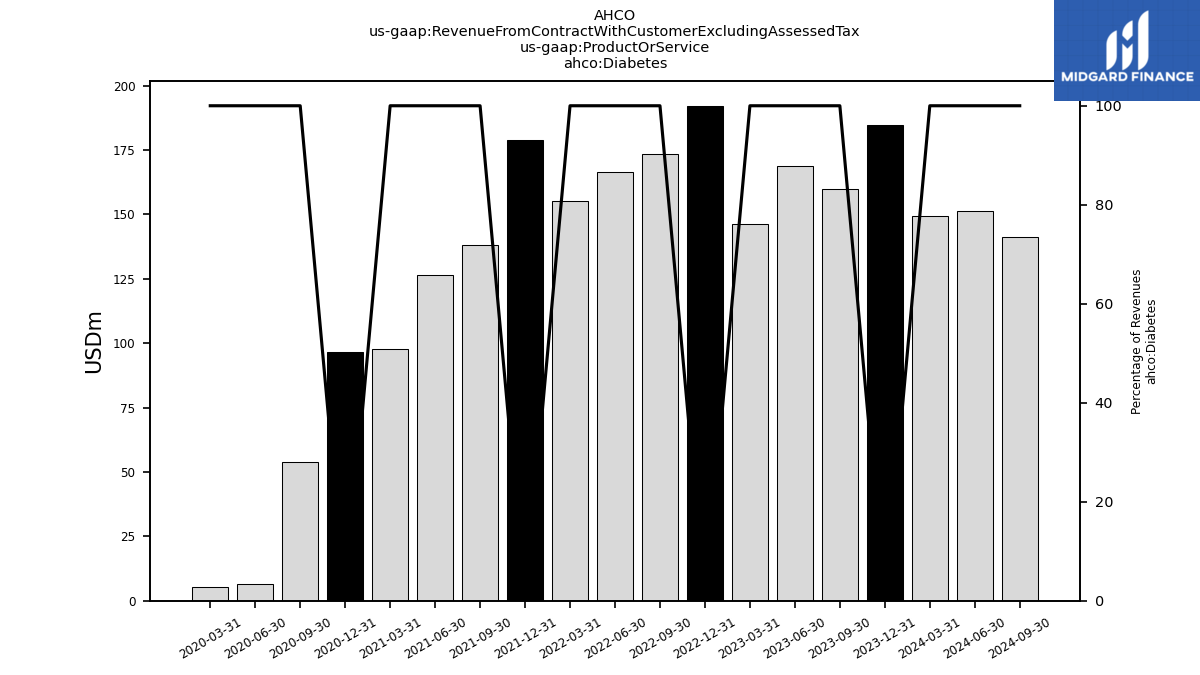
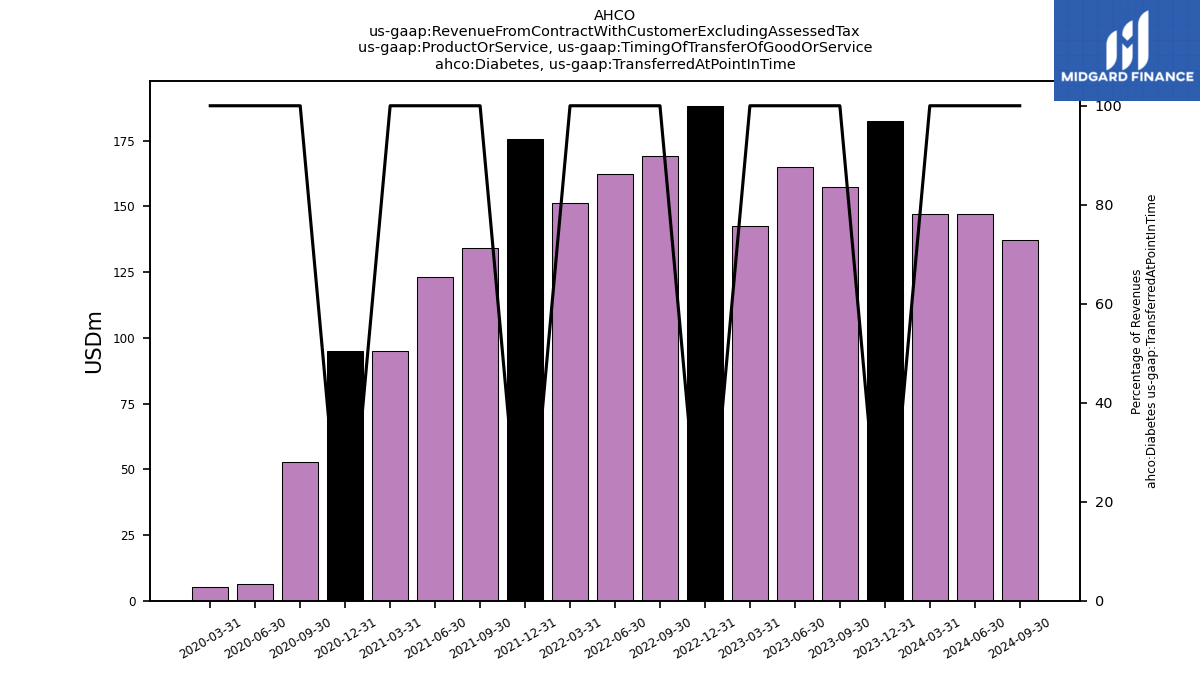
| Diabetes | 184.82 | 159.94 | 168.91 | 146.38 | 192.21 | 173.29 | 166.29 | 155.31 | 178.85 | 137.95 | 126.53 | 97.87 | 96.44 | 53.83 | 6.37 | 5.31 | NA | NA | NA | NA | |
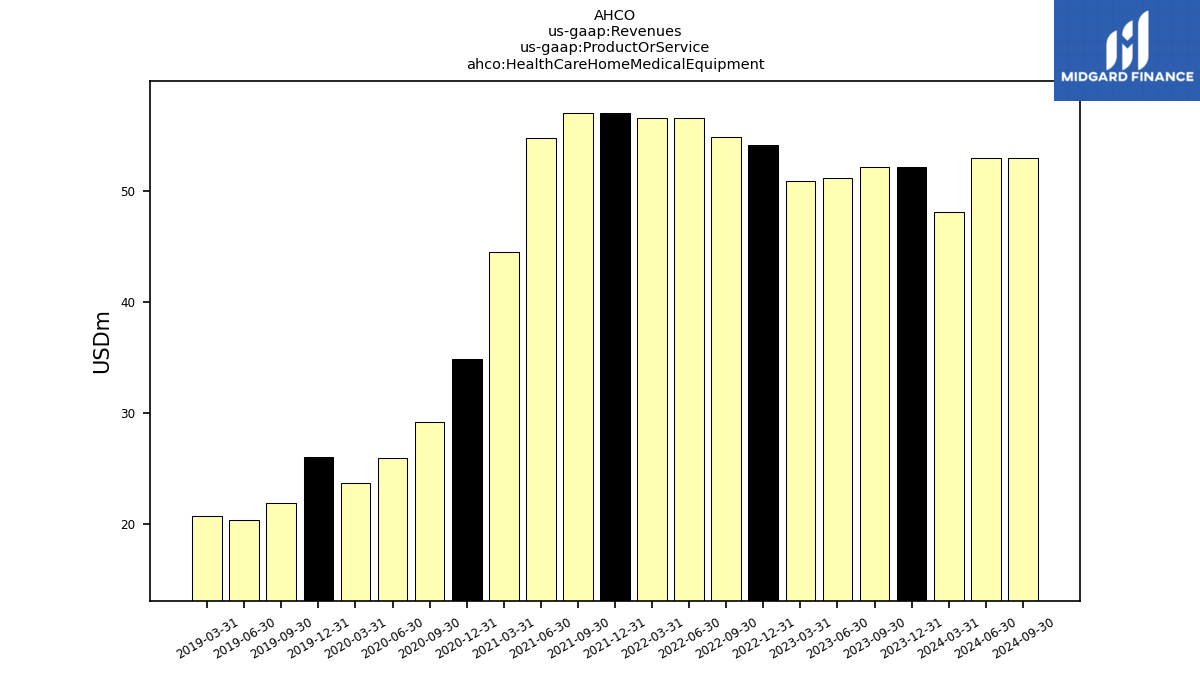
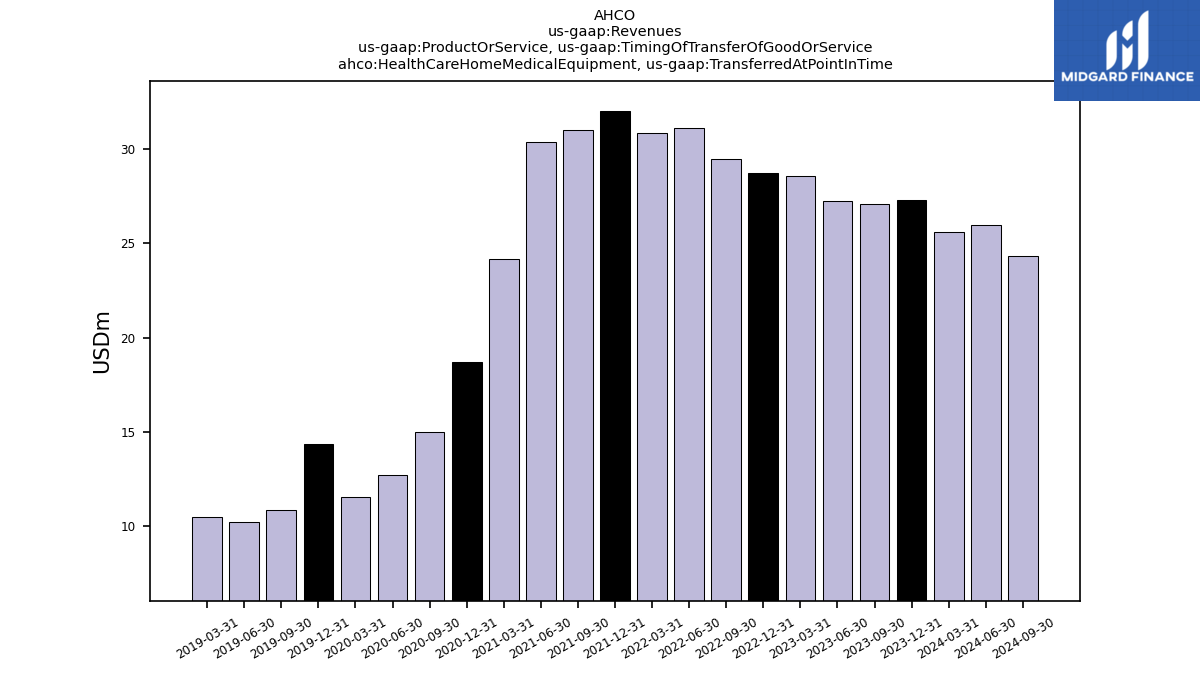
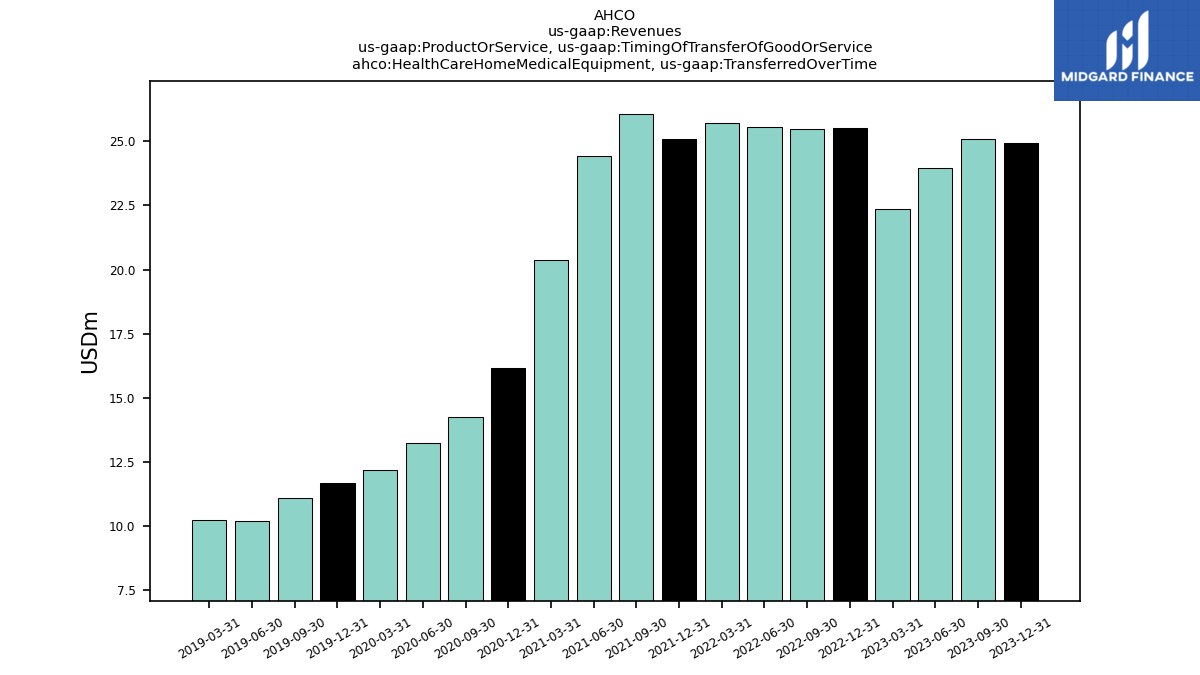
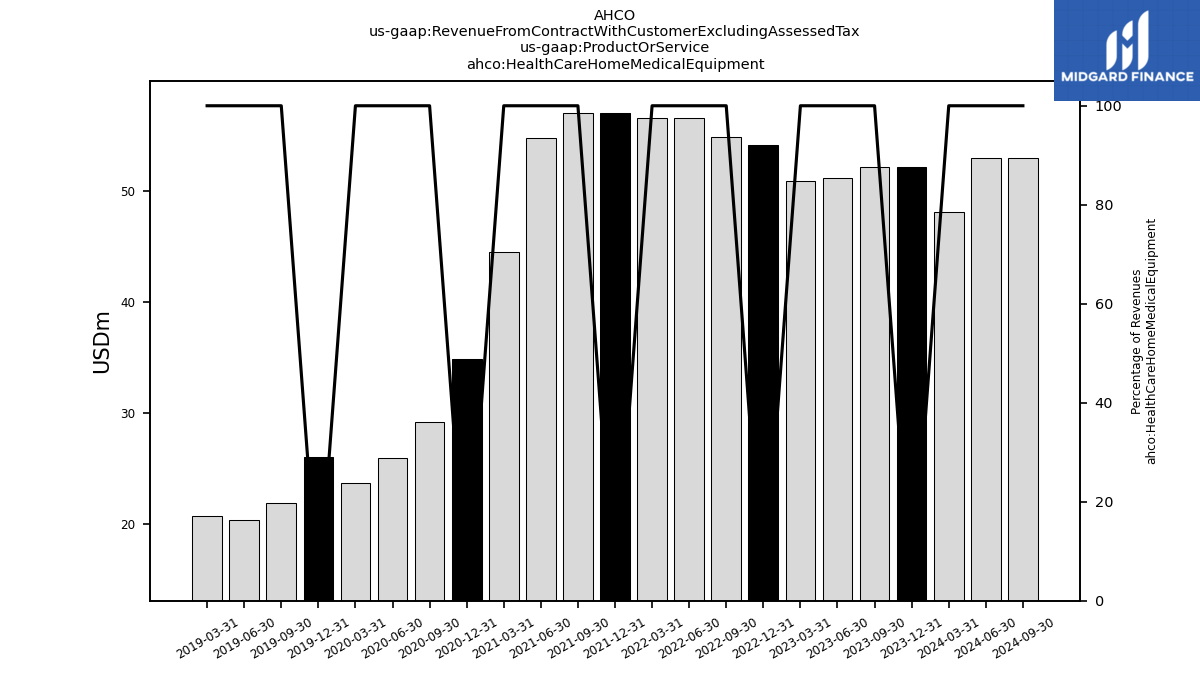
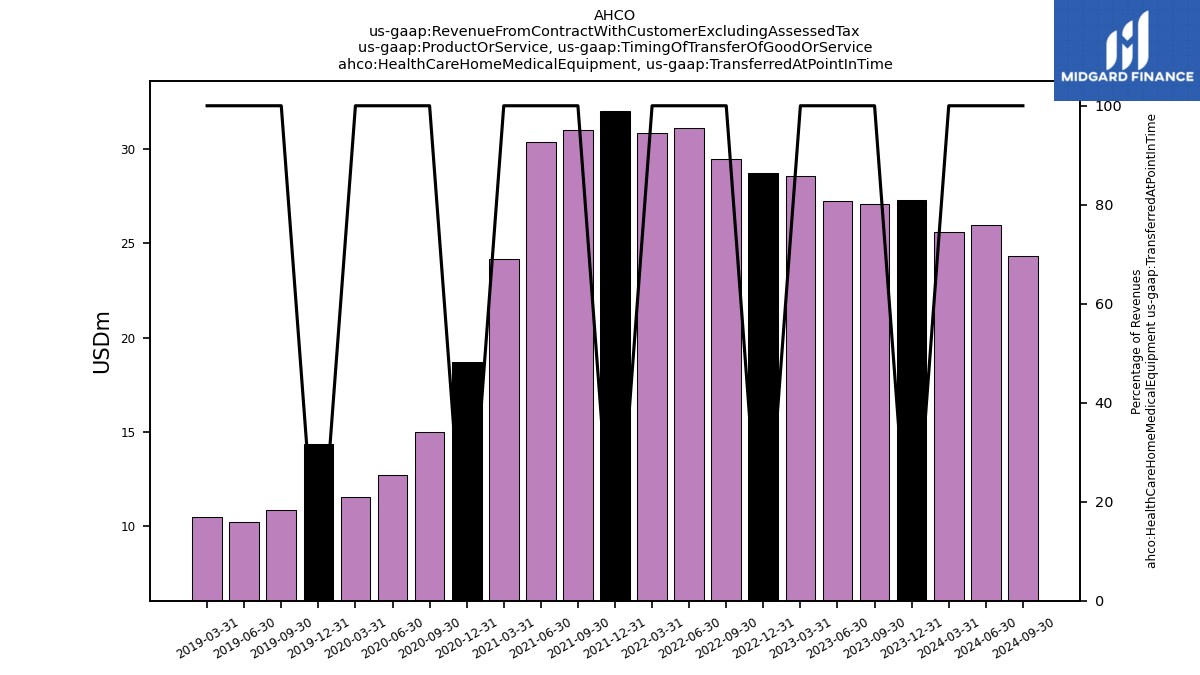
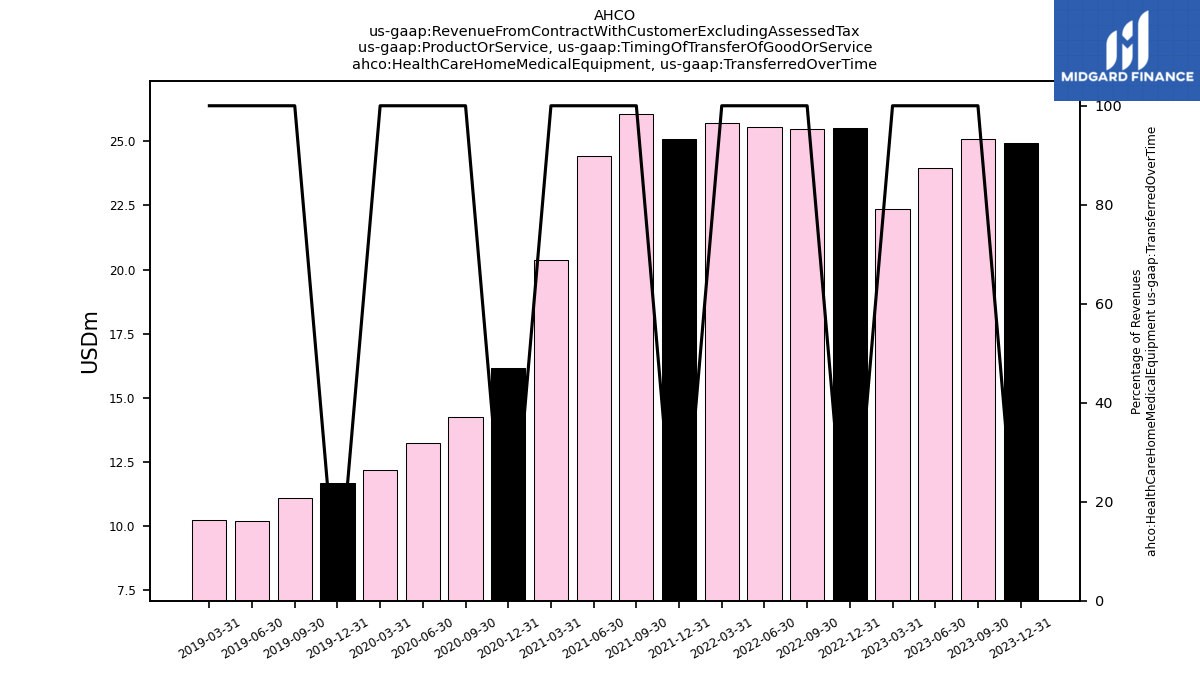
| Health Care Home Medical Equipment | 52.23 | 52.18 | 51.21 | 50.90 | 54.22 | 54.95 | 56.65 | 56.58 | 57.09 | 57.03 | 54.79 | 44.54 | 34.88 | 29.25 | 25.99 | 23.76 | 26.03 | 21.96 | 20.44 | 20.73 | |
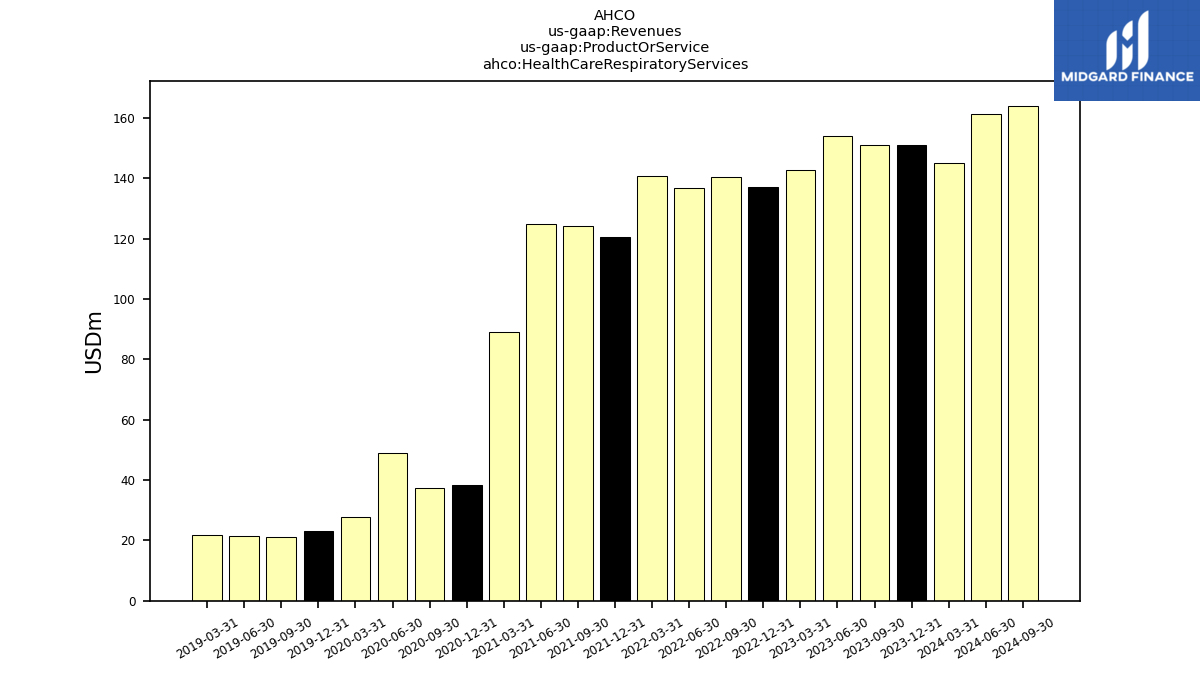
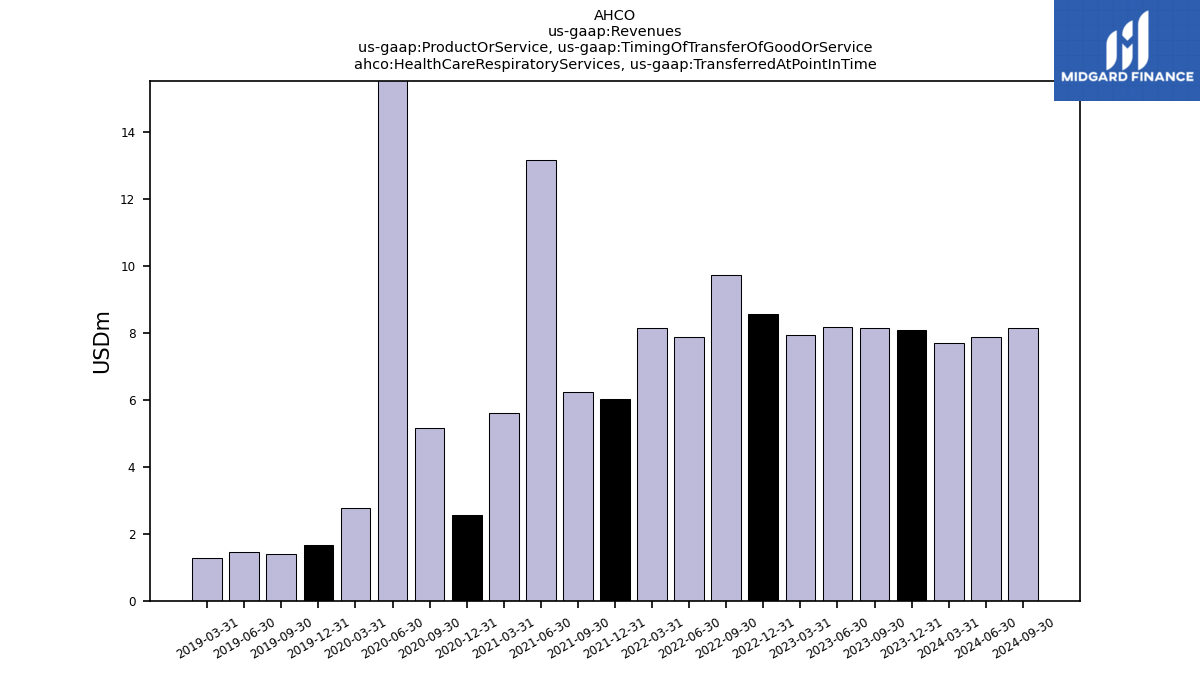
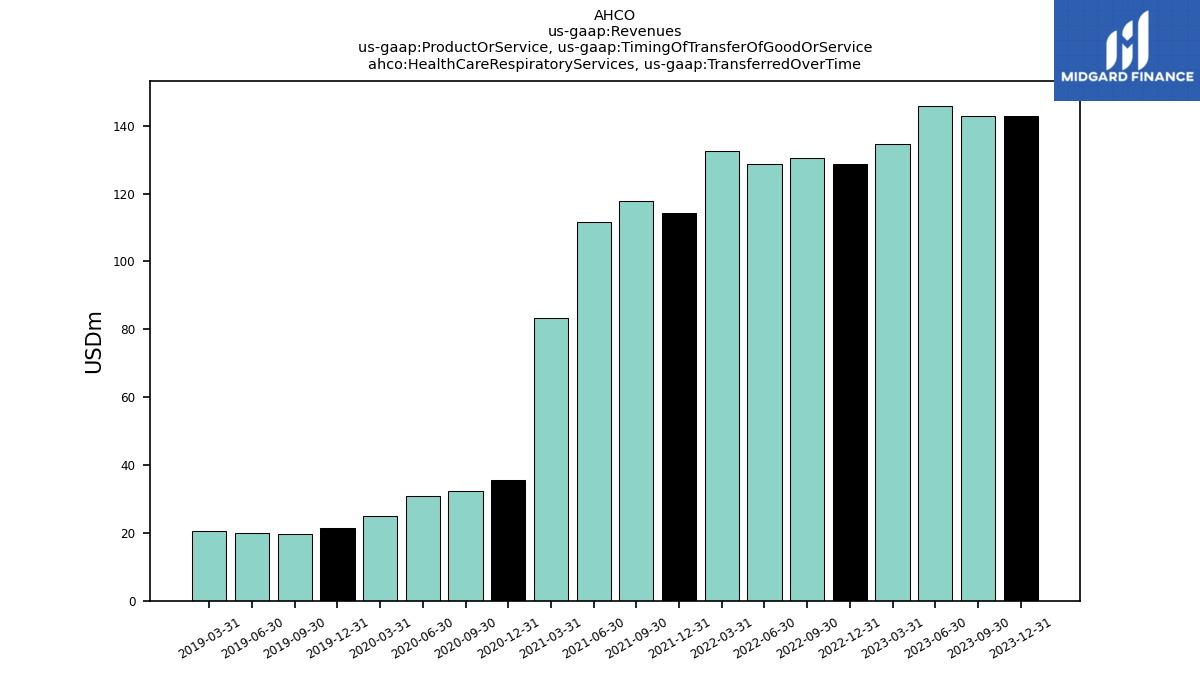
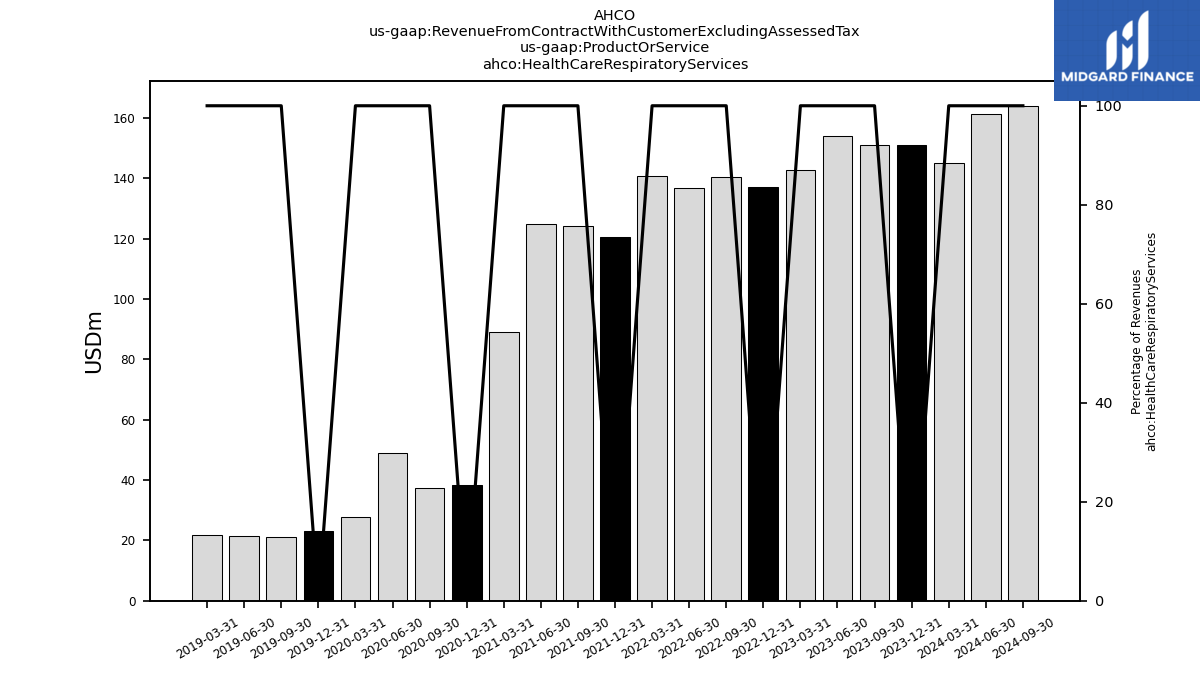
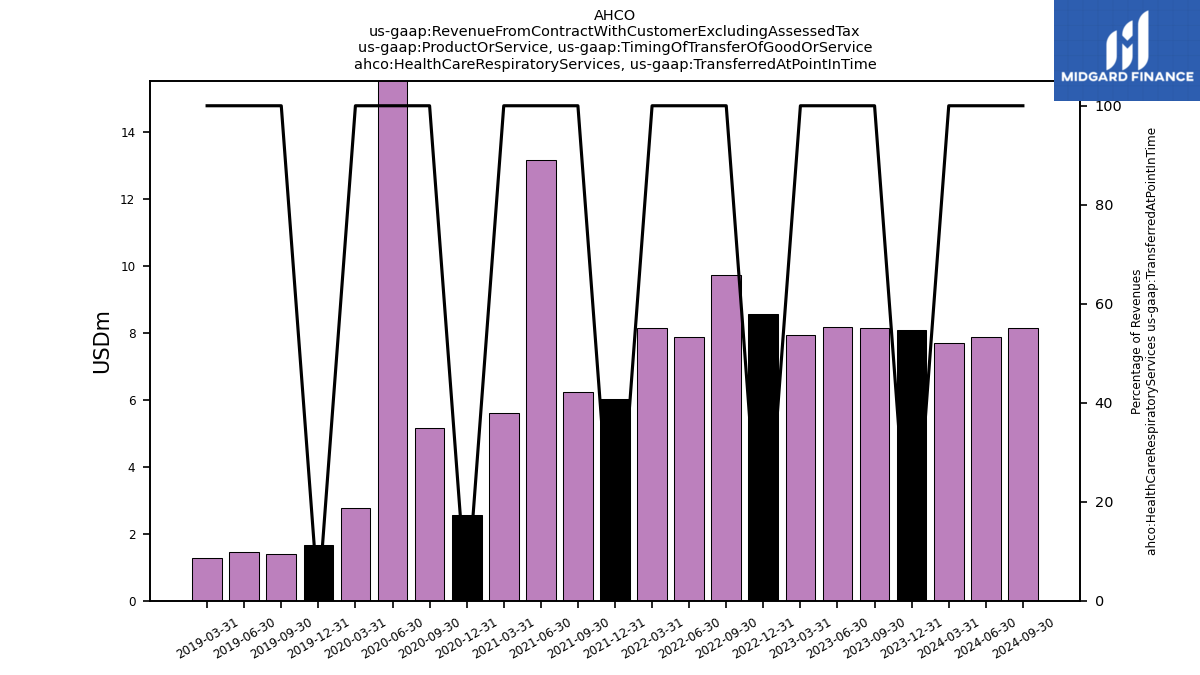
| Health Care Respiratory Services | 151.00 | 151.08 | 154.08 | 142.65 | 137.21 | 140.35 | 136.76 | 140.72 | 120.38 | 124.15 | 124.68 | 89.08 | 38.30 | 37.42 | 48.97 | 27.78 | 22.99 | 21.04 | 21.45 | 21.71 | |
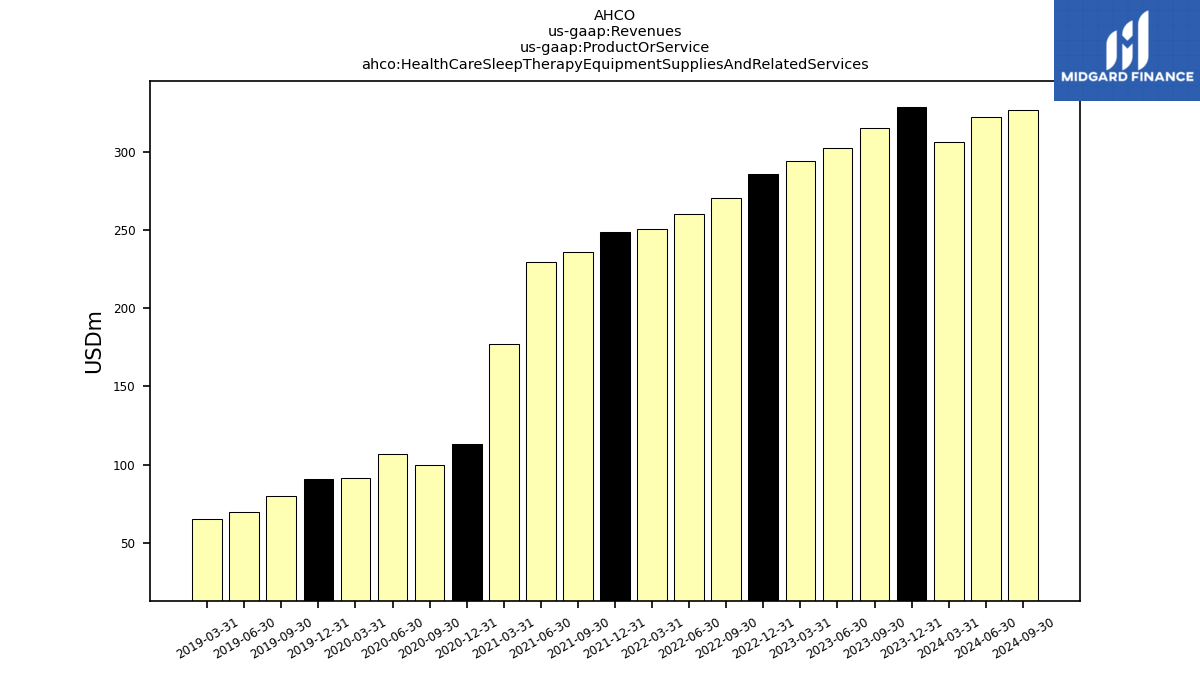
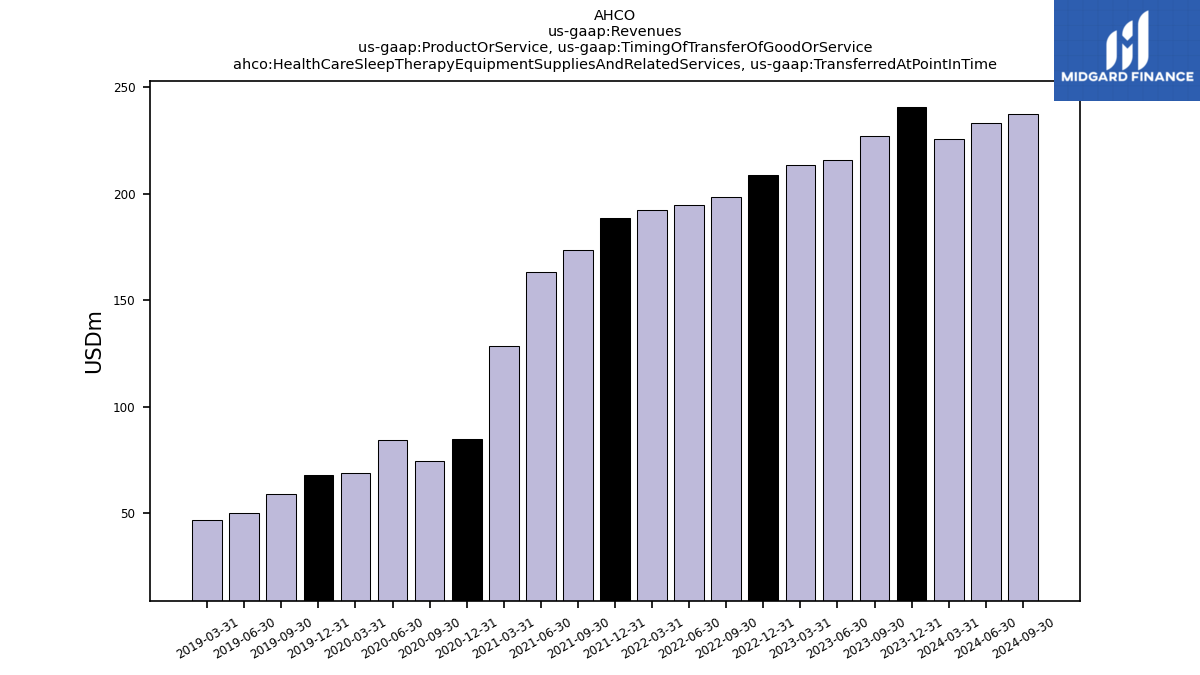
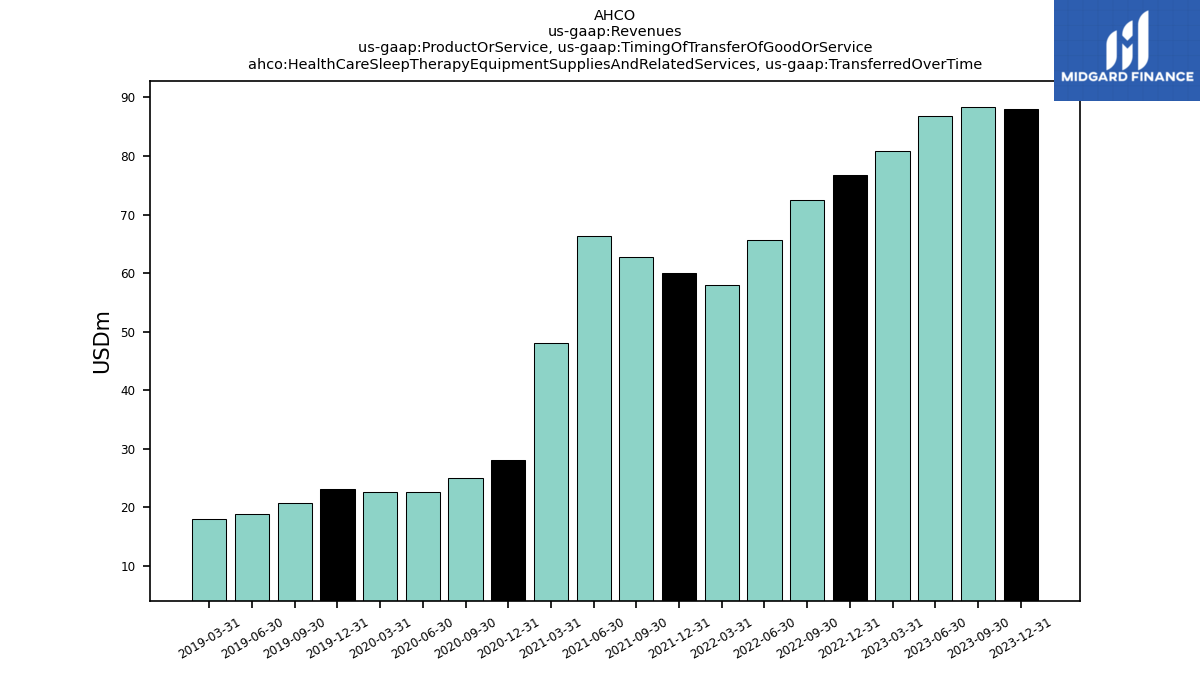
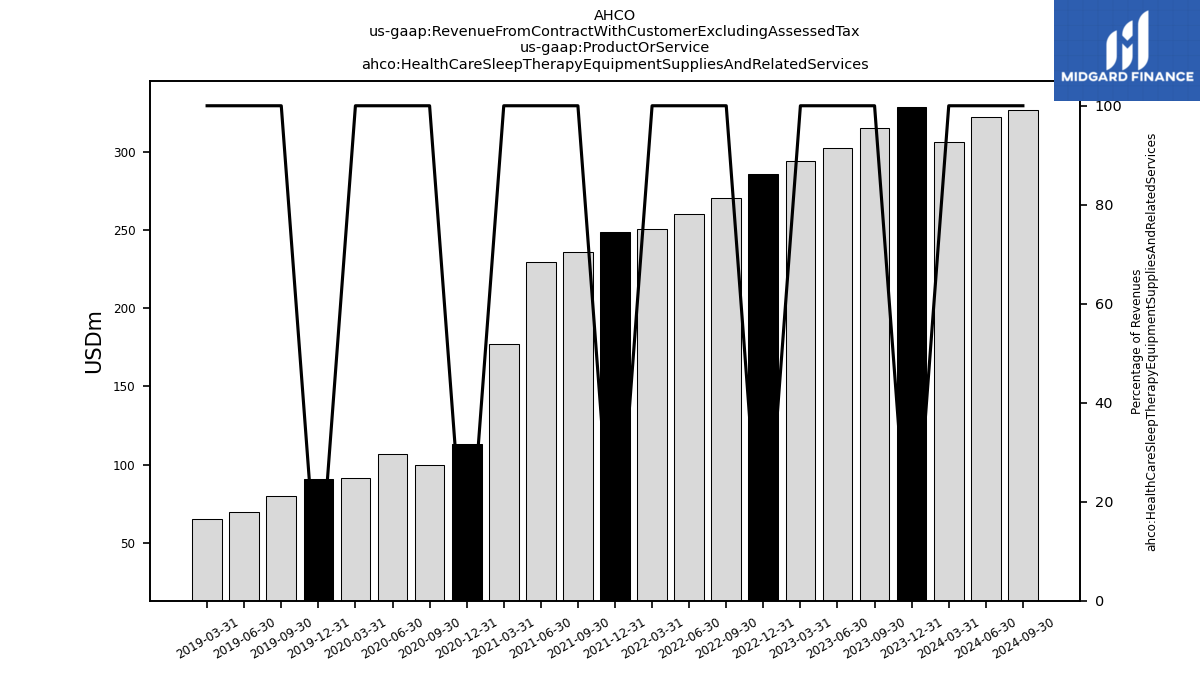
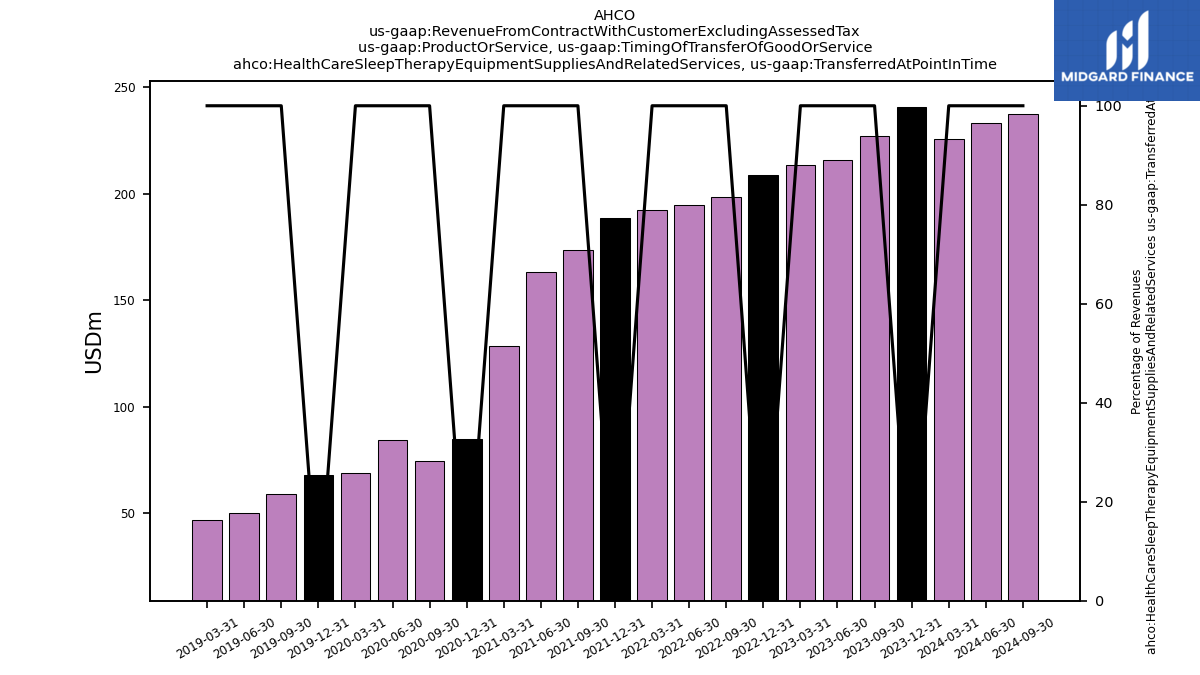
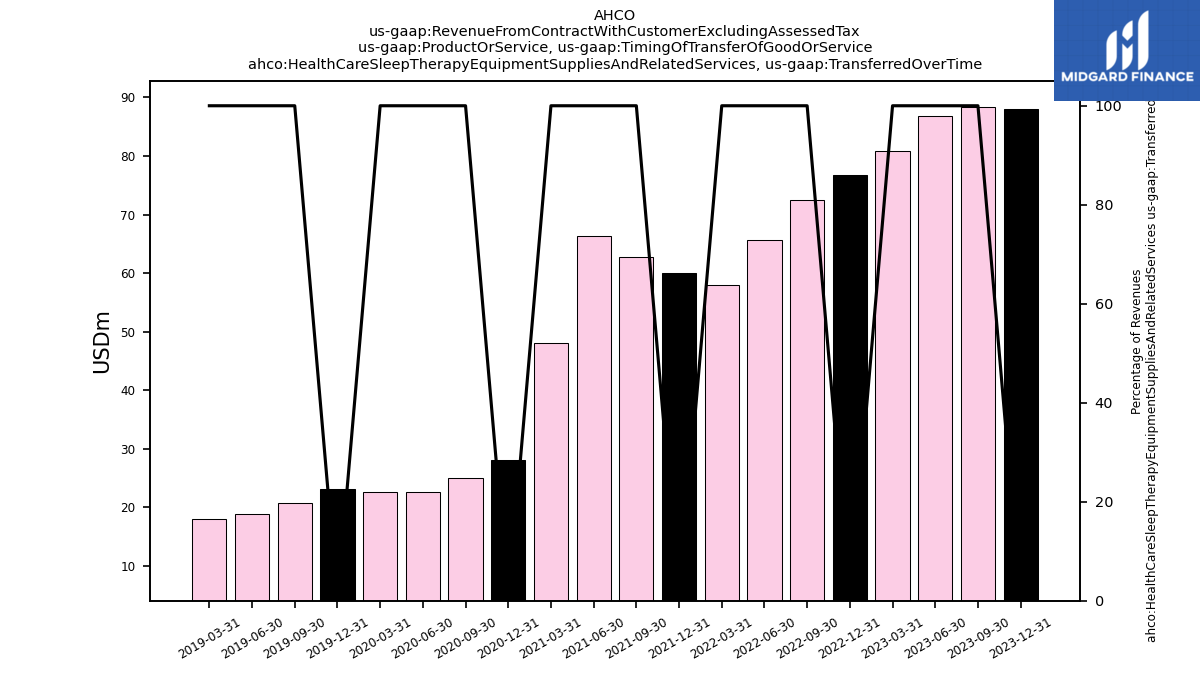
| Health Care Sleep Therapy Equipment Supplies And Related Services | 328.76 | 315.39 | 302.63 | 294.38 | 285.47 | 270.63 | 260.35 | 250.27 | 248.81 | 236.11 | 229.67 | 176.79 | 112.97 | 99.63 | 107.06 | 91.56 | 90.95 | 79.88 | 69.38 | 65.18 | |
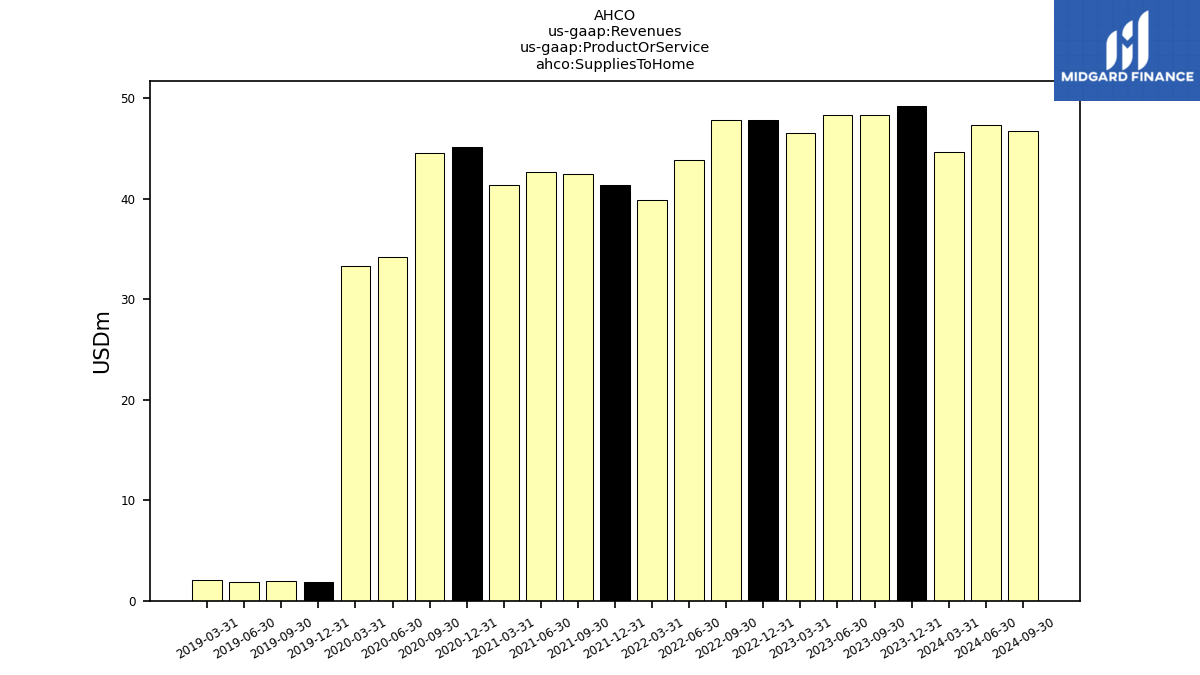
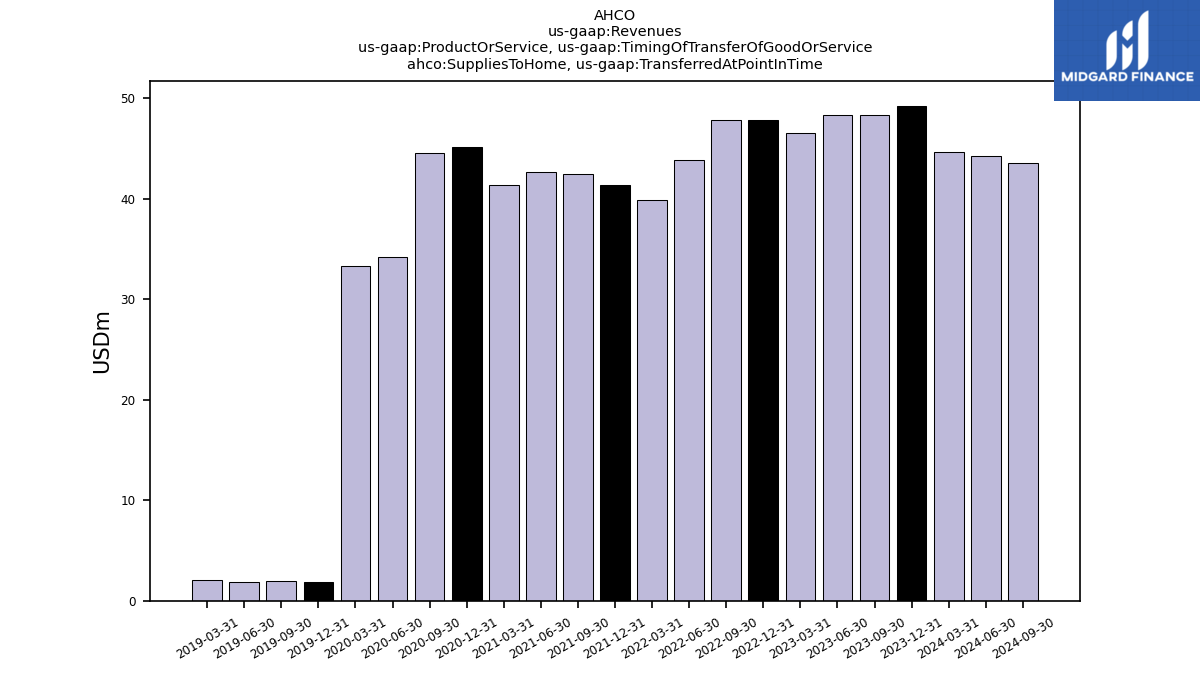
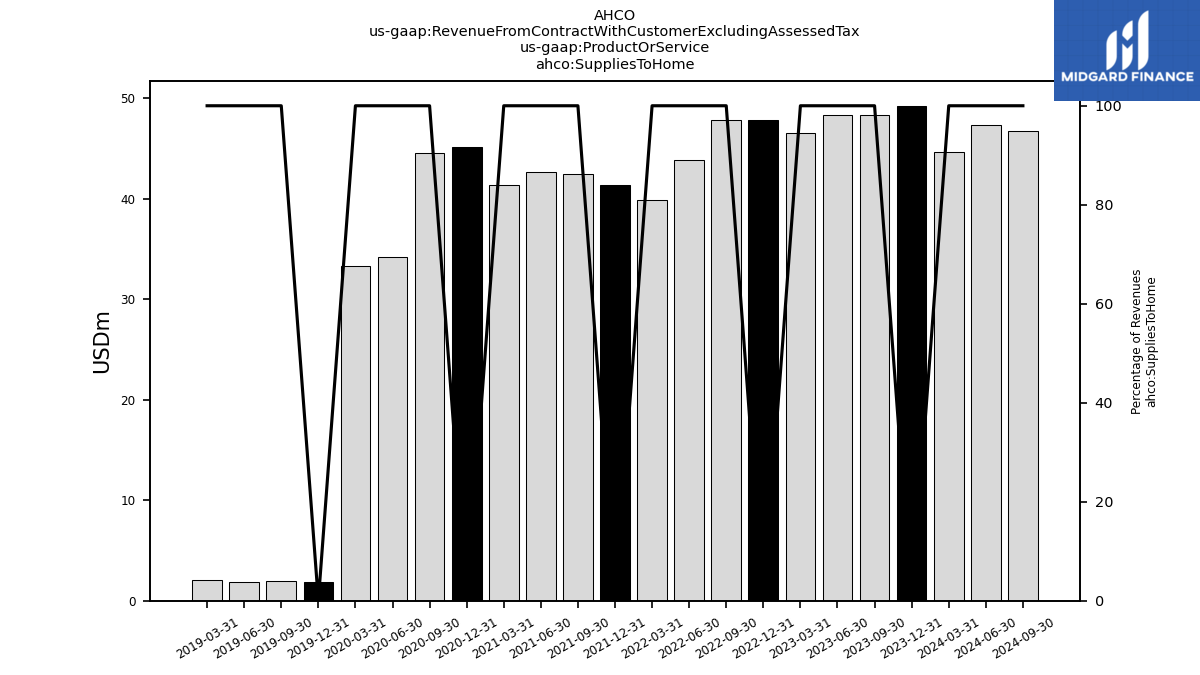
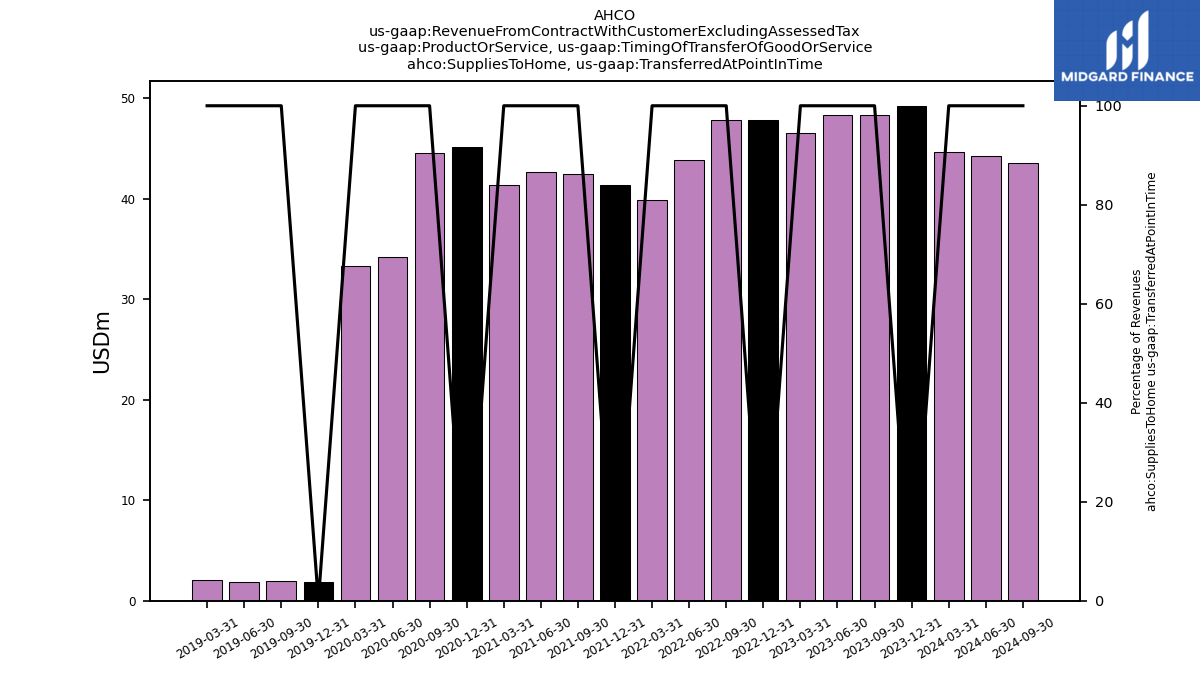
| Supplies To Home | 49.25 | 48.35 | 48.32 | 46.55 | 47.79 | 47.79 | 43.88 | 39.87 | 41.35 | 42.44 | 42.67 | 41.36 | 45.15 | 44.58 | 34.24 | 33.34 | 1.85 | 1.97 | 1.92 | 2.03 | |
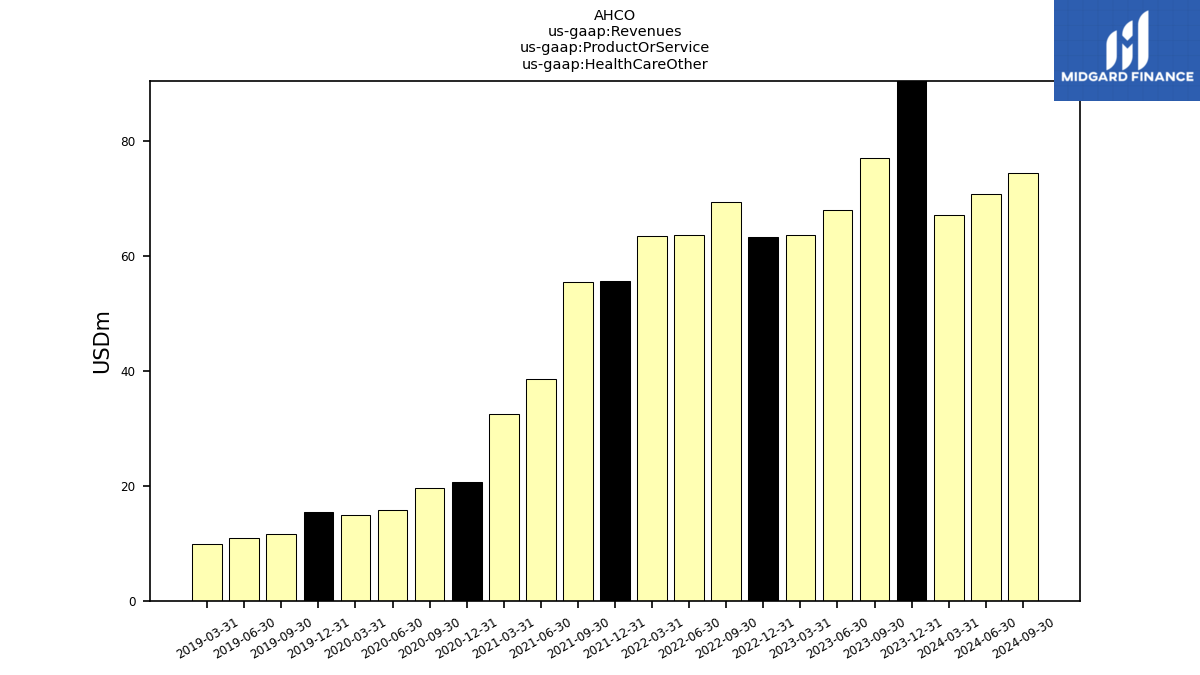
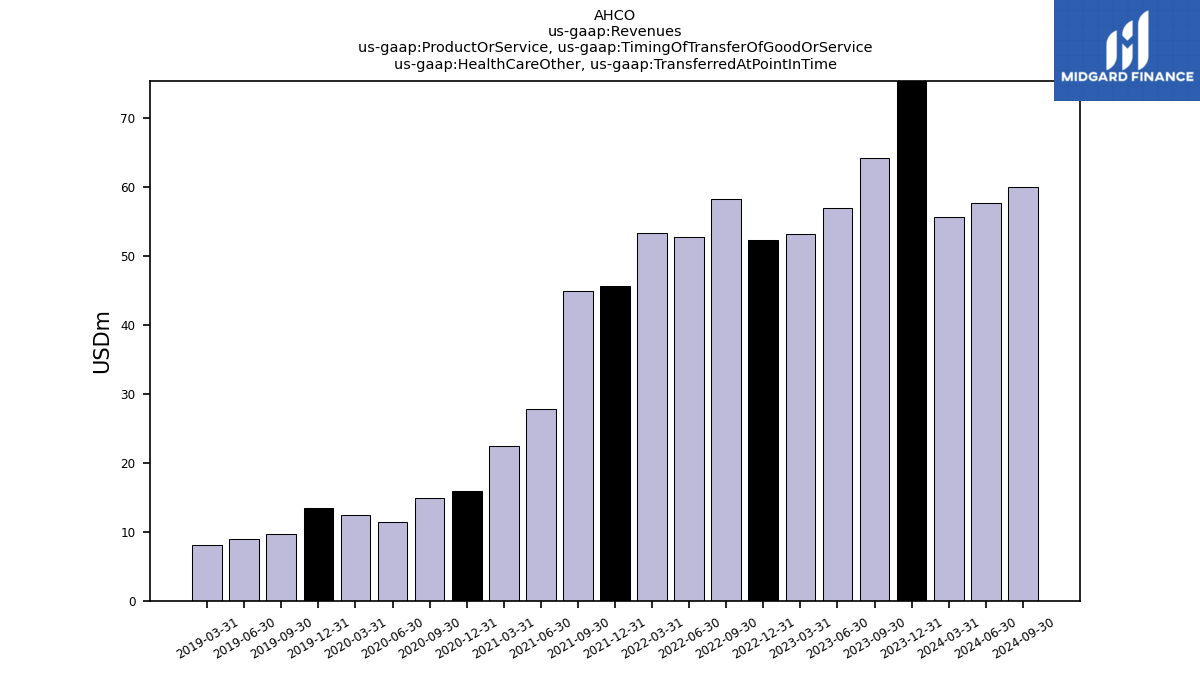
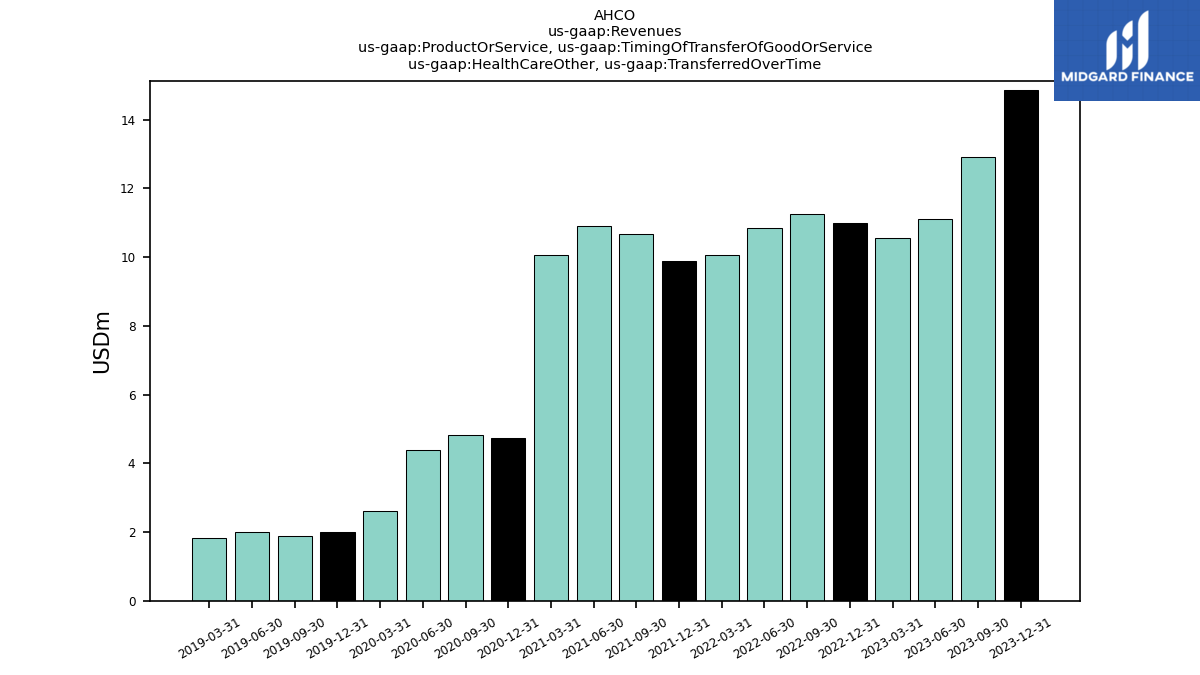
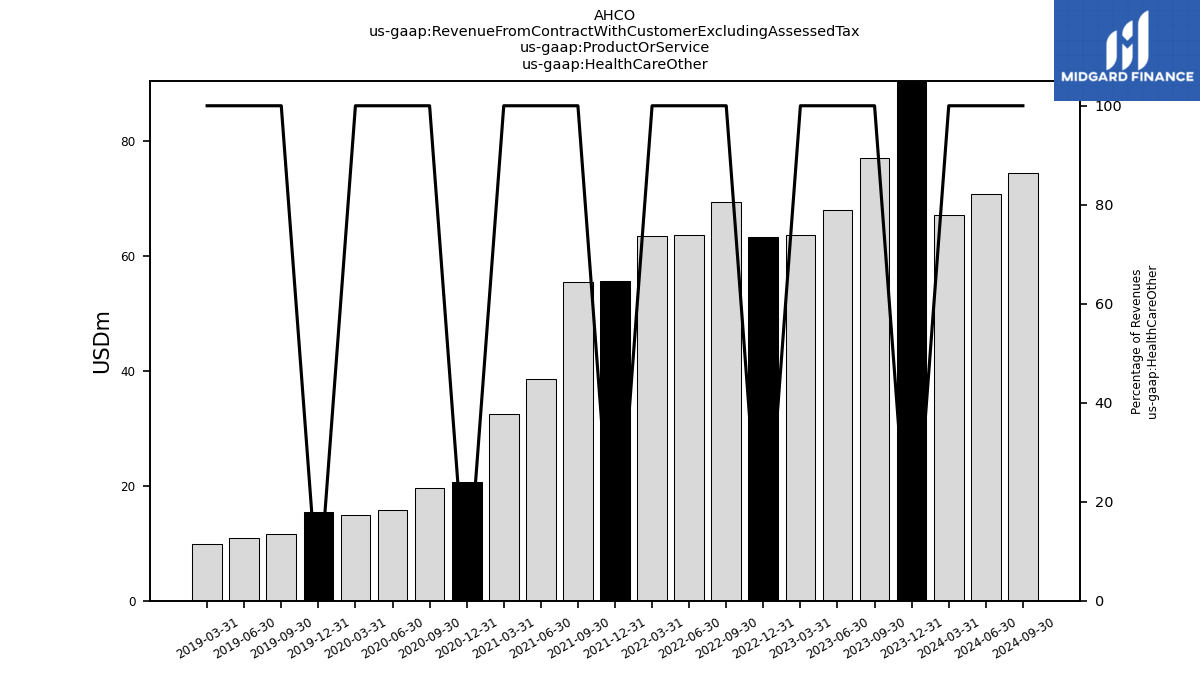
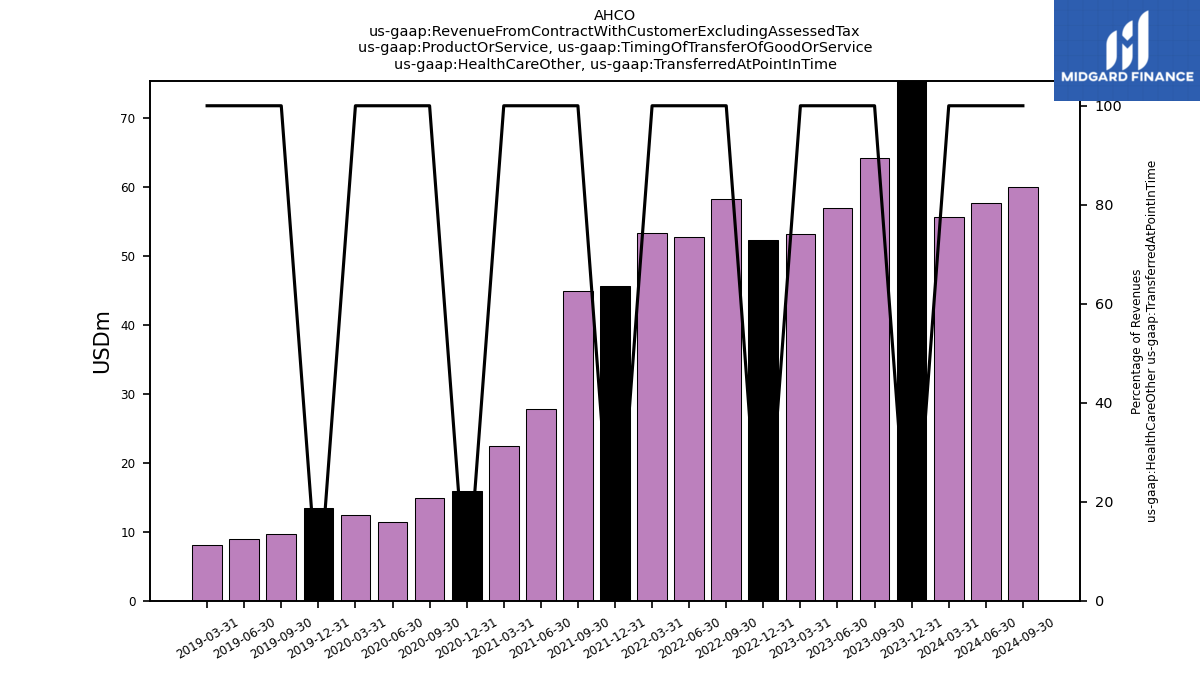
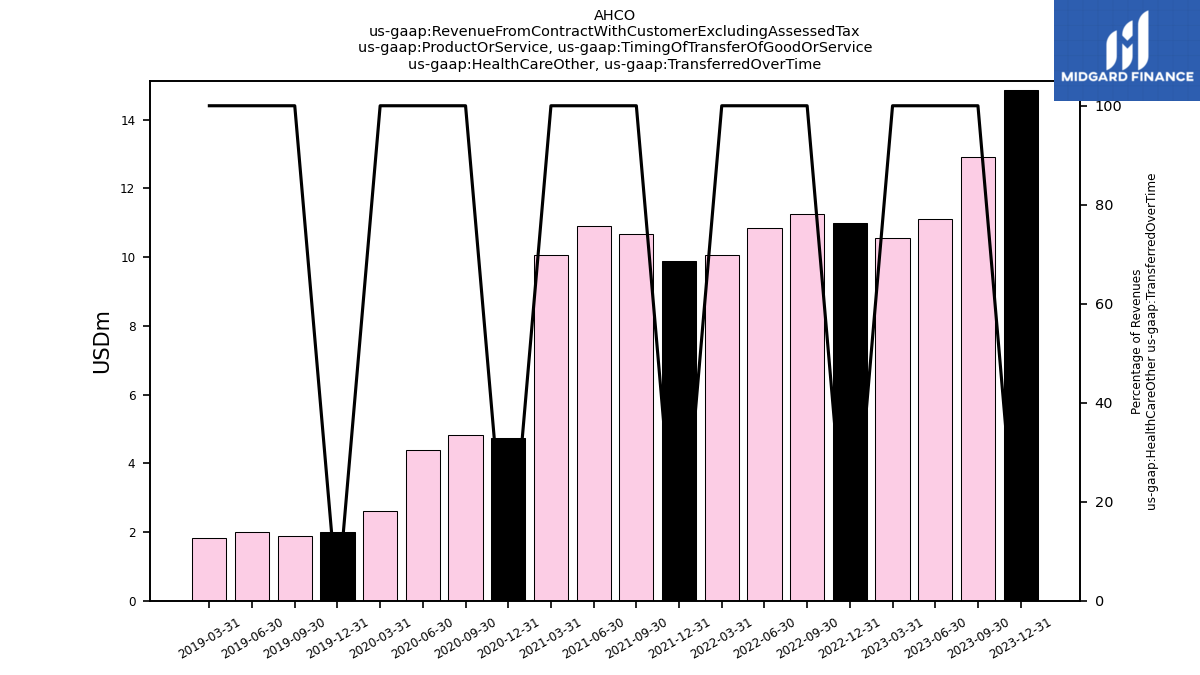
| Health Care Other | 92.17 | 77.09 | 68.13 | 63.76 | 63.40 | 69.49 | 63.68 | 63.46 | 55.61 | 55.61 | 38.67 | 32.48 | 20.70 | 19.69 | 15.85 | 15.01 | 15.48 | 11.60 | 10.97 | 9.85 | |
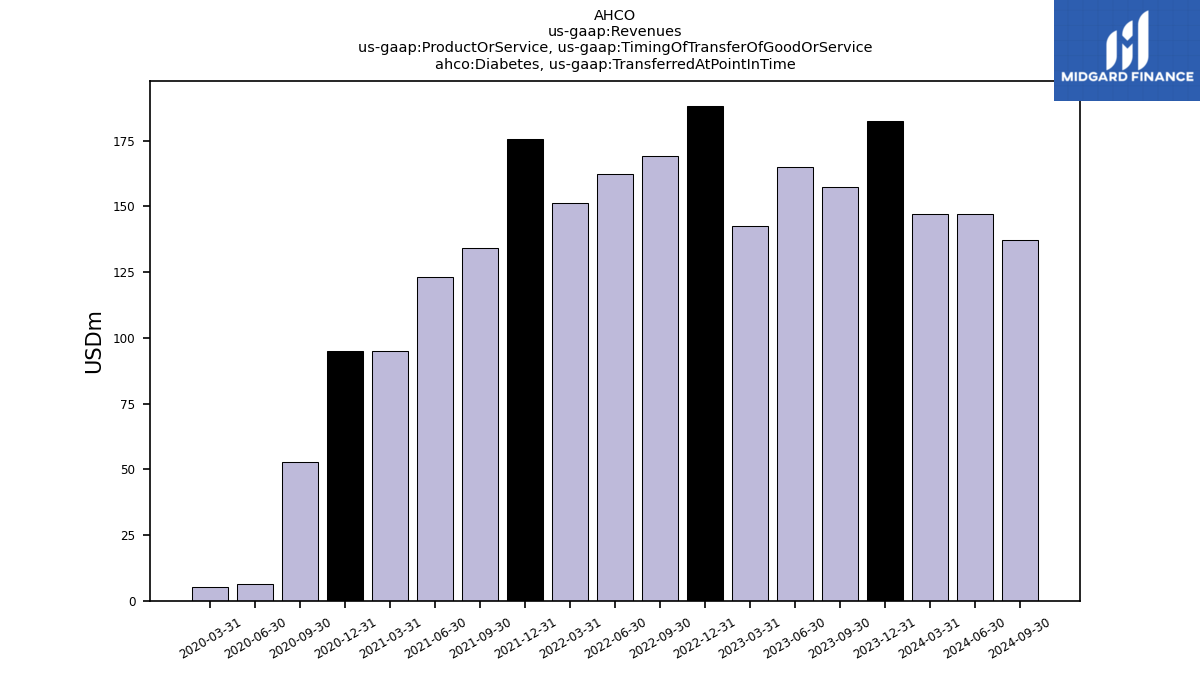
| Diabetes, Transferred At Point In Time | 182.54 | 157.33 | 165.02 | 142.54 | 188.29 | 169.07 | 162.26 | 151.36 | 175.52 | 134.23 | 123.31 | 95.02 | 94.92 | 52.89 | 6.37 | 5.31 | NA | NA | NA | NA | |
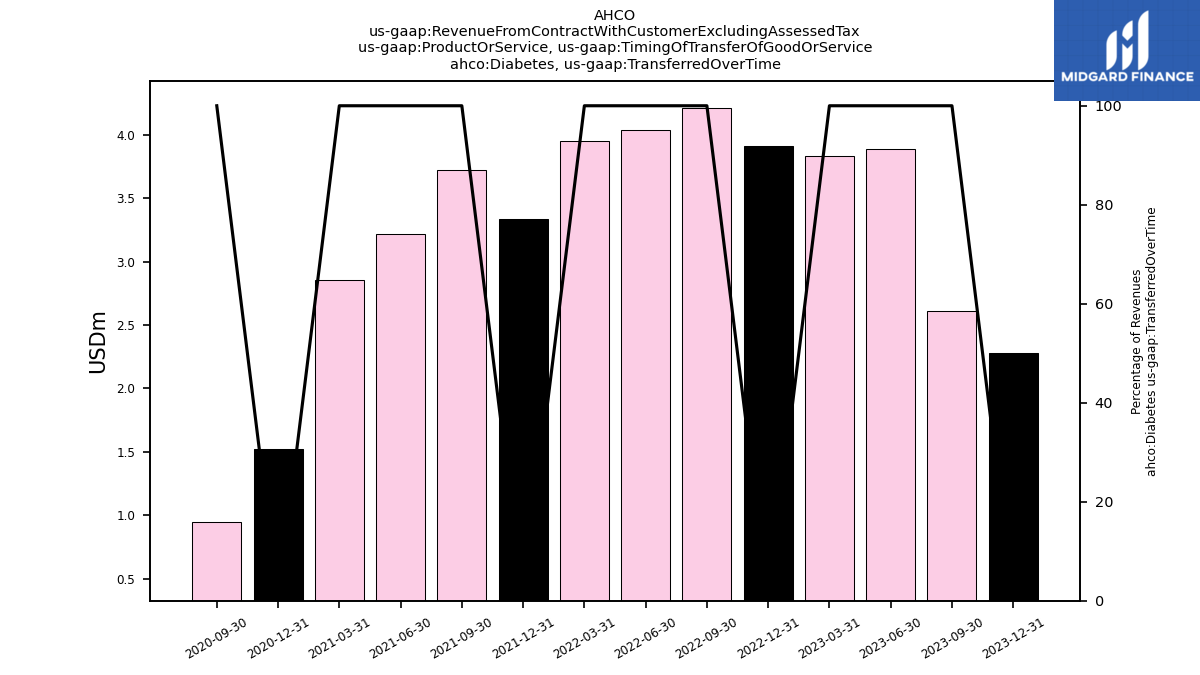
| Diabetes, Transferred Over Time | 2.28 | 2.61 | 3.89 | 3.83 | 3.91 | 4.21 | 4.03 | 3.95 | 3.33 | 3.72 | 3.22 | 2.85 | 1.52 | 0.95 | NA | NA | NA | NA | NA | NA | |
| Health Care Home Medical Equipment, Transferred At Point In Time | 27.30 | 27.09 | 27.24 | 28.56 | 28.71 | 29.46 | 31.10 | 30.85 | 32.01 | 30.99 | 30.36 | 24.16 | 18.73 | 15.00 | 12.73 | 11.58 | 14.35 | 10.87 | 10.24 | 10.49 | |
| Health Care Home Medical Equipment, Transferred Over Time | 24.93 | 25.09 | 23.97 | 22.34 | 25.50 | 25.48 | 25.55 | 25.73 | 25.08 | 26.04 | 24.43 | 20.38 | 16.15 | 14.26 | 13.26 | 12.18 | 11.68 | 11.09 | 10.20 | 10.24 | |
| Health Care Respiratory Services, Transferred At Point In Time | 8.09 | 8.16 | 8.19 | 7.93 | 8.57 | 9.73 | 7.89 | 8.14 | 6.01 | 6.23 | 13.15 | 5.62 | 2.57 | 5.15 | 18.11 | 2.77 | 1.66 | 1.40 | 1.45 | 1.28 | |
| Health Care Respiratory Services, Transferred Over Time | 142.92 | 142.92 | 145.89 | 134.72 | 128.63 | 130.62 | 128.87 | 132.58 | 114.37 | 117.92 | 111.53 | 83.45 | 35.73 | 32.27 | 30.86 | 25.01 | 21.33 | 19.65 | 20.01 | 20.43 | |
| Health Care Sleep Therapy Equipment Supplies And Related Services, Transferred At Point In Time | 240.81 | 227.00 | 215.85 | 213.46 | 208.79 | 198.21 | 194.69 | 192.34 | 188.76 | 173.36 | 163.33 | 128.68 | 84.89 | 74.66 | 84.42 | 68.89 | 67.87 | 59.12 | 50.43 | 47.13 | |
| Health Care Sleep Therapy Equipment Supplies And Related Services, Transferred Over Time | 87.96 | 88.39 | 86.78 | 80.92 | 76.68 | 72.42 | 65.66 | 57.94 | 60.05 | 62.76 | 66.33 | 48.11 | 28.08 | 24.97 | 22.64 | 22.67 | 23.08 | 20.76 | 18.94 | 18.06 | |
| Supplies To Home, Transferred At Point In Time | 49.25 | 48.35 | 48.32 | 46.55 | 47.79 | 47.79 | 43.88 | 39.87 | 41.35 | 42.44 | 42.67 | 41.36 | 45.15 | 44.58 | 34.24 | 33.34 | 1.85 | 1.97 | 1.92 | 2.03 | |
| Health Care Other, Transferred At Point In Time | 77.31 | 64.18 | 57.01 | 53.21 | 52.39 | 58.25 | 52.83 | 53.40 | 45.72 | 44.93 | 27.76 | 22.43 | 15.96 | 14.87 | 11.46 | 12.39 | 13.47 | 9.71 | 8.97 | 8.03 | |
| Health Care Other, Transferred Over Time | 14.86 | 12.90 | 11.12 | 10.55 | 11.00 | 11.24 | 10.85 | 10.06 | 9.90 | 10.68 | 10.91 | 10.06 | 4.73 | 4.82 | 4.39 | 2.61 | 2.01 | 1.89 | 2.00 | 1.81 | |
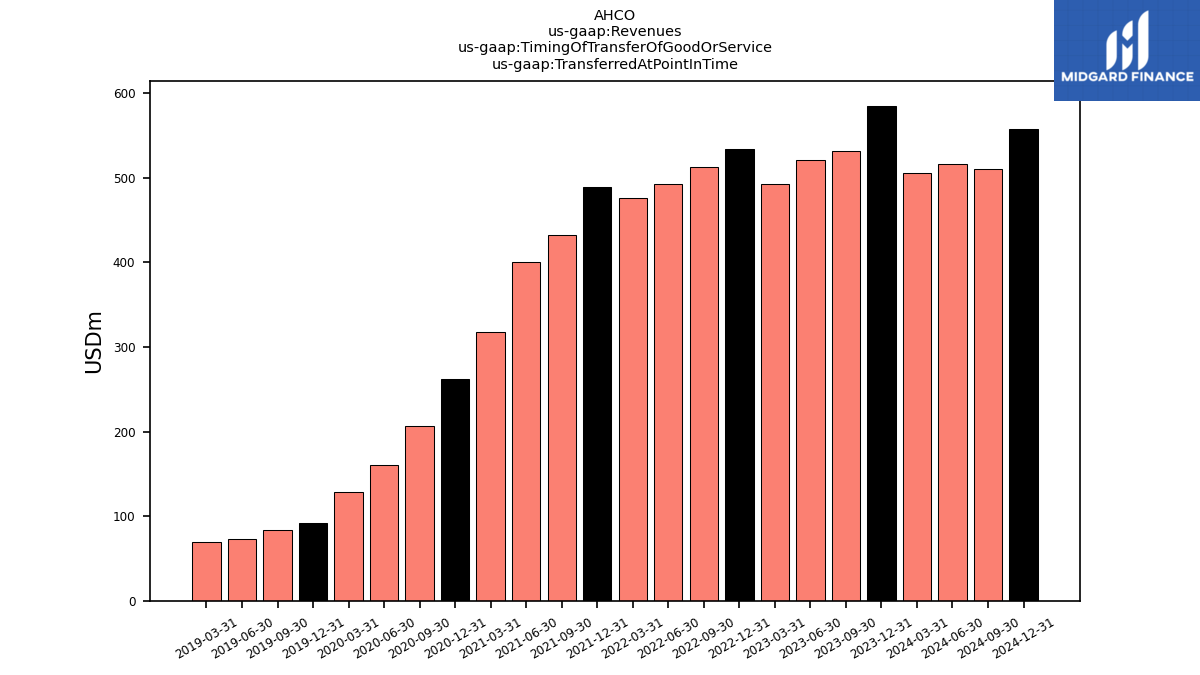
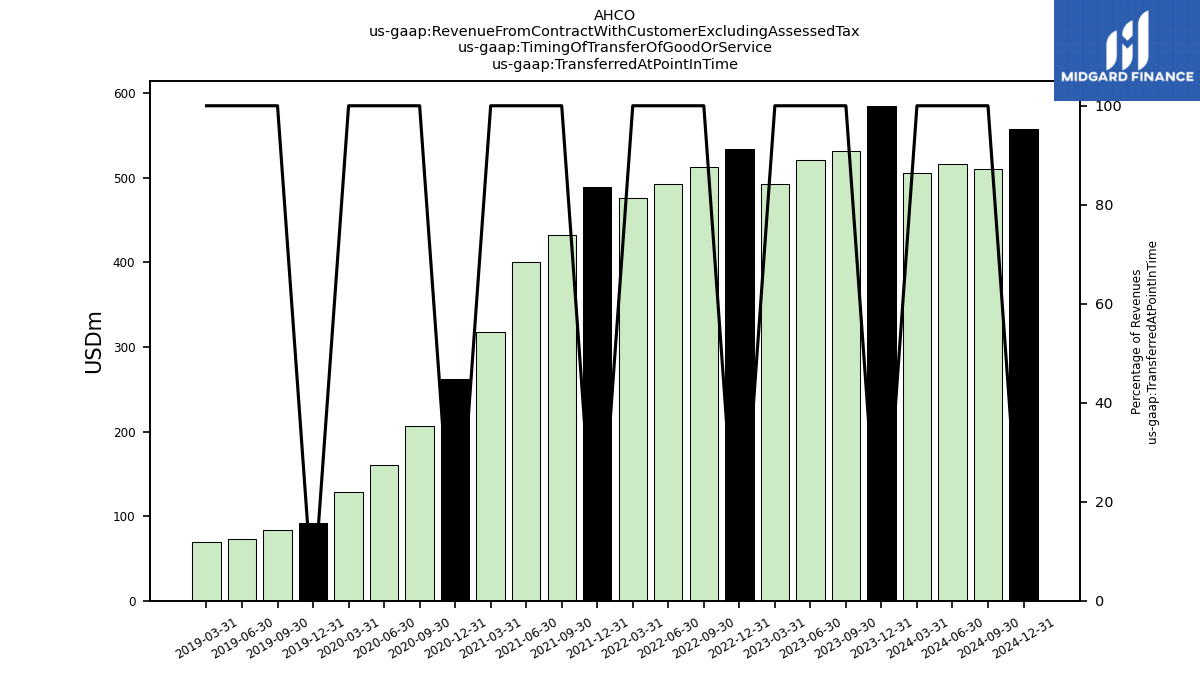
| Transferred At Point In Time | 585.29 | 532.12 | 521.63 | 492.25 | 534.55 | 512.52 | 492.65 | 475.95 | 489.37 | 432.17 | 400.60 | 317.26 | 262.22 | 207.14 | 160.97 | 128.97 | 91.43 | 83.06 | 73.00 | 68.96 | |
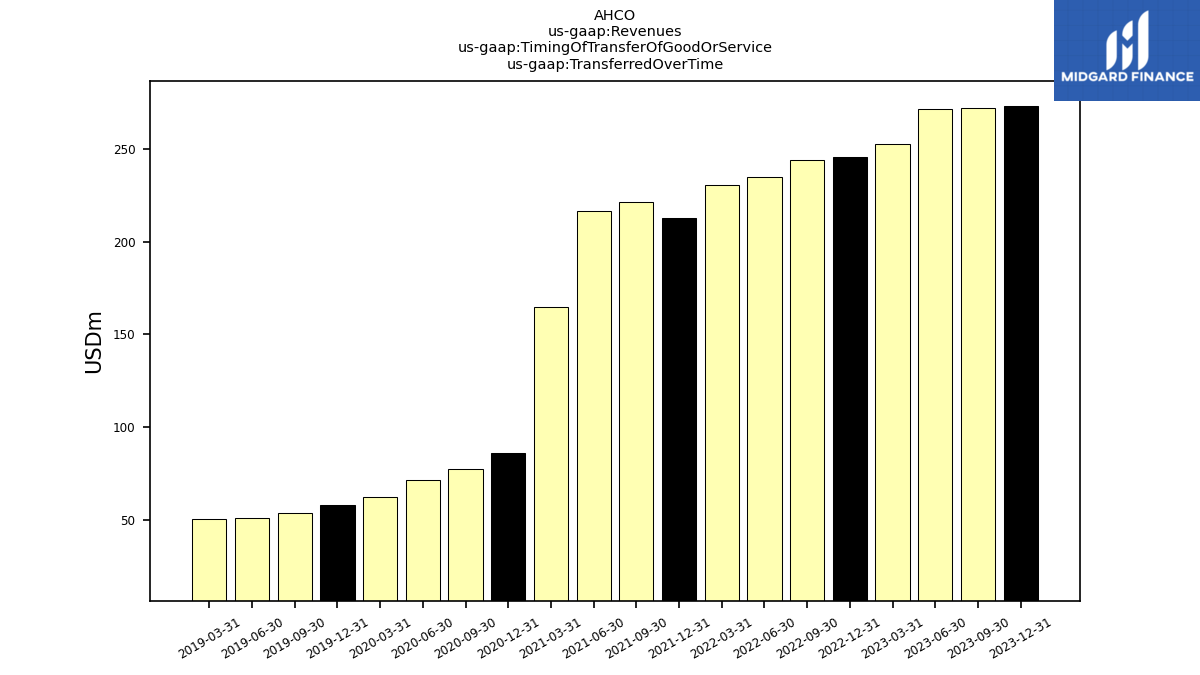
| Transferred Over Time | 272.94 | 271.91 | 271.65 | 252.37 | 245.74 | 243.97 | 234.96 | 230.25 | 212.73 | 221.12 | 216.42 | 164.85 | 86.21 | 77.27 | 71.15 | 62.47 | 58.11 | 53.39 | 51.16 | 50.54 | |
| Revenue From Contract With Customer Excluding Assessed Tax | 858.23 | 804.03 | 793.29 | 744.63 | 780.28 | 756.50 | 727.61 | 706.20 | 702.11 | 653.29 | 617.02 | 482.12 | 348.43 | 284.40 | 232.12 | 191.44 | 149.54 | 136.45 | 124.15 | 119.50 | |
| Government Payor | 233.93 | 220.35 | 209.66 | 188.85 | 205.15 | 198.84 | 196.34 | 181.65 | 193.95 | 180.51 | 177.32 | 133.73 | 101.93 | 81.97 | 60.51 | 51.24 | 46.33 | 43.68 | 40.58 | 38.10 | |
| Insurance Payor | 535.69 | 486.14 | 474.83 | 436.78 | 485.94 | 465.62 | 436.18 | 420.89 | 437.53 | 399.75 | 371.87 | 290.01 | 219.00 | 175.42 | 148.16 | 114.45 | 86.60 | 77.14 | 68.91 | 67.72 | |
| Patient Payor | 88.61 | 97.54 | 108.80 | 119.00 | 89.20 | 92.03 | 95.10 | 103.66 | 70.63 | 73.03 | 67.83 | 58.38 | 27.50 | 27.02 | 23.44 | 25.74 | 16.61 | 15.64 | 14.67 | 13.68 | |
| Diabetes | 184.82 | 159.94 | 168.91 | 146.38 | 192.21 | 173.29 | 166.29 | 155.31 | 178.85 | 137.95 | 126.53 | 97.87 | 96.44 | 53.83 | 6.37 | 5.31 | NA | NA | NA | NA | |
| Health Care Home Medical Equipment | 52.23 | 52.18 | 51.21 | 50.90 | 54.22 | 54.95 | 56.65 | 56.58 | 57.09 | 57.03 | 54.79 | 44.54 | 34.88 | 29.25 | 25.99 | 23.76 | 26.03 | 21.96 | 20.44 | 20.73 | |
| Health Care Respiratory Services | 151.00 | 151.08 | 154.08 | 142.65 | 137.21 | 140.35 | 136.76 | 140.72 | 120.38 | 124.15 | 124.68 | 89.08 | 38.30 | 37.42 | 48.97 | 27.78 | 22.99 | 21.04 | 21.45 | 21.71 | |
| Health Care Sleep Therapy Equipment Supplies And Related Services | 328.76 | 315.39 | 302.63 | 294.38 | 285.47 | 270.63 | 260.35 | 250.27 | 248.81 | 236.11 | 229.67 | 176.79 | 112.97 | 99.63 | 107.06 | 91.56 | 90.95 | 79.88 | 69.38 | 65.18 | |
| Supplies To Home | 49.25 | 48.35 | 48.32 | 46.55 | 47.79 | 47.79 | 43.88 | 39.87 | 41.35 | 42.44 | 42.67 | 41.36 | 45.15 | 44.58 | 34.24 | 33.34 | 1.85 | 1.97 | 1.92 | 2.03 | |
| Health Care Other | 92.17 | 77.09 | 68.13 | 63.76 | 63.40 | 69.49 | 63.68 | 63.46 | 55.61 | 55.61 | 38.67 | 32.48 | 20.70 | 19.69 | 15.85 | 15.01 | 15.48 | 11.60 | 10.97 | 9.85 | |
| Diabetes, Transferred At Point In Time | 182.54 | 157.33 | 165.02 | 142.54 | 188.29 | 169.07 | 162.26 | 151.36 | 175.52 | 134.23 | 123.31 | 95.02 | 94.92 | 52.89 | 6.37 | 5.31 | NA | NA | NA | NA | |
| Diabetes, Transferred Over Time | 2.28 | 2.61 | 3.89 | 3.83 | 3.91 | 4.21 | 4.03 | 3.95 | 3.33 | 3.72 | 3.22 | 2.85 | 1.52 | 0.95 | NA | NA | NA | NA | NA | NA | |
| Health Care Home Medical Equipment, Transferred At Point In Time | 27.30 | 27.09 | 27.24 | 28.56 | 28.71 | 29.46 | 31.10 | 30.85 | 32.01 | 30.99 | 30.36 | 24.16 | 18.73 | 15.00 | 12.73 | 11.58 | 14.35 | 10.87 | 10.24 | 10.49 | |
| Health Care Home Medical Equipment, Transferred Over Time | 24.93 | 25.09 | 23.97 | 22.34 | 25.50 | 25.48 | 25.55 | 25.73 | 25.08 | 26.04 | 24.43 | 20.38 | 16.15 | 14.26 | 13.26 | 12.18 | 11.68 | 11.09 | 10.20 | 10.24 | |
| Health Care Respiratory Services, Transferred At Point In Time | 8.09 | 8.16 | 8.19 | 7.93 | 8.57 | 9.73 | 7.89 | 8.14 | 6.01 | 6.23 | 13.15 | 5.62 | 2.57 | 5.15 | 18.11 | 2.77 | 1.66 | 1.40 | 1.45 | 1.28 | |
| Health Care Respiratory Services, Transferred Over Time | 142.92 | 142.92 | 145.89 | 134.72 | 128.63 | 130.62 | 128.87 | 132.58 | 114.37 | 117.92 | 111.53 | 83.45 | 35.73 | 32.27 | 30.86 | 25.01 | 21.33 | 19.65 | 20.01 | 20.43 | |
| Health Care Sleep Therapy Equipment Supplies And Related Services, Transferred At Point In Time | 240.81 | 227.00 | 215.85 | 213.46 | 208.79 | 198.21 | 194.69 | 192.34 | 188.76 | 173.36 | 163.33 | 128.68 | 84.89 | 74.66 | 84.42 | 68.89 | 67.87 | 59.12 | 50.43 | 47.13 | |
| Health Care Sleep Therapy Equipment Supplies And Related Services, Transferred Over Time | 87.96 | 88.39 | 86.78 | 80.92 | 76.68 | 72.42 | 65.66 | 57.94 | 60.05 | 62.76 | 66.33 | 48.11 | 28.08 | 24.97 | 22.64 | 22.67 | 23.08 | 20.76 | 18.94 | 18.06 | |
| Supplies To Home, Transferred At Point In Time | 49.25 | 48.35 | 48.32 | 46.55 | 47.79 | 47.79 | 43.88 | 39.87 | 41.35 | 42.44 | 42.67 | 41.36 | 45.15 | 44.58 | 34.24 | 33.34 | 1.85 | 1.97 | 1.92 | 2.03 | |
| Health Care Other, Transferred At Point In Time | 77.31 | 64.18 | 57.01 | 53.21 | 52.39 | 58.25 | 52.83 | 53.40 | 45.72 | 44.93 | 27.76 | 22.43 | 15.96 | 14.87 | 11.46 | 12.39 | 13.47 | 9.71 | 8.97 | 8.03 | |
| Health Care Other, Transferred Over Time | 14.86 | 12.90 | 11.12 | 10.55 | 11.00 | 11.24 | 10.85 | 10.06 | 9.90 | 10.68 | 10.91 | 10.06 | 4.73 | 4.82 | 4.39 | 2.61 | 2.01 | 1.89 | 2.00 | 1.81 | |
| Transferred At Point In Time | 585.29 | 532.12 | 521.63 | 492.25 | 534.55 | 512.52 | 492.65 | 475.95 | 489.37 | 432.17 | 400.60 | 317.26 | 262.22 | 207.14 | 160.97 | 128.97 | 91.43 | 83.06 | 73.00 | 68.96 | |
| Transferred Over Time | 272.94 | 271.91 | 271.65 | 252.37 | 245.74 | 243.97 | 234.96 | 230.25 | 212.73 | 221.12 | 216.42 | 164.85 | 86.21 | 77.27 | 71.15 | 62.47 | 58.11 | 53.39 | 51.16 | 50.54 |