
| 2023-12-29 | 2023-09-29 | 2023-06-30 | 2023-03-31 | 2022-12-23 | 2022-09-23 | 2022-09-22 | 2022-06-24 | 2022-03-25 | 2021-12-24 | 2021-09-24 | 2021-06-25 | 2021-03-26 | 2020-12-25 | 2020-09-25 | 2020-06-26 | 2020-03-27 | 2019-12-27 | 2019-09-27 | ||
|---|---|---|---|---|---|---|---|---|---|---|---|---|---|---|---|---|---|---|---|---|
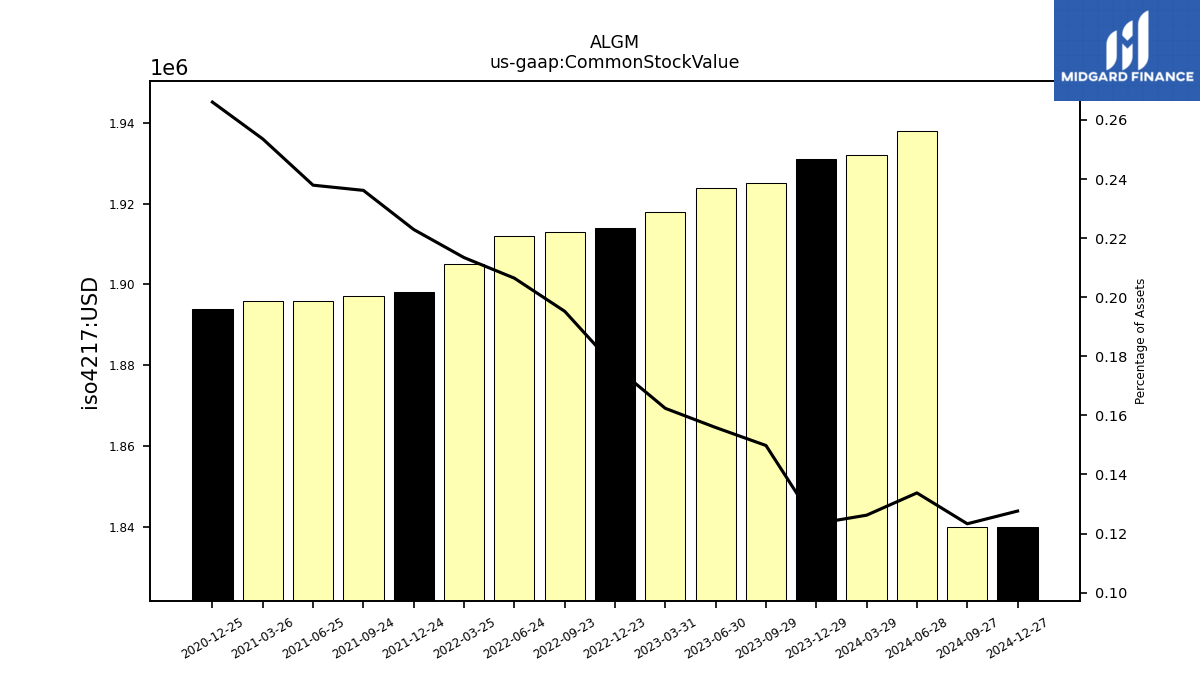
| Common Stock Value | 1.93 | 1.93 | 1.92 | 1.92 | 1.91 | 1.91 | NA | 1.91 | 1.91 | 1.90 | 1.90 | 1.90 | 1.90 | 1.89 | NA | NA | NA | NA | NA | |
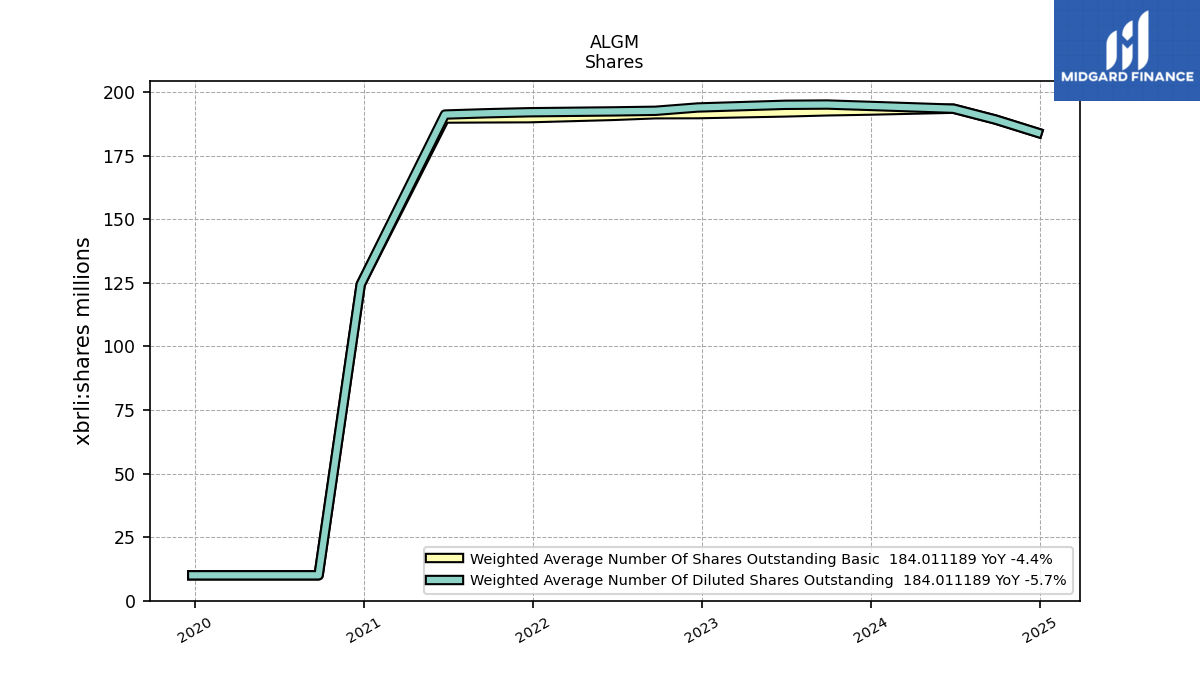
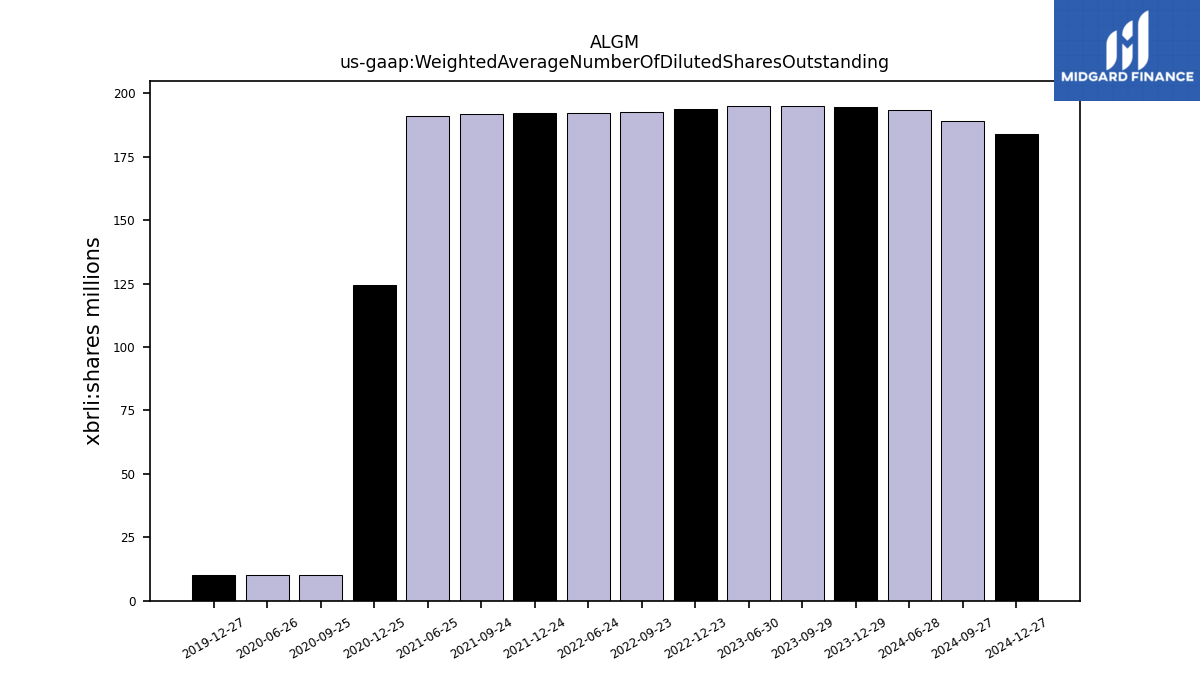
| Weighted Average Number Of Diluted Shares Outstanding | 194.57 | 195.10 | 194.99 | NA | 193.94 | 192.64 | NA | 192.41 | NA | 192.07 | 191.68 | 191.16 | NA | 124.36 | 10.00 | 10.00 | NA | 10.00 | NA | |
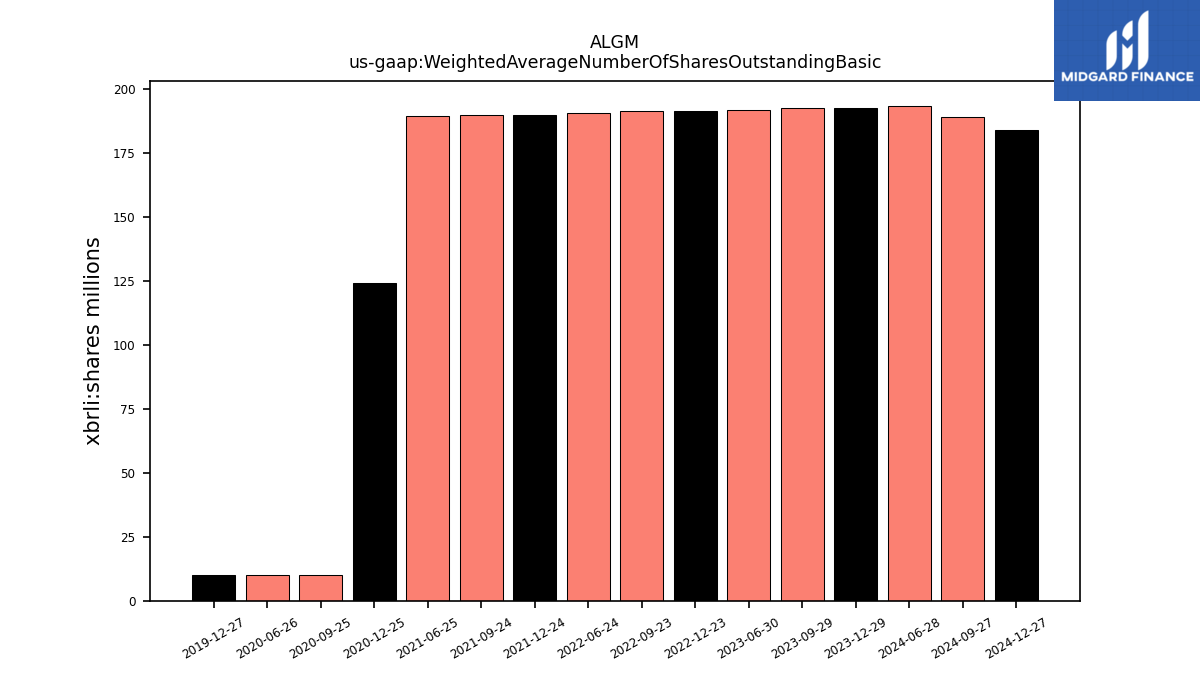
| Weighted Average Number Of Shares Outstanding Basic | 192.72 | 192.43 | 192.00 | NA | 191.33 | 191.28 | NA | 190.64 | NA | 189.74 | 189.67 | 189.59 | NA | 124.36 | 10.00 | 10.00 | NA | 10.00 | NA | |
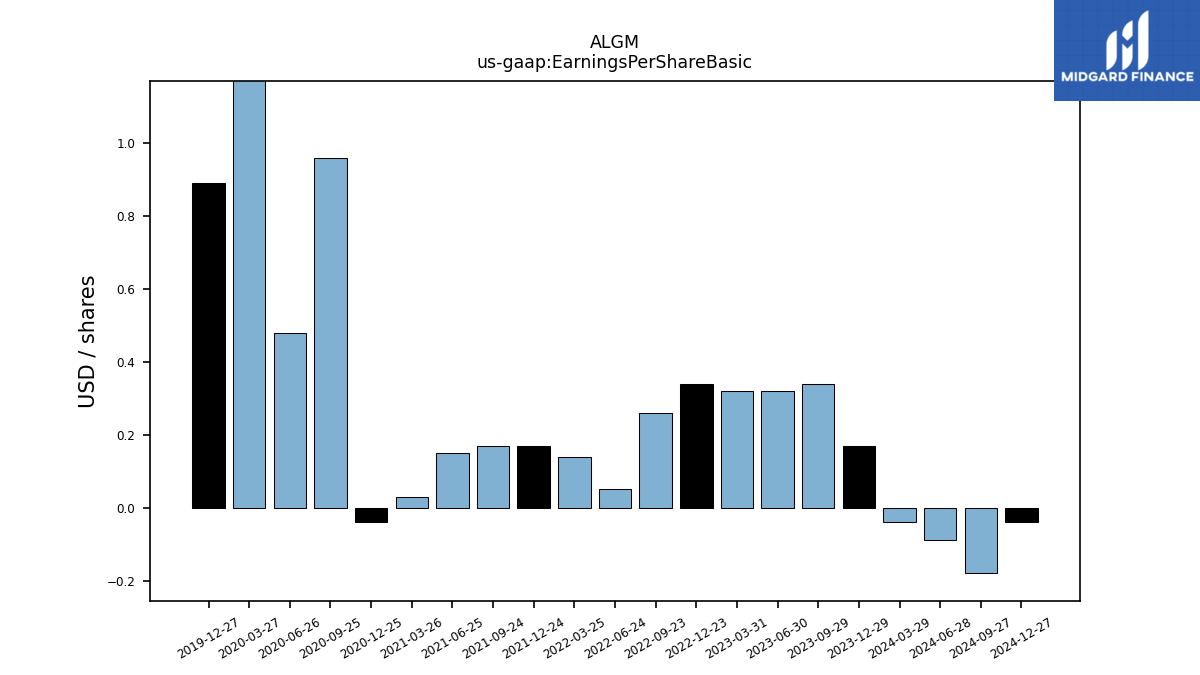
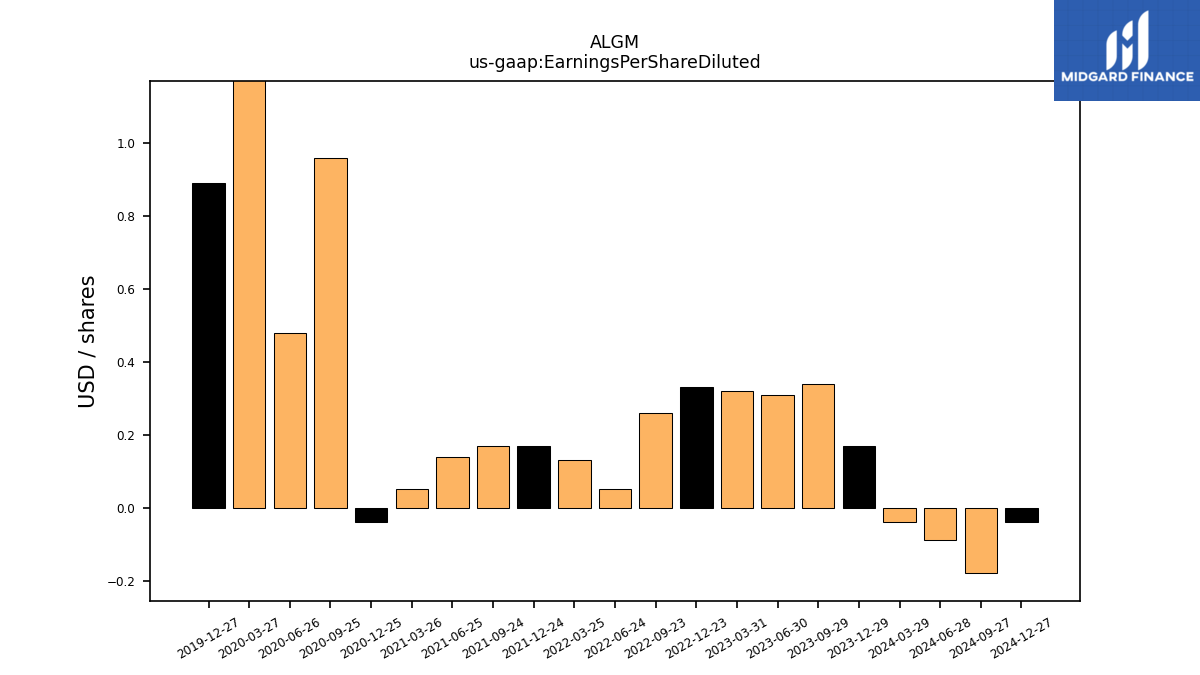
| Earnings Per Share Basic | 0.17 | 0.34 | 0.32 | 0.32 | 0.34 | 0.26 | NA | 0.05 | 0.14 | 0.17 | 0.17 | 0.15 | 0.03 | -0.04 | 0.96 | 0.48 | 1.33 | 0.89 | NA | |
| Earnings Per Share Diluted | 0.17 | 0.34 | 0.31 | 0.32 | 0.33 | 0.26 | NA | 0.05 | 0.13 | 0.17 | 0.17 | 0.14 | 0.05 | -0.04 | 0.96 | 0.48 | 1.33 | 0.89 | NA | |
| Income Loss From Continuing Operations Per Basic Share | 0.00 | 0.00 | 0.00 | 0.00 | 0.00 | 0.00 | NA | 0.00 | 0.00 | 0.00 | 0.00 | 0.00 | 0.00 | -0.00 | 0.00 | 0.00 | 0.00 | 0.00 | NA | |
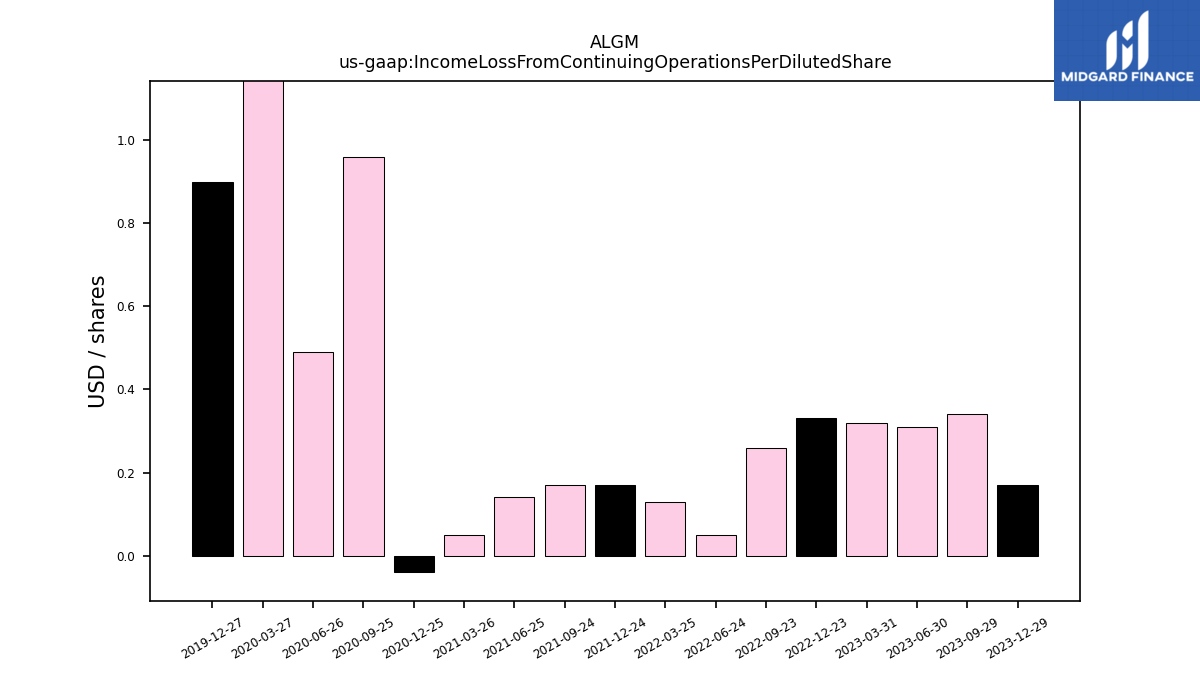
| Income Loss From Continuing Operations Per Diluted Share | 0.00 | 0.00 | 0.00 | 0.00 | 0.00 | 0.00 | NA | 0.00 | 0.00 | 0.00 | 0.00 | 0.00 | 0.00 | -0.00 | 0.00 | 0.00 | 0.00 | 0.00 | NA |
| 2023-12-29 | 2023-09-29 | 2023-06-30 | 2023-03-31 | 2022-12-23 | 2022-09-23 | 2022-09-22 | 2022-06-24 | 2022-03-25 | 2021-12-24 | 2021-09-24 | 2021-06-25 | 2021-03-26 | 2020-12-25 | 2020-09-25 | 2020-06-26 | 2020-03-27 | 2019-12-27 | 2019-09-27 | ||
|---|---|---|---|---|---|---|---|---|---|---|---|---|---|---|---|---|---|---|---|---|
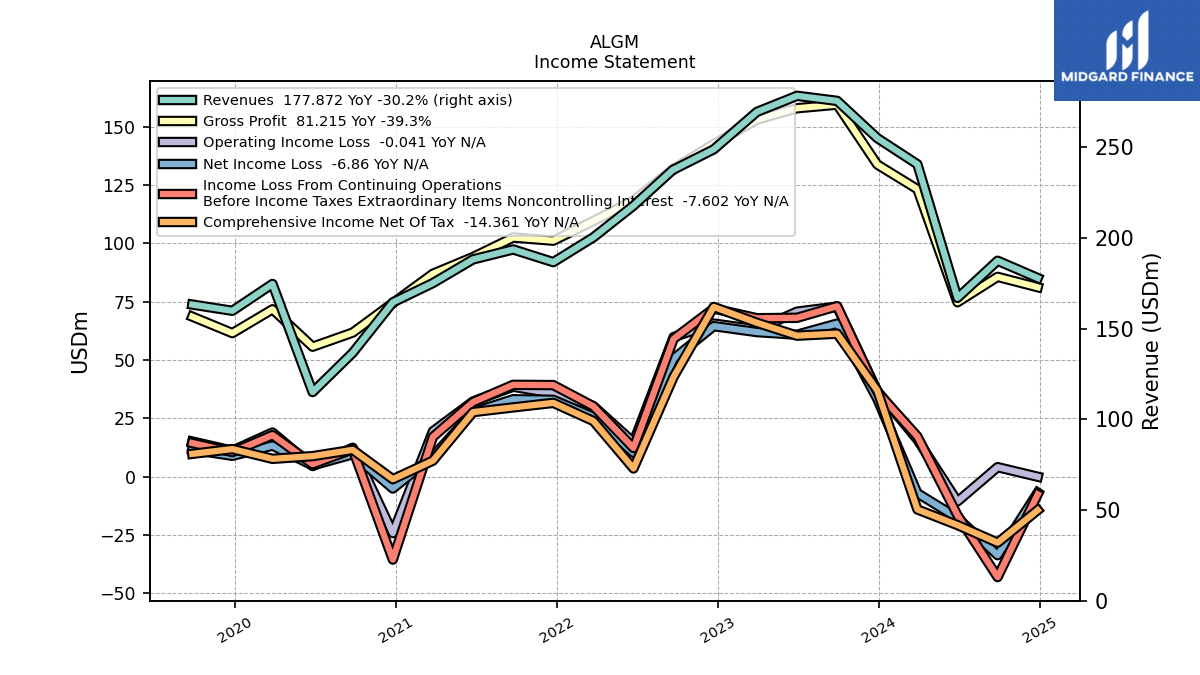
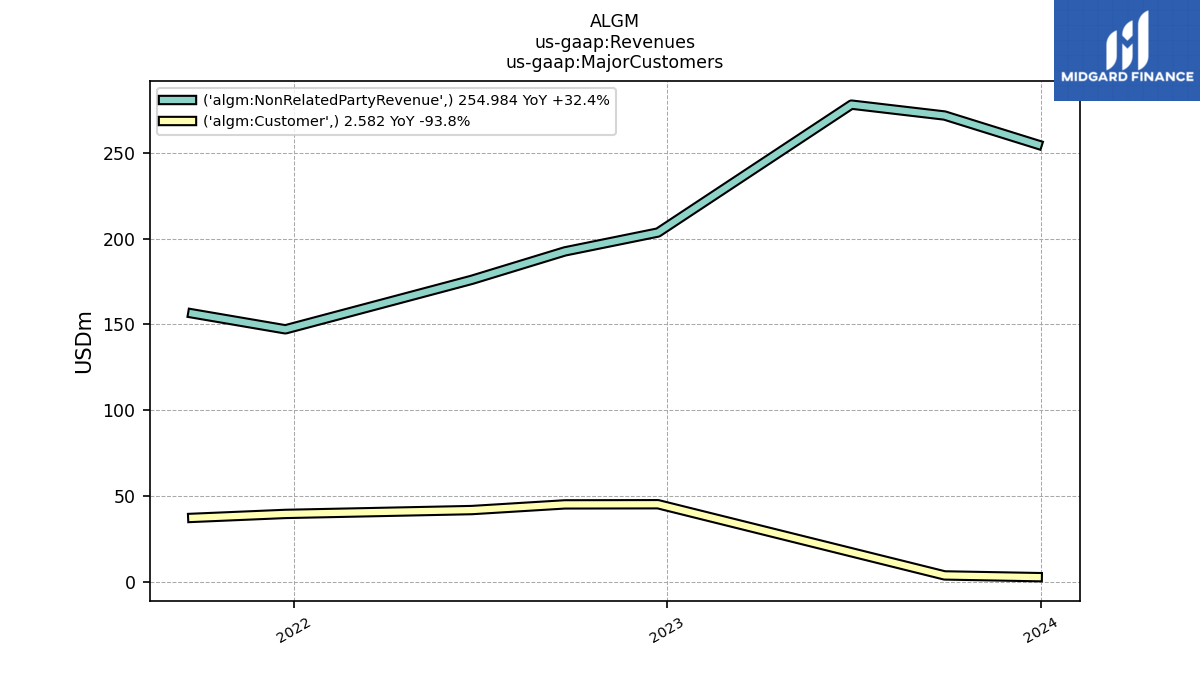
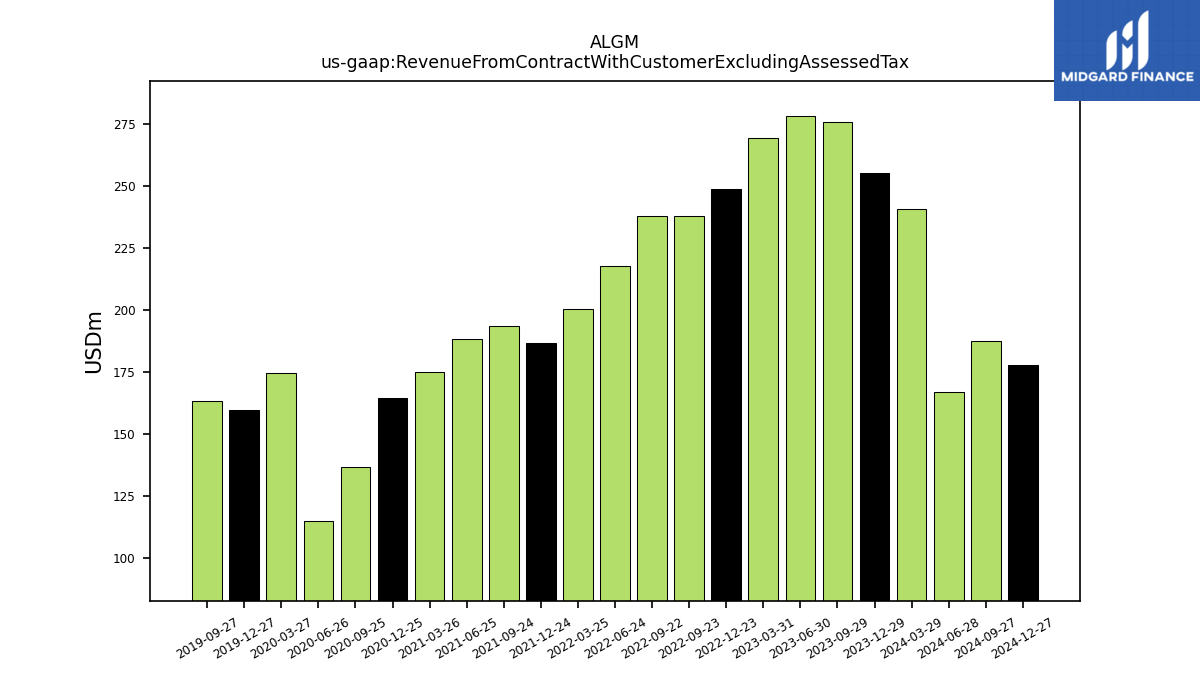
| Revenue From Contract With Customer Excluding Assessed Tax | 254.98 | 275.51 | 278.29 | 269.44 | 248.79 | 237.67 | 237.67 | 217.75 | 200.29 | 186.63 | 193.61 | 188.14 | 175.11 | 164.45 | 136.65 | 115.00 | 174.60 | 159.80 | 163.24 | |
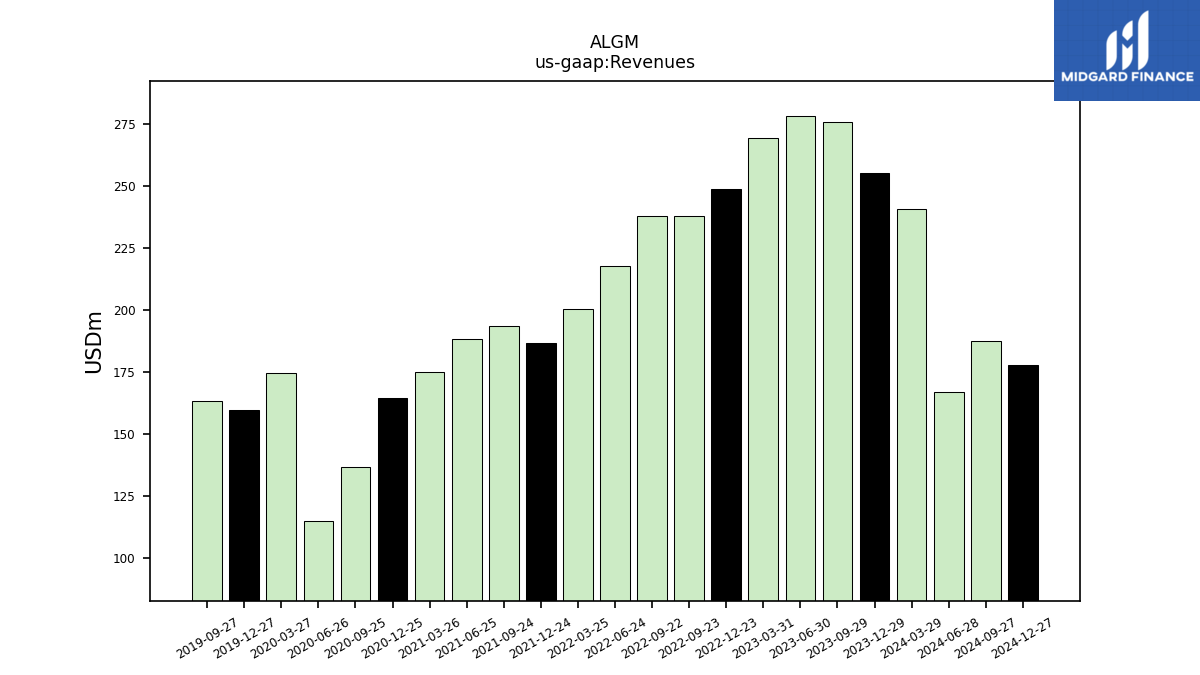
| Revenues | 254.98 | 275.51 | 278.29 | 269.44 | 248.79 | 237.67 | 237.67 | 217.75 | 200.29 | 186.63 | 193.61 | 188.14 | 175.11 | 164.45 | 136.65 | 115.00 | 174.60 | 159.80 | 163.24 | |
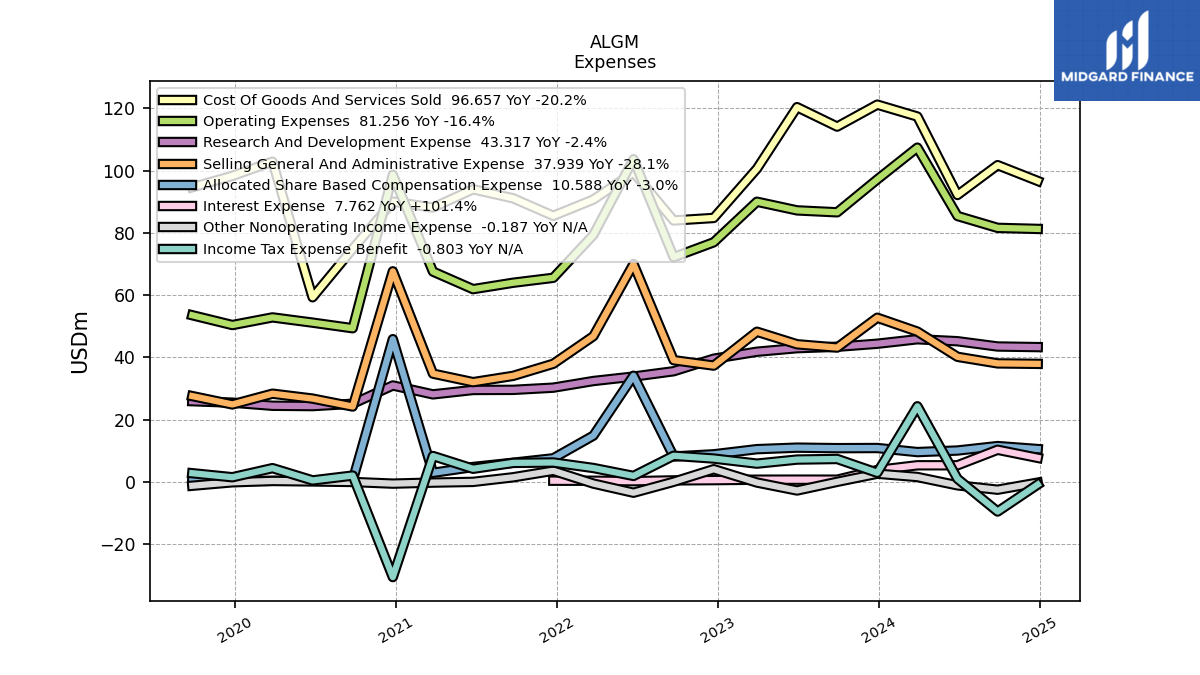
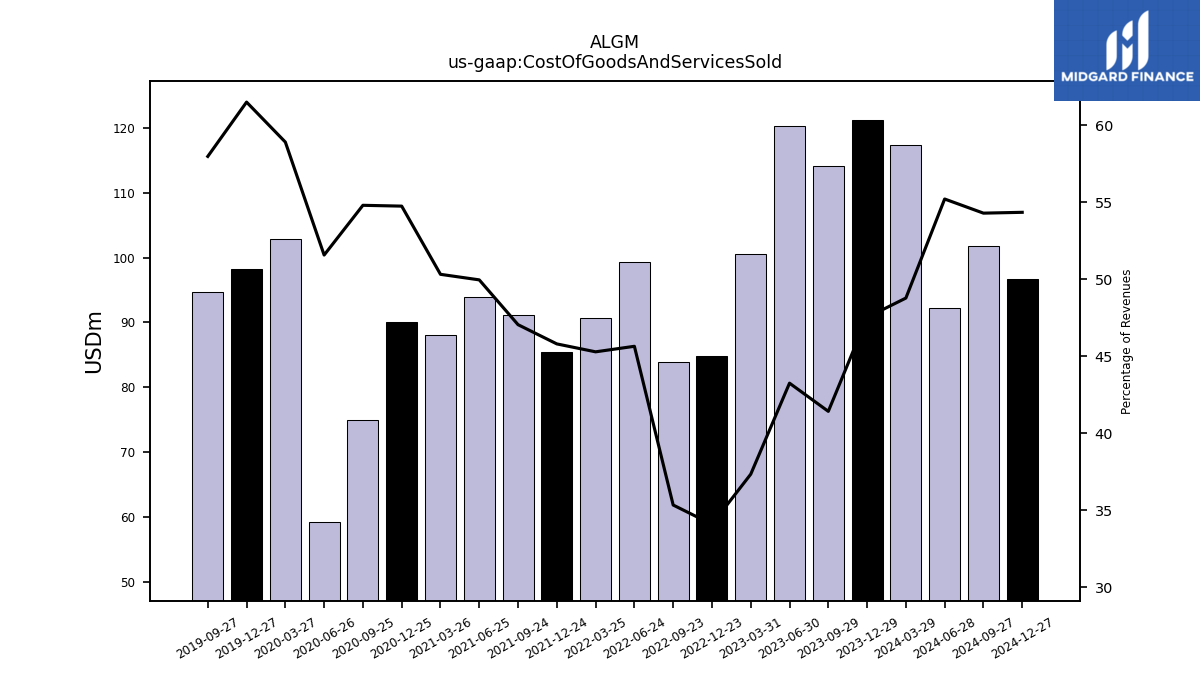
| Cost Of Goods And Services Sold | 121.16 | 114.09 | 120.34 | 100.58 | 84.78 | 83.96 | NA | 99.38 | 90.69 | 85.46 | 91.08 | 93.98 | 88.10 | 90.02 | 74.88 | 59.30 | 102.85 | 98.28 | 94.63 | |
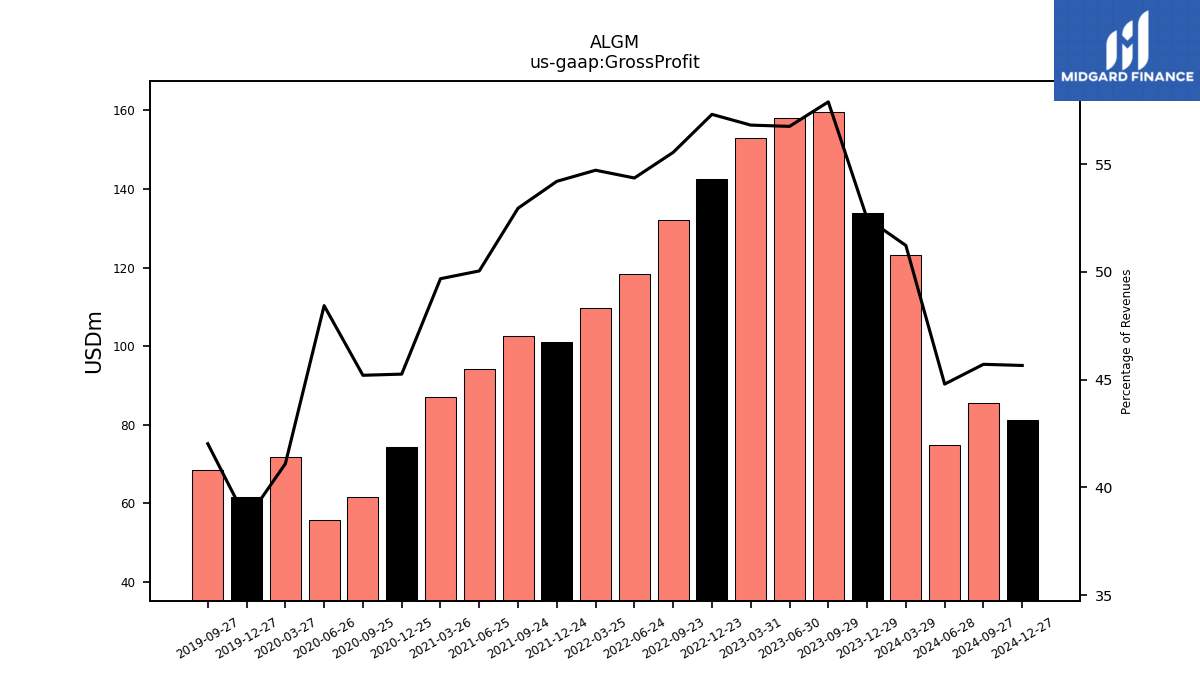
| Gross Profit | 133.83 | 159.50 | 157.95 | 153.09 | 142.59 | 132.02 | NA | 118.37 | 109.60 | 101.17 | 102.53 | 94.16 | 87.01 | 74.42 | 61.77 | 55.70 | 71.76 | 61.52 | 68.61 | |
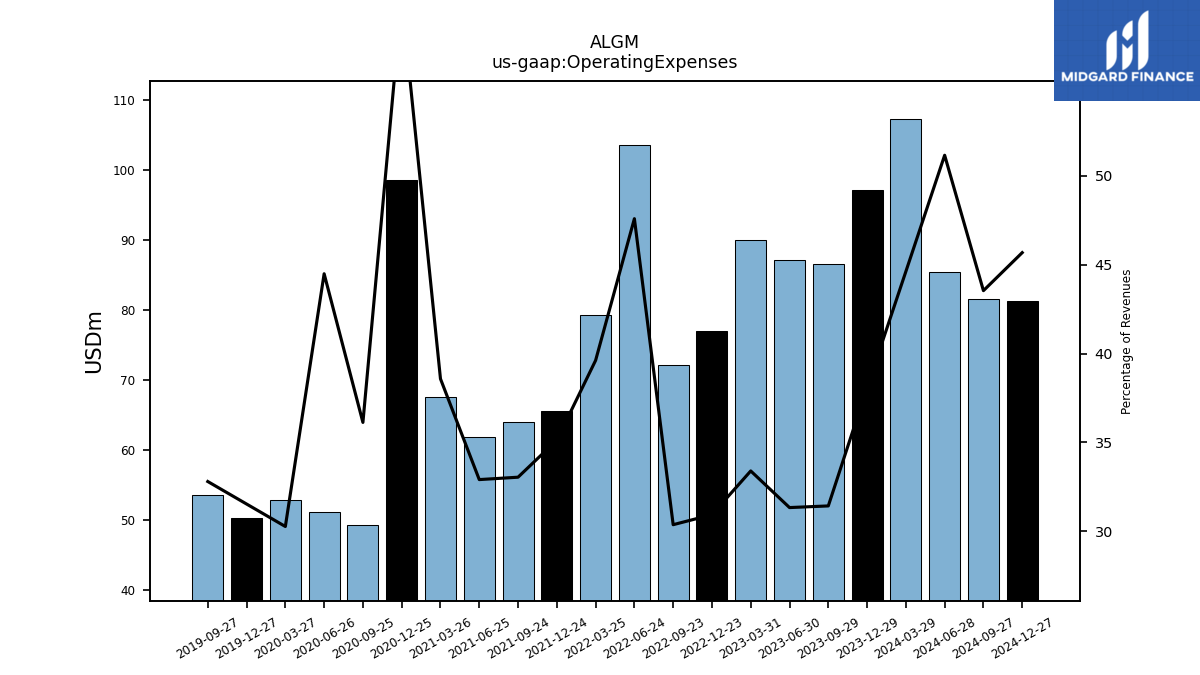
| Operating Expenses | 97.14 | 86.59 | 87.20 | 89.98 | 76.97 | 72.18 | NA | 103.64 | 79.35 | 65.56 | 63.98 | 61.92 | 67.56 | 98.65 | 49.37 | 51.17 | 52.85 | 50.39 | 53.55 | |
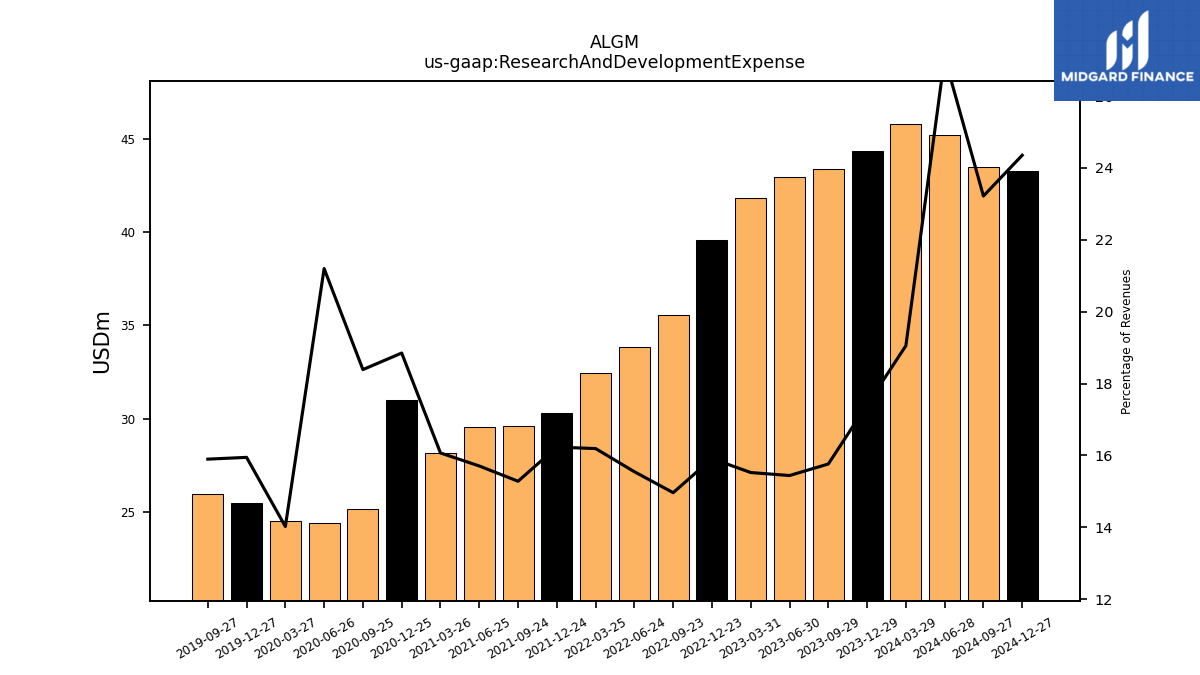
| Research And Development Expense | 44.40 | 43.43 | 42.98 | 41.83 | 39.59 | 35.57 | NA | 33.86 | 32.43 | 30.30 | 29.59 | 29.55 | 28.14 | 31.00 | 25.13 | 24.38 | 24.49 | 25.48 | 25.95 | |
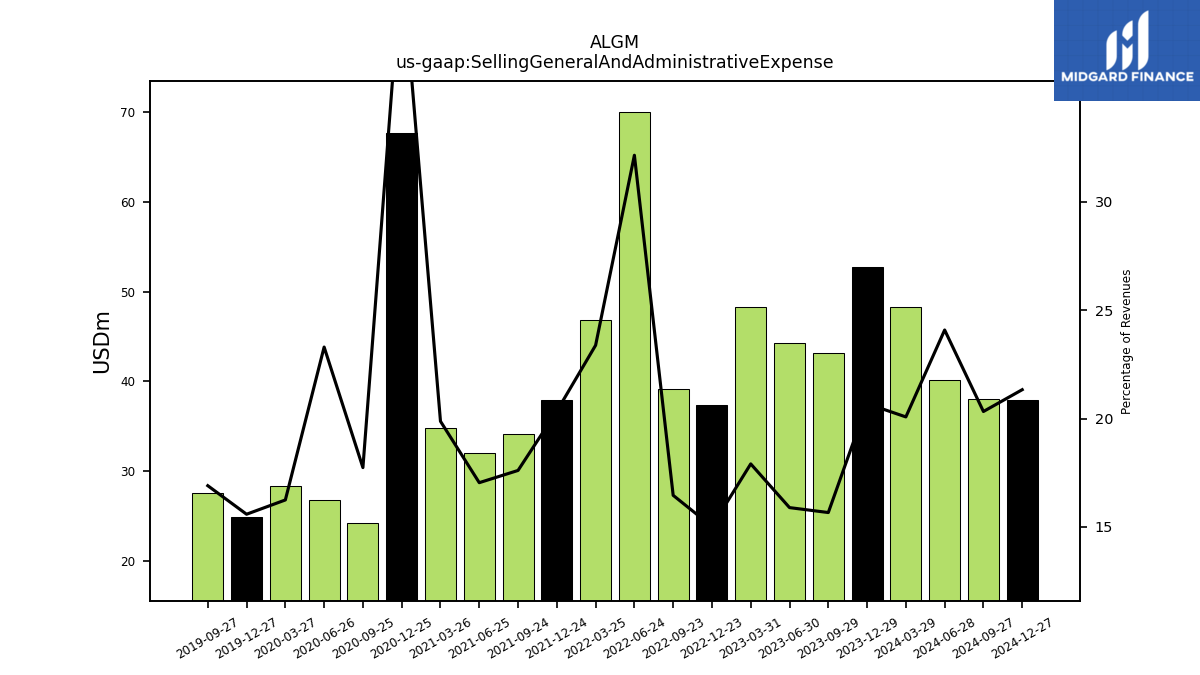
| Selling General And Administrative Expense | 52.75 | 43.16 | 44.23 | 48.25 | 37.37 | 39.12 | NA | 69.98 | 46.82 | 37.96 | 34.09 | 32.06 | 34.80 | 67.65 | 24.24 | 26.79 | 28.37 | 24.91 | 27.59 | |
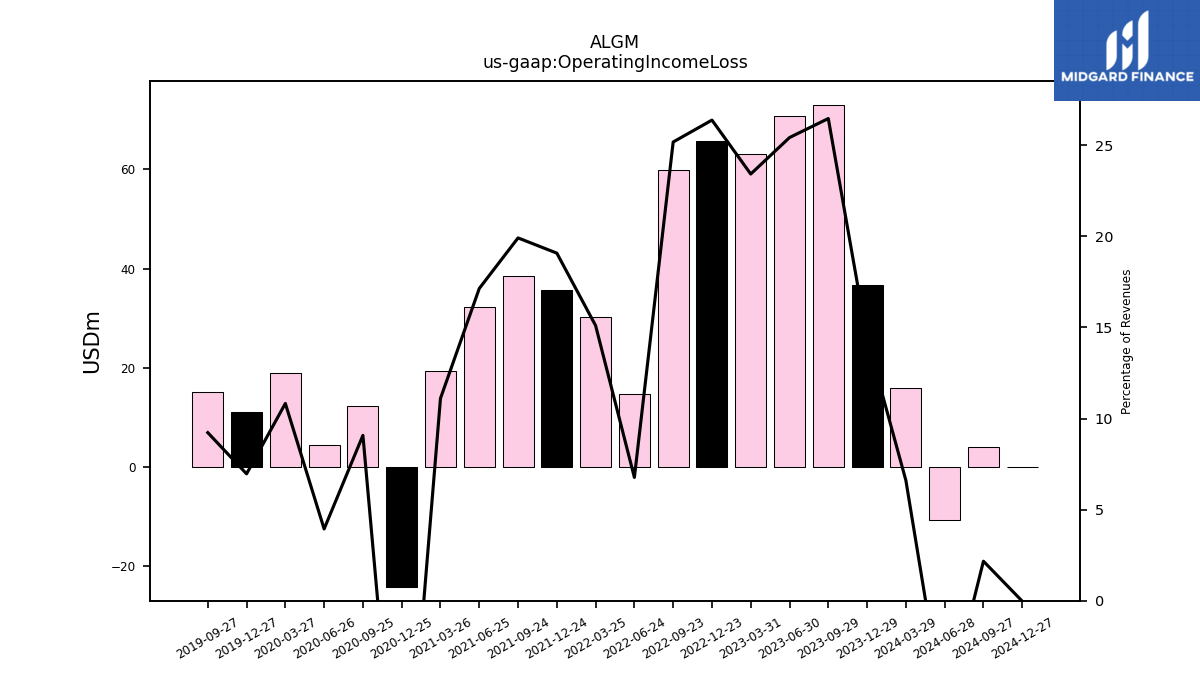
| Operating Income Loss | 36.69 | 72.92 | 70.75 | 63.10 | 65.63 | 59.84 | NA | 14.74 | 30.25 | 35.60 | 38.55 | 32.24 | 19.45 | -24.22 | 12.40 | 4.53 | 18.91 | 11.13 | 15.06 | |
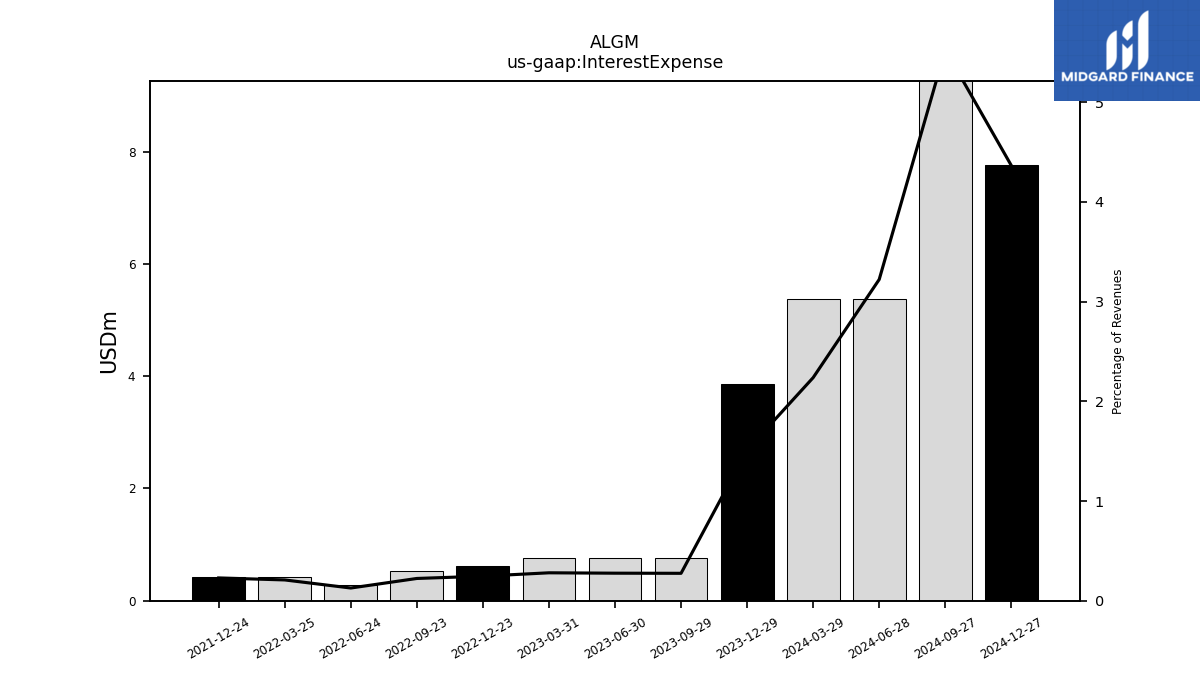
| Interest Expense | 3.85 | 0.76 | 0.77 | 0.76 | 0.61 | 0.53 | NA | 0.28 | 0.42 | 0.43 | NA | NA | NA | NA | NA | NA | NA | NA | NA | |
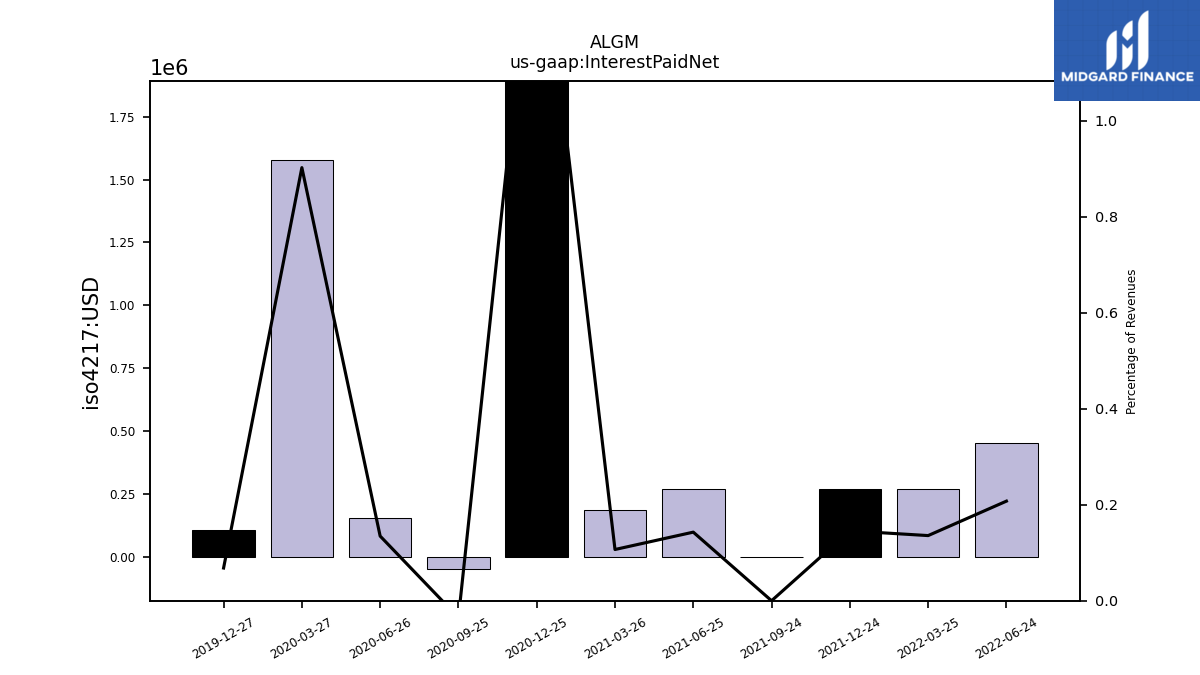
| Interest Paid Net | NA | NA | NA | NA | NA | NA | NA | 0.45 | 0.27 | 0.27 | 0.00 | 0.27 | 0.19 | 2.45 | -0.05 | 0.15 | 1.58 | 0.11 | NA | |
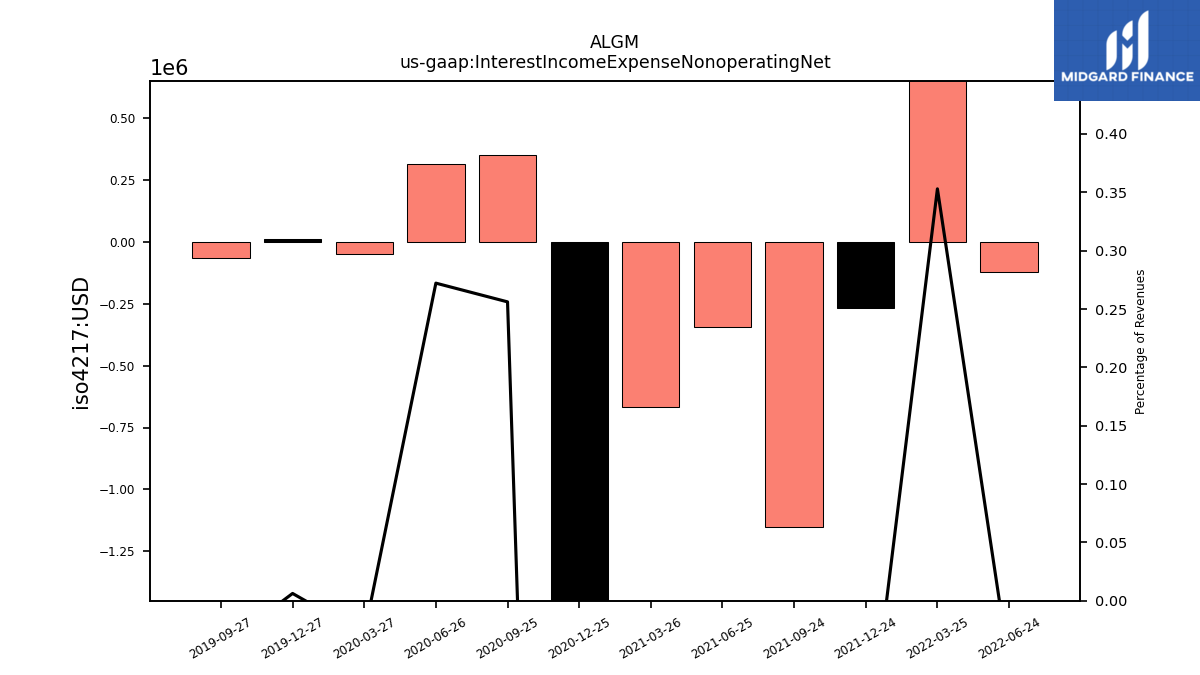
| Interest Income Expense Nonoperating Net | NA | NA | NA | NA | NA | NA | NA | -0.12 | 0.71 | -0.27 | -1.15 | -0.34 | -0.67 | -2.60 | 0.35 | 0.31 | -0.05 | 0.01 | -0.07 | |
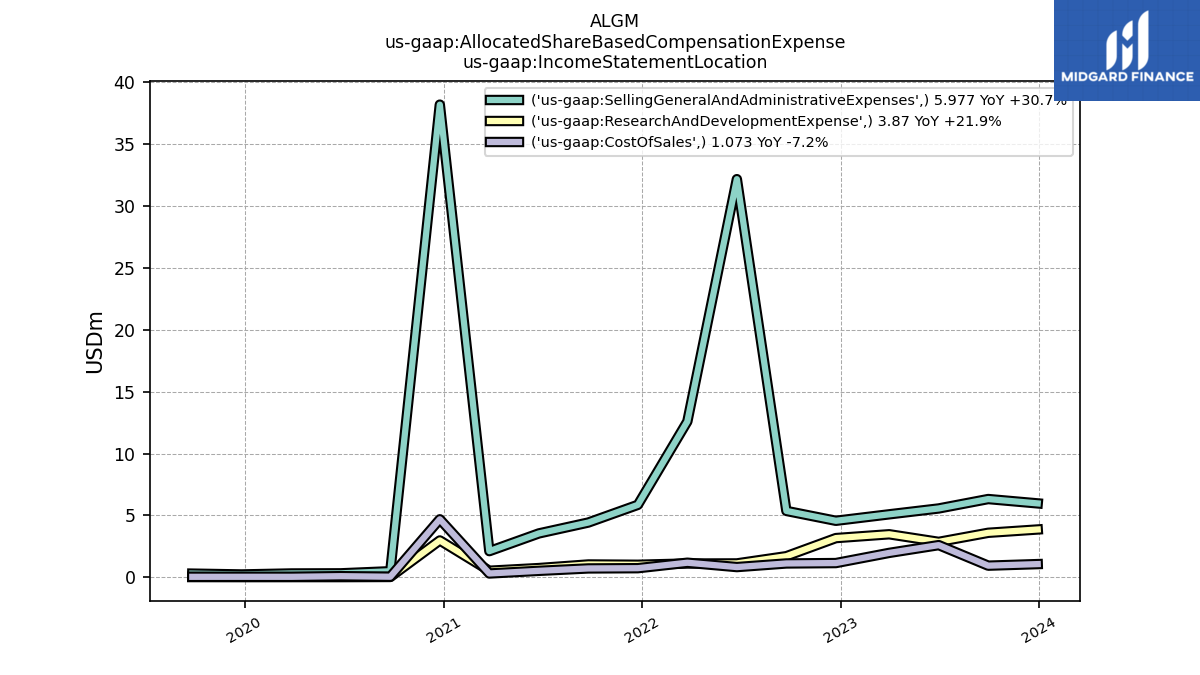
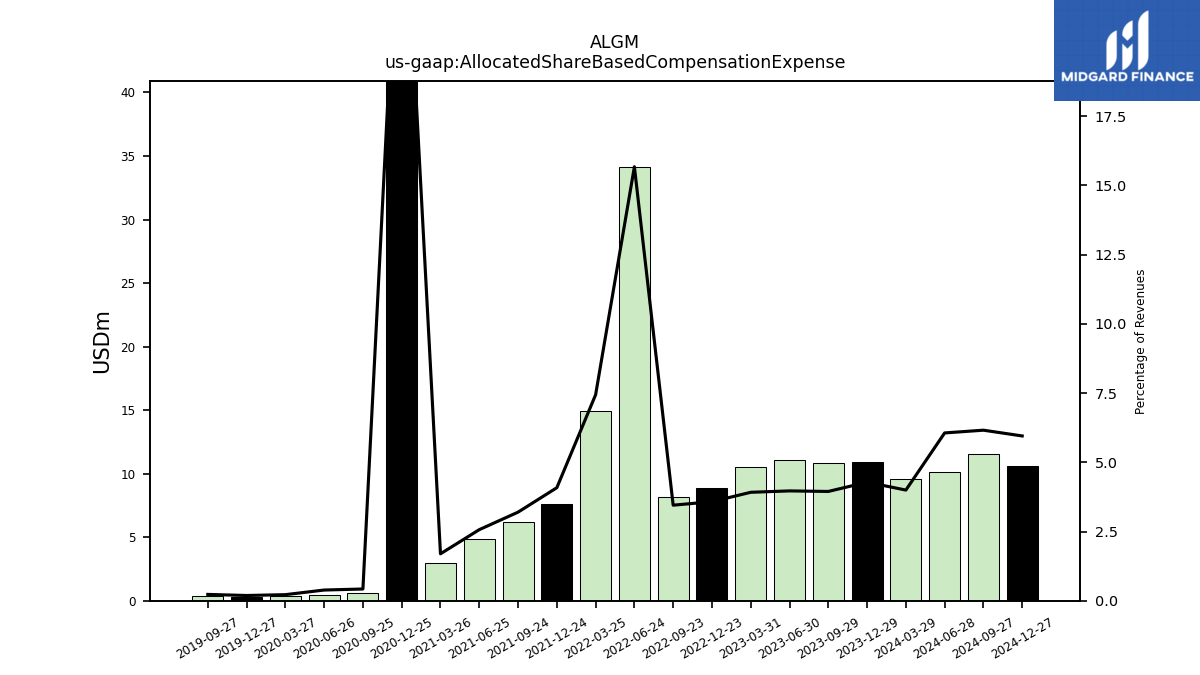
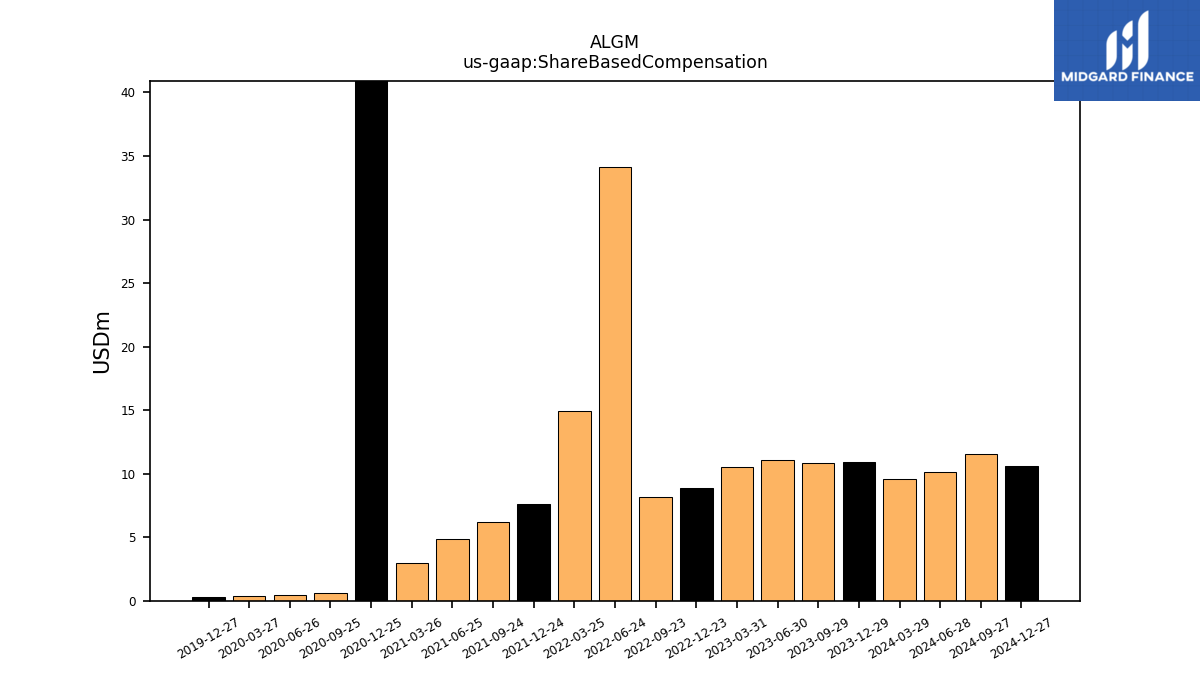
| Allocated Share Based Compensation Expense | 10.92 | 10.88 | 11.04 | 10.56 | 8.90 | 8.20 | NA | 34.14 | 14.90 | 7.62 | 6.20 | 4.83 | 2.97 | 45.88 | 0.58 | 0.45 | 0.38 | 0.30 | 0.37 | |
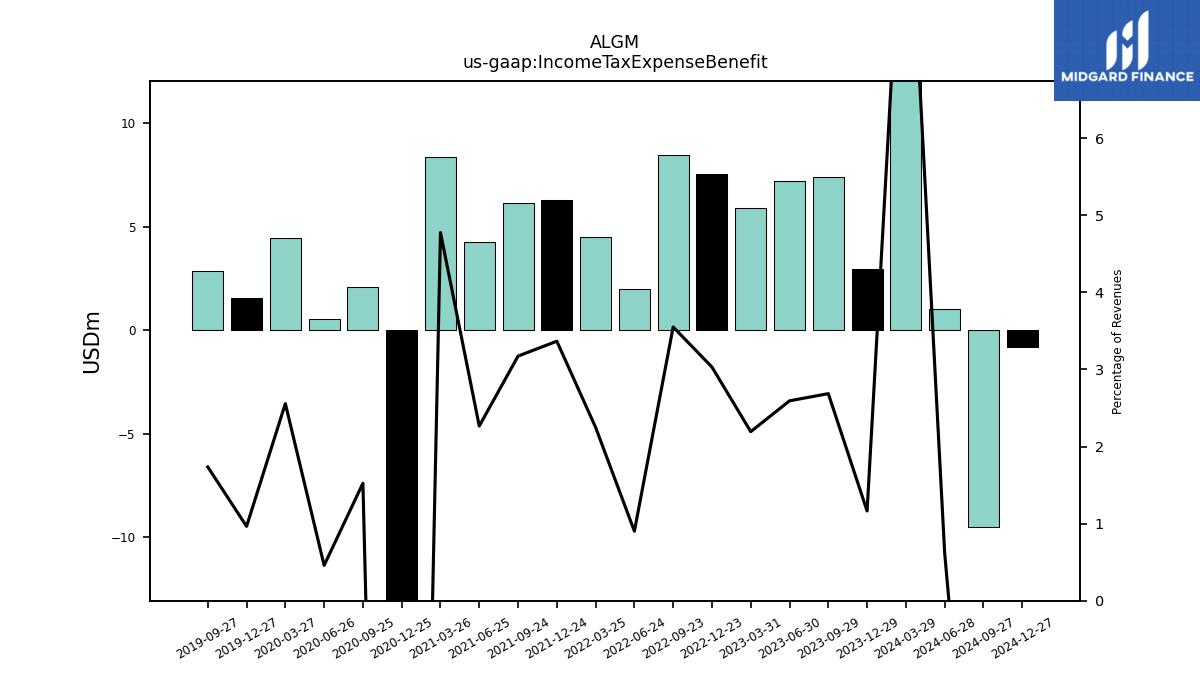
| Income Tax Expense Benefit | 2.97 | 7.40 | 7.21 | 5.91 | 7.54 | 8.44 | NA | 1.97 | 4.50 | 6.28 | 6.14 | 4.26 | 8.36 | -30.52 | 2.08 | 0.53 | 4.46 | 1.54 | 2.83 | |
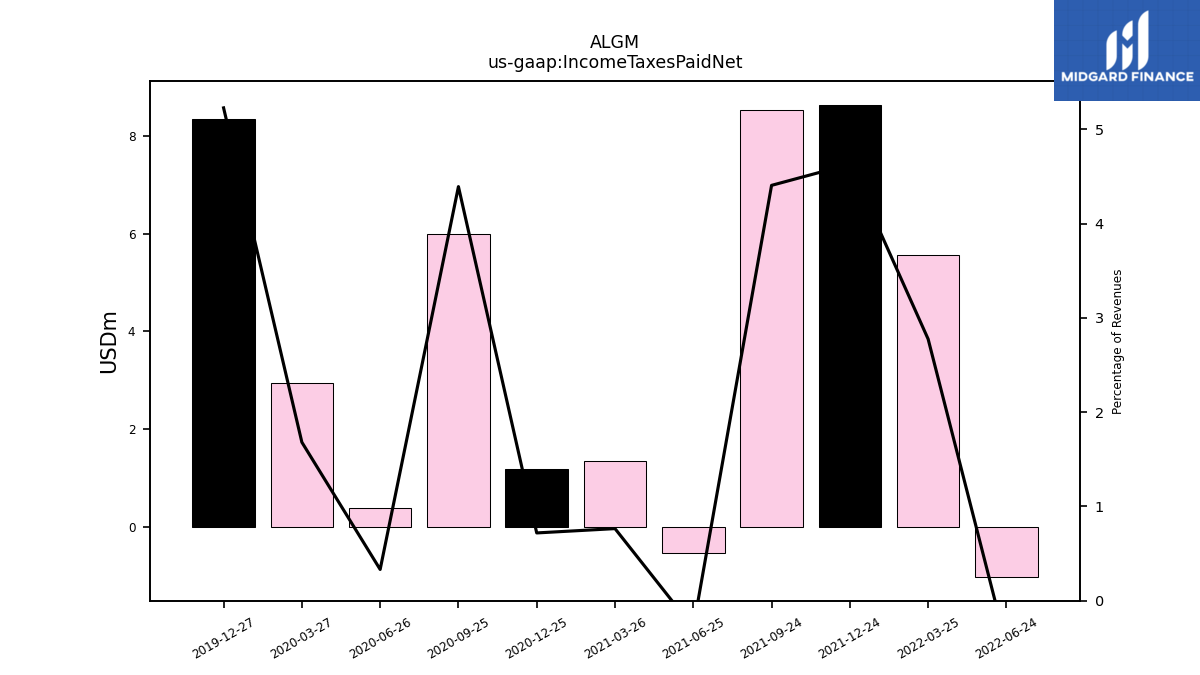
| Income Taxes Paid Net | NA | NA | NA | NA | NA | NA | NA | -1.03 | 5.56 | 8.64 | 8.53 | -0.54 | 1.34 | 1.18 | 6.00 | 0.38 | 2.94 | 8.36 | NA | |
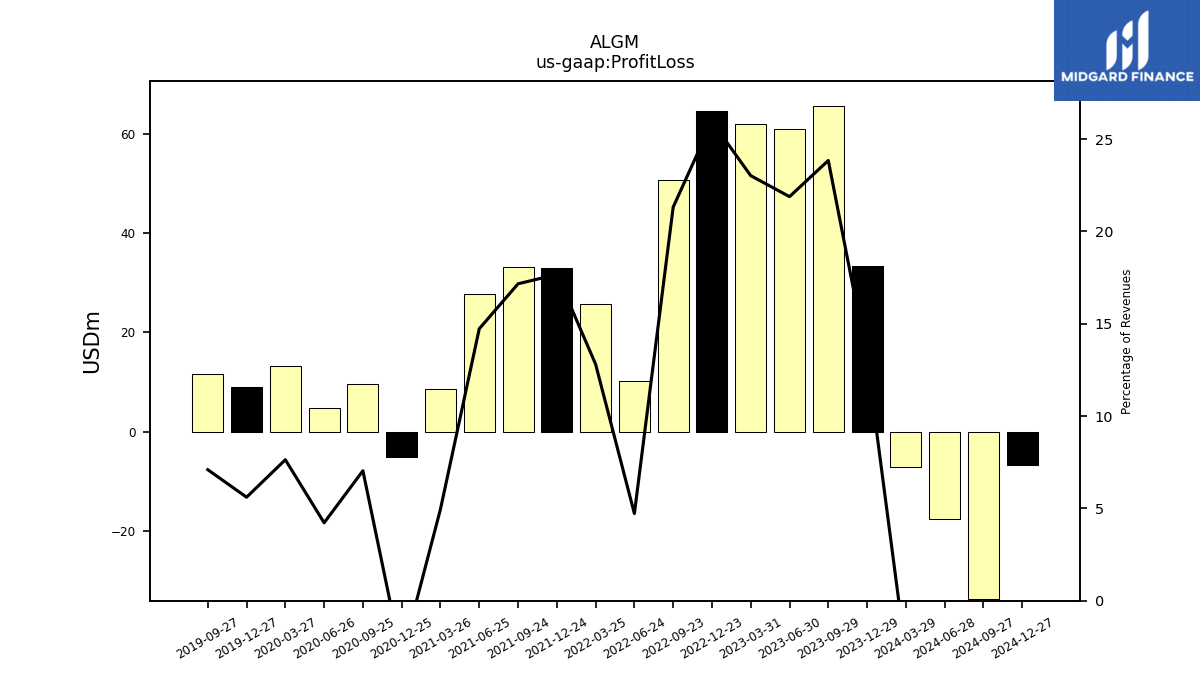
| Profit Loss | 33.40 | 65.67 | 60.89 | 62.01 | 64.55 | 50.65 | NA | 10.28 | 25.65 | 32.97 | 33.22 | 27.71 | 8.69 | -5.06 | 9.62 | 4.85 | 13.33 | 8.96 | 11.58 | |
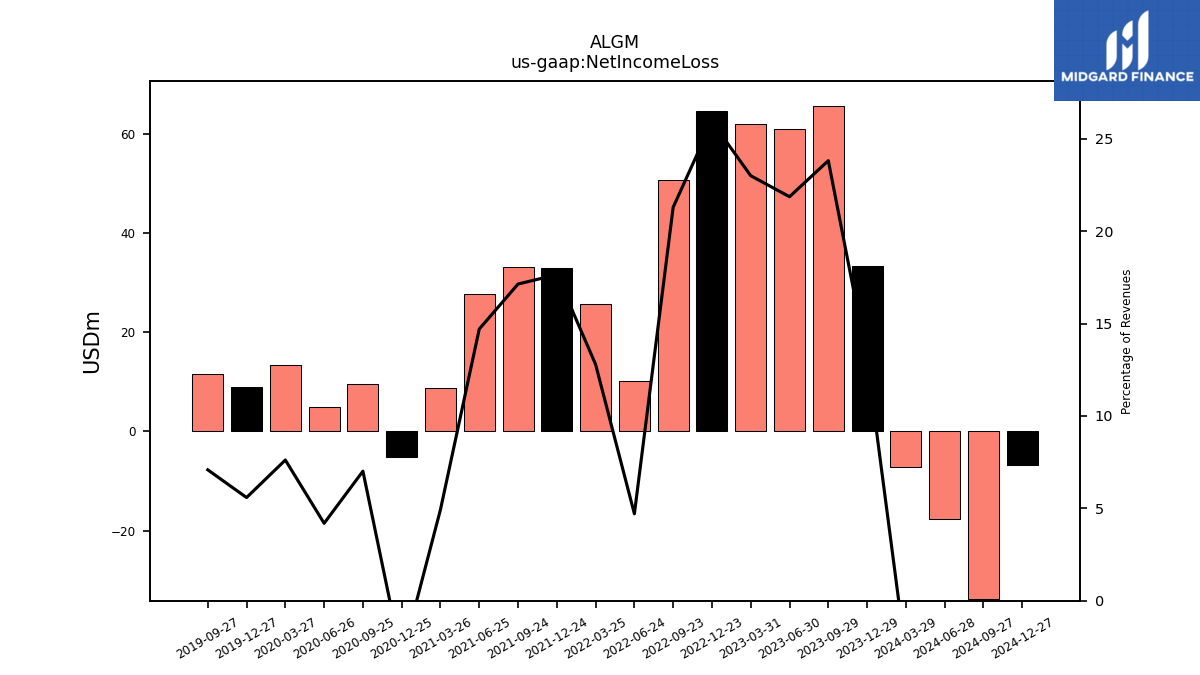
| Net Income Loss | 33.34 | 65.62 | 60.85 | 61.98 | 64.52 | 50.61 | NA | 10.25 | 25.62 | 32.94 | 33.19 | 27.67 | 8.64 | -5.09 | 9.58 | 4.82 | 13.30 | 8.93 | 11.56 | |
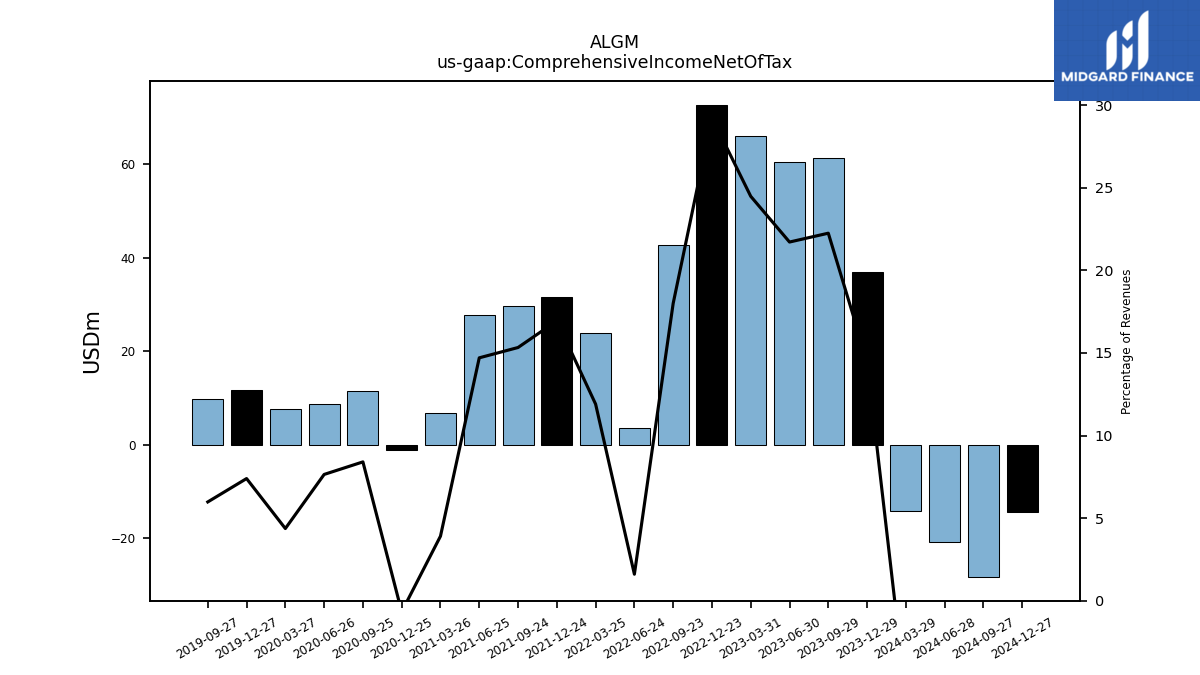
| Comprehensive Income Net Of Tax | 36.97 | 61.31 | 60.44 | 65.97 | 72.77 | 42.78 | NA | 3.50 | 23.84 | 31.63 | 29.68 | 27.67 | 6.85 | -1.10 | 11.49 | 8.79 | 7.63 | 11.82 | 9.77 | |
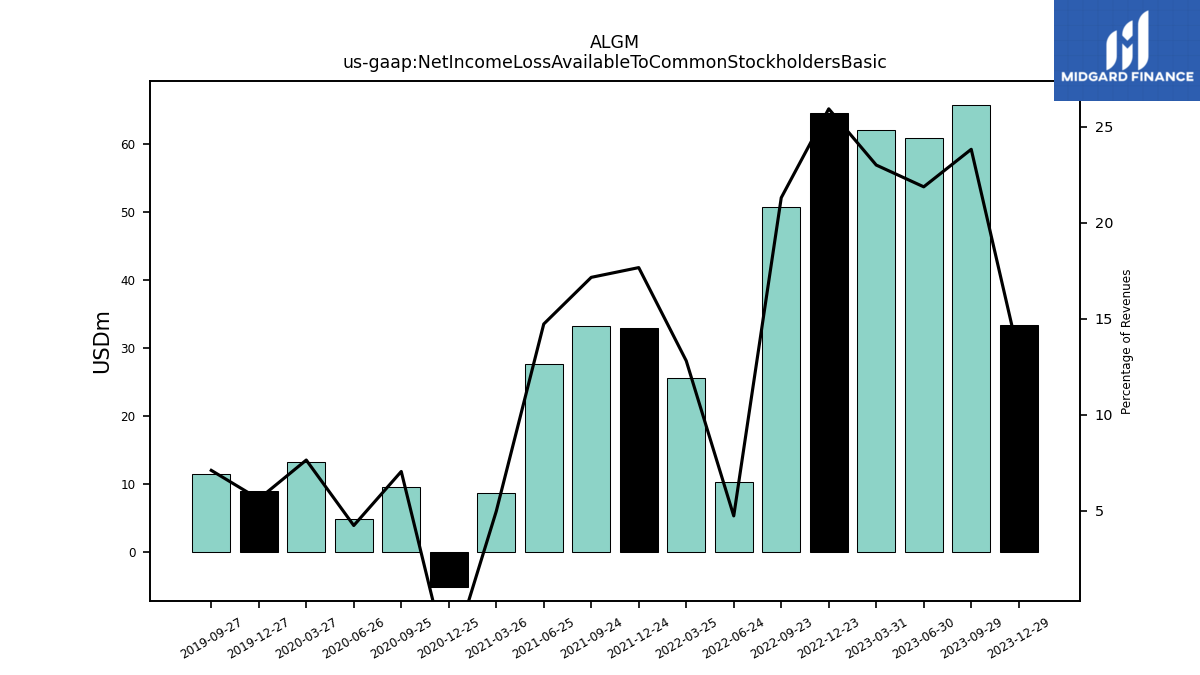
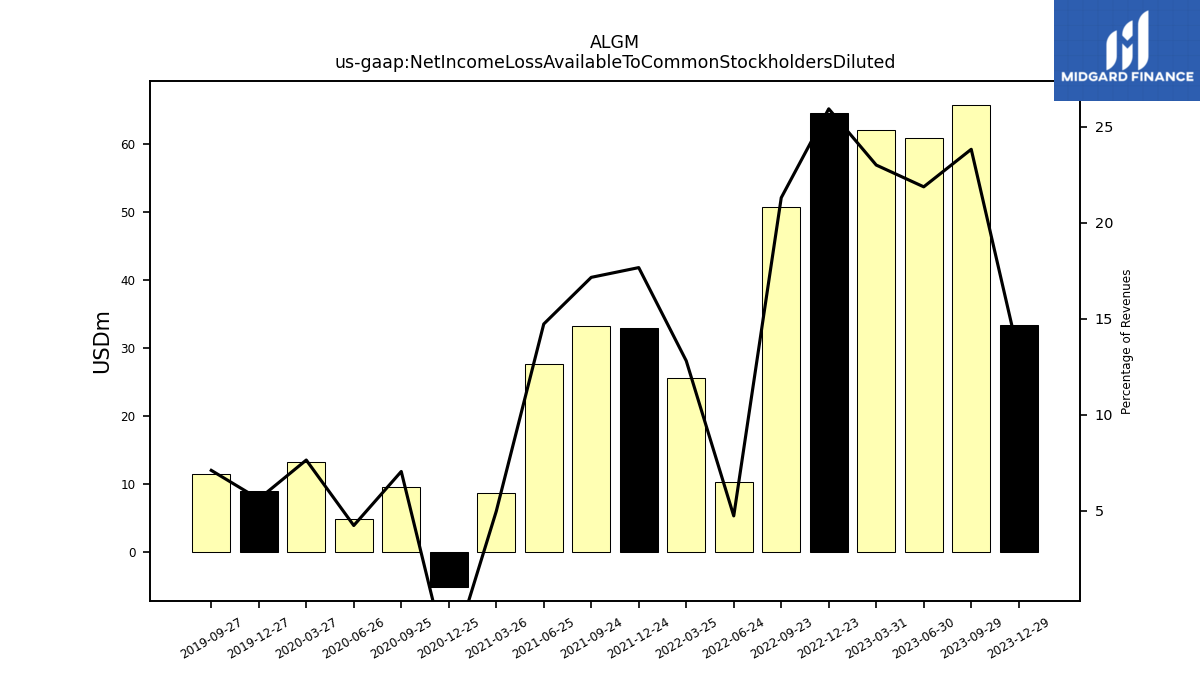
| Net Income Loss Available To Common Stockholders Basic | 33.40 | 65.67 | 60.89 | 62.01 | 64.55 | 50.65 | NA | 10.28 | 25.65 | 32.97 | 33.22 | 27.71 | 8.69 | -5.06 | 9.62 | 4.85 | 13.33 | 8.96 | 11.58 | |
| Net Income Loss Available To Common Stockholders Diluted | 33.40 | 65.67 | 60.89 | 62.01 | 64.55 | 50.65 | NA | 10.28 | 25.65 | 32.97 | 33.22 | 27.71 | 8.69 | -5.06 | 9.62 | 4.85 | 13.33 | 8.96 | 11.58 |
| 2023-12-29 | 2023-09-29 | 2023-06-30 | 2023-03-31 | 2022-12-23 | 2022-09-23 | 2022-09-22 | 2022-06-24 | 2022-03-25 | 2021-12-24 | 2021-09-24 | 2021-06-25 | 2021-03-26 | 2020-12-25 | 2020-09-25 | 2020-06-26 | 2020-03-27 | 2019-12-27 | 2019-09-27 | ||
|---|---|---|---|---|---|---|---|---|---|---|---|---|---|---|---|---|---|---|---|---|
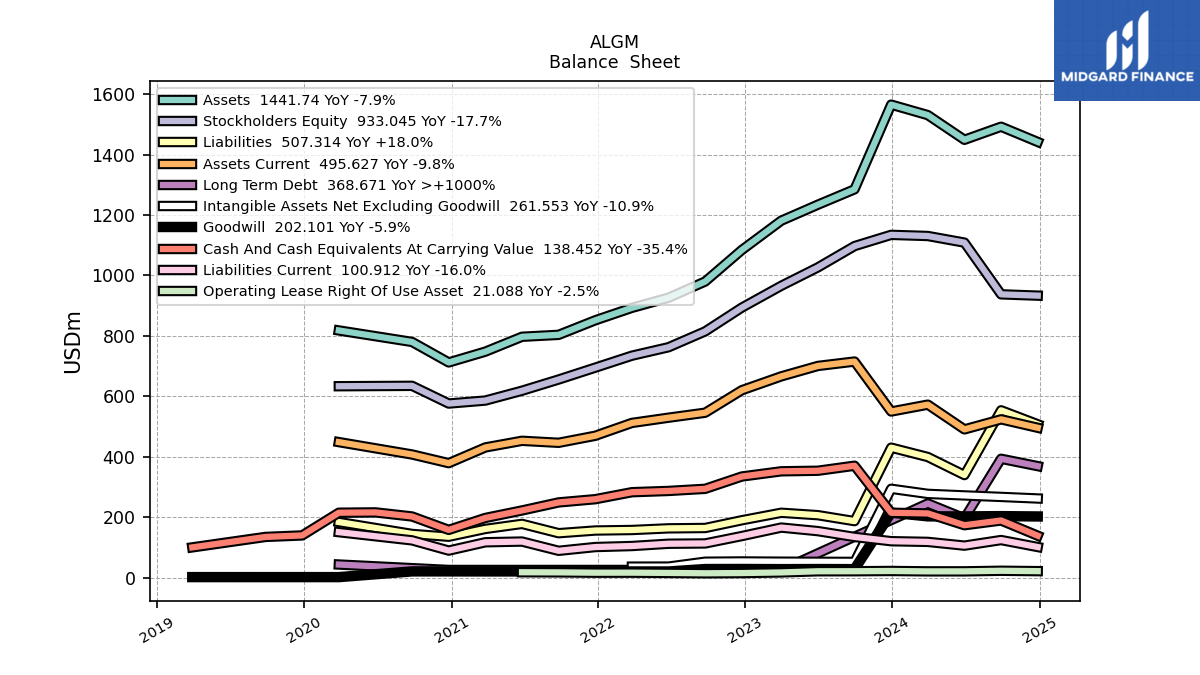
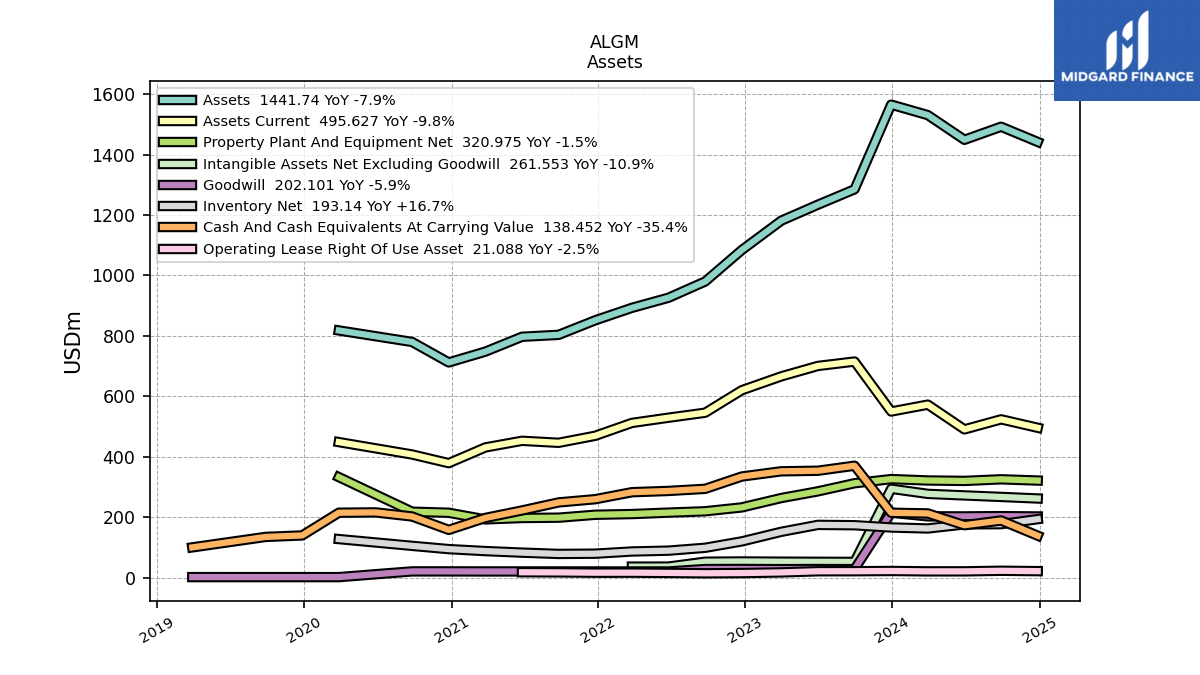
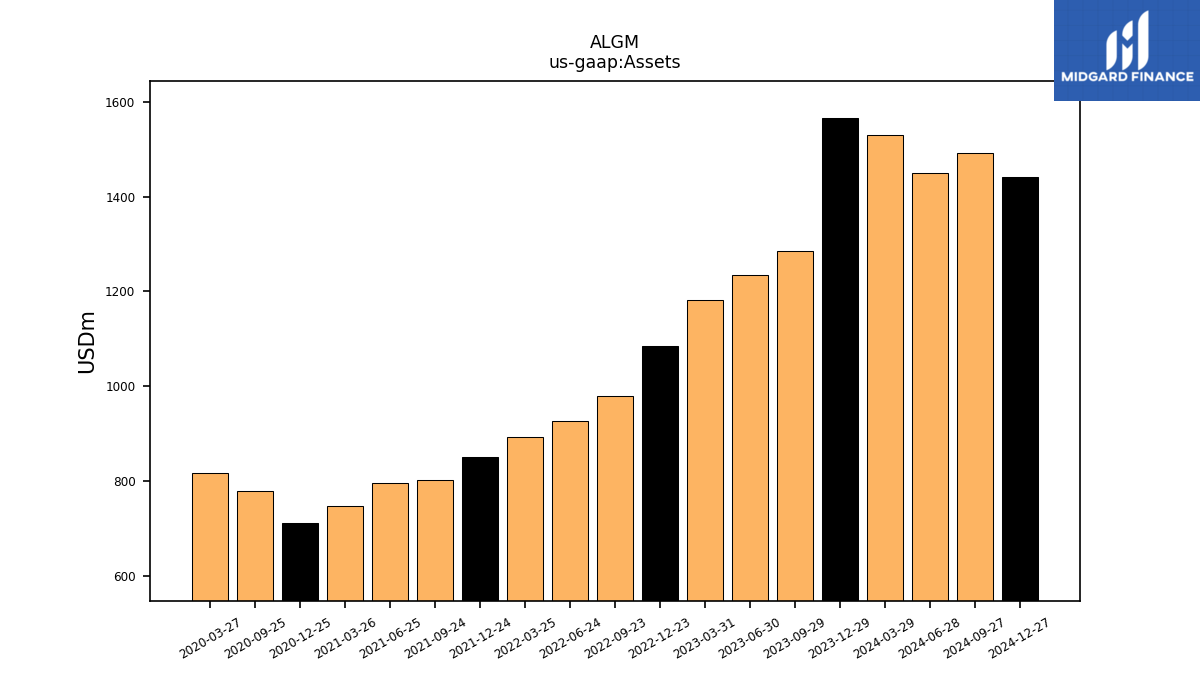
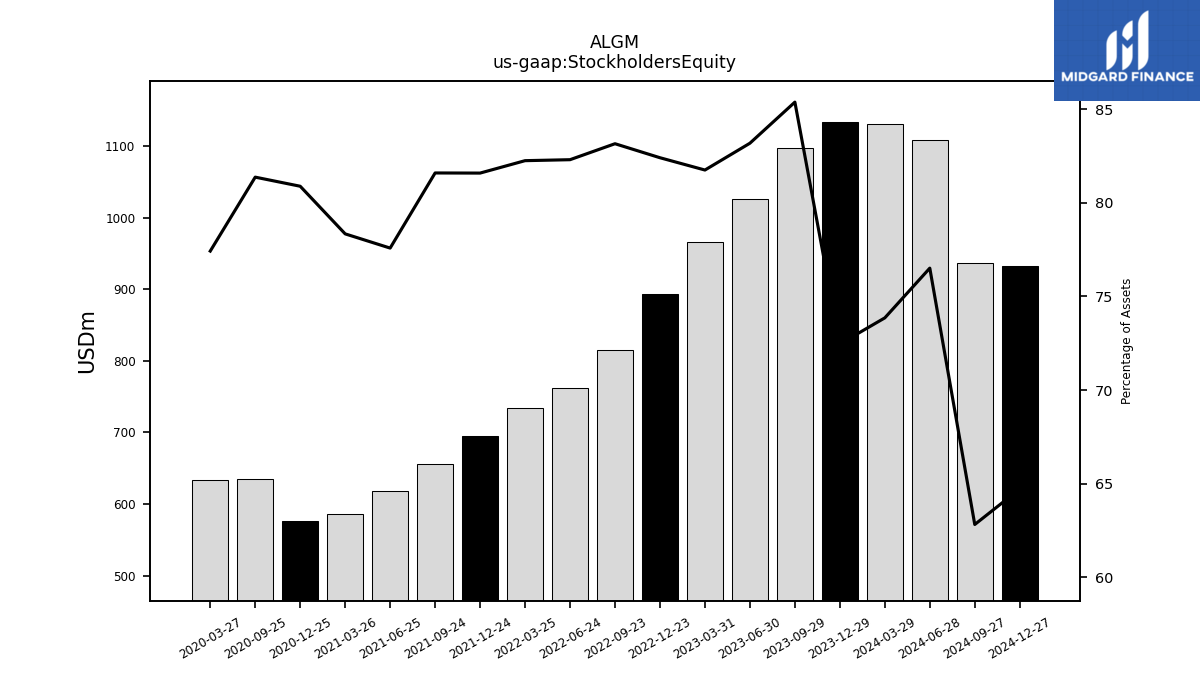
| Assets | 1565.30 | 1284.94 | 1234.09 | 1181.15 | 1084.07 | 979.80 | NA | 926.11 | 892.62 | 851.42 | 803.25 | 796.89 | 747.68 | 711.90 | 779.70 | NA | 817.82 | NA | NA | |
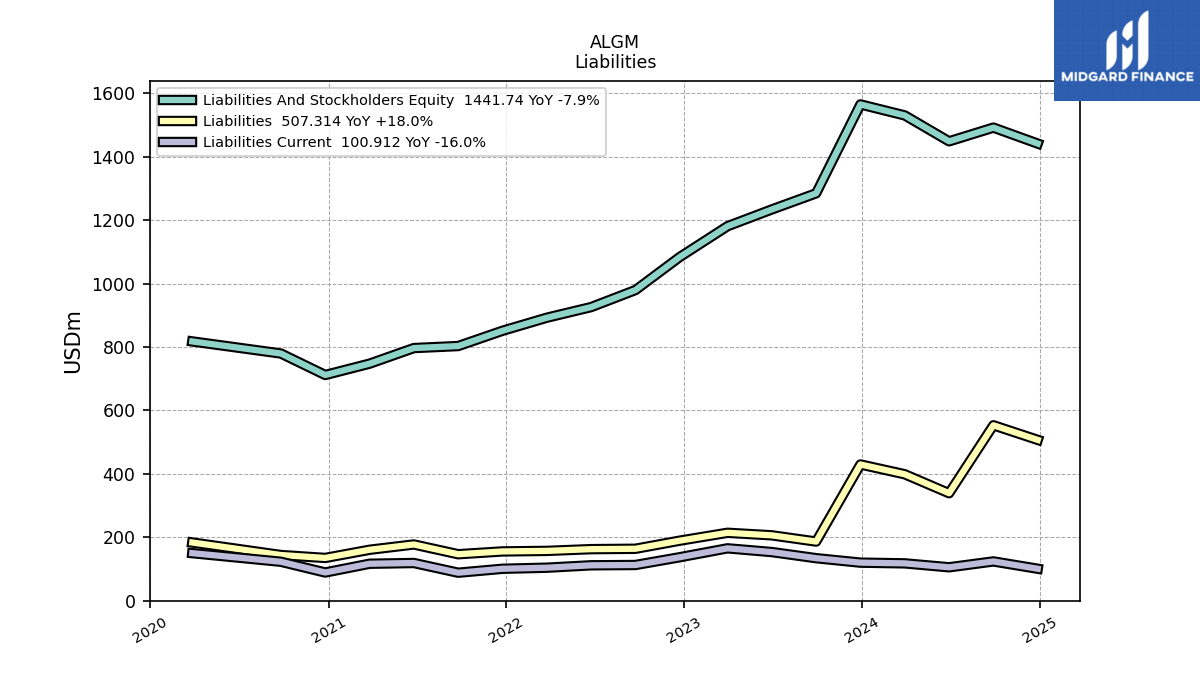
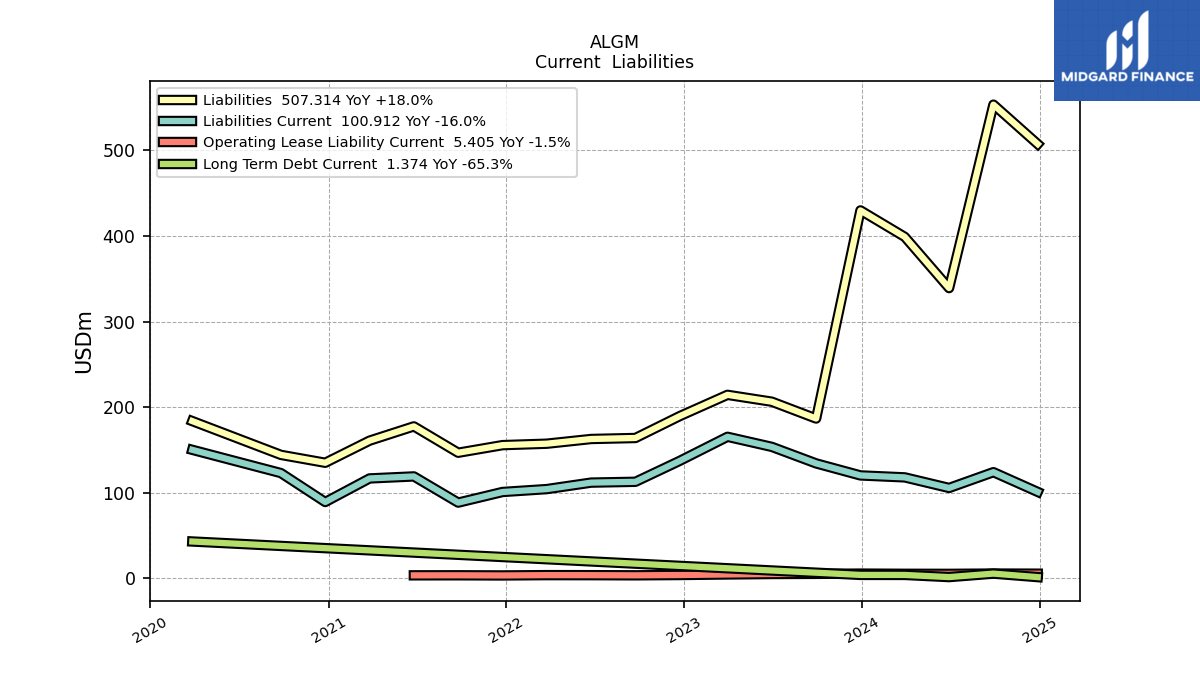
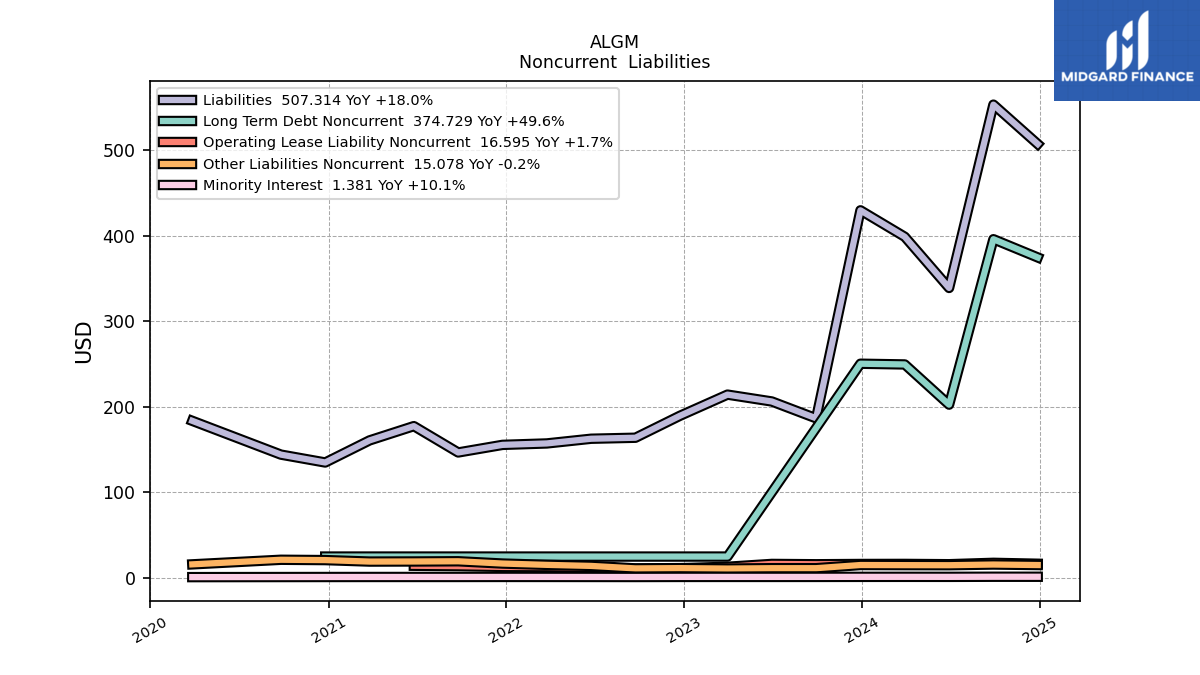
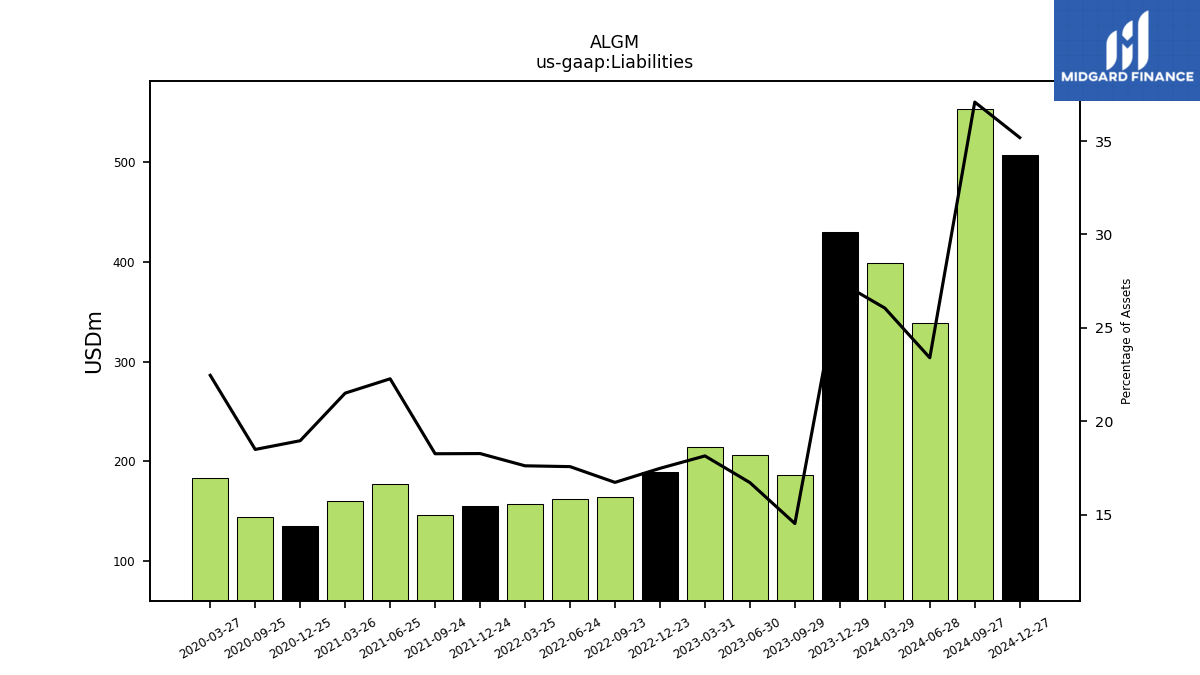
| Liabilities | 429.81 | 186.65 | 206.32 | 214.34 | 189.51 | 163.93 | NA | 162.75 | 157.26 | 155.58 | 146.70 | 177.51 | 160.81 | 134.98 | 144.19 | NA | 183.69 | NA | NA | |
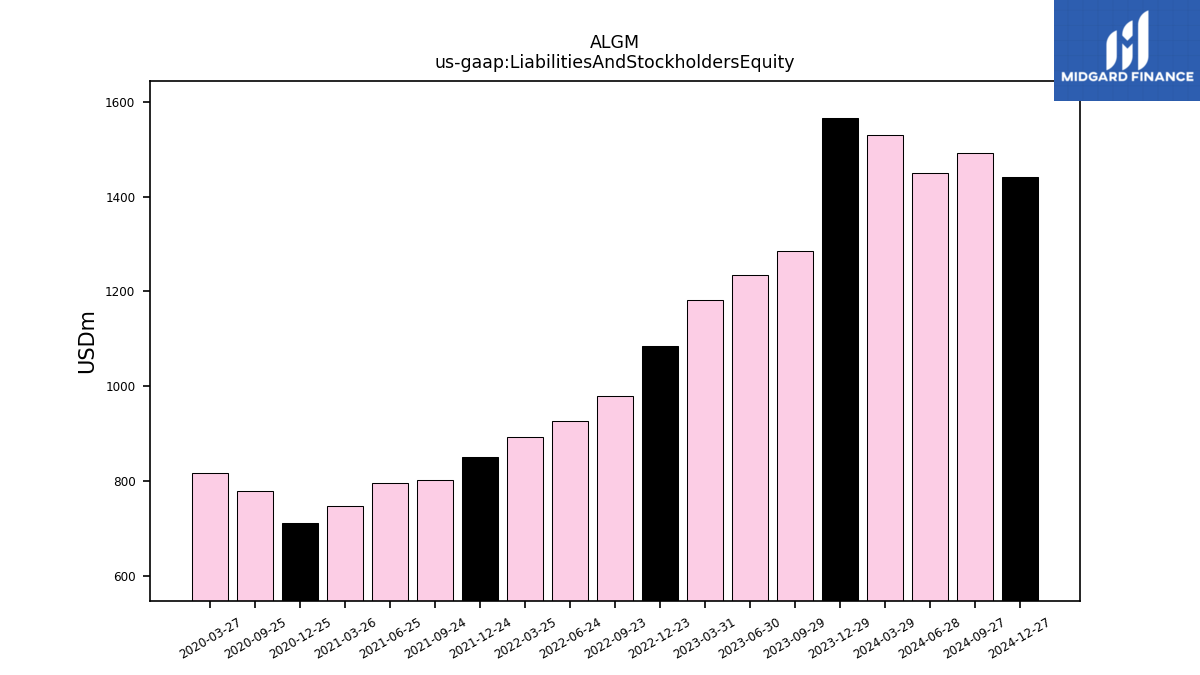
| Liabilities And Stockholders Equity | 1565.30 | 1284.94 | 1234.09 | 1181.15 | 1084.07 | 979.80 | NA | 926.11 | 892.62 | 851.42 | 803.25 | 796.89 | 747.68 | 711.90 | 779.70 | NA | 817.82 | NA | NA | |
| Stockholders Equity | 1134.23 | 1097.09 | 1026.58 | 965.63 | 893.38 | 814.79 | NA | 762.24 | 734.21 | 694.67 | 655.42 | 618.25 | 585.75 | 575.83 | 634.46 | NA | 633.18 | NA | NA |
| 2023-12-29 | 2023-09-29 | 2023-06-30 | 2023-03-31 | 2022-12-23 | 2022-09-23 | 2022-09-22 | 2022-06-24 | 2022-03-25 | 2021-12-24 | 2021-09-24 | 2021-06-25 | 2021-03-26 | 2020-12-25 | 2020-09-25 | 2020-06-26 | 2020-03-27 | 2019-12-27 | 2019-09-27 | ||
|---|---|---|---|---|---|---|---|---|---|---|---|---|---|---|---|---|---|---|---|---|
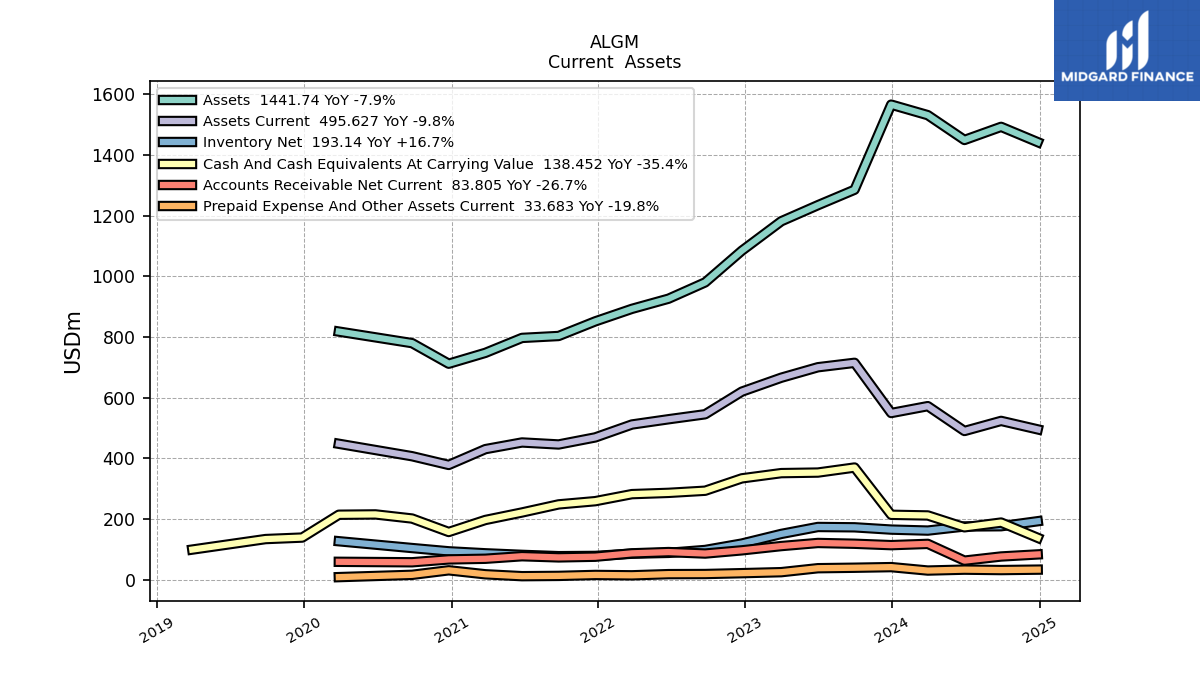
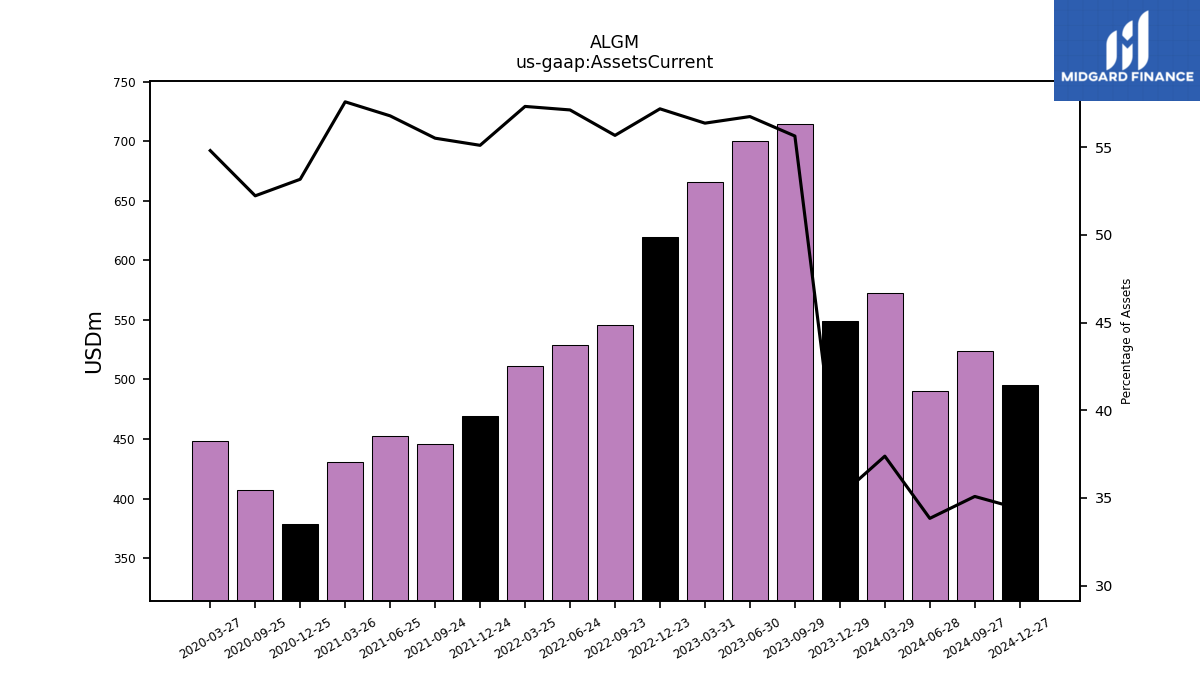
| Assets Current | 549.50 | 714.90 | 700.30 | 665.83 | 619.95 | 545.49 | NA | 529.03 | 511.69 | 469.19 | 445.91 | 452.53 | 430.56 | 378.53 | 407.22 | NA | 448.22 | NA | NA | |
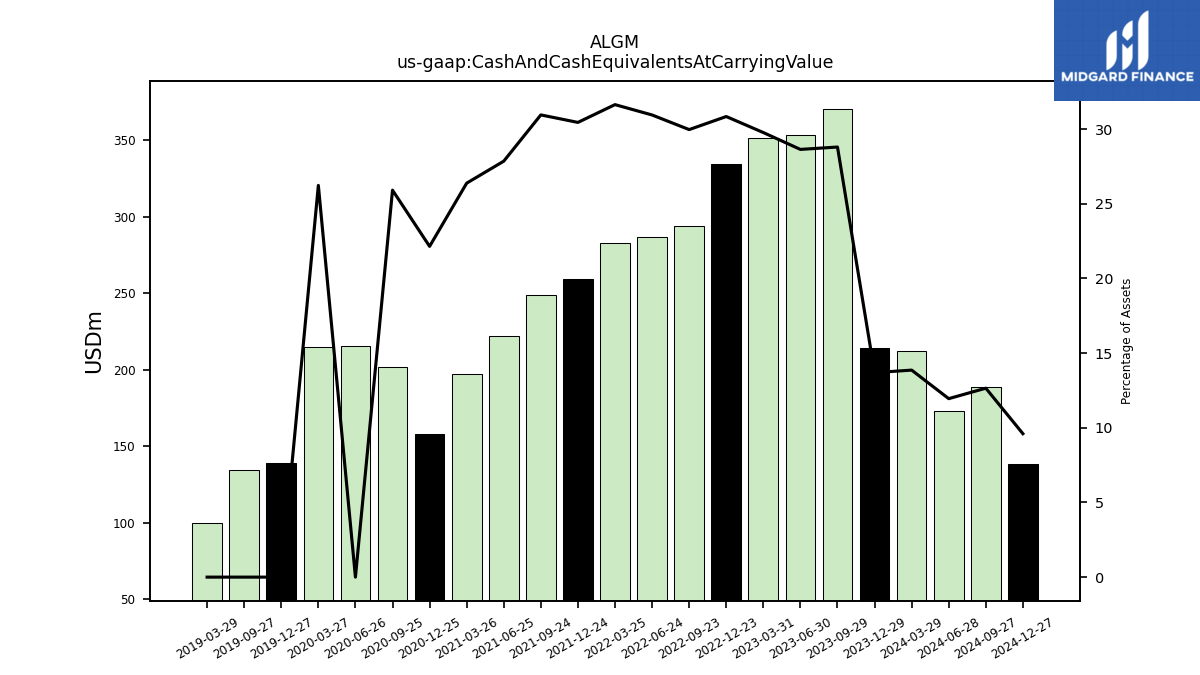
| Cash And Cash Equivalents At Carrying Value | 214.31 | 370.01 | 353.41 | 351.58 | 334.31 | 293.59 | NA | 286.56 | 282.38 | 259.21 | 248.58 | 221.93 | 197.21 | 157.65 | 202.00 | 215.58 | 214.49 | 139.31 | 134.35 | |
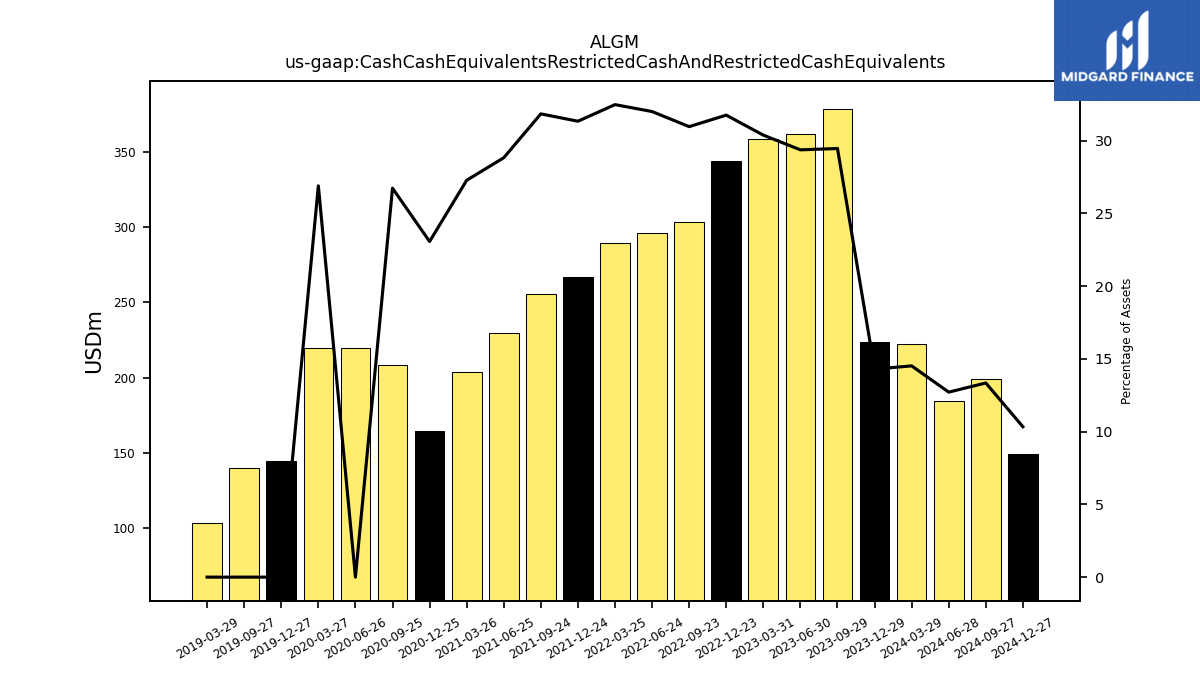
| Cash Cash Equivalents Restricted Cash And Restricted Cash Equivalents | 223.74 | 378.43 | 362.32 | 358.70 | 344.13 | 303.28 | NA | 296.27 | 289.80 | 266.70 | 255.68 | 229.63 | 203.88 | 164.17 | 208.35 | 219.96 | 219.88 | 144.51 | 139.54 | |
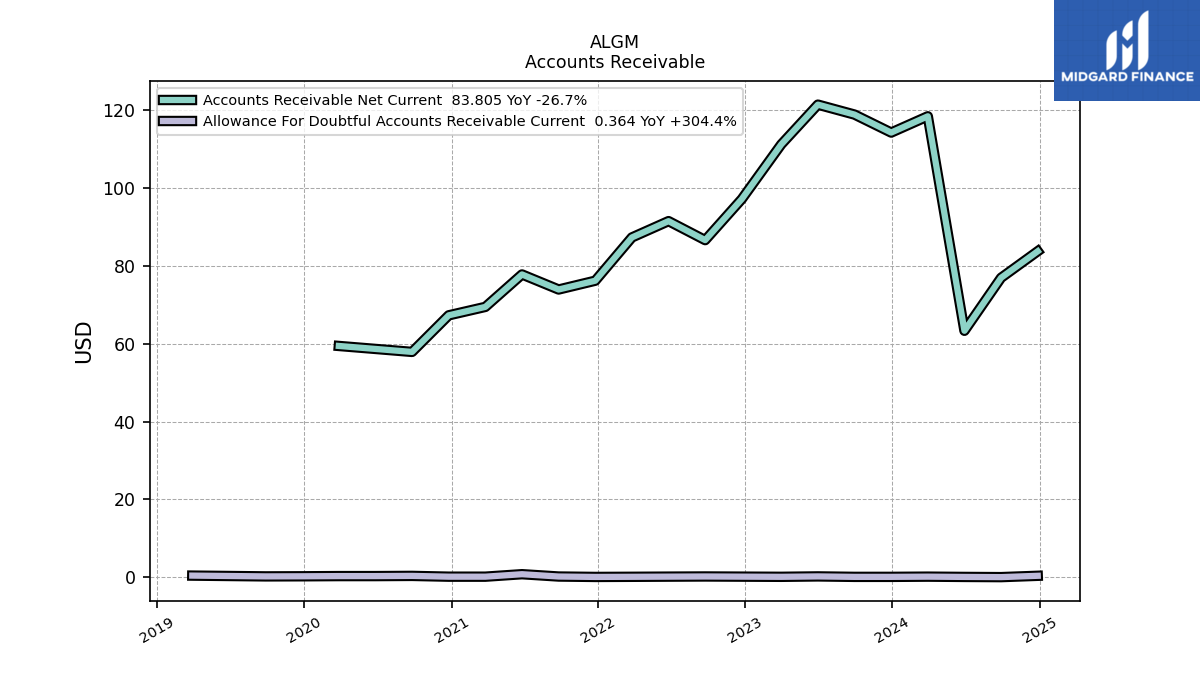
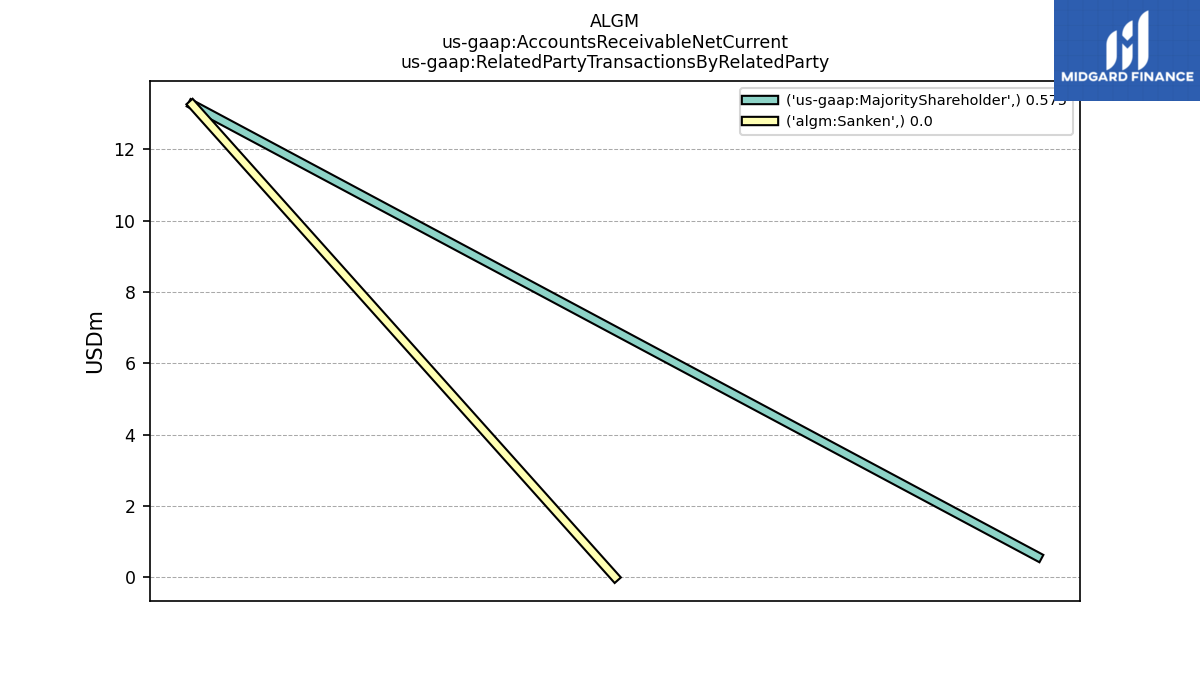
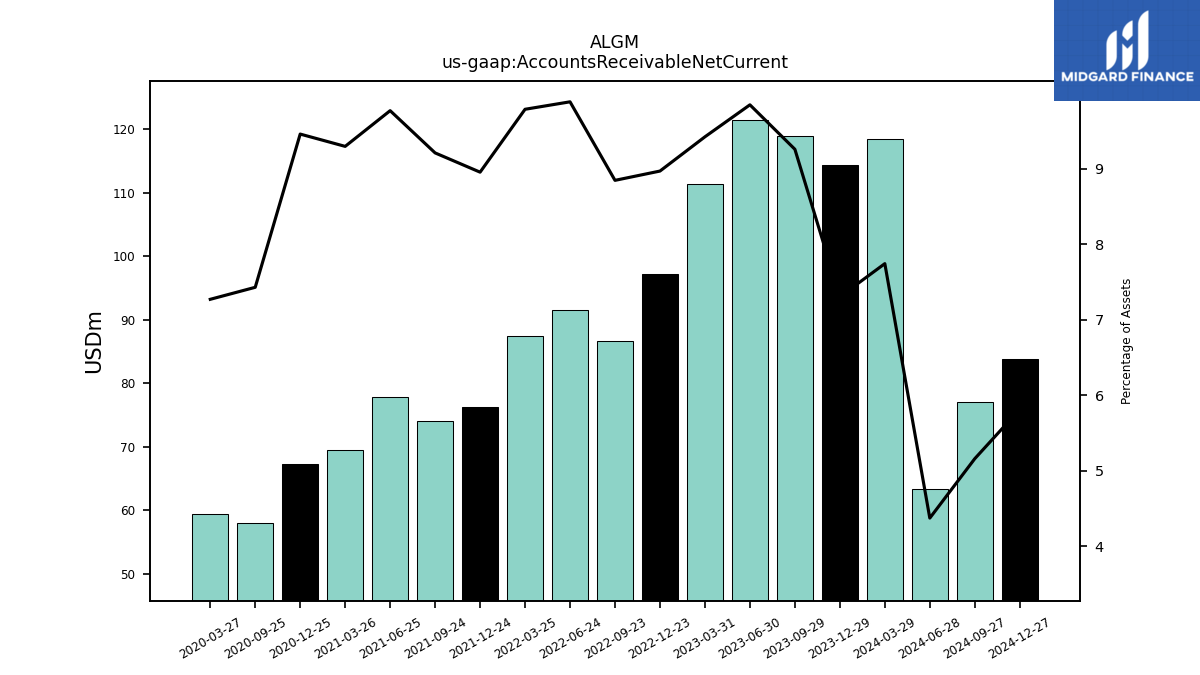
| Accounts Receivable Net Current | 114.32 | 118.95 | 121.51 | 111.29 | 97.22 | 86.67 | NA | 91.55 | 87.36 | 76.23 | 73.97 | 77.84 | 69.50 | 67.33 | 57.93 | NA | 59.46 | NA | NA | |
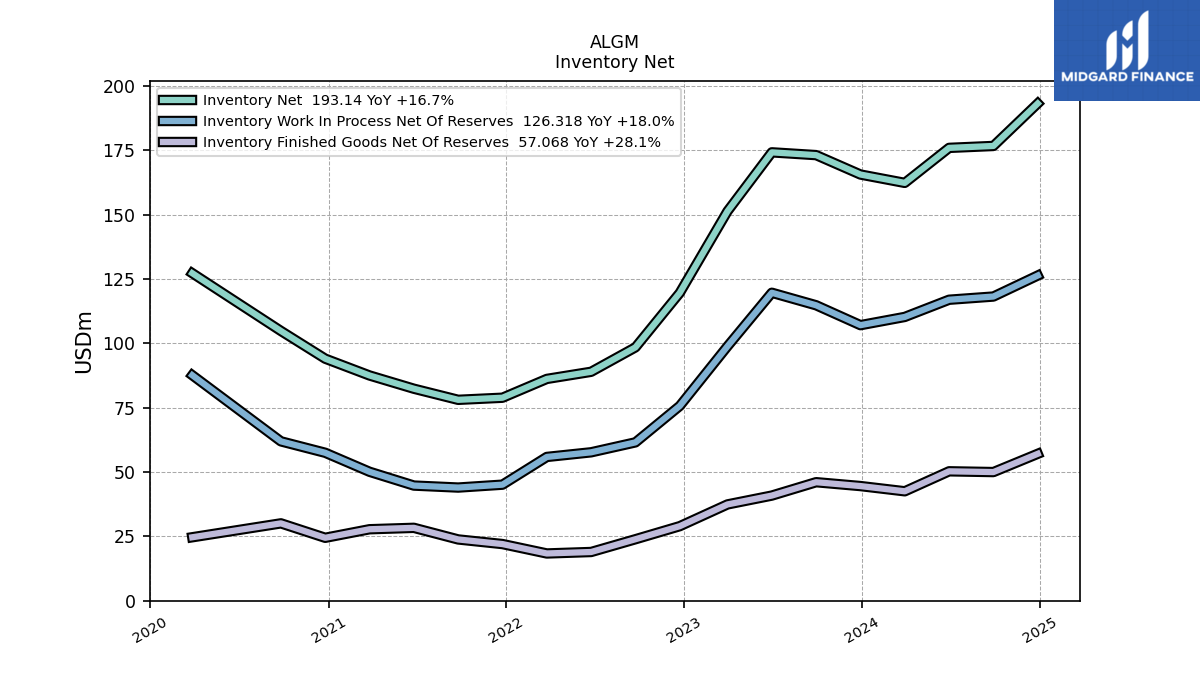
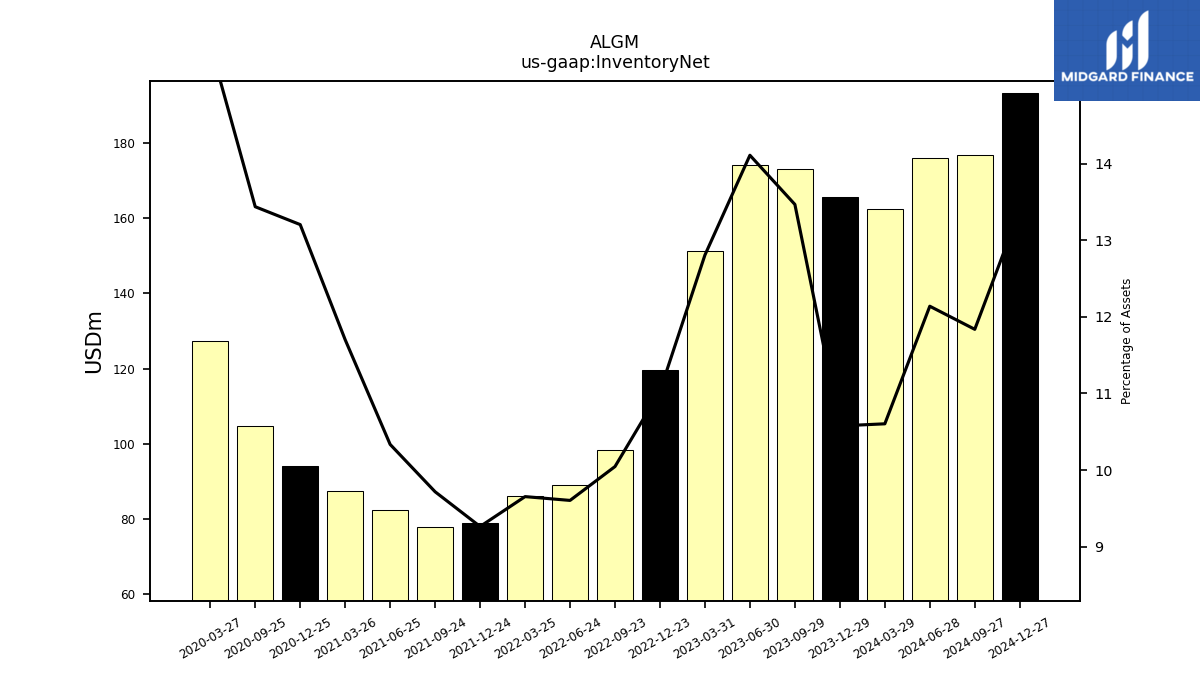
| Inventory Net | 165.55 | 173.09 | 174.17 | 151.30 | 119.58 | 98.43 | NA | 88.93 | 86.16 | 78.86 | 78.04 | 82.36 | 87.50 | 94.02 | 104.80 | NA | 127.23 | NA | NA | |
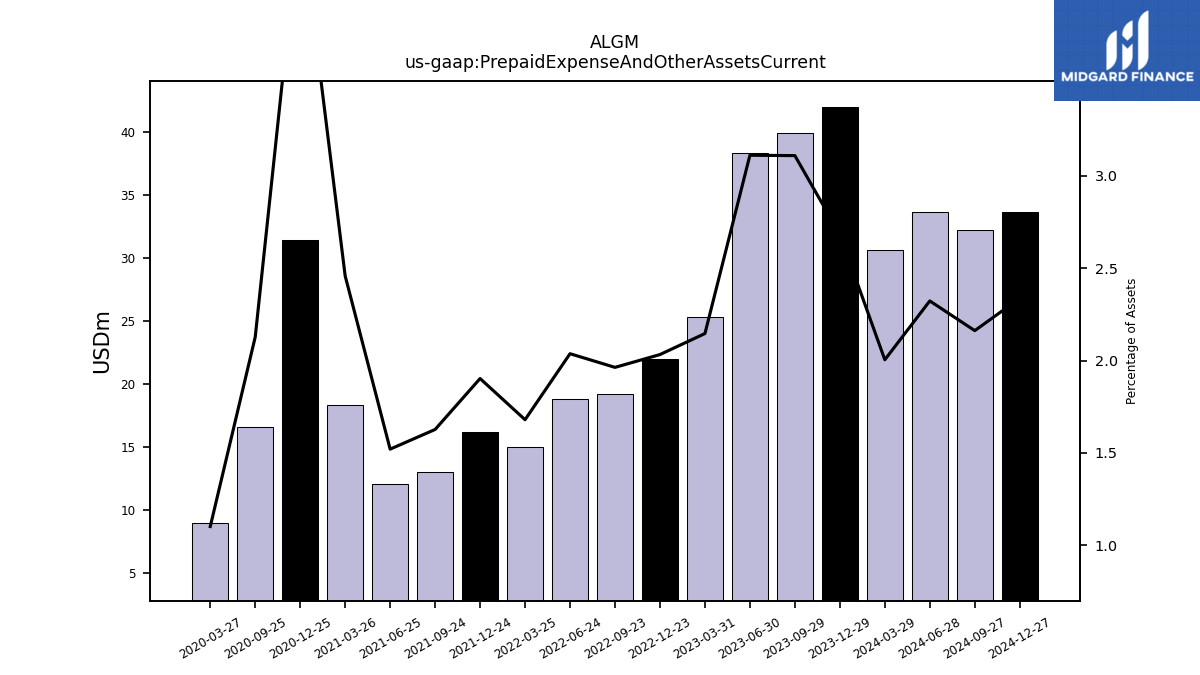
| Prepaid Expense And Other Assets Current | 41.98 | 39.94 | 38.38 | 25.35 | 22.03 | 19.23 | NA | 18.86 | 14.99 | 16.20 | 13.07 | 12.12 | 18.37 | 31.48 | 16.59 | NA | 9.01 | NA | NA |
| 2023-12-29 | 2023-09-29 | 2023-06-30 | 2023-03-31 | 2022-12-23 | 2022-09-23 | 2022-09-22 | 2022-06-24 | 2022-03-25 | 2021-12-24 | 2021-09-24 | 2021-06-25 | 2021-03-26 | 2020-12-25 | 2020-09-25 | 2020-06-26 | 2020-03-27 | 2019-12-27 | 2019-09-27 | ||
|---|---|---|---|---|---|---|---|---|---|---|---|---|---|---|---|---|---|---|---|---|
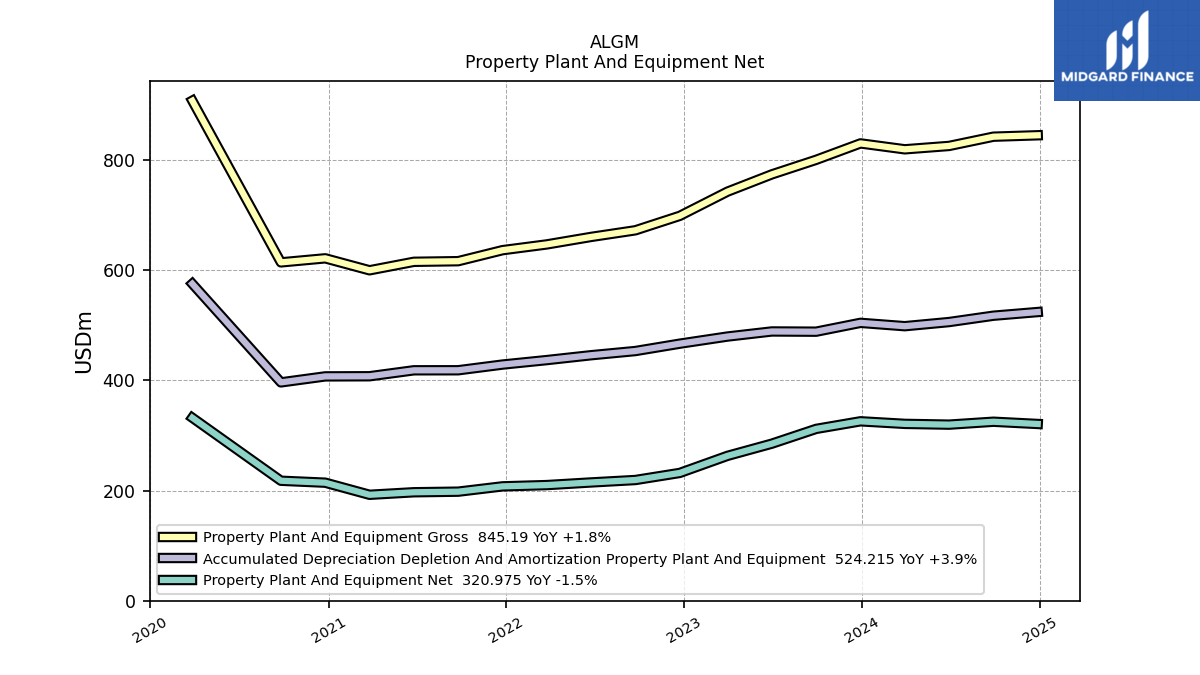
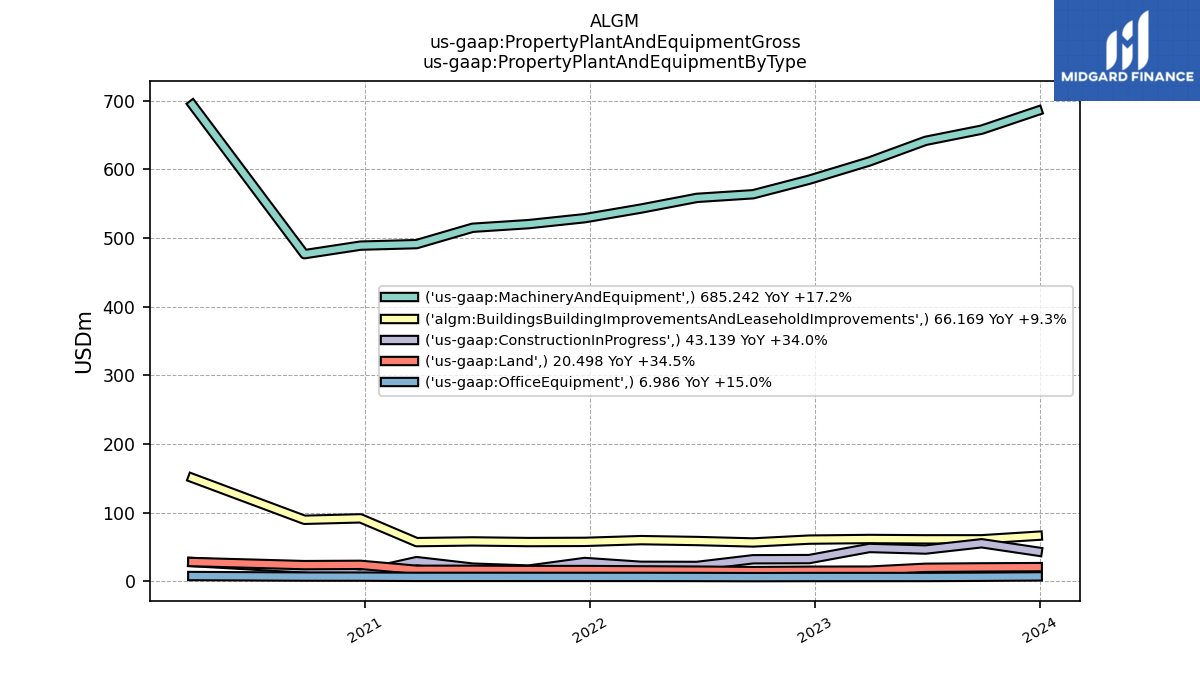
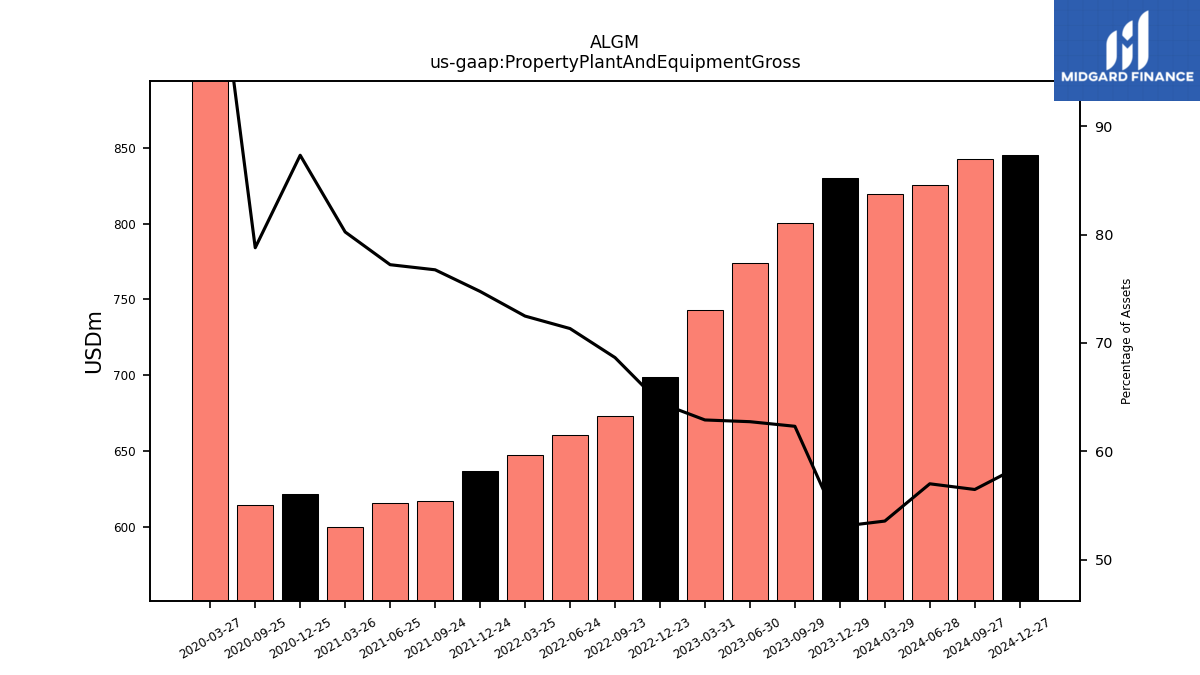
| Property Plant And Equipment Gross | 830.42 | 800.60 | 774.16 | 742.84 | 698.86 | 672.67 | NA | 660.62 | 647.01 | 636.55 | 616.57 | 615.44 | 600.02 | 621.76 | 614.38 | NA | 907.95 | NA | NA | |
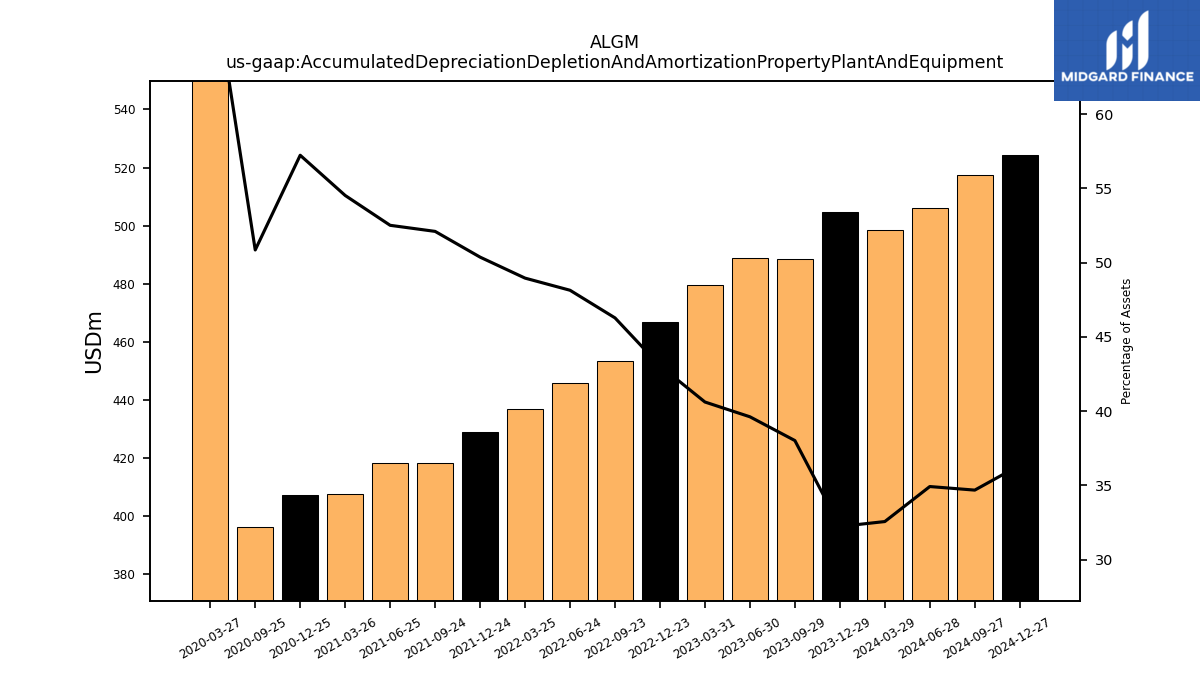
| Accumulated Depreciation Depletion And Amortization Property Plant And Equipment | 504.60 | 488.56 | 488.96 | 479.74 | 466.79 | 453.43 | NA | 445.81 | 436.98 | 428.84 | 418.50 | 418.44 | 407.63 | 407.39 | 396.48 | NA | 575.62 | NA | NA | |
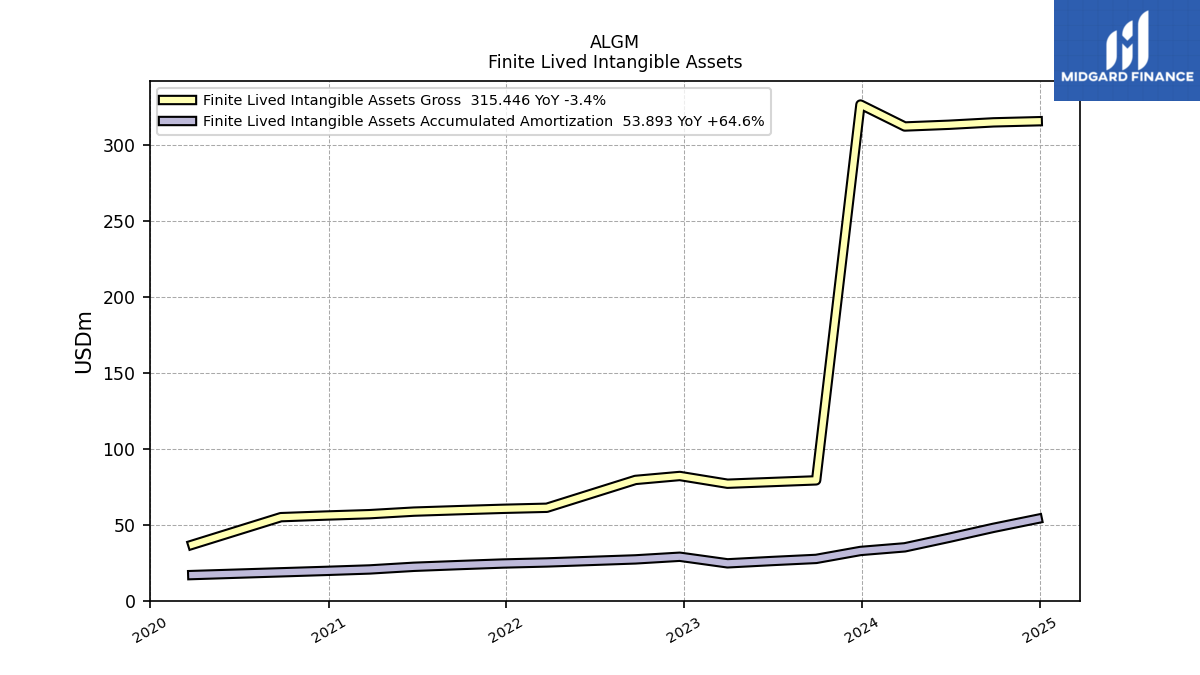
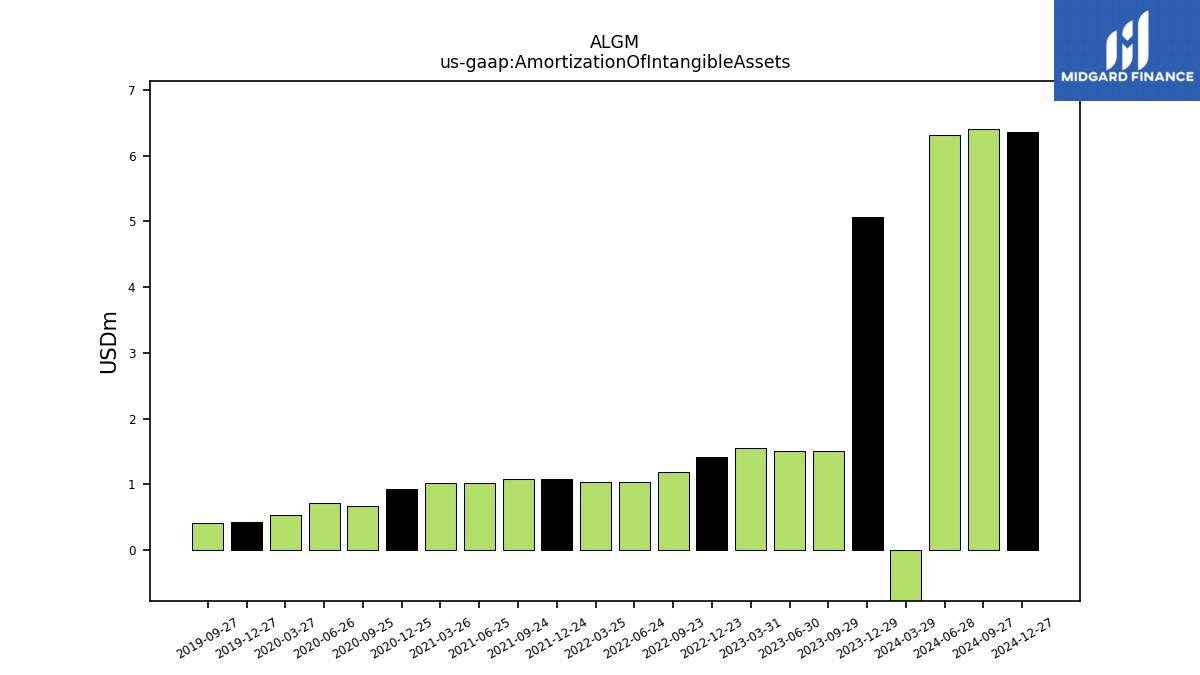
| Amortization Of Intangible Assets | 5.07 | 1.51 | 1.51 | 1.56 | 1.42 | 1.19 | NA | 1.04 | 1.03 | 1.09 | 1.08 | 1.02 | 1.02 | 0.93 | 0.67 | 0.71 | 0.54 | 0.42 | 0.42 | |
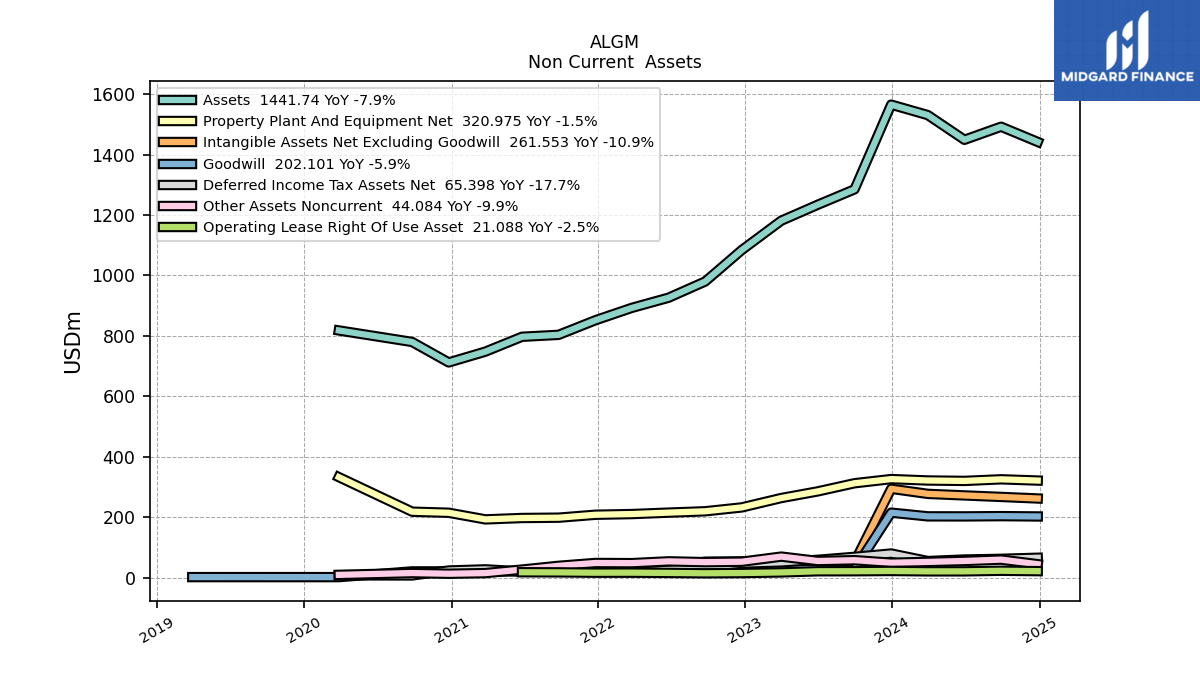
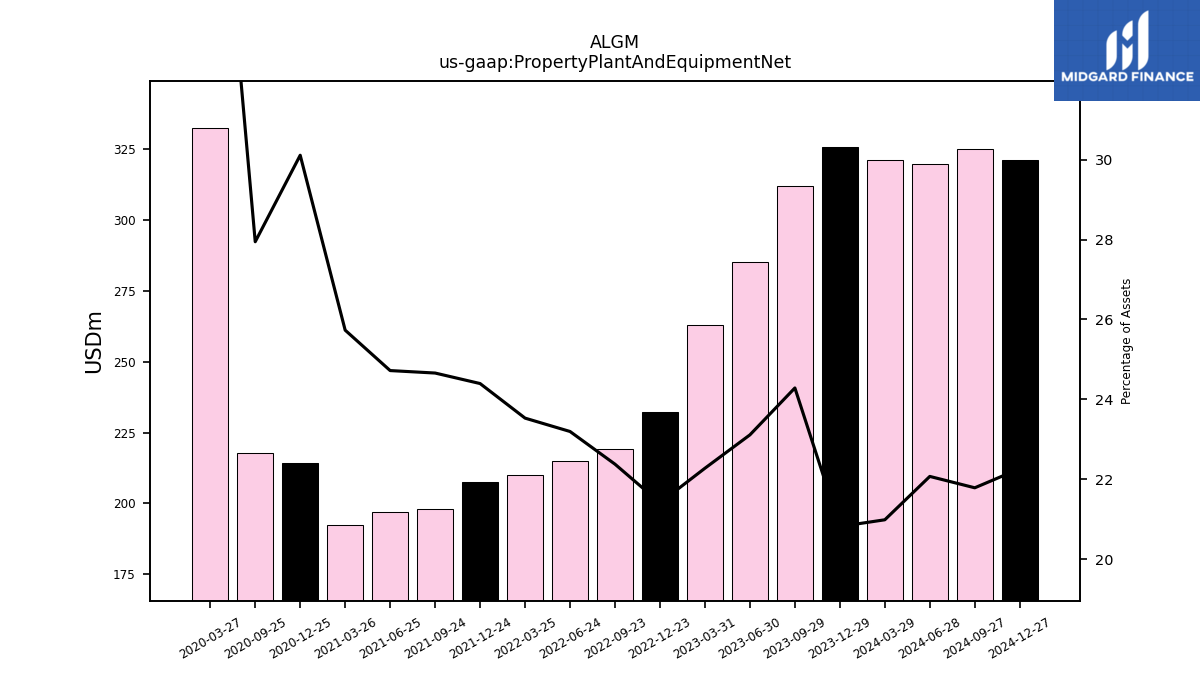
| Property Plant And Equipment Net | 325.82 | 312.05 | 285.20 | 263.10 | 232.08 | 219.24 | NA | 214.81 | 210.03 | 207.71 | 198.07 | 196.99 | 192.39 | 214.37 | 217.90 | NA | 332.33 | NA | NA | |
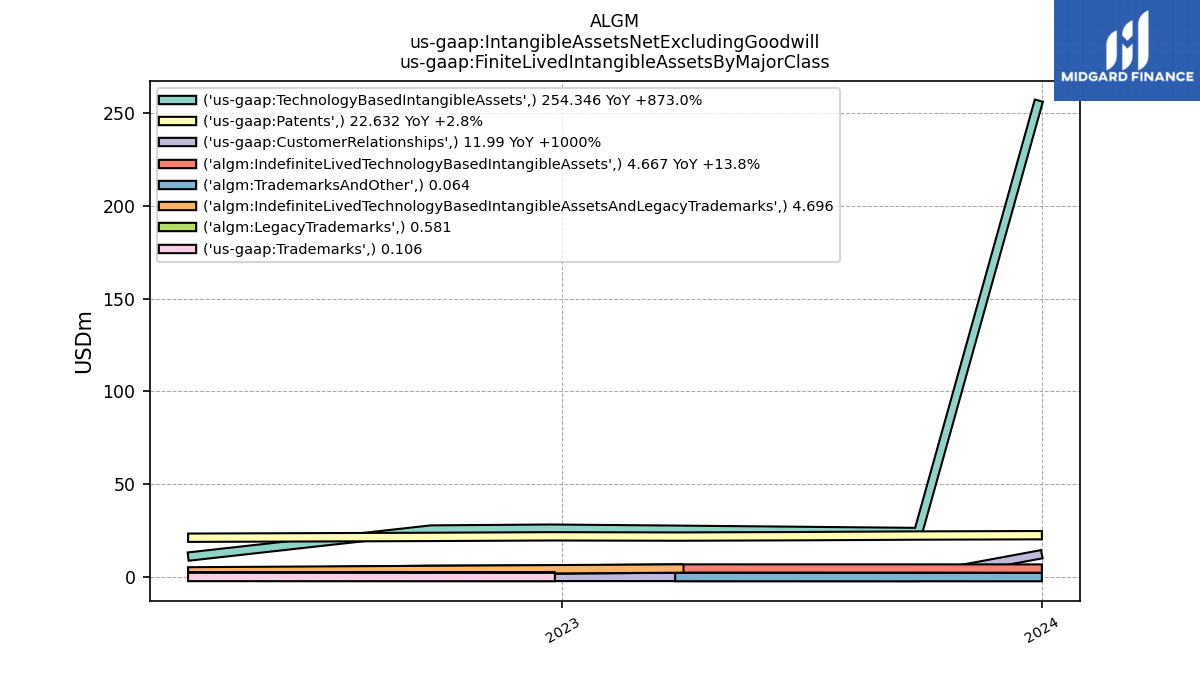
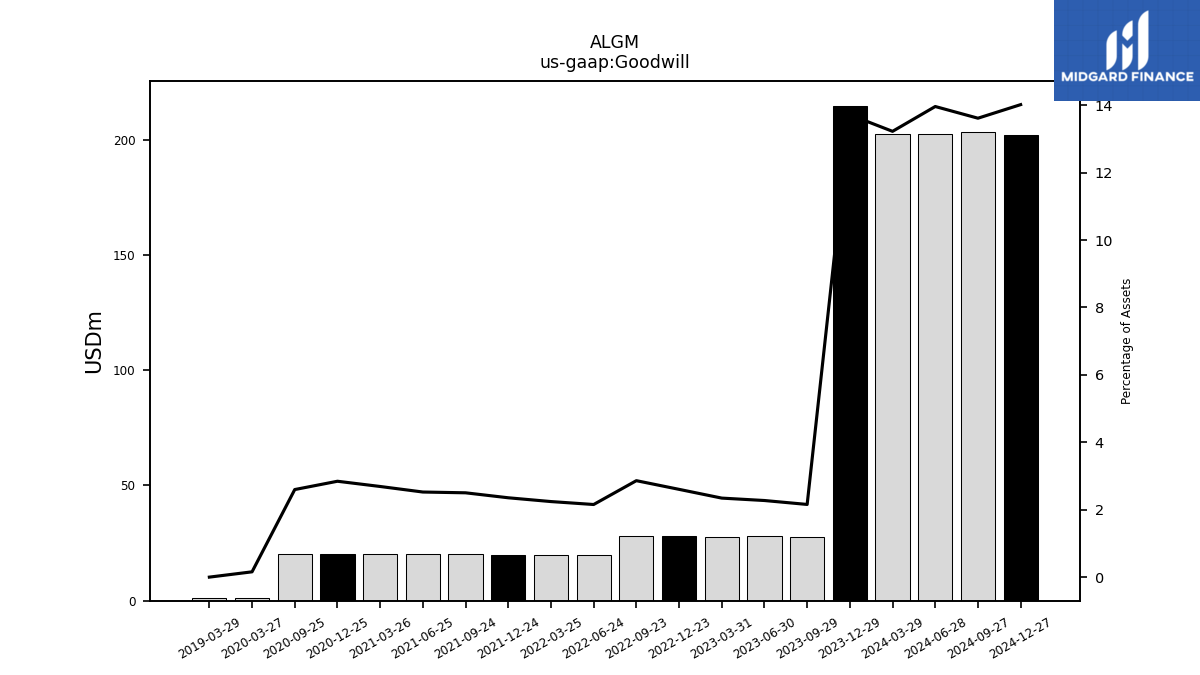
| Goodwill | 214.71 | 27.71 | 28.05 | 27.69 | 28.23 | 28.04 | NA | 19.95 | 20.01 | 20.04 | 20.09 | 20.12 | 20.11 | 20.25 | 20.26 | NA | 1.28 | NA | NA | |
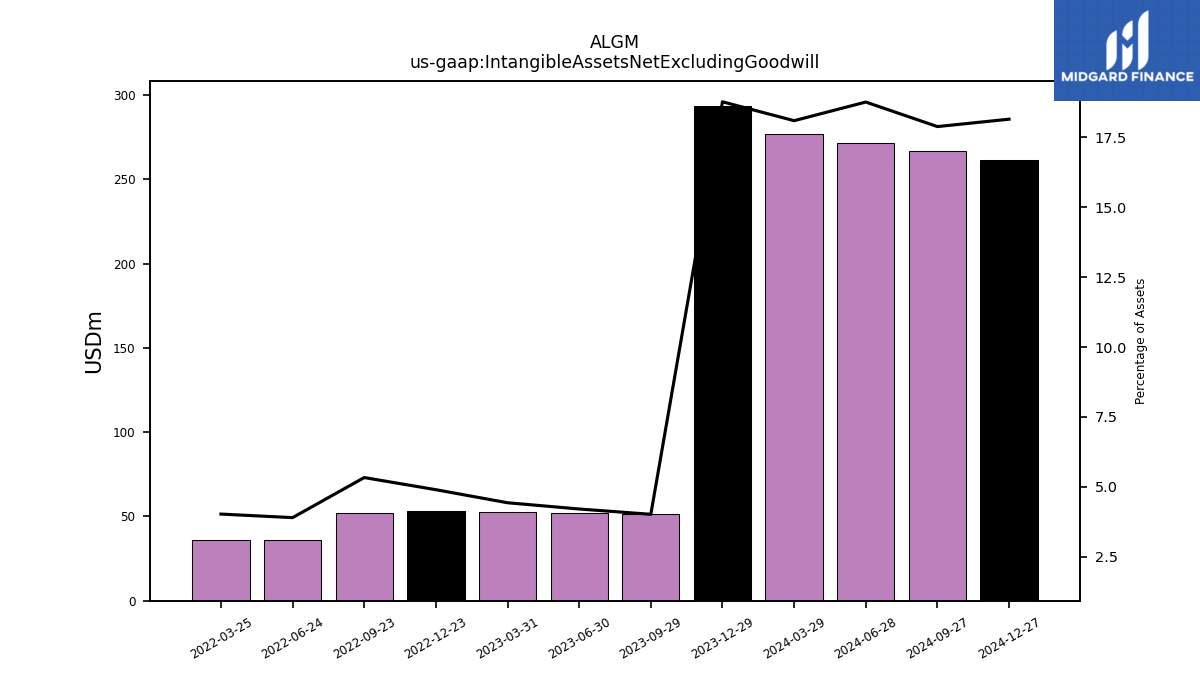
| Intangible Assets Net Excluding Goodwill | 293.70 | 51.68 | 51.97 | 52.38 | 53.13 | 52.27 | NA | 36.14 | 35.97 | NA | NA | NA | NA | NA | NA | NA | NA | NA | NA | |
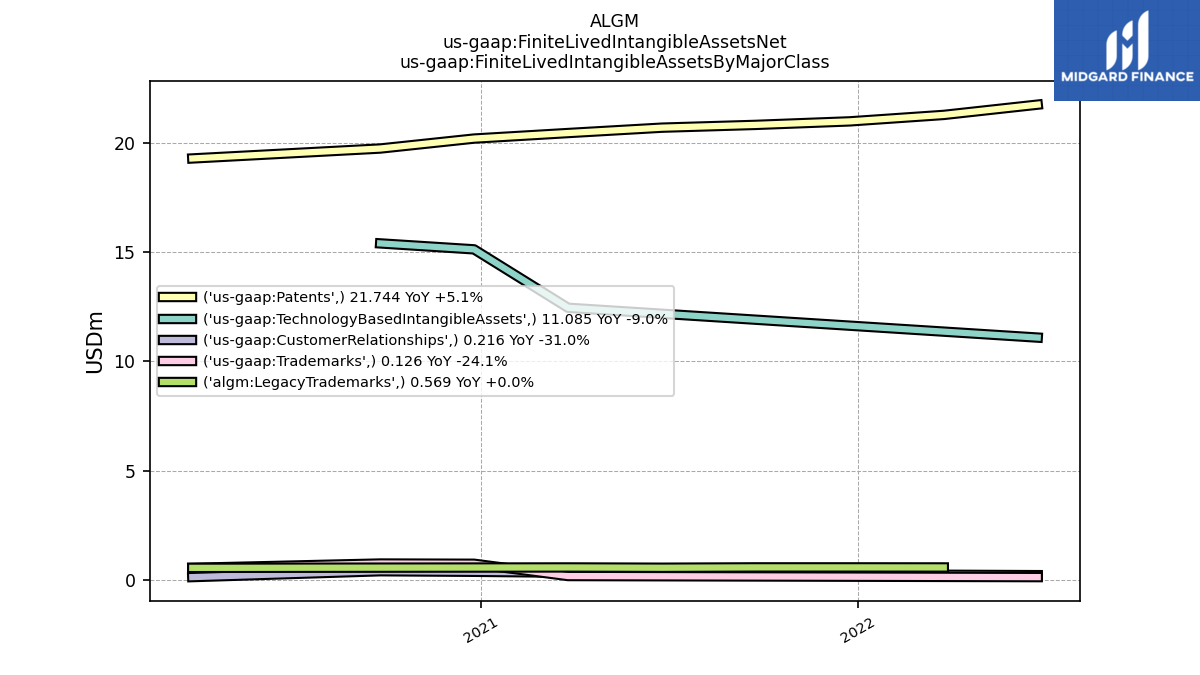
| Finite Lived Intangible Assets Net | NA | NA | NA | 47.68 | 48.45 | 47.71 | NA | 33.17 | 35.97 | 35.98 | 36.13 | 36.30 | 36.37 | 36.42 | 36.27 | NA | 19.96 | NA | NA | |
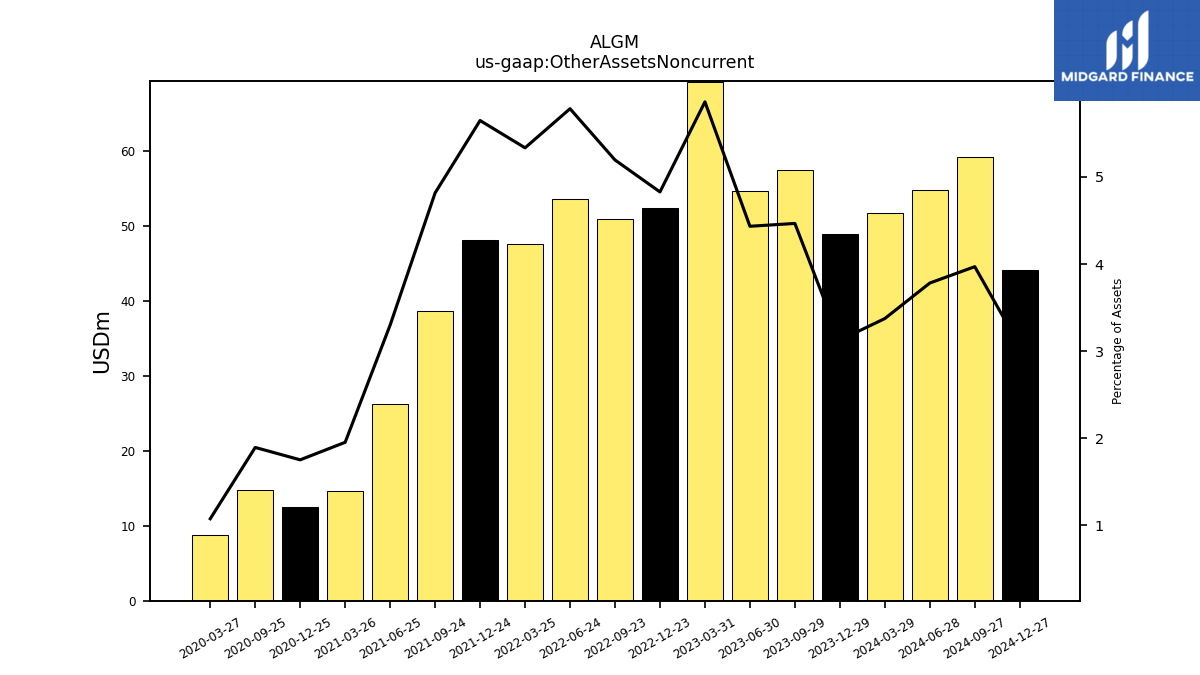
| Other Assets Noncurrent | 48.94 | 57.38 | 54.71 | 69.23 | 52.33 | 50.89 | NA | 53.55 | 47.61 | 48.08 | 38.69 | 26.30 | 14.61 | 12.48 | 14.78 | NA | 8.81 | NA | NA |
| 2023-12-29 | 2023-09-29 | 2023-06-30 | 2023-03-31 | 2022-12-23 | 2022-09-23 | 2022-09-22 | 2022-06-24 | 2022-03-25 | 2021-12-24 | 2021-09-24 | 2021-06-25 | 2021-03-26 | 2020-12-25 | 2020-09-25 | 2020-06-26 | 2020-03-27 | 2019-12-27 | 2019-09-27 | ||
|---|---|---|---|---|---|---|---|---|---|---|---|---|---|---|---|---|---|---|---|---|
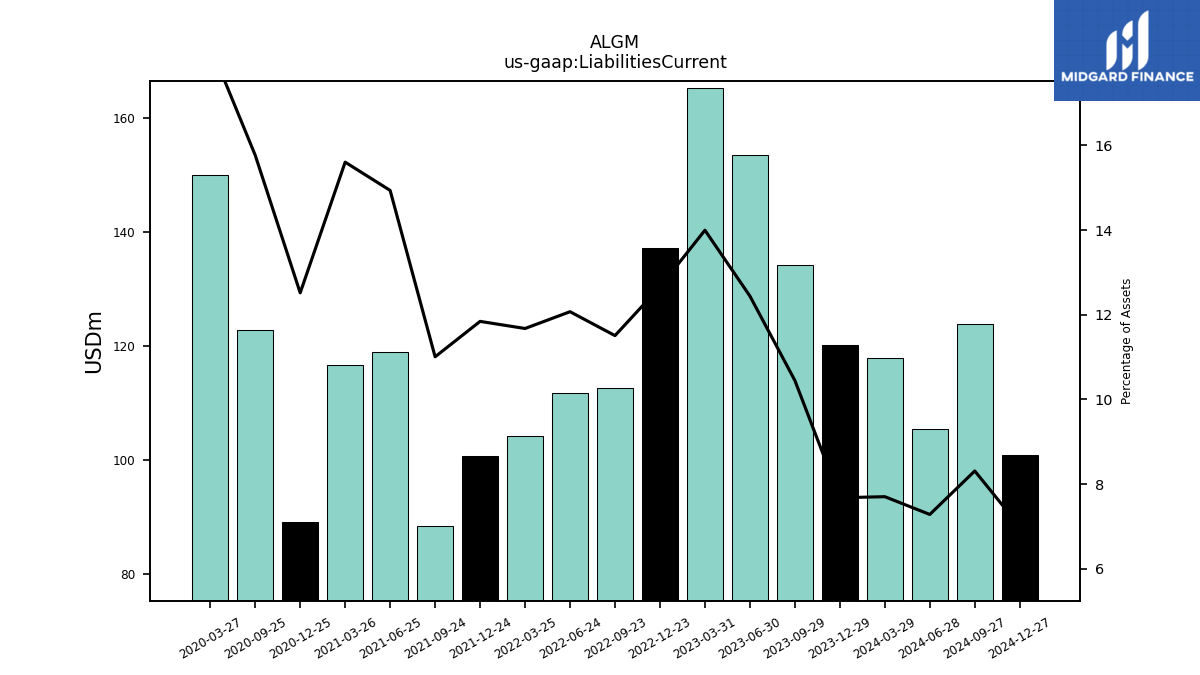
| Liabilities Current | 120.19 | 134.24 | 153.54 | 165.32 | 137.23 | 112.75 | NA | 111.80 | 104.22 | 100.84 | 88.42 | 119.03 | 116.67 | 89.12 | 122.94 | NA | 150.11 | NA | NA | |
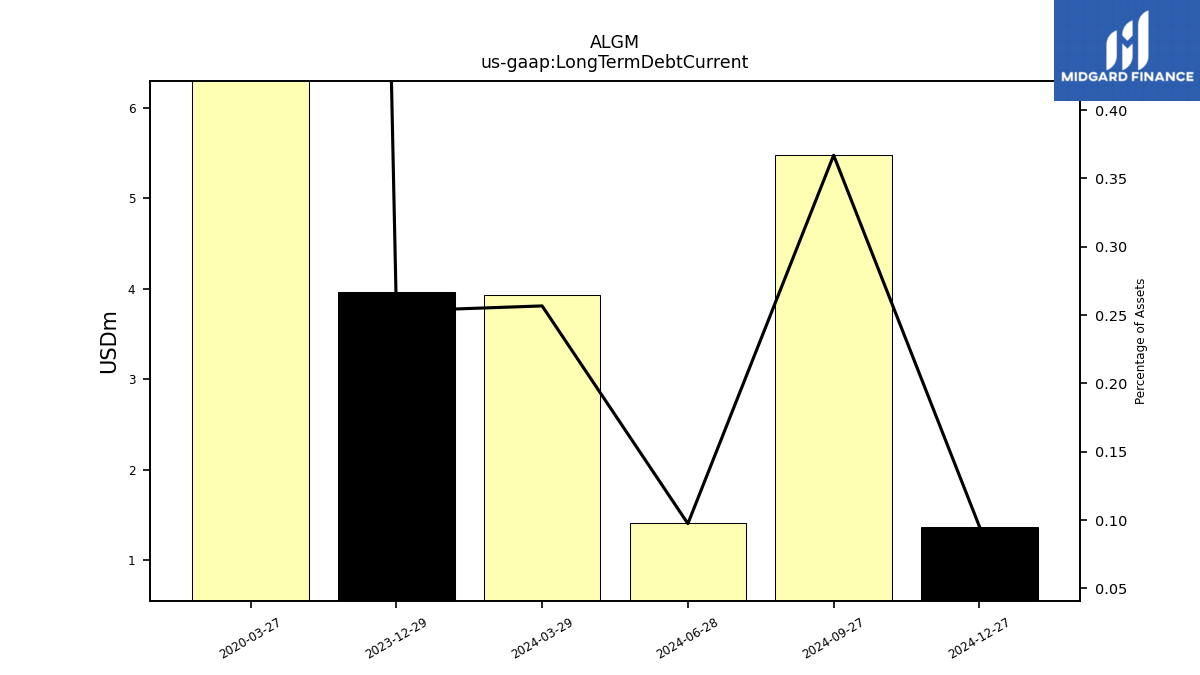
| Long Term Debt Current | 3.96 | NA | NA | NA | NA | NA | NA | NA | NA | NA | NA | NA | NA | NA | NA | NA | 43.00 | NA | NA | |
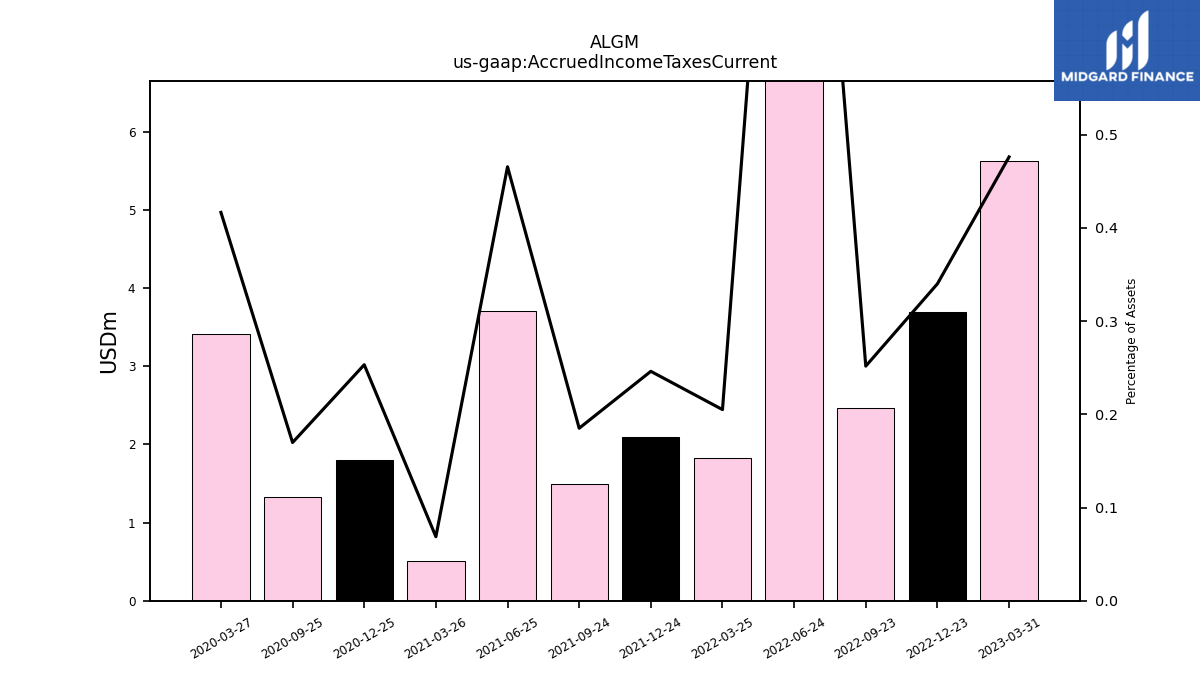
| Accrued Income Taxes Current | NA | NA | NA | 5.62 | 3.69 | 2.47 | NA | 11.16 | 1.83 | 2.10 | 1.49 | 3.71 | 0.51 | 1.80 | 1.32 | NA | 3.41 | NA | NA |
| 2023-12-29 | 2023-09-29 | 2023-06-30 | 2023-03-31 | 2022-12-23 | 2022-09-23 | 2022-09-22 | 2022-06-24 | 2022-03-25 | 2021-12-24 | 2021-09-24 | 2021-06-25 | 2021-03-26 | 2020-12-25 | 2020-09-25 | 2020-06-26 | 2020-03-27 | 2019-12-27 | 2019-09-27 | ||
|---|---|---|---|---|---|---|---|---|---|---|---|---|---|---|---|---|---|---|---|---|
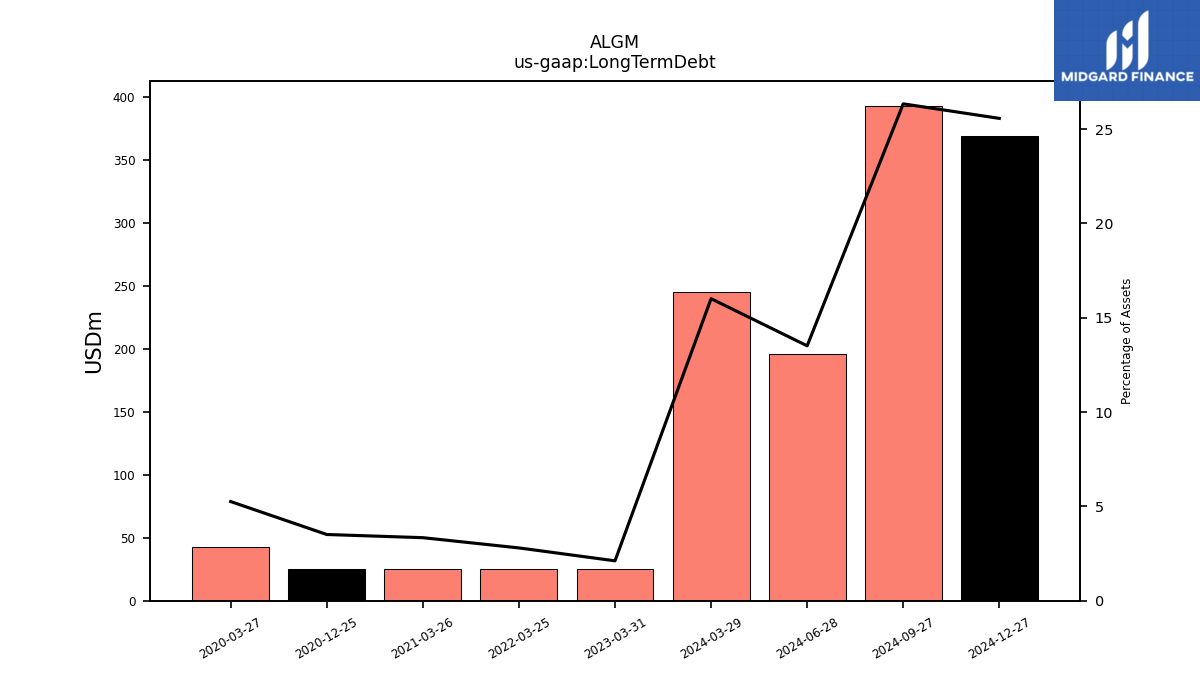
| Long Term Debt | NA | NA | NA | NA | NA | NA | NA | NA | 25.00 | NA | NA | NA | 25.00 | 25.00 | NA | NA | 43.00 | NA | NA | |
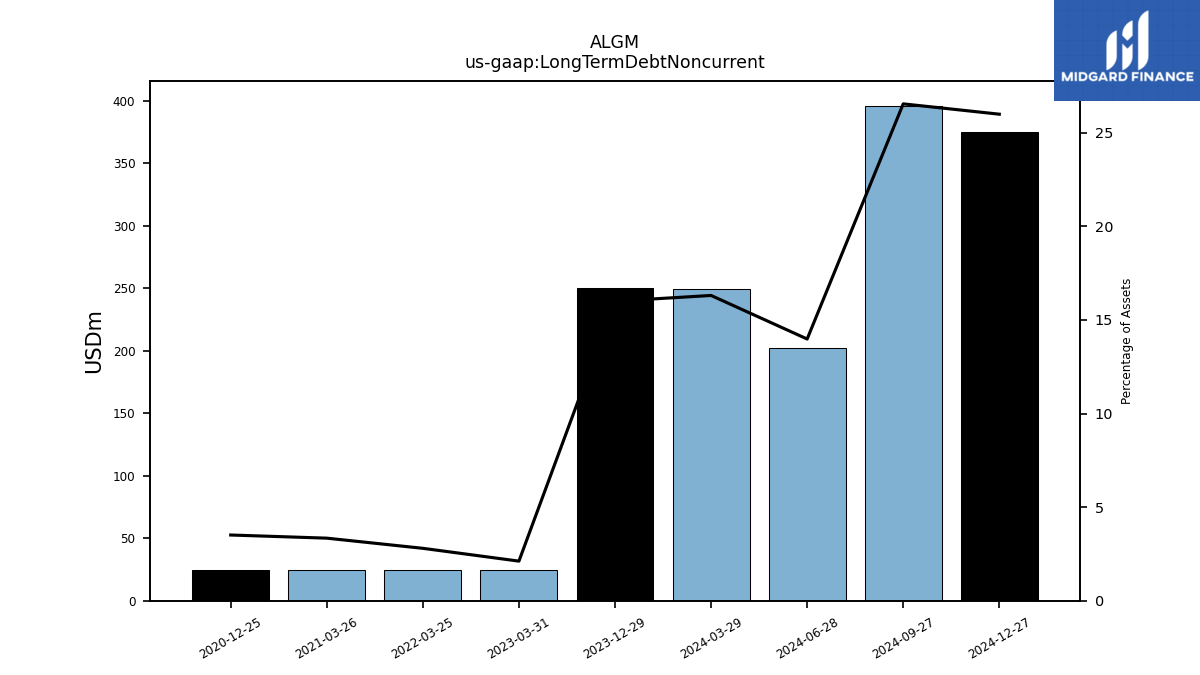
| Long Term Debt Noncurrent | 250.46 | NA | NA | 25.00 | NA | NA | NA | NA | 25.00 | NA | NA | NA | 25.00 | 25.00 | NA | NA | NA | NA | NA | |
| Deferred Income Tax Liabilities Net | 27.74 | NA | NA | NA | 4.44 | 4.14 | NA | NA | NA | NA | NA | NA | NA | NA | NA | NA | NA | NA | NA | |
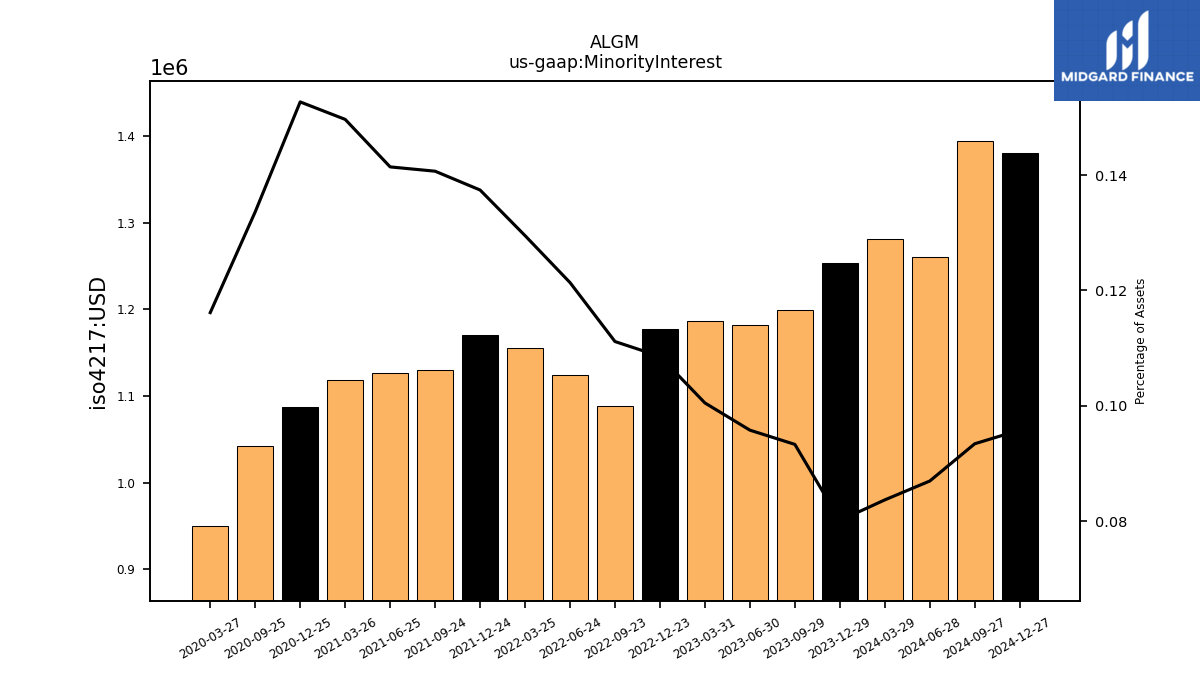
| Minority Interest | 1.25 | 1.20 | 1.18 | 1.19 | 1.18 | 1.09 | NA | 1.12 | 1.16 | 1.17 | 1.13 | 1.13 | 1.12 | 1.09 | 1.04 | NA | 0.95 | NA | NA | |
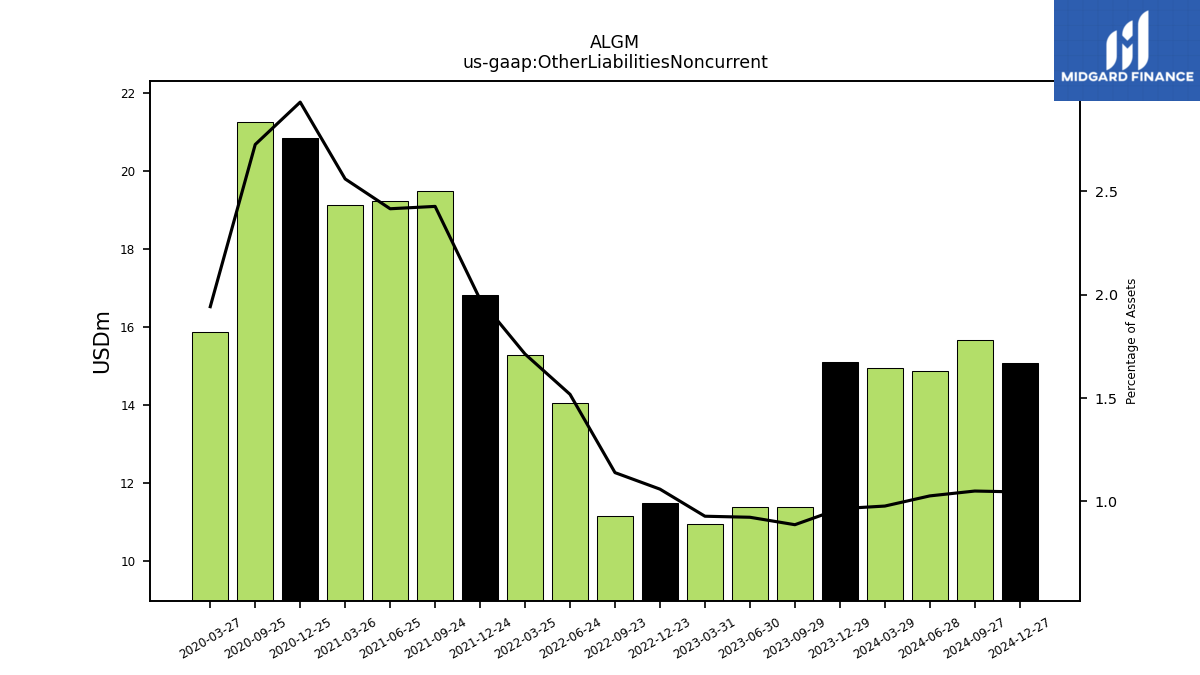
| Other Liabilities Noncurrent | 15.10 | 11.40 | 11.40 | 10.97 | 11.48 | 11.16 | NA | 14.06 | 15.29 | 16.83 | 19.49 | 19.24 | 19.13 | 20.86 | 21.25 | NA | 15.88 | NA | NA | |
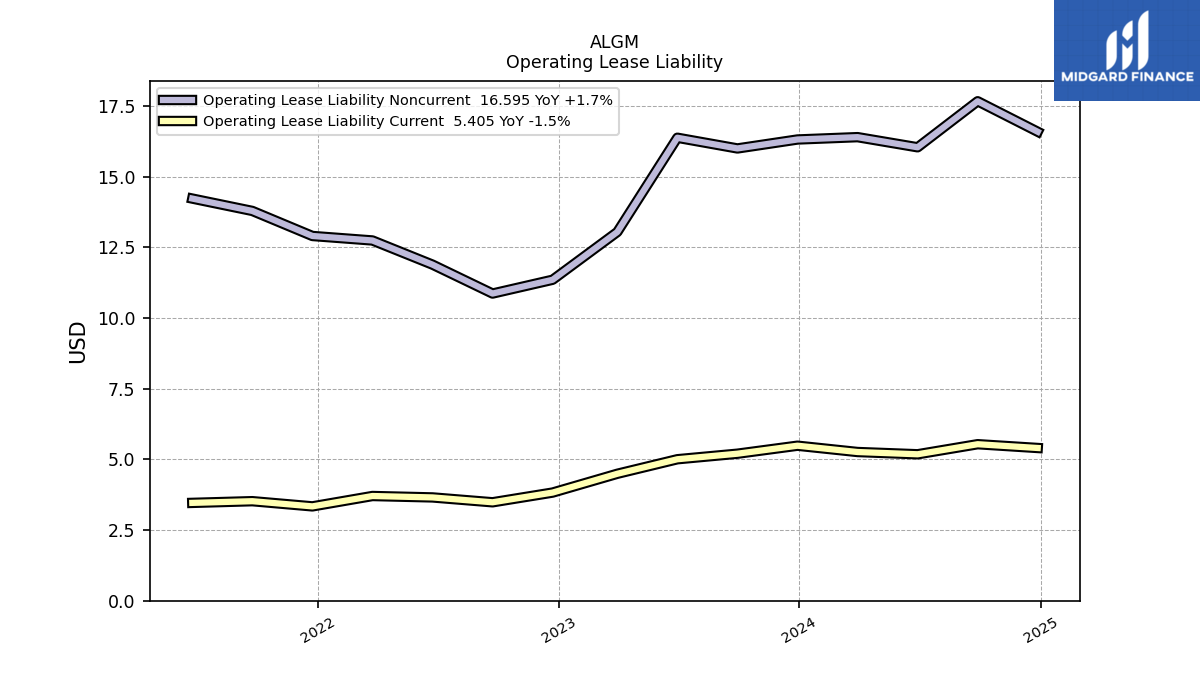
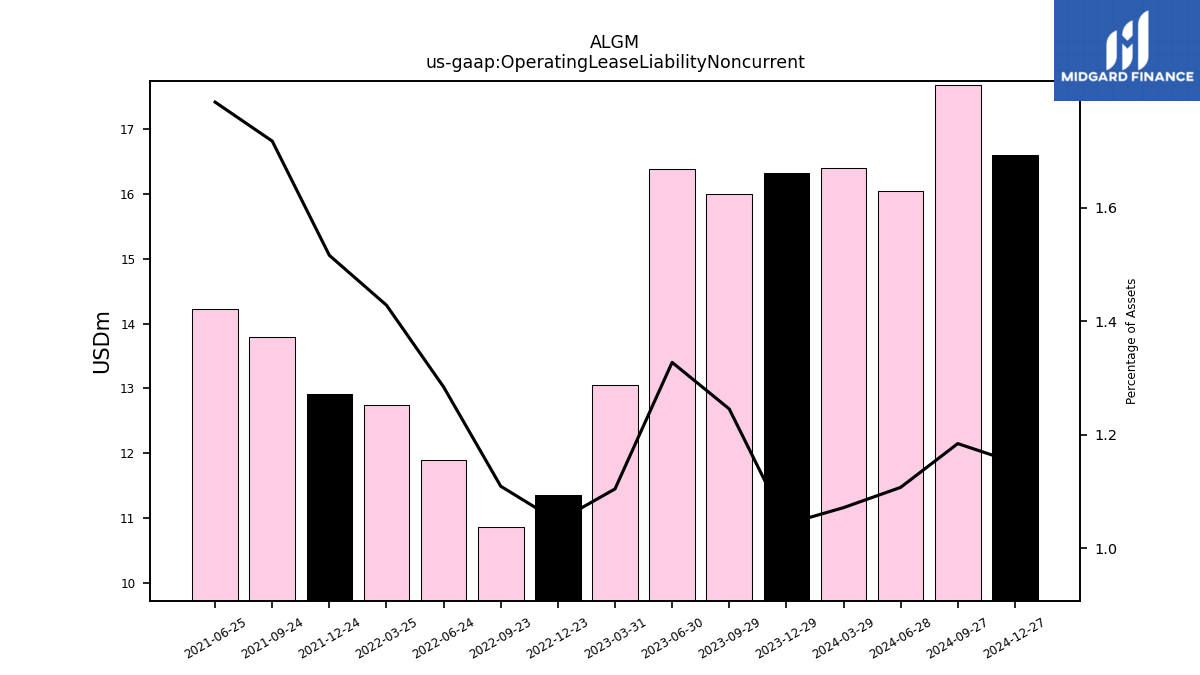
| Operating Lease Liability Noncurrent | 16.32 | 16.00 | 16.38 | 13.05 | 11.36 | 10.87 | NA | 11.89 | 12.75 | 12.91 | 13.79 | 14.23 | NA | NA | NA | NA | NA | NA | NA |
| 2023-12-29 | 2023-09-29 | 2023-06-30 | 2023-03-31 | 2022-12-23 | 2022-09-23 | 2022-09-22 | 2022-06-24 | 2022-03-25 | 2021-12-24 | 2021-09-24 | 2021-06-25 | 2021-03-26 | 2020-12-25 | 2020-09-25 | 2020-06-26 | 2020-03-27 | 2019-12-27 | 2019-09-27 | ||
|---|---|---|---|---|---|---|---|---|---|---|---|---|---|---|---|---|---|---|---|---|
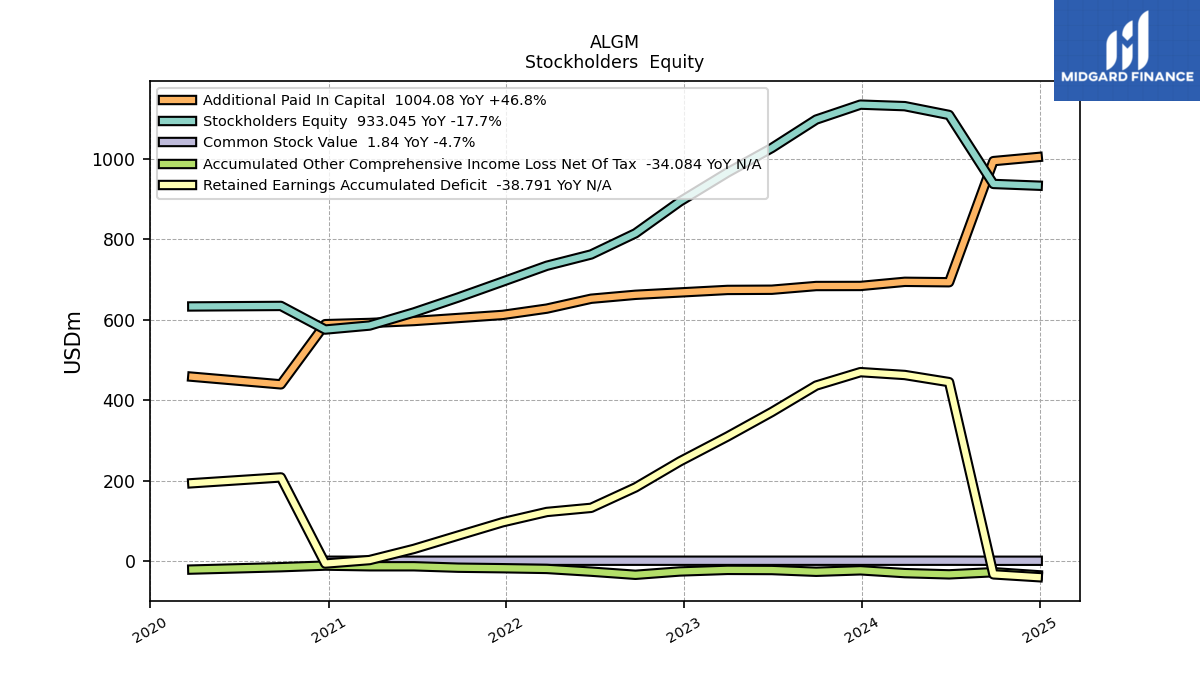
| Stockholders Equity | 1134.23 | 1097.09 | 1026.58 | 965.63 | 893.38 | 814.79 | NA | 762.24 | 734.21 | 694.67 | 655.42 | 618.25 | 585.75 | 575.83 | 634.46 | NA | 633.18 | NA | NA | |
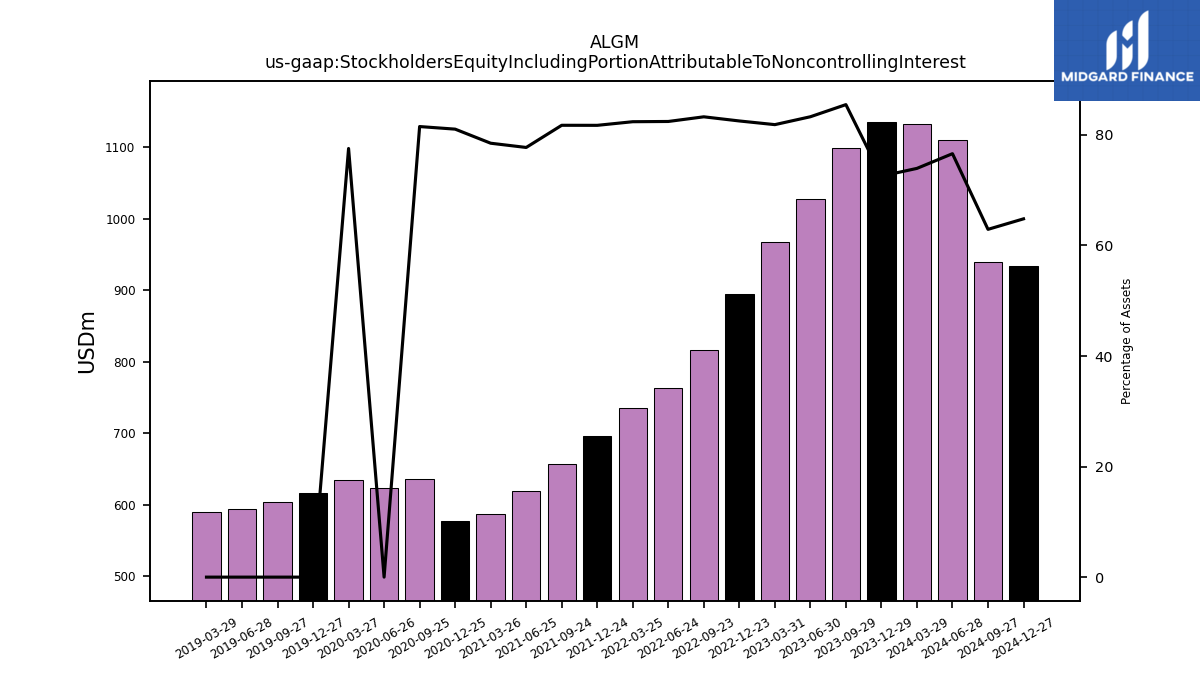
| Stockholders Equity Including Portion Attributable To Noncontrolling Interest | 1135.49 | 1098.29 | 1027.77 | 966.82 | 894.56 | 815.88 | NA | 763.36 | 735.36 | 695.84 | 656.55 | 619.38 | 586.87 | 576.92 | 635.51 | 623.93 | 634.13 | 616.49 | 604.34 | |
| Common Stock Value | 1.93 | 1.93 | 1.92 | 1.92 | 1.91 | 1.91 | NA | 1.91 | 1.91 | 1.90 | 1.90 | 1.90 | 1.90 | 1.89 | NA | NA | NA | NA | NA | |
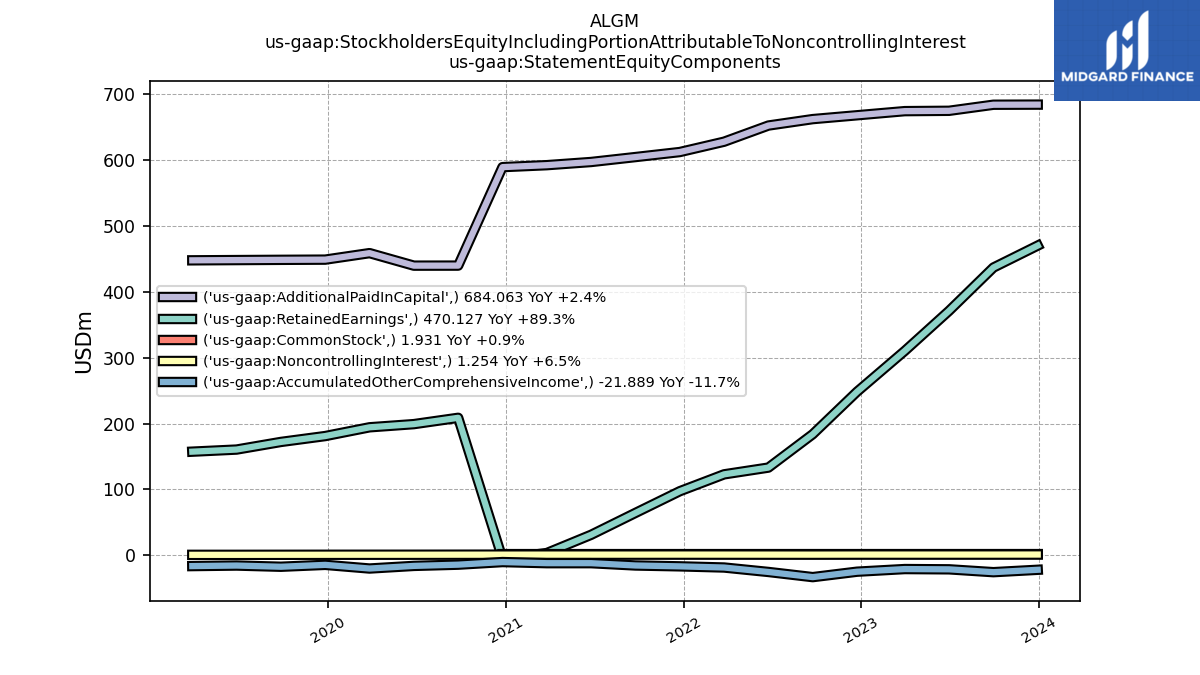
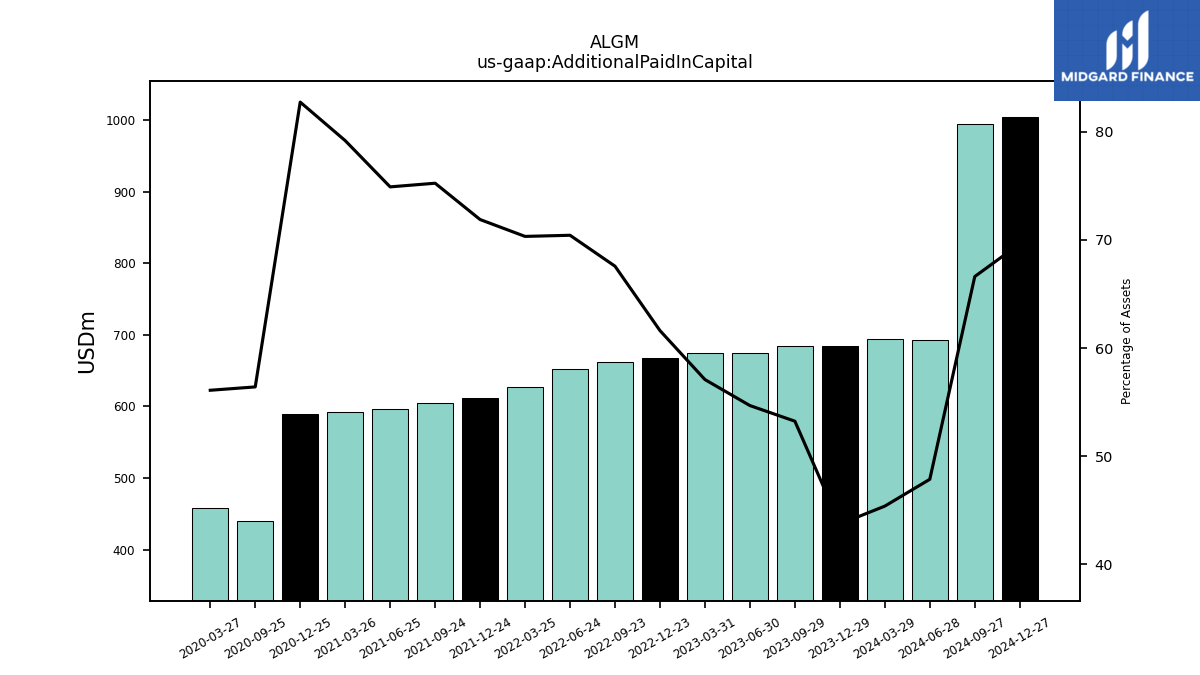
| Additional Paid In Capital | 684.06 | 683.89 | 674.69 | 674.18 | 667.91 | 662.08 | NA | 652.32 | 627.79 | 612.11 | 604.49 | 597.00 | 592.17 | 589.20 | 439.73 | NA | 458.70 | NA | NA | |
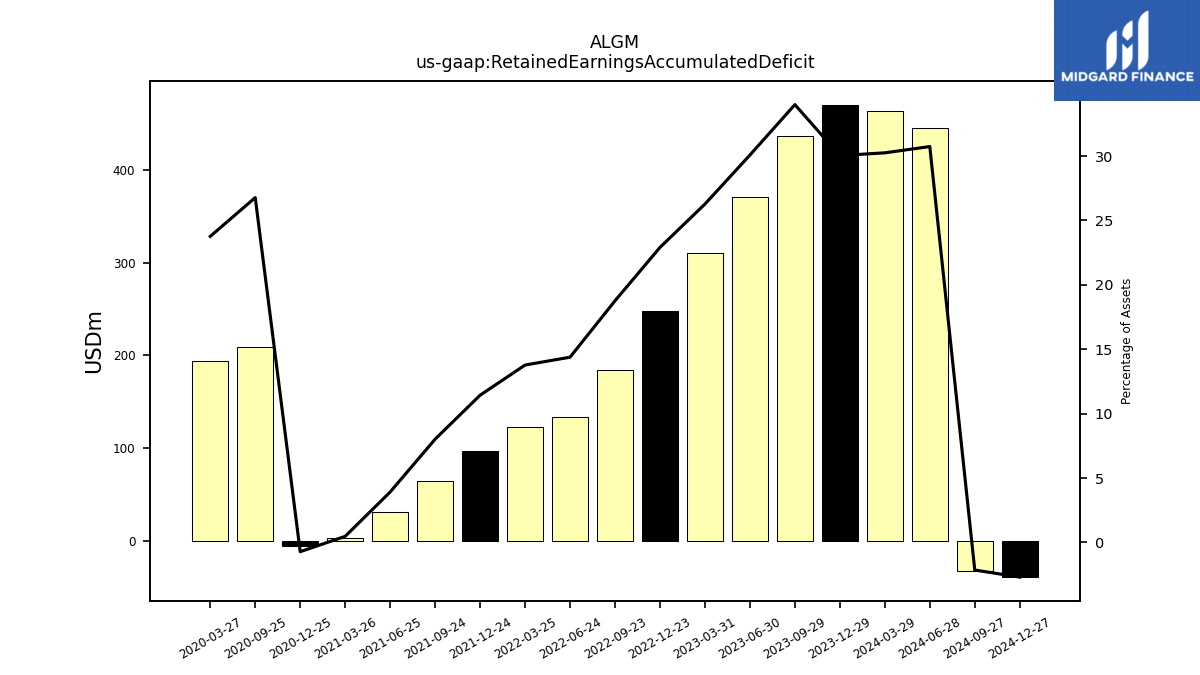
| Retained Earnings Accumulated Deficit | 470.13 | 436.78 | 371.17 | 310.31 | 248.34 | 183.82 | NA | 133.21 | 122.96 | 97.34 | 64.41 | 31.22 | 3.55 | -5.09 | 208.76 | NA | 194.35 | NA | NA | |
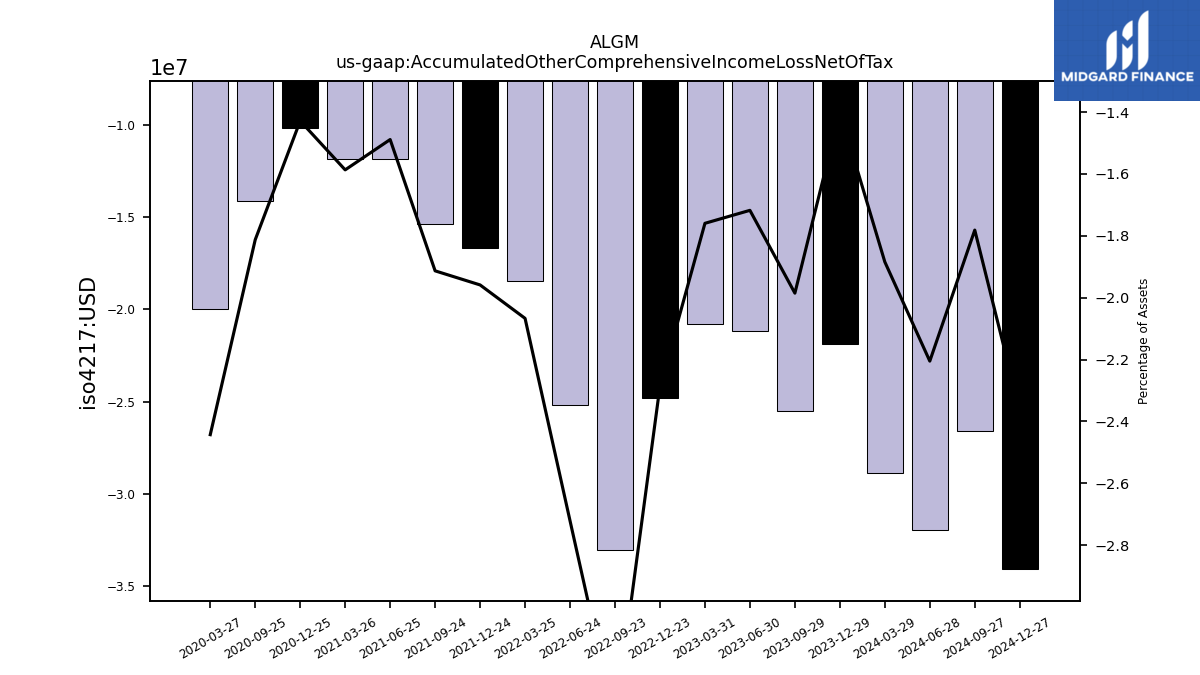
| Accumulated Other Comprehensive Income Loss Net Of Tax | -21.89 | -25.51 | -21.20 | -20.78 | -24.78 | -33.03 | NA | -25.20 | -18.45 | -16.68 | -15.37 | -11.87 | -11.87 | -10.17 | -14.13 | NA | -19.98 | NA | NA | |
| Minority Interest | 1.25 | 1.20 | 1.18 | 1.19 | 1.18 | 1.09 | NA | 1.12 | 1.16 | 1.17 | 1.13 | 1.13 | 1.12 | 1.09 | 1.04 | NA | 0.95 | NA | NA |
| 2023-12-29 | 2023-09-29 | 2023-06-30 | 2023-03-31 | 2022-12-23 | 2022-09-23 | 2022-09-22 | 2022-06-24 | 2022-03-25 | 2021-12-24 | 2021-09-24 | 2021-06-25 | 2021-03-26 | 2020-12-25 | 2020-09-25 | 2020-06-26 | 2020-03-27 | 2019-12-27 | 2019-09-27 | ||
|---|---|---|---|---|---|---|---|---|---|---|---|---|---|---|---|---|---|---|---|---|
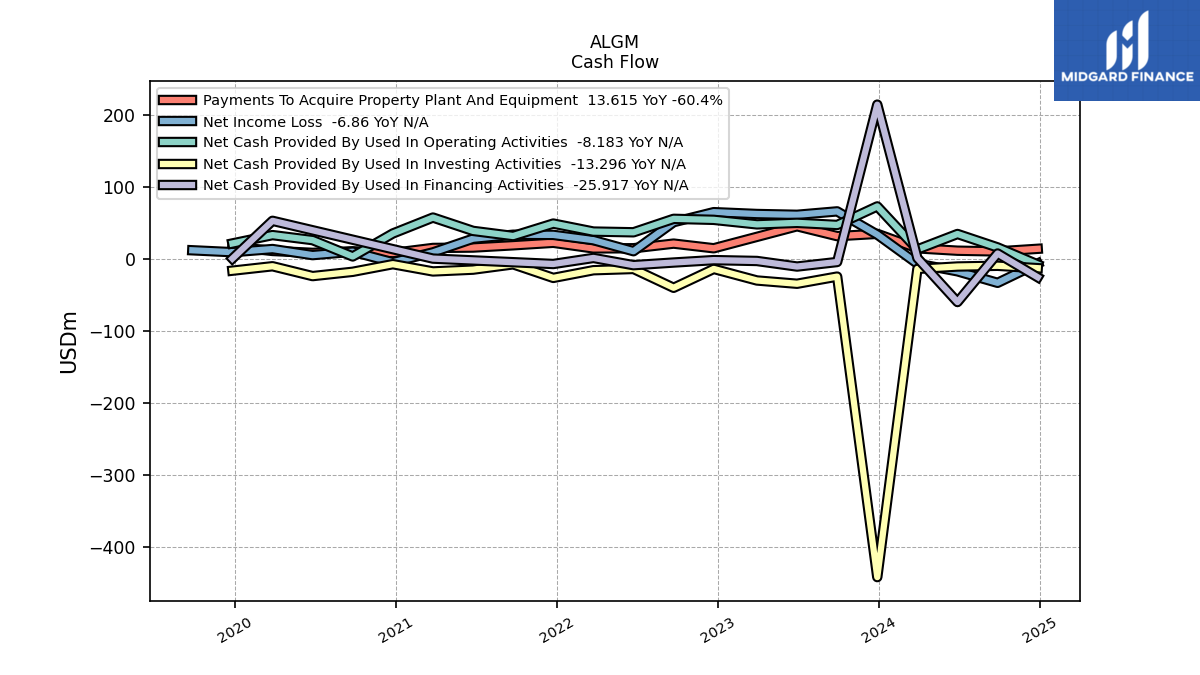
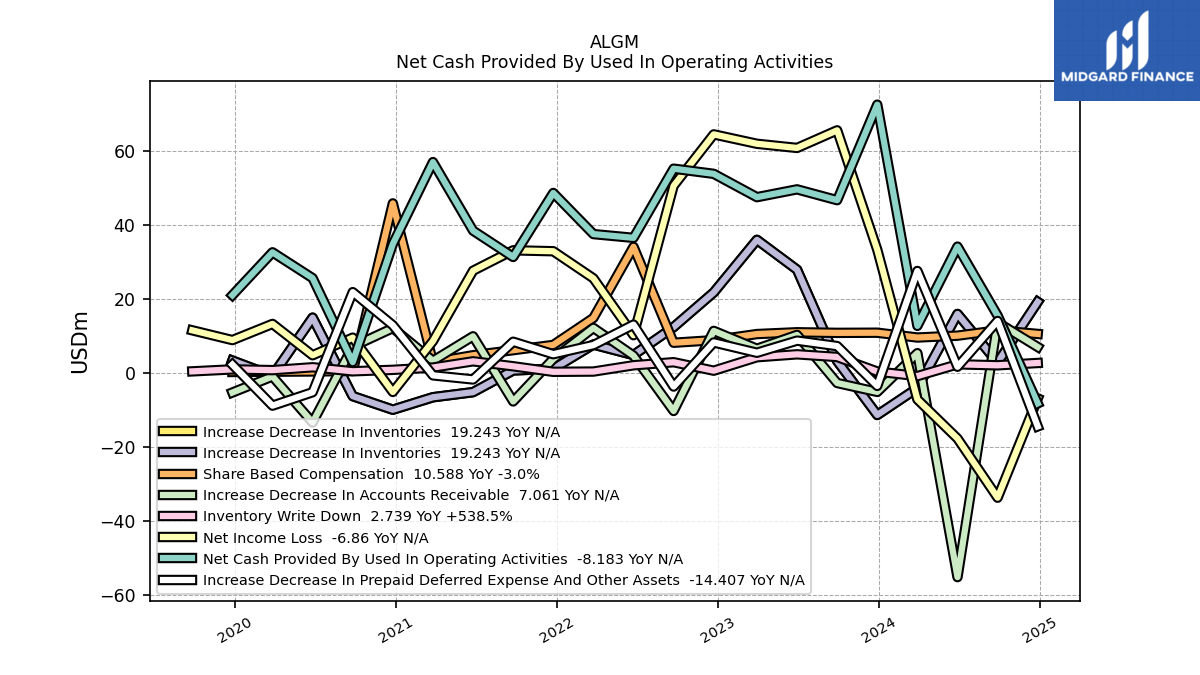
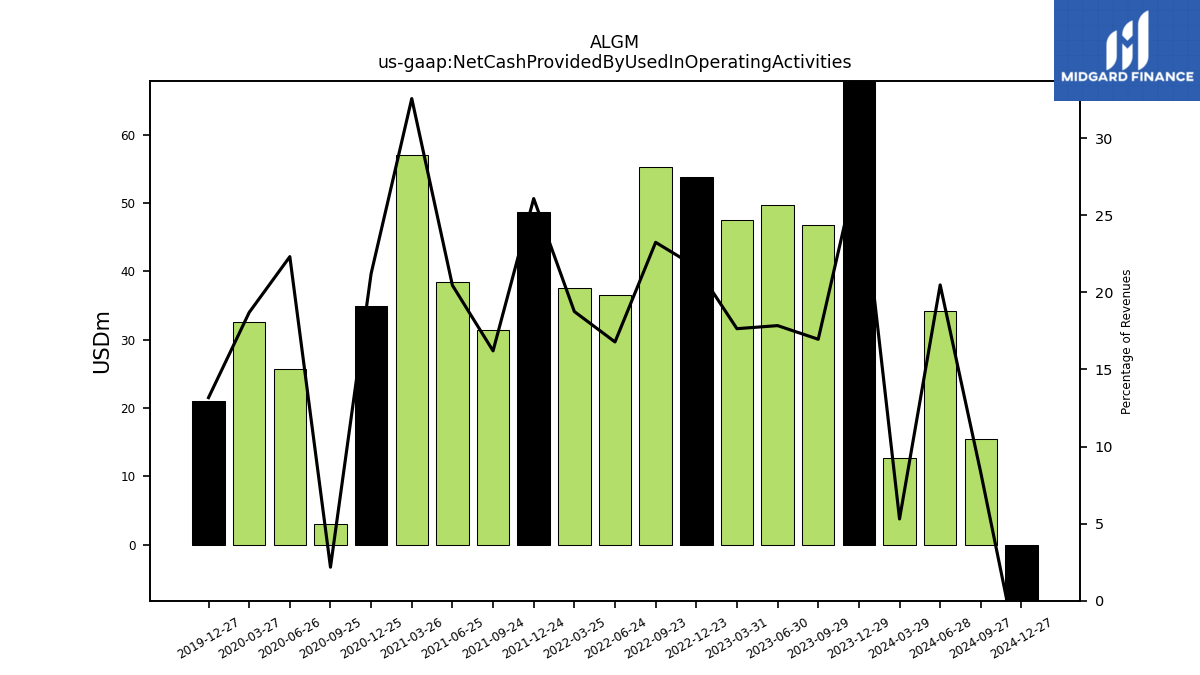
| Net Cash Provided By Used In Operating Activities | 72.56 | 46.73 | 49.66 | 47.55 | 53.85 | 55.25 | NA | 36.55 | 37.57 | 48.68 | 31.38 | 38.49 | 57.04 | 34.89 | 2.97 | 25.67 | 32.65 | 21.05 | NA | |
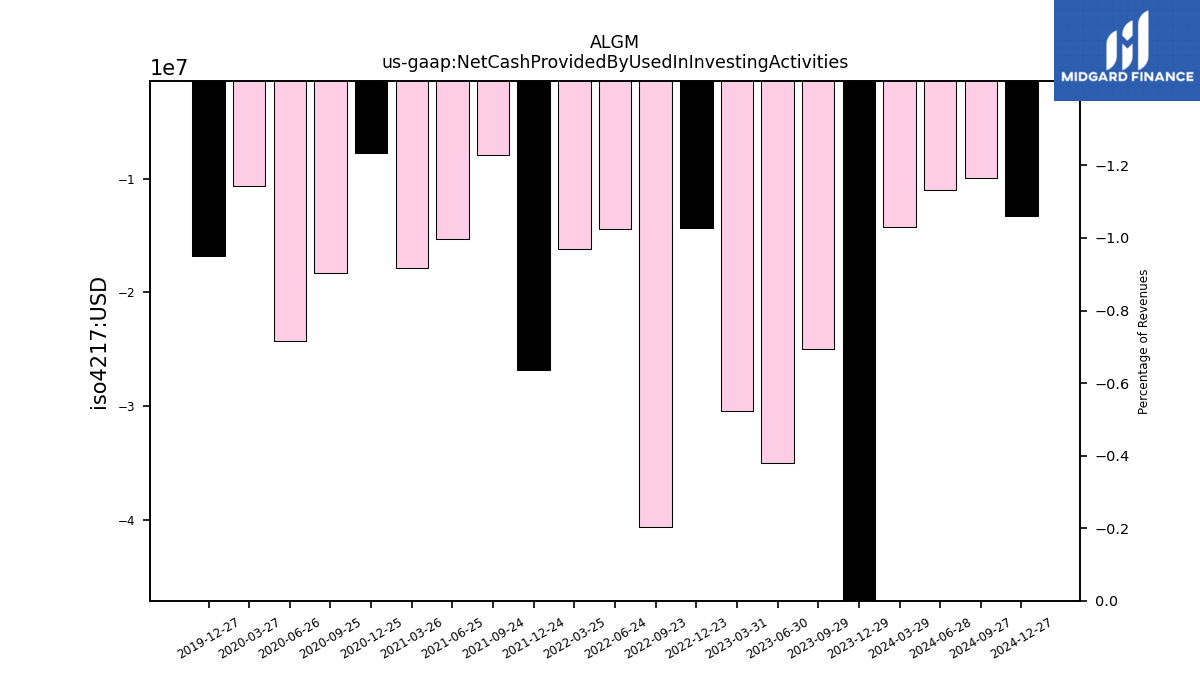
| Net Cash Provided By Used In Investing Activities | -442.52 | -24.99 | -34.94 | -30.41 | -14.34 | -40.56 | NA | -14.39 | -16.15 | -26.83 | -7.95 | -15.35 | -17.84 | -7.76 | -18.34 | -24.31 | -10.62 | -16.78 | NA | |
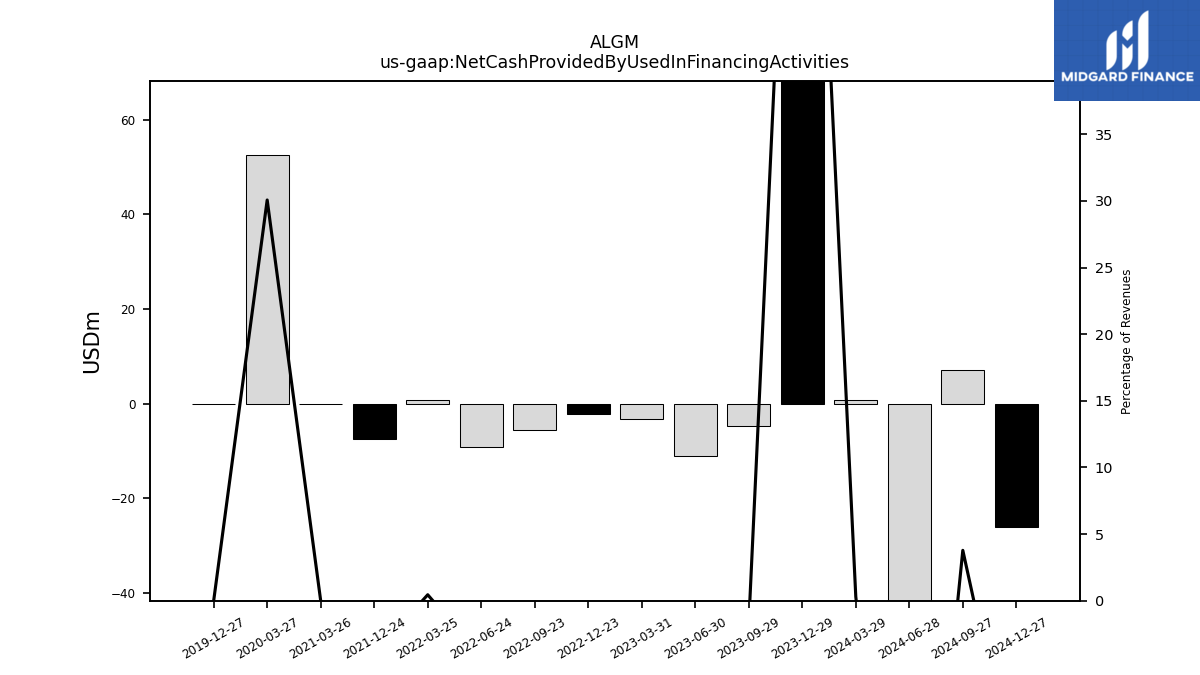
| Net Cash Provided By Used In Financing Activities | 213.91 | -4.73 | -11.04 | -3.30 | -2.10 | -5.46 | NA | -9.14 | 0.90 | -7.50 | NA | NA | 0.00 | NA | NA | NA | 52.50 | 0.00 | NA |
| 2023-12-29 | 2023-09-29 | 2023-06-30 | 2023-03-31 | 2022-12-23 | 2022-09-23 | 2022-09-22 | 2022-06-24 | 2022-03-25 | 2021-12-24 | 2021-09-24 | 2021-06-25 | 2021-03-26 | 2020-12-25 | 2020-09-25 | 2020-06-26 | 2020-03-27 | 2019-12-27 | 2019-09-27 | ||
|---|---|---|---|---|---|---|---|---|---|---|---|---|---|---|---|---|---|---|---|---|
| Net Cash Provided By Used In Operating Activities | 72.56 | 46.73 | 49.66 | 47.55 | 53.85 | 55.25 | NA | 36.55 | 37.57 | 48.68 | 31.38 | 38.49 | 57.04 | 34.89 | 2.97 | 25.67 | 32.65 | 21.05 | NA | |
| Net Income Loss | 33.34 | 65.62 | 60.85 | 61.98 | 64.52 | 50.61 | NA | 10.25 | 25.62 | 32.94 | 33.19 | 27.67 | 8.64 | -5.09 | 9.58 | 4.82 | 13.30 | 8.93 | 11.56 | |
| Profit Loss | 33.40 | 65.67 | 60.89 | 62.01 | 64.55 | 50.65 | NA | 10.28 | 25.65 | 32.97 | 33.22 | 27.71 | 8.69 | -5.06 | 9.62 | 4.85 | 13.33 | 8.96 | 11.58 | |
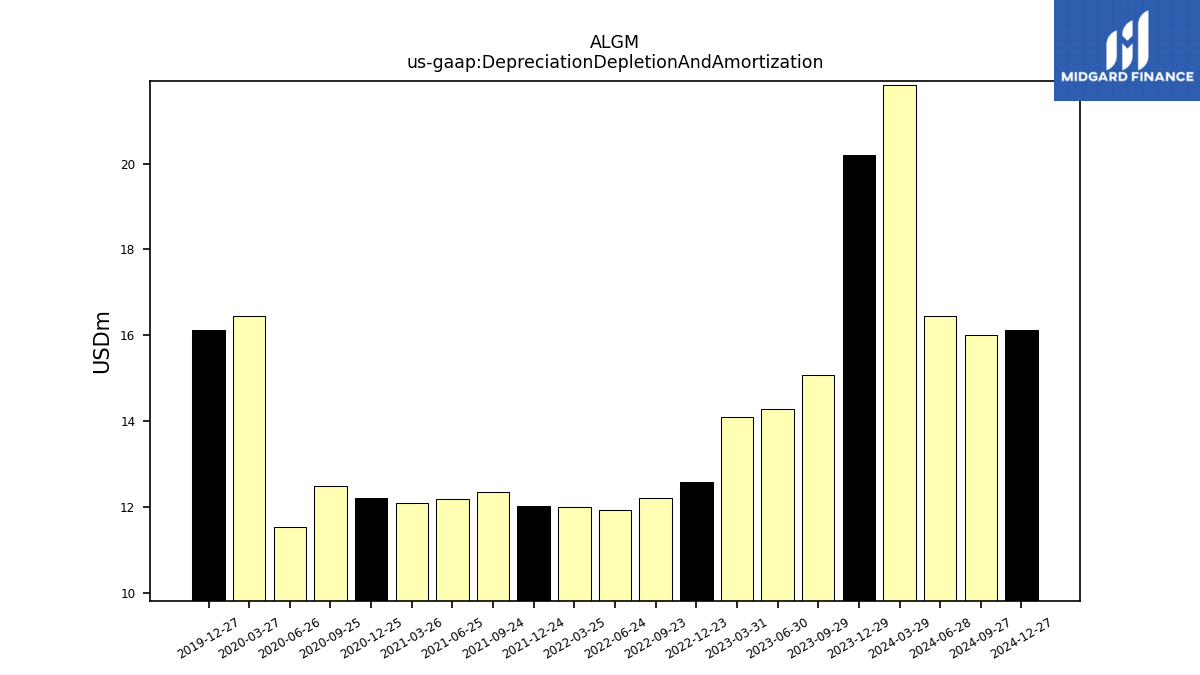
| Depreciation Depletion And Amortization | 20.20 | 15.08 | 14.27 | 14.10 | 12.58 | 12.21 | NA | 11.92 | 12.01 | 12.01 | 12.34 | 12.17 | 12.08 | 12.20 | 12.49 | 11.54 | 16.44 | 16.13 | NA | |
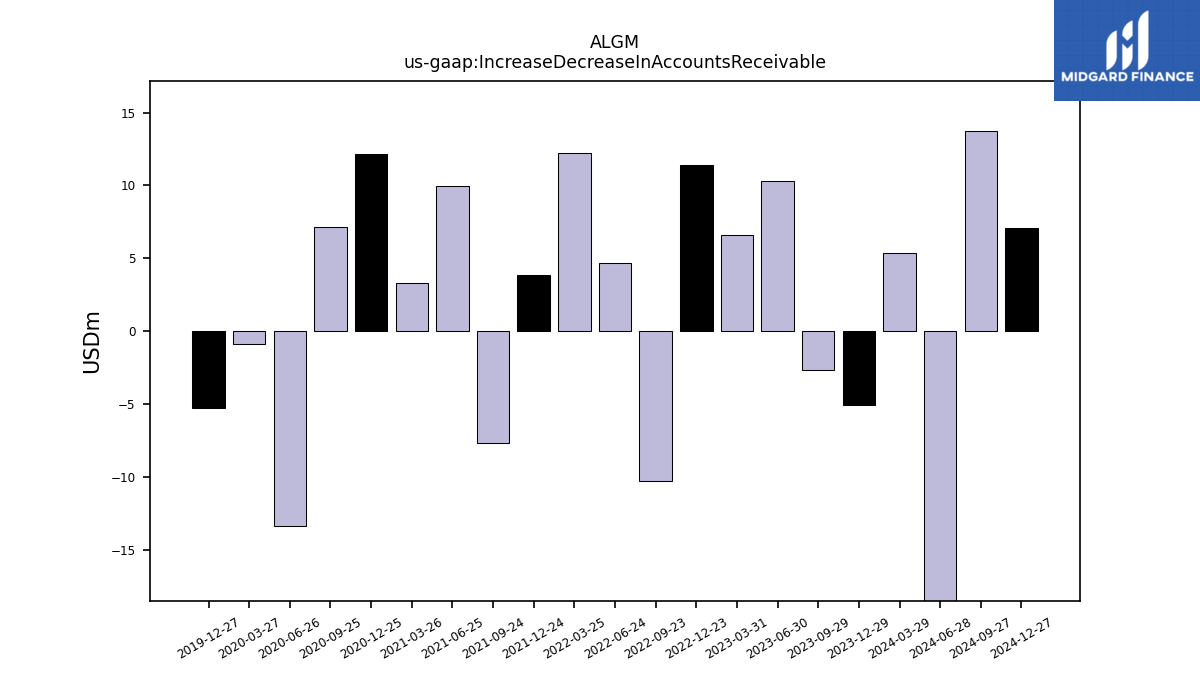
| Increase Decrease In Accounts Receivable | -5.08 | -2.68 | 10.32 | 6.59 | 11.41 | -10.24 | NA | 4.72 | 12.21 | 3.83 | -7.66 | 9.96 | 3.33 | 12.17 | 7.16 | -13.35 | -0.90 | -5.25 | NA | |
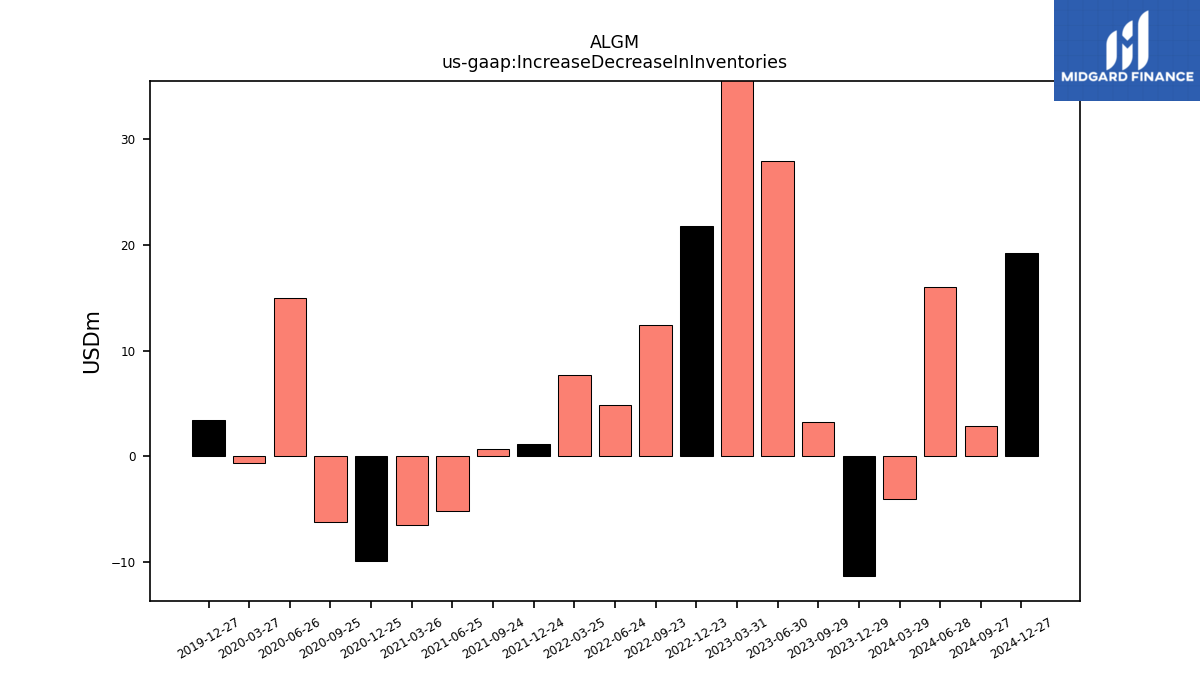
| Increase Decrease In Inventories | -11.31 | 3.27 | 27.95 | 36.01 | 21.81 | 12.44 | NA | 4.89 | 7.72 | 1.16 | 0.73 | -5.14 | -6.52 | -9.89 | -6.22 | 14.99 | -0.69 | 3.38 | NA | |
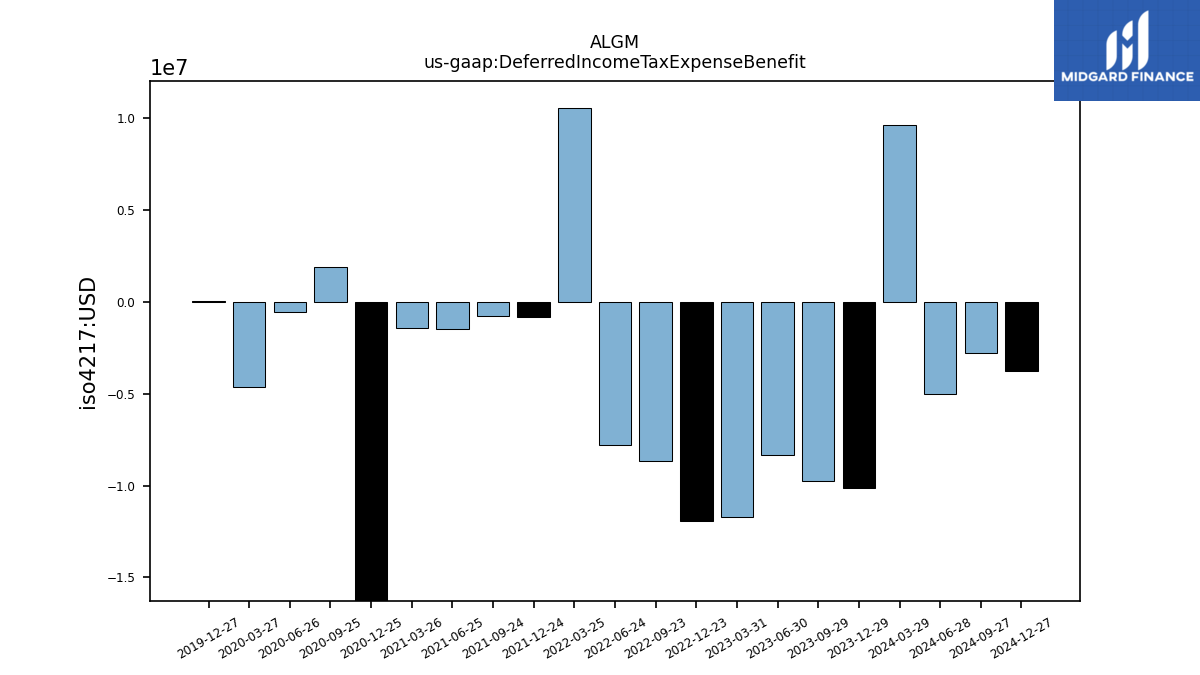
| Deferred Income Tax Expense Benefit | -10.12 | -9.77 | -8.36 | -11.73 | -11.96 | -8.65 | NA | -7.78 | 10.56 | -0.81 | -0.79 | -1.45 | -1.41 | -18.83 | 1.89 | -0.58 | -4.62 | 0.03 | NA | |
| Share Based Compensation | 10.92 | 10.88 | 11.04 | 10.56 | 8.90 | 8.20 | NA | 34.14 | 14.90 | 7.62 | 6.20 | 4.83 | 2.97 | 45.88 | 0.58 | 0.45 | 0.38 | 0.30 | NA | |
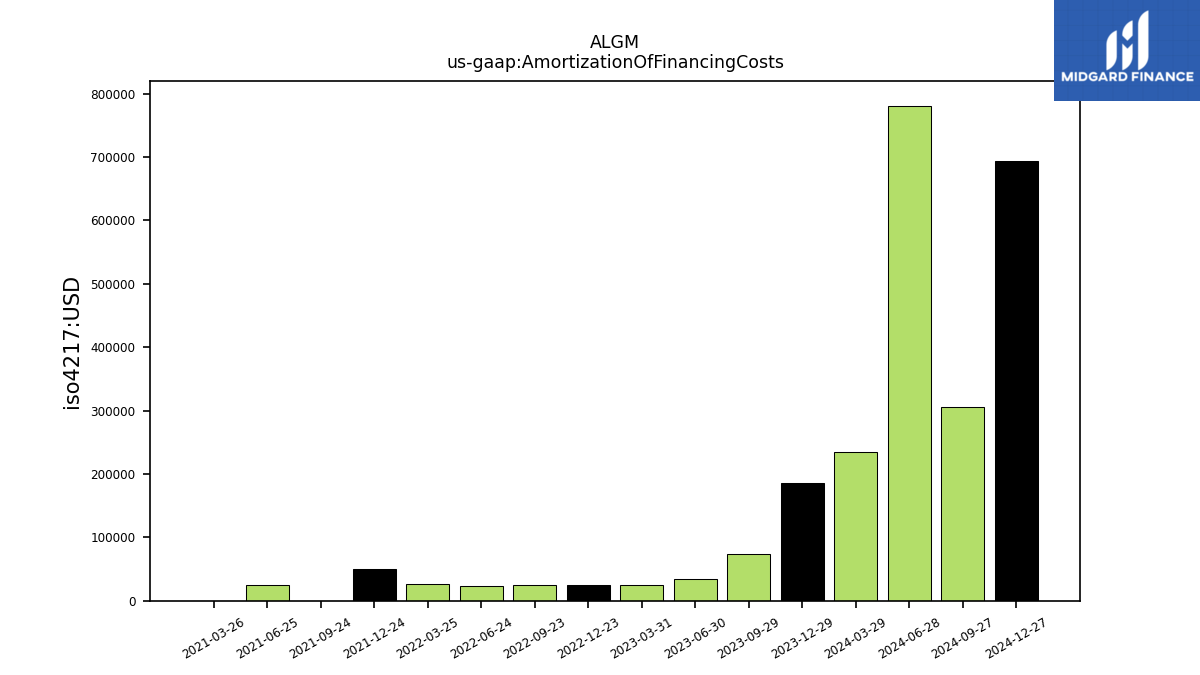
| Amortization Of Financing Costs | 0.18 | 0.07 | 0.03 | 0.03 | 0.03 | 0.03 | NA | 0.02 | 0.03 | 0.05 | 0.00 | 0.03 | 0.00 | NA | NA | NA | NA | NA | NA |
| 2023-12-29 | 2023-09-29 | 2023-06-30 | 2023-03-31 | 2022-12-23 | 2022-09-23 | 2022-09-22 | 2022-06-24 | 2022-03-25 | 2021-12-24 | 2021-09-24 | 2021-06-25 | 2021-03-26 | 2020-12-25 | 2020-09-25 | 2020-06-26 | 2020-03-27 | 2019-12-27 | 2019-09-27 | ||
|---|---|---|---|---|---|---|---|---|---|---|---|---|---|---|---|---|---|---|---|---|
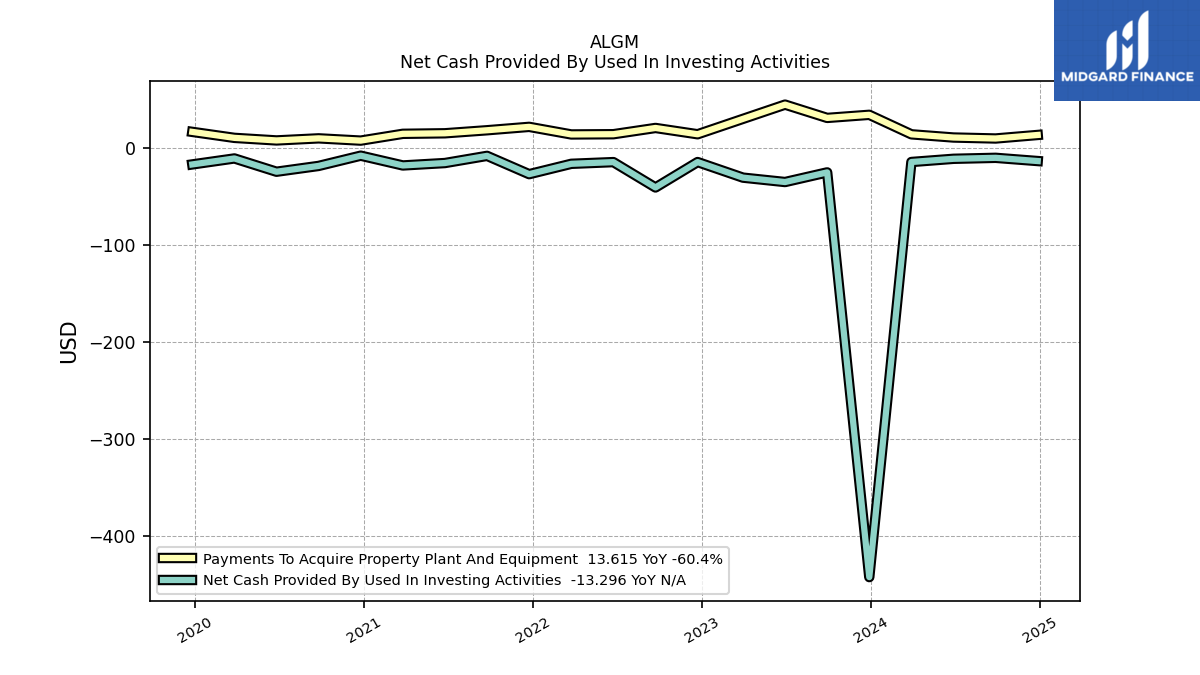
| Net Cash Provided By Used In Investing Activities | -442.52 | -24.99 | -34.94 | -30.41 | -14.34 | -40.56 | NA | -14.39 | -16.15 | -26.83 | -7.95 | -15.35 | -17.84 | -7.76 | -18.34 | -24.31 | -10.62 | -16.78 | NA | |
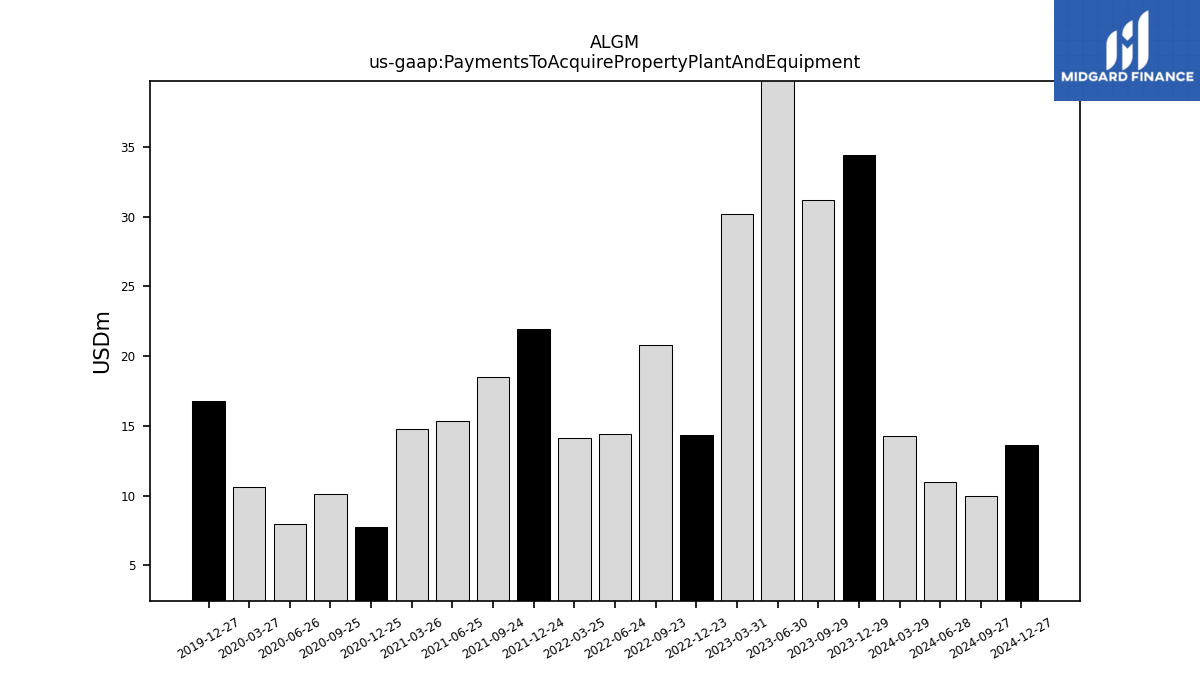
| Payments To Acquire Property Plant And Equipment | 34.40 | 31.19 | 44.91 | 30.21 | 14.34 | 20.83 | NA | 14.39 | 14.15 | 21.97 | 18.48 | 15.35 | 14.79 | 7.79 | 10.12 | 7.97 | 10.62 | 16.80 | NA |
| 2023-12-29 | 2023-09-29 | 2023-06-30 | 2023-03-31 | 2022-12-23 | 2022-09-23 | 2022-09-22 | 2022-06-24 | 2022-03-25 | 2021-12-24 | 2021-09-24 | 2021-06-25 | 2021-03-26 | 2020-12-25 | 2020-09-25 | 2020-06-26 | 2020-03-27 | 2019-12-27 | 2019-09-27 | ||
|---|---|---|---|---|---|---|---|---|---|---|---|---|---|---|---|---|---|---|---|---|
| Net Cash Provided By Used In Financing Activities | 213.91 | -4.73 | -11.04 | -3.30 | -2.10 | -5.46 | NA | -9.14 | 0.90 | -7.50 | NA | NA | 0.00 | NA | NA | NA | 52.50 | 0.00 | NA |
| 2023-12-29 | 2023-09-29 | 2023-06-30 | 2023-03-31 | 2022-12-23 | 2022-09-23 | 2022-09-22 | 2022-06-24 | 2022-03-25 | 2021-12-24 | 2021-09-24 | 2021-06-25 | 2021-03-26 | 2020-12-25 | 2020-09-25 | 2020-06-26 | 2020-03-27 | 2019-12-27 | 2019-09-27 | ||
|---|---|---|---|---|---|---|---|---|---|---|---|---|---|---|---|---|---|---|---|---|
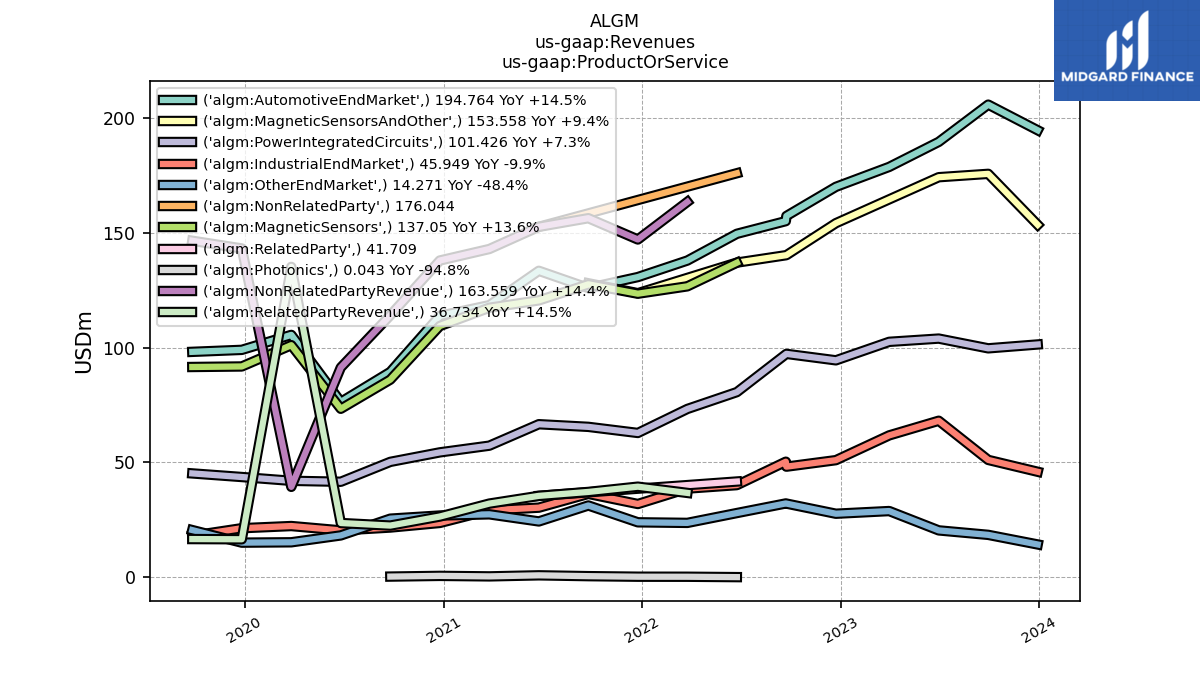
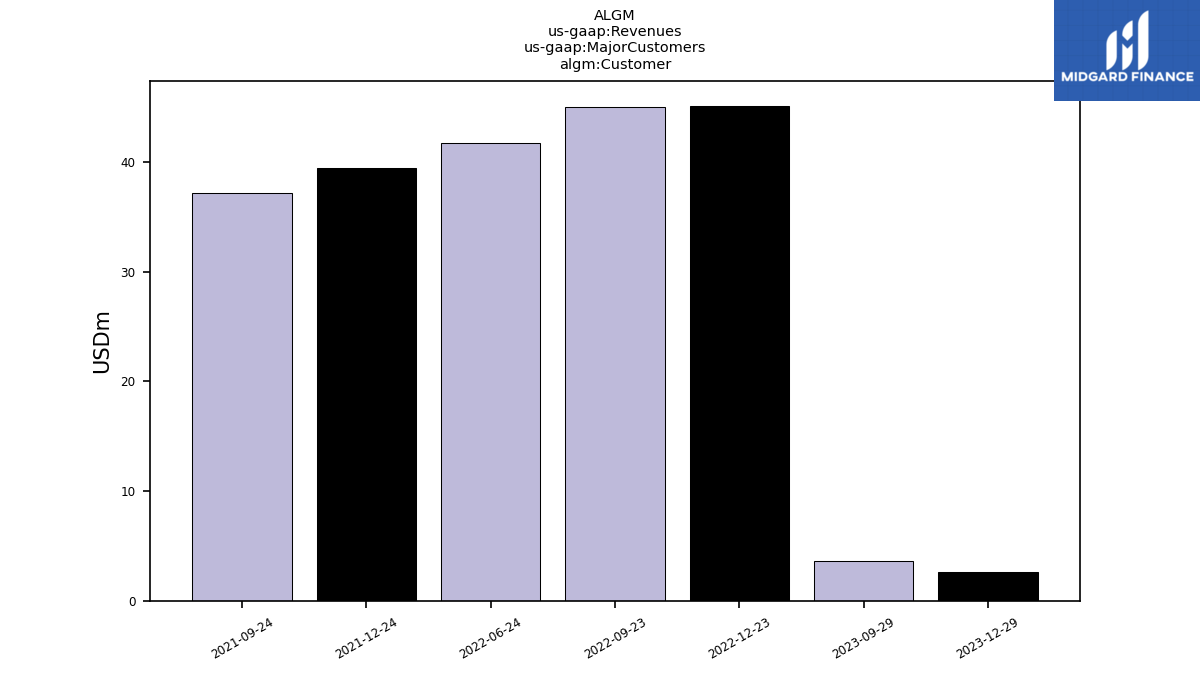
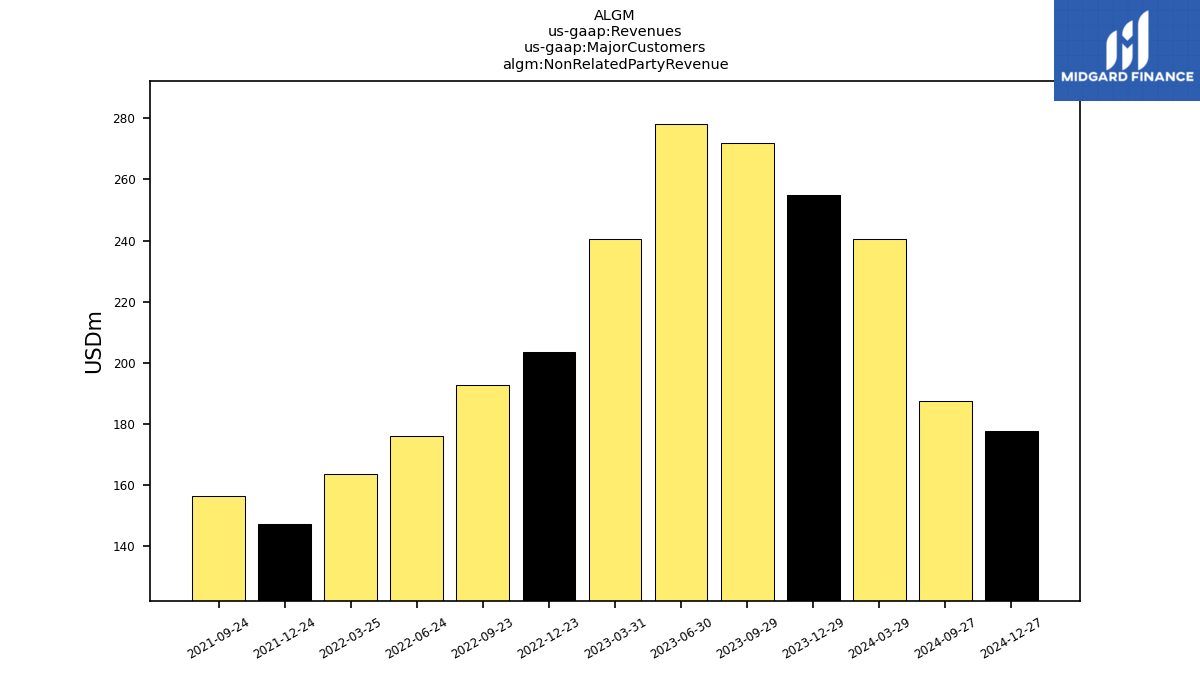
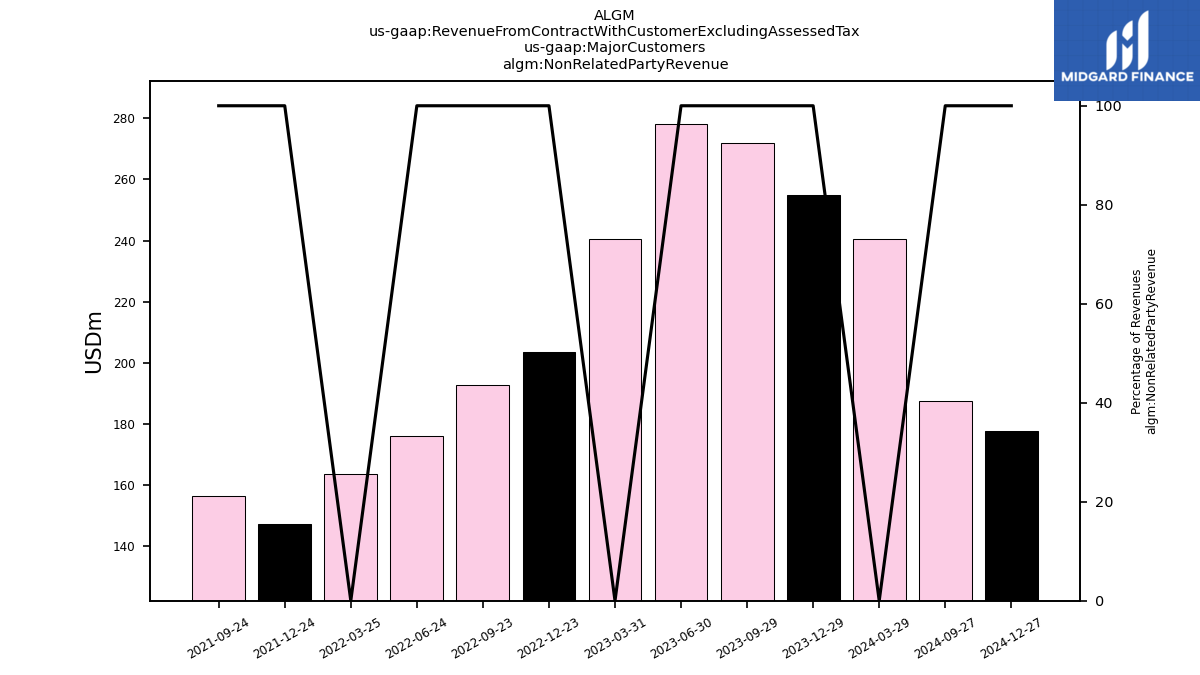
| Revenues | 254.98 | 275.51 | 278.29 | 269.44 | 248.79 | 237.67 | 237.67 | 217.75 | 200.29 | 186.63 | 193.61 | 188.14 | 175.11 | 164.45 | 136.65 | 115.00 | 174.60 | 159.80 | 163.24 | |
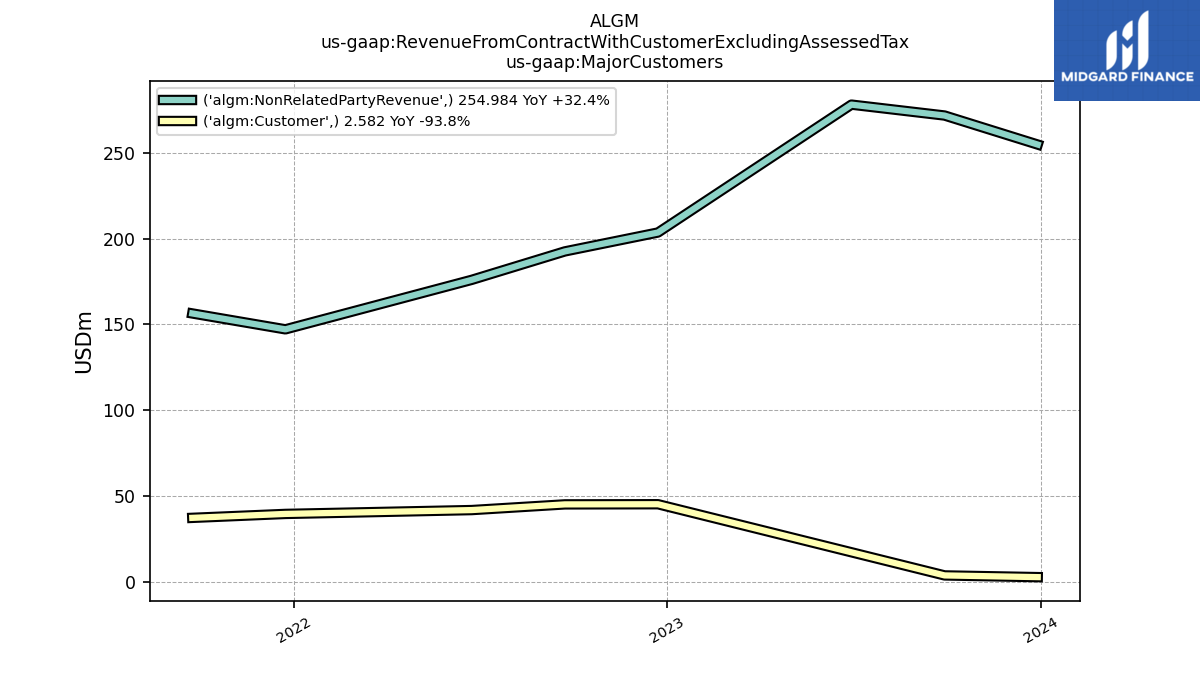
| Customer | 2.58 | 3.58 | NA | NA | 45.12 | 45.03 | NA | 41.71 | NA | 39.46 | 37.16 | NA | NA | NA | NA | NA | NA | NA | NA | |
| Non Related Party Revenue | 254.98 | 271.93 | 278.29 | NA | 203.67 | 192.64 | NA | 176.04 | NA | 147.17 | 156.44 | NA | NA | NA | NA | NA | NA | NA | NA | |
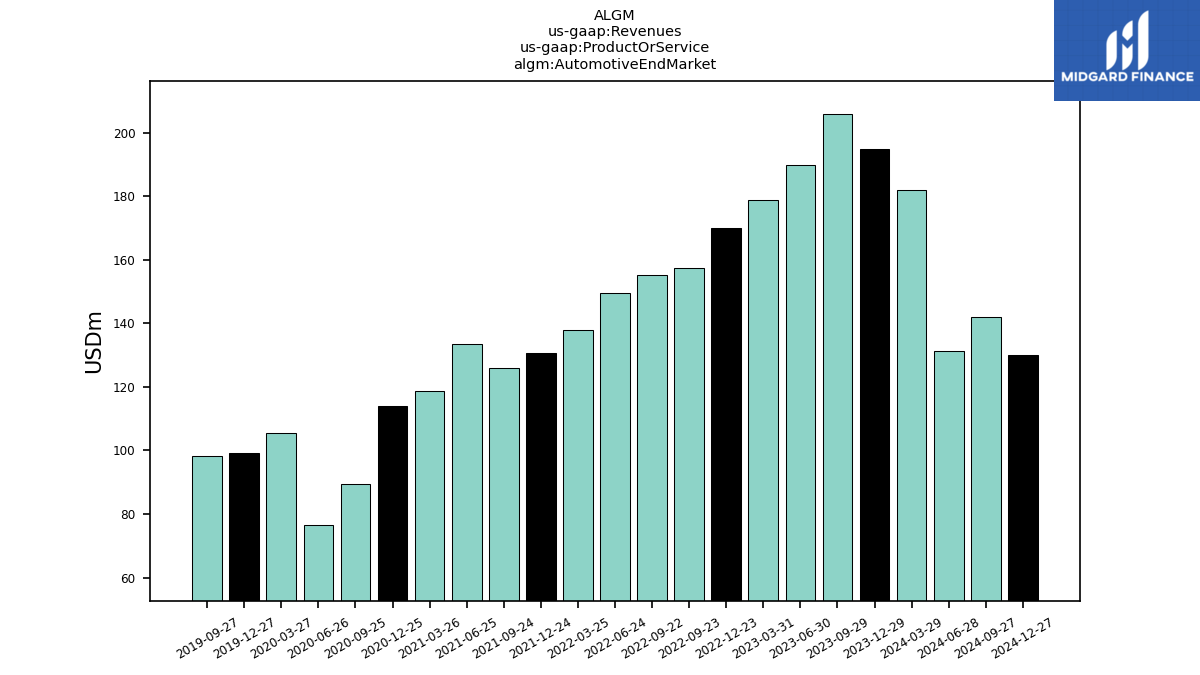
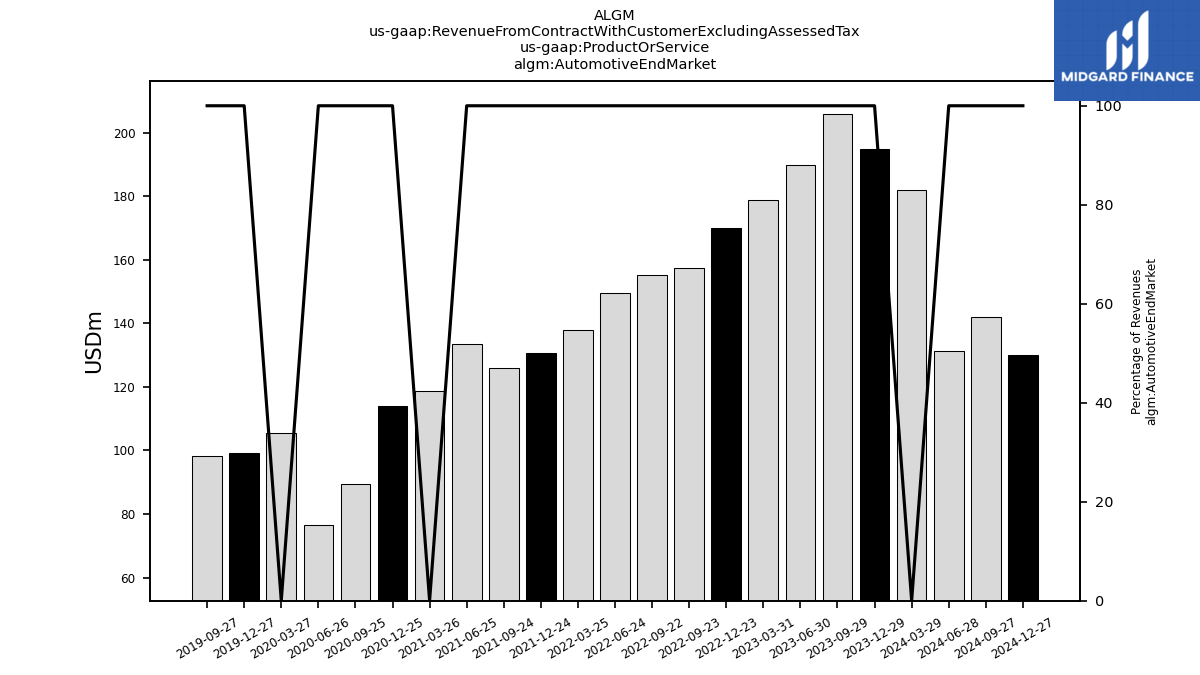
| Automotive End Market | 194.76 | 205.94 | 189.70 | 178.80 | 170.11 | 157.40 | 155.17 | 149.65 | 138.00 | 130.80 | 126.03 | 133.52 | 118.54 | 113.90 | 89.48 | 76.38 | 105.60 | 99.07 | 98.21 | |
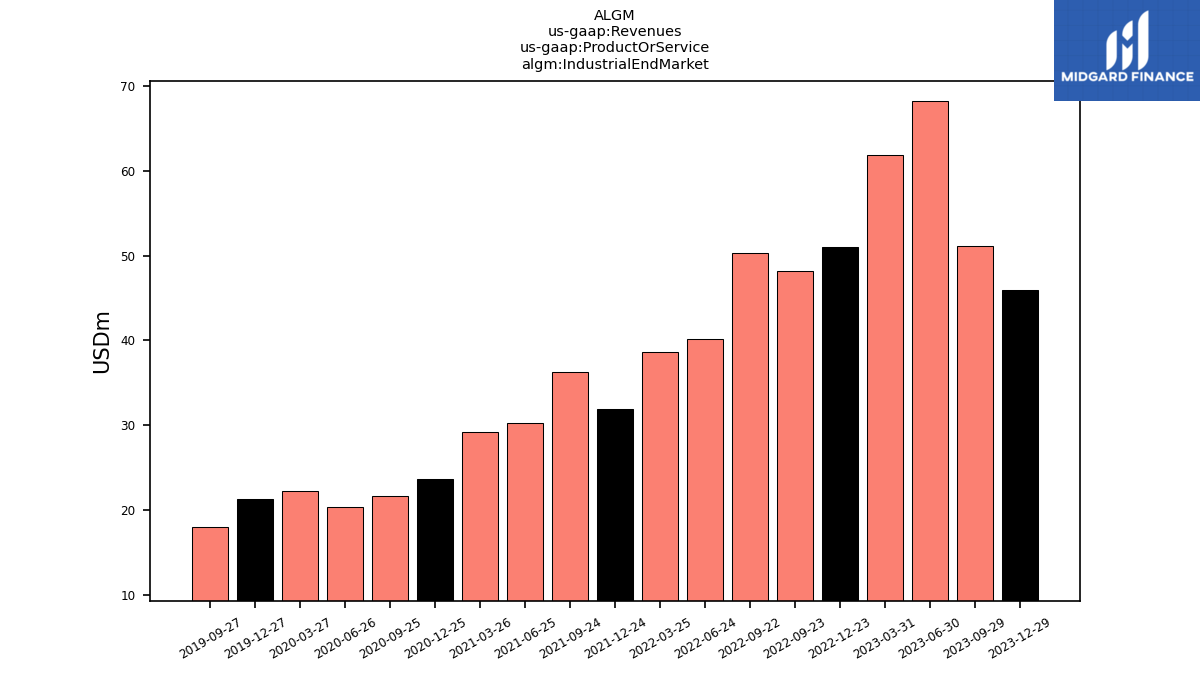
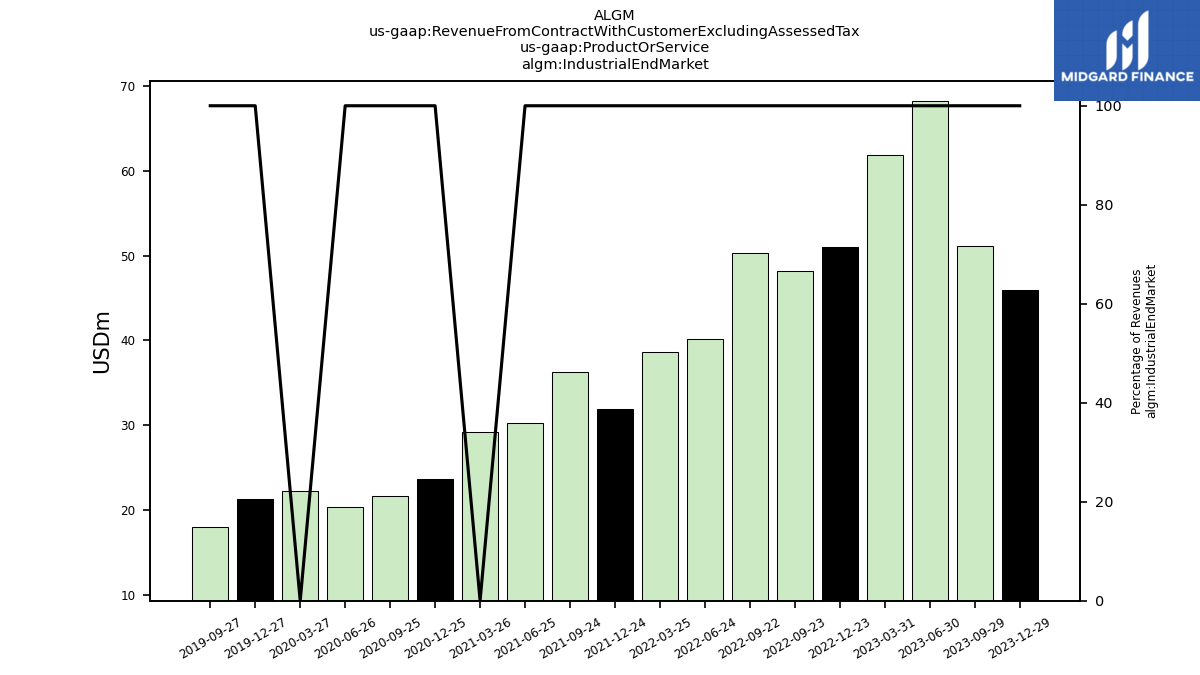
| Industrial End Market | 45.95 | 51.11 | 68.18 | 61.81 | 51.01 | 48.18 | 50.34 | 40.14 | 38.62 | 31.90 | 36.32 | 30.31 | 29.16 | 23.65 | 21.65 | 20.41 | 22.30 | 21.36 | 18.09 | |
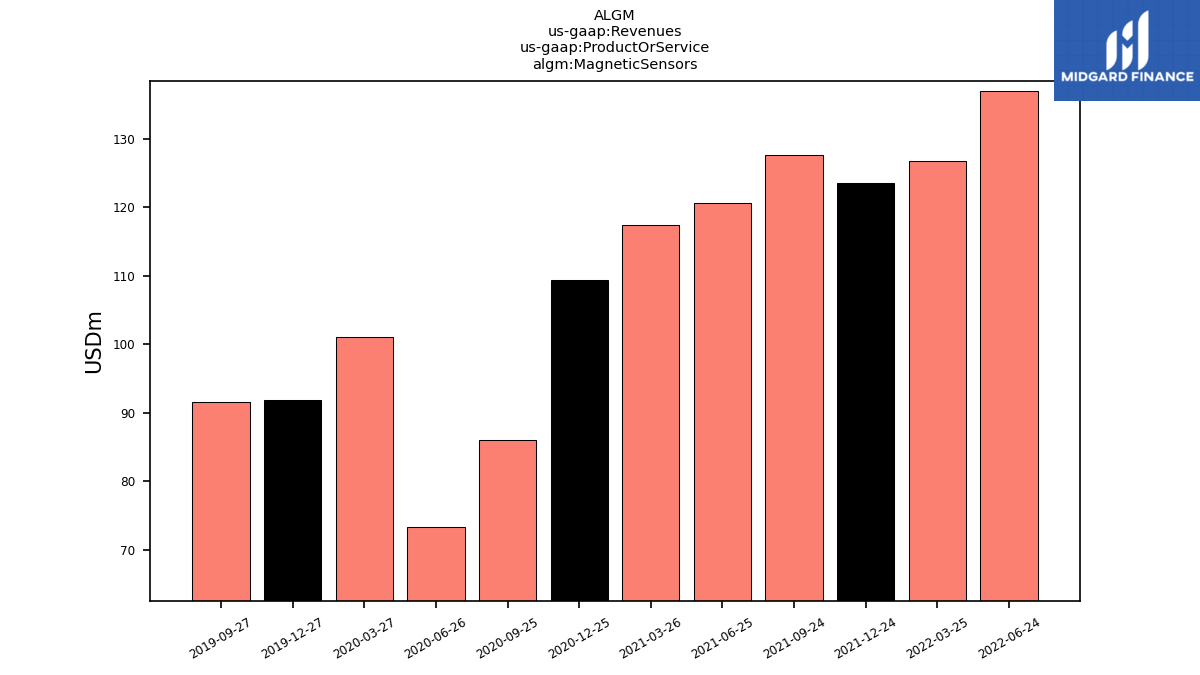
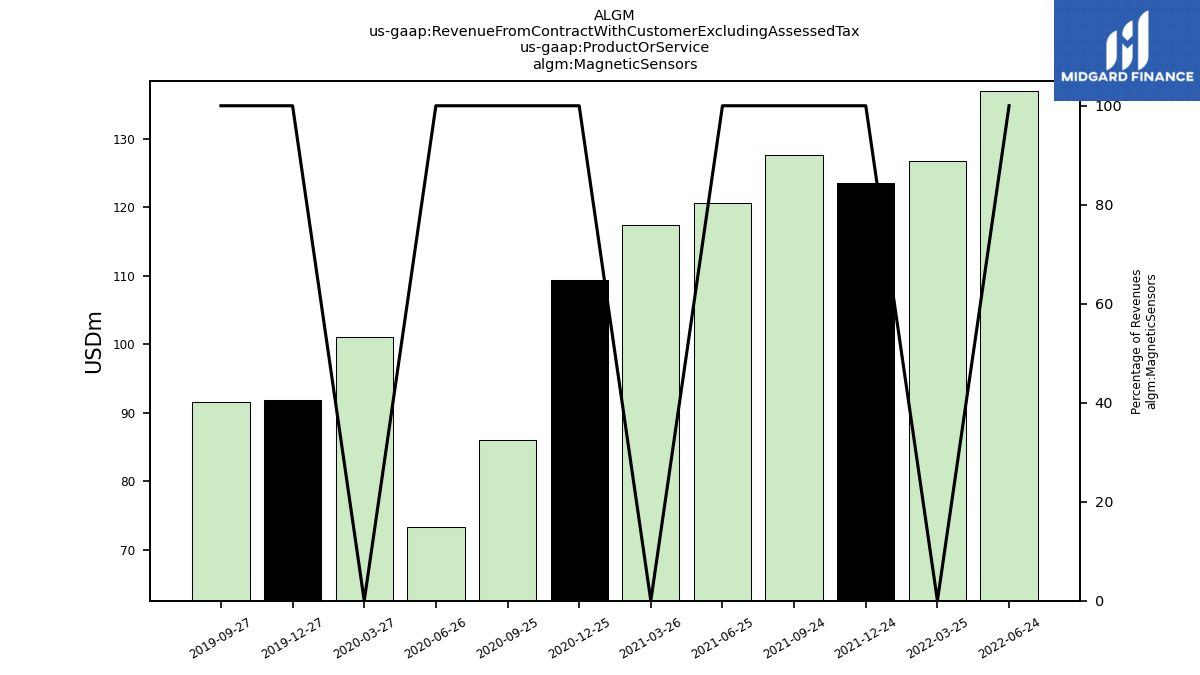
| Magnetic Sensors | NA | NA | NA | NA | NA | NA | NA | 137.05 | 126.75 | 123.54 | 127.62 | 120.64 | 117.42 | 109.46 | 86.10 | 73.40 | 101.11 | 91.84 | 91.61 | |
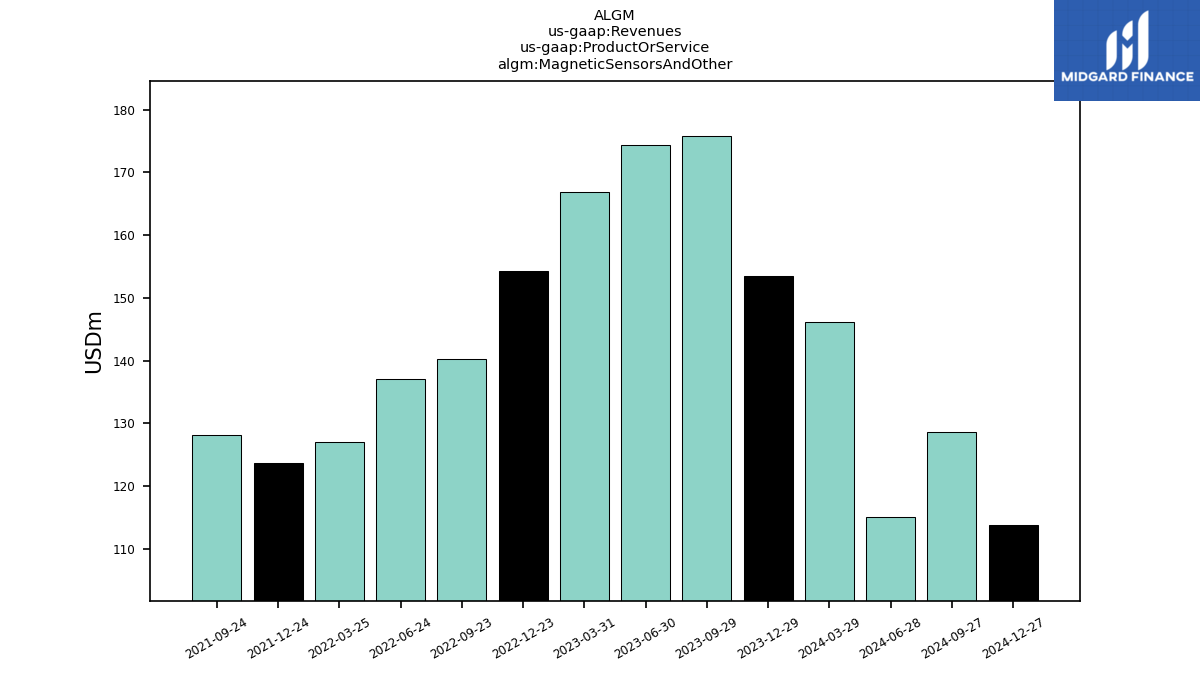
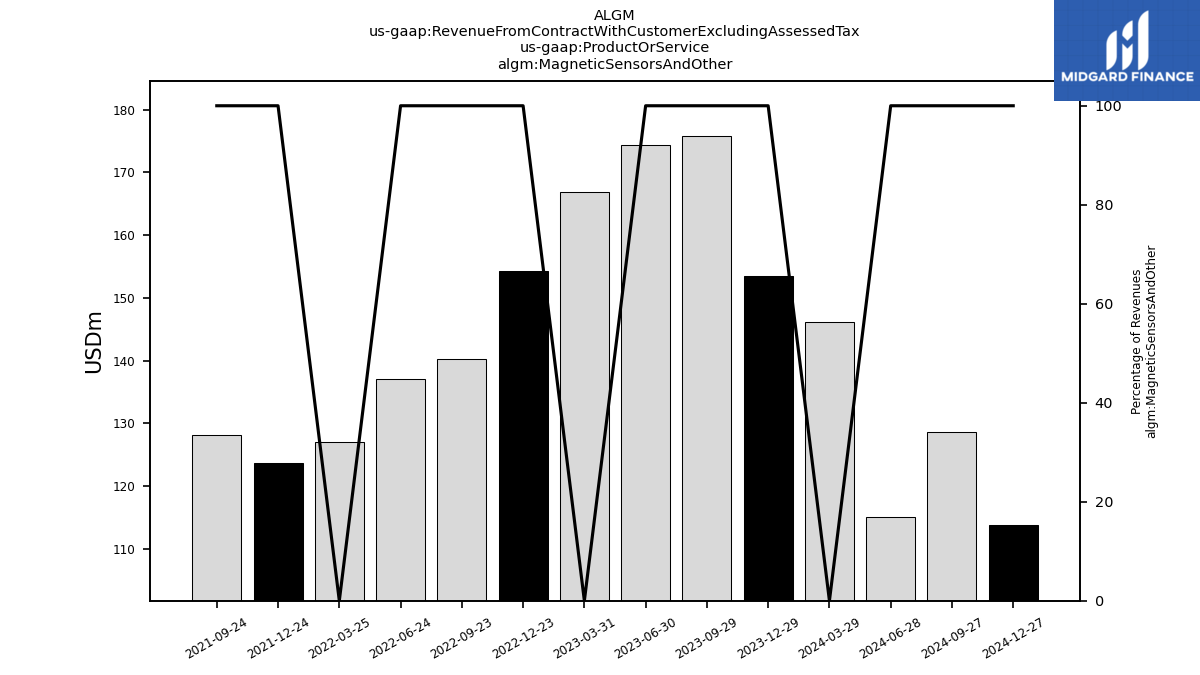
| Magnetic Sensors And Other | 153.56 | 175.77 | 174.31 | NA | 154.28 | 140.34 | NA | 137.09 | NA | 123.77 | 128.09 | NA | NA | NA | NA | NA | NA | NA | NA | |
| Non Related Party | NA | NA | NA | NA | NA | NA | NA | 176.04 | NA | NA | NA | 152.69 | NA | NA | NA | NA | NA | NA | NA | |
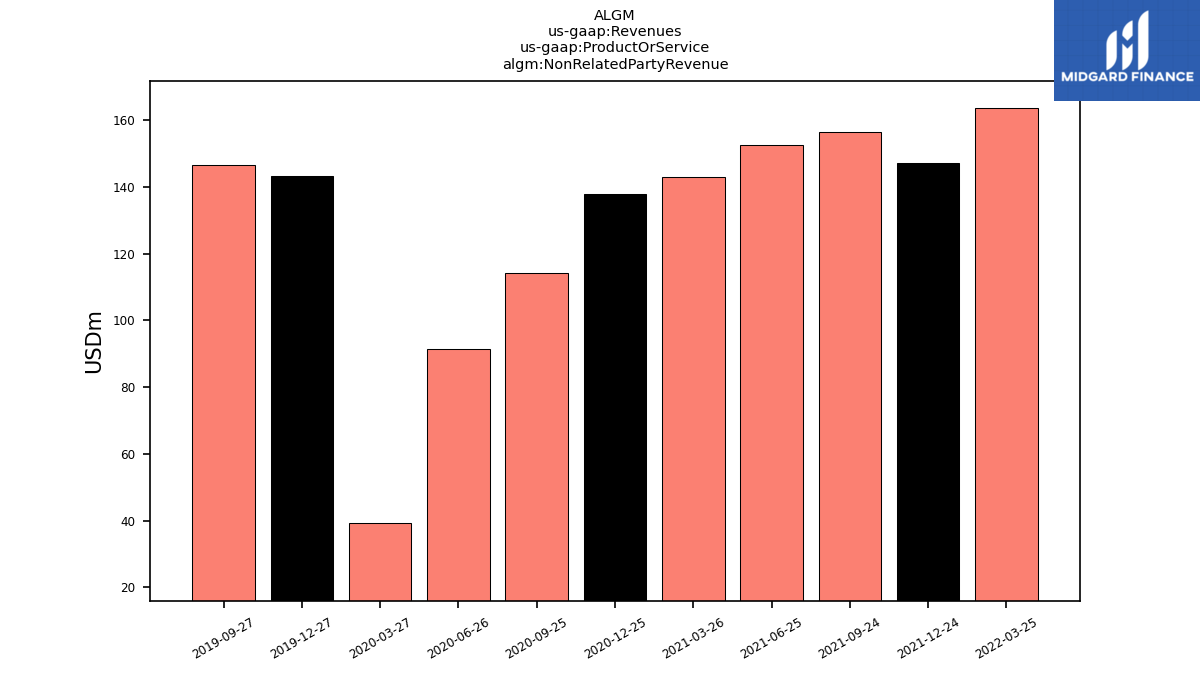
| Non Related Party Revenue | NA | NA | NA | NA | NA | NA | NA | NA | 163.56 | 147.17 | 156.44 | 152.69 | 143.02 | 138.01 | 114.14 | 91.38 | 39.37 | 143.27 | 146.62 | |
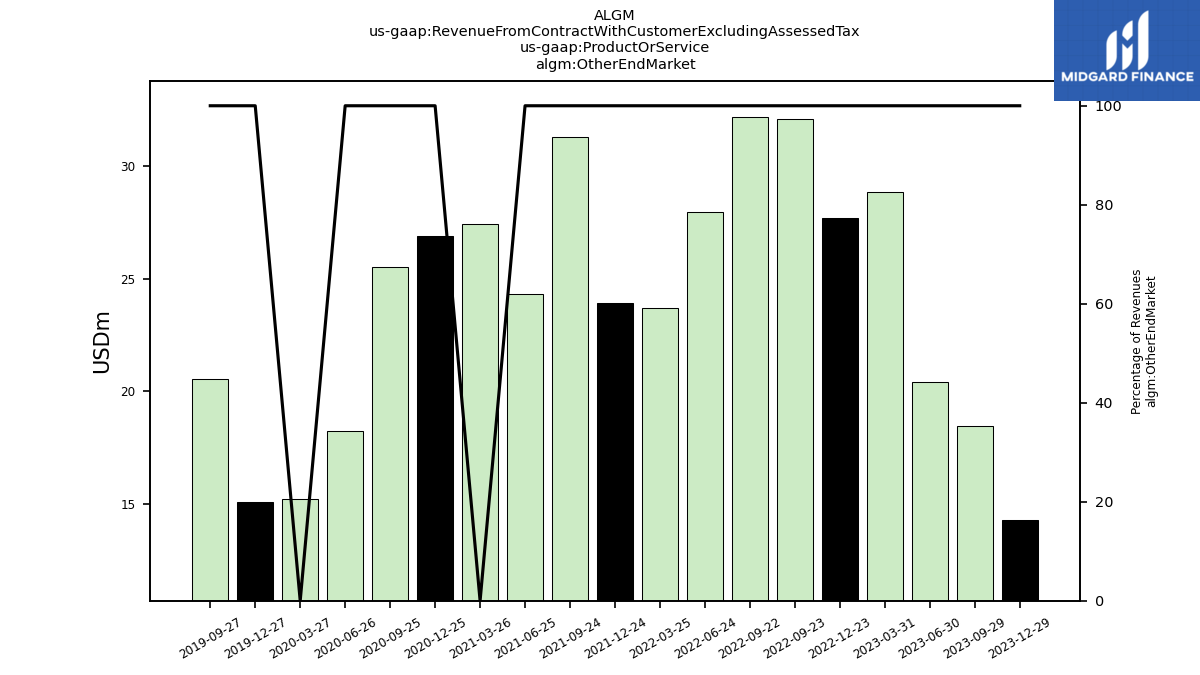
| Other End Market | 14.27 | 18.46 | 20.41 | 28.84 | 27.67 | 32.09 | 32.15 | 27.96 | 23.67 | 23.93 | 31.26 | 24.31 | 27.41 | 26.89 | 25.52 | 18.22 | 15.22 | 15.07 | 20.54 | |
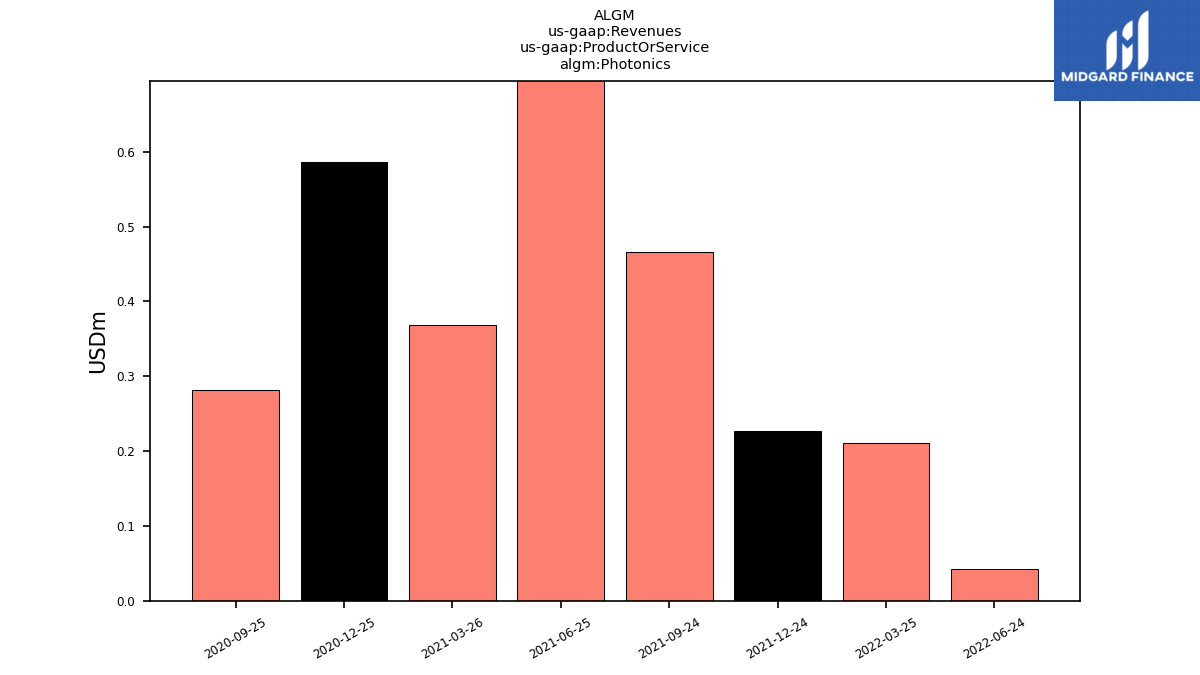
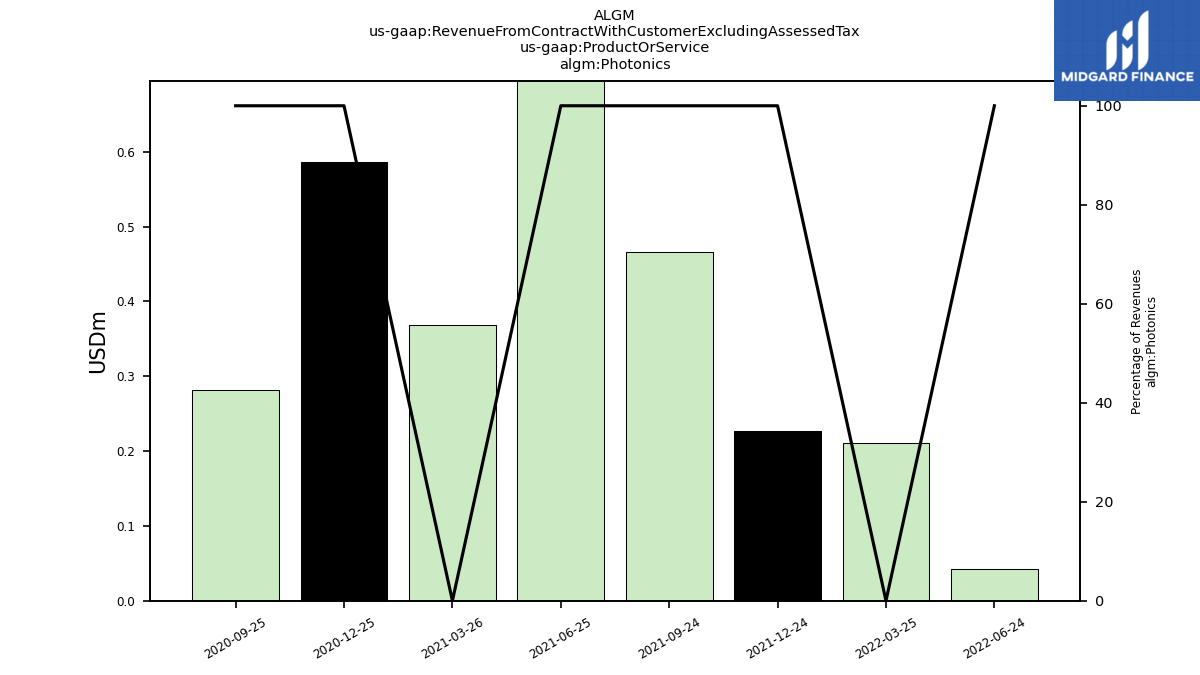
| Photonics | NA | NA | NA | NA | NA | NA | NA | 0.04 | 0.21 | 0.23 | 0.47 | 0.83 | 0.37 | 0.59 | 0.28 | NA | NA | NA | NA | |
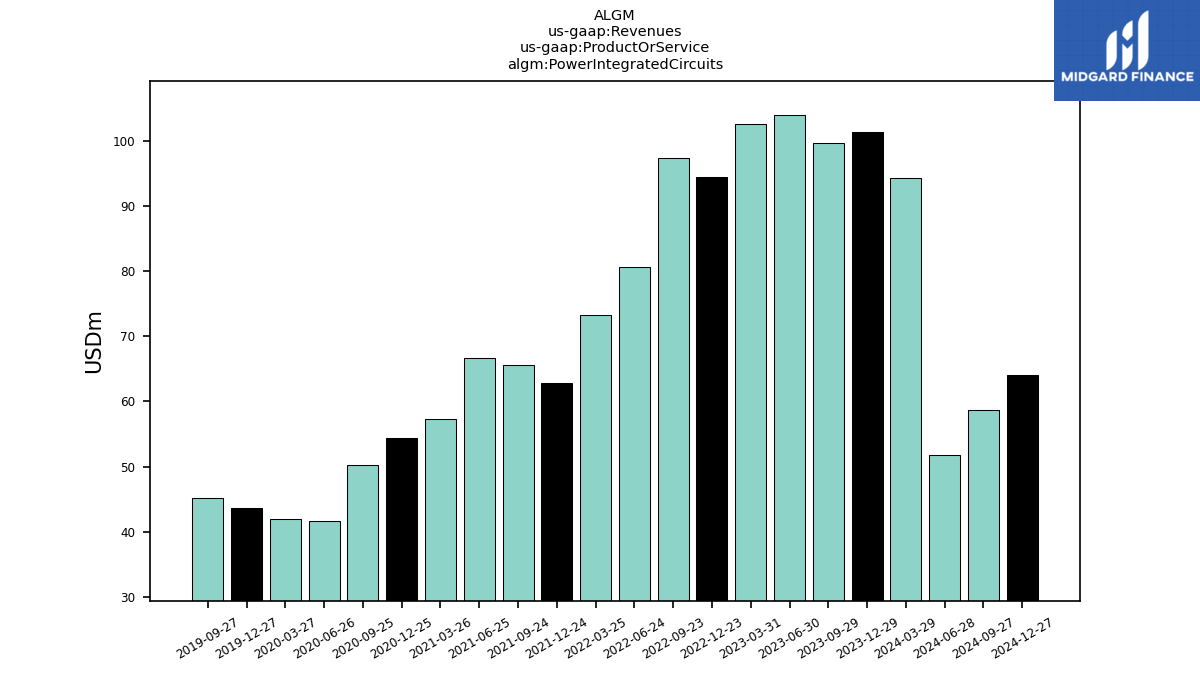
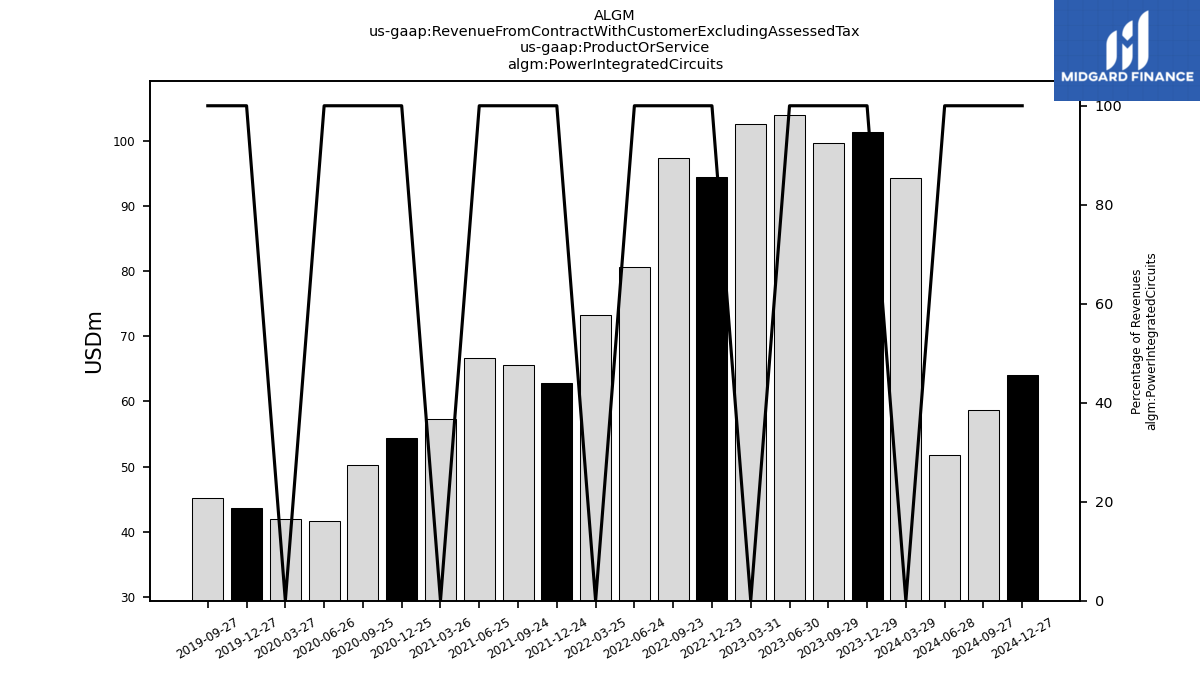
| Power Integrated Circuits | 101.43 | 99.74 | 103.99 | 102.57 | 94.51 | 97.33 | NA | 80.66 | 73.33 | 62.86 | 65.52 | 66.67 | 57.32 | 54.41 | 50.27 | 41.60 | 42.01 | 43.66 | 45.23 | |
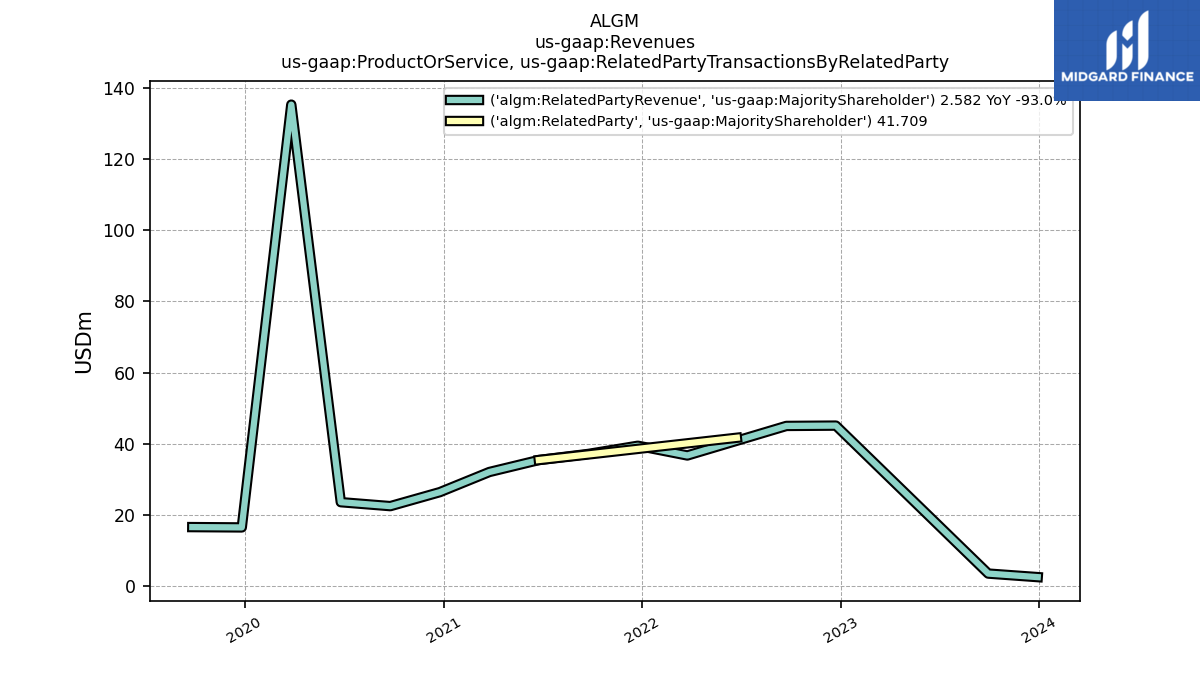
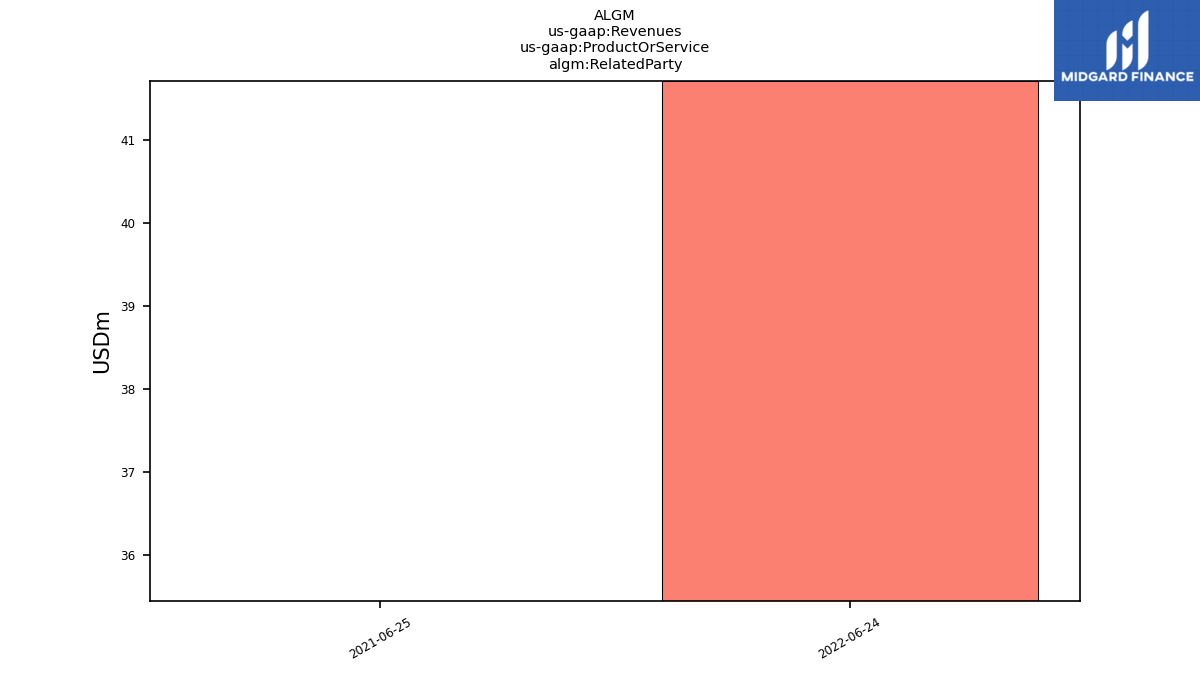
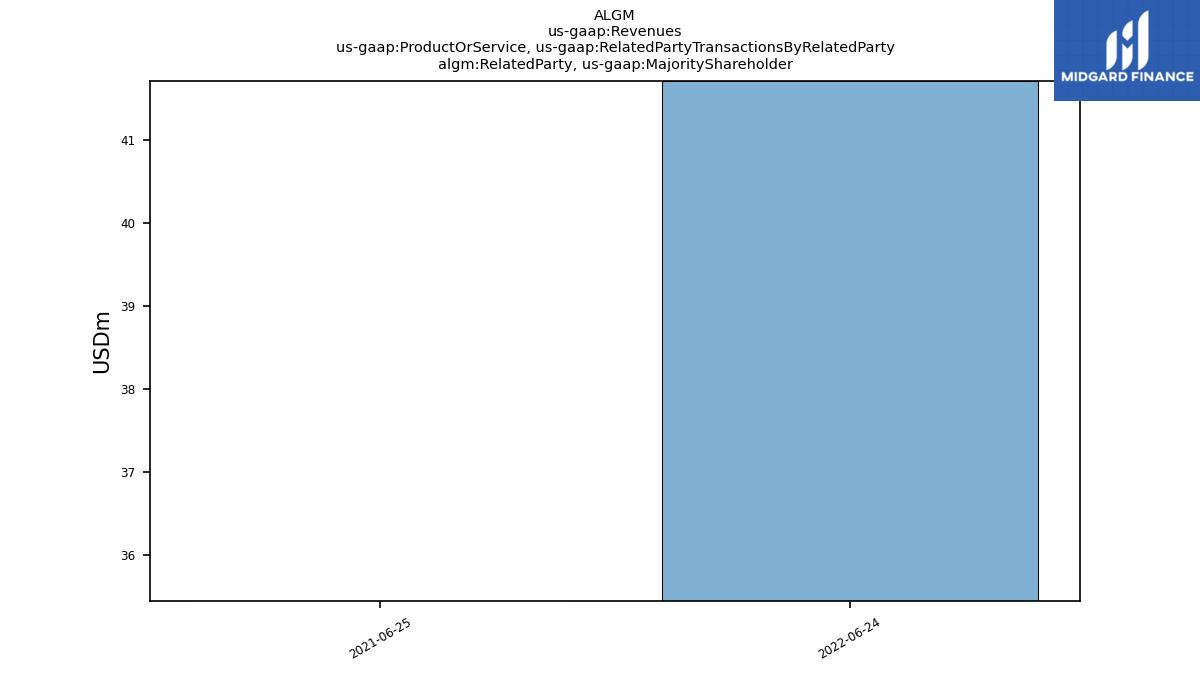
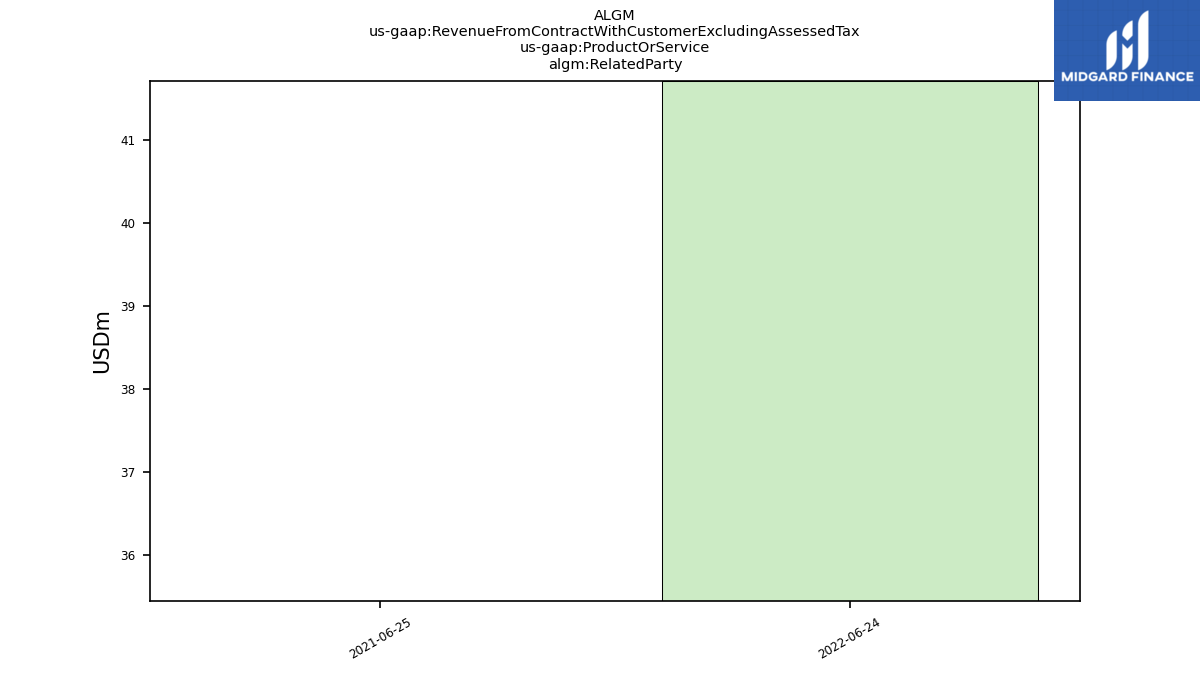
| Related Party | NA | NA | NA | NA | NA | NA | NA | 41.71 | NA | NA | NA | 35.45 | NA | NA | NA | NA | NA | NA | NA | |
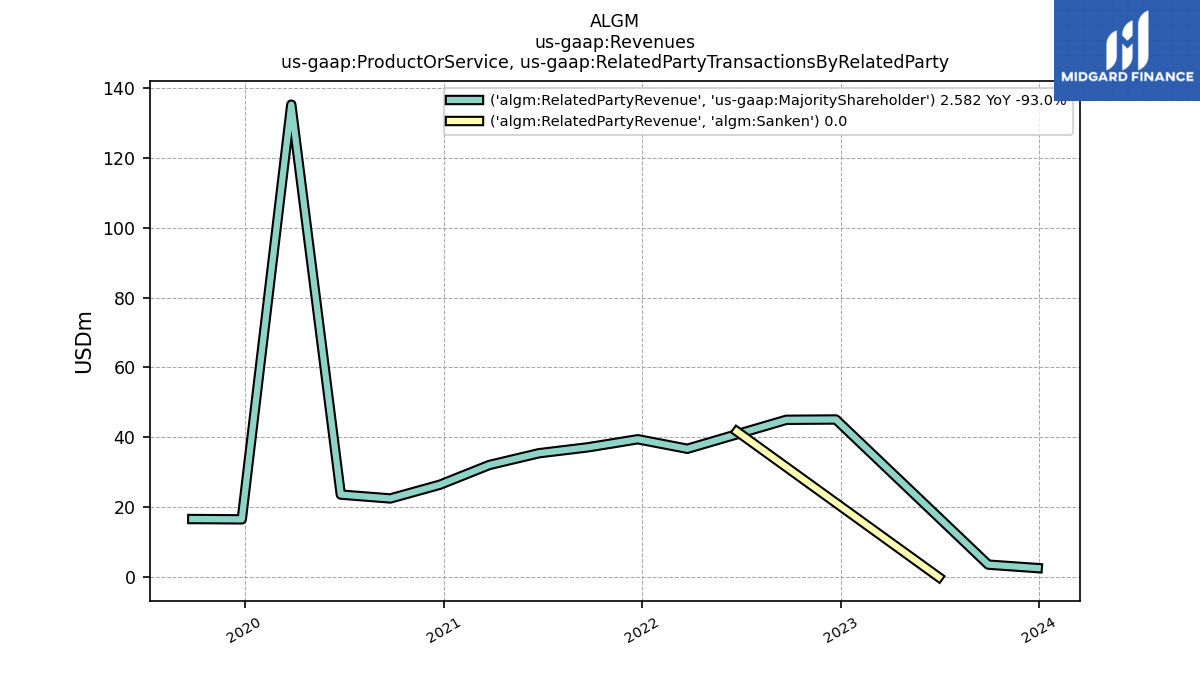
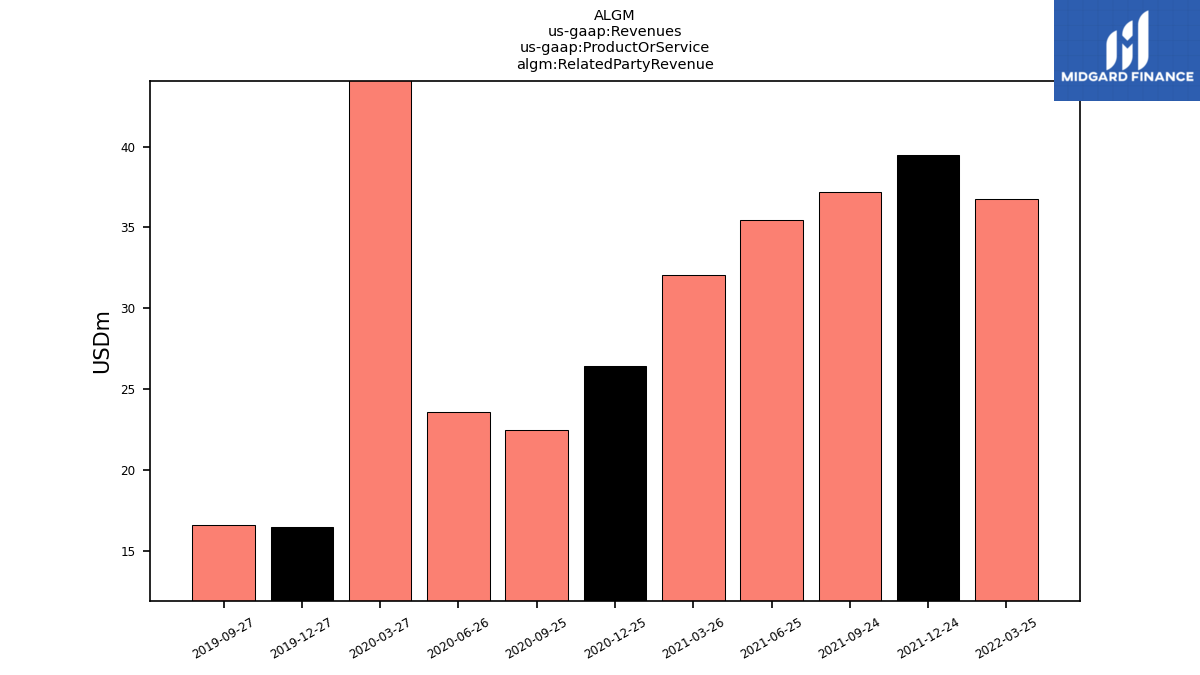
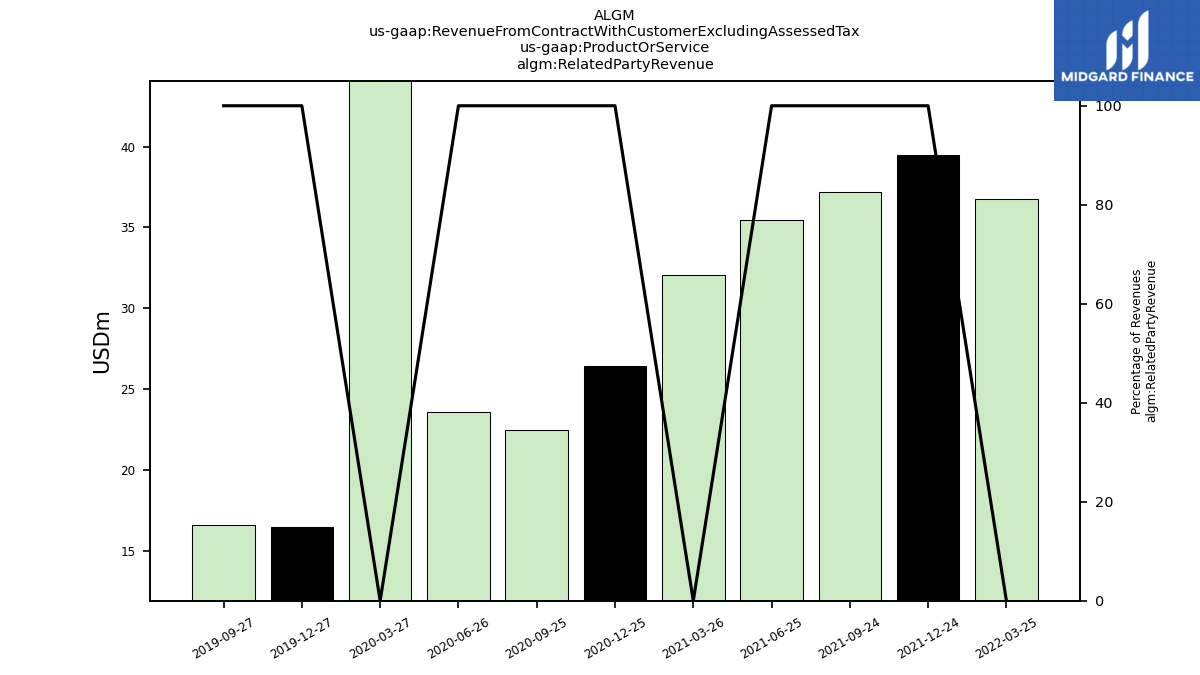
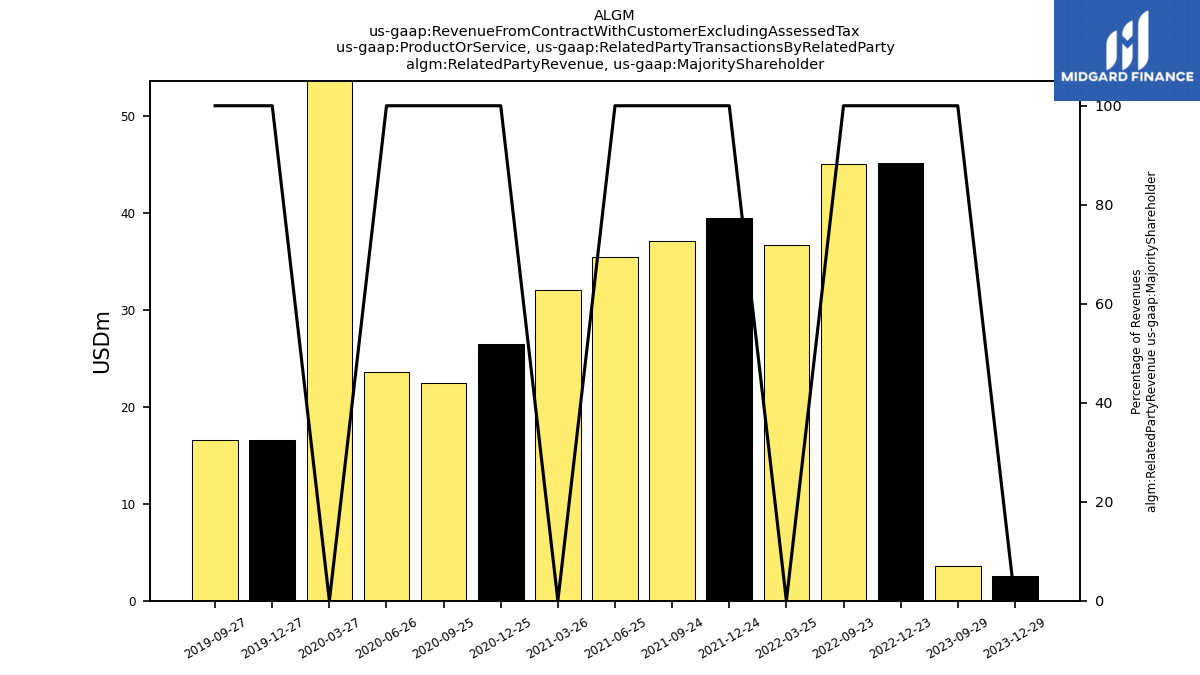
| Related Party Revenue | NA | NA | NA | NA | NA | NA | NA | NA | 36.73 | 39.46 | 37.16 | 35.45 | 32.09 | 26.44 | 22.51 | 23.62 | 135.23 | 16.54 | 16.62 | |
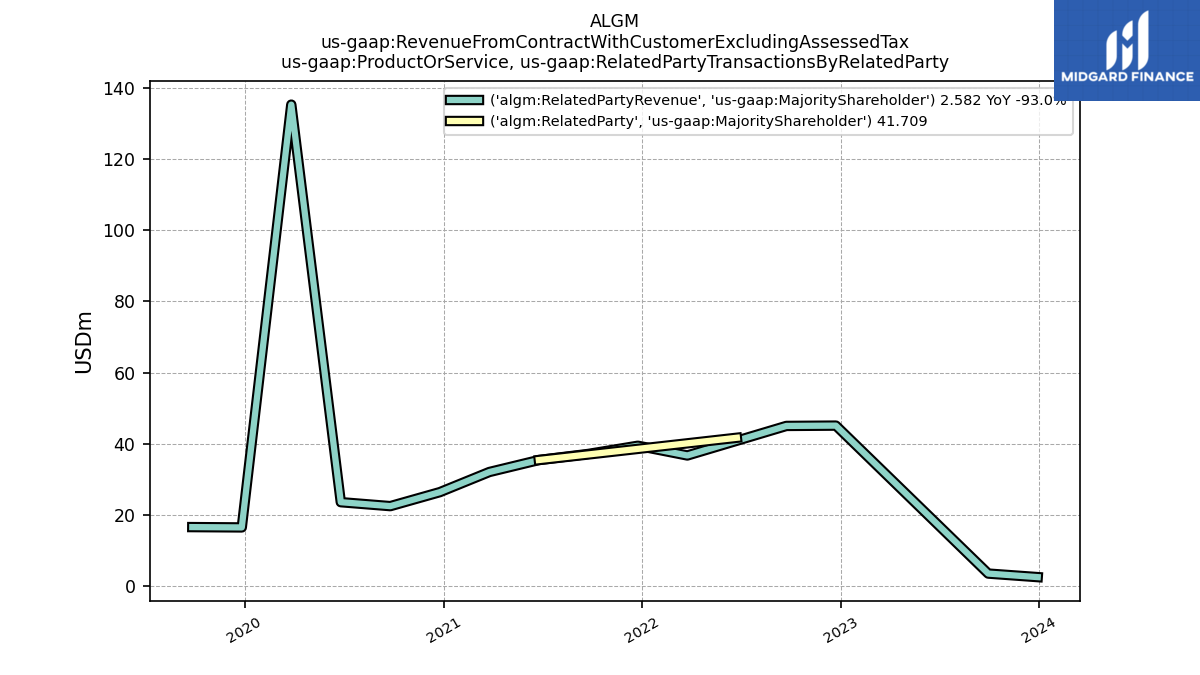
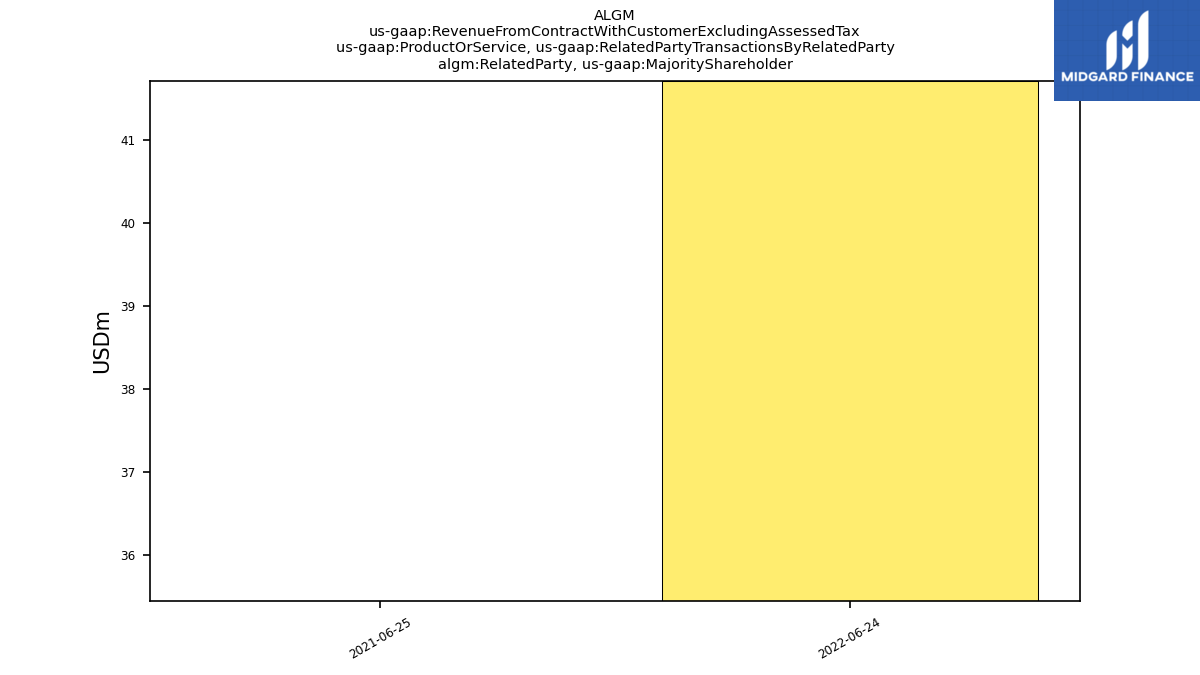
| Related Party, Majority Shareholder | NA | NA | NA | NA | NA | NA | NA | 41.71 | NA | NA | NA | 35.45 | NA | NA | NA | NA | NA | NA | NA | |
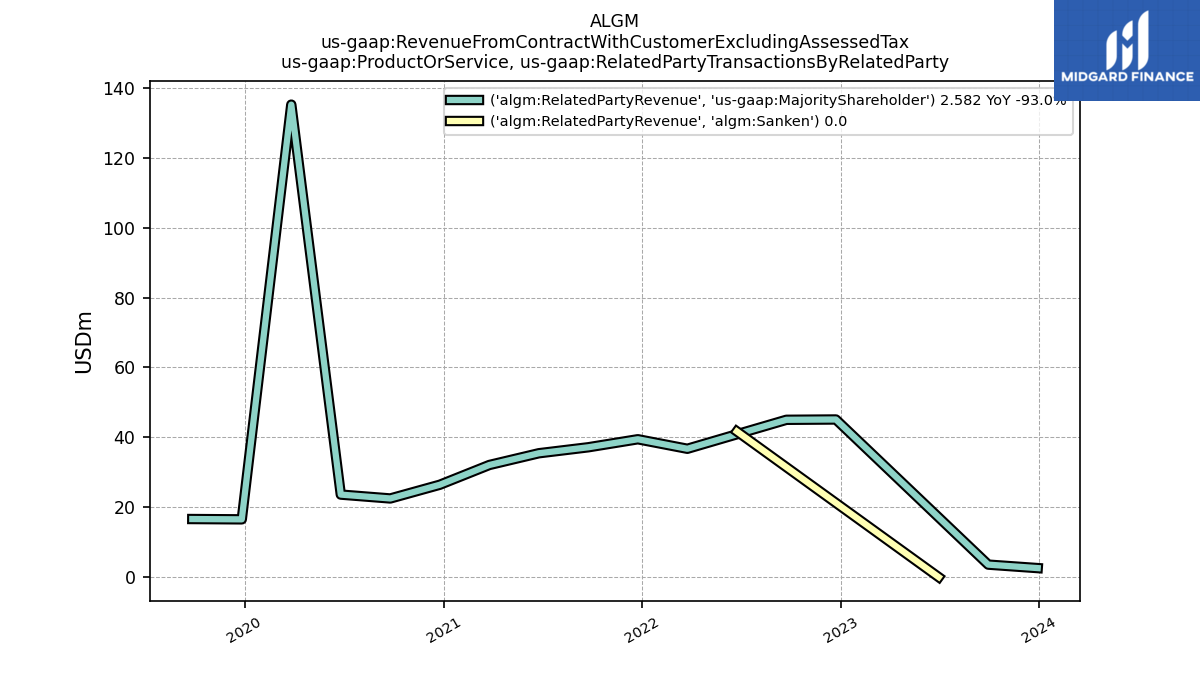
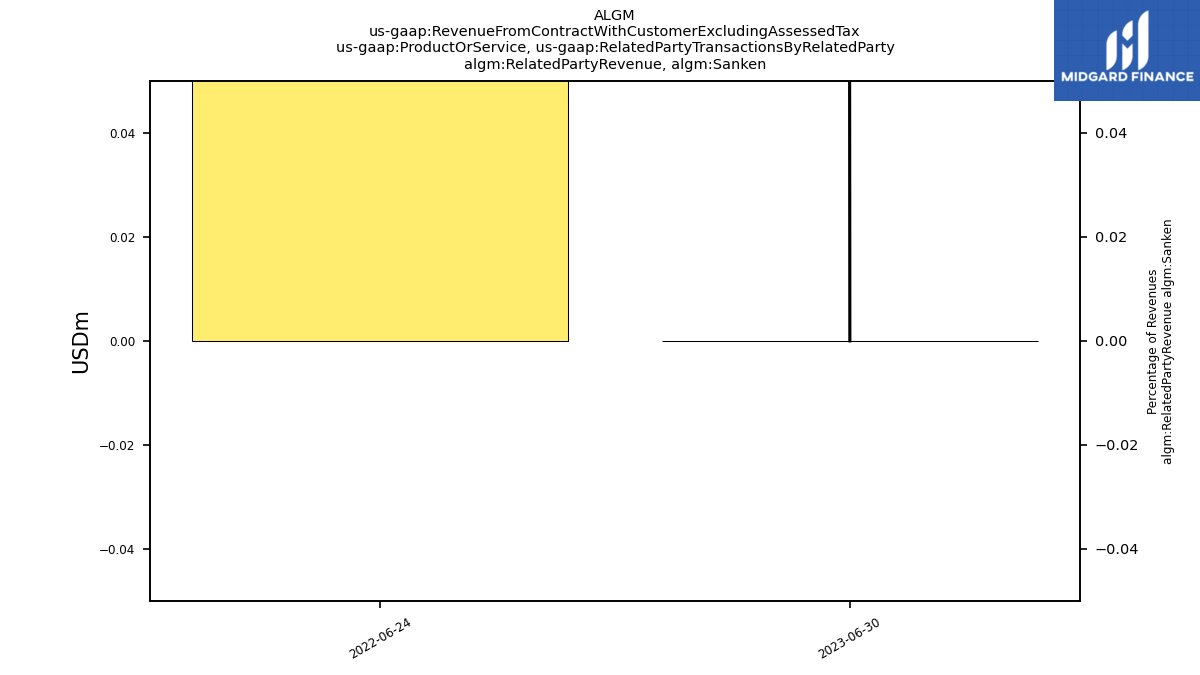
| Related Party Revenue, Sanken | NA | NA | 0.00 | NA | NA | NA | NA | 41.71 | NA | NA | NA | NA | NA | NA | NA | NA | NA | NA | NA | |
| Related Party Revenue, Majority Shareholder | 2.58 | 3.58 | NA | NA | 45.12 | 45.03 | NA | NA | 36.73 | 39.46 | 37.16 | 35.45 | 32.09 | 26.44 | 22.51 | 23.62 | 135.23 | 16.54 | 16.62 | |
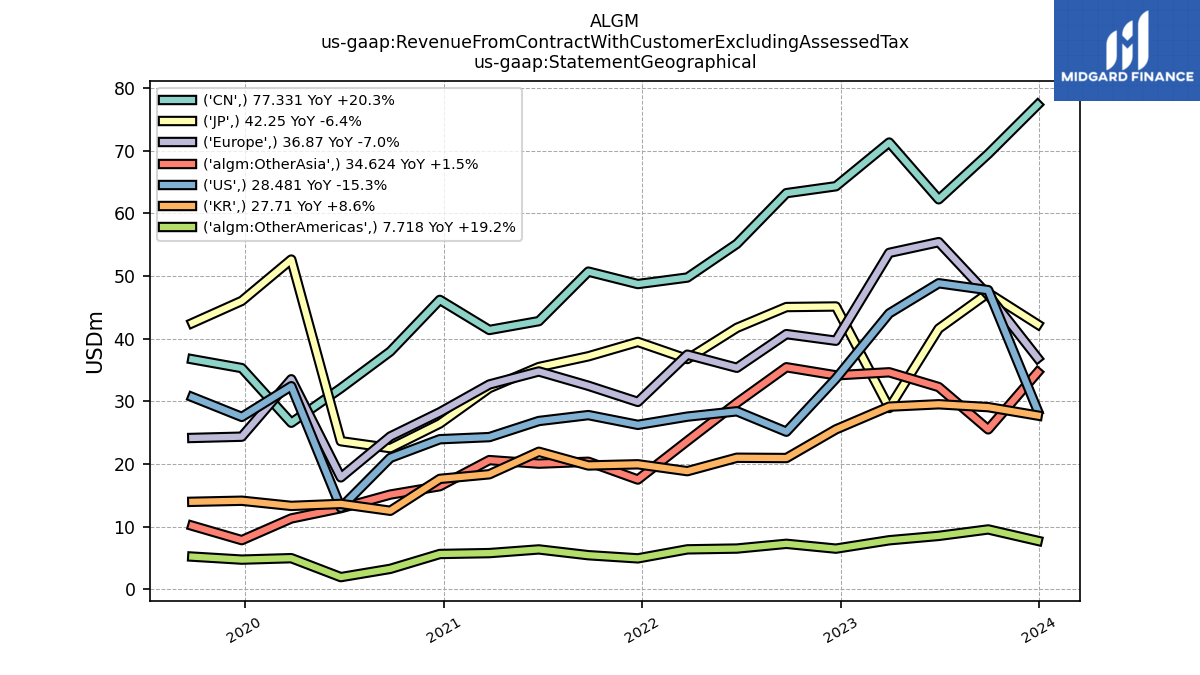
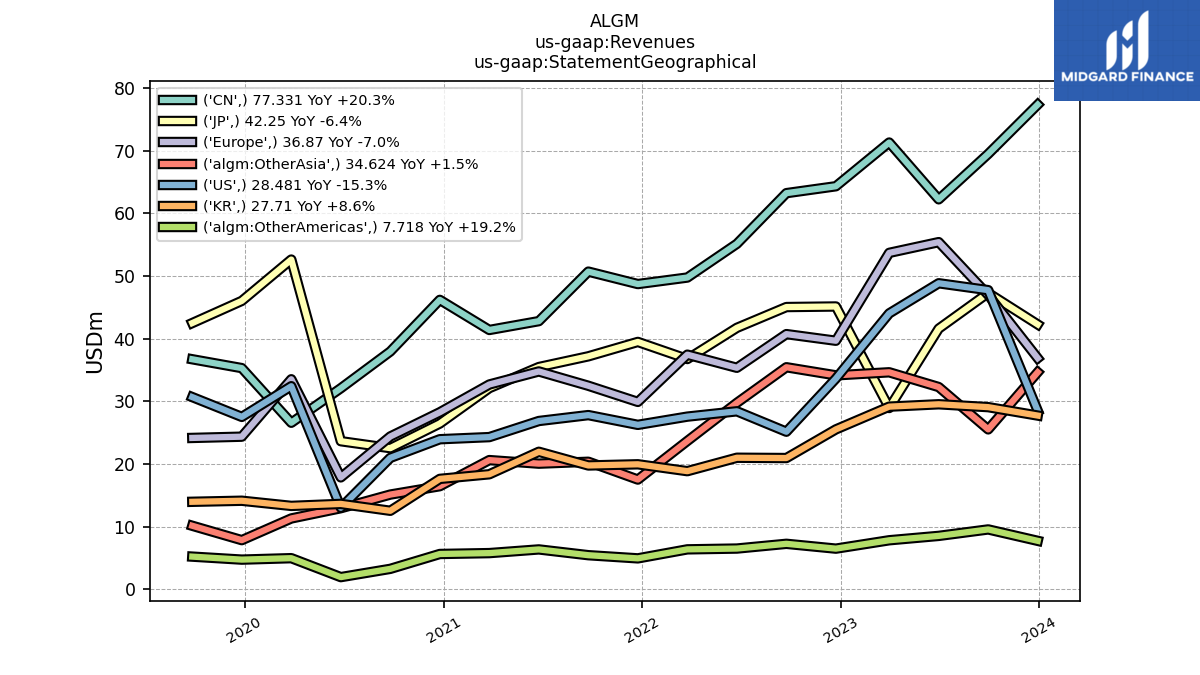
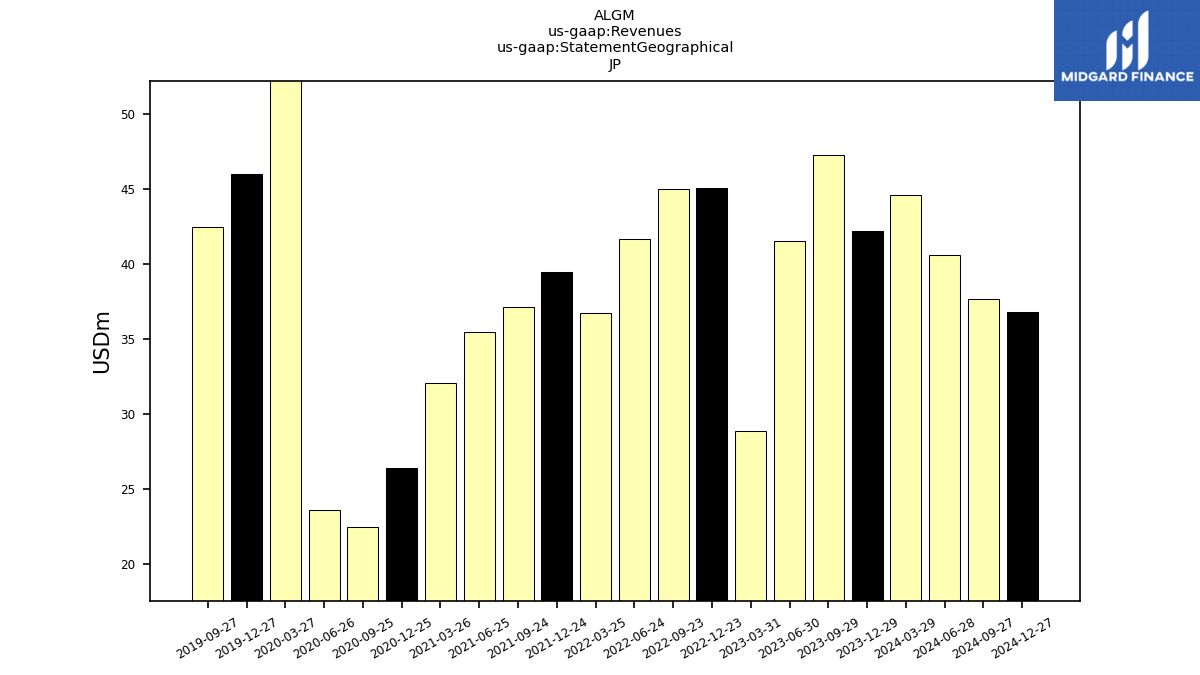
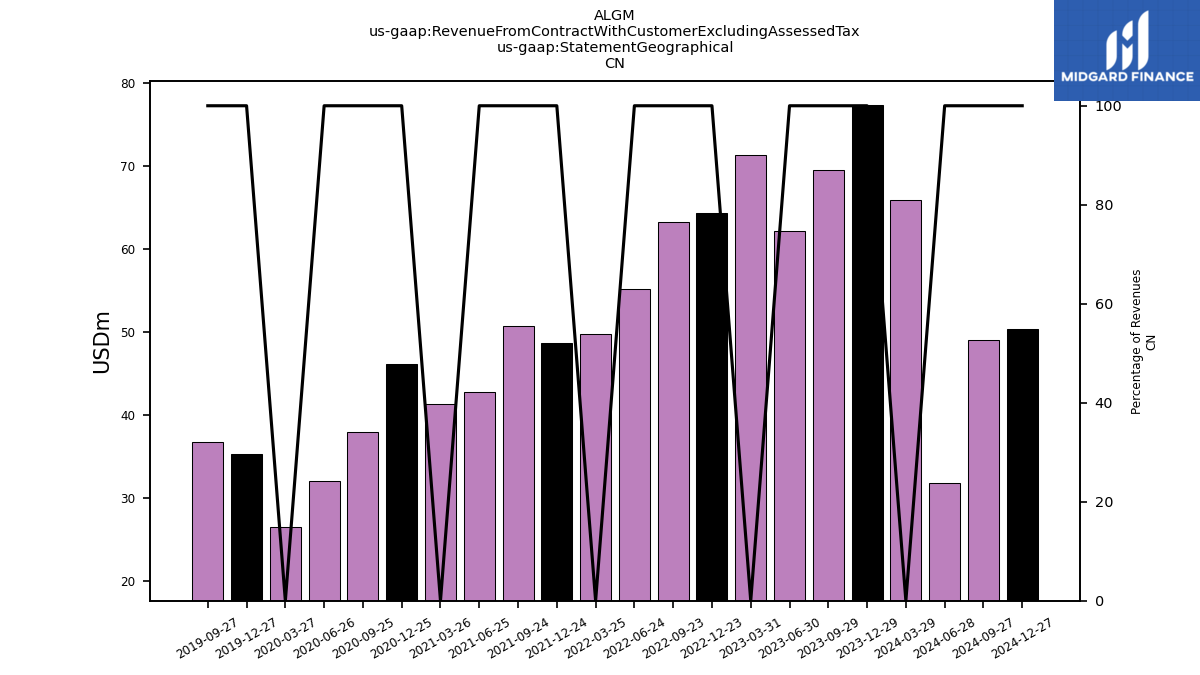
| 77.33 | 69.46 | 62.22 | 71.28 | 64.31 | 63.20 | NA | 55.12 | 49.74 | 48.70 | 50.68 | 42.78 | 41.37 | 46.17 | 37.94 | 32.07 | 26.56 | 35.28 | 36.70 | ||
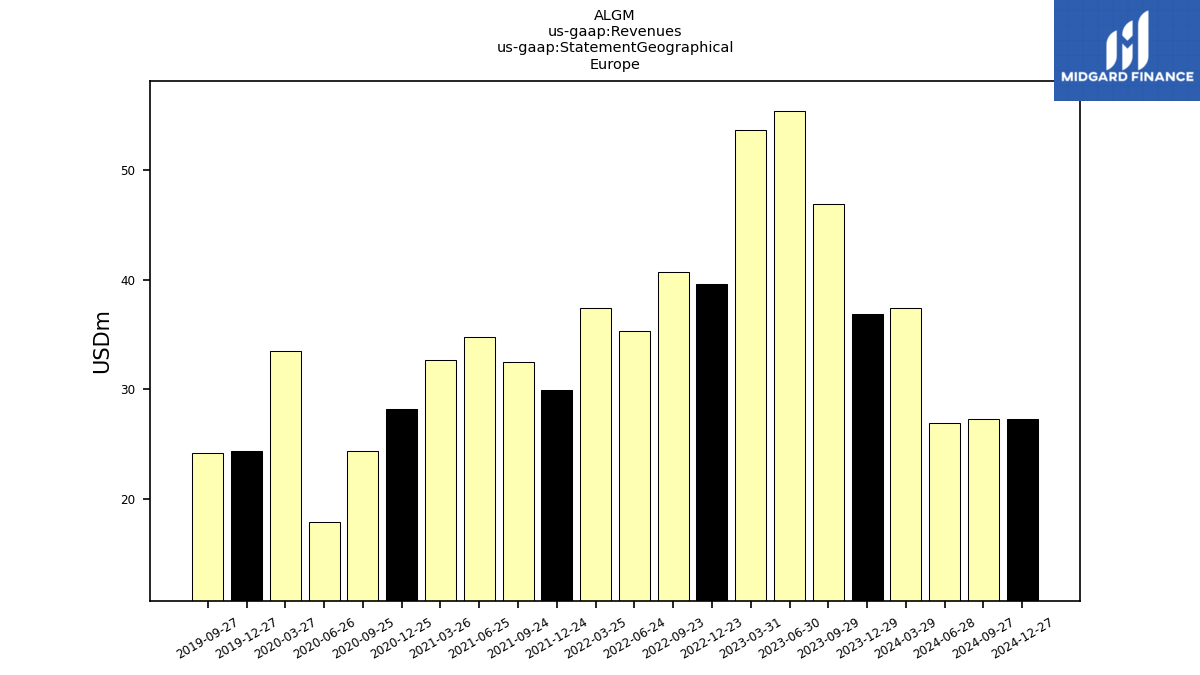
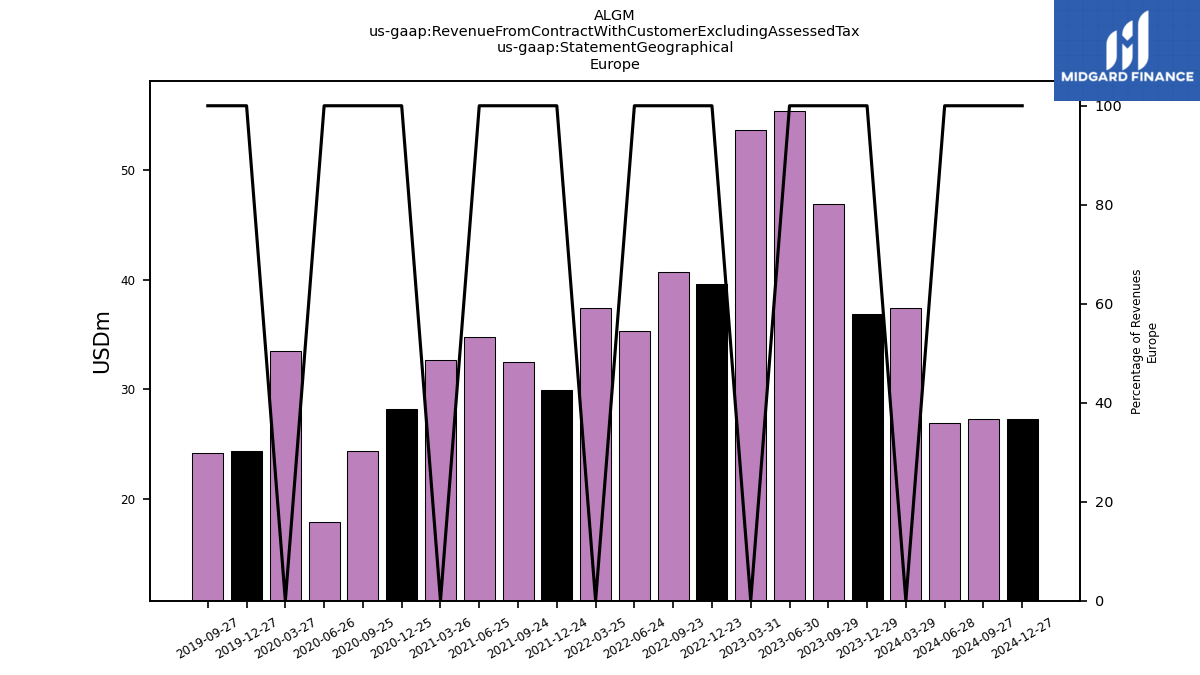
| 36.87 | 46.95 | 55.39 | 53.67 | 39.65 | 40.71 | NA | 35.33 | 37.43 | 29.89 | 32.47 | 34.75 | 32.67 | 28.24 | 24.37 | 17.85 | 33.50 | 24.34 | 24.14 | ||
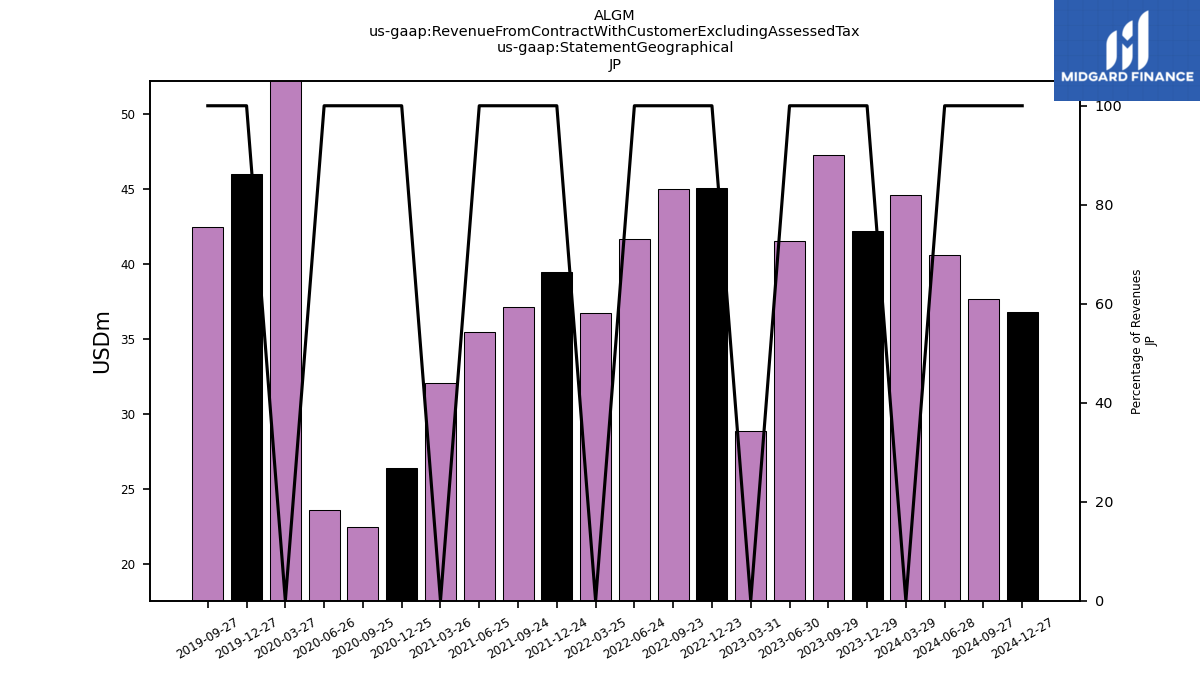
| 42.25 | 47.27 | 41.58 | 28.91 | 45.12 | 45.03 | NA | 41.71 | 36.73 | 39.46 | 37.16 | 35.45 | 32.09 | 26.44 | 22.51 | 23.62 | 52.61 | 46.01 | 42.47 | ||
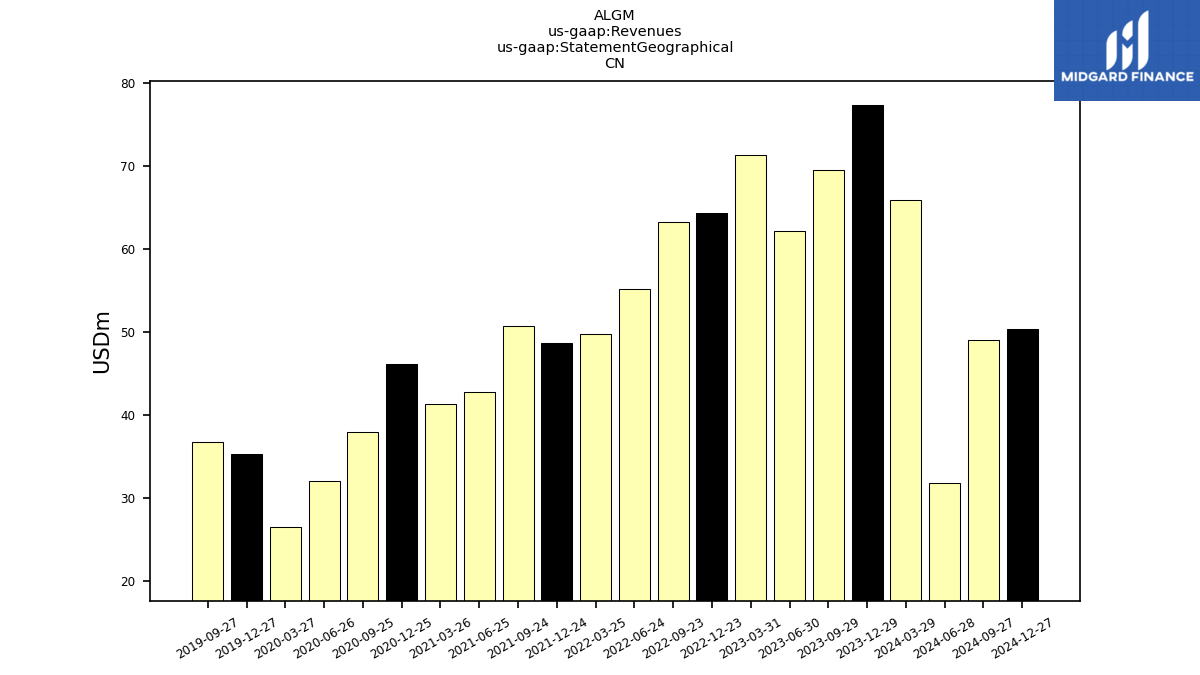
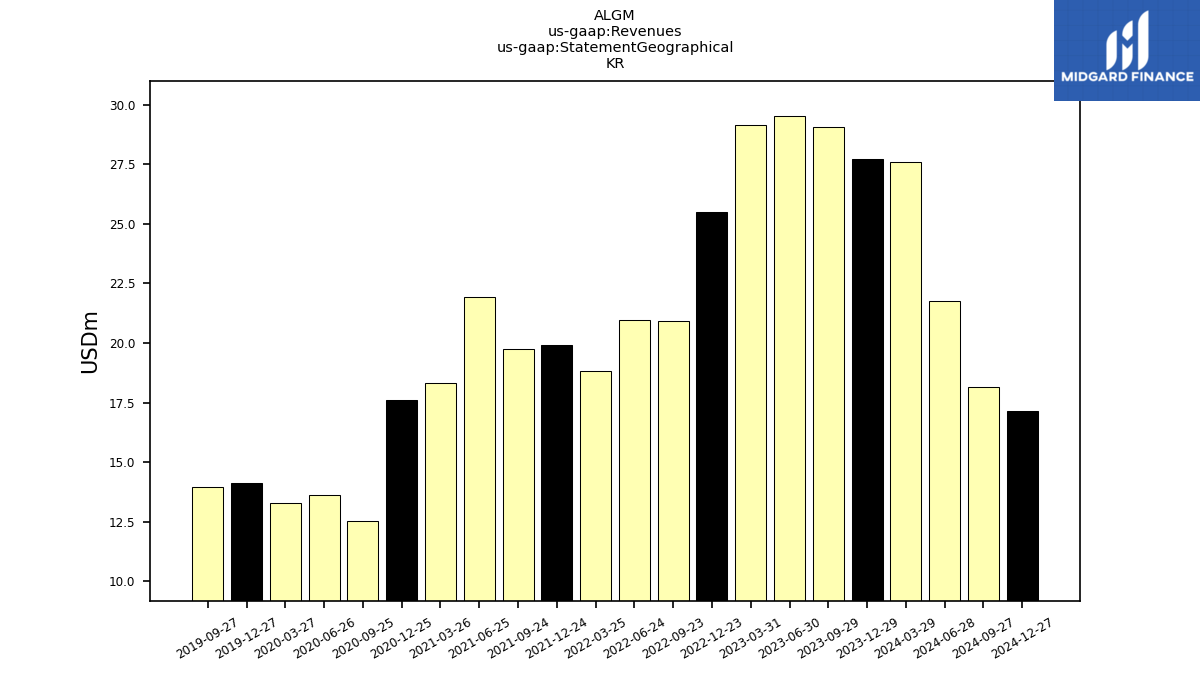
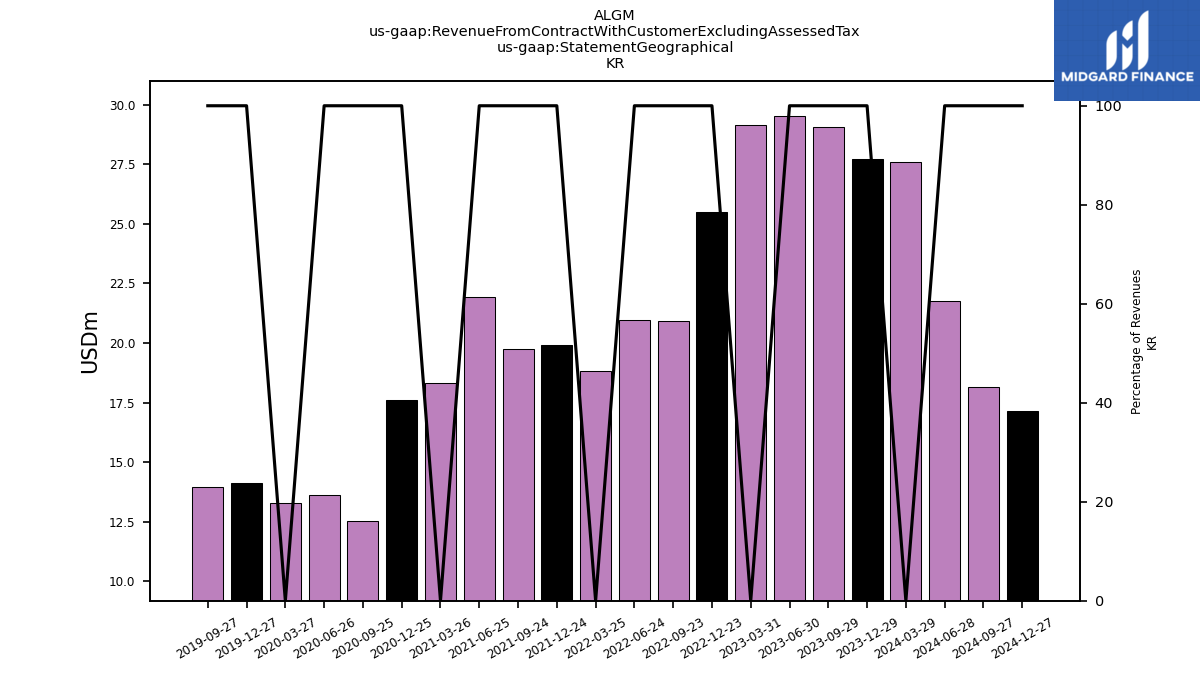
| 27.71 | 29.05 | 29.51 | 29.14 | 25.50 | 20.93 | NA | 20.98 | 18.84 | 19.93 | 19.75 | 21.93 | 18.34 | 17.61 | 12.52 | 13.61 | 13.29 | 14.12 | 13.95 | ||
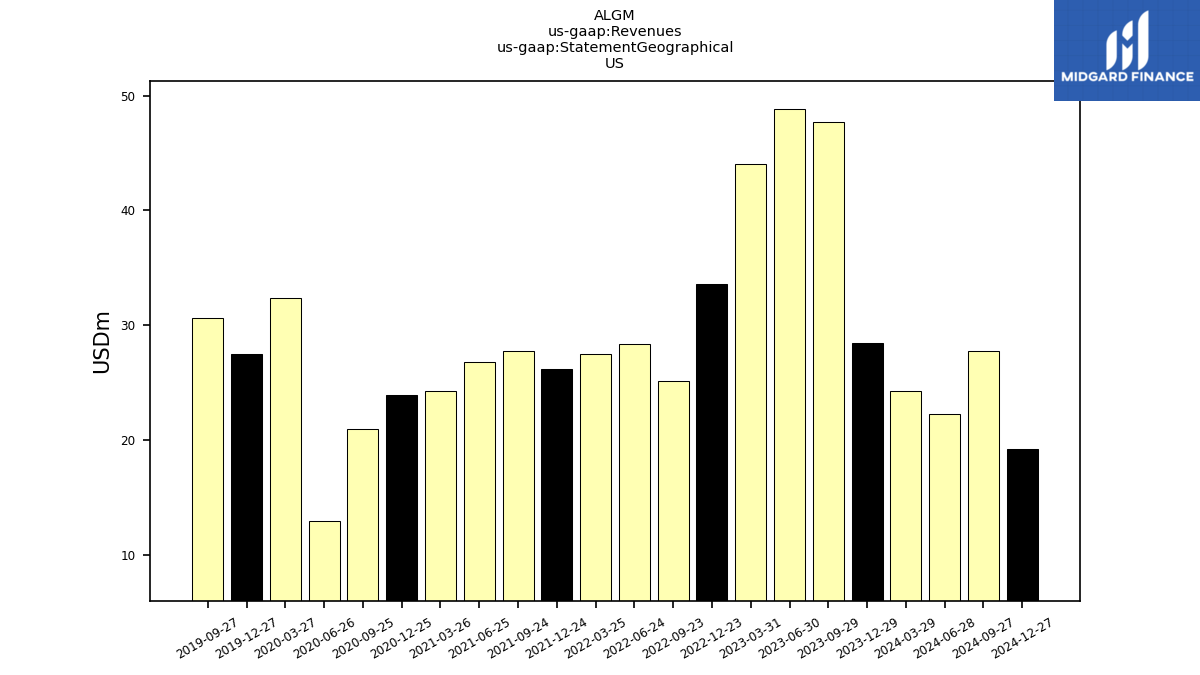
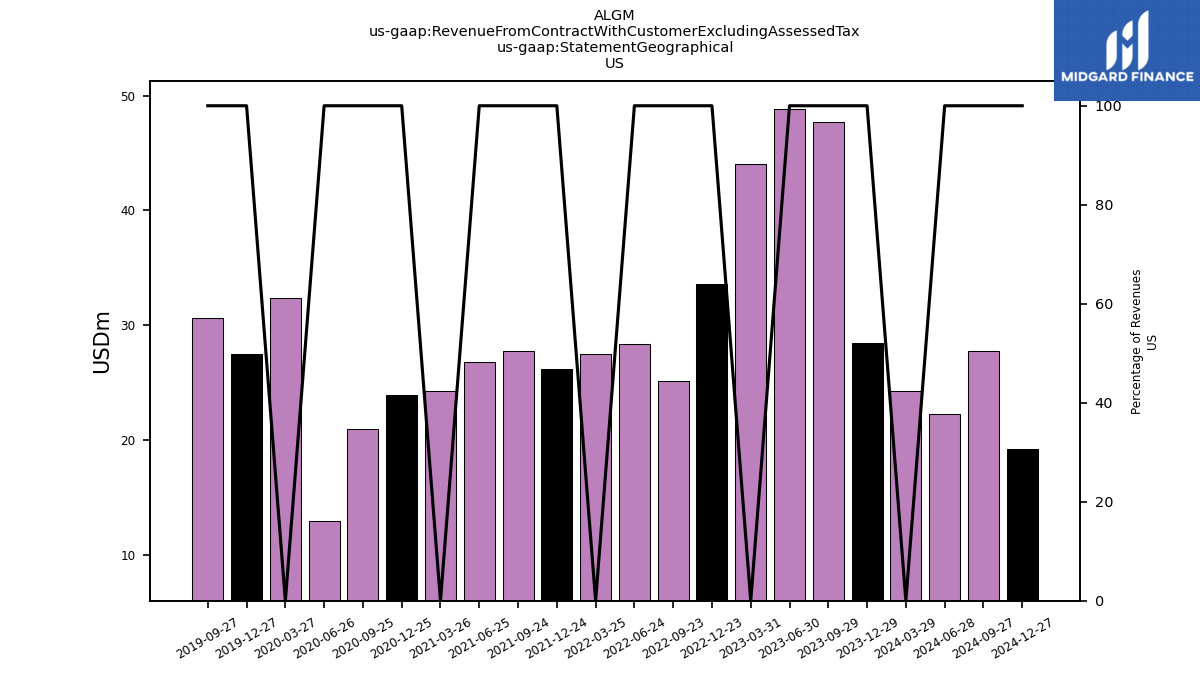
| US | 28.48 | 47.72 | 48.82 | 44.02 | 33.61 | 25.13 | NA | 28.39 | 27.54 | 26.23 | 27.79 | 26.84 | 24.27 | 23.93 | 20.96 | 13.00 | 32.39 | 27.50 | 30.66 | |
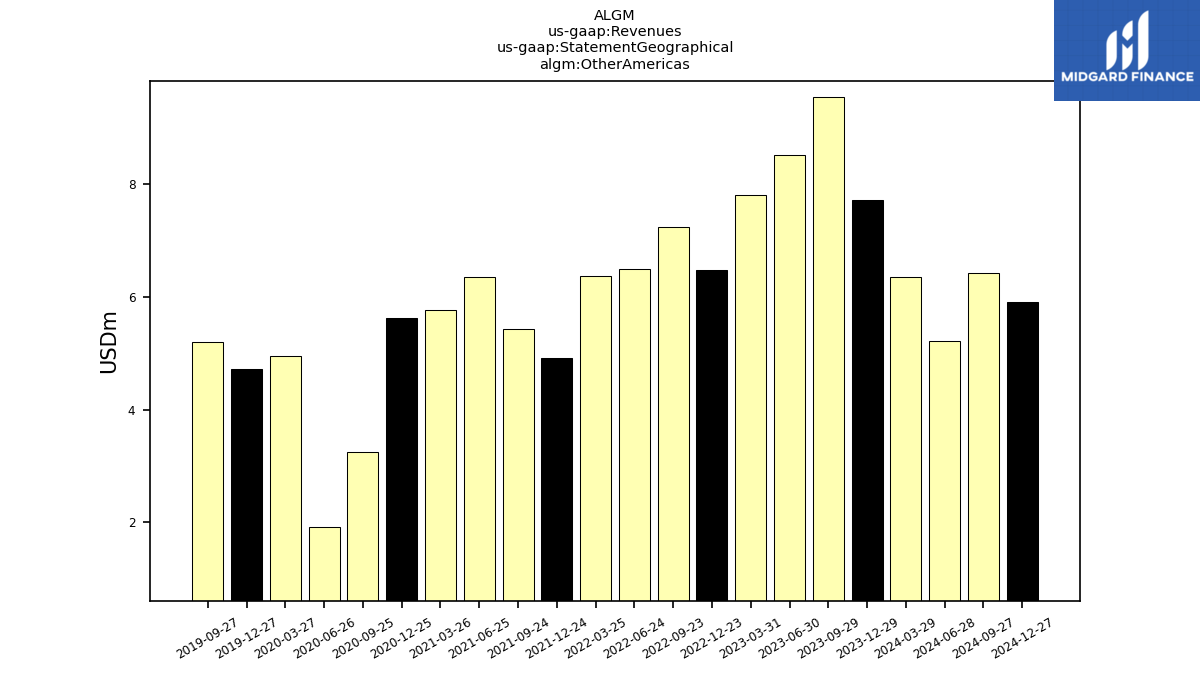
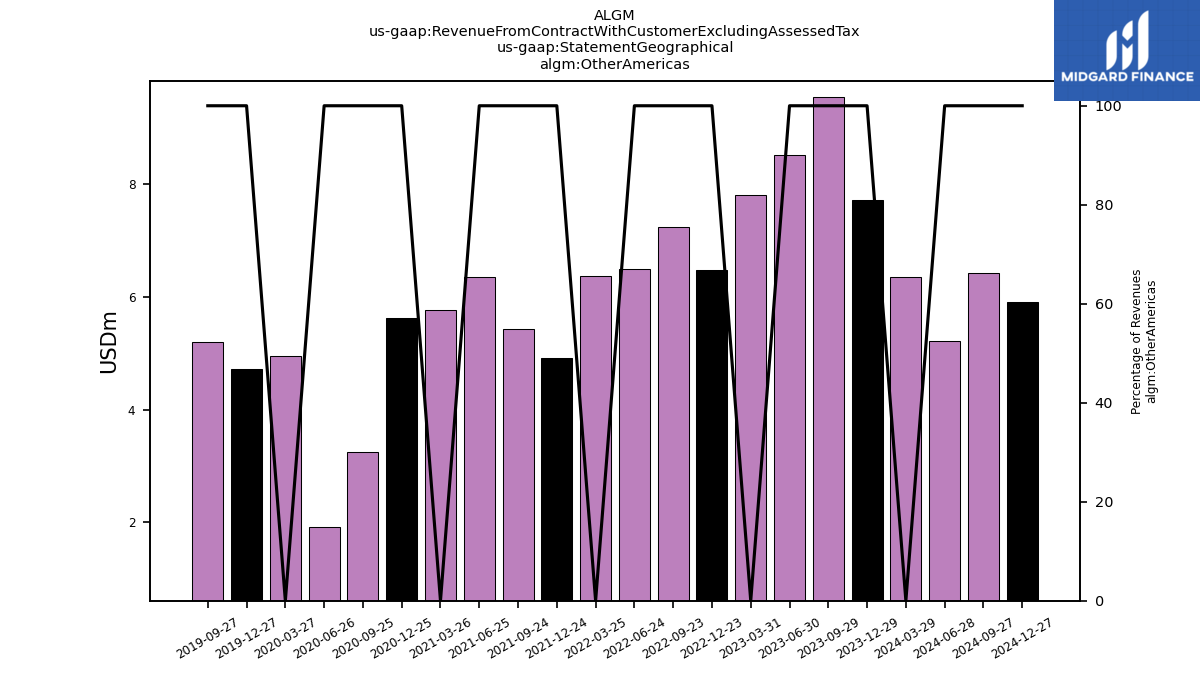
| Other Americas | 7.72 | 9.54 | 8.51 | 7.81 | 6.47 | 7.24 | NA | 6.49 | 6.36 | 4.92 | 5.43 | 6.35 | 5.76 | 5.62 | 3.25 | 1.93 | 4.95 | 4.72 | 5.20 | |
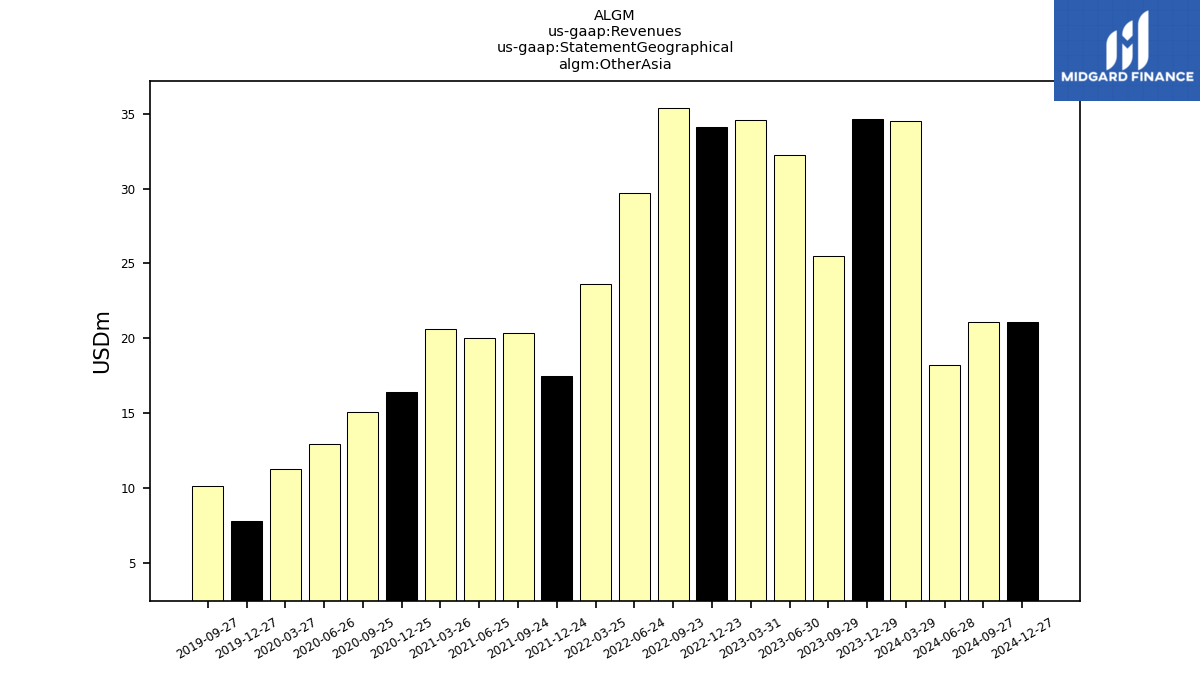
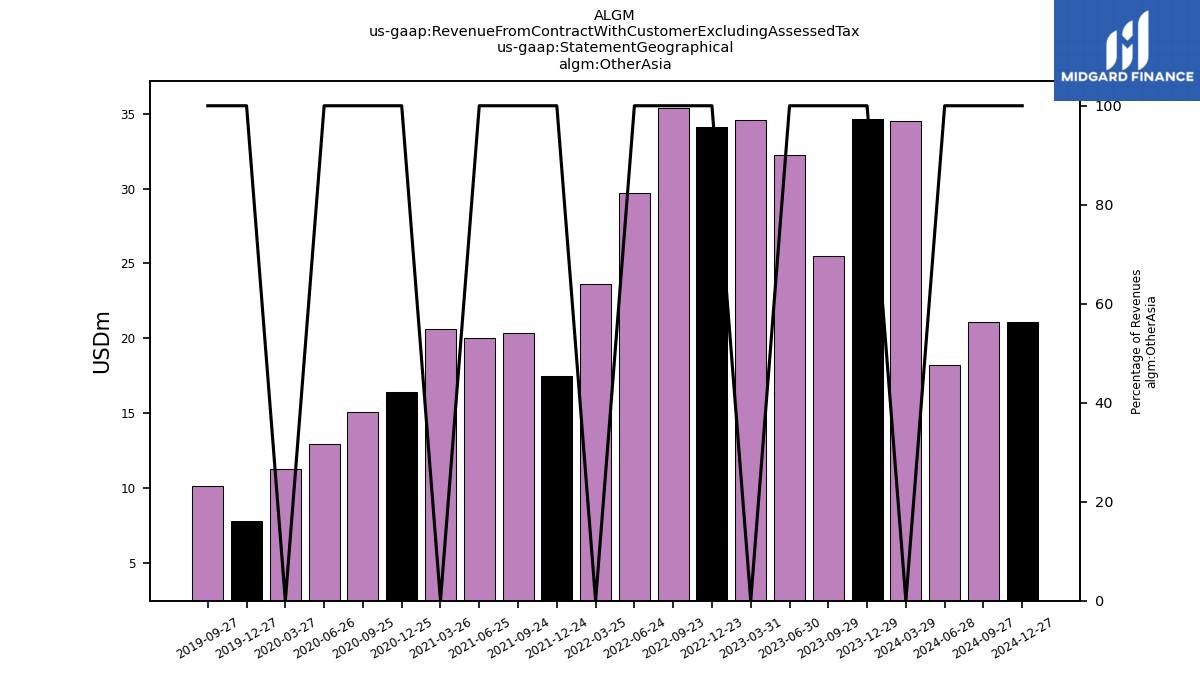
| Other Asia | 34.62 | 25.50 | 32.26 | 34.62 | 34.13 | 35.42 | NA | 29.74 | 23.66 | 17.50 | 20.34 | 20.04 | 20.60 | 16.44 | 15.10 | 12.93 | 11.29 | 7.83 | 10.12 | |
| Revenue From Contract With Customer Excluding Assessed Tax | 254.98 | 275.51 | 278.29 | 269.44 | 248.79 | 237.67 | 237.67 | 217.75 | 200.29 | 186.63 | 193.61 | 188.14 | 175.11 | 164.45 | 136.65 | 115.00 | 174.60 | 159.80 | 163.24 | |
| Customer | 2.58 | 3.58 | NA | NA | 45.12 | 45.03 | NA | 41.71 | NA | 39.46 | 37.16 | NA | NA | NA | NA | NA | NA | NA | NA | |
| Non Related Party Revenue | 254.98 | 271.93 | 278.29 | NA | 203.67 | 192.64 | NA | 176.04 | NA | 147.17 | 156.44 | NA | NA | NA | NA | NA | NA | NA | NA | |
| Automotive End Market | 194.76 | 205.94 | 189.70 | 178.80 | 170.11 | 157.40 | 155.17 | 149.65 | 138.00 | 130.80 | 126.03 | 133.52 | 118.54 | 113.90 | 89.48 | 76.38 | 105.60 | 99.07 | 98.21 | |
| Industrial End Market | 45.95 | 51.11 | 68.18 | 61.81 | 51.01 | 48.18 | 50.34 | 40.14 | 38.62 | 31.90 | 36.32 | 30.31 | 29.16 | 23.65 | 21.65 | 20.41 | 22.30 | 21.36 | 18.09 | |
| Magnetic Sensors | NA | NA | NA | NA | NA | NA | NA | 137.05 | 126.75 | 123.54 | 127.62 | 120.64 | 117.42 | 109.46 | 86.10 | 73.40 | 101.11 | 91.84 | 91.61 | |
| Magnetic Sensors And Other | 153.56 | 175.77 | 174.31 | NA | 154.28 | 140.34 | NA | 137.09 | NA | 123.77 | 128.09 | NA | NA | NA | NA | NA | NA | NA | NA | |
| Non Related Party | NA | NA | NA | NA | NA | NA | NA | 176.04 | NA | NA | NA | 152.69 | NA | NA | NA | NA | NA | NA | NA | |
| Non Related Party Revenue | NA | NA | NA | NA | NA | NA | NA | NA | 163.56 | 147.17 | 156.44 | 152.69 | 143.02 | 138.01 | 114.14 | 91.38 | 39.37 | 143.27 | 146.62 | |
| Other End Market | 14.27 | 18.46 | 20.41 | 28.84 | 27.67 | 32.09 | 32.15 | 27.96 | 23.67 | 23.93 | 31.26 | 24.31 | 27.41 | 26.89 | 25.52 | 18.22 | 15.22 | 15.07 | 20.54 | |
| Photonics | NA | NA | NA | NA | NA | NA | NA | 0.04 | 0.21 | 0.23 | 0.47 | 0.83 | 0.37 | 0.59 | 0.28 | NA | NA | NA | NA | |
| Power Integrated Circuits | 101.43 | 99.74 | 103.99 | 102.57 | 94.51 | 97.33 | NA | 80.66 | 73.33 | 62.86 | 65.52 | 66.67 | 57.32 | 54.41 | 50.27 | 41.60 | 42.01 | 43.66 | 45.23 | |
| Related Party | NA | NA | NA | NA | NA | NA | NA | 41.71 | NA | NA | NA | 35.45 | NA | NA | NA | NA | NA | NA | NA | |
| Related Party Revenue | NA | NA | NA | NA | NA | NA | NA | NA | 36.73 | 39.46 | 37.16 | 35.45 | 32.09 | 26.44 | 22.51 | 23.62 | 135.23 | 16.54 | 16.62 | |
| Related Party, Majority Shareholder | NA | NA | NA | NA | NA | NA | NA | 41.71 | NA | NA | NA | 35.45 | NA | NA | NA | NA | NA | NA | NA | |
| Related Party Revenue, Sanken | NA | NA | 0.00 | NA | NA | NA | NA | 41.71 | NA | NA | NA | NA | NA | NA | NA | NA | NA | NA | NA | |
| Related Party Revenue, Majority Shareholder | 2.58 | 3.58 | NA | NA | 45.12 | 45.03 | NA | NA | 36.73 | 39.46 | 37.16 | 35.45 | 32.09 | 26.44 | 22.51 | 23.62 | 135.23 | 16.54 | 16.62 | |
| 77.33 | 69.46 | 62.22 | 71.28 | 64.31 | 63.20 | NA | 55.12 | 49.74 | 48.70 | 50.68 | 42.78 | 41.37 | 46.17 | 37.94 | 32.07 | 26.56 | 35.28 | 36.70 | ||
| 36.87 | 46.95 | 55.39 | 53.67 | 39.65 | 40.71 | NA | 35.33 | 37.43 | 29.89 | 32.47 | 34.75 | 32.67 | 28.24 | 24.37 | 17.85 | 33.50 | 24.34 | 24.14 | ||
| 42.25 | 47.27 | 41.58 | 28.91 | 45.12 | 45.03 | NA | 41.71 | 36.73 | 39.46 | 37.16 | 35.45 | 32.09 | 26.44 | 22.51 | 23.62 | 52.61 | 46.01 | 42.47 | ||
| 27.71 | 29.05 | 29.51 | 29.14 | 25.50 | 20.93 | NA | 20.98 | 18.84 | 19.93 | 19.75 | 21.93 | 18.34 | 17.61 | 12.52 | 13.61 | 13.29 | 14.12 | 13.95 | ||
| US | 28.48 | 47.72 | 48.82 | 44.02 | 33.61 | 25.13 | NA | 28.39 | 27.54 | 26.23 | 27.79 | 26.84 | 24.27 | 23.93 | 20.96 | 13.00 | 32.39 | 27.50 | 30.66 | |
| Other Americas | 7.72 | 9.54 | 8.51 | 7.81 | 6.47 | 7.24 | NA | 6.49 | 6.36 | 4.92 | 5.43 | 6.35 | 5.76 | 5.62 | 3.25 | 1.93 | 4.95 | 4.72 | 5.20 | |
| Other Asia | 34.62 | 25.50 | 32.26 | 34.62 | 34.13 | 35.42 | NA | 29.74 | 23.66 | 17.50 | 20.34 | 20.04 | 20.60 | 16.44 | 15.10 | 12.93 | 11.29 | 7.83 | 10.12 |


