
| 2023-09-30 | 2023-06-30 | 2023-03-31 | 2022-12-31 | 2022-09-30 | 2022-06-30 | 2022-03-31 | 2021-12-31 | 2021-09-30 | 2021-06-30 | 2021-03-31 | 2020-12-31 | 2020-09-30 | 2020-06-30 | 2020-03-31 | ||
|---|---|---|---|---|---|---|---|---|---|---|---|---|---|---|---|---|
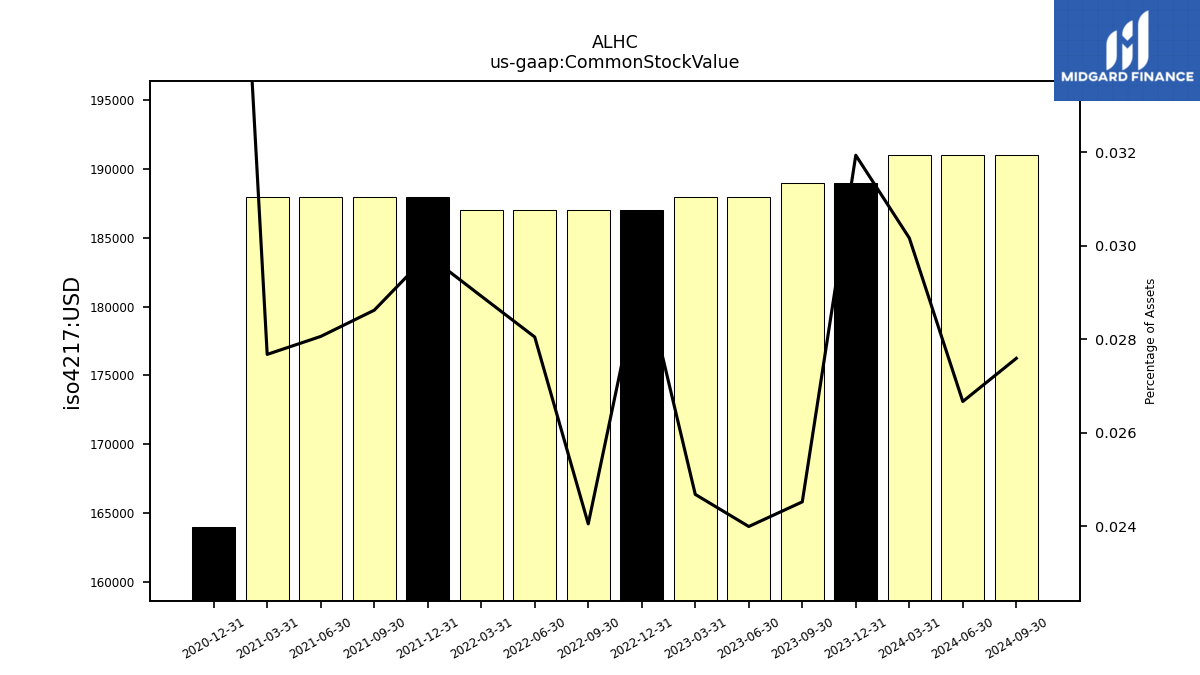
| Common Stock Value | 0.19 | 0.19 | 0.19 | 0.19 | 0.19 | 0.19 | 0.19 | 0.19 | 0.19 | 0.19 | 0.19 | 0.16 | NA | NA | NA | |
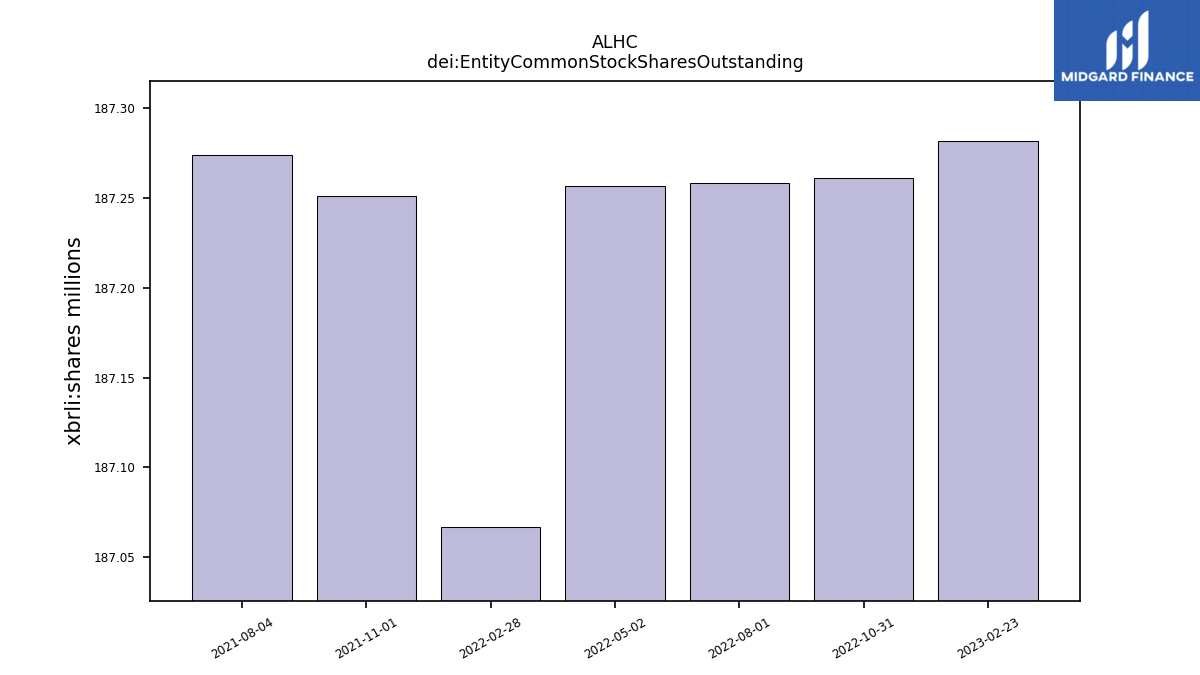
| dei: Entity Common Stock Shares Outstanding | NA | NA | NA | NA | NA | NA | NA | NA | NA | NA | NA | NA | NA | NA | NA | |
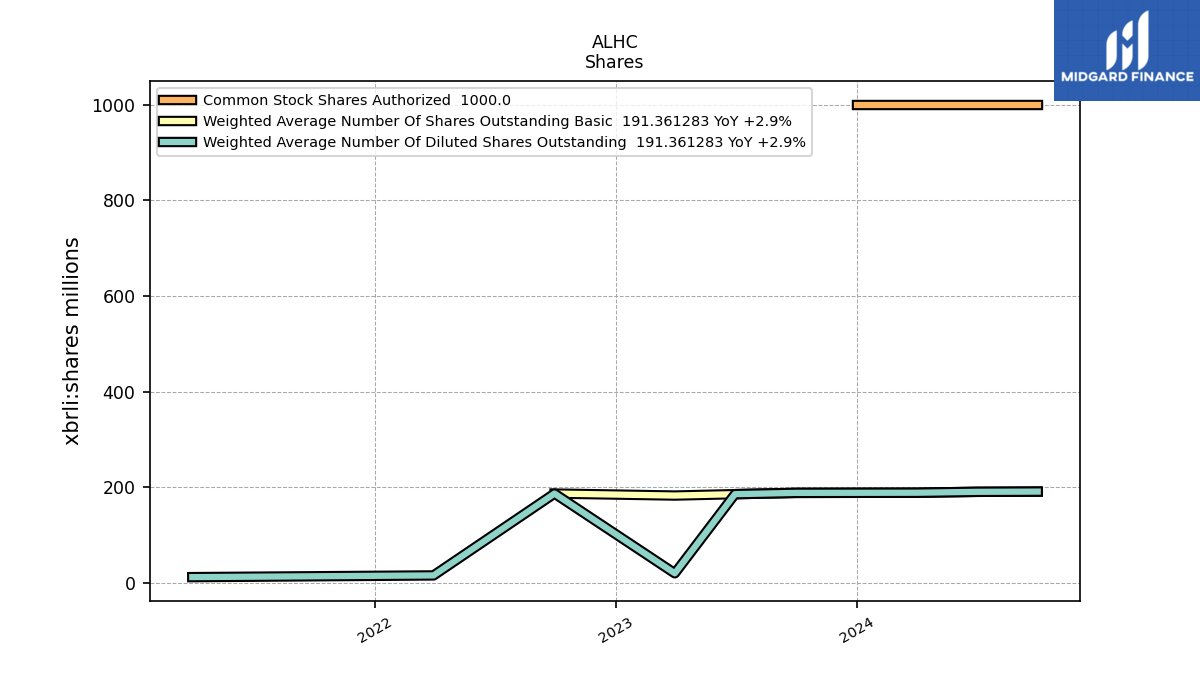
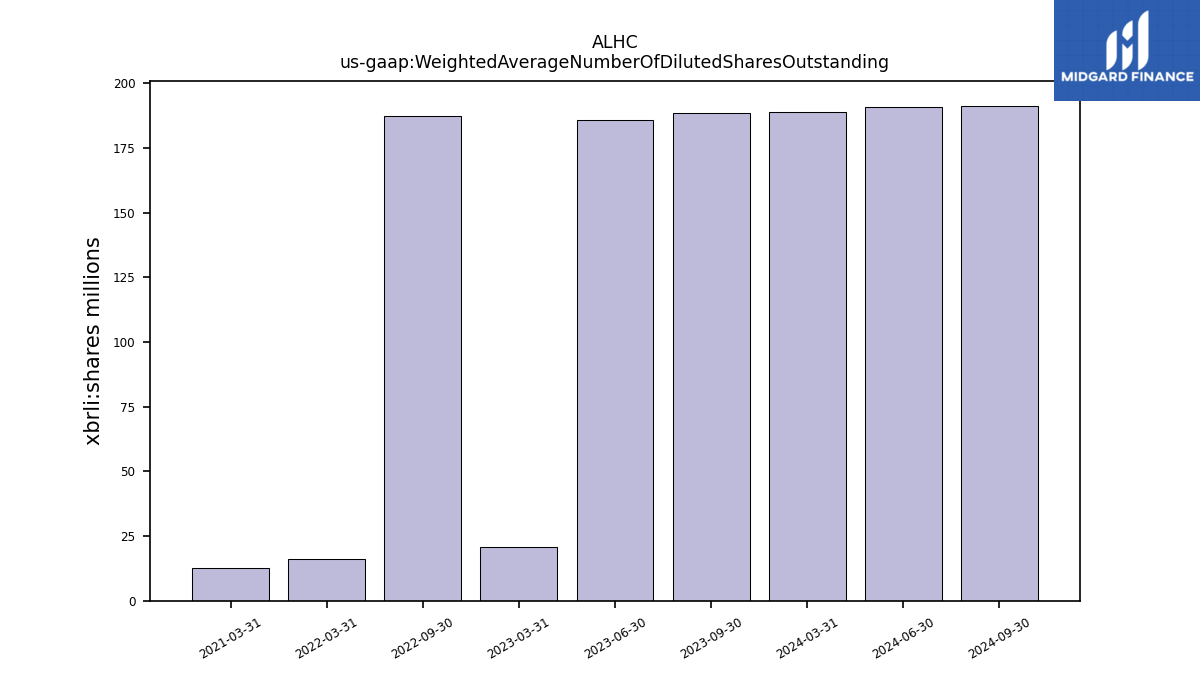
| Weighted Average Number Of Diluted Shares Outstanding | 188.66 | NA | 20.59 | NA | 187.27 | NA | 16.21 | NA | NA | NA | 12.64 | NA | NA | NA | NA | |
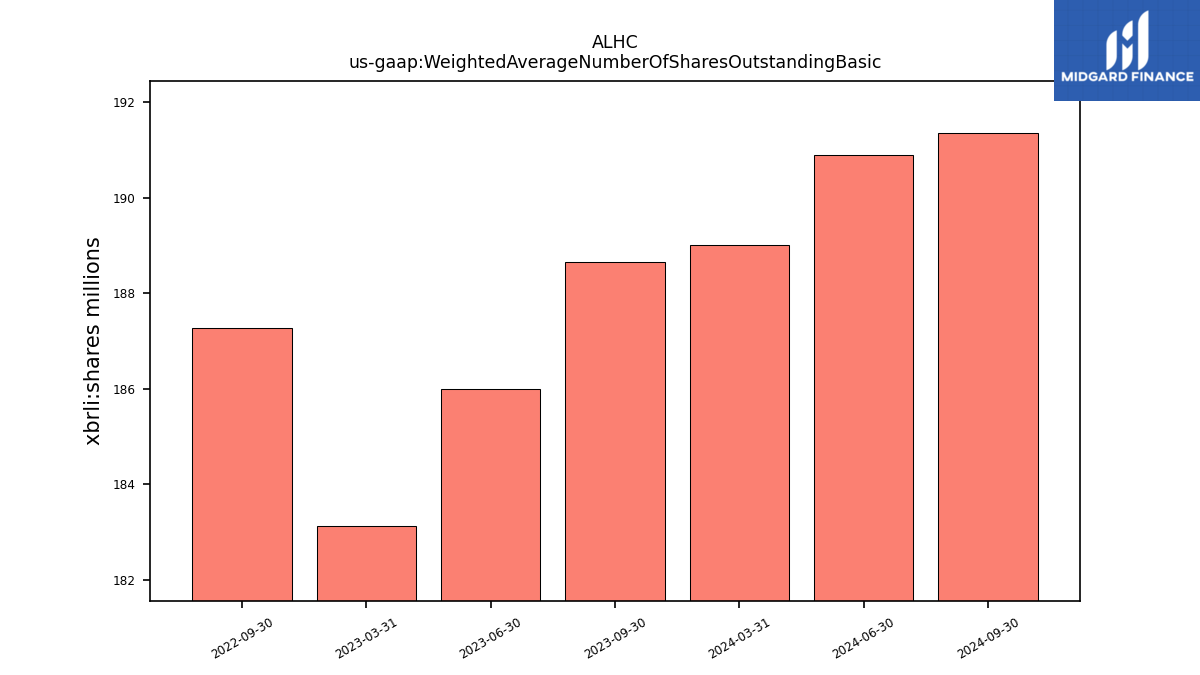
| Weighted Average Number Of Shares Outstanding Basic | 188.66 | NA | NA | NA | 187.27 | NA | NA | NA | NA | NA | NA | NA | NA | NA | NA | |
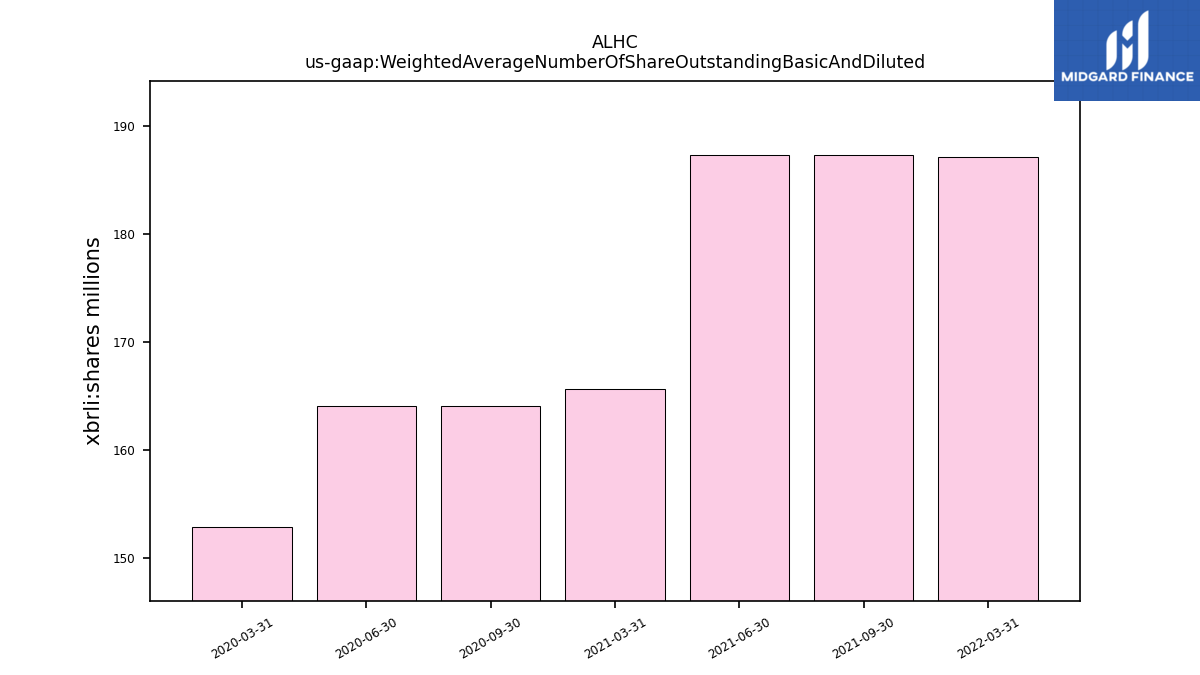
| Weighted Average Number Of Share Outstanding Basic And Diluted | NA | NA | NA | NA | NA | NA | 187.09 | NA | 187.25 | 187.27 | 165.61 | NA | 164.06 | 164.06 | 152.92 | |
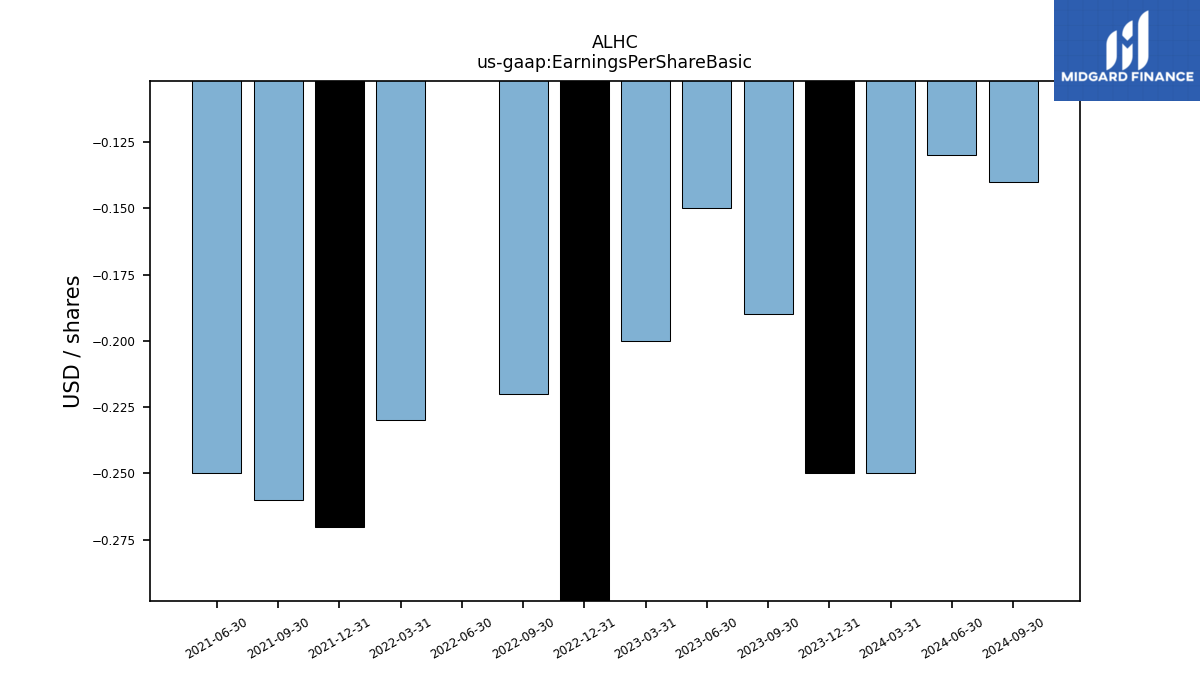
| Earnings Per Share Basic | -0.19 | -0.15 | -0.20 | -0.32 | -0.22 | -0.06 | -0.23 | -0.27 | -0.26 | -0.25 | NA | NA | NA | NA | NA | |
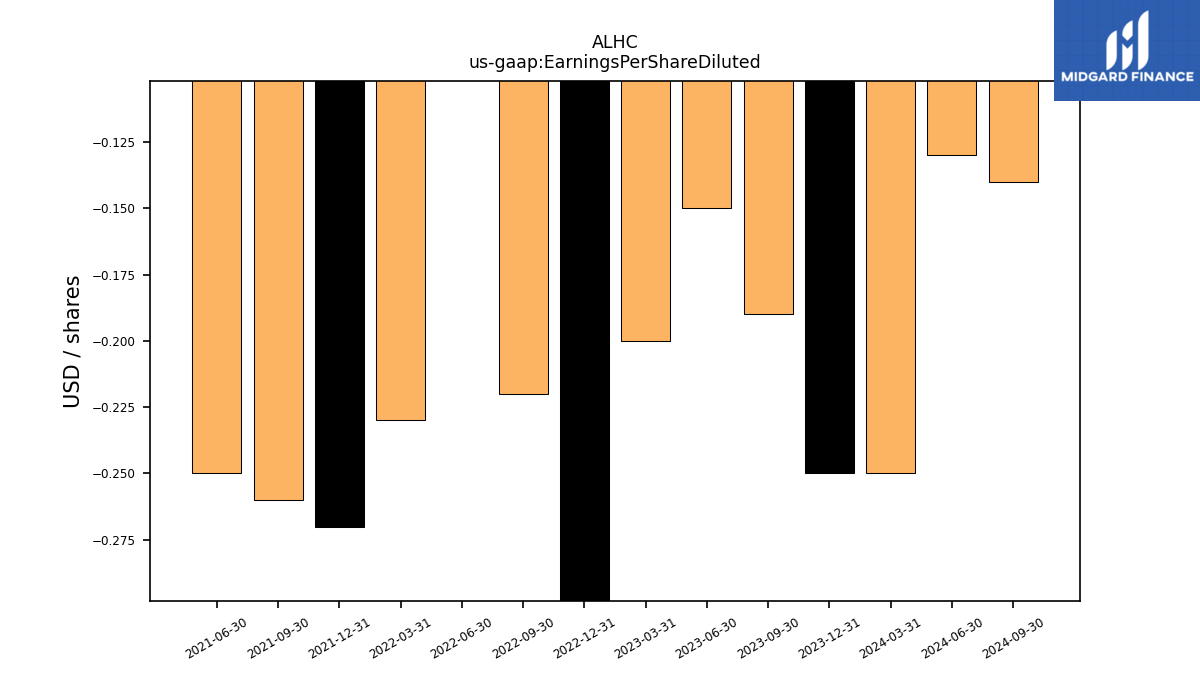
| Earnings Per Share Diluted | -0.19 | -0.15 | -0.20 | -0.32 | -0.22 | -0.06 | -0.23 | -0.27 | -0.26 | -0.25 | NA | NA | NA | NA | NA | |
| Earnings Per Share Basic And Diluted | NA | NA | NA | NA | NA | NA | -0.23 | -0.27 | -0.26 | -0.25 | -0.37 | -0.21 | 0.07 | 0.05 | -0.07 |
| 2023-09-30 | 2023-06-30 | 2023-03-31 | 2022-12-31 | 2022-09-30 | 2022-06-30 | 2022-03-31 | 2021-12-31 | 2021-09-30 | 2021-06-30 | 2021-03-31 | 2020-12-31 | 2020-09-30 | 2020-06-30 | 2020-03-31 | ||
|---|---|---|---|---|---|---|---|---|---|---|---|---|---|---|---|---|
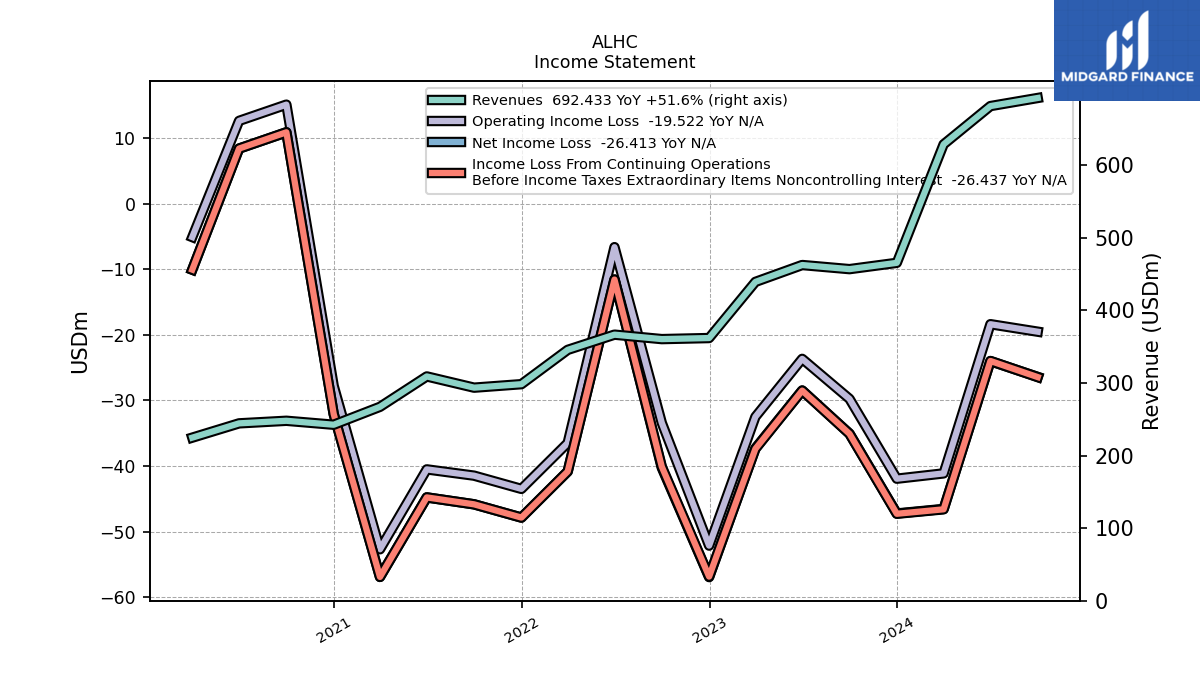
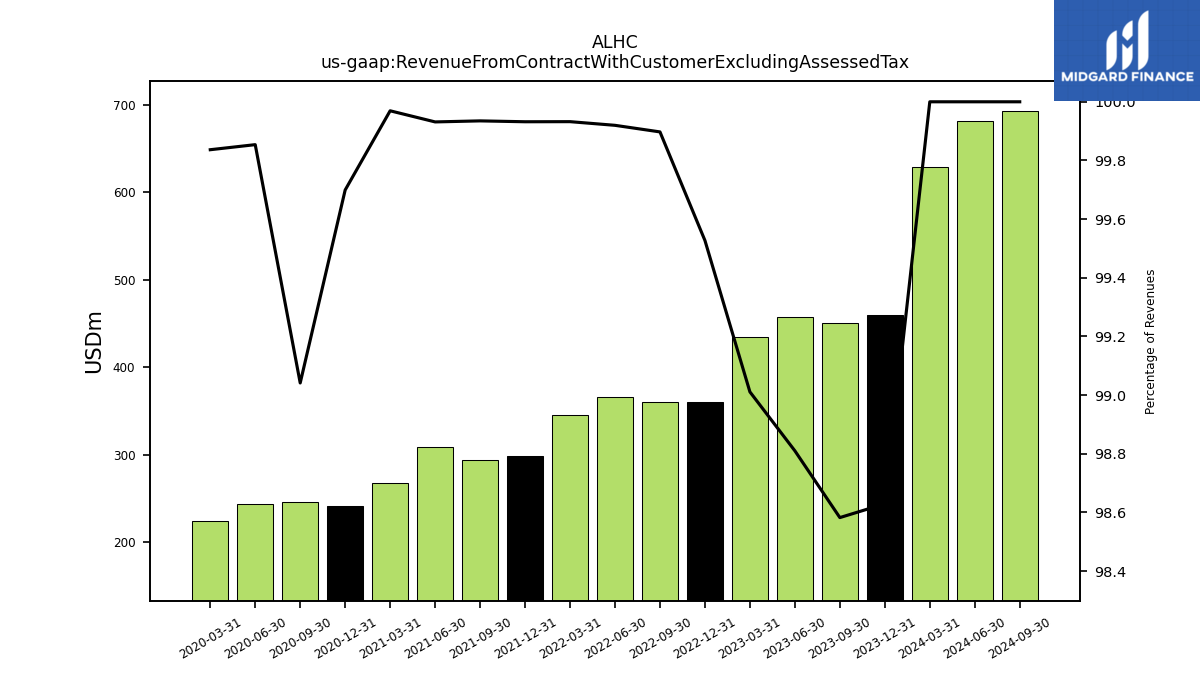
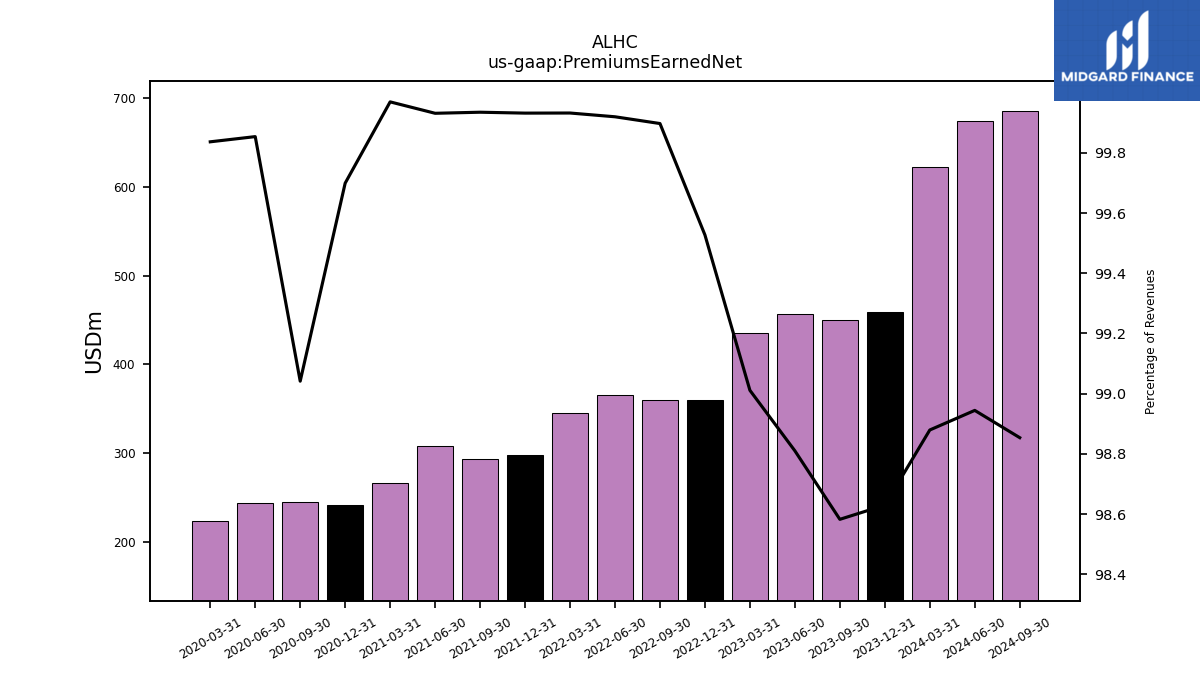
| Revenue From Contract With Customer Excluding Assessed Tax | 450.24 | 456.88 | 434.81 | 360.10 | 359.98 | 366.18 | 345.29 | 298.07 | 293.27 | 308.74 | 267.00 | 241.68 | 245.49 | 243.96 | 224.27 | |
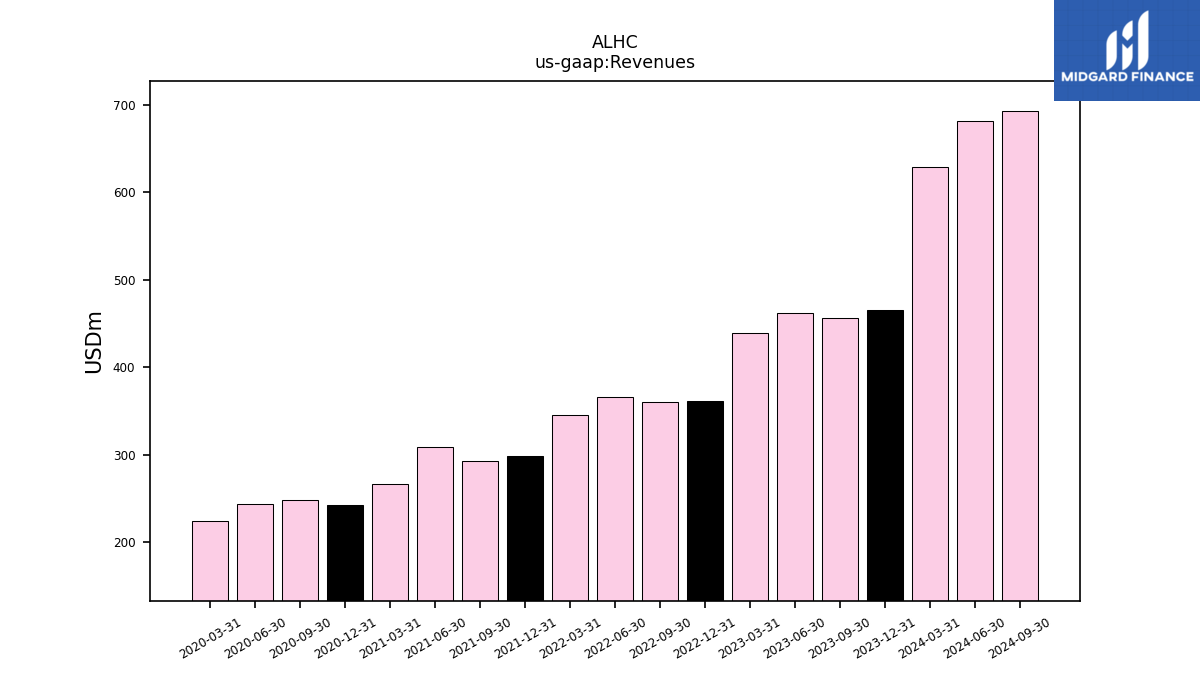
| Revenues | 456.71 | 462.38 | 439.15 | 361.81 | 360.35 | 366.47 | 345.53 | 298.27 | 293.47 | 308.95 | 267.08 | 242.41 | 247.87 | 244.31 | 224.63 | |
| Premiums Earned Net | 450.24 | 456.88 | 434.81 | 360.10 | 359.98 | 366.18 | 345.29 | 298.07 | 293.27 | 308.74 | 267.00 | 241.68 | 245.49 | 243.96 | 224.27 | |
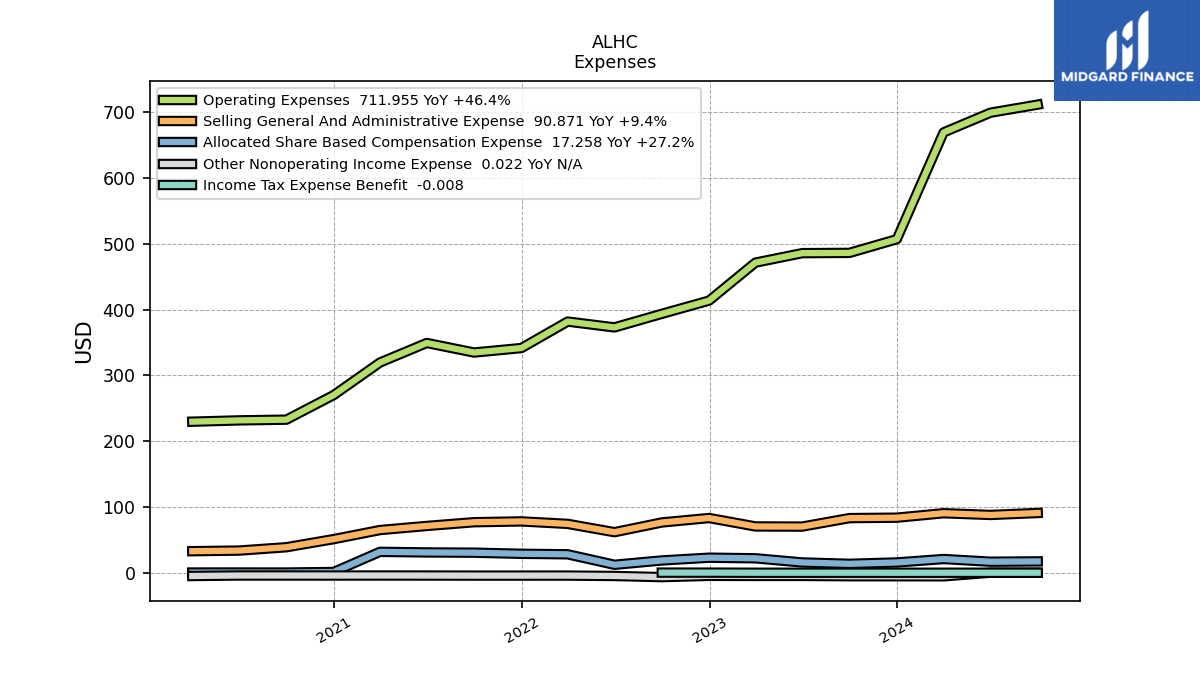
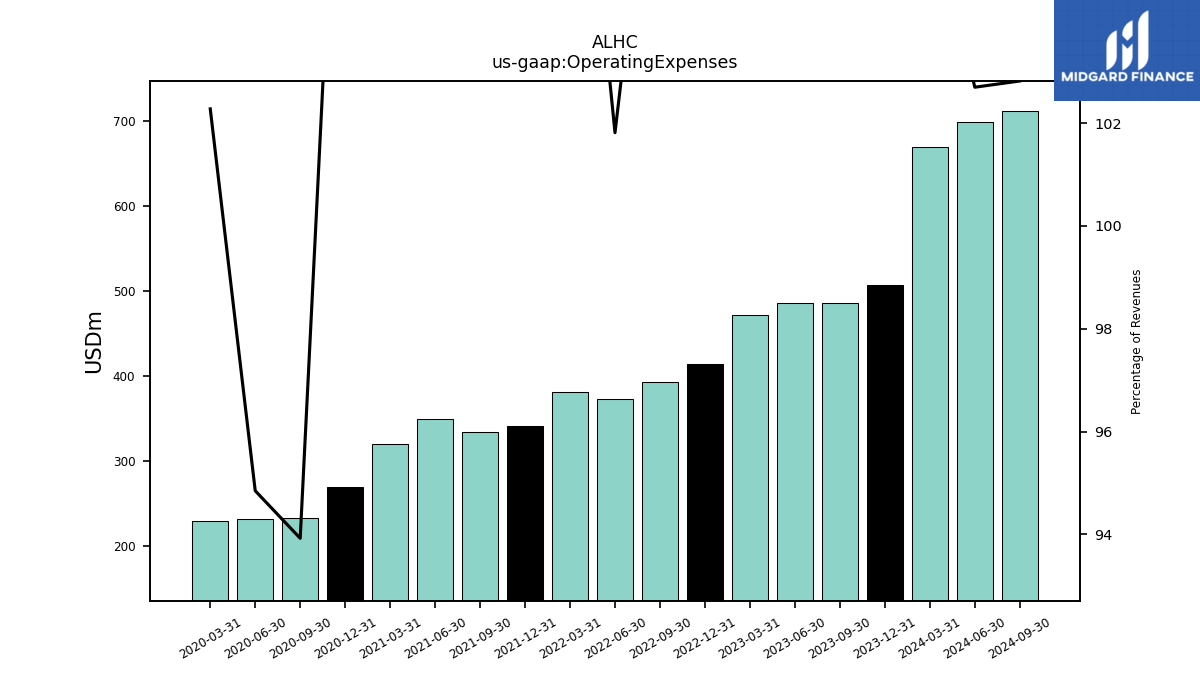
| Operating Expenses | 486.46 | 486.04 | 471.64 | 413.92 | 393.76 | 373.12 | 382.00 | 341.74 | 334.92 | 349.44 | 319.75 | 270.20 | 232.81 | 231.73 | 229.75 | |
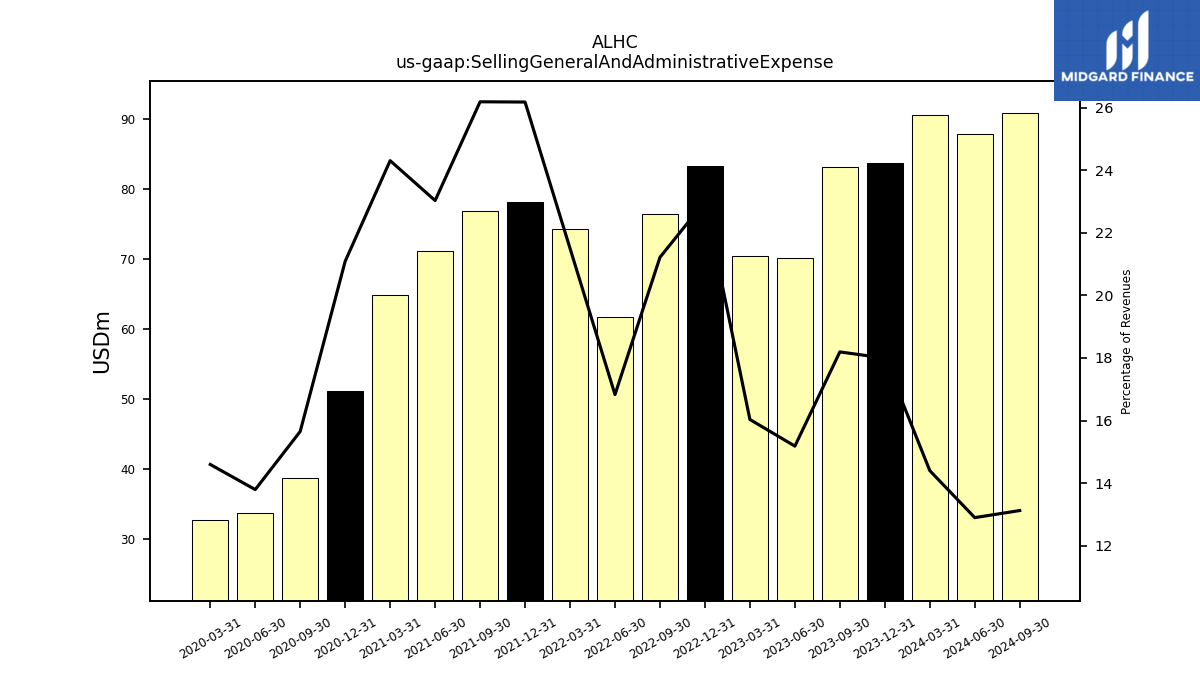
| Selling General And Administrative Expense | 83.09 | 70.20 | 70.41 | 83.23 | 76.45 | 61.67 | 74.29 | 78.08 | 76.85 | 71.15 | 64.91 | 51.12 | 38.79 | 33.70 | 32.79 | |
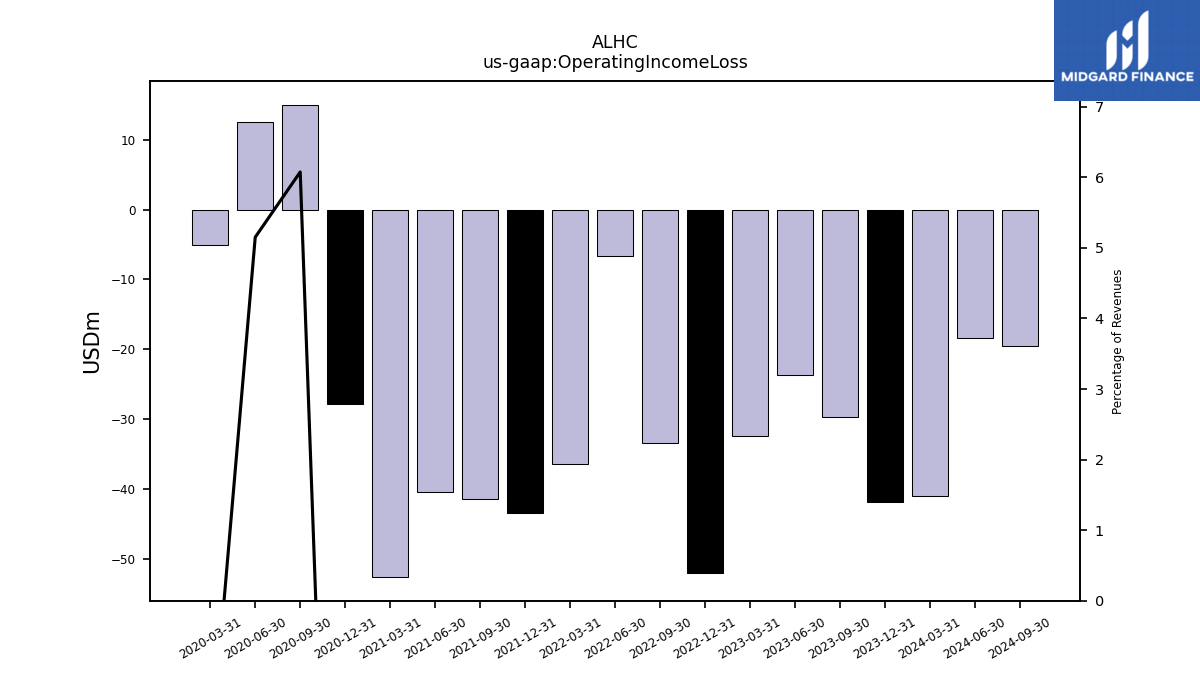
| Operating Income Loss | -29.76 | -23.66 | -32.49 | -52.11 | -33.41 | -6.65 | -36.48 | -43.47 | -41.45 | -40.49 | -52.66 | -27.80 | 15.06 | 12.59 | -5.12 | |
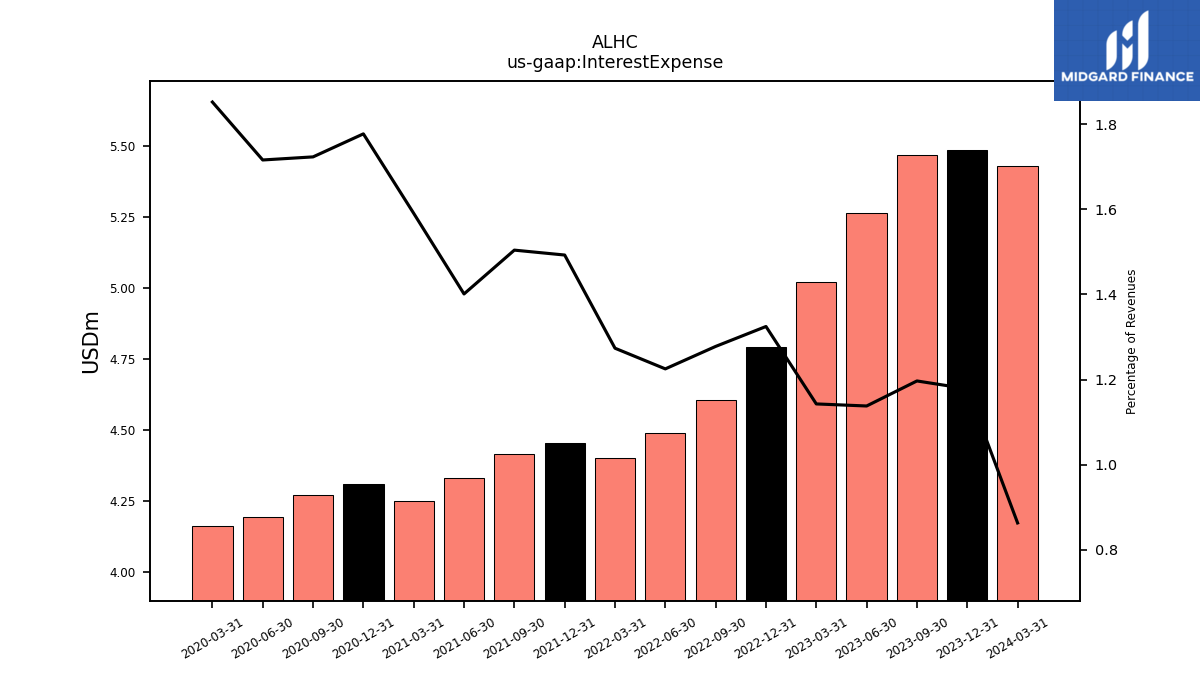
| Interest Expense | 5.47 | 5.26 | 5.02 | 4.79 | 4.61 | 4.49 | 4.40 | 4.45 | 4.41 | 4.33 | 4.25 | 4.31 | 4.27 | 4.19 | 4.16 | |
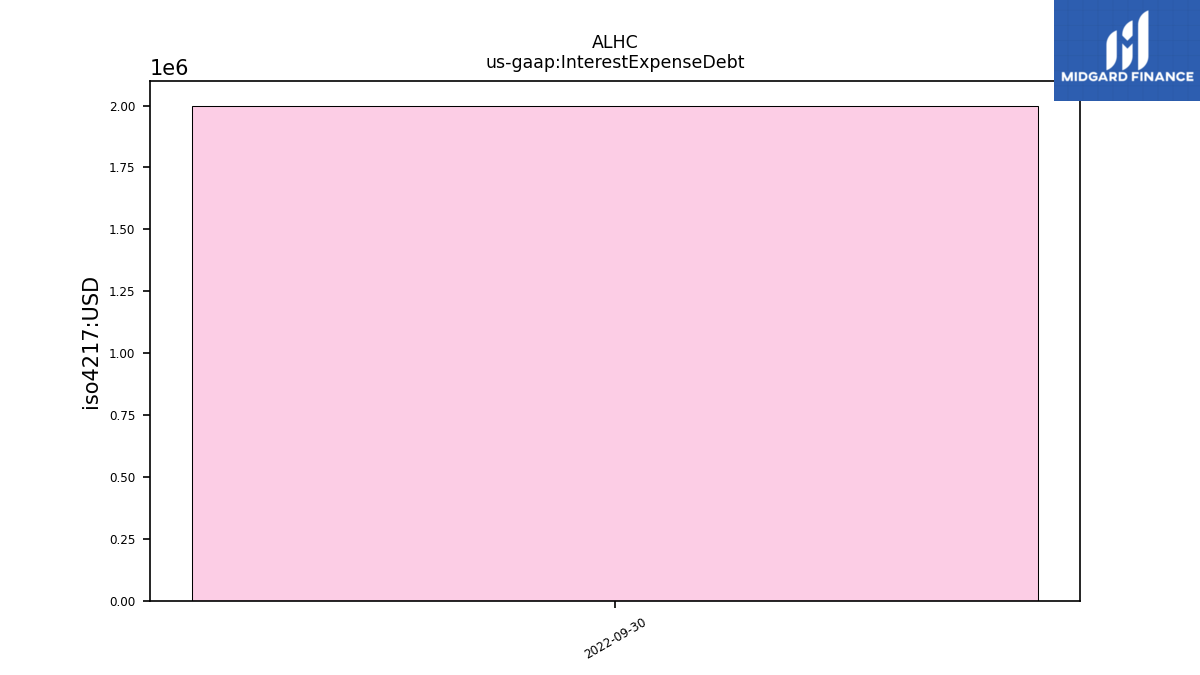
| Interest Expense Debt | NA | NA | NA | NA | 2.00 | NA | NA | NA | NA | NA | NA | NA | NA | NA | NA | |
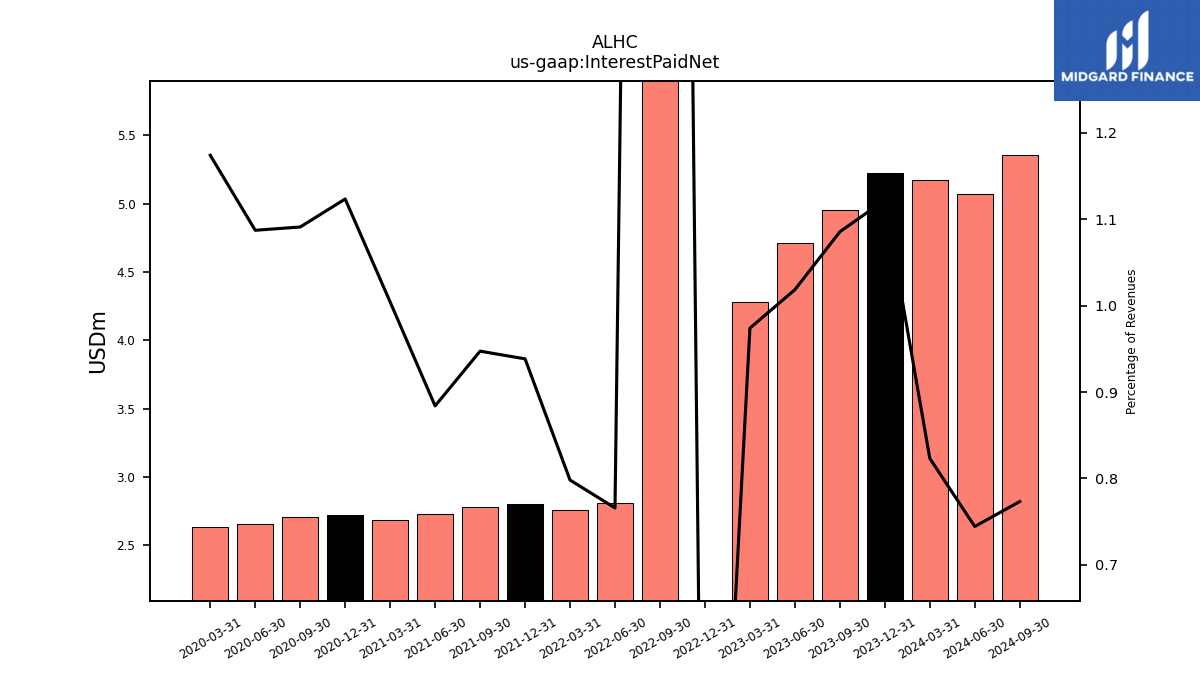
| Interest Paid Net | 4.96 | 4.71 | 4.28 | 0.00 | 16.88 | 2.81 | 2.76 | 2.80 | 2.78 | 2.73 | 2.68 | 2.72 | 2.70 | 2.66 | 2.64 | |
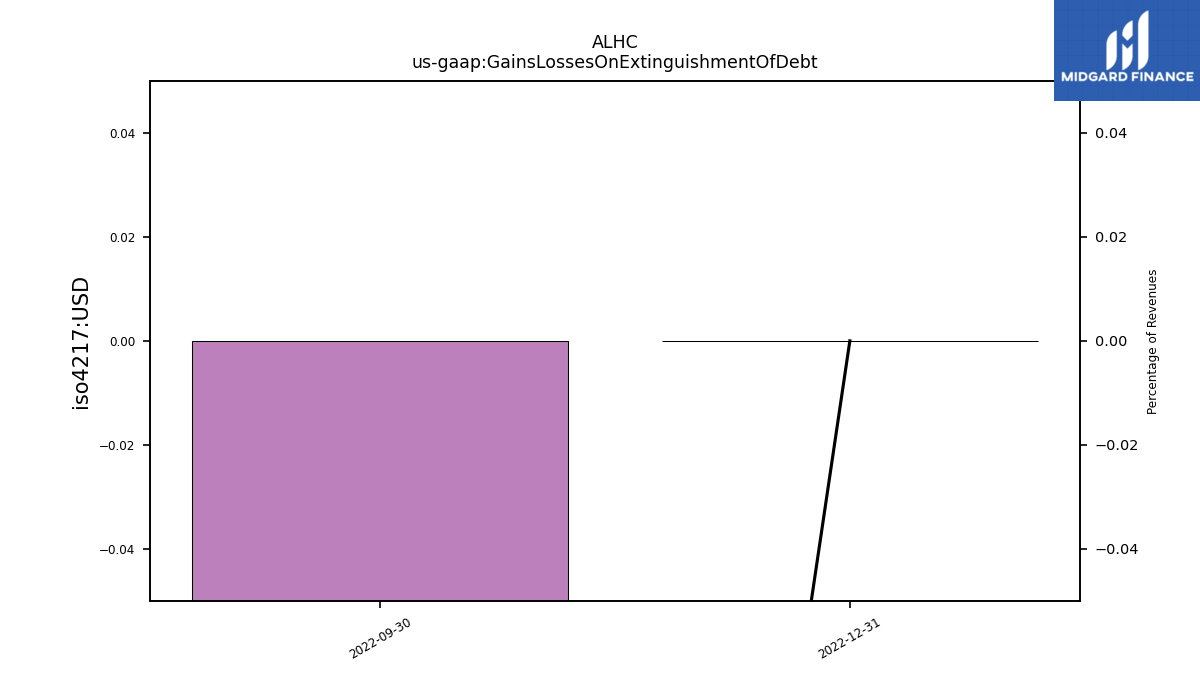
| Gains Losses On Extinguishment Of Debt | NA | NA | NA | 0.00 | -2.20 | NA | NA | NA | NA | NA | NA | NA | NA | NA | NA | |
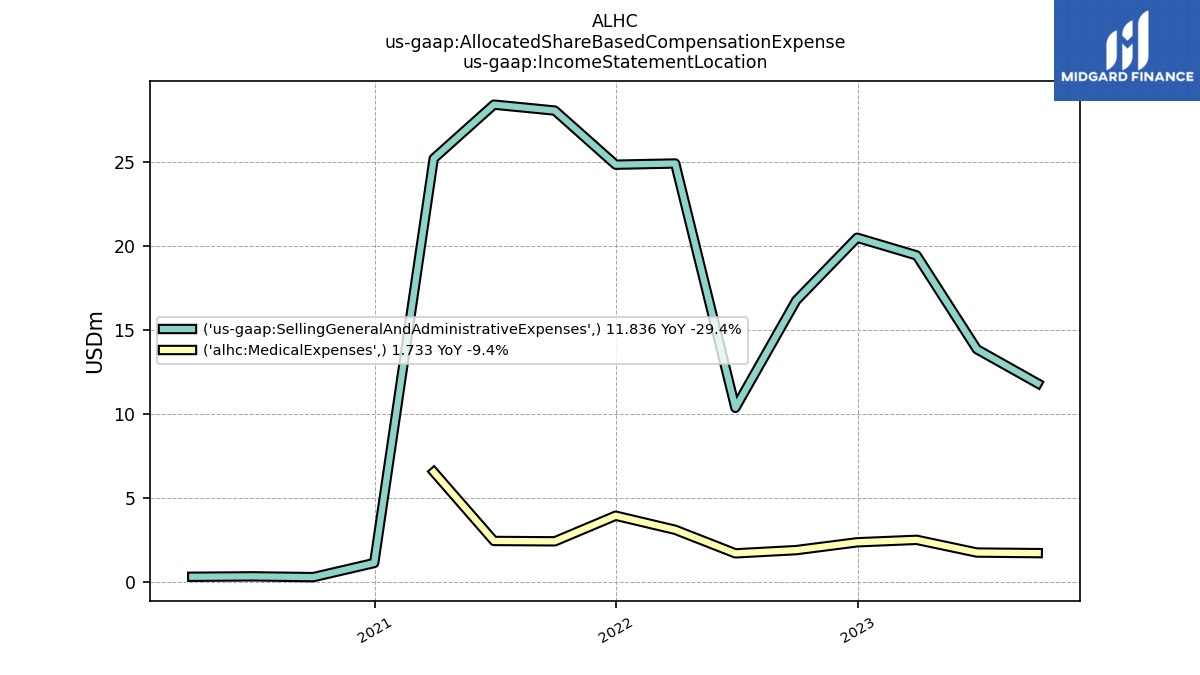
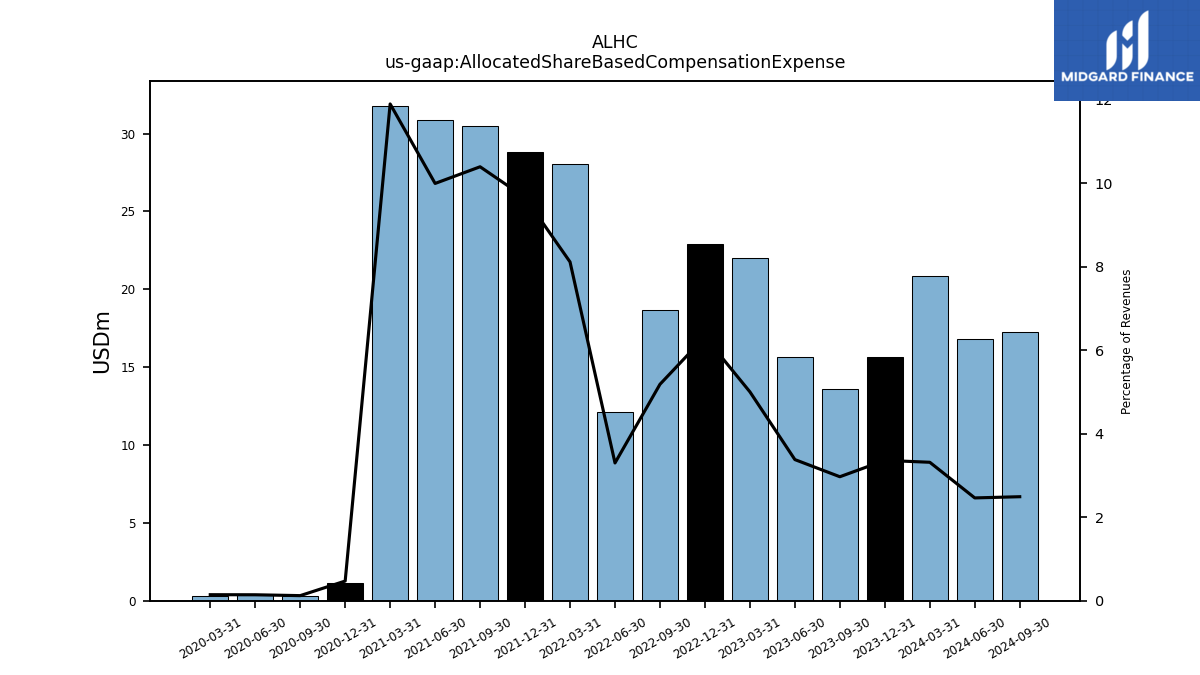
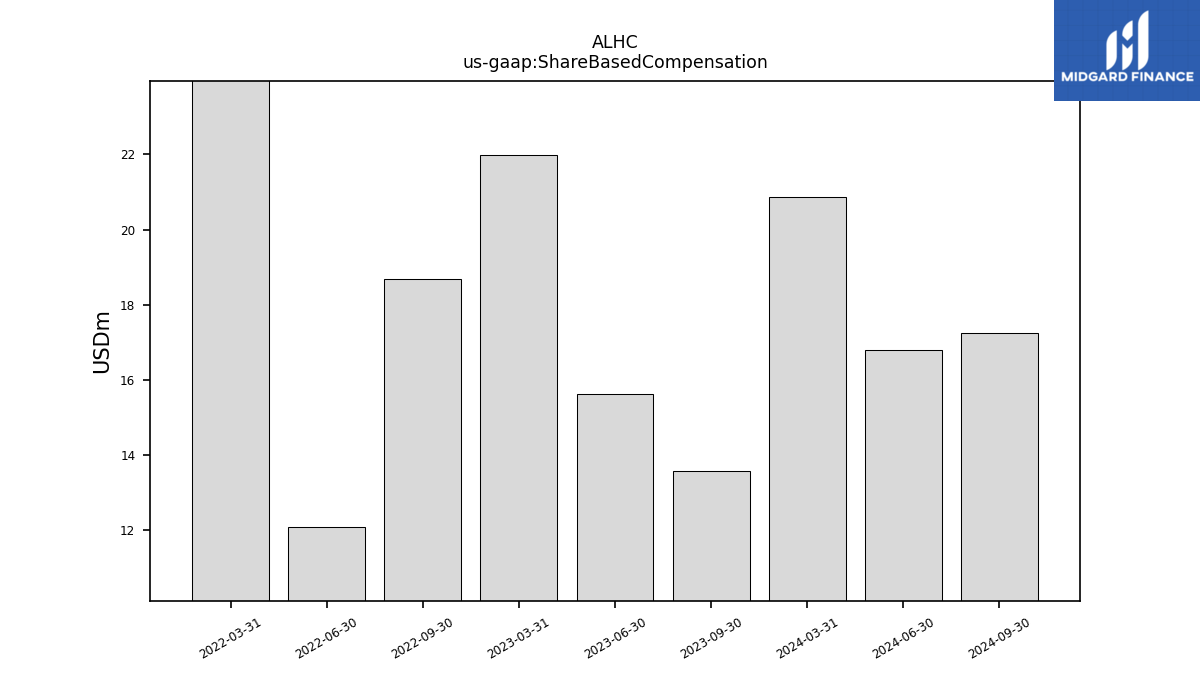
| Allocated Share Based Compensation Expense | 13.57 | 15.64 | 21.98 | 22.89 | 18.69 | 12.10 | 28.05 | 28.81 | 30.51 | 30.89 | 31.79 | 1.14 | 0.30 | 0.35 | 0.33 | |
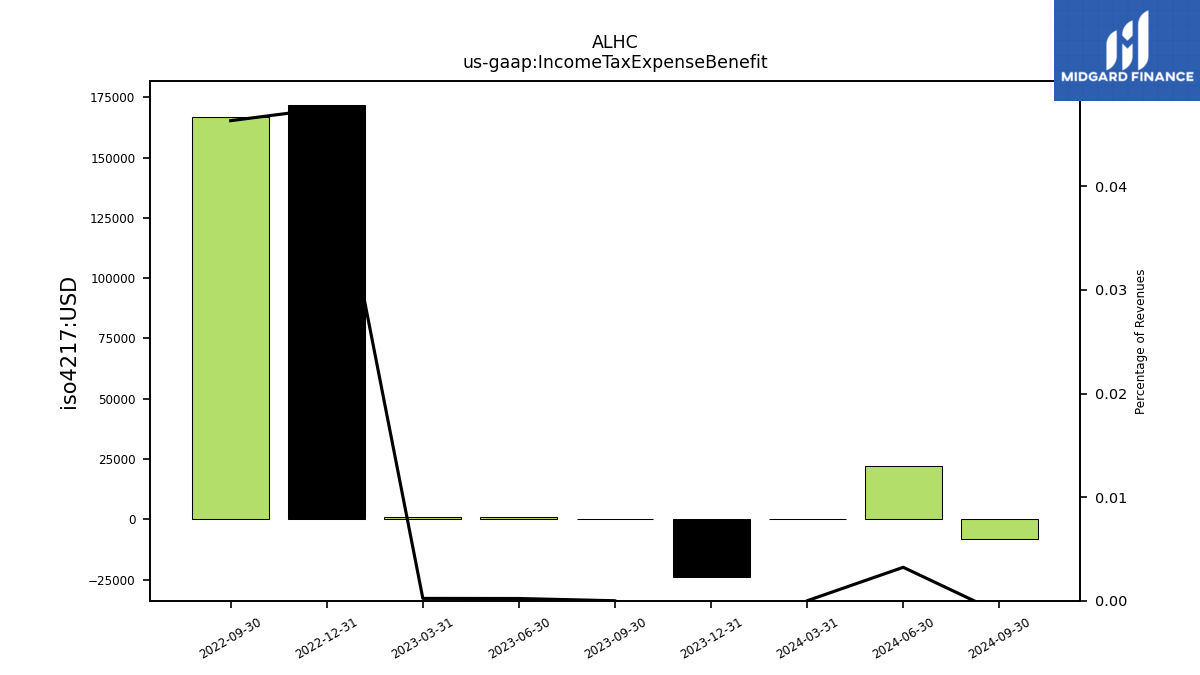
| Income Tax Expense Benefit | 0.00 | 0.00 | 0.00 | 0.17 | 0.17 | NA | NA | NA | NA | NA | NA | NA | NA | NA | NA | |
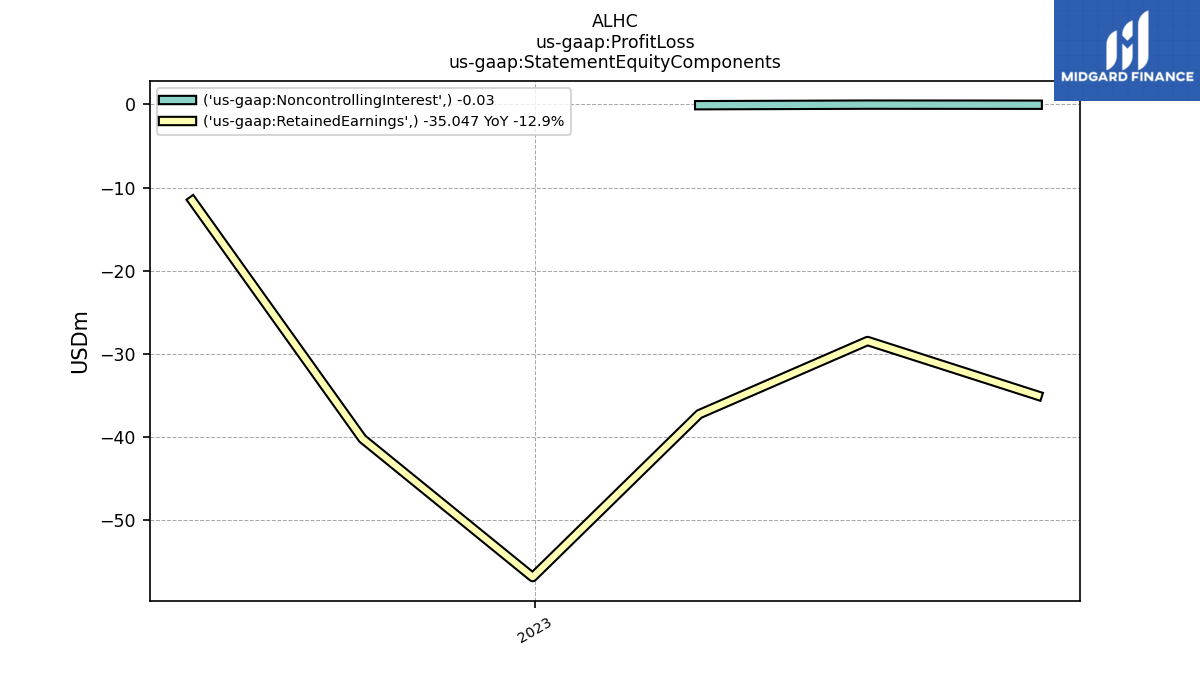
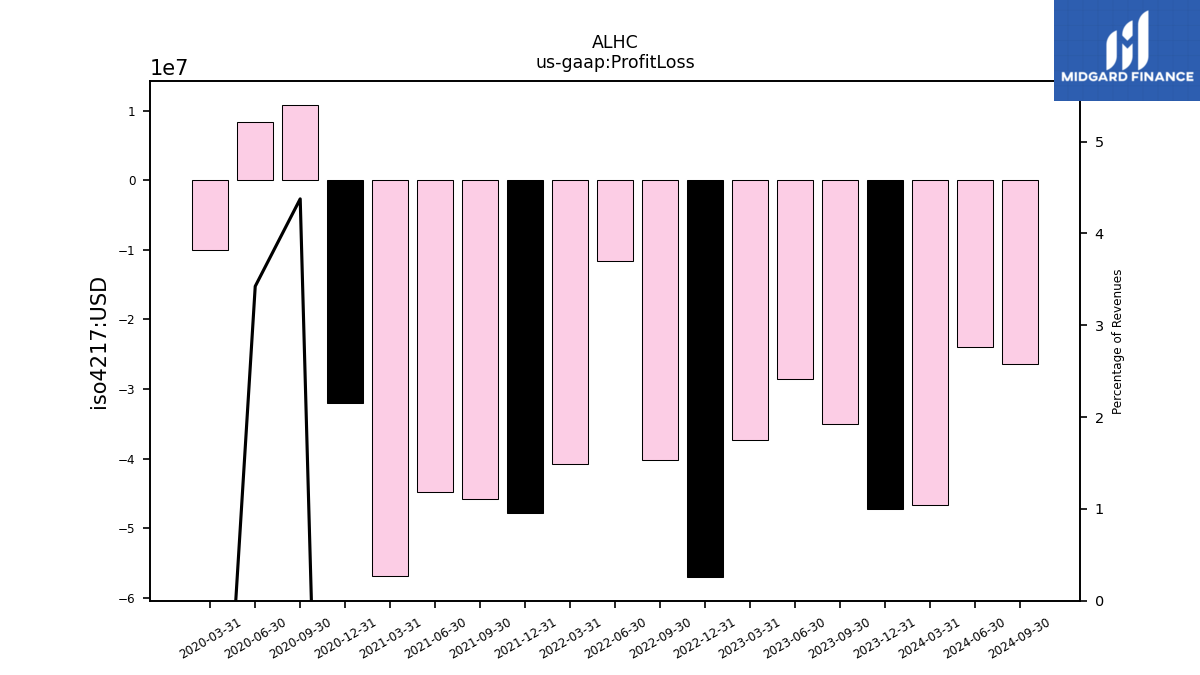
| Profit Loss | -35.08 | -28.49 | -37.37 | -56.99 | -40.25 | -11.58 | -40.82 | -47.83 | -45.82 | -44.76 | -56.87 | -32.06 | 10.85 | 8.37 | -10.07 | |
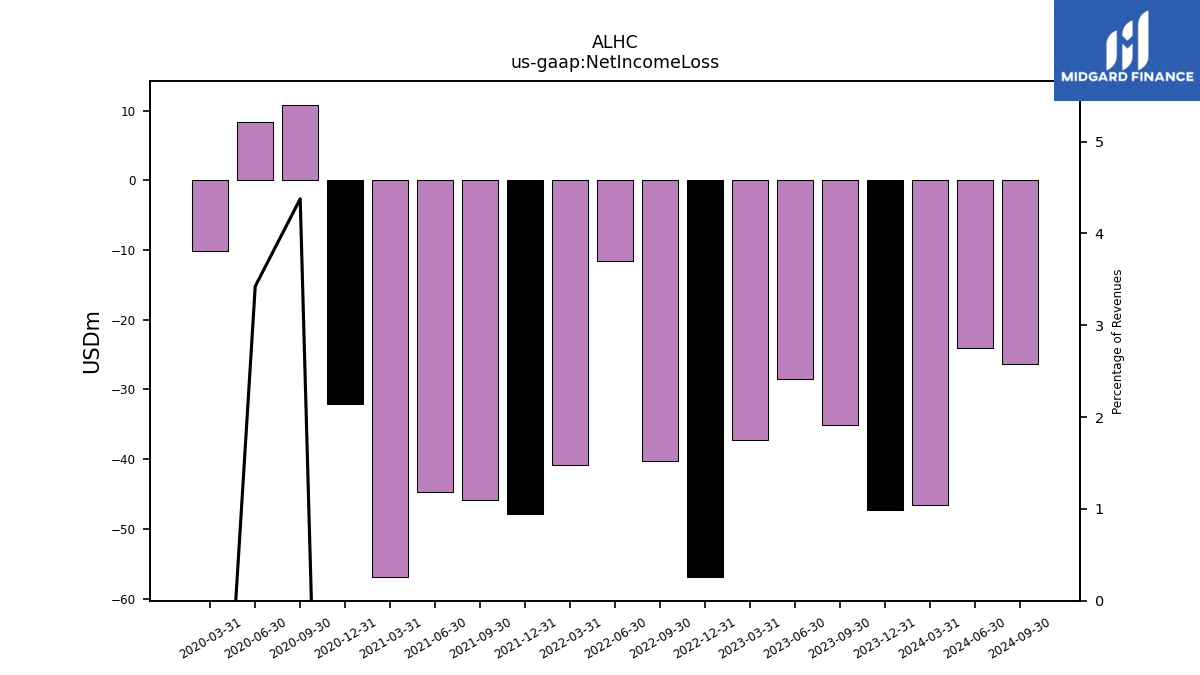
| Net Income Loss | -35.05 | -28.48 | -37.28 | -56.90 | -40.25 | -11.58 | -40.82 | -47.83 | -45.82 | -44.76 | -56.87 | -32.06 | 10.85 | 8.37 | -10.07 |
| 2023-09-30 | 2023-06-30 | 2023-03-31 | 2022-12-31 | 2022-09-30 | 2022-06-30 | 2022-03-31 | 2021-12-31 | 2021-09-30 | 2021-06-30 | 2021-03-31 | 2020-12-31 | 2020-09-30 | 2020-06-30 | 2020-03-31 | ||
|---|---|---|---|---|---|---|---|---|---|---|---|---|---|---|---|---|
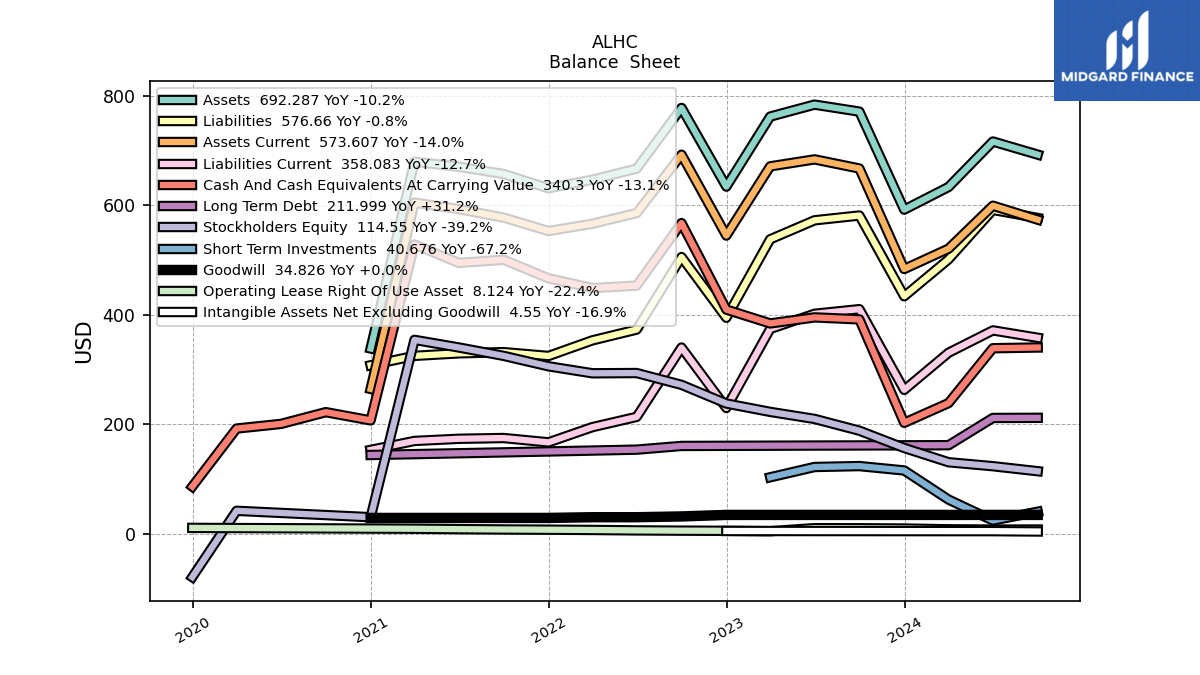
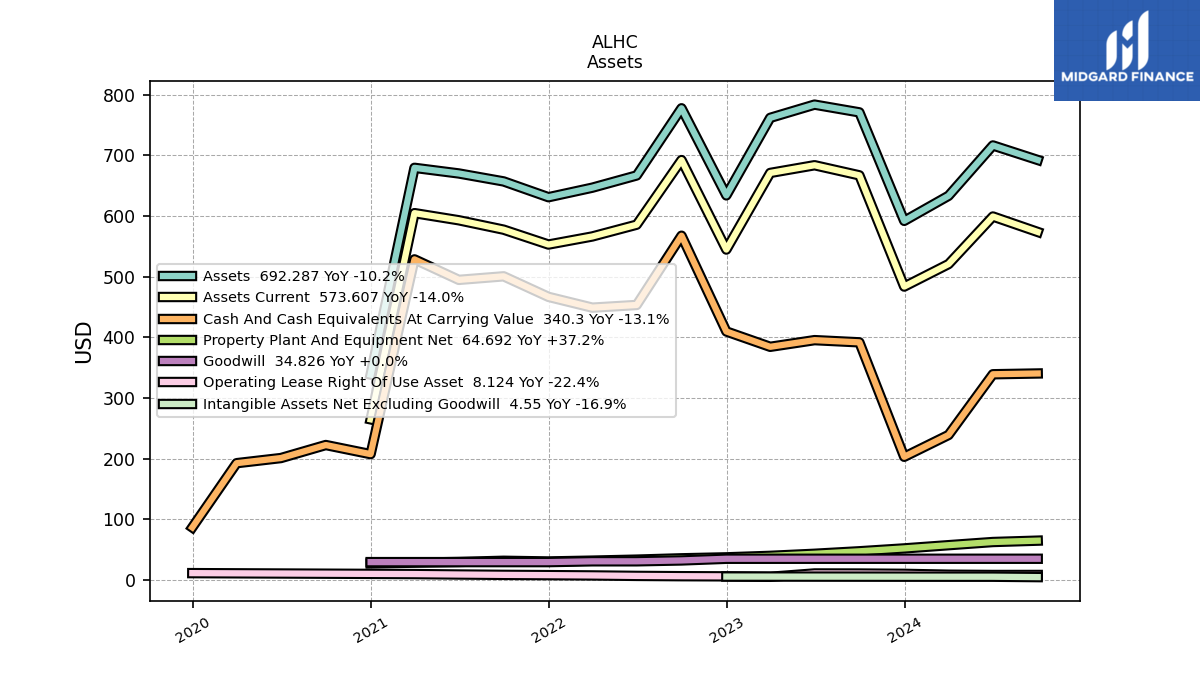
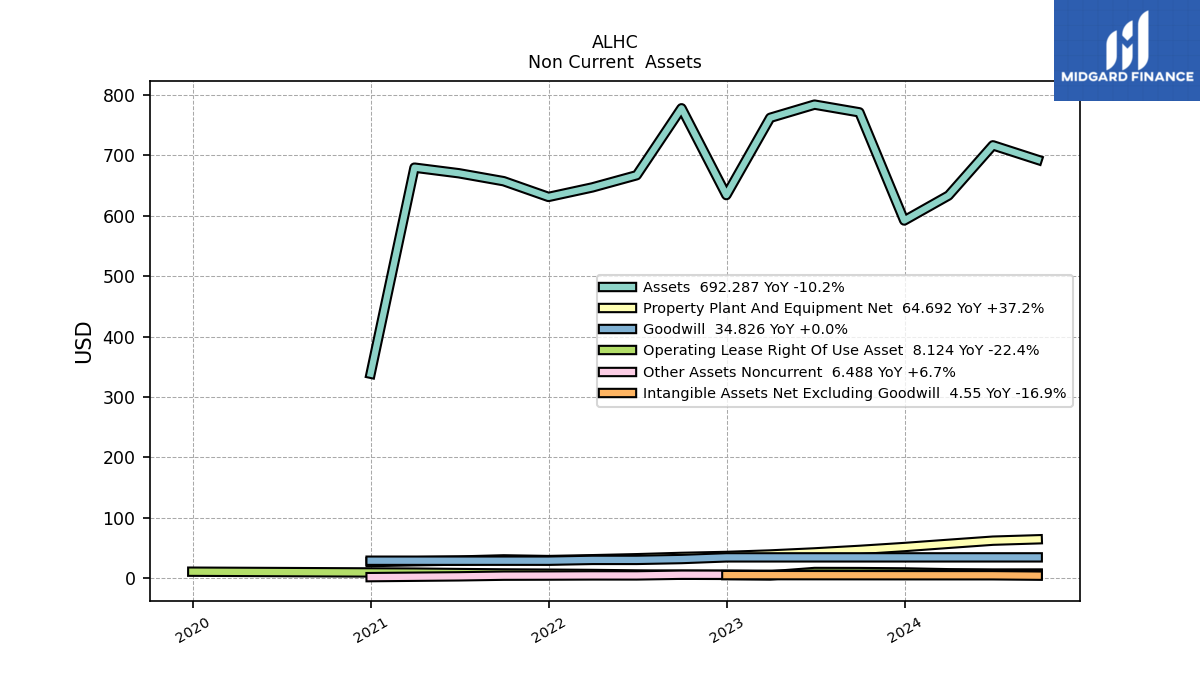
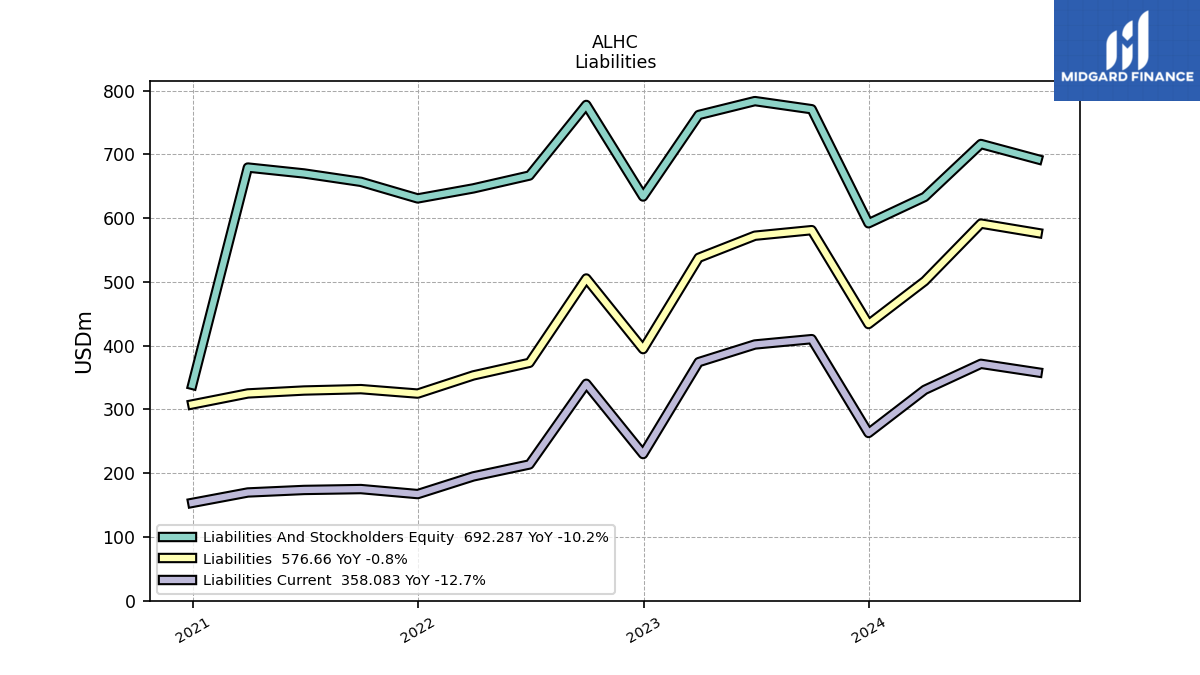
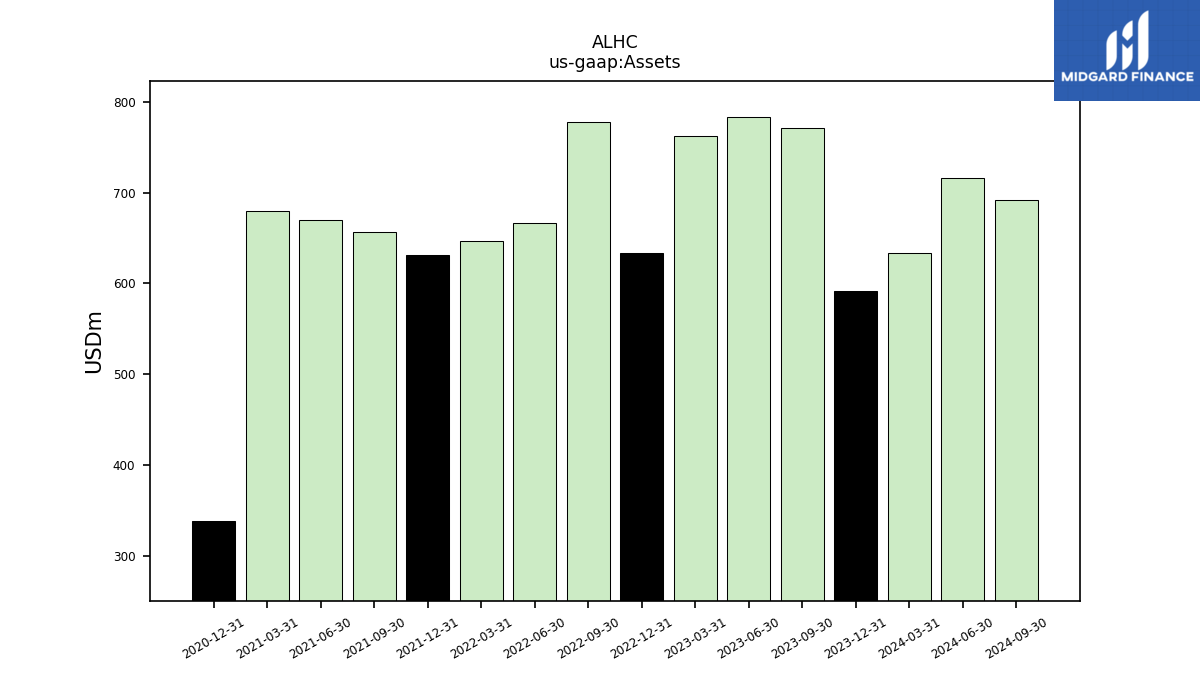
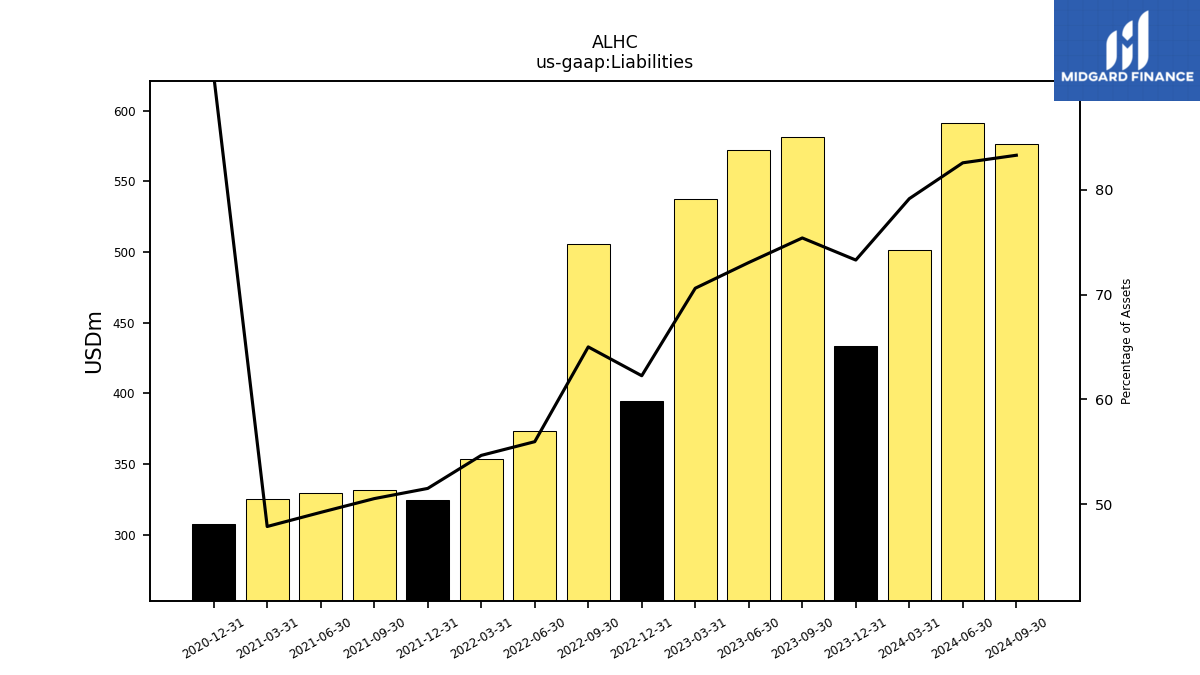
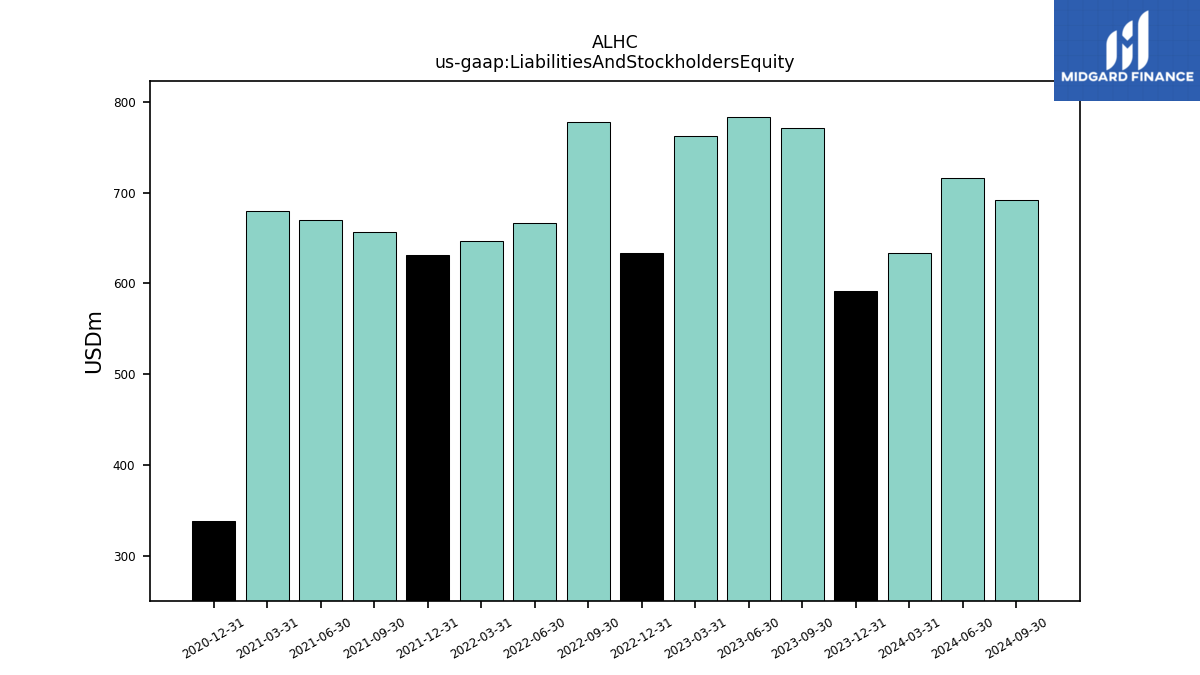
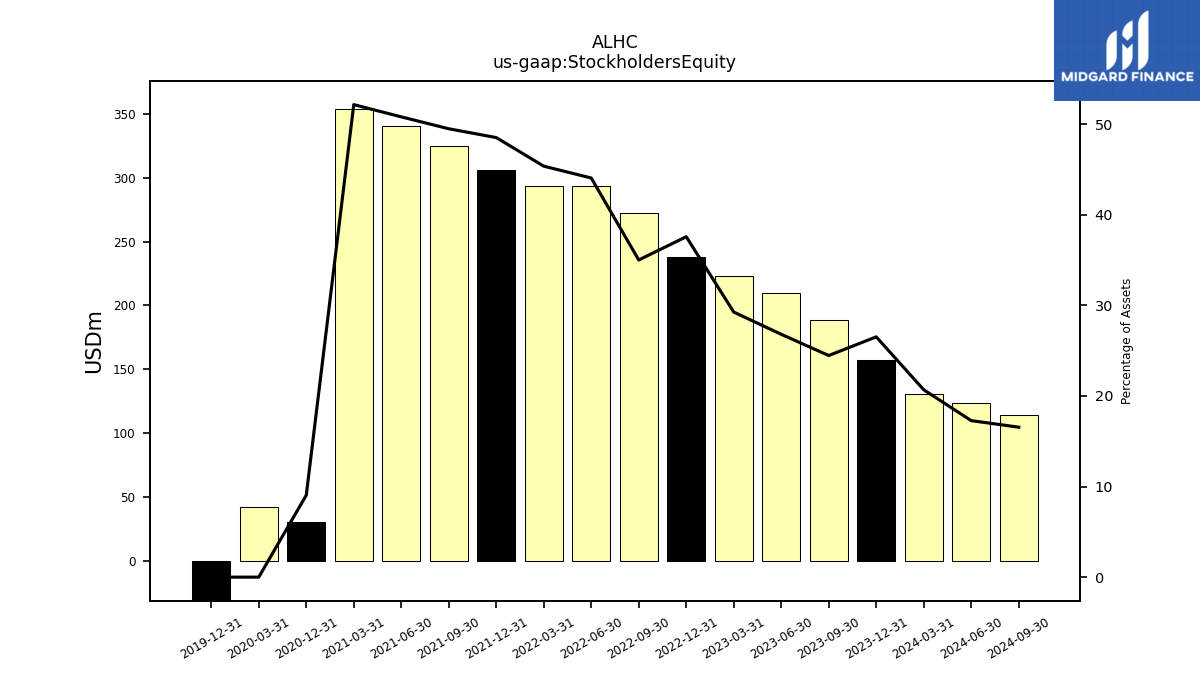
| Assets | 770.79 | 783.55 | 761.75 | 633.86 | 777.54 | 666.78 | 646.61 | 630.89 | 656.93 | 670.06 | 679.34 | 338.50 | NA | NA | NA | |
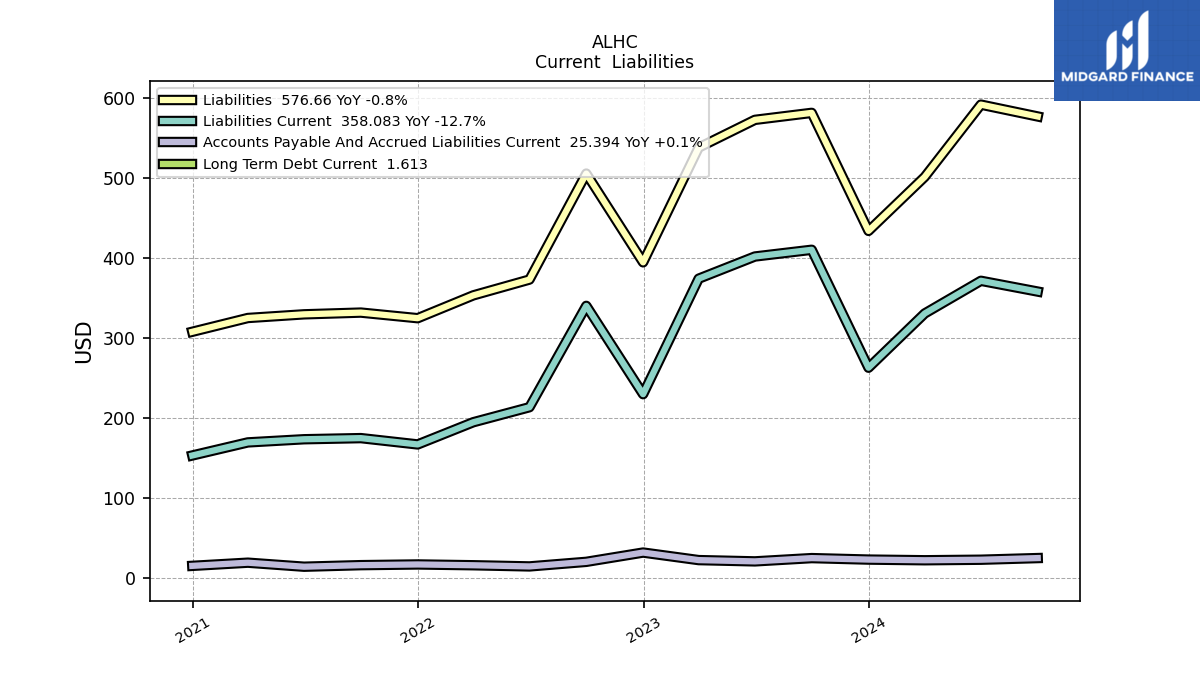
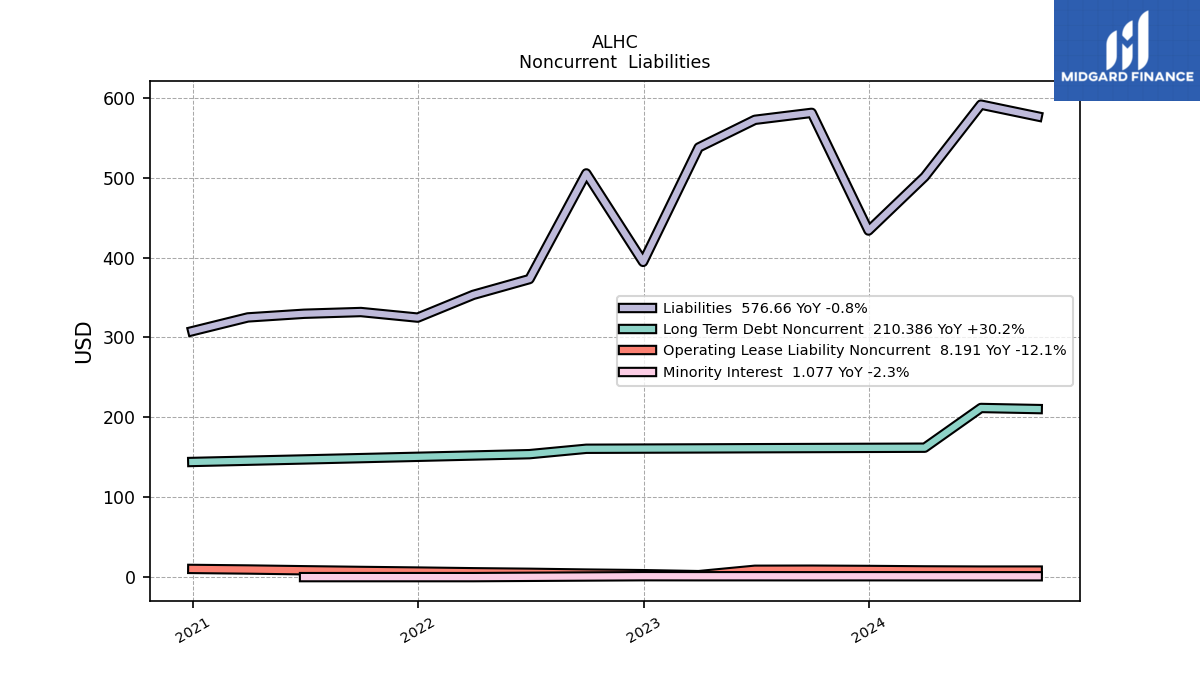
| Liabilities | 581.19 | 572.43 | 537.81 | 394.56 | 505.40 | 373.07 | 353.33 | 324.84 | 331.85 | 329.68 | 325.09 | 307.89 | NA | NA | NA | |
| Liabilities And Stockholders Equity | 770.79 | 783.55 | 761.75 | 633.86 | 777.54 | 666.78 | 646.61 | 630.89 | 656.93 | 670.06 | 679.34 | 338.50 | NA | NA | NA | |
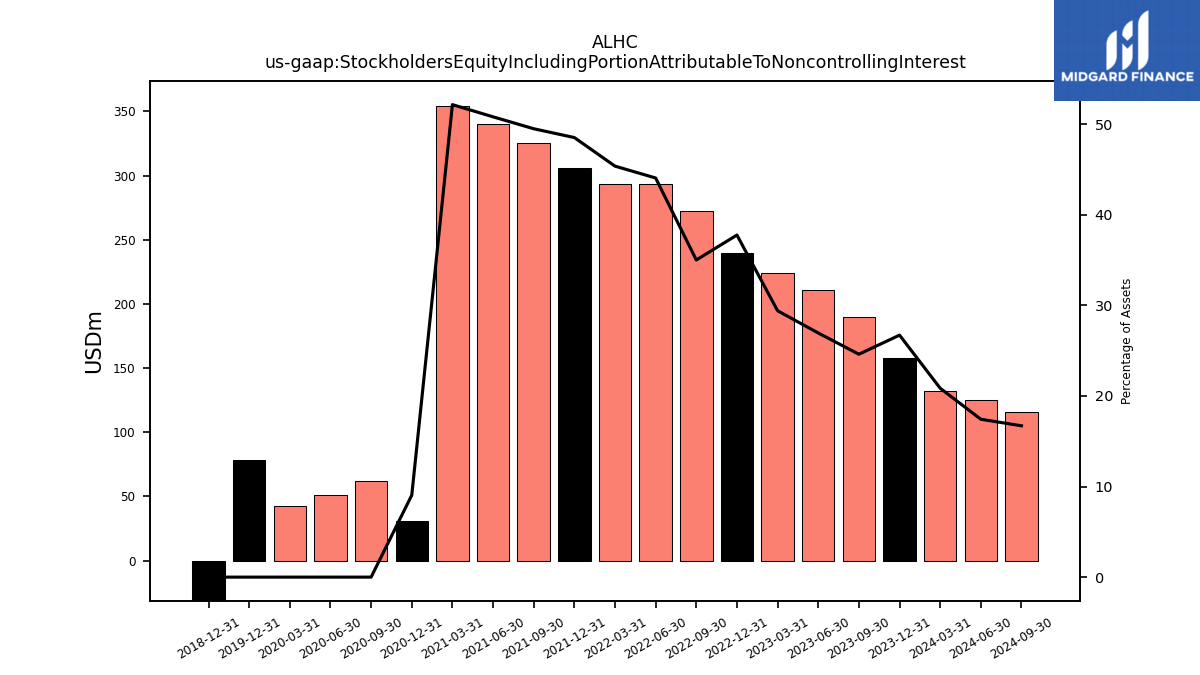
| Stockholders Equity | 188.50 | 209.98 | 222.82 | 238.13 | 272.14 | 293.70 | 293.27 | 306.04 | 325.06 | 340.37 | 354.25 | 30.61 | NA | NA | 42.33 |
| 2023-09-30 | 2023-06-30 | 2023-03-31 | 2022-12-31 | 2022-09-30 | 2022-06-30 | 2022-03-31 | 2021-12-31 | 2021-09-30 | 2021-06-30 | 2021-03-31 | 2020-12-31 | 2020-09-30 | 2020-06-30 | 2020-03-31 | ||
|---|---|---|---|---|---|---|---|---|---|---|---|---|---|---|---|---|
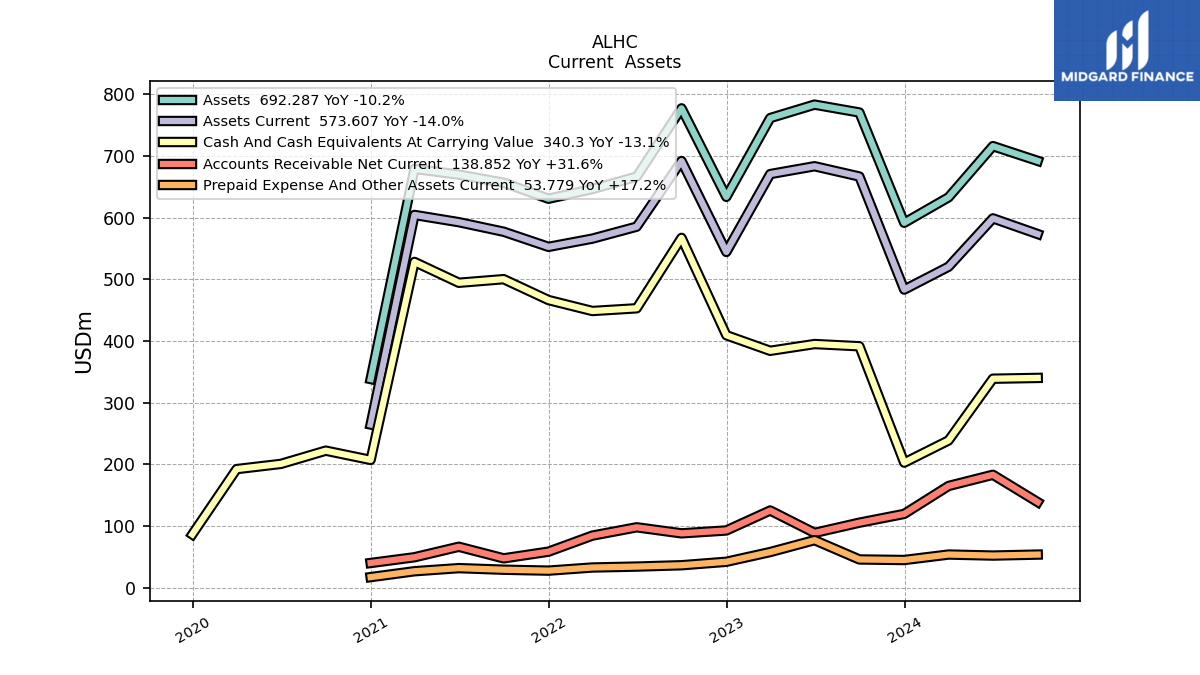
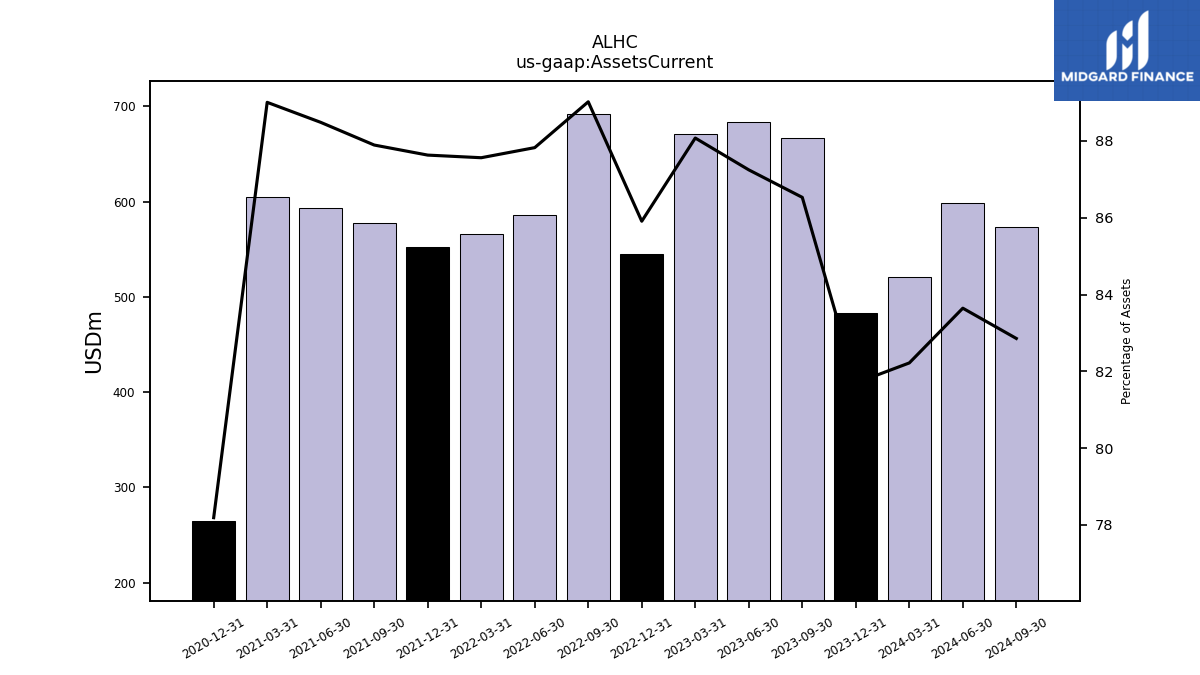
| Assets Current | 666.97 | 683.62 | 670.91 | 544.55 | 692.16 | 585.60 | 566.19 | 552.86 | 577.39 | 592.89 | 604.65 | 264.68 | NA | NA | NA | |
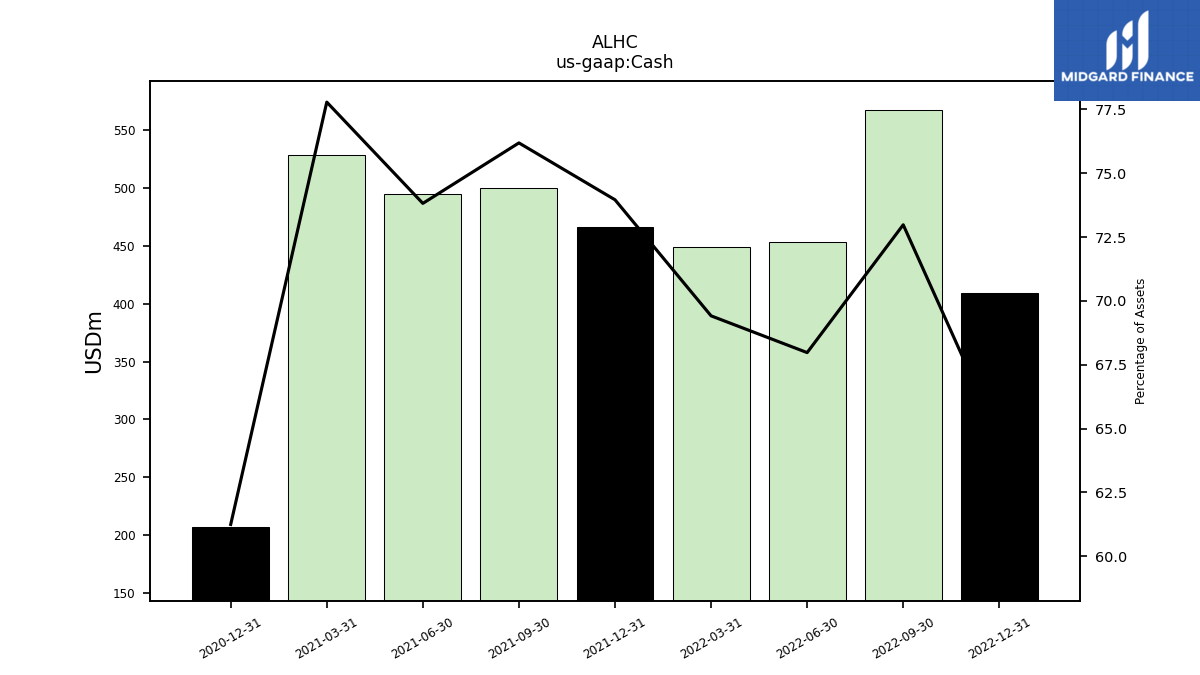
| Cash | NA | NA | NA | 409.55 | 567.45 | 453.23 | 448.83 | 466.60 | 500.49 | 494.62 | 528.42 | 207.31 | NA | NA | NA | |
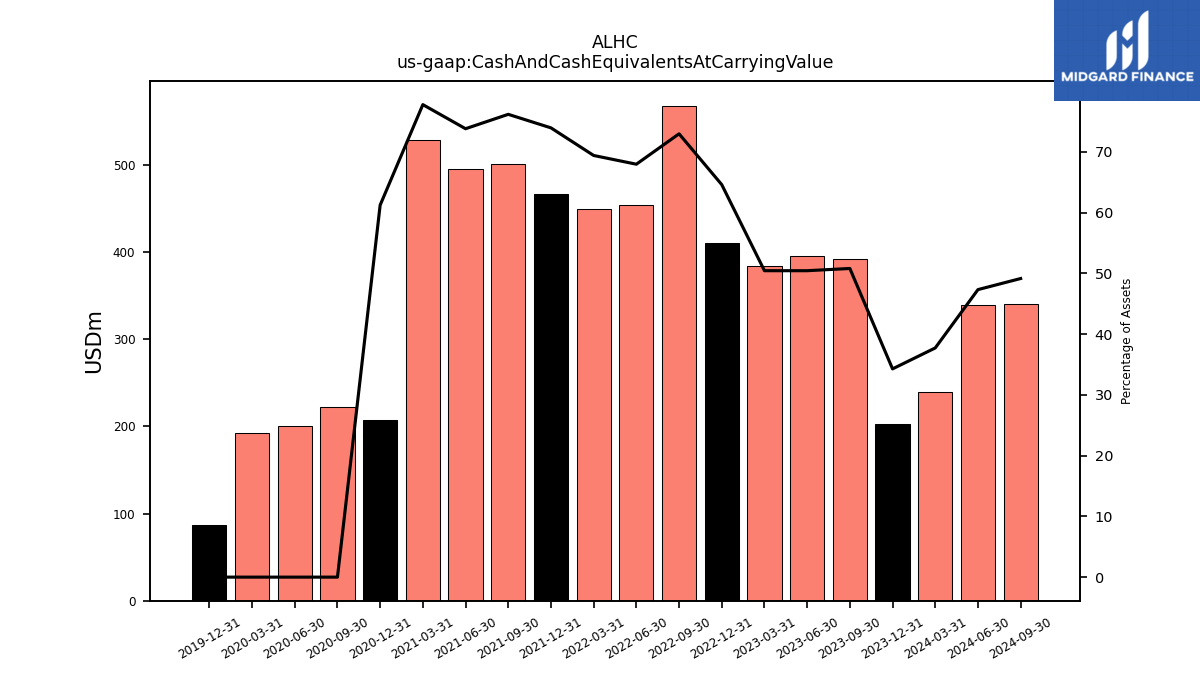
| Cash And Cash Equivalents At Carrying Value | 391.64 | 395.26 | 384.26 | 409.55 | 567.45 | 453.23 | 448.83 | 466.60 | 500.49 | 494.62 | 528.42 | 207.31 | 222.33 | 200.88 | 192.41 | |
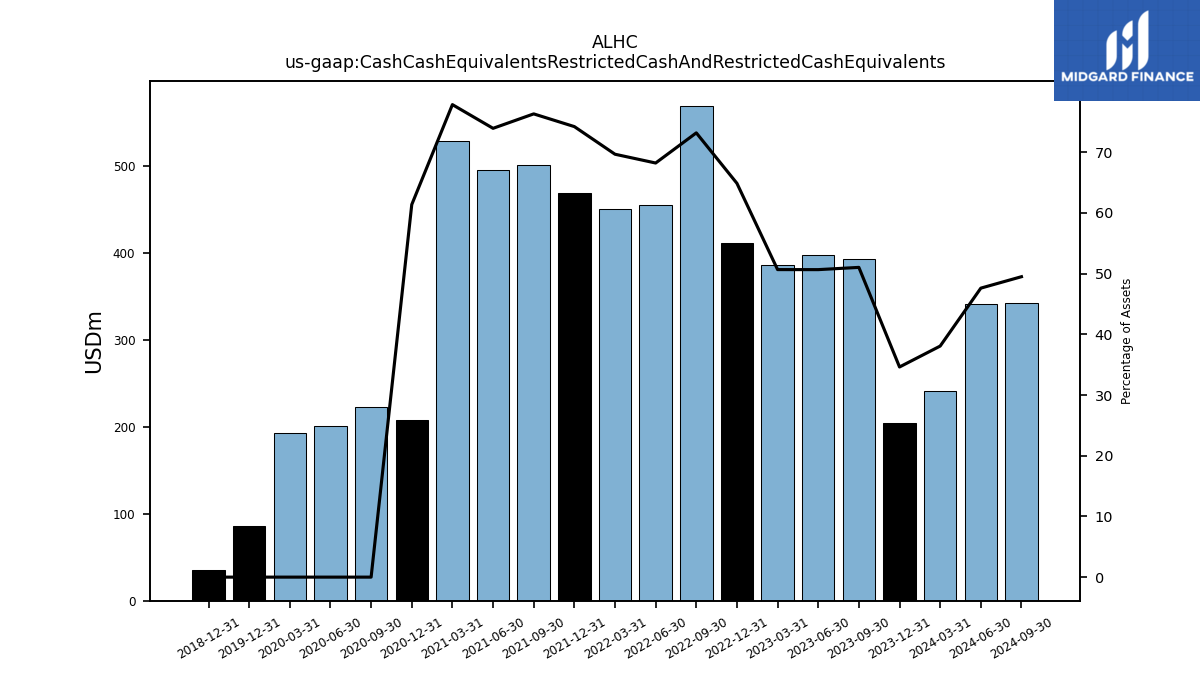
| Cash Cash Equivalents Restricted Cash And Restricted Cash Equivalents | 393.39 | 397.01 | 386.01 | 411.30 | 569.20 | 454.98 | 450.58 | 468.35 | 501.44 | 495.52 | 528.92 | 207.81 | 222.83 | 201.38 | 192.41 | |
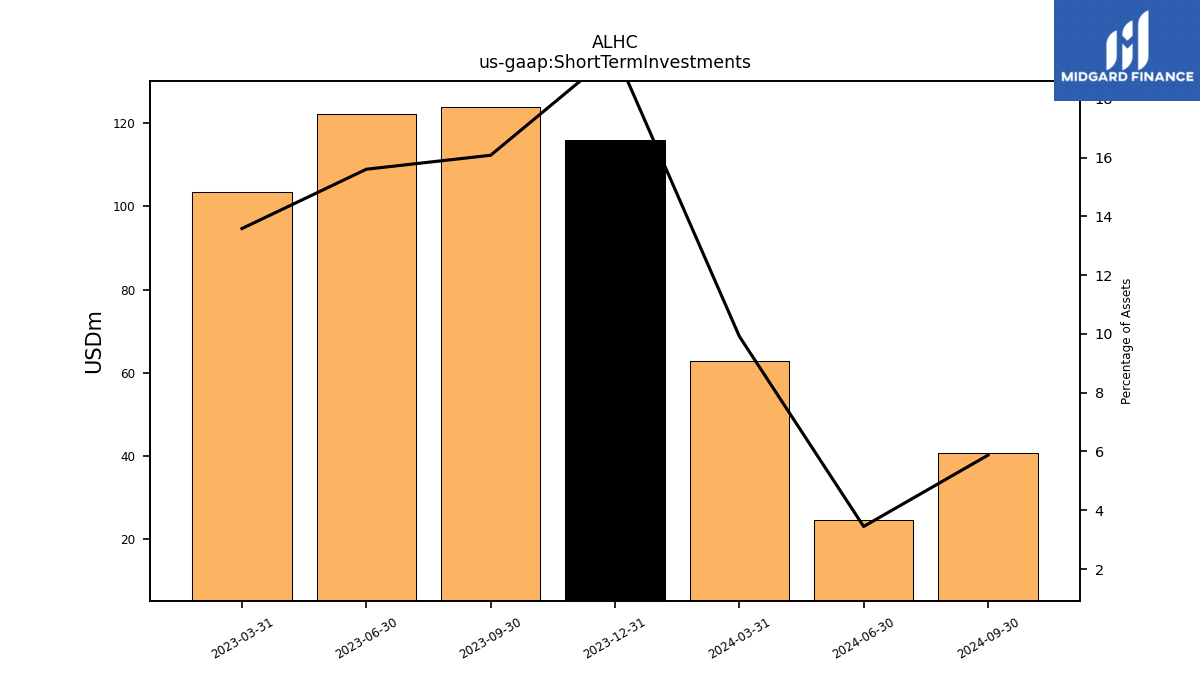
| Short Term Investments | 123.93 | 122.25 | 103.48 | NA | NA | NA | NA | NA | NA | NA | NA | NA | NA | NA | NA | |
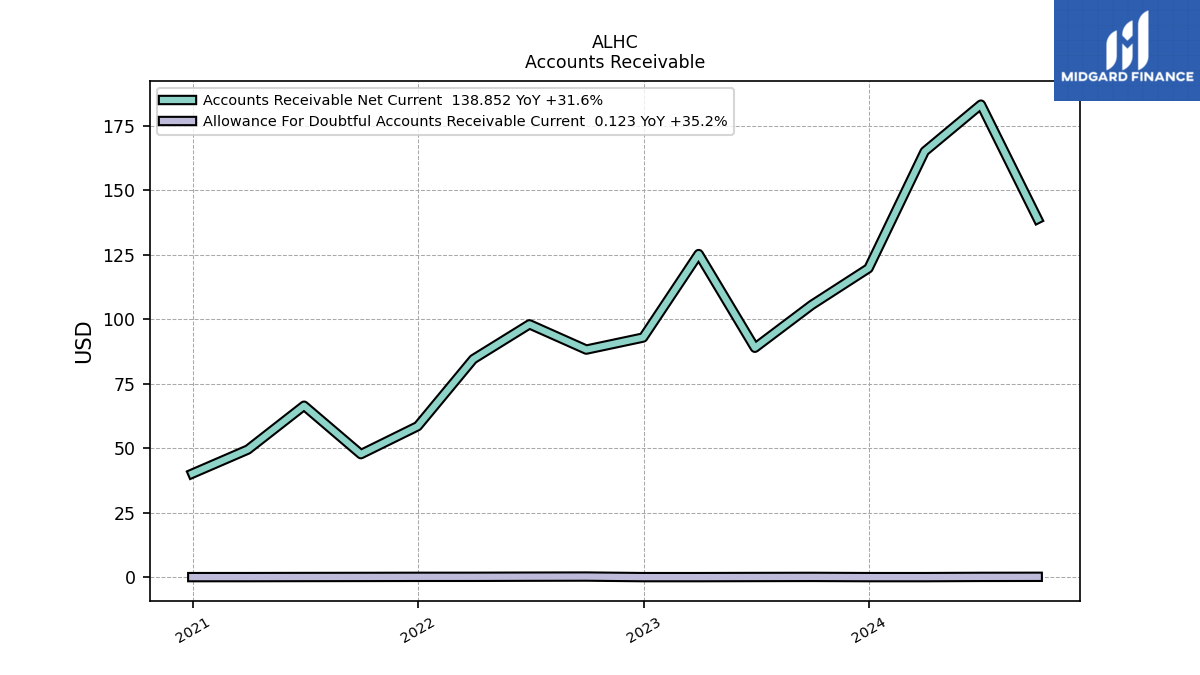
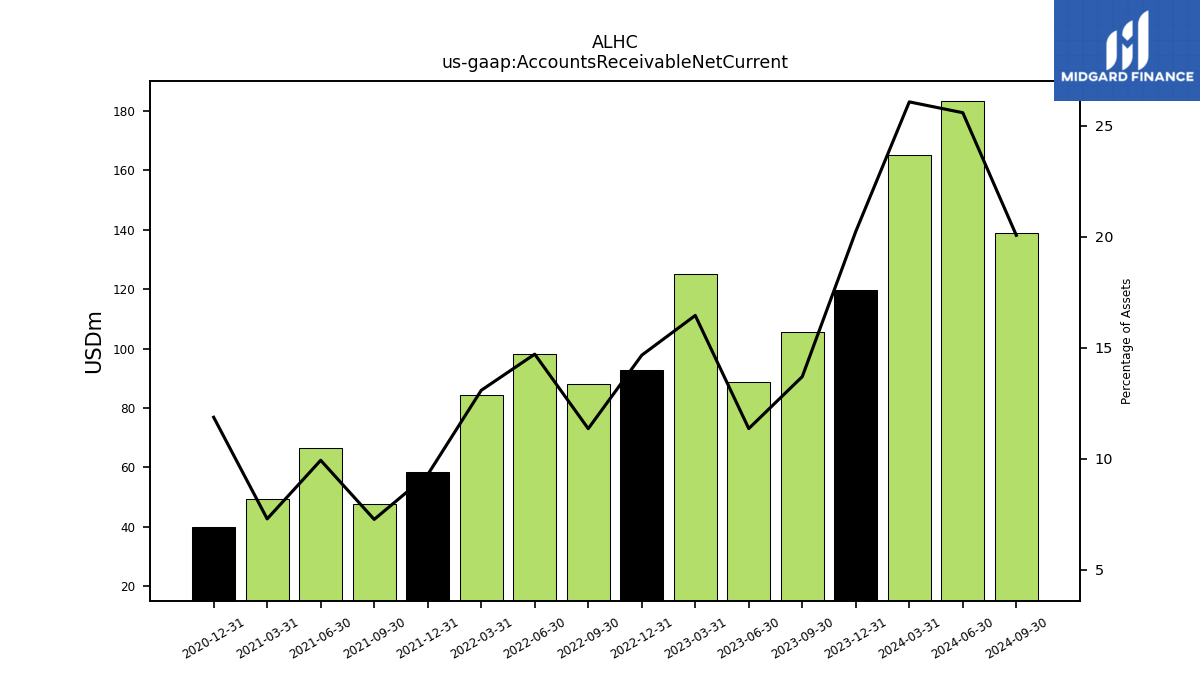
| Accounts Receivable Net Current | 105.52 | 88.92 | 125.28 | 92.89 | 88.22 | 98.03 | 84.53 | 58.51 | 47.67 | 66.47 | 49.46 | 40.14 | NA | NA | NA | |
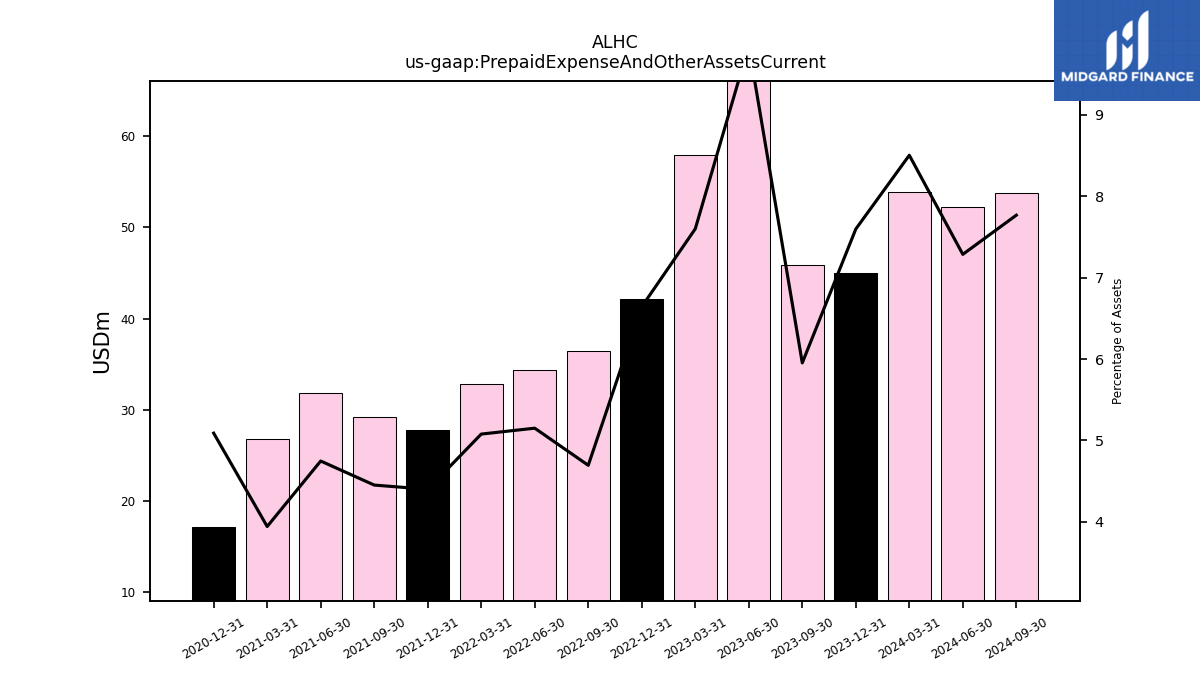
| Prepaid Expense And Other Assets Current | 45.88 | 77.19 | 57.89 | 42.11 | 36.49 | 34.34 | 32.83 | 27.75 | 29.24 | 31.80 | 26.77 | 17.23 | NA | NA | NA |
| 2023-09-30 | 2023-06-30 | 2023-03-31 | 2022-12-31 | 2022-09-30 | 2022-06-30 | 2022-03-31 | 2021-12-31 | 2021-09-30 | 2021-06-30 | 2021-03-31 | 2020-12-31 | 2020-09-30 | 2020-06-30 | 2020-03-31 | ||
|---|---|---|---|---|---|---|---|---|---|---|---|---|---|---|---|---|
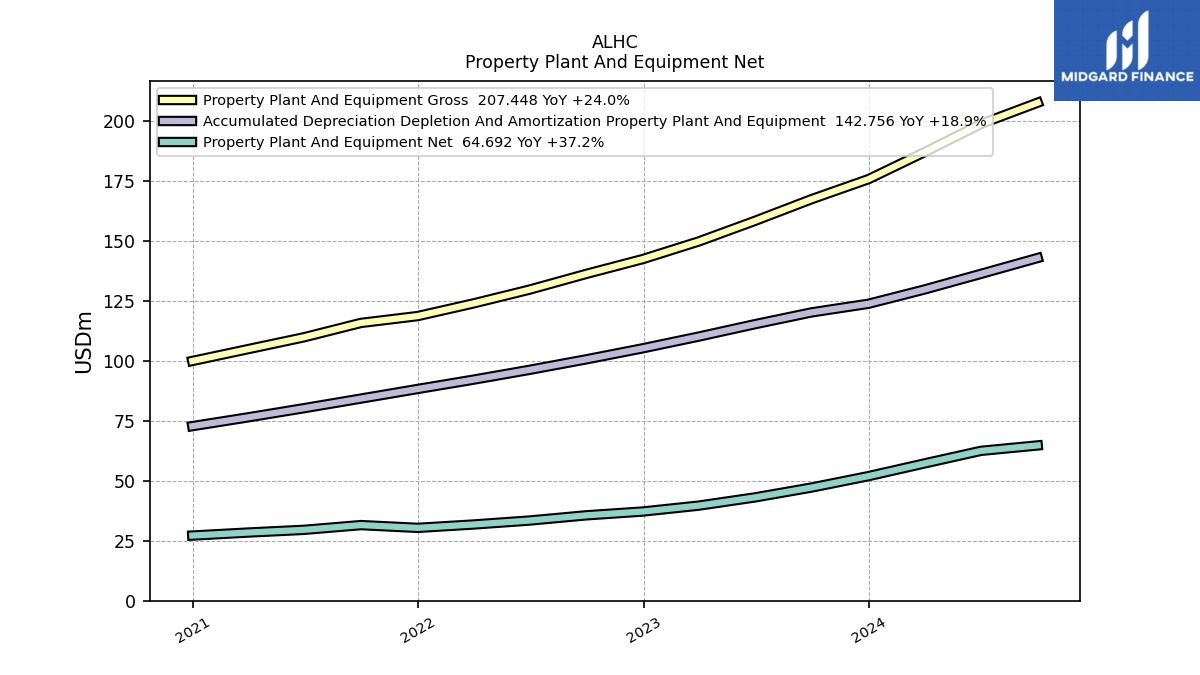
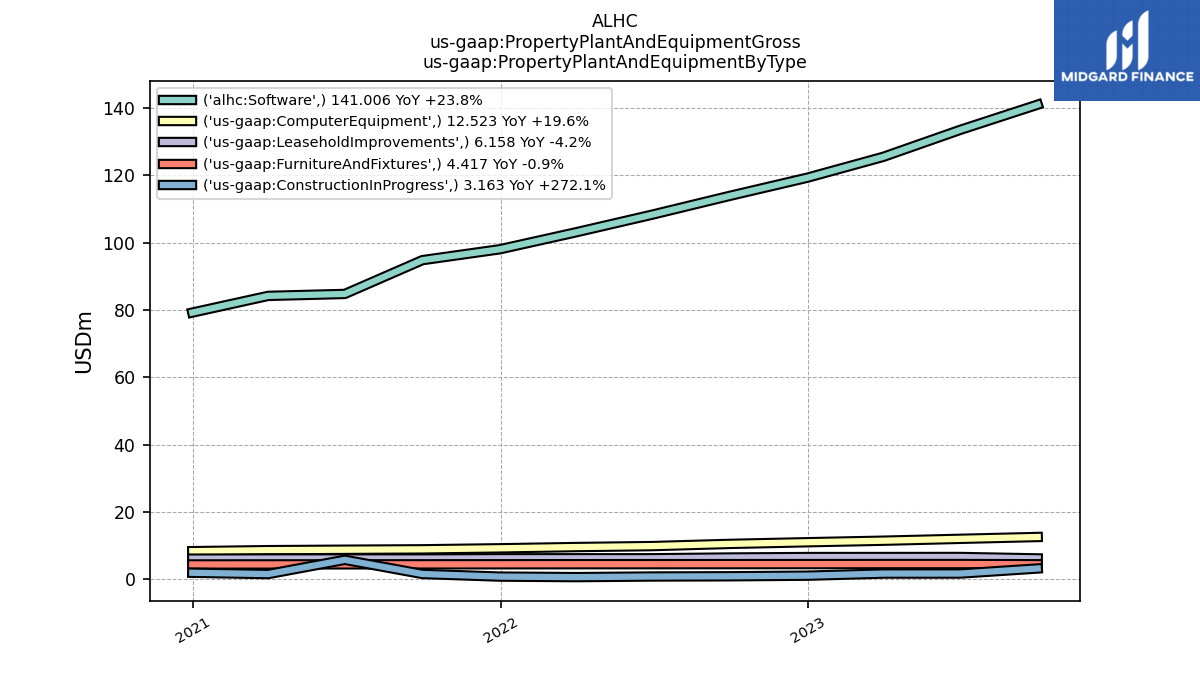
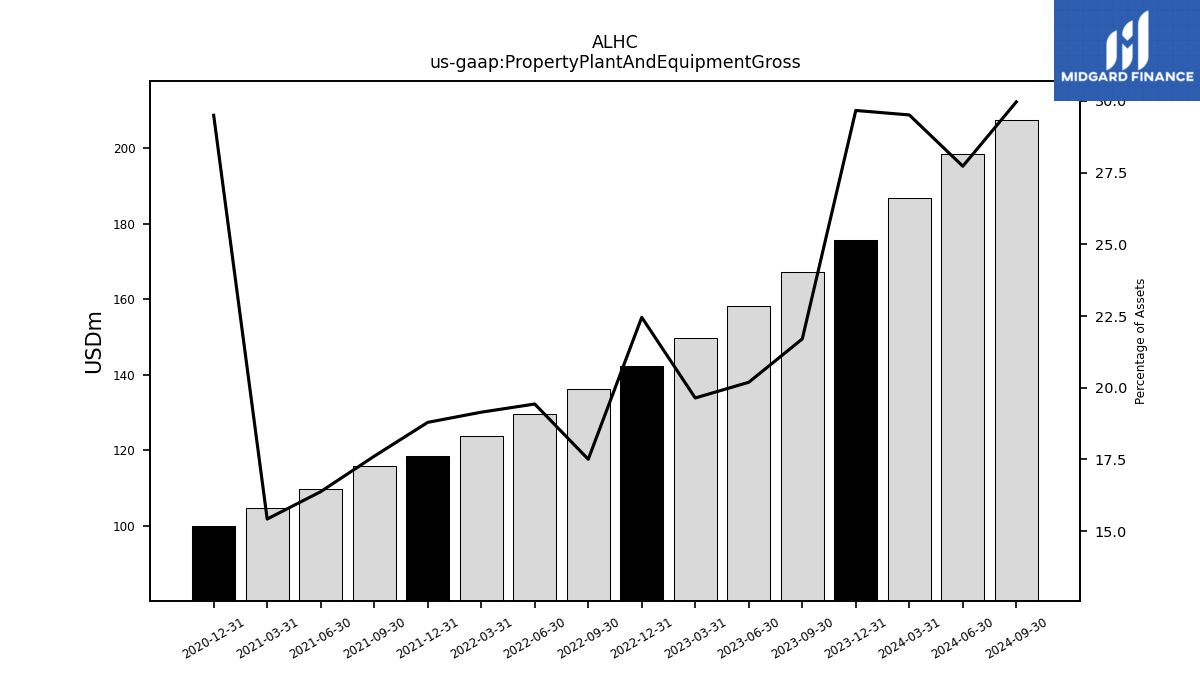
| Property Plant And Equipment Gross | 167.27 | 158.20 | 149.63 | 142.33 | 136.12 | 129.57 | 123.81 | 118.56 | 115.70 | 109.73 | 104.77 | 99.85 | NA | NA | NA | |
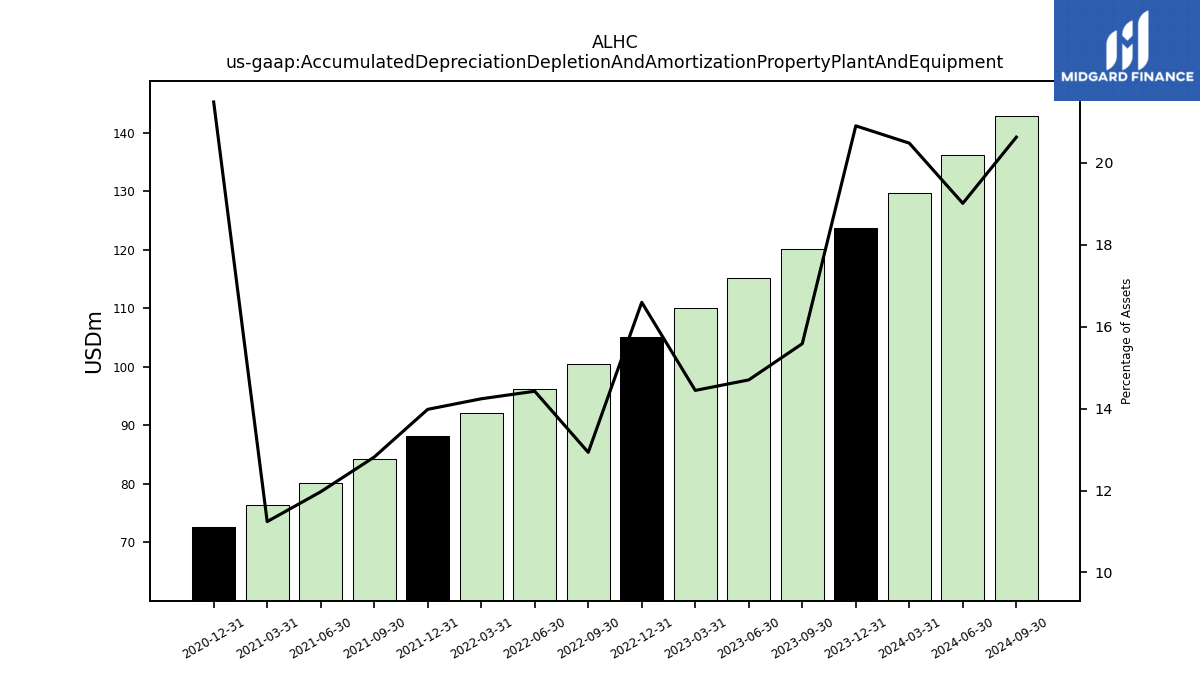
| Accumulated Depreciation Depletion And Amortization Property Plant And Equipment | 120.11 | 115.17 | 110.02 | 105.16 | 100.54 | 96.16 | 92.06 | 88.20 | 84.19 | 80.20 | 76.37 | 72.71 | NA | NA | NA | |
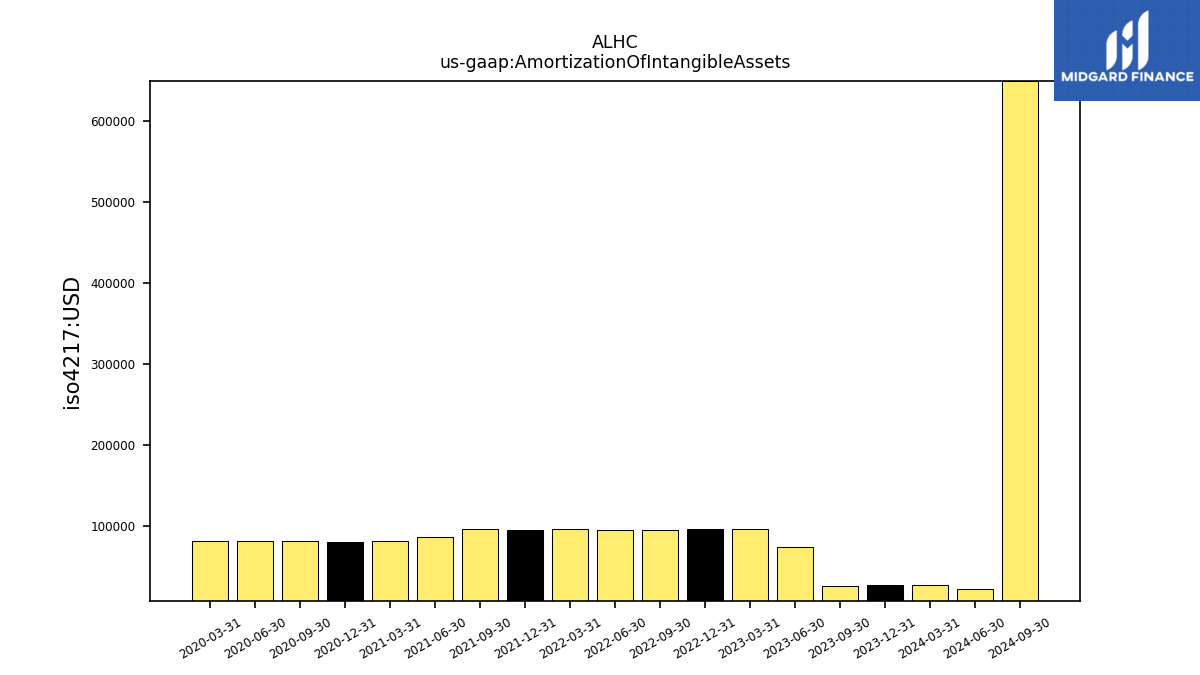
| Amortization Of Intangible Assets | 0.03 | 0.07 | 0.10 | 0.10 | 0.10 | 0.10 | 0.10 | 0.10 | 0.10 | 0.09 | 0.08 | 0.08 | 0.08 | 0.08 | 0.08 | |
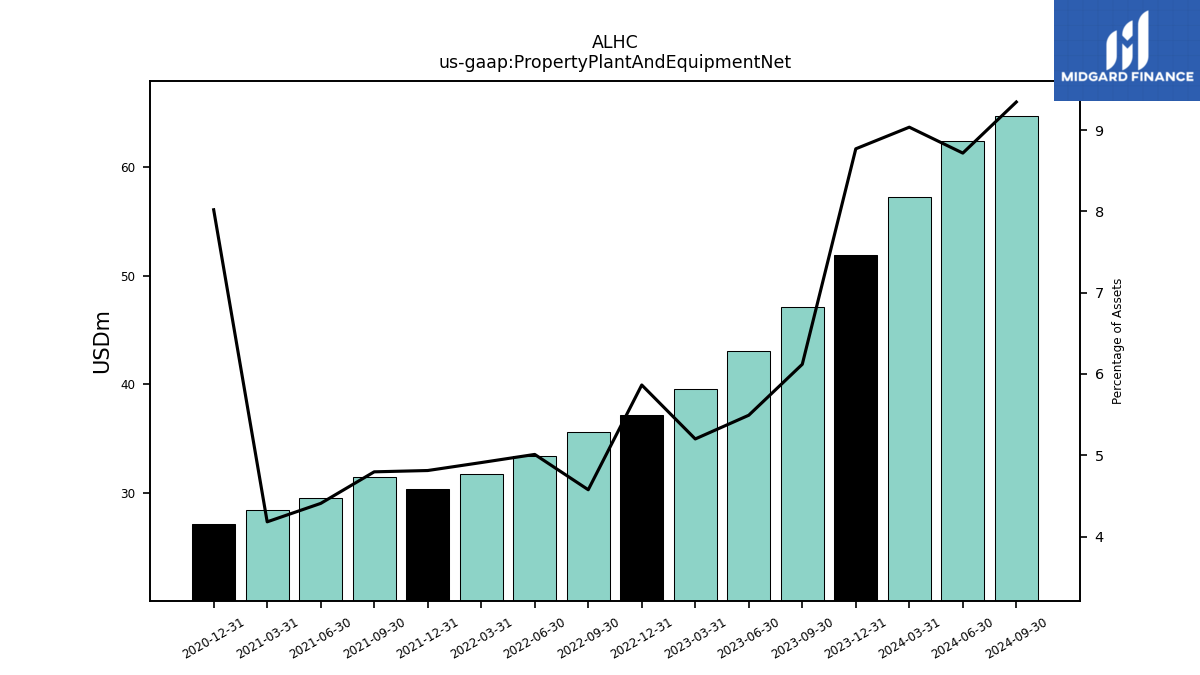
| Property Plant And Equipment Net | 47.16 | 43.03 | 39.61 | 37.17 | 35.58 | 33.41 | 31.75 | 30.36 | 31.50 | 29.53 | 28.40 | 27.14 | NA | NA | NA | |
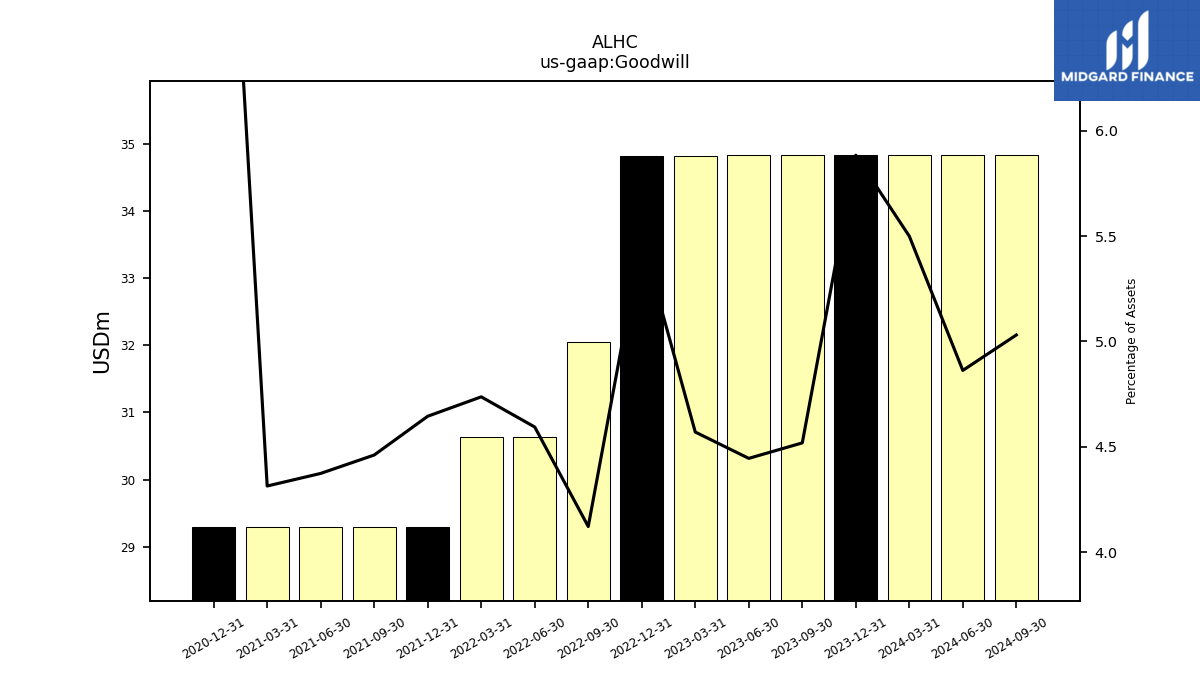
| Goodwill | 34.83 | 34.83 | 34.81 | 34.81 | 32.04 | 30.63 | 30.63 | 29.30 | 29.30 | 29.30 | 29.30 | 29.30 | NA | NA | NA | |
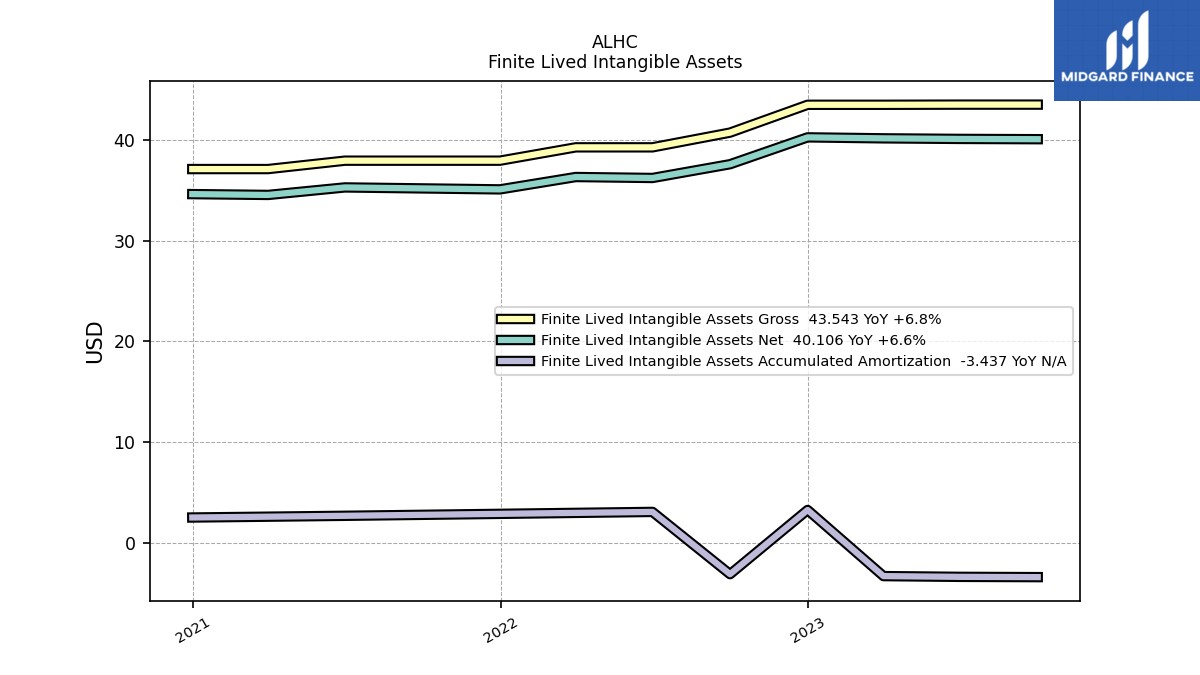
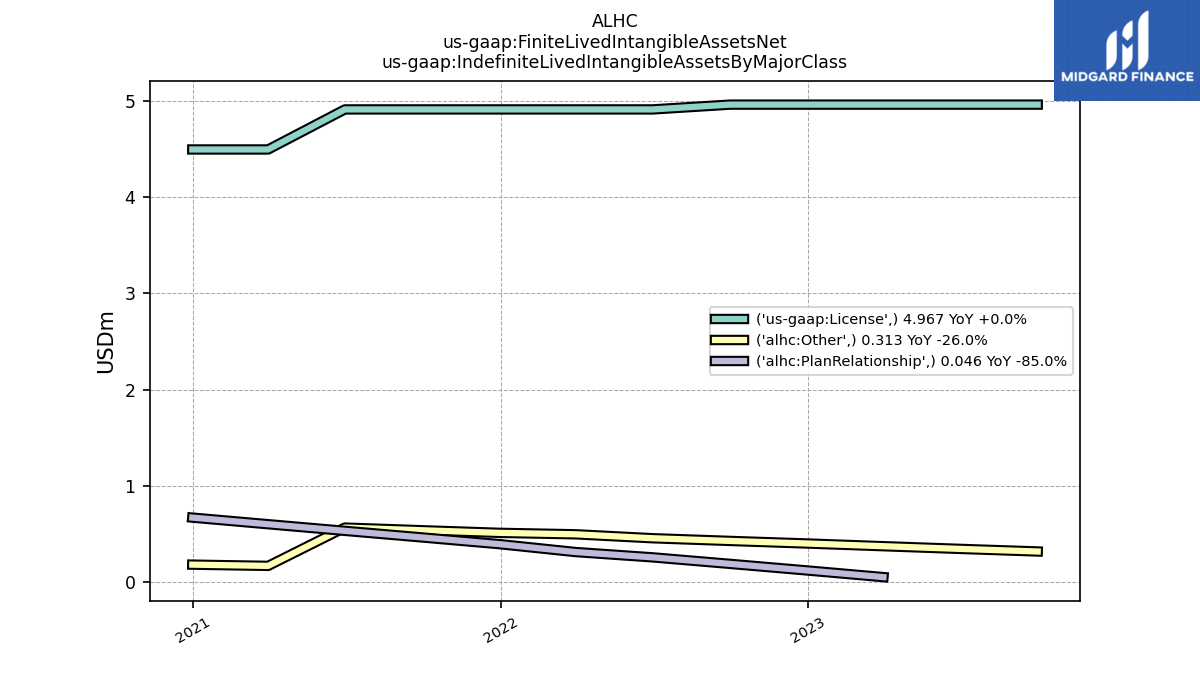
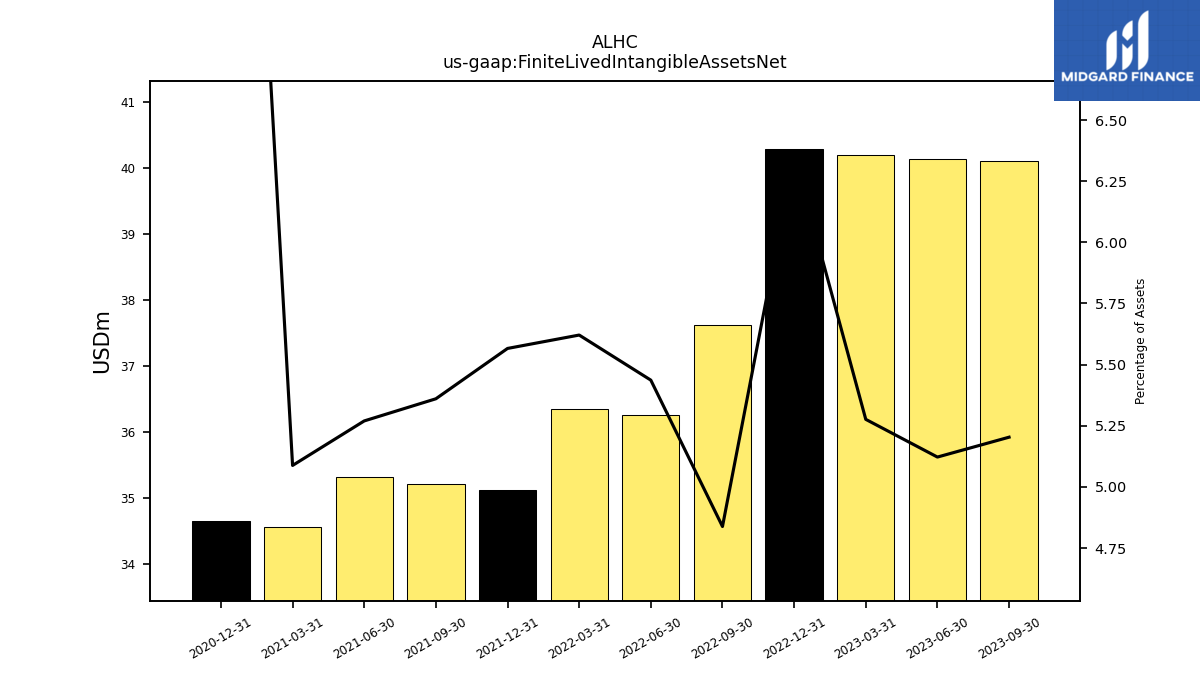
| Finite Lived Intangible Assets Net | 40.11 | 40.13 | 40.19 | 40.29 | 37.62 | 36.25 | 36.34 | 35.12 | 35.21 | 35.31 | 34.56 | 34.65 | NA | NA | NA | |
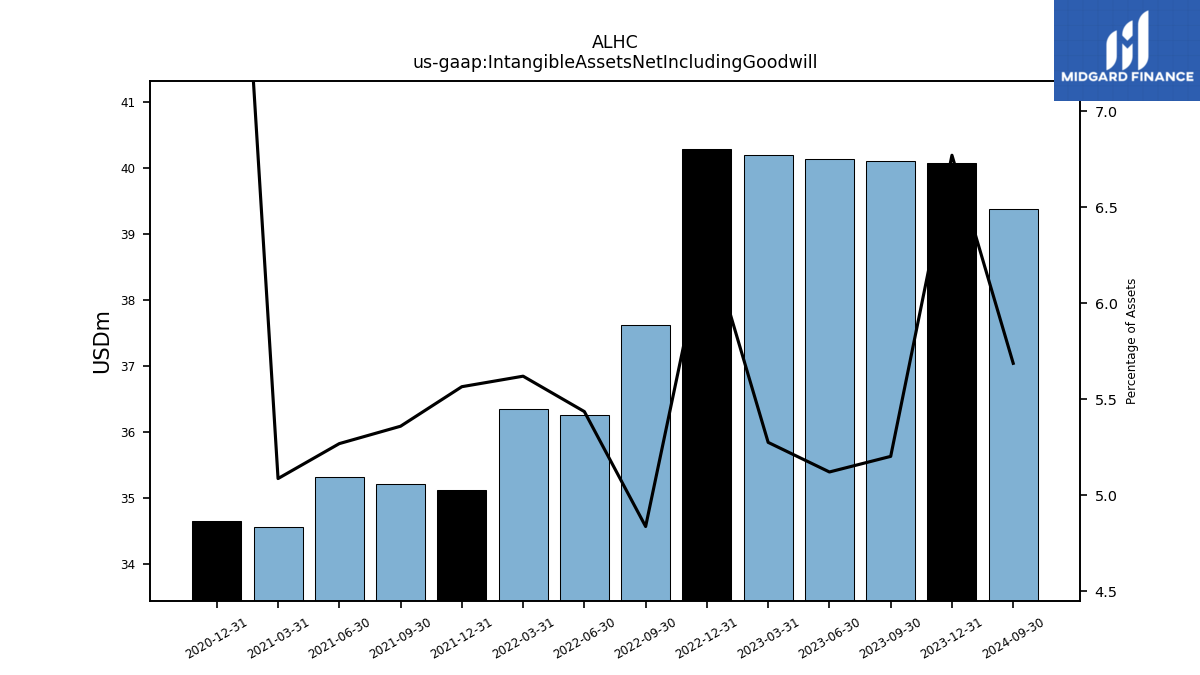
| Intangible Assets Net Including Goodwill | 40.11 | 40.13 | 40.19 | 40.29 | 37.62 | 36.25 | 36.34 | 35.12 | 35.21 | 35.31 | 34.56 | 34.65 | NA | NA | NA | |
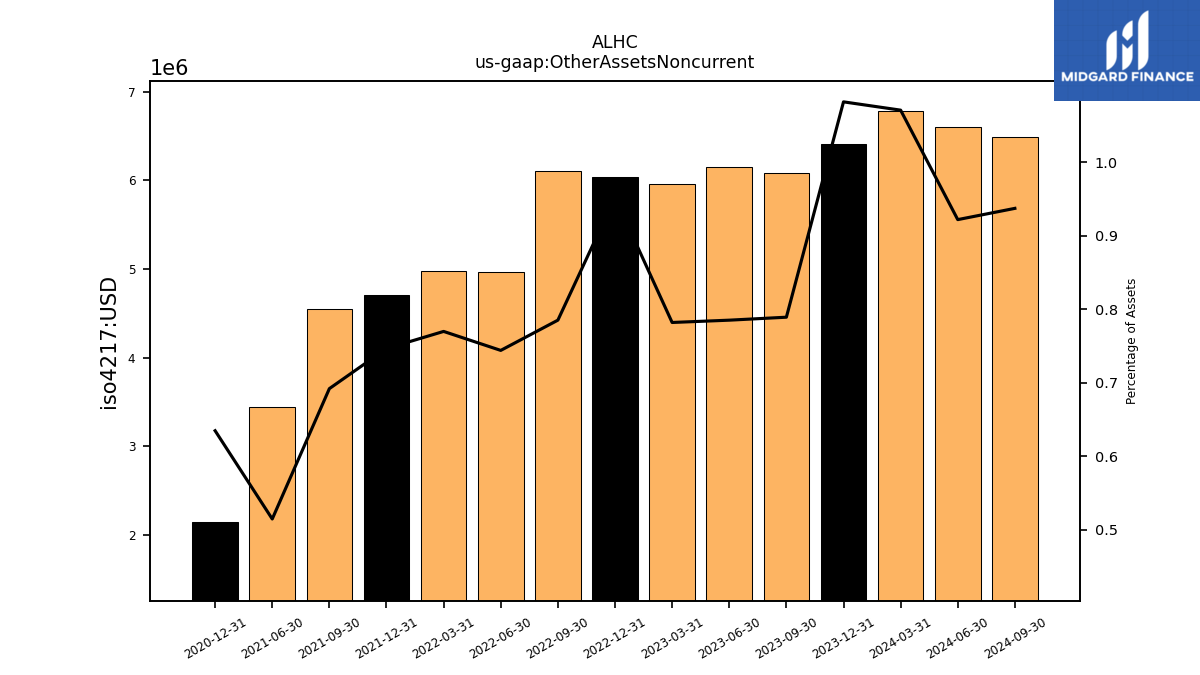
| Other Assets Noncurrent | 6.08 | 6.15 | 5.96 | 6.04 | 6.10 | 4.96 | 4.98 | 4.71 | 4.54 | 3.45 | NA | 2.15 | NA | NA | NA |
| 2023-09-30 | 2023-06-30 | 2023-03-31 | 2022-12-31 | 2022-09-30 | 2022-06-30 | 2022-03-31 | 2021-12-31 | 2021-09-30 | 2021-06-30 | 2021-03-31 | 2020-12-31 | 2020-09-30 | 2020-06-30 | 2020-03-31 | ||
|---|---|---|---|---|---|---|---|---|---|---|---|---|---|---|---|---|
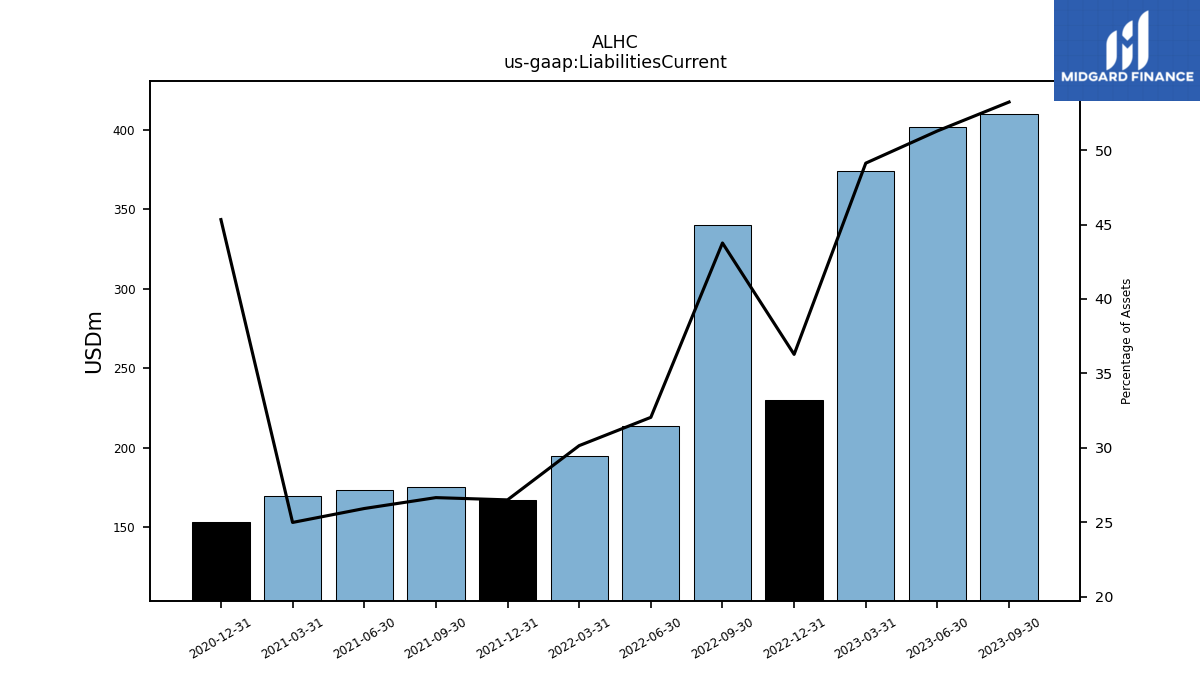
| Liabilities Current | 410.27 | 401.85 | 374.19 | 229.96 | 340.26 | 213.71 | 194.97 | 167.25 | 175.14 | 173.74 | 169.79 | 153.45 | NA | NA | NA | |
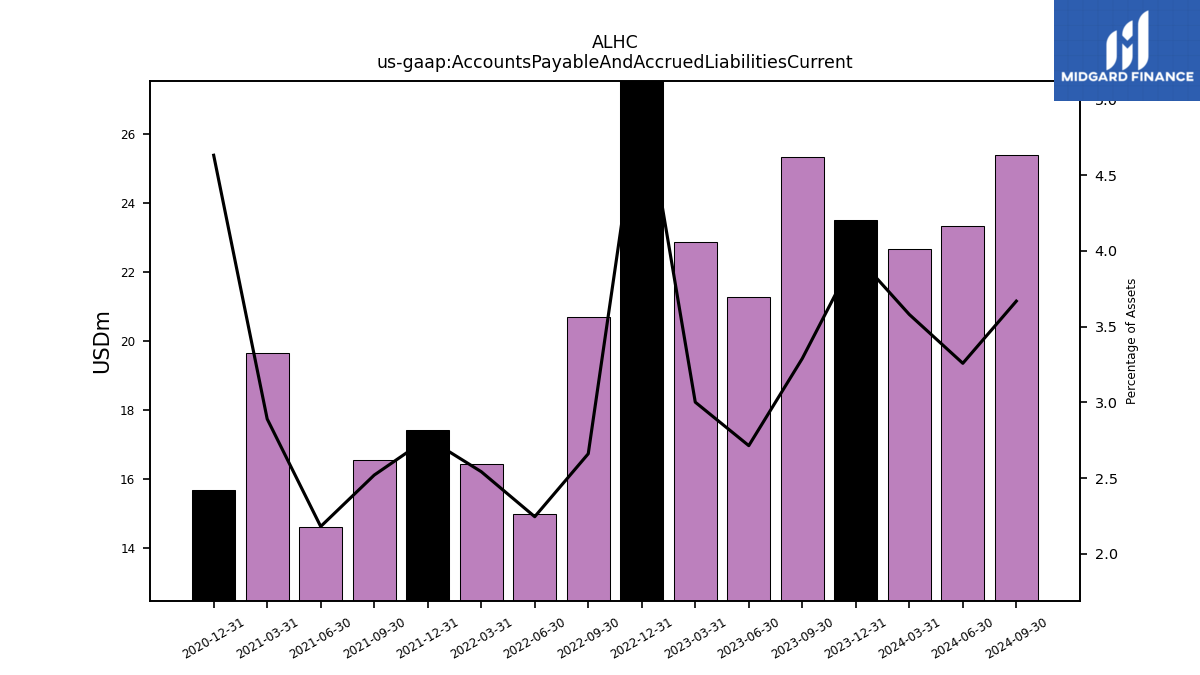
| Accounts Payable And Accrued Liabilities Current | 25.36 | 21.27 | 22.86 | 32.29 | 20.69 | 14.97 | 16.44 | 17.43 | 16.56 | 14.62 | 19.64 | 15.68 | NA | NA | NA | |
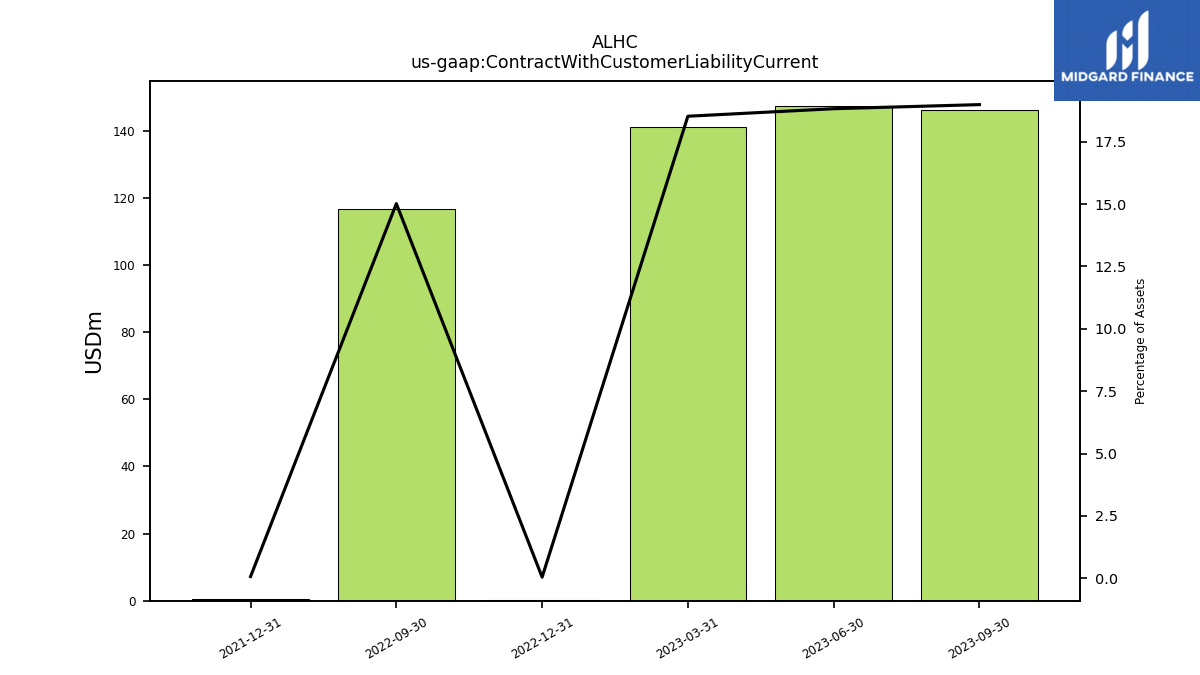
| Contract With Customer Liability Current | 146.34 | 147.48 | 141.08 | 0.31 | 116.77 | NA | NA | 0.47 | NA | NA | NA | NA | NA | NA | NA |
| 2023-09-30 | 2023-06-30 | 2023-03-31 | 2022-12-31 | 2022-09-30 | 2022-06-30 | 2022-03-31 | 2021-12-31 | 2021-09-30 | 2021-06-30 | 2021-03-31 | 2020-12-31 | 2020-09-30 | 2020-06-30 | 2020-03-31 | ||
|---|---|---|---|---|---|---|---|---|---|---|---|---|---|---|---|---|
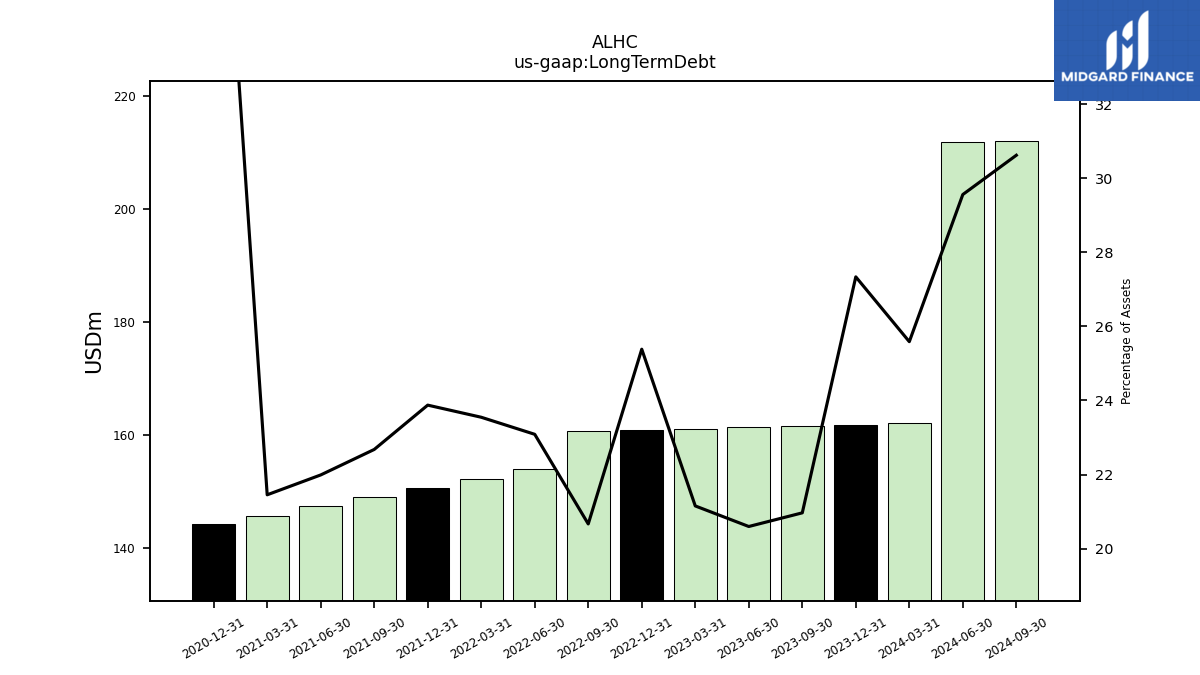
| Long Term Debt | 161.59 | 161.38 | 161.12 | 160.90 | 160.68 | 153.93 | 152.26 | 150.62 | 148.97 | 147.33 | 145.73 | 144.17 | NA | NA | NA | |
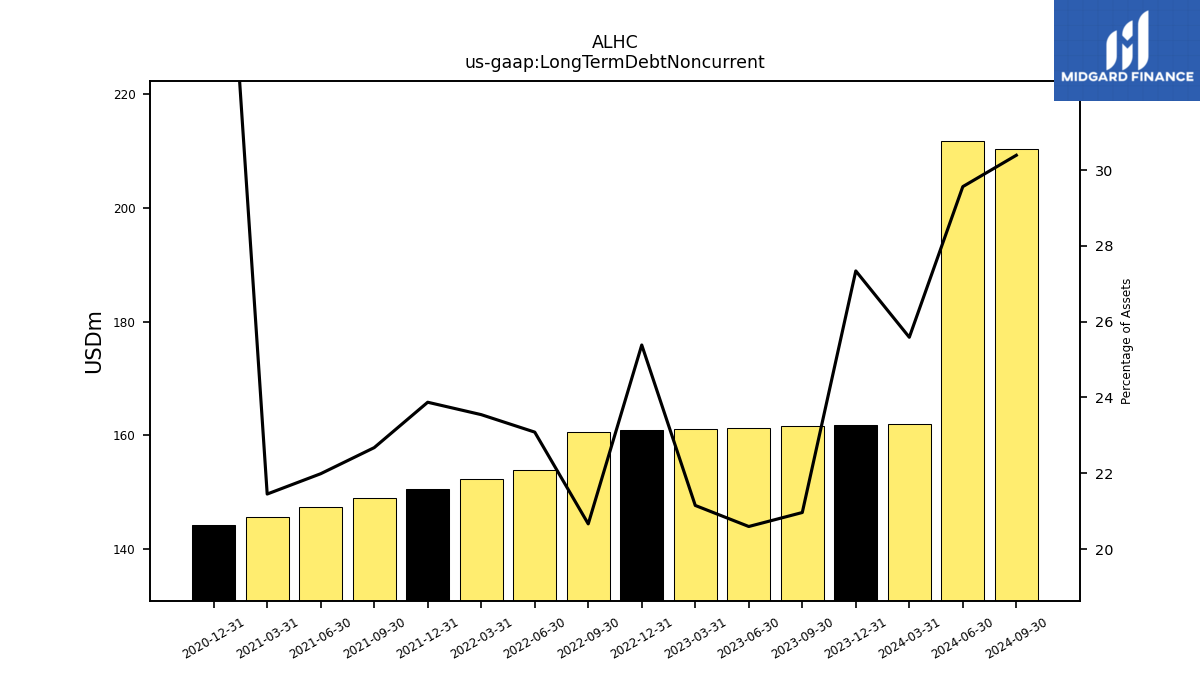
| Long Term Debt Noncurrent | 161.59 | 161.38 | 161.12 | 160.90 | 160.68 | 153.93 | 152.26 | 150.62 | 148.97 | 147.33 | 145.73 | 144.17 | NA | NA | NA | |
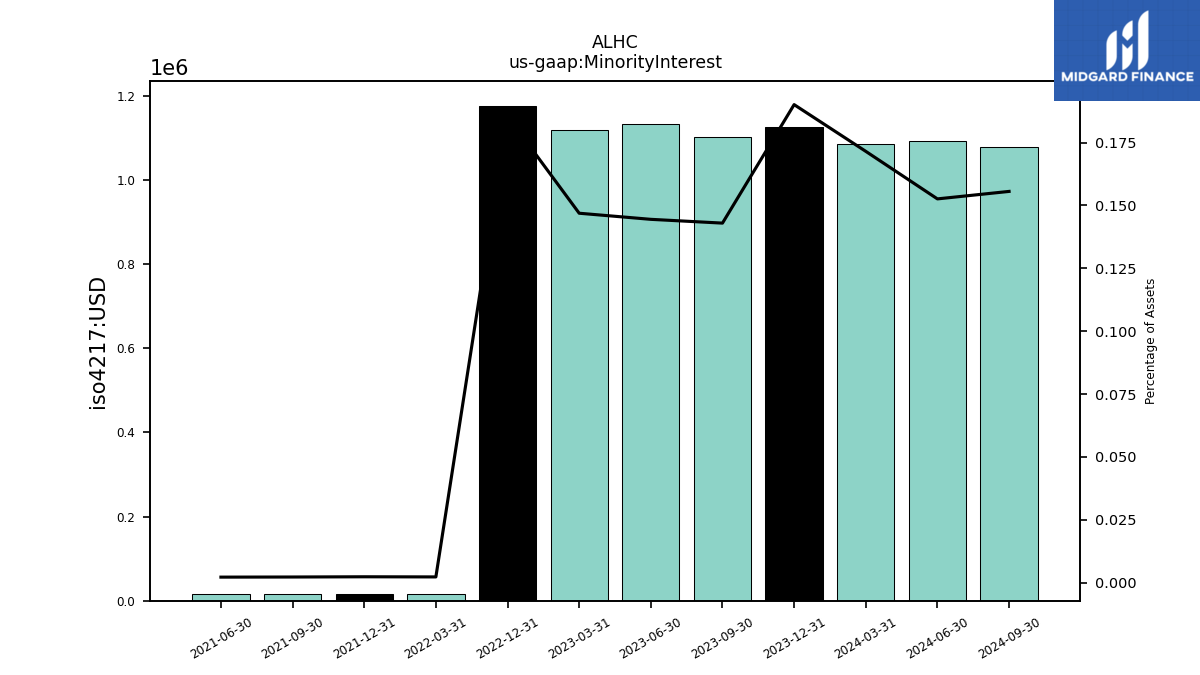
| Minority Interest | 1.10 | 1.13 | 1.12 | 1.18 | NA | NA | 0.01 | 0.01 | 0.01 | 0.01 | NA | NA | NA | NA | NA | |
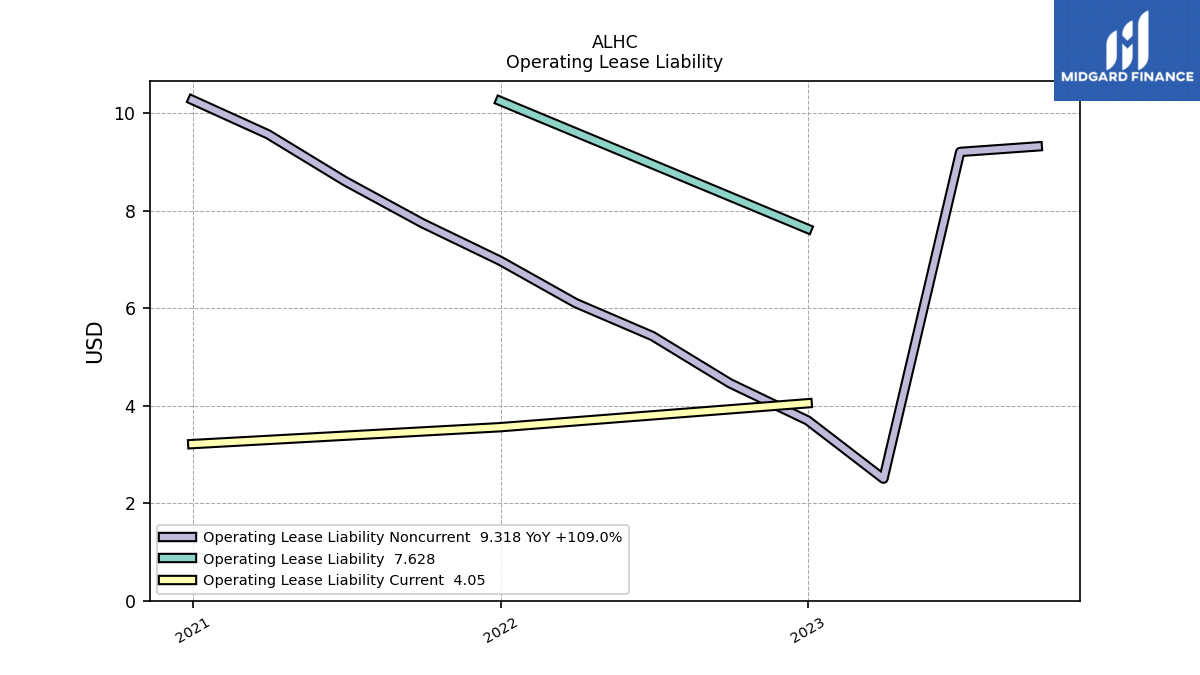
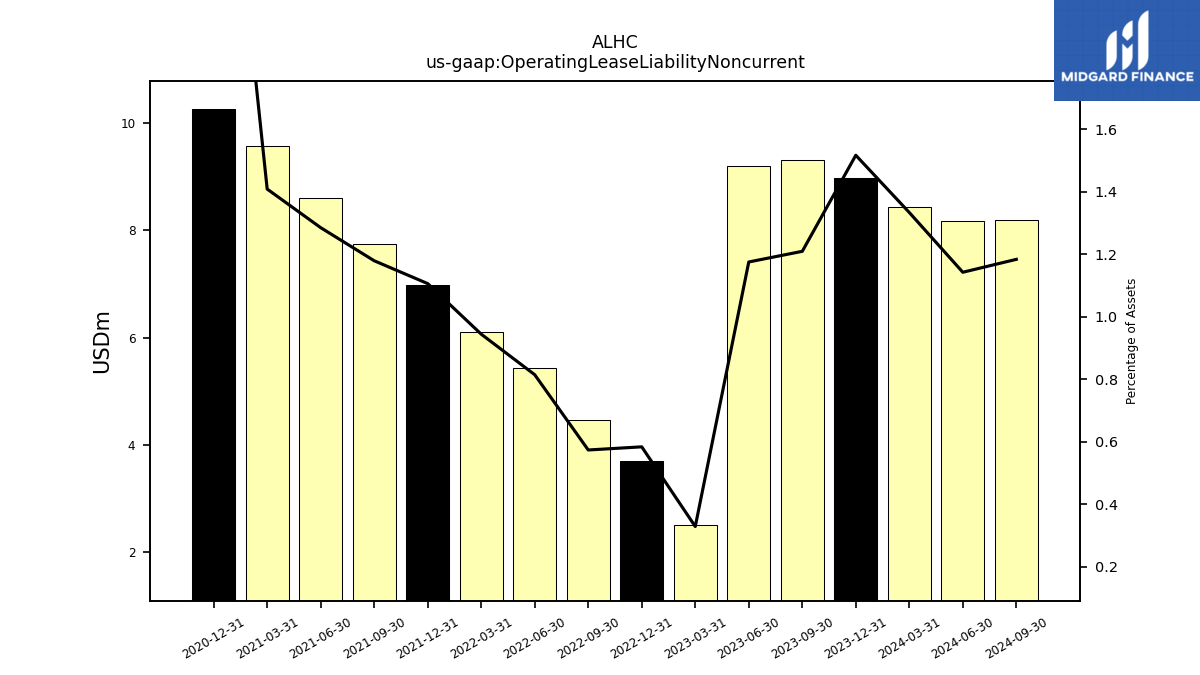
| Operating Lease Liability Noncurrent | 9.32 | 9.21 | 2.50 | 3.70 | 4.46 | 5.43 | 6.10 | 6.97 | 7.74 | 8.61 | 9.56 | 10.27 | NA | NA | NA |
| 2023-09-30 | 2023-06-30 | 2023-03-31 | 2022-12-31 | 2022-09-30 | 2022-06-30 | 2022-03-31 | 2021-12-31 | 2021-09-30 | 2021-06-30 | 2021-03-31 | 2020-12-31 | 2020-09-30 | 2020-06-30 | 2020-03-31 | ||
|---|---|---|---|---|---|---|---|---|---|---|---|---|---|---|---|---|
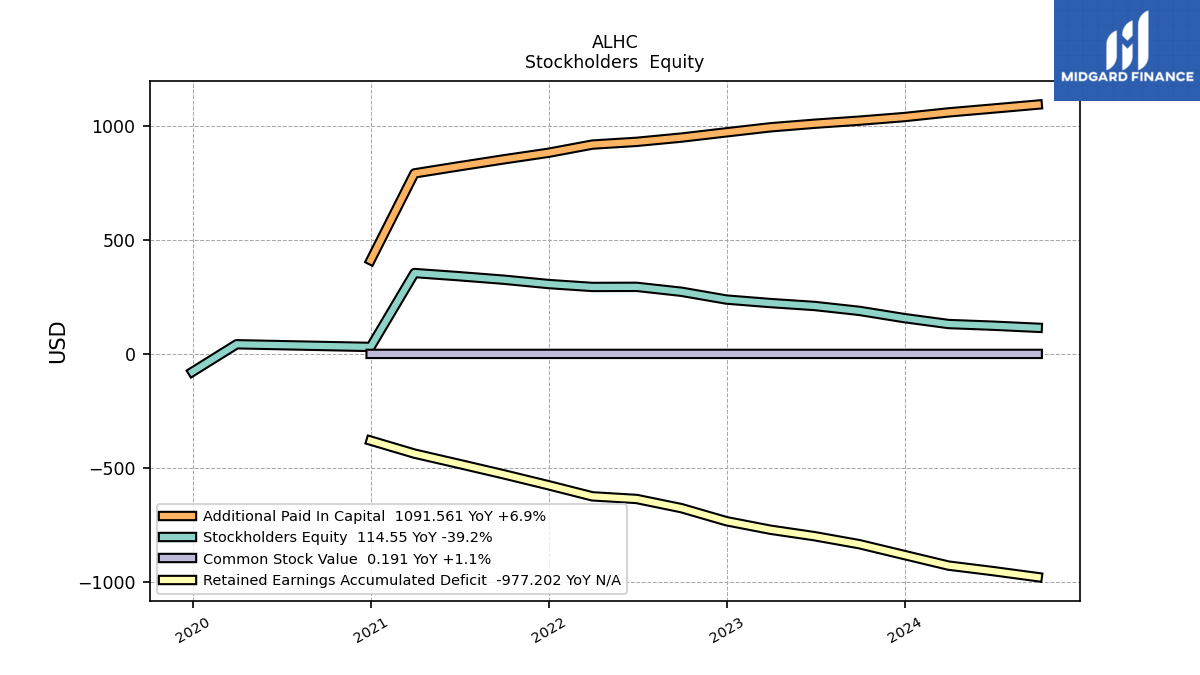
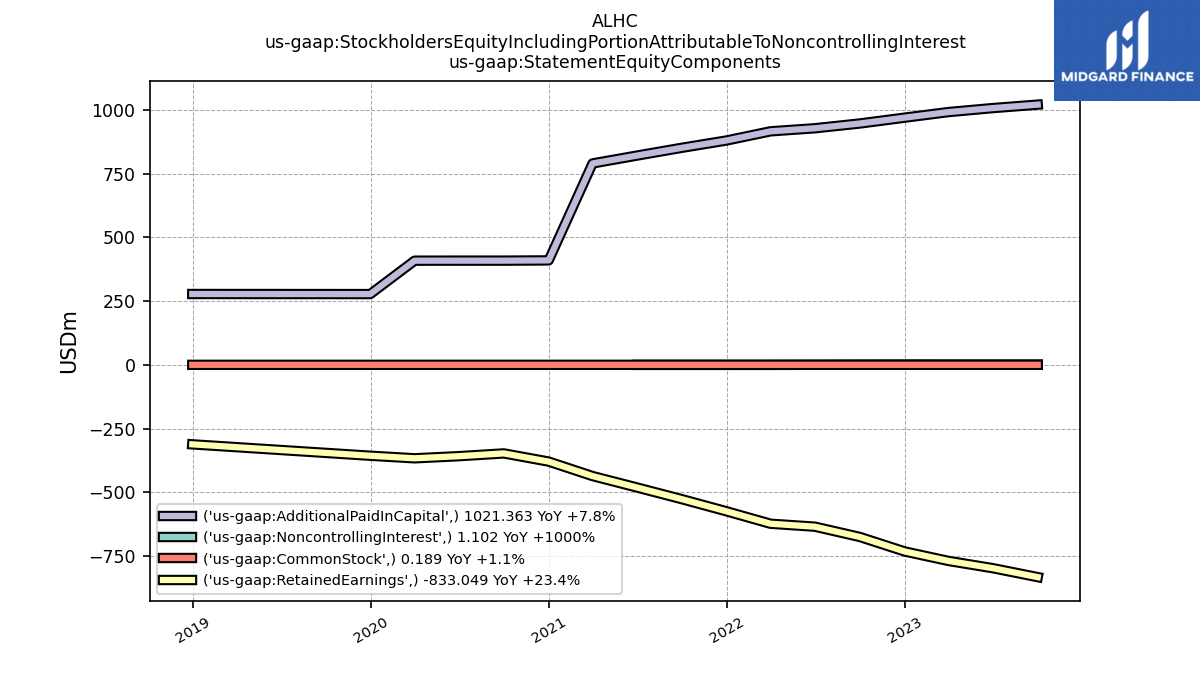
| Stockholders Equity | 188.50 | 209.98 | 222.82 | 238.13 | 272.14 | 293.70 | 293.27 | 306.04 | 325.06 | 340.37 | 354.25 | 30.61 | NA | NA | 42.33 | |
| Stockholders Equity Including Portion Attributable To Noncontrolling Interest | 189.60 | 211.11 | 223.94 | 239.30 | 272.14 | 293.70 | 293.29 | 306.06 | 325.07 | 340.38 | 354.25 | 30.61 | 61.68 | 50.86 | 42.33 | |
| Common Stock Value | 0.19 | 0.19 | 0.19 | 0.19 | 0.19 | 0.19 | 0.19 | 0.19 | 0.19 | 0.19 | 0.19 | 0.16 | NA | NA | NA | |
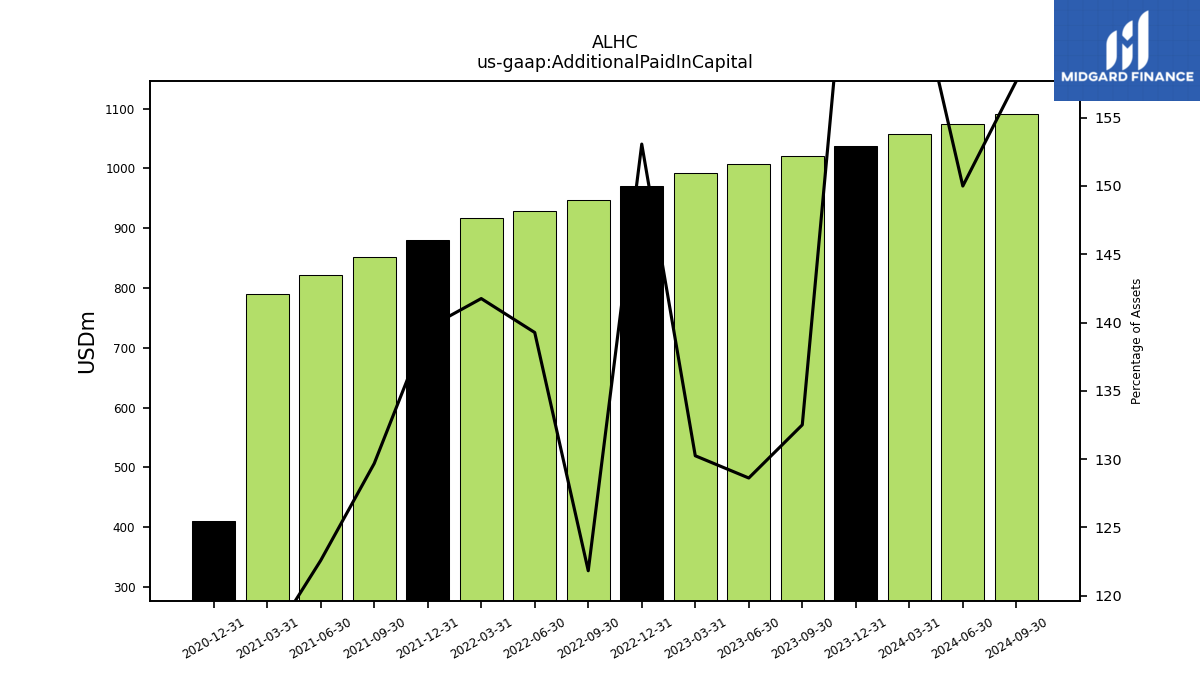
| Additional Paid In Capital | 1021.36 | 1007.79 | 992.16 | 970.18 | 947.29 | 928.61 | 916.59 | 880.71 | 851.89 | 821.38 | 790.51 | 410.02 | NA | NA | NA | |
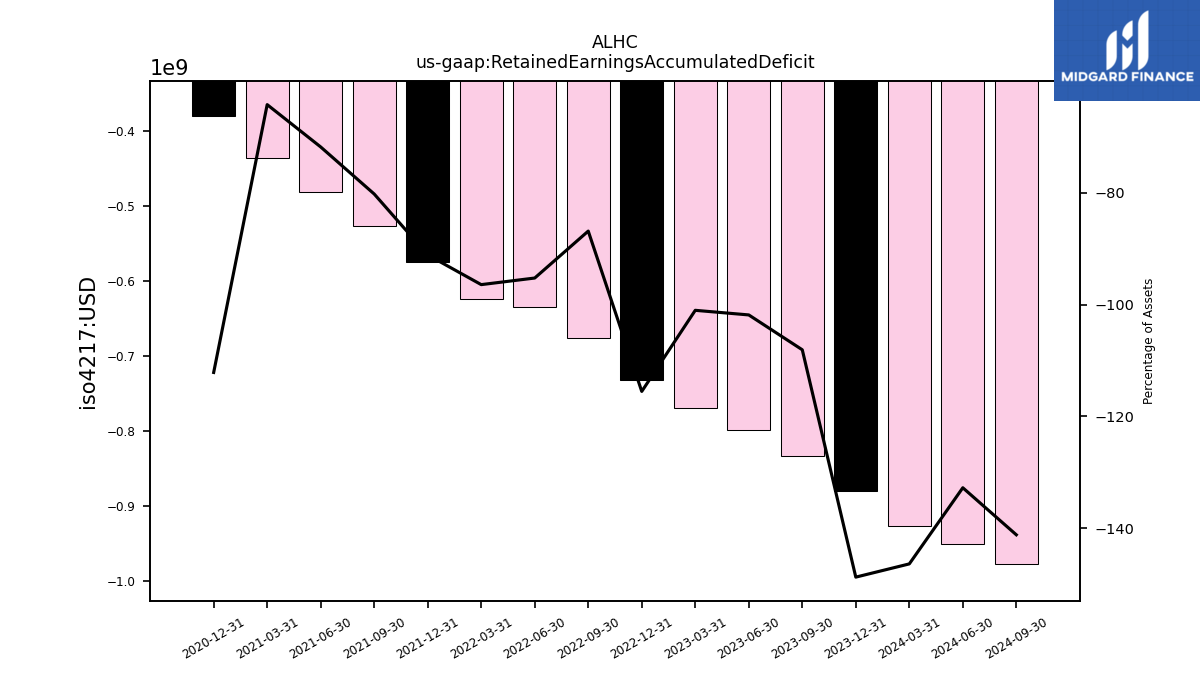
| Retained Earnings Accumulated Deficit | -833.05 | -798.00 | -769.52 | -732.24 | -675.34 | -635.09 | -623.51 | -574.86 | -527.02 | -481.21 | -436.44 | -379.57 | NA | NA | NA | |
| Minority Interest | 1.10 | 1.13 | 1.12 | 1.18 | NA | NA | 0.01 | 0.01 | 0.01 | 0.01 | NA | NA | NA | NA | NA | |
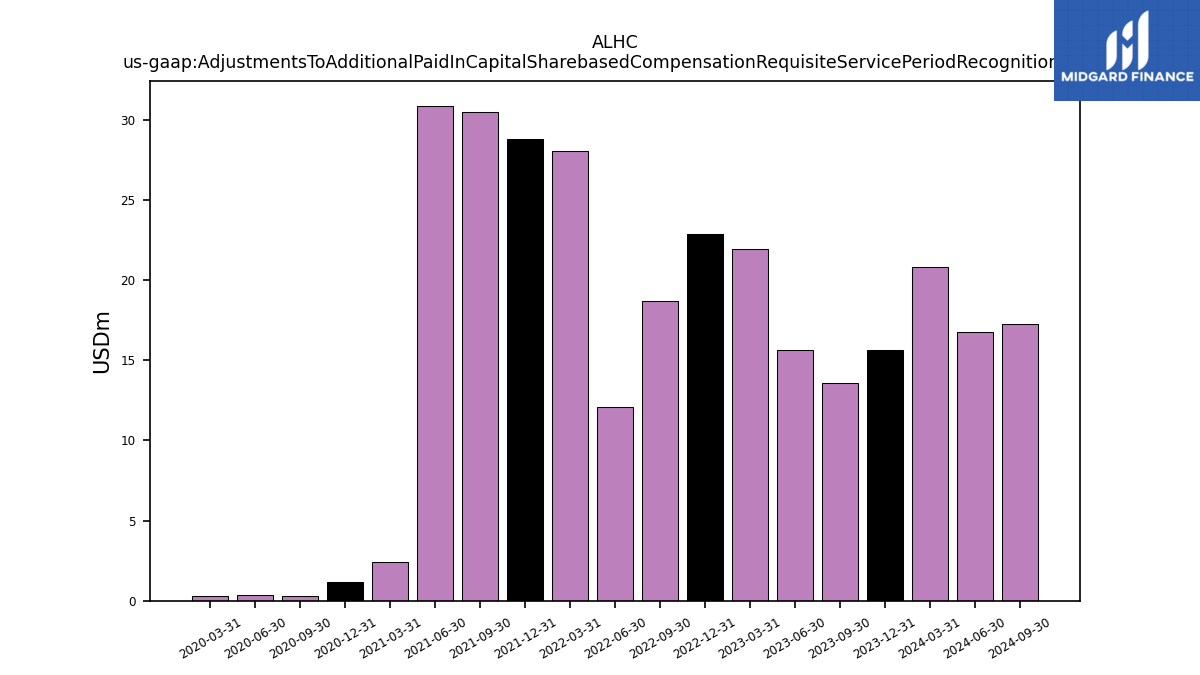
| Adjustments To Additional Paid In Capital Sharebased Compensation Requisite Service Period Recognition Value | 13.57 | 15.64 | 21.98 | 22.89 | 18.69 | 12.10 | 28.05 | 28.82 | 30.51 | 30.89 | 2.40 | 1.14 | 0.30 | 0.35 | 0.33 |
| 2023-09-30 | 2023-06-30 | 2023-03-31 | 2022-12-31 | 2022-09-30 | 2022-06-30 | 2022-03-31 | 2021-12-31 | 2021-09-30 | 2021-06-30 | 2021-03-31 | 2020-12-31 | 2020-09-30 | 2020-06-30 | 2020-03-31 | ||
|---|---|---|---|---|---|---|---|---|---|---|---|---|---|---|---|---|
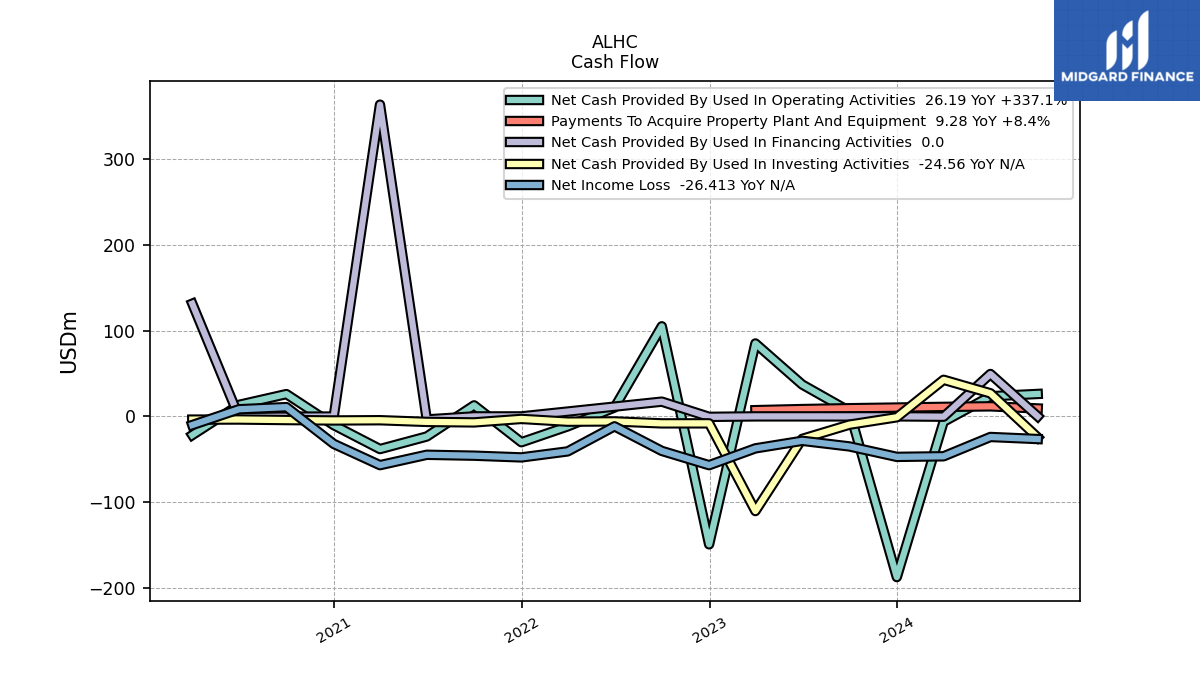
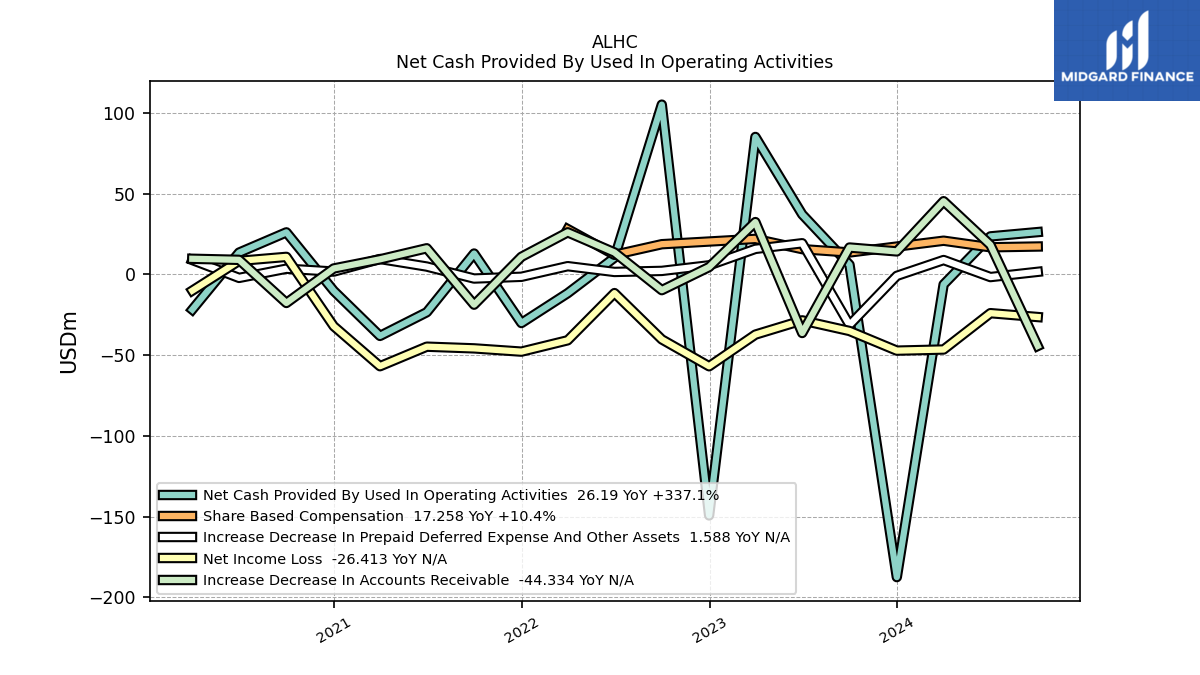
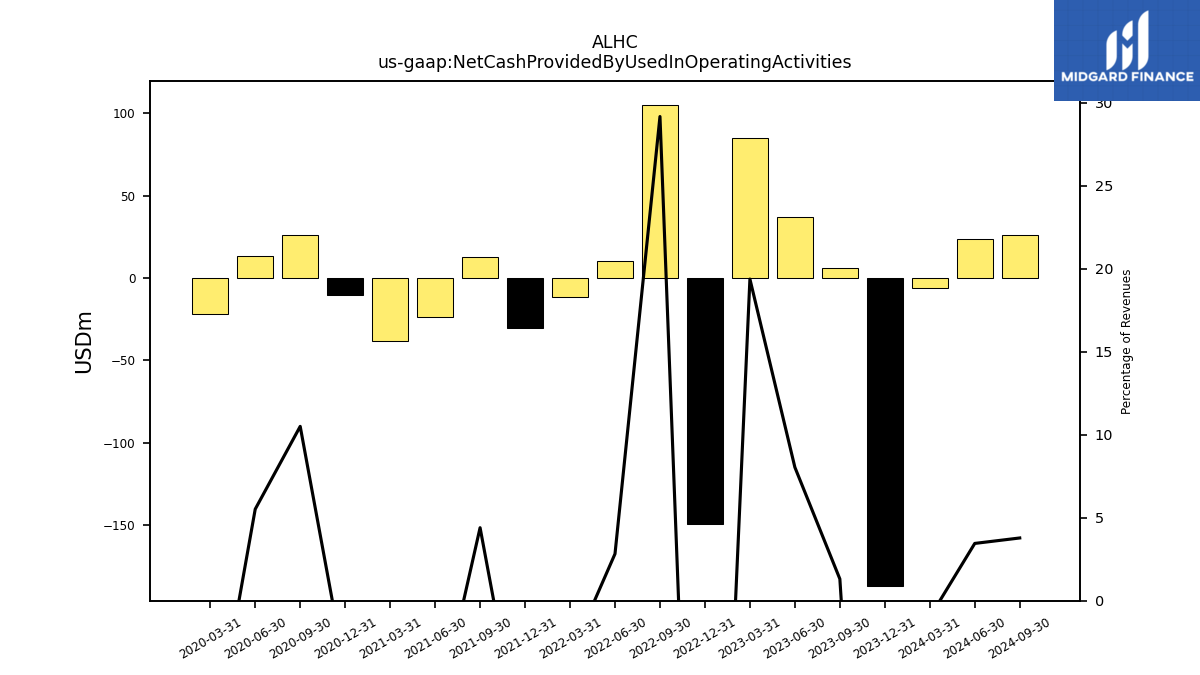
| Net Cash Provided By Used In Operating Activities | 5.99 | 37.18 | 85.11 | -149.26 | 105.12 | 10.35 | -11.64 | -30.13 | 12.91 | -23.45 | -38.11 | -10.15 | 26.04 | 13.49 | -21.82 | |
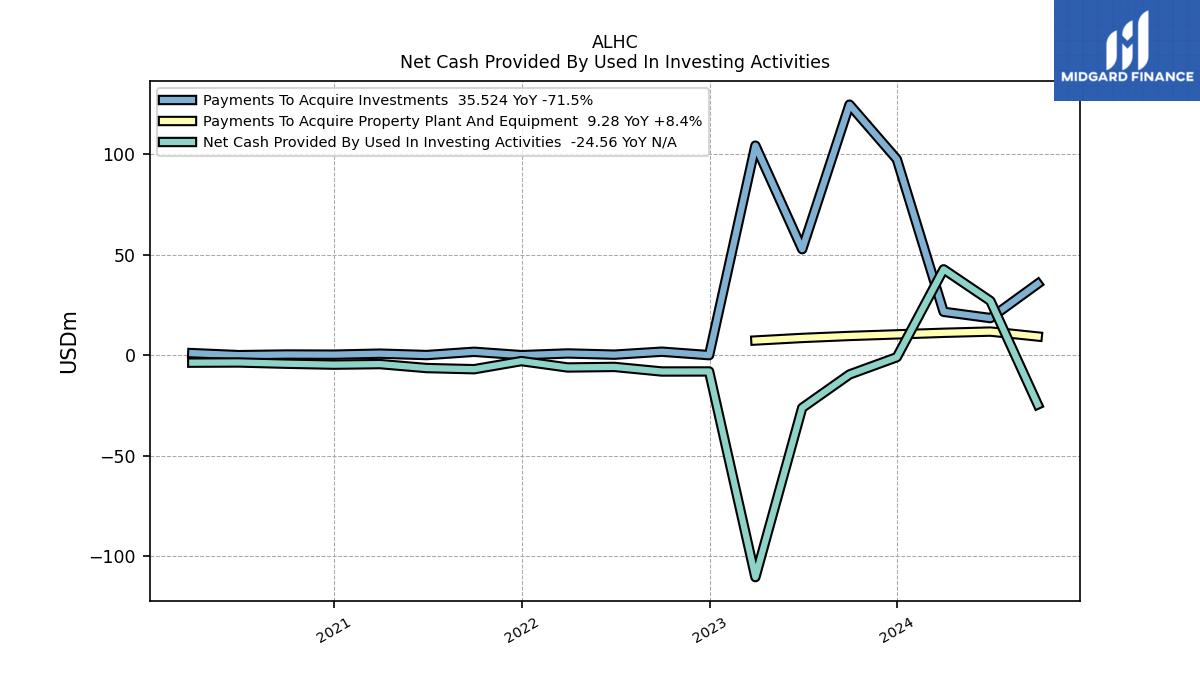
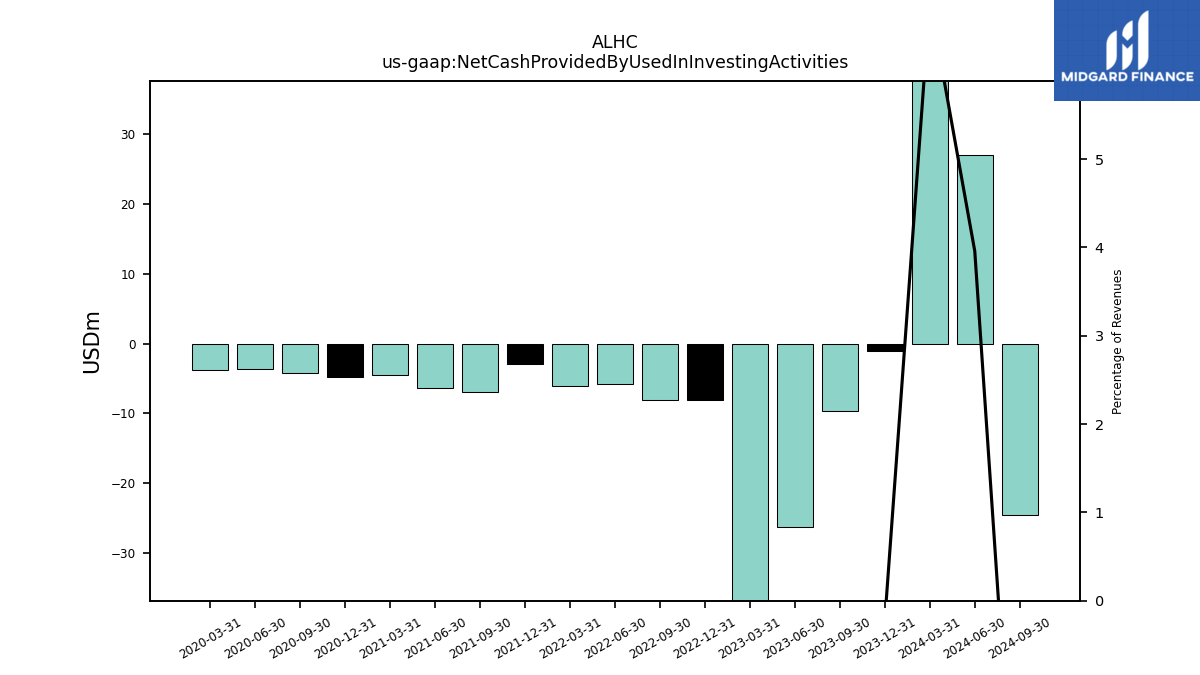
| Net Cash Provided By Used In Investing Activities | -9.61 | -26.21 | -110.43 | -8.11 | -8.13 | -5.86 | -6.13 | -2.95 | -7.00 | -6.42 | -4.45 | -4.72 | -4.26 | -3.64 | -3.73 | |
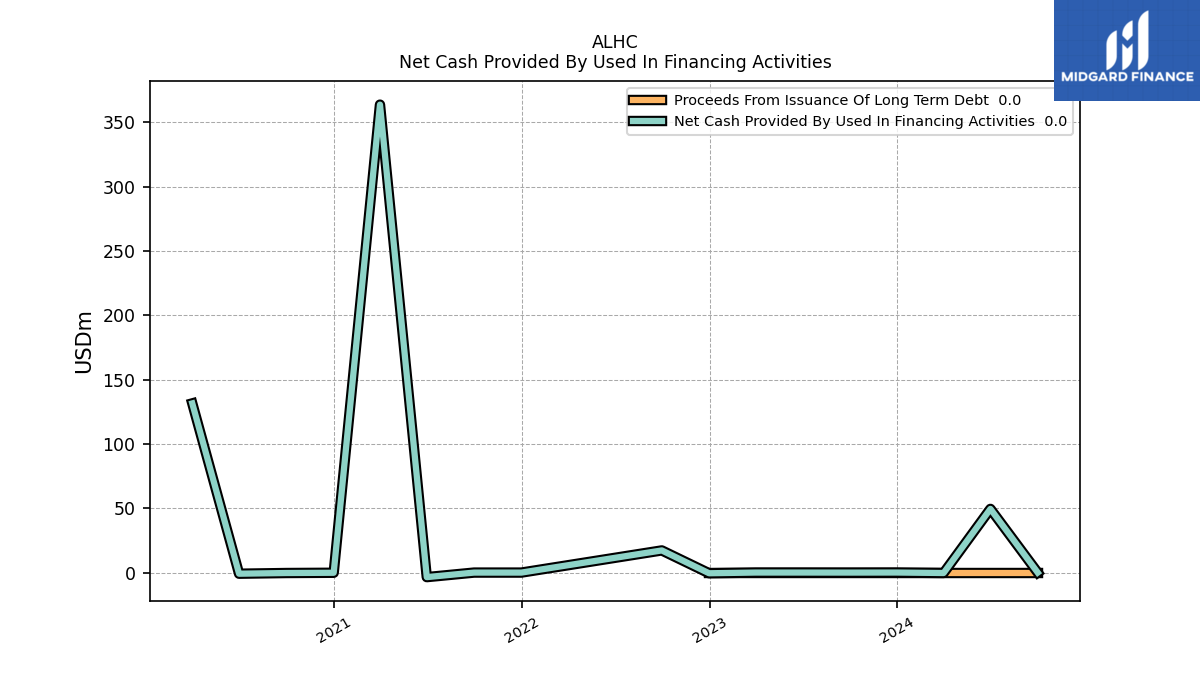
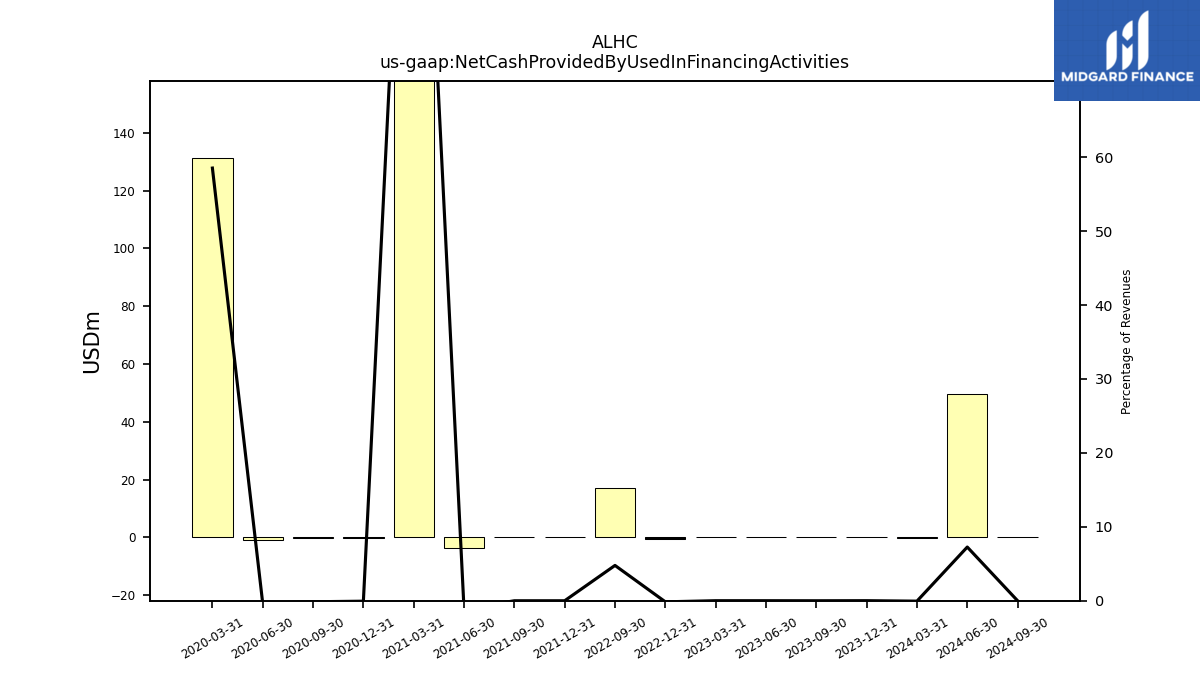
| Net Cash Provided By Used In Financing Activities | 0.00 | 0.03 | 0.03 | -0.53 | 17.22 | NA | NA | 0.00 | 0.00 | -3.53 | 363.66 | -0.14 | -0.34 | -0.88 | 131.48 |
| 2023-09-30 | 2023-06-30 | 2023-03-31 | 2022-12-31 | 2022-09-30 | 2022-06-30 | 2022-03-31 | 2021-12-31 | 2021-09-30 | 2021-06-30 | 2021-03-31 | 2020-12-31 | 2020-09-30 | 2020-06-30 | 2020-03-31 | ||
|---|---|---|---|---|---|---|---|---|---|---|---|---|---|---|---|---|
| Net Cash Provided By Used In Operating Activities | 5.99 | 37.18 | 85.11 | -149.26 | 105.12 | 10.35 | -11.64 | -30.13 | 12.91 | -23.45 | -38.11 | -10.15 | 26.04 | 13.49 | -21.82 | |
| Net Income Loss | -35.05 | -28.48 | -37.28 | -56.90 | -40.25 | -11.58 | -40.82 | -47.83 | -45.82 | -44.76 | -56.87 | -32.06 | 10.85 | 8.37 | -10.07 | |
| Profit Loss | -35.08 | -28.49 | -37.37 | -56.99 | -40.25 | -11.58 | -40.82 | -47.83 | -45.82 | -44.76 | -56.87 | -32.06 | 10.85 | 8.37 | -10.07 | |
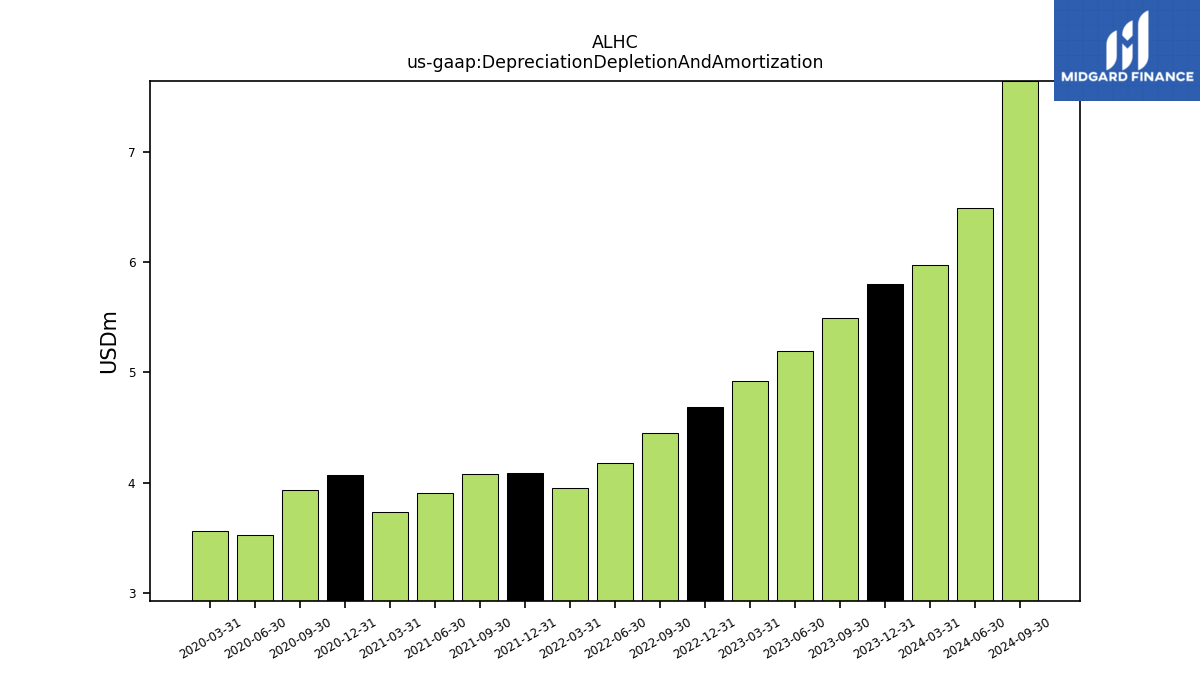
| Depreciation Depletion And Amortization | 5.50 | 5.20 | 4.92 | 4.69 | 4.46 | 4.18 | 3.95 | 4.09 | 4.08 | 3.91 | 3.74 | 4.07 | 3.93 | 3.53 | 3.56 | |
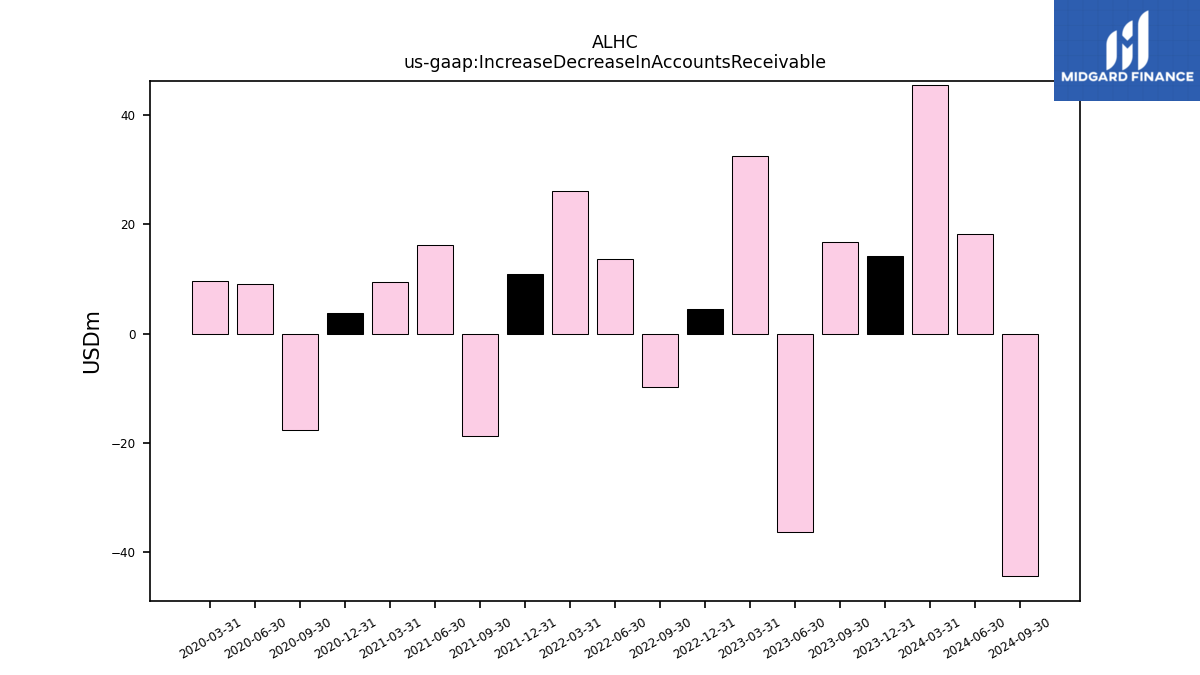
| Increase Decrease In Accounts Receivable | 16.64 | -36.30 | 32.39 | 4.54 | -9.77 | 13.56 | 26.05 | 10.88 | -18.77 | 16.18 | 9.33 | 3.65 | -17.70 | 9.00 | 9.67 | |
| Share Based Compensation | 13.57 | 15.64 | 21.98 | NA | 18.69 | 12.10 | 28.05 | NA | NA | NA | NA | NA | NA | NA | NA | |
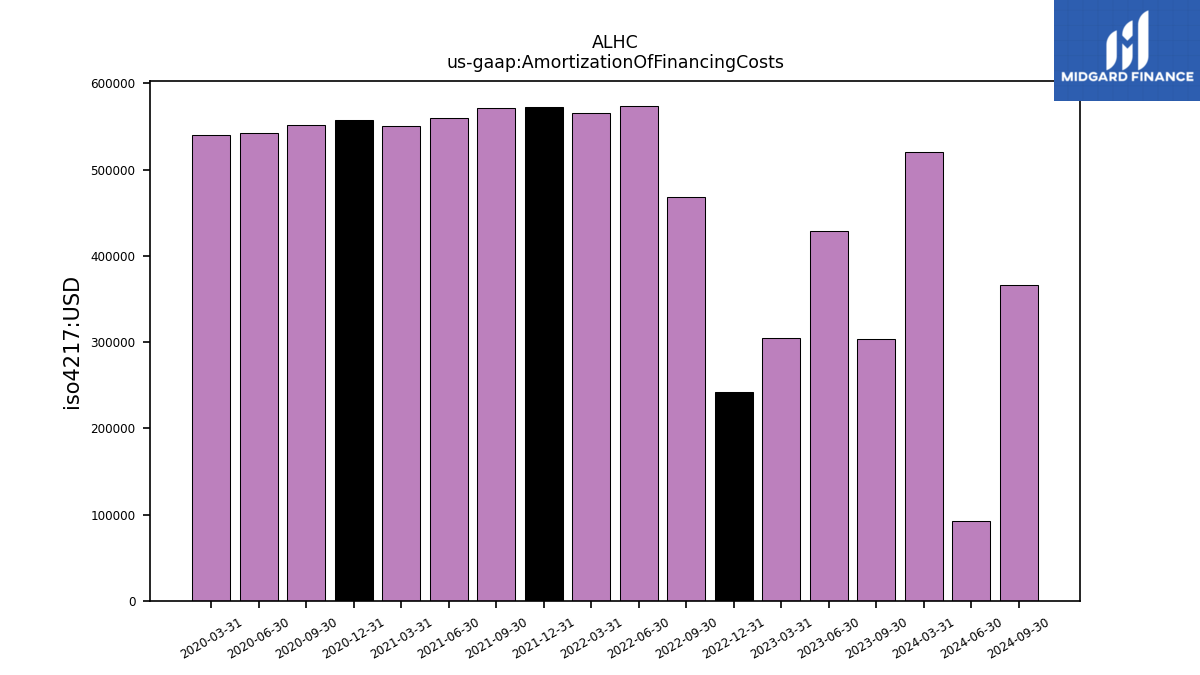
| Amortization Of Financing Costs | 0.30 | 0.43 | 0.30 | 0.24 | 0.47 | 0.57 | 0.57 | 0.57 | 0.57 | 0.56 | 0.55 | 0.56 | 0.55 | 0.54 | 0.54 |
| 2023-09-30 | 2023-06-30 | 2023-03-31 | 2022-12-31 | 2022-09-30 | 2022-06-30 | 2022-03-31 | 2021-12-31 | 2021-09-30 | 2021-06-30 | 2021-03-31 | 2020-12-31 | 2020-09-30 | 2020-06-30 | 2020-03-31 | ||
|---|---|---|---|---|---|---|---|---|---|---|---|---|---|---|---|---|
| Net Cash Provided By Used In Investing Activities | -9.61 | -26.21 | -110.43 | -8.11 | -8.13 | -5.86 | -6.13 | -2.95 | -7.00 | -6.42 | -4.45 | -4.72 | -4.26 | -3.64 | -3.73 | |
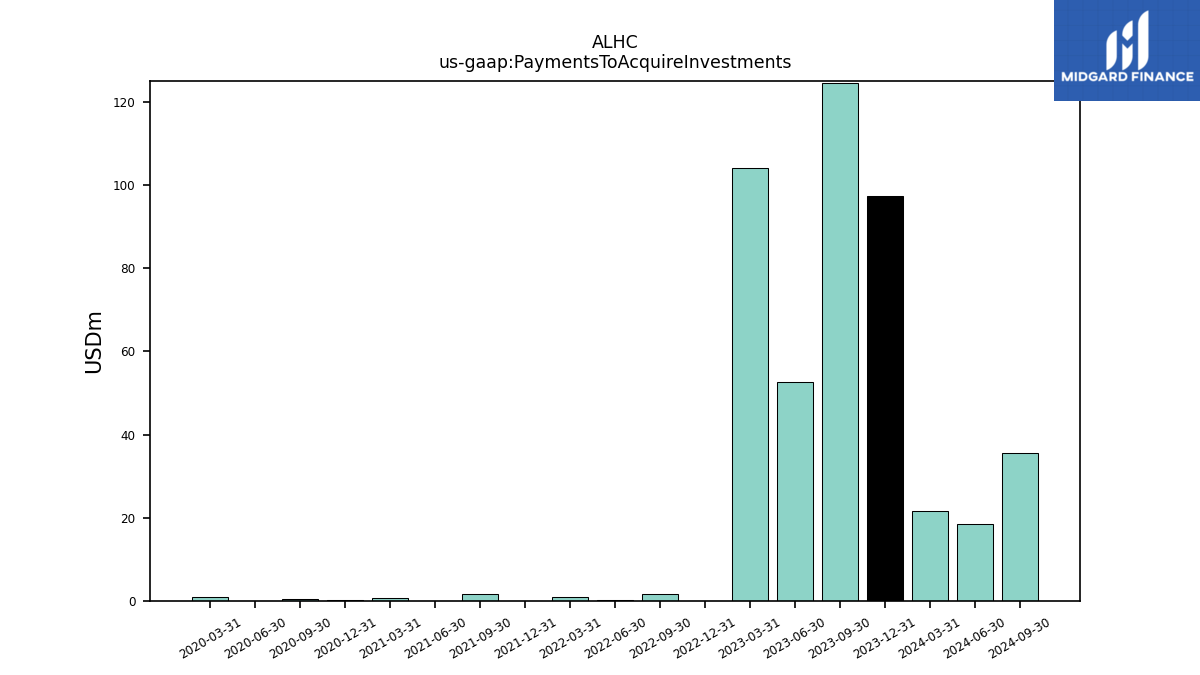
| Payments To Acquire Investments | 124.64 | 52.70 | 104.24 | 0.00 | 1.73 | 0.25 | 0.85 | 0.00 | 1.68 | 0.05 | 0.75 | 0.25 | 0.33 | 0.00 | 1.00 |
| 2023-09-30 | 2023-06-30 | 2023-03-31 | 2022-12-31 | 2022-09-30 | 2022-06-30 | 2022-03-31 | 2021-12-31 | 2021-09-30 | 2021-06-30 | 2021-03-31 | 2020-12-31 | 2020-09-30 | 2020-06-30 | 2020-03-31 | ||
|---|---|---|---|---|---|---|---|---|---|---|---|---|---|---|---|---|
| Net Cash Provided By Used In Financing Activities | 0.00 | 0.03 | 0.03 | -0.53 | 17.22 | NA | NA | 0.00 | 0.00 | -3.53 | 363.66 | -0.14 | -0.34 | -0.88 | 131.48 |
| 2023-09-30 | 2023-06-30 | 2023-03-31 | 2022-12-31 | 2022-09-30 | 2022-06-30 | 2022-03-31 | 2021-12-31 | 2021-09-30 | 2021-06-30 | 2021-03-31 | 2020-12-31 | 2020-09-30 | 2020-06-30 | 2020-03-31 | ||
|---|---|---|---|---|---|---|---|---|---|---|---|---|---|---|---|---|
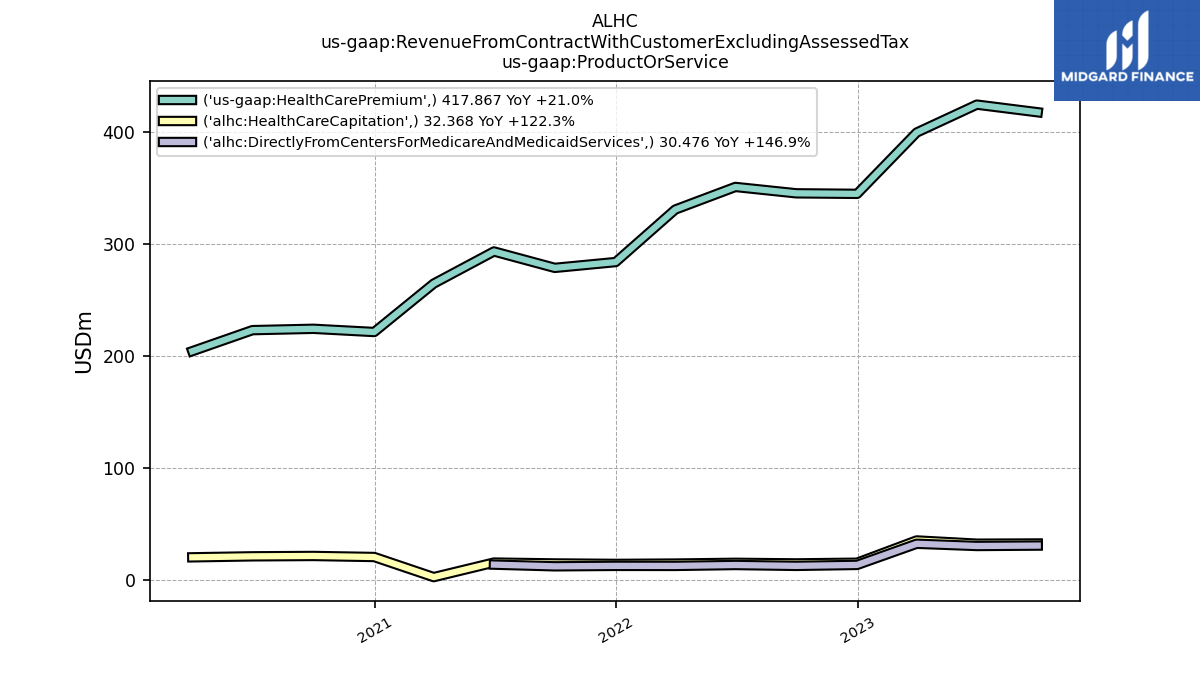
| Revenues | 456.71 | 462.38 | 439.15 | 361.81 | 360.35 | 366.47 | 345.53 | 298.27 | 293.47 | 308.95 | 267.08 | 242.41 | 247.87 | 244.31 | 224.63 | |
| Revenue From Contract With Customer Excluding Assessed Tax | 450.24 | 456.88 | 434.81 | 360.10 | 359.98 | 366.18 | 345.29 | 298.07 | 293.27 | 308.74 | 267.00 | 241.68 | 245.49 | 243.96 | 224.27 | |
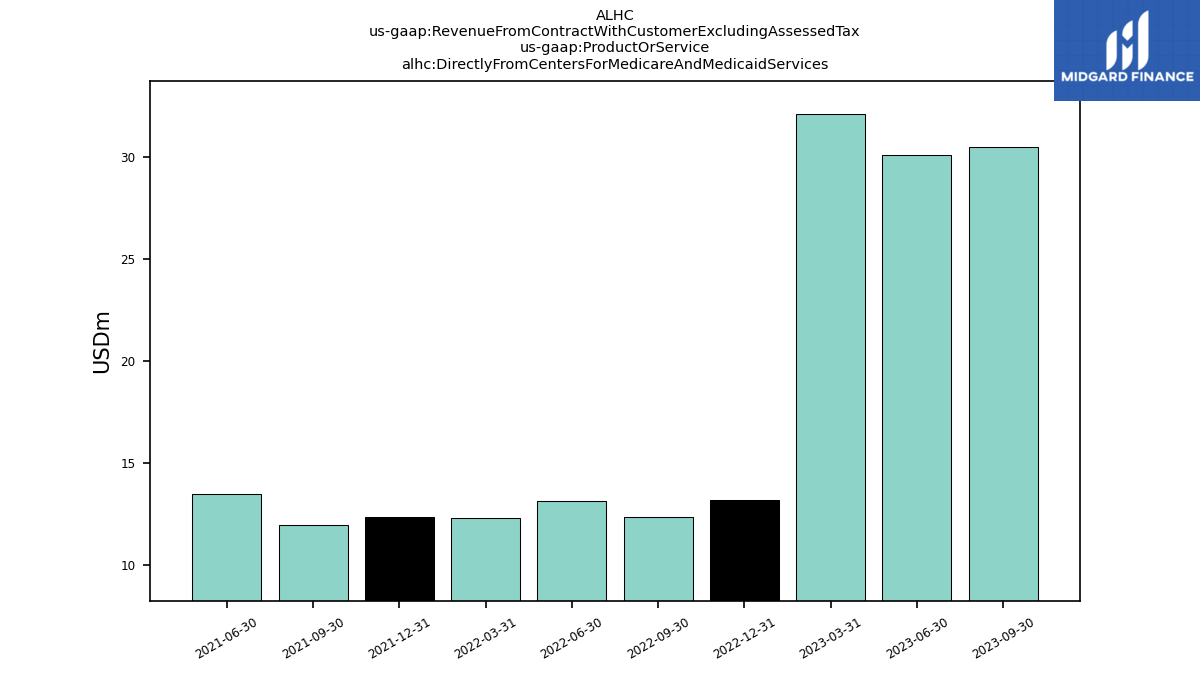
| Directly From Centers For Medicare And Medicaid Services | 30.48 | 30.11 | 32.11 | 13.19 | 12.34 | 13.11 | 12.30 | 12.34 | 11.95 | 13.45 | NA | NA | NA | NA | NA | |
| Health Care Capitation | 32.37 | 32.17 | 35.07 | 15.17 | 14.56 | 15.07 | 14.41 | 14.11 | 14.52 | 15.30 | 2.29 | 20.27 | 21.20 | 20.88 | 19.99 | |
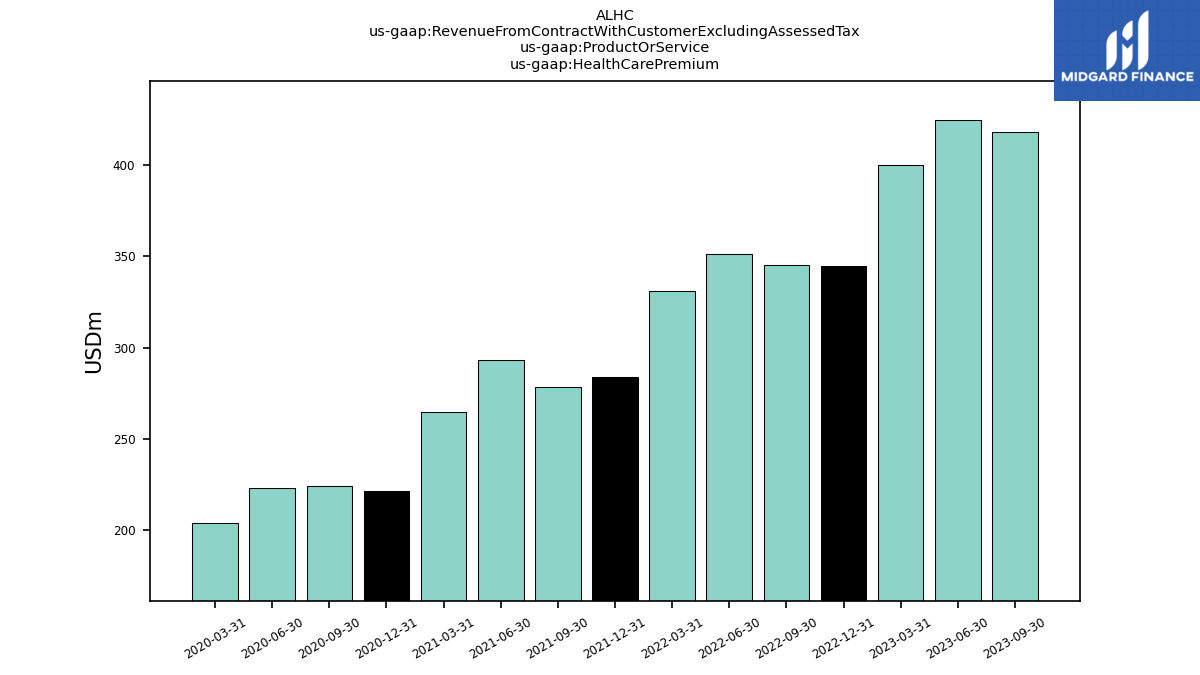
| Health Care Premium | 417.87 | 424.70 | 399.74 | 344.93 | 345.42 | 351.11 | 330.88 | 283.96 | 278.75 | 293.44 | 264.71 | 221.41 | 224.29 | 223.08 | 204.28 |