
| 2023-12-31 | 2023-09-30 | 2023-06-30 | 2023-03-31 | 2022-12-31 | 2022-09-30 | 2022-06-30 | 2022-03-31 | 2021-12-31 | 2021-09-30 | 2021-06-30 | 2021-03-31 | ||
|---|---|---|---|---|---|---|---|---|---|---|---|---|---|
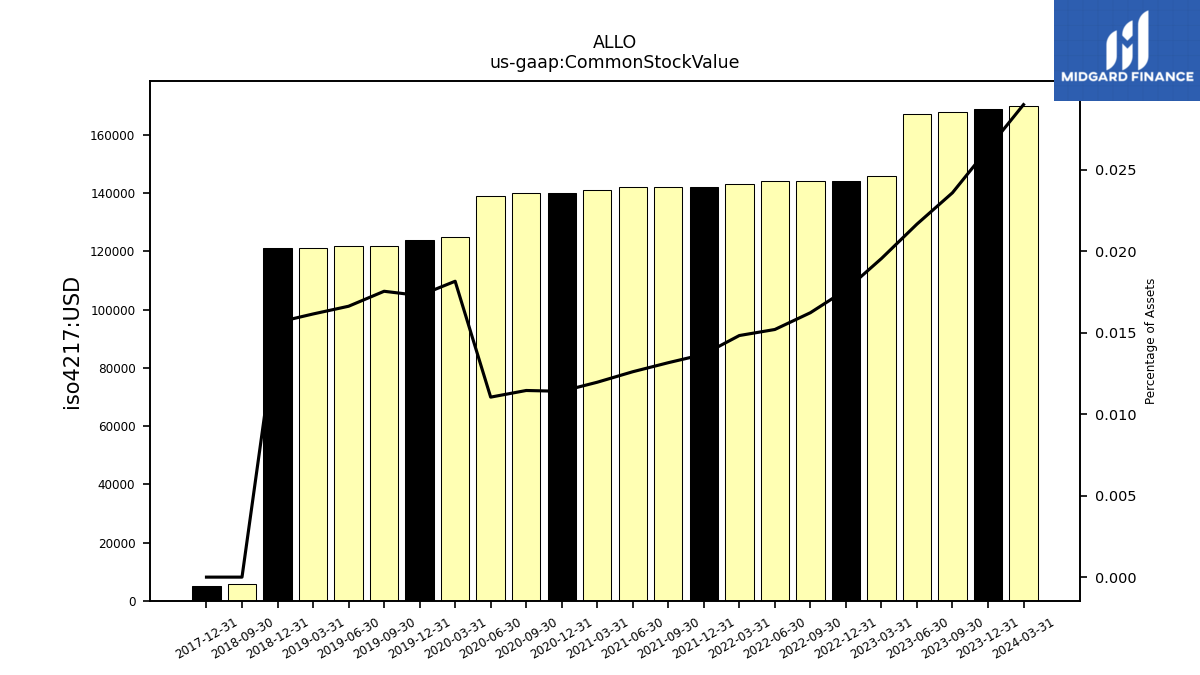
| Common Stock Value | 0.17 | 0.17 | 0.17 | 0.15 | 0.14 | 0.14 | 0.14 | 0.14 | 0.14 | 0.14 | 0.14 | 0.14 | |
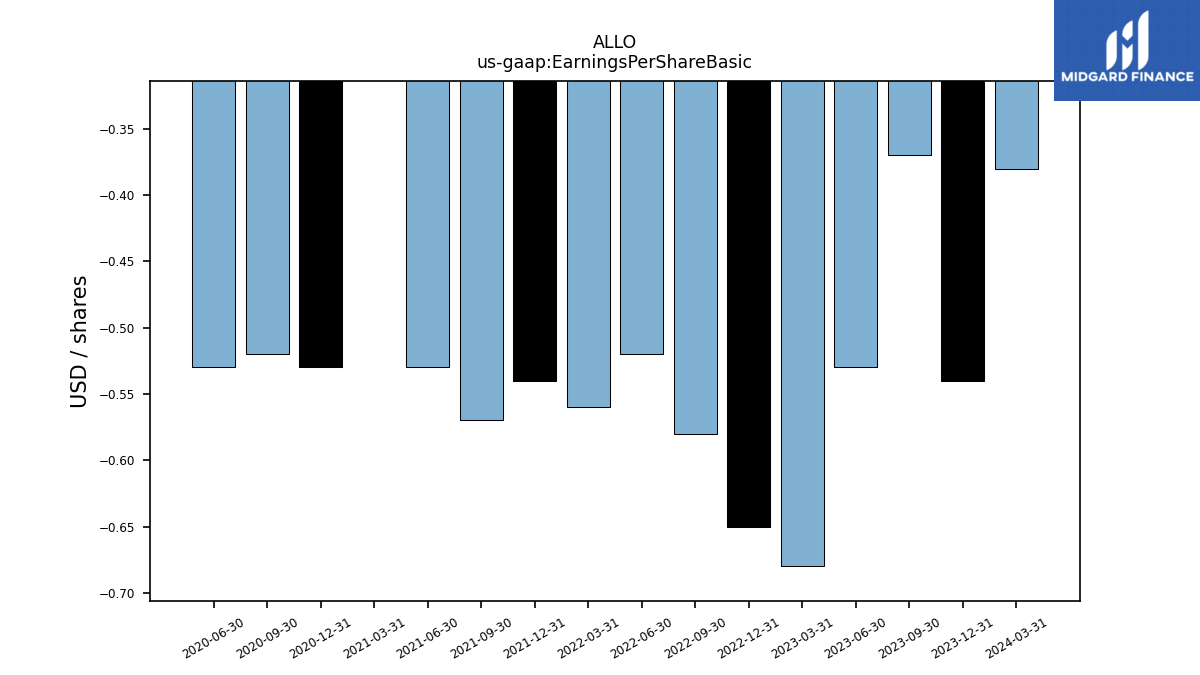
| Earnings Per Share Basic | -0.54 | -0.37 | -0.53 | -0.68 | -0.65 | -0.58 | -0.52 | -0.56 | -0.54 | -0.57 | -0.53 | -0.25 | |
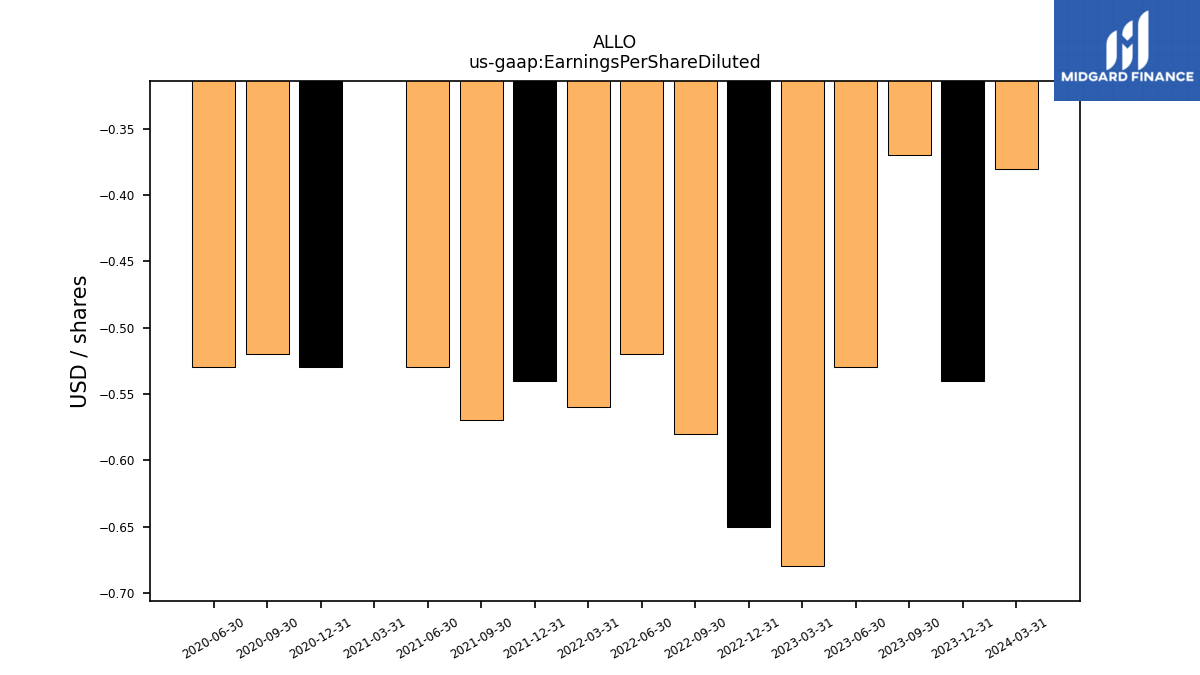
| Earnings Per Share Diluted | -0.54 | -0.37 | -0.53 | -0.68 | -0.65 | -0.58 | -0.52 | -0.56 | -0.54 | -0.57 | -0.53 | -0.25 |
| 2023-12-31 | 2023-09-30 | 2023-06-30 | 2023-03-31 | 2022-12-31 | 2022-09-30 | 2022-06-30 | 2022-03-31 | 2021-12-31 | 2021-09-30 | 2021-06-30 | 2021-03-31 | ||
|---|---|---|---|---|---|---|---|---|---|---|---|---|---|
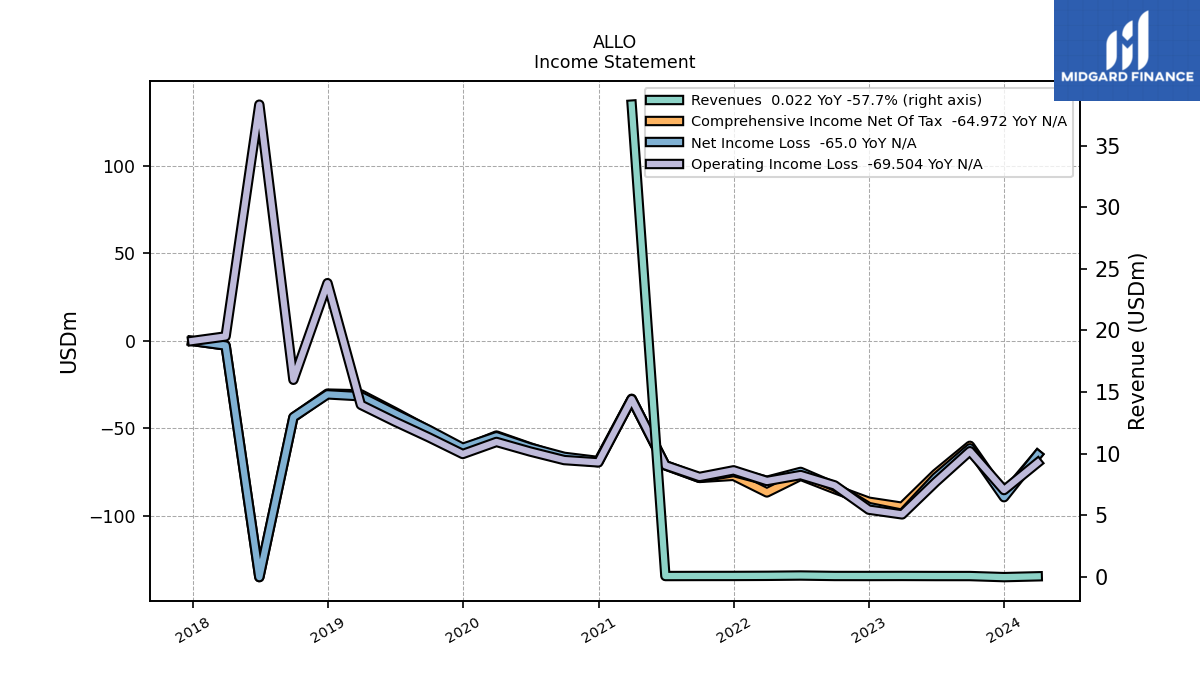
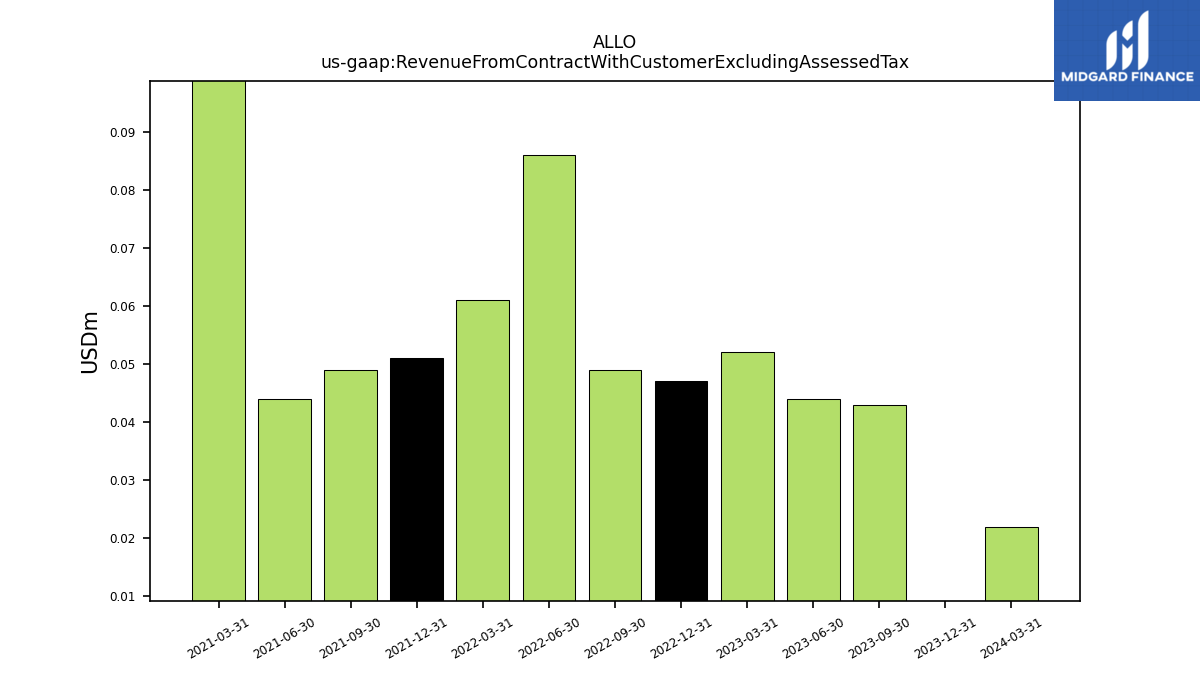
| Revenue From Contract With Customer Excluding Assessed Tax | -0.04 | 0.04 | 0.04 | 0.05 | 0.05 | 0.05 | 0.09 | 0.06 | 0.05 | 0.05 | 0.04 | 38.34 | |
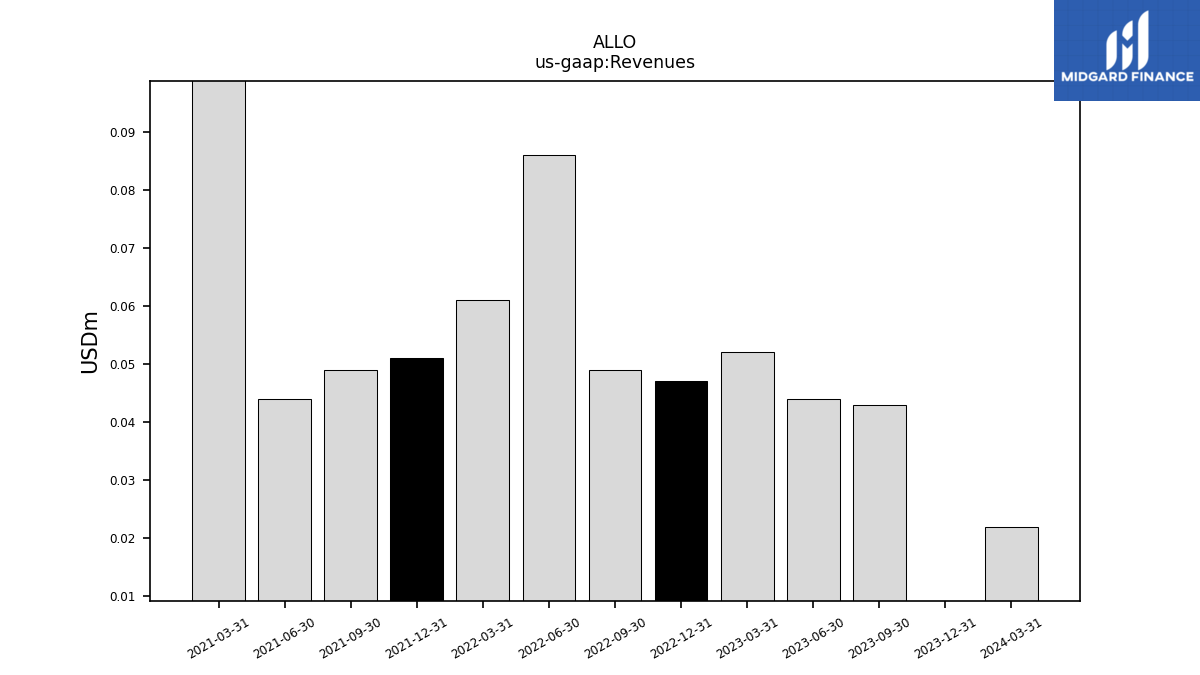
| Revenues | -0.04 | 0.04 | 0.04 | 0.05 | 0.05 | 0.05 | 0.09 | 0.06 | 0.05 | 0.05 | 0.04 | 38.34 | |
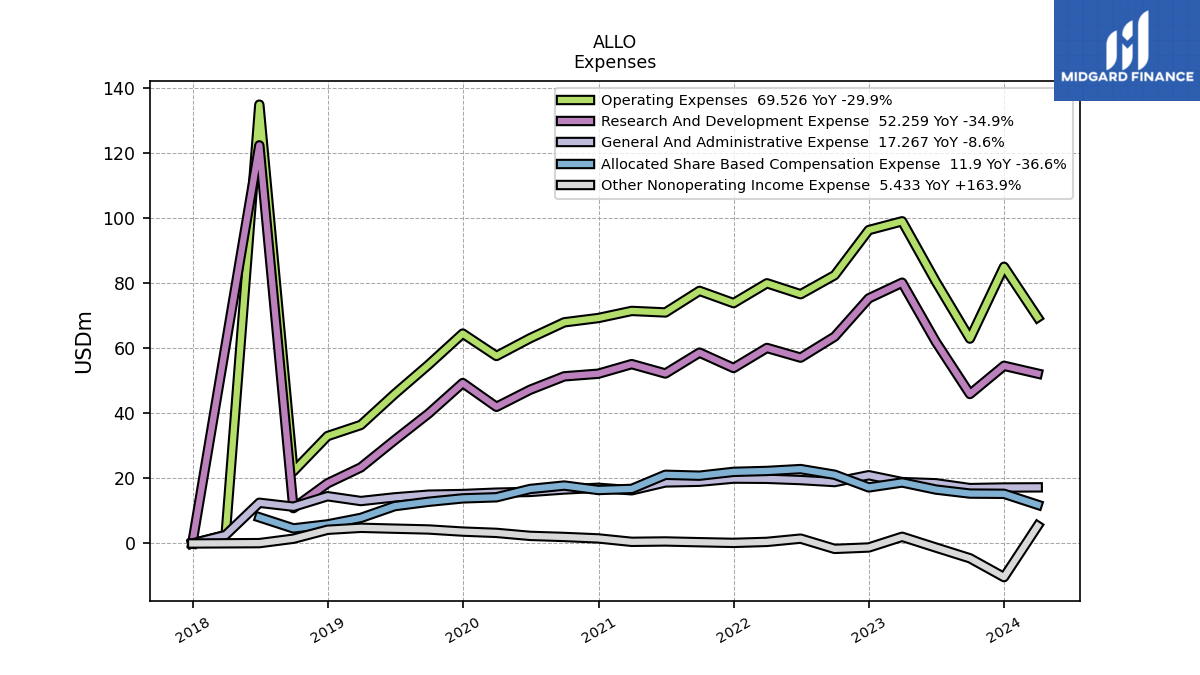
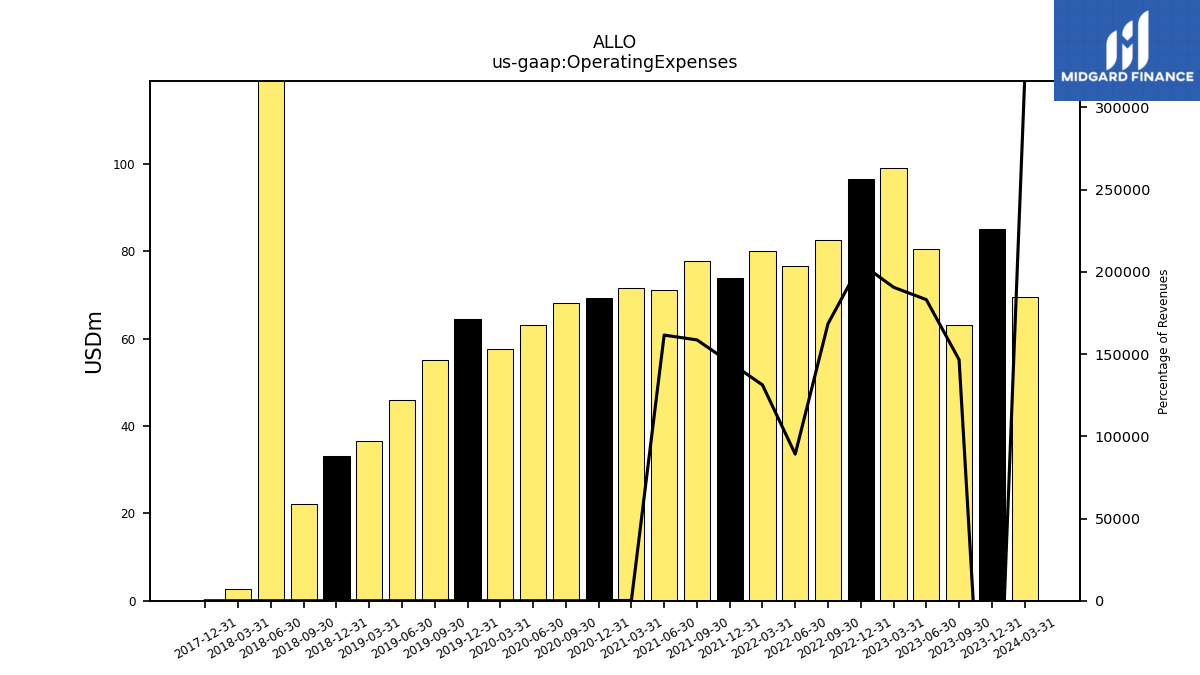
| Operating Expenses | 85.13 | 63.02 | 80.56 | 99.12 | 96.42 | 82.54 | 76.68 | 80.05 | 73.94 | 77.72 | 71.07 | 71.55 | |
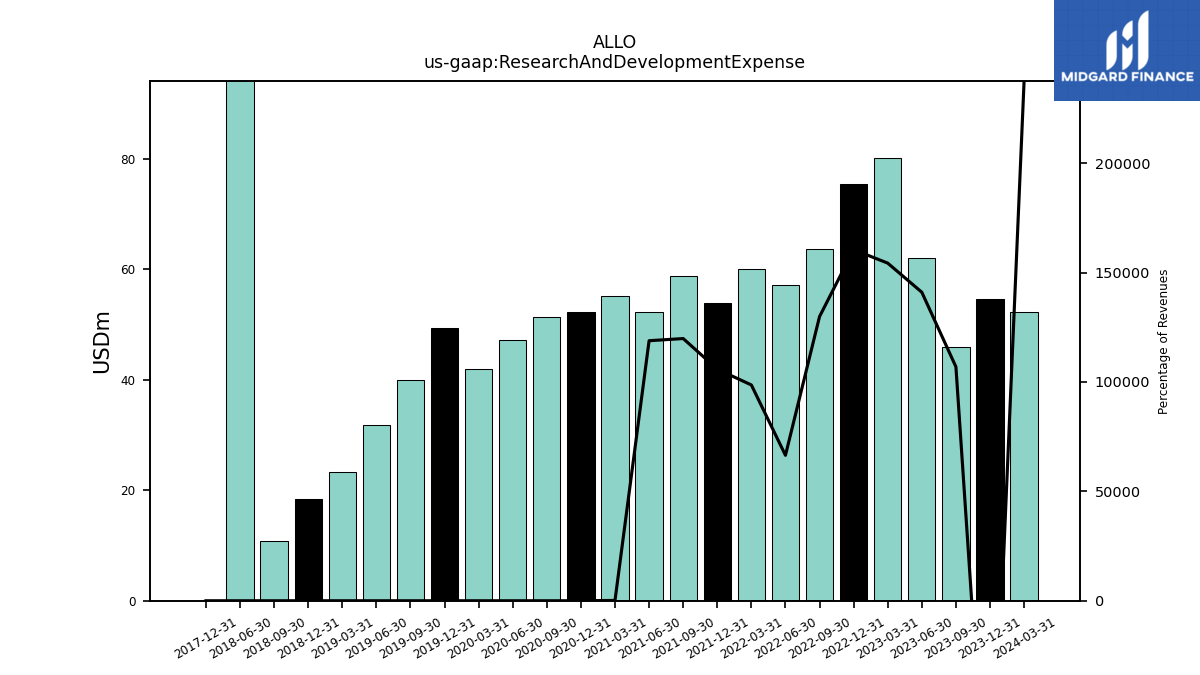
| Research And Development Expense | 54.66 | 45.98 | 62.04 | 80.24 | 75.42 | 63.64 | 57.17 | 60.16 | 53.98 | 58.72 | 52.29 | 55.18 | |
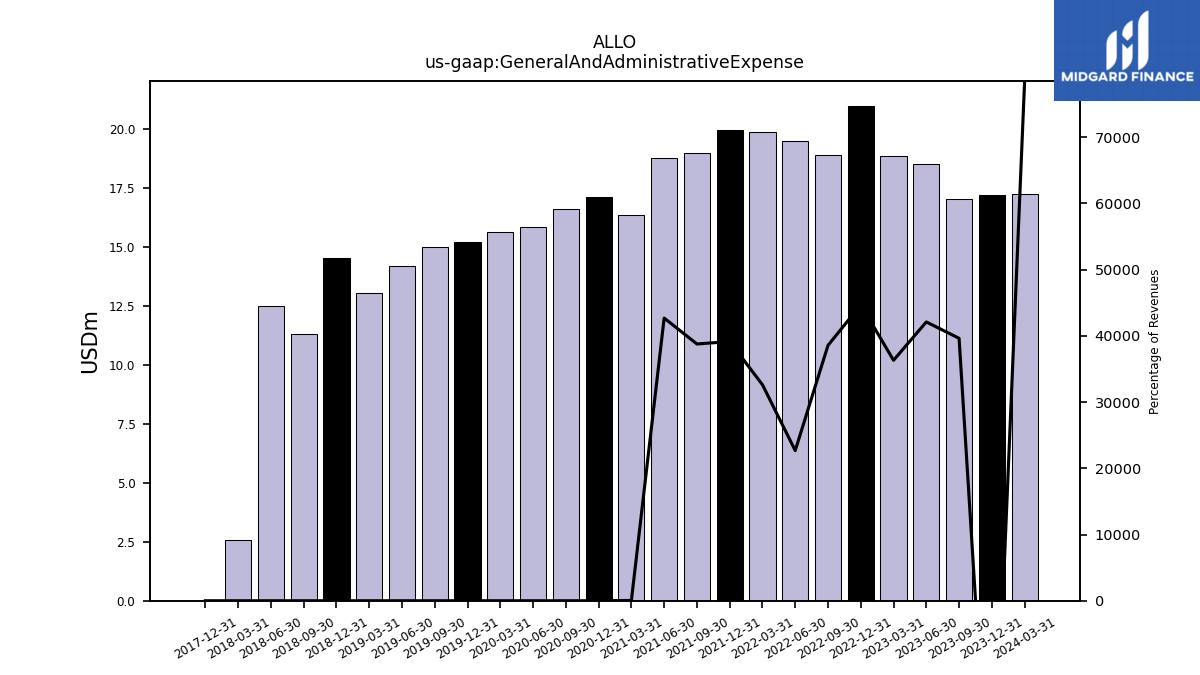
| General And Administrative Expense | 17.22 | 17.04 | 18.52 | 18.88 | 21.00 | 18.90 | 19.51 | 19.90 | 19.96 | 19.00 | 18.78 | 16.36 | |
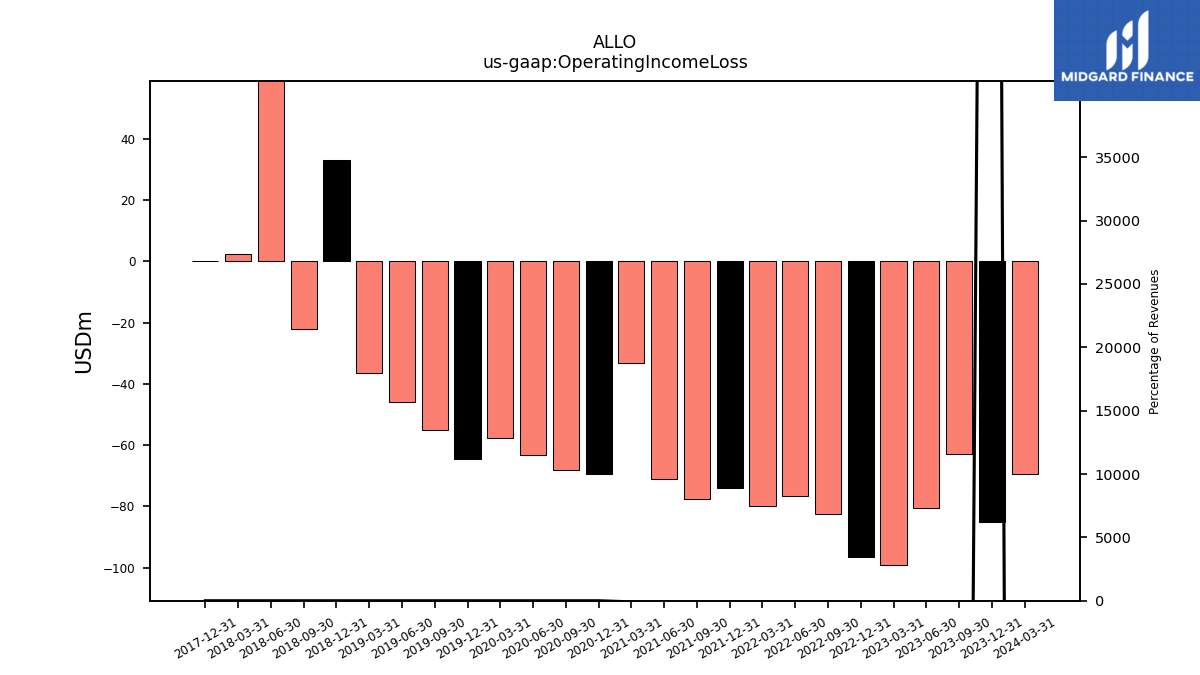
| Operating Income Loss | -85.17 | -62.98 | -80.52 | -99.07 | -96.37 | -82.49 | -76.59 | -79.99 | -73.89 | -77.67 | -71.03 | -33.20 | |
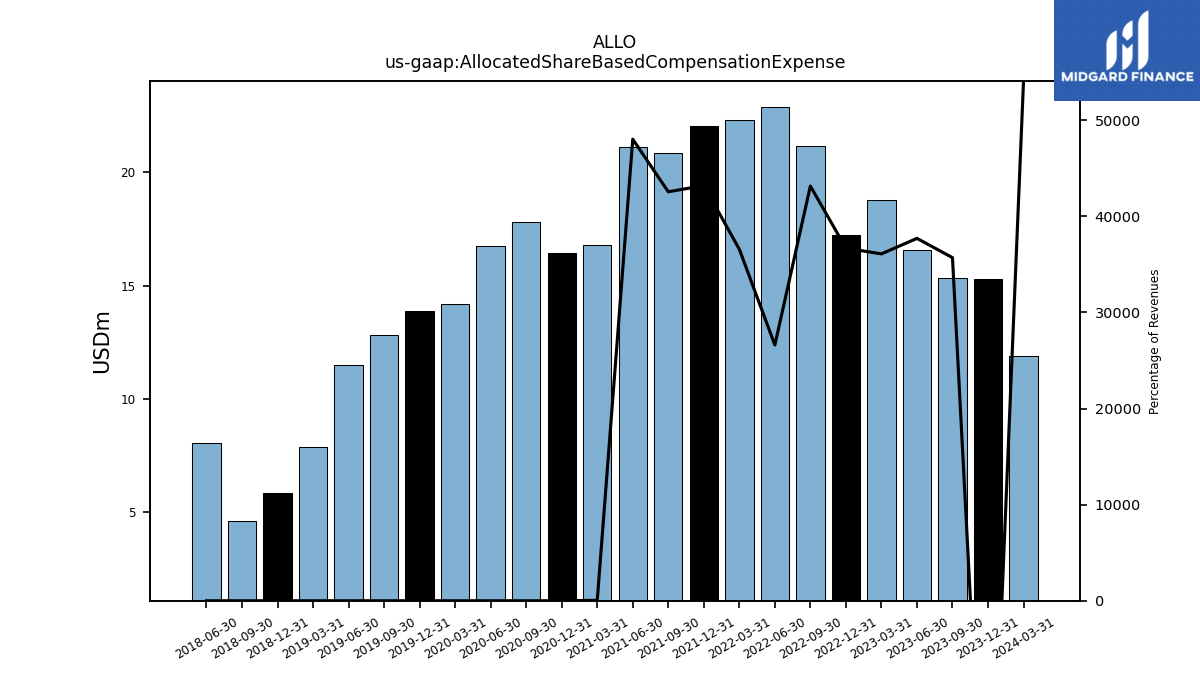
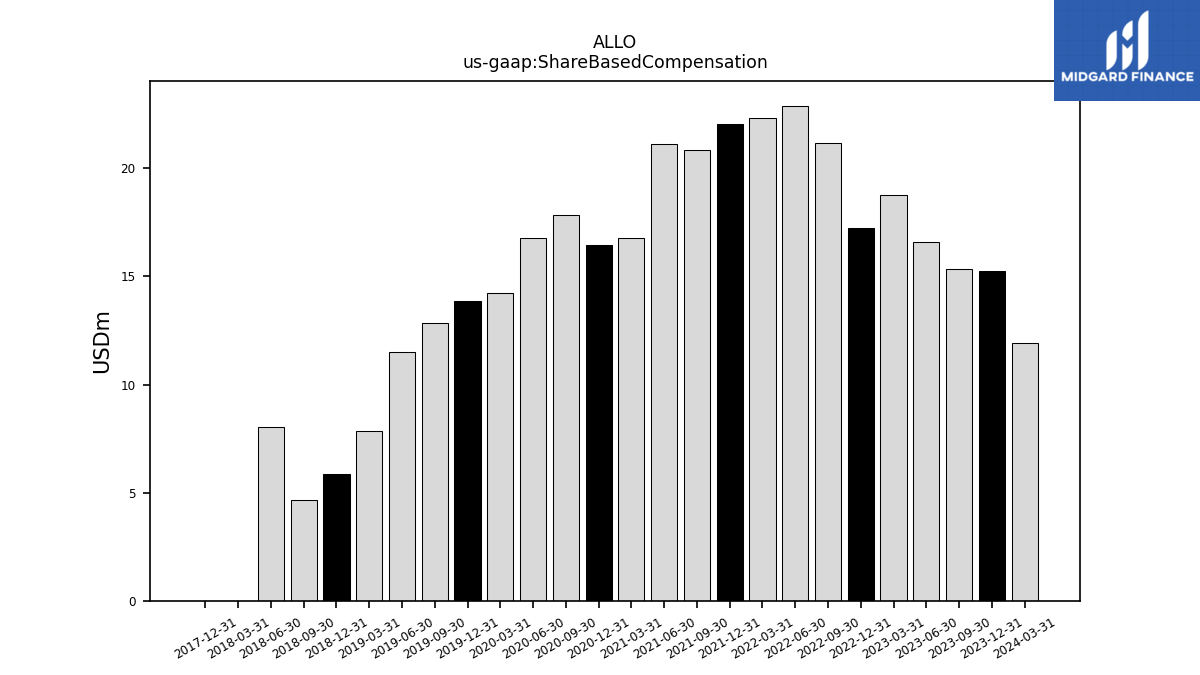
| Allocated Share Based Compensation Expense | 15.28 | 15.35 | 16.59 | 18.77 | 17.25 | 21.15 | 22.89 | 22.32 | 22.04 | 20.86 | 21.13 | 16.79 | |
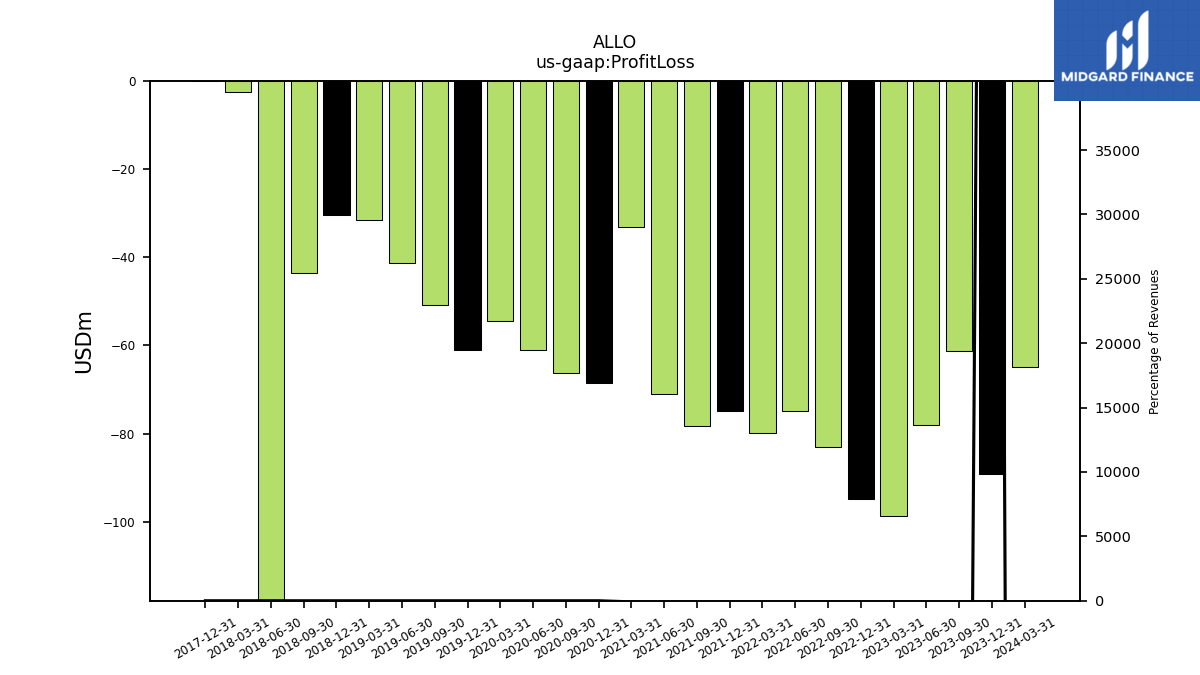
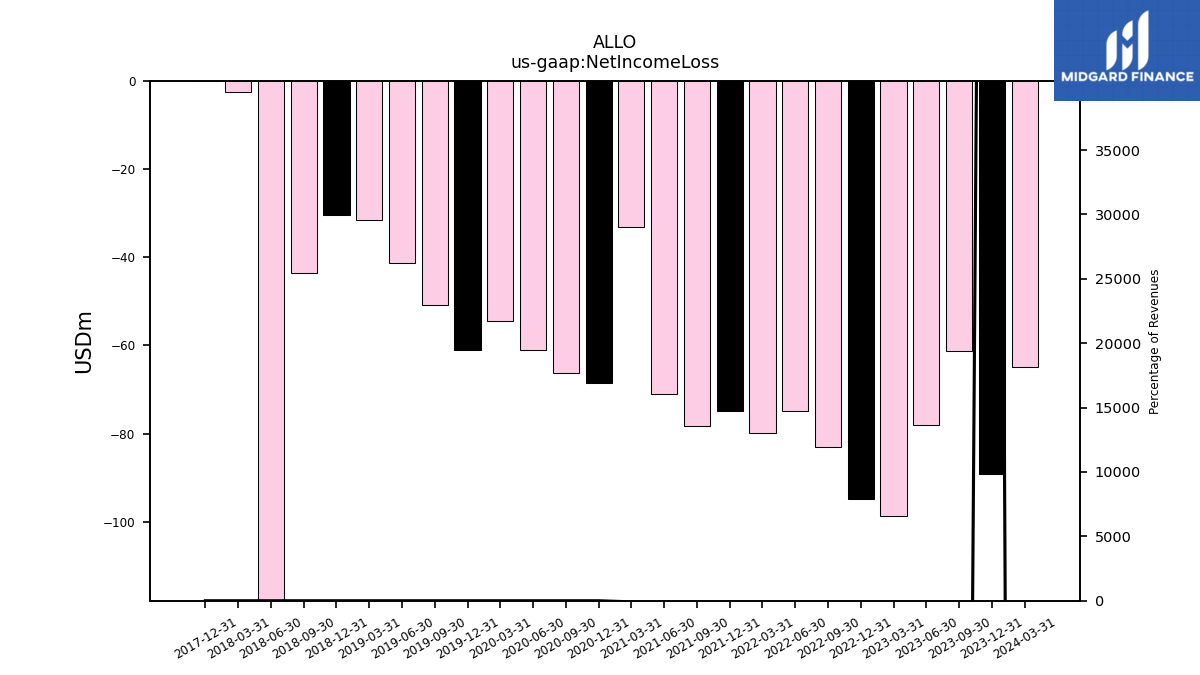
| Profit Loss | -89.26 | -61.31 | -77.99 | -98.70 | -94.85 | -83.15 | -74.79 | -79.85 | -74.87 | -78.19 | -70.94 | -33.02 | |
| Net Income Loss | -89.26 | -61.31 | -77.99 | -98.70 | -94.85 | -83.15 | -74.79 | -79.85 | -74.87 | -78.19 | -70.94 | -33.02 | |
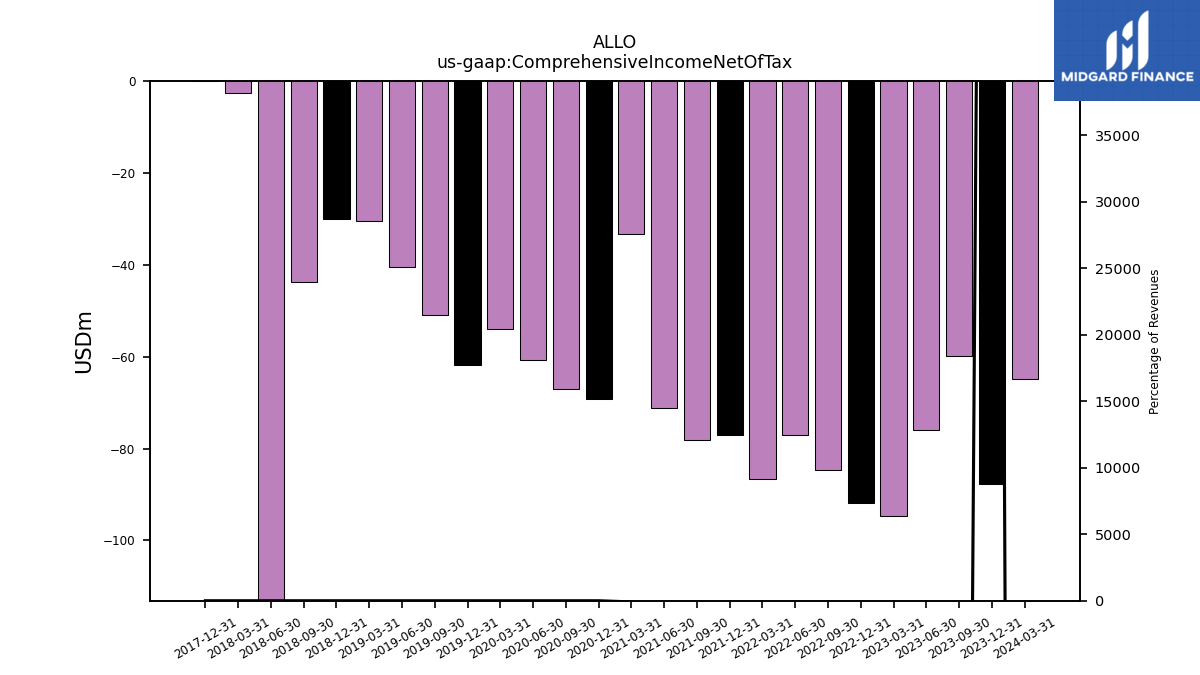
| Comprehensive Income Net Of Tax | -87.80 | -59.88 | -75.91 | -94.71 | -91.81 | -84.63 | -77.01 | -86.53 | -77.04 | -78.25 | -71.17 | -33.38 |
| 2023-12-31 | 2023-09-30 | 2023-06-30 | 2023-03-31 | 2022-12-31 | 2022-09-30 | 2022-06-30 | 2022-03-31 | 2021-12-31 | 2021-09-30 | 2021-06-30 | 2021-03-31 | ||
|---|---|---|---|---|---|---|---|---|---|---|---|---|---|
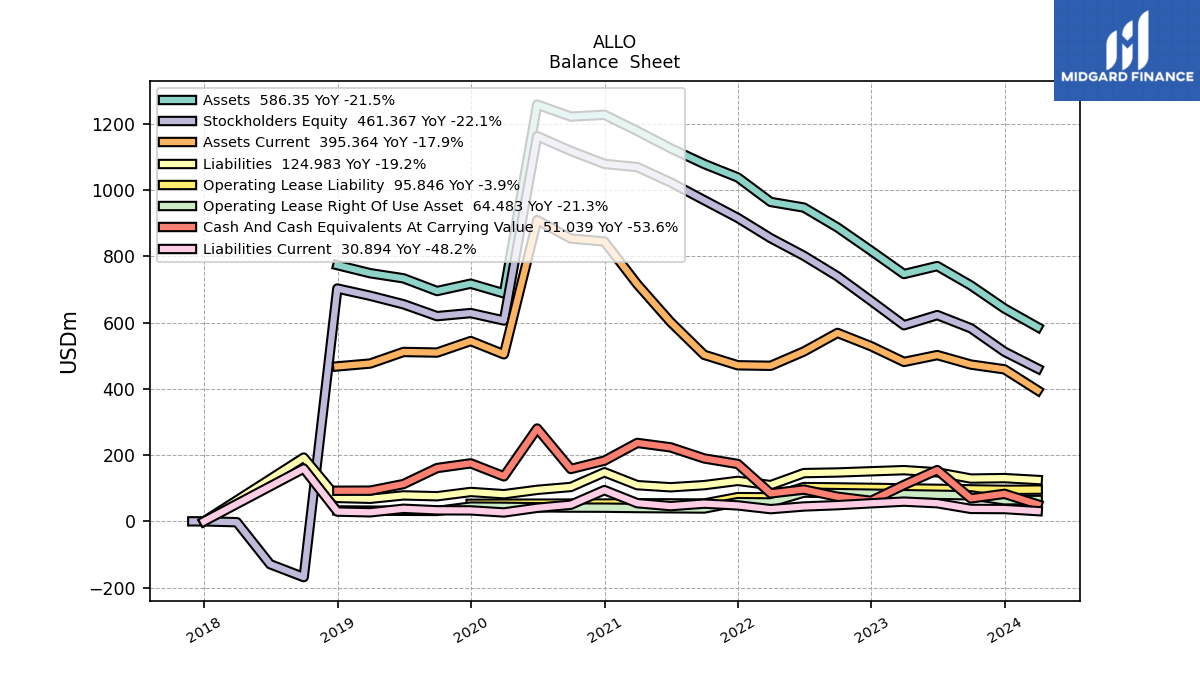
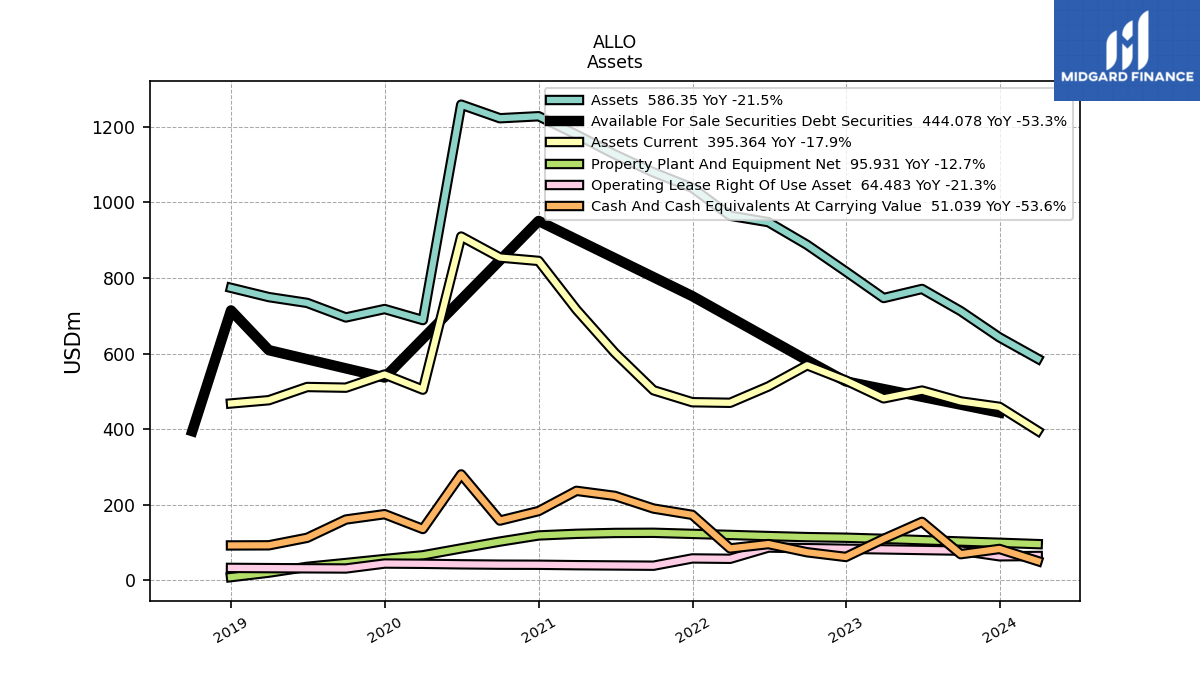
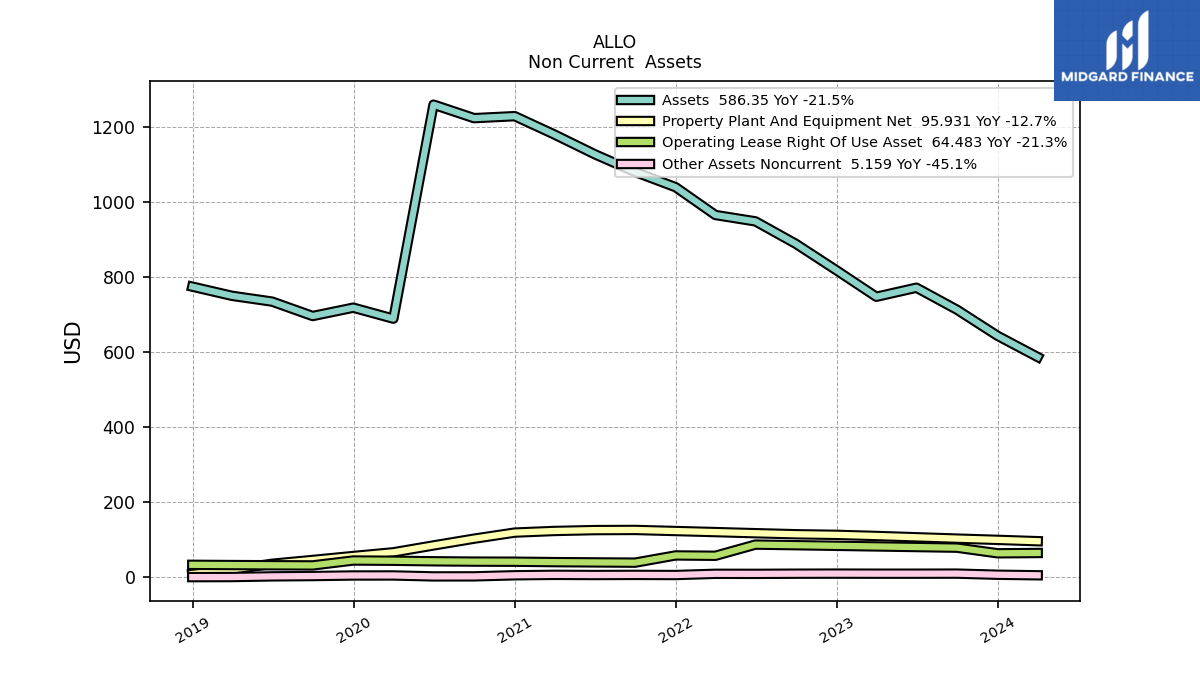
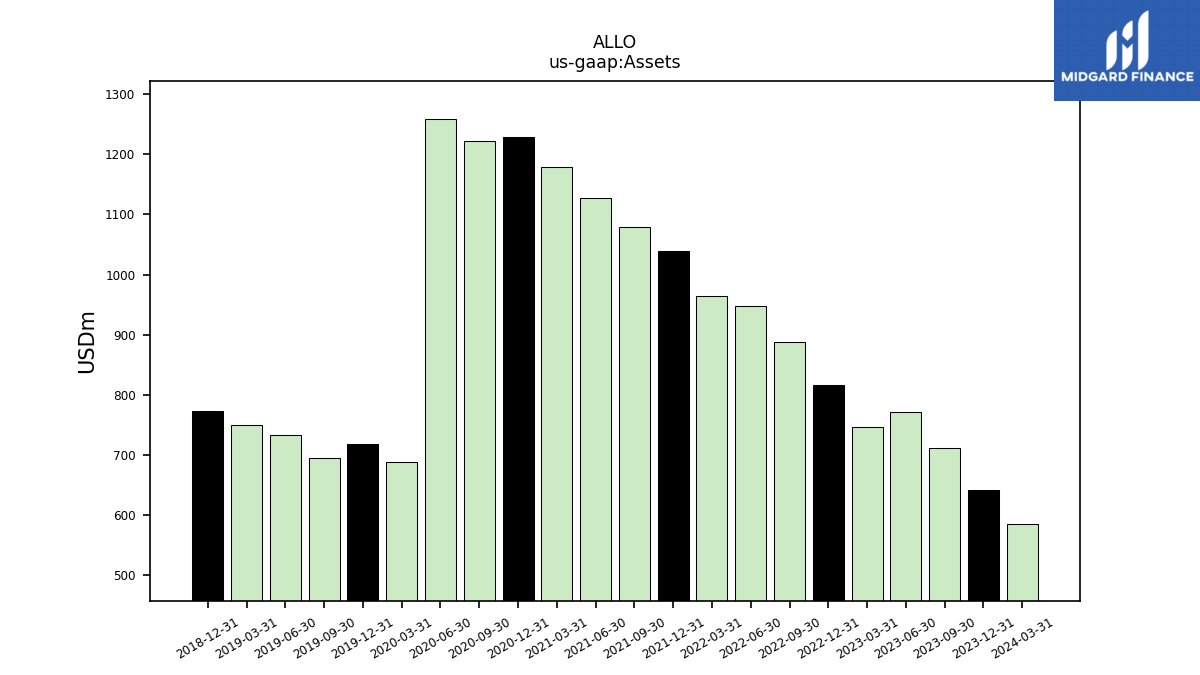
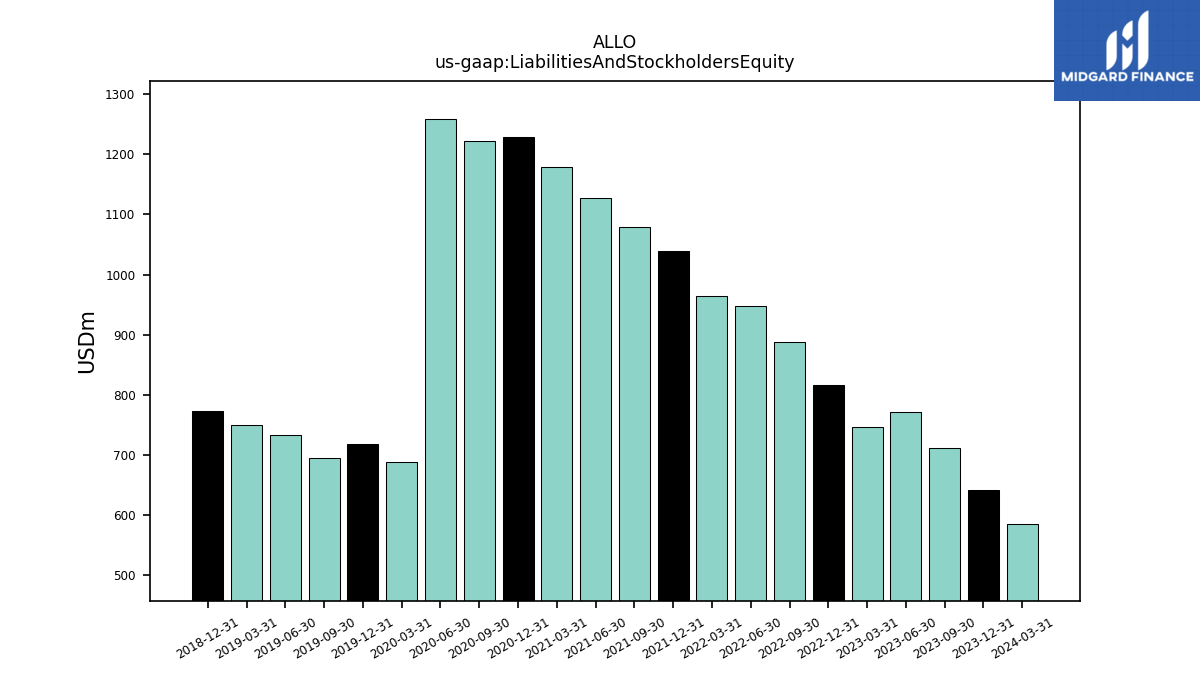
| Assets | 642.84 | 712.33 | 770.97 | 746.87 | 817.08 | 887.57 | 947.64 | 964.63 | 1038.63 | 1079.25 | 1126.72 | 1179.04 | |
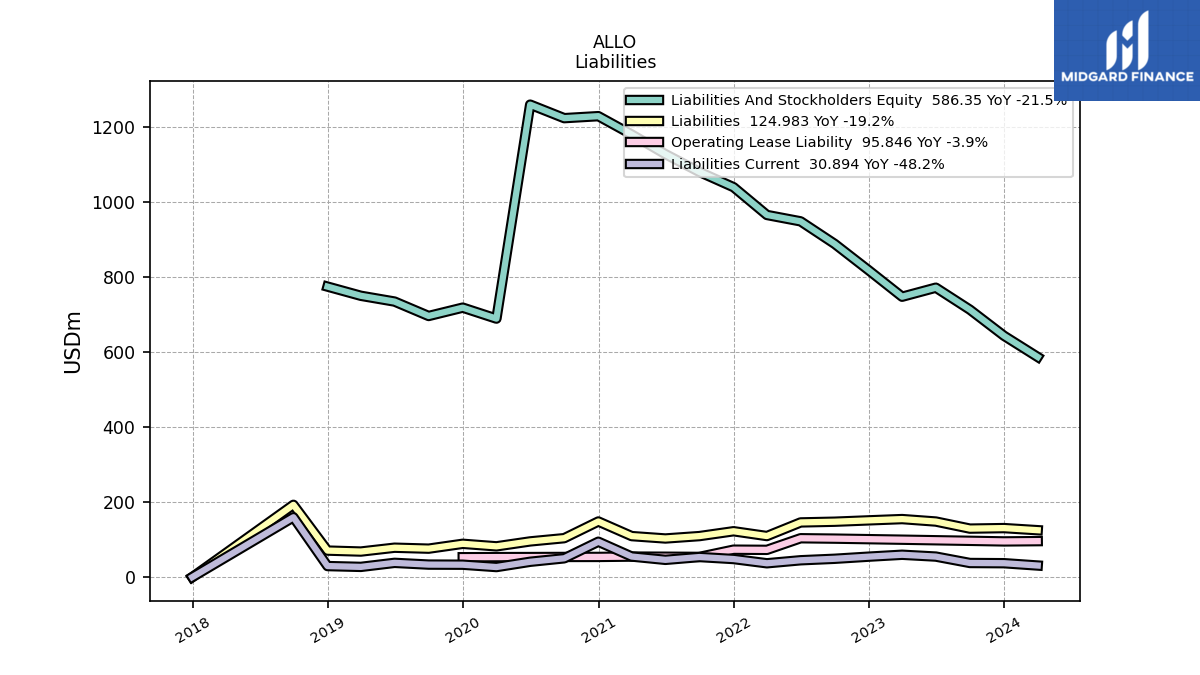
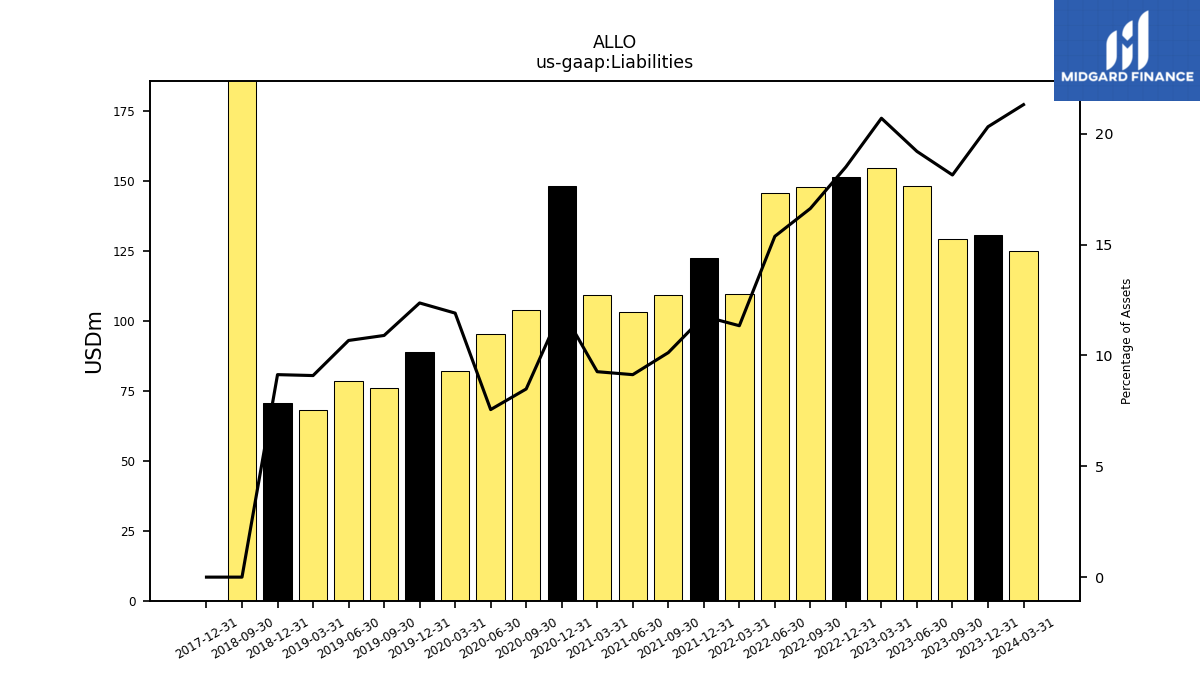
| Liabilities | 130.60 | 129.22 | 148.06 | 154.61 | 151.21 | 147.61 | 145.69 | 109.40 | 122.23 | 109.30 | 102.91 | 109.27 | |
| Liabilities And Stockholders Equity | 642.84 | 712.33 | 770.97 | 746.87 | 817.08 | 887.57 | 947.64 | 964.63 | 1038.63 | 1079.25 | 1126.72 | 1179.04 | |
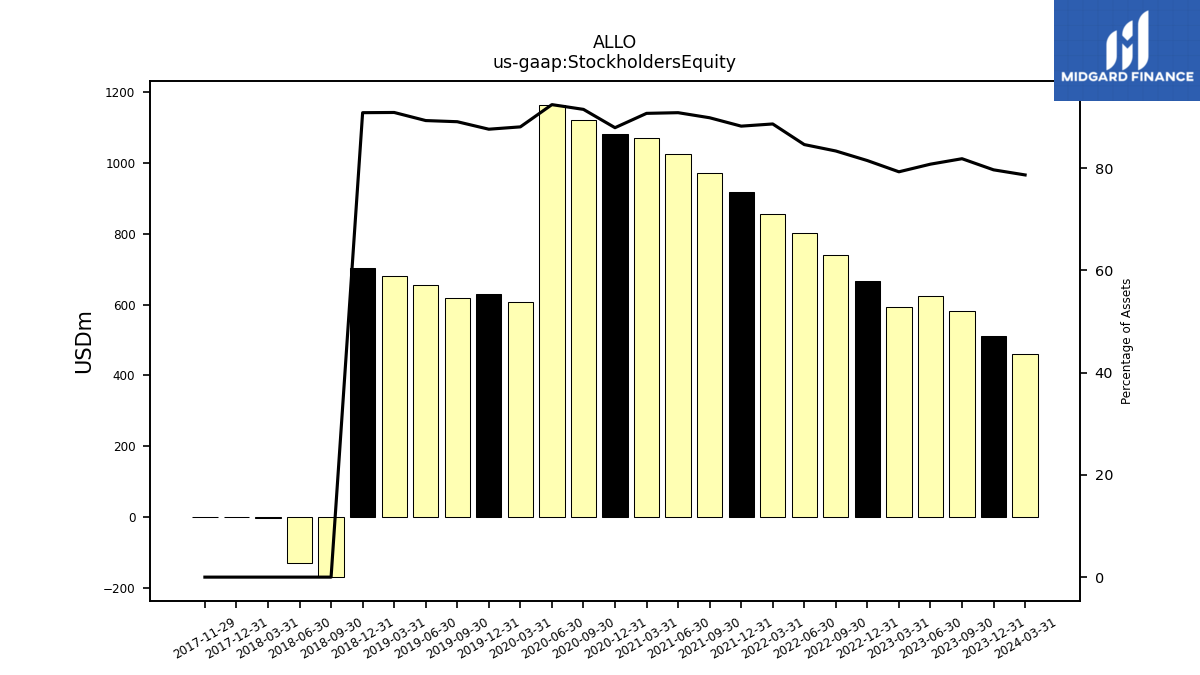
| Stockholders Equity | 512.23 | 583.10 | 622.91 | 592.26 | 665.87 | 739.96 | 801.95 | 855.23 | 916.41 | 969.94 | 1023.81 | 1069.78 |
| 2023-12-31 | 2023-09-30 | 2023-06-30 | 2023-03-31 | 2022-12-31 | 2022-09-30 | 2022-06-30 | 2022-03-31 | 2021-12-31 | 2021-09-30 | 2021-06-30 | 2021-03-31 | ||
|---|---|---|---|---|---|---|---|---|---|---|---|---|---|
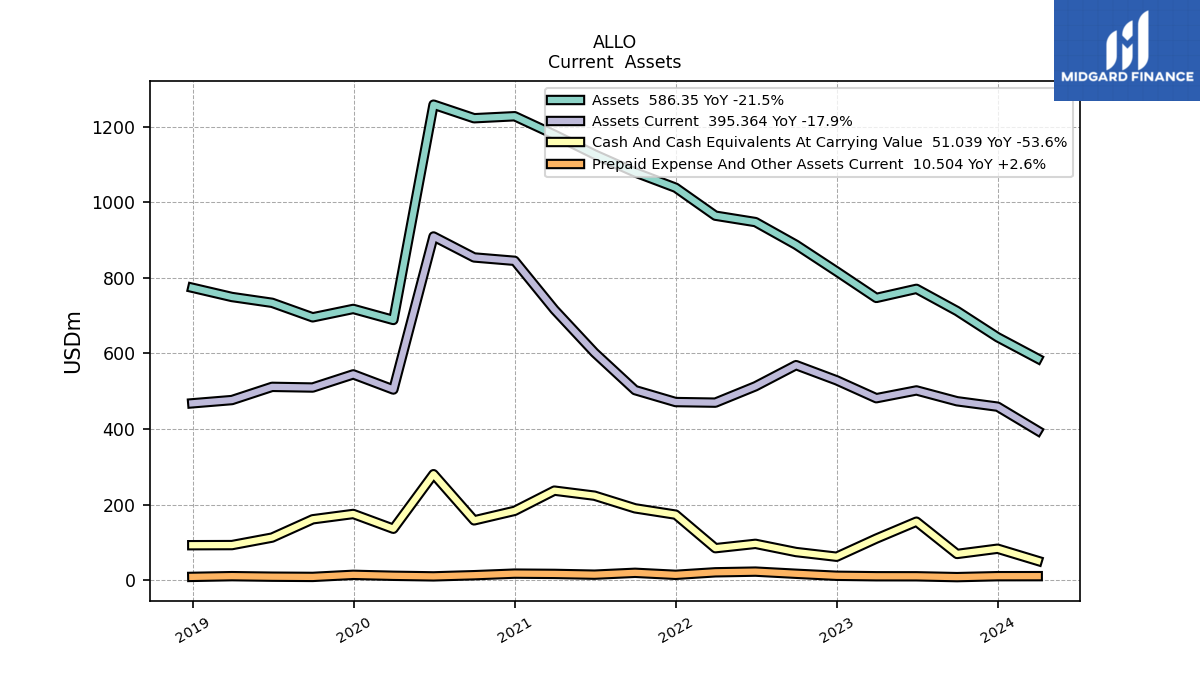
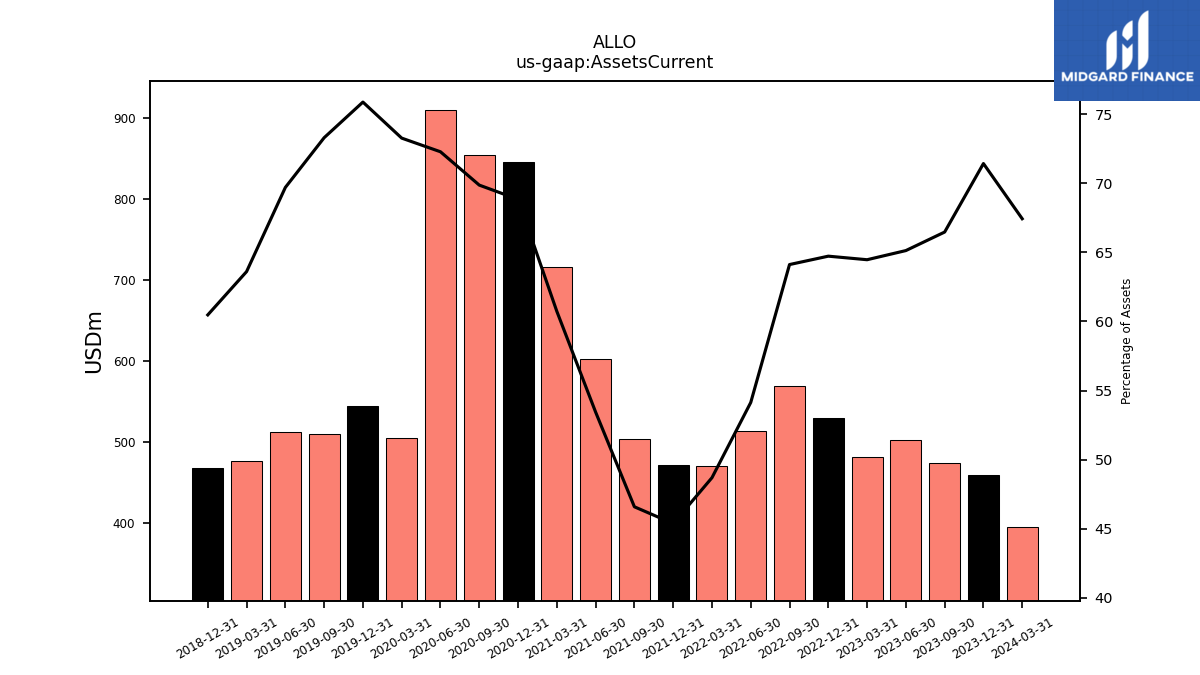
| Assets Current | 459.12 | 473.45 | 502.10 | 481.46 | 528.82 | 569.06 | 513.03 | 469.74 | 471.32 | 502.86 | 602.17 | 716.06 | |
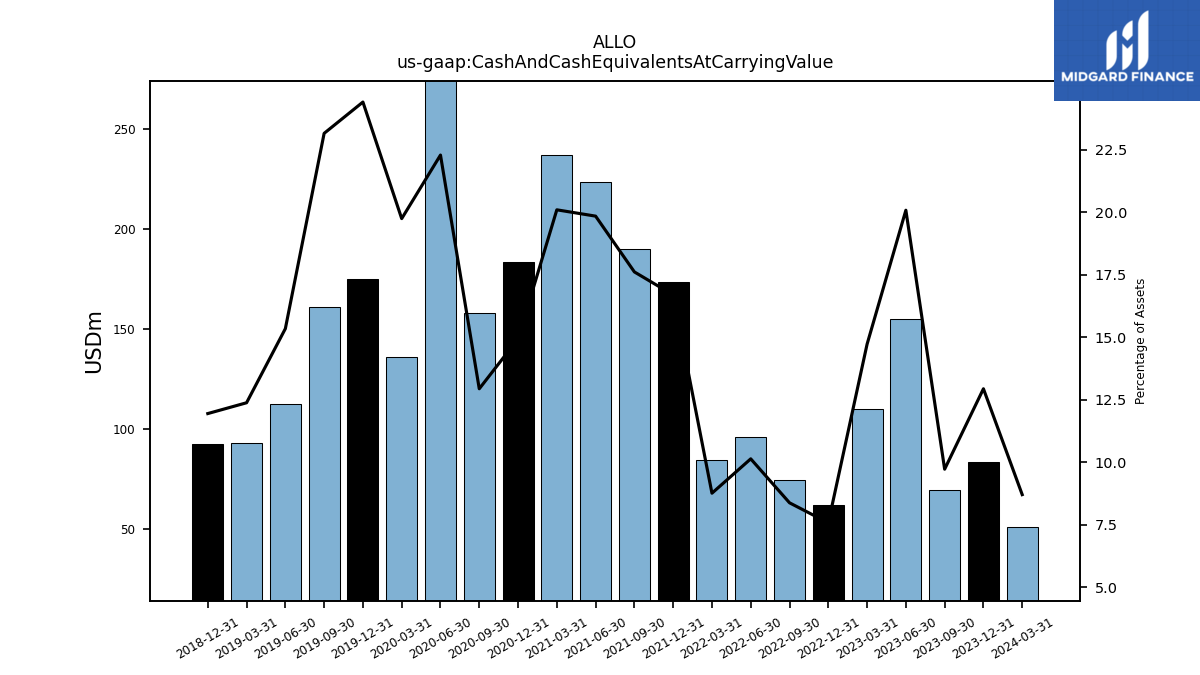
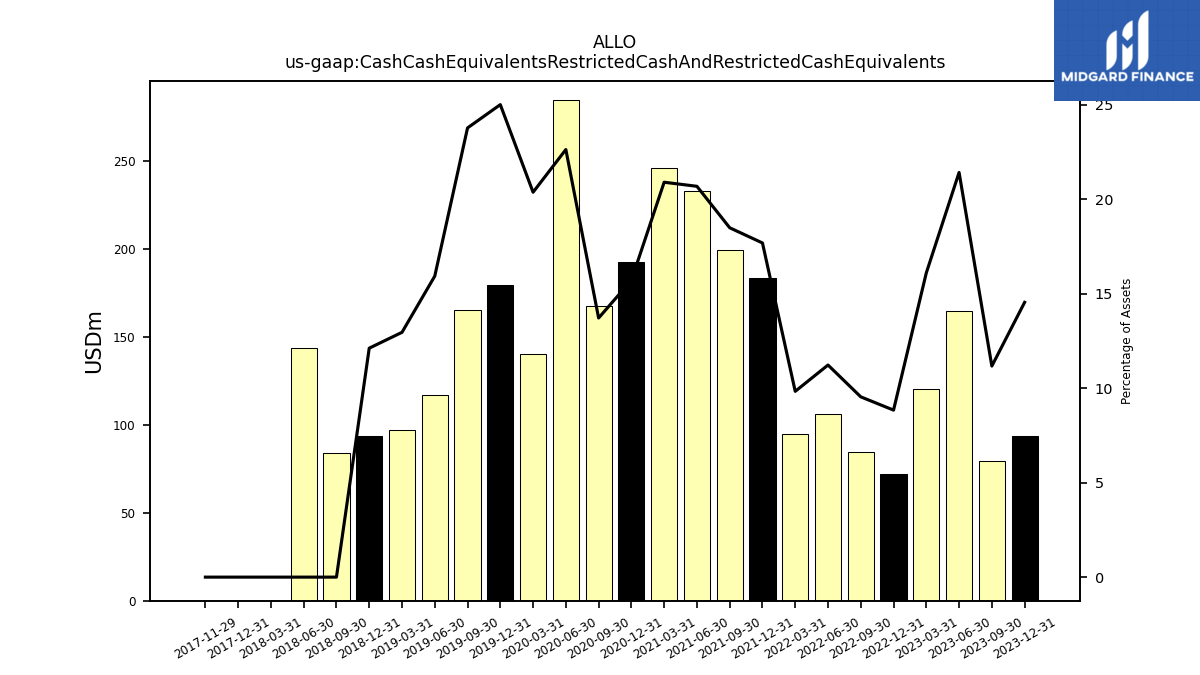
| Cash And Cash Equivalents At Carrying Value | 83.16 | 69.25 | 154.76 | 109.93 | 61.90 | 74.36 | 96.04 | 84.51 | 173.31 | 190.02 | 223.50 | 236.87 | |
| Cash Cash Equivalents Restricted Cash And Restricted Cash Equivalents | 93.45 | 79.54 | 165.05 | 120.22 | 72.20 | 84.65 | 106.33 | 94.81 | 183.61 | 199.47 | 232.95 | 246.31 | |
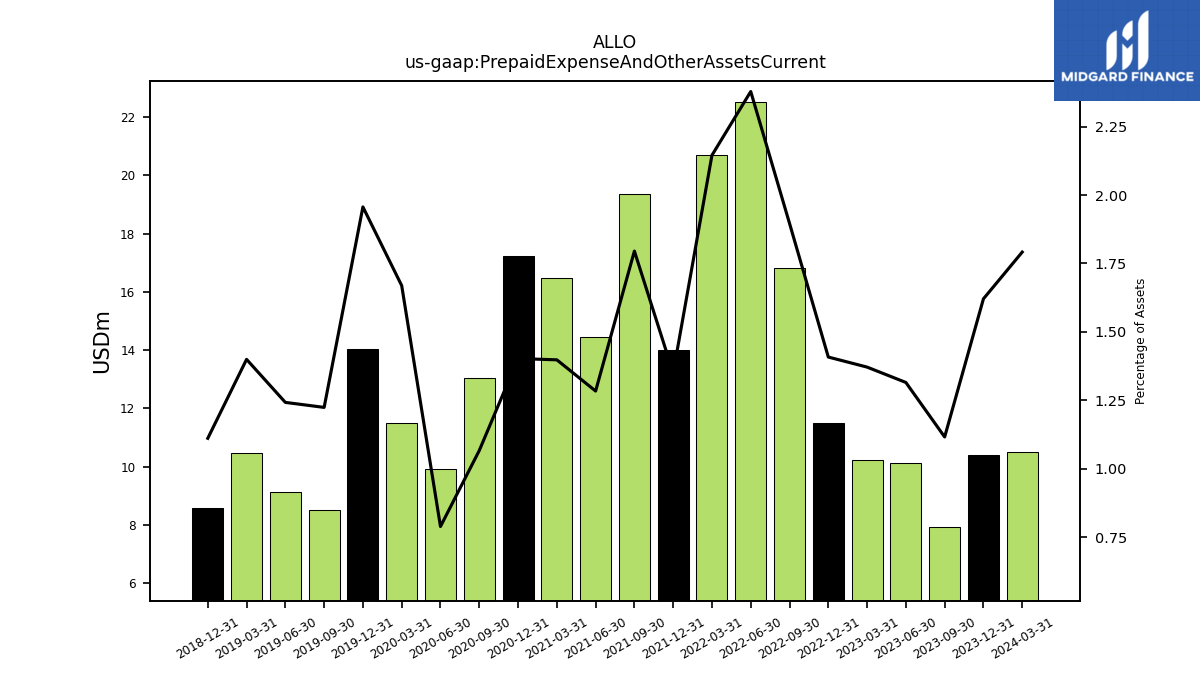
| Prepaid Expense And Other Assets Current | 10.42 | 7.95 | 10.14 | 10.24 | 11.50 | 16.83 | 22.54 | 20.69 | 14.02 | 19.37 | 14.46 | 16.48 | |
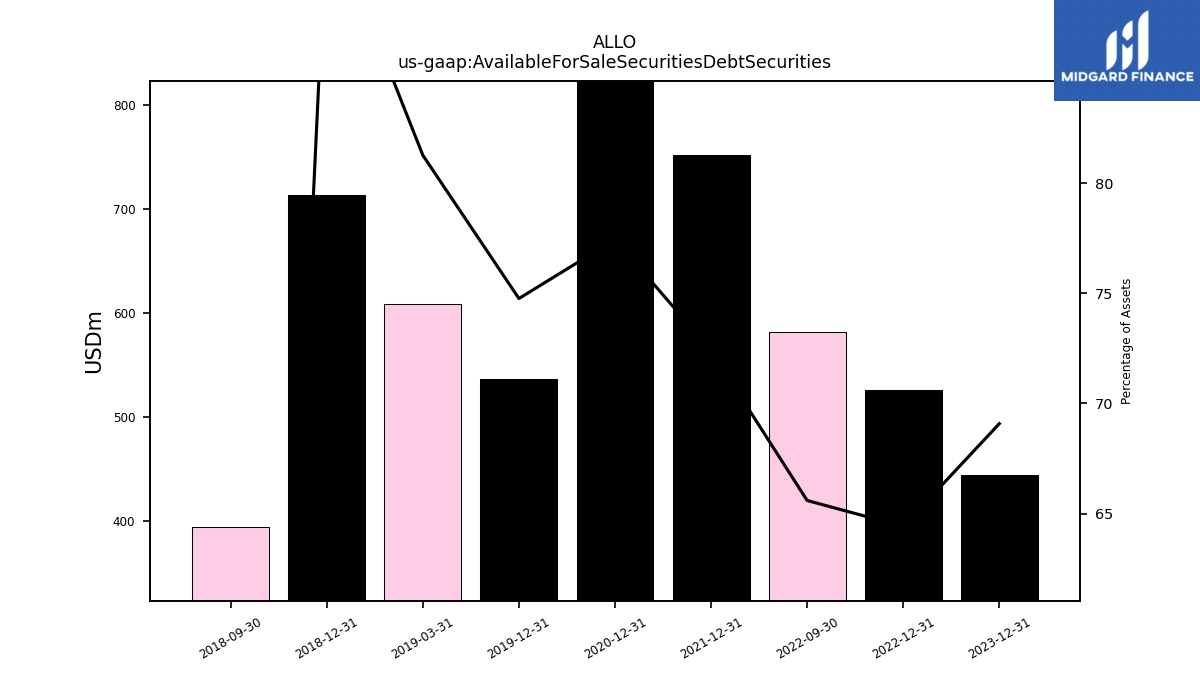
| Available For Sale Securities Debt Securities | 444.08 | NA | NA | NA | 526.33 | 582.21 | NA | NA | 752.03 | NA | NA | NA |
| 2023-12-31 | 2023-09-30 | 2023-06-30 | 2023-03-31 | 2022-12-31 | 2022-09-30 | 2022-06-30 | 2022-03-31 | 2021-12-31 | 2021-09-30 | 2021-06-30 | 2021-03-31 | ||
|---|---|---|---|---|---|---|---|---|---|---|---|---|---|
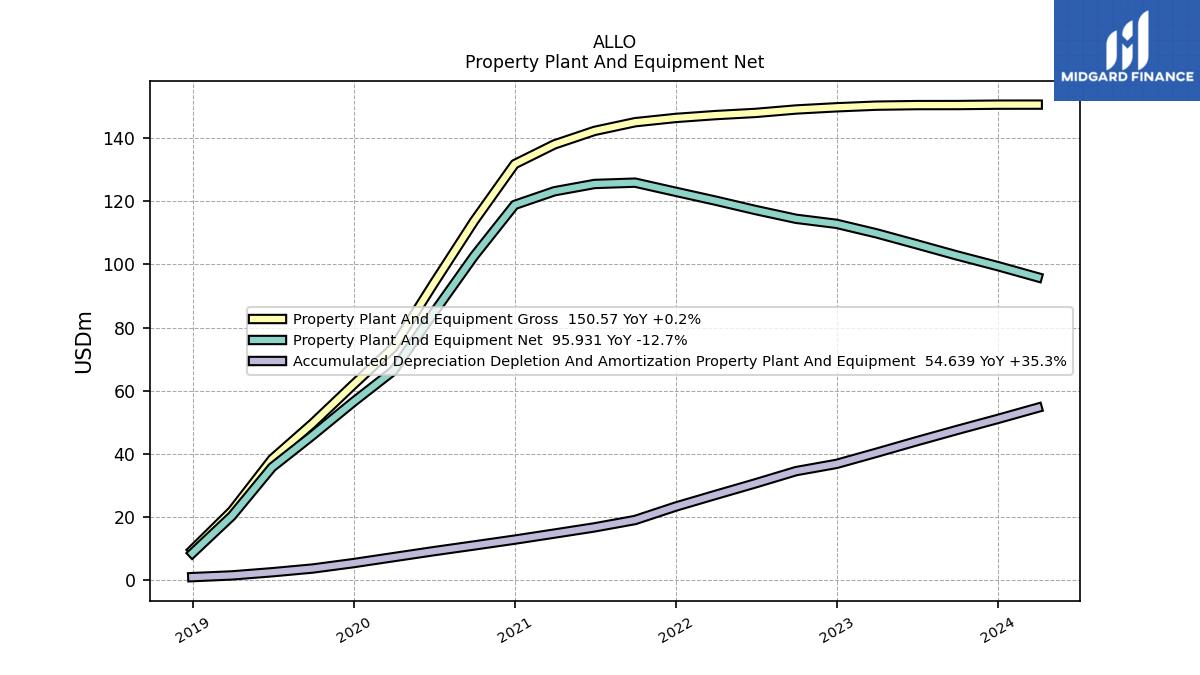
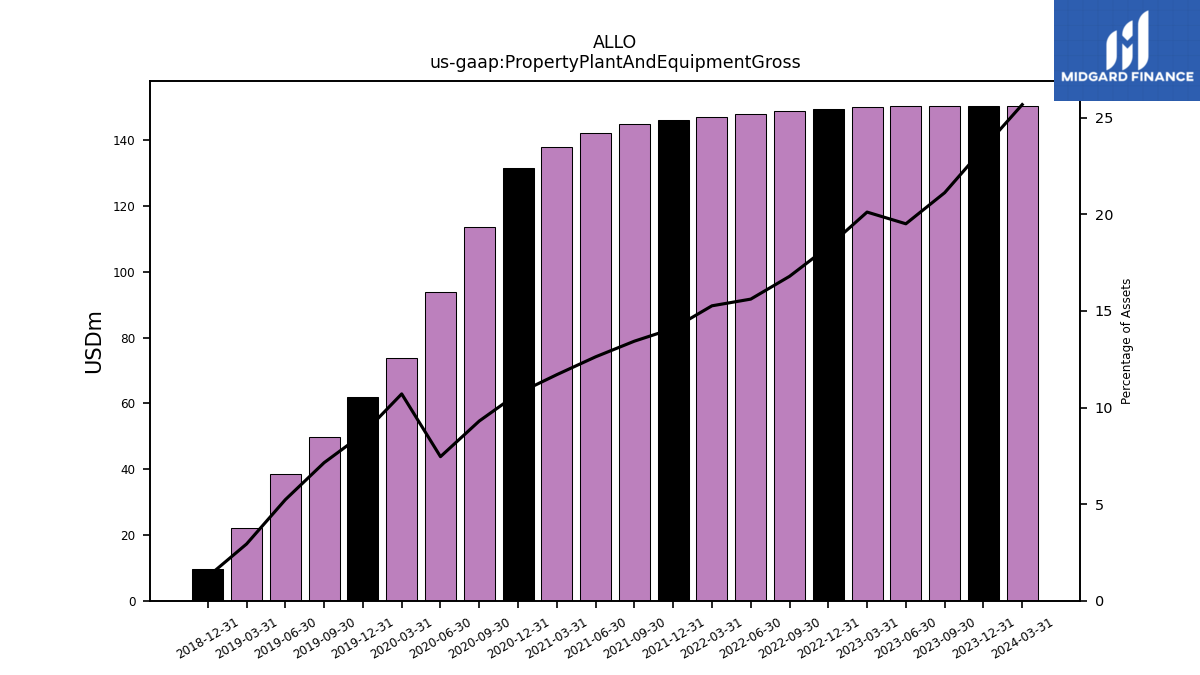
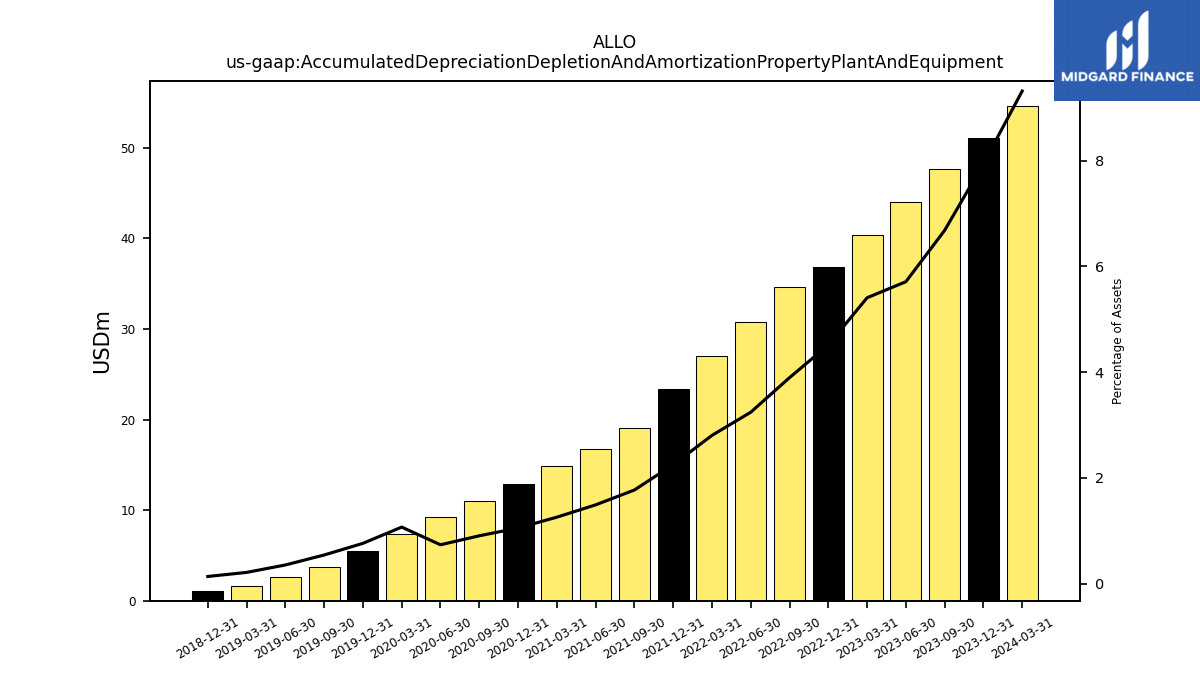
| Property Plant And Equipment Gross | 150.56 | 150.43 | 150.42 | 150.24 | 149.72 | 149.03 | 147.94 | 147.25 | 146.35 | 145.00 | 142.25 | 137.97 | |
| Accumulated Depreciation Depletion And Amortization Property Plant And Equipment | 51.08 | 47.61 | 44.03 | 40.39 | 36.88 | 34.59 | 30.73 | 27.05 | 23.36 | 19.12 | 16.79 | 14.82 | |
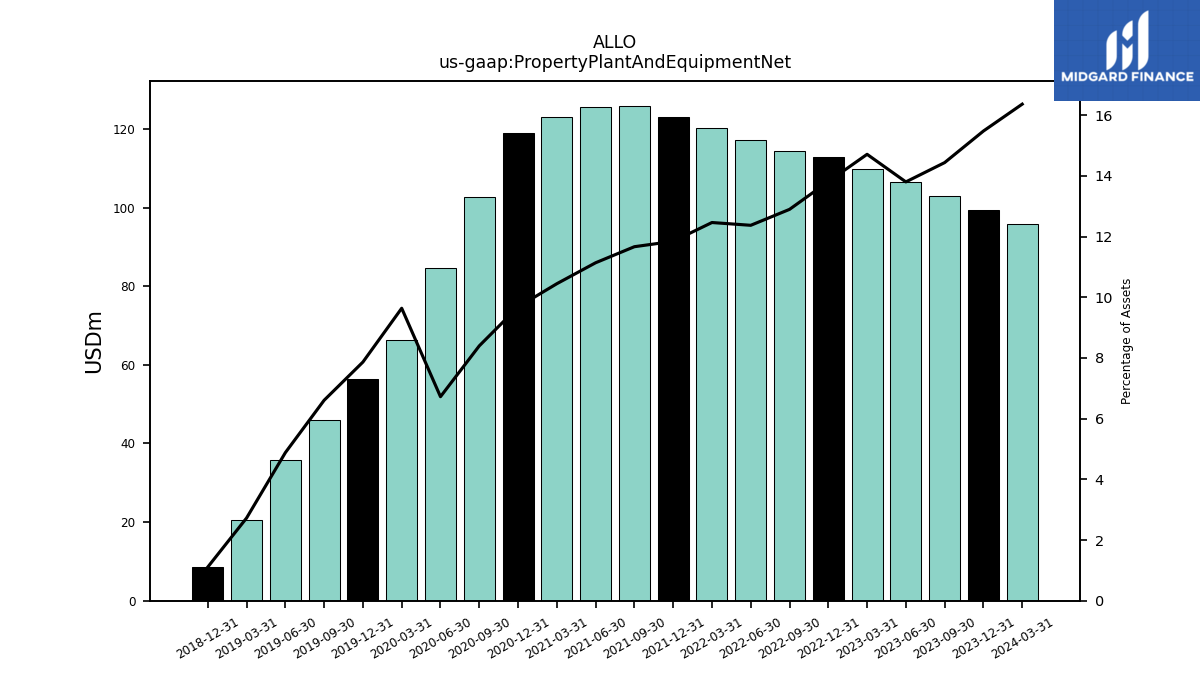
| Property Plant And Equipment Net | 99.48 | 102.83 | 106.39 | 109.85 | 112.84 | 114.44 | 117.22 | 120.20 | 122.99 | 125.88 | 125.46 | 123.15 | |
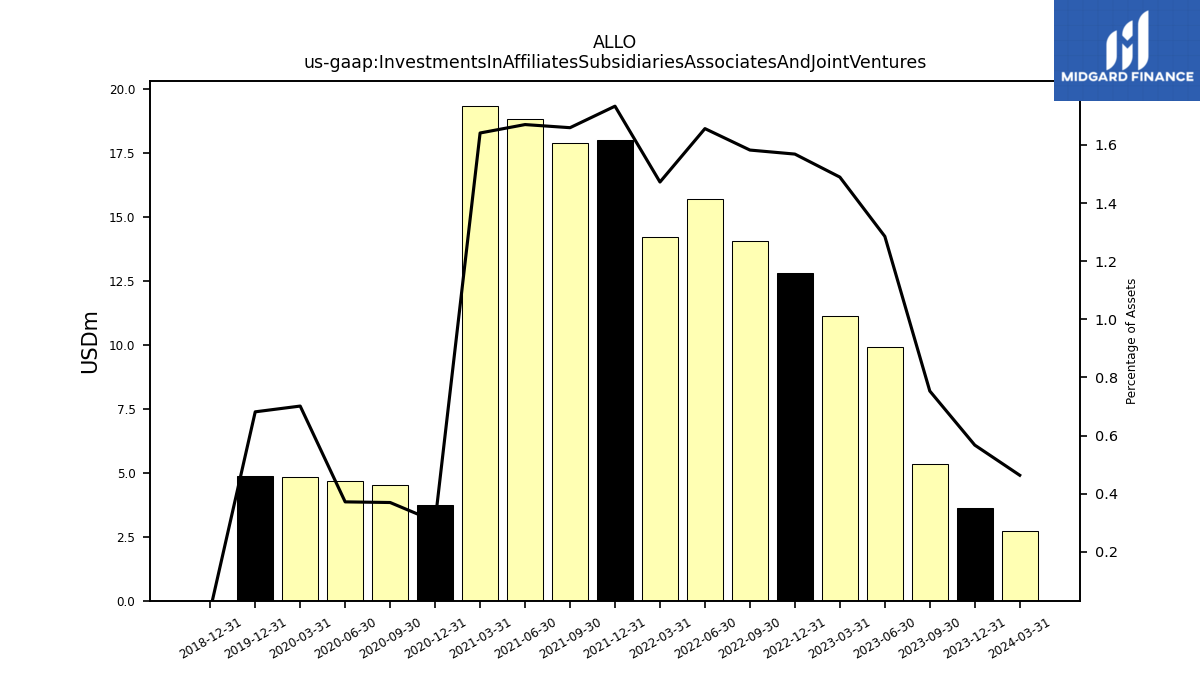
| Investments In Affiliates Subsidiaries Associates And Joint Ventures | 3.65 | 5.37 | 9.91 | 11.12 | 12.82 | 14.05 | 15.70 | 14.20 | 18.00 | 17.91 | 18.82 | 19.35 | |
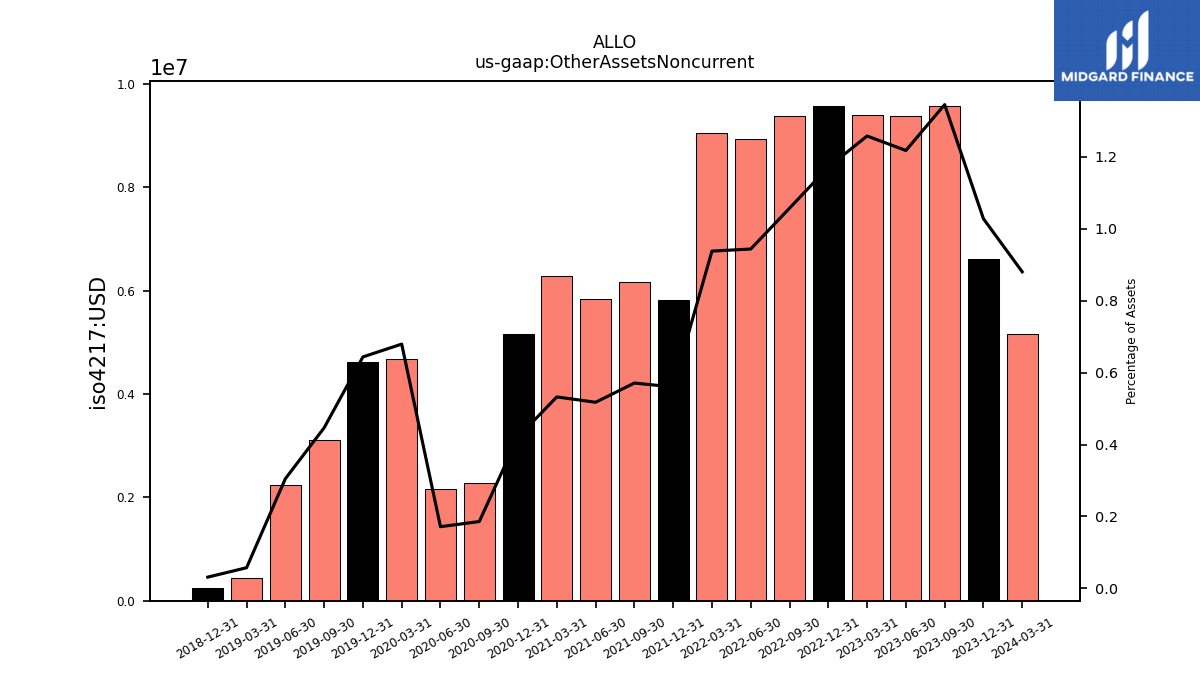
| Other Assets Noncurrent | 6.60 | 9.58 | 9.38 | 9.39 | 9.56 | 9.38 | 8.94 | 9.04 | 5.82 | 6.16 | 5.83 | 6.28 | |
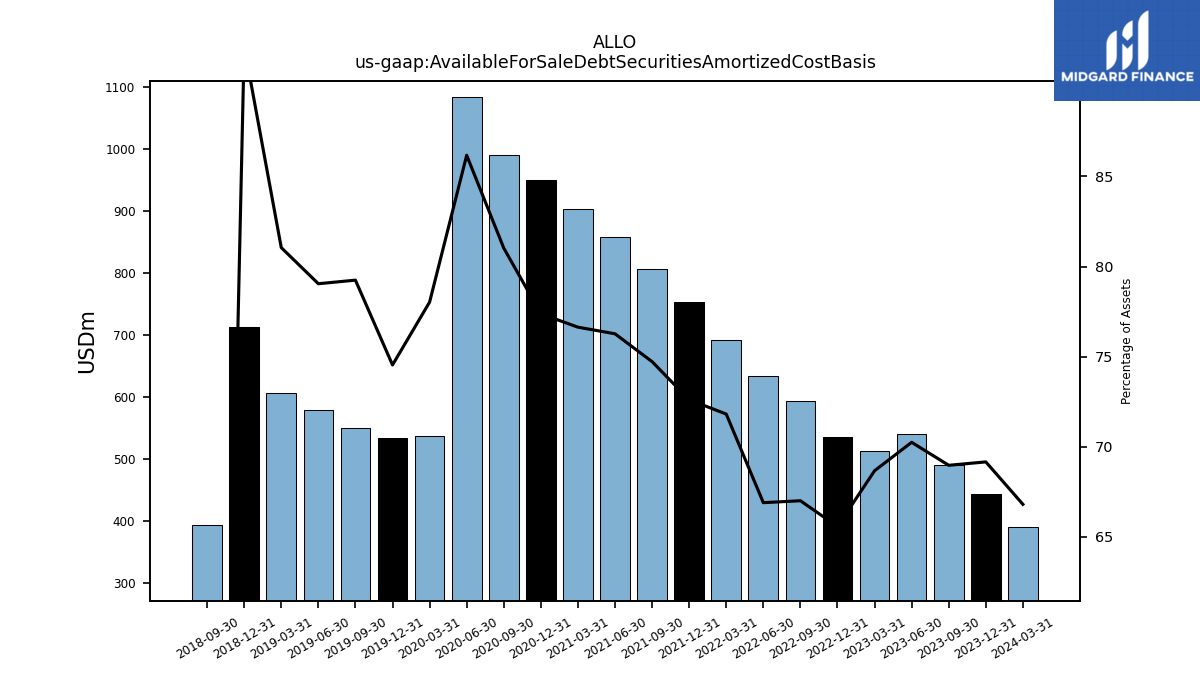
| Available For Sale Debt Securities Amortized Cost Basis | 444.59 | 491.31 | 541.59 | 512.88 | 535.81 | 594.72 | 633.96 | 692.75 | 754.16 | 806.45 | 859.35 | 903.58 |
| 2023-12-31 | 2023-09-30 | 2023-06-30 | 2023-03-31 | 2022-12-31 | 2022-09-30 | 2022-06-30 | 2022-03-31 | 2021-12-31 | 2021-09-30 | 2021-06-30 | 2021-03-31 | ||
|---|---|---|---|---|---|---|---|---|---|---|---|---|---|
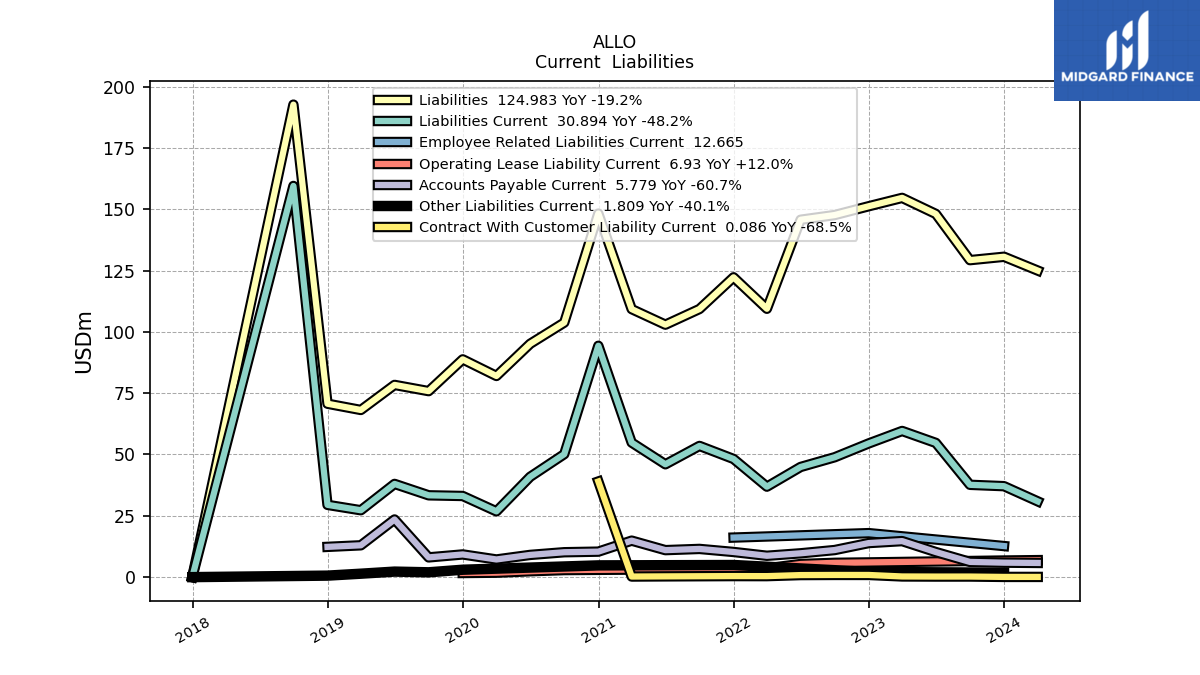
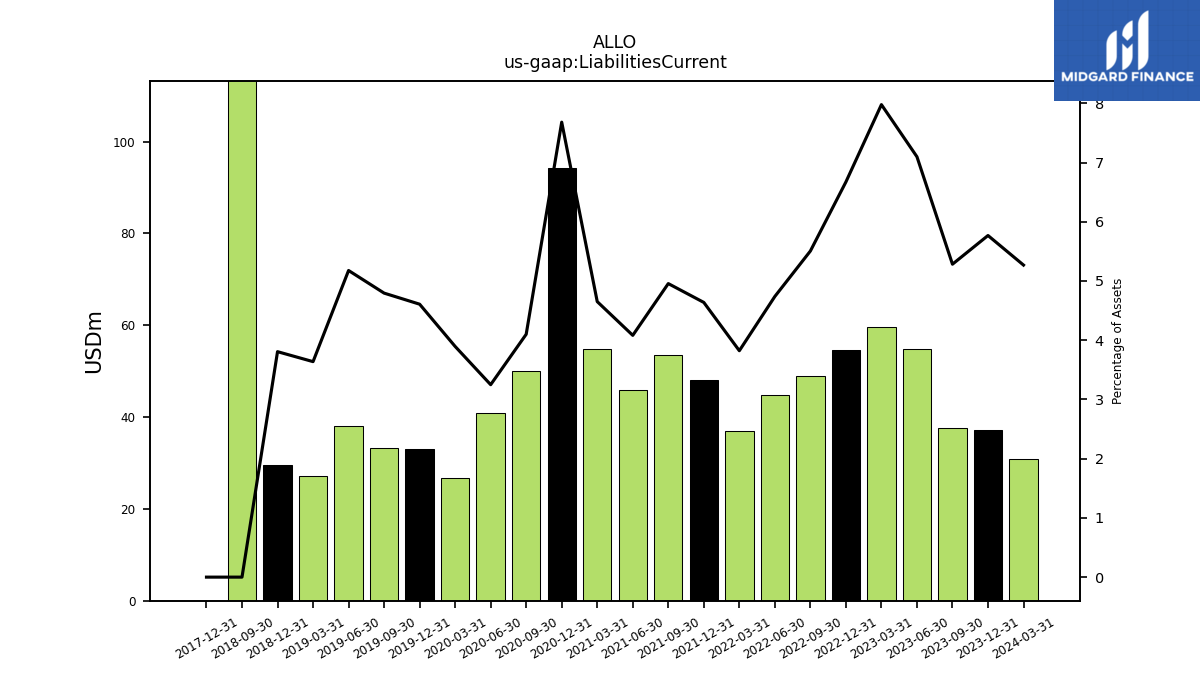
| Liabilities Current | 37.08 | 37.64 | 54.72 | 59.59 | 54.52 | 48.87 | 44.91 | 36.88 | 48.17 | 53.49 | 46.00 | 54.85 | |
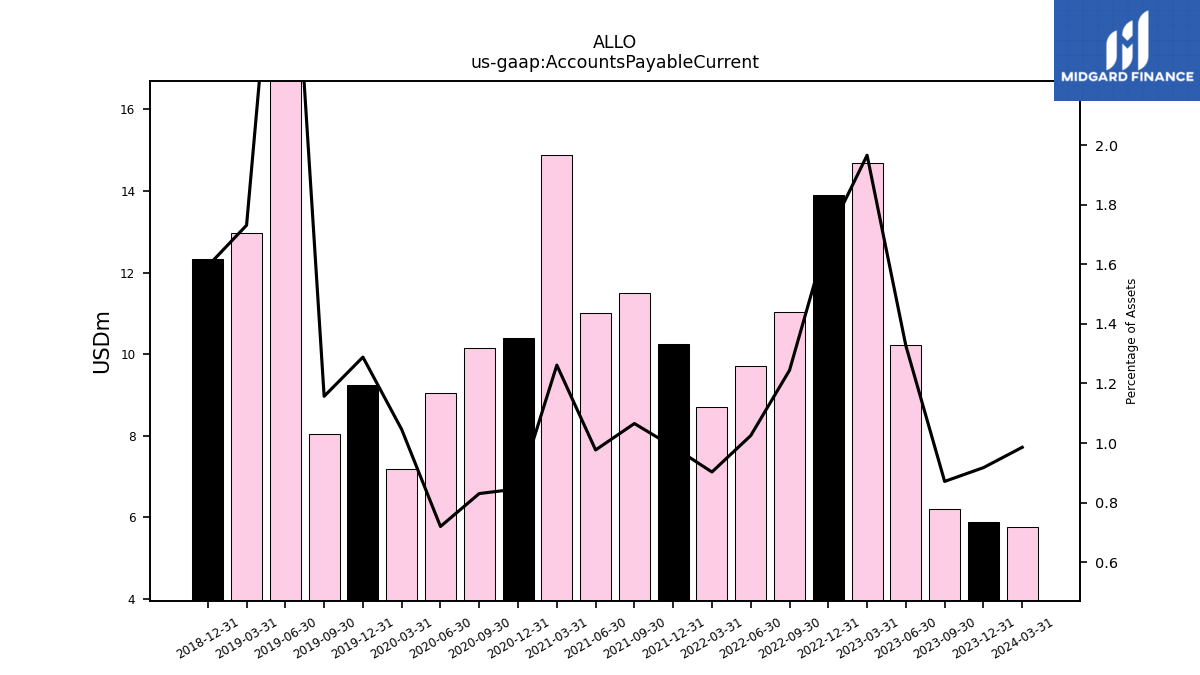
| Accounts Payable Current | 5.90 | 6.21 | 10.23 | 14.69 | 13.89 | 11.04 | 9.71 | 8.71 | 10.26 | 11.50 | 11.01 | 14.88 | |
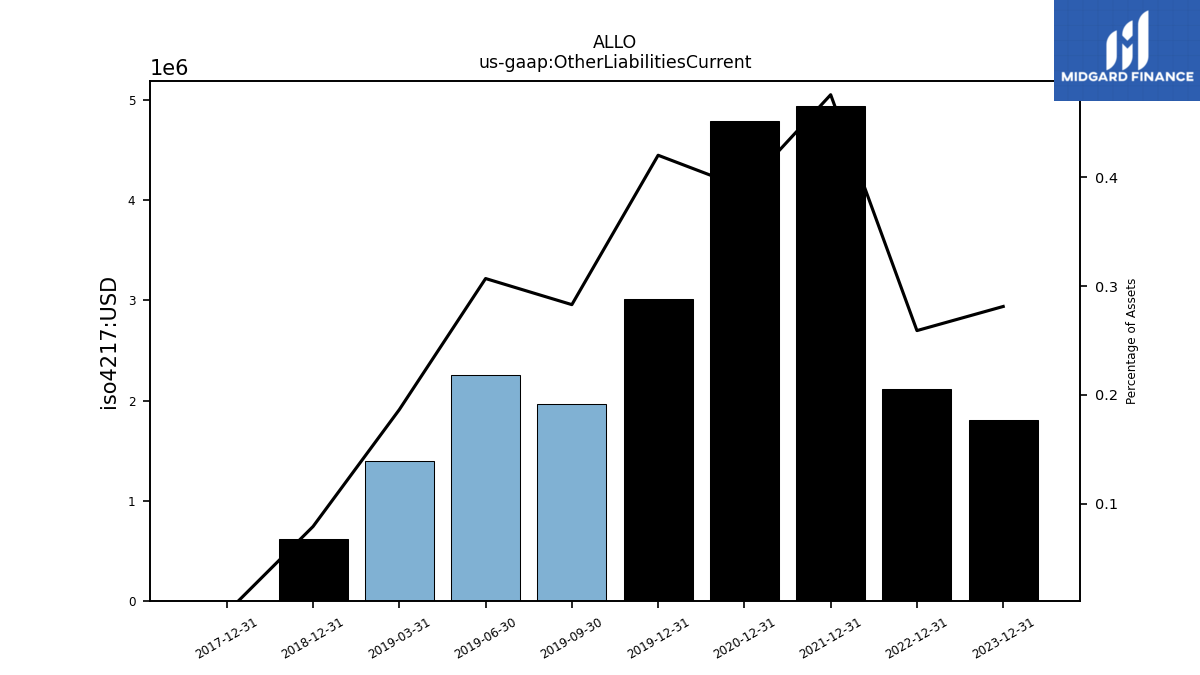
| Other Liabilities Current | 1.81 | NA | NA | NA | 2.12 | NA | NA | NA | 4.95 | NA | NA | NA | |
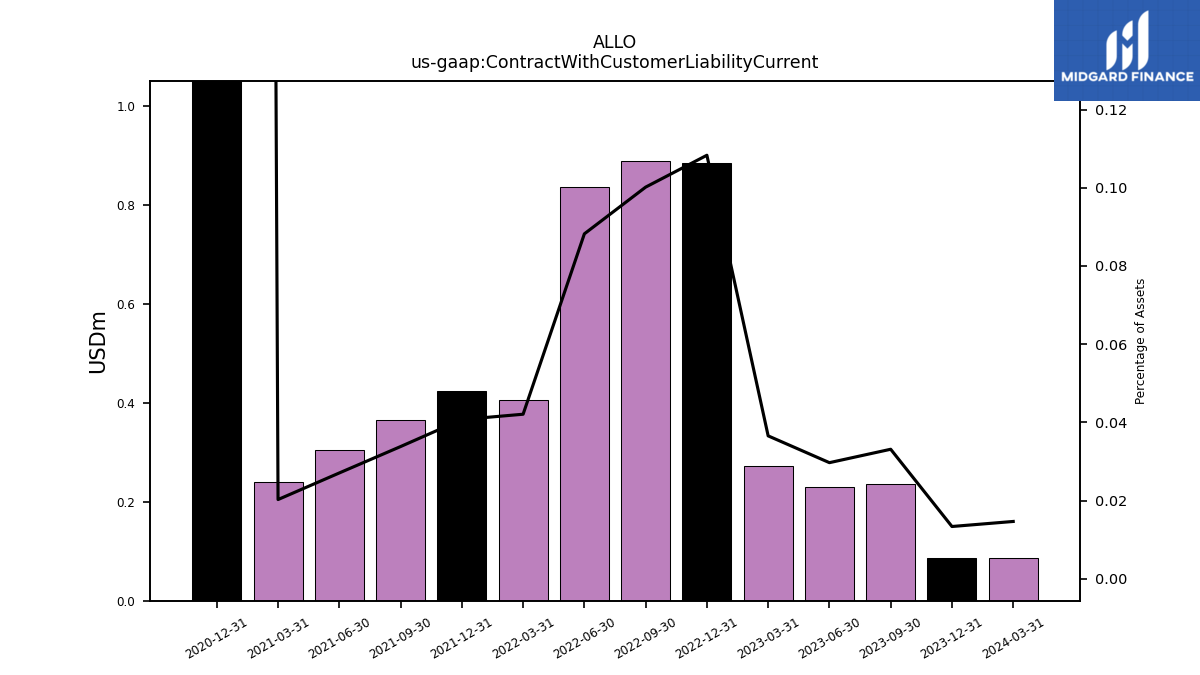
| Contract With Customer Liability Current | 0.09 | 0.24 | 0.23 | 0.27 | 0.89 | 0.89 | 0.84 | 0.41 | 0.42 | 0.36 | 0.30 | 0.24 |
| 2023-12-31 | 2023-09-30 | 2023-06-30 | 2023-03-31 | 2022-12-31 | 2022-09-30 | 2022-06-30 | 2022-03-31 | 2021-12-31 | 2021-09-30 | 2021-06-30 | 2021-03-31 | ||
|---|---|---|---|---|---|---|---|---|---|---|---|---|---|
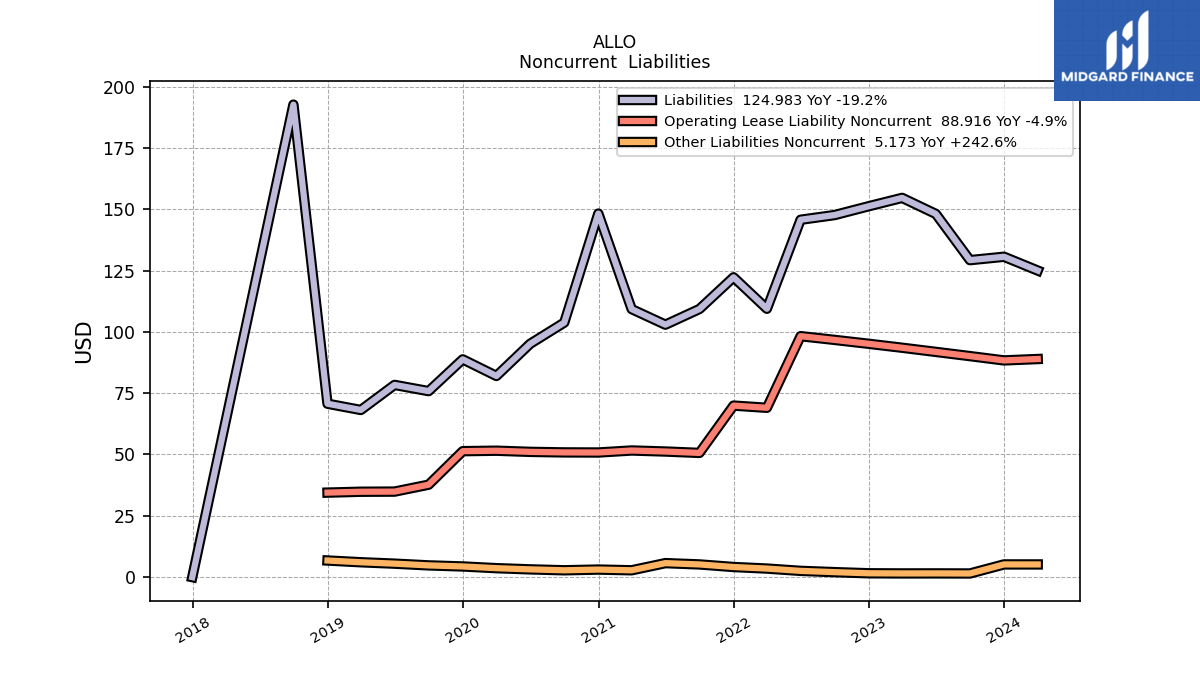
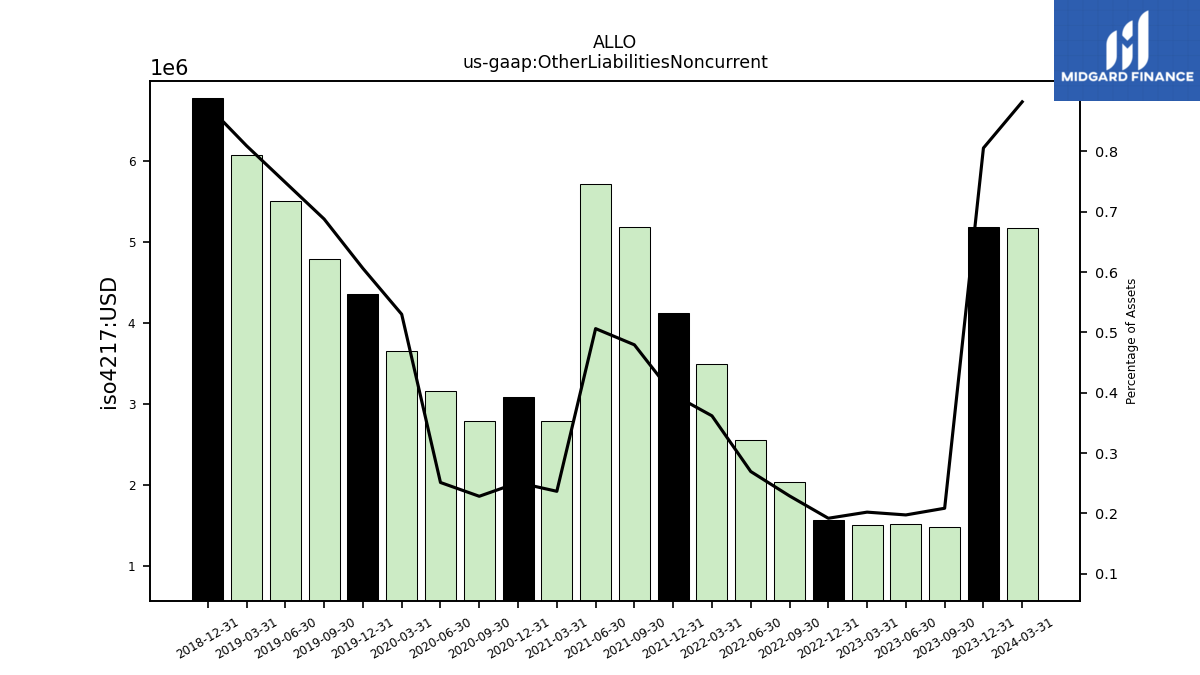
| Other Liabilities Noncurrent | 5.18 | 1.49 | 1.52 | 1.51 | 1.57 | 2.03 | 2.55 | 3.49 | 4.12 | 5.17 | 5.71 | 2.79 | |
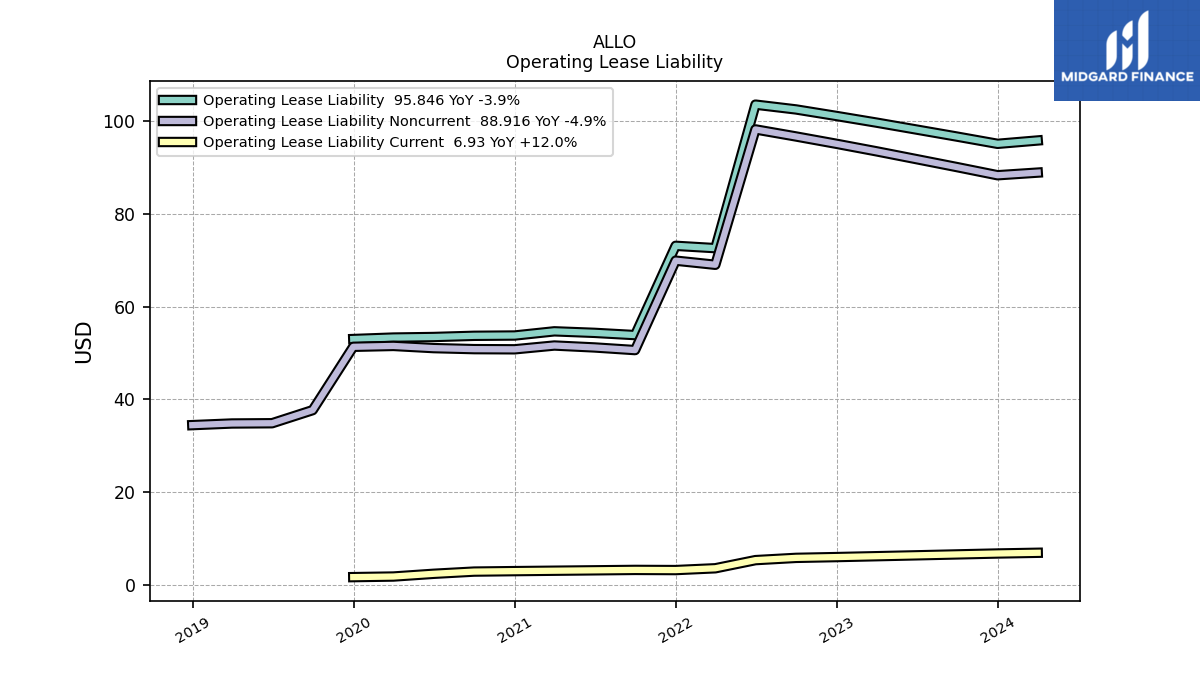
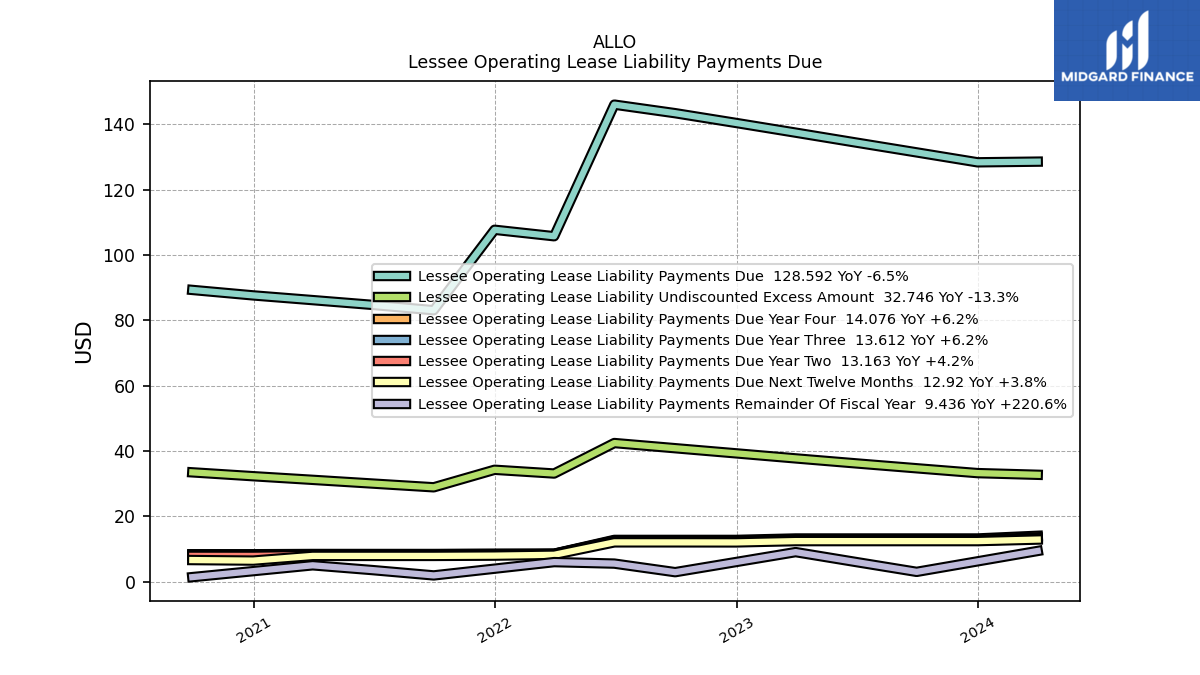
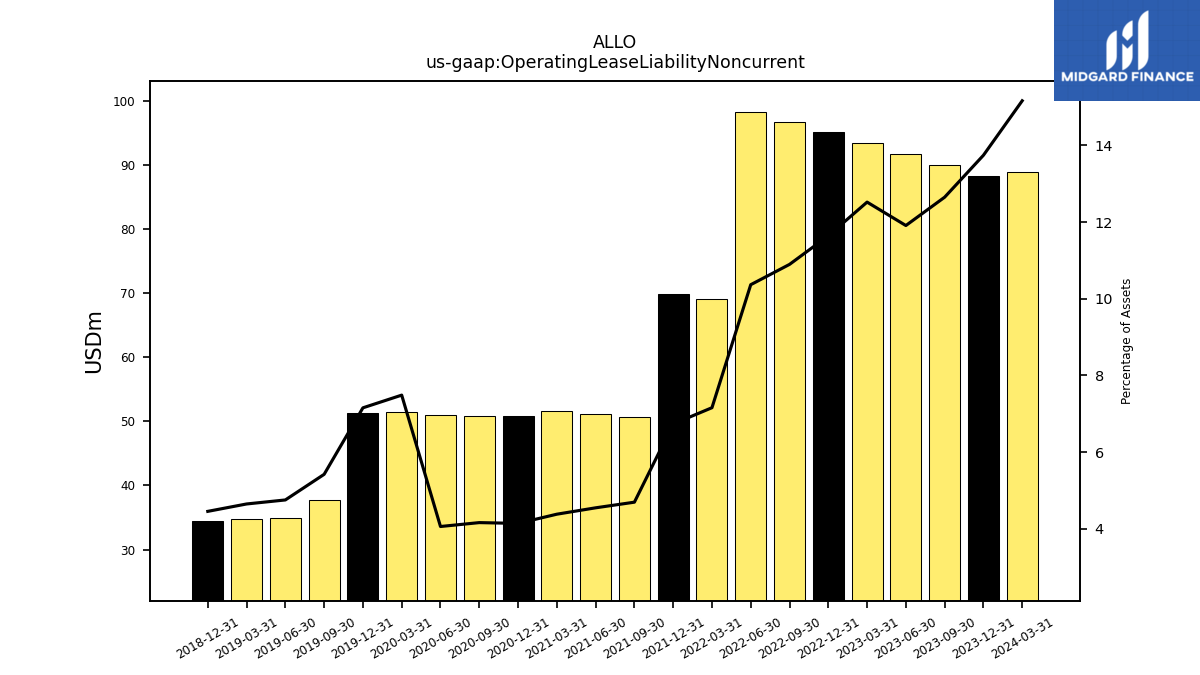
| Operating Lease Liability Noncurrent | 88.35 | 90.10 | 91.82 | 93.51 | 95.12 | 96.71 | 98.23 | 69.03 | 69.93 | 50.64 | 51.21 | 51.62 |
| 2023-12-31 | 2023-09-30 | 2023-06-30 | 2023-03-31 | 2022-12-31 | 2022-09-30 | 2022-06-30 | 2022-03-31 | 2021-12-31 | 2021-09-30 | 2021-06-30 | 2021-03-31 | ||
|---|---|---|---|---|---|---|---|---|---|---|---|---|---|
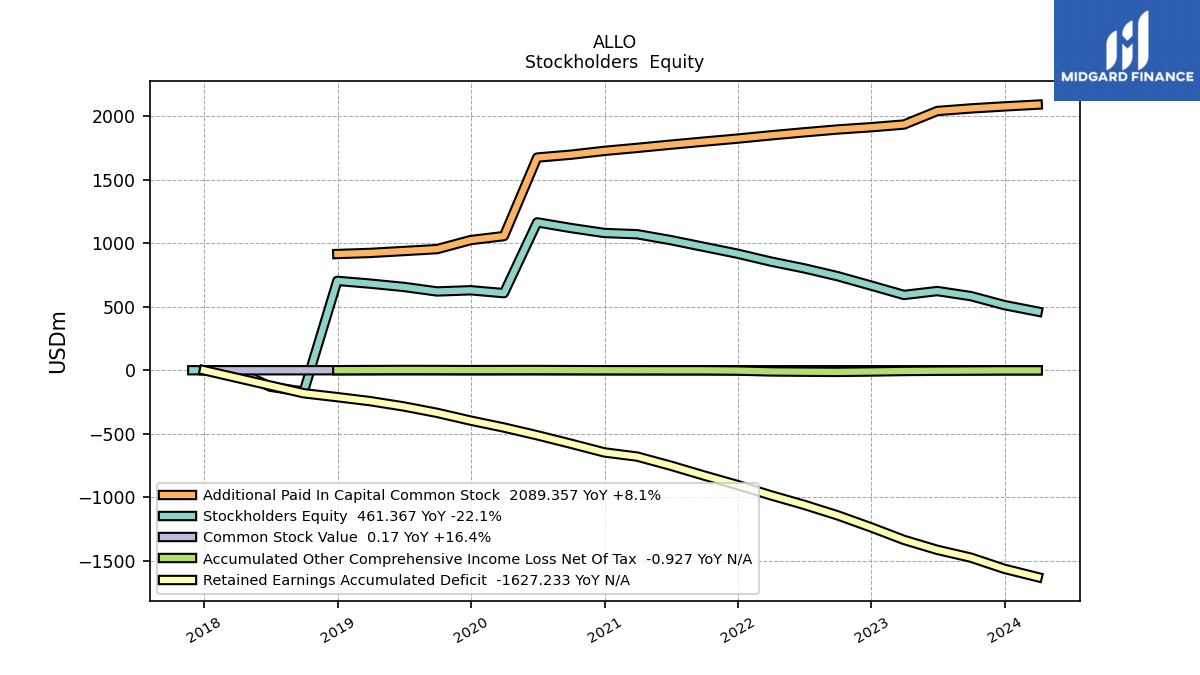
| Stockholders Equity | 512.23 | 583.10 | 622.91 | 592.26 | 665.87 | 739.96 | 801.95 | 855.23 | 916.41 | 969.94 | 1023.81 | 1069.78 | |
| Common Stock Value | 0.17 | 0.17 | 0.17 | 0.15 | 0.14 | 0.14 | 0.14 | 0.14 | 0.14 | 0.14 | 0.14 | 0.14 | |
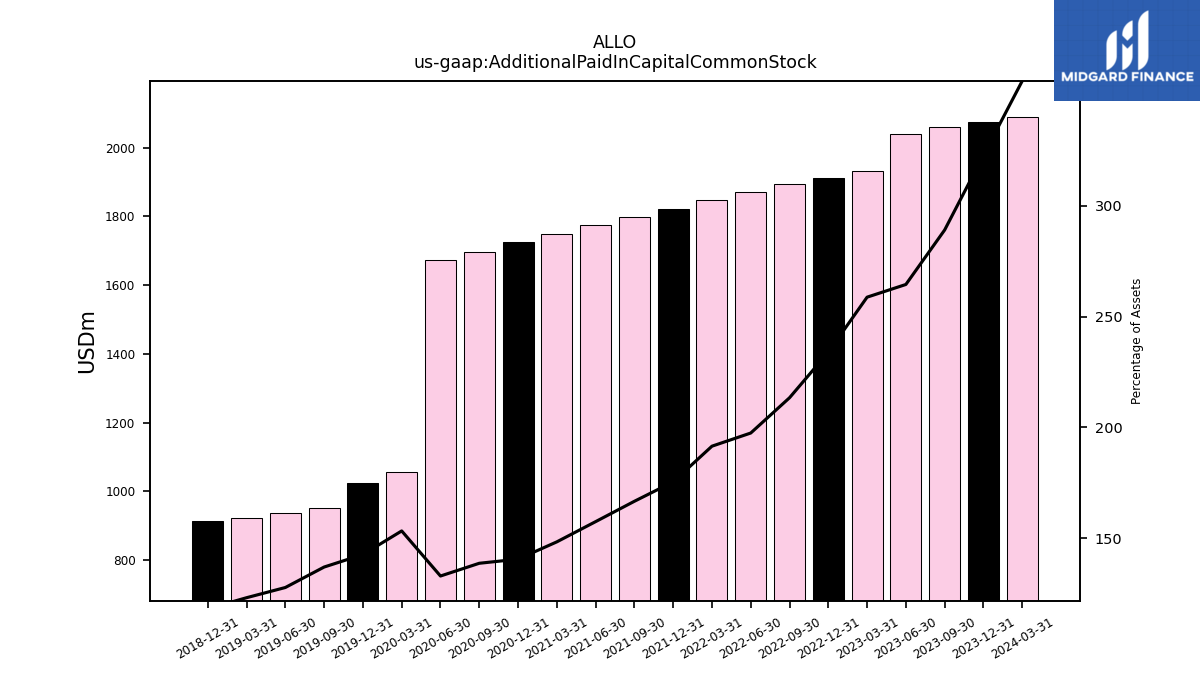
| Additional Paid In Capital Common Stock | 2075.25 | 2059.33 | 2039.26 | 1932.73 | 1911.63 | 1893.91 | 1871.26 | 1847.53 | 1822.18 | 1798.68 | 1774.30 | 1749.10 | |
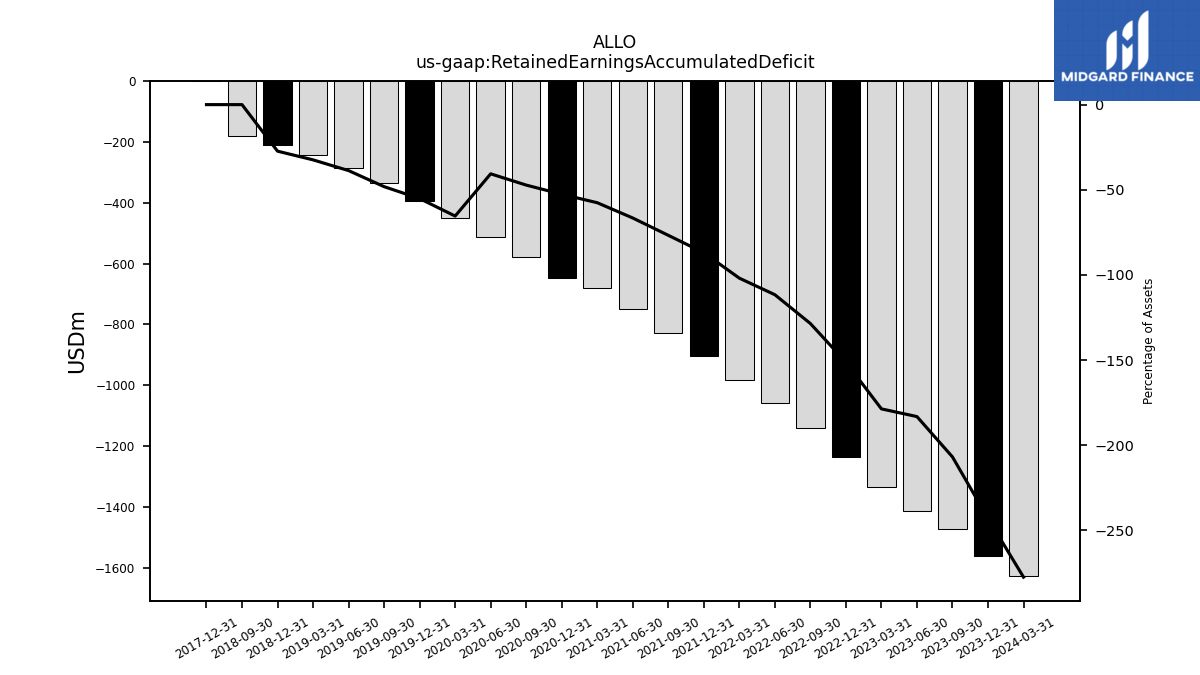
| Retained Earnings Accumulated Deficit | -1562.23 | -1473.99 | -1412.67 | -1334.68 | -1235.98 | -1141.13 | -1057.98 | -983.20 | -903.35 | -828.48 | -750.29 | -679.36 | |
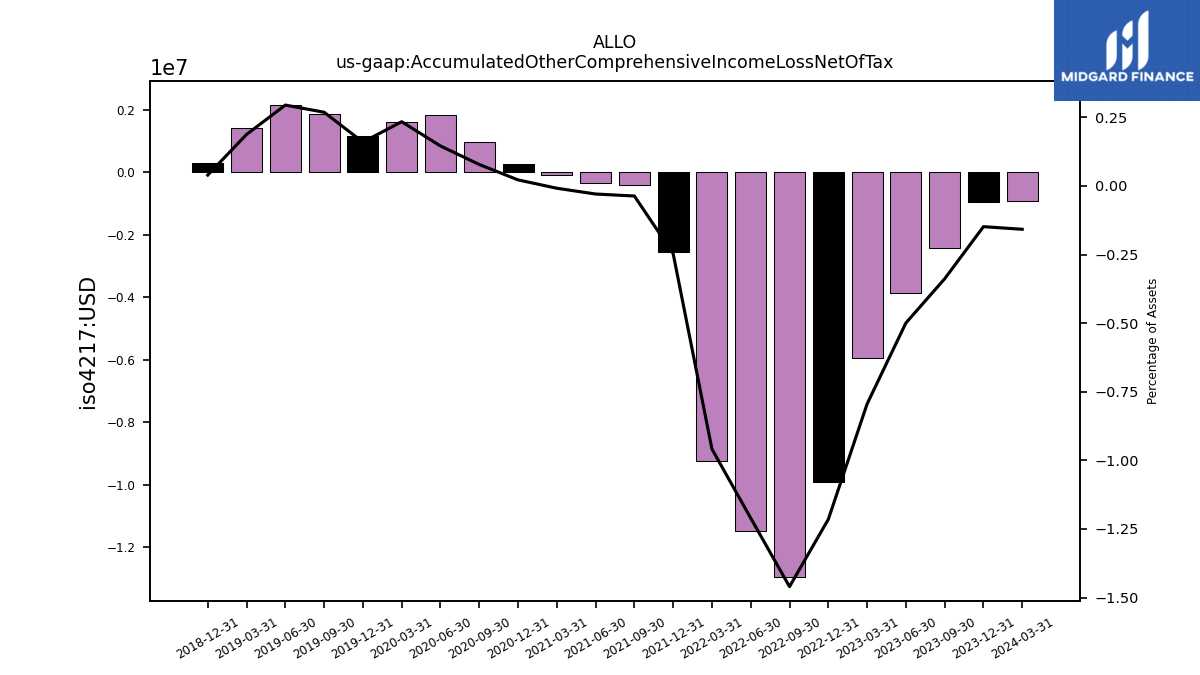
| Accumulated Other Comprehensive Income Loss Net Of Tax | -0.95 | -2.41 | -3.85 | -5.93 | -9.93 | -12.96 | -11.47 | -9.25 | -2.57 | -0.40 | -0.33 | -0.10 |
| 2023-12-31 | 2023-09-30 | 2023-06-30 | 2023-03-31 | 2022-12-31 | 2022-09-30 | 2022-06-30 | 2022-03-31 | 2021-12-31 | 2021-09-30 | 2021-06-30 | 2021-03-31 | ||
|---|---|---|---|---|---|---|---|---|---|---|---|---|---|
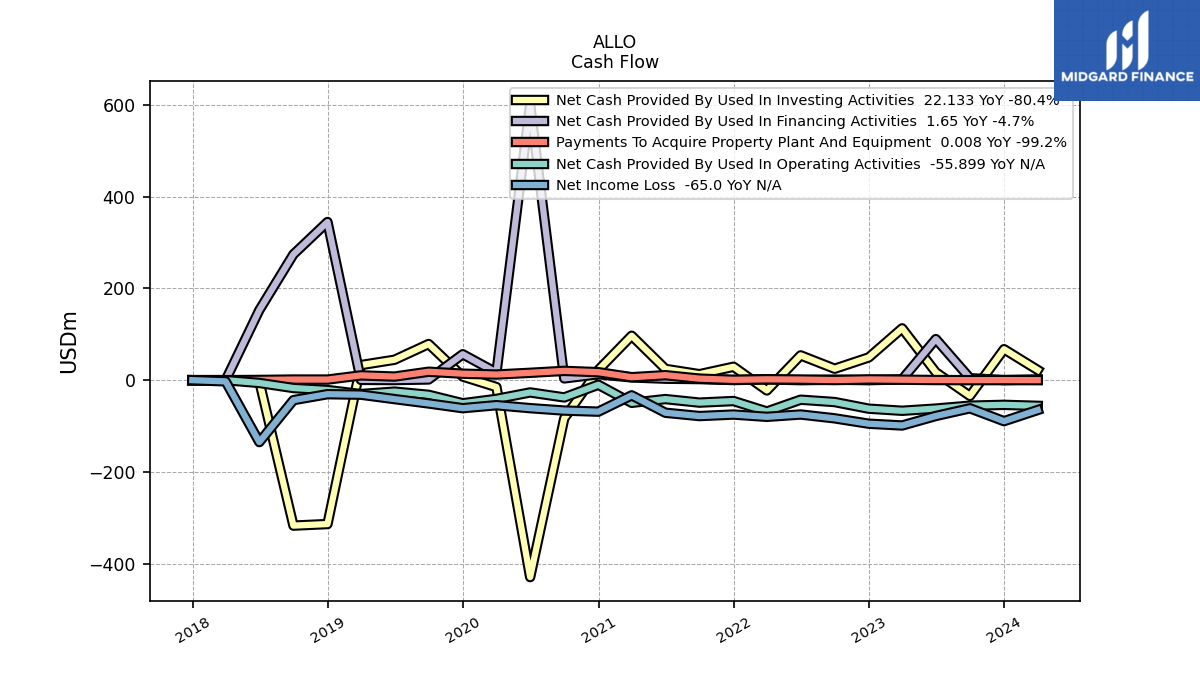
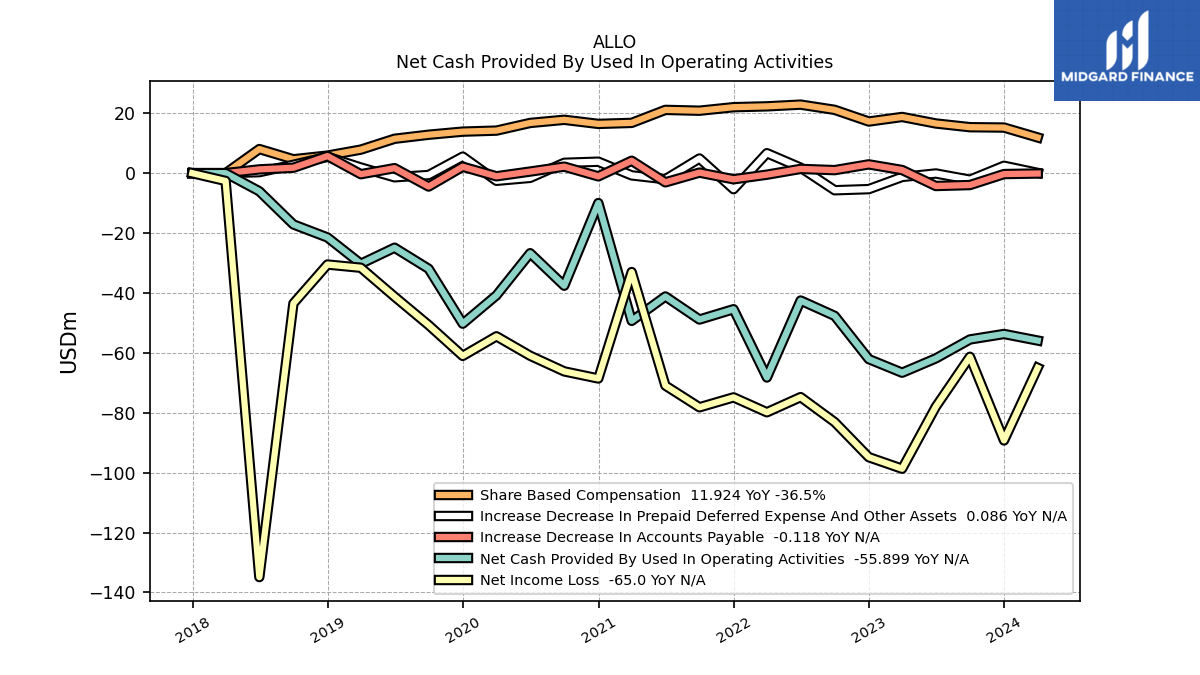
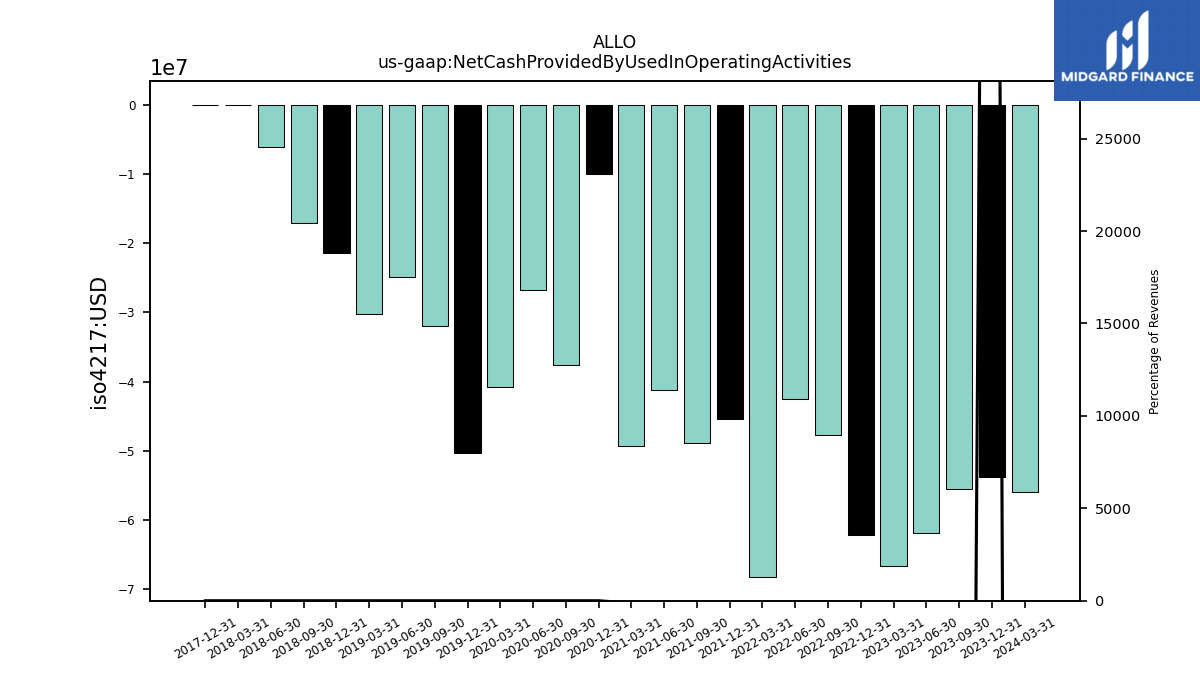
| Net Cash Provided By Used In Operating Activities | -53.71 | -55.53 | -61.86 | -66.64 | -62.10 | -47.66 | -42.53 | -68.24 | -45.44 | -48.88 | -41.17 | -49.33 | |
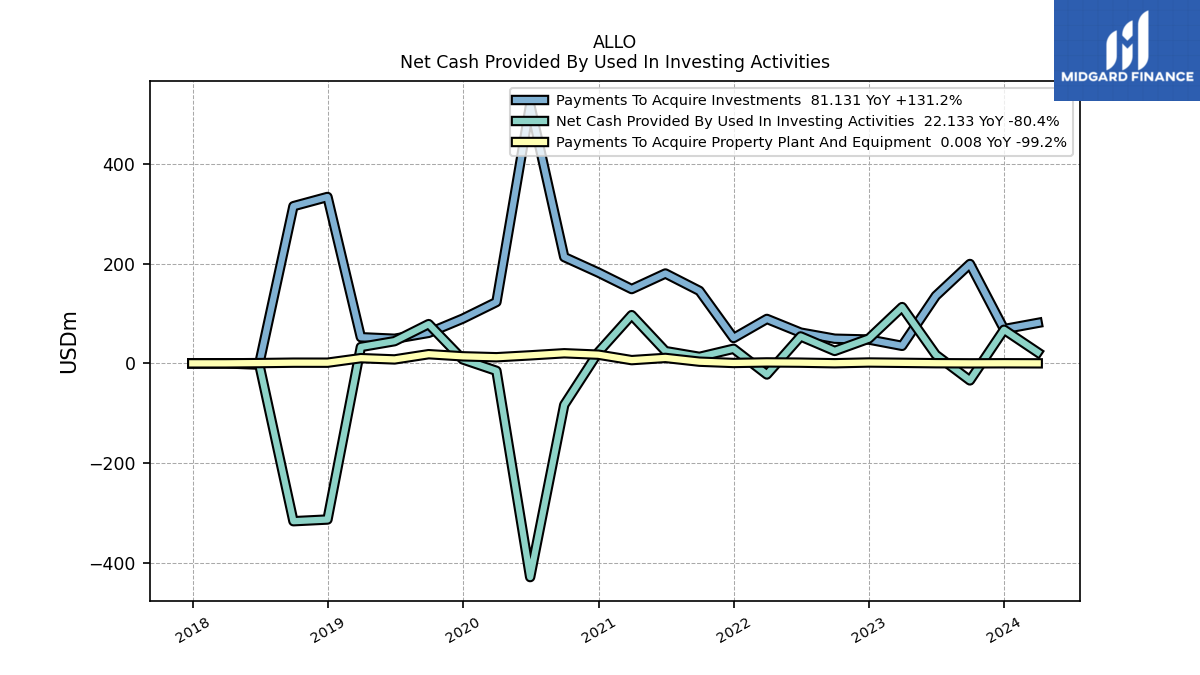
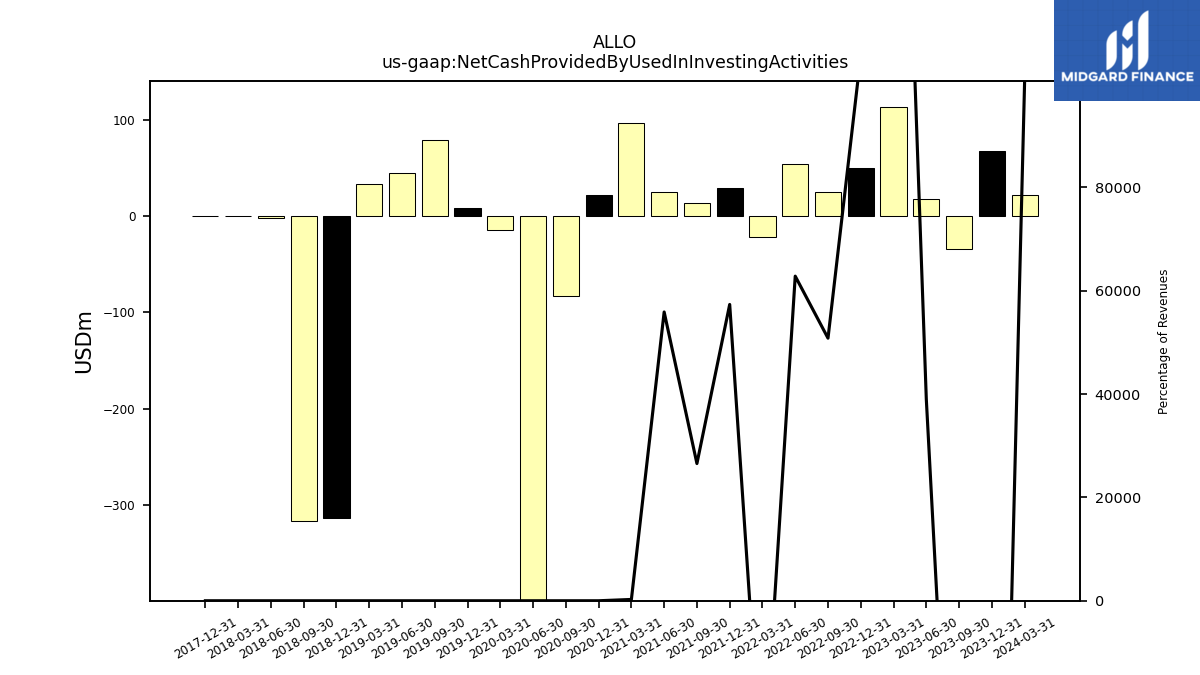
| Net Cash Provided By Used In Investing Activities | 67.46 | -34.27 | 17.16 | 112.94 | 49.60 | 24.91 | 54.03 | -22.38 | 29.25 | 13.01 | 24.59 | 96.80 | |
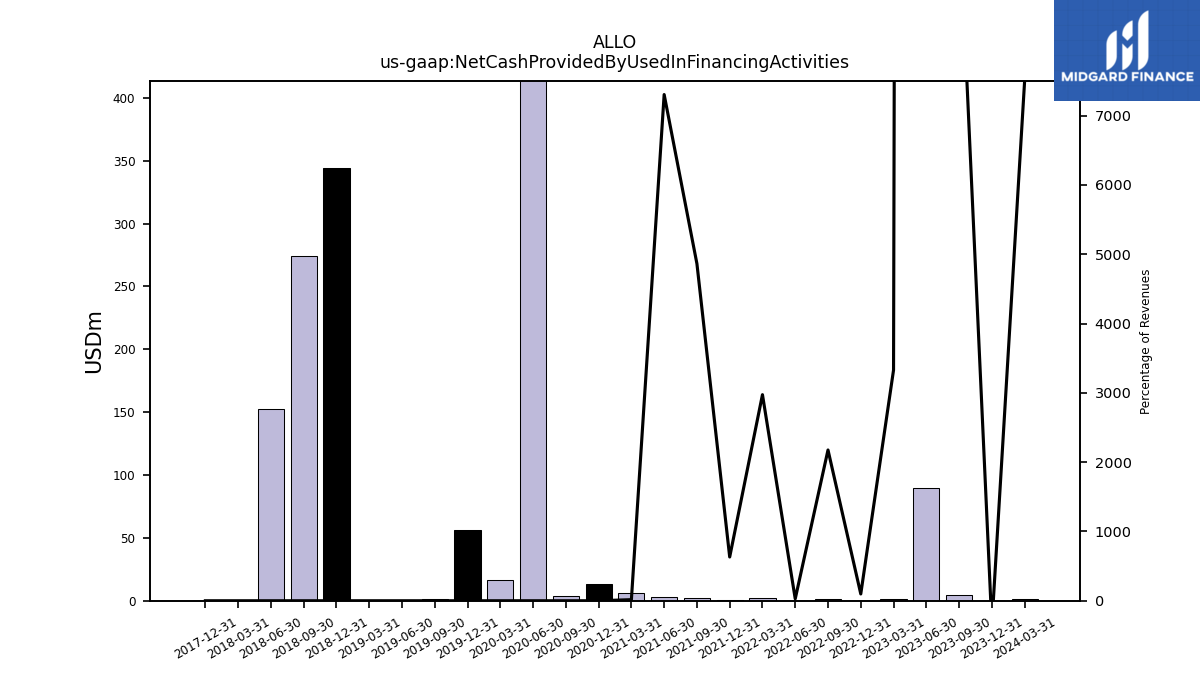
| Net Cash Provided By Used In Financing Activities | 0.15 | 4.29 | 89.52 | 1.73 | 0.05 | 1.07 | 0.02 | 1.81 | 0.32 | 2.38 | 3.21 | 6.04 |
| 2023-12-31 | 2023-09-30 | 2023-06-30 | 2023-03-31 | 2022-12-31 | 2022-09-30 | 2022-06-30 | 2022-03-31 | 2021-12-31 | 2021-09-30 | 2021-06-30 | 2021-03-31 | ||
|---|---|---|---|---|---|---|---|---|---|---|---|---|---|
| Net Cash Provided By Used In Operating Activities | -53.71 | -55.53 | -61.86 | -66.64 | -62.10 | -47.66 | -42.53 | -68.24 | -45.44 | -48.88 | -41.17 | -49.33 | |
| Net Income Loss | -89.26 | -61.31 | -77.99 | -98.70 | -94.85 | -83.15 | -74.79 | -79.85 | -74.87 | -78.19 | -70.94 | -33.02 | |
| Profit Loss | -89.26 | -61.31 | -77.99 | -98.70 | -94.85 | -83.15 | -74.79 | -79.85 | -74.87 | -78.19 | -70.94 | -33.02 | |
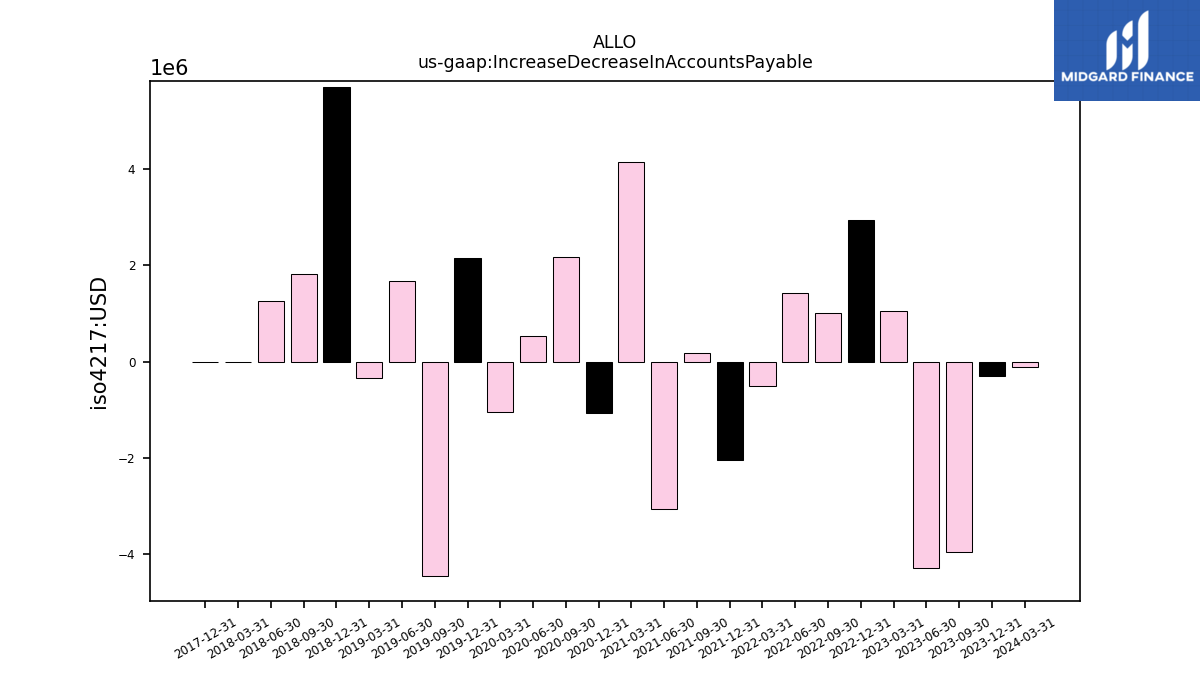
| Increase Decrease In Accounts Payable | -0.30 | -3.97 | -4.29 | 1.06 | 2.94 | 1.01 | 1.42 | -0.51 | -2.04 | 0.19 | -3.06 | 4.15 | |
| Share Based Compensation | 15.23 | 15.35 | 16.59 | 18.77 | 17.25 | 21.15 | 22.89 | 22.32 | 22.04 | 20.86 | 21.13 | 16.79 |
| 2023-12-31 | 2023-09-30 | 2023-06-30 | 2023-03-31 | 2022-12-31 | 2022-09-30 | 2022-06-30 | 2022-03-31 | 2021-12-31 | 2021-09-30 | 2021-06-30 | 2021-03-31 | ||
|---|---|---|---|---|---|---|---|---|---|---|---|---|---|
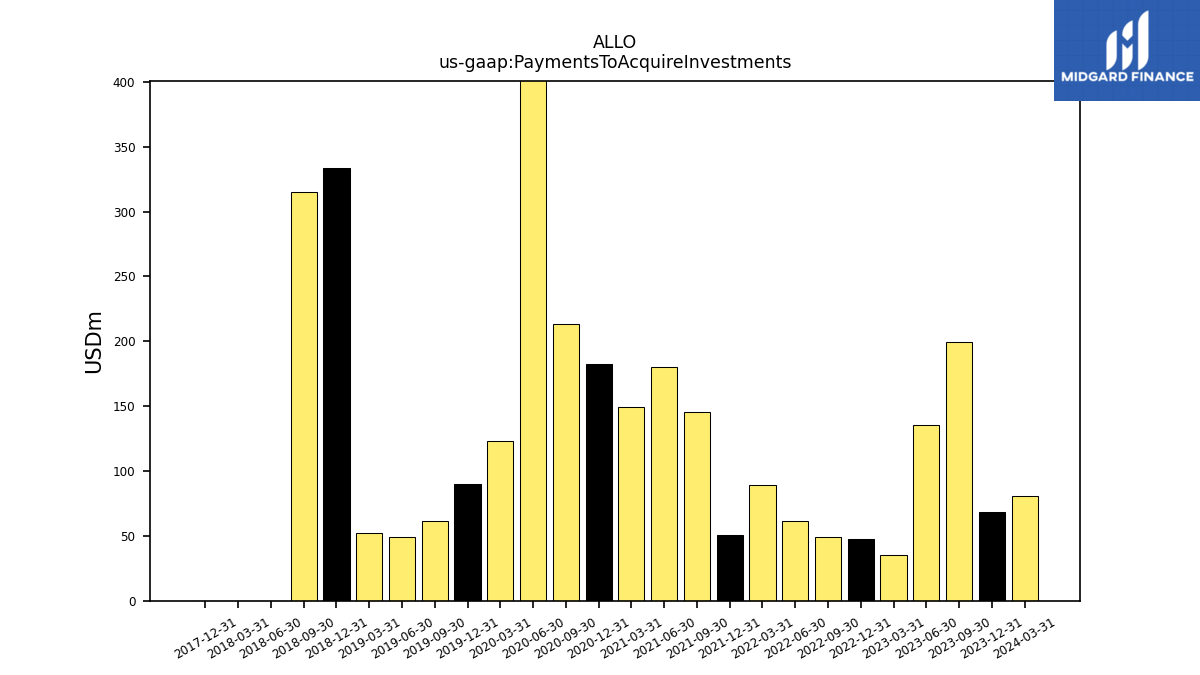
| Net Cash Provided By Used In Investing Activities | 67.46 | -34.27 | 17.16 | 112.94 | 49.60 | 24.91 | 54.03 | -22.38 | 29.25 | 13.01 | 24.59 | 96.80 | |
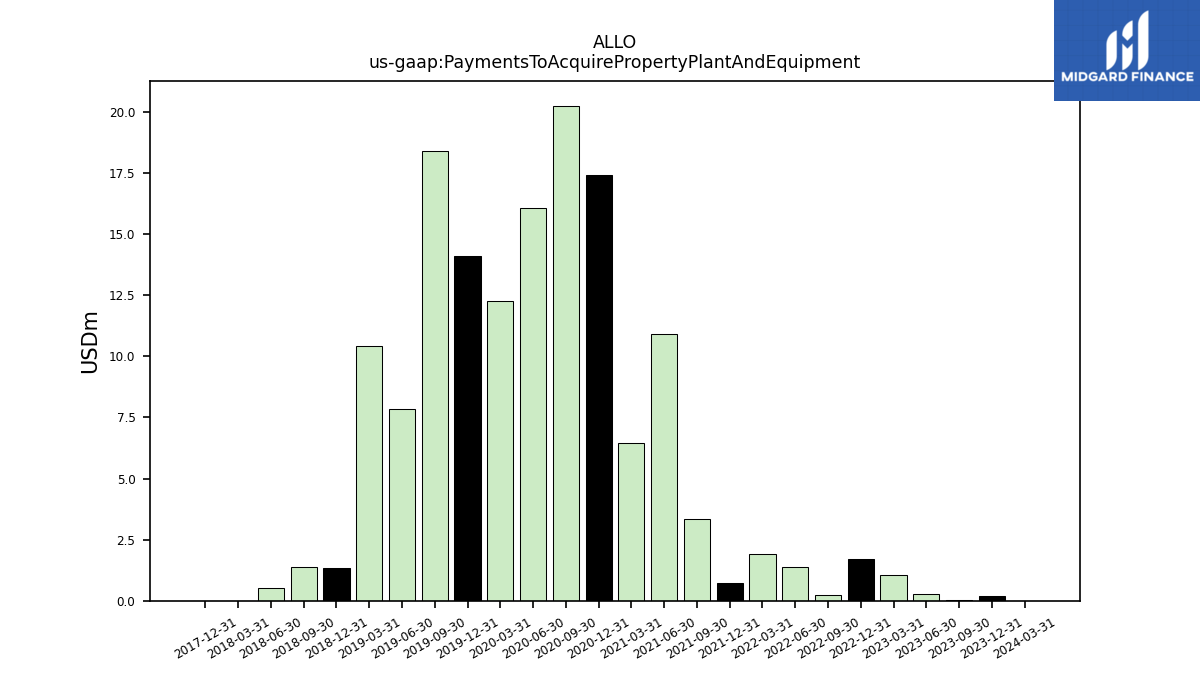
| Payments To Acquire Property Plant And Equipment | 0.18 | 0.01 | 0.29 | 1.03 | 1.69 | 0.22 | 1.37 | 1.90 | 0.74 | 3.35 | 10.90 | 6.46 | |
| Payments To Acquire Investments | 68.70 | 199.41 | 135.42 | 35.09 | 47.79 | 49.45 | 61.71 | 89.16 | 50.78 | 145.42 | 180.33 | 149.05 |
| 2023-12-31 | 2023-09-30 | 2023-06-30 | 2023-03-31 | 2022-12-31 | 2022-09-30 | 2022-06-30 | 2022-03-31 | 2021-12-31 | 2021-09-30 | 2021-06-30 | 2021-03-31 | ||
|---|---|---|---|---|---|---|---|---|---|---|---|---|---|
| Net Cash Provided By Used In Financing Activities | 0.15 | 4.29 | 89.52 | 1.73 | 0.05 | 1.07 | 0.02 | 1.81 | 0.32 | 2.38 | 3.21 | 6.04 |
| 2023-12-31 | 2023-09-30 | 2023-06-30 | 2023-03-31 | 2022-12-31 | 2022-09-30 | 2022-06-30 | 2022-03-31 | 2021-12-31 | 2021-09-30 | 2021-06-30 | 2021-03-31 | ||
|---|---|---|---|---|---|---|---|---|---|---|---|---|---|
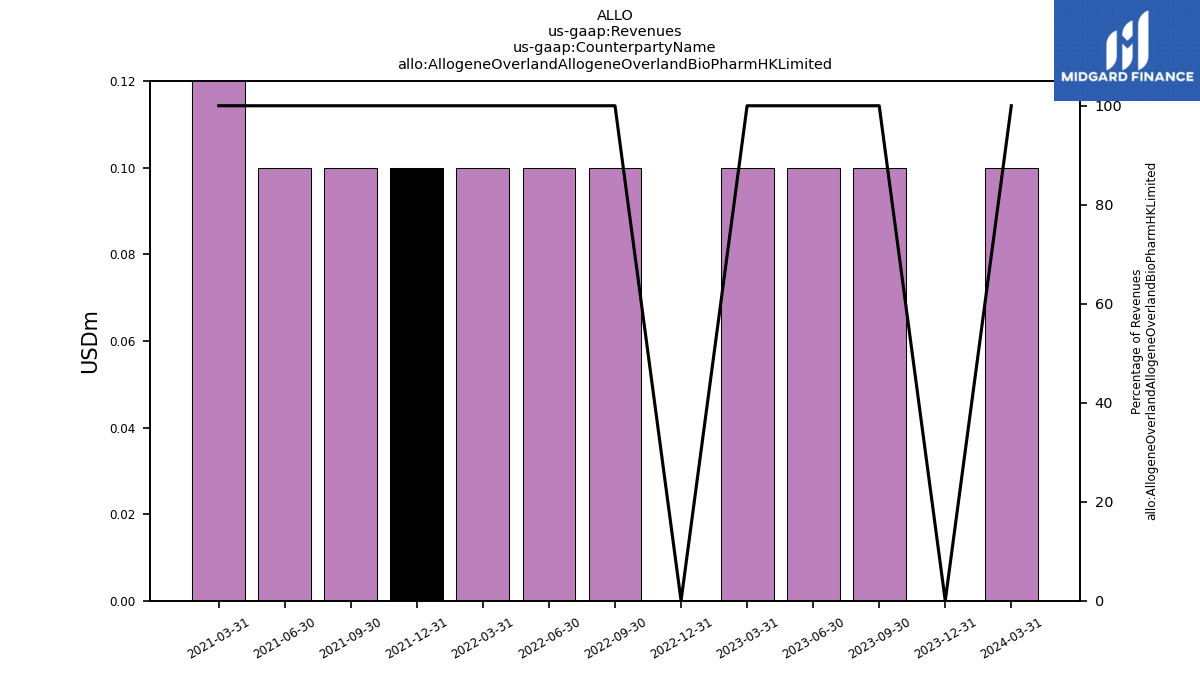
| Revenues | -0.04 | 0.04 | 0.04 | 0.05 | 0.05 | 0.05 | 0.09 | 0.06 | 0.05 | 0.05 | 0.04 | 38.34 | |
| Allogene Overland Allogene Overland Bio Pharm H K Limited | 0.00 | 0.10 | 0.10 | 0.10 | 0.00 | 0.10 | 0.10 | 0.10 | 0.10 | 0.10 | 0.10 | 38.30 | |
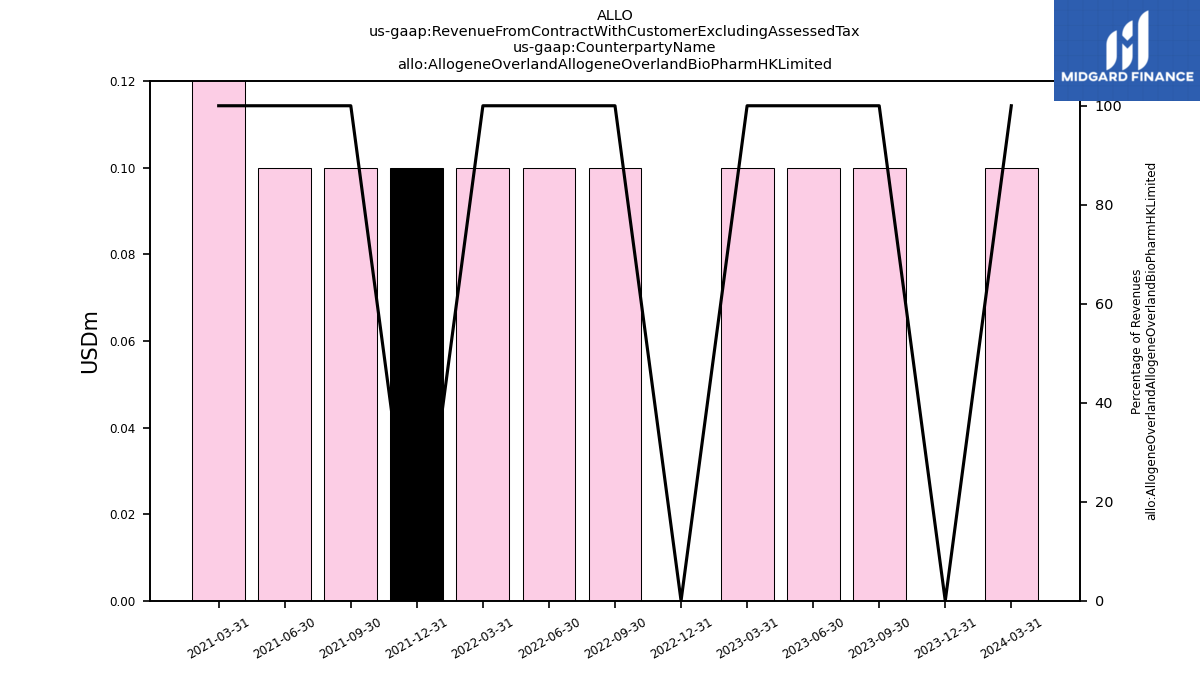
| Revenue From Contract With Customer Excluding Assessed Tax | -0.04 | 0.04 | 0.04 | 0.05 | 0.05 | 0.05 | 0.09 | 0.06 | 0.05 | 0.05 | 0.04 | 38.34 | |
| Allogene Overland Allogene Overland Bio Pharm H K Limited | 0.00 | 0.10 | 0.10 | 0.10 | 0.00 | 0.10 | 0.10 | 0.10 | 0.10 | 0.10 | 0.10 | 38.30 |