
| 2023-09-30 | 2023-06-30 | 2023-03-31 | 2022-12-31 | 2022-09-30 | 2022-06-30 | 2022-03-31 | 2021-12-31 | 2021-09-30 | 2021-06-30 | 2021-03-31 | 2020-12-31 | 2020-09-30 | 2020-06-30 | 2020-03-31 | 2019-12-31 | 2019-09-30 | 2019-06-30 | 2019-03-31 | 2018-12-31 | 2018-09-30 | 2018-06-30 | 2018-03-31 | 2017-12-31 | 2017-09-30 | 2017-06-30 | 2017-03-31 | 2016-12-31 | 2016-09-30 | 2016-06-30 | 2016-03-31 | 2015-12-31 | 2015-09-30 | 2015-06-30 | 2015-03-31 | 2014-12-31 | 2014-09-30 | 2014-06-30 | 2014-03-31 | 2013-12-31 | 2013-09-30 | 2013-06-30 | 2013-03-31 | 2012-12-31 | 2012-09-30 | 2012-06-30 | 2012-03-31 | 2011-12-31 | 2011-09-30 | 2011-06-30 | 2011-03-31 | ||
|---|---|---|---|---|---|---|---|---|---|---|---|---|---|---|---|---|---|---|---|---|---|---|---|---|---|---|---|---|---|---|---|---|---|---|---|---|---|---|---|---|---|---|---|---|---|---|---|---|---|---|---|---|
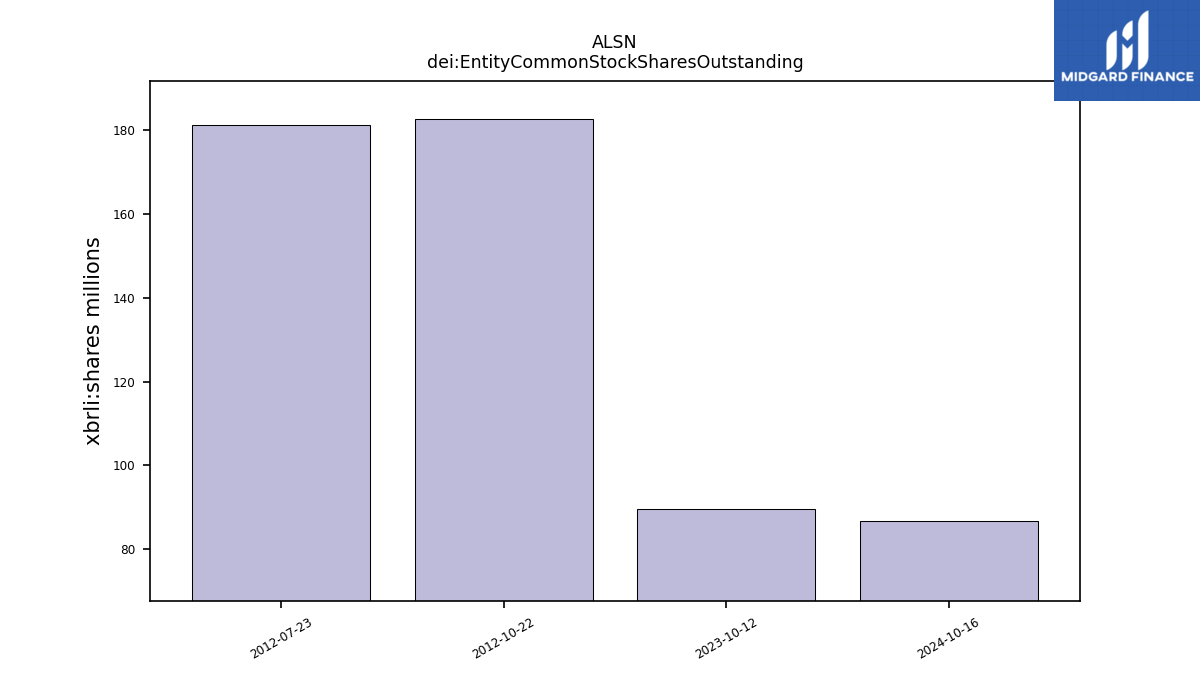
| dei: Entity Common Stock Shares Outstanding | NA | NA | NA | NA | NA | NA | NA | NA | NA | NA | NA | NA | NA | NA | NA | NA | NA | NA | NA | NA | NA | NA | NA | NA | NA | NA | NA | NA | NA | NA | NA | NA | NA | NA | NA | NA | NA | NA | NA | NA | NA | NA | NA | NA | NA | NA | NA | NA | NA | NA | NA | |
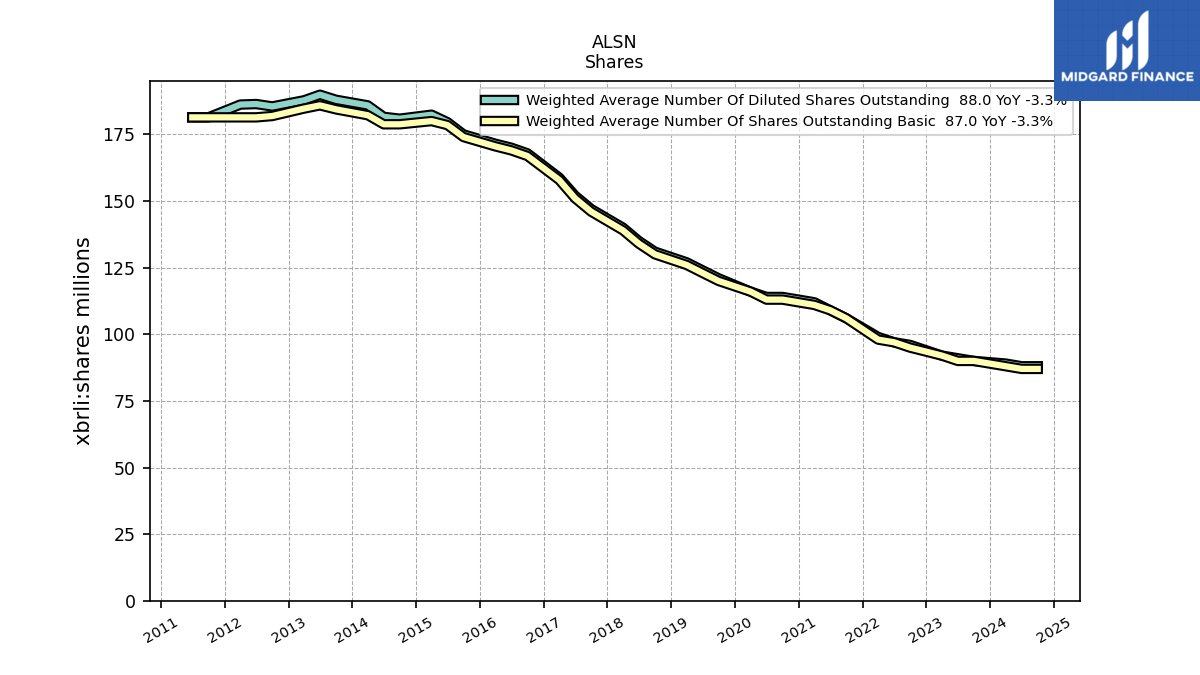
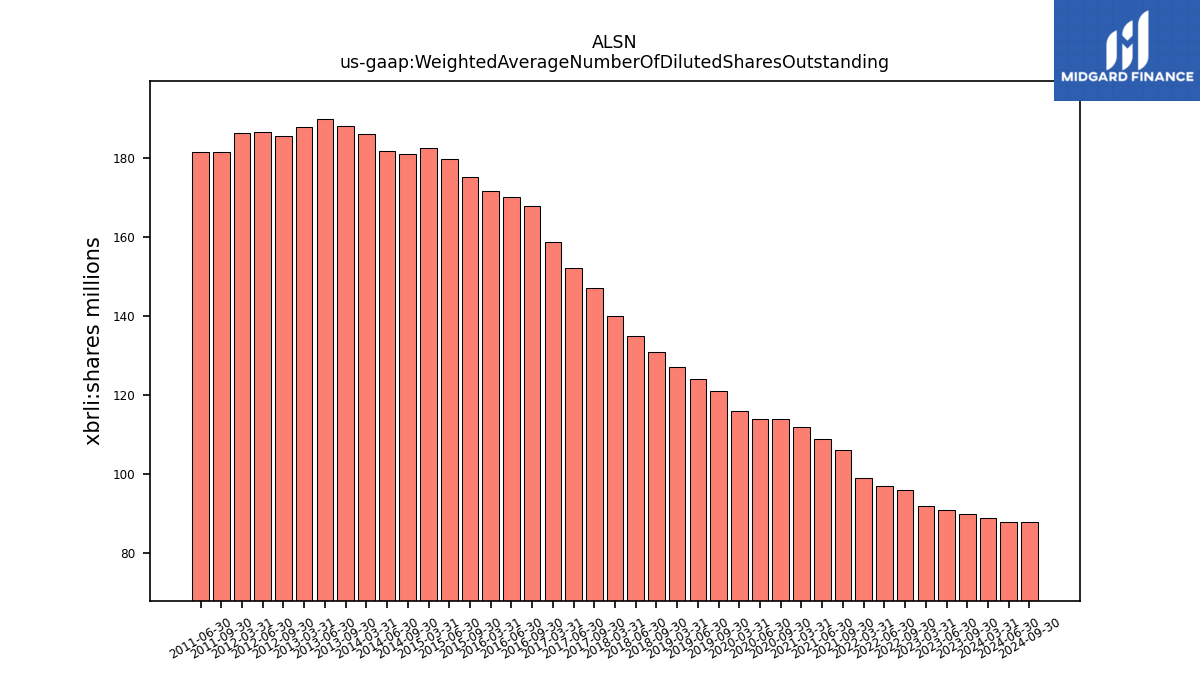
| Weighted Average Number Of Diluted Shares Outstanding | 90.00 | 91.00 | 92.00 | NA | 96.00 | 97.00 | 99.00 | NA | 106.00 | 109.00 | 112.00 | NA | 114.00 | 114.00 | 116.00 | NA | 121.00 | 124.00 | 127.00 | NA | 131.00 | 135.00 | 140.00 | NA | 147.00 | 152.00 | 158.80 | NA | 167.90 | 170.00 | 171.50 | NA | 175.00 | 179.60 | 182.40 | NA | 180.90 | 181.60 | 185.90 | NA | 188.00 | 189.90 | 187.80 | NA | 185.50 | 186.40 | 186.20 | NA | 181.40 | 181.40 | NA | |
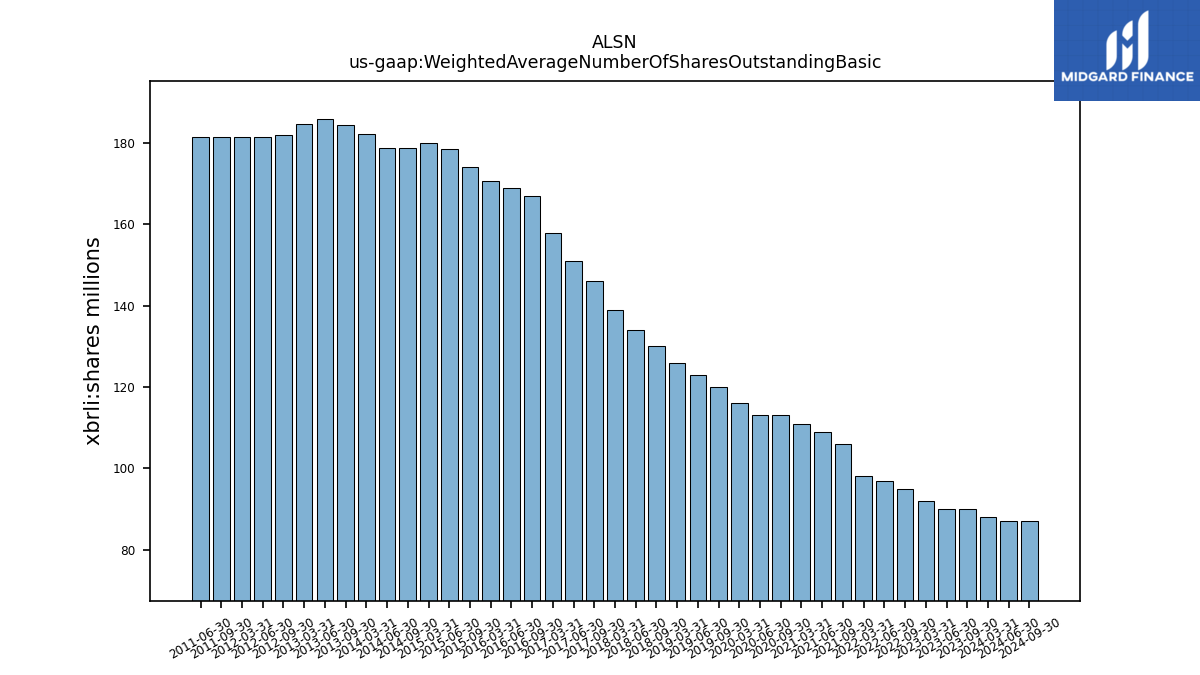
| Weighted Average Number Of Shares Outstanding Basic | 90.00 | 90.00 | 92.00 | NA | 95.00 | 97.00 | 98.00 | NA | 106.00 | 109.00 | 111.00 | NA | 113.00 | 113.00 | 116.00 | NA | 120.00 | 123.00 | 126.00 | NA | 130.00 | 134.00 | 139.00 | NA | 146.00 | 151.00 | 157.90 | NA | 166.90 | 169.00 | 170.50 | NA | 174.00 | 178.50 | 180.00 | NA | 178.80 | 178.80 | 182.20 | NA | 184.40 | 185.90 | 184.70 | NA | 181.90 | 181.40 | 181.40 | NA | 181.40 | 181.40 | NA | |
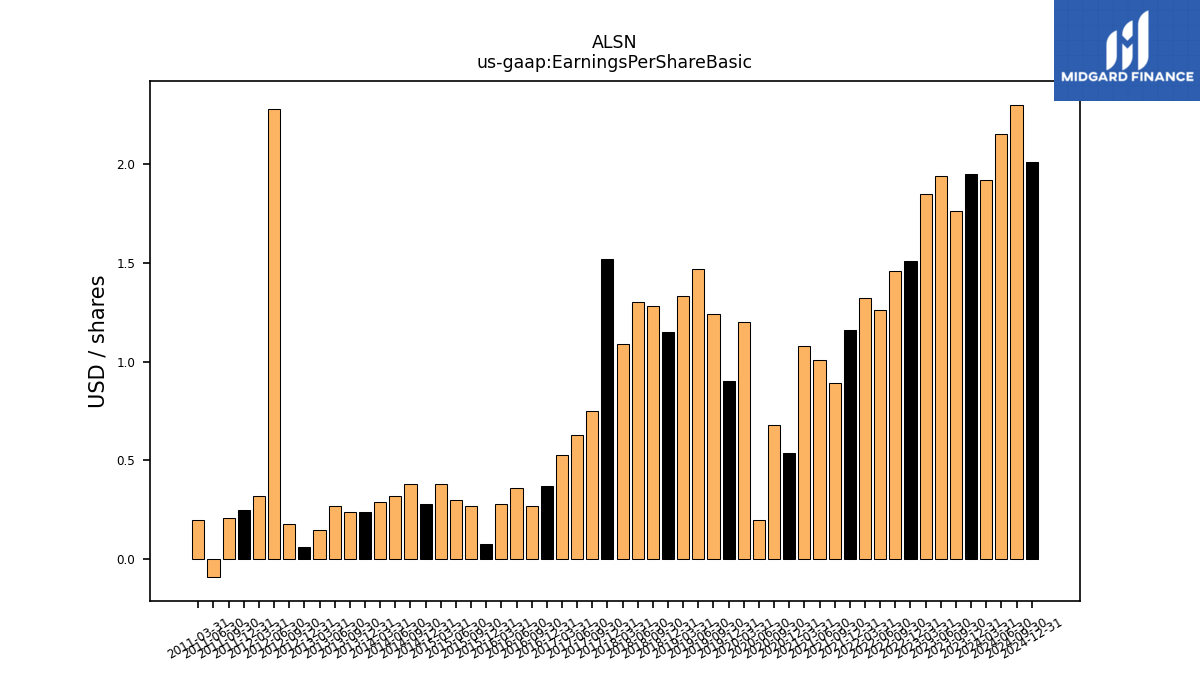
| Earnings Per Share Basic | 1.76 | 1.94 | 1.85 | 1.51 | 1.46 | 1.26 | 1.32 | 1.16 | 0.89 | 1.01 | 1.08 | 0.54 | 0.68 | 0.20 | 1.20 | 0.90 | 1.24 | 1.47 | 1.33 | 1.15 | 1.28 | 1.30 | 1.09 | 1.52 | 0.75 | 0.63 | 0.53 | 0.37 | 0.27 | 0.36 | 0.28 | 0.08 | 0.27 | 0.30 | 0.38 | 0.28 | 0.38 | 0.32 | 0.29 | 0.24 | 0.24 | 0.27 | 0.15 | 0.06 | 0.18 | 2.28 | 0.32 | 0.25 | 0.21 | -0.09 | 0.20 | |
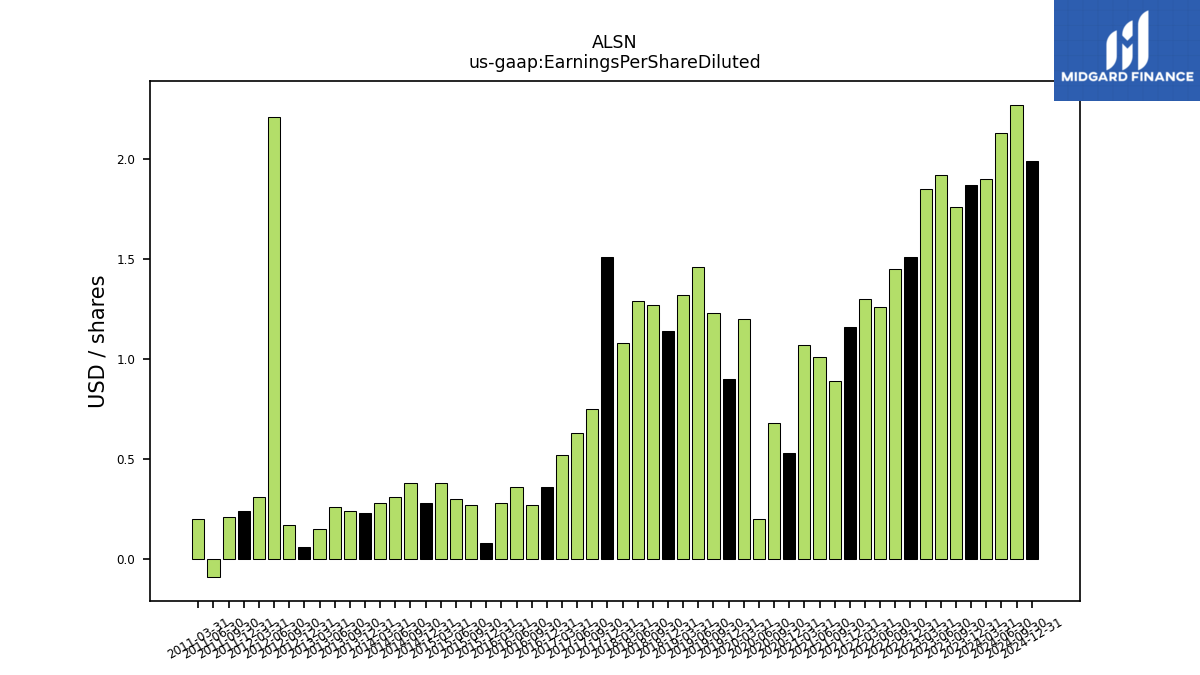
| Earnings Per Share Diluted | 1.76 | 1.92 | 1.85 | 1.51 | 1.45 | 1.26 | 1.30 | 1.16 | 0.89 | 1.01 | 1.07 | 0.53 | 0.68 | 0.20 | 1.20 | 0.90 | 1.23 | 1.46 | 1.32 | 1.14 | 1.27 | 1.29 | 1.08 | 1.51 | 0.75 | 0.63 | 0.52 | 0.36 | 0.27 | 0.36 | 0.28 | 0.08 | 0.27 | 0.30 | 0.38 | 0.28 | 0.38 | 0.31 | 0.28 | 0.23 | 0.24 | 0.26 | 0.15 | 0.06 | 0.17 | 2.21 | 0.31 | 0.24 | 0.21 | -0.09 | 0.20 |
| 2023-09-30 | 2023-06-30 | 2023-03-31 | 2022-12-31 | 2022-09-30 | 2022-06-30 | 2022-03-31 | 2021-12-31 | 2021-09-30 | 2021-06-30 | 2021-03-31 | 2020-12-31 | 2020-09-30 | 2020-06-30 | 2020-03-31 | 2019-12-31 | 2019-09-30 | 2019-06-30 | 2019-03-31 | 2018-12-31 | 2018-09-30 | 2018-06-30 | 2018-03-31 | 2017-12-31 | 2017-09-30 | 2017-06-30 | 2017-03-31 | 2016-12-31 | 2016-09-30 | 2016-06-30 | 2016-03-31 | 2015-12-31 | 2015-09-30 | 2015-06-30 | 2015-03-31 | 2014-12-31 | 2014-09-30 | 2014-06-30 | 2014-03-31 | 2013-12-31 | 2013-09-30 | 2013-06-30 | 2013-03-31 | 2012-12-31 | 2012-09-30 | 2012-06-30 | 2012-03-31 | 2011-12-31 | 2011-09-30 | 2011-06-30 | 2011-03-31 | ||
|---|---|---|---|---|---|---|---|---|---|---|---|---|---|---|---|---|---|---|---|---|---|---|---|---|---|---|---|---|---|---|---|---|---|---|---|---|---|---|---|---|---|---|---|---|---|---|---|---|---|---|---|---|
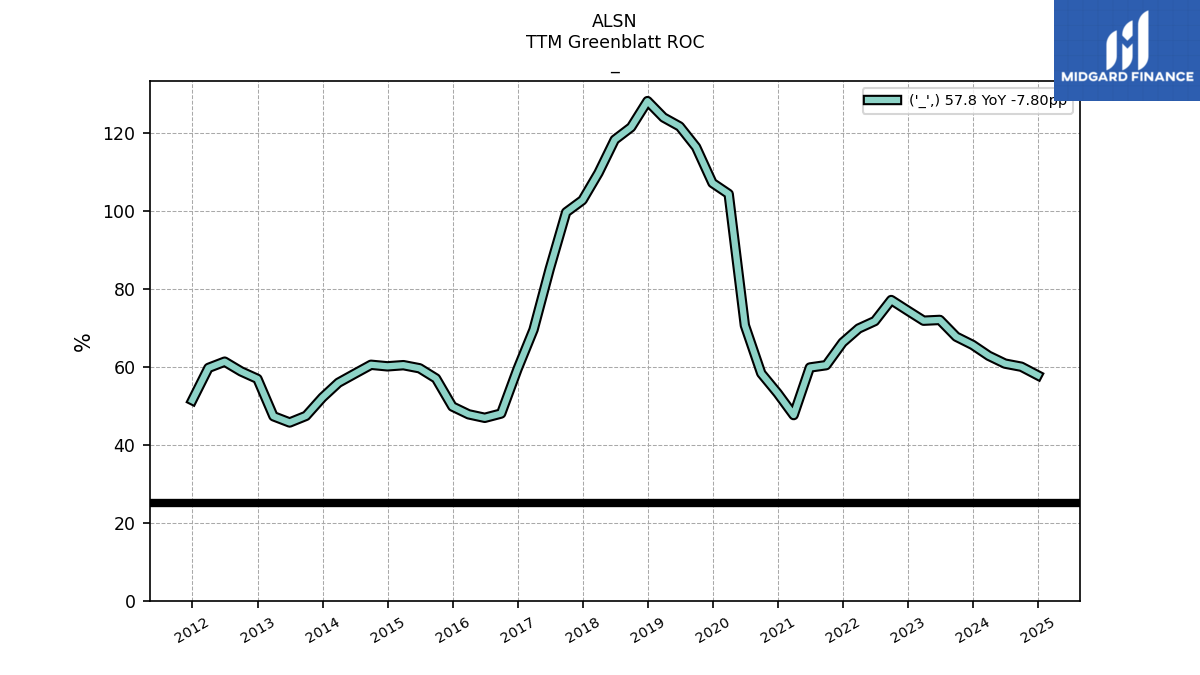
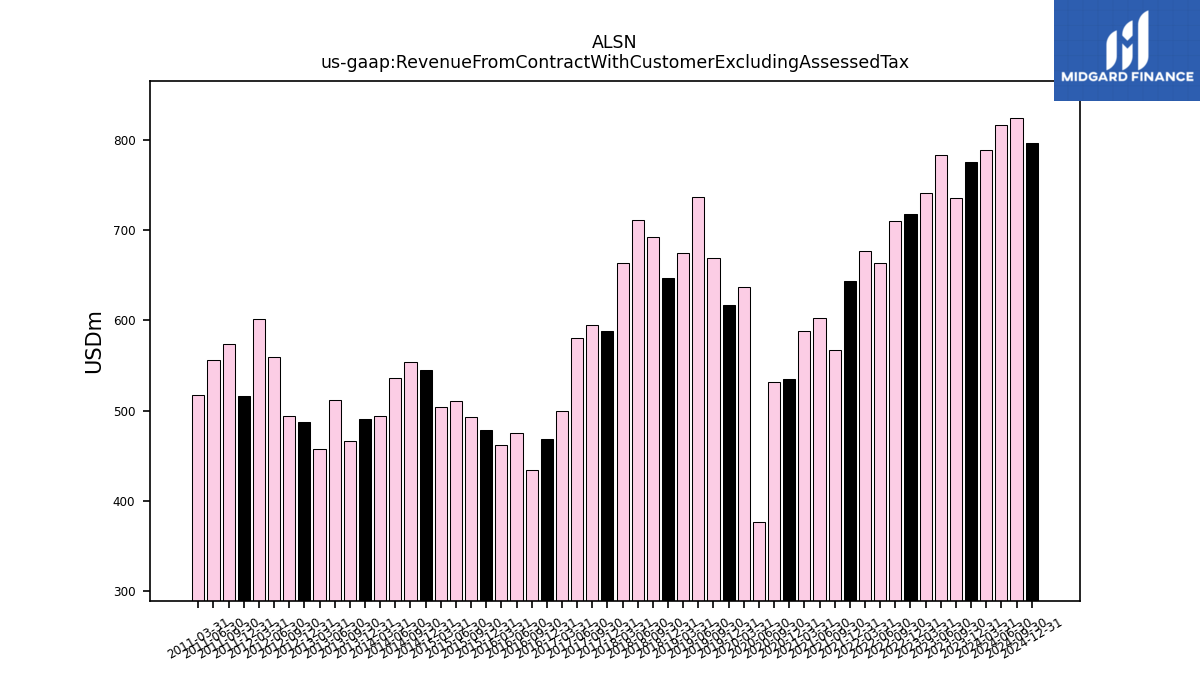
| Revenue From Contract With Customer Excluding Assessed Tax | 736.00 | 783.00 | 741.00 | 718.00 | 710.00 | 664.00 | 677.00 | 644.00 | 567.00 | 603.00 | 588.00 | 535.00 | 532.00 | 377.00 | 637.00 | 617.00 | 669.00 | 737.00 | 675.00 | 647.00 | 692.00 | 711.00 | 663.00 | 588.00 | 595.00 | 580.00 | 499.00 | 468.90 | 434.30 | 474.90 | 462.10 | 478.20 | 493.00 | 511.00 | 503.60 | 544.40 | 553.30 | 536.10 | 493.60 | 491.00 | 466.30 | 512.10 | 457.40 | 487.00 | 493.50 | 559.40 | 601.90 | 516.10 | 574.00 | 555.70 | 517.00 | |
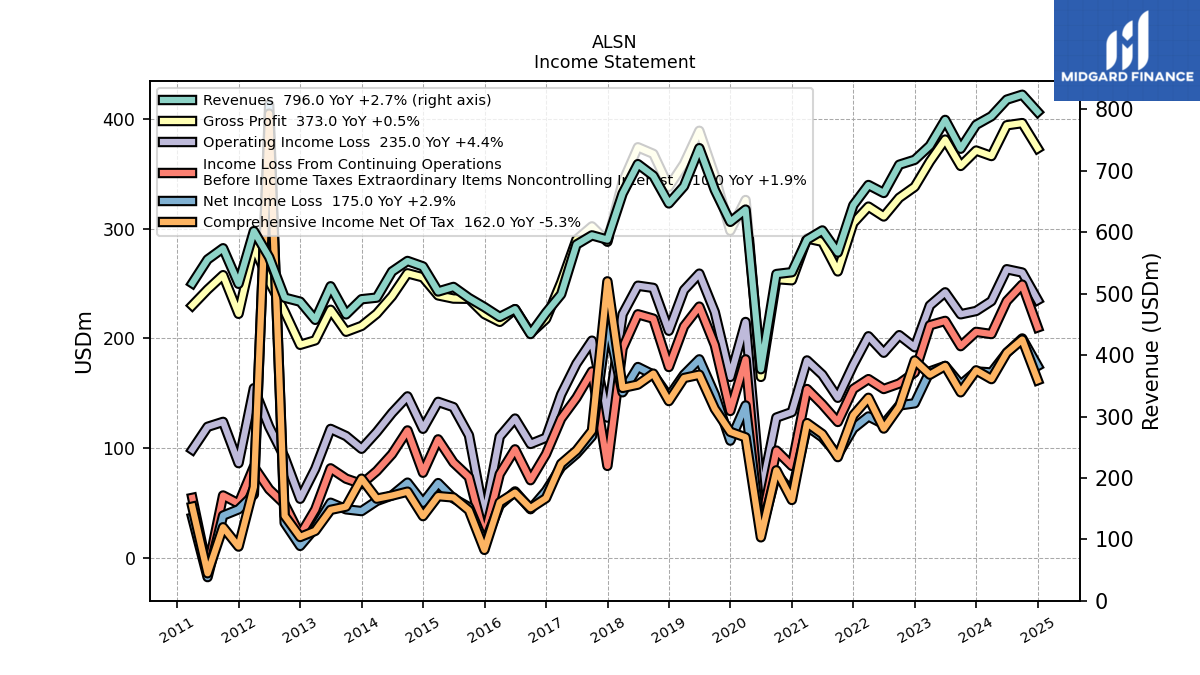
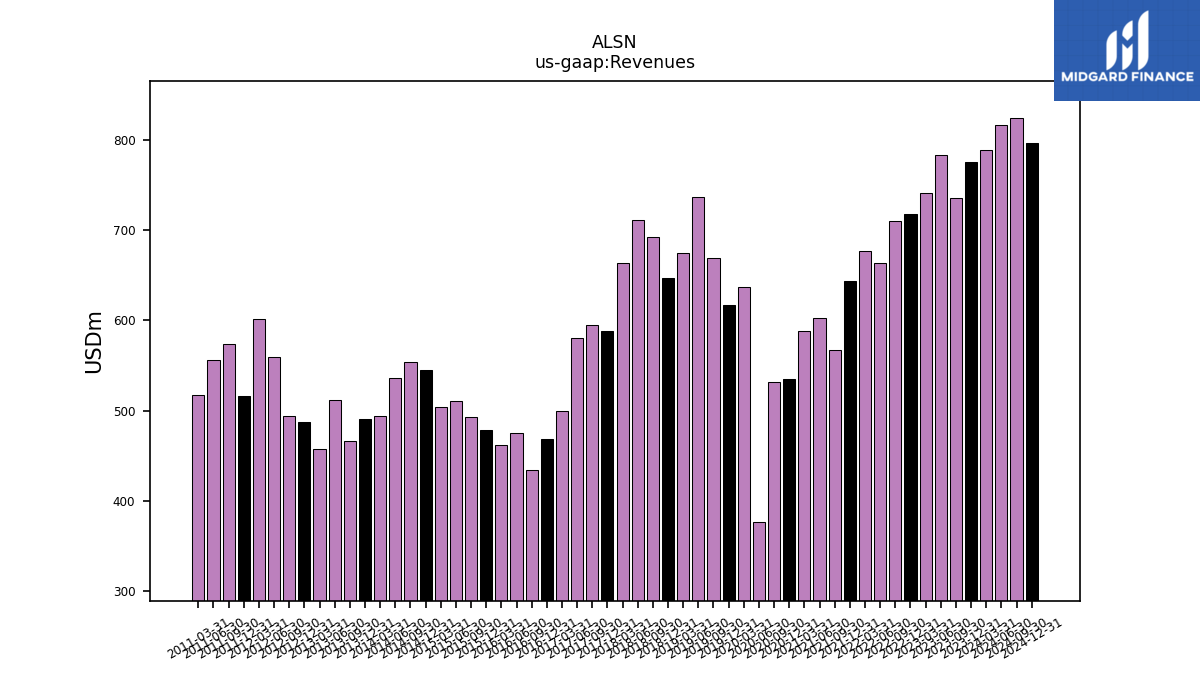
| Revenues | 736.00 | 783.00 | 741.00 | 718.00 | 710.00 | 664.00 | 677.00 | 644.00 | 567.00 | 603.00 | 588.00 | 535.00 | 532.00 | 377.00 | 637.00 | 617.00 | 669.00 | 737.00 | 675.00 | 647.00 | 692.00 | 711.00 | 663.00 | 588.00 | 595.00 | 580.00 | 499.00 | 468.90 | 434.30 | 474.90 | 462.10 | 478.20 | 493.00 | 511.00 | 503.60 | 544.40 | 553.30 | 536.10 | 493.60 | 491.00 | 466.30 | 512.10 | 457.40 | 487.00 | 493.50 | 559.40 | 601.90 | 516.10 | 574.00 | 555.70 | 517.00 | |
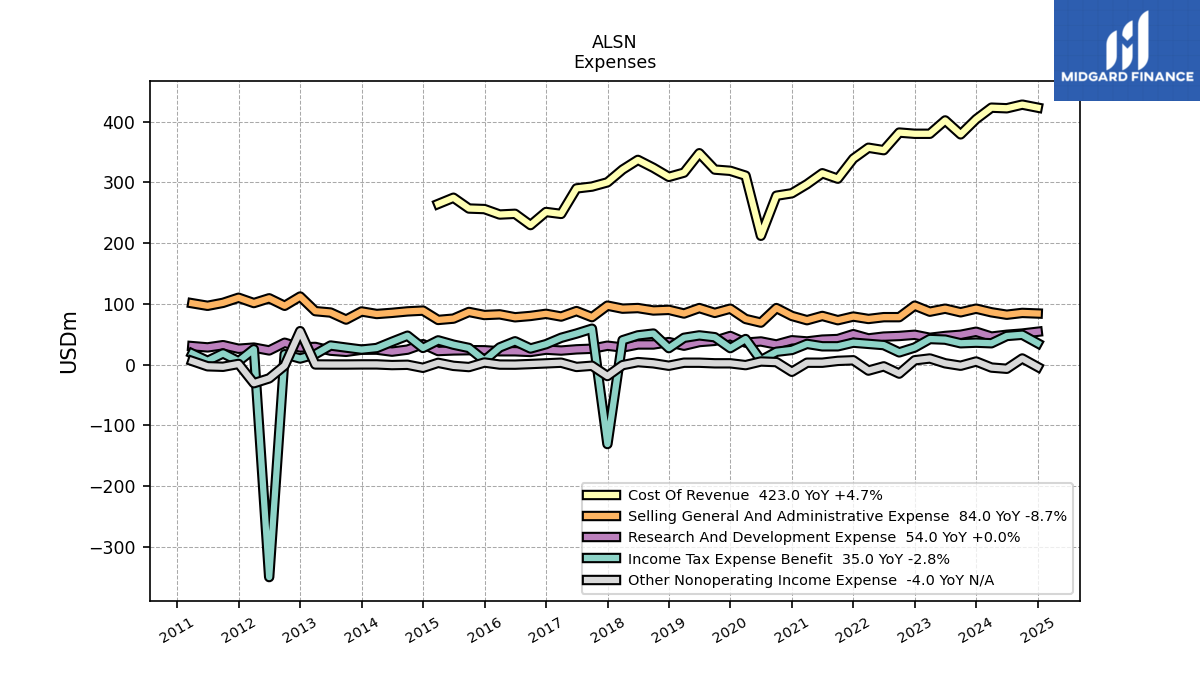
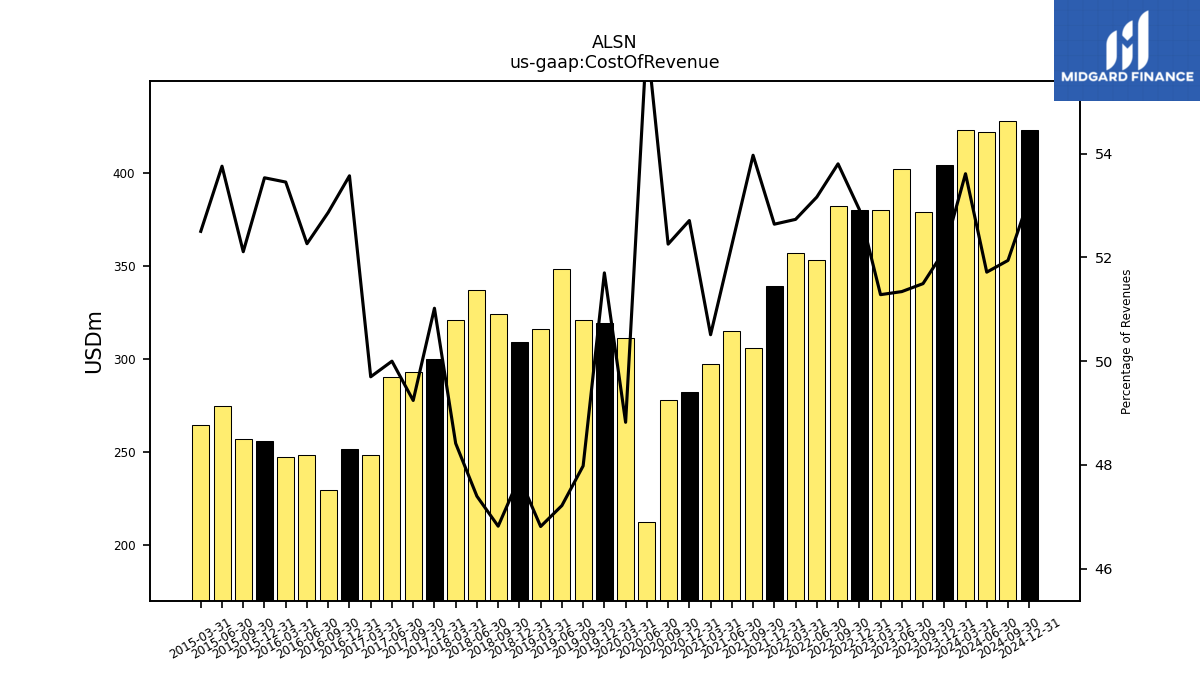
| Cost Of Revenue | 379.00 | 402.00 | 380.00 | 380.00 | 382.00 | 353.00 | 357.00 | 339.00 | 306.00 | 315.00 | 297.00 | 282.00 | 278.00 | 212.00 | 311.00 | 319.00 | 321.00 | 348.00 | 316.00 | 309.00 | 324.00 | 337.00 | 321.00 | 300.00 | 293.00 | 290.00 | 248.00 | 251.20 | 229.60 | 248.20 | 247.00 | 256.00 | 256.90 | 274.70 | 264.40 | NA | NA | NA | NA | NA | NA | NA | NA | NA | NA | NA | NA | NA | NA | NA | NA | |
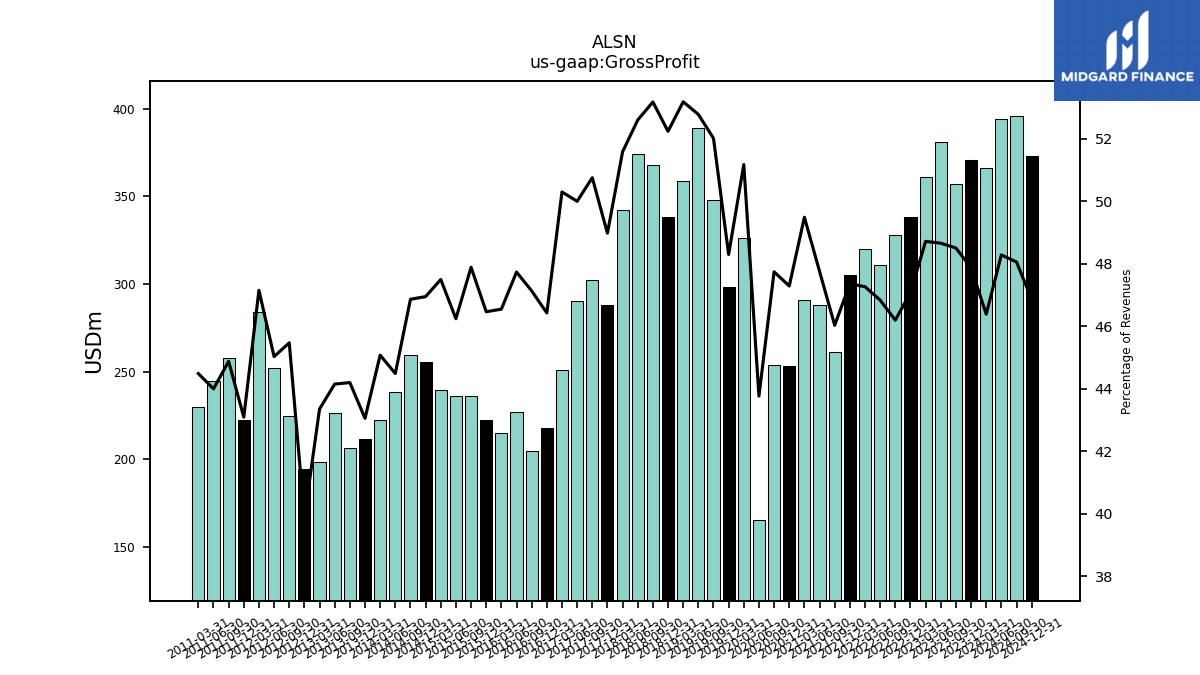
| Gross Profit | 357.00 | 381.00 | 361.00 | 338.00 | 328.00 | 311.00 | 320.00 | 305.00 | 261.00 | 288.00 | 291.00 | 253.00 | 254.00 | 165.00 | 326.00 | 298.00 | 348.00 | 389.00 | 359.00 | 338.00 | 368.00 | 374.00 | 342.00 | 288.00 | 302.00 | 290.00 | 251.00 | 217.70 | 204.70 | 226.70 | 215.10 | 222.20 | 236.10 | 236.30 | 239.20 | 255.60 | 259.30 | 238.50 | 222.50 | 211.40 | 206.10 | 226.10 | 198.30 | 194.20 | 224.40 | 251.90 | 283.80 | 222.40 | 257.60 | 244.50 | 230.00 | |
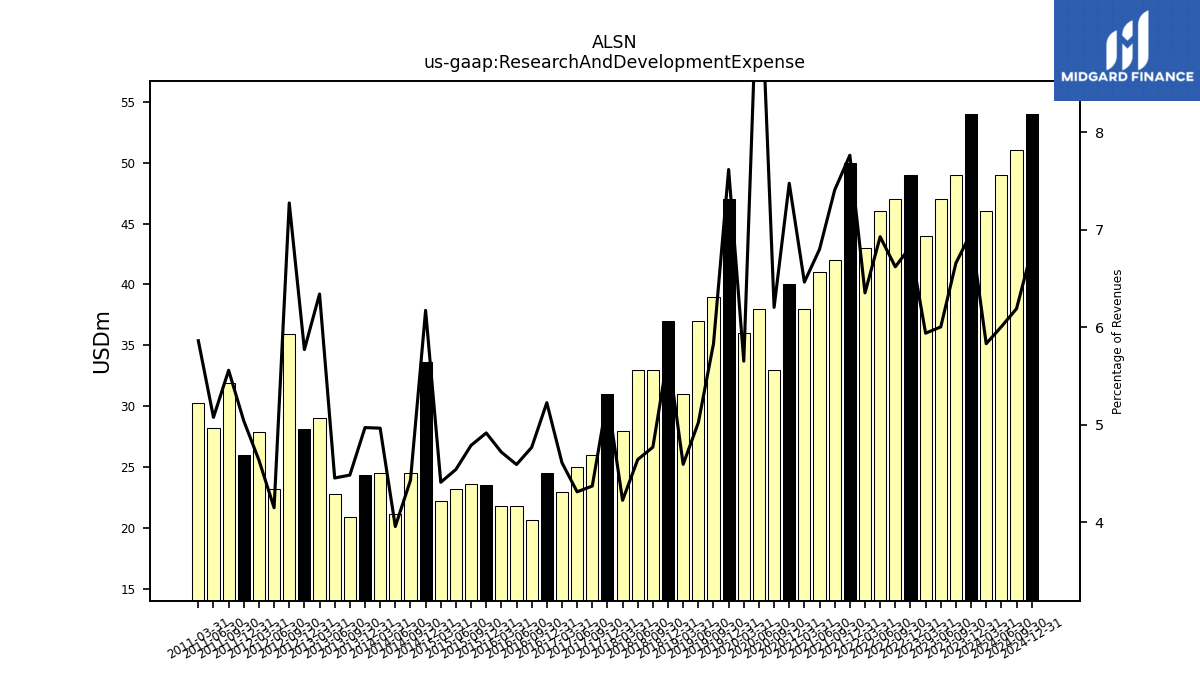
| Research And Development Expense | 49.00 | 47.00 | 44.00 | 49.00 | 47.00 | 46.00 | 43.00 | 50.00 | 42.00 | 41.00 | 38.00 | 40.00 | 33.00 | 38.00 | 36.00 | 47.00 | 39.00 | 37.00 | 31.00 | 37.00 | 33.00 | 33.00 | 28.00 | 31.00 | 26.00 | 25.00 | 23.00 | 24.50 | 20.70 | 21.80 | 21.80 | 23.50 | 23.60 | 23.20 | 22.20 | 33.60 | 24.50 | 21.20 | 24.50 | 24.40 | 20.90 | 22.80 | 29.00 | 28.10 | 35.90 | 23.20 | 27.90 | 26.00 | 31.90 | 28.20 | 30.30 | |
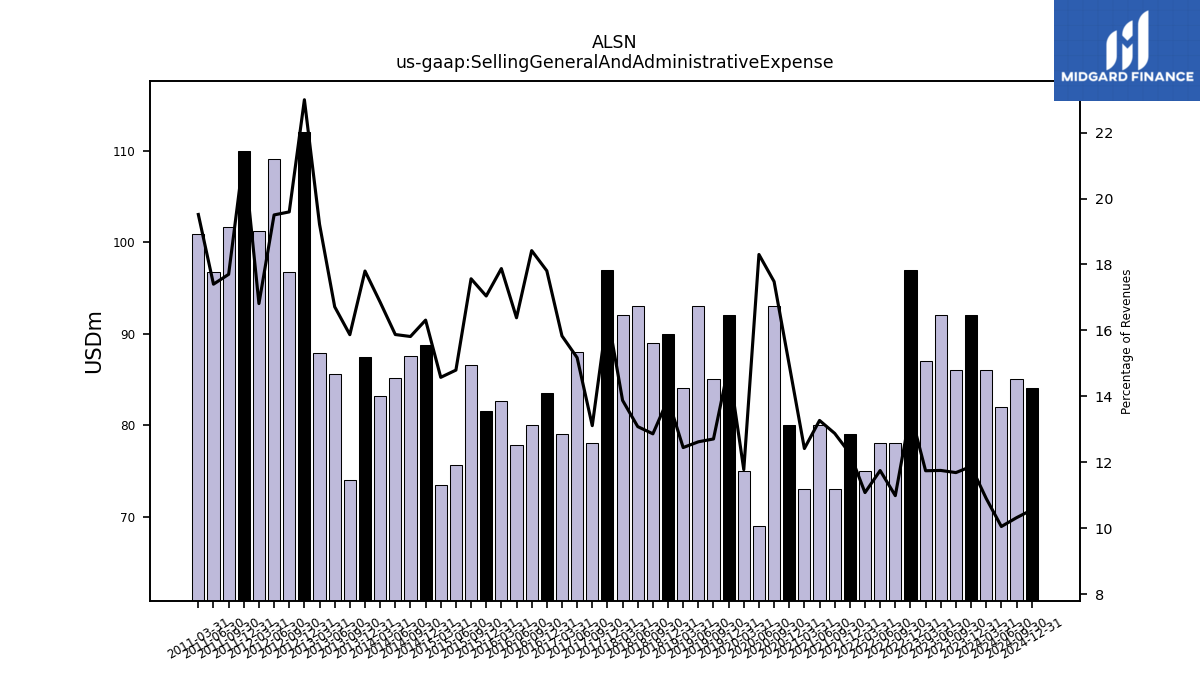
| Selling General And Administrative Expense | 86.00 | 92.00 | 87.00 | 97.00 | 78.00 | 78.00 | 75.00 | 79.00 | 73.00 | 80.00 | 73.00 | 80.00 | 93.00 | 69.00 | 75.00 | 92.00 | 85.00 | 93.00 | 84.00 | 90.00 | 89.00 | 93.00 | 92.00 | 97.00 | 78.00 | 88.00 | 79.00 | 83.50 | 80.00 | 77.80 | 82.60 | 81.50 | 86.60 | 75.60 | 73.40 | 88.80 | 87.50 | 85.10 | 83.20 | 87.40 | 74.00 | 85.60 | 87.90 | 112.00 | 96.70 | 109.10 | 101.20 | 110.00 | 101.60 | 96.70 | 100.90 | |
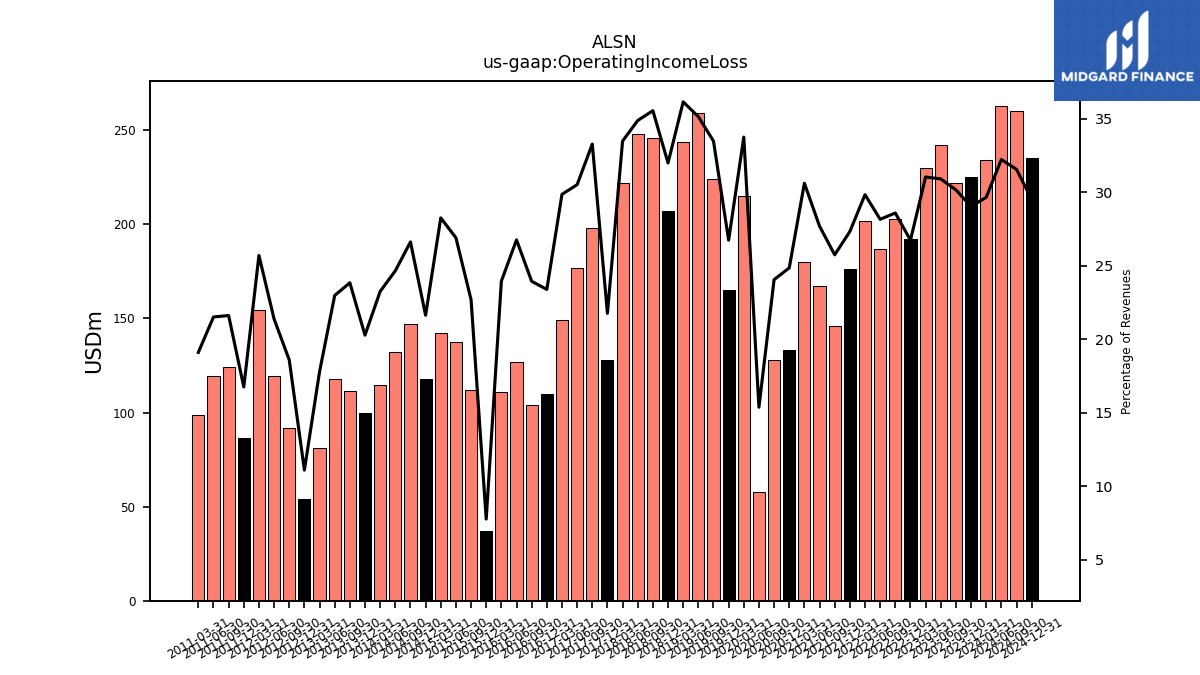
| Operating Income Loss | 222.00 | 242.00 | 230.00 | 192.00 | 203.00 | 187.00 | 202.00 | 176.00 | 146.00 | 167.00 | 180.00 | 133.00 | 128.00 | 58.00 | 215.00 | 165.00 | 224.00 | 259.00 | 244.00 | 207.00 | 246.00 | 248.00 | 222.00 | 128.00 | 198.00 | 177.00 | 149.00 | 109.70 | 104.00 | 127.10 | 110.70 | 37.20 | 111.90 | 137.50 | 142.30 | 117.80 | 147.30 | 132.20 | 114.80 | 99.60 | 111.20 | 117.70 | 81.40 | 54.10 | 91.80 | 119.60 | 154.70 | 86.50 | 124.10 | 119.60 | 98.80 | |
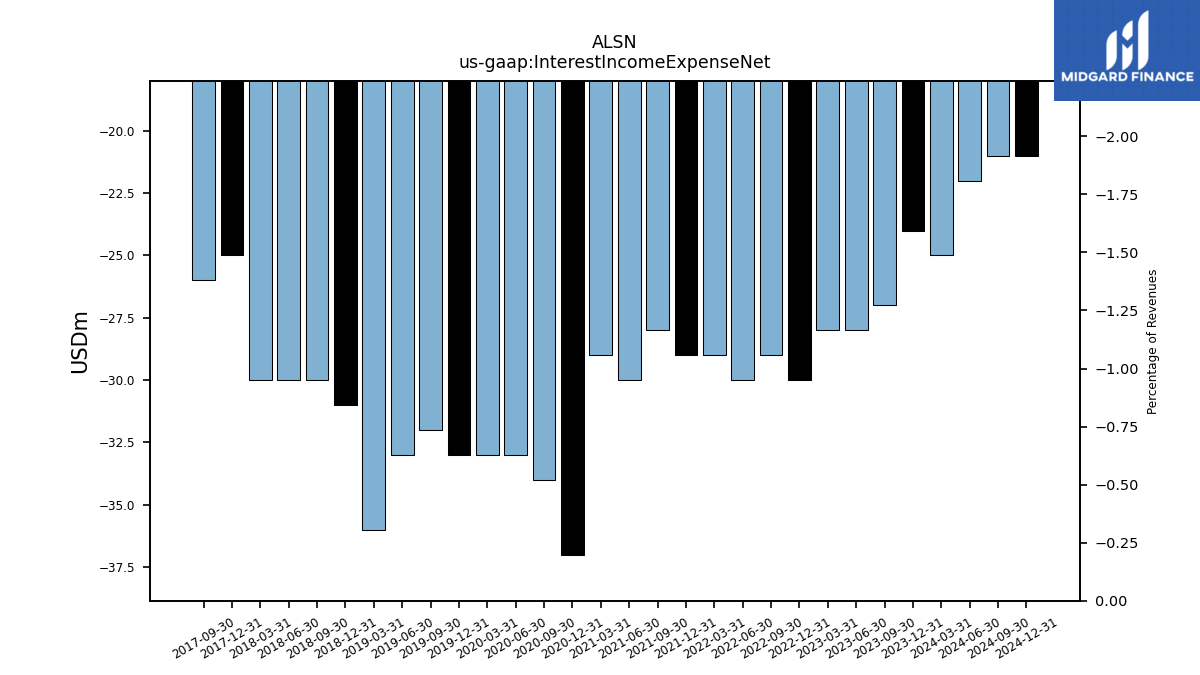
| Interest Income Expense Net | -27.00 | -28.00 | -28.00 | -30.00 | -29.00 | -30.00 | -29.00 | -29.00 | -28.00 | -30.00 | -29.00 | -37.00 | -34.00 | -33.00 | -33.00 | -33.00 | -32.00 | -33.00 | -36.00 | -31.00 | -30.00 | -30.00 | -30.00 | -25.00 | -26.00 | NA | NA | NA | NA | NA | NA | NA | NA | NA | NA | NA | NA | NA | NA | NA | NA | NA | NA | NA | NA | NA | NA | NA | NA | NA | NA | |
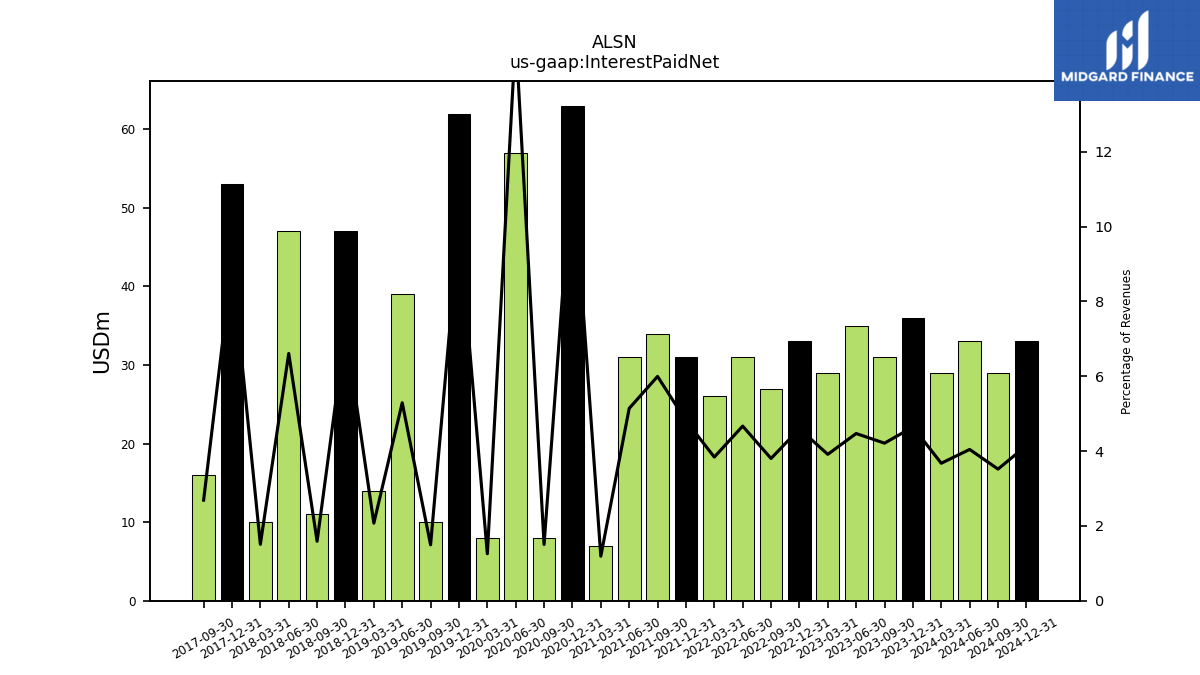
| Interest Paid Net | 31.00 | 35.00 | 29.00 | 33.00 | 27.00 | 31.00 | 26.00 | 31.00 | 34.00 | 31.00 | 7.00 | 63.00 | 8.00 | 57.00 | 8.00 | 62.00 | 10.00 | 39.00 | 14.00 | 47.00 | 11.00 | 47.00 | 10.00 | 53.00 | 16.00 | NA | NA | NA | NA | NA | NA | NA | NA | NA | NA | NA | NA | NA | NA | NA | NA | NA | NA | NA | NA | NA | NA | NA | NA | NA | NA | |
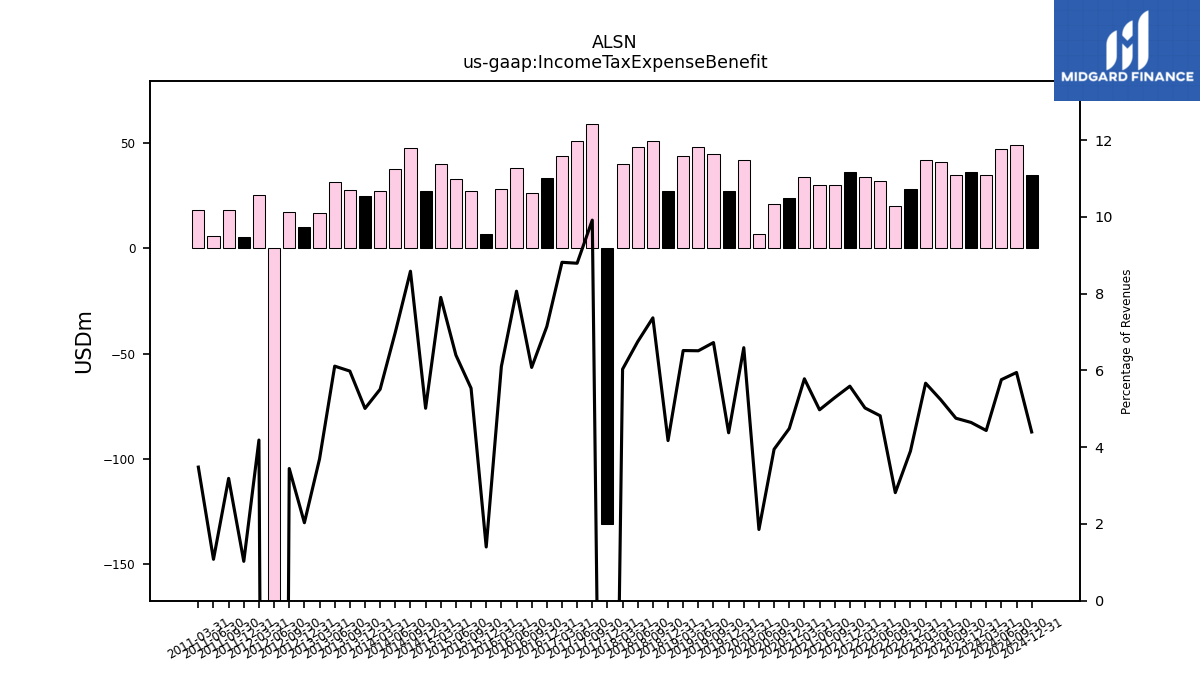
| Income Tax Expense Benefit | 35.00 | 41.00 | 42.00 | 28.00 | 20.00 | 32.00 | 34.00 | 36.00 | 30.00 | 30.00 | 34.00 | 24.00 | 21.00 | 7.00 | 42.00 | 27.00 | 45.00 | 48.00 | 44.00 | 27.00 | 51.00 | 48.00 | 40.00 | -131.00 | 59.00 | 51.00 | 44.00 | 33.50 | 26.40 | 38.30 | 28.20 | 6.70 | 27.30 | 32.70 | 39.80 | 27.30 | 47.50 | 37.50 | 27.20 | 24.60 | 27.90 | 31.30 | 16.90 | 9.90 | 17.00 | -350.10 | 25.20 | 5.30 | 18.30 | 6.00 | 18.00 | |
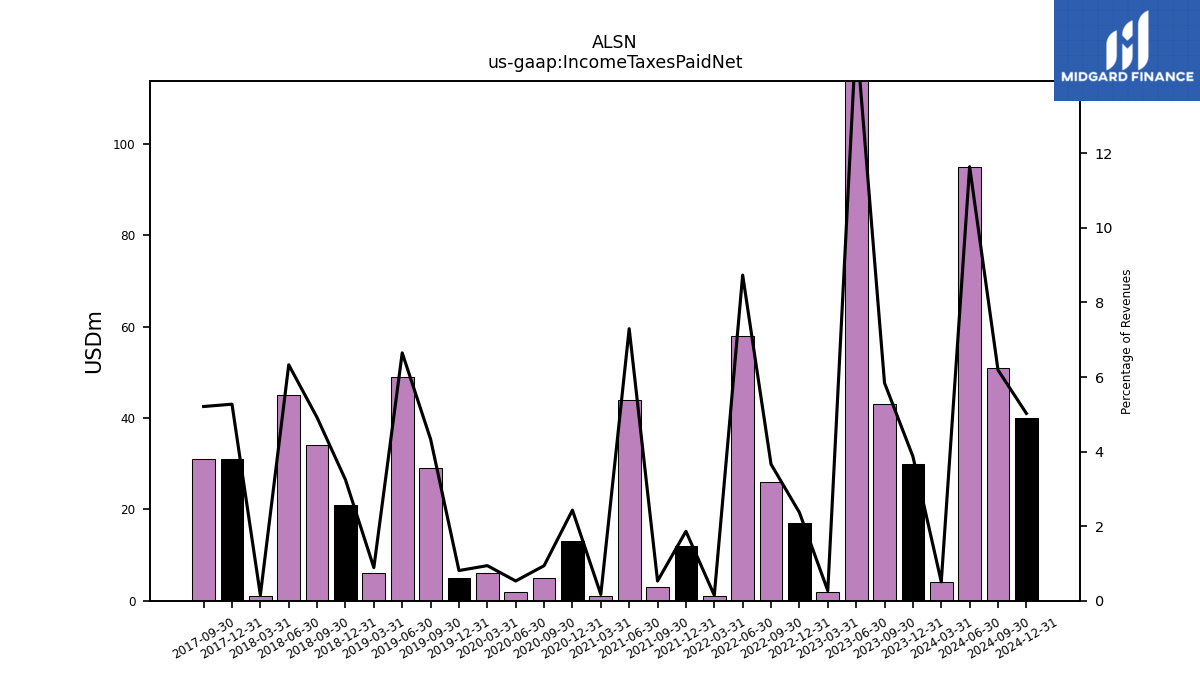
| Income Taxes Paid Net | 43.00 | 119.00 | 2.00 | 17.00 | 26.00 | 58.00 | 1.00 | 12.00 | 3.00 | 44.00 | 1.00 | 13.00 | 5.00 | 2.00 | 6.00 | 5.00 | 29.00 | 49.00 | 6.00 | 21.00 | 34.00 | 45.00 | 1.00 | 31.00 | 31.00 | NA | NA | NA | NA | NA | NA | NA | NA | NA | NA | NA | NA | NA | NA | NA | NA | NA | NA | NA | NA | NA | NA | NA | NA | NA | NA | |
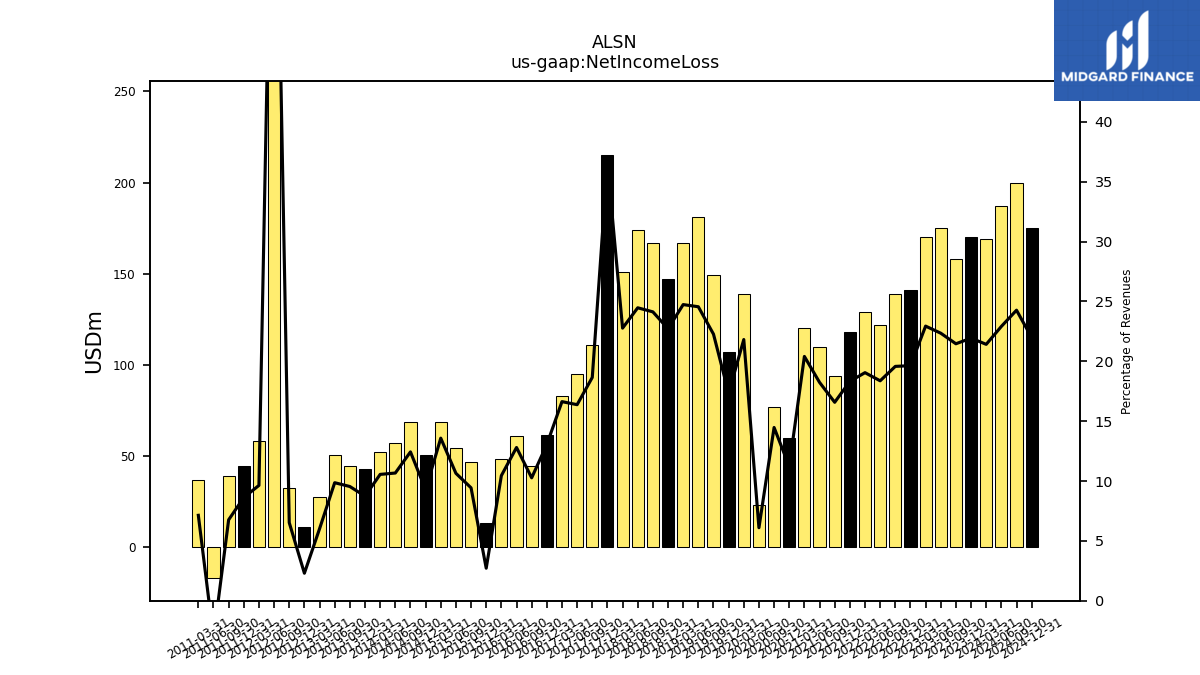
| Net Income Loss | 158.00 | 175.00 | 170.00 | 141.00 | 139.00 | 122.00 | 129.00 | 118.00 | 94.00 | 110.00 | 120.00 | 60.00 | 77.00 | 23.00 | 139.00 | 107.00 | 149.00 | 181.00 | 167.00 | 147.00 | 167.00 | 174.00 | 151.00 | 215.00 | 111.00 | 95.00 | 83.00 | 61.20 | 44.60 | 60.80 | 48.30 | 13.00 | 46.50 | 54.40 | 68.40 | 50.50 | 68.80 | 57.20 | 52.10 | 42.90 | 44.50 | 50.50 | 27.50 | 11.20 | 32.20 | 412.80 | 58.00 | 44.50 | 38.80 | -17.20 | 36.90 | |
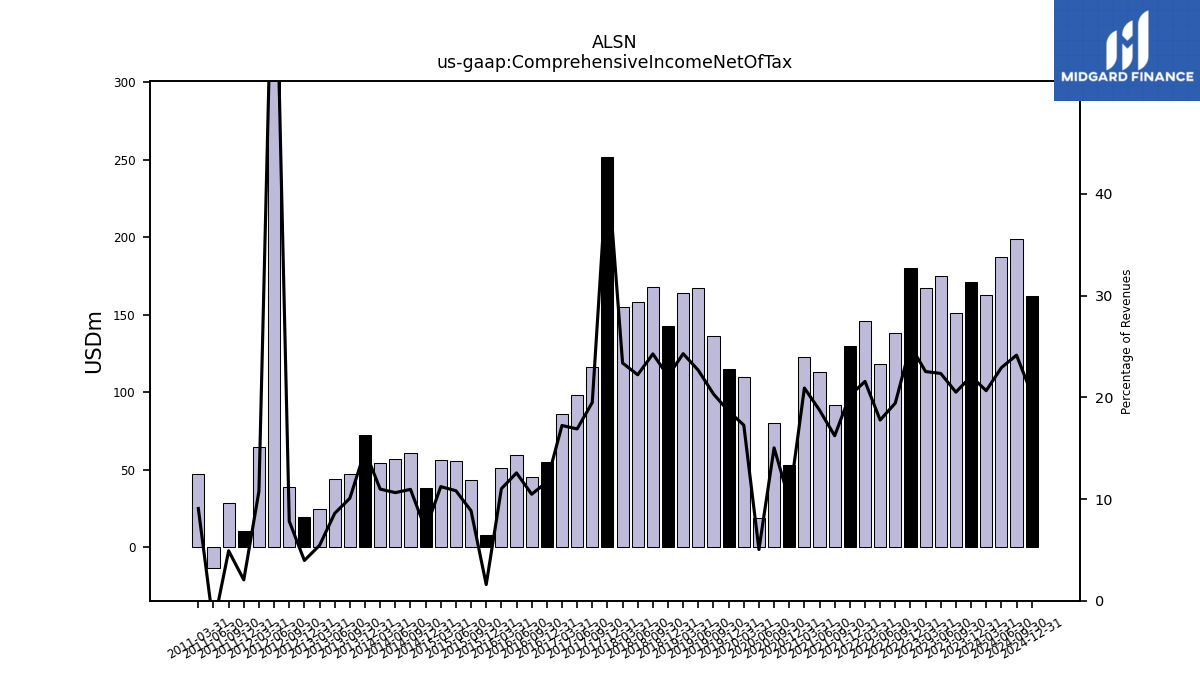
| Comprehensive Income Net Of Tax | 151.00 | 175.00 | 167.00 | 180.00 | 138.00 | 118.00 | 146.00 | 130.00 | 92.00 | 113.00 | 123.00 | 53.00 | 80.00 | 19.00 | 110.00 | 115.00 | 136.00 | 167.00 | 164.00 | 143.00 | 168.00 | 158.00 | 155.00 | 252.00 | 116.00 | 98.00 | 86.00 | 54.70 | 45.50 | 59.70 | 50.90 | 7.60 | 43.60 | 55.30 | 56.50 | 38.30 | 60.60 | 57.00 | 54.20 | 72.40 | 47.00 | 44.00 | 24.90 | 19.30 | 38.60 | 404.60 | 64.80 | 10.60 | 28.20 | -13.70 | 46.90 |
| 2023-09-30 | 2023-06-30 | 2023-03-31 | 2022-12-31 | 2022-09-30 | 2022-06-30 | 2022-03-31 | 2021-12-31 | 2021-09-30 | 2021-06-30 | 2021-03-31 | 2020-12-31 | 2020-09-30 | 2020-06-30 | 2020-03-31 | 2019-12-31 | 2019-09-30 | 2019-06-30 | 2019-03-31 | 2018-12-31 | 2018-09-30 | 2018-06-30 | 2018-03-31 | 2017-12-31 | 2017-09-30 | 2017-06-30 | 2017-03-31 | 2016-12-31 | 2016-09-30 | 2016-06-30 | 2016-03-31 | 2015-12-31 | 2015-09-30 | 2015-06-30 | 2015-03-31 | 2014-12-31 | 2014-09-30 | 2014-06-30 | 2014-03-31 | 2013-12-31 | 2013-09-30 | 2013-06-30 | 2013-03-31 | 2012-12-31 | 2012-09-30 | 2012-06-30 | 2012-03-31 | 2011-12-31 | 2011-09-30 | 2011-06-30 | 2011-03-31 | ||
|---|---|---|---|---|---|---|---|---|---|---|---|---|---|---|---|---|---|---|---|---|---|---|---|---|---|---|---|---|---|---|---|---|---|---|---|---|---|---|---|---|---|---|---|---|---|---|---|---|---|---|---|---|
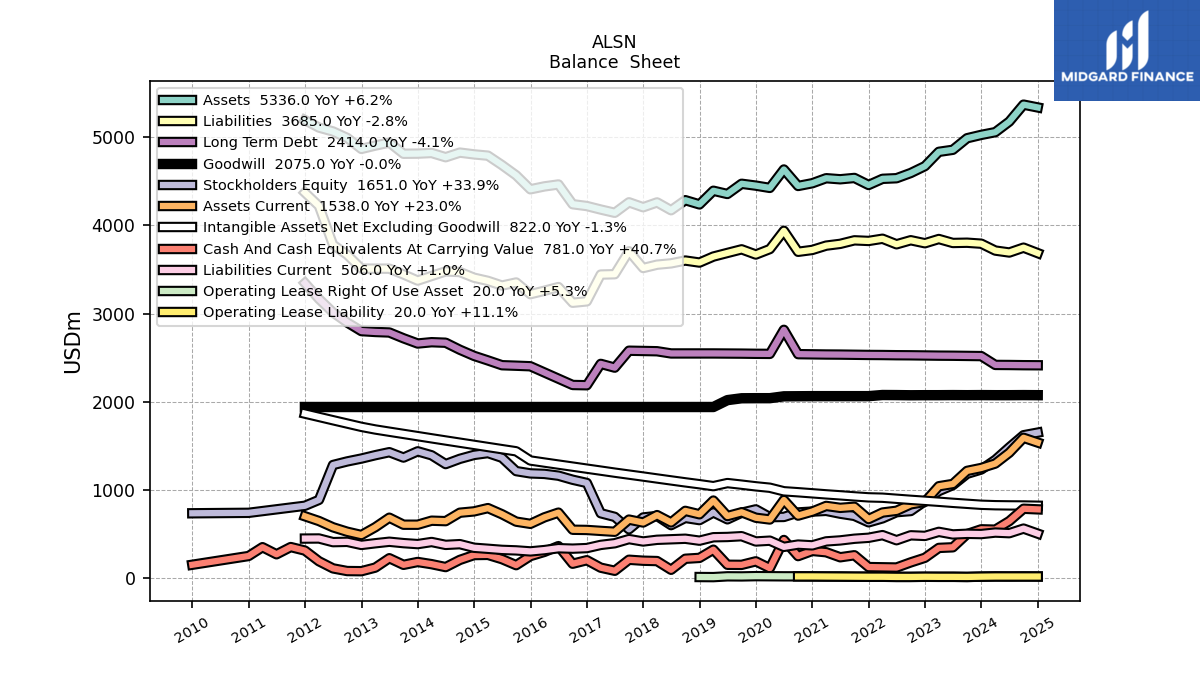
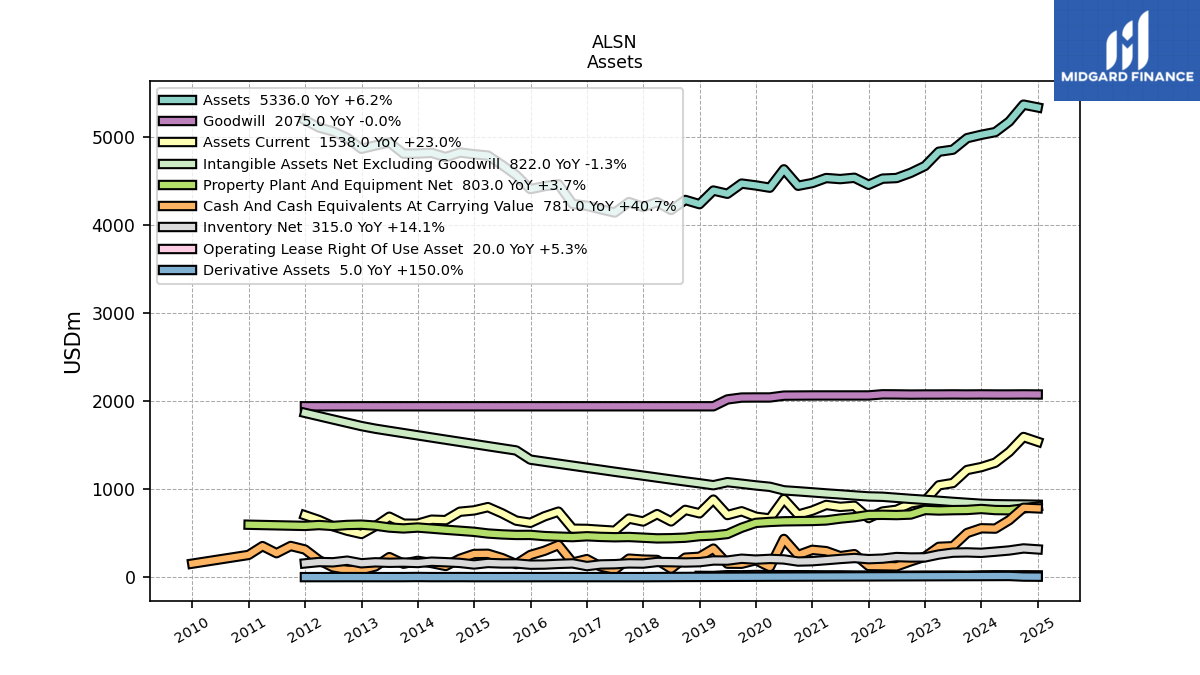
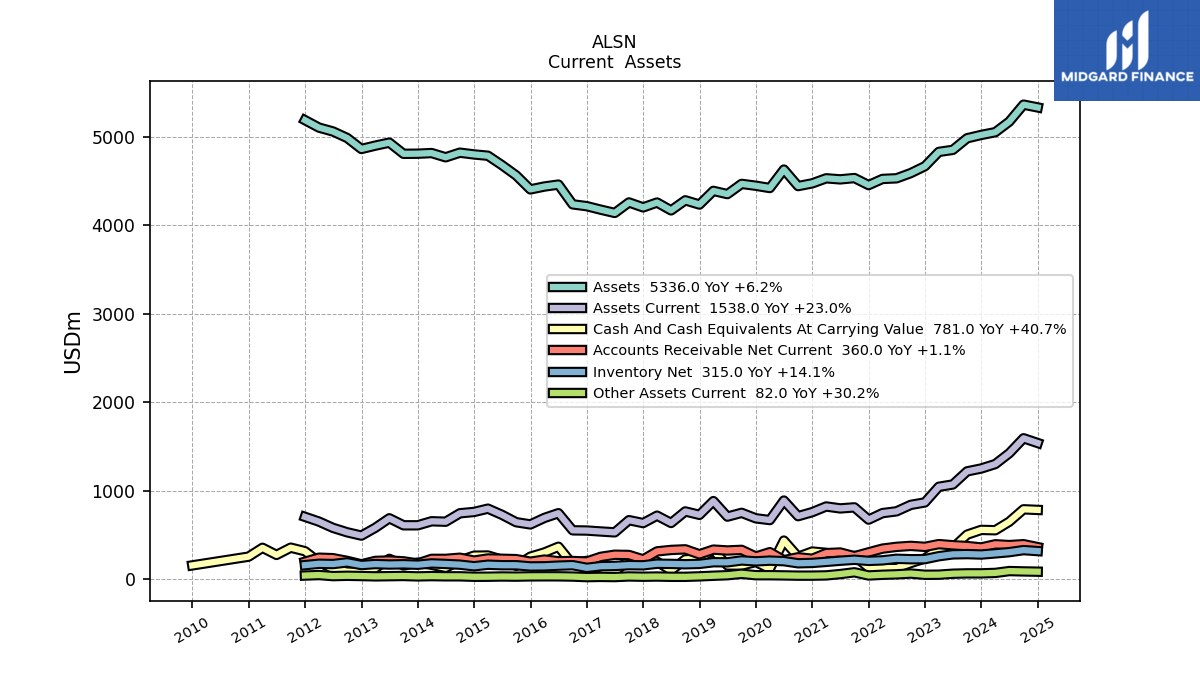
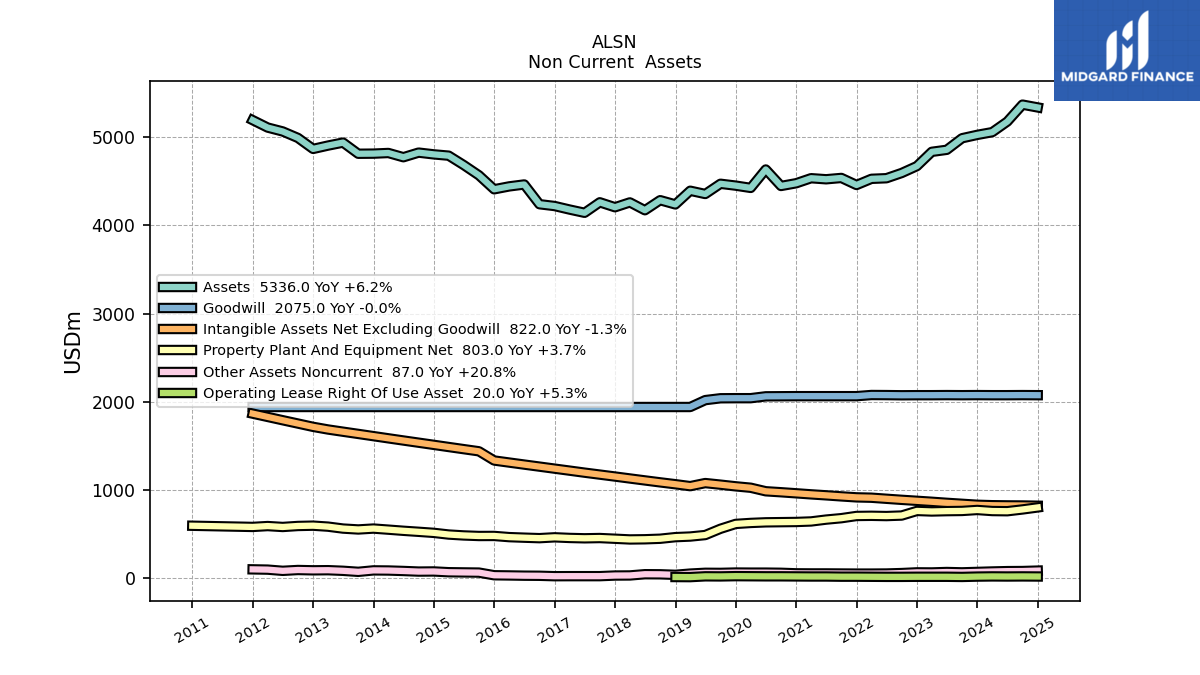
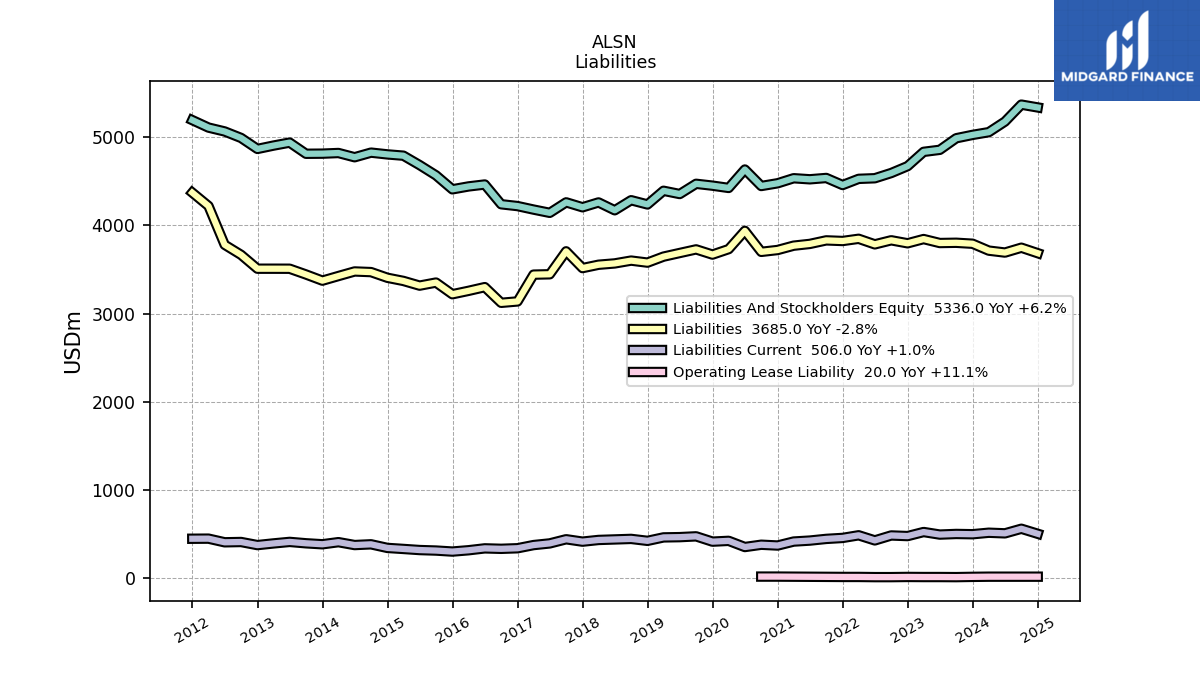
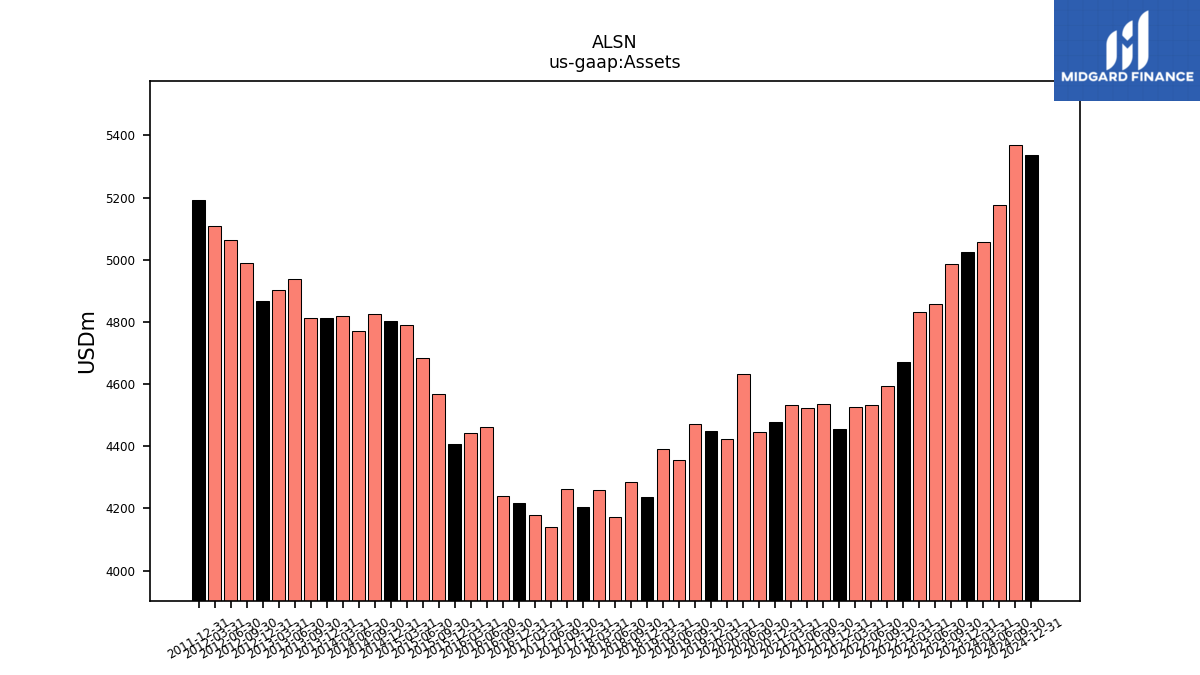
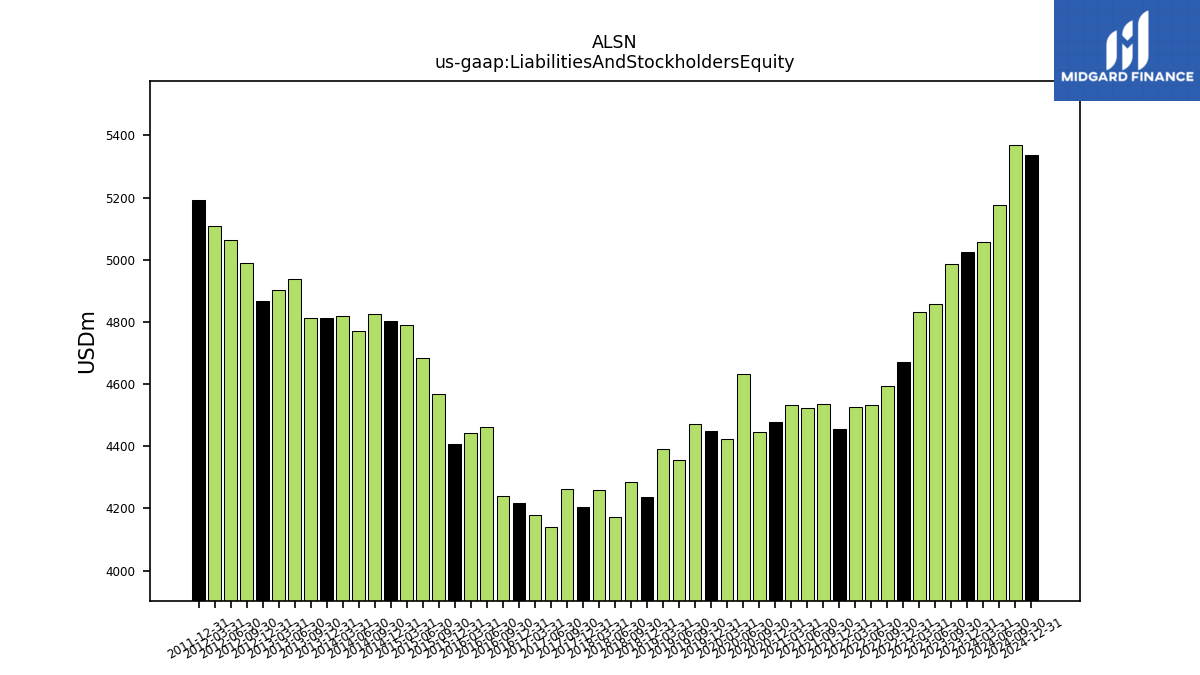
| Assets | 4987.00 | 4856.00 | 4833.00 | 4671.00 | 4593.00 | 4534.00 | 4527.00 | 4457.00 | 4537.00 | 4522.00 | 4534.00 | 4477.00 | 4446.00 | 4633.00 | 4424.00 | 4450.00 | 4471.00 | 4355.00 | 4392.00 | 4237.00 | 4285.00 | 4171.00 | 4260.00 | 4205.00 | 4261.00 | 4142.00 | 4179.00 | 4218.60 | 4239.30 | 4463.10 | 4441.20 | 4408.40 | 4566.70 | 4683.00 | 4789.50 | 4804.20 | 4824.20 | 4771.90 | 4819.90 | 4812.60 | 4811.20 | 4937.80 | 4903.90 | 4866.00 | 4990.60 | 5064.00 | 5108.10 | 5192.60 | NA | NA | NA | |
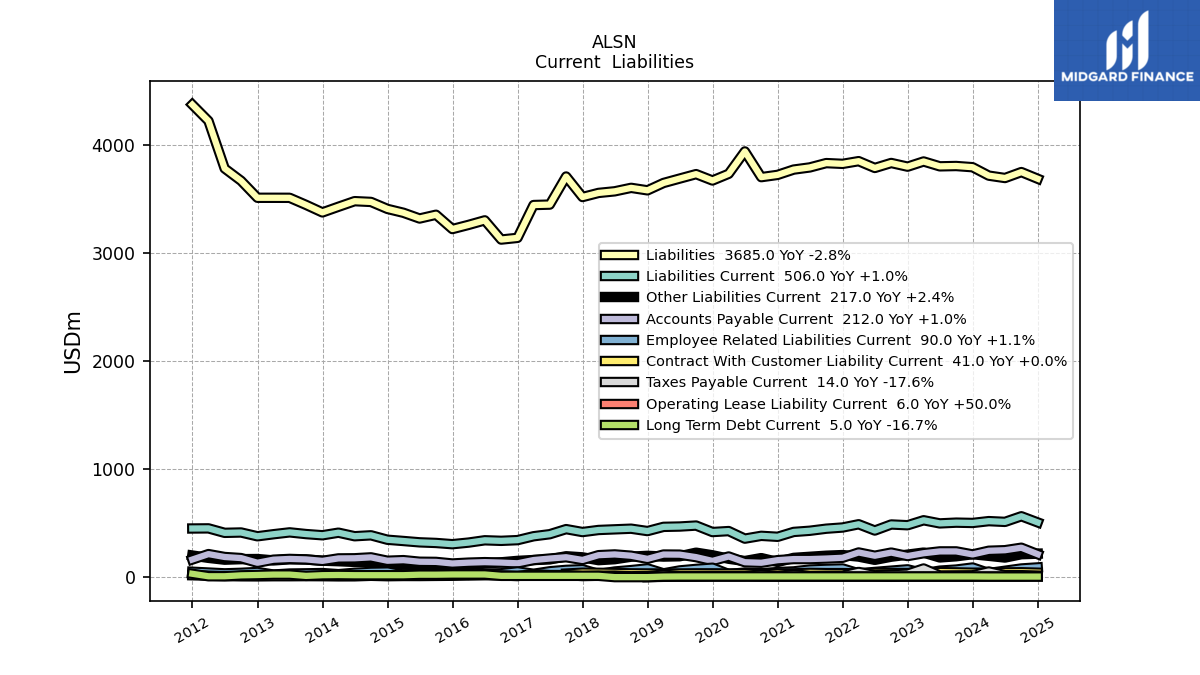
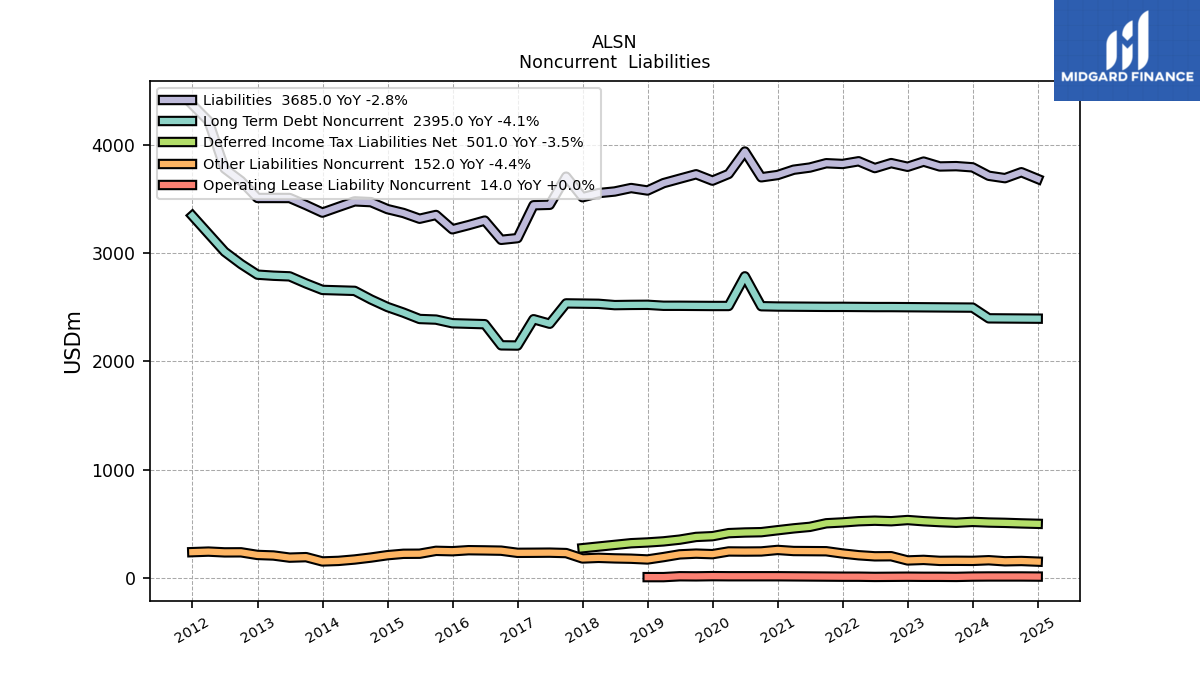
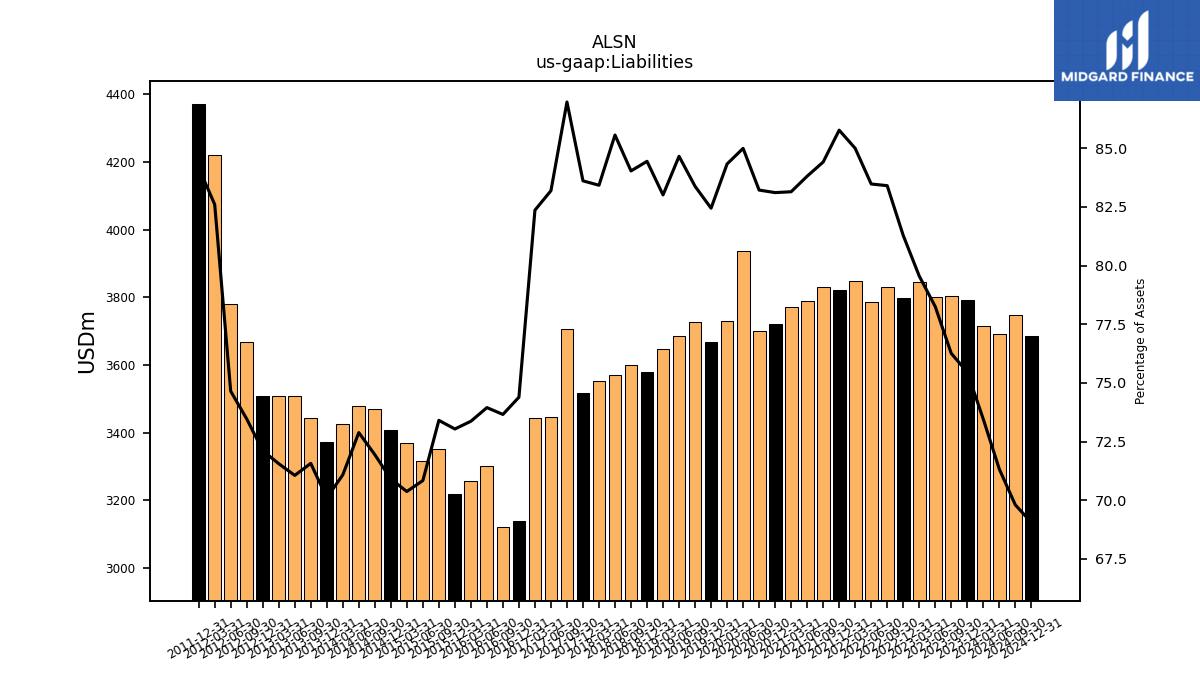
| Liabilities | 3803.00 | 3800.00 | 3845.00 | 3797.00 | 3831.00 | 3785.00 | 3848.00 | 3823.00 | 3830.00 | 3790.00 | 3770.00 | 3721.00 | 3700.00 | 3938.00 | 3731.00 | 3669.00 | 3728.00 | 3687.00 | 3646.00 | 3578.00 | 3601.00 | 3569.00 | 3554.00 | 3516.00 | 3706.00 | 3446.00 | 3442.00 | 3138.30 | 3122.60 | 3300.40 | 3258.40 | 3219.80 | 3352.20 | 3317.40 | 3370.50 | 3406.40 | 3470.70 | 3477.90 | 3426.10 | 3373.80 | 3443.40 | 3508.80 | 3509.10 | 3509.10 | 3666.40 | 3780.20 | 4219.80 | 4370.90 | NA | NA | NA | |
| Liabilities And Stockholders Equity | 4987.00 | 4856.00 | 4833.00 | 4671.00 | 4593.00 | 4534.00 | 4527.00 | 4457.00 | 4537.00 | 4522.00 | 4534.00 | 4477.00 | 4446.00 | 4633.00 | 4424.00 | 4450.00 | 4471.00 | 4355.00 | 4392.00 | 4237.00 | 4285.00 | 4171.00 | 4260.00 | 4205.00 | 4261.00 | 4142.00 | 4179.00 | 4218.60 | 4239.30 | 4463.10 | 4441.20 | 4408.40 | 4566.70 | 4683.00 | 4789.50 | 4804.20 | 4824.20 | 4771.90 | 4819.90 | 4812.60 | 4811.20 | 4937.80 | 4903.90 | 4866.00 | 4990.60 | 5064.00 | 5108.10 | 5192.60 | NA | NA | NA | |
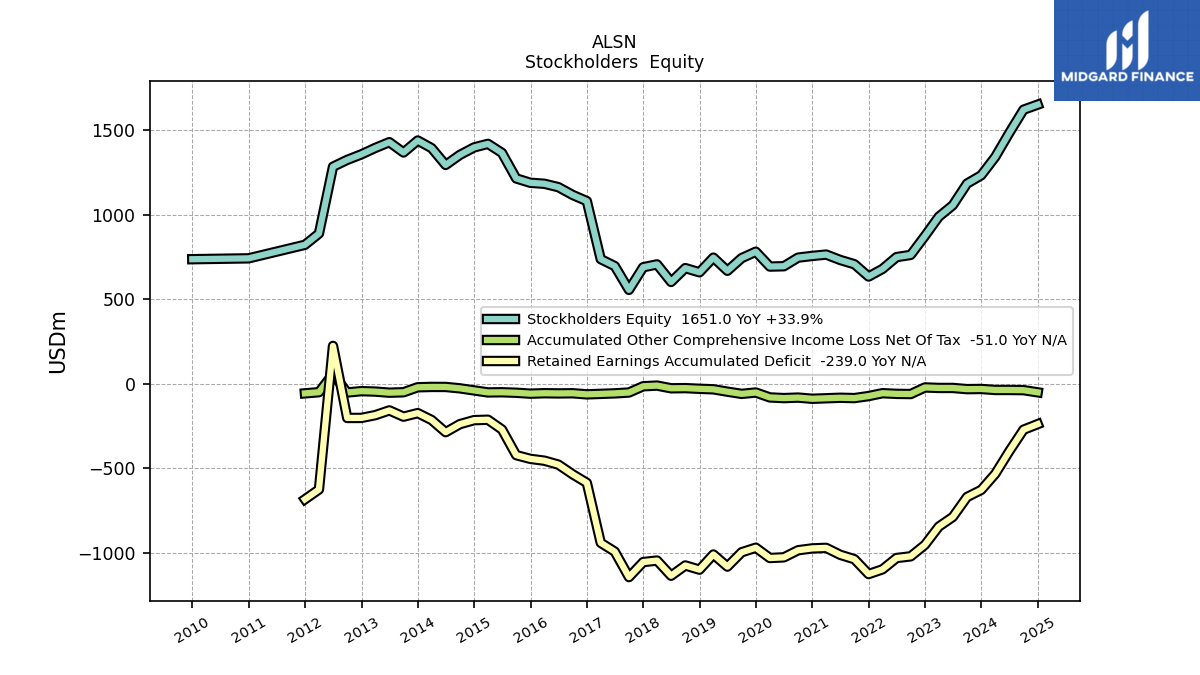
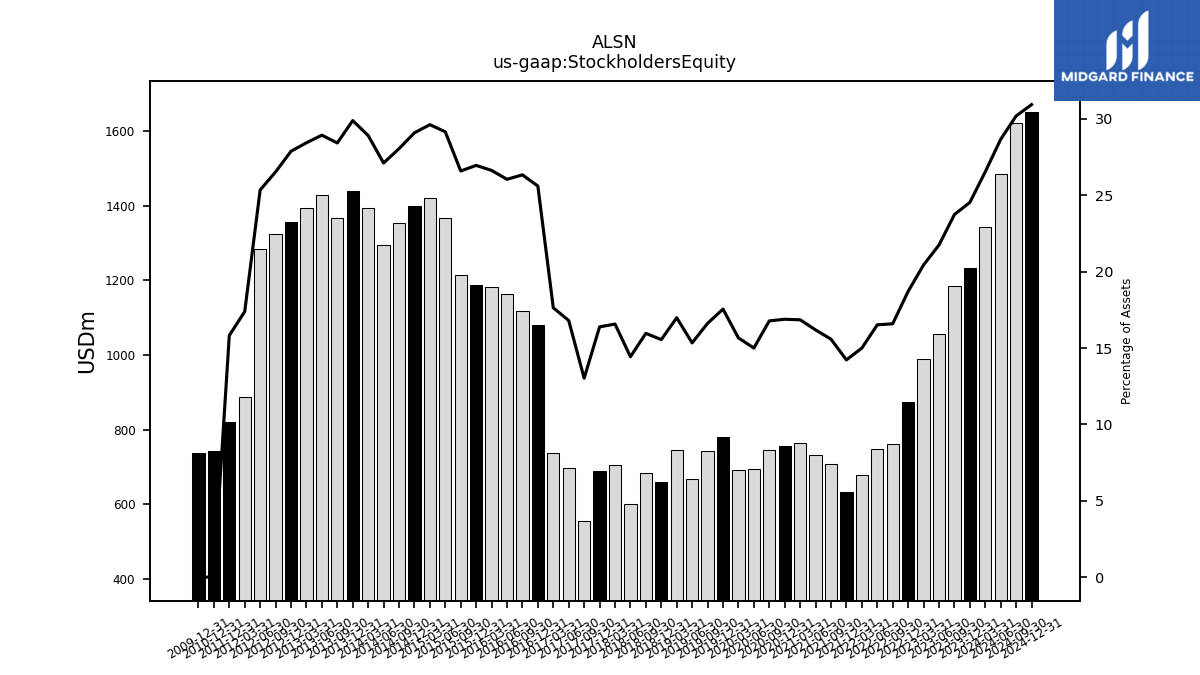
| Stockholders Equity | 1184.00 | 1056.00 | 988.00 | 874.00 | 762.00 | 749.00 | 679.00 | 634.00 | 707.00 | 732.00 | 764.00 | 756.00 | 746.00 | 695.00 | 693.00 | 781.00 | 743.00 | 668.00 | 746.00 | 659.00 | 684.00 | 602.00 | 706.00 | 689.00 | 555.00 | 696.00 | 737.00 | 1080.30 | 1116.70 | 1162.70 | 1182.80 | 1188.60 | 1214.50 | 1365.60 | 1419.00 | 1397.80 | 1353.50 | 1294.00 | 1393.80 | 1438.80 | 1367.80 | 1429.00 | 1394.80 | 1356.90 | 1324.20 | 1283.80 | 888.30 | 821.70 | NA | NA | NA |
| 2023-09-30 | 2023-06-30 | 2023-03-31 | 2022-12-31 | 2022-09-30 | 2022-06-30 | 2022-03-31 | 2021-12-31 | 2021-09-30 | 2021-06-30 | 2021-03-31 | 2020-12-31 | 2020-09-30 | 2020-06-30 | 2020-03-31 | 2019-12-31 | 2019-09-30 | 2019-06-30 | 2019-03-31 | 2018-12-31 | 2018-09-30 | 2018-06-30 | 2018-03-31 | 2017-12-31 | 2017-09-30 | 2017-06-30 | 2017-03-31 | 2016-12-31 | 2016-09-30 | 2016-06-30 | 2016-03-31 | 2015-12-31 | 2015-09-30 | 2015-06-30 | 2015-03-31 | 2014-12-31 | 2014-09-30 | 2014-06-30 | 2014-03-31 | 2013-12-31 | 2013-09-30 | 2013-06-30 | 2013-03-31 | 2012-12-31 | 2012-09-30 | 2012-06-30 | 2012-03-31 | 2011-12-31 | 2011-09-30 | 2011-06-30 | 2011-03-31 | ||
|---|---|---|---|---|---|---|---|---|---|---|---|---|---|---|---|---|---|---|---|---|---|---|---|---|---|---|---|---|---|---|---|---|---|---|---|---|---|---|---|---|---|---|---|---|---|---|---|---|---|---|---|---|
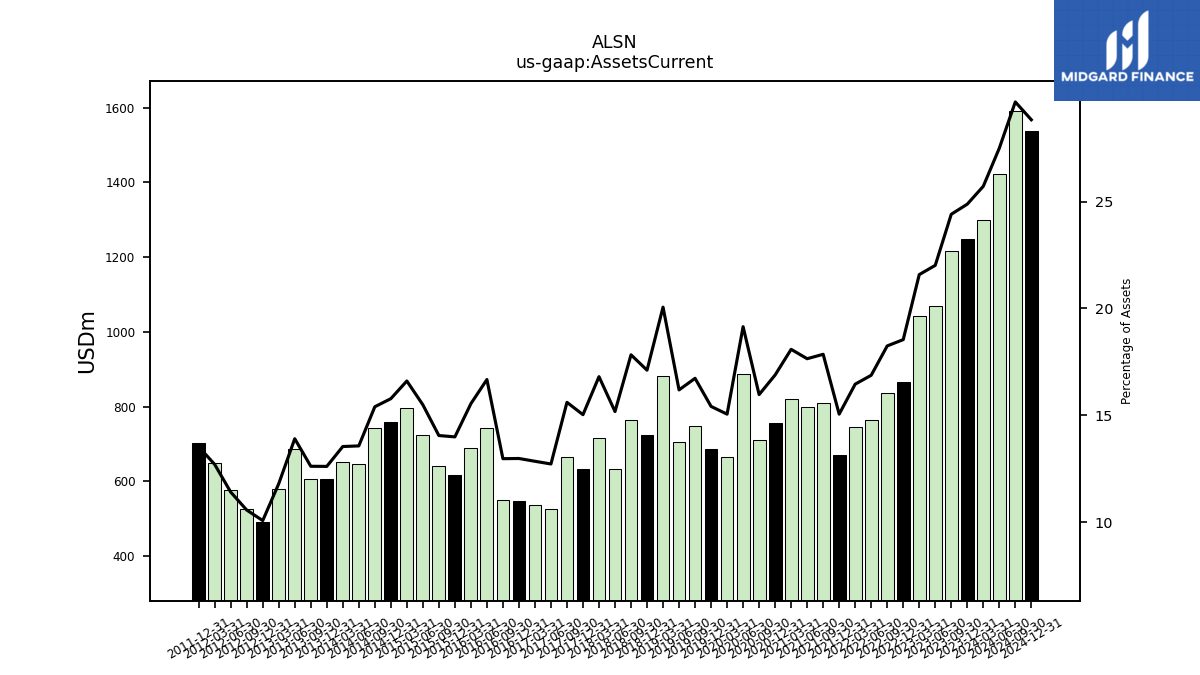
| Assets Current | 1217.00 | 1069.00 | 1043.00 | 866.00 | 838.00 | 765.00 | 745.00 | 671.00 | 810.00 | 798.00 | 820.00 | 756.00 | 710.00 | 887.00 | 666.00 | 686.00 | 748.00 | 705.00 | 881.00 | 725.00 | 764.00 | 633.00 | 716.00 | 632.00 | 665.00 | 527.00 | 537.00 | 547.60 | 549.90 | 744.10 | 690.30 | 616.80 | 641.80 | 725.50 | 795.30 | 758.00 | 742.90 | 647.50 | 652.60 | 606.90 | 607.00 | 686.60 | 578.70 | 490.30 | 527.50 | 577.80 | 648.80 | 702.70 | NA | NA | NA | |
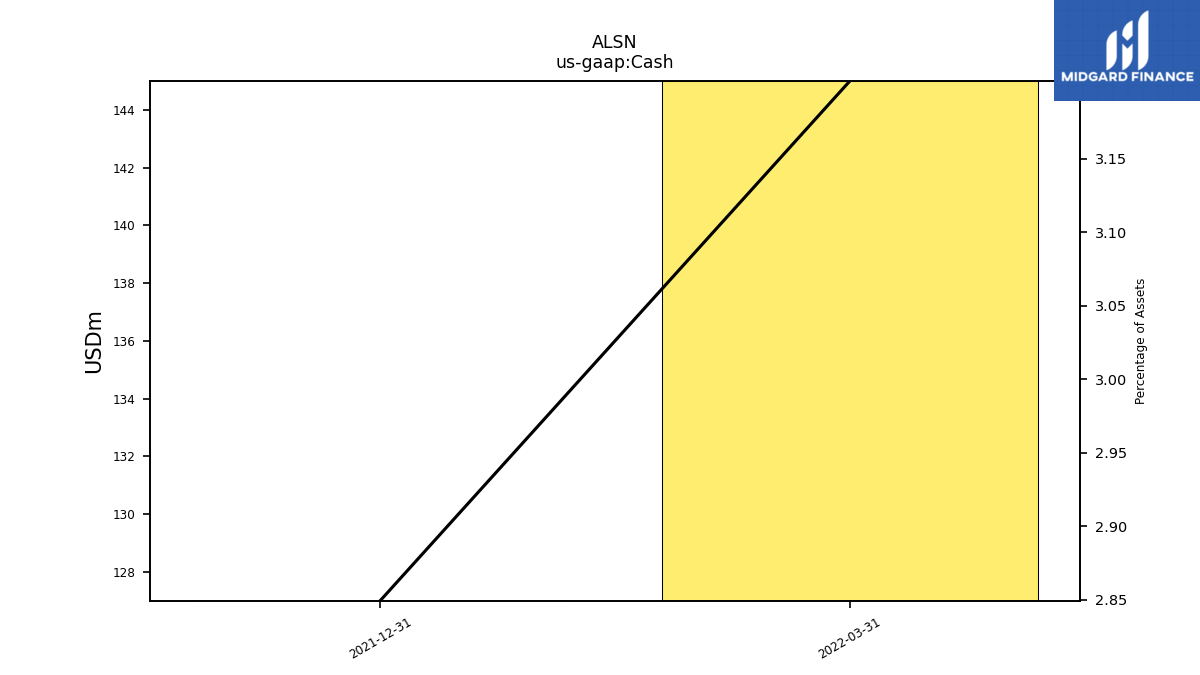
| Cash | NA | NA | NA | NA | NA | NA | 145.00 | 127.00 | NA | NA | NA | NA | NA | NA | NA | NA | NA | NA | NA | NA | NA | NA | NA | NA | NA | NA | NA | NA | NA | NA | NA | NA | NA | NA | NA | NA | NA | NA | NA | NA | NA | NA | NA | NA | NA | NA | NA | NA | NA | NA | NA | |
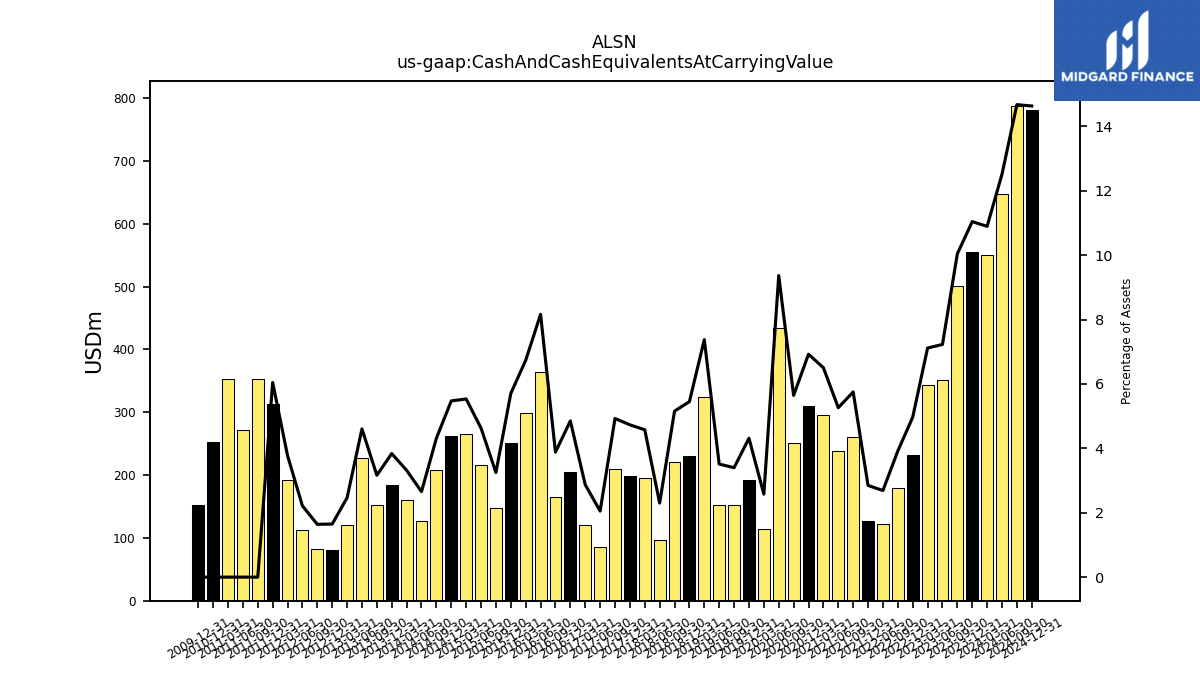
| Cash And Cash Equivalents At Carrying Value | 501.00 | 351.00 | 344.00 | 232.00 | 180.00 | 122.00 | NA | 127.00 | 261.00 | 238.00 | 295.00 | 310.00 | 251.00 | 434.00 | 114.00 | 192.00 | 152.00 | 153.00 | 324.00 | 231.00 | 221.00 | 96.00 | 195.00 | 199.00 | 210.00 | 85.00 | 120.00 | 204.70 | 164.70 | 364.40 | 299.10 | 251.60 | 148.40 | 216.80 | 265.10 | 263.00 | 208.10 | 126.70 | 159.90 | 184.70 | 152.30 | 227.40 | 120.90 | 80.20 | 81.90 | 112.10 | 192.90 | 314.00 | 353.80 | 271.80 | 352.40 | |
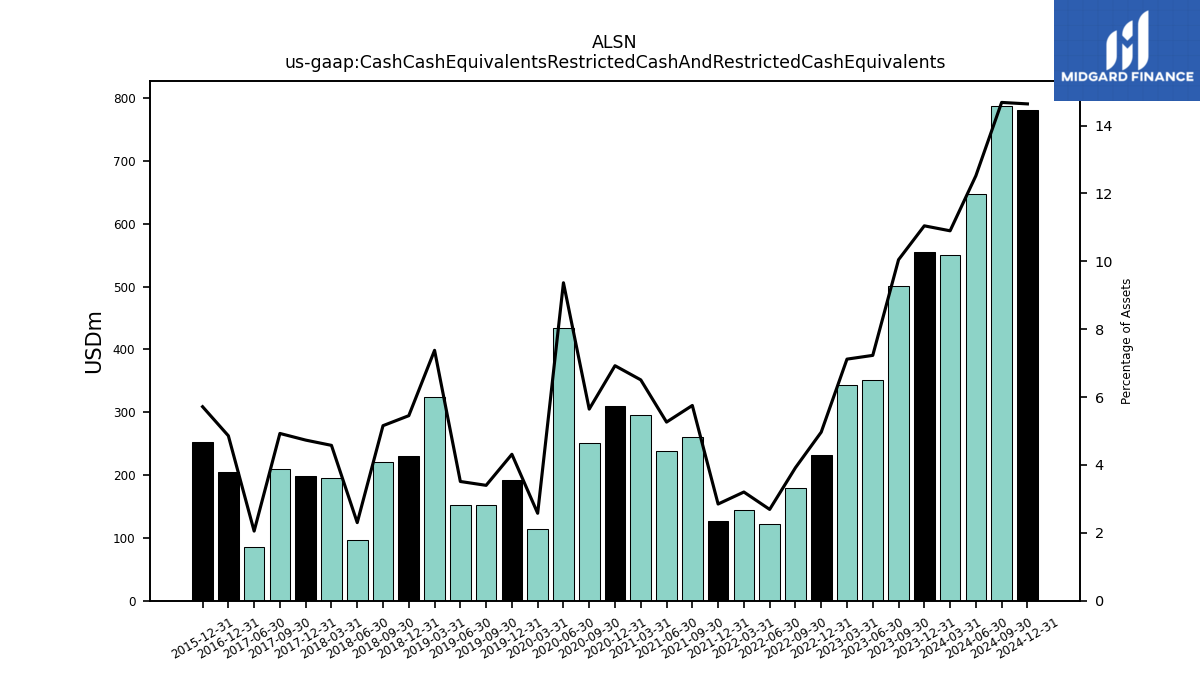
| Cash Cash Equivalents Restricted Cash And Restricted Cash Equivalents | 501.00 | 351.00 | 344.00 | 232.00 | 180.00 | 122.00 | 145.00 | 127.00 | 261.00 | 238.00 | 295.00 | 310.00 | 251.00 | 434.00 | 114.00 | 192.00 | 152.00 | 153.00 | 324.00 | 231.00 | 221.00 | 96.00 | 195.00 | 199.00 | 210.00 | 85.00 | NA | 205.00 | NA | NA | NA | 252.00 | NA | NA | NA | NA | NA | NA | NA | NA | NA | NA | NA | NA | NA | NA | NA | NA | NA | NA | NA | |
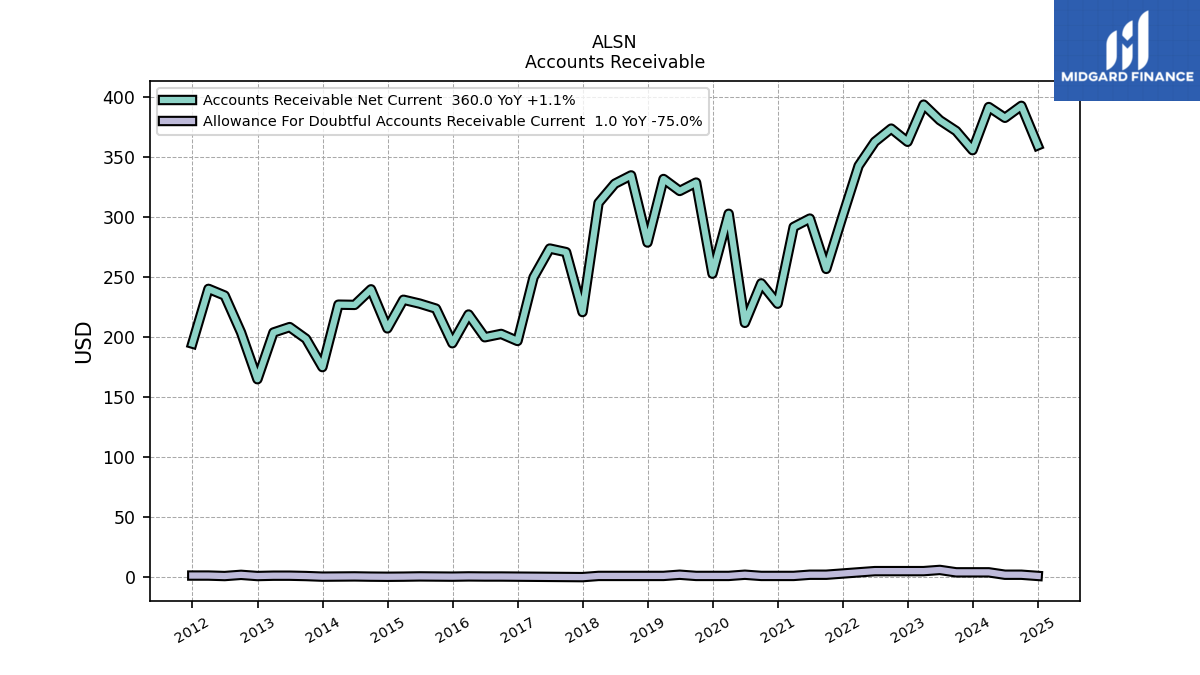
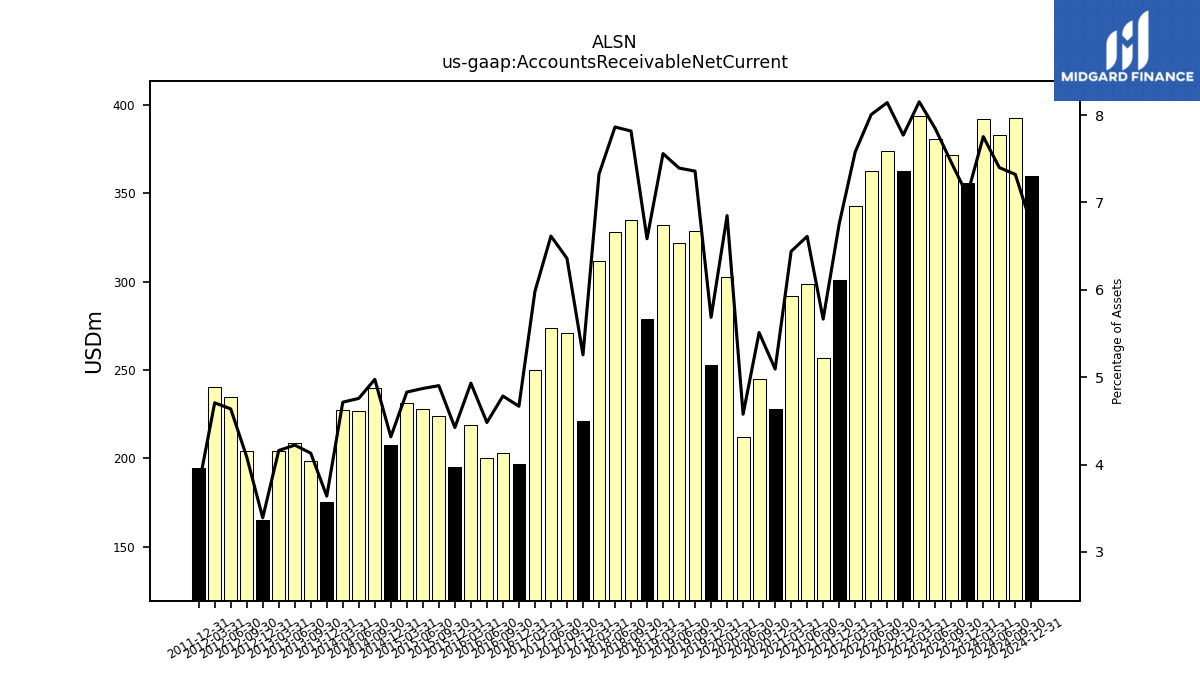
| Accounts Receivable Net Current | 372.00 | 381.00 | 394.00 | 363.00 | 374.00 | 363.00 | 343.00 | 301.00 | 257.00 | 299.00 | 292.00 | 228.00 | 245.00 | 212.00 | 303.00 | 253.00 | 329.00 | 322.00 | 332.00 | 279.00 | 335.00 | 328.00 | 312.00 | 221.00 | 271.00 | 274.00 | 250.00 | 196.90 | 202.80 | 200.00 | 219.00 | 195.00 | 223.90 | 228.10 | 231.30 | 207.40 | 240.00 | 227.00 | 227.20 | 175.10 | 198.70 | 208.50 | 204.00 | 165.00 | 204.00 | 234.80 | 240.40 | 194.70 | NA | NA | NA | |
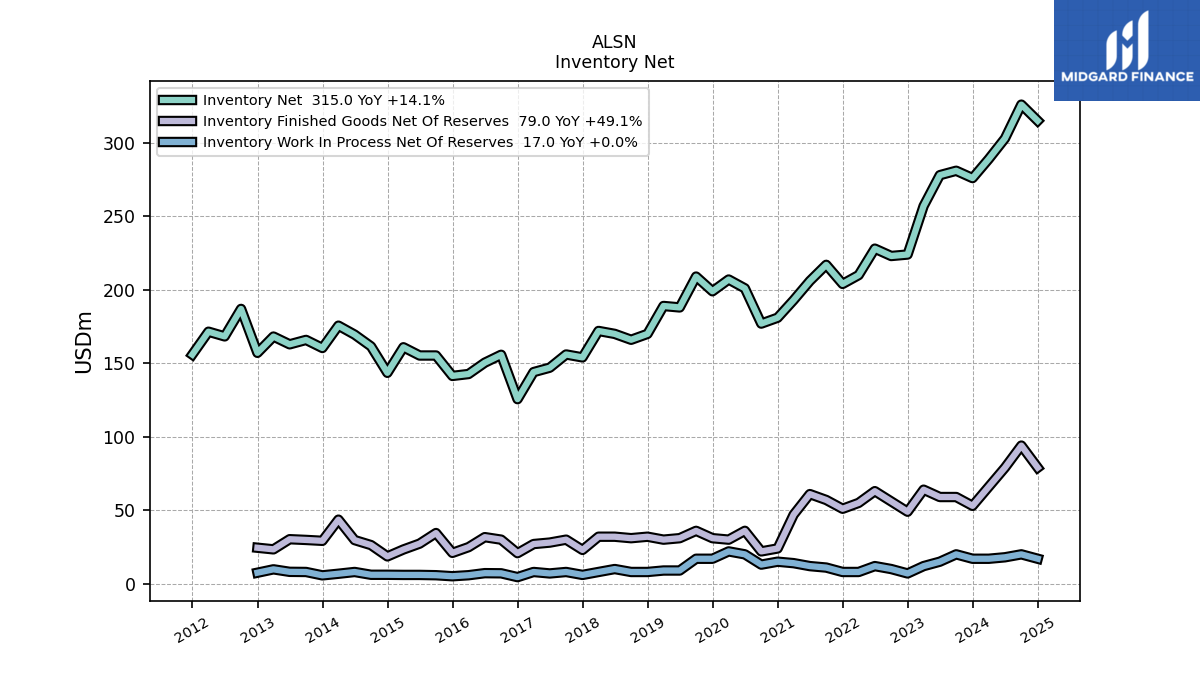
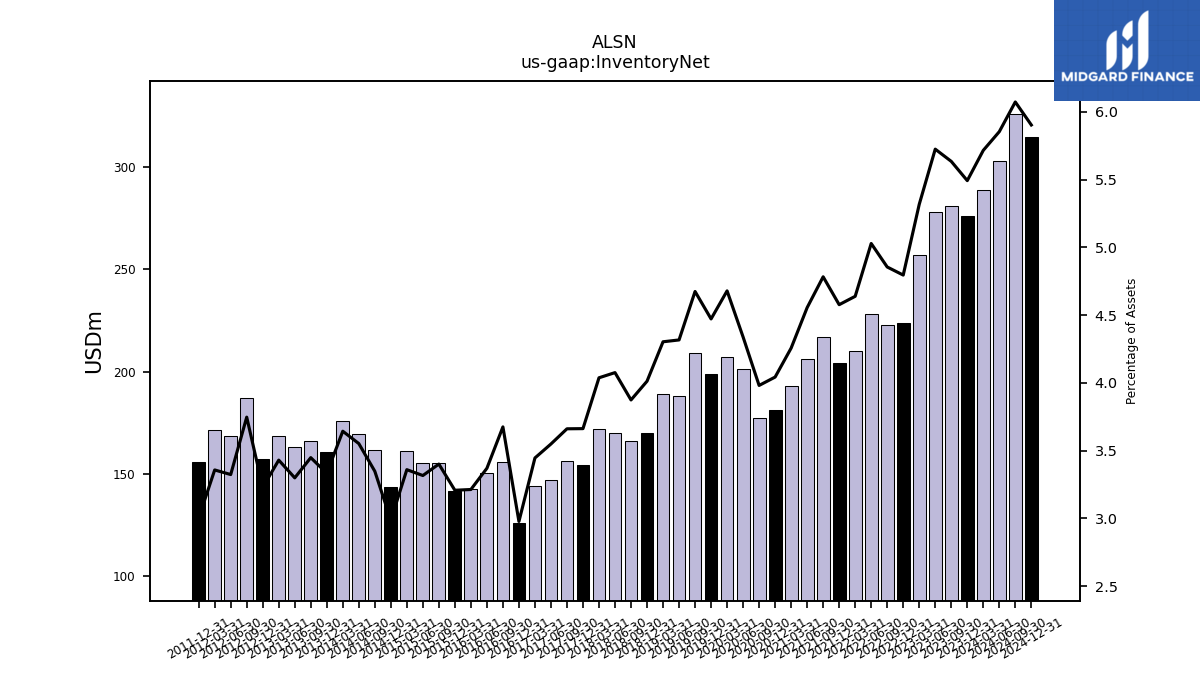
| Inventory Net | 281.00 | 278.00 | 257.00 | 224.00 | 223.00 | 228.00 | 210.00 | 204.00 | 217.00 | 206.00 | 193.00 | 181.00 | 177.00 | 201.00 | 207.00 | 199.00 | 209.00 | 188.00 | 189.00 | 170.00 | 166.00 | 170.00 | 172.00 | 154.00 | 156.00 | 147.00 | 144.00 | 125.60 | 155.80 | 150.40 | 142.70 | 141.40 | 155.30 | 155.30 | 160.90 | 143.50 | 161.50 | 169.50 | 175.60 | 160.40 | 165.90 | 162.90 | 168.20 | 157.10 | 187.00 | 168.30 | 171.50 | 155.90 | NA | NA | NA | |
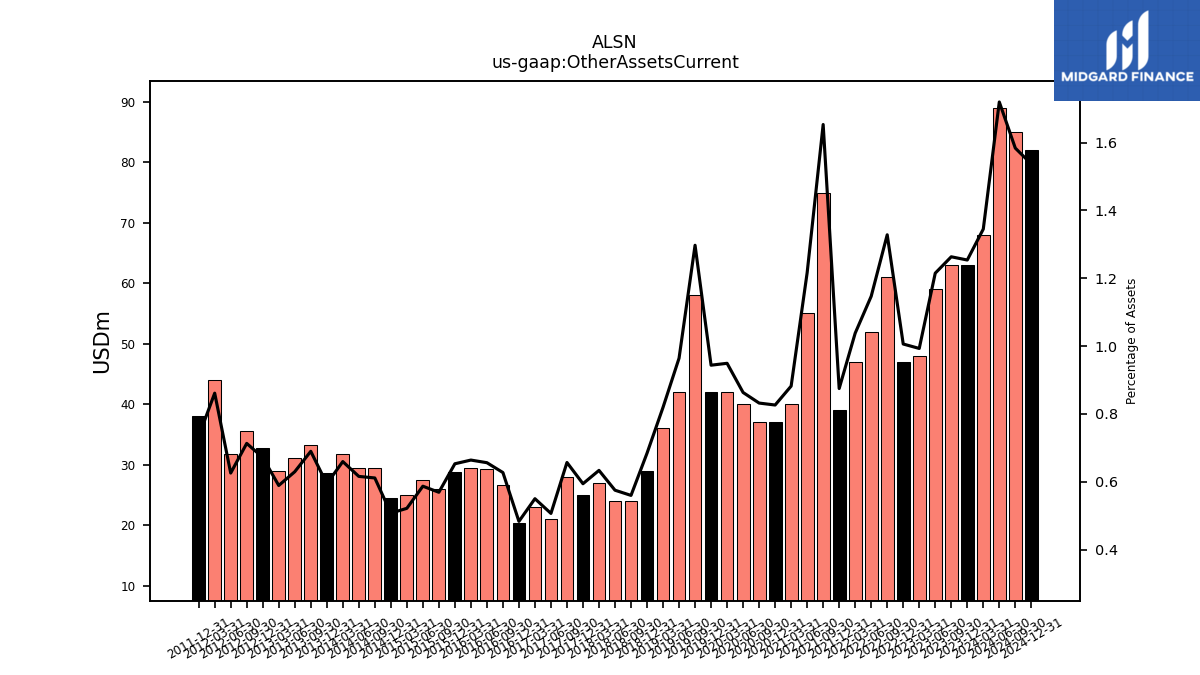
| Other Assets Current | 63.00 | 59.00 | 48.00 | 47.00 | 61.00 | 52.00 | 47.00 | 39.00 | 75.00 | 55.00 | 40.00 | 37.00 | 37.00 | 40.00 | 42.00 | 42.00 | 58.00 | 42.00 | 36.00 | 29.00 | 24.00 | 24.00 | 27.00 | 25.00 | 28.00 | 21.00 | 23.00 | 20.40 | 26.60 | 29.30 | 29.50 | 28.80 | 26.00 | 27.50 | 25.00 | 24.40 | 29.50 | 29.40 | 31.80 | 28.60 | 33.20 | 31.10 | 28.90 | 32.70 | 35.60 | 31.70 | 44.00 | 38.10 | NA | NA | NA |
| 2023-09-30 | 2023-06-30 | 2023-03-31 | 2022-12-31 | 2022-09-30 | 2022-06-30 | 2022-03-31 | 2021-12-31 | 2021-09-30 | 2021-06-30 | 2021-03-31 | 2020-12-31 | 2020-09-30 | 2020-06-30 | 2020-03-31 | 2019-12-31 | 2019-09-30 | 2019-06-30 | 2019-03-31 | 2018-12-31 | 2018-09-30 | 2018-06-30 | 2018-03-31 | 2017-12-31 | 2017-09-30 | 2017-06-30 | 2017-03-31 | 2016-12-31 | 2016-09-30 | 2016-06-30 | 2016-03-31 | 2015-12-31 | 2015-09-30 | 2015-06-30 | 2015-03-31 | 2014-12-31 | 2014-09-30 | 2014-06-30 | 2014-03-31 | 2013-12-31 | 2013-09-30 | 2013-06-30 | 2013-03-31 | 2012-12-31 | 2012-09-30 | 2012-06-30 | 2012-03-31 | 2011-12-31 | 2011-09-30 | 2011-06-30 | 2011-03-31 | ||
|---|---|---|---|---|---|---|---|---|---|---|---|---|---|---|---|---|---|---|---|---|---|---|---|---|---|---|---|---|---|---|---|---|---|---|---|---|---|---|---|---|---|---|---|---|---|---|---|---|---|---|---|---|
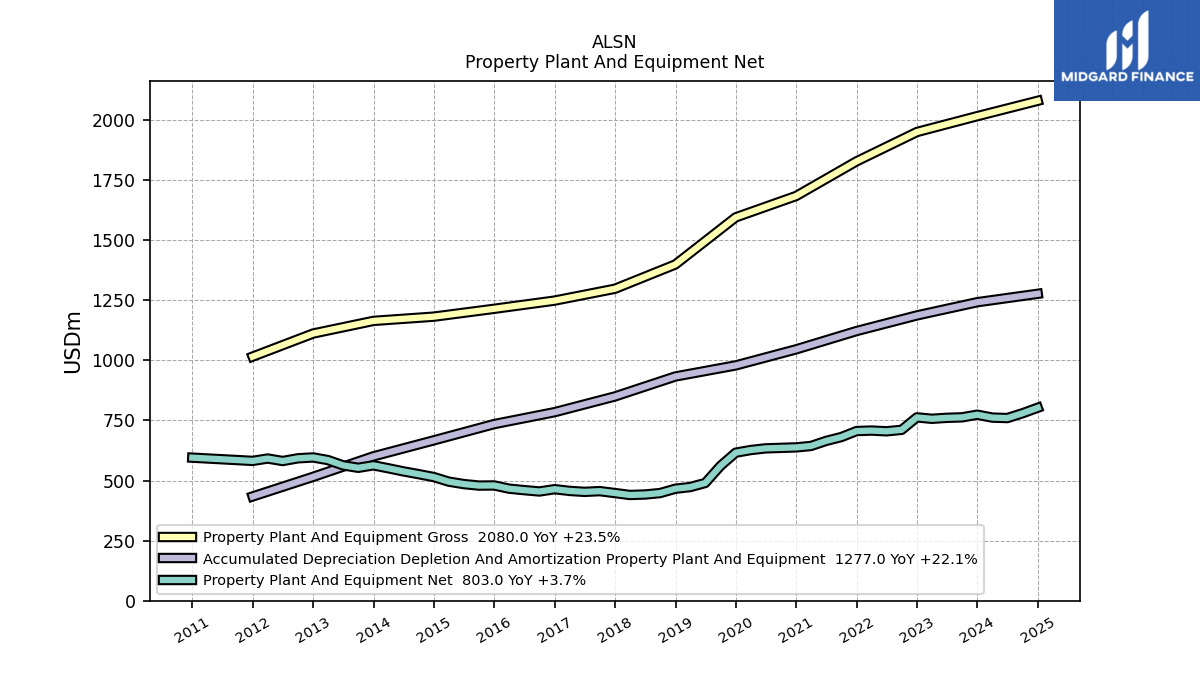
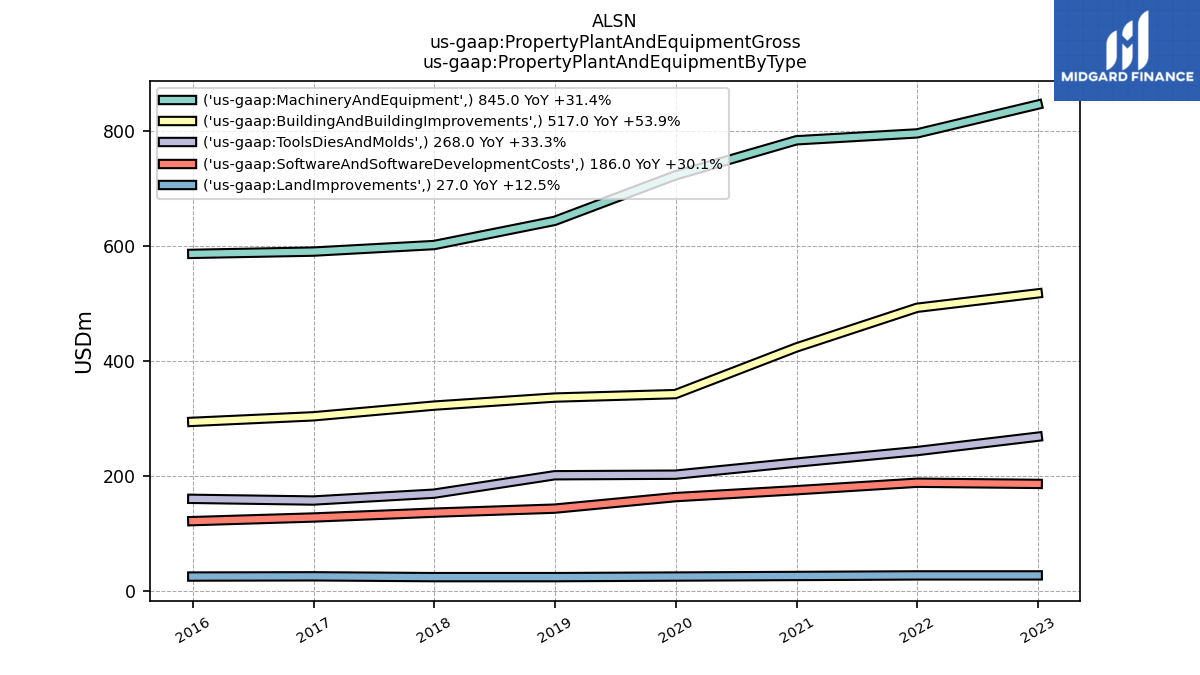
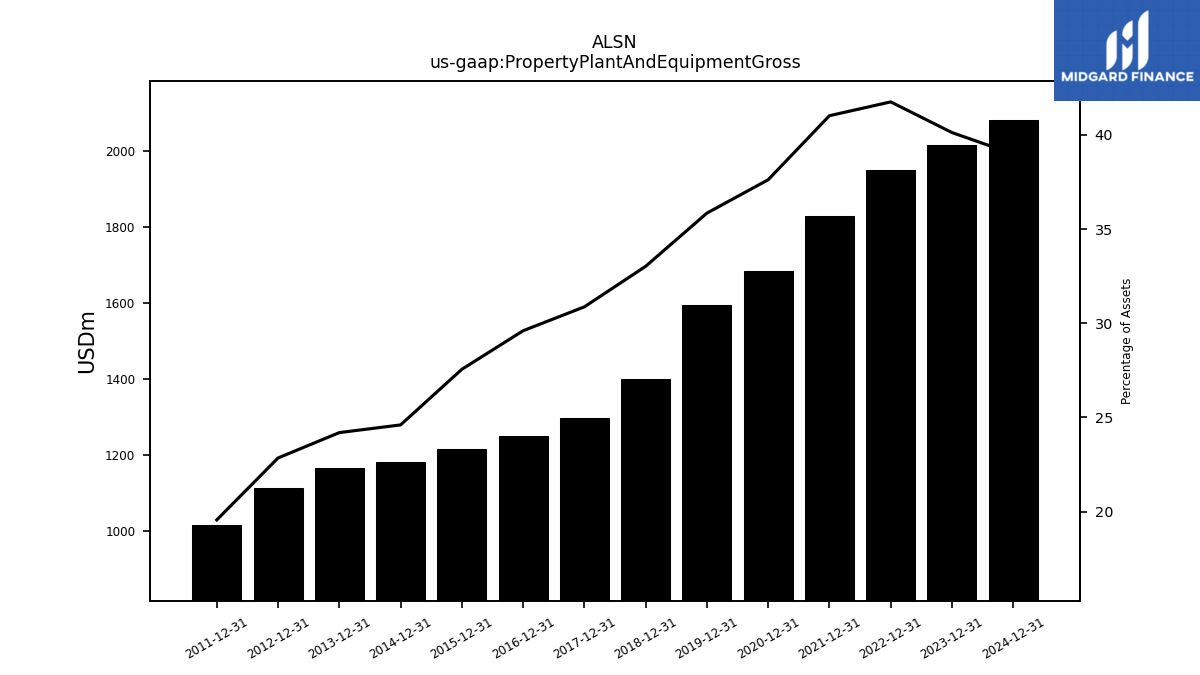
| Property Plant And Equipment Gross | NA | NA | NA | 1950.00 | NA | NA | NA | 1828.00 | NA | NA | NA | 1684.00 | NA | NA | NA | 1595.00 | NA | NA | NA | 1399.00 | NA | NA | NA | 1298.00 | NA | NA | NA | 1248.70 | NA | NA | NA | 1214.60 | NA | NA | NA | 1181.90 | NA | NA | NA | 1164.30 | NA | NA | NA | 1111.70 | NA | NA | NA | 1015.60 | NA | NA | NA | |
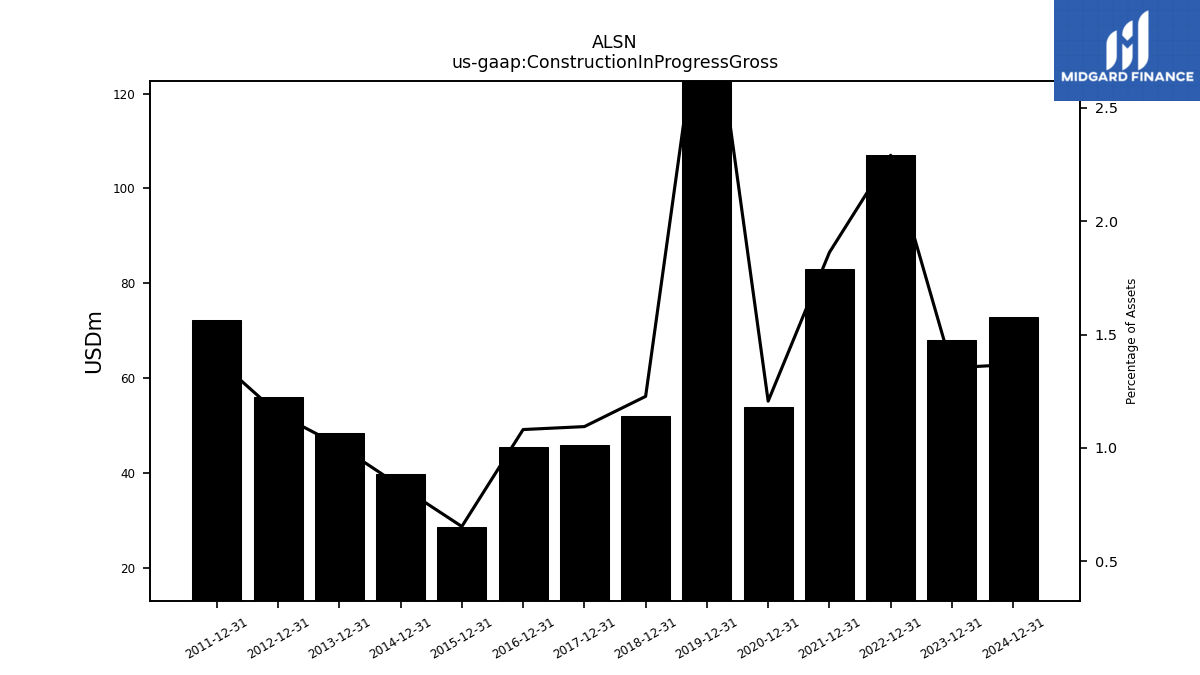
| Construction In Progress Gross | NA | NA | NA | 107.00 | NA | NA | NA | 83.00 | NA | NA | NA | 54.00 | NA | NA | NA | 141.00 | NA | NA | NA | 52.00 | NA | NA | NA | 46.00 | NA | NA | NA | 45.60 | NA | NA | NA | 28.80 | NA | NA | NA | 39.90 | NA | NA | NA | 48.60 | NA | NA | NA | 56.00 | NA | NA | NA | 72.30 | NA | NA | NA | |
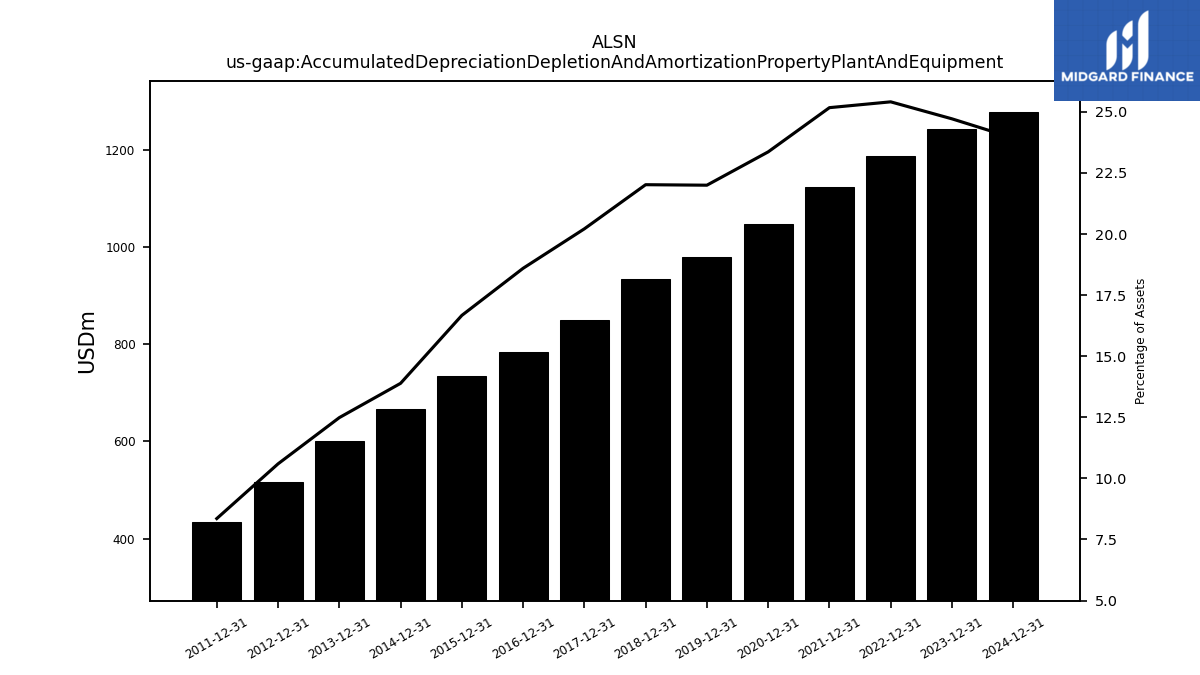
| Accumulated Depreciation Depletion And Amortization Property Plant And Equipment | NA | NA | NA | 1187.00 | NA | NA | NA | 1122.00 | NA | NA | NA | 1046.00 | NA | NA | NA | 979.00 | NA | NA | NA | 933.00 | NA | NA | NA | 850.00 | NA | NA | NA | 784.60 | NA | NA | NA | 734.90 | NA | NA | NA | 667.30 | NA | NA | NA | 600.90 | NA | NA | NA | 515.50 | NA | NA | NA | 433.80 | NA | NA | NA | |
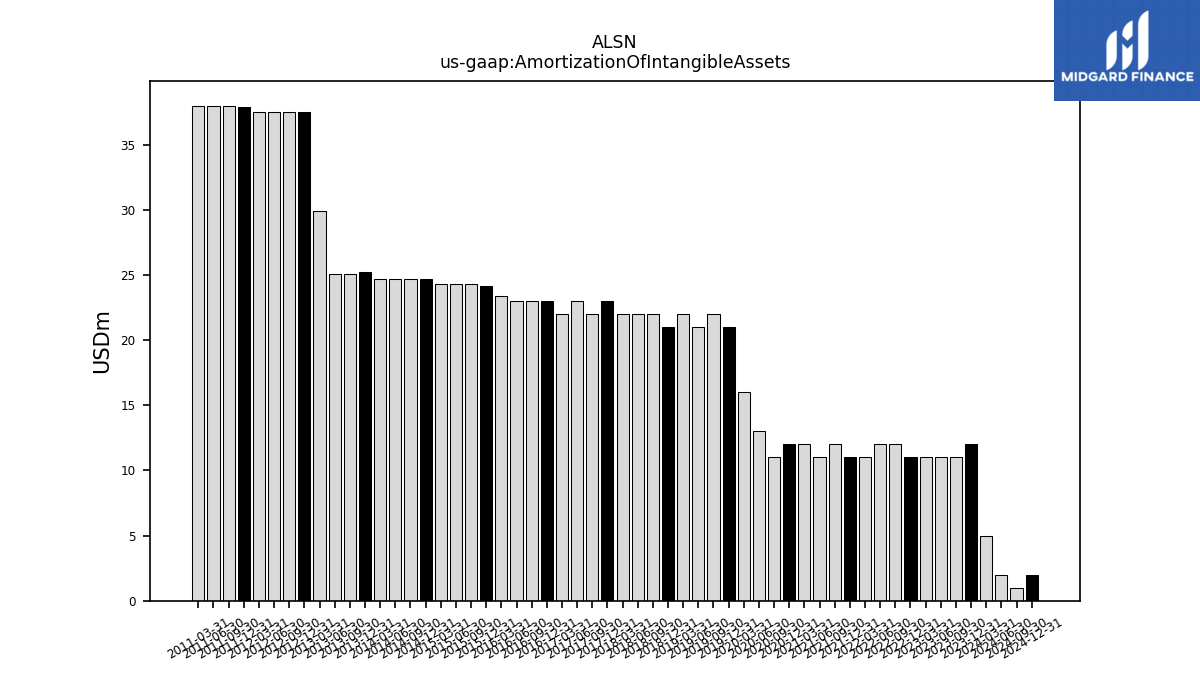
| Amortization Of Intangible Assets | 11.00 | 11.00 | 11.00 | 11.00 | 12.00 | 12.00 | 11.00 | 11.00 | 12.00 | 11.00 | 12.00 | 12.00 | 11.00 | 13.00 | 16.00 | 21.00 | 22.00 | 21.00 | 22.00 | 21.00 | 22.00 | 22.00 | 22.00 | 23.00 | 22.00 | 23.00 | 22.00 | 23.00 | 23.00 | 23.00 | 23.40 | 24.20 | 24.30 | 24.30 | 24.30 | 24.70 | 24.70 | 24.70 | 24.70 | 25.20 | 25.10 | 25.10 | 29.90 | 37.50 | 37.50 | 37.50 | 37.50 | 37.90 | 38.00 | 38.00 | 38.00 | |
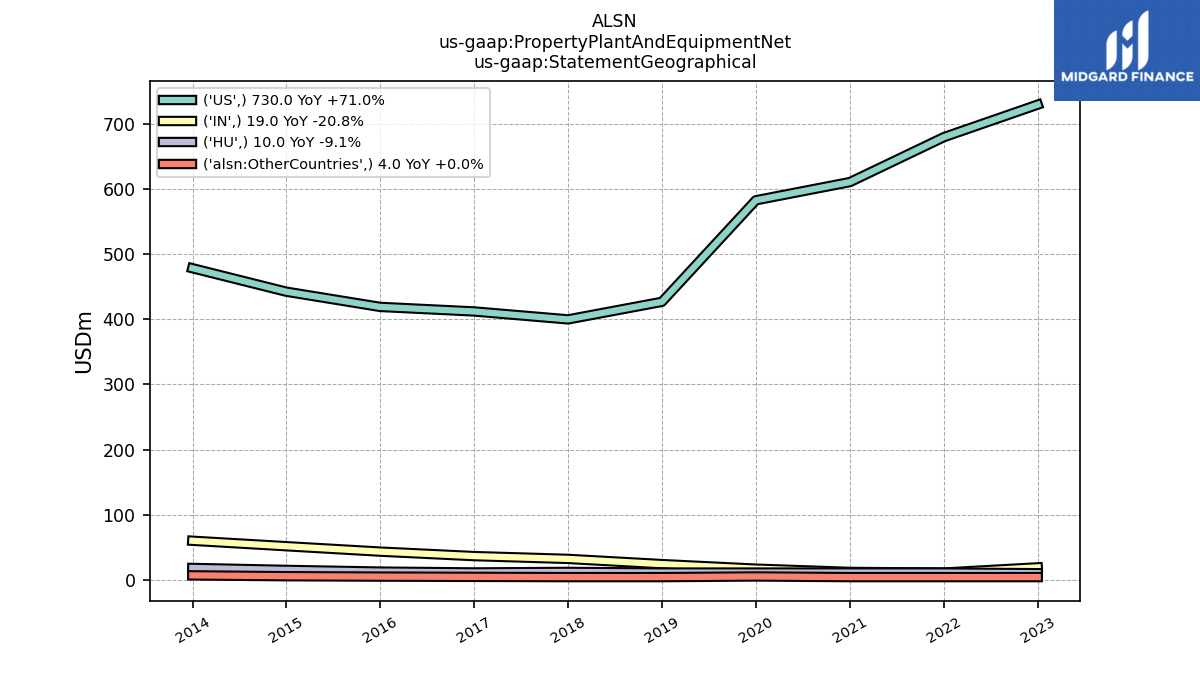
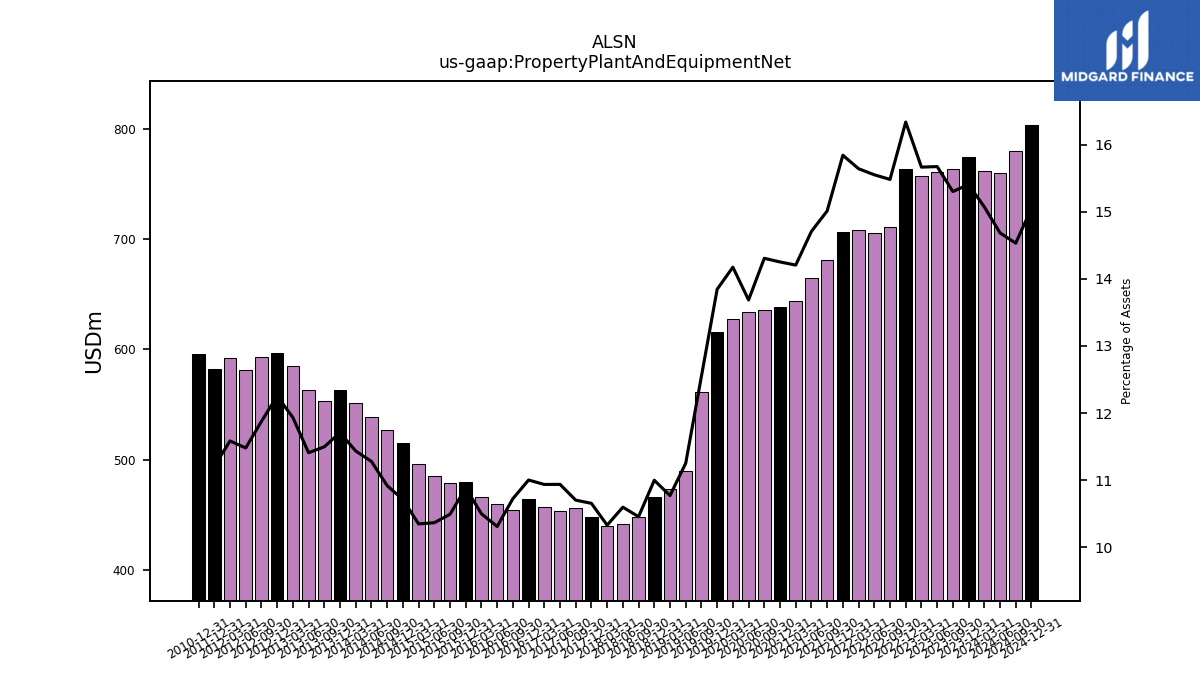
| Property Plant And Equipment Net | 763.00 | 761.00 | 757.00 | 763.00 | 711.00 | 705.00 | 708.00 | 706.00 | 681.00 | 665.00 | 644.00 | 638.00 | 636.00 | 634.00 | 627.00 | 616.00 | 561.00 | 490.00 | 473.00 | 466.00 | 448.00 | 442.00 | 440.00 | 448.00 | 456.00 | 453.00 | 457.00 | 464.10 | 454.60 | 460.10 | 466.30 | 479.70 | 479.10 | 485.40 | 495.60 | 514.60 | 526.70 | 538.20 | 551.10 | 563.40 | 553.10 | 563.30 | 585.20 | 596.20 | 592.60 | 581.30 | 591.70 | 581.80 | NA | NA | NA | |
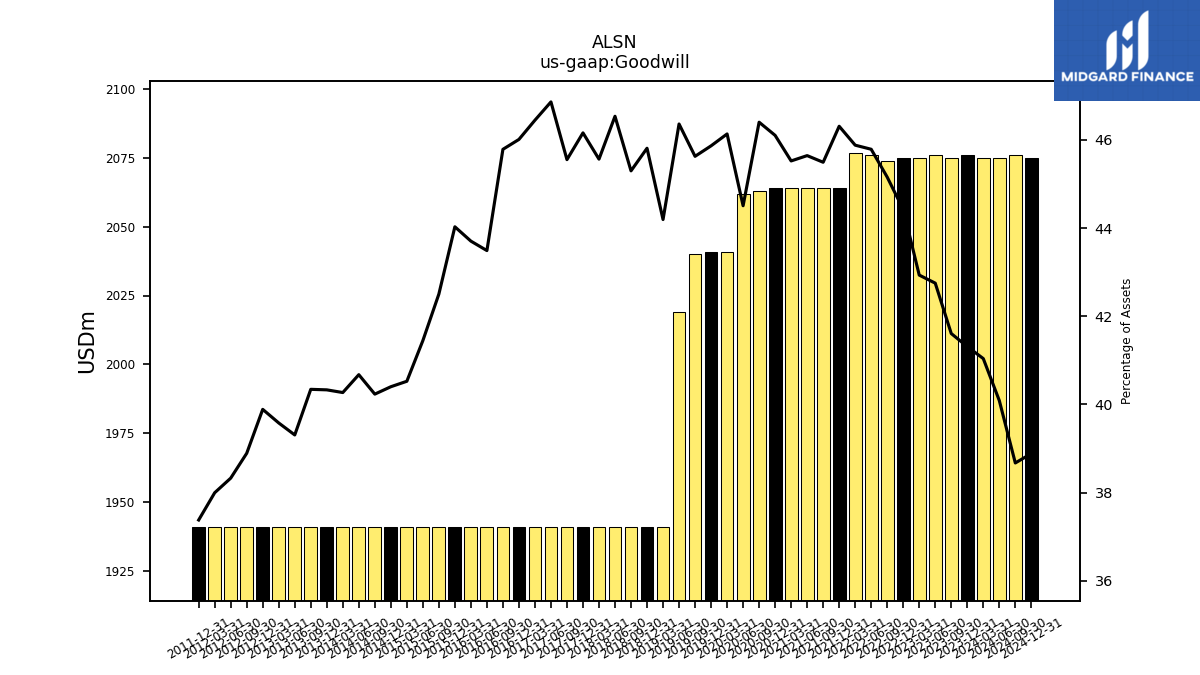
| Goodwill | 2075.00 | 2076.00 | 2075.00 | 2075.00 | 2074.00 | 2076.00 | 2077.00 | 2064.00 | 2064.00 | 2064.00 | 2064.00 | 2064.00 | 2063.00 | 2062.00 | 2041.00 | 2041.00 | 2040.00 | 2019.00 | 1941.00 | 1941.00 | 1941.00 | 1941.00 | 1941.00 | 1941.00 | 1941.00 | 1941.00 | 1941.00 | 1941.00 | 1941.00 | 1941.00 | 1941.00 | 1941.00 | 1941.00 | 1941.00 | 1941.00 | 1941.00 | 1941.00 | 1941.00 | 1941.00 | 1941.00 | 1941.00 | 1941.00 | 1941.00 | 1941.00 | 1941.00 | 1941.00 | 1941.00 | 1941.00 | NA | NA | NA | |
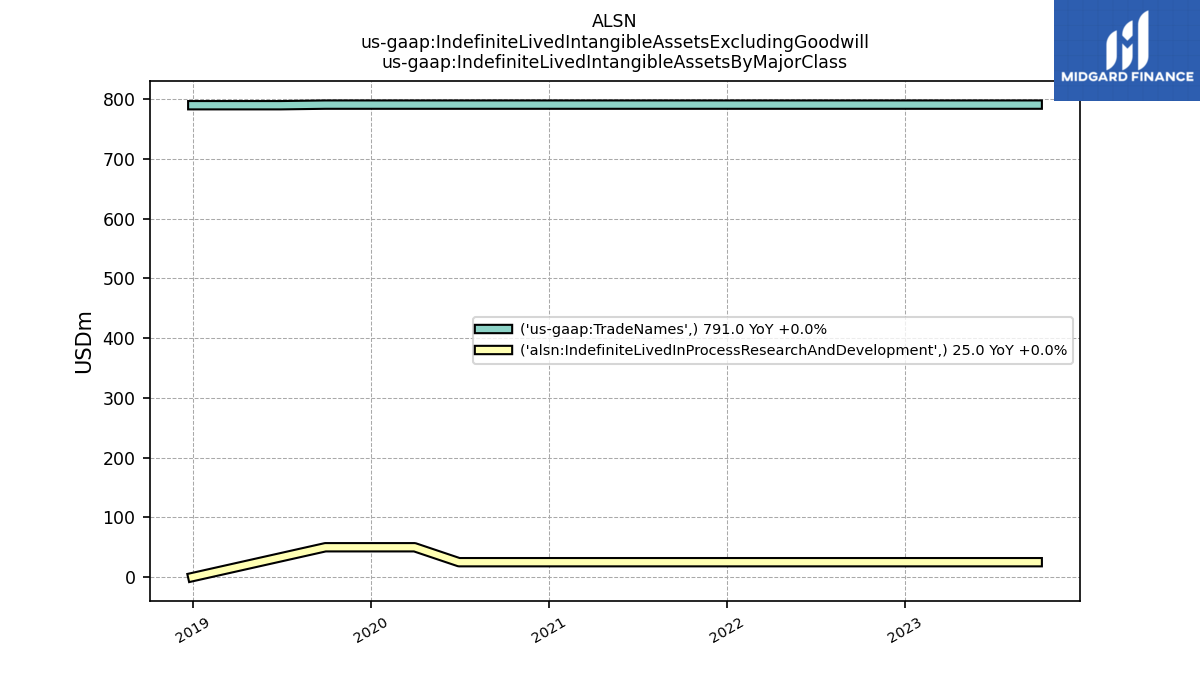
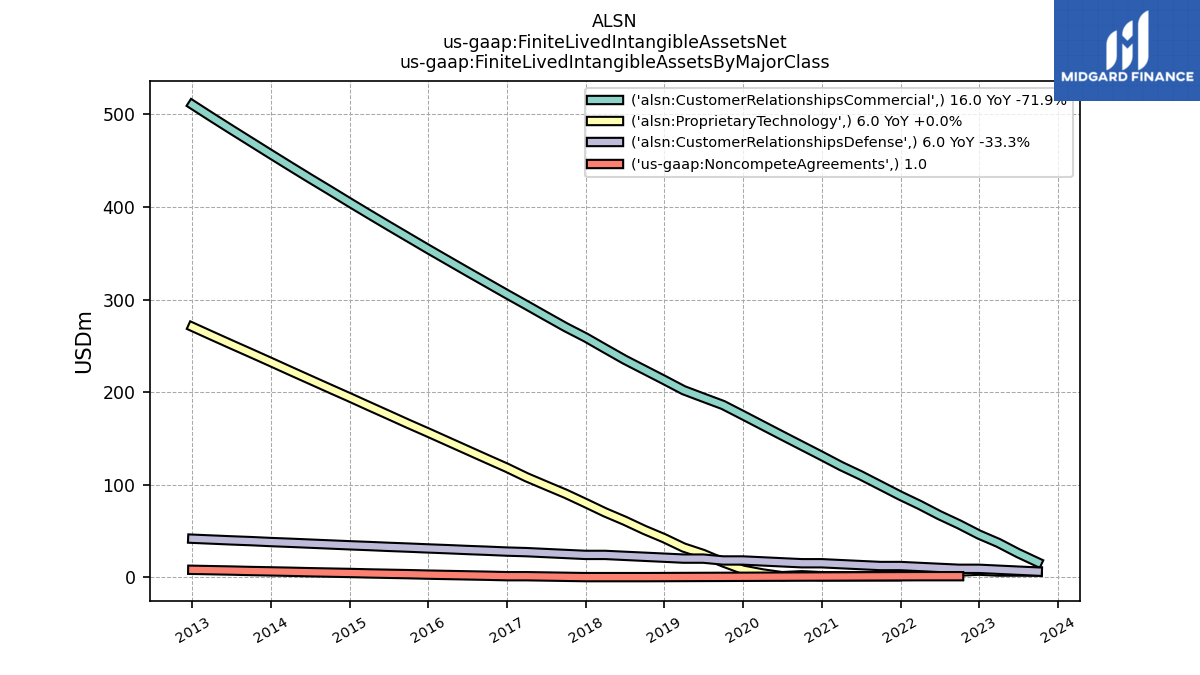
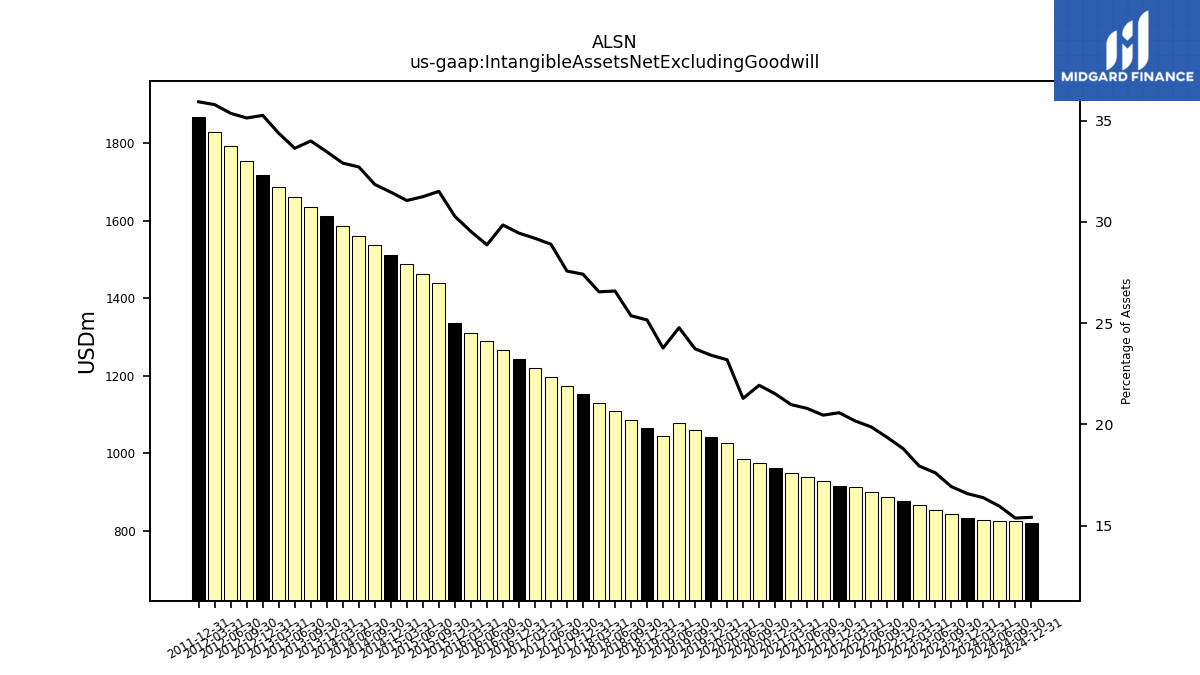
| Intangible Assets Net Excluding Goodwill | 844.00 | 855.00 | 867.00 | 878.00 | 889.00 | 901.00 | 913.00 | 917.00 | 928.00 | 940.00 | 951.00 | 963.00 | 975.00 | 986.00 | 1026.00 | 1042.00 | 1061.00 | 1079.00 | 1044.00 | 1066.00 | 1087.00 | 1109.00 | 1131.00 | 1153.00 | 1175.00 | 1197.00 | 1220.00 | 1242.40 | 1265.50 | 1288.50 | 1311.50 | 1334.80 | 1439.10 | 1463.40 | 1487.70 | 1512.00 | 1536.70 | 1561.40 | 1586.10 | 1610.80 | 1636.00 | 1661.10 | 1686.20 | 1716.10 | 1753.60 | 1791.10 | 1828.60 | 1866.10 | NA | NA | NA | |
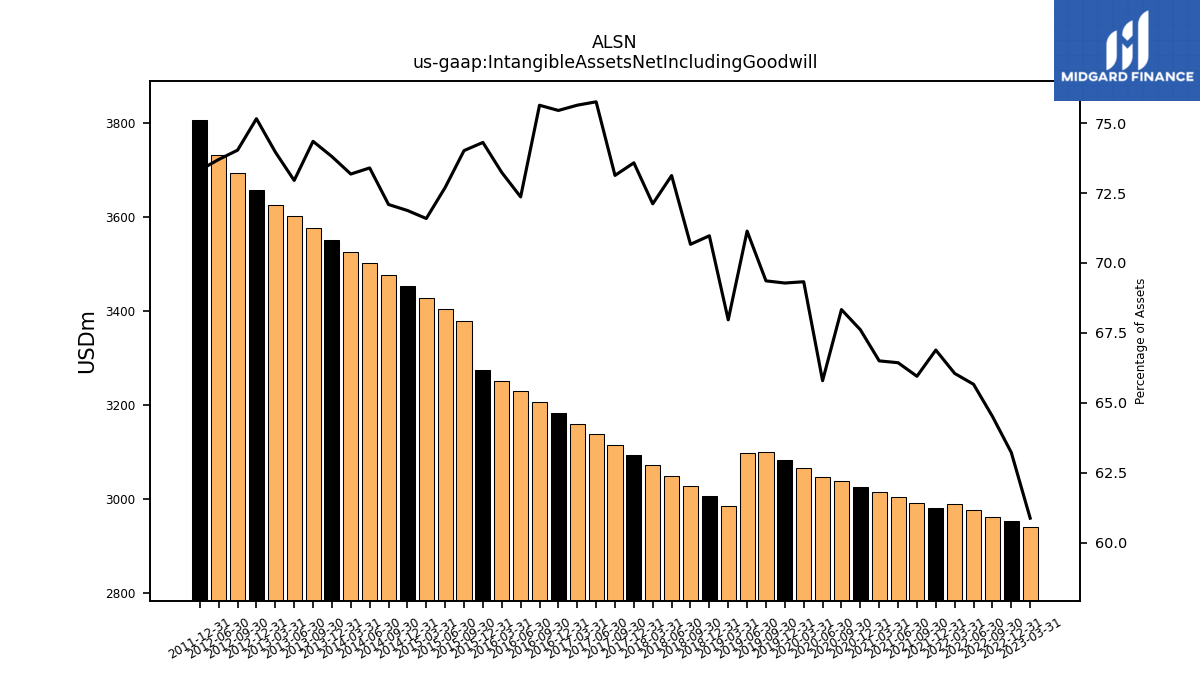
| Intangible Assets Net Including Goodwill | NA | NA | 2942.00 | 2953.00 | 2963.00 | 2977.00 | 2990.00 | 2981.00 | 2992.00 | 3004.00 | 3015.00 | 3027.00 | 3038.00 | 3048.00 | 3067.00 | 3083.00 | 3101.00 | 3098.00 | 2985.00 | 3007.00 | 3028.00 | 3050.00 | 3072.00 | 3094.00 | 3116.00 | 3138.00 | 3161.00 | 3183.00 | 3206.50 | 3229.50 | 3252.50 | 3275.80 | 3380.10 | 3404.40 | 3428.70 | 3453.00 | 3477.70 | 3502.40 | 3527.10 | 3551.80 | 3577.00 | 3602.10 | 3627.20 | 3657.10 | 3694.60 | 3732.10 | NA | 3807.10 | NA | NA | NA | |
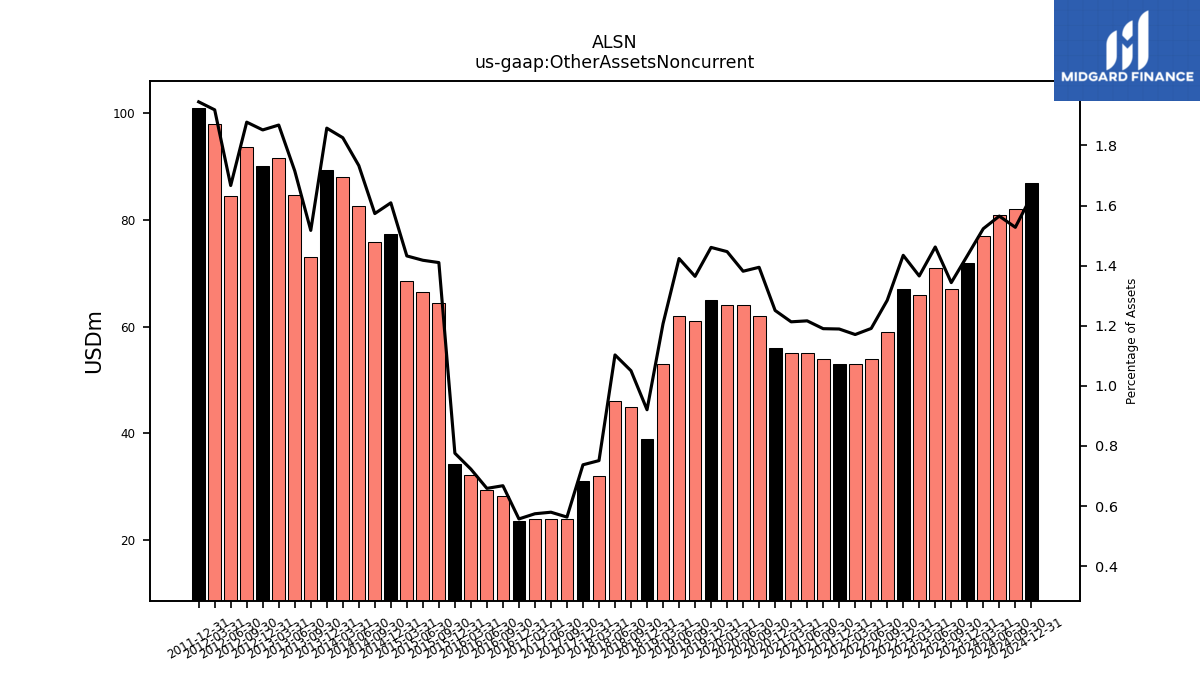
| Other Assets Noncurrent | 67.00 | 71.00 | 66.00 | 67.00 | 59.00 | 54.00 | 53.00 | 53.00 | 54.00 | 55.00 | 55.00 | 56.00 | 62.00 | 64.00 | 64.00 | 65.00 | 61.00 | 62.00 | 53.00 | 39.00 | 45.00 | 46.00 | 32.00 | 31.00 | 24.00 | 24.00 | 24.00 | 23.50 | 28.30 | 29.40 | 32.10 | 34.20 | 64.40 | 66.40 | 68.60 | 77.30 | 75.90 | 82.70 | 88.00 | 89.40 | 73.00 | 84.70 | 91.60 | 90.10 | 93.70 | 84.40 | 98.00 | 101.00 | NA | NA | NA |
| 2023-09-30 | 2023-06-30 | 2023-03-31 | 2022-12-31 | 2022-09-30 | 2022-06-30 | 2022-03-31 | 2021-12-31 | 2021-09-30 | 2021-06-30 | 2021-03-31 | 2020-12-31 | 2020-09-30 | 2020-06-30 | 2020-03-31 | 2019-12-31 | 2019-09-30 | 2019-06-30 | 2019-03-31 | 2018-12-31 | 2018-09-30 | 2018-06-30 | 2018-03-31 | 2017-12-31 | 2017-09-30 | 2017-06-30 | 2017-03-31 | 2016-12-31 | 2016-09-30 | 2016-06-30 | 2016-03-31 | 2015-12-31 | 2015-09-30 | 2015-06-30 | 2015-03-31 | 2014-12-31 | 2014-09-30 | 2014-06-30 | 2014-03-31 | 2013-12-31 | 2013-09-30 | 2013-06-30 | 2013-03-31 | 2012-12-31 | 2012-09-30 | 2012-06-30 | 2012-03-31 | 2011-12-31 | 2011-09-30 | 2011-06-30 | 2011-03-31 | ||
|---|---|---|---|---|---|---|---|---|---|---|---|---|---|---|---|---|---|---|---|---|---|---|---|---|---|---|---|---|---|---|---|---|---|---|---|---|---|---|---|---|---|---|---|---|---|---|---|---|---|---|---|---|
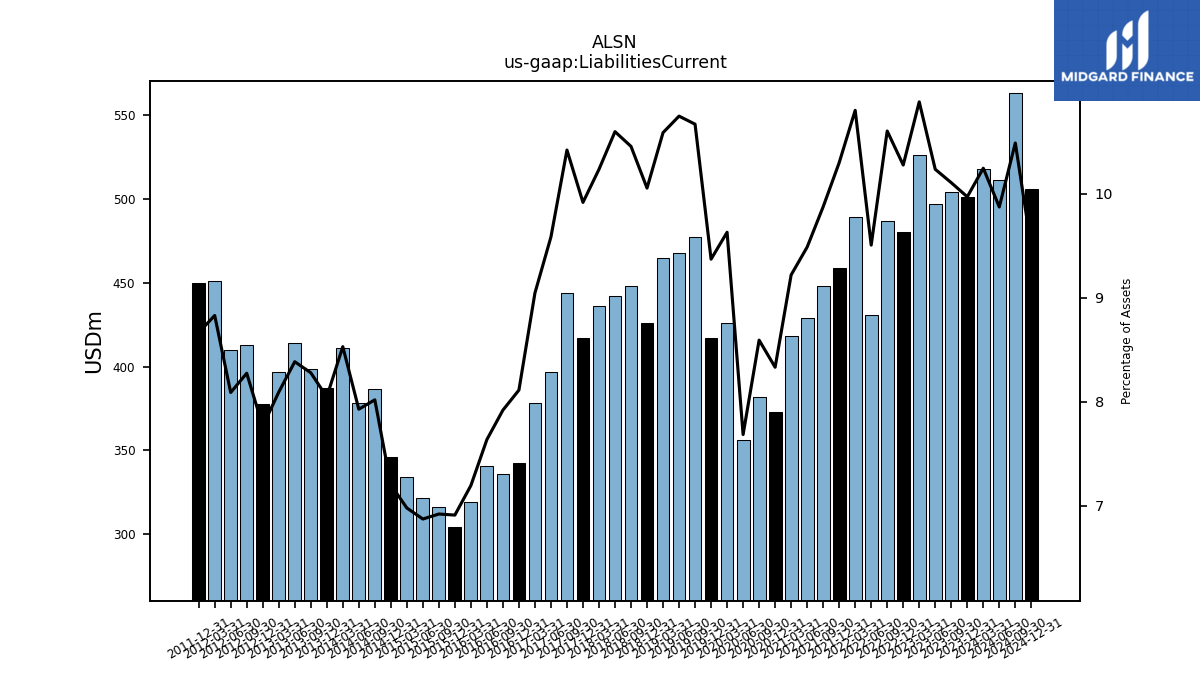
| Liabilities Current | 504.00 | 497.00 | 526.00 | 480.00 | 487.00 | 431.00 | 489.00 | 459.00 | 448.00 | 429.00 | 418.00 | 373.00 | 382.00 | 356.00 | 426.00 | 417.00 | 477.00 | 468.00 | 465.00 | 426.00 | 448.00 | 442.00 | 436.00 | 417.00 | 444.00 | 397.00 | 378.00 | 342.20 | 335.70 | 340.80 | 319.50 | 304.60 | 316.00 | 321.80 | 334.20 | 345.90 | 386.80 | 378.30 | 411.10 | 387.20 | 398.30 | 414.00 | 396.80 | 377.80 | 412.90 | 409.60 | 451.00 | 449.90 | NA | NA | NA | |
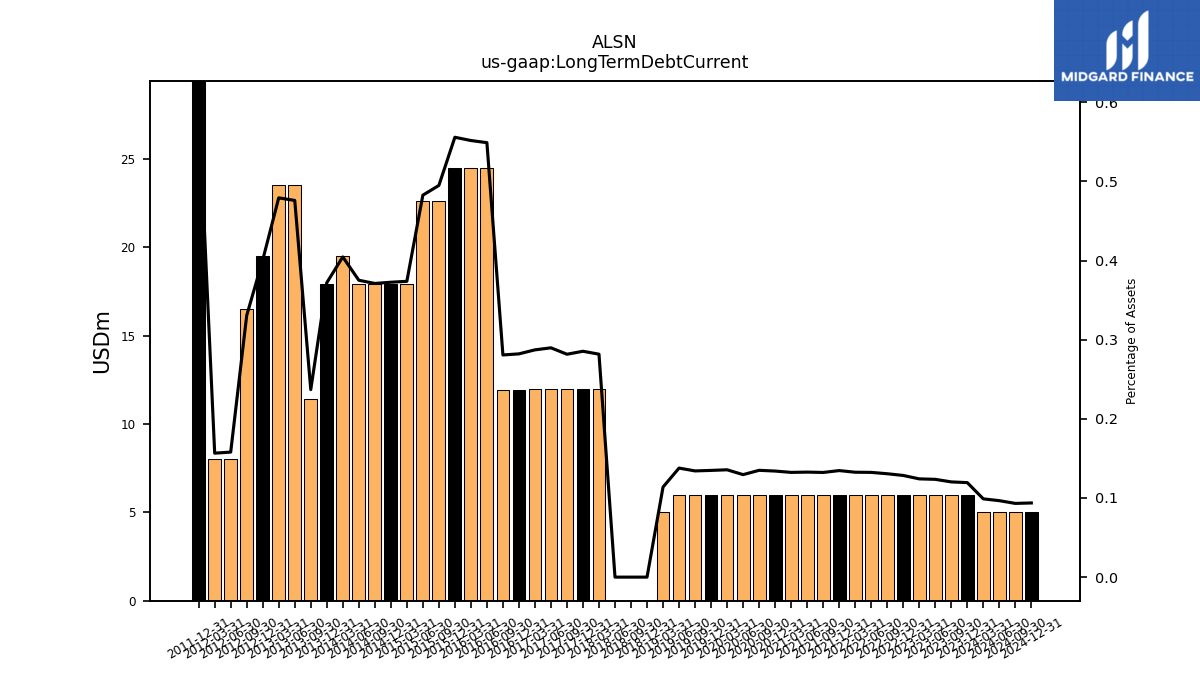
| Long Term Debt Current | 6.00 | 6.00 | 6.00 | 6.00 | 6.00 | 6.00 | 6.00 | 6.00 | 6.00 | 6.00 | 6.00 | 6.00 | 6.00 | 6.00 | 6.00 | 6.00 | 6.00 | 6.00 | 5.00 | 0.00 | 0.00 | 0.00 | 12.00 | 12.00 | 12.00 | 12.00 | 12.00 | 11.90 | 11.90 | 24.50 | 24.50 | 24.50 | 22.60 | 22.60 | 17.90 | 17.90 | 17.90 | 17.90 | 19.50 | 17.90 | 11.40 | 23.50 | 23.50 | 19.50 | 16.50 | 8.00 | 8.00 | 31.00 | NA | NA | NA | |
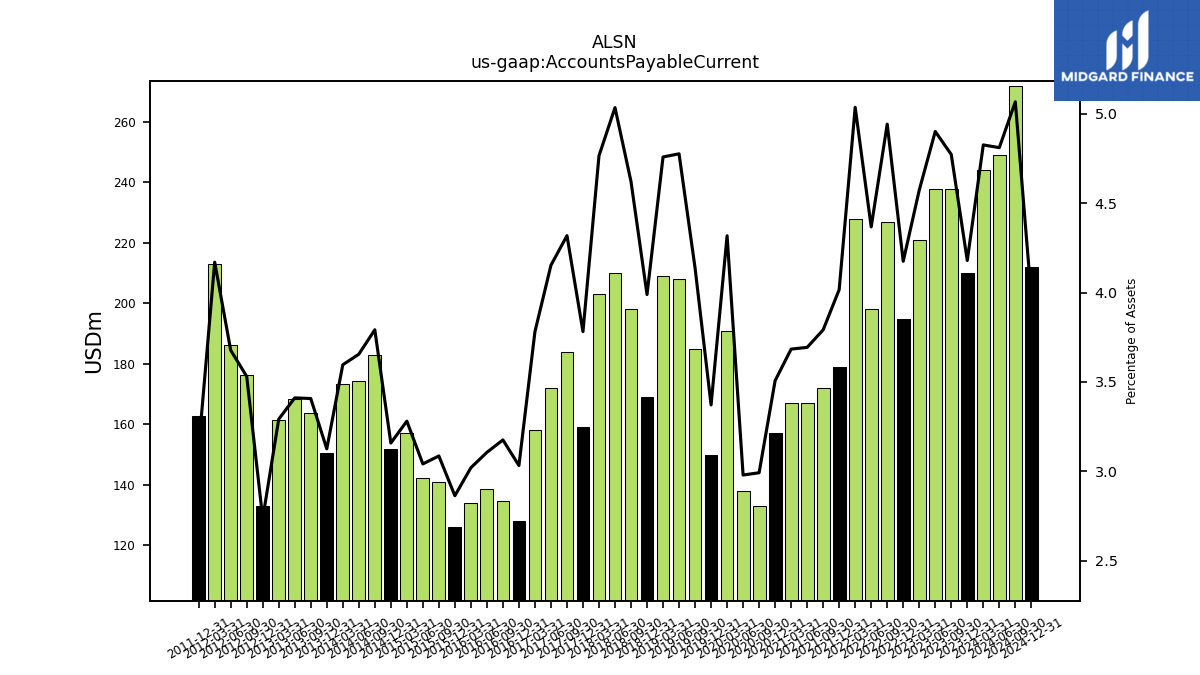
| Accounts Payable Current | 238.00 | 238.00 | 221.00 | 195.00 | 227.00 | 198.00 | 228.00 | 179.00 | 172.00 | 167.00 | 167.00 | 157.00 | 133.00 | 138.00 | 191.00 | 150.00 | 185.00 | 208.00 | 209.00 | 169.00 | 198.00 | 210.00 | 203.00 | 159.00 | 184.00 | 172.00 | 158.00 | 127.90 | 134.60 | 138.60 | 134.10 | 126.20 | 140.90 | 142.40 | 157.10 | 151.70 | 182.90 | 174.40 | 173.30 | 150.40 | 163.90 | 168.40 | 161.40 | 133.10 | 176.20 | 186.20 | 213.00 | 162.60 | NA | NA | NA | |
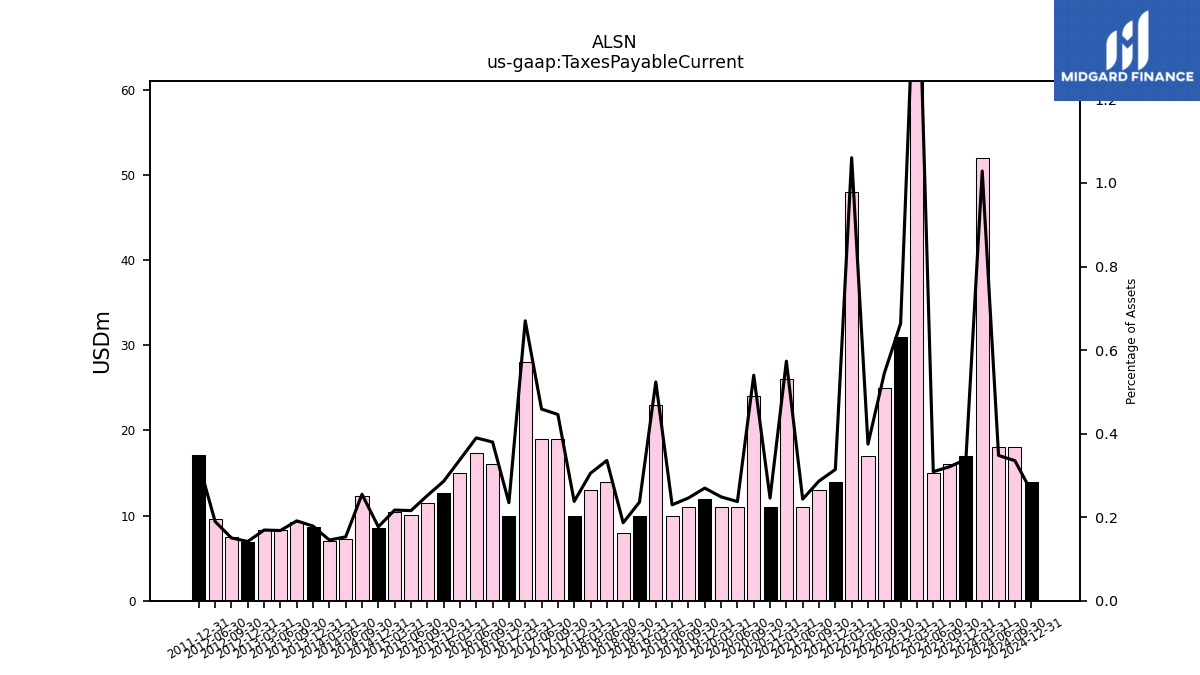
| Taxes Payable Current | 16.00 | 15.00 | 80.00 | 31.00 | 25.00 | 17.00 | 48.00 | 14.00 | 13.00 | 11.00 | 26.00 | 11.00 | 24.00 | 11.00 | 11.00 | 12.00 | 11.00 | 10.00 | 23.00 | 10.00 | 8.00 | 14.00 | 13.00 | 10.00 | 19.00 | 19.00 | 28.00 | 9.90 | 16.10 | 17.40 | 15.00 | 12.60 | 11.50 | 10.10 | 10.40 | 8.50 | 12.30 | 7.30 | 7.00 | 8.60 | 9.20 | 8.30 | 8.30 | 6.90 | 7.50 | 9.60 | NA | 17.10 | NA | NA | NA | |
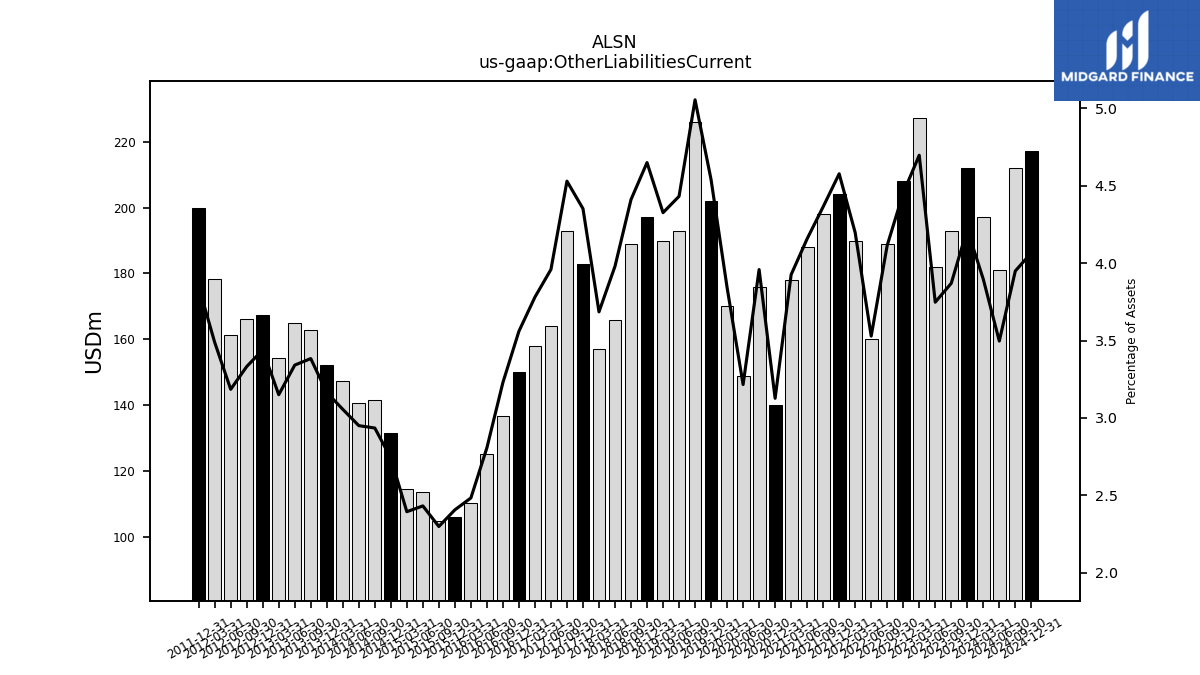
| Other Liabilities Current | 193.00 | 182.00 | 227.00 | 208.00 | 189.00 | 160.00 | 190.00 | 204.00 | 198.00 | 188.00 | 178.00 | 140.00 | 176.00 | 149.00 | 170.00 | 202.00 | 226.00 | 193.00 | 190.00 | 197.00 | 189.00 | 166.00 | 157.00 | 183.00 | 193.00 | 164.00 | 158.00 | 150.20 | 136.90 | 125.30 | 110.30 | 106.10 | 105.00 | 113.90 | 114.70 | 131.70 | 141.60 | 140.80 | 147.30 | 152.30 | 162.80 | 165.00 | 154.50 | 167.40 | 166.30 | 161.30 | 178.20 | 199.90 | NA | NA | NA | |
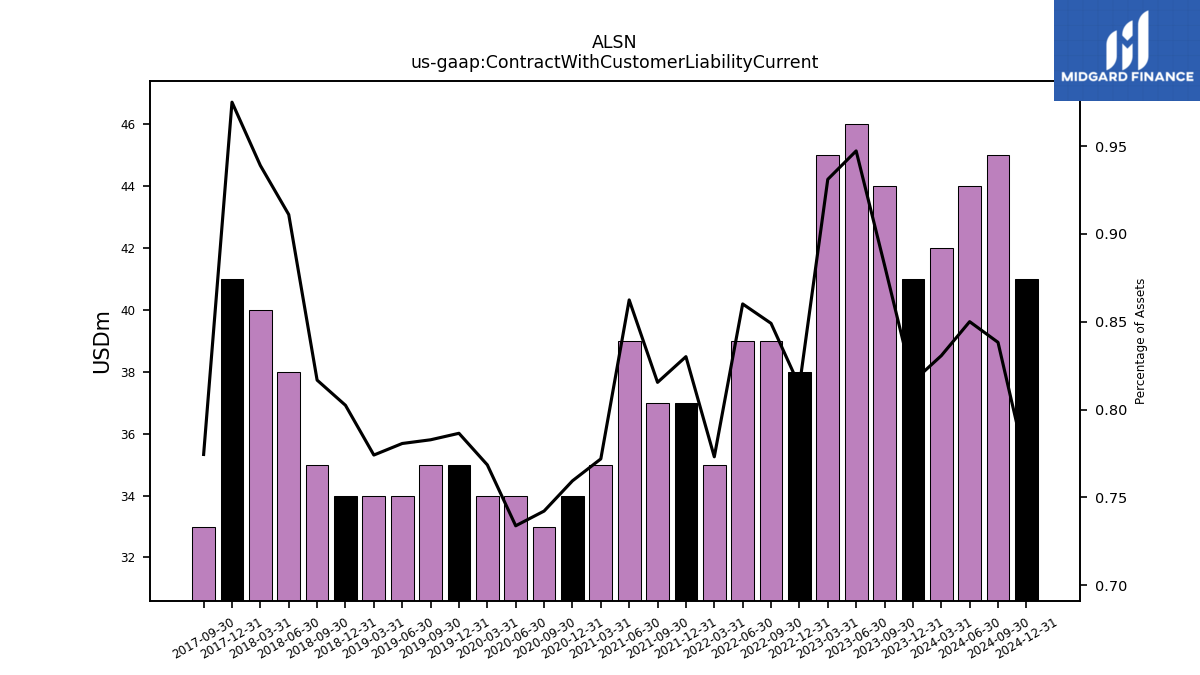
| Contract With Customer Liability Current | 44.00 | 46.00 | 45.00 | 38.00 | 39.00 | 39.00 | 35.00 | 37.00 | 37.00 | 39.00 | 35.00 | 34.00 | 33.00 | 34.00 | 34.00 | 35.00 | 35.00 | 34.00 | 34.00 | 34.00 | 35.00 | 38.00 | 40.00 | 41.00 | 33.00 | NA | NA | NA | NA | NA | NA | NA | NA | NA | NA | NA | NA | NA | NA | NA | NA | NA | NA | NA | NA | NA | NA | NA | NA | NA | NA |
| 2023-09-30 | 2023-06-30 | 2023-03-31 | 2022-12-31 | 2022-09-30 | 2022-06-30 | 2022-03-31 | 2021-12-31 | 2021-09-30 | 2021-06-30 | 2021-03-31 | 2020-12-31 | 2020-09-30 | 2020-06-30 | 2020-03-31 | 2019-12-31 | 2019-09-30 | 2019-06-30 | 2019-03-31 | 2018-12-31 | 2018-09-30 | 2018-06-30 | 2018-03-31 | 2017-12-31 | 2017-09-30 | 2017-06-30 | 2017-03-31 | 2016-12-31 | 2016-09-30 | 2016-06-30 | 2016-03-31 | 2015-12-31 | 2015-09-30 | 2015-06-30 | 2015-03-31 | 2014-12-31 | 2014-09-30 | 2014-06-30 | 2014-03-31 | 2013-12-31 | 2013-09-30 | 2013-06-30 | 2013-03-31 | 2012-12-31 | 2012-09-30 | 2012-06-30 | 2012-03-31 | 2011-12-31 | 2011-09-30 | 2011-06-30 | 2011-03-31 | ||
|---|---|---|---|---|---|---|---|---|---|---|---|---|---|---|---|---|---|---|---|---|---|---|---|---|---|---|---|---|---|---|---|---|---|---|---|---|---|---|---|---|---|---|---|---|---|---|---|---|---|---|---|---|
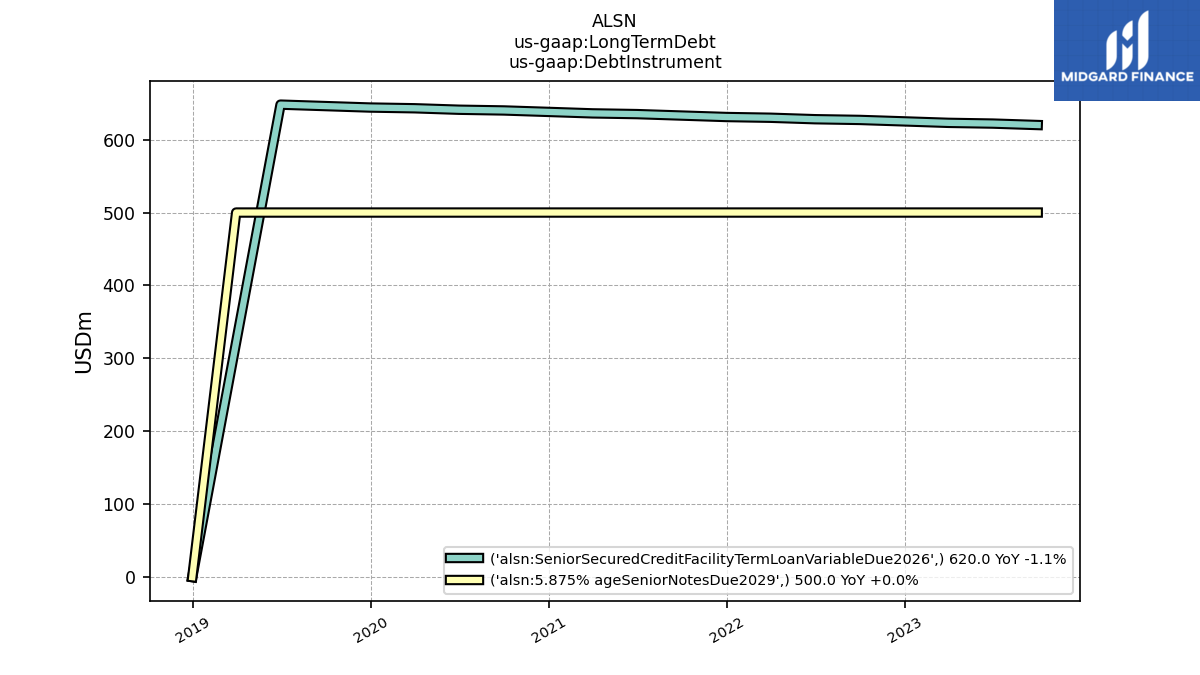
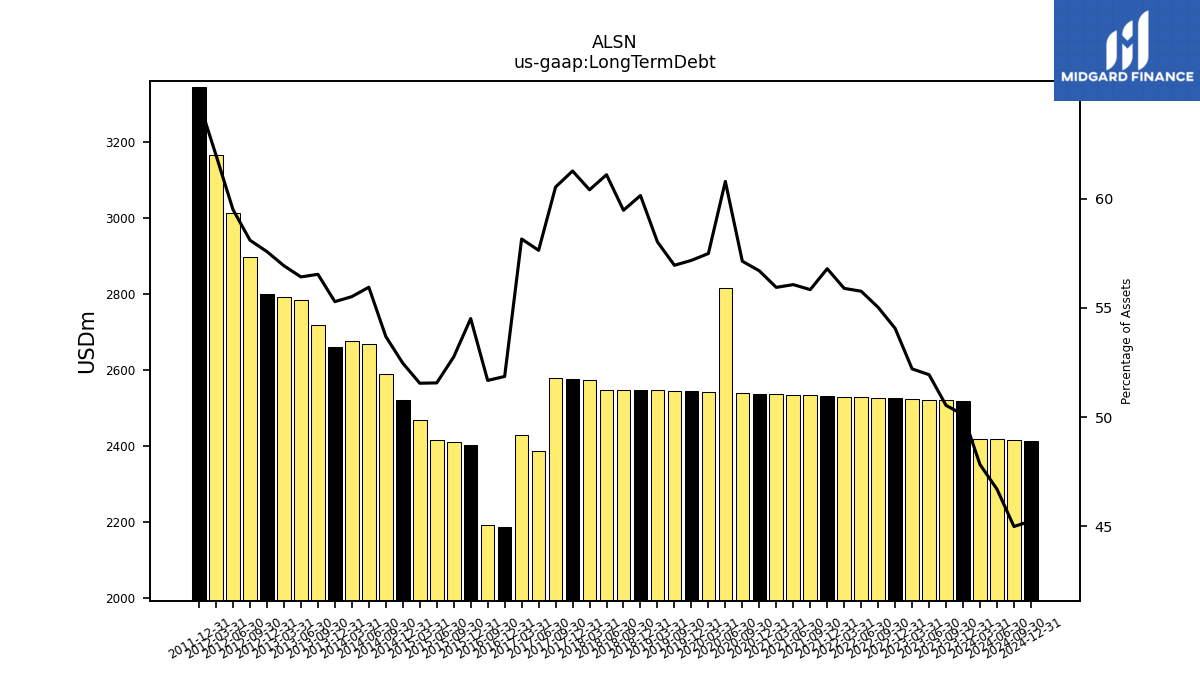
| Long Term Debt | 2520.00 | 2522.00 | 2523.00 | 2525.00 | 2527.00 | 2528.00 | 2530.00 | 2531.00 | 2533.00 | 2535.00 | 2536.00 | 2538.00 | 2540.00 | 2816.00 | 2543.00 | 2544.00 | 2546.00 | NA | 2548.00 | 2548.00 | 2548.00 | 2548.00 | 2573.00 | 2576.00 | 2579.00 | 2387.00 | 2430.00 | 2187.60 | 2190.60 | NA | NA | 2402.80 | 2409.00 | 2414.60 | 2468.80 | 2520.50 | 2589.90 | 2669.40 | 2675.50 | 2660.40 | 2719.80 | 2785.50 | 2791.40 | 2801.30 | 2899.10 | 3012.60 | 3166.00 | 3345.00 | NA | NA | NA | |
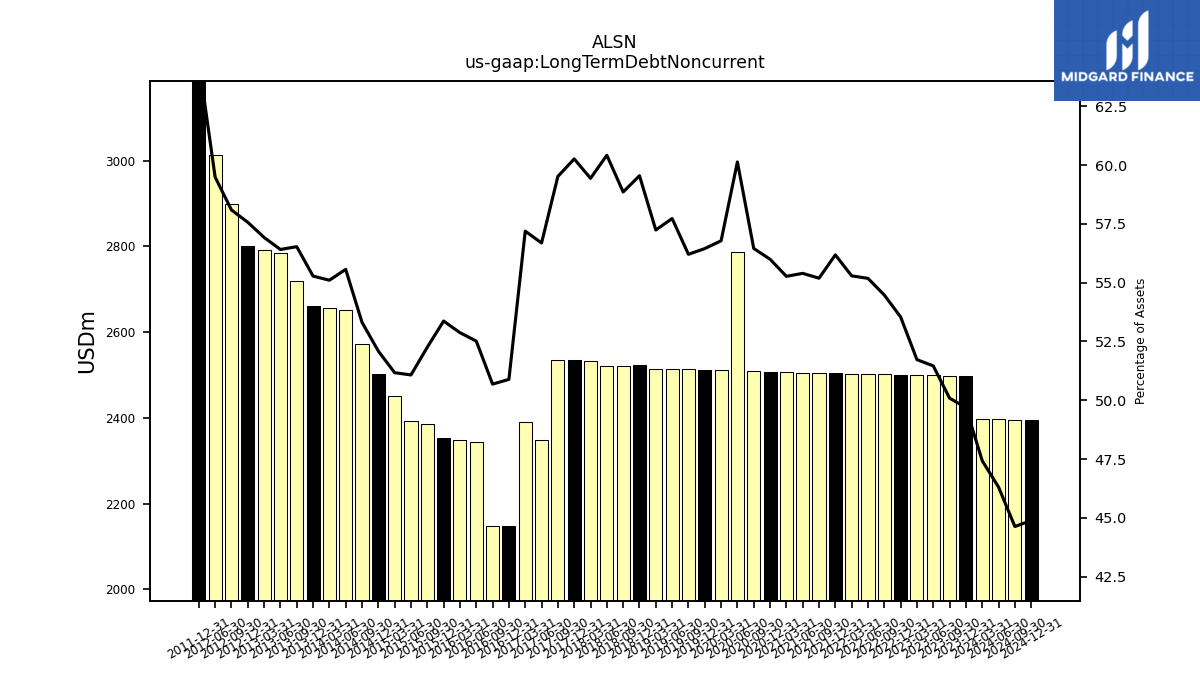
| Long Term Debt Noncurrent | 2498.00 | 2499.00 | 2500.00 | 2501.00 | 2502.00 | 2502.00 | 2503.00 | 2504.00 | 2504.00 | 2505.00 | 2506.00 | 2507.00 | 2510.00 | 2786.00 | 2512.00 | 2512.00 | 2513.00 | 2514.00 | 2514.00 | 2523.00 | 2522.00 | 2520.00 | 2532.00 | 2534.00 | 2536.00 | 2348.00 | 2390.00 | 2146.80 | 2148.80 | 2343.90 | 2348.30 | 2352.70 | 2386.40 | 2392.00 | 2450.90 | 2502.60 | 2572.00 | 2651.50 | 2656.00 | 2660.40 | 2719.80 | 2785.50 | 2791.40 | 2801.30 | 2899.10 | 3012.60 | NA | 3345.00 | NA | NA | NA | |
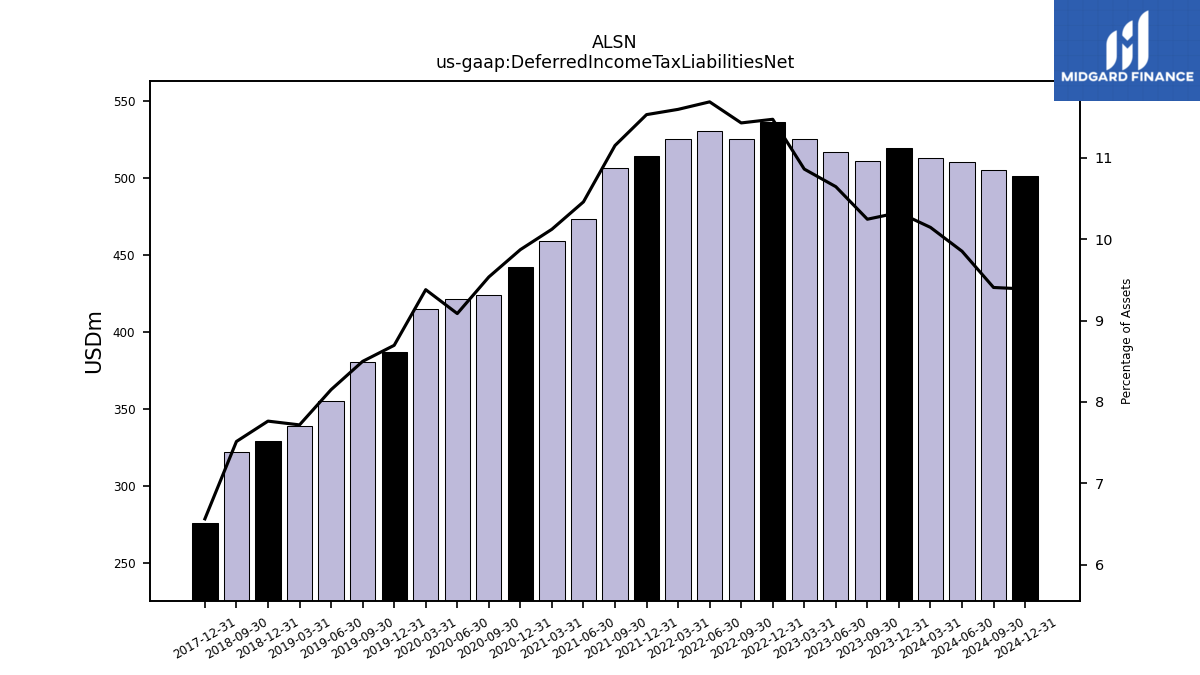
| Deferred Income Tax Liabilities Net | 511.00 | 517.00 | 525.00 | 536.00 | 525.00 | 530.00 | 525.00 | 514.00 | 506.00 | 473.00 | 459.00 | 442.00 | 424.00 | 421.00 | 415.00 | 387.00 | 380.00 | 355.00 | 339.00 | 329.00 | 322.00 | NA | NA | 276.00 | NA | NA | NA | NA | NA | NA | NA | NA | NA | NA | NA | NA | NA | NA | NA | NA | NA | NA | NA | NA | NA | NA | NA | NA | NA | NA | NA | |
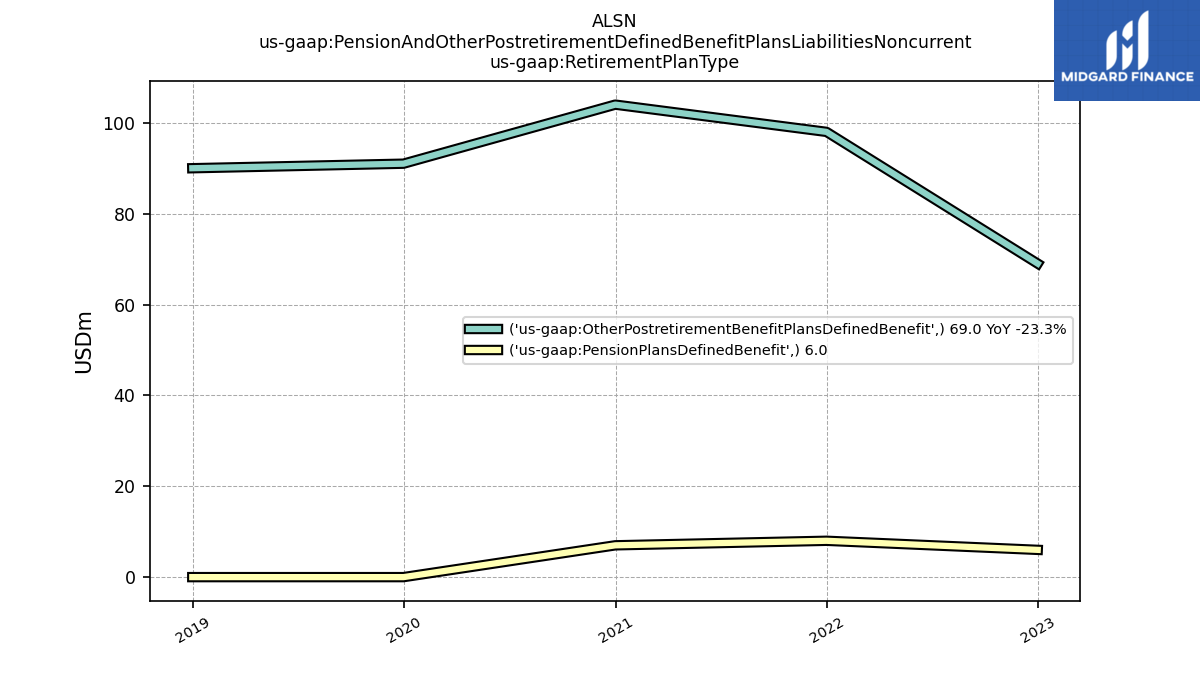
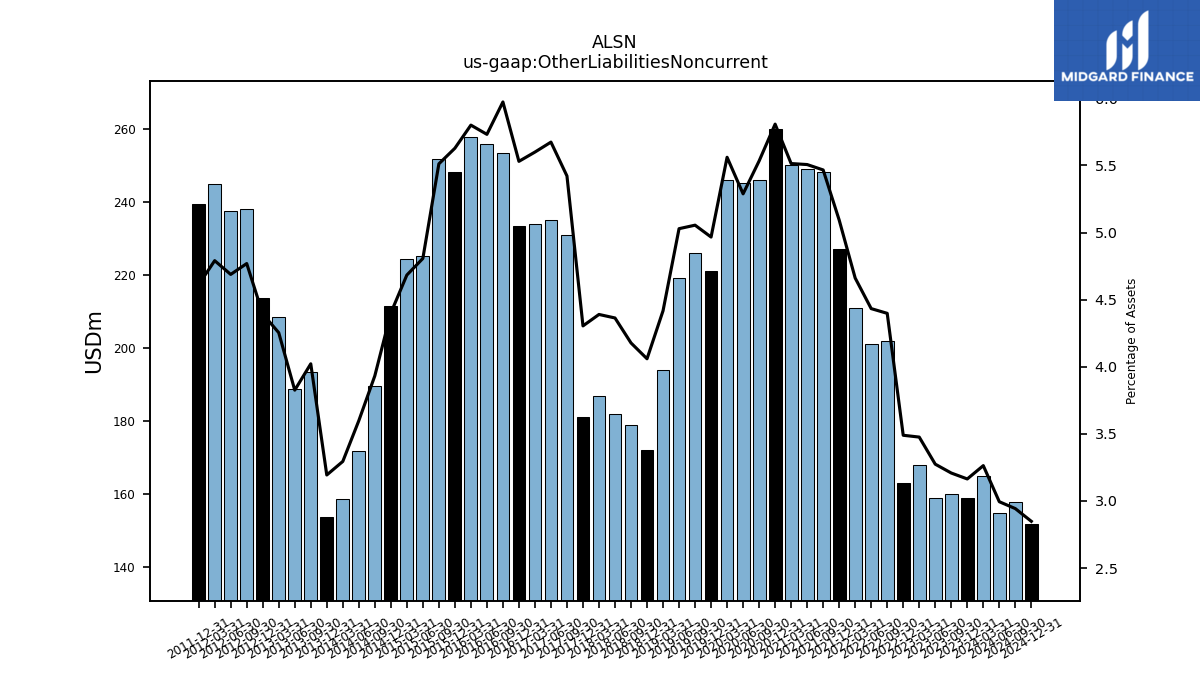
| Other Liabilities Noncurrent | 160.00 | 159.00 | 168.00 | 163.00 | 202.00 | 201.00 | 211.00 | 227.00 | 248.00 | 249.00 | 250.00 | 260.00 | 246.00 | 245.00 | 246.00 | 221.00 | 226.00 | 219.00 | 194.00 | 172.00 | 179.00 | 182.00 | 187.00 | 181.00 | 231.00 | 235.00 | 234.00 | 233.30 | 253.20 | 255.80 | 257.60 | 248.10 | 251.70 | 225.10 | 224.30 | 211.40 | 189.70 | 171.70 | 158.80 | 153.70 | 193.50 | 188.90 | 208.60 | 213.80 | 238.00 | 237.40 | 244.70 | 239.50 | NA | NA | NA | |
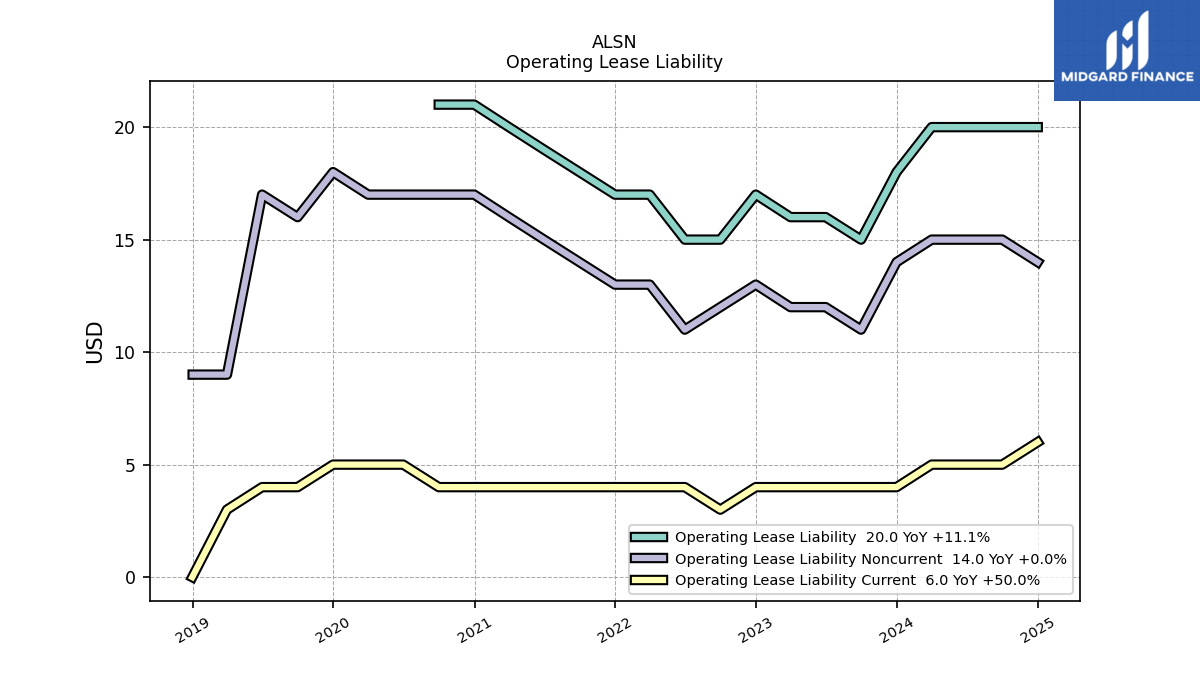
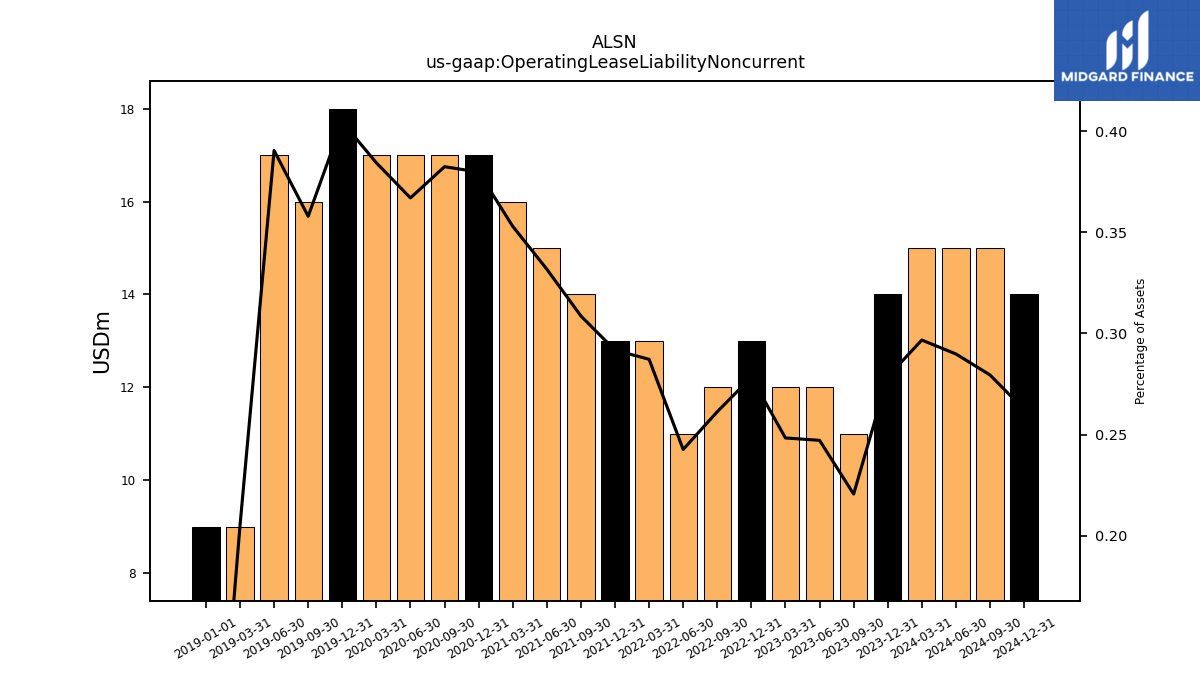
| Operating Lease Liability Noncurrent | 11.00 | 12.00 | 12.00 | 13.00 | 12.00 | 11.00 | 13.00 | 13.00 | 14.00 | 15.00 | 16.00 | 17.00 | 17.00 | 17.00 | 17.00 | 18.00 | 16.00 | 17.00 | 9.00 | NA | NA | NA | NA | NA | NA | NA | NA | NA | NA | NA | NA | NA | NA | NA | NA | NA | NA | NA | NA | NA | NA | NA | NA | NA | NA | NA | NA | NA | NA | NA | NA |
| 2023-09-30 | 2023-06-30 | 2023-03-31 | 2022-12-31 | 2022-09-30 | 2022-06-30 | 2022-03-31 | 2021-12-31 | 2021-09-30 | 2021-06-30 | 2021-03-31 | 2020-12-31 | 2020-09-30 | 2020-06-30 | 2020-03-31 | 2019-12-31 | 2019-09-30 | 2019-06-30 | 2019-03-31 | 2018-12-31 | 2018-09-30 | 2018-06-30 | 2018-03-31 | 2017-12-31 | 2017-09-30 | 2017-06-30 | 2017-03-31 | 2016-12-31 | 2016-09-30 | 2016-06-30 | 2016-03-31 | 2015-12-31 | 2015-09-30 | 2015-06-30 | 2015-03-31 | 2014-12-31 | 2014-09-30 | 2014-06-30 | 2014-03-31 | 2013-12-31 | 2013-09-30 | 2013-06-30 | 2013-03-31 | 2012-12-31 | 2012-09-30 | 2012-06-30 | 2012-03-31 | 2011-12-31 | 2011-09-30 | 2011-06-30 | 2011-03-31 | ||
|---|---|---|---|---|---|---|---|---|---|---|---|---|---|---|---|---|---|---|---|---|---|---|---|---|---|---|---|---|---|---|---|---|---|---|---|---|---|---|---|---|---|---|---|---|---|---|---|---|---|---|---|---|
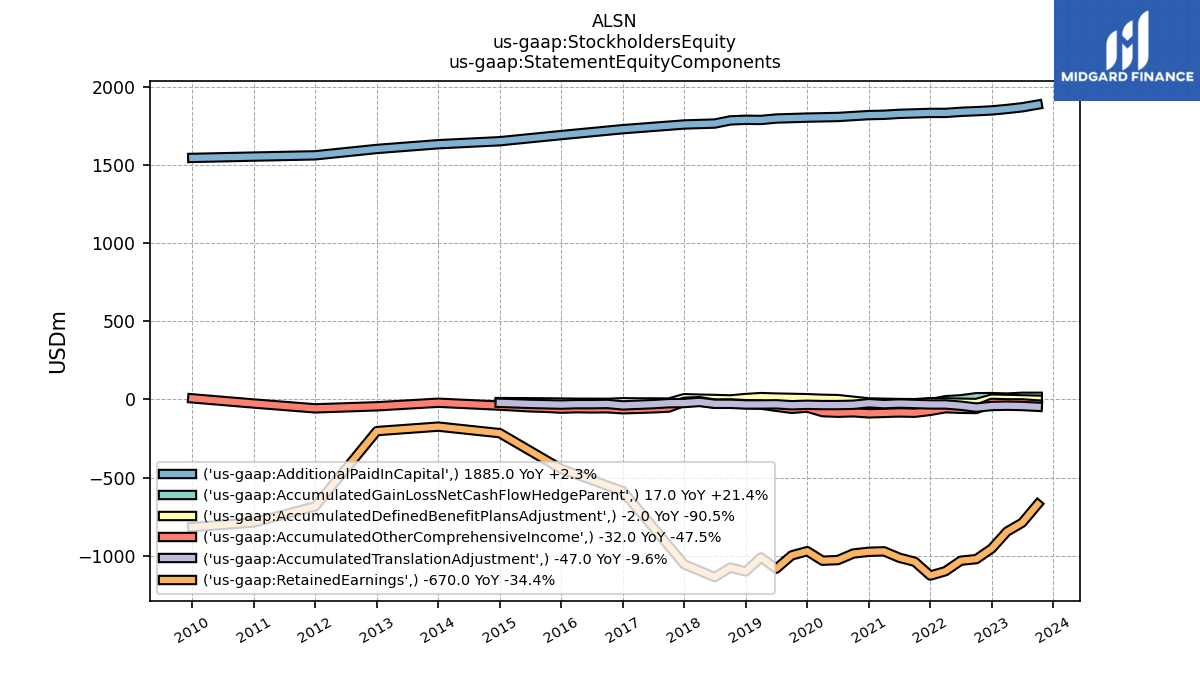
| Stockholders Equity | 1184.00 | 1056.00 | 988.00 | 874.00 | 762.00 | 749.00 | 679.00 | 634.00 | 707.00 | 732.00 | 764.00 | 756.00 | 746.00 | 695.00 | 693.00 | 781.00 | 743.00 | 668.00 | 746.00 | 659.00 | 684.00 | 602.00 | 706.00 | 689.00 | 555.00 | 696.00 | 737.00 | 1080.30 | 1116.70 | 1162.70 | 1182.80 | 1188.60 | 1214.50 | 1365.60 | 1419.00 | 1397.80 | 1353.50 | 1294.00 | 1393.80 | 1438.80 | 1367.80 | 1429.00 | 1394.80 | 1356.90 | 1324.20 | 1283.80 | 888.30 | 821.70 | NA | NA | NA | |
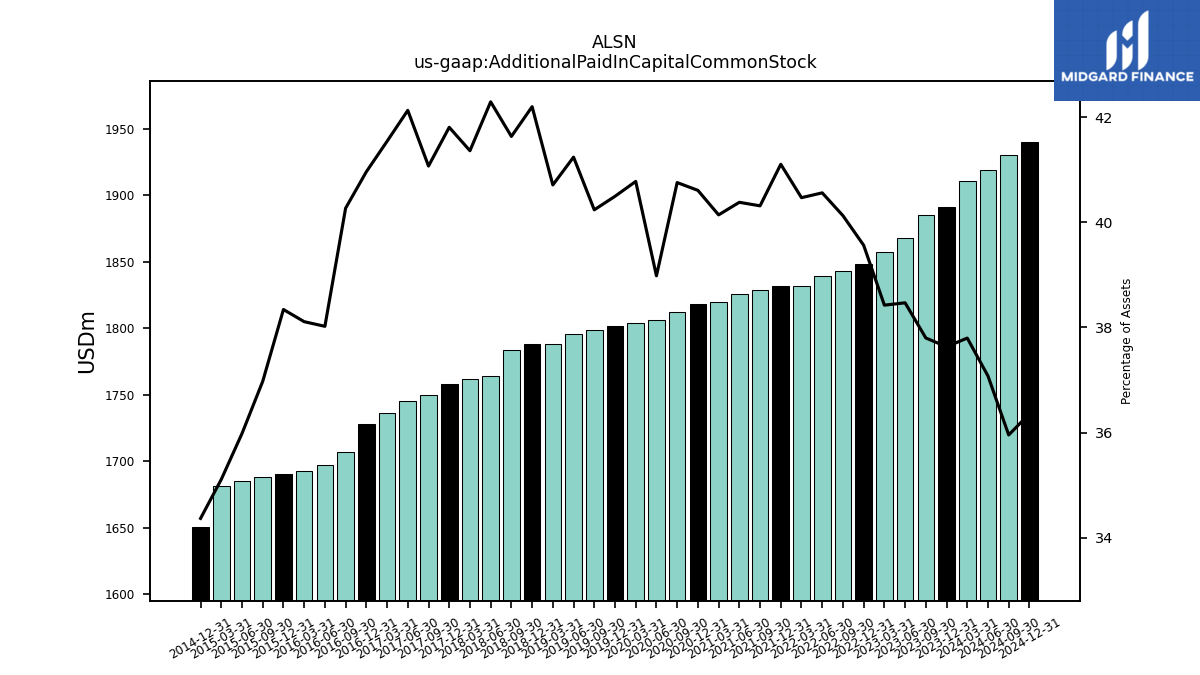
| Additional Paid In Capital Common Stock | 1885.00 | 1868.00 | 1857.00 | 1848.00 | 1843.00 | 1839.00 | 1832.00 | 1832.00 | 1829.00 | 1826.00 | 1820.00 | 1818.00 | 1812.00 | 1806.00 | 1804.00 | 1802.00 | 1799.00 | 1796.00 | 1788.00 | 1788.00 | 1784.00 | 1764.00 | 1762.00 | 1758.00 | 1750.00 | 1745.00 | 1736.00 | 1728.00 | 1707.10 | 1696.90 | 1692.50 | 1690.20 | 1688.50 | 1685.00 | 1681.50 | 1651.00 | NA | NA | NA | NA | NA | NA | NA | NA | NA | NA | NA | NA | NA | NA | NA | |
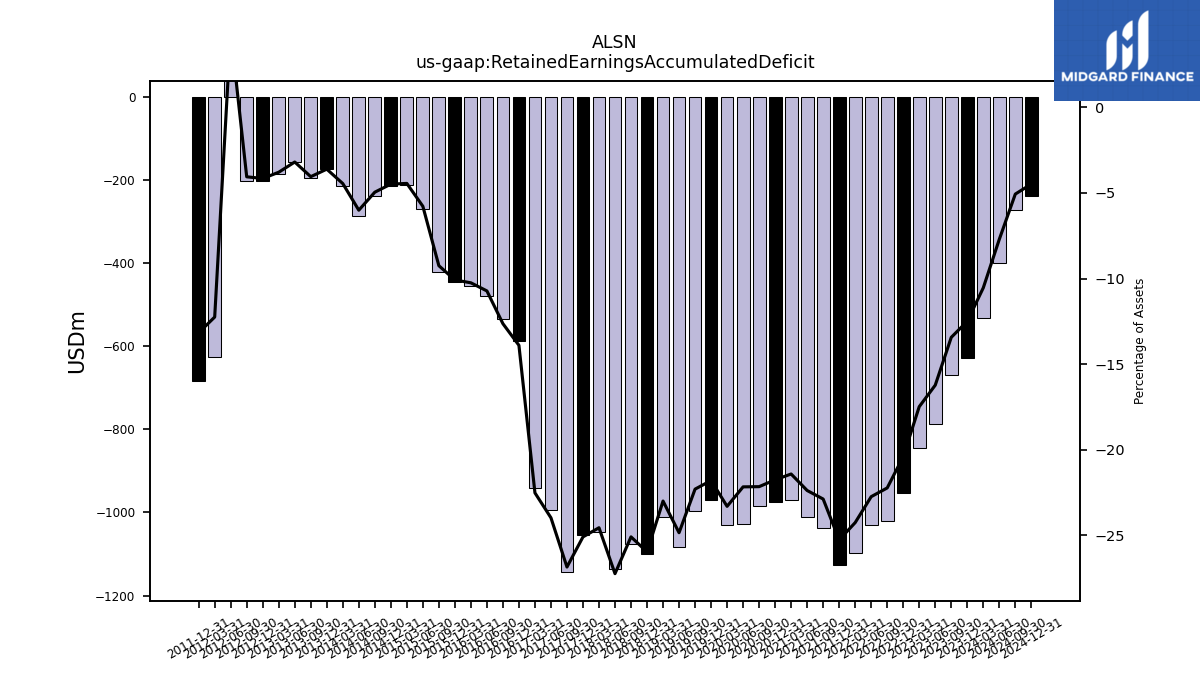
| Retained Earnings Accumulated Deficit | -670.00 | -788.00 | -845.00 | -953.00 | -1021.00 | -1031.00 | -1098.00 | -1126.00 | -1038.00 | -1012.00 | -971.00 | -974.00 | -985.00 | -1027.00 | -1031.00 | -970.00 | -997.00 | -1082.00 | -1010.00 | -1100.00 | -1075.00 | -1136.00 | -1046.00 | -1055.00 | -1144.00 | -993.00 | -941.00 | -586.40 | -535.70 | -478.60 | -455.20 | -444.50 | -422.40 | -270.70 | -212.90 | -215.50 | -239.10 | -286.70 | -214.60 | -173.80 | -194.90 | -157.70 | -185.90 | -202.30 | -202.50 | 223.80 | -625.70 | -683.70 | NA | NA | NA | |
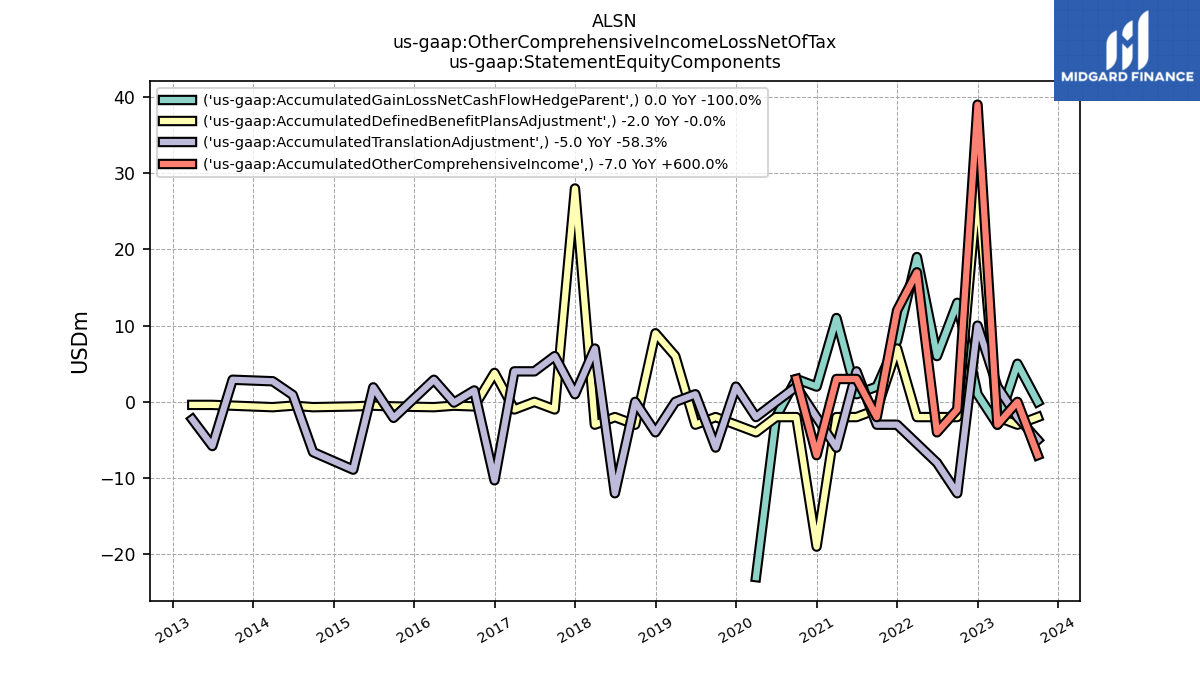
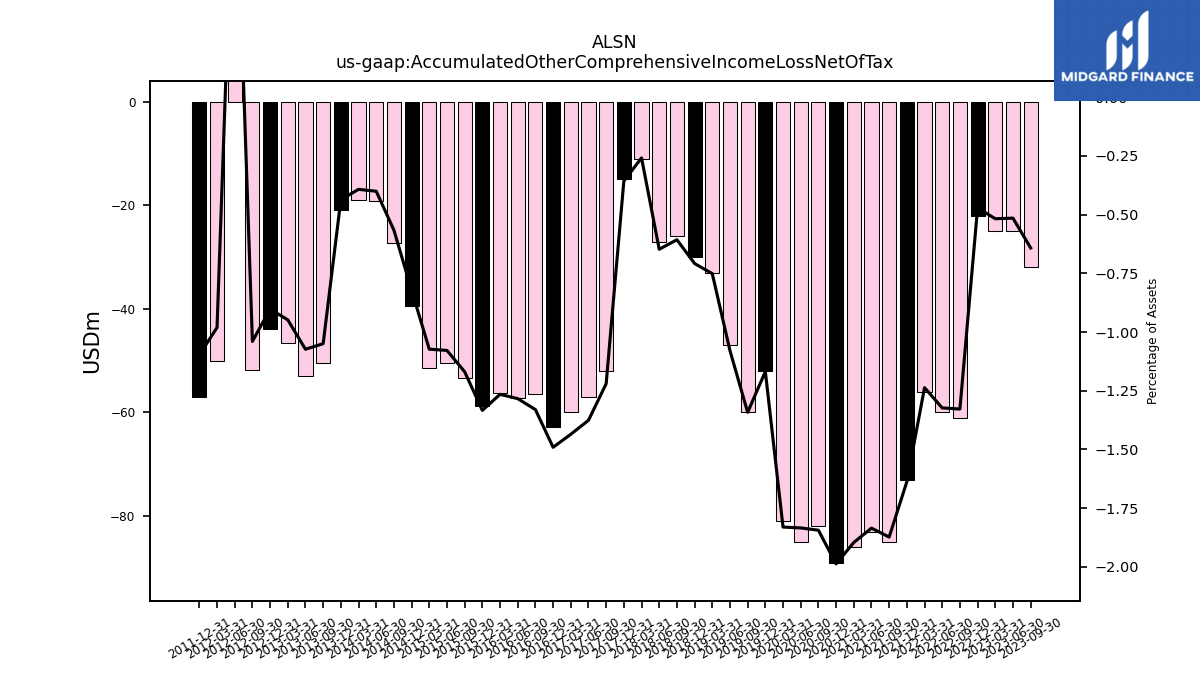
| Accumulated Other Comprehensive Income Loss Net Of Tax | -32.00 | -25.00 | -25.00 | -22.00 | -61.00 | -60.00 | -56.00 | -73.00 | -85.00 | -83.00 | -86.00 | -89.00 | -82.00 | -85.00 | -81.00 | -52.00 | -60.00 | -47.00 | -33.00 | -30.00 | -26.00 | -27.00 | -11.00 | -15.00 | -52.00 | -57.00 | -60.00 | -62.90 | -56.40 | -57.30 | -56.20 | -58.80 | -53.40 | -50.50 | -51.40 | -39.50 | -27.30 | -19.10 | -18.90 | -21.00 | -50.50 | -53.00 | -46.50 | -43.90 | -51.90 | 58.30 | -50.10 | -57.00 | NA | NA | NA | |
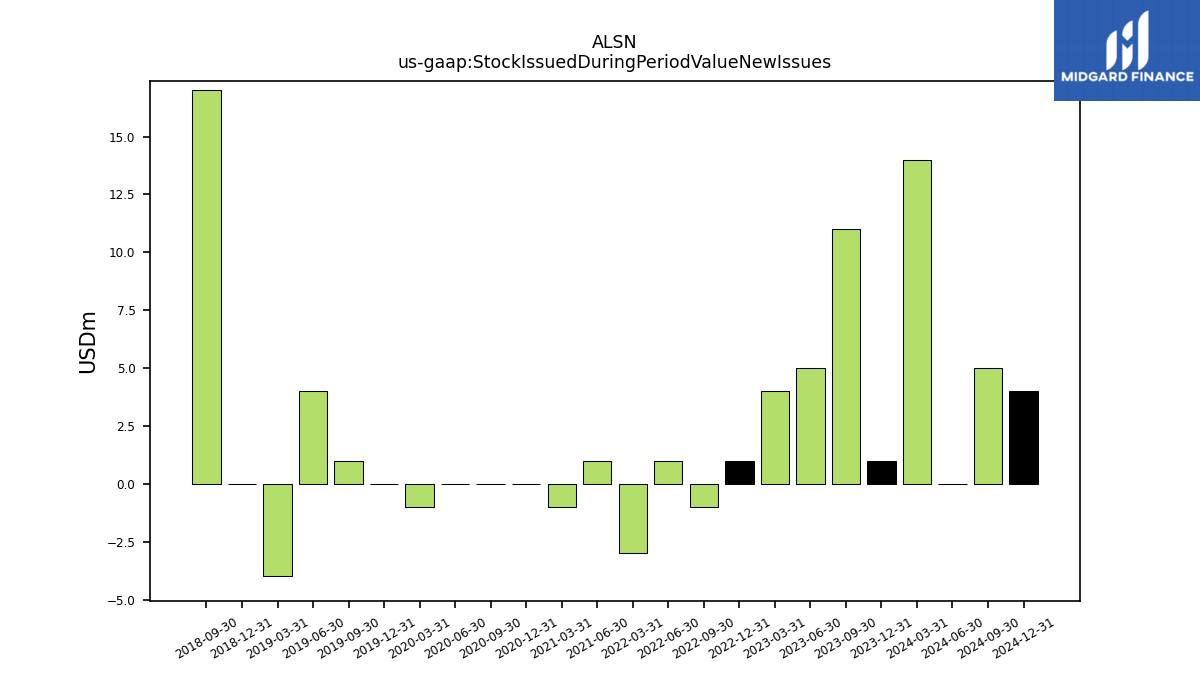
| Stock Issued During Period Value New Issues | 11.00 | 5.00 | 4.00 | 1.00 | -1.00 | 1.00 | -3.00 | NA | NA | 1.00 | -1.00 | 0.00 | 0.00 | 0.00 | -1.00 | 0.00 | 1.00 | 4.00 | -4.00 | 0.00 | 17.00 | NA | NA | NA | NA | NA | NA | NA | NA | NA | NA | NA | NA | NA | NA | NA | NA | NA | NA | NA | NA | NA | NA | NA | NA | NA | NA | NA | NA | NA | NA | |
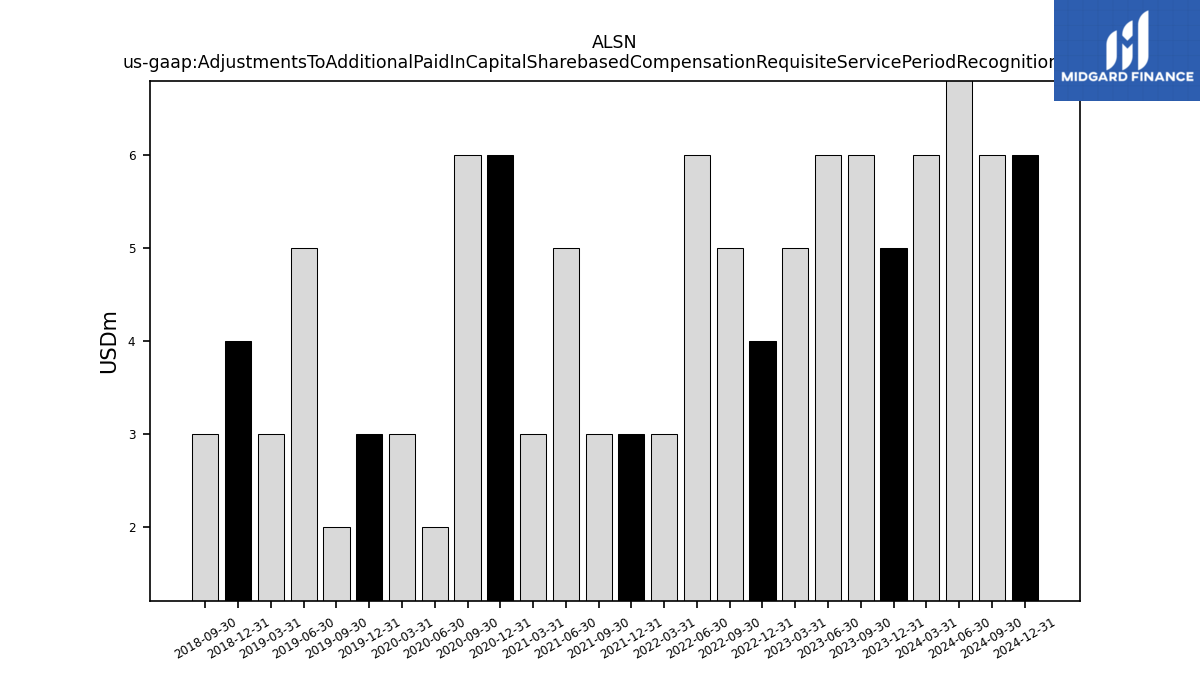
| Adjustments To Additional Paid In Capital Sharebased Compensation Requisite Service Period Recognition Value | 6.00 | 6.00 | 5.00 | 4.00 | 5.00 | 6.00 | 3.00 | 3.00 | 3.00 | 5.00 | 3.00 | 6.00 | 6.00 | 2.00 | 3.00 | 3.00 | 2.00 | 5.00 | 3.00 | 4.00 | 3.00 | NA | NA | NA | NA | NA | NA | NA | NA | NA | NA | NA | NA | NA | NA | NA | NA | NA | NA | NA | NA | NA | NA | NA | NA | NA | NA | NA | NA | NA | NA |
| 2023-09-30 | 2023-06-30 | 2023-03-31 | 2022-12-31 | 2022-09-30 | 2022-06-30 | 2022-03-31 | 2021-12-31 | 2021-09-30 | 2021-06-30 | 2021-03-31 | 2020-12-31 | 2020-09-30 | 2020-06-30 | 2020-03-31 | 2019-12-31 | 2019-09-30 | 2019-06-30 | 2019-03-31 | 2018-12-31 | 2018-09-30 | 2018-06-30 | 2018-03-31 | 2017-12-31 | 2017-09-30 | 2017-06-30 | 2017-03-31 | 2016-12-31 | 2016-09-30 | 2016-06-30 | 2016-03-31 | 2015-12-31 | 2015-09-30 | 2015-06-30 | 2015-03-31 | 2014-12-31 | 2014-09-30 | 2014-06-30 | 2014-03-31 | 2013-12-31 | 2013-09-30 | 2013-06-30 | 2013-03-31 | 2012-12-31 | 2012-09-30 | 2012-06-30 | 2012-03-31 | 2011-12-31 | 2011-09-30 | 2011-06-30 | 2011-03-31 | ||
|---|---|---|---|---|---|---|---|---|---|---|---|---|---|---|---|---|---|---|---|---|---|---|---|---|---|---|---|---|---|---|---|---|---|---|---|---|---|---|---|---|---|---|---|---|---|---|---|---|---|---|---|---|
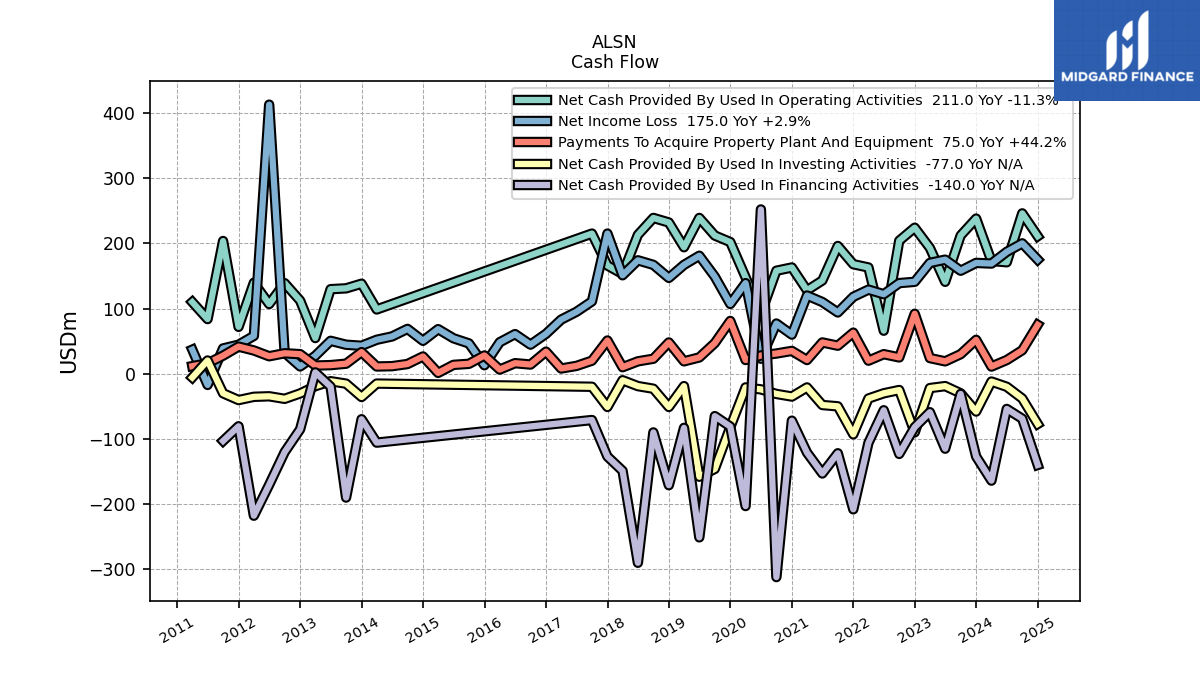
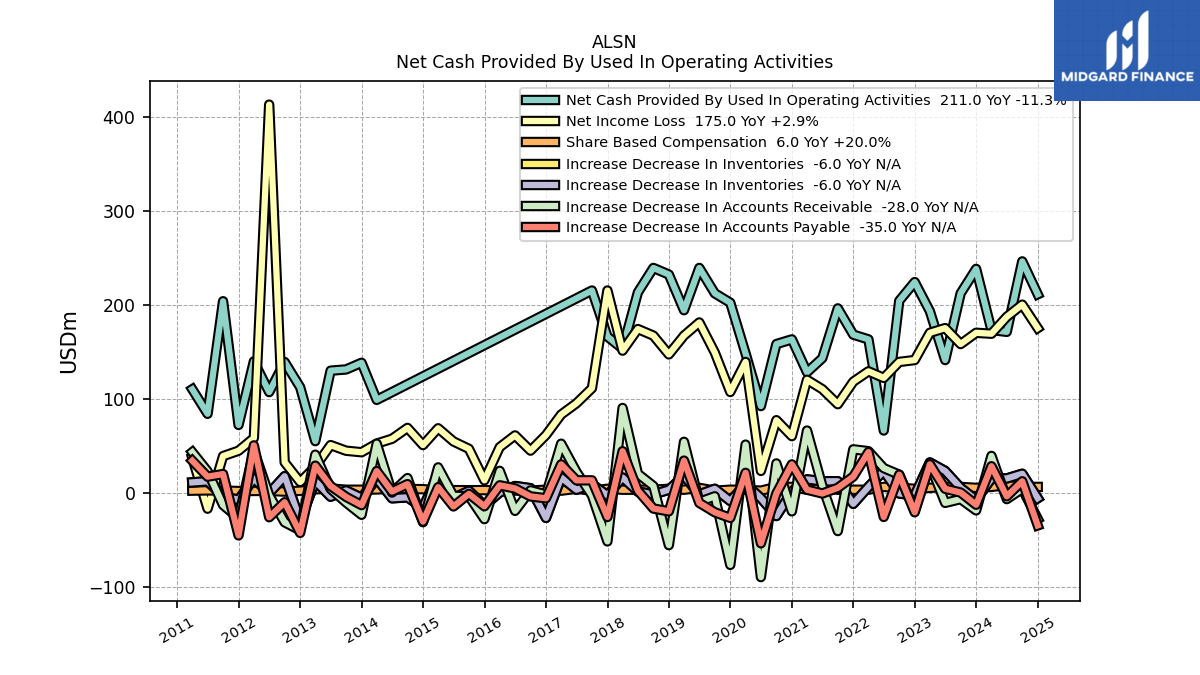
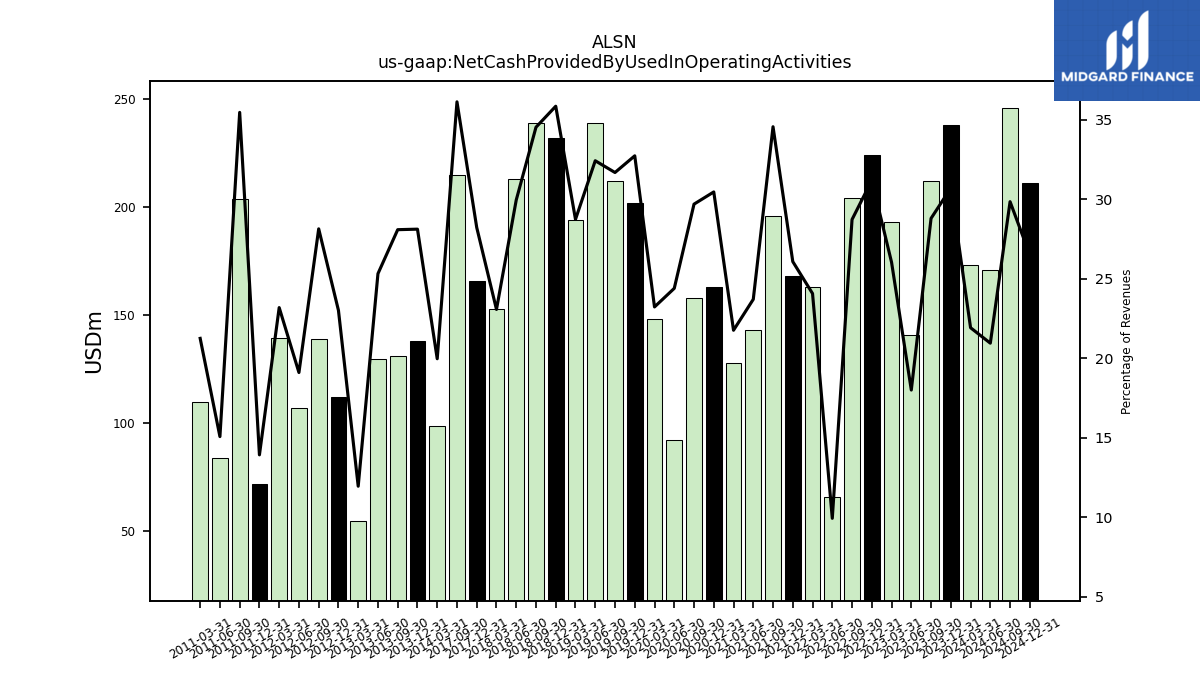
| Net Cash Provided By Used In Operating Activities | 212.00 | 141.00 | 193.00 | 224.00 | 204.00 | 66.00 | 163.00 | 168.00 | 196.00 | 143.00 | 128.00 | 163.00 | 158.00 | 92.00 | 148.00 | 202.00 | 212.00 | 239.00 | 194.00 | 232.00 | 239.00 | 213.00 | 153.00 | 166.00 | 215.00 | NA | NA | NA | NA | NA | NA | NA | NA | NA | NA | NA | NA | NA | 98.60 | 138.10 | 131.00 | 129.70 | 54.70 | 112.10 | 138.90 | 106.90 | 139.60 | 71.90 | 203.60 | 83.80 | 109.90 | |
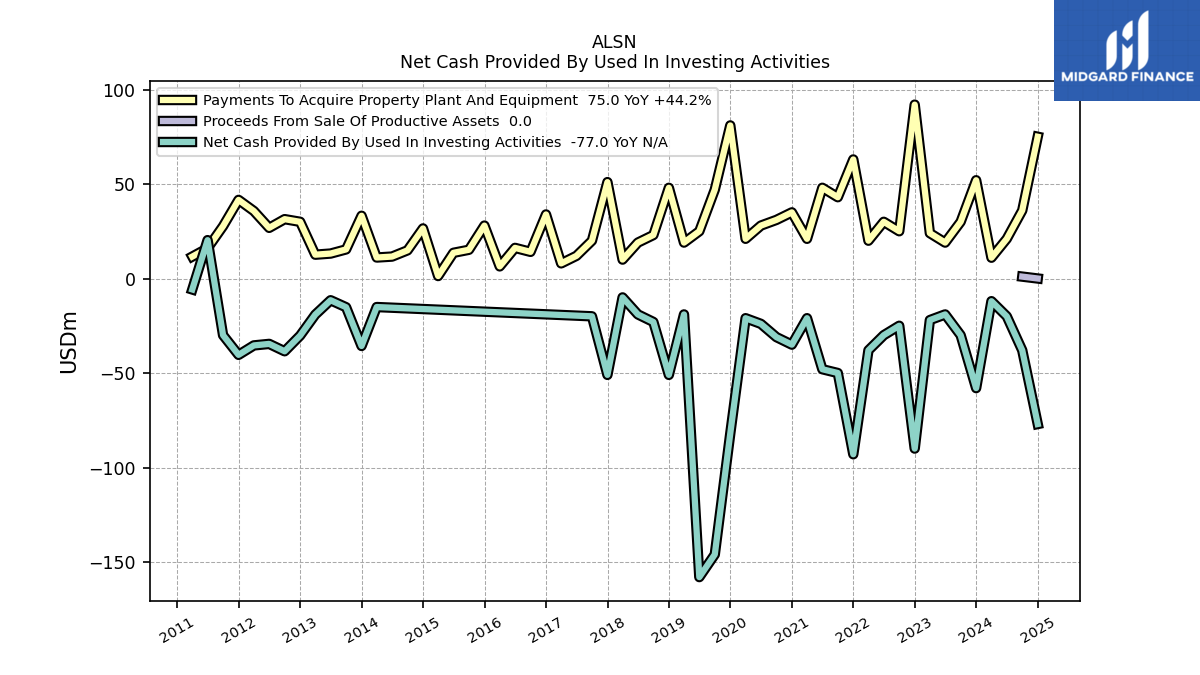
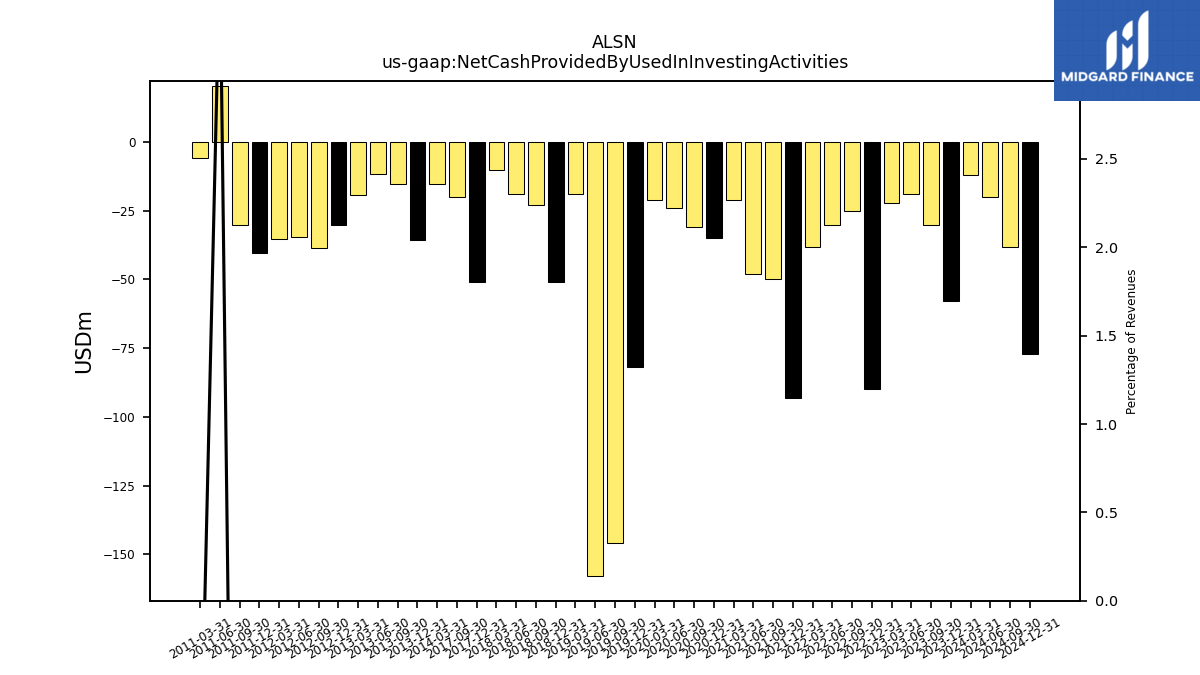
| Net Cash Provided By Used In Investing Activities | -30.00 | -19.00 | -22.00 | -90.00 | -25.00 | -30.00 | -38.00 | -93.00 | -50.00 | -48.00 | -21.00 | -35.00 | -31.00 | -24.00 | -21.00 | -82.00 | -146.00 | -158.00 | -19.00 | -51.00 | -23.00 | -19.00 | -10.00 | -51.00 | -20.00 | NA | NA | NA | NA | NA | NA | NA | NA | NA | NA | NA | NA | NA | -15.10 | -35.70 | -15.20 | -11.50 | -19.10 | -30.20 | -38.50 | -34.60 | -35.40 | -40.40 | -30.00 | 20.30 | -5.80 | |
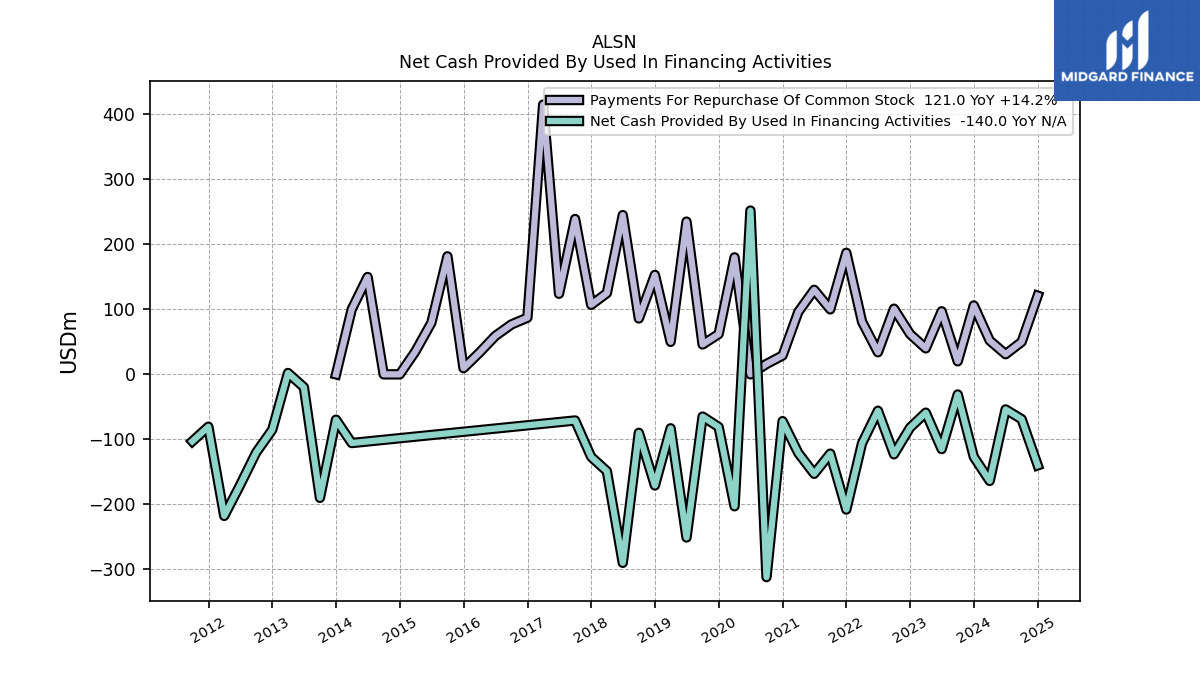
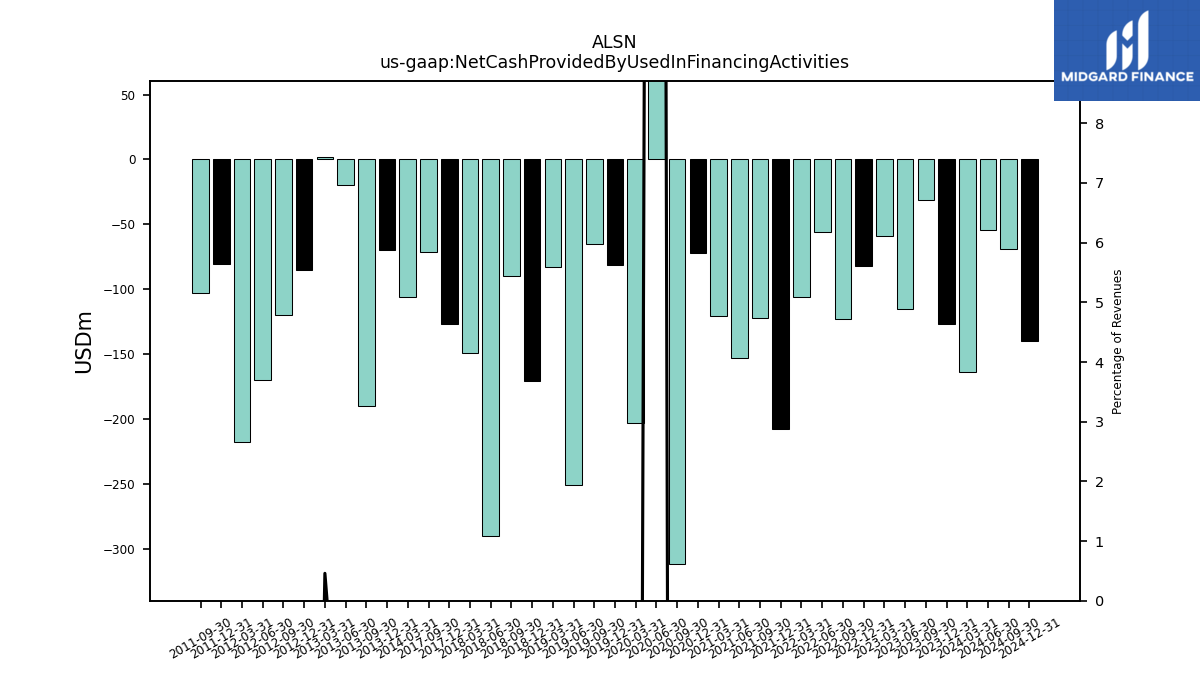
| Net Cash Provided By Used In Financing Activities | -31.00 | -115.00 | -59.00 | -82.00 | -123.00 | -56.00 | -106.00 | -208.00 | -122.00 | -153.00 | -121.00 | -72.00 | -312.00 | 252.00 | -203.00 | -81.00 | -65.00 | -251.00 | -83.00 | -171.00 | -90.00 | -290.00 | -149.00 | -127.00 | -71.00 | NA | NA | NA | NA | NA | NA | NA | NA | NA | NA | NA | NA | NA | -105.70 | -69.80 | -190.00 | -19.80 | 2.10 | -85.20 | -120.20 | -170.30 | -217.80 | -80.60 | -103.10 | NA | NA |
| 2023-09-30 | 2023-06-30 | 2023-03-31 | 2022-12-31 | 2022-09-30 | 2022-06-30 | 2022-03-31 | 2021-12-31 | 2021-09-30 | 2021-06-30 | 2021-03-31 | 2020-12-31 | 2020-09-30 | 2020-06-30 | 2020-03-31 | 2019-12-31 | 2019-09-30 | 2019-06-30 | 2019-03-31 | 2018-12-31 | 2018-09-30 | 2018-06-30 | 2018-03-31 | 2017-12-31 | 2017-09-30 | 2017-06-30 | 2017-03-31 | 2016-12-31 | 2016-09-30 | 2016-06-30 | 2016-03-31 | 2015-12-31 | 2015-09-30 | 2015-06-30 | 2015-03-31 | 2014-12-31 | 2014-09-30 | 2014-06-30 | 2014-03-31 | 2013-12-31 | 2013-09-30 | 2013-06-30 | 2013-03-31 | 2012-12-31 | 2012-09-30 | 2012-06-30 | 2012-03-31 | 2011-12-31 | 2011-09-30 | 2011-06-30 | 2011-03-31 | ||
|---|---|---|---|---|---|---|---|---|---|---|---|---|---|---|---|---|---|---|---|---|---|---|---|---|---|---|---|---|---|---|---|---|---|---|---|---|---|---|---|---|---|---|---|---|---|---|---|---|---|---|---|---|
| Net Cash Provided By Used In Operating Activities | 212.00 | 141.00 | 193.00 | 224.00 | 204.00 | 66.00 | 163.00 | 168.00 | 196.00 | 143.00 | 128.00 | 163.00 | 158.00 | 92.00 | 148.00 | 202.00 | 212.00 | 239.00 | 194.00 | 232.00 | 239.00 | 213.00 | 153.00 | 166.00 | 215.00 | NA | NA | NA | NA | NA | NA | NA | NA | NA | NA | NA | NA | NA | 98.60 | 138.10 | 131.00 | 129.70 | 54.70 | 112.10 | 138.90 | 106.90 | 139.60 | 71.90 | 203.60 | 83.80 | 109.90 | |
| Net Income Loss | 158.00 | 175.00 | 170.00 | 141.00 | 139.00 | 122.00 | 129.00 | 118.00 | 94.00 | 110.00 | 120.00 | 60.00 | 77.00 | 23.00 | 139.00 | 107.00 | 149.00 | 181.00 | 167.00 | 147.00 | 167.00 | 174.00 | 151.00 | 215.00 | 111.00 | 95.00 | 83.00 | 61.20 | 44.60 | 60.80 | 48.30 | 13.00 | 46.50 | 54.40 | 68.40 | 50.50 | 68.80 | 57.20 | 52.10 | 42.90 | 44.50 | 50.50 | 27.50 | 11.20 | 32.20 | 412.80 | 58.00 | 44.50 | 38.80 | -17.20 | 36.90 | |
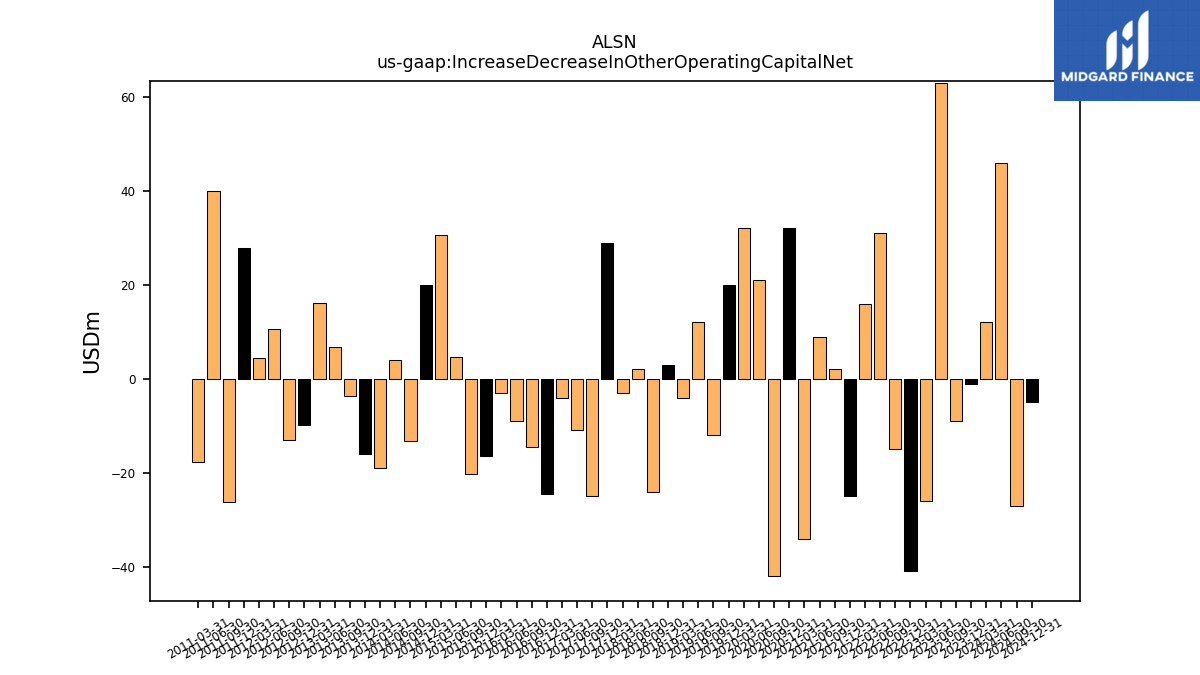
| Increase Decrease In Other Operating Capital Net | -9.00 | 63.00 | -26.00 | -41.00 | -15.00 | 31.00 | 16.00 | -25.00 | 2.00 | 9.00 | -34.00 | 32.00 | -42.00 | 21.00 | 32.00 | 20.00 | -12.00 | 12.00 | -4.00 | 3.00 | -24.00 | 2.00 | -3.00 | 29.00 | -25.00 | -11.00 | -4.00 | -24.60 | -14.60 | -8.90 | -3.00 | -16.50 | -20.30 | 4.70 | 30.60 | 19.90 | -13.20 | 3.90 | -18.90 | -16.10 | -3.60 | 6.80 | 16.10 | -9.90 | -13.10 | 10.60 | 4.50 | 27.80 | -26.30 | 40.00 | -17.80 | |
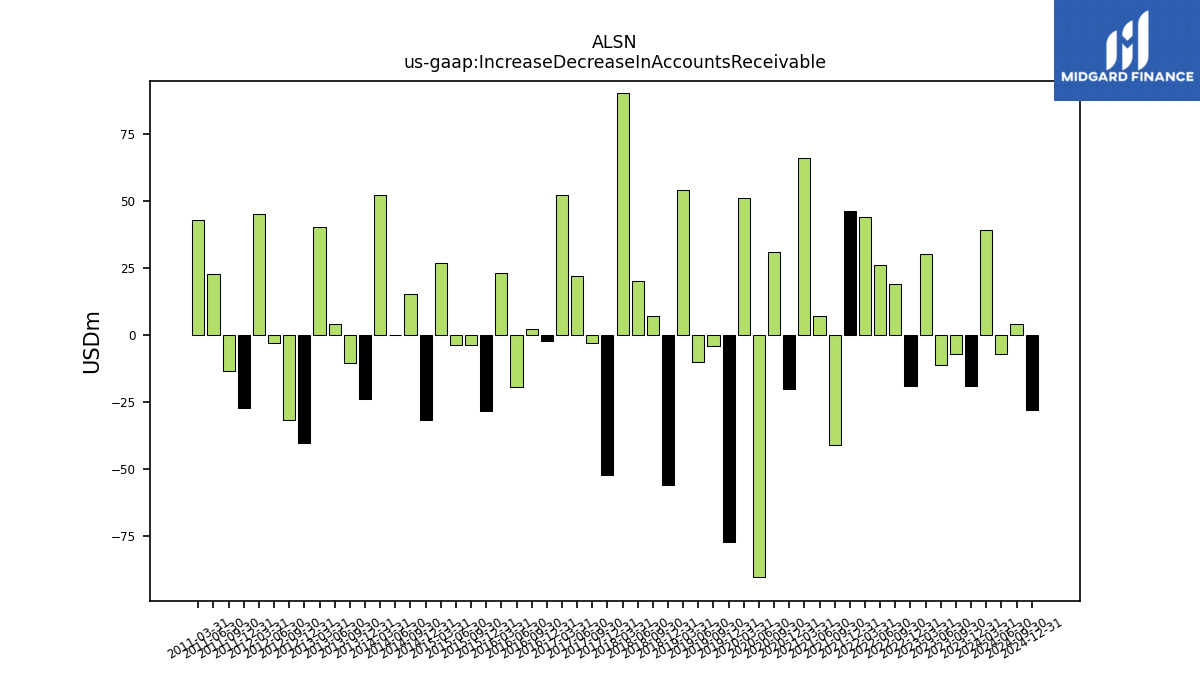
| Increase Decrease In Accounts Receivable | -7.00 | -11.00 | 30.00 | -19.00 | 19.00 | 26.00 | 44.00 | 46.00 | -41.00 | 7.00 | 66.00 | -20.00 | 31.00 | -90.00 | 51.00 | -77.00 | -4.00 | -10.00 | 54.00 | -56.00 | 7.00 | 20.00 | 90.00 | -52.00 | -3.00 | 22.00 | 52.00 | -2.20 | 2.30 | -19.50 | 23.10 | -28.30 | -3.90 | -3.60 | 26.80 | -31.60 | 15.40 | 0.00 | 52.00 | -23.70 | -10.60 | 3.90 | 40.30 | -40.20 | -31.70 | -2.90 | 44.90 | -27.30 | -13.30 | 22.60 | 43.00 | |
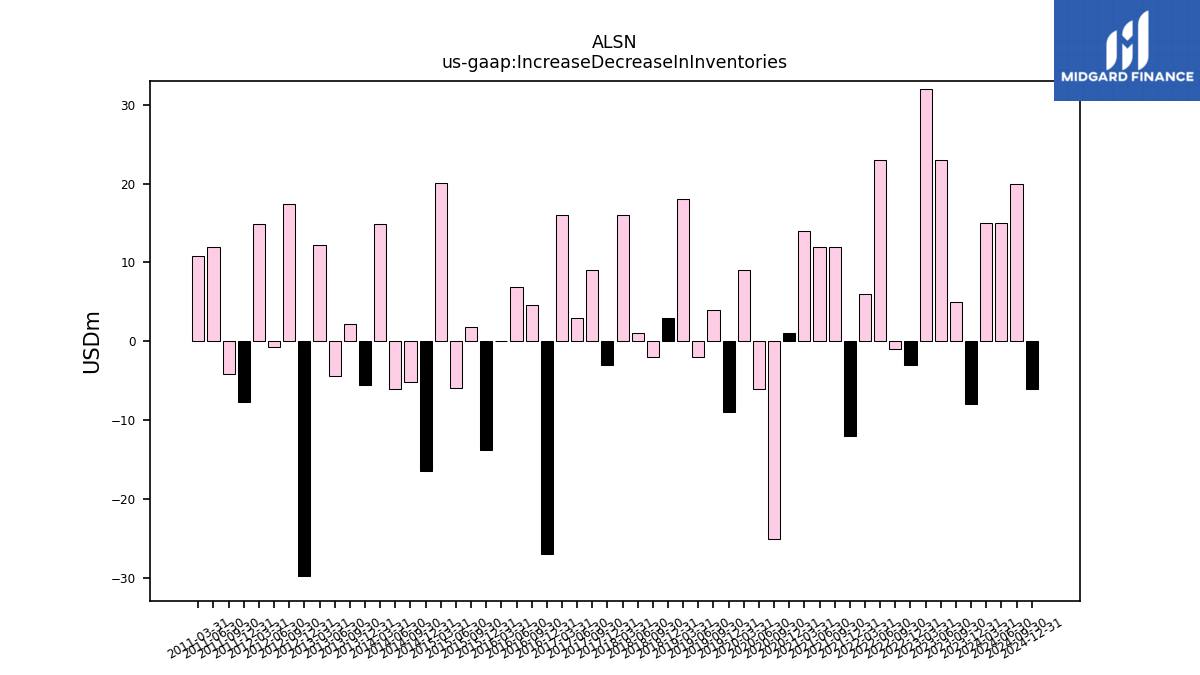
| Increase Decrease In Inventories | 5.00 | 23.00 | 32.00 | -3.00 | -1.00 | 23.00 | 6.00 | -12.00 | 12.00 | 12.00 | 14.00 | 1.00 | -25.00 | -6.00 | 9.00 | -9.00 | 4.00 | -2.00 | 18.00 | 3.00 | -2.00 | 1.00 | 16.00 | -3.00 | 9.00 | 3.00 | 16.00 | -27.00 | 4.60 | 6.90 | 0.10 | -13.80 | 1.80 | -5.90 | 20.10 | -16.40 | -5.10 | -6.10 | 14.90 | -5.60 | 2.20 | -4.40 | 12.20 | -29.80 | 17.40 | -0.70 | 14.90 | -7.70 | -4.10 | 12.00 | 10.80 | |
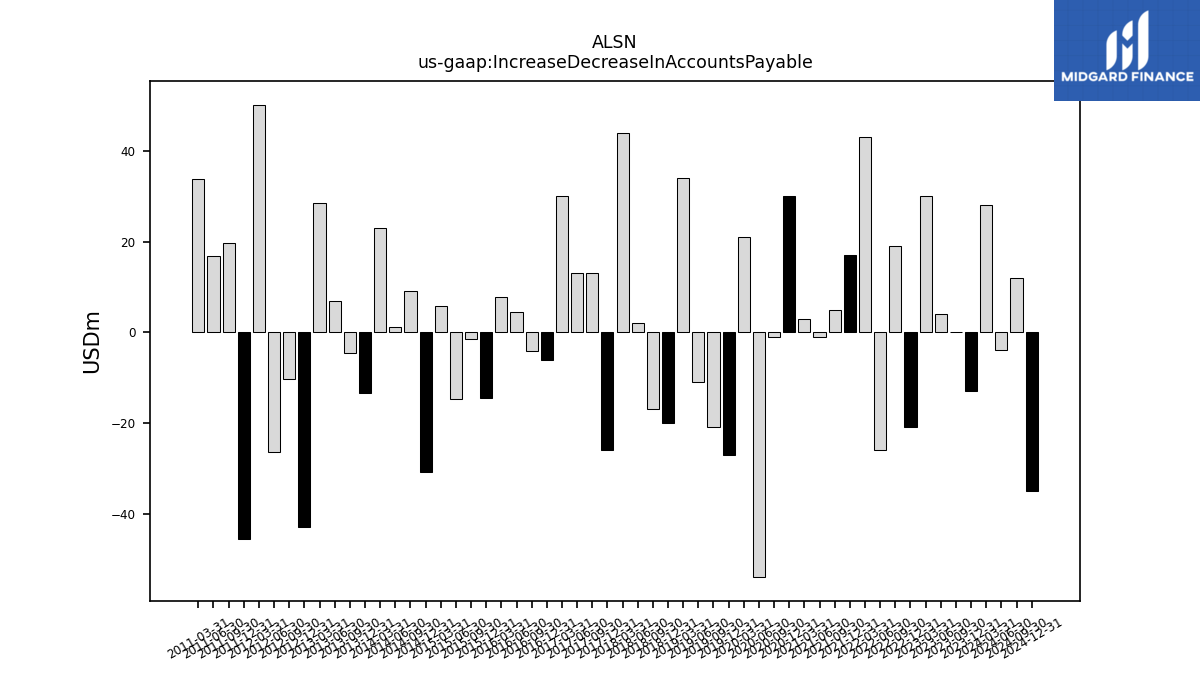
| Increase Decrease In Accounts Payable | 0.00 | 4.00 | 30.00 | -21.00 | 19.00 | -26.00 | 43.00 | 17.00 | 5.00 | -1.00 | 3.00 | 30.00 | -1.00 | -54.00 | 21.00 | -27.00 | -21.00 | -11.00 | 34.00 | -20.00 | -17.00 | 2.00 | 44.00 | -26.00 | 13.00 | 13.00 | 30.00 | -6.10 | -4.10 | 4.40 | 7.70 | -14.60 | -1.40 | -14.80 | 5.70 | -30.90 | 9.00 | 1.10 | 22.90 | -13.40 | -4.60 | 7.00 | 28.60 | -43.00 | -10.30 | -26.30 | 50.20 | -45.60 | 19.70 | 16.90 | 33.90 | |
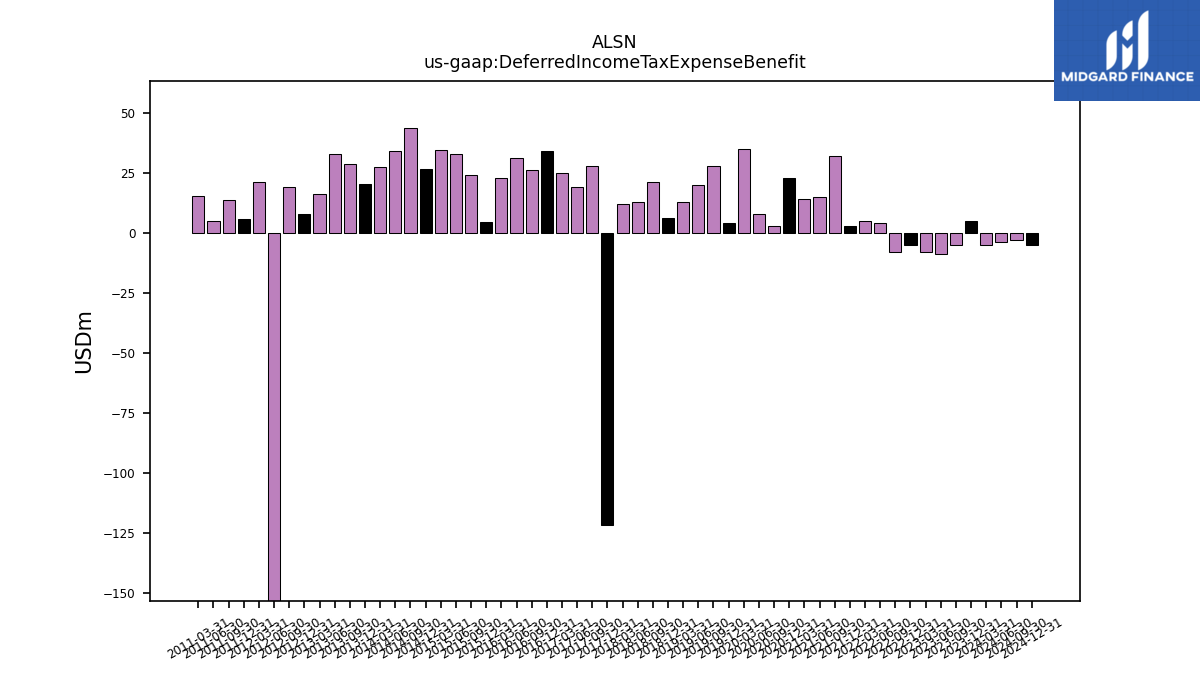
| Deferred Income Tax Expense Benefit | -5.00 | -9.00 | -8.00 | -5.00 | -8.00 | 4.00 | 5.00 | 3.00 | 32.00 | 15.00 | 14.00 | 23.00 | 3.00 | 8.00 | 35.00 | 4.00 | 28.00 | 20.00 | 13.00 | 6.00 | 21.00 | 13.00 | 12.00 | -122.00 | 28.00 | 19.00 | 25.00 | 33.90 | 26.30 | 31.20 | 22.80 | 4.50 | 24.20 | 32.90 | 34.40 | 26.60 | 43.50 | 34.20 | 27.50 | 20.20 | 28.80 | 32.90 | 16.10 | 8.00 | 19.00 | -351.80 | 21.00 | 5.90 | 13.80 | 4.90 | 15.20 | |
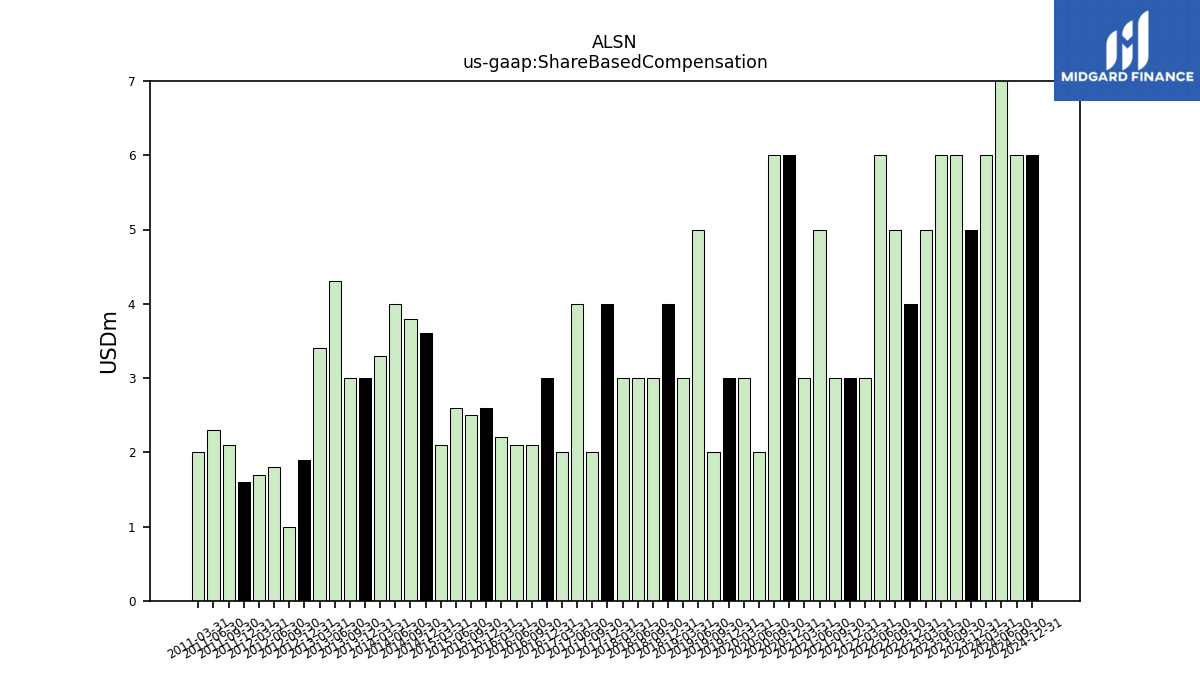
| Share Based Compensation | 6.00 | 6.00 | 5.00 | 4.00 | 5.00 | 6.00 | 3.00 | 3.00 | 3.00 | 5.00 | 3.00 | 6.00 | 6.00 | 2.00 | 3.00 | 3.00 | 2.00 | 5.00 | 3.00 | 4.00 | 3.00 | 3.00 | 3.00 | 4.00 | 2.00 | 4.00 | 2.00 | 3.00 | 2.10 | 2.10 | 2.20 | 2.60 | 2.50 | 2.60 | 2.10 | 3.60 | 3.80 | 4.00 | 3.30 | 3.00 | 3.00 | 4.30 | 3.40 | 1.90 | 1.00 | 1.80 | 1.70 | 1.60 | 2.10 | 2.30 | 2.00 |
| 2023-09-30 | 2023-06-30 | 2023-03-31 | 2022-12-31 | 2022-09-30 | 2022-06-30 | 2022-03-31 | 2021-12-31 | 2021-09-30 | 2021-06-30 | 2021-03-31 | 2020-12-31 | 2020-09-30 | 2020-06-30 | 2020-03-31 | 2019-12-31 | 2019-09-30 | 2019-06-30 | 2019-03-31 | 2018-12-31 | 2018-09-30 | 2018-06-30 | 2018-03-31 | 2017-12-31 | 2017-09-30 | 2017-06-30 | 2017-03-31 | 2016-12-31 | 2016-09-30 | 2016-06-30 | 2016-03-31 | 2015-12-31 | 2015-09-30 | 2015-06-30 | 2015-03-31 | 2014-12-31 | 2014-09-30 | 2014-06-30 | 2014-03-31 | 2013-12-31 | 2013-09-30 | 2013-06-30 | 2013-03-31 | 2012-12-31 | 2012-09-30 | 2012-06-30 | 2012-03-31 | 2011-12-31 | 2011-09-30 | 2011-06-30 | 2011-03-31 | ||
|---|---|---|---|---|---|---|---|---|---|---|---|---|---|---|---|---|---|---|---|---|---|---|---|---|---|---|---|---|---|---|---|---|---|---|---|---|---|---|---|---|---|---|---|---|---|---|---|---|---|---|---|---|
| Net Cash Provided By Used In Investing Activities | -30.00 | -19.00 | -22.00 | -90.00 | -25.00 | -30.00 | -38.00 | -93.00 | -50.00 | -48.00 | -21.00 | -35.00 | -31.00 | -24.00 | -21.00 | -82.00 | -146.00 | -158.00 | -19.00 | -51.00 | -23.00 | -19.00 | -10.00 | -51.00 | -20.00 | NA | NA | NA | NA | NA | NA | NA | NA | NA | NA | NA | NA | NA | -15.10 | -35.70 | -15.20 | -11.50 | -19.10 | -30.20 | -38.50 | -34.60 | -35.40 | -40.40 | -30.00 | 20.30 | -5.80 | |
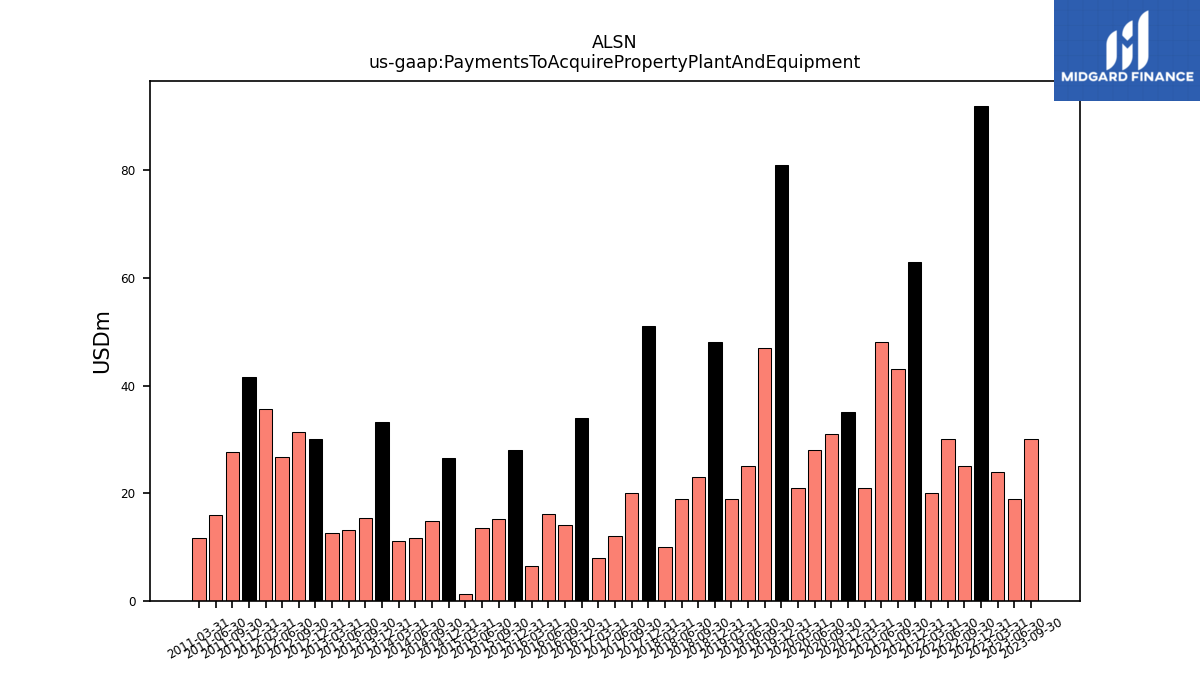
| Payments To Acquire Property Plant And Equipment | 30.00 | 19.00 | 24.00 | 92.00 | 25.00 | 30.00 | 20.00 | 63.00 | 43.00 | 48.00 | 21.00 | 35.00 | 31.00 | 28.00 | 21.00 | 81.00 | 47.00 | 25.00 | 19.00 | 48.00 | 23.00 | 19.00 | 10.00 | 51.00 | 20.00 | 12.00 | 8.00 | 33.90 | 14.10 | 16.20 | 6.40 | 28.00 | 15.20 | 13.60 | 1.30 | 26.50 | 14.90 | 11.60 | 11.10 | 33.20 | 15.40 | 13.20 | 12.60 | 30.00 | 31.40 | 26.80 | 35.70 | 41.60 | 27.70 | 16.00 | 11.60 |
| 2023-09-30 | 2023-06-30 | 2023-03-31 | 2022-12-31 | 2022-09-30 | 2022-06-30 | 2022-03-31 | 2021-12-31 | 2021-09-30 | 2021-06-30 | 2021-03-31 | 2020-12-31 | 2020-09-30 | 2020-06-30 | 2020-03-31 | 2019-12-31 | 2019-09-30 | 2019-06-30 | 2019-03-31 | 2018-12-31 | 2018-09-30 | 2018-06-30 | 2018-03-31 | 2017-12-31 | 2017-09-30 | 2017-06-30 | 2017-03-31 | 2016-12-31 | 2016-09-30 | 2016-06-30 | 2016-03-31 | 2015-12-31 | 2015-09-30 | 2015-06-30 | 2015-03-31 | 2014-12-31 | 2014-09-30 | 2014-06-30 | 2014-03-31 | 2013-12-31 | 2013-09-30 | 2013-06-30 | 2013-03-31 | 2012-12-31 | 2012-09-30 | 2012-06-30 | 2012-03-31 | 2011-12-31 | 2011-09-30 | 2011-06-30 | 2011-03-31 | ||
|---|---|---|---|---|---|---|---|---|---|---|---|---|---|---|---|---|---|---|---|---|---|---|---|---|---|---|---|---|---|---|---|---|---|---|---|---|---|---|---|---|---|---|---|---|---|---|---|---|---|---|---|---|
| Net Cash Provided By Used In Financing Activities | -31.00 | -115.00 | -59.00 | -82.00 | -123.00 | -56.00 | -106.00 | -208.00 | -122.00 | -153.00 | -121.00 | -72.00 | -312.00 | 252.00 | -203.00 | -81.00 | -65.00 | -251.00 | -83.00 | -171.00 | -90.00 | -290.00 | -149.00 | -127.00 | -71.00 | NA | NA | NA | NA | NA | NA | NA | NA | NA | NA | NA | NA | NA | -105.70 | -69.80 | -190.00 | -19.80 | 2.10 | -85.20 | -120.20 | -170.30 | -217.80 | -80.60 | -103.10 | NA | NA | |
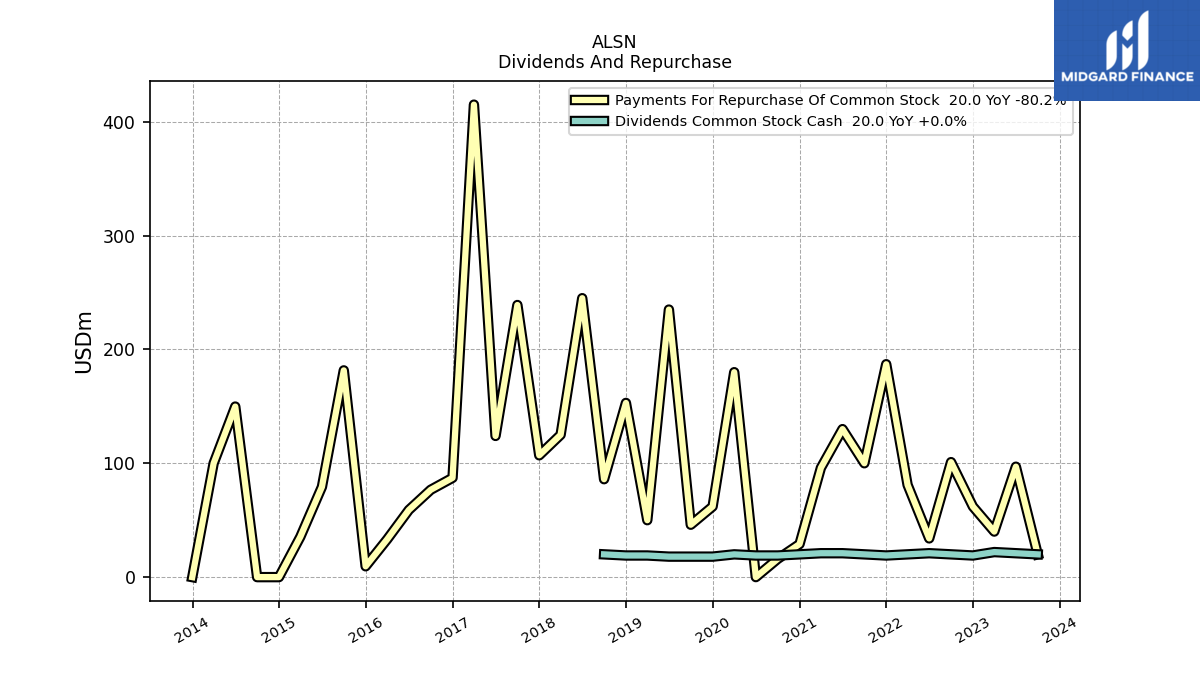
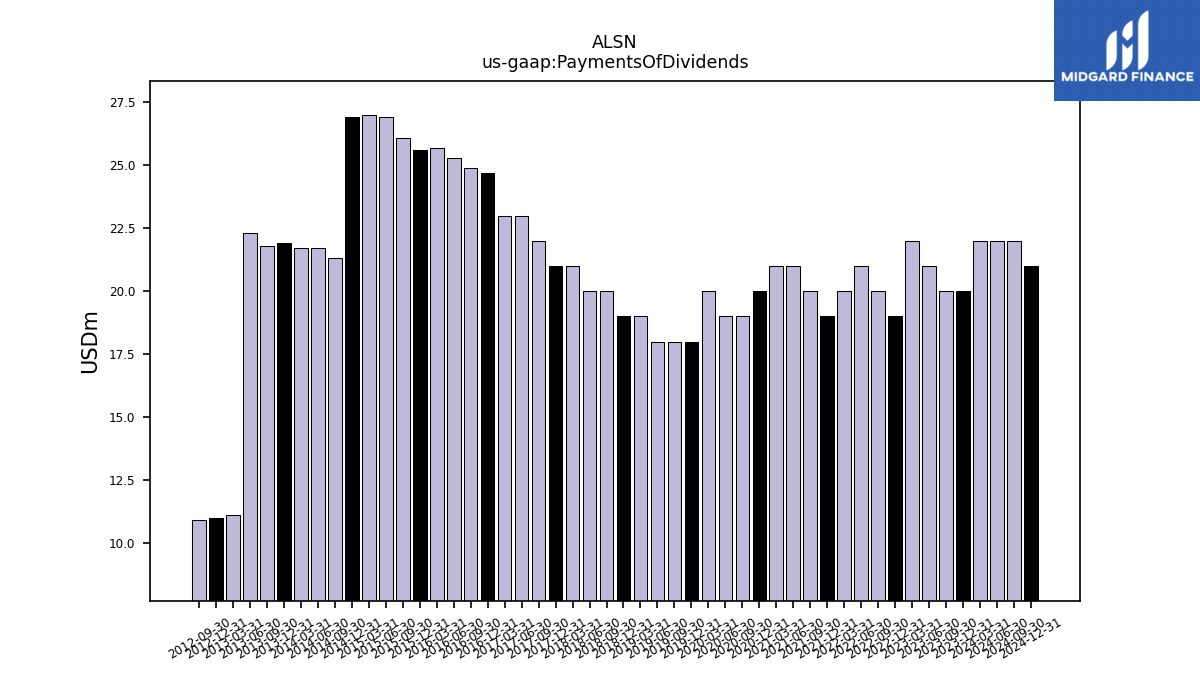
| Payments Of Dividends | 20.00 | 21.00 | 22.00 | 19.00 | 20.00 | 21.00 | 20.00 | 19.00 | 20.00 | 21.00 | 21.00 | 20.00 | 19.00 | 19.00 | 20.00 | 18.00 | 18.00 | 18.00 | 19.00 | 19.00 | 20.00 | 20.00 | 21.00 | 21.00 | 22.00 | 23.00 | 23.00 | 24.70 | 24.90 | 25.30 | 25.70 | 25.60 | 26.10 | 26.90 | 27.00 | 26.90 | 21.30 | 21.70 | 21.70 | 21.90 | 21.80 | 22.30 | 11.10 | 11.00 | 10.90 | NA | NA | NA | NA | NA | NA | |
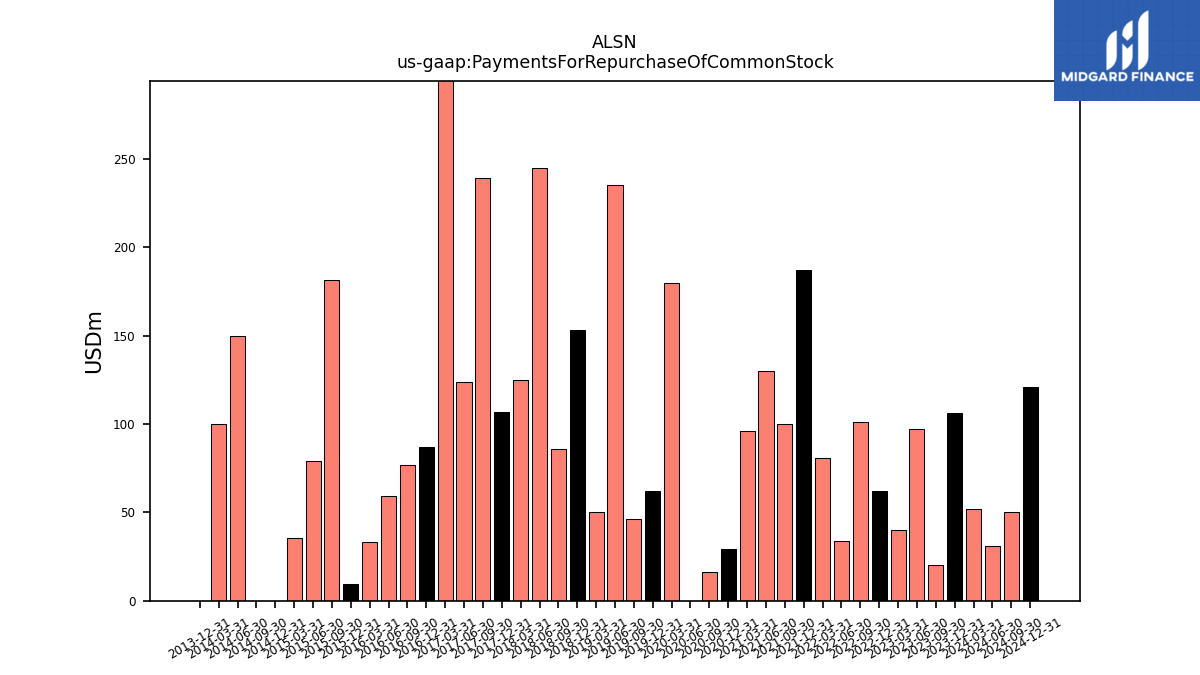
| Payments For Repurchase Of Common Stock | 20.00 | 97.00 | 40.00 | 62.00 | 101.00 | 34.00 | 81.00 | 187.00 | 100.00 | 130.00 | 96.00 | 29.00 | 16.00 | 0.00 | 180.00 | 62.00 | 46.00 | 235.00 | 50.00 | 153.00 | 86.00 | 245.00 | 125.00 | 107.00 | 239.00 | 124.00 | 415.00 | 87.20 | 76.70 | 59.00 | 33.30 | 9.50 | 181.60 | 79.30 | 35.40 | 0.00 | 0.00 | 149.80 | 100.00 | 0.00 | NA | NA | NA | NA | NA | NA | NA | NA | NA | NA | NA |
| 2023-09-30 | 2023-06-30 | 2023-03-31 | 2022-12-31 | 2022-09-30 | 2022-06-30 | 2022-03-31 | 2021-12-31 | 2021-09-30 | 2021-06-30 | 2021-03-31 | 2020-12-31 | 2020-09-30 | 2020-06-30 | 2020-03-31 | 2019-12-31 | 2019-09-30 | 2019-06-30 | 2019-03-31 | 2018-12-31 | 2018-09-30 | 2018-06-30 | 2018-03-31 | 2017-12-31 | 2017-09-30 | 2017-06-30 | 2017-03-31 | 2016-12-31 | 2016-09-30 | 2016-06-30 | 2016-03-31 | 2015-12-31 | 2015-09-30 | 2015-06-30 | 2015-03-31 | 2014-12-31 | 2014-09-30 | 2014-06-30 | 2014-03-31 | 2013-12-31 | 2013-09-30 | 2013-06-30 | 2013-03-31 | 2012-12-31 | 2012-09-30 | 2012-06-30 | 2012-03-31 | 2011-12-31 | 2011-09-30 | 2011-06-30 | 2011-03-31 | ||
|---|---|---|---|---|---|---|---|---|---|---|---|---|---|---|---|---|---|---|---|---|---|---|---|---|---|---|---|---|---|---|---|---|---|---|---|---|---|---|---|---|---|---|---|---|---|---|---|---|---|---|---|---|
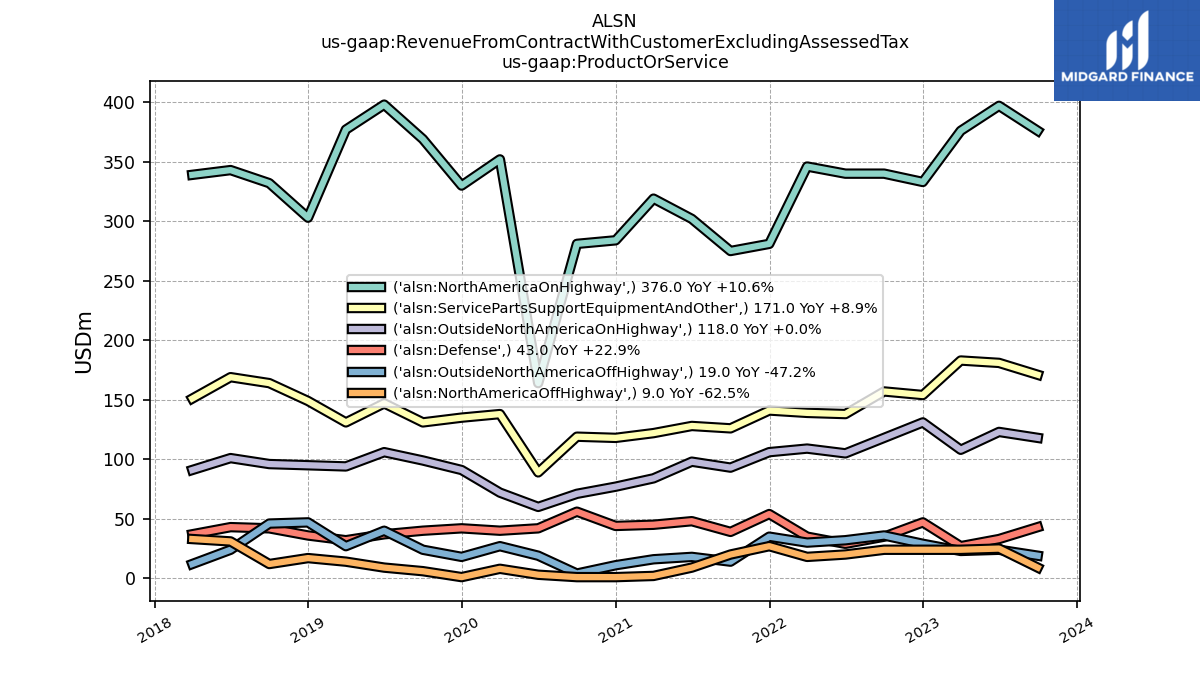
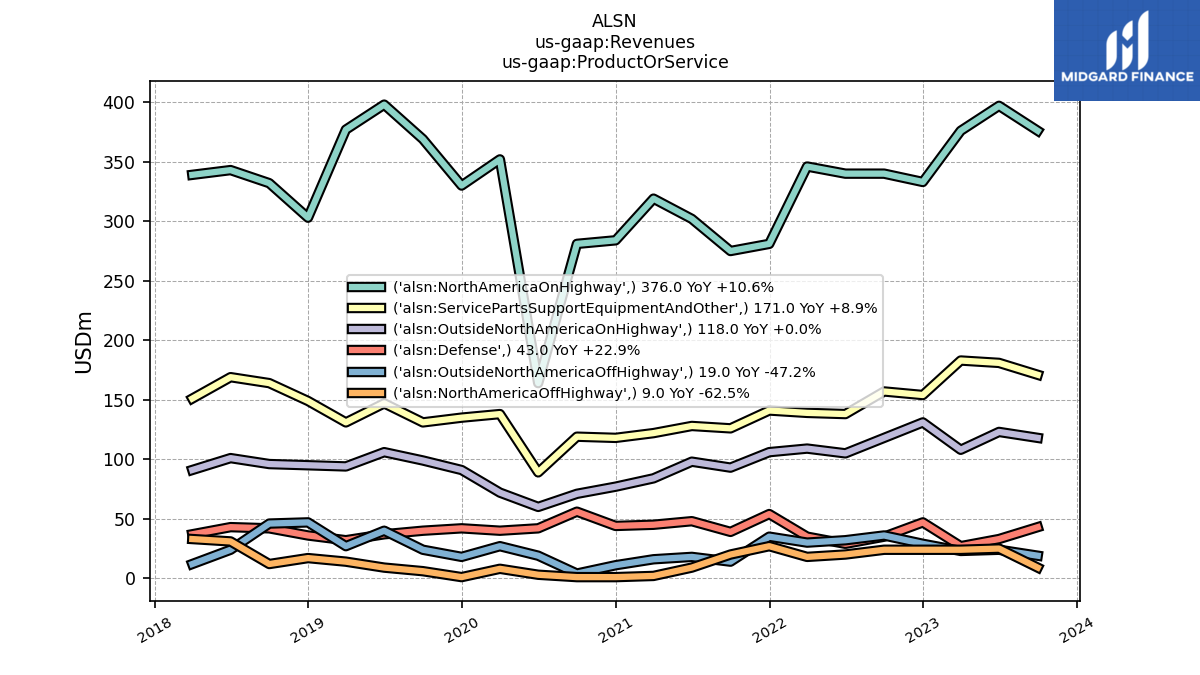
| Revenues | 736.00 | 783.00 | 741.00 | 718.00 | 710.00 | 664.00 | 677.00 | 644.00 | 567.00 | 603.00 | 588.00 | 535.00 | 532.00 | 377.00 | 637.00 | 617.00 | 669.00 | 737.00 | 675.00 | 647.00 | 692.00 | 711.00 | 663.00 | 588.00 | 595.00 | 580.00 | 499.00 | 468.90 | 434.30 | 474.90 | 462.10 | 478.20 | 493.00 | 511.00 | 503.60 | 544.40 | 553.30 | 536.10 | 493.60 | 491.00 | 466.30 | 512.10 | 457.40 | 487.00 | 493.50 | 559.40 | 601.90 | 516.10 | 574.00 | 555.70 | 517.00 | |
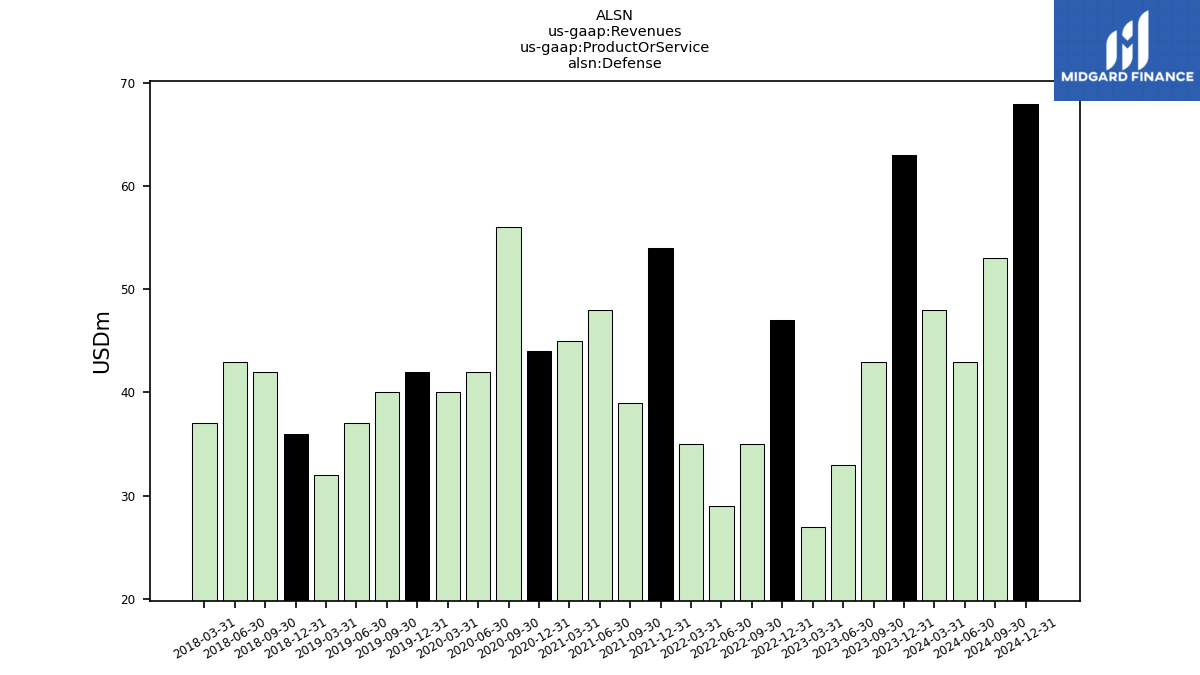
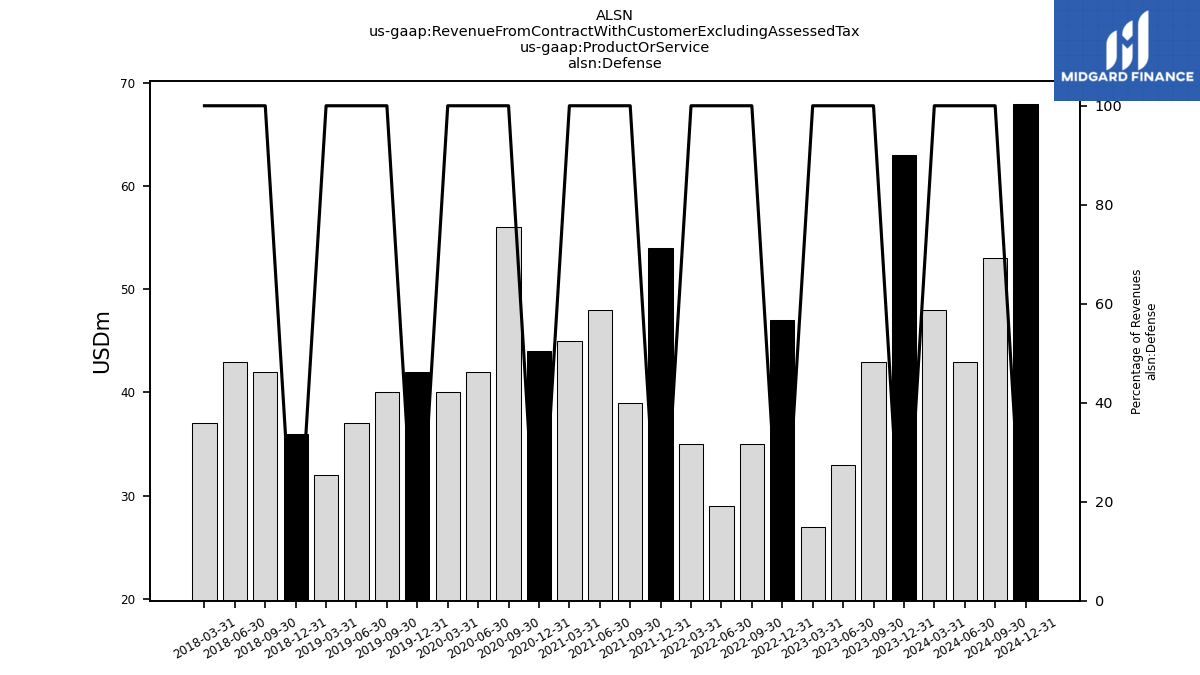
| Defense | 43.00 | 33.00 | 27.00 | 47.00 | 35.00 | 29.00 | 35.00 | 54.00 | 39.00 | 48.00 | 45.00 | 44.00 | 56.00 | 42.00 | 40.00 | 42.00 | 40.00 | 37.00 | 32.00 | 36.00 | 42.00 | 43.00 | 37.00 | NA | NA | NA | NA | NA | NA | NA | NA | NA | NA | NA | NA | NA | NA | NA | NA | NA | NA | NA | NA | NA | NA | NA | NA | NA | NA | NA | NA | |
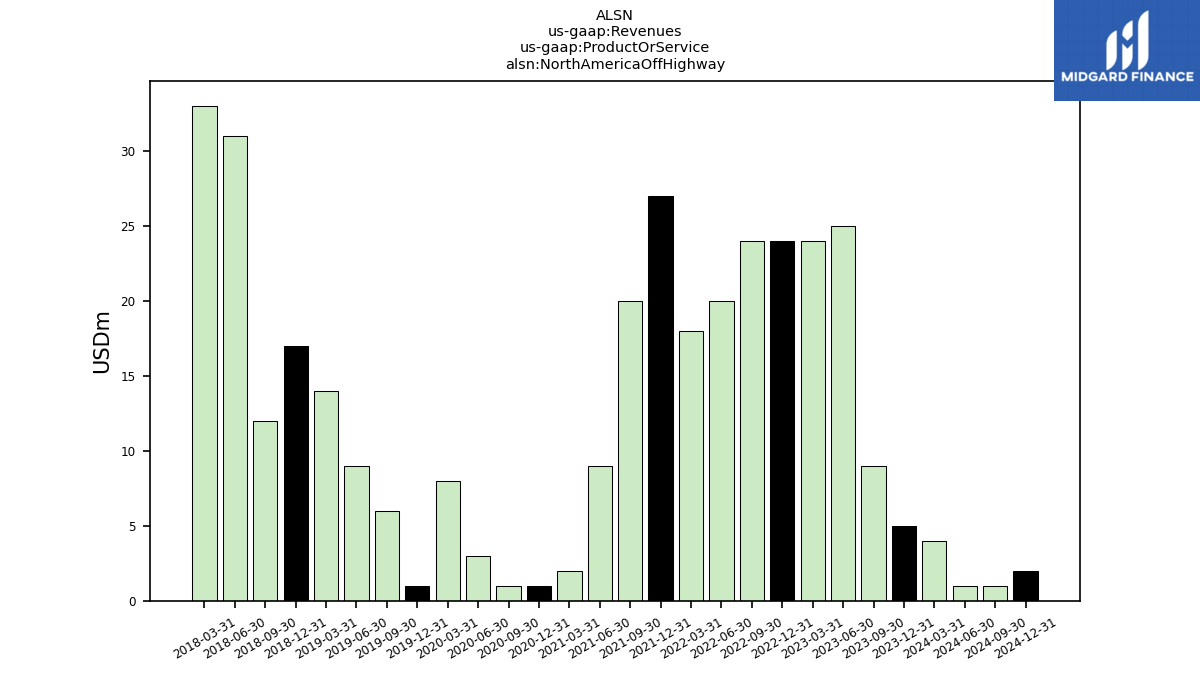
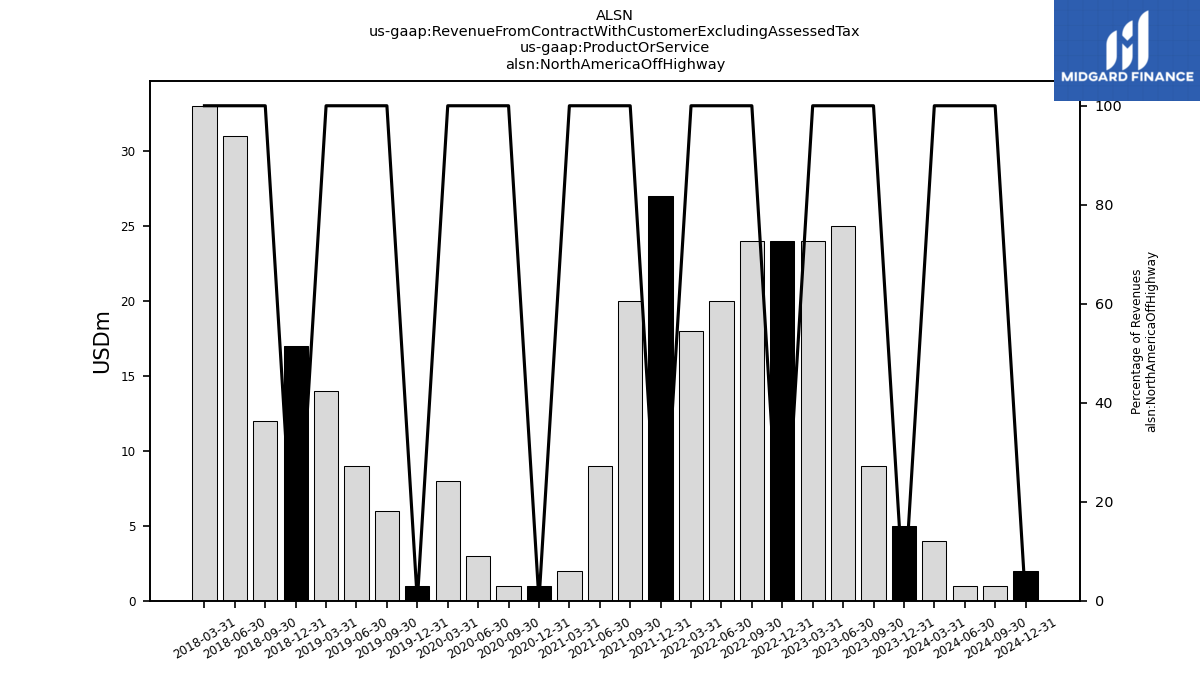
| North America Off Highway | 9.00 | 25.00 | 24.00 | 24.00 | 24.00 | 20.00 | 18.00 | 27.00 | 20.00 | 9.00 | 2.00 | 1.00 | 1.00 | 3.00 | 8.00 | 1.00 | 6.00 | 9.00 | 14.00 | 17.00 | 12.00 | 31.00 | 33.00 | NA | NA | NA | NA | NA | NA | NA | NA | NA | NA | NA | NA | NA | NA | NA | NA | NA | NA | NA | NA | NA | NA | NA | NA | NA | NA | NA | NA | |
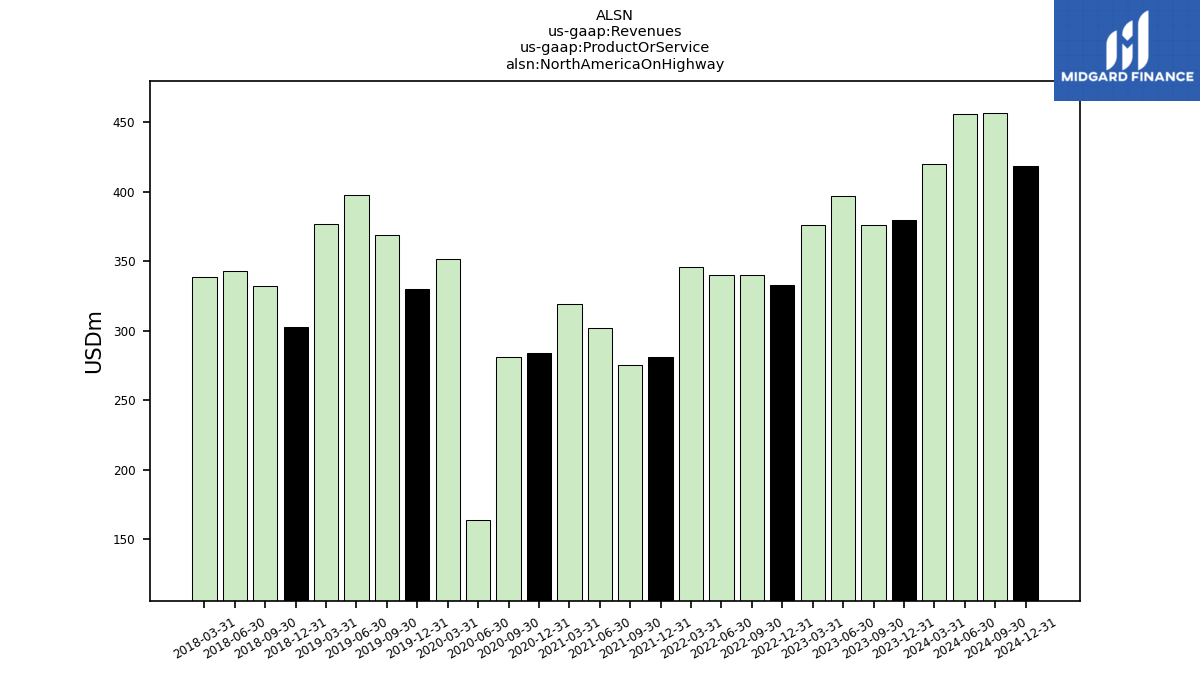
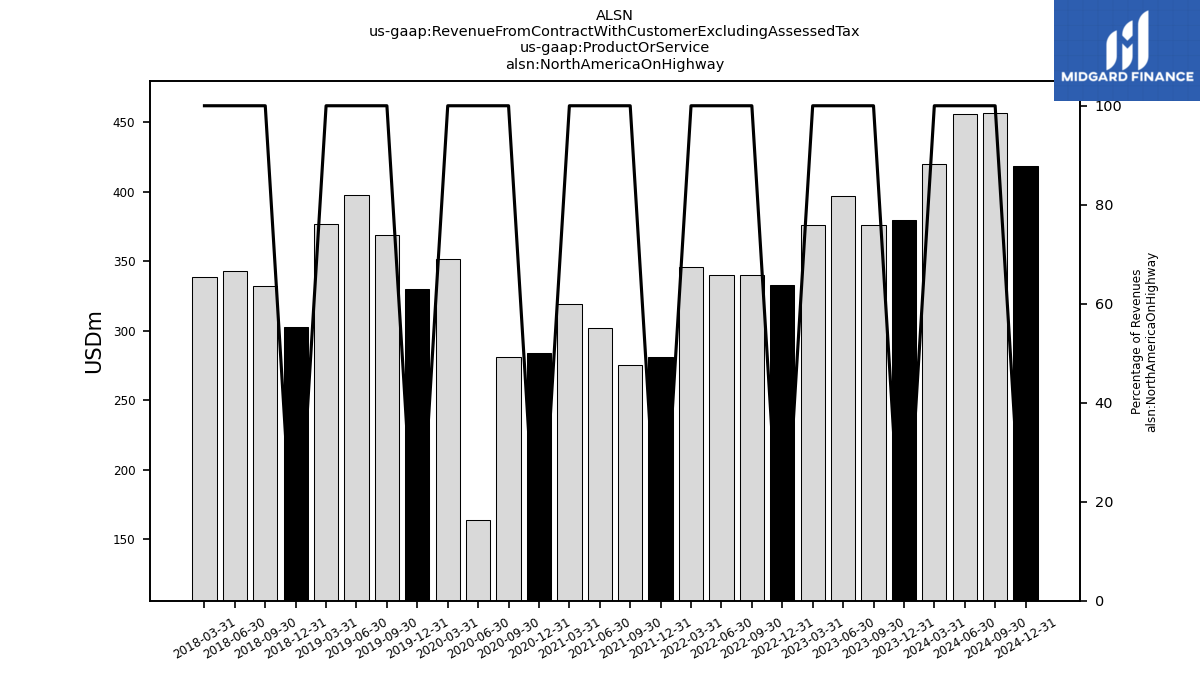
| North America On Highway | 376.00 | 397.00 | 376.00 | 333.00 | 340.00 | 340.00 | 346.00 | 281.00 | 275.00 | 302.00 | 319.00 | 284.00 | 281.00 | 164.00 | 352.00 | 330.00 | 369.00 | 398.00 | 377.00 | 303.00 | 332.00 | 343.00 | 339.00 | NA | NA | NA | NA | NA | NA | NA | NA | NA | NA | NA | NA | NA | NA | NA | NA | NA | NA | NA | NA | NA | NA | NA | NA | NA | NA | NA | NA | |
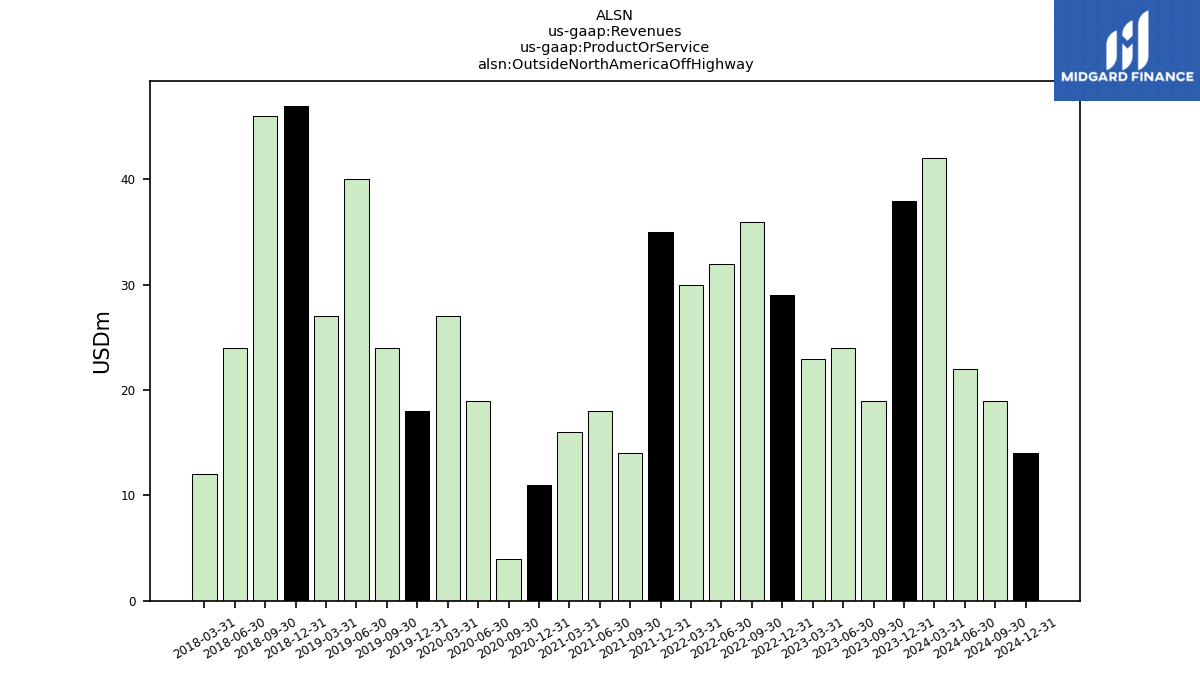
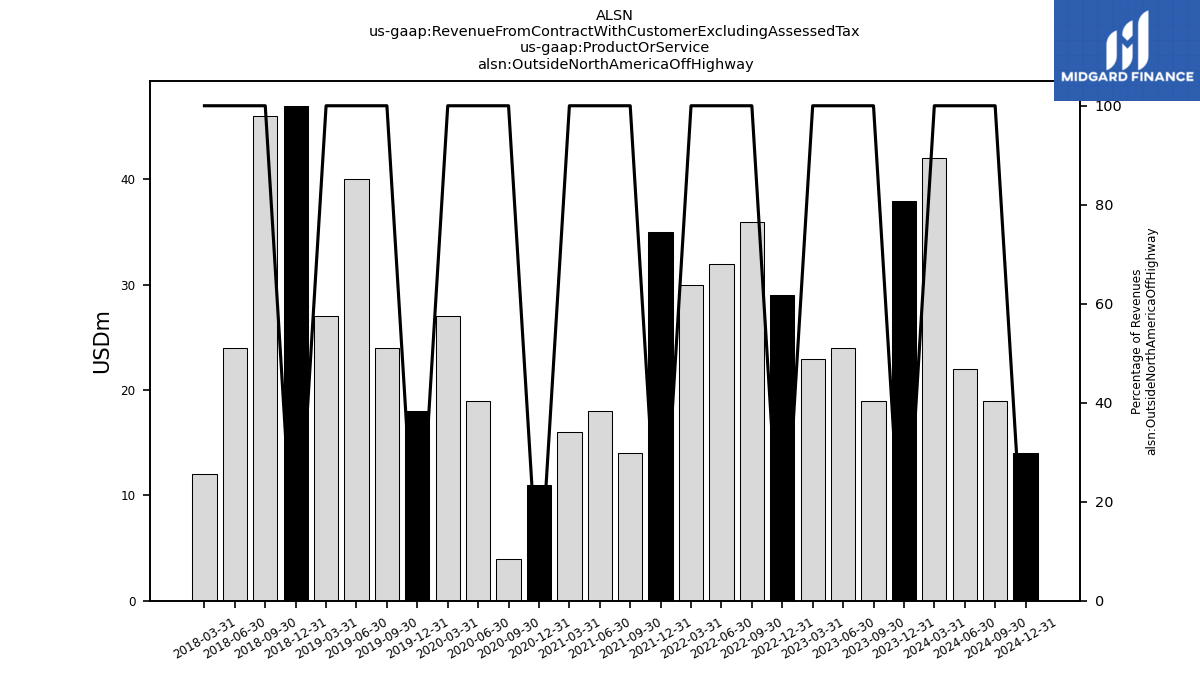
| Outside North America Off Highway | 19.00 | 24.00 | 23.00 | 29.00 | 36.00 | 32.00 | 30.00 | 35.00 | 14.00 | 18.00 | 16.00 | 11.00 | 4.00 | 19.00 | 27.00 | 18.00 | 24.00 | 40.00 | 27.00 | 47.00 | 46.00 | 24.00 | 12.00 | NA | NA | NA | NA | NA | NA | NA | NA | NA | NA | NA | NA | NA | NA | NA | NA | NA | NA | NA | NA | NA | NA | NA | NA | NA | NA | NA | NA | |
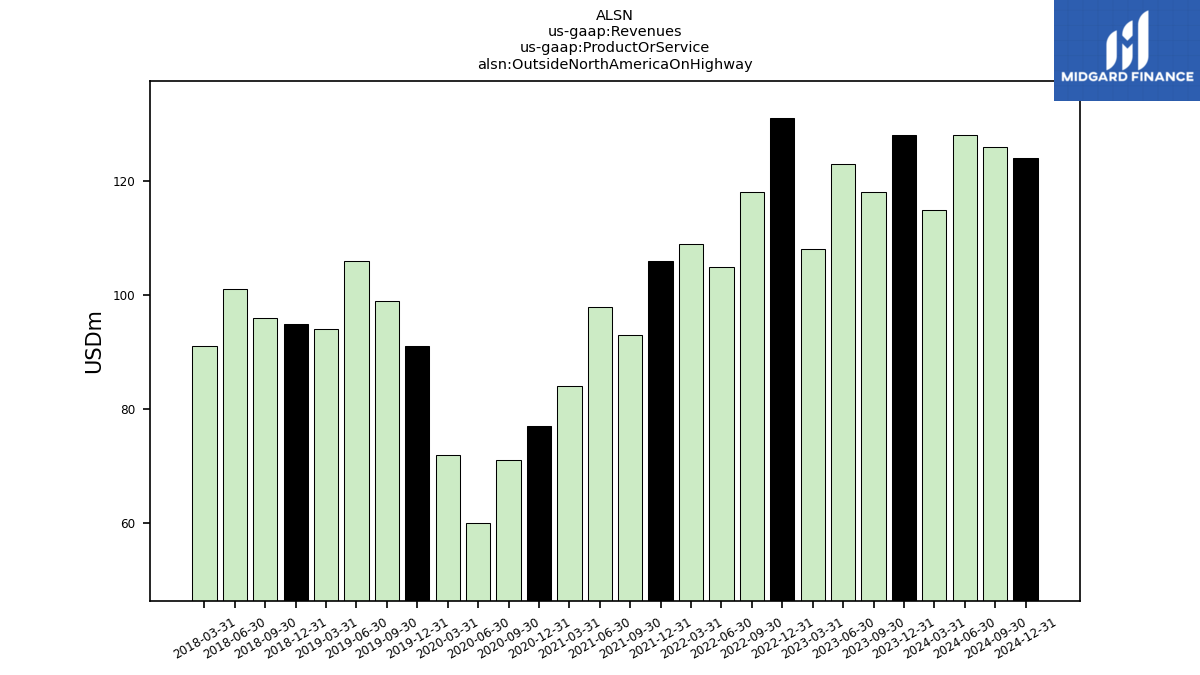
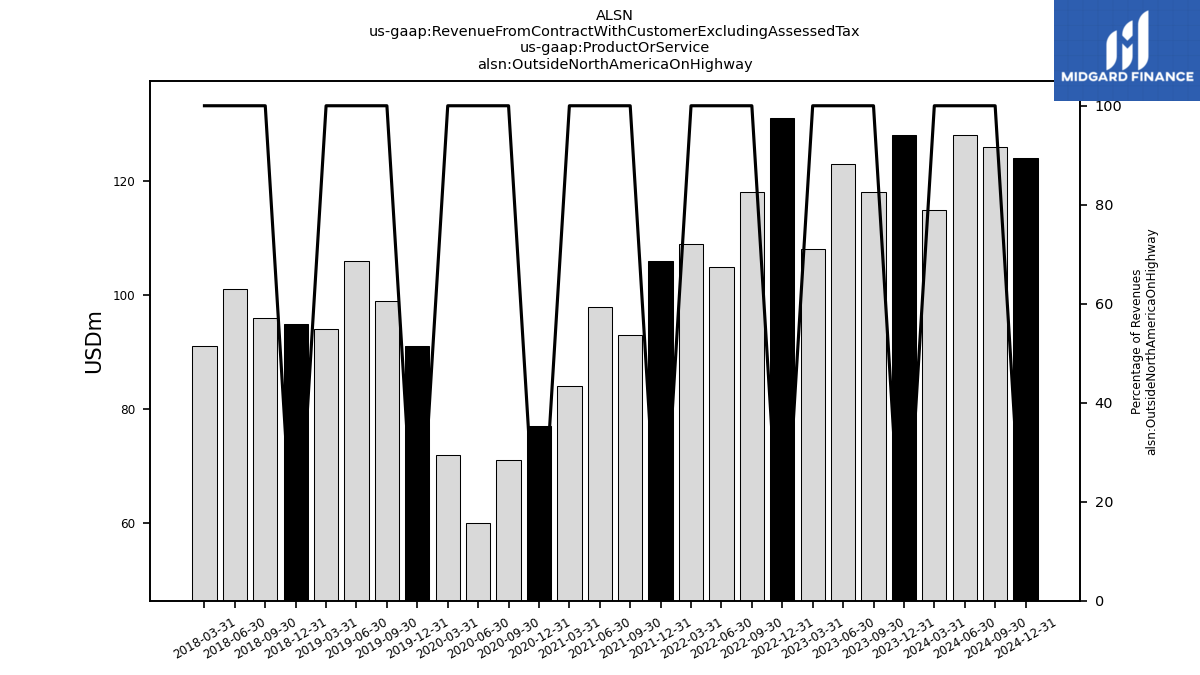
| Outside North America On Highway | 118.00 | 123.00 | 108.00 | 131.00 | 118.00 | 105.00 | 109.00 | 106.00 | 93.00 | 98.00 | 84.00 | 77.00 | 71.00 | 60.00 | 72.00 | 91.00 | 99.00 | 106.00 | 94.00 | 95.00 | 96.00 | 101.00 | 91.00 | NA | NA | NA | NA | NA | NA | NA | NA | NA | NA | NA | NA | NA | NA | NA | NA | NA | NA | NA | NA | NA | NA | NA | NA | NA | NA | NA | NA | |
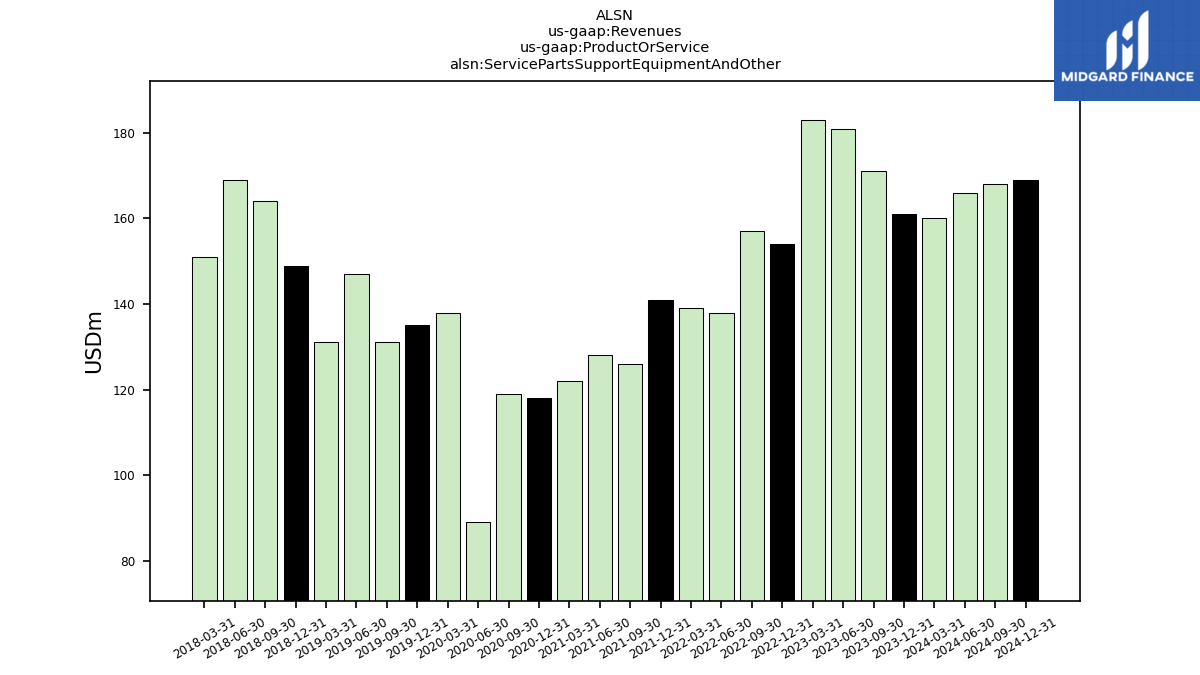
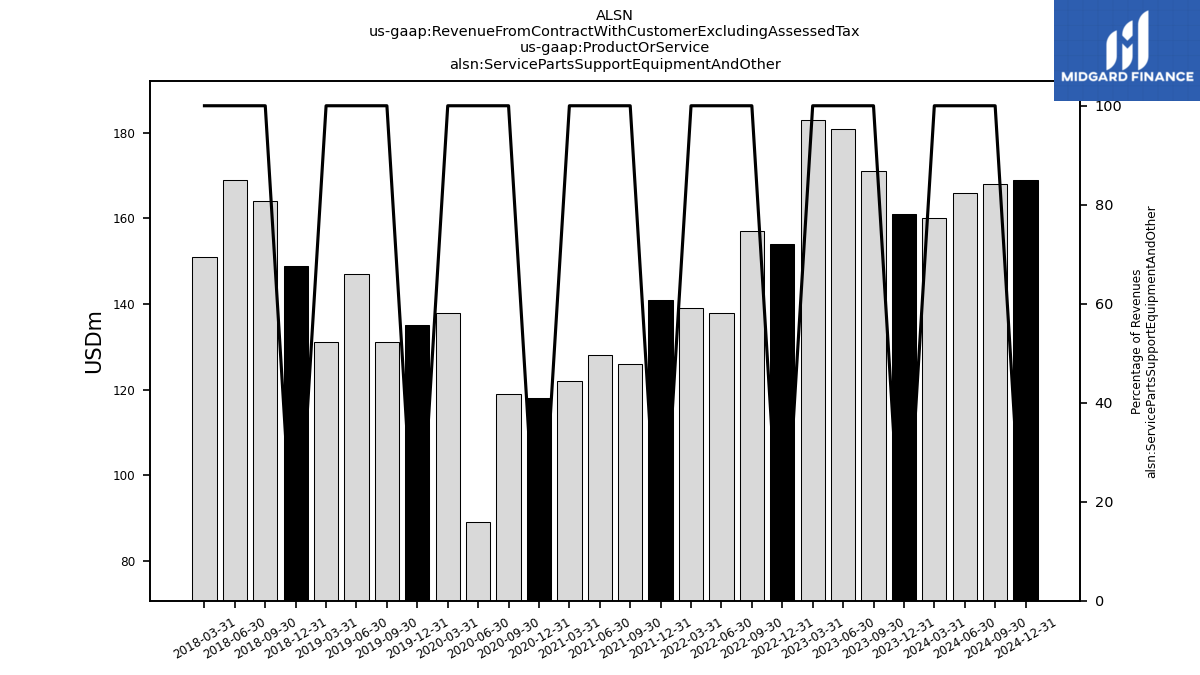
| Service Parts Support Equipment And Other | 171.00 | 181.00 | 183.00 | 154.00 | 157.00 | 138.00 | 139.00 | 141.00 | 126.00 | 128.00 | 122.00 | 118.00 | 119.00 | 89.00 | 138.00 | 135.00 | 131.00 | 147.00 | 131.00 | 149.00 | 164.00 | 169.00 | 151.00 | NA | NA | NA | NA | NA | NA | NA | NA | NA | NA | NA | NA | NA | NA | NA | NA | NA | NA | NA | NA | NA | NA | NA | NA | NA | NA | NA | NA | |
| Revenue From Contract With Customer Excluding Assessed Tax | 736.00 | 783.00 | 741.00 | 718.00 | 710.00 | 664.00 | 677.00 | 644.00 | 567.00 | 603.00 | 588.00 | 535.00 | 532.00 | 377.00 | 637.00 | 617.00 | 669.00 | 737.00 | 675.00 | 647.00 | 692.00 | 711.00 | 663.00 | 588.00 | 595.00 | 580.00 | 499.00 | 468.90 | 434.30 | 474.90 | 462.10 | 478.20 | 493.00 | 511.00 | 503.60 | 544.40 | 553.30 | 536.10 | 493.60 | 491.00 | 466.30 | 512.10 | 457.40 | 487.00 | 493.50 | 559.40 | 601.90 | 516.10 | 574.00 | 555.70 | 517.00 | |
| Defense | 43.00 | 33.00 | 27.00 | 47.00 | 35.00 | 29.00 | 35.00 | 54.00 | 39.00 | 48.00 | 45.00 | 44.00 | 56.00 | 42.00 | 40.00 | 42.00 | 40.00 | 37.00 | 32.00 | 36.00 | 42.00 | 43.00 | 37.00 | NA | NA | NA | NA | NA | NA | NA | NA | NA | NA | NA | NA | NA | NA | NA | NA | NA | NA | NA | NA | NA | NA | NA | NA | NA | NA | NA | NA | |
| North America Off Highway | 9.00 | 25.00 | 24.00 | 24.00 | 24.00 | 20.00 | 18.00 | 27.00 | 20.00 | 9.00 | 2.00 | 1.00 | 1.00 | 3.00 | 8.00 | 1.00 | 6.00 | 9.00 | 14.00 | 17.00 | 12.00 | 31.00 | 33.00 | NA | NA | NA | NA | NA | NA | NA | NA | NA | NA | NA | NA | NA | NA | NA | NA | NA | NA | NA | NA | NA | NA | NA | NA | NA | NA | NA | NA | |
| North America On Highway | 376.00 | 397.00 | 376.00 | 333.00 | 340.00 | 340.00 | 346.00 | 281.00 | 275.00 | 302.00 | 319.00 | 284.00 | 281.00 | 164.00 | 352.00 | 330.00 | 369.00 | 398.00 | 377.00 | 303.00 | 332.00 | 343.00 | 339.00 | NA | NA | NA | NA | NA | NA | NA | NA | NA | NA | NA | NA | NA | NA | NA | NA | NA | NA | NA | NA | NA | NA | NA | NA | NA | NA | NA | NA | |
| Outside North America Off Highway | 19.00 | 24.00 | 23.00 | 29.00 | 36.00 | 32.00 | 30.00 | 35.00 | 14.00 | 18.00 | 16.00 | 11.00 | 4.00 | 19.00 | 27.00 | 18.00 | 24.00 | 40.00 | 27.00 | 47.00 | 46.00 | 24.00 | 12.00 | NA | NA | NA | NA | NA | NA | NA | NA | NA | NA | NA | NA | NA | NA | NA | NA | NA | NA | NA | NA | NA | NA | NA | NA | NA | NA | NA | NA | |
| Outside North America On Highway | 118.00 | 123.00 | 108.00 | 131.00 | 118.00 | 105.00 | 109.00 | 106.00 | 93.00 | 98.00 | 84.00 | 77.00 | 71.00 | 60.00 | 72.00 | 91.00 | 99.00 | 106.00 | 94.00 | 95.00 | 96.00 | 101.00 | 91.00 | NA | NA | NA | NA | NA | NA | NA | NA | NA | NA | NA | NA | NA | NA | NA | NA | NA | NA | NA | NA | NA | NA | NA | NA | NA | NA | NA | NA | |
| Service Parts Support Equipment And Other | 171.00 | 181.00 | 183.00 | 154.00 | 157.00 | 138.00 | 139.00 | 141.00 | 126.00 | 128.00 | 122.00 | 118.00 | 119.00 | 89.00 | 138.00 | 135.00 | 131.00 | 147.00 | 131.00 | 149.00 | 164.00 | 169.00 | 151.00 | NA | NA | NA | NA | NA | NA | NA | NA | NA | NA | NA | NA | NA | NA | NA | NA | NA | NA | NA | NA | NA | NA | NA | NA | NA | NA | NA | NA |