
| 2023-12-31 | 2023-09-30 | 2023-06-30 | 2023-03-31 | 2022-12-31 | 2022-09-30 | 2022-06-30 | 2022-03-31 | 2021-12-31 | 2021-09-30 | 2021-06-30 | 2021-03-31 | 2020-12-31 | 2020-09-30 | 2020-06-30 | 2020-03-31 | 2019-12-31 | 2019-09-30 | 2019-06-30 | 2019-03-31 | 2018-12-31 | 2018-09-30 | 2018-06-30 | 2018-03-31 | 2017-12-31 | 2017-09-30 | 2017-06-30 | 2017-03-31 | 2016-12-31 | 2016-09-30 | 2016-06-30 | 2016-03-31 | 2015-12-31 | 2015-09-30 | 2015-06-30 | 2015-03-31 | 2014-12-31 | 2014-09-30 | 2014-06-30 | 2014-03-31 | 2013-12-31 | 2013-09-30 | 2013-06-30 | 2013-03-31 | 2012-12-31 | 2012-09-30 | 2012-06-30 | 2012-03-31 | 2011-12-31 | 2011-09-30 | 2011-06-30 | 2011-03-31 | 2010-12-31 | 2009-12-31 | ||
|---|---|---|---|---|---|---|---|---|---|---|---|---|---|---|---|---|---|---|---|---|---|---|---|---|---|---|---|---|---|---|---|---|---|---|---|---|---|---|---|---|---|---|---|---|---|---|---|---|---|---|---|---|---|---|---|
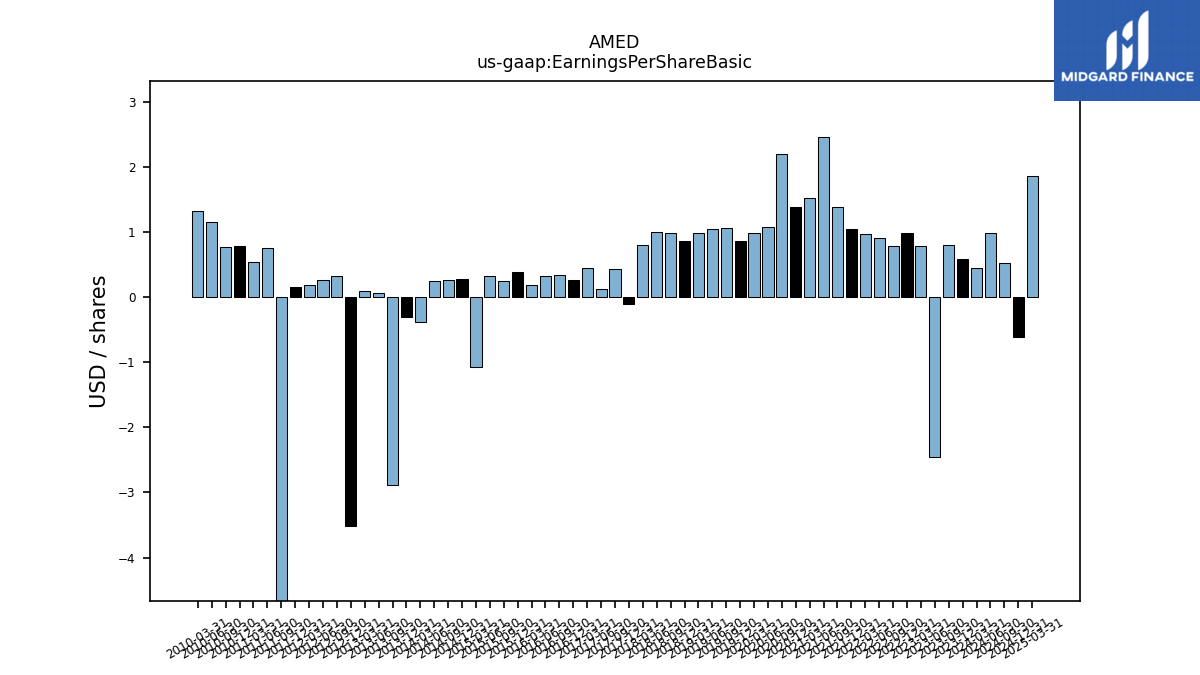
| Earnings Per Share Basic | 0.59 | 0.80 | -2.46 | 0.78 | 0.98 | 0.79 | 0.91 | 0.97 | 1.05 | 1.38 | 2.46 | 1.52 | 1.38 | 2.20 | 1.07 | 0.98 | 0.86 | 1.06 | 1.05 | 0.98 | 0.86 | 0.99 | 1.00 | 0.80 | -0.11 | 0.43 | 0.13 | 0.45 | 0.27 | 0.34 | 0.32 | 0.19 | 0.39 | 0.25 | 0.32 | -1.07 | 0.28 | 0.26 | 0.24 | -0.39 | -0.30 | -2.89 | 0.06 | 0.09 | -3.52 | 0.33 | 0.26 | 0.18 | 0.15 | -14.73 | 0.76 | 0.54 | 0.79 | NA | |
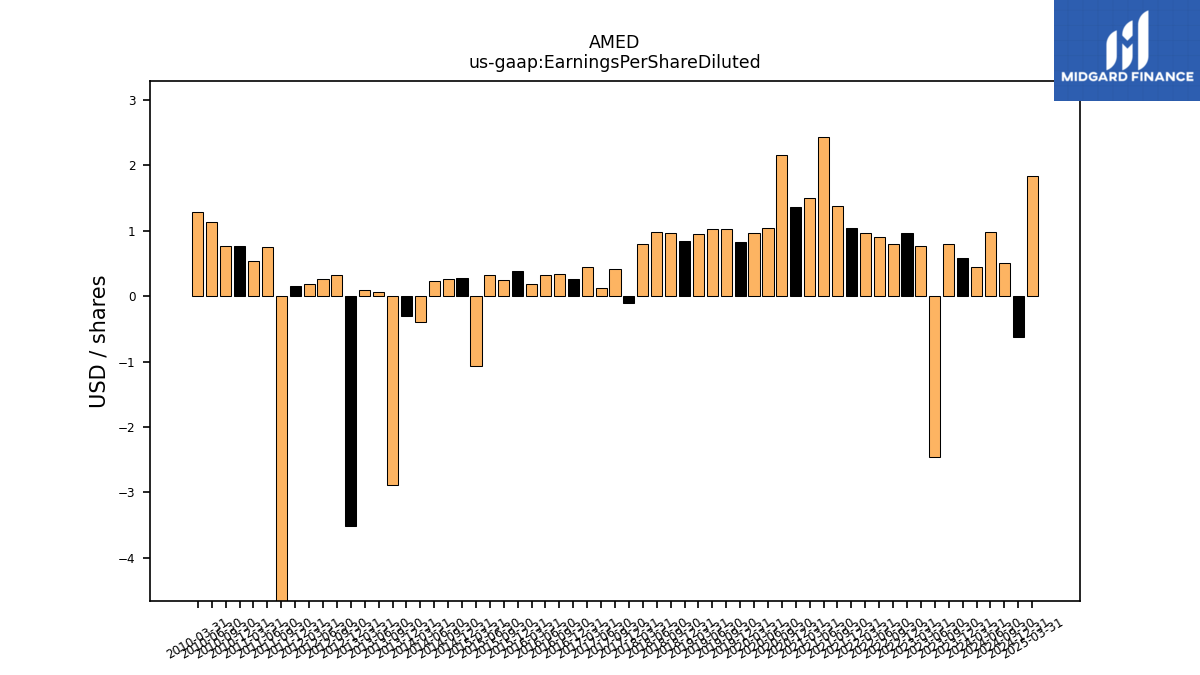
| Earnings Per Share Diluted | 0.59 | 0.79 | -2.46 | 0.77 | 0.97 | 0.79 | 0.91 | 0.97 | 1.04 | 1.37 | 2.43 | 1.50 | 1.36 | 2.16 | 1.04 | 0.96 | 0.83 | 1.03 | 1.02 | 0.95 | 0.84 | 0.96 | 0.98 | 0.79 | -0.11 | 0.42 | 0.13 | 0.44 | 0.26 | 0.34 | 0.32 | 0.19 | 0.38 | 0.25 | 0.32 | -1.07 | 0.28 | 0.26 | 0.23 | -0.39 | -0.30 | -2.89 | 0.06 | 0.09 | -3.52 | 0.33 | 0.26 | 0.18 | 0.15 | -14.73 | 0.75 | 0.53 | 0.77 | NA |
| 2023-12-31 | 2023-09-30 | 2023-06-30 | 2023-03-31 | 2022-12-31 | 2022-09-30 | 2022-06-30 | 2022-03-31 | 2021-12-31 | 2021-09-30 | 2021-06-30 | 2021-03-31 | 2020-12-31 | 2020-09-30 | 2020-06-30 | 2020-03-31 | 2019-12-31 | 2019-09-30 | 2019-06-30 | 2019-03-31 | 2018-12-31 | 2018-09-30 | 2018-06-30 | 2018-03-31 | 2017-12-31 | 2017-09-30 | 2017-06-30 | 2017-03-31 | 2016-12-31 | 2016-09-30 | 2016-06-30 | 2016-03-31 | 2015-12-31 | 2015-09-30 | 2015-06-30 | 2015-03-31 | 2014-12-31 | 2014-09-30 | 2014-06-30 | 2014-03-31 | 2013-12-31 | 2013-09-30 | 2013-06-30 | 2013-03-31 | 2012-12-31 | 2012-09-30 | 2012-06-30 | 2012-03-31 | 2011-12-31 | 2011-09-30 | 2011-06-30 | 2011-03-31 | 2010-12-31 | 2009-12-31 | ||
|---|---|---|---|---|---|---|---|---|---|---|---|---|---|---|---|---|---|---|---|---|---|---|---|---|---|---|---|---|---|---|---|---|---|---|---|---|---|---|---|---|---|---|---|---|---|---|---|---|---|---|---|---|---|---|---|
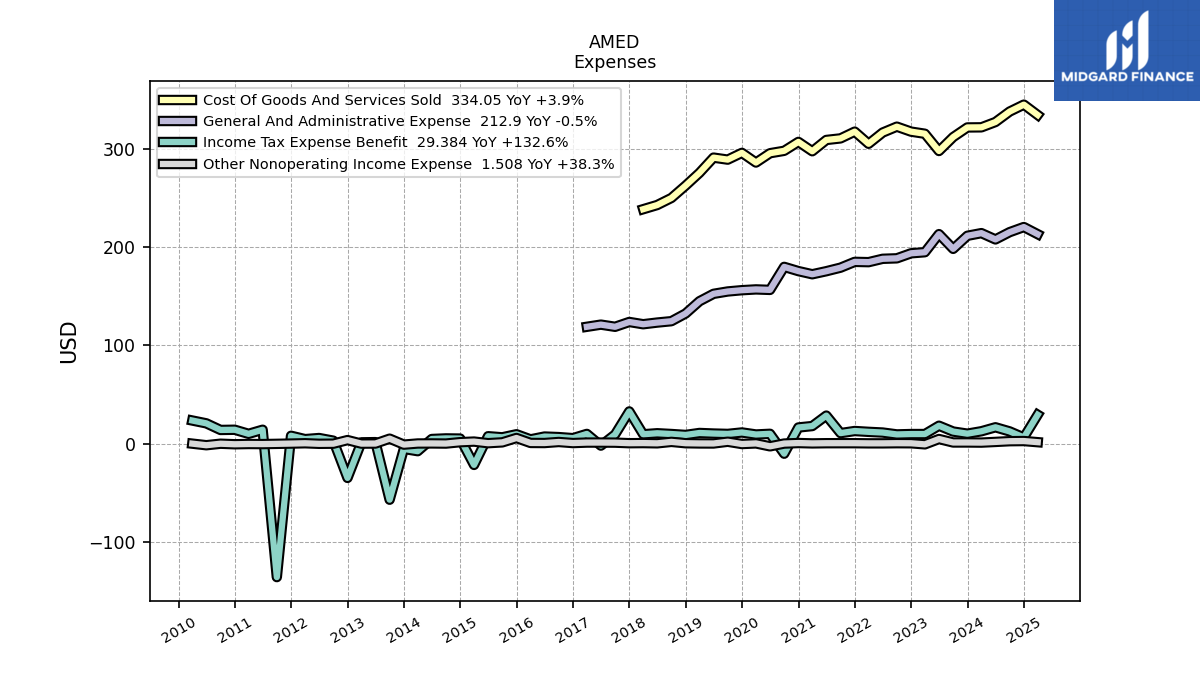
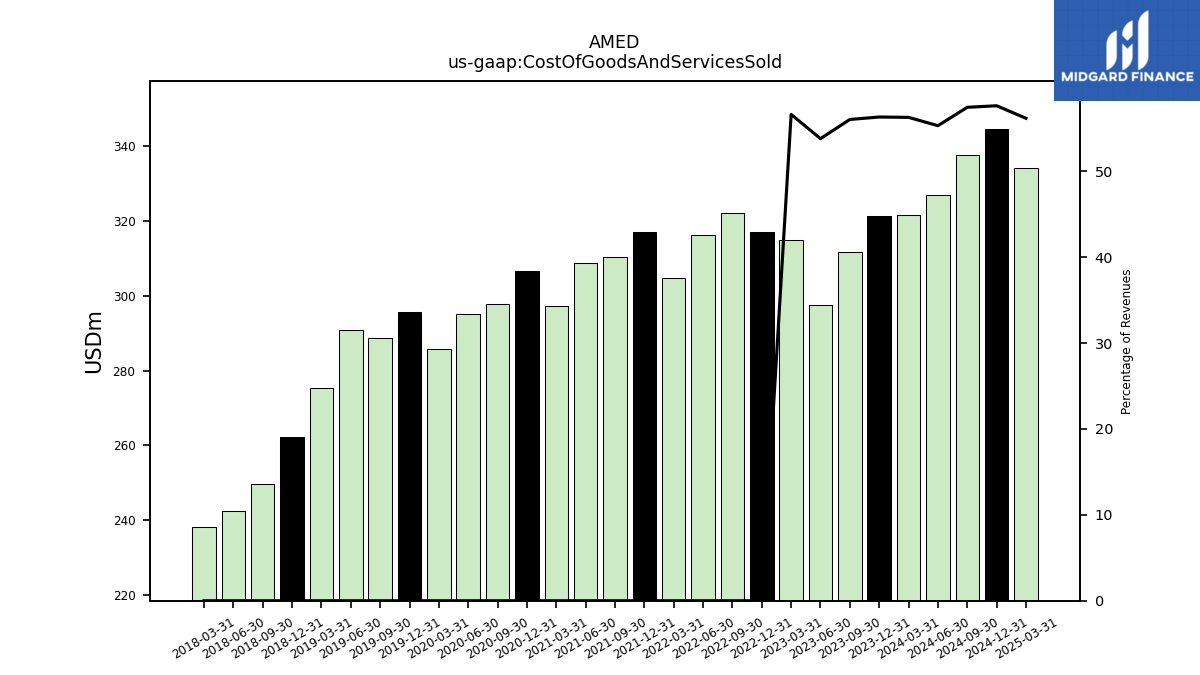
| Cost Of Goods And Services Sold | 321.42 | 311.63 | 297.45 | 315.01 | 317.17 | 322.23 | 316.21 | 304.82 | 317.17 | 310.29 | 308.69 | 297.20 | 306.74 | 297.67 | 295.23 | 285.74 | 295.60 | 288.71 | 290.75 | 275.27 | 262.29 | 249.74 | 242.56 | 238.30 | NA | NA | NA | NA | NA | NA | NA | NA | NA | NA | NA | NA | NA | NA | NA | NA | NA | NA | NA | NA | NA | NA | NA | NA | NA | NA | NA | NA | NA | NA | |
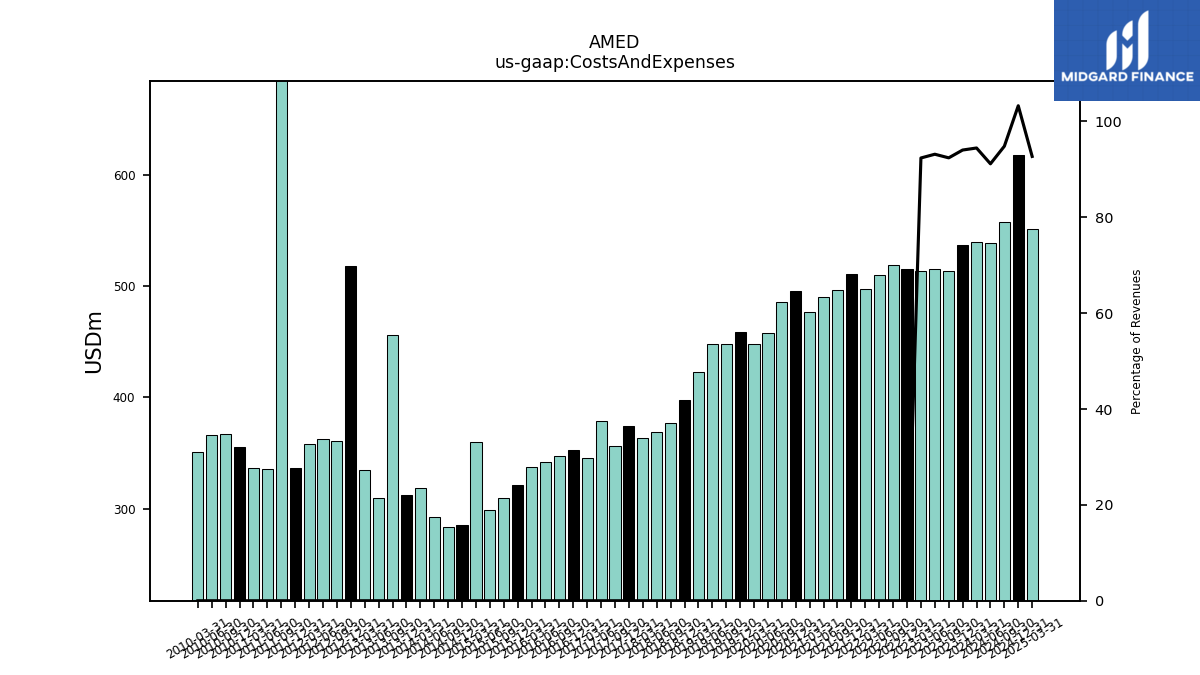
| Costs And Expenses | 536.78 | 514.03 | 515.17 | 514.01 | 515.83 | 519.06 | 510.25 | 497.30 | 511.16 | 496.71 | 490.63 | 477.00 | 495.33 | 485.57 | 457.91 | 447.81 | 459.12 | 447.79 | 448.23 | 423.00 | 397.93 | 377.45 | 368.77 | 363.26 | 374.54 | 356.79 | 378.58 | 345.29 | 352.74 | 347.24 | 342.39 | 337.75 | 321.67 | 309.74 | 298.62 | 359.68 | 285.72 | 284.03 | 292.44 | 318.31 | 312.26 | 455.93 | 309.36 | 335.01 | 517.84 | 360.94 | 362.95 | 358.38 | 336.51 | 932.18 | 335.71 | 336.82 | 355.91 | NA | |
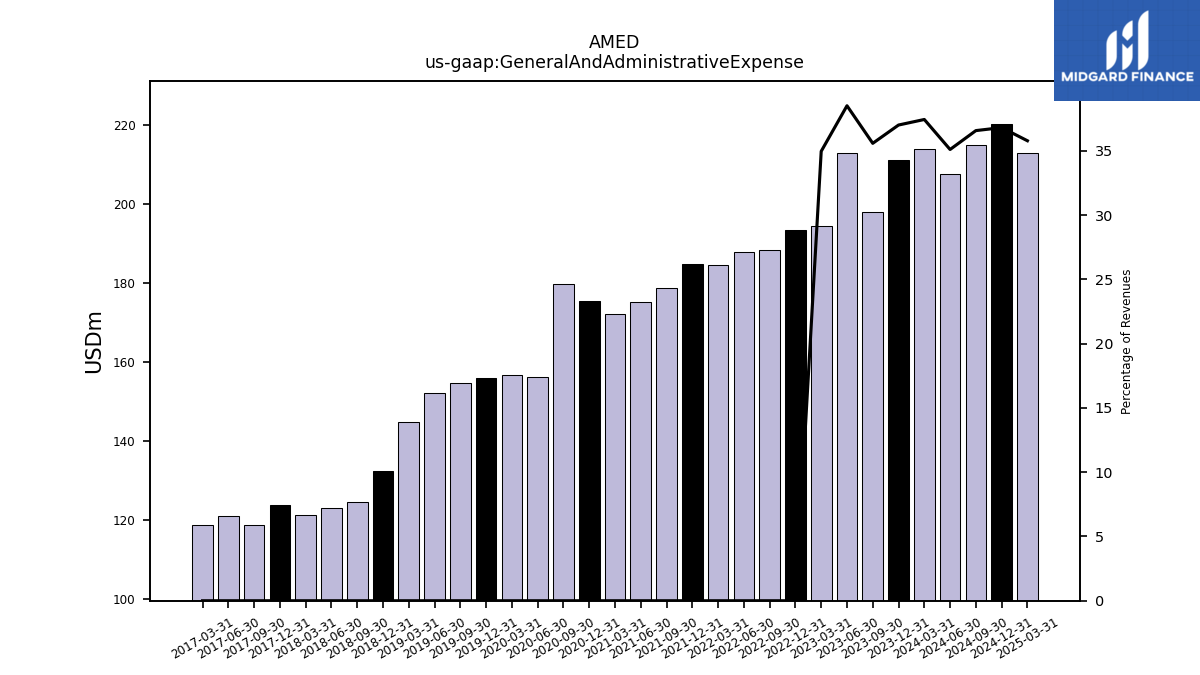
| General And Administrative Expense | 211.30 | 198.00 | 213.00 | 194.60 | 193.50 | 188.40 | 187.90 | 184.50 | 184.80 | 178.90 | 175.30 | 172.20 | 175.40 | 179.70 | 156.30 | 156.80 | 156.00 | 154.70 | 152.30 | 144.80 | 132.30 | 124.50 | 123.10 | 121.40 | 123.70 | 118.80 | 121.00 | 118.80 | NA | NA | NA | NA | NA | NA | NA | NA | NA | NA | NA | NA | NA | NA | NA | NA | NA | NA | NA | NA | NA | NA | NA | NA | NA | NA | |
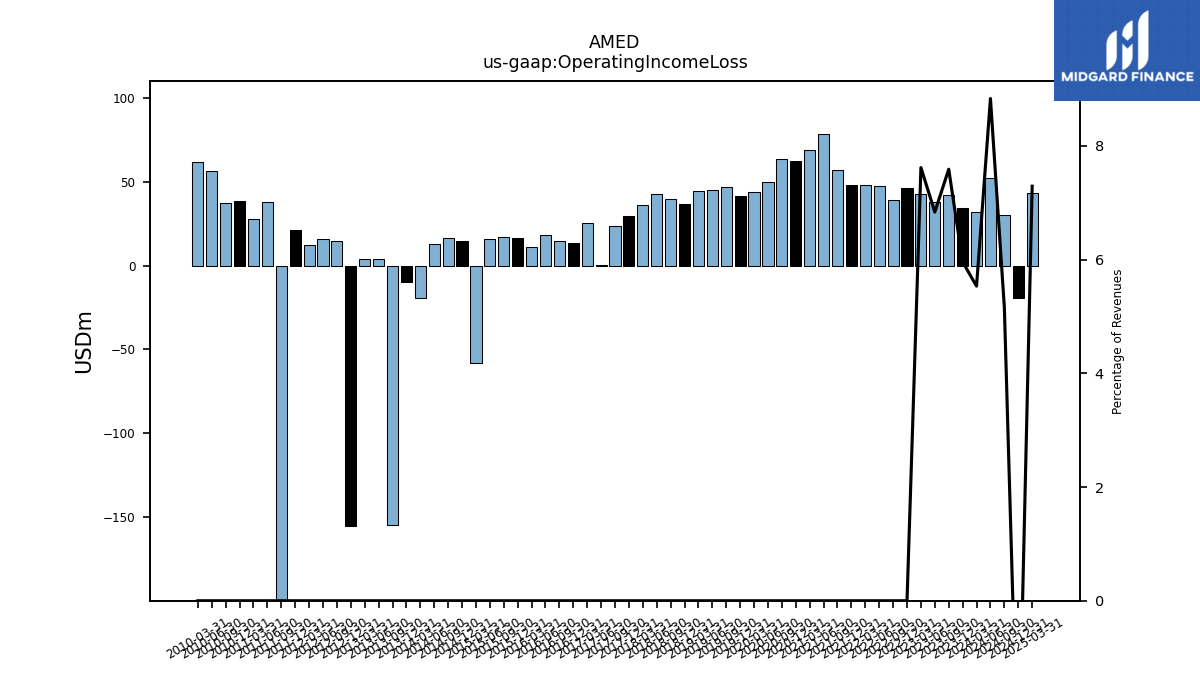
| Operating Income Loss | 34.01 | 42.21 | 37.80 | 42.38 | 46.24 | 38.93 | 47.64 | 47.96 | 48.16 | 56.77 | 78.14 | 68.85 | 62.15 | 63.31 | 49.93 | 43.87 | 41.55 | 46.84 | 44.75 | 44.32 | 36.45 | 39.90 | 42.83 | 36.01 | 29.72 | 23.37 | 0.24 | 25.16 | 13.56 | 14.36 | 18.36 | 11.06 | 16.70 | 16.71 | 15.53 | -58.10 | 14.81 | 16.25 | 12.56 | -19.57 | -10.08 | -154.29 | 3.79 | 4.17 | -154.89 | 14.68 | 15.55 | 12.46 | 20.96 | -557.32 | 38.01 | 27.48 | 38.41 | NA | |
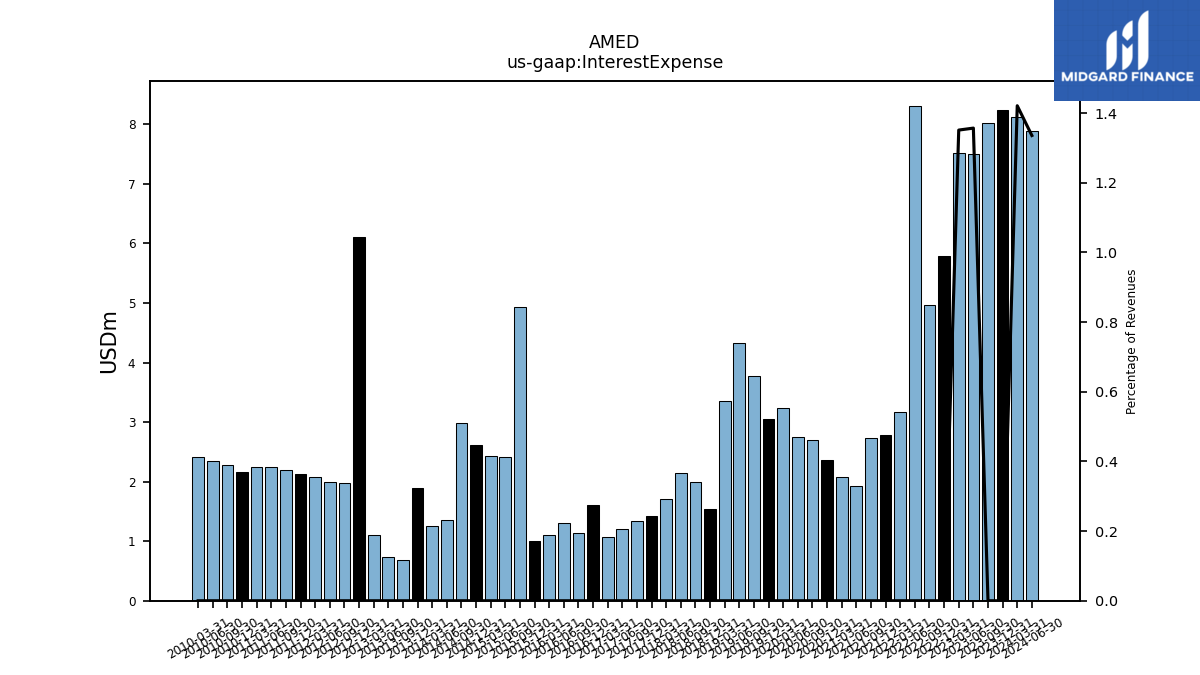
| Interest Expense | 8.23 | 8.02 | 7.50 | 7.52 | 5.78 | 4.96 | 8.31 | 3.17 | 2.79 | 2.73 | 1.93 | 2.07 | 2.36 | 2.69 | 2.75 | 3.23 | 3.06 | 3.78 | 4.33 | 3.35 | 1.54 | 1.99 | 2.14 | 1.70 | 1.43 | 1.33 | 1.20 | 1.07 | 1.61 | 1.14 | 1.30 | 1.11 | 1.00 | 4.94 | 2.42 | 2.43 | 2.61 | 2.99 | 1.35 | 1.26 | 1.89 | 0.69 | 0.73 | 1.11 | 6.11 | 1.98 | 2.00 | 2.07 | 2.13 | 2.19 | 2.25 | 2.25 | 2.16 | NA | |
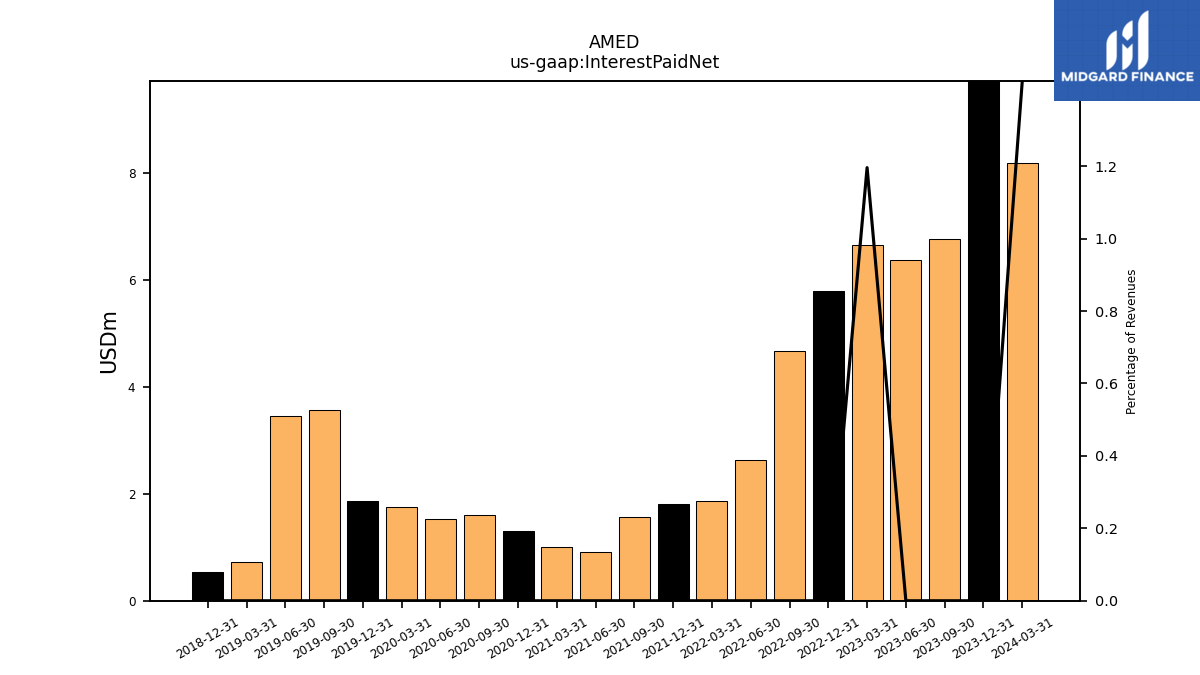
| Interest Paid Net | 9.98 | 6.76 | 6.38 | 6.65 | 5.79 | 4.66 | 2.62 | 1.86 | 1.81 | 1.56 | 0.90 | 1.01 | 1.30 | 1.61 | 1.54 | 1.75 | 1.87 | 3.57 | 3.46 | 0.72 | 0.53 | NA | NA | NA | NA | NA | NA | NA | NA | NA | NA | NA | NA | NA | NA | NA | NA | NA | NA | NA | NA | NA | NA | NA | NA | NA | NA | NA | NA | NA | NA | NA | NA | NA | |
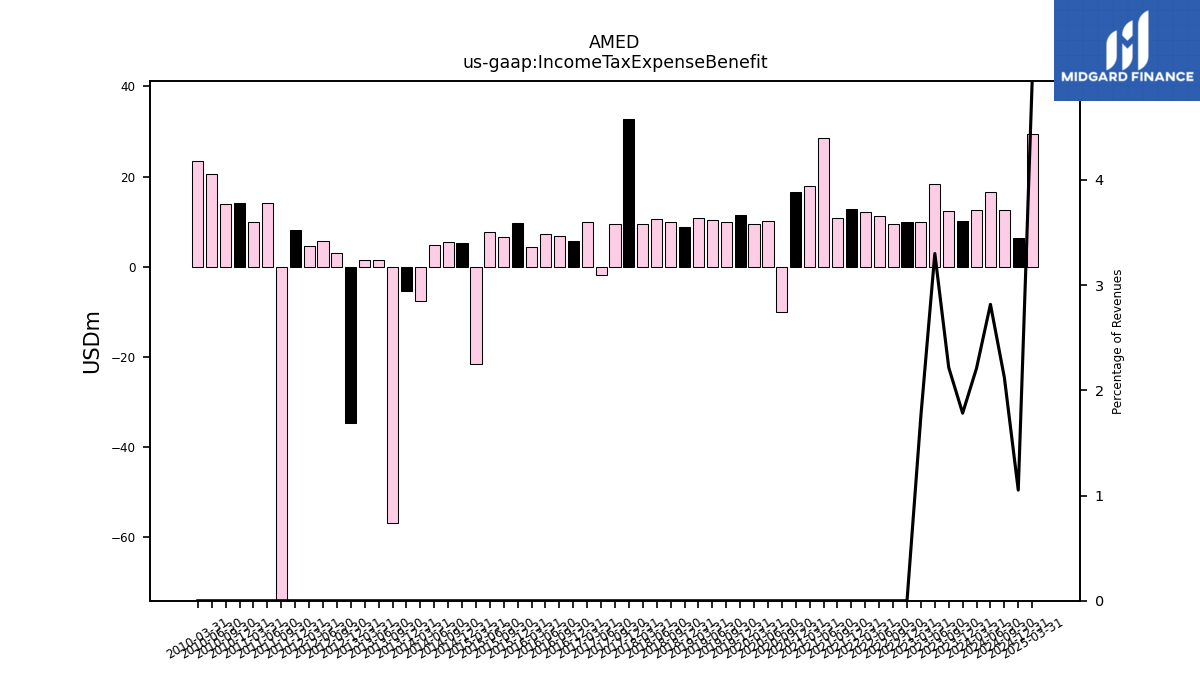
| Income Tax Expense Benefit | 10.18 | 12.33 | 18.25 | 9.80 | 9.79 | 9.42 | 11.32 | 12.02 | 12.87 | 10.73 | 28.55 | 17.91 | 16.46 | -10.20 | 10.03 | 9.35 | 11.40 | 9.92 | 10.31 | 10.88 | 8.88 | 9.82 | 10.60 | 9.56 | 32.79 | 9.36 | -1.96 | 9.92 | 5.61 | 6.69 | 7.24 | 4.39 | 9.56 | 6.46 | 7.57 | -21.59 | 5.19 | 5.36 | 4.74 | -7.62 | -5.32 | -56.96 | 1.57 | 1.36 | -34.81 | 3.05 | 5.74 | 4.62 | 8.03 | -135.64 | 14.18 | 10.01 | 14.16 | NA | |
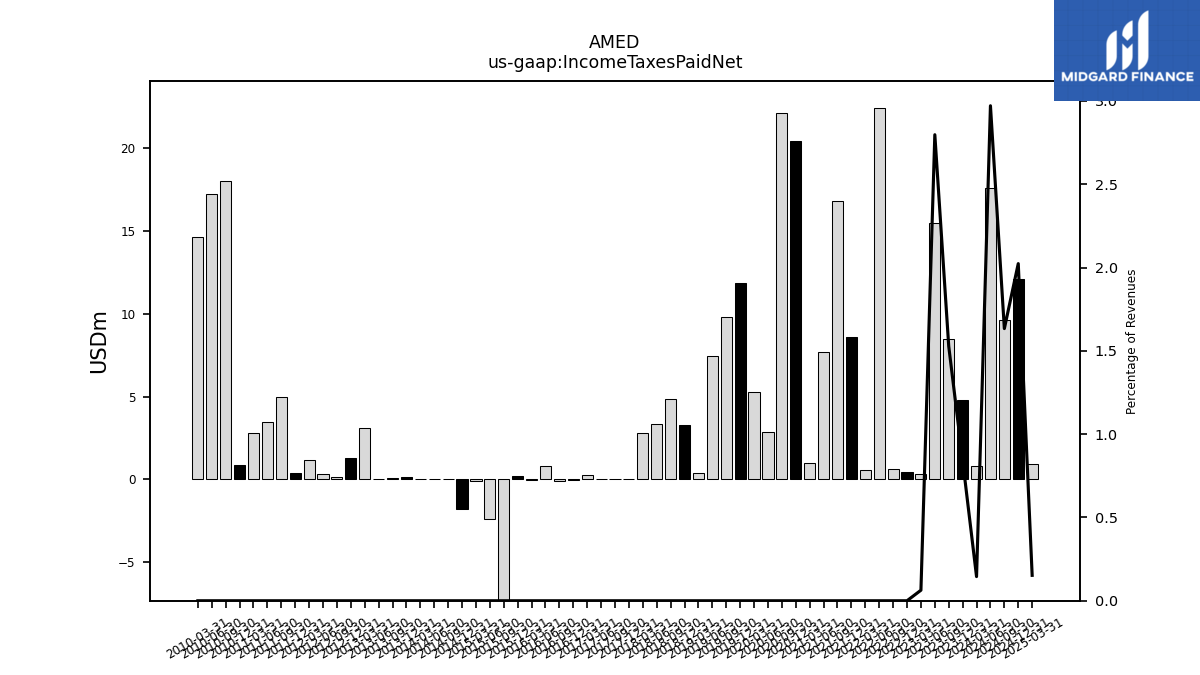
| Income Taxes Paid Net | 4.81 | 8.50 | 15.47 | 0.35 | 0.43 | 0.60 | 22.43 | 0.55 | 8.62 | 16.82 | 7.70 | 0.97 | 20.43 | 22.14 | 2.88 | 5.27 | 11.87 | 9.81 | 7.45 | 0.40 | 3.26 | 4.87 | 3.34 | 2.81 | 0.00 | 0.03 | 0.00 | 0.28 | -0.00 | -0.07 | 0.83 | -0.01 | 0.20 | -9.89 | -2.41 | -0.09 | -1.78 | 0.01 | 0.00 | 0.00 | 0.15 | 0.10 | 0.00 | 3.13 | 1.32 | 0.15 | 0.32 | 1.15 | 0.38 | 5.00 | 3.48 | 2.79 | 0.90 | NA | |
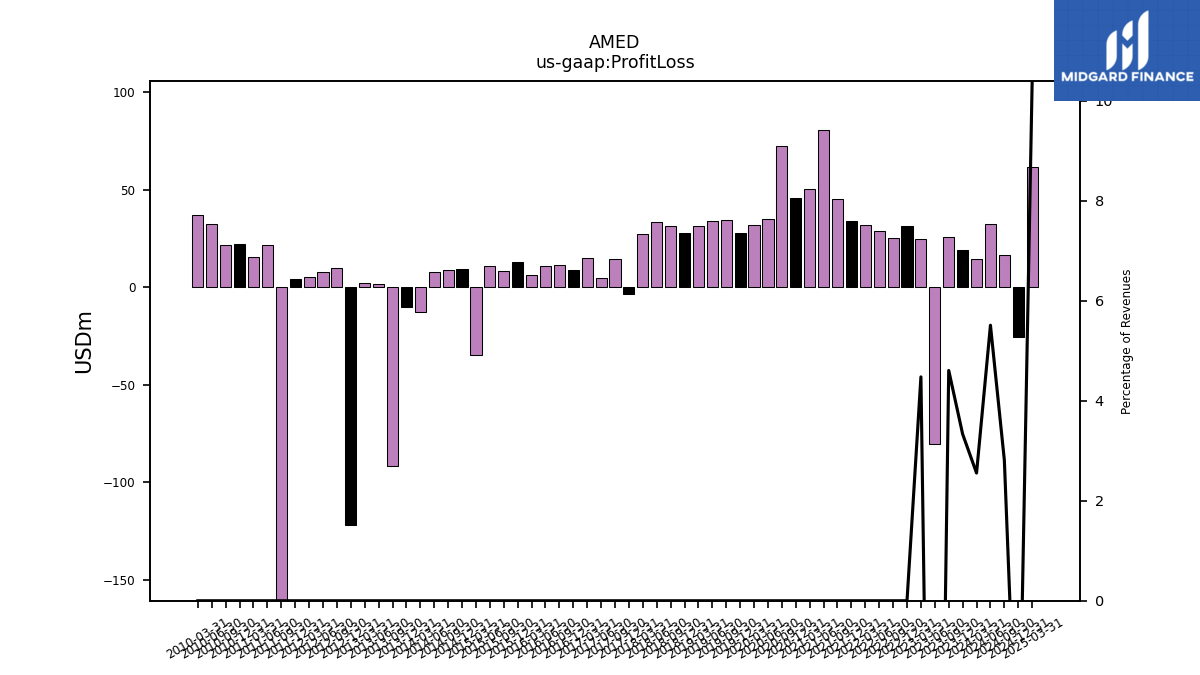
| Profit Loss | 19.02 | 25.62 | -80.48 | 24.91 | 31.55 | 25.40 | 29.04 | 31.71 | 34.01 | 45.24 | 80.62 | 50.29 | 45.58 | 72.41 | 35.15 | 32.05 | 27.97 | 34.33 | 34.04 | 31.57 | 27.72 | 31.55 | 33.54 | 27.32 | -3.71 | 14.66 | 4.53 | 15.20 | 8.97 | 11.50 | 10.84 | 6.32 | 13.07 | 8.57 | 10.87 | -34.83 | 9.33 | 8.60 | 7.67 | -12.51 | -9.98 | -91.78 | 1.85 | 2.13 | -122.01 | 9.99 | 7.97 | 5.46 | 4.32 | -423.70 | 21.71 | 15.32 | 22.27 | NA | |
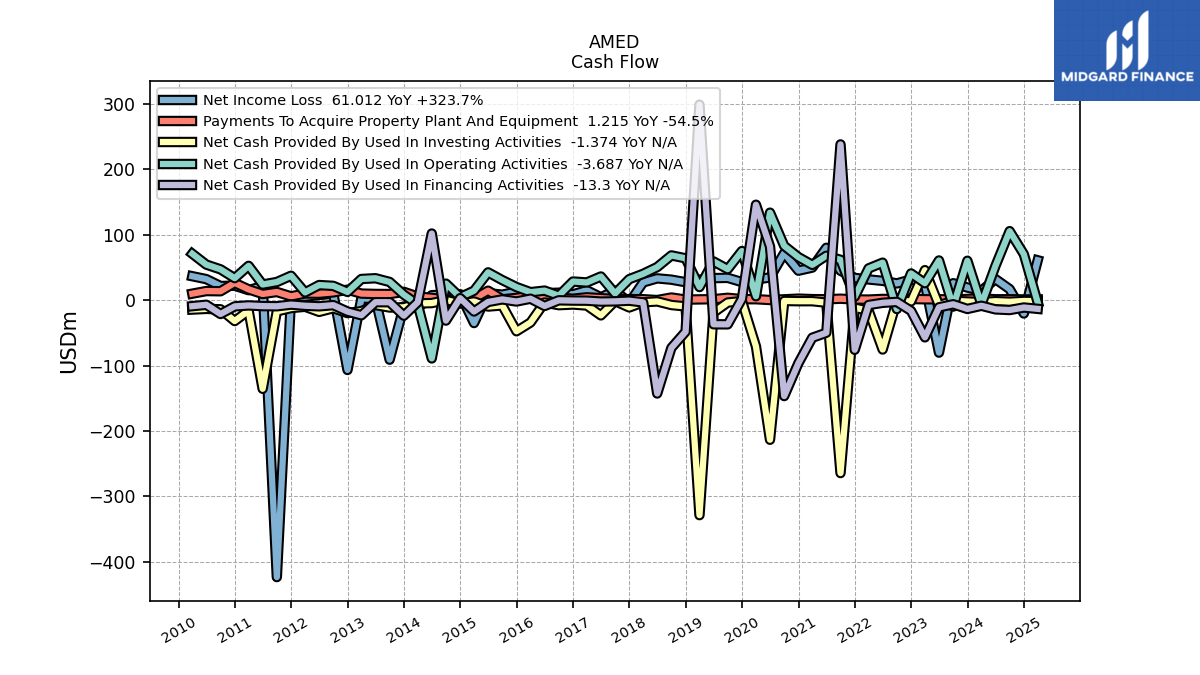
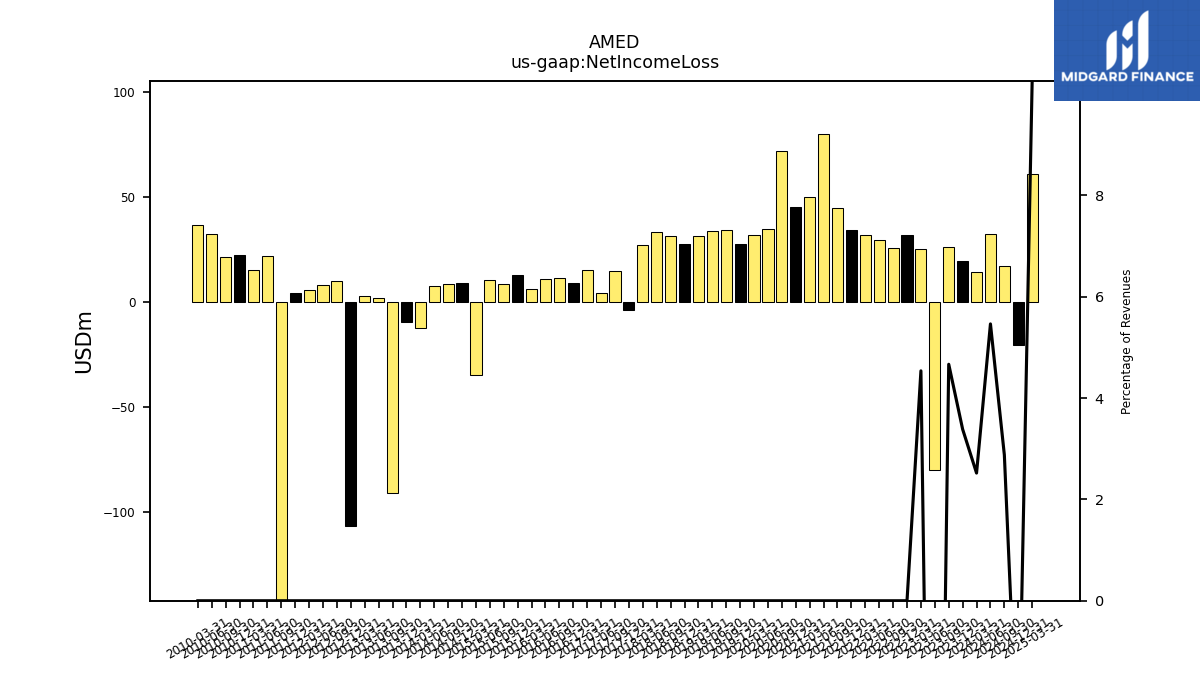
| Net Income Loss | 19.32 | 25.96 | -80.28 | 25.25 | 31.72 | 25.64 | 29.58 | 31.67 | 34.05 | 45.01 | 80.15 | 49.87 | 45.10 | 71.98 | 34.67 | 31.80 | 27.70 | 34.13 | 33.74 | 31.30 | 27.50 | 31.38 | 33.35 | 27.16 | -3.80 | 14.56 | 4.46 | 15.13 | 8.90 | 11.44 | 10.70 | 6.21 | 12.90 | 8.44 | 10.64 | -35.01 | 9.10 | 8.44 | 7.62 | -12.42 | -9.60 | -91.07 | 1.84 | 2.68 | -106.80 | 9.92 | 7.88 | 5.42 | 4.30 | -423.72 | 21.66 | 15.29 | 22.20 | NA |
| 2023-12-31 | 2023-09-30 | 2023-06-30 | 2023-03-31 | 2022-12-31 | 2022-09-30 | 2022-06-30 | 2022-03-31 | 2021-12-31 | 2021-09-30 | 2021-06-30 | 2021-03-31 | 2020-12-31 | 2020-09-30 | 2020-06-30 | 2020-03-31 | 2019-12-31 | 2019-09-30 | 2019-06-30 | 2019-03-31 | 2018-12-31 | 2018-09-30 | 2018-06-30 | 2018-03-31 | 2017-12-31 | 2017-09-30 | 2017-06-30 | 2017-03-31 | 2016-12-31 | 2016-09-30 | 2016-06-30 | 2016-03-31 | 2015-12-31 | 2015-09-30 | 2015-06-30 | 2015-03-31 | 2014-12-31 | 2014-09-30 | 2014-06-30 | 2014-03-31 | 2013-12-31 | 2013-09-30 | 2013-06-30 | 2013-03-31 | 2012-12-31 | 2012-09-30 | 2012-06-30 | 2012-03-31 | 2011-12-31 | 2011-09-30 | 2011-06-30 | 2011-03-31 | 2010-12-31 | 2009-12-31 | ||
|---|---|---|---|---|---|---|---|---|---|---|---|---|---|---|---|---|---|---|---|---|---|---|---|---|---|---|---|---|---|---|---|---|---|---|---|---|---|---|---|---|---|---|---|---|---|---|---|---|---|---|---|---|---|---|---|
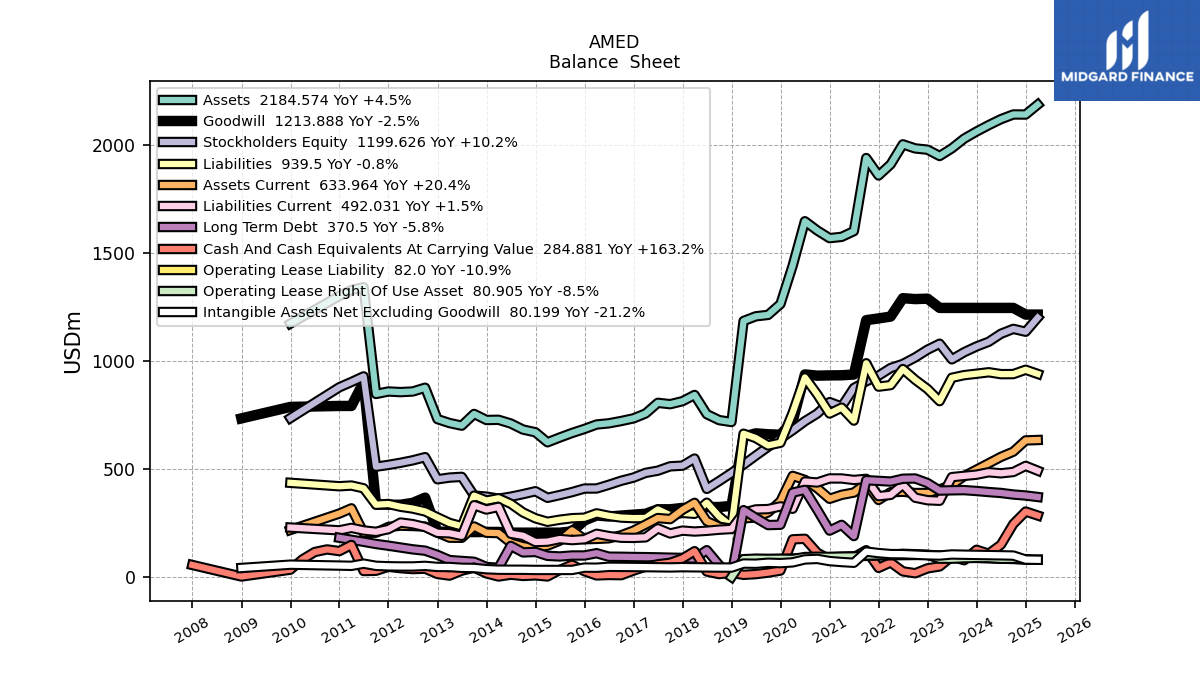
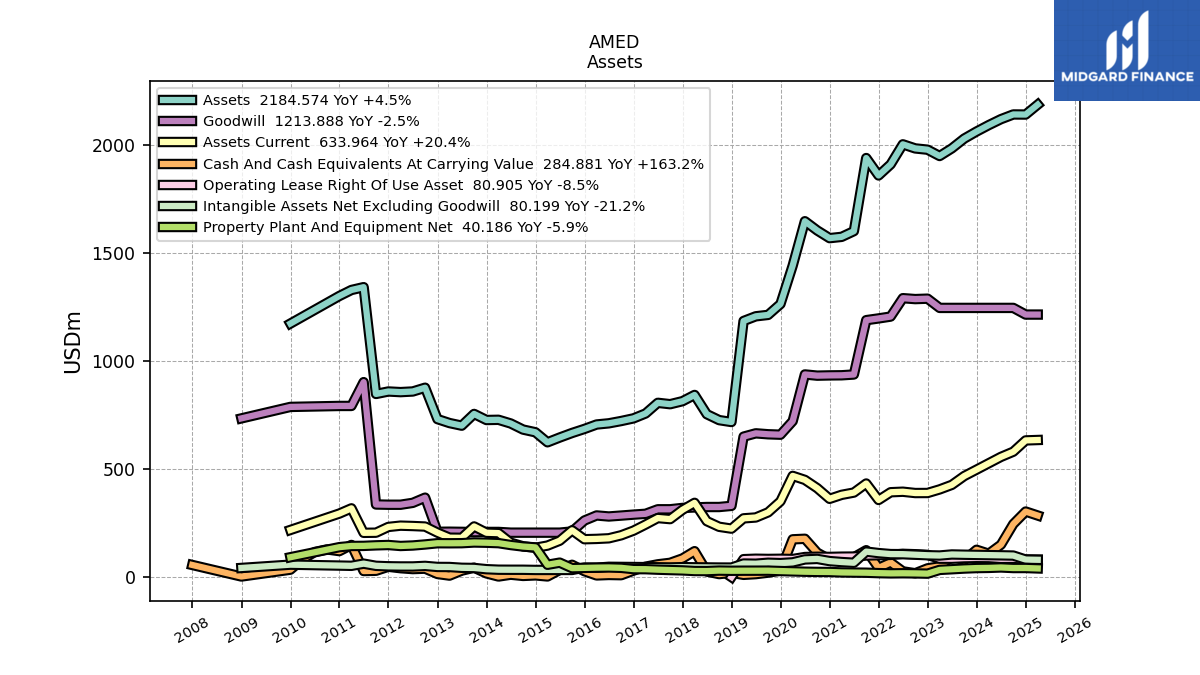
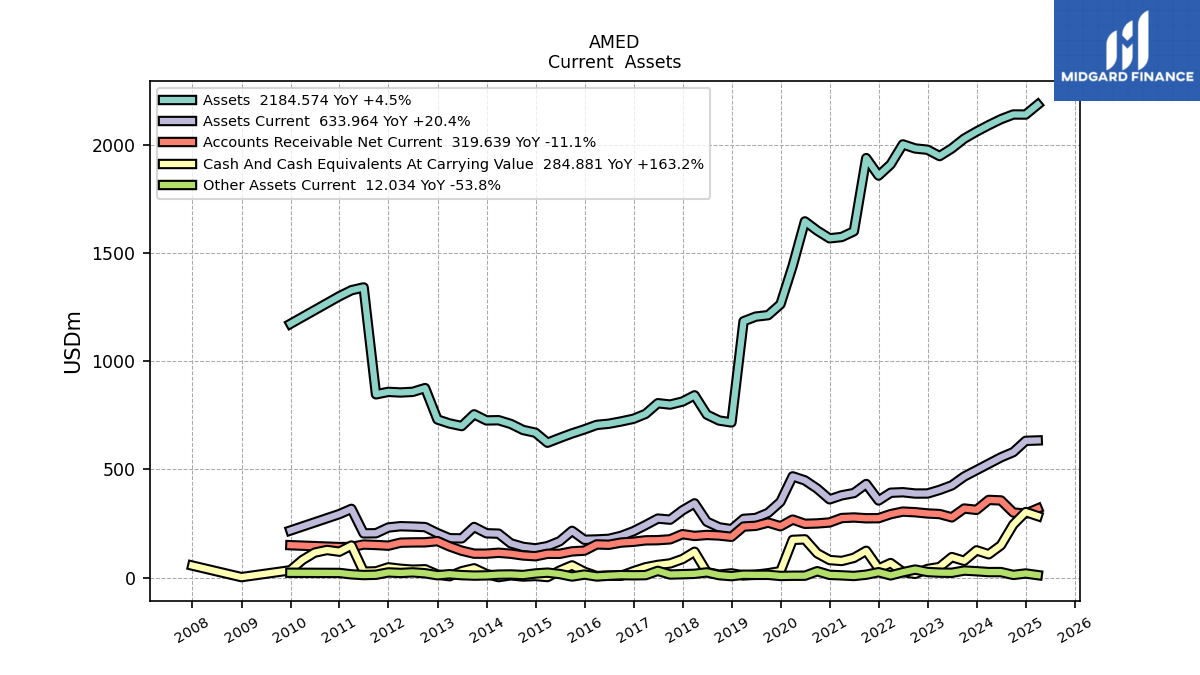
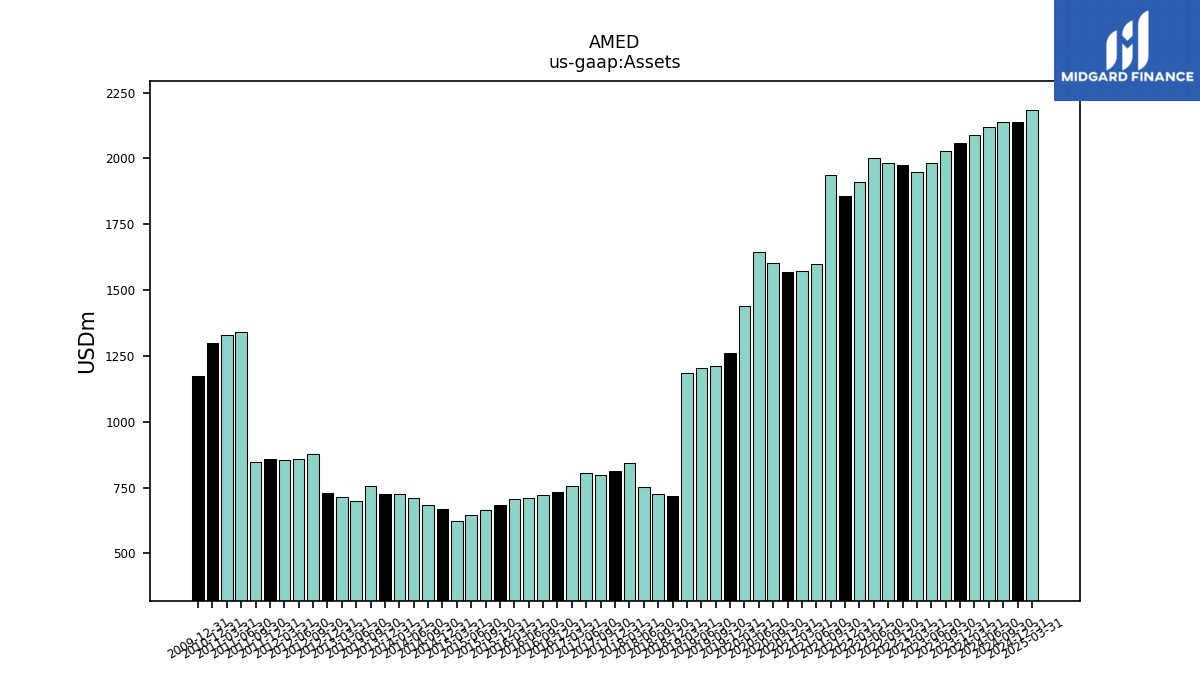
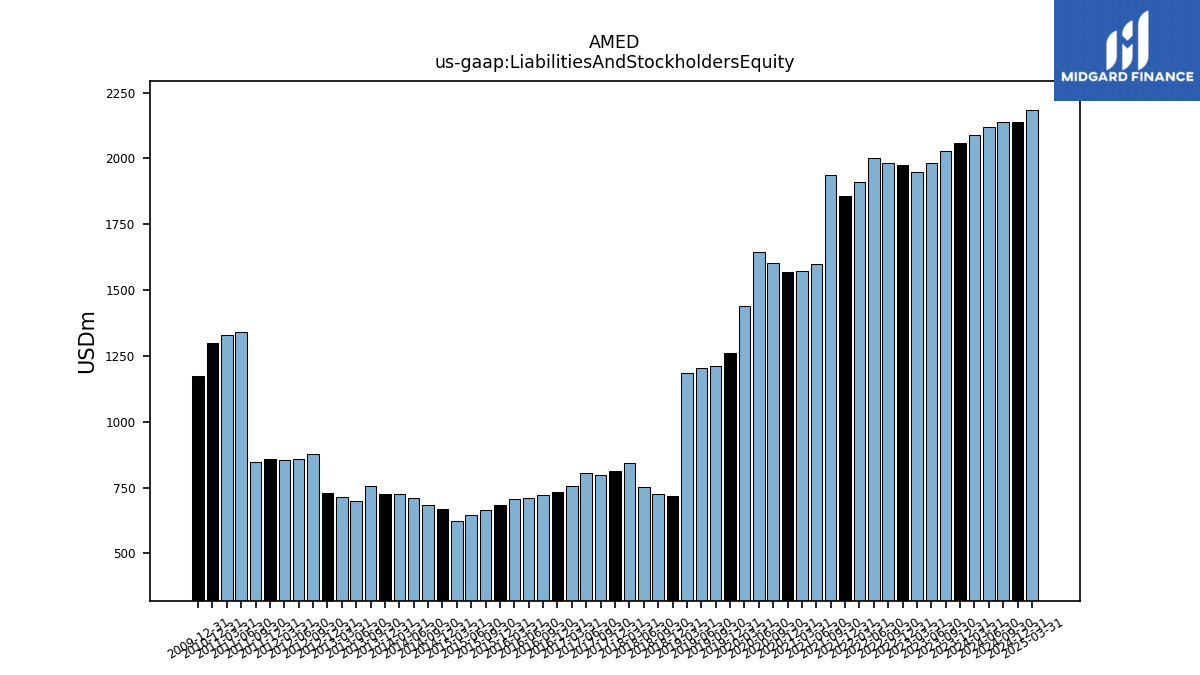
| Assets | 2060.17 | 2027.42 | 1982.40 | 1946.96 | 1976.24 | 1982.13 | 2000.99 | 1908.39 | 1856.97 | 1937.64 | 1599.56 | 1573.21 | 1567.20 | 1602.72 | 1645.49 | 1440.08 | 1262.74 | 1212.38 | 1205.86 | 1184.24 | 717.12 | 725.89 | 753.32 | 842.29 | 813.48 | 799.53 | 805.87 | 756.63 | 734.03 | 721.73 | 711.10 | 705.64 | 685.09 | 666.44 | 645.43 | 623.33 | 669.74 | 682.21 | 710.30 | 727.39 | 726.41 | 754.57 | 700.25 | 712.32 | 730.60 | 875.72 | 858.30 | 855.38 | 858.28 | 846.78 | 1340.65 | 1327.56 | 1299.83 | 1172.35 | |
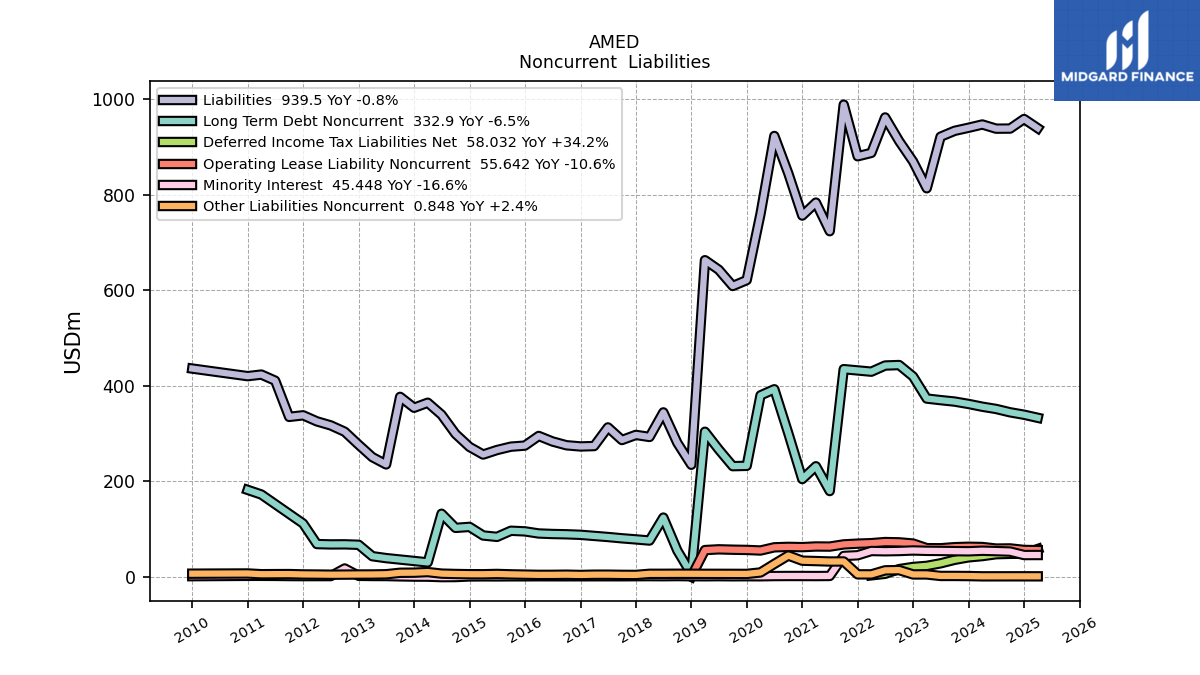
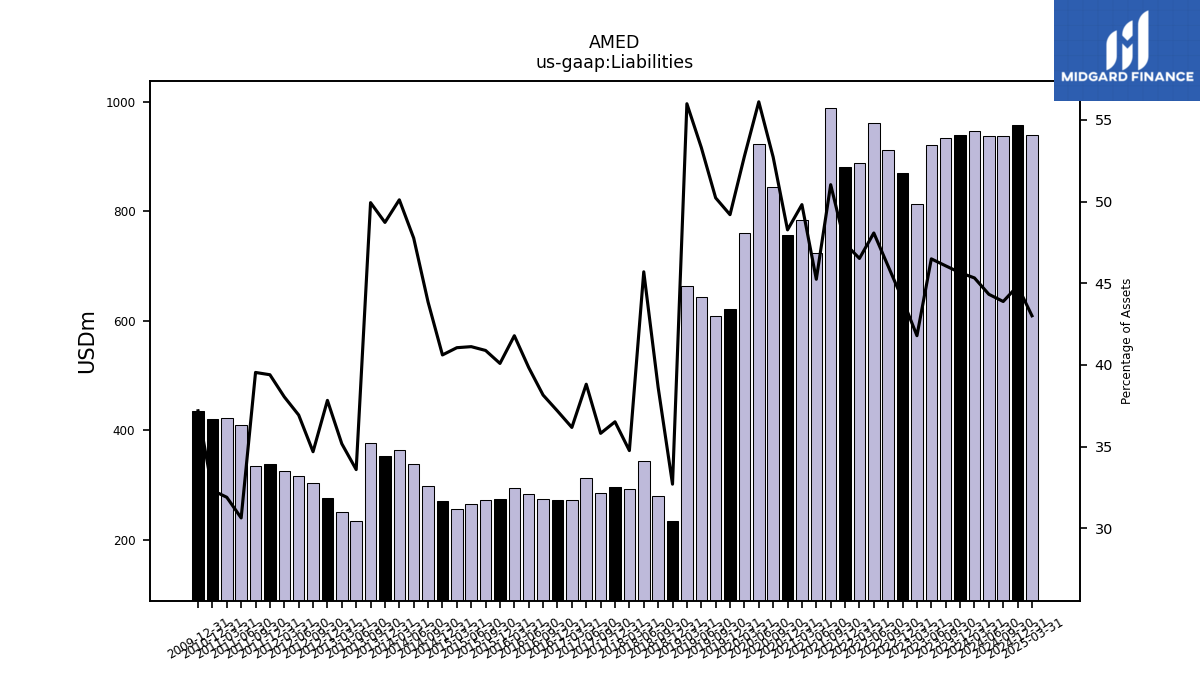
| Liabilities | 940.39 | 933.90 | 921.64 | 813.61 | 869.67 | 912.52 | 961.99 | 887.74 | 880.64 | 988.84 | 723.68 | 783.63 | 756.46 | 844.98 | 923.23 | 759.94 | 621.23 | 608.91 | 642.92 | 663.04 | 234.49 | 280.40 | 344.26 | 292.73 | 297.06 | 286.31 | 312.81 | 273.68 | 272.89 | 275.35 | 283.28 | 294.87 | 274.65 | 272.46 | 265.38 | 255.89 | 271.98 | 299.11 | 339.25 | 364.48 | 353.93 | 376.78 | 235.22 | 250.53 | 276.36 | 303.74 | 316.98 | 325.41 | 338.14 | 334.80 | 410.67 | 423.43 | 420.11 | 436.02 | |
| Liabilities And Stockholders Equity | 2060.17 | 2027.42 | 1982.40 | 1946.96 | 1976.24 | 1982.13 | 2000.99 | 1908.39 | 1856.97 | 1937.64 | 1599.56 | 1573.21 | 1567.20 | 1602.72 | 1645.49 | 1440.08 | 1262.74 | 1212.38 | 1205.86 | 1184.24 | 717.12 | 725.89 | 753.32 | 842.29 | 813.48 | 799.53 | 805.87 | 756.63 | 734.03 | 721.73 | 711.10 | 705.64 | 685.09 | 666.44 | 645.43 | 623.33 | 669.74 | 682.21 | 710.30 | 727.39 | 726.41 | 754.57 | 700.25 | 712.32 | 730.60 | 875.72 | 858.30 | 855.38 | 858.28 | 846.78 | 1340.65 | 1327.56 | 1299.83 | 1172.35 | |
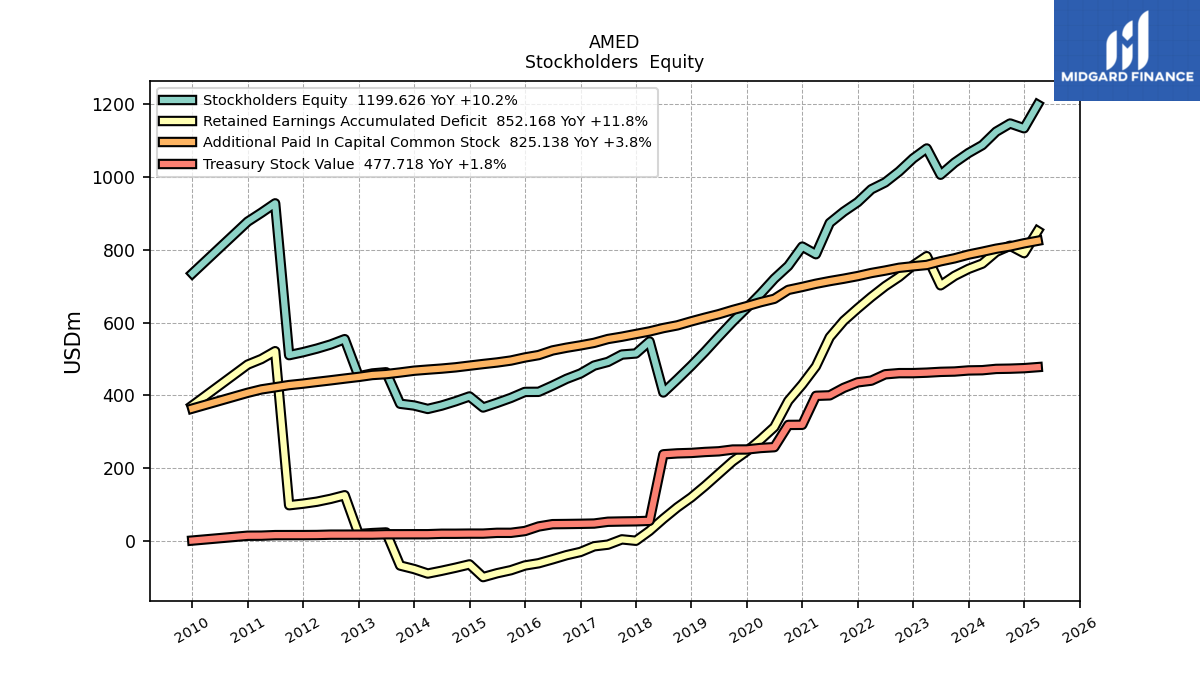
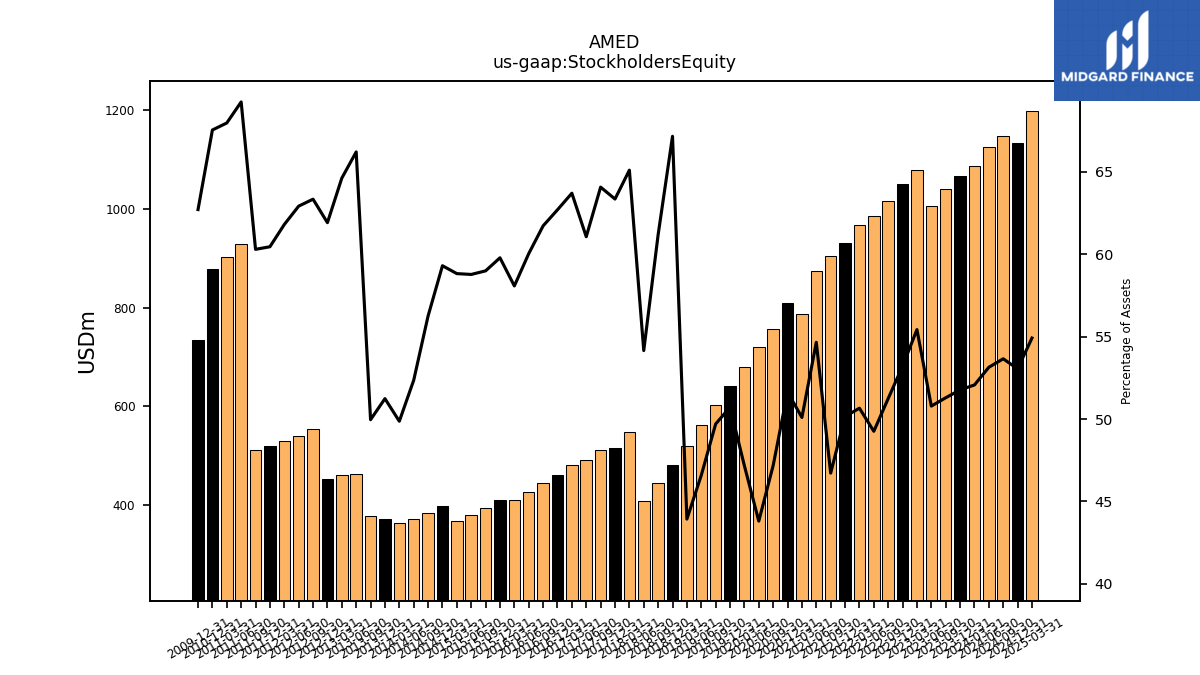
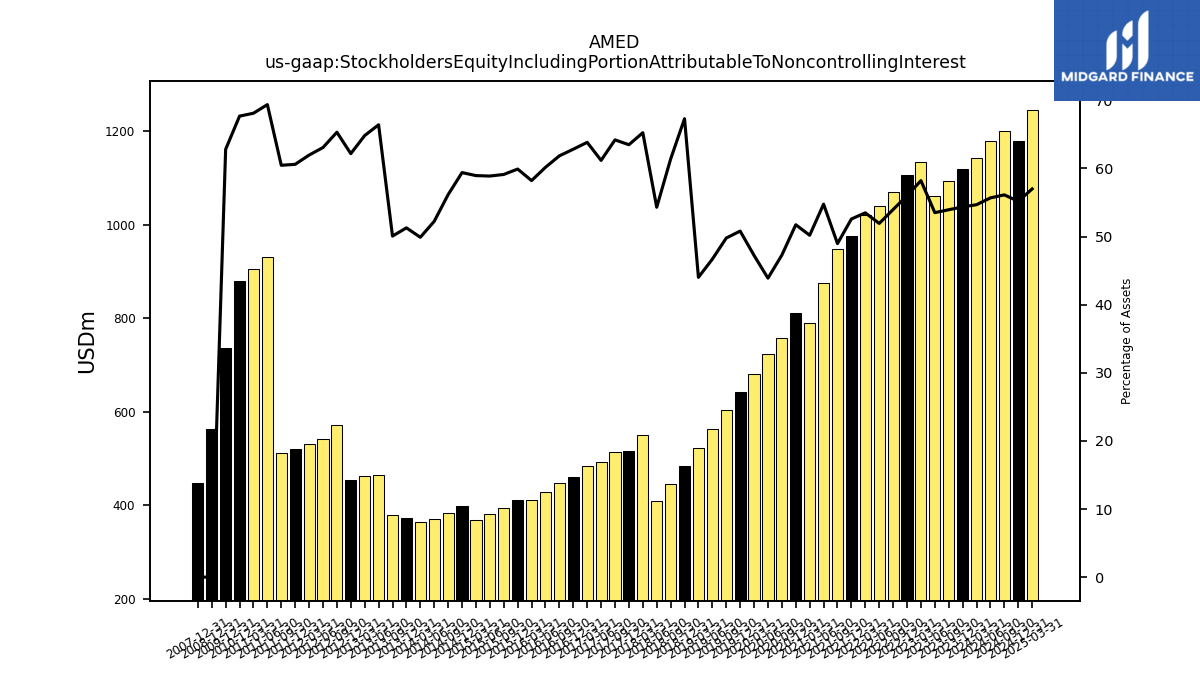
| Stockholders Equity | 1066.51 | 1039.91 | 1006.78 | 1079.12 | 1051.57 | 1015.74 | 985.65 | 966.76 | 931.35 | 905.26 | 874.27 | 788.15 | 809.22 | 756.21 | 720.85 | 679.20 | 640.45 | 602.56 | 561.78 | 520.25 | 481.58 | 444.14 | 407.95 | 548.32 | 515.32 | 512.26 | 492.07 | 481.98 | 460.20 | 445.45 | 426.91 | 409.81 | 409.57 | 393.13 | 379.34 | 366.66 | 397.17 | 383.76 | 371.86 | 362.73 | 372.20 | 377.00 | 463.60 | 460.27 | 452.34 | 554.67 | 540.02 | 528.65 | 518.87 | 510.57 | 928.23 | 902.23 | 877.86 | 735.17 |
| 2023-12-31 | 2023-09-30 | 2023-06-30 | 2023-03-31 | 2022-12-31 | 2022-09-30 | 2022-06-30 | 2022-03-31 | 2021-12-31 | 2021-09-30 | 2021-06-30 | 2021-03-31 | 2020-12-31 | 2020-09-30 | 2020-06-30 | 2020-03-31 | 2019-12-31 | 2019-09-30 | 2019-06-30 | 2019-03-31 | 2018-12-31 | 2018-09-30 | 2018-06-30 | 2018-03-31 | 2017-12-31 | 2017-09-30 | 2017-06-30 | 2017-03-31 | 2016-12-31 | 2016-09-30 | 2016-06-30 | 2016-03-31 | 2015-12-31 | 2015-09-30 | 2015-06-30 | 2015-03-31 | 2014-12-31 | 2014-09-30 | 2014-06-30 | 2014-03-31 | 2013-12-31 | 2013-09-30 | 2013-06-30 | 2013-03-31 | 2012-12-31 | 2012-09-30 | 2012-06-30 | 2012-03-31 | 2011-12-31 | 2011-09-30 | 2011-06-30 | 2011-03-31 | 2010-12-31 | 2009-12-31 | ||
|---|---|---|---|---|---|---|---|---|---|---|---|---|---|---|---|---|---|---|---|---|---|---|---|---|---|---|---|---|---|---|---|---|---|---|---|---|---|---|---|---|---|---|---|---|---|---|---|---|---|---|---|---|---|---|---|
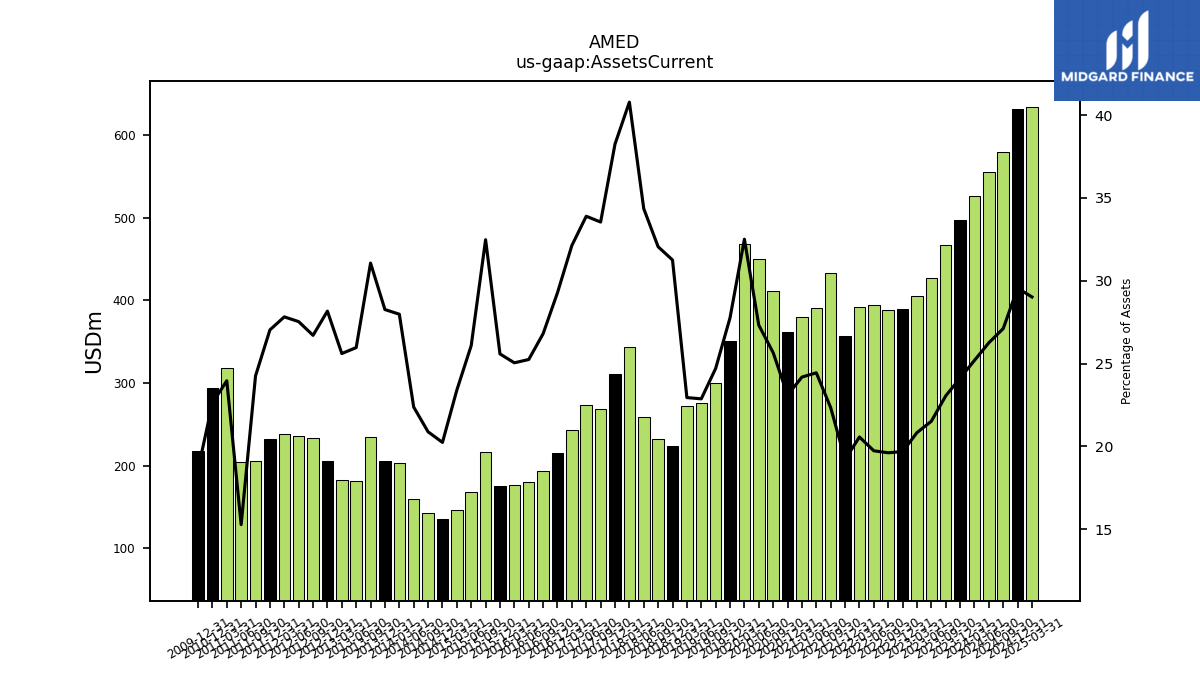
| Assets Current | 496.94 | 467.23 | 426.54 | 405.56 | 388.96 | 388.78 | 394.87 | 392.49 | 356.68 | 432.88 | 390.96 | 380.45 | 361.98 | 411.25 | 449.54 | 468.13 | 350.55 | 299.52 | 275.79 | 271.73 | 224.12 | 232.67 | 258.77 | 343.52 | 311.16 | 268.19 | 273.14 | 243.10 | 214.91 | 193.43 | 179.52 | 176.73 | 175.26 | 216.44 | 168.37 | 145.84 | 135.56 | 142.43 | 158.91 | 203.52 | 205.28 | 234.41 | 181.81 | 182.39 | 205.79 | 233.85 | 236.30 | 237.96 | 232.02 | 205.41 | 204.78 | 318.10 | 293.93 | 218.04 | |
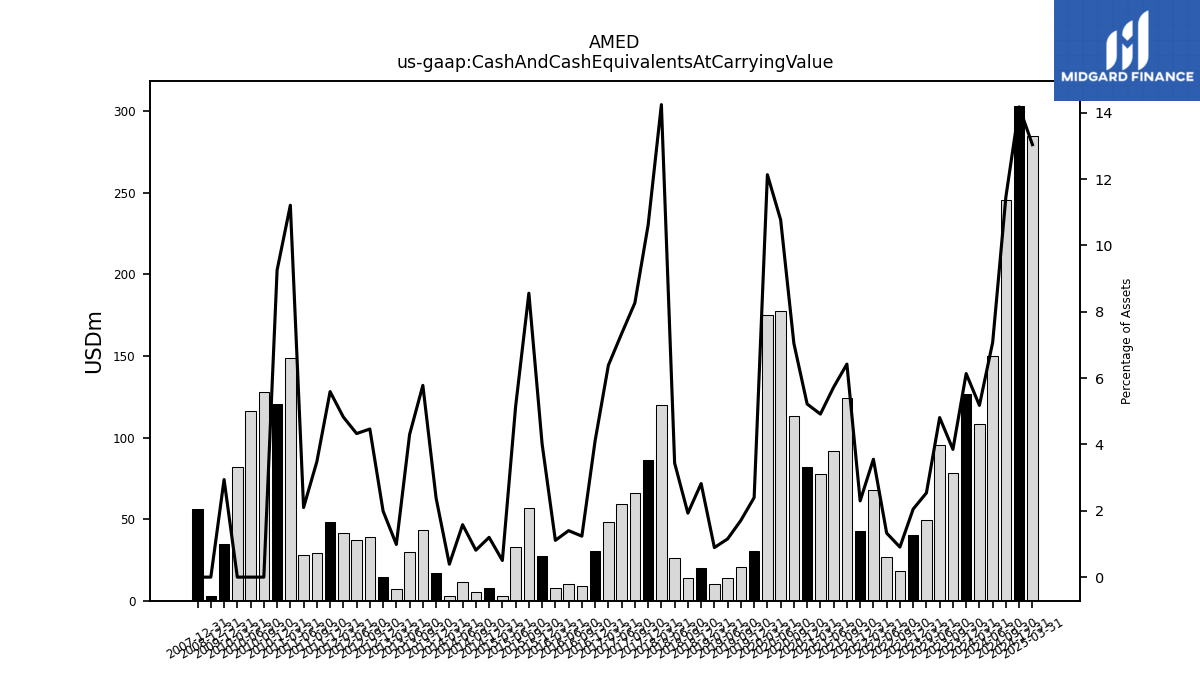
| Cash And Cash Equivalents At Carrying Value | 126.45 | 78.11 | 95.38 | 49.44 | 40.54 | 17.96 | 26.57 | 67.83 | 42.69 | 124.46 | 91.65 | 77.34 | 81.81 | 112.90 | 177.28 | 174.76 | 30.29 | 20.76 | 13.90 | 10.55 | 20.23 | 14.01 | 25.90 | 120.00 | 86.36 | 66.11 | 59.16 | 48.33 | 30.20 | 8.91 | 9.97 | 7.82 | 27.50 | 57.05 | 33.20 | 3.13 | 8.03 | 5.54 | 11.22 | 2.84 | 17.30 | 43.63 | 30.12 | 7.02 | 14.54 | 39.11 | 37.16 | 41.29 | 48.00 | 29.46 | 28.13 | 148.87 | 120.30 | 34.48 | |
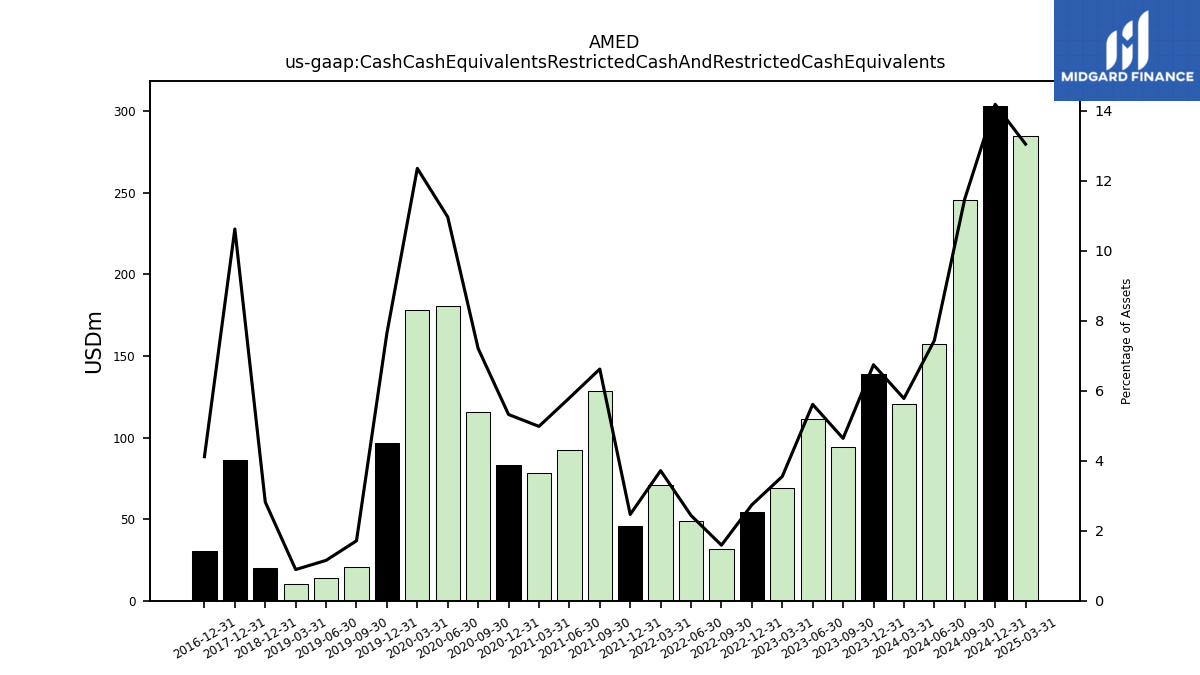
| Cash Cash Equivalents Restricted Cash And Restricted Cash Equivalents | 138.86 | 94.02 | 111.16 | 69.10 | 54.13 | 31.46 | 48.76 | 70.91 | 45.77 | 128.21 | 92.65 | 78.34 | 83.36 | 115.45 | 180.33 | 177.81 | 96.49 | 20.76 | 13.90 | 10.55 | 20.23 | NA | NA | NA | 86.36 | NA | NA | NA | 30.20 | NA | NA | NA | NA | NA | NA | NA | NA | NA | NA | NA | NA | NA | NA | NA | NA | NA | NA | NA | NA | NA | NA | NA | NA | NA | |
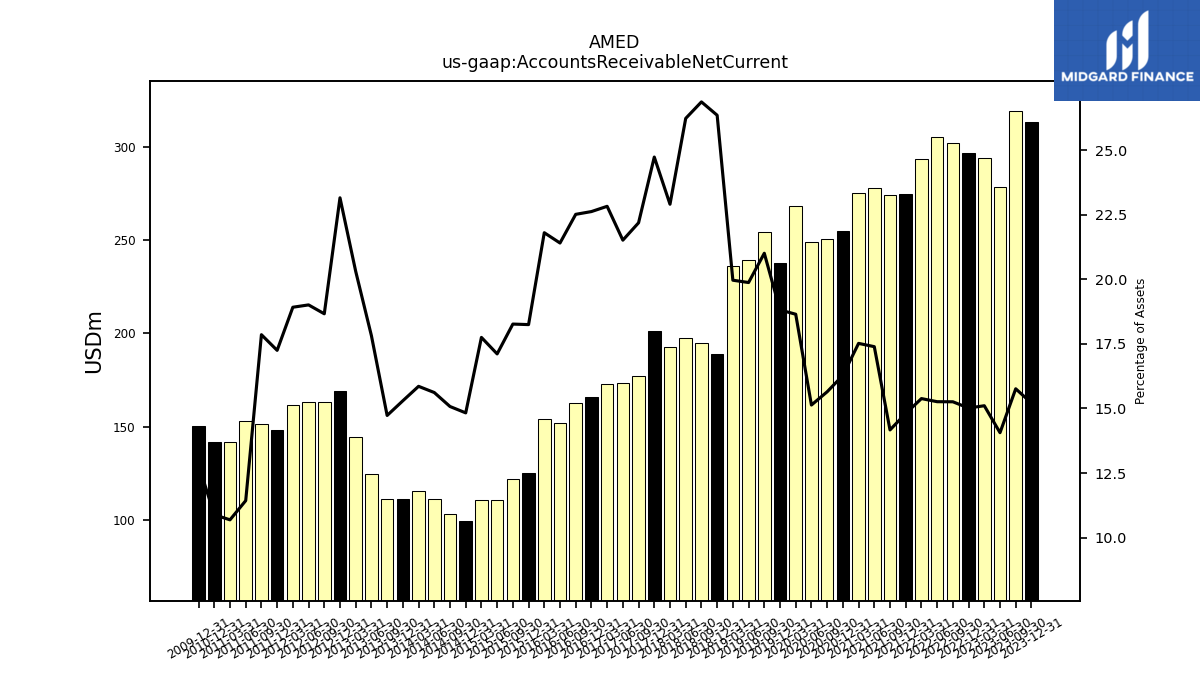
| Accounts Receivable Net Current | 313.37 | 319.58 | 278.79 | 294.12 | 296.79 | 302.47 | 305.41 | 293.58 | 274.96 | 274.57 | 278.22 | 275.63 | 255.15 | 250.78 | 249.03 | 268.55 | 237.60 | 254.70 | 239.67 | 236.44 | 188.97 | 195.03 | 197.59 | 192.94 | 201.20 | 177.40 | 173.39 | 172.71 | 166.06 | 162.50 | 152.21 | 153.86 | 125.01 | 121.74 | 110.45 | 110.65 | 99.33 | 102.86 | 110.93 | 115.35 | 111.13 | 111.15 | 124.77 | 144.66 | 169.17 | 163.46 | 163.16 | 161.83 | 148.06 | 151.21 | 153.27 | 141.92 | 141.55 | 150.27 | |
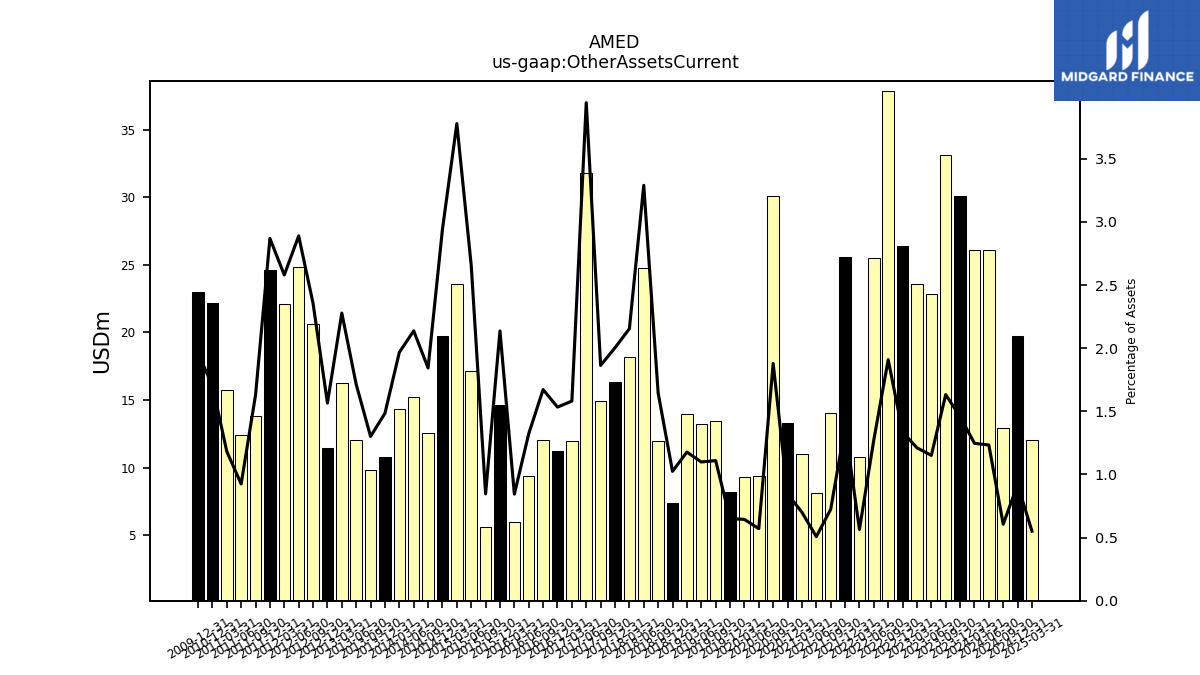
| Other Assets Current | 30.06 | 33.10 | 22.82 | 23.58 | 26.41 | 37.84 | 25.49 | 10.78 | 25.60 | 14.02 | 8.12 | 11.03 | 13.27 | 30.11 | 9.39 | 9.28 | 8.22 | 13.46 | 13.25 | 13.95 | 7.35 | 11.95 | 24.78 | 18.15 | 16.30 | 14.90 | 31.79 | 11.96 | 11.26 | 12.07 | 9.41 | 5.96 | 14.64 | 5.64 | 17.15 | 23.56 | 19.71 | 12.58 | 15.19 | 14.31 | 10.79 | 9.82 | 12.01 | 16.23 | 11.44 | 20.64 | 24.80 | 22.07 | 24.63 | 13.79 | 12.40 | 15.70 | 22.14 | 23.00 |
| 2023-12-31 | 2023-09-30 | 2023-06-30 | 2023-03-31 | 2022-12-31 | 2022-09-30 | 2022-06-30 | 2022-03-31 | 2021-12-31 | 2021-09-30 | 2021-06-30 | 2021-03-31 | 2020-12-31 | 2020-09-30 | 2020-06-30 | 2020-03-31 | 2019-12-31 | 2019-09-30 | 2019-06-30 | 2019-03-31 | 2018-12-31 | 2018-09-30 | 2018-06-30 | 2018-03-31 | 2017-12-31 | 2017-09-30 | 2017-06-30 | 2017-03-31 | 2016-12-31 | 2016-09-30 | 2016-06-30 | 2016-03-31 | 2015-12-31 | 2015-09-30 | 2015-06-30 | 2015-03-31 | 2014-12-31 | 2014-09-30 | 2014-06-30 | 2014-03-31 | 2013-12-31 | 2013-09-30 | 2013-06-30 | 2013-03-31 | 2012-12-31 | 2012-09-30 | 2012-06-30 | 2012-03-31 | 2011-12-31 | 2011-09-30 | 2011-06-30 | 2011-03-31 | 2010-12-31 | 2009-12-31 | ||
|---|---|---|---|---|---|---|---|---|---|---|---|---|---|---|---|---|---|---|---|---|---|---|---|---|---|---|---|---|---|---|---|---|---|---|---|---|---|---|---|---|---|---|---|---|---|---|---|---|---|---|---|---|---|---|---|
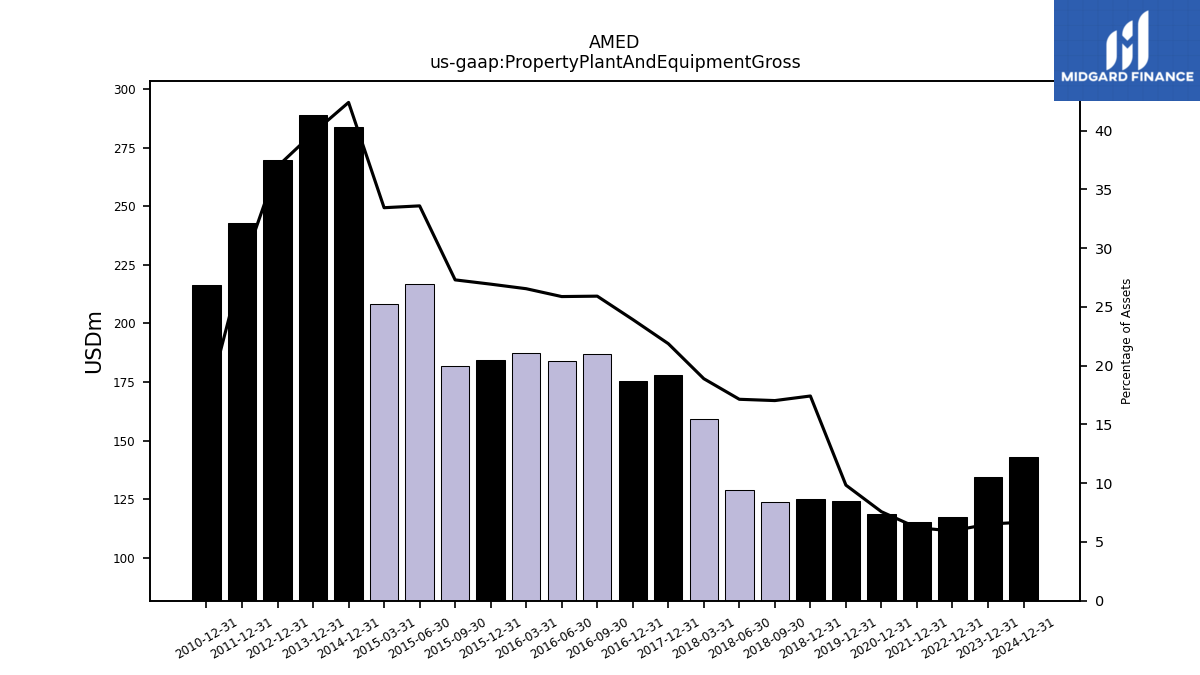
| Property Plant And Equipment Gross | 134.27 | NA | NA | NA | 117.40 | NA | NA | NA | 115.37 | NA | NA | NA | 118.70 | NA | NA | NA | 124.20 | NA | NA | NA | 124.90 | 123.60 | 129.10 | 159.10 | 177.90 | NA | NA | NA | 175.60 | 187.00 | 184.00 | 187.30 | 184.50 | 181.90 | 216.80 | 208.40 | 283.90 | NA | NA | NA | 289.00 | NA | NA | NA | 269.90 | NA | NA | NA | 242.80 | NA | NA | NA | 216.60 | NA | |
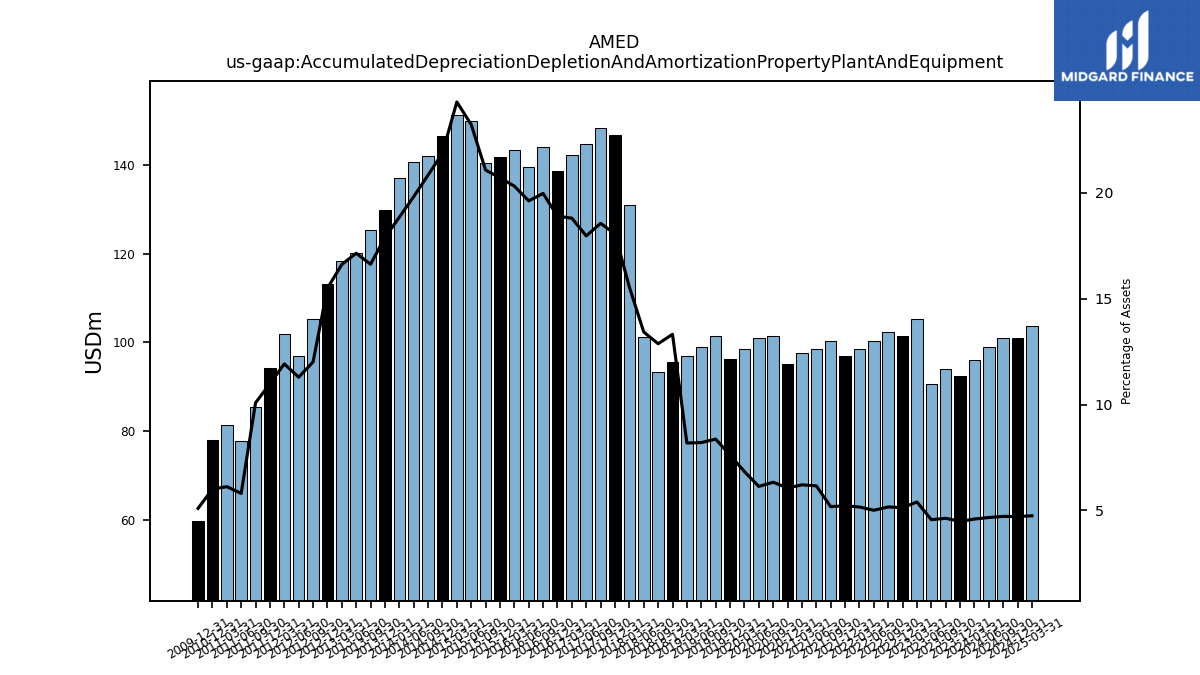
| Accumulated Depreciation Depletion And Amortization Property Plant And Equipment | 92.42 | 93.91 | 90.52 | 105.18 | 101.36 | 102.41 | 100.27 | 98.57 | 96.94 | 100.41 | 98.55 | 97.70 | 95.02 | 101.51 | 100.96 | 98.47 | 96.14 | 101.45 | 98.94 | 96.89 | 95.47 | 93.40 | 101.10 | 130.88 | 146.81 | 148.30 | 144.71 | 142.19 | 138.65 | 144.06 | 139.43 | 143.28 | 141.79 | 140.36 | 149.80 | 151.31 | 146.44 | 142.07 | 140.71 | 137.02 | 129.89 | 125.39 | 120.01 | 118.28 | 113.15 | 105.16 | 96.89 | 101.94 | 94.27 | 85.35 | 77.83 | 81.30 | 78.07 | 59.78 | |
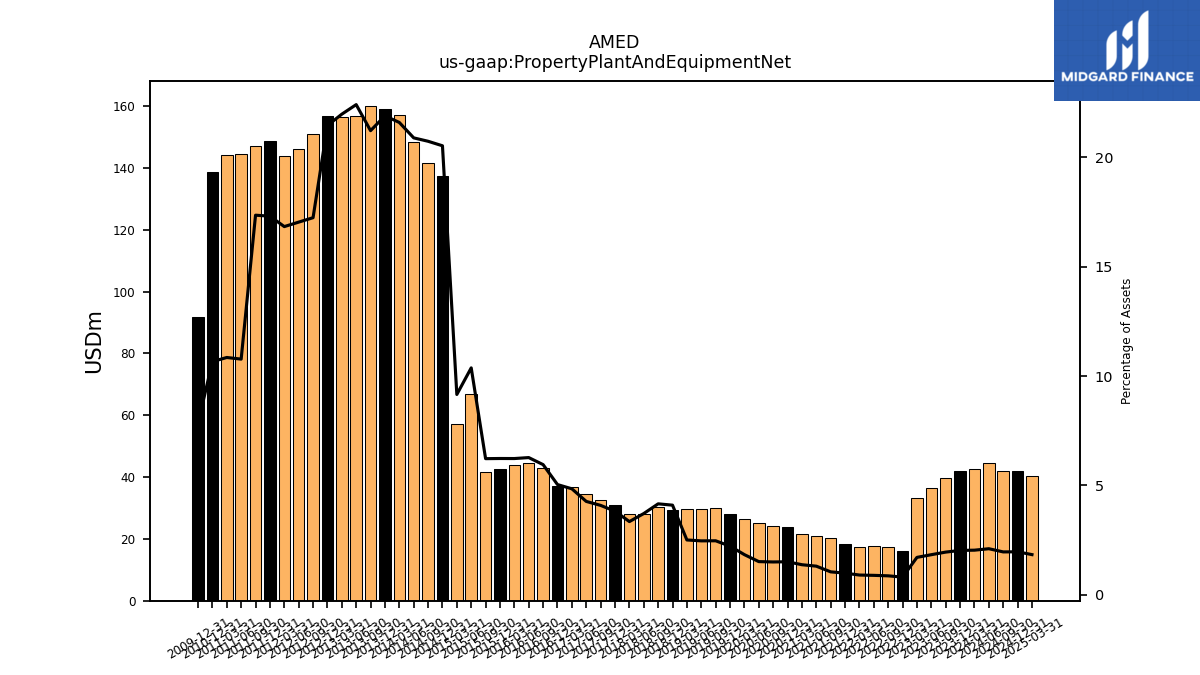
| Property Plant And Equipment Net | 41.84 | 39.63 | 36.40 | 33.35 | 16.03 | 17.25 | 17.85 | 17.30 | 18.43 | 20.38 | 20.99 | 21.68 | 23.72 | 24.10 | 25.01 | 26.48 | 28.11 | 29.97 | 29.76 | 29.72 | 29.40 | 30.20 | 28.00 | 28.21 | 31.12 | 32.70 | 34.42 | 36.68 | 37.00 | 42.96 | 44.62 | 43.96 | 42.70 | 41.48 | 66.95 | 57.09 | 137.46 | 141.42 | 148.35 | 157.03 | 159.03 | 160.08 | 156.89 | 156.48 | 156.71 | 150.95 | 146.21 | 143.97 | 148.54 | 146.93 | 144.45 | 144.02 | 138.55 | 91.92 | |
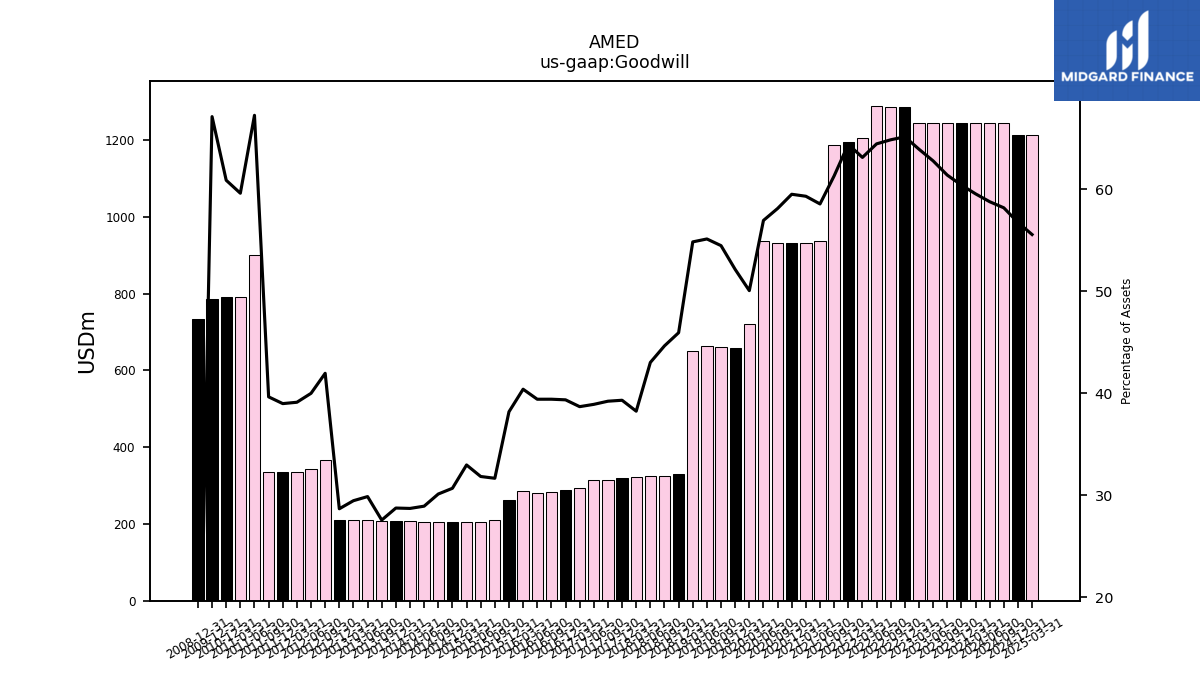
| Goodwill | 1244.68 | 1244.68 | 1244.68 | 1244.68 | 1287.40 | 1285.45 | 1289.67 | 1204.64 | 1196.09 | 1188.05 | 936.77 | 933.21 | 932.68 | 931.48 | 937.09 | 721.05 | 658.50 | 660.47 | 664.82 | 649.51 | 329.48 | 324.14 | 324.14 | 322.20 | 319.90 | 313.66 | 313.66 | 292.79 | 288.96 | 284.55 | 280.35 | 285.12 | 261.66 | 211.11 | 205.59 | 205.59 | 205.59 | 205.59 | 205.59 | 208.92 | 208.91 | 208.13 | 209.26 | 209.99 | 209.59 | 367.50 | 343.35 | 334.69 | 334.69 | 335.81 | 901.61 | 791.41 | 791.41 | 786.92 | |
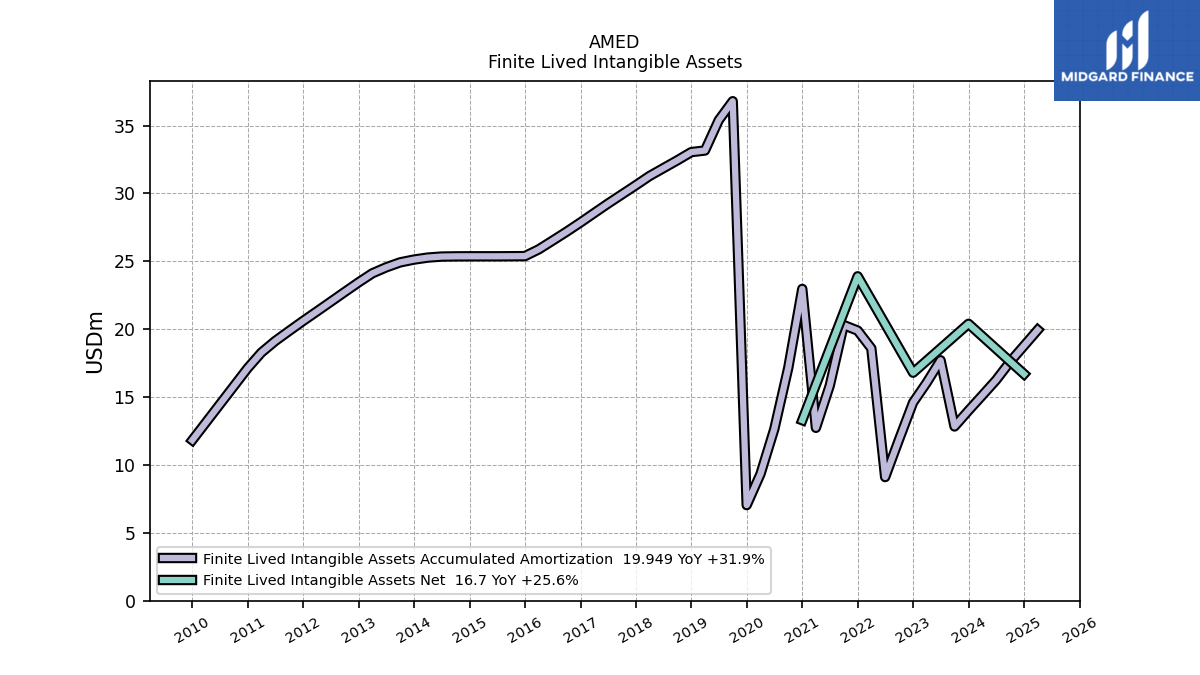
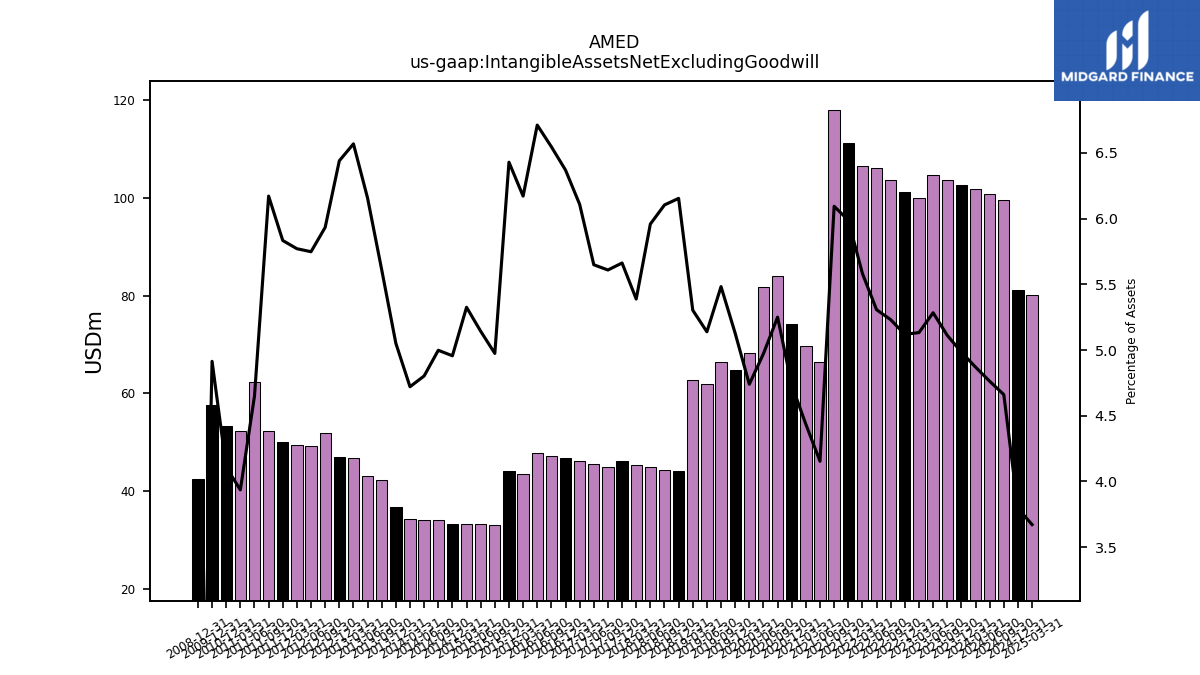
| Intangible Assets Net Excluding Goodwill | 102.67 | 103.63 | 104.74 | 99.93 | 101.17 | 103.68 | 106.19 | 106.53 | 111.19 | 118.08 | 66.43 | 69.76 | 74.18 | 84.14 | 81.81 | 68.25 | 64.75 | 66.47 | 61.97 | 62.80 | 44.13 | 44.31 | 44.89 | 45.38 | 46.06 | 44.84 | 45.52 | 46.22 | 46.76 | 47.25 | 47.73 | 43.55 | 44.05 | 33.15 | 33.19 | 33.19 | 33.19 | 34.10 | 34.11 | 34.34 | 36.69 | 42.33 | 43.11 | 46.79 | 47.05 | 51.96 | 49.34 | 49.36 | 50.07 | 52.26 | 62.33 | 52.25 | 53.39 | 57.61 | |
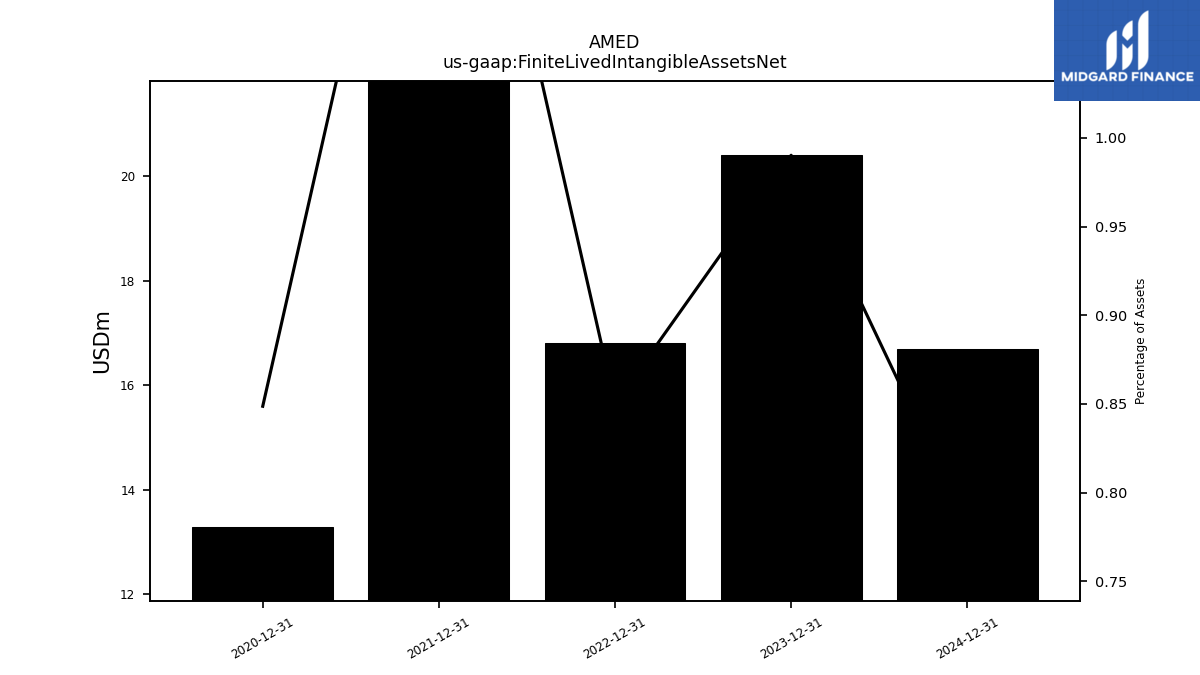
| Finite Lived Intangible Assets Net | 20.40 | NA | NA | NA | 16.80 | NA | NA | NA | 23.90 | NA | NA | NA | 13.30 | NA | NA | NA | NA | NA | NA | NA | NA | NA | NA | NA | NA | NA | NA | NA | NA | NA | NA | NA | NA | NA | NA | NA | NA | NA | NA | NA | NA | NA | NA | NA | NA | NA | NA | NA | NA | NA | NA | NA | NA | NA | |
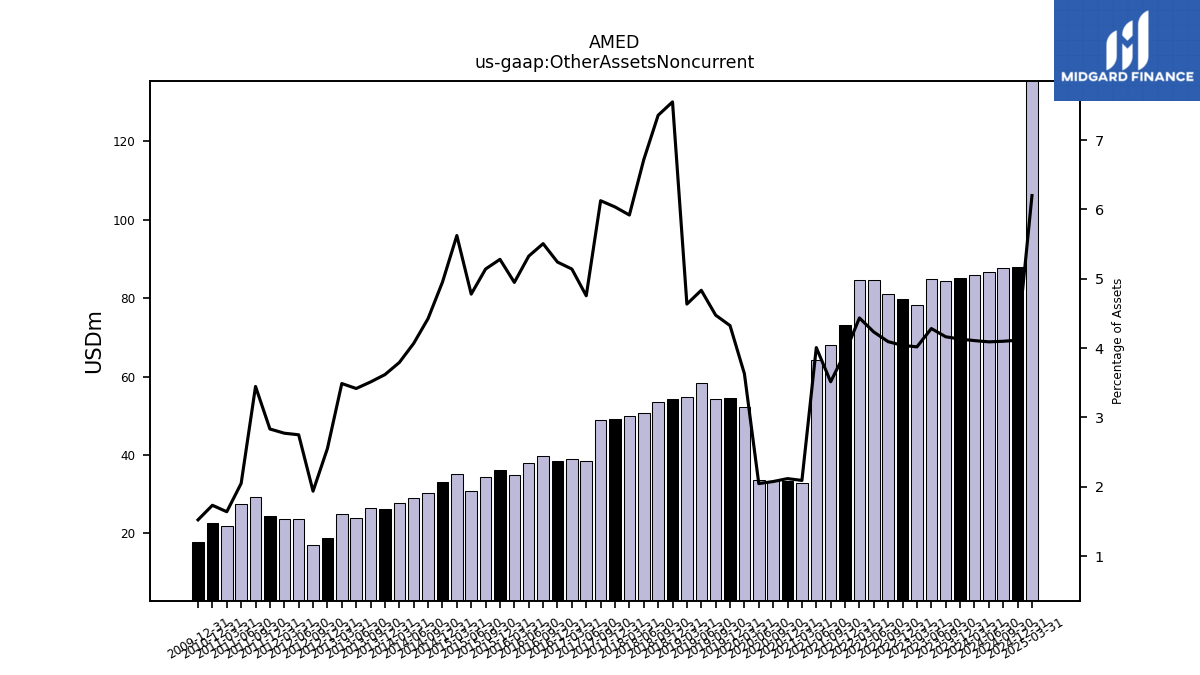
| Other Assets Noncurrent | 85.10 | 84.41 | 84.89 | 78.23 | 79.84 | 81.12 | 84.69 | 84.64 | 73.02 | 68.11 | 64.10 | 32.91 | 33.20 | 33.28 | 33.67 | 52.29 | 54.61 | 54.26 | 58.29 | 54.89 | 54.15 | 53.41 | 50.60 | 49.86 | 49.10 | 48.98 | 38.32 | 38.89 | 38.47 | 39.74 | 37.88 | 34.91 | 36.17 | 34.26 | 30.84 | 35.05 | 33.16 | 30.20 | 28.90 | 27.59 | 26.28 | 26.50 | 23.93 | 24.86 | 18.65 | 16.96 | 23.61 | 23.72 | 24.32 | 29.19 | 27.48 | 21.78 | 22.54 | 17.86 |
| 2023-12-31 | 2023-09-30 | 2023-06-30 | 2023-03-31 | 2022-12-31 | 2022-09-30 | 2022-06-30 | 2022-03-31 | 2021-12-31 | 2021-09-30 | 2021-06-30 | 2021-03-31 | 2020-12-31 | 2020-09-30 | 2020-06-30 | 2020-03-31 | 2019-12-31 | 2019-09-30 | 2019-06-30 | 2019-03-31 | 2018-12-31 | 2018-09-30 | 2018-06-30 | 2018-03-31 | 2017-12-31 | 2017-09-30 | 2017-06-30 | 2017-03-31 | 2016-12-31 | 2016-09-30 | 2016-06-30 | 2016-03-31 | 2015-12-31 | 2015-09-30 | 2015-06-30 | 2015-03-31 | 2014-12-31 | 2014-09-30 | 2014-06-30 | 2014-03-31 | 2013-12-31 | 2013-09-30 | 2013-06-30 | 2013-03-31 | 2012-12-31 | 2012-09-30 | 2012-06-30 | 2012-03-31 | 2011-12-31 | 2011-09-30 | 2011-06-30 | 2011-03-31 | 2010-12-31 | 2009-12-31 | ||
|---|---|---|---|---|---|---|---|---|---|---|---|---|---|---|---|---|---|---|---|---|---|---|---|---|---|---|---|---|---|---|---|---|---|---|---|---|---|---|---|---|---|---|---|---|---|---|---|---|---|---|---|---|---|---|---|
| Liabilities Current | 473.72 | 468.12 | 462.40 | 353.05 | 355.53 | 367.20 | 427.37 | 380.15 | 374.28 | 454.35 | 449.22 | 456.08 | 456.34 | 437.50 | 442.05 | 316.11 | 326.94 | 314.65 | 313.01 | 297.38 | 222.48 | 219.29 | 214.19 | 210.81 | 215.06 | 201.86 | 225.32 | 183.90 | 181.35 | 182.17 | 189.79 | 200.37 | 175.19 | 171.21 | 176.03 | 164.23 | 162.32 | 191.06 | 200.74 | 324.71 | 312.42 | 332.48 | 191.01 | 202.82 | 204.79 | 231.46 | 245.00 | 252.42 | 221.73 | 209.51 | 215.79 | 227.73 | 216.30 | 229.31 | |
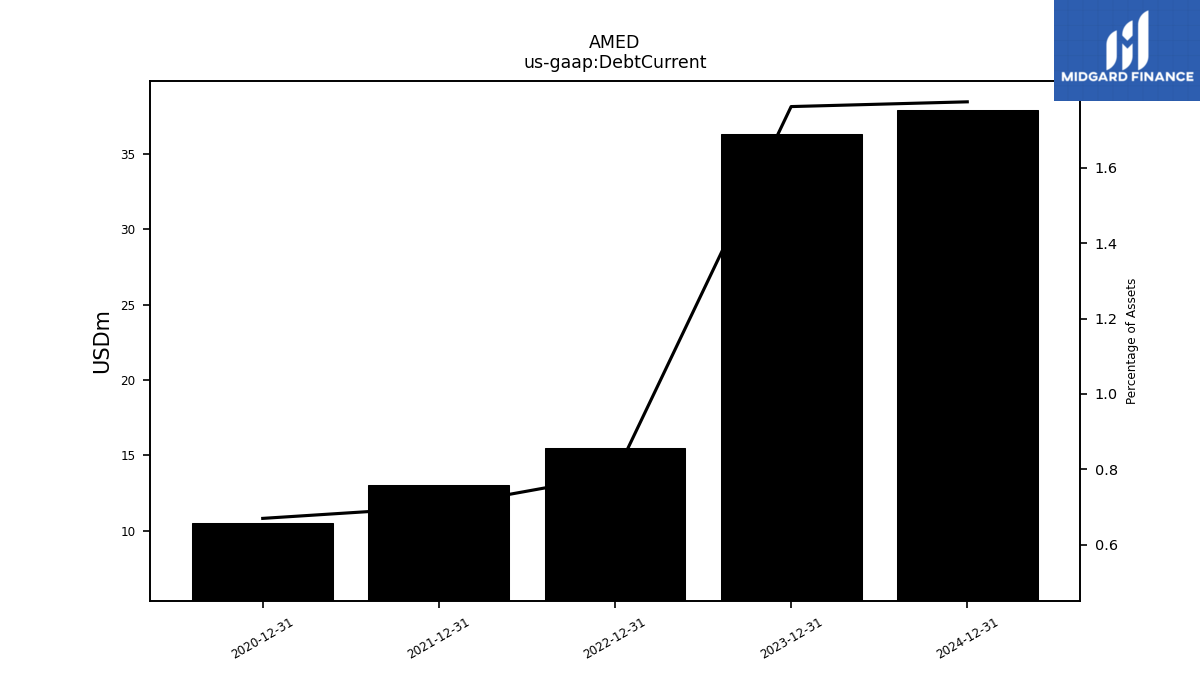
| Debt Current | 36.31 | NA | NA | NA | 15.50 | NA | NA | NA | 12.99 | NA | NA | NA | 10.50 | NA | NA | NA | NA | NA | NA | NA | NA | NA | NA | NA | NA | NA | NA | NA | NA | NA | NA | NA | NA | NA | NA | NA | NA | NA | NA | NA | NA | NA | NA | NA | NA | NA | NA | NA | NA | NA | NA | NA | NA | NA | |
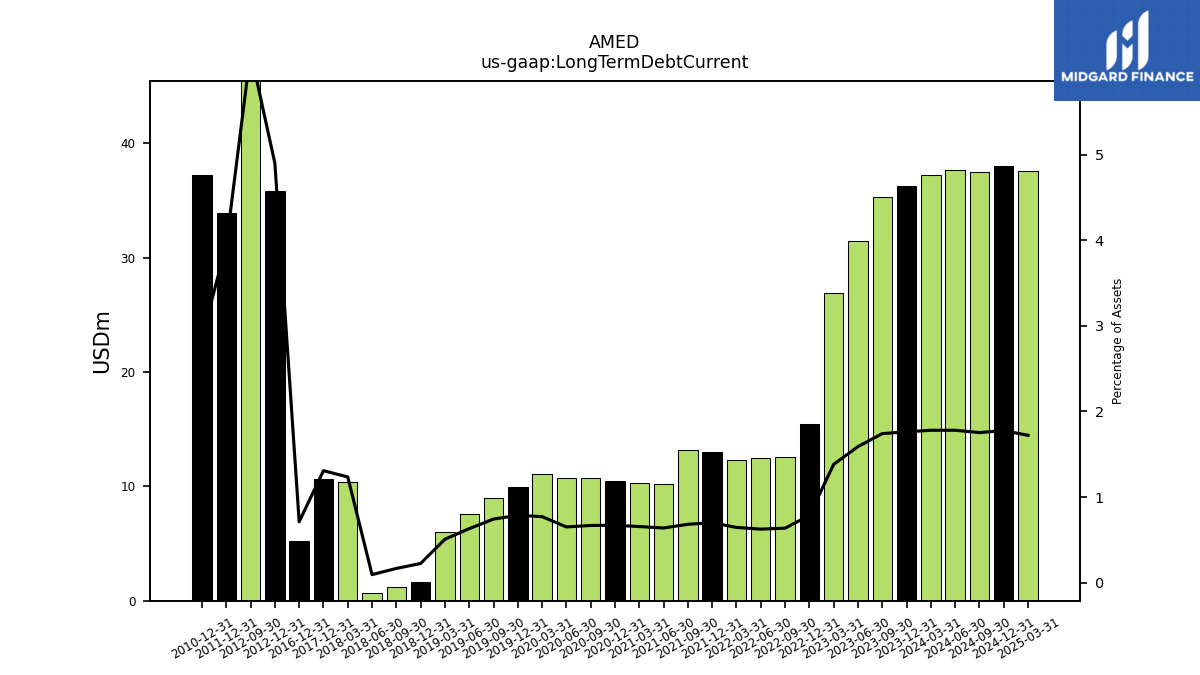
| Long Term Debt Current | 36.30 | 35.30 | 31.50 | 26.90 | 15.50 | 12.60 | 12.50 | 12.30 | 13.00 | 13.20 | 10.20 | 10.30 | 10.50 | 10.70 | 10.70 | 11.10 | 9.93 | 9.00 | 7.60 | 6.00 | 1.60 | 1.20 | 0.70 | 10.40 | 10.64 | NA | NA | NA | 5.22 | NA | NA | NA | NA | NA | NA | NA | NA | NA | NA | NA | NA | NA | NA | NA | 35.81 | 54.31 | NA | NA | 33.90 | NA | NA | NA | 37.20 | NA | |
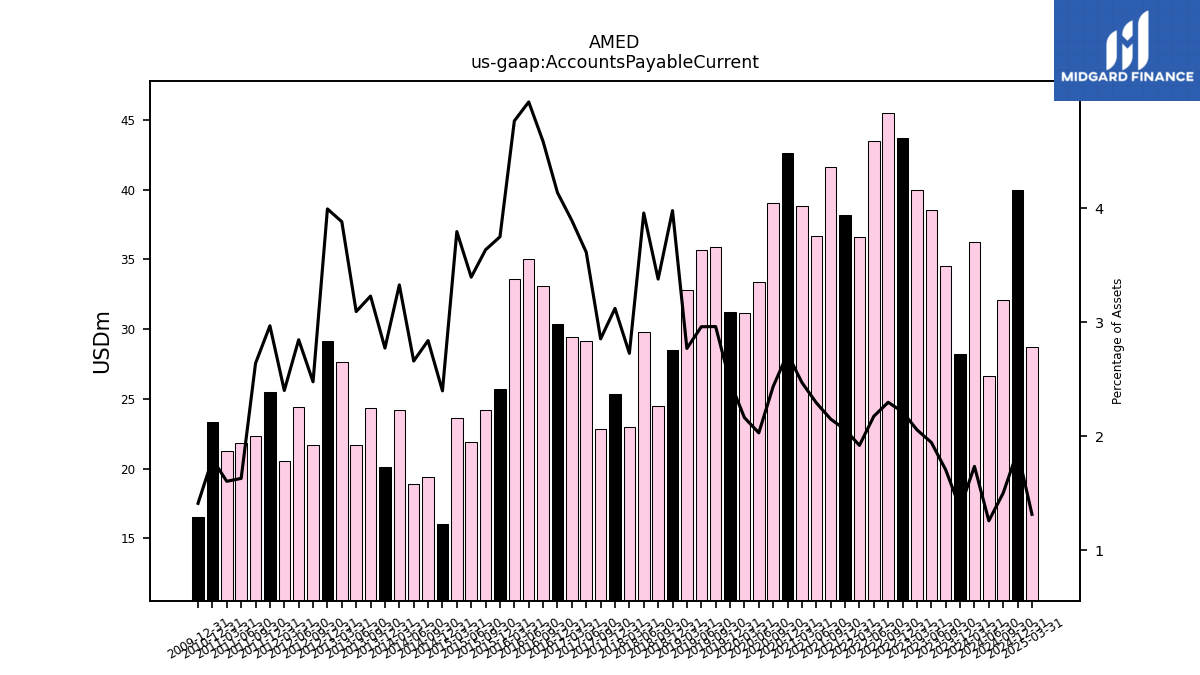
| Accounts Payable Current | 28.24 | 34.55 | 38.56 | 40.02 | 43.73 | 45.53 | 43.51 | 36.62 | 38.22 | 41.65 | 36.67 | 38.87 | 42.67 | 39.04 | 33.38 | 31.15 | 31.26 | 35.90 | 35.69 | 32.80 | 28.53 | 24.52 | 29.81 | 22.97 | 25.38 | 22.82 | 29.12 | 29.44 | 30.36 | 33.09 | 35.07 | 33.63 | 25.68 | 24.23 | 21.91 | 23.65 | 16.06 | 19.36 | 18.89 | 24.20 | 20.14 | 24.36 | 21.66 | 27.65 | 29.18 | 21.69 | 24.43 | 20.53 | 25.48 | 22.35 | 21.84 | 21.29 | 23.37 | 16.54 | |
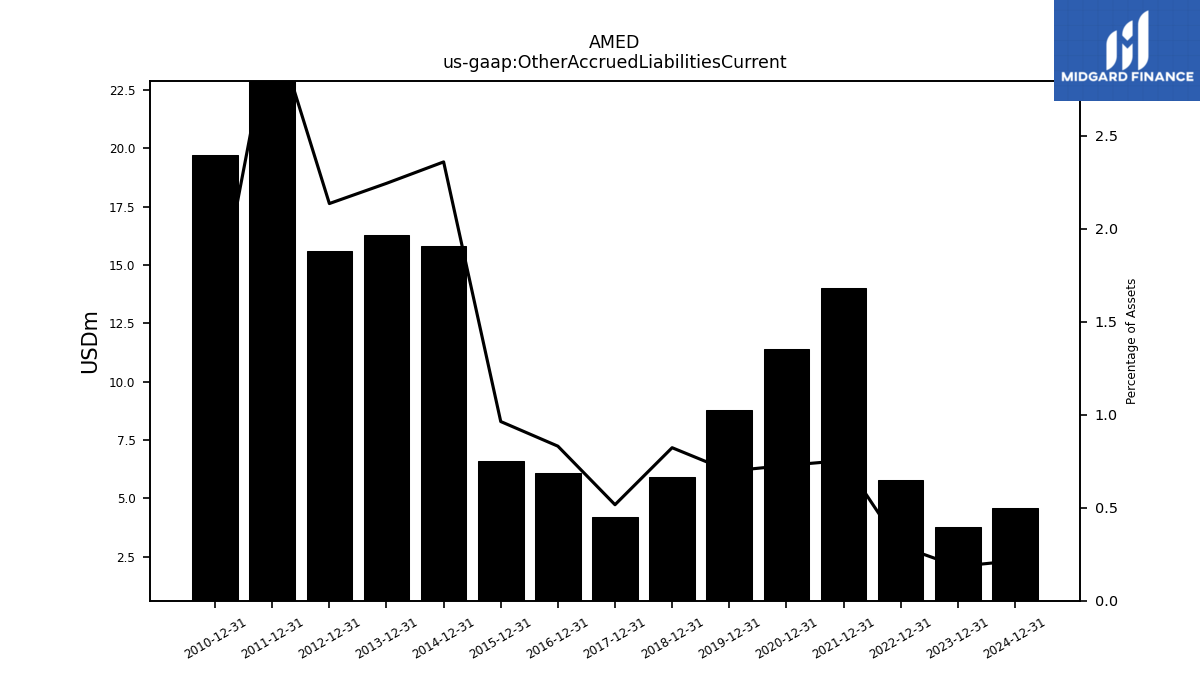
| Other Accrued Liabilities Current | 3.80 | NA | NA | NA | 5.80 | NA | NA | NA | 14.00 | NA | NA | NA | 11.40 | NA | NA | NA | 8.80 | NA | NA | NA | 5.90 | NA | NA | NA | 4.20 | NA | NA | NA | 6.10 | NA | NA | NA | 6.60 | NA | NA | NA | 15.80 | NA | NA | NA | 16.30 | NA | NA | NA | 15.60 | NA | NA | NA | 26.80 | NA | NA | NA | 19.70 | NA | |
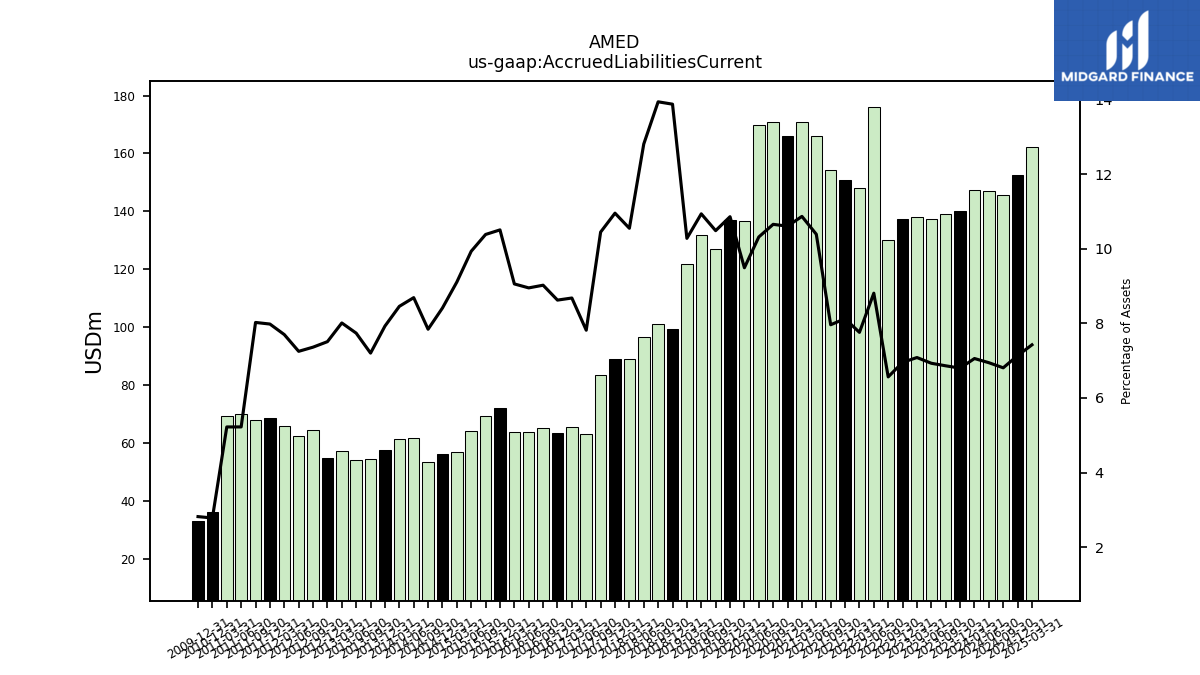
| Accrued Liabilities Current | 140.05 | 139.10 | 137.36 | 137.90 | 137.39 | 130.10 | 176.24 | 148.04 | 150.84 | 154.26 | 166.16 | 170.95 | 166.19 | 170.74 | 169.72 | 136.66 | 137.11 | 127.11 | 131.86 | 121.72 | 99.50 | 101.18 | 96.47 | 88.84 | 89.10 | 83.52 | 62.98 | 65.66 | 63.29 | 65.11 | 63.64 | 63.90 | 71.97 | 69.19 | 64.10 | 56.76 | 56.33 | 53.49 | 61.71 | 61.50 | 57.57 | 54.34 | 54.17 | 57.05 | 54.85 | 64.46 | 62.22 | 65.84 | 68.49 | 67.94 | 70.01 | 69.32 | 36.15 | 33.03 |
| 2023-12-31 | 2023-09-30 | 2023-06-30 | 2023-03-31 | 2022-12-31 | 2022-09-30 | 2022-06-30 | 2022-03-31 | 2021-12-31 | 2021-09-30 | 2021-06-30 | 2021-03-31 | 2020-12-31 | 2020-09-30 | 2020-06-30 | 2020-03-31 | 2019-12-31 | 2019-09-30 | 2019-06-30 | 2019-03-31 | 2018-12-31 | 2018-09-30 | 2018-06-30 | 2018-03-31 | 2017-12-31 | 2017-09-30 | 2017-06-30 | 2017-03-31 | 2016-12-31 | 2016-09-30 | 2016-06-30 | 2016-03-31 | 2015-12-31 | 2015-09-30 | 2015-06-30 | 2015-03-31 | 2014-12-31 | 2014-09-30 | 2014-06-30 | 2014-03-31 | 2013-12-31 | 2013-09-30 | 2013-06-30 | 2013-03-31 | 2012-12-31 | 2012-09-30 | 2012-06-30 | 2012-03-31 | 2011-12-31 | 2011-09-30 | 2011-06-30 | 2011-03-31 | 2010-12-31 | 2009-12-31 | ||
|---|---|---|---|---|---|---|---|---|---|---|---|---|---|---|---|---|---|---|---|---|---|---|---|---|---|---|---|---|---|---|---|---|---|---|---|---|---|---|---|---|---|---|---|---|---|---|---|---|---|---|---|---|---|---|---|
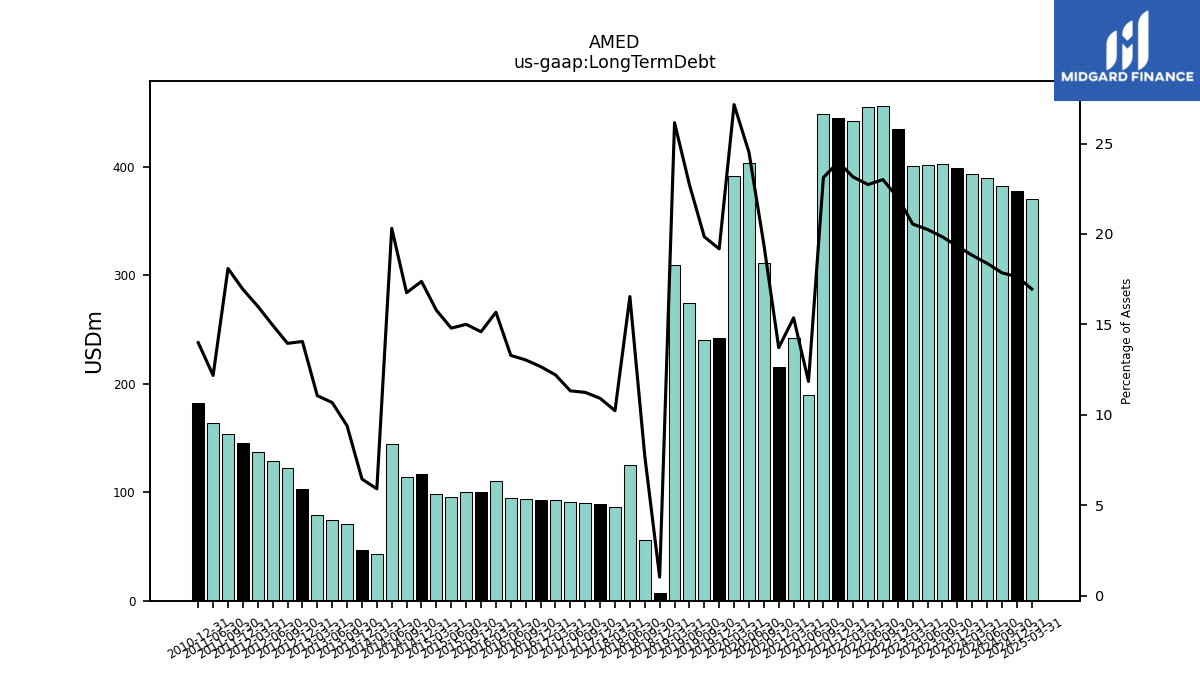
| Long Term Debt | 398.20 | 402.20 | 401.40 | 400.10 | 434.90 | 456.00 | 454.90 | 441.80 | 445.10 | 448.00 | 189.60 | 241.70 | 215.00 | 311.30 | 403.40 | 391.00 | 242.20 | 240.60 | 274.10 | 309.70 | 7.40 | 56.10 | 124.60 | 86.20 | 88.80 | 89.90 | 91.30 | 92.40 | 93.00 | 94.10 | 94.50 | 110.60 | 100.00 | 100.00 | 95.50 | 98.40 | 116.40 | 114.30 | 144.30 | 43.00 | 46.90 | 70.90 | 74.80 | 78.80 | 102.70 | 122.20 | 128.40 | 136.90 | 145.40 | 153.20 | 163.30 | NA | 181.90 | NA | |
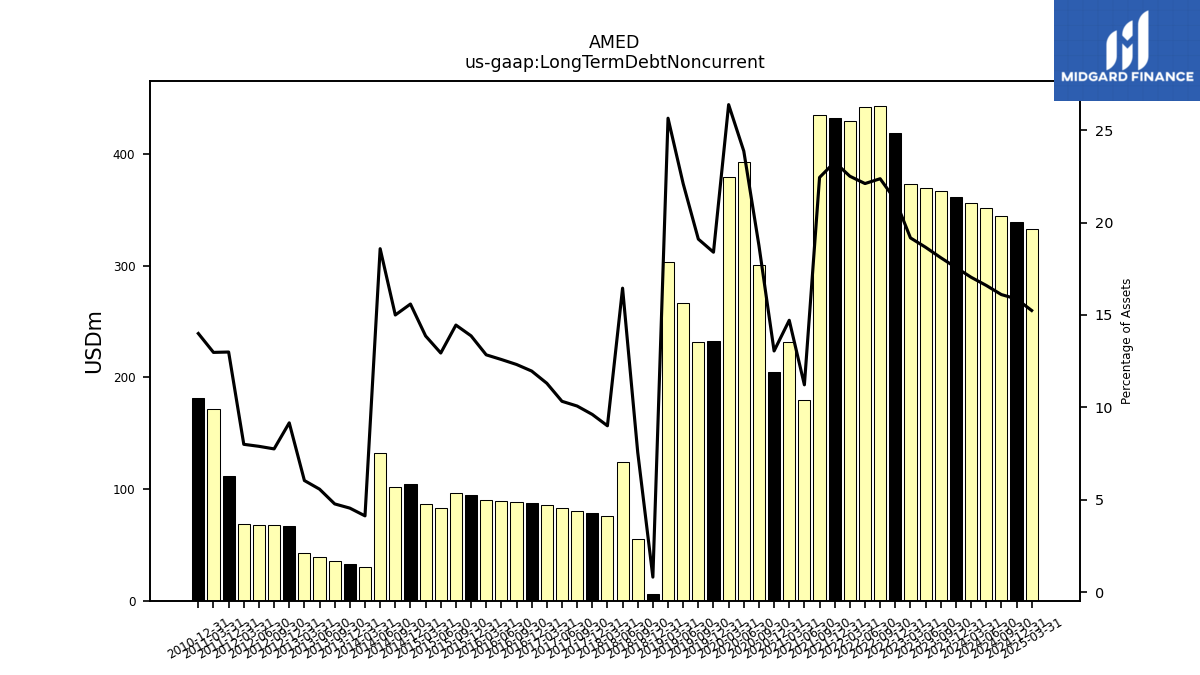
| Long Term Debt Noncurrent | 361.90 | 366.90 | 369.90 | 373.20 | 419.40 | 443.40 | 442.40 | 429.50 | 432.10 | 434.80 | 179.40 | 231.40 | 204.51 | 300.60 | 392.70 | 379.90 | 232.26 | 231.60 | 266.50 | 303.70 | 5.80 | 54.90 | 123.90 | 75.80 | 78.20 | 80.50 | 83.20 | 85.50 | 87.80 | 88.90 | 89.50 | 90.60 | 95.00 | 96.30 | 83.50 | 86.40 | 104.40 | 102.30 | 132.00 | 30.00 | 33.00 | 36.00 | 39.00 | 43.00 | 66.90 | 67.86 | 67.70 | 68.40 | 111.50 | NA | NA | 172.20 | 181.90 | NA | |
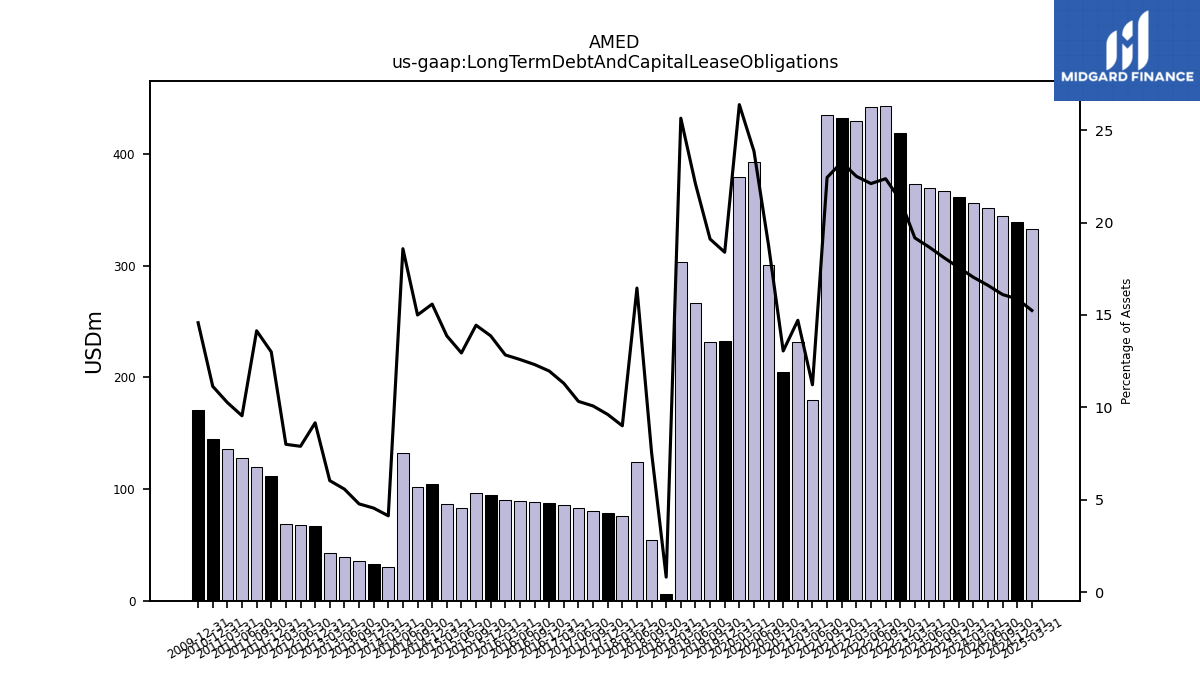
| Long Term Debt And Capital Lease Obligations | 361.86 | 366.85 | 369.90 | 373.20 | 419.42 | 443.43 | 442.41 | 429.45 | 432.07 | 434.78 | 179.41 | 231.38 | 204.51 | 300.58 | 392.71 | 379.94 | 232.26 | 231.64 | 266.47 | 303.73 | 5.78 | 54.85 | 123.94 | 75.78 | 78.20 | 80.52 | 83.16 | 85.47 | 87.81 | 88.87 | 89.50 | 90.56 | 95.00 | 96.25 | 83.52 | 86.44 | 104.37 | 102.30 | 132.00 | 30.00 | 33.00 | 36.00 | 39.00 | 42.95 | 66.90 | NA | 67.70 | 68.38 | 111.55 | 119.73 | 127.90 | 136.14 | 144.69 | 170.90 | |
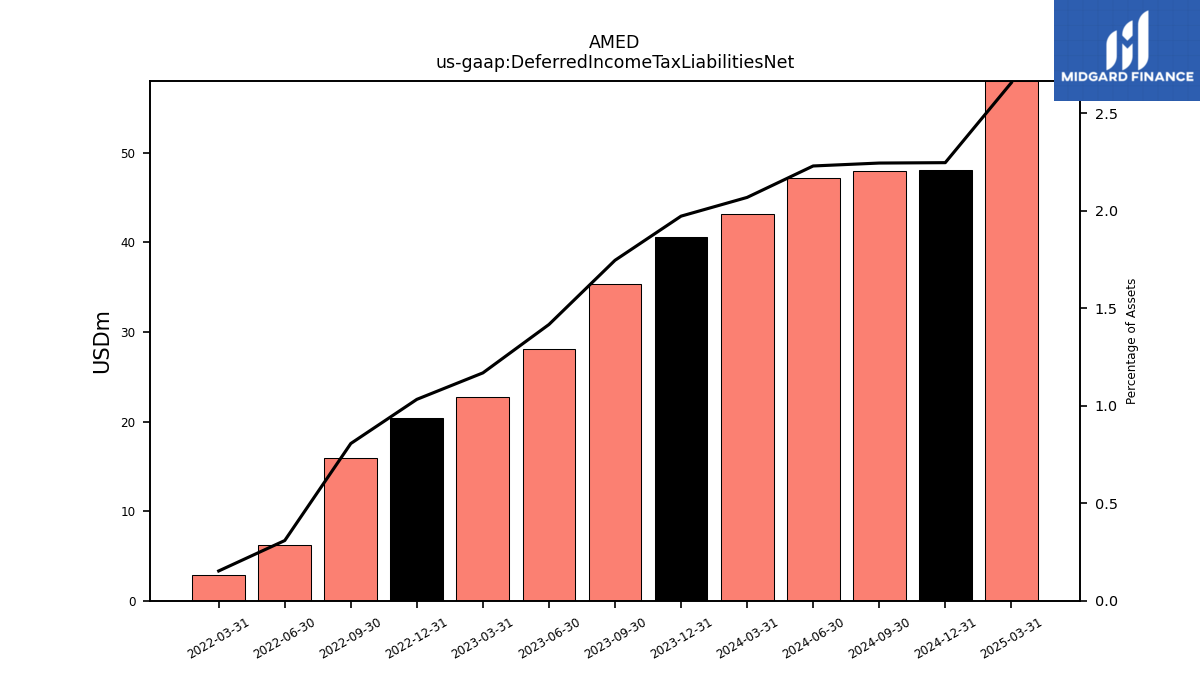
| Deferred Income Tax Liabilities Net | 40.63 | 35.40 | 28.09 | 22.75 | 20.41 | 15.98 | 6.18 | 2.92 | NA | NA | NA | NA | NA | NA | NA | NA | NA | NA | NA | NA | NA | NA | NA | NA | NA | NA | NA | NA | NA | NA | NA | NA | NA | NA | NA | NA | NA | NA | NA | NA | NA | NA | NA | NA | NA | NA | NA | NA | NA | NA | NA | NA | NA | NA | |
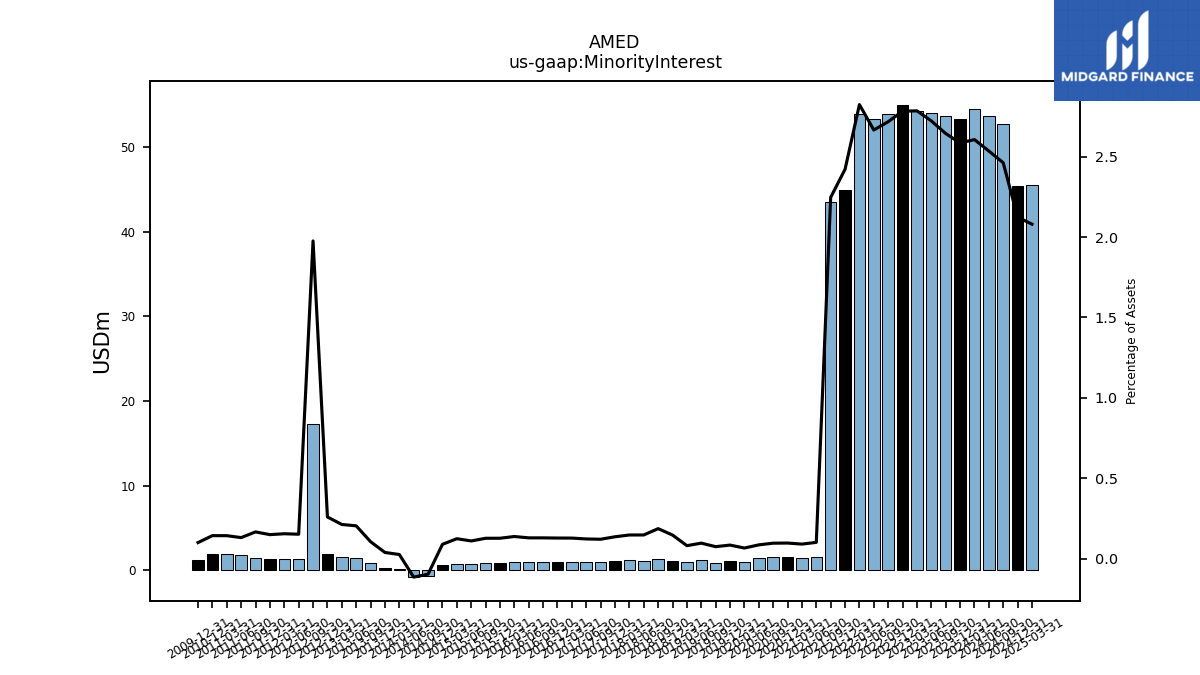
| Minority Interest | 53.27 | 53.61 | 53.98 | 54.23 | 55.00 | 53.87 | 53.35 | 53.89 | 44.97 | 43.54 | 1.61 | 1.42 | 1.52 | 1.54 | 1.41 | 0.95 | 1.06 | 0.90 | 1.16 | 0.95 | 1.05 | 1.35 | 1.11 | 1.24 | 1.10 | 0.96 | 0.99 | 0.97 | 0.94 | 0.93 | 0.92 | 0.97 | 0.87 | 0.84 | 0.71 | 0.77 | 0.59 | -0.66 | -0.82 | 0.18 | 0.28 | 0.79 | 1.43 | 1.51 | 1.89 | 17.30 | 1.30 | 1.32 | 1.28 | 1.41 | 1.75 | 1.89 | 1.86 | 1.17 | |
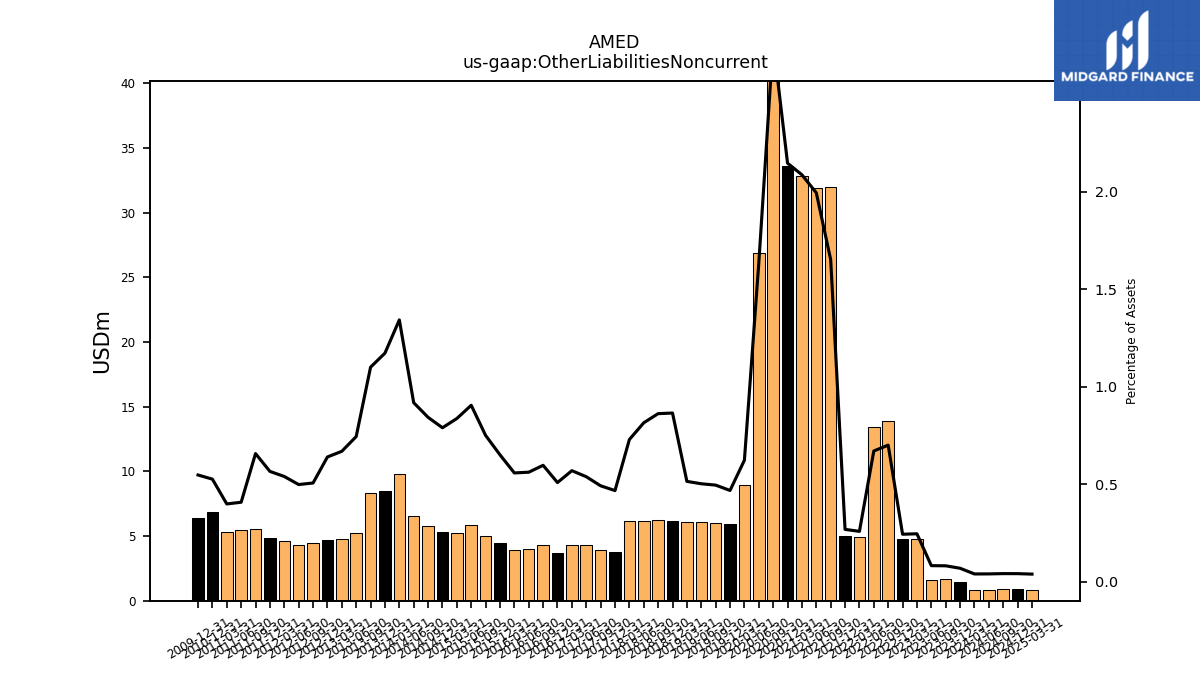
| Other Liabilities Noncurrent | 1.42 | 1.65 | 1.63 | 4.78 | 4.81 | 13.87 | 13.41 | 4.92 | 4.98 | 31.99 | 31.89 | 32.81 | 33.62 | 44.39 | 26.86 | 8.97 | 5.91 | 6.00 | 6.05 | 6.09 | 6.20 | 6.25 | 6.14 | 6.14 | 3.80 | 3.93 | 4.34 | 4.31 | 3.73 | 4.31 | 3.99 | 3.93 | 4.46 | 5.00 | 5.84 | 5.21 | 5.29 | 5.75 | 6.52 | 9.76 | 8.51 | 8.30 | 5.21 | 4.76 | 4.67 | 4.43 | 4.27 | 4.61 | 4.85 | 5.56 | 5.46 | 5.29 | 6.83 | 6.41 | |
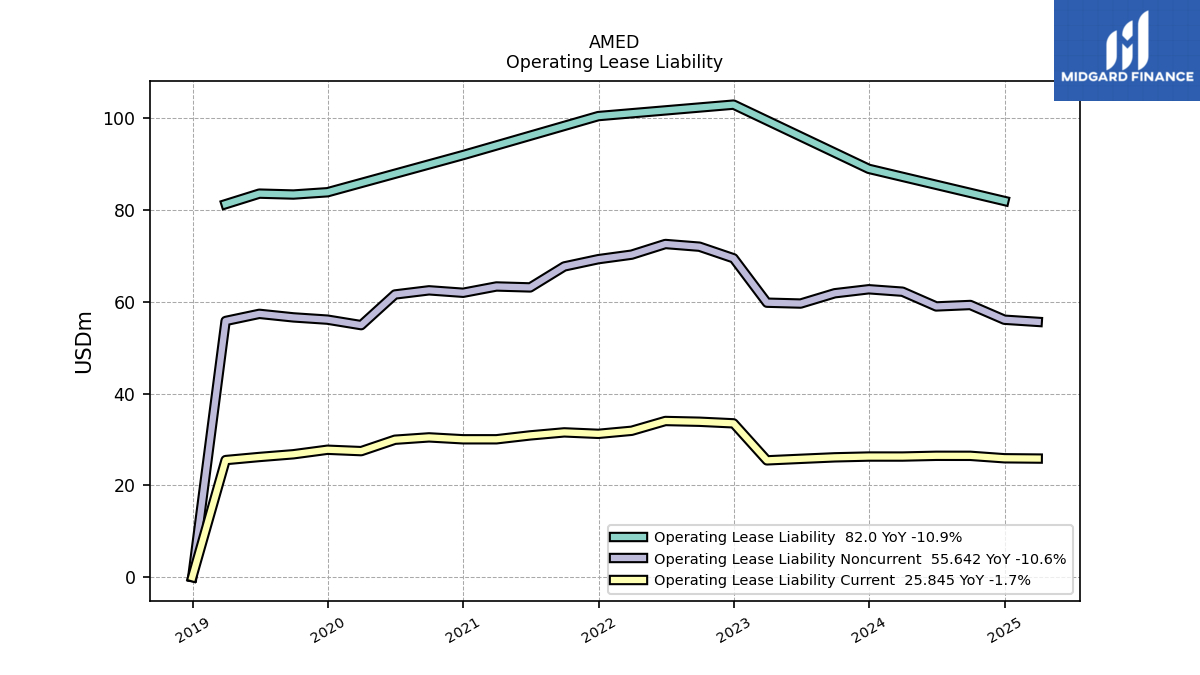
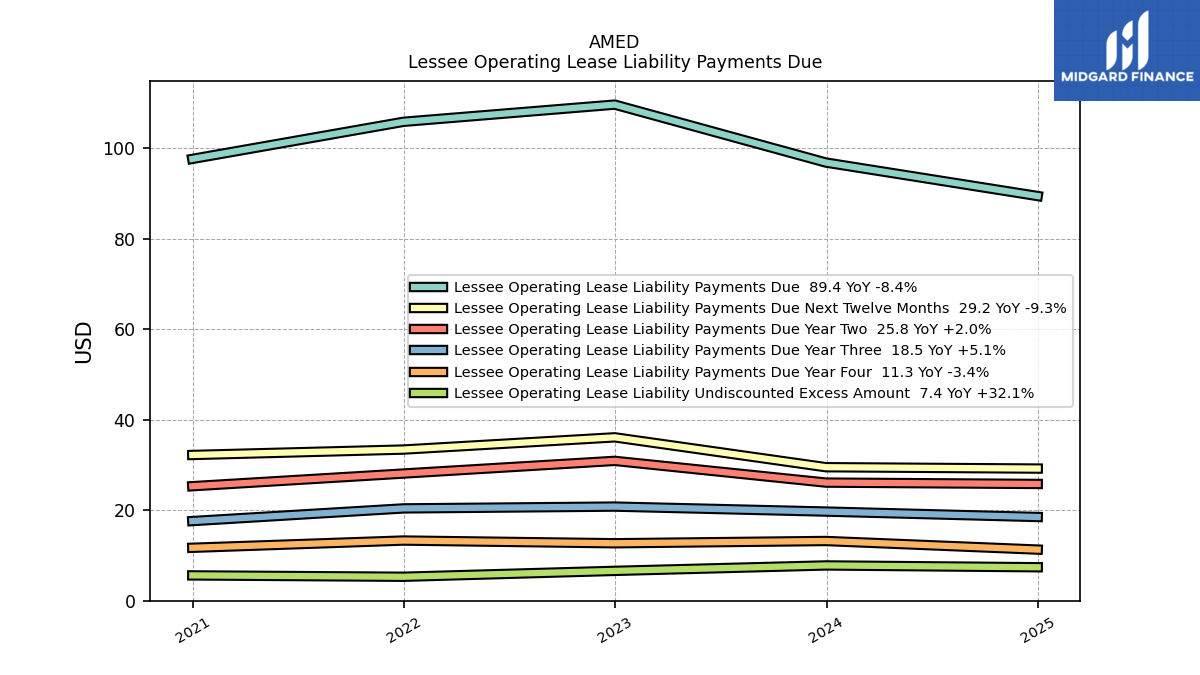
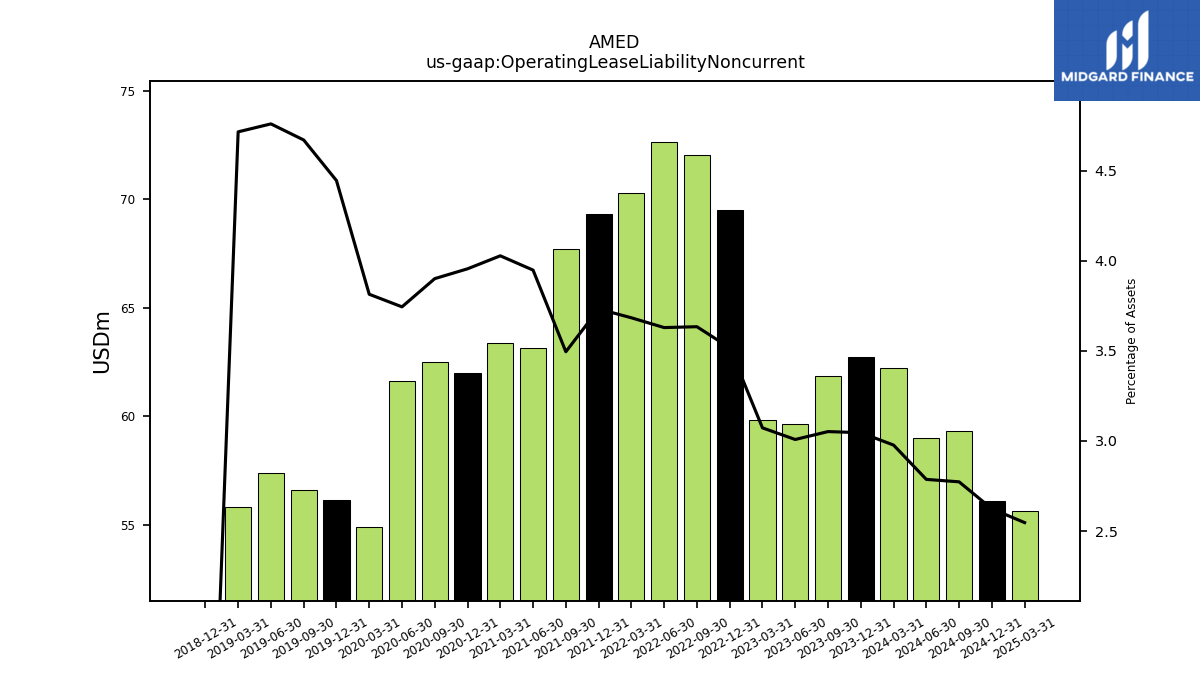
| Operating Lease Liability Noncurrent | 62.75 | 61.88 | 59.63 | 59.83 | 69.50 | 72.03 | 72.62 | 70.30 | 69.31 | 67.72 | 63.15 | 63.36 | 61.99 | 62.52 | 61.61 | 54.93 | 56.13 | 56.62 | 57.39 | 55.84 | 0.00 | NA | NA | NA | NA | NA | NA | NA | NA | NA | NA | NA | NA | NA | NA | NA | NA | NA | NA | NA | NA | NA | NA | NA | NA | NA | NA | NA | NA | NA | NA | NA | NA | NA |
| 2023-12-31 | 2023-09-30 | 2023-06-30 | 2023-03-31 | 2022-12-31 | 2022-09-30 | 2022-06-30 | 2022-03-31 | 2021-12-31 | 2021-09-30 | 2021-06-30 | 2021-03-31 | 2020-12-31 | 2020-09-30 | 2020-06-30 | 2020-03-31 | 2019-12-31 | 2019-09-30 | 2019-06-30 | 2019-03-31 | 2018-12-31 | 2018-09-30 | 2018-06-30 | 2018-03-31 | 2017-12-31 | 2017-09-30 | 2017-06-30 | 2017-03-31 | 2016-12-31 | 2016-09-30 | 2016-06-30 | 2016-03-31 | 2015-12-31 | 2015-09-30 | 2015-06-30 | 2015-03-31 | 2014-12-31 | 2014-09-30 | 2014-06-30 | 2014-03-31 | 2013-12-31 | 2013-09-30 | 2013-06-30 | 2013-03-31 | 2012-12-31 | 2012-09-30 | 2012-06-30 | 2012-03-31 | 2011-12-31 | 2011-09-30 | 2011-06-30 | 2011-03-31 | 2010-12-31 | 2009-12-31 | ||
|---|---|---|---|---|---|---|---|---|---|---|---|---|---|---|---|---|---|---|---|---|---|---|---|---|---|---|---|---|---|---|---|---|---|---|---|---|---|---|---|---|---|---|---|---|---|---|---|---|---|---|---|---|---|---|---|
| Stockholders Equity | 1066.51 | 1039.91 | 1006.78 | 1079.12 | 1051.57 | 1015.74 | 985.65 | 966.76 | 931.35 | 905.26 | 874.27 | 788.15 | 809.22 | 756.21 | 720.85 | 679.20 | 640.45 | 602.56 | 561.78 | 520.25 | 481.58 | 444.14 | 407.95 | 548.32 | 515.32 | 512.26 | 492.07 | 481.98 | 460.20 | 445.45 | 426.91 | 409.81 | 409.57 | 393.13 | 379.34 | 366.66 | 397.17 | 383.76 | 371.86 | 362.73 | 372.20 | 377.00 | 463.60 | 460.27 | 452.34 | 554.67 | 540.02 | 528.65 | 518.87 | 510.57 | 928.23 | 902.23 | 877.86 | 735.17 | |
| Stockholders Equity Including Portion Attributable To Noncontrolling Interest | 1119.78 | 1093.52 | 1060.76 | 1133.35 | 1106.57 | 1069.61 | 1038.99 | 1020.65 | 976.32 | 948.80 | 875.89 | 789.57 | 810.74 | 757.74 | 722.26 | 680.14 | 641.51 | 603.47 | 562.94 | 521.20 | 482.63 | 445.50 | 409.06 | 549.56 | 516.43 | 513.22 | 493.06 | 482.95 | 461.14 | 446.38 | 427.82 | 410.78 | 410.44 | 393.97 | 380.05 | 367.44 | 397.76 | 383.10 | 371.04 | 362.92 | 372.48 | 377.79 | 465.03 | 461.78 | 454.23 | 571.98 | 541.32 | 529.97 | 520.15 | 511.98 | 929.98 | 904.13 | 879.72 | 736.34 | |
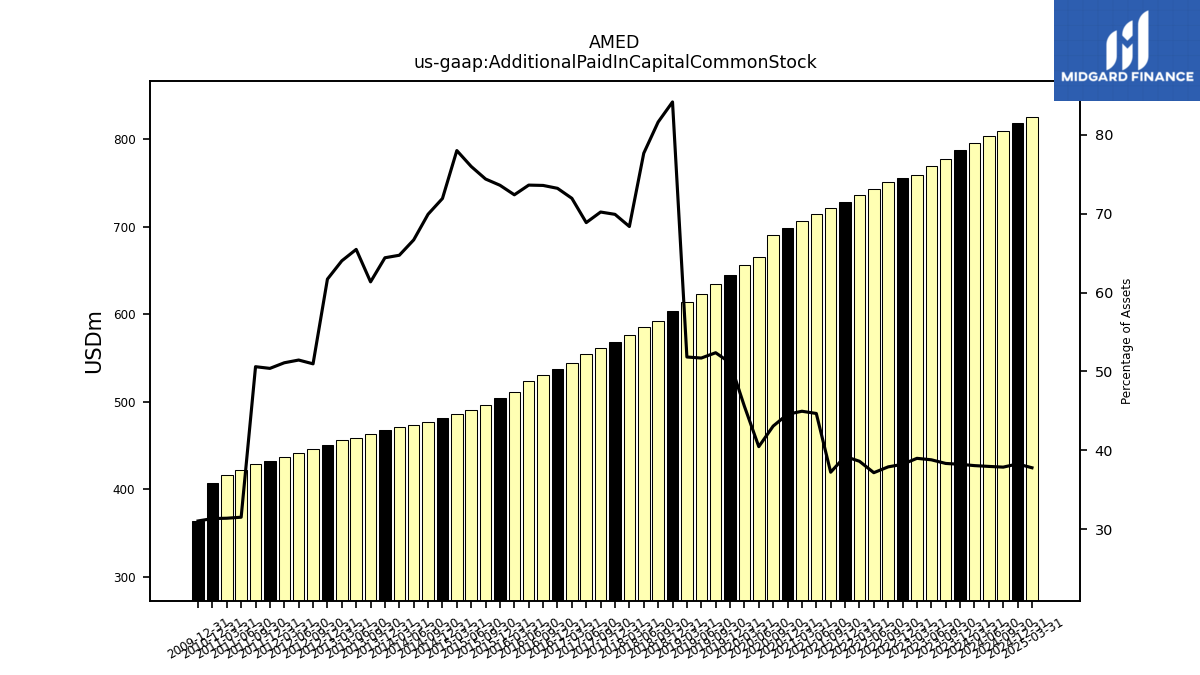
| Additional Paid In Capital Common Stock | 787.18 | 776.88 | 768.79 | 758.67 | 755.06 | 750.91 | 743.28 | 736.54 | 728.12 | 720.88 | 714.33 | 707.01 | 698.29 | 690.10 | 665.58 | 656.27 | 645.26 | 634.85 | 623.31 | 613.71 | 603.67 | 592.54 | 585.14 | 575.93 | 568.78 | 561.38 | 555.03 | 544.43 | 537.47 | 531.11 | 523.58 | 510.88 | 504.29 | 495.83 | 490.47 | 486.27 | 481.76 | 477.12 | 473.63 | 470.85 | 467.89 | 462.96 | 458.48 | 456.05 | 450.79 | 446.23 | 441.48 | 437.02 | 432.39 | 428.40 | 422.27 | 416.43 | 407.16 | 363.67 | |
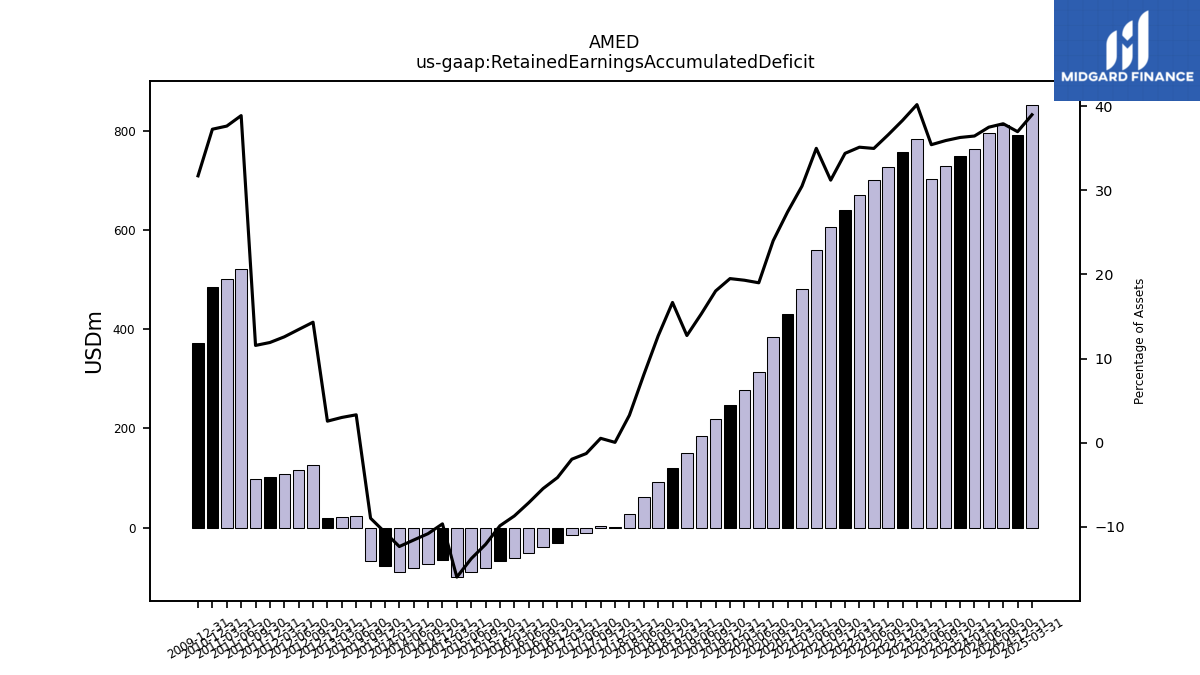
| Retained Earnings Accumulated Deficit | 747.92 | 728.60 | 702.64 | 782.92 | 757.67 | 725.96 | 700.31 | 670.73 | 639.06 | 605.02 | 560.01 | 479.86 | 429.99 | 384.84 | 312.86 | 278.19 | 246.38 | 218.73 | 184.60 | 150.85 | 119.55 | 92.09 | 60.71 | 27.36 | 0.20 | 4.05 | -10.51 | -14.97 | -30.55 | -39.46 | -50.90 | -61.59 | -67.81 | -80.72 | -89.16 | -99.79 | -64.78 | -73.92 | -82.36 | -89.98 | -77.56 | -67.93 | 23.14 | 21.30 | 18.62 | 125.43 | 115.51 | 107.62 | 102.20 | 97.89 | 521.61 | 499.96 | 484.67 | 372.09 | |
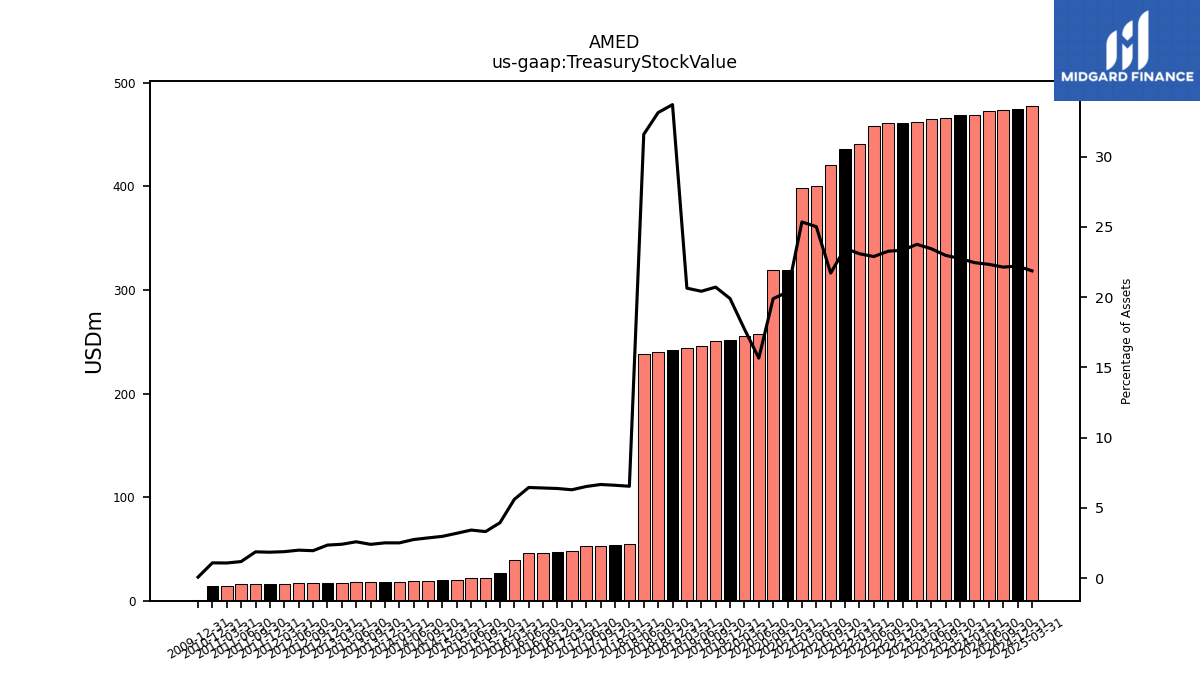
| Treasury Stock Value | 468.63 | 465.61 | 464.69 | 462.51 | 461.20 | 461.17 | 457.98 | 440.55 | 435.87 | 420.67 | 400.11 | 398.75 | 319.09 | 318.77 | 257.62 | 255.29 | 251.24 | 251.07 | 246.18 | 244.37 | 241.69 | 240.54 | 237.95 | 55.02 | 53.71 | 53.23 | 52.50 | 47.53 | 46.77 | 46.25 | 45.83 | 39.53 | 26.97 | 22.03 | 22.03 | 19.86 | 19.86 | 19.48 | 19.46 | 18.19 | 18.18 | 18.08 | 18.06 | 17.12 | 17.12 | 17.03 | 17.01 | 16.04 | 15.77 | 15.76 | 15.70 | 14.19 | 14.02 | 0.73 | |
| Minority Interest | 53.27 | 53.61 | 53.98 | 54.23 | 55.00 | 53.87 | 53.35 | 53.89 | 44.97 | 43.54 | 1.61 | 1.42 | 1.52 | 1.54 | 1.41 | 0.95 | 1.06 | 0.90 | 1.16 | 0.95 | 1.05 | 1.35 | 1.11 | 1.24 | 1.10 | 0.96 | 0.99 | 0.97 | 0.94 | 0.93 | 0.92 | 0.97 | 0.87 | 0.84 | 0.71 | 0.77 | 0.59 | -0.66 | -0.82 | 0.18 | 0.28 | 0.79 | 1.43 | 1.51 | 1.89 | 17.30 | 1.30 | 1.32 | 1.28 | 1.41 | 1.75 | 1.89 | 1.86 | 1.17 | |
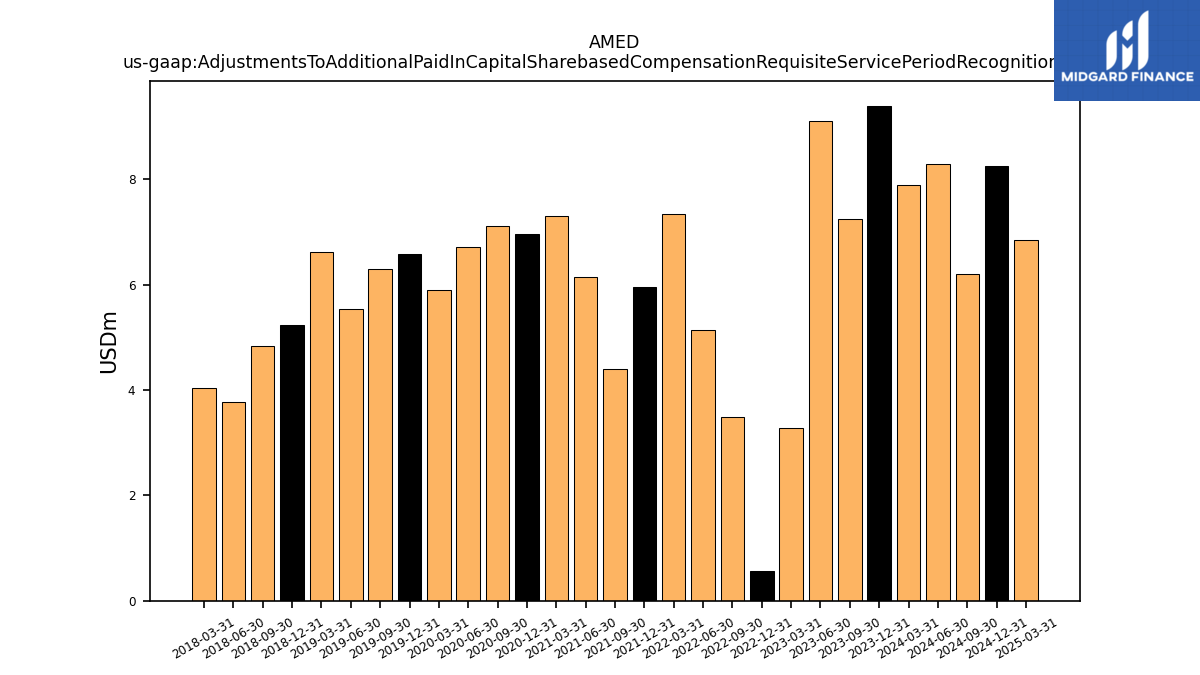
| Adjustments To Additional Paid In Capital Sharebased Compensation Requisite Service Period Recognition Value | 9.40 | 7.24 | 9.11 | 3.27 | 0.57 | 3.50 | 5.15 | 7.35 | 5.95 | 4.40 | 6.16 | 7.31 | 6.97 | 7.12 | 6.72 | 5.91 | 6.59 | 6.30 | 5.54 | 6.62 | 5.23 | 4.84 | 3.77 | 4.04 | NA | NA | NA | NA | NA | NA | NA | NA | NA | NA | NA | NA | NA | NA | NA | NA | NA | NA | NA | NA | NA | NA | NA | NA | NA | NA | NA | NA | NA | NA | |
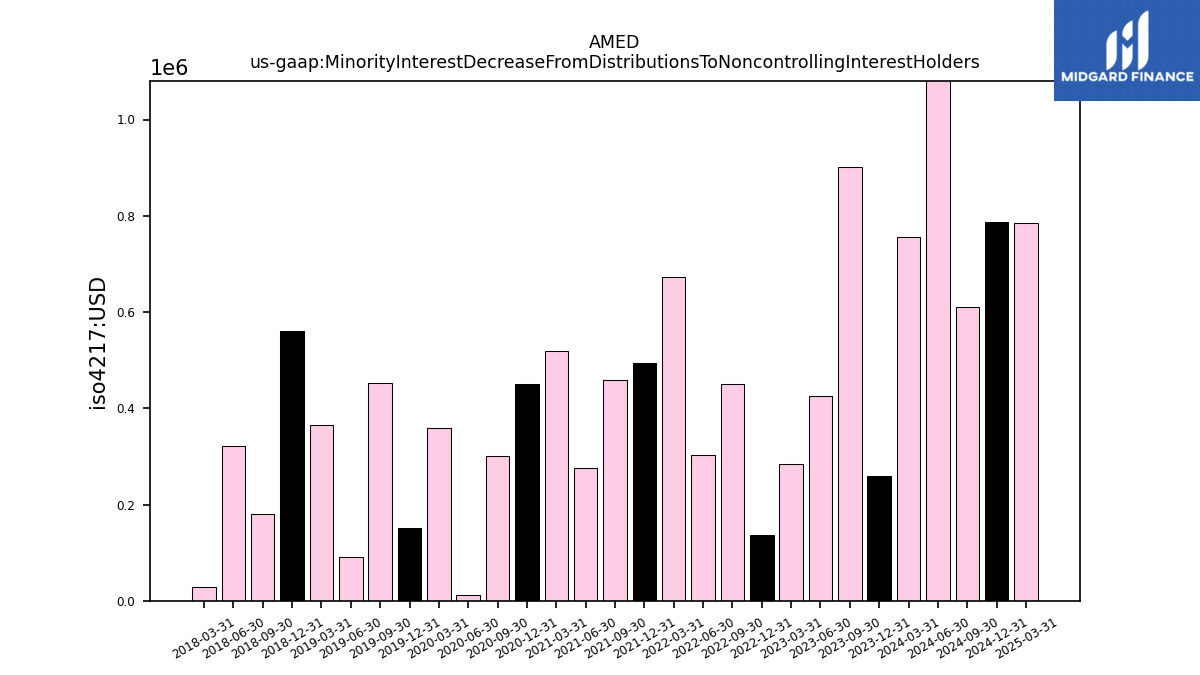
| Minority Interest Decrease From Distributions To Noncontrolling Interest Holders | 0.26 | 0.90 | 0.43 | 0.28 | 0.14 | 0.45 | 0.30 | 0.67 | 0.49 | 0.46 | 0.28 | 0.52 | 0.45 | 0.30 | 0.01 | 0.36 | 0.15 | 0.45 | 0.09 | 0.37 | 0.56 | 0.18 | 0.32 | 0.03 | NA | NA | NA | NA | NA | NA | NA | NA | NA | NA | NA | NA | NA | NA | NA | NA | NA | NA | NA | NA | NA | NA | NA | NA | NA | NA | NA | NA | NA | NA |
| 2023-12-31 | 2023-09-30 | 2023-06-30 | 2023-03-31 | 2022-12-31 | 2022-09-30 | 2022-06-30 | 2022-03-31 | 2021-12-31 | 2021-09-30 | 2021-06-30 | 2021-03-31 | 2020-12-31 | 2020-09-30 | 2020-06-30 | 2020-03-31 | 2019-12-31 | 2019-09-30 | 2019-06-30 | 2019-03-31 | 2018-12-31 | 2018-09-30 | 2018-06-30 | 2018-03-31 | 2017-12-31 | 2017-09-30 | 2017-06-30 | 2017-03-31 | 2016-12-31 | 2016-09-30 | 2016-06-30 | 2016-03-31 | 2015-12-31 | 2015-09-30 | 2015-06-30 | 2015-03-31 | 2014-12-31 | 2014-09-30 | 2014-06-30 | 2014-03-31 | 2013-12-31 | 2013-09-30 | 2013-06-30 | 2013-03-31 | 2012-12-31 | 2012-09-30 | 2012-06-30 | 2012-03-31 | 2011-12-31 | 2011-09-30 | 2011-06-30 | 2011-03-31 | 2010-12-31 | 2009-12-31 | ||
|---|---|---|---|---|---|---|---|---|---|---|---|---|---|---|---|---|---|---|---|---|---|---|---|---|---|---|---|---|---|---|---|---|---|---|---|---|---|---|---|---|---|---|---|---|---|---|---|---|---|---|---|---|---|---|---|
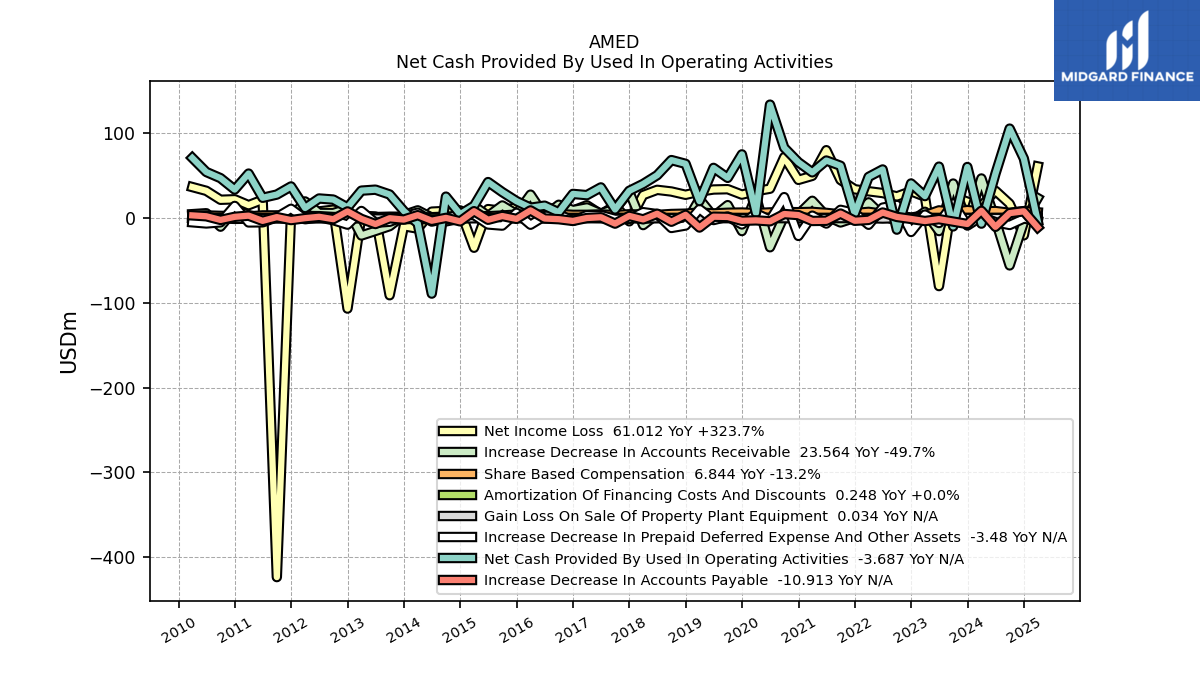
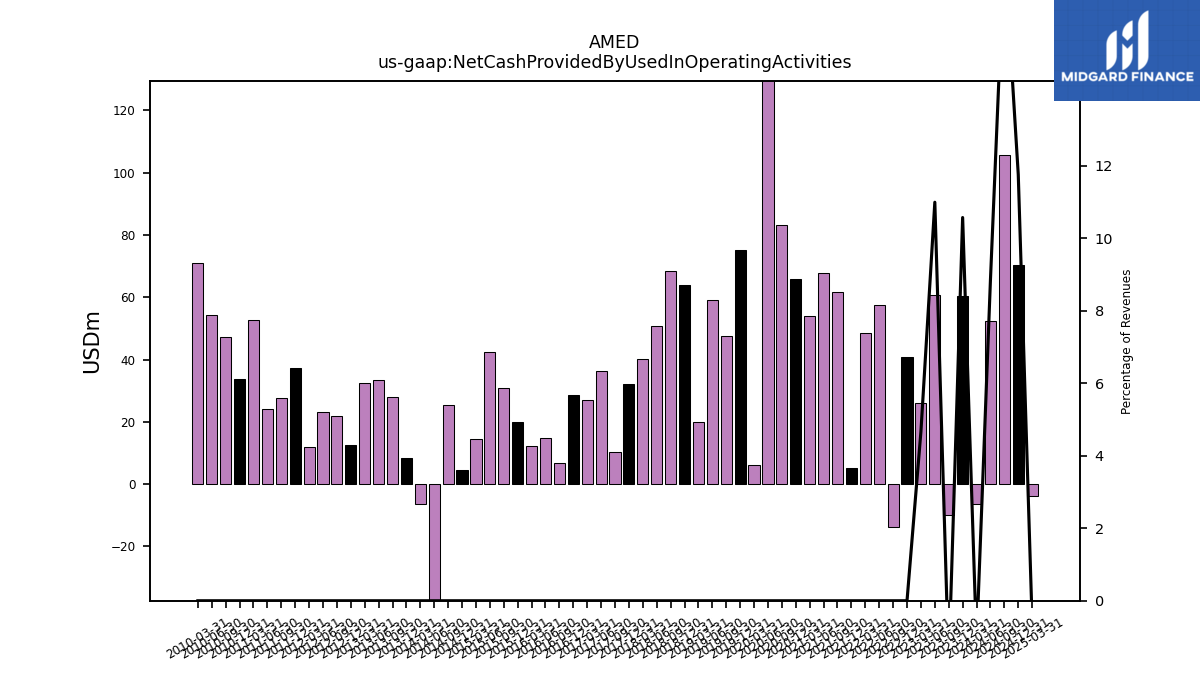
| Net Cash Provided By Used In Operating Activities | 60.31 | -9.84 | 60.76 | 25.96 | 40.88 | -13.63 | 57.41 | 48.62 | 5.17 | 61.77 | 67.96 | 54.00 | 65.91 | 83.08 | 133.92 | 6.04 | 75.22 | 47.45 | 59.27 | 20.06 | 64.03 | 68.48 | 50.65 | 40.32 | 32.19 | 10.20 | 36.24 | 27.10 | 28.56 | 6.80 | 14.65 | 12.24 | 20.04 | 30.70 | 42.55 | 14.48 | 4.59 | 25.34 | -89.13 | -6.34 | 8.40 | 27.89 | 33.56 | 32.42 | 12.59 | 21.88 | 23.15 | 11.87 | 37.37 | 27.78 | 23.96 | 52.55 | 33.66 | NA | |
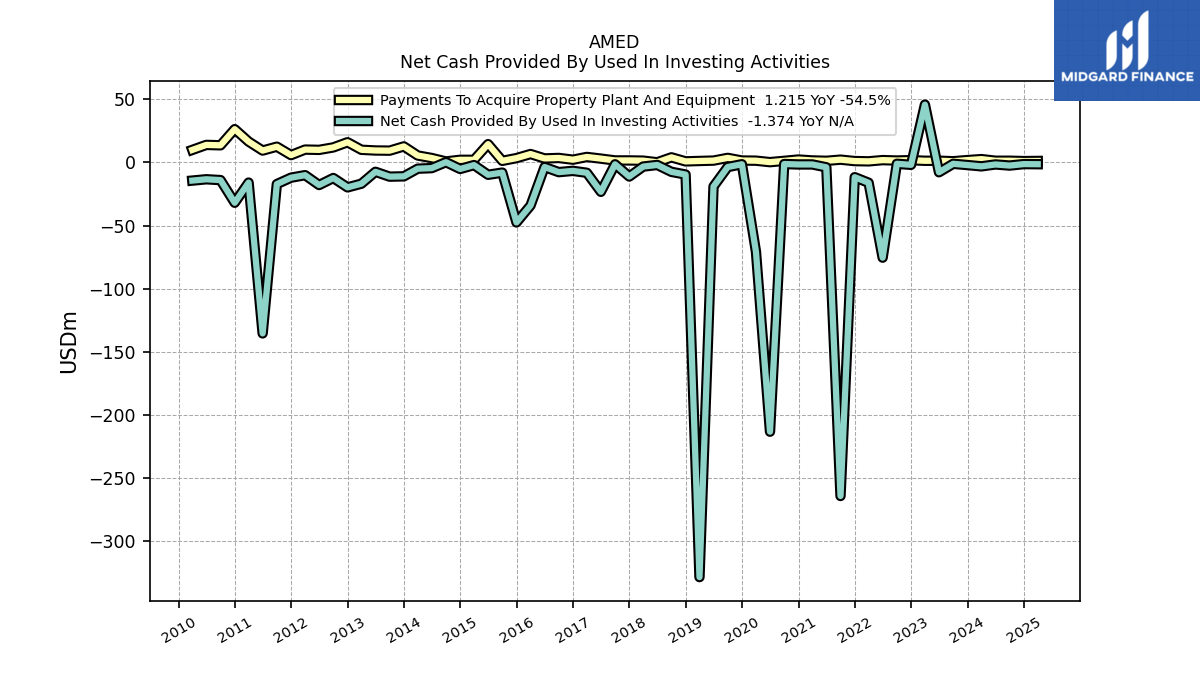
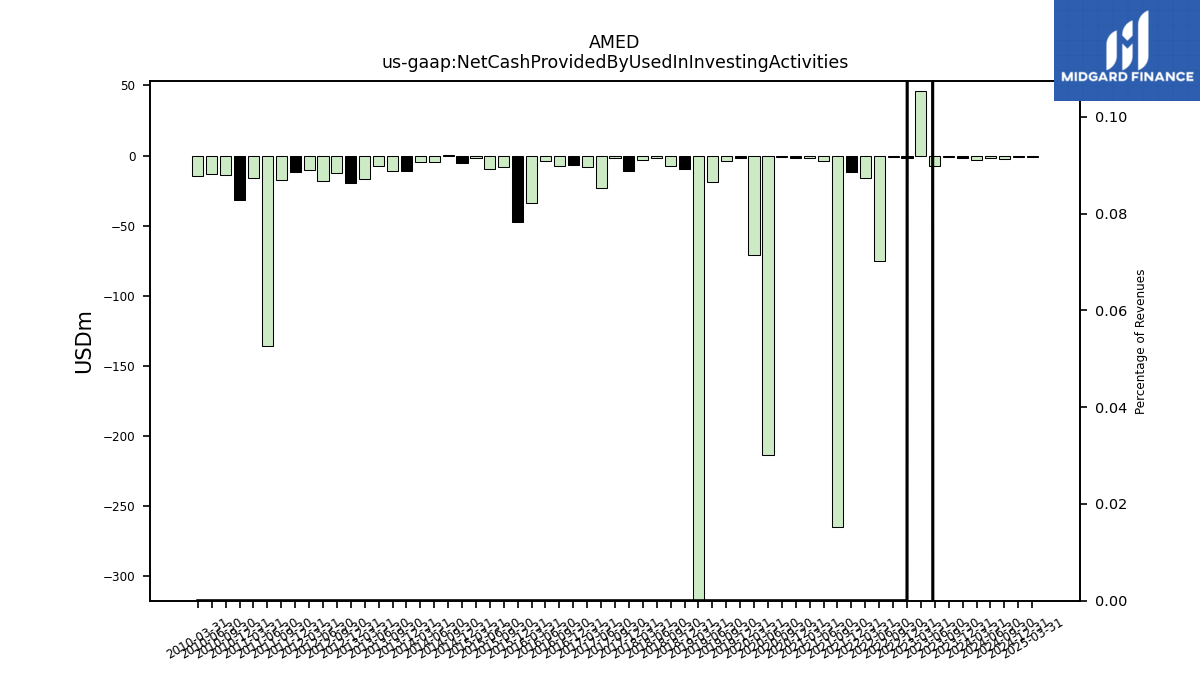
| Net Cash Provided By Used In Investing Activities | -2.04 | -1.05 | -7.75 | 45.90 | -1.87 | -1.03 | -75.51 | -16.08 | -11.67 | -264.56 | -3.82 | -1.56 | -1.56 | -1.22 | -213.57 | -70.75 | -1.39 | -3.60 | -19.05 | -328.91 | -9.57 | -7.42 | -1.96 | -3.25 | -11.13 | -1.45 | -23.27 | -8.18 | -6.65 | -7.65 | -3.60 | -34.15 | -47.56 | -8.04 | -9.75 | -2.07 | -5.14 | 0.23 | -4.47 | -4.92 | -11.00 | -11.24 | -7.39 | -16.82 | -19.74 | -12.32 | -17.88 | -10.05 | -12.05 | -17.13 | -135.59 | -15.95 | -31.96 | NA | |
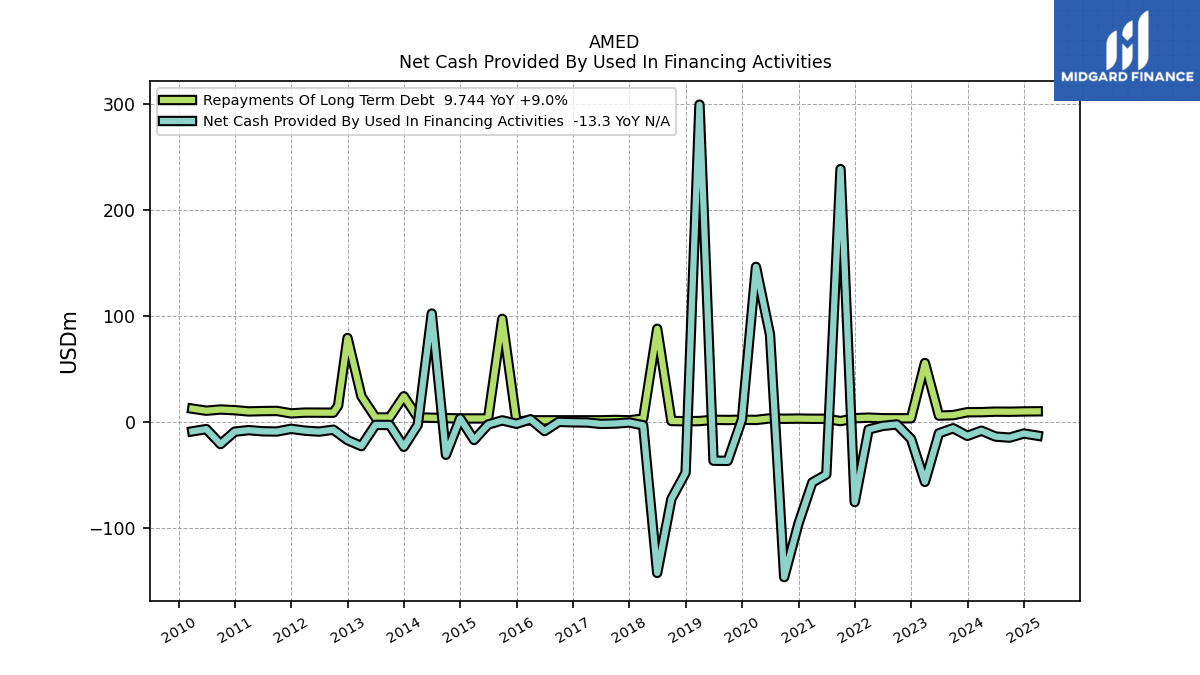
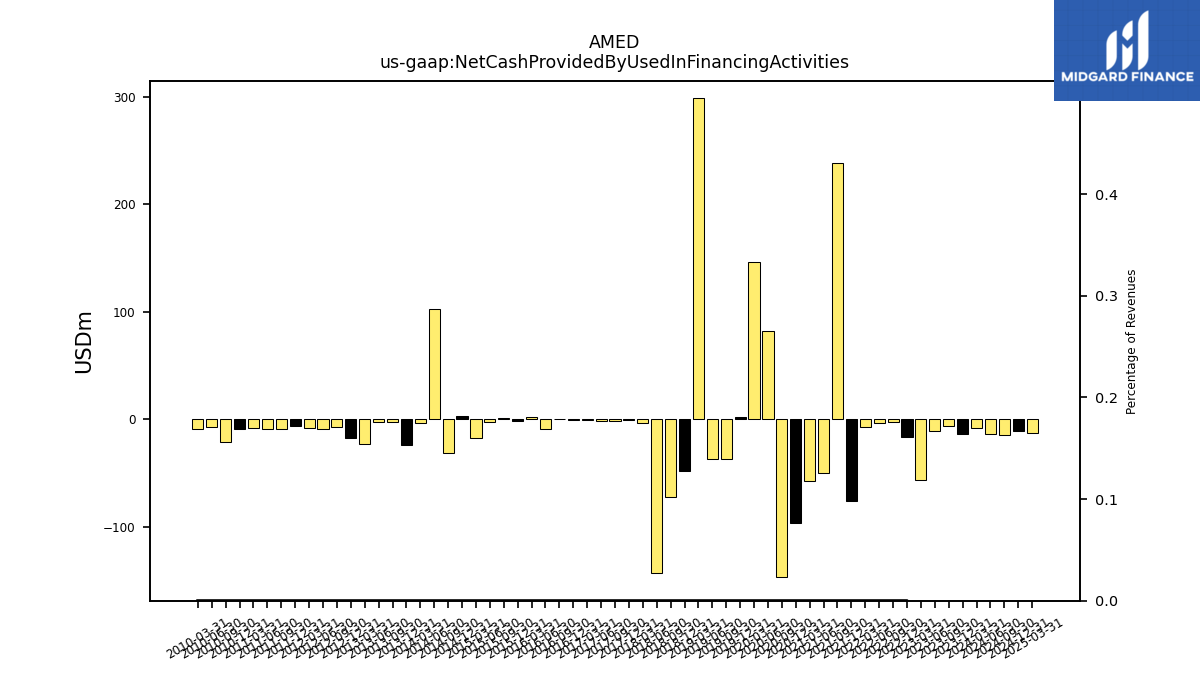
| Net Cash Provided By Used In Financing Activities | -13.43 | -6.25 | -10.95 | -56.89 | -16.34 | -2.64 | -4.05 | -7.40 | -75.94 | 238.36 | -49.83 | -57.46 | -96.44 | -146.74 | 82.16 | 146.04 | 1.90 | -37.00 | -36.87 | 299.18 | -48.24 | -72.96 | -142.80 | -3.43 | -0.81 | -1.80 | -2.14 | -0.79 | -0.63 | -0.21 | -8.91 | 2.23 | -2.03 | 1.18 | -2.73 | -17.32 | 3.03 | -31.25 | 101.99 | -3.20 | -23.72 | -3.14 | -3.07 | -23.11 | -17.41 | -7.62 | -9.40 | -8.53 | -6.78 | -9.32 | -9.11 | -8.04 | -9.45 | NA |
| 2023-12-31 | 2023-09-30 | 2023-06-30 | 2023-03-31 | 2022-12-31 | 2022-09-30 | 2022-06-30 | 2022-03-31 | 2021-12-31 | 2021-09-30 | 2021-06-30 | 2021-03-31 | 2020-12-31 | 2020-09-30 | 2020-06-30 | 2020-03-31 | 2019-12-31 | 2019-09-30 | 2019-06-30 | 2019-03-31 | 2018-12-31 | 2018-09-30 | 2018-06-30 | 2018-03-31 | 2017-12-31 | 2017-09-30 | 2017-06-30 | 2017-03-31 | 2016-12-31 | 2016-09-30 | 2016-06-30 | 2016-03-31 | 2015-12-31 | 2015-09-30 | 2015-06-30 | 2015-03-31 | 2014-12-31 | 2014-09-30 | 2014-06-30 | 2014-03-31 | 2013-12-31 | 2013-09-30 | 2013-06-30 | 2013-03-31 | 2012-12-31 | 2012-09-30 | 2012-06-30 | 2012-03-31 | 2011-12-31 | 2011-09-30 | 2011-06-30 | 2011-03-31 | 2010-12-31 | 2009-12-31 | ||
|---|---|---|---|---|---|---|---|---|---|---|---|---|---|---|---|---|---|---|---|---|---|---|---|---|---|---|---|---|---|---|---|---|---|---|---|---|---|---|---|---|---|---|---|---|---|---|---|---|---|---|---|---|---|---|---|
| Net Cash Provided By Used In Operating Activities | 60.31 | -9.84 | 60.76 | 25.96 | 40.88 | -13.63 | 57.41 | 48.62 | 5.17 | 61.77 | 67.96 | 54.00 | 65.91 | 83.08 | 133.92 | 6.04 | 75.22 | 47.45 | 59.27 | 20.06 | 64.03 | 68.48 | 50.65 | 40.32 | 32.19 | 10.20 | 36.24 | 27.10 | 28.56 | 6.80 | 14.65 | 12.24 | 20.04 | 30.70 | 42.55 | 14.48 | 4.59 | 25.34 | -89.13 | -6.34 | 8.40 | 27.89 | 33.56 | 32.42 | 12.59 | 21.88 | 23.15 | 11.87 | 37.37 | 27.78 | 23.96 | 52.55 | 33.66 | NA | |
| Net Income Loss | 19.32 | 25.96 | -80.28 | 25.25 | 31.72 | 25.64 | 29.58 | 31.67 | 34.05 | 45.01 | 80.15 | 49.87 | 45.10 | 71.98 | 34.67 | 31.80 | 27.70 | 34.13 | 33.74 | 31.30 | 27.50 | 31.38 | 33.35 | 27.16 | -3.80 | 14.56 | 4.46 | 15.13 | 8.90 | 11.44 | 10.70 | 6.21 | 12.90 | 8.44 | 10.64 | -35.01 | 9.10 | 8.44 | 7.62 | -12.42 | -9.60 | -91.07 | 1.84 | 2.68 | -106.80 | 9.92 | 7.88 | 5.42 | 4.30 | -423.72 | 21.66 | 15.29 | 22.20 | NA | |
| Profit Loss | 19.02 | 25.62 | -80.48 | 24.91 | 31.55 | 25.40 | 29.04 | 31.71 | 34.01 | 45.24 | 80.62 | 50.29 | 45.58 | 72.41 | 35.15 | 32.05 | 27.97 | 34.33 | 34.04 | 31.57 | 27.72 | 31.55 | 33.54 | 27.32 | -3.71 | 14.66 | 4.53 | 15.20 | 8.97 | 11.50 | 10.84 | 6.32 | 13.07 | 8.57 | 10.87 | -34.83 | 9.33 | 8.60 | 7.67 | -12.51 | -9.98 | -91.78 | 1.85 | 2.13 | -122.01 | 9.99 | 7.97 | 5.46 | 4.32 | -423.70 | 21.71 | 15.32 | 22.27 | NA | |
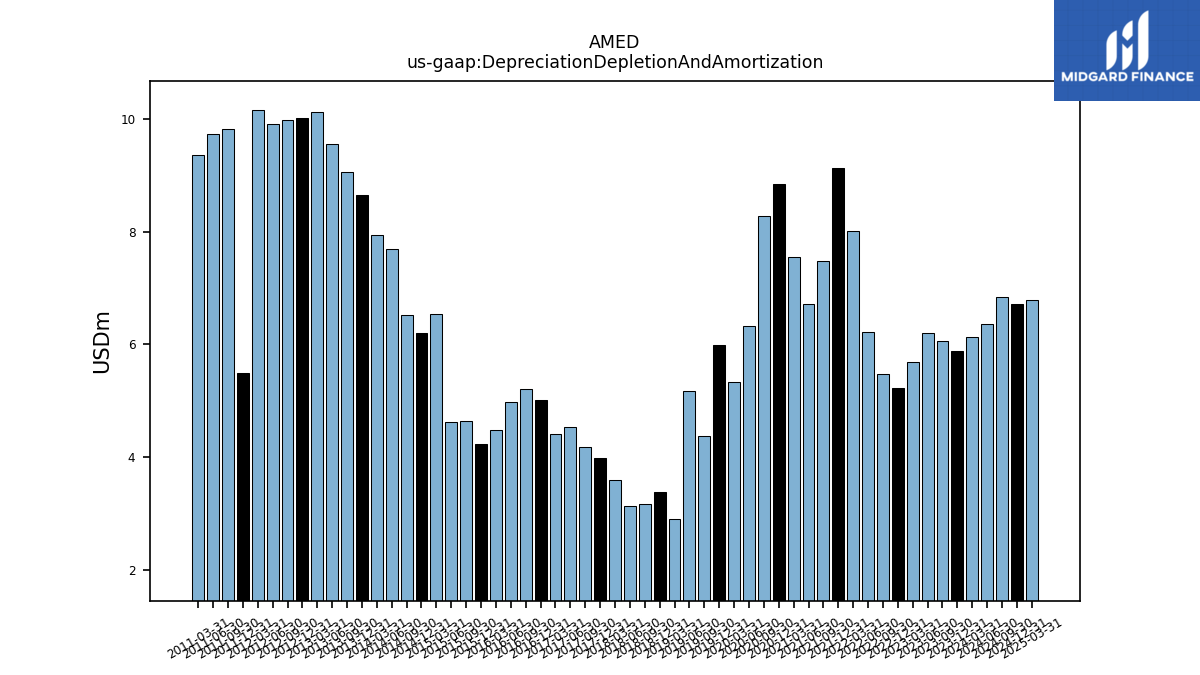
| Depreciation Depletion And Amortization | 5.89 | 6.06 | 6.20 | 5.69 | 5.23 | 5.48 | 6.22 | 8.01 | 9.14 | 7.49 | 6.72 | 7.55 | 8.85 | 8.28 | 6.33 | 5.34 | 5.99 | 4.37 | 5.18 | 2.90 | 3.38 | 3.16 | 3.12 | 3.59 | 3.98 | 4.18 | 4.54 | 4.42 | 5.02 | 5.21 | 4.97 | 4.47 | 4.24 | 4.65 | 4.62 | 6.54 | 6.20 | 6.51 | 7.70 | 7.94 | 8.65 | 9.05 | 9.56 | 10.12 | 10.01 | 9.97 | 9.90 | 10.17 | 5.49 | 9.83 | 9.73 | 9.36 | NA | NA | |
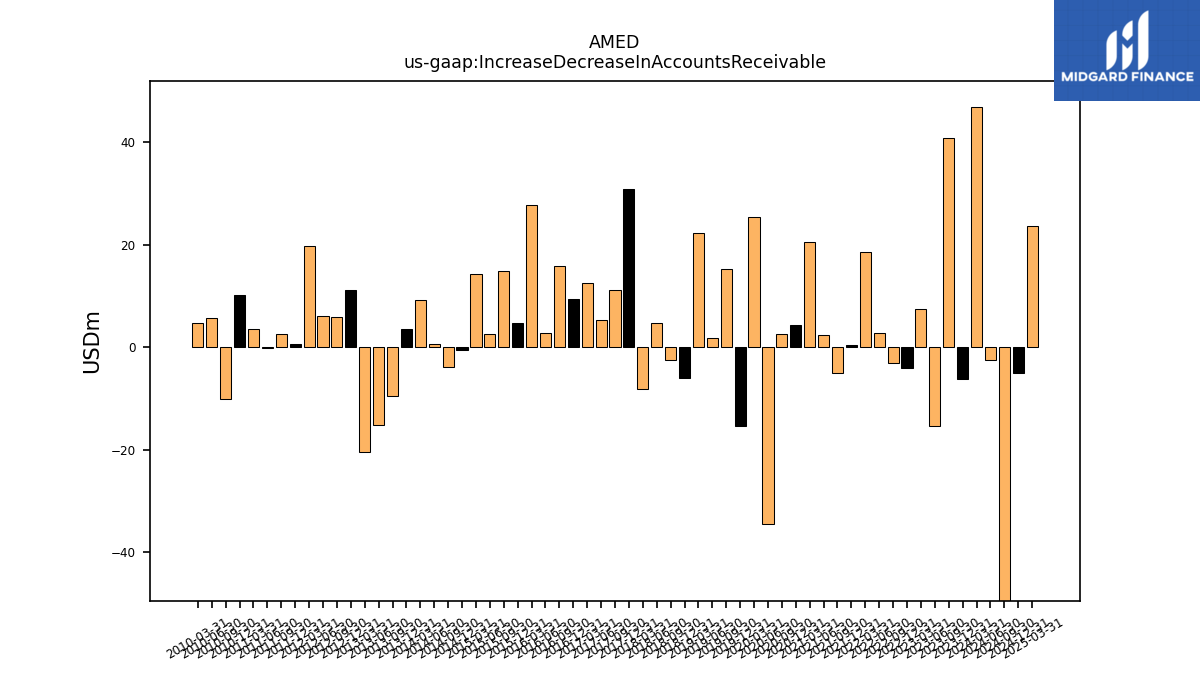
| Increase Decrease In Accounts Receivable | -6.21 | 40.80 | -15.34 | 7.48 | -4.04 | -3.08 | 2.73 | 18.62 | 0.39 | -5.15 | 2.34 | 20.45 | 4.37 | 2.51 | -34.46 | 25.46 | -15.32 | 15.30 | 1.83 | 22.33 | -6.06 | -2.56 | 4.66 | -8.26 | 30.81 | 11.10 | 5.33 | 12.49 | 9.41 | 15.76 | 2.66 | 27.69 | 4.71 | 14.93 | 2.56 | 14.30 | -0.56 | -3.89 | 0.56 | 9.19 | 3.59 | -9.49 | -15.14 | -20.55 | 11.15 | 5.96 | 6.04 | 19.69 | 0.64 | 2.56 | -0.22 | 3.54 | 10.24 | NA | |
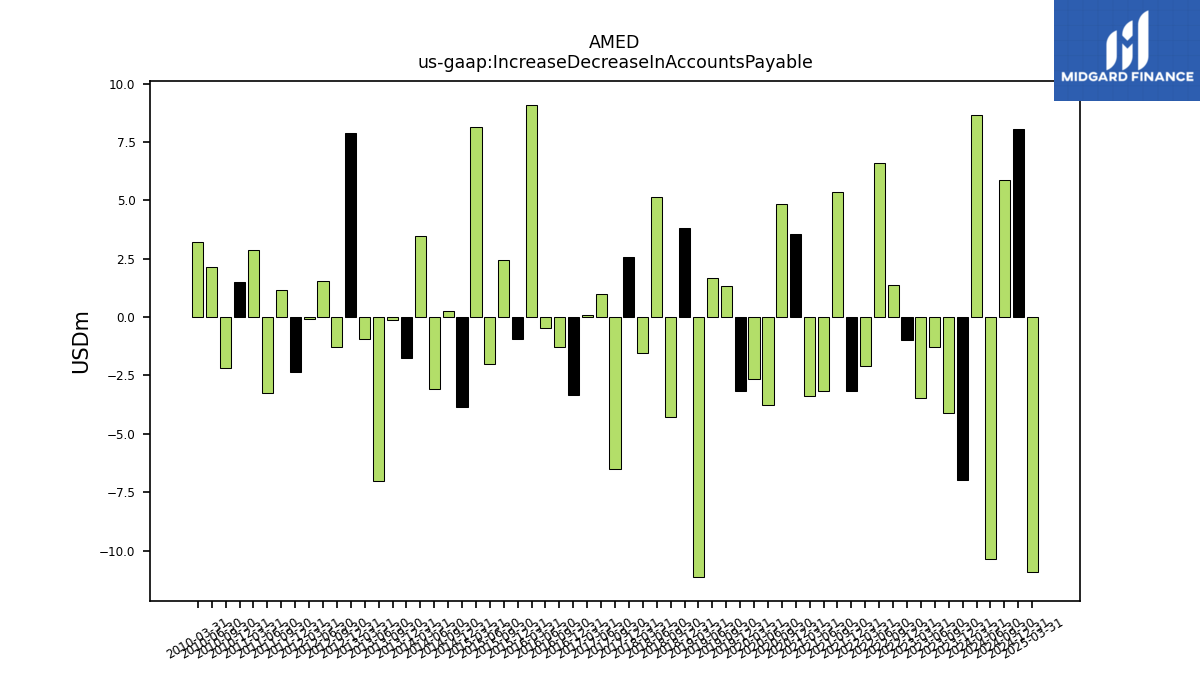
| Increase Decrease In Accounts Payable | -6.98 | -4.11 | -1.27 | -3.46 | -0.99 | 1.39 | 6.61 | -2.12 | -3.16 | 5.34 | -3.16 | -3.37 | 3.57 | 4.83 | -3.78 | -2.67 | -3.18 | 1.33 | 1.67 | -11.14 | 3.83 | -4.29 | 5.15 | -1.52 | 2.59 | -6.52 | 1.00 | 0.09 | -3.34 | -1.30 | -0.49 | 9.10 | -0.96 | 2.43 | -1.99 | 8.16 | -3.84 | 0.25 | -3.08 | 3.49 | -1.76 | -0.15 | -7.02 | -0.94 | 7.88 | -1.26 | 1.54 | -0.09 | -2.33 | 1.17 | -3.25 | 2.89 | 1.50 | NA | |
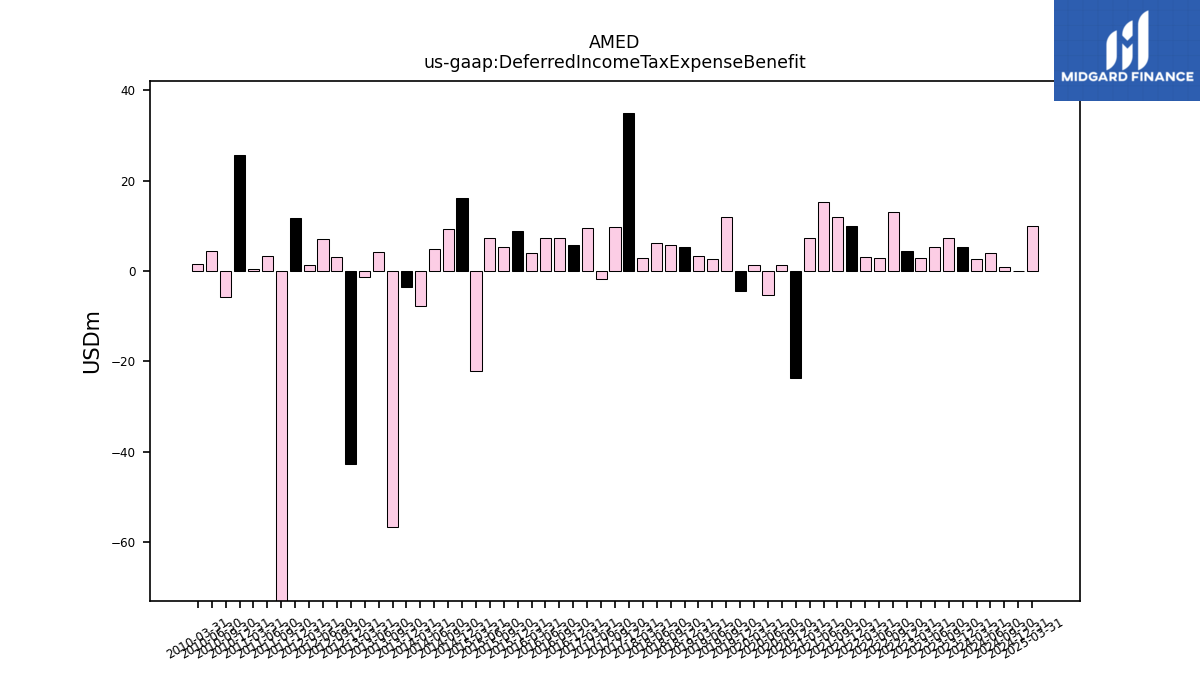
| Deferred Income Tax Expense Benefit | 5.24 | 7.31 | 5.33 | 2.77 | 4.35 | 13.03 | 2.80 | 3.21 | 9.85 | 12.01 | 15.30 | 7.41 | -23.80 | 1.27 | -5.26 | 1.23 | -4.33 | 11.92 | 2.61 | 3.27 | 5.36 | 5.77 | 6.20 | 2.94 | 34.95 | 9.65 | -1.86 | 9.45 | 5.86 | 7.33 | 7.32 | 4.04 | 8.87 | 5.24 | 7.38 | -22.16 | 16.20 | 9.37 | 4.78 | -7.80 | -3.48 | -56.57 | 4.25 | -1.29 | -42.80 | 3.16 | 7.05 | 1.42 | 11.67 | -137.33 | 3.31 | 0.40 | 25.63 | NA | |
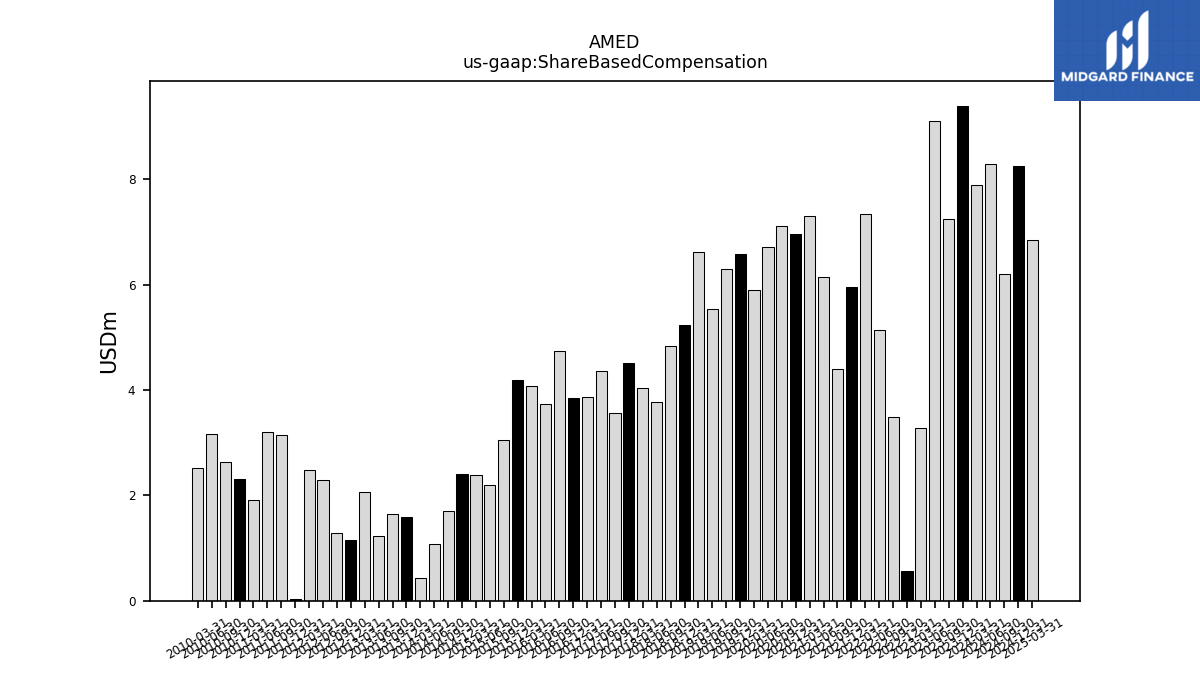
| Share Based Compensation | 9.40 | 7.24 | 9.11 | 3.27 | 0.57 | 3.50 | 5.15 | 7.35 | 5.95 | 4.40 | 6.16 | 7.31 | 6.97 | 7.12 | 6.72 | 5.91 | 6.59 | 6.30 | 5.54 | 6.62 | 5.23 | 4.84 | 3.77 | 4.04 | 4.51 | 3.56 | 4.36 | 3.87 | 3.85 | 4.75 | 3.74 | 4.07 | 4.19 | 3.06 | 2.19 | 2.38 | 2.40 | 1.70 | 1.07 | 0.43 | 1.59 | 1.65 | 1.22 | 2.06 | 1.15 | 1.28 | 2.30 | 2.48 | 0.03 | 3.15 | 3.21 | 1.91 | 2.32 | NA |
| 2023-12-31 | 2023-09-30 | 2023-06-30 | 2023-03-31 | 2022-12-31 | 2022-09-30 | 2022-06-30 | 2022-03-31 | 2021-12-31 | 2021-09-30 | 2021-06-30 | 2021-03-31 | 2020-12-31 | 2020-09-30 | 2020-06-30 | 2020-03-31 | 2019-12-31 | 2019-09-30 | 2019-06-30 | 2019-03-31 | 2018-12-31 | 2018-09-30 | 2018-06-30 | 2018-03-31 | 2017-12-31 | 2017-09-30 | 2017-06-30 | 2017-03-31 | 2016-12-31 | 2016-09-30 | 2016-06-30 | 2016-03-31 | 2015-12-31 | 2015-09-30 | 2015-06-30 | 2015-03-31 | 2014-12-31 | 2014-09-30 | 2014-06-30 | 2014-03-31 | 2013-12-31 | 2013-09-30 | 2013-06-30 | 2013-03-31 | 2012-12-31 | 2012-09-30 | 2012-06-30 | 2012-03-31 | 2011-12-31 | 2011-09-30 | 2011-06-30 | 2011-03-31 | 2010-12-31 | 2009-12-31 | ||
|---|---|---|---|---|---|---|---|---|---|---|---|---|---|---|---|---|---|---|---|---|---|---|---|---|---|---|---|---|---|---|---|---|---|---|---|---|---|---|---|---|---|---|---|---|---|---|---|---|---|---|---|---|---|---|---|
| Net Cash Provided By Used In Investing Activities | -2.04 | -1.05 | -7.75 | 45.90 | -1.87 | -1.03 | -75.51 | -16.08 | -11.67 | -264.56 | -3.82 | -1.56 | -1.56 | -1.22 | -213.57 | -70.75 | -1.39 | -3.60 | -19.05 | -328.91 | -9.57 | -7.42 | -1.96 | -3.25 | -11.13 | -1.45 | -23.27 | -8.18 | -6.65 | -7.65 | -3.60 | -34.15 | -47.56 | -8.04 | -9.75 | -2.07 | -5.14 | 0.23 | -4.47 | -4.92 | -11.00 | -11.24 | -7.39 | -16.82 | -19.74 | -12.32 | -17.88 | -10.05 | -12.05 | -17.13 | -135.59 | -15.95 | -31.96 | NA | |
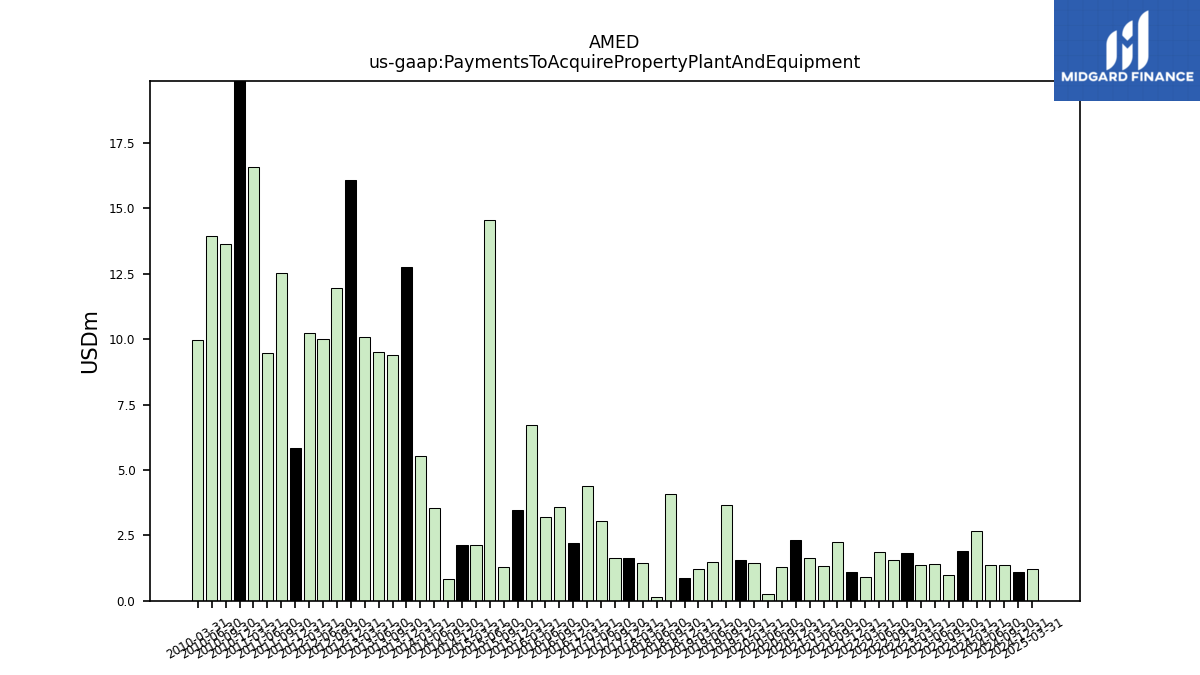
| Payments To Acquire Property Plant And Equipment | 1.89 | 0.98 | 1.39 | 1.35 | 1.83 | 1.56 | 1.88 | 0.90 | 1.11 | 2.24 | 1.32 | 1.62 | 2.34 | 1.29 | 0.27 | 1.43 | 1.55 | 3.64 | 1.50 | 1.20 | 0.87 | 4.07 | 0.15 | 1.46 | 1.63 | 1.62 | 3.06 | 4.38 | 2.21 | 3.59 | 3.21 | 6.70 | 3.46 | 1.30 | 14.55 | 2.11 | 2.13 | 0.81 | 3.54 | 5.53 | 12.75 | 9.39 | 9.52 | 10.07 | 16.06 | 11.96 | 10.01 | 10.24 | 5.84 | 12.54 | 9.45 | 16.58 | 26.44 | NA |
| 2023-12-31 | 2023-09-30 | 2023-06-30 | 2023-03-31 | 2022-12-31 | 2022-09-30 | 2022-06-30 | 2022-03-31 | 2021-12-31 | 2021-09-30 | 2021-06-30 | 2021-03-31 | 2020-12-31 | 2020-09-30 | 2020-06-30 | 2020-03-31 | 2019-12-31 | 2019-09-30 | 2019-06-30 | 2019-03-31 | 2018-12-31 | 2018-09-30 | 2018-06-30 | 2018-03-31 | 2017-12-31 | 2017-09-30 | 2017-06-30 | 2017-03-31 | 2016-12-31 | 2016-09-30 | 2016-06-30 | 2016-03-31 | 2015-12-31 | 2015-09-30 | 2015-06-30 | 2015-03-31 | 2014-12-31 | 2014-09-30 | 2014-06-30 | 2014-03-31 | 2013-12-31 | 2013-09-30 | 2013-06-30 | 2013-03-31 | 2012-12-31 | 2012-09-30 | 2012-06-30 | 2012-03-31 | 2011-12-31 | 2011-09-30 | 2011-06-30 | 2011-03-31 | 2010-12-31 | 2009-12-31 | ||
|---|---|---|---|---|---|---|---|---|---|---|---|---|---|---|---|---|---|---|---|---|---|---|---|---|---|---|---|---|---|---|---|---|---|---|---|---|---|---|---|---|---|---|---|---|---|---|---|---|---|---|---|---|---|---|---|
| Net Cash Provided By Used In Financing Activities | -13.43 | -6.25 | -10.95 | -56.89 | -16.34 | -2.64 | -4.05 | -7.40 | -75.94 | 238.36 | -49.83 | -57.46 | -96.44 | -146.74 | 82.16 | 146.04 | 1.90 | -37.00 | -36.87 | 299.18 | -48.24 | -72.96 | -142.80 | -3.43 | -0.81 | -1.80 | -2.14 | -0.79 | -0.63 | -0.21 | -8.91 | 2.23 | -2.03 | 1.18 | -2.73 | -17.32 | 3.03 | -31.25 | 101.99 | -3.20 | -23.72 | -3.14 | -3.07 | -23.11 | -17.41 | -7.62 | -9.40 | -8.53 | -6.78 | -9.32 | -9.11 | -8.04 | -9.45 | NA |