
| 2023-09-30 | 2023-06-30 | 2023-03-31 | 2022-12-31 | 2022-09-30 | 2022-06-30 | 2022-03-31 | 2021-12-31 | 2021-09-30 | 2021-06-30 | 2021-03-31 | 2020-12-31 | 2020-09-30 | 2020-06-30 | 2020-03-31 | 2019-12-31 | 2019-09-30 | 2019-06-30 | 2019-03-31 | 2018-12-31 | 2018-09-30 | 2018-06-30 | ||
|---|---|---|---|---|---|---|---|---|---|---|---|---|---|---|---|---|---|---|---|---|---|---|---|
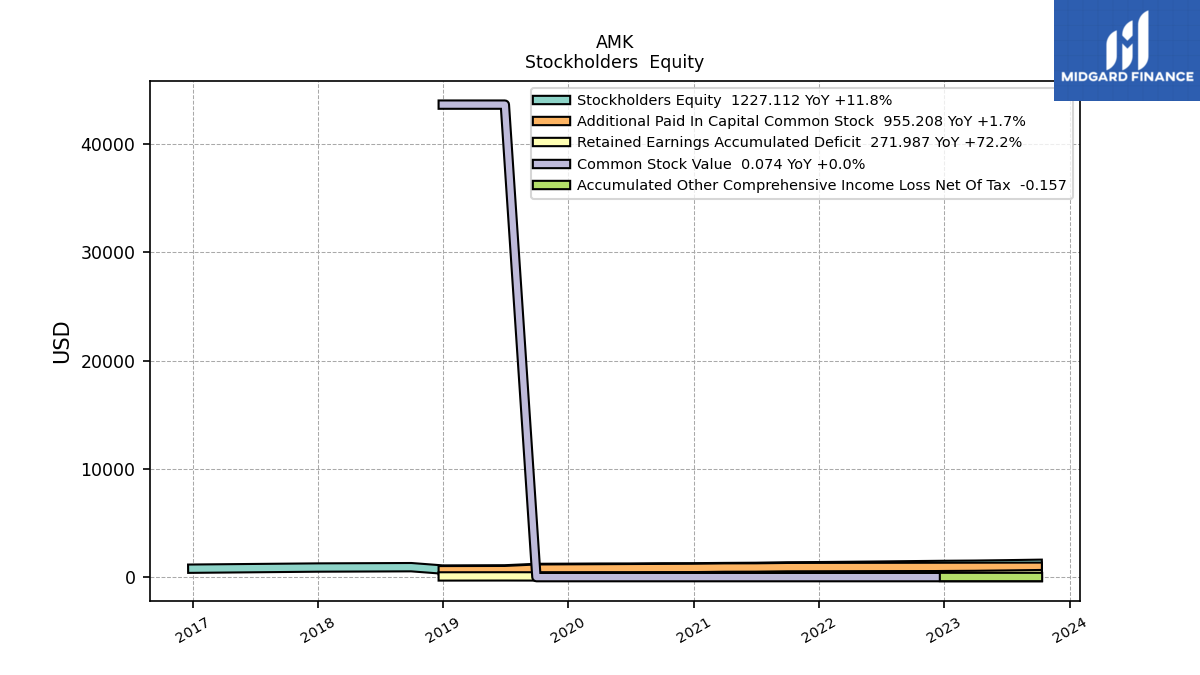
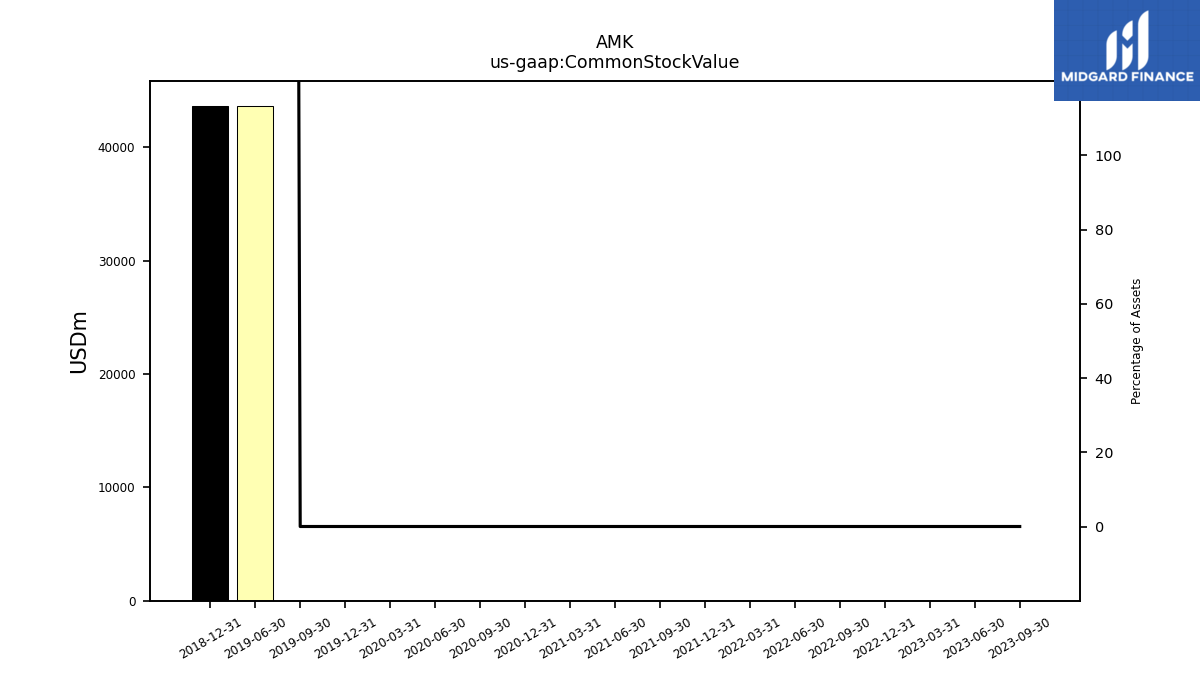
| Common Stock Value | 0.07 | 0.07 | 0.07 | 0.07 | 0.07 | 0.07 | 0.07 | 0.07 | 0.07 | 0.07 | 0.07 | 0.07 | 0.07 | 0.07 | 0.07 | 0.07 | 0.07 | 43659.00 | NA | 43659.00 | NA | NA | |
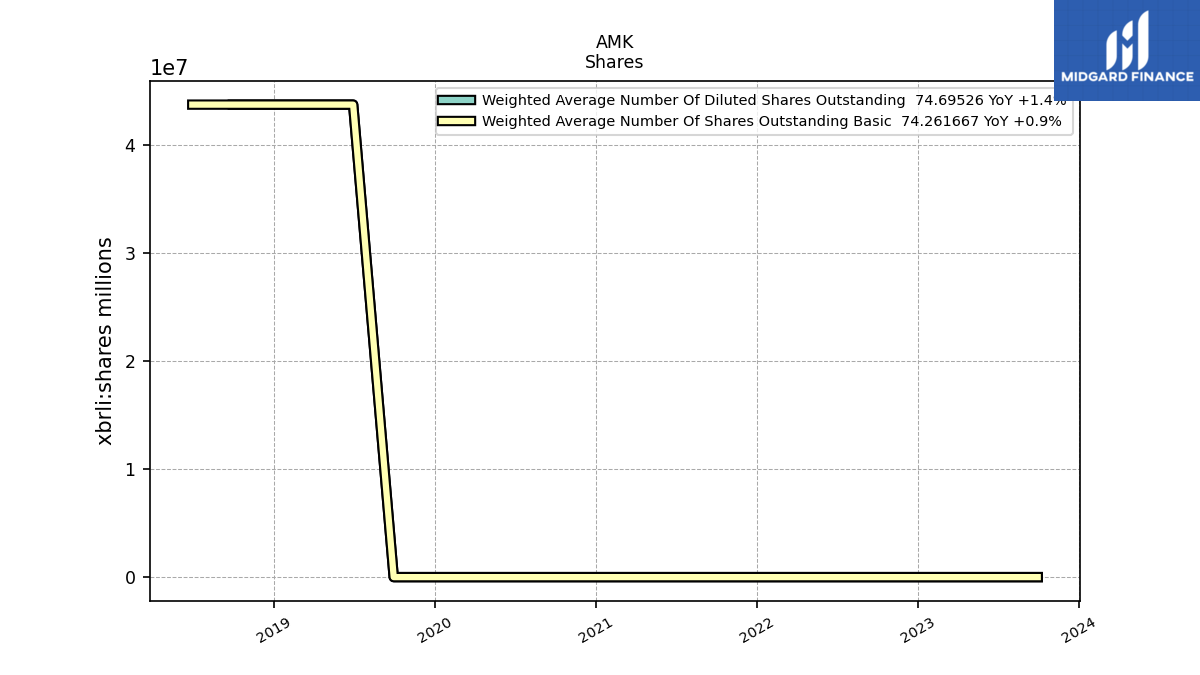
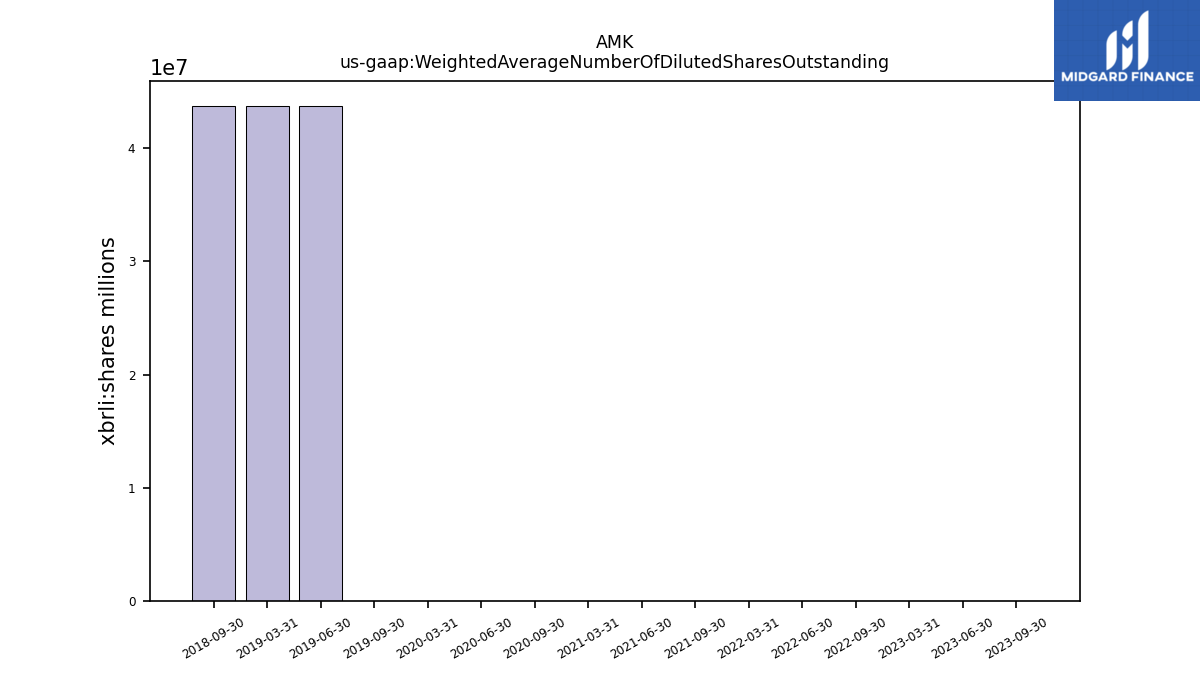
| Weighted Average Number Of Diluted Shares Outstanding | 74.70 | 74.51 | 74.37 | NA | 73.84 | 73.69 | 73.68 | NA | 73.57 | 72.16 | 70.42 | NA | 70.07 | 67.21 | 69.32 | NA | 69.50 | 43758225.00 | 43758225.00 | NA | 43758225.00 | NA | |
| Weighted Average Number Of Shares Outstanding Basic | 74.26 | 73.99 | 73.89 | NA | 73.84 | 73.63 | 73.57 | NA | 72.92 | 71.92 | 70.42 | NA | 67.28 | 67.21 | 67.14 | NA | 69.28 | 43758225.00 | 43758225.00 | NA | 43758225.00 | 43758225.00 | |
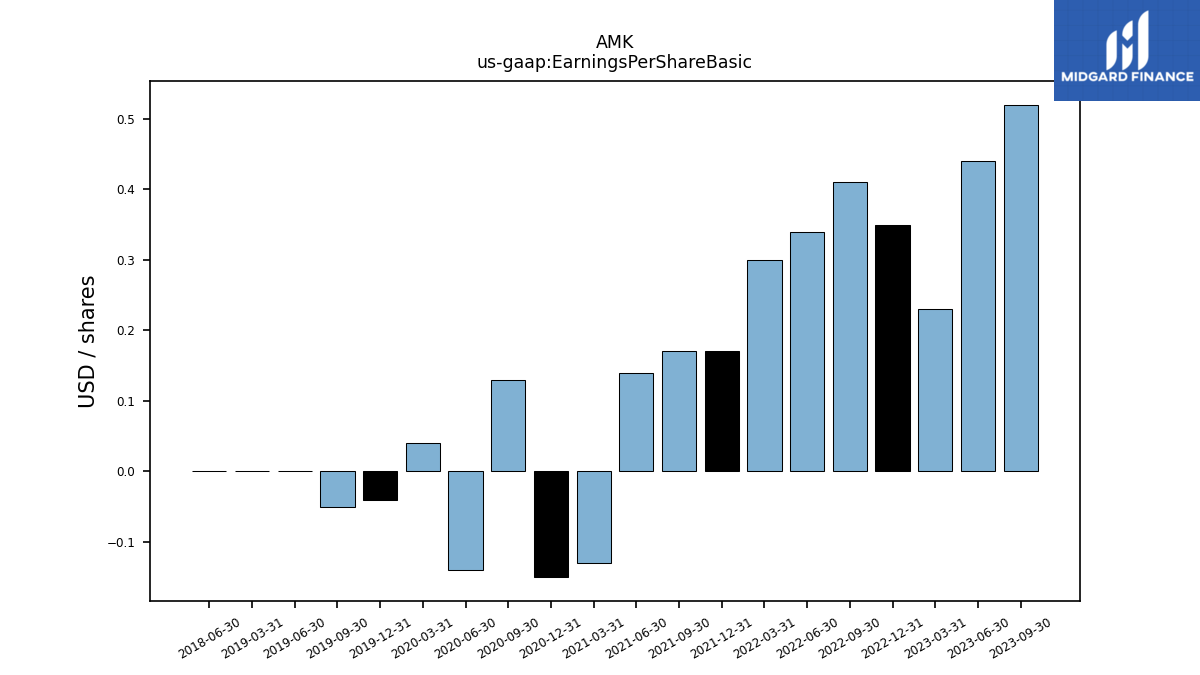
| Earnings Per Share Basic | 0.52 | 0.44 | 0.23 | 0.35 | 0.41 | 0.34 | 0.30 | 0.17 | 0.17 | 0.14 | -0.13 | -0.15 | 0.13 | -0.14 | 0.04 | -0.04 | -0.05 | 0.00 | 0.00 | NA | NA | 0.00 | |
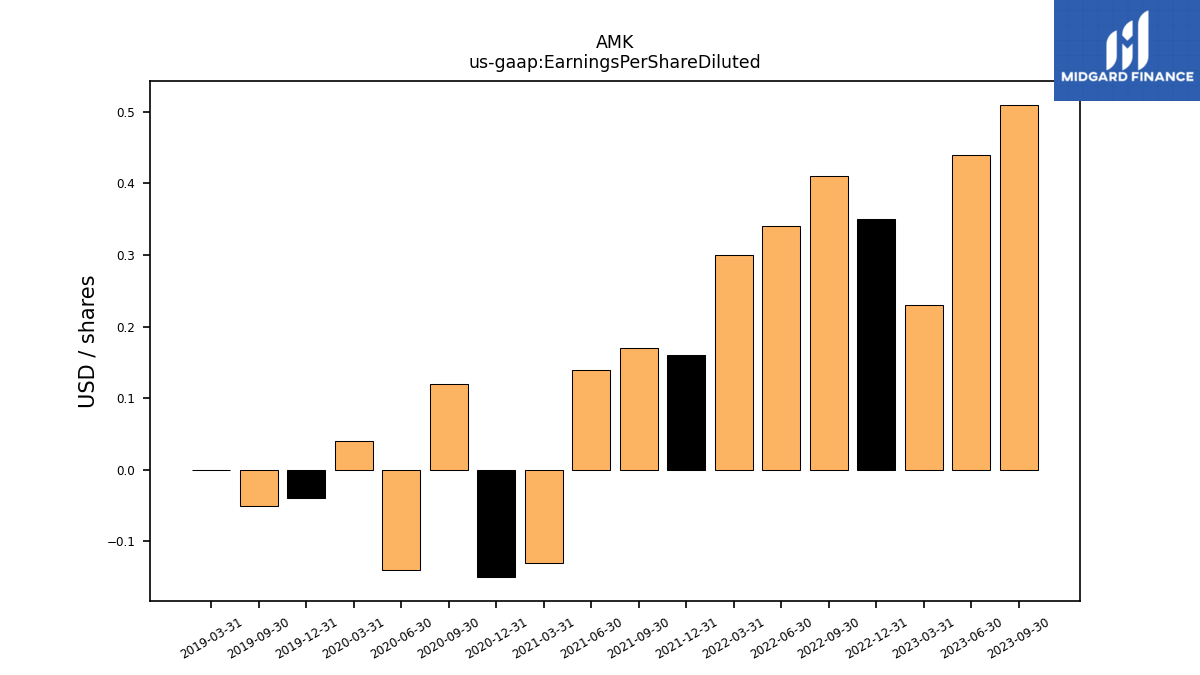
| Earnings Per Share Diluted | 0.51 | 0.44 | 0.23 | 0.35 | 0.41 | 0.34 | 0.30 | 0.16 | 0.17 | 0.14 | -0.13 | -0.15 | 0.12 | -0.14 | 0.04 | -0.04 | -0.05 | NA | 0.00 | NA | NA | NA |
| 2023-09-30 | 2023-06-30 | 2023-03-31 | 2022-12-31 | 2022-09-30 | 2022-06-30 | 2022-03-31 | 2021-12-31 | 2021-09-30 | 2021-06-30 | 2021-03-31 | 2020-12-31 | 2020-09-30 | 2020-06-30 | 2020-03-31 | 2019-12-31 | 2019-09-30 | 2019-06-30 | 2019-03-31 | 2018-12-31 | 2018-09-30 | 2018-06-30 | ||
|---|---|---|---|---|---|---|---|---|---|---|---|---|---|---|---|---|---|---|---|---|---|---|---|
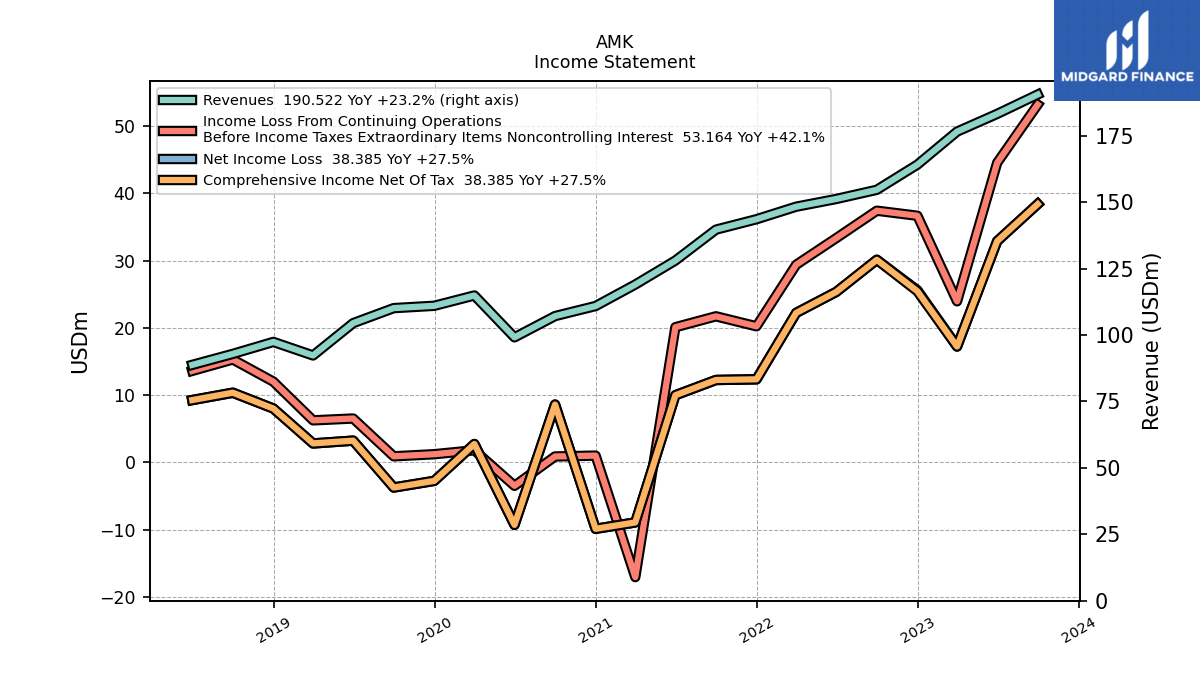
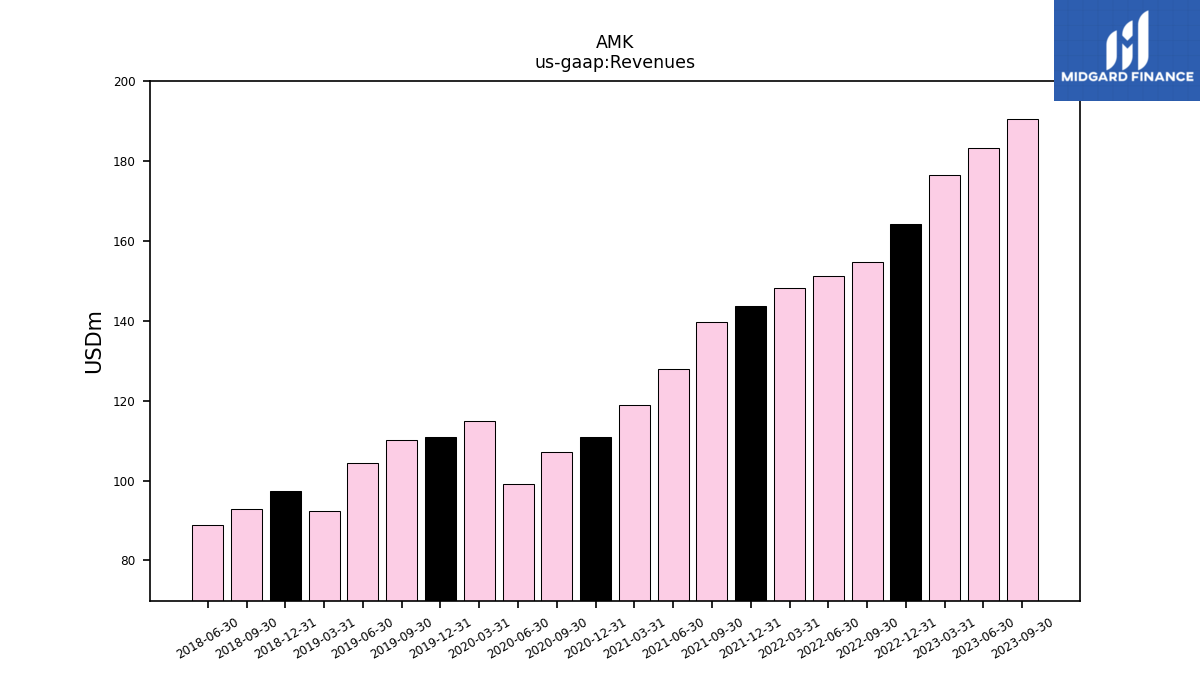
| Revenues | 190.52 | 183.23 | 176.56 | 164.13 | 154.66 | 151.21 | 148.30 | 143.58 | 139.67 | 128.04 | 119.01 | 110.92 | 107.14 | 99.13 | 114.89 | 111.01 | 110.13 | 104.48 | 92.31 | 97.41 | 92.91 | 88.78 | |
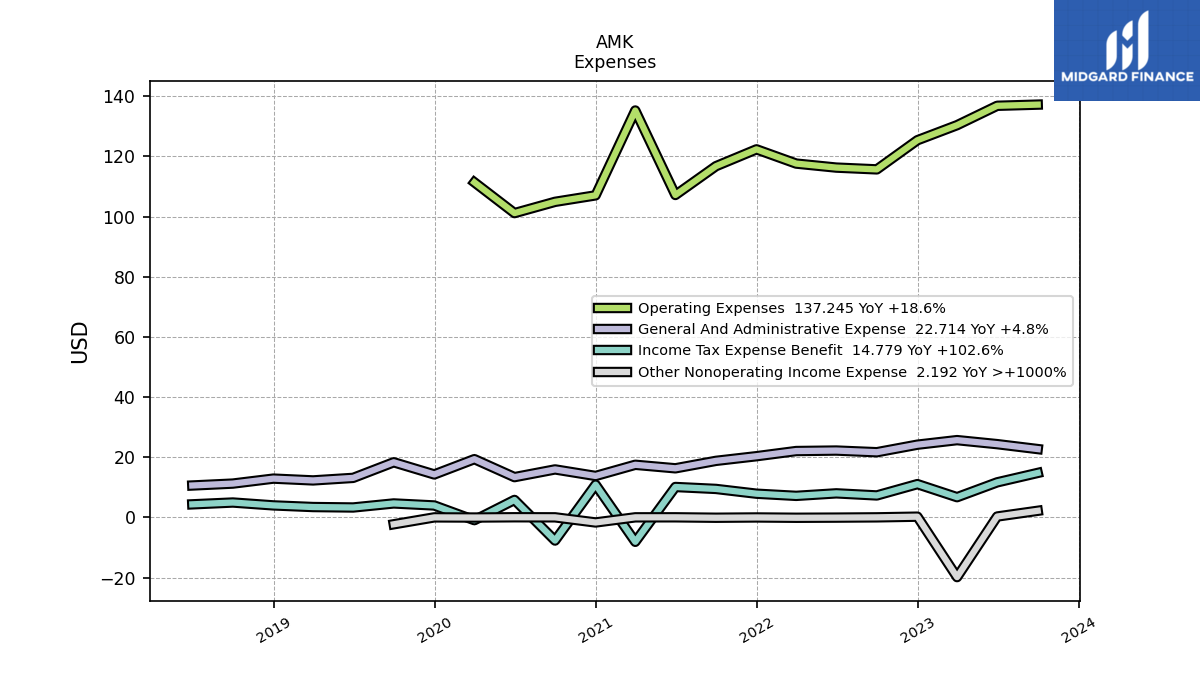
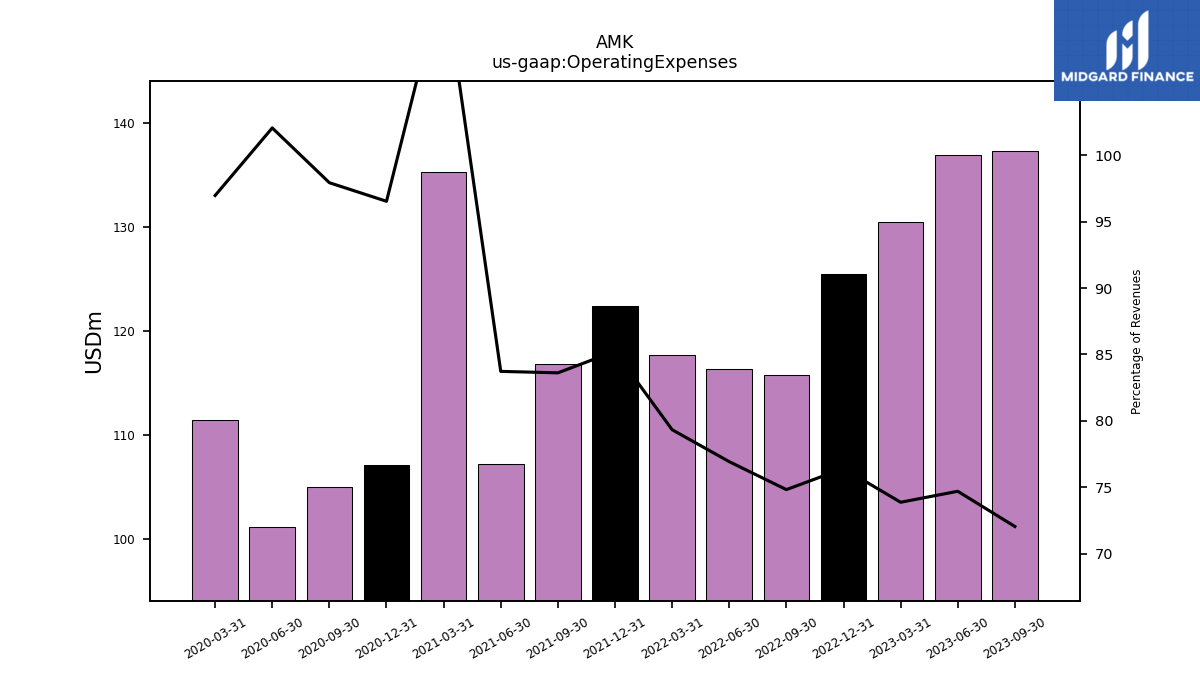
| Operating Expenses | 137.25 | 136.86 | 130.41 | 125.41 | 115.71 | 116.31 | 117.64 | 122.38 | 116.78 | 107.20 | 135.29 | 107.07 | 104.92 | 101.17 | 111.41 | NA | NA | NA | NA | NA | NA | NA | |
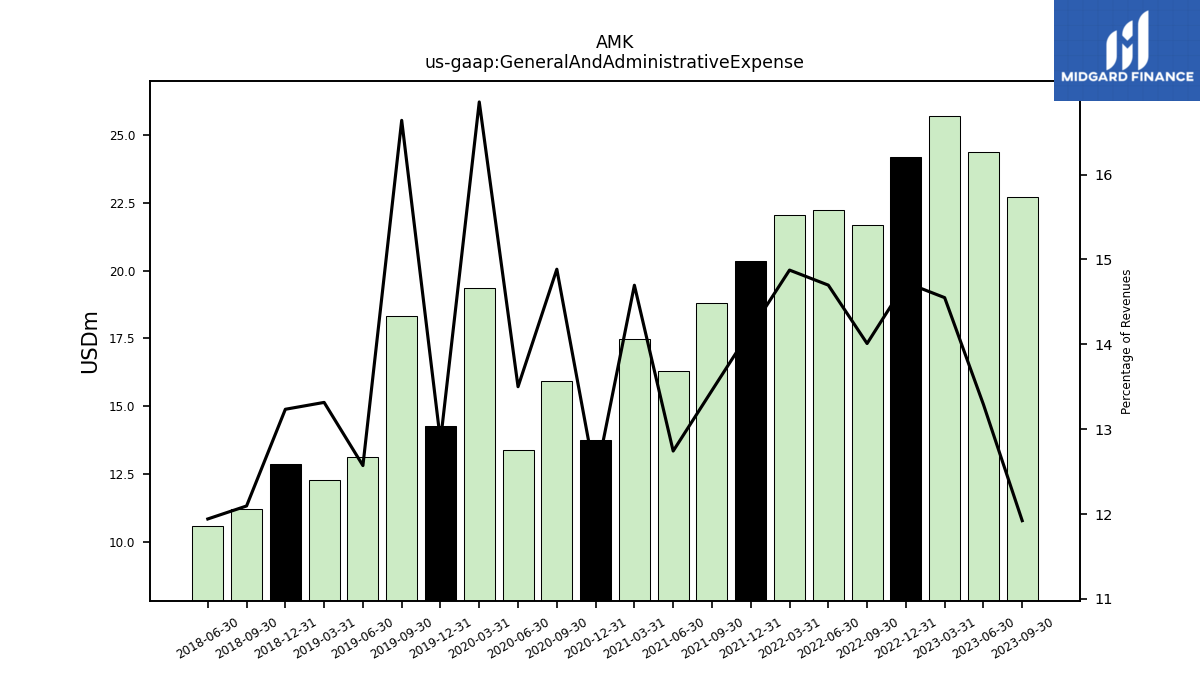
| General And Administrative Expense | 22.71 | 24.35 | 25.69 | 24.17 | 21.67 | 22.22 | 22.06 | 20.34 | 18.79 | 16.32 | 17.49 | 13.77 | 15.95 | 13.38 | 19.36 | 14.28 | 18.32 | 13.13 | 12.29 | 12.89 | 11.24 | 10.60 | |
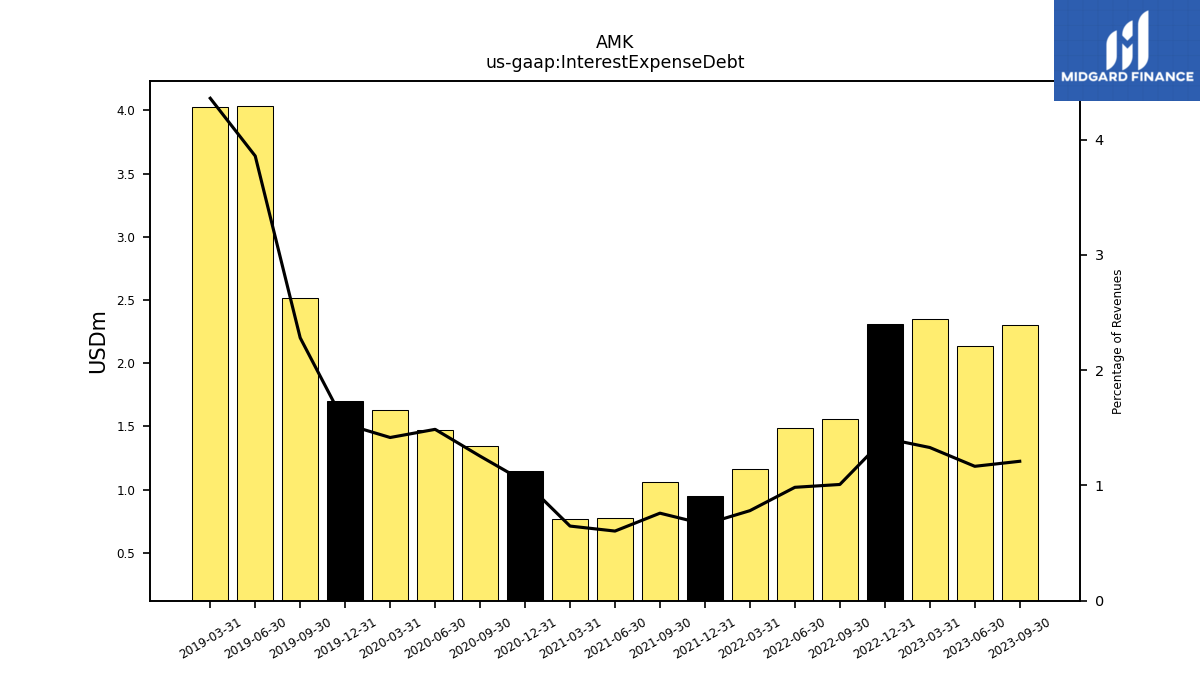
| Interest Expense Debt | 2.31 | 2.14 | 2.35 | 2.31 | 1.56 | 1.49 | 1.16 | 0.95 | 1.06 | 0.77 | 0.77 | 1.14 | 1.34 | 1.47 | 1.63 | 1.70 | 2.51 | 4.03 | 4.02 | NA | NA | NA | |
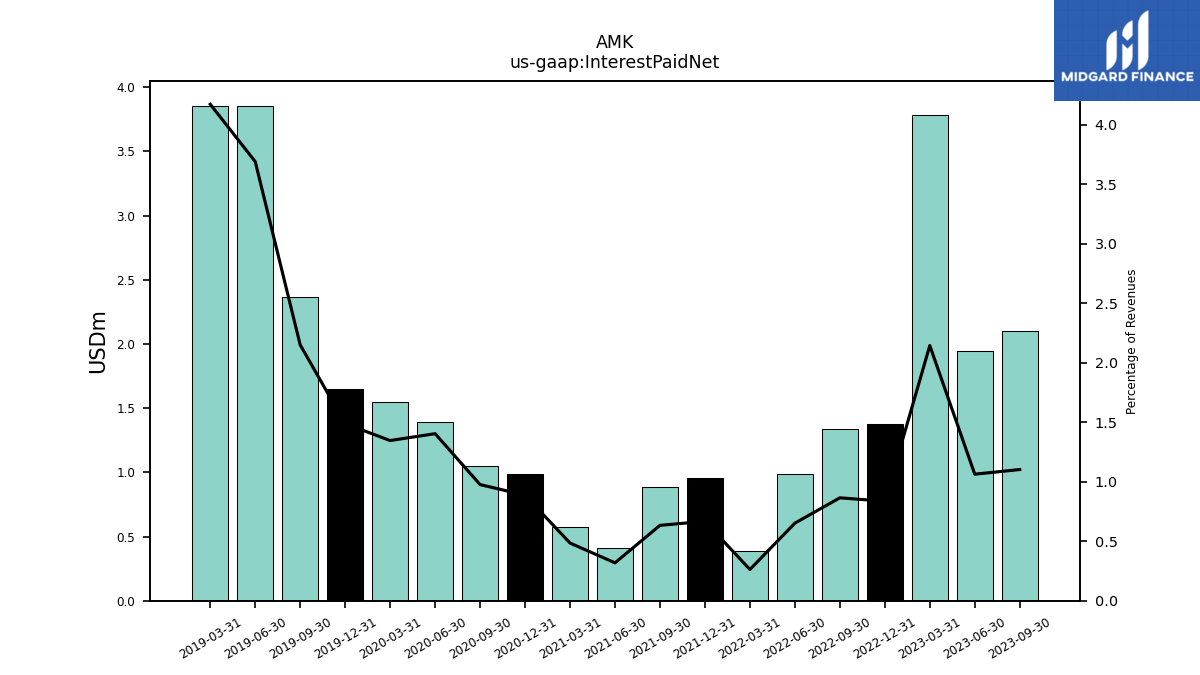
| Interest Paid Net | 2.10 | 1.95 | 3.79 | 1.37 | 1.34 | 0.99 | 0.39 | 0.96 | 0.89 | 0.41 | 0.58 | 0.98 | 1.05 | 1.39 | 1.55 | 1.65 | 2.37 | 3.86 | 3.85 | NA | NA | NA | |
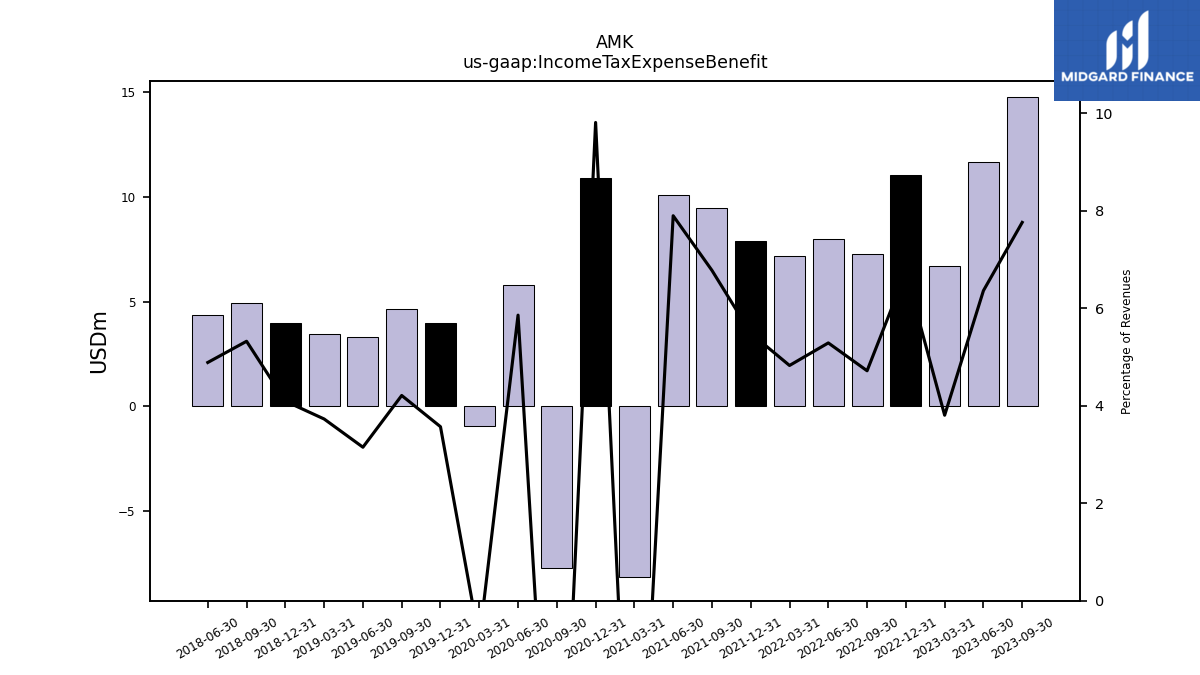
| Income Tax Expense Benefit | 14.78 | 11.65 | 6.72 | 11.06 | 7.29 | 7.99 | 7.15 | 7.88 | 9.46 | 10.11 | -8.13 | 10.88 | -7.71 | 5.80 | -0.93 | 3.96 | 4.63 | 3.29 | 3.44 | 3.99 | 4.94 | 4.34 | |
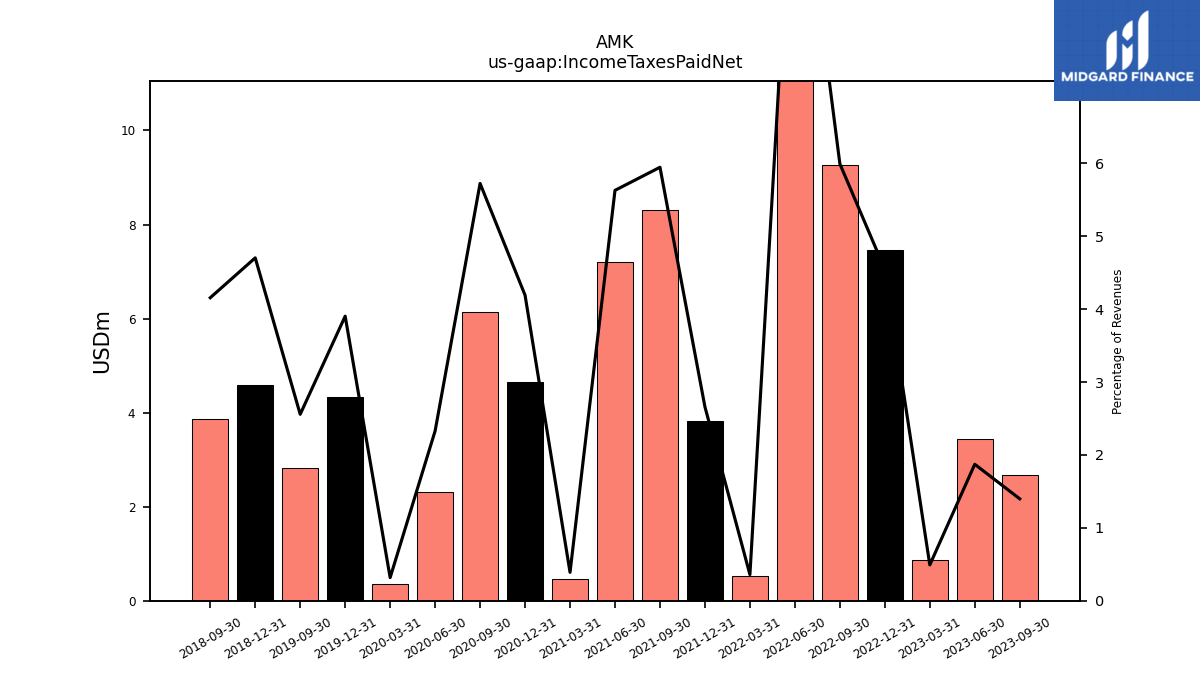
| Income Taxes Paid Net | 2.66 | 3.43 | 0.87 | 7.46 | 9.27 | 16.37 | 0.53 | 3.82 | 8.30 | 7.21 | 0.46 | 4.65 | 6.13 | 2.31 | 0.36 | 4.33 | 2.82 | NA | NA | 4.58 | 3.86 | NA | |
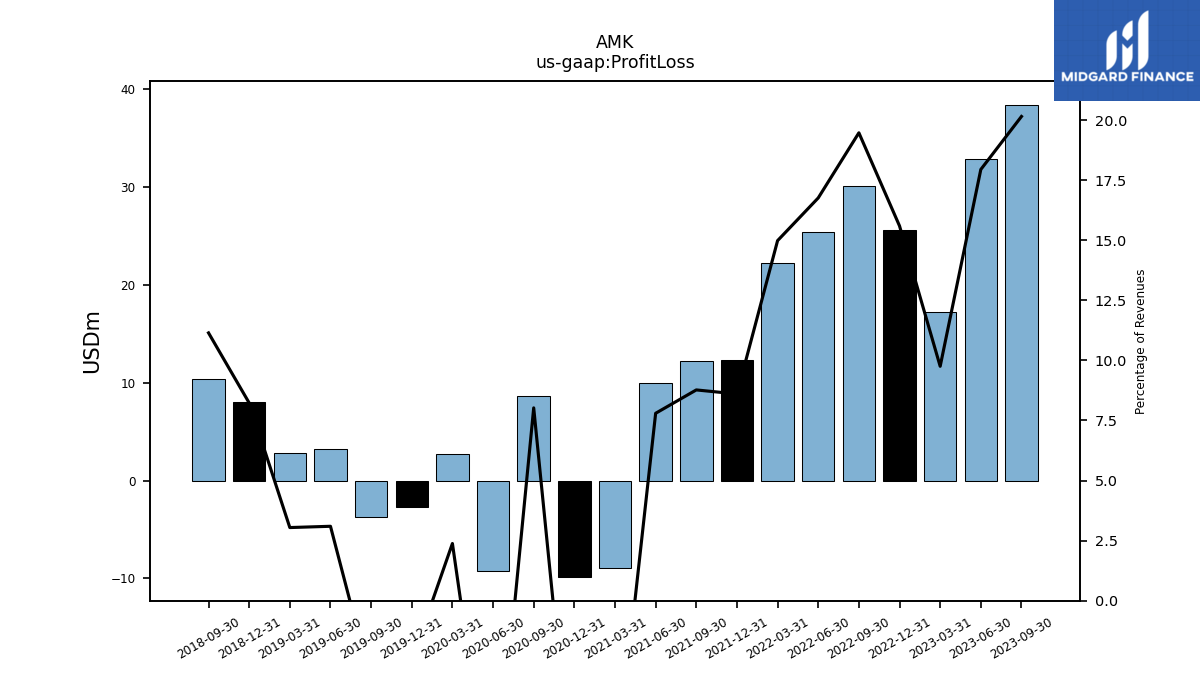
| Profit Loss | 38.38 | 32.88 | 17.22 | 25.59 | 30.11 | 25.34 | 22.22 | 12.35 | 12.25 | 9.99 | -8.92 | -9.87 | 8.60 | -9.28 | 2.74 | -2.74 | -3.73 | 3.24 | 2.81 | 8.02 | 10.35 | NA | |
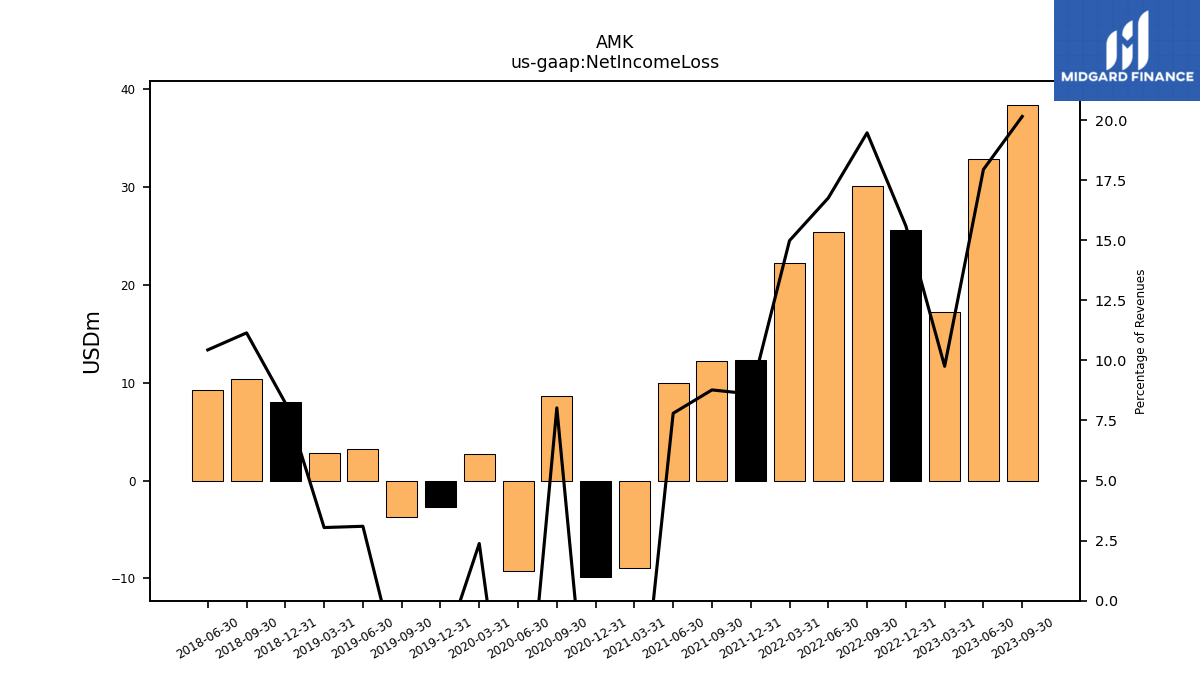
| Net Income Loss | 38.38 | 32.88 | 17.22 | 25.59 | 30.11 | 25.34 | 22.22 | 12.35 | 12.25 | 9.99 | -8.92 | -9.87 | 8.60 | -9.28 | 2.74 | -2.74 | -3.73 | 3.24 | 2.81 | 8.02 | 10.35 | 9.27 | |
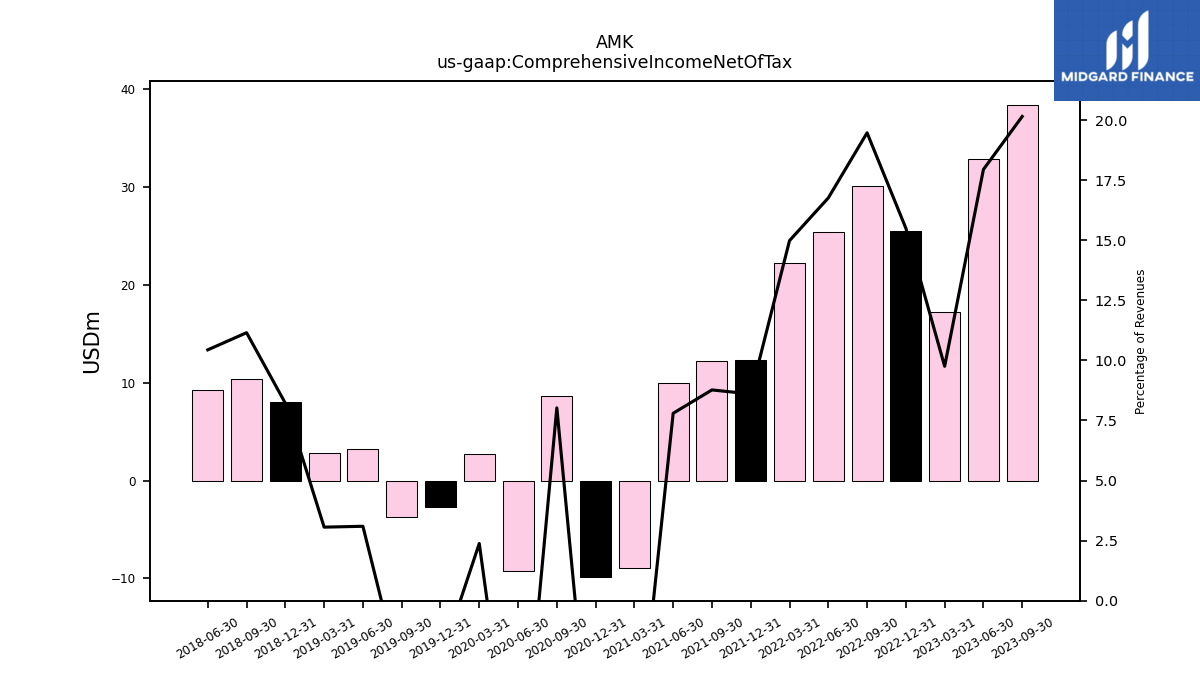
| Comprehensive Income Net Of Tax | 38.38 | 32.88 | 17.22 | 25.44 | 30.11 | 25.34 | 22.22 | 12.35 | 12.25 | 9.99 | -8.92 | -9.87 | 8.60 | -9.28 | 2.74 | -2.74 | -3.73 | 3.24 | 2.83 | 8.00 | 10.36 | 9.27 |
| 2023-09-30 | 2023-06-30 | 2023-03-31 | 2022-12-31 | 2022-09-30 | 2022-06-30 | 2022-03-31 | 2021-12-31 | 2021-09-30 | 2021-06-30 | 2021-03-31 | 2020-12-31 | 2020-09-30 | 2020-06-30 | 2020-03-31 | 2019-12-31 | 2019-09-30 | 2019-06-30 | 2019-03-31 | 2018-12-31 | 2018-09-30 | 2018-06-30 | ||
|---|---|---|---|---|---|---|---|---|---|---|---|---|---|---|---|---|---|---|---|---|---|---|---|
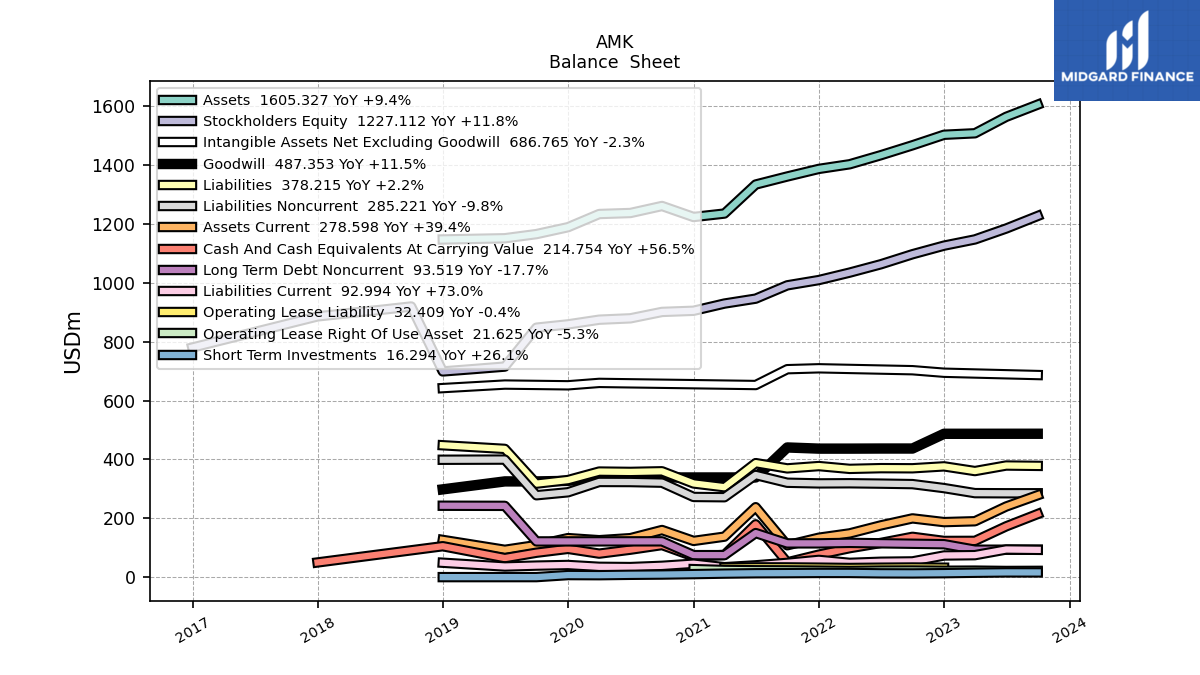
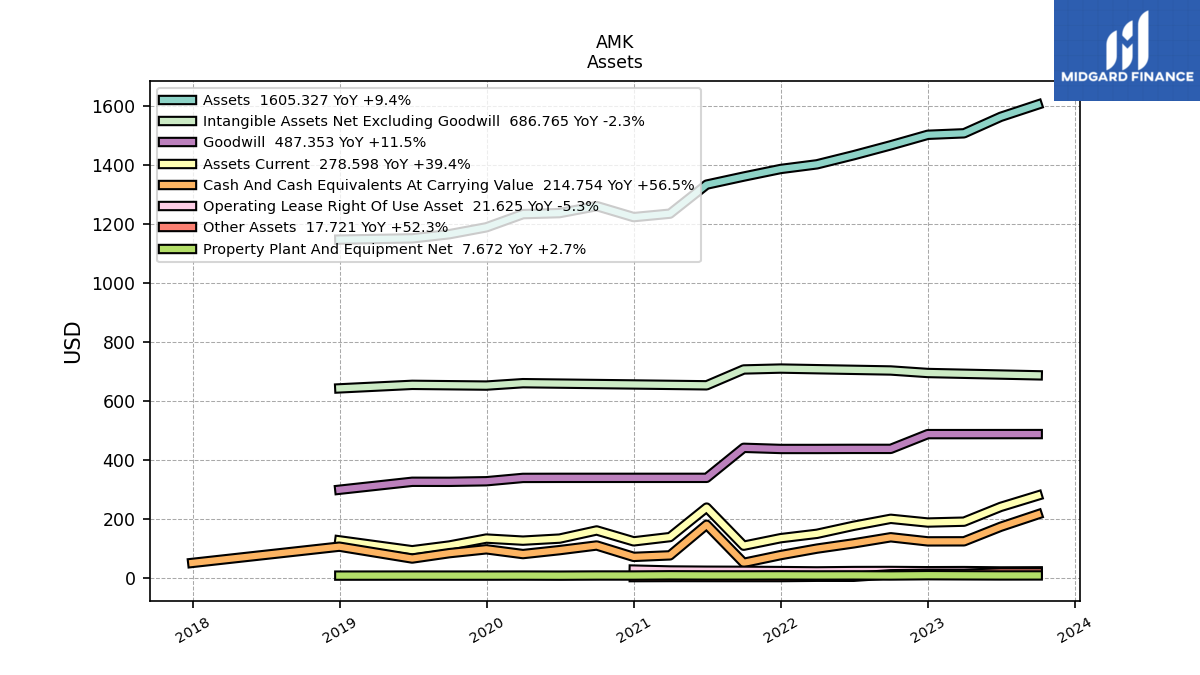
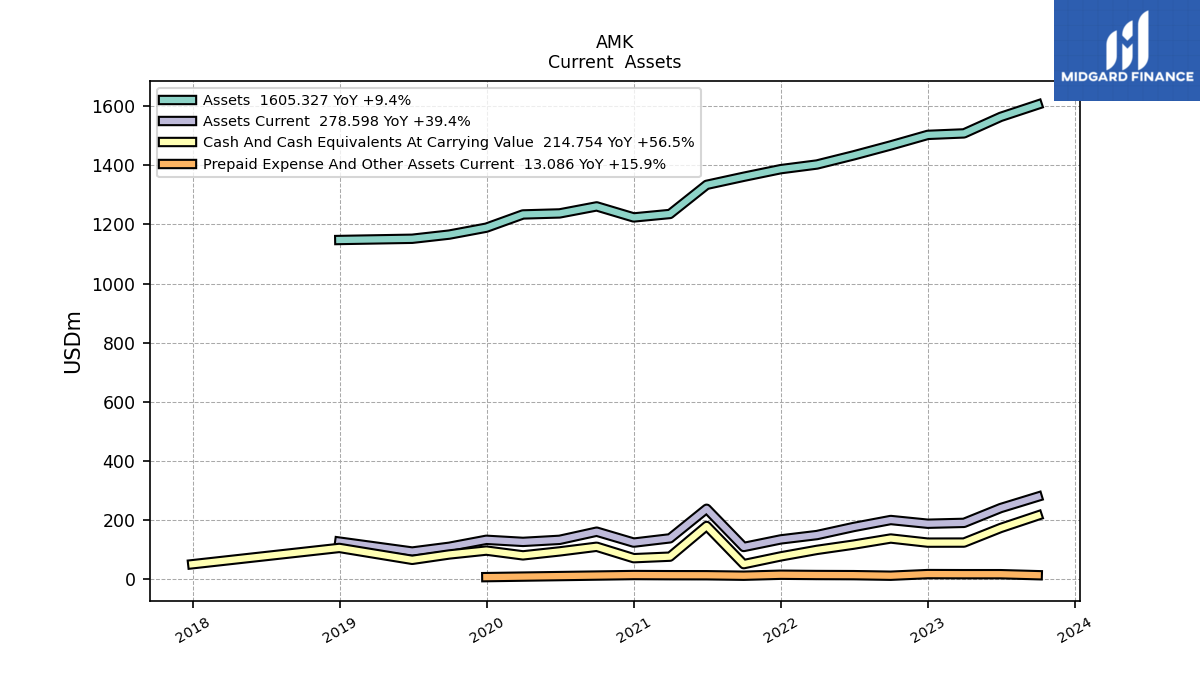
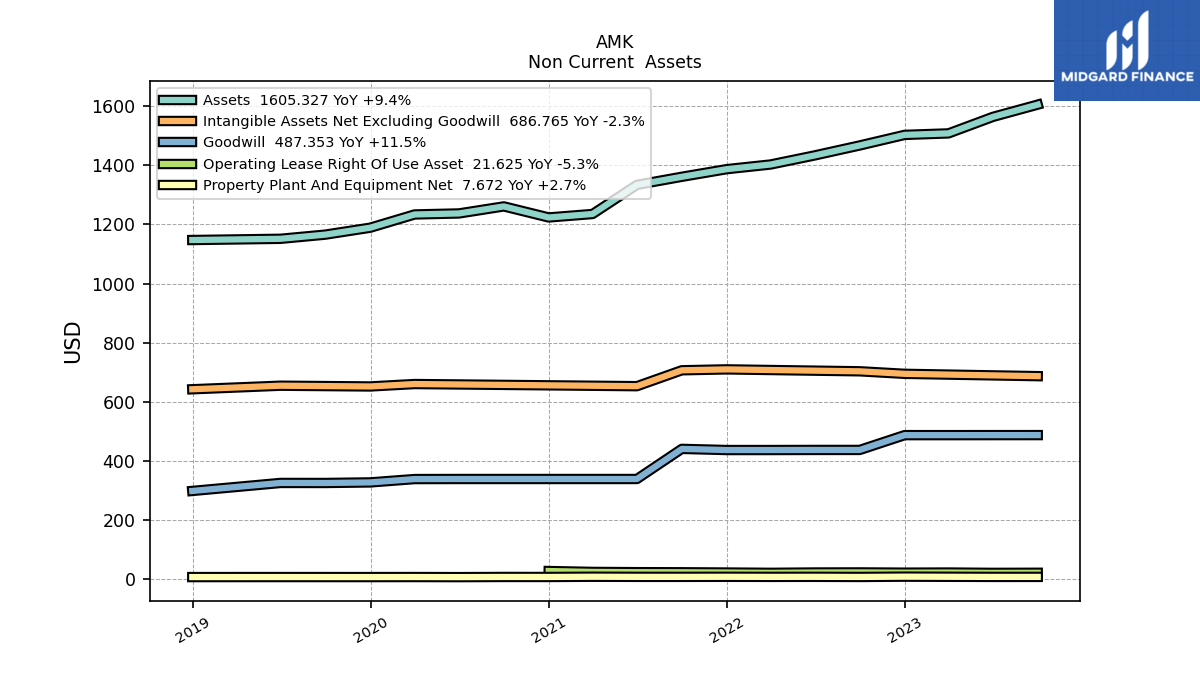
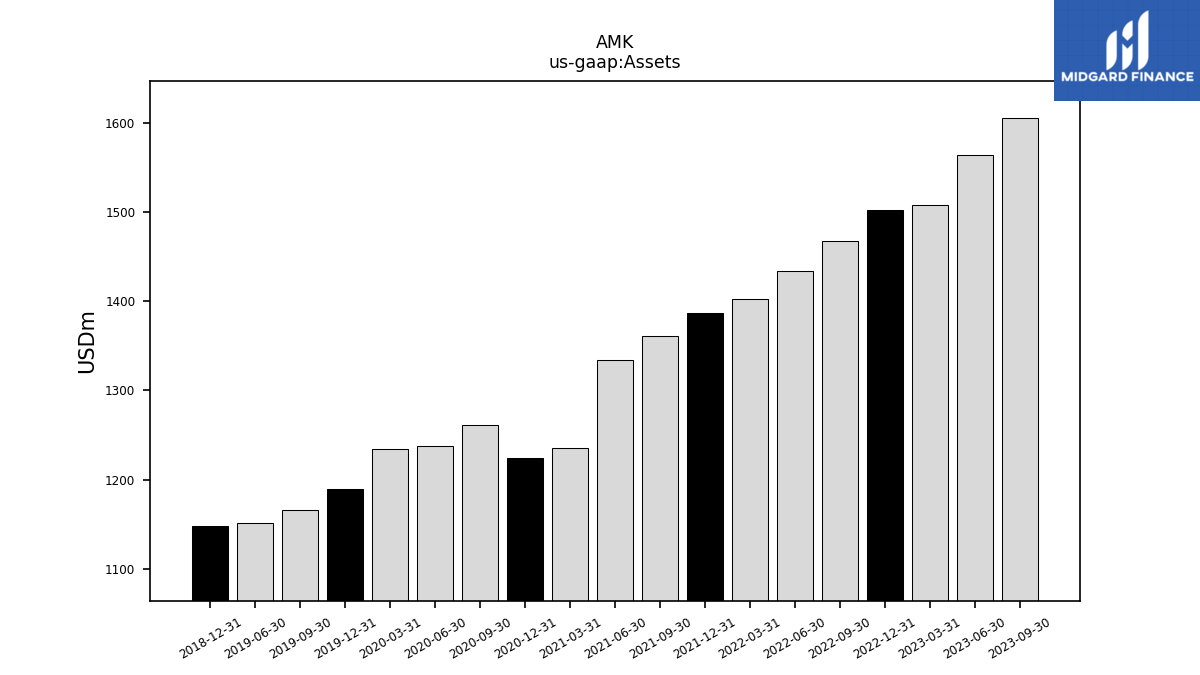
| Assets | 1605.33 | 1563.84 | 1508.01 | 1502.93 | 1467.20 | 1433.61 | 1402.76 | 1386.96 | 1361.18 | 1333.89 | 1235.34 | 1223.59 | 1261.01 | 1237.21 | 1233.73 | 1188.96 | 1165.54 | 1151.43 | NA | 1147.28 | NA | NA | |
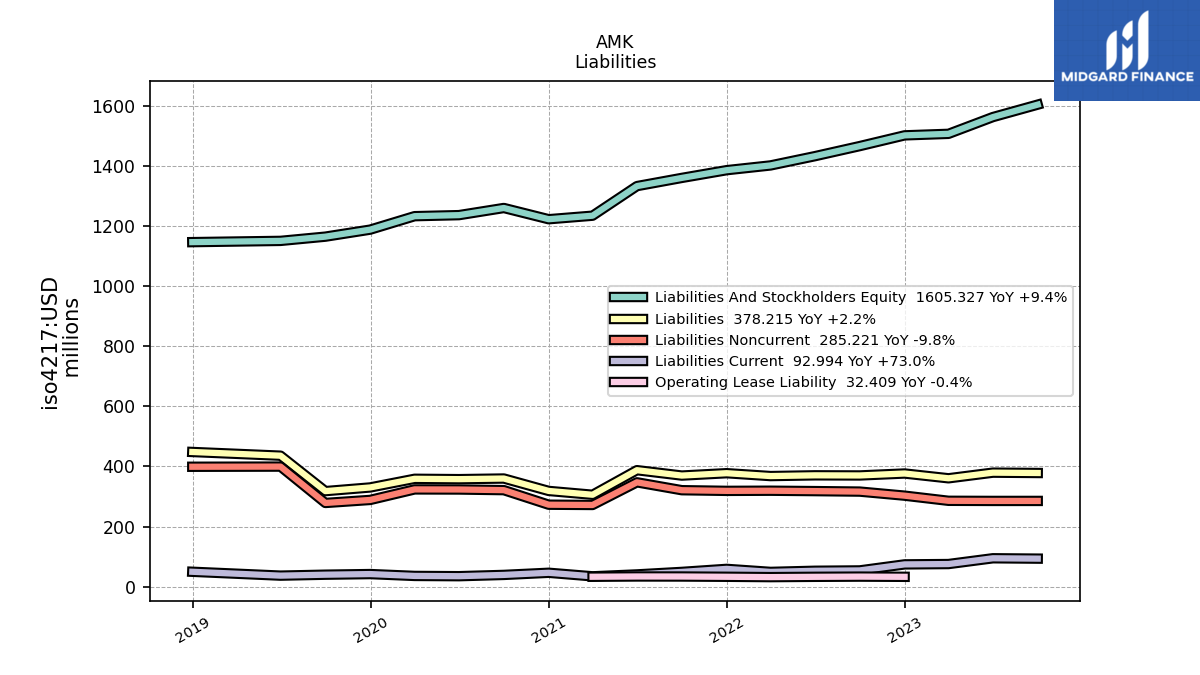
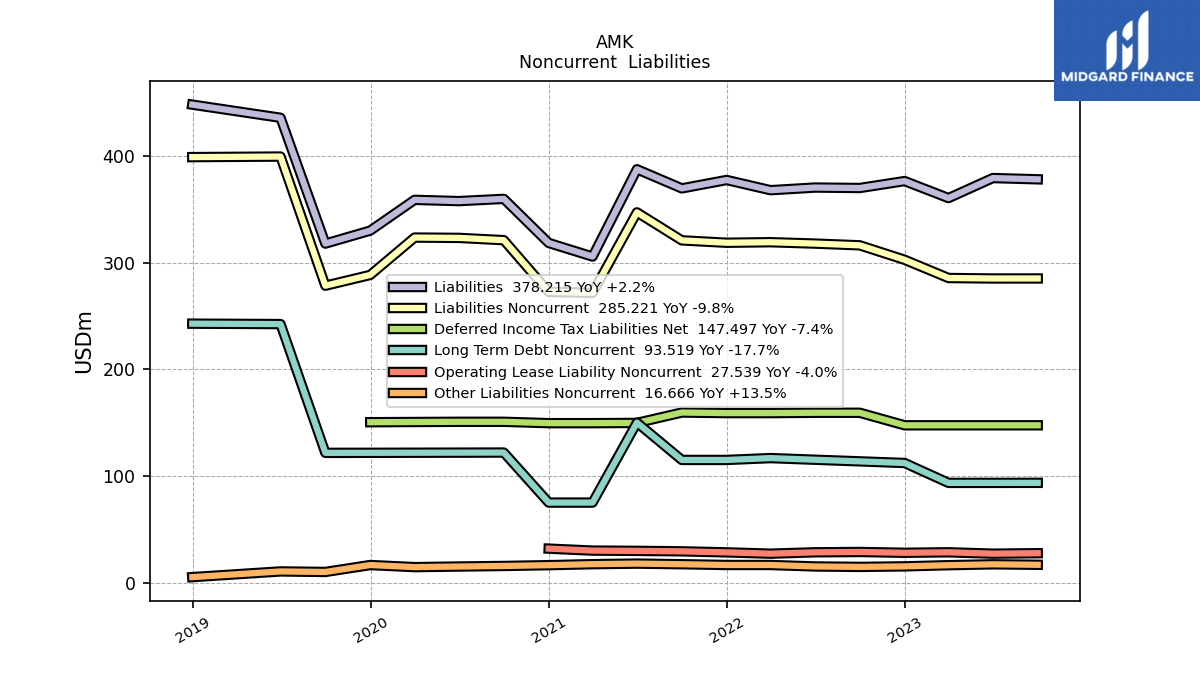
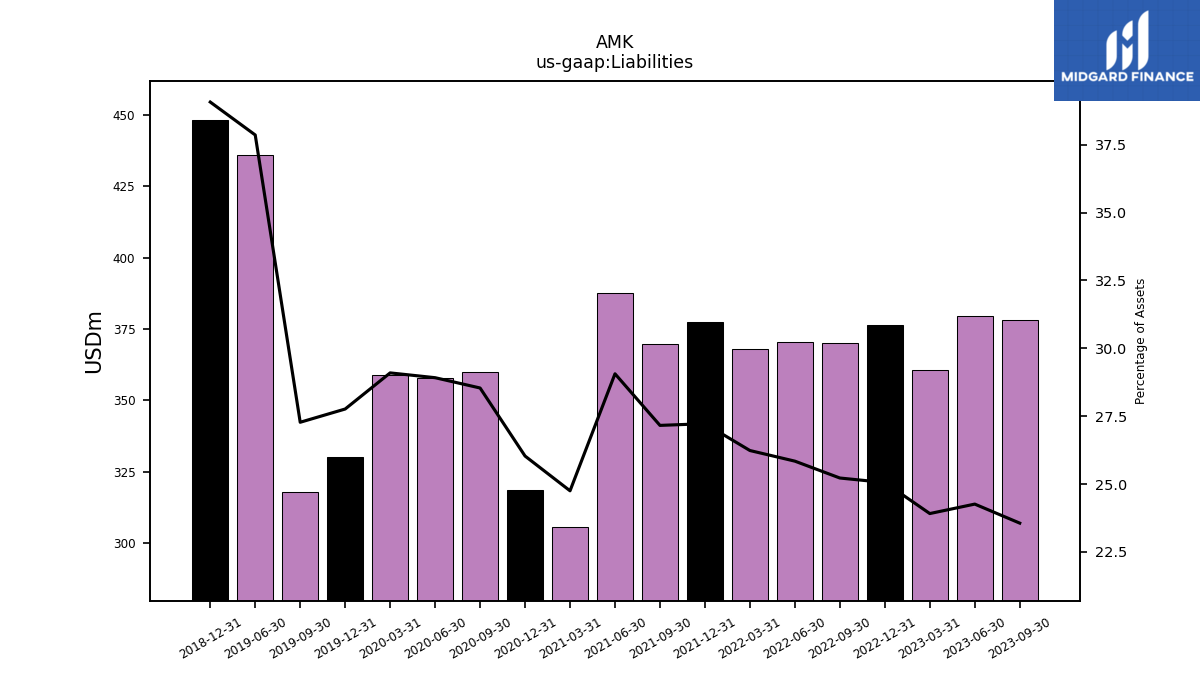
| Liabilities | 378.21 | 379.40 | 360.60 | 376.56 | 370.06 | 370.49 | 368.01 | 377.58 | 369.70 | 387.64 | 305.75 | 318.51 | 359.87 | 357.77 | 358.95 | 330.10 | 317.91 | 435.92 | NA | 448.26 | NA | NA | |
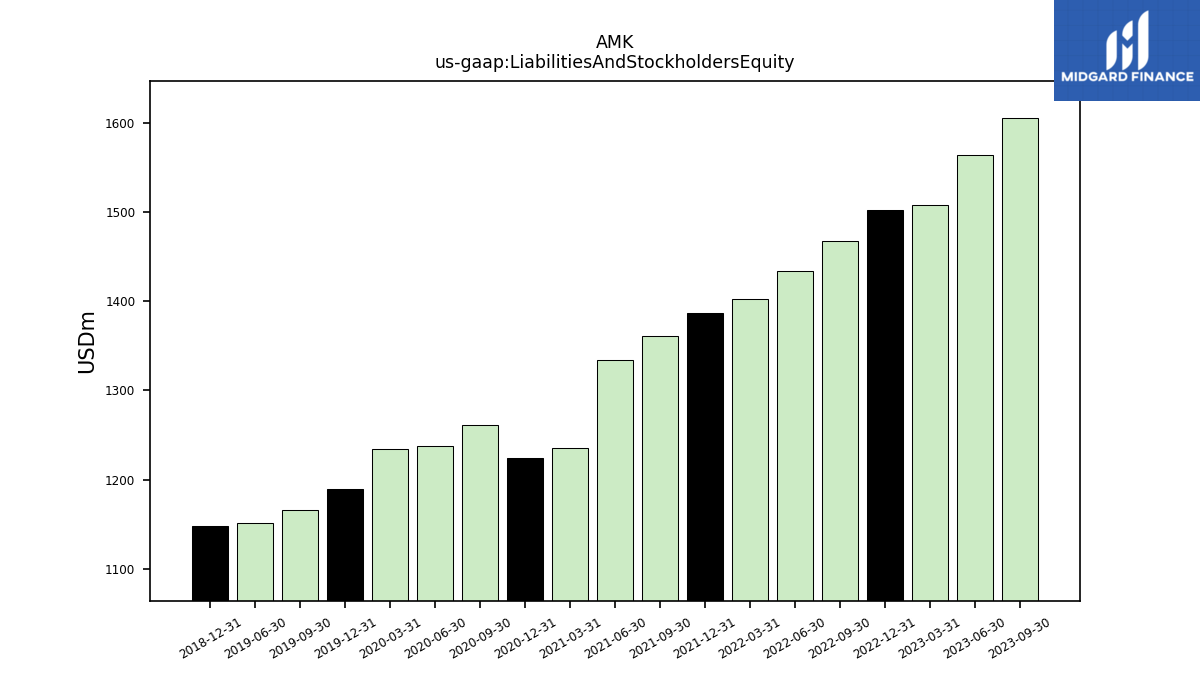
| Liabilities And Stockholders Equity | 1605.33 | 1563.84 | 1508.01 | 1502.93 | 1467.20 | 1433.61 | 1402.76 | 1386.96 | 1361.18 | 1333.89 | 1235.34 | 1223.59 | 1261.01 | 1237.21 | 1233.73 | 1188.96 | 1165.54 | 1151.43 | NA | 1147.28 | NA | NA | |
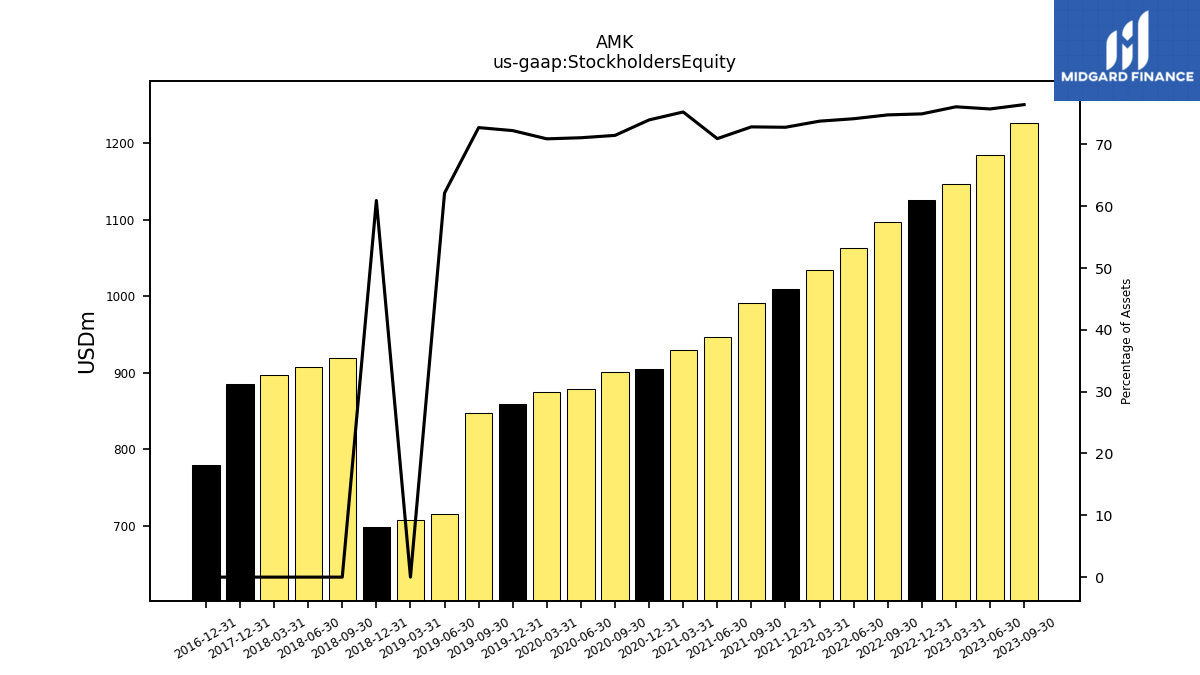
| Stockholders Equity | 1227.11 | 1184.44 | 1147.41 | 1126.37 | 1097.15 | 1063.12 | 1034.75 | 1009.39 | 991.48 | 946.25 | 929.59 | 905.07 | 901.14 | 879.44 | 874.78 | 858.86 | 847.63 | 715.51 | 707.06 | 699.01 | 919.63 | 907.75 |
| 2023-09-30 | 2023-06-30 | 2023-03-31 | 2022-12-31 | 2022-09-30 | 2022-06-30 | 2022-03-31 | 2021-12-31 | 2021-09-30 | 2021-06-30 | 2021-03-31 | 2020-12-31 | 2020-09-30 | 2020-06-30 | 2020-03-31 | 2019-12-31 | 2019-09-30 | 2019-06-30 | 2019-03-31 | 2018-12-31 | 2018-09-30 | 2018-06-30 | ||
|---|---|---|---|---|---|---|---|---|---|---|---|---|---|---|---|---|---|---|---|---|---|---|---|
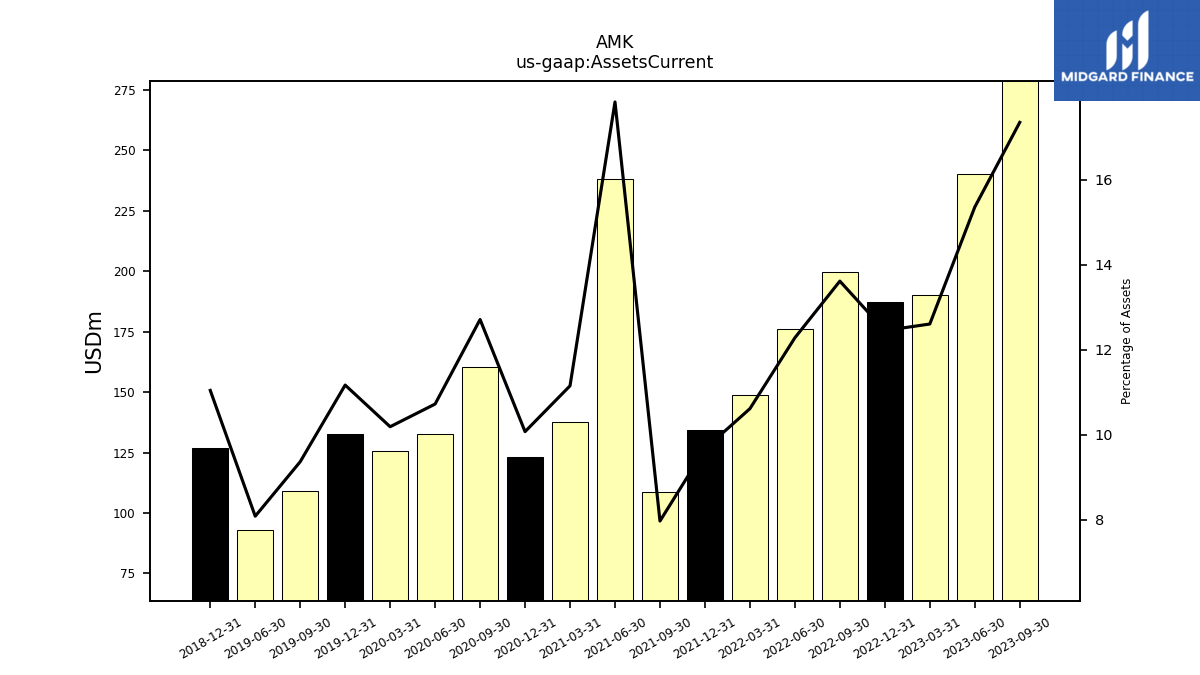
| Assets Current | 278.60 | 240.23 | 190.16 | 187.21 | 199.83 | 176.14 | 148.95 | 134.17 | 108.56 | 237.90 | 137.82 | 123.32 | 160.36 | 132.72 | 125.76 | 132.85 | 109.21 | 93.13 | NA | 126.76 | NA | NA | |
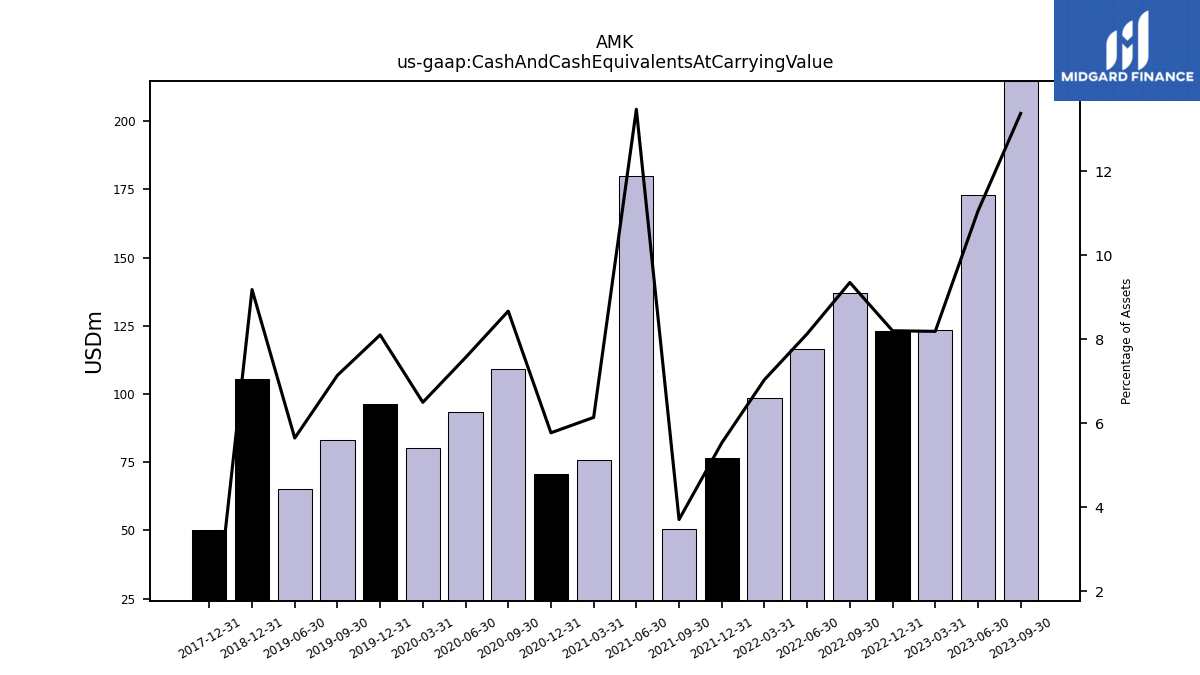
| Cash And Cash Equivalents At Carrying Value | 214.75 | 172.82 | 123.47 | 123.27 | 137.21 | 116.54 | 98.72 | 76.71 | 50.45 | 179.76 | 75.83 | 70.62 | 109.32 | 93.58 | 80.16 | 96.34 | 83.24 | 65.02 | NA | 105.35 | NA | NA | |
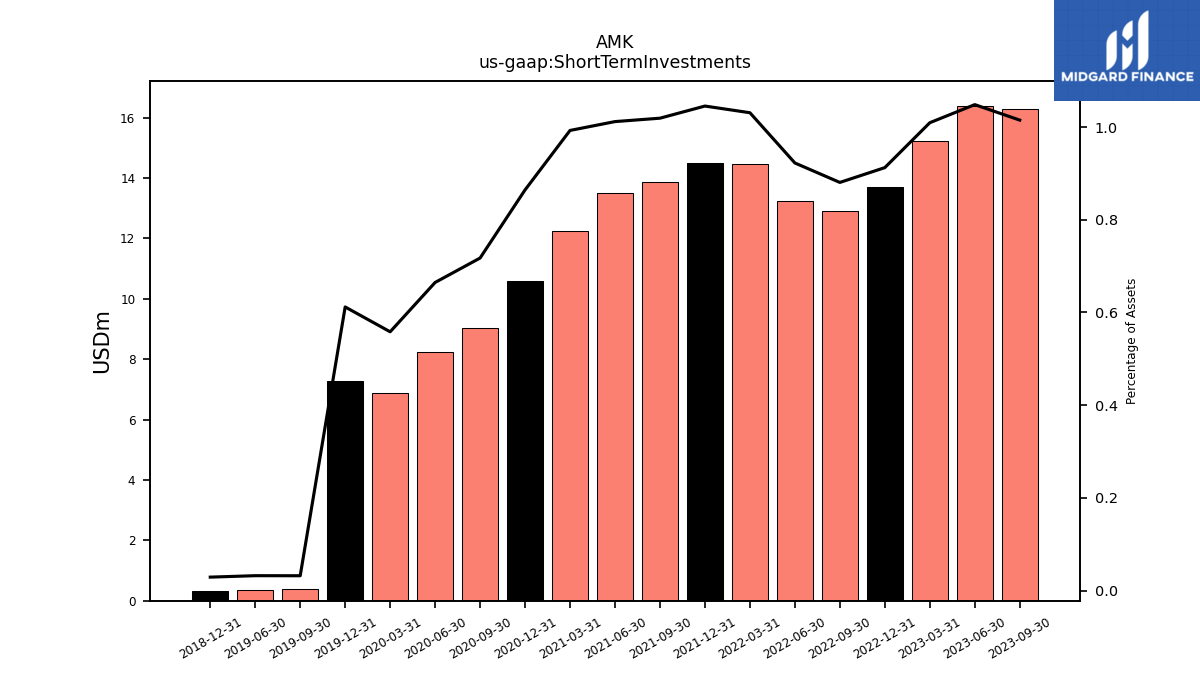
| Short Term Investments | 16.29 | 16.39 | 15.22 | 13.71 | 12.92 | 13.22 | 14.46 | 14.50 | 13.87 | 13.50 | 12.26 | 10.58 | 9.05 | 8.22 | 6.89 | 7.28 | 0.37 | 0.37 | NA | 0.33 | NA | NA | |
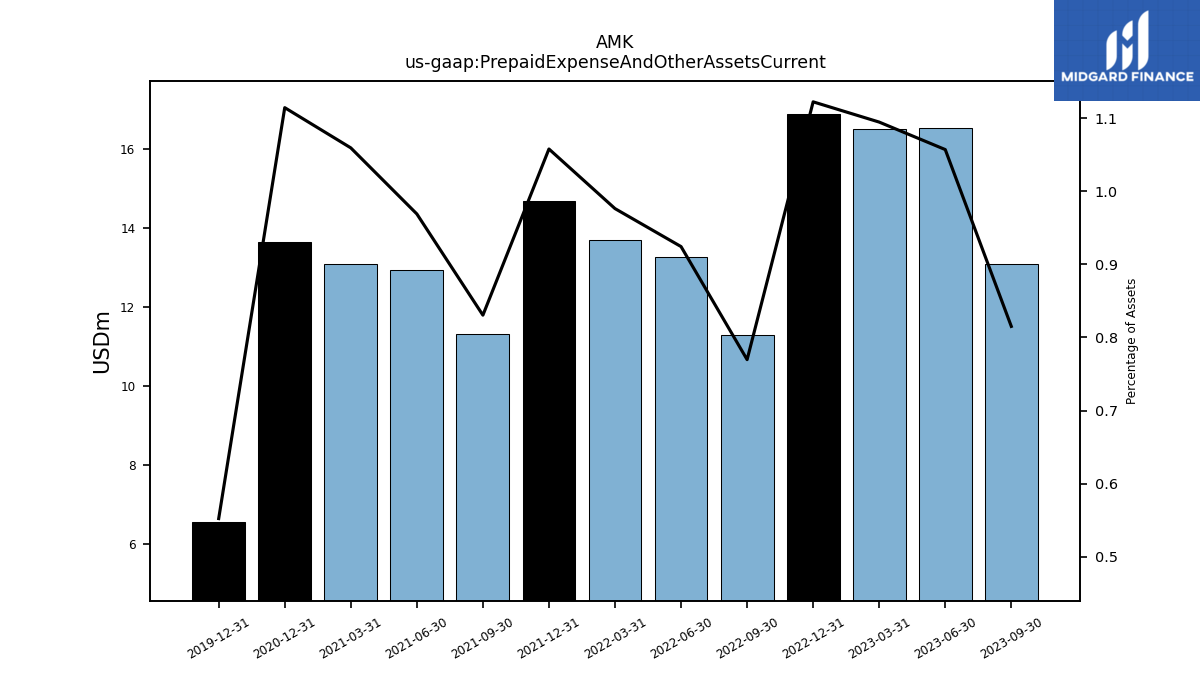
| Prepaid Expense And Other Assets Current | 13.09 | 16.53 | 16.51 | 16.87 | 11.29 | 13.25 | 13.70 | 14.67 | 11.30 | 12.93 | 13.09 | 13.64 | NA | NA | NA | 6.57 | NA | NA | NA | NA | NA | NA |
| 2023-09-30 | 2023-06-30 | 2023-03-31 | 2022-12-31 | 2022-09-30 | 2022-06-30 | 2022-03-31 | 2021-12-31 | 2021-09-30 | 2021-06-30 | 2021-03-31 | 2020-12-31 | 2020-09-30 | 2020-06-30 | 2020-03-31 | 2019-12-31 | 2019-09-30 | 2019-06-30 | 2019-03-31 | 2018-12-31 | 2018-09-30 | 2018-06-30 | ||
|---|---|---|---|---|---|---|---|---|---|---|---|---|---|---|---|---|---|---|---|---|---|---|---|
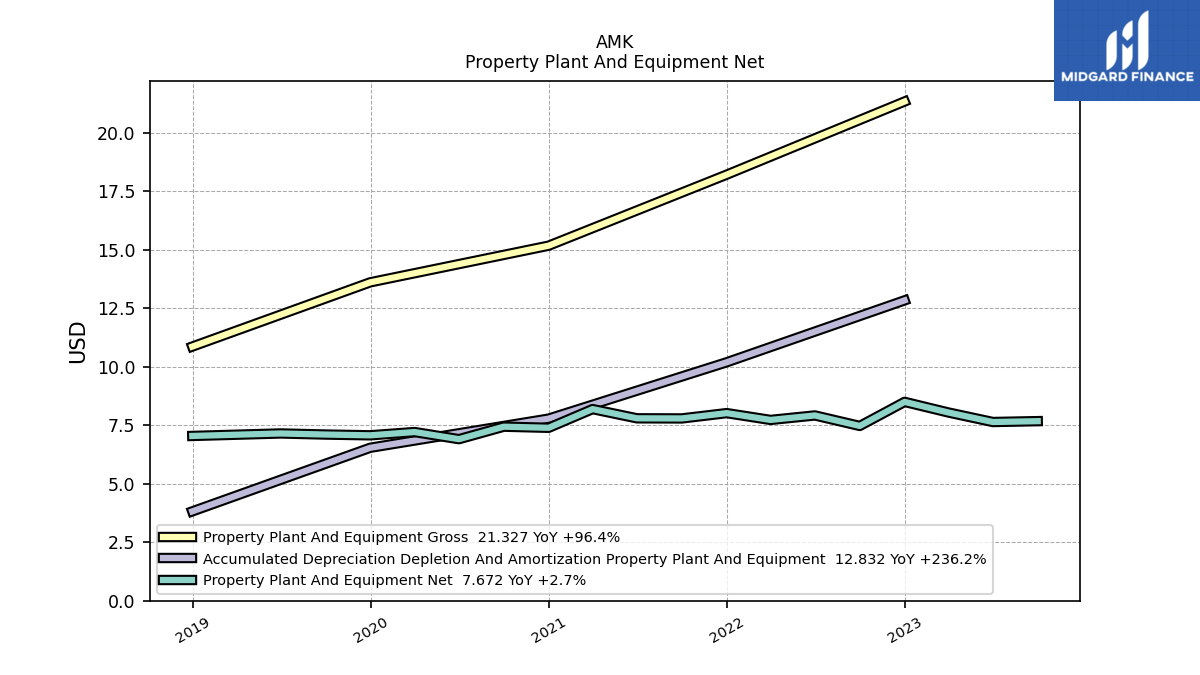
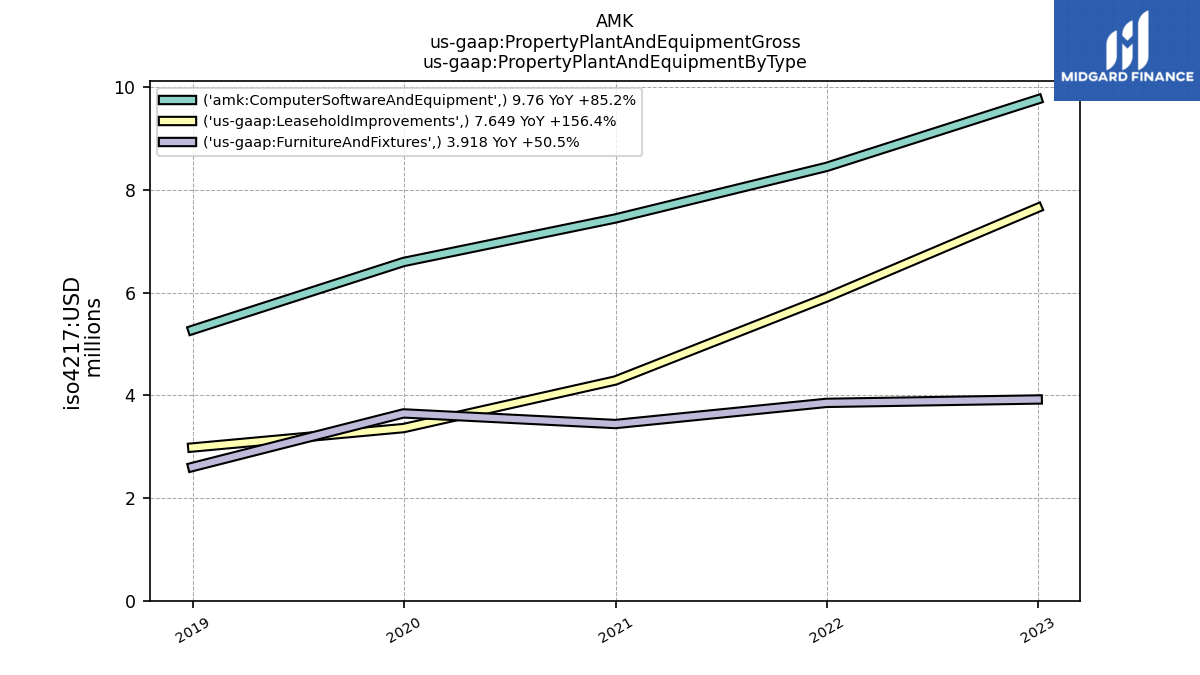
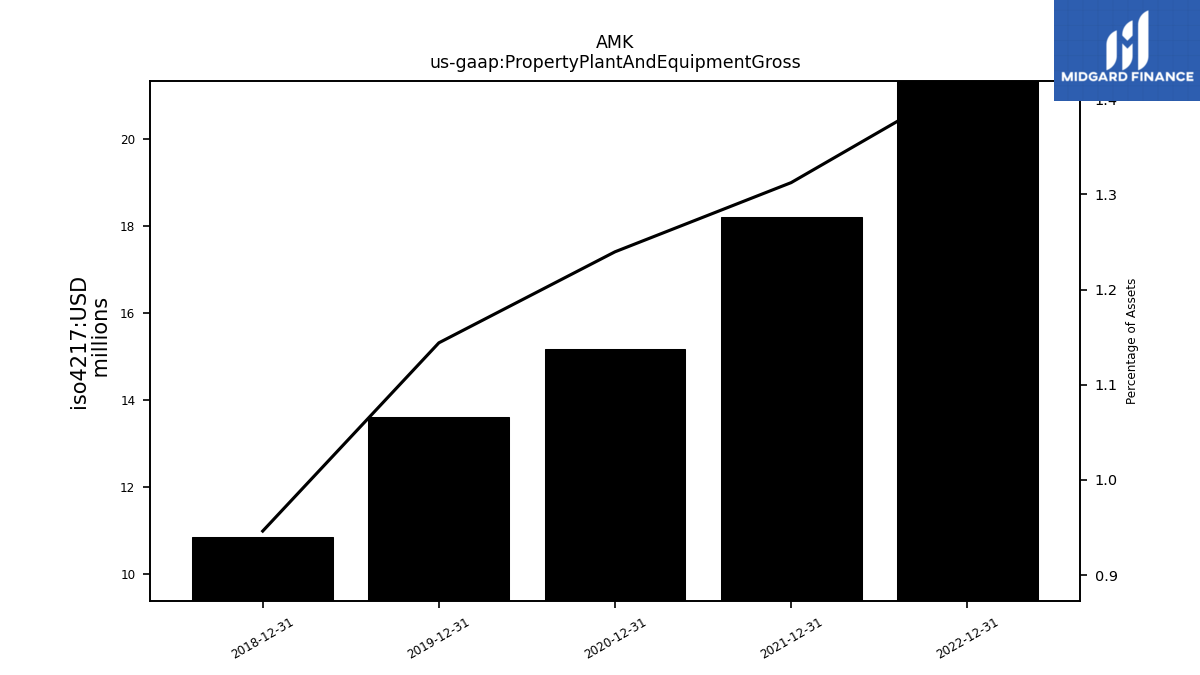
| Property Plant And Equipment Gross | NA | NA | NA | 21.33 | NA | NA | NA | 18.20 | NA | NA | NA | 15.17 | NA | NA | NA | 13.60 | NA | NA | NA | 10.86 | NA | NA | |
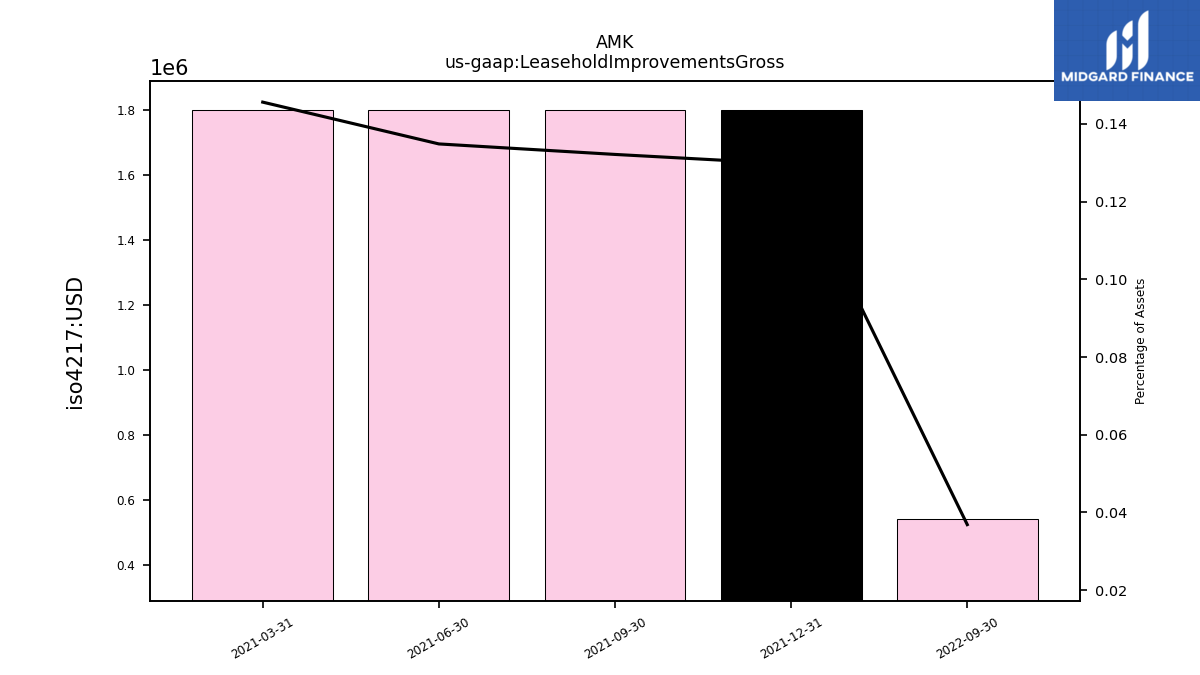
| Leasehold Improvements Gross | NA | NA | NA | NA | 0.54 | NA | NA | 1.80 | 1.80 | 1.80 | 1.80 | NA | NA | NA | NA | NA | NA | NA | NA | NA | NA | NA | |
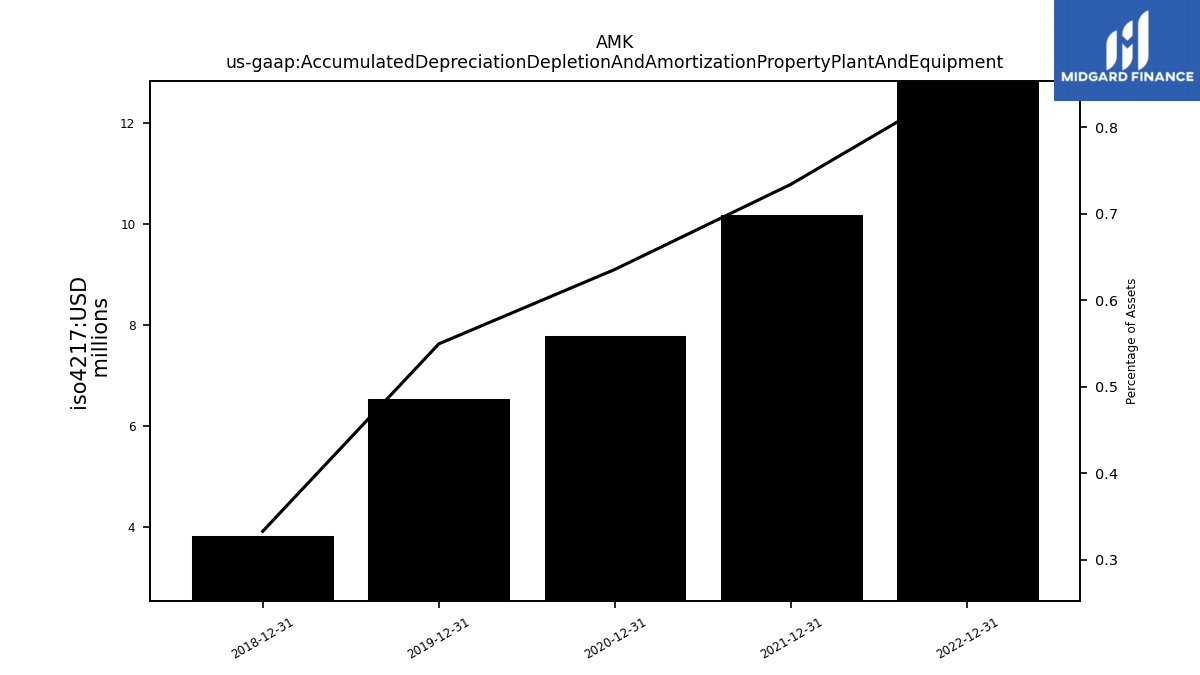
| Accumulated Depreciation Depletion And Amortization Property Plant And Equipment | NA | NA | NA | 12.83 | NA | NA | NA | 10.19 | NA | NA | NA | 7.78 | NA | NA | NA | 6.54 | NA | NA | NA | 3.82 | NA | NA | |
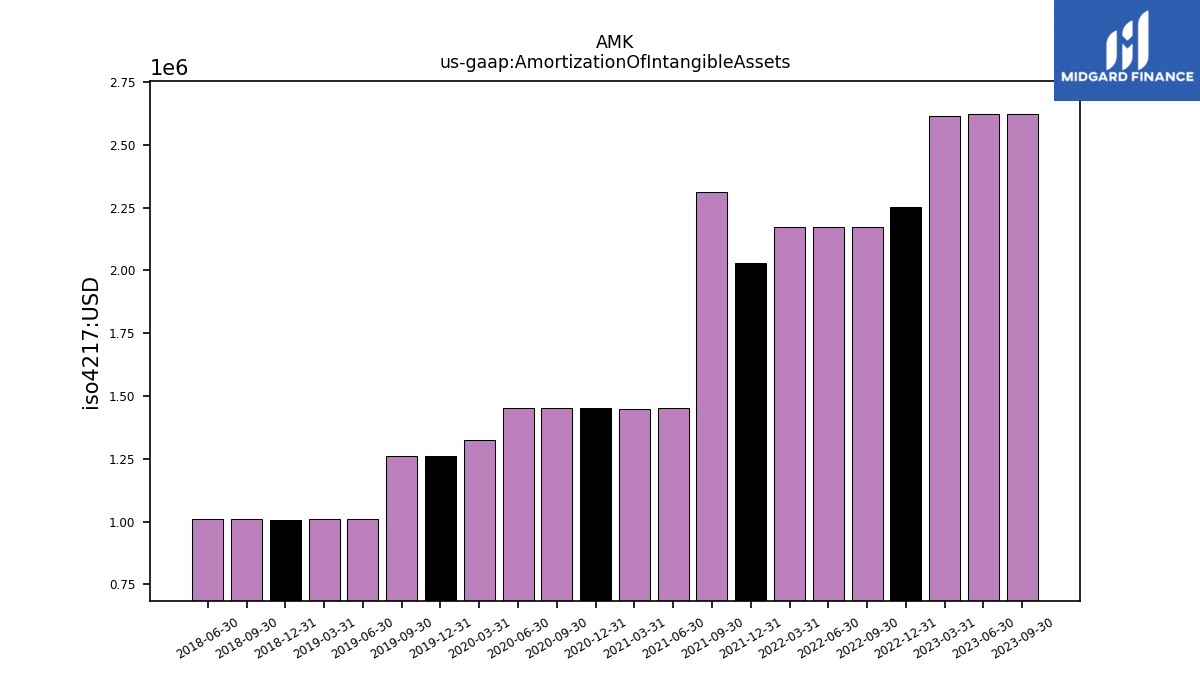
| Amortization Of Intangible Assets | 2.62 | 2.62 | 2.62 | 2.25 | 2.17 | 2.17 | 2.17 | 2.03 | 2.31 | 1.45 | 1.45 | 1.45 | 1.45 | 1.45 | 1.33 | 1.26 | 1.26 | 1.01 | 1.01 | 1.01 | 1.01 | 1.01 | |
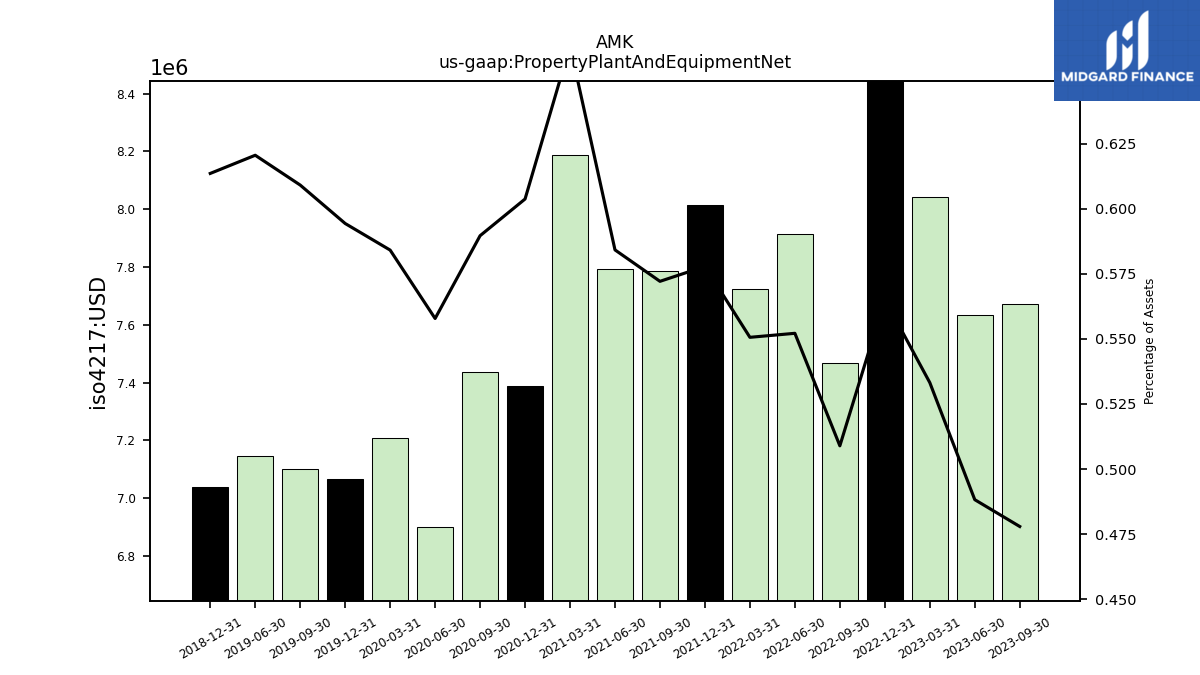
| Property Plant And Equipment Net | 7.67 | 7.63 | 8.04 | 8.49 | 7.47 | 7.92 | 7.72 | 8.02 | 7.79 | 7.79 | 8.19 | 7.39 | 7.44 | 6.90 | 7.21 | 7.07 | 7.10 | 7.15 | NA | 7.04 | NA | NA | |
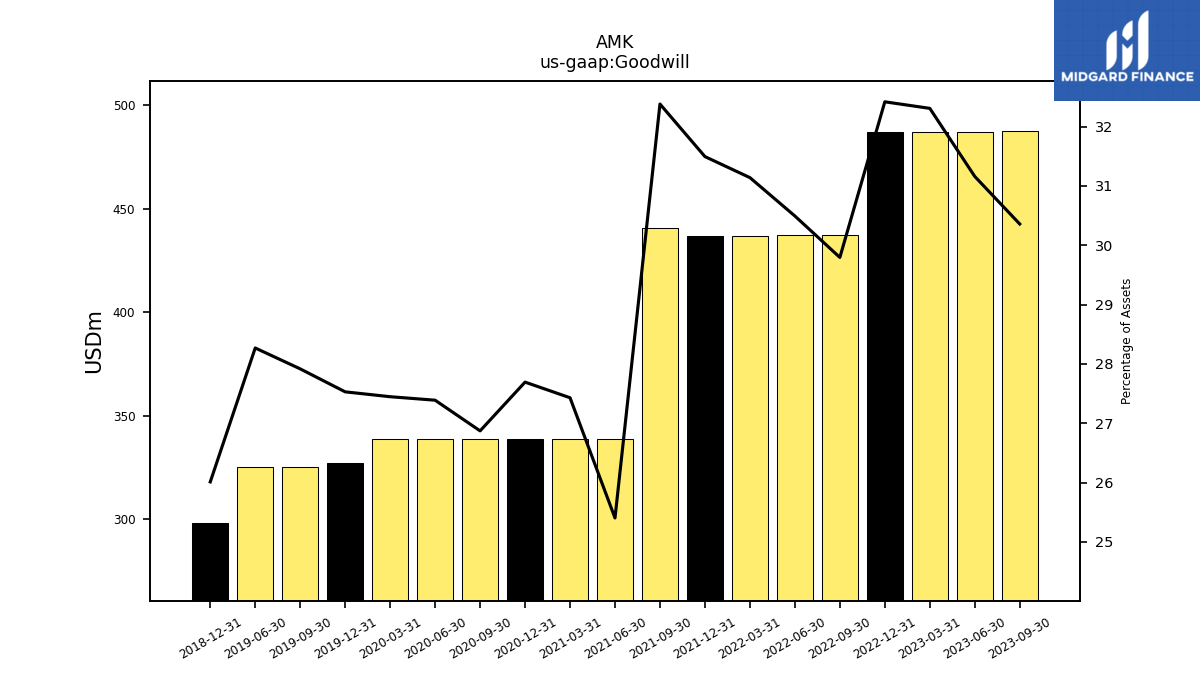
| Goodwill | 487.35 | 487.29 | 487.21 | 487.23 | 437.15 | 437.15 | 436.82 | 436.82 | 440.76 | 338.85 | 338.85 | 338.85 | 338.85 | 338.85 | 338.62 | 327.31 | 325.38 | 325.49 | NA | 298.42 | NA | NA | |
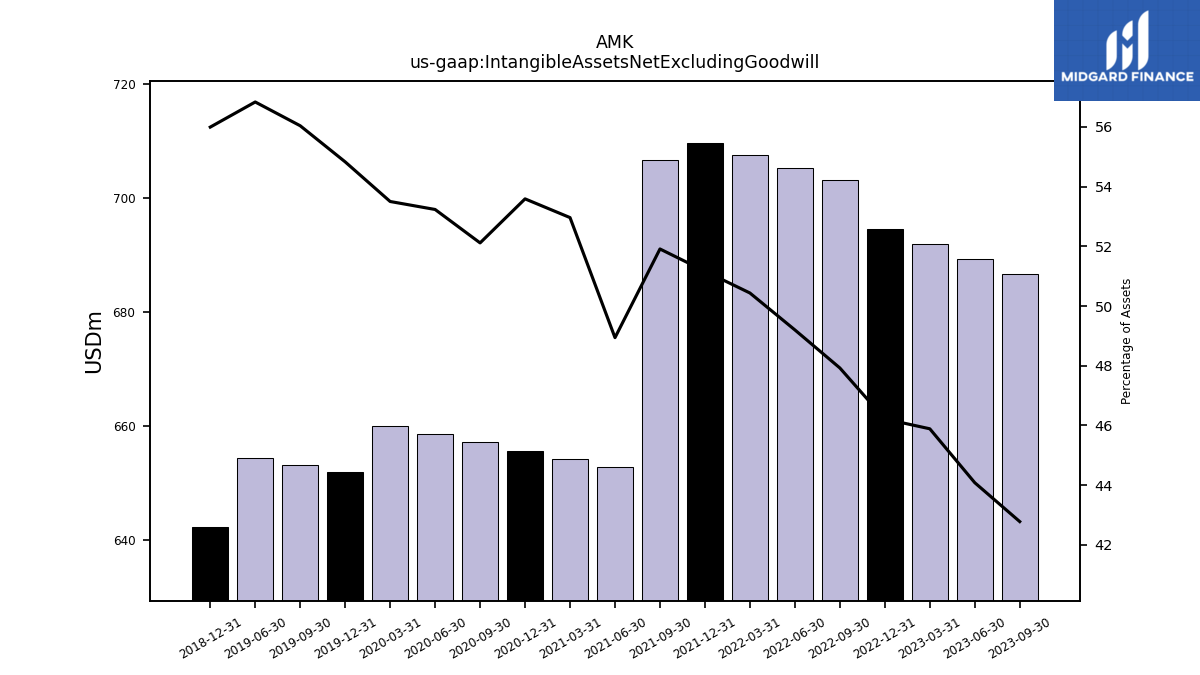
| Intangible Assets Net Excluding Goodwill | 686.76 | 689.39 | 692.01 | 694.63 | 703.18 | 705.35 | 707.52 | 709.69 | 706.62 | 652.84 | 654.29 | 655.74 | 657.19 | 658.64 | 660.09 | 651.91 | 653.18 | 654.44 | NA | 642.42 | NA | NA | |
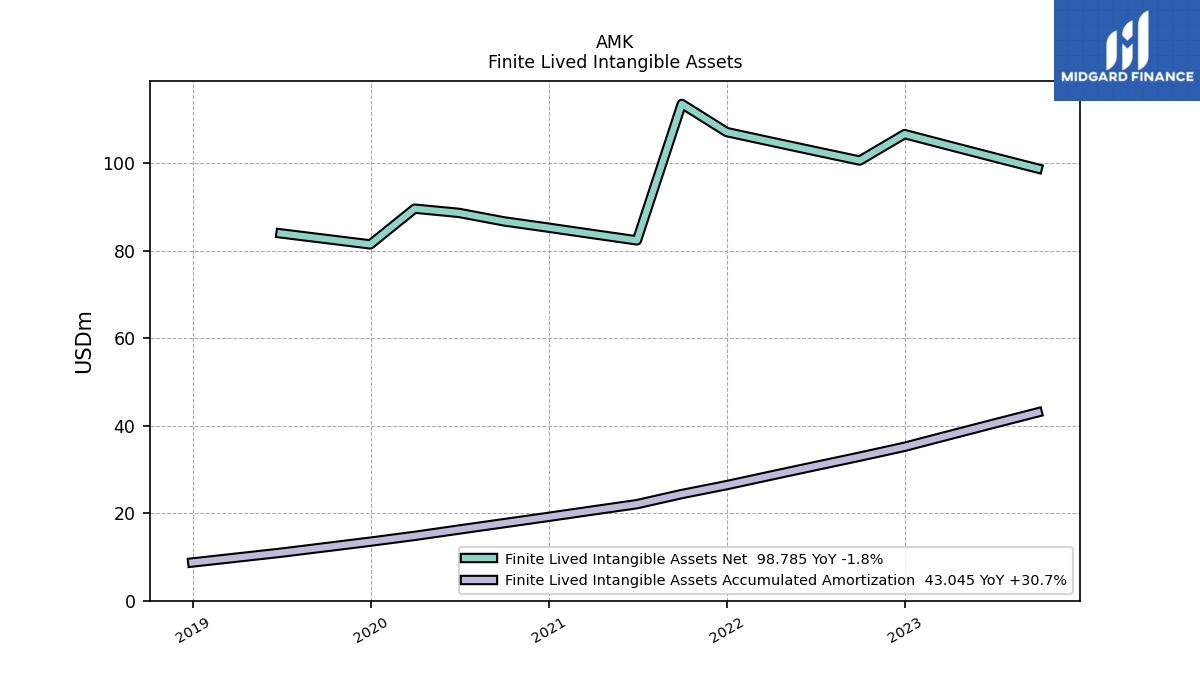
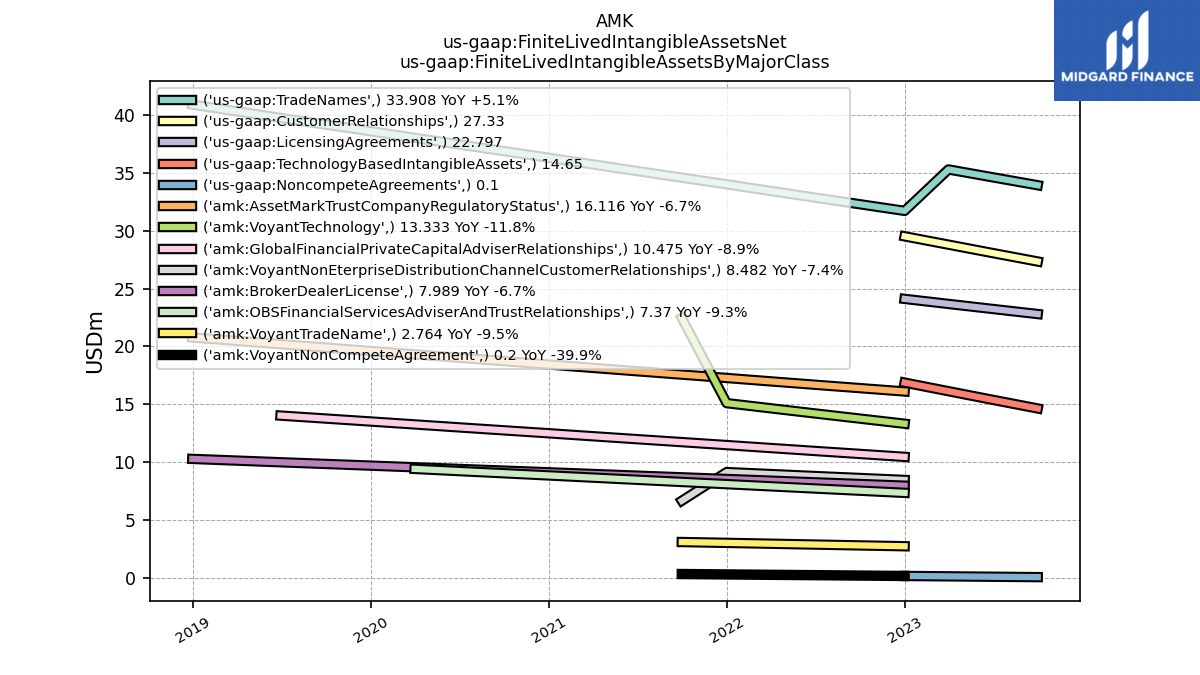
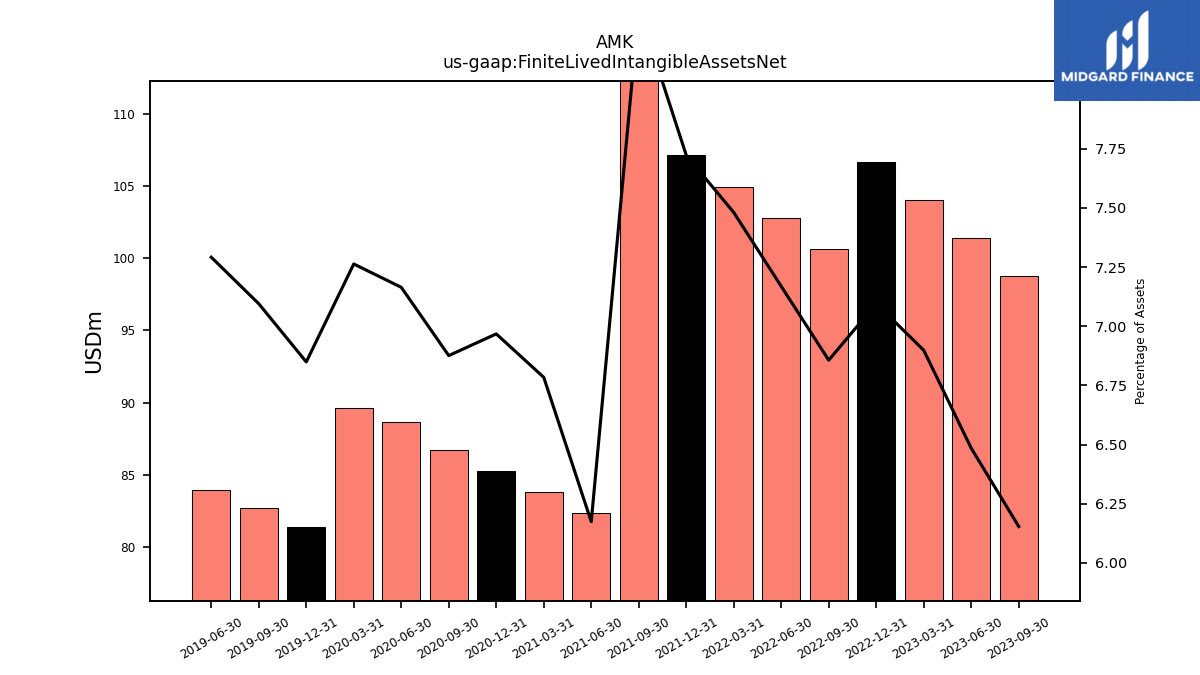
| Finite Lived Intangible Assets Net | 98.78 | 101.41 | 104.03 | 106.65 | 100.60 | 102.77 | 104.94 | 107.11 | 113.54 | 82.36 | 83.81 | 85.26 | 86.71 | 88.64 | 89.61 | 81.44 | 82.70 | 83.96 | NA | NA | NA | NA |
| 2023-09-30 | 2023-06-30 | 2023-03-31 | 2022-12-31 | 2022-09-30 | 2022-06-30 | 2022-03-31 | 2021-12-31 | 2021-09-30 | 2021-06-30 | 2021-03-31 | 2020-12-31 | 2020-09-30 | 2020-06-30 | 2020-03-31 | 2019-12-31 | 2019-09-30 | 2019-06-30 | 2019-03-31 | 2018-12-31 | 2018-09-30 | 2018-06-30 | ||
|---|---|---|---|---|---|---|---|---|---|---|---|---|---|---|---|---|---|---|---|---|---|---|---|
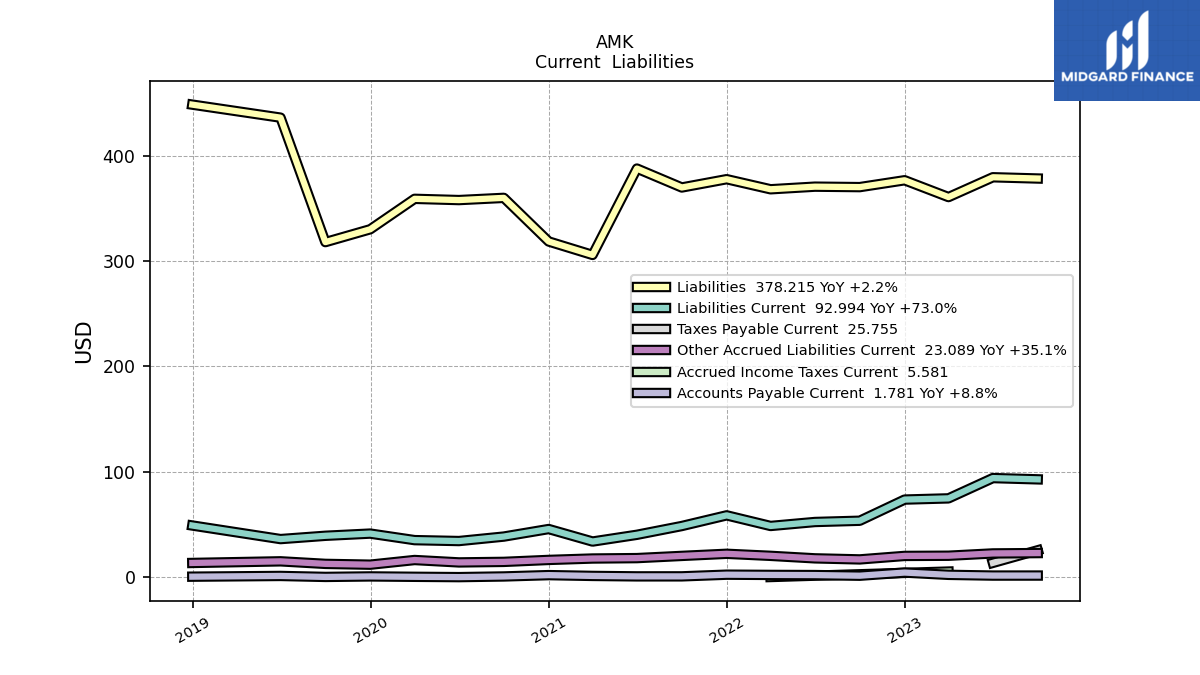
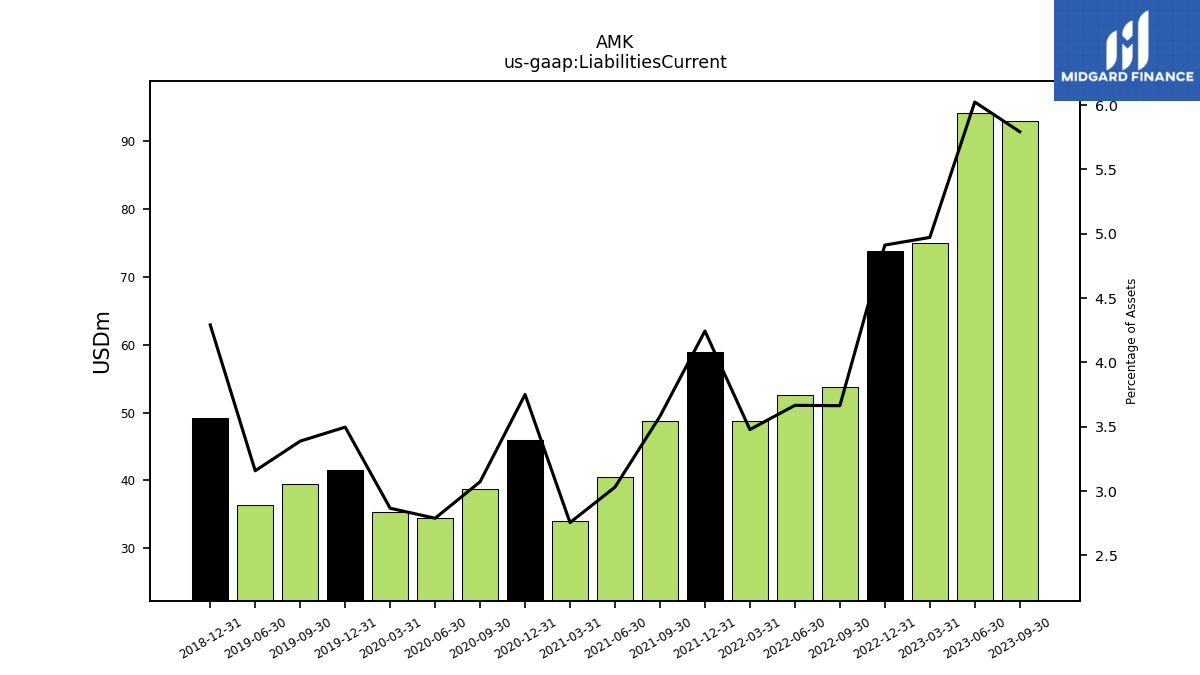
| Liabilities Current | 92.99 | 94.20 | 74.97 | 73.82 | 53.76 | 52.56 | 48.79 | 58.86 | 48.75 | 40.43 | 34.04 | 45.89 | 38.74 | 34.50 | 35.37 | 41.58 | 39.49 | 36.36 | NA | 49.23 | NA | NA | |
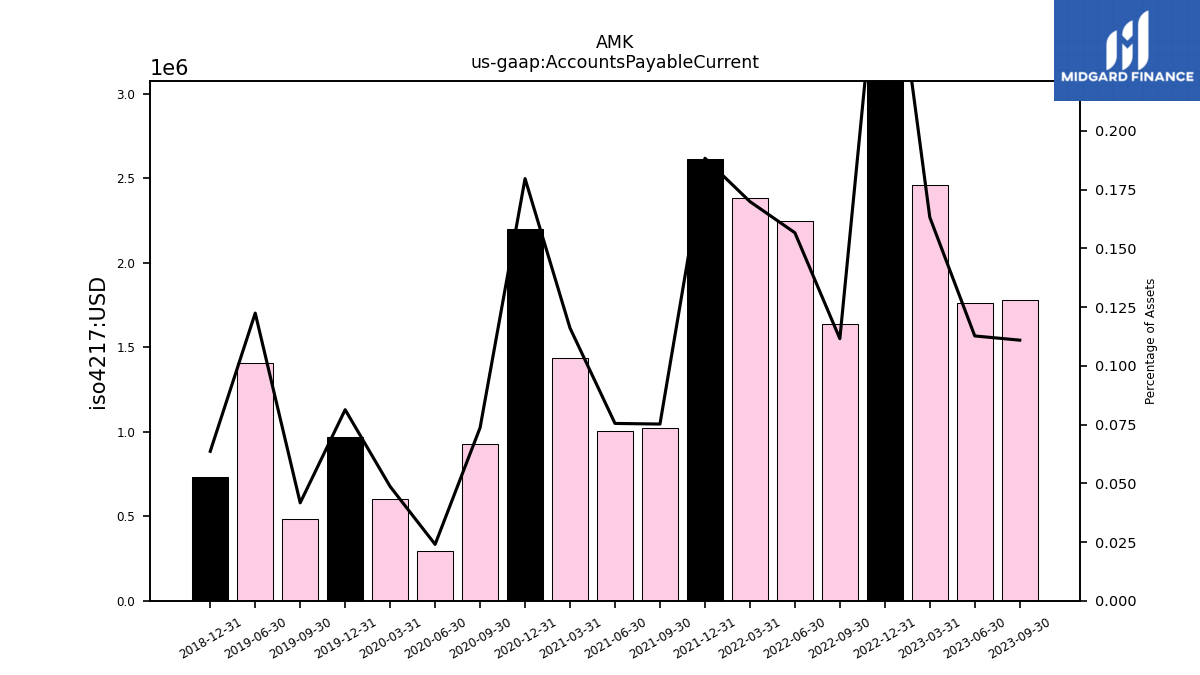
| Accounts Payable Current | 1.78 | 1.76 | 2.46 | 4.62 | 1.64 | 2.25 | 2.38 | 2.61 | 1.02 | 1.01 | 1.43 | 2.20 | 0.93 | 0.30 | 0.60 | 0.97 | 0.49 | 1.41 | NA | 0.73 | NA | NA | |
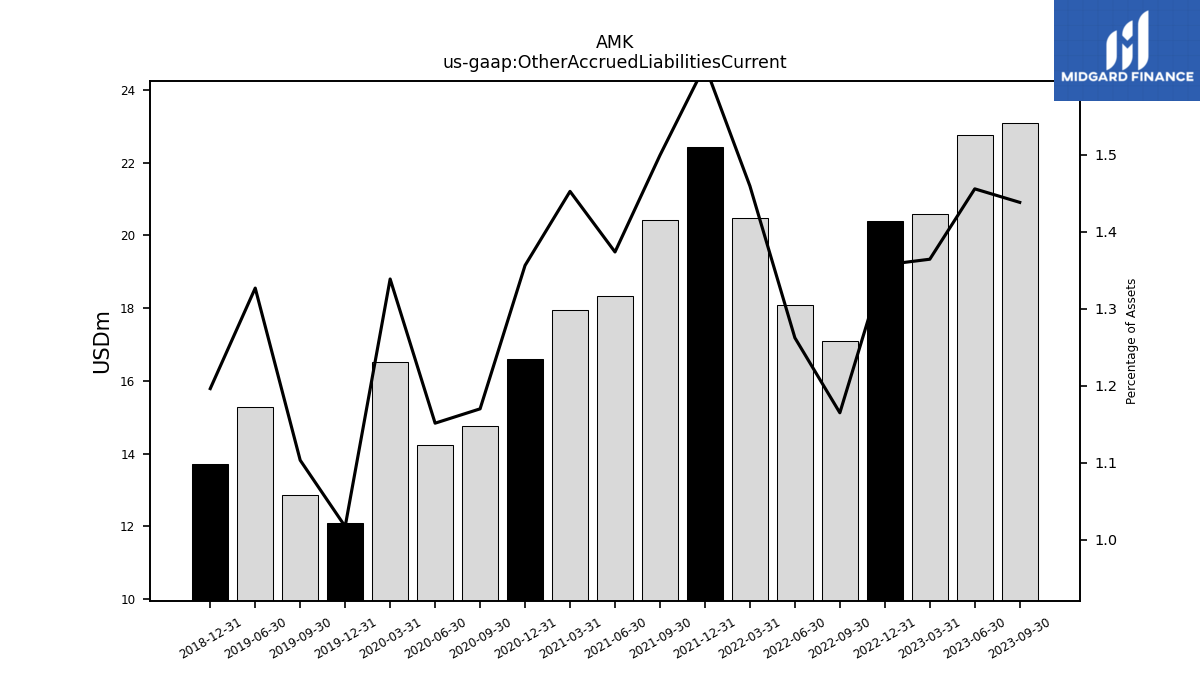
| Other Accrued Liabilities Current | 23.09 | 22.77 | 20.57 | 20.40 | 17.09 | 18.10 | 20.47 | 22.42 | 20.41 | 18.32 | 17.94 | 16.60 | 14.75 | 14.24 | 16.52 | 12.09 | 12.86 | 15.28 | NA | 13.72 | NA | NA | |
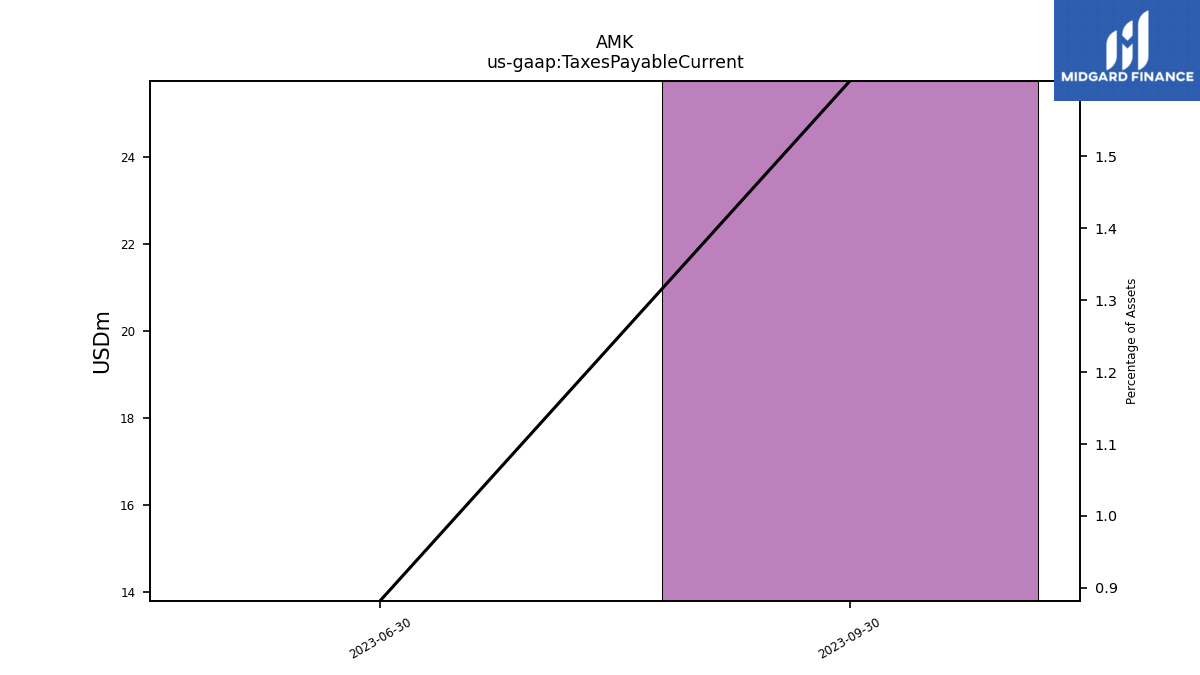
| Taxes Payable Current | 25.75 | 13.80 | NA | NA | NA | NA | NA | NA | NA | NA | NA | NA | NA | NA | NA | NA | NA | NA | NA | NA | NA | NA | |
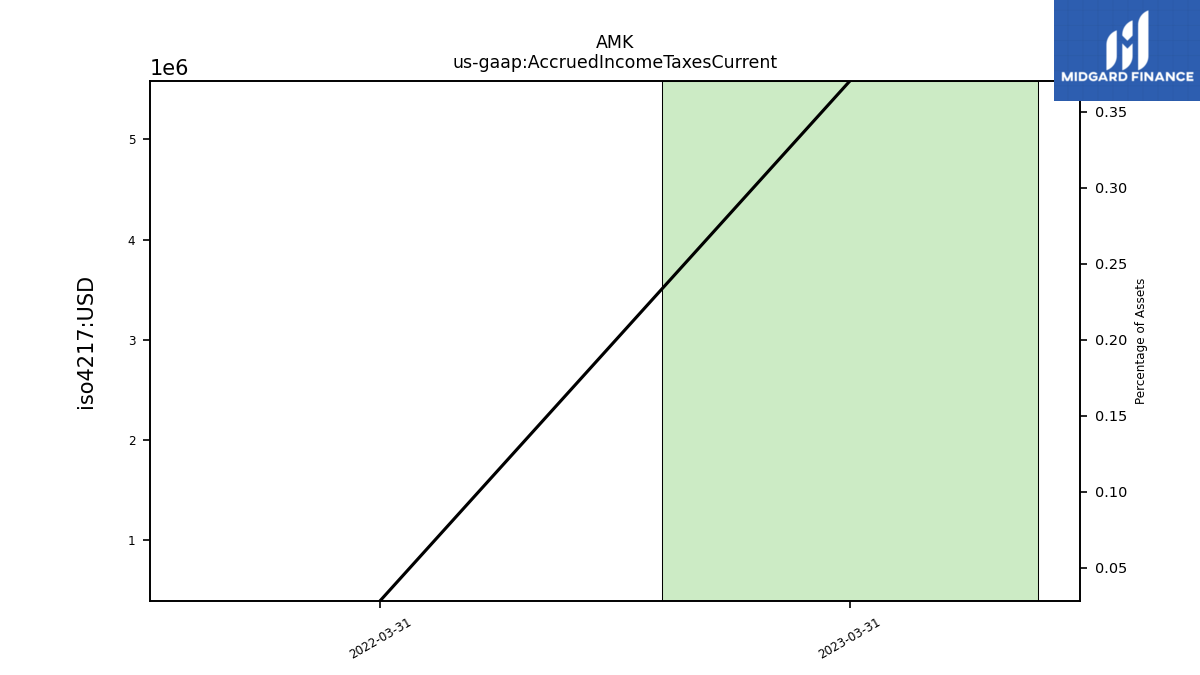
| Accrued Income Taxes Current | NA | NA | 5.58 | NA | NA | NA | 0.40 | NA | NA | NA | NA | NA | NA | NA | NA | NA | NA | NA | NA | NA | NA | NA |
| 2023-09-30 | 2023-06-30 | 2023-03-31 | 2022-12-31 | 2022-09-30 | 2022-06-30 | 2022-03-31 | 2021-12-31 | 2021-09-30 | 2021-06-30 | 2021-03-31 | 2020-12-31 | 2020-09-30 | 2020-06-30 | 2020-03-31 | 2019-12-31 | 2019-09-30 | 2019-06-30 | 2019-03-31 | 2018-12-31 | 2018-09-30 | 2018-06-30 | ||
|---|---|---|---|---|---|---|---|---|---|---|---|---|---|---|---|---|---|---|---|---|---|---|---|
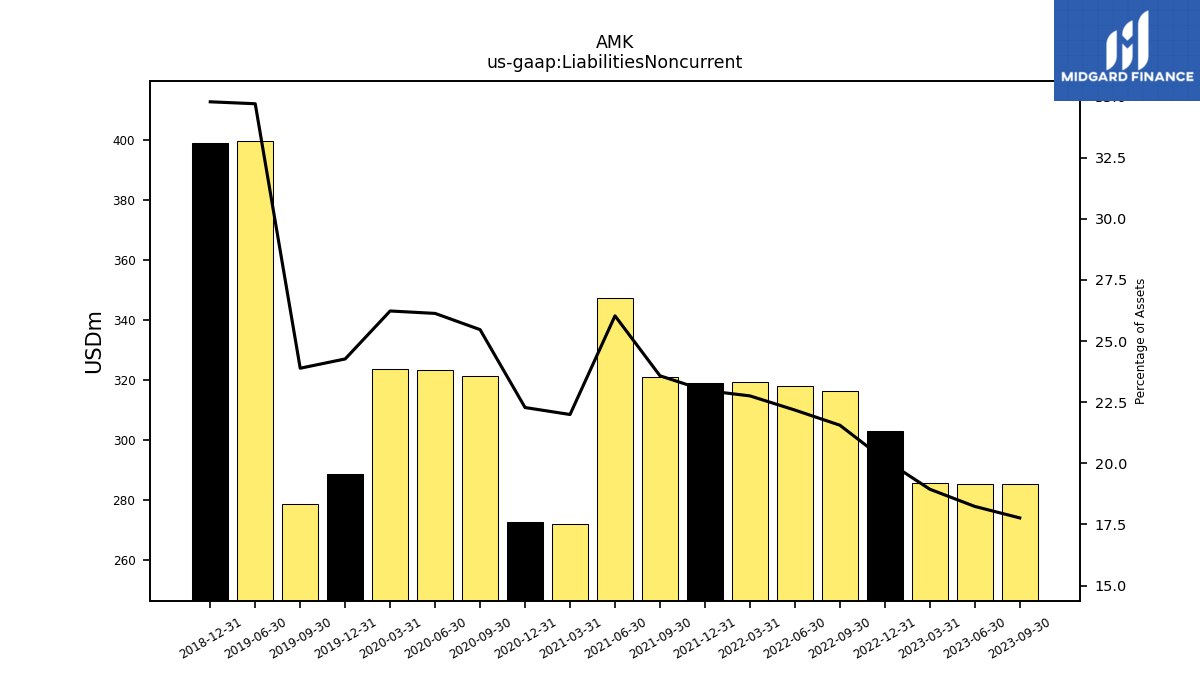
| Liabilities Noncurrent | 285.22 | 285.20 | 285.63 | 302.74 | 316.30 | 317.93 | 319.22 | 318.71 | 320.95 | 347.21 | 271.72 | 272.62 | 321.12 | 323.27 | 323.58 | 288.52 | 278.42 | 399.56 | NA | 399.03 | NA | NA | |
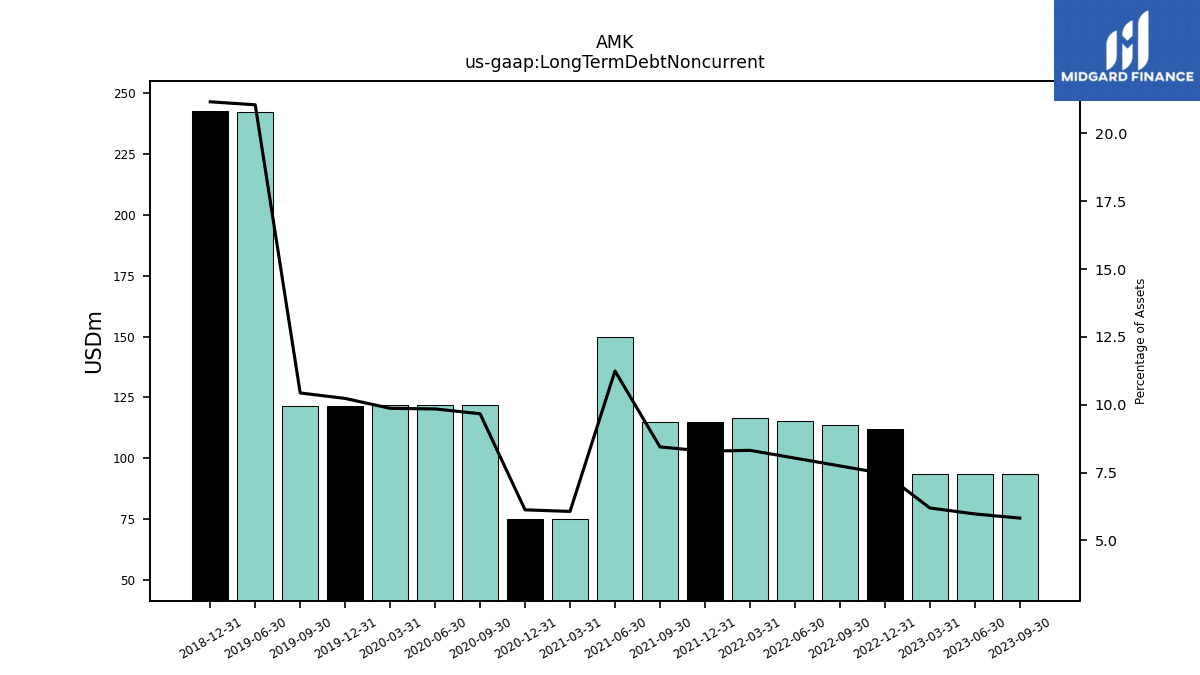
| Long Term Debt Noncurrent | 93.52 | 93.50 | 93.47 | 112.14 | 113.67 | 115.20 | 116.73 | 115.00 | 115.00 | 150.00 | 75.00 | 75.00 | 121.93 | 121.85 | 121.77 | 121.69 | 121.64 | 242.43 | NA | 242.82 | NA | NA | |
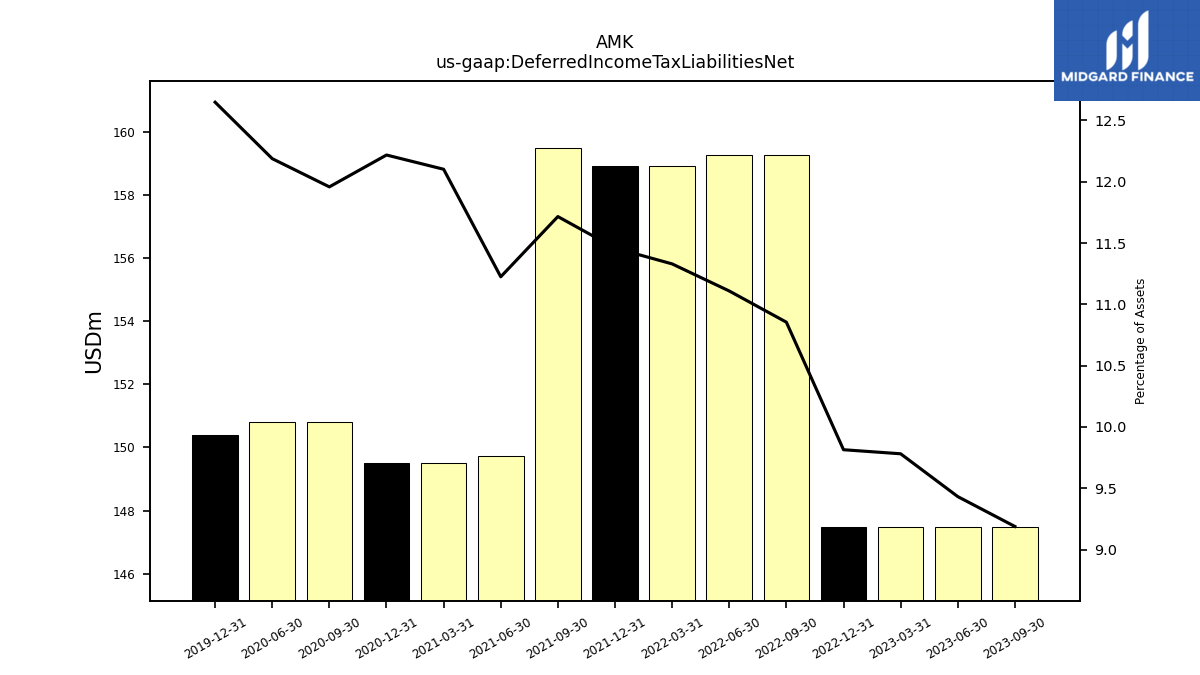
| Deferred Income Tax Liabilities Net | 147.50 | 147.50 | 147.50 | 147.50 | 159.26 | 159.26 | 158.93 | 158.93 | 159.47 | 149.73 | 149.50 | 149.50 | 150.79 | 150.79 | NA | 150.39 | NA | NA | NA | NA | NA | NA | |
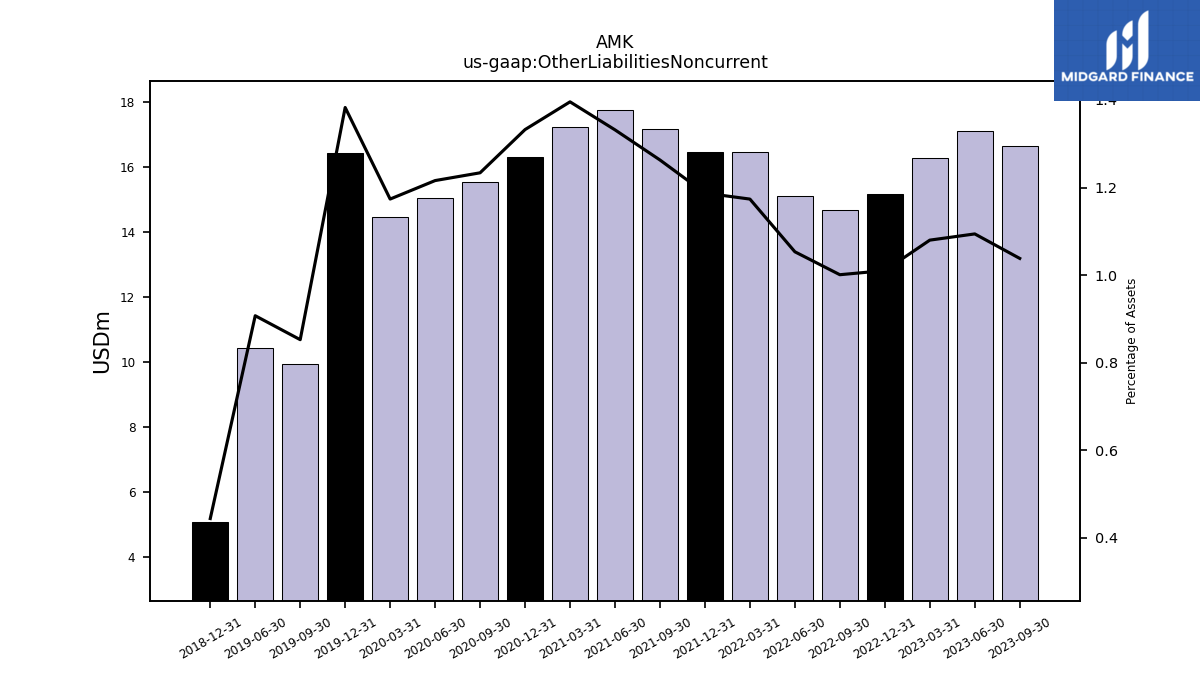
| Other Liabilities Noncurrent | 16.67 | 17.11 | 16.29 | 15.19 | 14.69 | 15.10 | 16.46 | 16.47 | 17.19 | 17.76 | 17.24 | 16.30 | 15.56 | 15.04 | 14.48 | 16.44 | 9.94 | 10.45 | NA | 5.10 | NA | NA | |
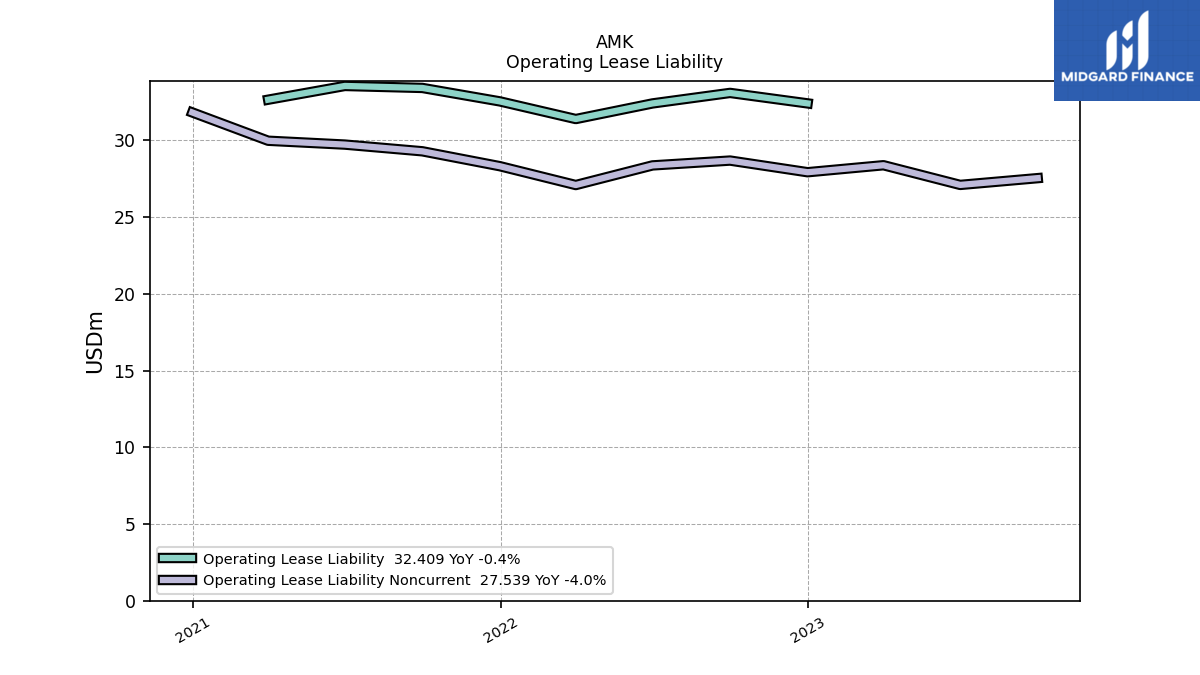
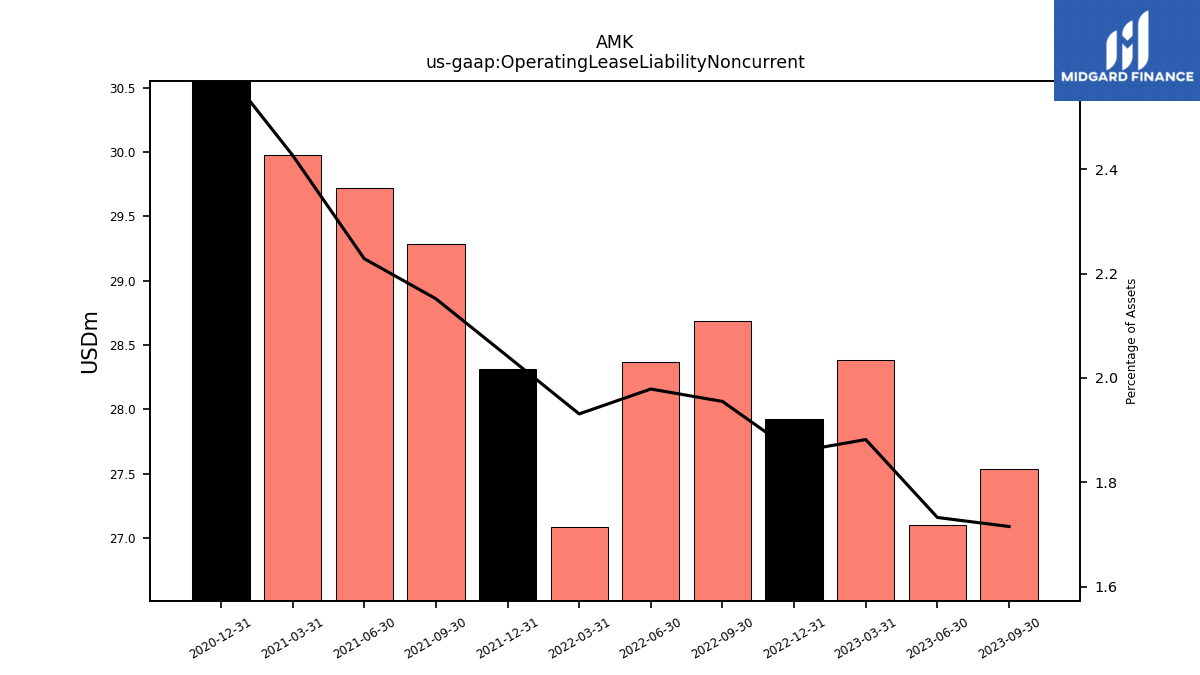
| Operating Lease Liability Noncurrent | 27.54 | 27.10 | 28.38 | 27.92 | 28.68 | 28.37 | 27.09 | 28.32 | 29.29 | 29.73 | 29.98 | 31.82 | NA | NA | NA | NA | NA | NA | NA | NA | NA | NA |
| 2023-09-30 | 2023-06-30 | 2023-03-31 | 2022-12-31 | 2022-09-30 | 2022-06-30 | 2022-03-31 | 2021-12-31 | 2021-09-30 | 2021-06-30 | 2021-03-31 | 2020-12-31 | 2020-09-30 | 2020-06-30 | 2020-03-31 | 2019-12-31 | 2019-09-30 | 2019-06-30 | 2019-03-31 | 2018-12-31 | 2018-09-30 | 2018-06-30 | ||
|---|---|---|---|---|---|---|---|---|---|---|---|---|---|---|---|---|---|---|---|---|---|---|---|
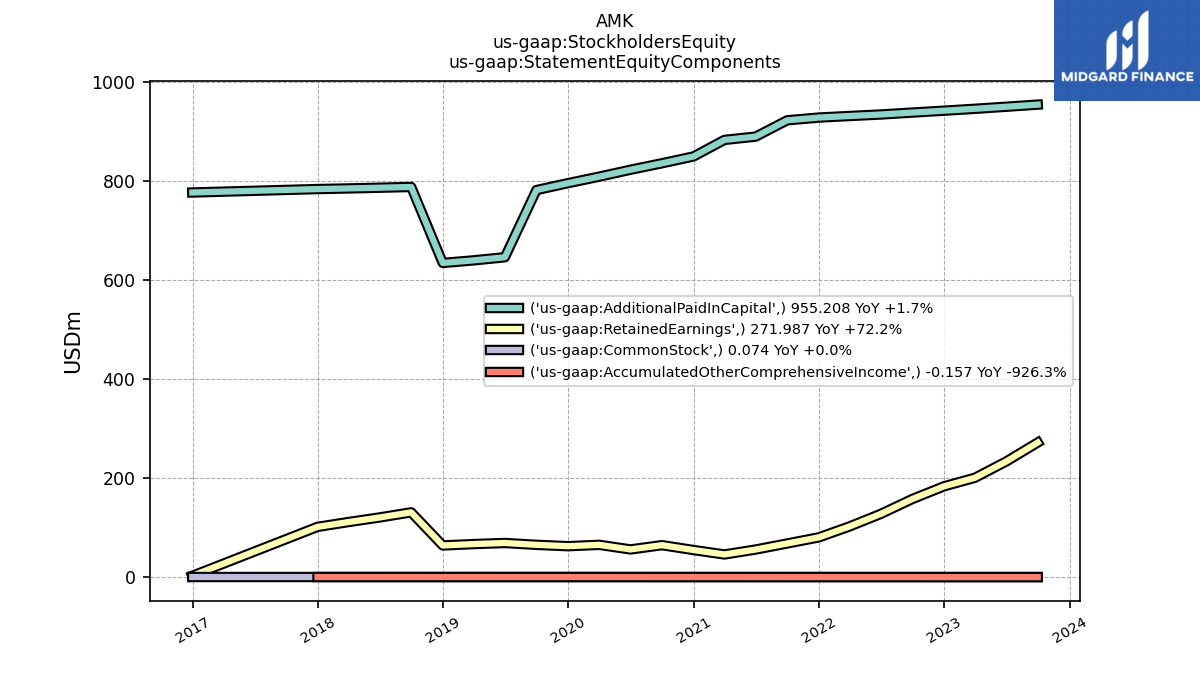
| Stockholders Equity | 1227.11 | 1184.44 | 1147.41 | 1126.37 | 1097.15 | 1063.12 | 1034.75 | 1009.39 | 991.48 | 946.25 | 929.59 | 905.07 | 901.14 | 879.44 | 874.78 | 858.86 | 847.63 | 715.51 | 707.06 | 699.01 | 919.63 | 907.75 | |
| Common Stock Value | 0.07 | 0.07 | 0.07 | 0.07 | 0.07 | 0.07 | 0.07 | 0.07 | 0.07 | 0.07 | 0.07 | 0.07 | 0.07 | 0.07 | 0.07 | 0.07 | 0.07 | 43659.00 | NA | 43659.00 | NA | NA | |
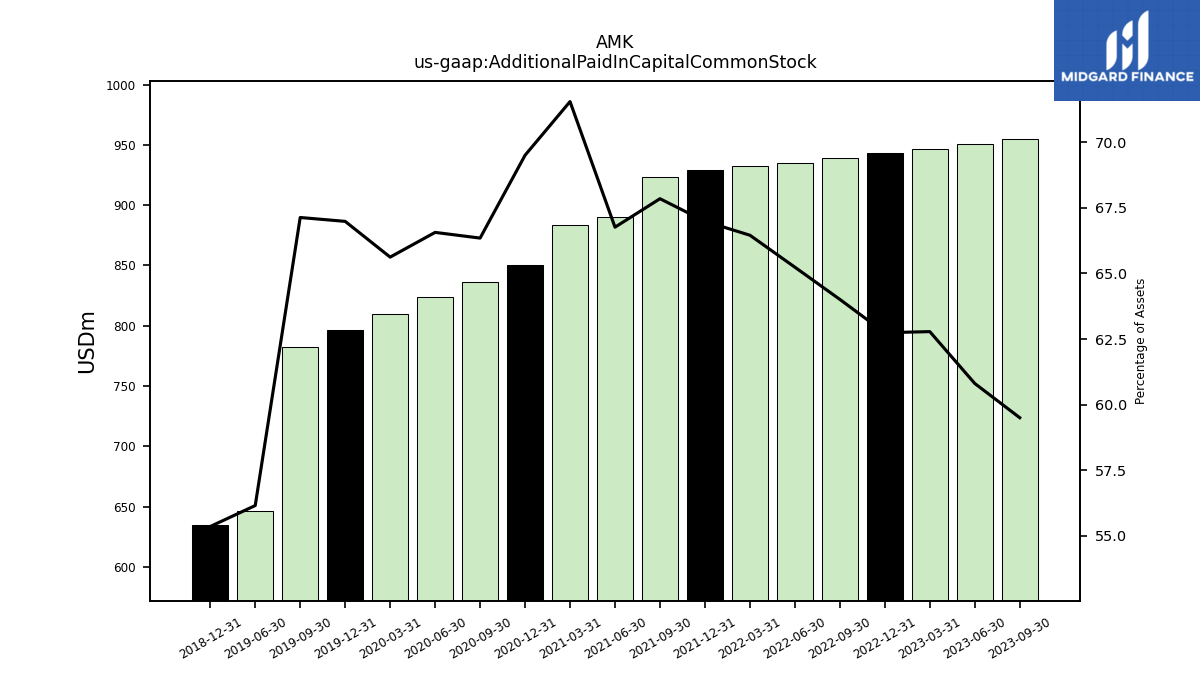
| Additional Paid In Capital Common Stock | 955.21 | 950.92 | 946.77 | 942.95 | 939.17 | 935.24 | 932.21 | 929.07 | 923.51 | 890.53 | 883.86 | 850.43 | 836.63 | 823.53 | 809.59 | 796.41 | 782.44 | 646.59 | NA | 635.10 | NA | NA | |
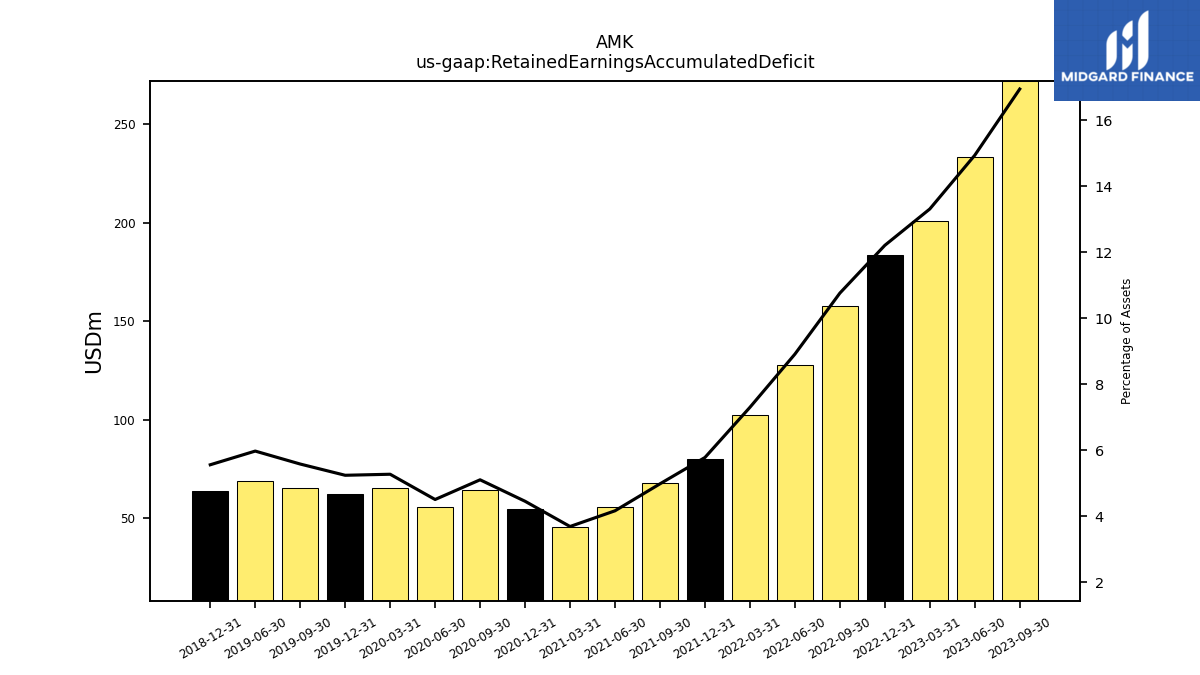
| Retained Earnings Accumulated Deficit | 271.99 | 233.60 | 200.72 | 183.50 | 157.91 | 127.80 | 102.46 | 80.24 | 67.89 | 55.64 | 45.66 | 54.57 | 64.44 | 55.84 | 65.12 | 62.38 | 65.12 | 68.85 | NA | 63.85 | NA | NA | |
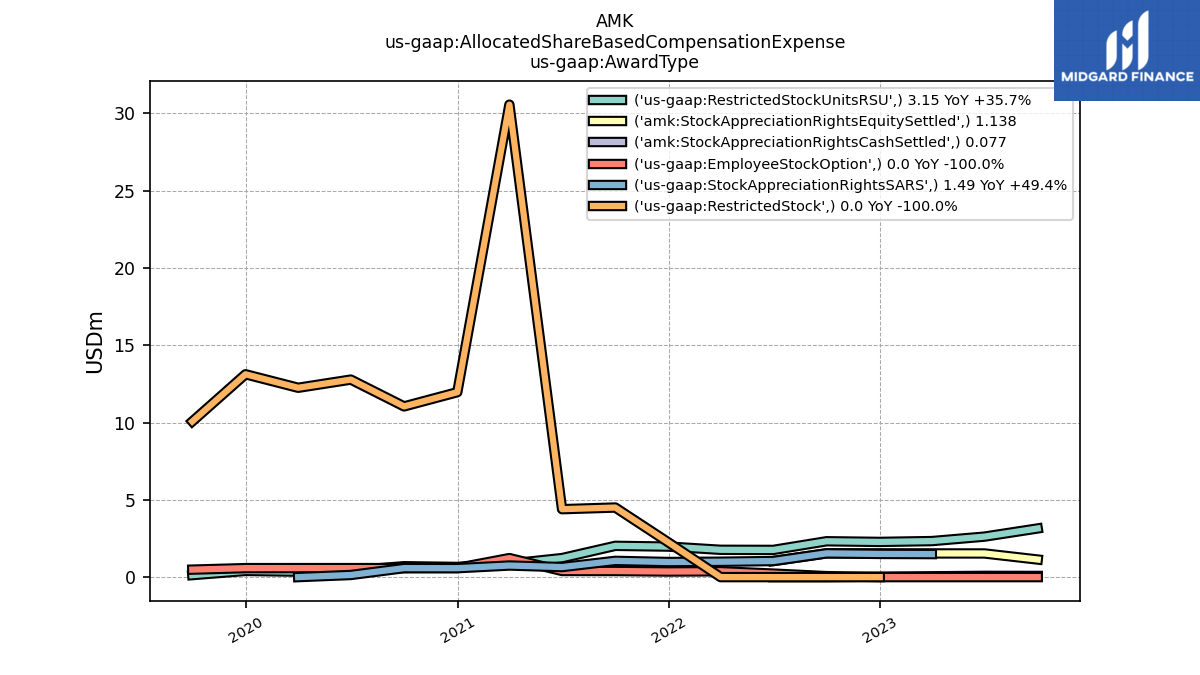
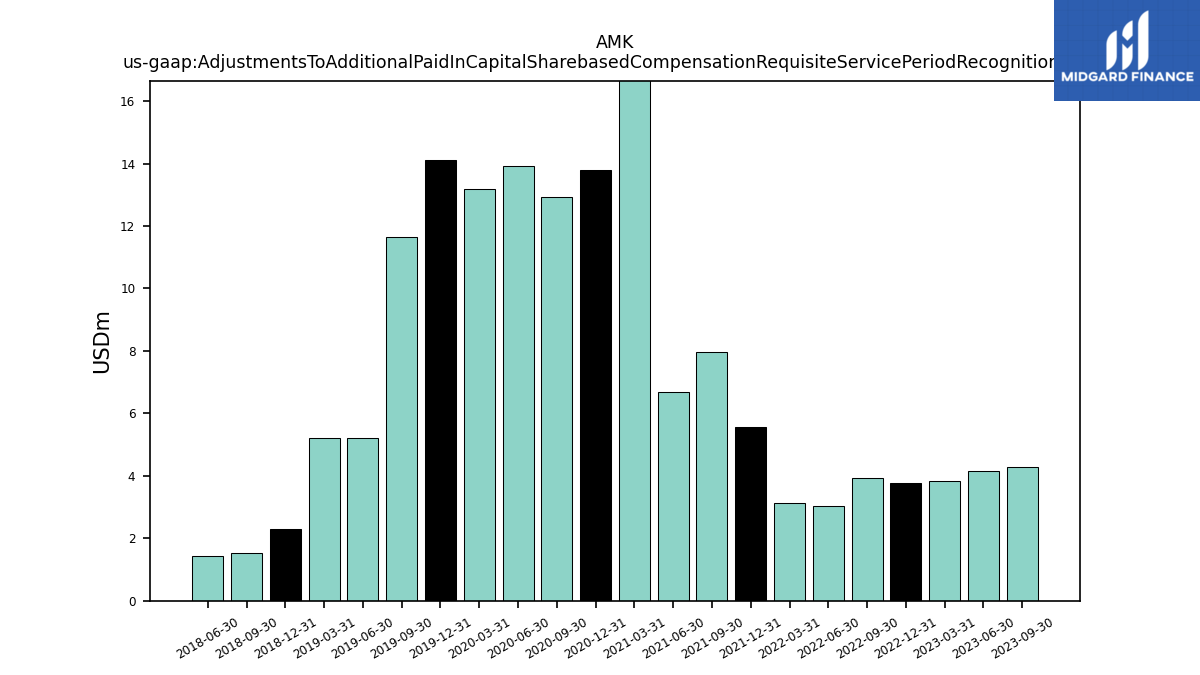
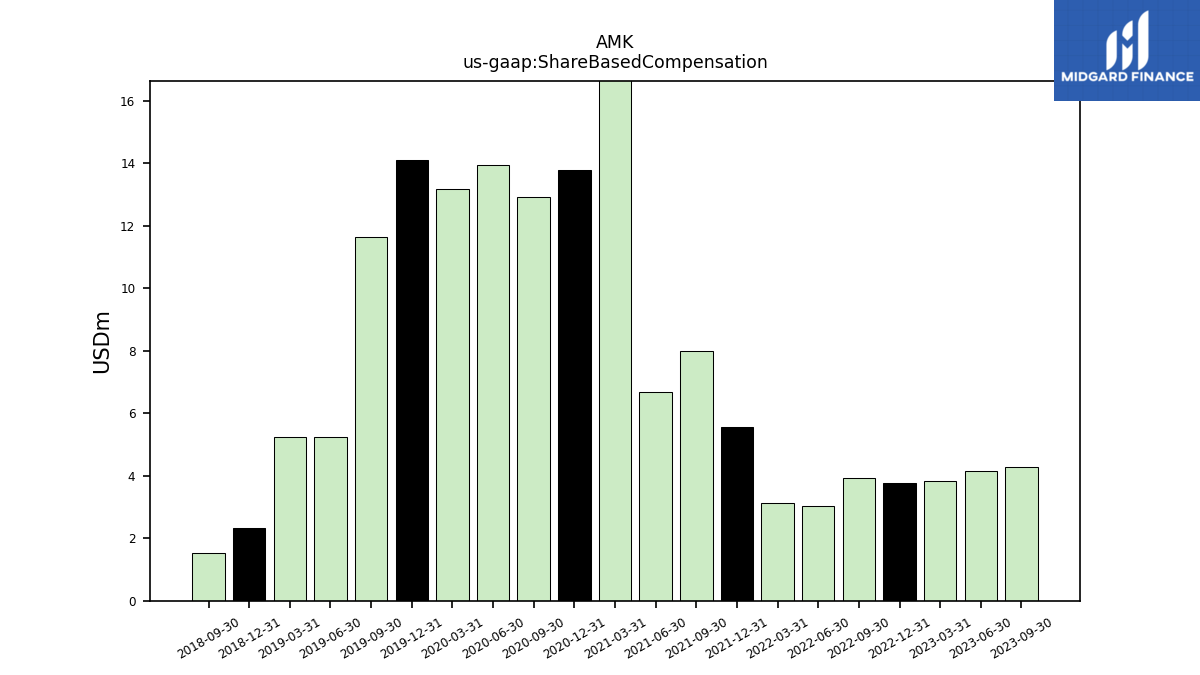
| Adjustments To Additional Paid In Capital Sharebased Compensation Requisite Service Period Recognition Value | 4.29 | 4.15 | 3.82 | 3.78 | 3.92 | 3.03 | 3.14 | 5.56 | 7.97 | 6.68 | 33.43 | 13.80 | 12.92 | 13.93 | 13.19 | 14.11 | 11.64 | 5.23 | 5.23 | 2.31 | 1.52 | 1.44 |
| 2023-09-30 | 2023-06-30 | 2023-03-31 | 2022-12-31 | 2022-09-30 | 2022-06-30 | 2022-03-31 | 2021-12-31 | 2021-09-30 | 2021-06-30 | 2021-03-31 | 2020-12-31 | 2020-09-30 | 2020-06-30 | 2020-03-31 | 2019-12-31 | 2019-09-30 | 2019-06-30 | 2019-03-31 | 2018-12-31 | 2018-09-30 | 2018-06-30 | ||
|---|---|---|---|---|---|---|---|---|---|---|---|---|---|---|---|---|---|---|---|---|---|---|---|
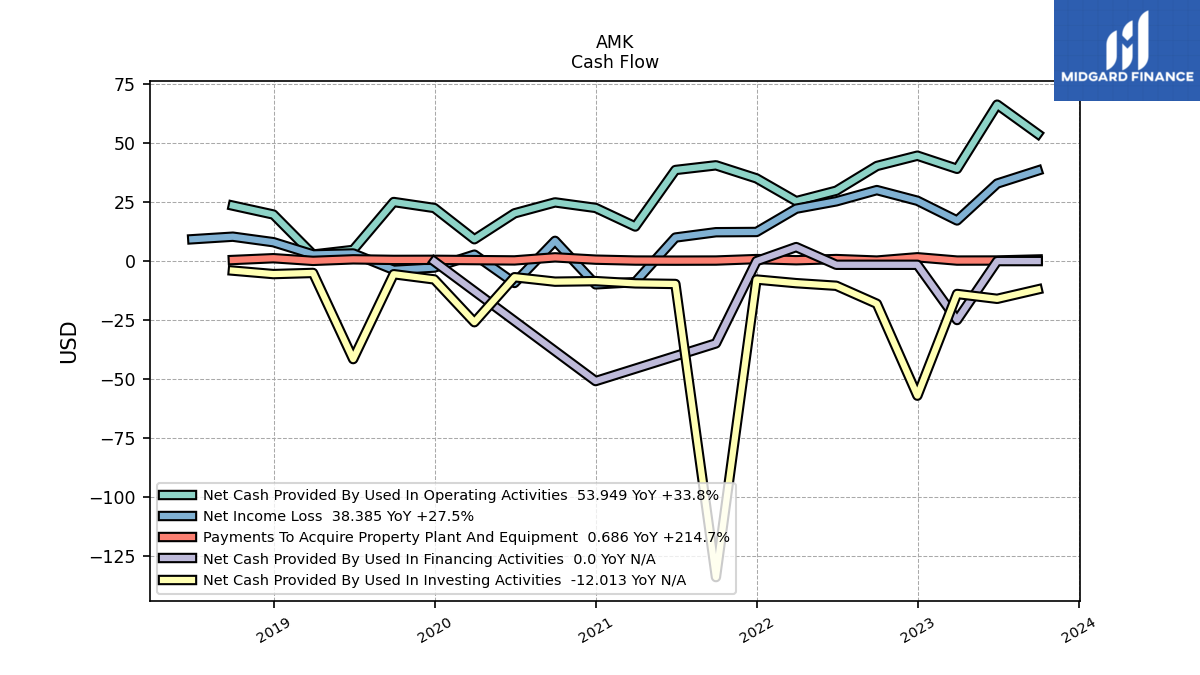
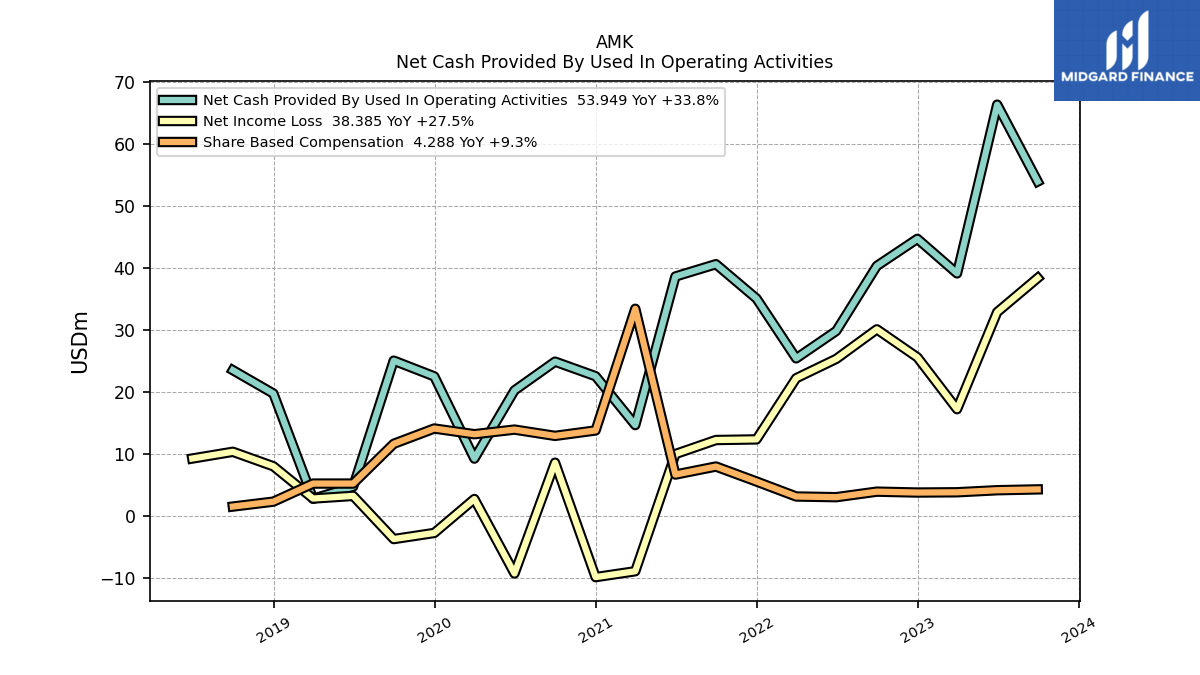
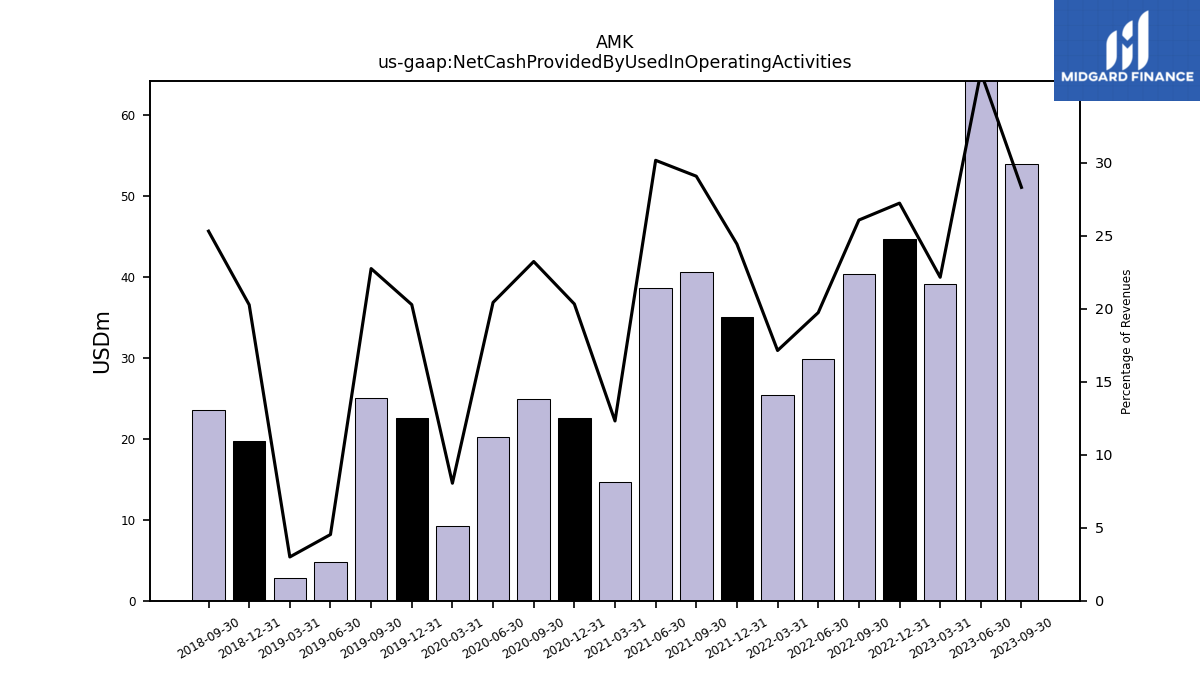
| Net Cash Provided By Used In Operating Activities | 53.95 | 66.35 | 39.13 | 44.70 | 40.33 | 29.85 | 25.42 | 35.08 | 40.62 | 38.63 | 14.66 | 22.55 | 24.89 | 20.25 | 9.25 | 22.52 | 25.06 | 4.74 | 2.77 | 19.75 | 23.52 | NA | |
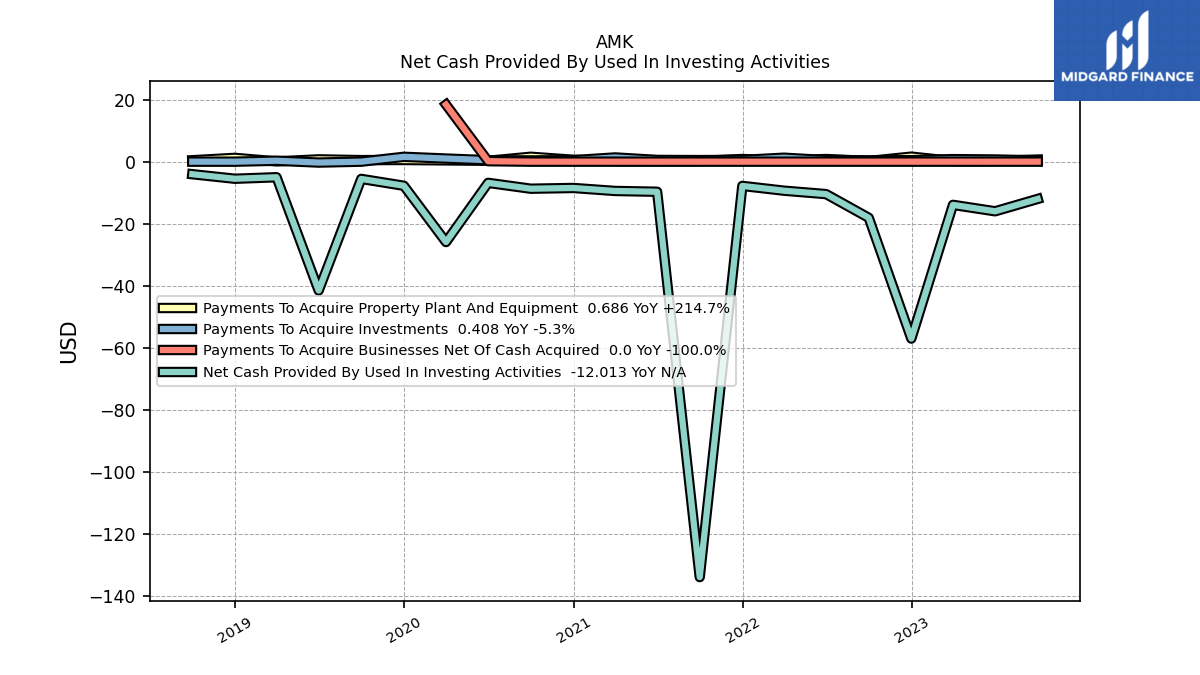
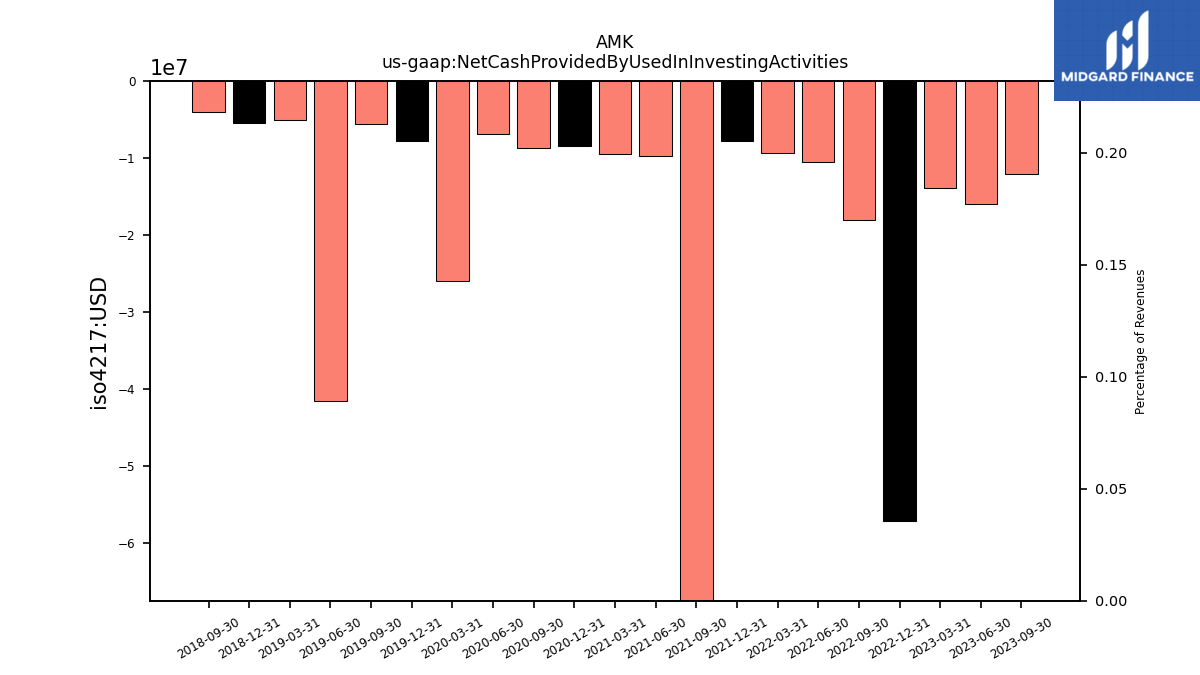
| Net Cash Provided By Used In Investing Activities | -12.01 | -16.00 | -13.93 | -57.08 | -18.09 | -10.46 | -9.36 | -7.82 | -134.02 | -9.70 | -9.45 | -8.49 | -8.72 | -6.83 | -25.93 | -7.77 | -5.56 | -41.57 | -5.02 | -5.51 | -4.04 | NA | |
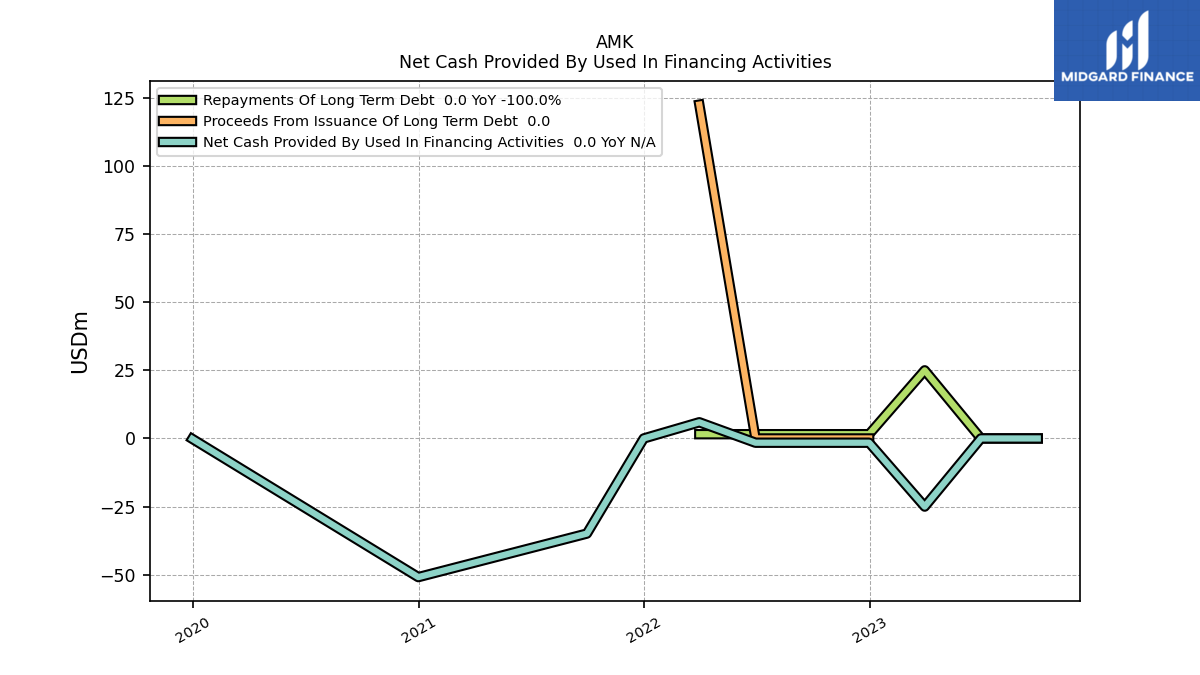
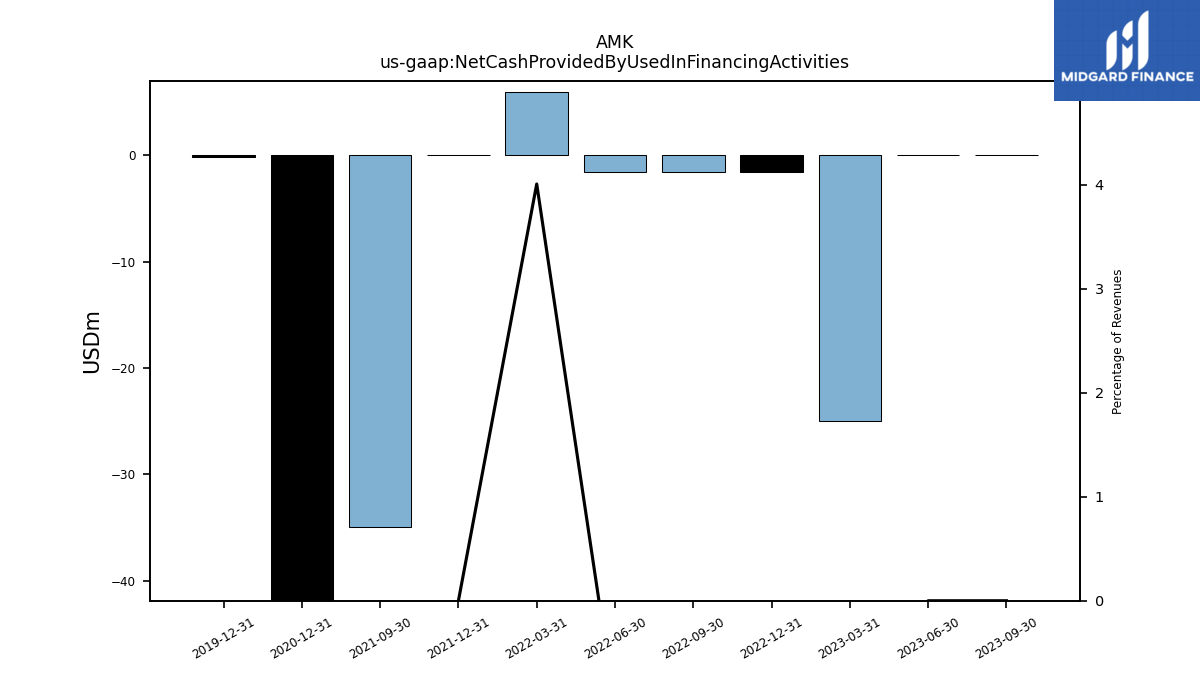
| Net Cash Provided By Used In Financing Activities | 0.00 | 0.00 | -25.00 | -1.56 | -1.56 | -1.56 | 5.95 | 0.00 | -34.91 | NA | NA | -50.89 | NA | NA | NA | -0.14 | NA | NA | NA | NA | NA | NA |
| 2023-09-30 | 2023-06-30 | 2023-03-31 | 2022-12-31 | 2022-09-30 | 2022-06-30 | 2022-03-31 | 2021-12-31 | 2021-09-30 | 2021-06-30 | 2021-03-31 | 2020-12-31 | 2020-09-30 | 2020-06-30 | 2020-03-31 | 2019-12-31 | 2019-09-30 | 2019-06-30 | 2019-03-31 | 2018-12-31 | 2018-09-30 | 2018-06-30 | ||
|---|---|---|---|---|---|---|---|---|---|---|---|---|---|---|---|---|---|---|---|---|---|---|---|
| Net Cash Provided By Used In Operating Activities | 53.95 | 66.35 | 39.13 | 44.70 | 40.33 | 29.85 | 25.42 | 35.08 | 40.62 | 38.63 | 14.66 | 22.55 | 24.89 | 20.25 | 9.25 | 22.52 | 25.06 | 4.74 | 2.77 | 19.75 | 23.52 | NA | |
| Net Income Loss | 38.38 | 32.88 | 17.22 | 25.59 | 30.11 | 25.34 | 22.22 | 12.35 | 12.25 | 9.99 | -8.92 | -9.87 | 8.60 | -9.28 | 2.74 | -2.74 | -3.73 | 3.24 | 2.81 | 8.02 | 10.35 | 9.27 | |
| Profit Loss | 38.38 | 32.88 | 17.22 | 25.59 | 30.11 | 25.34 | 22.22 | 12.35 | 12.25 | 9.99 | -8.92 | -9.87 | 8.60 | -9.28 | 2.74 | -2.74 | -3.73 | 3.24 | 2.81 | 8.02 | 10.35 | NA | |
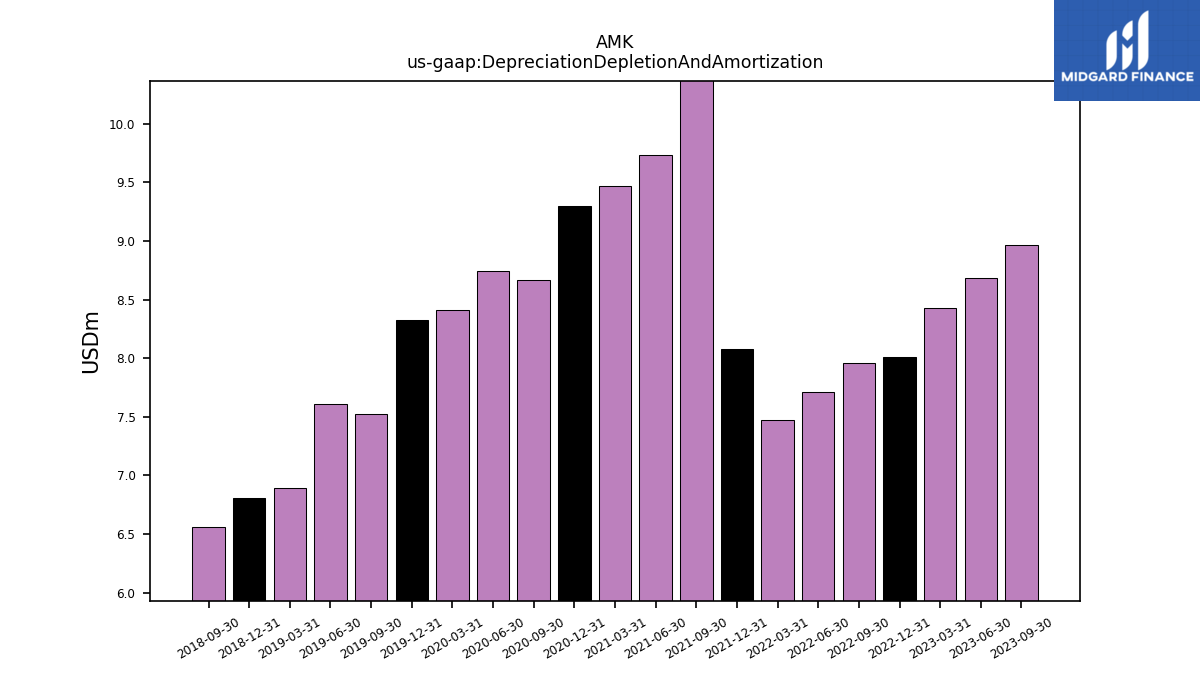
| Depreciation Depletion And Amortization | 8.96 | 8.68 | 8.43 | 8.01 | 7.96 | 7.71 | 7.47 | 8.08 | 10.65 | 9.73 | 9.47 | 9.30 | 8.67 | 8.75 | 8.41 | 8.32 | 7.52 | 7.61 | 6.90 | 6.80 | 6.57 | NA | |
| Share Based Compensation | 4.29 | 4.15 | 3.82 | 3.78 | 3.92 | 3.03 | 3.14 | 5.56 | 7.97 | 6.68 | 33.43 | 13.80 | 12.92 | 13.93 | 13.19 | 14.11 | 11.64 | 5.23 | 5.23 | 2.31 | 1.52 | NA |
| 2023-09-30 | 2023-06-30 | 2023-03-31 | 2022-12-31 | 2022-09-30 | 2022-06-30 | 2022-03-31 | 2021-12-31 | 2021-09-30 | 2021-06-30 | 2021-03-31 | 2020-12-31 | 2020-09-30 | 2020-06-30 | 2020-03-31 | 2019-12-31 | 2019-09-30 | 2019-06-30 | 2019-03-31 | 2018-12-31 | 2018-09-30 | 2018-06-30 | ||
|---|---|---|---|---|---|---|---|---|---|---|---|---|---|---|---|---|---|---|---|---|---|---|---|
| Net Cash Provided By Used In Investing Activities | -12.01 | -16.00 | -13.93 | -57.08 | -18.09 | -10.46 | -9.36 | -7.82 | -134.02 | -9.70 | -9.45 | -8.49 | -8.72 | -6.83 | -25.93 | -7.77 | -5.56 | -41.57 | -5.02 | -5.51 | -4.04 | NA | |
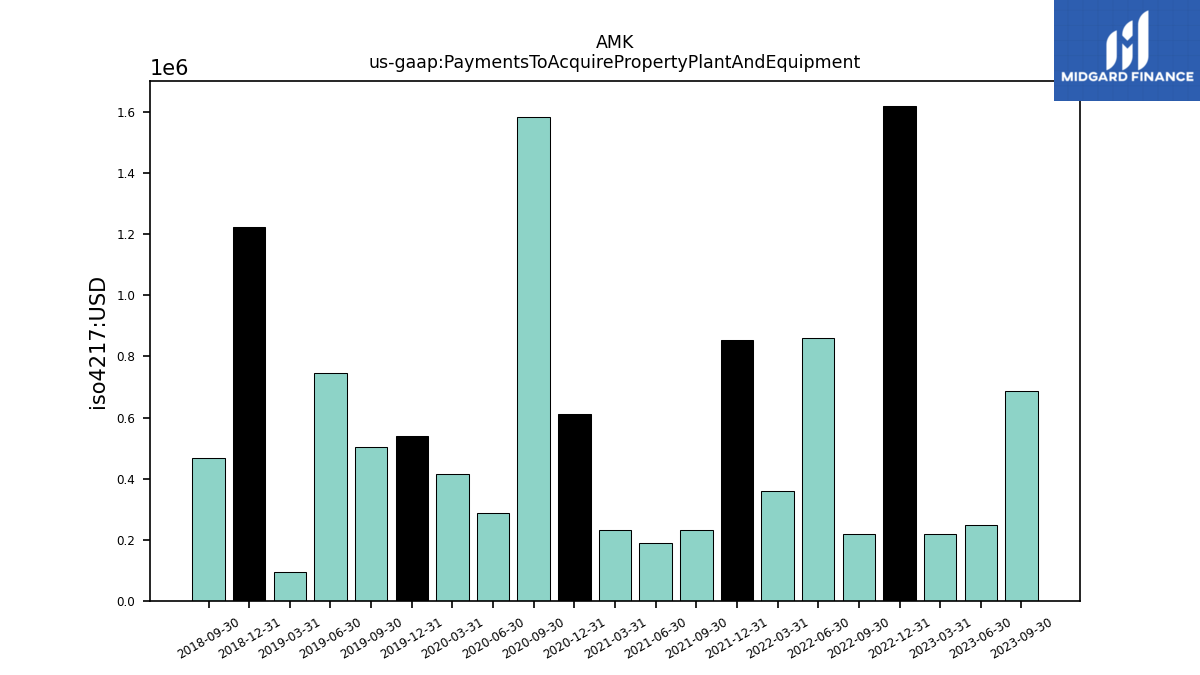
| Payments To Acquire Property Plant And Equipment | 0.69 | 0.25 | 0.22 | 1.62 | 0.22 | 0.86 | 0.36 | 0.85 | 0.23 | 0.19 | 0.23 | 0.61 | 1.58 | 0.29 | 0.42 | 0.54 | 0.50 | 0.74 | 0.09 | 1.22 | 0.47 | NA | |
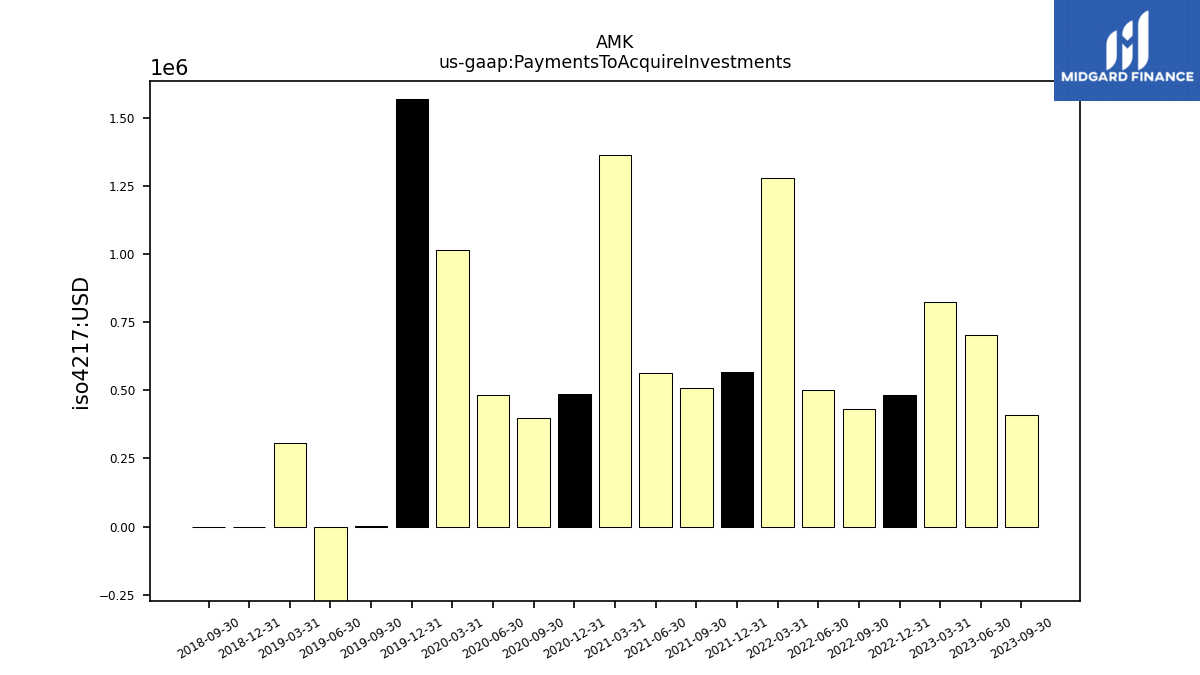
| Payments To Acquire Investments | 0.41 | 0.70 | 0.82 | 0.48 | 0.43 | 0.50 | 1.28 | 0.57 | 0.51 | 0.56 | 1.36 | 0.49 | 0.40 | 0.48 | 1.01 | 1.57 | 0.00 | -0.29 | 0.31 | 0.00 | 0.00 | NA |
| 2023-09-30 | 2023-06-30 | 2023-03-31 | 2022-12-31 | 2022-09-30 | 2022-06-30 | 2022-03-31 | 2021-12-31 | 2021-09-30 | 2021-06-30 | 2021-03-31 | 2020-12-31 | 2020-09-30 | 2020-06-30 | 2020-03-31 | 2019-12-31 | 2019-09-30 | 2019-06-30 | 2019-03-31 | 2018-12-31 | 2018-09-30 | 2018-06-30 | ||
|---|---|---|---|---|---|---|---|---|---|---|---|---|---|---|---|---|---|---|---|---|---|---|---|
| Net Cash Provided By Used In Financing Activities | 0.00 | 0.00 | -25.00 | -1.56 | -1.56 | -1.56 | 5.95 | 0.00 | -34.91 | NA | NA | -50.89 | NA | NA | NA | -0.14 | NA | NA | NA | NA | NA | NA |
| 2023-09-30 | 2023-06-30 | 2023-03-31 | 2022-12-31 | 2022-09-30 | 2022-06-30 | 2022-03-31 | 2021-12-31 | 2021-09-30 | 2021-06-30 | 2021-03-31 | 2020-12-31 | 2020-09-30 | 2020-06-30 | 2020-03-31 | 2019-12-31 | 2019-09-30 | 2019-06-30 | 2019-03-31 | 2018-12-31 | 2018-09-30 | 2018-06-30 | ||
|---|---|---|---|---|---|---|---|---|---|---|---|---|---|---|---|---|---|---|---|---|---|---|---|
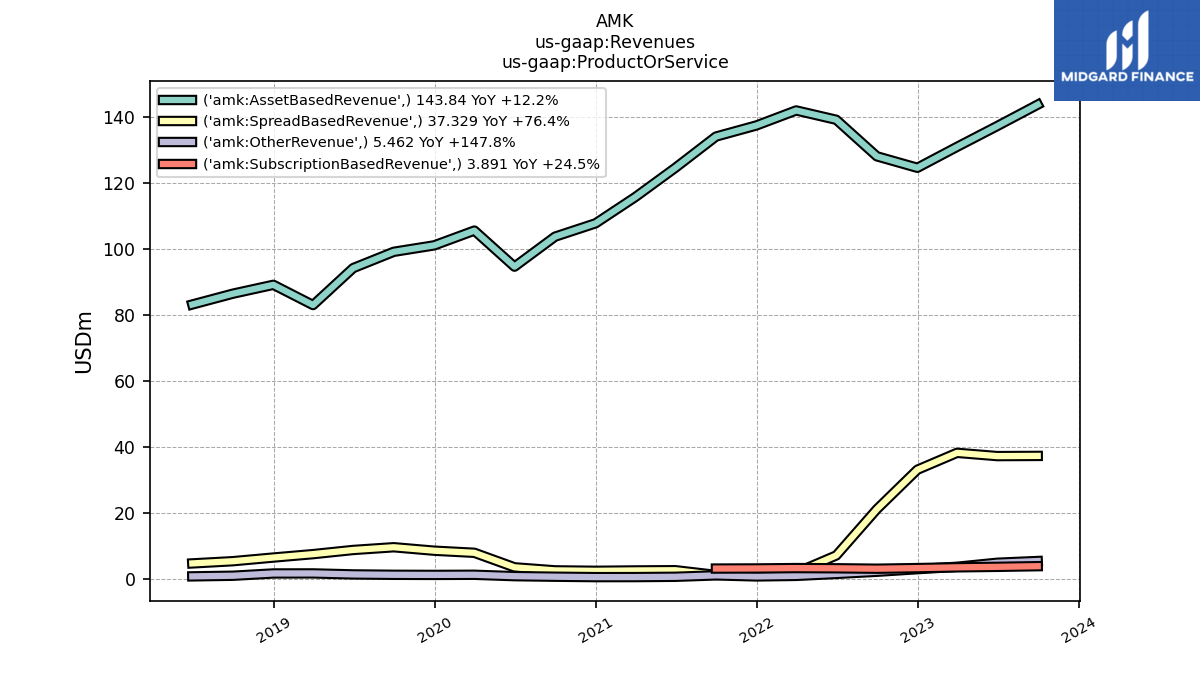
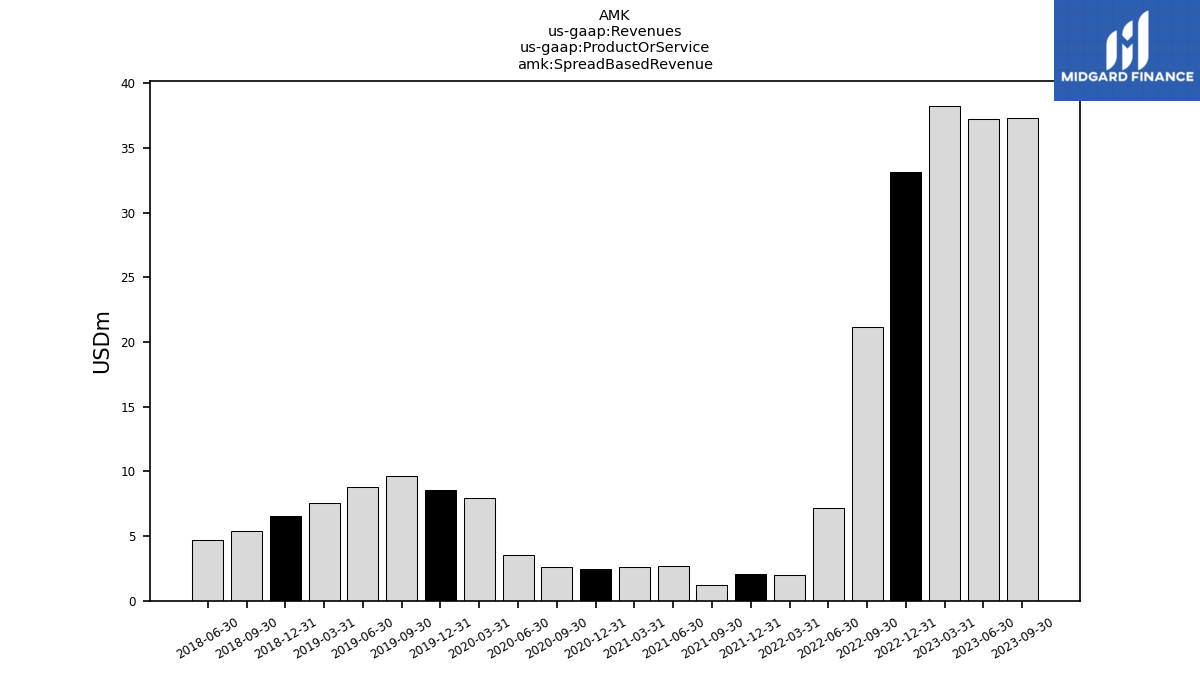
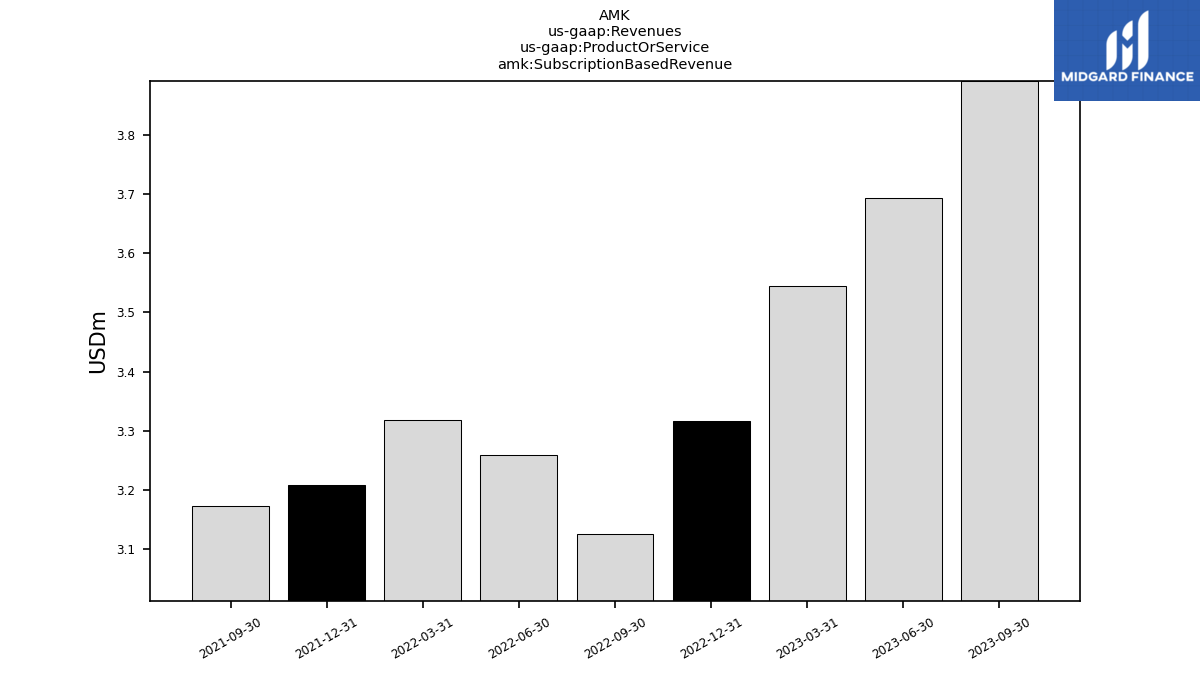
| Revenues | 190.52 | 183.23 | 176.56 | 164.13 | 154.66 | 151.21 | 148.30 | 143.58 | 139.67 | 128.04 | 119.01 | 110.92 | 107.14 | 99.13 | 114.89 | 111.01 | 110.13 | 104.48 | 92.31 | 97.41 | 92.91 | 88.78 | |
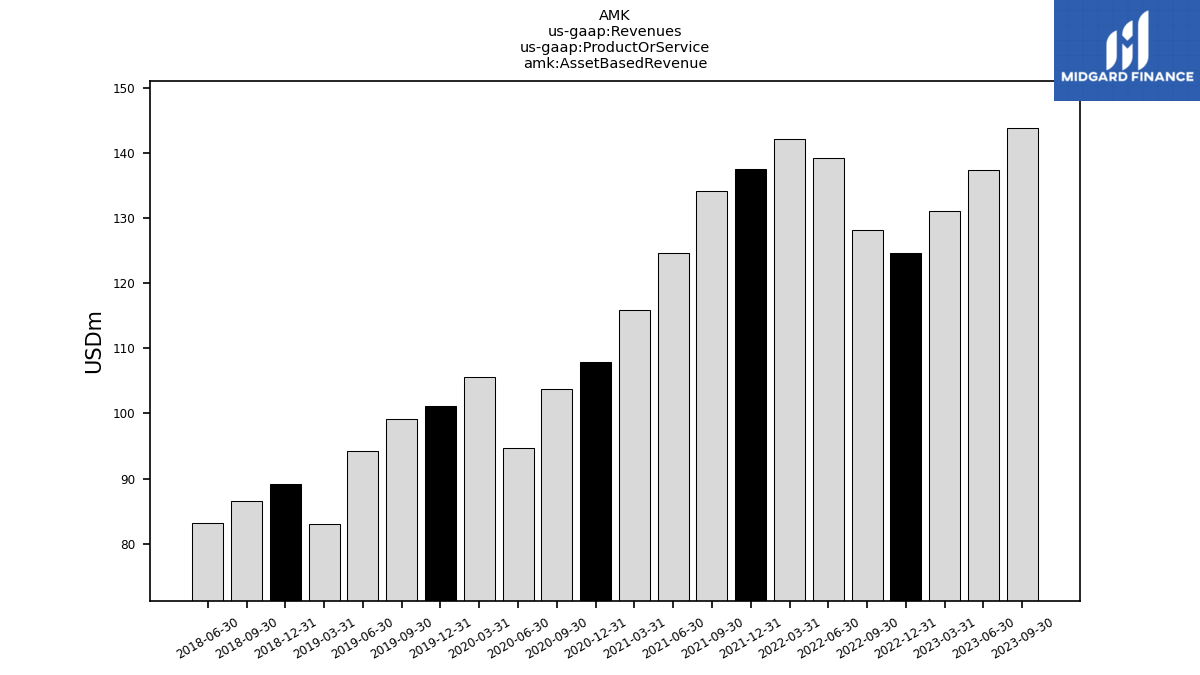
| Asset Based Revenue | 143.84 | 137.34 | 131.04 | 124.68 | 128.17 | 139.25 | 142.08 | 137.53 | 134.15 | 124.69 | 115.81 | 107.85 | 103.81 | 94.71 | 105.65 | 101.17 | 99.21 | 94.27 | 83.06 | 89.21 | 86.51 | 83.23 | |
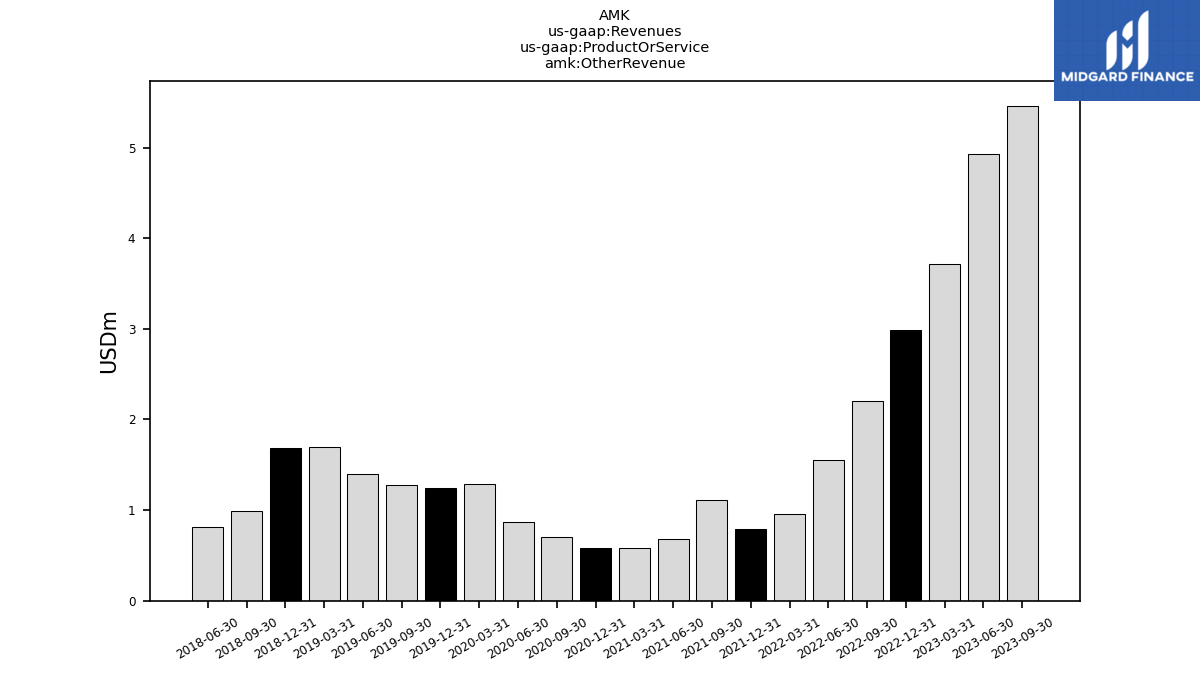
| Other Revenue | 5.46 | 4.93 | 3.72 | 2.99 | 2.20 | 1.55 | 0.95 | 0.79 | 1.11 | 0.68 | 0.59 | 0.58 | 0.70 | 0.87 | 1.29 | 1.25 | 1.28 | 1.40 | 1.70 | 1.69 | 0.99 | 0.81 | |
| Spread Based Revenue | 37.33 | 37.27 | 38.26 | 33.14 | 21.16 | 7.15 | 1.96 | 2.06 | 1.24 | 2.67 | 2.61 | 2.49 | 2.63 | 3.55 | 7.95 | 8.59 | 9.64 | 8.81 | 7.55 | 6.51 | 5.41 | 4.73 | |
| Subscription Based Revenue | 3.89 | 3.69 | 3.54 | 3.32 | 3.13 | 3.26 | 3.32 | 3.21 | 3.17 | NA | NA | NA | NA | NA | NA | NA | NA | NA | NA | NA | NA | NA | |
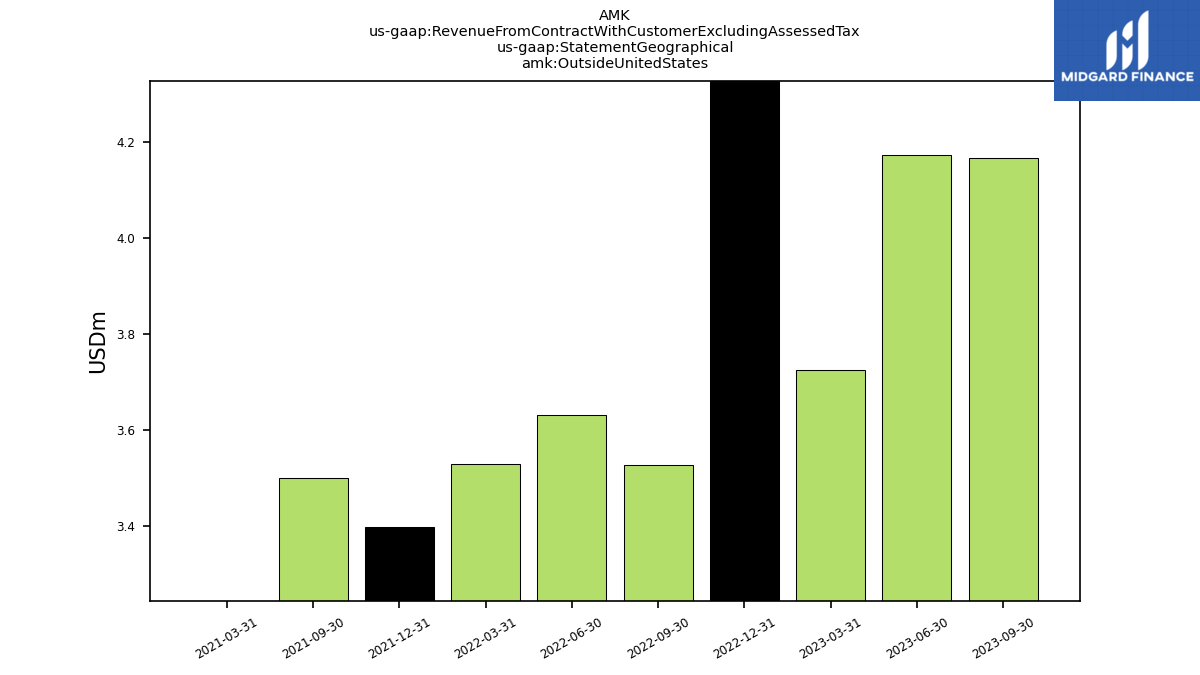
| Outside United States | 4.17 | 4.17 | 3.73 | 14473.31 | 3.53 | 3.63 | 3.53 | 3.40 | 3.50 | NA | 0.00 | NA | NA | NA | NA | NA | NA | NA | NA | NA | NA | NA |