
| 2023-12-31 | 2023-09-30 | 2023-06-30 | 2023-03-31 | 2022-12-31 | 2022-09-30 | 2022-06-30 | 2022-03-31 | 2021-12-31 | 2021-09-30 | 2021-06-30 | 2021-03-31 | 2020-12-31 | 2020-09-30 | 2020-06-30 | 2020-03-31 | 2019-12-31 | 2019-09-30 | 2019-06-30 | 2019-03-31 | 2018-12-31 | 2018-09-30 | 2018-06-30 | 2018-03-31 | 2017-12-31 | 2017-09-30 | 2017-06-30 | 2017-03-31 | 2016-12-31 | 2016-09-30 | 2016-06-30 | 2016-03-31 | 2015-12-31 | 2015-09-30 | 2015-06-30 | 2015-03-31 | 2014-12-31 | 2014-09-30 | 2014-06-30 | 2014-03-31 | 2013-12-31 | 2013-09-30 | 2013-06-30 | 2013-03-31 | 2012-12-31 | 2012-09-30 | 2012-06-30 | 2012-03-31 | 2011-12-31 | 2011-09-30 | 2011-06-30 | 2011-03-31 | 2010-12-31 | 2010-09-30 | 2010-06-30 | 2010-03-31 | ||
|---|---|---|---|---|---|---|---|---|---|---|---|---|---|---|---|---|---|---|---|---|---|---|---|---|---|---|---|---|---|---|---|---|---|---|---|---|---|---|---|---|---|---|---|---|---|---|---|---|---|---|---|---|---|---|---|---|---|
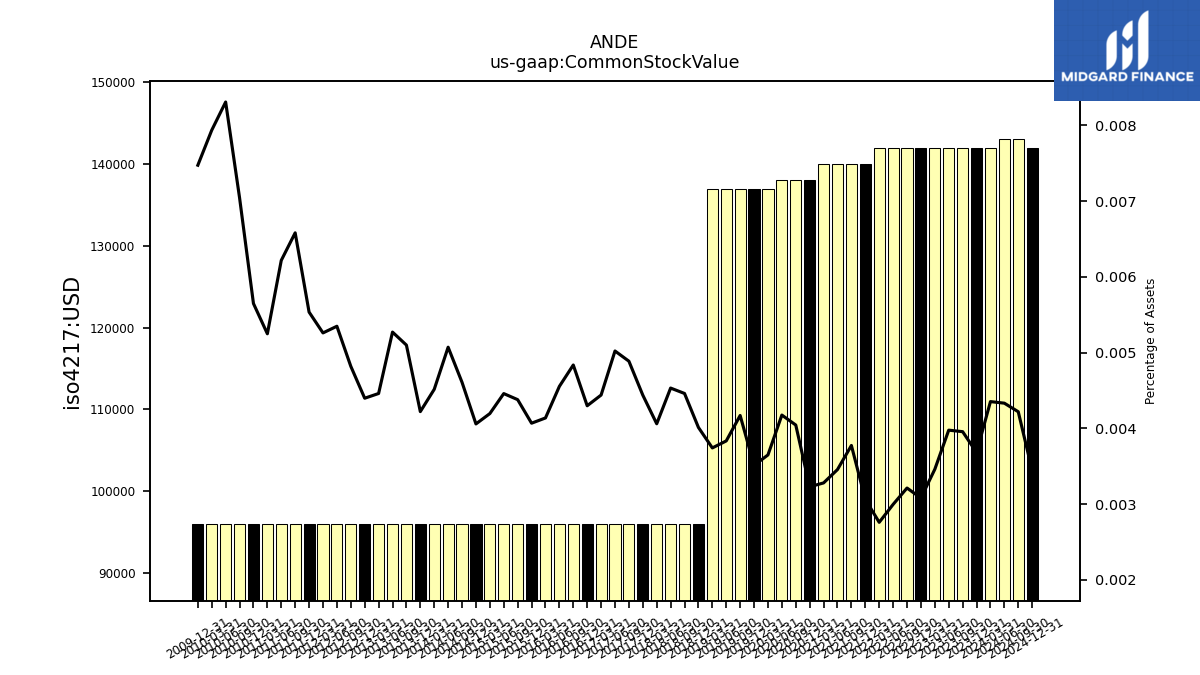
| Common Stock Value | 0.14 | 0.14 | 0.14 | 0.14 | 0.14 | 0.14 | 0.14 | 0.14 | 0.14 | 0.14 | 0.14 | 0.14 | 0.14 | 0.14 | 0.14 | 0.14 | 0.14 | 0.14 | 0.14 | 0.14 | 0.10 | 0.10 | 0.10 | 0.10 | 0.10 | 0.10 | 0.10 | 0.10 | 0.10 | 0.10 | 0.10 | 0.10 | 0.10 | 0.10 | 0.10 | 0.10 | 0.10 | 0.10 | 0.10 | 0.10 | 0.10 | 0.10 | 0.10 | 0.10 | 0.10 | 0.10 | 0.10 | 0.10 | 0.10 | 0.10 | 0.10 | 0.10 | 0.10 | 0.10 | 0.10 | 0.10 | |
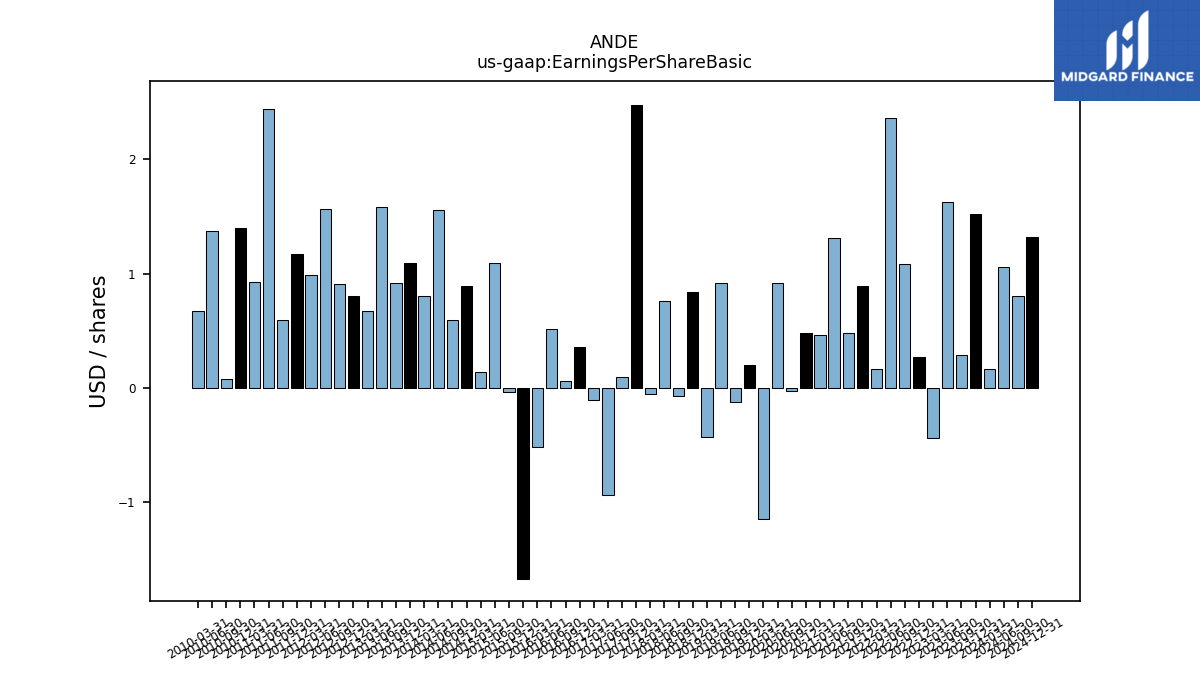
| Earnings Per Share Basic | 1.52 | 0.29 | 1.63 | -0.44 | 0.27 | 1.08 | 2.36 | 0.16 | 0.89 | 0.48 | 1.31 | 0.46 | 0.48 | -0.03 | 0.92 | -1.15 | 0.20 | -0.13 | 0.92 | -0.43 | 0.84 | -0.07 | 0.76 | -0.06 | 2.48 | 0.09 | -0.94 | -0.11 | 0.36 | 0.06 | 0.51 | -0.52 | -1.68 | -0.04 | 1.09 | 0.14 | 0.89 | 0.59 | 1.56 | 0.80 | 1.09 | 0.92 | 1.58 | 0.67 | 0.80 | 0.91 | 1.57 | 0.99 | 1.17 | 0.59 | 2.44 | 0.93 | 1.40 | 0.08 | 1.37 | 0.67 | |
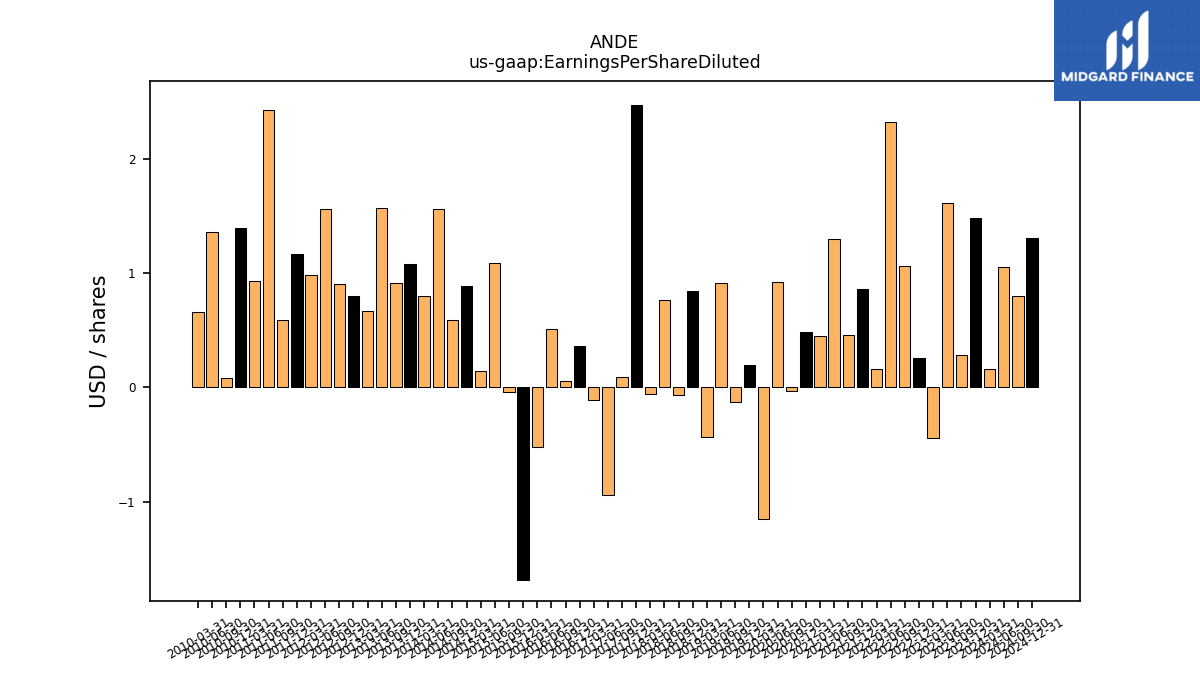
| Earnings Per Share Diluted | 1.48 | 0.28 | 1.61 | -0.44 | 0.26 | 1.06 | 2.32 | 0.16 | 0.86 | 0.46 | 1.30 | 0.45 | 0.48 | -0.03 | 0.92 | -1.15 | 0.20 | -0.13 | 0.91 | -0.43 | 0.84 | -0.07 | 0.76 | -0.06 | 2.47 | 0.09 | -0.94 | -0.11 | 0.36 | 0.06 | 0.51 | -0.52 | -1.68 | -0.04 | 1.09 | 0.14 | 0.89 | 0.59 | 1.56 | 0.80 | 1.08 | 0.91 | 1.57 | 0.67 | 0.80 | 0.90 | 1.56 | 0.98 | 1.17 | 0.59 | 2.42 | 0.93 | 1.39 | 0.08 | 1.36 | 0.66 | |
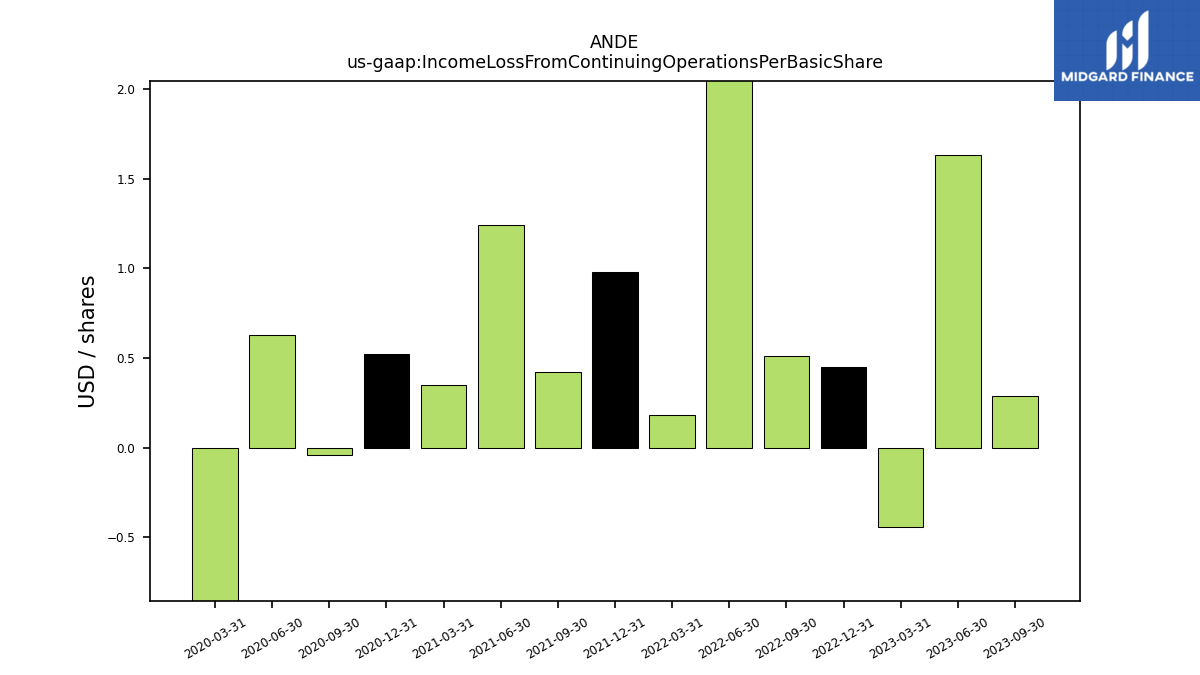
| Income Loss From Continuing Operations Per Basic Share | 0.00 | 0.00 | 0.00 | -0.00 | 0.00 | 0.00 | 0.00 | 0.00 | 0.00 | 0.00 | 0.00 | 0.00 | 0.00 | -0.00 | 0.00 | -0.00 | NA | NA | NA | NA | NA | NA | NA | NA | NA | NA | NA | NA | NA | NA | NA | NA | NA | NA | NA | NA | NA | NA | NA | NA | NA | NA | NA | NA | NA | NA | NA | NA | NA | NA | NA | NA | NA | NA | NA | NA | |
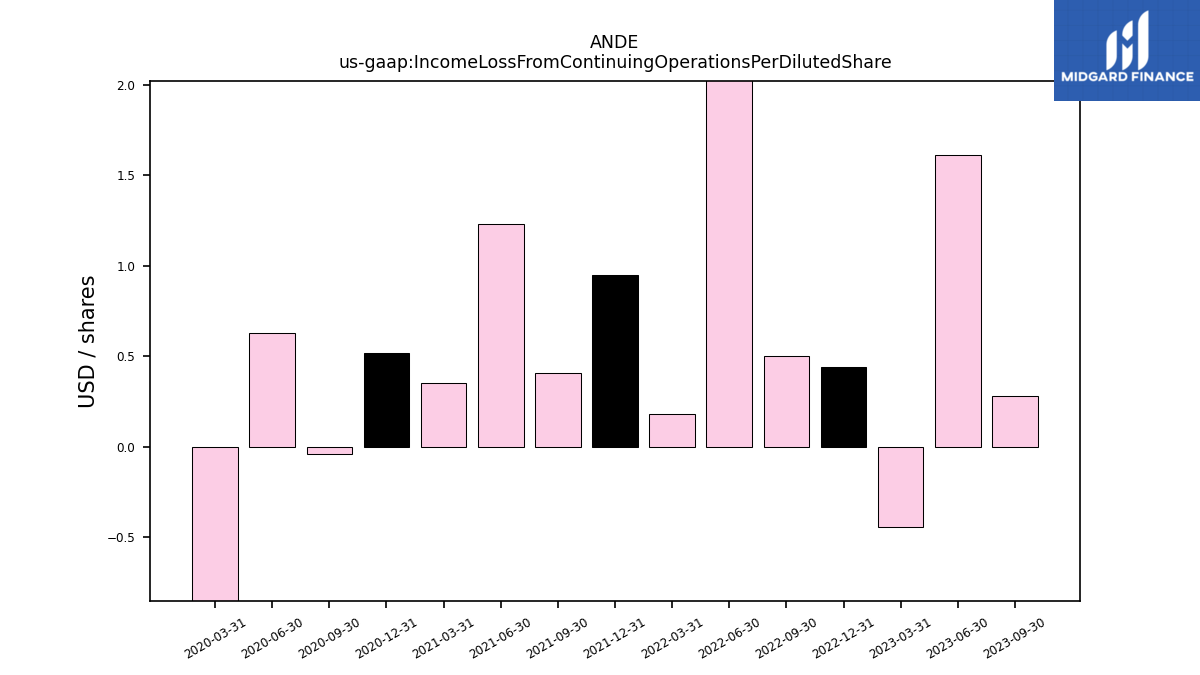
| Income Loss From Continuing Operations Per Diluted Share | 0.00 | 0.00 | 0.00 | -0.00 | 0.00 | 0.00 | 0.00 | 0.00 | 0.00 | 0.00 | 0.00 | 0.00 | 0.00 | -0.00 | 0.00 | -0.00 | NA | NA | NA | NA | NA | NA | NA | NA | NA | NA | NA | NA | NA | NA | NA | NA | NA | NA | NA | NA | NA | NA | NA | NA | NA | NA | NA | NA | NA | NA | NA | NA | NA | NA | NA | NA | NA | NA | NA | NA |
| 2023-12-31 | 2023-09-30 | 2023-06-30 | 2023-03-31 | 2022-12-31 | 2022-09-30 | 2022-06-30 | 2022-03-31 | 2021-12-31 | 2021-09-30 | 2021-06-30 | 2021-03-31 | 2020-12-31 | 2020-09-30 | 2020-06-30 | 2020-03-31 | 2019-12-31 | 2019-09-30 | 2019-06-30 | 2019-03-31 | 2018-12-31 | 2018-09-30 | 2018-06-30 | 2018-03-31 | 2017-12-31 | 2017-09-30 | 2017-06-30 | 2017-03-31 | 2016-12-31 | 2016-09-30 | 2016-06-30 | 2016-03-31 | 2015-12-31 | 2015-09-30 | 2015-06-30 | 2015-03-31 | 2014-12-31 | 2014-09-30 | 2014-06-30 | 2014-03-31 | 2013-12-31 | 2013-09-30 | 2013-06-30 | 2013-03-31 | 2012-12-31 | 2012-09-30 | 2012-06-30 | 2012-03-31 | 2011-12-31 | 2011-09-30 | 2011-06-30 | 2011-03-31 | 2010-12-31 | 2010-09-30 | 2010-06-30 | 2010-03-31 | ||
|---|---|---|---|---|---|---|---|---|---|---|---|---|---|---|---|---|---|---|---|---|---|---|---|---|---|---|---|---|---|---|---|---|---|---|---|---|---|---|---|---|---|---|---|---|---|---|---|---|---|---|---|---|---|---|---|---|---|
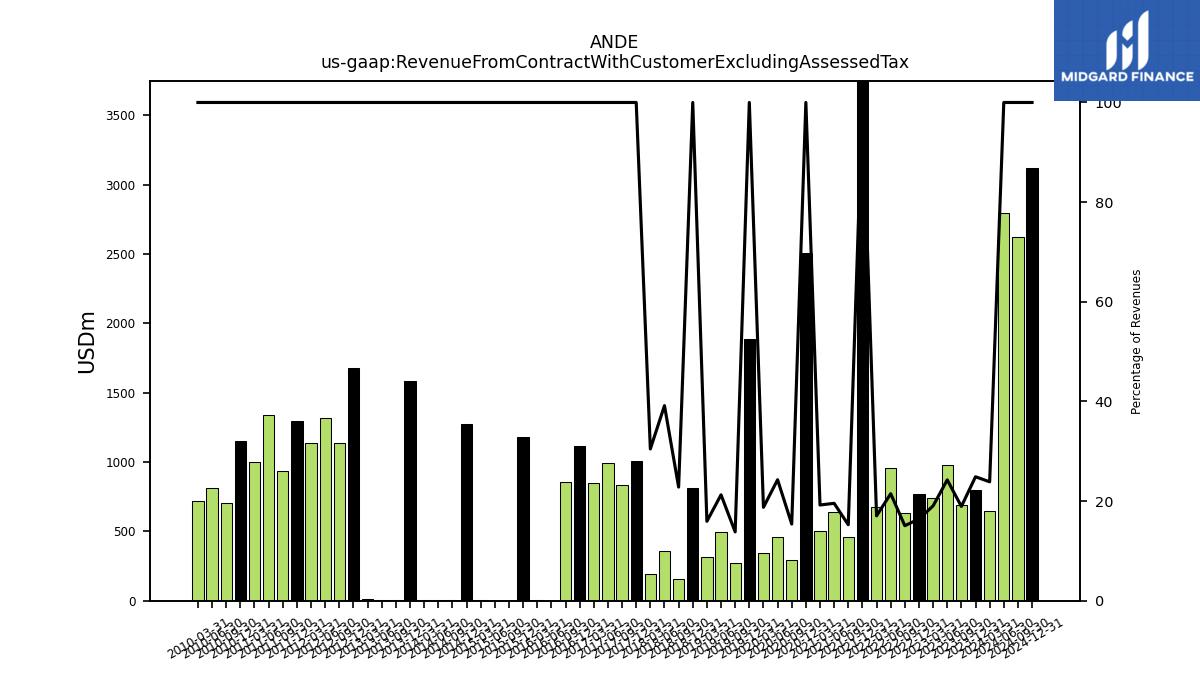
| Revenue From Contract With Customer Excluding Assessed Tax | 799.54 | 688.11 | 975.27 | 738.98 | 767.54 | 635.45 | 956.01 | 677.86 | 3782.70 | 457.62 | 640.08 | 506.47 | 2508.30 | 295.85 | 459.11 | 347.50 | 1885.60 | 273.94 | 494.27 | 315.17 | 812.66 | 156.39 | 356.88 | 193.65 | 1004.07 | 836.60 | 993.66 | 852.02 | 1113.06 | 859.61 | 0.64 | 2.08 | 1183.47 | 0.84 | 0.83 | 2.19 | 1271.77 | 4.80 | 6.47 | 8.28 | 1584.27 | 4.87 | 4.96 | 9.13 | 1680.64 | 1138.40 | 1315.83 | 1137.13 | 1297.83 | 938.66 | 1338.17 | 1001.67 | 1153.97 | 706.83 | 811.00 | 722.00 | |
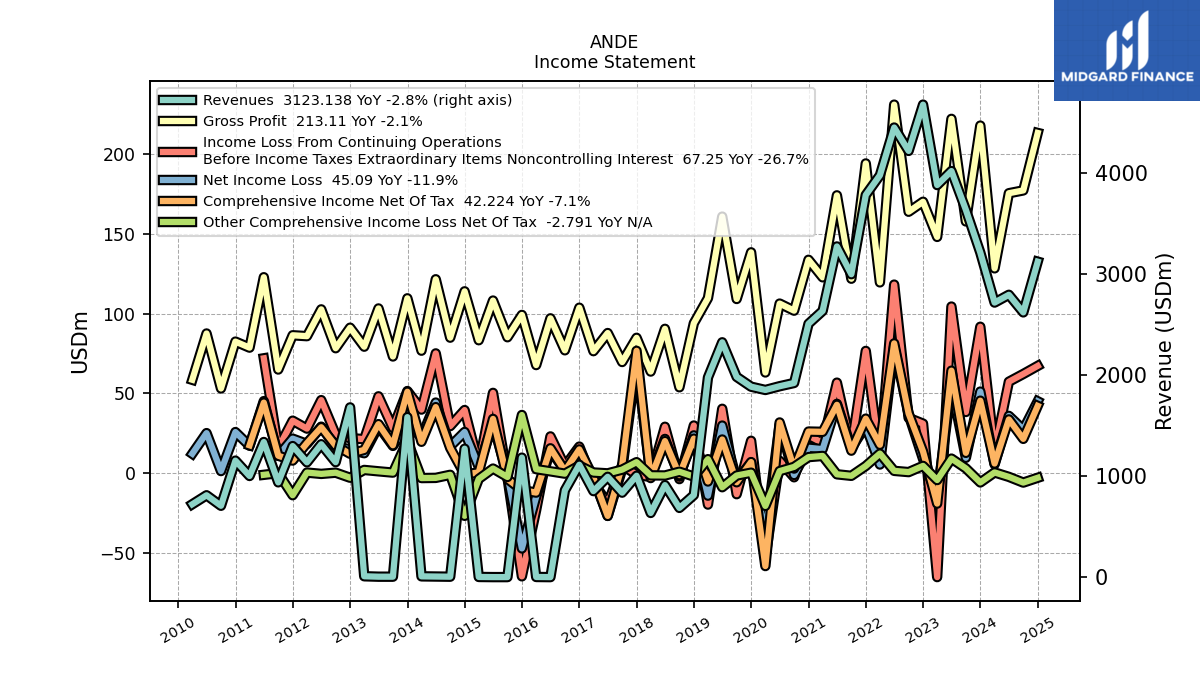
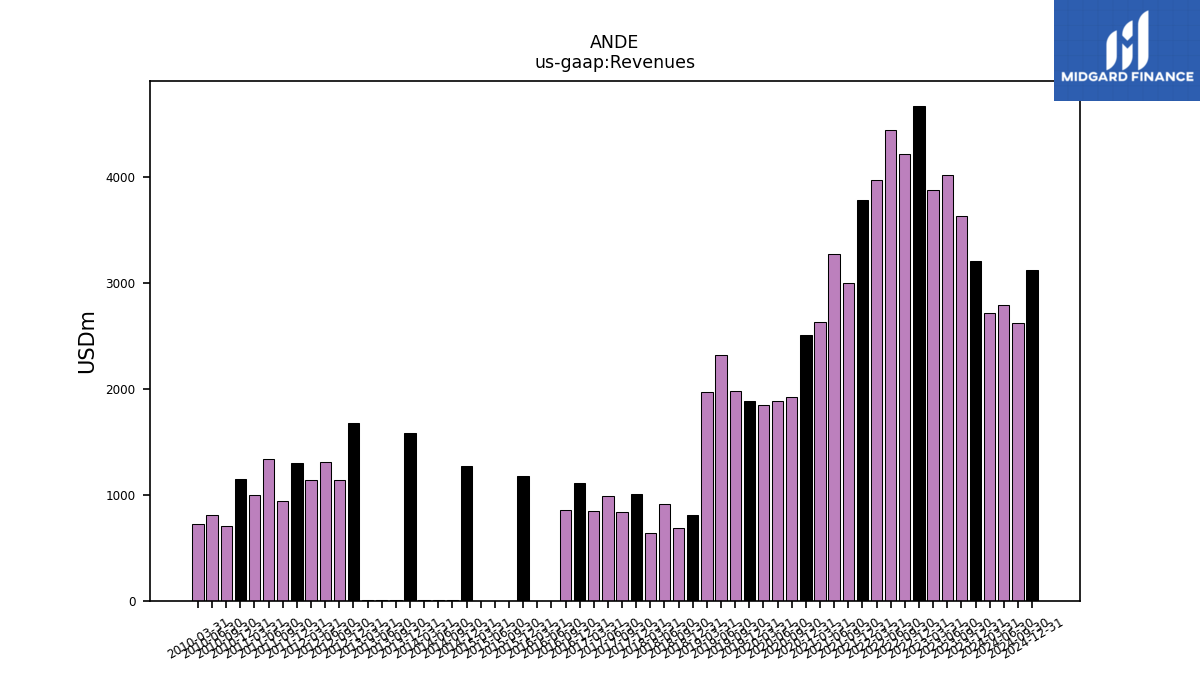
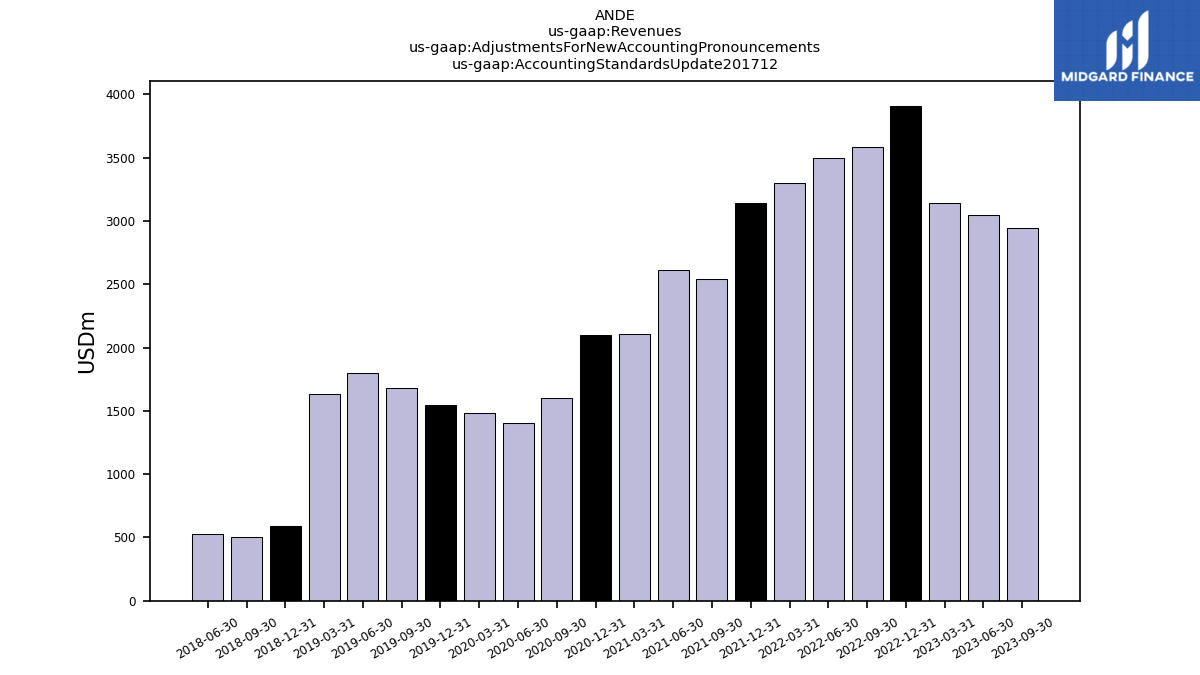
| Revenues | 3213.00 | 3635.69 | 4020.18 | 3881.24 | 4677.49 | 4219.32 | 4450.62 | 3977.95 | 3782.70 | 2998.82 | 3273.73 | 2635.73 | 2508.30 | 1922.23 | 1890.18 | 1853.11 | 1885.60 | 1982.76 | 2325.04 | 1976.79 | 812.66 | 685.58 | 911.40 | 635.74 | 1004.07 | 836.60 | 993.66 | 852.02 | 1113.06 | 859.61 | 0.64 | 2.08 | 1183.47 | 0.84 | 0.83 | 2.19 | 1271.77 | 4.80 | 6.47 | 8.28 | 1584.27 | 4.87 | 4.96 | 9.13 | 1680.64 | 1138.40 | 1315.83 | 1137.13 | 1297.83 | 938.66 | 1338.17 | 1001.67 | 1153.97 | 706.83 | 811.00 | 722.00 | |
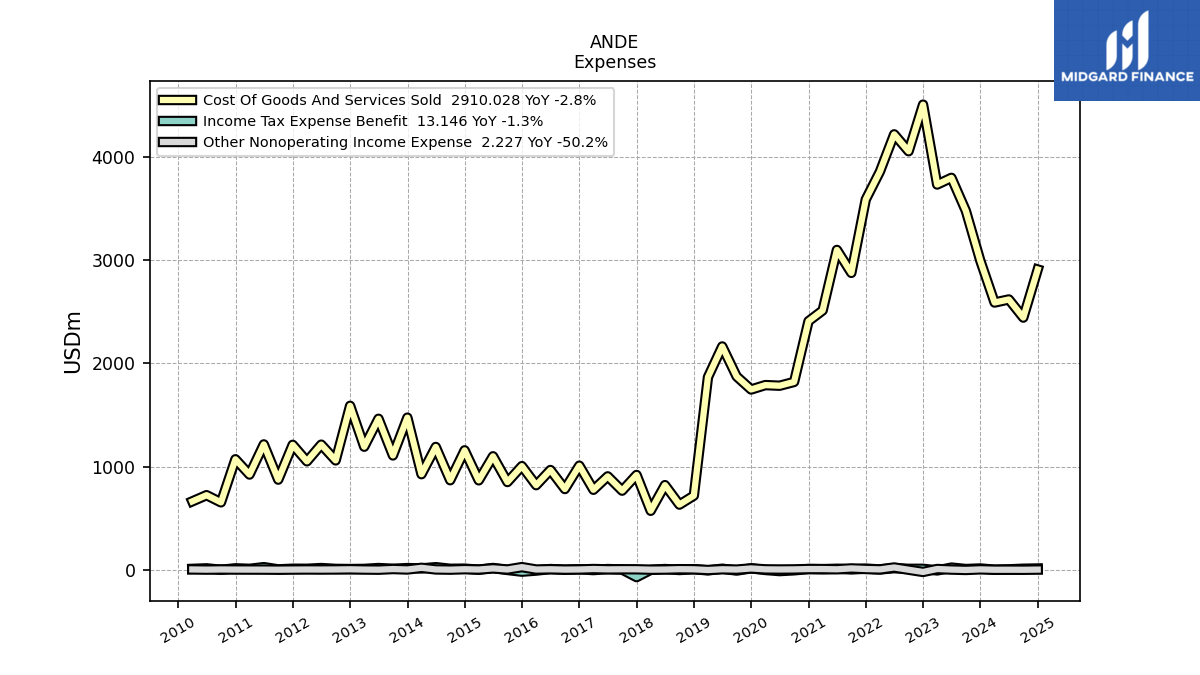
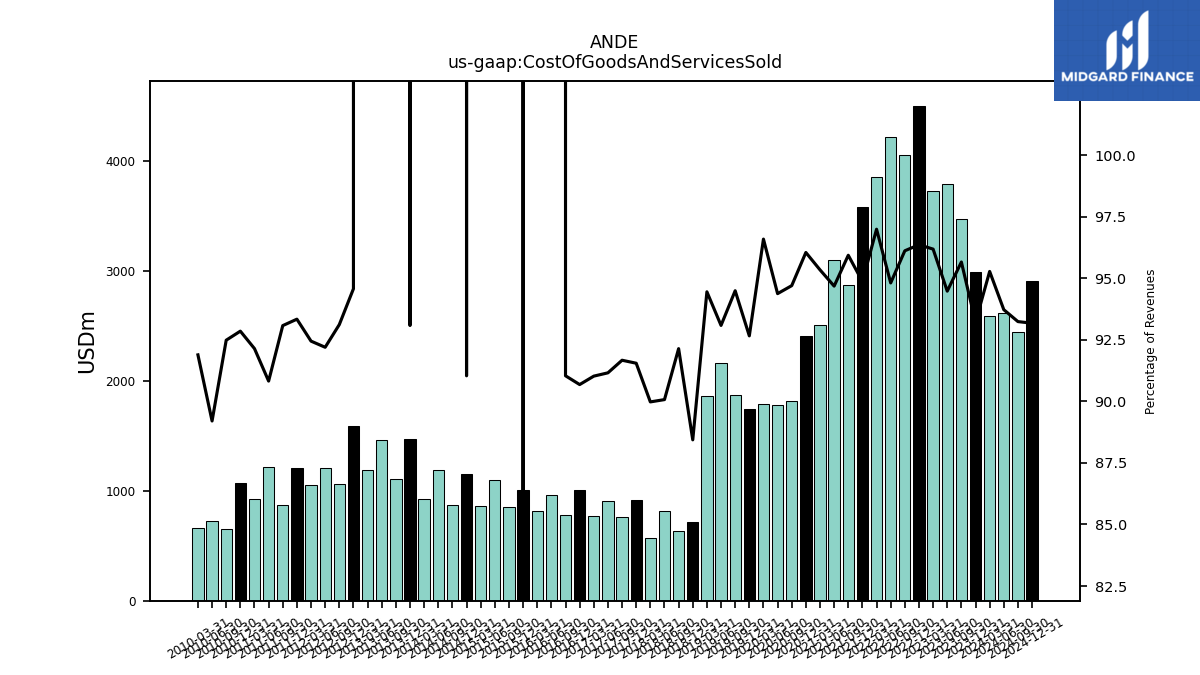
| Cost Of Goods And Services Sold | 2995.29 | 3477.99 | 3798.25 | 3733.23 | 4507.47 | 4055.56 | 4219.78 | 3858.42 | 3588.69 | 2876.99 | 3099.68 | 2513.02 | 2409.23 | 1820.40 | 1783.91 | 1789.97 | 1747.24 | 1873.61 | 2164.31 | 1867.13 | 718.70 | 631.72 | 820.93 | 572.03 | 919.24 | 766.92 | 905.83 | 775.56 | 1009.36 | 782.60 | 967.20 | 820.12 | 1004.98 | 850.58 | 1100.32 | 866.78 | 1157.82 | 868.01 | 1190.59 | 926.52 | 1474.69 | 1108.23 | 1463.73 | 1192.70 | 1589.47 | 1060.09 | 1213.18 | 1051.26 | 1211.40 | 873.70 | 1215.39 | 922.99 | 1071.50 | 653.72 | 723.45 | 663.45 | |
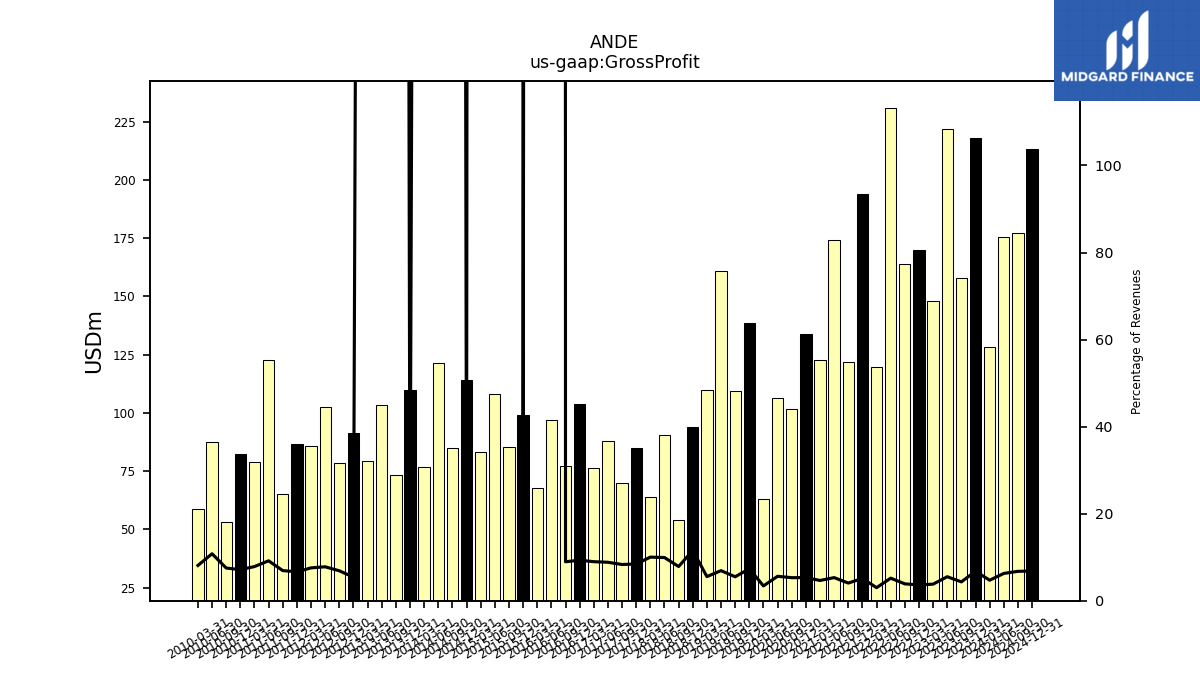
| Gross Profit | 217.71 | 157.70 | 221.94 | 148.01 | 170.02 | 163.76 | 230.84 | 119.53 | 194.01 | 121.83 | 174.04 | 122.71 | 133.69 | 101.83 | 106.27 | 63.13 | 138.36 | 109.14 | 160.73 | 109.66 | 93.96 | 53.86 | 90.47 | 63.70 | 84.84 | 69.67 | 87.83 | 76.46 | 103.69 | 77.02 | 97.04 | 67.75 | 99.16 | 85.19 | 108.17 | 83.31 | 113.95 | 84.92 | 121.50 | 76.78 | 109.58 | 73.15 | 103.23 | 79.27 | 91.17 | 78.32 | 102.65 | 85.87 | 86.43 | 64.96 | 122.77 | 78.69 | 82.47 | 53.11 | 87.55 | 58.55 | |
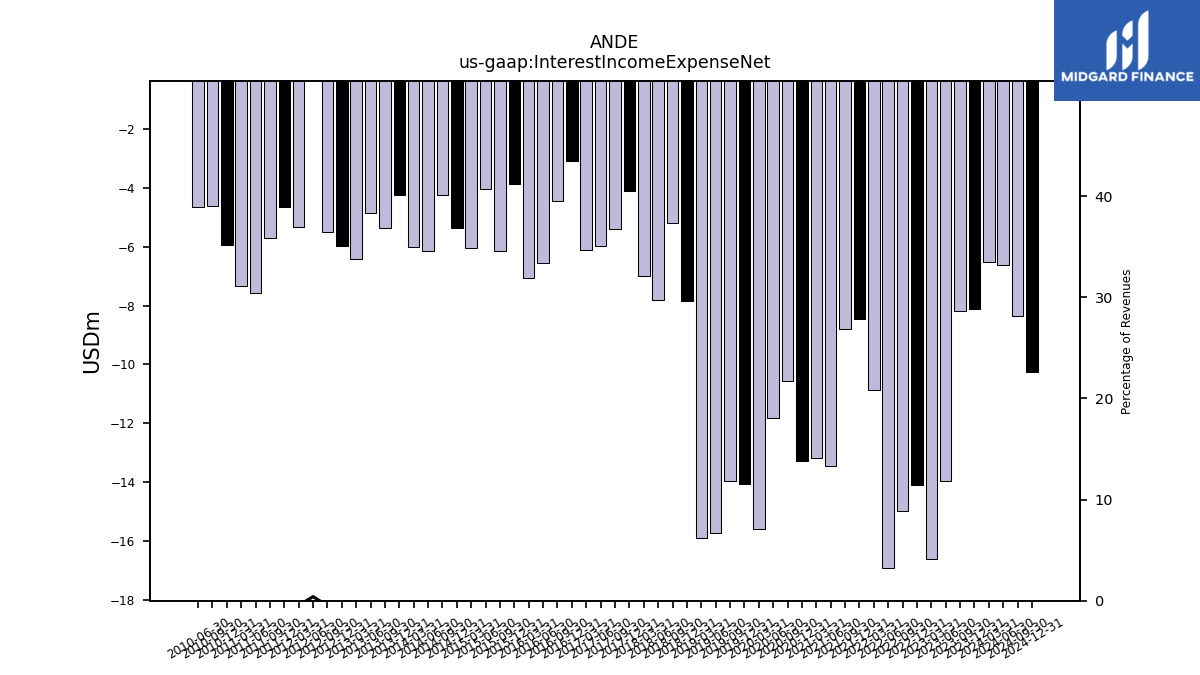
| Interest Income Expense Net | -8.10 | -8.19 | -13.95 | -16.62 | -14.09 | -14.98 | -16.92 | -10.86 | -8.44 | -8.80 | -13.45 | -13.17 | -13.29 | -10.57 | -11.83 | -15.59 | -14.08 | -13.97 | -15.73 | -15.91 | -7.85 | -5.18 | -7.83 | -7.00 | -4.09 | -5.38 | -5.99 | -6.10 | -3.07 | -4.44 | -6.55 | -7.05 | -3.86 | -6.15 | -4.03 | -6.04 | -5.36 | -4.25 | -6.15 | -6.00 | -4.25 | -5.35 | -4.86 | -6.40 | -5.96 | -5.48 | 5.38 | -5.33 | -4.65 | -5.71 | -7.56 | -7.34 | -5.94 | -4.62 | -4.66 | NA | |
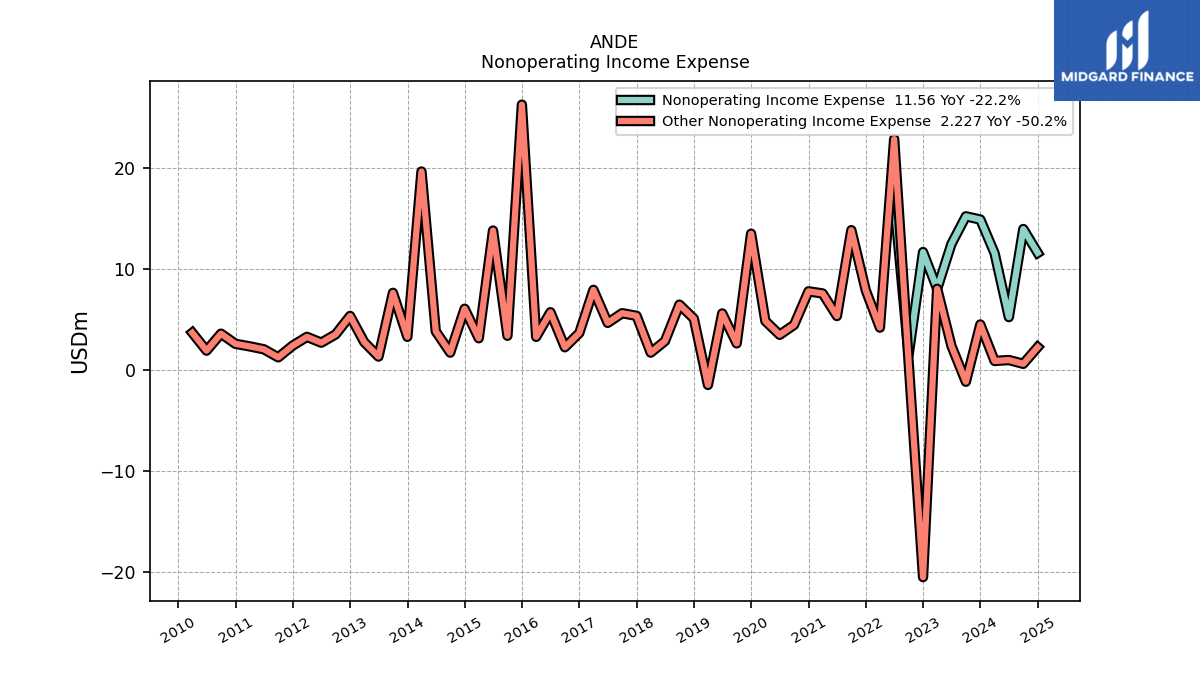
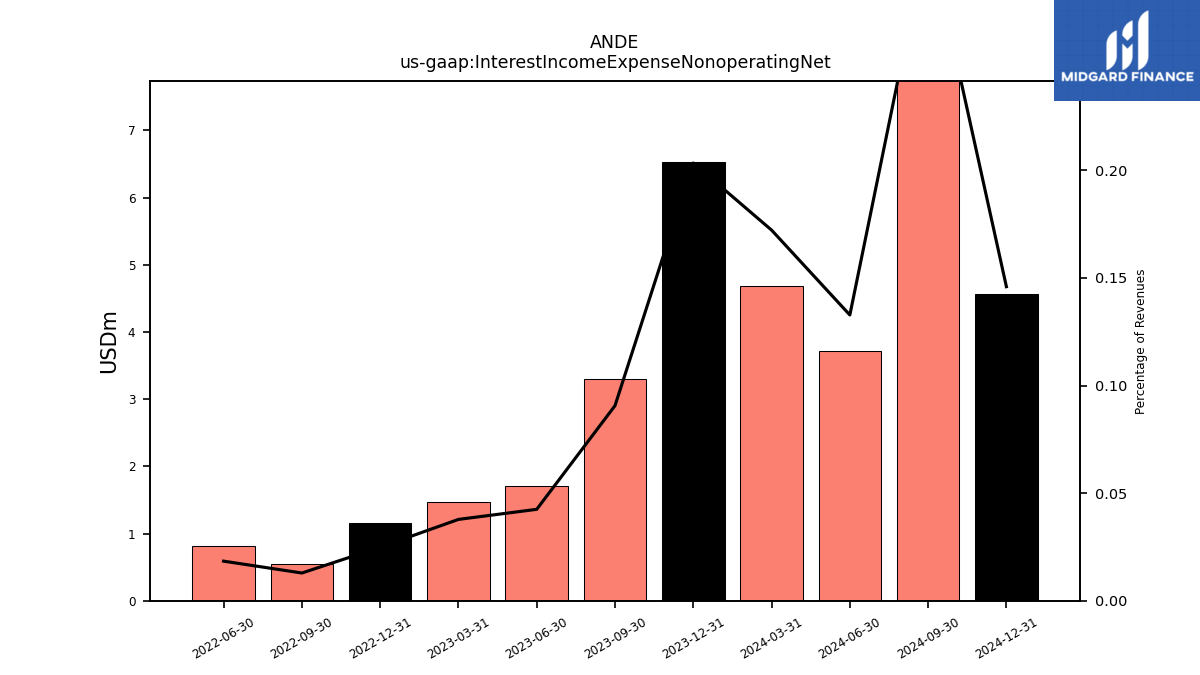
| Interest Income Expense Nonoperating Net | 6.54 | 3.30 | 1.71 | NA | 1.16 | 0.54 | 0.82 | NA | NA | NA | NA | NA | NA | NA | NA | NA | NA | NA | NA | NA | NA | NA | NA | NA | NA | NA | NA | NA | NA | NA | NA | NA | NA | NA | NA | NA | NA | NA | NA | NA | NA | NA | NA | NA | NA | NA | NA | NA | NA | NA | NA | NA | NA | NA | NA | NA | |
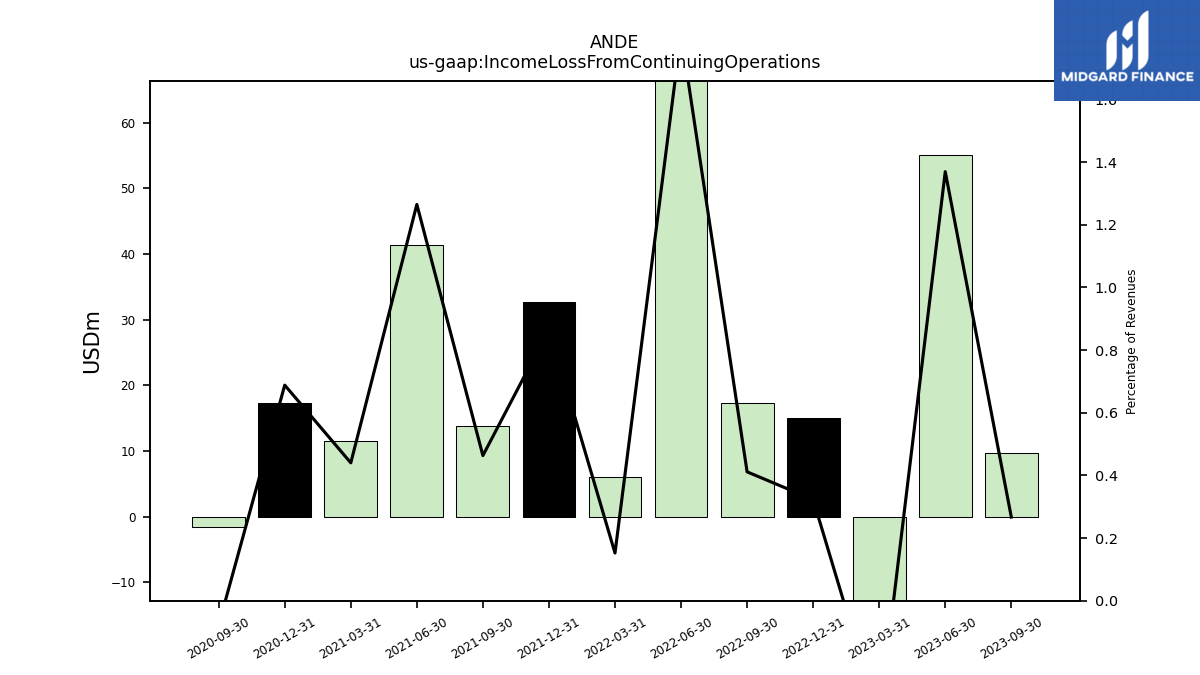
| Income Loss From Continuing Operations | 51.19 | 9.71 | 55.05 | -14.75 | 15.10 | 17.36 | 80.54 | 6.06 | 32.77 | 13.89 | 41.40 | 11.60 | 17.26 | -1.49 | NA | NA | NA | NA | NA | NA | NA | NA | NA | NA | NA | NA | NA | NA | NA | NA | NA | NA | NA | NA | NA | NA | NA | NA | NA | NA | NA | NA | NA | NA | NA | NA | NA | NA | NA | NA | NA | NA | NA | NA | NA | NA | |
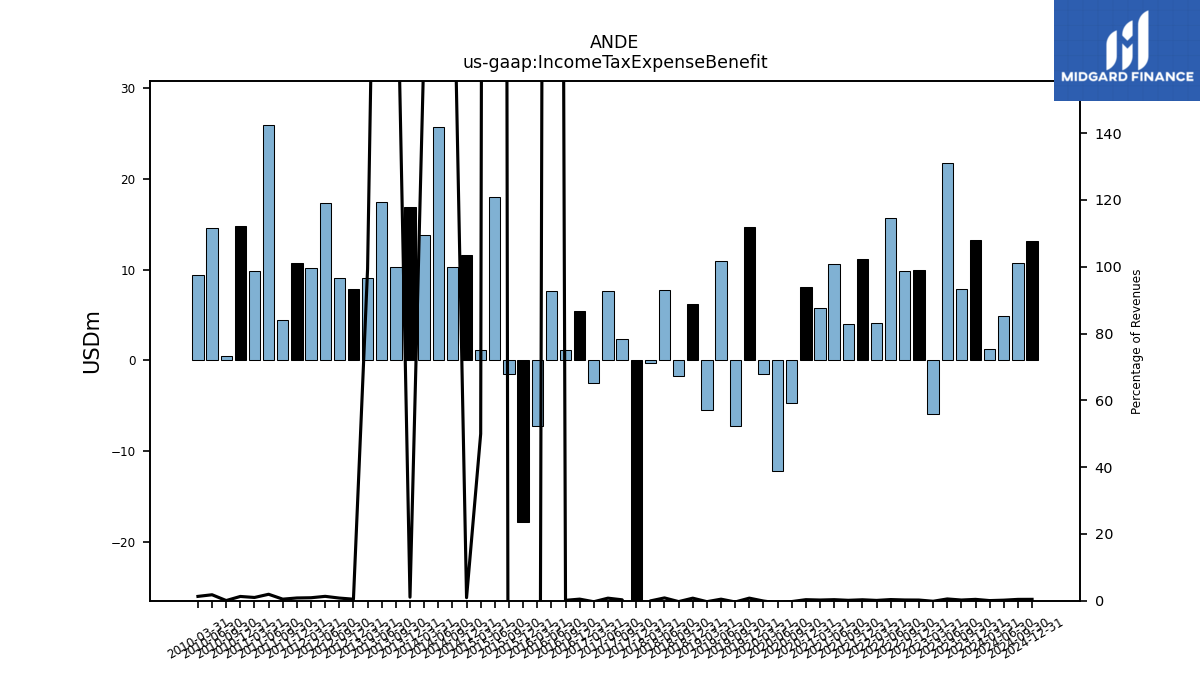
| Income Tax Expense Benefit | 13.32 | 7.86 | 21.73 | -5.88 | 9.93 | 9.84 | 15.75 | 4.10 | 11.16 | 4.03 | 10.64 | 5.75 | 8.12 | -4.71 | -12.20 | -1.46 | 14.71 | -7.21 | 11.00 | -5.44 | 6.26 | -1.76 | 7.74 | -0.30 | -70.64 | 2.39 | 7.70 | -2.54 | 5.42 | 1.10 | 7.67 | -7.29 | -17.80 | -1.50 | 17.97 | 1.09 | 11.66 | 10.25 | 25.71 | 13.87 | 16.90 | 10.35 | 17.48 | 9.08 | 7.84 | 9.13 | 17.36 | 10.24 | 10.79 | 4.48 | 25.98 | 9.81 | 14.86 | 0.44 | 14.55 | 9.41 | |
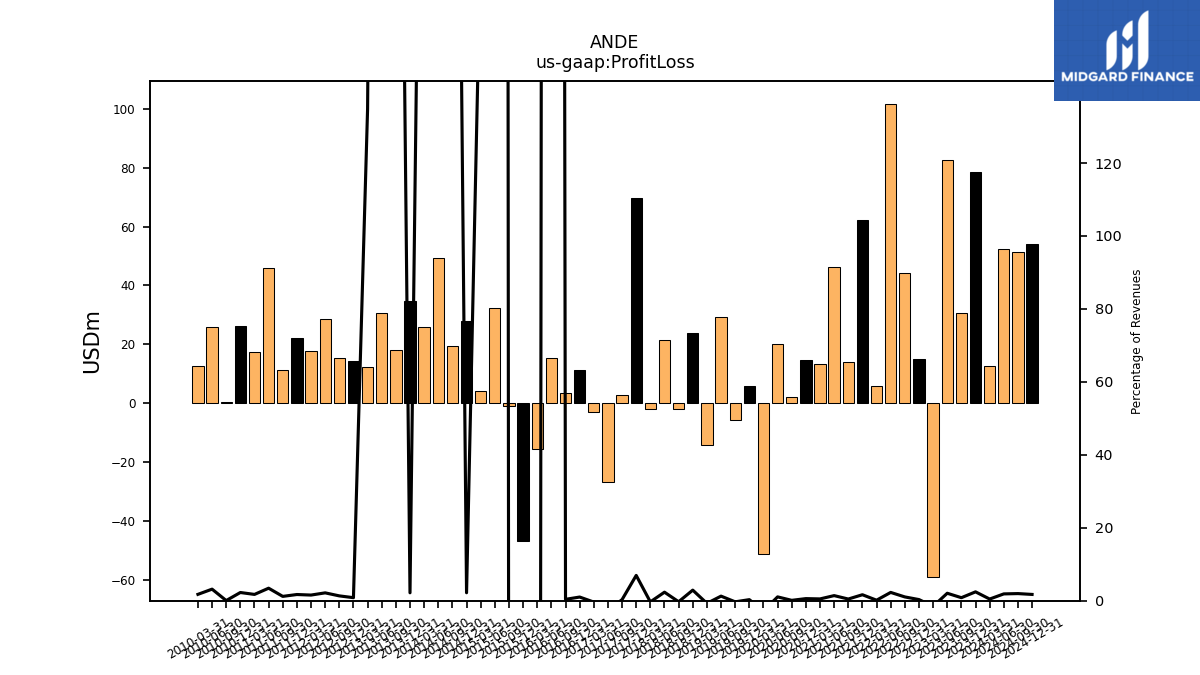
| Profit Loss | 78.44 | 30.52 | 82.69 | -59.12 | 15.10 | 44.27 | 101.66 | 5.95 | 62.34 | 14.14 | 46.12 | 13.26 | 14.65 | 2.21 | 20.03 | -51.11 | 5.67 | -5.87 | 29.41 | -14.15 | 23.67 | -1.88 | 21.41 | -1.98 | 69.74 | 2.62 | -26.72 | -3.04 | 11.31 | 3.34 | 15.44 | -15.62 | -46.72 | -0.95 | 32.40 | 3.94 | 27.97 | 19.28 | 49.37 | 26.03 | 34.62 | 18.04 | 30.73 | 12.31 | 14.18 | 15.19 | 28.47 | 17.73 | 22.17 | 11.23 | 46.03 | 17.39 | 26.08 | 0.37 | 25.78 | 12.66 | |
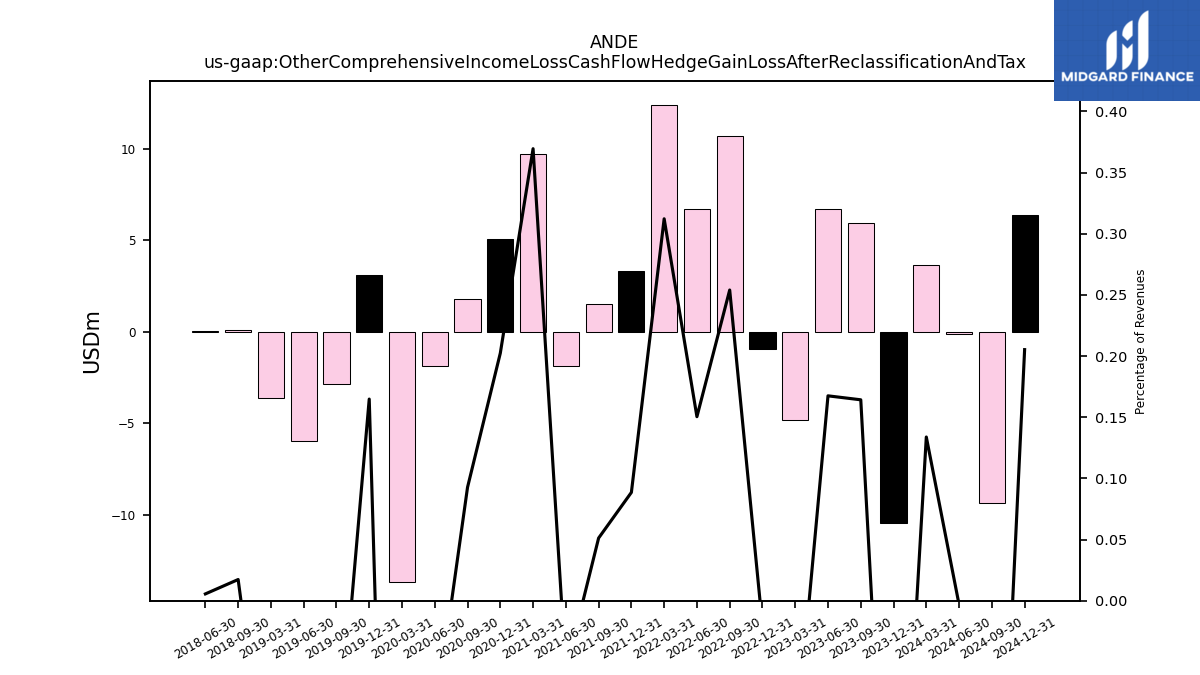
| Other Comprehensive Income Loss Cash Flow Hedge Gain Loss After Reclassification And Tax | -10.47 | 5.97 | 6.74 | -4.80 | -0.96 | 10.72 | 6.70 | 12.42 | 3.35 | 1.54 | -1.86 | 9.74 | 5.08 | 1.78 | -1.86 | -13.66 | 3.11 | -2.85 | -5.95 | -3.62 | NA | 0.12 | 0.05 | NA | NA | NA | NA | NA | NA | NA | NA | NA | NA | NA | NA | NA | NA | NA | NA | NA | NA | NA | NA | NA | NA | NA | NA | NA | NA | NA | NA | NA | NA | NA | NA | NA | |
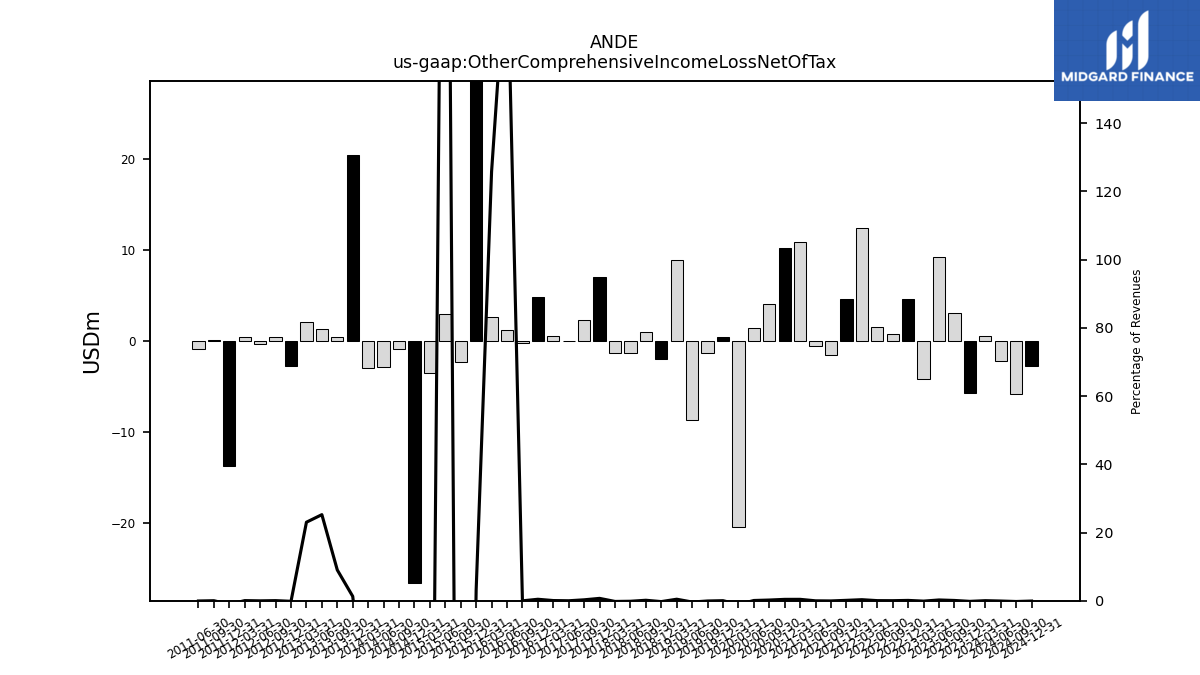
| Other Comprehensive Income Loss Net Of Tax | -5.71 | 3.10 | 9.21 | -4.22 | 4.63 | 0.76 | 1.53 | 12.36 | 4.60 | -1.57 | -0.62 | 10.86 | 10.15 | 4.01 | 1.40 | -20.42 | 0.39 | -1.38 | -8.71 | 8.86 | -2.02 | 0.98 | -1.36 | -1.29 | 6.98 | 2.31 | -0.03 | 0.50 | 4.84 | -0.21 | 1.23 | 2.61 | 36.52 | -2.30 | 2.97 | -3.54 | -26.62 | -0.95 | -2.87 | -2.98 | 20.41 | 0.44 | 1.25 | 2.10 | -2.77 | 0.39 | -0.37 | 0.47 | -13.72 | 0.10 | -0.95 | NA | NA | NA | NA | NA | |
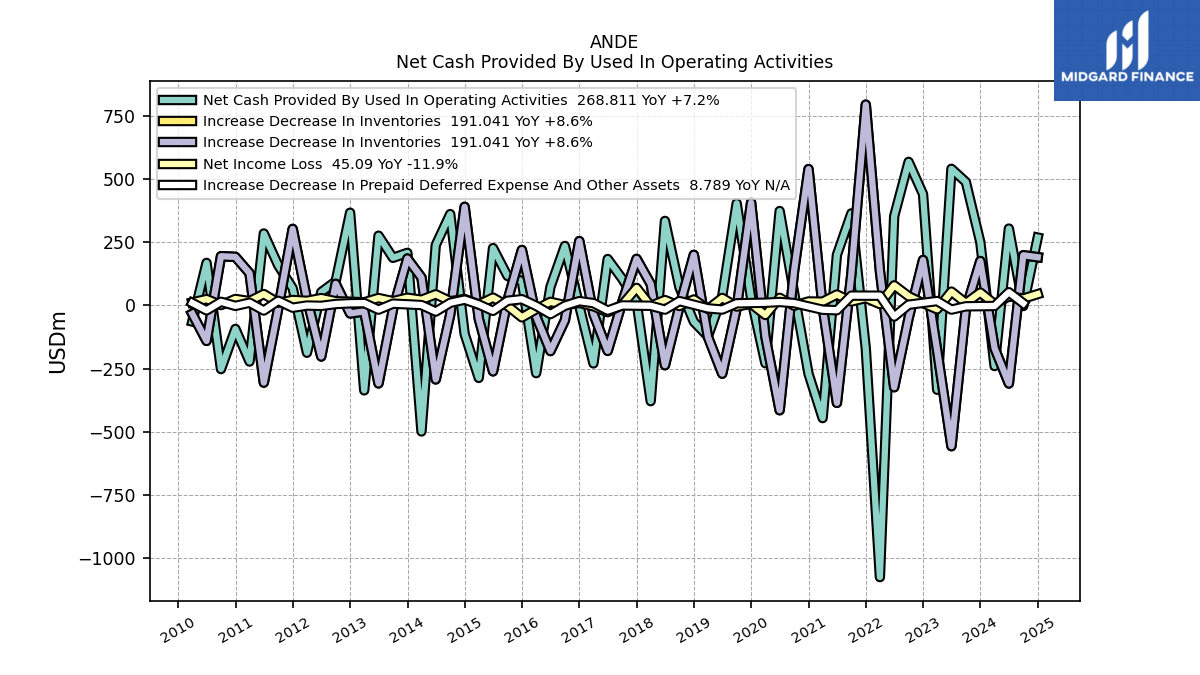
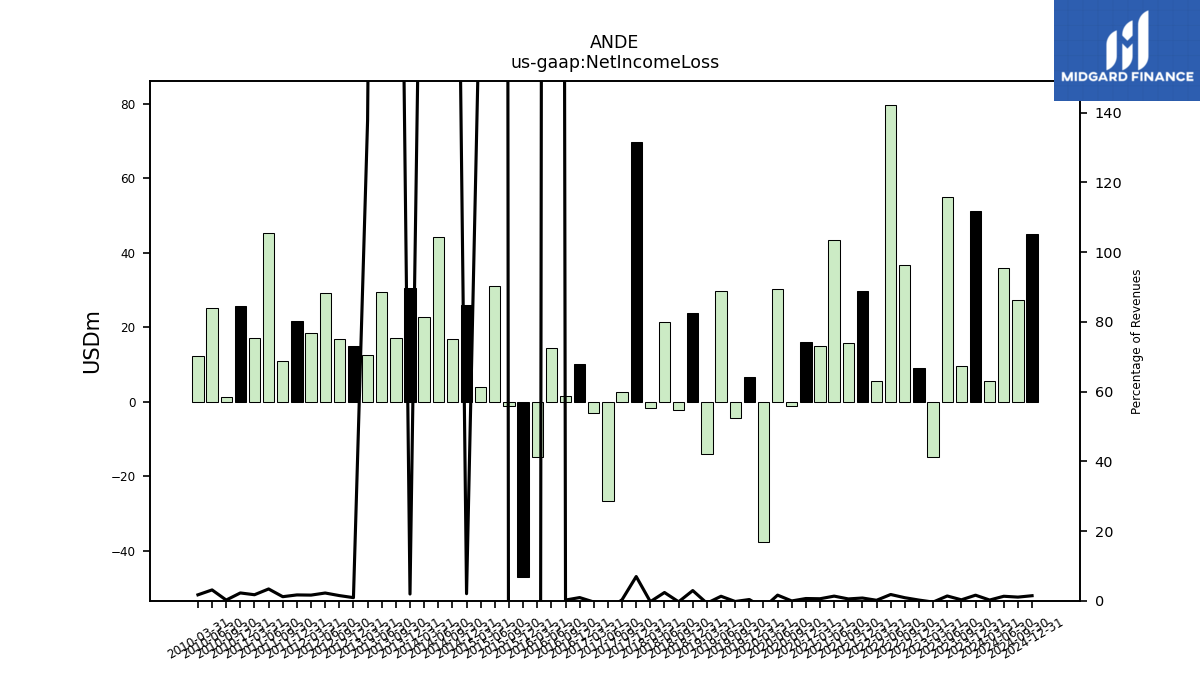
| Net Income Loss | 51.19 | 9.71 | 55.05 | -14.75 | 9.02 | 36.75 | 79.81 | 5.50 | 29.64 | 15.74 | 43.50 | 15.11 | 15.99 | -1.06 | 30.44 | -37.66 | 6.65 | -4.24 | 29.89 | -13.99 | 23.75 | -2.10 | 21.53 | -1.70 | 69.72 | 2.53 | -26.65 | -3.09 | 10.14 | 1.72 | 14.42 | -14.70 | -47.03 | -1.23 | 31.09 | 4.10 | 25.89 | 16.82 | 44.30 | 22.71 | 30.66 | 17.16 | 29.54 | 12.58 | 14.99 | 16.88 | 29.20 | 18.41 | 21.70 | 10.93 | 45.22 | 17.27 | 25.83 | 1.39 | 25.17 | 12.27 | |
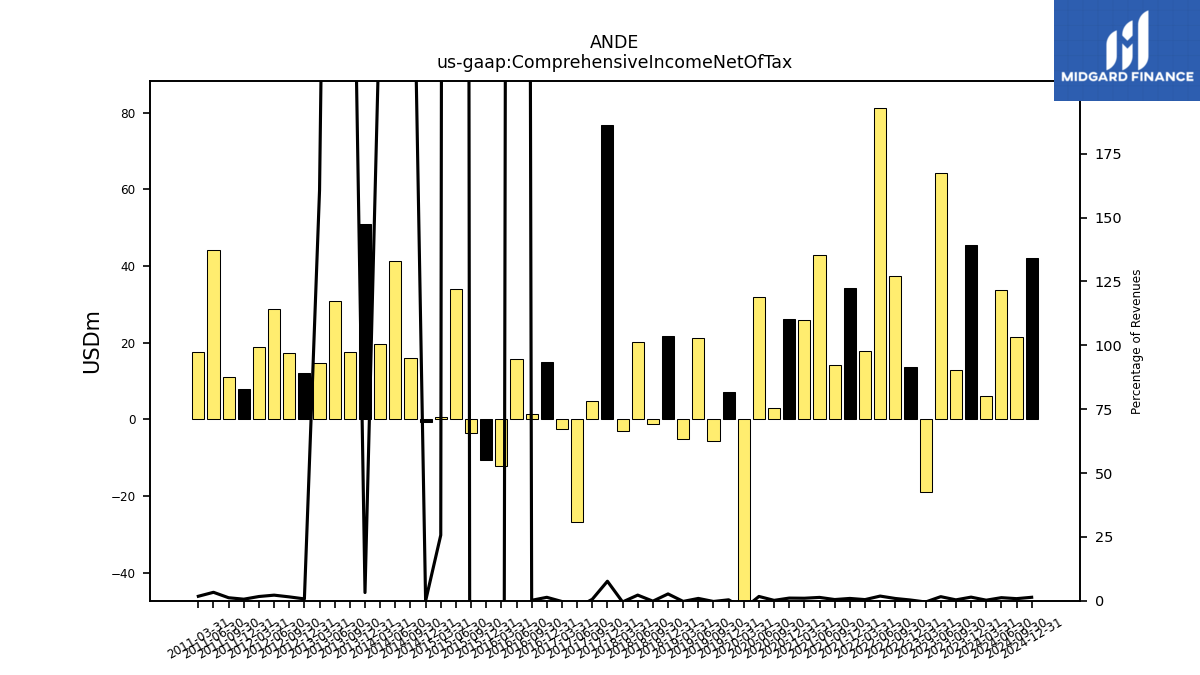
| Comprehensive Income Net Of Tax | 45.47 | 12.80 | 64.26 | -18.97 | 13.66 | 37.51 | 81.34 | 17.86 | 34.24 | 14.17 | 42.88 | 25.97 | 26.14 | 2.96 | 31.84 | -58.08 | 7.04 | -5.62 | 21.17 | -5.13 | 21.73 | -1.11 | 20.17 | -2.99 | 76.70 | 4.84 | -26.68 | -2.58 | 14.98 | 1.51 | 15.66 | -12.08 | -10.51 | -3.53 | 34.06 | 0.56 | -0.73 | 15.88 | 41.44 | 19.73 | 51.07 | 17.60 | 30.79 | 14.68 | 12.22 | 17.27 | 28.83 | 18.87 | 7.97 | 11.03 | 44.27 | 17.55 | NA | NA | NA | NA |
| 2023-12-31 | 2023-09-30 | 2023-06-30 | 2023-03-31 | 2022-12-31 | 2022-09-30 | 2022-06-30 | 2022-03-31 | 2021-12-31 | 2021-09-30 | 2021-06-30 | 2021-03-31 | 2020-12-31 | 2020-09-30 | 2020-06-30 | 2020-03-31 | 2019-12-31 | 2019-09-30 | 2019-06-30 | 2019-03-31 | 2018-12-31 | 2018-09-30 | 2018-06-30 | 2018-03-31 | 2017-12-31 | 2017-09-30 | 2017-06-30 | 2017-03-31 | 2016-12-31 | 2016-09-30 | 2016-06-30 | 2016-03-31 | 2015-12-31 | 2015-09-30 | 2015-06-30 | 2015-03-31 | 2014-12-31 | 2014-09-30 | 2014-06-30 | 2014-03-31 | 2013-12-31 | 2013-09-30 | 2013-06-30 | 2013-03-31 | 2012-12-31 | 2012-09-30 | 2012-06-30 | 2012-03-31 | 2011-12-31 | 2011-09-30 | 2011-06-30 | 2011-03-31 | 2010-12-31 | 2010-09-30 | 2010-06-30 | 2010-03-31 | ||
|---|---|---|---|---|---|---|---|---|---|---|---|---|---|---|---|---|---|---|---|---|---|---|---|---|---|---|---|---|---|---|---|---|---|---|---|---|---|---|---|---|---|---|---|---|---|---|---|---|---|---|---|---|---|---|---|---|---|
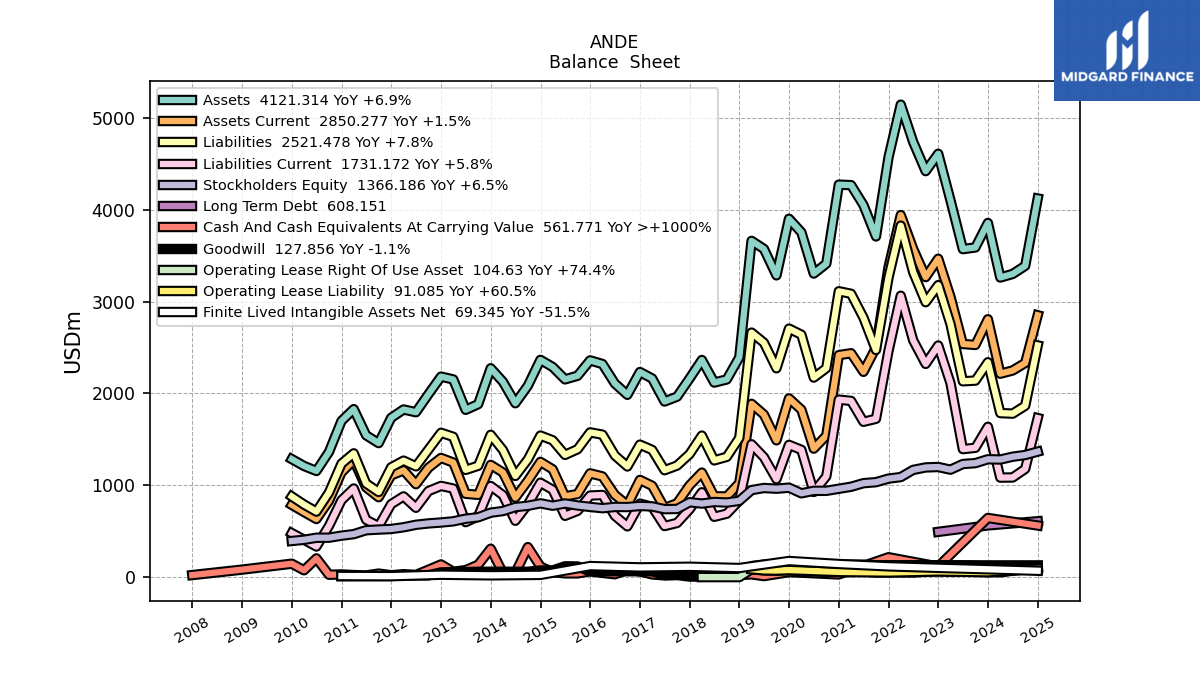
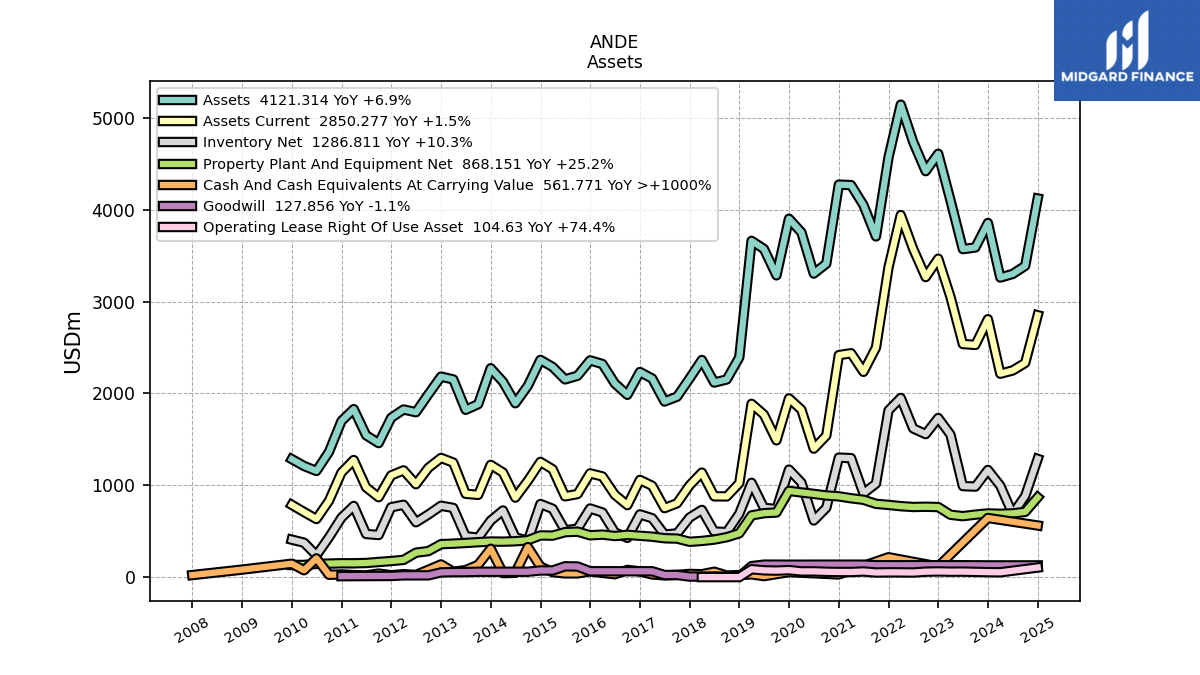
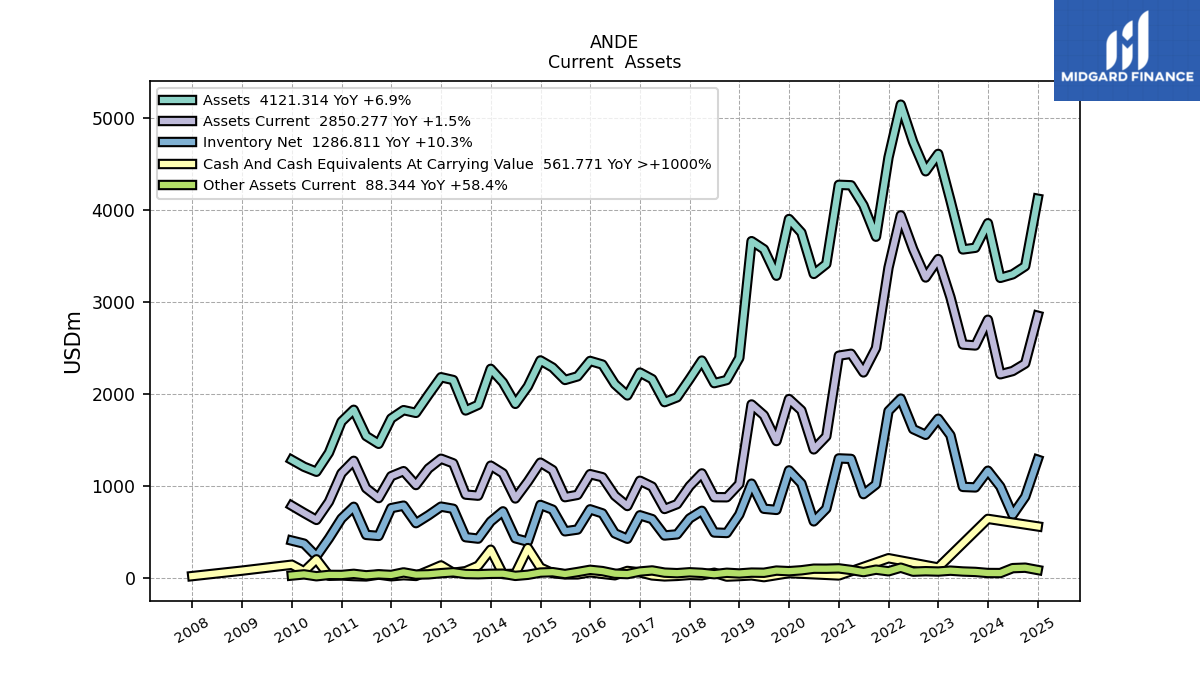
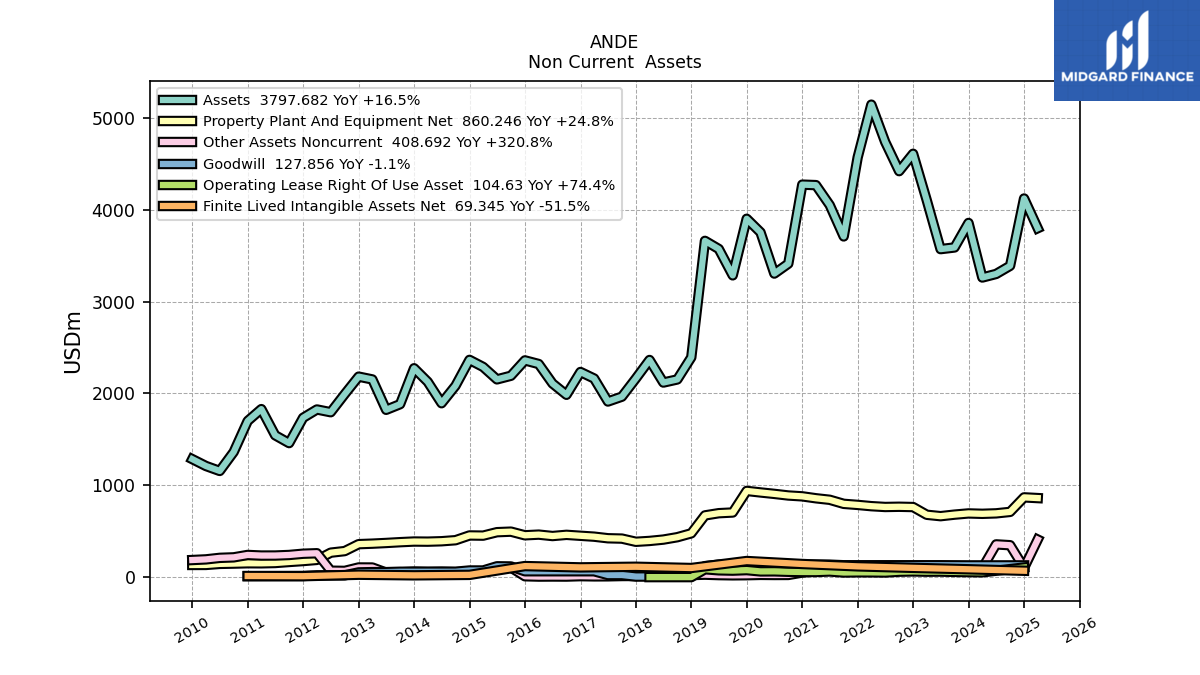
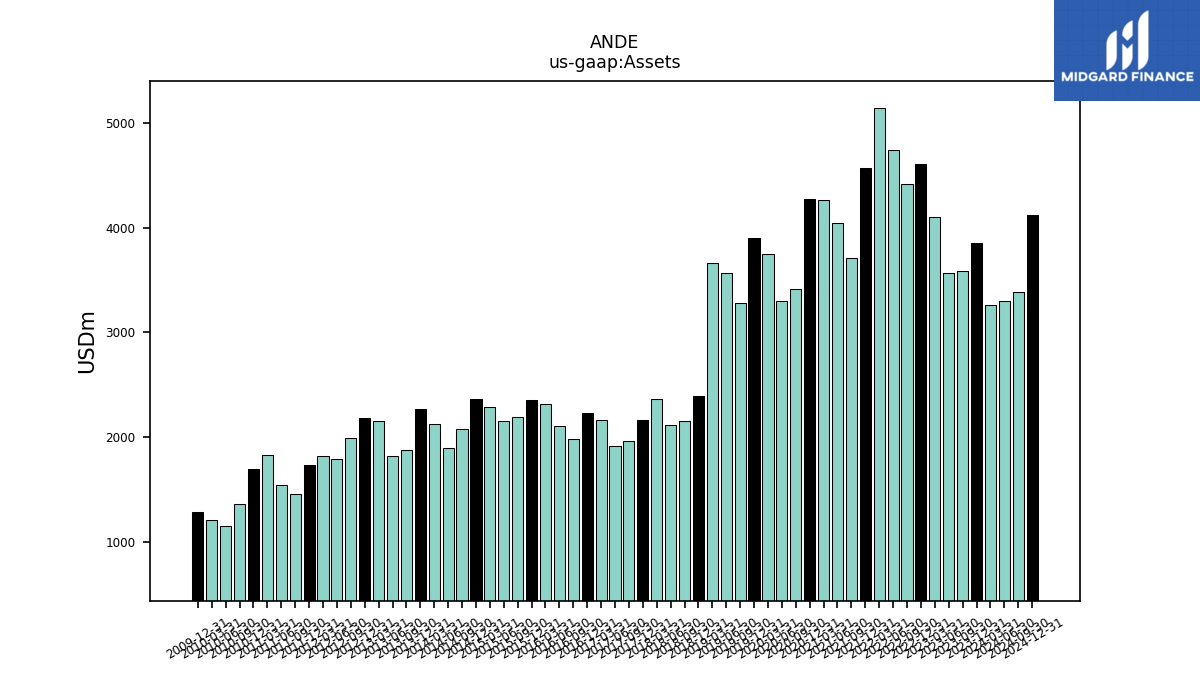
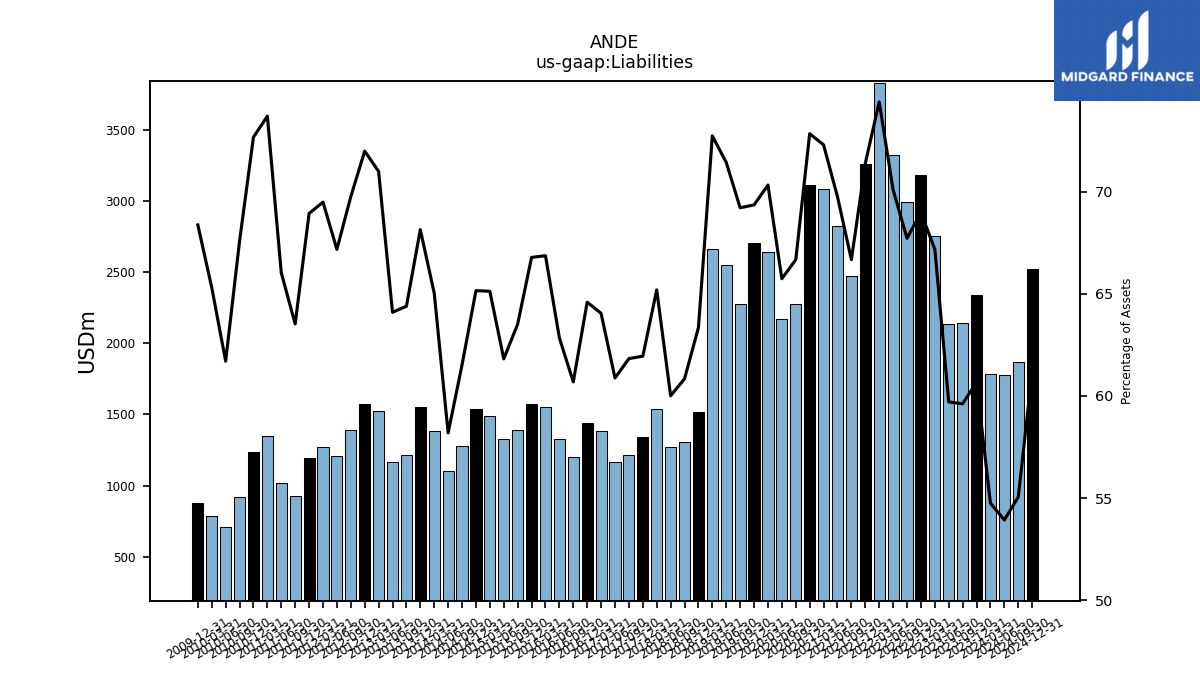
| Assets | 3855.01 | 3588.10 | 3570.05 | 4102.04 | 4608.00 | 4418.62 | 4737.18 | 5142.94 | 4569.22 | 3708.14 | 4049.09 | 4266.74 | 4272.12 | 3411.61 | 3303.99 | 3752.69 | 3900.74 | 3284.45 | 3571.86 | 3660.25 | 2392.00 | 2151.62 | 2117.79 | 2363.53 | 2162.35 | 1964.16 | 1911.42 | 2161.75 | 2232.85 | 1984.41 | 2107.41 | 2319.64 | 2359.10 | 2191.69 | 2152.36 | 2287.63 | 2364.69 | 2082.99 | 1892.63 | 2125.58 | 2273.56 | 1882.29 | 1820.98 | 2151.79 | 2182.30 | 1991.44 | 1794.77 | 1824.76 | 1734.12 | 1458.58 | 1543.85 | 1828.66 | 1699.39 | 1362.53 | 1155.44 | 1209.58 | |
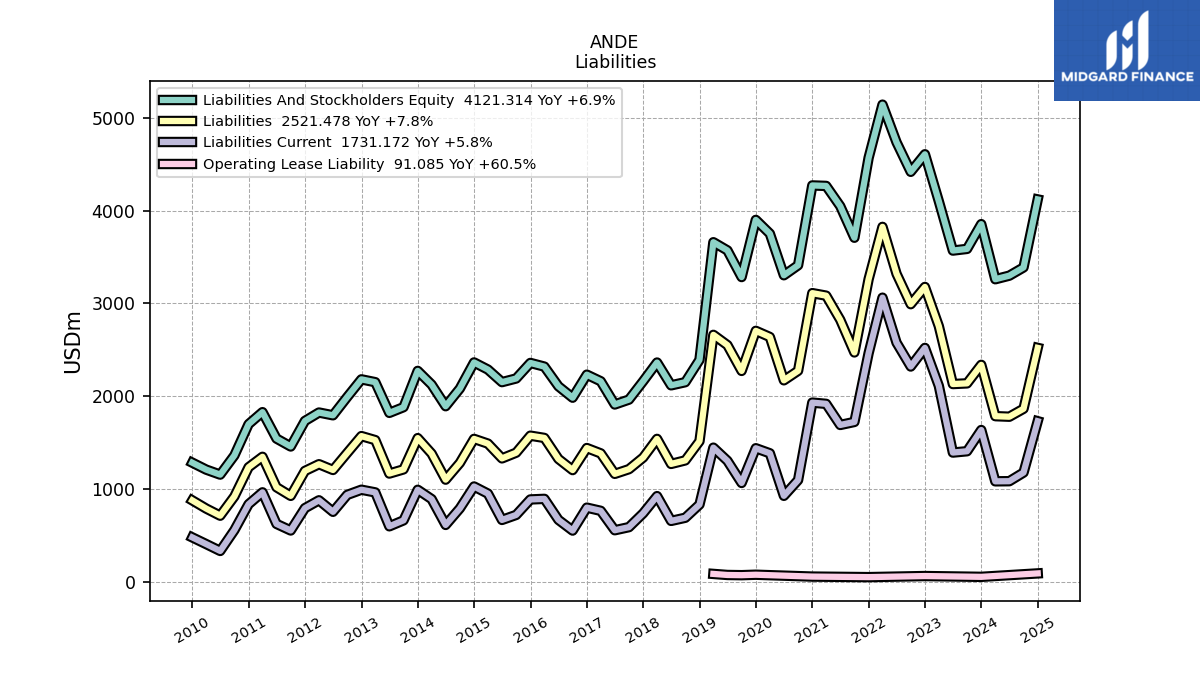
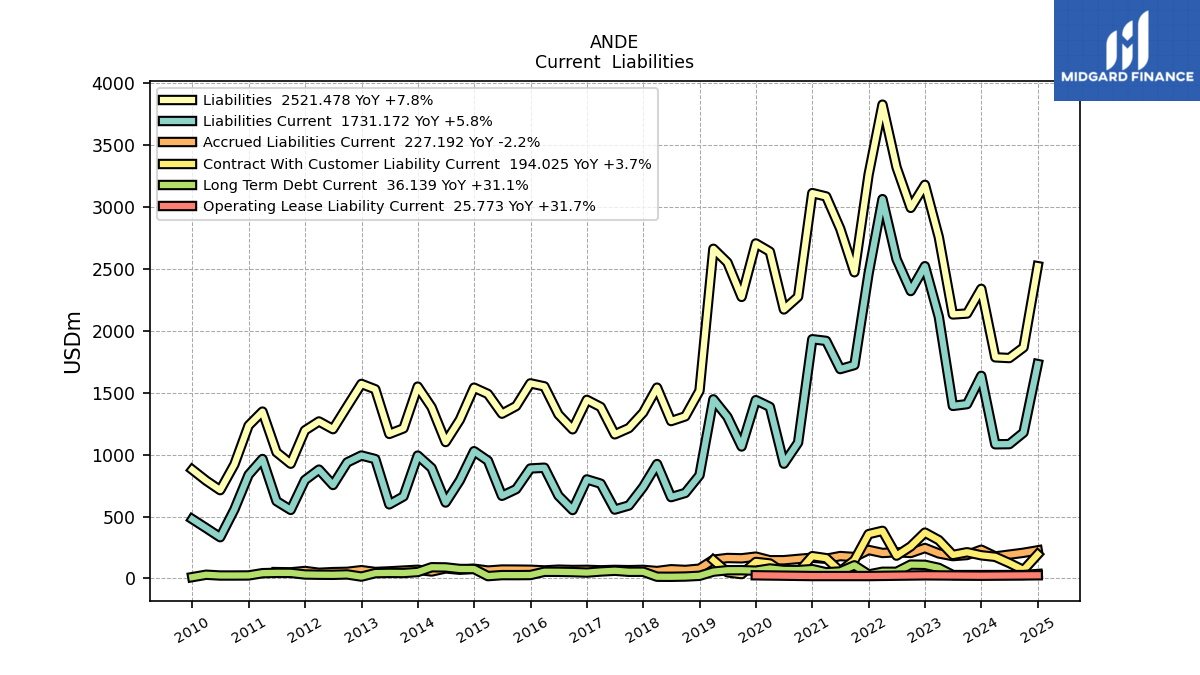
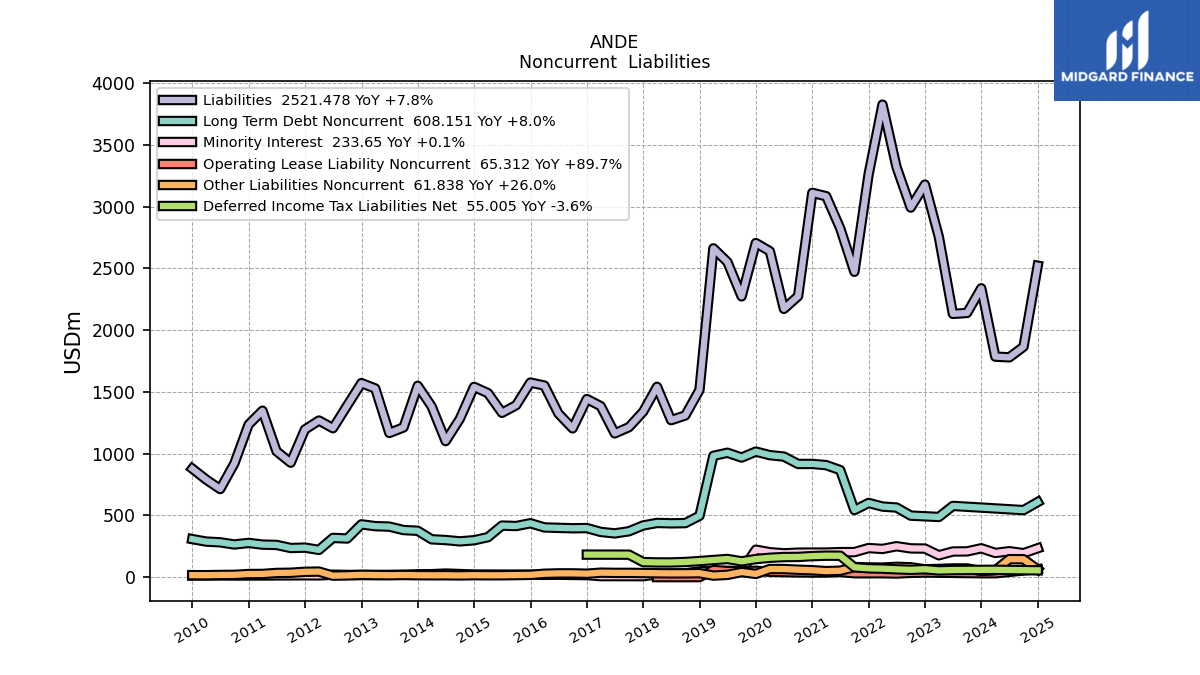
| Liabilities | 2338.62 | 2139.02 | 2131.56 | 2755.63 | 3178.23 | 2992.08 | 3319.97 | 3825.72 | 3261.51 | 2472.13 | 2824.12 | 3084.19 | 3111.46 | 2274.38 | 2171.91 | 2638.83 | 2705.09 | 2273.10 | 2551.22 | 2661.97 | 1515.24 | 1308.97 | 1270.80 | 1540.77 | 1339.45 | 1214.35 | 1163.63 | 1384.39 | 1442.15 | 1204.24 | 1324.31 | 1550.92 | 1575.36 | 1392.00 | 1330.45 | 1489.71 | 1540.64 | 1281.41 | 1101.35 | 1382.25 | 1549.13 | 1212.00 | 1167.10 | 1527.47 | 1570.86 | 1389.02 | 1205.58 | 1267.90 | 1195.28 | 926.51 | 1019.39 | 1347.57 | 1234.83 | 920.68 | 712.89 | 789.92 | |
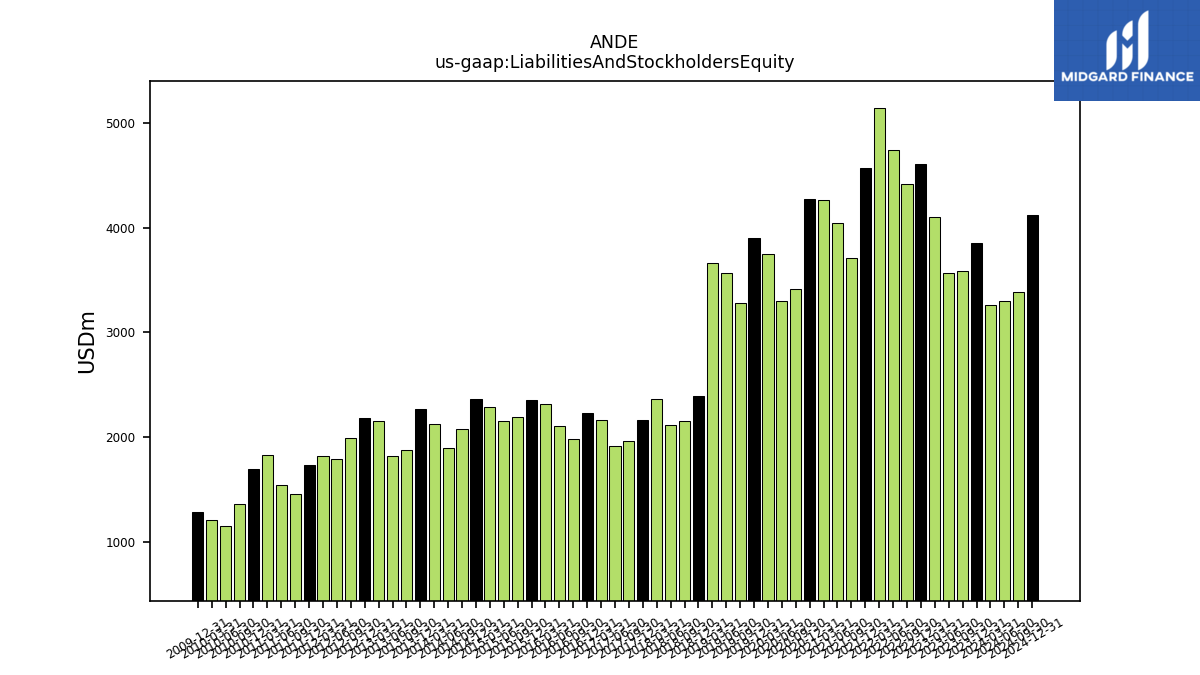
| Liabilities And Stockholders Equity | 3855.01 | 3588.10 | 3570.05 | 4102.04 | 4608.00 | 4418.62 | 4737.18 | 5142.94 | 4569.22 | 3708.14 | 4049.09 | 4266.74 | 4272.12 | 3411.61 | 3303.99 | 3752.69 | 3900.74 | 3284.45 | 3571.86 | 3660.25 | 2392.00 | 2151.62 | 2117.79 | 2363.53 | 2162.35 | 1964.16 | 1911.42 | 2161.75 | 2232.85 | 1984.41 | 2107.41 | 2319.64 | 2359.10 | 2191.69 | 2152.36 | 2287.63 | 2364.69 | 2082.99 | 1892.63 | 2125.58 | 2273.56 | 1882.29 | 1820.98 | 2151.79 | 2182.30 | 1991.44 | 1794.77 | 1824.76 | 1734.12 | 1458.58 | 1543.85 | 1828.66 | 1699.39 | 1362.53 | 1155.44 | 1209.58 | |
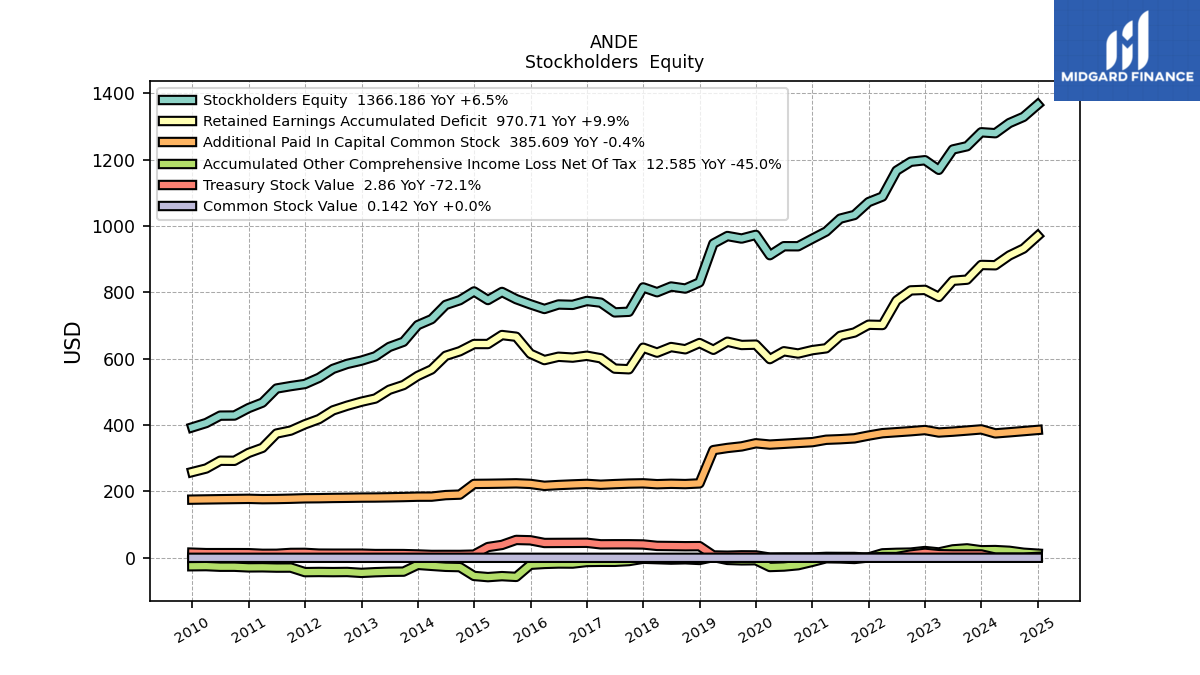
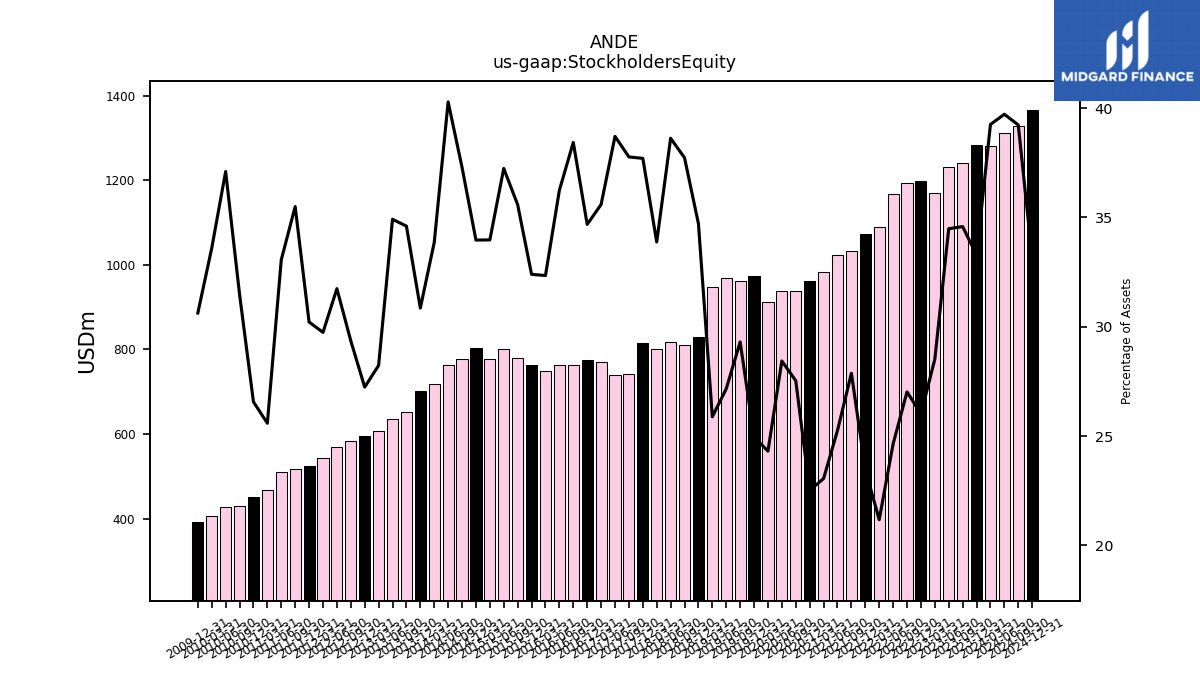
| Stockholders Equity | 1282.90 | 1240.73 | 1230.99 | 1169.59 | 1198.60 | 1193.91 | 1167.15 | 1089.03 | 1072.42 | 1033.44 | 1022.50 | 983.67 | 961.89 | 939.20 | 939.39 | 912.26 | 973.61 | 962.46 | 970.11 | 947.28 | 830.32 | 811.74 | 817.88 | 800.64 | 815.20 | 741.76 | 739.83 | 769.33 | 774.36 | 762.54 | 763.70 | 750.16 | 764.25 | 779.77 | 801.51 | 777.12 | 803.10 | 776.70 | 762.39 | 719.51 | 701.47 | 651.30 | 635.77 | 607.40 | 594.41 | 584.57 | 569.65 | 542.69 | 524.00 | 517.70 | 510.40 | 467.85 | 451.43 | 428.97 | 428.65 | 406.37 |
| 2023-12-31 | 2023-09-30 | 2023-06-30 | 2023-03-31 | 2022-12-31 | 2022-09-30 | 2022-06-30 | 2022-03-31 | 2021-12-31 | 2021-09-30 | 2021-06-30 | 2021-03-31 | 2020-12-31 | 2020-09-30 | 2020-06-30 | 2020-03-31 | 2019-12-31 | 2019-09-30 | 2019-06-30 | 2019-03-31 | 2018-12-31 | 2018-09-30 | 2018-06-30 | 2018-03-31 | 2017-12-31 | 2017-09-30 | 2017-06-30 | 2017-03-31 | 2016-12-31 | 2016-09-30 | 2016-06-30 | 2016-03-31 | 2015-12-31 | 2015-09-30 | 2015-06-30 | 2015-03-31 | 2014-12-31 | 2014-09-30 | 2014-06-30 | 2014-03-31 | 2013-12-31 | 2013-09-30 | 2013-06-30 | 2013-03-31 | 2012-12-31 | 2012-09-30 | 2012-06-30 | 2012-03-31 | 2011-12-31 | 2011-09-30 | 2011-06-30 | 2011-03-31 | 2010-12-31 | 2010-09-30 | 2010-06-30 | 2010-03-31 | ||
|---|---|---|---|---|---|---|---|---|---|---|---|---|---|---|---|---|---|---|---|---|---|---|---|---|---|---|---|---|---|---|---|---|---|---|---|---|---|---|---|---|---|---|---|---|---|---|---|---|---|---|---|---|---|---|---|---|---|
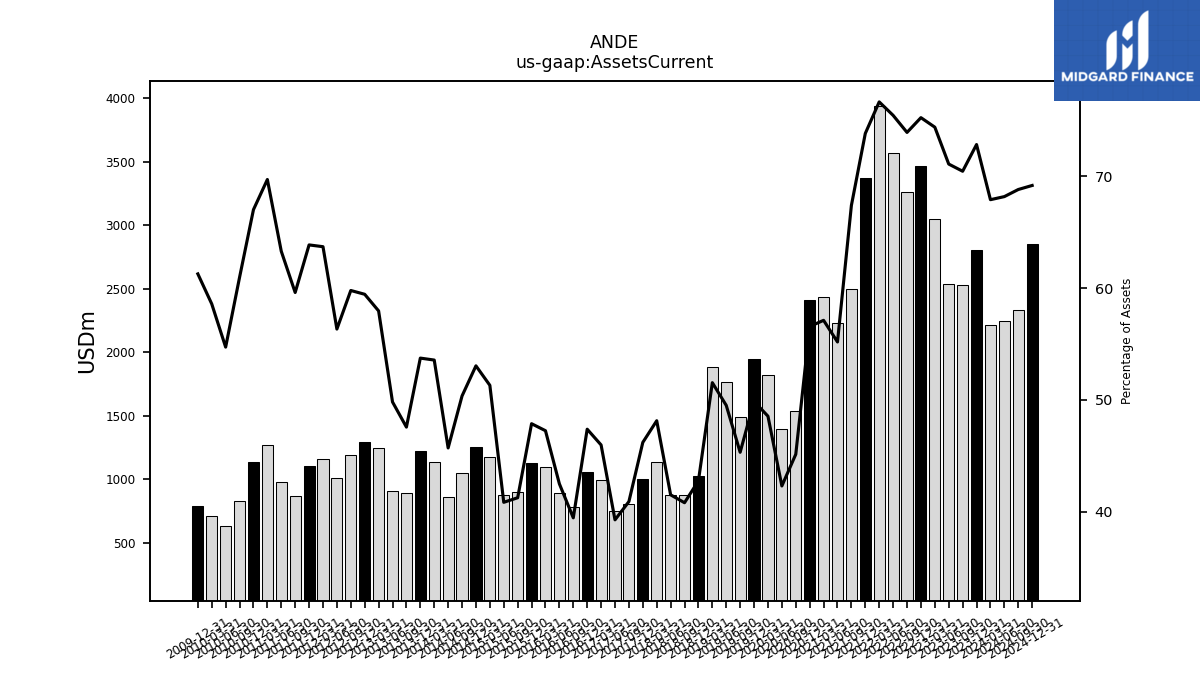
| Assets Current | 2806.96 | 2527.10 | 2537.26 | 3050.47 | 3465.95 | 3265.23 | 3572.88 | 3940.70 | 3372.33 | 2498.39 | 2234.30 | 2436.89 | 2416.41 | 1540.25 | 1398.19 | 1821.88 | 1945.34 | 1488.78 | 1768.63 | 1886.61 | 1023.20 | 878.29 | 879.42 | 1137.88 | 999.21 | 803.82 | 751.02 | 993.99 | 1058.13 | 783.29 | 895.87 | 1096.10 | 1129.52 | 904.40 | 879.42 | 1173.75 | 1254.45 | 1048.91 | 865.19 | 1138.55 | 1221.78 | 895.51 | 907.27 | 1247.05 | 1297.15 | 1190.44 | 1011.04 | 1162.19 | 1107.22 | 869.30 | 977.01 | 1274.42 | 1138.56 | 830.44 | 632.27 | 708.55 | |
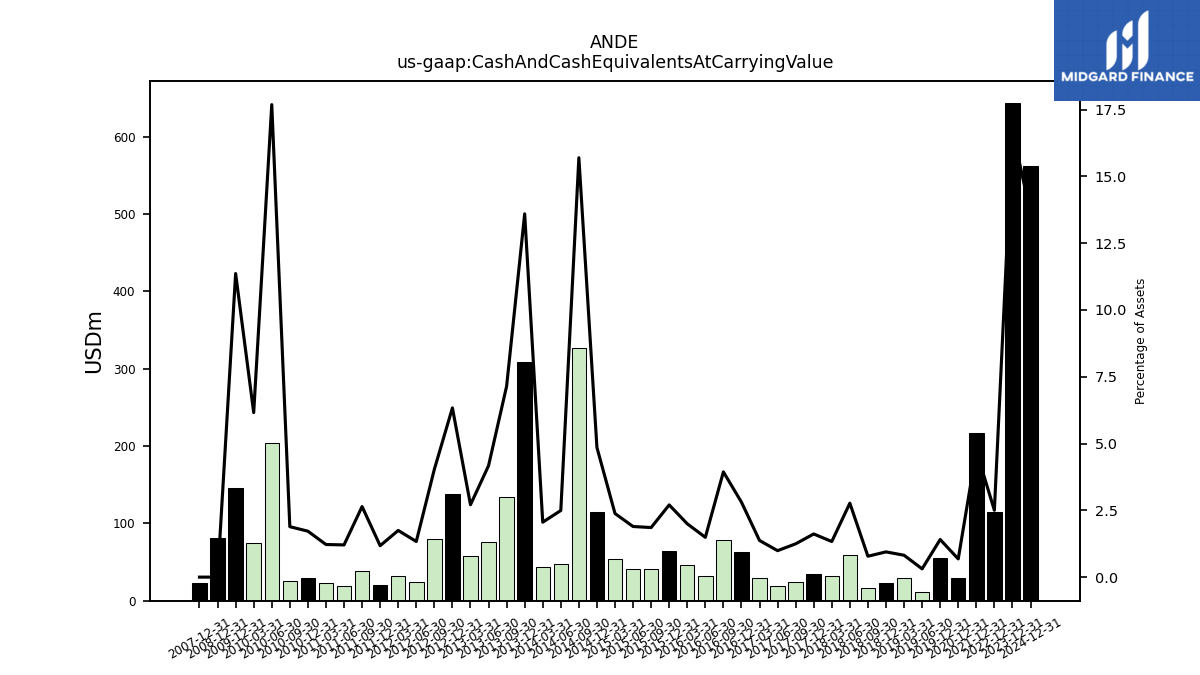
| Cash And Cash Equivalents At Carrying Value | 643.85 | NA | NA | NA | 115.27 | NA | NA | NA | 216.44 | NA | NA | NA | 29.12 | NA | NA | NA | 54.90 | NA | 11.09 | 29.99 | 22.59 | 16.82 | 58.61 | 31.50 | 34.92 | 24.48 | 18.93 | 29.64 | 62.63 | 78.16 | 31.38 | 46.30 | 63.75 | 40.66 | 40.77 | 54.46 | 114.70 | 326.95 | 47.19 | 43.69 | 309.08 | 134.44 | 75.92 | 58.28 | 138.22 | 80.37 | 23.93 | 31.87 | 20.39 | 38.51 | 18.62 | 22.32 | 29.22 | 25.73 | 204.32 | 74.46 | |
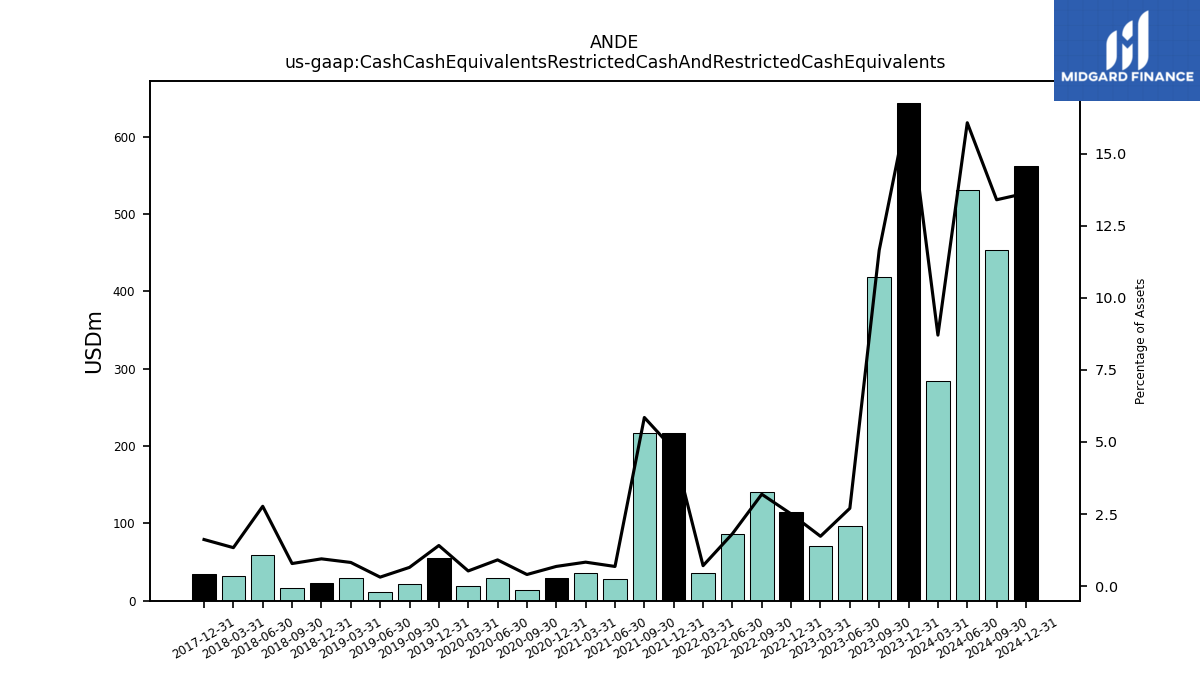
| Cash Cash Equivalents Restricted Cash And Restricted Cash Equivalents | 643.85 | 418.06 | 96.29 | 70.85 | 115.27 | 140.77 | 86.03 | 36.38 | 216.44 | 216.87 | 27.54 | 35.39 | 29.12 | 13.69 | 30.01 | 19.69 | 54.90 | 21.30 | 11.09 | 29.99 | 22.59 | 16.82 | 58.61 | 31.50 | 34.92 | NA | NA | NA | NA | NA | NA | NA | NA | NA | NA | NA | NA | NA | NA | NA | NA | NA | NA | NA | NA | NA | NA | NA | NA | NA | NA | NA | NA | NA | NA | NA | |
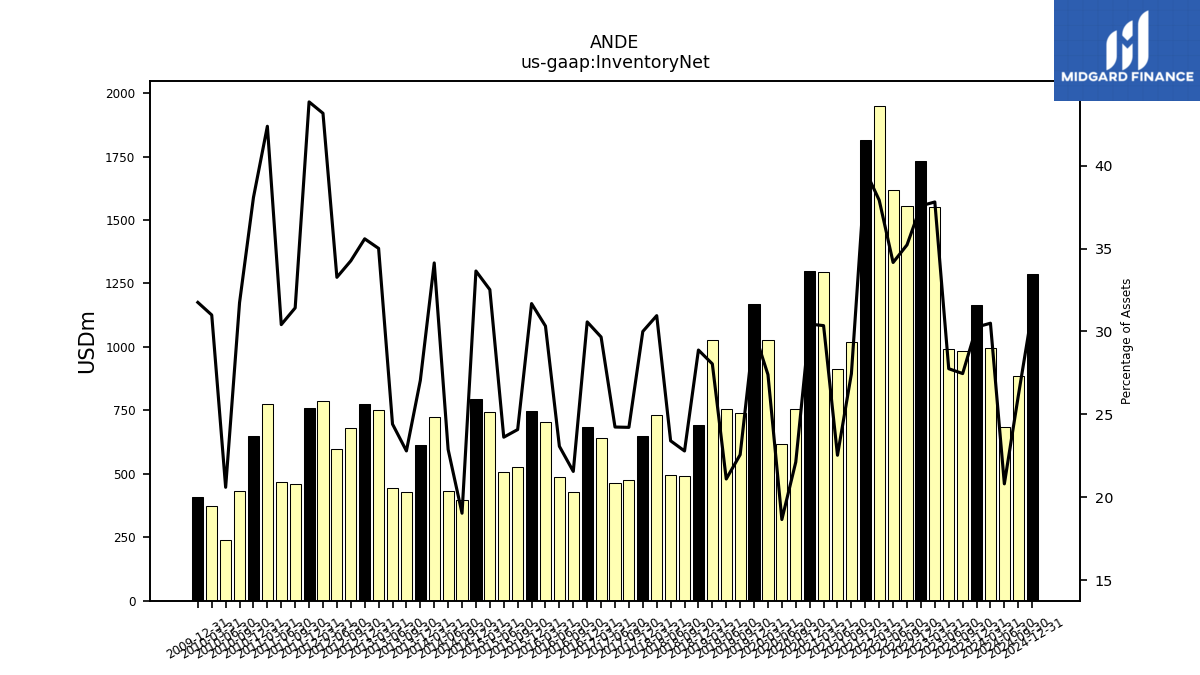
| Inventory Net | 1166.70 | 985.29 | 990.79 | 1551.10 | 1731.72 | 1556.43 | 1618.33 | 1950.30 | 1814.54 | 1017.80 | 912.30 | 1295.06 | 1300.69 | 754.60 | 616.32 | 1028.08 | 1170.54 | 741.09 | 753.64 | 1026.46 | 690.80 | 490.33 | 495.61 | 731.63 | 648.70 | 475.60 | 463.20 | 641.29 | 682.75 | 427.75 | 486.24 | 703.45 | 747.40 | 527.79 | 508.41 | 743.96 | 795.65 | 396.46 | 433.00 | 725.58 | 614.92 | 429.02 | 444.52 | 753.38 | 776.68 | 682.29 | 597.09 | 787.65 | 760.46 | 458.31 | 469.55 | 775.02 | 647.19 | 432.45 | 237.99 | 374.89 | |
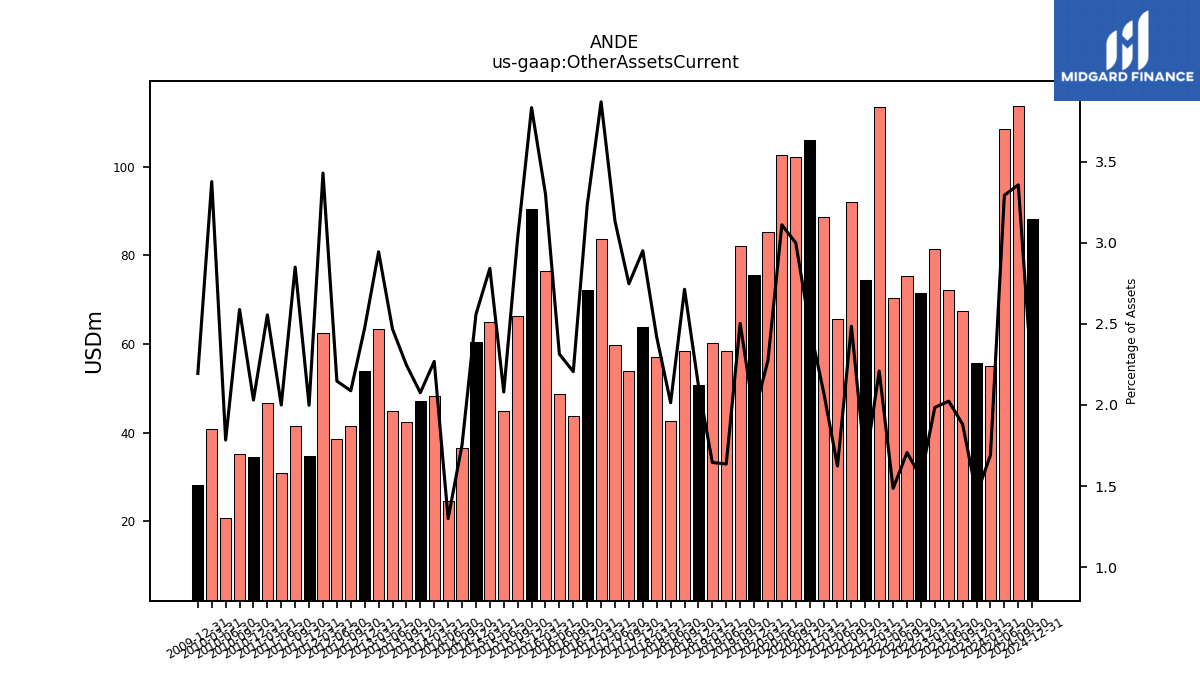
| Other Assets Current | 55.78 | 67.47 | 72.23 | 81.41 | 71.62 | 75.40 | 70.37 | 113.59 | 74.47 | 92.16 | 65.74 | 88.77 | 106.05 | 102.30 | 102.75 | 85.37 | 75.68 | 82.20 | 58.44 | 60.22 | 50.70 | 58.37 | 42.65 | 57.15 | 63.79 | 53.96 | 59.87 | 83.62 | 72.13 | 43.76 | 48.75 | 76.58 | 90.41 | 66.41 | 44.77 | 65.02 | 60.49 | 36.52 | 24.60 | 48.21 | 47.19 | 42.28 | 44.94 | 63.35 | 54.02 | 41.57 | 38.53 | 62.58 | 34.65 | 41.56 | 30.87 | 46.72 | 34.50 | 35.27 | 20.60 | 40.84 | |
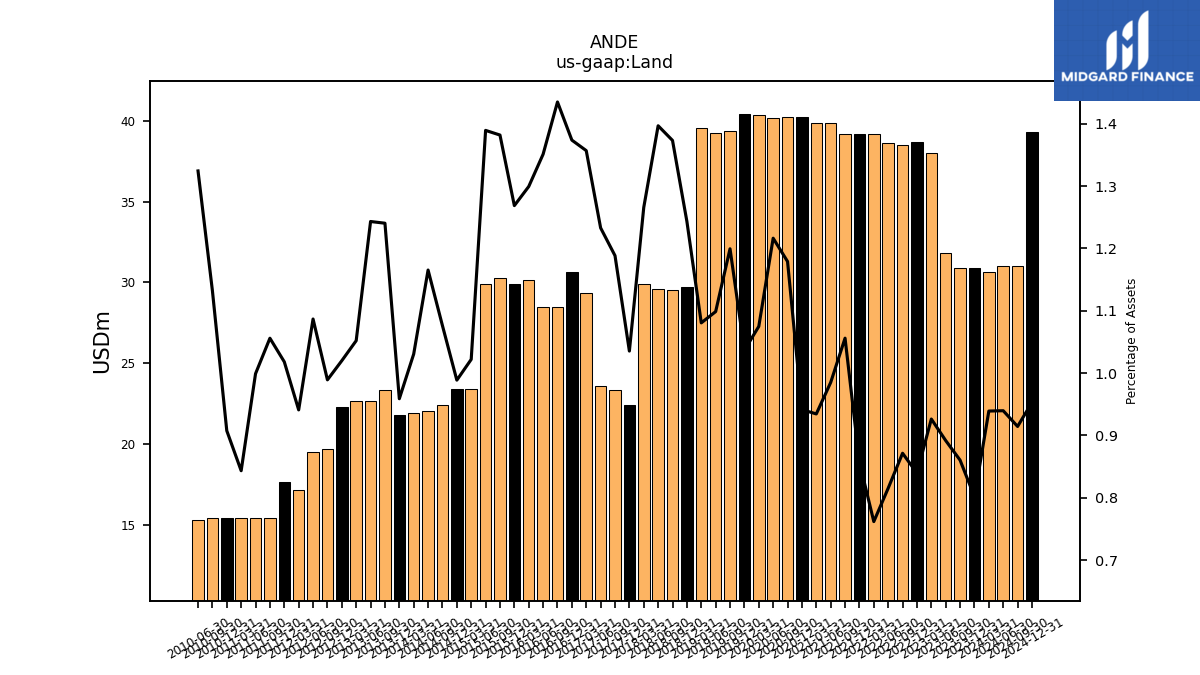
| Land | 30.91 | 30.87 | 31.84 | 38.00 | 38.69 | 38.51 | 38.63 | 39.18 | 39.16 | 39.16 | 39.88 | 39.87 | 40.22 | 40.22 | 40.19 | 40.34 | 40.44 | 39.39 | 39.24 | 39.55 | 29.74 | 29.55 | 29.58 | 29.91 | 22.39 | 23.34 | 23.57 | 29.33 | 30.67 | 28.47 | 28.47 | 30.14 | 29.93 | 30.29 | 29.90 | 23.38 | 23.38 | 22.41 | 22.05 | 21.91 | 21.80 | 23.35 | 22.64 | 22.64 | 22.26 | 19.70 | 19.50 | 17.17 | 17.66 | 15.40 | 15.42 | 15.42 | 15.42 | 15.43 | 15.30 | NA | |
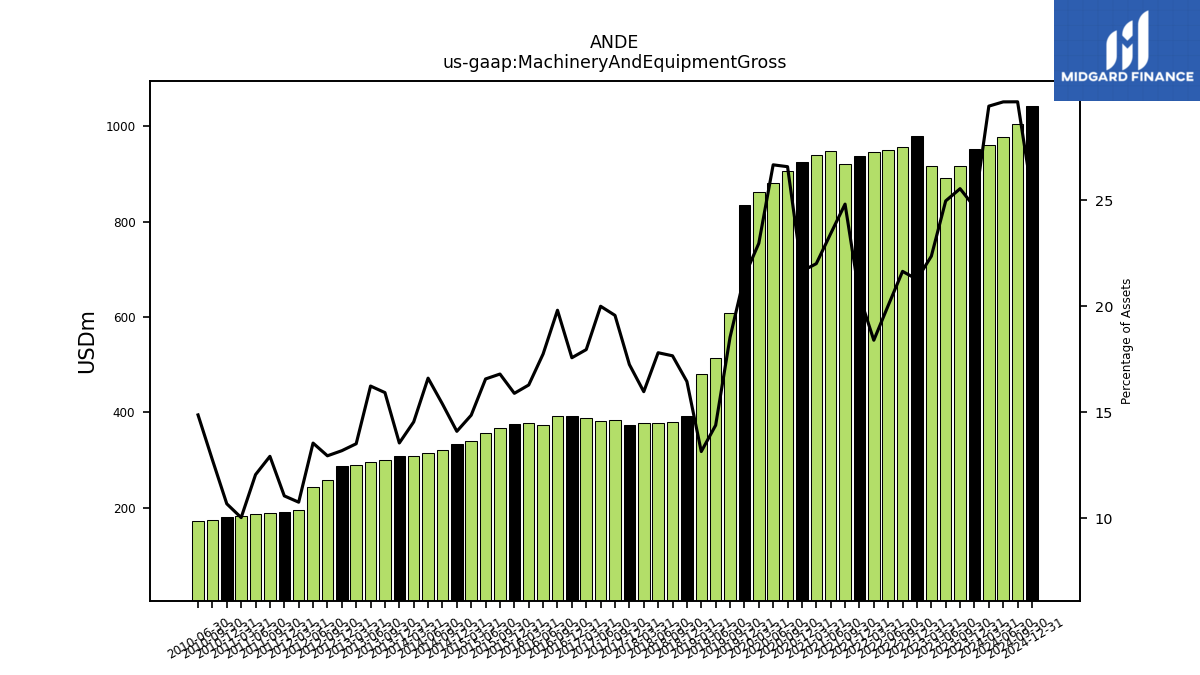
| Machinery And Equipment Gross | 951.54 | 916.55 | 891.37 | 917.27 | 980.16 | 956.47 | 949.14 | 946.35 | 936.48 | 920.23 | 948.52 | 939.12 | 925.07 | 906.86 | 881.14 | 861.81 | 835.16 | 608.83 | 514.03 | 481.45 | 393.64 | 380.11 | 377.20 | 377.56 | 373.13 | 384.42 | 382.32 | 388.23 | 392.42 | 393.18 | 374.11 | 377.88 | 375.03 | 368.34 | 356.76 | 340.11 | 333.56 | 320.65 | 314.43 | 309.28 | 308.21 | 299.87 | 295.72 | 290.93 | 287.90 | 257.93 | 243.22 | 196.43 | 191.83 | 188.55 | 186.25 | 183.57 | 181.65 | 173.89 | 171.92 | NA |
| 2023-12-31 | 2023-09-30 | 2023-06-30 | 2023-03-31 | 2022-12-31 | 2022-09-30 | 2022-06-30 | 2022-03-31 | 2021-12-31 | 2021-09-30 | 2021-06-30 | 2021-03-31 | 2020-12-31 | 2020-09-30 | 2020-06-30 | 2020-03-31 | 2019-12-31 | 2019-09-30 | 2019-06-30 | 2019-03-31 | 2018-12-31 | 2018-09-30 | 2018-06-30 | 2018-03-31 | 2017-12-31 | 2017-09-30 | 2017-06-30 | 2017-03-31 | 2016-12-31 | 2016-09-30 | 2016-06-30 | 2016-03-31 | 2015-12-31 | 2015-09-30 | 2015-06-30 | 2015-03-31 | 2014-12-31 | 2014-09-30 | 2014-06-30 | 2014-03-31 | 2013-12-31 | 2013-09-30 | 2013-06-30 | 2013-03-31 | 2012-12-31 | 2012-09-30 | 2012-06-30 | 2012-03-31 | 2011-12-31 | 2011-09-30 | 2011-06-30 | 2011-03-31 | 2010-12-31 | 2010-09-30 | 2010-06-30 | 2010-03-31 | ||
|---|---|---|---|---|---|---|---|---|---|---|---|---|---|---|---|---|---|---|---|---|---|---|---|---|---|---|---|---|---|---|---|---|---|---|---|---|---|---|---|---|---|---|---|---|---|---|---|---|---|---|---|---|---|---|---|---|---|
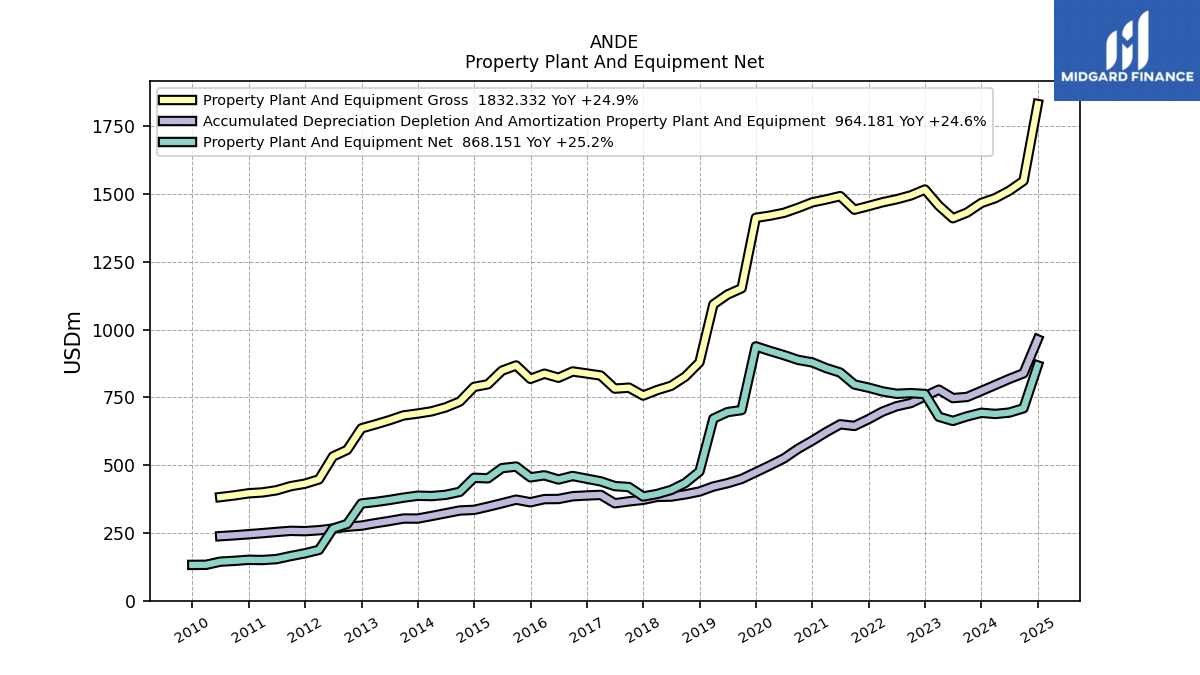
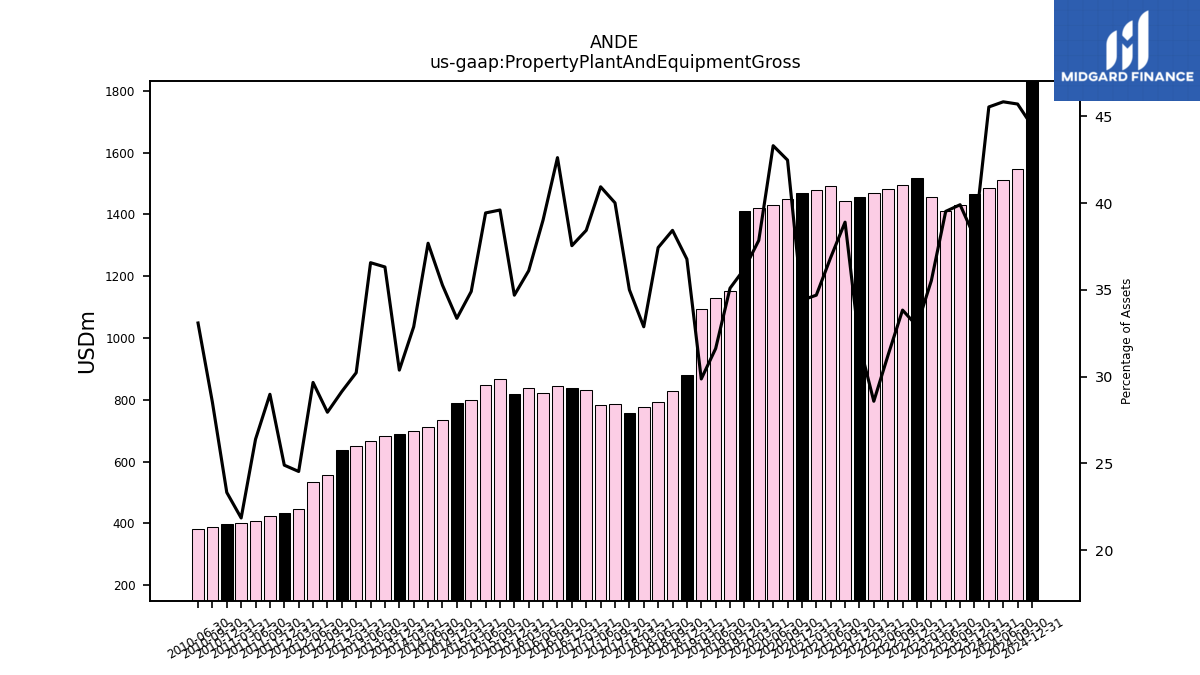
| Property Plant And Equipment Gross | 1467.18 | 1431.91 | 1411.03 | 1457.38 | 1517.08 | 1495.06 | 1481.00 | 1469.96 | 1456.01 | 1442.57 | 1492.67 | 1480.37 | 1469.71 | 1449.24 | 1430.99 | 1420.56 | 1412.70 | 1152.73 | 1129.35 | 1093.21 | 879.60 | 826.88 | 792.85 | 777.00 | 756.96 | 785.98 | 782.57 | 830.82 | 838.36 | 845.79 | 822.63 | 837.58 | 818.50 | 867.99 | 848.78 | 798.56 | 788.87 | 734.75 | 713.30 | 698.78 | 690.63 | 683.67 | 665.88 | 650.40 | 635.95 | 556.57 | 532.43 | 447.69 | 431.77 | 422.74 | 407.47 | 399.65 | 396.38 | 388.65 | 382.35 | NA | |
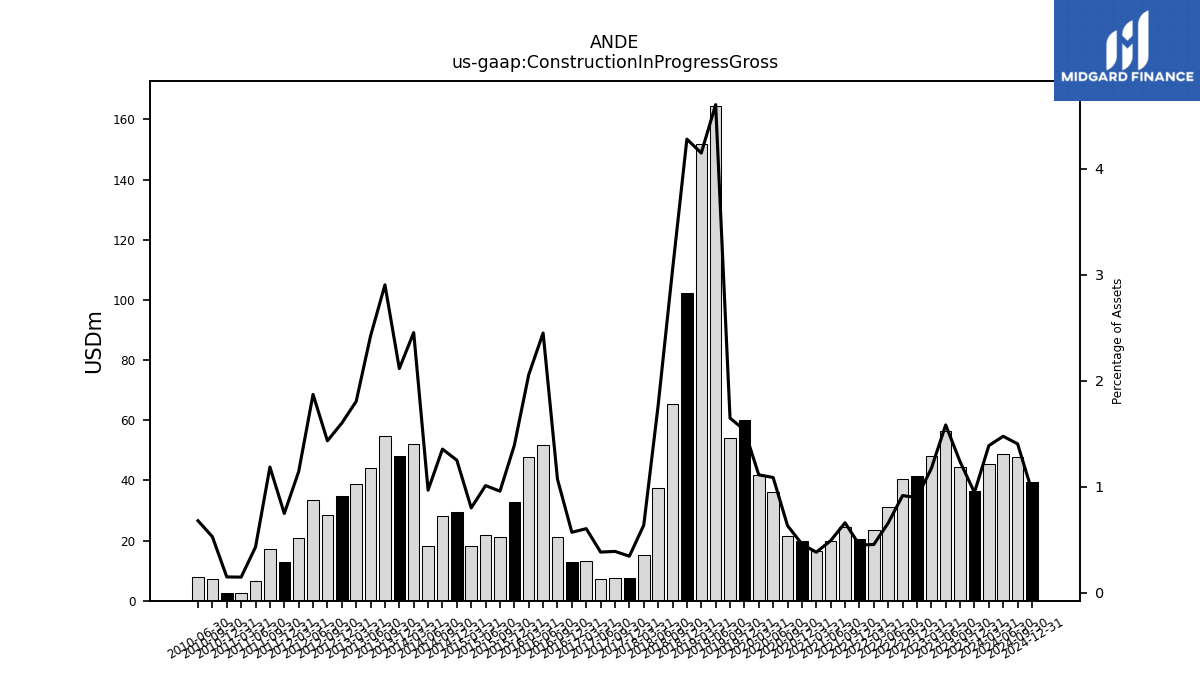
| Construction In Progress Gross | 36.54 | 44.42 | 56.58 | 48.16 | 41.43 | 40.60 | 31.24 | 23.51 | 20.68 | 24.56 | 19.99 | 16.40 | 19.73 | 21.66 | 35.98 | 41.82 | 59.99 | 54.16 | 164.53 | 151.90 | 102.39 | 65.54 | 37.46 | 15.12 | 7.50 | 7.70 | 7.37 | 13.11 | 12.78 | 21.28 | 51.67 | 47.76 | 32.87 | 21.04 | 21.80 | 18.35 | 29.62 | 28.26 | 18.36 | 52.20 | 48.13 | 54.71 | 44.15 | 38.89 | 34.97 | 28.58 | 33.61 | 20.89 | 13.01 | 17.32 | 6.70 | 2.73 | 2.57 | 7.22 | 7.87 | NA | |
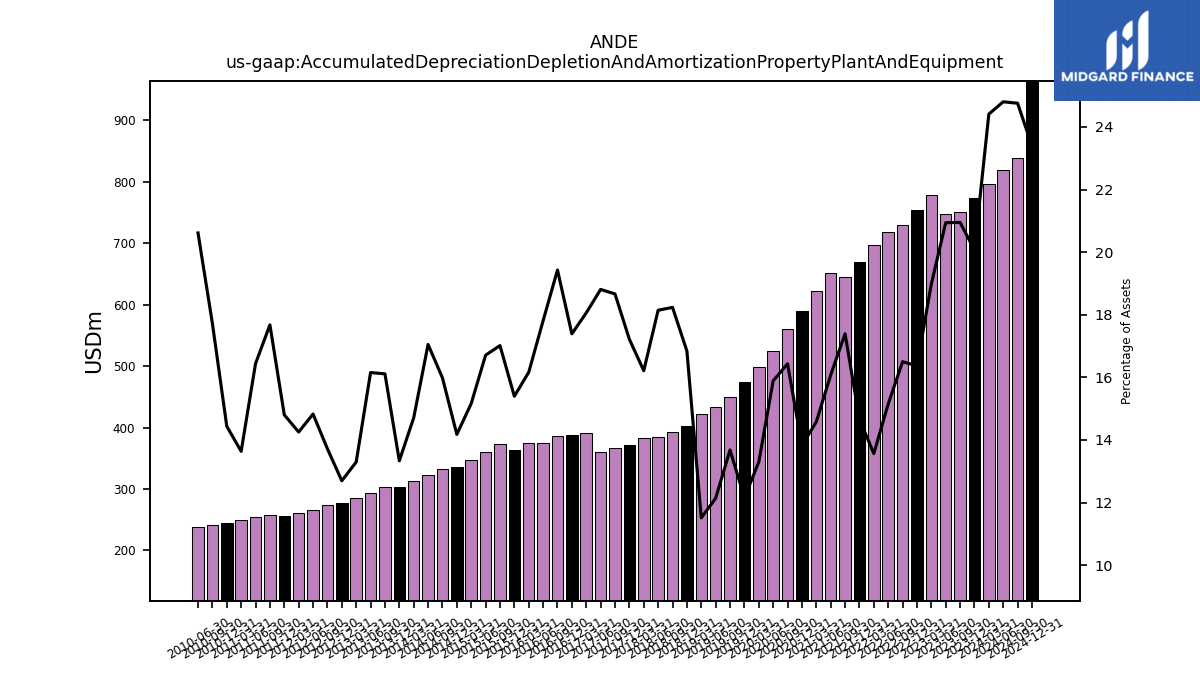
| Accumulated Depreciation Depletion And Amortization Property Plant And Equipment | 773.81 | 751.72 | 747.59 | 778.66 | 754.35 | 729.12 | 717.56 | 697.71 | 669.98 | 644.91 | 650.91 | 622.10 | 590.53 | 560.73 | 524.98 | 498.97 | 474.28 | 449.34 | 433.52 | 421.41 | 402.89 | 392.37 | 384.27 | 383.24 | 372.29 | 366.63 | 359.53 | 390.42 | 388.31 | 385.55 | 375.36 | 374.92 | 363.24 | 372.94 | 359.63 | 346.93 | 335.26 | 332.95 | 322.71 | 312.64 | 303.17 | 303.29 | 294.17 | 286.09 | 277.07 | 273.17 | 266.15 | 260.11 | 256.69 | 257.84 | 253.82 | 249.39 | 245.35 | 241.46 | 238.19 | NA | |
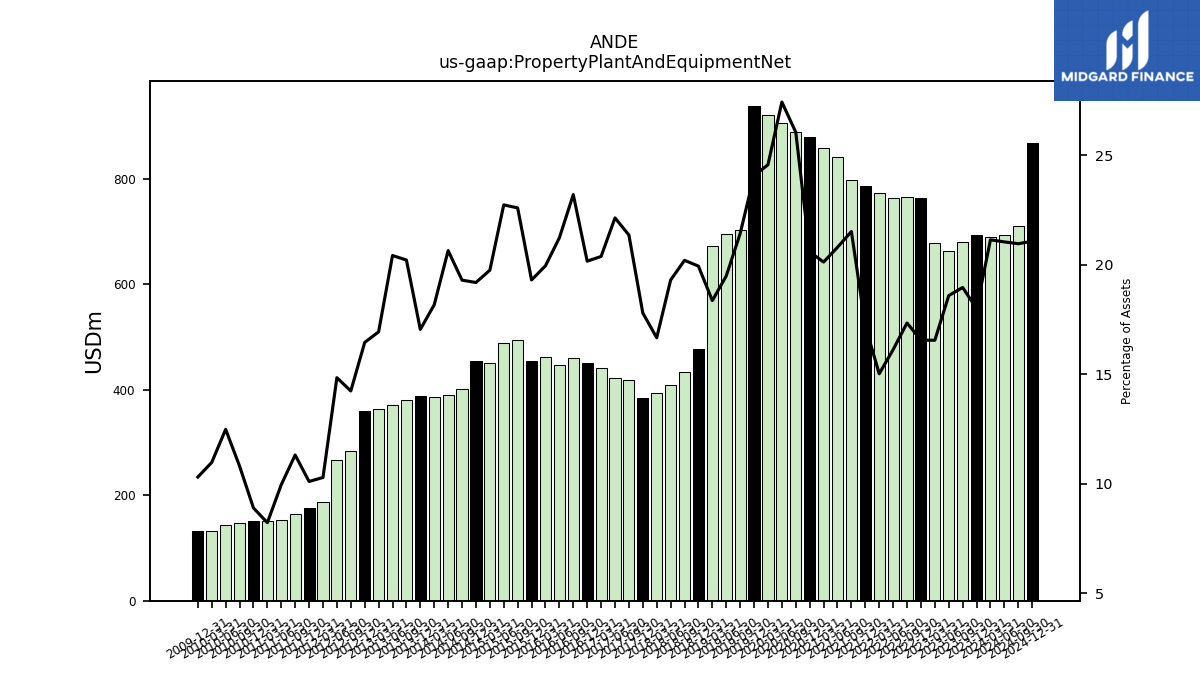
| Property Plant And Equipment Net | 693.37 | 680.19 | 663.44 | 678.72 | 762.73 | 765.94 | 763.44 | 772.25 | 786.03 | 797.66 | 841.76 | 858.27 | 879.18 | 888.51 | 906.02 | 921.59 | 938.42 | 703.40 | 695.83 | 671.80 | 476.71 | 434.50 | 408.57 | 393.76 | 384.68 | 419.35 | 423.04 | 440.39 | 450.05 | 460.25 | 447.27 | 462.66 | 455.26 | 495.05 | 489.14 | 451.64 | 453.61 | 401.80 | 390.59 | 386.13 | 387.46 | 380.37 | 371.72 | 364.31 | 358.88 | 283.39 | 266.27 | 187.58 | 175.09 | 164.89 | 153.64 | 150.26 | 151.03 | 147.18 | 144.16 | 132.66 | |
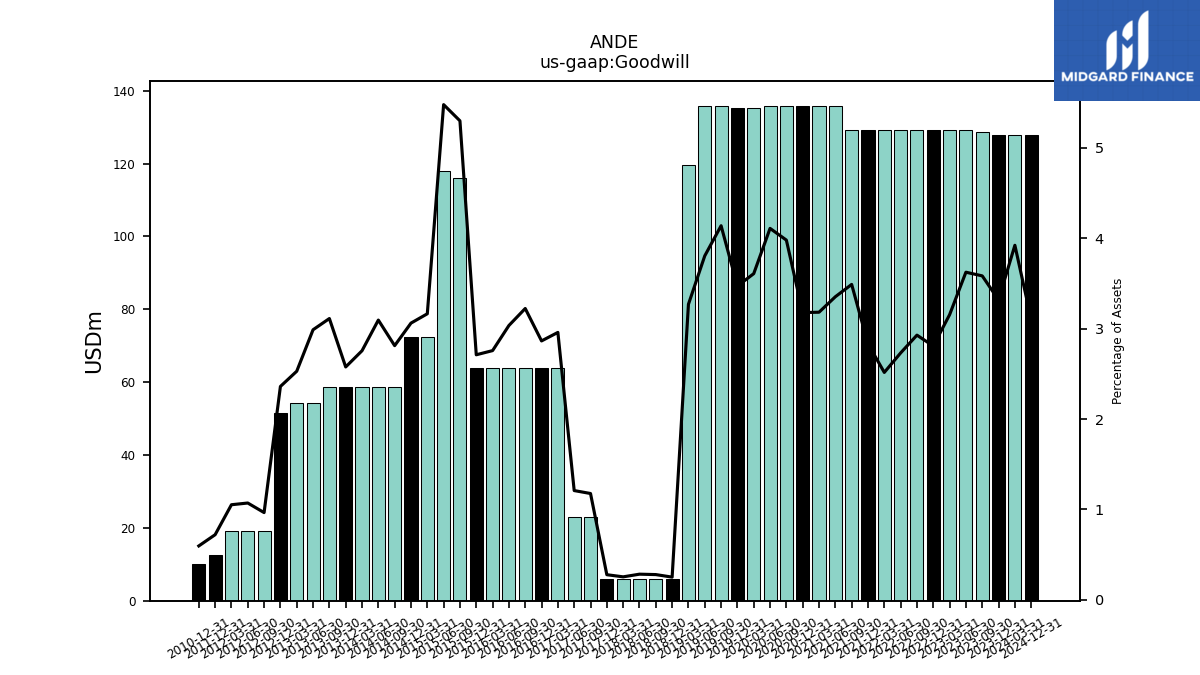
| Goodwill | 127.86 | 128.54 | 129.34 | 129.34 | 129.34 | 129.34 | 129.34 | 129.34 | 129.34 | 129.34 | 135.71 | 135.71 | 135.71 | 135.71 | 135.71 | 135.36 | 135.36 | 135.87 | 135.87 | 119.64 | 6.02 | 6.02 | 6.02 | 6.02 | 6.02 | 23.11 | 23.11 | 63.93 | 63.93 | 63.93 | 63.93 | 63.93 | 63.93 | 116.09 | 117.86 | 72.36 | 72.36 | 58.55 | 58.55 | 58.55 | 58.55 | 58.55 | 54.39 | 54.40 | 51.50 | 19.23 | 19.23 | 19.20 | 12.50 | NA | NA | NA | 10.14 | NA | NA | NA | |
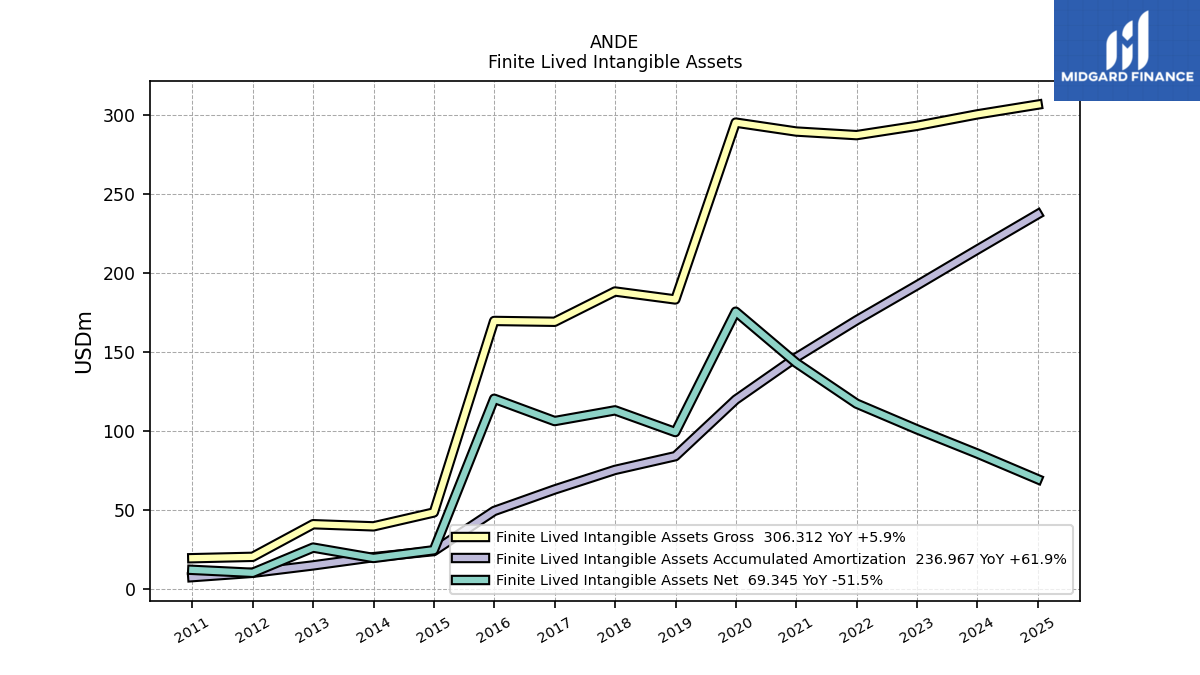
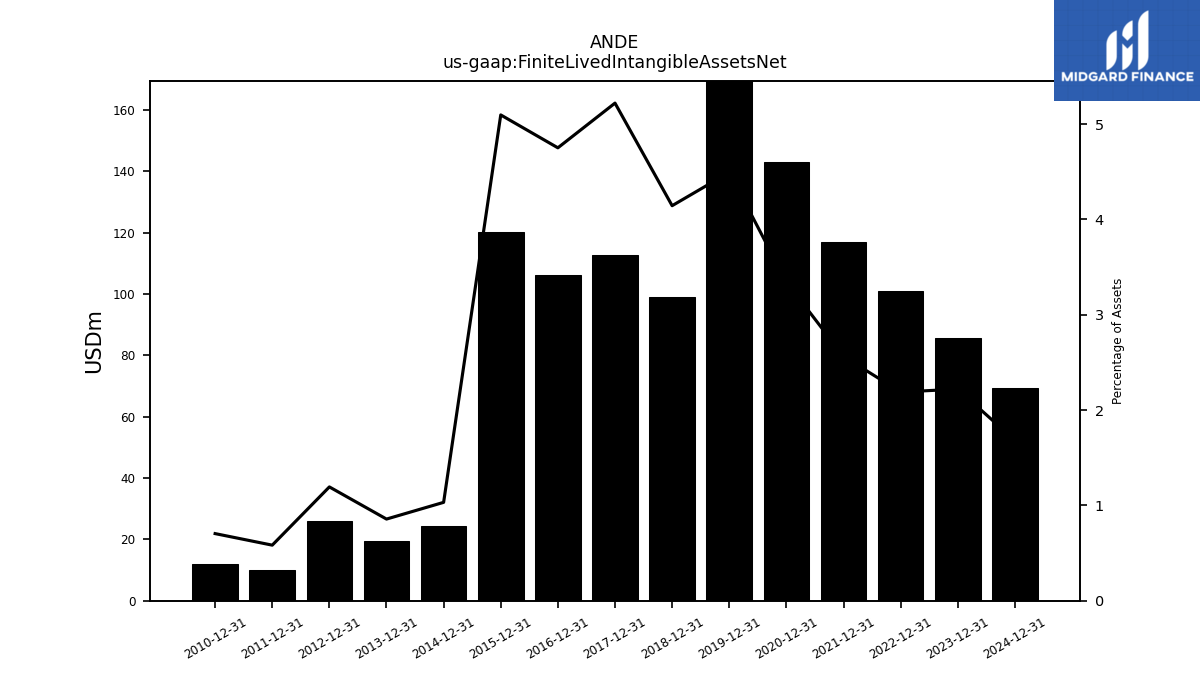
| Finite Lived Intangible Assets Net | 85.58 | NA | NA | NA | 100.91 | NA | NA | NA | 117.14 | NA | NA | NA | 142.94 | NA | NA | NA | 175.31 | NA | NA | NA | 99.14 | NA | NA | NA | 112.89 | NA | NA | NA | 106.10 | NA | NA | NA | 120.24 | NA | NA | NA | 24.41 | NA | NA | NA | 19.48 | NA | NA | NA | 26.06 | NA | NA | NA | 10.12 | NA | NA | NA | 11.97 | NA | NA | NA | |
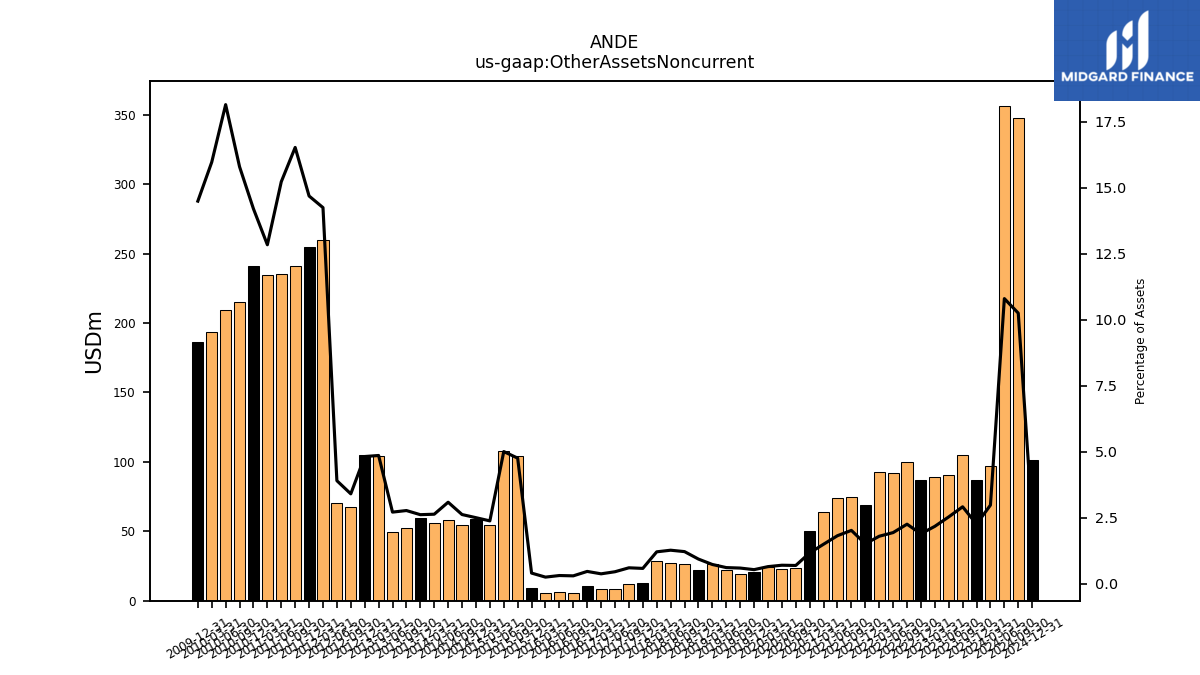
| Other Assets Noncurrent | 87.01 | 104.59 | 90.39 | 89.17 | 87.17 | 99.65 | 91.76 | 92.51 | 69.07 | 74.92 | 73.68 | 63.86 | 49.91 | 23.60 | 23.15 | 24.30 | 20.80 | 19.50 | 21.84 | 26.69 | 22.34 | 26.17 | 26.89 | 28.57 | 12.56 | 11.85 | 8.69 | 8.11 | 10.41 | 5.92 | 6.55 | 5.80 | 9.52 | 104.27 | 107.74 | 54.45 | 59.16 | 54.59 | 58.43 | 55.97 | 59.46 | 52.18 | 49.39 | 104.53 | 105.13 | 67.80 | 70.04 | 259.96 | 254.68 | 241.03 | 235.06 | 234.79 | 241.32 | 215.21 | 209.68 | 193.15 |
| 2023-12-31 | 2023-09-30 | 2023-06-30 | 2023-03-31 | 2022-12-31 | 2022-09-30 | 2022-06-30 | 2022-03-31 | 2021-12-31 | 2021-09-30 | 2021-06-30 | 2021-03-31 | 2020-12-31 | 2020-09-30 | 2020-06-30 | 2020-03-31 | 2019-12-31 | 2019-09-30 | 2019-06-30 | 2019-03-31 | 2018-12-31 | 2018-09-30 | 2018-06-30 | 2018-03-31 | 2017-12-31 | 2017-09-30 | 2017-06-30 | 2017-03-31 | 2016-12-31 | 2016-09-30 | 2016-06-30 | 2016-03-31 | 2015-12-31 | 2015-09-30 | 2015-06-30 | 2015-03-31 | 2014-12-31 | 2014-09-30 | 2014-06-30 | 2014-03-31 | 2013-12-31 | 2013-09-30 | 2013-06-30 | 2013-03-31 | 2012-12-31 | 2012-09-30 | 2012-06-30 | 2012-03-31 | 2011-12-31 | 2011-09-30 | 2011-06-30 | 2011-03-31 | 2010-12-31 | 2010-09-30 | 2010-06-30 | 2010-03-31 | ||
|---|---|---|---|---|---|---|---|---|---|---|---|---|---|---|---|---|---|---|---|---|---|---|---|---|---|---|---|---|---|---|---|---|---|---|---|---|---|---|---|---|---|---|---|---|---|---|---|---|---|---|---|---|---|---|---|---|---|
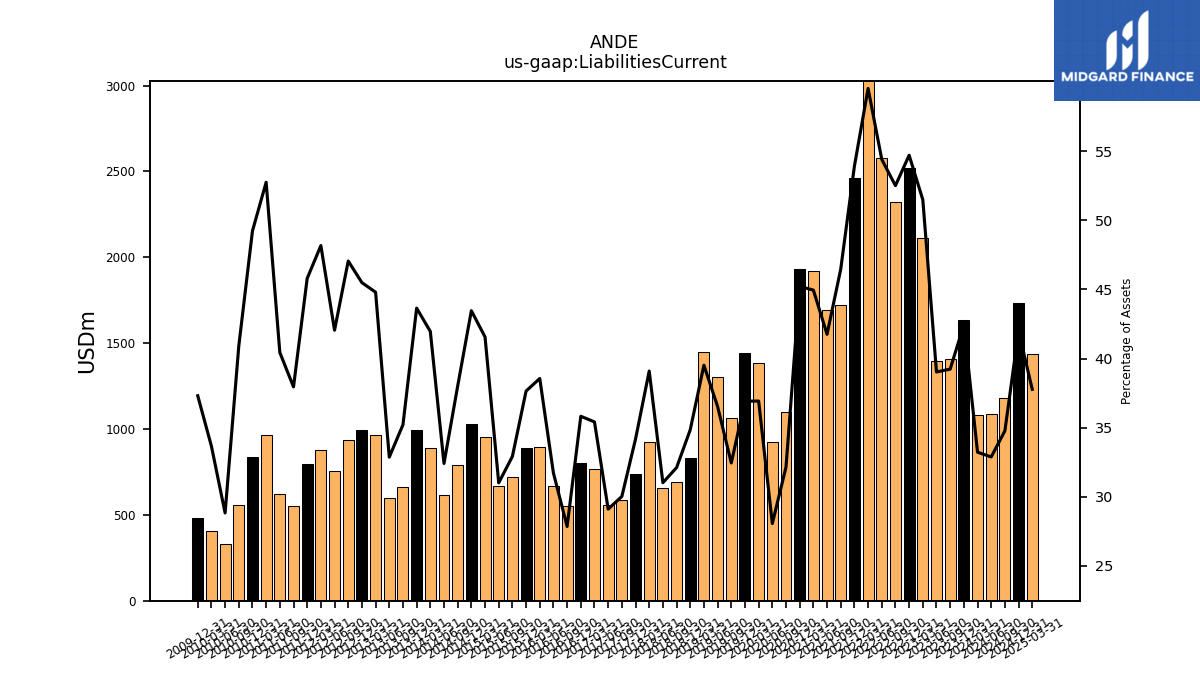
| Liabilities Current | 1636.33 | 1407.63 | 1393.24 | 2112.31 | 2521.32 | 2320.51 | 2577.58 | 3062.77 | 2463.93 | 1723.16 | 1690.56 | 1918.12 | 1931.68 | 1096.54 | 926.78 | 1385.49 | 1439.92 | 1065.48 | 1304.57 | 1446.34 | 833.35 | 690.65 | 656.70 | 923.95 | 738.72 | 589.49 | 556.15 | 765.47 | 799.78 | 552.41 | 668.14 | 894.29 | 888.04 | 721.30 | 667.21 | 950.79 | 1027.71 | 791.63 | 613.22 | 891.90 | 992.33 | 662.58 | 598.34 | 964.03 | 992.81 | 937.09 | 754.69 | 879.05 | 794.25 | 553.48 | 624.26 | 964.81 | 836.74 | 557.28 | 332.97 | 407.04 | |
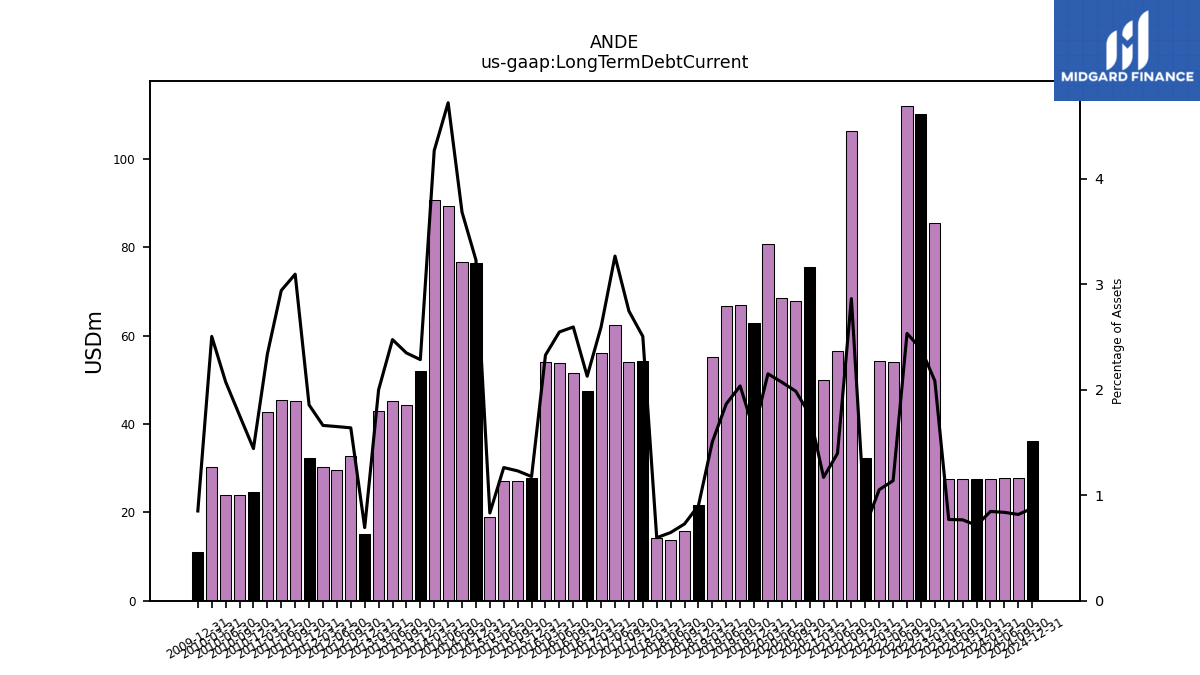
| Long Term Debt Current | 27.56 | 27.54 | 27.51 | 85.57 | 110.16 | 112.03 | 53.95 | 54.16 | 32.26 | 106.25 | 56.58 | 49.94 | 75.47 | 67.79 | 68.48 | 80.76 | 62.90 | 66.90 | 66.68 | 55.16 | 21.59 | 15.68 | 13.70 | 14.13 | 54.20 | 53.97 | 62.48 | 56.14 | 47.55 | 51.52 | 53.72 | 54.04 | 27.79 | 26.99 | 27.19 | 19.04 | 76.42 | 76.76 | 89.39 | 90.76 | 52.00 | 44.23 | 45.10 | 43.05 | 15.14 | 32.66 | 29.65 | 30.34 | 32.21 | 45.17 | 45.43 | 42.78 | 24.52 | 23.95 | 23.99 | 30.32 | |
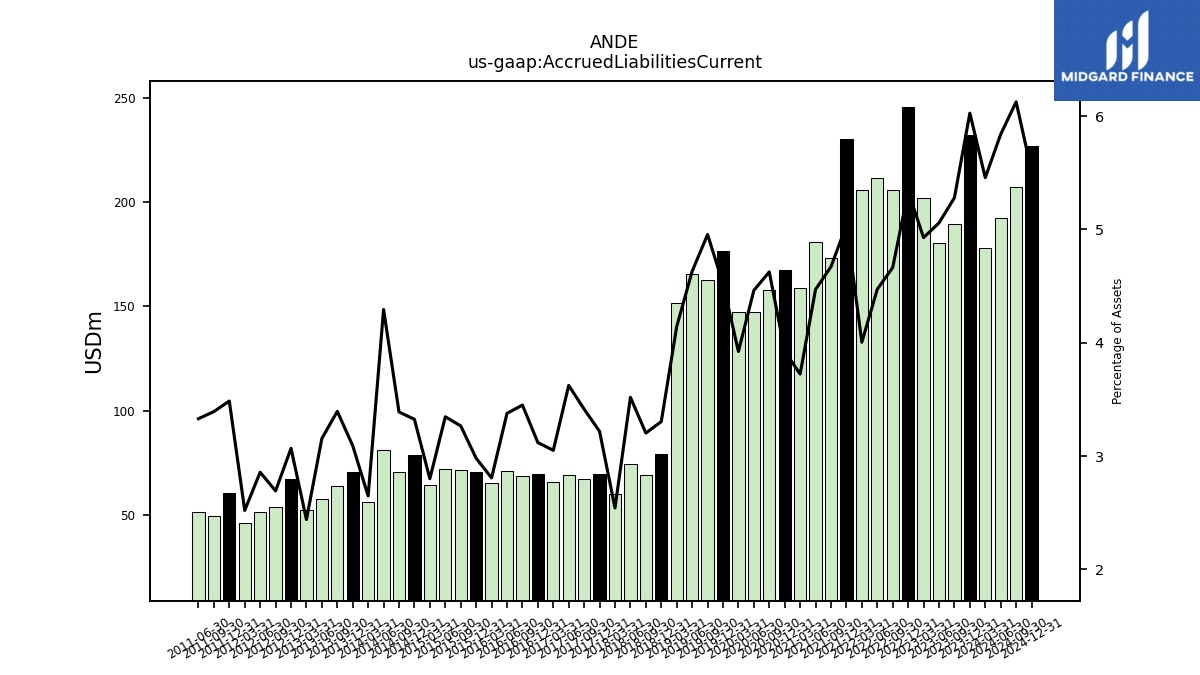
| Accrued Liabilities Current | 232.29 | 189.43 | 180.55 | 202.13 | 245.92 | 206.07 | 211.83 | 205.96 | 230.15 | 173.22 | 181.01 | 158.90 | 167.67 | 157.80 | 147.42 | 147.22 | 176.38 | 162.75 | 165.38 | 151.65 | 79.05 | 68.92 | 74.51 | 60.09 | 69.58 | 67.06 | 69.26 | 65.95 | 69.65 | 68.47 | 71.17 | 65.13 | 70.32 | 71.59 | 72.03 | 64.06 | 78.61 | 70.60 | 81.26 | 56.29 | 70.30 | 63.90 | 57.46 | 52.52 | 66.96 | 53.63 | 51.28 | 45.99 | 60.45 | 49.49 | 51.41 | NA | NA | NA | NA | NA | |
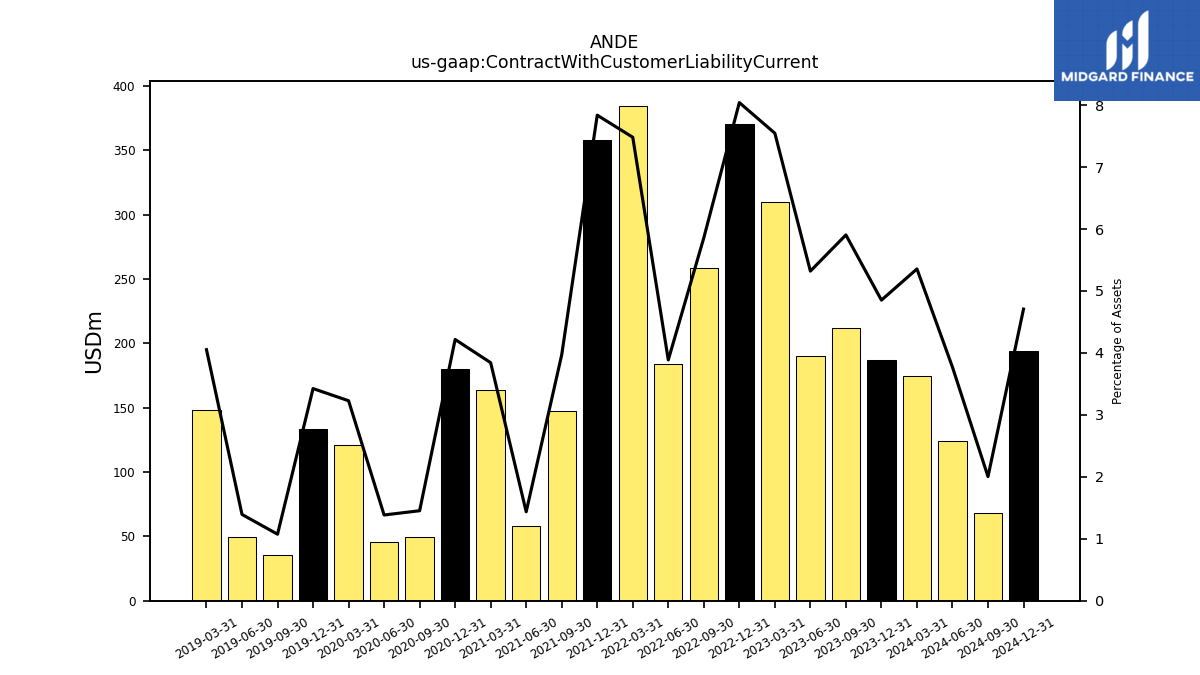
| Contract With Customer Liability Current | 187.05 | 211.87 | 189.95 | 309.55 | 370.52 | 258.83 | 184.15 | 384.72 | 358.12 | 147.22 | 58.16 | 163.94 | 180.16 | 49.57 | 45.73 | 121.15 | 133.59 | 35.27 | 49.76 | 148.34 | NA | NA | NA | NA | NA | NA | NA | NA | NA | NA | NA | NA | NA | NA | NA | NA | NA | NA | NA | NA | NA | NA | NA | NA | NA | NA | NA | NA | NA | NA | NA | NA | NA | NA | NA | NA |
| 2023-12-31 | 2023-09-30 | 2023-06-30 | 2023-03-31 | 2022-12-31 | 2022-09-30 | 2022-06-30 | 2022-03-31 | 2021-12-31 | 2021-09-30 | 2021-06-30 | 2021-03-31 | 2020-12-31 | 2020-09-30 | 2020-06-30 | 2020-03-31 | 2019-12-31 | 2019-09-30 | 2019-06-30 | 2019-03-31 | 2018-12-31 | 2018-09-30 | 2018-06-30 | 2018-03-31 | 2017-12-31 | 2017-09-30 | 2017-06-30 | 2017-03-31 | 2016-12-31 | 2016-09-30 | 2016-06-30 | 2016-03-31 | 2015-12-31 | 2015-09-30 | 2015-06-30 | 2015-03-31 | 2014-12-31 | 2014-09-30 | 2014-06-30 | 2014-03-31 | 2013-12-31 | 2013-09-30 | 2013-06-30 | 2013-03-31 | 2012-12-31 | 2012-09-30 | 2012-06-30 | 2012-03-31 | 2011-12-31 | 2011-09-30 | 2011-06-30 | 2011-03-31 | 2010-12-31 | 2010-09-30 | 2010-06-30 | 2010-03-31 | ||
|---|---|---|---|---|---|---|---|---|---|---|---|---|---|---|---|---|---|---|---|---|---|---|---|---|---|---|---|---|---|---|---|---|---|---|---|---|---|---|---|---|---|---|---|---|---|---|---|---|---|---|---|---|---|---|---|---|---|
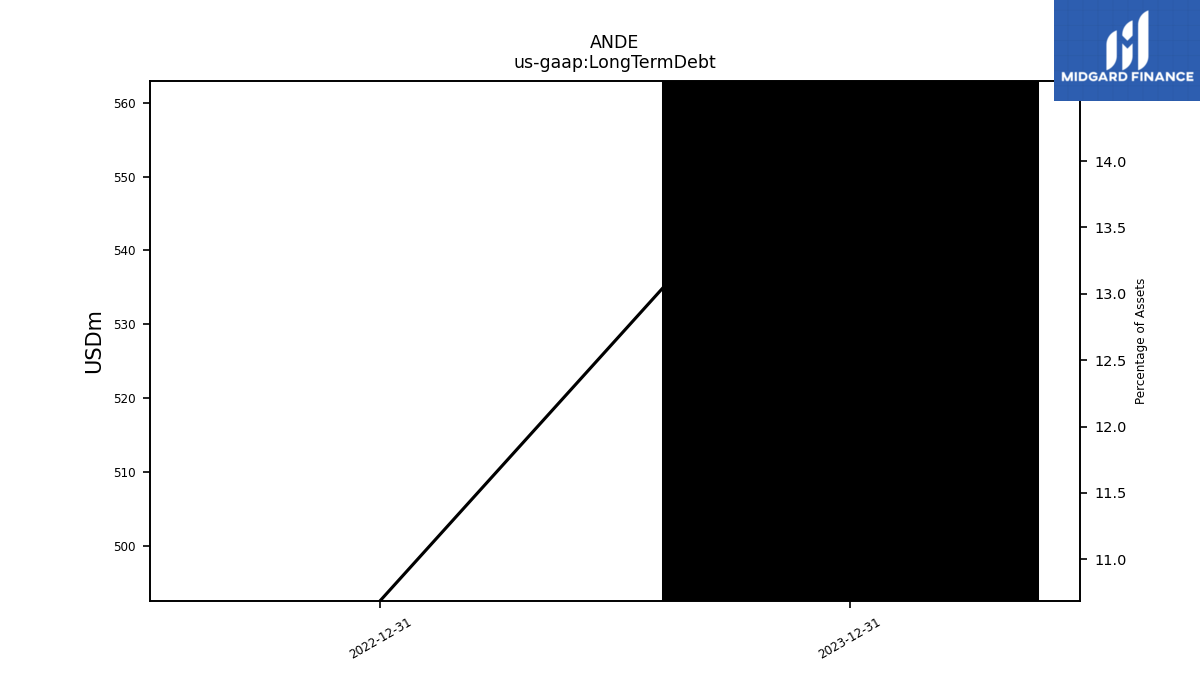
| Long Term Debt | 562.96 | NA | NA | NA | 492.52 | NA | NA | NA | NA | NA | NA | NA | NA | NA | NA | NA | NA | NA | NA | NA | NA | NA | NA | NA | NA | NA | NA | NA | NA | NA | NA | NA | NA | NA | NA | NA | NA | NA | NA | NA | NA | NA | NA | NA | NA | NA | NA | NA | NA | NA | NA | NA | NA | NA | NA | NA | |
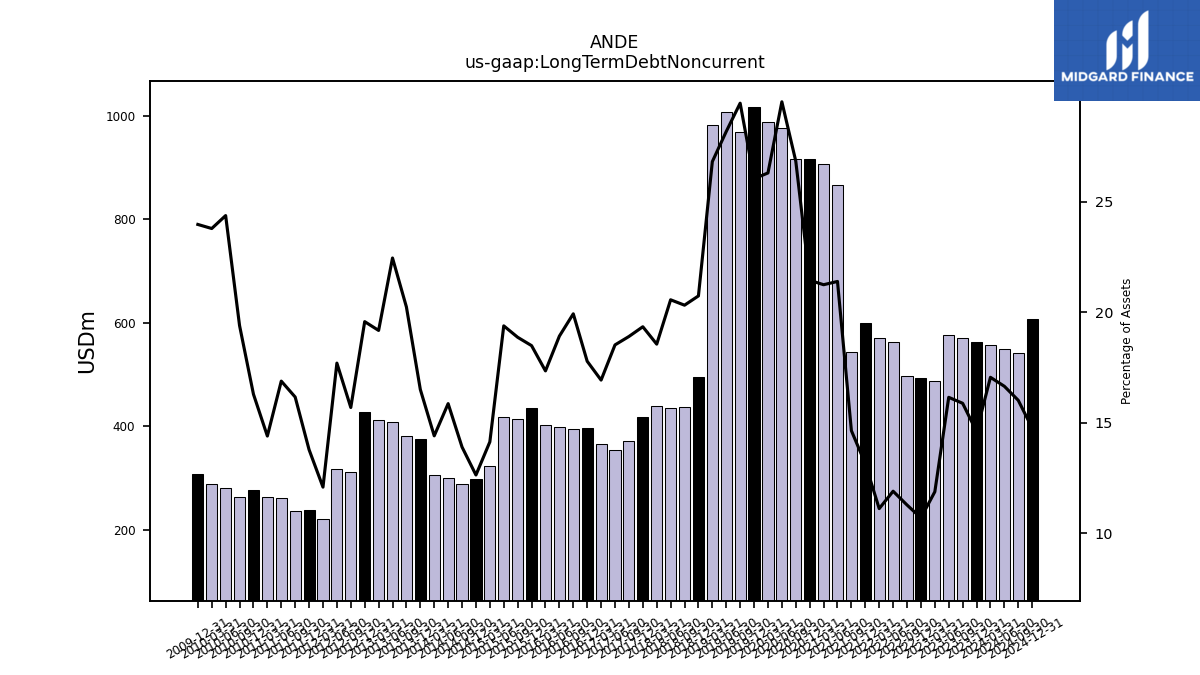
| Long Term Debt Noncurrent | 562.96 | 569.73 | 576.49 | 486.89 | 492.52 | 497.99 | 563.45 | 571.18 | 600.49 | 542.82 | 866.45 | 906.72 | 916.54 | 916.09 | 975.97 | 987.53 | 1016.25 | 968.12 | 1007.01 | 982.02 | 496.19 | 437.28 | 435.58 | 438.63 | 418.34 | 371.31 | 354.07 | 365.97 | 397.06 | 395.56 | 398.75 | 402.36 | 436.21 | 413.56 | 417.28 | 323.26 | 298.64 | 289.45 | 300.22 | 306.16 | 375.21 | 381.02 | 409.02 | 412.70 | 427.24 | 312.40 | 317.65 | 220.42 | 238.88 | 235.73 | 260.64 | 263.22 | 276.82 | 264.35 | 281.74 | 287.85 | |
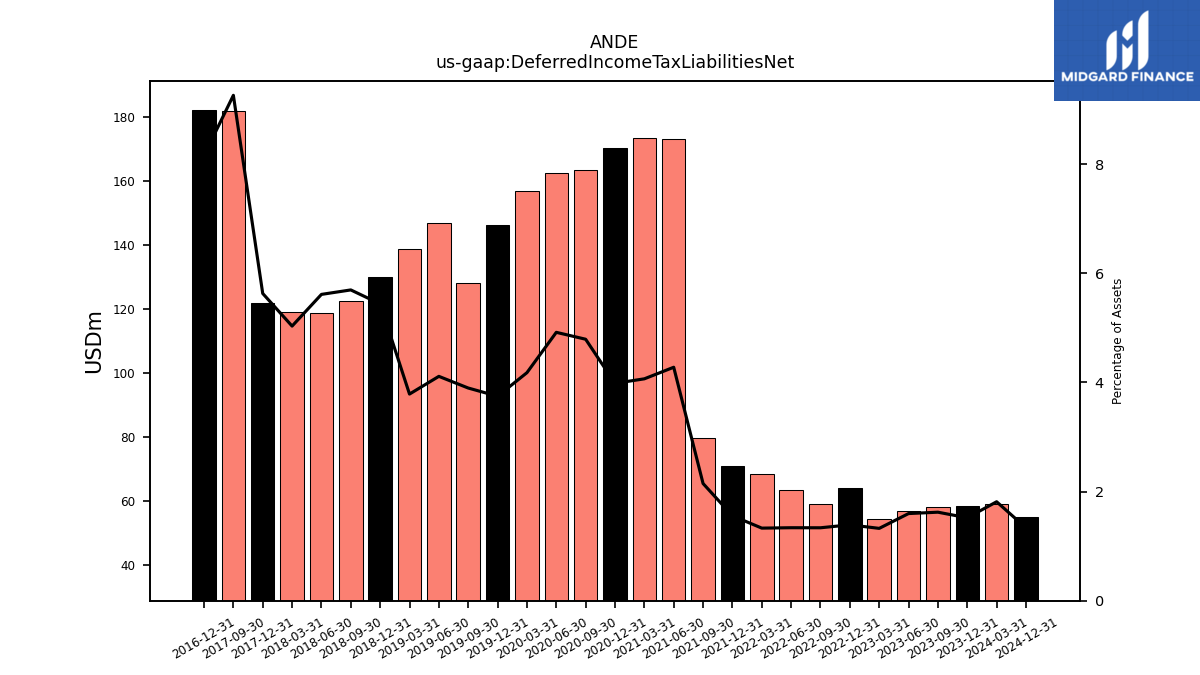
| Deferred Income Tax Liabilities Net | 58.58 | 58.22 | 57.03 | 54.39 | 64.08 | 59.08 | 63.38 | 68.44 | 71.13 | 79.64 | 173.21 | 173.48 | 170.15 | 163.45 | 162.47 | 156.80 | 146.16 | 128.00 | 146.84 | 138.60 | 130.09 | 122.52 | 118.86 | 118.93 | 121.73 | 181.88 | NA | NA | 182.11 | NA | NA | NA | NA | NA | NA | NA | NA | NA | NA | NA | NA | NA | NA | NA | NA | NA | NA | NA | NA | NA | NA | NA | NA | NA | NA | NA | |
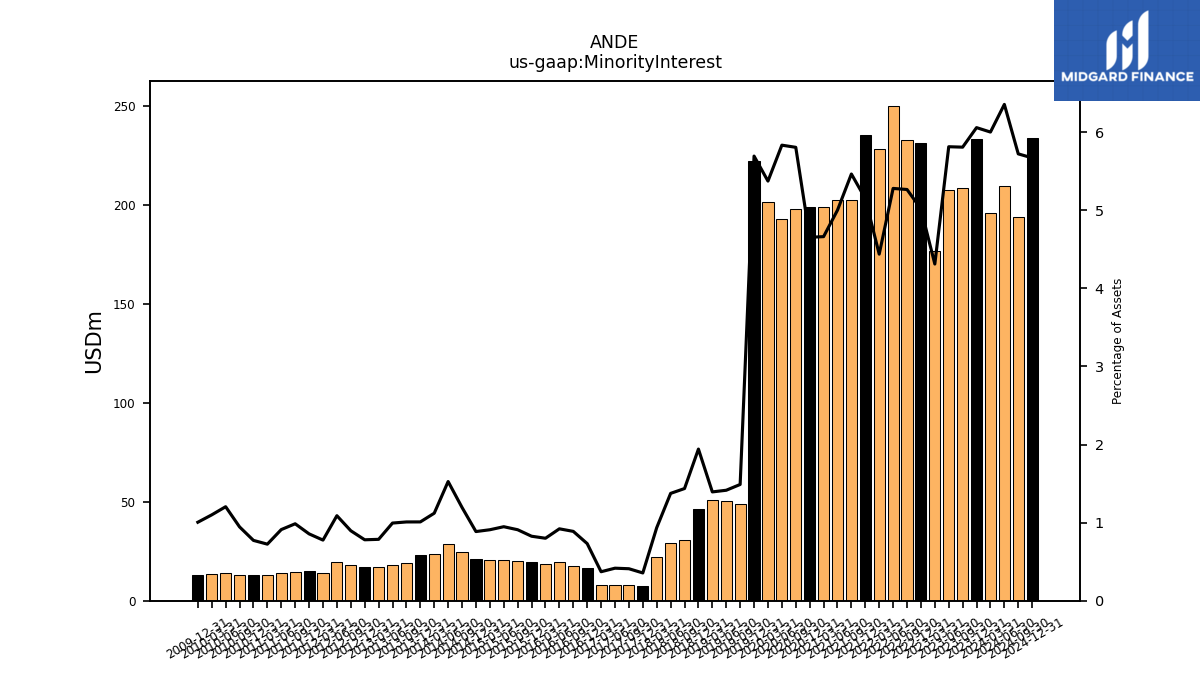
| Minority Interest | 233.49 | 208.35 | 207.50 | 176.82 | 231.17 | 232.63 | 250.05 | 228.20 | 235.28 | 202.58 | 202.46 | 198.88 | 198.77 | 198.03 | 192.69 | 201.60 | 222.04 | 48.89 | 50.52 | 51.00 | 46.44 | 30.91 | 29.11 | 22.11 | 7.70 | 8.05 | 7.97 | 8.03 | 16.34 | 17.62 | 19.41 | 18.56 | 19.48 | 19.93 | 20.40 | 20.79 | 20.95 | 24.88 | 28.89 | 23.82 | 22.95 | 18.99 | 18.11 | 16.92 | 17.03 | 17.85 | 19.54 | 14.17 | 14.85 | 14.37 | 14.07 | 13.25 | 13.13 | 12.88 | 13.91 | 13.30 | |
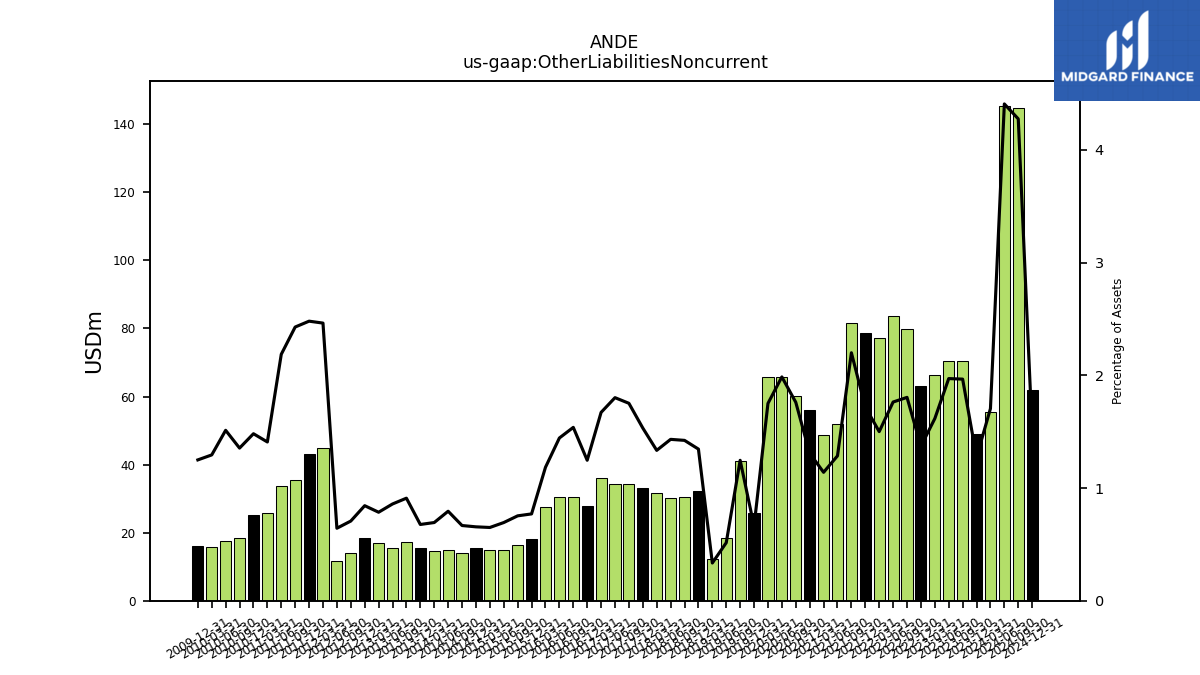
| Other Liabilities Noncurrent | 49.09 | 70.55 | 70.37 | 66.31 | 63.16 | 79.73 | 83.52 | 77.17 | 78.53 | 81.59 | 52.05 | 48.62 | 55.91 | 60.08 | 65.61 | 65.70 | 25.81 | 40.93 | 18.40 | 12.26 | 32.18 | 30.61 | 30.32 | 31.54 | 33.13 | 34.41 | 34.44 | 36.12 | 27.83 | 30.52 | 30.43 | 27.46 | 18.18 | 16.51 | 14.93 | 14.87 | 15.51 | 13.90 | 15.03 | 14.75 | 15.39 | 17.13 | 15.63 | 16.90 | 18.41 | 14.08 | 11.55 | 44.95 | 43.01 | 35.42 | 33.76 | 25.76 | 25.18 | 18.45 | 17.47 | 15.65 | |
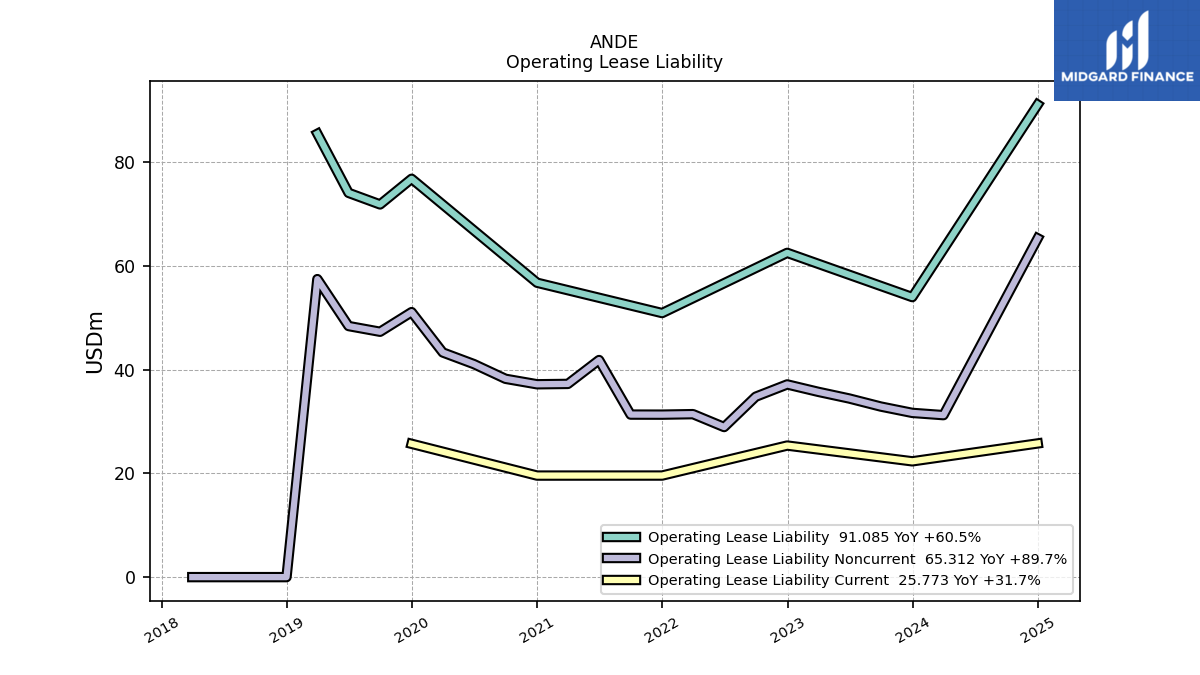
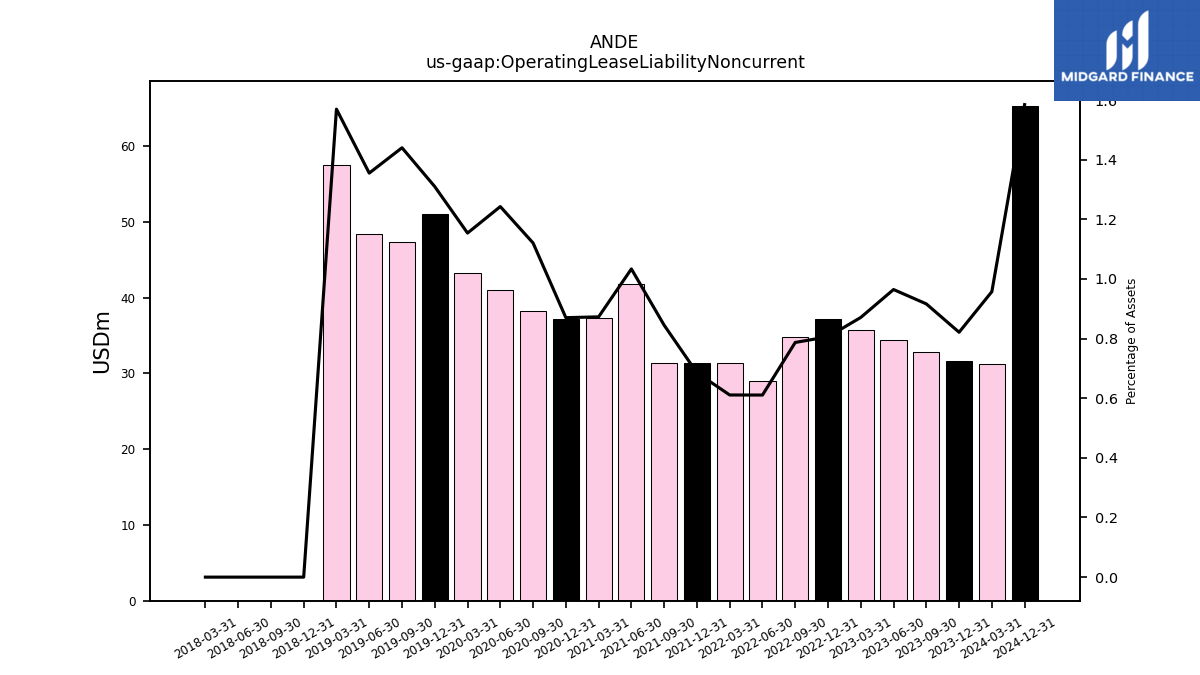
| Operating Lease Liability Noncurrent | 31.66 | 32.88 | 34.44 | 35.73 | 37.15 | 34.78 | 28.93 | 31.42 | 31.32 | 31.33 | 41.85 | 37.25 | 37.18 | 38.23 | 41.06 | 43.31 | 51.09 | 47.30 | 48.40 | 57.45 | 0.00 | 0.00 | 0.00 | 0.00 | NA | NA | NA | NA | NA | NA | NA | NA | NA | NA | NA | NA | NA | NA | NA | NA | NA | NA | NA | NA | NA | NA | NA | NA | NA | NA | NA | NA | NA | NA | NA | NA |
| 2023-12-31 | 2023-09-30 | 2023-06-30 | 2023-03-31 | 2022-12-31 | 2022-09-30 | 2022-06-30 | 2022-03-31 | 2021-12-31 | 2021-09-30 | 2021-06-30 | 2021-03-31 | 2020-12-31 | 2020-09-30 | 2020-06-30 | 2020-03-31 | 2019-12-31 | 2019-09-30 | 2019-06-30 | 2019-03-31 | 2018-12-31 | 2018-09-30 | 2018-06-30 | 2018-03-31 | 2017-12-31 | 2017-09-30 | 2017-06-30 | 2017-03-31 | 2016-12-31 | 2016-09-30 | 2016-06-30 | 2016-03-31 | 2015-12-31 | 2015-09-30 | 2015-06-30 | 2015-03-31 | 2014-12-31 | 2014-09-30 | 2014-06-30 | 2014-03-31 | 2013-12-31 | 2013-09-30 | 2013-06-30 | 2013-03-31 | 2012-12-31 | 2012-09-30 | 2012-06-30 | 2012-03-31 | 2011-12-31 | 2011-09-30 | 2011-06-30 | 2011-03-31 | 2010-12-31 | 2010-09-30 | 2010-06-30 | 2010-03-31 | ||
|---|---|---|---|---|---|---|---|---|---|---|---|---|---|---|---|---|---|---|---|---|---|---|---|---|---|---|---|---|---|---|---|---|---|---|---|---|---|---|---|---|---|---|---|---|---|---|---|---|---|---|---|---|---|---|---|---|---|
| Stockholders Equity | 1282.90 | 1240.73 | 1230.99 | 1169.59 | 1198.60 | 1193.91 | 1167.15 | 1089.03 | 1072.42 | 1033.44 | 1022.50 | 983.67 | 961.89 | 939.20 | 939.39 | 912.26 | 973.61 | 962.46 | 970.11 | 947.28 | 830.32 | 811.74 | 817.88 | 800.64 | 815.20 | 741.76 | 739.83 | 769.33 | 774.36 | 762.54 | 763.70 | 750.16 | 764.25 | 779.77 | 801.51 | 777.12 | 803.10 | 776.70 | 762.39 | 719.51 | 701.47 | 651.30 | 635.77 | 607.40 | 594.41 | 584.57 | 569.65 | 542.69 | 524.00 | 517.70 | 510.40 | 467.85 | 451.43 | 428.97 | 428.65 | 406.37 | |
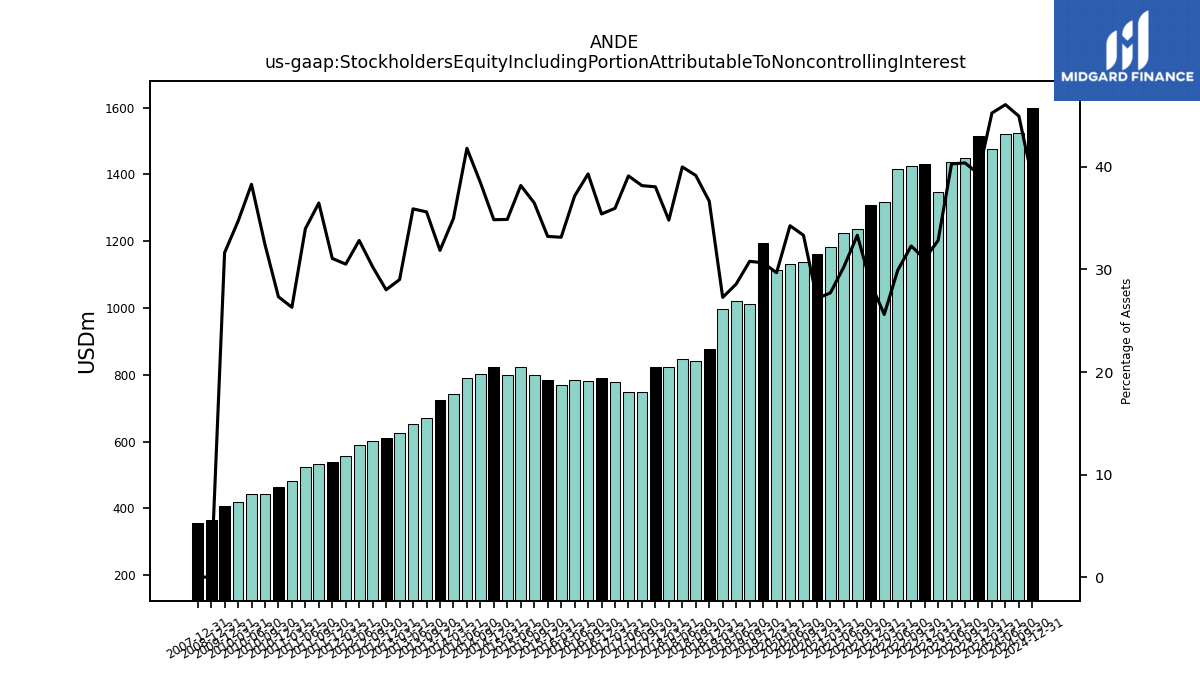
| Stockholders Equity Including Portion Attributable To Noncontrolling Interest | 1516.39 | 1449.09 | 1438.48 | 1346.41 | 1429.77 | 1426.54 | 1417.21 | 1317.22 | 1307.70 | 1236.01 | 1224.96 | 1182.55 | 1160.66 | 1137.23 | 1132.08 | 1113.86 | 1195.65 | 1011.35 | 1020.64 | 998.29 | 876.76 | 842.64 | 846.99 | 822.76 | 822.90 | 749.81 | 747.79 | 777.36 | 790.70 | 780.17 | 783.10 | 768.72 | 783.74 | 799.69 | 821.91 | 797.92 | 824.05 | 801.58 | 791.28 | 743.33 | 724.42 | 670.29 | 653.88 | 624.32 | 611.45 | 602.42 | 589.19 | 556.86 | 538.84 | 532.07 | 524.46 | 481.10 | 464.56 | 441.85 | 442.56 | 419.67 | |
| Common Stock Value | 0.14 | 0.14 | 0.14 | 0.14 | 0.14 | 0.14 | 0.14 | 0.14 | 0.14 | 0.14 | 0.14 | 0.14 | 0.14 | 0.14 | 0.14 | 0.14 | 0.14 | 0.14 | 0.14 | 0.14 | 0.10 | 0.10 | 0.10 | 0.10 | 0.10 | 0.10 | 0.10 | 0.10 | 0.10 | 0.10 | 0.10 | 0.10 | 0.10 | 0.10 | 0.10 | 0.10 | 0.10 | 0.10 | 0.10 | 0.10 | 0.10 | 0.10 | 0.10 | 0.10 | 0.10 | 0.10 | 0.10 | 0.10 | 0.10 | 0.10 | 0.10 | 0.10 | 0.10 | 0.10 | 0.10 | 0.10 | |
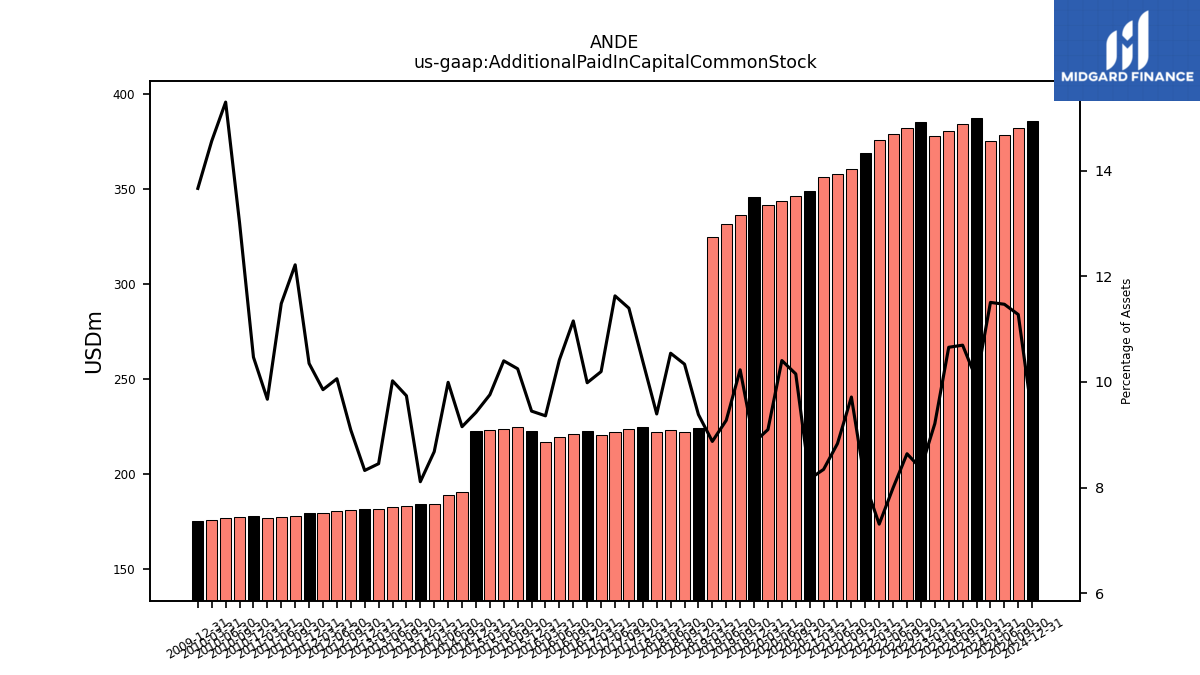
| Additional Paid In Capital Common Stock | 387.21 | 383.72 | 380.38 | 377.77 | 385.25 | 381.73 | 378.74 | 375.79 | 368.60 | 360.16 | 357.61 | 355.96 | 348.71 | 346.28 | 343.73 | 341.38 | 345.36 | 335.92 | 331.19 | 324.75 | 224.40 | 222.37 | 223.26 | 221.99 | 224.62 | 223.81 | 222.26 | 220.37 | 222.91 | 221.33 | 219.49 | 217.05 | 222.85 | 224.59 | 223.80 | 223.18 | 222.79 | 190.62 | 189.10 | 184.47 | 184.38 | 183.27 | 182.46 | 181.84 | 181.63 | 181.00 | 180.53 | 179.78 | 179.46 | 178.17 | 177.27 | 176.85 | 177.88 | 177.30 | 176.74 | 176.12 | |
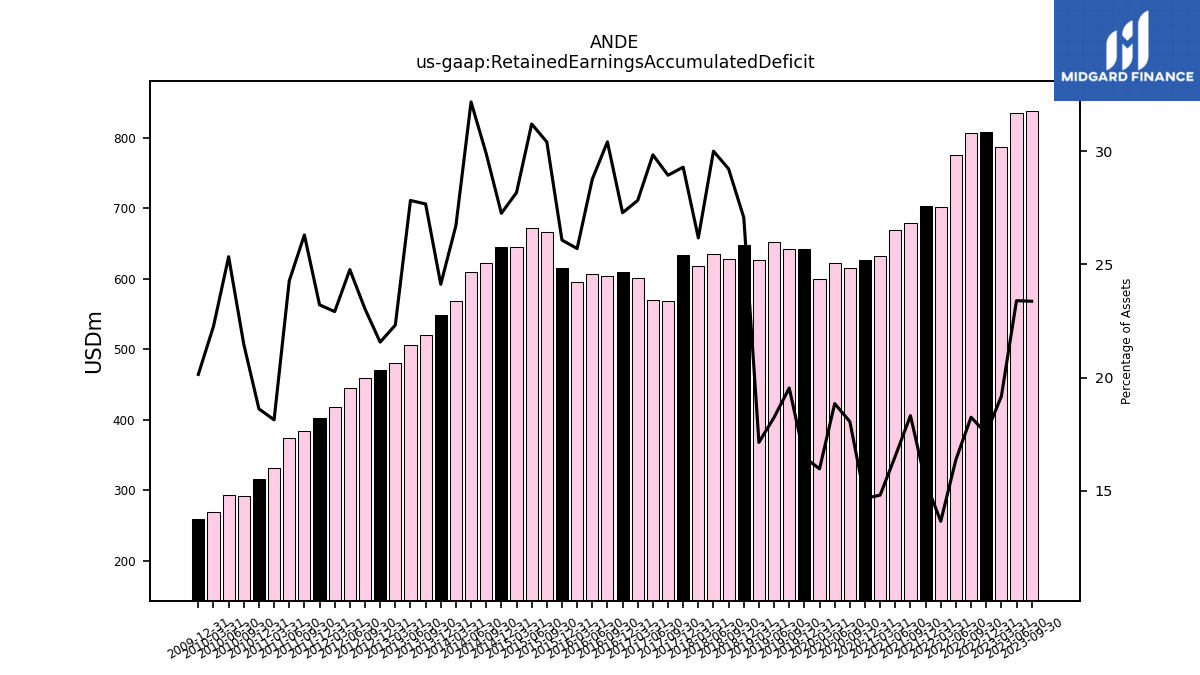
| Retained Earnings Accumulated Deficit | 882.94 | 838.56 | 835.26 | 786.42 | 807.77 | 806.19 | 775.50 | 701.80 | 702.76 | 679.15 | 669.24 | 631.65 | 626.08 | 615.89 | 622.72 | 599.04 | 642.69 | 641.61 | 651.48 | 627.14 | 647.52 | 628.68 | 635.44 | 618.57 | 633.50 | 568.44 | 570.41 | 601.56 | 609.21 | 603.56 | 606.18 | 596.12 | 615.15 | 666.51 | 671.65 | 644.53 | 644.56 | 622.72 | 609.02 | 567.85 | 548.40 | 520.85 | 506.69 | 480.16 | 470.63 | 458.63 | 444.54 | 418.14 | 402.52 | 383.61 | 374.71 | 331.54 | 316.32 | 292.51 | 292.78 | 269.27 | |
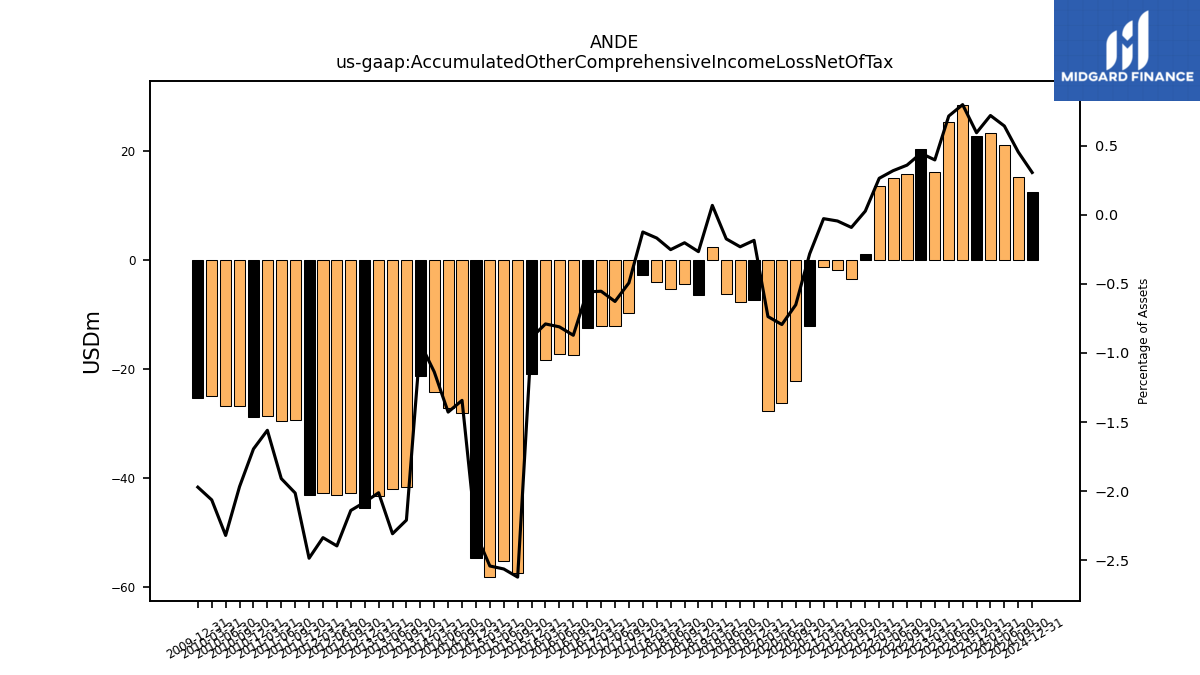
| Accumulated Other Comprehensive Income Loss Net Of Tax | 22.86 | 28.58 | 25.48 | 16.27 | 20.48 | 15.85 | 15.09 | 13.55 | 1.19 | -3.41 | -1.84 | -1.21 | -12.08 | -22.23 | -26.25 | -27.65 | -7.23 | -7.62 | -6.24 | 2.47 | -6.39 | -4.36 | -5.35 | -3.99 | -2.70 | -9.68 | -11.99 | -11.96 | -12.47 | -17.30 | -17.09 | -18.33 | -20.94 | -57.46 | -55.16 | -58.13 | -54.59 | -27.97 | -27.02 | -24.16 | -21.18 | -41.59 | -42.02 | -43.28 | -45.38 | -42.61 | -43.00 | -42.62 | -43.09 | -29.36 | -29.47 | -28.52 | -28.80 | -26.80 | -26.81 | -24.95 | |
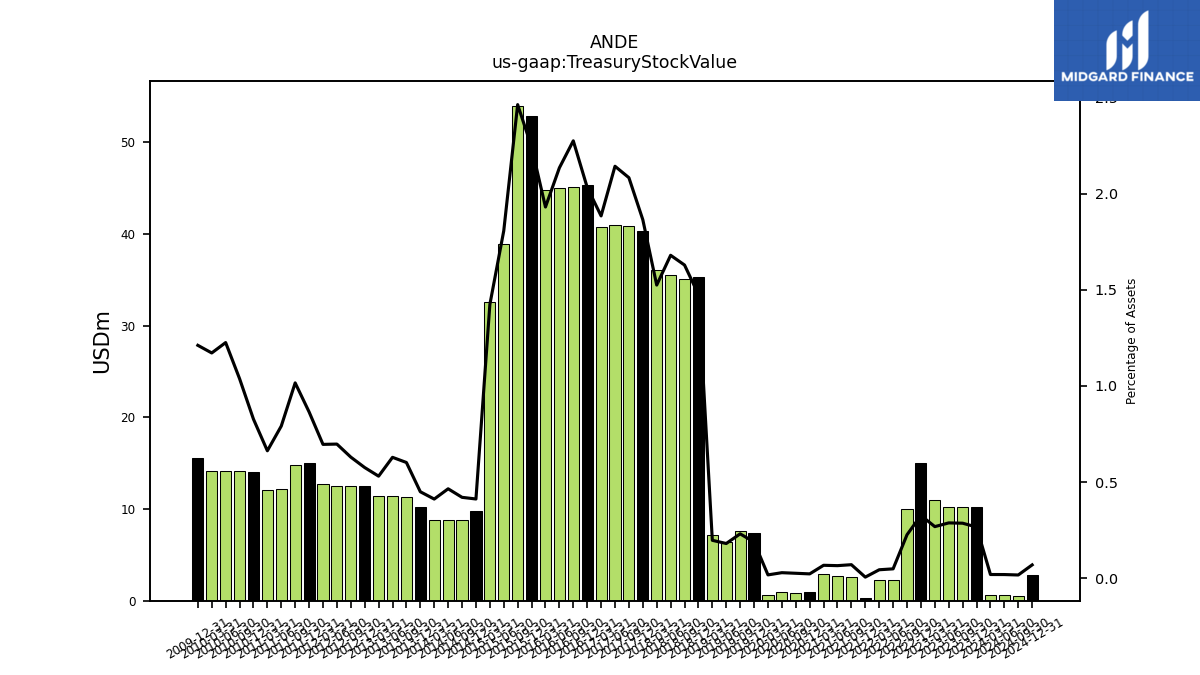
| Treasury Stock Value | 10.26 | 10.27 | 10.27 | 11.01 | 15.04 | 9.99 | 2.31 | 2.27 | 0.26 | 2.61 | 2.65 | 2.87 | 0.97 | 0.88 | 0.95 | 0.65 | 7.34 | 7.58 | 6.45 | 7.22 | 35.30 | 35.04 | 35.56 | 36.03 | 40.31 | 40.91 | 40.95 | 40.73 | 45.38 | 45.13 | 44.97 | 44.77 | 52.90 | 53.97 | 38.88 | 32.55 | 9.74 | 8.76 | 8.80 | 8.75 | 10.22 | 11.33 | 11.45 | 11.42 | 12.56 | 12.54 | 12.52 | 12.70 | 15.00 | 14.81 | 12.21 | 12.12 | 14.06 | 14.14 | 14.16 | 14.17 | |
| Minority Interest | 233.49 | 208.35 | 207.50 | 176.82 | 231.17 | 232.63 | 250.05 | 228.20 | 235.28 | 202.58 | 202.46 | 198.88 | 198.77 | 198.03 | 192.69 | 201.60 | 222.04 | 48.89 | 50.52 | 51.00 | 46.44 | 30.91 | 29.11 | 22.11 | 7.70 | 8.05 | 7.97 | 8.03 | 16.34 | 17.62 | 19.41 | 18.56 | 19.48 | 19.93 | 20.40 | 20.79 | 20.95 | 24.88 | 28.89 | 23.82 | 22.95 | 18.99 | 18.11 | 16.92 | 17.03 | 17.85 | 19.54 | 14.17 | 14.85 | 14.37 | 14.07 | 13.25 | 13.13 | 12.88 | 13.91 | 13.30 | |
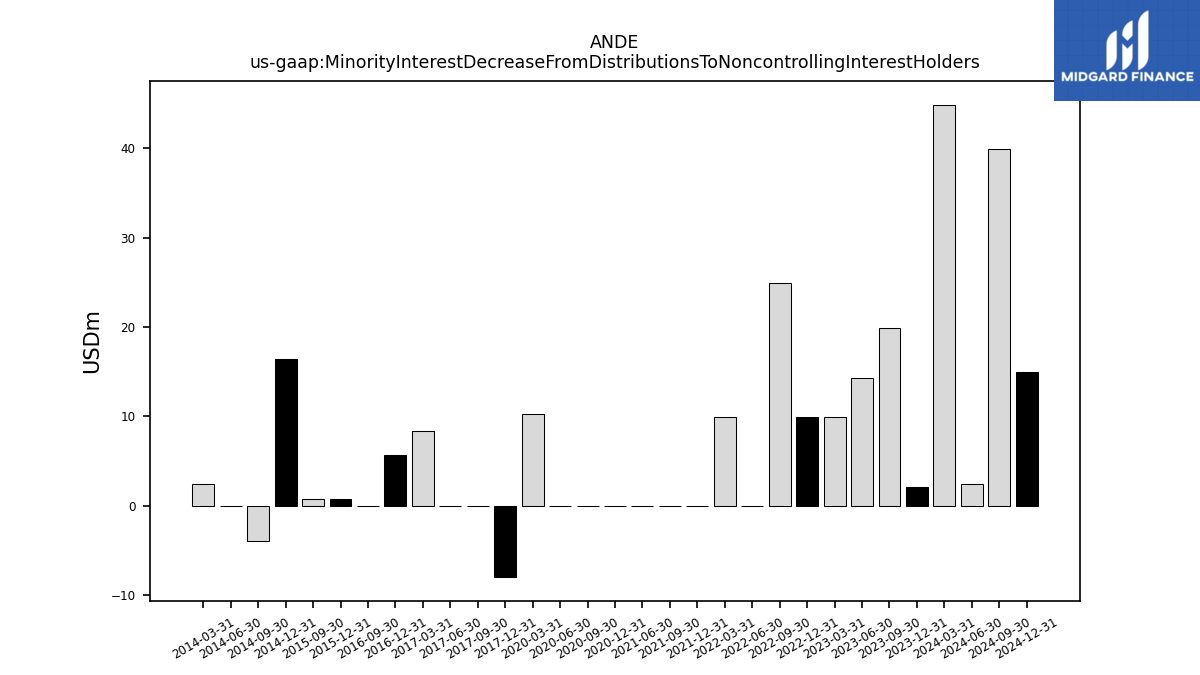
| Minority Interest Decrease From Distributions To Noncontrolling Interest Holders | 2.11 | 19.96 | 14.36 | 9.98 | 9.98 | 24.95 | 0.00 | 9.98 | 0.00 | 0.00 | 0.03 | NA | 0.00 | 0.02 | 0.00 | 10.30 | NA | NA | NA | NA | NA | NA | NA | NA | -7.98 | 0.00 | 0.00 | 8.36 | 5.68 | 0.00 | NA | NA | 0.75 | 0.75 | NA | NA | 16.41 | -3.94 | 0.00 | 2.45 | NA | NA | NA | NA | NA | NA | NA | NA | NA | NA | NA | NA | NA | NA | NA | NA |
| 2023-12-31 | 2023-09-30 | 2023-06-30 | 2023-03-31 | 2022-12-31 | 2022-09-30 | 2022-06-30 | 2022-03-31 | 2021-12-31 | 2021-09-30 | 2021-06-30 | 2021-03-31 | 2020-12-31 | 2020-09-30 | 2020-06-30 | 2020-03-31 | 2019-12-31 | 2019-09-30 | 2019-06-30 | 2019-03-31 | 2018-12-31 | 2018-09-30 | 2018-06-30 | 2018-03-31 | 2017-12-31 | 2017-09-30 | 2017-06-30 | 2017-03-31 | 2016-12-31 | 2016-09-30 | 2016-06-30 | 2016-03-31 | 2015-12-31 | 2015-09-30 | 2015-06-30 | 2015-03-31 | 2014-12-31 | 2014-09-30 | 2014-06-30 | 2014-03-31 | 2013-12-31 | 2013-09-30 | 2013-06-30 | 2013-03-31 | 2012-12-31 | 2012-09-30 | 2012-06-30 | 2012-03-31 | 2011-12-31 | 2011-09-30 | 2011-06-30 | 2011-03-31 | 2010-12-31 | 2010-09-30 | 2010-06-30 | 2010-03-31 | ||
|---|---|---|---|---|---|---|---|---|---|---|---|---|---|---|---|---|---|---|---|---|---|---|---|---|---|---|---|---|---|---|---|---|---|---|---|---|---|---|---|---|---|---|---|---|---|---|---|---|---|---|---|---|---|---|---|---|---|
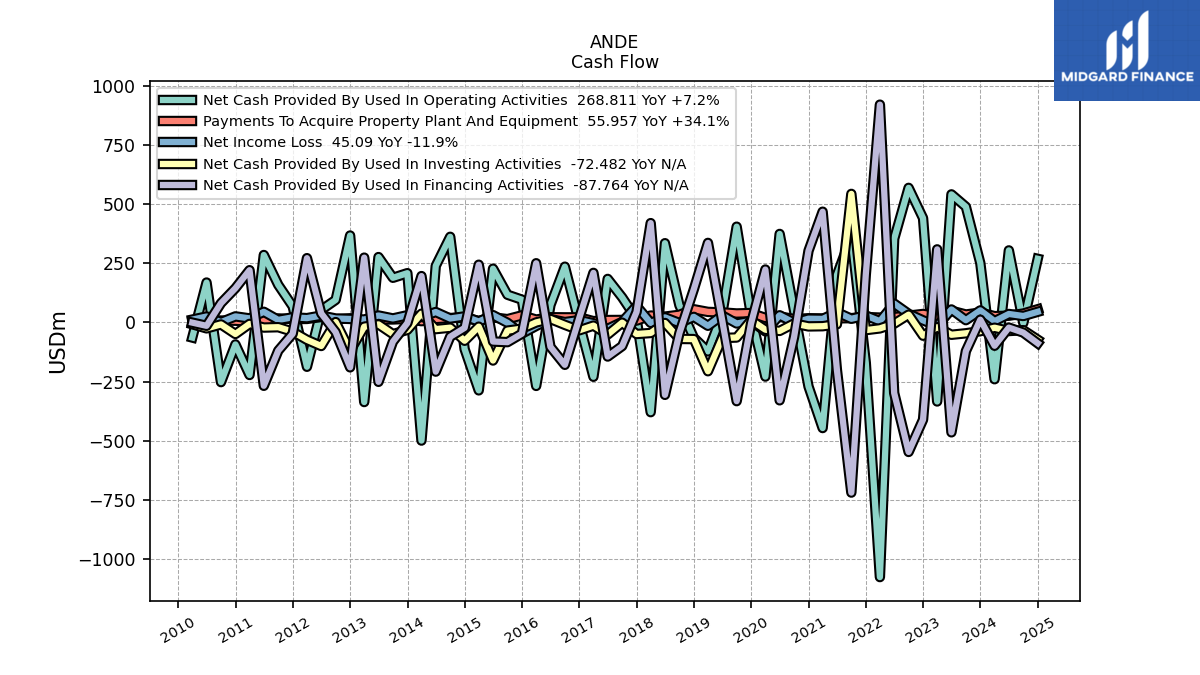
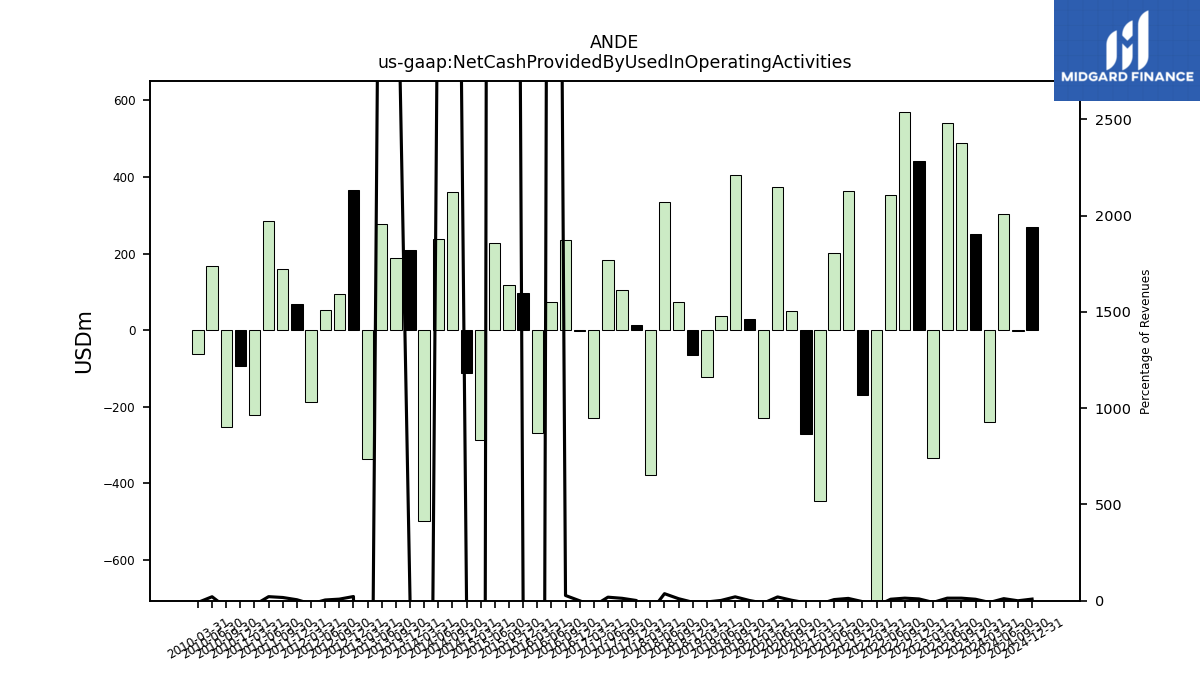
| Net Cash Provided By Used In Operating Activities | 250.66 | 488.68 | 540.94 | -333.54 | 440.49 | 568.43 | 353.20 | -1075.00 | -170.12 | 364.56 | 200.23 | -445.73 | -270.22 | 50.28 | 373.94 | -228.43 | 28.94 | 404.47 | 37.20 | -122.05 | -64.35 | 72.76 | 334.78 | -378.71 | 14.55 | 105.96 | 184.01 | -229.24 | -1.76 | 235.71 | 73.49 | -267.85 | 96.36 | 117.17 | 227.26 | -286.66 | -112.34 | 361.86 | 239.03 | -498.61 | 208.23 | 188.63 | 276.31 | -335.98 | 367.21 | 95.36 | 52.92 | -187.01 | 68.25 | 158.78 | 284.99 | -221.75 | -92.65 | -251.83 | 168.71 | -63.52 | |
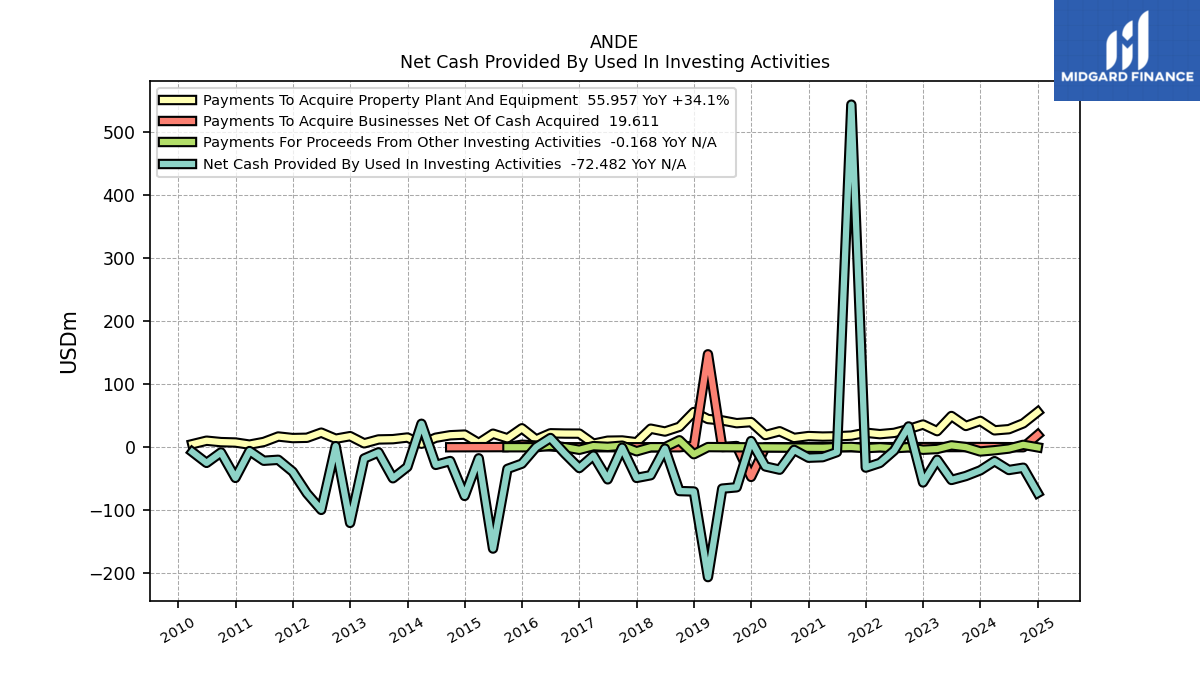
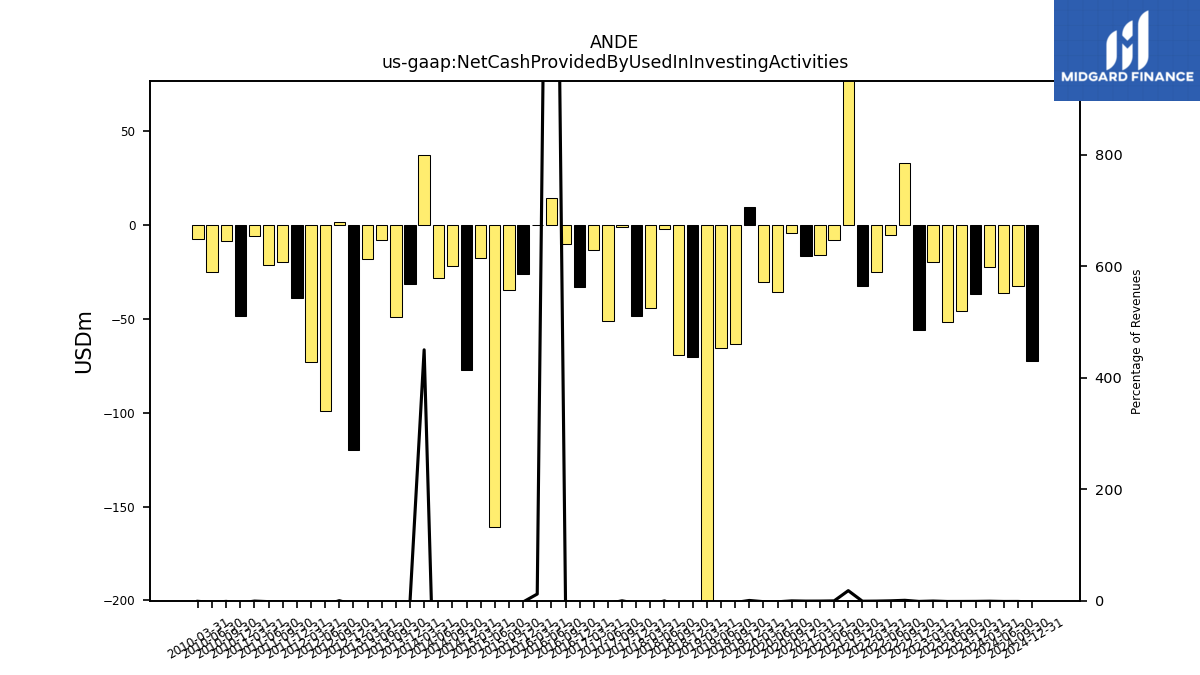
| Net Cash Provided By Used In Investing Activities | -36.62 | -45.59 | -51.87 | -19.81 | -55.82 | 33.01 | -5.17 | -24.92 | -32.27 | 543.00 | -7.74 | -15.73 | -16.60 | -4.16 | -35.59 | -30.42 | 9.84 | -63.48 | -65.56 | -205.84 | -70.11 | -69.44 | -2.09 | -44.35 | -48.62 | -0.72 | -50.91 | -13.25 | -33.02 | -10.11 | 14.65 | 0.25 | -26.05 | -34.30 | -160.62 | -17.52 | -77.18 | -21.83 | -27.98 | 37.26 | -31.16 | -49.22 | -8.08 | -17.80 | -119.96 | 1.82 | -99.29 | -73.13 | -38.74 | -19.89 | -21.40 | -5.97 | -48.61 | -8.19 | -24.81 | -7.40 | |
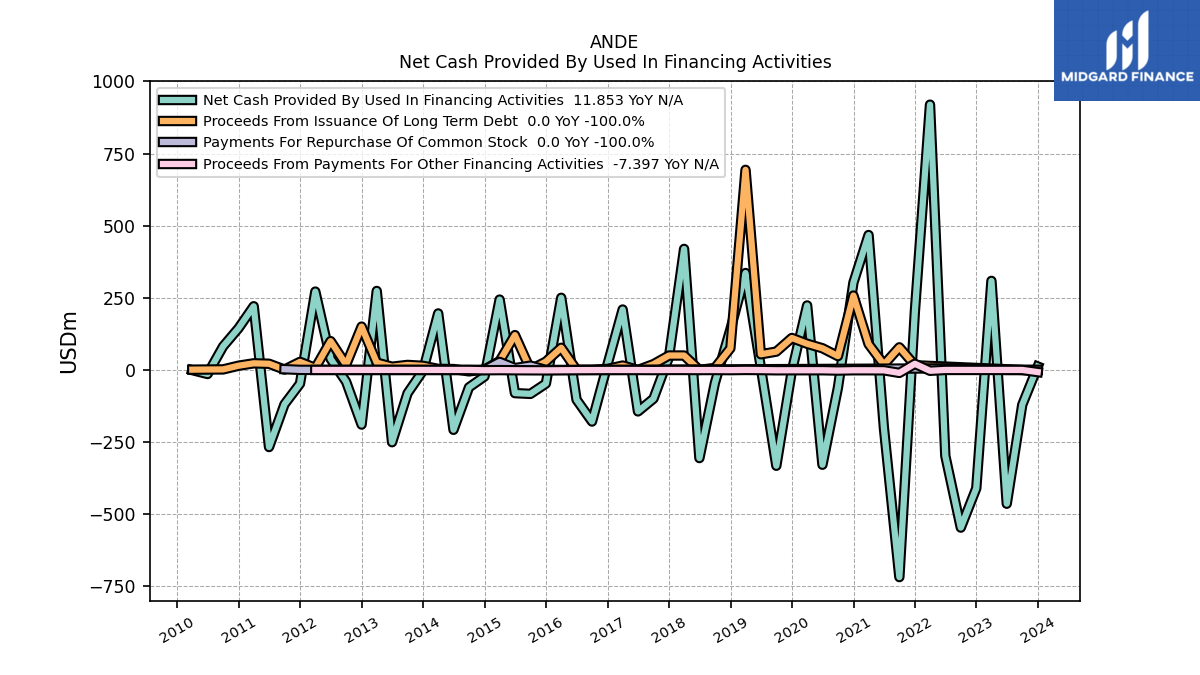
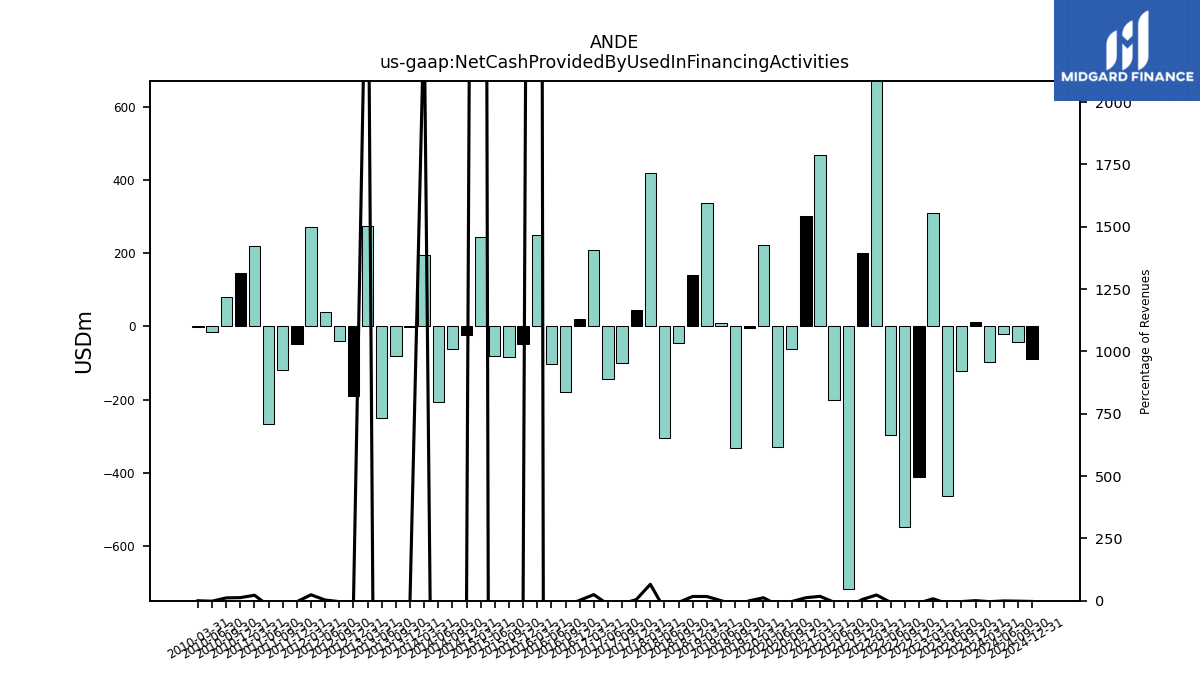
| Net Cash Provided By Used In Financing Activities | 11.85 | -120.86 | -463.80 | 308.82 | -410.22 | -546.62 | -297.64 | 919.76 | 201.88 | -718.20 | -200.21 | 467.76 | 302.72 | -61.36 | -328.64 | 223.58 | -3.55 | -332.15 | 8.36 | 336.05 | 140.23 | -45.11 | -305.57 | 419.63 | 44.51 | -99.70 | -143.81 | 209.50 | 19.25 | -178.82 | -103.06 | 250.15 | -47.22 | -82.99 | -80.33 | 243.94 | -22.72 | -60.27 | -207.55 | 195.96 | -2.42 | -80.89 | -250.60 | 273.85 | -189.40 | -40.75 | 38.43 | 271.62 | -47.63 | -118.99 | -267.30 | 220.83 | 144.74 | 81.43 | -14.04 | -0.55 |
| 2023-12-31 | 2023-09-30 | 2023-06-30 | 2023-03-31 | 2022-12-31 | 2022-09-30 | 2022-06-30 | 2022-03-31 | 2021-12-31 | 2021-09-30 | 2021-06-30 | 2021-03-31 | 2020-12-31 | 2020-09-30 | 2020-06-30 | 2020-03-31 | 2019-12-31 | 2019-09-30 | 2019-06-30 | 2019-03-31 | 2018-12-31 | 2018-09-30 | 2018-06-30 | 2018-03-31 | 2017-12-31 | 2017-09-30 | 2017-06-30 | 2017-03-31 | 2016-12-31 | 2016-09-30 | 2016-06-30 | 2016-03-31 | 2015-12-31 | 2015-09-30 | 2015-06-30 | 2015-03-31 | 2014-12-31 | 2014-09-30 | 2014-06-30 | 2014-03-31 | 2013-12-31 | 2013-09-30 | 2013-06-30 | 2013-03-31 | 2012-12-31 | 2012-09-30 | 2012-06-30 | 2012-03-31 | 2011-12-31 | 2011-09-30 | 2011-06-30 | 2011-03-31 | 2010-12-31 | 2010-09-30 | 2010-06-30 | 2010-03-31 | ||
|---|---|---|---|---|---|---|---|---|---|---|---|---|---|---|---|---|---|---|---|---|---|---|---|---|---|---|---|---|---|---|---|---|---|---|---|---|---|---|---|---|---|---|---|---|---|---|---|---|---|---|---|---|---|---|---|---|---|
| Net Cash Provided By Used In Operating Activities | 250.66 | 488.68 | 540.94 | -333.54 | 440.49 | 568.43 | 353.20 | -1075.00 | -170.12 | 364.56 | 200.23 | -445.73 | -270.22 | 50.28 | 373.94 | -228.43 | 28.94 | 404.47 | 37.20 | -122.05 | -64.35 | 72.76 | 334.78 | -378.71 | 14.55 | 105.96 | 184.01 | -229.24 | -1.76 | 235.71 | 73.49 | -267.85 | 96.36 | 117.17 | 227.26 | -286.66 | -112.34 | 361.86 | 239.03 | -498.61 | 208.23 | 188.63 | 276.31 | -335.98 | 367.21 | 95.36 | 52.92 | -187.01 | 68.25 | 158.78 | 284.99 | -221.75 | -92.65 | -251.83 | 168.71 | -63.52 | |
| Net Income Loss | 51.19 | 9.71 | 55.05 | -14.75 | 9.02 | 36.75 | 79.81 | 5.50 | 29.64 | 15.74 | 43.50 | 15.11 | 15.99 | -1.06 | 30.44 | -37.66 | 6.65 | -4.24 | 29.89 | -13.99 | 23.75 | -2.10 | 21.53 | -1.70 | 69.72 | 2.53 | -26.65 | -3.09 | 10.14 | 1.72 | 14.42 | -14.70 | -47.03 | -1.23 | 31.09 | 4.10 | 25.89 | 16.82 | 44.30 | 22.71 | 30.66 | 17.16 | 29.54 | 12.58 | 14.99 | 16.88 | 29.20 | 18.41 | 21.70 | 10.93 | 45.22 | 17.27 | 25.83 | 1.39 | 25.17 | 12.27 | |
| Profit Loss | 78.44 | 30.52 | 82.69 | -59.12 | 15.10 | 44.27 | 101.66 | 5.95 | 62.34 | 14.14 | 46.12 | 13.26 | 14.65 | 2.21 | 20.03 | -51.11 | 5.67 | -5.87 | 29.41 | -14.15 | 23.67 | -1.88 | 21.41 | -1.98 | 69.74 | 2.62 | -26.72 | -3.04 | 11.31 | 3.34 | 15.44 | -15.62 | -46.72 | -0.95 | 32.40 | 3.94 | 27.97 | 19.28 | 49.37 | 26.03 | 34.62 | 18.04 | 30.73 | 12.31 | 14.18 | 15.19 | 28.47 | 17.73 | 22.17 | 11.23 | 46.03 | 17.39 | 26.08 | 0.37 | 25.78 | 12.66 | |
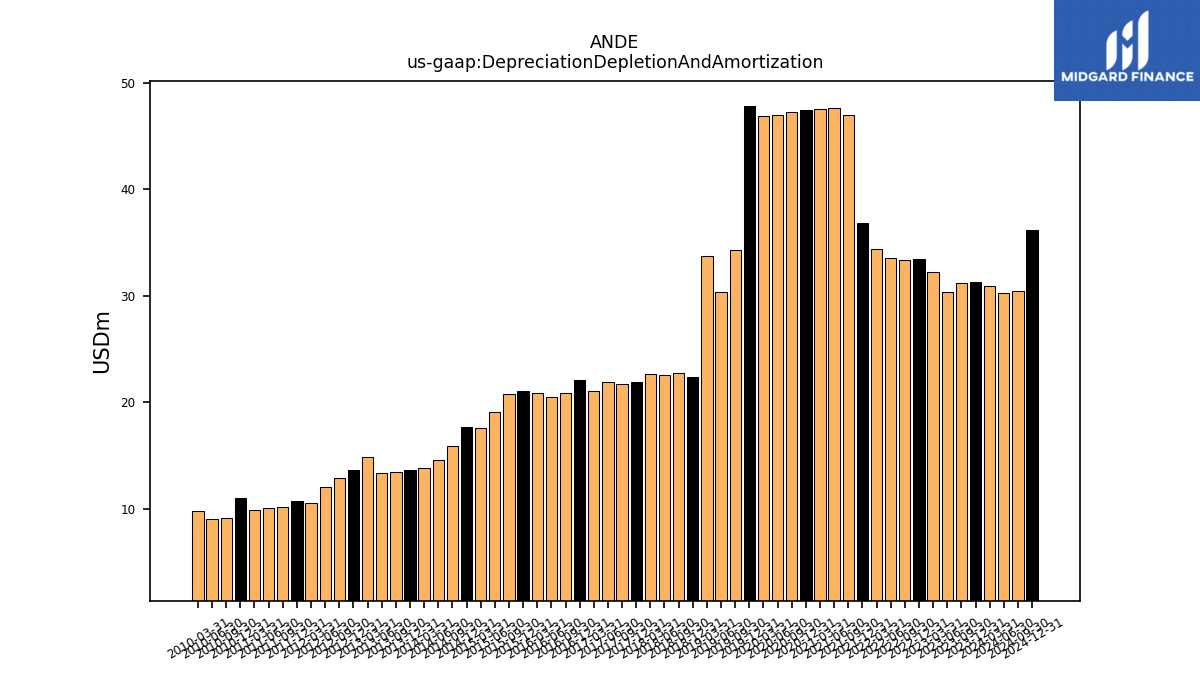
| Depreciation Depletion And Amortization | 31.31 | 31.21 | 30.36 | 32.22 | 33.48 | 33.32 | 33.57 | 34.38 | 36.80 | 46.98 | 47.65 | 47.50 | 47.47 | 47.27 | 47.00 | 46.90 | 47.77 | 34.25 | 30.39 | 33.76 | 22.34 | 22.73 | 22.55 | 22.68 | 21.87 | 21.67 | 21.88 | 21.00 | 22.08 | 20.86 | 20.48 | 20.90 | 21.09 | 20.77 | 19.07 | 17.52 | 17.70 | 15.87 | 14.58 | 13.86 | 13.67 | 13.45 | 13.38 | 14.80 | 13.65 | 12.83 | 12.01 | 10.49 | 10.75 | 10.14 | 10.07 | 9.88 | 10.98 | 9.12 | 9.06 | 9.75 | |
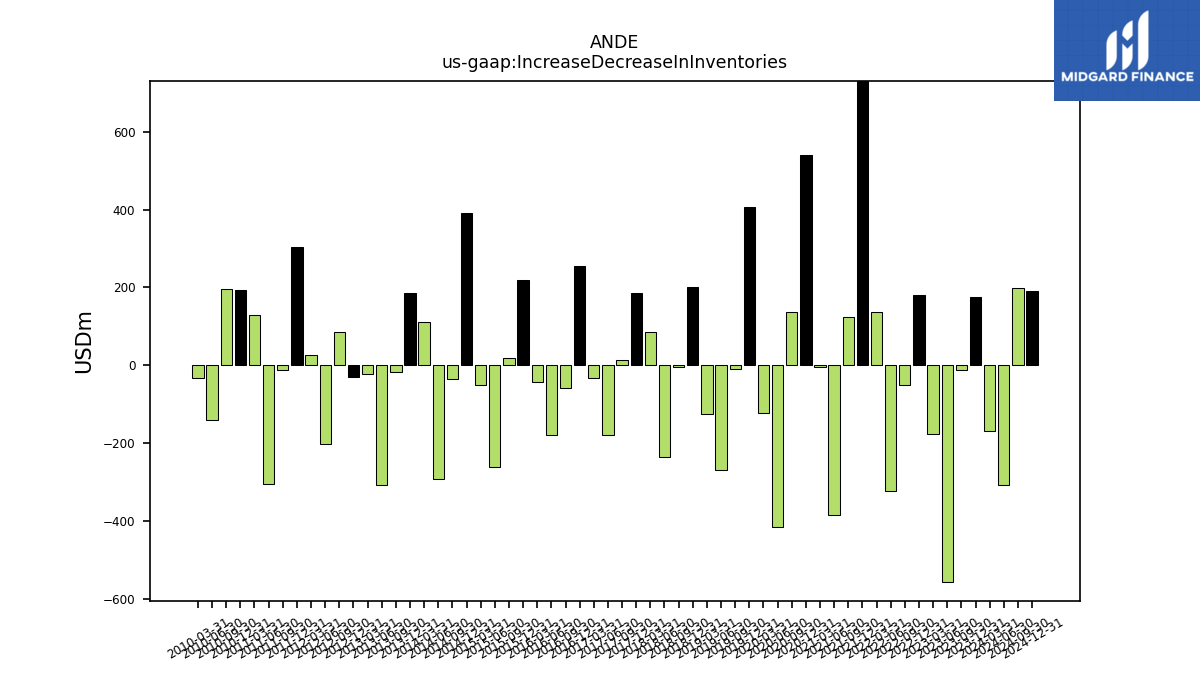
| Increase Decrease In Inventories | 175.88 | -13.26 | -556.85 | -178.01 | 180.00 | -50.17 | -323.50 | 136.82 | 794.94 | 123.64 | -385.50 | -5.01 | 539.76 | 136.69 | -414.63 | -122.32 | 407.20 | -10.99 | -269.89 | -124.74 | 200.44 | -5.28 | -236.36 | 85.26 | 184.53 | 12.40 | -179.61 | -33.46 | 254.99 | -58.79 | -180.42 | -43.95 | 219.61 | 19.38 | -260.64 | -51.70 | 390.50 | -36.53 | -292.59 | 110.66 | 185.73 | -16.58 | -308.30 | -23.30 | -31.39 | 85.73 | -201.86 | 25.09 | 303.08 | -11.29 | -305.19 | 127.83 | 192.35 | 195.05 | -140.28 | -32.95 |
| 2023-12-31 | 2023-09-30 | 2023-06-30 | 2023-03-31 | 2022-12-31 | 2022-09-30 | 2022-06-30 | 2022-03-31 | 2021-12-31 | 2021-09-30 | 2021-06-30 | 2021-03-31 | 2020-12-31 | 2020-09-30 | 2020-06-30 | 2020-03-31 | 2019-12-31 | 2019-09-30 | 2019-06-30 | 2019-03-31 | 2018-12-31 | 2018-09-30 | 2018-06-30 | 2018-03-31 | 2017-12-31 | 2017-09-30 | 2017-06-30 | 2017-03-31 | 2016-12-31 | 2016-09-30 | 2016-06-30 | 2016-03-31 | 2015-12-31 | 2015-09-30 | 2015-06-30 | 2015-03-31 | 2014-12-31 | 2014-09-30 | 2014-06-30 | 2014-03-31 | 2013-12-31 | 2013-09-30 | 2013-06-30 | 2013-03-31 | 2012-12-31 | 2012-09-30 | 2012-06-30 | 2012-03-31 | 2011-12-31 | 2011-09-30 | 2011-06-30 | 2011-03-31 | 2010-12-31 | 2010-09-30 | 2010-06-30 | 2010-03-31 | ||
|---|---|---|---|---|---|---|---|---|---|---|---|---|---|---|---|---|---|---|---|---|---|---|---|---|---|---|---|---|---|---|---|---|---|---|---|---|---|---|---|---|---|---|---|---|---|---|---|---|---|---|---|---|---|---|---|---|---|
| Net Cash Provided By Used In Investing Activities | -36.62 | -45.59 | -51.87 | -19.81 | -55.82 | 33.01 | -5.17 | -24.92 | -32.27 | 543.00 | -7.74 | -15.73 | -16.60 | -4.16 | -35.59 | -30.42 | 9.84 | -63.48 | -65.56 | -205.84 | -70.11 | -69.44 | -2.09 | -44.35 | -48.62 | -0.72 | -50.91 | -13.25 | -33.02 | -10.11 | 14.65 | 0.25 | -26.05 | -34.30 | -160.62 | -17.52 | -77.18 | -21.83 | -27.98 | 37.26 | -31.16 | -49.22 | -8.08 | -17.80 | -119.96 | 1.82 | -99.29 | -73.13 | -38.74 | -19.89 | -21.40 | -5.97 | -48.61 | -8.19 | -24.81 | -7.40 | |
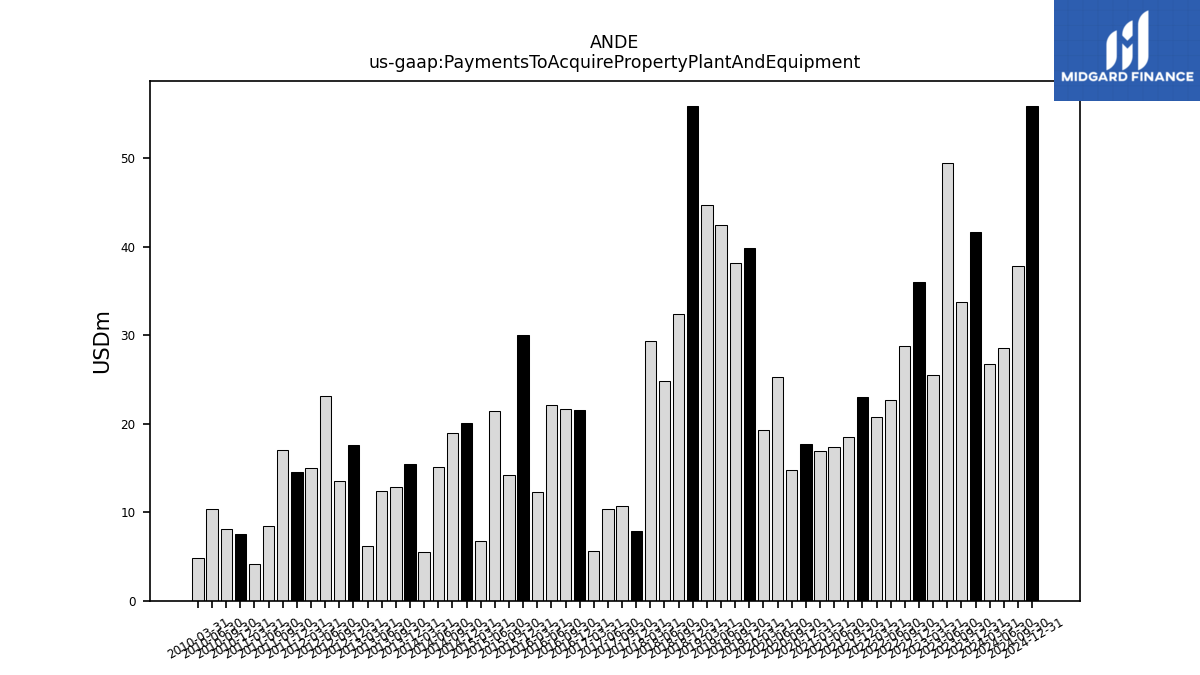
| Payments To Acquire Property Plant And Equipment | 41.73 | 33.73 | 49.52 | 25.47 | 36.04 | 28.77 | 22.75 | 20.72 | 23.04 | 18.47 | 17.34 | 16.92 | 17.73 | 14.77 | 25.34 | 19.31 | 39.87 | 38.14 | 42.48 | 44.73 | 55.88 | 32.39 | 24.89 | 29.41 | 7.90 | 10.73 | 10.37 | 5.61 | 21.60 | 21.70 | 22.14 | 12.30 | 30.08 | 14.17 | 21.47 | 6.74 | 20.05 | 18.99 | 15.11 | 5.52 | 15.43 | 12.81 | 12.36 | 6.19 | 17.59 | 13.51 | 23.16 | 15.01 | 14.56 | 17.03 | 8.41 | 4.16 | 7.50 | 8.15 | 10.39 | 4.86 |
| 2023-12-31 | 2023-09-30 | 2023-06-30 | 2023-03-31 | 2022-12-31 | 2022-09-30 | 2022-06-30 | 2022-03-31 | 2021-12-31 | 2021-09-30 | 2021-06-30 | 2021-03-31 | 2020-12-31 | 2020-09-30 | 2020-06-30 | 2020-03-31 | 2019-12-31 | 2019-09-30 | 2019-06-30 | 2019-03-31 | 2018-12-31 | 2018-09-30 | 2018-06-30 | 2018-03-31 | 2017-12-31 | 2017-09-30 | 2017-06-30 | 2017-03-31 | 2016-12-31 | 2016-09-30 | 2016-06-30 | 2016-03-31 | 2015-12-31 | 2015-09-30 | 2015-06-30 | 2015-03-31 | 2014-12-31 | 2014-09-30 | 2014-06-30 | 2014-03-31 | 2013-12-31 | 2013-09-30 | 2013-06-30 | 2013-03-31 | 2012-12-31 | 2012-09-30 | 2012-06-30 | 2012-03-31 | 2011-12-31 | 2011-09-30 | 2011-06-30 | 2011-03-31 | 2010-12-31 | 2010-09-30 | 2010-06-30 | 2010-03-31 | ||
|---|---|---|---|---|---|---|---|---|---|---|---|---|---|---|---|---|---|---|---|---|---|---|---|---|---|---|---|---|---|---|---|---|---|---|---|---|---|---|---|---|---|---|---|---|---|---|---|---|---|---|---|---|---|---|---|---|---|
| Net Cash Provided By Used In Financing Activities | 11.85 | -120.86 | -463.80 | 308.82 | -410.22 | -546.62 | -297.64 | 919.76 | 201.88 | -718.20 | -200.21 | 467.76 | 302.72 | -61.36 | -328.64 | 223.58 | -3.55 | -332.15 | 8.36 | 336.05 | 140.23 | -45.11 | -305.57 | 419.63 | 44.51 | -99.70 | -143.81 | 209.50 | 19.25 | -178.82 | -103.06 | 250.15 | -47.22 | -82.99 | -80.33 | 243.94 | -22.72 | -60.27 | -207.55 | 195.96 | -2.42 | -80.89 | -250.60 | 273.85 | -189.40 | -40.75 | 38.43 | 271.62 | -47.63 | -118.99 | -267.30 | 220.83 | 144.74 | 81.43 | -14.04 | -0.55 | |
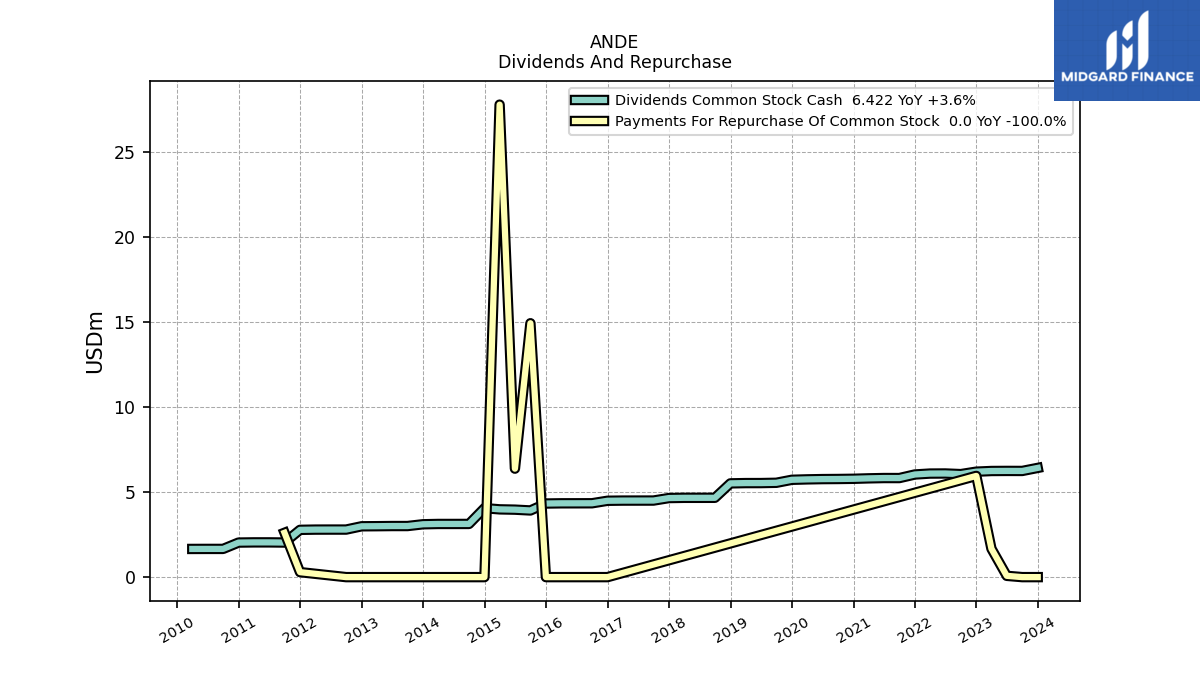
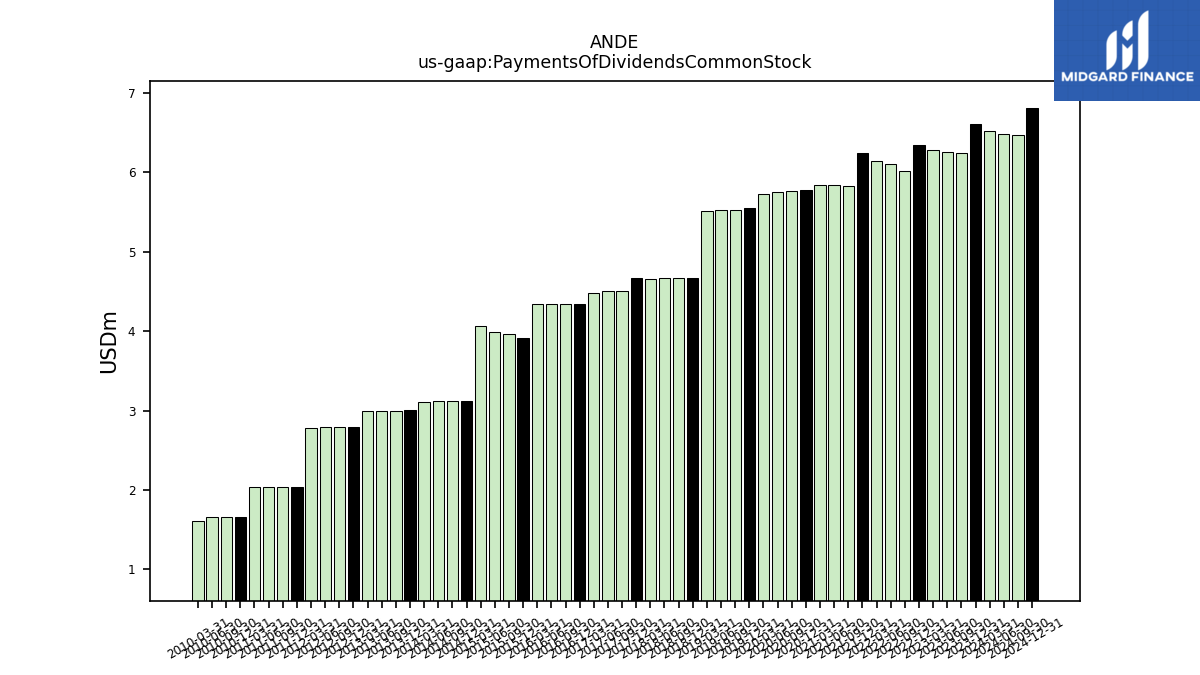
| Payments Of Dividends Common Stock | 6.60 | 6.24 | 6.25 | 6.28 | 6.35 | 6.02 | 6.10 | 6.14 | 6.24 | 5.83 | 5.84 | 5.84 | 5.77 | 5.76 | 5.75 | 5.72 | 5.55 | 5.53 | 5.53 | 5.51 | 4.66 | 4.66 | 4.66 | 4.65 | 4.67 | 4.50 | 4.50 | 4.48 | 4.34 | 4.34 | 4.34 | 4.34 | 3.91 | 3.97 | 3.98 | 4.06 | 3.13 | 3.13 | 3.13 | 3.11 | 3.00 | 3.00 | 3.00 | 2.99 | 2.80 | 2.80 | 2.79 | 2.78 | 2.04 | 2.04 | 2.04 | 2.03 | 1.66 | 1.66 | 1.66 | 1.60 | |
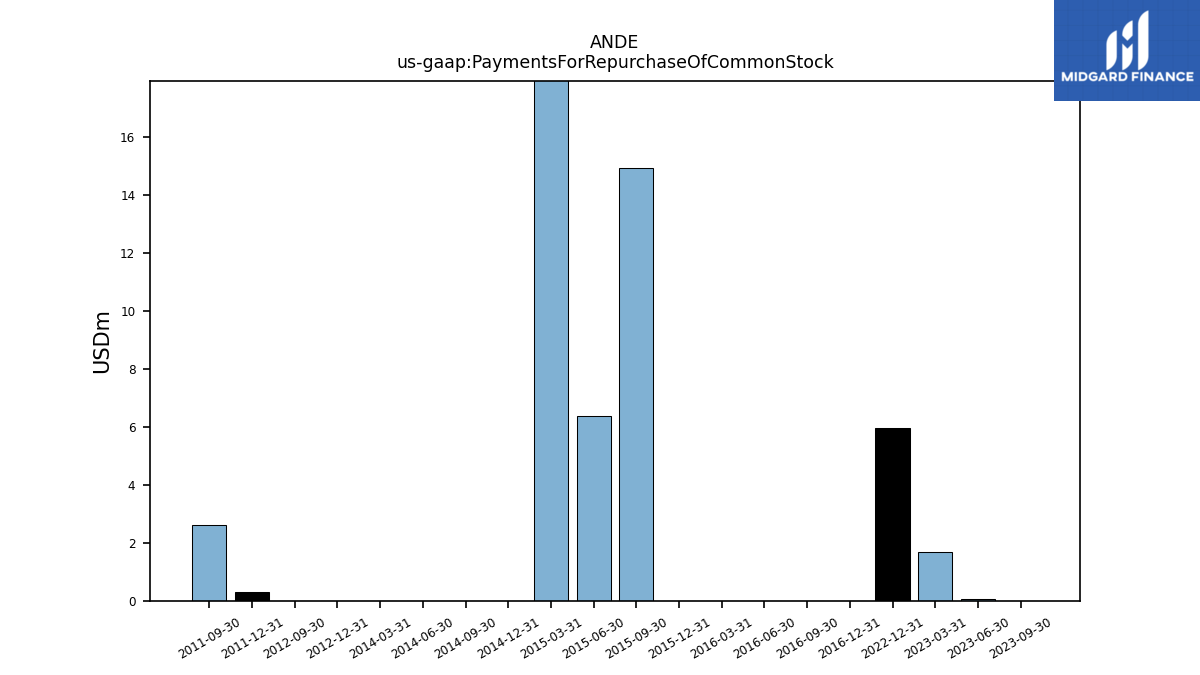
| Payments For Repurchase Of Common Stock | 0.00 | 0.00 | 0.08 | 1.67 | 5.95 | NA | NA | NA | NA | NA | NA | NA | NA | NA | NA | NA | NA | NA | NA | NA | NA | NA | NA | NA | NA | NA | NA | NA | 0.00 | 0.00 | 0.00 | 0.00 | 0.00 | 14.93 | 6.38 | 27.78 | 0.00 | 0.00 | 0.00 | 0.00 | NA | NA | NA | NA | 0.00 | 0.00 | NA | NA | 0.29 | 2.61 | NA | NA | NA | NA | NA | NA |
| 2023-12-31 | 2023-09-30 | 2023-06-30 | 2023-03-31 | 2022-12-31 | 2022-09-30 | 2022-06-30 | 2022-03-31 | 2021-12-31 | 2021-09-30 | 2021-06-30 | 2021-03-31 | 2020-12-31 | 2020-09-30 | 2020-06-30 | 2020-03-31 | 2019-12-31 | 2019-09-30 | 2019-06-30 | 2019-03-31 | 2018-12-31 | 2018-09-30 | 2018-06-30 | 2018-03-31 | 2017-12-31 | 2017-09-30 | 2017-06-30 | 2017-03-31 | 2016-12-31 | 2016-09-30 | 2016-06-30 | 2016-03-31 | 2015-12-31 | 2015-09-30 | 2015-06-30 | 2015-03-31 | 2014-12-31 | 2014-09-30 | 2014-06-30 | 2014-03-31 | 2013-12-31 | 2013-09-30 | 2013-06-30 | 2013-03-31 | 2012-12-31 | 2012-09-30 | 2012-06-30 | 2012-03-31 | 2011-12-31 | 2011-09-30 | 2011-06-30 | 2011-03-31 | 2010-12-31 | 2010-09-30 | 2010-06-30 | 2010-03-31 | ||
|---|---|---|---|---|---|---|---|---|---|---|---|---|---|---|---|---|---|---|---|---|---|---|---|---|---|---|---|---|---|---|---|---|---|---|---|---|---|---|---|---|---|---|---|---|---|---|---|---|---|---|---|---|---|---|---|---|---|
| Revenues | 3213.00 | 3635.69 | 4020.18 | 3881.24 | 4677.49 | 4219.32 | 4450.62 | 3977.95 | 3782.70 | 2998.82 | 3273.73 | 2635.73 | 2508.30 | 1922.23 | 1890.18 | 1853.11 | 1885.60 | 1982.76 | 2325.04 | 1976.79 | 812.66 | 685.58 | 911.40 | 635.74 | 1004.07 | 836.60 | 993.66 | 852.02 | 1113.06 | 859.61 | 0.64 | 2.08 | 1183.47 | 0.84 | 0.83 | 2.19 | 1271.77 | 4.80 | 6.47 | 8.28 | 1584.27 | 4.87 | 4.96 | 9.13 | 1680.64 | 1138.40 | 1315.83 | 1137.13 | 1297.83 | 938.66 | 1338.17 | 1001.67 | 1153.97 | 706.83 | 811.00 | 722.00 | |
| Accounting Standards Update201712 | 2413.46 | 2947.58 | 3044.91 | 3142.26 | 3909.95 | 3583.88 | 3494.60 | 3300.10 | 3139.69 | 2541.20 | 2611.98 | 2107.62 | 2095.22 | 1603.33 | 1406.31 | 1480.05 | 1545.85 | 1682.39 | 1798.94 | 1632.75 | 593.18 | 503.33 | 528.29 | NA | NA | NA | NA | NA | NA | NA | NA | NA | NA | NA | NA | NA | NA | NA | NA | NA | NA | NA | NA | NA | NA | NA | NA | NA | NA | NA | NA | NA | NA | NA | NA | NA | |
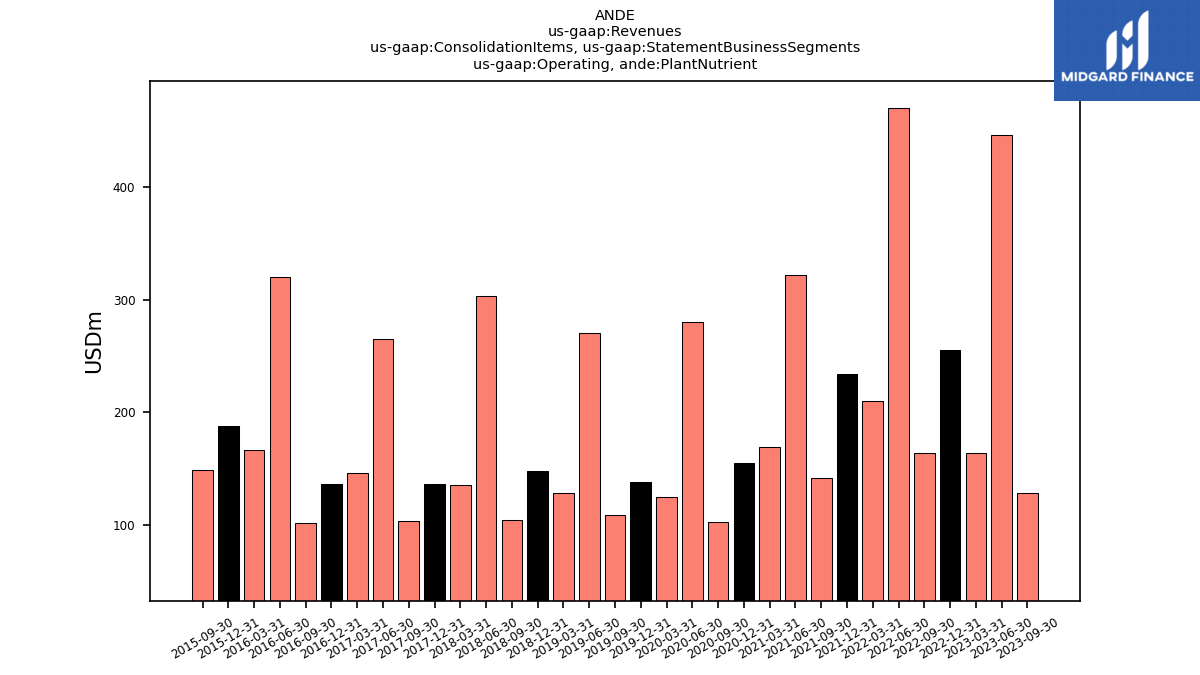
| Operating, Plant Nutrient | 205.33 | 128.53 | 445.59 | 163.94 | 255.11 | 163.88 | 470.28 | 210.04 | 234.18 | 142.06 | 321.41 | 169.25 | 155.51 | 102.71 | 279.82 | 124.91 | 138.18 | 109.45 | 270.58 | 128.53 | 147.62 | 104.19 | 303.11 | 135.62 | 136.88 | 103.62 | 264.74 | 146.59 | 136.38 | 101.77 | 320.04 | 166.99 | 187.90 | 149.30 | NA | NA | NA | NA | NA | NA | NA | NA | NA | NA | NA | NA | NA | NA | NA | NA | NA | NA | NA | NA | NA | NA | |
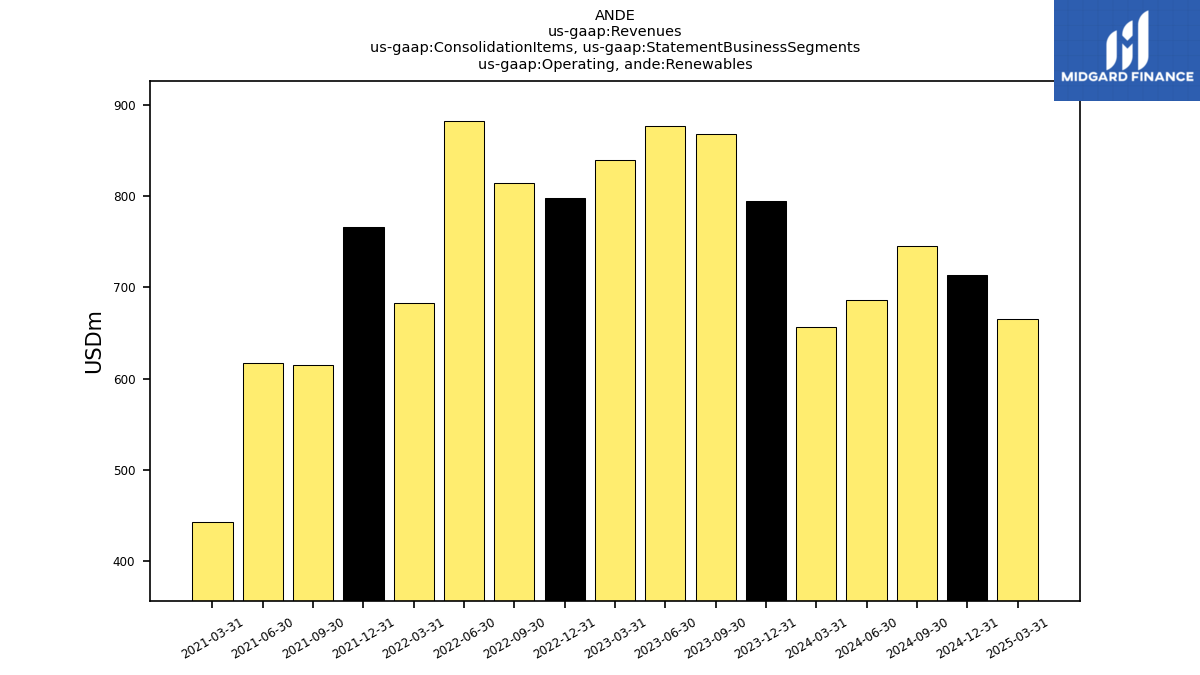
| Operating, Renewables | 795.24 | 868.10 | 877.78 | 839.52 | 797.82 | 814.92 | 882.57 | 683.23 | 766.67 | 614.64 | 616.53 | 442.96 | NA | NA | NA | NA | NA | NA | NA | NA | NA | NA | NA | NA | NA | NA | NA | NA | NA | NA | NA | NA | NA | NA | NA | NA | NA | NA | NA | NA | NA | NA | NA | NA | NA | NA | NA | NA | NA | NA | NA | NA | NA | NA | NA | NA | |
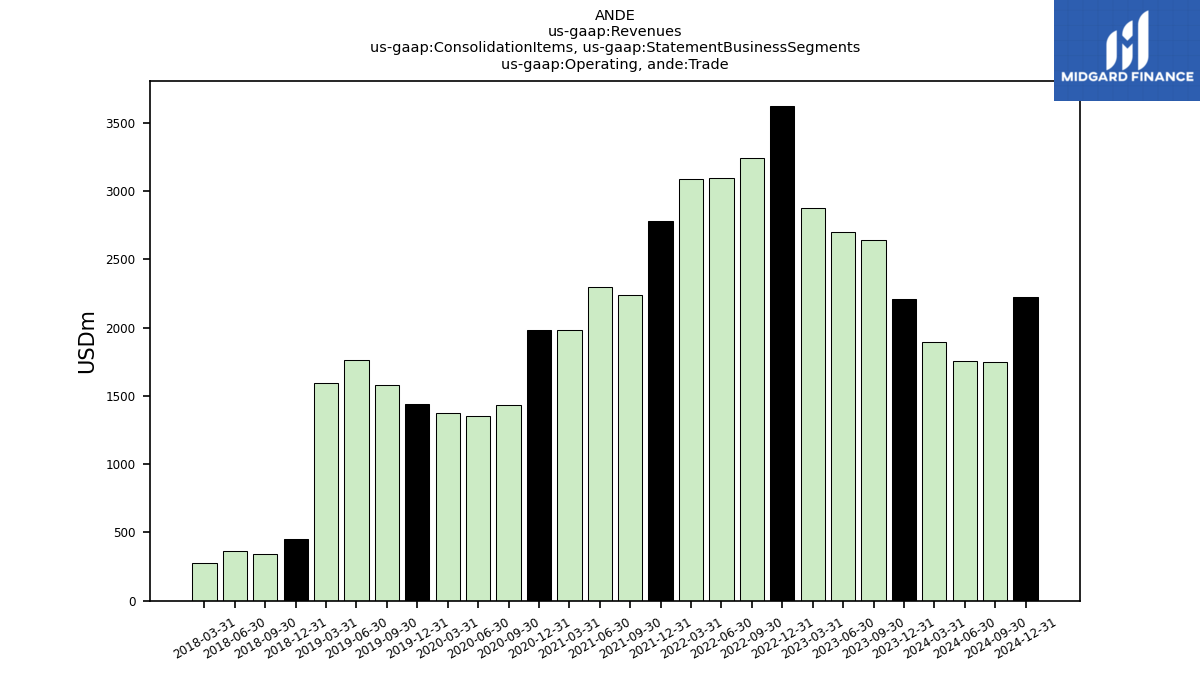
| Operating, Trade | 2212.43 | 2639.06 | 2696.81 | 2877.78 | 3624.56 | 3240.53 | 3097.77 | 3084.68 | 2781.85 | 2242.13 | 2297.87 | 1982.51 | 1979.27 | 1432.92 | 1351.17 | 1378.04 | 1443.26 | 1580.16 | 1766.31 | 1598.02 | 449.92 | 342.61 | 365.92 | 276.85 | NA | NA | NA | NA | NA | NA | NA | NA | NA | NA | NA | NA | NA | NA | NA | NA | NA | NA | NA | NA | NA | NA | NA | NA | NA | NA | NA | NA | NA | NA | NA | NA | |
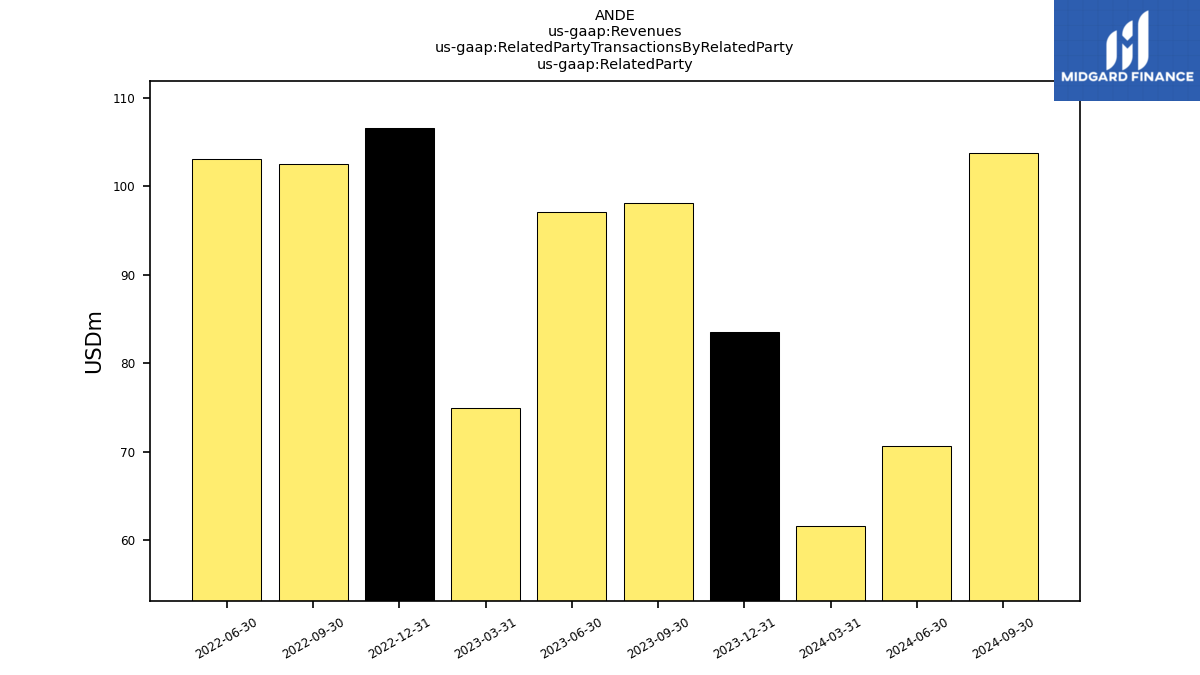
| Related Party | 83.56 | 98.06 | 97.10 | NA | 106.57 | 102.56 | 103.11 | NA | NA | NA | NA | NA | NA | NA | NA | NA | NA | NA | NA | NA | NA | NA | NA | NA | NA | NA | NA | NA | NA | NA | NA | NA | NA | NA | NA | NA | NA | NA | NA | NA | NA | NA | NA | NA | NA | NA | NA | NA | NA | NA | NA | NA | NA | NA | NA | NA | |
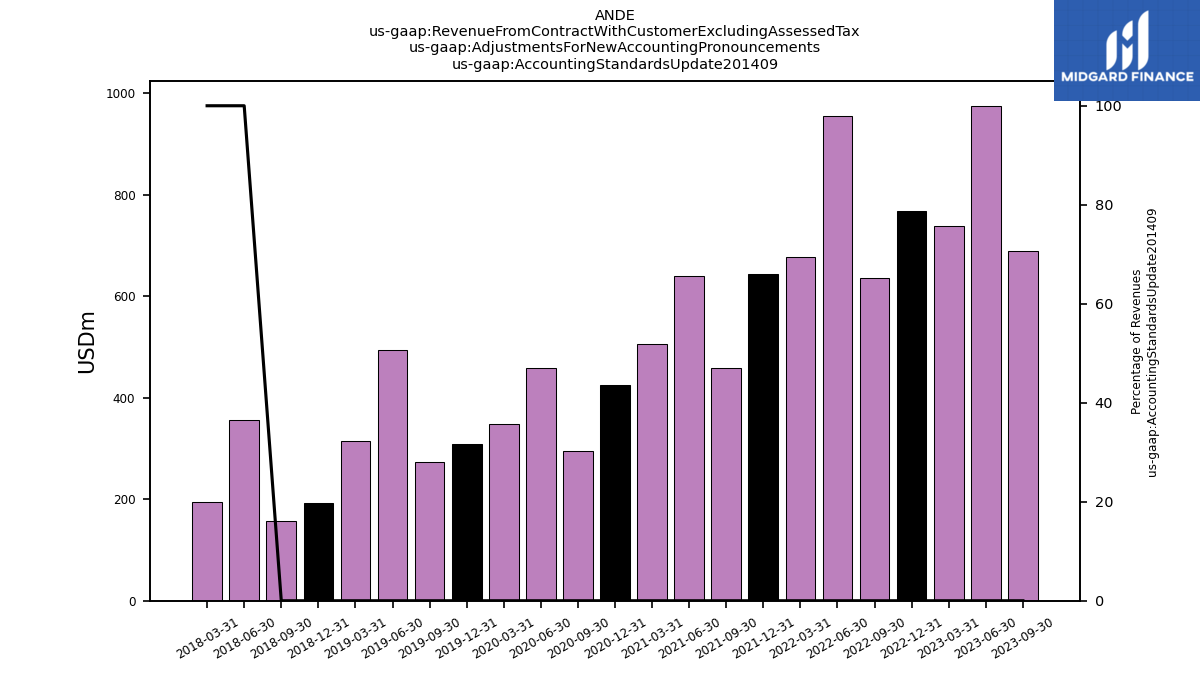
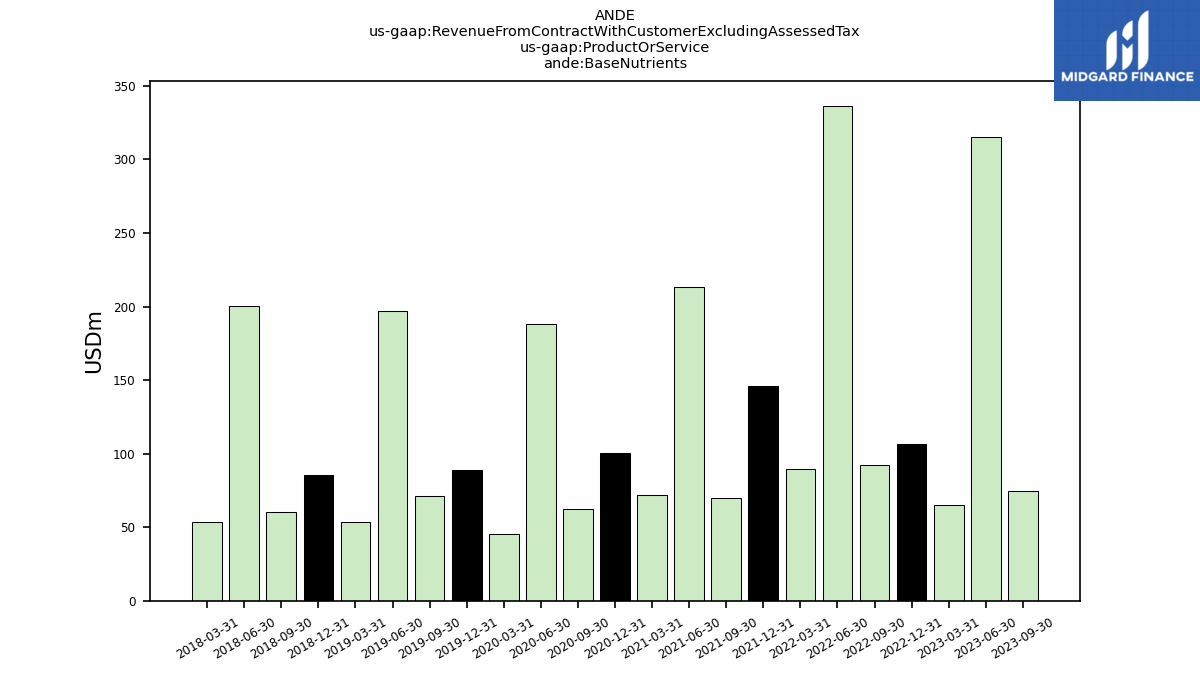
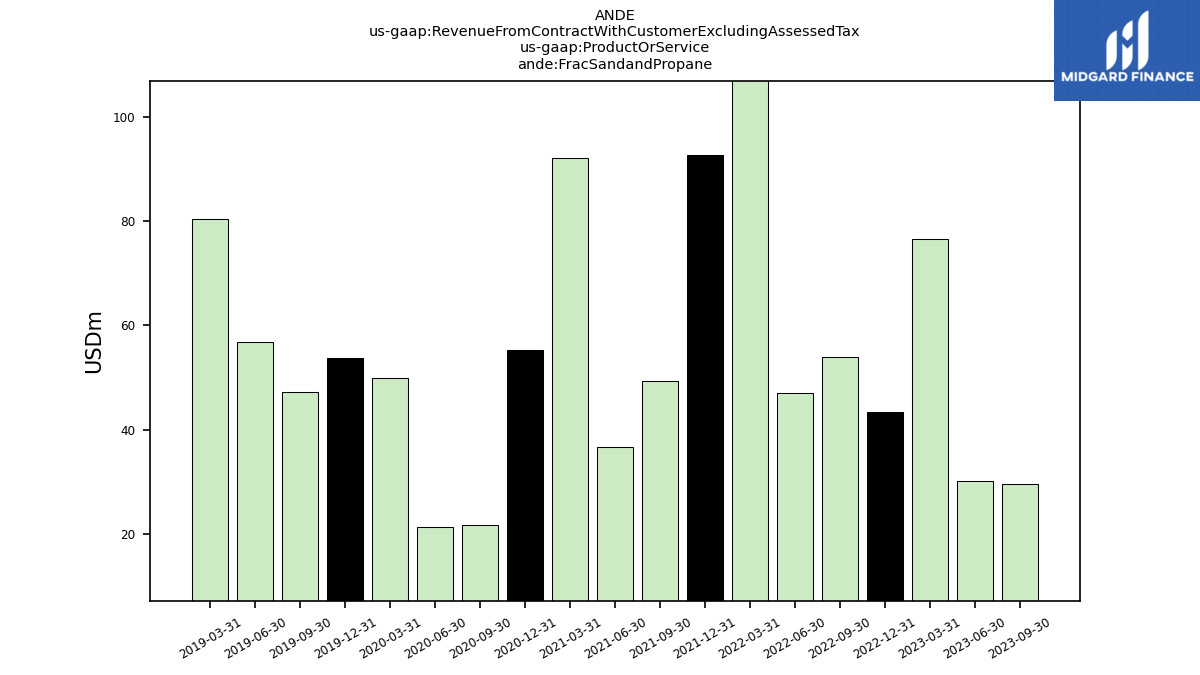
| Revenue From Contract With Customer Excluding Assessed Tax | 799.54 | 688.11 | 975.27 | 738.98 | 767.54 | 635.45 | 956.01 | 677.86 | 3782.70 | 457.62 | 640.08 | 506.47 | 2508.30 | 295.85 | 459.11 | 347.50 | 1885.60 | 273.94 | 494.27 | 315.17 | 812.66 | 156.39 | 356.88 | 193.65 | 1004.07 | 836.60 | 993.66 | 852.02 | 1113.06 | 859.61 | 0.64 | 2.08 | 1183.47 | 0.84 | 0.83 | 2.19 | 1271.77 | 4.80 | 6.47 | 8.28 | 1584.27 | 4.87 | 4.96 | 9.13 | 1680.64 | 1138.40 | 1315.83 | 1137.13 | 1297.83 | 938.66 | 1338.17 | 1001.67 | 1153.97 | 706.83 | 811.00 | 722.00 | |
| Accounting Standards Update201409 | 799.54 | 688.11 | 975.27 | 738.98 | 767.54 | 635.45 | 956.01 | 677.86 | 643.01 | 457.62 | 640.08 | 506.47 | 424.68 | 295.85 | 459.11 | 347.50 | 308.46 | 273.94 | 494.27 | 315.17 | 191.96 | 156.39 | 356.88 | 193.65 | NA | NA | NA | NA | NA | NA | NA | NA | NA | NA | NA | NA | NA | NA | NA | NA | NA | NA | NA | NA | NA | NA | NA | NA | NA | NA | NA | NA | NA | NA | NA | NA | |
| Base Nutrients | 118.49 | 74.56 | 315.10 | 64.75 | 106.69 | 92.07 | 336.49 | 89.88 | 145.79 | 69.83 | 213.60 | 71.66 | 100.27 | 62.09 | 188.46 | 45.69 | 89.13 | 71.34 | 197.27 | 53.52 | 85.60 | 60.46 | 200.29 | 53.22 | NA | NA | NA | NA | NA | NA | NA | NA | NA | NA | NA | NA | NA | NA | NA | NA | NA | NA | NA | NA | NA | NA | NA | NA | NA | NA | NA | NA | NA | NA | NA | NA | |
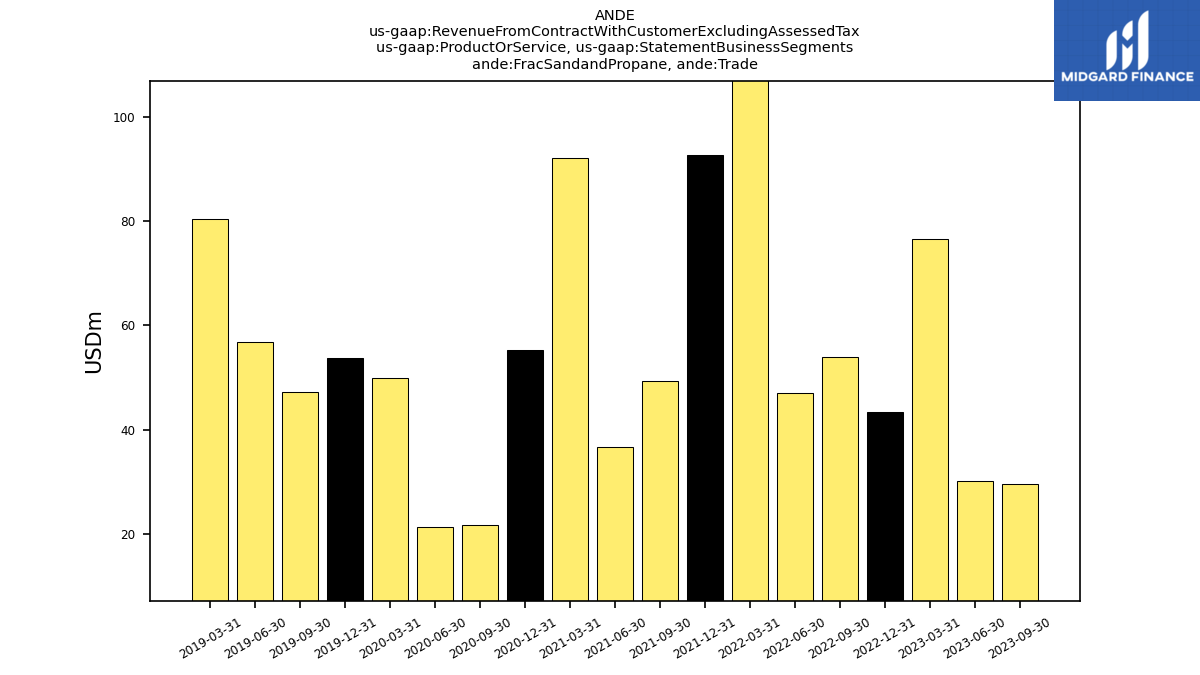
| Frac Sandand Propane | 53.97 | 29.57 | 30.16 | 76.52 | 43.38 | 53.96 | 46.94 | 119.79 | 92.60 | 49.38 | 36.65 | 92.06 | 55.19 | 21.68 | 21.44 | 49.88 | 53.68 | 47.19 | 56.77 | 80.46 | NA | NA | NA | NA | NA | NA | NA | NA | NA | NA | NA | NA | NA | NA | NA | NA | NA | NA | NA | NA | NA | NA | NA | NA | NA | NA | NA | NA | NA | NA | NA | NA | NA | NA | NA | NA | |
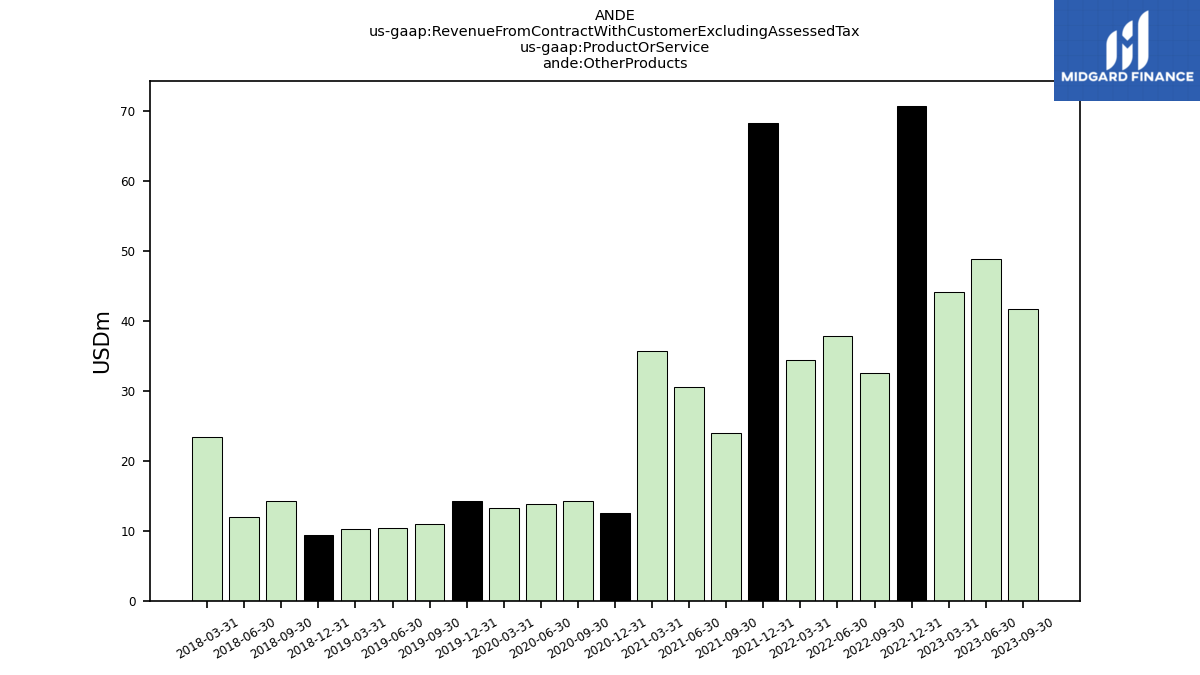
| Other Products | 58.41 | 41.72 | 48.74 | 44.13 | 70.68 | 32.58 | 37.81 | 34.35 | 68.21 | 23.95 | 30.49 | 35.62 | 12.49 | 14.19 | 13.84 | 13.24 | 14.30 | 10.89 | 10.44 | 10.26 | 9.33 | 14.23 | 11.99 | 23.42 | NA | NA | NA | NA | NA | NA | NA | NA | NA | NA | NA | NA | NA | NA | NA | NA | NA | NA | NA | NA | NA | NA | NA | NA | NA | NA | NA | NA | NA | NA | NA | NA | |
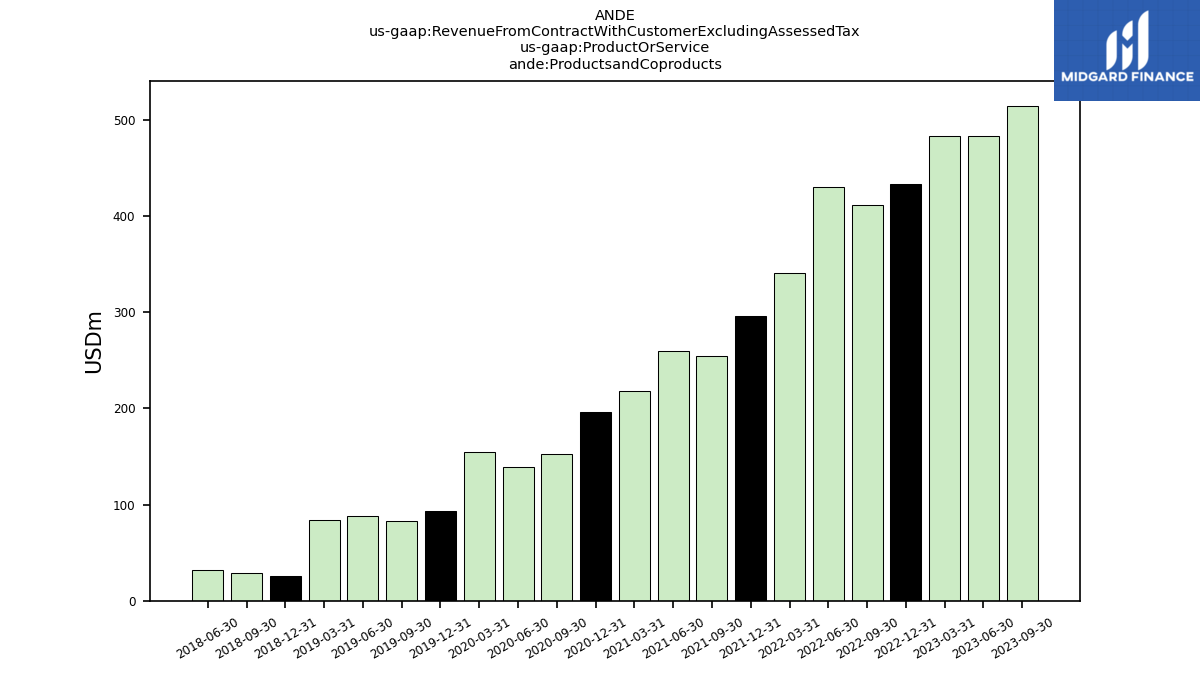
| Productsand Coproducts | 515.26 | 514.61 | 482.94 | 483.57 | 433.72 | 411.88 | 430.42 | 340.56 | 296.32 | 254.15 | 259.21 | 217.63 | 195.98 | 152.94 | 139.12 | 154.86 | 93.45 | 82.81 | 87.99 | 84.23 | 26.10 | 29.28 | 32.46 | NA | NA | NA | NA | NA | NA | NA | NA | NA | NA | NA | NA | NA | NA | NA | NA | NA | NA | NA | NA | NA | NA | NA | NA | NA | NA | NA | NA | NA | NA | NA | NA | NA | |
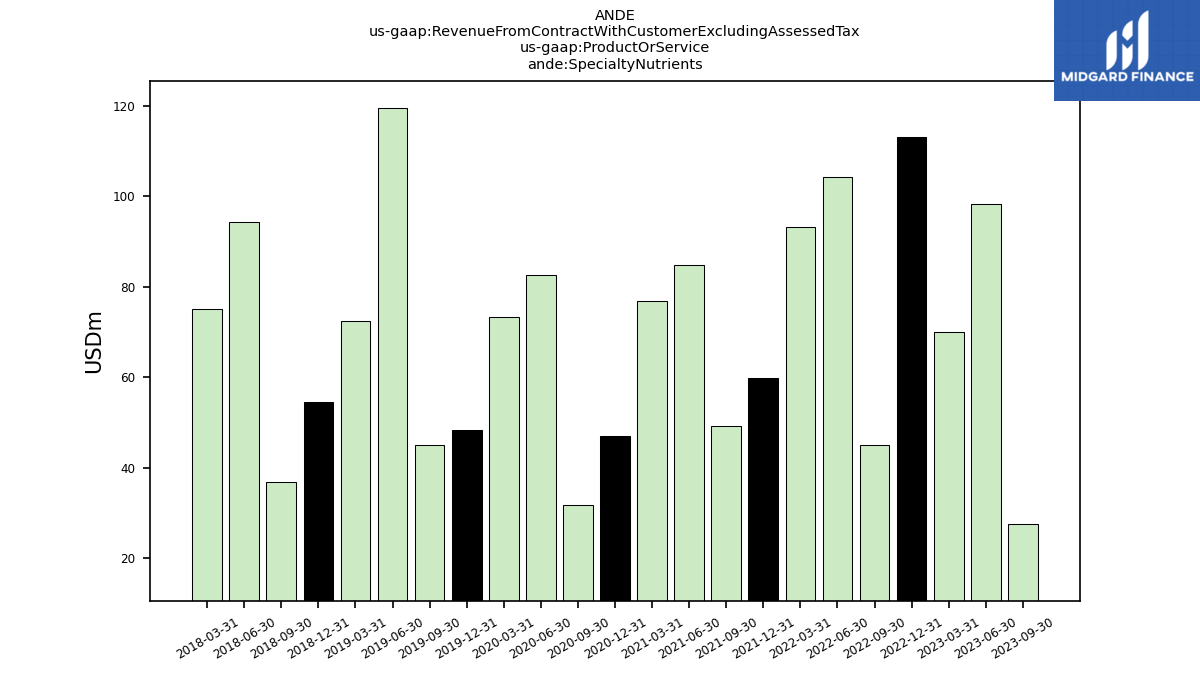
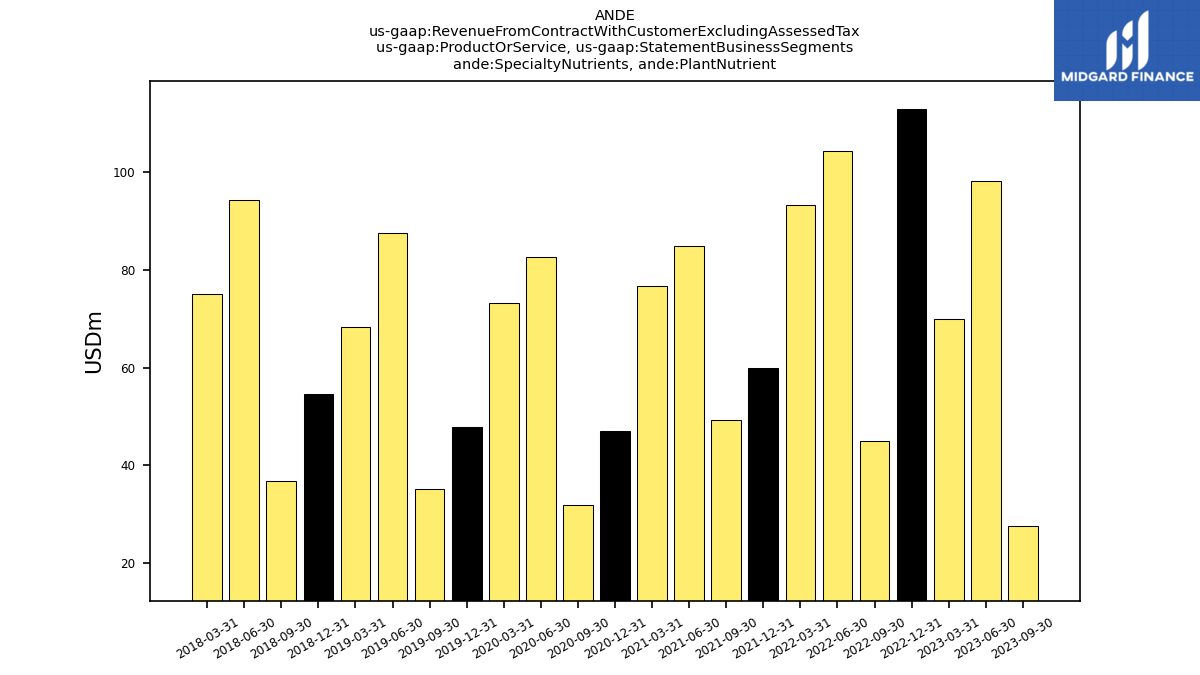
| Specialty Nutrients | 53.41 | 27.65 | 98.33 | 70.00 | 113.05 | 44.96 | 104.36 | 93.27 | 59.87 | 49.25 | 84.92 | 76.81 | 47.11 | 31.84 | 82.63 | 73.23 | 48.22 | 45.02 | 119.53 | 72.34 | 54.61 | 36.86 | 94.28 | 75.08 | NA | NA | NA | NA | NA | NA | NA | NA | NA | NA | NA | NA | NA | NA | NA | NA | NA | NA | NA | NA | NA | NA | NA | NA | NA | NA | NA | NA | NA | NA | NA | NA | |
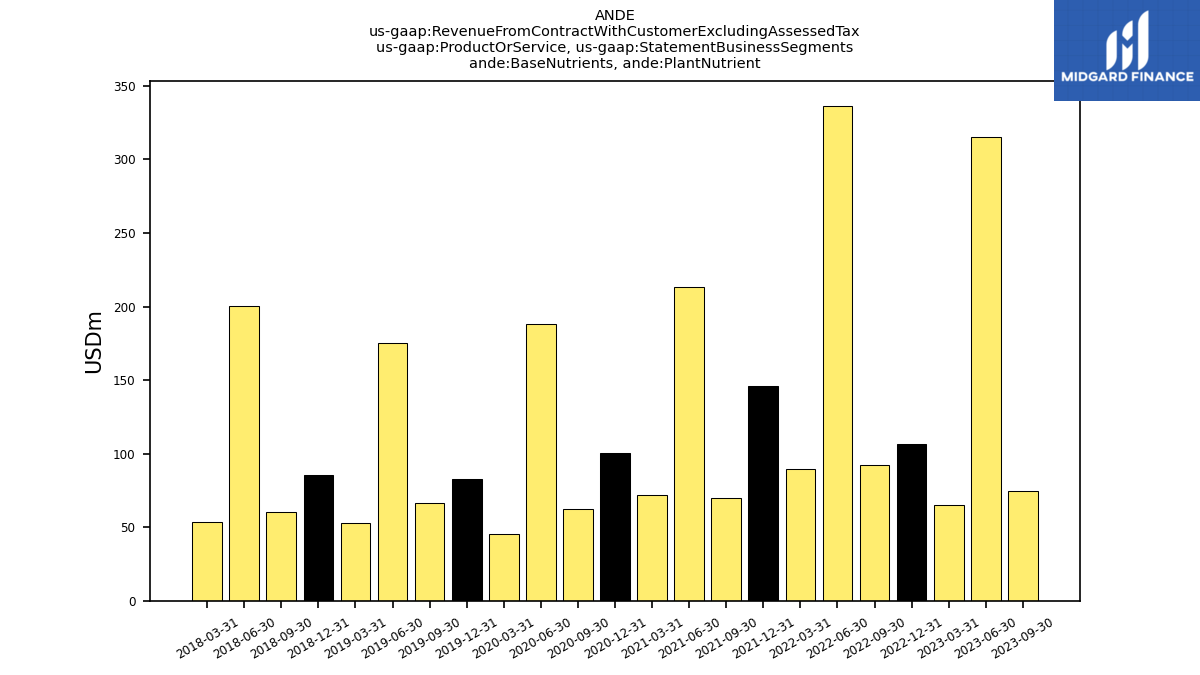
| Base Nutrients, Plant Nutrient | 118.49 | 74.56 | 315.10 | 64.75 | 106.69 | 92.07 | 336.49 | 89.88 | 145.79 | 69.83 | 213.60 | 71.66 | 100.27 | 62.09 | 188.46 | 45.69 | 82.92 | 66.73 | 174.91 | 53.09 | 85.60 | 60.46 | 200.29 | 53.22 | NA | NA | NA | NA | NA | NA | NA | NA | NA | NA | NA | NA | NA | NA | NA | NA | NA | NA | NA | NA | NA | NA | NA | NA | NA | NA | NA | NA | NA | NA | NA | NA | |
| Frac Sandand Propane, Trade | 53.97 | 29.57 | 30.16 | 76.52 | 43.38 | 53.96 | 46.94 | 119.79 | 92.60 | 49.38 | 36.65 | 92.06 | 55.19 | 21.68 | 21.44 | 49.88 | 53.68 | 47.19 | 56.77 | 80.46 | NA | NA | NA | NA | NA | NA | NA | NA | NA | NA | NA | NA | NA | NA | NA | NA | NA | NA | NA | NA | NA | NA | NA | NA | NA | NA | NA | NA | NA | NA | NA | NA | NA | NA | NA | NA | |
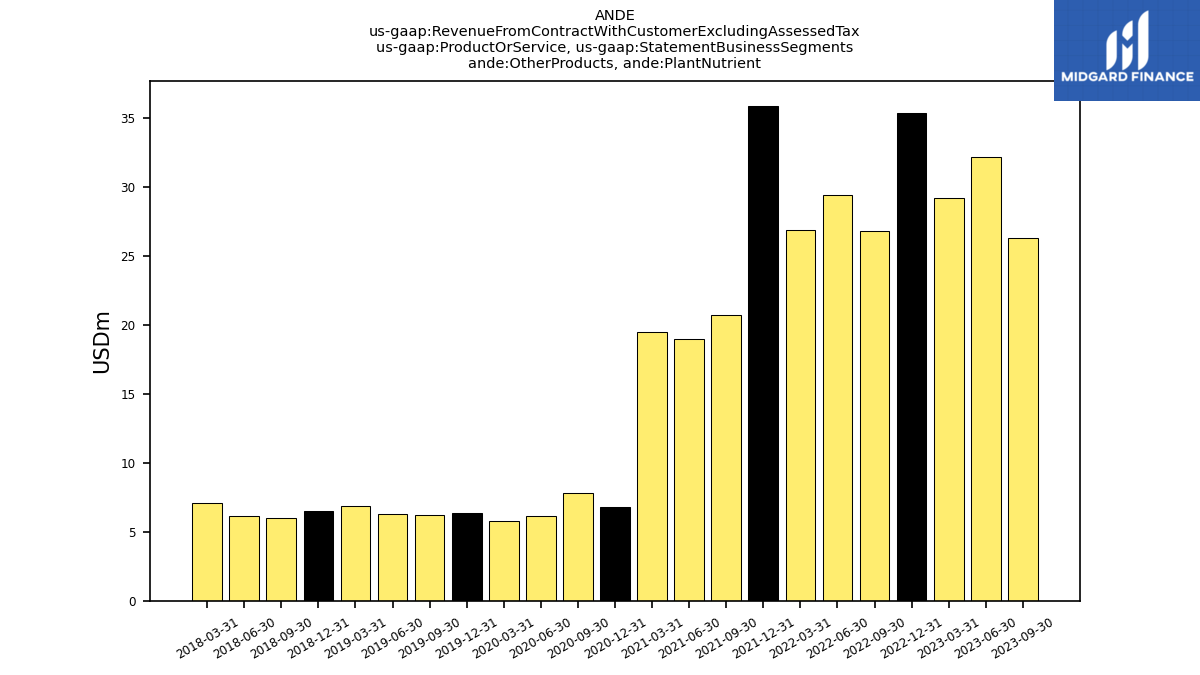
| Other Products, Plant Nutrient | 33.43 | 26.32 | 32.16 | 29.20 | 35.36 | 26.85 | 29.44 | 26.89 | 35.91 | 20.74 | 19.02 | 19.50 | 6.79 | 7.80 | 6.13 | 5.81 | 6.39 | 6.26 | 6.31 | 6.87 | 6.51 | 6.00 | 6.12 | 7.11 | NA | NA | NA | NA | NA | NA | NA | NA | NA | NA | NA | NA | NA | NA | NA | NA | NA | NA | NA | NA | NA | NA | NA | NA | NA | NA | NA | NA | NA | NA | NA | NA | |
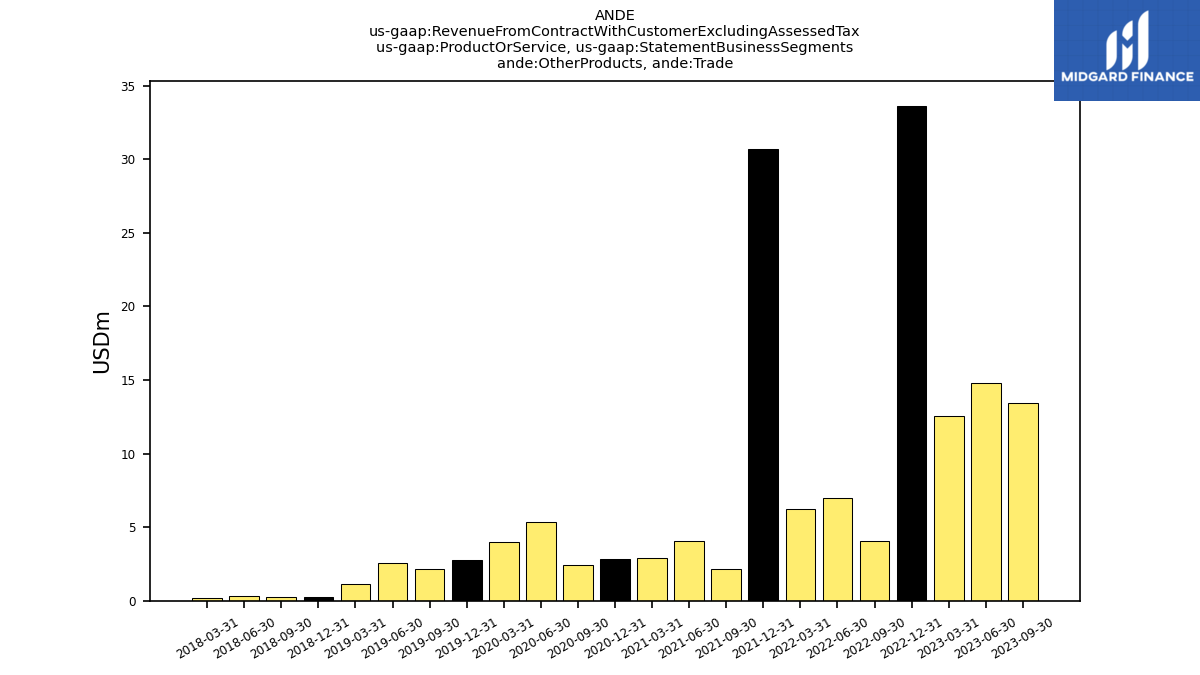
| Other Products, Trade | 23.46 | 13.46 | 14.78 | 12.59 | 33.64 | 4.08 | 7.00 | 6.24 | 30.73 | 2.16 | 4.04 | 2.93 | 2.84 | 2.41 | 5.33 | 3.99 | 2.77 | 2.16 | 2.54 | 1.16 | 0.29 | 0.24 | 0.29 | 0.21 | NA | NA | NA | NA | NA | NA | NA | NA | NA | NA | NA | NA | NA | NA | NA | NA | NA | NA | NA | NA | NA | NA | NA | NA | NA | NA | NA | NA | NA | NA | NA | NA | |
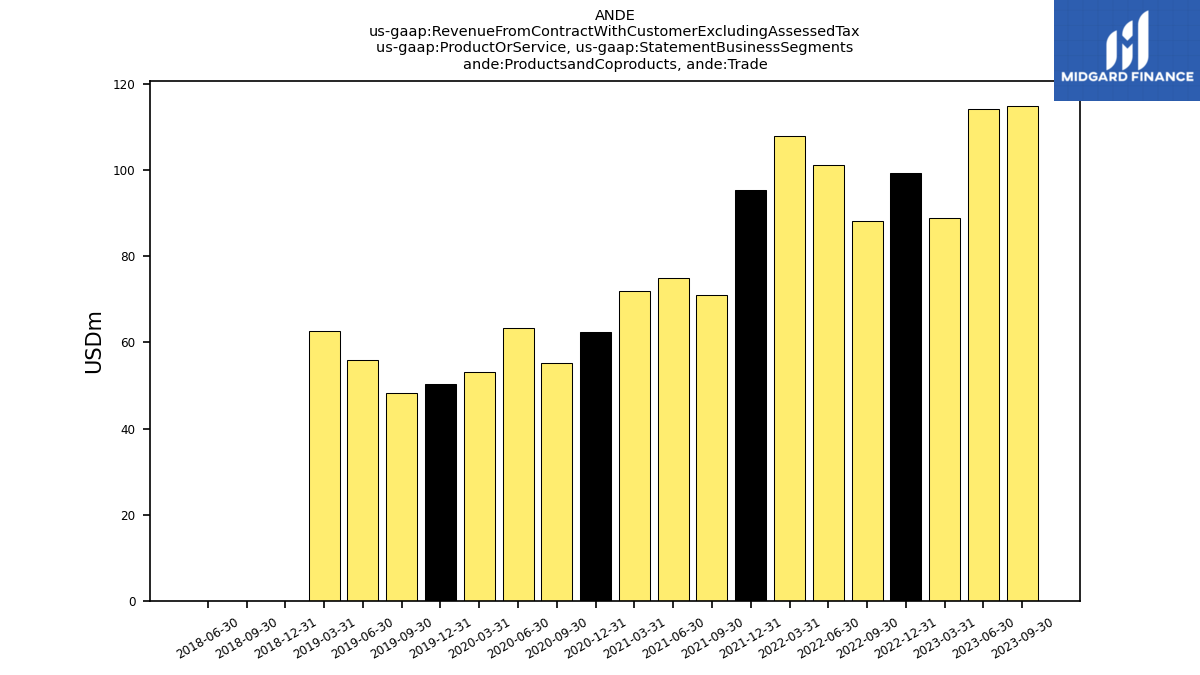
| Productsand Coproducts, Trade | 116.09 | 114.96 | 114.29 | 88.97 | 99.35 | 88.20 | 101.19 | 107.87 | 95.34 | 70.92 | 74.95 | 71.99 | 62.48 | 55.23 | 63.34 | 53.16 | 50.44 | 48.16 | 55.94 | 62.76 | 0.00 | 0.00 | 0.00 | NA | NA | NA | NA | NA | NA | NA | NA | NA | NA | NA | NA | NA | NA | NA | NA | NA | NA | NA | NA | NA | NA | NA | NA | NA | NA | NA | NA | NA | NA | NA | NA | NA | |
| Specialty Nutrients, Plant Nutrient | 53.41 | 27.65 | 98.33 | 70.00 | 113.05 | 44.96 | 104.36 | 93.27 | 59.87 | 49.25 | 84.92 | 76.81 | 47.11 | 31.84 | 82.63 | 73.23 | 47.80 | 35.18 | 87.67 | 68.40 | 54.61 | 36.86 | 94.28 | 75.08 | NA | NA | NA | NA | NA | NA | NA | NA | NA | NA | NA | NA | NA | NA | NA | NA | NA | NA | NA | NA | NA | NA | NA | NA | NA | NA | NA | NA | NA | NA | NA | NA | |
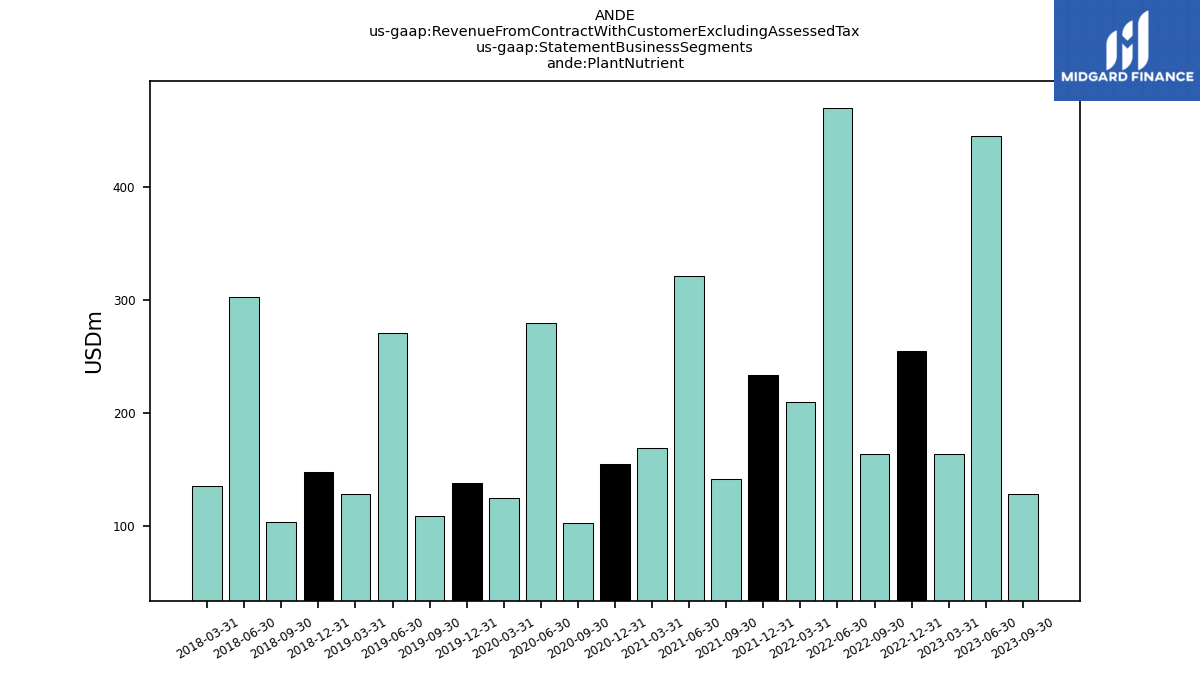
| Plant Nutrient | 205.33 | 128.53 | 445.59 | 163.94 | 255.11 | 163.88 | 470.28 | 210.04 | 234.18 | 142.06 | 321.41 | 169.25 | 155.51 | 102.71 | 279.82 | 124.91 | 138.18 | 109.45 | 270.58 | 128.53 | 147.62 | 104.19 | 303.11 | 135.62 | NA | NA | NA | NA | NA | NA | NA | NA | NA | NA | NA | NA | NA | NA | NA | NA | NA | NA | NA | NA | NA | NA | NA | NA | NA | NA | NA | NA | NA | NA | NA | NA | |
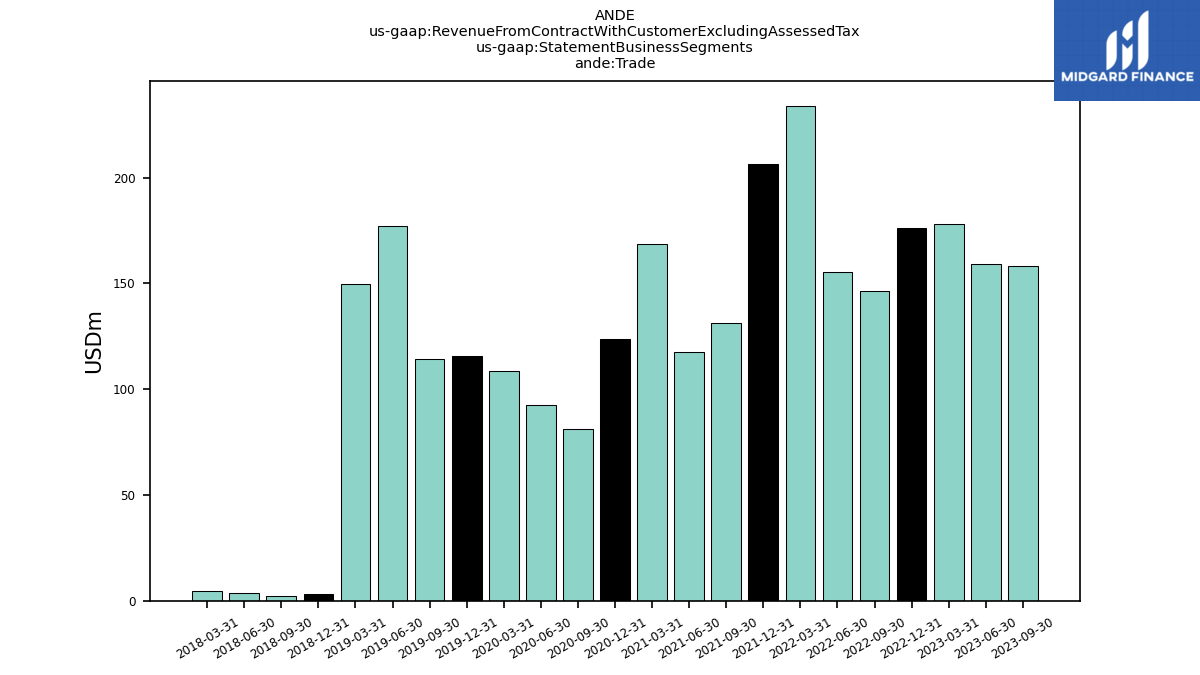
| Trade | 193.51 | 157.99 | 159.23 | 178.08 | 176.37 | 146.25 | 155.13 | 233.91 | 206.27 | 131.29 | 117.75 | 168.44 | 123.47 | 81.33 | 92.47 | 108.72 | 115.55 | 114.46 | 177.23 | 149.57 | 3.25 | 2.48 | 3.67 | 4.63 | NA | NA | NA | NA | NA | NA | NA | NA | NA | NA | NA | NA | NA | NA | NA | NA | NA | NA | NA | NA | NA | NA | NA | NA | NA | NA | NA | NA | NA | NA | NA | NA |