
| 2024-02-03 | 2023-10-28 | 2023-07-29 | 2023-04-29 | 2023-01-28 | 2022-10-29 | 2022-07-30 | 2022-04-30 | 2022-01-29 | 2021-10-30 | 2021-07-31 | 2021-05-01 | 2021-01-30 | 2020-10-31 | 2020-08-01 | 2020-05-02 | 2020-02-01 | 2019-11-02 | 2019-08-03 | 2019-05-04 | 2019-02-02 | 2018-11-03 | 2018-08-04 | 2018-05-05 | 2018-02-03 | 2017-10-28 | 2017-07-29 | 2017-04-29 | 2017-01-28 | 2016-10-29 | 2016-07-30 | 2016-04-30 | 2016-01-30 | 2015-10-31 | 2015-08-01 | 2015-05-02 | 2015-01-31 | 2014-11-01 | 2014-08-02 | 2014-05-03 | 2014-02-01 | 2013-11-02 | 2013-08-03 | 2013-05-04 | 2013-02-02 | 2012-10-27 | 2012-07-28 | 2012-04-28 | 2012-01-28 | 2011-10-29 | 2011-07-30 | 2011-04-30 | 2011-01-29 | 2010-01-30 | ||
|---|---|---|---|---|---|---|---|---|---|---|---|---|---|---|---|---|---|---|---|---|---|---|---|---|---|---|---|---|---|---|---|---|---|---|---|---|---|---|---|---|---|---|---|---|---|---|---|---|---|---|---|---|---|---|---|
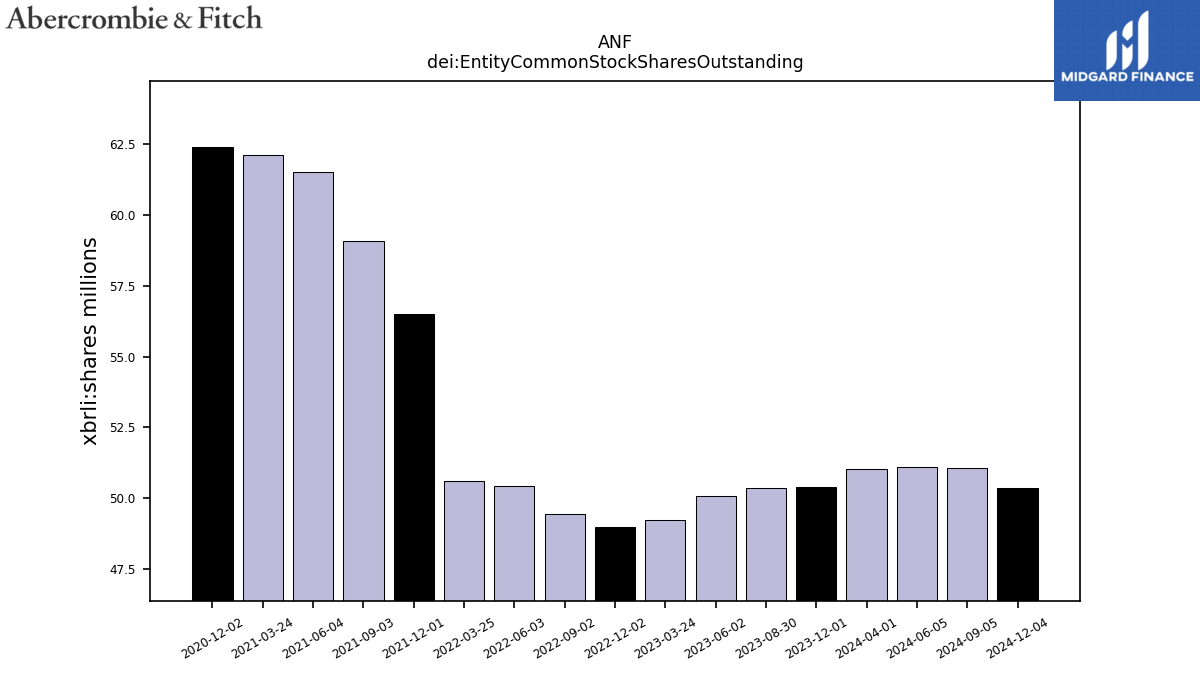
| dei: Entity Common Stock Shares Outstanding | NA | NA | NA | NA | NA | NA | NA | NA | NA | NA | NA | NA | NA | NA | NA | NA | NA | NA | NA | NA | NA | NA | NA | NA | NA | NA | NA | NA | NA | NA | NA | NA | NA | NA | NA | NA | NA | NA | NA | NA | NA | NA | NA | NA | NA | NA | NA | NA | NA | NA | NA | NA | NA | NA |
| 2024-02-03 | 2023-10-28 | 2023-07-29 | 2023-04-29 | 2023-01-28 | 2022-10-29 | 2022-07-30 | 2022-04-30 | 2022-01-29 | 2021-10-30 | 2021-07-31 | 2021-05-01 | 2021-01-30 | 2020-10-31 | 2020-08-01 | 2020-05-02 | 2020-02-01 | 2019-11-02 | 2019-08-03 | 2019-05-04 | 2019-02-02 | 2018-11-03 | 2018-08-04 | 2018-05-05 | 2018-02-03 | 2017-10-28 | 2017-07-29 | 2017-04-29 | 2017-01-28 | 2016-10-29 | 2016-07-30 | 2016-04-30 | 2016-01-30 | 2015-10-31 | 2015-08-01 | 2015-05-02 | 2015-01-31 | 2014-11-01 | 2014-08-02 | 2014-05-03 | 2014-02-01 | 2013-11-02 | 2013-08-03 | 2013-05-04 | 2013-02-02 | 2012-10-27 | 2012-07-28 | 2012-04-28 | 2012-01-28 | 2011-10-29 | 2011-07-30 | 2011-04-30 | 2011-01-29 | 2010-01-30 | ||
|---|---|---|---|---|---|---|---|---|---|---|---|---|---|---|---|---|---|---|---|---|---|---|---|---|---|---|---|---|---|---|---|---|---|---|---|---|---|---|---|---|---|---|---|---|---|---|---|---|---|---|---|---|---|---|---|
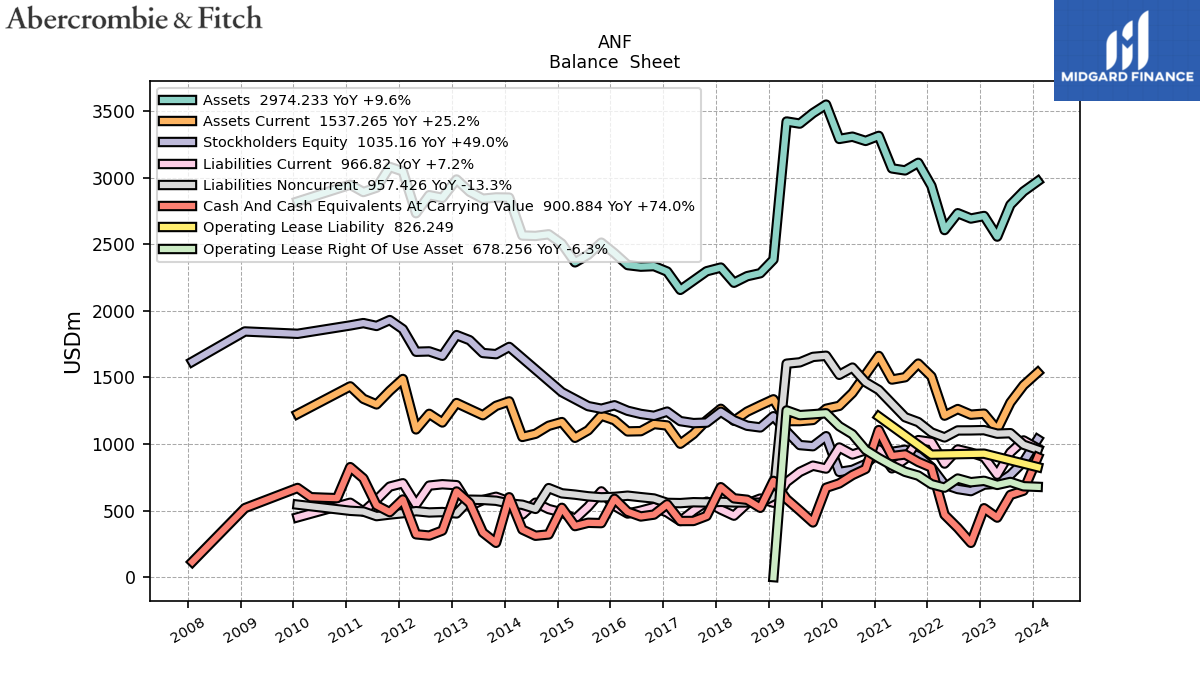
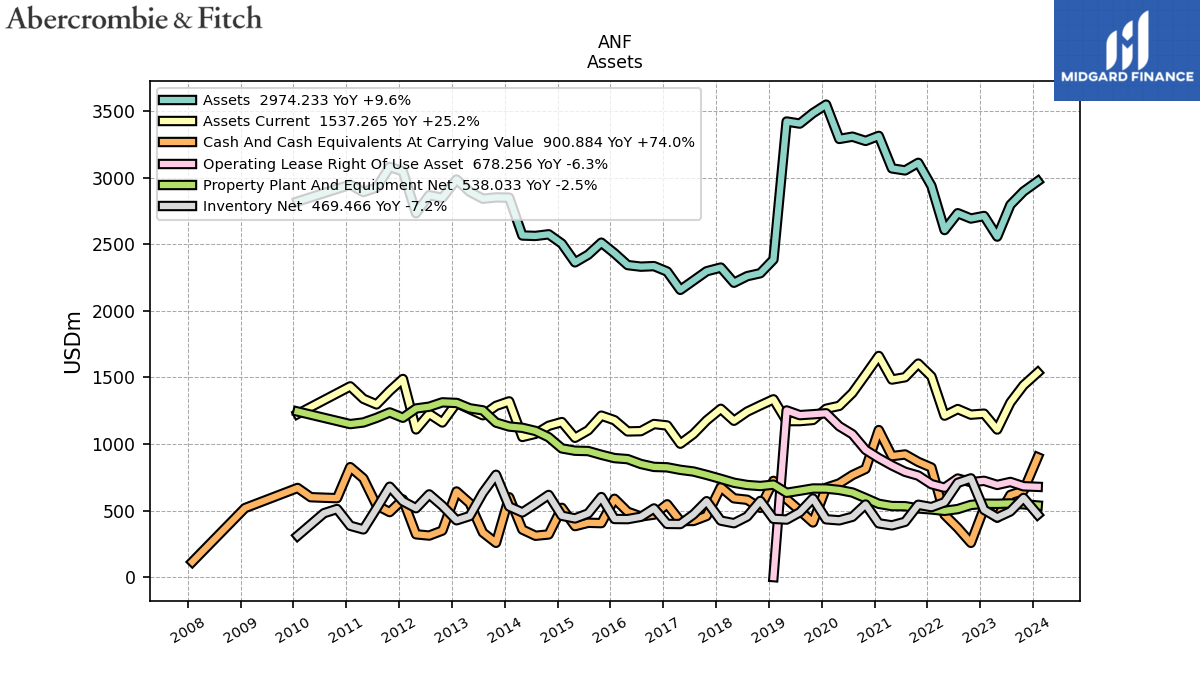
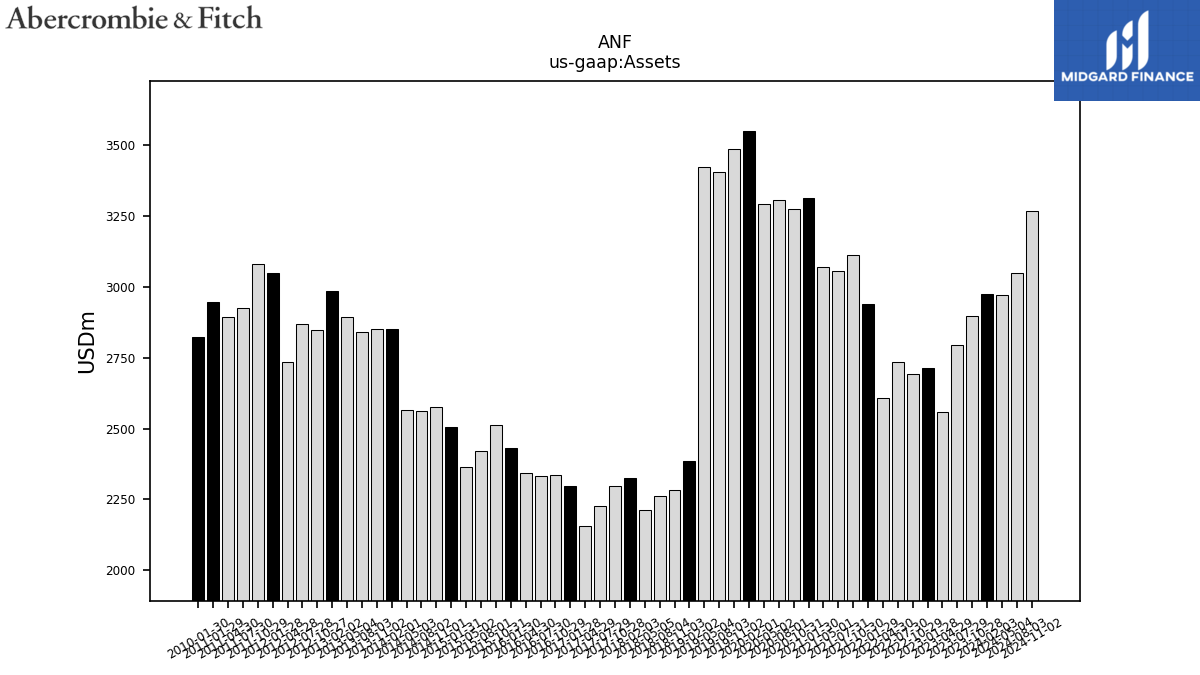
| Assets | 2974.23 | 2897.65 | 2796.71 | 2558.08 | 2713.10 | 2693.99 | 2734.09 | 2607.30 | 2939.49 | 3112.53 | 3055.39 | 3070.55 | 3314.90 | 3276.96 | 3308.81 | 3291.83 | 3549.66 | 3486.01 | 3407.00 | 3422.97 | 2385.59 | 2283.07 | 2260.85 | 2211.52 | 2325.69 | 2297.90 | 2227.91 | 2157.97 | 2295.76 | 2336.47 | 2332.39 | 2344.18 | 2433.04 | 2512.74 | 2422.20 | 2364.59 | 2505.17 | 2575.57 | 2563.18 | 2566.39 | 2851.00 | 2852.40 | 2842.84 | 2895.01 | 2987.40 | 2849.45 | 2869.24 | 2733.94 | 3048.15 | 3081.52 | 2926.05 | 2892.99 | 2947.90 | 2821.87 | |
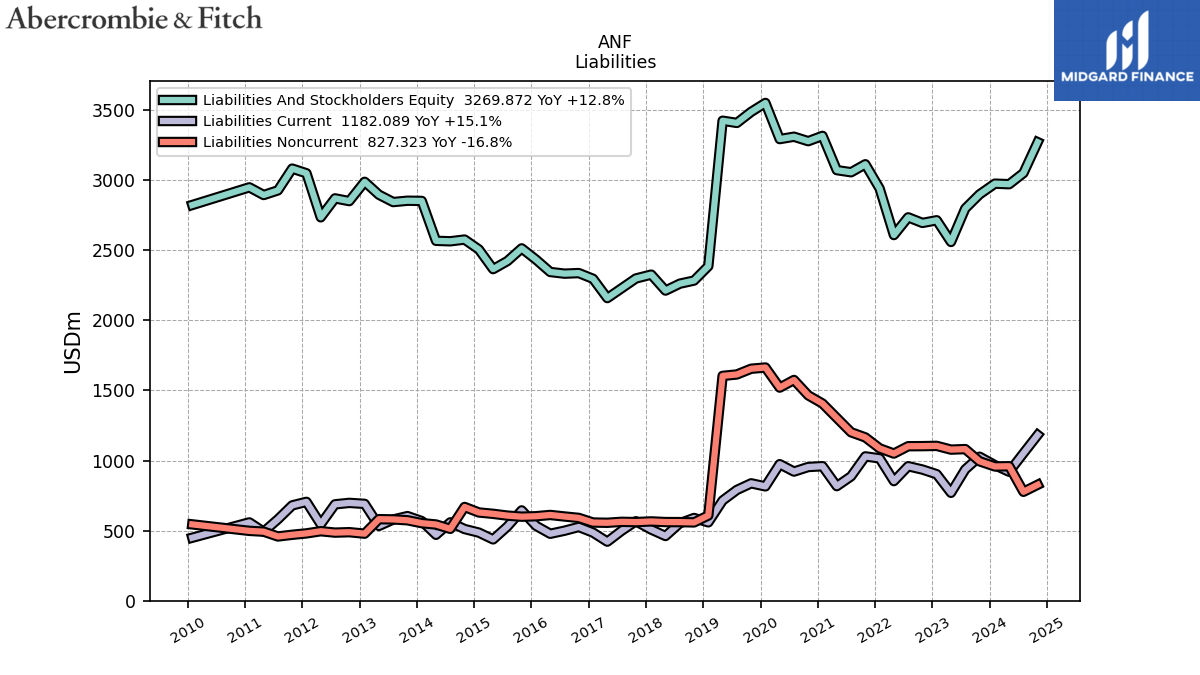
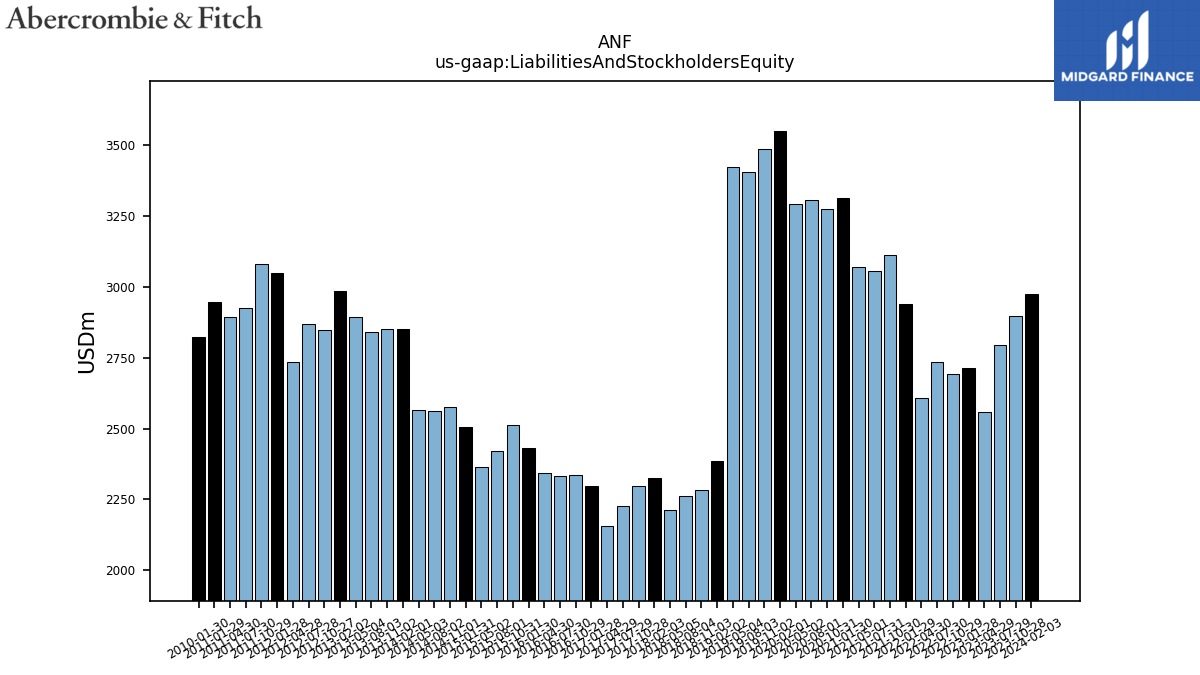
| Liabilities And Stockholders Equity | 2974.23 | 2897.65 | 2796.71 | 2558.08 | 2713.10 | 2693.99 | 2734.09 | 2607.30 | 2939.49 | 3112.53 | 3055.39 | 3070.55 | 3314.90 | 3276.96 | 3308.81 | 3291.83 | 3549.66 | 3486.01 | 3407.00 | 3422.97 | 2385.59 | 2283.07 | 2260.85 | 2211.52 | 2325.69 | 2297.90 | 2227.91 | 2157.97 | 2295.76 | 2336.47 | 2332.39 | 2344.18 | 2433.04 | 2512.74 | 2422.20 | 2364.59 | 2505.17 | 2575.57 | 2563.18 | 2566.39 | 2851.00 | 2852.40 | 2842.84 | 2895.01 | 2987.40 | 2849.45 | 2869.24 | 2733.94 | 3048.15 | 3081.52 | 2926.05 | 2892.99 | 2947.90 | 2821.87 | |
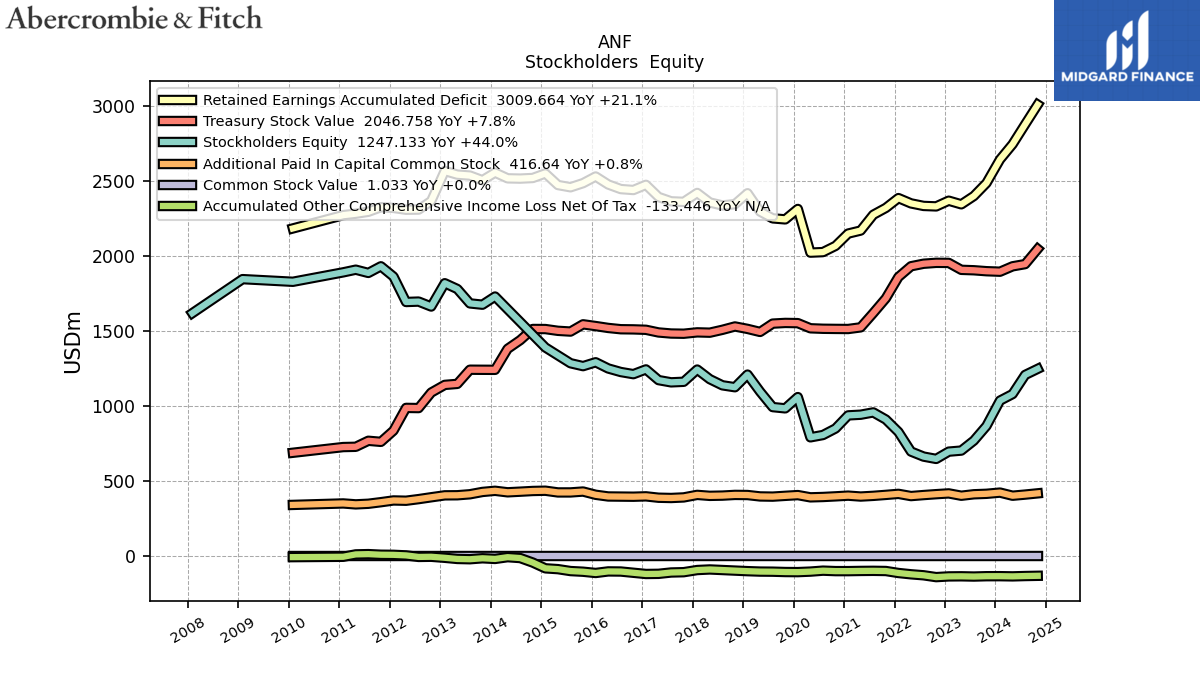
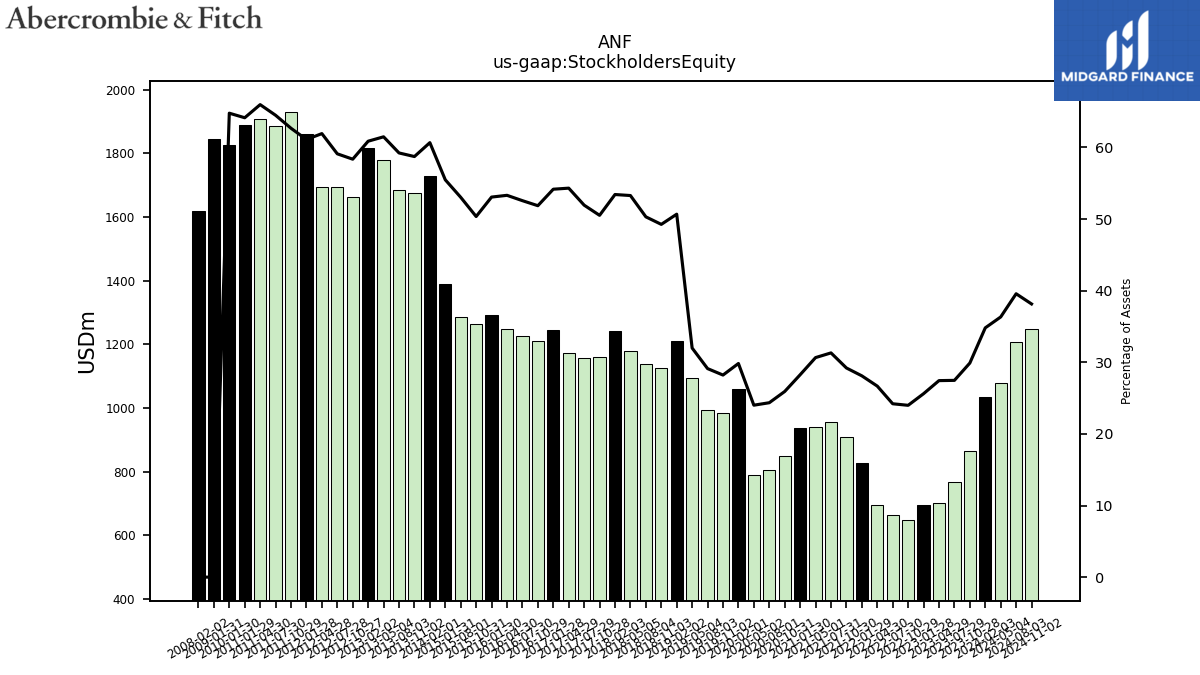
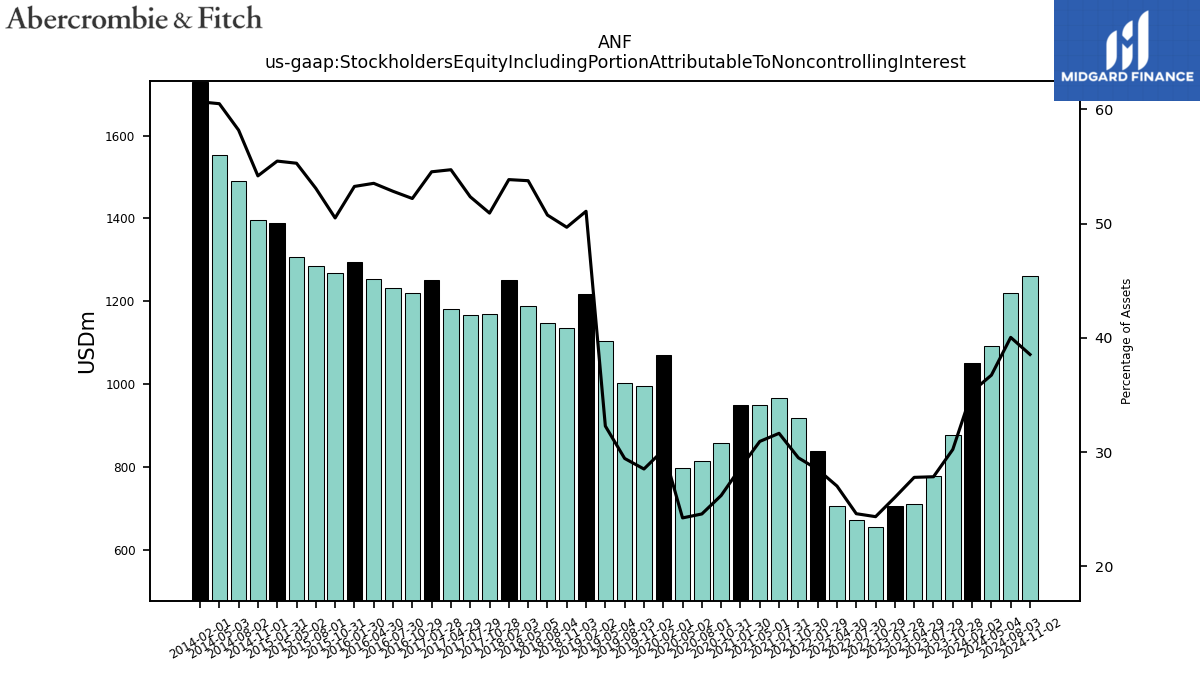
| Stockholders Equity | 1035.16 | 866.11 | 768.31 | 701.86 | 694.84 | 646.23 | 661.79 | 695.36 | 826.09 | 908.93 | 956.57 | 941.17 | 936.63 | 849.38 | 805.68 | 790.24 | 1058.81 | 983.51 | 991.98 | 1094.84 | 1208.90 | 1124.47 | 1137.31 | 1178.27 | 1242.38 | 1160.76 | 1157.07 | 1171.97 | 1243.43 | 1211.67 | 1225.94 | 1249.66 | 1291.06 | 1265.16 | 1284.53 | NA | 1389.70 | NA | NA | NA | 1729.49 | 1675.02 | 1683.66 | 1779.78 | 1818.27 | 1662.77 | 1695.84 | 1693.02 | 1862.46 | 1931.23 | 1886.87 | 1908.56 | 1890.78 | 1827.92 |
| 2024-02-03 | 2023-10-28 | 2023-07-29 | 2023-04-29 | 2023-01-28 | 2022-10-29 | 2022-07-30 | 2022-04-30 | 2022-01-29 | 2021-10-30 | 2021-07-31 | 2021-05-01 | 2021-01-30 | 2020-10-31 | 2020-08-01 | 2020-05-02 | 2020-02-01 | 2019-11-02 | 2019-08-03 | 2019-05-04 | 2019-02-02 | 2018-11-03 | 2018-08-04 | 2018-05-05 | 2018-02-03 | 2017-10-28 | 2017-07-29 | 2017-04-29 | 2017-01-28 | 2016-10-29 | 2016-07-30 | 2016-04-30 | 2016-01-30 | 2015-10-31 | 2015-08-01 | 2015-05-02 | 2015-01-31 | 2014-11-01 | 2014-08-02 | 2014-05-03 | 2014-02-01 | 2013-11-02 | 2013-08-03 | 2013-05-04 | 2013-02-02 | 2012-10-27 | 2012-07-28 | 2012-04-28 | 2012-01-28 | 2011-10-29 | 2011-07-30 | 2011-04-30 | 2011-01-29 | 2010-01-30 | ||
|---|---|---|---|---|---|---|---|---|---|---|---|---|---|---|---|---|---|---|---|---|---|---|---|---|---|---|---|---|---|---|---|---|---|---|---|---|---|---|---|---|---|---|---|---|---|---|---|---|---|---|---|---|---|---|---|
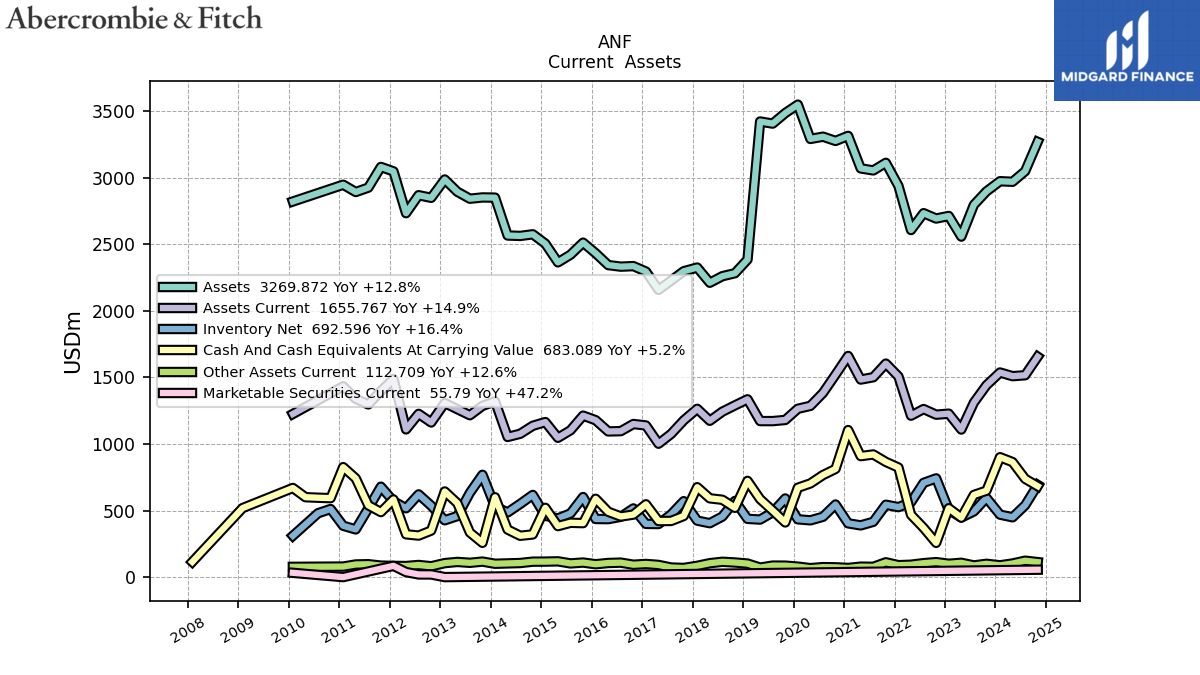
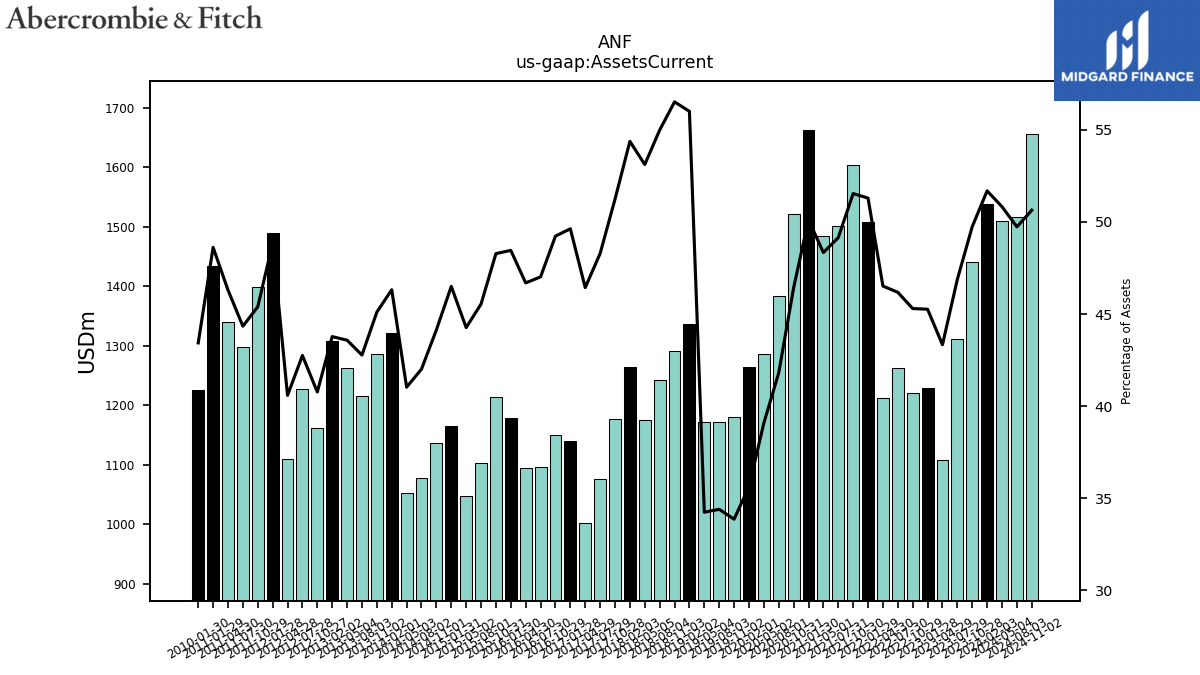
| Assets Current | 1537.27 | 1441.40 | 1311.27 | 1108.59 | 1228.02 | 1220.37 | 1262.69 | 1212.87 | 1507.76 | 1604.20 | 1501.65 | 1484.19 | 1661.63 | 1521.28 | 1383.44 | 1286.63 | 1264.75 | 1180.67 | 1172.14 | 1172.31 | 1335.95 | 1290.30 | 1243.07 | 1174.67 | 1264.54 | 1177.23 | 1075.74 | 1002.10 | 1139.30 | 1150.27 | 1096.67 | 1094.53 | 1178.98 | 1213.15 | 1103.14 | 1046.74 | 1164.97 | 1136.89 | 1076.89 | 1053.03 | 1320.57 | 1286.61 | 1216.07 | 1261.71 | 1307.82 | 1161.77 | 1226.66 | 1109.67 | 1488.78 | 1398.88 | 1297.45 | 1339.53 | 1433.27 | 1225.68 | |
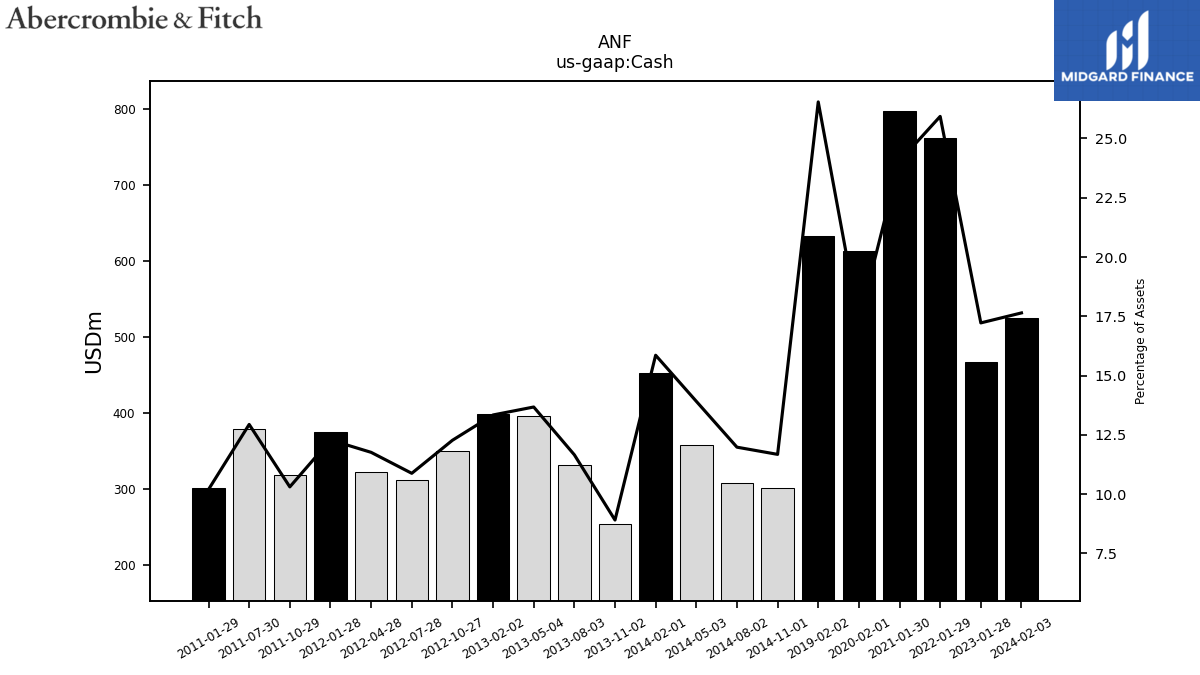
| Cash | 524.74 | NA | NA | NA | 467.24 | NA | NA | NA | 762.19 | NA | NA | NA | 796.99 | NA | NA | NA | 612.60 | NA | NA | NA | 633.14 | NA | NA | NA | NA | NA | NA | NA | NA | NA | NA | NA | NA | NA | NA | NA | NA | 300.77 | 307.10 | 357.12 | 452.12 | 254.13 | 331.45 | 395.89 | 398.51 | 349.67 | 312.15 | 321.60 | 374.48 | 317.60 | 378.63 | NA | 300.62 | NA | |
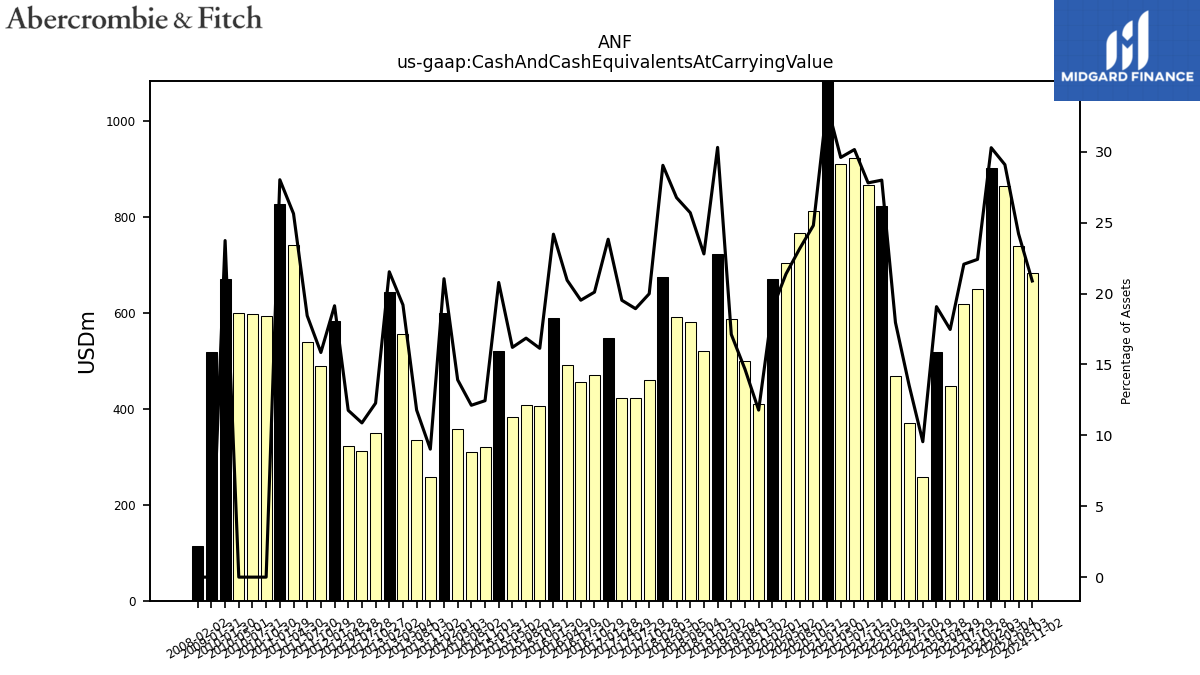
| Cash And Cash Equivalents At Carrying Value | 900.88 | 649.49 | 617.34 | 446.95 | 517.60 | 257.33 | 369.96 | 468.38 | 823.14 | 865.62 | 921.50 | 909.01 | 1104.86 | 812.88 | 766.72 | 703.99 | 671.27 | 410.77 | 499.76 | 586.13 | 723.13 | 520.52 | 581.17 | 591.96 | 675.56 | 459.29 | 421.90 | 421.44 | 547.19 | 469.72 | 455.61 | 490.98 | 588.58 | 405.61 | 408.31 | 383.22 | 520.71 | 320.56 | 310.74 | 357.12 | 600.12 | 257.52 | 335.02 | 555.90 | 643.50 | 349.67 | 312.15 | 321.62 | 583.50 | 488.34 | 539.61 | 741.82 | 826.35 | 669.95 | |
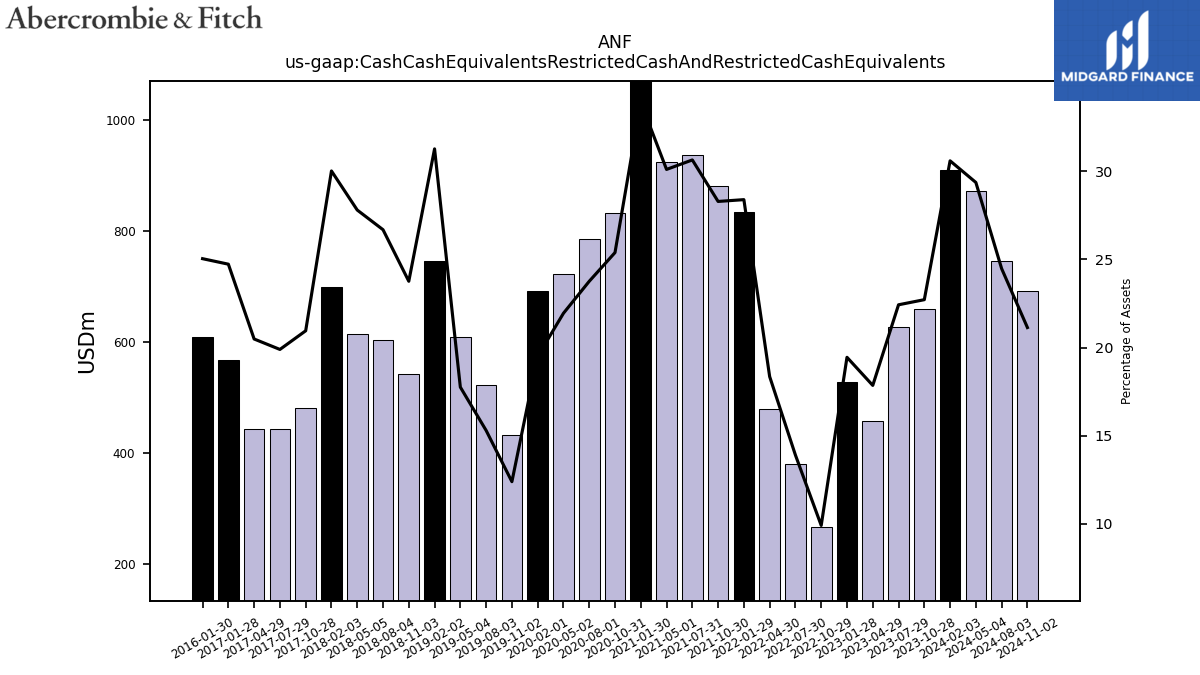
| Cash Cash Equivalents Restricted Cash And Restricted Cash Equivalents | 909.68 | 658.13 | 627.10 | 456.66 | 527.57 | 267.01 | 380.03 | 478.48 | 834.37 | 880.30 | 936.04 | 924.19 | 1124.16 | 831.81 | 785.99 | 722.27 | 692.26 | 432.02 | 521.17 | 607.68 | 745.83 | 542.38 | 603.19 | 614.68 | 697.96 | 481.38 | 443.15 | 442.01 | 567.63 | NA | NA | NA | 609.16 | NA | NA | NA | NA | NA | NA | NA | NA | NA | NA | NA | NA | NA | NA | NA | NA | NA | NA | NA | NA | NA | |
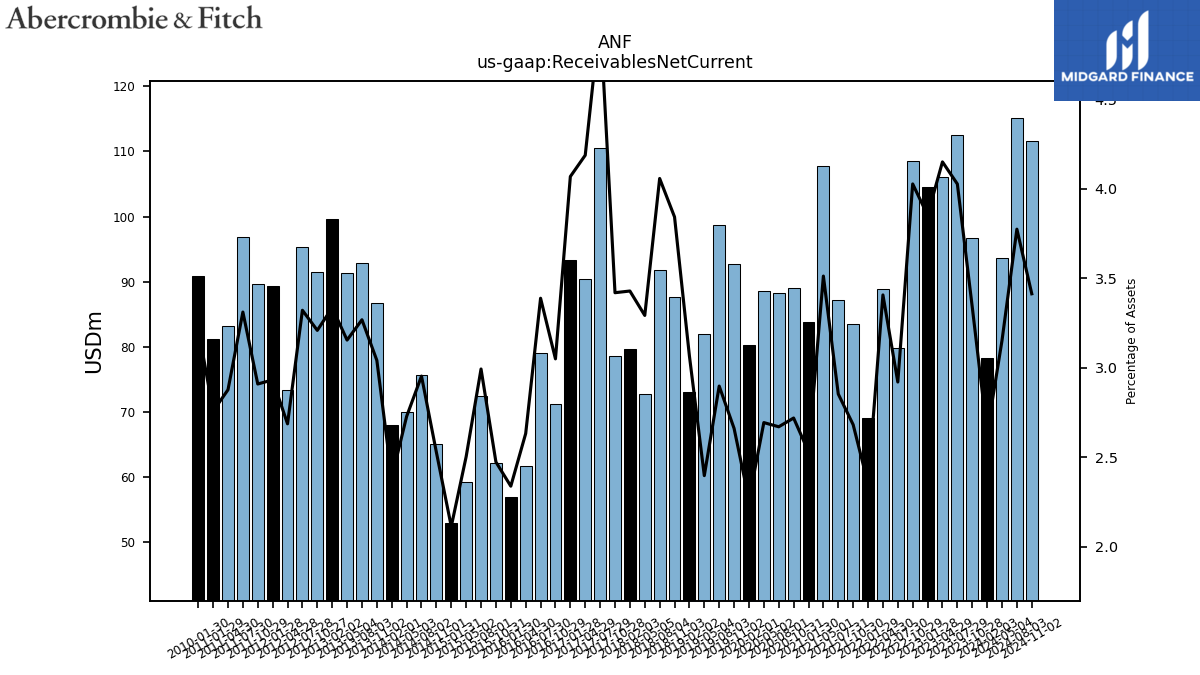
| Receivables Net Current | 78.35 | 96.76 | 112.60 | 106.15 | 104.51 | 108.47 | 79.82 | 88.81 | 69.10 | 83.45 | 87.15 | 107.82 | 83.86 | 89.07 | 88.32 | 88.64 | 80.25 | 92.74 | 98.69 | 82.03 | 73.11 | 87.71 | 91.72 | 72.80 | 79.72 | 78.55 | 110.59 | 90.35 | 93.38 | 71.23 | 79.01 | 61.69 | 56.87 | 62.13 | 72.48 | 59.17 | 52.91 | 65.08 | 75.68 | 69.98 | 67.97 | 86.73 | 92.89 | 91.30 | 99.62 | 91.41 | 95.27 | 73.43 | 89.35 | 89.62 | 96.86 | 83.21 | 81.26 | 90.86 | |
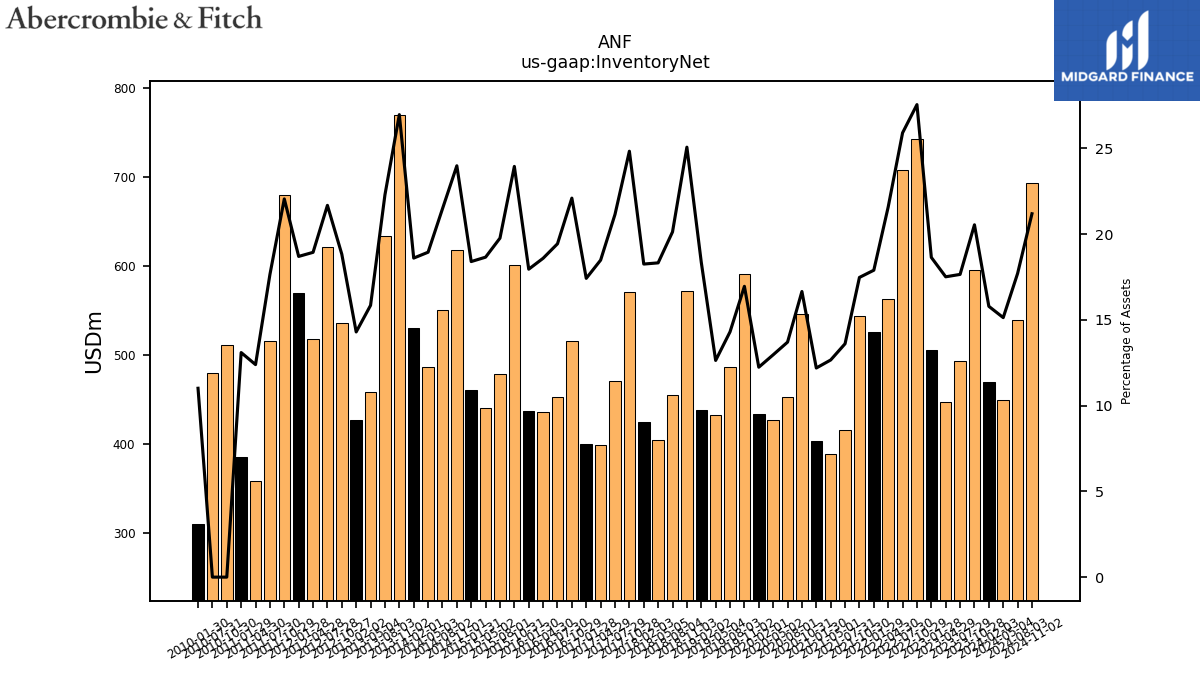
| Inventory Net | 469.47 | 595.07 | 493.48 | 447.81 | 505.62 | 741.96 | 708.02 | 562.51 | 525.86 | 543.71 | 415.60 | 388.63 | 404.05 | 545.55 | 453.24 | 426.59 | 434.33 | 590.88 | 487.11 | 432.35 | 437.88 | 572.17 | 454.91 | 405.11 | 424.39 | 570.48 | 471.04 | 398.75 | 399.80 | 516.15 | 453.18 | 435.66 | 436.70 | 601.54 | 478.62 | 441.00 | 460.79 | 617.54 | 550.23 | 486.03 | 530.19 | 768.95 | 633.48 | 458.63 | 426.96 | 536.32 | 621.74 | 517.56 | 569.82 | 679.34 | 516.13 | 358.37 | 385.86 | 310.64 | |
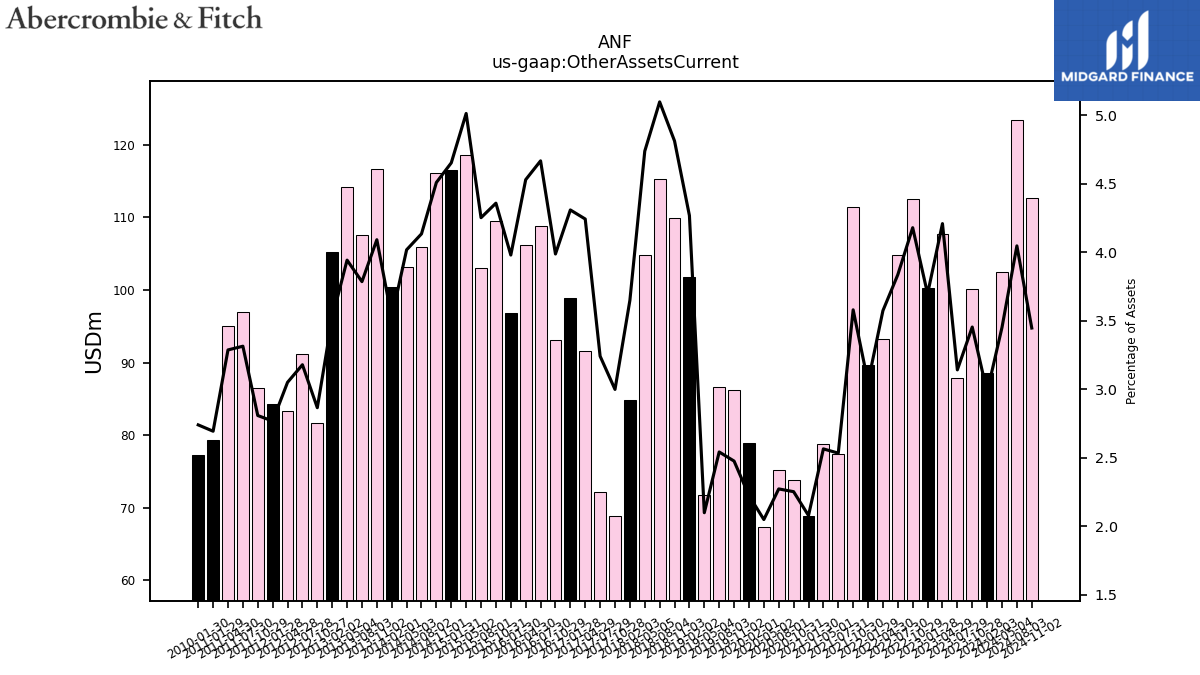
| Other Assets Current | 88.57 | 100.08 | 87.85 | 107.68 | 100.29 | 112.60 | 104.89 | 93.18 | 89.65 | 111.42 | 77.39 | 78.73 | 68.86 | 73.78 | 75.16 | 67.41 | 78.91 | 86.28 | 86.59 | 71.80 | 101.82 | 109.89 | 115.28 | 104.81 | 84.86 | 68.90 | 72.22 | 91.56 | 98.93 | 93.17 | 108.88 | 106.20 | 96.83 | 109.53 | 103.01 | 118.56 | 116.57 | 116.16 | 105.98 | 103.12 | 100.46 | 116.71 | 107.62 | 114.15 | 105.18 | 81.63 | 91.20 | 83.39 | 84.34 | 86.52 | 96.97 | 95.09 | 79.39 | 77.30 | |
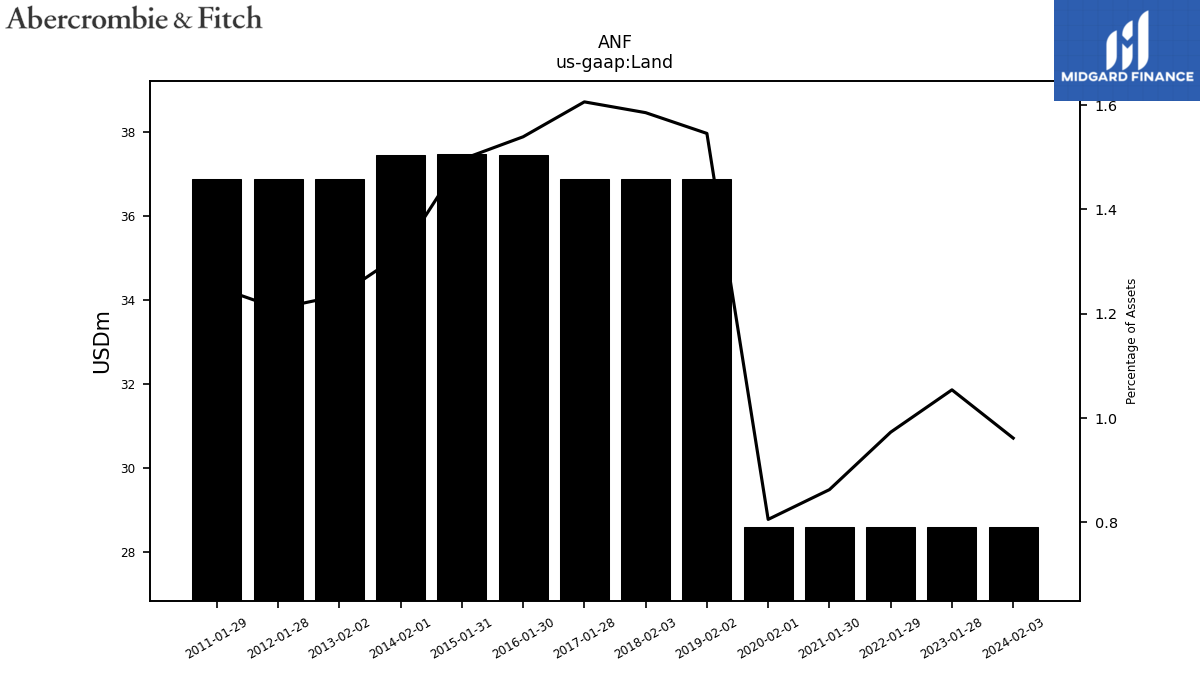
| Land | 28.60 | NA | NA | NA | 28.60 | NA | NA | NA | 28.60 | NA | NA | NA | 28.60 | NA | NA | NA | 28.60 | NA | NA | NA | 36.88 | NA | NA | NA | 36.88 | NA | NA | NA | 36.88 | NA | NA | NA | 37.45 | NA | NA | NA | 37.47 | NA | NA | NA | 37.45 | NA | NA | NA | 36.89 | NA | NA | NA | 36.89 | NA | NA | NA | 36.88 | NA |
| 2024-02-03 | 2023-10-28 | 2023-07-29 | 2023-04-29 | 2023-01-28 | 2022-10-29 | 2022-07-30 | 2022-04-30 | 2022-01-29 | 2021-10-30 | 2021-07-31 | 2021-05-01 | 2021-01-30 | 2020-10-31 | 2020-08-01 | 2020-05-02 | 2020-02-01 | 2019-11-02 | 2019-08-03 | 2019-05-04 | 2019-02-02 | 2018-11-03 | 2018-08-04 | 2018-05-05 | 2018-02-03 | 2017-10-28 | 2017-07-29 | 2017-04-29 | 2017-01-28 | 2016-10-29 | 2016-07-30 | 2016-04-30 | 2016-01-30 | 2015-10-31 | 2015-08-01 | 2015-05-02 | 2015-01-31 | 2014-11-01 | 2014-08-02 | 2014-05-03 | 2014-02-01 | 2013-11-02 | 2013-08-03 | 2013-05-04 | 2013-02-02 | 2012-10-27 | 2012-07-28 | 2012-04-28 | 2012-01-28 | 2011-10-29 | 2011-07-30 | 2011-04-30 | 2011-01-29 | 2010-01-30 | ||
|---|---|---|---|---|---|---|---|---|---|---|---|---|---|---|---|---|---|---|---|---|---|---|---|---|---|---|---|---|---|---|---|---|---|---|---|---|---|---|---|---|---|---|---|---|---|---|---|---|---|---|---|---|---|---|---|
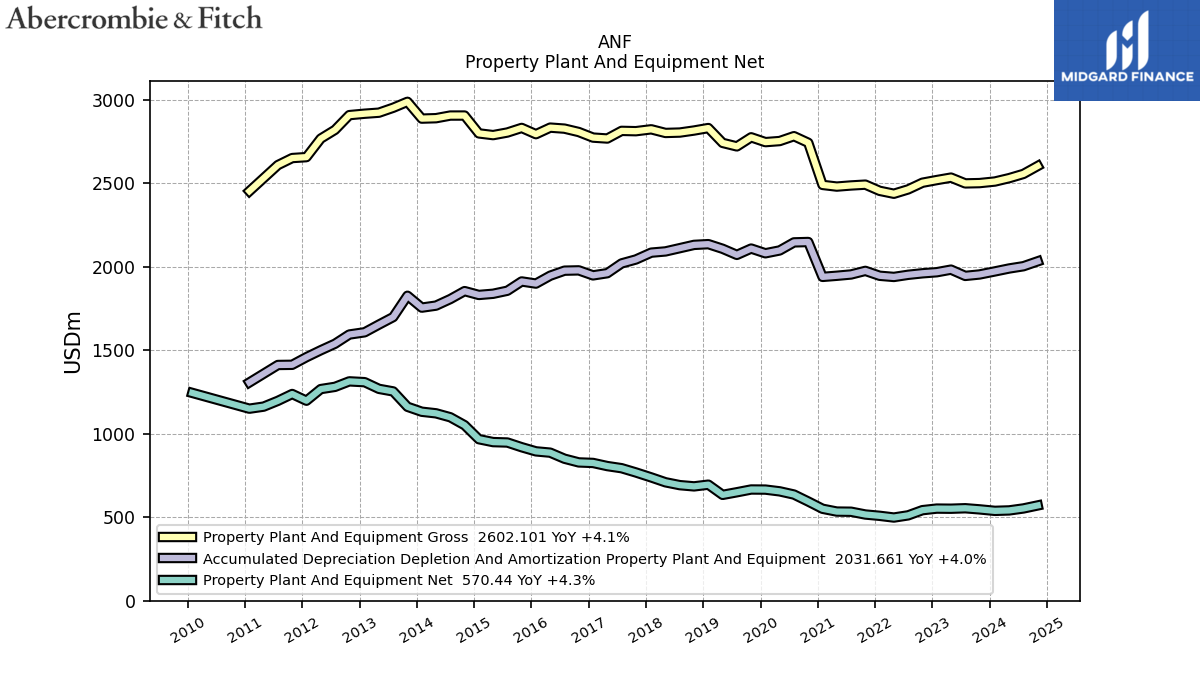
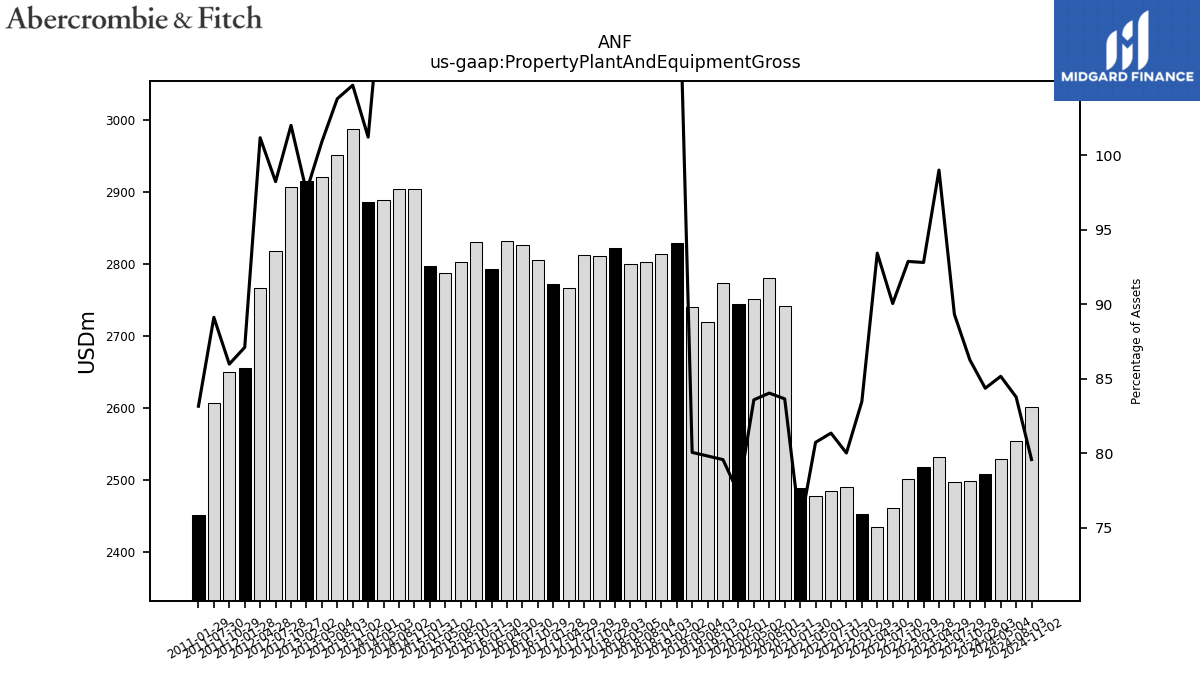
| Property Plant And Equipment Gross | 2509.18 | 2499.78 | 2497.95 | 2532.64 | 2517.86 | 2502.01 | 2462.07 | 2436.02 | 2453.49 | 2490.55 | 2485.62 | 2478.89 | 2488.96 | 2741.17 | 2780.62 | 2751.47 | 2744.97 | 2773.86 | 2719.35 | 2740.34 | 2829.25 | 2814.44 | 2802.25 | 2799.84 | 2821.71 | 2810.47 | 2812.37 | 2766.56 | 2772.14 | 2805.45 | 2825.74 | 2831.85 | 2792.44 | 2830.01 | 2802.56 | 2786.96 | 2797.25 | 2904.09 | 2903.97 | 2888.28 | 2885.71 | 2986.43 | 2950.69 | 2921.21 | 2915.07 | 2906.56 | 2818.46 | 2766.09 | 2655.22 | 2649.64 | 2607.71 | NA | 2451.41 | NA | |
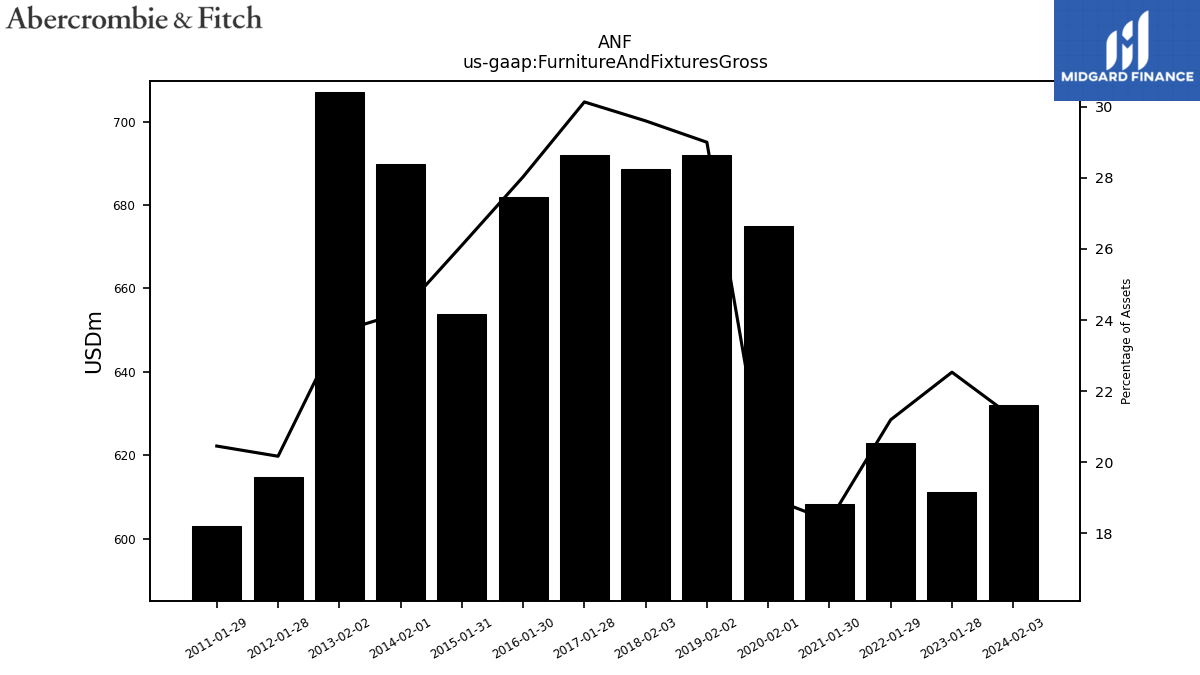
| Furniture And Fixtures Gross | 632.06 | NA | NA | NA | 611.28 | NA | NA | NA | 622.91 | NA | NA | NA | 608.21 | NA | NA | NA | 674.88 | NA | NA | NA | 691.91 | NA | NA | NA | 688.53 | NA | NA | NA | 691.92 | NA | NA | NA | 682.01 | NA | NA | NA | 653.93 | NA | NA | NA | 689.82 | NA | NA | NA | 707.06 | NA | NA | NA | 614.64 | NA | NA | NA | 602.88 | NA | |
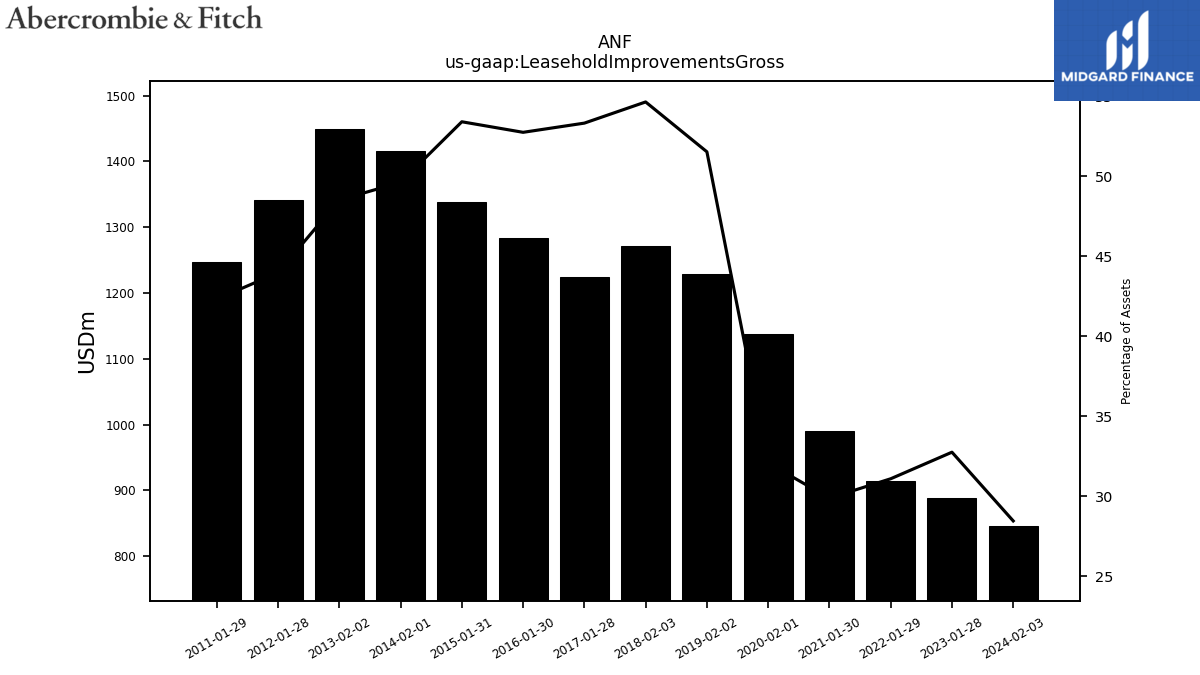
| Leasehold Improvements Gross | 846.10 | NA | NA | NA | 888.46 | NA | NA | NA | 913.73 | NA | NA | NA | 990.24 | NA | NA | NA | 1138.37 | NA | NA | NA | 1229.49 | NA | NA | NA | 1271.17 | NA | NA | NA | 1224.40 | NA | NA | NA | 1283.61 | NA | NA | NA | 1338.21 | NA | NA | NA | 1414.94 | NA | NA | NA | 1449.57 | NA | NA | NA | 1340.49 | NA | NA | NA | 1247.49 | NA | |
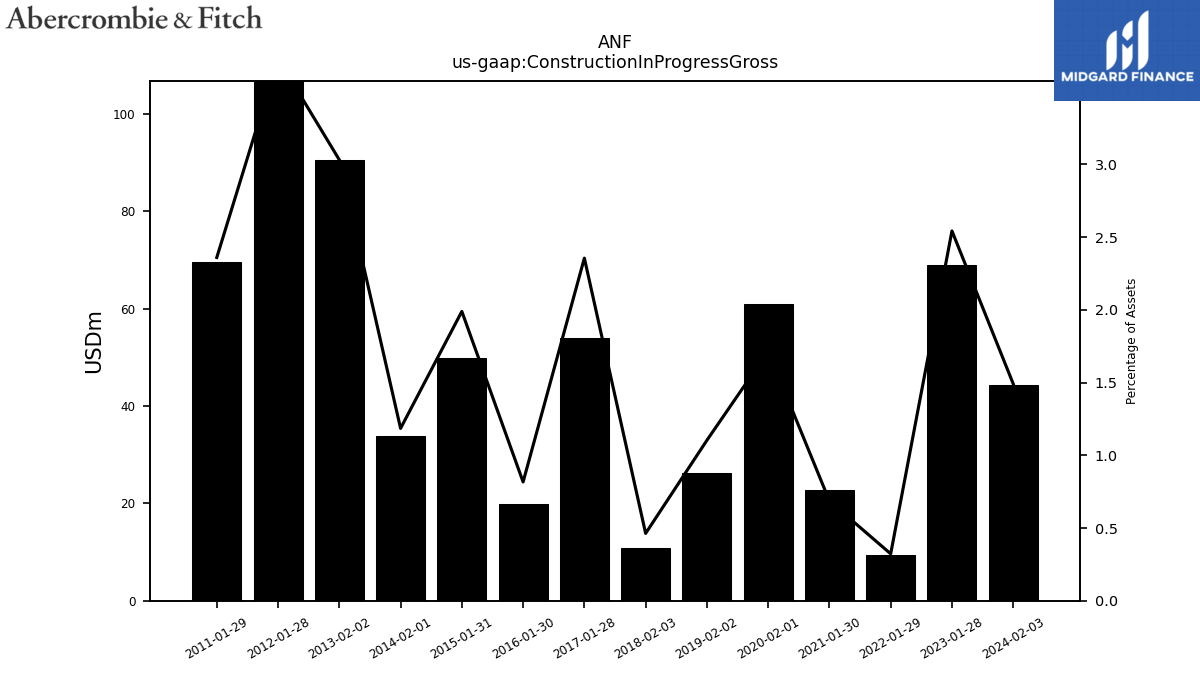
| Construction In Progress Gross | 44.36 | NA | NA | NA | 68.98 | NA | NA | NA | 9.48 | NA | NA | NA | 22.74 | NA | NA | NA | 60.91 | NA | NA | NA | 26.32 | NA | NA | NA | 10.77 | NA | NA | NA | 54.08 | NA | NA | NA | 19.88 | NA | NA | NA | 49.84 | NA | NA | NA | 33.79 | NA | NA | NA | 90.57 | NA | NA | NA | 113.66 | NA | NA | NA | 69.58 | NA | |
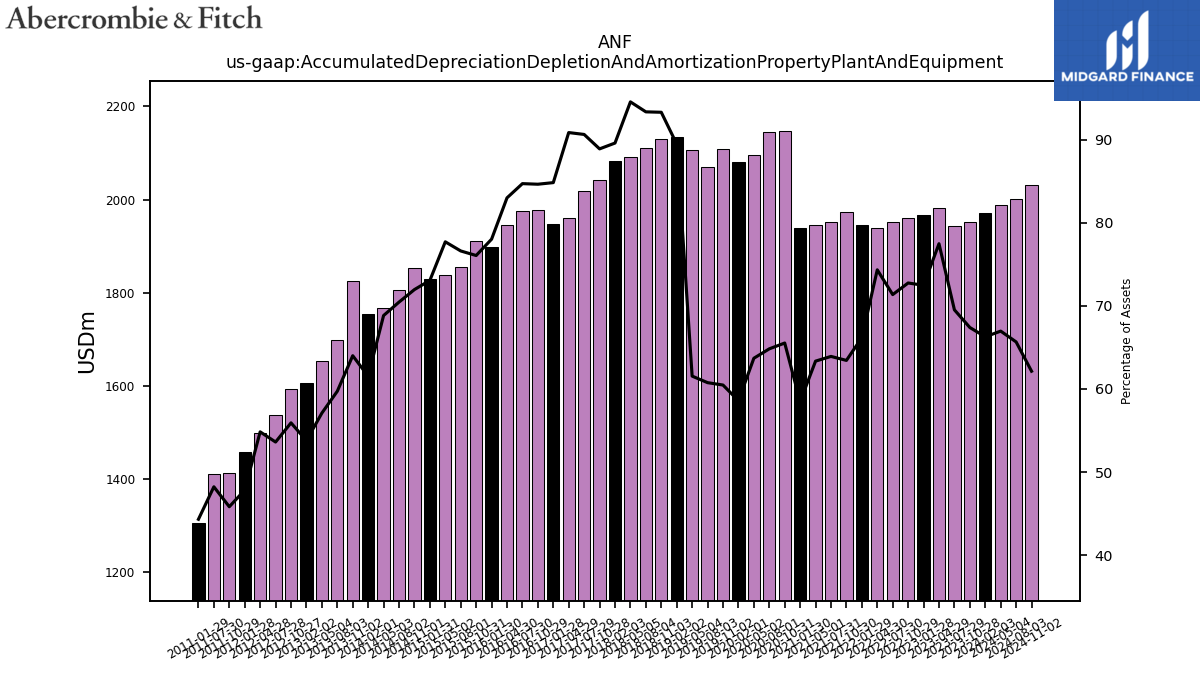
| Accumulated Depreciation Depletion And Amortization Property Plant And Equipment | 1971.15 | 1952.84 | 1944.27 | 1981.83 | 1966.28 | 1959.87 | 1950.89 | 1938.04 | 1945.16 | 1974.38 | 1952.83 | 1945.12 | 1938.37 | 2147.24 | 2144.92 | 2096.69 | 2079.68 | 2108.00 | 2069.99 | 2106.65 | 2134.39 | 2129.91 | 2110.32 | 2090.84 | 2083.53 | 2042.54 | 2018.99 | 1960.50 | 1947.40 | 1977.45 | 1975.62 | 1945.51 | 1898.26 | 1911.09 | 1855.51 | 1837.37 | 1830.25 | 1853.30 | 1805.73 | 1766.50 | 1754.37 | 1825.53 | 1697.85 | 1652.92 | 1606.84 | 1593.43 | 1538.22 | 1499.22 | 1457.95 | 1412.21 | 1411.13 | NA | 1306.47 | NA | |
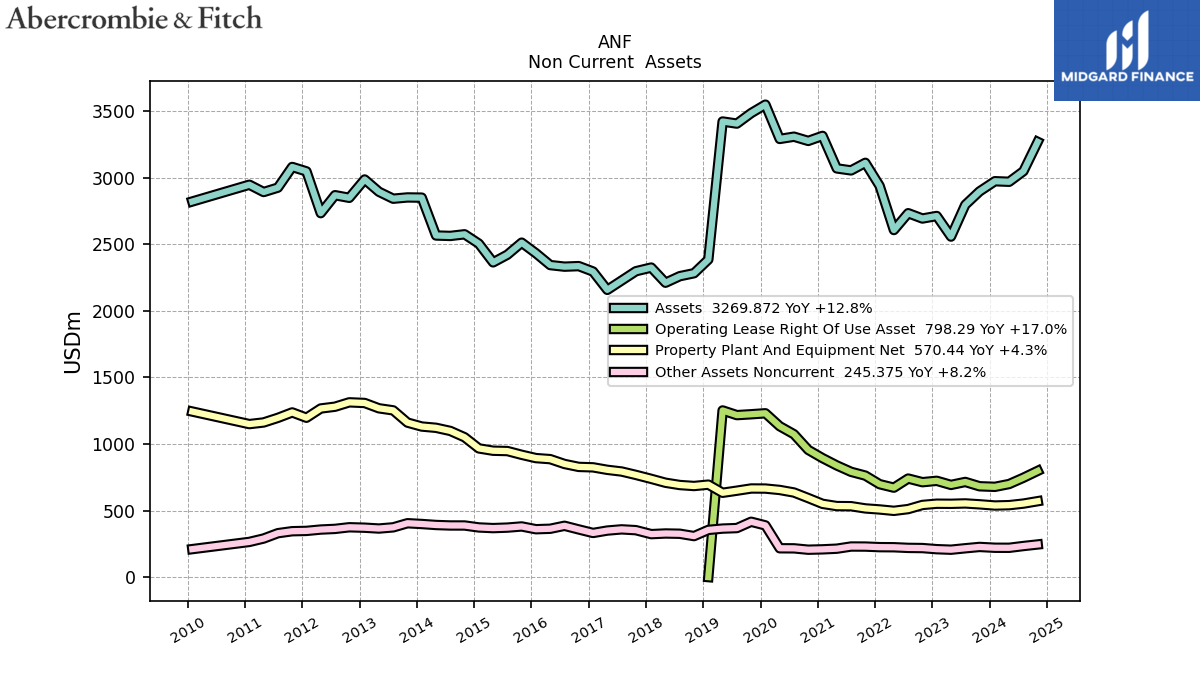
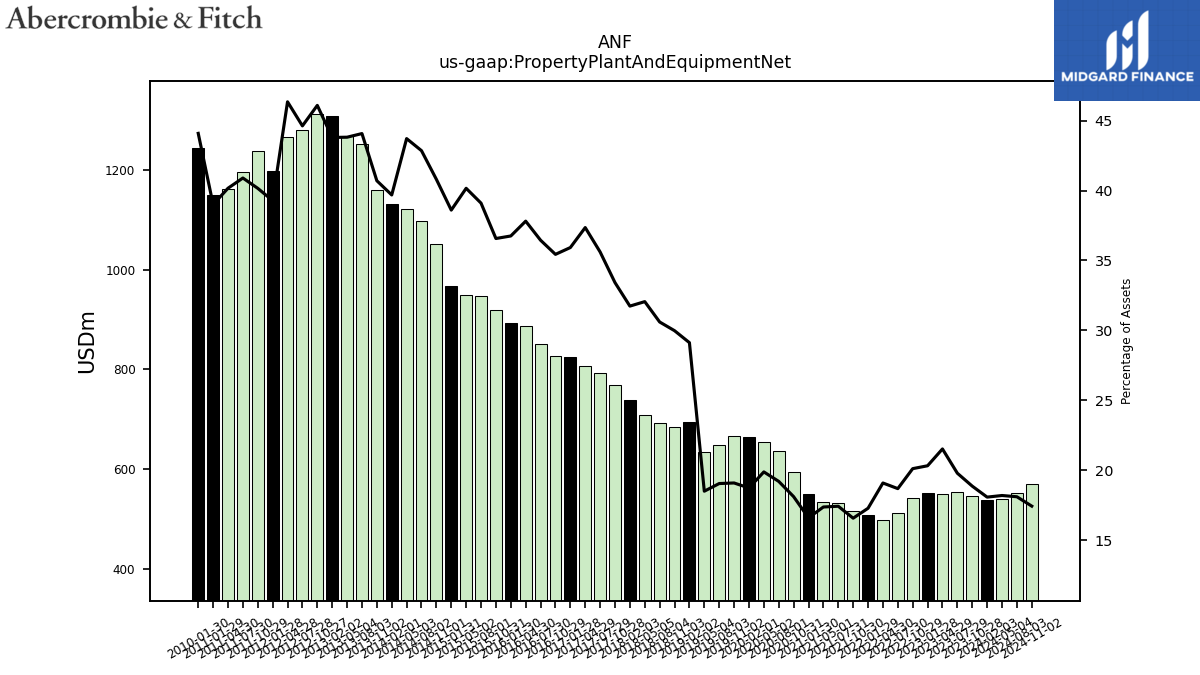
| Property Plant And Equipment Net | 538.03 | 546.93 | 553.68 | 550.81 | 551.59 | 542.14 | 511.18 | 497.98 | 508.34 | 516.18 | 532.79 | 533.77 | 550.59 | 593.93 | 635.70 | 654.78 | 665.29 | 665.86 | 649.36 | 633.69 | 694.86 | 684.53 | 691.93 | 709.01 | 738.18 | 767.93 | 793.37 | 806.06 | 824.74 | 828.00 | 850.11 | 886.35 | 894.18 | 918.93 | 947.05 | 949.59 | 967.00 | 1050.80 | 1098.24 | 1121.78 | 1131.34 | 1160.90 | 1252.84 | 1268.29 | 1308.23 | 1313.13 | 1280.24 | 1266.88 | 1197.27 | 1237.43 | 1196.59 | 1161.90 | 1149.58 | 1244.02 | |
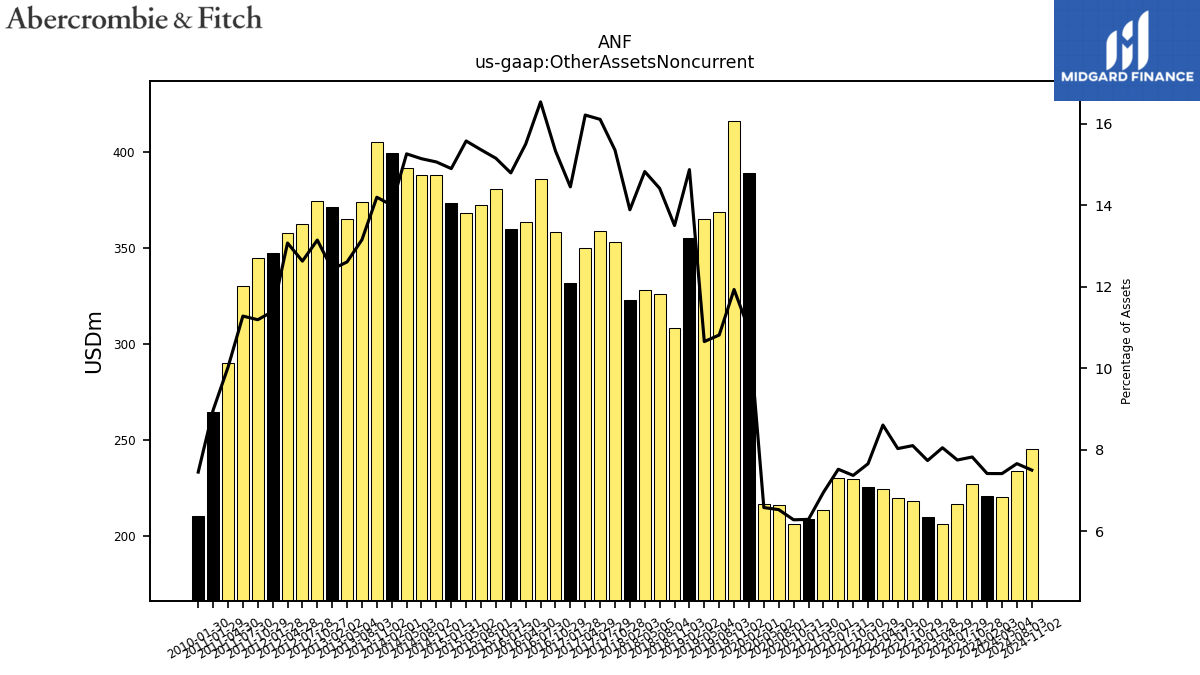
| Other Assets Noncurrent | 220.68 | 226.75 | 216.79 | 205.98 | 209.95 | 218.32 | 219.60 | 224.46 | 225.16 | 229.51 | 229.91 | 213.59 | 208.70 | 205.97 | 216.20 | 216.79 | 388.67 | 415.96 | 368.50 | 364.72 | 354.79 | 308.24 | 325.84 | 327.84 | 322.97 | 352.74 | 358.79 | 349.81 | 331.72 | 358.20 | 385.61 | 363.31 | 359.88 | 380.66 | 372.01 | 368.26 | 373.19 | 387.88 | 388.04 | 391.59 | 399.09 | 404.88 | 373.93 | 365.02 | 371.35 | 374.55 | 362.34 | 357.39 | 347.25 | 344.88 | 330.08 | 290.01 | 264.52 | 210.37 |
| 2024-02-03 | 2023-10-28 | 2023-07-29 | 2023-04-29 | 2023-01-28 | 2022-10-29 | 2022-07-30 | 2022-04-30 | 2022-01-29 | 2021-10-30 | 2021-07-31 | 2021-05-01 | 2021-01-30 | 2020-10-31 | 2020-08-01 | 2020-05-02 | 2020-02-01 | 2019-11-02 | 2019-08-03 | 2019-05-04 | 2019-02-02 | 2018-11-03 | 2018-08-04 | 2018-05-05 | 2018-02-03 | 2017-10-28 | 2017-07-29 | 2017-04-29 | 2017-01-28 | 2016-10-29 | 2016-07-30 | 2016-04-30 | 2016-01-30 | 2015-10-31 | 2015-08-01 | 2015-05-02 | 2015-01-31 | 2014-11-01 | 2014-08-02 | 2014-05-03 | 2014-02-01 | 2013-11-02 | 2013-08-03 | 2013-05-04 | 2013-02-02 | 2012-10-27 | 2012-07-28 | 2012-04-28 | 2012-01-28 | 2011-10-29 | 2011-07-30 | 2011-04-30 | 2011-01-29 | 2010-01-30 | ||
|---|---|---|---|---|---|---|---|---|---|---|---|---|---|---|---|---|---|---|---|---|---|---|---|---|---|---|---|---|---|---|---|---|---|---|---|---|---|---|---|---|---|---|---|---|---|---|---|---|---|---|---|---|---|---|---|
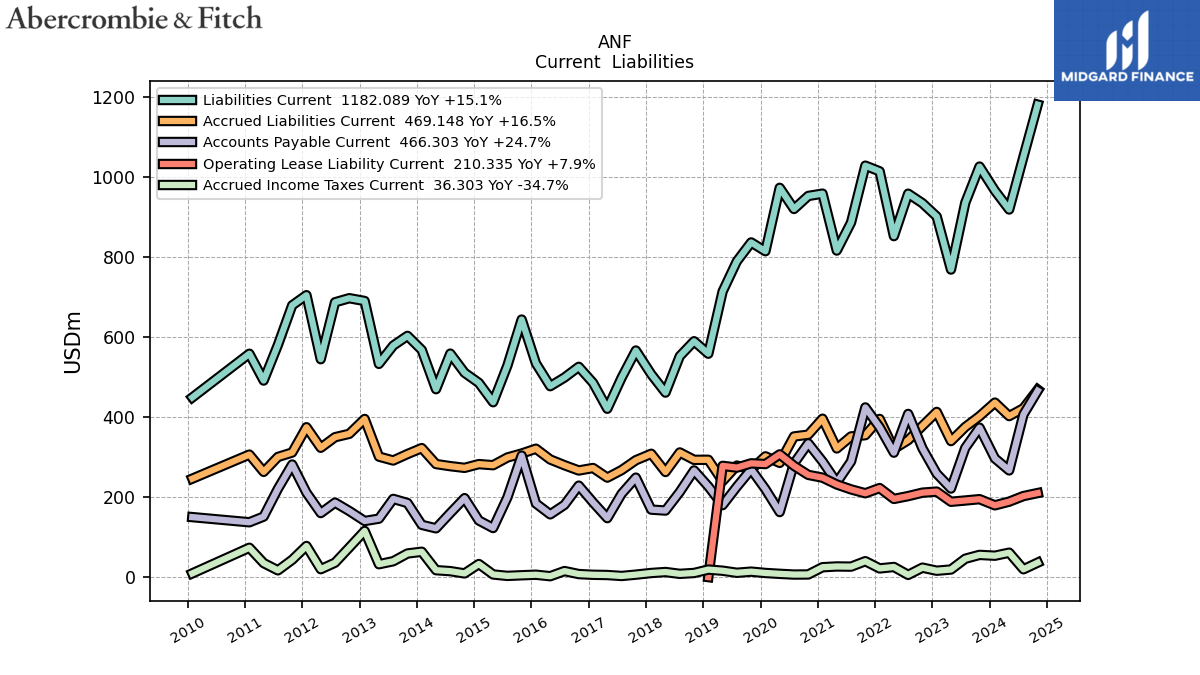
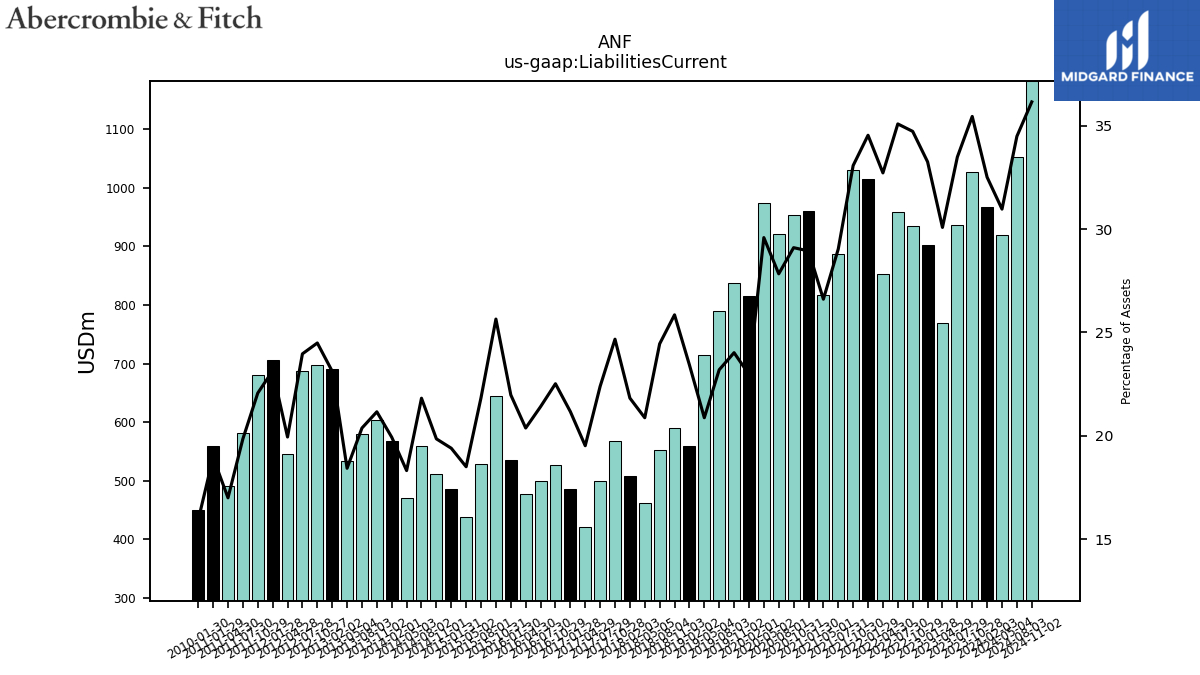
| Liabilities Current | 966.82 | 1027.14 | 936.48 | 769.46 | 902.20 | 935.49 | 959.27 | 853.03 | 1015.24 | 1029.42 | 887.18 | 817.00 | 959.40 | 953.58 | 920.99 | 973.95 | 815.35 | 837.33 | 790.18 | 714.50 | 558.92 | 590.17 | 552.74 | 461.59 | 507.55 | 566.95 | 498.78 | 421.23 | 486.00 | 526.12 | 499.34 | 477.64 | 534.70 | 644.41 | 529.13 | 437.50 | 485.96 | 511.29 | 559.22 | 470.10 | 568.22 | 603.58 | 579.23 | 533.51 | 690.80 | 697.79 | 687.58 | 545.17 | 705.35 | 679.95 | 580.85 | 491.78 | 558.85 | 449.37 | |
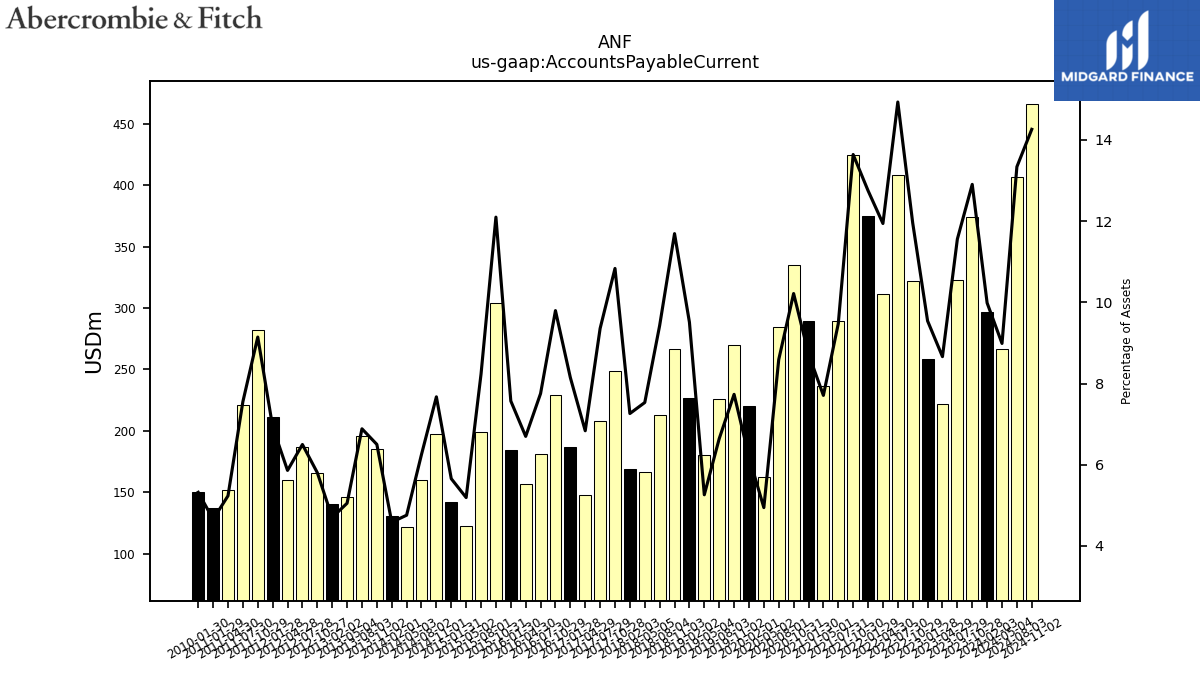
| Accounts Payable Current | 296.98 | 373.93 | 323.20 | 221.59 | 258.89 | 322.13 | 408.30 | 311.35 | 374.83 | 424.56 | 289.48 | 236.67 | 289.40 | 334.77 | 284.22 | 162.75 | 219.92 | 269.58 | 226.23 | 180.04 | 226.88 | 266.93 | 213.17 | 166.58 | 168.87 | 248.96 | 208.43 | 147.53 | 187.02 | 228.88 | 180.83 | 157.02 | 184.18 | 303.99 | 199.41 | 122.76 | 141.69 | 197.61 | 160.28 | 122.08 | 130.72 | 185.44 | 195.73 | 146.24 | 140.40 | 165.39 | 186.45 | 160.20 | 211.37 | 281.77 | 221.00 | 151.43 | 137.24 | 150.13 | |
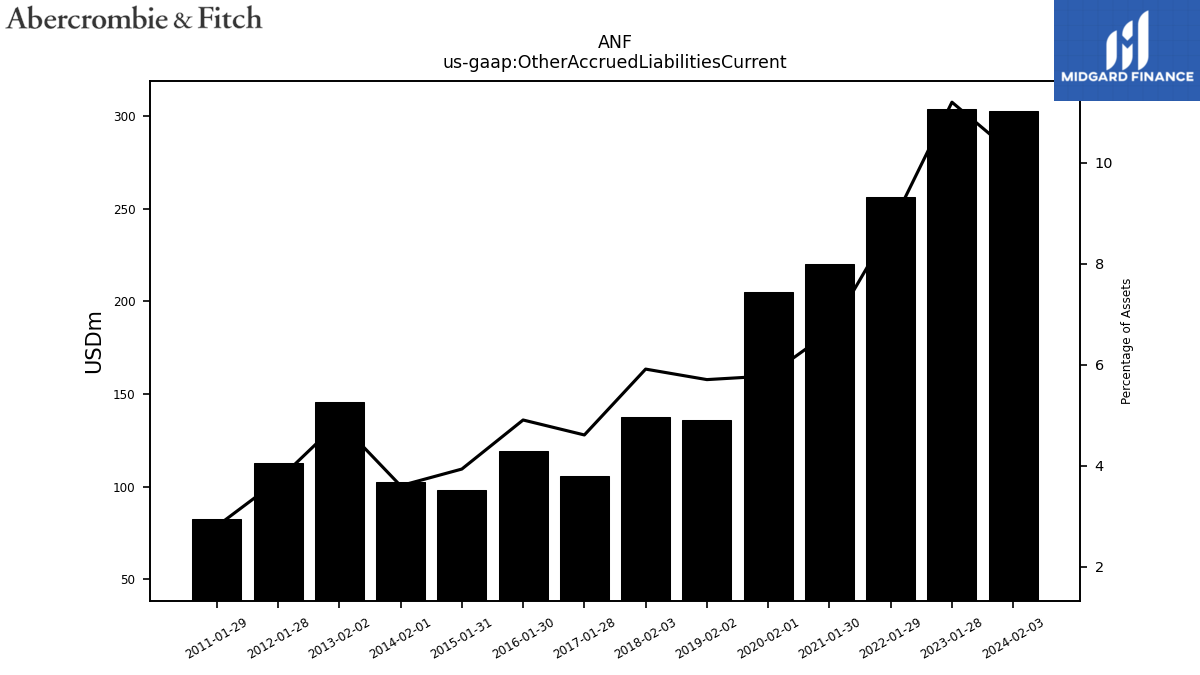
| Other Accrued Liabilities Current | 302.61 | NA | NA | NA | 303.76 | NA | NA | NA | 256.51 | NA | NA | NA | 220.25 | NA | NA | NA | 204.99 | NA | NA | NA | 136.07 | NA | NA | NA | 137.49 | NA | NA | NA | 105.78 | NA | NA | NA | 119.32 | NA | NA | NA | 98.52 | NA | NA | NA | 102.71 | NA | NA | NA | 145.49 | NA | NA | NA | 113.06 | NA | NA | NA | 82.55 | NA | |
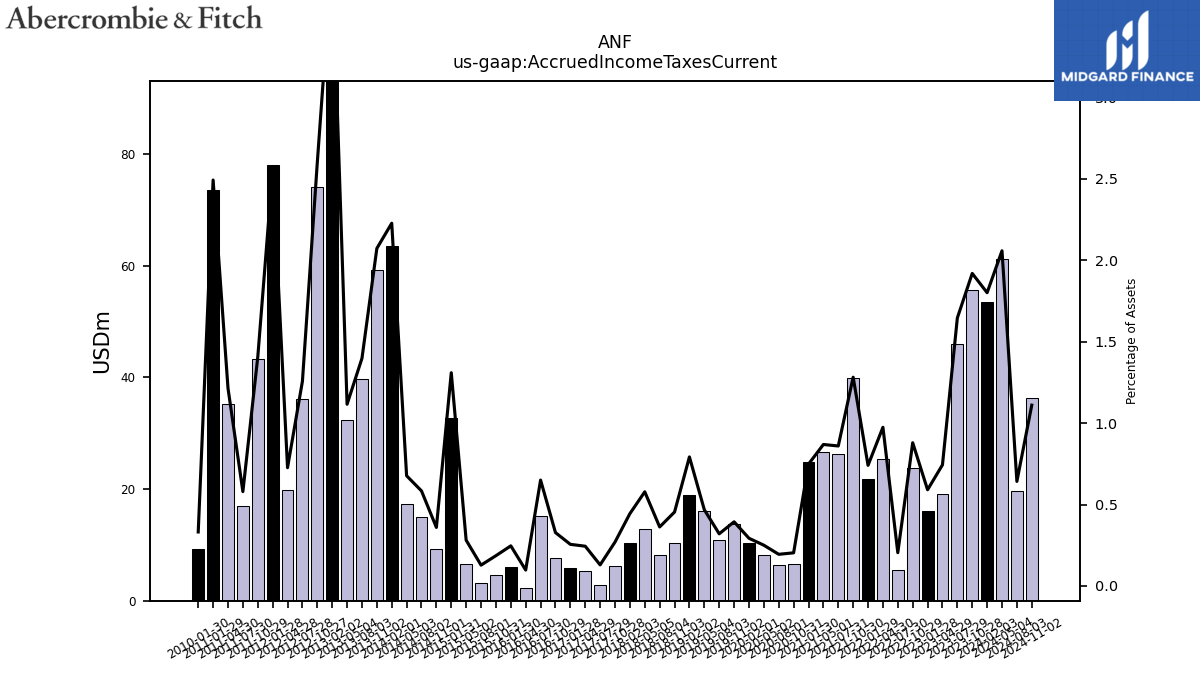
| Accrued Income Taxes Current | 53.56 | 55.62 | 46.04 | 19.02 | 16.02 | 23.69 | 5.58 | 25.40 | 21.77 | 39.90 | 26.26 | 26.67 | 24.79 | 6.66 | 6.42 | 8.23 | 10.39 | 13.73 | 10.90 | 16.02 | 18.90 | 10.36 | 8.19 | 12.78 | 10.33 | 6.19 | 2.88 | 5.26 | 5.86 | 7.65 | 15.16 | 2.29 | 5.99 | 4.67 | 3.09 | 6.64 | 32.80 | 9.25 | 14.96 | 17.36 | 63.51 | 59.13 | 39.73 | 32.30 | 115.62 | 74.10 | 36.06 | 19.85 | 77.92 | 43.30 | 16.95 | 35.14 | 73.49 | 9.35 | |
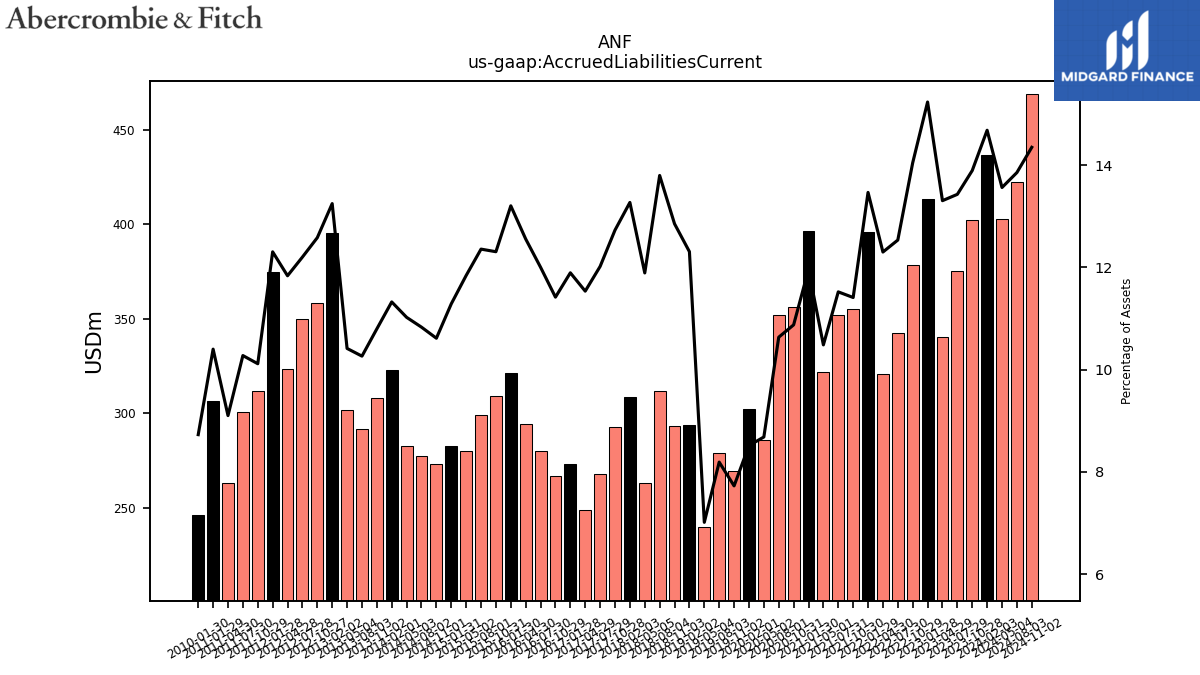
| Accrued Liabilities Current | 436.65 | 402.57 | 375.54 | 340.33 | 413.30 | 378.37 | 342.69 | 320.68 | 395.81 | 355.15 | 351.99 | 321.91 | 396.37 | 356.37 | 351.85 | 285.80 | 302.21 | 269.33 | 279.05 | 240.05 | 293.58 | 293.41 | 311.93 | 262.96 | 308.60 | 292.48 | 267.75 | 248.91 | 273.04 | 266.76 | 279.92 | 294.30 | 321.24 | 309.21 | 299.30 | 279.99 | 282.74 | 273.36 | 277.59 | 282.88 | 322.83 | 307.96 | 291.77 | 301.49 | 395.73 | 358.48 | 350.07 | 323.57 | 375.02 | 311.69 | 300.65 | 263.29 | 306.59 | 246.29 |
| 2024-02-03 | 2023-10-28 | 2023-07-29 | 2023-04-29 | 2023-01-28 | 2022-10-29 | 2022-07-30 | 2022-04-30 | 2022-01-29 | 2021-10-30 | 2021-07-31 | 2021-05-01 | 2021-01-30 | 2020-10-31 | 2020-08-01 | 2020-05-02 | 2020-02-01 | 2019-11-02 | 2019-08-03 | 2019-05-04 | 2019-02-02 | 2018-11-03 | 2018-08-04 | 2018-05-05 | 2018-02-03 | 2017-10-28 | 2017-07-29 | 2017-04-29 | 2017-01-28 | 2016-10-29 | 2016-07-30 | 2016-04-30 | 2016-01-30 | 2015-10-31 | 2015-08-01 | 2015-05-02 | 2015-01-31 | 2014-11-01 | 2014-08-02 | 2014-05-03 | 2014-02-01 | 2013-11-02 | 2013-08-03 | 2013-05-04 | 2013-02-02 | 2012-10-27 | 2012-07-28 | 2012-04-28 | 2012-01-28 | 2011-10-29 | 2011-07-30 | 2011-04-30 | 2011-01-29 | 2010-01-30 | ||
|---|---|---|---|---|---|---|---|---|---|---|---|---|---|---|---|---|---|---|---|---|---|---|---|---|---|---|---|---|---|---|---|---|---|---|---|---|---|---|---|---|---|---|---|---|---|---|---|---|---|---|---|---|---|---|---|
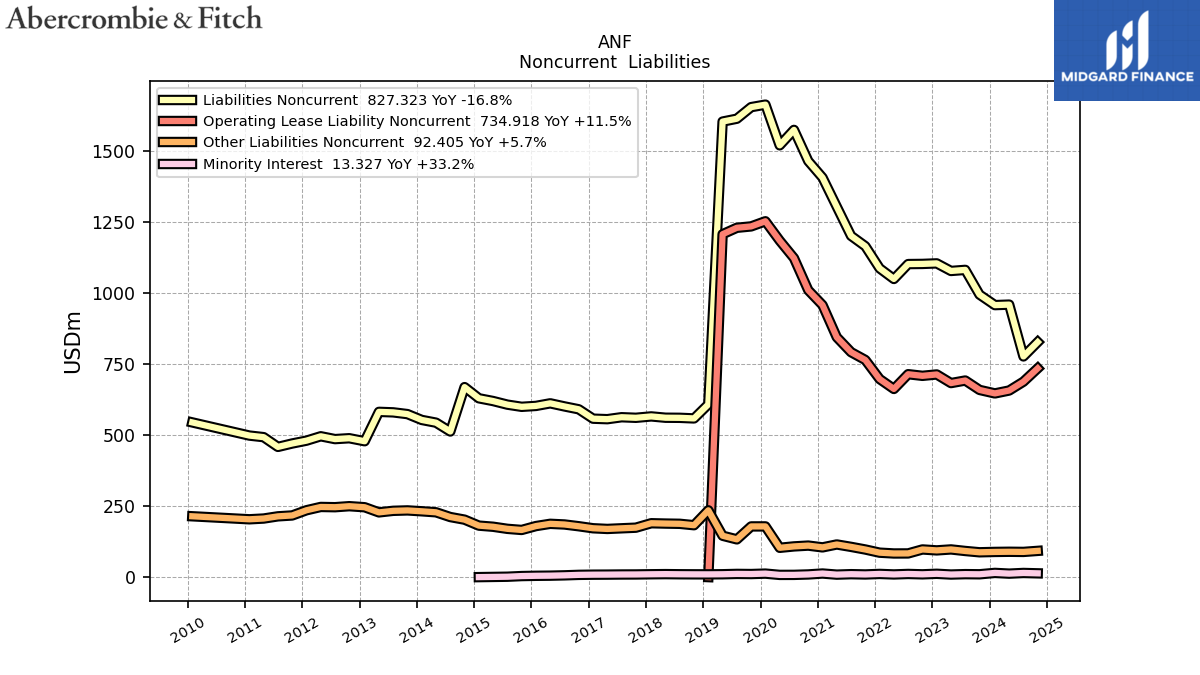
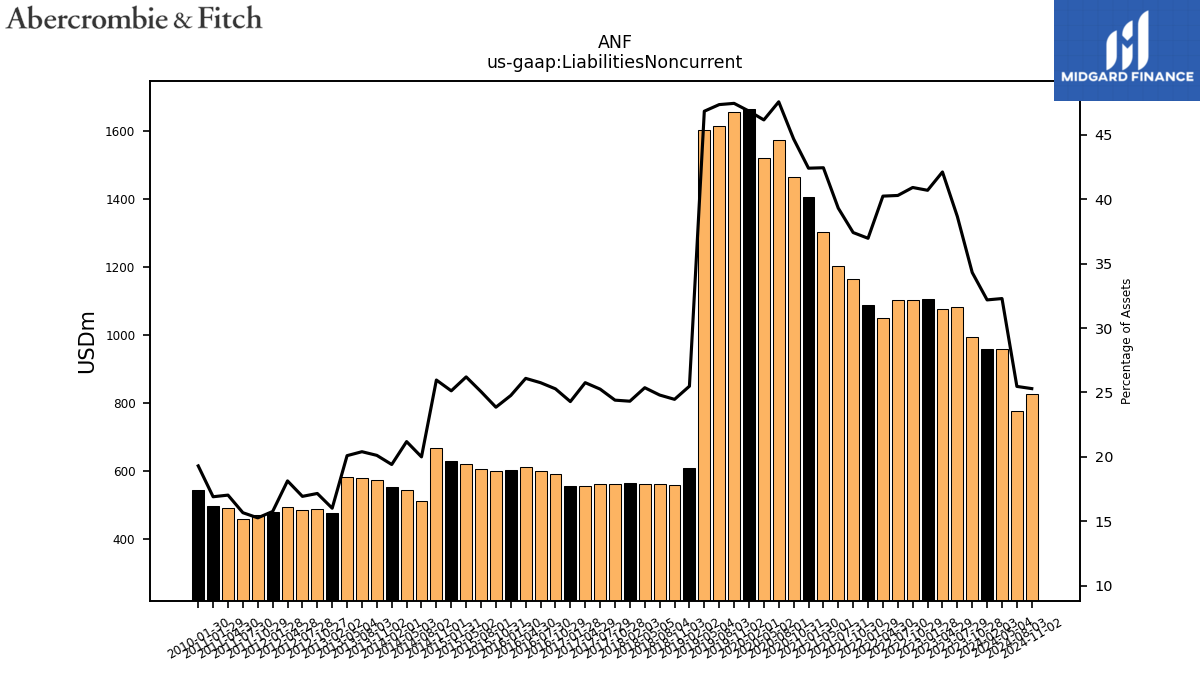
| Liabilities Noncurrent | 957.43 | 994.39 | 1081.45 | 1077.64 | 1104.33 | 1102.44 | 1101.90 | 1049.47 | 1086.93 | 1164.78 | 1201.28 | 1303.61 | 1406.19 | 1464.58 | 1574.21 | 1519.81 | 1663.13 | 1654.31 | 1613.53 | 1603.50 | 608.05 | 558.61 | 560.73 | 561.08 | 565.67 | 560.80 | 562.82 | 555.95 | 557.72 | 590.72 | 600.82 | 611.74 | 602.61 | 599.46 | 607.13 | 619.79 | 629.51 | 668.82 | 512.59 | 543.69 | 553.28 | 573.80 | 579.95 | 581.73 | 478.33 | 488.88 | 485.82 | 495.76 | 480.34 | 470.34 | 458.33 | 492.65 | 498.27 | 544.58 | |
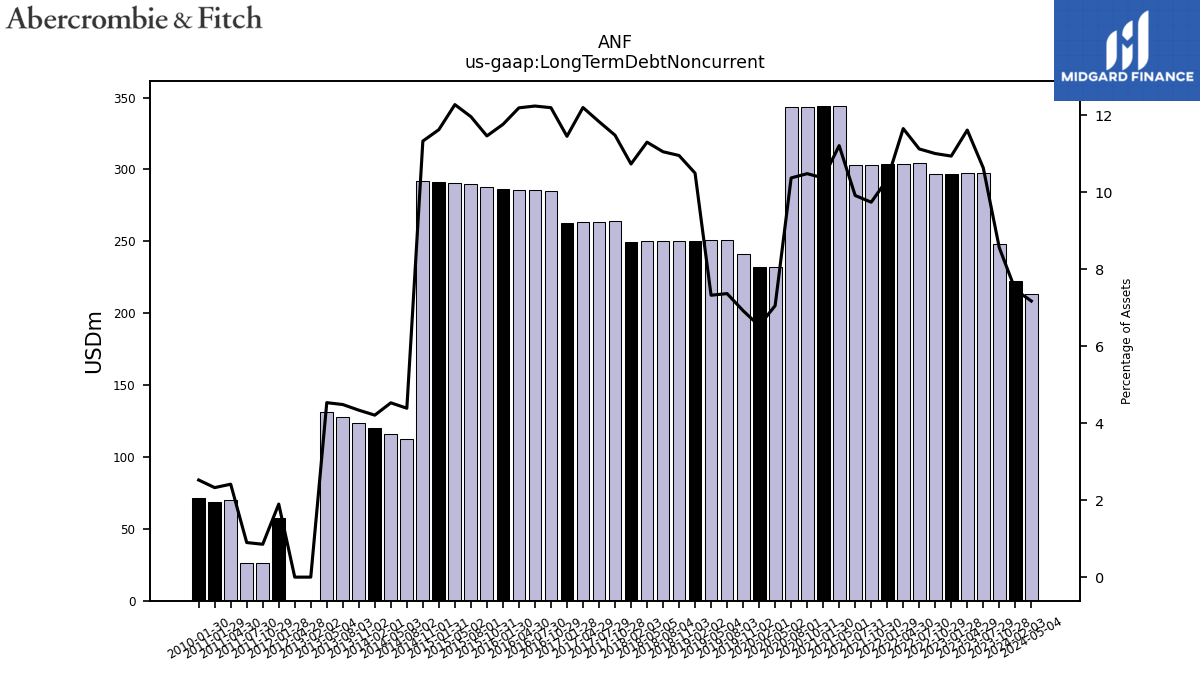
| Long Term Debt Noncurrent | 222.12 | 248.03 | 297.38 | 297.17 | 296.85 | 296.53 | 304.22 | 303.90 | 303.57 | 303.25 | 303.01 | 344.28 | 343.91 | 343.56 | 343.25 | 232.18 | 231.96 | 241.34 | 251.03 | 250.74 | 250.44 | 250.14 | 249.92 | 249.96 | 249.69 | 263.91 | 263.71 | 263.35 | 262.99 | 285.03 | 285.53 | 285.88 | 286.24 | 288.09 | 289.83 | 290.34 | 291.31 | 291.84 | 112.50 | 116.25 | 120.00 | 123.75 | 127.50 | 131.25 | 0.00 | NA | NA | 0.00 | 57.85 | 26.32 | 26.29 | 69.87 | 68.57 | 71.21 | |
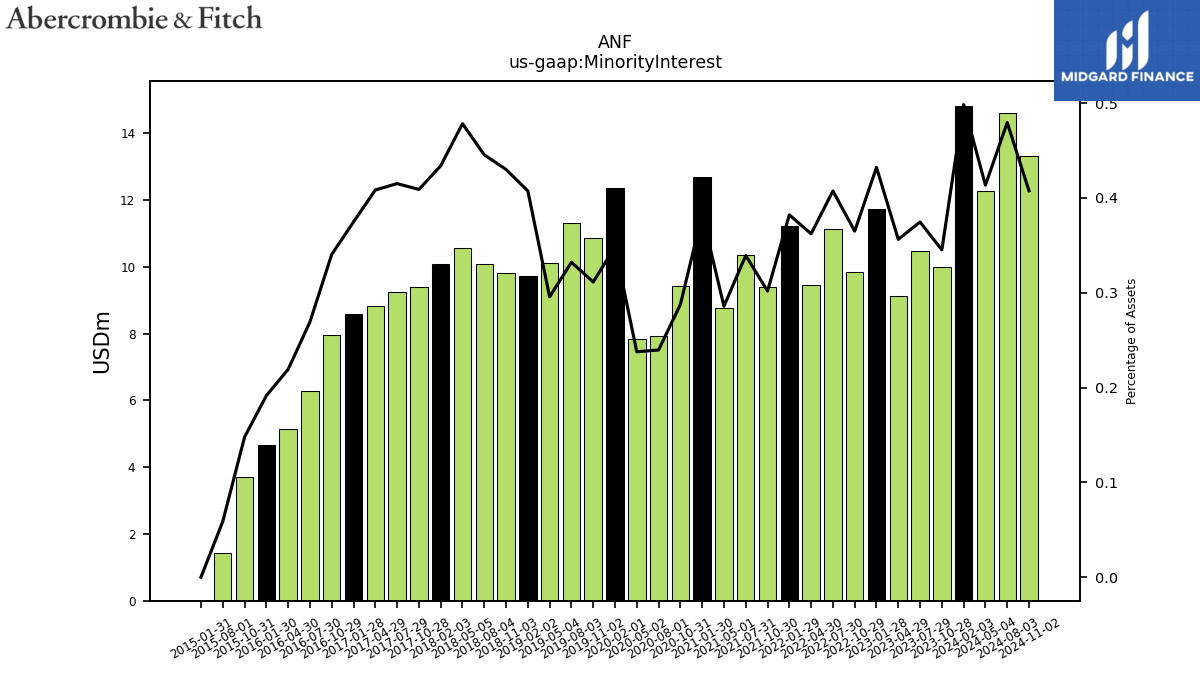
| Minority Interest | 14.83 | 10.01 | 10.48 | 9.12 | 11.73 | 9.83 | 11.14 | 9.44 | 11.23 | 9.39 | 10.37 | 8.78 | 12.68 | 9.43 | 7.93 | 7.83 | 12.37 | 10.85 | 11.32 | 10.12 | 9.72 | 9.82 | 10.07 | 10.58 | 10.09 | 9.40 | 9.25 | 8.81 | 8.60 | 7.96 | 6.28 | 5.14 | 4.66 | 3.71 | 1.42 | NA | 0.00 | NA | NA | NA | NA | NA | NA | NA | NA | NA | NA | NA | NA | NA | NA | NA | NA | NA | |
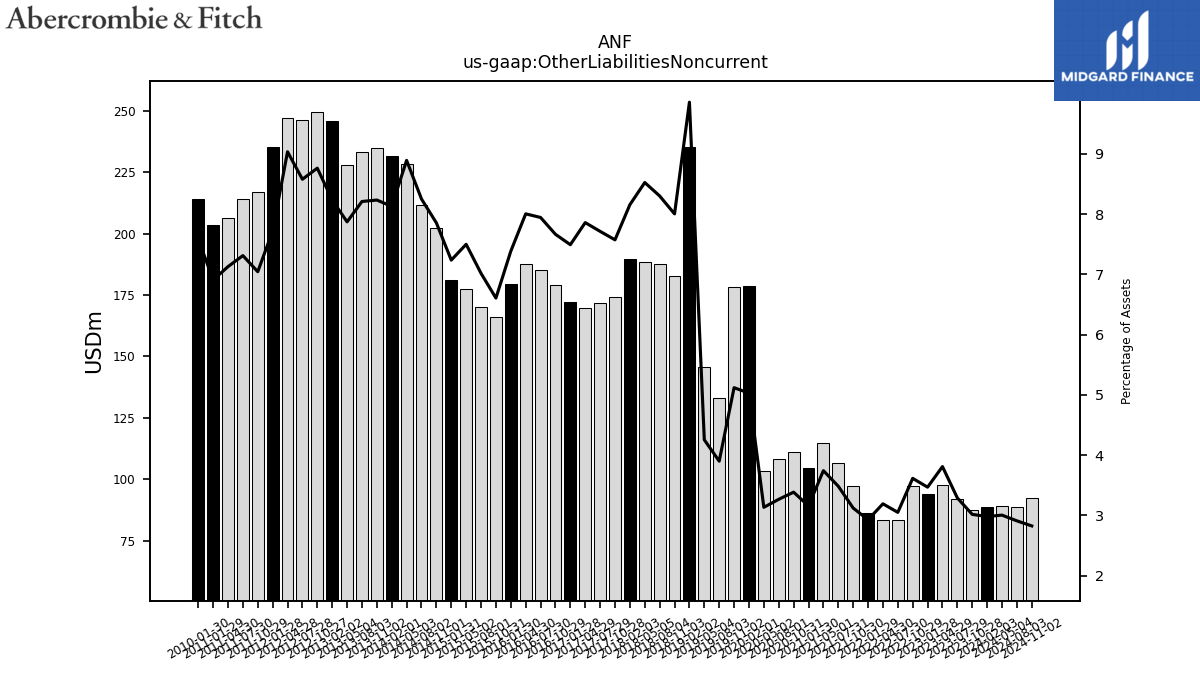
| Other Liabilities Noncurrent | 88.68 | 87.44 | 92.02 | 97.48 | 94.12 | 97.39 | 83.42 | 83.24 | 86.09 | 97.19 | 106.47 | 114.93 | 104.69 | 110.97 | 108.11 | 103.19 | 178.54 | 178.46 | 132.89 | 145.66 | 235.15 | 182.72 | 187.68 | 188.50 | 189.69 | 174.02 | 171.85 | 169.59 | 172.01 | 179.09 | 185.28 | 187.63 | 179.68 | 166.00 | 169.97 | 177.31 | 181.29 | 202.28 | 211.47 | 228.18 | 231.76 | 234.84 | 233.37 | 227.88 | 245.99 | 249.67 | 246.12 | 246.98 | 235.35 | 217.06 | 213.94 | 206.22 | 203.57 | 214.17 | |
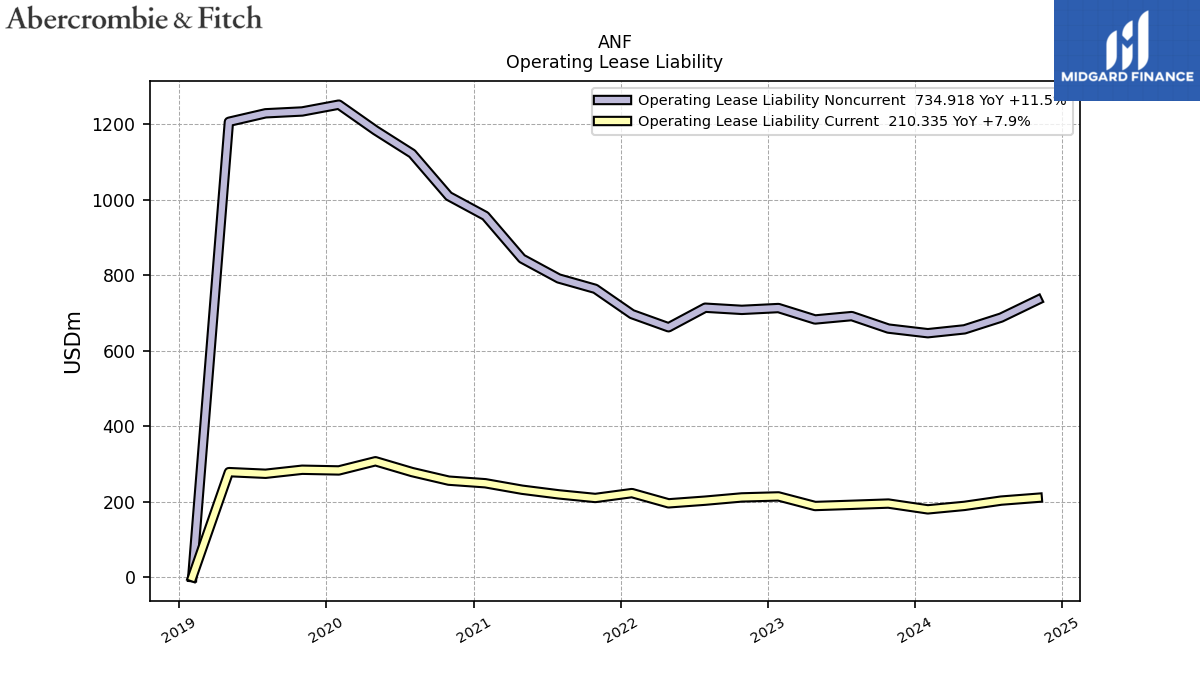
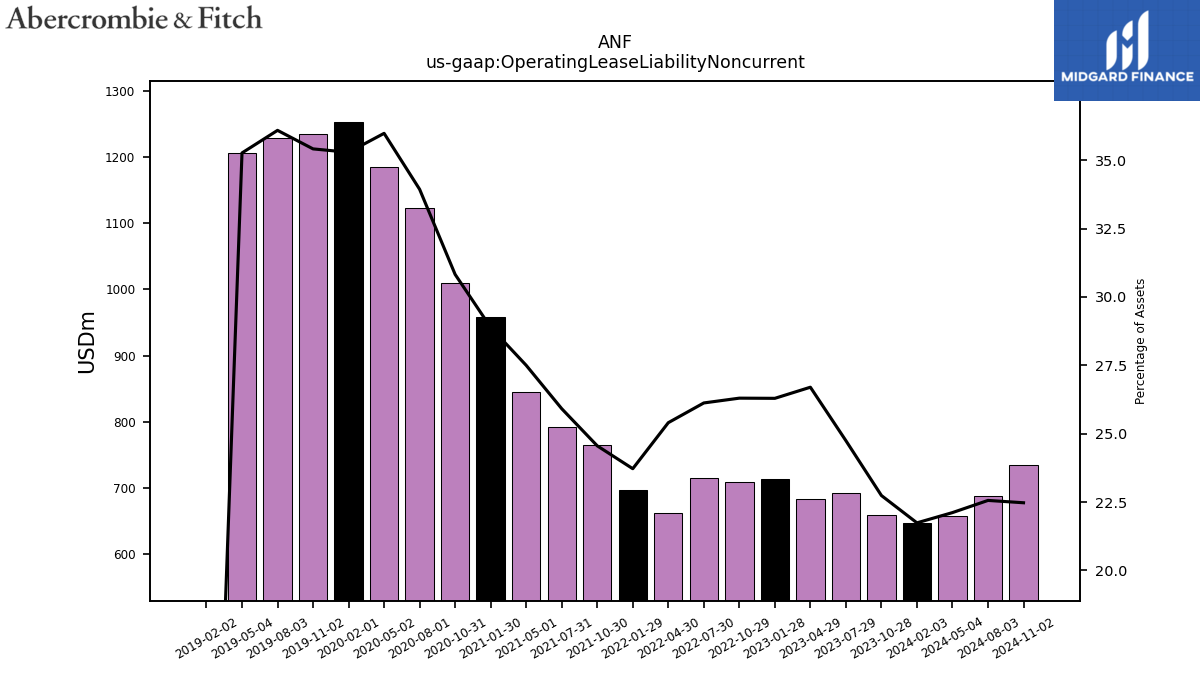
| Operating Lease Liability Noncurrent | 646.62 | 658.92 | 692.05 | 683.00 | 713.36 | 708.51 | 714.26 | 662.32 | 697.26 | 764.35 | 791.79 | 844.40 | 957.59 | 1010.05 | 1122.85 | 1184.45 | 1252.63 | 1234.50 | 1229.61 | 1207.10 | 0.00 | NA | NA | NA | NA | NA | NA | NA | NA | NA | NA | NA | NA | NA | NA | NA | NA | NA | NA | NA | NA | NA | NA | NA | NA | NA | NA | NA | NA | NA | NA | NA | NA | NA |
| 2024-02-03 | 2023-10-28 | 2023-07-29 | 2023-04-29 | 2023-01-28 | 2022-10-29 | 2022-07-30 | 2022-04-30 | 2022-01-29 | 2021-10-30 | 2021-07-31 | 2021-05-01 | 2021-01-30 | 2020-10-31 | 2020-08-01 | 2020-05-02 | 2020-02-01 | 2019-11-02 | 2019-08-03 | 2019-05-04 | 2019-02-02 | 2018-11-03 | 2018-08-04 | 2018-05-05 | 2018-02-03 | 2017-10-28 | 2017-07-29 | 2017-04-29 | 2017-01-28 | 2016-10-29 | 2016-07-30 | 2016-04-30 | 2016-01-30 | 2015-10-31 | 2015-08-01 | 2015-05-02 | 2015-01-31 | 2014-11-01 | 2014-08-02 | 2014-05-03 | 2014-02-01 | 2013-11-02 | 2013-08-03 | 2013-05-04 | 2013-02-02 | 2012-10-27 | 2012-07-28 | 2012-04-28 | 2012-01-28 | 2011-10-29 | 2011-07-30 | 2011-04-30 | 2011-01-29 | 2010-01-30 | ||
|---|---|---|---|---|---|---|---|---|---|---|---|---|---|---|---|---|---|---|---|---|---|---|---|---|---|---|---|---|---|---|---|---|---|---|---|---|---|---|---|---|---|---|---|---|---|---|---|---|---|---|---|---|---|---|---|
| Stockholders Equity | 1035.16 | 866.11 | 768.31 | 701.86 | 694.84 | 646.23 | 661.79 | 695.36 | 826.09 | 908.93 | 956.57 | 941.17 | 936.63 | 849.38 | 805.68 | 790.24 | 1058.81 | 983.51 | 991.98 | 1094.84 | 1208.90 | 1124.47 | 1137.31 | 1178.27 | 1242.38 | 1160.76 | 1157.07 | 1171.97 | 1243.43 | 1211.67 | 1225.94 | 1249.66 | 1291.06 | 1265.16 | 1284.53 | NA | 1389.70 | NA | NA | NA | 1729.49 | 1675.02 | 1683.66 | 1779.78 | 1818.27 | 1662.77 | 1695.84 | 1693.02 | 1862.46 | 1931.23 | 1886.87 | 1908.56 | 1890.78 | 1827.92 | |
| Stockholders Equity Including Portion Attributable To Noncontrolling Interest | 1049.99 | 876.11 | 778.78 | 710.97 | 706.57 | 656.07 | 672.93 | 704.80 | 837.32 | 918.33 | 966.93 | 949.95 | 949.31 | 858.80 | 813.61 | 798.07 | 1071.18 | 994.37 | 1003.29 | 1104.96 | 1218.62 | 1134.29 | 1147.38 | 1188.85 | 1252.47 | 1170.16 | 1166.32 | 1180.79 | 1252.04 | 1219.62 | 1232.22 | 1254.80 | 1295.72 | 1268.88 | 1285.95 | 1307.30 | 1389.70 | 1395.46 | 1491.36 | 1552.60 | 1729.49 | NA | NA | NA | NA | NA | NA | NA | NA | NA | NA | NA | NA | NA | |
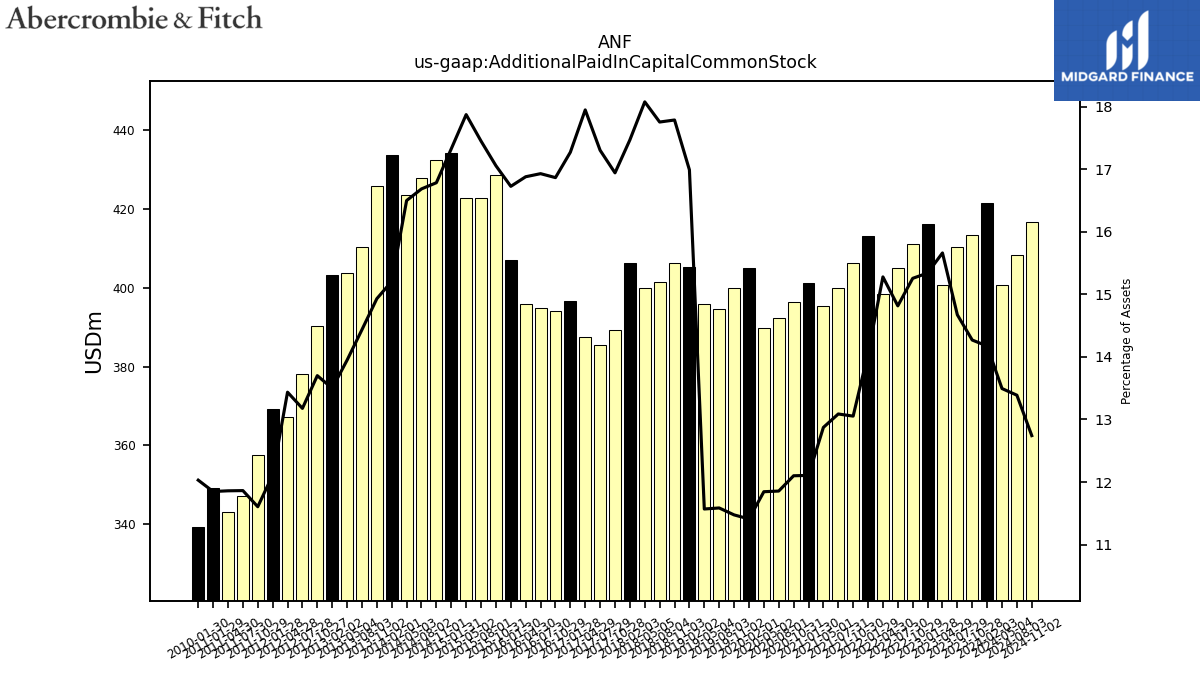
| Additional Paid In Capital Common Stock | 421.61 | 413.51 | 410.40 | 400.70 | 416.25 | 411.04 | 405.13 | 398.41 | 413.19 | 406.31 | 399.89 | 395.28 | 401.28 | 396.50 | 392.27 | 389.90 | 404.98 | 399.98 | 394.69 | 395.97 | 405.38 | 406.17 | 401.48 | 399.86 | 406.35 | 389.38 | 385.57 | 387.39 | 396.59 | 394.13 | 394.93 | 395.76 | 407.03 | 428.65 | 422.76 | 422.71 | 434.14 | 432.37 | 427.75 | 423.51 | 433.62 | 425.93 | 410.41 | 403.82 | 403.27 | 390.41 | 378.10 | 367.35 | 369.17 | 357.59 | 347.10 | 343.08 | 349.26 | 339.45 | |
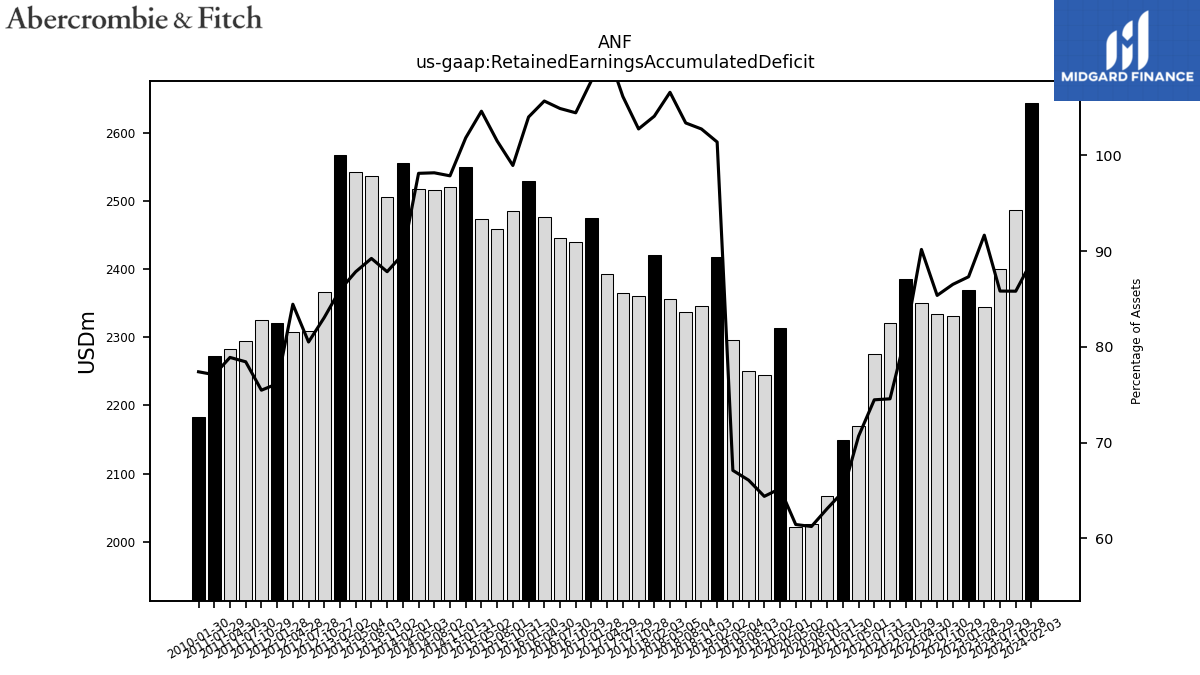
| Retained Earnings Accumulated Deficit | 2643.63 | 2486.22 | 2400.03 | 2344.52 | 2368.82 | 2330.73 | 2333.87 | 2350.81 | 2386.16 | 2320.80 | 2275.01 | 2169.75 | 2149.47 | 2067.52 | 2025.91 | 2022.37 | 2313.74 | 2244.15 | 2251.03 | 2296.35 | 2418.54 | 2345.71 | 2337.10 | 2356.88 | 2420.55 | 2361.05 | 2364.60 | 2393.69 | 2474.70 | 2440.07 | 2446.29 | 2476.94 | 2530.20 | 2485.88 | 2458.32 | 2473.35 | 2550.67 | 2520.21 | 2516.20 | 2517.93 | 2556.27 | 2505.45 | 2536.50 | 2542.77 | 2567.26 | 2366.67 | 2309.61 | 2308.55 | 2320.57 | 2325.45 | 2294.87 | 2282.17 | 2272.32 | 2183.69 | |
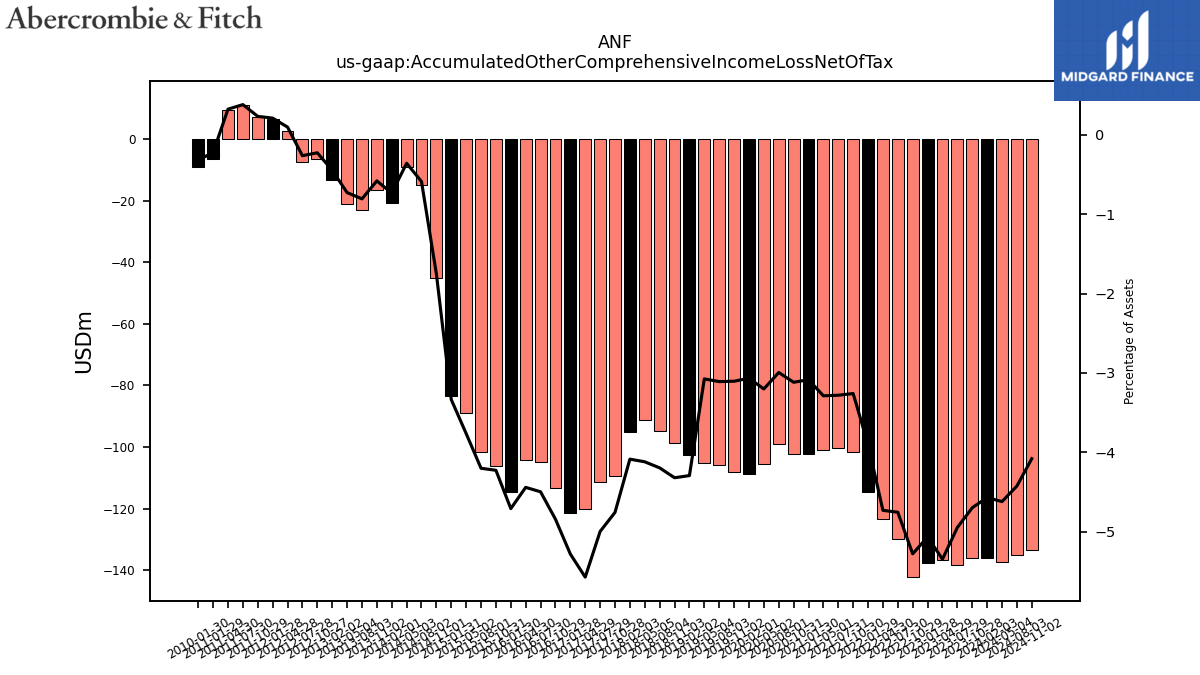
| Accumulated Other Comprehensive Income Loss Net Of Tax | -135.97 | -136.19 | -138.41 | -136.81 | -137.53 | -142.27 | -130.04 | -123.40 | -114.71 | -101.48 | -100.27 | -100.98 | -102.31 | -102.19 | -99.09 | -105.42 | -108.89 | -108.25 | -105.95 | -105.29 | -102.45 | -98.67 | -94.89 | -91.13 | -95.05 | -109.35 | -111.37 | -120.30 | -121.30 | -113.19 | -104.94 | -104.15 | -114.62 | -106.23 | -101.79 | -89.02 | -83.58 | -45.12 | -15.07 | -9.18 | -20.92 | -16.53 | -22.92 | -21.05 | -13.29 | -6.42 | -7.53 | 2.69 | 6.46 | 7.20 | 11.17 | 9.39 | -6.52 | -8.97 | |
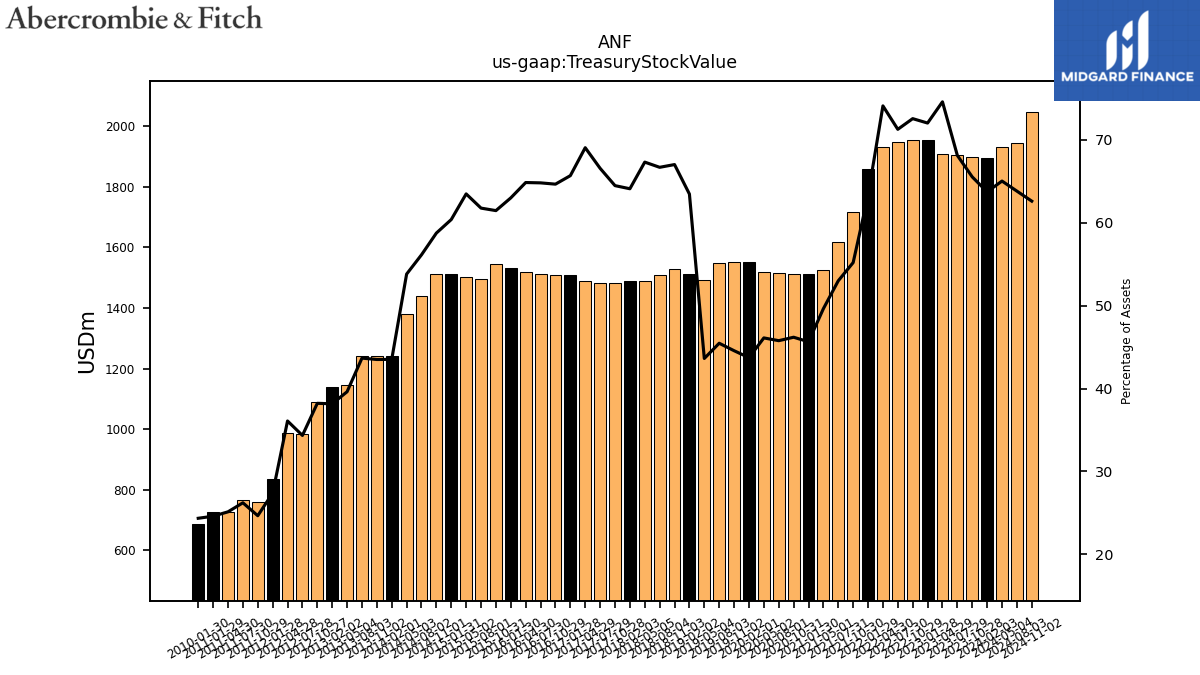
| Treasury Stock Value | 1895.14 | 1898.47 | 1904.75 | 1907.59 | 1953.73 | 1954.31 | 1948.20 | 1931.49 | 1859.58 | 1717.73 | 1619.10 | 1523.90 | 1512.85 | 1513.49 | 1514.44 | 1517.64 | 1552.07 | 1553.41 | 1548.84 | 1493.22 | 1513.60 | 1529.77 | 1507.41 | 1488.37 | 1490.50 | 1481.36 | 1482.76 | 1489.85 | 1507.59 | 1510.38 | 1511.37 | 1519.93 | 1532.58 | 1544.17 | 1495.80 | 1500.78 | 1512.56 | 1513.04 | 1438.55 | 1380.70 | 1240.51 | 1240.87 | 1241.36 | 1146.79 | 1140.01 | 1088.93 | 985.38 | 986.61 | 834.77 | 760.05 | 767.30 | 727.11 | 725.31 | 687.29 | |
| Minority Interest | 14.83 | 10.01 | 10.48 | 9.12 | 11.73 | 9.83 | 11.14 | 9.44 | 11.23 | 9.39 | 10.37 | 8.78 | 12.68 | 9.43 | 7.93 | 7.83 | 12.37 | 10.85 | 11.32 | 10.12 | 9.72 | 9.82 | 10.07 | 10.58 | 10.09 | 9.40 | 9.25 | 8.81 | 8.60 | 7.96 | 6.28 | 5.14 | 4.66 | 3.71 | 1.42 | NA | 0.00 | NA | NA | NA | NA | NA | NA | NA | NA | NA | NA | NA | NA | NA | NA | NA | NA | NA |