
| 2023-09-30 | 2023-06-30 | 2023-03-31 | 2022-12-31 | 2022-09-30 | 2022-06-30 | 2022-03-31 | 2021-12-31 | 2021-09-30 | 2021-06-30 | 2021-03-31 | 2020-12-31 | 2020-09-30 | 2020-06-30 | 2020-03-31 | ||
|---|---|---|---|---|---|---|---|---|---|---|---|---|---|---|---|---|
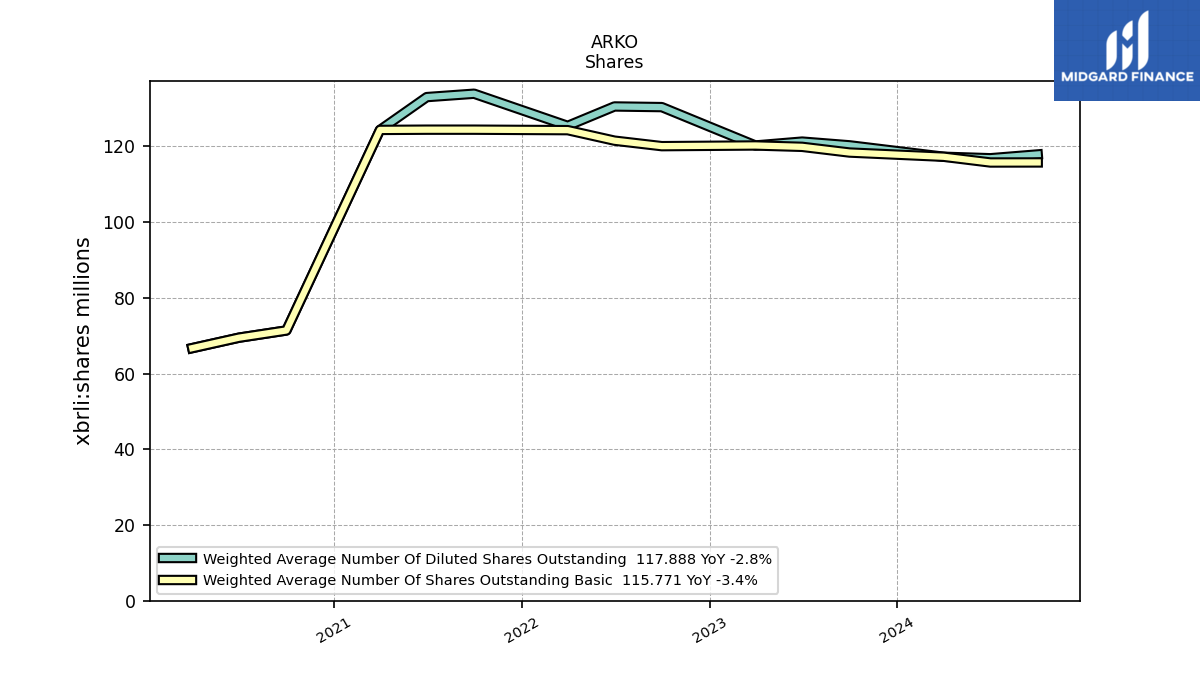
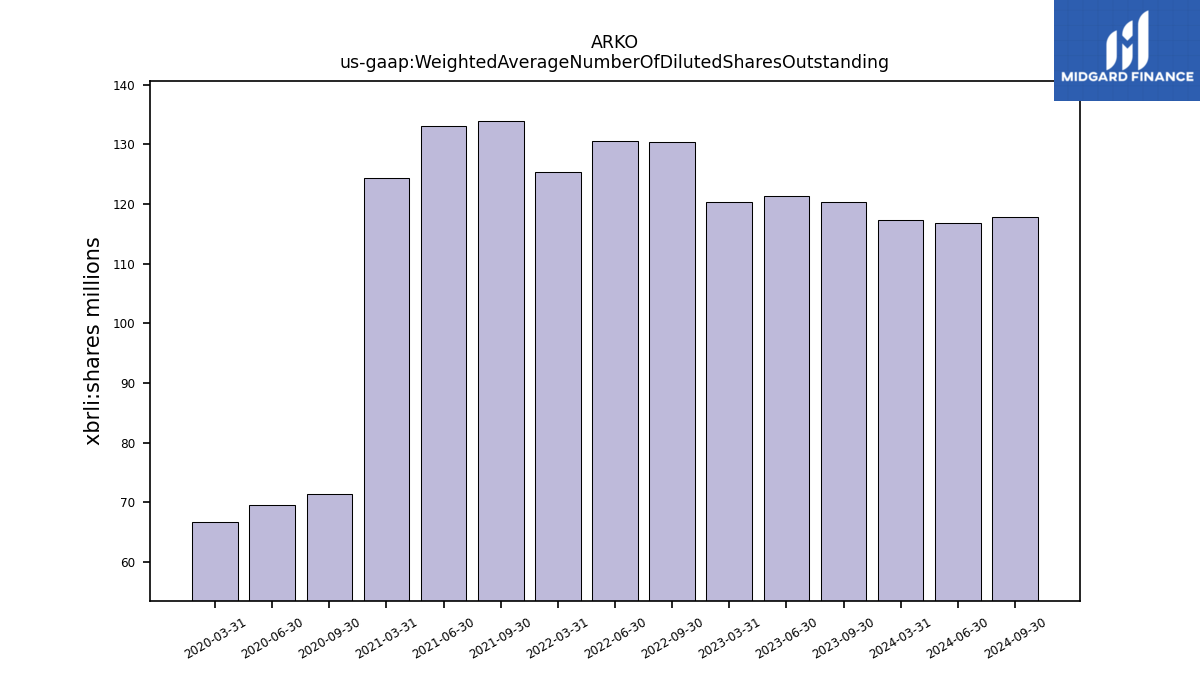
| Weighted Average Number Of Diluted Shares Outstanding | 120.29 | 121.28 | 120.25 | NA | 130.39 | 130.56 | 125.43 | NA | 133.93 | 133.03 | 124.36 | NA | 71.39 | 69.49 | 66.73 | |
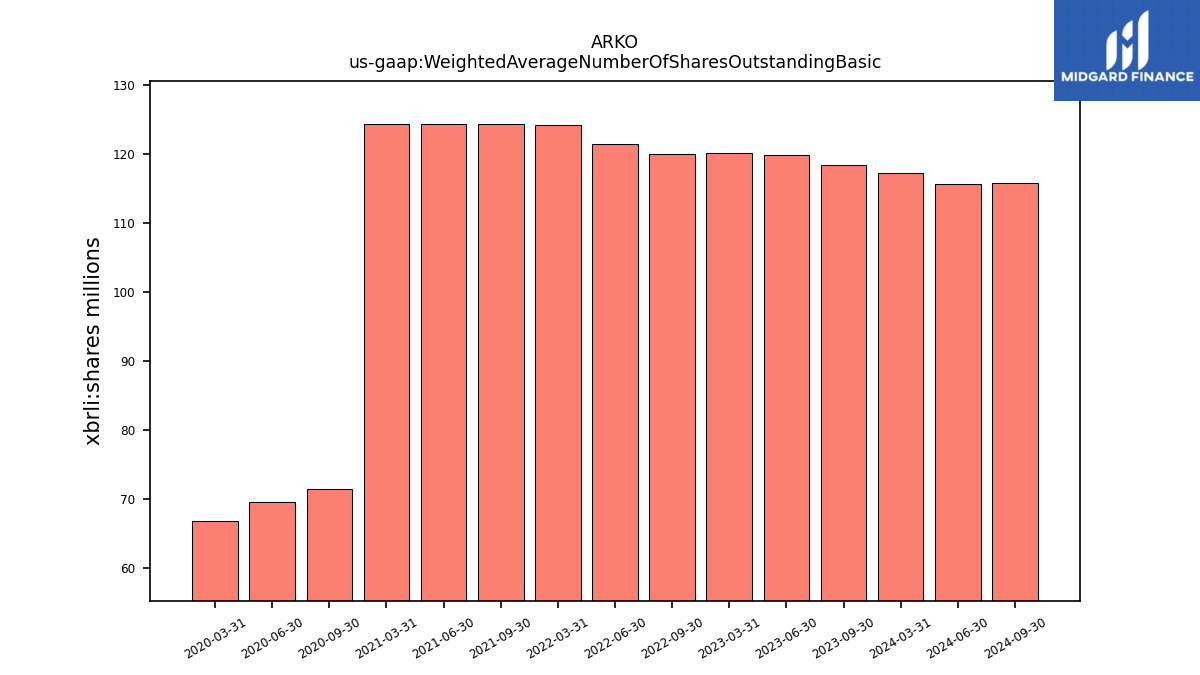
| Weighted Average Number Of Shares Outstanding Basic | 118.39 | 119.89 | 120.25 | NA | 120.07 | 121.53 | 124.30 | NA | 124.43 | 124.43 | 124.36 | NA | 71.39 | 69.49 | 66.73 | |
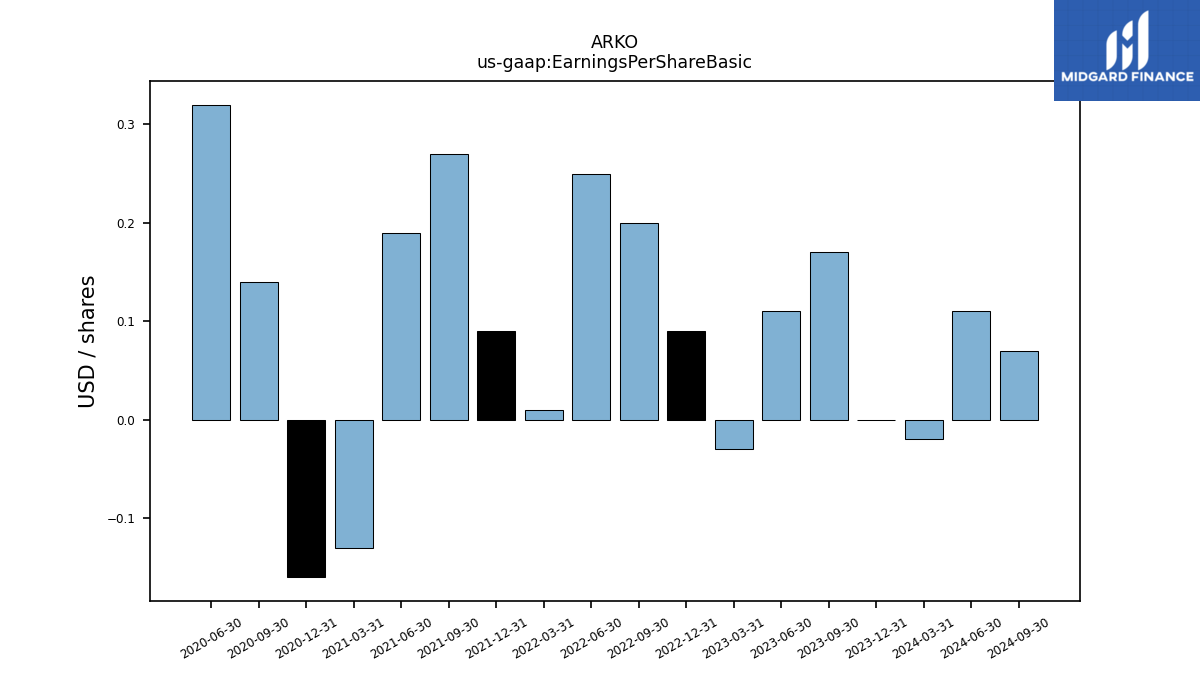
| Earnings Per Share Basic | 0.17 | 0.11 | -0.03 | 0.09 | 0.20 | 0.25 | 0.01 | 0.09 | 0.27 | 0.19 | -0.13 | -0.16 | 0.14 | 0.32 | NA | |
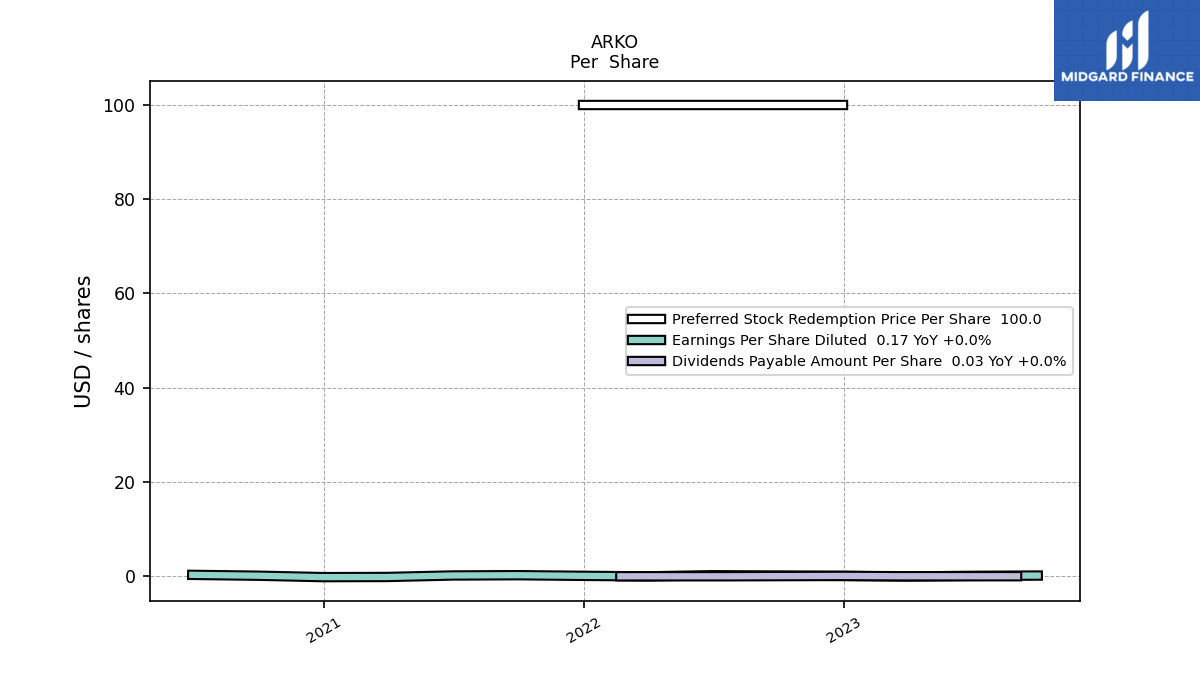
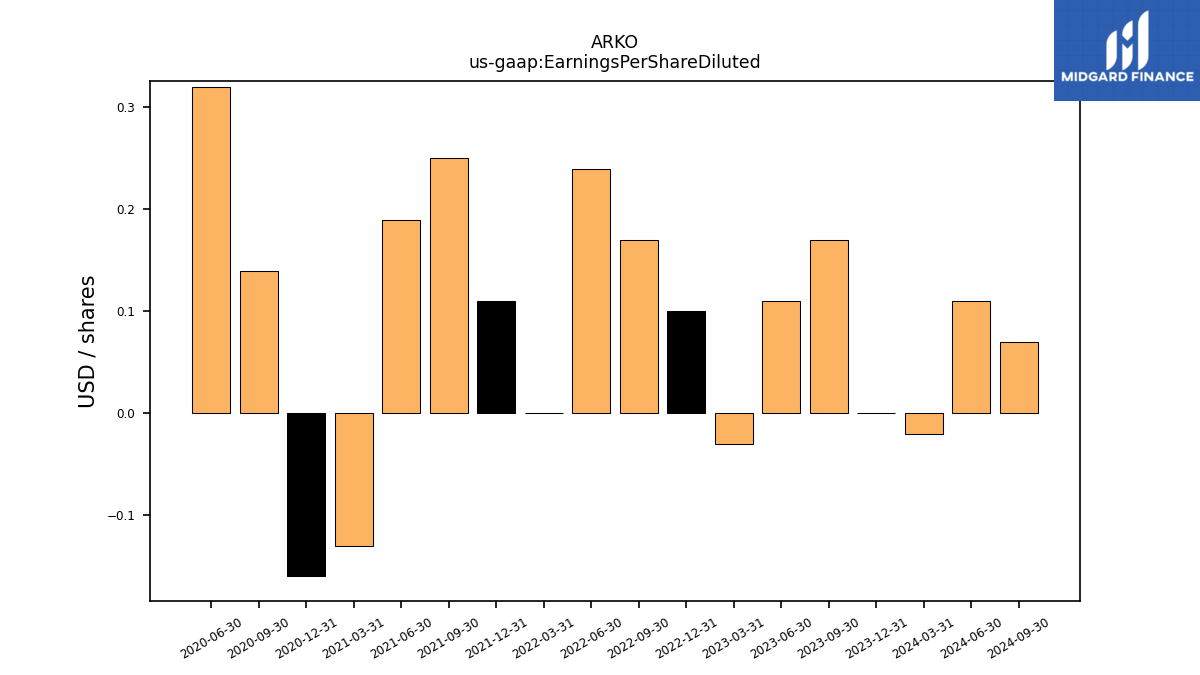
| Earnings Per Share Diluted | 0.17 | 0.11 | -0.03 | 0.10 | 0.17 | 0.24 | -0.00 | 0.11 | 0.25 | 0.19 | -0.13 | -0.16 | 0.14 | 0.32 | NA |
| 2023-09-30 | 2023-06-30 | 2023-03-31 | 2022-12-31 | 2022-09-30 | 2022-06-30 | 2022-03-31 | 2021-12-31 | 2021-09-30 | 2021-06-30 | 2021-03-31 | 2020-12-31 | 2020-09-30 | 2020-06-30 | 2020-03-31 | ||
|---|---|---|---|---|---|---|---|---|---|---|---|---|---|---|---|---|
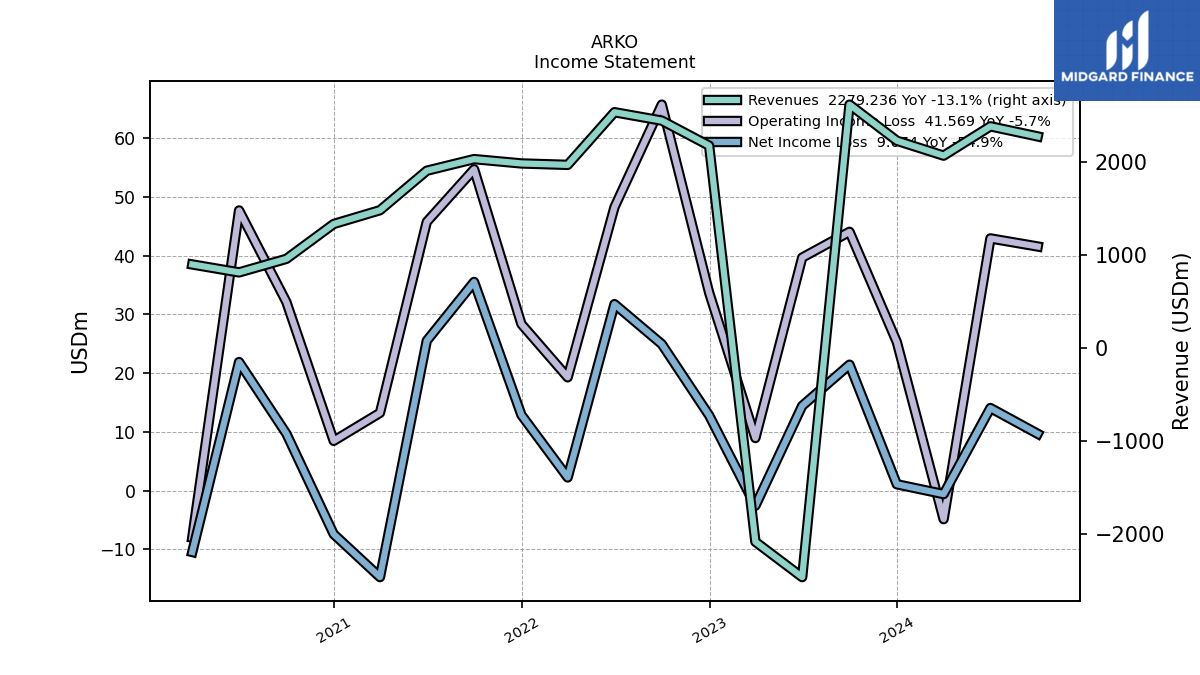
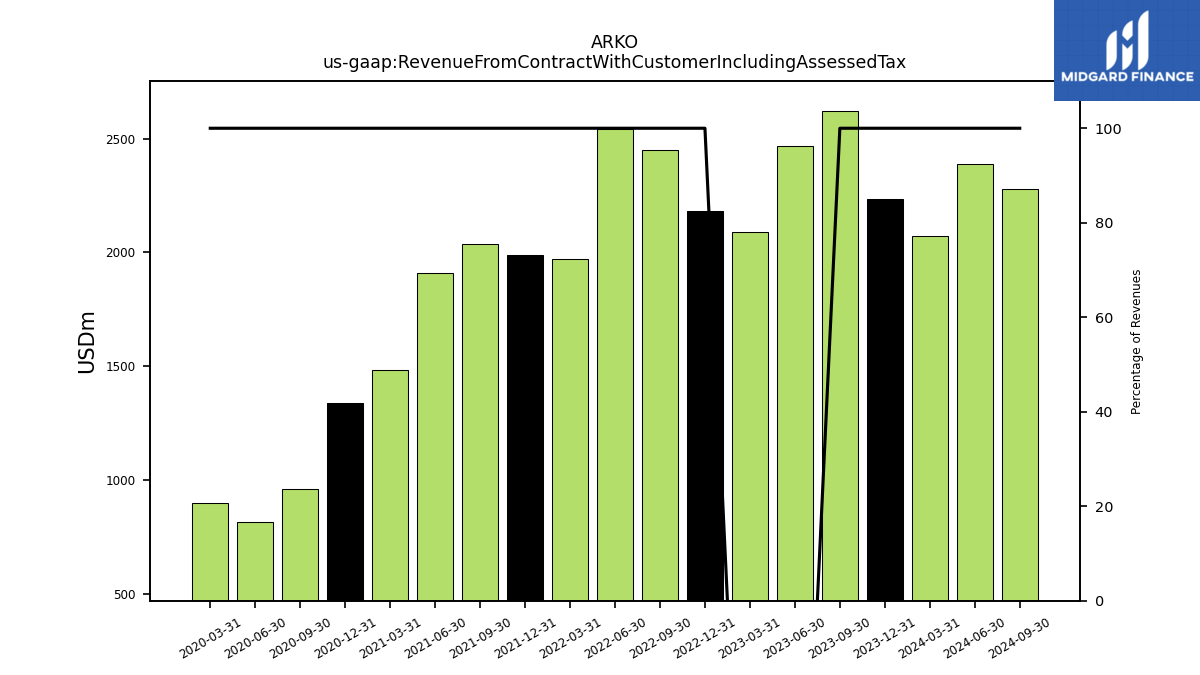
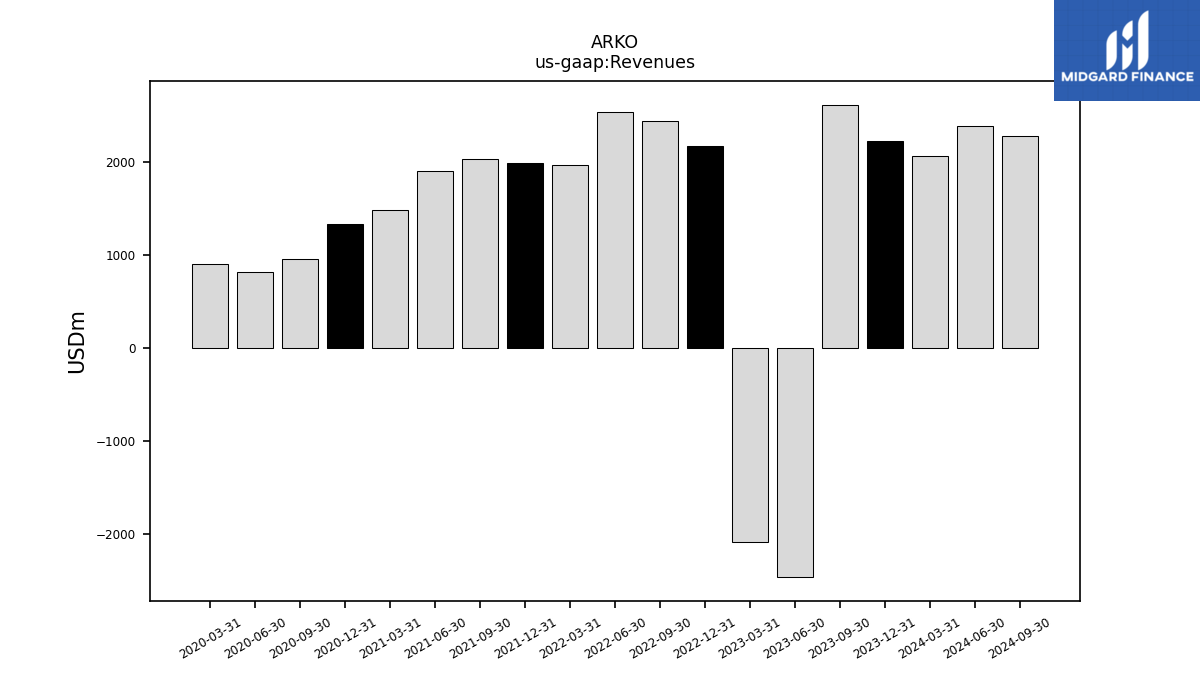
| Revenue From Contract With Customer Including Assessed Tax | 2622.05 | 2469.14 | 2088.50 | 2180.08 | 2449.65 | 2540.26 | 1972.81 | 1988.20 | 2035.02 | 1909.81 | 1484.36 | 1336.00 | 960.08 | 814.27 | 899.88 | |
| Revenues | 2622.05 | -2469.14 | -2088.50 | 2180.08 | 2449.65 | 2540.26 | 1972.81 | 1988.20 | 2035.02 | 1909.81 | 1484.36 | 1336.00 | 960.08 | 814.27 | 899.88 | |
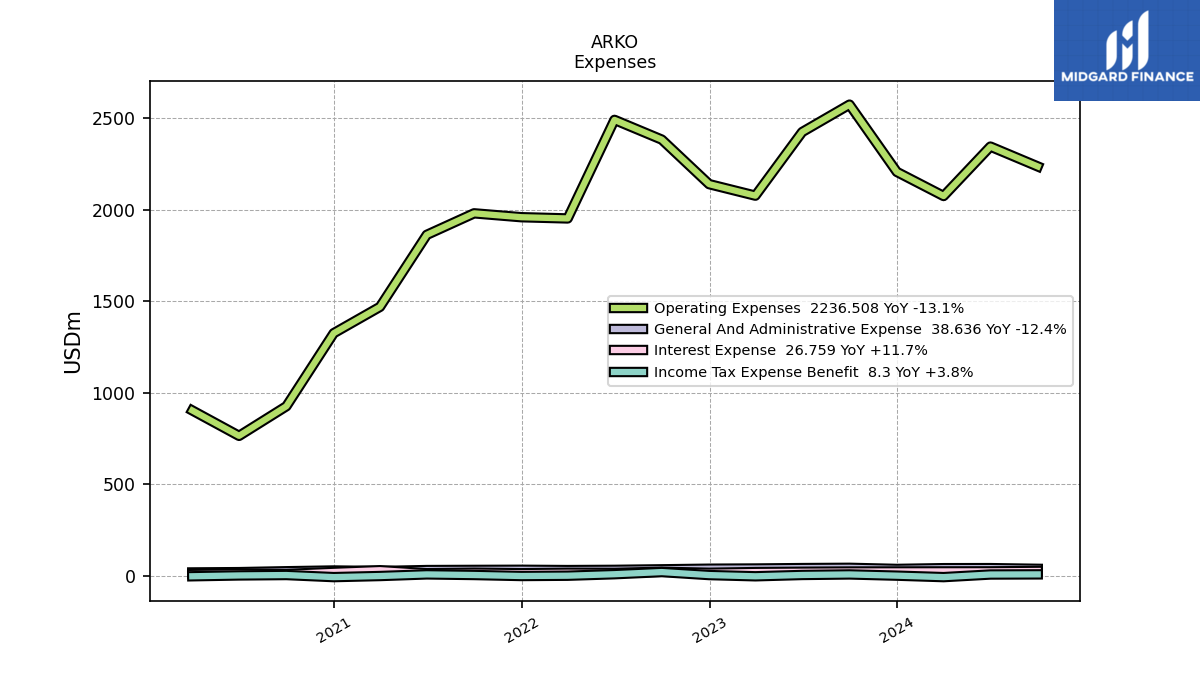
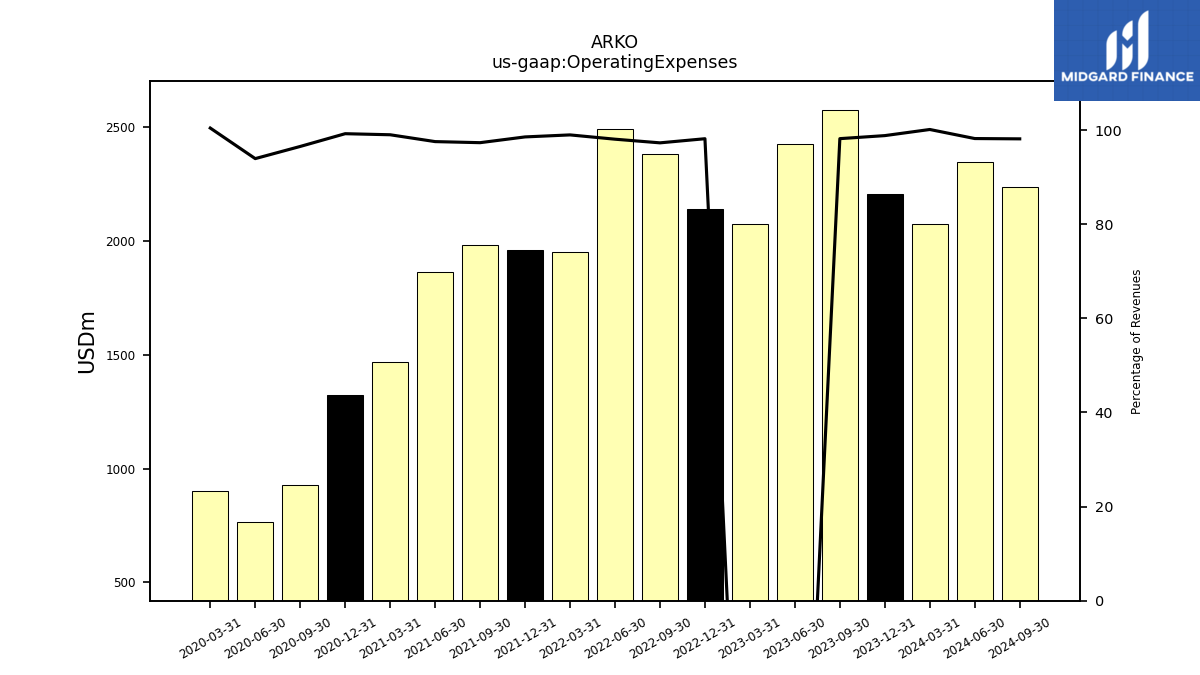
| Operating Expenses | 2574.09 | 2424.51 | 2076.82 | 2139.81 | 2382.96 | 2490.79 | 1952.40 | 1959.12 | 1980.36 | 1862.86 | 1469.44 | 1325.59 | 926.58 | 764.83 | 903.69 | |
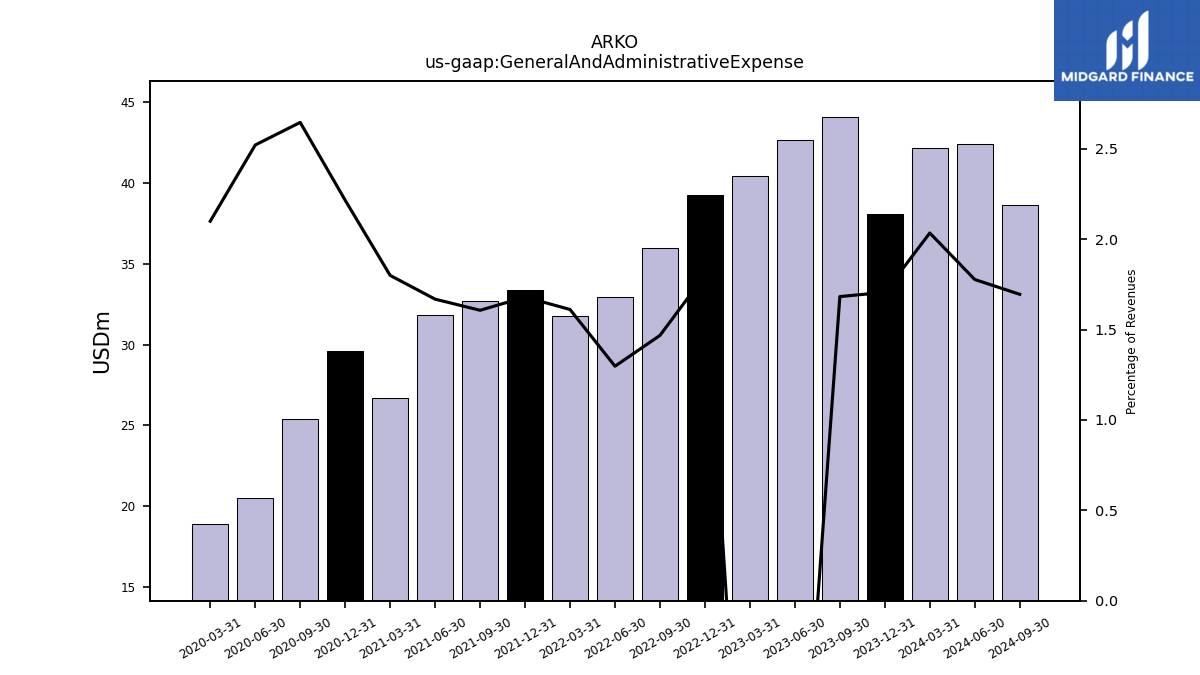
| General And Administrative Expense | 44.12 | 42.66 | 40.42 | 39.27 | 35.95 | 32.96 | 31.79 | 33.40 | 32.70 | 31.86 | 26.71 | 29.60 | 25.40 | 20.53 | 18.89 | |
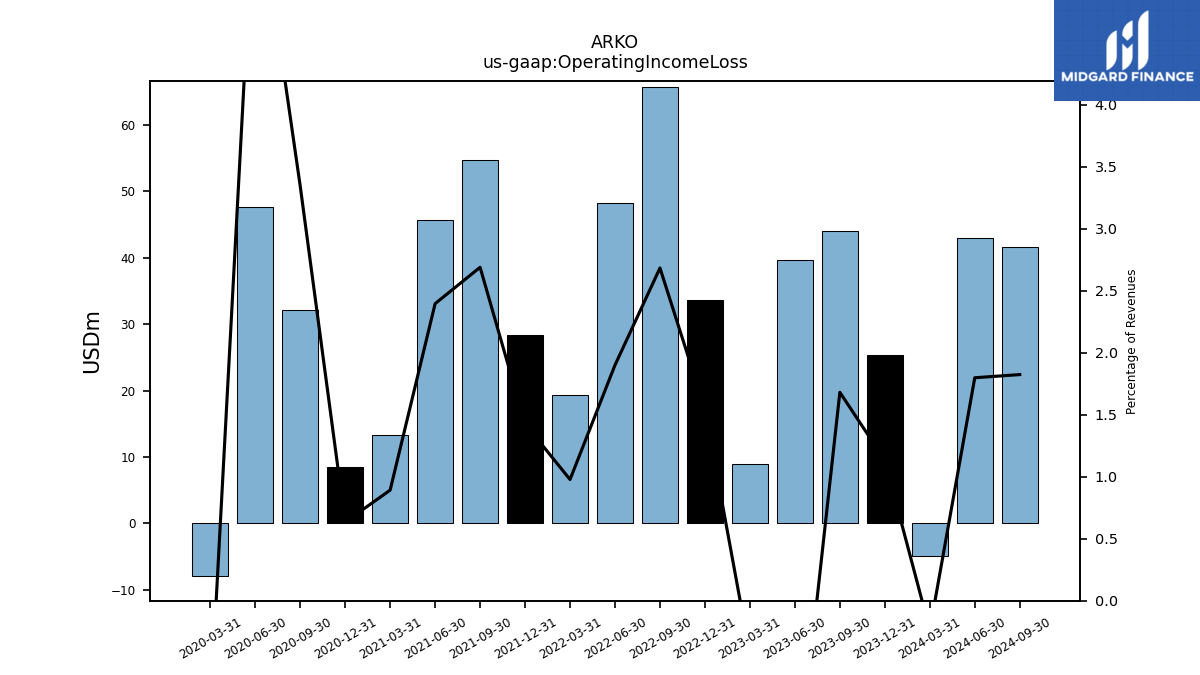
| Operating Income Loss | 44.07 | 39.68 | 8.95 | 33.72 | 65.73 | 48.27 | 19.29 | 28.36 | 54.72 | 45.76 | 13.24 | 8.47 | 32.11 | 47.71 | -7.98 | |
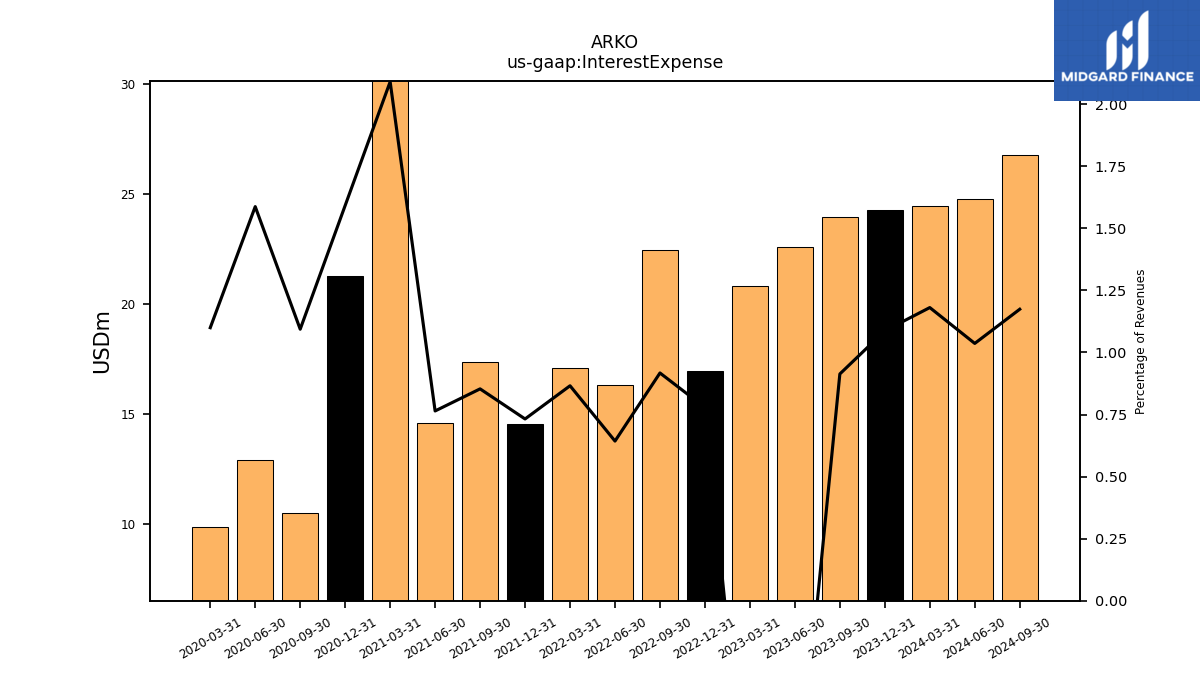
| Interest Expense | 23.95 | 22.59 | 20.81 | 16.96 | 22.47 | 16.34 | 17.08 | 14.56 | 17.36 | 14.60 | 31.02 | 21.27 | 10.50 | 12.93 | 9.90 | |
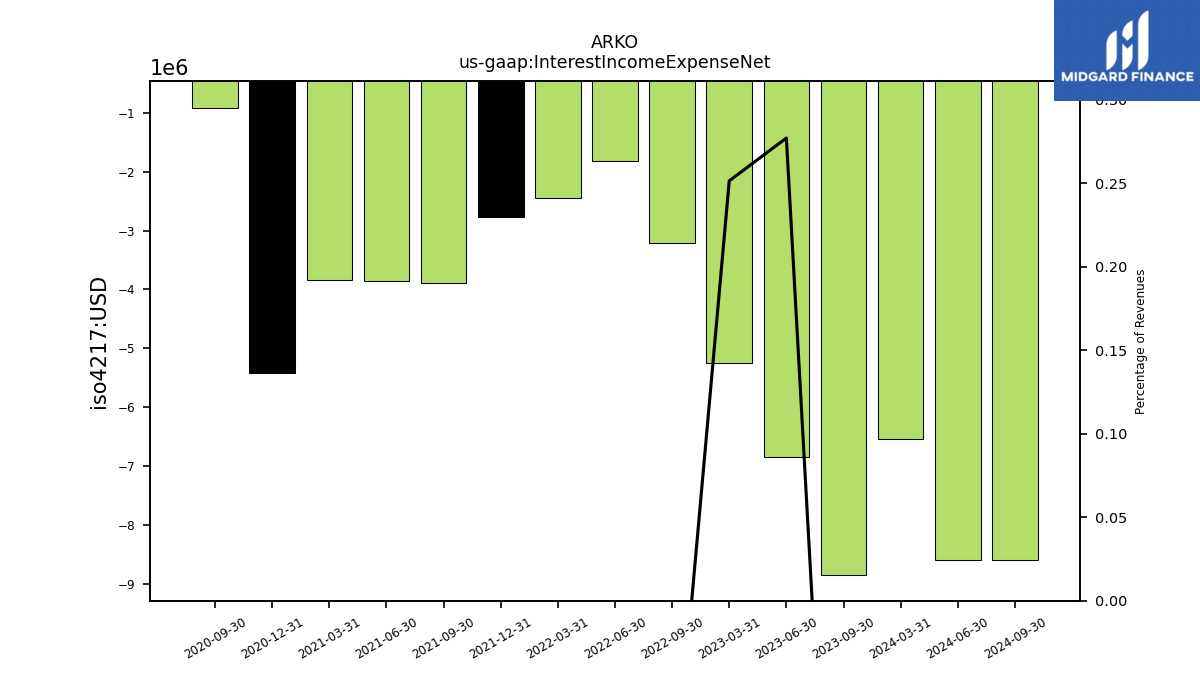
| Interest Income Expense Net | -8.84 | -6.84 | -5.25 | NA | -3.21 | -1.82 | -2.44 | -2.77 | -3.89 | -3.86 | -3.84 | -5.42 | -0.93 | NA | NA | |
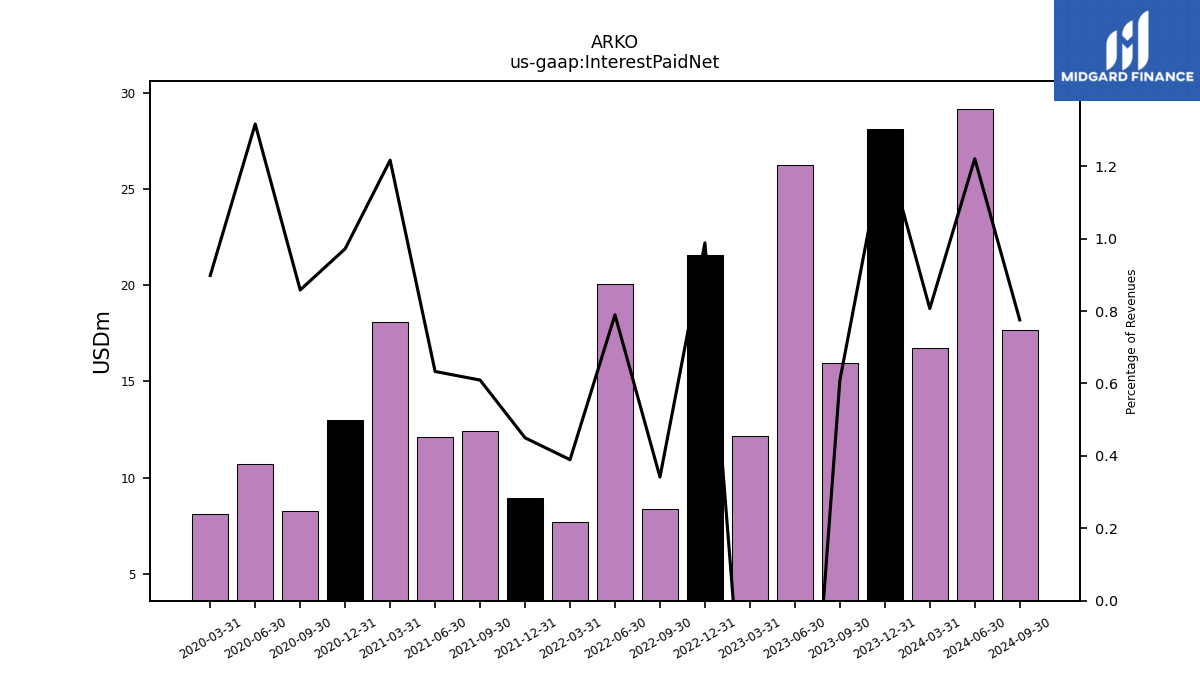
| Interest Paid Net | 15.95 | 26.23 | 12.17 | 21.54 | 8.37 | 20.06 | 7.68 | 8.95 | 12.40 | 12.09 | 18.06 | 12.99 | 8.24 | 10.72 | 8.08 | |
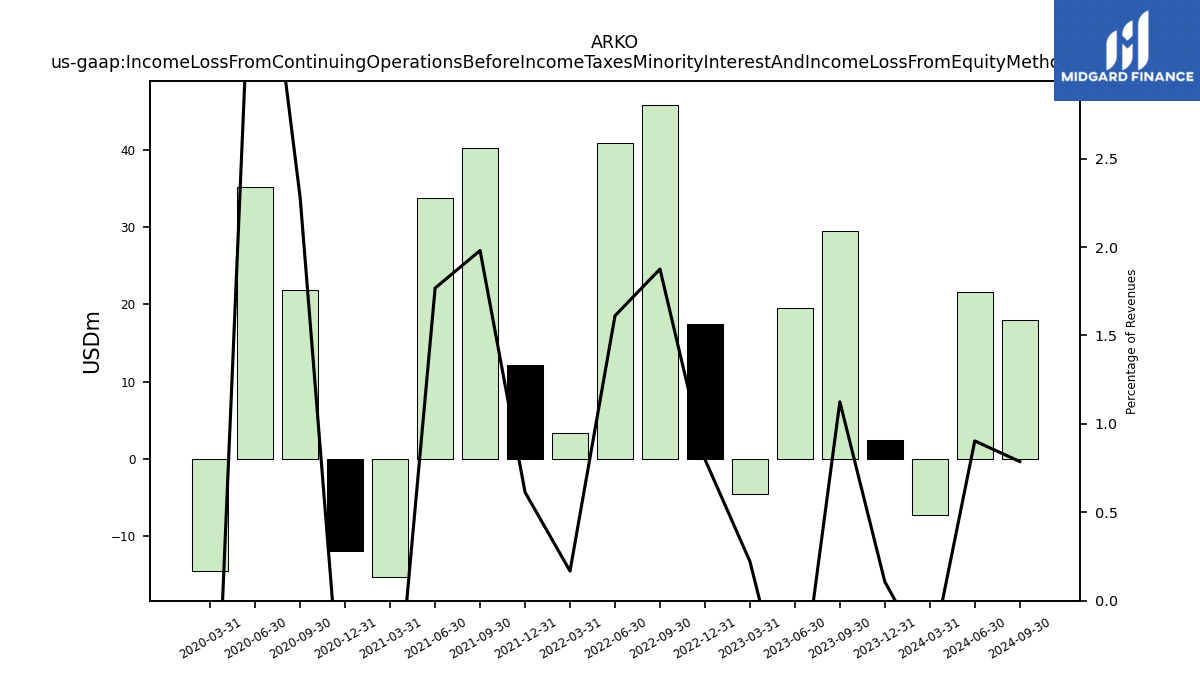
| Income Loss From Continuing Operations Before Income Taxes Minority Interest And Income Loss From Equity Method Investments | 29.50 | 19.52 | -4.65 | 17.42 | 45.94 | 40.94 | 3.31 | 12.20 | 40.30 | 33.76 | -15.38 | -12.01 | 21.85 | 35.20 | -14.63 | |
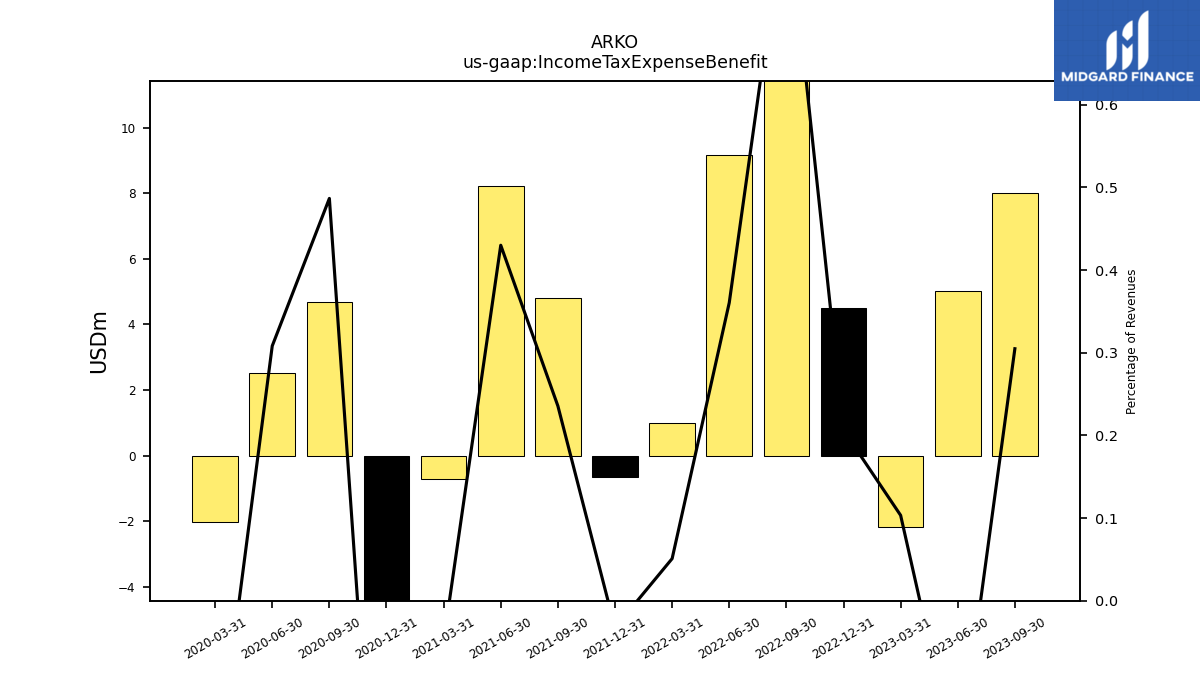
| Income Tax Expense Benefit | 7.99 | 5.01 | -2.16 | 4.50 | 20.90 | 9.16 | 1.00 | -0.65 | 4.79 | 8.21 | -0.72 | -6.67 | 4.67 | 2.51 | -2.01 | |
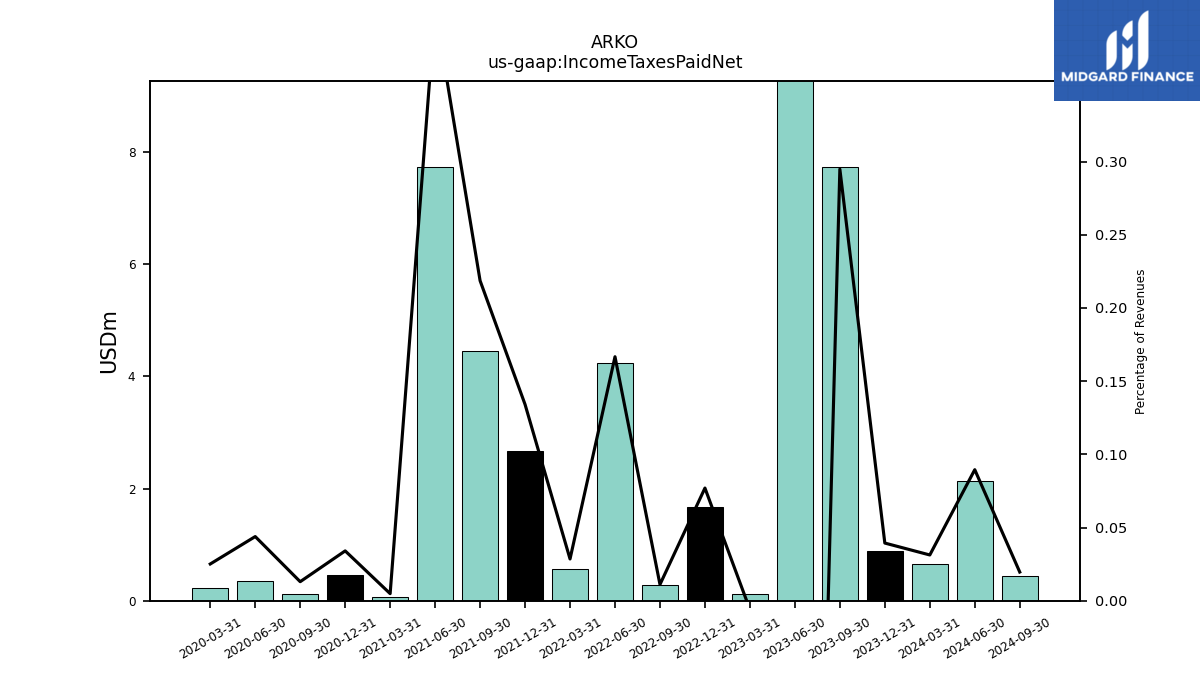
| Income Taxes Paid Net | 7.73 | 20.72 | 0.12 | 1.68 | 0.27 | 4.23 | 0.56 | 2.67 | 4.45 | 7.72 | 0.07 | 0.46 | 0.12 | 0.36 | 0.23 | |
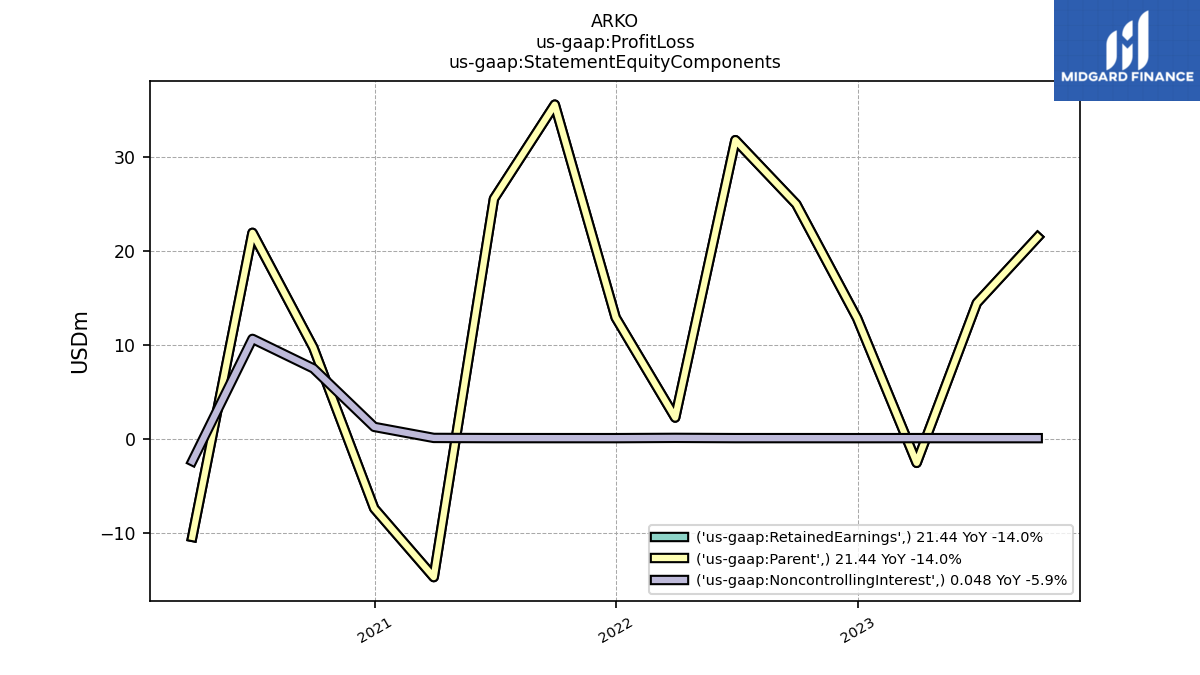
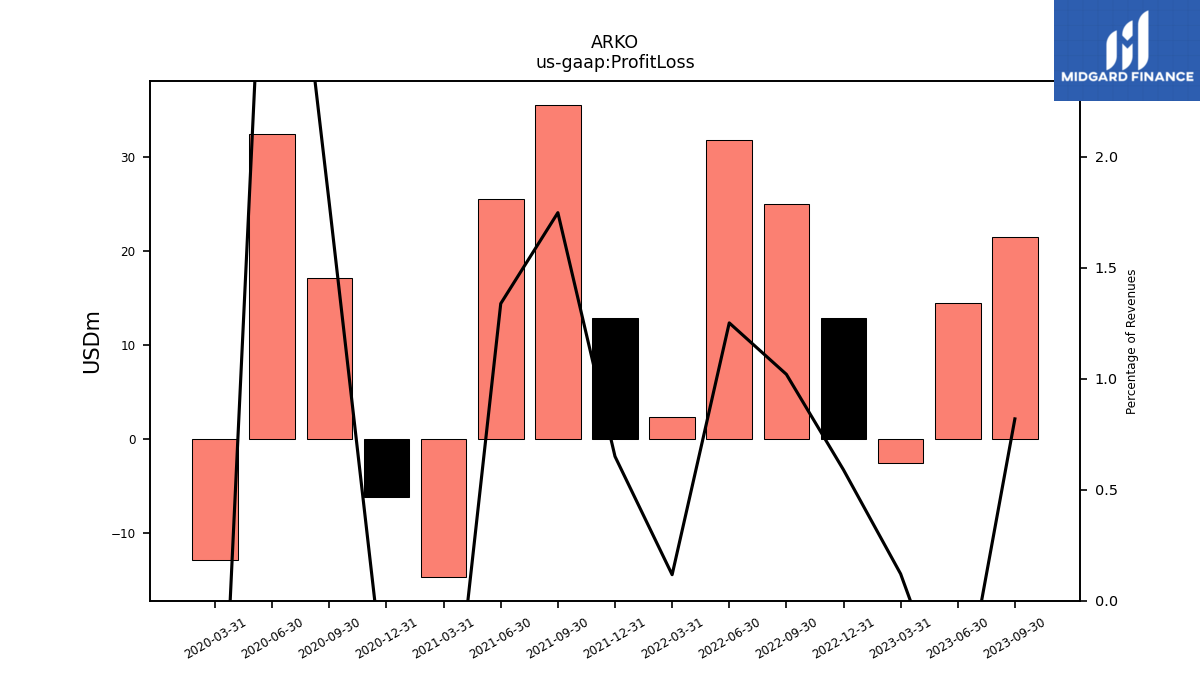
| Profit Loss | 21.49 | 14.48 | -2.53 | 12.86 | 24.99 | 31.81 | 2.32 | 12.93 | 35.59 | 25.57 | -14.66 | -6.17 | 17.16 | 32.51 | -12.86 | |
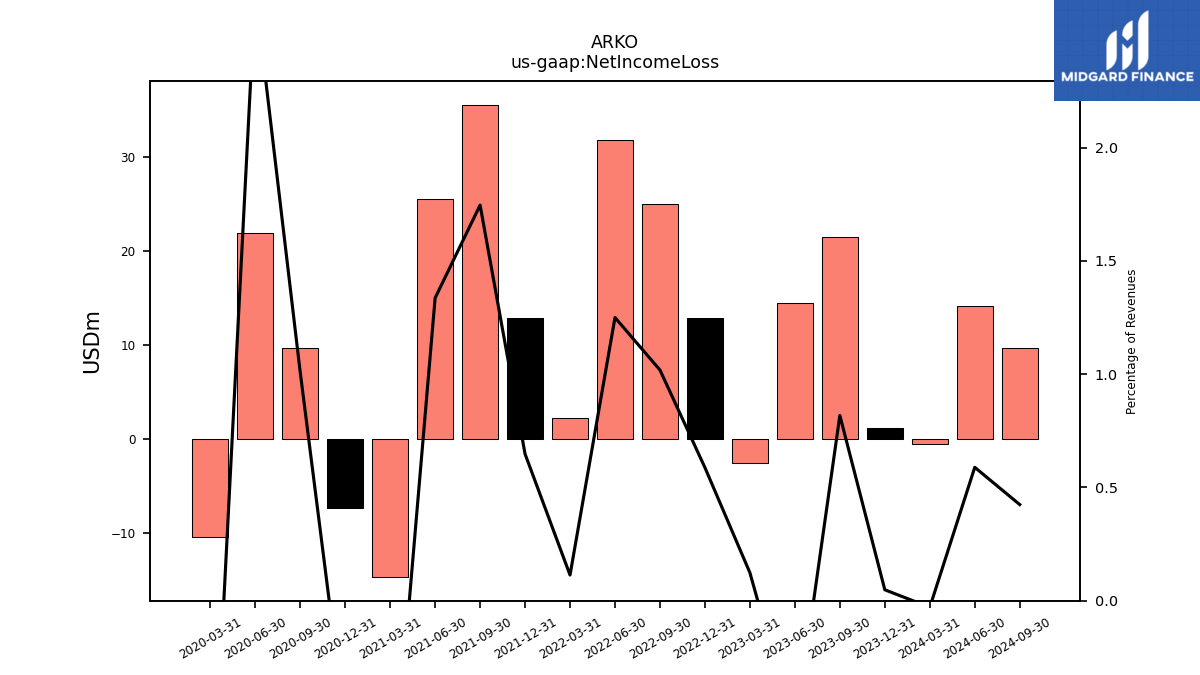
| Net Income Loss | 21.44 | 14.43 | -2.58 | 12.81 | 24.94 | 31.75 | 2.24 | 12.88 | 35.53 | 25.52 | -14.74 | -7.42 | 9.69 | 21.89 | -10.46 | |
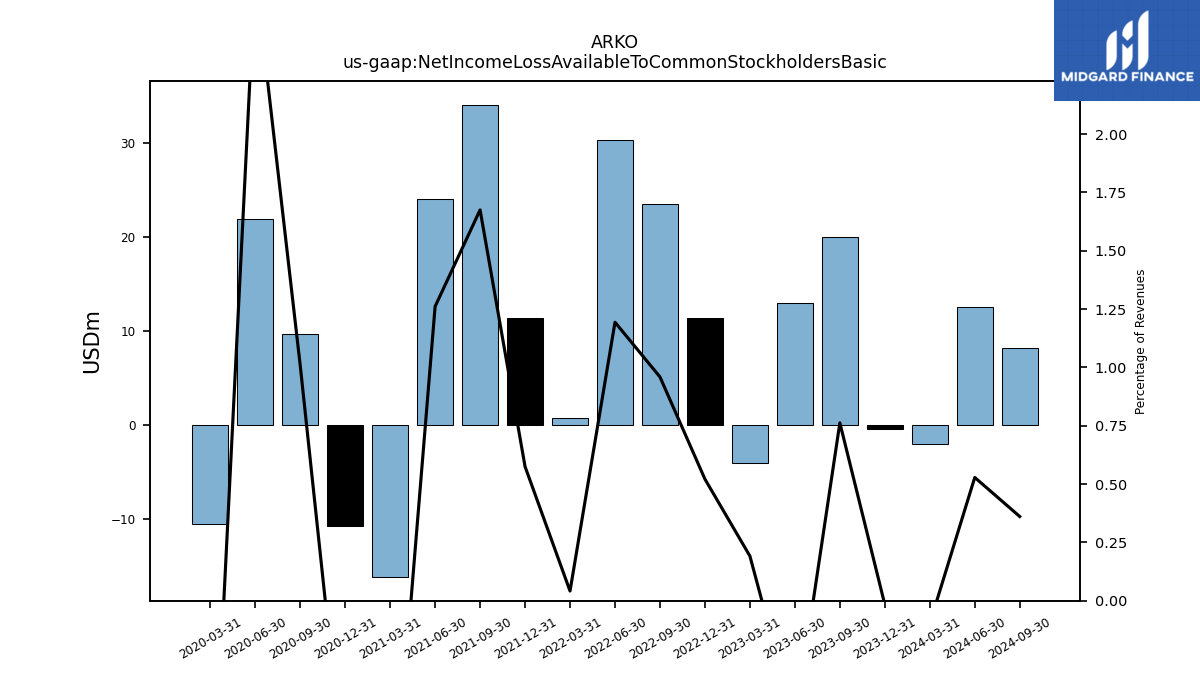
| Net Income Loss Available To Common Stockholders Basic | 19.99 | 13.00 | -4.00 | 11.36 | 23.49 | 30.32 | 0.82 | 11.43 | 34.09 | 24.09 | -16.14 | -10.69 | 9.69 | 21.89 | -10.46 | |
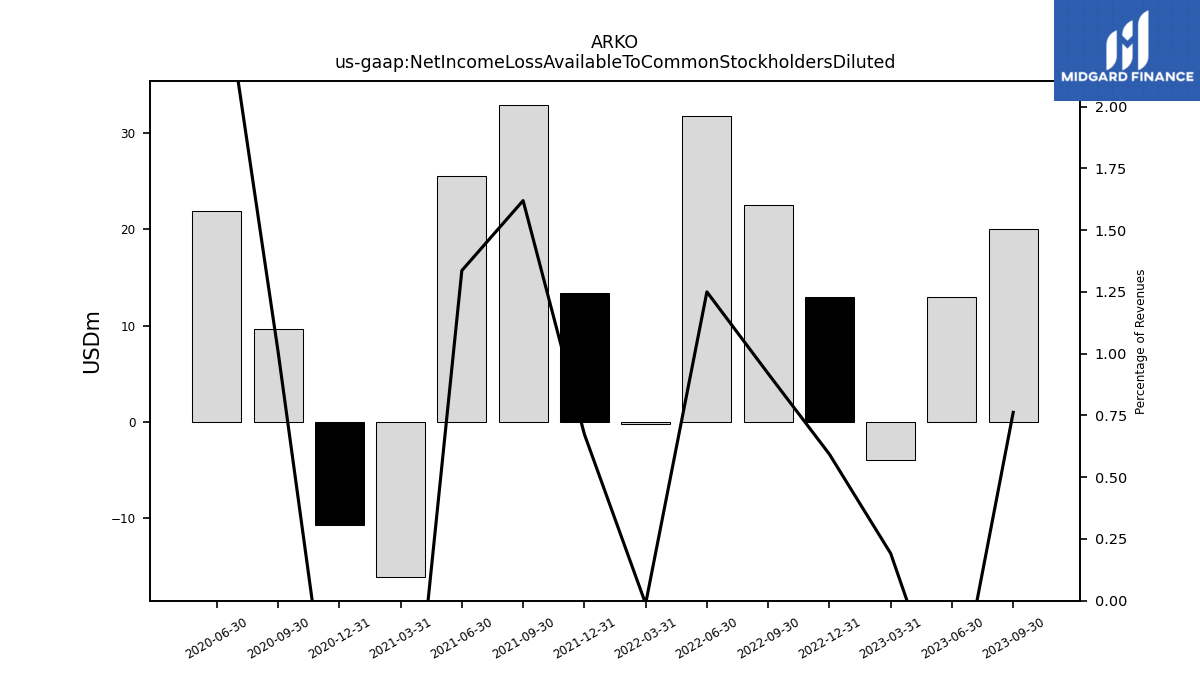
| Net Income Loss Available To Common Stockholders Diluted | 19.99 | 13.00 | -4.00 | 12.93 | 22.52 | 31.75 | -0.24 | 13.40 | 32.96 | 25.52 | -16.14 | -10.69 | 9.69 | 21.89 | NA |
| 2023-09-30 | 2023-06-30 | 2023-03-31 | 2022-12-31 | 2022-09-30 | 2022-06-30 | 2022-03-31 | 2021-12-31 | 2021-09-30 | 2021-06-30 | 2021-03-31 | 2020-12-31 | 2020-09-30 | 2020-06-30 | 2020-03-31 | ||
|---|---|---|---|---|---|---|---|---|---|---|---|---|---|---|---|---|
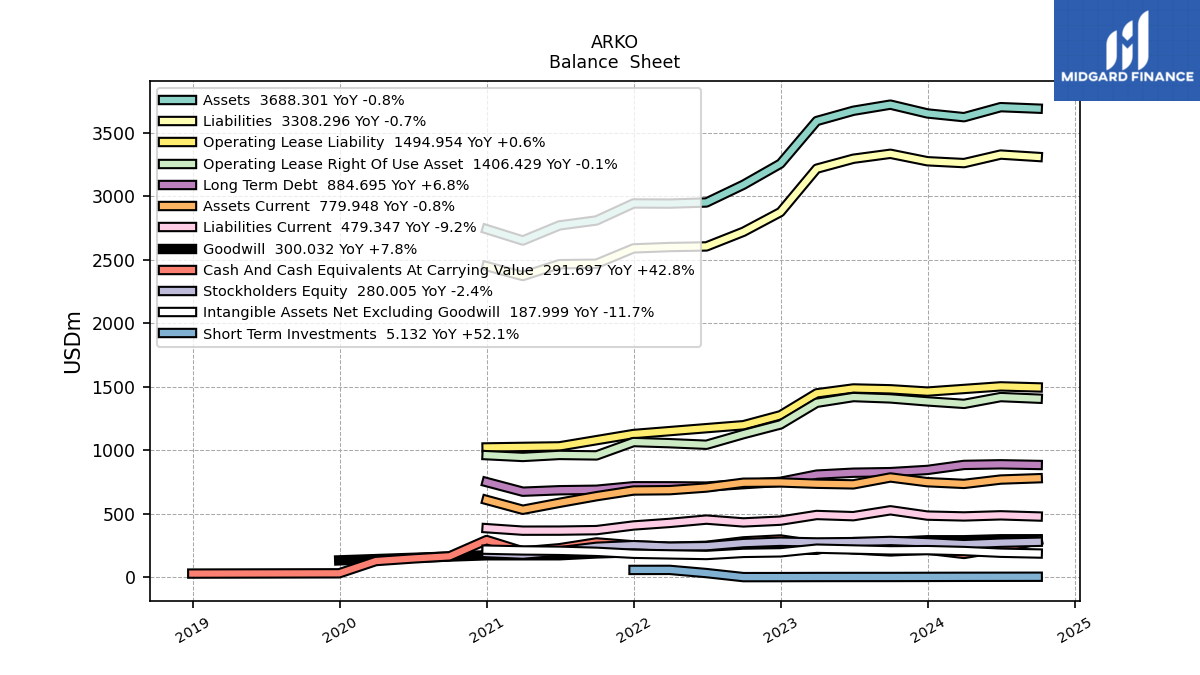
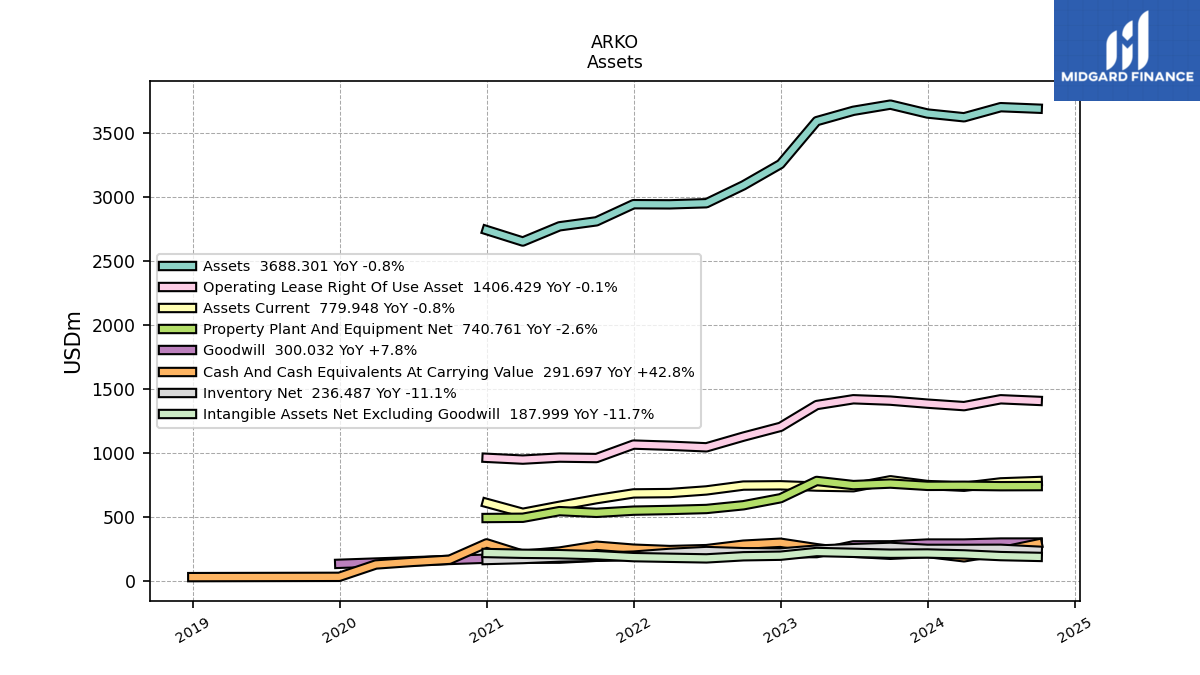
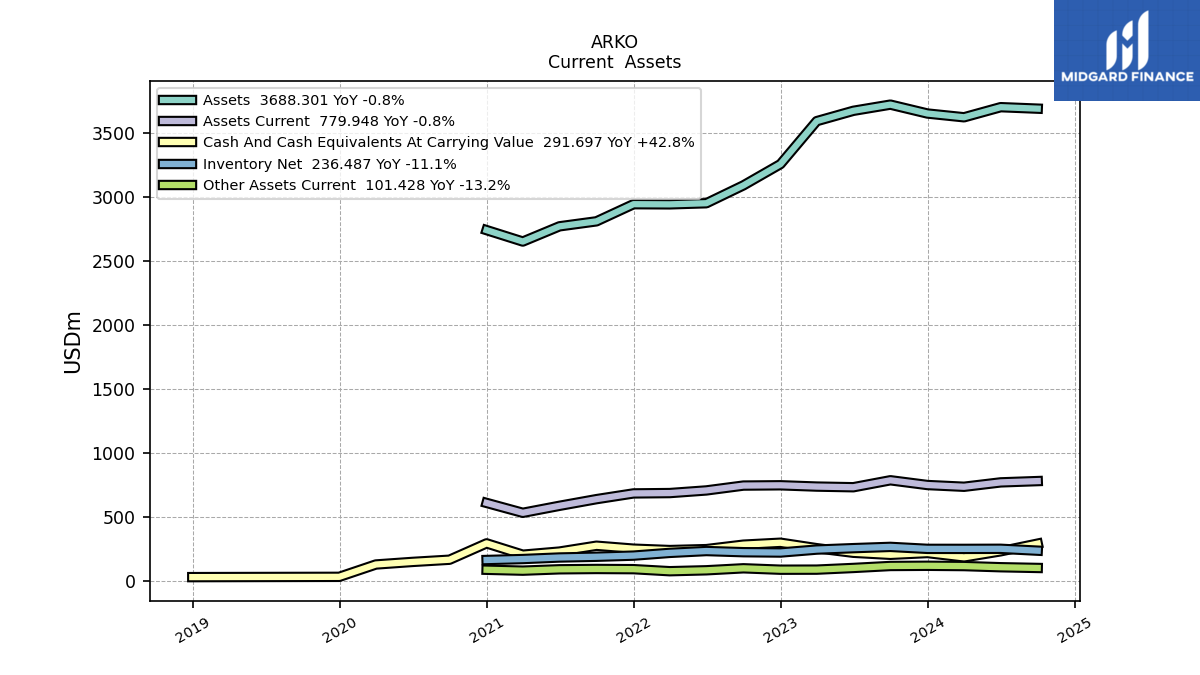
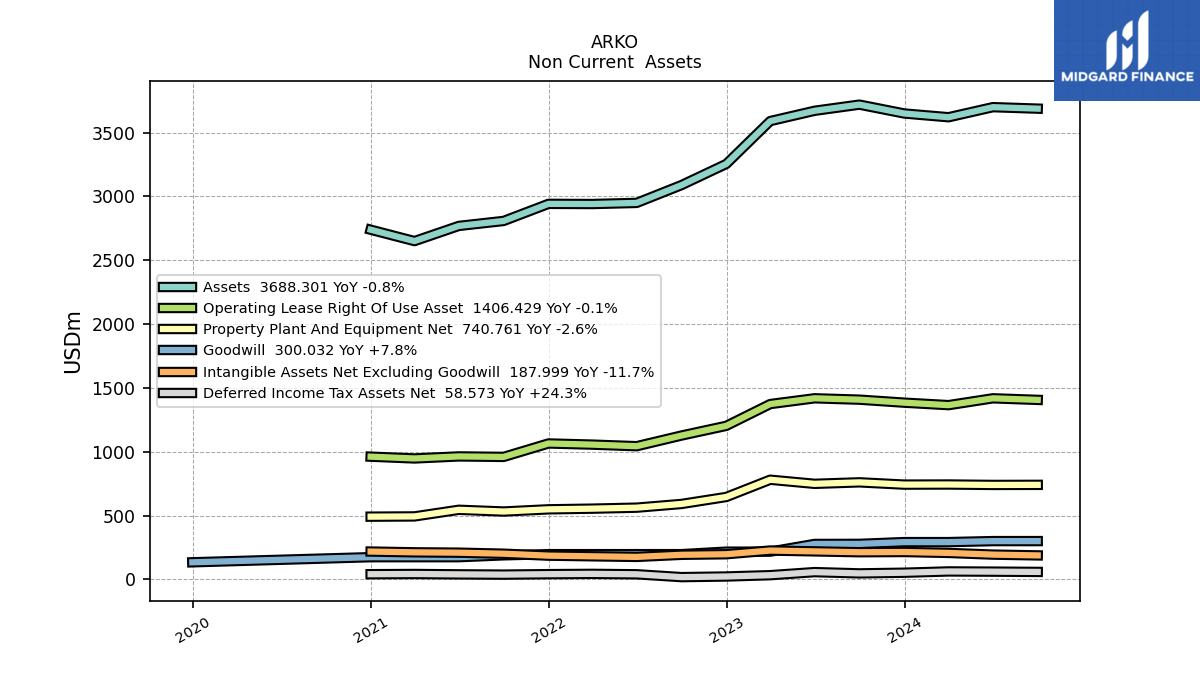
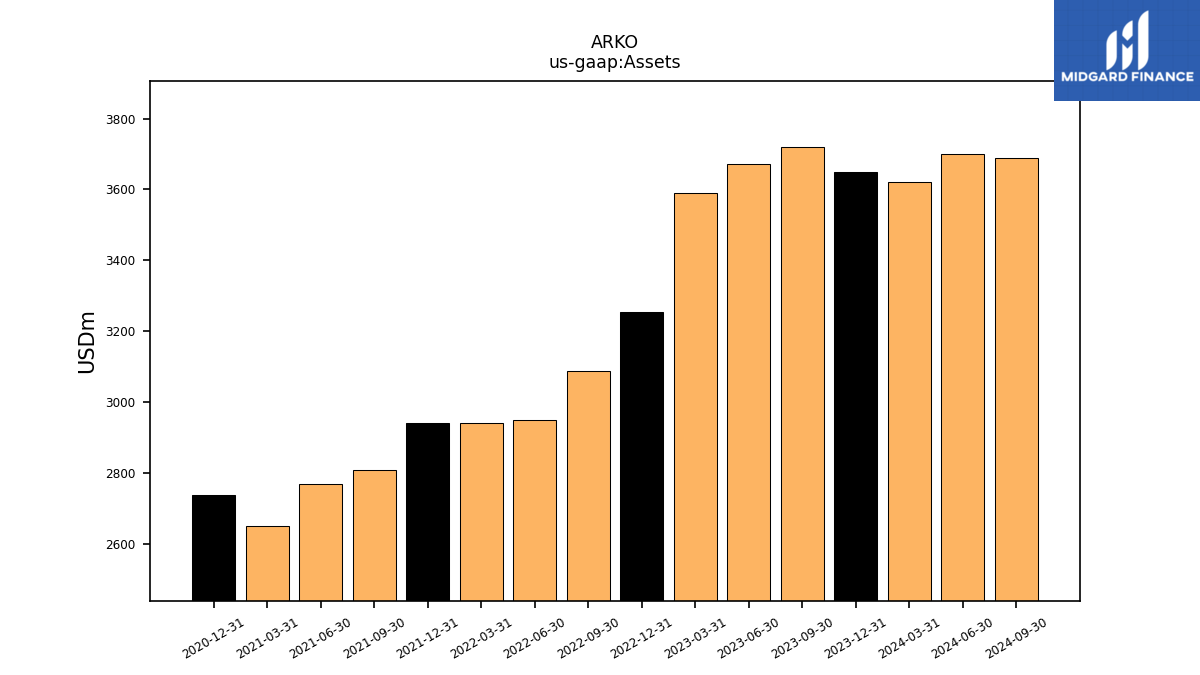
| Assets | 3719.78 | 3671.46 | 3590.80 | 3255.17 | 3089.26 | 2949.77 | 2940.95 | 2942.28 | 2808.43 | 2769.39 | 2650.55 | 2739.81 | NA | NA | NA | |
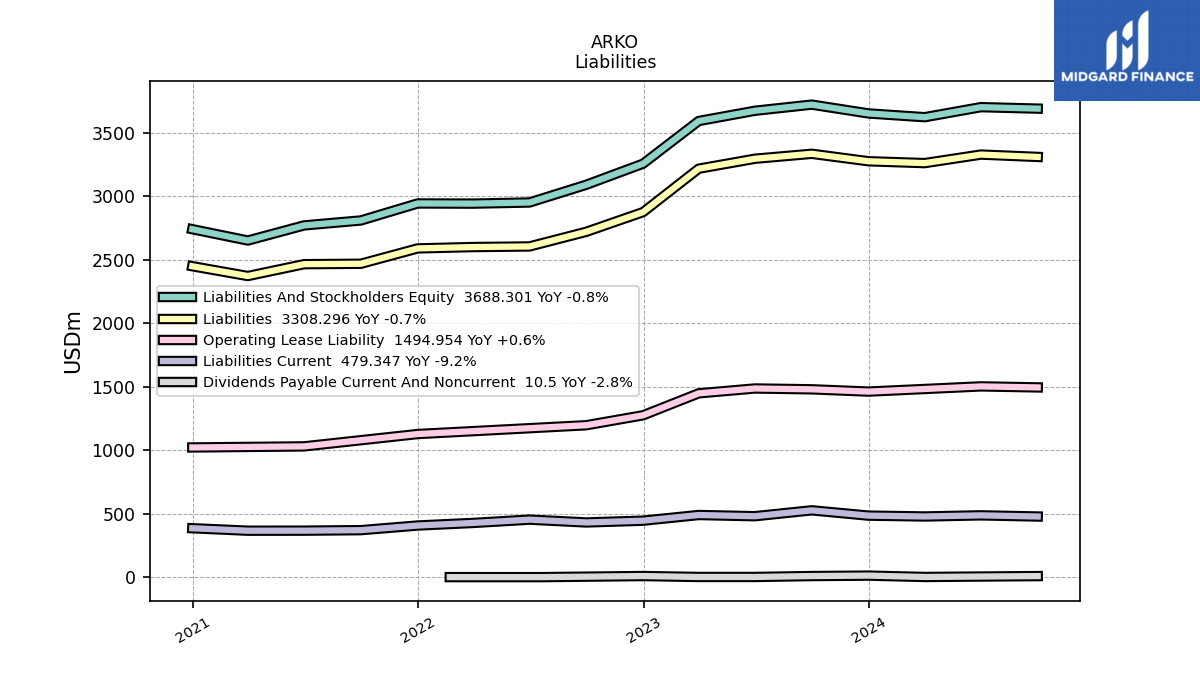
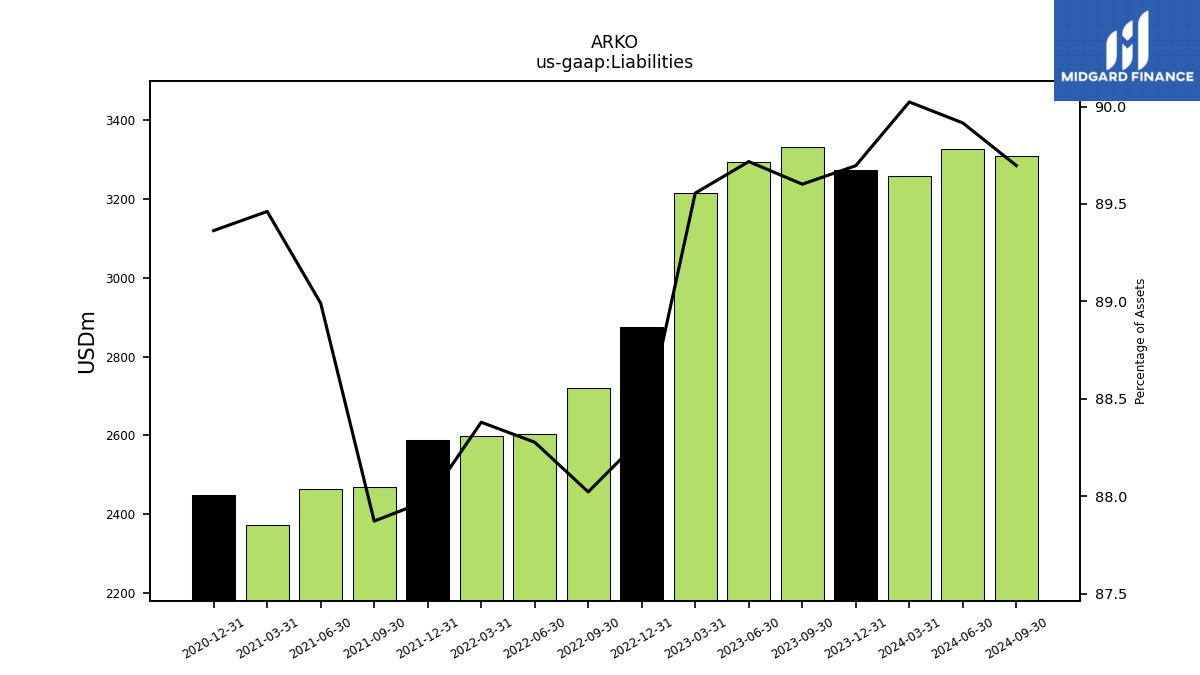
| Liabilities | 3332.98 | 3293.94 | 3215.76 | 2874.28 | 2719.26 | 2603.99 | 2599.22 | 2588.60 | 2467.85 | 2464.50 | 2371.23 | 2448.39 | NA | NA | NA | |
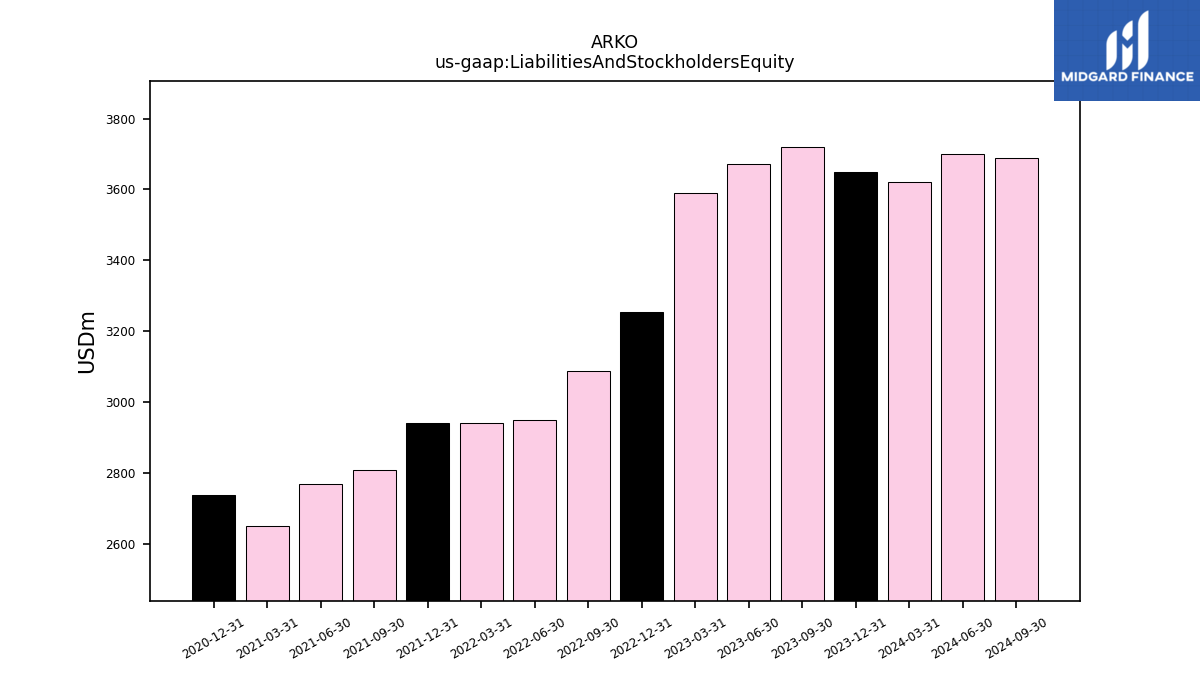
| Liabilities And Stockholders Equity | 3719.78 | 3671.46 | 3590.80 | 3255.17 | 3089.26 | 2949.77 | 2940.95 | 2942.28 | 2808.43 | 2769.39 | 2650.55 | 2739.81 | NA | NA | NA | |
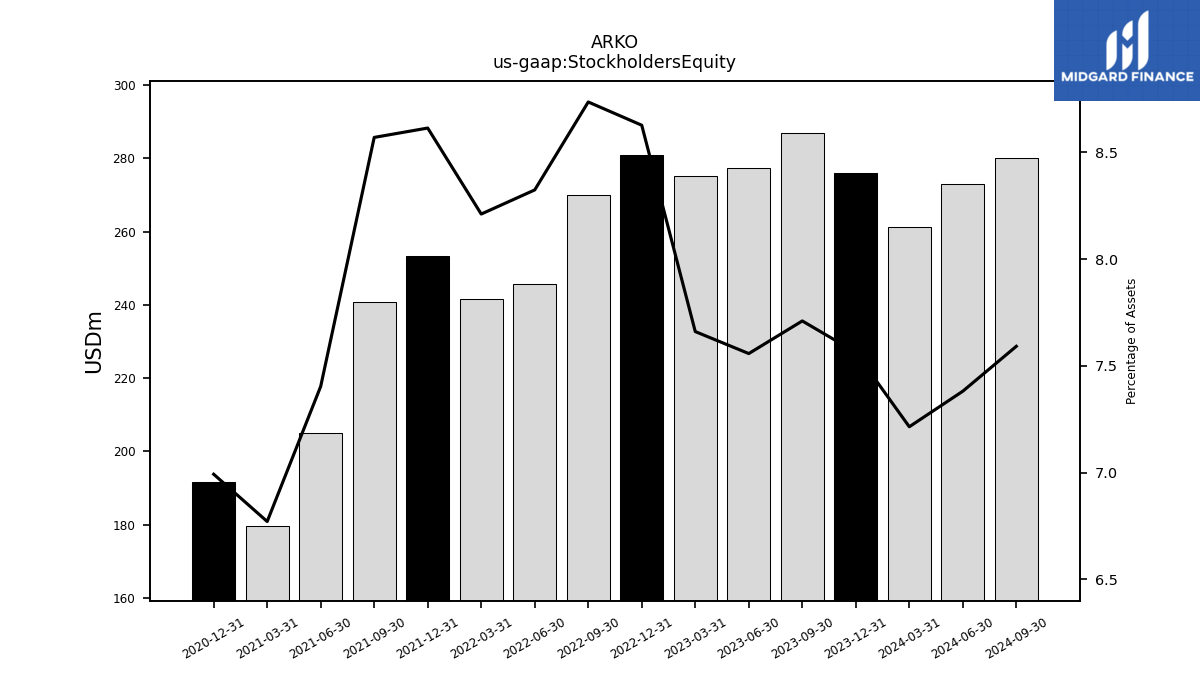
| Stockholders Equity | 286.81 | 277.48 | 275.08 | 280.83 | 269.89 | 245.55 | 241.49 | 253.45 | 240.69 | 205.04 | 179.47 | 191.58 | NA | NA | NA |
| 2023-09-30 | 2023-06-30 | 2023-03-31 | 2022-12-31 | 2022-09-30 | 2022-06-30 | 2022-03-31 | 2021-12-31 | 2021-09-30 | 2021-06-30 | 2021-03-31 | 2020-12-31 | 2020-09-30 | 2020-06-30 | 2020-03-31 | ||
|---|---|---|---|---|---|---|---|---|---|---|---|---|---|---|---|---|
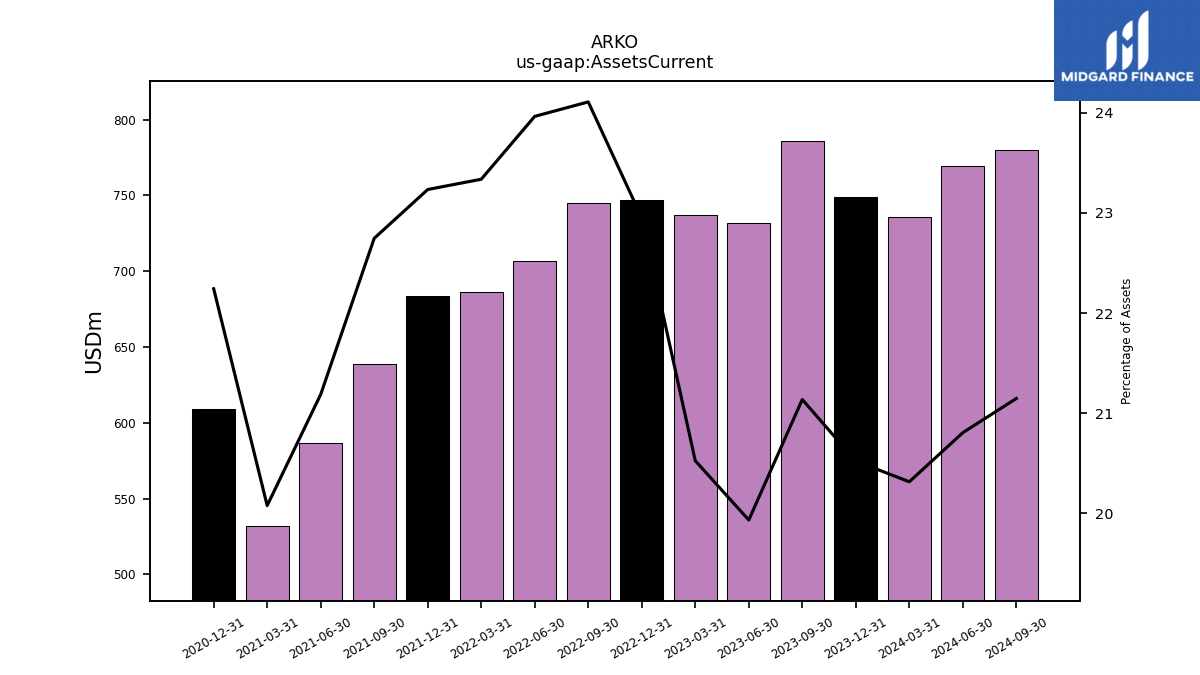
| Assets Current | 786.24 | 731.81 | 737.00 | 747.13 | 744.81 | 706.92 | 686.33 | 683.62 | 638.83 | 586.75 | 532.15 | 609.41 | NA | NA | NA | |
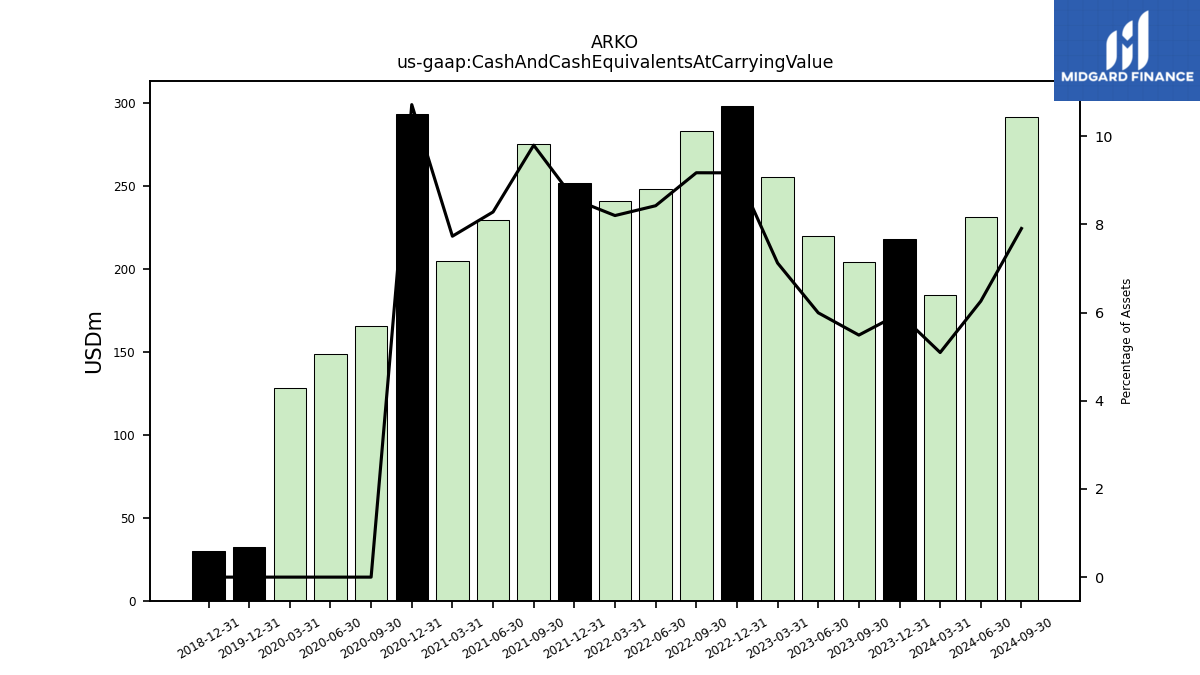
| Cash And Cash Equivalents At Carrying Value | 204.24 | 220.14 | 255.85 | 298.53 | 283.38 | 248.52 | 241.22 | 252.14 | 275.19 | 229.40 | 204.99 | 293.67 | 165.78 | 148.62 | 128.51 | |
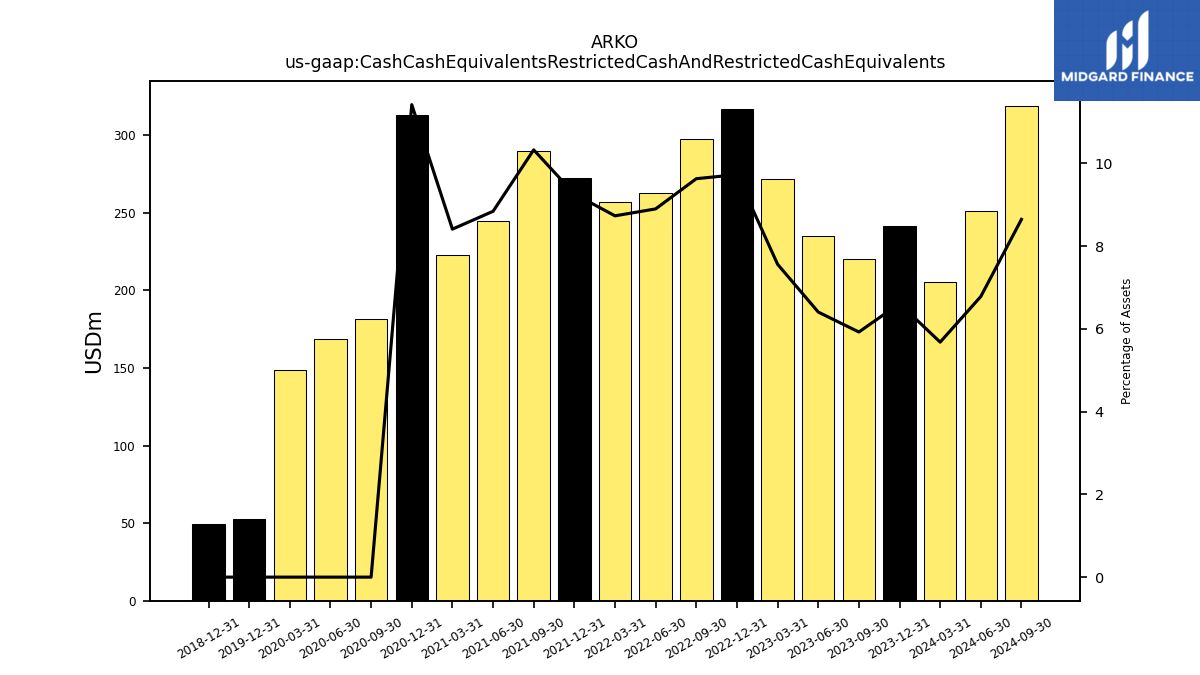
| Cash Cash Equivalents Restricted Cash And Restricted Cash Equivalents | 220.44 | 235.28 | 271.60 | 316.77 | 297.57 | 262.60 | 256.88 | 272.54 | 290.11 | 244.94 | 223.00 | 312.98 | 181.88 | 168.51 | 148.75 | |
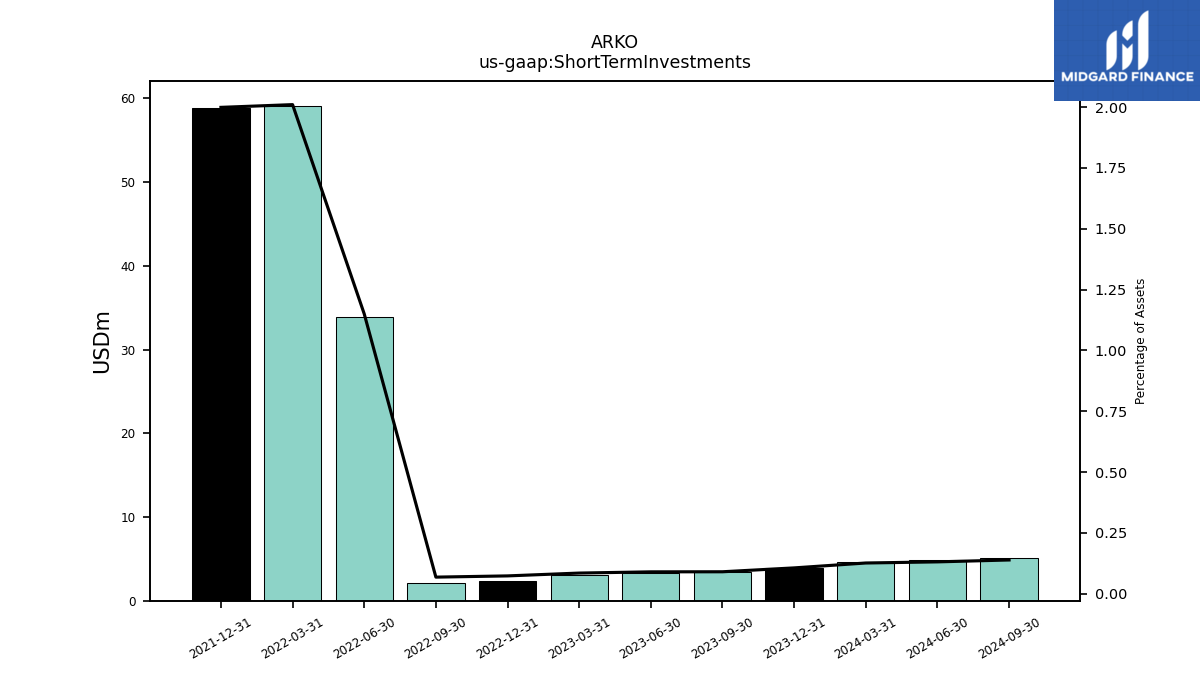
| Short Term Investments | 3.38 | 3.32 | 3.06 | 2.40 | 2.12 | 33.93 | 59.11 | 58.81 | NA | NA | NA | NA | NA | NA | NA | |
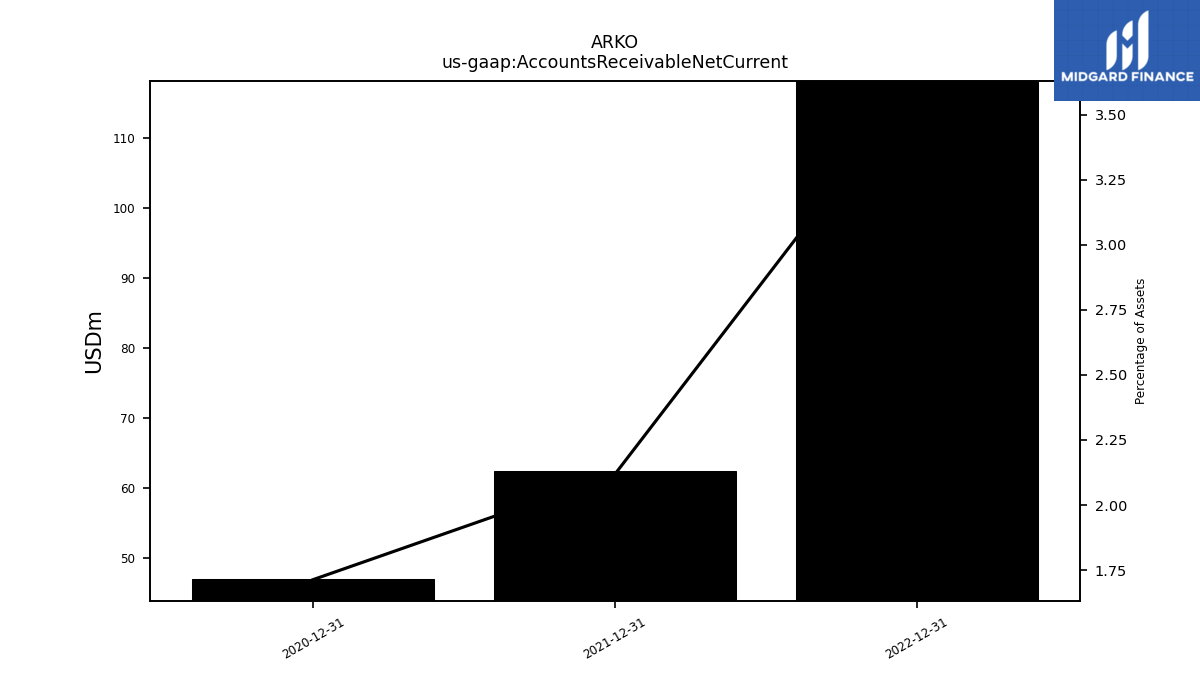
| Accounts Receivable Net Current | NA | NA | NA | 118.14 | NA | NA | NA | 62.34 | NA | NA | NA | 46.94 | NA | NA | NA | |
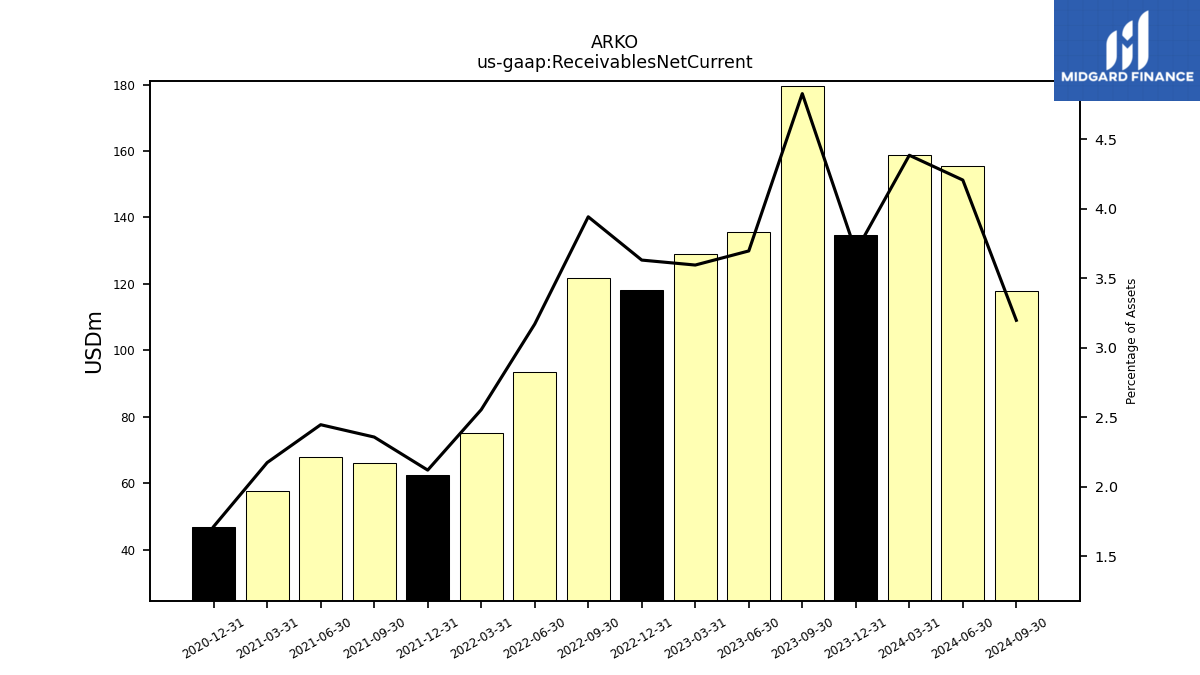
| Receivables Net Current | 179.53 | 135.66 | 129.04 | 118.14 | 121.74 | 93.48 | 75.09 | 62.34 | 66.18 | 67.72 | 57.60 | 46.94 | NA | NA | NA | |
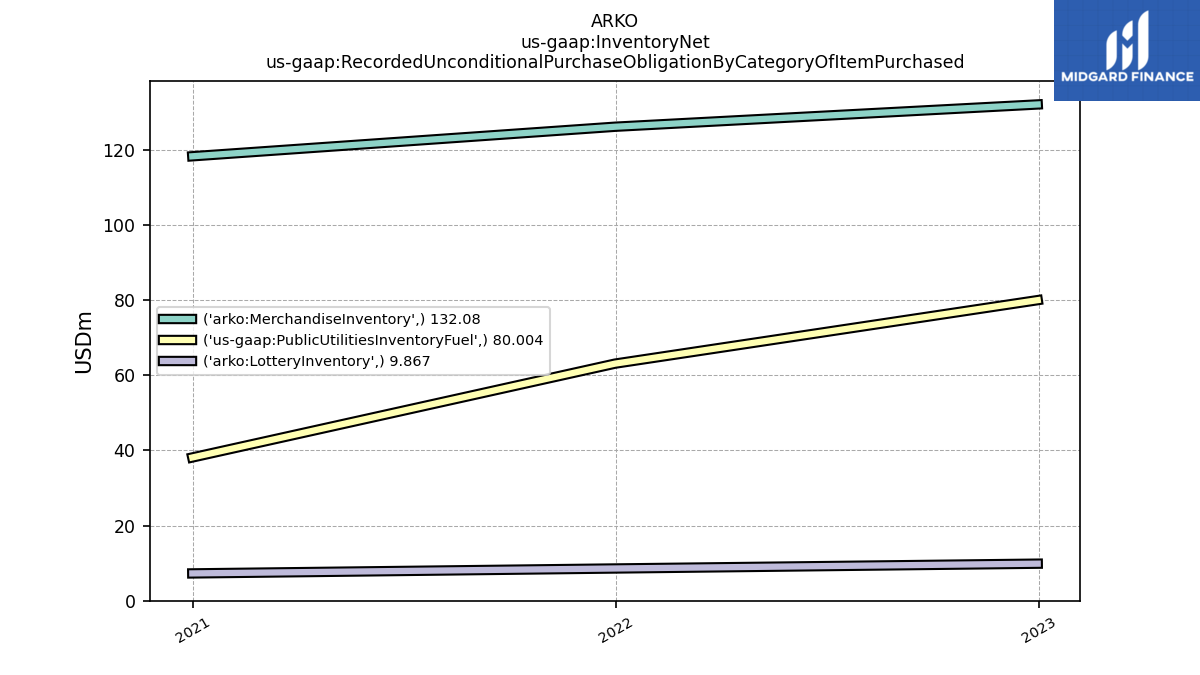
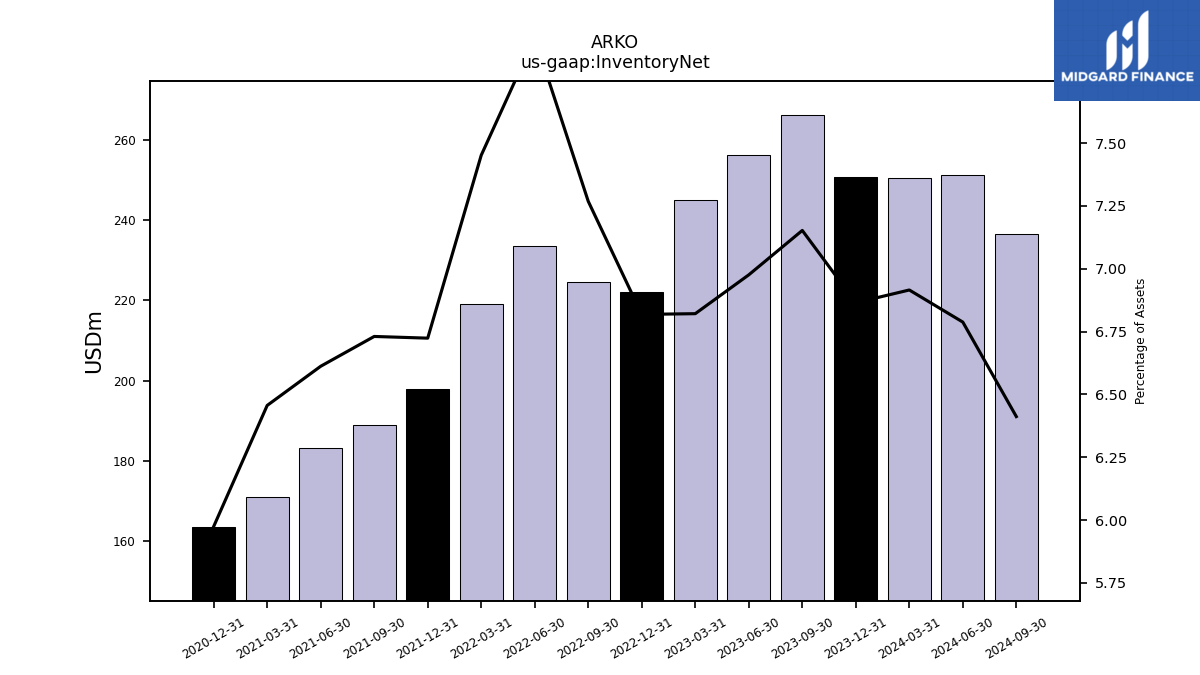
| Inventory Net | 266.06 | 256.12 | 244.94 | 221.95 | 224.54 | 233.61 | 219.15 | 197.84 | 189.03 | 183.11 | 171.12 | 163.69 | NA | NA | NA | |
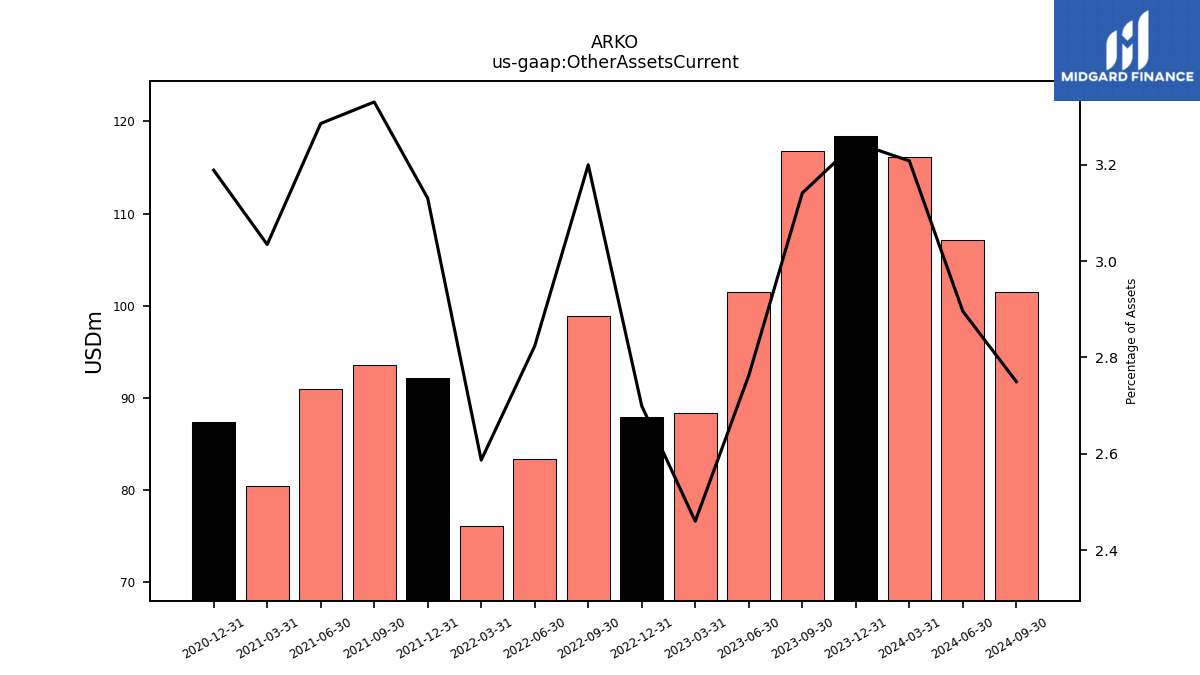
| Other Assets Current | 116.83 | 101.44 | 88.35 | 87.87 | 98.84 | 83.30 | 76.09 | 92.09 | 93.52 | 90.98 | 80.42 | 87.36 | NA | NA | NA | |
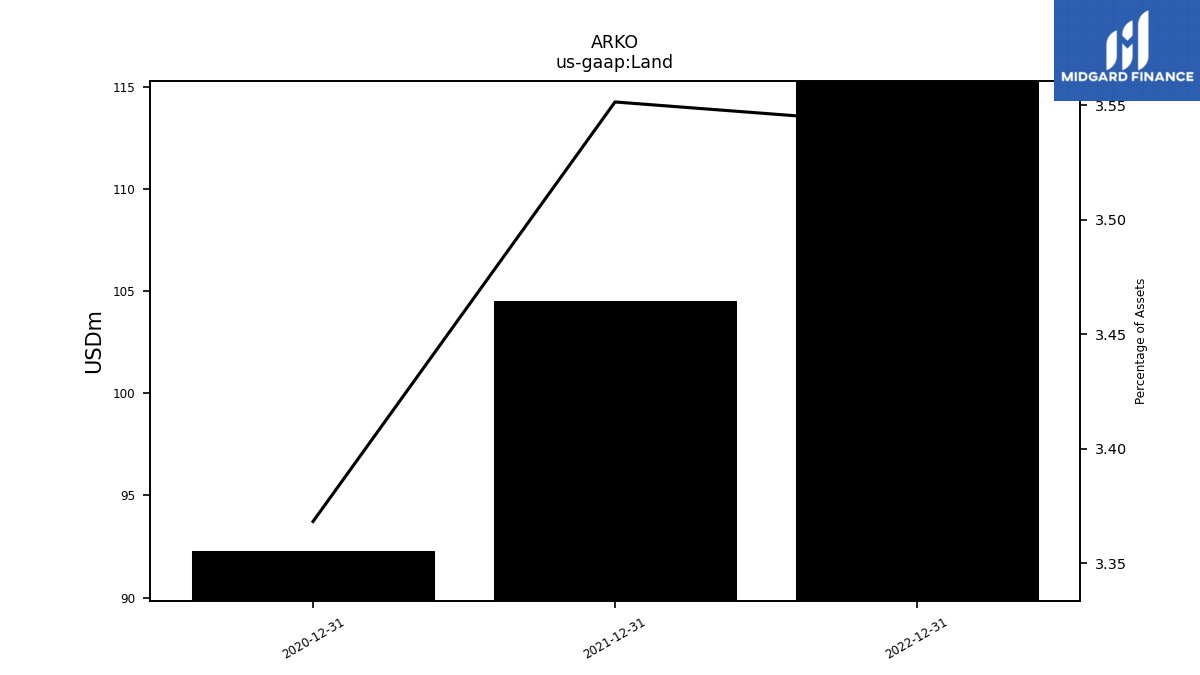
| Land | NA | NA | NA | 115.28 | NA | NA | NA | 104.49 | NA | NA | NA | 92.28 | NA | NA | NA | |
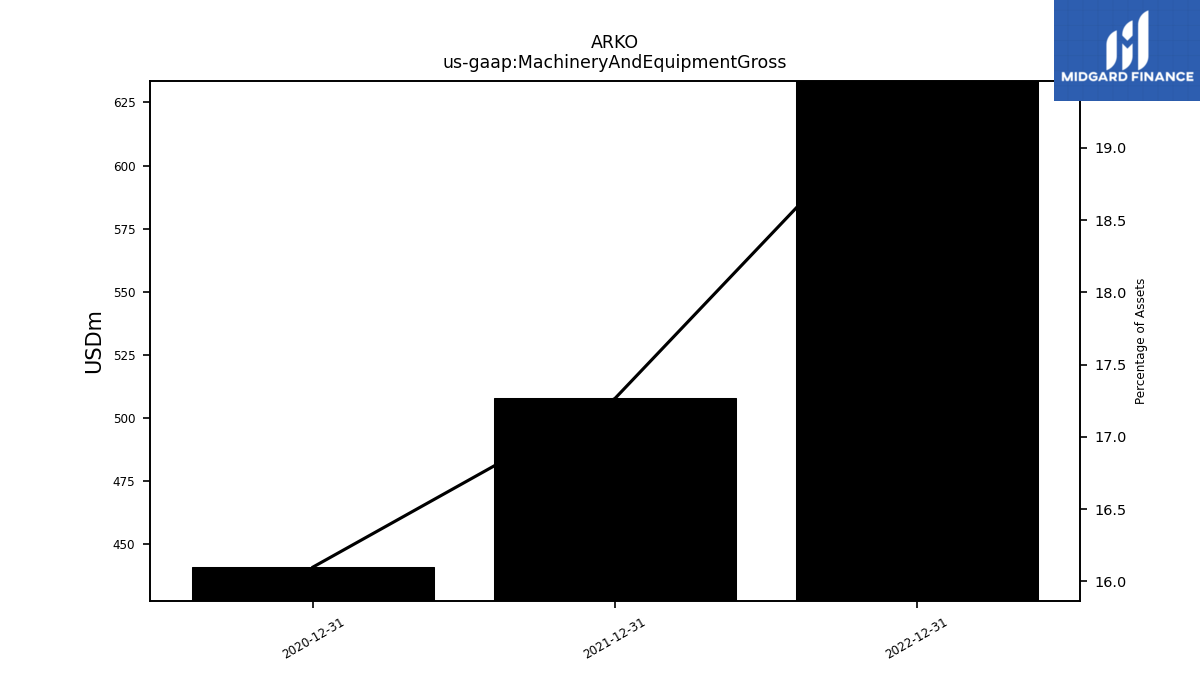
| Machinery And Equipment Gross | NA | NA | NA | 633.51 | NA | NA | NA | 508.00 | NA | NA | NA | 441.08 | NA | NA | NA |
| 2023-09-30 | 2023-06-30 | 2023-03-31 | 2022-12-31 | 2022-09-30 | 2022-06-30 | 2022-03-31 | 2021-12-31 | 2021-09-30 | 2021-06-30 | 2021-03-31 | 2020-12-31 | 2020-09-30 | 2020-06-30 | 2020-03-31 | ||
|---|---|---|---|---|---|---|---|---|---|---|---|---|---|---|---|---|
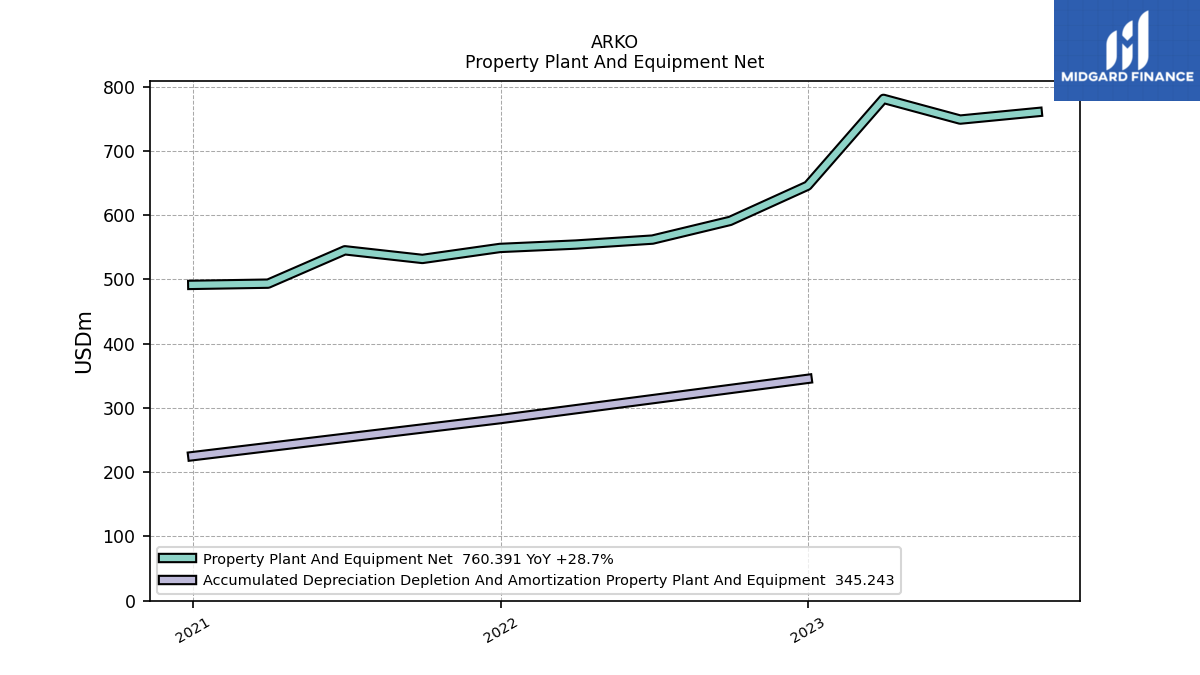
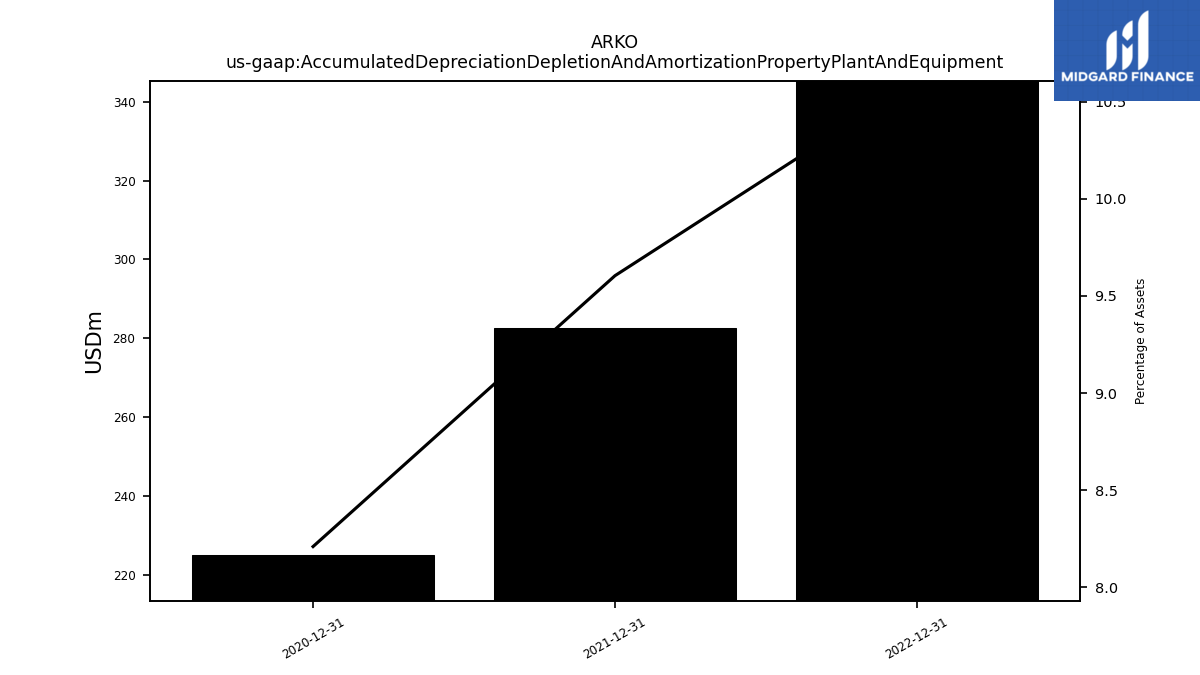
| Accumulated Depreciation Depletion And Amortization Property Plant And Equipment | NA | NA | NA | 345.24 | NA | NA | NA | 282.57 | NA | NA | NA | 224.93 | NA | NA | NA | |
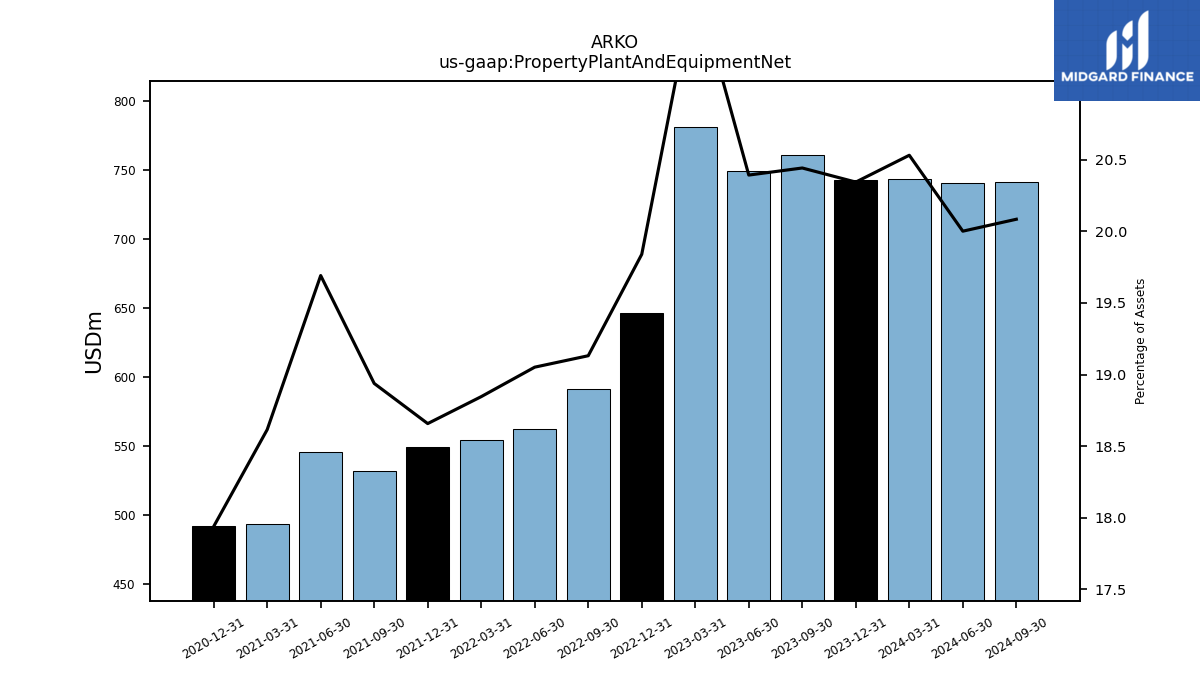
| Property Plant And Equipment Net | 760.39 | 748.70 | 780.95 | 645.81 | 591.02 | 561.98 | 554.25 | 548.97 | 531.86 | 545.32 | 493.42 | 491.51 | NA | NA | NA | |
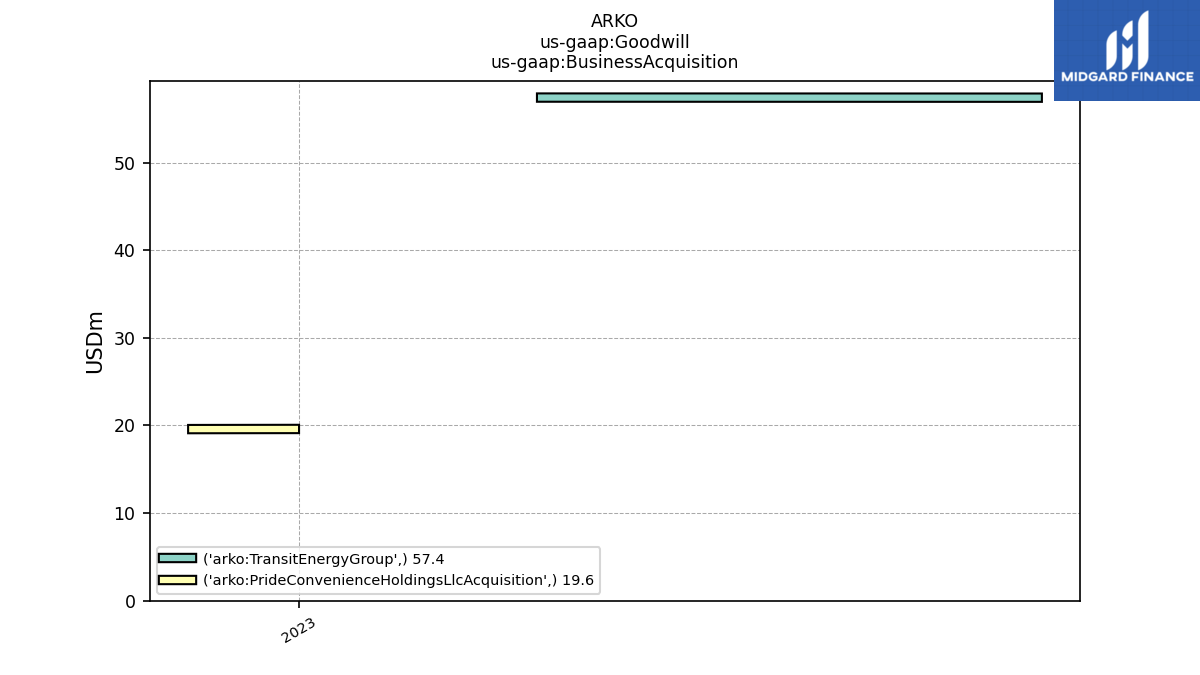
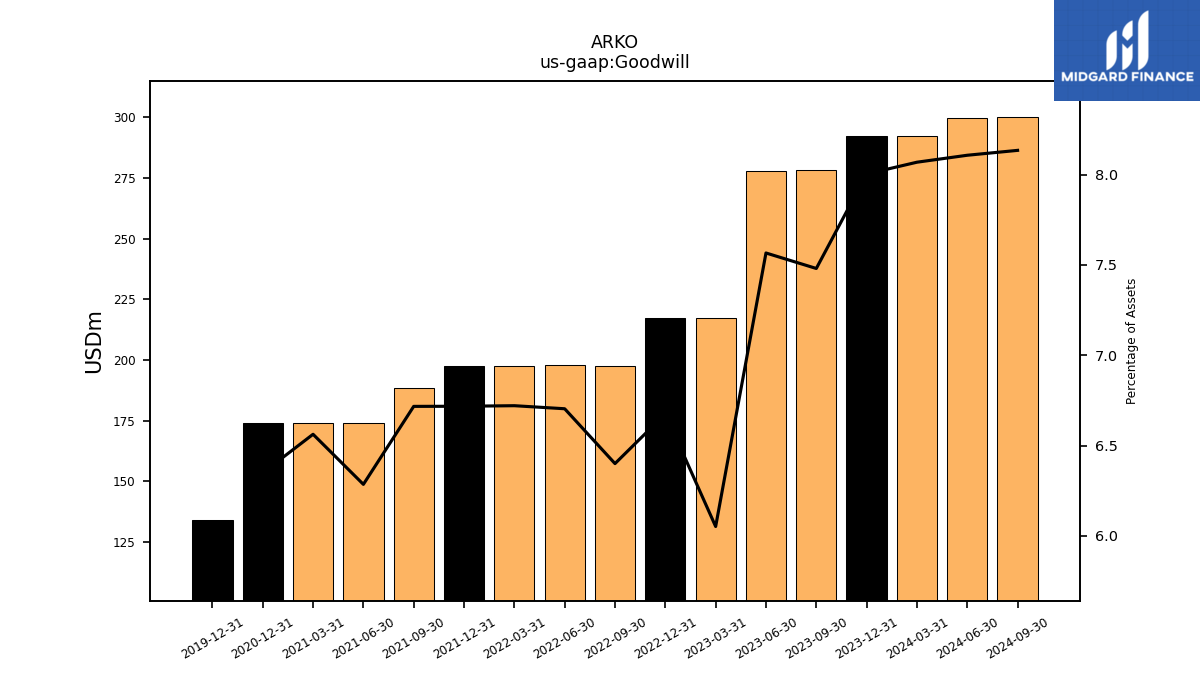
| Goodwill | 278.26 | 277.80 | 217.30 | 217.30 | 197.71 | 197.74 | 197.65 | 197.65 | 188.64 | 174.05 | 173.94 | 173.94 | NA | NA | NA | |
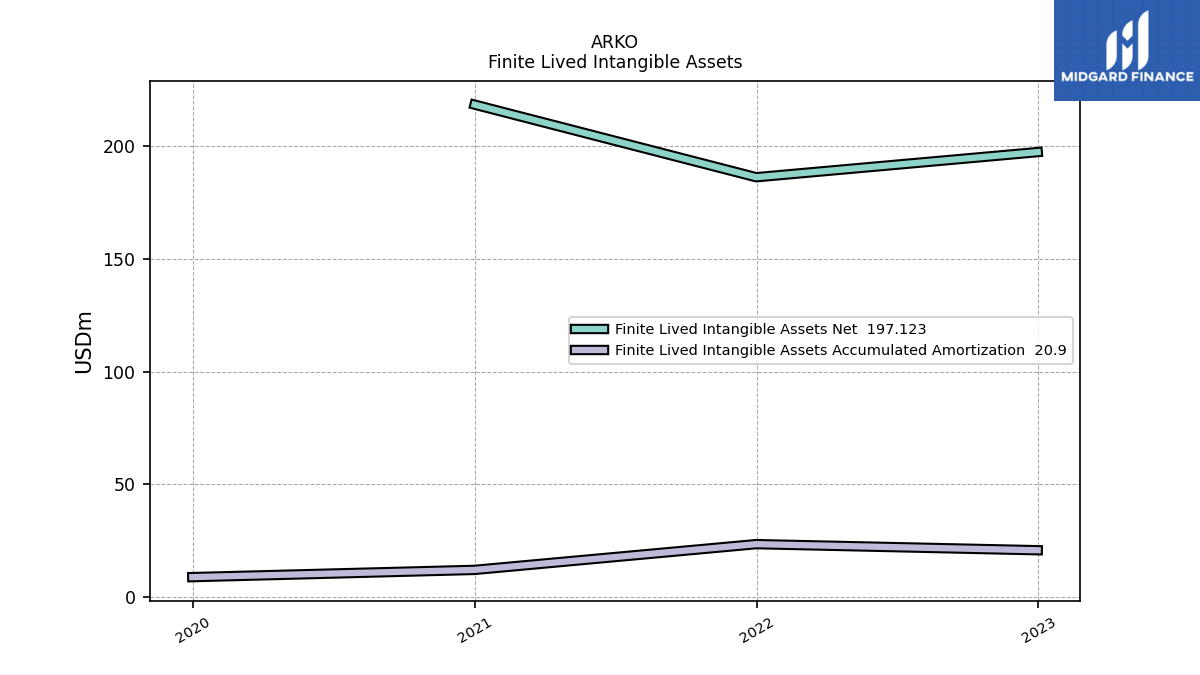
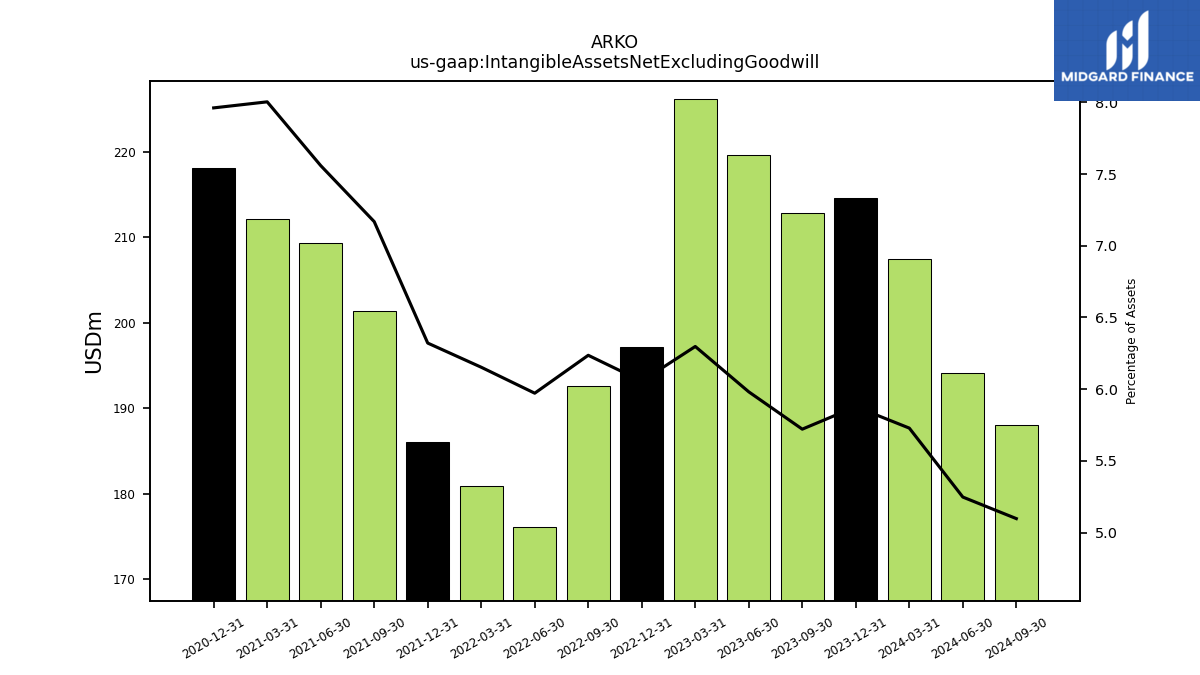
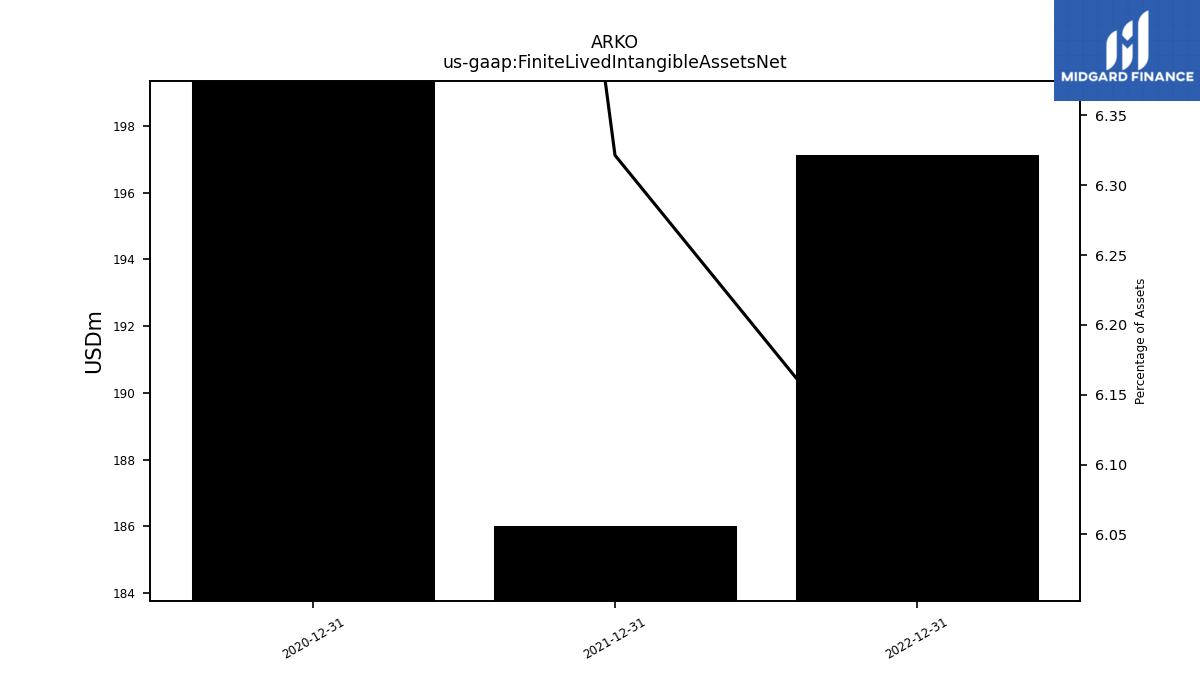
| Intangible Assets Net Excluding Goodwill | 212.81 | 219.60 | 226.13 | 197.12 | 192.65 | 176.16 | 180.95 | 185.99 | 201.32 | 209.34 | 212.14 | 218.13 | NA | NA | NA | |
| Finite Lived Intangible Assets Net | NA | NA | NA | 197.12 | NA | NA | NA | 185.99 | NA | NA | NA | 218.13 | NA | NA | NA |
| 2023-09-30 | 2023-06-30 | 2023-03-31 | 2022-12-31 | 2022-09-30 | 2022-06-30 | 2022-03-31 | 2021-12-31 | 2021-09-30 | 2021-06-30 | 2021-03-31 | 2020-12-31 | 2020-09-30 | 2020-06-30 | 2020-03-31 | ||
|---|---|---|---|---|---|---|---|---|---|---|---|---|---|---|---|---|
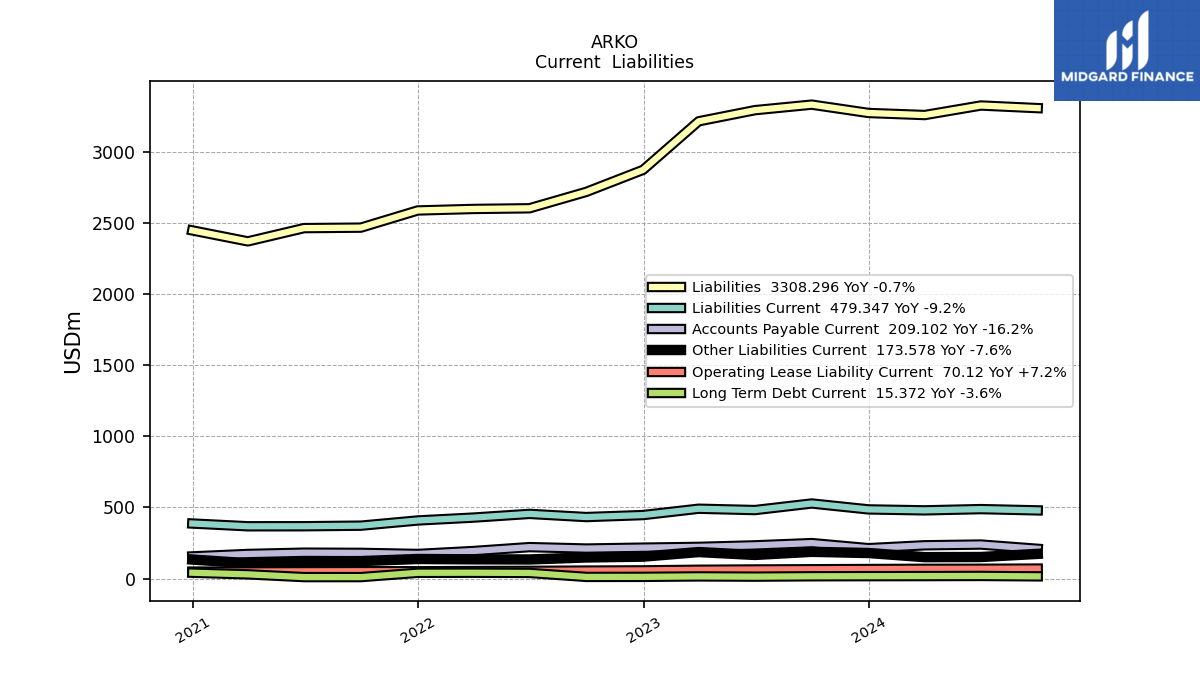
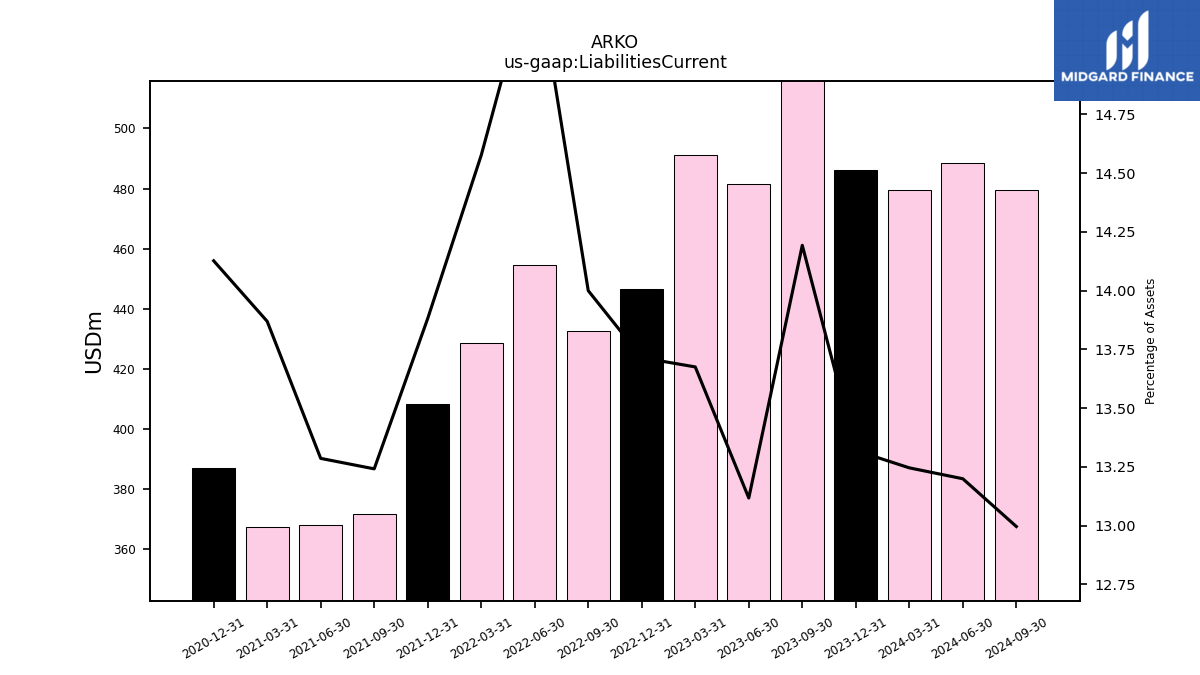
| Liabilities Current | 527.94 | 481.61 | 491.06 | 446.43 | 432.49 | 454.71 | 428.68 | 408.43 | 371.88 | 367.95 | 367.61 | 387.05 | NA | NA | NA | |
| Long Term Debt Current | 15.95 | 13.37 | 15.03 | 11.94 | 11.48 | 39.39 | 40.91 | 40.38 | 10.03 | 10.12 | 29.50 | 40.99 | NA | NA | NA | |
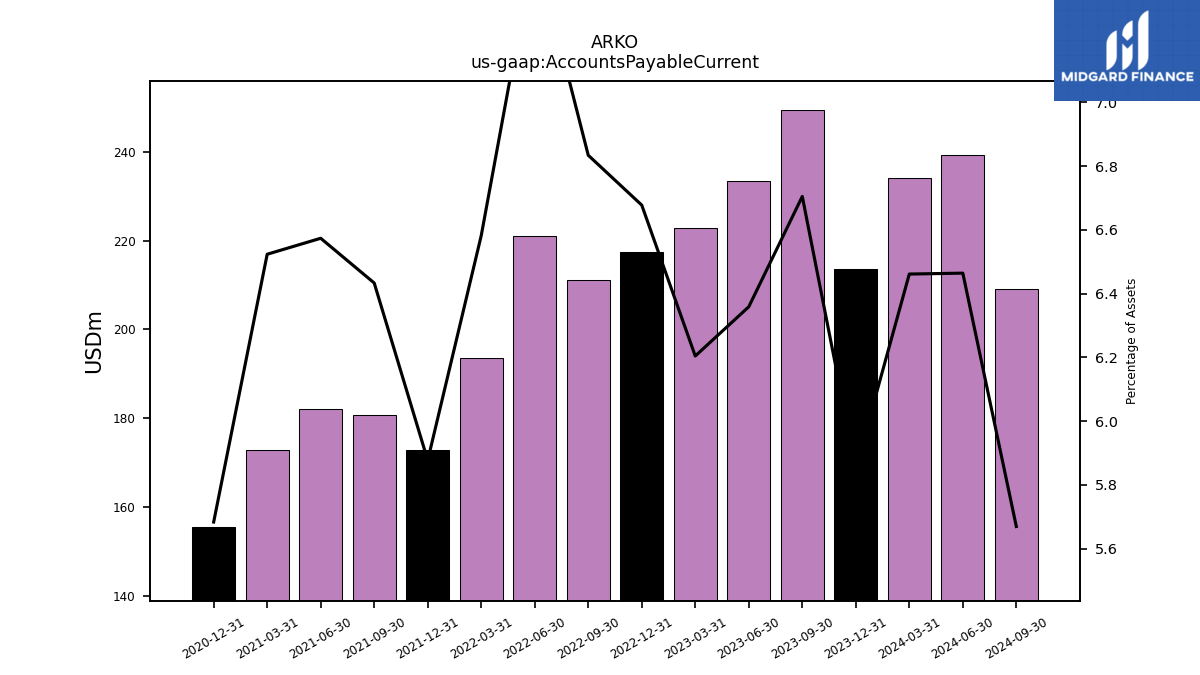
| Accounts Payable Current | 249.41 | 233.46 | 222.78 | 217.37 | 211.12 | 221.05 | 193.57 | 172.92 | 180.68 | 182.05 | 172.91 | 155.71 | NA | NA | NA | |
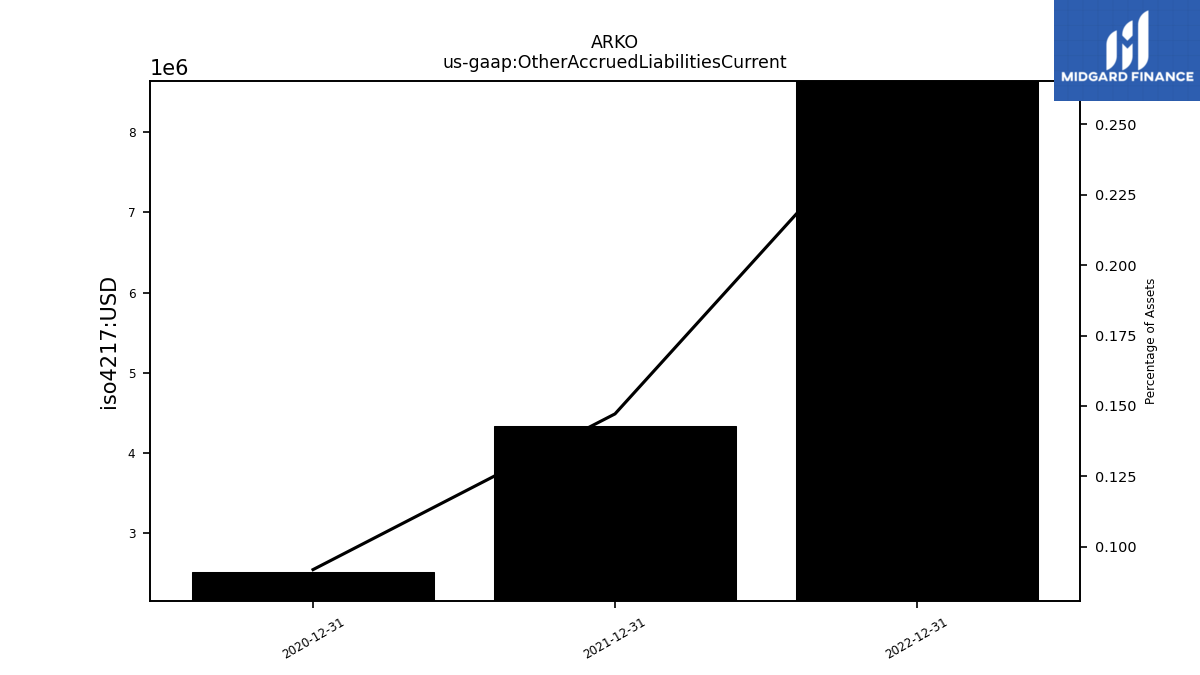
| Other Accrued Liabilities Current | NA | NA | NA | 8.64 | NA | NA | NA | 4.33 | NA | NA | NA | 2.52 | NA | NA | NA | |
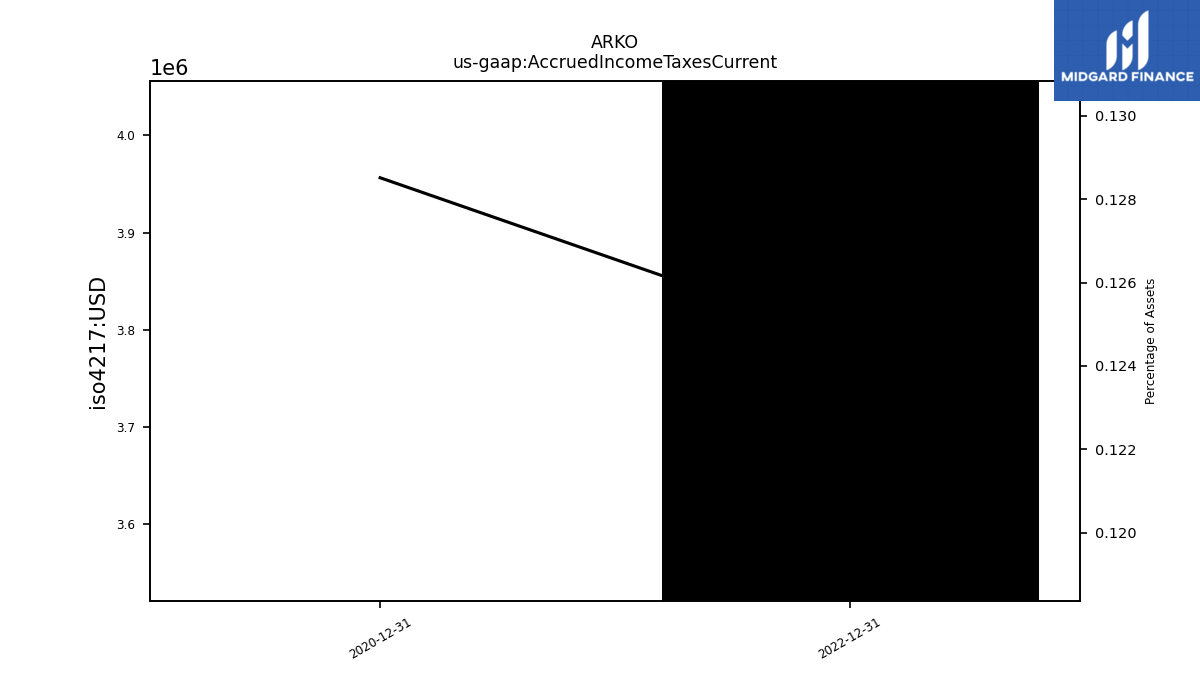
| Accrued Income Taxes Current | NA | NA | NA | 4.06 | NA | NA | NA | NA | NA | NA | NA | 3.52 | NA | NA | NA | |
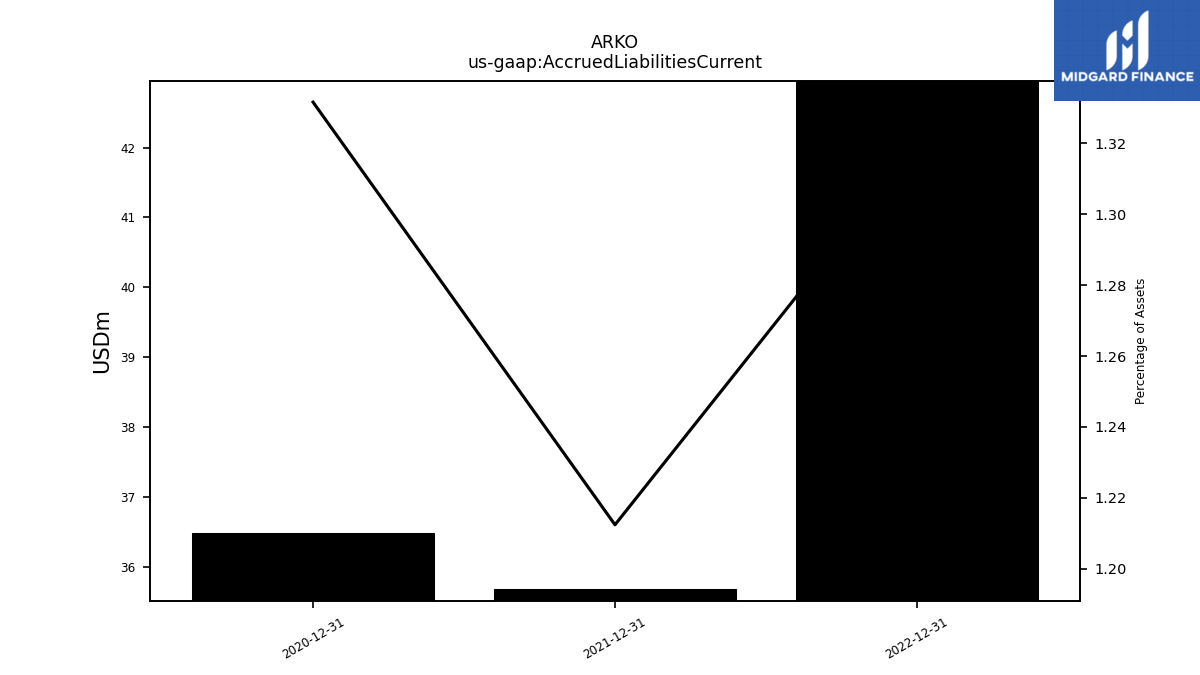
| Accrued Liabilities Current | NA | NA | NA | 42.95 | NA | NA | NA | 35.67 | NA | NA | NA | 36.48 | NA | NA | NA | |
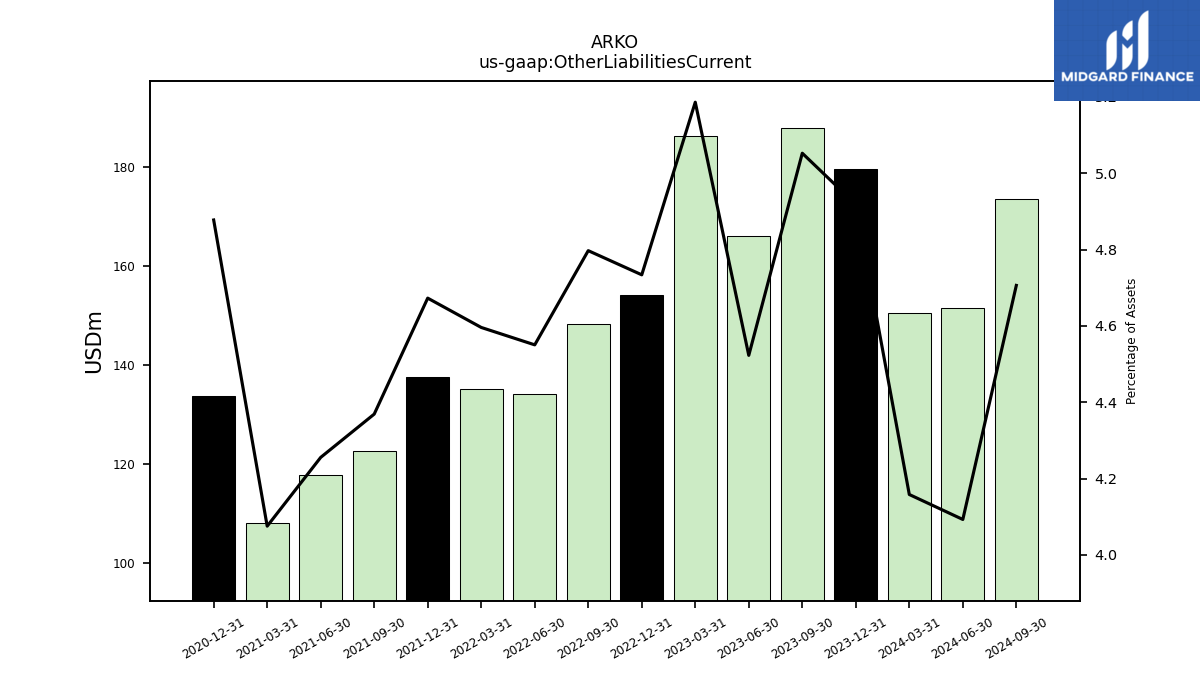
| Other Liabilities Current | 187.94 | 166.06 | 186.22 | 154.10 | 148.20 | 134.23 | 135.17 | 137.49 | 122.70 | 117.85 | 108.02 | 133.64 | NA | NA | NA |
| 2023-09-30 | 2023-06-30 | 2023-03-31 | 2022-12-31 | 2022-09-30 | 2022-06-30 | 2022-03-31 | 2021-12-31 | 2021-09-30 | 2021-06-30 | 2021-03-31 | 2020-12-31 | 2020-09-30 | 2020-06-30 | 2020-03-31 | ||
|---|---|---|---|---|---|---|---|---|---|---|---|---|---|---|---|---|
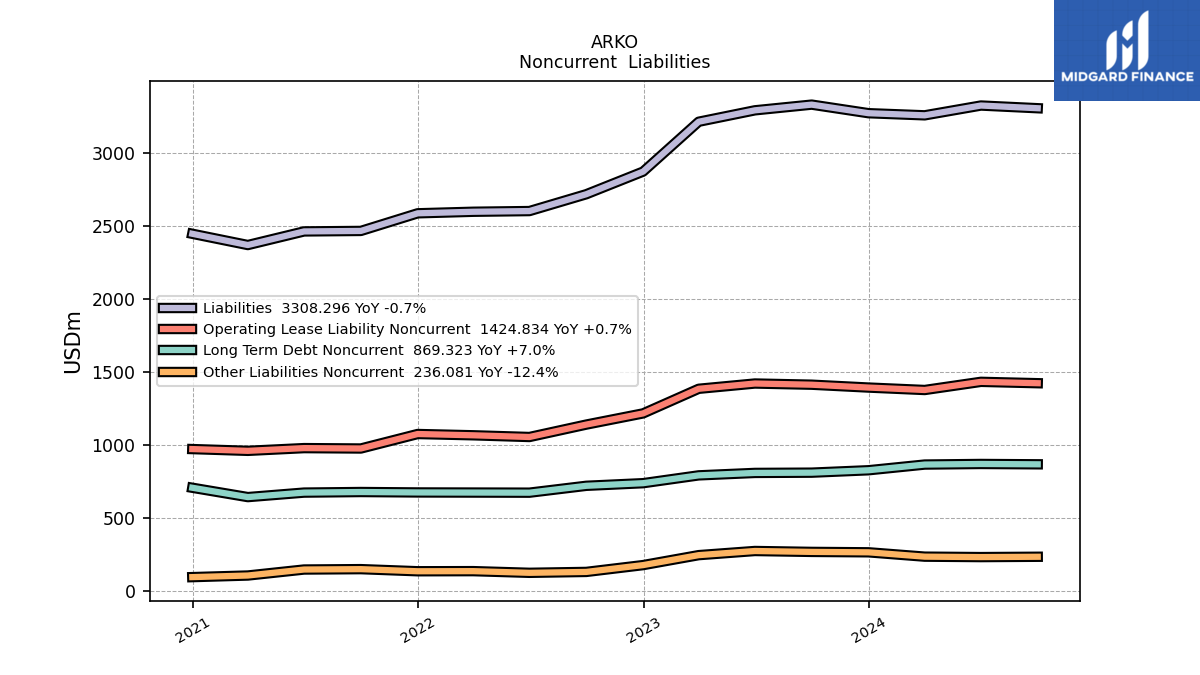
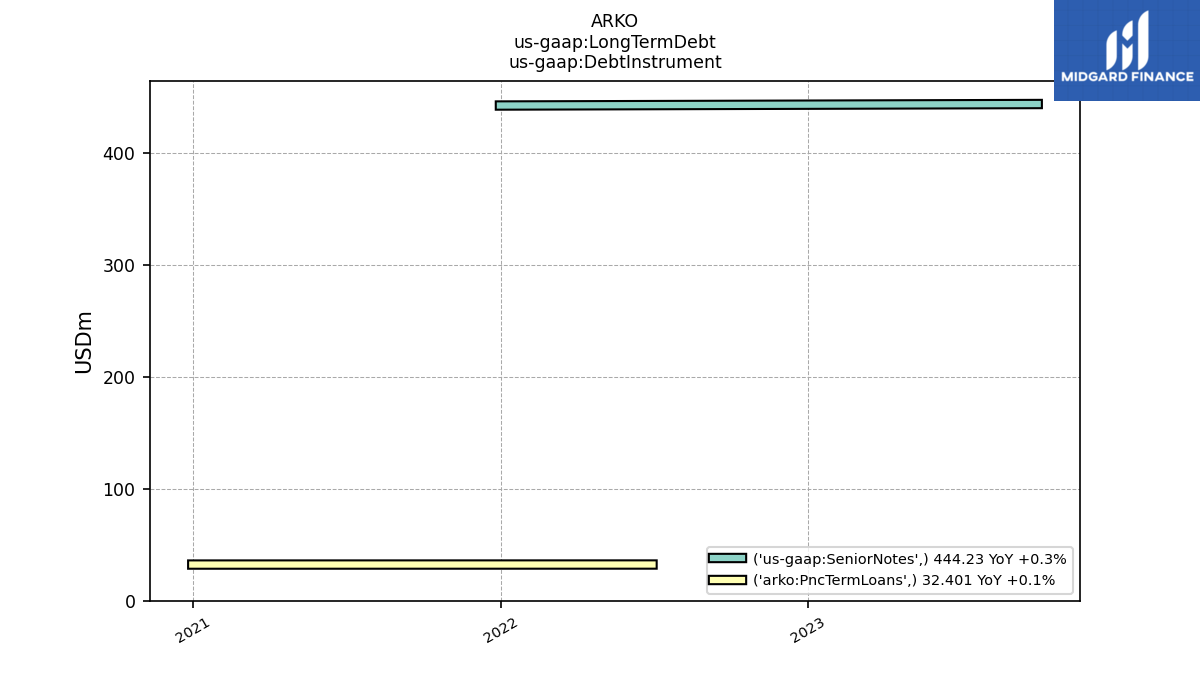
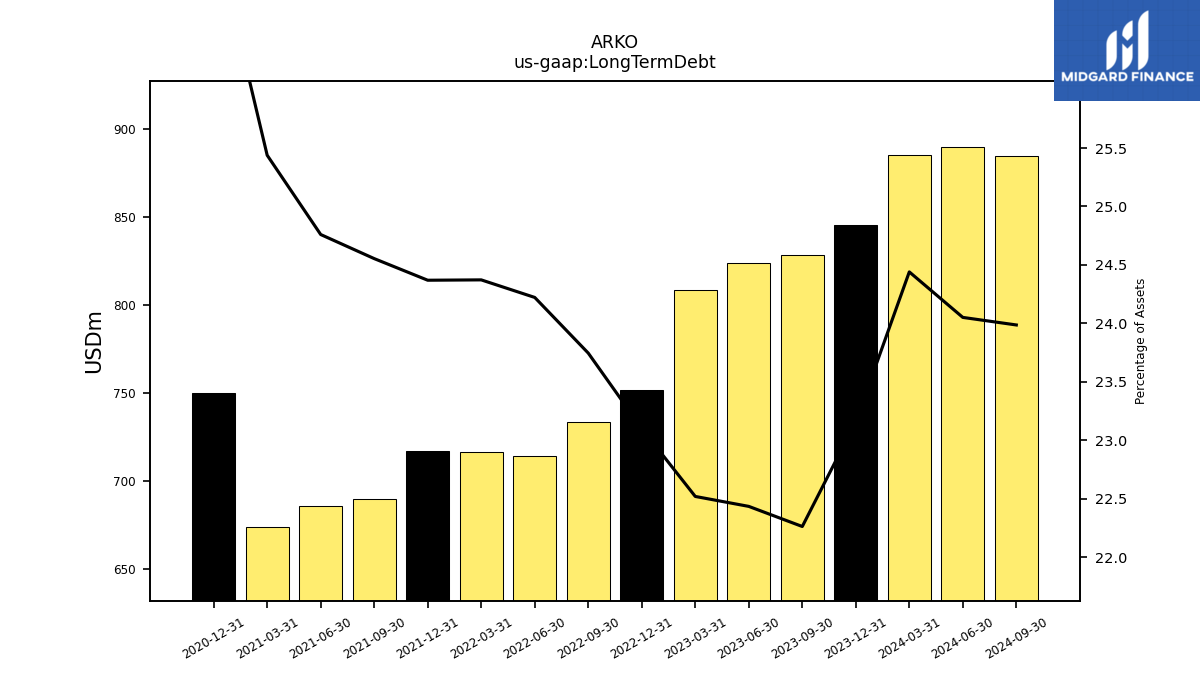
| Long Term Debt | 828.11 | 823.67 | 808.63 | 751.99 | 733.57 | 714.49 | 716.78 | 717.01 | 689.59 | 685.71 | 674.26 | 749.79 | NA | NA | NA | |
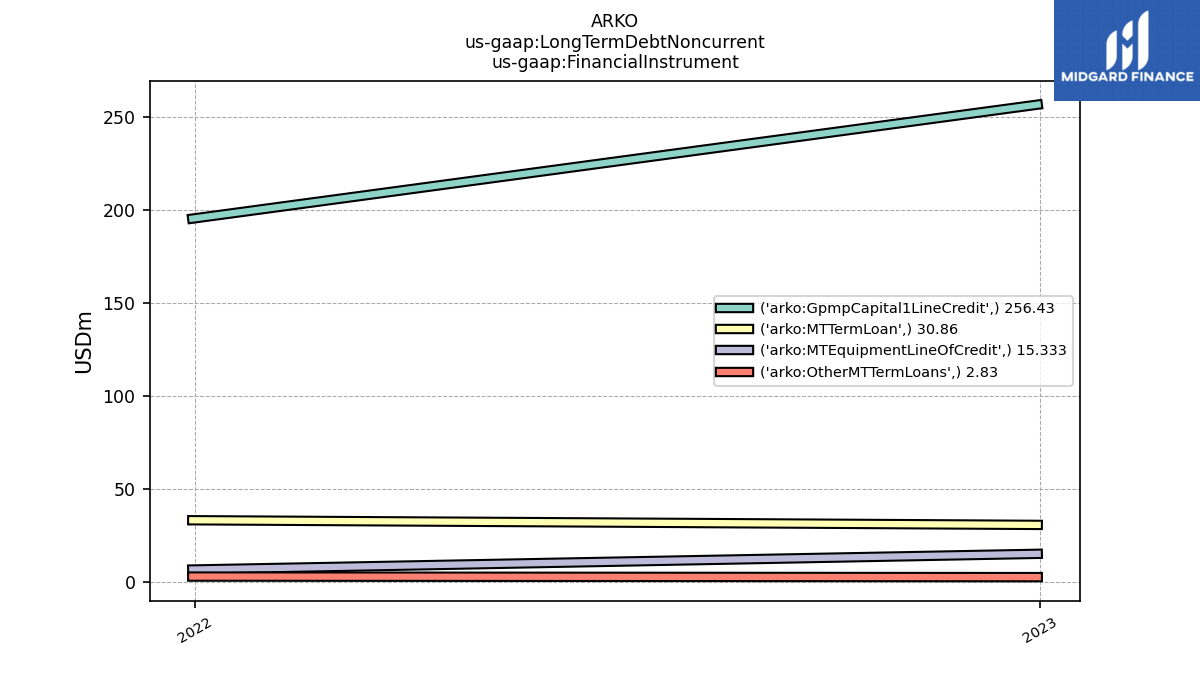
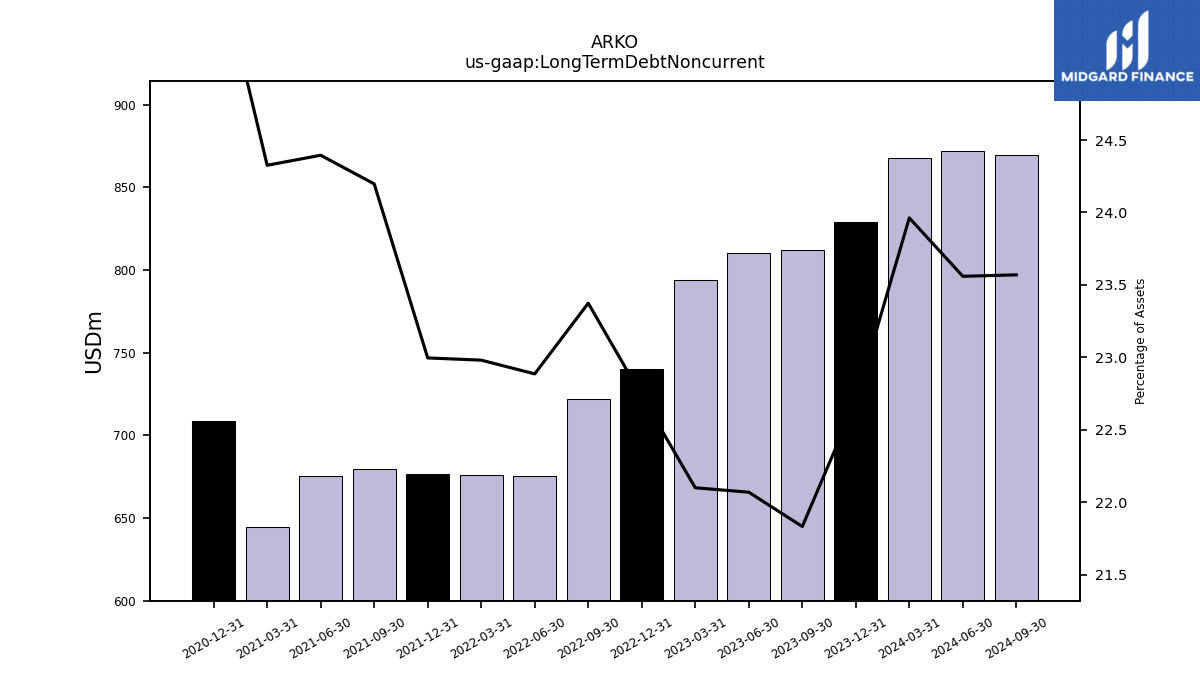
| Long Term Debt Noncurrent | 812.17 | 810.30 | 793.60 | 740.04 | 722.10 | 675.10 | 675.87 | 676.62 | 679.56 | 675.59 | 644.76 | 708.80 | NA | NA | NA | |
| Deferred Income Tax Liabilities Net | NA | NA | NA | NA | NA | 4.26 | 2.21 | 2.55 | 0.36 | 3.74 | 2.66 | 2.82 | NA | NA | NA | |
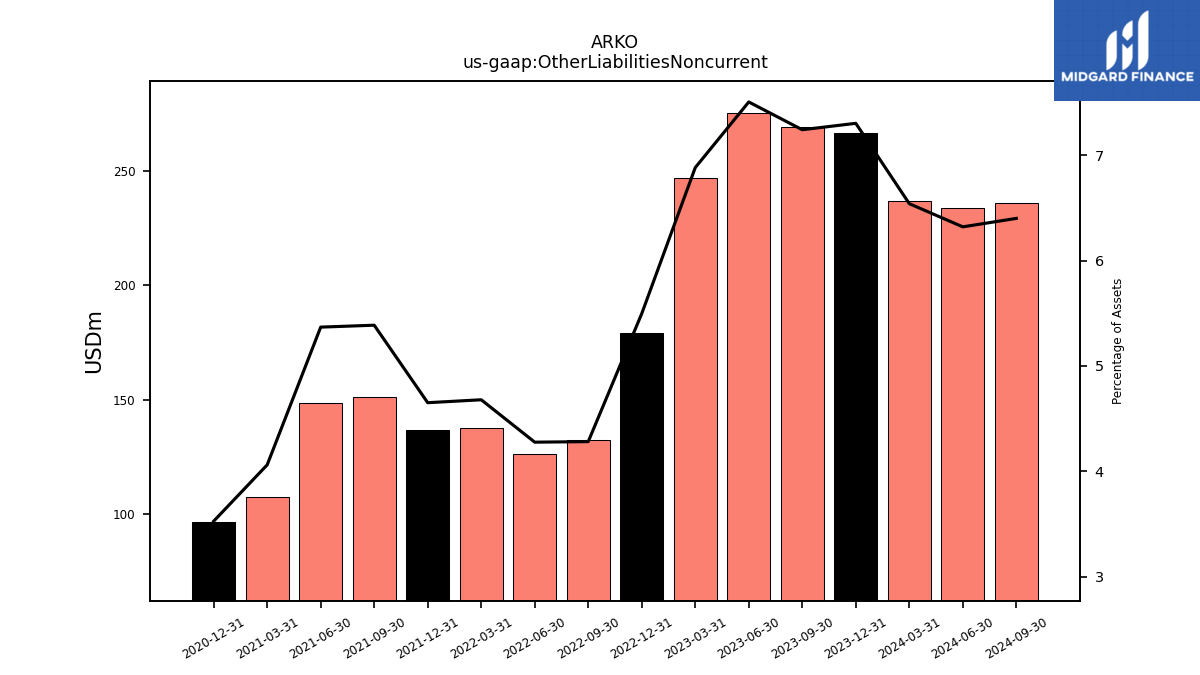
| Other Liabilities Noncurrent | 269.40 | 275.58 | 247.16 | 178.94 | 132.28 | 126.15 | 137.61 | 136.85 | 151.29 | 148.68 | 107.64 | 96.62 | NA | NA | NA | |
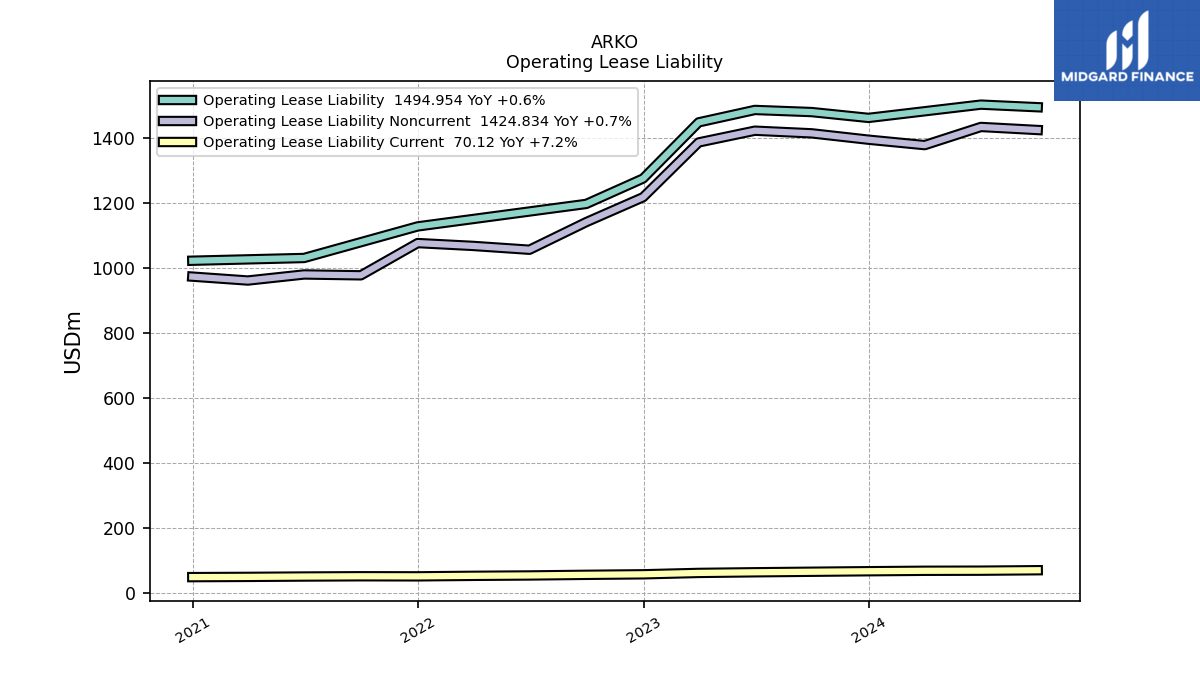
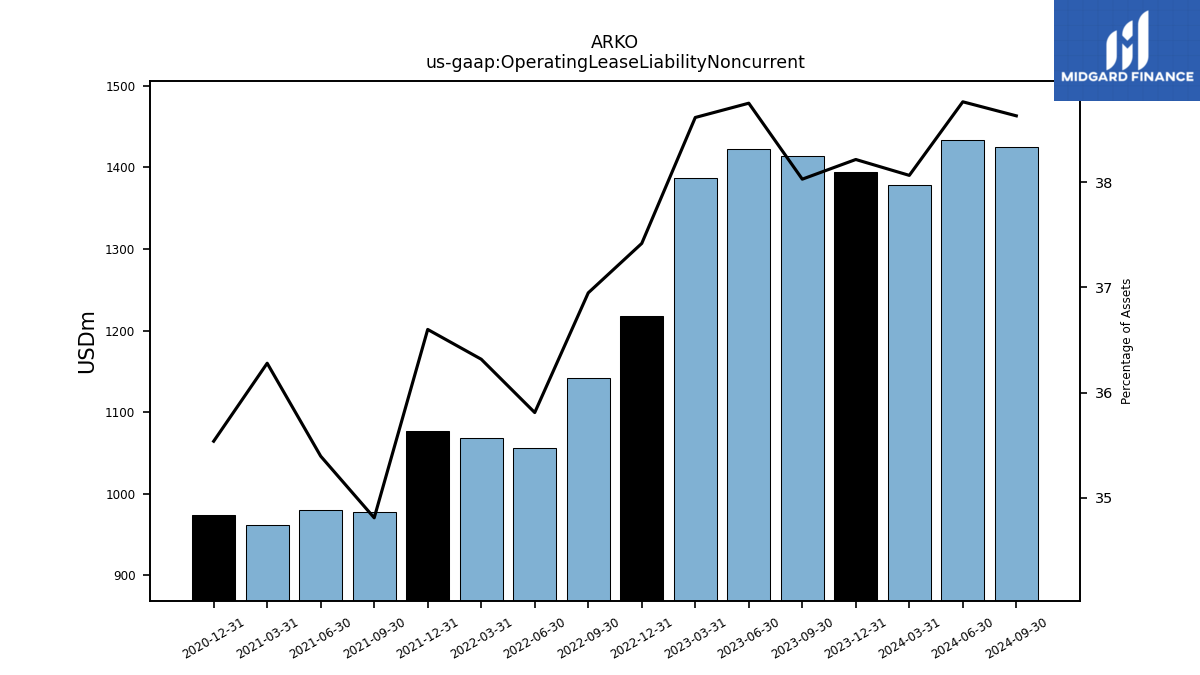
| Operating Lease Liability Noncurrent | 1414.61 | 1422.74 | 1386.60 | 1218.05 | 1141.45 | 1056.35 | 1068.10 | 1076.90 | 977.64 | 980.27 | 961.62 | 973.70 | NA | NA | NA |
| 2023-09-30 | 2023-06-30 | 2023-03-31 | 2022-12-31 | 2022-09-30 | 2022-06-30 | 2022-03-31 | 2021-12-31 | 2021-09-30 | 2021-06-30 | 2021-03-31 | 2020-12-31 | 2020-09-30 | 2020-06-30 | 2020-03-31 | ||
|---|---|---|---|---|---|---|---|---|---|---|---|---|---|---|---|---|
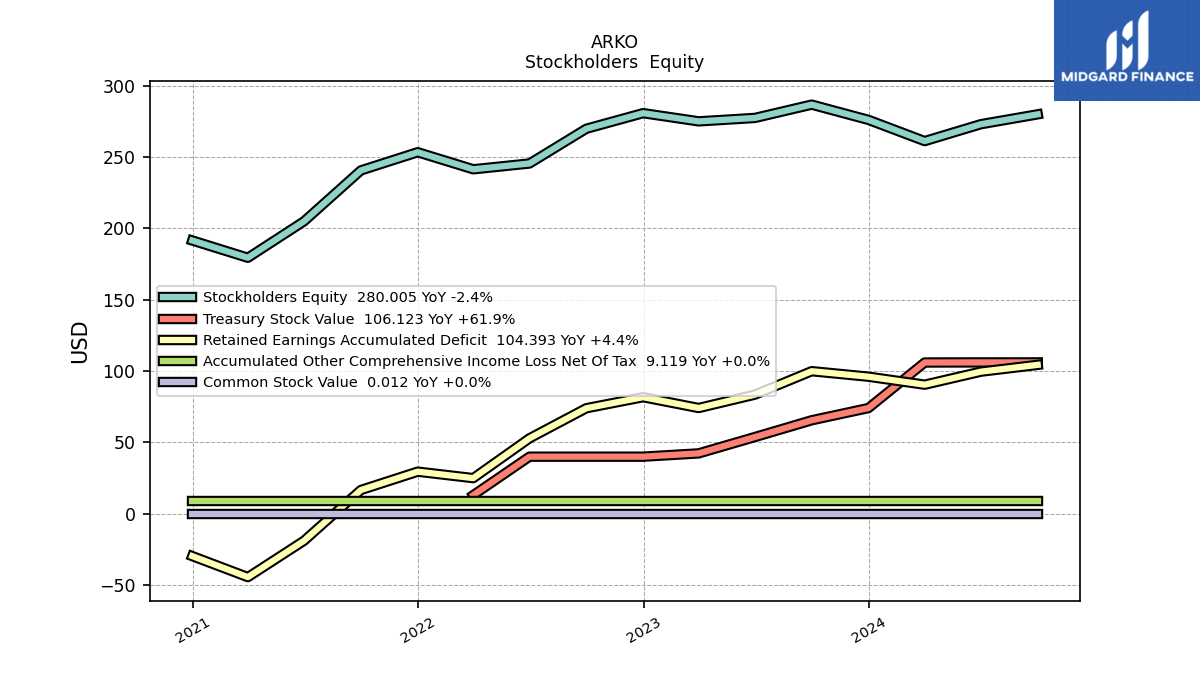
| Stockholders Equity | 286.81 | 277.48 | 275.08 | 280.83 | 269.89 | 245.55 | 241.49 | 253.45 | 240.69 | 205.04 | 179.47 | 191.58 | NA | NA | NA | |
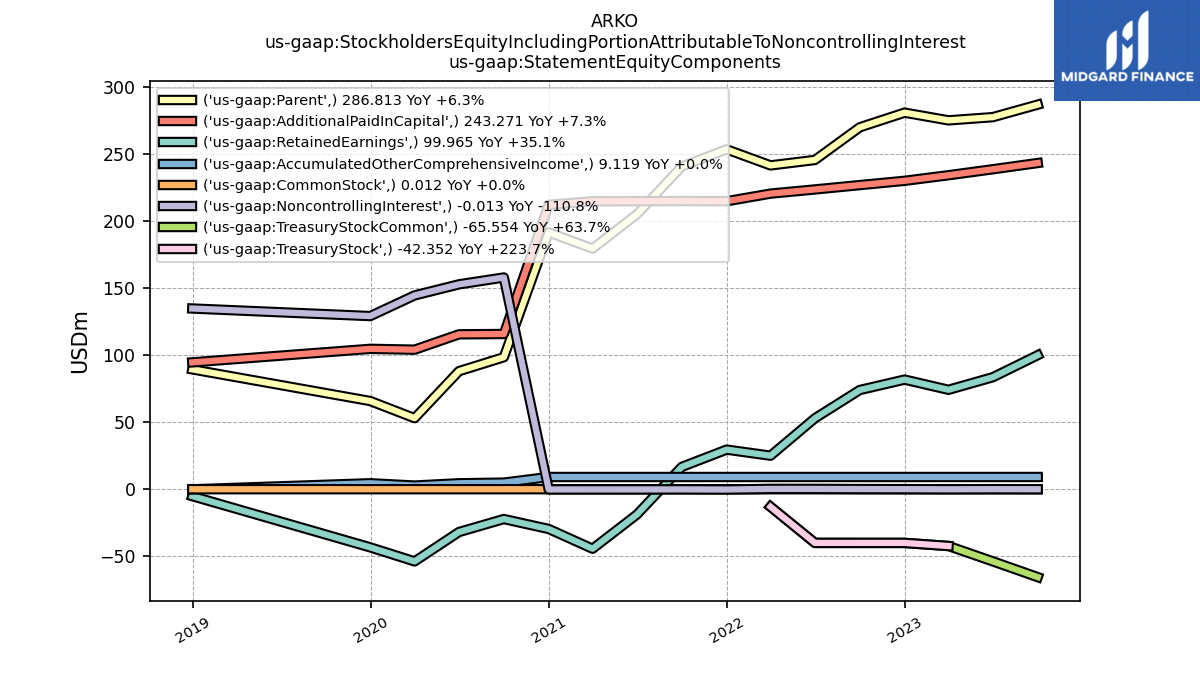
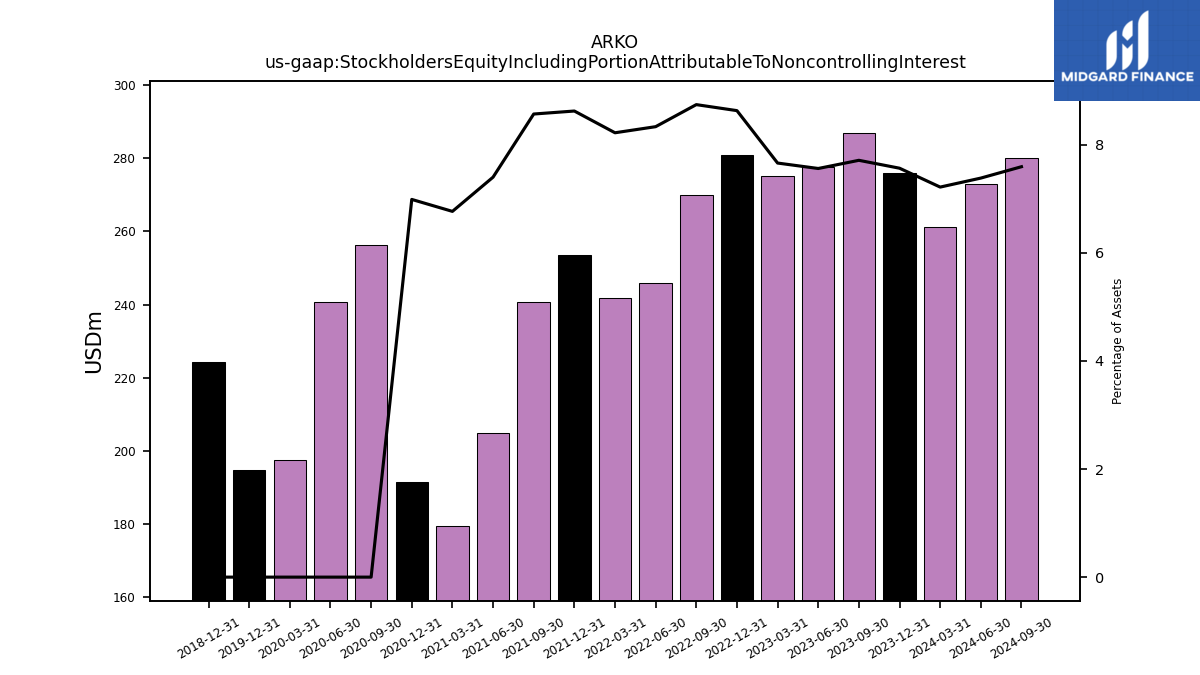
| Stockholders Equity Including Portion Attributable To Noncontrolling Interest | 286.80 | 277.52 | 275.04 | 280.89 | 270.01 | 245.78 | 241.73 | 253.68 | 240.58 | 204.89 | 179.32 | 191.42 | 256.34 | 240.83 | 197.52 | |
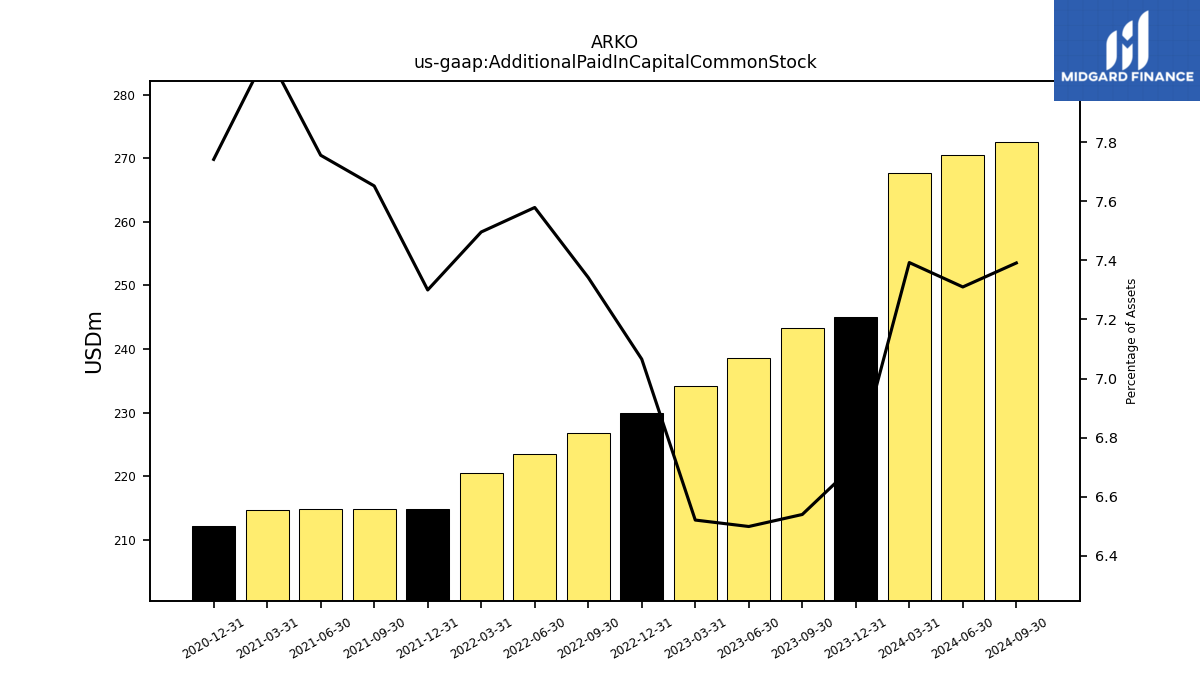
| Additional Paid In Capital Common Stock | 243.27 | 238.62 | 234.16 | 230.00 | 226.81 | 223.56 | 220.45 | 214.78 | 214.90 | 214.78 | 214.73 | 212.10 | NA | NA | NA | |
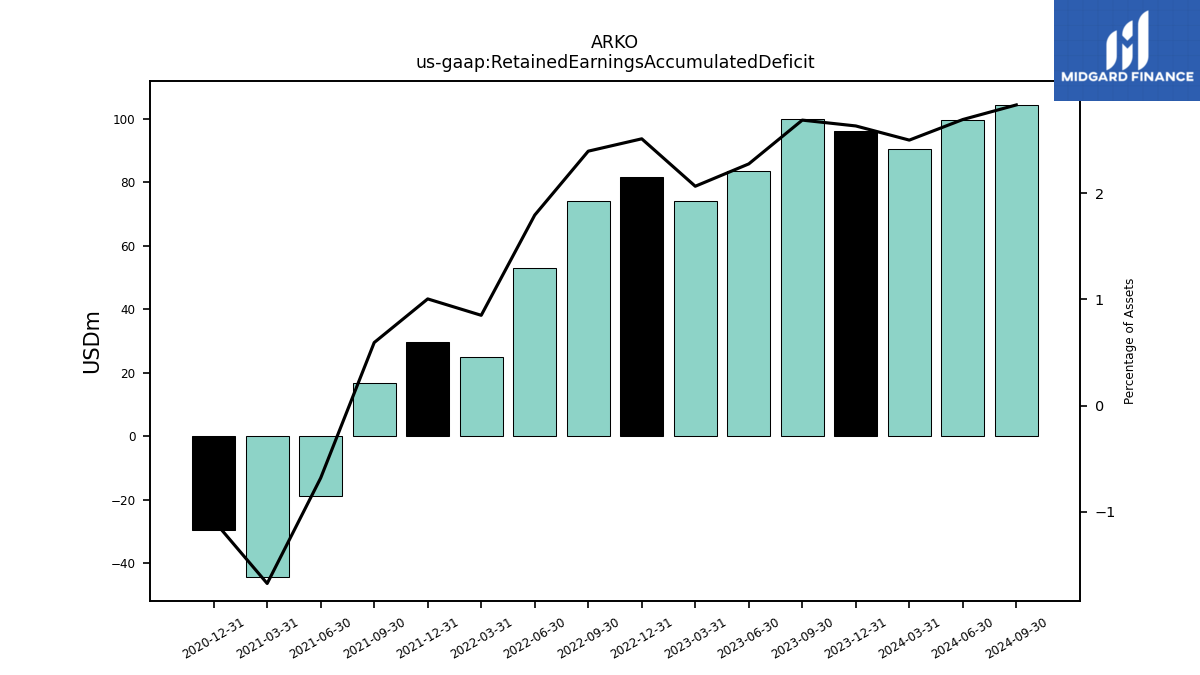
| Retained Earnings Accumulated Deficit | 99.97 | 83.53 | 74.14 | 81.75 | 73.99 | 52.90 | 24.99 | 29.55 | 16.66 | -18.87 | -44.39 | -29.65 | NA | NA | NA | |
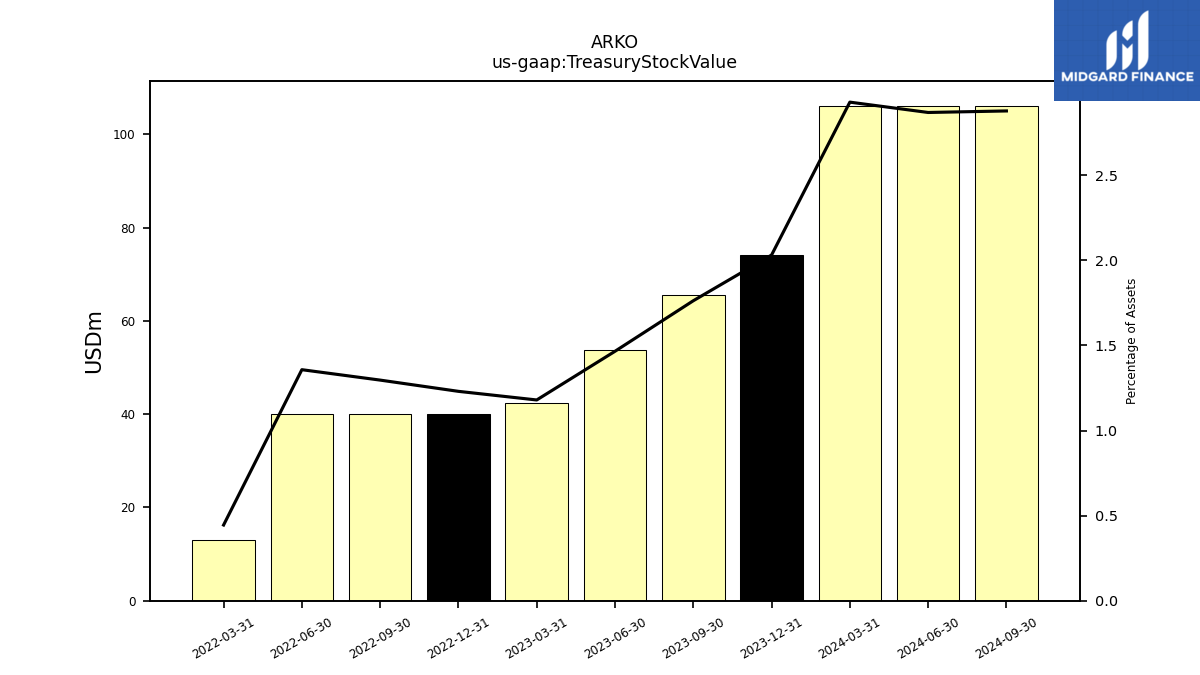
| Treasury Stock Value | 65.55 | 53.80 | 42.35 | 40.04 | 40.04 | 40.04 | 13.08 | NA | NA | NA | NA | NA | NA | NA | NA | |
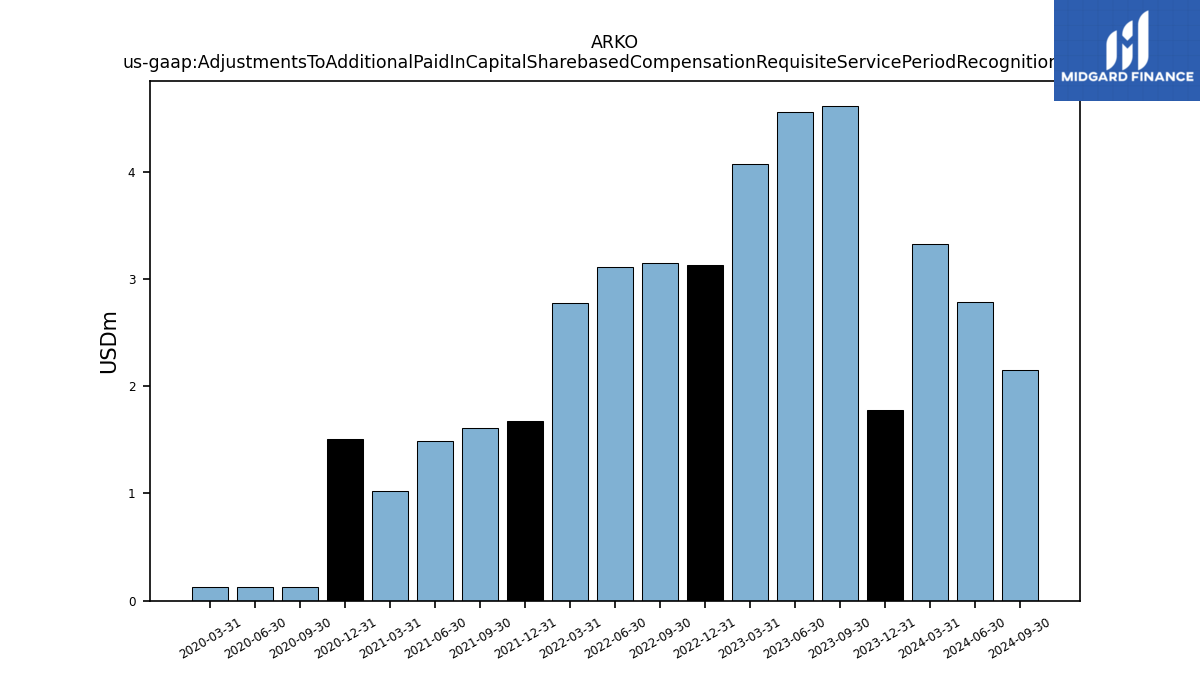
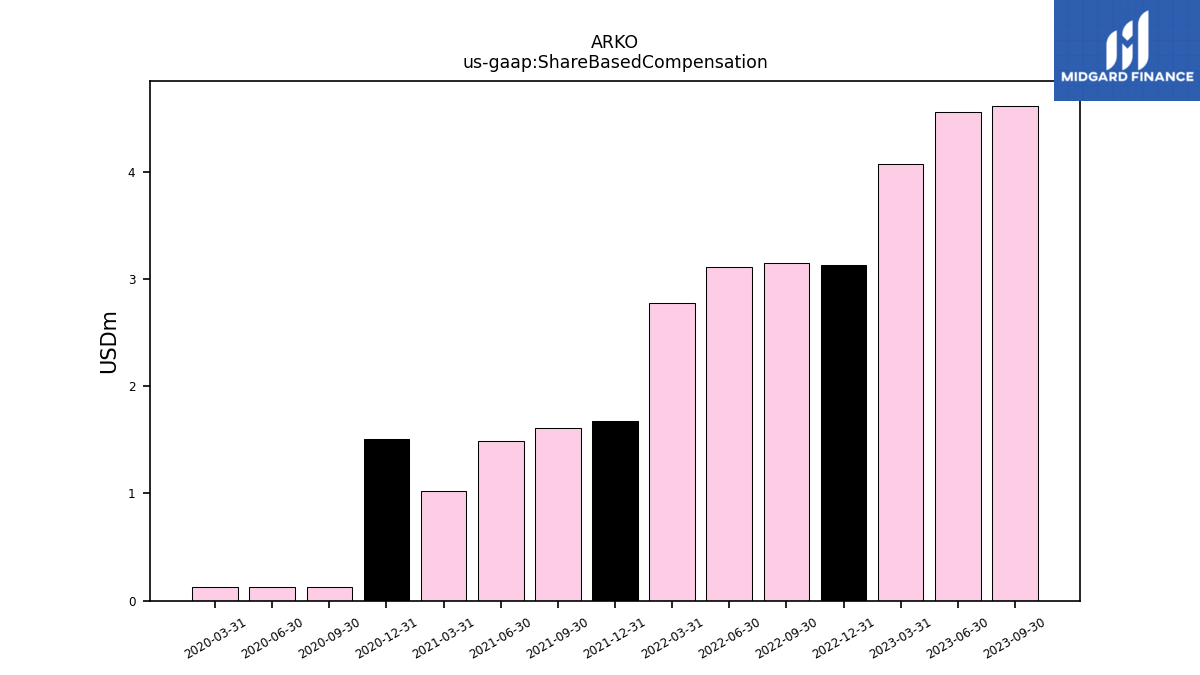
| Adjustments To Additional Paid In Capital Sharebased Compensation Requisite Service Period Recognition Value | 4.61 | 4.55 | 4.07 | 3.13 | 3.15 | 3.11 | 2.77 | 1.68 | 1.61 | 1.49 | 1.03 | 1.50 | 0.13 | 0.13 | 0.13 | |
| Minority Interest Decrease From Distributions To Noncontrolling Interest Holders | 0.06 | 0.06 | 0.06 | 0.06 | 0.06 | 0.06 | 0.06 | 0.06 | 0.06 | 0.06 | 0.06 | 1.62 | 2.36 | 2.36 | 2.38 |
| 2023-09-30 | 2023-06-30 | 2023-03-31 | 2022-12-31 | 2022-09-30 | 2022-06-30 | 2022-03-31 | 2021-12-31 | 2021-09-30 | 2021-06-30 | 2021-03-31 | 2020-12-31 | 2020-09-30 | 2020-06-30 | 2020-03-31 | ||
|---|---|---|---|---|---|---|---|---|---|---|---|---|---|---|---|---|
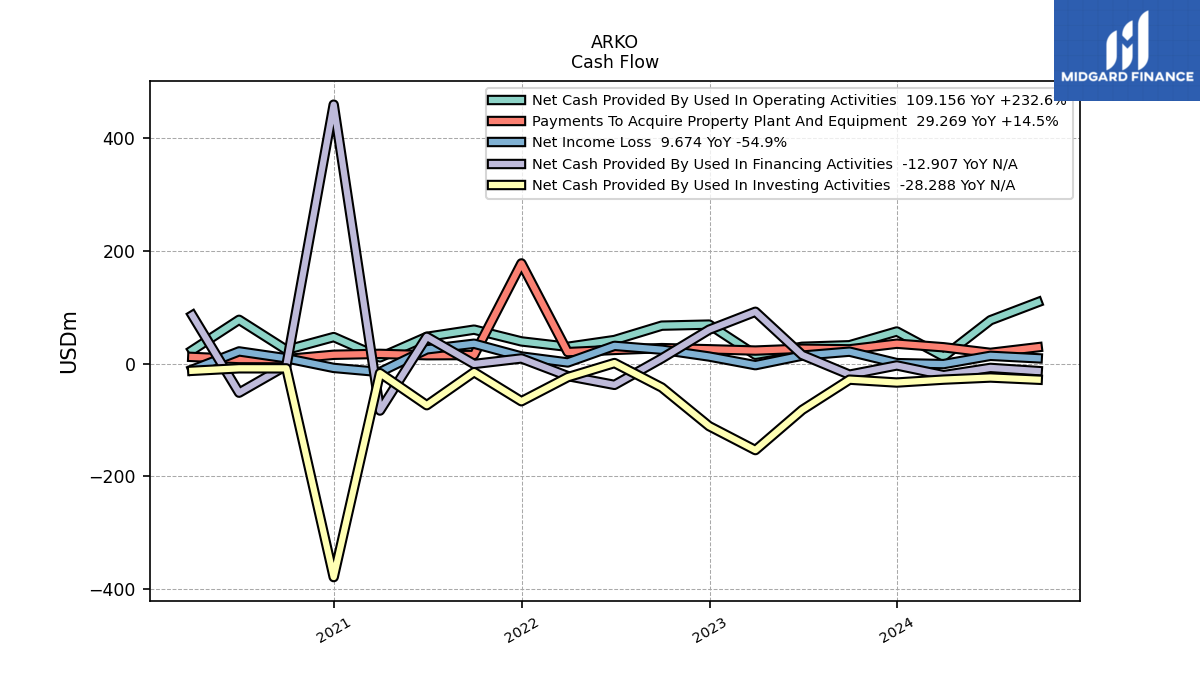
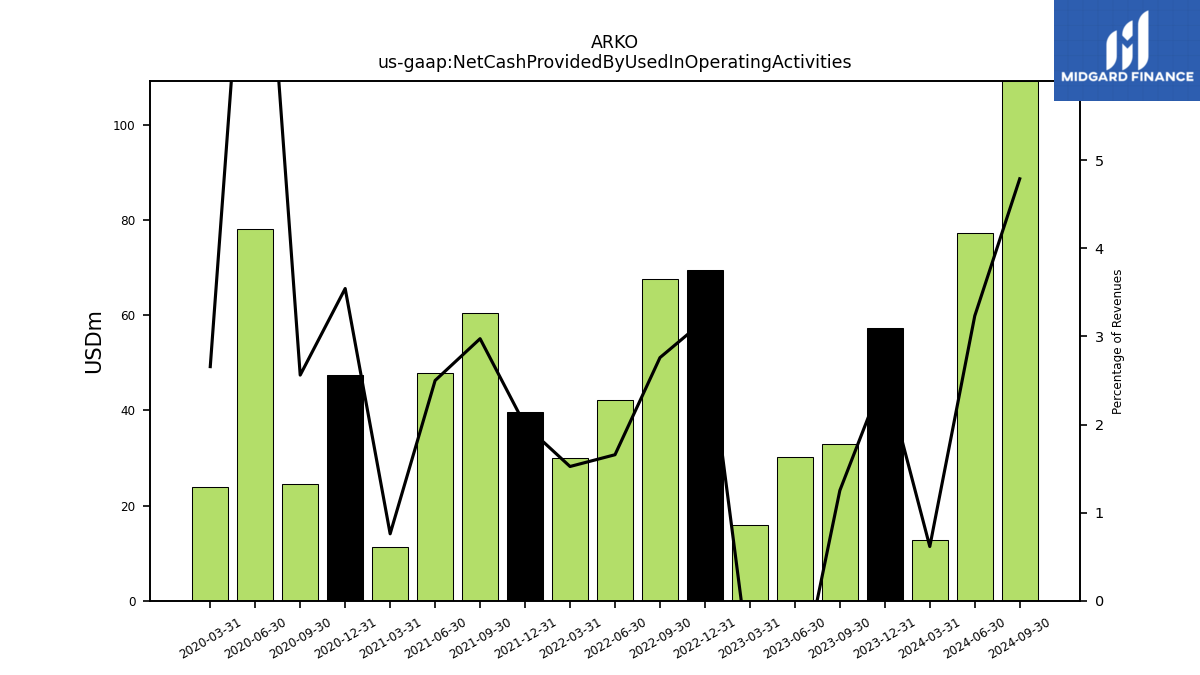
| Net Cash Provided By Used In Operating Activities | 32.82 | 30.10 | 15.88 | 69.49 | 67.60 | 42.10 | 30.06 | 39.64 | 60.53 | 47.74 | 11.28 | 47.34 | 24.59 | 78.00 | 23.91 | |
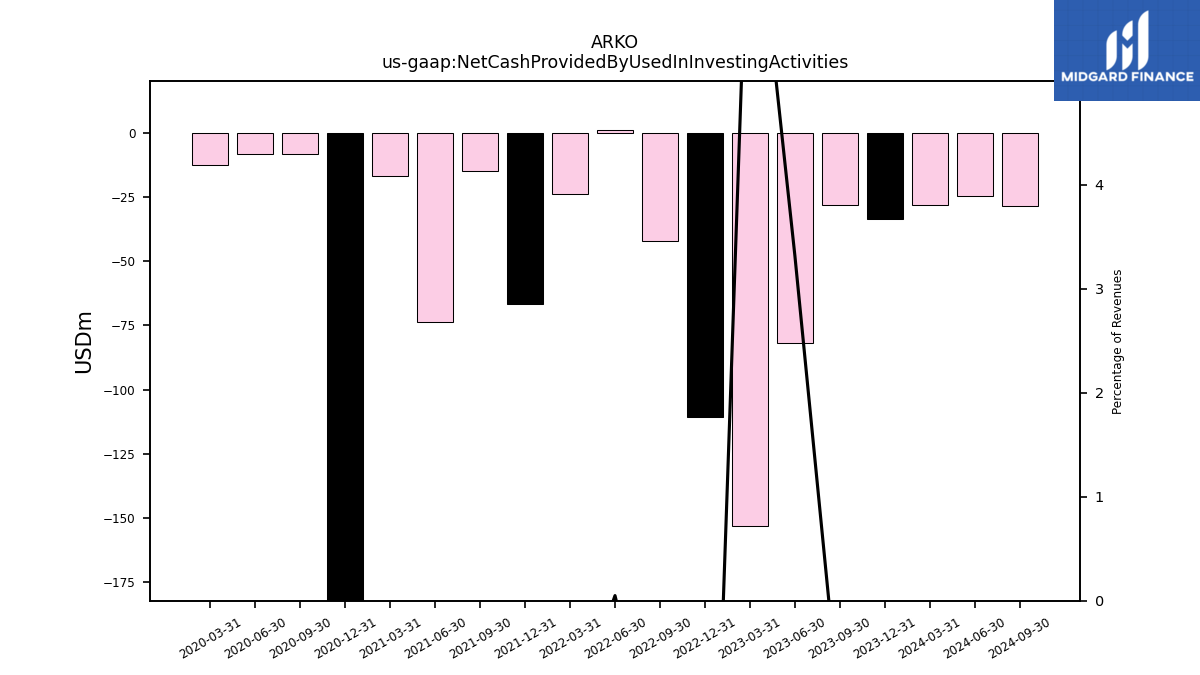
| Net Cash Provided By Used In Investing Activities | -28.22 | -81.94 | -153.29 | -110.69 | -42.19 | 1.26 | -23.86 | -66.59 | -14.91 | -73.64 | -16.64 | -378.70 | -8.19 | -8.12 | -12.54 | |
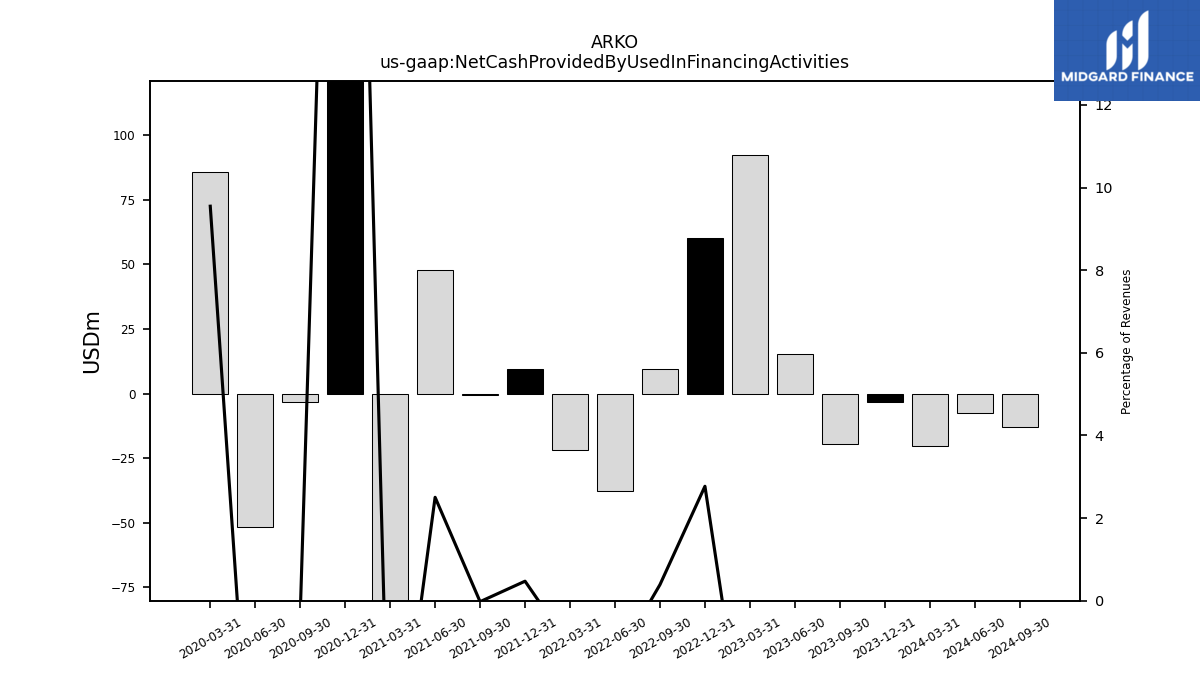
| Net Cash Provided By Used In Financing Activities | -19.38 | 15.51 | 92.26 | 60.39 | 9.55 | -37.54 | -21.84 | 9.41 | -0.45 | 47.80 | -83.14 | 459.86 | -3.32 | -51.40 | 85.92 |
| 2023-09-30 | 2023-06-30 | 2023-03-31 | 2022-12-31 | 2022-09-30 | 2022-06-30 | 2022-03-31 | 2021-12-31 | 2021-09-30 | 2021-06-30 | 2021-03-31 | 2020-12-31 | 2020-09-30 | 2020-06-30 | 2020-03-31 | ||
|---|---|---|---|---|---|---|---|---|---|---|---|---|---|---|---|---|
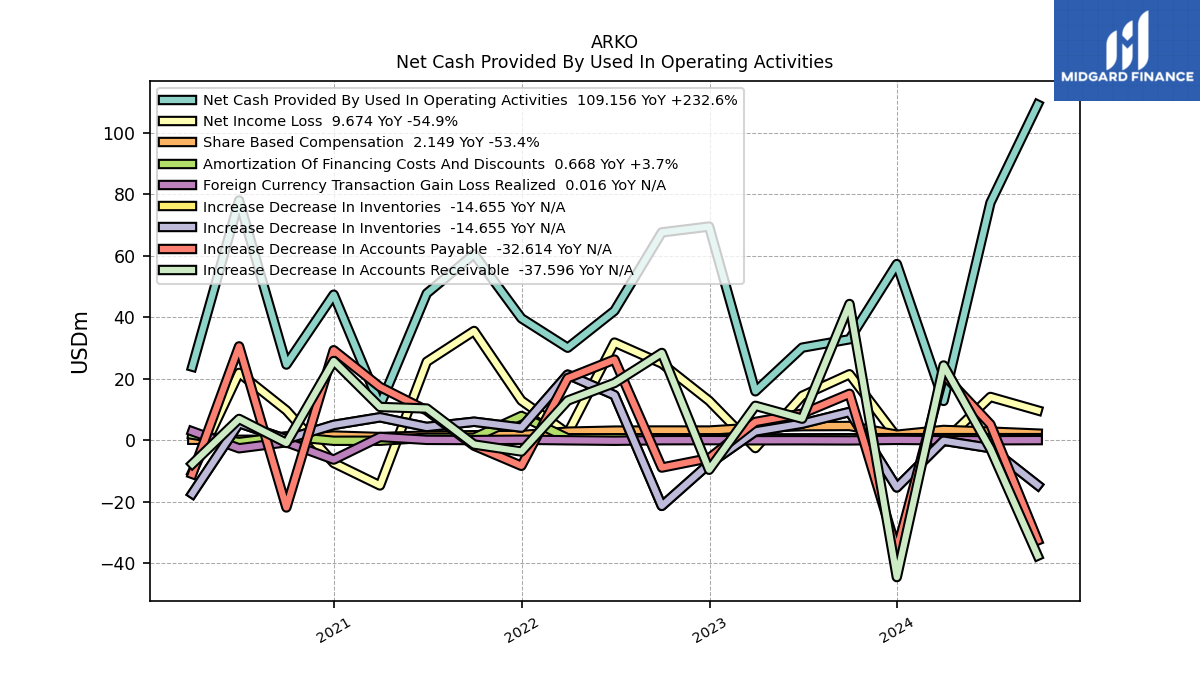
| Net Cash Provided By Used In Operating Activities | 32.82 | 30.10 | 15.88 | 69.49 | 67.60 | 42.10 | 30.06 | 39.64 | 60.53 | 47.74 | 11.28 | 47.34 | 24.59 | 78.00 | 23.91 | |
| Net Income Loss | 21.44 | 14.43 | -2.58 | 12.81 | 24.94 | 31.75 | 2.24 | 12.88 | 35.53 | 25.52 | -14.74 | -7.42 | 9.69 | 21.89 | -10.46 | |
| Profit Loss | 21.49 | 14.48 | -2.53 | 12.86 | 24.99 | 31.81 | 2.32 | 12.93 | 35.59 | 25.57 | -14.66 | -6.17 | 17.16 | 32.51 | -12.86 | |
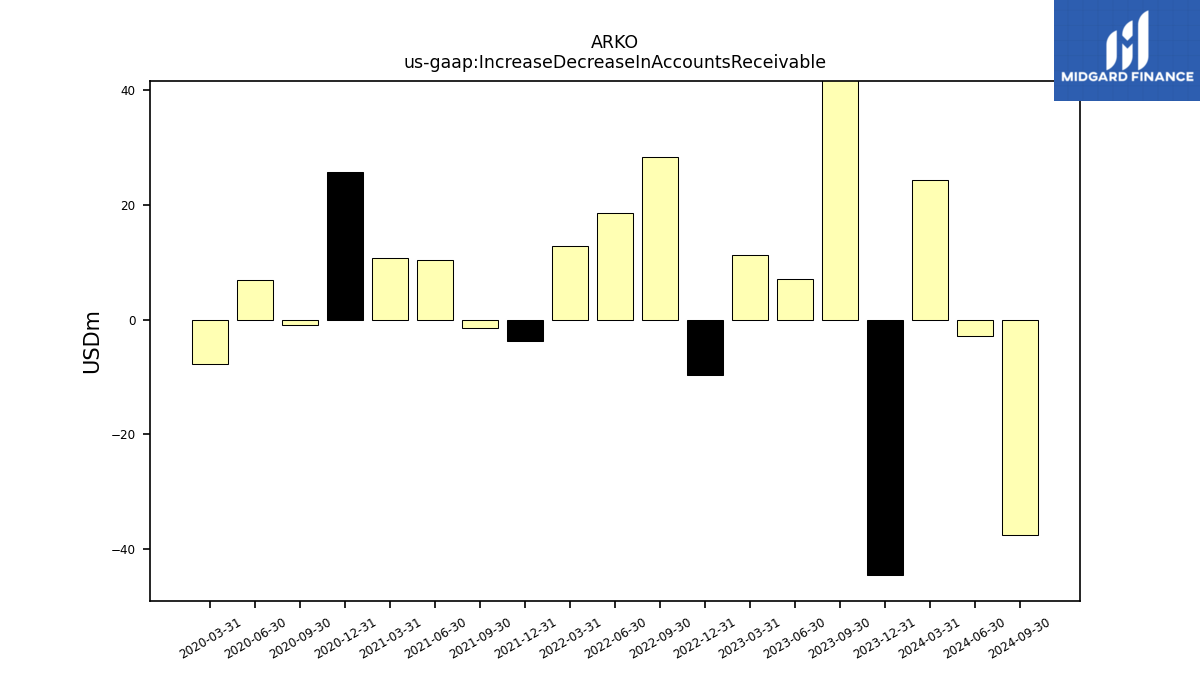
| Increase Decrease In Accounts Receivable | 44.31 | 6.99 | 11.18 | -9.64 | 28.38 | 18.61 | 12.89 | -3.69 | -1.41 | 10.30 | 10.80 | 25.75 | -0.92 | 6.91 | -7.73 | |
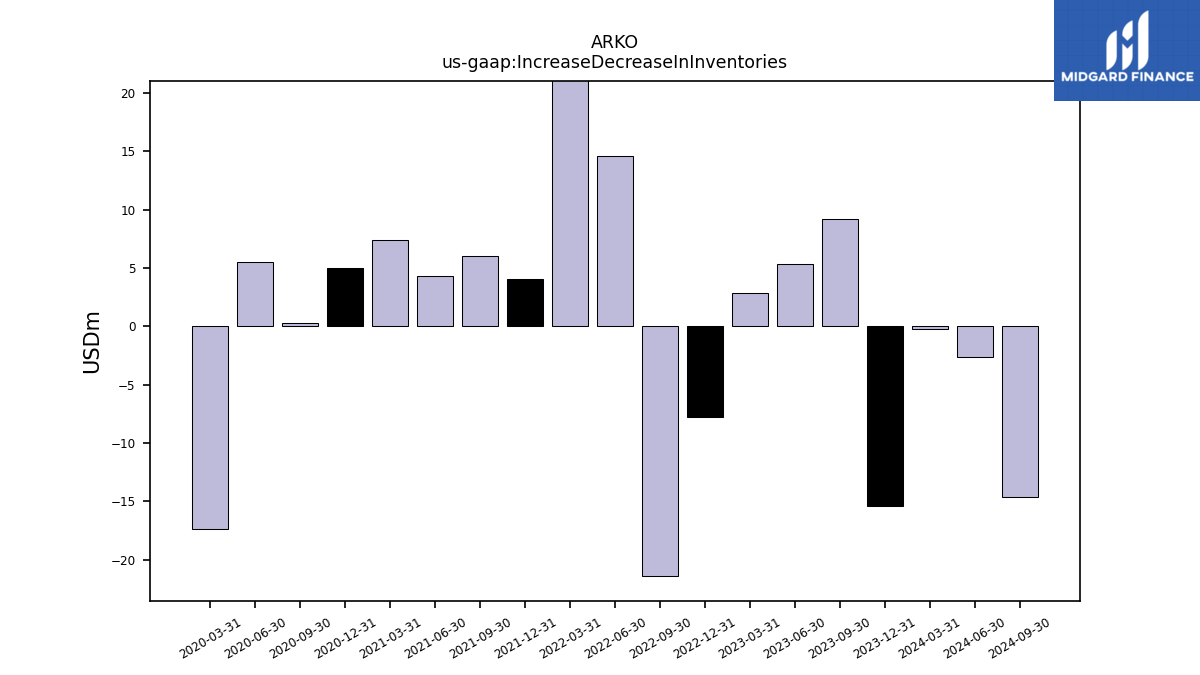
| Increase Decrease In Inventories | 9.18 | 5.36 | 2.85 | -7.72 | -21.38 | 14.63 | 21.32 | 4.08 | 6.00 | 4.29 | 7.44 | 4.97 | 0.31 | 5.51 | -17.40 | |
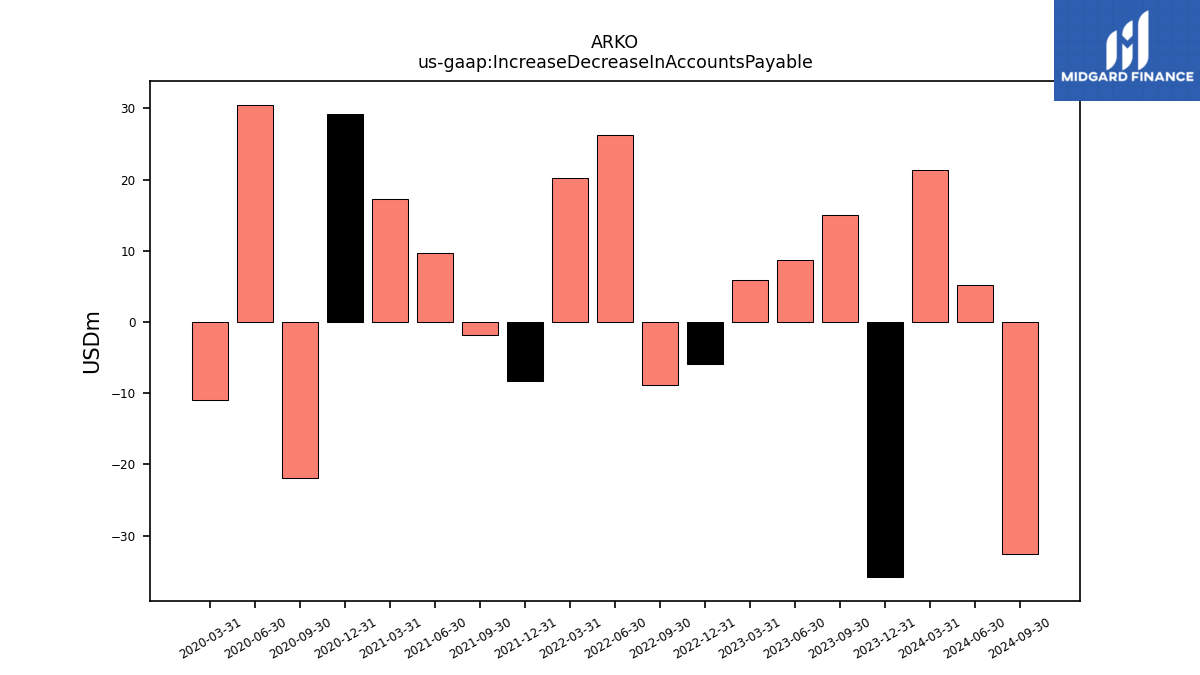
| Increase Decrease In Accounts Payable | 15.09 | 8.64 | 5.94 | -5.85 | -8.91 | 26.23 | 20.18 | -8.35 | -1.80 | 9.65 | 17.31 | 29.27 | -21.90 | 30.52 | -11.00 | |
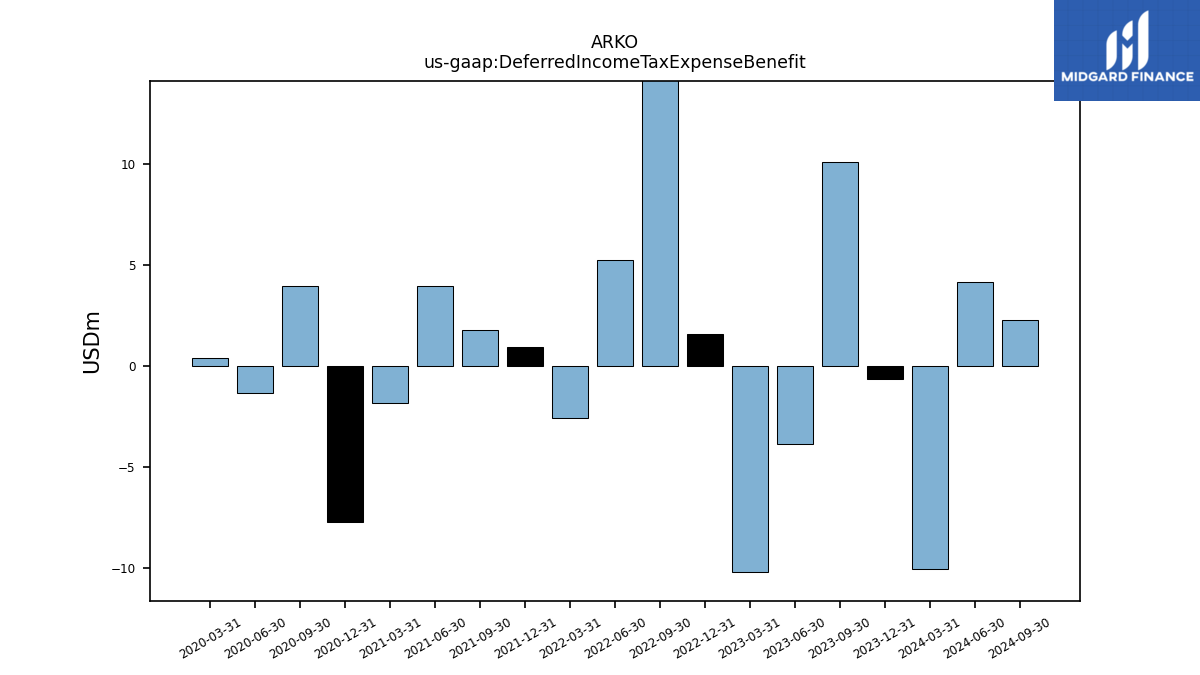
| Deferred Income Tax Expense Benefit | 10.09 | -3.88 | -10.23 | 1.57 | 18.06 | 5.25 | -2.58 | 0.94 | 1.80 | 3.95 | -1.84 | -7.73 | 3.94 | -1.34 | 0.39 | |
| Share Based Compensation | 4.61 | 4.55 | 4.07 | 3.13 | 3.15 | 3.11 | 2.77 | 1.68 | 1.61 | 1.49 | 1.03 | 1.50 | 0.13 | 0.13 | 0.13 |
| 2023-09-30 | 2023-06-30 | 2023-03-31 | 2022-12-31 | 2022-09-30 | 2022-06-30 | 2022-03-31 | 2021-12-31 | 2021-09-30 | 2021-06-30 | 2021-03-31 | 2020-12-31 | 2020-09-30 | 2020-06-30 | 2020-03-31 | ||
|---|---|---|---|---|---|---|---|---|---|---|---|---|---|---|---|---|
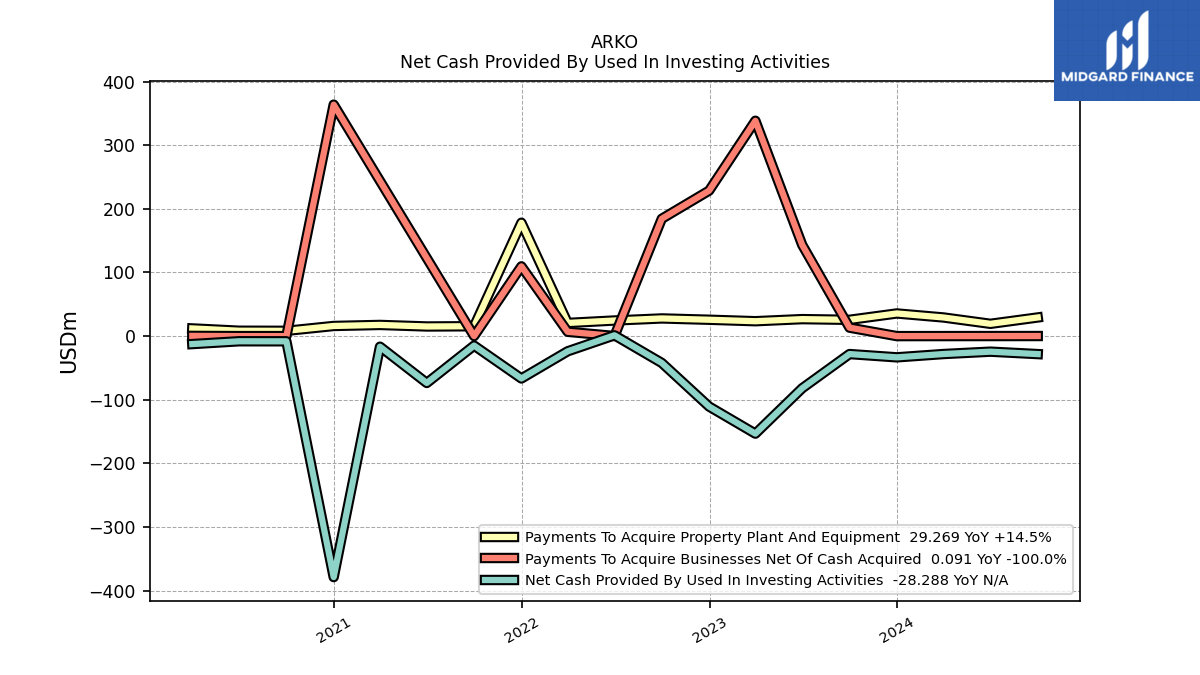
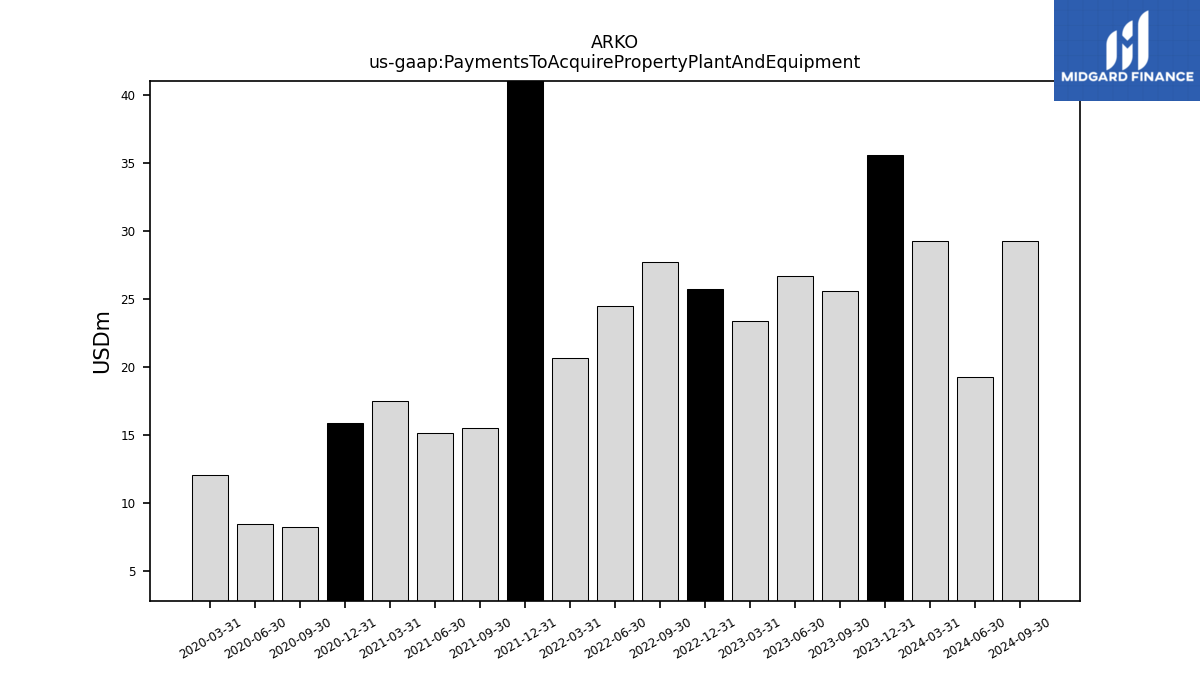
| Net Cash Provided By Used In Investing Activities | -28.22 | -81.94 | -153.29 | -110.69 | -42.19 | 1.26 | -23.86 | -66.59 | -14.91 | -73.64 | -16.64 | -378.70 | -8.19 | -8.12 | -12.54 | |
| Payments To Acquire Property Plant And Equipment | 25.57 | 26.66 | 23.38 | 25.69 | 27.73 | 24.50 | 20.67 | 178.08 | 15.48 | 15.11 | 17.52 | 15.89 | 8.27 | 8.43 | 12.05 |
| 2023-09-30 | 2023-06-30 | 2023-03-31 | 2022-12-31 | 2022-09-30 | 2022-06-30 | 2022-03-31 | 2021-12-31 | 2021-09-30 | 2021-06-30 | 2021-03-31 | 2020-12-31 | 2020-09-30 | 2020-06-30 | 2020-03-31 | ||
|---|---|---|---|---|---|---|---|---|---|---|---|---|---|---|---|---|
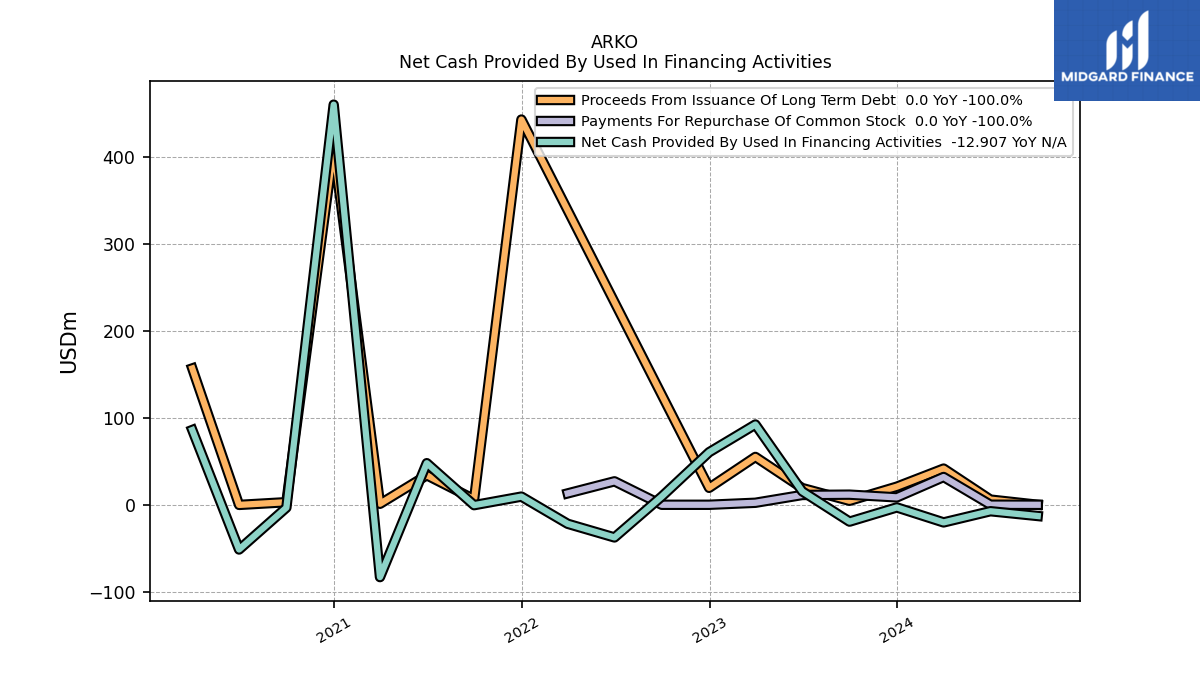
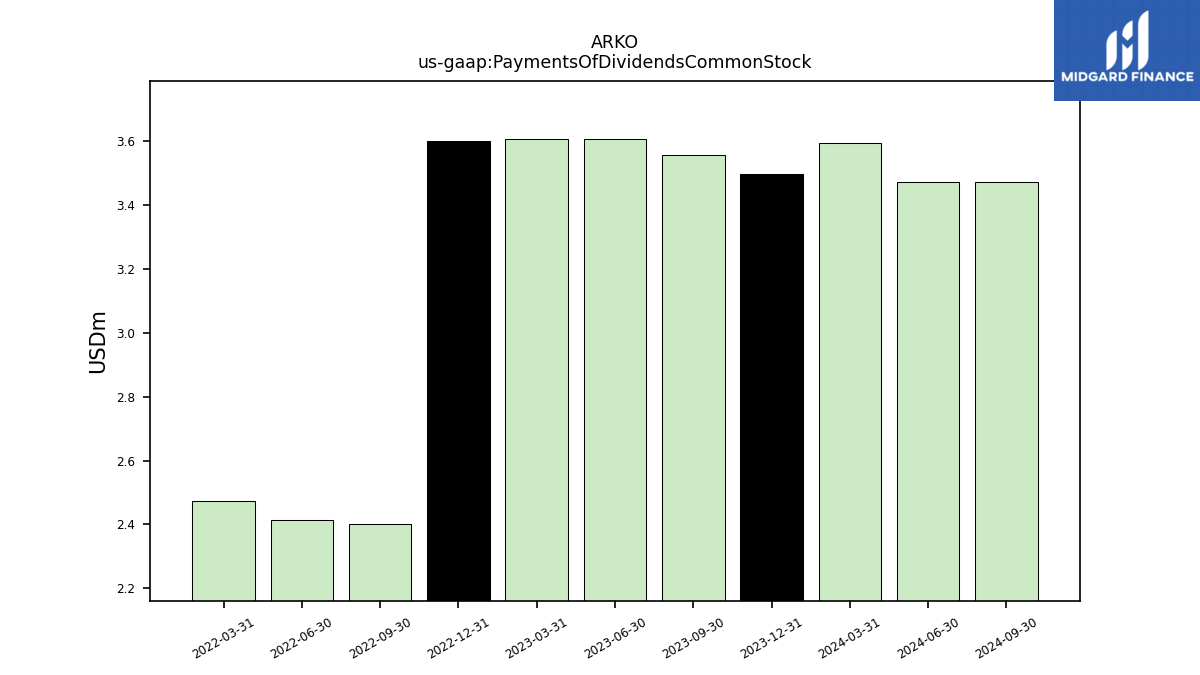
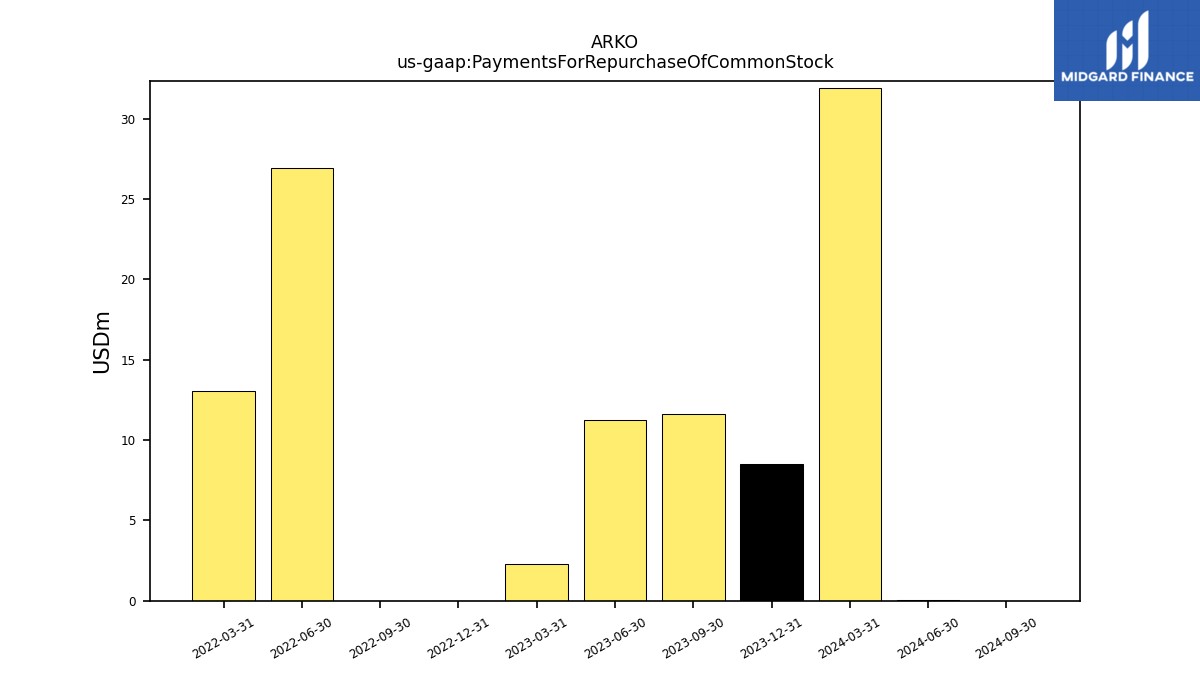
| Net Cash Provided By Used In Financing Activities | -19.38 | 15.51 | 92.26 | 60.39 | 9.55 | -37.54 | -21.84 | 9.41 | -0.45 | 47.80 | -83.14 | 459.86 | -3.32 | -51.40 | 85.92 | |
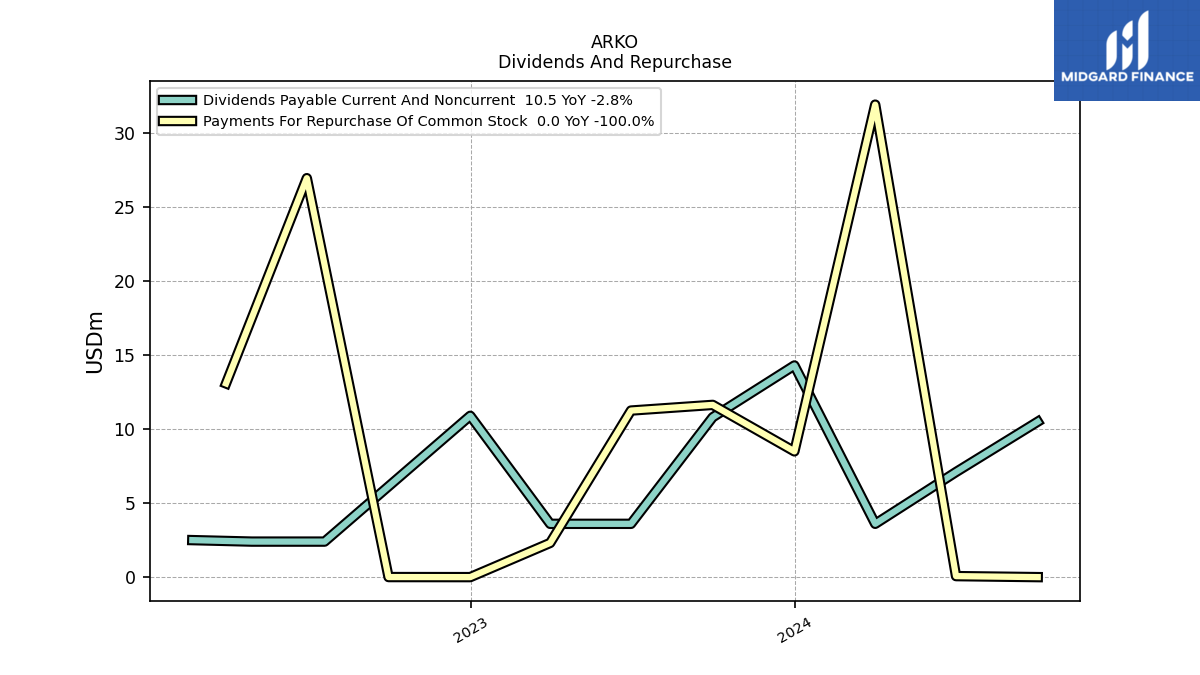
| Payments Of Dividends Common Stock | 3.56 | 3.61 | 3.61 | 3.60 | 2.40 | 2.42 | 2.47 | NA | NA | NA | NA | NA | NA | NA | NA | |
| Payments For Repurchase Of Common Stock | 11.64 | 11.25 | 2.31 | 0.00 | 0.00 | 26.95 | 13.08 | NA | NA | NA | NA | NA | NA | NA | NA |
| 2023-09-30 | 2023-06-30 | 2023-03-31 | 2022-12-31 | 2022-09-30 | 2022-06-30 | 2022-03-31 | 2021-12-31 | 2021-09-30 | 2021-06-30 | 2021-03-31 | 2020-12-31 | 2020-09-30 | 2020-06-30 | 2020-03-31 | ||
|---|---|---|---|---|---|---|---|---|---|---|---|---|---|---|---|---|
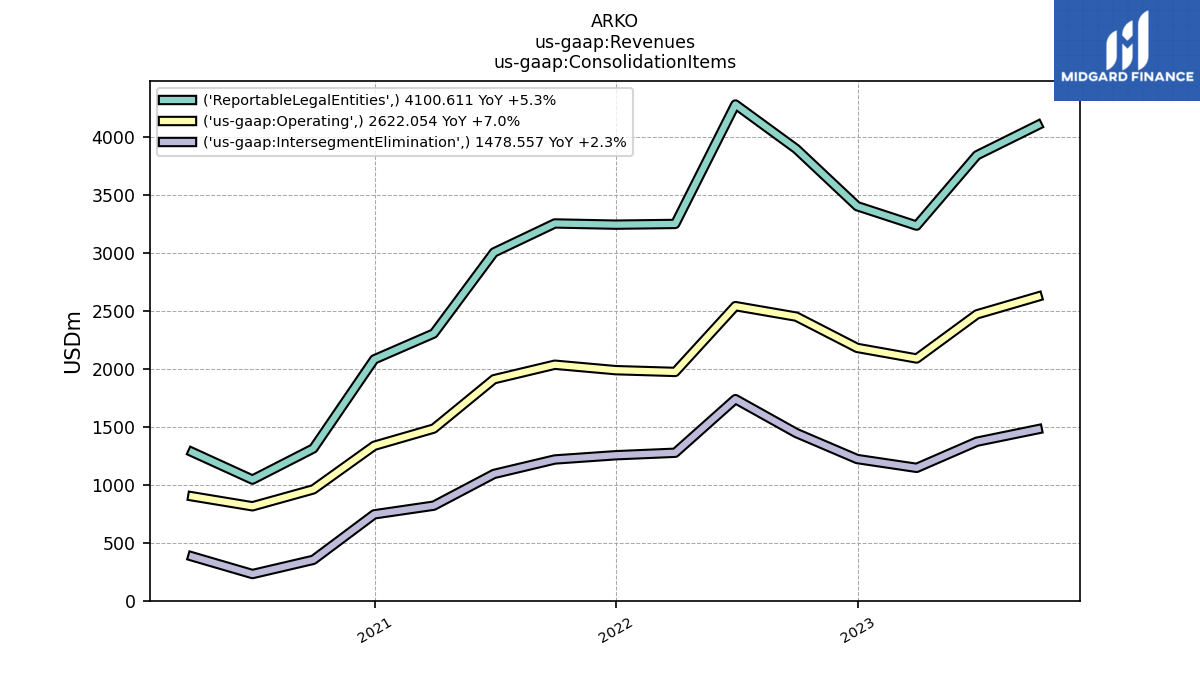
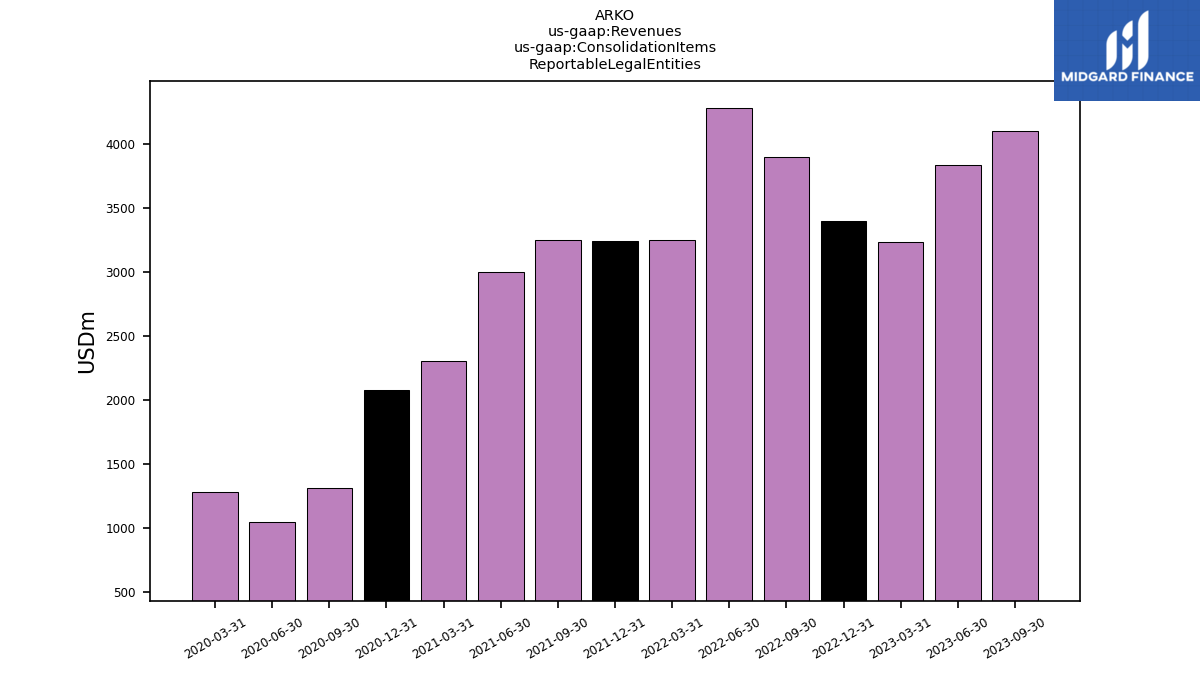
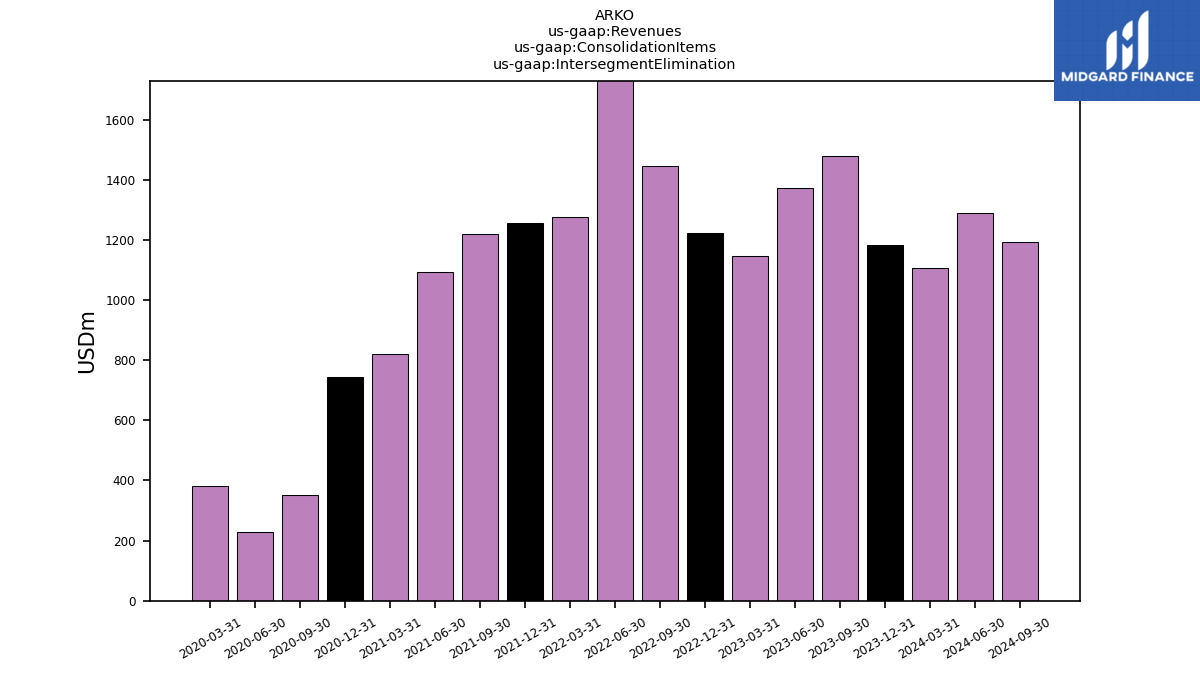
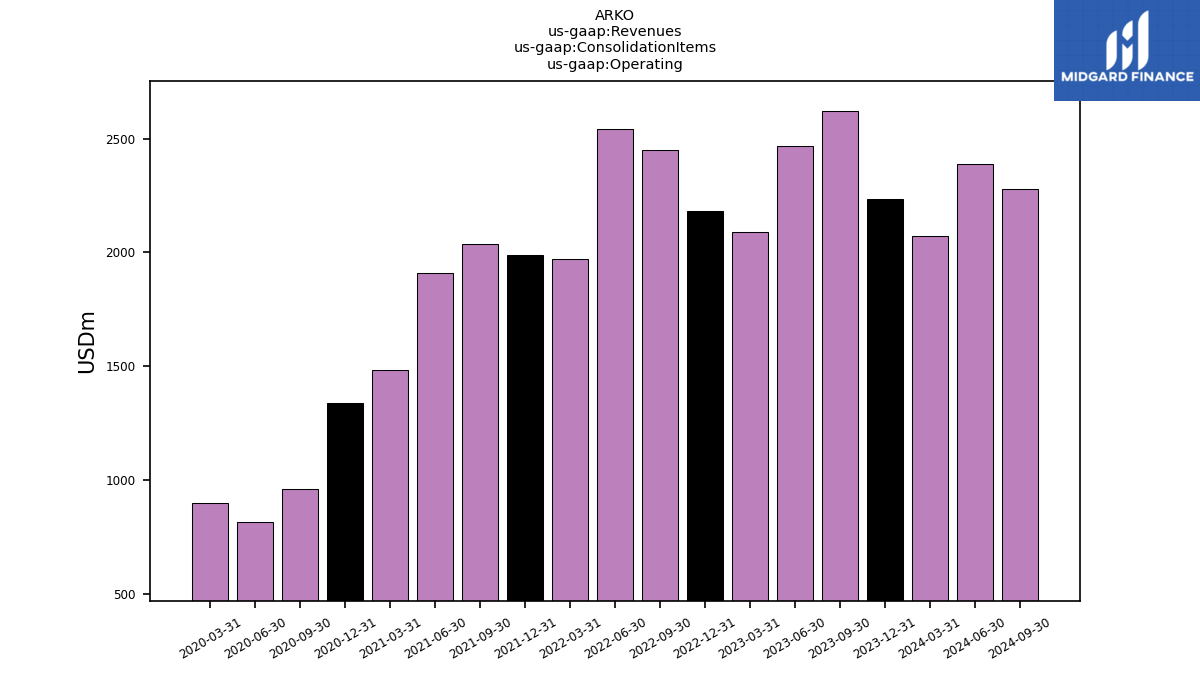
| Revenues | 2622.05 | -2469.14 | -2088.50 | 2180.08 | 2449.65 | 2540.26 | 1972.81 | 1988.20 | 2035.02 | 1909.81 | 1484.36 | 1336.00 | 960.08 | 814.27 | 899.88 | |
| 4100.61 | 3840.47 | 3234.18 | 3402.01 | 3895.58 | 4278.81 | 3248.83 | 3242.61 | 3253.00 | 3003.10 | 2304.18 | 2080.95 | 1312.82 | 1044.49 | 1281.42 | ||
| Intersegment Elimination | 1478.56 | 1371.33 | 1145.68 | 1221.93 | 1445.93 | 1738.55 | 1276.02 | 1254.53 | 1217.94 | 1093.24 | 819.78 | 744.89 | 352.70 | 230.18 | 381.50 | |
| Operating | 2622.05 | 2469.14 | 2088.50 | 2180.08 | 2449.65 | 2540.26 | 1972.81 | 1988.08 | 2035.06 | 1909.86 | 1484.40 | 1336.05 | 960.12 | 814.31 | 899.92 | |
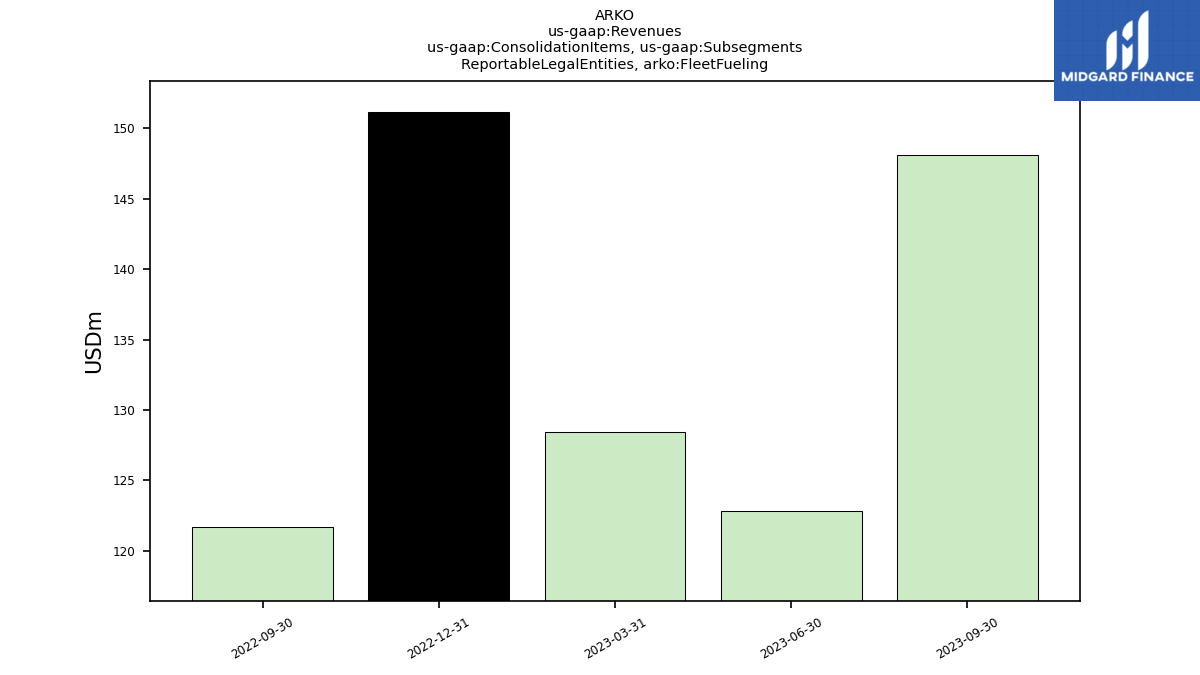
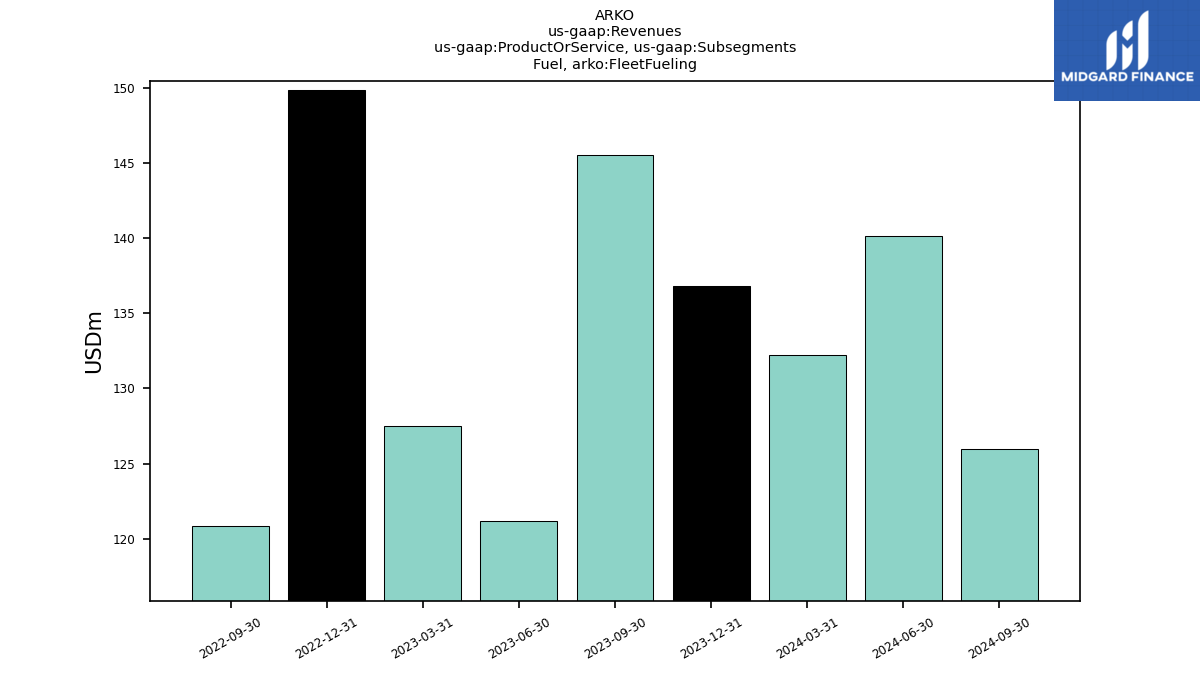
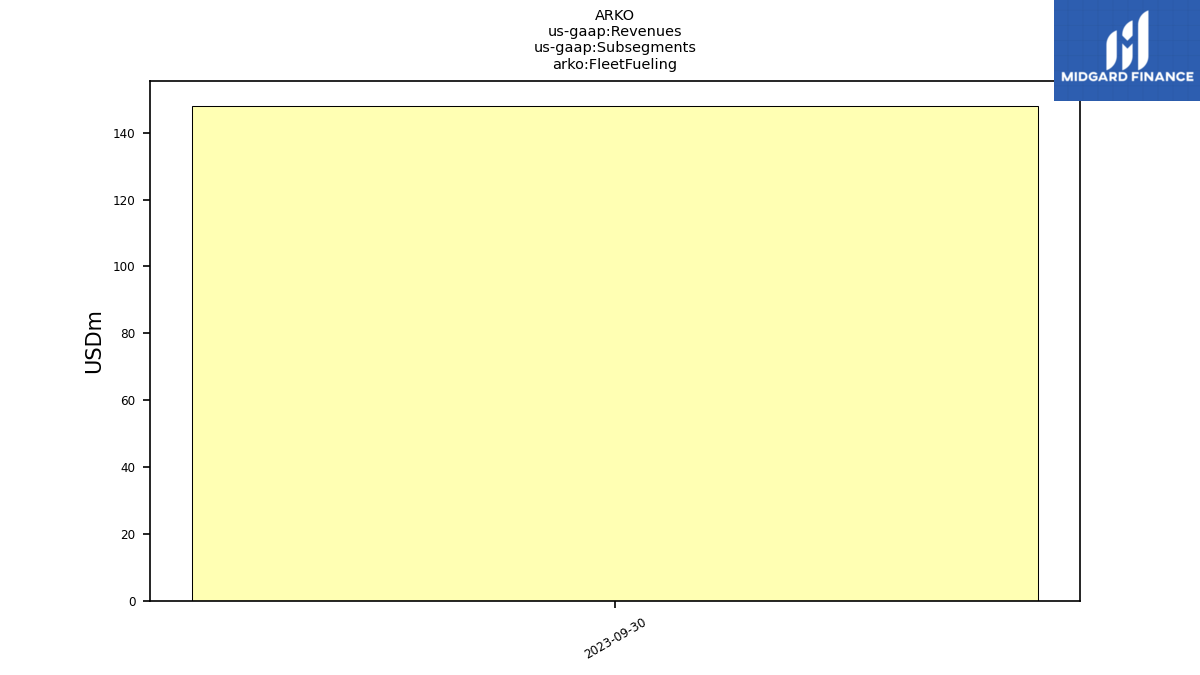
| , Fleet Fueling | 148.07 | 122.82 | 128.44 | 151.11 | 121.74 | NA | NA | NA | NA | NA | NA | NA | NA | NA | NA | |
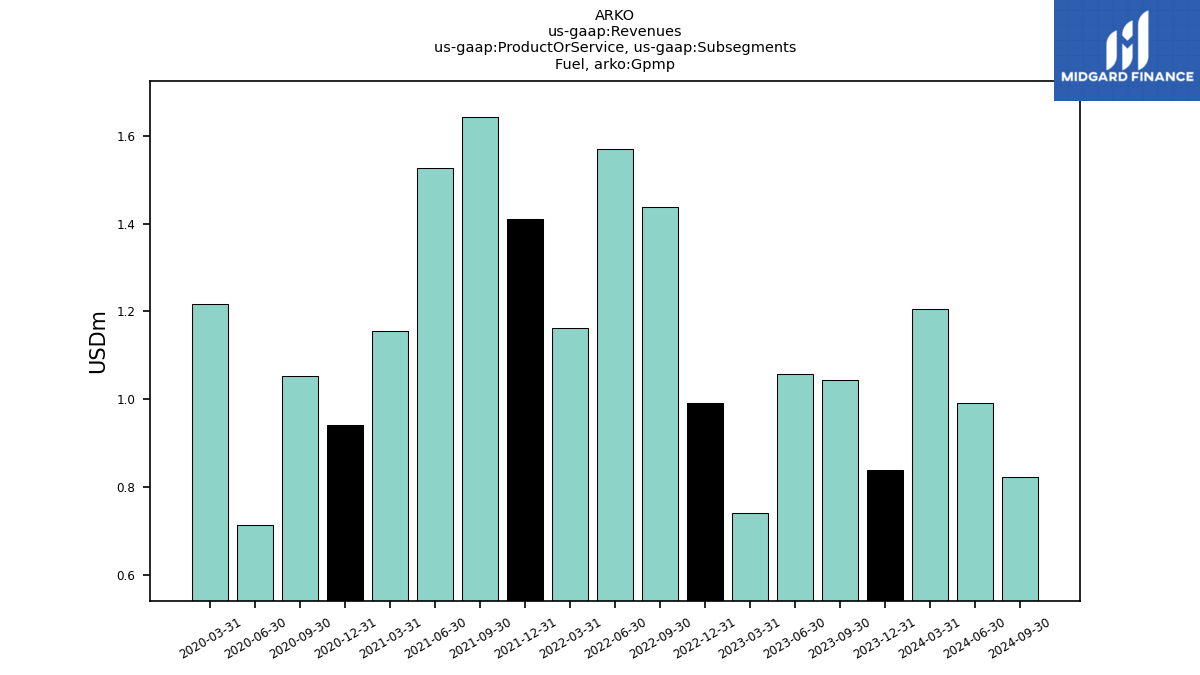
| , Gpmp | 1473.61 | 1368.12 | 1143.53 | 1220.37 | 1446.77 | 1740.07 | 1277.14 | 1255.91 | 1219.55 | 1094.72 | 820.88 | 745.77 | 353.66 | 231.07 | 380.56 | |
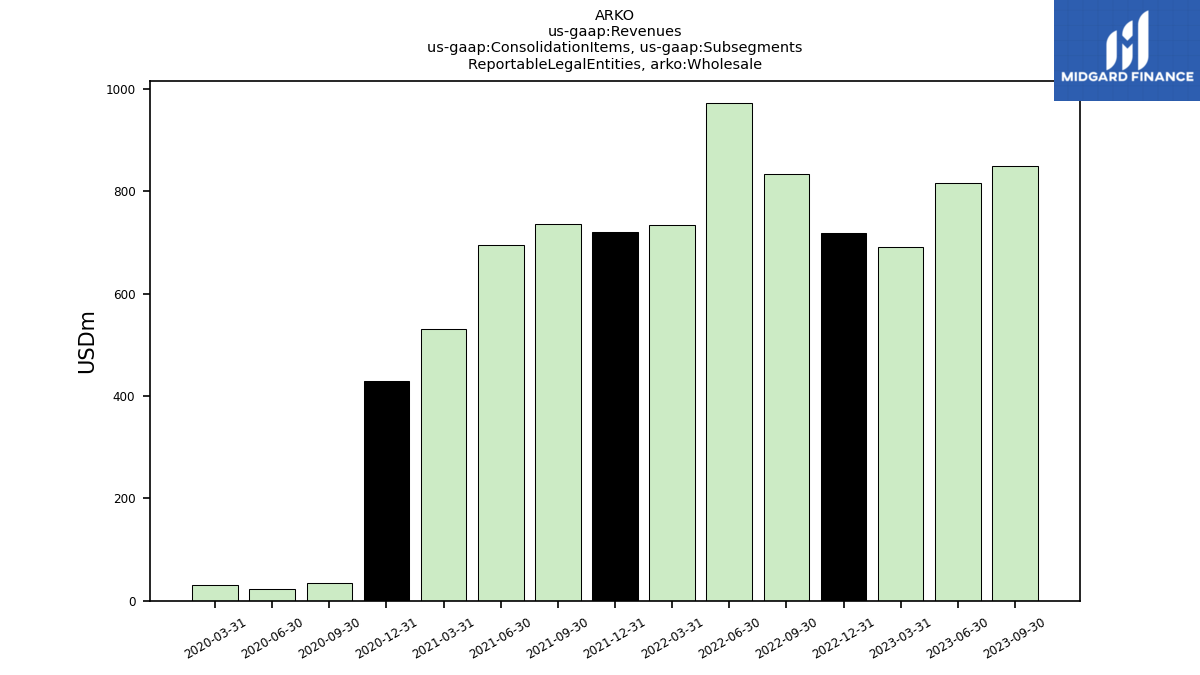
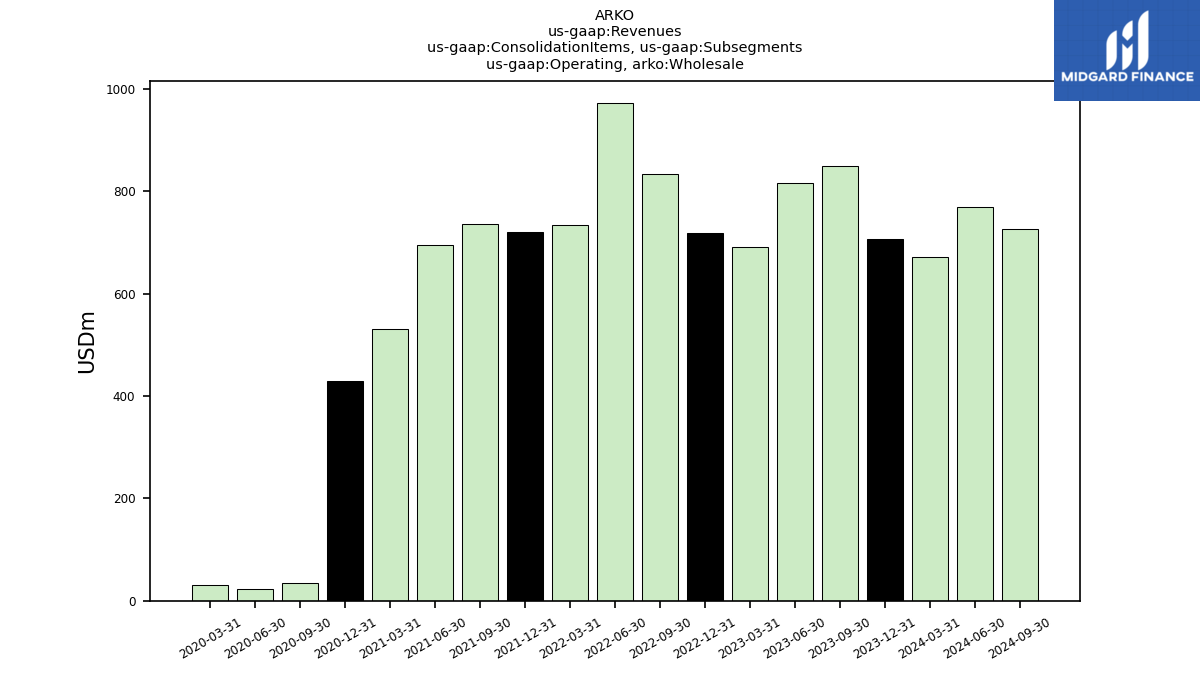
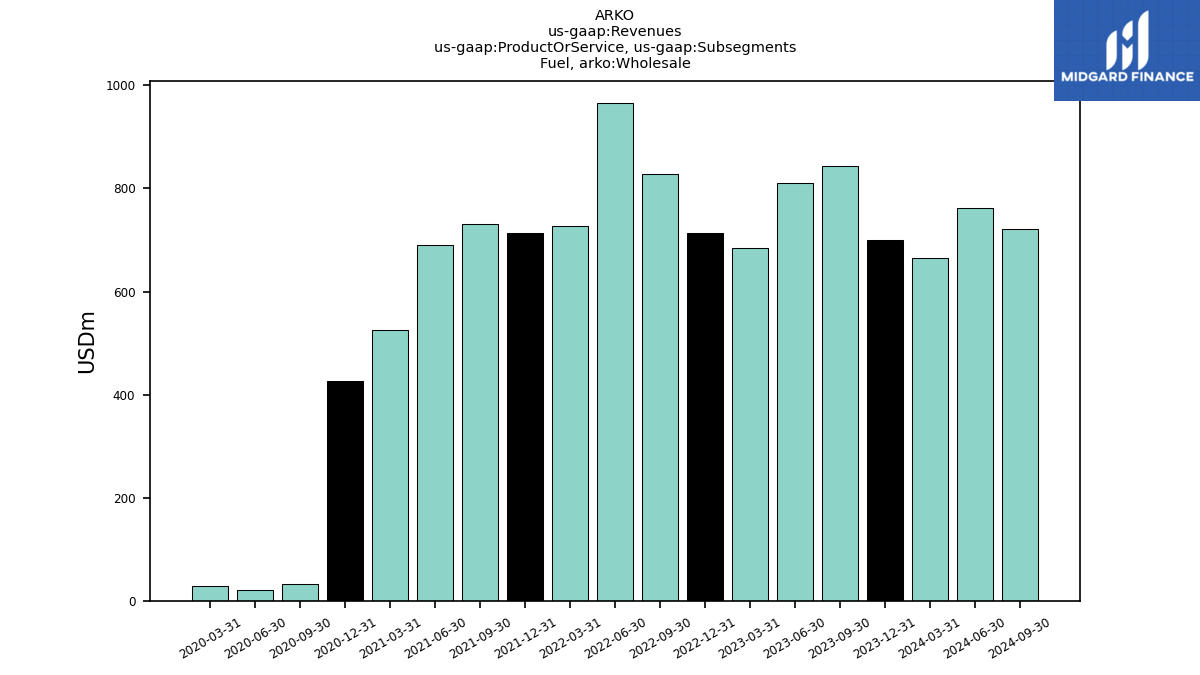
| , Wholesale | 850.16 | 817.25 | 691.34 | 718.88 | 833.13 | 972.17 | 733.42 | 719.72 | 736.12 | 695.73 | 530.43 | 429.82 | 34.88 | 22.59 | 30.22 | |
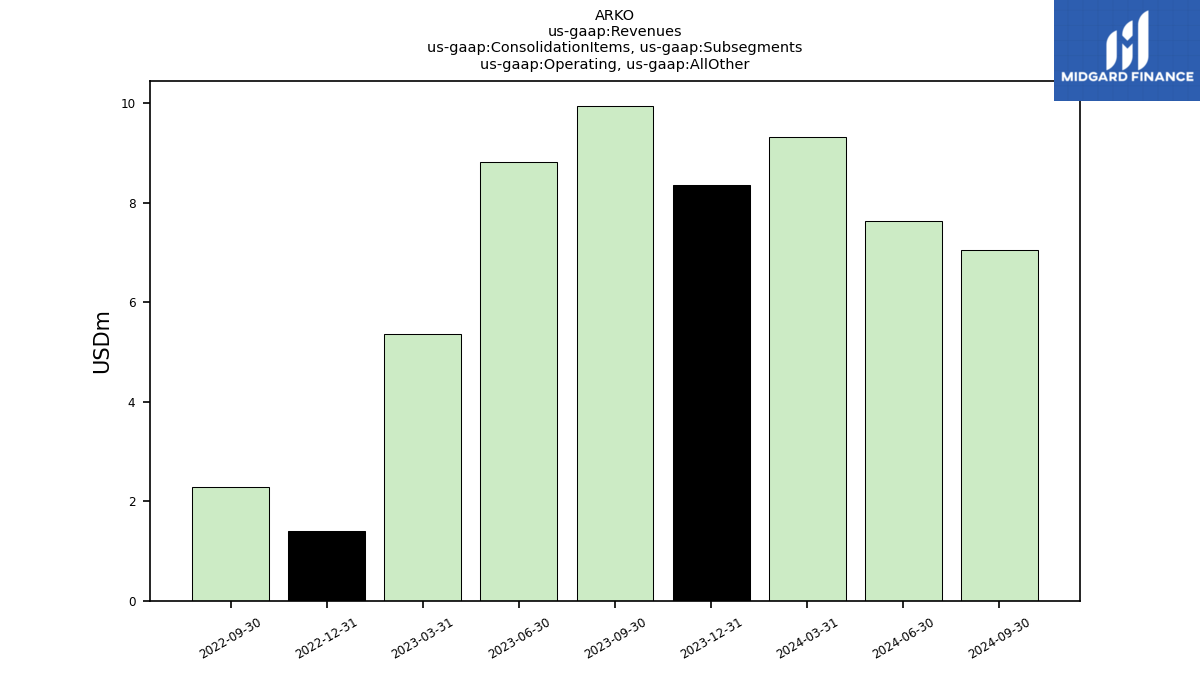
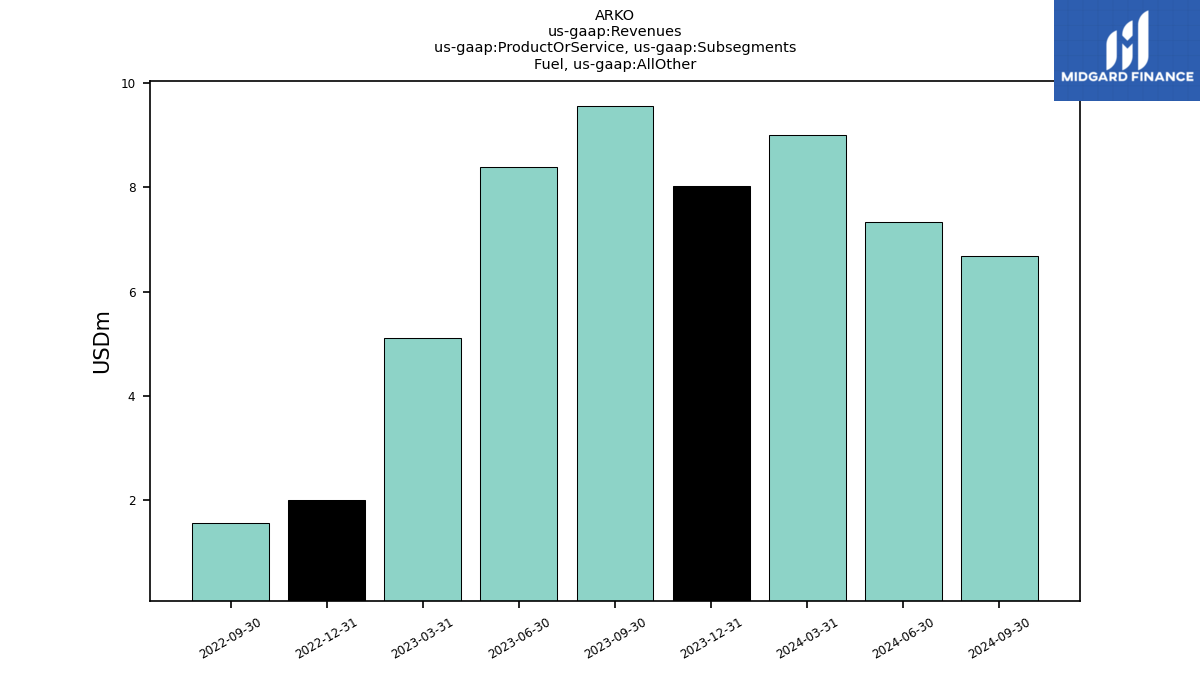
| , All Other | 16.19 | 13.36 | 8.42 | 4.21 | 3.15 | 0.30 | 0.30 | 0.31 | 0.32 | 0.32 | 0.32 | 0.33 | 0.34 | 0.00 | 2.38 | |
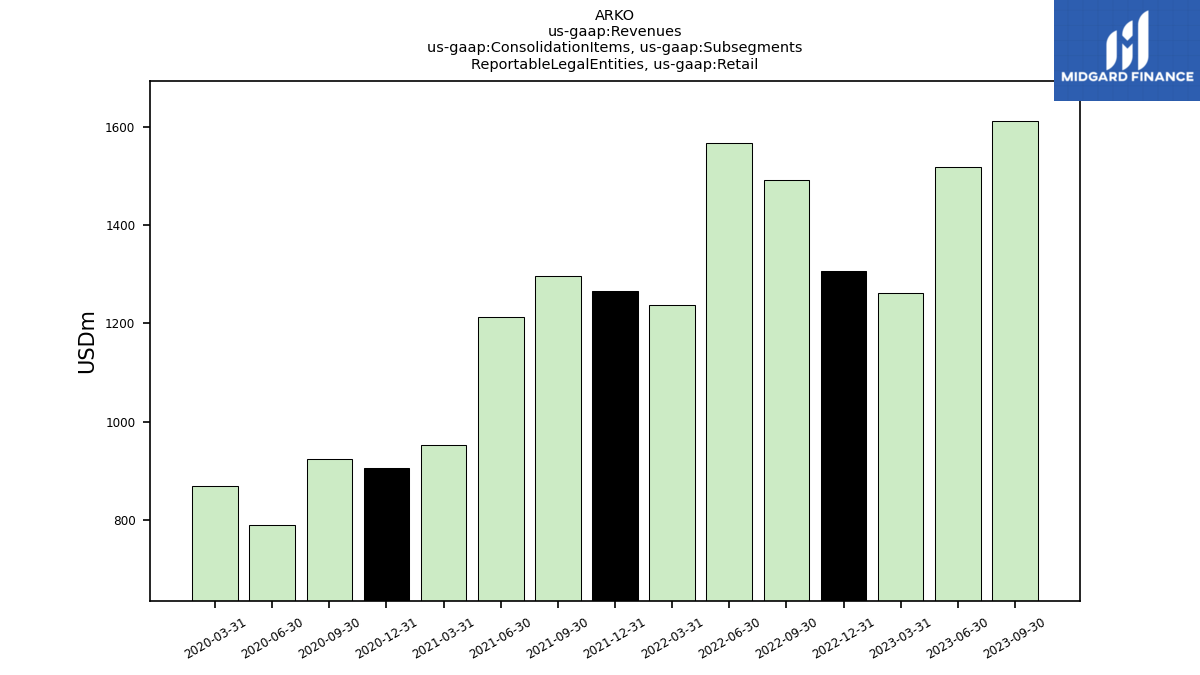
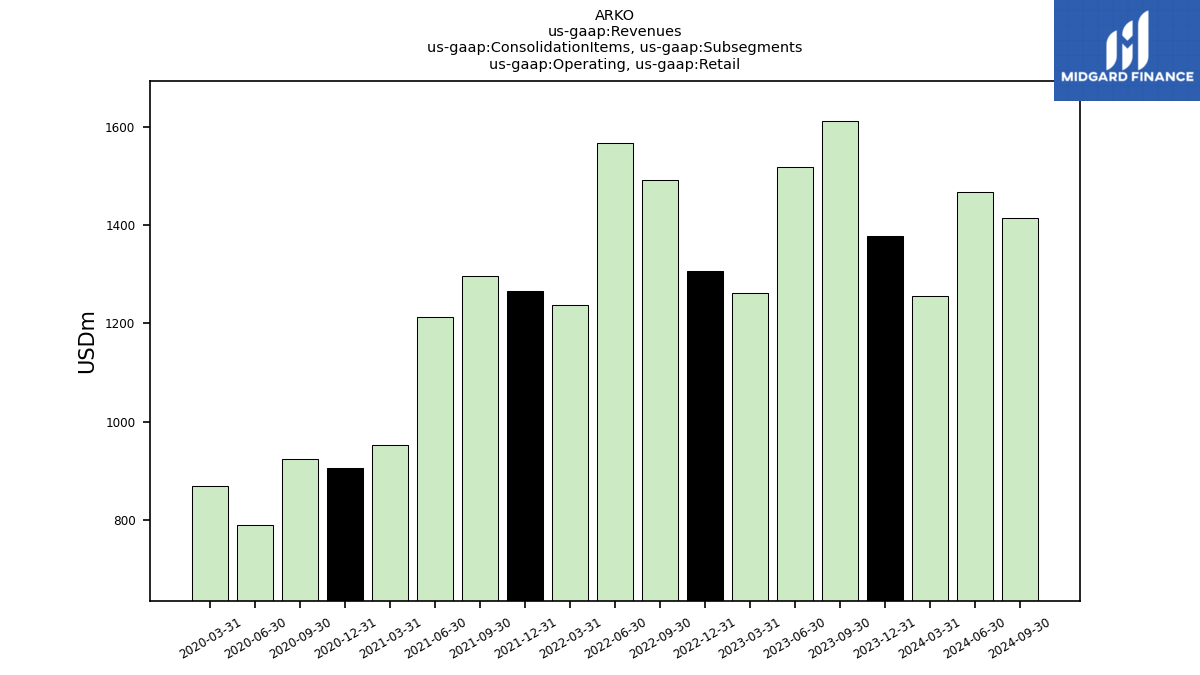
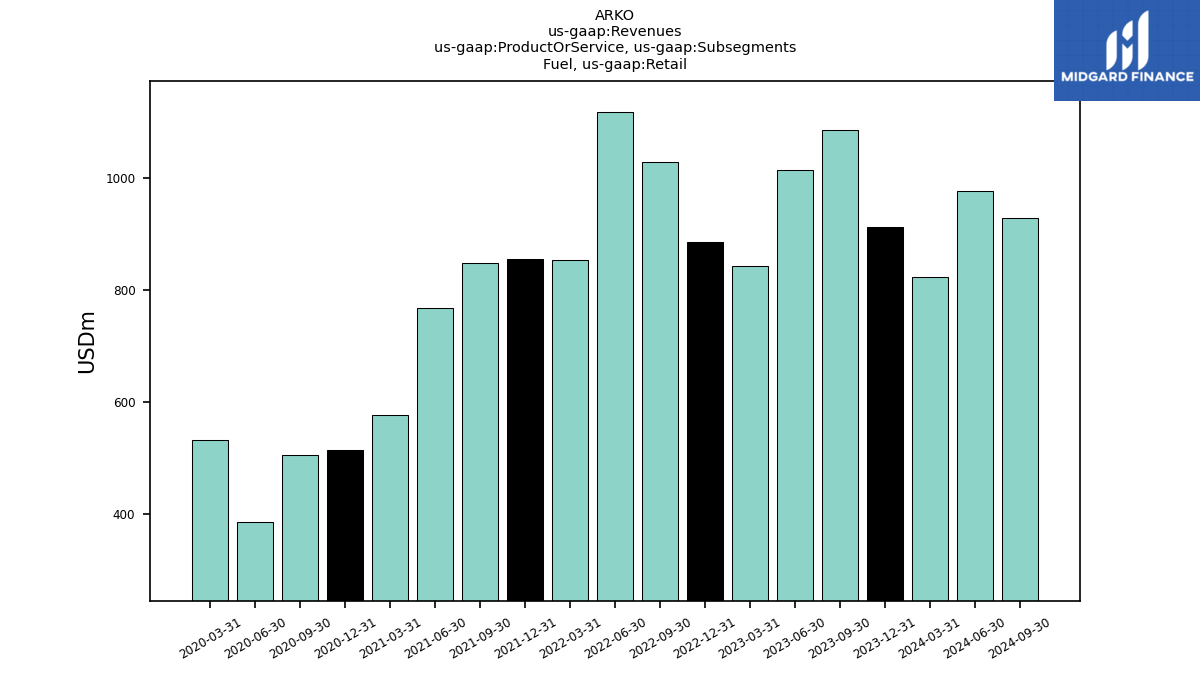
| , Retail | 1612.58 | 1518.92 | 1262.44 | 1307.43 | 1490.80 | 1566.27 | 1237.98 | 1266.66 | 1297.01 | 1212.33 | 952.56 | 905.03 | 923.94 | 790.83 | 868.26 | |
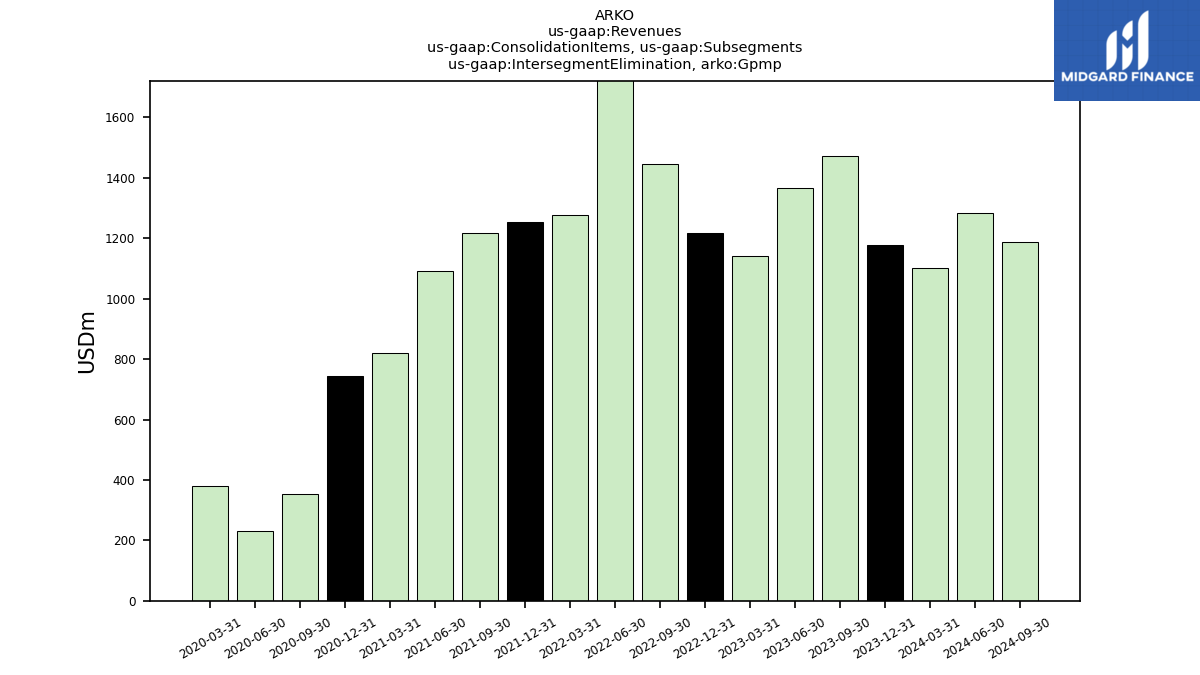
| Intersegment Elimination, Gpmp | 1472.32 | 1366.79 | 1142.62 | 1219.13 | 1445.07 | 1738.24 | 1275.72 | 1254.21 | 1217.62 | 1092.93 | 819.47 | 744.57 | 352.36 | 230.18 | 379.12 | |
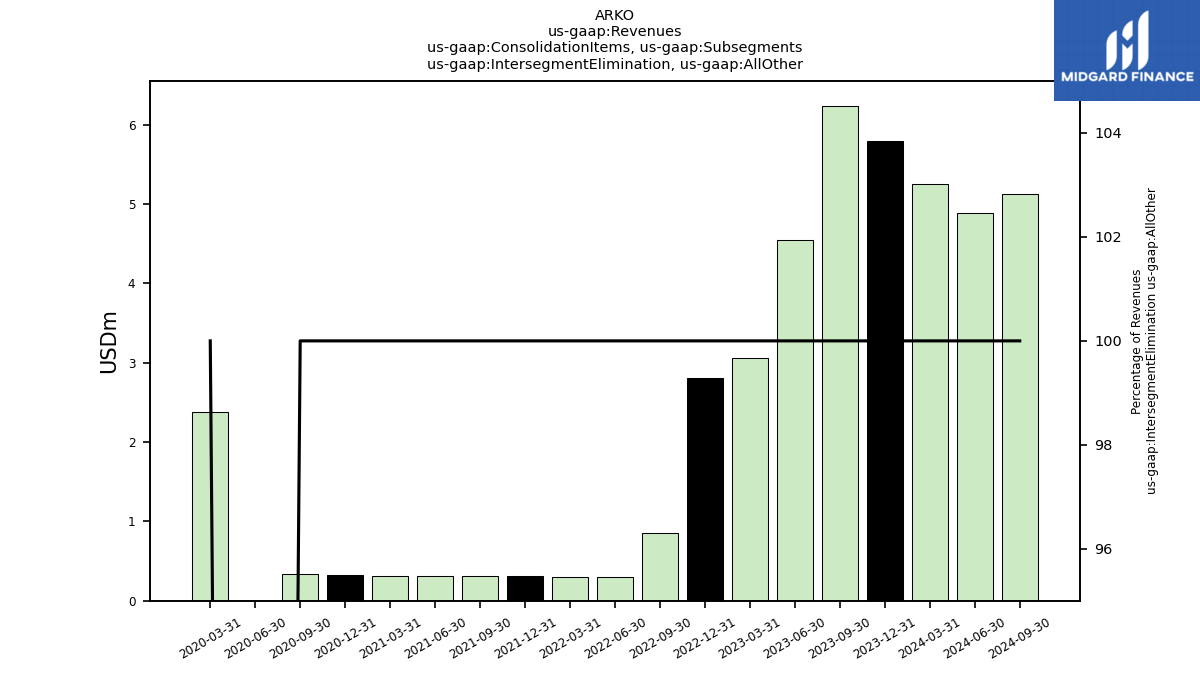
| Intersegment Elimination, All Other | 6.24 | 4.54 | 3.06 | 2.80 | 0.86 | 0.30 | 0.30 | 0.31 | 0.32 | 0.32 | 0.32 | 0.33 | 0.34 | 0.00 | 2.38 | |
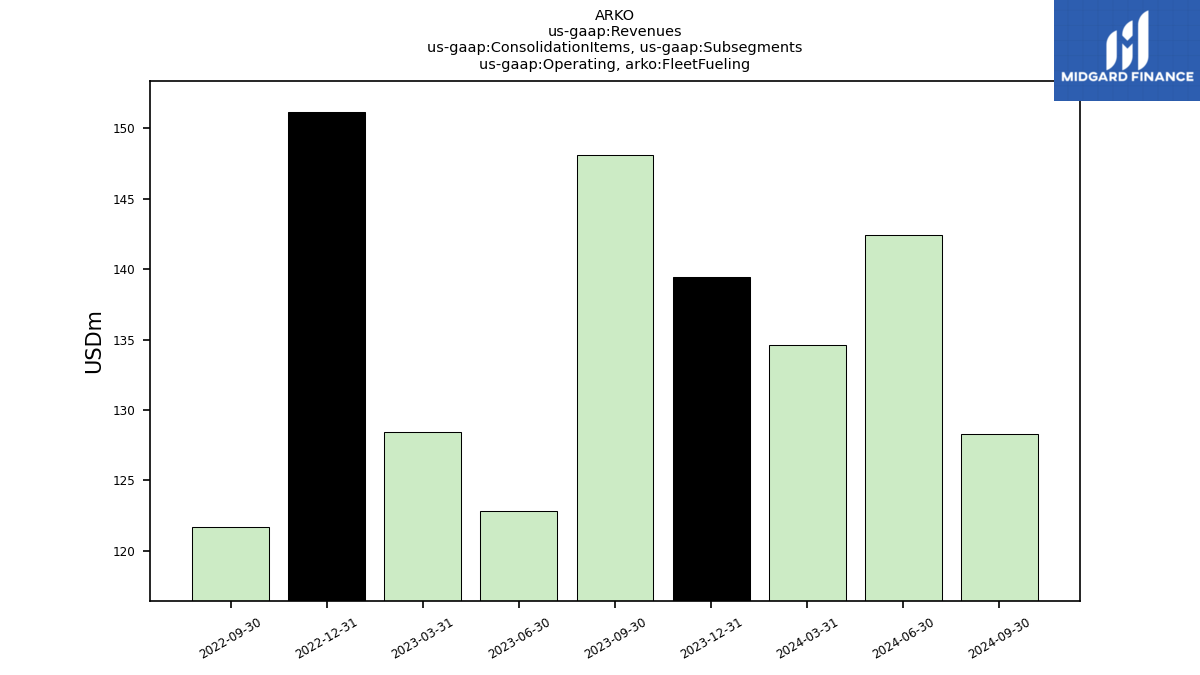
| Operating, Fleet Fueling | 148.07 | 122.82 | 128.44 | 151.11 | 121.74 | NA | NA | NA | NA | NA | NA | NA | NA | NA | NA | |
| Operating, Gpmp | 1.30 | 1.33 | 0.91 | 1.24 | 1.70 | 1.83 | 1.42 | 1.70 | 1.93 | 1.79 | 1.41 | 1.20 | 1.30 | 0.89 | 1.43 | |
| Operating, Wholesale | 850.16 | 817.25 | 691.34 | 718.88 | 833.13 | 972.17 | 733.42 | 719.72 | 736.12 | 695.73 | 530.43 | 429.82 | 34.88 | 22.59 | 30.22 | |
| Operating, All Other | 9.95 | 8.81 | 5.37 | 1.41 | 2.29 | NA | NA | NA | NA | NA | NA | NA | NA | NA | NA | |
| Operating, Retail | 1612.58 | 1518.92 | 1262.44 | 1307.43 | 1490.80 | 1566.27 | 1237.98 | 1266.66 | 1297.01 | 1212.33 | 952.56 | 905.03 | 923.94 | 790.83 | 868.26 | |
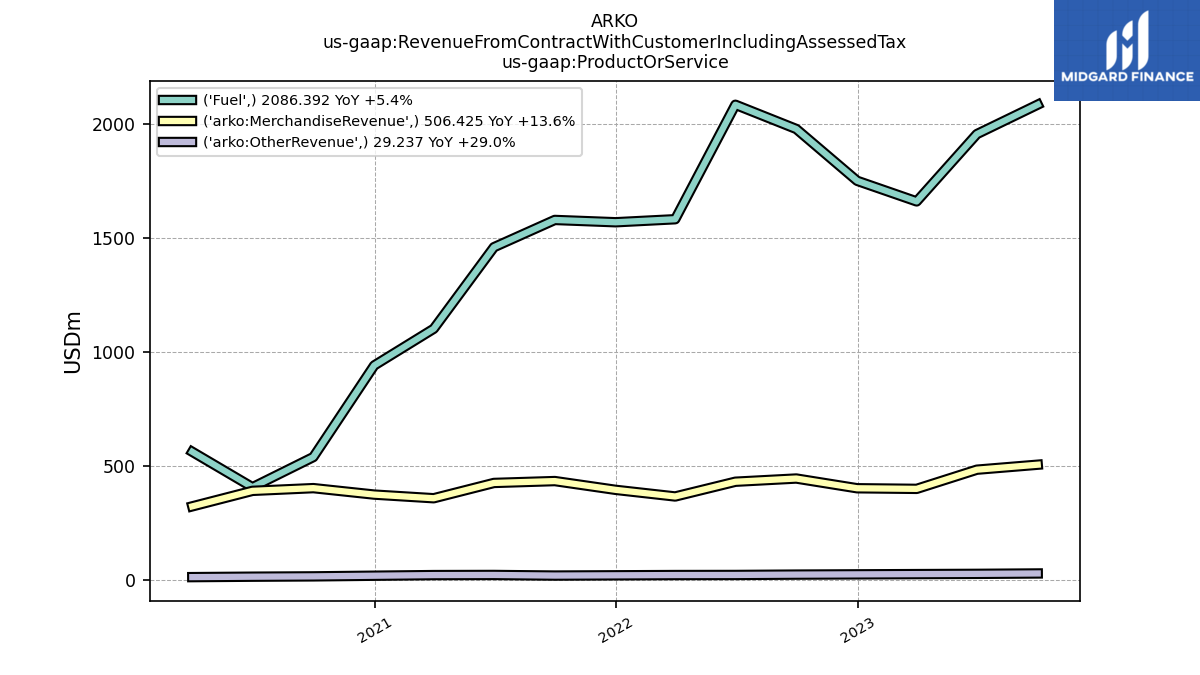
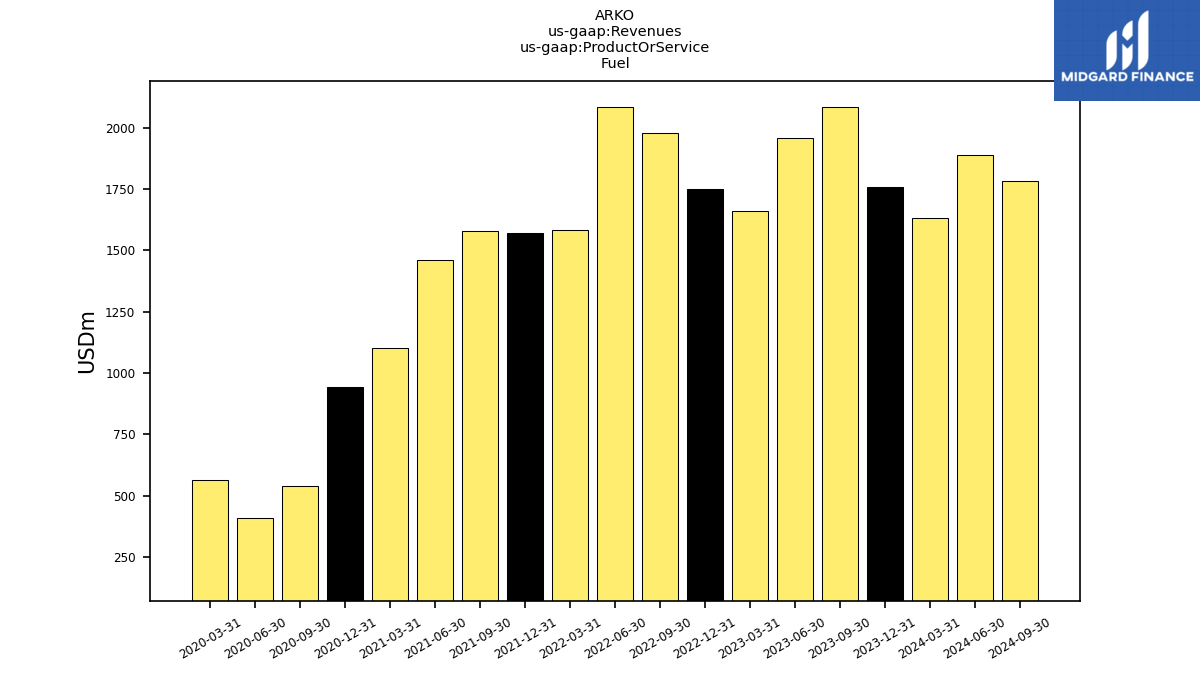
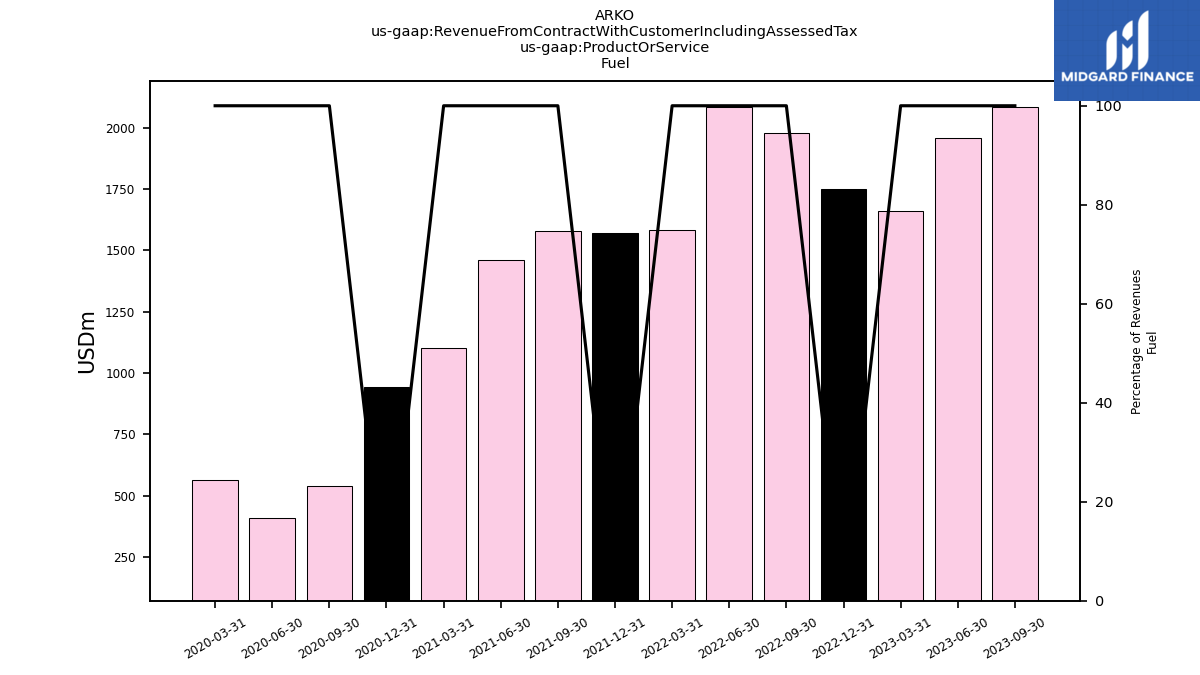
| 2086.39 | 1957.10 | 1661.66 | 1752.14 | 1979.57 | 2085.85 | 1583.53 | 1570.26 | 1580.36 | 1460.76 | 1102.95 | 941.91 | 539.94 | 407.51 | 563.04 | ||
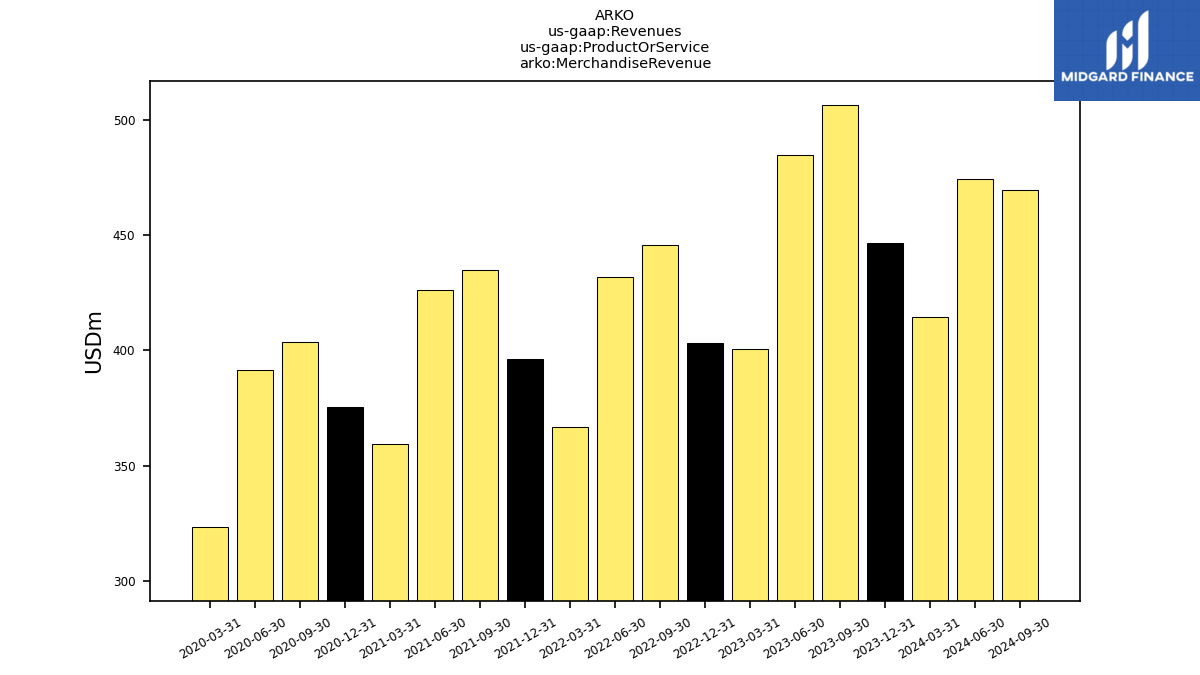
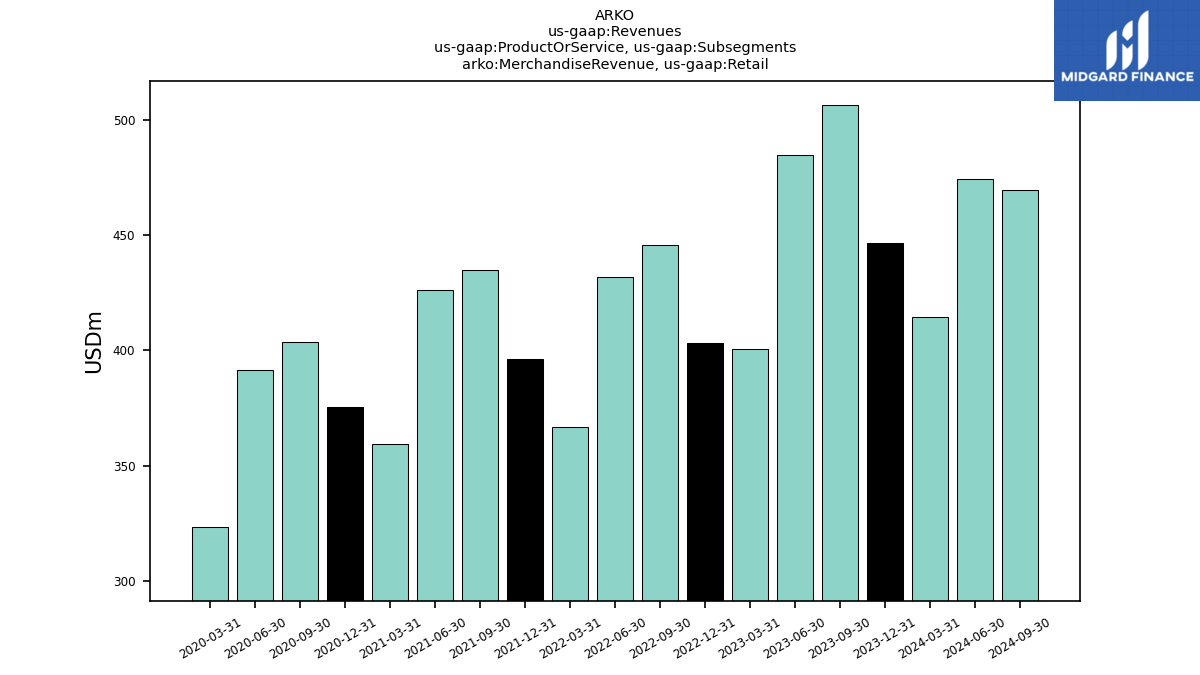
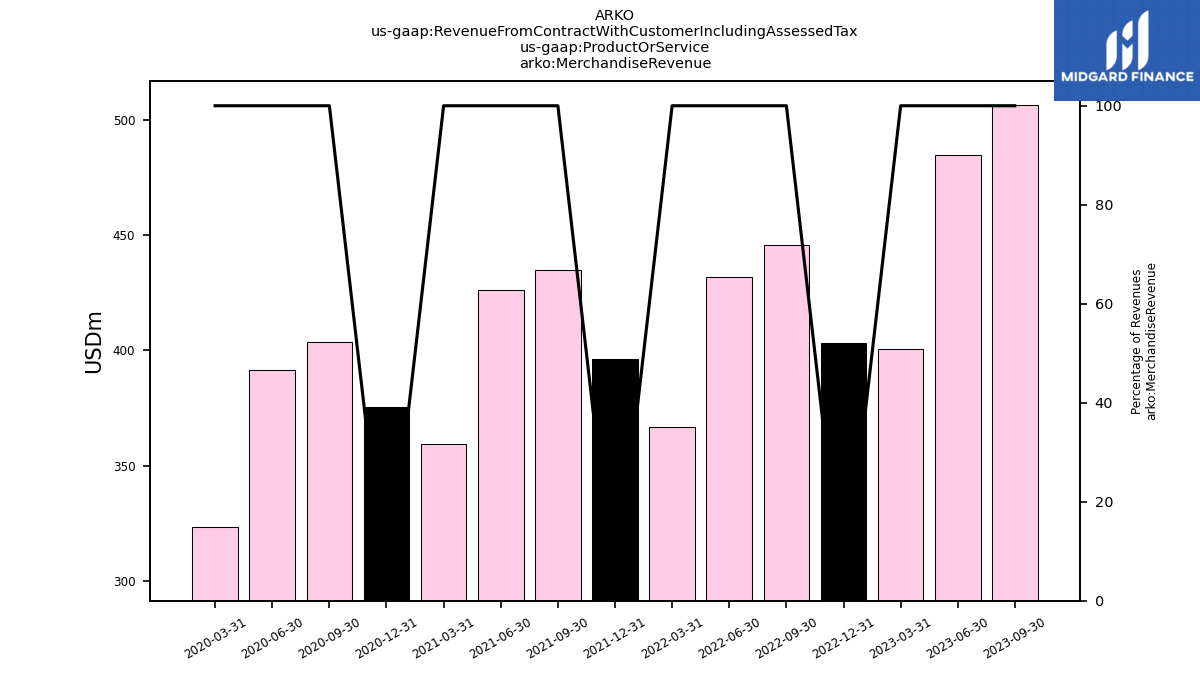
| Merchandise Revenue | 506.43 | 484.56 | 400.41 | 403.08 | 445.82 | 431.75 | 366.99 | 396.11 | 434.65 | 426.37 | 359.28 | 375.30 | 403.67 | 391.70 | 323.68 | |
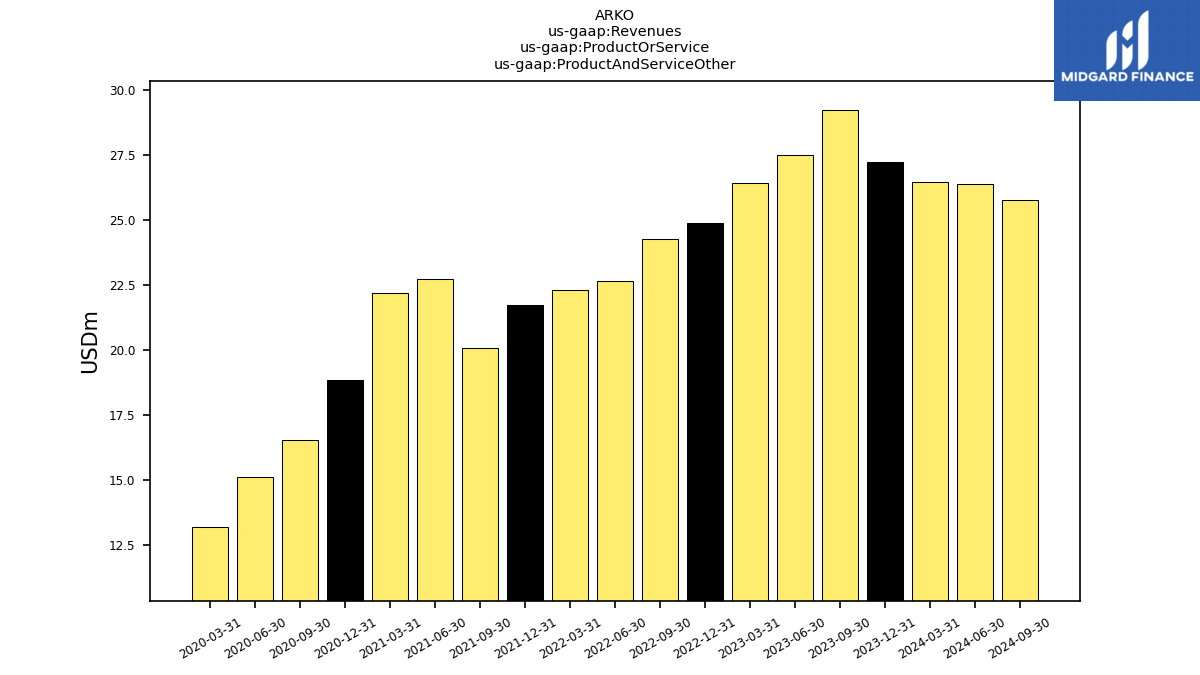
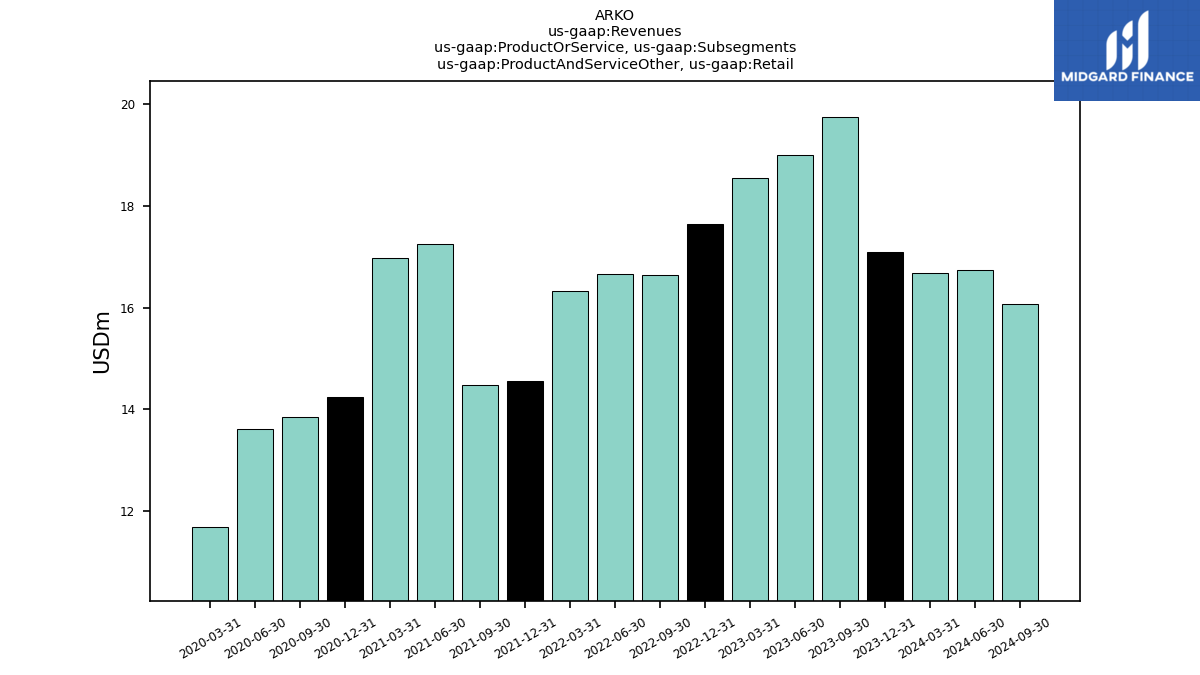
| Product And Service Other | 29.24 | 27.48 | 26.42 | 24.86 | 24.25 | 22.66 | 22.30 | 21.71 | 20.05 | 22.73 | 22.17 | 18.84 | 16.51 | 15.10 | 13.20 | |
| , Fleet Fueling | 145.50 | 121.15 | 127.49 | 149.86 | 120.81 | NA | NA | NA | NA | NA | NA | NA | NA | NA | NA | |
| , Gpmp | 1.04 | 1.06 | 0.74 | 0.99 | 1.44 | 1.57 | 1.16 | 1.41 | 1.64 | 1.53 | 1.16 | 0.94 | 1.05 | 0.71 | 1.22 | |
| , Wholesale | 843.89 | 811.14 | 684.85 | 712.58 | 827.44 | 966.43 | 727.70 | 712.85 | 730.85 | 690.52 | 525.49 | 425.49 | 32.47 | 21.28 | 28.94 | |
| , All Other | 9.56 | 8.39 | 5.11 | 2.00 | 1.56 | NA | NA | NA | NA | NA | NA | NA | NA | NA | NA | |
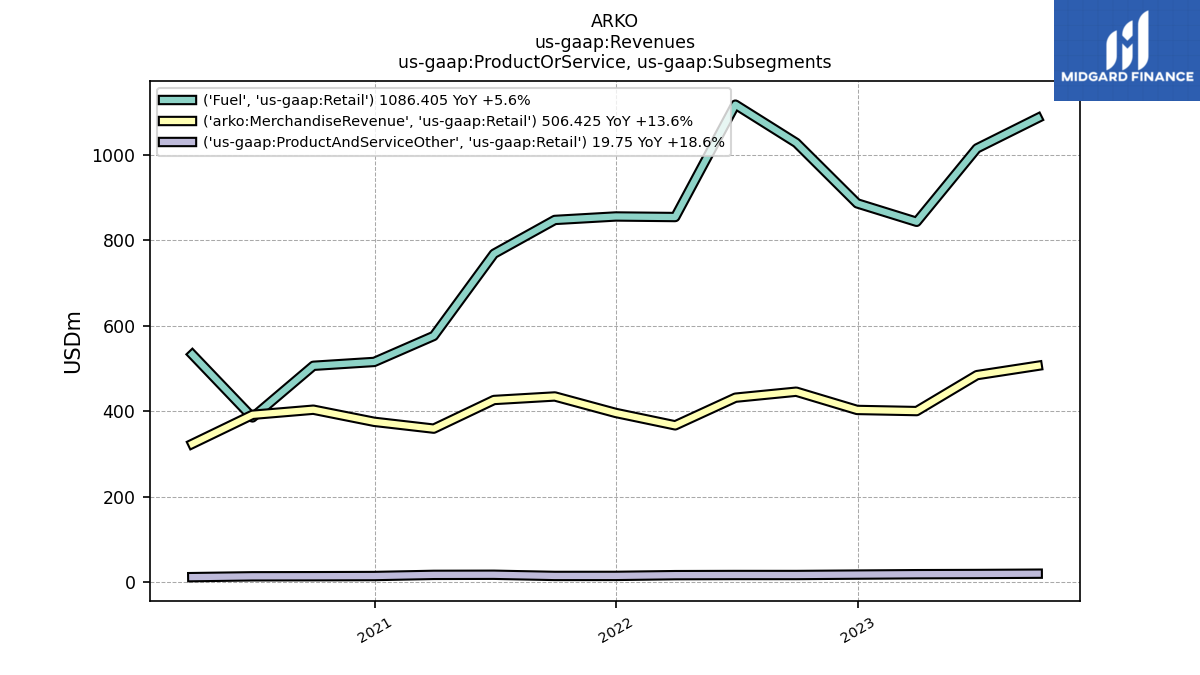
| , Retail | 1086.40 | 1015.37 | 843.47 | 886.71 | 1028.32 | 1117.85 | 854.67 | 856.00 | 847.87 | 768.72 | 576.30 | 515.48 | 506.42 | 385.52 | 532.89 | |
| Merchandise Revenue, Retail | 506.43 | 484.56 | 400.41 | 403.08 | 445.82 | 431.75 | 366.99 | 396.11 | 434.65 | 426.37 | 359.28 | 375.30 | 403.67 | 391.70 | 323.68 | |
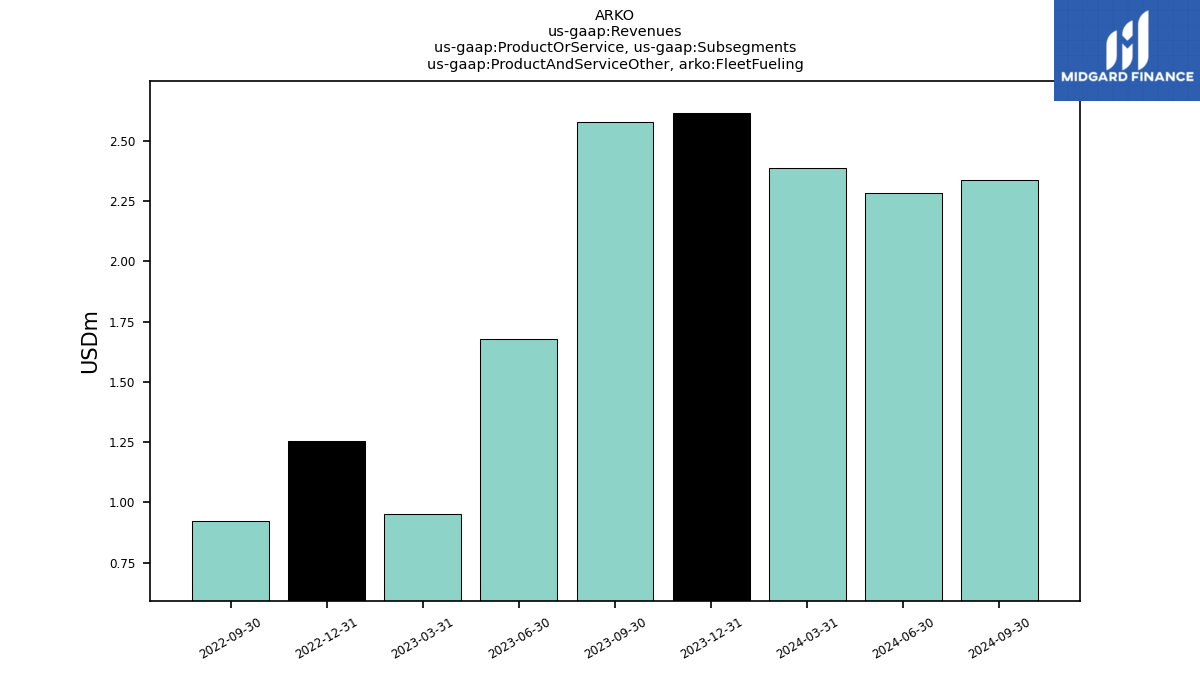
| Product And Service Other, Fleet Fueling | 2.58 | 1.68 | 0.95 | 1.25 | 0.92 | NA | NA | NA | NA | NA | NA | NA | NA | NA | NA | |
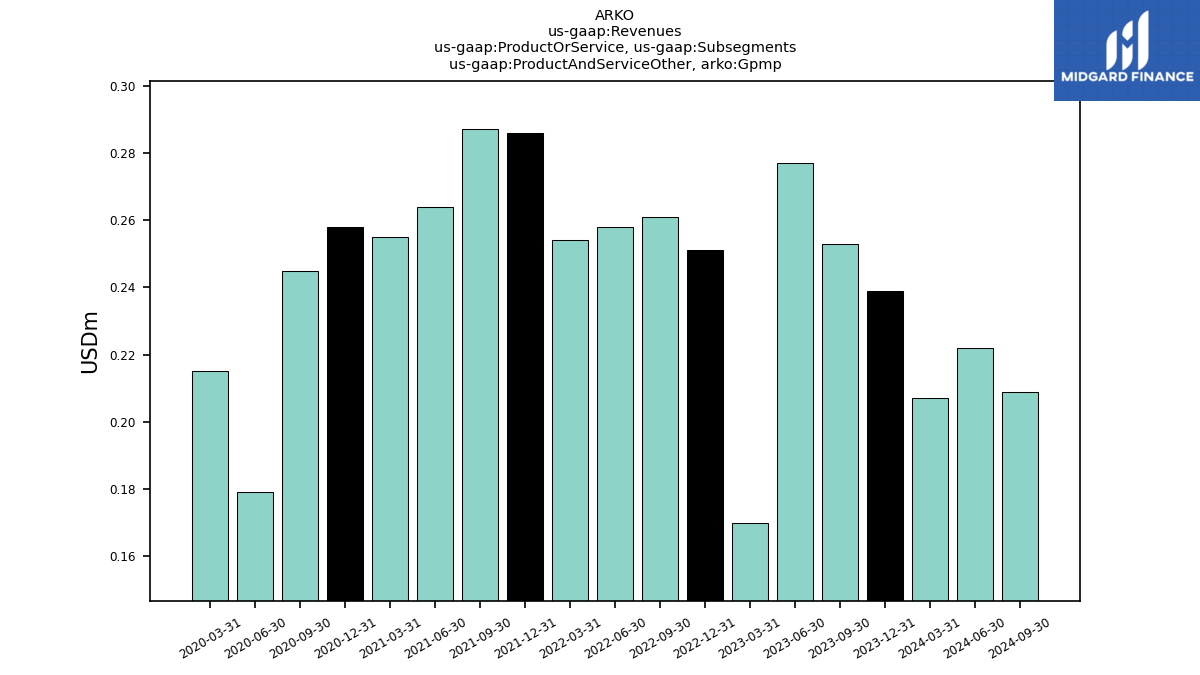
| Product And Service Other, Gpmp | 0.25 | 0.28 | 0.17 | 0.25 | 0.26 | 0.26 | 0.25 | 0.29 | 0.29 | 0.26 | 0.26 | 0.26 | 0.24 | 0.18 | 0.21 | |
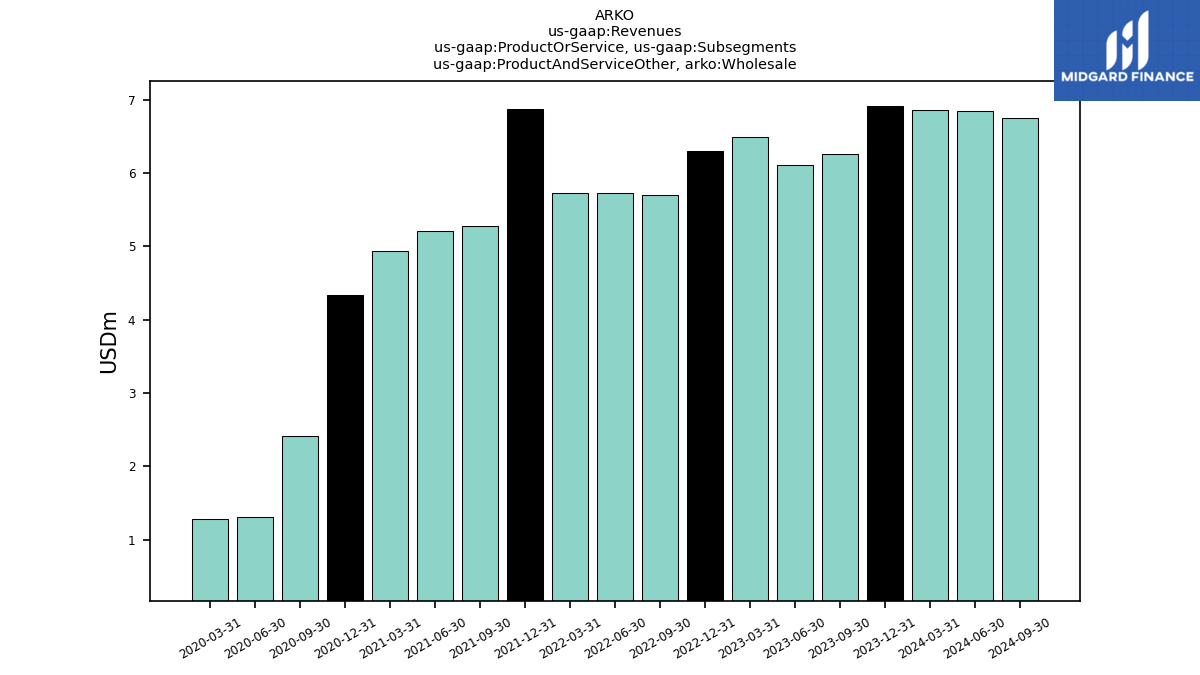
| Product And Service Other, Wholesale | 6.26 | 6.11 | 6.49 | 6.30 | 5.69 | 5.73 | 5.72 | 6.87 | 5.28 | 5.21 | 4.94 | 4.34 | 2.41 | 1.31 | 1.28 | |
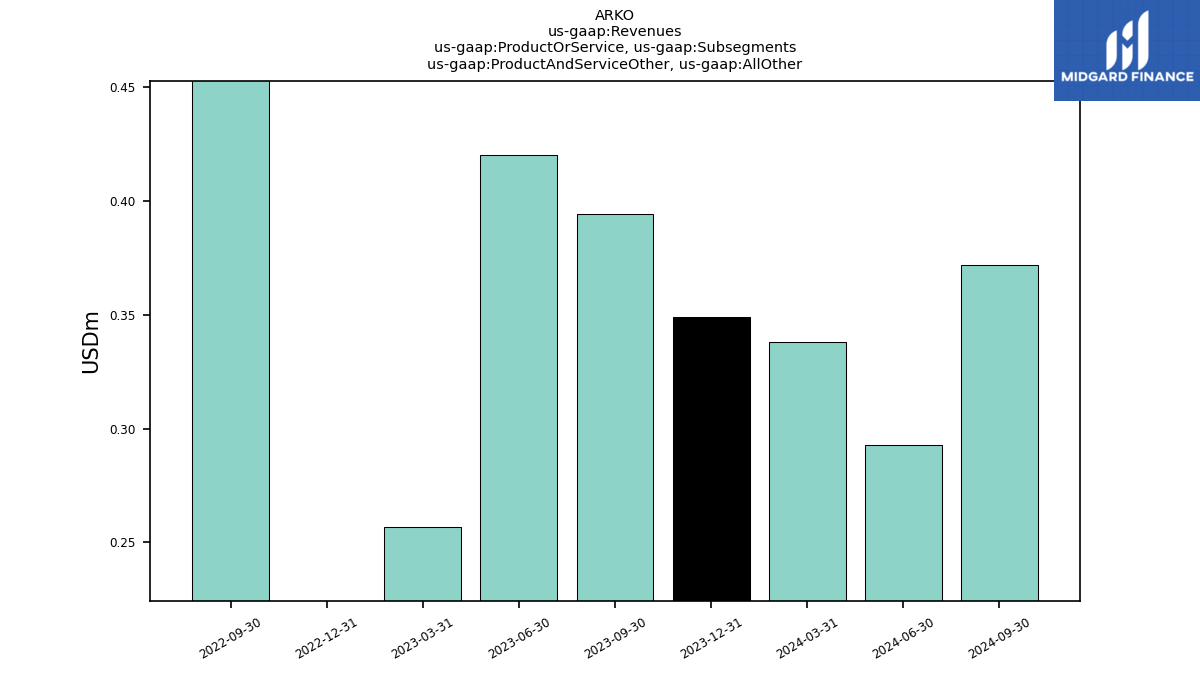
| Product And Service Other, All Other | 0.39 | 0.42 | 0.26 | -0.59 | 0.72 | NA | NA | NA | NA | NA | NA | NA | NA | NA | NA | |
| Product And Service Other, Retail | 19.75 | 19.00 | 18.55 | 17.64 | 16.65 | 16.67 | 16.32 | 14.55 | 14.49 | 17.25 | 16.98 | 14.25 | 13.86 | 13.62 | 11.70 | |
| Fleet Fueling | 148.07 | NA | NA | NA | NA | NA | NA | NA | NA | NA | NA | NA | NA | NA | NA | |
| Gpmp | 1.30 | NA | NA | NA | NA | NA | NA | NA | NA | NA | NA | NA | NA | NA | NA | |
| Wholesale | 850.16 | NA | NA | NA | NA | NA | NA | NA | NA | NA | NA | NA | NA | NA | NA | |
| Retail | 1612.58 | NA | NA | NA | NA | NA | NA | NA | NA | NA | NA | NA | NA | NA | NA | |
| Revenue From Contract With Customer Including Assessed Tax | 2622.05 | 2469.14 | 2088.50 | 2180.08 | 2449.65 | 2540.26 | 1972.81 | 1988.20 | 2035.02 | 1909.81 | 1484.36 | 1336.00 | 960.08 | 814.27 | 899.88 | |
| 2086.39 | 1957.10 | 1661.66 | 1752.14 | 1979.57 | 2085.85 | 1583.53 | 1570.26 | 1580.36 | 1460.76 | 1102.95 | 941.91 | 539.94 | 407.51 | 563.04 | ||
| Merchandise Revenue | 506.43 | 484.56 | 400.41 | 403.08 | 445.82 | 431.75 | 366.99 | 396.11 | 434.65 | 426.37 | 359.28 | 375.30 | 403.67 | 391.70 | 323.68 | |
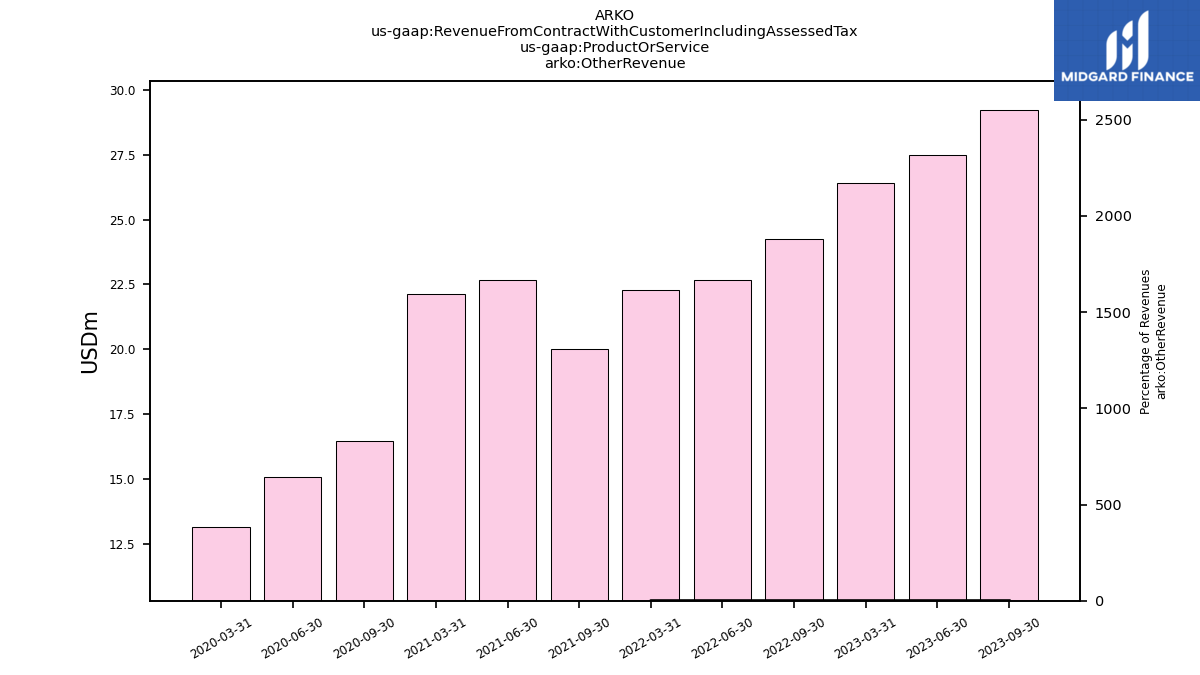
| Other Revenue | 29.24 | 27.48 | 26.42 | NA | 24.25 | 22.66 | 22.30 | NA | 20.01 | 22.69 | 22.13 | NA | 16.48 | 15.07 | 13.16 |

