
| 2023-12-31 | 2023-09-30 | 2023-06-30 | 2023-03-31 | 2022-12-31 | 2022-09-30 | 2022-06-30 | 2022-03-31 | 2021-12-31 | 2021-09-30 | 2021-06-30 | 2021-03-31 | 2020-12-31 | 2020-09-30 | 2020-06-30 | 2020-03-31 | 2019-12-31 | 2019-09-30 | 2019-06-30 | 2019-03-31 | 2018-12-31 | 2018-09-30 | 2018-06-30 | 2018-03-31 | 2017-12-31 | 2017-09-30 | 2017-06-30 | 2017-03-31 | 2016-12-31 | 2016-09-30 | 2016-06-30 | 2016-03-31 | 2015-12-31 | 2015-09-30 | 2015-06-30 | 2015-03-31 | 2014-12-31 | 2014-09-30 | 2014-06-30 | 2014-03-31 | 2013-12-31 | 2013-09-30 | 2013-06-30 | 2013-03-31 | 2012-12-31 | 2012-09-30 | 2012-06-30 | 2012-03-31 | 2011-12-31 | 2011-09-30 | 2011-06-30 | 2011-03-31 | 2010-12-31 | 2010-09-30 | 2010-06-30 | ||
|---|---|---|---|---|---|---|---|---|---|---|---|---|---|---|---|---|---|---|---|---|---|---|---|---|---|---|---|---|---|---|---|---|---|---|---|---|---|---|---|---|---|---|---|---|---|---|---|---|---|---|---|---|---|---|---|---|
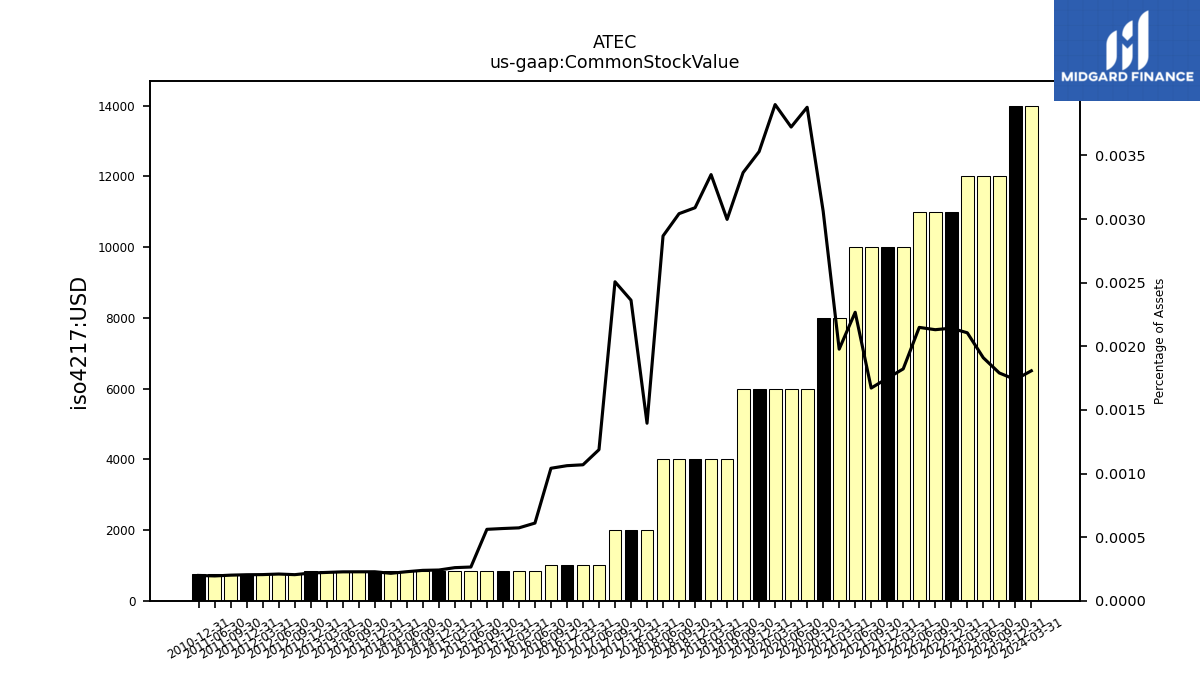
| Common Stock Value | 0.01 | 0.01 | 0.01 | 0.01 | 0.01 | 0.01 | 0.01 | 0.01 | 0.01 | 0.01 | 0.01 | 0.01 | 0.01 | 0.01 | 0.01 | 0.01 | 0.01 | 0.01 | 0.00 | 0.00 | 0.00 | 0.00 | 0.00 | 0.00 | 0.00 | 0.00 | 0.00 | 0.00 | 0.00 | 0.00 | 0.00 | 0.00 | 0.00 | 0.00 | 0.00 | 0.00 | 0.00 | 0.00 | 0.00 | 0.00 | 0.00 | 0.00 | 0.00 | 0.00 | 0.00 | 0.00 | 0.00 | 0.00 | 0.00 | 0.00 | 0.00 | NA | 0.00 | NA | NA | |
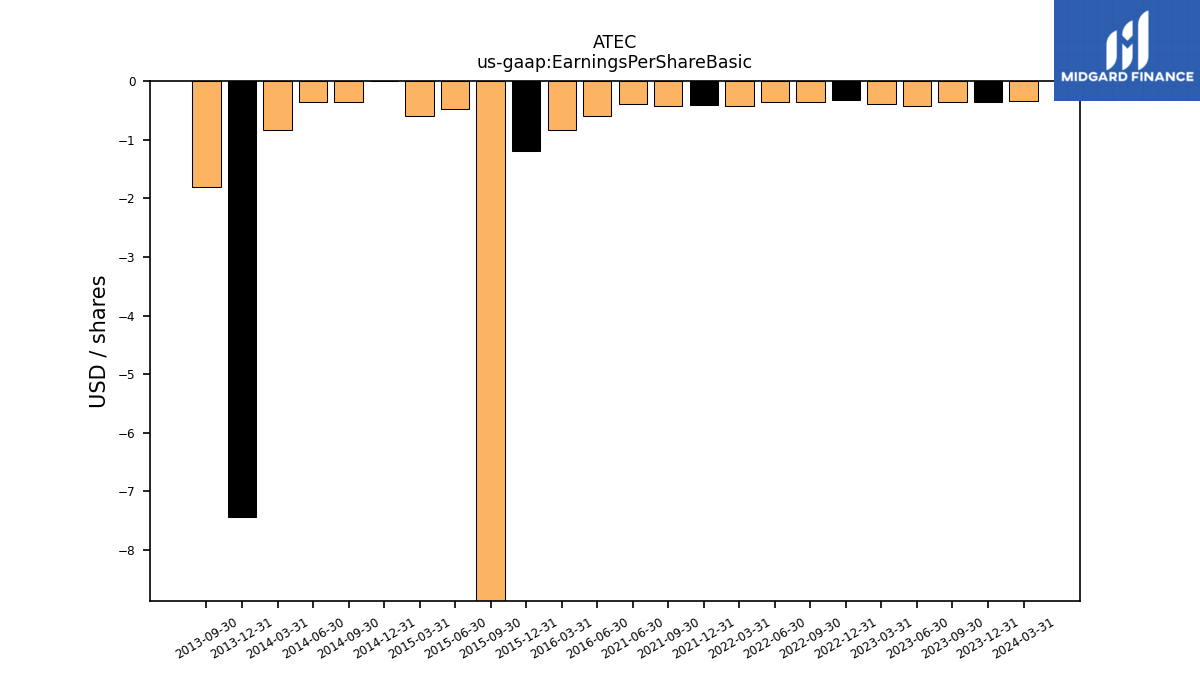
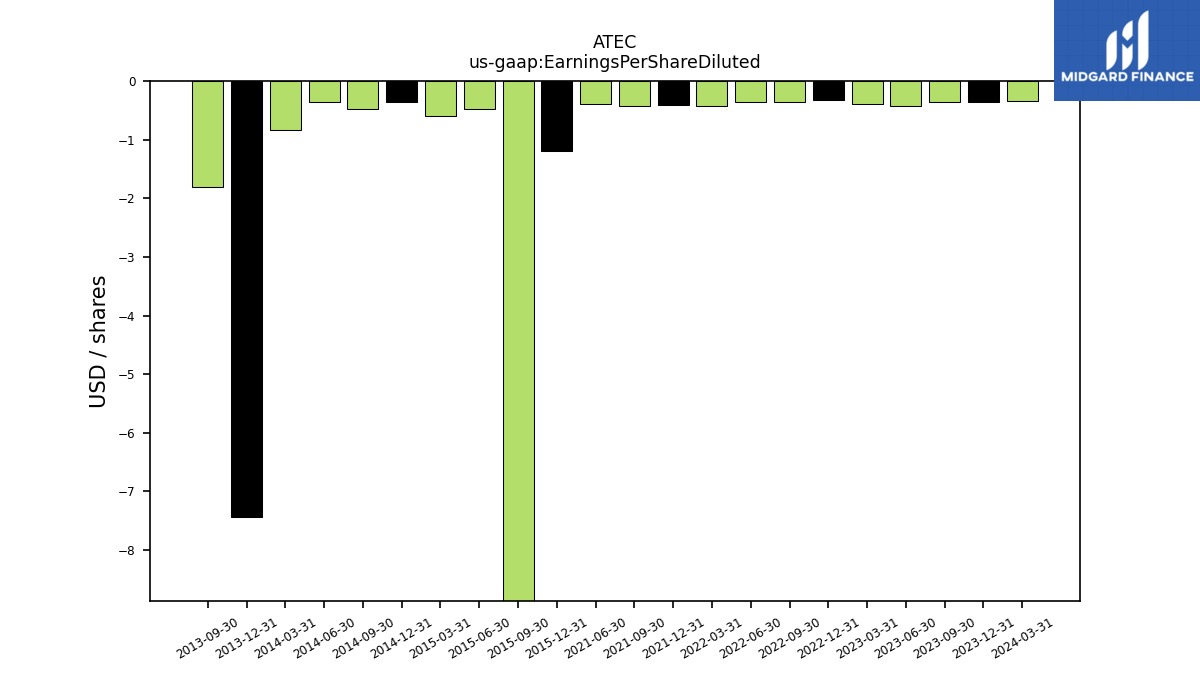
| Earnings Per Share Basic | -0.36 | -0.35 | -0.43 | -0.40 | -0.33 | -0.35 | -0.36 | -0.43 | -0.41 | -0.43 | -0.39 | NA | NA | NA | NA | NA | NA | NA | NA | NA | NA | NA | NA | NA | NA | NA | NA | NA | NA | NA | -0.60 | -0.84 | -1.20 | -19.33 | -0.48 | -0.60 | 0.00 | -0.36 | -0.36 | -0.84 | -7.44 | -1.80 | NA | NA | NA | NA | NA | NA | NA | NA | NA | NA | NA | NA | NA | |
| Earnings Per Share Diluted | -0.36 | -0.35 | -0.43 | -0.40 | -0.33 | -0.35 | -0.36 | -0.43 | -0.41 | -0.43 | -0.39 | NA | NA | NA | NA | NA | NA | NA | NA | NA | NA | NA | NA | NA | NA | NA | NA | NA | NA | NA | NA | NA | -1.20 | -19.33 | -0.48 | -0.60 | -0.36 | -0.48 | -0.36 | -0.84 | -7.44 | -1.80 | NA | NA | NA | NA | NA | NA | NA | NA | NA | NA | NA | NA | NA |
| 2023-12-31 | 2023-09-30 | 2023-06-30 | 2023-03-31 | 2022-12-31 | 2022-09-30 | 2022-06-30 | 2022-03-31 | 2021-12-31 | 2021-09-30 | 2021-06-30 | 2021-03-31 | 2020-12-31 | 2020-09-30 | 2020-06-30 | 2020-03-31 | 2019-12-31 | 2019-09-30 | 2019-06-30 | 2019-03-31 | 2018-12-31 | 2018-09-30 | 2018-06-30 | 2018-03-31 | 2017-12-31 | 2017-09-30 | 2017-06-30 | 2017-03-31 | 2016-12-31 | 2016-09-30 | 2016-06-30 | 2016-03-31 | 2015-12-31 | 2015-09-30 | 2015-06-30 | 2015-03-31 | 2014-12-31 | 2014-09-30 | 2014-06-30 | 2014-03-31 | 2013-12-31 | 2013-09-30 | 2013-06-30 | 2013-03-31 | 2012-12-31 | 2012-09-30 | 2012-06-30 | 2012-03-31 | 2011-12-31 | 2011-09-30 | 2011-06-30 | 2011-03-31 | 2010-12-31 | 2010-09-30 | 2010-06-30 | ||
|---|---|---|---|---|---|---|---|---|---|---|---|---|---|---|---|---|---|---|---|---|---|---|---|---|---|---|---|---|---|---|---|---|---|---|---|---|---|---|---|---|---|---|---|---|---|---|---|---|---|---|---|---|---|---|---|---|
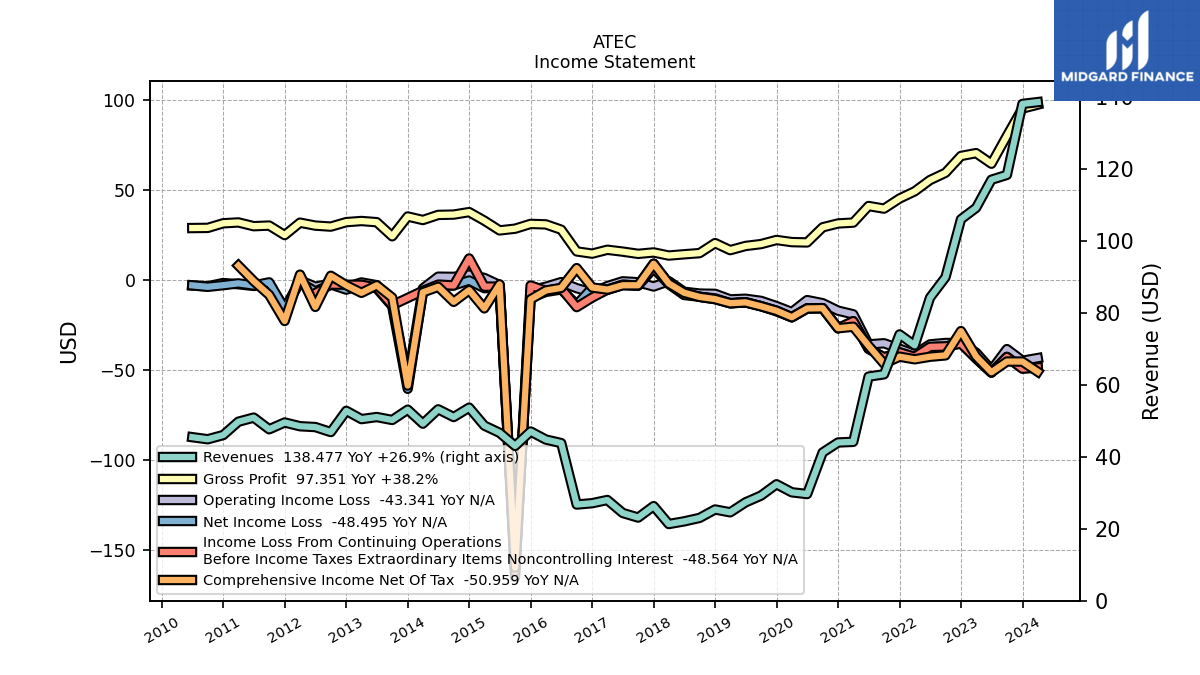
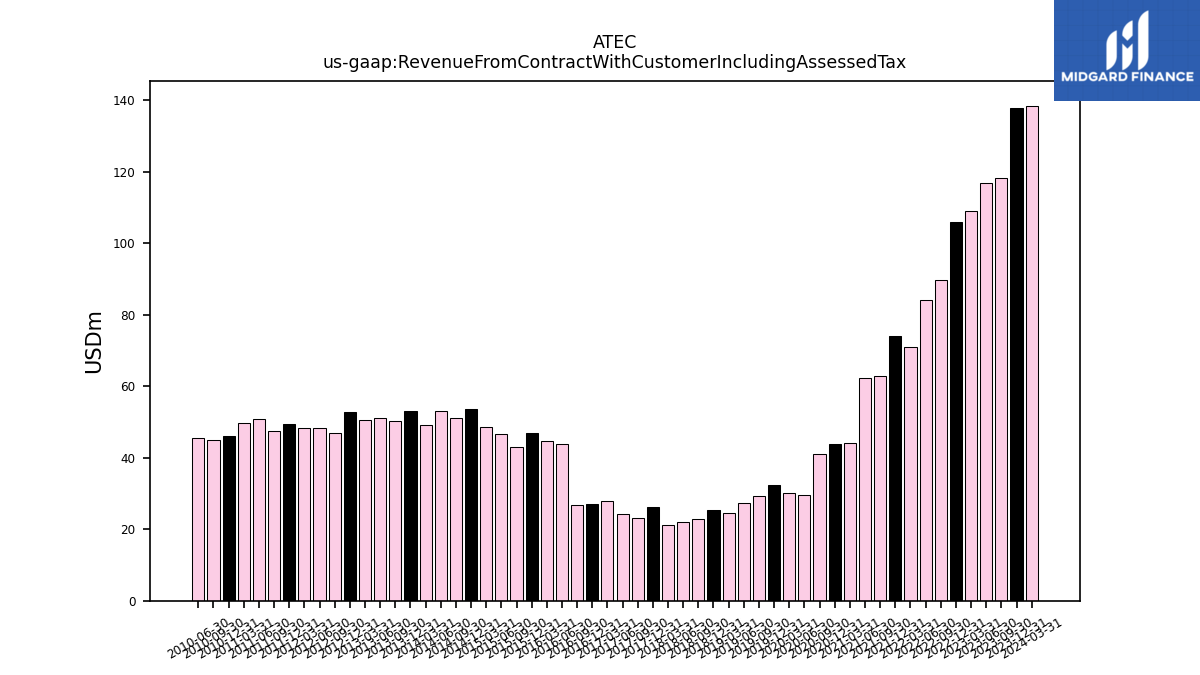
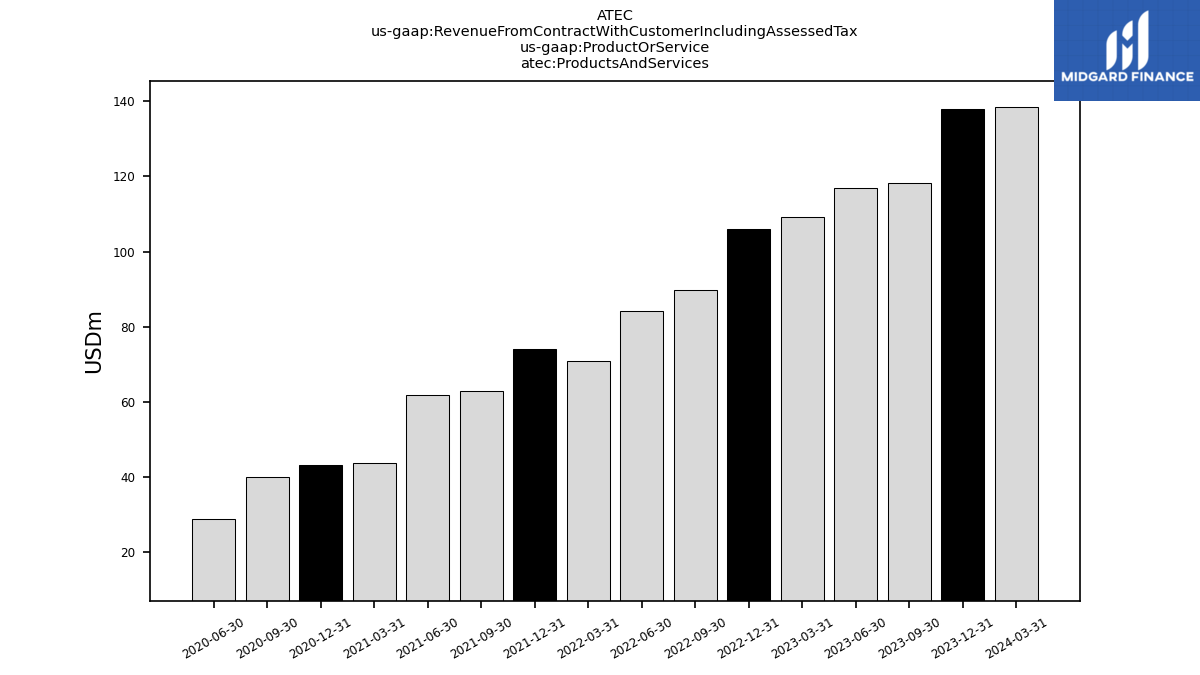
| Revenue From Contract With Customer Including Assessed Tax | 137.97 | 118.26 | 116.92 | 109.11 | 105.94 | 89.84 | 84.15 | 70.93 | 73.96 | 62.88 | 62.25 | 44.12 | 43.95 | 41.16 | 29.63 | 30.11 | 32.35 | 29.20 | 27.32 | 24.55 | 25.34 | 23.00 | 22.04 | 21.31 | 26.28 | 23.10 | 24.38 | 27.98 | 27.09 | 26.71 | 43.79 | 44.76 | 47.00 | 43.00 | 46.63 | 48.65 | 53.63 | 51.01 | 53.17 | 49.17 | 53.06 | 50.20 | 51.02 | 50.44 | 52.74 | 46.84 | 48.23 | 48.46 | 49.51 | 47.62 | 50.86 | 49.72 | 46.02 | 44.85 | 45.42 | |
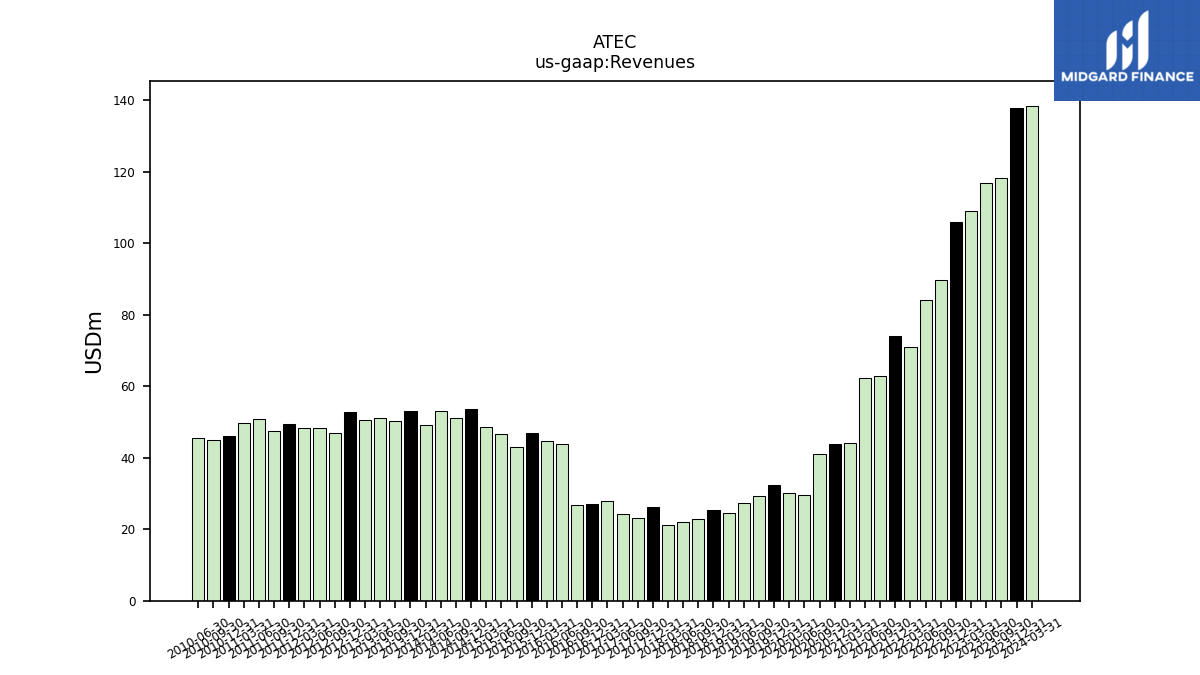
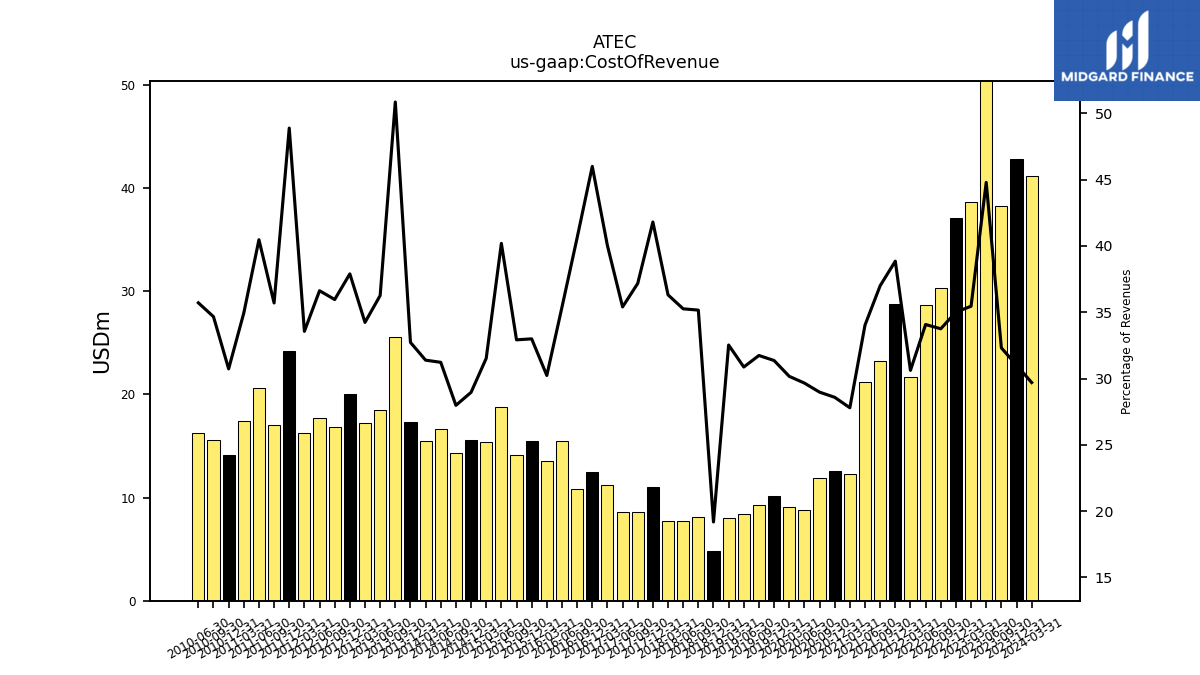
| Revenues | 137.97 | 118.26 | 116.92 | 109.11 | 105.94 | 89.84 | 84.15 | 70.93 | 73.96 | 62.88 | 62.25 | 44.12 | 43.95 | 41.16 | 29.63 | 30.11 | 32.35 | 29.20 | 27.32 | 24.55 | 25.34 | 23.00 | 22.04 | 21.31 | 26.28 | 23.10 | 24.38 | 27.98 | 27.09 | 26.71 | 43.79 | 44.76 | 47.00 | 43.00 | 46.63 | 48.65 | 53.63 | 51.01 | 53.17 | 49.17 | 53.06 | 50.20 | 51.02 | 50.44 | 52.74 | 46.84 | 48.23 | 48.46 | 49.51 | 47.62 | 50.86 | 49.72 | 46.02 | 44.85 | 45.42 | |
| Cost Of Revenue | 42.78 | 38.22 | 52.38 | 38.69 | 37.09 | 30.32 | 28.68 | 21.72 | 28.74 | 23.27 | 21.18 | 12.26 | 12.56 | 11.93 | 8.79 | 9.08 | 10.14 | 9.27 | 8.43 | 7.99 | 4.86 | 8.09 | 7.77 | 7.74 | 10.99 | 8.59 | 8.63 | 11.20 | 12.46 | 10.85 | 15.49 | 13.53 | 15.51 | 14.15 | 18.75 | 15.34 | 15.53 | 14.27 | 16.60 | 15.43 | 17.37 | 25.53 | 18.50 | 17.27 | 19.99 | 16.84 | 17.67 | 16.26 | 24.21 | 17.00 | 20.59 | 17.37 | 14.14 | 15.55 | 16.22 | |
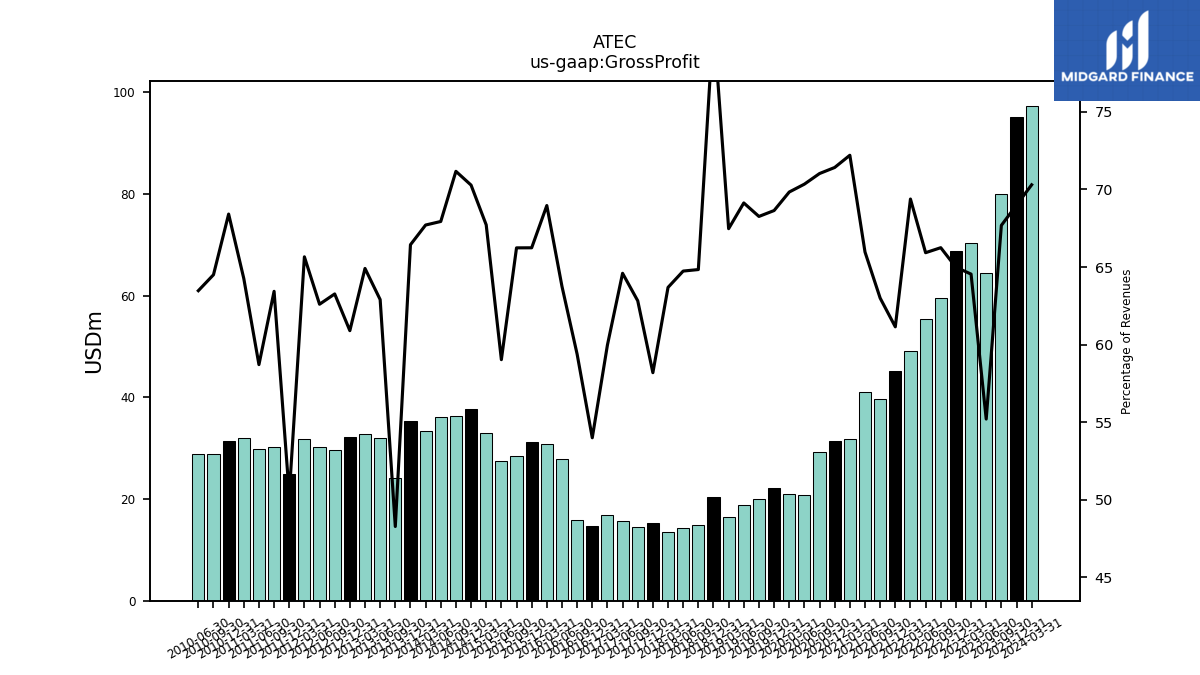
| Gross Profit | 95.19 | 80.05 | 64.54 | 70.42 | 68.85 | 59.52 | 55.48 | 49.22 | 45.23 | 39.61 | 41.06 | 31.86 | 31.39 | 29.24 | 20.84 | 21.03 | 22.21 | 19.93 | 18.89 | 16.57 | 20.48 | 14.91 | 14.27 | 13.57 | 15.29 | 14.51 | 15.75 | 16.78 | 14.63 | 15.86 | 27.92 | 30.87 | 31.14 | 28.48 | 27.53 | 32.94 | 37.69 | 36.31 | 36.12 | 33.29 | 35.26 | 24.23 | 32.09 | 32.74 | 32.12 | 29.63 | 30.20 | 31.82 | 24.91 | 30.21 | 29.86 | 31.95 | 31.48 | 28.93 | 28.83 | |
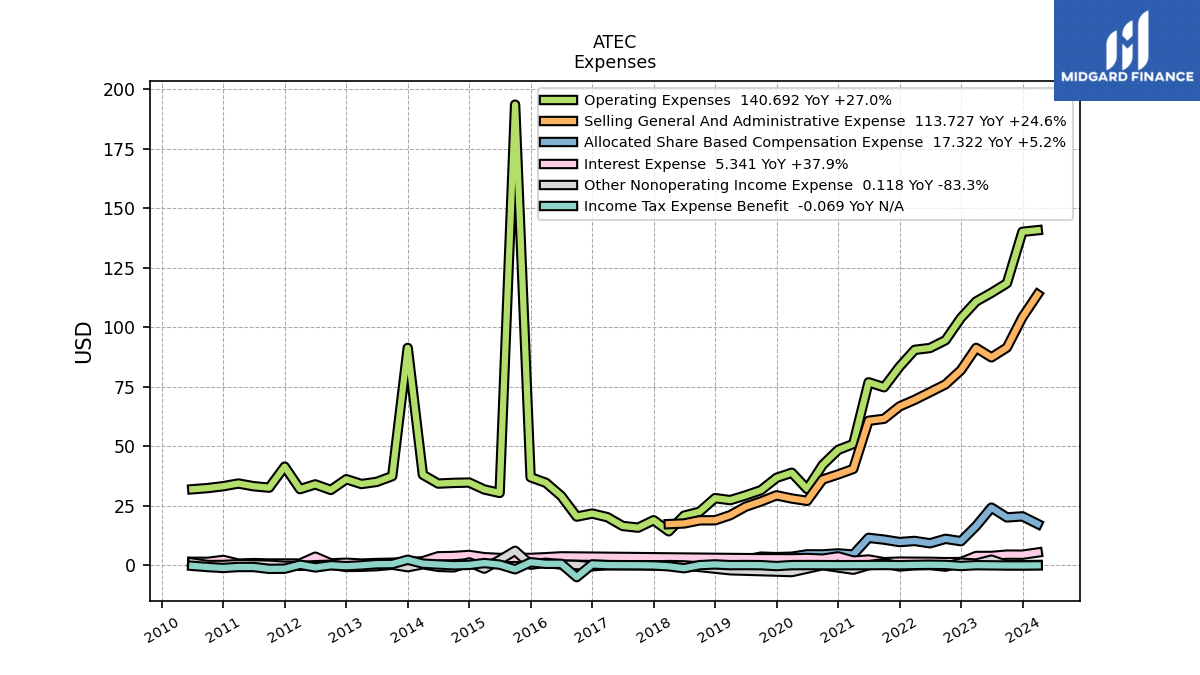
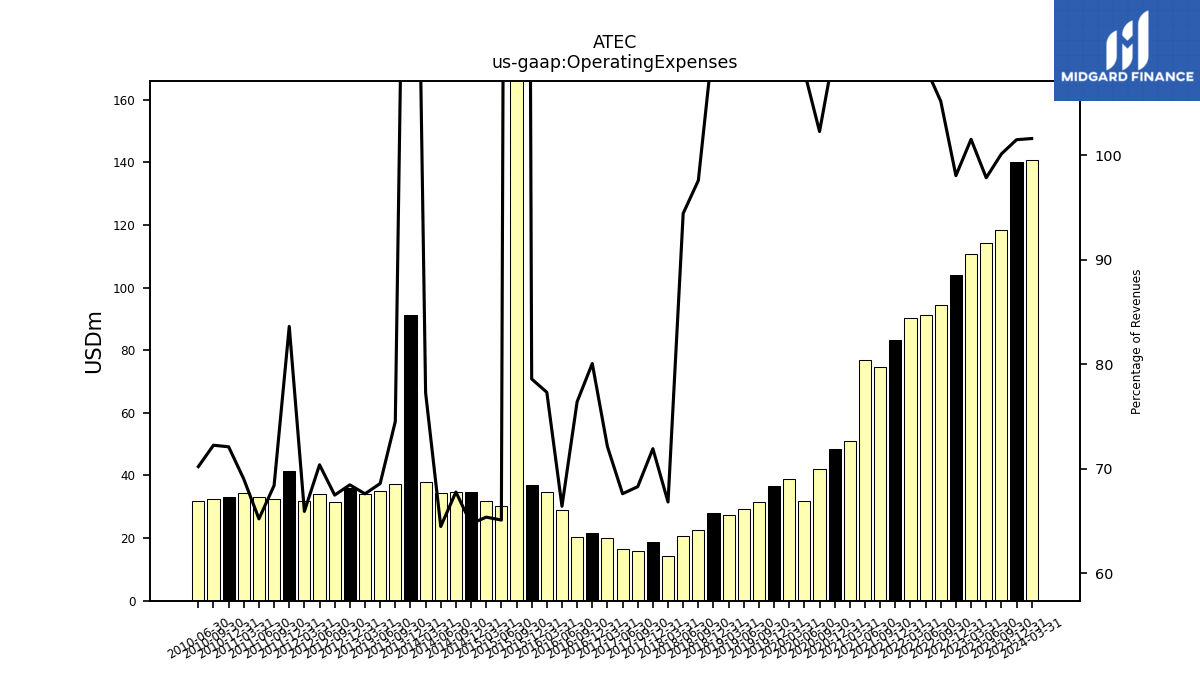
| Operating Expenses | 140.02 | 118.41 | 114.40 | 110.77 | 103.88 | 94.49 | 91.22 | 90.44 | 83.36 | 74.73 | 76.82 | 50.90 | 48.43 | 42.10 | 32.00 | 38.84 | 36.71 | 31.53 | 29.30 | 27.33 | 28.18 | 22.45 | 20.82 | 14.24 | 18.90 | 15.77 | 16.48 | 20.18 | 21.69 | 20.41 | 29.08 | 34.61 | 36.94 | 193.43 | 30.35 | 31.80 | 34.72 | 34.57 | 34.28 | 38.00 | 91.26 | 37.41 | 34.99 | 34.10 | 36.11 | 31.61 | 33.95 | 31.95 | 41.40 | 32.57 | 33.16 | 34.31 | 33.18 | 32.40 | 31.89 | |
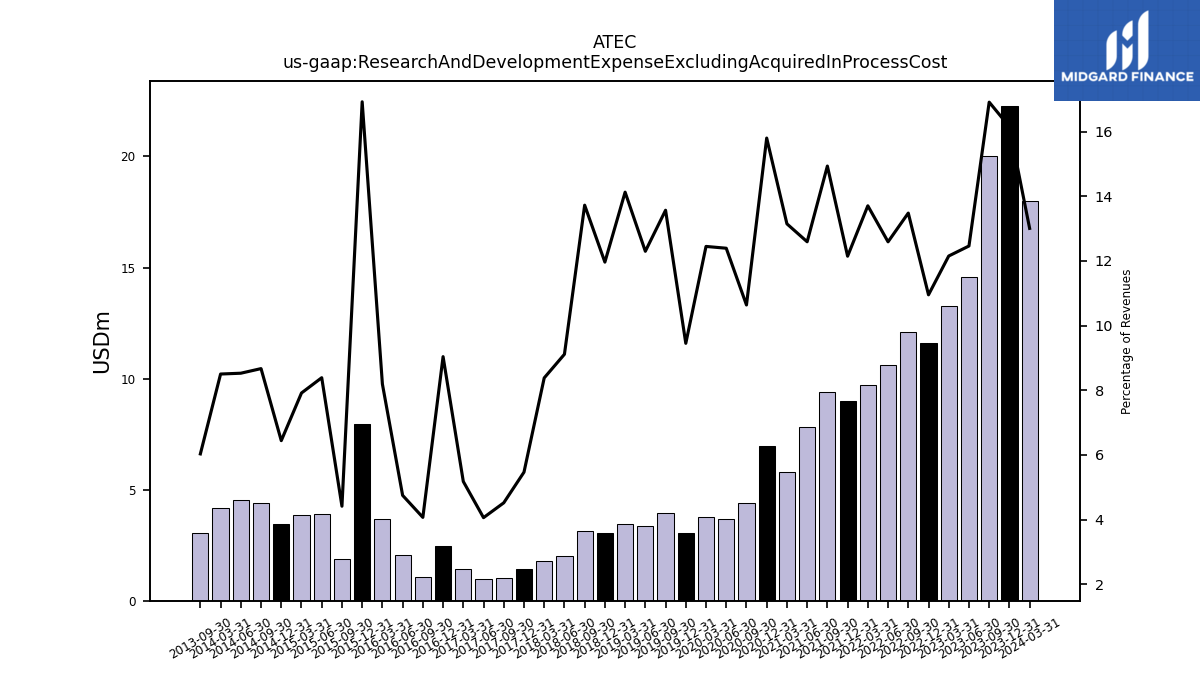
| Research And Development Expense Excluding Acquired In Process Cost | 22.28 | 20.00 | 14.57 | 13.26 | 11.60 | 12.11 | 10.60 | 9.72 | 8.98 | 9.39 | 7.84 | 5.80 | 6.95 | 4.38 | 3.67 | 3.75 | 3.06 | 3.96 | 3.36 | 3.47 | 3.03 | 3.16 | 2.01 | 1.79 | 1.44 | 1.04 | 0.99 | 1.45 | 2.45 | 1.09 | 2.08 | 3.67 | 7.95 | 1.90 | 3.91 | 3.85 | 3.46 | 4.42 | 4.53 | 4.18 | NA | 3.03 | NA | NA | NA | NA | NA | NA | NA | NA | NA | NA | NA | NA | NA | |
| Selling General And Administrative Expense | 104.12 | 91.41 | 87.29 | 91.26 | 81.92 | 75.95 | 72.67 | 69.47 | 66.69 | 61.49 | 60.66 | 40.43 | 38.13 | 35.98 | 27.03 | 28.00 | 29.35 | 26.79 | 24.57 | 21.00 | 18.88 | 18.83 | 17.54 | 17.26 | NA | NA | NA | NA | NA | NA | NA | NA | NA | NA | NA | NA | NA | NA | NA | NA | NA | NA | NA | NA | NA | NA | NA | NA | NA | NA | NA | NA | NA | NA | NA | |
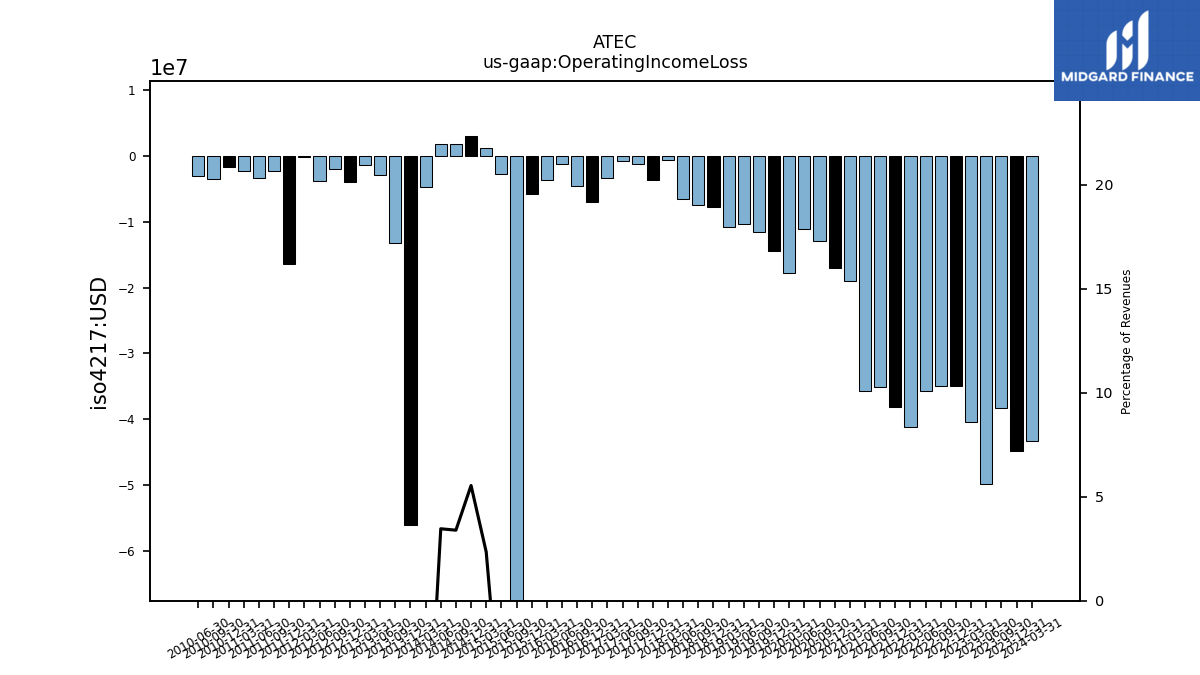
| Operating Income Loss | -44.83 | -38.36 | -49.86 | -40.35 | -35.03 | -34.97 | -35.75 | -41.23 | -38.14 | -35.12 | -35.75 | -19.05 | -17.04 | -12.86 | -11.16 | -17.81 | -14.50 | -11.60 | -10.41 | -10.77 | -7.70 | -7.53 | -6.54 | -0.67 | -3.61 | -1.26 | -0.73 | -3.40 | -7.06 | -4.55 | -1.16 | -3.74 | -5.81 | -164.95 | -2.83 | 1.14 | 2.97 | 1.73 | 1.84 | -4.70 | -56.00 | -13.17 | -2.90 | -1.36 | -3.99 | -1.97 | -3.75 | -0.13 | -16.49 | -2.36 | -3.30 | -2.36 | -1.70 | -3.48 | -3.06 | |
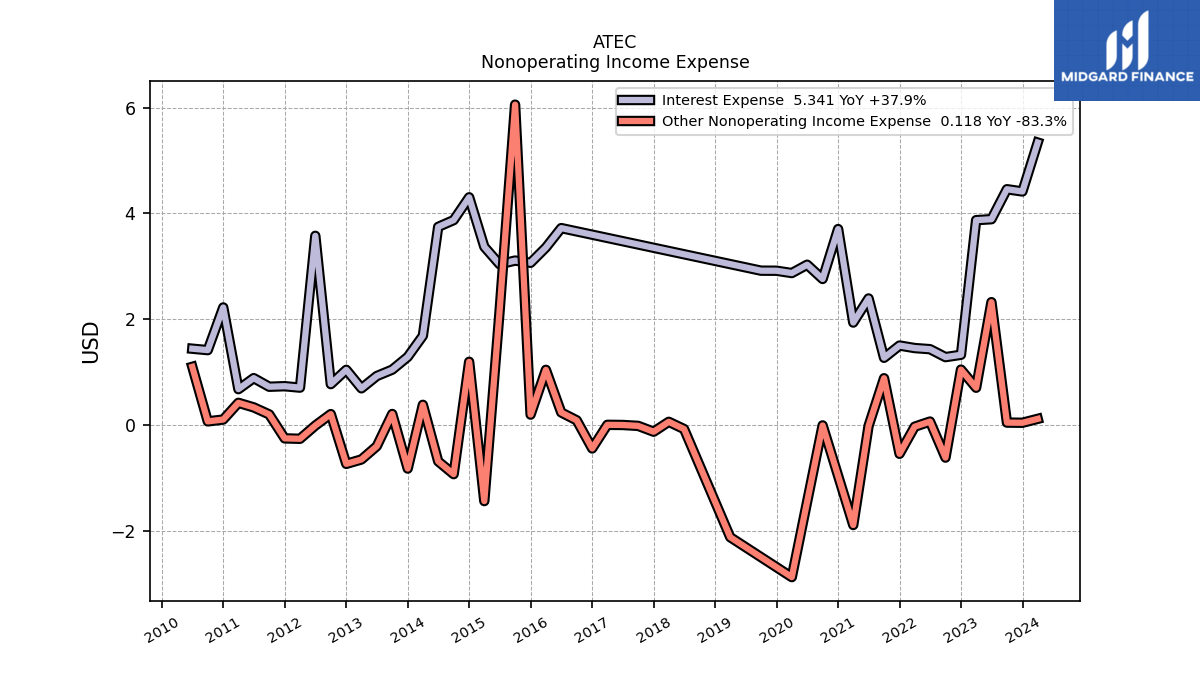
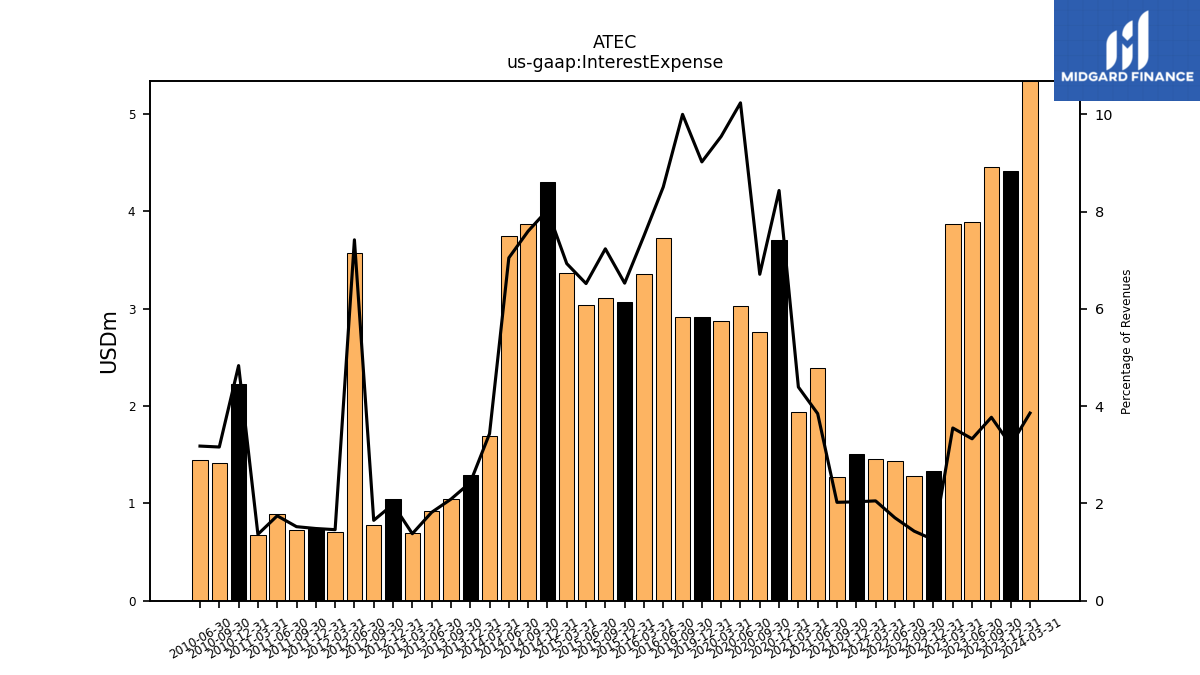
| Interest Expense | 4.42 | 4.46 | 3.89 | 3.87 | 1.33 | 1.28 | 1.44 | 1.46 | 1.50 | 1.27 | 2.39 | 1.94 | 3.71 | 2.76 | 3.03 | 2.87 | 2.92 | 2.92 | NA | NA | NA | NA | NA | NA | NA | NA | NA | NA | NA | NA | 3.72 | 3.36 | 3.07 | 3.11 | 3.04 | 3.37 | 4.31 | 3.88 | 3.75 | 1.69 | 1.29 | 1.05 | 0.93 | 0.69 | 1.04 | 0.77 | 3.58 | 0.71 | 0.73 | 0.72 | 0.89 | 0.68 | 2.22 | 1.42 | 1.44 | |
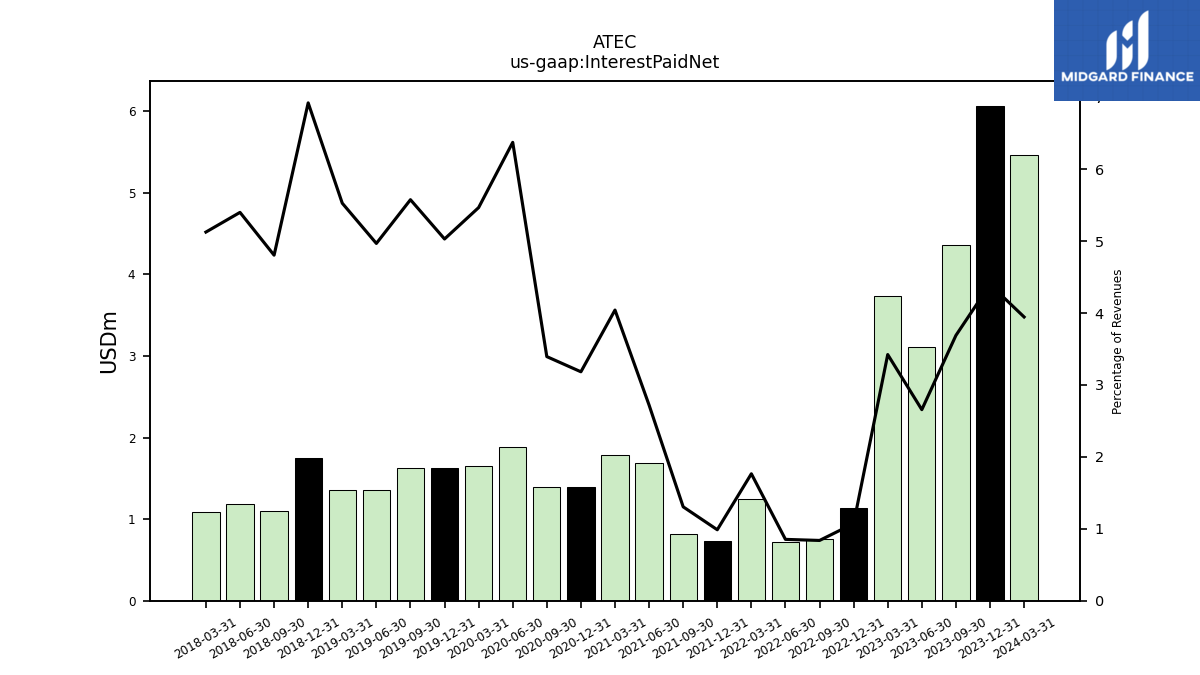
| Interest Paid Net | 6.07 | 4.36 | 3.11 | 3.73 | 1.14 | 0.75 | 0.72 | 1.25 | 0.73 | 0.82 | 1.69 | 1.78 | 1.40 | 1.40 | 1.89 | 1.65 | 1.63 | 1.63 | 1.36 | 1.36 | 1.75 | 1.10 | 1.19 | 1.09 | NA | NA | NA | NA | NA | NA | NA | NA | NA | NA | NA | NA | NA | NA | NA | NA | NA | NA | NA | NA | NA | NA | NA | NA | NA | NA | NA | NA | NA | NA | NA | |
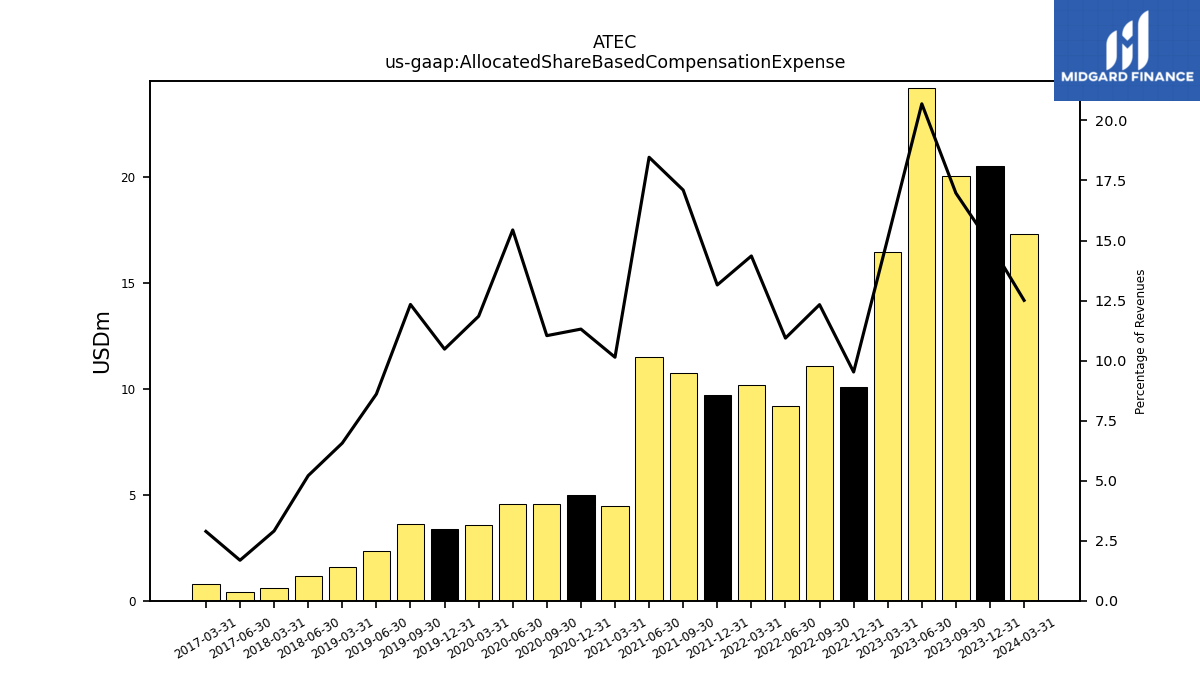
| Allocated Share Based Compensation Expense | 20.52 | 20.07 | 24.19 | 16.46 | 10.09 | 11.08 | 9.20 | 10.18 | 9.73 | 10.75 | 11.50 | 4.47 | 4.97 | 4.54 | 4.58 | 3.57 | 3.39 | 3.60 | 2.35 | 1.61 | NA | NA | 1.15 | 0.62 | NA | NA | 0.41 | 0.81 | NA | NA | NA | NA | NA | NA | NA | NA | NA | NA | NA | NA | NA | NA | NA | NA | NA | NA | NA | NA | NA | NA | NA | NA | NA | NA | NA | |
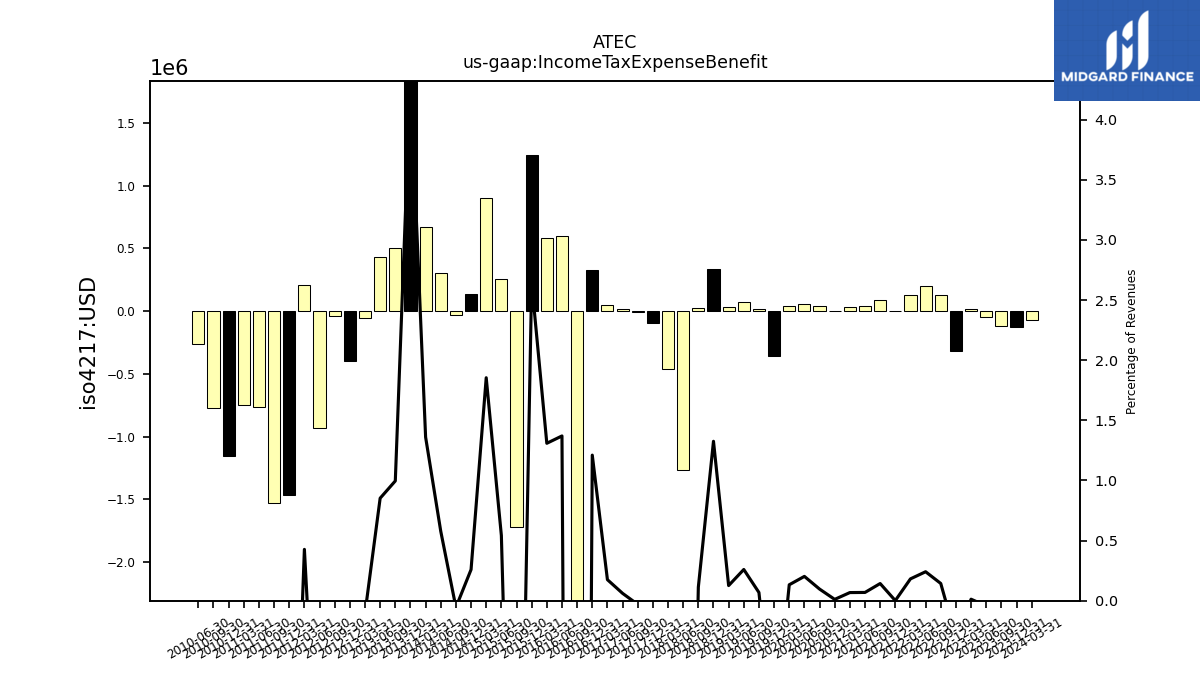
| Income Tax Expense Benefit | -0.12 | -0.12 | -0.05 | 0.01 | -0.32 | 0.13 | 0.20 | 0.13 | 0.00 | 0.09 | 0.04 | 0.03 | 0.01 | 0.04 | 0.06 | 0.04 | -0.36 | 0.02 | 0.07 | 0.03 | 0.34 | 0.03 | -1.26 | -0.46 | -0.09 | -0.01 | 0.01 | 0.05 | 0.33 | -5.00 | 0.60 | 0.59 | 1.24 | -1.72 | 0.25 | 0.90 | 0.14 | -0.03 | 0.31 | 0.67 | 2.30 | 0.50 | 0.43 | -0.05 | -0.40 | -0.04 | -0.93 | 0.21 | -1.46 | -1.53 | -0.76 | -0.75 | -1.16 | -0.77 | -0.27 | |
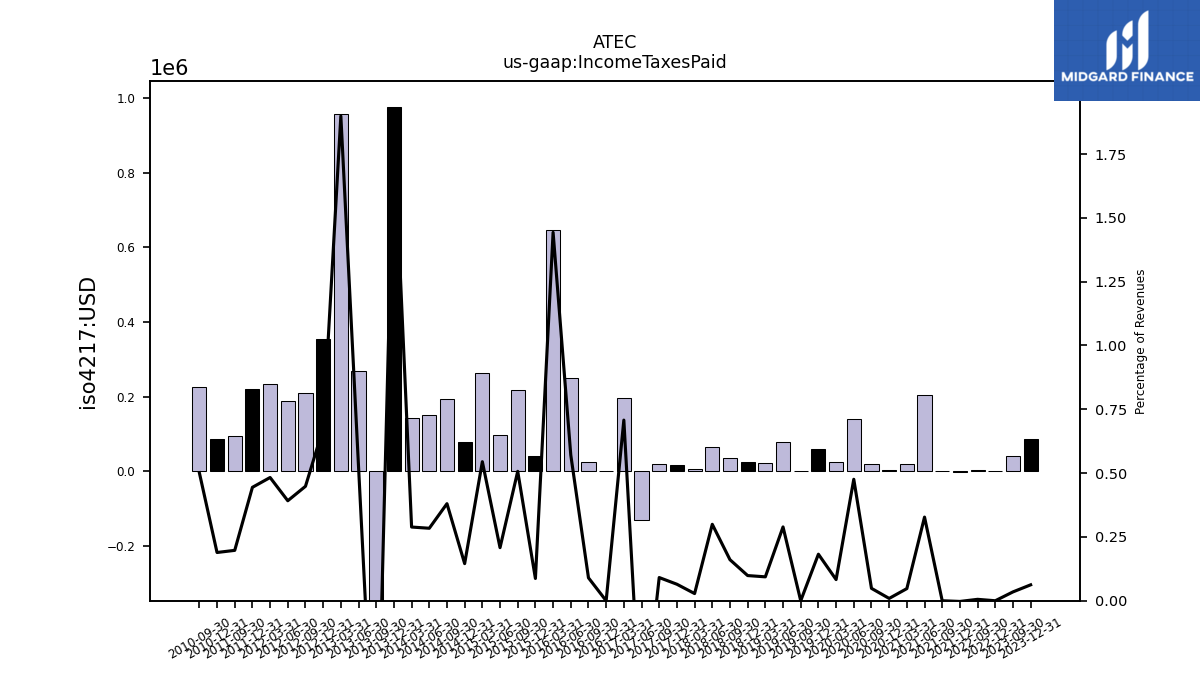
| Income Taxes Paid | 0.09 | 0.04 | NA | NA | 0.00 | 0.01 | NA | NA | -0.00 | 0.00 | 0.20 | 0.02 | 0.00 | 0.02 | 0.14 | 0.03 | 0.06 | 0.00 | 0.08 | 0.02 | 0.03 | 0.04 | 0.07 | 0.01 | 0.02 | 0.02 | -0.13 | 0.20 | 0.00 | 0.02 | 0.25 | 0.65 | 0.04 | 0.22 | 0.10 | 0.27 | 0.08 | 0.19 | 0.15 | 0.14 | 0.98 | -0.42 | 0.27 | 0.96 | 0.36 | 0.21 | 0.19 | 0.23 | 0.22 | 0.09 | NA | NA | 0.09 | 0.23 | NA | |
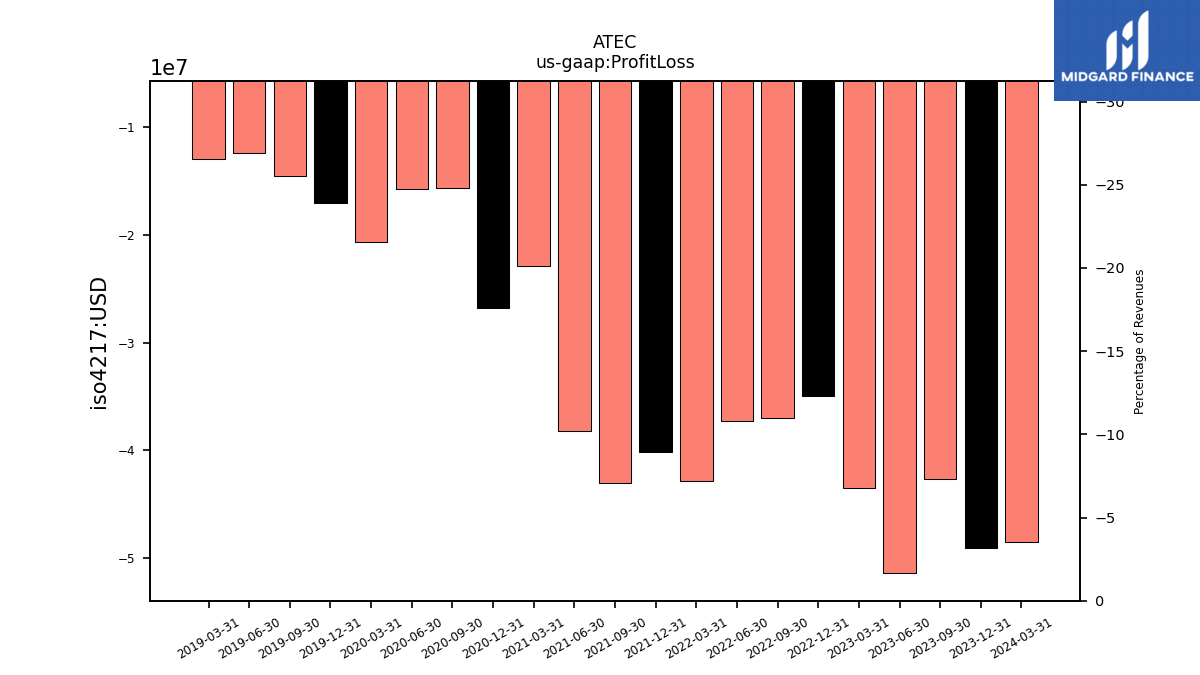
| Profit Loss | -49.08 | -42.65 | -51.38 | -43.53 | -34.99 | -37.00 | -37.32 | -42.84 | -40.19 | -43.03 | -38.20 | -22.90 | -26.80 | -15.67 | -15.80 | -20.72 | -17.03 | -14.57 | -12.44 | -12.97 | NA | NA | NA | NA | NA | NA | NA | NA | NA | NA | NA | NA | NA | NA | NA | NA | NA | NA | NA | NA | NA | NA | NA | NA | NA | NA | NA | NA | NA | NA | NA | NA | NA | NA | NA | |
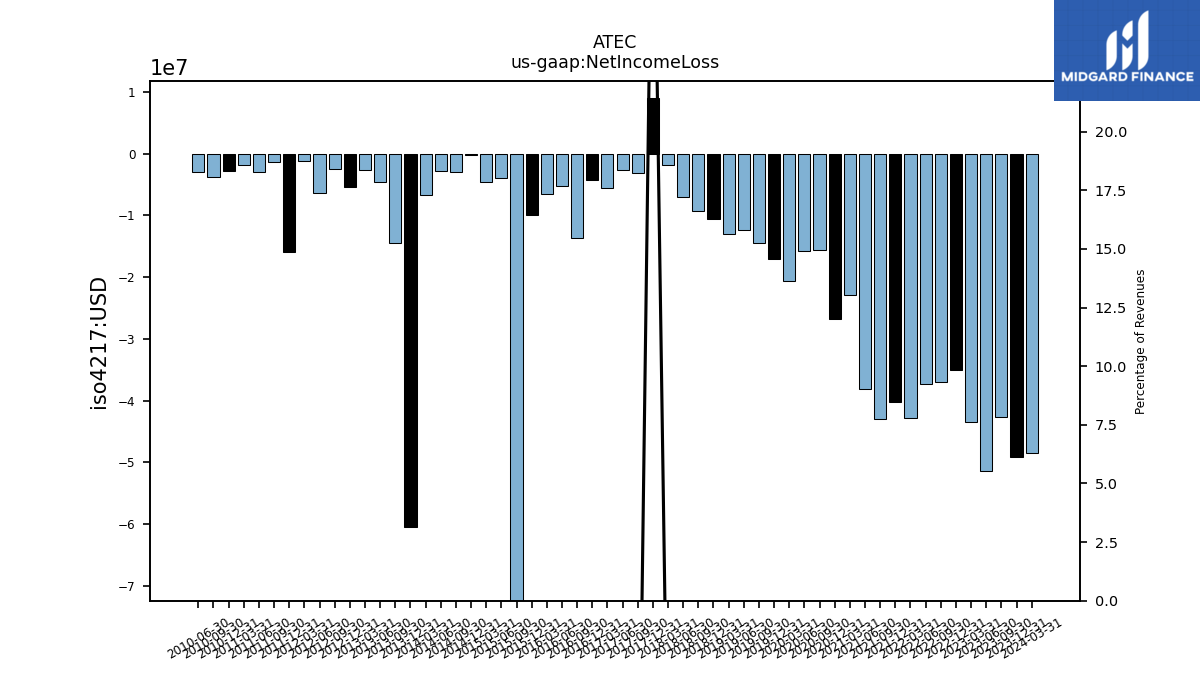
| Net Income Loss | -49.08 | -42.65 | -51.38 | -43.53 | -34.99 | -37.00 | -37.32 | -42.84 | -40.19 | -43.03 | -38.20 | -22.90 | -26.80 | -15.67 | -15.80 | -20.72 | -17.03 | -14.57 | -12.44 | -12.97 | -10.63 | -9.36 | -7.08 | -1.92 | 9.05 | -3.14 | -2.70 | -5.51 | -4.35 | -13.72 | -5.23 | -6.62 | -9.90 | -160.26 | -3.95 | -4.56 | -0.27 | -3.04 | -2.90 | -6.67 | -60.41 | -14.51 | -4.66 | -2.65 | -5.36 | -2.47 | -6.37 | -1.26 | -15.97 | -1.30 | -3.04 | -1.87 | -2.88 | -3.79 | -2.98 | |
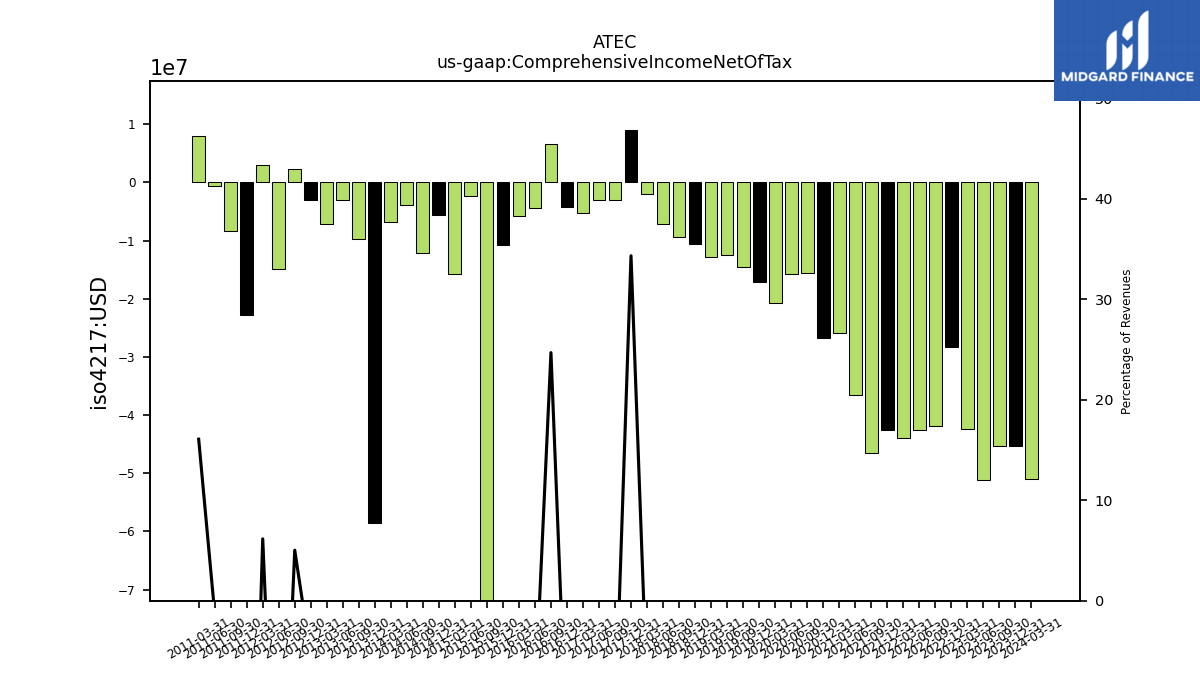
| Comprehensive Income Net Of Tax | -45.29 | -45.25 | -51.20 | -42.42 | -28.36 | -41.85 | -42.61 | -44.02 | -42.57 | -46.49 | -36.51 | -25.95 | -26.77 | -15.65 | -15.80 | -20.65 | -17.06 | -14.60 | -12.42 | -12.89 | -10.60 | -9.40 | -7.07 | -1.94 | 9.02 | -2.93 | -2.94 | -5.33 | -4.15 | 6.59 | -4.38 | -5.83 | -10.74 | -159.64 | -2.41 | -15.76 | -5.65 | -12.13 | -3.80 | -6.85 | -58.61 | -9.77 | -2.94 | -7.13 | -2.94 | 2.36 | -14.94 | 2.98 | -22.76 | -8.28 | -0.63 | 8.00 | NA | NA | NA | |
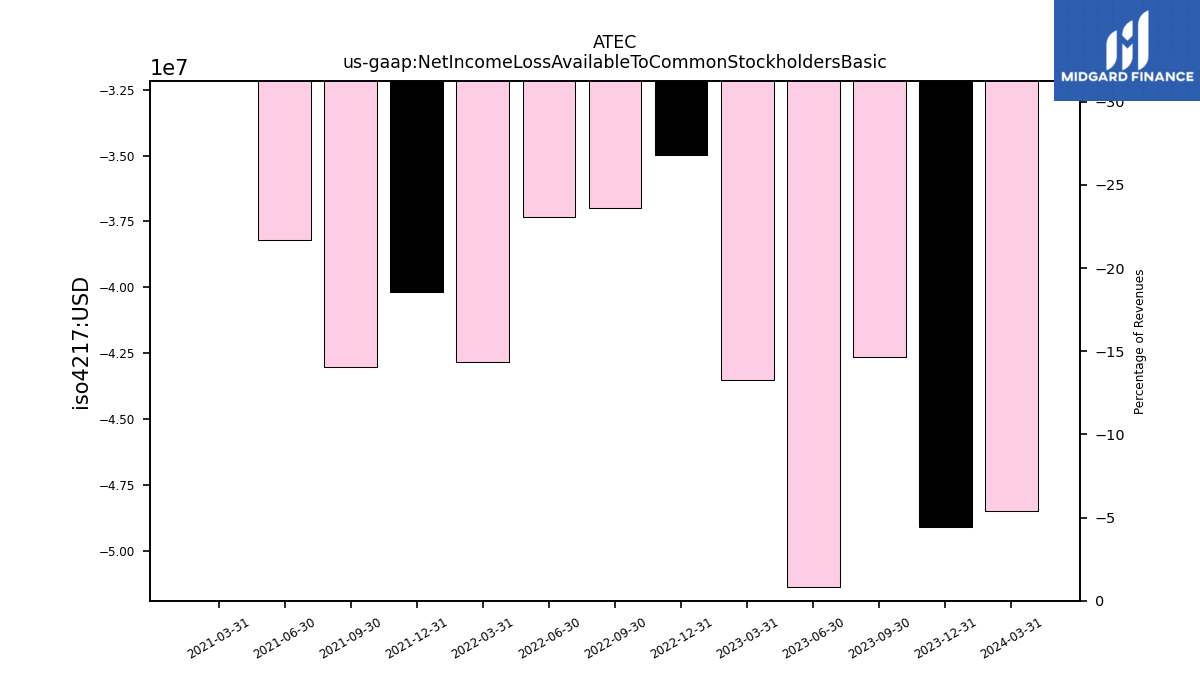
| Net Income Loss Available To Common Stockholders Basic | -49.08 | -42.65 | -51.38 | -43.53 | -34.99 | -37.00 | -37.32 | -42.84 | -40.19 | -43.03 | -38.20 | -22.90 | NA | NA | NA | NA | NA | NA | NA | NA | NA | NA | NA | NA | NA | NA | NA | NA | NA | NA | NA | NA | NA | NA | NA | NA | NA | NA | NA | NA | NA | NA | NA | NA | NA | NA | NA | NA | NA | NA | NA | NA | NA | NA | NA |
| 2023-12-31 | 2023-09-30 | 2023-06-30 | 2023-03-31 | 2022-12-31 | 2022-09-30 | 2022-06-30 | 2022-03-31 | 2021-12-31 | 2021-09-30 | 2021-06-30 | 2021-03-31 | 2020-12-31 | 2020-09-30 | 2020-06-30 | 2020-03-31 | 2019-12-31 | 2019-09-30 | 2019-06-30 | 2019-03-31 | 2018-12-31 | 2018-09-30 | 2018-06-30 | 2018-03-31 | 2017-12-31 | 2017-09-30 | 2017-06-30 | 2017-03-31 | 2016-12-31 | 2016-09-30 | 2016-06-30 | 2016-03-31 | 2015-12-31 | 2015-09-30 | 2015-06-30 | 2015-03-31 | 2014-12-31 | 2014-09-30 | 2014-06-30 | 2014-03-31 | 2013-12-31 | 2013-09-30 | 2013-06-30 | 2013-03-31 | 2012-12-31 | 2012-09-30 | 2012-06-30 | 2012-03-31 | 2011-12-31 | 2011-09-30 | 2011-06-30 | 2011-03-31 | 2010-12-31 | 2010-09-30 | 2010-06-30 | ||
|---|---|---|---|---|---|---|---|---|---|---|---|---|---|---|---|---|---|---|---|---|---|---|---|---|---|---|---|---|---|---|---|---|---|---|---|---|---|---|---|---|---|---|---|---|---|---|---|---|---|---|---|---|---|---|---|---|
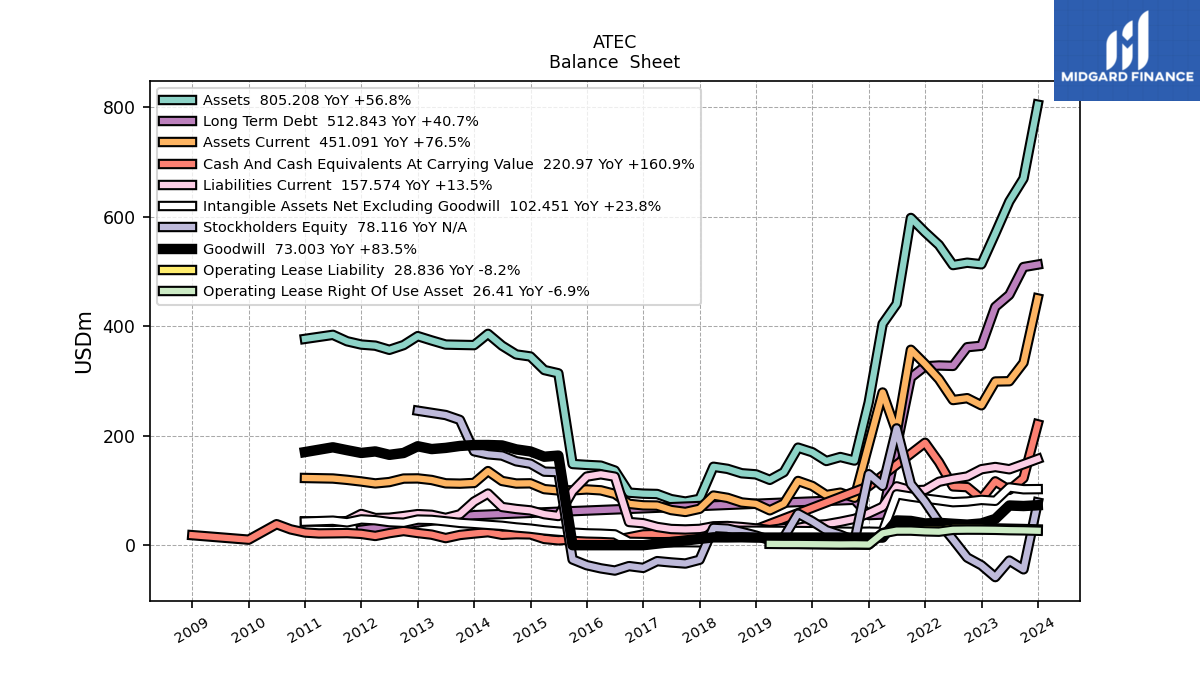
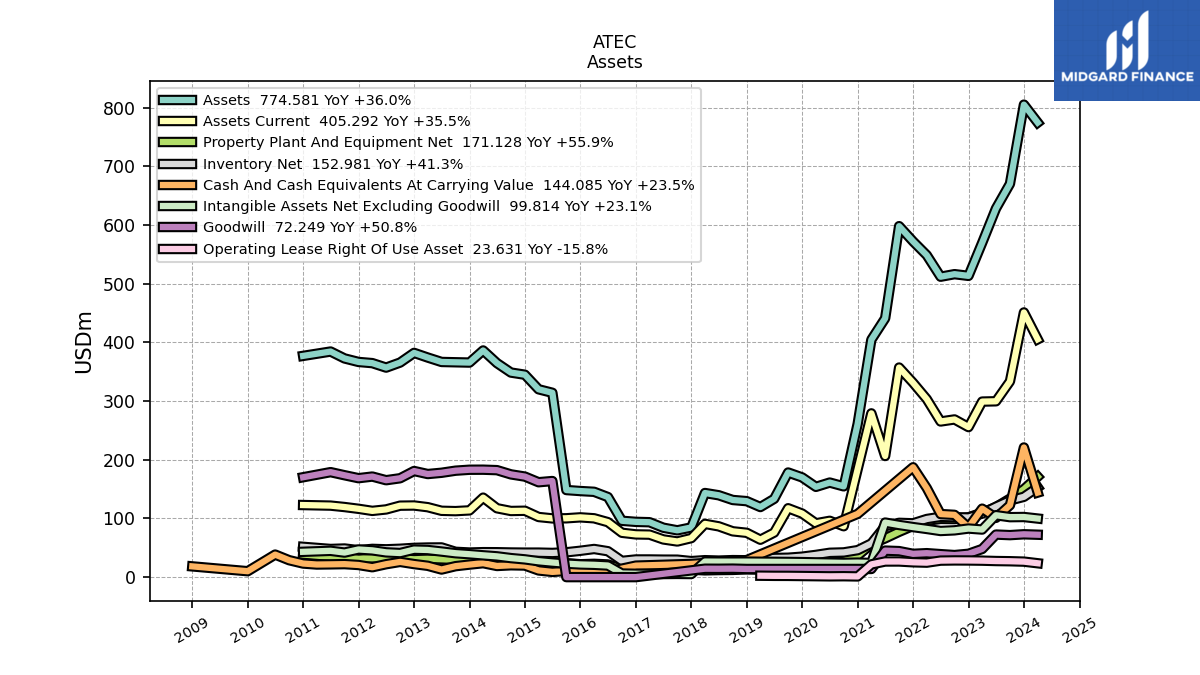
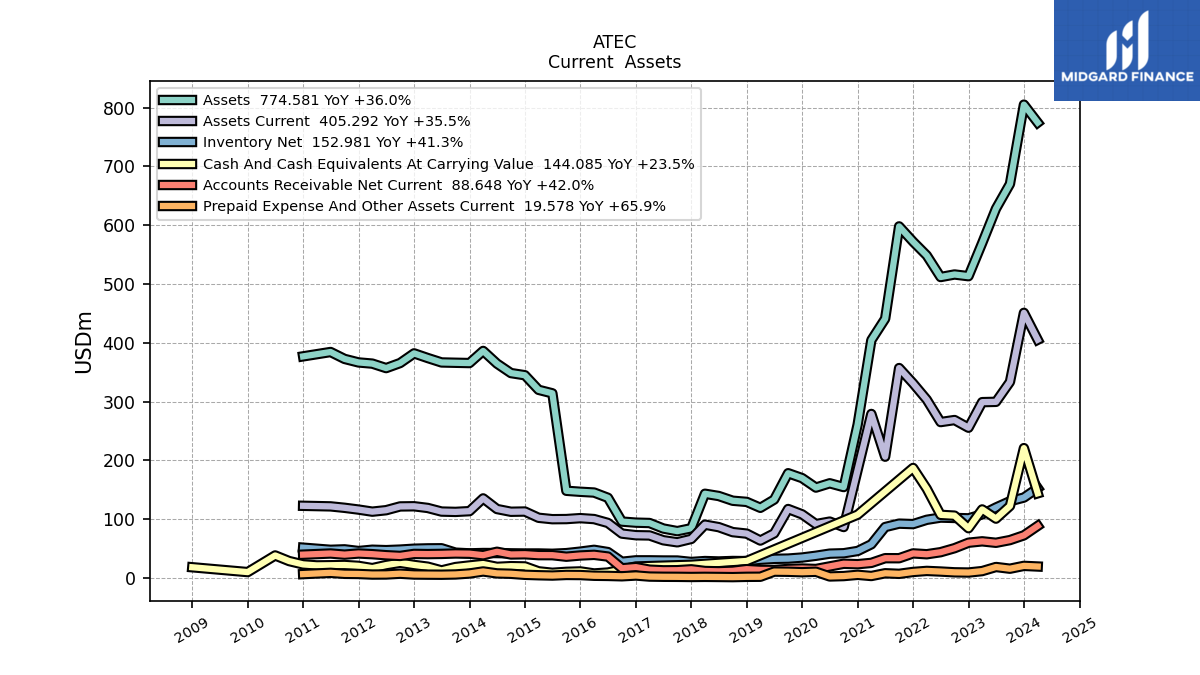
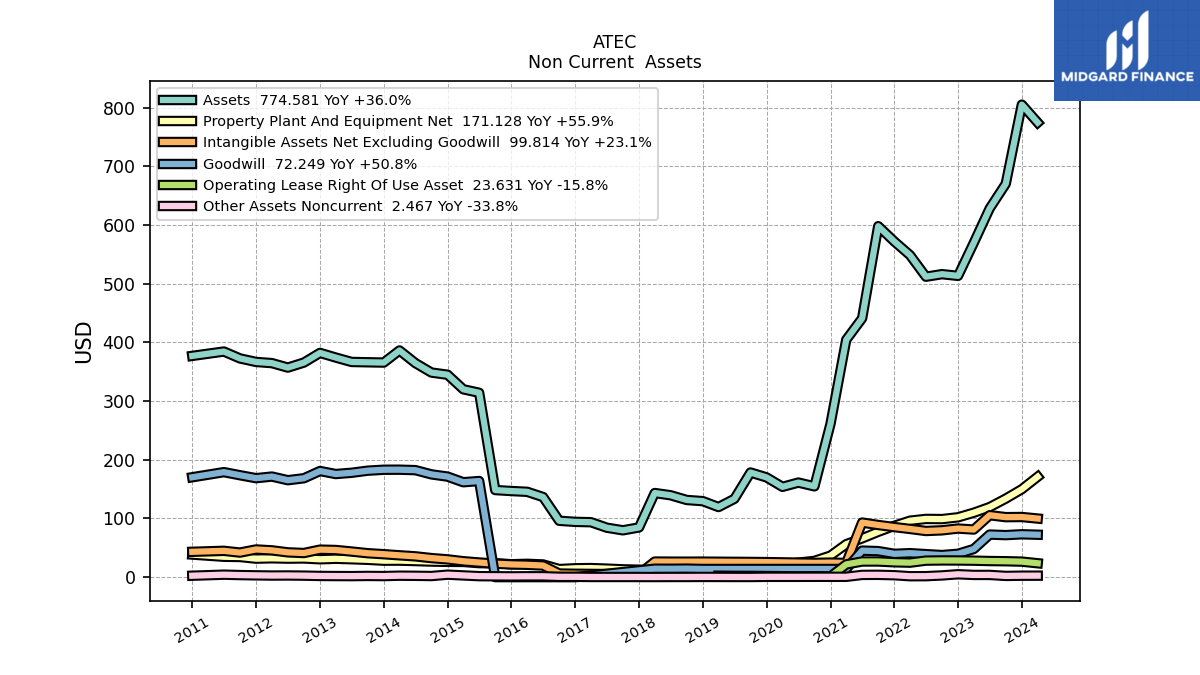
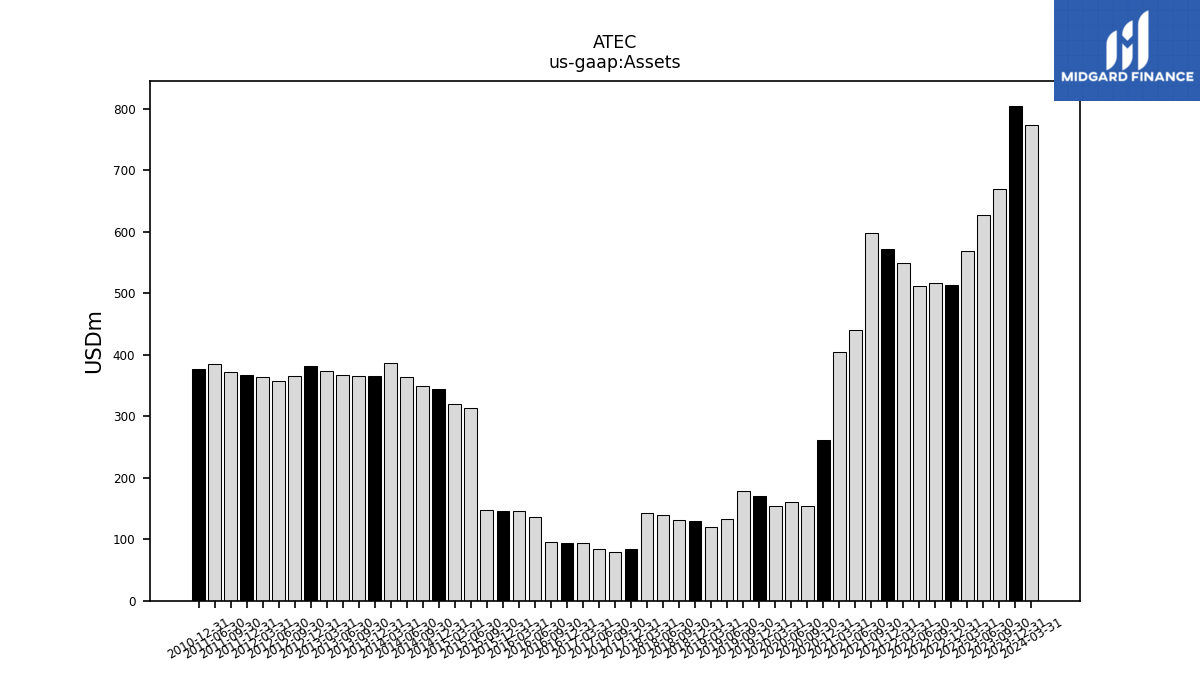
| Assets | 805.21 | 670.22 | 628.23 | 569.69 | 513.38 | 516.28 | 511.94 | 548.69 | 572.05 | 598.11 | 441.03 | 404.50 | 261.22 | 154.68 | 161.13 | 153.84 | 169.95 | 178.28 | 133.43 | 119.42 | 129.48 | 131.47 | 139.50 | 143.34 | 84.66 | 79.77 | 84.20 | 93.57 | 94.19 | 96.03 | 136.45 | 145.39 | 146.70 | 148.38 | 314.17 | 320.11 | 344.92 | 348.60 | 364.71 | 386.28 | 365.63 | 366.13 | 366.67 | 374.20 | 382.13 | 365.67 | 357.05 | 364.68 | 366.69 | 372.69 | 384.45 | NA | 377.02 | NA | NA | |
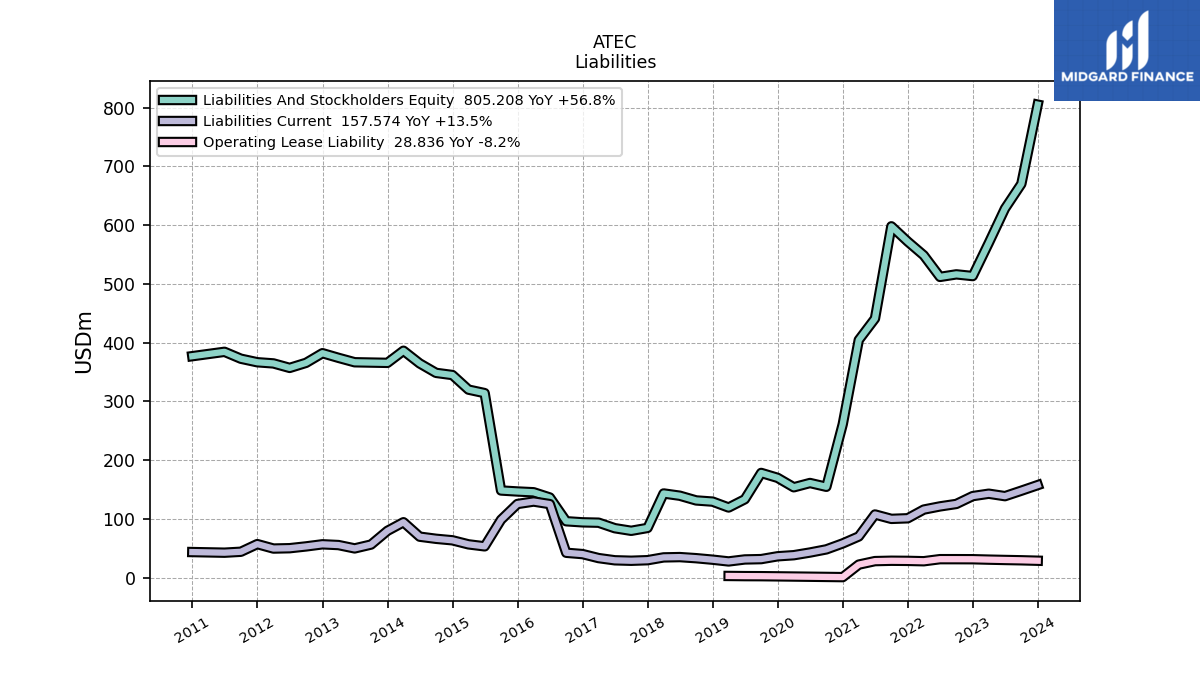
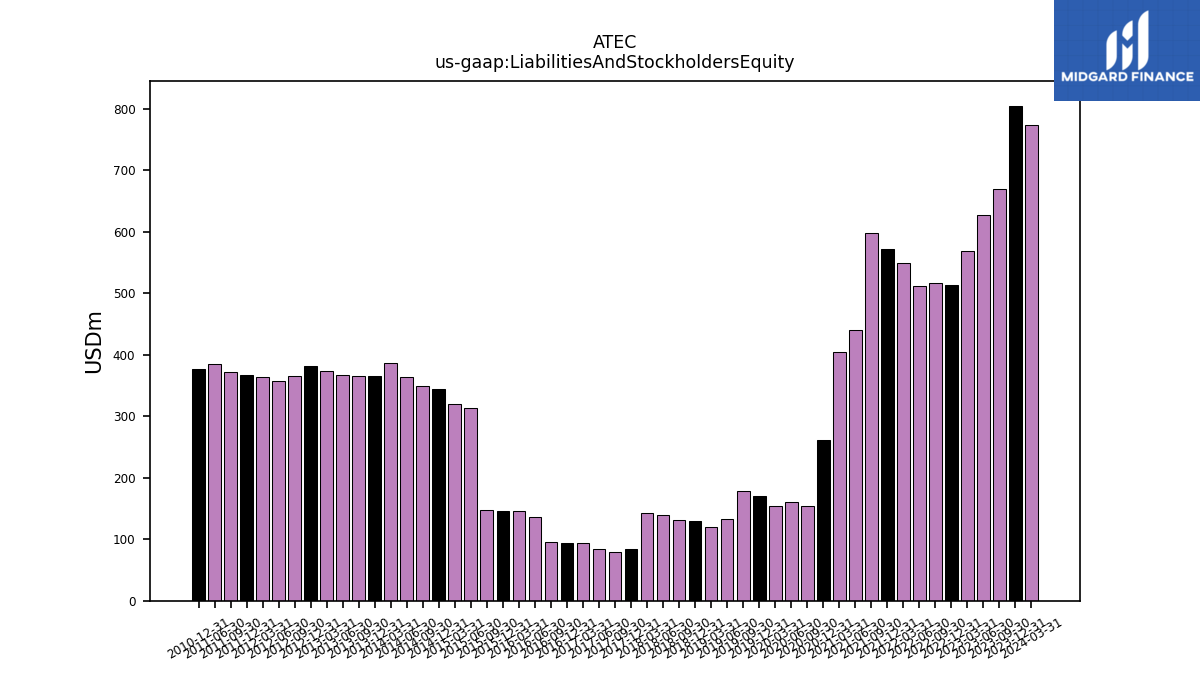
| Liabilities And Stockholders Equity | 805.21 | 670.22 | 628.23 | 569.69 | 513.38 | 516.28 | 511.94 | 548.69 | 572.05 | 598.11 | 441.03 | 404.50 | 261.22 | 154.68 | 161.13 | 153.84 | 169.95 | 178.28 | 133.43 | 119.42 | 129.48 | 131.47 | 139.50 | 143.34 | 84.66 | 79.77 | 84.20 | 93.57 | 94.19 | 96.03 | 136.45 | 145.39 | 146.70 | 148.38 | 314.17 | 320.11 | 344.92 | 348.60 | 364.71 | 386.28 | 365.63 | 366.13 | 366.67 | 374.20 | 382.13 | 365.67 | 357.05 | 364.68 | 366.69 | 372.69 | 384.45 | NA | 377.02 | NA | NA | |
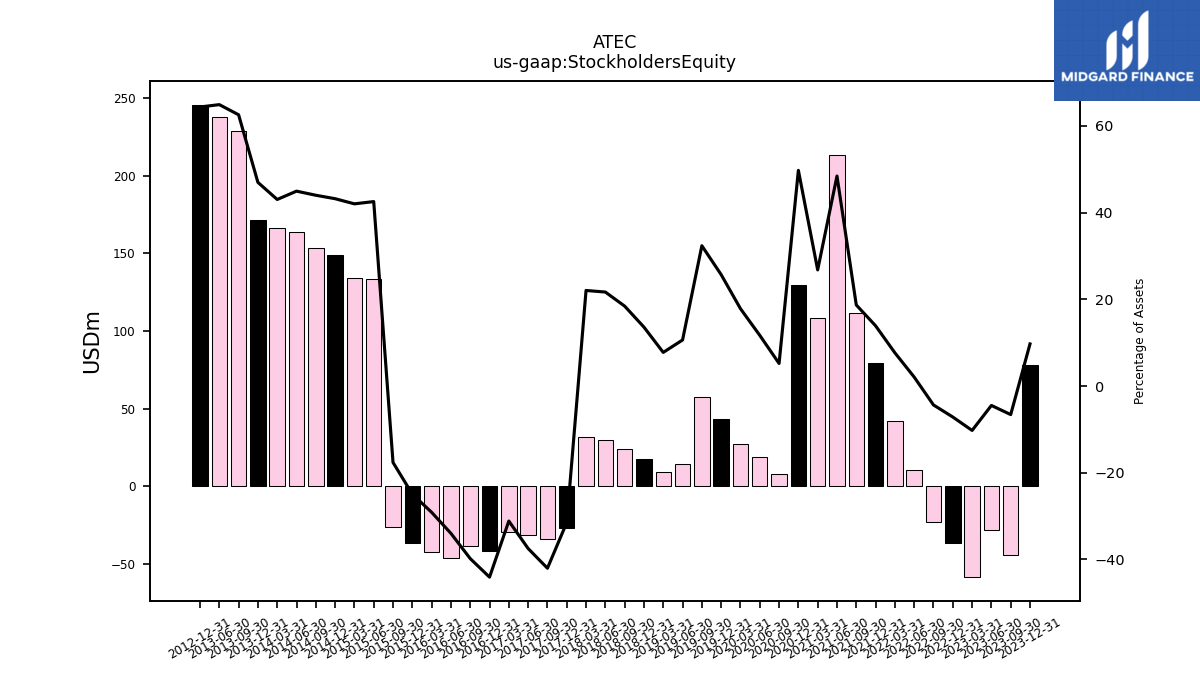
| Stockholders Equity | 78.12 | -44.16 | -28.15 | -58.36 | -36.71 | -22.57 | 10.54 | 41.98 | 79.42 | 111.76 | 213.51 | 108.29 | 129.88 | 8.05 | 18.82 | 27.43 | 43.63 | 57.65 | 14.16 | 9.25 | 17.57 | 24.21 | 30.22 | 31.57 | -26.66 | -33.52 | -31.55 | -29.13 | -41.50 | -38.21 | -46.36 | -42.34 | -36.58 | -26.15 | 133.59 | 134.44 | 148.95 | 153.32 | 163.85 | 166.13 | 171.68 | 228.97 | 237.88 | NA | 245.82 | NA | NA | NA | NA | NA | NA | NA | NA | NA | NA |
| 2023-12-31 | 2023-09-30 | 2023-06-30 | 2023-03-31 | 2022-12-31 | 2022-09-30 | 2022-06-30 | 2022-03-31 | 2021-12-31 | 2021-09-30 | 2021-06-30 | 2021-03-31 | 2020-12-31 | 2020-09-30 | 2020-06-30 | 2020-03-31 | 2019-12-31 | 2019-09-30 | 2019-06-30 | 2019-03-31 | 2018-12-31 | 2018-09-30 | 2018-06-30 | 2018-03-31 | 2017-12-31 | 2017-09-30 | 2017-06-30 | 2017-03-31 | 2016-12-31 | 2016-09-30 | 2016-06-30 | 2016-03-31 | 2015-12-31 | 2015-09-30 | 2015-06-30 | 2015-03-31 | 2014-12-31 | 2014-09-30 | 2014-06-30 | 2014-03-31 | 2013-12-31 | 2013-09-30 | 2013-06-30 | 2013-03-31 | 2012-12-31 | 2012-09-30 | 2012-06-30 | 2012-03-31 | 2011-12-31 | 2011-09-30 | 2011-06-30 | 2011-03-31 | 2010-12-31 | 2010-09-30 | 2010-06-30 | ||
|---|---|---|---|---|---|---|---|---|---|---|---|---|---|---|---|---|---|---|---|---|---|---|---|---|---|---|---|---|---|---|---|---|---|---|---|---|---|---|---|---|---|---|---|---|---|---|---|---|---|---|---|---|---|---|---|---|
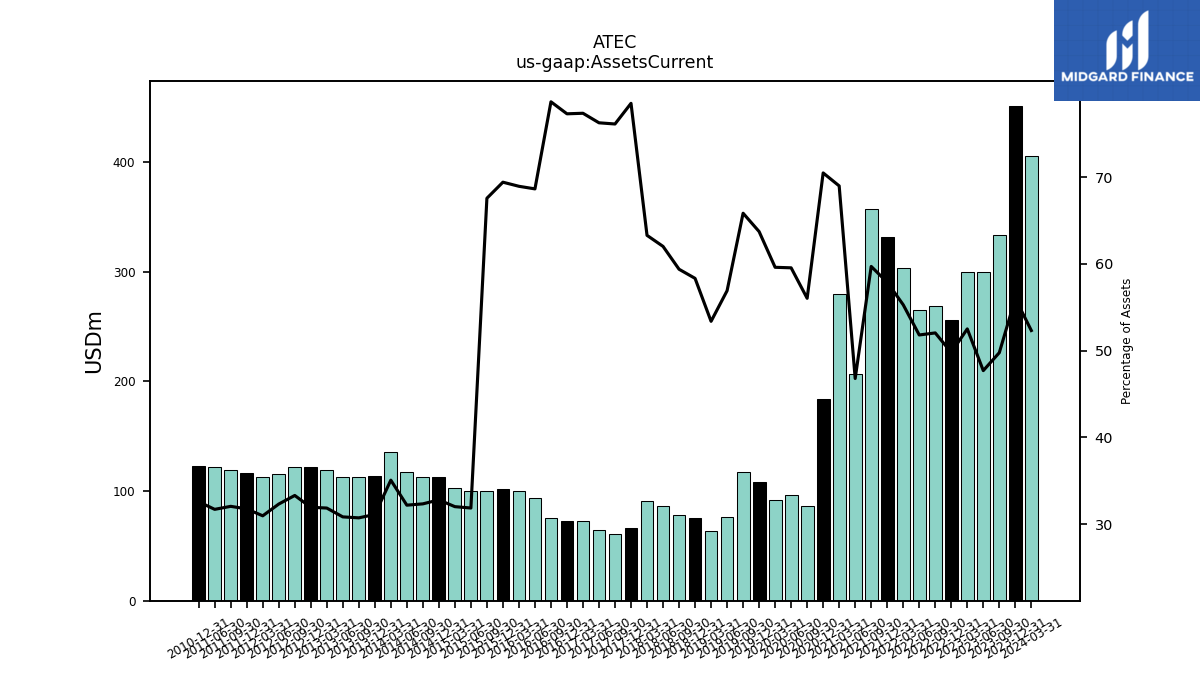
| Assets Current | 451.09 | 333.56 | 299.67 | 299.15 | 255.63 | 268.71 | 265.24 | 303.38 | 331.16 | 357.16 | 206.36 | 279.12 | 184.16 | 86.68 | 95.96 | 91.71 | 108.32 | 117.40 | 75.95 | 63.75 | 75.54 | 78.08 | 86.52 | 90.73 | 66.48 | 60.74 | 64.23 | 72.41 | 72.82 | 75.57 | 93.69 | 100.26 | 101.86 | 100.28 | 100.07 | 102.47 | 113.11 | 112.71 | 117.37 | 135.45 | 113.75 | 112.47 | 113.05 | 119.18 | 122.05 | 121.77 | 115.36 | 112.89 | 116.43 | 119.44 | 121.86 | NA | 122.82 | NA | NA | |
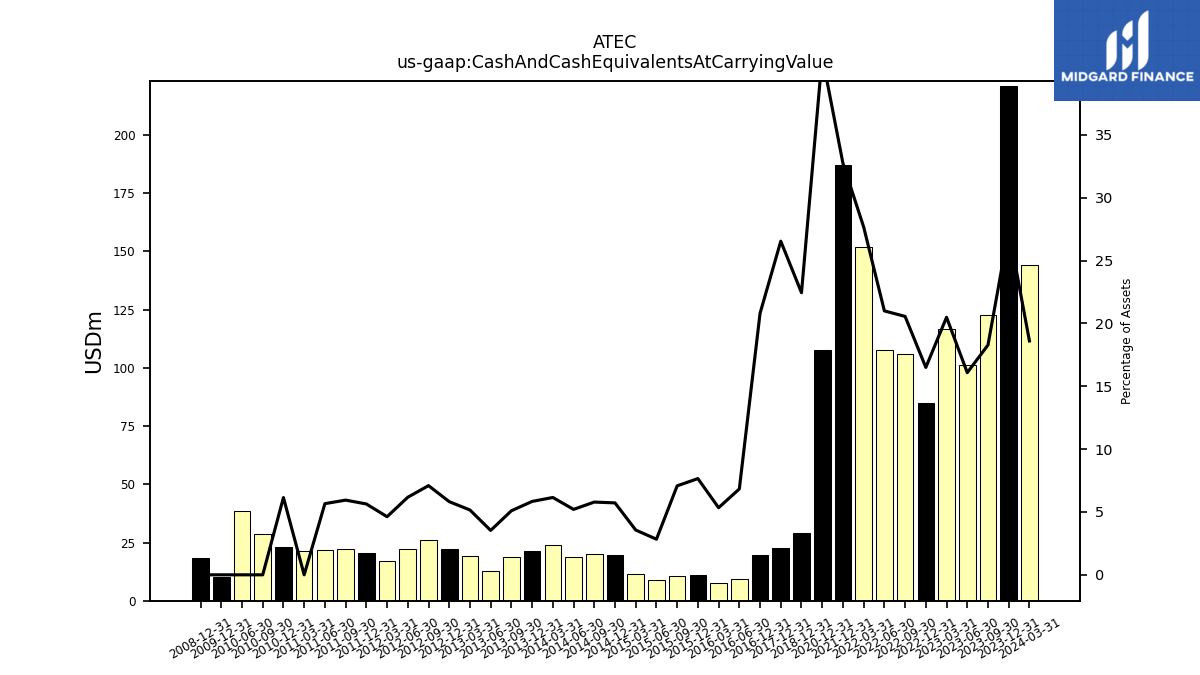
| Cash And Cash Equivalents At Carrying Value | 220.97 | 122.53 | 101.02 | 116.70 | 84.70 | 106.11 | 107.47 | 151.81 | 187.25 | NA | NA | NA | 107.77 | NA | NA | NA | NA | NA | NA | NA | 29.05 | NA | NA | NA | 22.47 | NA | NA | NA | 19.59 | NA | 9.32 | 7.76 | 11.23 | 10.50 | 8.90 | 11.40 | 19.73 | 20.17 | 18.98 | 23.76 | 21.34 | 18.65 | 12.95 | 19.29 | 22.24 | 25.94 | 22.02 | 16.86 | 20.67 | 22.14 | 21.76 | 21.48 | 23.17 | 28.85 | 38.41 | |
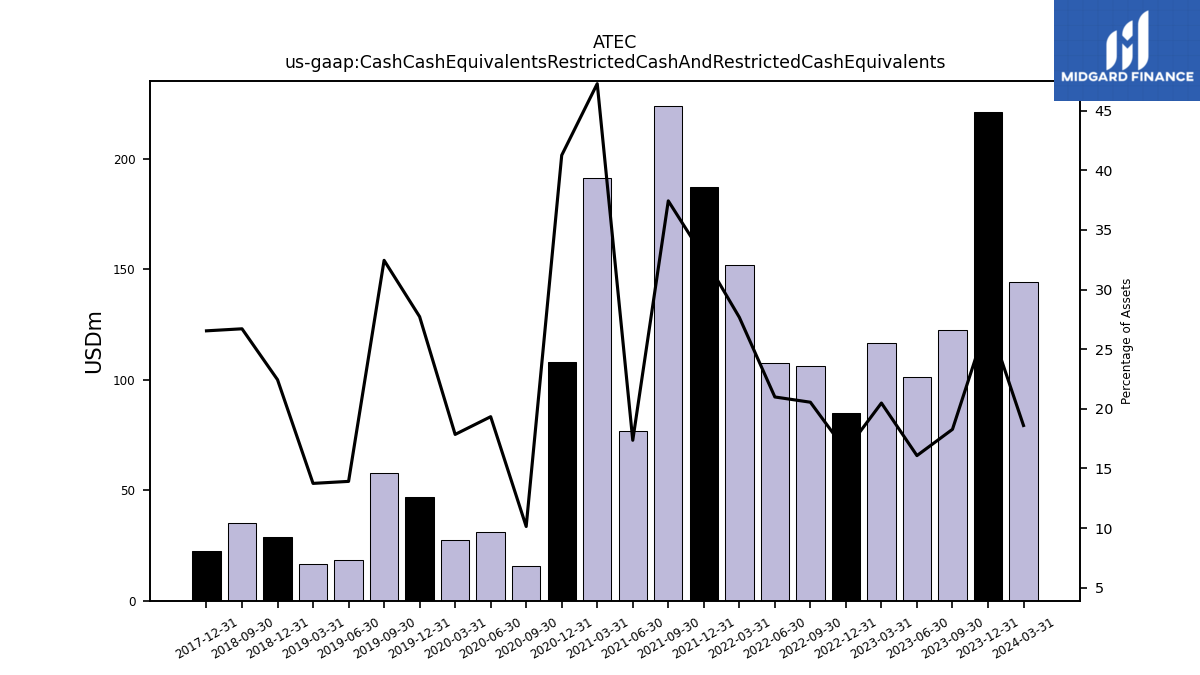
| Cash Cash Equivalents Restricted Cash And Restricted Cash Equivalents | 220.97 | 122.53 | 101.02 | 116.70 | 84.70 | 106.11 | 107.47 | 151.81 | 187.25 | 223.87 | 76.58 | 191.14 | 107.77 | 15.68 | 31.16 | 27.47 | 47.11 | 57.84 | 18.57 | 16.42 | 29.05 | 35.11 | NA | NA | 22.47 | NA | NA | NA | NA | NA | NA | NA | NA | NA | NA | NA | NA | NA | NA | NA | NA | NA | NA | NA | NA | NA | NA | NA | NA | NA | NA | NA | NA | NA | NA | |
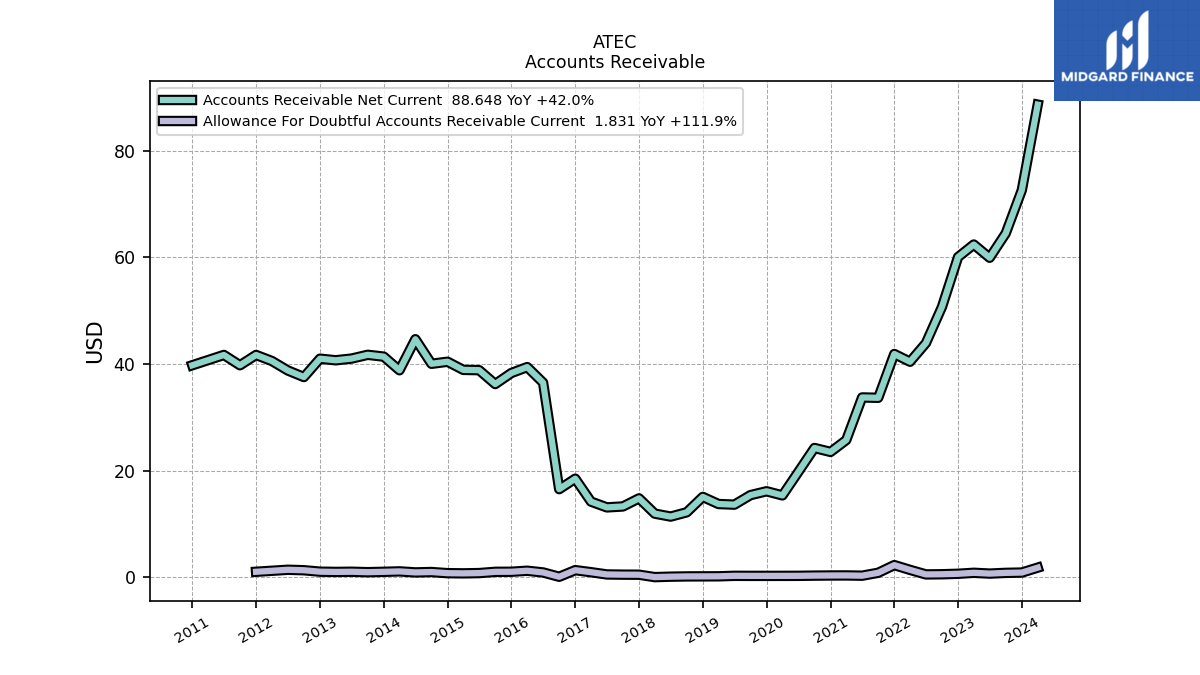
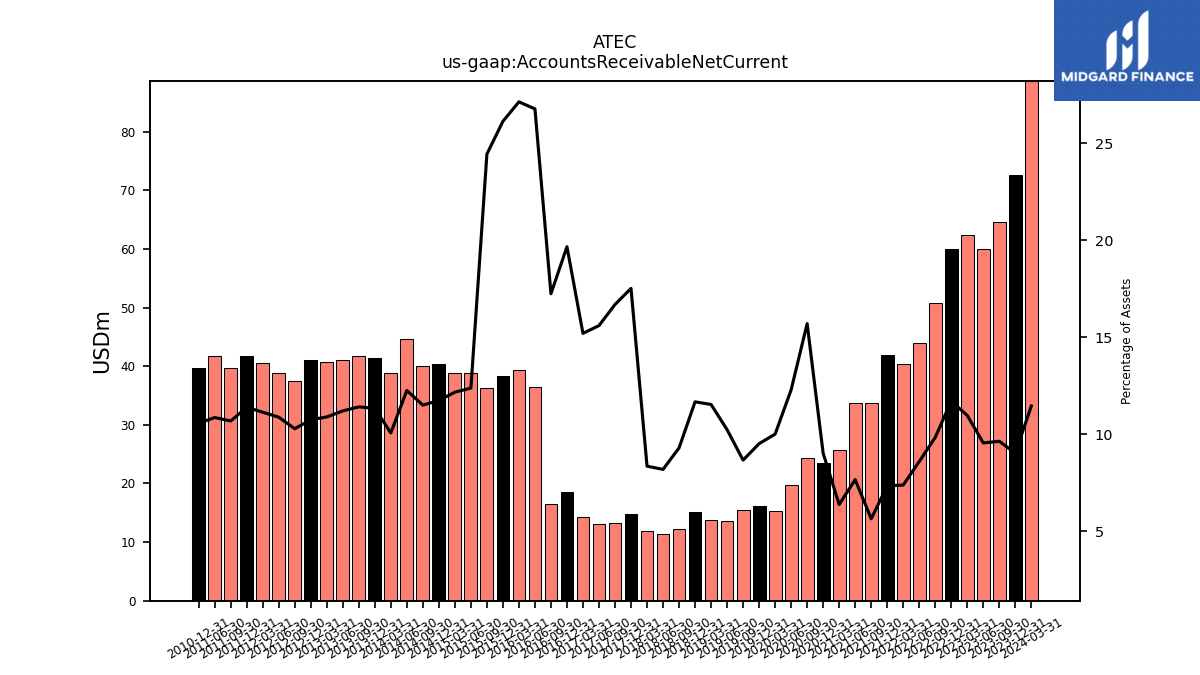
| Accounts Receivable Net Current | 72.61 | 64.52 | 59.93 | 62.41 | 60.06 | 50.72 | 43.93 | 40.44 | 41.89 | 33.68 | 33.74 | 25.75 | 23.53 | 24.27 | 19.79 | 15.38 | 16.15 | 15.43 | 13.64 | 13.76 | 15.10 | 12.20 | 11.40 | 11.96 | 14.82 | 13.30 | 13.13 | 14.21 | 18.51 | 16.55 | 36.52 | 39.44 | 38.32 | 36.25 | 38.86 | 38.91 | 40.44 | 40.05 | 44.66 | 38.84 | 41.40 | 41.74 | 41.03 | 40.71 | 41.01 | 37.56 | 38.80 | 40.57 | 41.71 | 39.77 | 41.71 | NA | 39.78 | NA | NA | |
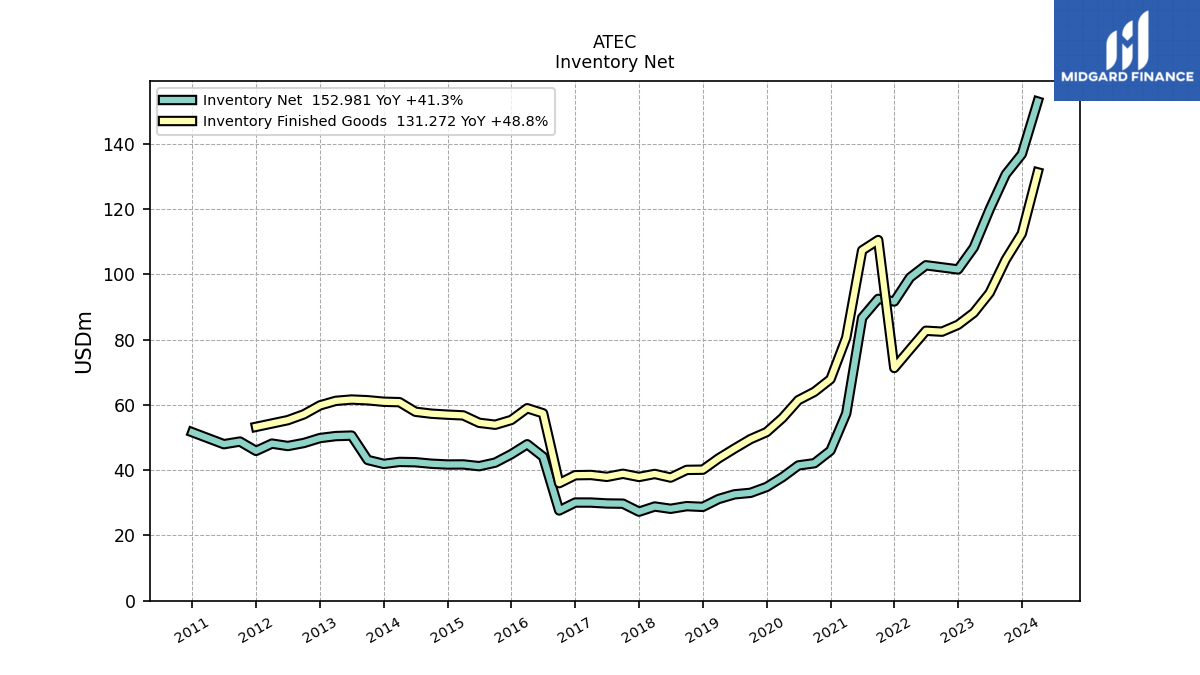
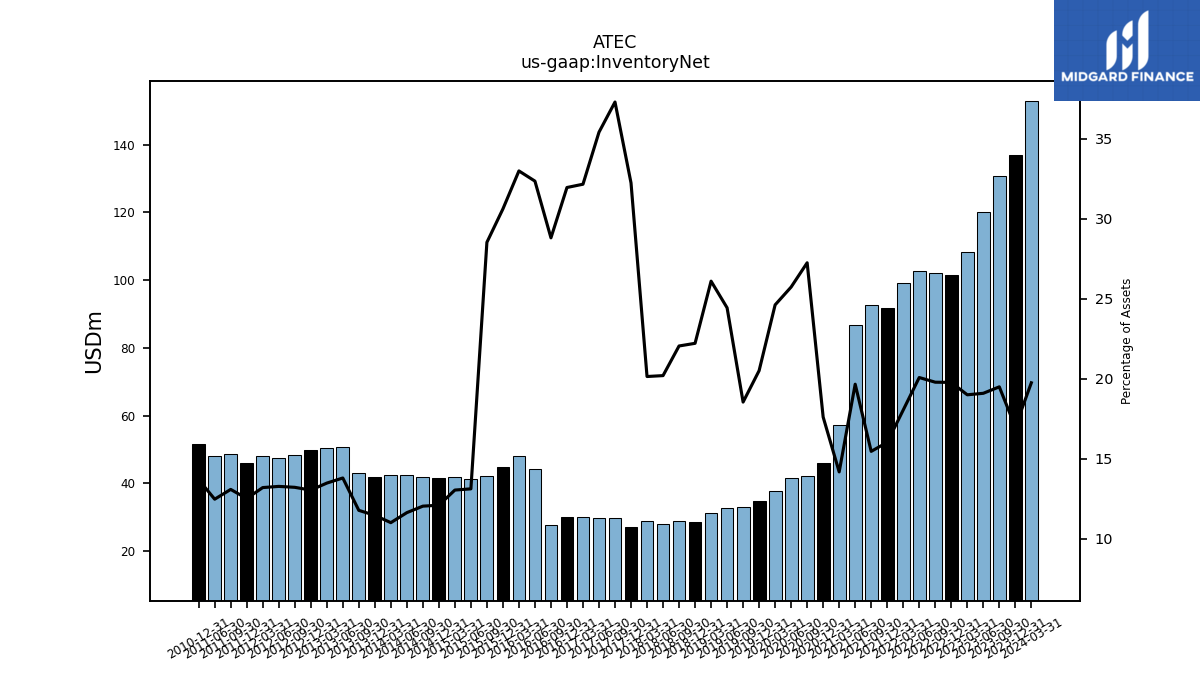
| Inventory Net | 136.84 | 130.67 | 119.96 | 108.24 | 101.52 | 102.16 | 102.80 | 99.04 | 91.70 | 92.51 | 86.72 | 57.38 | 46.00 | 42.14 | 41.47 | 37.87 | 34.85 | 33.06 | 32.60 | 31.17 | 28.77 | 28.99 | 28.18 | 28.87 | 27.29 | 29.75 | 29.81 | 30.09 | 30.09 | 27.66 | 44.14 | 47.96 | 44.91 | 42.33 | 41.24 | 41.77 | 41.75 | 41.99 | 42.45 | 42.54 | 41.94 | 43.14 | 50.61 | 50.46 | 49.85 | 48.34 | 47.41 | 48.16 | 45.92 | 48.78 | 47.97 | NA | 51.63 | NA | NA | |
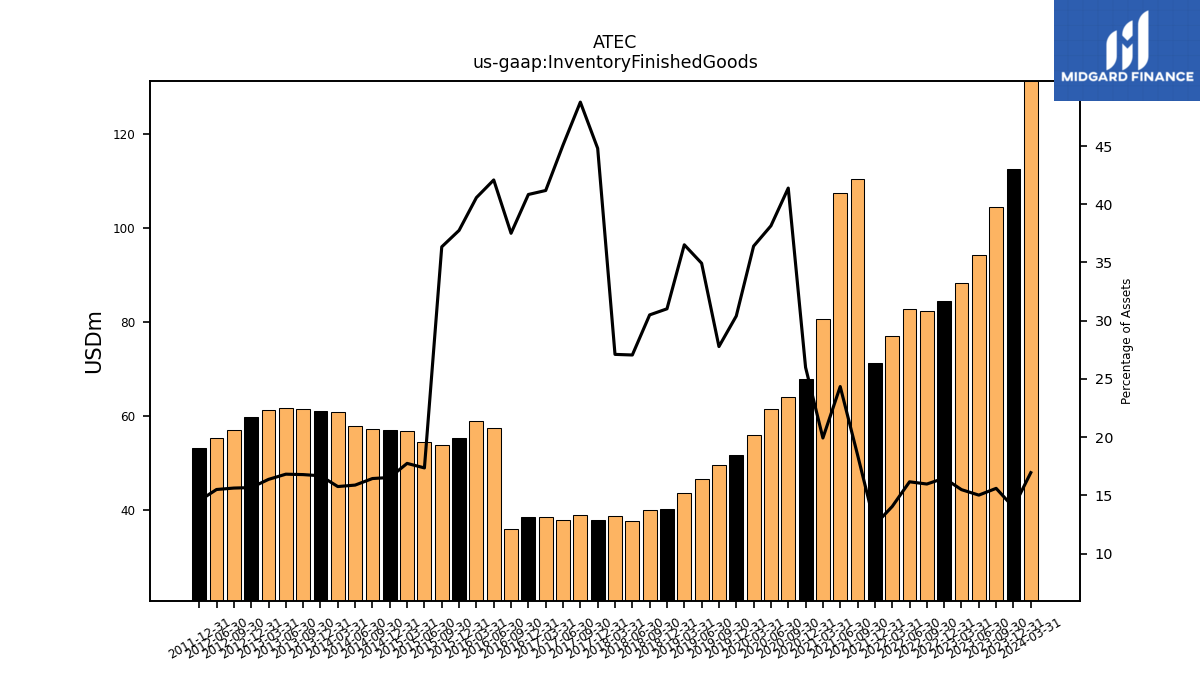
| Inventory Finished Goods | 112.50 | 104.54 | 94.35 | 88.22 | 84.56 | 82.45 | 82.73 | 77.03 | 71.32 | 110.53 | 107.36 | 80.60 | 67.89 | 64.03 | 61.47 | 56.01 | 51.67 | 49.53 | 46.62 | 43.61 | 40.16 | 40.09 | 37.74 | 38.85 | 37.93 | 38.91 | 37.96 | 38.54 | 38.47 | 36.02 | 57.43 | 58.99 | 55.39 | 53.93 | 54.52 | 56.80 | 57.02 | 57.32 | 57.91 | 60.85 | 60.98 | 61.44 | 61.66 | 61.25 | 59.86 | 57.13 | 55.34 | NA | 53.29 | NA | NA | NA | NA | NA | NA | |
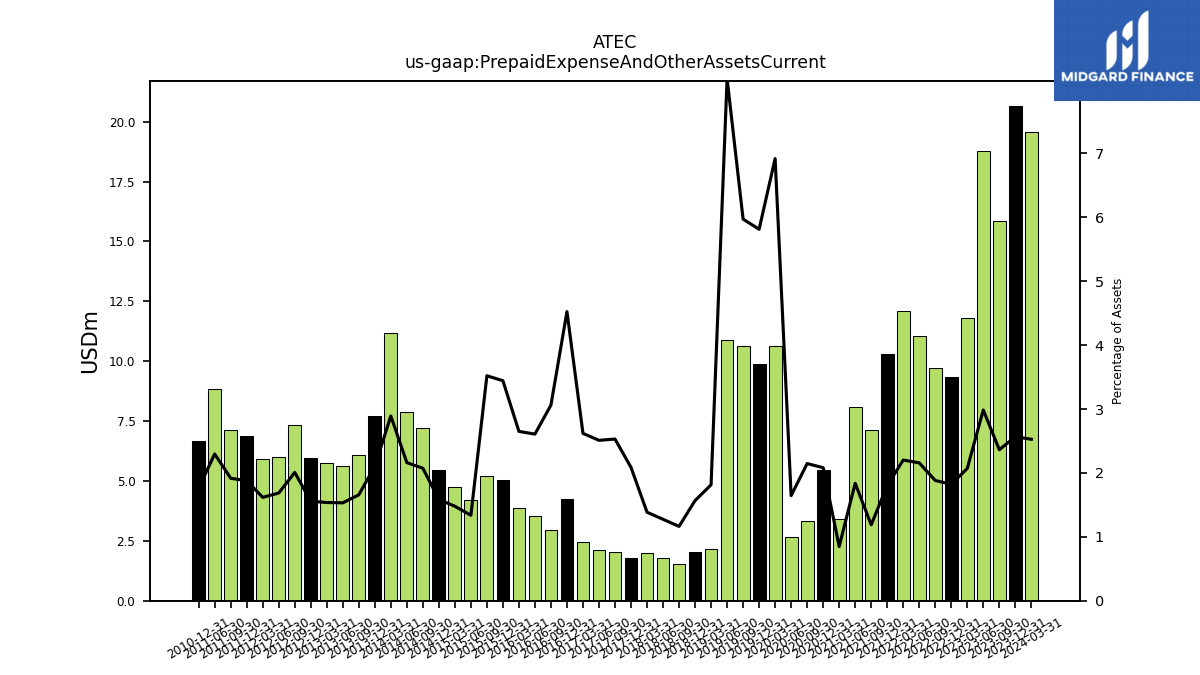
| Prepaid Expense And Other Assets Current | 20.67 | 15.84 | 18.76 | 11.80 | 9.36 | 9.72 | 11.04 | 12.09 | 10.31 | 7.11 | 8.11 | 3.43 | 5.44 | 3.32 | 2.65 | 10.65 | 9.88 | 10.65 | 10.90 | 2.17 | 2.03 | 1.53 | 1.78 | 1.99 | 1.77 | 2.02 | 2.11 | 2.45 | 4.26 | 2.94 | 3.56 | 3.85 | 5.05 | 5.22 | 4.20 | 4.73 | 5.47 | 7.23 | 7.89 | 11.17 | 7.69 | 6.07 | 5.62 | 5.75 | 5.95 | 7.34 | 6.02 | 5.90 | 6.89 | 7.14 | 8.83 | NA | 6.65 | NA | NA |
| 2023-12-31 | 2023-09-30 | 2023-06-30 | 2023-03-31 | 2022-12-31 | 2022-09-30 | 2022-06-30 | 2022-03-31 | 2021-12-31 | 2021-09-30 | 2021-06-30 | 2021-03-31 | 2020-12-31 | 2020-09-30 | 2020-06-30 | 2020-03-31 | 2019-12-31 | 2019-09-30 | 2019-06-30 | 2019-03-31 | 2018-12-31 | 2018-09-30 | 2018-06-30 | 2018-03-31 | 2017-12-31 | 2017-09-30 | 2017-06-30 | 2017-03-31 | 2016-12-31 | 2016-09-30 | 2016-06-30 | 2016-03-31 | 2015-12-31 | 2015-09-30 | 2015-06-30 | 2015-03-31 | 2014-12-31 | 2014-09-30 | 2014-06-30 | 2014-03-31 | 2013-12-31 | 2013-09-30 | 2013-06-30 | 2013-03-31 | 2012-12-31 | 2012-09-30 | 2012-06-30 | 2012-03-31 | 2011-12-31 | 2011-09-30 | 2011-06-30 | 2011-03-31 | 2010-12-31 | 2010-09-30 | 2010-06-30 | ||
|---|---|---|---|---|---|---|---|---|---|---|---|---|---|---|---|---|---|---|---|---|---|---|---|---|---|---|---|---|---|---|---|---|---|---|---|---|---|---|---|---|---|---|---|---|---|---|---|---|---|---|---|---|---|---|---|---|
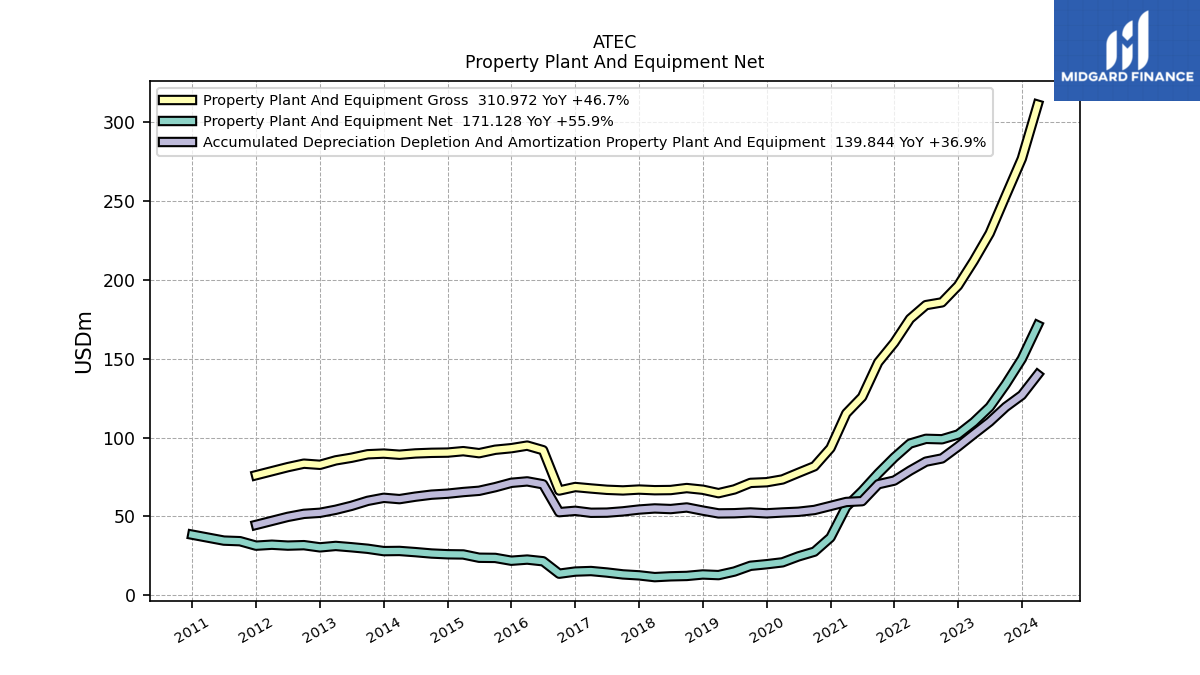
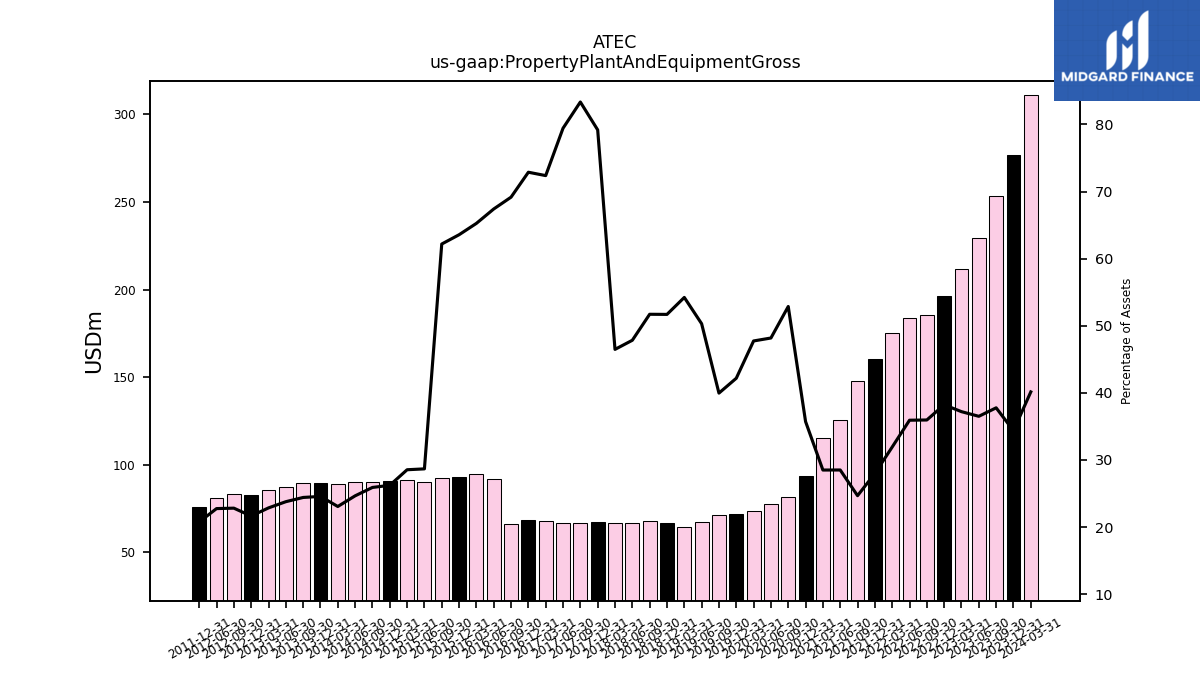
| Property Plant And Equipment Gross | 276.71 | 253.18 | 229.36 | 211.94 | 196.25 | 185.66 | 183.92 | 175.21 | 160.12 | 147.62 | 125.73 | 115.29 | 93.32 | 81.78 | 77.63 | 73.44 | 71.69 | 71.25 | 67.13 | 64.75 | 66.94 | 67.99 | 66.74 | 66.62 | 67.05 | 66.49 | 66.89 | 67.73 | 68.65 | 66.42 | 91.98 | 94.89 | 93.26 | 92.27 | 90.09 | 91.38 | 90.46 | 90.31 | 89.93 | 89.11 | 89.84 | 89.39 | 87.21 | 85.54 | 82.72 | 83.45 | 81.25 | NA | 76.12 | NA | NA | NA | NA | NA | NA | |
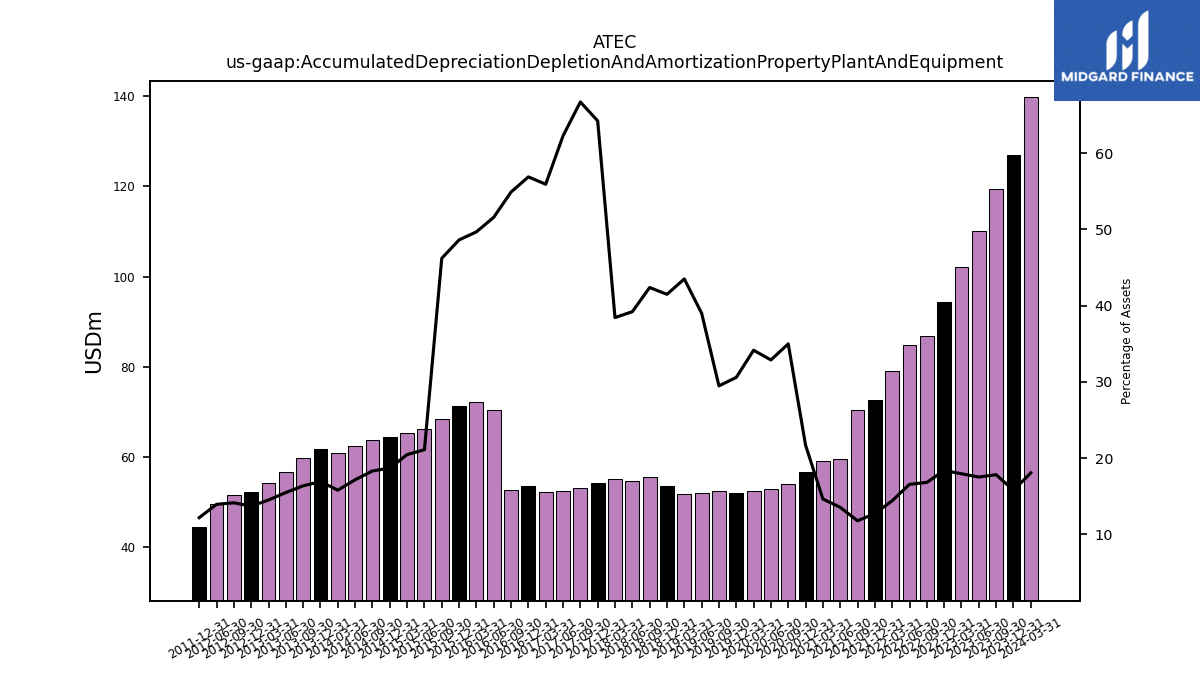
| Accumulated Depreciation Depletion And Amortization Property Plant And Equipment | 126.88 | 119.40 | 109.99 | 102.19 | 94.29 | 86.75 | 84.74 | 79.02 | 72.72 | 70.40 | 59.68 | 59.17 | 56.65 | 54.10 | 52.96 | 52.52 | 51.97 | 52.53 | 52.04 | 51.93 | 53.70 | 55.69 | 54.68 | 55.08 | 54.38 | 53.22 | 52.42 | 52.32 | 53.57 | 52.71 | 70.38 | 72.21 | 71.31 | 68.55 | 66.26 | 65.46 | 64.42 | 63.80 | 62.54 | 60.98 | 61.81 | 59.88 | 56.74 | 54.23 | 52.32 | 51.64 | 49.73 | NA | 44.64 | NA | NA | NA | NA | NA | NA | |
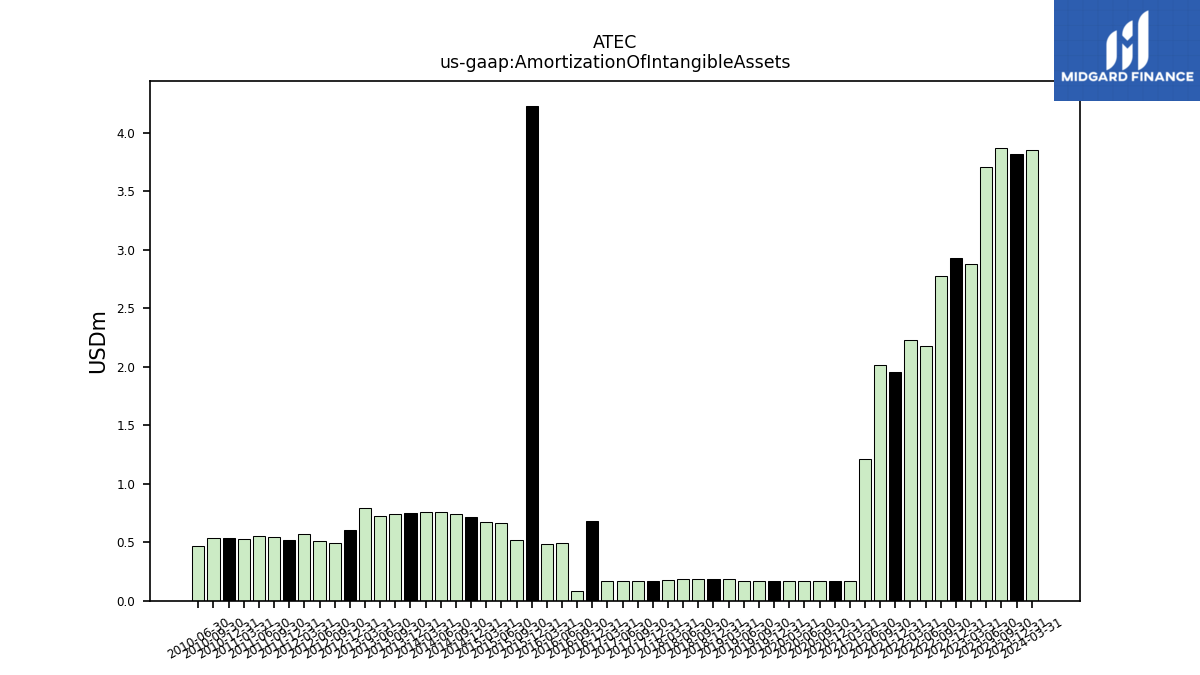
| Amortization Of Intangible Assets | 3.82 | 3.87 | 3.71 | 2.88 | 2.93 | 2.77 | 2.18 | 2.23 | 1.96 | 2.01 | 1.21 | 0.17 | 0.17 | 0.17 | 0.17 | 0.17 | 0.17 | 0.17 | 0.17 | 0.18 | 0.19 | 0.19 | 0.19 | 0.18 | 0.17 | 0.17 | 0.17 | 0.17 | 0.69 | 0.08 | 0.49 | 0.49 | 4.23 | 0.52 | 0.67 | 0.68 | 0.72 | 0.74 | 0.76 | 0.76 | 0.75 | 0.74 | 0.72 | 0.79 | 0.61 | 0.49 | 0.51 | 0.57 | 0.52 | 0.55 | 0.55 | 0.53 | 0.53 | 0.53 | 0.47 | |
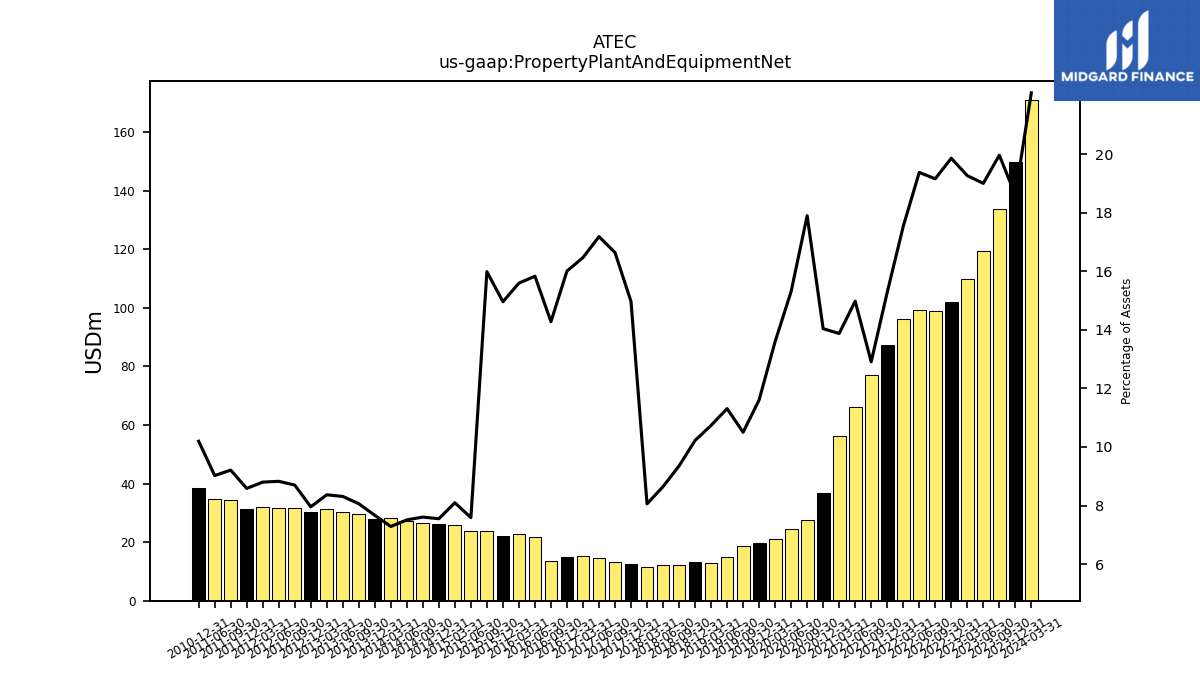
| Property Plant And Equipment Net | 149.84 | 133.78 | 119.37 | 109.75 | 101.95 | 98.91 | 99.18 | 96.19 | 87.40 | 77.21 | 66.05 | 56.12 | 36.67 | 27.68 | 24.67 | 20.92 | 19.72 | 18.72 | 15.09 | 12.82 | 13.23 | 12.29 | 12.06 | 11.55 | 12.67 | 13.28 | 14.47 | 15.41 | 15.08 | 13.71 | 21.60 | 22.67 | 21.95 | 23.72 | 23.83 | 25.91 | 26.04 | 26.51 | 27.39 | 28.14 | 28.03 | 29.52 | 30.47 | 31.31 | 30.40 | 31.81 | 31.52 | 32.09 | 31.48 | 34.32 | 34.69 | NA | 38.44 | NA | NA | |
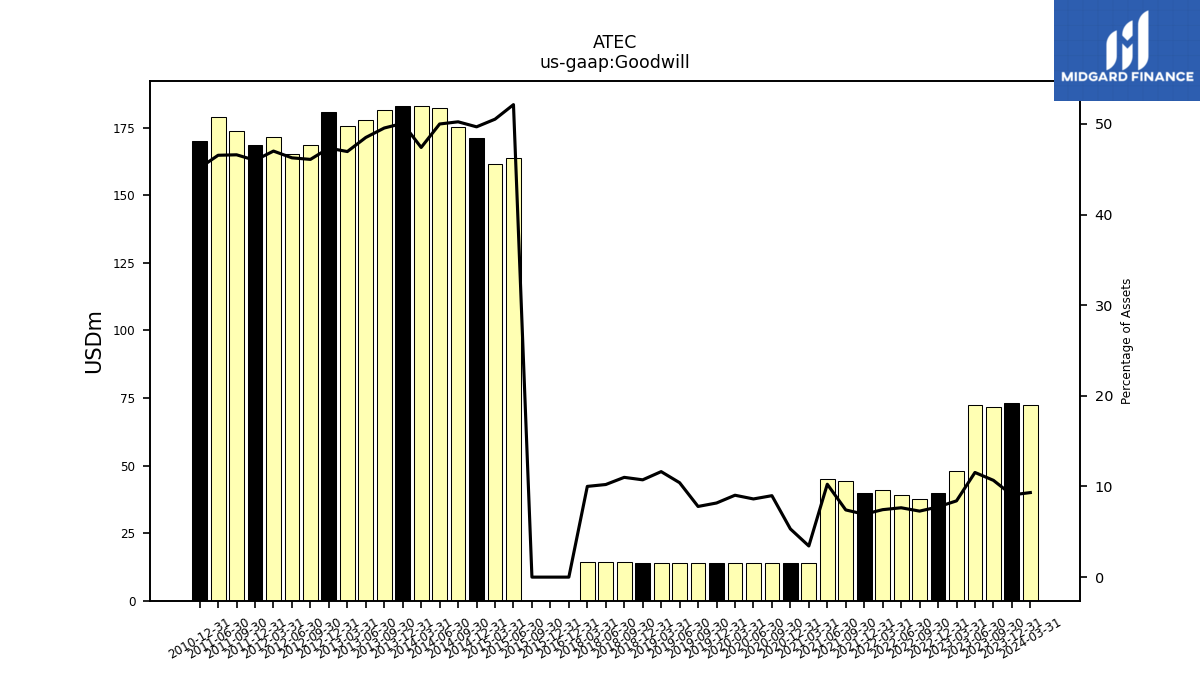
| Goodwill | 73.00 | 71.56 | 72.53 | 47.92 | 39.77 | 37.59 | 39.17 | 40.83 | 39.69 | 44.34 | 45.19 | 13.90 | 13.90 | 13.90 | 13.90 | 13.90 | 13.90 | 13.90 | 13.90 | 13.90 | 13.90 | 14.47 | 14.25 | 14.35 | NA | NA | NA | NA | 0.00 | NA | NA | NA | 0.00 | 0.00 | 163.75 | 161.70 | 171.33 | 175.09 | 182.30 | 183.09 | 183.00 | 181.39 | 177.83 | 175.67 | 180.84 | 168.50 | 165.14 | 171.39 | 168.61 | 173.63 | 178.91 | NA | 170.19 | NA | NA | |
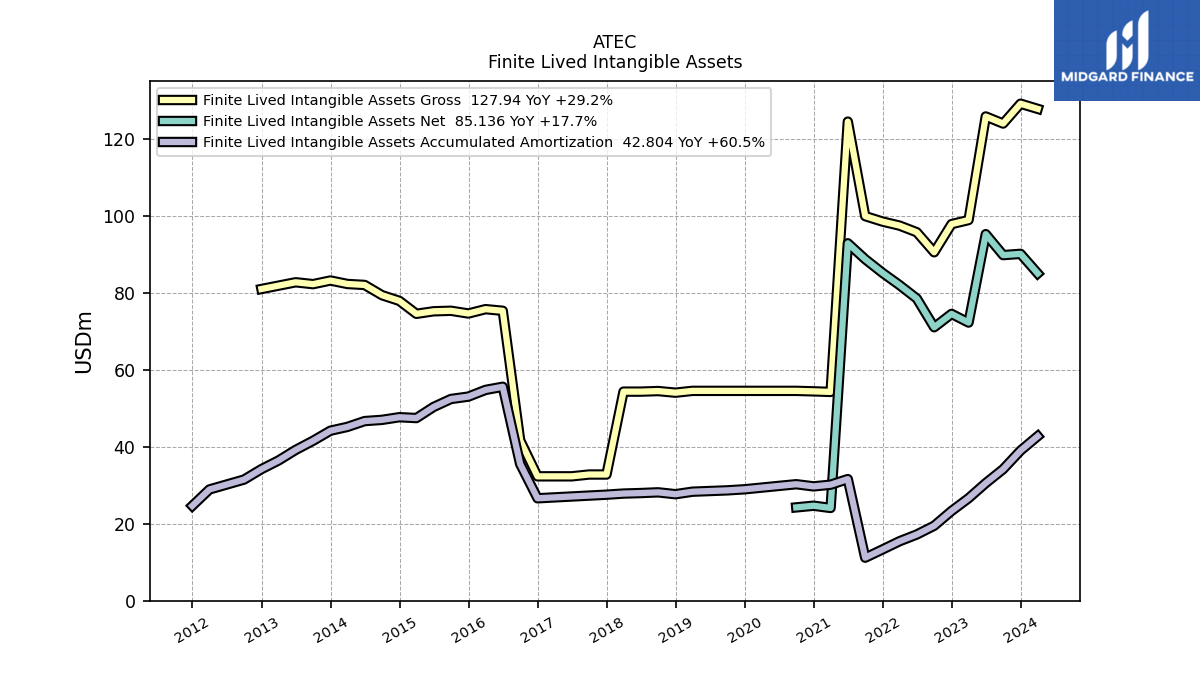
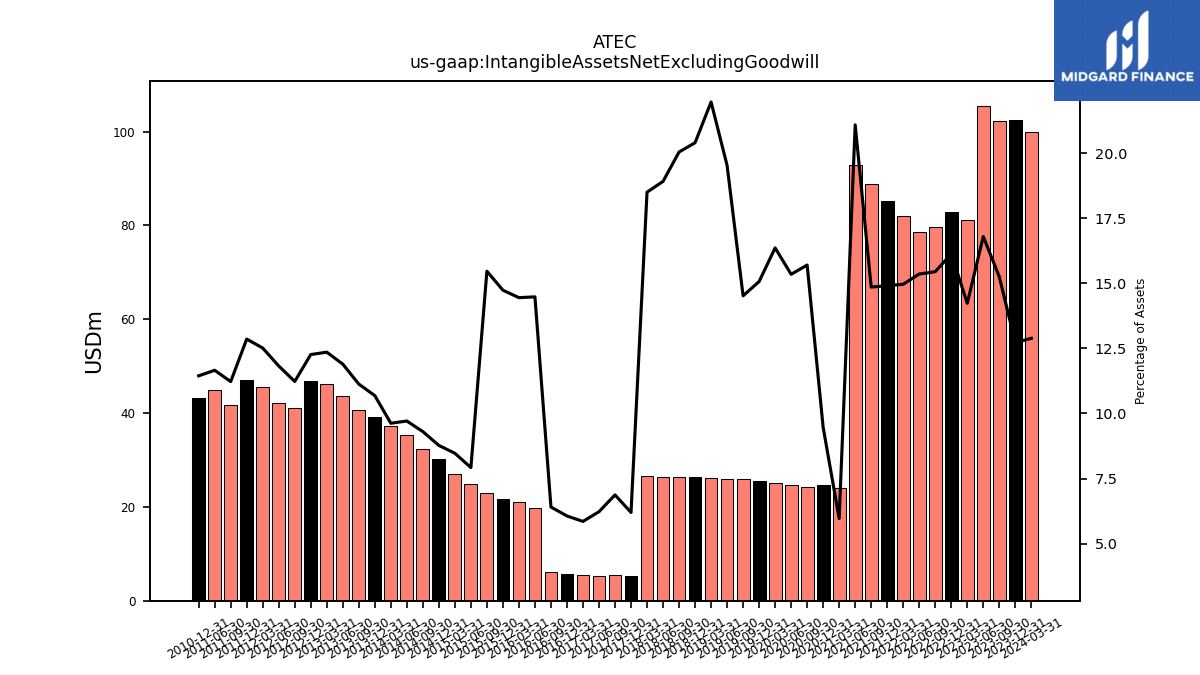
| Intangible Assets Net Excluding Goodwill | 102.45 | 102.20 | 105.51 | 81.08 | 82.78 | 79.74 | 78.61 | 82.09 | 85.27 | 88.84 | 92.98 | 24.13 | 24.72 | 24.28 | 24.72 | 25.16 | 25.61 | 25.88 | 26.05 | 26.23 | 26.41 | 26.34 | 26.38 | 26.51 | 5.25 | 5.48 | 5.24 | 5.48 | 5.71 | 6.15 | 19.76 | 21.00 | 21.62 | 22.94 | 24.89 | 27.11 | 30.26 | 32.43 | 35.41 | 37.18 | 39.06 | 40.74 | 43.61 | 46.23 | 46.86 | 41.06 | 42.22 | 45.63 | 47.14 | 41.83 | 44.82 | NA | 43.15 | NA | NA | |
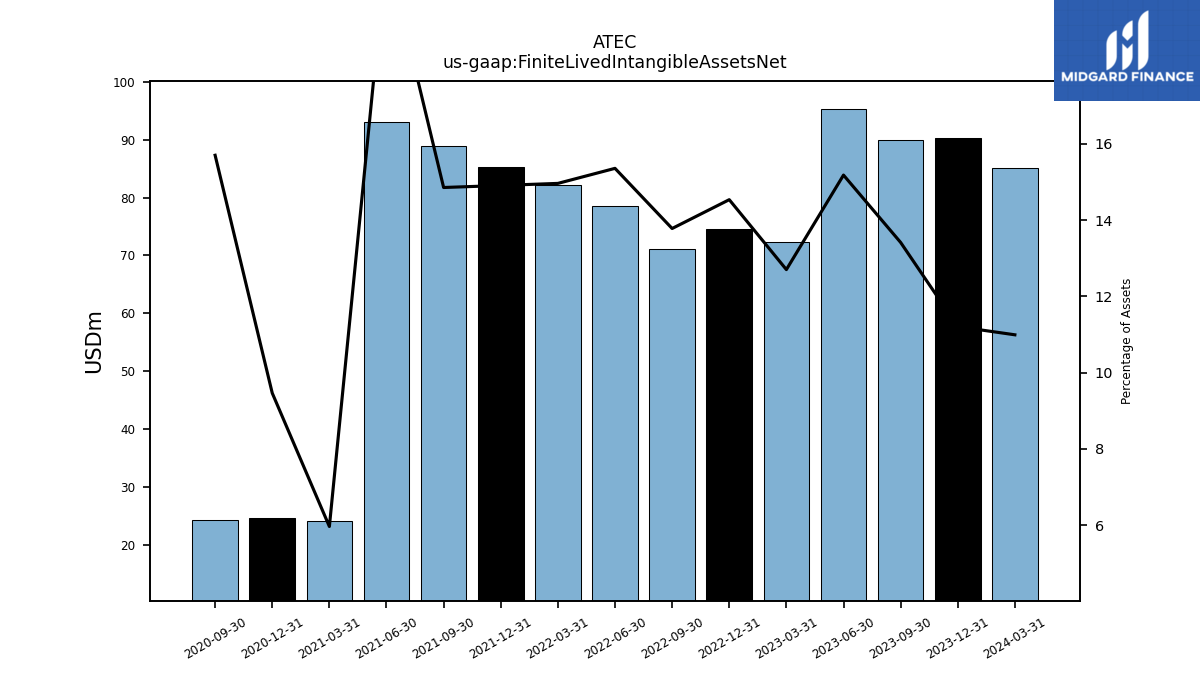
| Finite Lived Intangible Assets Net | 90.23 | 89.90 | 95.36 | 72.36 | 74.62 | 71.14 | 78.61 | 82.09 | 85.27 | 88.84 | 92.98 | 24.13 | 24.72 | 24.28 | NA | NA | NA | NA | NA | NA | NA | NA | NA | NA | NA | NA | NA | NA | NA | NA | NA | NA | NA | NA | NA | NA | NA | NA | NA | NA | NA | NA | NA | NA | NA | NA | NA | NA | NA | NA | NA | NA | NA | NA | NA | |
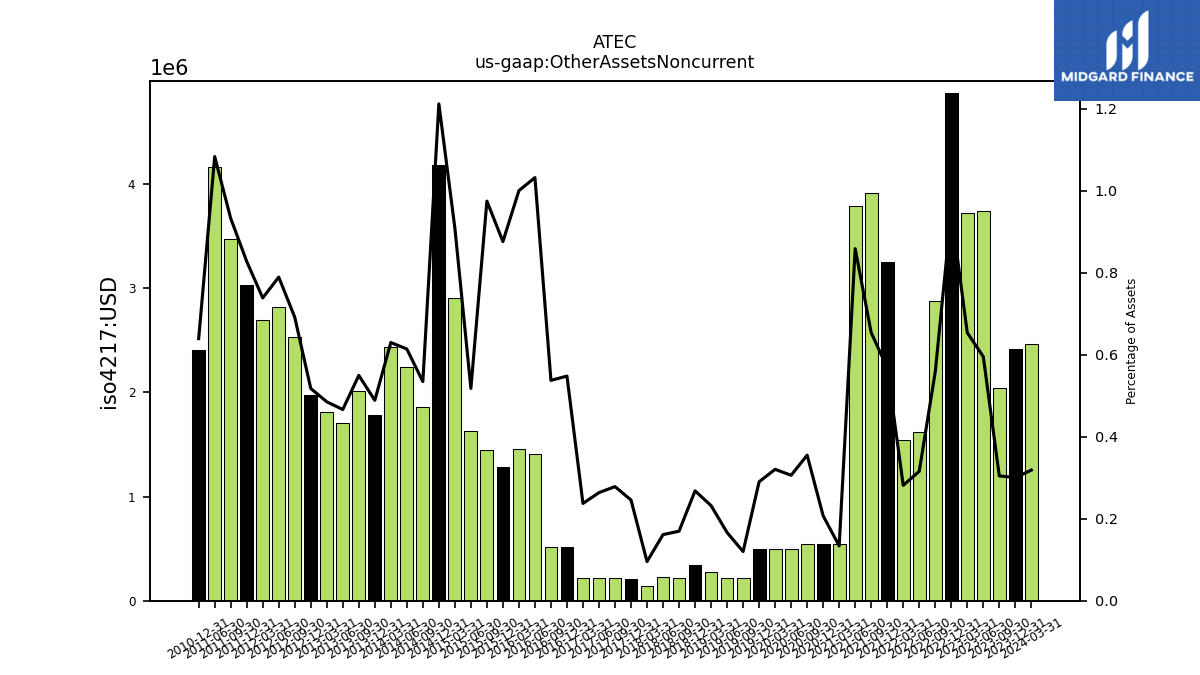
| Other Assets Noncurrent | 2.42 | 2.04 | 3.74 | 3.72 | 4.87 | 2.88 | 1.62 | 1.54 | 3.25 | 3.91 | 3.79 | 0.54 | 0.54 | 0.55 | 0.49 | 0.49 | 0.49 | 0.21 | 0.22 | 0.28 | 0.35 | 0.22 | 0.23 | 0.14 | 0.21 | 0.22 | 0.22 | 0.22 | 0.52 | 0.52 | 1.41 | 1.45 | 1.28 | 1.45 | 1.63 | 2.91 | 4.18 | 1.86 | 2.24 | 2.43 | 1.79 | 2.01 | 1.71 | 1.81 | 1.98 | 2.53 | 2.82 | 2.69 | 3.03 | 3.48 | 4.16 | NA | 2.41 | NA | NA |
| 2023-12-31 | 2023-09-30 | 2023-06-30 | 2023-03-31 | 2022-12-31 | 2022-09-30 | 2022-06-30 | 2022-03-31 | 2021-12-31 | 2021-09-30 | 2021-06-30 | 2021-03-31 | 2020-12-31 | 2020-09-30 | 2020-06-30 | 2020-03-31 | 2019-12-31 | 2019-09-30 | 2019-06-30 | 2019-03-31 | 2018-12-31 | 2018-09-30 | 2018-06-30 | 2018-03-31 | 2017-12-31 | 2017-09-30 | 2017-06-30 | 2017-03-31 | 2016-12-31 | 2016-09-30 | 2016-06-30 | 2016-03-31 | 2015-12-31 | 2015-09-30 | 2015-06-30 | 2015-03-31 | 2014-12-31 | 2014-09-30 | 2014-06-30 | 2014-03-31 | 2013-12-31 | 2013-09-30 | 2013-06-30 | 2013-03-31 | 2012-12-31 | 2012-09-30 | 2012-06-30 | 2012-03-31 | 2011-12-31 | 2011-09-30 | 2011-06-30 | 2011-03-31 | 2010-12-31 | 2010-09-30 | 2010-06-30 | ||
|---|---|---|---|---|---|---|---|---|---|---|---|---|---|---|---|---|---|---|---|---|---|---|---|---|---|---|---|---|---|---|---|---|---|---|---|---|---|---|---|---|---|---|---|---|---|---|---|---|---|---|---|---|---|---|---|---|
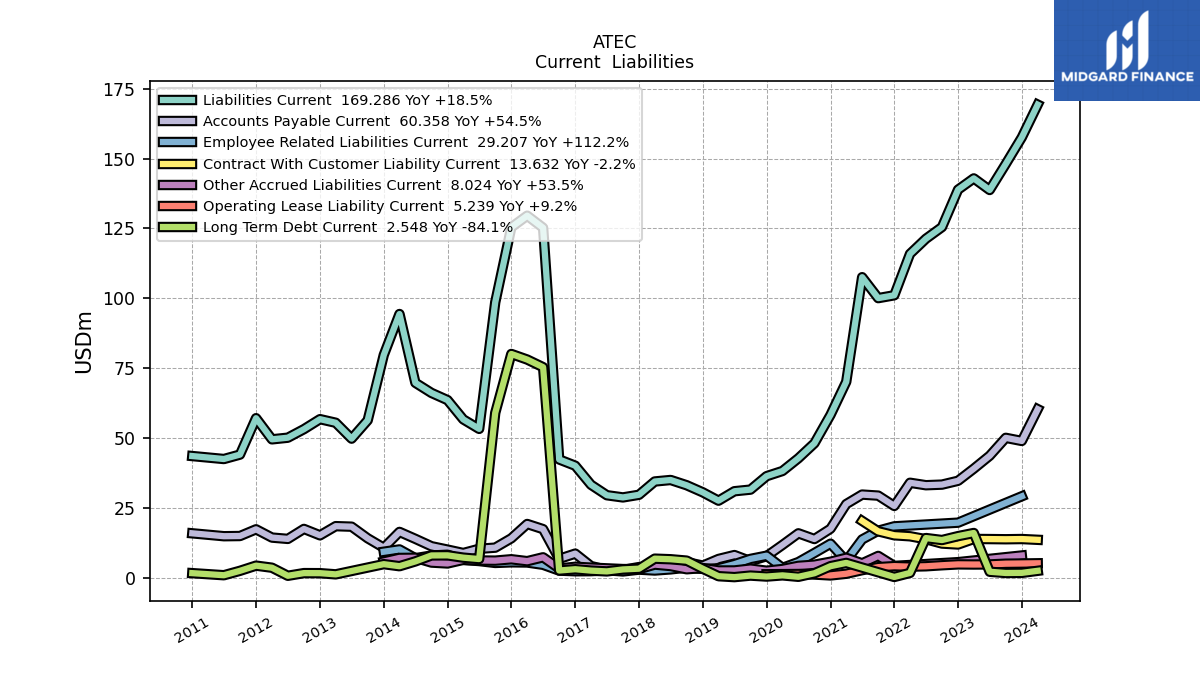
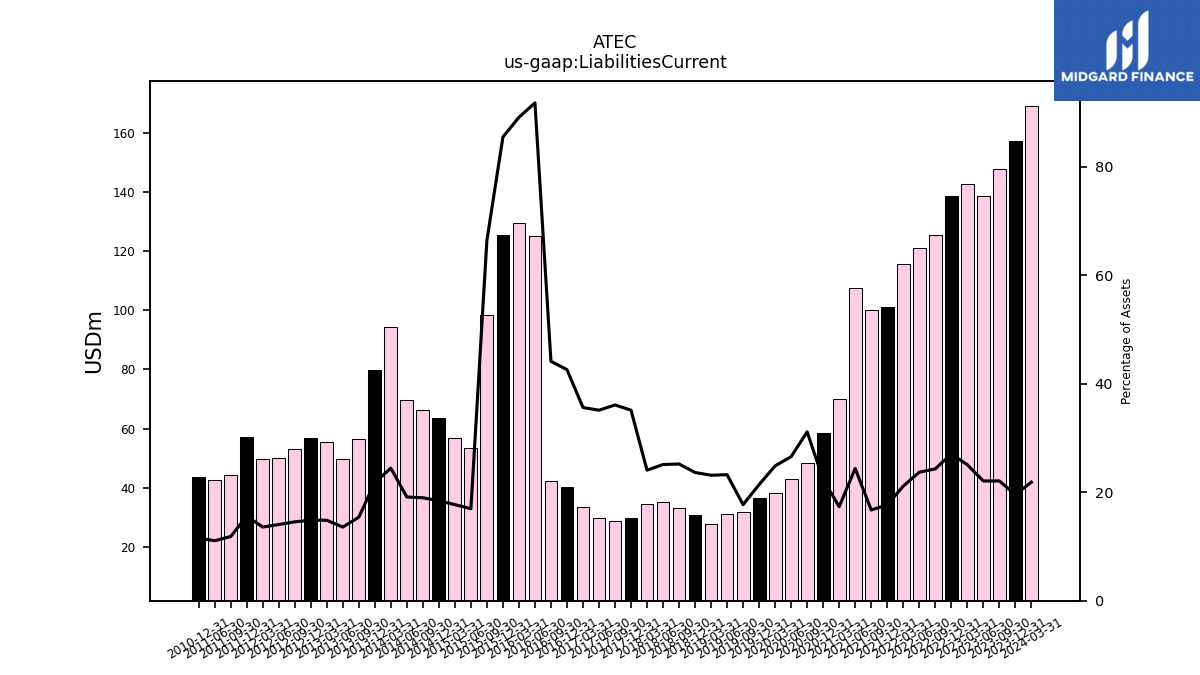
| Liabilities Current | 157.57 | 148.04 | 138.75 | 142.90 | 138.87 | 125.49 | 121.31 | 115.90 | 101.09 | 100.07 | 107.56 | 70.15 | 58.31 | 48.16 | 42.80 | 38.24 | 36.39 | 31.59 | 31.01 | 27.63 | 30.61 | 33.14 | 35.03 | 34.49 | 29.74 | 28.79 | 29.57 | 33.33 | 40.13 | 42.38 | 125.23 | 129.56 | 125.40 | 98.58 | 53.31 | 56.71 | 63.60 | 66.17 | 69.79 | 94.40 | 79.72 | 56.37 | 49.81 | 55.50 | 56.79 | 53.20 | 50.16 | 49.57 | 57.14 | 44.11 | 42.53 | NA | 43.59 | NA | NA | |
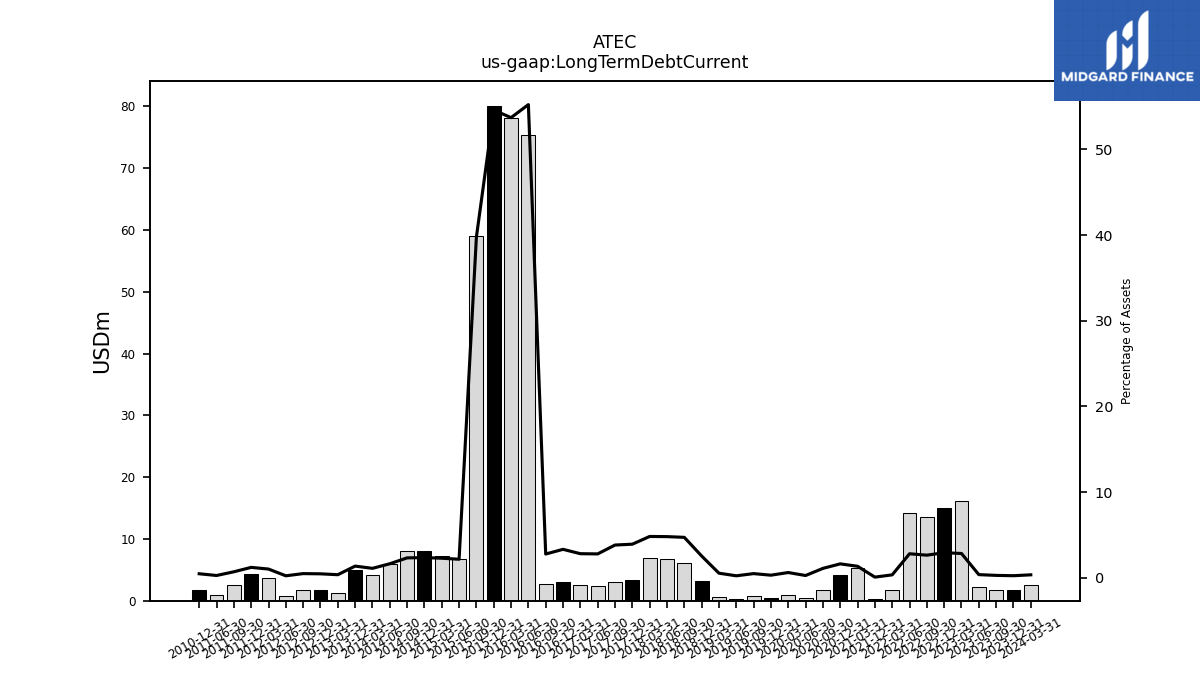
| Long Term Debt Current | 1.81 | 1.77 | 2.21 | 16.07 | 14.95 | 13.55 | 14.27 | 1.79 | 0.34 | NA | NA | 5.37 | 4.20 | 1.67 | 0.40 | 0.92 | 0.49 | 0.84 | 0.29 | 0.62 | 3.28 | 6.19 | 6.68 | 6.89 | 3.31 | 3.04 | 2.33 | 2.62 | 3.11 | 2.65 | 75.38 | 78.11 | 80.11 | 59.02 | 6.75 | 7.26 | 8.08 | 8.04 | 5.91 | 4.19 | 4.92 | NA | NA | 1.28 | 1.70 | 1.72 | 0.77 | 3.65 | 4.40 | 2.54 | 0.96 | NA | 1.71 | NA | NA | |
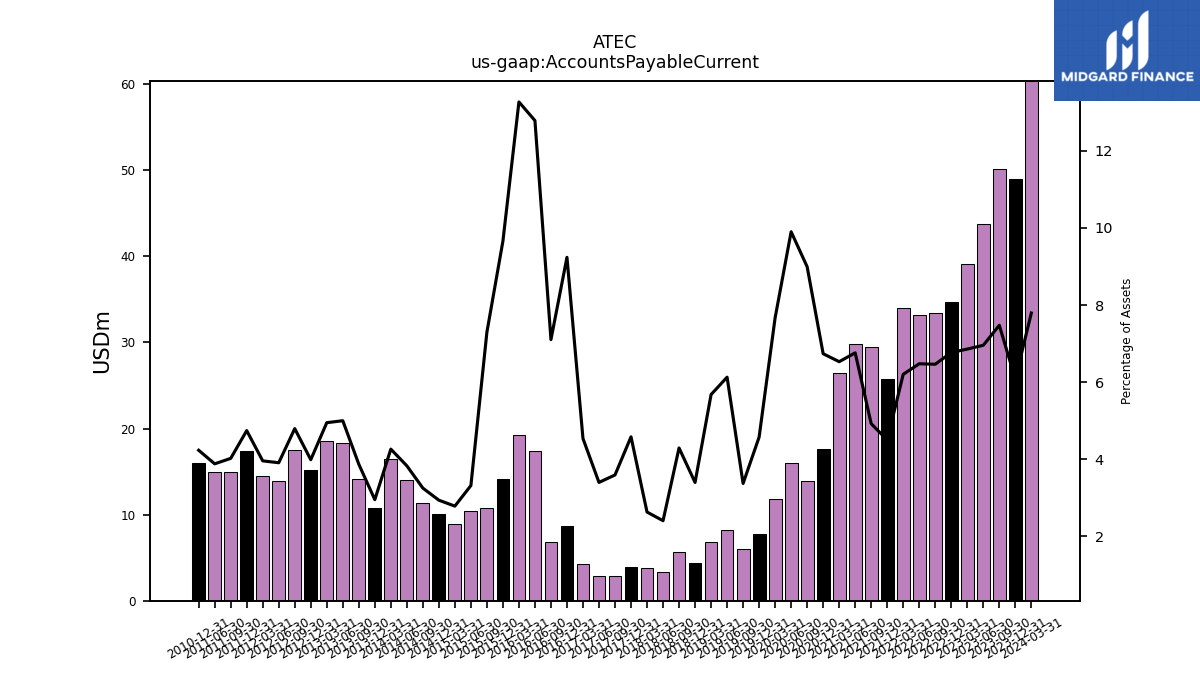
| Accounts Payable Current | 48.98 | 50.10 | 43.70 | 39.07 | 34.74 | 33.37 | 33.16 | 34.04 | 25.74 | 29.44 | 29.81 | 26.42 | 17.60 | 13.91 | 15.96 | 11.80 | 7.77 | 6.01 | 8.18 | 6.78 | 4.40 | 5.64 | 3.35 | 3.77 | 3.88 | 2.87 | 2.86 | 4.25 | 8.70 | 6.82 | 17.45 | 19.29 | 14.17 | 10.83 | 10.42 | 8.91 | 10.13 | 11.33 | 13.96 | 16.46 | 10.79 | 14.17 | 18.33 | 18.52 | 15.24 | 17.53 | 13.96 | 14.43 | 17.39 | 14.99 | 14.92 | NA | 15.96 | NA | NA | |
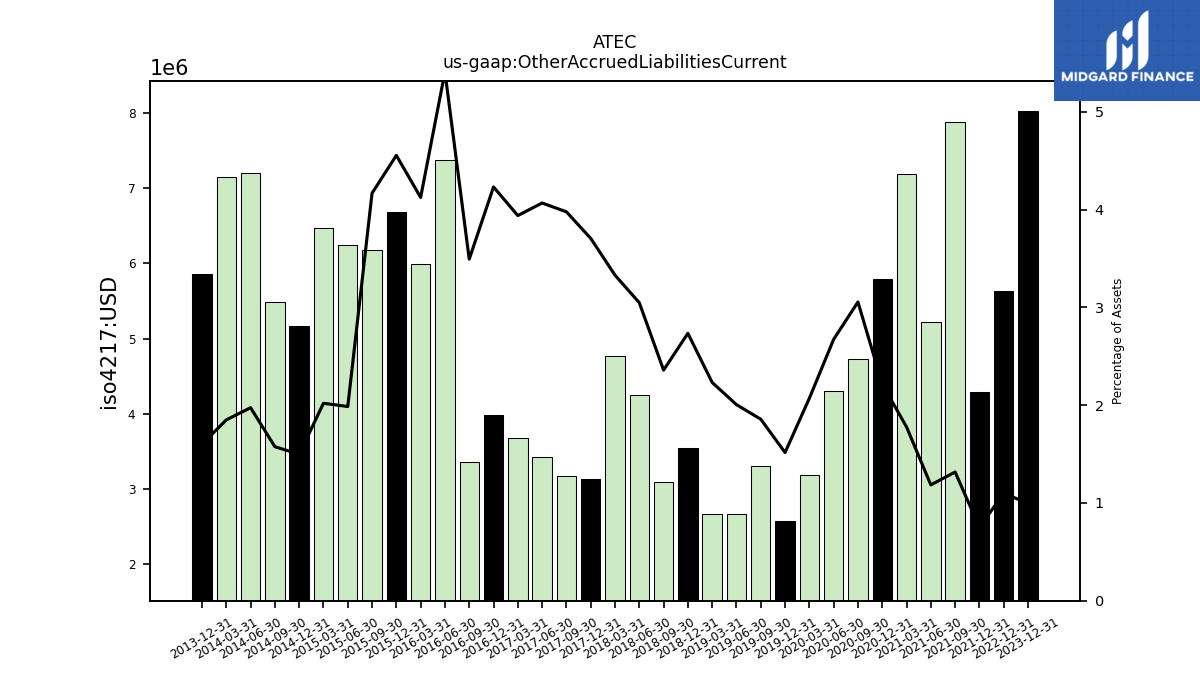
| Other Accrued Liabilities Current | 8.02 | NA | NA | NA | 5.64 | NA | NA | NA | 4.29 | 7.87 | 5.23 | 7.19 | 5.79 | 4.73 | 4.31 | 3.19 | 2.58 | 3.31 | 2.68 | 2.67 | 3.54 | 3.10 | 4.25 | 4.77 | 3.14 | 3.17 | 3.42 | 3.69 | 3.99 | 3.35 | 7.38 | 6.00 | 6.68 | 6.18 | 6.24 | 6.46 | 5.17 | 5.49 | 7.20 | 7.14 | 5.86 | NA | NA | NA | NA | NA | NA | NA | NA | NA | NA | NA | NA | NA | NA | |
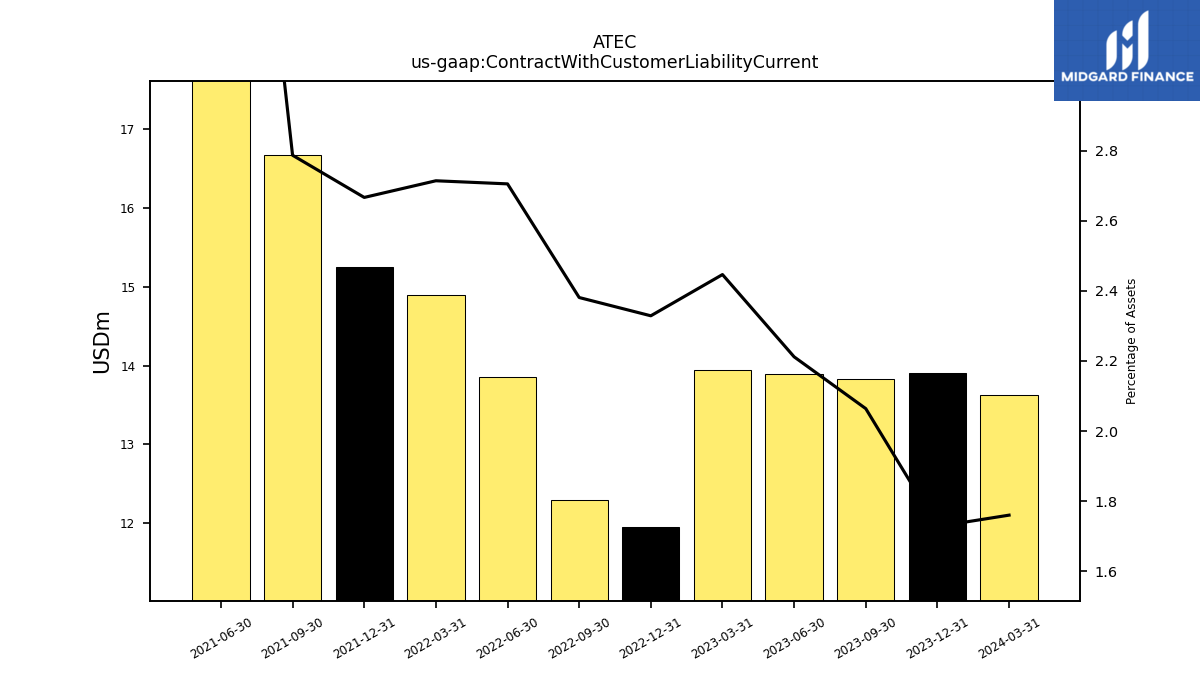
| Contract With Customer Liability Current | 13.91 | 13.83 | 13.89 | 13.94 | 11.96 | 12.29 | 13.85 | 14.89 | 15.26 | 16.67 | 20.39 | NA | NA | NA | NA | NA | NA | NA | NA | NA | NA | NA | NA | NA | NA | NA | NA | NA | NA | NA | NA | NA | NA | NA | NA | NA | NA | NA | NA | NA | NA | NA | NA | NA | NA | NA | NA | NA | NA | NA | NA | NA | NA | NA | NA |
| 2023-12-31 | 2023-09-30 | 2023-06-30 | 2023-03-31 | 2022-12-31 | 2022-09-30 | 2022-06-30 | 2022-03-31 | 2021-12-31 | 2021-09-30 | 2021-06-30 | 2021-03-31 | 2020-12-31 | 2020-09-30 | 2020-06-30 | 2020-03-31 | 2019-12-31 | 2019-09-30 | 2019-06-30 | 2019-03-31 | 2018-12-31 | 2018-09-30 | 2018-06-30 | 2018-03-31 | 2017-12-31 | 2017-09-30 | 2017-06-30 | 2017-03-31 | 2016-12-31 | 2016-09-30 | 2016-06-30 | 2016-03-31 | 2015-12-31 | 2015-09-30 | 2015-06-30 | 2015-03-31 | 2014-12-31 | 2014-09-30 | 2014-06-30 | 2014-03-31 | 2013-12-31 | 2013-09-30 | 2013-06-30 | 2013-03-31 | 2012-12-31 | 2012-09-30 | 2012-06-30 | 2012-03-31 | 2011-12-31 | 2011-09-30 | 2011-06-30 | 2011-03-31 | 2010-12-31 | 2010-09-30 | 2010-06-30 | ||
|---|---|---|---|---|---|---|---|---|---|---|---|---|---|---|---|---|---|---|---|---|---|---|---|---|---|---|---|---|---|---|---|---|---|---|---|---|---|---|---|---|---|---|---|---|---|---|---|---|---|---|---|---|---|---|---|---|
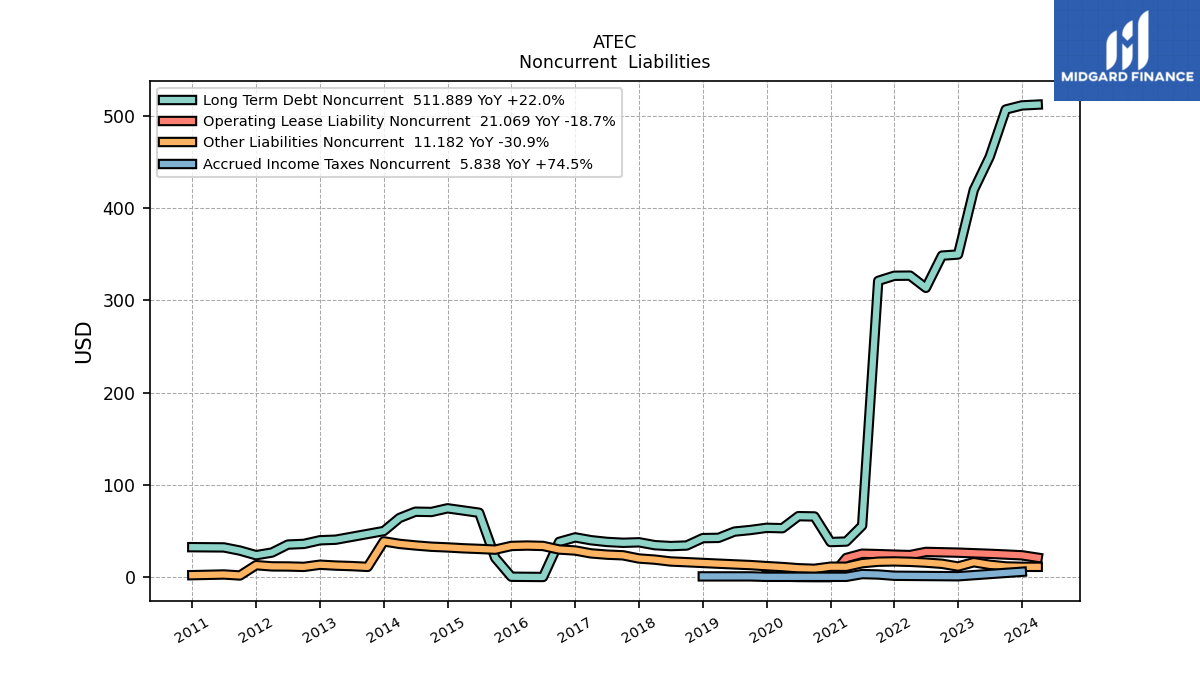
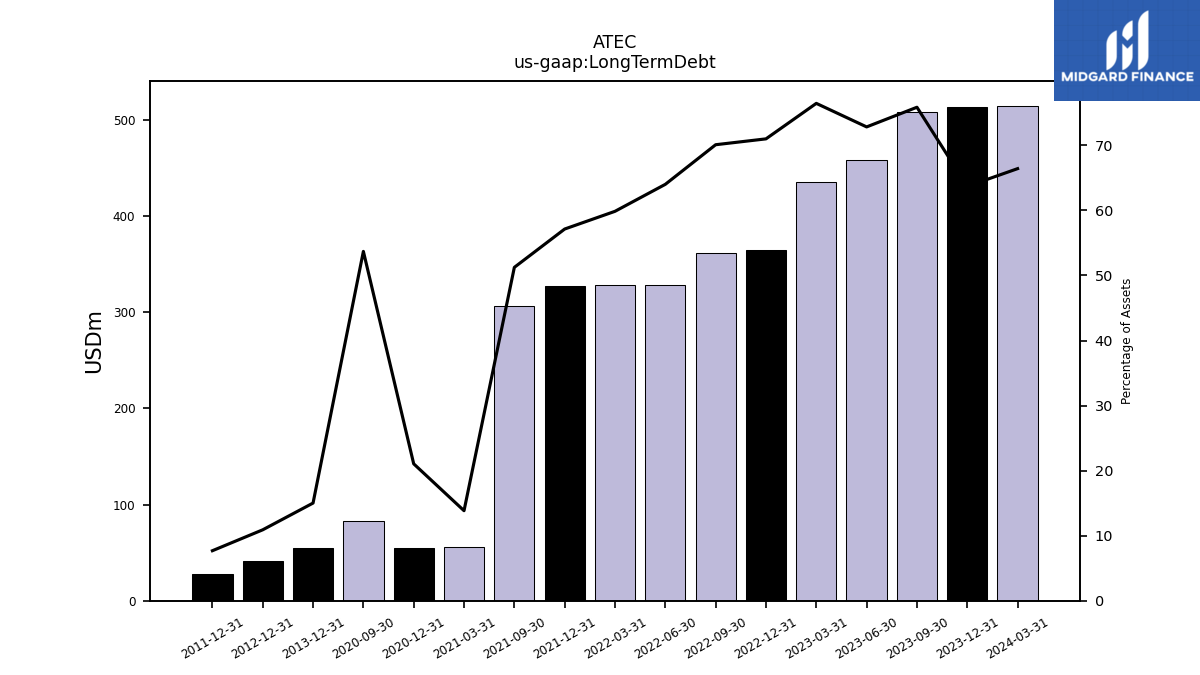
| Long Term Debt | 512.84 | 508.38 | 457.55 | 435.52 | 364.46 | 361.87 | 327.66 | 328.43 | 326.83 | 306.50 | NA | 55.98 | 54.98 | 83.06 | NA | NA | NA | NA | NA | NA | NA | NA | NA | NA | NA | NA | NA | NA | NA | NA | NA | NA | NA | NA | NA | NA | NA | NA | NA | NA | 54.90 | NA | NA | NA | 41.67 | NA | NA | NA | 28.20 | NA | NA | NA | NA | NA | NA | |
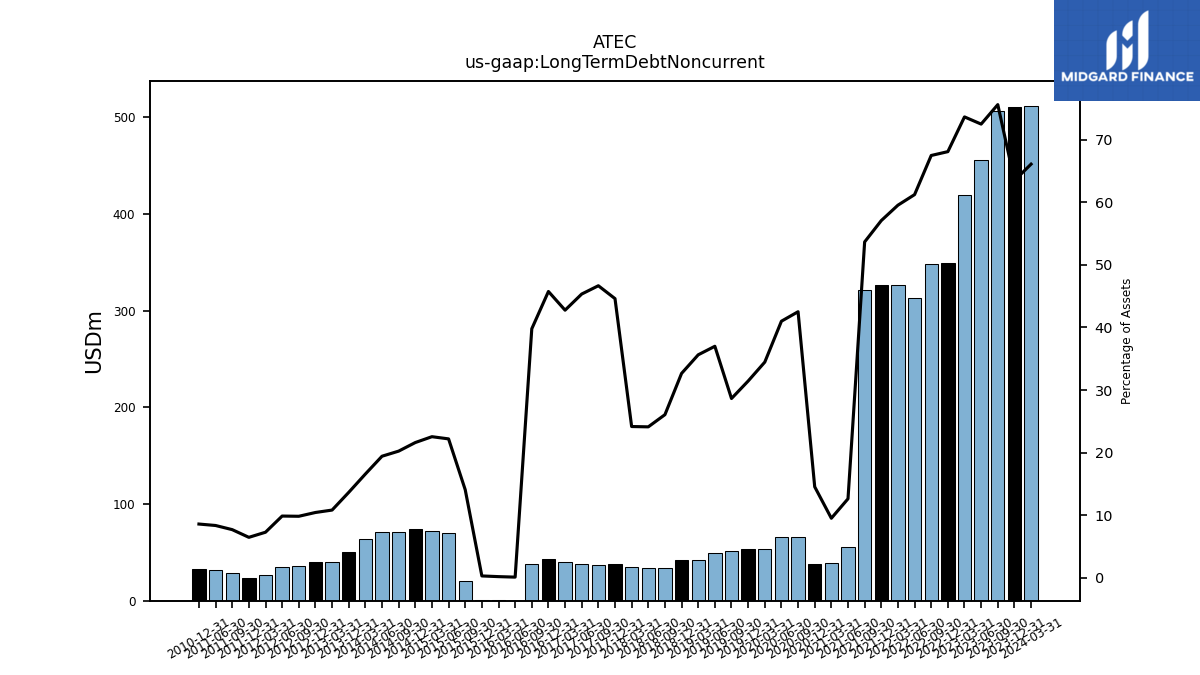
| Long Term Debt Noncurrent | 511.04 | 506.61 | 455.34 | 419.45 | 349.51 | 348.32 | 313.40 | 326.64 | 326.49 | 320.97 | 55.79 | 38.58 | 38.03 | 65.76 | 66.07 | 53.03 | 53.45 | 51.09 | 49.37 | 42.56 | 42.30 | 34.28 | 33.67 | 34.66 | 37.77 | 37.23 | 38.18 | 40.02 | 43.09 | 38.22 | 0.19 | 0.31 | 0.48 | 20.92 | 69.78 | 72.22 | 74.60 | 70.62 | 70.91 | 64.11 | 49.98 | NA | NA | 40.58 | 39.97 | 36.03 | 35.31 | 26.65 | 23.80 | 28.77 | 32.22 | NA | 32.47 | NA | NA | |
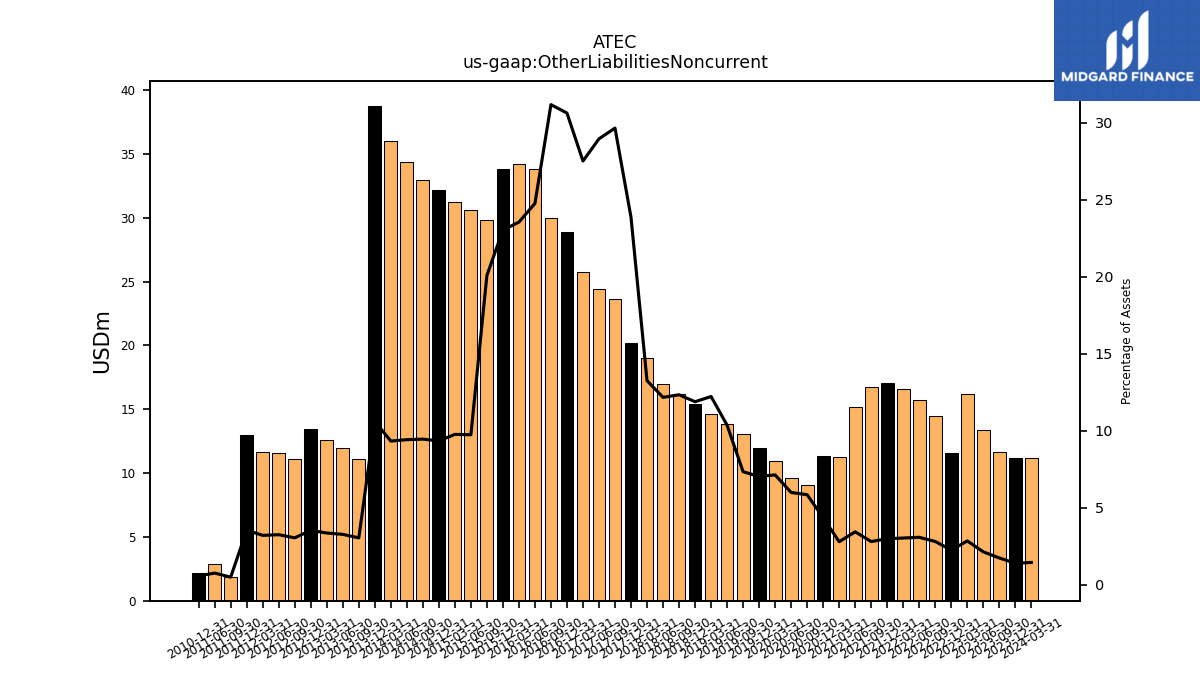
| Other Liabilities Noncurrent | 11.20 | 11.63 | 13.41 | 16.19 | 11.54 | 14.49 | 15.75 | 16.62 | 17.06 | 16.75 | 15.14 | 11.29 | 11.35 | 9.04 | 9.65 | 10.97 | 11.95 | 13.08 | 13.83 | 14.60 | 15.39 | 16.22 | 16.98 | 19.00 | 20.21 | 23.67 | 24.39 | 25.76 | 28.86 | 29.95 | 33.80 | 34.25 | 33.80 | 29.81 | 30.60 | 31.26 | 32.22 | 32.97 | 34.36 | 36.04 | 38.78 | 11.13 | 11.99 | 12.56 | 13.48 | 11.13 | 11.59 | 11.68 | 13.00 | 1.83 | 2.89 | NA | 2.15 | NA | NA | |
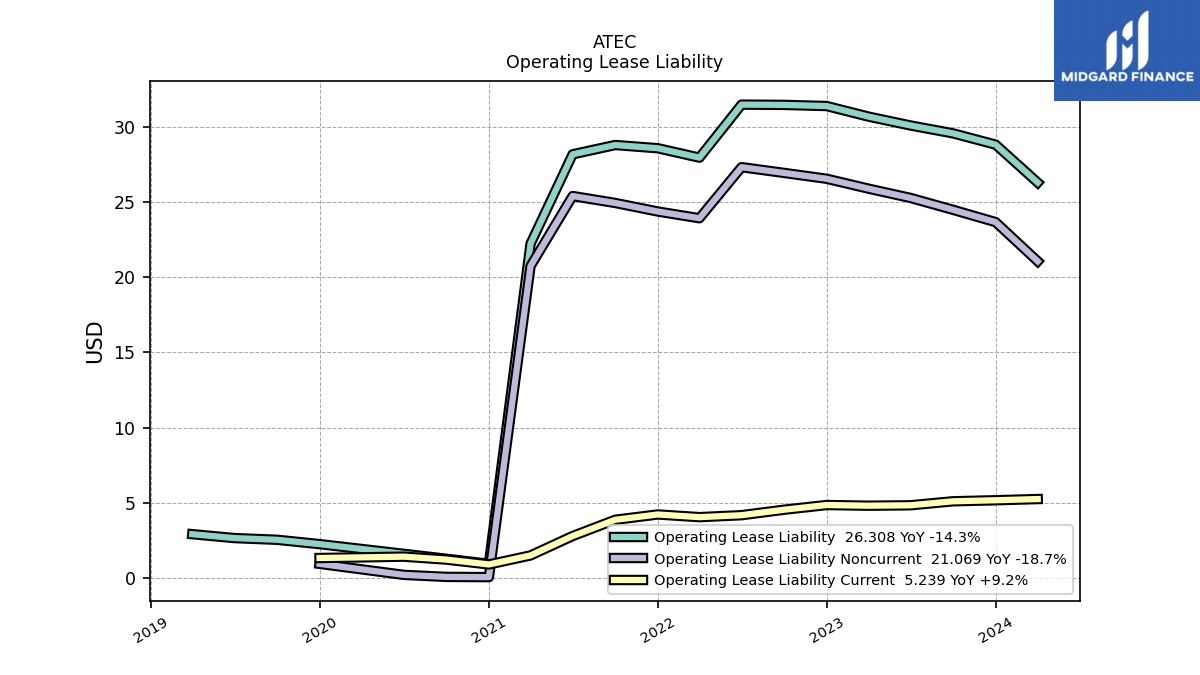
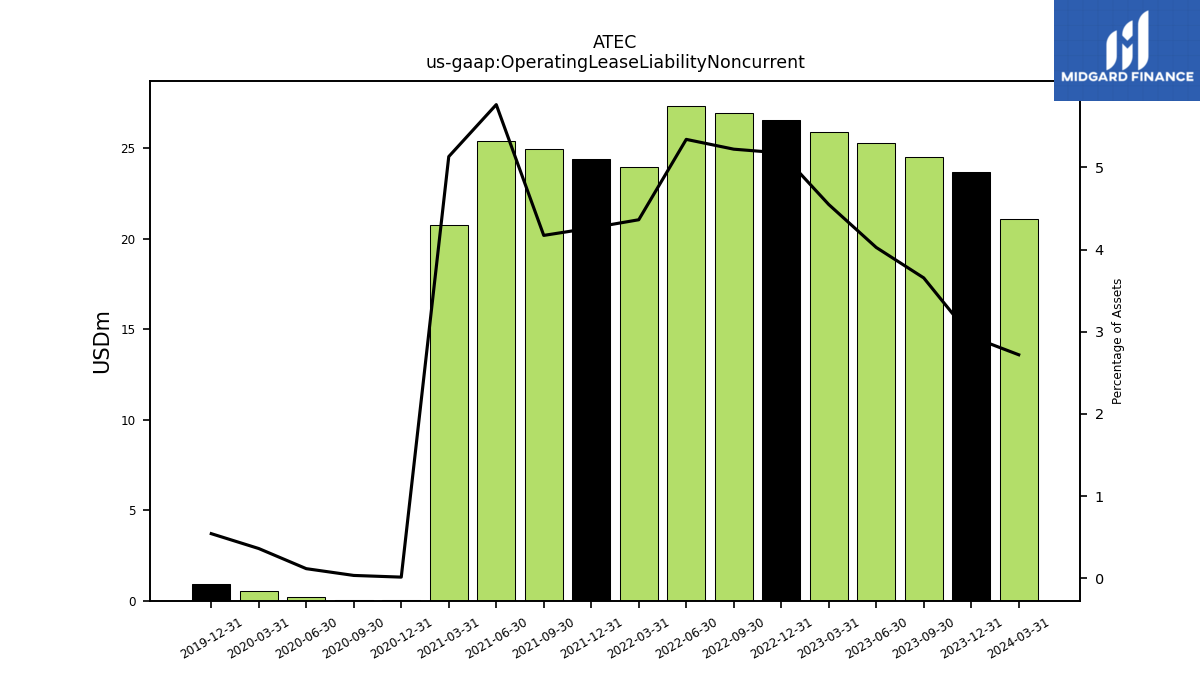
| Operating Lease Liability Noncurrent | 23.68 | 24.50 | 25.29 | 25.91 | 26.56 | 26.95 | 27.34 | 23.93 | 24.38 | 24.95 | 25.41 | 20.75 | 0.04 | 0.06 | 0.19 | 0.56 | 0.93 | NA | NA | NA | NA | NA | NA | NA | NA | NA | NA | NA | NA | NA | NA | NA | NA | NA | NA | NA | NA | NA | NA | NA | NA | NA | NA | NA | NA | NA | NA | NA | NA | NA | NA | NA | NA | NA | NA |
| 2023-12-31 | 2023-09-30 | 2023-06-30 | 2023-03-31 | 2022-12-31 | 2022-09-30 | 2022-06-30 | 2022-03-31 | 2021-12-31 | 2021-09-30 | 2021-06-30 | 2021-03-31 | 2020-12-31 | 2020-09-30 | 2020-06-30 | 2020-03-31 | 2019-12-31 | 2019-09-30 | 2019-06-30 | 2019-03-31 | 2018-12-31 | 2018-09-30 | 2018-06-30 | 2018-03-31 | 2017-12-31 | 2017-09-30 | 2017-06-30 | 2017-03-31 | 2016-12-31 | 2016-09-30 | 2016-06-30 | 2016-03-31 | 2015-12-31 | 2015-09-30 | 2015-06-30 | 2015-03-31 | 2014-12-31 | 2014-09-30 | 2014-06-30 | 2014-03-31 | 2013-12-31 | 2013-09-30 | 2013-06-30 | 2013-03-31 | 2012-12-31 | 2012-09-30 | 2012-06-30 | 2012-03-31 | 2011-12-31 | 2011-09-30 | 2011-06-30 | 2011-03-31 | 2010-12-31 | 2010-09-30 | 2010-06-30 | ||
|---|---|---|---|---|---|---|---|---|---|---|---|---|---|---|---|---|---|---|---|---|---|---|---|---|---|---|---|---|---|---|---|---|---|---|---|---|---|---|---|---|---|---|---|---|---|---|---|---|---|---|---|---|---|---|---|---|
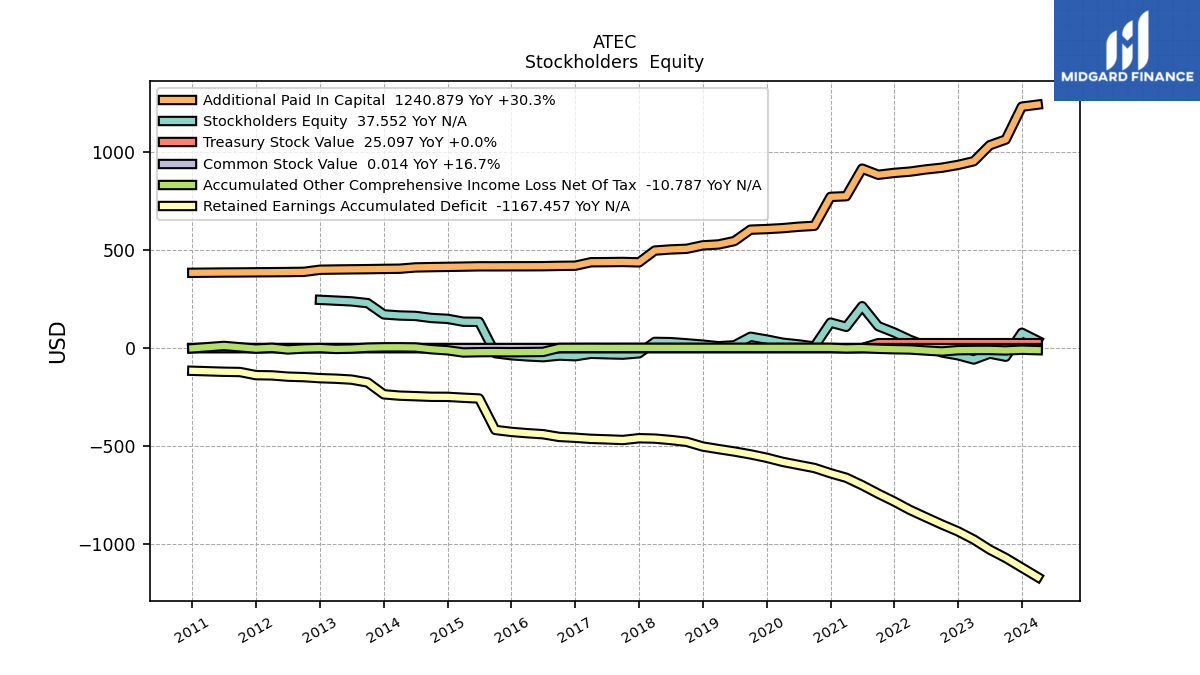
| Stockholders Equity | 78.12 | -44.16 | -28.15 | -58.36 | -36.71 | -22.57 | 10.54 | 41.98 | 79.42 | 111.76 | 213.51 | 108.29 | 129.88 | 8.05 | 18.82 | 27.43 | 43.63 | 57.65 | 14.16 | 9.25 | 17.57 | 24.21 | 30.22 | 31.57 | -26.66 | -33.52 | -31.55 | -29.13 | -41.50 | -38.21 | -46.36 | -42.34 | -36.58 | -26.15 | 133.59 | 134.44 | 148.95 | 153.32 | 163.85 | 166.13 | 171.68 | 228.97 | 237.88 | NA | 245.82 | NA | NA | NA | NA | NA | NA | NA | NA | NA | NA | |
| Common Stock Value | 0.01 | 0.01 | 0.01 | 0.01 | 0.01 | 0.01 | 0.01 | 0.01 | 0.01 | 0.01 | 0.01 | 0.01 | 0.01 | 0.01 | 0.01 | 0.01 | 0.01 | 0.01 | 0.00 | 0.00 | 0.00 | 0.00 | 0.00 | 0.00 | 0.00 | 0.00 | 0.00 | 0.00 | 0.00 | 0.00 | 0.00 | 0.00 | 0.00 | 0.00 | 0.00 | 0.00 | 0.00 | 0.00 | 0.00 | 0.00 | 0.00 | 0.00 | 0.00 | 0.00 | 0.00 | 0.00 | 0.00 | 0.00 | 0.00 | 0.00 | 0.00 | NA | 0.00 | NA | NA | |
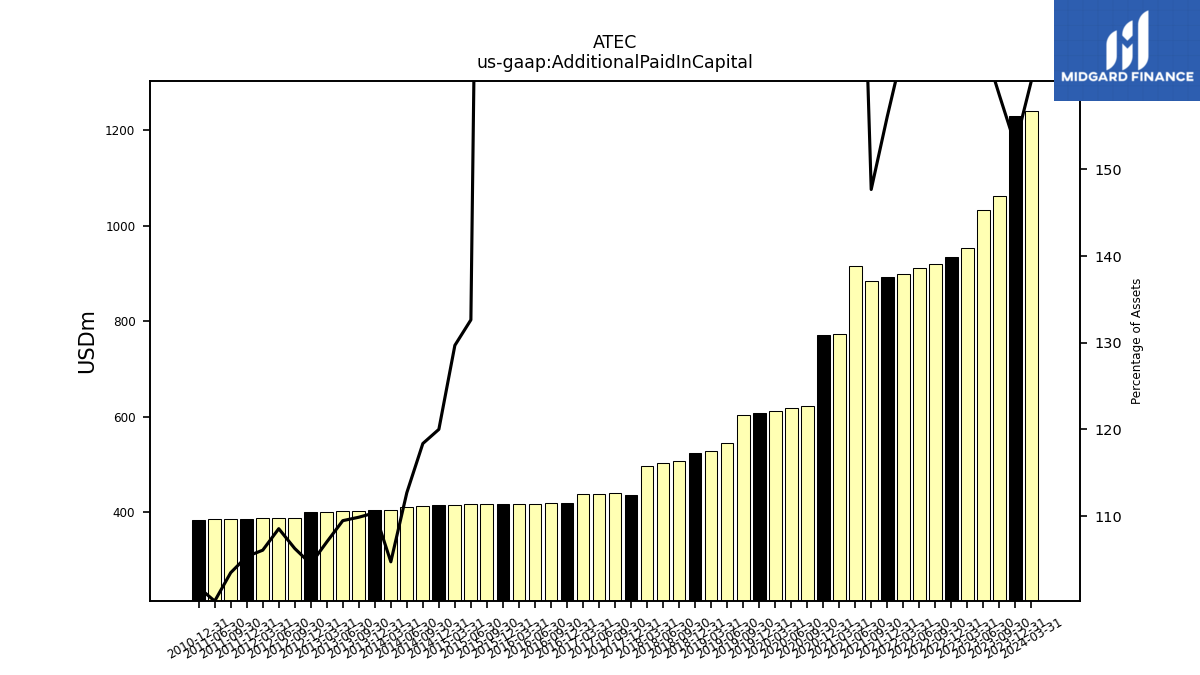
| Additional Paid In Capital | 1230.48 | 1062.92 | 1033.67 | 952.26 | 933.54 | 919.32 | 910.58 | 899.41 | 892.83 | 883.30 | 914.66 | 774.03 | 770.76 | 623.16 | 618.28 | 611.09 | 606.56 | 603.52 | 545.42 | 528.09 | 523.52 | 506.08 | 502.68 | 496.97 | 436.80 | 438.97 | 438.00 | 437.48 | 419.79 | 418.93 | 417.36 | 417.00 | 416.94 | 416.62 | 416.72 | 415.17 | 413.92 | 412.64 | 411.03 | 404.51 | 403.57 | 402.25 | 401.39 | 400.43 | 399.25 | 388.55 | 387.55 | 386.79 | 386.22 | 385.60 | 385.17 | NA | 383.65 | NA | NA | |
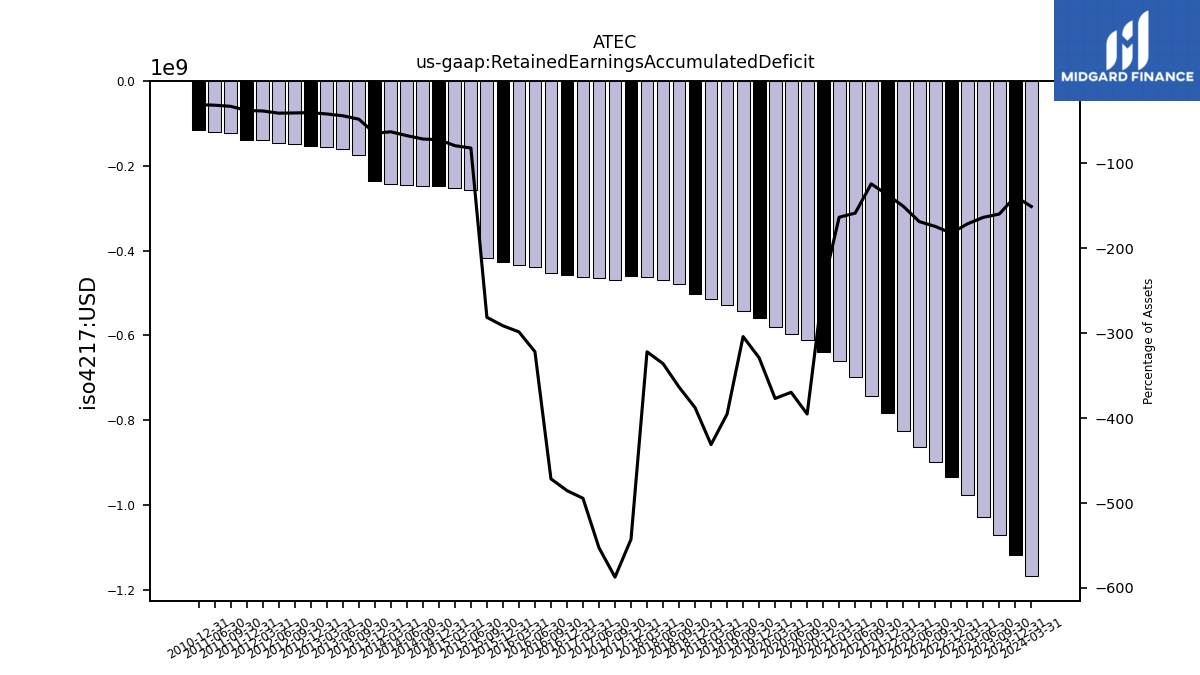
| Retained Earnings Accumulated Deficit | -1118.96 | -1069.88 | -1027.23 | -975.85 | -934.47 | -899.49 | -862.49 | -825.17 | -782.33 | -742.14 | -699.11 | -660.90 | -638.00 | -611.20 | -595.53 | -579.73 | -558.92 | -541.89 | -527.33 | -514.89 | -501.92 | -477.81 | -468.45 | -461.38 | -459.46 | -468.51 | -465.38 | -462.68 | -457.17 | -452.81 | -439.09 | -433.86 | -427.24 | -417.34 | -257.07 | -253.12 | -248.56 | -248.29 | -245.25 | -242.35 | -235.68 | -175.28 | -160.76 | -156.10 | -153.46 | -148.10 | -145.63 | -139.26 | -138.00 | -122.03 | -120.73 | NA | -115.81 | NA | NA | |
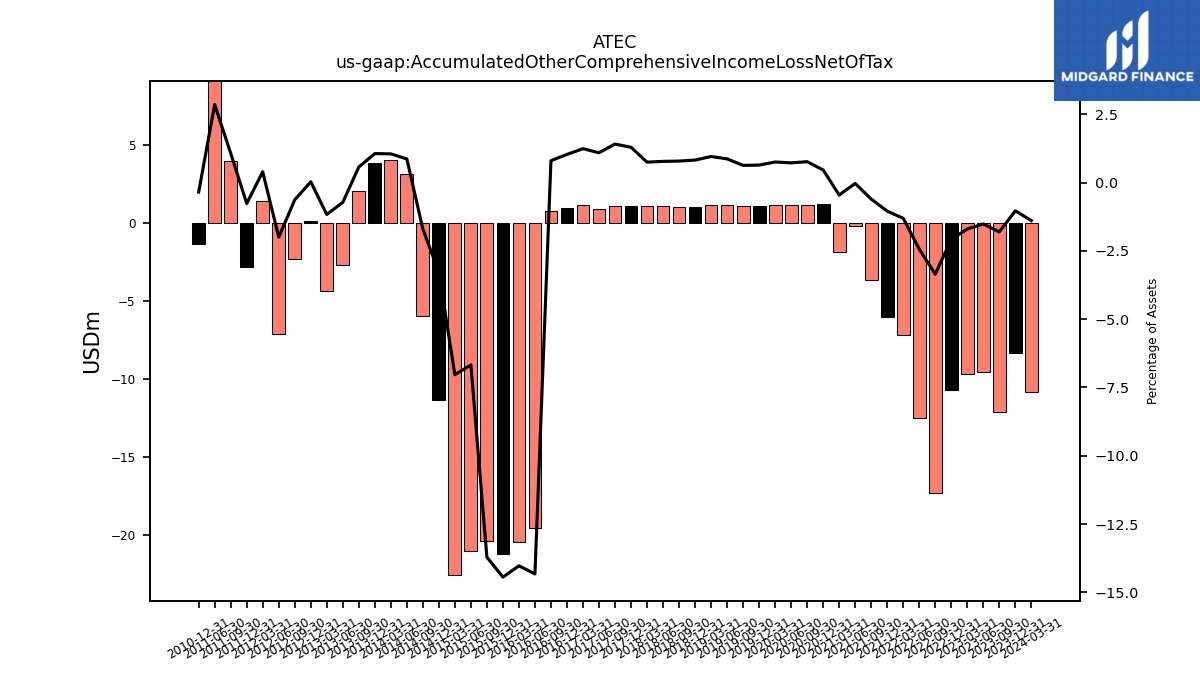
| Accumulated Other Comprehensive Income Loss Net Of Tax | -8.32 | -12.11 | -9.51 | -9.69 | -10.69 | -17.31 | -12.46 | -7.17 | -5.99 | -3.61 | -0.15 | -1.85 | 1.20 | 1.18 | 1.16 | 1.16 | 1.09 | 1.12 | 1.16 | 1.14 | 1.06 | 1.03 | 1.08 | 1.07 | 1.09 | 1.12 | 0.92 | 1.16 | 0.97 | 0.77 | -19.55 | -20.40 | -21.19 | -20.35 | -20.97 | -22.51 | -11.32 | -5.94 | 3.15 | 4.06 | 3.88 | 2.08 | -2.65 | -4.37 | 0.11 | -2.31 | -7.13 | 1.43 | -2.81 | 3.99 | 10.97 | NA | -1.31 | NA | NA | |
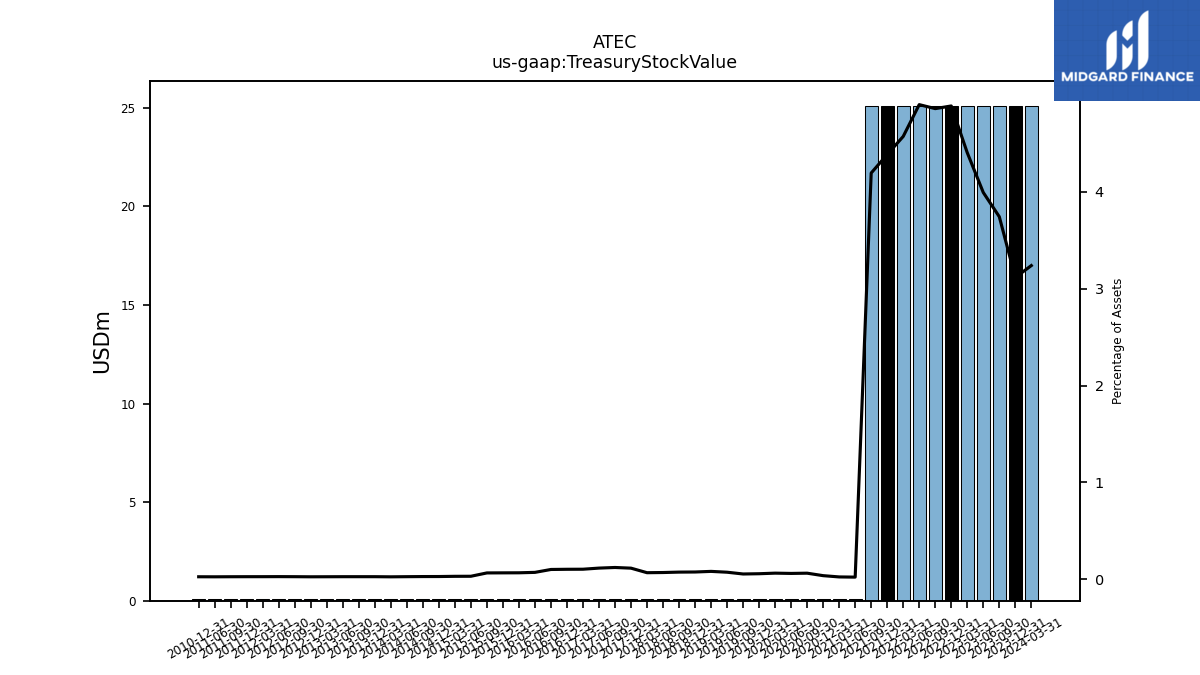
| Treasury Stock Value | 25.10 | 25.10 | 25.10 | 25.10 | 25.10 | 25.10 | 25.10 | 25.10 | 25.10 | 25.10 | 0.10 | 0.10 | 0.10 | 0.10 | 0.10 | 0.10 | 0.10 | 0.10 | 0.10 | 0.10 | 0.10 | 0.10 | 0.10 | 0.10 | 0.10 | 0.10 | 0.10 | 0.10 | 0.10 | 0.10 | 0.10 | 0.10 | 0.10 | 0.10 | 0.10 | 0.10 | 0.10 | 0.10 | 0.10 | 0.10 | 0.10 | 0.10 | 0.10 | 0.10 | 0.10 | 0.10 | 0.10 | 0.10 | 0.10 | 0.10 | 0.10 | NA | 0.10 | NA | NA |
| 2023-12-31 | 2023-09-30 | 2023-06-30 | 2023-03-31 | 2022-12-31 | 2022-09-30 | 2022-06-30 | 2022-03-31 | 2021-12-31 | 2021-09-30 | 2021-06-30 | 2021-03-31 | 2020-12-31 | 2020-09-30 | 2020-06-30 | 2020-03-31 | 2019-12-31 | 2019-09-30 | 2019-06-30 | 2019-03-31 | 2018-12-31 | 2018-09-30 | 2018-06-30 | 2018-03-31 | 2017-12-31 | 2017-09-30 | 2017-06-30 | 2017-03-31 | 2016-12-31 | 2016-09-30 | 2016-06-30 | 2016-03-31 | 2015-12-31 | 2015-09-30 | 2015-06-30 | 2015-03-31 | 2014-12-31 | 2014-09-30 | 2014-06-30 | 2014-03-31 | 2013-12-31 | 2013-09-30 | 2013-06-30 | 2013-03-31 | 2012-12-31 | 2012-09-30 | 2012-06-30 | 2012-03-31 | 2011-12-31 | 2011-09-30 | 2011-06-30 | 2011-03-31 | 2010-12-31 | 2010-09-30 | 2010-06-30 | ||
|---|---|---|---|---|---|---|---|---|---|---|---|---|---|---|---|---|---|---|---|---|---|---|---|---|---|---|---|---|---|---|---|---|---|---|---|---|---|---|---|---|---|---|---|---|---|---|---|---|---|---|---|---|---|---|---|---|
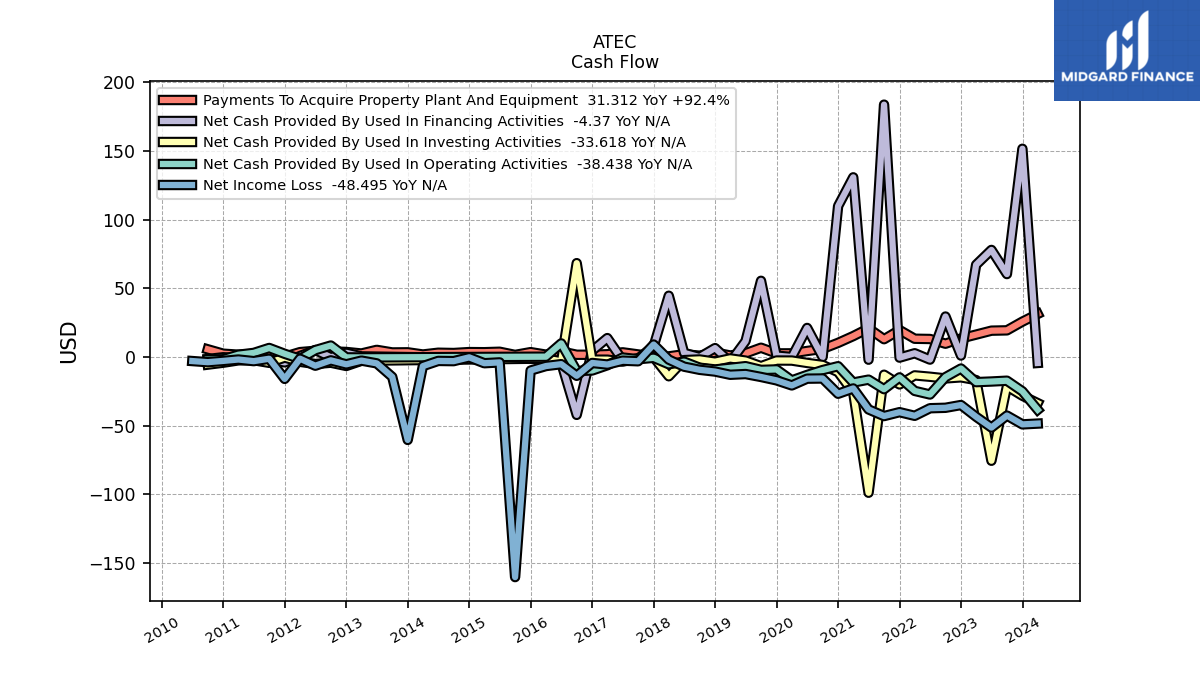
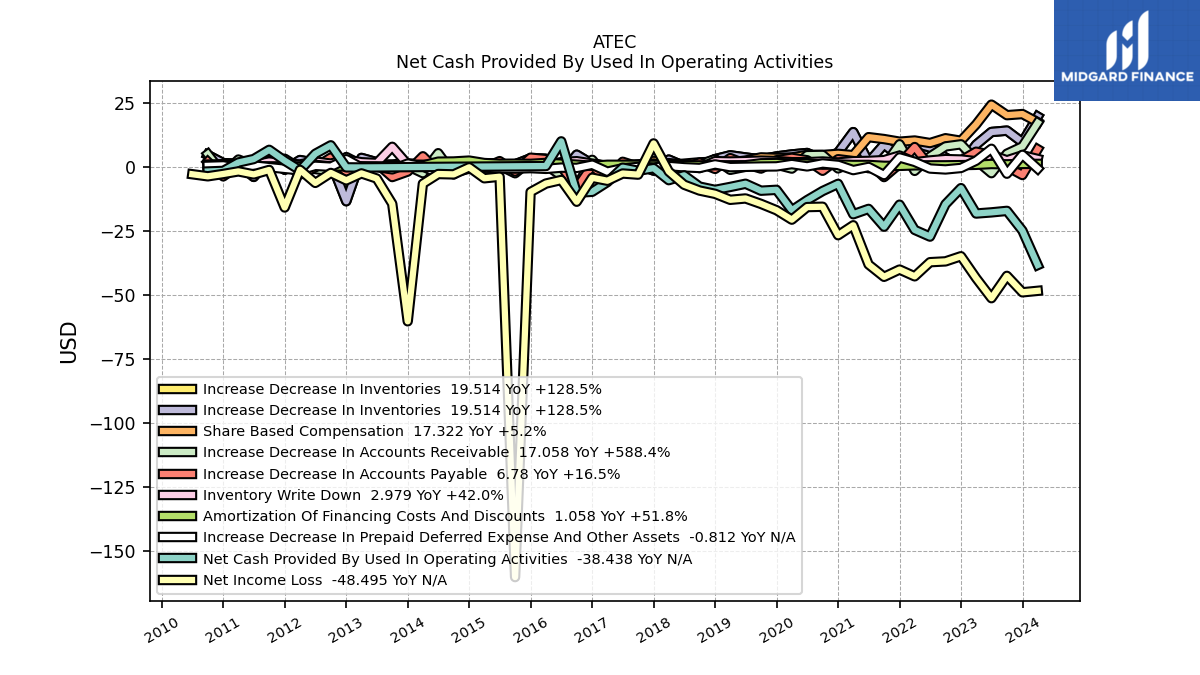
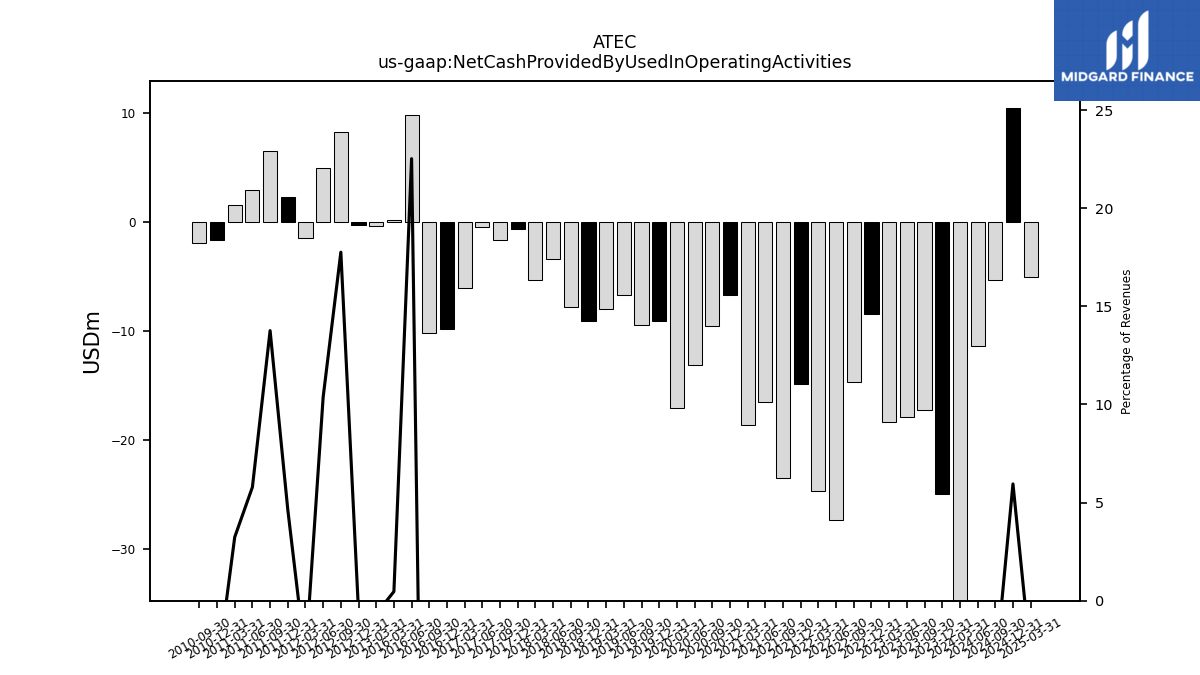
| Net Cash Provided By Used In Operating Activities | -25.00 | -17.29 | -17.87 | -18.32 | -8.40 | -14.69 | -27.34 | -24.71 | -14.86 | -23.47 | -16.51 | -18.60 | -6.73 | -9.54 | -13.10 | -17.05 | -9.07 | -9.41 | -6.70 | -7.94 | -9.09 | -7.81 | -3.41 | -5.30 | -0.61 | -1.64 | -0.42 | -6.05 | -9.83 | -10.20 | 9.86 | 0.21 | NA | NA | NA | NA | NA | NA | NA | NA | NA | NA | NA | -0.34 | -0.30 | 8.32 | 5.00 | -1.43 | 2.30 | 6.55 | 2.94 | 1.61 | -1.68 | -1.91 | NA | |
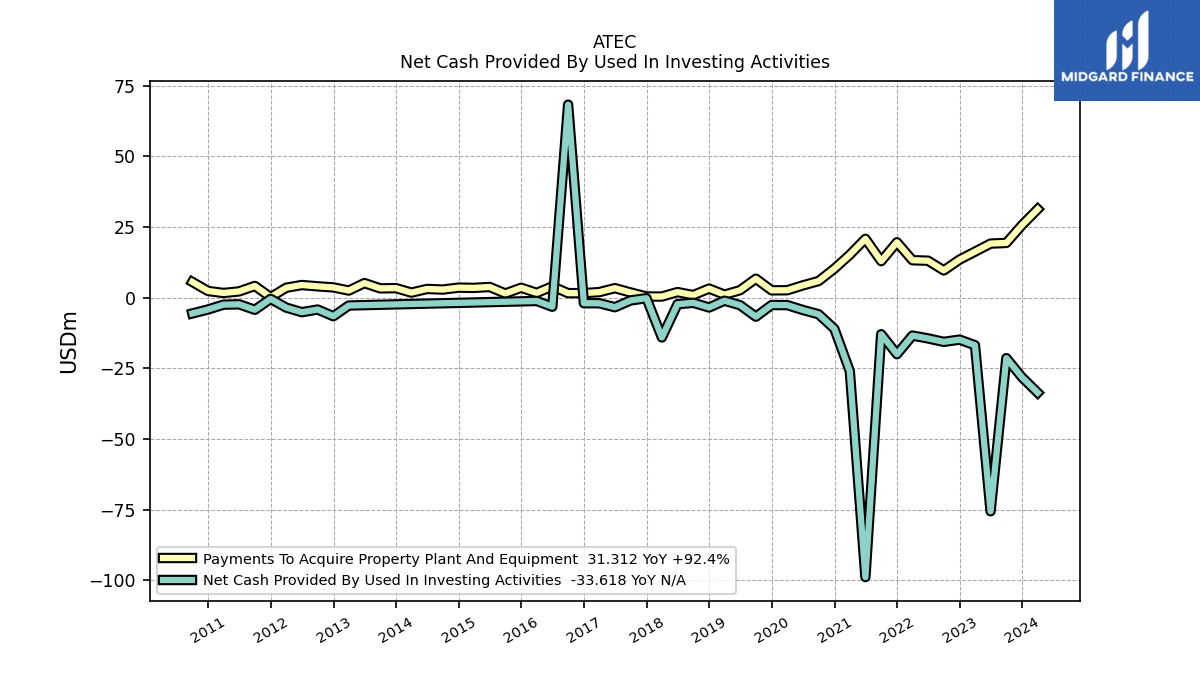
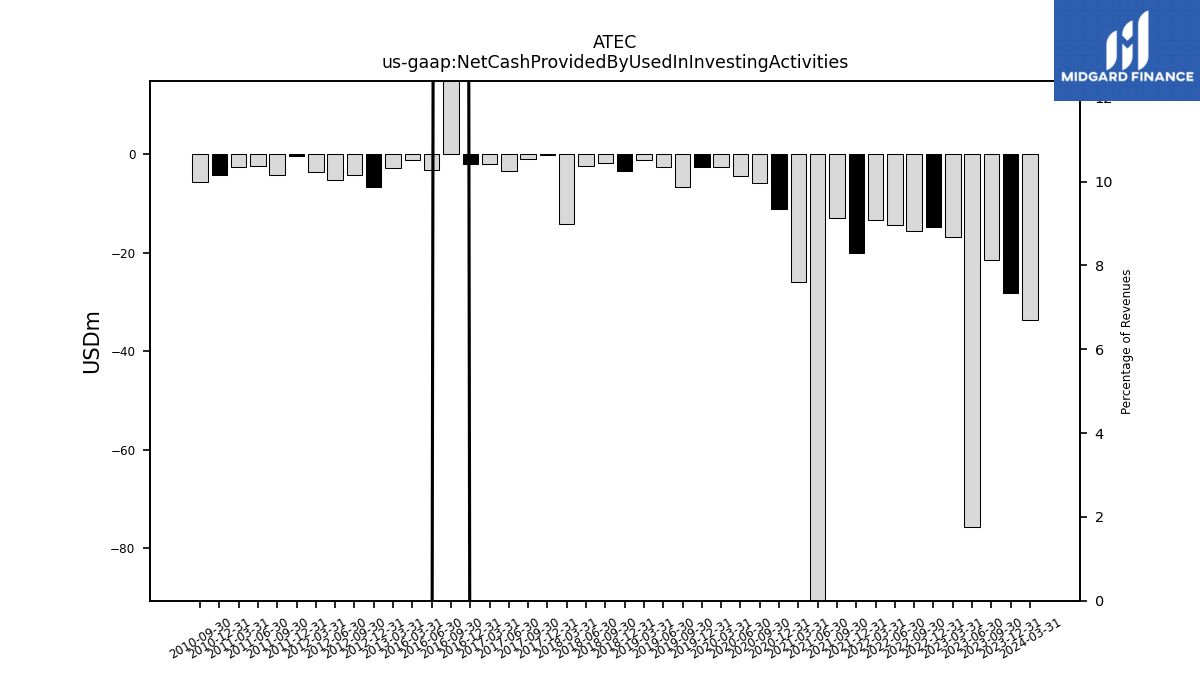
| Net Cash Provided By Used In Investing Activities | -28.21 | -21.38 | -75.56 | -16.82 | -14.84 | -15.63 | -14.41 | -13.41 | -20.00 | -12.92 | -98.85 | -25.99 | -11.02 | -5.86 | -4.35 | -2.63 | -2.60 | -6.72 | -2.65 | -1.07 | -3.47 | -1.82 | -2.30 | -14.08 | -0.18 | -0.97 | -3.37 | -1.98 | -1.96 | 68.29 | -3.21 | -1.17 | NA | NA | NA | NA | NA | NA | NA | NA | NA | NA | NA | -2.77 | -6.56 | -4.19 | -5.13 | -3.52 | -0.42 | -4.28 | -2.34 | -2.47 | -4.17 | -5.58 | NA | |
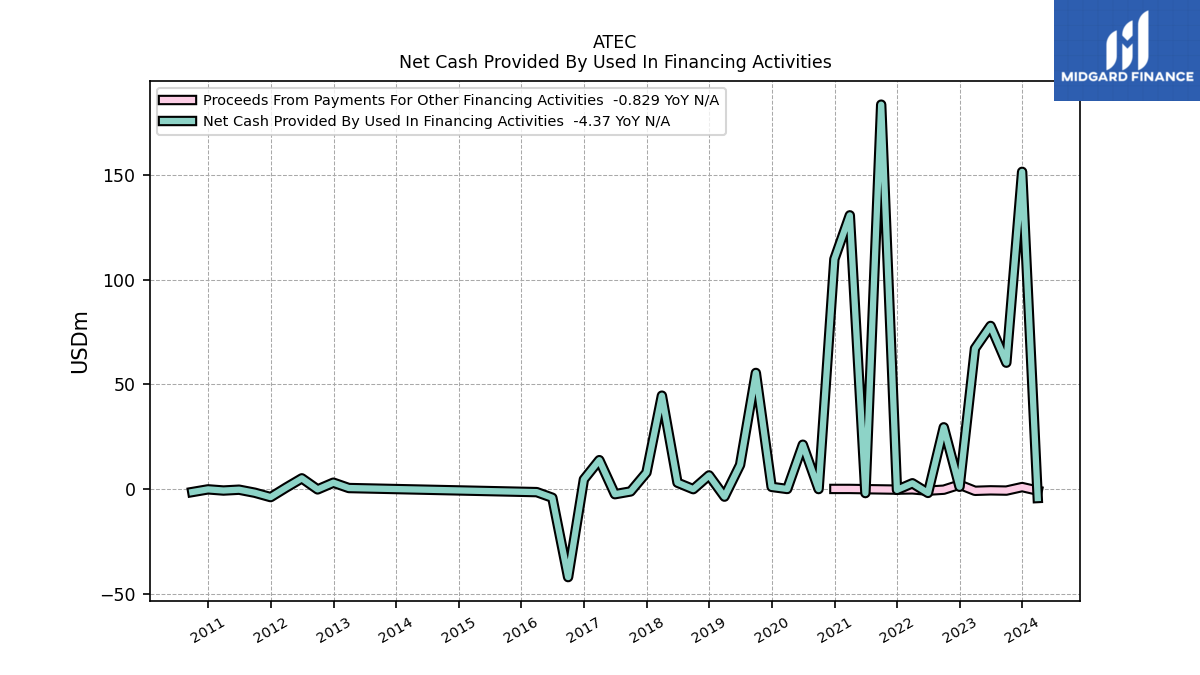
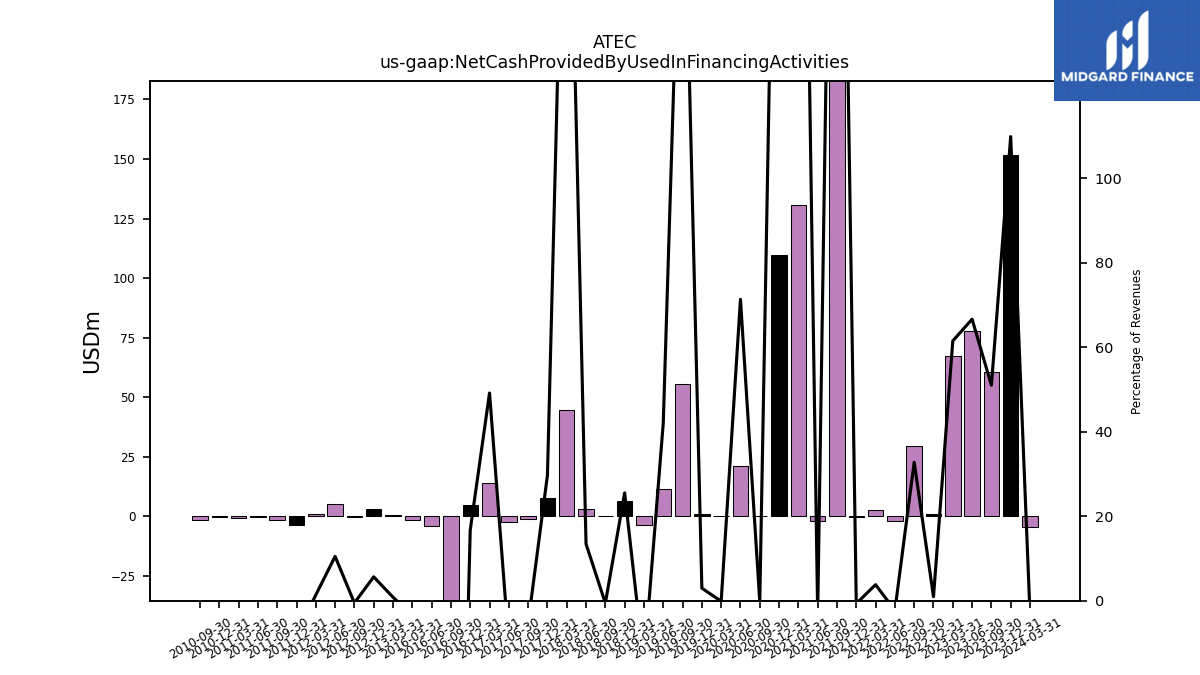
| Net Cash Provided By Used In Financing Activities | 151.57 | 60.33 | 77.91 | 67.11 | 1.01 | 29.44 | -1.93 | 2.70 | -0.49 | 183.68 | -2.01 | 130.78 | 109.82 | -0.09 | 21.14 | -0.04 | 0.96 | 55.44 | 11.48 | -3.70 | 6.47 | -0.13 | 2.96 | 44.58 | 7.80 | -1.21 | -2.53 | 13.76 | 4.53 | -42.17 | -4.22 | -1.54 | NA | NA | NA | NA | NA | NA | NA | NA | NA | NA | NA | 0.42 | 2.98 | -0.24 | 5.06 | 0.67 | -3.93 | -1.83 | -0.38 | -0.77 | -0.22 | -1.50 | NA |
| 2023-12-31 | 2023-09-30 | 2023-06-30 | 2023-03-31 | 2022-12-31 | 2022-09-30 | 2022-06-30 | 2022-03-31 | 2021-12-31 | 2021-09-30 | 2021-06-30 | 2021-03-31 | 2020-12-31 | 2020-09-30 | 2020-06-30 | 2020-03-31 | 2019-12-31 | 2019-09-30 | 2019-06-30 | 2019-03-31 | 2018-12-31 | 2018-09-30 | 2018-06-30 | 2018-03-31 | 2017-12-31 | 2017-09-30 | 2017-06-30 | 2017-03-31 | 2016-12-31 | 2016-09-30 | 2016-06-30 | 2016-03-31 | 2015-12-31 | 2015-09-30 | 2015-06-30 | 2015-03-31 | 2014-12-31 | 2014-09-30 | 2014-06-30 | 2014-03-31 | 2013-12-31 | 2013-09-30 | 2013-06-30 | 2013-03-31 | 2012-12-31 | 2012-09-30 | 2012-06-30 | 2012-03-31 | 2011-12-31 | 2011-09-30 | 2011-06-30 | 2011-03-31 | 2010-12-31 | 2010-09-30 | 2010-06-30 | ||
|---|---|---|---|---|---|---|---|---|---|---|---|---|---|---|---|---|---|---|---|---|---|---|---|---|---|---|---|---|---|---|---|---|---|---|---|---|---|---|---|---|---|---|---|---|---|---|---|---|---|---|---|---|---|---|---|---|
| Net Cash Provided By Used In Operating Activities | -25.00 | -17.29 | -17.87 | -18.32 | -8.40 | -14.69 | -27.34 | -24.71 | -14.86 | -23.47 | -16.51 | -18.60 | -6.73 | -9.54 | -13.10 | -17.05 | -9.07 | -9.41 | -6.70 | -7.94 | -9.09 | -7.81 | -3.41 | -5.30 | -0.61 | -1.64 | -0.42 | -6.05 | -9.83 | -10.20 | 9.86 | 0.21 | NA | NA | NA | NA | NA | NA | NA | NA | NA | NA | NA | -0.34 | -0.30 | 8.32 | 5.00 | -1.43 | 2.30 | 6.55 | 2.94 | 1.61 | -1.68 | -1.91 | NA | |
| Net Income Loss | -49.08 | -42.65 | -51.38 | -43.53 | -34.99 | -37.00 | -37.32 | -42.84 | -40.19 | -43.03 | -38.20 | -22.90 | -26.80 | -15.67 | -15.80 | -20.72 | -17.03 | -14.57 | -12.44 | -12.97 | -10.63 | -9.36 | -7.08 | -1.92 | 9.05 | -3.14 | -2.70 | -5.51 | -4.35 | -13.72 | -5.23 | -6.62 | -9.90 | -160.26 | -3.95 | -4.56 | -0.27 | -3.04 | -2.90 | -6.67 | -60.41 | -14.51 | -4.66 | -2.65 | -5.36 | -2.47 | -6.37 | -1.26 | -15.97 | -1.30 | -3.04 | -1.87 | -2.88 | -3.79 | -2.98 | |
| Profit Loss | -49.08 | -42.65 | -51.38 | -43.53 | -34.99 | -37.00 | -37.32 | -42.84 | -40.19 | -43.03 | -38.20 | -22.90 | -26.80 | -15.67 | -15.80 | -20.72 | -17.03 | -14.57 | -12.44 | -12.97 | NA | NA | NA | NA | NA | NA | NA | NA | NA | NA | NA | NA | NA | NA | NA | NA | NA | NA | NA | NA | NA | NA | NA | NA | NA | NA | NA | NA | NA | NA | NA | NA | NA | NA | NA | |
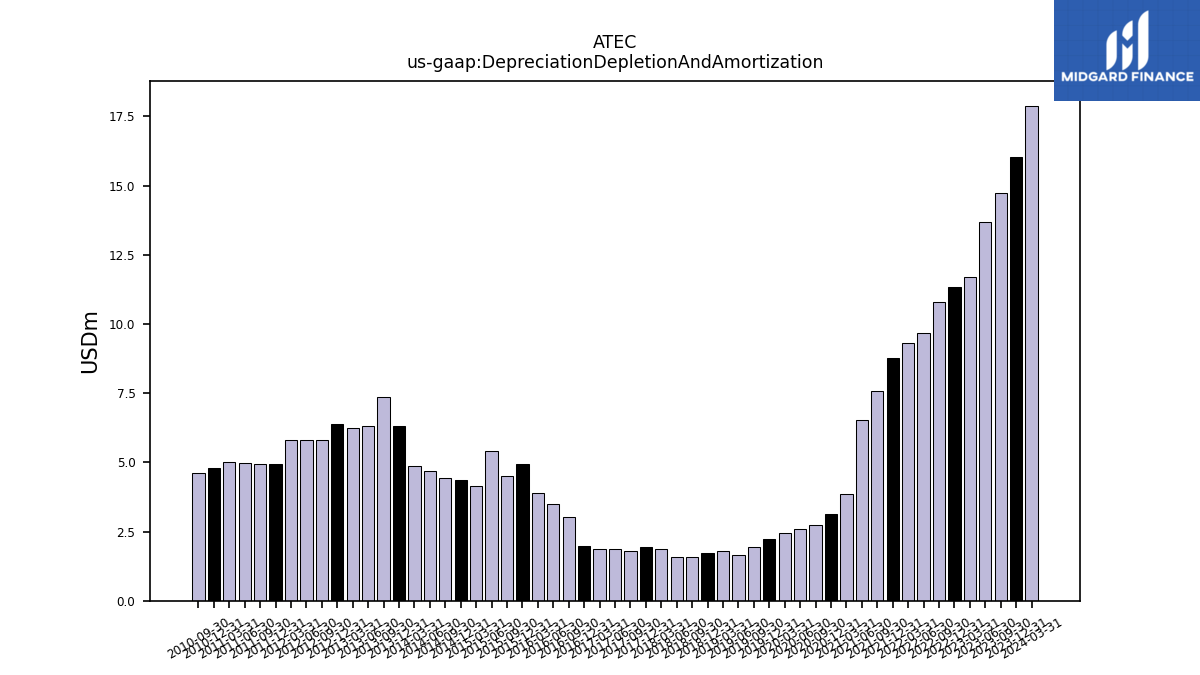
| Depreciation Depletion And Amortization | 16.02 | 14.74 | 13.68 | 11.69 | 11.35 | 10.81 | 9.69 | 9.31 | 8.77 | 7.59 | 6.54 | 3.85 | 3.15 | 2.75 | 2.60 | 2.45 | 2.22 | 1.92 | 1.65 | 1.78 | 1.72 | 1.59 | 1.59 | 1.89 | 1.95 | 1.80 | 1.87 | 1.87 | 1.96 | 3.02 | 3.50 | 3.88 | 4.93 | 4.51 | 5.42 | 4.16 | 4.38 | 4.45 | 4.70 | 4.85 | 6.31 | 7.38 | 6.33 | 6.26 | 6.37 | 5.80 | 5.82 | 5.80 | 4.94 | 4.96 | 4.98 | 5.00 | 4.79 | 4.61 | NA | |
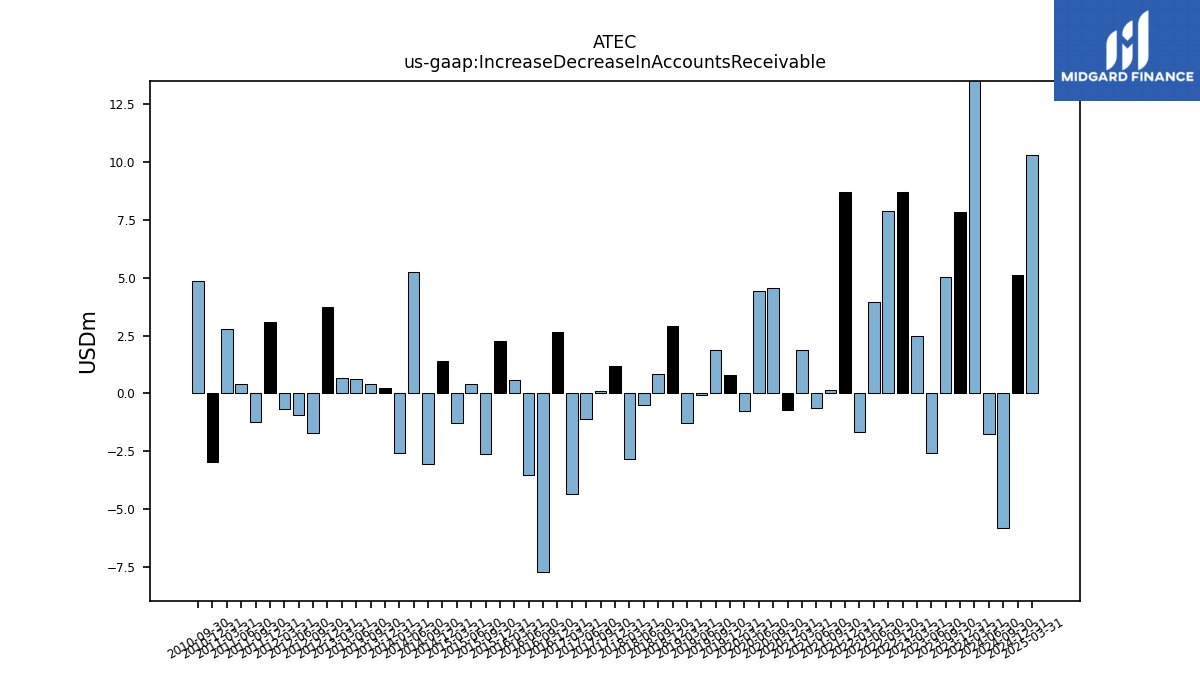
| Increase Decrease In Accounts Receivable | 7.86 | 5.04 | -2.58 | 2.48 | 8.70 | 7.88 | 3.93 | -1.67 | 8.72 | 0.16 | -0.63 | 1.89 | -0.71 | 4.54 | 4.44 | -0.78 | 0.77 | 1.86 | -0.06 | -1.27 | 2.92 | 0.82 | -0.50 | -2.85 | 1.20 | 0.10 | -1.10 | -4.36 | 2.66 | -7.72 | -3.53 | 0.60 | 2.28 | -2.61 | 0.40 | -1.26 | 1.40 | -3.05 | 5.23 | -2.56 | 0.24 | 0.39 | 0.64 | 0.67 | 3.75 | -1.73 | -0.95 | -0.69 | 3.08 | -1.25 | 0.40 | 2.77 | -2.97 | 4.87 | NA | |
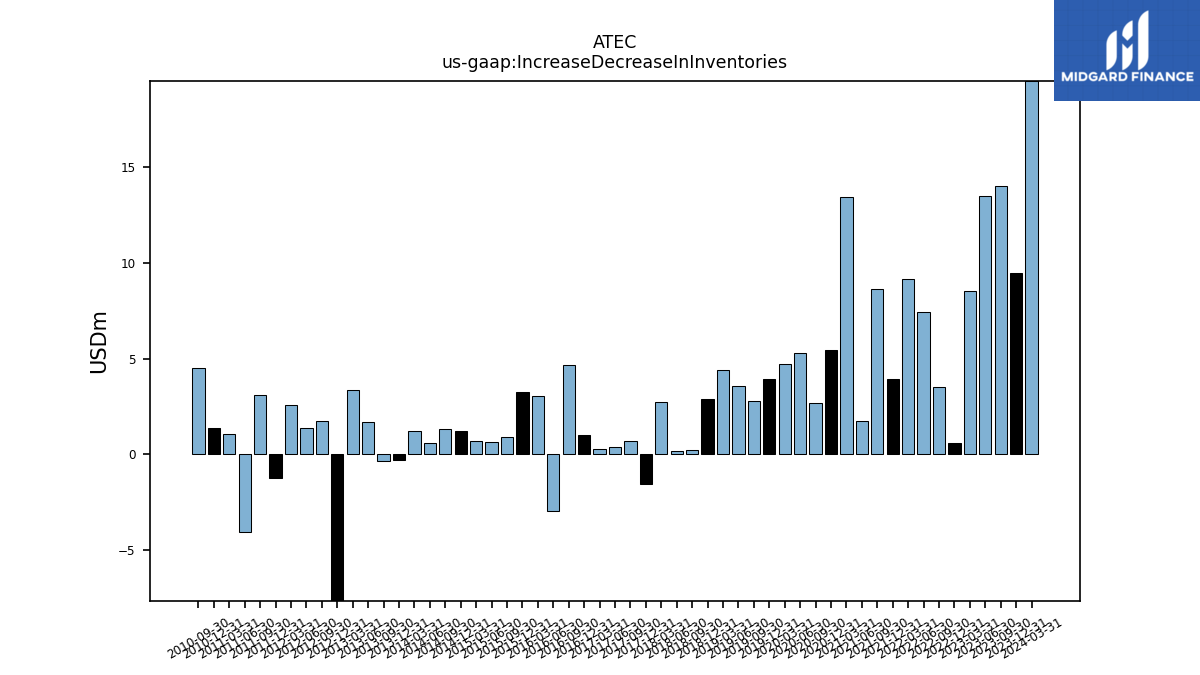
| Increase Decrease In Inventories | 9.47 | 14.04 | 13.51 | 8.54 | 0.57 | 3.52 | 7.46 | 9.15 | 3.93 | 8.62 | 1.72 | 13.47 | 5.47 | 2.67 | 5.31 | 4.74 | 3.96 | 2.79 | 3.56 | 4.40 | 2.91 | 0.21 | 0.17 | 2.73 | -1.55 | 0.68 | 0.36 | 0.25 | 1.02 | 4.64 | -2.97 | 3.05 | 3.25 | 0.89 | 0.63 | 0.69 | 1.21 | 1.31 | 0.59 | 1.24 | -0.31 | -0.36 | 1.69 | 3.39 | -13.53 | 1.75 | 1.36 | 2.56 | -1.22 | 3.09 | -4.04 | 1.09 | 1.36 | 4.51 | NA | |
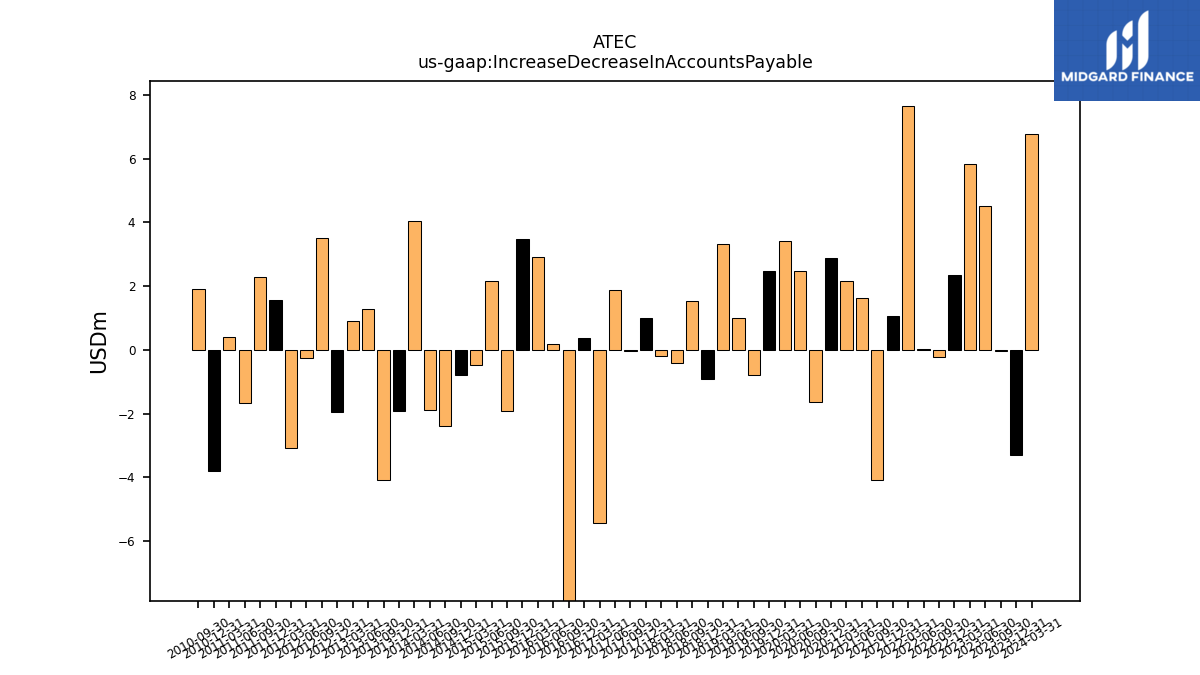
| Increase Decrease In Accounts Payable | -3.30 | -0.03 | 4.50 | 5.82 | 2.36 | -0.21 | 0.01 | 7.64 | 1.05 | -4.09 | 1.64 | 2.16 | 2.88 | -1.64 | 2.47 | 3.41 | 2.46 | -0.78 | 1.00 | 3.32 | -0.91 | 1.54 | -0.43 | -0.19 | 1.00 | -0.05 | 1.89 | -5.43 | 0.38 | -8.32 | 0.17 | 2.90 | 3.49 | -1.93 | 2.14 | -0.49 | -0.78 | -2.41 | -1.89 | 4.04 | -1.93 | -4.09 | 1.27 | 0.90 | -1.96 | 3.51 | -0.27 | -3.08 | 1.55 | 2.28 | -1.68 | 0.40 | -3.82 | 1.91 | NA | |
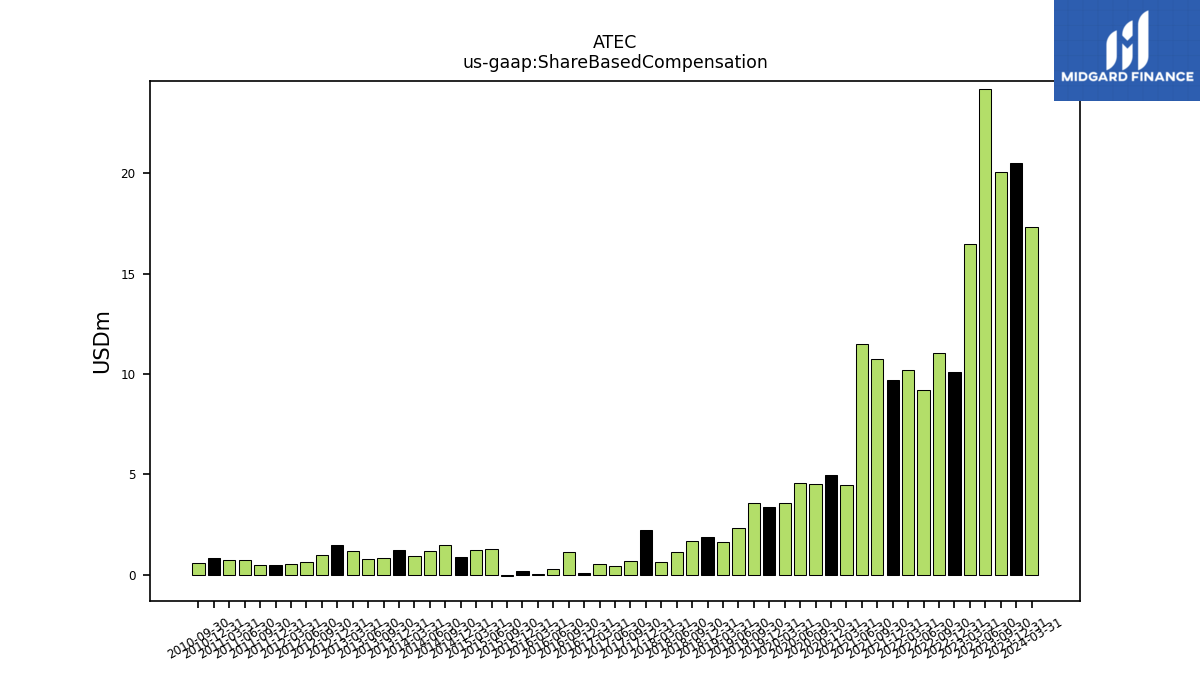
| Share Based Compensation | 20.52 | 20.07 | 24.19 | 16.46 | 10.09 | 11.08 | 9.20 | 10.18 | 9.73 | 10.75 | 11.50 | 4.47 | 4.97 | 4.54 | 4.58 | 3.57 | 3.39 | 3.60 | 2.35 | 1.61 | 1.86 | 1.68 | 1.15 | 0.62 | 2.23 | 0.71 | 0.44 | 0.52 | 0.12 | 1.15 | 0.30 | 0.06 | 0.20 | -0.08 | 1.26 | 1.25 | 0.91 | 1.50 | 1.20 | 0.94 | 1.25 | 0.85 | 0.80 | 1.18 | 1.48 | 1.00 | 0.66 | 0.55 | 0.50 | 0.48 | 0.73 | 0.71 | 0.85 | 0.57 | NA |
| 2023-12-31 | 2023-09-30 | 2023-06-30 | 2023-03-31 | 2022-12-31 | 2022-09-30 | 2022-06-30 | 2022-03-31 | 2021-12-31 | 2021-09-30 | 2021-06-30 | 2021-03-31 | 2020-12-31 | 2020-09-30 | 2020-06-30 | 2020-03-31 | 2019-12-31 | 2019-09-30 | 2019-06-30 | 2019-03-31 | 2018-12-31 | 2018-09-30 | 2018-06-30 | 2018-03-31 | 2017-12-31 | 2017-09-30 | 2017-06-30 | 2017-03-31 | 2016-12-31 | 2016-09-30 | 2016-06-30 | 2016-03-31 | 2015-12-31 | 2015-09-30 | 2015-06-30 | 2015-03-31 | 2014-12-31 | 2014-09-30 | 2014-06-30 | 2014-03-31 | 2013-12-31 | 2013-09-30 | 2013-06-30 | 2013-03-31 | 2012-12-31 | 2012-09-30 | 2012-06-30 | 2012-03-31 | 2011-12-31 | 2011-09-30 | 2011-06-30 | 2011-03-31 | 2010-12-31 | 2010-09-30 | 2010-06-30 | ||
|---|---|---|---|---|---|---|---|---|---|---|---|---|---|---|---|---|---|---|---|---|---|---|---|---|---|---|---|---|---|---|---|---|---|---|---|---|---|---|---|---|---|---|---|---|---|---|---|---|---|---|---|---|---|---|---|---|
| Net Cash Provided By Used In Investing Activities | -28.21 | -21.38 | -75.56 | -16.82 | -14.84 | -15.63 | -14.41 | -13.41 | -20.00 | -12.92 | -98.85 | -25.99 | -11.02 | -5.86 | -4.35 | -2.63 | -2.60 | -6.72 | -2.65 | -1.07 | -3.47 | -1.82 | -2.30 | -14.08 | -0.18 | -0.97 | -3.37 | -1.98 | -1.96 | 68.29 | -3.21 | -1.17 | NA | NA | NA | NA | NA | NA | NA | NA | NA | NA | NA | -2.77 | -6.56 | -4.19 | -5.13 | -3.52 | -0.42 | -4.28 | -2.34 | -2.47 | -4.17 | -5.58 | NA | |
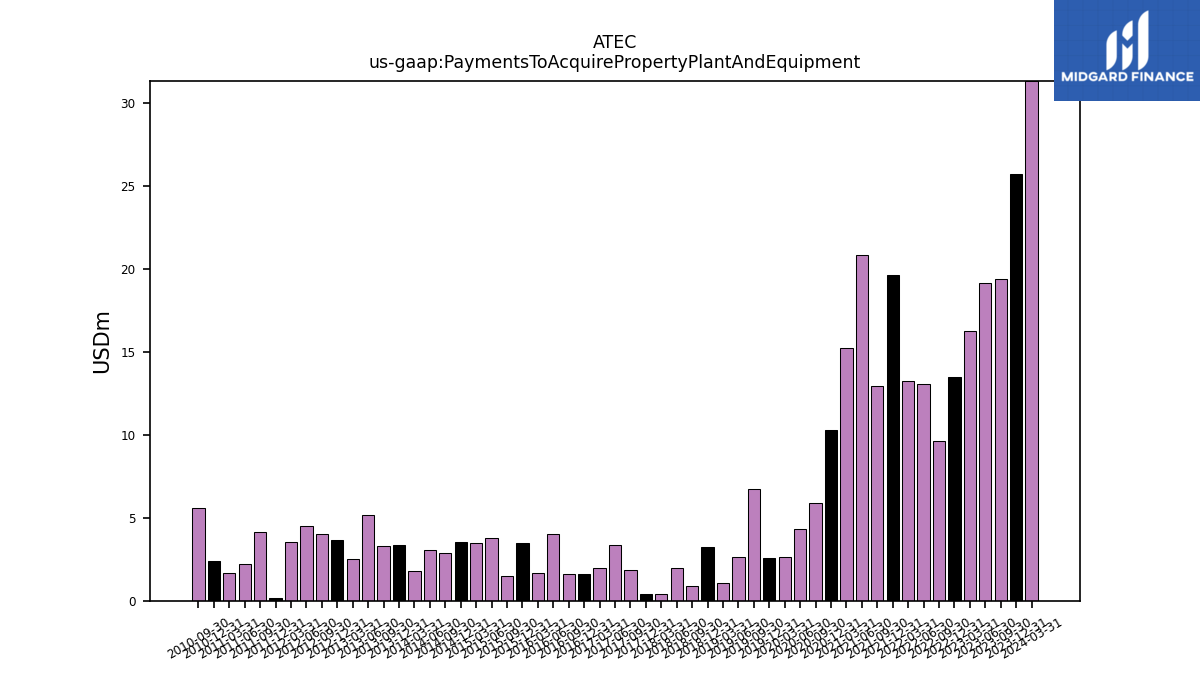
| Payments To Acquire Property Plant And Equipment | 25.72 | 19.37 | 19.14 | 16.28 | 13.47 | 9.65 | 13.08 | 13.26 | 19.60 | 12.92 | 20.83 | 15.20 | 10.26 | 5.89 | 4.35 | 2.63 | 2.60 | 6.72 | 2.65 | 1.07 | 3.22 | 0.91 | 1.98 | 0.41 | 0.41 | 1.84 | 3.37 | 1.98 | 1.61 | 1.60 | 4.00 | 1.69 | 3.51 | 1.48 | 3.79 | 3.46 | 3.55 | 2.88 | 3.08 | 1.79 | 3.38 | 3.29 | 5.16 | 2.52 | 3.64 | 4.01 | 4.48 | 3.52 | 0.17 | 4.15 | 2.22 | 1.66 | 2.37 | 5.58 | NA |
| 2023-12-31 | 2023-09-30 | 2023-06-30 | 2023-03-31 | 2022-12-31 | 2022-09-30 | 2022-06-30 | 2022-03-31 | 2021-12-31 | 2021-09-30 | 2021-06-30 | 2021-03-31 | 2020-12-31 | 2020-09-30 | 2020-06-30 | 2020-03-31 | 2019-12-31 | 2019-09-30 | 2019-06-30 | 2019-03-31 | 2018-12-31 | 2018-09-30 | 2018-06-30 | 2018-03-31 | 2017-12-31 | 2017-09-30 | 2017-06-30 | 2017-03-31 | 2016-12-31 | 2016-09-30 | 2016-06-30 | 2016-03-31 | 2015-12-31 | 2015-09-30 | 2015-06-30 | 2015-03-31 | 2014-12-31 | 2014-09-30 | 2014-06-30 | 2014-03-31 | 2013-12-31 | 2013-09-30 | 2013-06-30 | 2013-03-31 | 2012-12-31 | 2012-09-30 | 2012-06-30 | 2012-03-31 | 2011-12-31 | 2011-09-30 | 2011-06-30 | 2011-03-31 | 2010-12-31 | 2010-09-30 | 2010-06-30 | ||
|---|---|---|---|---|---|---|---|---|---|---|---|---|---|---|---|---|---|---|---|---|---|---|---|---|---|---|---|---|---|---|---|---|---|---|---|---|---|---|---|---|---|---|---|---|---|---|---|---|---|---|---|---|---|---|---|---|
| Net Cash Provided By Used In Financing Activities | 151.57 | 60.33 | 77.91 | 67.11 | 1.01 | 29.44 | -1.93 | 2.70 | -0.49 | 183.68 | -2.01 | 130.78 | 109.82 | -0.09 | 21.14 | -0.04 | 0.96 | 55.44 | 11.48 | -3.70 | 6.47 | -0.13 | 2.96 | 44.58 | 7.80 | -1.21 | -2.53 | 13.76 | 4.53 | -42.17 | -4.22 | -1.54 | NA | NA | NA | NA | NA | NA | NA | NA | NA | NA | NA | 0.42 | 2.98 | -0.24 | 5.06 | 0.67 | -3.93 | -1.83 | -0.38 | -0.77 | -0.22 | -1.50 | NA |
| 2023-12-31 | 2023-09-30 | 2023-06-30 | 2023-03-31 | 2022-12-31 | 2022-09-30 | 2022-06-30 | 2022-03-31 | 2021-12-31 | 2021-09-30 | 2021-06-30 | 2021-03-31 | 2020-12-31 | 2020-09-30 | 2020-06-30 | 2020-03-31 | 2019-12-31 | 2019-09-30 | 2019-06-30 | 2019-03-31 | 2018-12-31 | 2018-09-30 | 2018-06-30 | 2018-03-31 | 2017-12-31 | 2017-09-30 | 2017-06-30 | 2017-03-31 | 2016-12-31 | 2016-09-30 | 2016-06-30 | 2016-03-31 | 2015-12-31 | 2015-09-30 | 2015-06-30 | 2015-03-31 | 2014-12-31 | 2014-09-30 | 2014-06-30 | 2014-03-31 | 2013-12-31 | 2013-09-30 | 2013-06-30 | 2013-03-31 | 2012-12-31 | 2012-09-30 | 2012-06-30 | 2012-03-31 | 2011-12-31 | 2011-09-30 | 2011-06-30 | 2011-03-31 | 2010-12-31 | 2010-09-30 | 2010-06-30 | ||
|---|---|---|---|---|---|---|---|---|---|---|---|---|---|---|---|---|---|---|---|---|---|---|---|---|---|---|---|---|---|---|---|---|---|---|---|---|---|---|---|---|---|---|---|---|---|---|---|---|---|---|---|---|---|---|---|---|
| Revenues | 137.97 | 118.26 | 116.92 | 109.11 | 105.94 | 89.84 | 84.15 | 70.93 | 73.96 | 62.88 | 62.25 | 44.12 | 43.95 | 41.16 | 29.63 | 30.11 | 32.35 | 29.20 | 27.32 | 24.55 | 25.34 | 23.00 | 22.04 | 21.31 | 26.28 | 23.10 | 24.38 | 27.98 | 27.09 | 26.71 | 43.79 | 44.76 | 47.00 | 43.00 | 46.63 | 48.65 | 53.63 | 51.01 | 53.17 | 49.17 | 53.06 | 50.20 | 51.02 | 50.44 | 52.74 | 46.84 | 48.23 | 48.46 | 49.51 | 47.62 | 50.86 | 49.72 | 46.02 | 44.85 | 45.42 | |
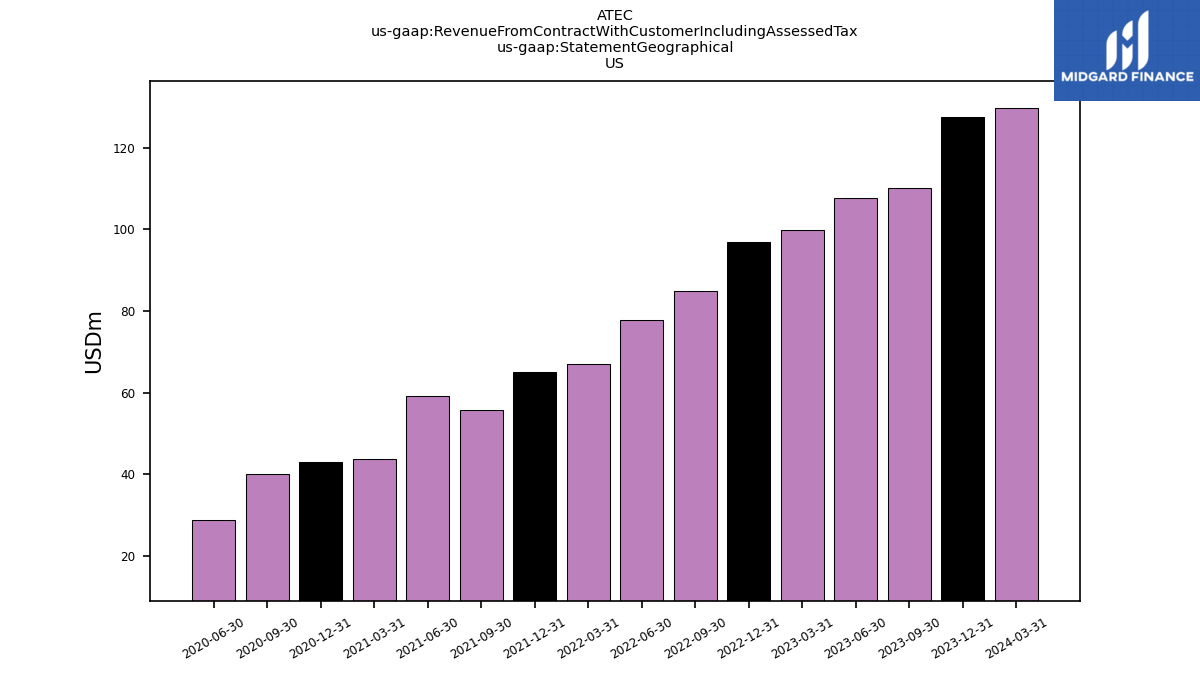
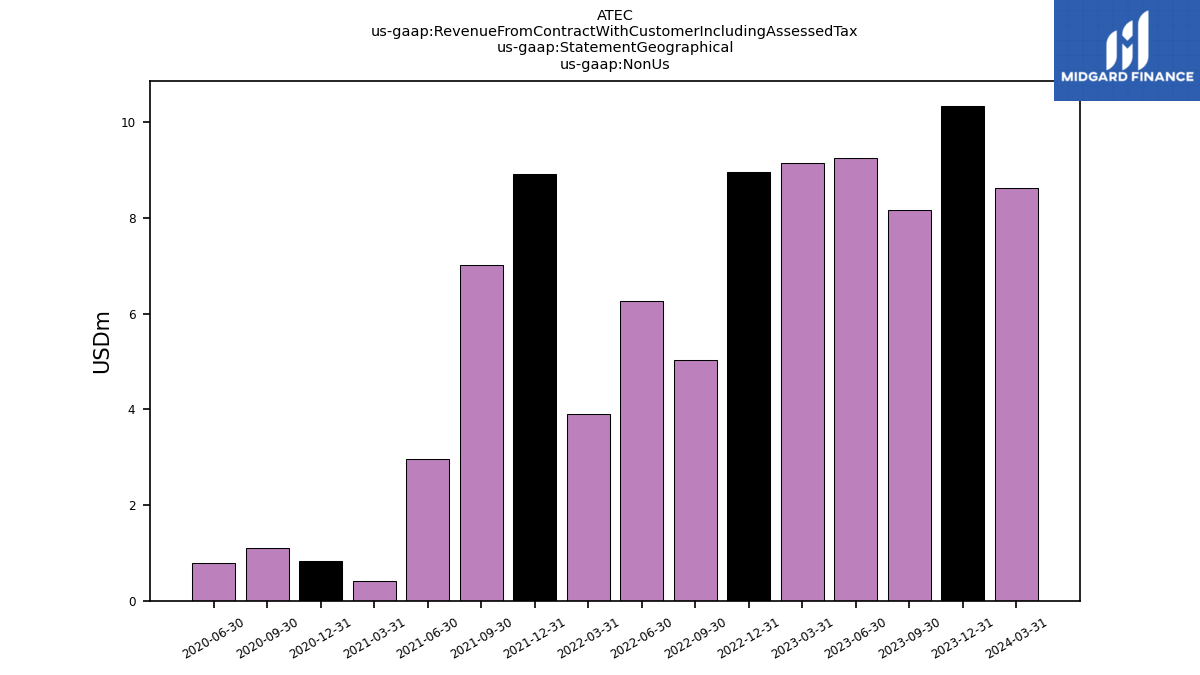
| Revenue From Contract With Customer Including Assessed Tax | 137.97 | 118.26 | 116.92 | 109.11 | 105.94 | 89.84 | 84.15 | 70.93 | 73.96 | 62.88 | 62.25 | 44.12 | 43.95 | 41.16 | 29.63 | 30.11 | 32.35 | 29.20 | 27.32 | 24.55 | 25.34 | 23.00 | 22.04 | 21.31 | 26.28 | 23.10 | 24.38 | 27.98 | 27.09 | 26.71 | 43.79 | 44.76 | 47.00 | 43.00 | 46.63 | 48.65 | 53.63 | 51.01 | 53.17 | 49.17 | 53.06 | 50.20 | 51.02 | 50.44 | 52.74 | 46.84 | 48.23 | 48.46 | 49.51 | 47.62 | 50.86 | 49.72 | 46.02 | 44.85 | 45.42 | |
| Products And Services | 137.97 | 118.26 | 116.92 | 109.11 | 105.94 | 89.84 | 84.15 | 70.92 | 73.92 | 62.73 | 61.88 | 43.72 | 43.12 | 40.05 | 28.83 | NA | NA | NA | NA | NA | NA | NA | NA | NA | NA | NA | NA | NA | NA | NA | NA | NA | NA | NA | NA | NA | NA | NA | NA | NA | NA | NA | NA | NA | NA | NA | NA | NA | NA | NA | NA | NA | NA | NA | NA | |
| US | 127.62 | 110.10 | 107.66 | 99.97 | 96.98 | 84.80 | 77.88 | 67.03 | 65.04 | 55.87 | 59.29 | 43.72 | 43.12 | 40.05 | 28.83 | NA | NA | NA | NA | NA | NA | NA | NA | NA | NA | NA | NA | NA | NA | NA | NA | NA | NA | NA | NA | NA | NA | NA | NA | NA | NA | NA | NA | NA | NA | NA | NA | NA | NA | NA | NA | NA | NA | NA | NA | |
| Non Us | 10.35 | 8.17 | 9.26 | 9.14 | 8.97 | 5.04 | 6.27 | 3.90 | 8.93 | 7.01 | 2.96 | 0.41 | 0.83 | 1.11 | 0.80 | NA | NA | NA | NA | NA | NA | NA | NA | NA | NA | NA | NA | NA | NA | NA | NA | NA | NA | NA | NA | NA | NA | NA | NA | NA | NA | NA | NA | NA | NA | NA | NA | NA | NA | NA | NA | NA | NA | NA | NA |