
| 2023-09-30 | 2023-06-30 | 2023-03-31 | 2022-12-31 | 2022-09-30 | 2022-06-30 | ||
|---|---|---|---|---|---|---|---|
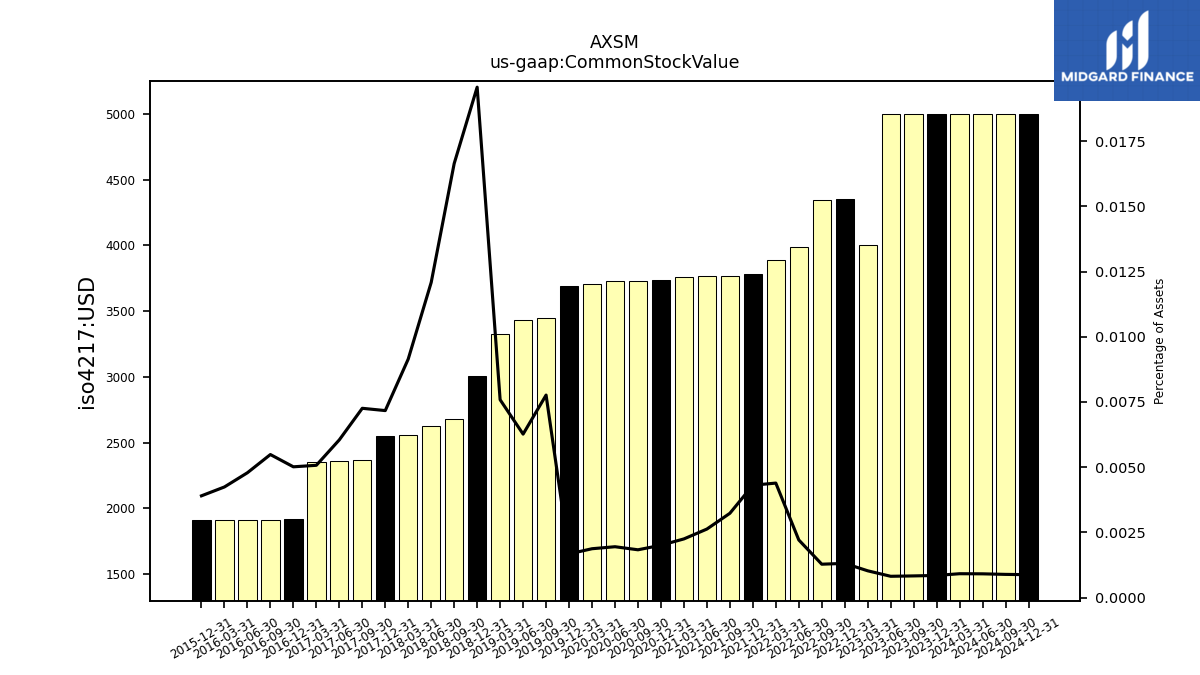
| Common Stock Value | 0.01 | 0.01 | 0.00 | 0.00 | 0.00 | 0.00 | |
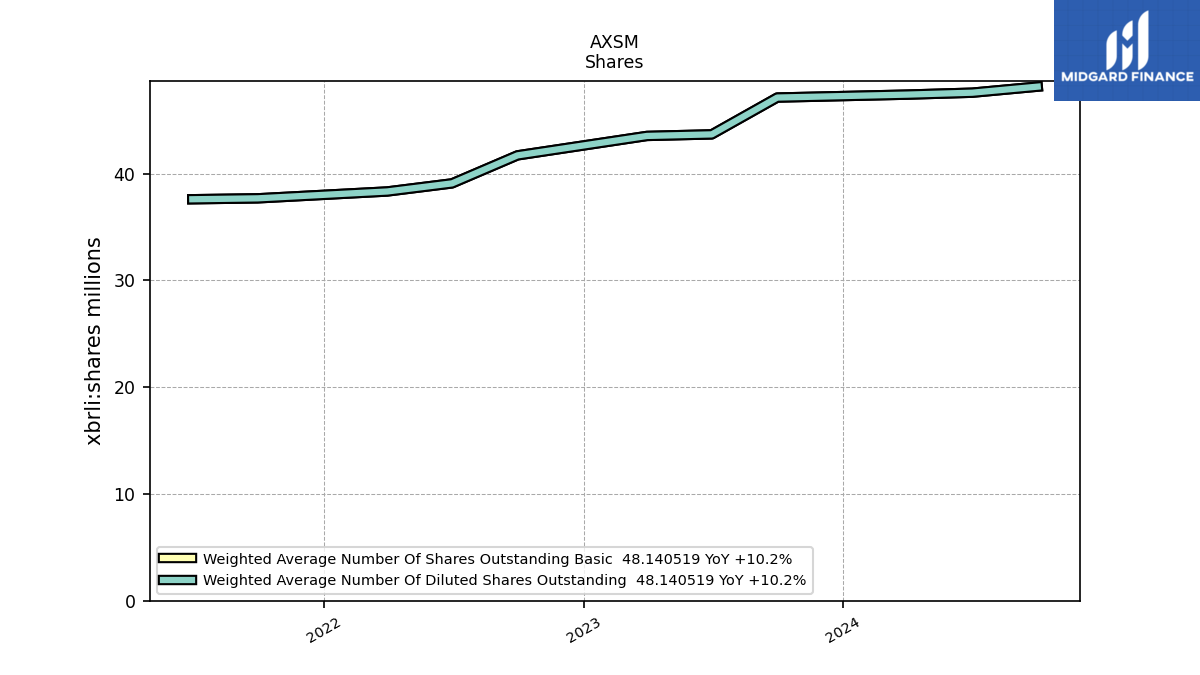
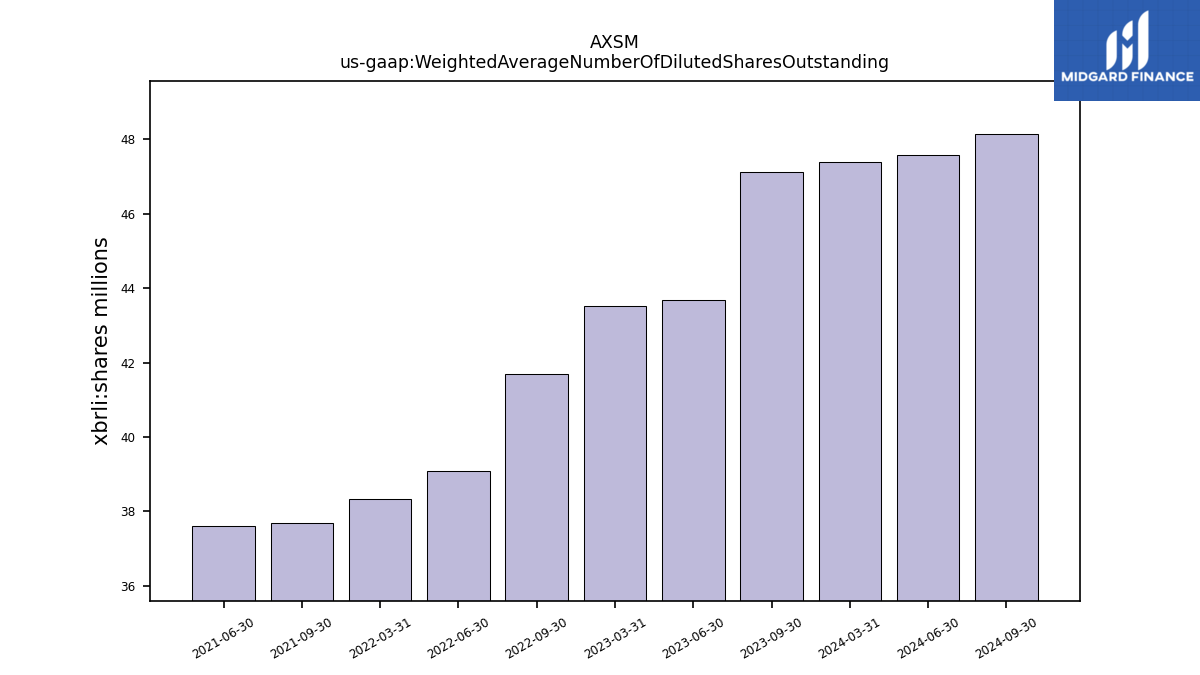
| Weighted Average Number Of Diluted Shares Outstanding | 47.12 | 43.67 | 43.52 | NA | 41.70 | 39.08 | |
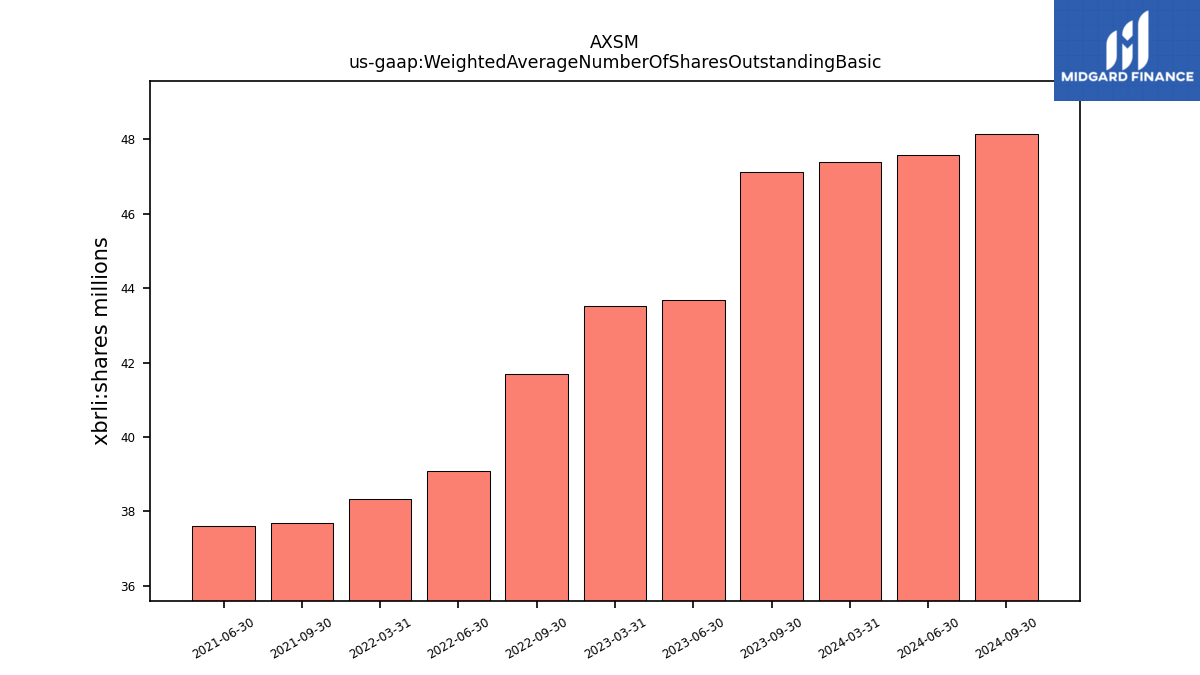
| Weighted Average Number Of Shares Outstanding Basic | 47.12 | 43.67 | 43.52 | NA | 41.70 | 39.08 | |
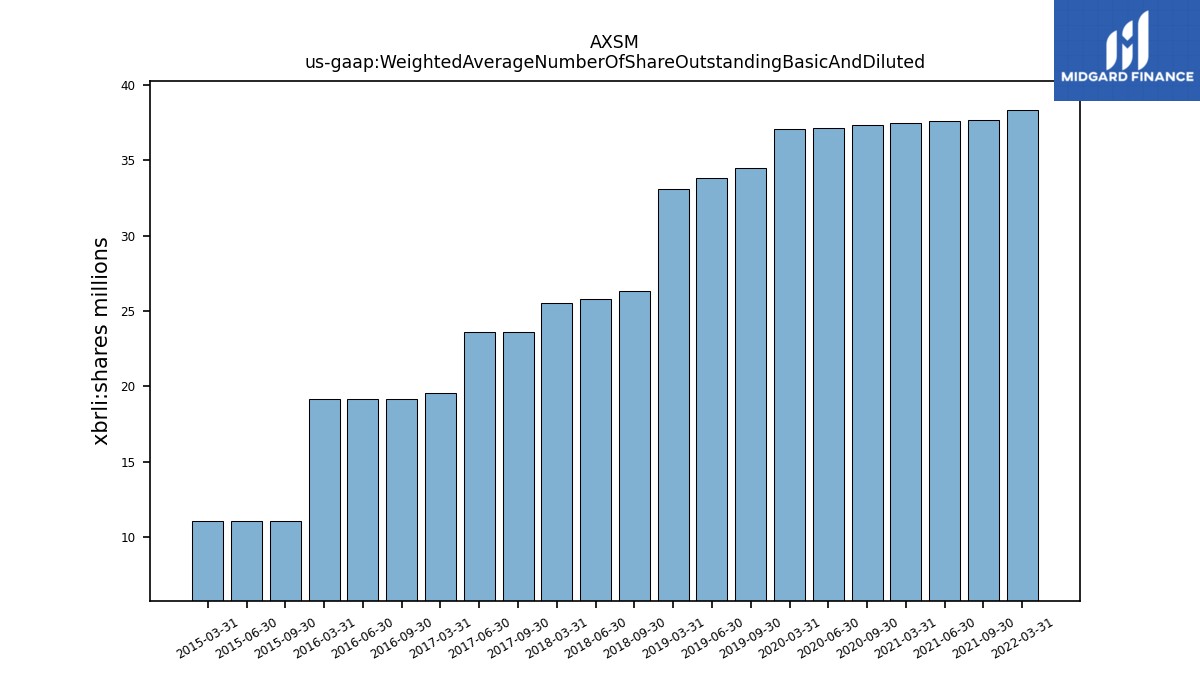
| Weighted Average Number Of Share Outstanding Basic And Diluted | NA | NA | NA | NA | NA | NA | |
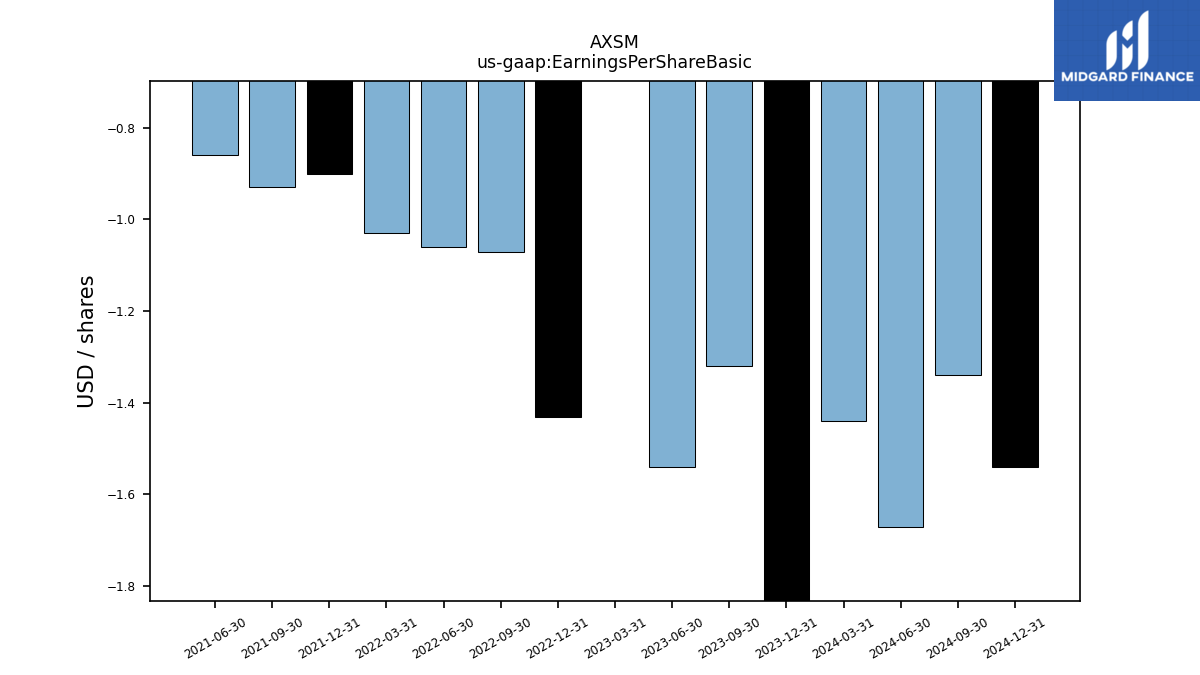
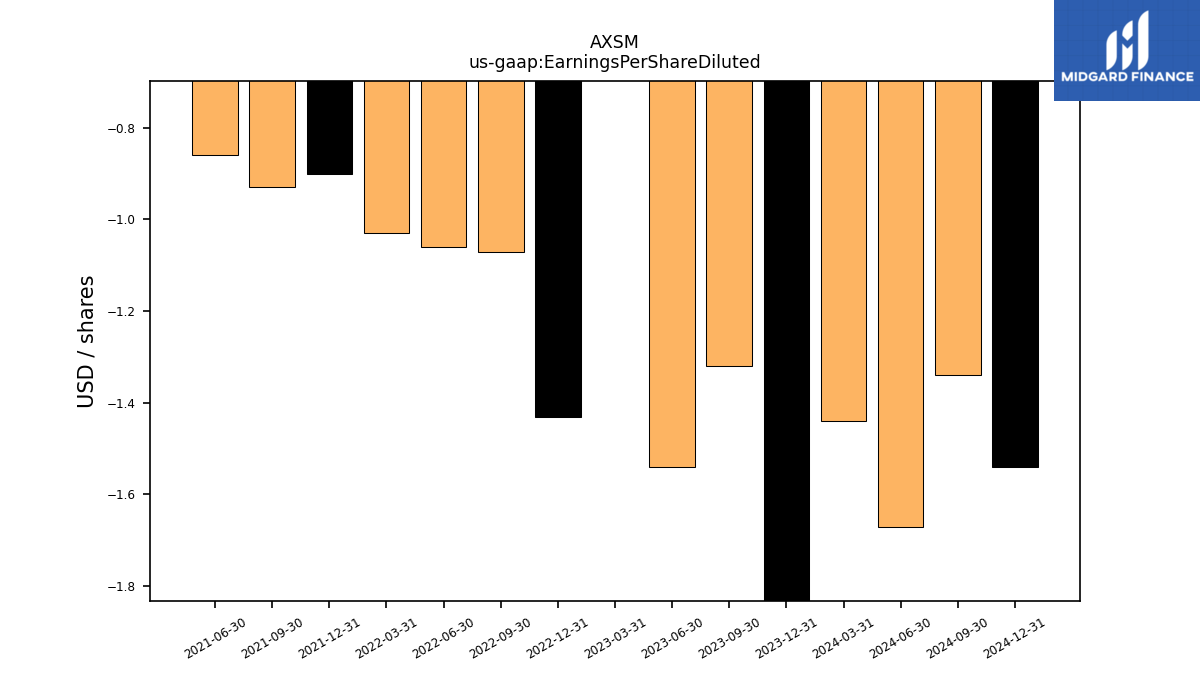
| Earnings Per Share Basic | -1.32 | -1.54 | -0.26 | -1.43 | -1.07 | -1.06 | |
| Earnings Per Share Diluted | -1.32 | -1.54 | -0.26 | -1.43 | -1.07 | -1.06 | |
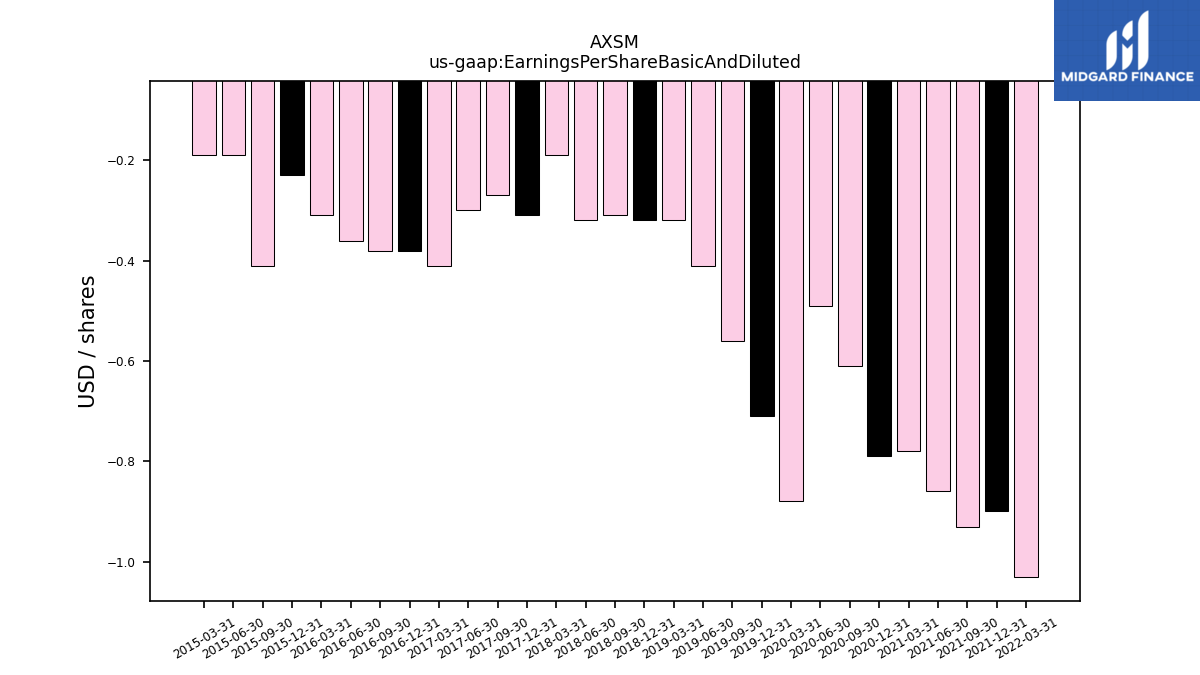
| Earnings Per Share Basic And Diluted | NA | NA | NA | NA | NA | NA |
| 2023-09-30 | 2023-06-30 | 2023-03-31 | 2022-12-31 | 2022-09-30 | 2022-06-30 | ||
|---|---|---|---|---|---|---|---|
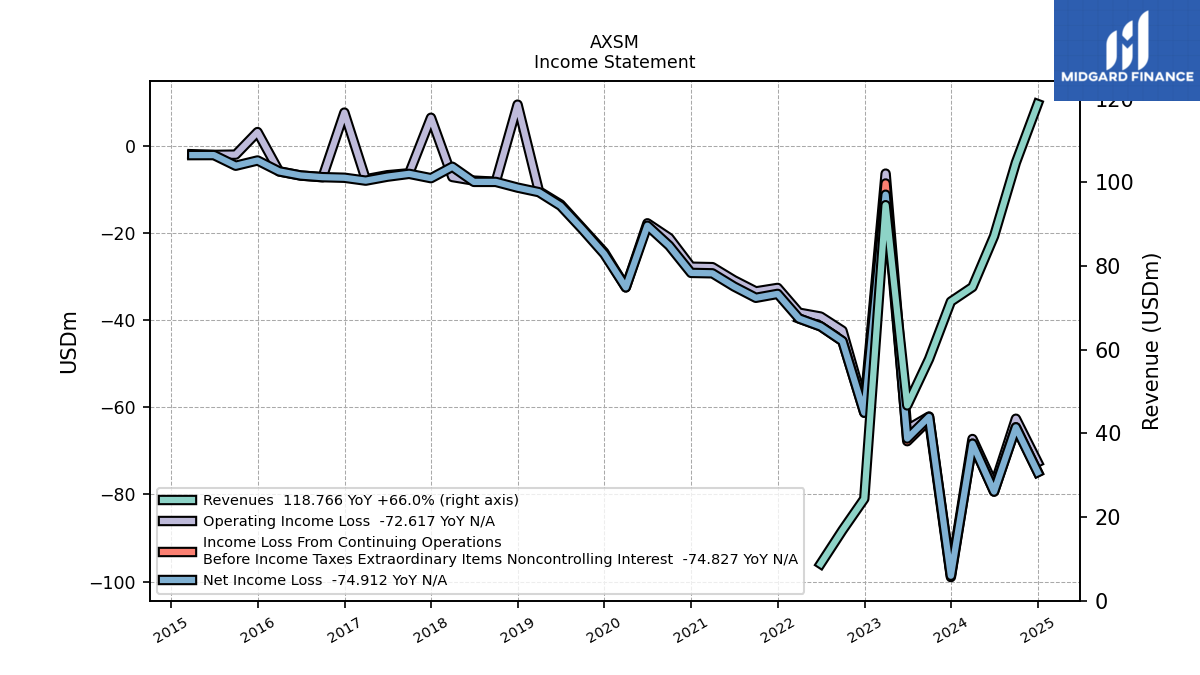
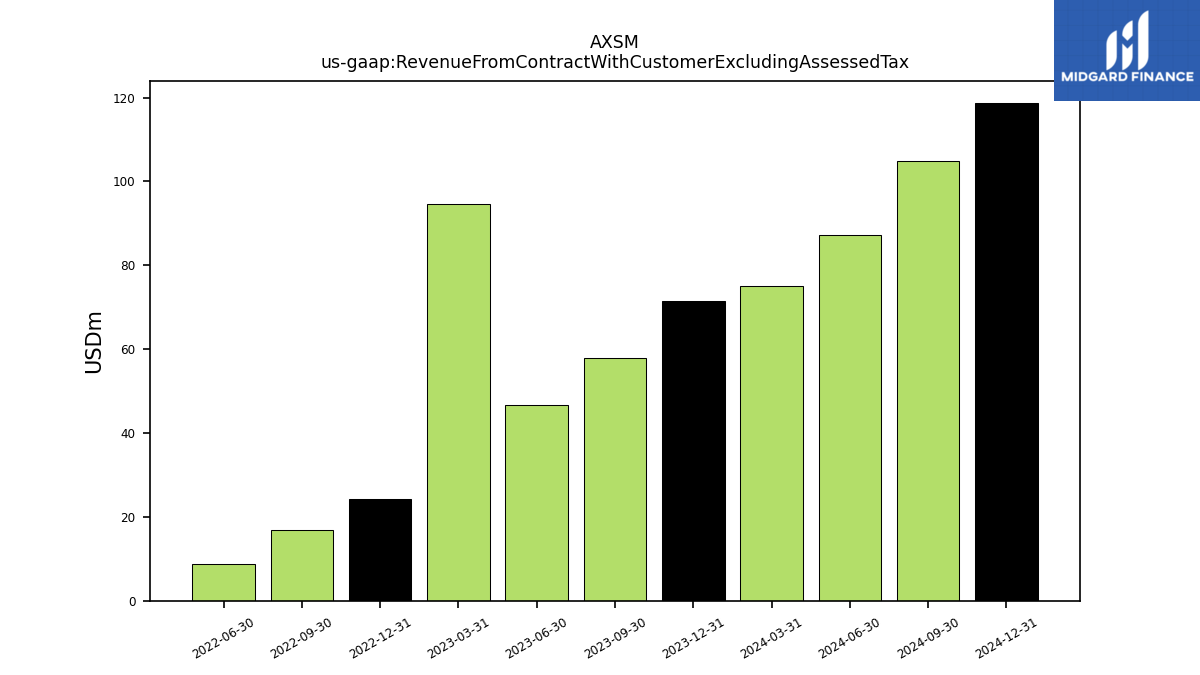
| Revenue From Contract With Customer Excluding Assessed Tax | 57.79 | 46.70 | 94.58 | 24.37 | 16.85 | 8.82 | |
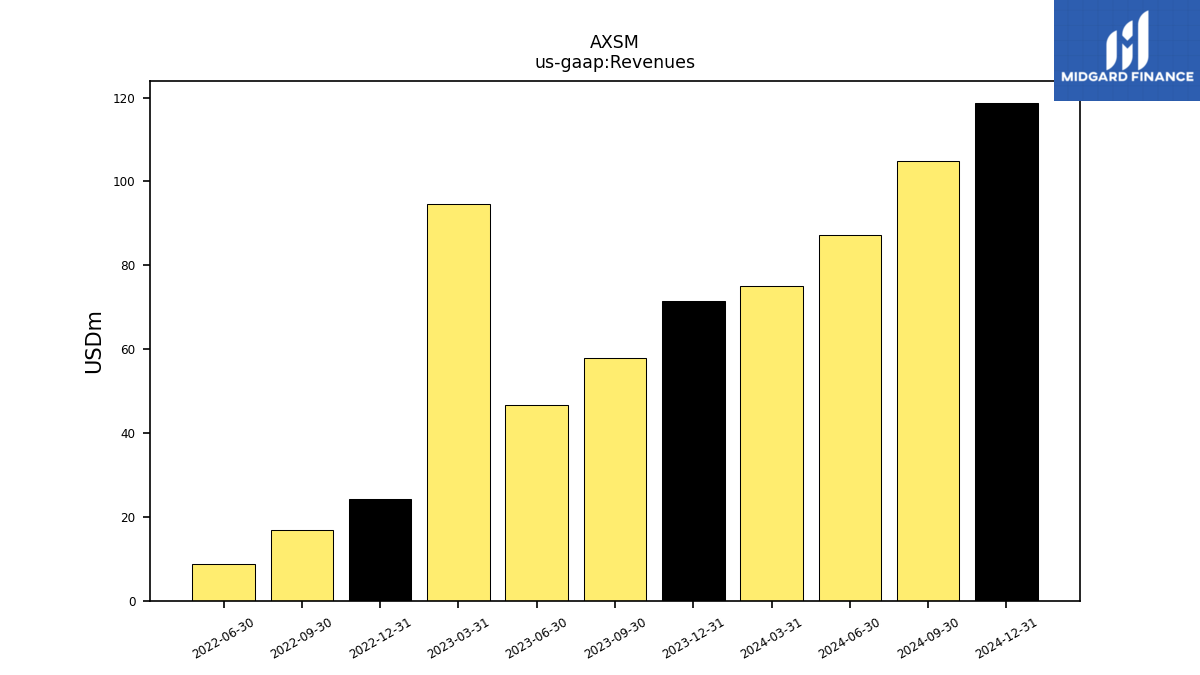
| Revenues | 57.79 | 46.70 | 94.58 | 24.37 | 16.85 | 8.82 | |
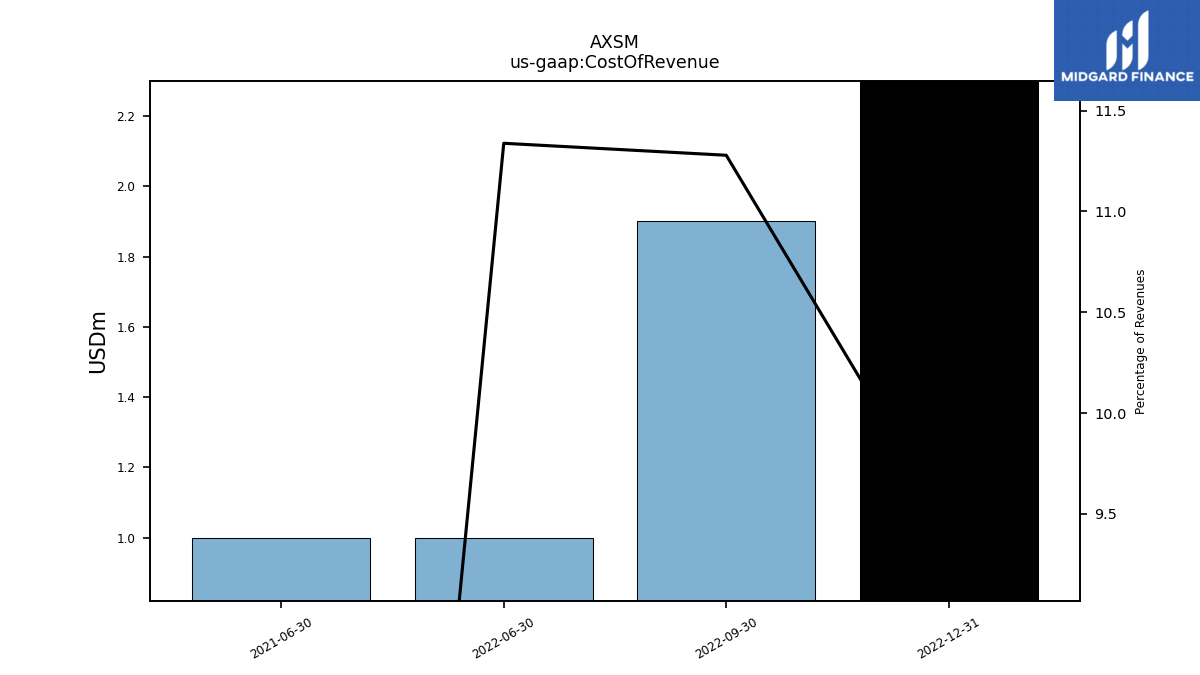
| Cost Of Revenue | NA | NA | NA | 2.30 | 1.90 | 1.00 | |
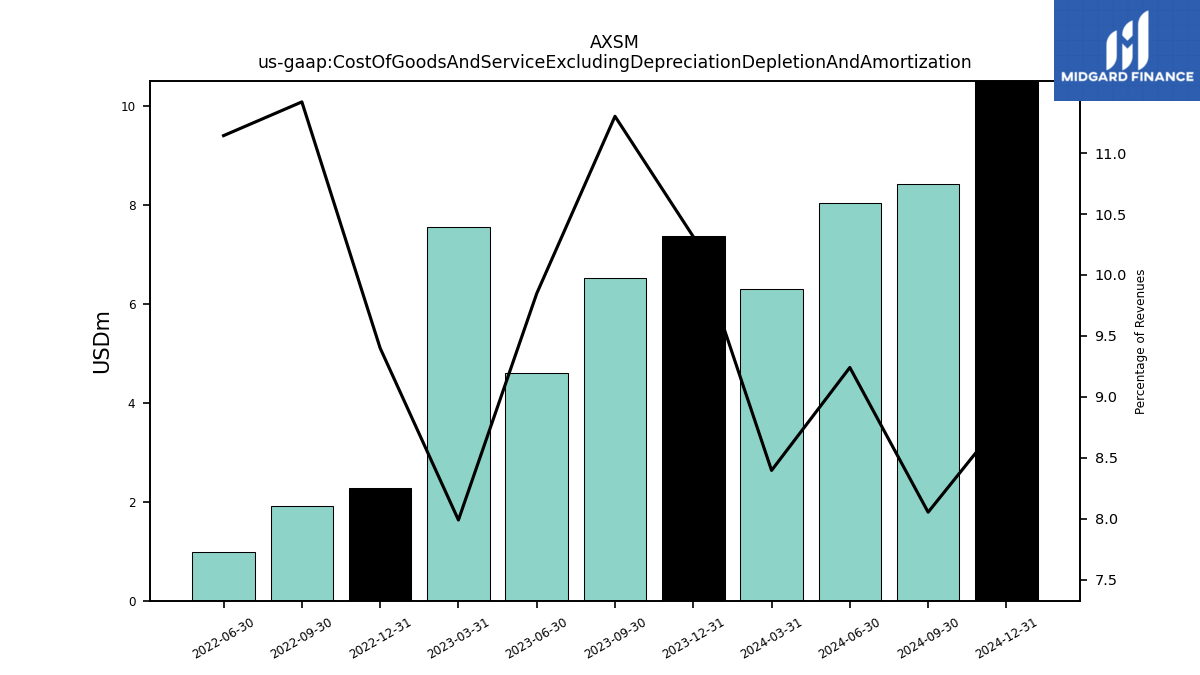
| Cost Of Goods And Service Excluding Depreciation Depletion And Amortization | 6.53 | 4.60 | 7.56 | 2.29 | 1.92 | 0.98 | |
| Operating Expenses | NA | NA | NA | NA | NA | NA | |
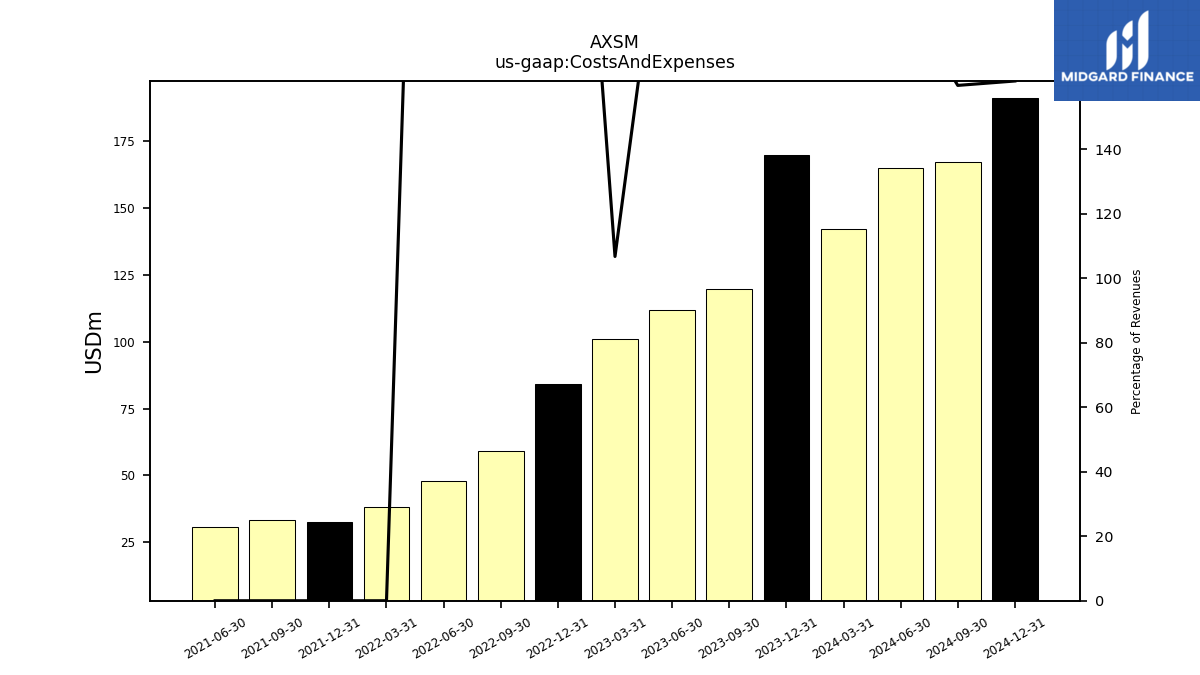
| Costs And Expenses | 119.91 | 111.76 | 100.95 | 84.29 | 59.26 | 48.00 | |
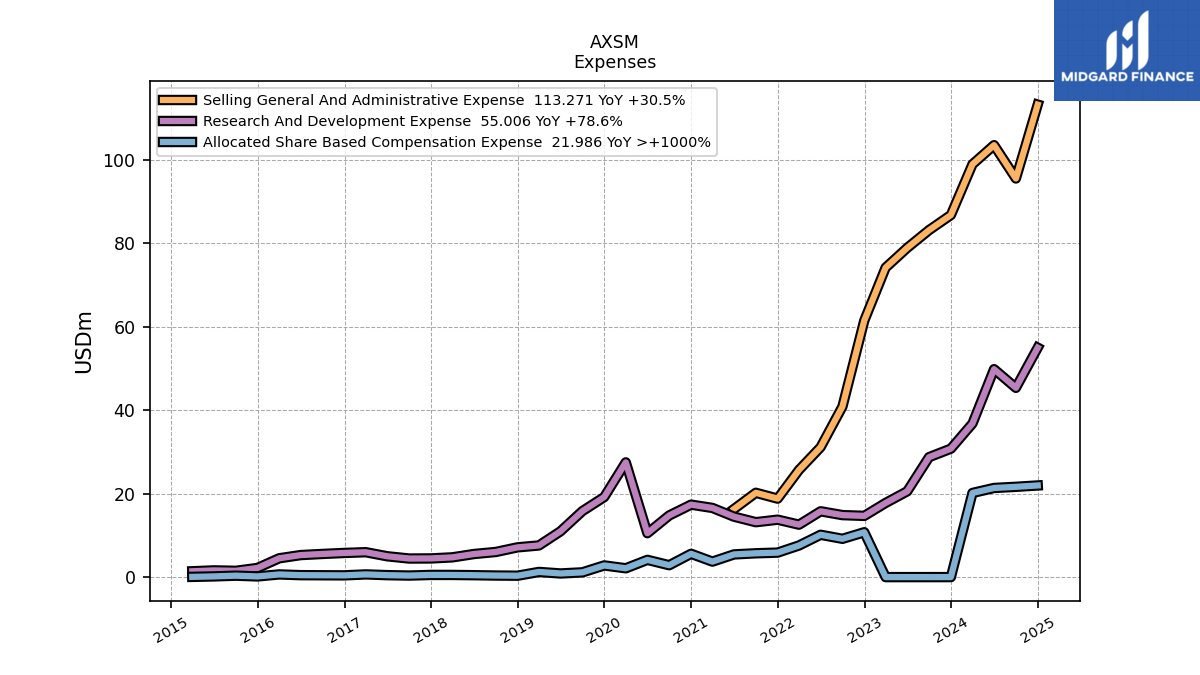
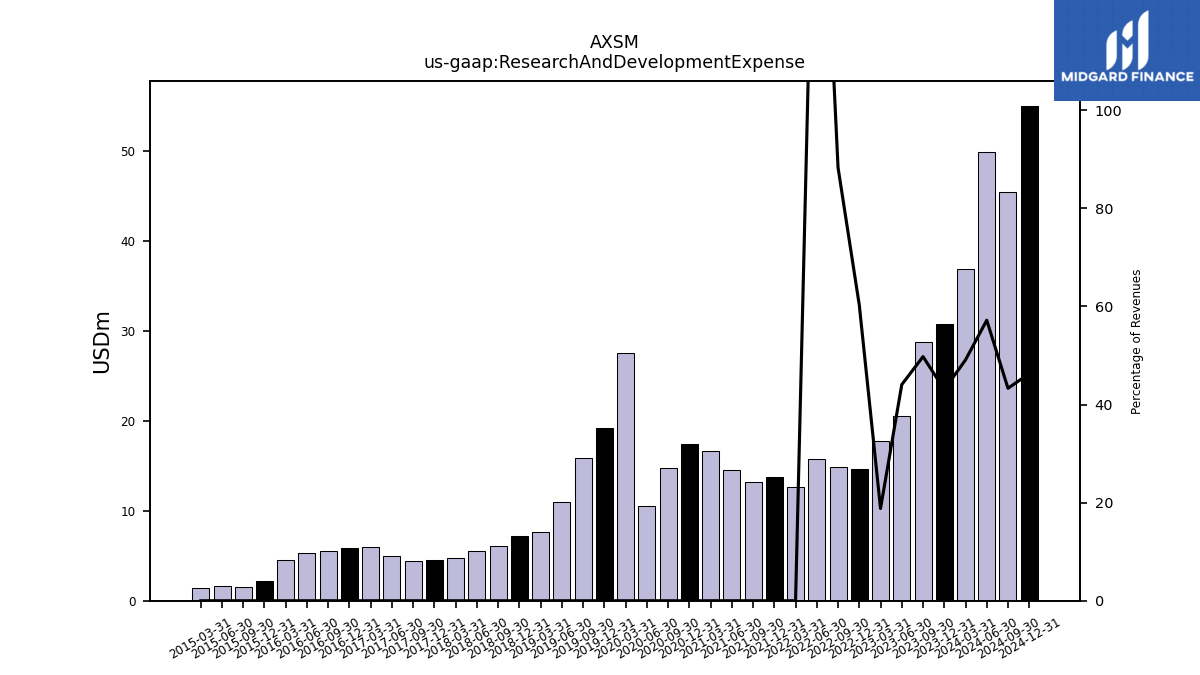
| Research And Development Expense | 28.77 | 20.58 | 17.79 | 14.69 | 14.88 | 15.79 | |
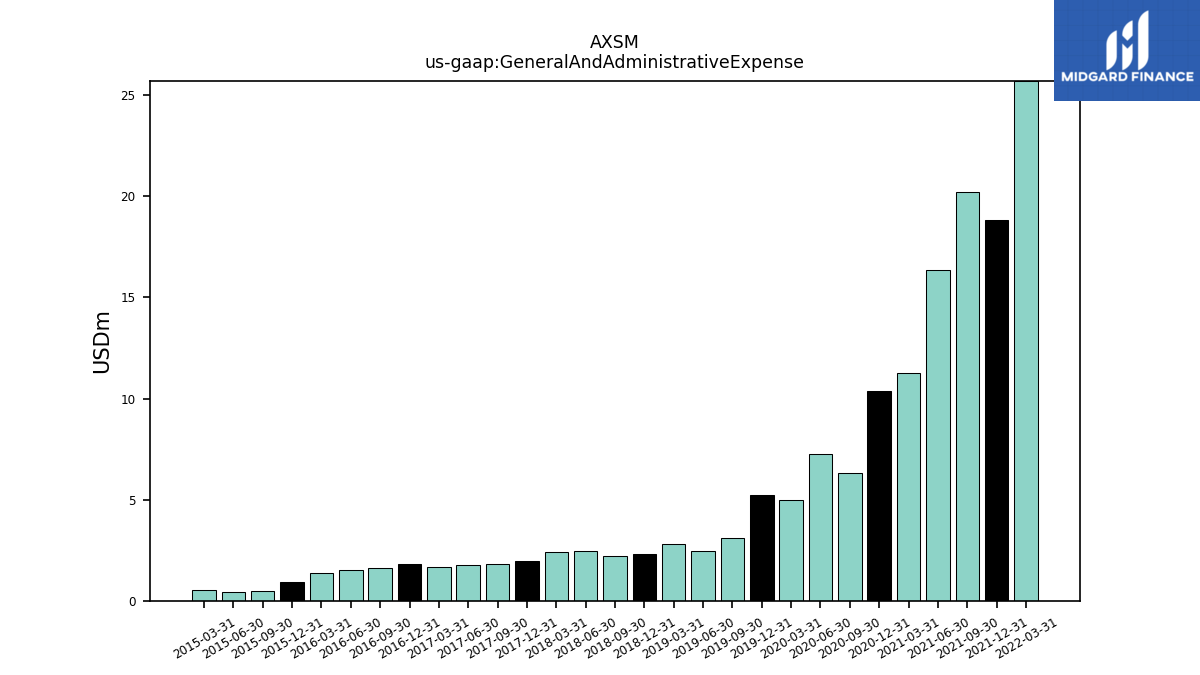
| General And Administrative Expense | NA | NA | NA | NA | NA | NA | |
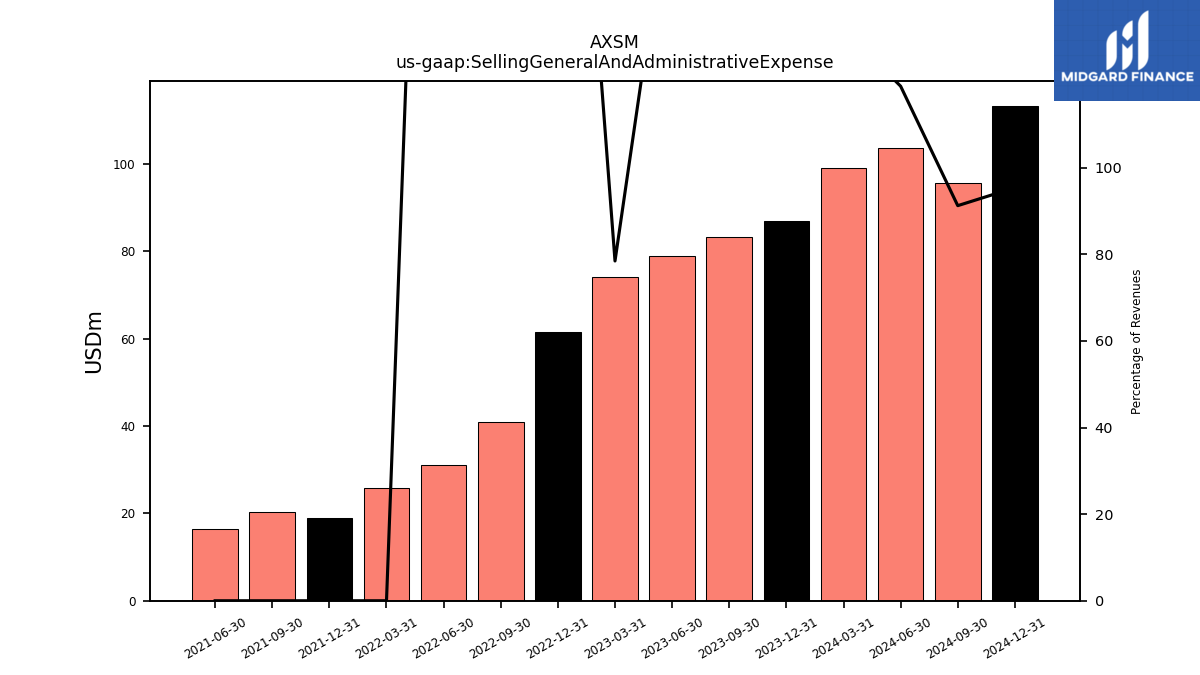
| Selling General And Administrative Expense | 83.19 | 78.94 | 74.19 | 61.50 | 40.89 | 31.16 | |
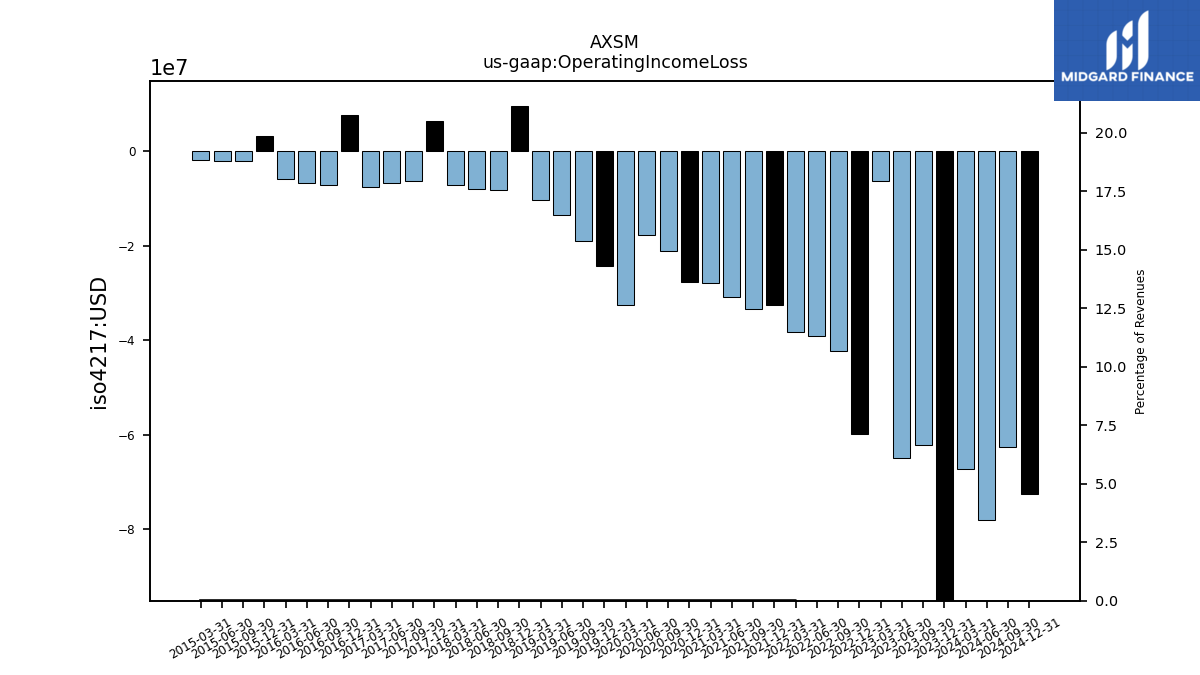
| Operating Income Loss | -62.12 | -65.06 | -6.37 | -59.92 | -42.41 | -39.18 | |
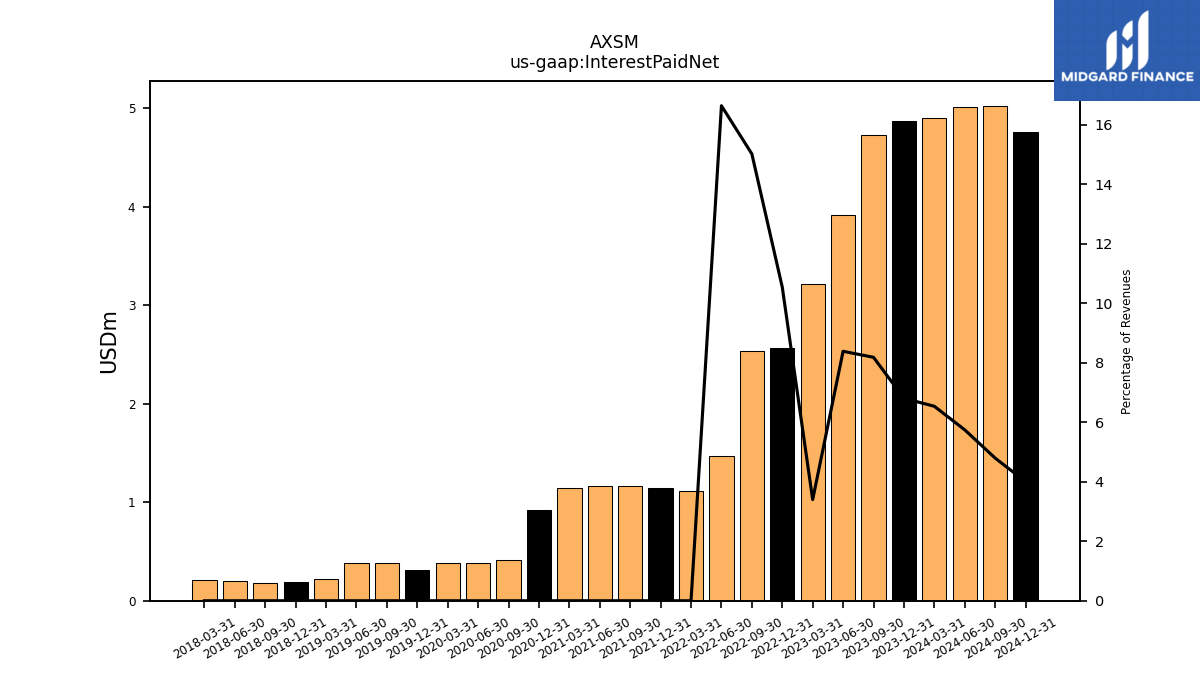
| Interest Paid Net | 4.73 | 3.92 | 3.22 | 2.57 | 2.53 | 1.47 | |
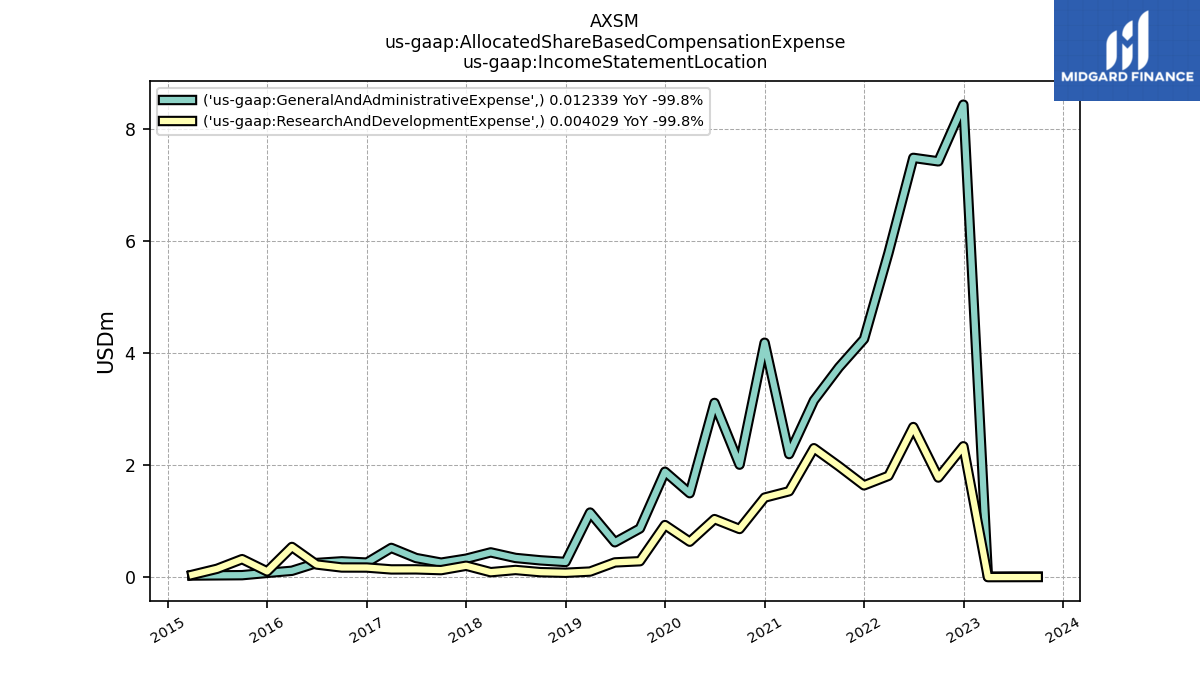
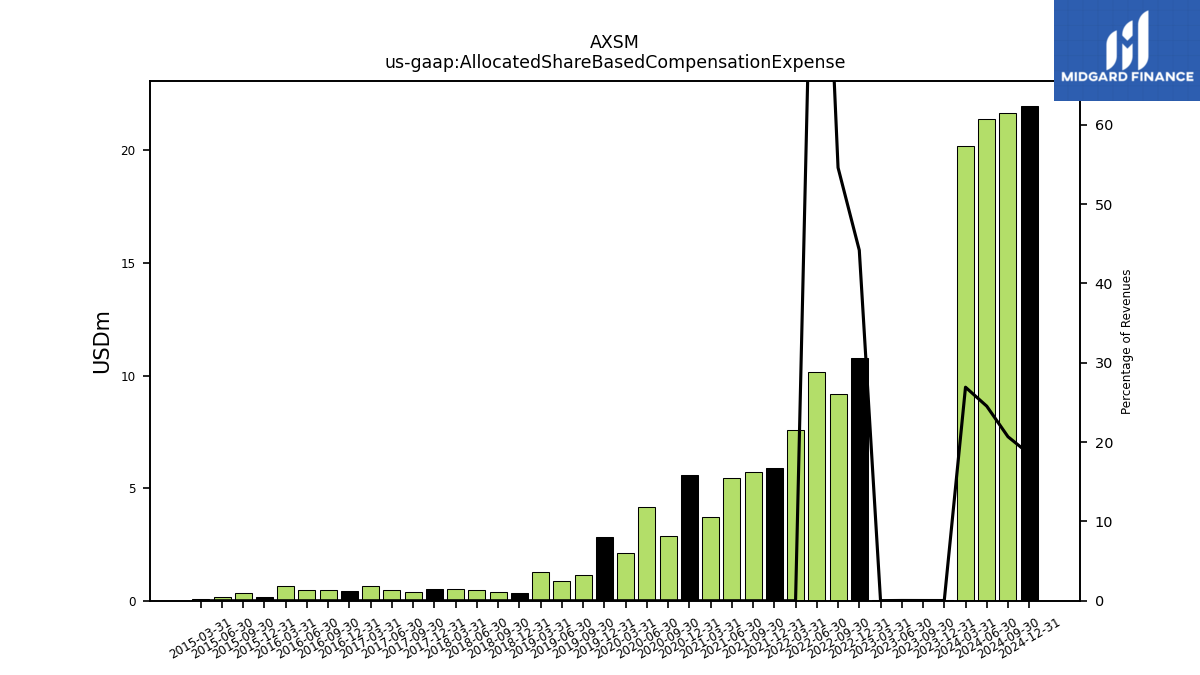
| Allocated Share Based Compensation Expense | 0.02 | 0.02 | 0.01 | 10.77 | 9.20 | 10.16 | |
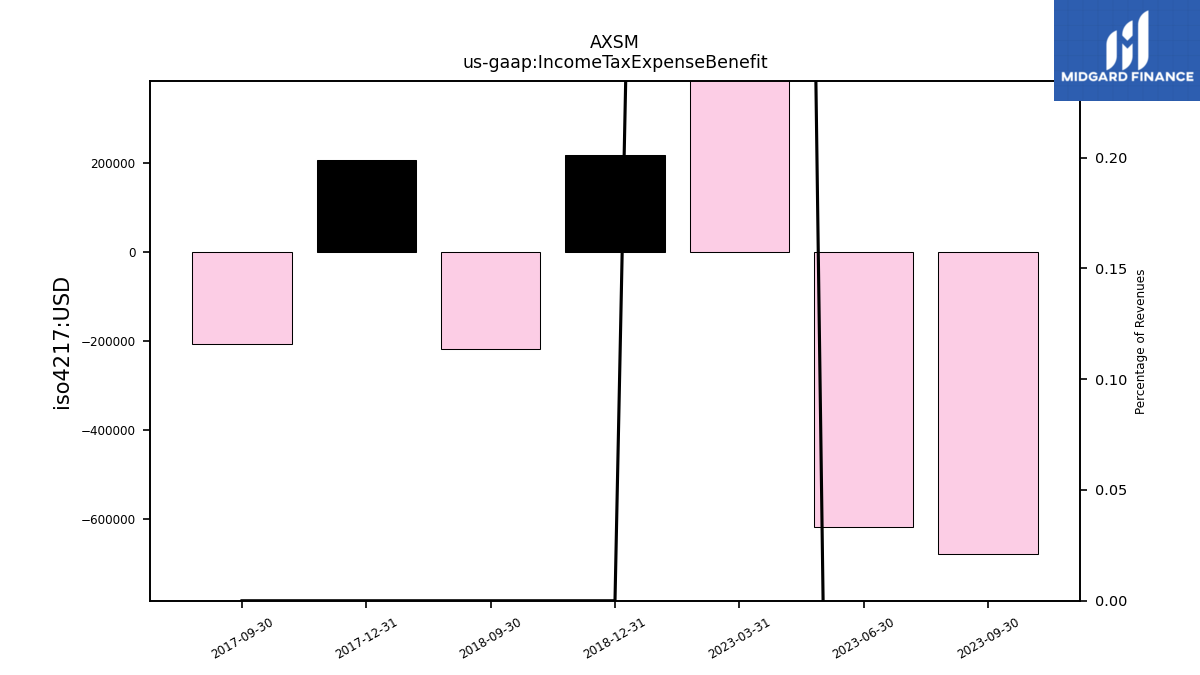
| Income Tax Expense Benefit | -0.68 | -0.62 | 2.58 | NA | NA | NA | |
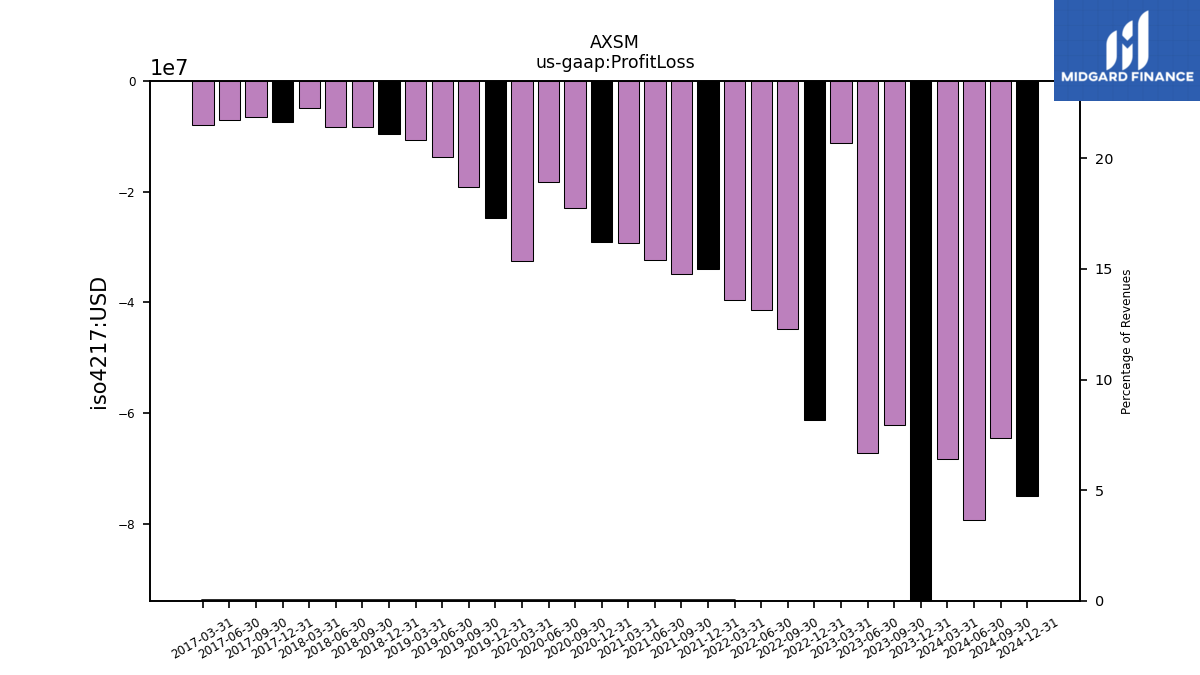
| Profit Loss | -62.20 | -67.17 | -11.22 | -61.24 | -44.82 | -41.44 | |
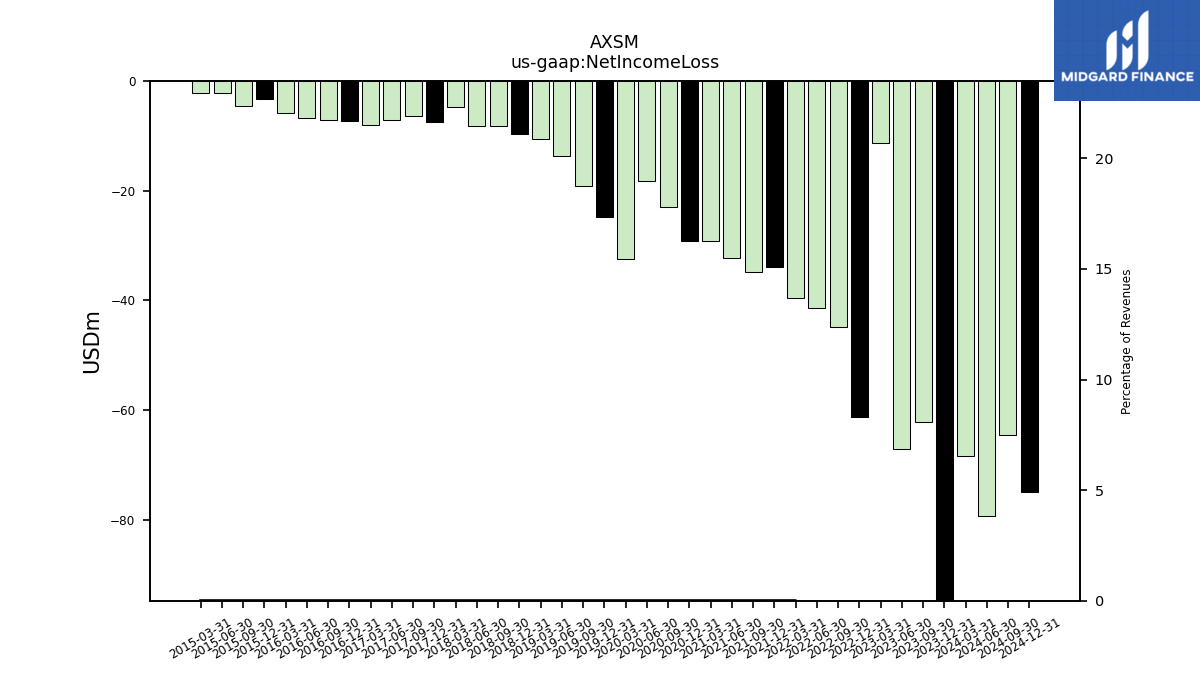
| Net Income Loss | -62.20 | -67.17 | -11.22 | -61.24 | -44.82 | -41.44 |
| 2023-09-30 | 2023-06-30 | 2023-03-31 | 2022-12-31 | 2022-09-30 | 2022-06-30 | ||
|---|---|---|---|---|---|---|---|
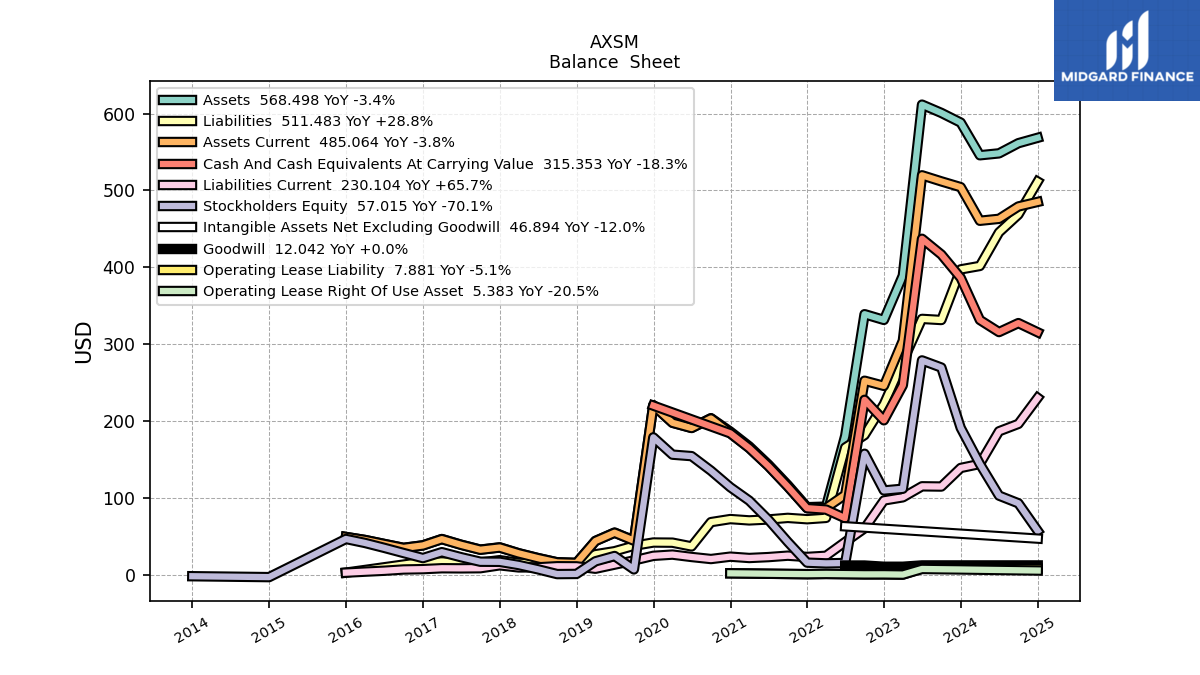
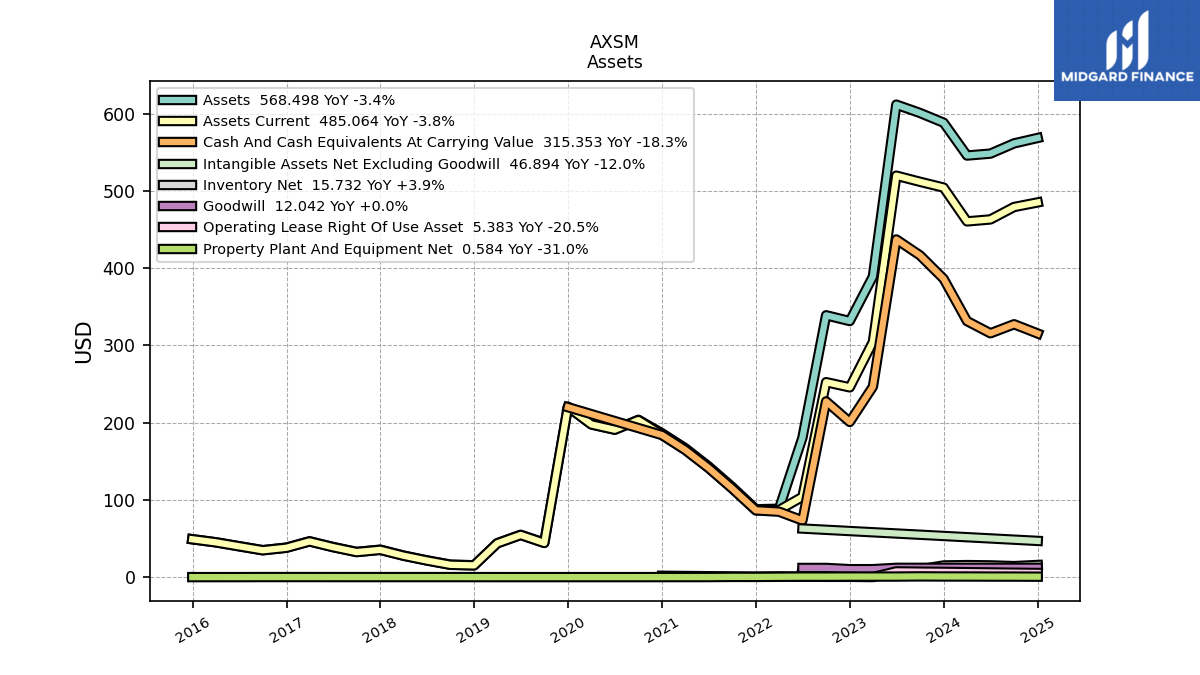
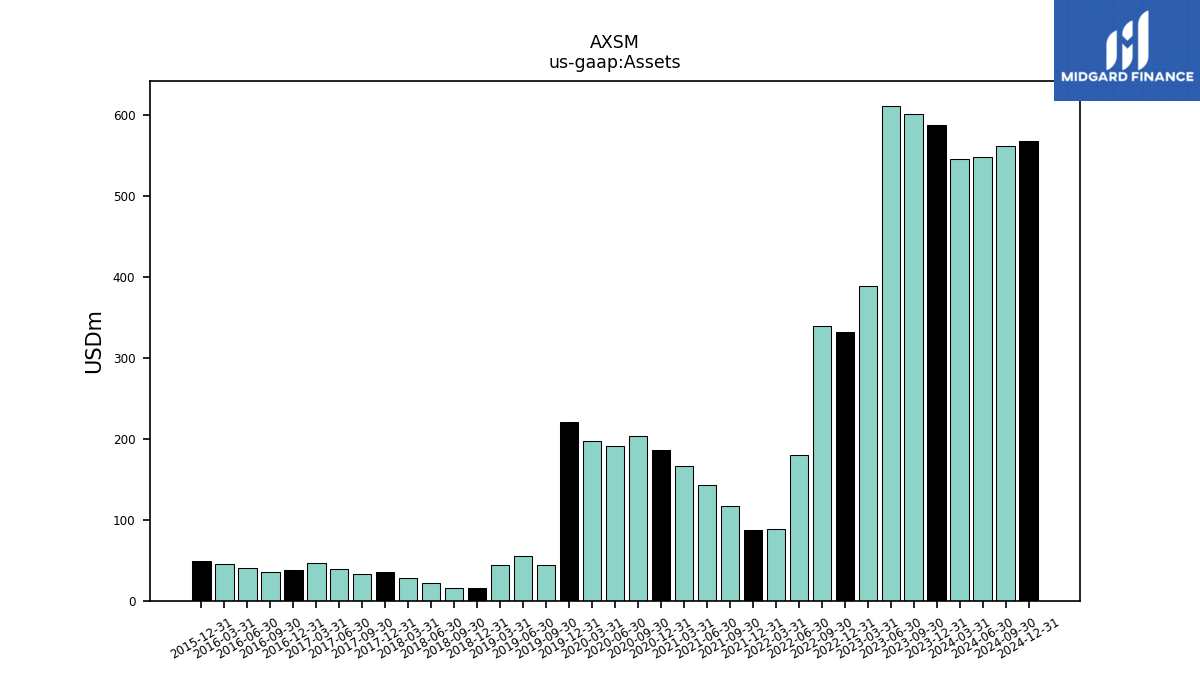
| Assets | 600.86 | 611.64 | 389.18 | 331.48 | 338.96 | 180.56 | |
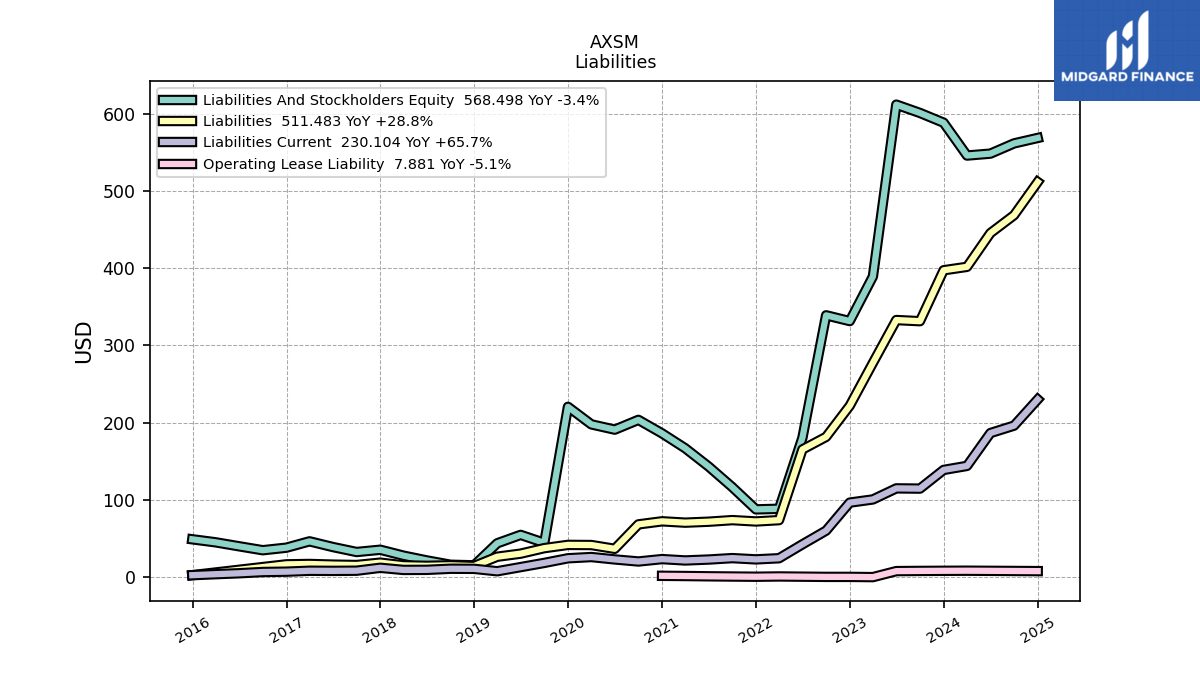
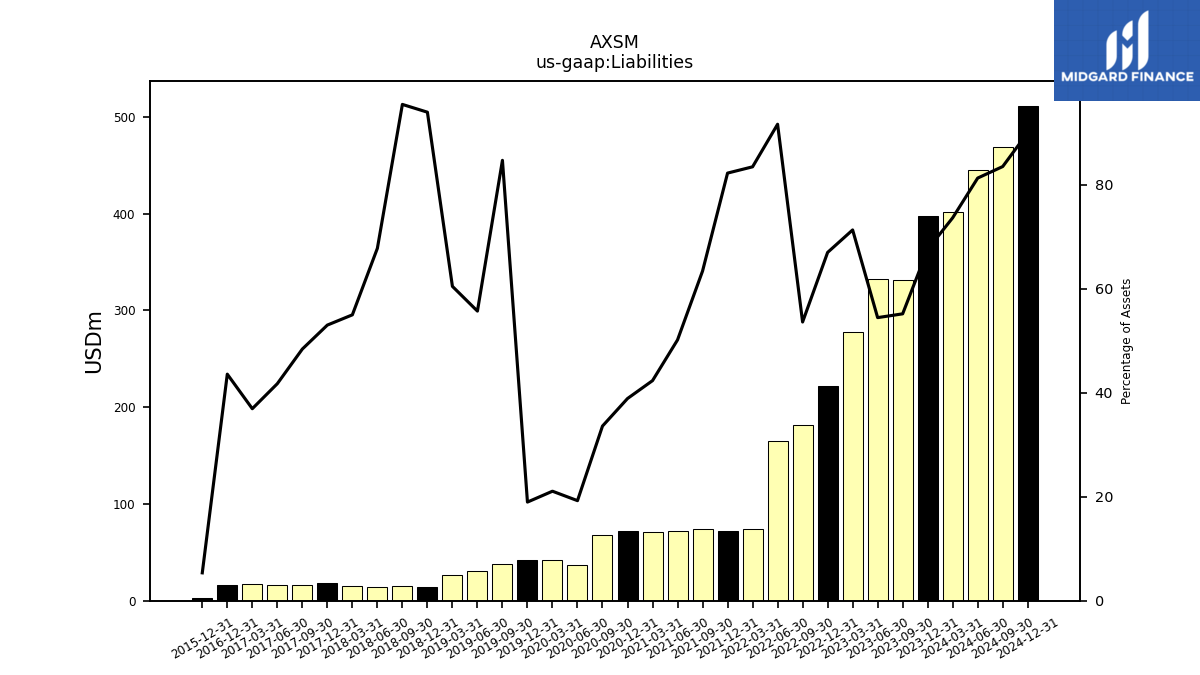
| Liabilities | 331.35 | 332.83 | 277.37 | 221.92 | 181.60 | 165.36 | |
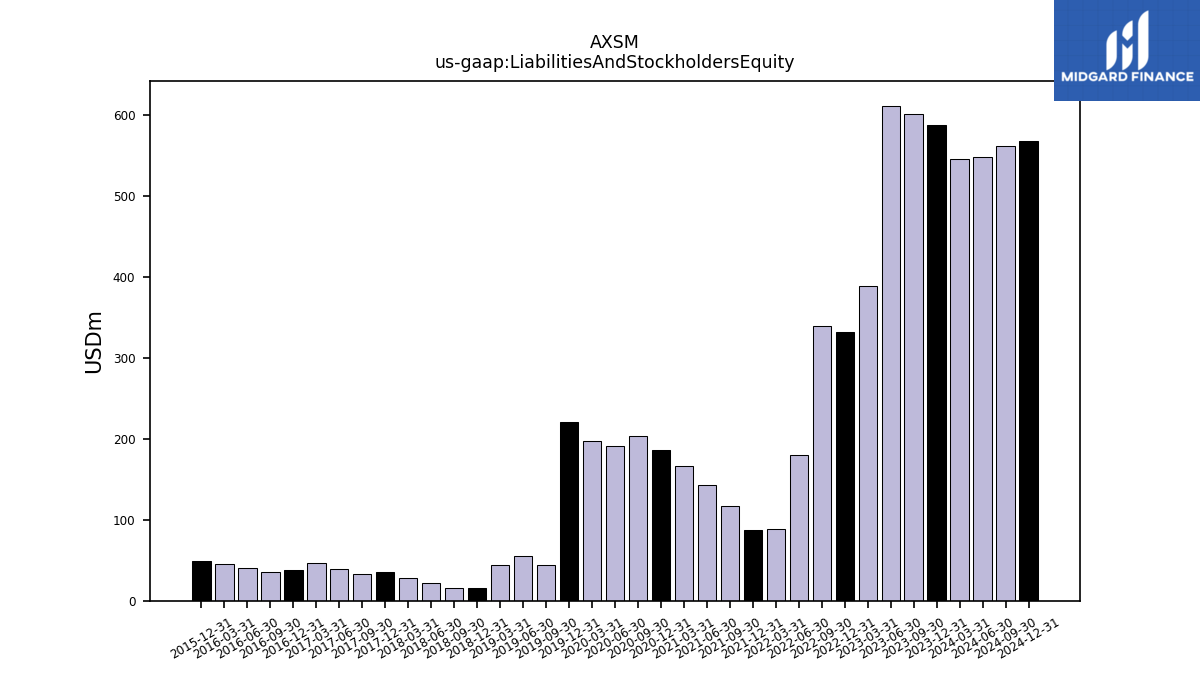
| Liabilities And Stockholders Equity | 600.86 | 611.64 | 389.18 | 331.48 | 338.96 | 180.56 | |
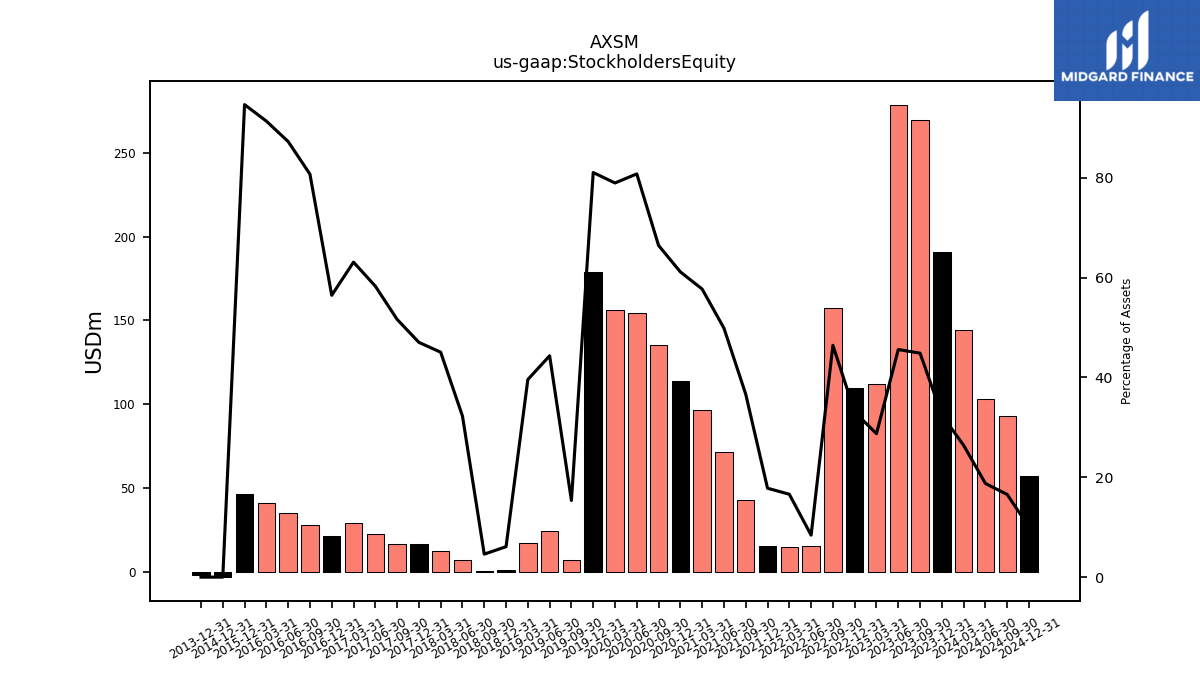
| Stockholders Equity | 269.51 | 278.80 | 111.81 | 109.56 | 157.36 | 15.20 |
| 2023-09-30 | 2023-06-30 | 2023-03-31 | 2022-12-31 | 2022-09-30 | 2022-06-30 | ||
|---|---|---|---|---|---|---|---|
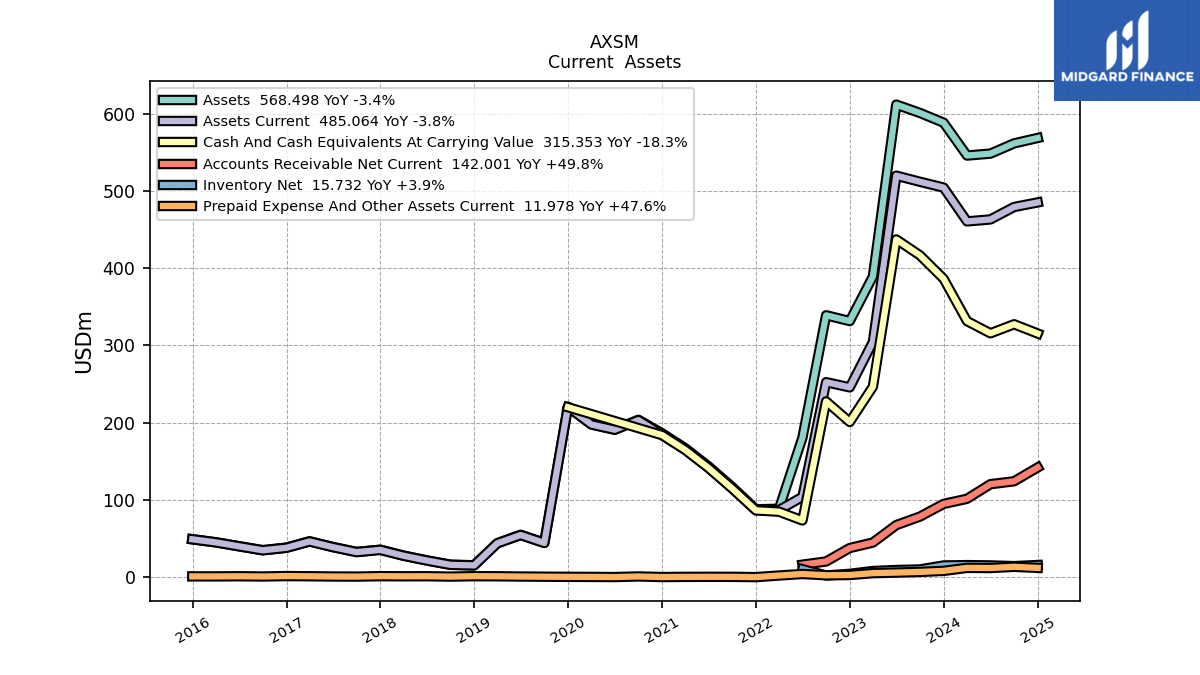
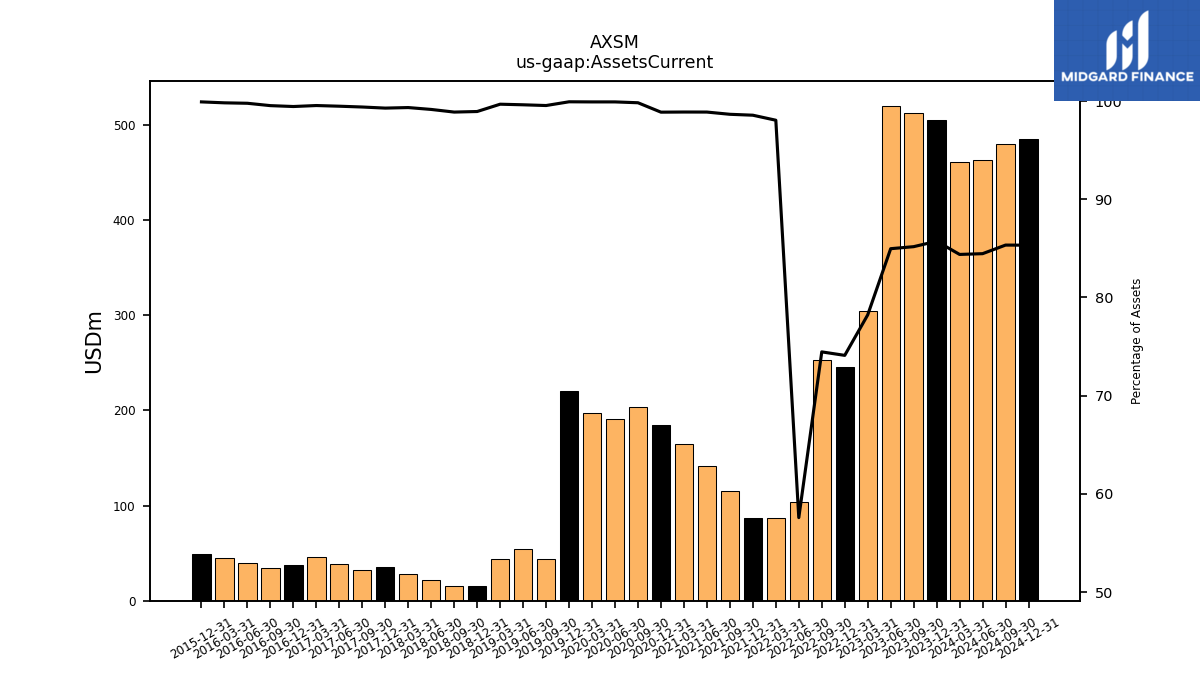
| Assets Current | 511.76 | 519.69 | 304.45 | 245.64 | 252.38 | 103.98 | |
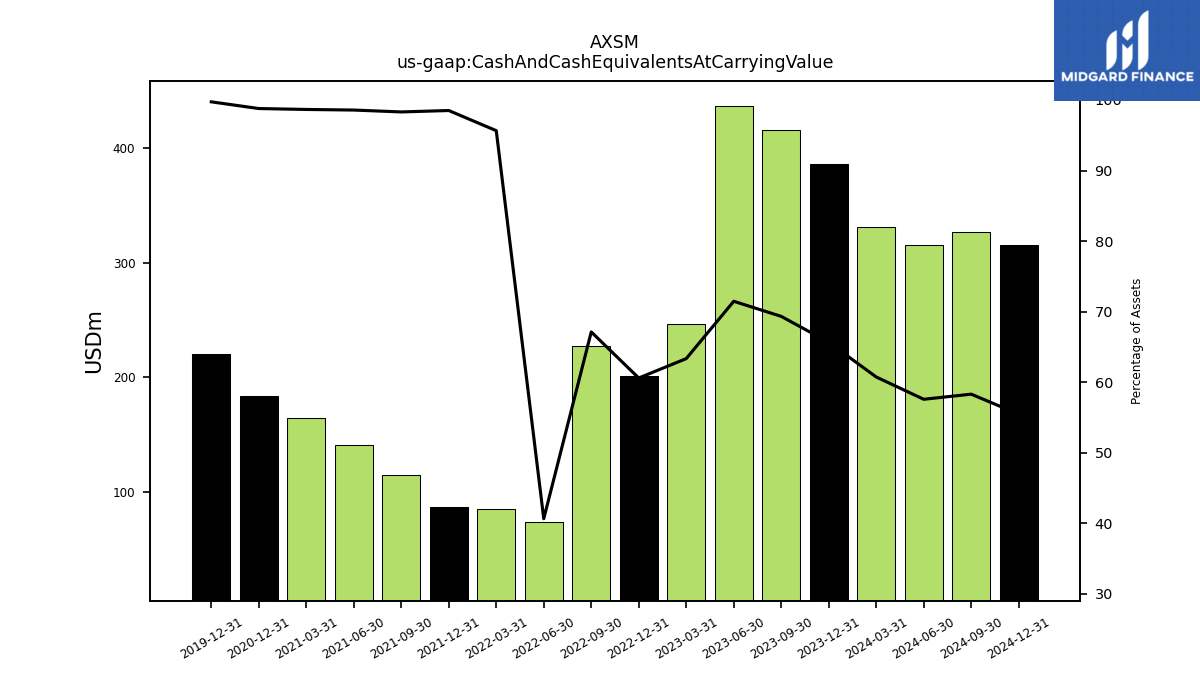
| Cash And Cash Equivalents At Carrying Value | 416.56 | 437.11 | 246.51 | 200.84 | 227.52 | 73.39 | |
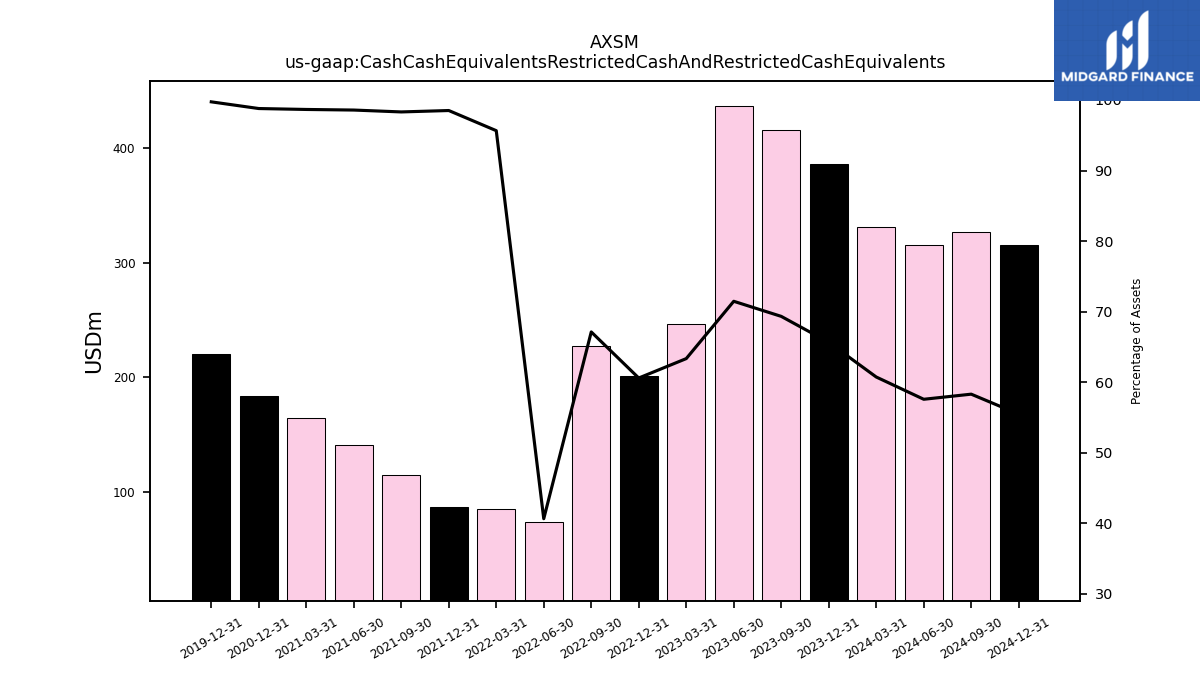
| Cash Cash Equivalents Restricted Cash And Restricted Cash Equivalents | 416.56 | 437.11 | 246.51 | 200.84 | 227.52 | 73.39 | |
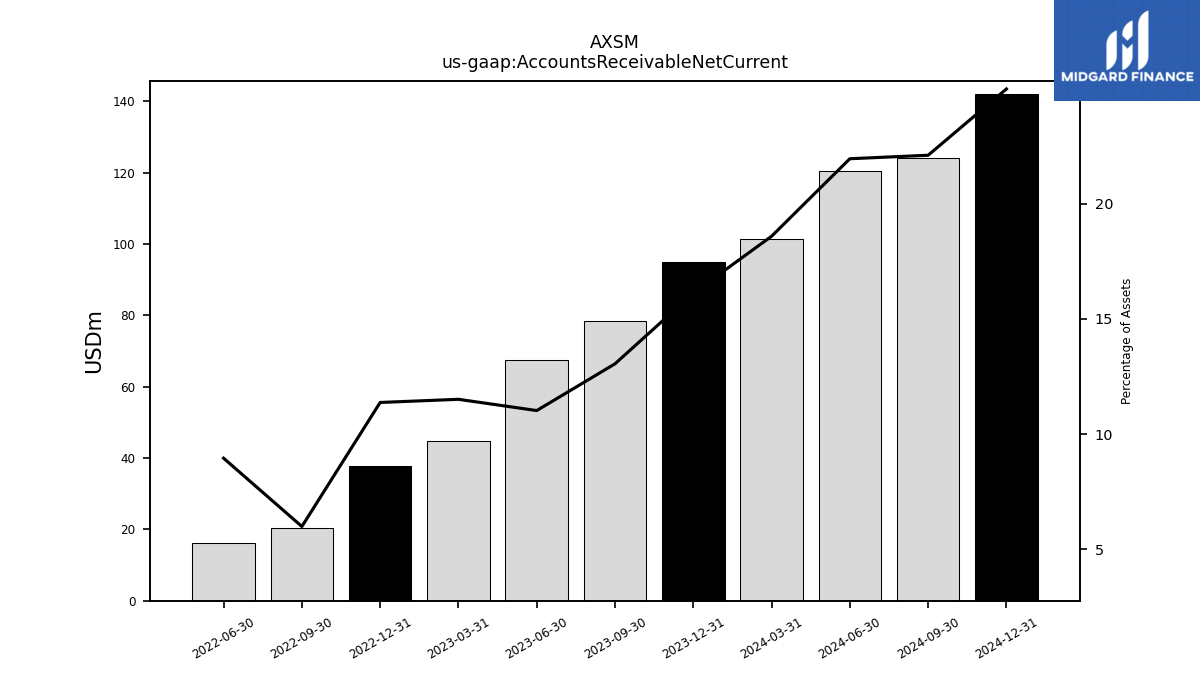
| Accounts Receivable Net Current | 78.42 | 67.41 | 44.79 | 37.70 | 20.30 | 16.17 | |
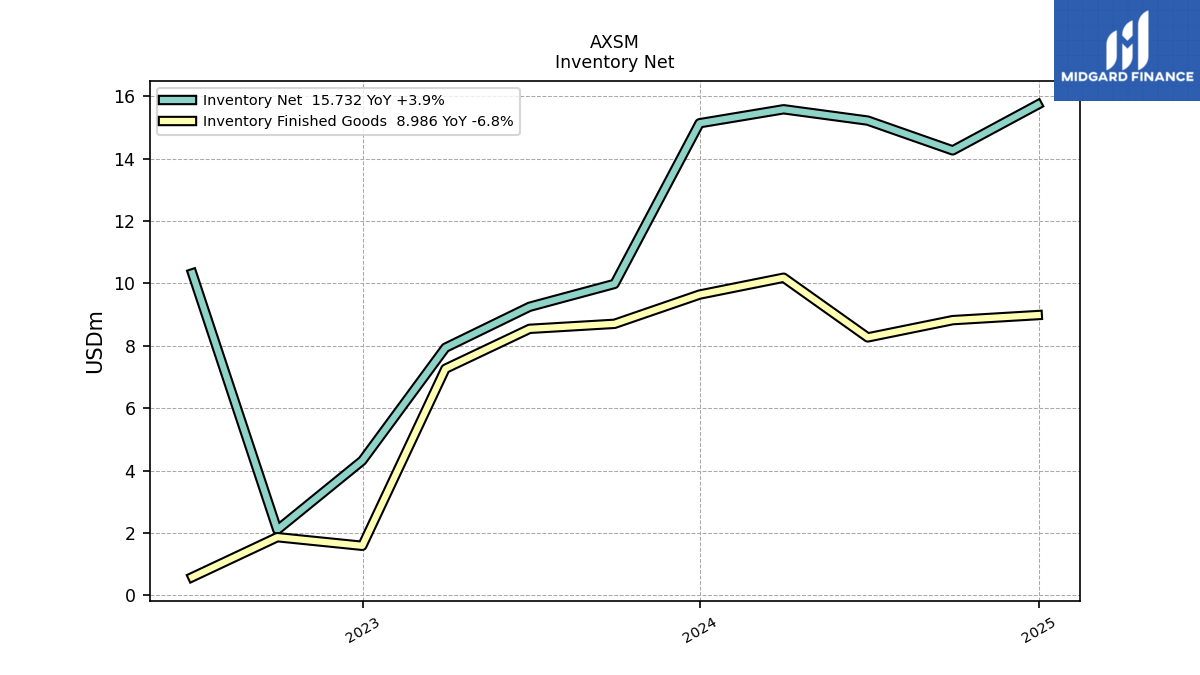
| Inventory Net | 9.98 | 9.25 | 7.94 | 4.32 | 2.10 | 10.32 | |
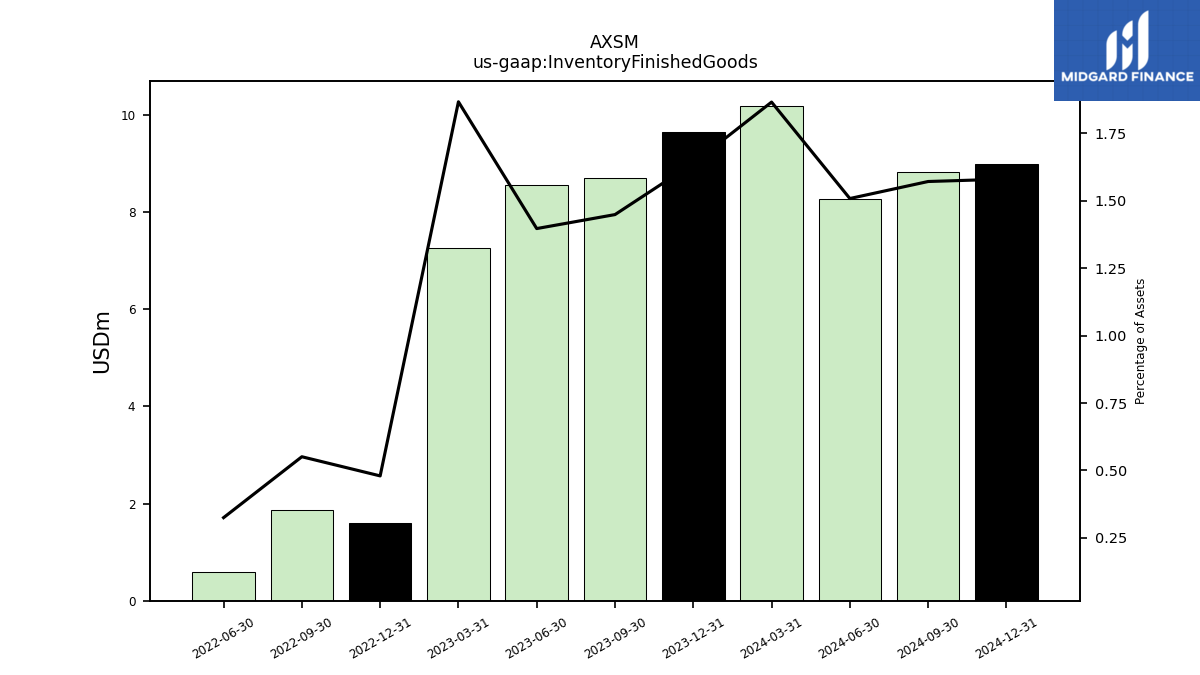
| Inventory Finished Goods | 8.71 | 8.54 | 7.27 | 1.59 | 1.87 | 0.59 | |
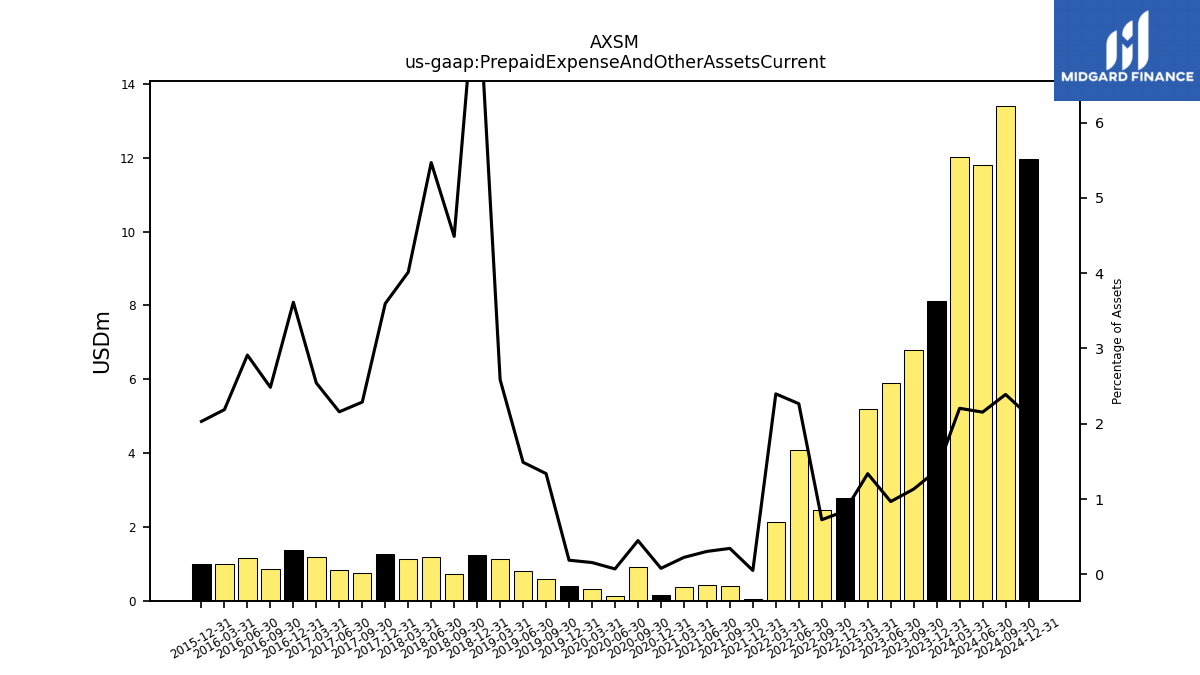
| Prepaid Expense And Other Assets Current | 6.80 | 5.91 | 5.20 | 2.78 | 2.46 | 4.09 |
| 2023-09-30 | 2023-06-30 | 2023-03-31 | 2022-12-31 | 2022-09-30 | 2022-06-30 | ||
|---|---|---|---|---|---|---|---|
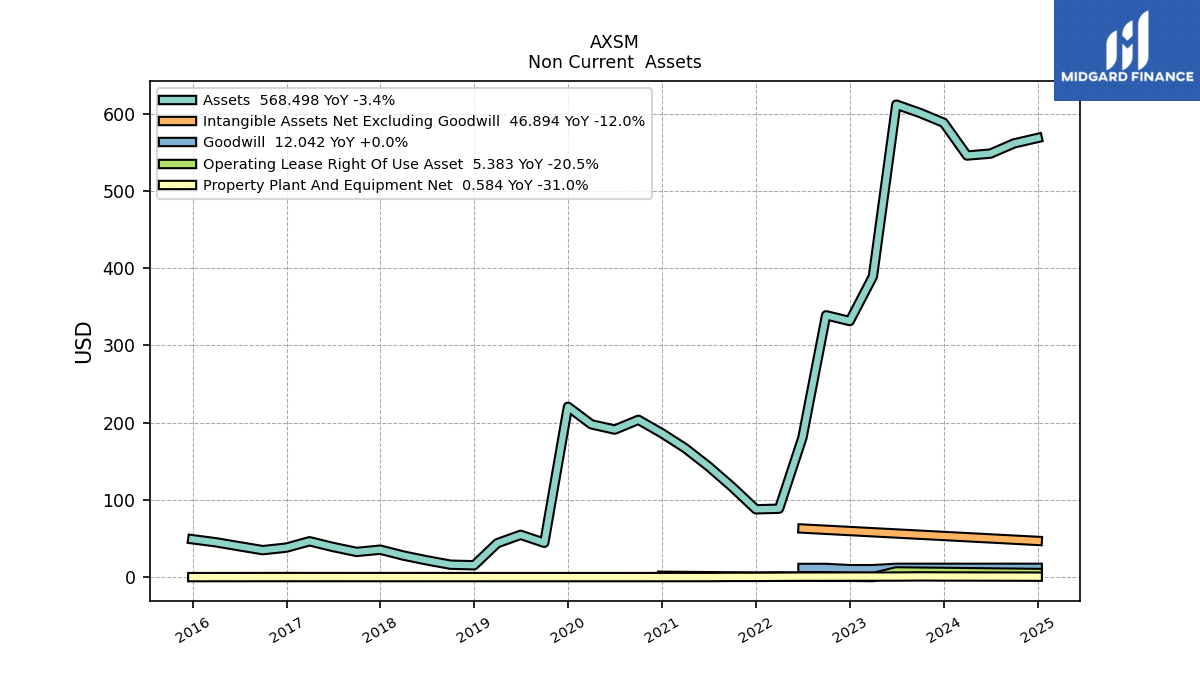
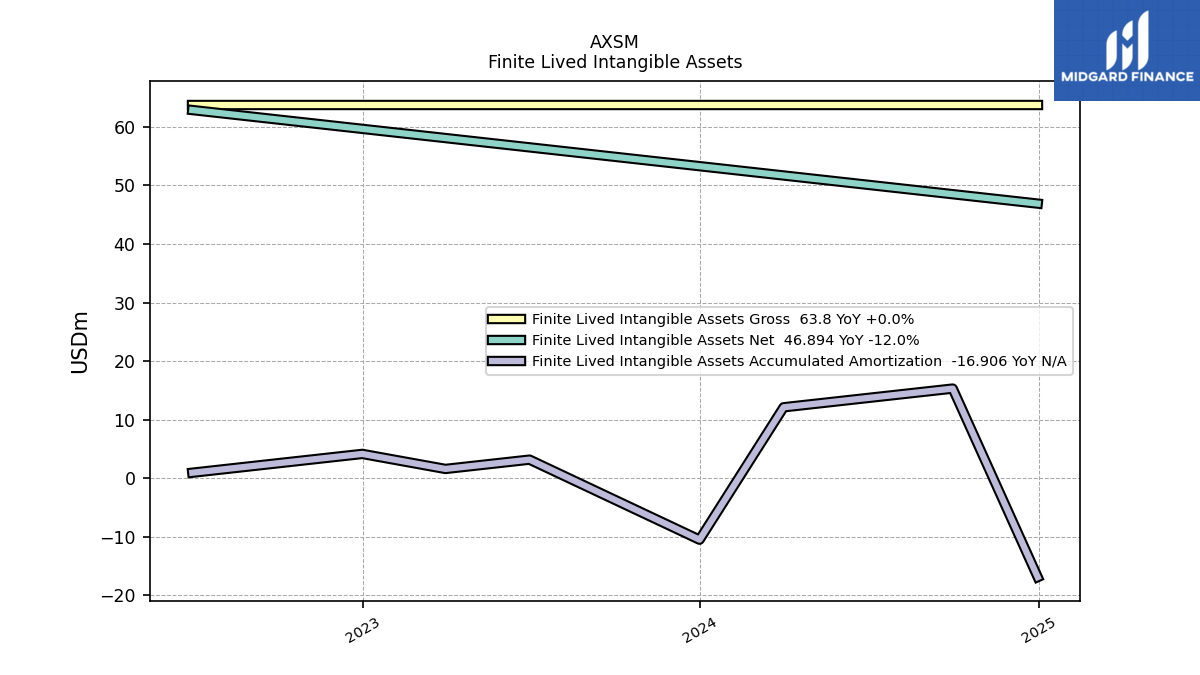
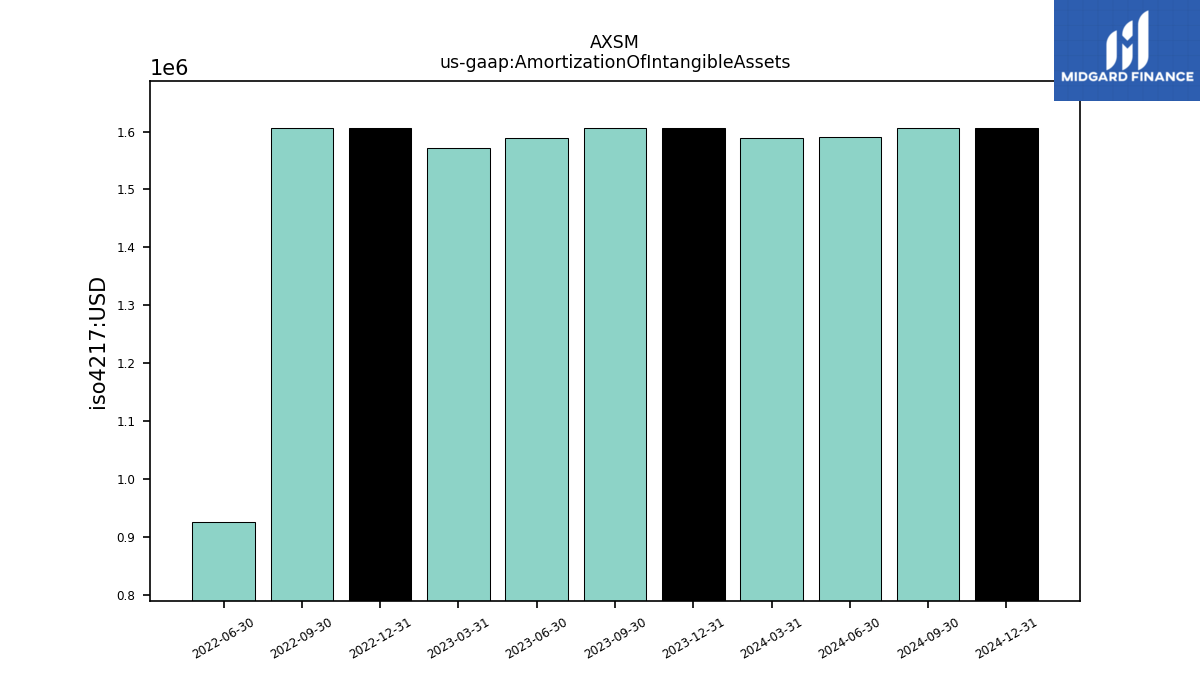
| Amortization Of Intangible Assets | 1.61 | 1.59 | 1.57 | 1.61 | 1.61 | 0.93 | |
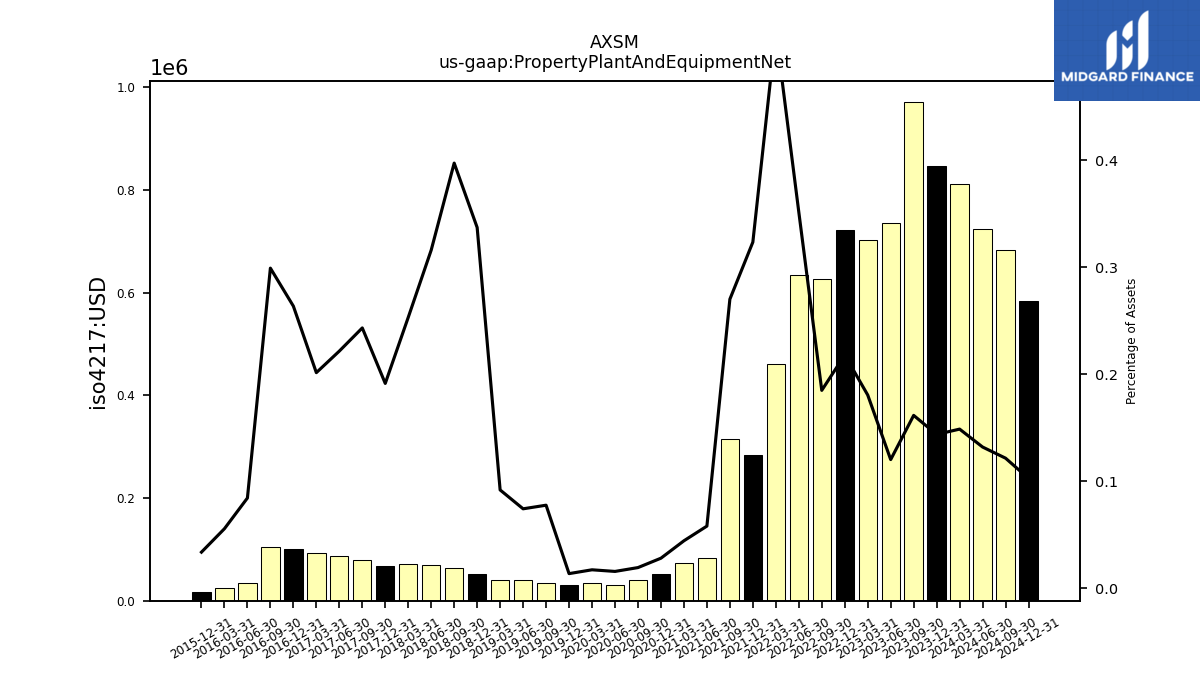
| Property Plant And Equipment Net | 0.97 | 0.74 | 0.70 | 0.72 | 0.63 | 0.63 | |
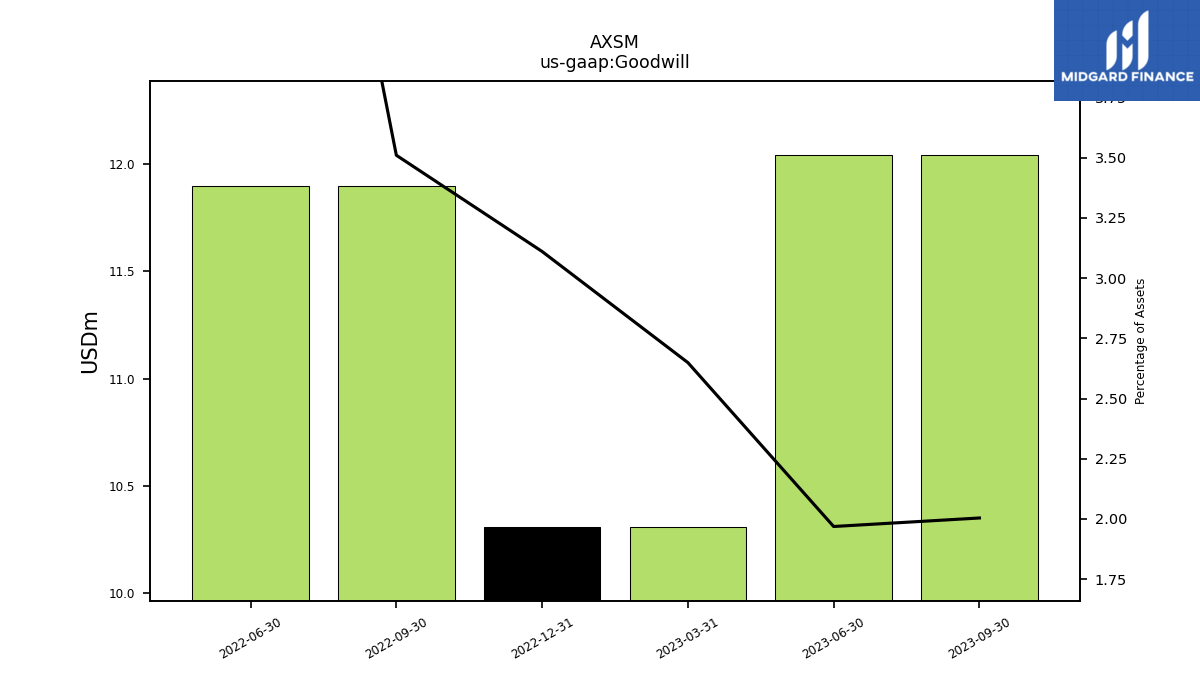
| Goodwill | 12.04 | 12.04 | 10.31 | 10.31 | 11.90 | 11.90 | |
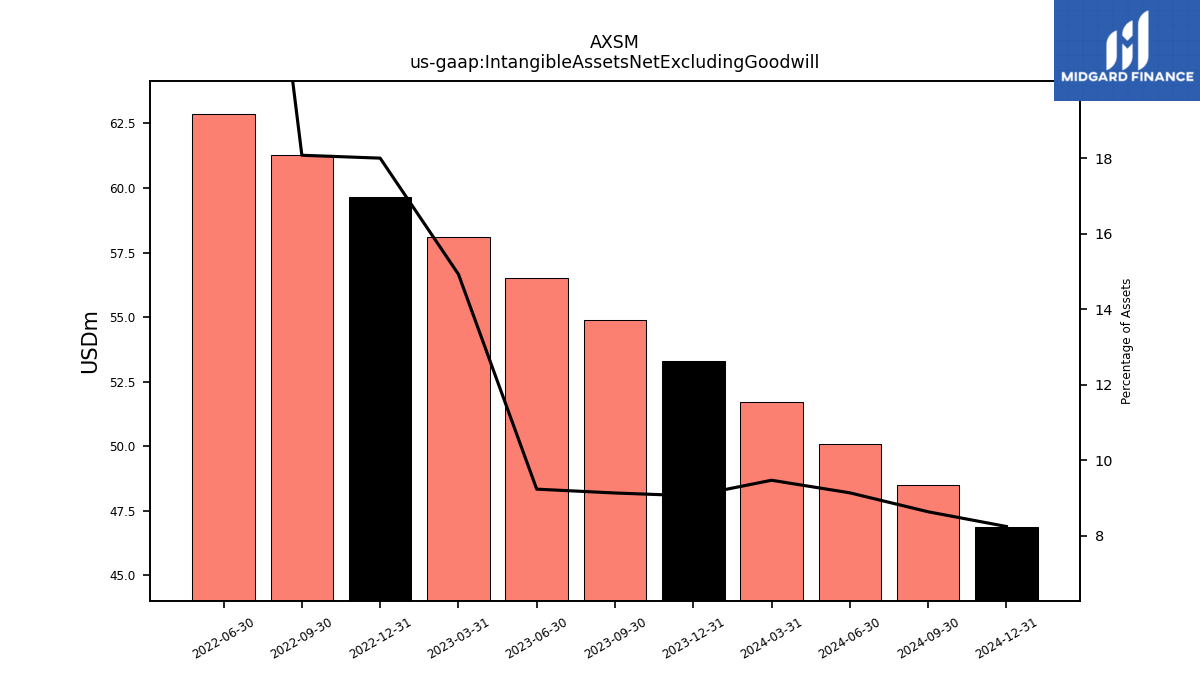
| Intangible Assets Net Excluding Goodwill | 54.89 | 56.50 | 58.09 | 59.66 | 61.27 | 62.87 | |
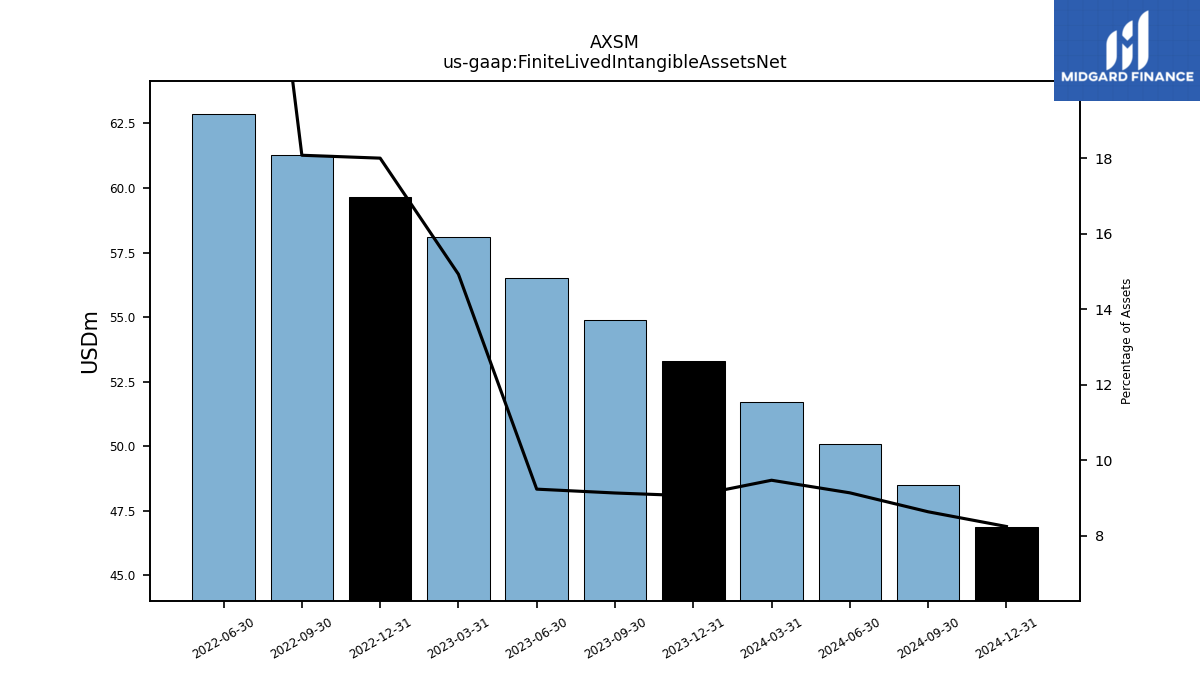
| Finite Lived Intangible Assets Net | 54.89 | 56.50 | 58.09 | 59.66 | 61.27 | 62.87 | |
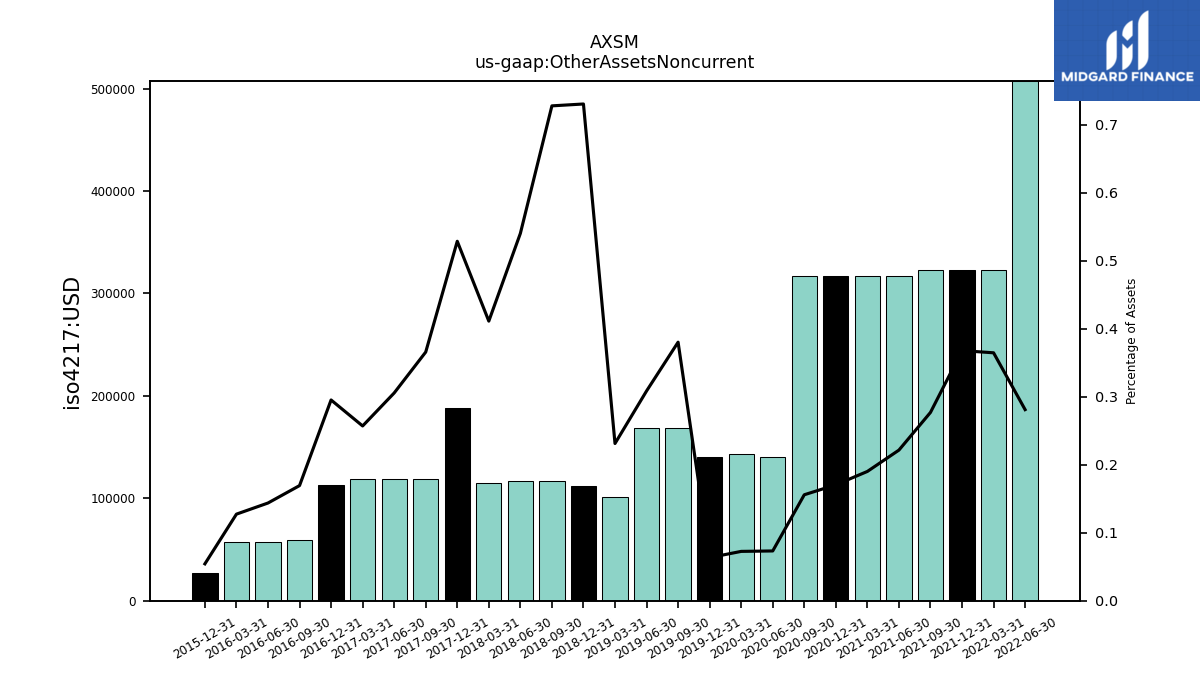
| Other Assets Noncurrent | NA | NA | NA | NA | NA | 0.51 |
| 2023-09-30 | 2023-06-30 | 2023-03-31 | 2022-12-31 | 2022-09-30 | 2022-06-30 | ||
|---|---|---|---|---|---|---|---|
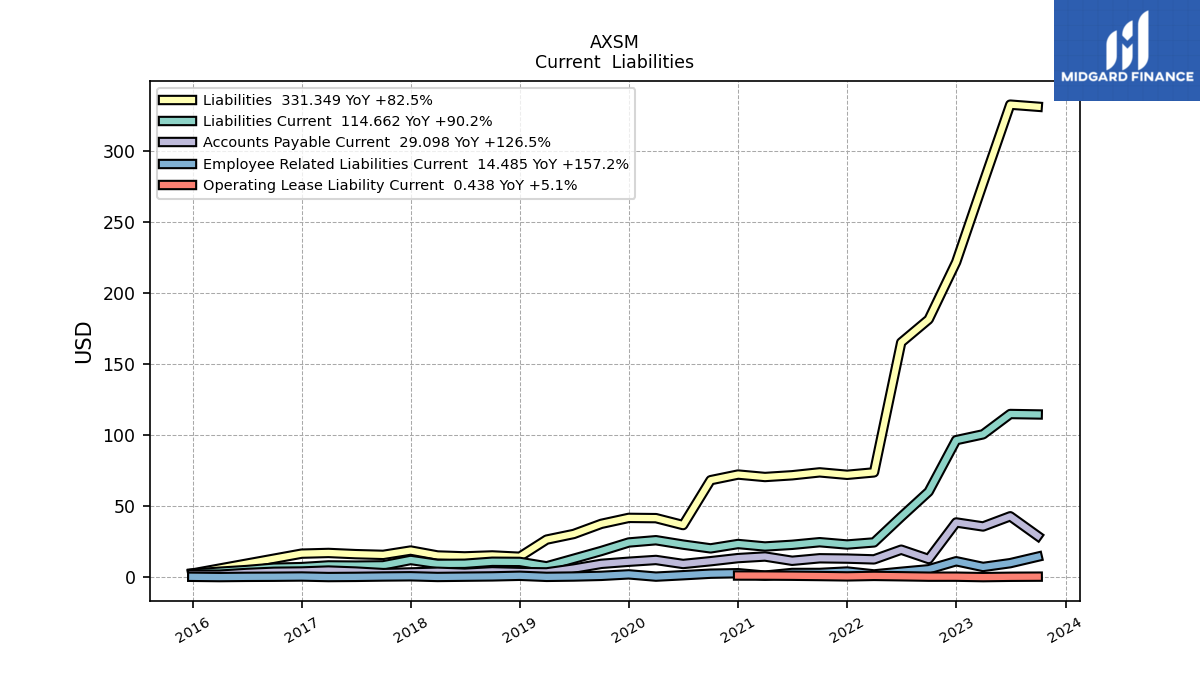
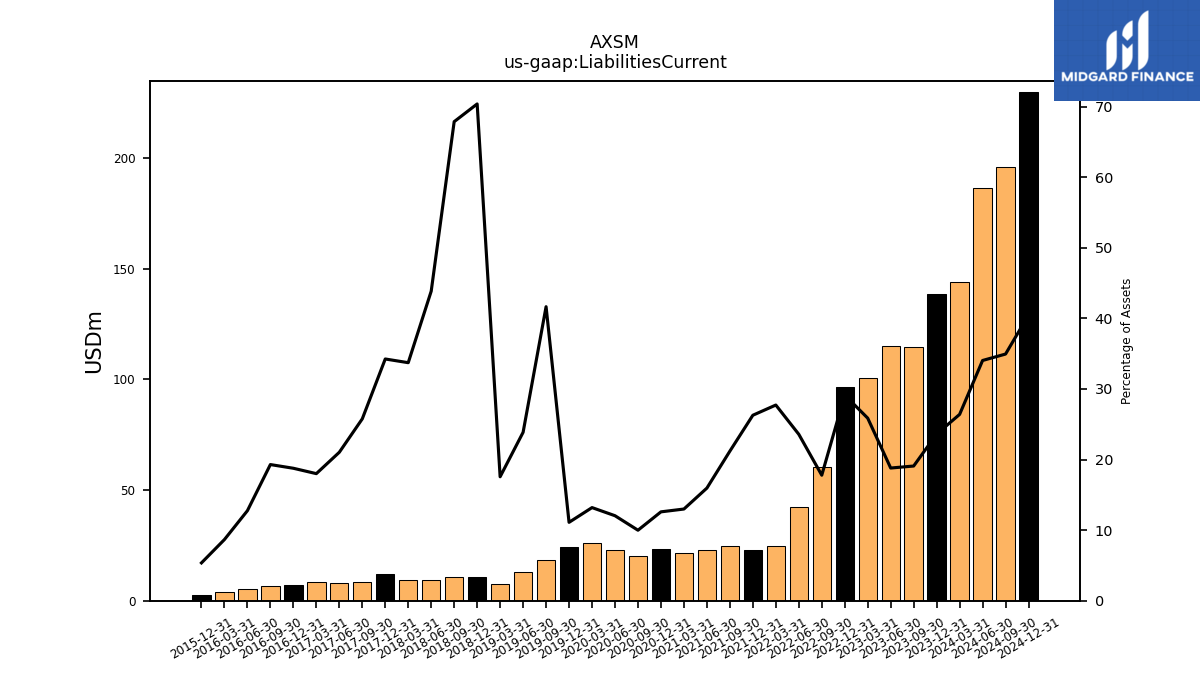
| Liabilities Current | 114.66 | 114.97 | 100.65 | 96.56 | 60.28 | 42.57 | |
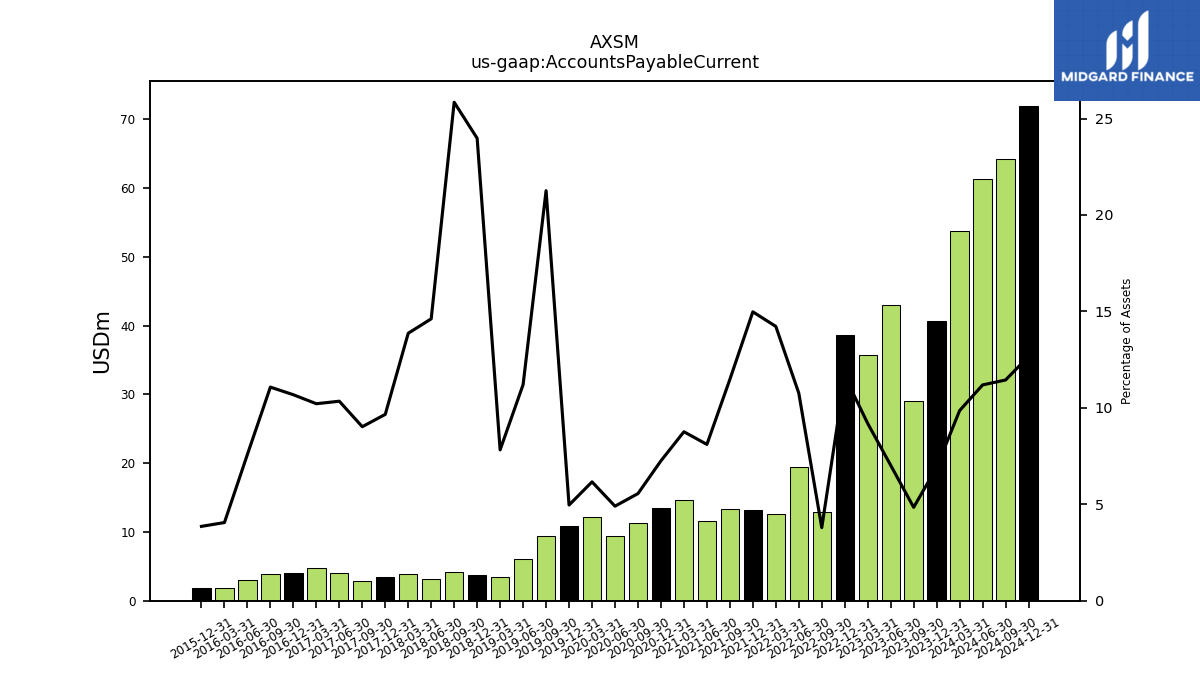
| Accounts Payable Current | 29.10 | 42.96 | 35.77 | 38.61 | 12.84 | 19.43 |
| 2023-09-30 | 2023-06-30 | 2023-03-31 | 2022-12-31 | 2022-09-30 | 2022-06-30 | ||
|---|---|---|---|---|---|---|---|
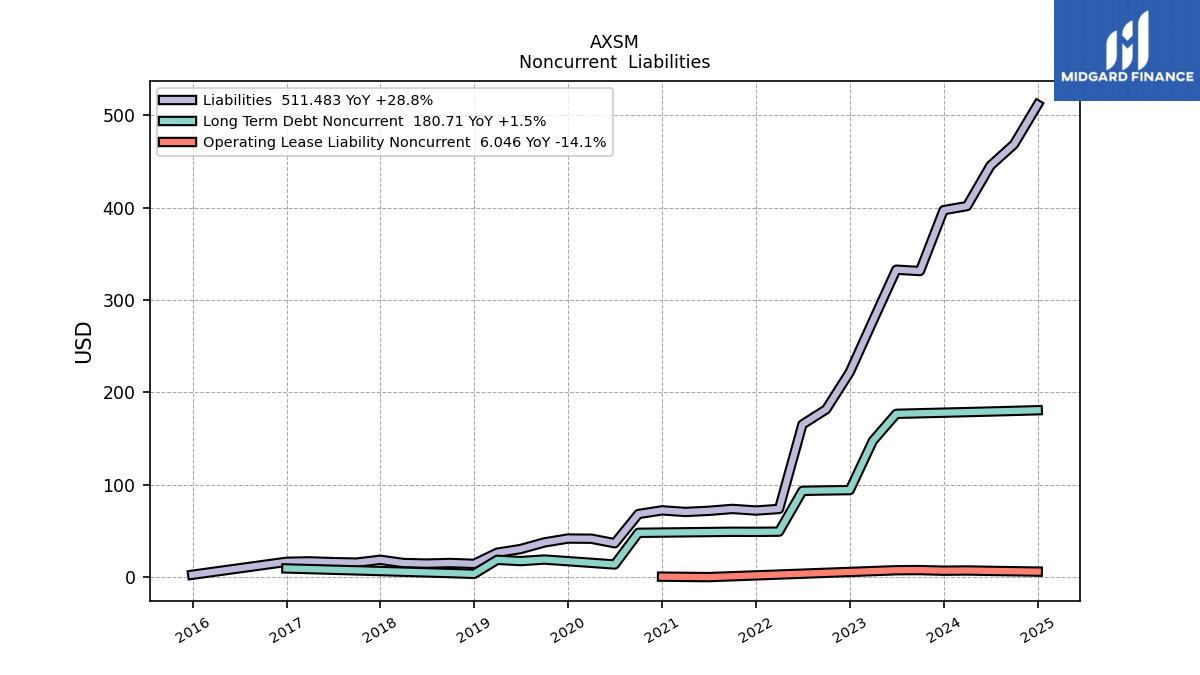
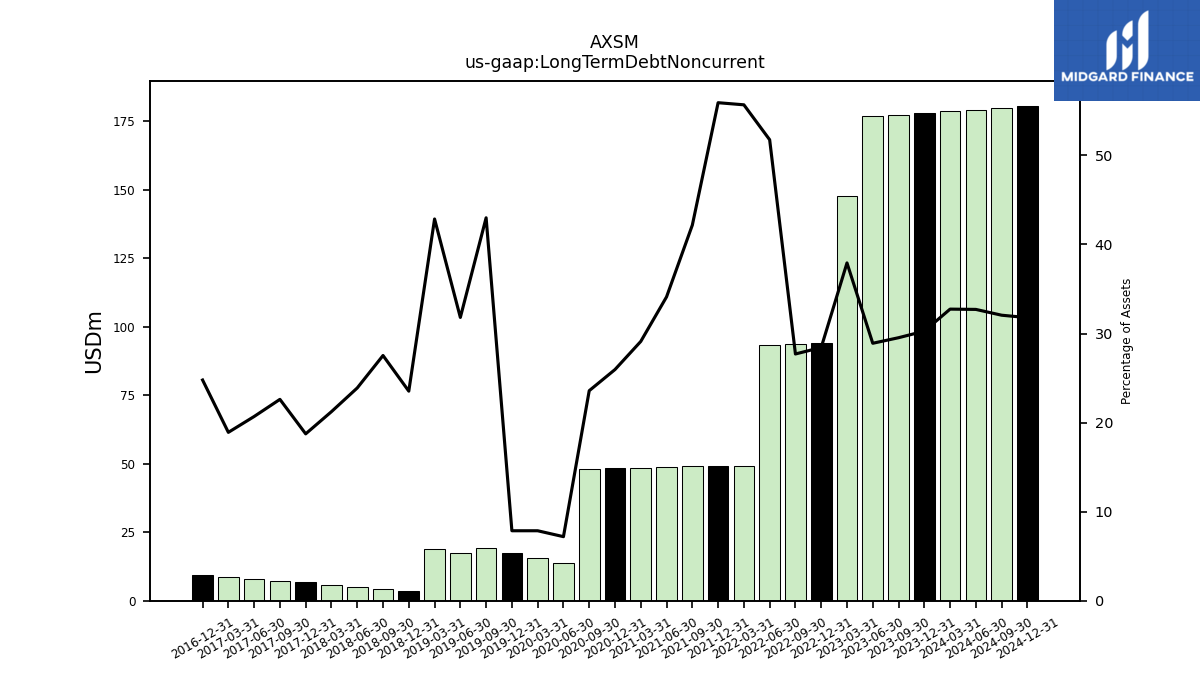
| Long Term Debt Noncurrent | 177.45 | 176.82 | 147.62 | 94.26 | 93.91 | 93.46 | |
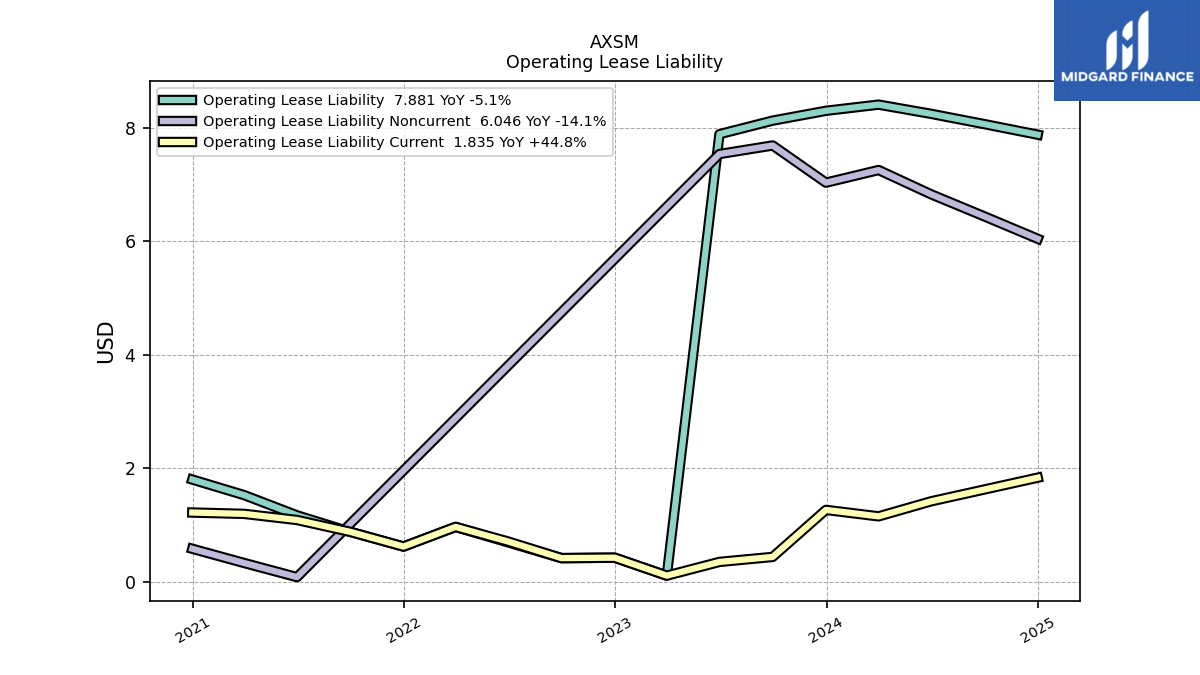
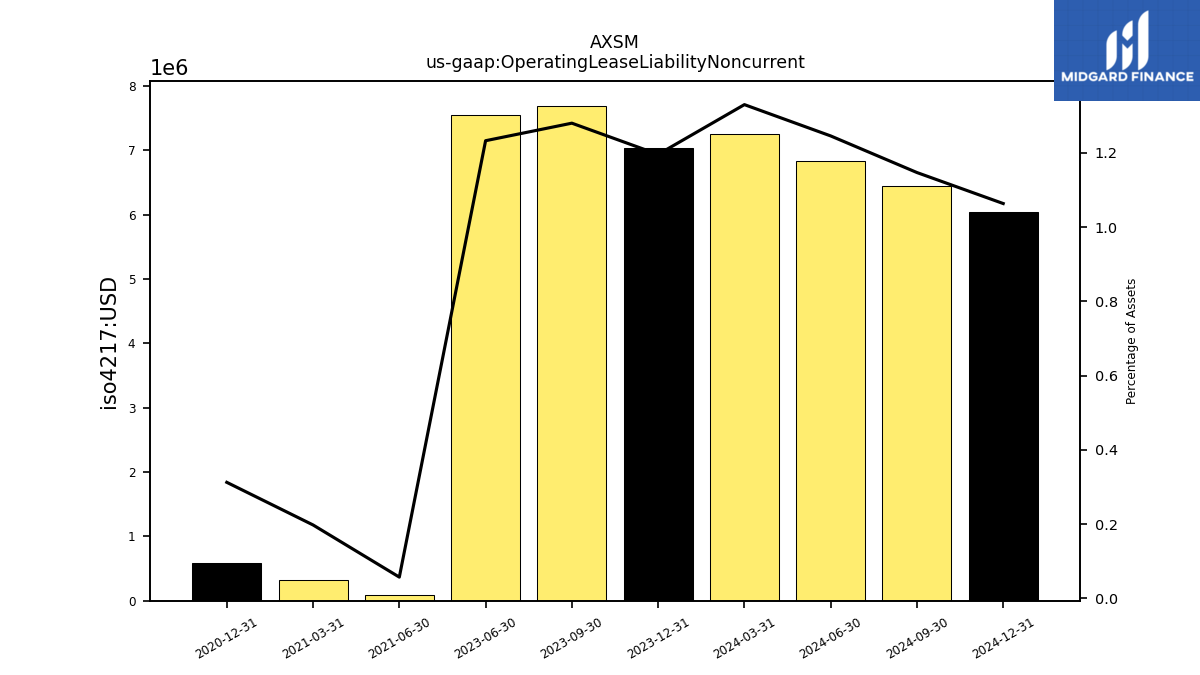
| Operating Lease Liability Noncurrent | 7.69 | 7.54 | NA | NA | NA | NA |
| 2023-09-30 | 2023-06-30 | 2023-03-31 | 2022-12-31 | 2022-09-30 | 2022-06-30 | ||
|---|---|---|---|---|---|---|---|
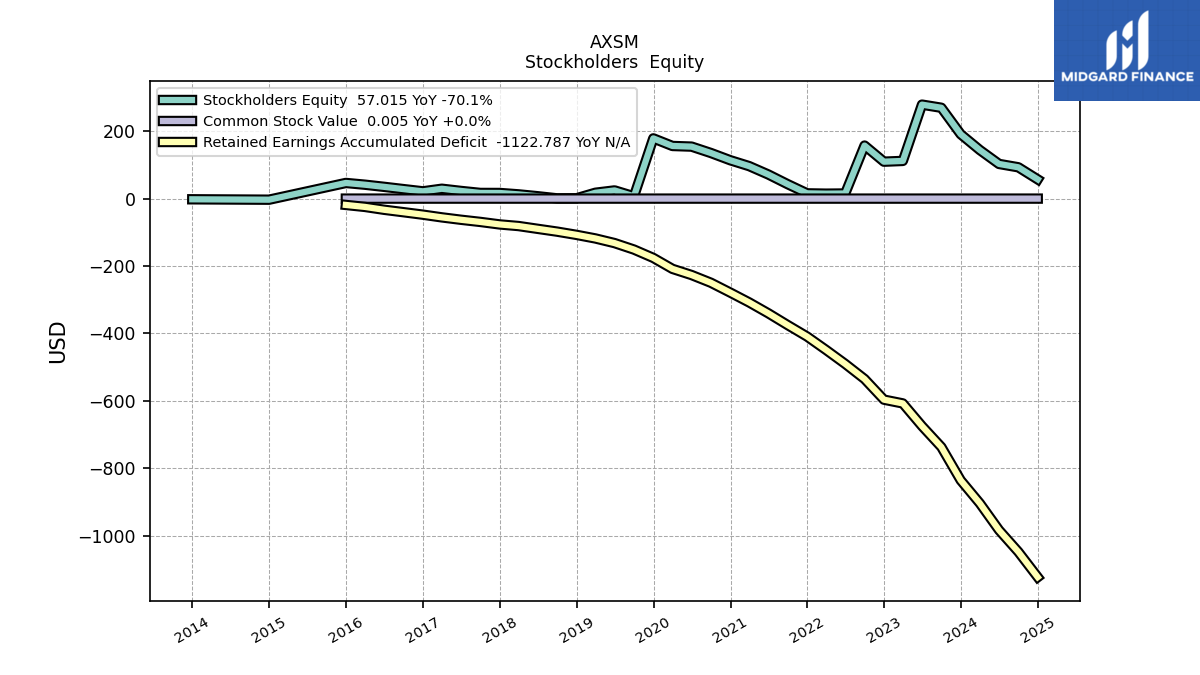
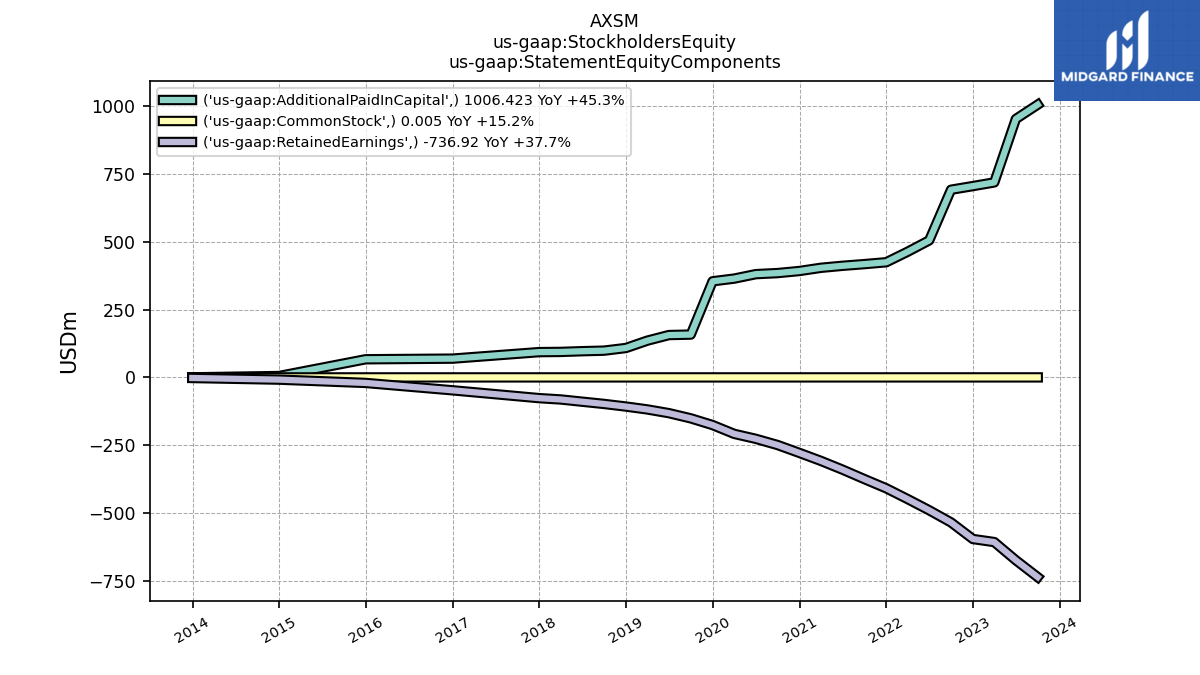
| Stockholders Equity | 269.51 | 278.80 | 111.81 | 109.56 | 157.36 | 15.20 | |
| Common Stock Value | 0.01 | 0.01 | 0.00 | 0.00 | 0.00 | 0.00 | |
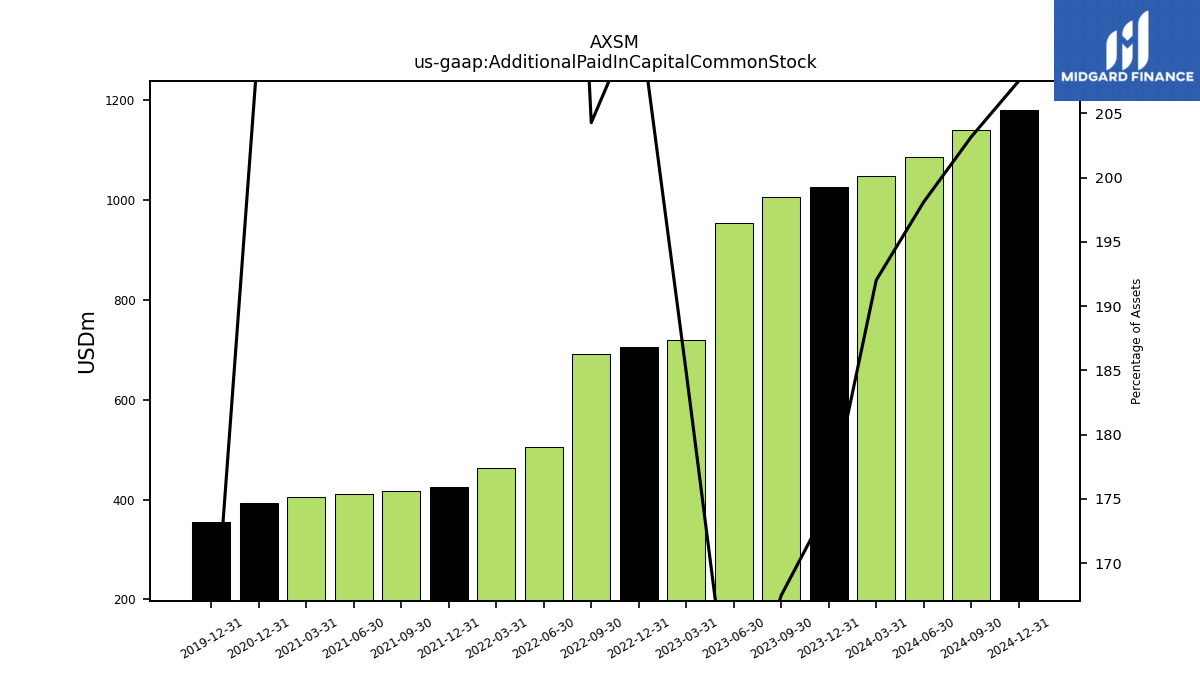
| Additional Paid In Capital Common Stock | 1006.42 | 953.52 | 719.36 | 705.88 | 692.45 | 505.47 | |
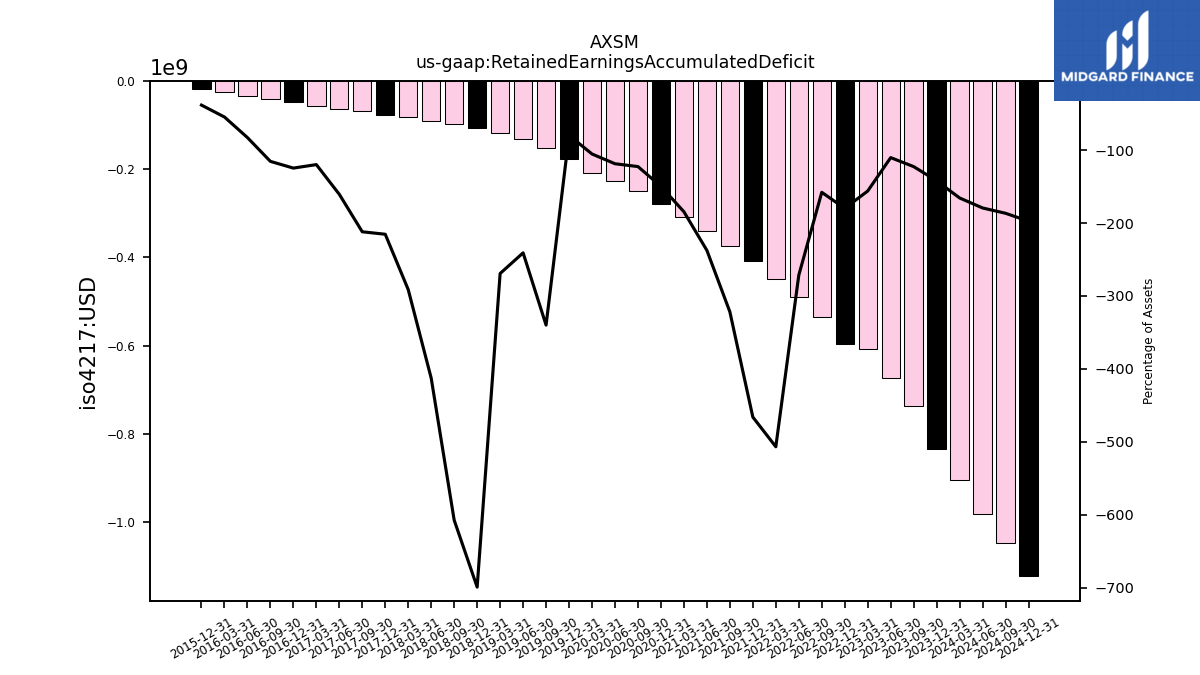
| Retained Earnings Accumulated Deficit | -736.92 | -674.72 | -607.55 | -596.33 | -535.09 | -490.27 | |
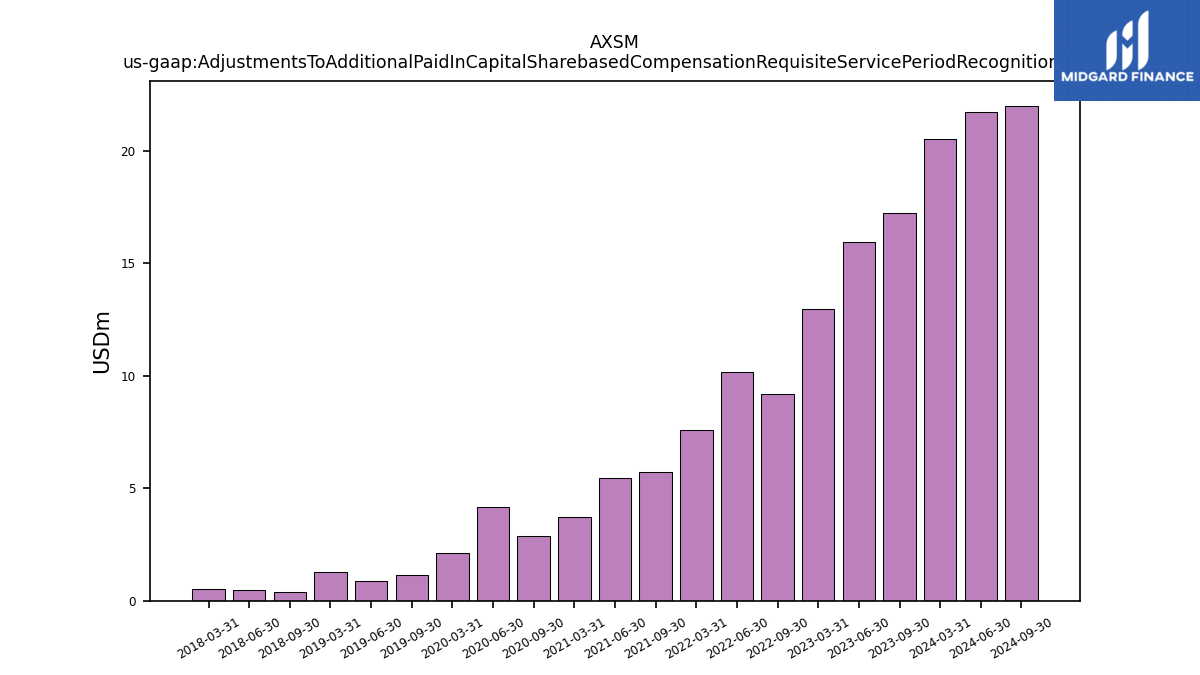
| Adjustments To Additional Paid In Capital Sharebased Compensation Requisite Service Period Recognition Value | 17.24 | 15.92 | 12.94 | NA | 9.20 | 10.16 |
| 2023-09-30 | 2023-06-30 | 2023-03-31 | 2022-12-31 | 2022-09-30 | 2022-06-30 | ||
|---|---|---|---|---|---|---|---|
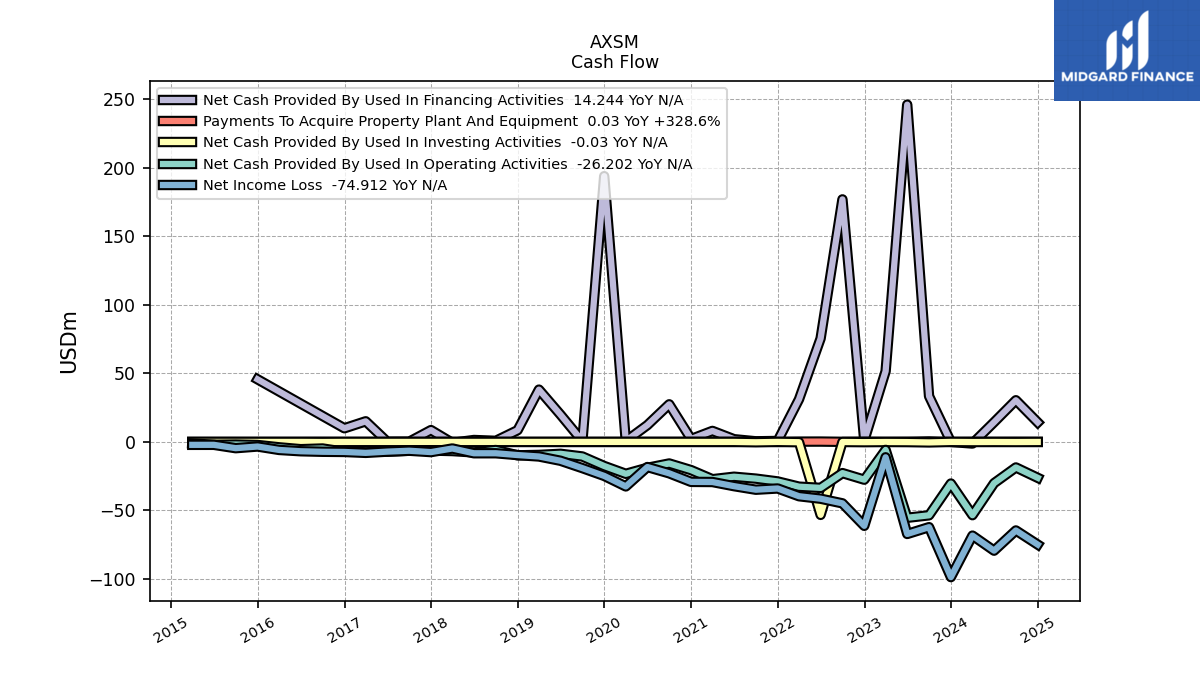
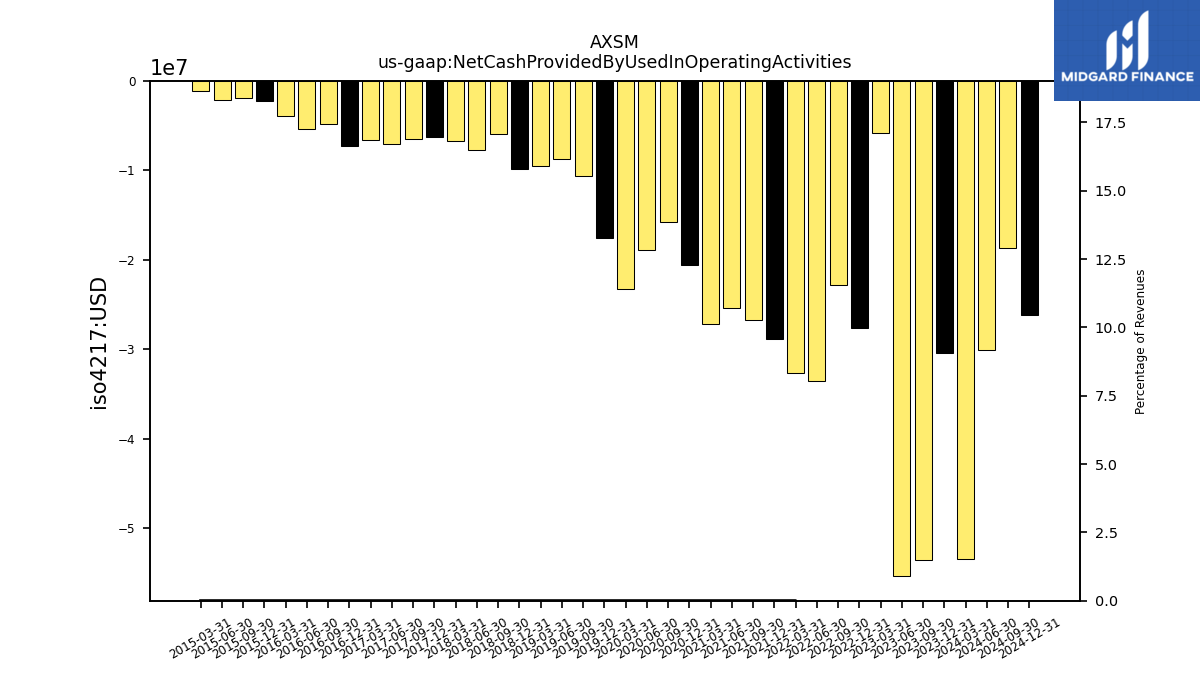
| Net Cash Provided By Used In Operating Activities | -53.55 | -55.35 | -5.82 | -27.56 | -22.76 | -33.54 | |
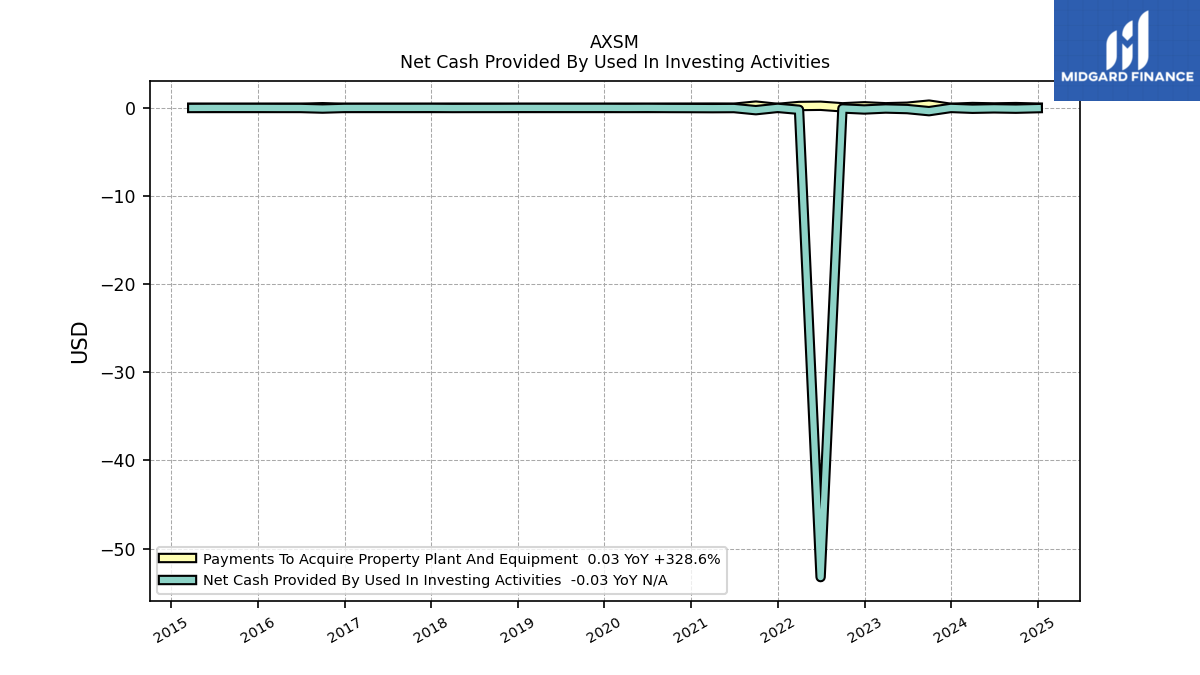
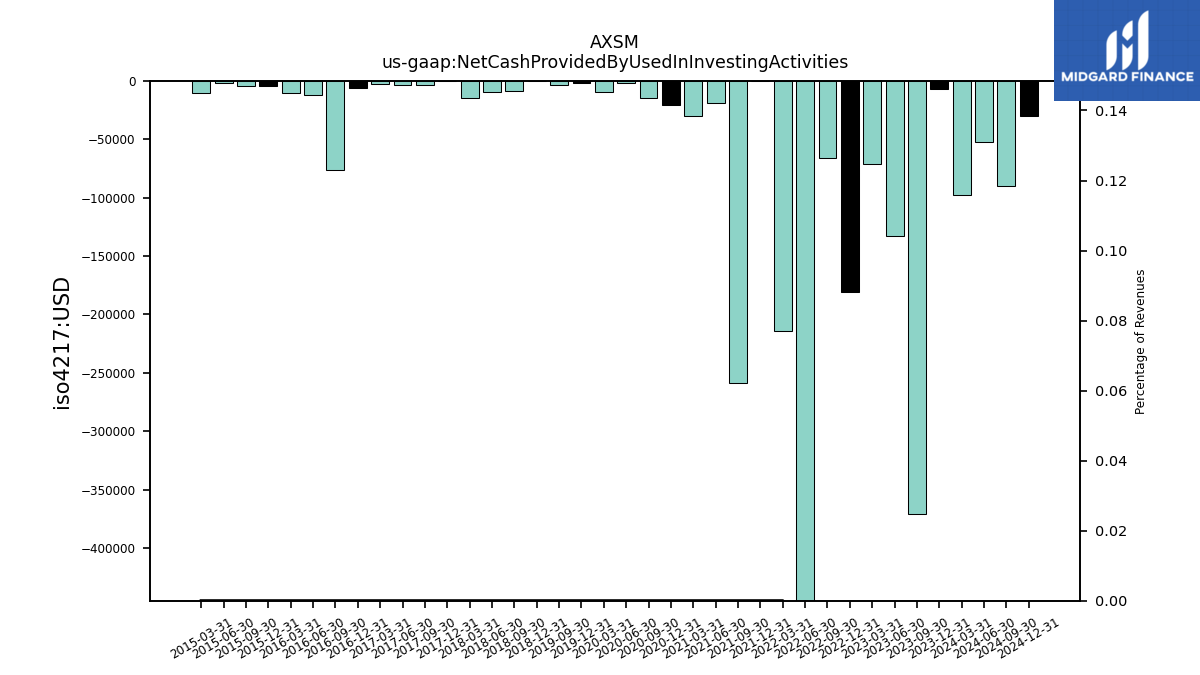
| Net Cash Provided By Used In Investing Activities | -0.37 | -0.13 | -0.07 | -0.18 | -0.07 | -53.24 | |
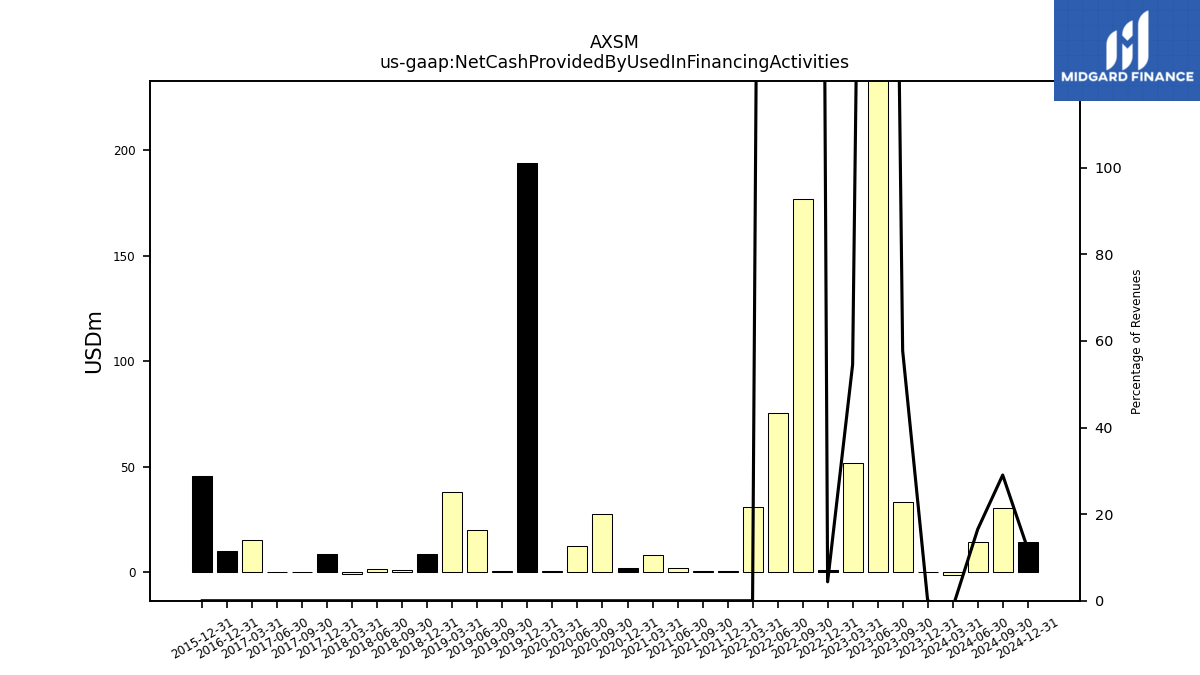
| Net Cash Provided By Used In Financing Activities | 33.37 | 246.08 | 51.56 | 1.07 | 176.95 | 75.46 |
| 2023-09-30 | 2023-06-30 | 2023-03-31 | 2022-12-31 | 2022-09-30 | 2022-06-30 | ||
|---|---|---|---|---|---|---|---|
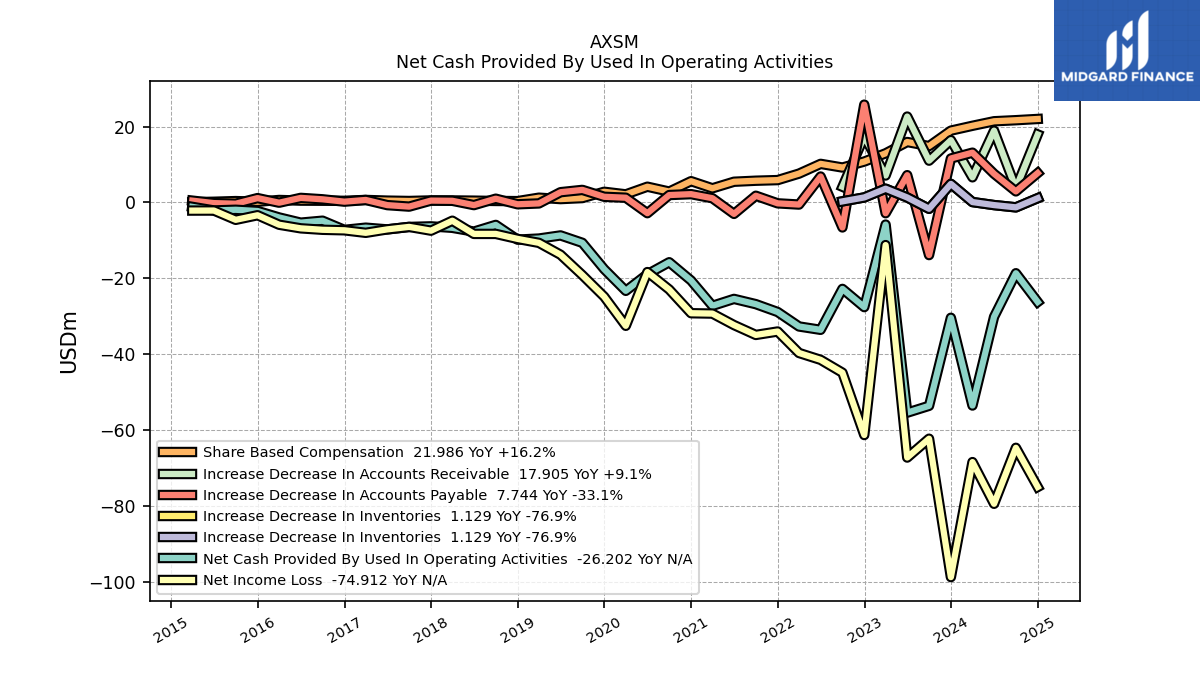
| Net Cash Provided By Used In Operating Activities | -53.55 | -55.35 | -5.82 | -27.56 | -22.76 | -33.54 | |
| Net Income Loss | -62.20 | -67.17 | -11.22 | -61.24 | -44.82 | -41.44 | |
| Profit Loss | -62.20 | -67.17 | -11.22 | -61.24 | -44.82 | -41.44 | |
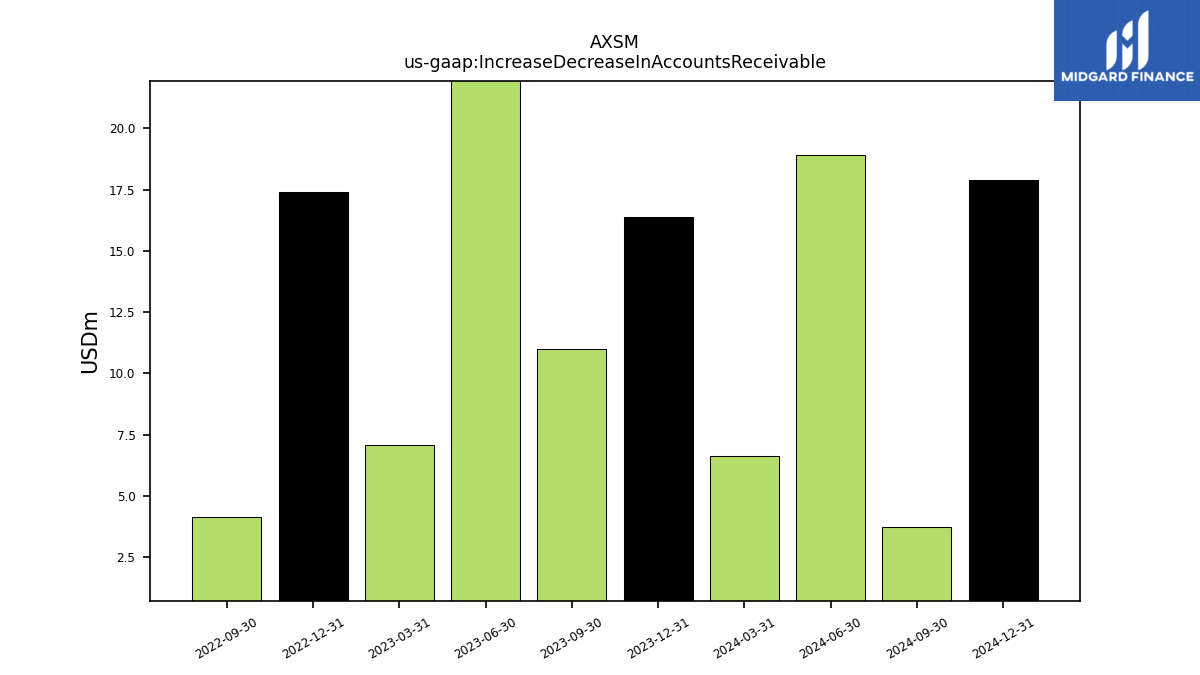
| Increase Decrease In Accounts Receivable | 11.01 | 22.62 | 7.09 | 17.40 | 4.13 | NA | |
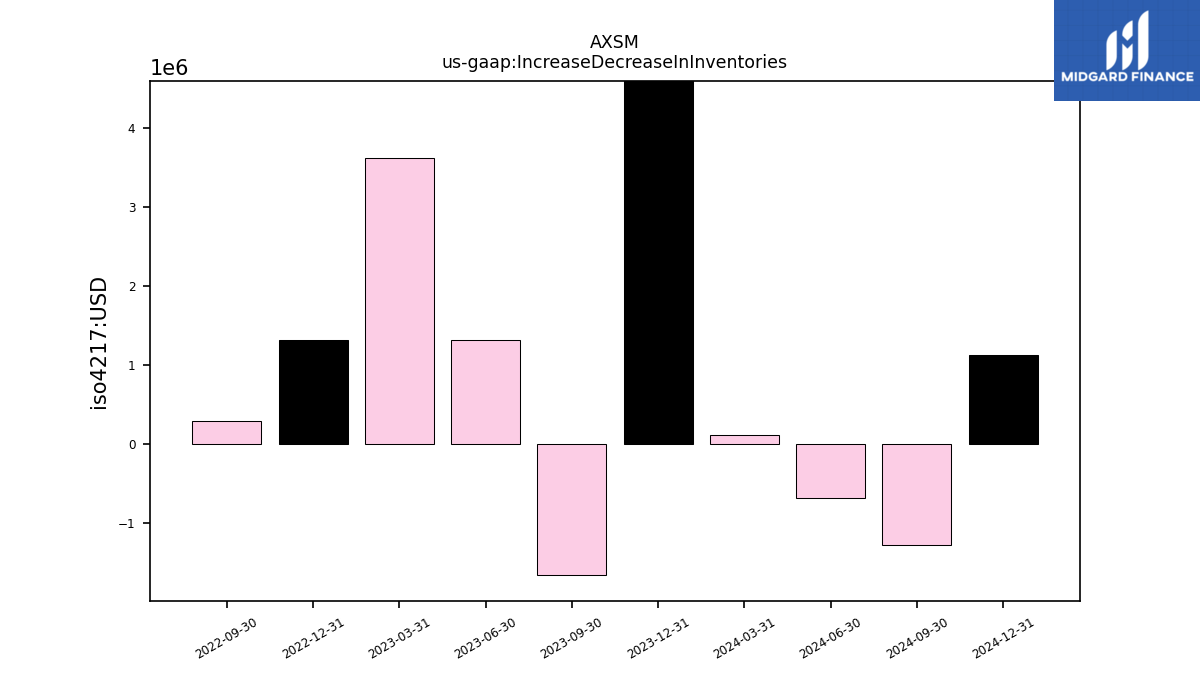
| Increase Decrease In Inventories | -1.66 | 1.31 | 3.62 | 1.32 | 0.29 | NA | |
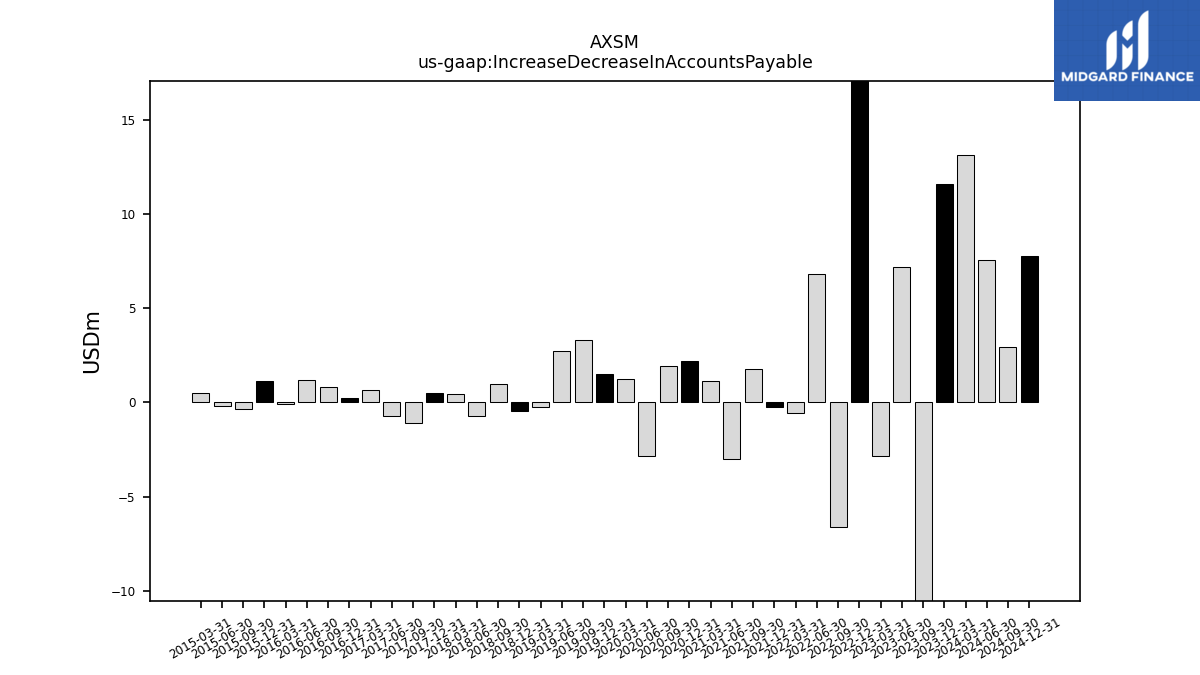
| Increase Decrease In Accounts Payable | -13.86 | 7.19 | -2.83 | 25.76 | -6.59 | 6.84 | |
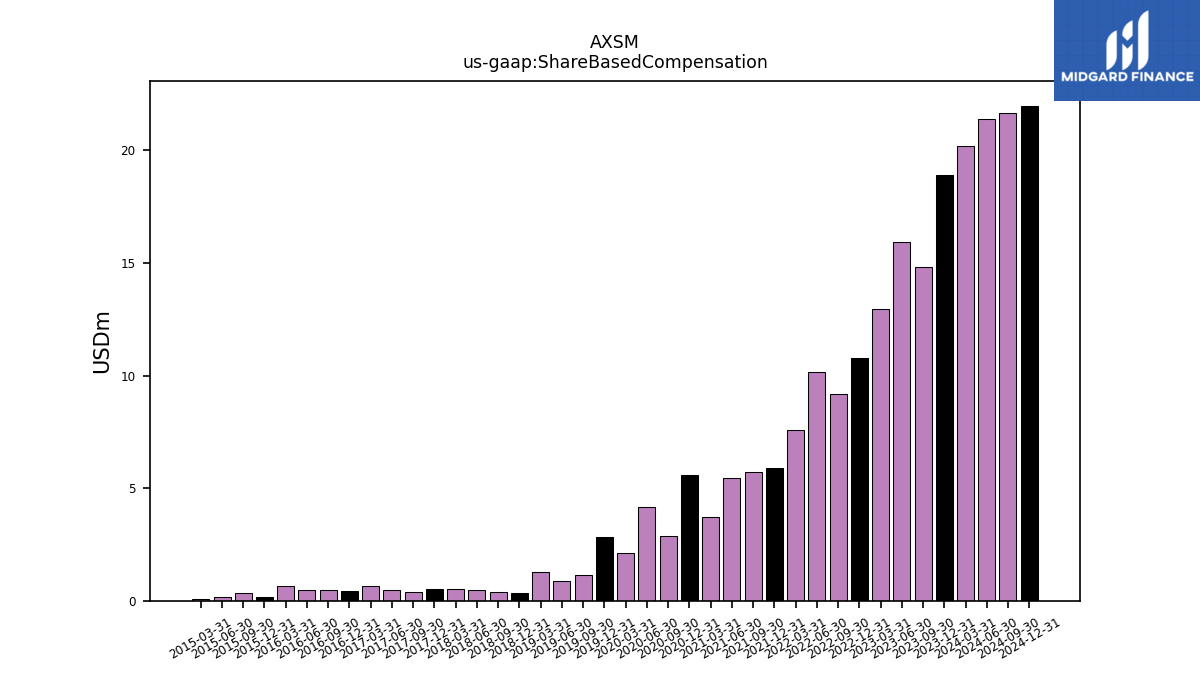
| Share Based Compensation | 14.84 | 15.92 | 12.94 | 10.77 | 9.20 | 10.16 | |
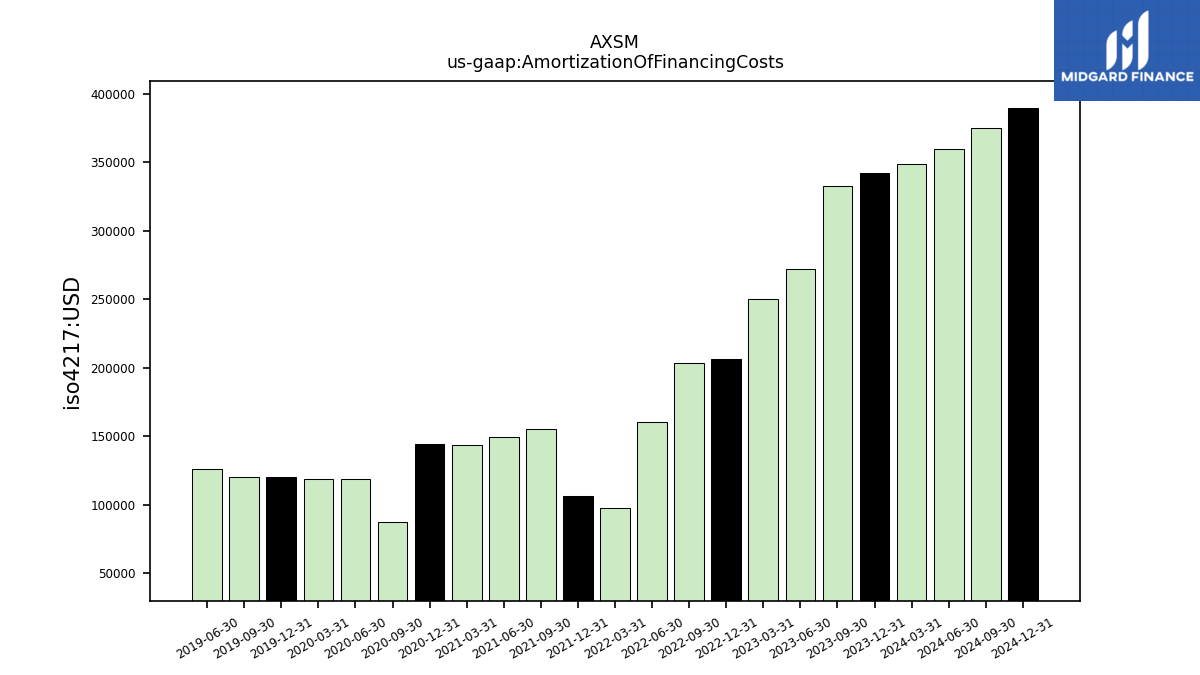
| Amortization Of Financing Costs | 0.33 | 0.27 | 0.25 | 0.21 | 0.20 | 0.16 |
| 2023-09-30 | 2023-06-30 | 2023-03-31 | 2022-12-31 | 2022-09-30 | 2022-06-30 | ||
|---|---|---|---|---|---|---|---|
| Net Cash Provided By Used In Investing Activities | -0.37 | -0.13 | -0.07 | -0.18 | -0.07 | -53.24 | |
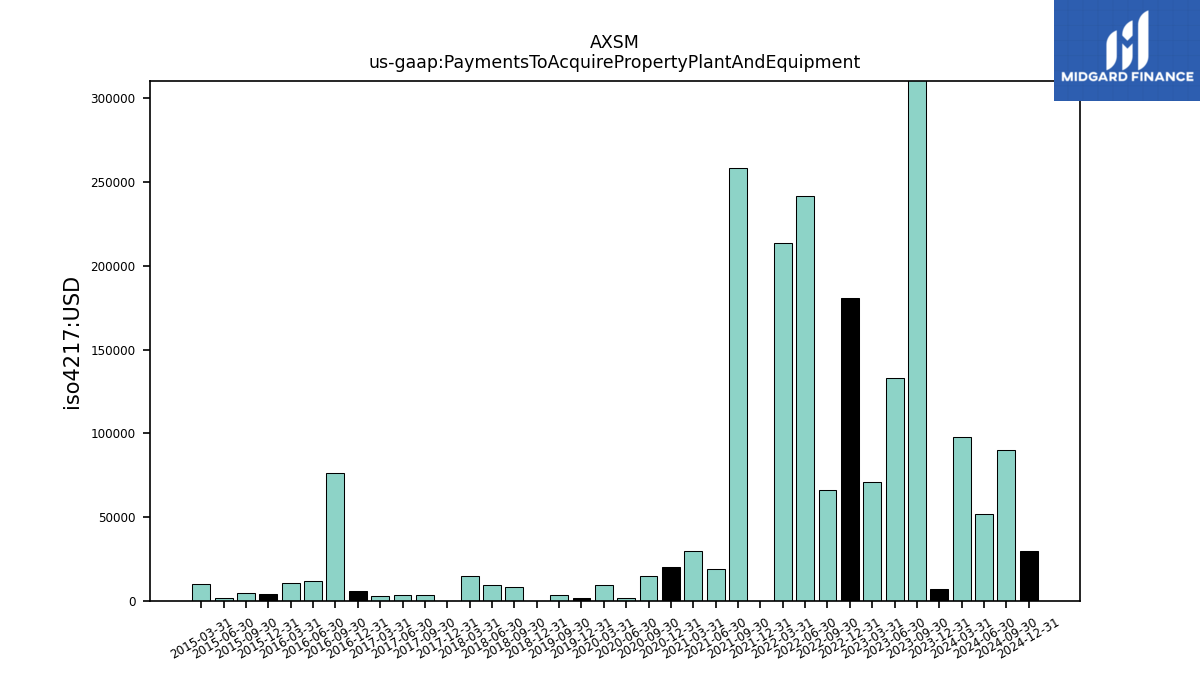
| Payments To Acquire Property Plant And Equipment | 0.37 | 0.13 | 0.07 | 0.18 | 0.07 | 0.24 |
| 2023-09-30 | 2023-06-30 | 2023-03-31 | 2022-12-31 | 2022-09-30 | 2022-06-30 | ||
|---|---|---|---|---|---|---|---|
| Net Cash Provided By Used In Financing Activities | 33.37 | 246.08 | 51.56 | 1.07 | 176.95 | 75.46 |
| 2023-09-30 | 2023-06-30 | 2023-03-31 | 2022-12-31 | 2022-09-30 | 2022-06-30 | ||
|---|---|---|---|---|---|---|---|
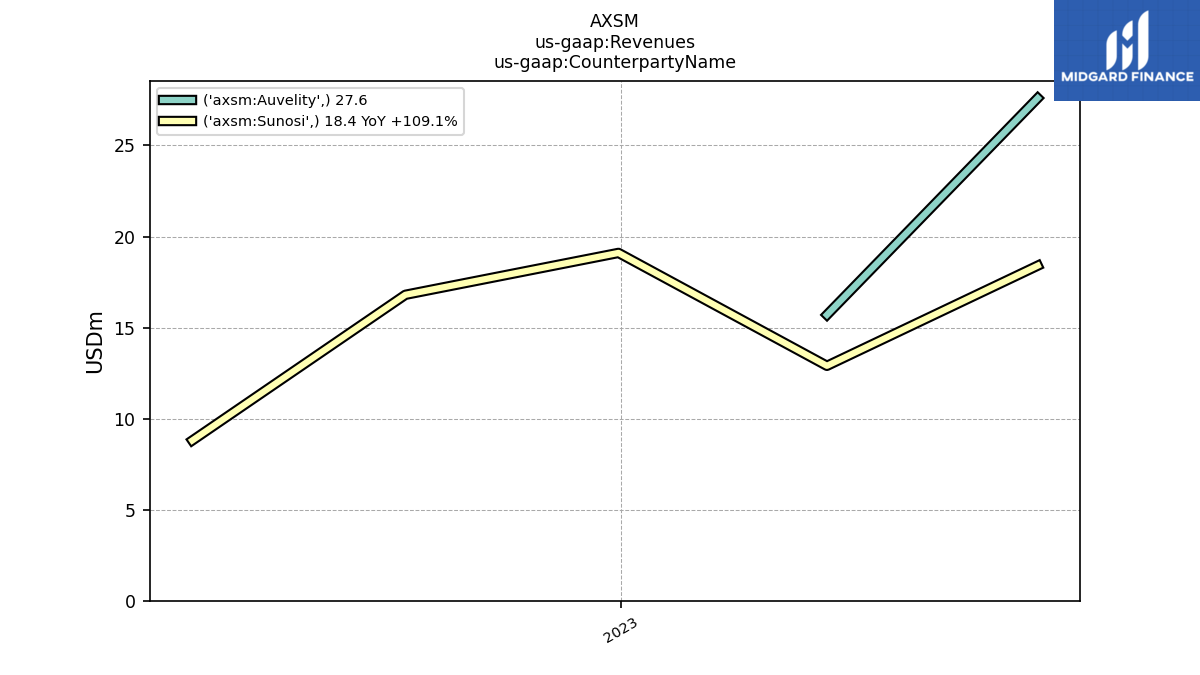
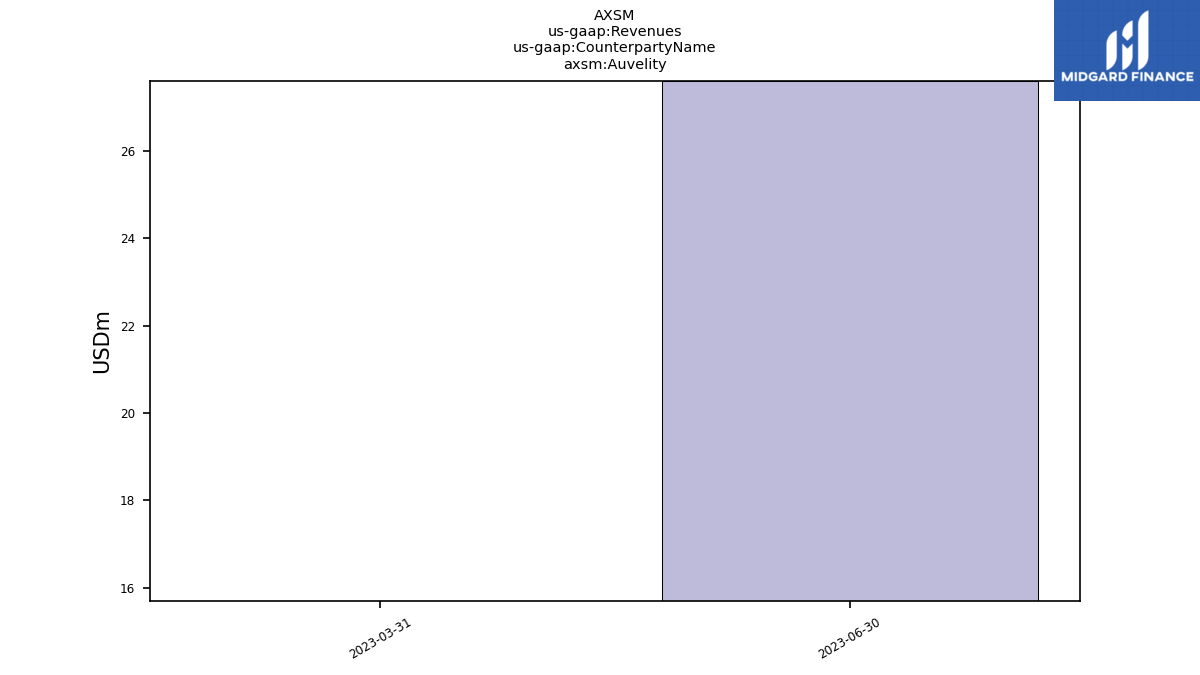
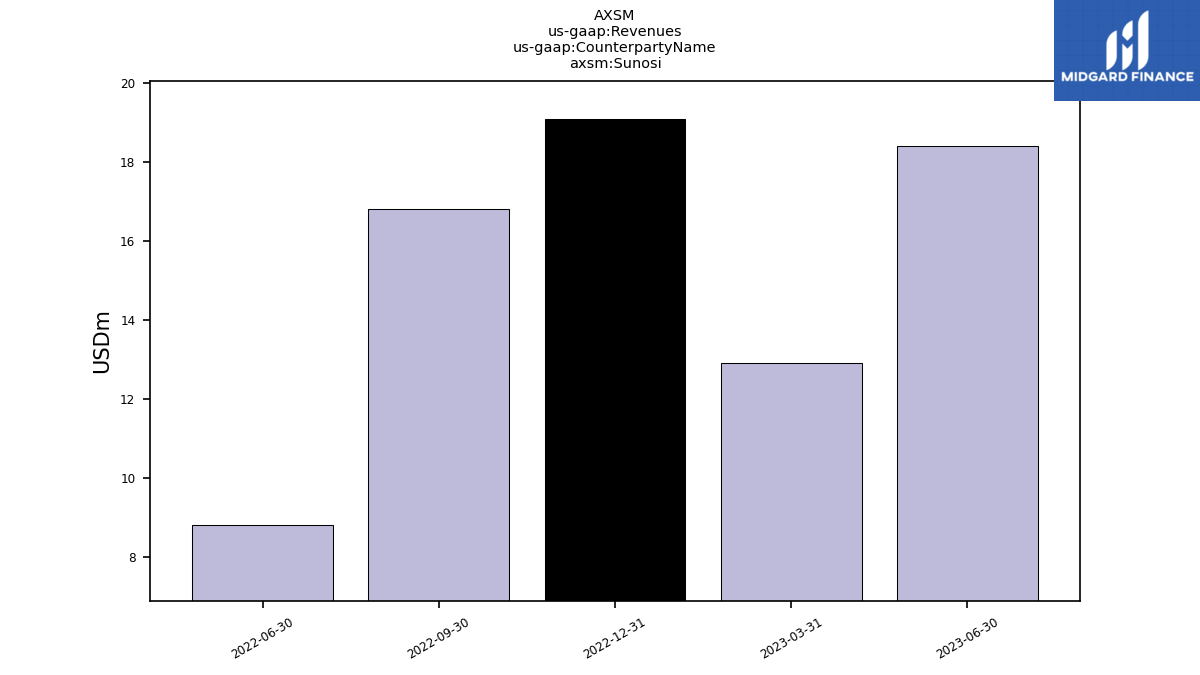
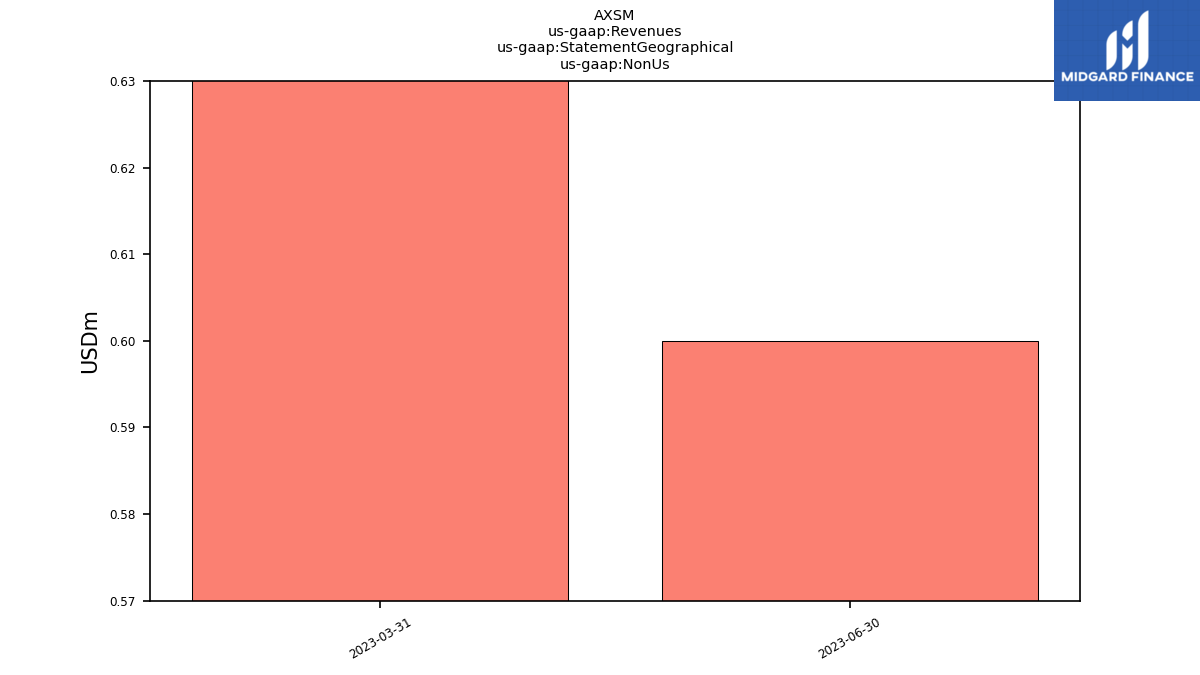
| Revenues | 57.79 | 46.70 | 94.58 | 24.37 | 16.85 | 8.82 | |
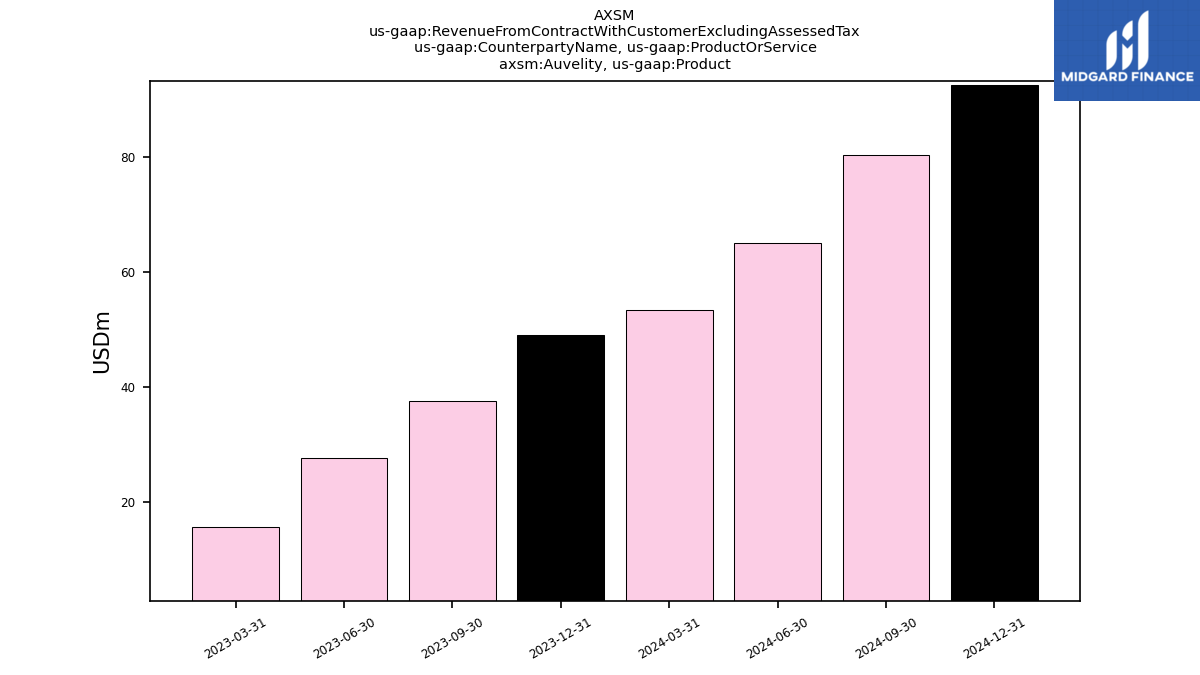
| Auvelity | NA | 27.60 | 15.70 | NA | NA | NA | |
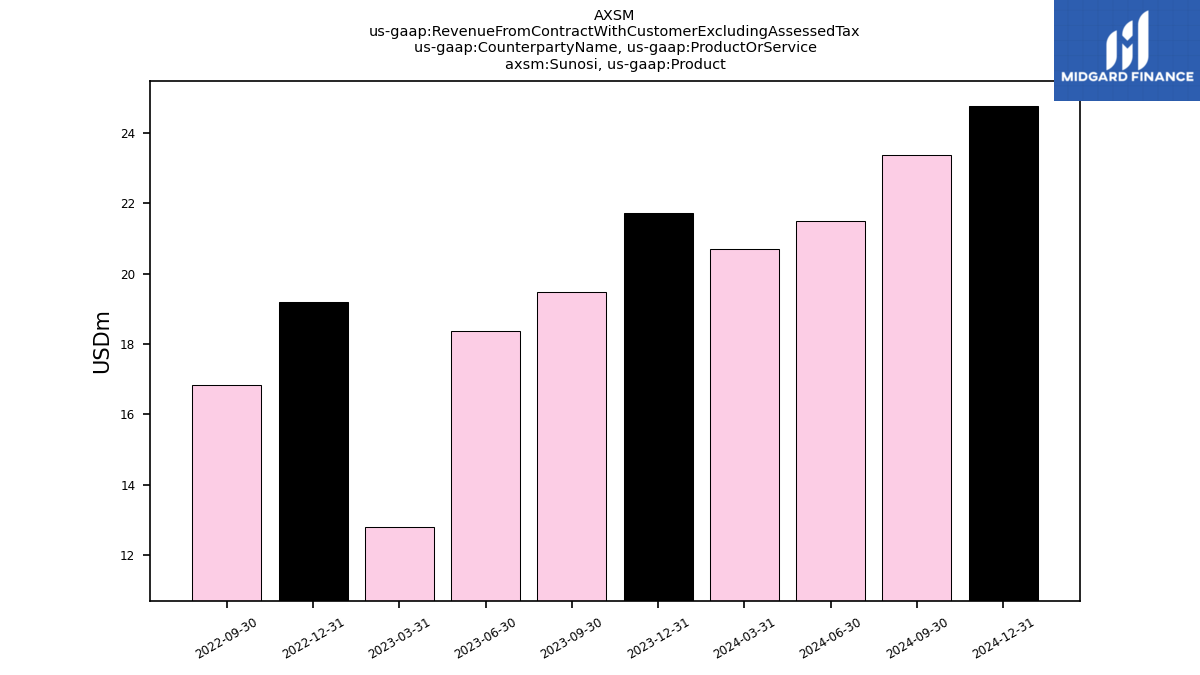
| Sunosi | NA | 18.40 | 12.90 | 19.10 | 16.80 | 8.80 | |
| Non Us | NA | 0.60 | 1.70 | NA | NA | NA | |
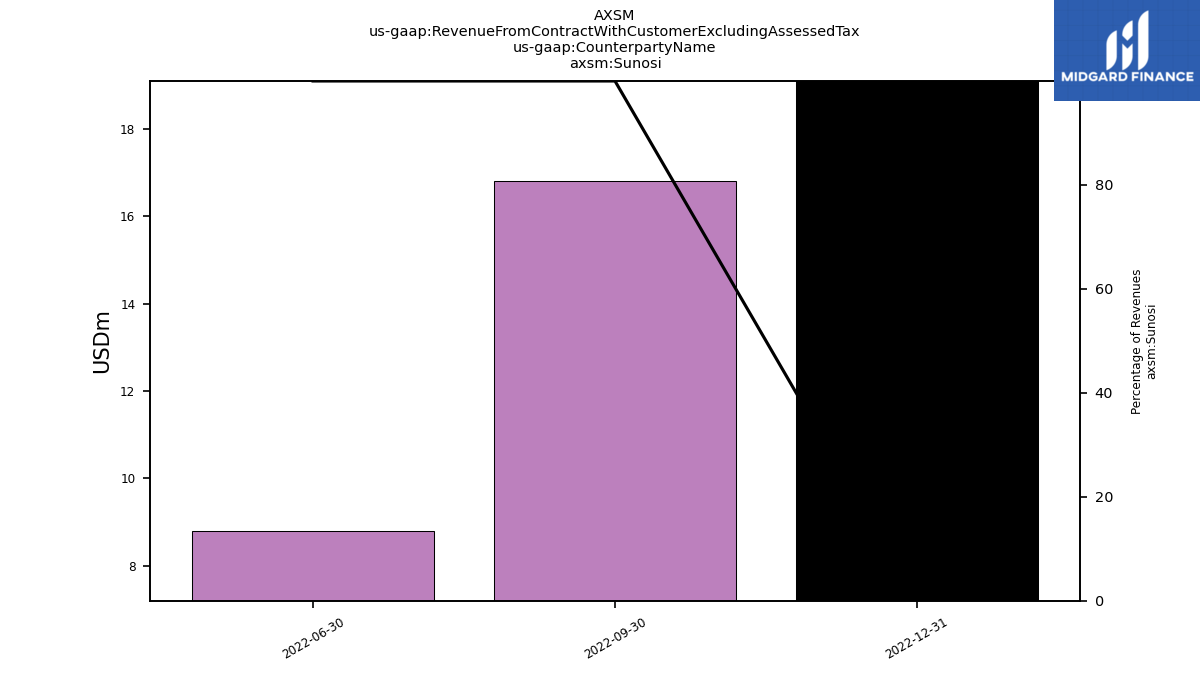
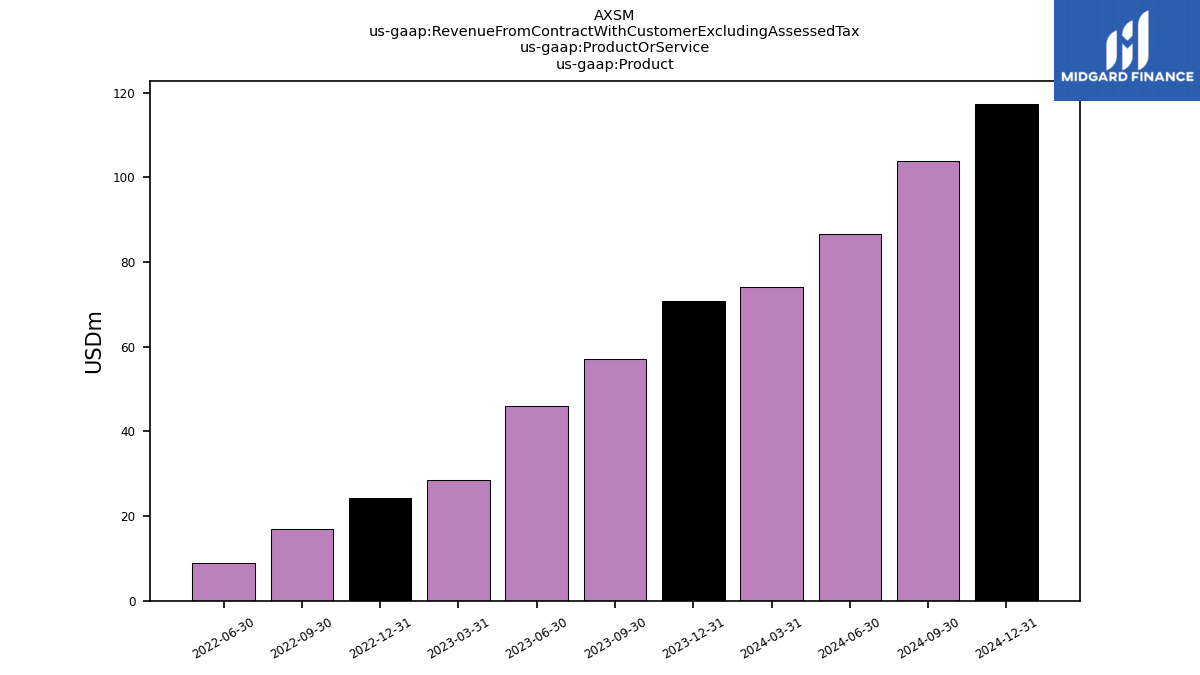
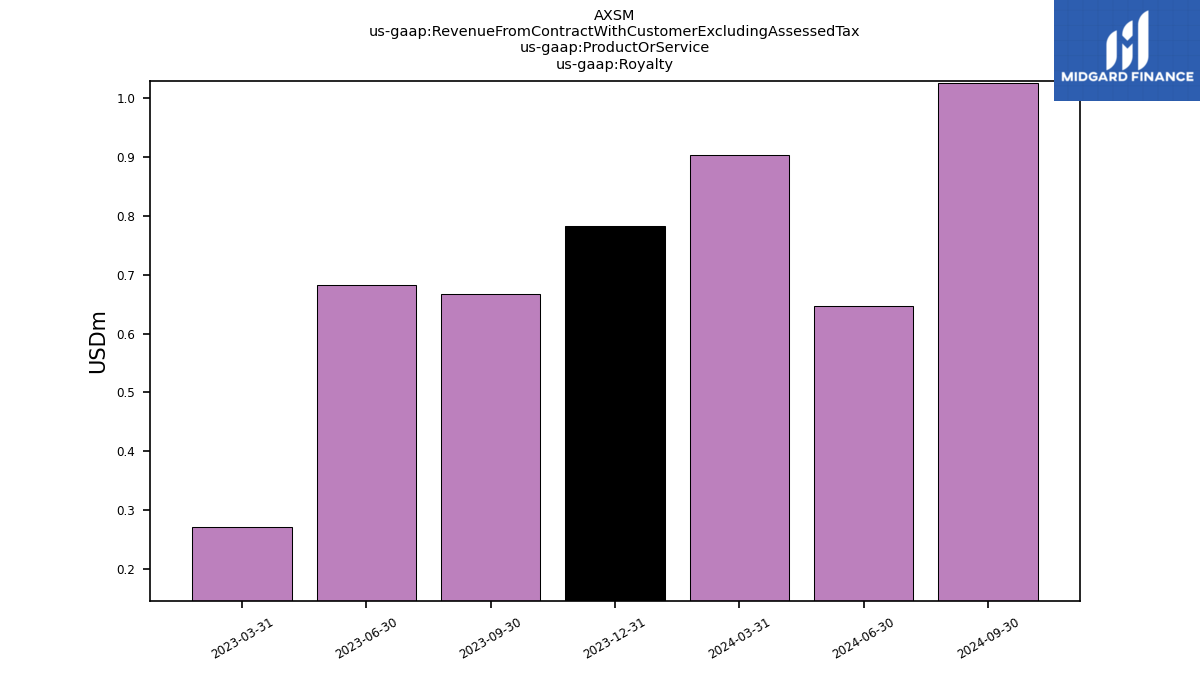
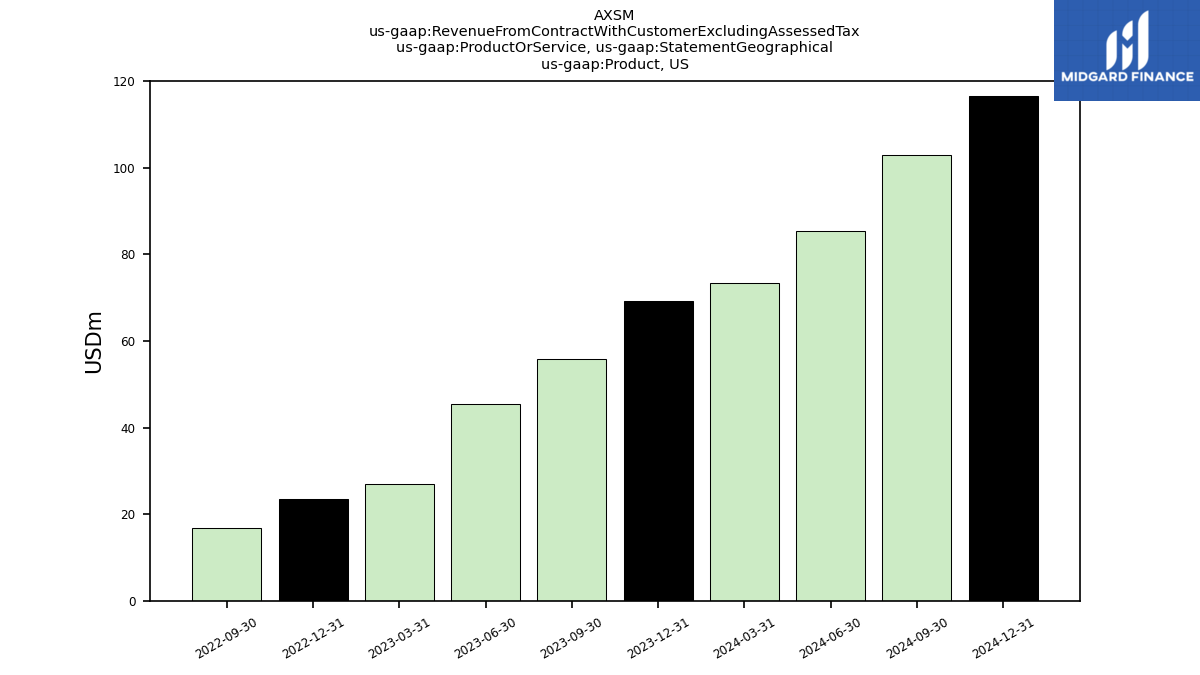
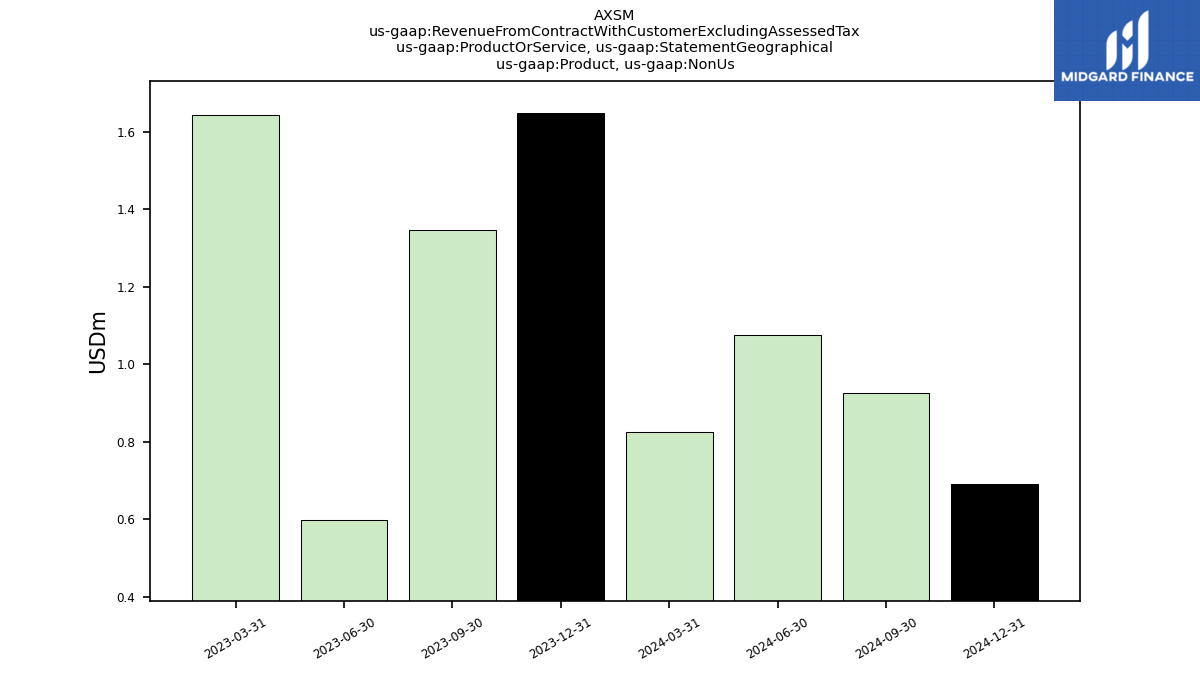
| Revenue From Contract With Customer Excluding Assessed Tax | 57.79 | 46.70 | 94.58 | 24.37 | 16.85 | 8.82 | |
| Sunosi | NA | NA | NA | 19.10 | 16.80 | 8.80 | |
| Auvelity, Product | 37.65 | NA | NA | NA | NA | NA | |
| Sunosi, Product | 19.47 | NA | NA | NA | 16.85 | NA | |
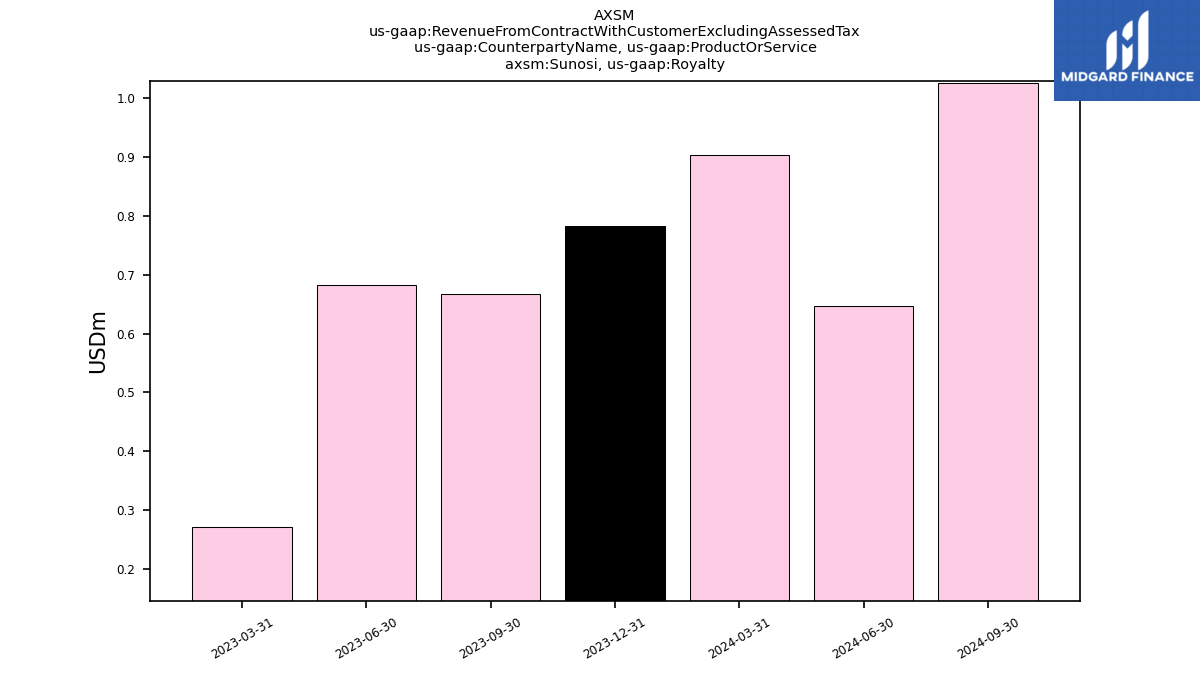
| Sunosi, Royalty | 0.67 | NA | NA | NA | NA | NA | |
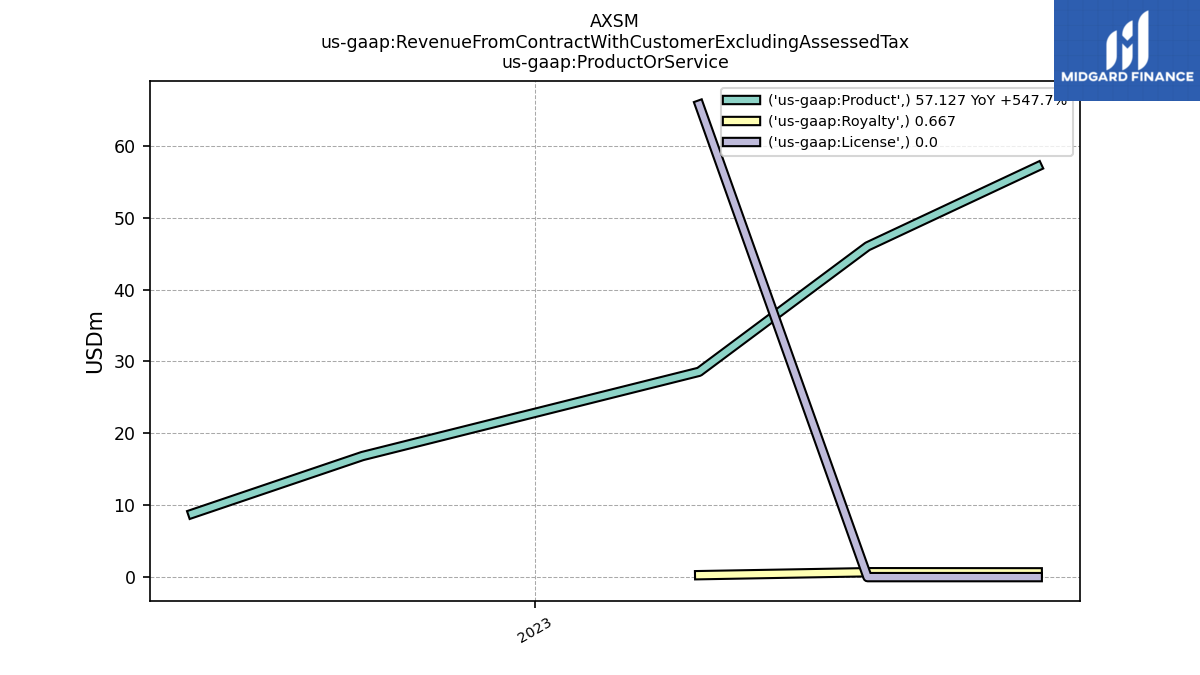
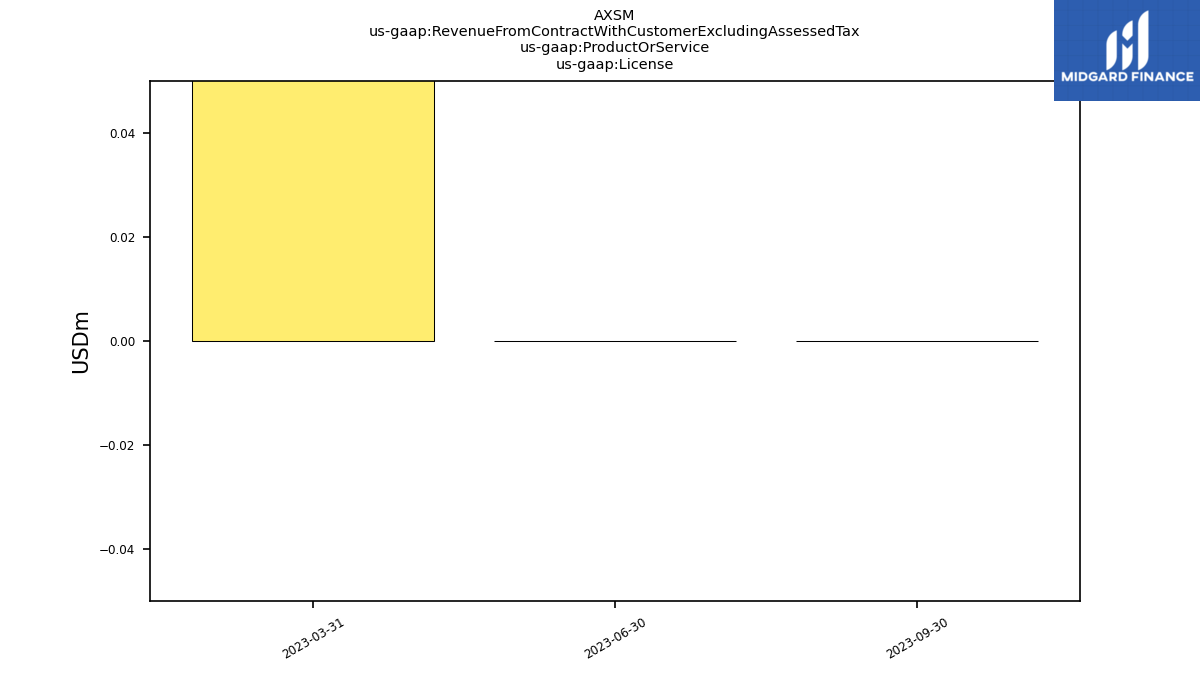
| License | 0.00 | 0.00 | 65.73 | NA | NA | NA | |
| Product | 57.13 | 46.02 | 28.57 | NA | 16.85 | 8.82 | |
| Royalty | 0.67 | 0.68 | 0.27 | NA | NA | NA | |
| Product,US | 55.78 | NA | NA | NA | 16.85 | NA | |
| Product, Non Us | 1.35 | NA | NA | NA | NA | NA | |
| Royalty, Non Us | 0.67 | NA | NA | NA | NA | NA |