
| 2023-12-31 | 2023-09-30 | 2023-06-30 | 2023-03-31 | 2022-12-31 | 2022-09-30 | 2022-06-30 | 2022-03-31 | 2021-12-31 | 2021-09-30 | 2021-06-30 | 2021-03-31 | 2020-12-31 | 2020-09-30 | 2020-06-30 | 2020-03-31 | 2019-12-31 | 2019-09-30 | 2019-06-30 | 2019-03-31 | 2018-12-31 | 2018-09-30 | 2018-06-30 | 2018-03-31 | 2017-12-31 | 2017-09-30 | 2017-06-30 | 2017-03-31 | 2016-12-31 | 2016-09-30 | 2016-06-30 | 2016-03-31 | 2015-12-31 | 2015-09-30 | 2015-06-30 | 2015-03-31 | 2014-12-31 | 2014-09-30 | 2014-06-30 | 2014-03-31 | ||
|---|---|---|---|---|---|---|---|---|---|---|---|---|---|---|---|---|---|---|---|---|---|---|---|---|---|---|---|---|---|---|---|---|---|---|---|---|---|---|---|---|---|
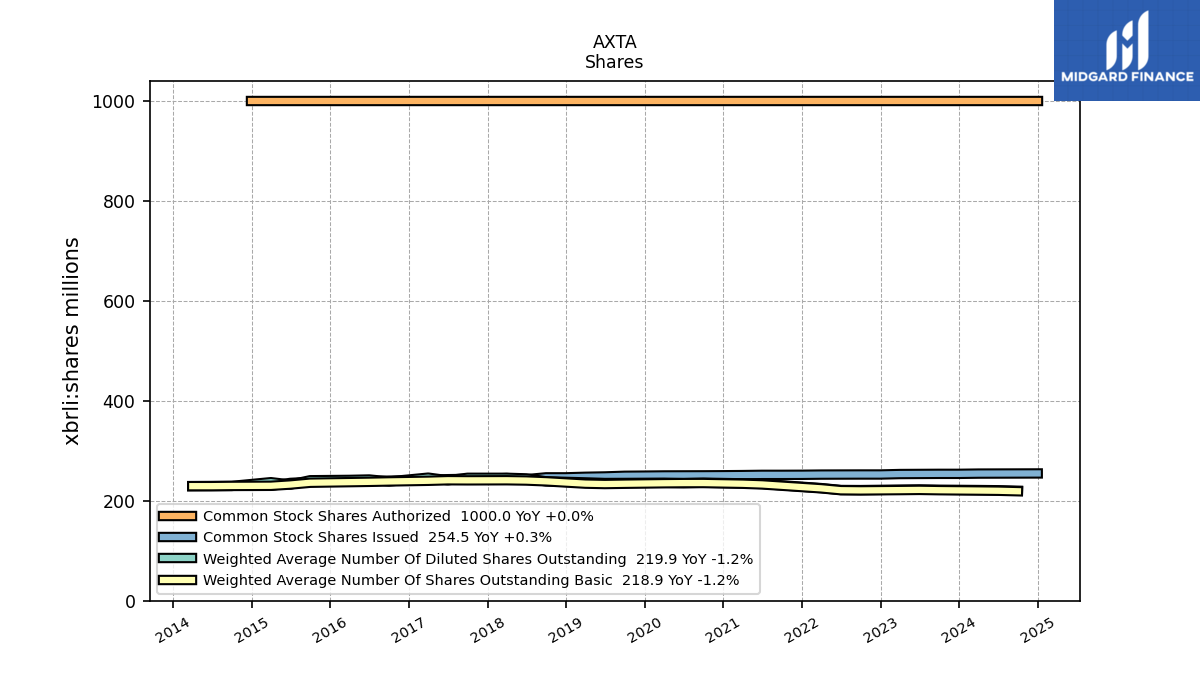
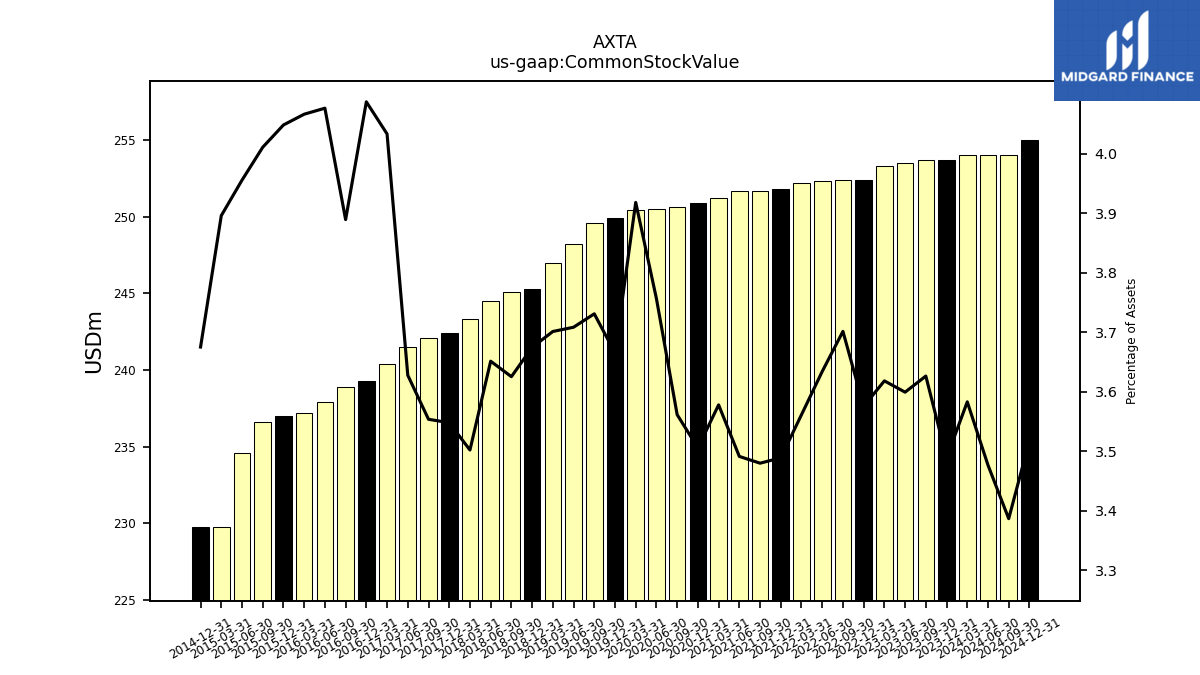
| Common Stock Value | 253.70 | 253.70 | 253.50 | 253.30 | 252.40 | 252.40 | 252.30 | 252.20 | 251.80 | 251.70 | 251.70 | 251.20 | 250.90 | 250.60 | 250.50 | 250.40 | 249.90 | 249.60 | 248.20 | 247.00 | 245.30 | 245.10 | 244.50 | 243.30 | 242.40 | 242.10 | 241.50 | 240.40 | 239.30 | 238.90 | 237.90 | 237.20 | 237.00 | 236.60 | 234.60 | 229.80 | 229.80 | NA | NA | NA | |
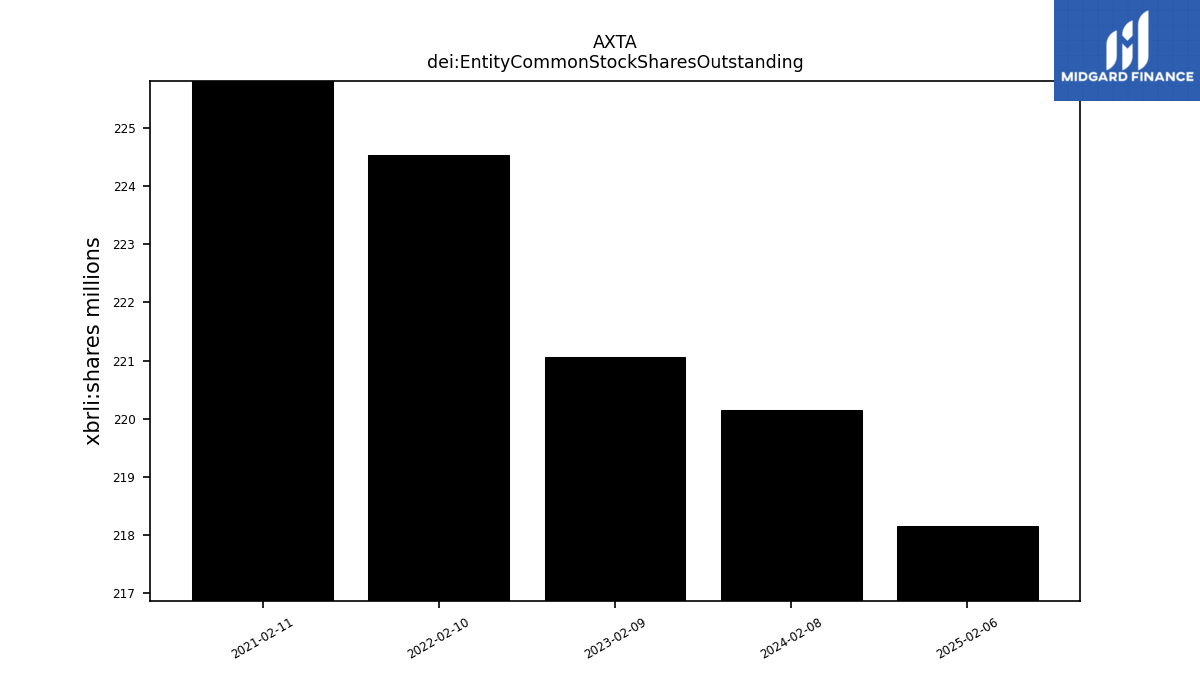
| dei: Entity Common Stock Shares Outstanding | NA | NA | NA | NA | NA | NA | NA | NA | NA | NA | NA | NA | NA | NA | NA | NA | NA | NA | NA | NA | NA | NA | NA | NA | NA | NA | NA | NA | NA | NA | NA | NA | NA | NA | NA | NA | NA | NA | NA | NA | |
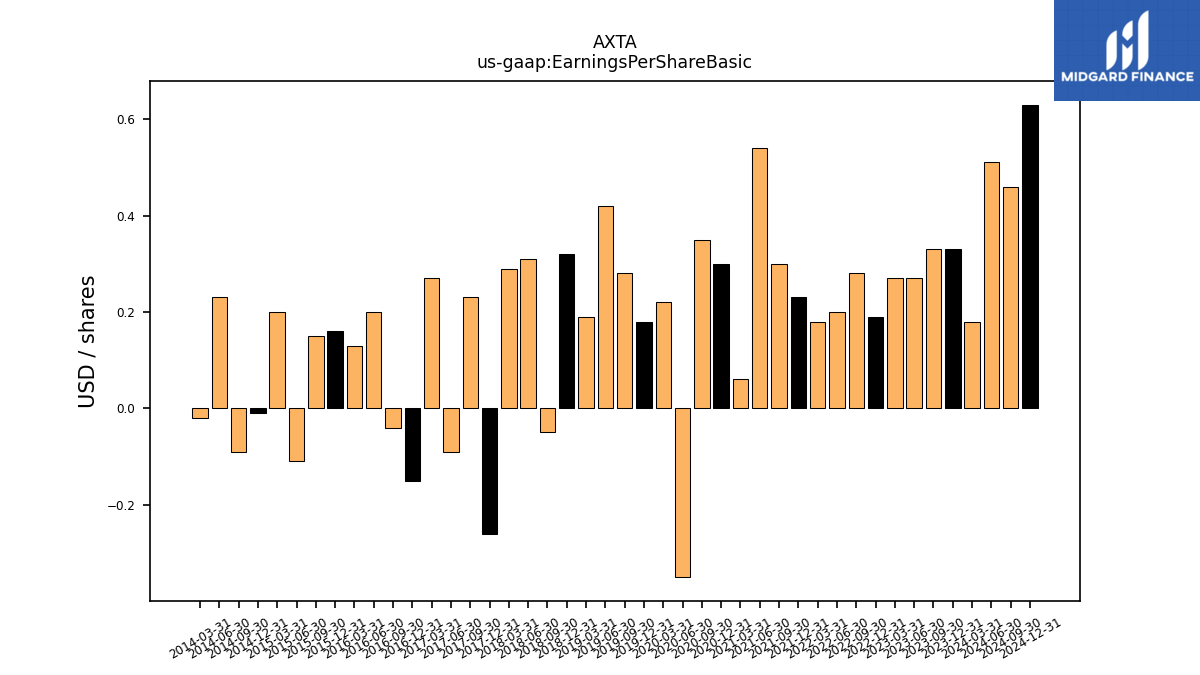
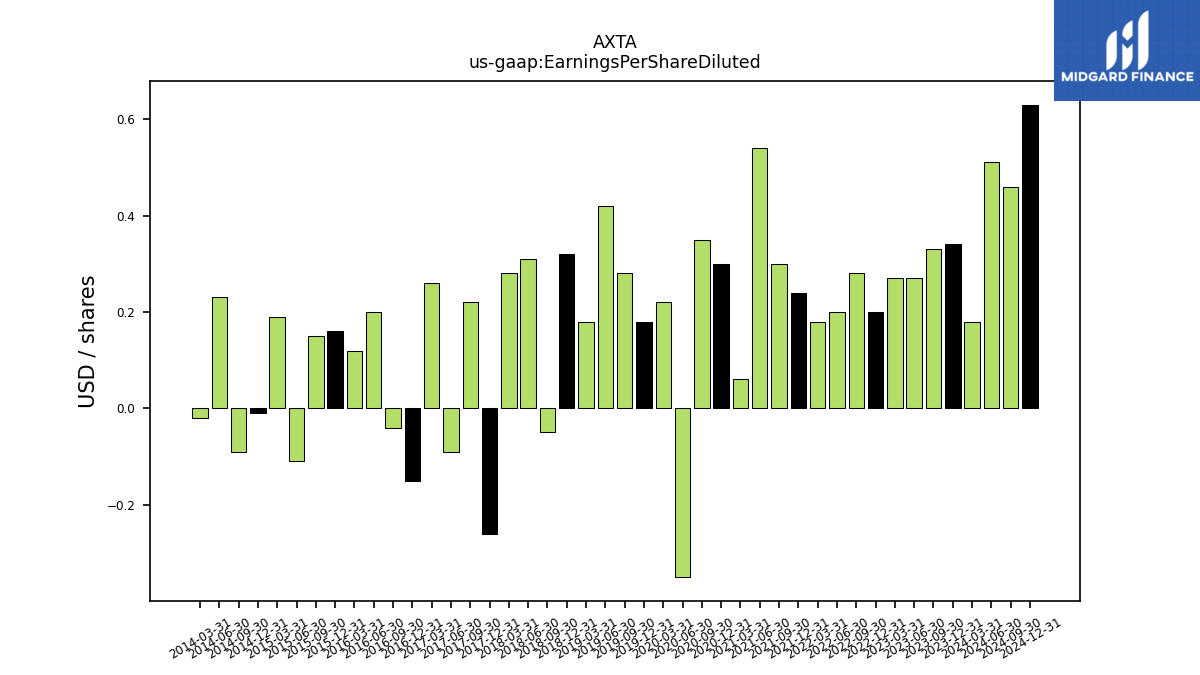
| Earnings Per Share Basic | 0.33 | 0.33 | 0.27 | 0.27 | 0.19 | 0.28 | 0.20 | 0.18 | 0.23 | 0.30 | 0.54 | 0.06 | 0.30 | 0.35 | -0.35 | 0.22 | 0.18 | 0.28 | 0.42 | 0.19 | 0.32 | -0.05 | 0.31 | 0.29 | -0.26 | 0.23 | -0.09 | 0.27 | -0.15 | -0.04 | 0.20 | 0.13 | 0.16 | 0.15 | -0.11 | 0.20 | -0.01 | -0.09 | 0.23 | -0.02 | |
| Earnings Per Share Diluted | 0.34 | 0.33 | 0.27 | 0.27 | 0.20 | 0.28 | 0.20 | 0.18 | 0.24 | 0.30 | 0.54 | 0.06 | 0.30 | 0.35 | -0.35 | 0.22 | 0.18 | 0.28 | 0.42 | 0.18 | 0.32 | -0.05 | 0.31 | 0.28 | -0.26 | 0.22 | -0.09 | 0.26 | -0.15 | -0.04 | 0.20 | 0.12 | 0.16 | 0.15 | -0.11 | 0.19 | -0.01 | -0.09 | 0.23 | -0.02 |
| 2023-12-31 | 2023-09-30 | 2023-06-30 | 2023-03-31 | 2022-12-31 | 2022-09-30 | 2022-06-30 | 2022-03-31 | 2021-12-31 | 2021-09-30 | 2021-06-30 | 2021-03-31 | 2020-12-31 | 2020-09-30 | 2020-06-30 | 2020-03-31 | 2019-12-31 | 2019-09-30 | 2019-06-30 | 2019-03-31 | 2018-12-31 | 2018-09-30 | 2018-06-30 | 2018-03-31 | 2017-12-31 | 2017-09-30 | 2017-06-30 | 2017-03-31 | 2016-12-31 | 2016-09-30 | 2016-06-30 | 2016-03-31 | 2015-12-31 | 2015-09-30 | 2015-06-30 | 2015-03-31 | 2014-12-31 | 2014-09-30 | 2014-06-30 | 2014-03-31 | ||
|---|---|---|---|---|---|---|---|---|---|---|---|---|---|---|---|---|---|---|---|---|---|---|---|---|---|---|---|---|---|---|---|---|---|---|---|---|---|---|---|---|---|
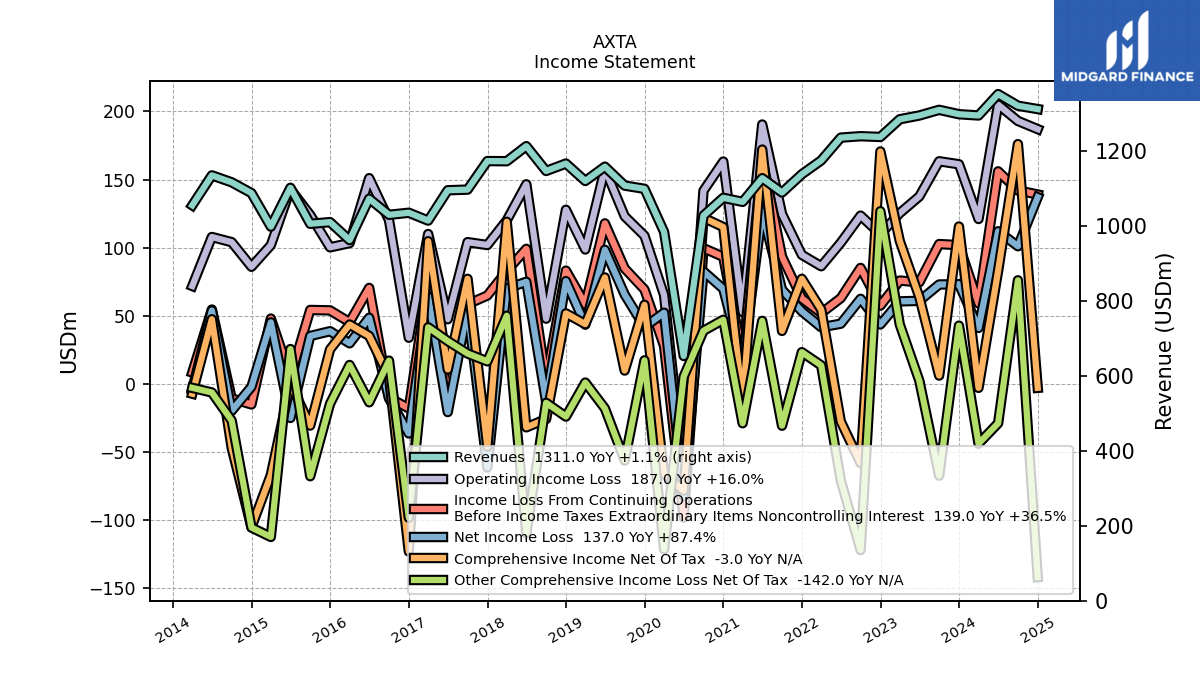
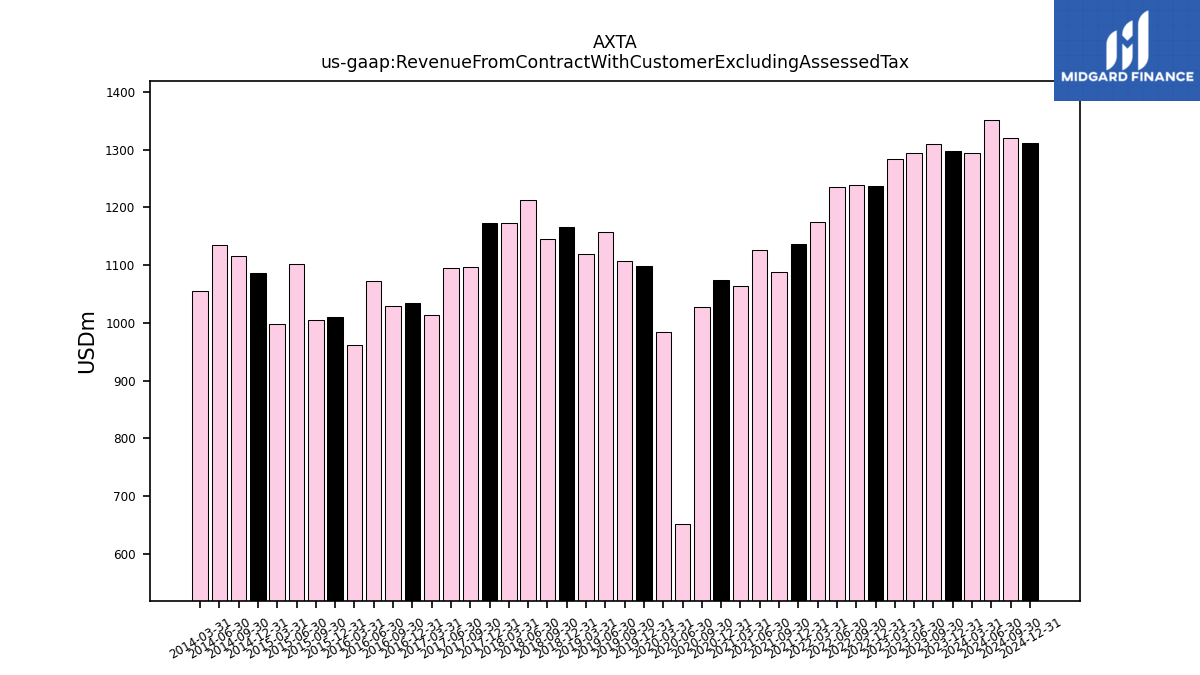
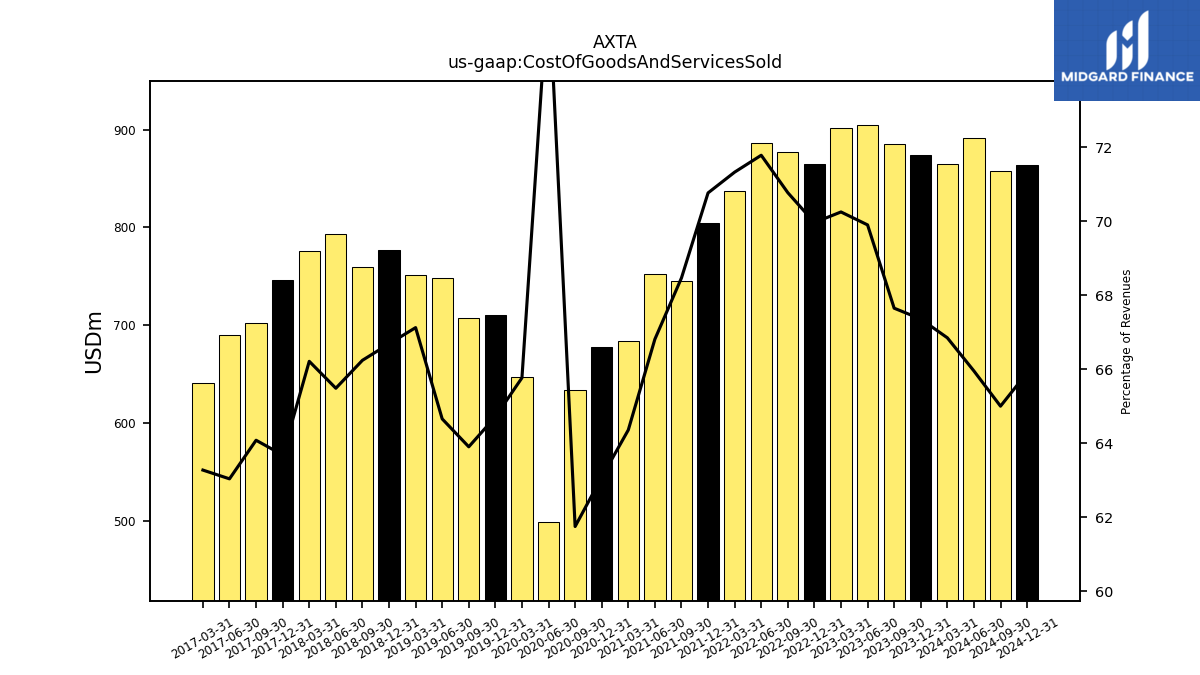
| Revenue From Contract With Customer Excluding Assessed Tax | 1297.30 | 1309.00 | 1293.90 | 1283.90 | 1236.70 | 1238.70 | 1234.90 | 1174.10 | 1137.20 | 1088.60 | 1126.80 | 1063.60 | 1074.50 | 1026.90 | 652.70 | 983.50 | 1098.40 | 1107.00 | 1157.50 | 1119.30 | 1165.80 | 1146.00 | 1212.20 | 1172.00 | 1172.40 | 1096.30 | 1094.60 | 1013.70 | 1034.60 | 1029.10 | 1072.10 | 961.60 | 1009.60 | 1005.10 | 1101.10 | 997.50 | 1087.00 | 1115.80 | 1134.30 | 1054.40 | |
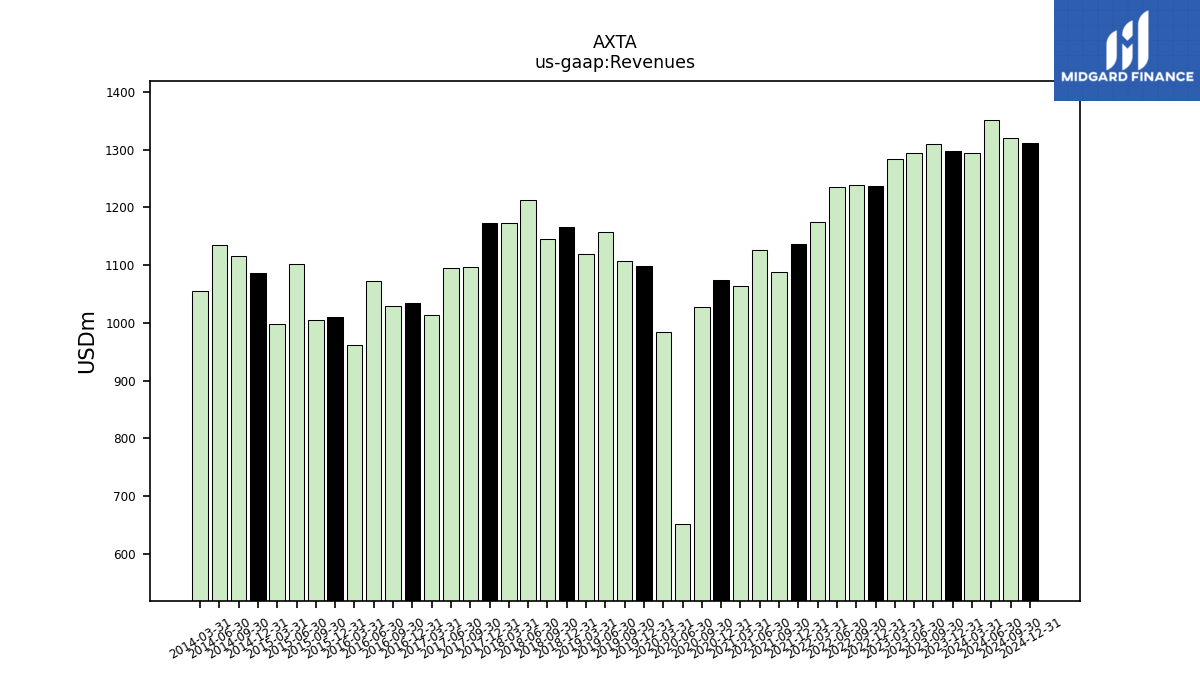
| Revenues | 1297.30 | 1309.00 | 1293.90 | 1283.90 | 1236.70 | 1238.70 | 1234.90 | 1174.10 | 1137.20 | 1088.60 | 1126.80 | 1063.60 | 1074.50 | 1026.90 | 652.70 | 983.50 | 1098.40 | 1107.00 | 1157.50 | 1119.30 | 1165.80 | 1146.00 | 1212.20 | 1172.00 | 1172.40 | 1096.30 | 1094.60 | 1013.70 | 1034.60 | 1029.10 | 1072.10 | 961.60 | 1009.60 | 1005.10 | 1101.10 | 997.50 | 1087.00 | 1115.80 | 1134.30 | 1054.40 | |
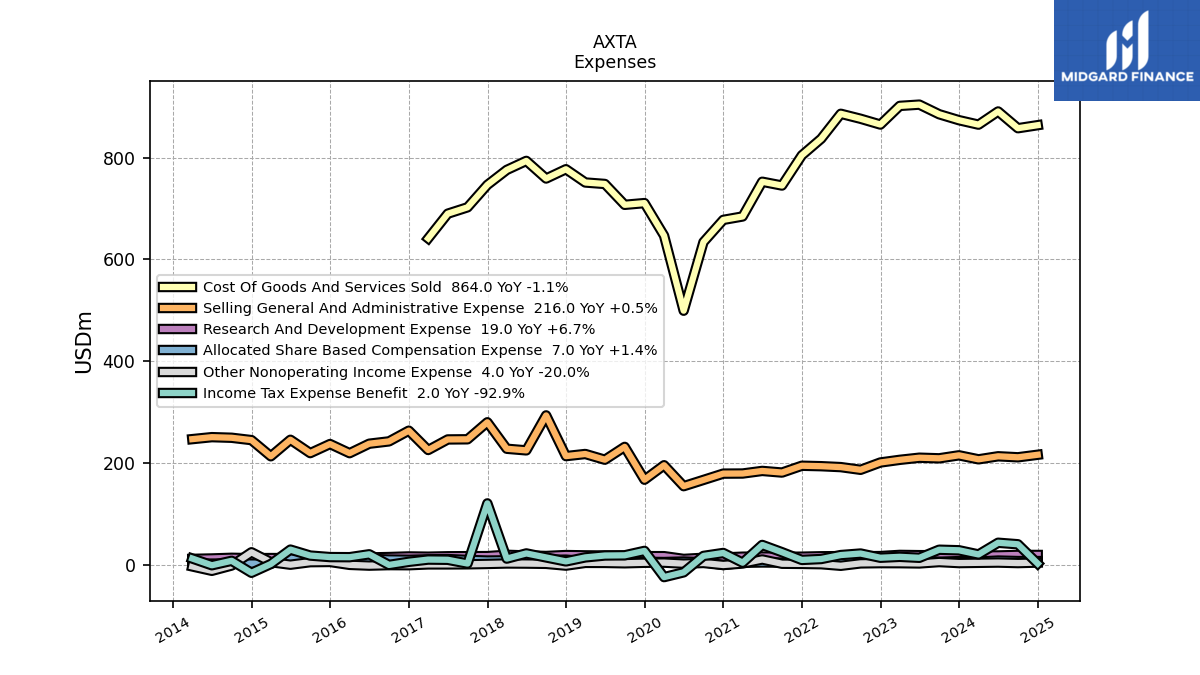
| Cost Of Goods And Services Sold | 873.80 | 885.50 | 904.40 | 901.90 | 865.20 | 876.60 | 886.40 | 837.40 | 804.70 | 745.30 | 752.80 | 684.50 | 677.80 | 634.10 | 499.20 | 646.80 | 710.80 | 707.40 | 748.40 | 751.30 | 777.40 | 759.10 | 793.80 | 776.00 | 746.60 | 702.50 | 690.00 | 641.40 | NA | NA | NA | NA | NA | NA | NA | NA | NA | NA | NA | NA | |
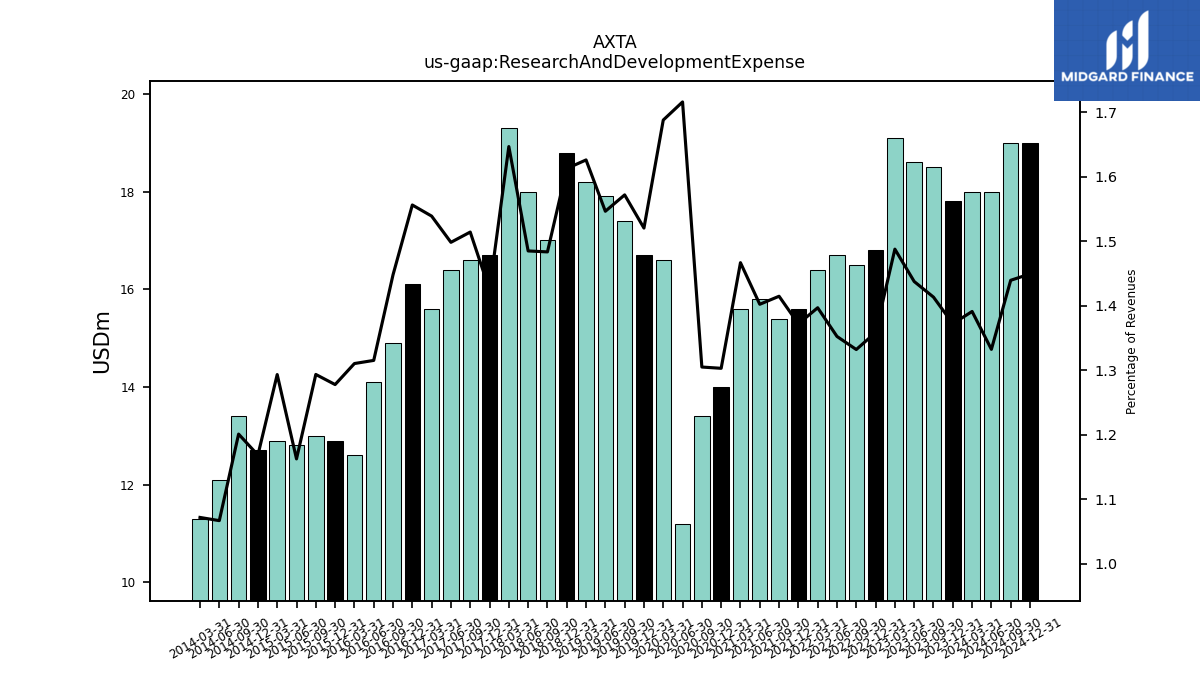
| Research And Development Expense | 17.80 | 18.50 | 18.60 | 19.10 | 16.80 | 16.50 | 16.70 | 16.40 | 15.60 | 15.40 | 15.80 | 15.60 | 14.00 | 13.40 | 11.20 | 16.60 | 16.70 | 17.40 | 17.90 | 18.20 | 18.80 | 17.00 | 18.00 | 19.30 | 16.70 | 16.60 | 16.40 | 15.60 | 16.10 | 14.90 | 14.10 | 12.60 | 12.90 | 13.00 | 12.80 | 12.90 | 12.70 | 13.40 | 12.10 | 11.30 | |
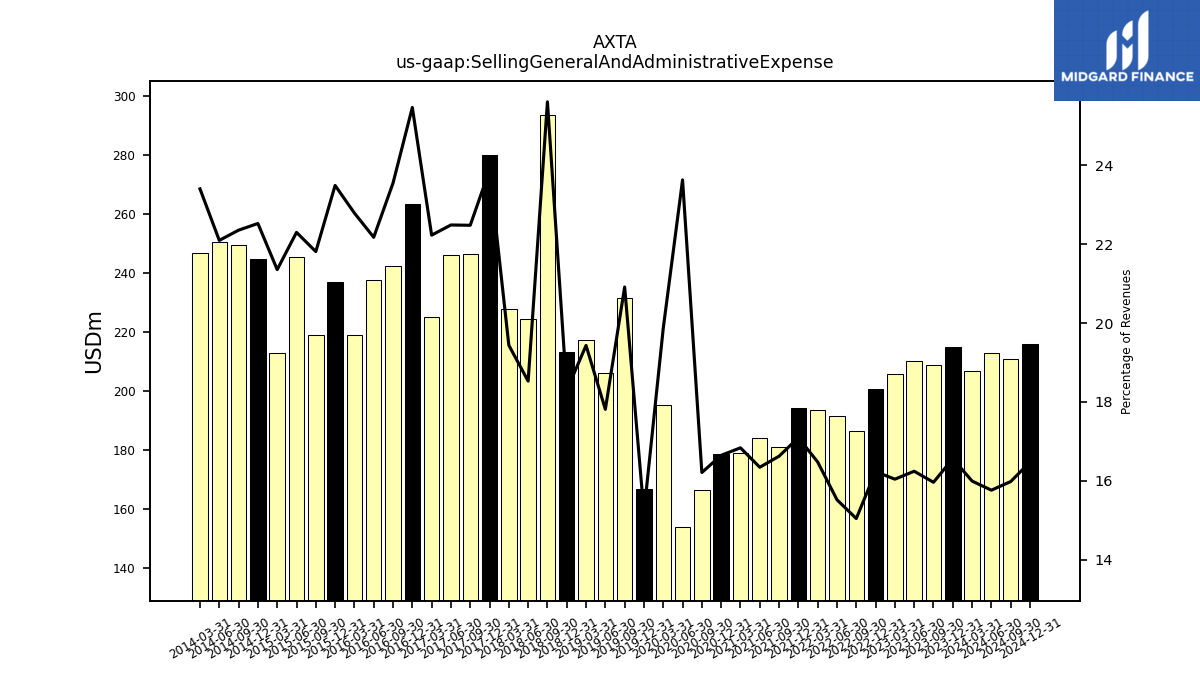
| Selling General And Administrative Expense | 214.90 | 209.00 | 210.20 | 206.00 | 200.80 | 186.40 | 191.70 | 193.50 | 194.40 | 181.00 | 184.20 | 179.10 | 178.90 | 166.50 | 154.20 | 195.40 | 166.90 | 231.50 | 206.20 | 217.50 | 213.30 | 293.40 | 224.60 | 227.80 | 279.90 | 246.40 | 246.10 | 225.30 | 263.40 | 242.30 | 237.70 | 219.10 | 237.10 | 219.20 | 245.50 | 213.00 | 244.80 | 249.40 | 250.60 | 246.70 | |
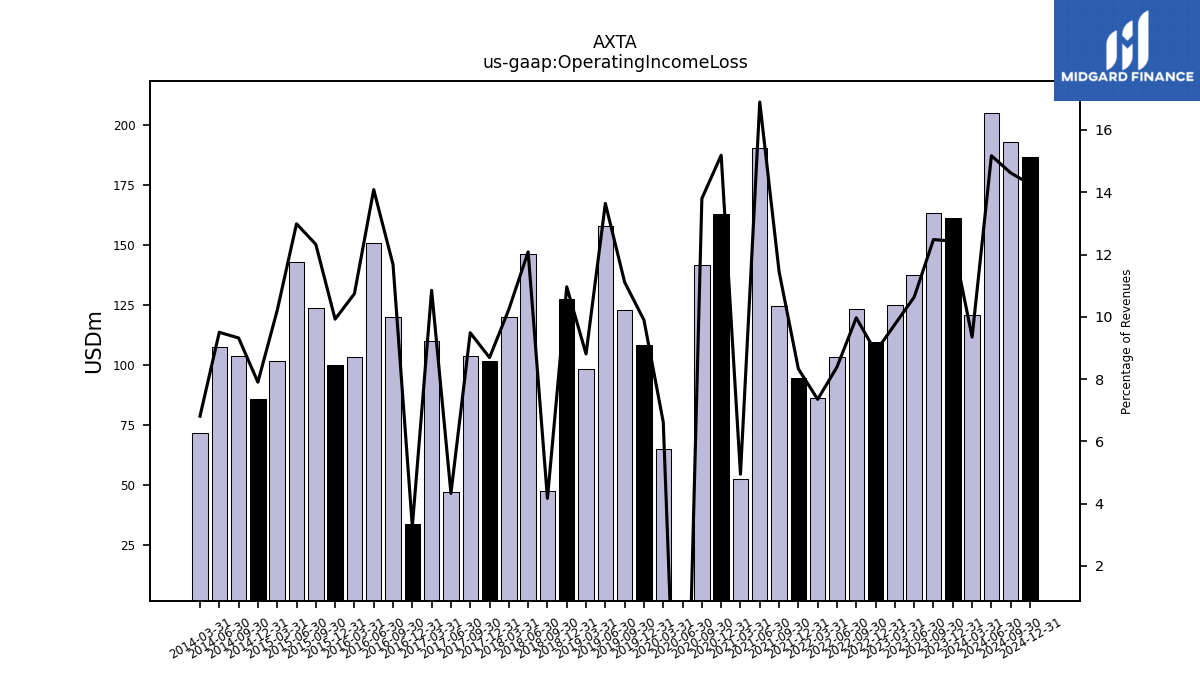
| Operating Income Loss | 161.20 | 163.40 | 137.60 | 125.30 | 109.80 | 123.50 | 103.60 | 86.30 | 94.70 | 124.70 | 190.40 | 52.60 | 163.20 | 141.70 | -64.50 | 65.10 | 108.70 | 123.00 | 157.90 | 98.60 | 127.80 | 47.80 | 146.50 | 120.00 | 101.90 | 104.00 | 47.40 | 110.00 | 33.80 | 120.20 | 151.00 | 103.30 | 100.20 | 123.90 | 143.00 | 101.80 | 85.90 | 104.00 | 107.80 | 71.80 | |
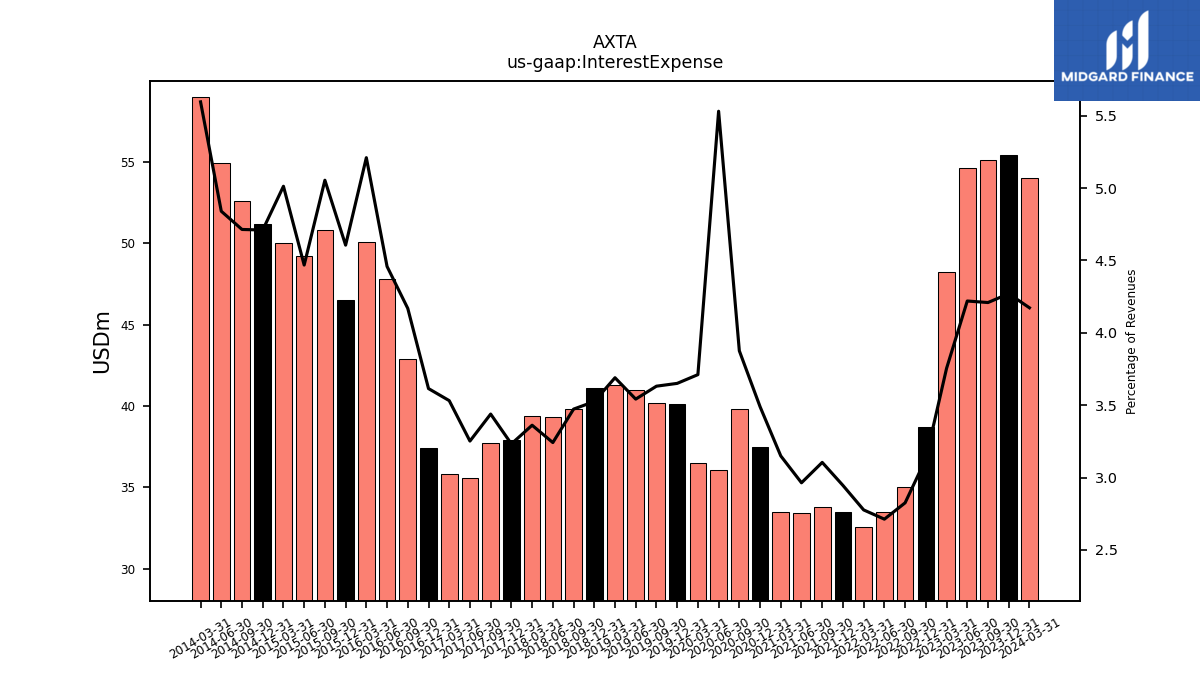
| Interest Expense | 55.40 | 55.10 | 54.60 | 48.20 | 38.70 | 35.00 | 33.50 | 32.60 | 33.50 | 33.80 | 33.40 | 33.50 | 37.50 | 39.80 | 36.10 | 36.50 | 40.10 | 40.20 | 41.00 | 41.30 | 41.10 | 39.80 | 39.30 | 39.40 | 37.90 | 37.70 | 35.60 | 35.80 | 37.40 | 42.90 | 47.80 | 50.10 | 46.50 | 50.80 | 49.20 | 50.00 | 51.20 | 52.60 | 54.90 | 59.00 | |
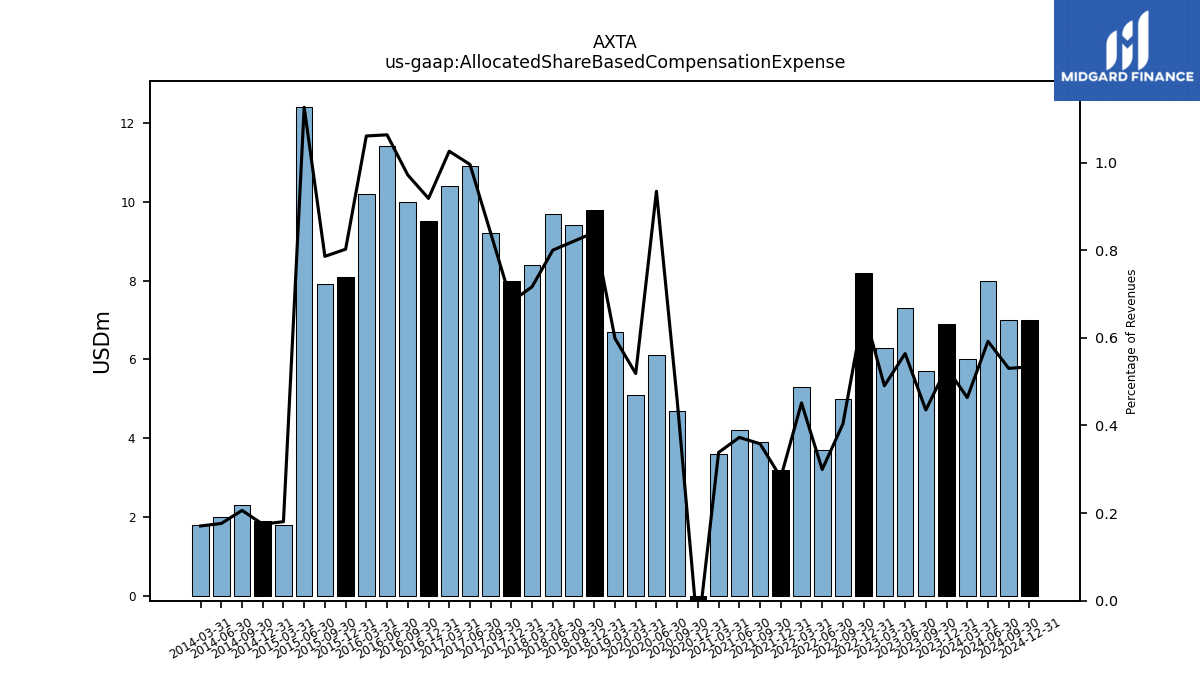
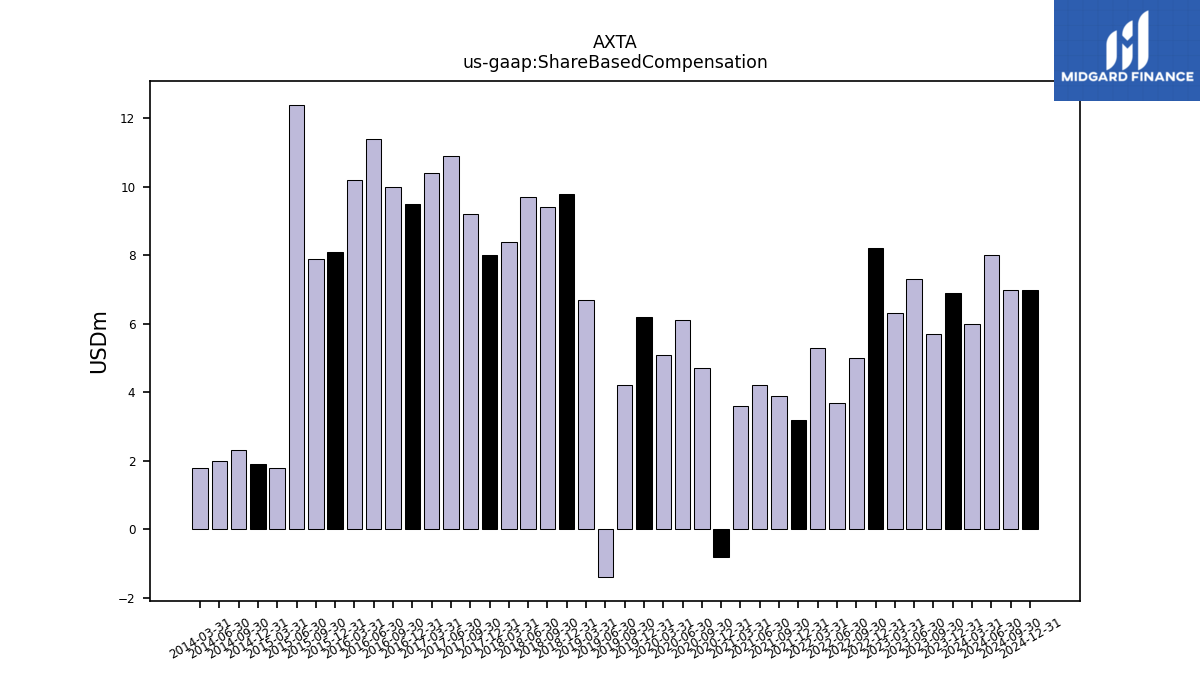
| Allocated Share Based Compensation Expense | 6.90 | 5.70 | 7.30 | 6.30 | 8.20 | 5.00 | 3.70 | 5.30 | 3.20 | 3.90 | 4.20 | 3.60 | -0.80 | 4.70 | 6.10 | 5.10 | NA | NA | NA | 6.70 | 9.80 | 9.40 | 9.70 | 8.40 | 8.00 | 9.20 | 10.90 | 10.40 | 9.50 | 10.00 | 11.40 | 10.20 | 8.10 | 7.90 | 12.40 | 1.80 | 1.90 | 2.30 | 2.00 | 1.80 | |
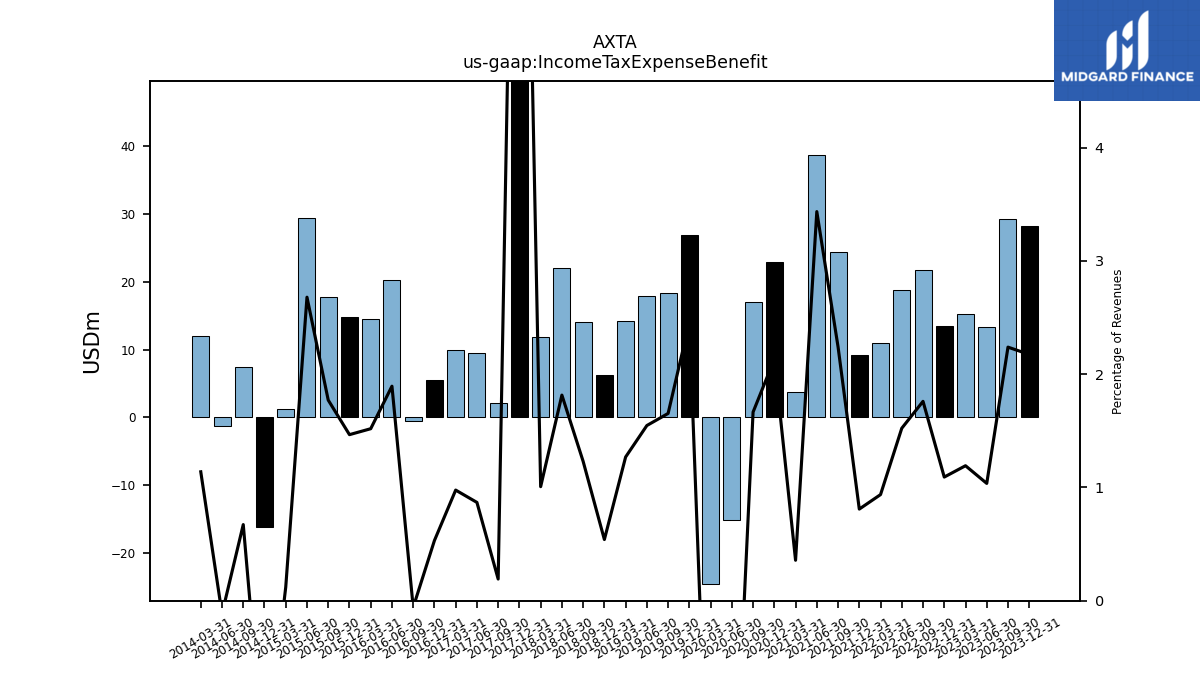
| Income Tax Expense Benefit | 28.20 | 29.30 | 13.40 | 15.30 | 13.50 | 21.80 | 18.80 | 11.00 | 9.20 | 24.40 | 38.70 | 3.80 | 22.90 | 17.10 | -15.20 | -24.60 | 27.00 | 18.30 | 17.90 | 14.20 | 6.30 | 14.10 | 22.00 | 11.80 | 120.40 | 2.10 | 9.50 | 9.90 | 5.50 | -0.60 | 20.30 | 14.60 | 14.80 | 17.80 | 29.50 | 1.20 | -16.10 | 7.50 | -1.30 | 12.00 | |
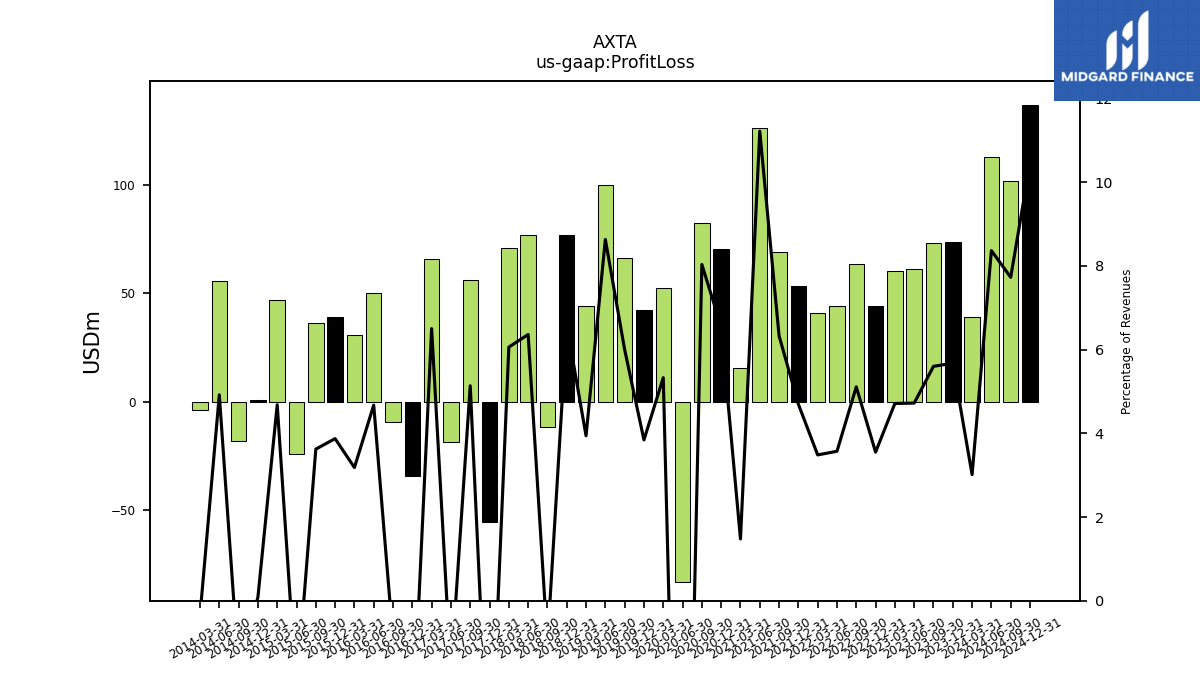
| Profit Loss | 73.60 | 73.30 | 61.10 | 60.50 | 43.90 | 63.30 | 44.10 | 40.90 | 53.40 | 68.90 | 126.40 | 15.70 | 70.30 | 82.50 | -83.20 | 52.40 | 42.20 | 66.40 | 99.90 | 44.10 | 76.80 | -11.60 | 77.10 | 71.00 | -55.60 | 56.30 | -18.90 | 65.90 | -34.40 | -9.50 | 50.10 | 30.60 | 39.10 | 36.40 | -24.30 | 46.70 | 0.90 | -18.30 | 55.80 | -3.70 | |
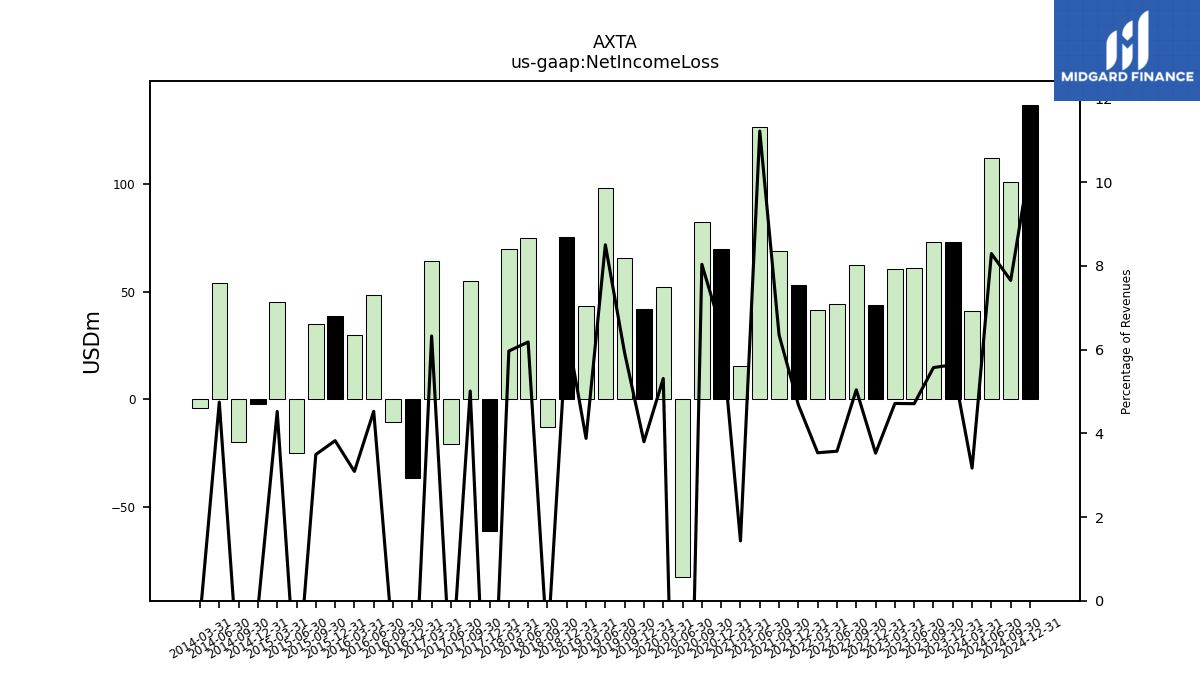
| Net Income Loss | 73.10 | 72.90 | 60.90 | 60.50 | 43.60 | 62.40 | 44.10 | 41.50 | 53.20 | 69.10 | 126.40 | 15.20 | 69.70 | 82.50 | -82.80 | 52.20 | 41.70 | 65.50 | 98.40 | 43.40 | 75.40 | -13.10 | 74.90 | 69.90 | -61.50 | 54.90 | -20.80 | 64.10 | -36.50 | -10.70 | 48.50 | 29.70 | 38.60 | 35.10 | -25.10 | 45.10 | -2.20 | -19.90 | 53.80 | -4.30 | |
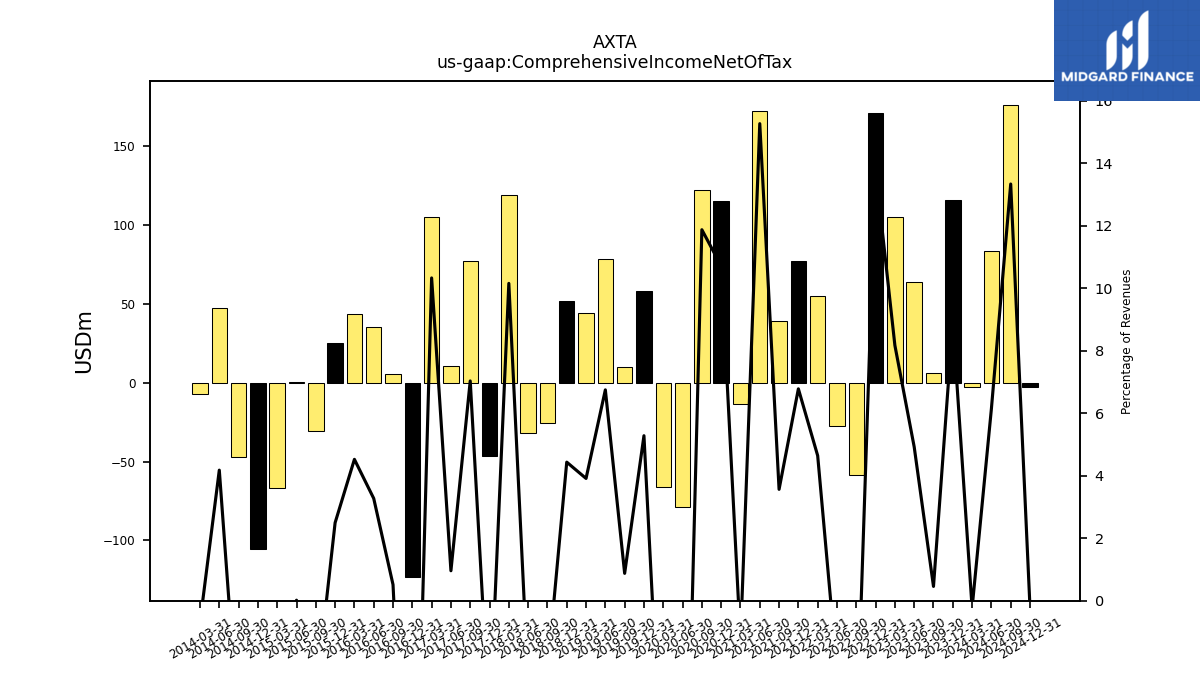
| Comprehensive Income Net Of Tax | 115.50 | 6.00 | 63.70 | 104.90 | 170.60 | -58.30 | -27.70 | 54.50 | 77.10 | 38.80 | 172.00 | -13.60 | 115.10 | 121.90 | -78.50 | -66.20 | 58.00 | 9.70 | 78.10 | 43.80 | 51.70 | -25.90 | -32.00 | 119.00 | -46.20 | 77.10 | 10.50 | 104.70 | -123.20 | 5.30 | 35.10 | 43.50 | 25.20 | -30.70 | 0.20 | -67.00 | -105.30 | -46.90 | 47.40 | -7.30 |
| 2023-12-31 | 2023-09-30 | 2023-06-30 | 2023-03-31 | 2022-12-31 | 2022-09-30 | 2022-06-30 | 2022-03-31 | 2021-12-31 | 2021-09-30 | 2021-06-30 | 2021-03-31 | 2020-12-31 | 2020-09-30 | 2020-06-30 | 2020-03-31 | 2019-12-31 | 2019-09-30 | 2019-06-30 | 2019-03-31 | 2018-12-31 | 2018-09-30 | 2018-06-30 | 2018-03-31 | 2017-12-31 | 2017-09-30 | 2017-06-30 | 2017-03-31 | 2016-12-31 | 2016-09-30 | 2016-06-30 | 2016-03-31 | 2015-12-31 | 2015-09-30 | 2015-06-30 | 2015-03-31 | 2014-12-31 | 2014-09-30 | 2014-06-30 | 2014-03-31 | ||
|---|---|---|---|---|---|---|---|---|---|---|---|---|---|---|---|---|---|---|---|---|---|---|---|---|---|---|---|---|---|---|---|---|---|---|---|---|---|---|---|---|---|
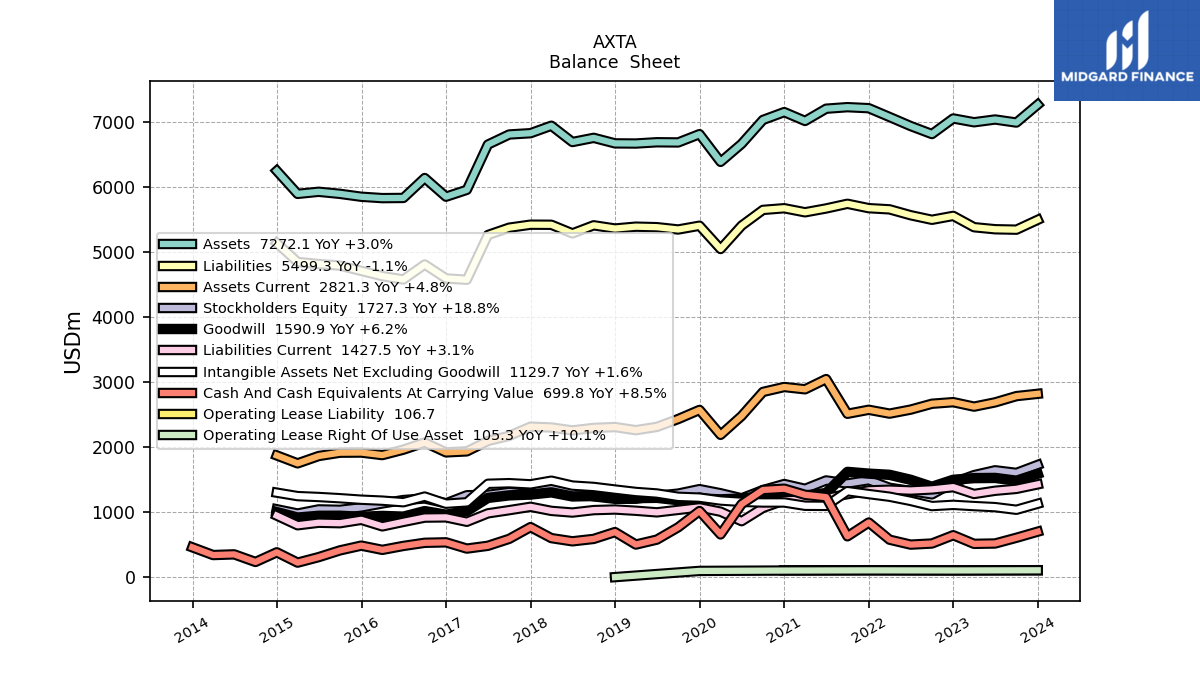
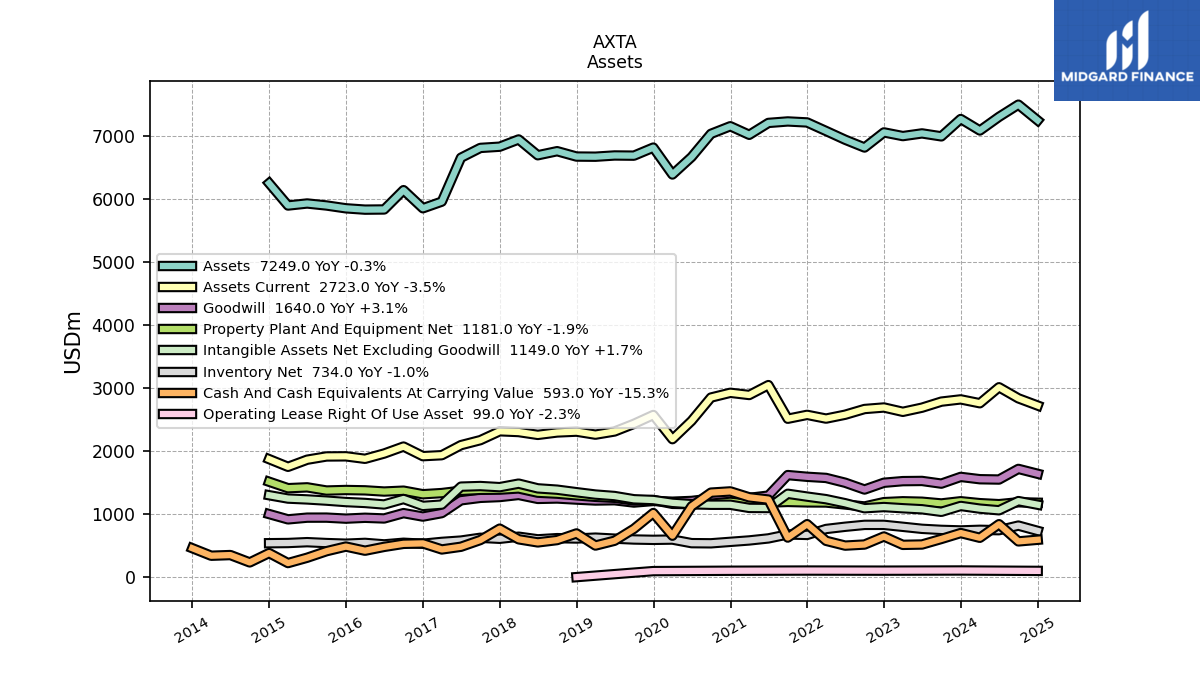
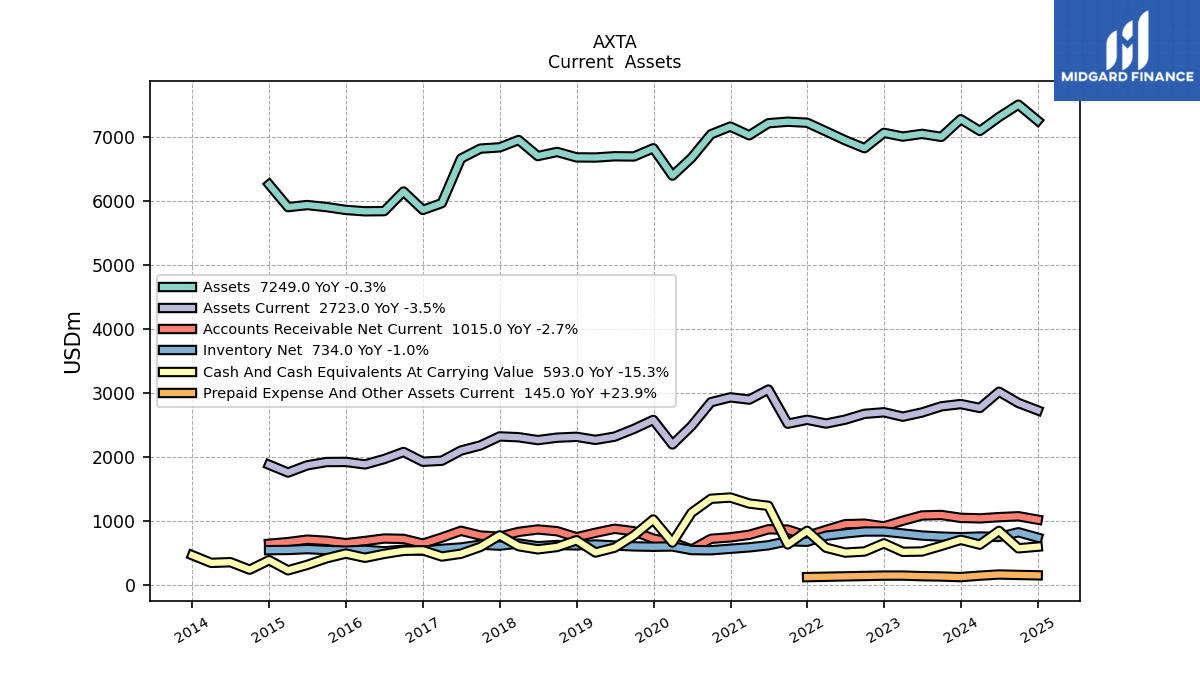
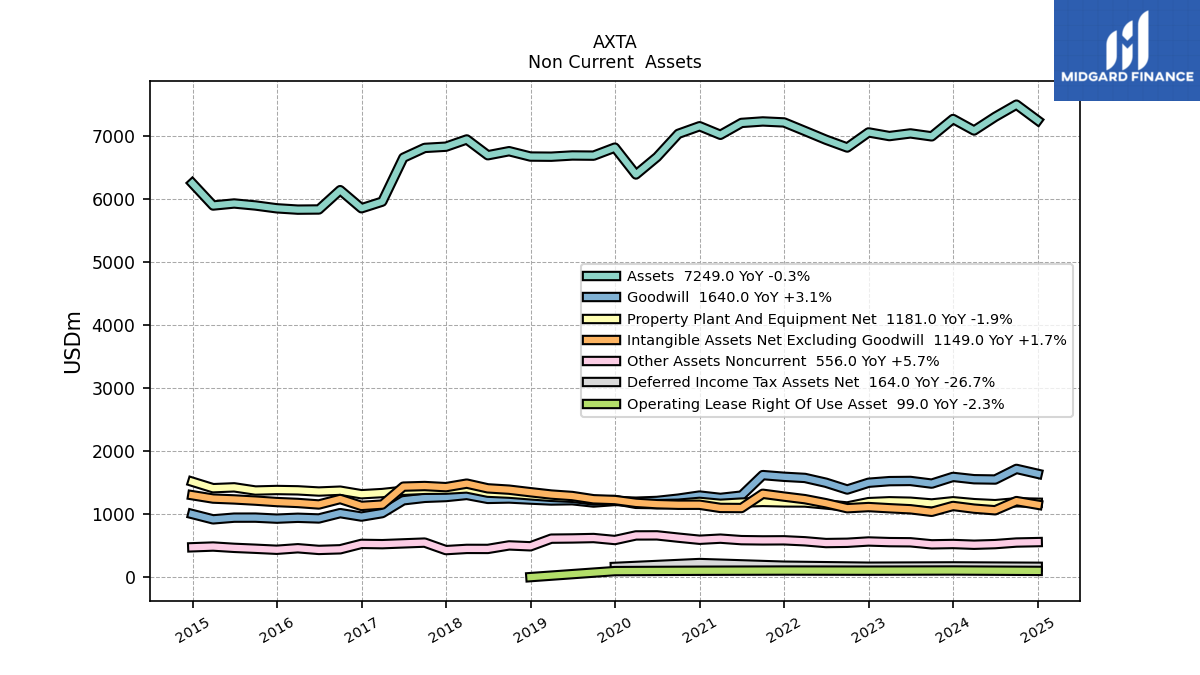
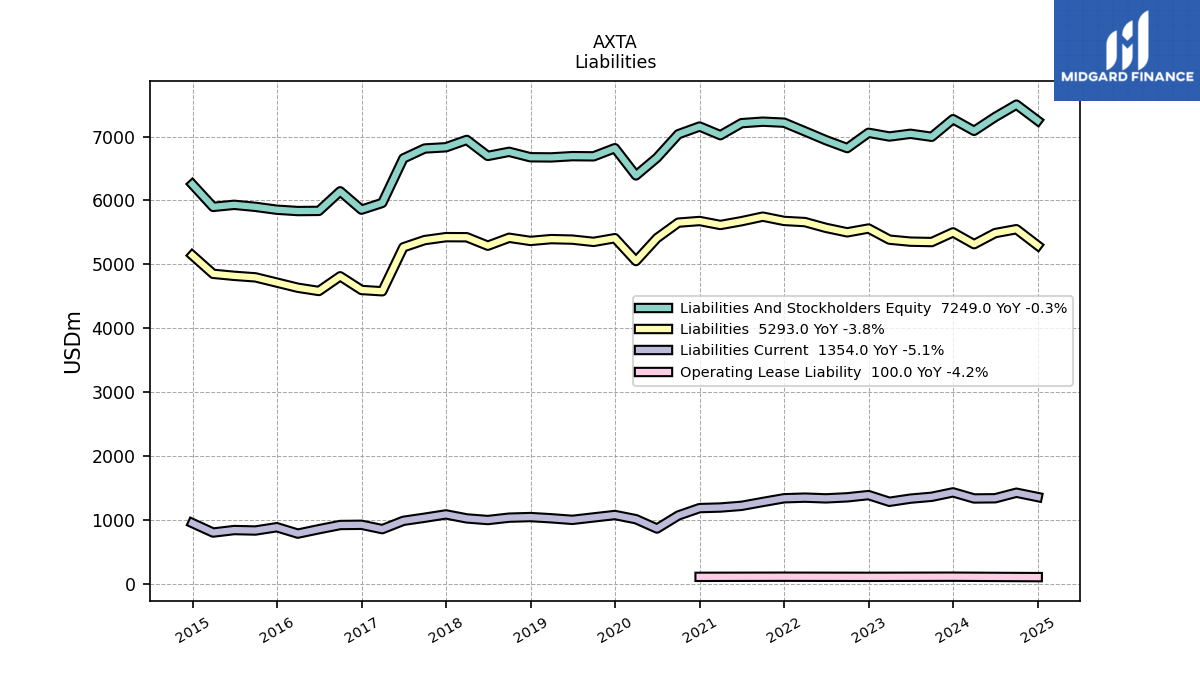
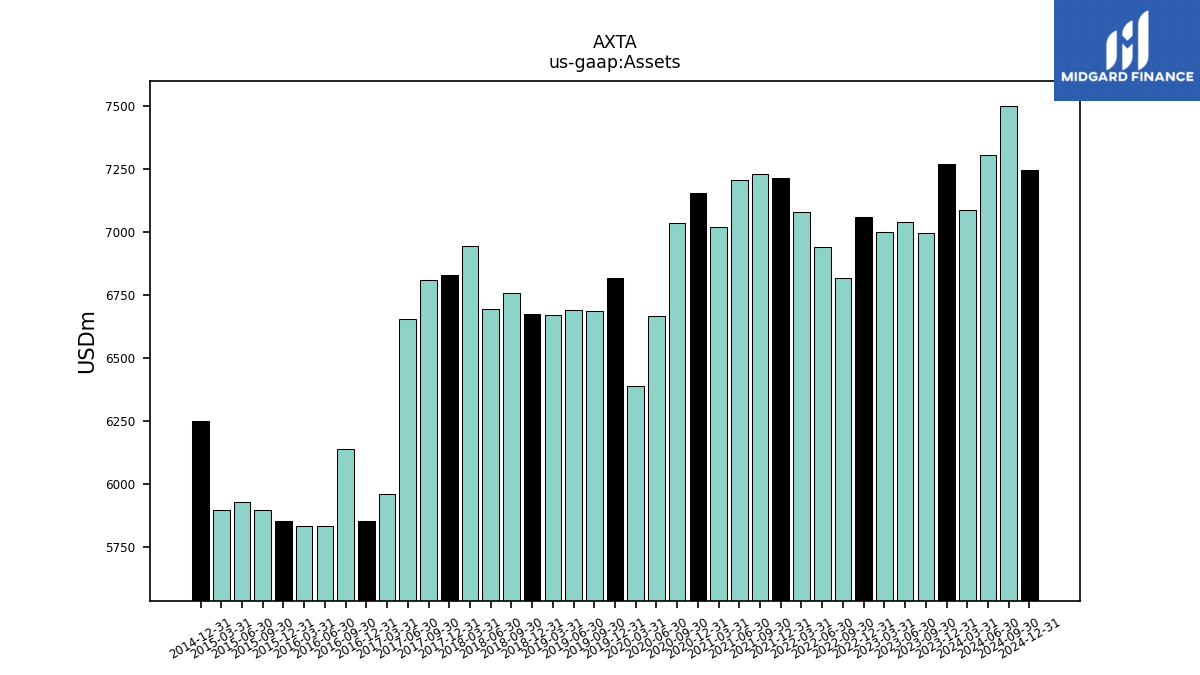
| Assets | 7272.10 | 6996.00 | 7043.10 | 7000.60 | 7059.20 | 6819.00 | 6942.60 | 7081.50 | 7217.20 | 7233.00 | 7209.40 | 7020.80 | 7157.20 | 7036.50 | 6668.60 | 6390.70 | 6818.00 | 6690.00 | 6692.90 | 6673.40 | 6675.70 | 6760.80 | 6696.20 | 6947.40 | 6832.20 | 6812.60 | 6657.10 | 5960.40 | 5854.80 | 6142.50 | 5835.80 | 5833.10 | 5854.20 | 5898.90 | 5930.80 | 5898.40 | 6252.80 | NA | NA | NA | |
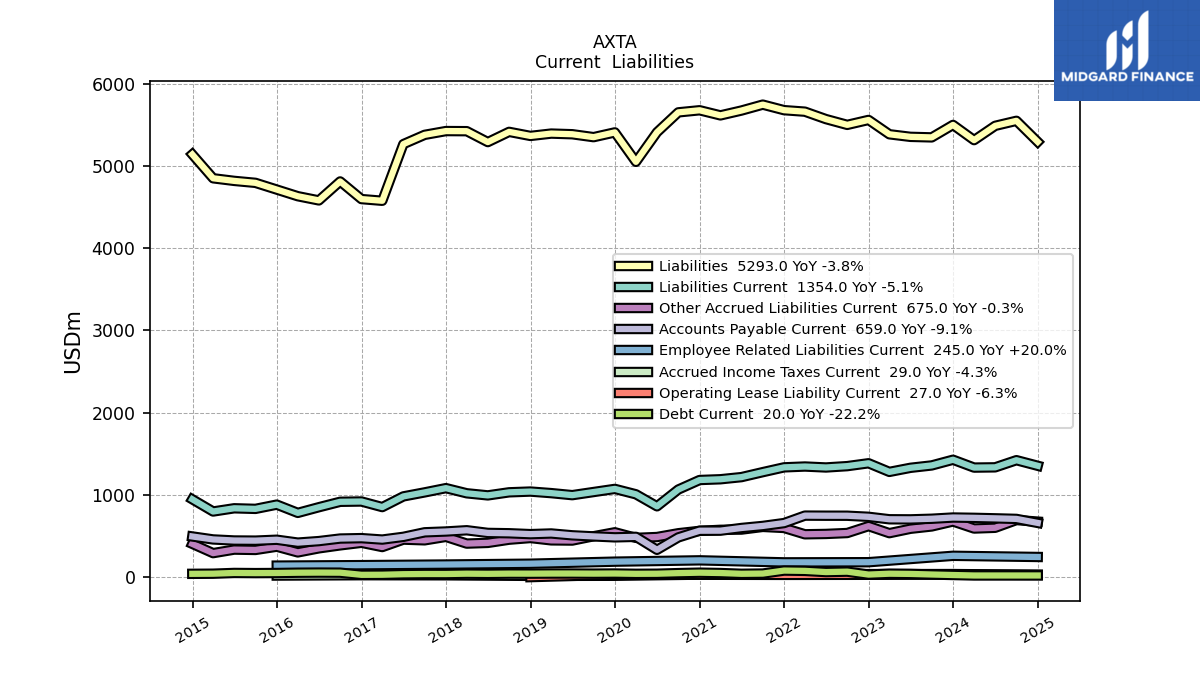
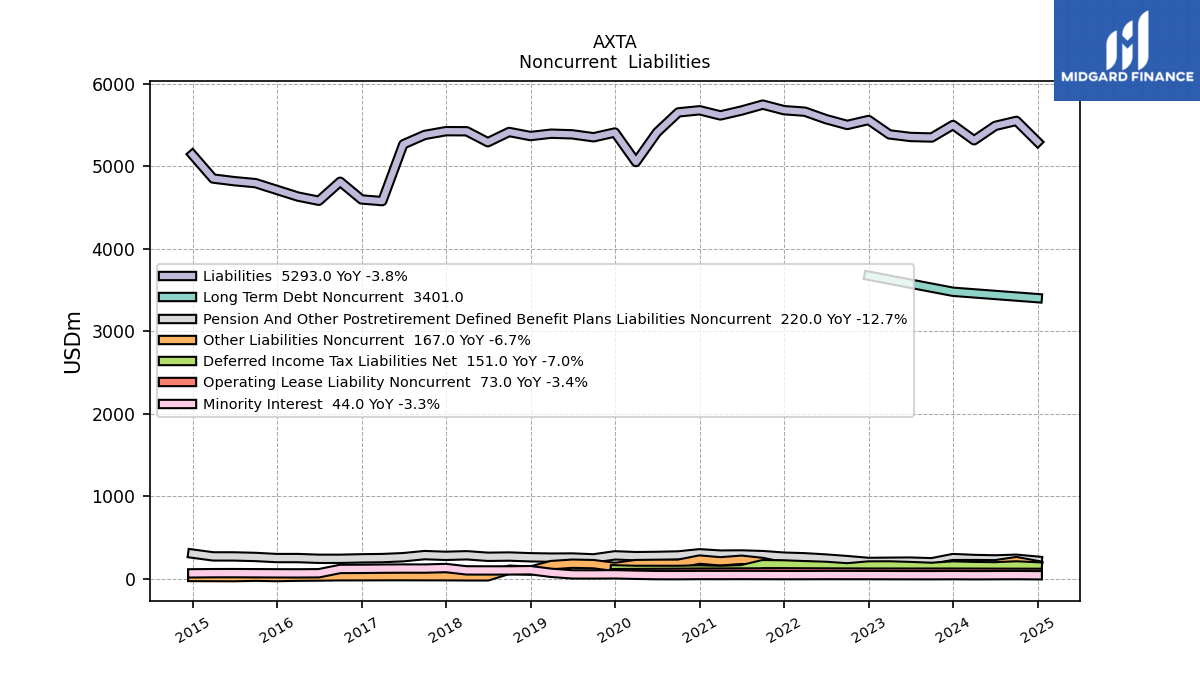
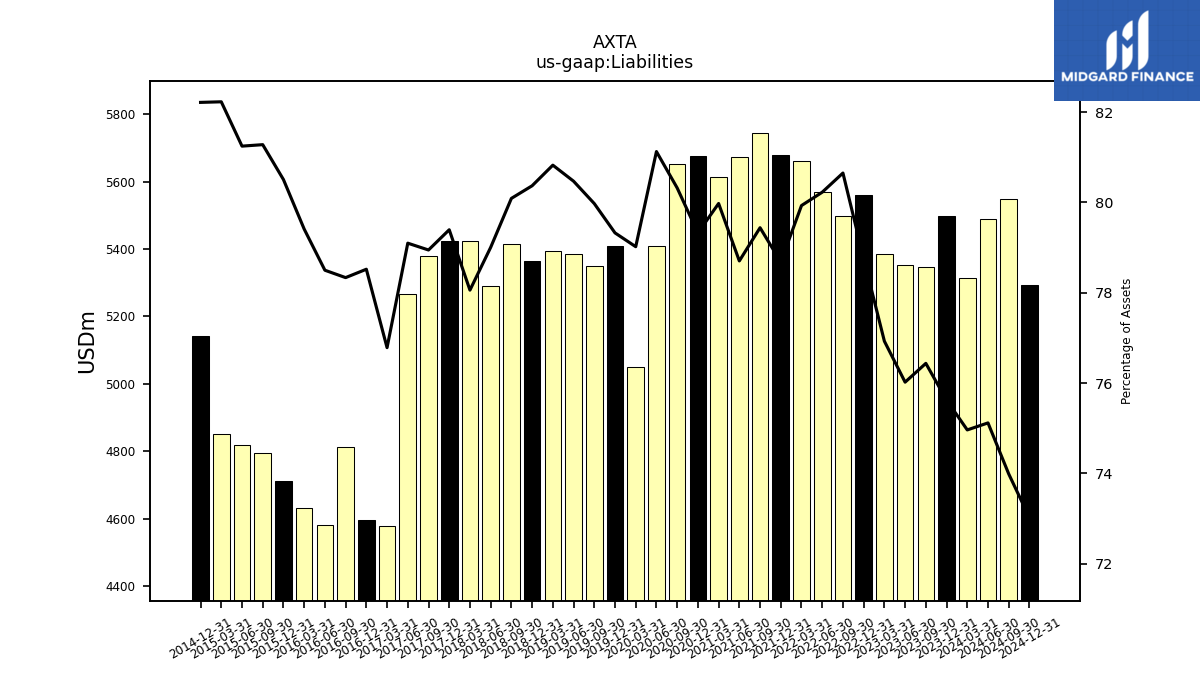
| Liabilities | 5499.30 | 5347.40 | 5354.10 | 5385.30 | 5559.70 | 5499.60 | 5569.80 | 5660.30 | 5678.50 | 5745.90 | 5674.10 | 5615.00 | 5677.40 | 5651.80 | 5410.00 | 5049.90 | 5408.40 | 5350.30 | 5385.80 | 5393.80 | 5365.20 | 5414.70 | 5290.30 | 5423.00 | 5424.40 | 5378.30 | 5265.60 | 4576.60 | 4597.20 | 4811.70 | 4581.00 | 4632.10 | 4713.00 | 4794.60 | 4818.60 | 4850.20 | 5140.80 | NA | NA | NA | |
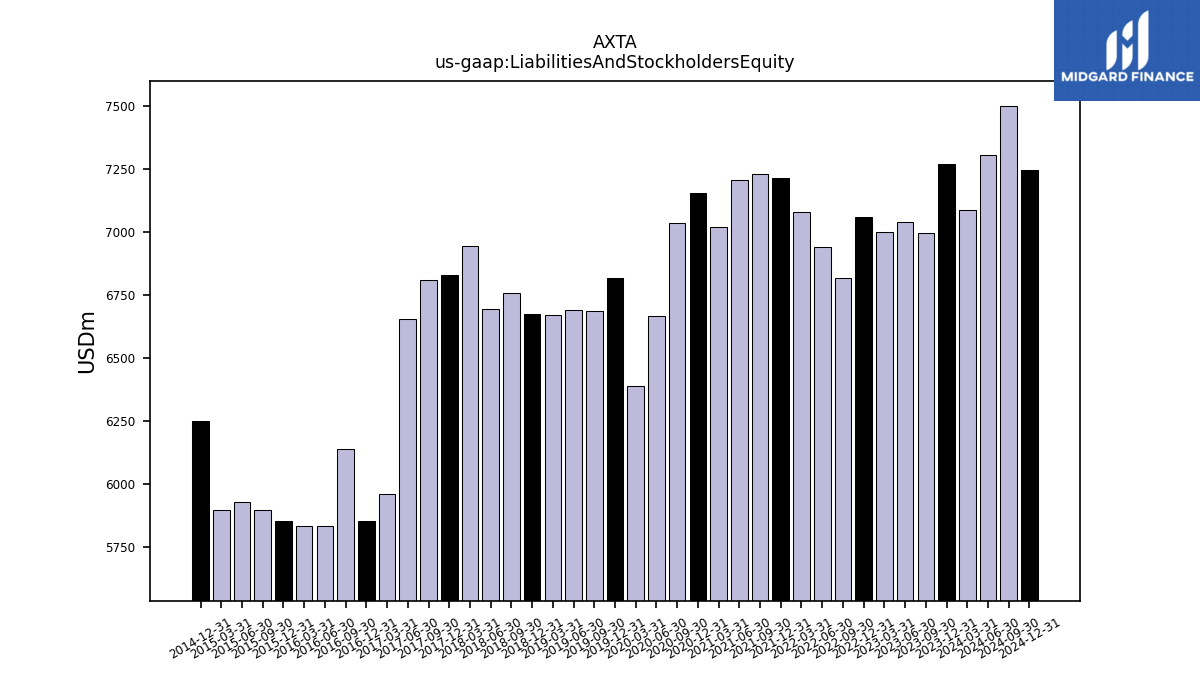
| Liabilities And Stockholders Equity | 7272.10 | 6996.00 | 7043.10 | 7000.60 | 7059.20 | 6819.00 | 6942.60 | 7081.50 | 7217.20 | 7233.00 | 7209.40 | 7020.80 | 7157.20 | 7036.50 | 6668.60 | 6390.70 | 6818.00 | 6690.00 | 6692.90 | 6673.40 | 6675.70 | 6760.80 | 6696.20 | 6947.40 | 6832.20 | 6812.60 | 6657.10 | 5960.40 | 5854.80 | 6142.50 | 5835.80 | 5833.10 | 5854.20 | 5898.90 | 5930.80 | 5898.40 | 6252.80 | NA | NA | NA | |
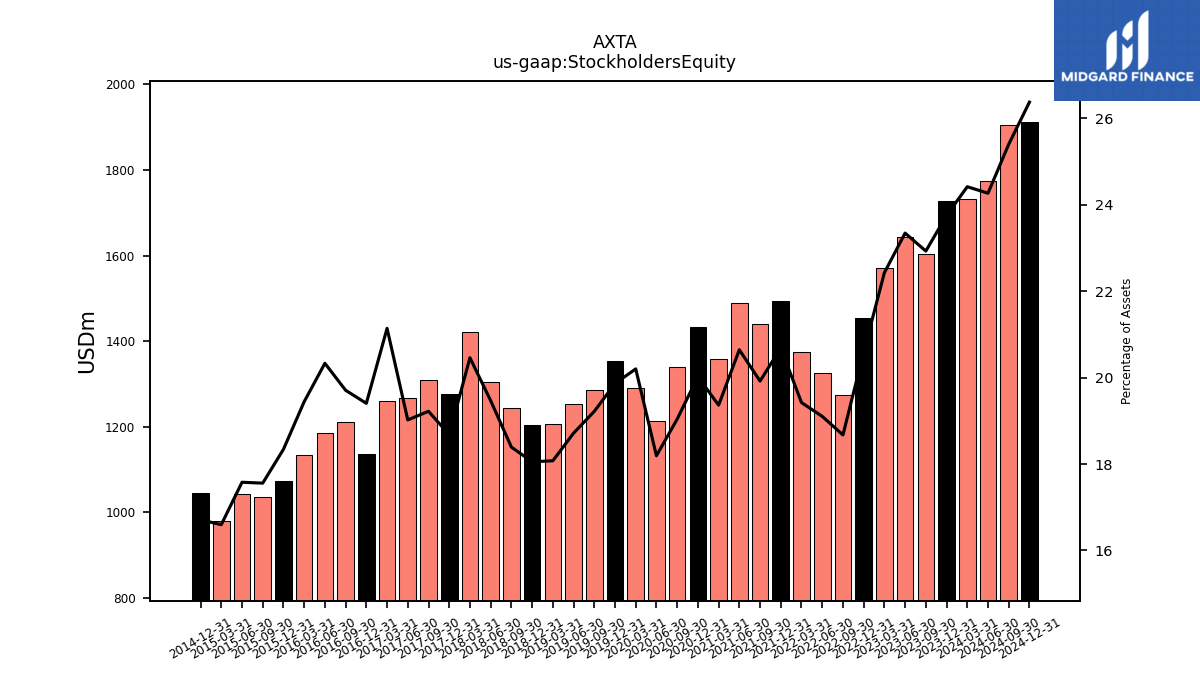
| Stockholders Equity | 1727.30 | 1604.10 | 1644.20 | 1570.10 | 1453.50 | 1273.30 | 1326.20 | 1375.40 | 1492.90 | 1440.80 | 1488.30 | 1359.40 | 1433.00 | 1339.70 | 1213.10 | 1291.00 | 1354.20 | 1285.70 | 1252.50 | 1206.20 | 1205.10 | 1243.40 | 1303.50 | 1421.40 | 1276.10 | 1309.40 | 1266.20 | 1260.00 | 1136.10 | 1210.50 | 1186.50 | 1134.10 | 1073.70 | 1035.70 | 1042.50 | 978.90 | 1044.70 | NA | NA | NA |
| 2023-12-31 | 2023-09-30 | 2023-06-30 | 2023-03-31 | 2022-12-31 | 2022-09-30 | 2022-06-30 | 2022-03-31 | 2021-12-31 | 2021-09-30 | 2021-06-30 | 2021-03-31 | 2020-12-31 | 2020-09-30 | 2020-06-30 | 2020-03-31 | 2019-12-31 | 2019-09-30 | 2019-06-30 | 2019-03-31 | 2018-12-31 | 2018-09-30 | 2018-06-30 | 2018-03-31 | 2017-12-31 | 2017-09-30 | 2017-06-30 | 2017-03-31 | 2016-12-31 | 2016-09-30 | 2016-06-30 | 2016-03-31 | 2015-12-31 | 2015-09-30 | 2015-06-30 | 2015-03-31 | 2014-12-31 | 2014-09-30 | 2014-06-30 | 2014-03-31 | ||
|---|---|---|---|---|---|---|---|---|---|---|---|---|---|---|---|---|---|---|---|---|---|---|---|---|---|---|---|---|---|---|---|---|---|---|---|---|---|---|---|---|---|
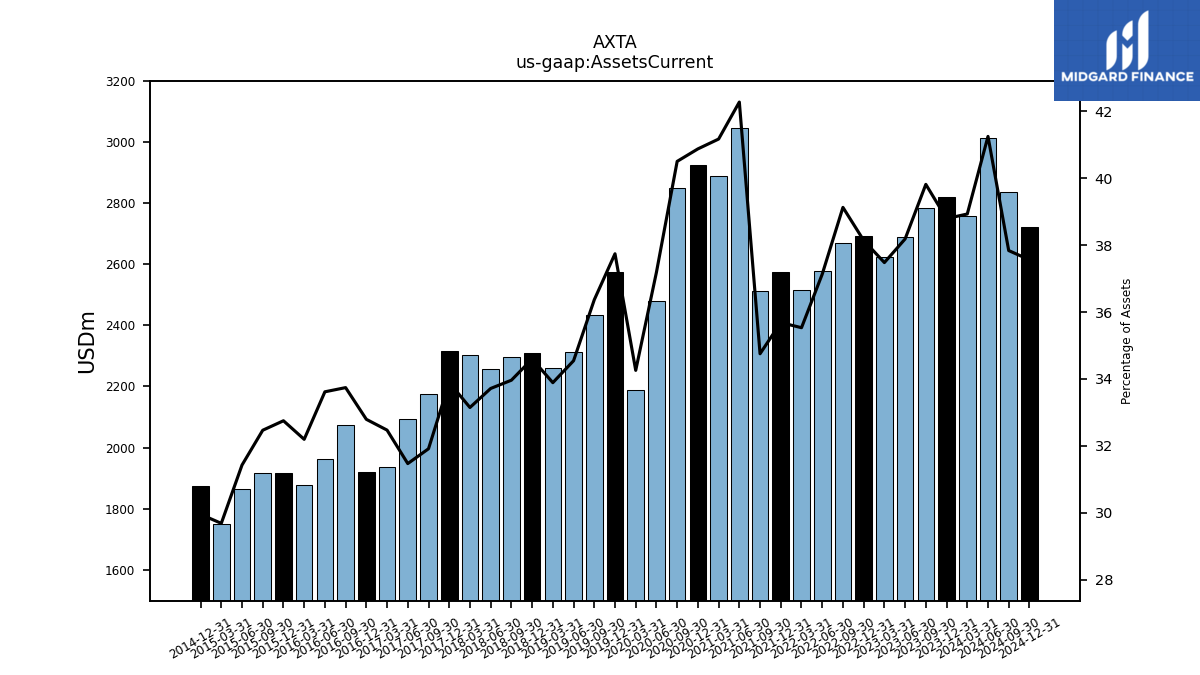
| Assets Current | 2821.30 | 2785.80 | 2689.60 | 2623.90 | 2692.70 | 2668.40 | 2578.00 | 2516.30 | 2575.60 | 2513.80 | 3048.20 | 2890.80 | 2925.90 | 2850.30 | 2480.20 | 2189.30 | 2573.40 | 2433.10 | 2312.10 | 2261.60 | 2309.60 | 2296.20 | 2257.70 | 2302.90 | 2315.60 | 2174.10 | 2095.00 | 1935.40 | 1920.00 | 2072.60 | 1961.80 | 1878.00 | 1917.30 | 1915.20 | 1863.80 | 1750.80 | 1872.90 | NA | NA | NA | |
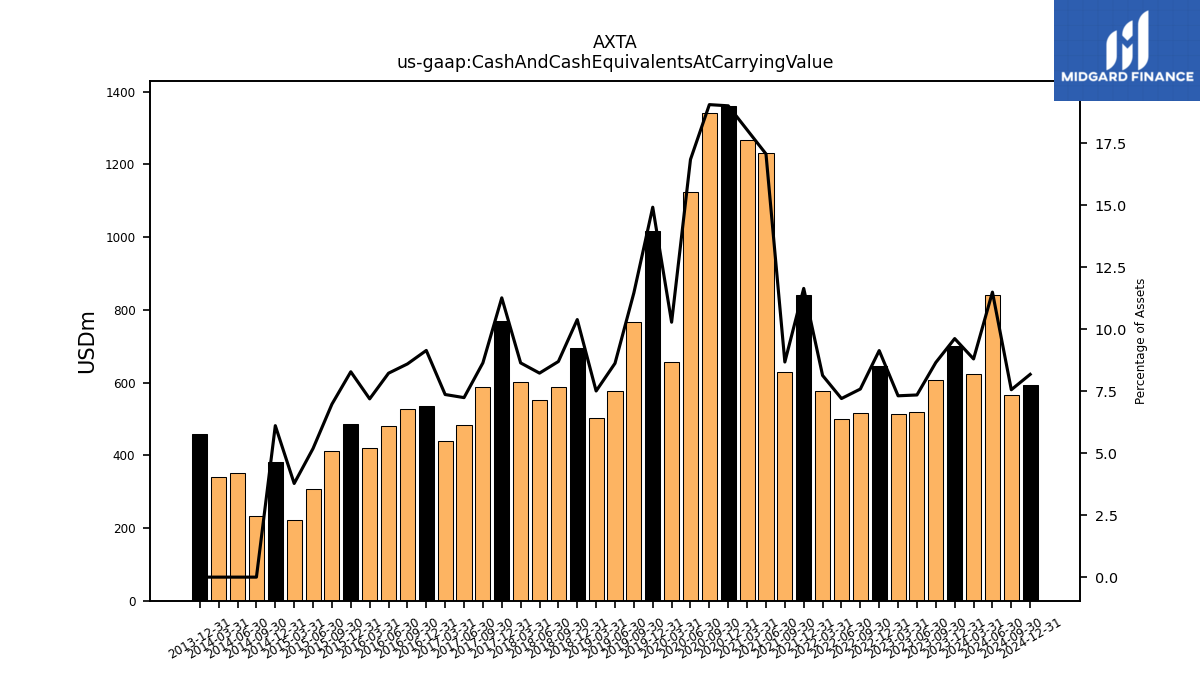
| Cash And Cash Equivalents At Carrying Value | 699.80 | 605.80 | 517.60 | 512.10 | 645.20 | 517.40 | 500.20 | 576.20 | 840.60 | 627.70 | 1230.90 | 1266.90 | 1360.90 | 1341.30 | 1123.60 | 657.20 | 1017.50 | 767.20 | 577.30 | 501.10 | 693.60 | 588.10 | 551.10 | 600.40 | 769.80 | 588.90 | 482.10 | 439.10 | 535.40 | 528.30 | 480.10 | 419.50 | 485.00 | 411.60 | 307.80 | 222.90 | 382.10 | 233.30 | 350.30 | 339.60 | |
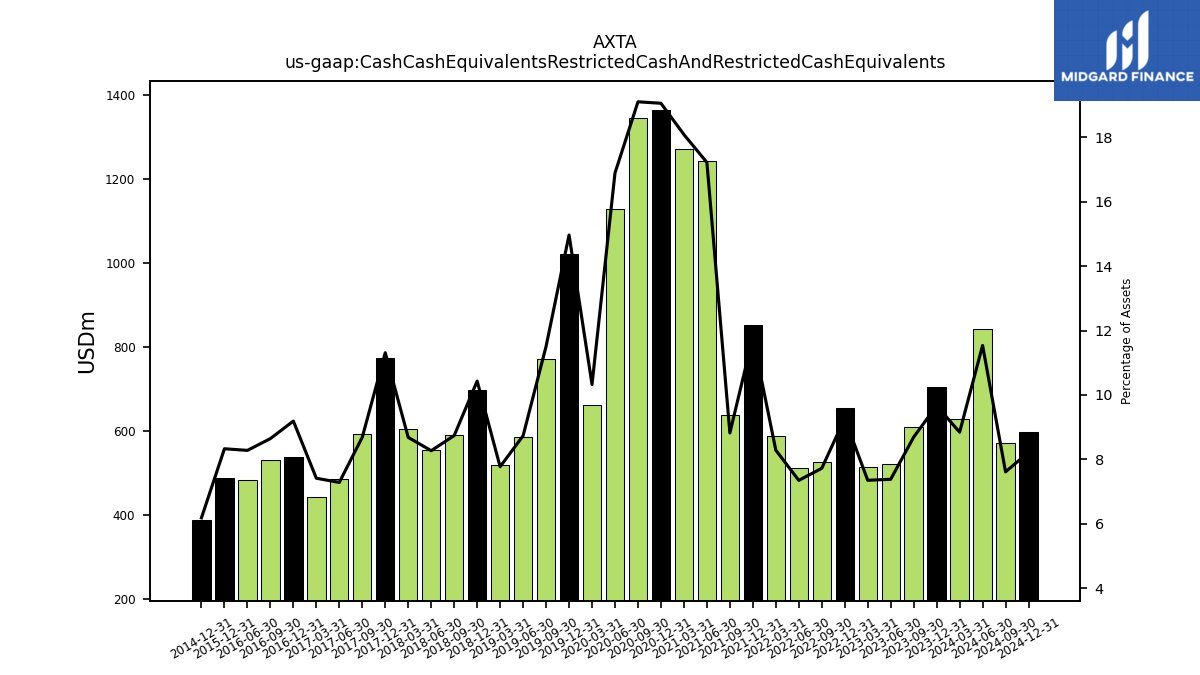
| Cash Cash Equivalents Restricted Cash And Restricted Cash Equivalents | 703.10 | 608.10 | 520.00 | 514.70 | 654.90 | 526.70 | 510.20 | 586.80 | 851.20 | 638.10 | 1241.50 | 1269.80 | 1364.00 | 1344.20 | 1126.50 | 660.00 | 1020.50 | 770.10 | 584.60 | 518.70 | 696.40 | 590.90 | 553.80 | 603.30 | 772.90 | 592.00 | 485.00 | 442.00 | 538.10 | 531.10 | 483.20 | NA | 487.70 | NA | NA | NA | 386.80 | NA | NA | NA | |
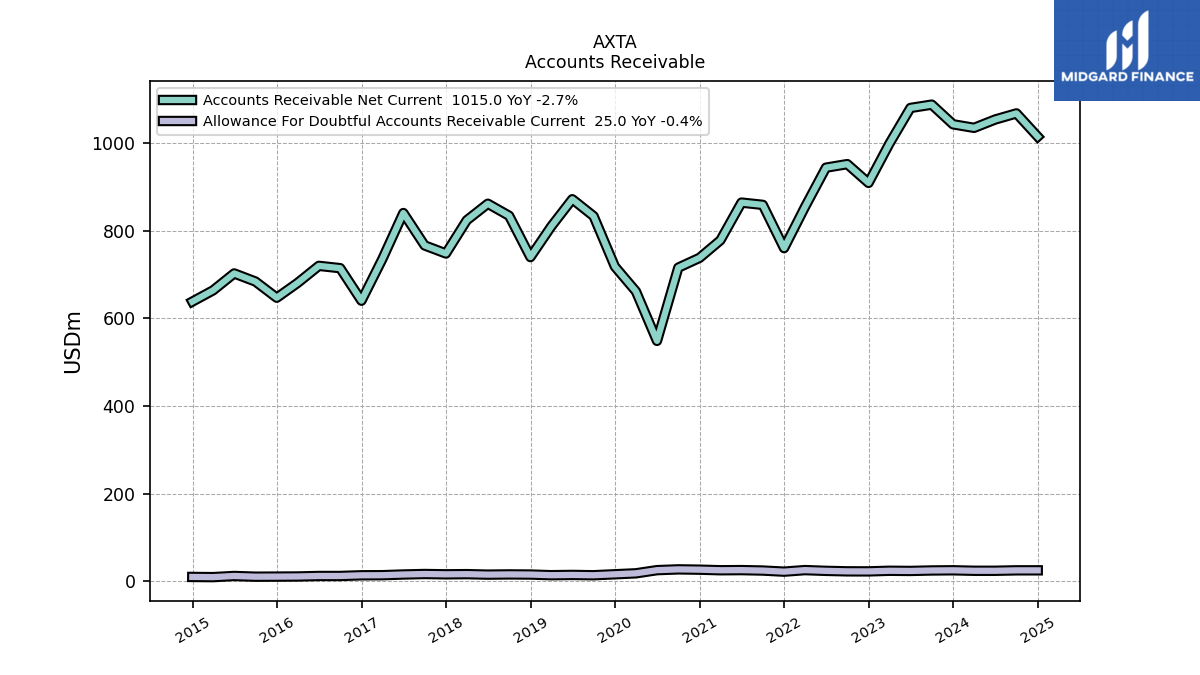
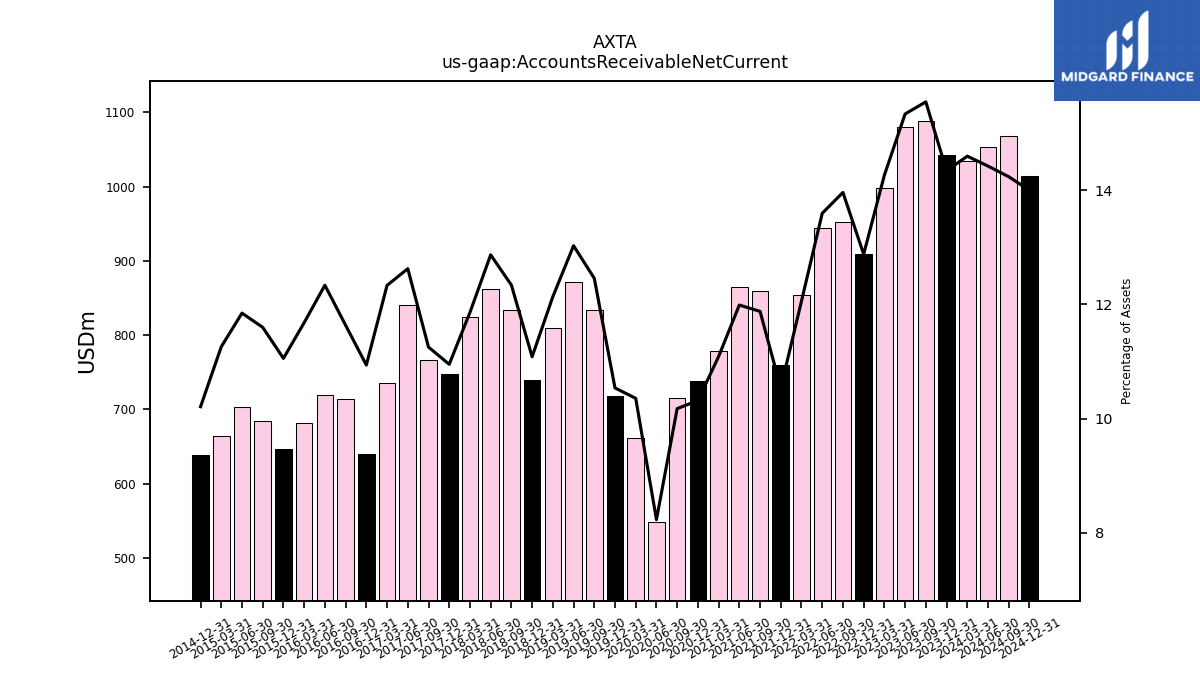
| Accounts Receivable Net Current | 1043.10 | 1088.00 | 1080.40 | 998.80 | 909.30 | 952.20 | 944.10 | 854.00 | 760.40 | 859.20 | 864.40 | 778.40 | 738.30 | 715.90 | 548.70 | 661.70 | 718.40 | 833.50 | 872.10 | 809.90 | 739.90 | 834.30 | 861.80 | 824.00 | 748.20 | 766.60 | 840.60 | 735.20 | 640.40 | 714.70 | 720.00 | 681.40 | 647.20 | 684.20 | 702.70 | 664.10 | 638.30 | NA | NA | NA | |
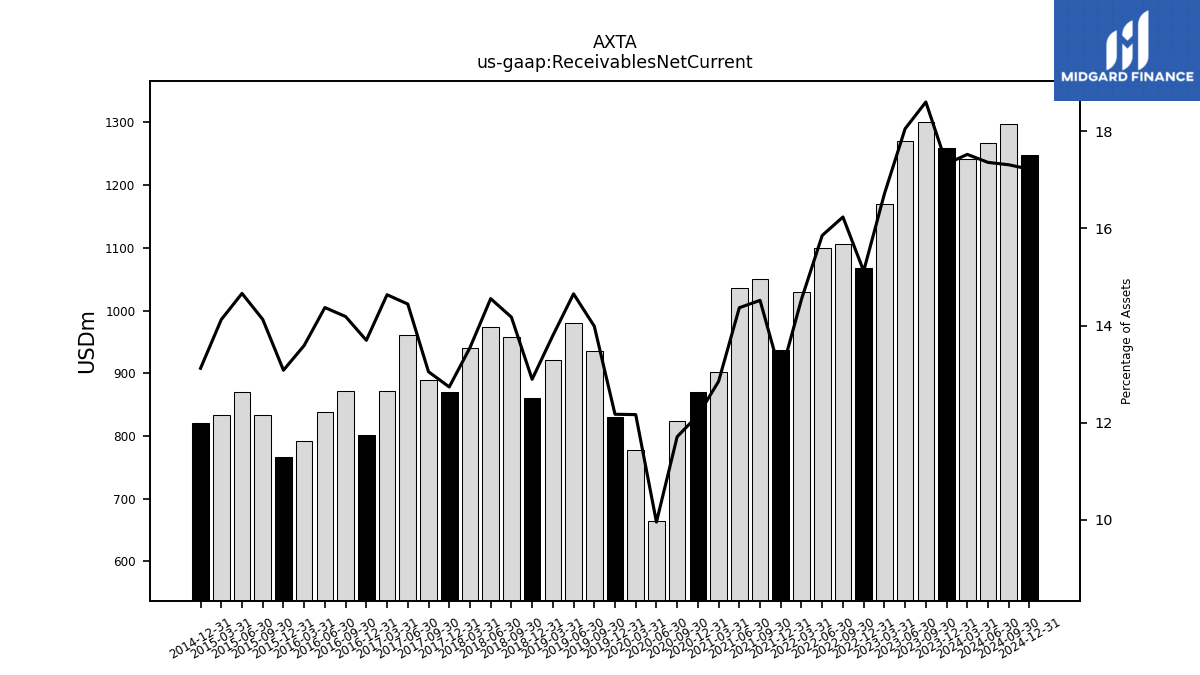
| Receivables Net Current | 1259.90 | 1301.10 | 1271.10 | 1169.60 | 1067.40 | 1106.90 | 1100.60 | 1029.80 | 937.50 | 1050.10 | 1035.70 | 902.30 | 869.80 | 824.20 | 664.00 | 777.60 | 830.10 | 935.70 | 980.60 | 920.50 | 860.80 | 958.20 | 974.50 | 940.90 | 870.20 | 889.00 | 961.40 | 872.20 | 801.90 | 871.30 | 838.60 | 792.70 | 765.80 | 833.30 | 869.50 | 833.00 | 820.40 | NA | NA | NA | |
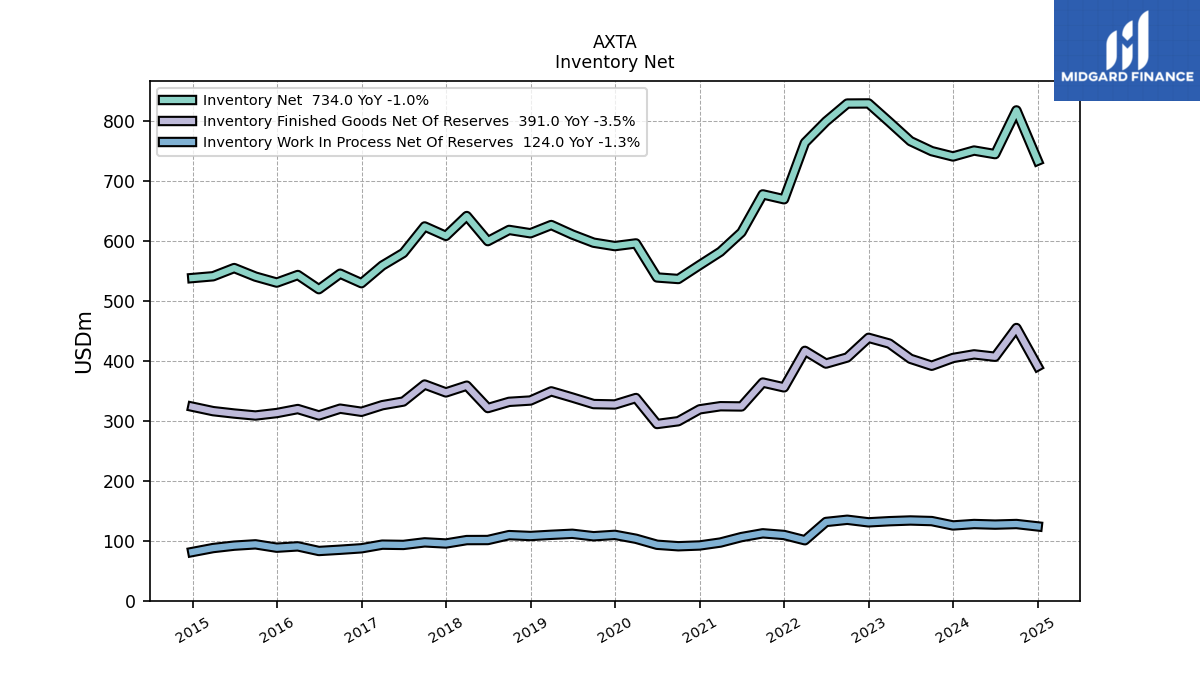
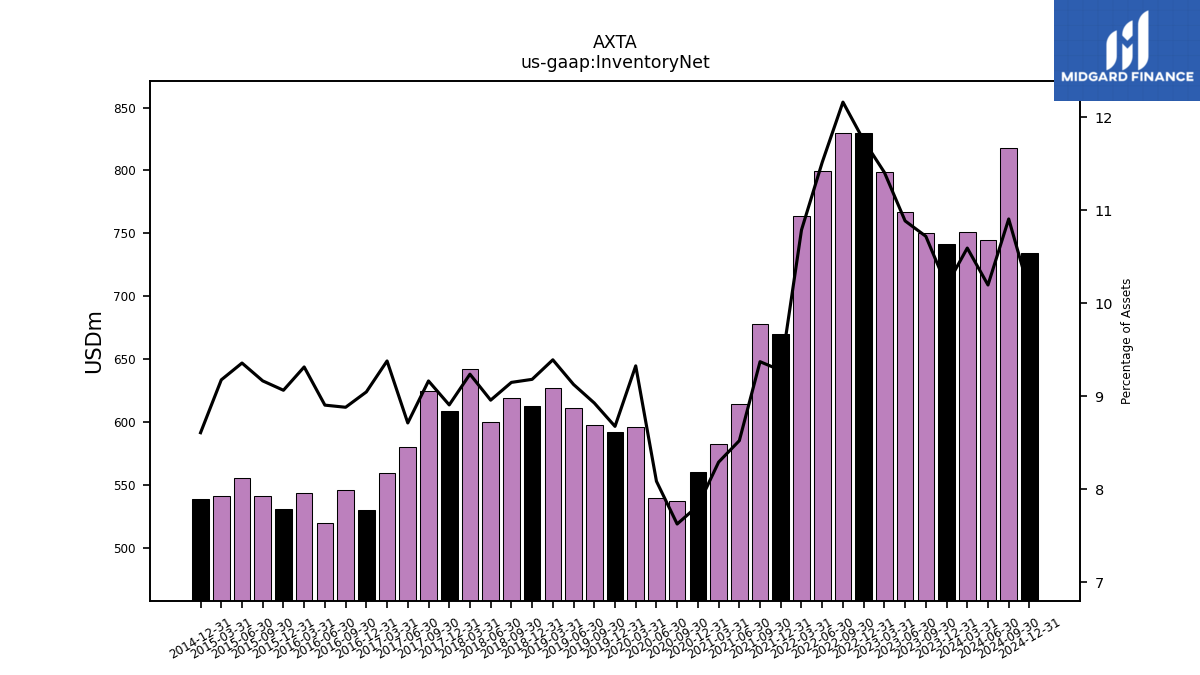
| Inventory Net | 741.10 | 750.00 | 766.70 | 798.60 | 829.60 | 829.40 | 799.50 | 764.00 | 669.70 | 677.90 | 614.50 | 582.20 | 559.90 | 536.70 | 539.30 | 596.10 | 591.60 | 597.30 | 610.90 | 626.80 | 613.00 | 618.60 | 599.90 | 641.80 | 608.60 | 624.40 | 580.10 | 559.10 | 529.70 | 545.60 | 519.70 | 543.40 | 530.70 | 540.70 | 555.00 | 541.30 | 538.30 | NA | NA | NA |
| 2023-12-31 | 2023-09-30 | 2023-06-30 | 2023-03-31 | 2022-12-31 | 2022-09-30 | 2022-06-30 | 2022-03-31 | 2021-12-31 | 2021-09-30 | 2021-06-30 | 2021-03-31 | 2020-12-31 | 2020-09-30 | 2020-06-30 | 2020-03-31 | 2019-12-31 | 2019-09-30 | 2019-06-30 | 2019-03-31 | 2018-12-31 | 2018-09-30 | 2018-06-30 | 2018-03-31 | 2017-12-31 | 2017-09-30 | 2017-06-30 | 2017-03-31 | 2016-12-31 | 2016-09-30 | 2016-06-30 | 2016-03-31 | 2015-12-31 | 2015-09-30 | 2015-06-30 | 2015-03-31 | 2014-12-31 | 2014-09-30 | 2014-06-30 | 2014-03-31 | ||
|---|---|---|---|---|---|---|---|---|---|---|---|---|---|---|---|---|---|---|---|---|---|---|---|---|---|---|---|---|---|---|---|---|---|---|---|---|---|---|---|---|---|
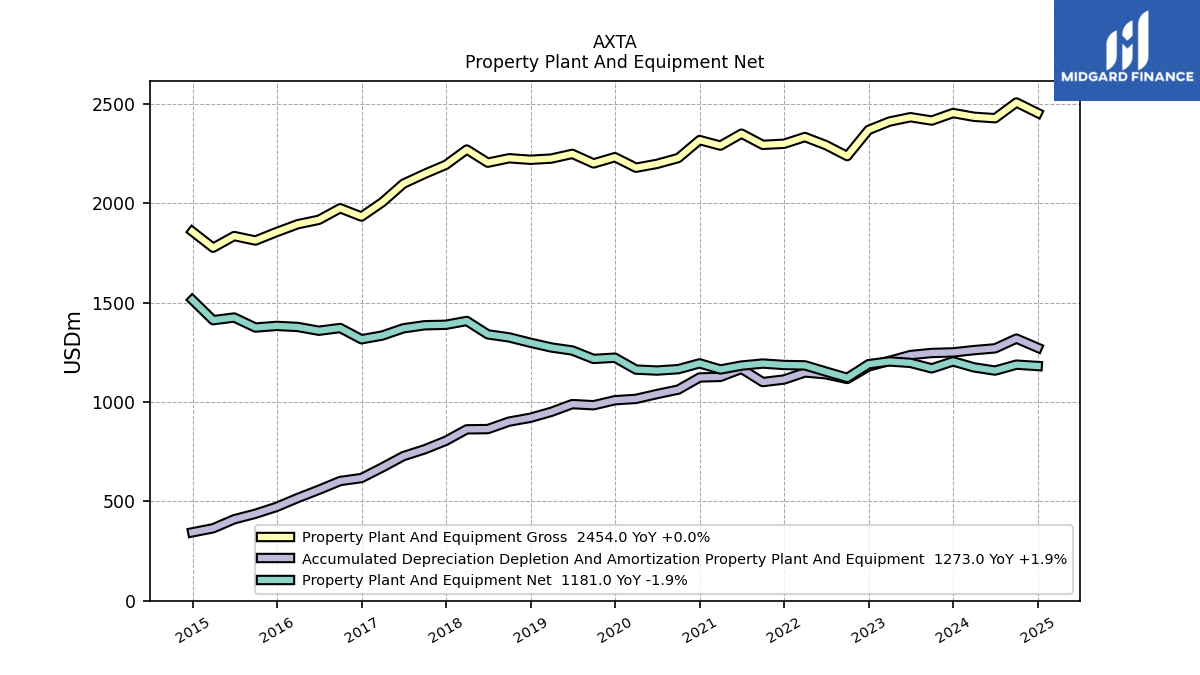
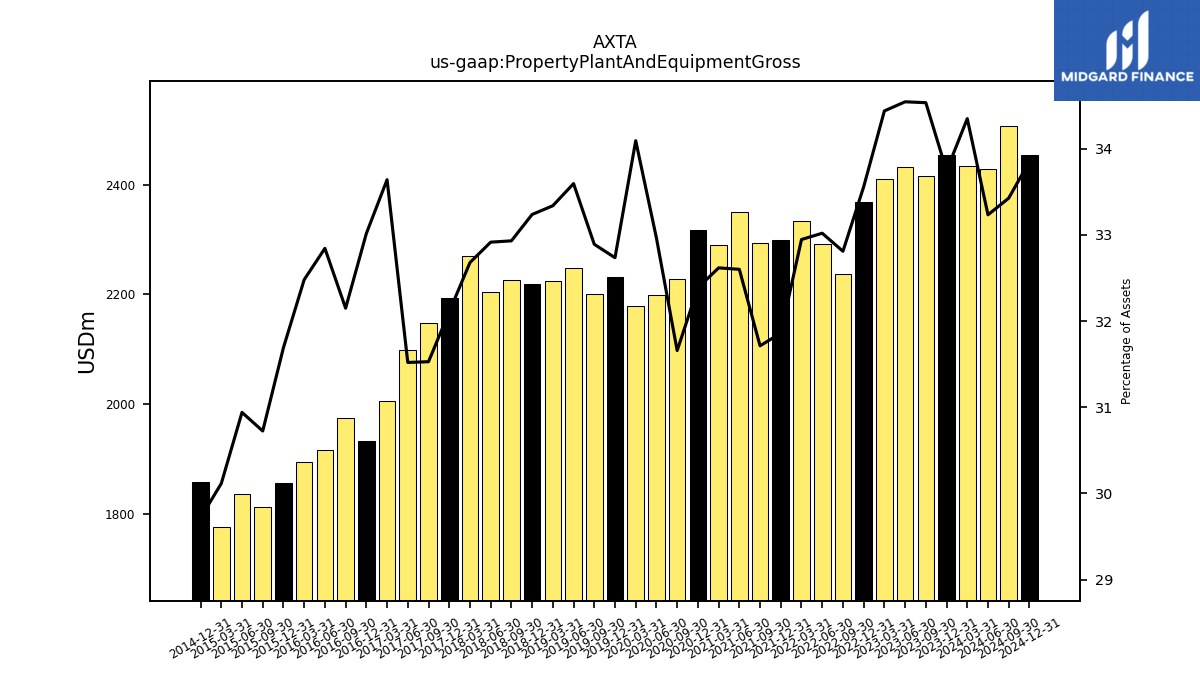
| Property Plant And Equipment Gross | 2453.90 | 2416.00 | 2433.00 | 2410.90 | 2368.90 | 2237.30 | 2292.40 | 2333.10 | 2299.40 | 2293.80 | 2350.30 | 2290.00 | 2317.90 | 2227.60 | 2198.20 | 2178.80 | 2231.90 | 2200.40 | 2248.50 | 2224.80 | 2218.80 | 2226.40 | 2204.10 | 2270.30 | 2193.60 | 2147.90 | 2098.30 | 2005.10 | 1933.00 | 1974.80 | 1916.70 | 1894.60 | 1855.30 | 1812.40 | 1835.00 | 1776.30 | 1858.20 | NA | NA | NA | |
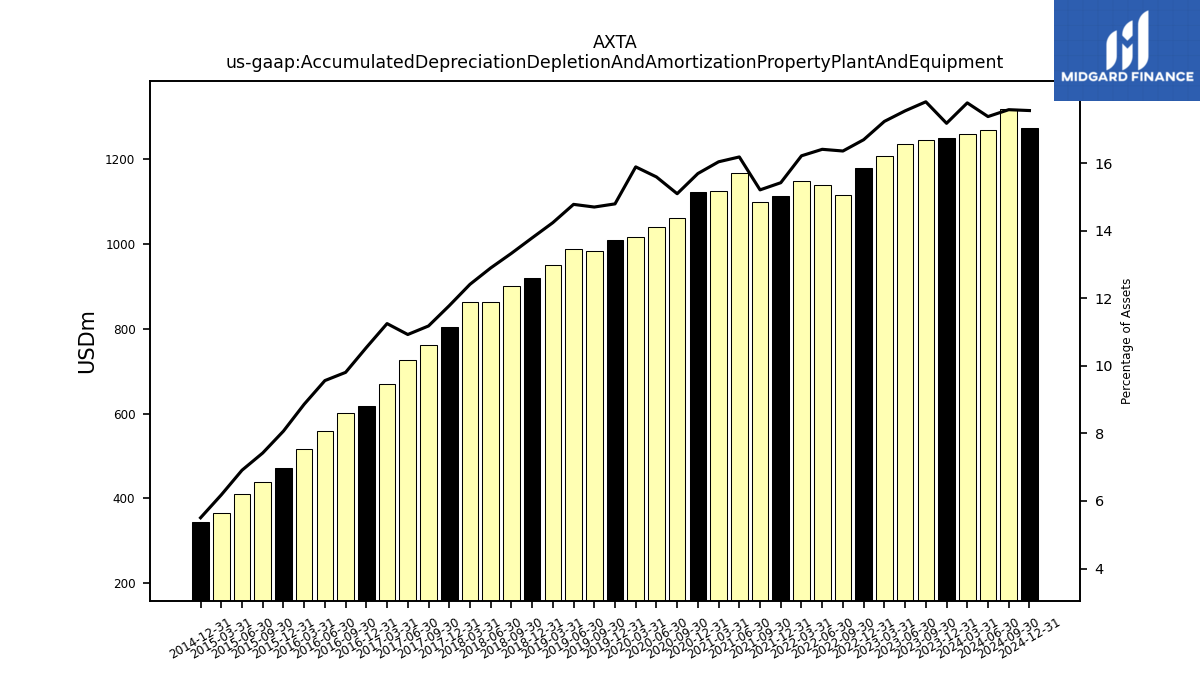
| Accumulated Depreciation Depletion And Amortization Property Plant And Equipment | 1249.60 | 1246.70 | 1236.20 | 1206.90 | 1178.70 | 1115.80 | 1139.50 | 1148.70 | 1113.20 | 1100.30 | 1167.00 | 1126.40 | 1123.40 | 1062.40 | 1040.00 | 1015.70 | 1008.90 | 983.70 | 989.40 | 950.40 | 920.60 | 901.40 | 863.80 | 862.50 | 805.00 | 761.80 | 727.60 | 670.70 | 617.30 | 602.50 | 558.20 | 517.10 | 472.40 | 437.80 | 409.90 | 364.60 | 344.10 | NA | NA | NA | |
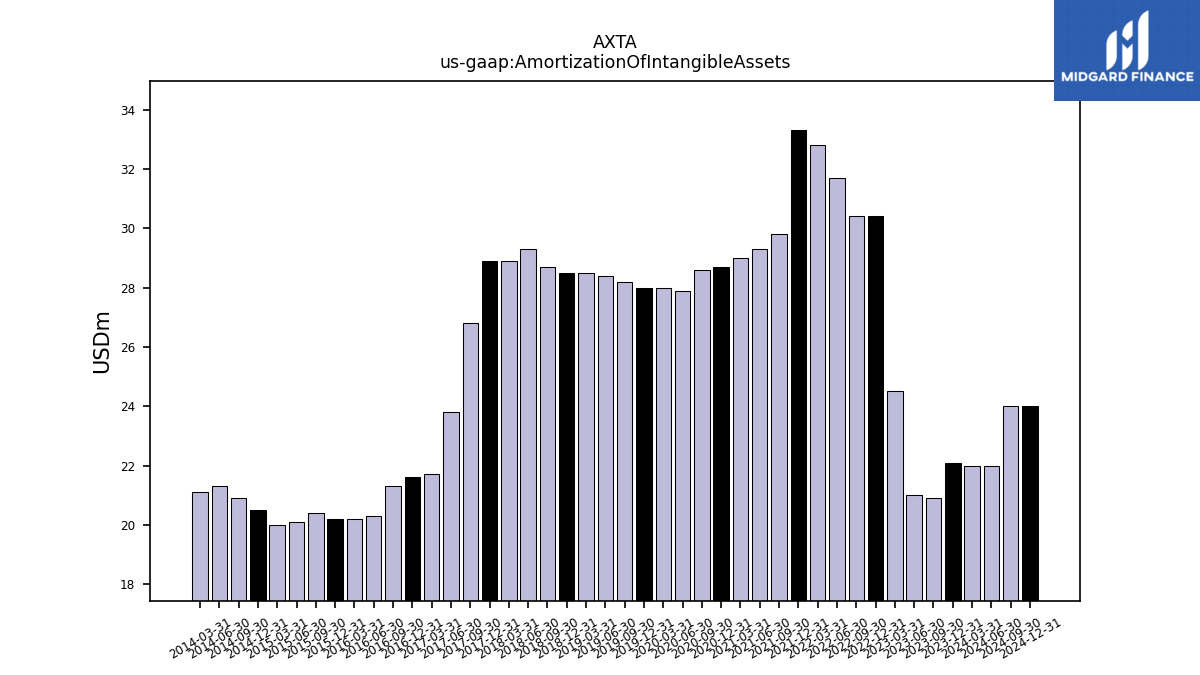
| Amortization Of Intangible Assets | 22.10 | 20.90 | 21.00 | 24.50 | 30.40 | 30.40 | 31.70 | 32.80 | 33.30 | 29.80 | 29.30 | 29.00 | 28.70 | 28.60 | 27.90 | 28.00 | 28.00 | 28.20 | 28.40 | 28.50 | 28.50 | 28.70 | 29.30 | 28.90 | 28.90 | 26.80 | 23.80 | 21.70 | 21.60 | 21.30 | 20.30 | 20.20 | 20.20 | 20.40 | 20.10 | 20.00 | 20.50 | 20.90 | 21.30 | 21.10 | |
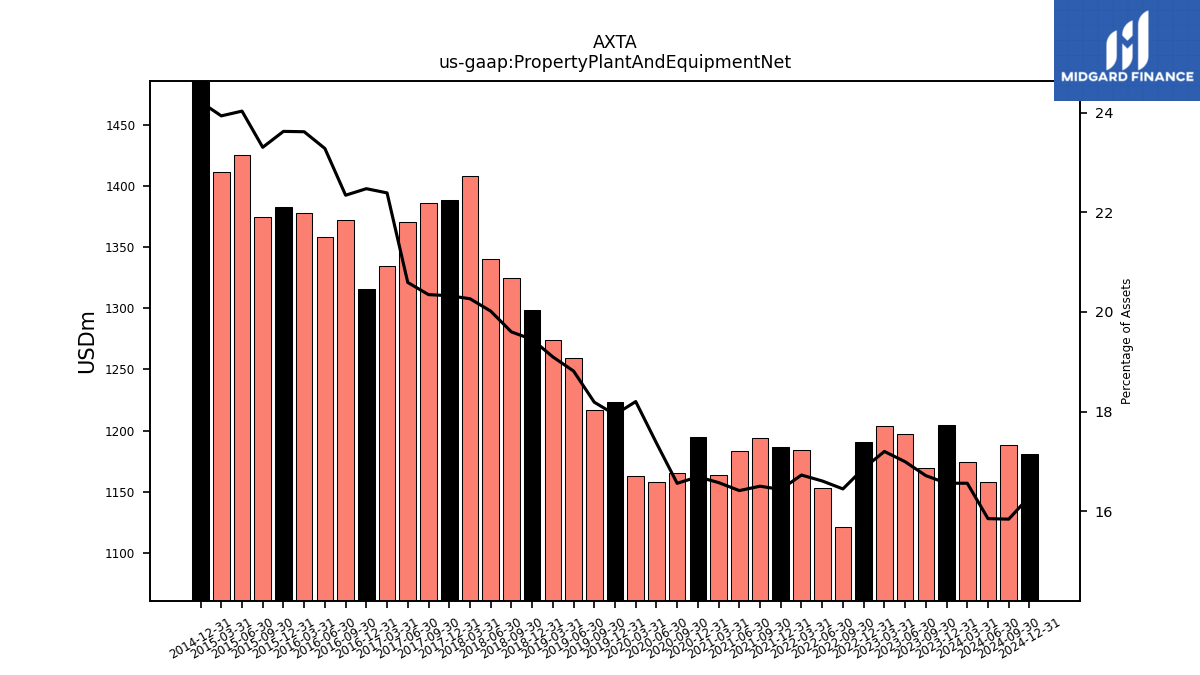
| Property Plant And Equipment Net | 1204.30 | 1169.30 | 1196.80 | 1204.00 | 1190.20 | 1121.50 | 1152.90 | 1184.40 | 1186.20 | 1193.50 | 1183.30 | 1163.60 | 1194.50 | 1165.20 | 1158.20 | 1163.10 | 1223.00 | 1216.70 | 1259.10 | 1274.40 | 1298.20 | 1325.00 | 1340.30 | 1407.80 | 1388.60 | 1386.10 | 1370.70 | 1334.40 | 1315.70 | 1372.30 | 1358.50 | 1377.50 | 1382.90 | 1374.60 | 1425.10 | 1411.70 | 1514.10 | NA | NA | NA | |
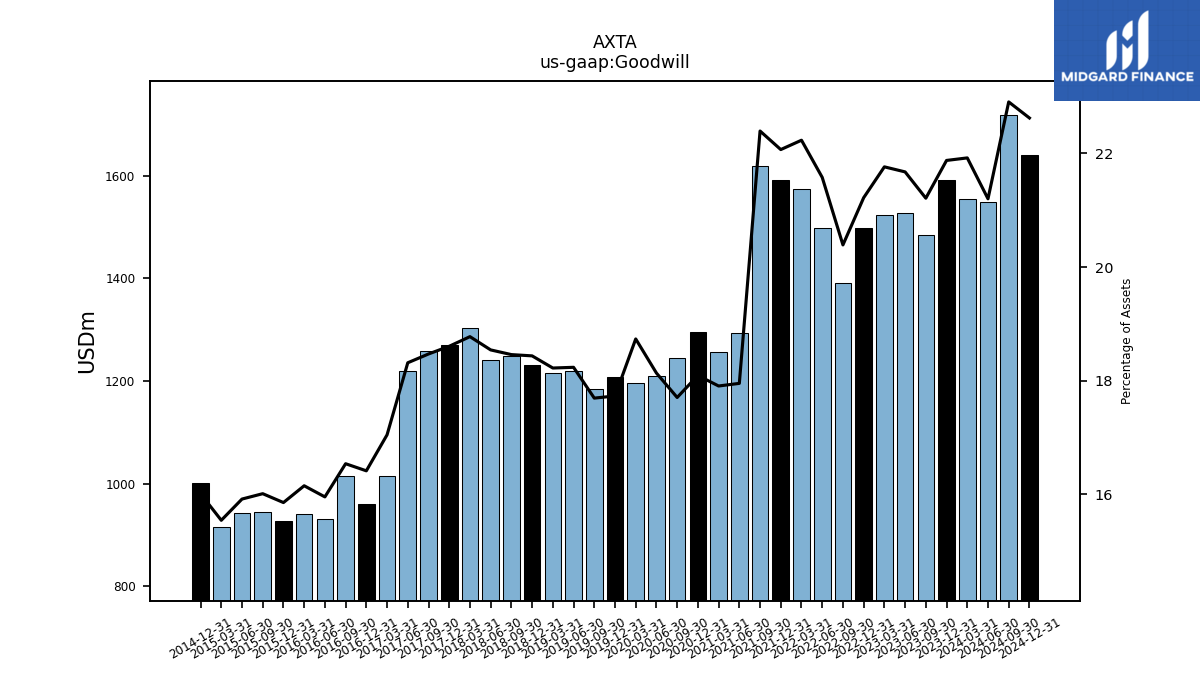
| Goodwill | 1590.90 | 1484.00 | 1526.60 | 1523.60 | 1498.00 | 1390.40 | 1498.10 | 1574.40 | 1592.70 | 1619.80 | 1294.30 | 1257.20 | 1294.90 | 1245.80 | 1209.30 | 1197.30 | 1208.90 | 1183.70 | 1220.50 | 1216.10 | 1230.80 | 1248.00 | 1241.60 | 1304.40 | 1271.20 | 1258.30 | 1219.30 | 1016.10 | 961.00 | 1015.90 | 931.10 | 942.10 | 928.20 | 944.50 | 944.00 | 916.80 | 1001.10 | NA | NA | NA | |
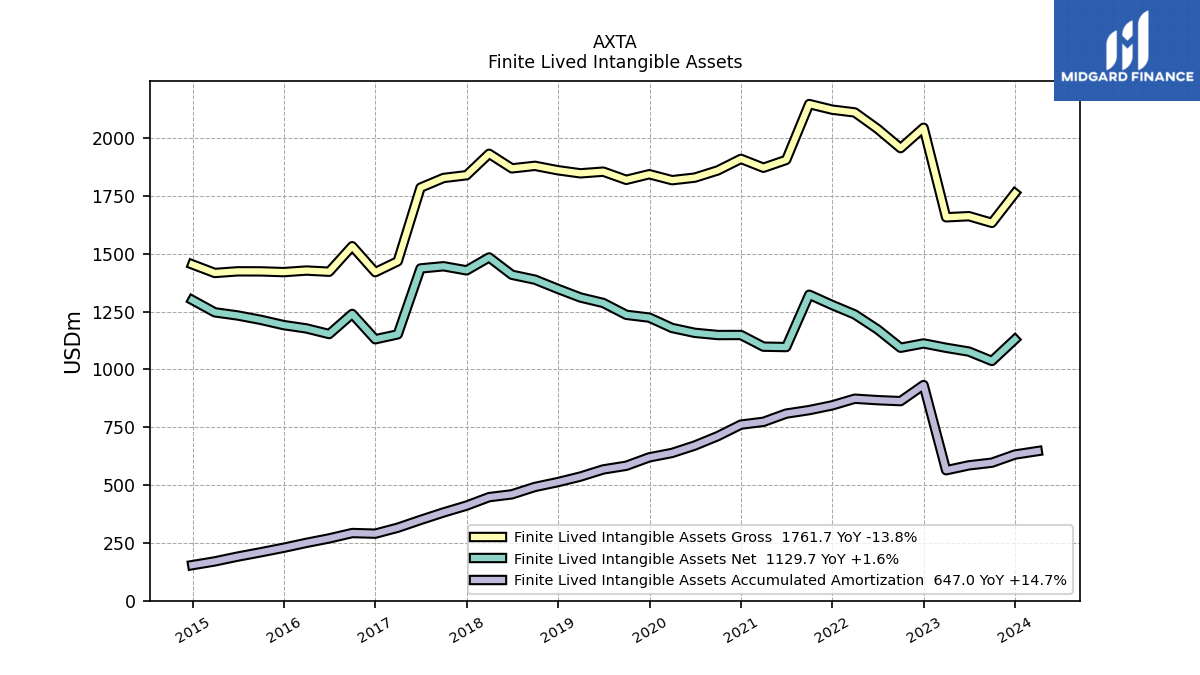
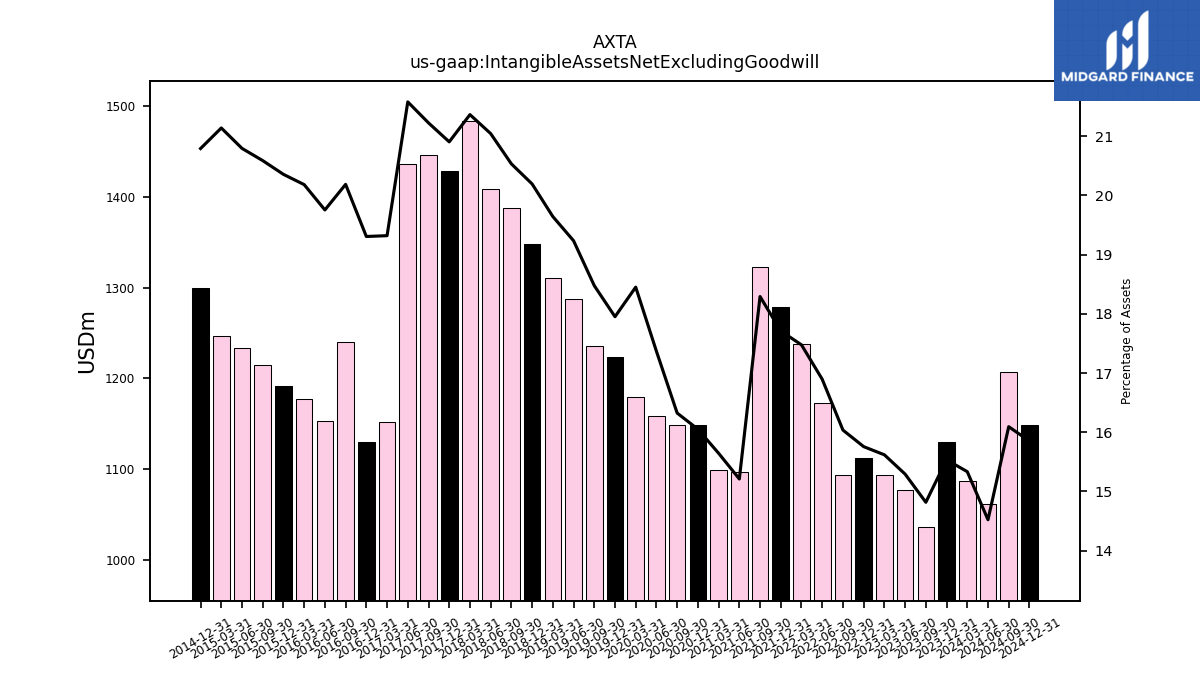
| Intangible Assets Net Excluding Goodwill | 1129.70 | 1036.60 | 1077.10 | 1093.40 | 1112.30 | 1093.50 | 1172.90 | 1237.50 | 1278.20 | 1323.00 | 1096.60 | 1098.40 | 1148.80 | 1148.60 | 1158.10 | 1179.10 | 1223.90 | 1236.00 | 1287.30 | 1310.80 | 1348.00 | 1388.10 | 1409.10 | 1484.20 | 1428.20 | 1445.90 | 1436.50 | 1151.50 | 1130.30 | 1239.90 | 1152.80 | 1177.20 | 1191.60 | 1214.40 | 1233.20 | 1246.80 | 1300.00 | NA | NA | NA | |
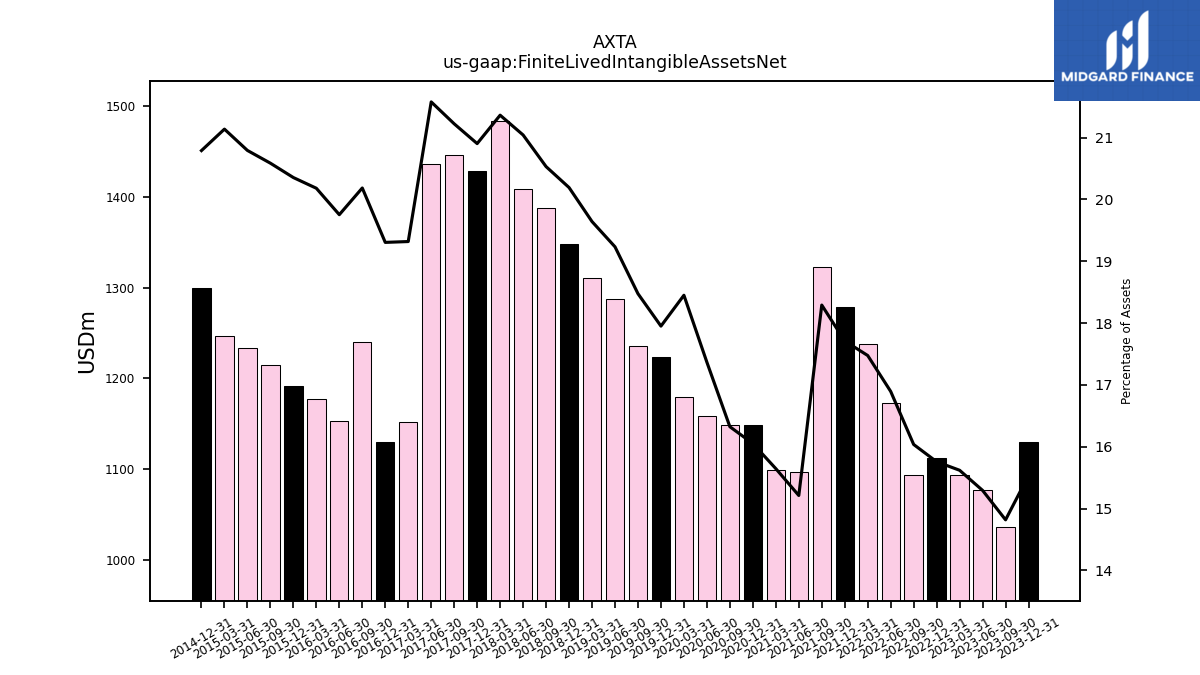
| Finite Lived Intangible Assets Net | 1129.70 | 1036.60 | 1077.10 | 1093.40 | 1112.30 | 1093.50 | 1172.90 | 1237.50 | 1278.20 | 1323.00 | 1096.60 | 1098.40 | 1148.80 | 1148.60 | 1158.10 | 1179.10 | 1223.90 | 1236.00 | 1287.30 | 1310.80 | 1348.00 | 1388.10 | 1409.10 | 1484.20 | 1428.20 | 1445.90 | 1436.50 | 1151.50 | 1130.30 | 1239.90 | 1152.80 | 1177.20 | 1191.60 | 1214.40 | 1233.20 | 1246.80 | 1300.00 | NA | NA | NA | |
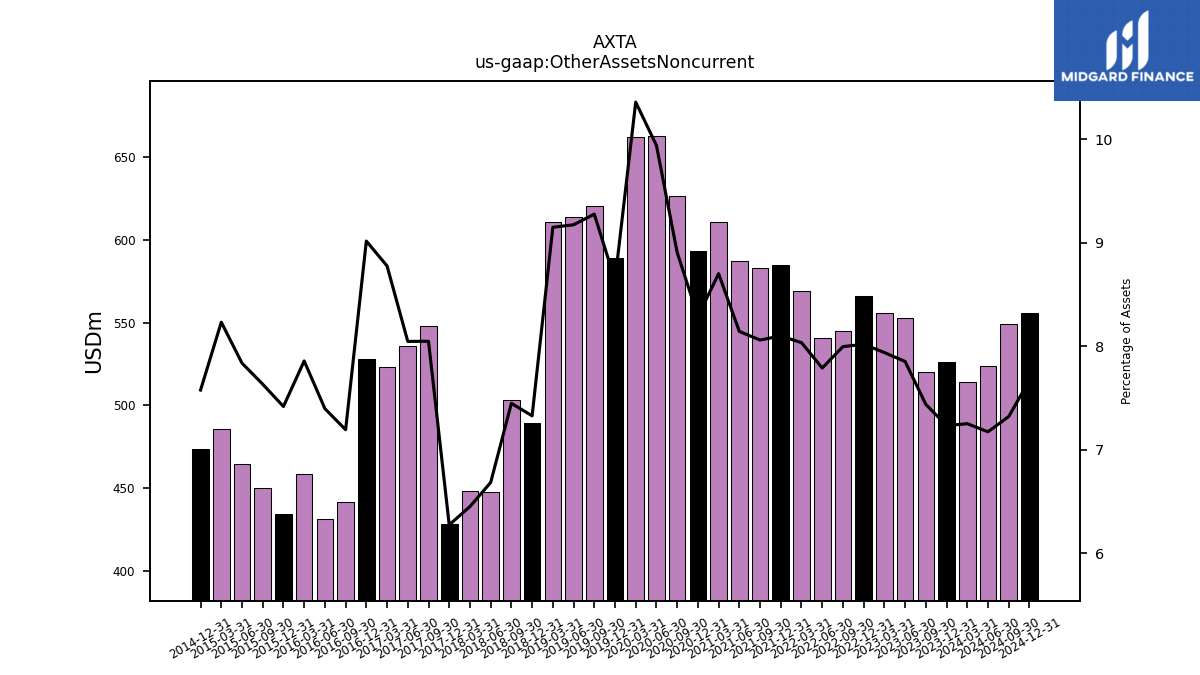
| Other Assets Noncurrent | 525.90 | 520.30 | 553.00 | 555.70 | 566.00 | 545.20 | 540.70 | 568.90 | 584.50 | 582.90 | 587.00 | 610.80 | 593.10 | 626.60 | 662.80 | 661.90 | 588.80 | 620.50 | 613.90 | 610.50 | 489.10 | 503.50 | 447.50 | 448.10 | 428.60 | 548.20 | 535.60 | 523.00 | 527.80 | 441.80 | 431.60 | 458.30 | 434.20 | 450.20 | 464.70 | 485.50 | 473.70 | NA | NA | NA |
| 2023-12-31 | 2023-09-30 | 2023-06-30 | 2023-03-31 | 2022-12-31 | 2022-09-30 | 2022-06-30 | 2022-03-31 | 2021-12-31 | 2021-09-30 | 2021-06-30 | 2021-03-31 | 2020-12-31 | 2020-09-30 | 2020-06-30 | 2020-03-31 | 2019-12-31 | 2019-09-30 | 2019-06-30 | 2019-03-31 | 2018-12-31 | 2018-09-30 | 2018-06-30 | 2018-03-31 | 2017-12-31 | 2017-09-30 | 2017-06-30 | 2017-03-31 | 2016-12-31 | 2016-09-30 | 2016-06-30 | 2016-03-31 | 2015-12-31 | 2015-09-30 | 2015-06-30 | 2015-03-31 | 2014-12-31 | 2014-09-30 | 2014-06-30 | 2014-03-31 | ||
|---|---|---|---|---|---|---|---|---|---|---|---|---|---|---|---|---|---|---|---|---|---|---|---|---|---|---|---|---|---|---|---|---|---|---|---|---|---|---|---|---|---|
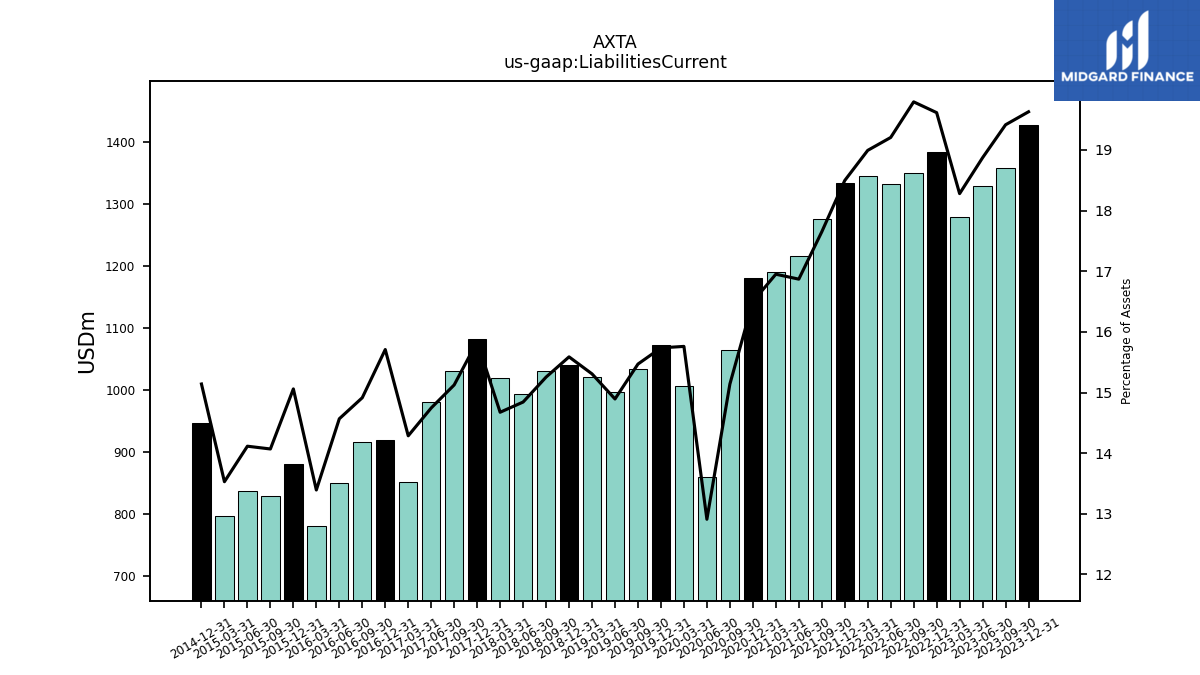
| Liabilities Current | 1427.50 | 1358.30 | 1329.20 | 1279.70 | 1384.70 | 1349.70 | 1333.40 | 1345.00 | 1334.90 | 1276.60 | 1216.20 | 1190.10 | 1180.90 | 1065.20 | 860.90 | 1007.20 | 1072.90 | 1034.90 | 996.80 | 1021.50 | 1040.60 | 1031.30 | 993.90 | 1019.50 | 1082.20 | 1030.40 | 981.60 | 851.50 | 919.70 | 916.10 | 850.10 | 781.20 | 881.60 | 829.90 | 837.10 | 798.00 | 946.70 | NA | NA | NA | |
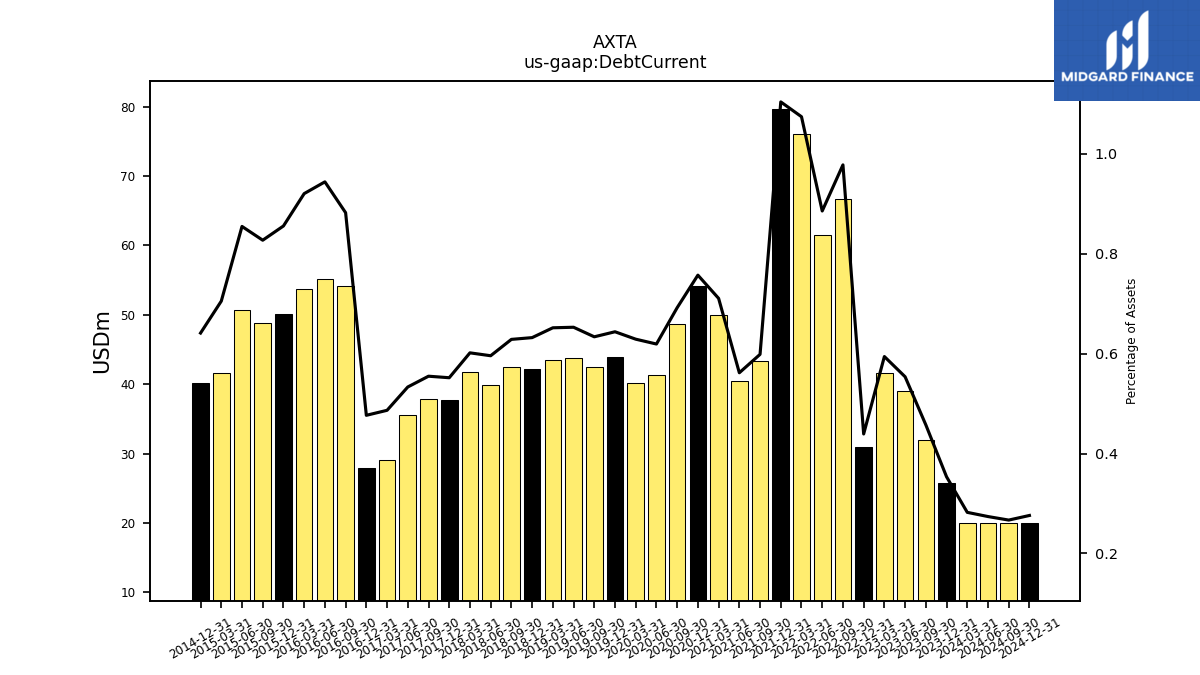
| Debt Current | 25.70 | 32.00 | 39.00 | 41.60 | 31.00 | 66.70 | 61.50 | 76.10 | 79.70 | 43.30 | 40.50 | 49.90 | 54.20 | 48.70 | 41.30 | 40.20 | 43.90 | 42.40 | 43.70 | 43.50 | 42.20 | 42.50 | 39.90 | 41.80 | 37.70 | 37.80 | 35.50 | 29.00 | 27.90 | 54.20 | 55.10 | 53.70 | 50.10 | 48.80 | 50.70 | 41.60 | 40.10 | NA | NA | NA | |
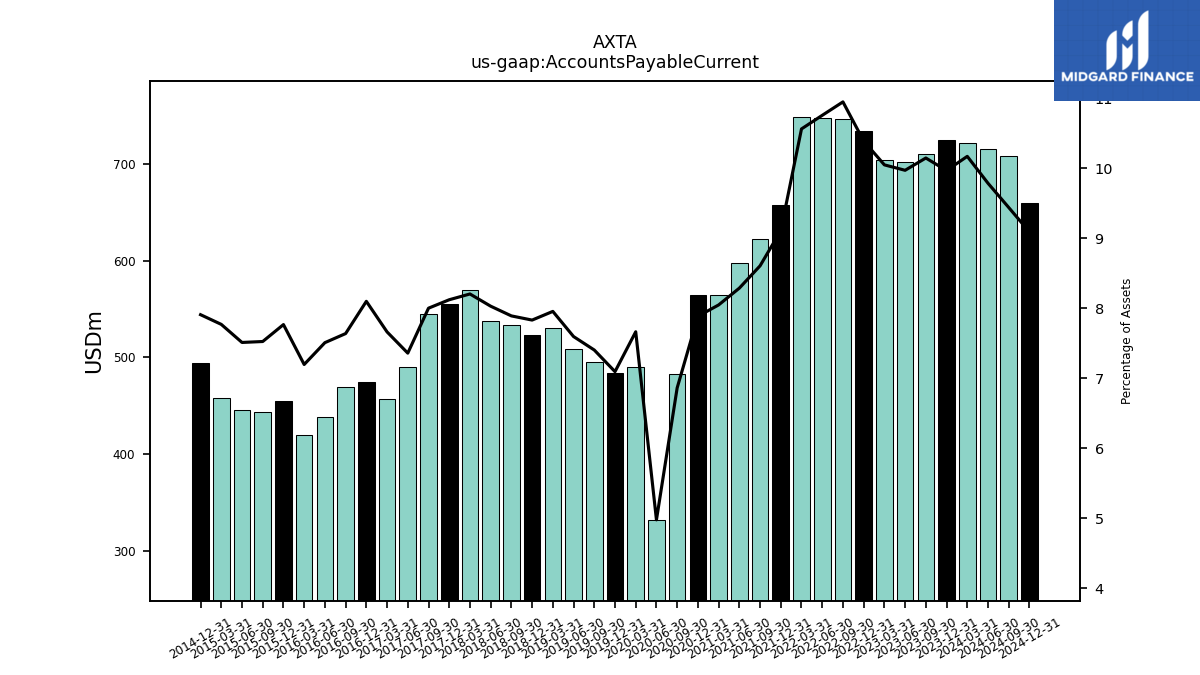
| Accounts Payable Current | 724.90 | 709.90 | 702.30 | 703.50 | 733.50 | 746.60 | 746.80 | 748.00 | 657.40 | 622.50 | 597.50 | 565.00 | 564.40 | 482.90 | 331.90 | 489.80 | 483.70 | 495.30 | 508.40 | 530.90 | 522.80 | 533.50 | 537.70 | 570.00 | 554.90 | 545.10 | 489.90 | 456.70 | 474.20 | 469.20 | 438.20 | 419.80 | 454.70 | 443.90 | 445.50 | 458.30 | 494.50 | NA | NA | NA | |
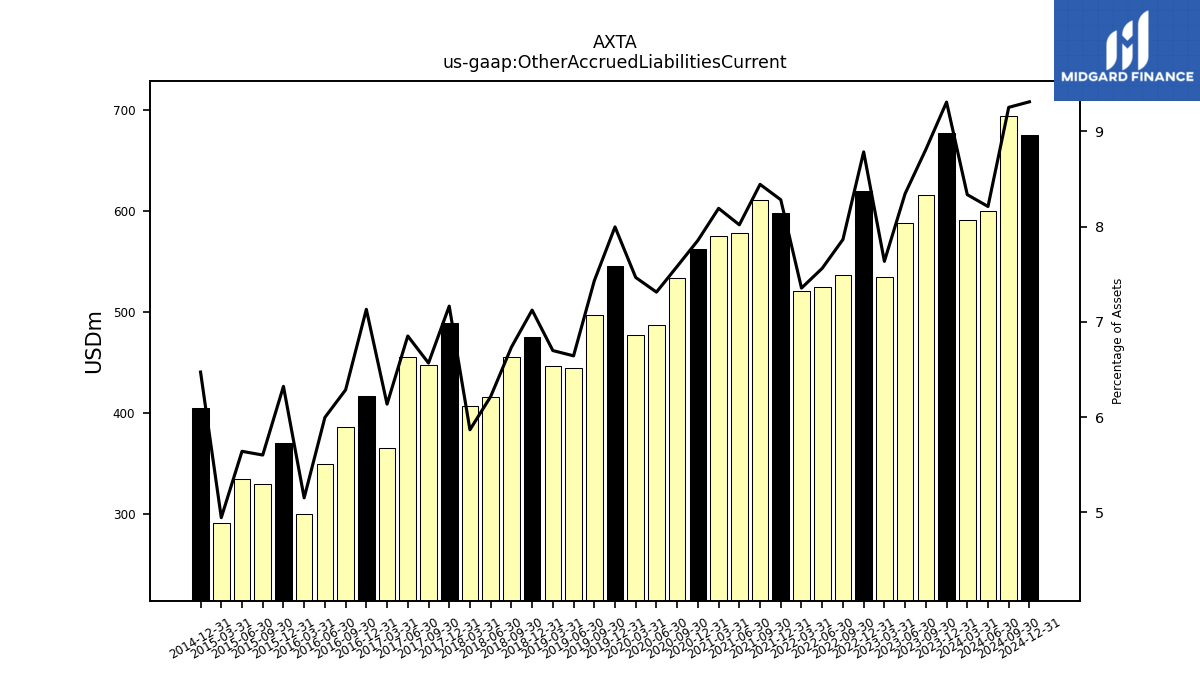
| Other Accrued Liabilities Current | 676.90 | 616.40 | 587.90 | 534.60 | 620.20 | 536.40 | 525.10 | 520.90 | 597.80 | 610.80 | 578.20 | 575.20 | 562.30 | 533.60 | 487.70 | 477.20 | 545.30 | 497.20 | 444.70 | 447.10 | 475.60 | 455.30 | 416.30 | 407.70 | 489.60 | 447.50 | 456.20 | 365.80 | 417.60 | 386.20 | 350.00 | 300.60 | 370.20 | 330.50 | 334.60 | 291.70 | 404.80 | NA | NA | NA | |
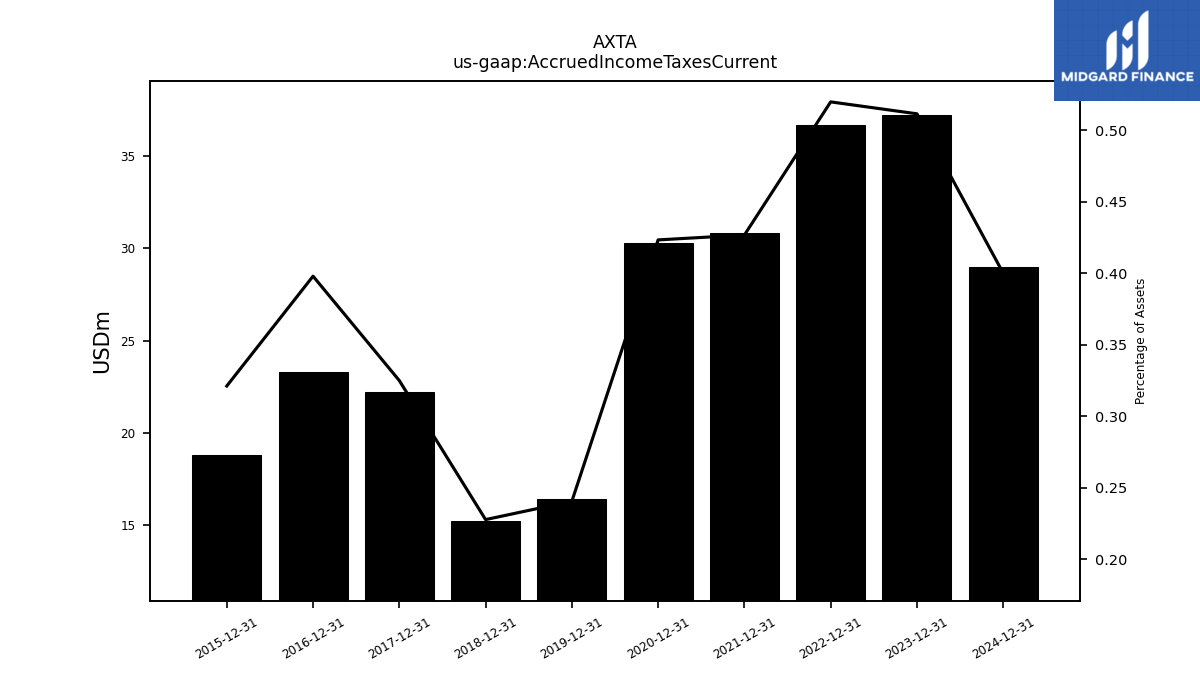
| Accrued Income Taxes Current | 37.20 | NA | NA | NA | 36.70 | NA | NA | NA | 30.80 | NA | NA | NA | 30.30 | NA | NA | NA | 16.40 | NA | NA | NA | 15.20 | NA | NA | NA | 22.20 | NA | NA | NA | 23.30 | NA | NA | NA | 18.80 | NA | NA | NA | NA | NA | NA | NA |
| 2023-12-31 | 2023-09-30 | 2023-06-30 | 2023-03-31 | 2022-12-31 | 2022-09-30 | 2022-06-30 | 2022-03-31 | 2021-12-31 | 2021-09-30 | 2021-06-30 | 2021-03-31 | 2020-12-31 | 2020-09-30 | 2020-06-30 | 2020-03-31 | 2019-12-31 | 2019-09-30 | 2019-06-30 | 2019-03-31 | 2018-12-31 | 2018-09-30 | 2018-06-30 | 2018-03-31 | 2017-12-31 | 2017-09-30 | 2017-06-30 | 2017-03-31 | 2016-12-31 | 2016-09-30 | 2016-06-30 | 2016-03-31 | 2015-12-31 | 2015-09-30 | 2015-06-30 | 2015-03-31 | 2014-12-31 | 2014-09-30 | 2014-06-30 | 2014-03-31 | ||
|---|---|---|---|---|---|---|---|---|---|---|---|---|---|---|---|---|---|---|---|---|---|---|---|---|---|---|---|---|---|---|---|---|---|---|---|---|---|---|---|---|---|
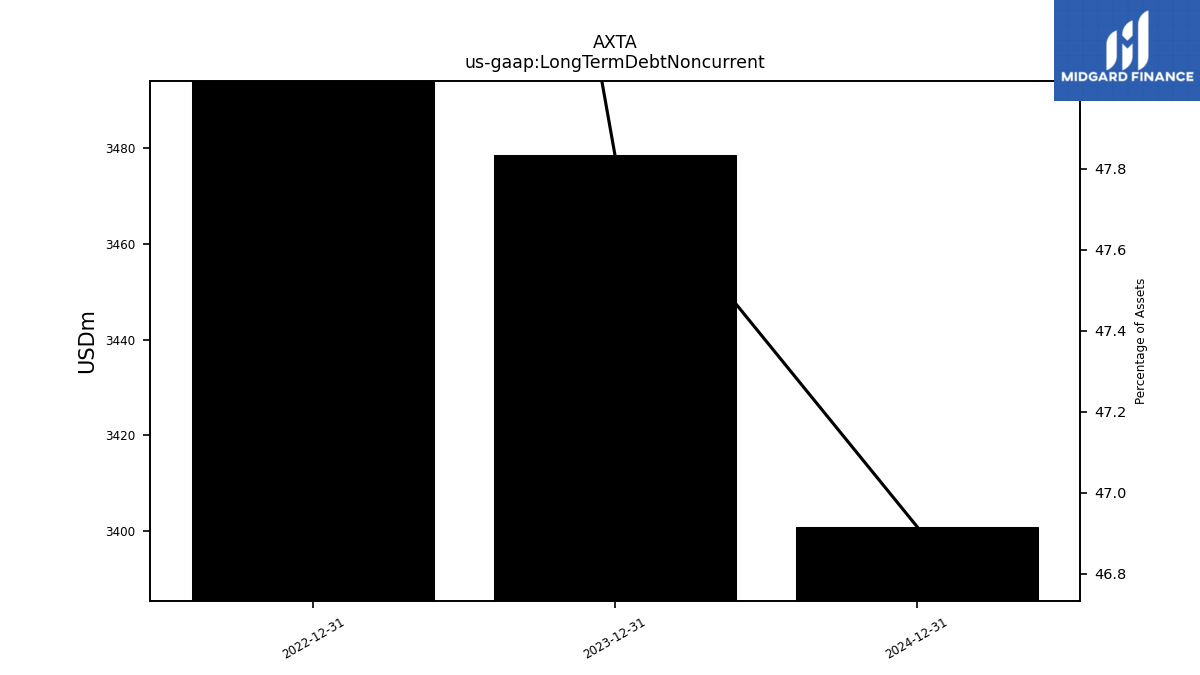
| Long Term Debt Noncurrent | 3478.50 | NA | NA | NA | 3673.30 | NA | NA | NA | NA | NA | NA | NA | NA | NA | NA | NA | NA | NA | NA | NA | NA | NA | NA | NA | NA | NA | NA | NA | NA | NA | NA | NA | NA | NA | NA | NA | NA | NA | NA | NA | |
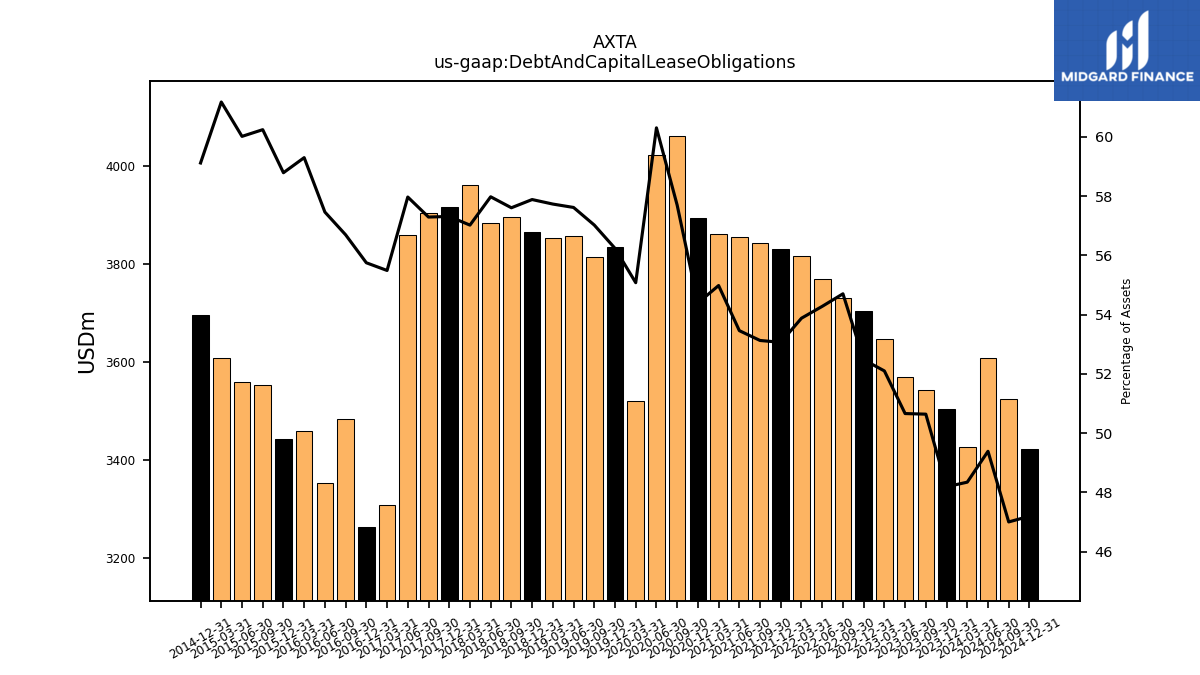
| Debt And Capital Lease Obligations | 3504.20 | 3542.60 | 3567.90 | 3647.10 | 3704.30 | 3730.00 | 3768.20 | 3815.30 | 3829.60 | 3842.50 | 3853.90 | 3860.00 | 3892.70 | 4059.60 | 4021.30 | 3519.70 | 3834.10 | 3814.70 | 3856.10 | 3852.50 | 3864.00 | 3894.50 | 3882.10 | 3961.30 | 3915.60 | 3903.00 | 3858.90 | 3307.30 | 3263.90 | 3482.30 | 3353.20 | 3458.80 | 3441.50 | 3553.50 | 3559.30 | 3608.30 | 3696.40 | NA | NA | NA | |
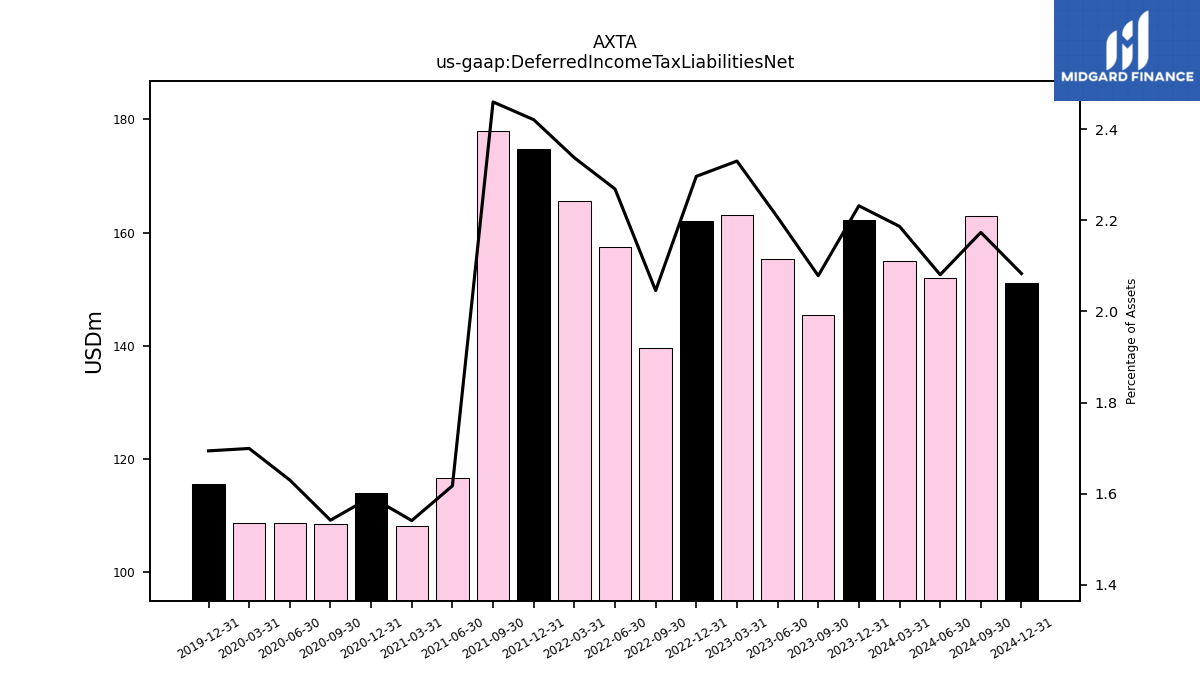
| Deferred Income Tax Liabilities Net | 162.30 | 145.40 | 155.40 | 163.10 | 162.10 | 139.50 | 157.50 | 165.50 | 174.70 | 177.90 | 116.60 | 108.20 | 114.00 | 108.50 | 108.70 | 108.60 | 115.50 | NA | NA | NA | NA | NA | NA | NA | NA | NA | NA | NA | NA | NA | NA | NA | NA | NA | NA | NA | NA | NA | NA | NA | |
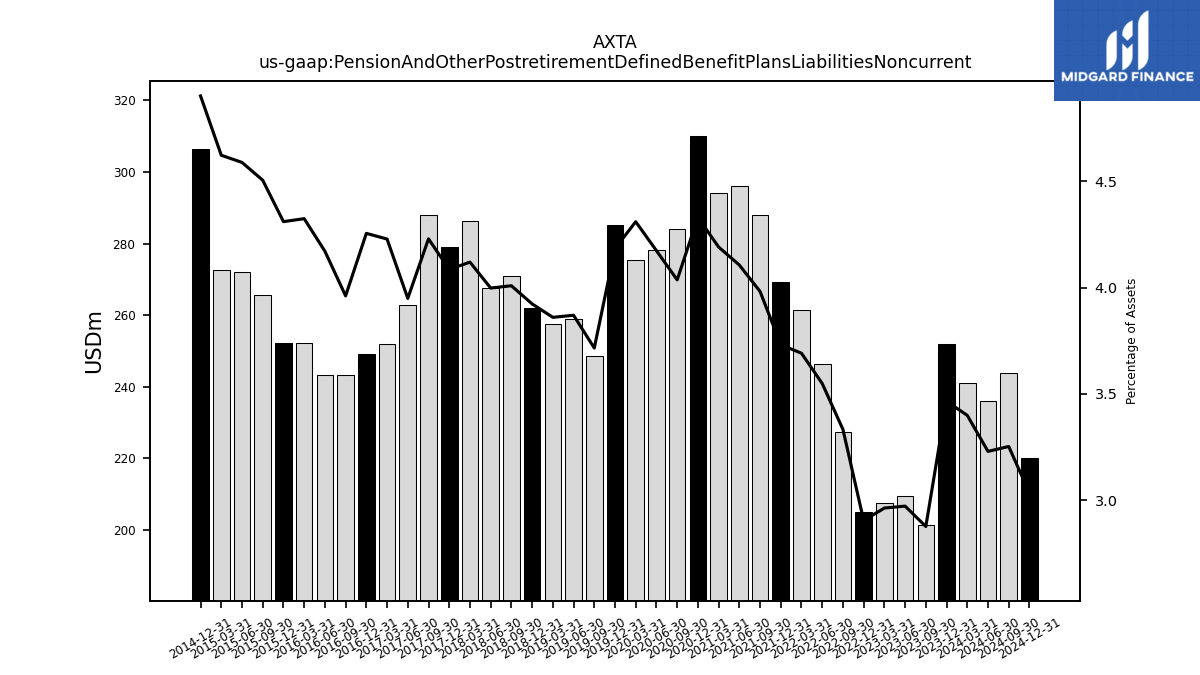
| Pension And Other Postretirement Defined Benefit Plans Liabilities Noncurrent | 252.00 | 201.30 | 209.40 | 207.50 | 205.10 | 227.30 | 246.40 | 261.40 | 269.30 | 288.00 | 296.00 | 294.20 | 309.90 | 284.00 | 278.30 | 275.40 | 285.20 | 248.60 | 259.00 | 257.60 | 261.90 | 271.00 | 267.70 | 286.20 | 279.10 | 288.10 | 262.90 | 252.00 | 249.10 | 243.30 | 243.40 | 252.20 | 252.30 | 265.70 | 272.10 | 272.60 | 306.40 | NA | NA | NA | |
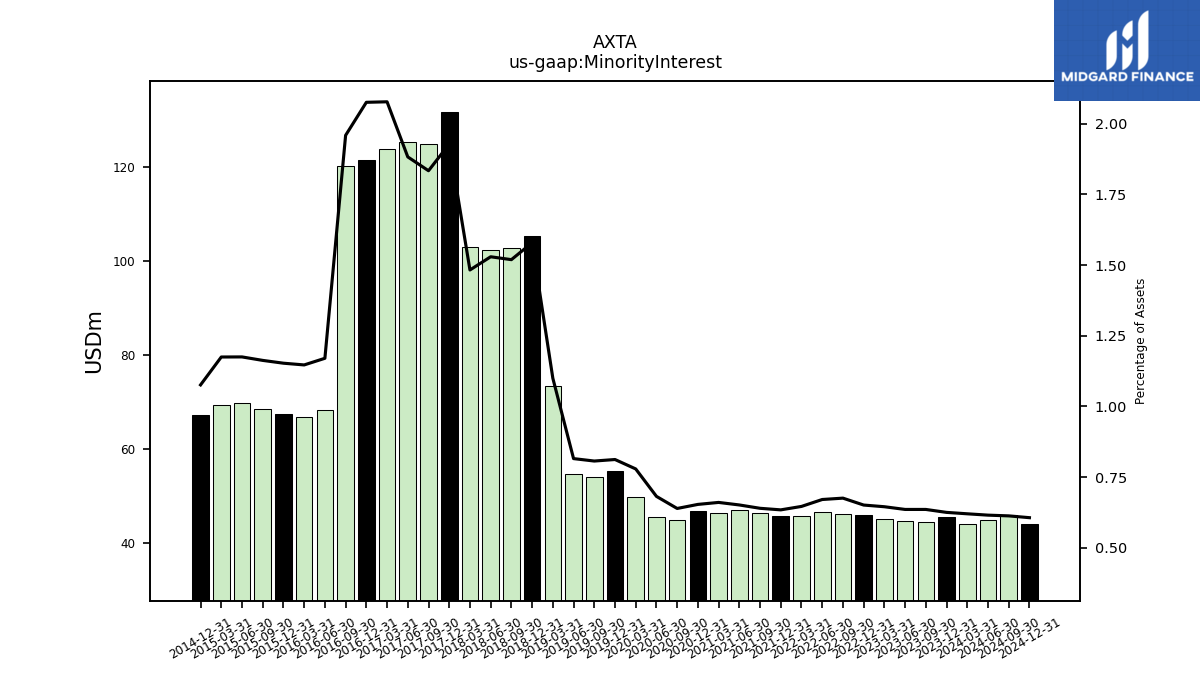
| Minority Interest | 45.50 | 44.50 | 44.80 | 45.20 | 46.00 | 46.10 | 46.60 | 45.80 | 45.80 | 46.30 | 47.00 | 46.40 | 46.80 | 45.00 | 45.50 | 49.80 | 55.40 | 54.00 | 54.60 | 73.40 | 105.40 | 102.70 | 102.40 | 103.00 | 131.70 | 124.90 | 125.30 | 123.80 | 121.50 | 120.30 | 68.30 | 66.90 | 67.50 | 68.60 | 69.70 | 69.30 | 67.30 | NA | NA | NA | |
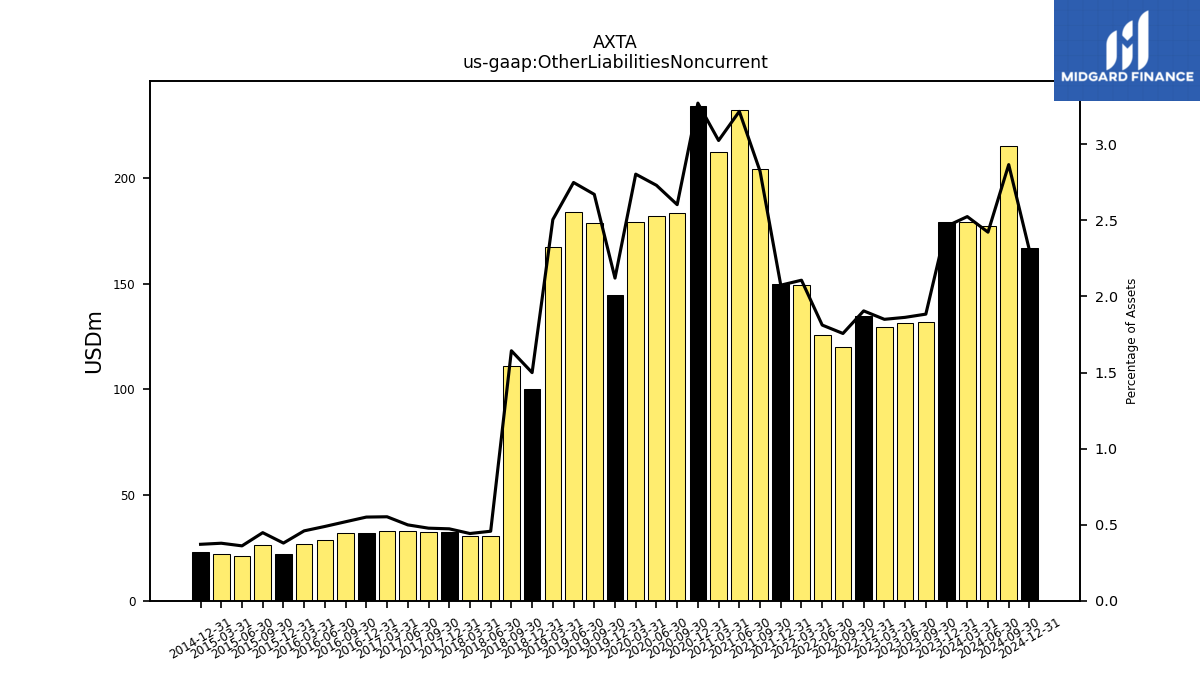
| Other Liabilities Noncurrent | 179.00 | 131.80 | 131.20 | 129.50 | 134.50 | 119.80 | 125.80 | 149.20 | 149.70 | 204.20 | 231.90 | 212.40 | 234.10 | 183.20 | 182.10 | 179.20 | 144.60 | 178.70 | 184.00 | 167.20 | 100.10 | 111.10 | 30.60 | 30.70 | 32.30 | 32.50 | 33.20 | 32.90 | 32.20 | 31.90 | 28.50 | 26.80 | 22.20 | 26.40 | 21.40 | 22.30 | 23.20 | NA | NA | NA | |
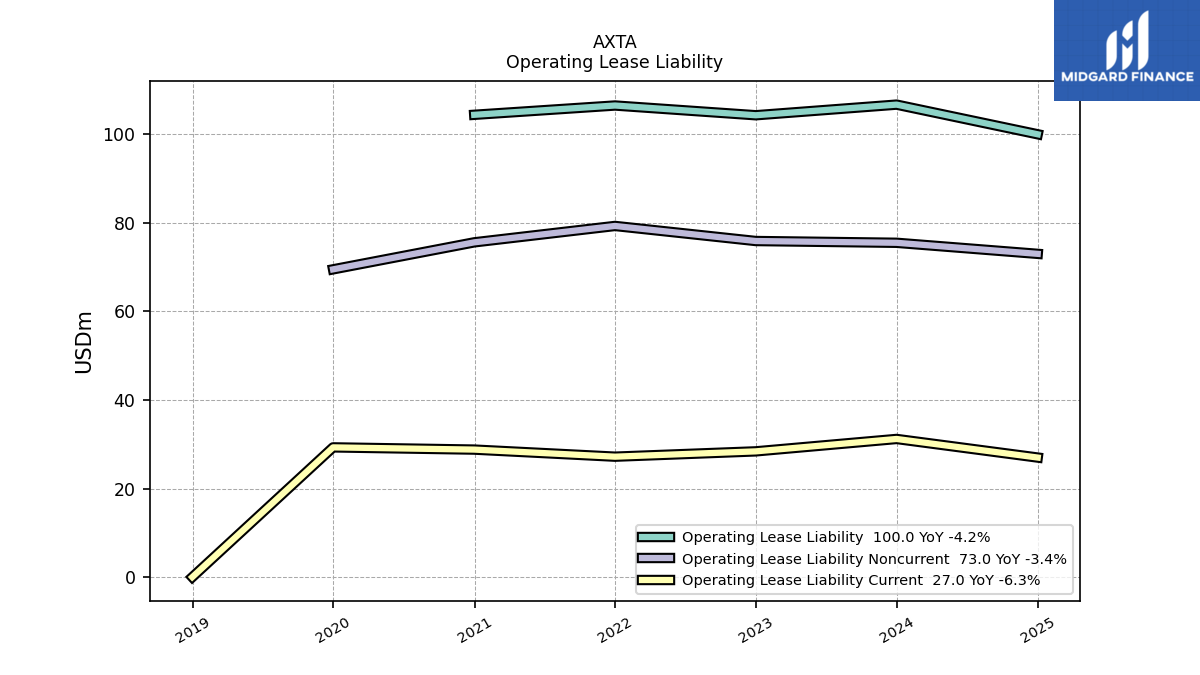
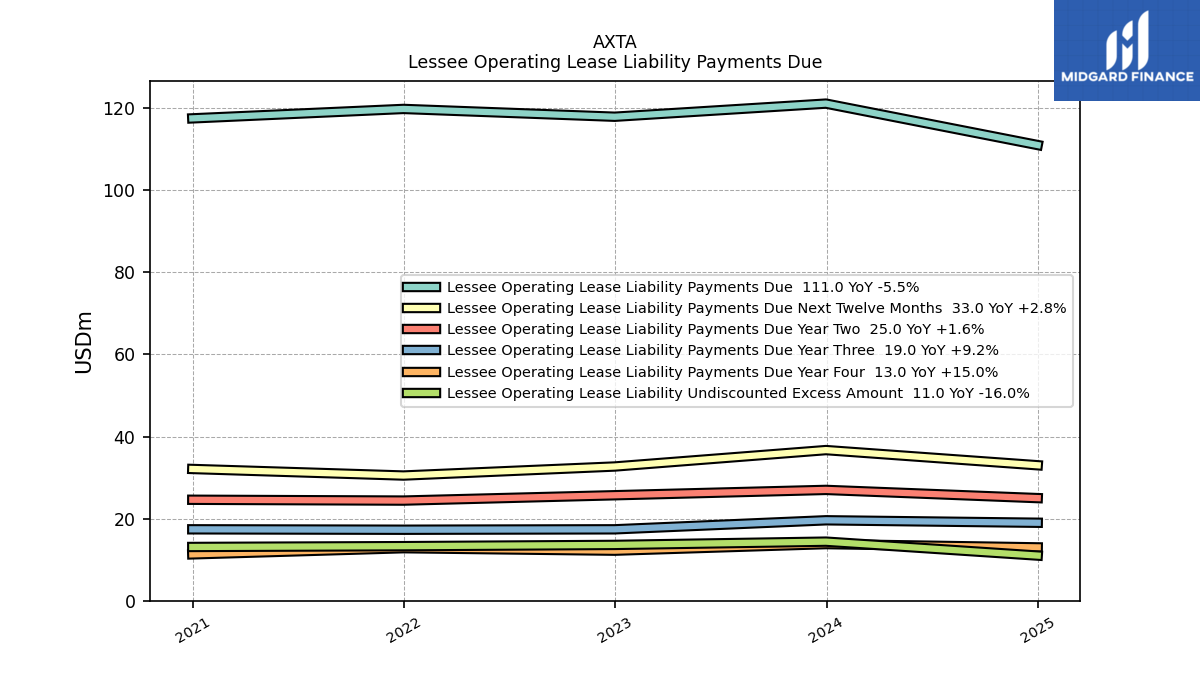
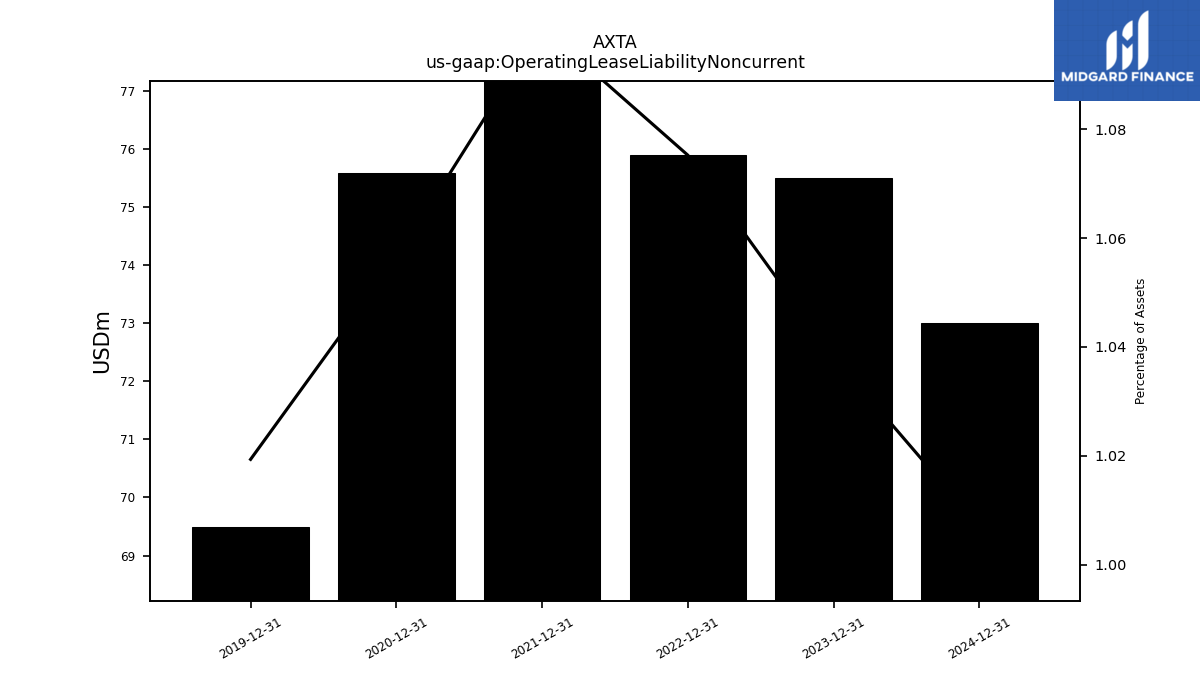
| Operating Lease Liability Noncurrent | 75.50 | NA | NA | NA | 75.90 | NA | NA | NA | 79.30 | NA | NA | NA | 75.60 | NA | NA | NA | 69.50 | NA | NA | NA | NA | NA | NA | NA | NA | NA | NA | NA | NA | NA | NA | NA | NA | NA | NA | NA | NA | NA | NA | NA |
| 2023-12-31 | 2023-09-30 | 2023-06-30 | 2023-03-31 | 2022-12-31 | 2022-09-30 | 2022-06-30 | 2022-03-31 | 2021-12-31 | 2021-09-30 | 2021-06-30 | 2021-03-31 | 2020-12-31 | 2020-09-30 | 2020-06-30 | 2020-03-31 | 2019-12-31 | 2019-09-30 | 2019-06-30 | 2019-03-31 | 2018-12-31 | 2018-09-30 | 2018-06-30 | 2018-03-31 | 2017-12-31 | 2017-09-30 | 2017-06-30 | 2017-03-31 | 2016-12-31 | 2016-09-30 | 2016-06-30 | 2016-03-31 | 2015-12-31 | 2015-09-30 | 2015-06-30 | 2015-03-31 | 2014-12-31 | 2014-09-30 | 2014-06-30 | 2014-03-31 | ||
|---|---|---|---|---|---|---|---|---|---|---|---|---|---|---|---|---|---|---|---|---|---|---|---|---|---|---|---|---|---|---|---|---|---|---|---|---|---|---|---|---|---|
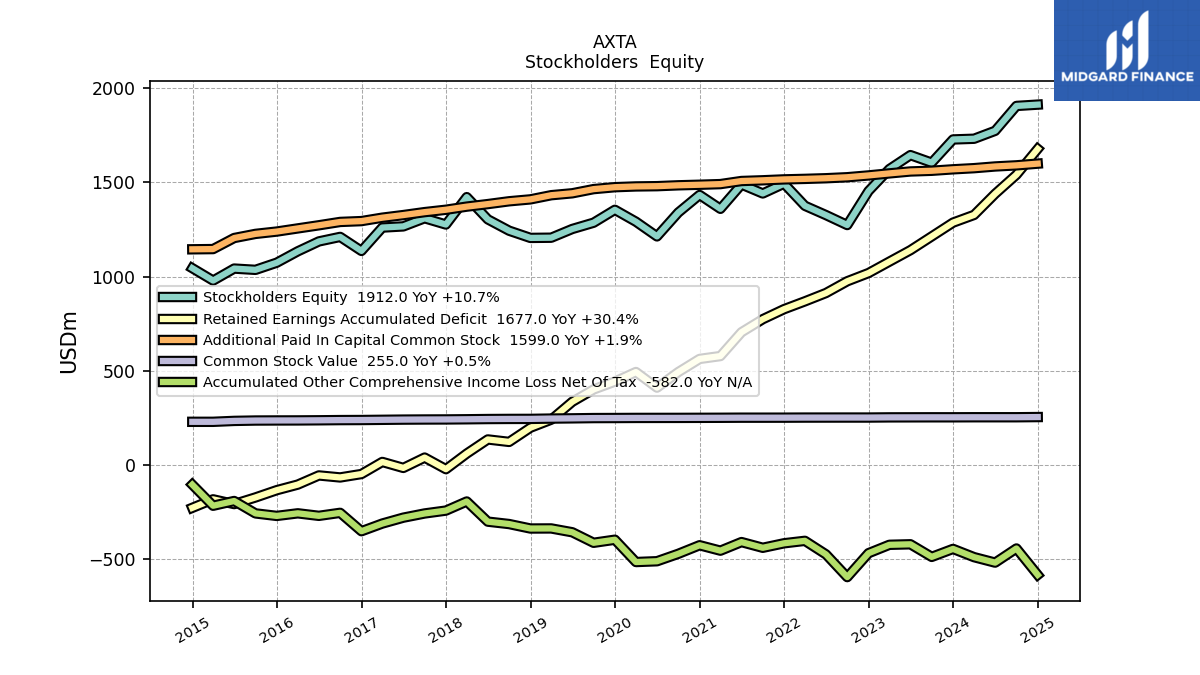
| Stockholders Equity | 1727.30 | 1604.10 | 1644.20 | 1570.10 | 1453.50 | 1273.30 | 1326.20 | 1375.40 | 1492.90 | 1440.80 | 1488.30 | 1359.40 | 1433.00 | 1339.70 | 1213.10 | 1291.00 | 1354.20 | 1285.70 | 1252.50 | 1206.20 | 1205.10 | 1243.40 | 1303.50 | 1421.40 | 1276.10 | 1309.40 | 1266.20 | 1260.00 | 1136.10 | 1210.50 | 1186.50 | 1134.10 | 1073.70 | 1035.70 | 1042.50 | 978.90 | 1044.70 | NA | NA | NA | |
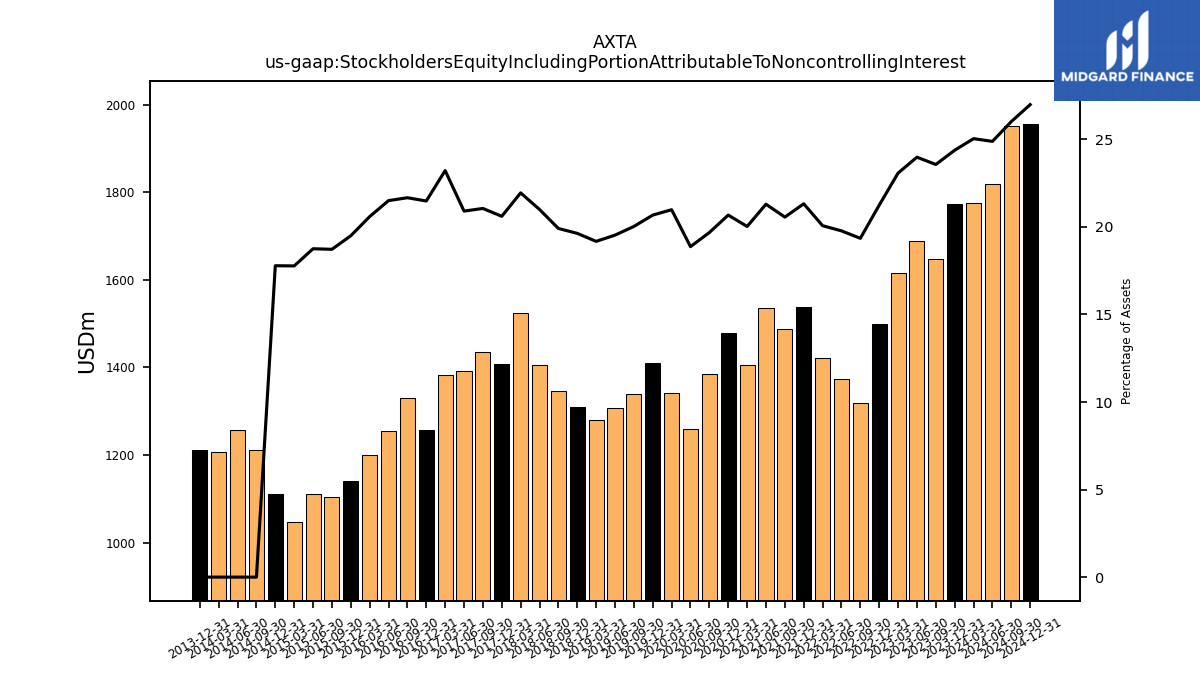
| Stockholders Equity Including Portion Attributable To Noncontrolling Interest | 1772.80 | 1648.60 | 1689.00 | 1615.30 | 1499.50 | 1319.40 | 1372.80 | 1421.20 | 1538.70 | 1487.10 | 1535.30 | 1405.80 | 1479.80 | 1384.70 | 1258.60 | 1340.80 | 1409.60 | 1339.70 | 1307.10 | 1279.60 | 1310.50 | 1346.10 | 1405.90 | 1524.40 | 1407.80 | 1434.30 | 1391.50 | 1383.80 | 1257.60 | 1330.80 | 1254.80 | 1201.00 | 1141.20 | 1104.30 | 1112.20 | 1048.20 | 1112.00 | 1212.60 | 1256.70 | 1206.00 | |
| Common Stock Value | 253.70 | 253.70 | 253.50 | 253.30 | 252.40 | 252.40 | 252.30 | 252.20 | 251.80 | 251.70 | 251.70 | 251.20 | 250.90 | 250.60 | 250.50 | 250.40 | 249.90 | 249.60 | 248.20 | 247.00 | 245.30 | 245.10 | 244.50 | 243.30 | 242.40 | 242.10 | 241.50 | 240.40 | 239.30 | 238.90 | 237.90 | 237.20 | 237.00 | 236.60 | 234.60 | 229.80 | 229.80 | NA | NA | NA | |
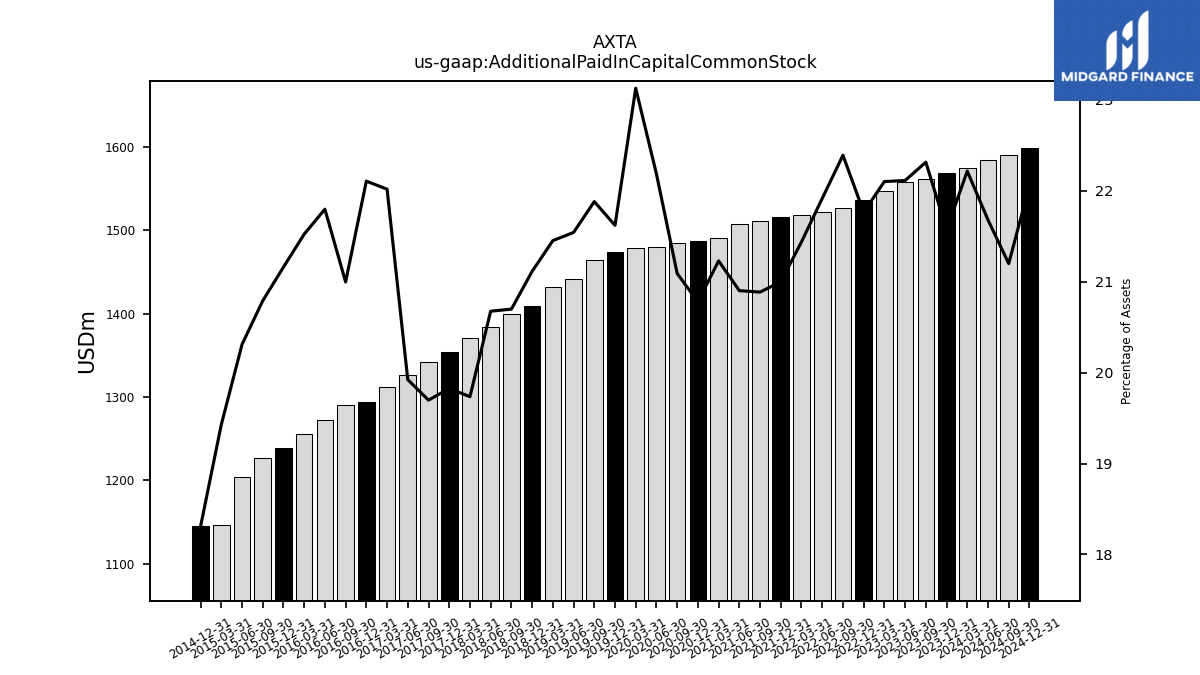
| Additional Paid In Capital Common Stock | 1568.90 | 1561.20 | 1557.50 | 1547.30 | 1536.50 | 1526.90 | 1521.60 | 1518.20 | 1515.50 | 1510.70 | 1506.90 | 1490.50 | 1487.10 | 1484.10 | 1479.50 | 1478.10 | 1474.10 | 1463.90 | 1441.80 | 1431.60 | 1409.50 | 1399.40 | 1384.50 | 1371.10 | 1354.50 | 1341.90 | 1326.30 | 1312.40 | 1294.30 | 1289.80 | 1272.10 | 1255.50 | 1238.80 | 1226.40 | 1204.50 | 1145.90 | 1144.70 | NA | NA | NA | |
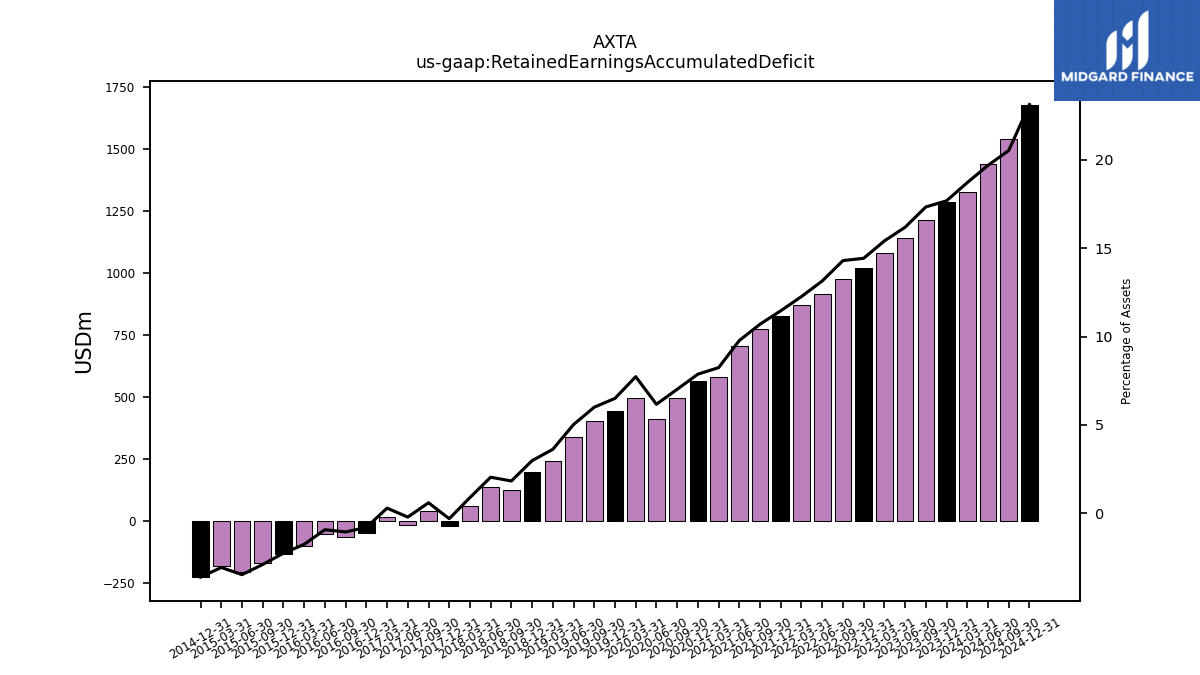
| Retained Earnings Accumulated Deficit | 1286.20 | 1213.10 | 1140.20 | 1079.30 | 1018.80 | 975.20 | 912.80 | 868.70 | 827.20 | 774.00 | 704.90 | 578.50 | 563.30 | 493.60 | 411.10 | 493.90 | 443.20 | 401.50 | 336.00 | 241.30 | 198.60 | 123.20 | 136.30 | 61.40 | -21.40 | 40.10 | -14.80 | 17.00 | -47.10 | -65.30 | -54.60 | -103.10 | -132.80 | -171.40 | -206.50 | -181.40 | -226.50 | NA | NA | NA | |
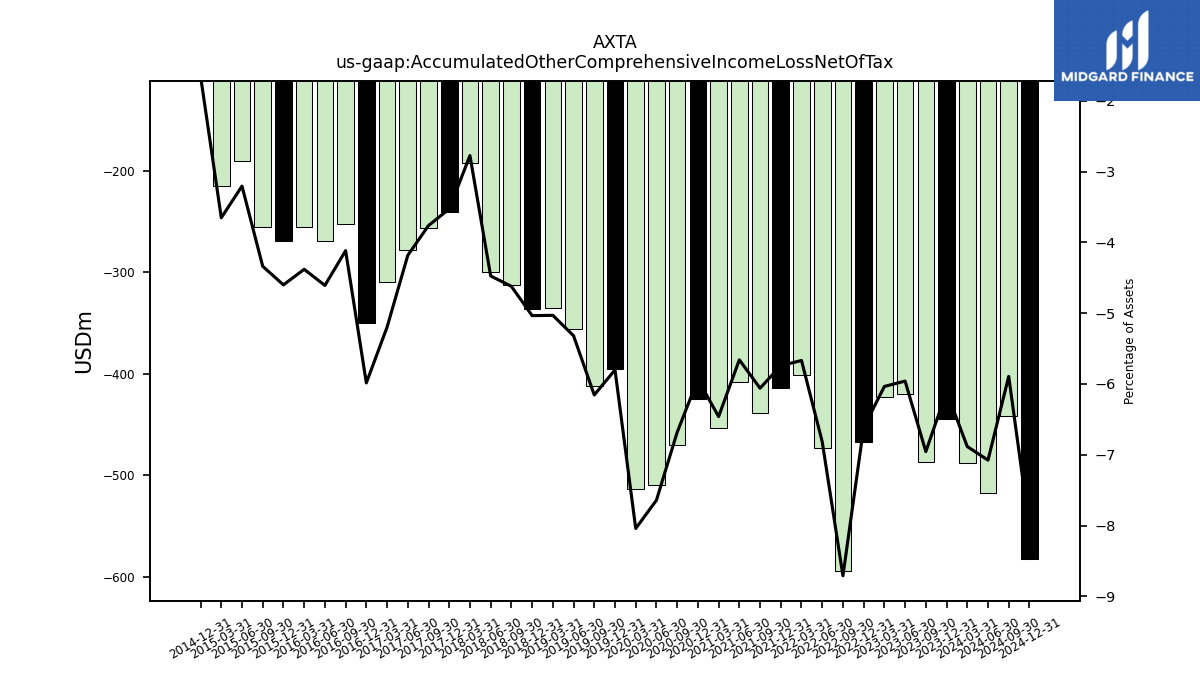
| Accumulated Other Comprehensive Income Loss Net Of Tax | -444.20 | -486.60 | -419.70 | -422.50 | -466.90 | -593.90 | -473.20 | -401.40 | -414.40 | -438.30 | -408.00 | -453.60 | -424.80 | -470.20 | -509.60 | -513.90 | -395.50 | -411.80 | -356.00 | -335.70 | -336.10 | -312.40 | -299.60 | -192.70 | -241.00 | -256.30 | -278.50 | -309.80 | -350.40 | -252.90 | -268.90 | -255.50 | -269.30 | -255.90 | -190.10 | -215.40 | -103.30 | NA | NA | NA | |
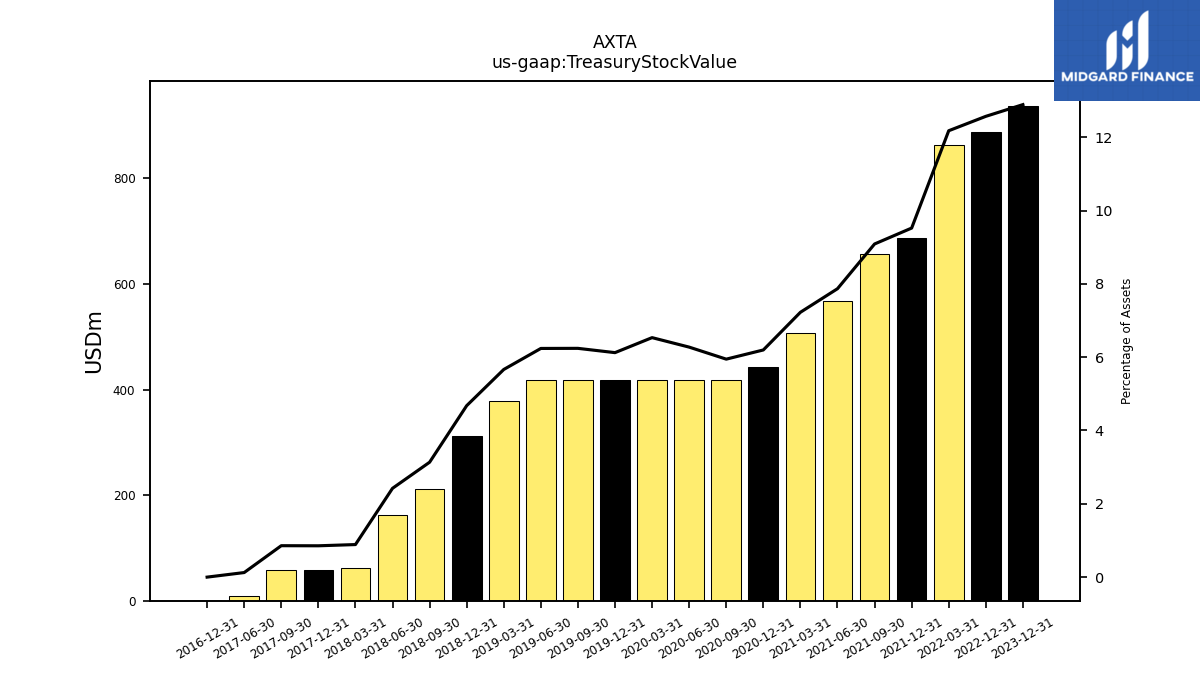
| Treasury Stock Value | 937.30 | NA | NA | NA | 887.30 | NA | NA | 862.30 | 687.20 | 657.30 | 567.20 | 507.20 | 443.50 | 418.40 | 418.40 | 417.50 | 417.50 | 417.50 | 417.50 | 378.00 | 312.20 | 211.90 | 162.20 | 61.70 | 58.40 | 58.40 | 8.30 | NA | 0.00 | NA | NA | NA | NA | NA | NA | NA | NA | NA | NA | NA | |
| Minority Interest | 45.50 | 44.50 | 44.80 | 45.20 | 46.00 | 46.10 | 46.60 | 45.80 | 45.80 | 46.30 | 47.00 | 46.40 | 46.80 | 45.00 | 45.50 | 49.80 | 55.40 | 54.00 | 54.60 | 73.40 | 105.40 | 102.70 | 102.40 | 103.00 | 131.70 | 124.90 | 125.30 | 123.80 | 121.50 | 120.30 | 68.30 | 66.90 | 67.50 | 68.60 | 69.70 | 69.30 | 67.30 | NA | NA | NA |
| 2023-12-31 | 2023-09-30 | 2023-06-30 | 2023-03-31 | 2022-12-31 | 2022-09-30 | 2022-06-30 | 2022-03-31 | 2021-12-31 | 2021-09-30 | 2021-06-30 | 2021-03-31 | 2020-12-31 | 2020-09-30 | 2020-06-30 | 2020-03-31 | 2019-12-31 | 2019-09-30 | 2019-06-30 | 2019-03-31 | 2018-12-31 | 2018-09-30 | 2018-06-30 | 2018-03-31 | 2017-12-31 | 2017-09-30 | 2017-06-30 | 2017-03-31 | 2016-12-31 | 2016-09-30 | 2016-06-30 | 2016-03-31 | 2015-12-31 | 2015-09-30 | 2015-06-30 | 2015-03-31 | 2014-12-31 | 2014-09-30 | 2014-06-30 | 2014-03-31 | ||
|---|---|---|---|---|---|---|---|---|---|---|---|---|---|---|---|---|---|---|---|---|---|---|---|---|---|---|---|---|---|---|---|---|---|---|---|---|---|---|---|---|---|
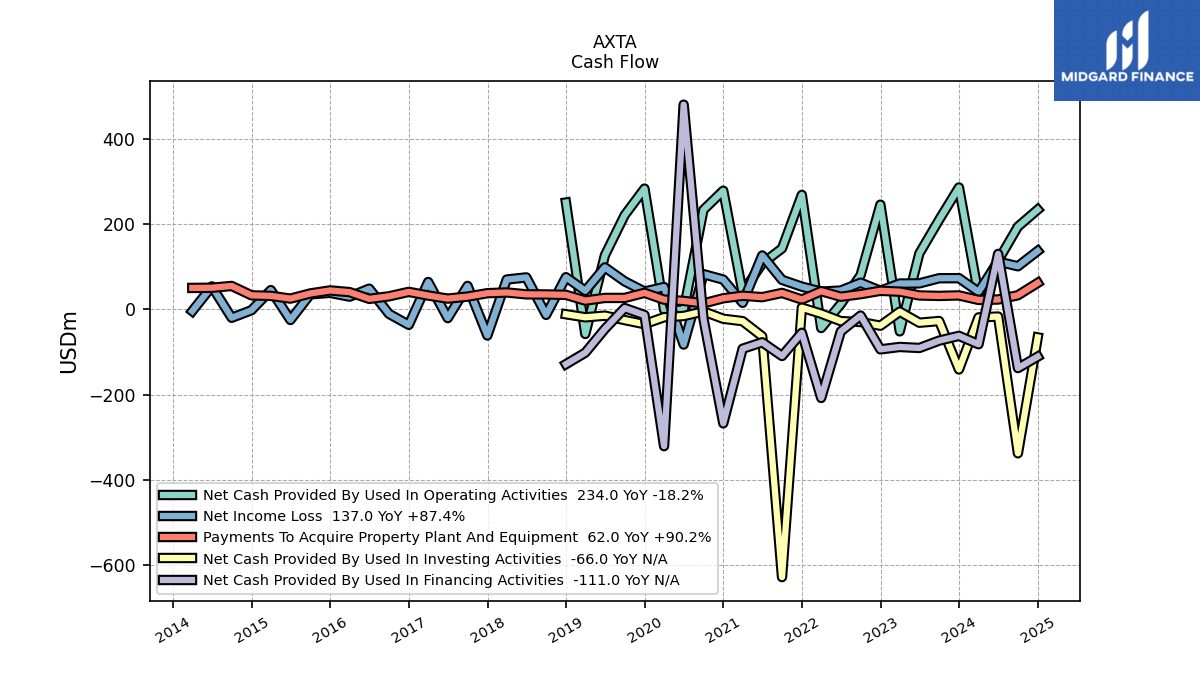
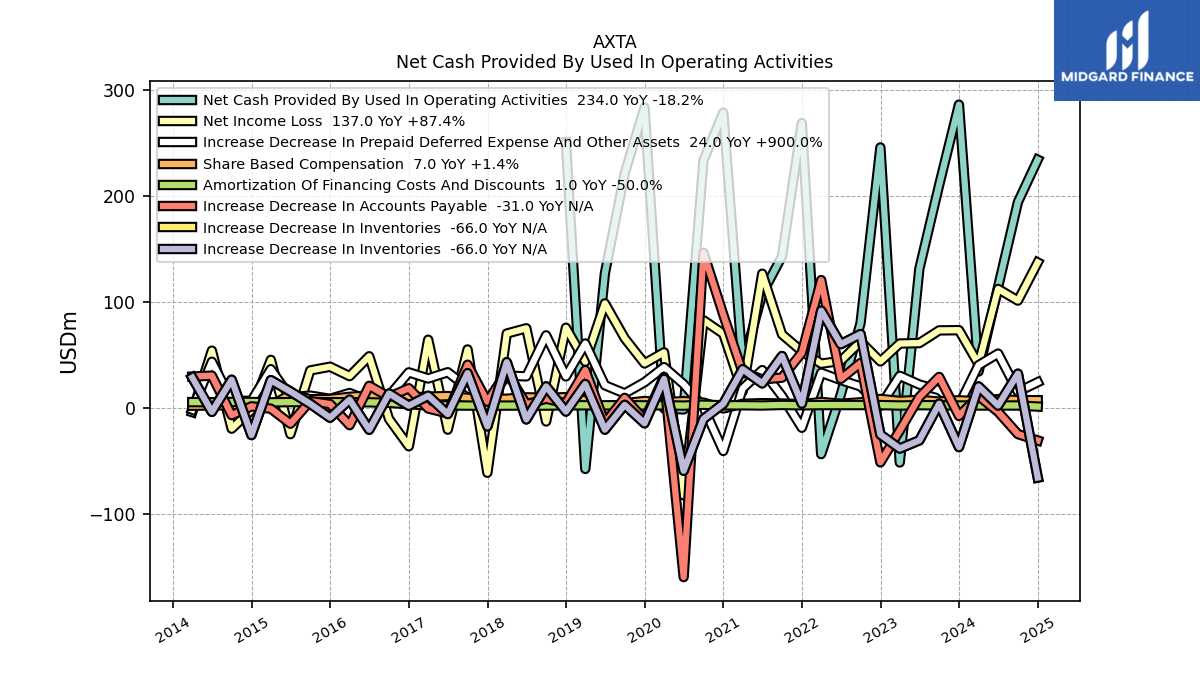
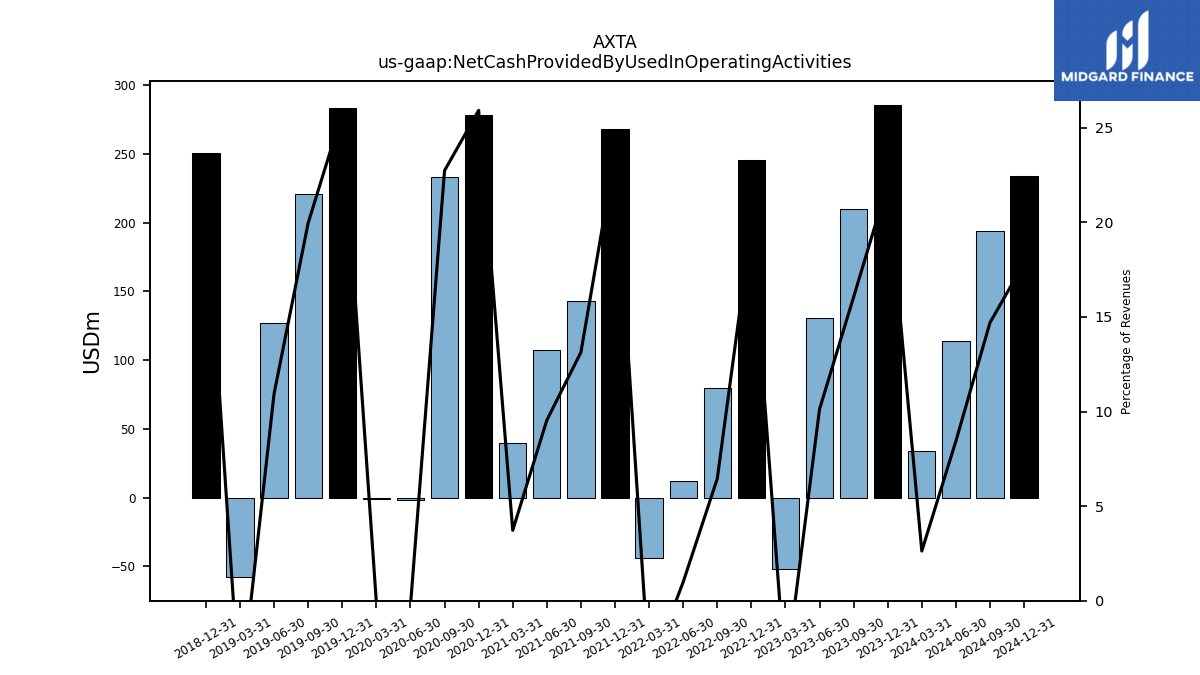
| Net Cash Provided By Used In Operating Activities | 286.00 | 210.10 | 131.00 | -51.80 | 245.60 | 79.90 | 12.20 | -43.90 | 268.60 | 142.90 | 107.50 | 39.60 | 278.40 | 233.40 | -1.70 | -0.80 | 283.30 | 221.00 | 126.70 | -57.90 | 250.60 | NA | NA | NA | NA | NA | NA | NA | NA | NA | NA | NA | NA | NA | NA | NA | NA | NA | NA | NA | |
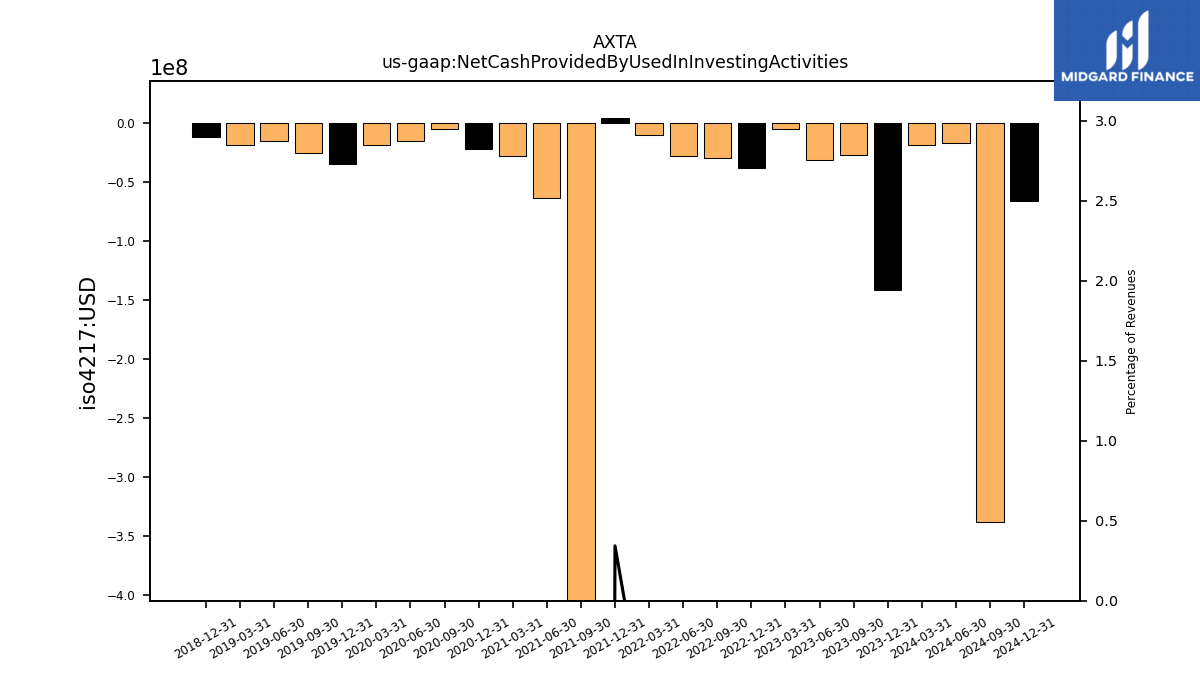
| Net Cash Provided By Used In Investing Activities | -141.20 | -27.50 | -31.50 | -5.50 | -38.50 | -29.80 | -27.80 | -10.30 | 3.90 | -628.60 | -63.50 | -27.80 | -22.20 | -5.00 | -15.70 | -18.60 | -34.90 | -25.30 | -14.90 | -18.80 | -11.60 | NA | NA | NA | NA | NA | NA | NA | NA | NA | NA | NA | NA | NA | NA | NA | NA | NA | NA | NA | |
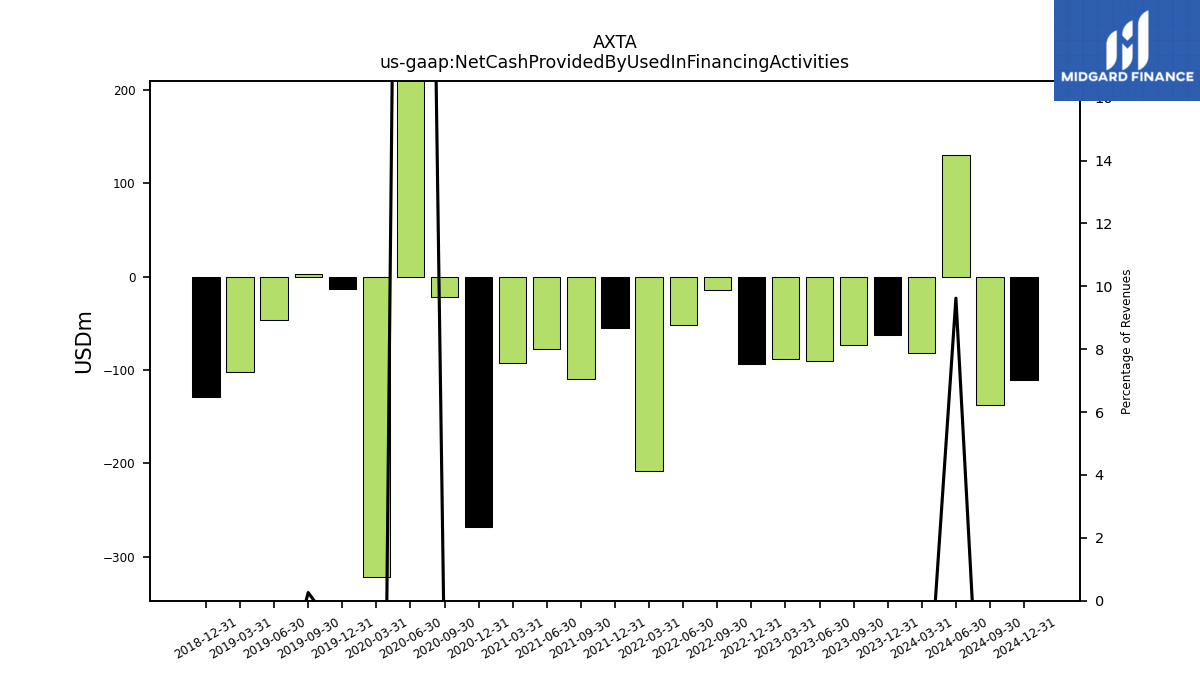
| Net Cash Provided By Used In Financing Activities | -62.30 | -73.50 | -90.80 | -88.40 | -94.00 | -14.70 | -52.10 | -208.10 | -55.00 | -109.60 | -77.40 | -92.50 | -267.70 | -22.30 | 480.40 | -321.30 | -13.40 | 2.90 | -46.10 | -101.80 | -128.80 | NA | NA | NA | NA | NA | NA | NA | NA | NA | NA | NA | NA | NA | NA | NA | NA | NA | NA | NA |
| 2023-12-31 | 2023-09-30 | 2023-06-30 | 2023-03-31 | 2022-12-31 | 2022-09-30 | 2022-06-30 | 2022-03-31 | 2021-12-31 | 2021-09-30 | 2021-06-30 | 2021-03-31 | 2020-12-31 | 2020-09-30 | 2020-06-30 | 2020-03-31 | 2019-12-31 | 2019-09-30 | 2019-06-30 | 2019-03-31 | 2018-12-31 | 2018-09-30 | 2018-06-30 | 2018-03-31 | 2017-12-31 | 2017-09-30 | 2017-06-30 | 2017-03-31 | 2016-12-31 | 2016-09-30 | 2016-06-30 | 2016-03-31 | 2015-12-31 | 2015-09-30 | 2015-06-30 | 2015-03-31 | 2014-12-31 | 2014-09-30 | 2014-06-30 | 2014-03-31 | ||
|---|---|---|---|---|---|---|---|---|---|---|---|---|---|---|---|---|---|---|---|---|---|---|---|---|---|---|---|---|---|---|---|---|---|---|---|---|---|---|---|---|---|
| Net Cash Provided By Used In Operating Activities | 286.00 | 210.10 | 131.00 | -51.80 | 245.60 | 79.90 | 12.20 | -43.90 | 268.60 | 142.90 | 107.50 | 39.60 | 278.40 | 233.40 | -1.70 | -0.80 | 283.30 | 221.00 | 126.70 | -57.90 | 250.60 | NA | NA | NA | NA | NA | NA | NA | NA | NA | NA | NA | NA | NA | NA | NA | NA | NA | NA | NA | |
| Net Income Loss | 73.10 | 72.90 | 60.90 | 60.50 | 43.60 | 62.40 | 44.10 | 41.50 | 53.20 | 69.10 | 126.40 | 15.20 | 69.70 | 82.50 | -82.80 | 52.20 | 41.70 | 65.50 | 98.40 | 43.40 | 75.40 | -13.10 | 74.90 | 69.90 | -61.50 | 54.90 | -20.80 | 64.10 | -36.50 | -10.70 | 48.50 | 29.70 | 38.60 | 35.10 | -25.10 | 45.10 | -2.20 | -19.90 | 53.80 | -4.30 | |
| Profit Loss | 73.60 | 73.30 | 61.10 | 60.50 | 43.90 | 63.30 | 44.10 | 40.90 | 53.40 | 68.90 | 126.40 | 15.70 | 70.30 | 82.50 | -83.20 | 52.40 | 42.20 | 66.40 | 99.90 | 44.10 | 76.80 | -11.60 | 77.10 | 71.00 | -55.60 | 56.30 | -18.90 | 65.90 | -34.40 | -9.50 | 50.10 | 30.60 | 39.10 | 36.40 | -24.30 | 46.70 | 0.90 | -18.30 | 55.80 | -3.70 | |
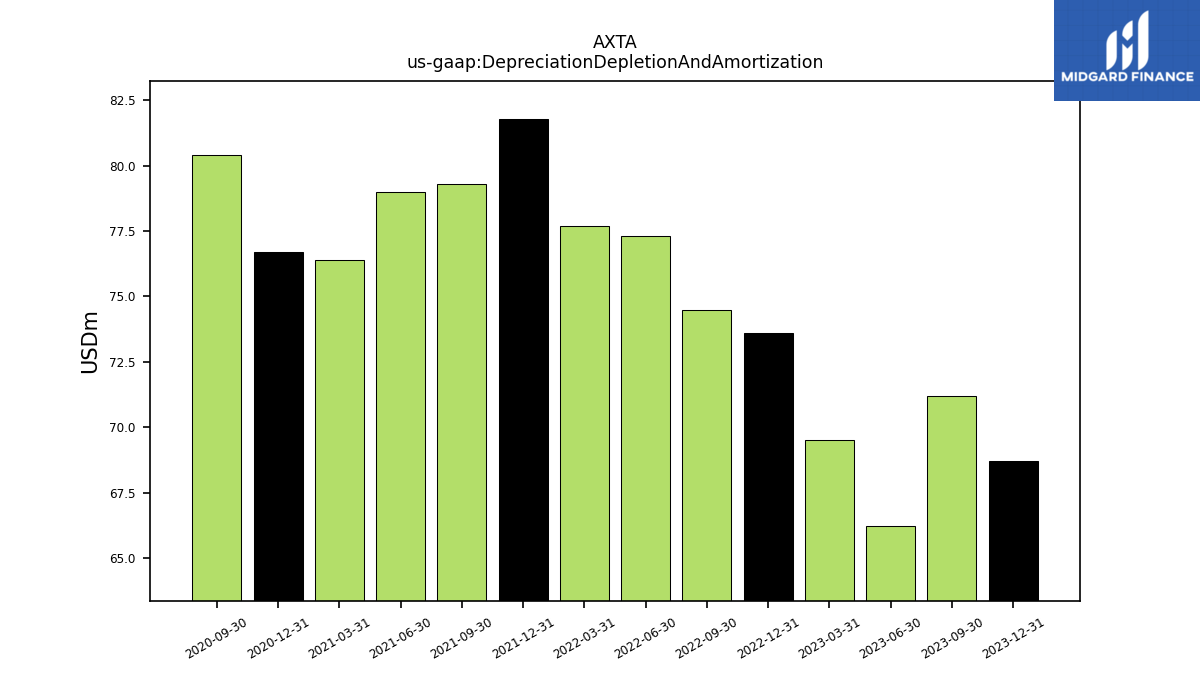
| Depreciation Depletion And Amortization | 68.70 | 71.20 | 66.20 | 69.50 | 73.60 | 74.50 | 77.30 | 77.70 | 81.80 | 79.30 | 79.00 | 76.40 | 76.70 | 80.40 | NA | NA | NA | NA | NA | NA | NA | NA | NA | NA | NA | NA | NA | NA | NA | NA | NA | NA | NA | NA | NA | NA | NA | NA | NA | NA | |
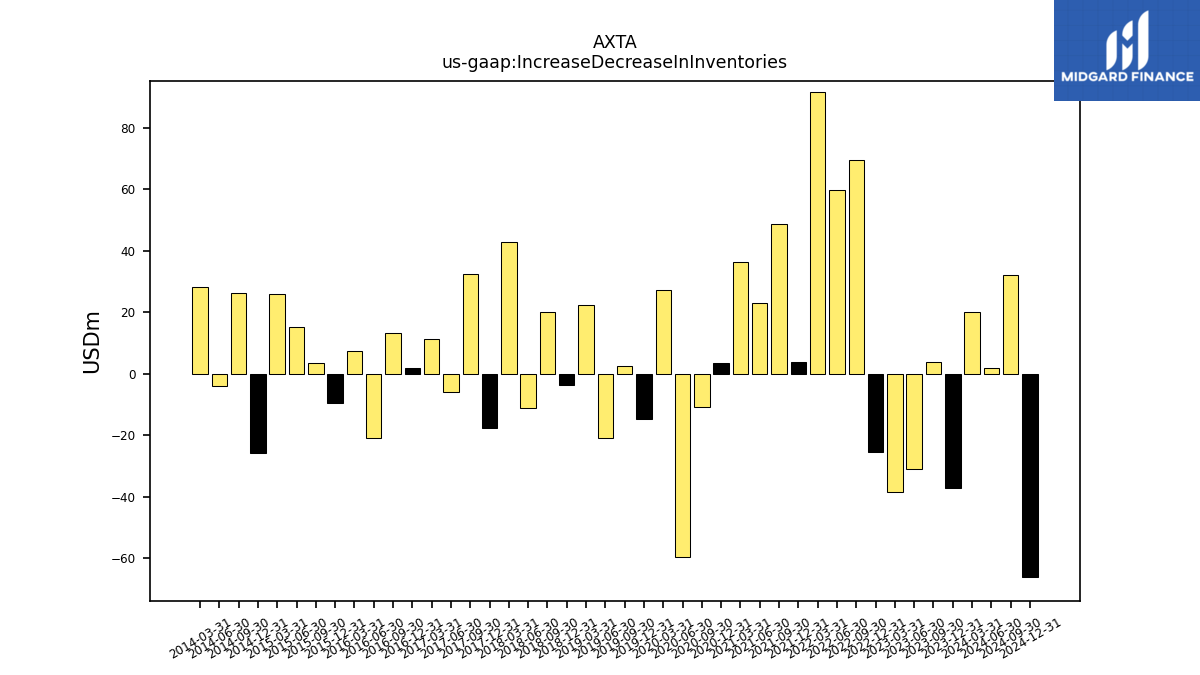
| Increase Decrease In Inventories | -37.30 | 3.70 | -30.90 | -38.60 | -25.40 | 69.40 | 59.90 | 91.50 | 3.80 | 48.70 | 22.90 | 36.20 | 3.60 | -10.70 | -59.60 | 27.10 | -14.80 | 2.60 | -20.80 | 22.20 | -3.70 | 20.00 | -11.10 | 42.90 | -17.70 | 32.50 | -6.10 | 11.20 | 1.80 | 13.30 | -20.90 | 7.50 | -9.50 | 3.60 | 15.20 | 25.90 | -25.90 | 26.30 | -4.00 | 28.30 | |
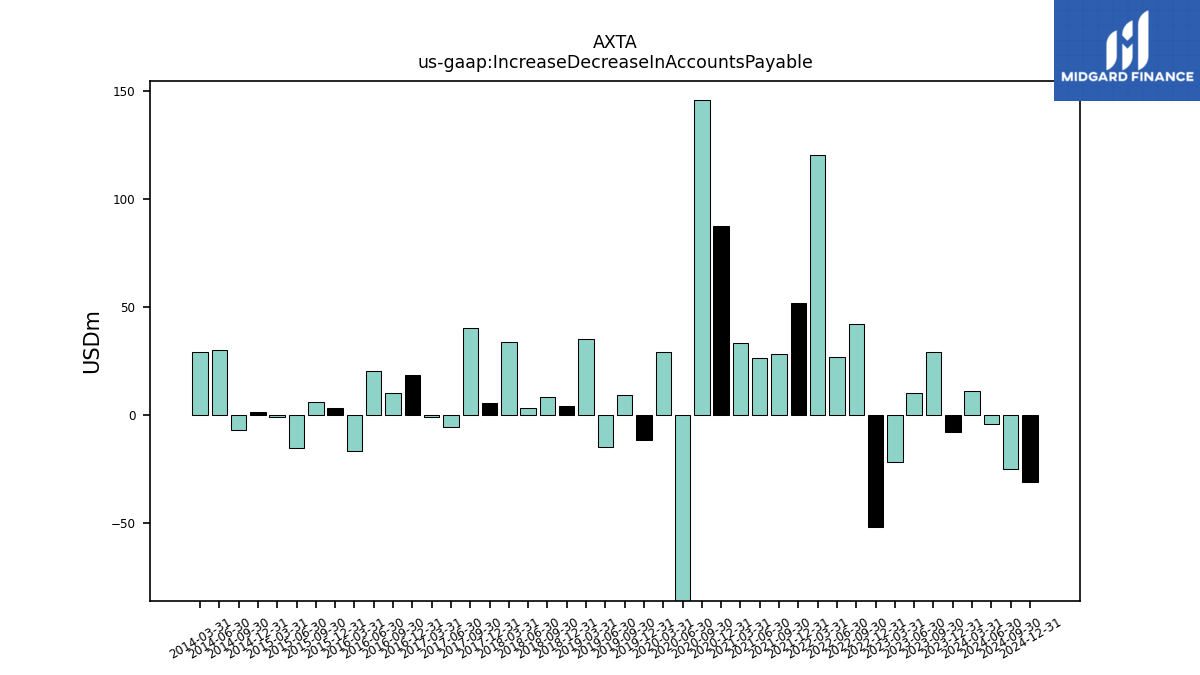
| Increase Decrease In Accounts Payable | -7.90 | 29.00 | 10.00 | -21.70 | -51.70 | 42.20 | 27.10 | 120.40 | 51.80 | 28.30 | 26.60 | 33.40 | 87.80 | 146.20 | -160.00 | 29.00 | -11.70 | 9.20 | -14.70 | 35.40 | 4.10 | 8.40 | 3.10 | 33.90 | 5.60 | 40.50 | -5.50 | -0.80 | 18.30 | 10.00 | 20.60 | -16.60 | 3.40 | 6.10 | -15.20 | -1.00 | 1.20 | -7.10 | 30.20 | 29.30 | |
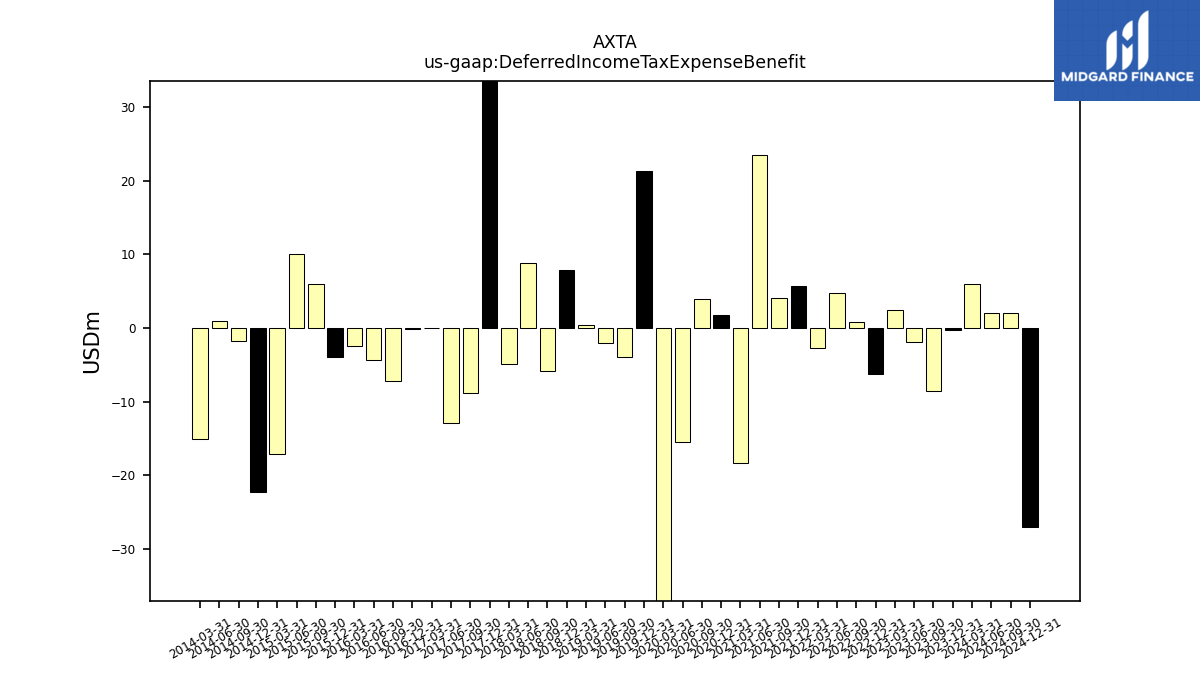
| Deferred Income Tax Expense Benefit | -0.30 | -8.60 | -1.90 | 2.40 | -6.20 | 0.80 | 4.70 | -2.70 | 5.70 | 4.10 | 23.50 | -18.30 | 1.80 | 4.00 | -15.50 | -45.70 | 21.30 | -4.00 | -2.00 | 0.40 | 7.90 | -5.80 | 8.90 | -4.90 | 113.40 | -8.80 | -12.90 | 0.00 | -0.20 | -7.20 | -4.40 | -2.40 | -3.90 | 6.00 | 10.10 | -17.20 | -22.30 | -1.80 | 1.00 | -15.10 | |
| Share Based Compensation | 6.90 | 5.70 | 7.30 | 6.30 | 8.20 | 5.00 | 3.70 | 5.30 | 3.20 | 3.90 | 4.20 | 3.60 | -0.80 | 4.70 | 6.10 | 5.10 | 6.20 | 4.20 | -1.40 | 6.70 | 9.80 | 9.40 | 9.70 | 8.40 | 8.00 | 9.20 | 10.90 | 10.40 | 9.50 | 10.00 | 11.40 | 10.20 | 8.10 | 7.90 | 12.40 | 1.80 | 1.90 | 2.30 | 2.00 | 1.80 |
| 2023-12-31 | 2023-09-30 | 2023-06-30 | 2023-03-31 | 2022-12-31 | 2022-09-30 | 2022-06-30 | 2022-03-31 | 2021-12-31 | 2021-09-30 | 2021-06-30 | 2021-03-31 | 2020-12-31 | 2020-09-30 | 2020-06-30 | 2020-03-31 | 2019-12-31 | 2019-09-30 | 2019-06-30 | 2019-03-31 | 2018-12-31 | 2018-09-30 | 2018-06-30 | 2018-03-31 | 2017-12-31 | 2017-09-30 | 2017-06-30 | 2017-03-31 | 2016-12-31 | 2016-09-30 | 2016-06-30 | 2016-03-31 | 2015-12-31 | 2015-09-30 | 2015-06-30 | 2015-03-31 | 2014-12-31 | 2014-09-30 | 2014-06-30 | 2014-03-31 | ||
|---|---|---|---|---|---|---|---|---|---|---|---|---|---|---|---|---|---|---|---|---|---|---|---|---|---|---|---|---|---|---|---|---|---|---|---|---|---|---|---|---|---|
| Net Cash Provided By Used In Investing Activities | -141.20 | -27.50 | -31.50 | -5.50 | -38.50 | -29.80 | -27.80 | -10.30 | 3.90 | -628.60 | -63.50 | -27.80 | -22.20 | -5.00 | -15.70 | -18.60 | -34.90 | -25.30 | -14.90 | -18.80 | -11.60 | NA | NA | NA | NA | NA | NA | NA | NA | NA | NA | NA | NA | NA | NA | NA | NA | NA | NA | NA | |
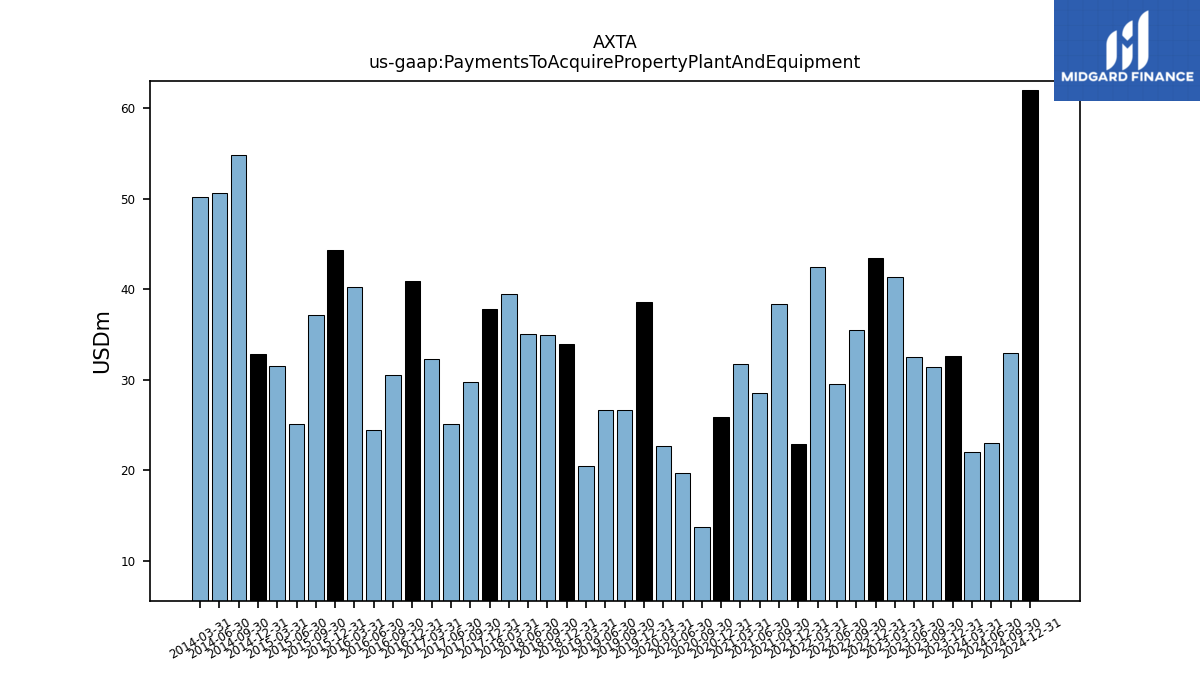
| Payments To Acquire Property Plant And Equipment | 32.60 | 31.40 | 32.50 | 41.40 | 43.40 | 35.50 | 29.50 | 42.50 | 22.90 | 38.40 | 28.50 | 31.80 | 25.90 | 13.80 | 19.70 | 22.70 | 38.60 | 26.70 | 26.70 | 20.50 | 33.90 | 34.90 | 35.10 | 39.50 | 37.80 | 29.80 | 25.10 | 32.30 | 40.90 | 30.50 | 24.50 | 40.30 | 44.30 | 37.20 | 25.10 | 31.50 | 32.80 | 54.80 | 50.60 | 50.20 |
| 2023-12-31 | 2023-09-30 | 2023-06-30 | 2023-03-31 | 2022-12-31 | 2022-09-30 | 2022-06-30 | 2022-03-31 | 2021-12-31 | 2021-09-30 | 2021-06-30 | 2021-03-31 | 2020-12-31 | 2020-09-30 | 2020-06-30 | 2020-03-31 | 2019-12-31 | 2019-09-30 | 2019-06-30 | 2019-03-31 | 2018-12-31 | 2018-09-30 | 2018-06-30 | 2018-03-31 | 2017-12-31 | 2017-09-30 | 2017-06-30 | 2017-03-31 | 2016-12-31 | 2016-09-30 | 2016-06-30 | 2016-03-31 | 2015-12-31 | 2015-09-30 | 2015-06-30 | 2015-03-31 | 2014-12-31 | 2014-09-30 | 2014-06-30 | 2014-03-31 | ||
|---|---|---|---|---|---|---|---|---|---|---|---|---|---|---|---|---|---|---|---|---|---|---|---|---|---|---|---|---|---|---|---|---|---|---|---|---|---|---|---|---|---|
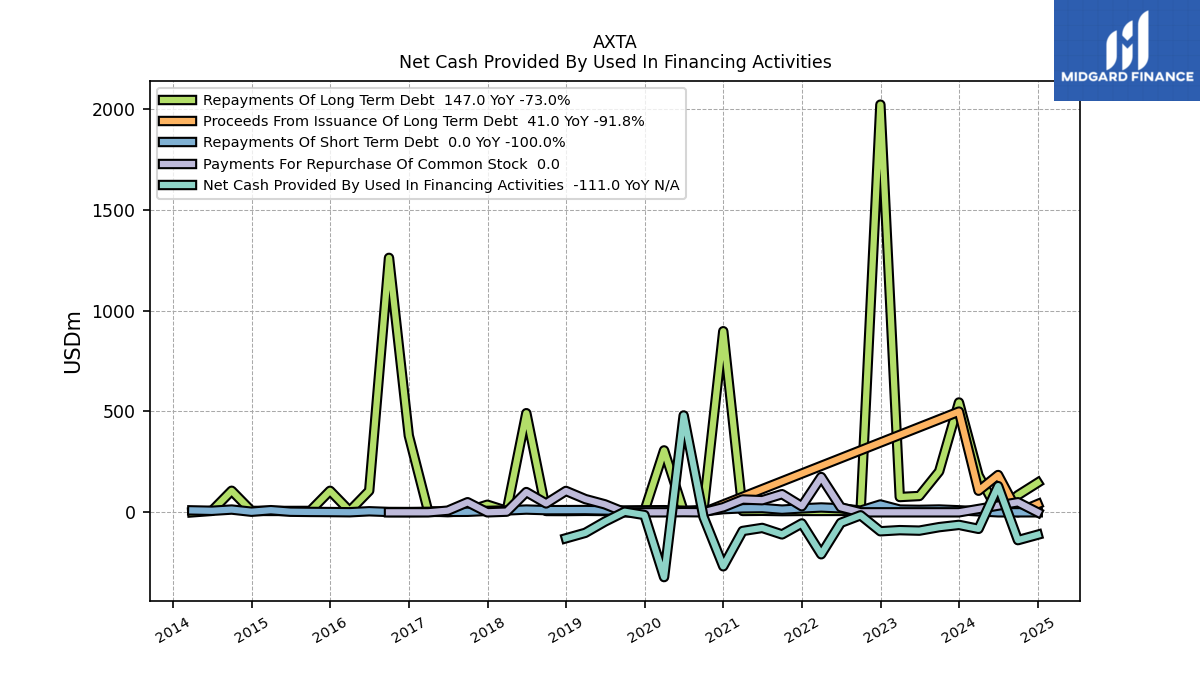
| Net Cash Provided By Used In Financing Activities | -62.30 | -73.50 | -90.80 | -88.40 | -94.00 | -14.70 | -52.10 | -208.10 | -55.00 | -109.60 | -77.40 | -92.50 | -267.70 | -22.30 | 480.40 | -321.30 | -13.40 | 2.90 | -46.10 | -101.80 | -128.80 | NA | NA | NA | NA | NA | NA | NA | NA | NA | NA | NA | NA | NA | NA | NA | NA | NA | NA | NA | |
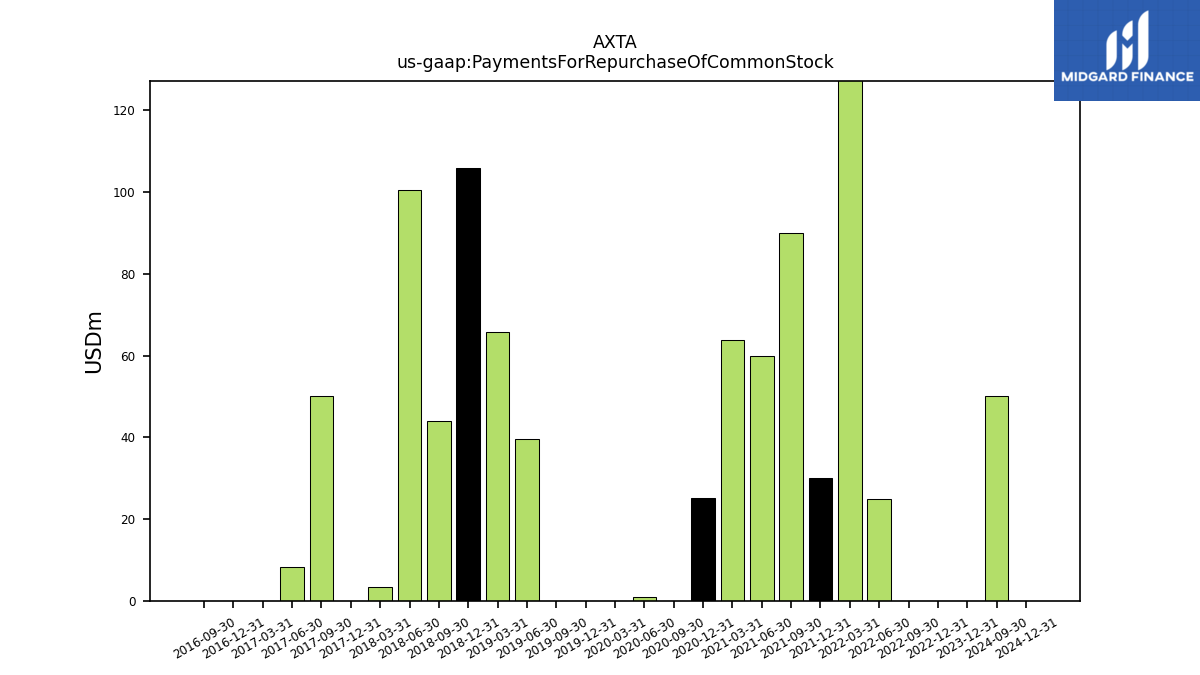
| Payments For Repurchase Of Common Stock | 0.00 | NA | NA | NA | 0.00 | 0.00 | 25.00 | 175.10 | 30.00 | 90.10 | 60.00 | 63.70 | 25.10 | 0.00 | 0.90 | 0.00 | 0.00 | 0.00 | 39.60 | 65.70 | 106.00 | 44.00 | 100.50 | 3.30 | 0.00 | 50.10 | 8.30 | 0.00 | 0.00 | 0.00 | NA | NA | NA | NA | NA | NA | NA | NA | NA | NA |
| 2023-12-31 | 2023-09-30 | 2023-06-30 | 2023-03-31 | 2022-12-31 | 2022-09-30 | 2022-06-30 | 2022-03-31 | 2021-12-31 | 2021-09-30 | 2021-06-30 | 2021-03-31 | 2020-12-31 | 2020-09-30 | 2020-06-30 | 2020-03-31 | 2019-12-31 | 2019-09-30 | 2019-06-30 | 2019-03-31 | 2018-12-31 | 2018-09-30 | 2018-06-30 | 2018-03-31 | 2017-12-31 | 2017-09-30 | 2017-06-30 | 2017-03-31 | 2016-12-31 | 2016-09-30 | 2016-06-30 | 2016-03-31 | 2015-12-31 | 2015-09-30 | 2015-06-30 | 2015-03-31 | 2014-12-31 | 2014-09-30 | 2014-06-30 | 2014-03-31 | ||
|---|---|---|---|---|---|---|---|---|---|---|---|---|---|---|---|---|---|---|---|---|---|---|---|---|---|---|---|---|---|---|---|---|---|---|---|---|---|---|---|---|---|
| Revenues | 1297.30 | 1309.00 | 1293.90 | 1283.90 | 1236.70 | 1238.70 | 1234.90 | 1174.10 | 1137.20 | 1088.60 | 1126.80 | 1063.60 | 1074.50 | 1026.90 | 652.70 | 983.50 | 1098.40 | 1107.00 | 1157.50 | 1119.30 | 1165.80 | 1146.00 | 1212.20 | 1172.00 | 1172.40 | 1096.30 | 1094.60 | 1013.70 | 1034.60 | 1029.10 | 1072.10 | 961.60 | 1009.60 | 1005.10 | 1101.10 | 997.50 | 1087.00 | 1115.80 | 1134.30 | 1054.40 | |
| Revenue From Contract With Customer Excluding Assessed Tax | 1297.30 | 1309.00 | 1293.90 | 1283.90 | 1236.70 | 1238.70 | 1234.90 | 1174.10 | 1137.20 | 1088.60 | 1126.80 | 1063.60 | 1074.50 | 1026.90 | 652.70 | 983.50 | 1098.40 | 1107.00 | 1157.50 | 1119.30 | 1165.80 | 1146.00 | 1212.20 | 1172.00 | 1172.40 | 1096.30 | 1094.60 | 1013.70 | 1034.60 | 1029.10 | 1072.10 | 961.60 | 1009.60 | 1005.10 | 1101.10 | 997.50 | 1087.00 | 1115.80 | 1134.30 | 1054.40 | |
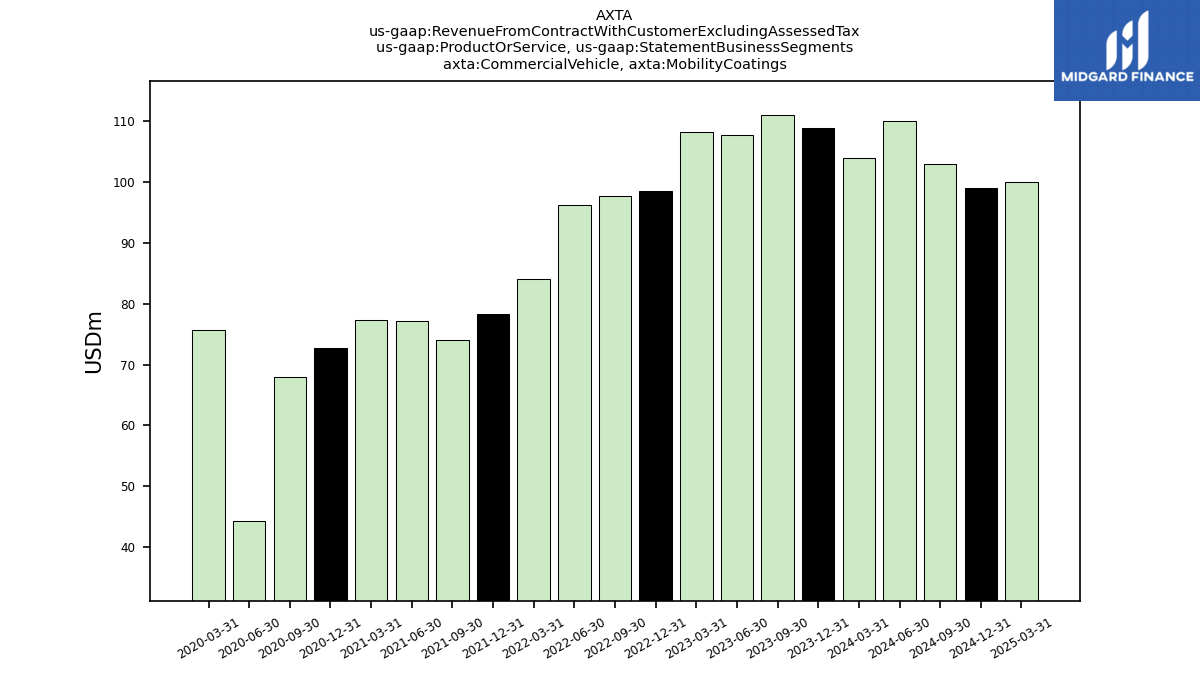
| Commercial Vehicle, Mobility Coatings | 108.90 | 111.10 | 107.70 | 108.30 | 98.60 | 97.70 | 96.20 | 84.10 | 78.30 | 74.00 | 77.10 | 77.40 | 72.80 | 67.90 | 44.30 | 75.70 | NA | NA | NA | NA | NA | NA | NA | NA | NA | NA | NA | NA | NA | NA | NA | NA | NA | NA | NA | NA | NA | NA | NA | NA | |
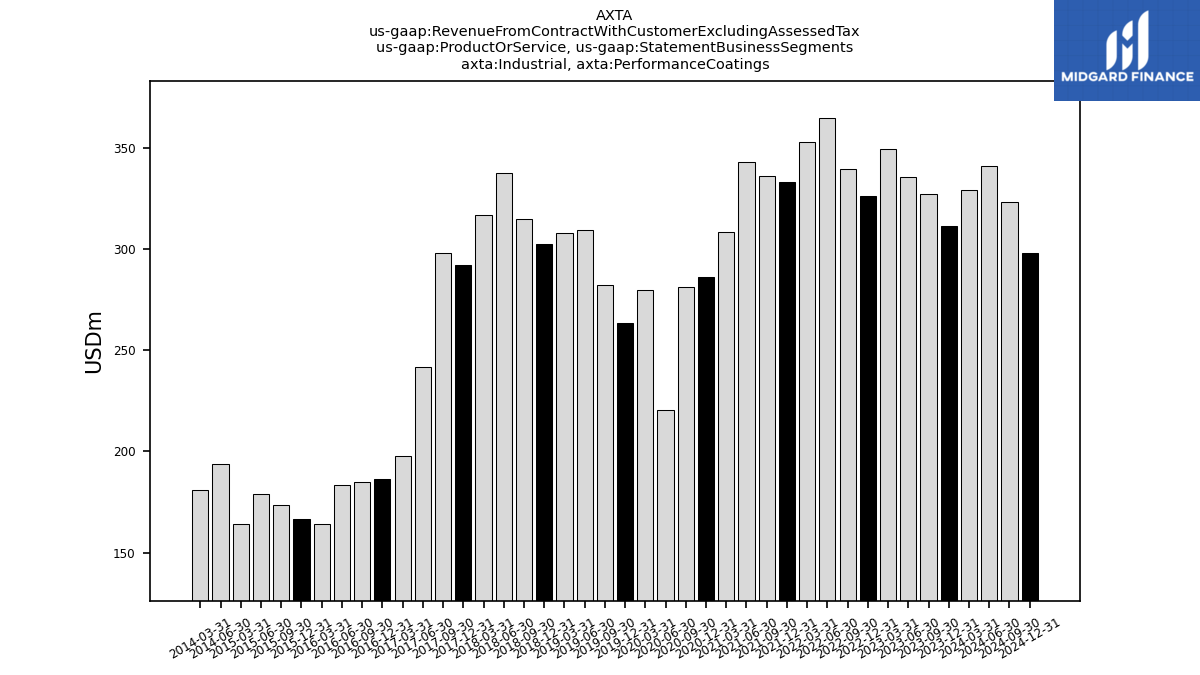
| Industrial, Performance Coatings | 311.40 | 327.20 | 335.30 | 349.50 | 326.30 | 339.30 | 364.70 | 353.00 | 333.10 | 335.80 | 342.70 | 308.30 | 286.30 | 281.00 | 220.20 | 279.90 | 263.60 | 282.20 | 309.40 | 307.80 | 302.20 | 314.90 | 337.60 | 316.80 | 292.20 | 298.20 | 241.70 | 197.80 | 186.40 | 184.80 | 183.30 | 164.30 | 166.70 | 173.70 | 178.70 | 164.00 | NA | NA | 193.90 | 180.90 | |
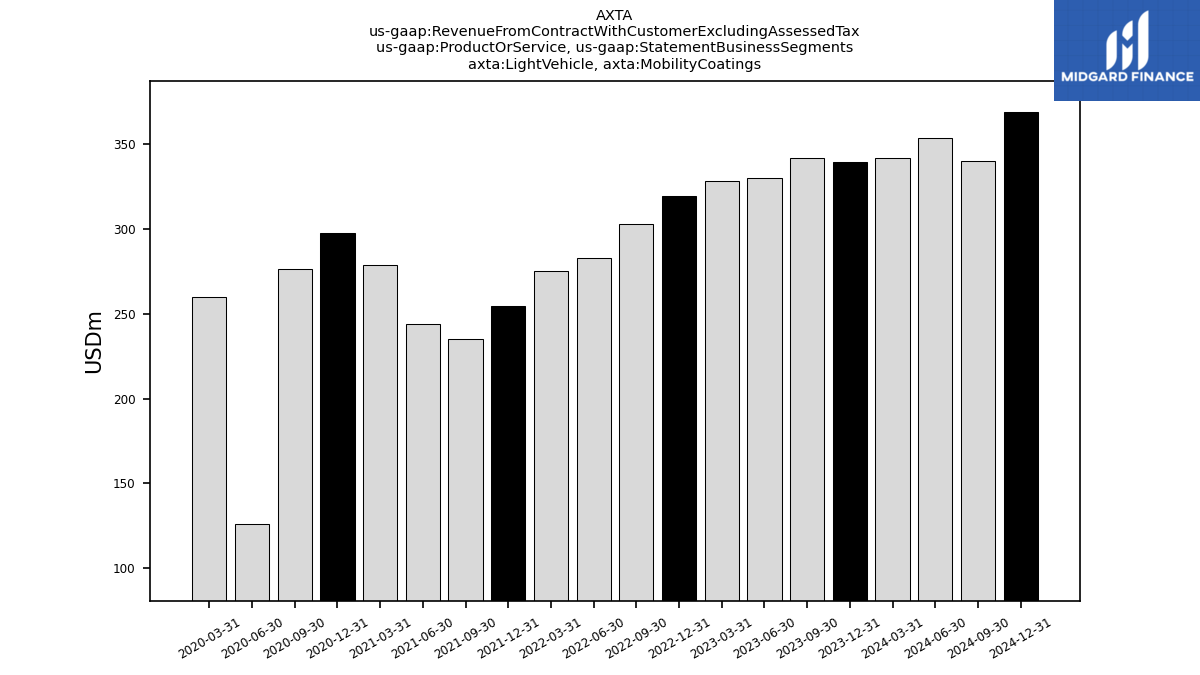
| Light Vehicle, Mobility Coatings | 339.90 | 341.80 | 330.20 | 328.50 | 319.60 | 303.00 | 282.90 | 275.60 | 254.90 | 235.40 | 243.90 | 278.90 | 297.80 | 276.30 | 126.30 | 260.10 | NA | NA | NA | NA | NA | NA | NA | NA | NA | NA | NA | NA | NA | NA | NA | NA | NA | NA | NA | NA | NA | NA | NA | NA | |
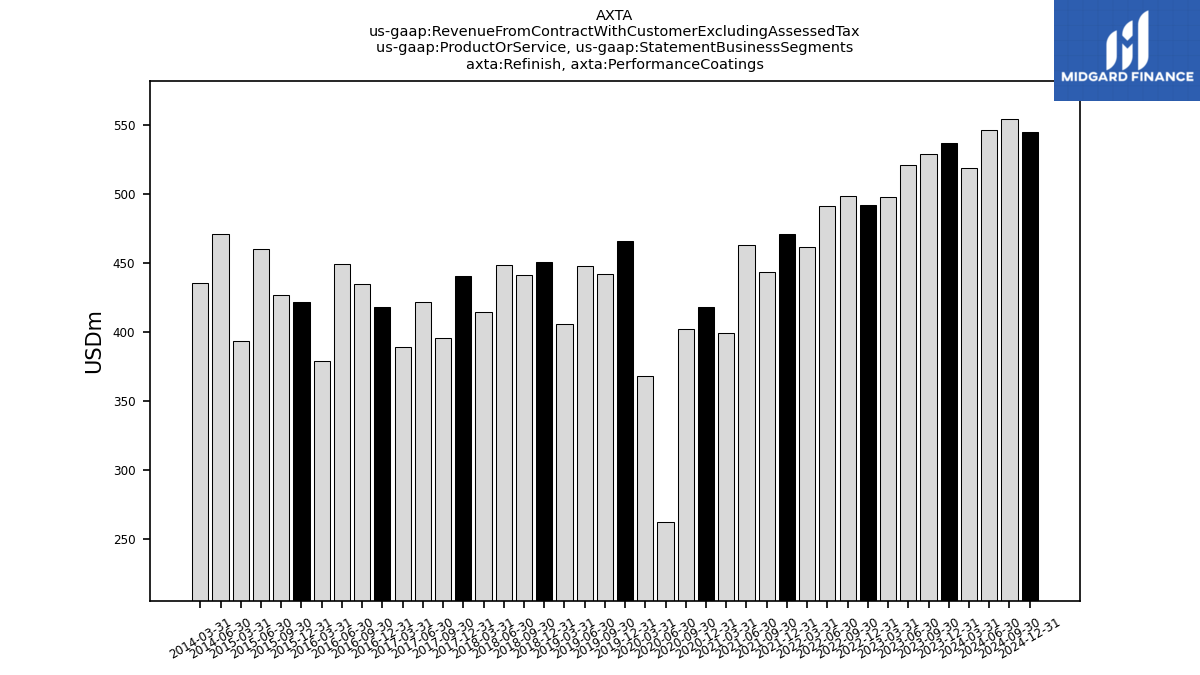
| Refinish, Performance Coatings | 537.10 | 528.90 | 520.70 | 497.60 | 492.20 | 498.70 | 491.10 | 461.40 | 470.90 | 443.40 | 463.10 | 399.00 | 417.60 | 401.70 | 261.90 | 367.80 | 466.10 | 441.50 | 447.30 | 405.50 | 450.30 | 441.30 | 448.40 | 414.20 | 440.10 | 395.30 | 421.20 | 388.60 | 417.70 | 434.50 | 448.80 | 378.70 | 421.80 | 426.90 | 460.10 | 393.20 | NA | NA | 471.10 | 435.20 | |
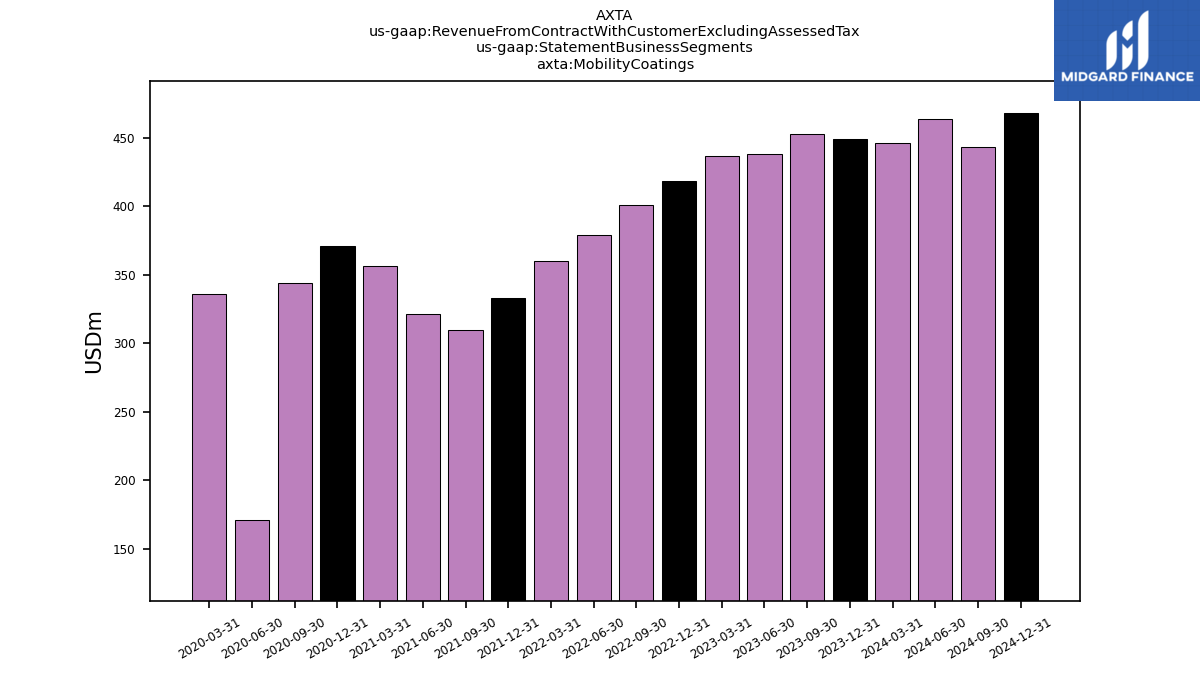
| Mobility Coatings | 448.80 | 452.90 | 437.90 | 436.80 | 418.20 | 400.70 | 379.10 | 359.70 | 333.20 | 309.40 | 321.00 | 356.30 | 370.60 | 344.20 | 170.60 | 335.80 | NA | NA | NA | NA | NA | NA | NA | NA | NA | NA | NA | NA | NA | NA | NA | NA | NA | NA | NA | NA | NA | NA | NA | NA | |
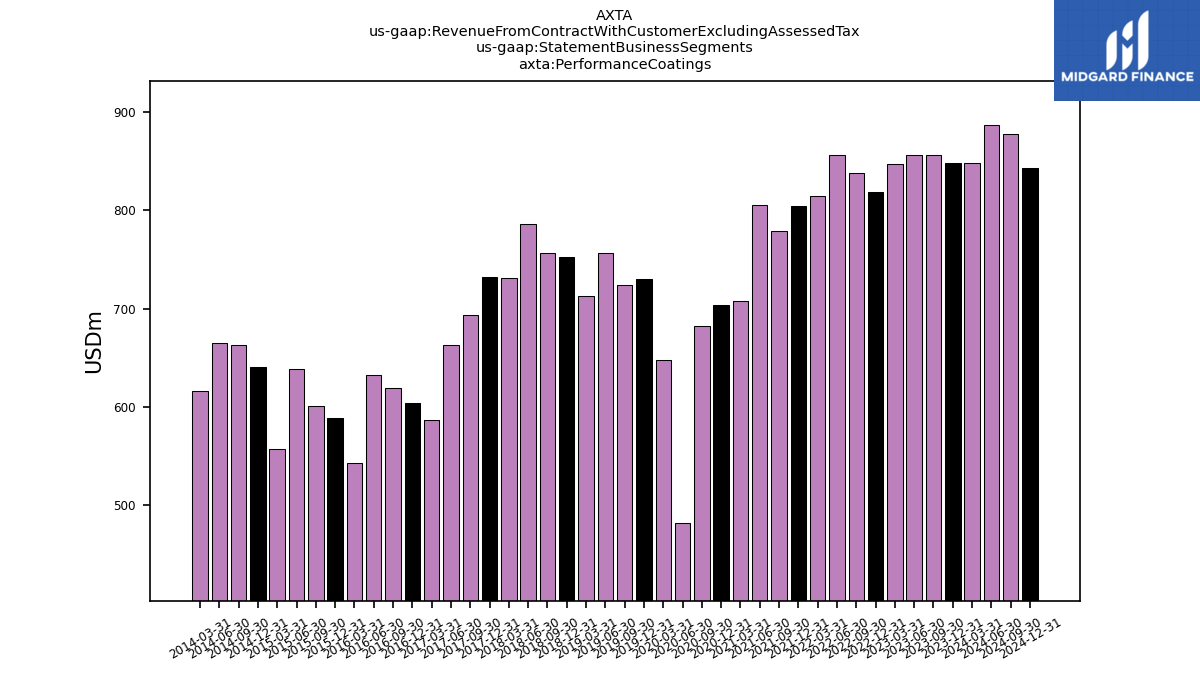
| Performance Coatings | 848.50 | 856.10 | 856.00 | 847.10 | 818.50 | 838.00 | 855.80 | 814.40 | 804.00 | 779.20 | 805.80 | 707.30 | 703.90 | 682.70 | 482.10 | 647.70 | 729.70 | 723.70 | 756.70 | 713.30 | 752.50 | 756.20 | 786.00 | 731.00 | 732.30 | 693.50 | 662.90 | 586.40 | 604.10 | 619.30 | 632.10 | 543.00 | 588.50 | 600.60 | 638.80 | 557.20 | 640.40 | 663.50 | 665.00 | 616.10 |
