
| 2023-09-30 | 2023-06-30 | 2023-03-31 | 2022-12-31 | 2022-09-30 | 2022-06-30 | 2022-03-31 | 2021-12-31 | 2021-09-30 | 2021-06-30 | 2021-03-31 | 2020-12-31 | 2020-09-30 | 2020-06-30 | 2020-03-31 | 2019-12-31 | 2019-09-30 | 2019-06-30 | 2019-03-31 | 2018-12-31 | 2018-09-30 | 2018-06-30 | 2018-03-31 | ||
|---|---|---|---|---|---|---|---|---|---|---|---|---|---|---|---|---|---|---|---|---|---|---|---|---|
| Common Stock Value | 0.46 | 0.46 | 0.46 | 0.47 | 0.47 | 0.53 | 0.53 | 0.53 | 0.45 | 0.45 | 0.32 | 0.31 | 0.30 | 0.30 | 0.31 | 0.41 | 0.41 | 0.41 | 0.41 | 0.38 | NA | NA | NA | |
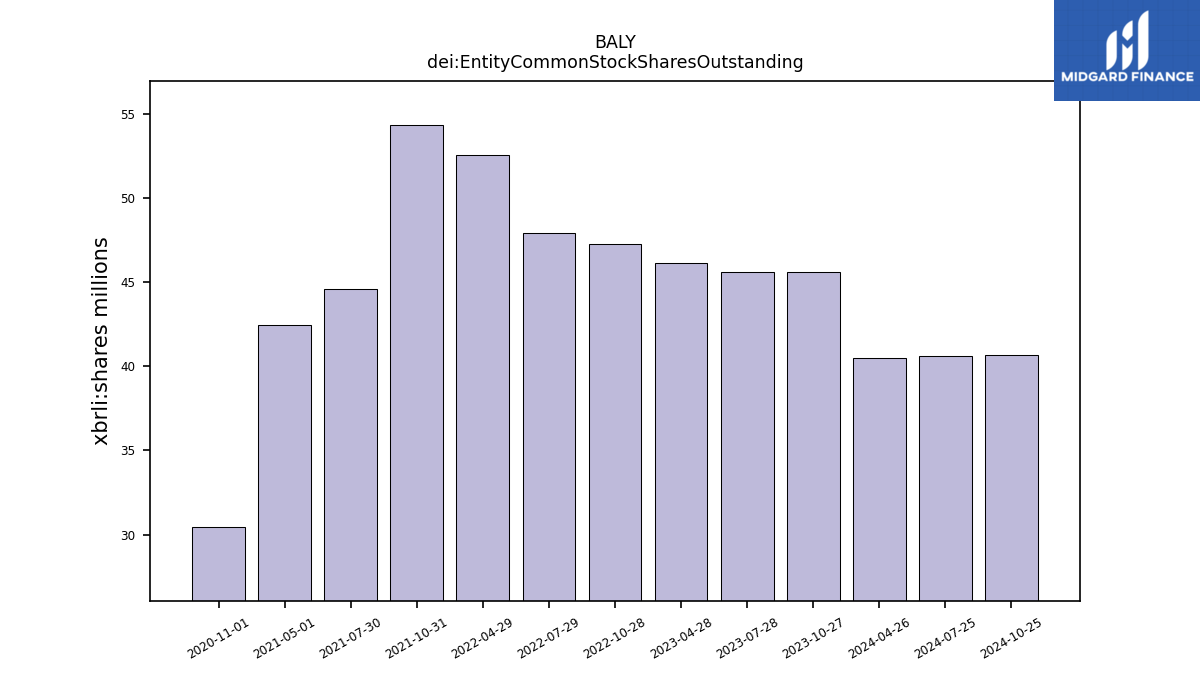
| dei: Entity Common Stock Shares Outstanding | NA | NA | NA | NA | NA | NA | NA | NA | NA | NA | NA | NA | NA | NA | NA | NA | NA | NA | NA | NA | NA | NA | NA | |
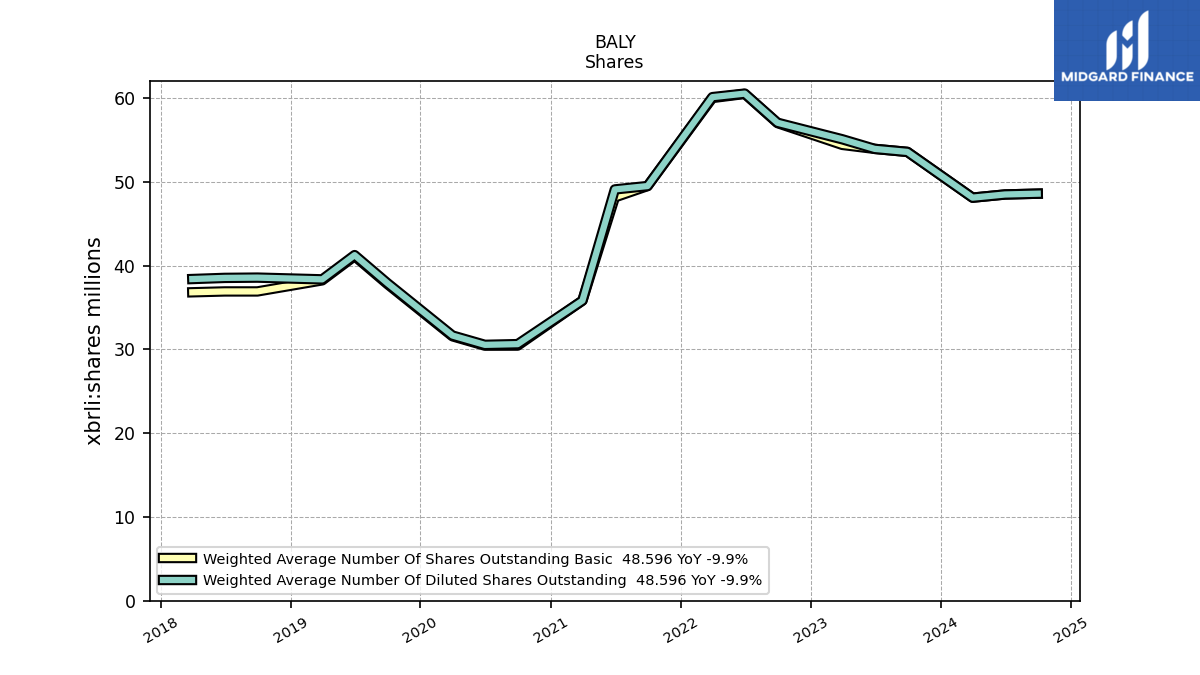
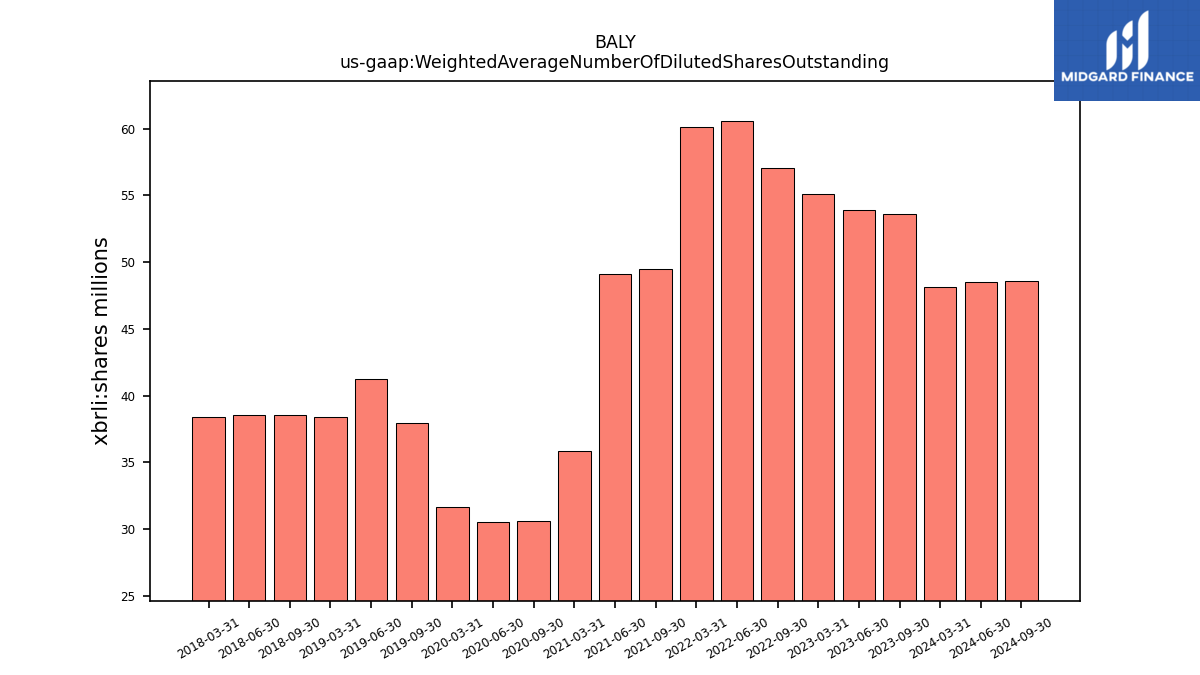
| Weighted Average Number Of Diluted Shares Outstanding | 53.58 | 53.94 | 55.09 | NA | 57.06 | 60.54 | 60.12 | NA | 49.51 | 49.10 | 35.83 | NA | 30.64 | 30.55 | 31.66 | NA | 37.92 | 41.26 | 38.37 | NA | 38.58 | 38.54 | 38.41 | |
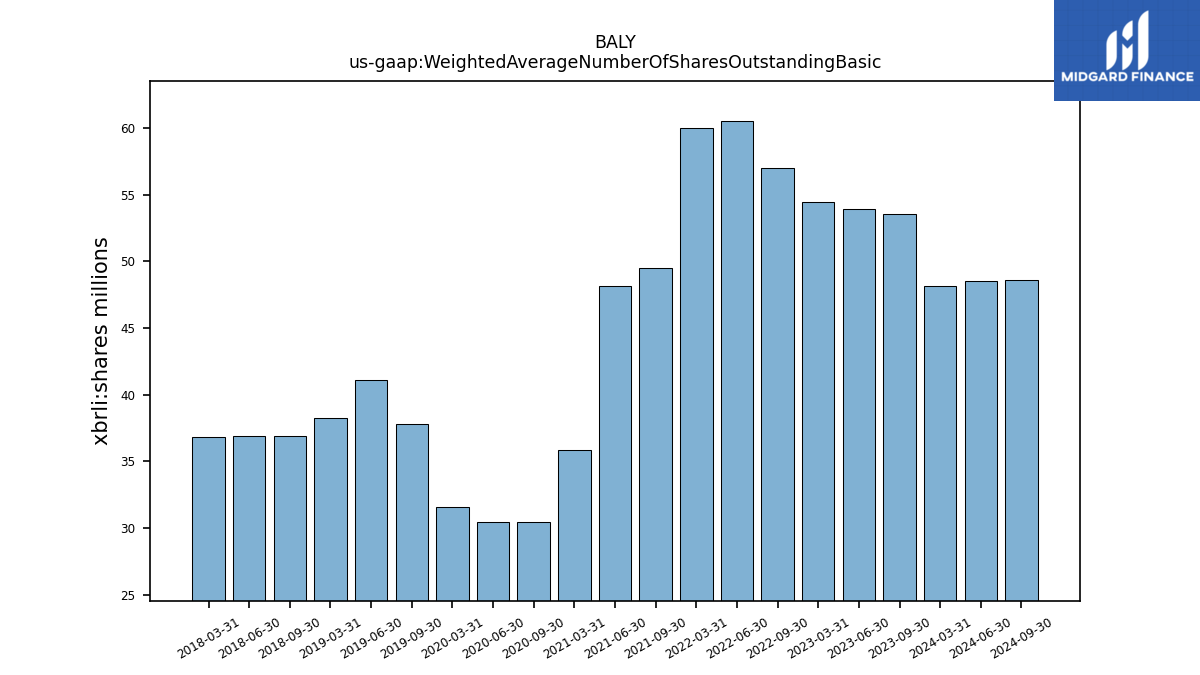
| Weighted Average Number Of Shares Outstanding Basic | 53.58 | 53.94 | 54.42 | NA | 57.02 | 60.51 | 60.02 | NA | 49.51 | 48.16 | 35.83 | NA | 30.46 | 30.45 | 31.57 | NA | 37.81 | 41.14 | 38.25 | NA | 36.92 | 36.92 | 36.82 | |
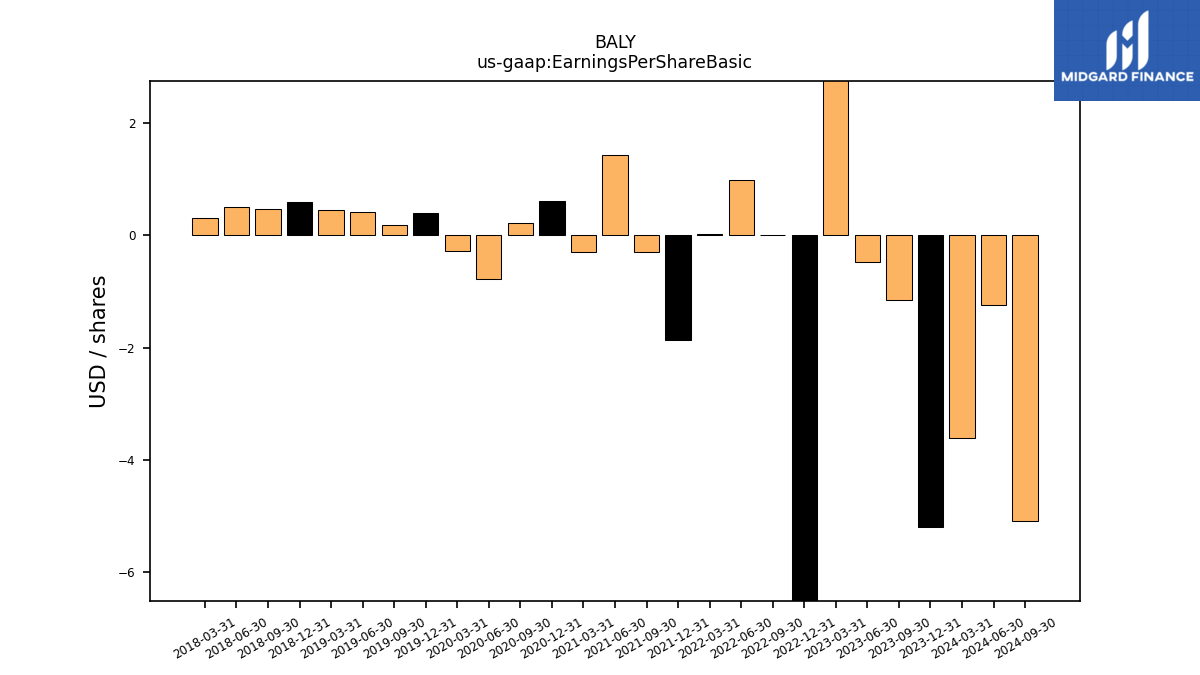
| Earnings Per Share Basic | -1.15 | -0.48 | 3.28 | -8.37 | 0.01 | 0.98 | 0.03 | -1.87 | -0.30 | 1.43 | -0.30 | 0.62 | 0.22 | -0.77 | -0.28 | 0.40 | 0.19 | 0.42 | 0.46 | 0.60 | 0.47 | 0.51 | 0.31 | |
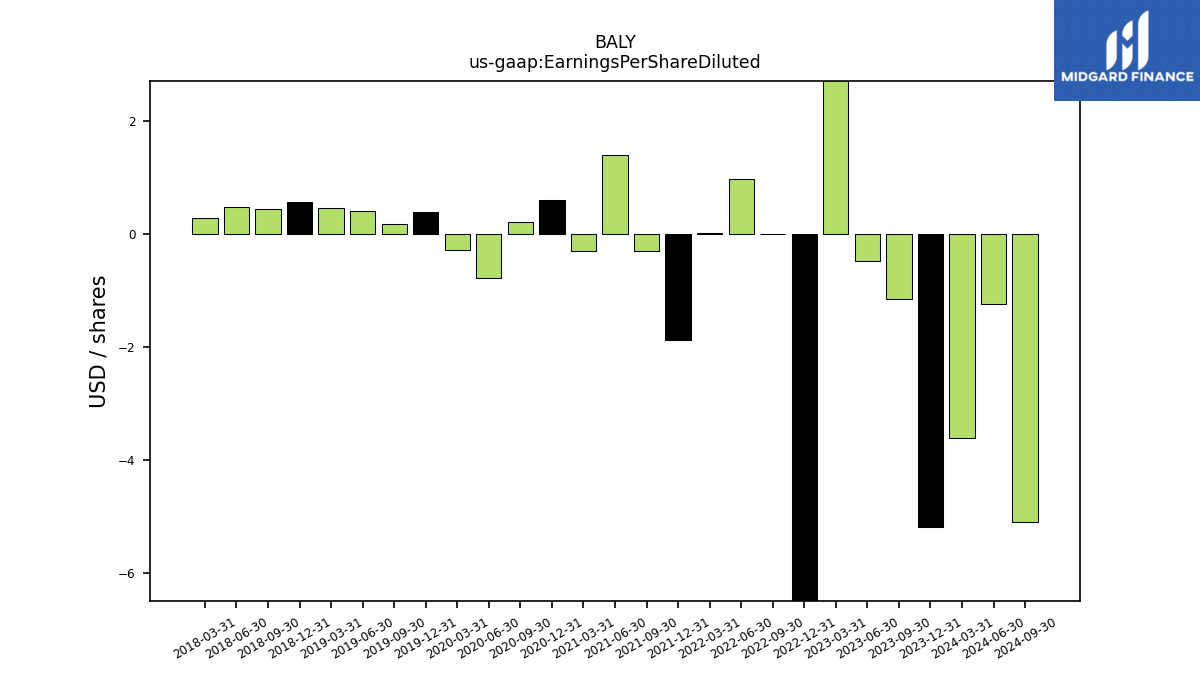
| Earnings Per Share Diluted | -1.15 | -0.48 | 3.24 | -8.37 | 0.01 | 0.98 | 0.03 | -1.87 | -0.30 | 1.40 | -0.30 | 0.61 | 0.22 | -0.77 | -0.28 | 0.40 | 0.18 | 0.42 | 0.46 | 0.57 | 0.45 | 0.49 | 0.29 |
| 2023-09-30 | 2023-06-30 | 2023-03-31 | 2022-12-31 | 2022-09-30 | 2022-06-30 | 2022-03-31 | 2021-12-31 | 2021-09-30 | 2021-06-30 | 2021-03-31 | 2020-12-31 | 2020-09-30 | 2020-06-30 | 2020-03-31 | 2019-12-31 | 2019-09-30 | 2019-06-30 | 2019-03-31 | 2018-12-31 | 2018-09-30 | 2018-06-30 | 2018-03-31 | ||
|---|---|---|---|---|---|---|---|---|---|---|---|---|---|---|---|---|---|---|---|---|---|---|---|---|
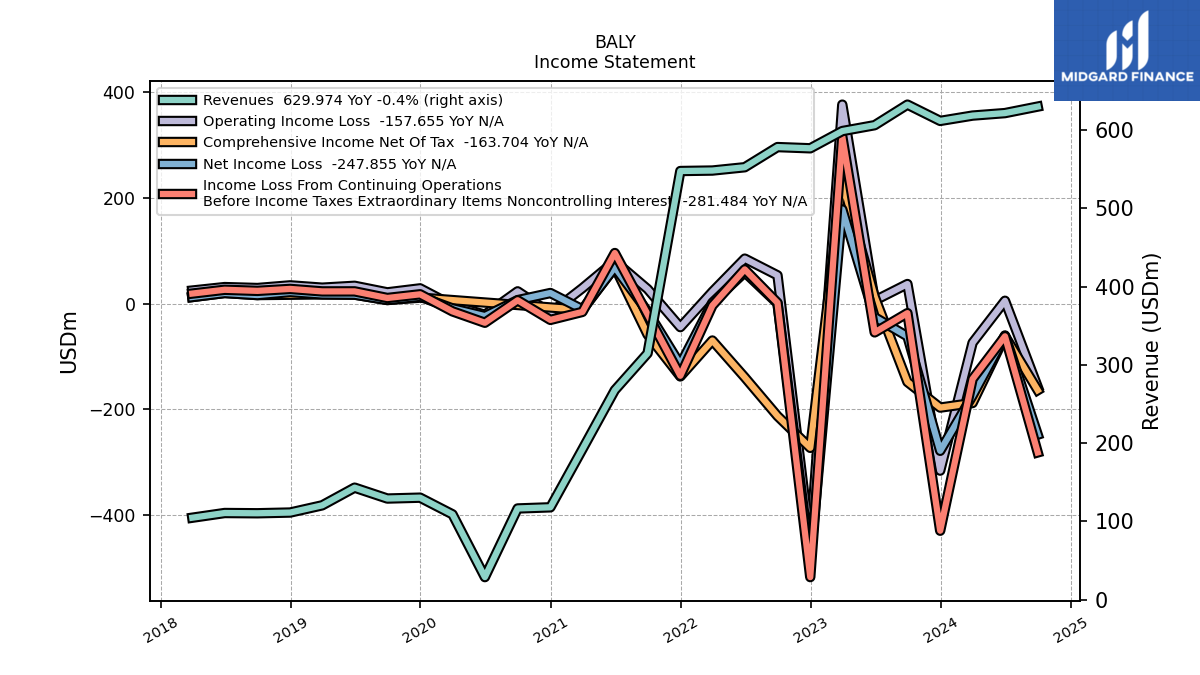
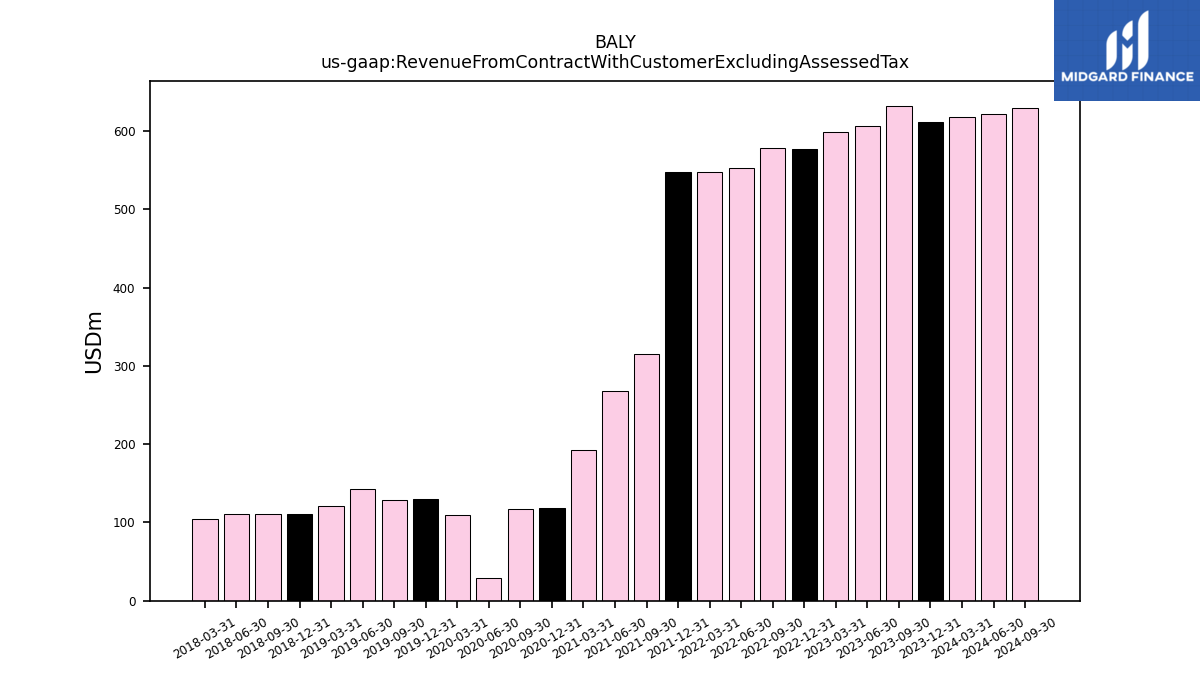
| Revenue From Contract With Customer Excluding Assessed Tax | 632.48 | 606.21 | 598.72 | 576.69 | 578.25 | 552.50 | 548.27 | 547.66 | 314.78 | 267.73 | 192.27 | 118.10 | 116.62 | 28.92 | 109.15 | 130.42 | 129.31 | 143.22 | 120.63 | 111.42 | 110.49 | 110.81 | 104.81 | |
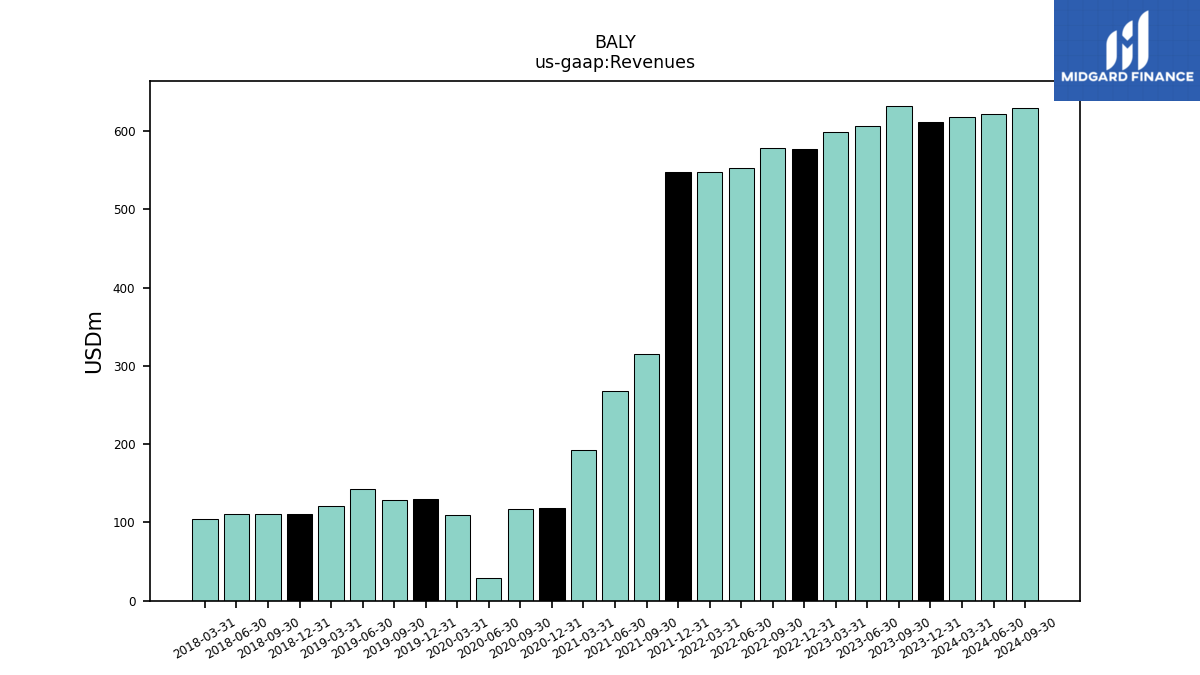
| Revenues | 632.48 | 606.21 | 598.72 | 576.69 | 578.25 | 552.50 | 548.27 | 547.66 | 314.78 | 267.73 | 192.27 | 118.10 | 116.62 | 28.92 | 109.15 | 130.42 | 129.31 | 143.22 | 120.63 | 111.42 | 110.49 | 110.81 | 104.81 | |
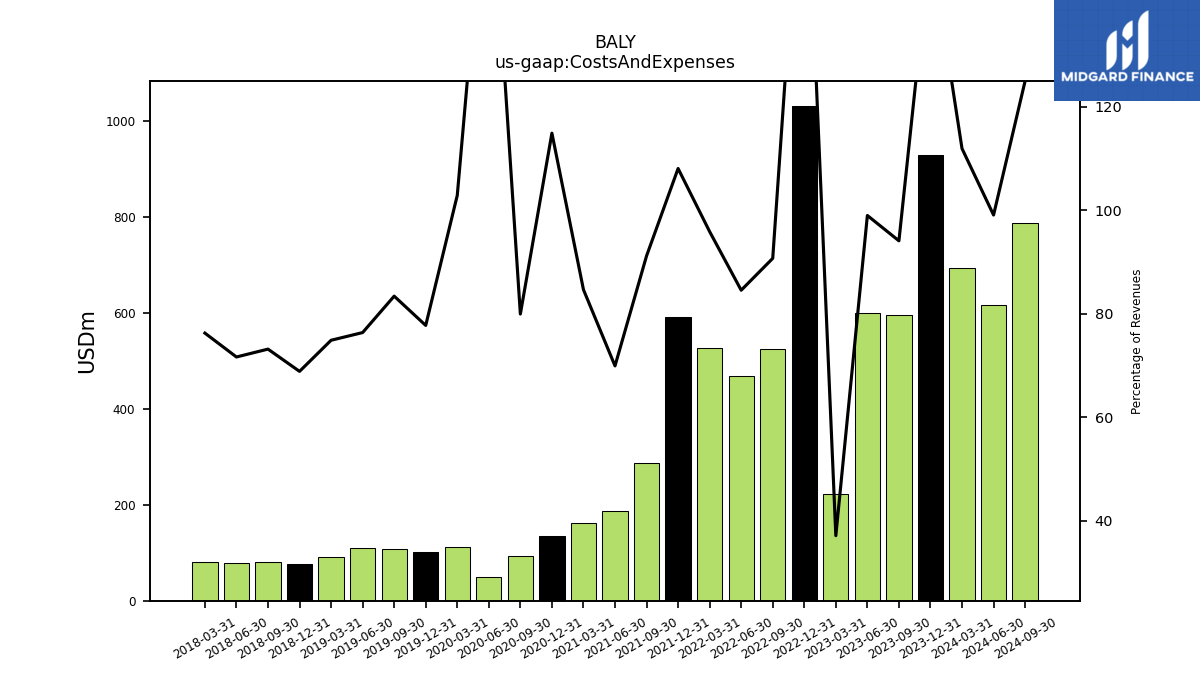
| Costs And Expenses | 595.24 | 600.22 | 221.99 | 1031.20 | 524.59 | 467.18 | 525.75 | 592.02 | 287.05 | 187.20 | 162.79 | 135.73 | 93.24 | 49.89 | 112.32 | 101.40 | 107.86 | 109.37 | 90.32 | 76.72 | 80.84 | 79.39 | 79.93 | |
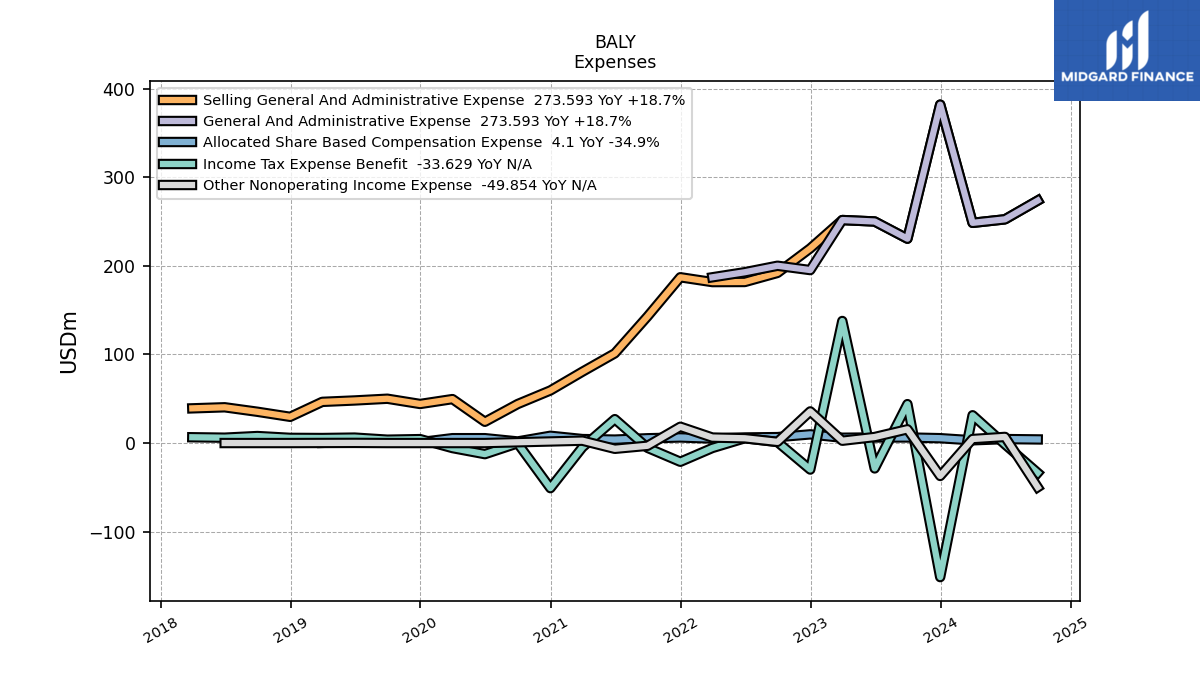
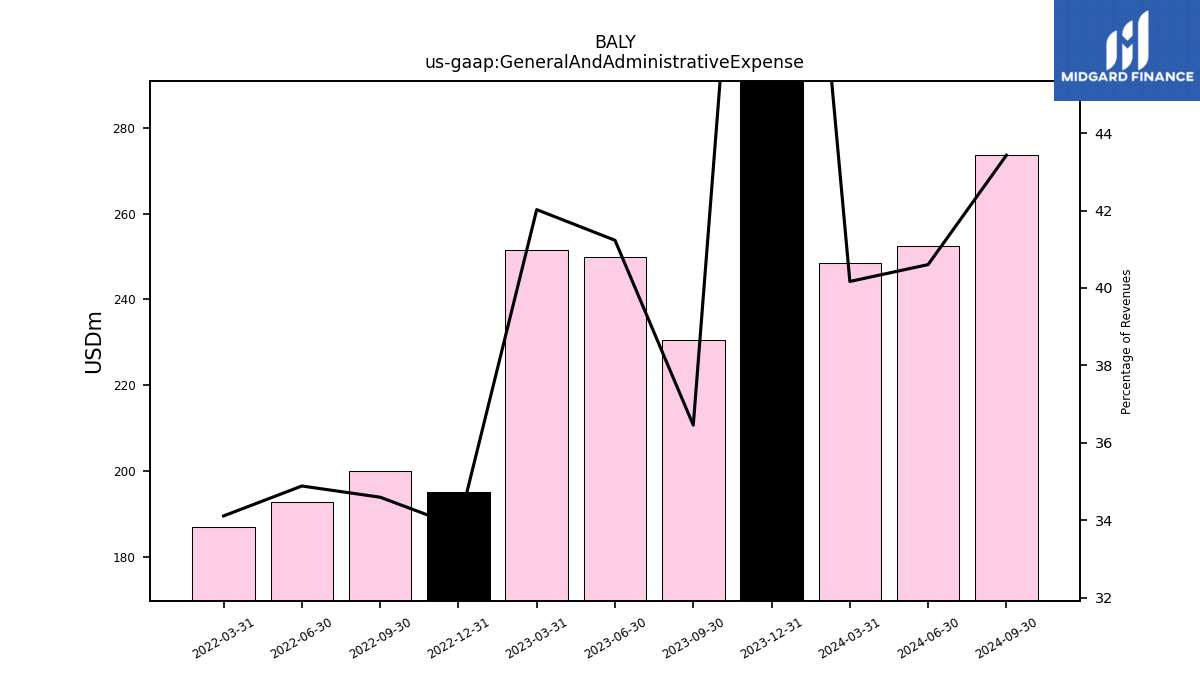
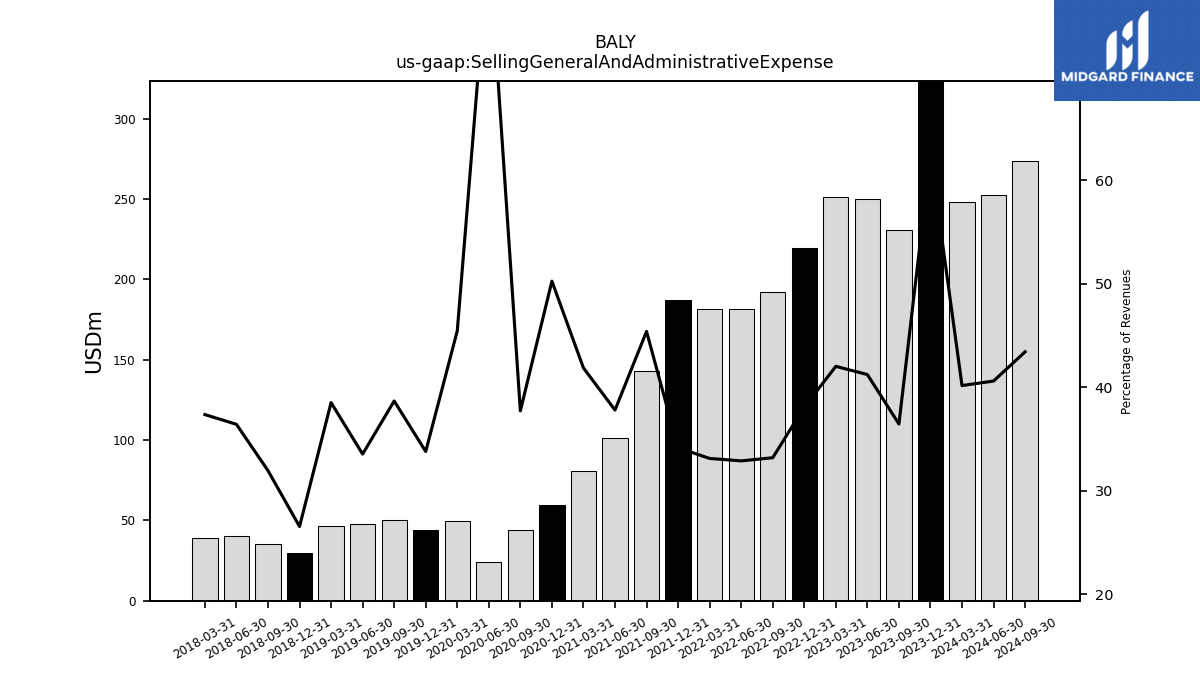
| General And Administrative Expense | 230.58 | 249.96 | 251.61 | 195.14 | 200.04 | 192.74 | 187.02 | NA | NA | NA | NA | NA | NA | NA | NA | NA | NA | NA | NA | NA | NA | NA | NA | |
| Selling General And Administrative Expense | 230.58 | 249.96 | 251.61 | 219.66 | 191.95 | 181.71 | 181.62 | 187.05 | 142.91 | 101.21 | 80.50 | 59.35 | 44.00 | 23.99 | 49.61 | 44.08 | 50.01 | 48.05 | 46.47 | 29.58 | 35.30 | 40.36 | 39.16 | |
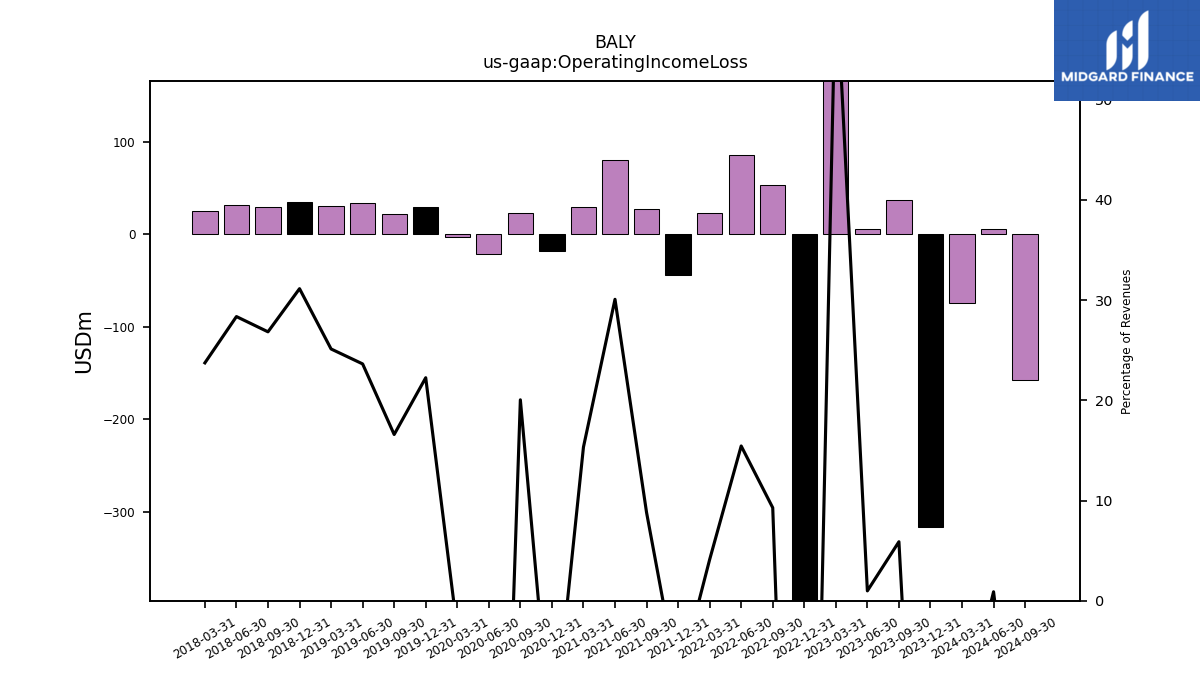
| Operating Income Loss | 37.24 | 5.98 | 376.73 | -454.51 | 53.66 | 85.32 | 22.52 | -44.36 | 27.73 | 80.53 | 29.47 | -17.64 | 23.38 | -20.96 | -3.17 | 29.02 | 21.45 | 33.85 | 30.31 | 34.70 | 29.65 | 31.42 | 24.88 | |
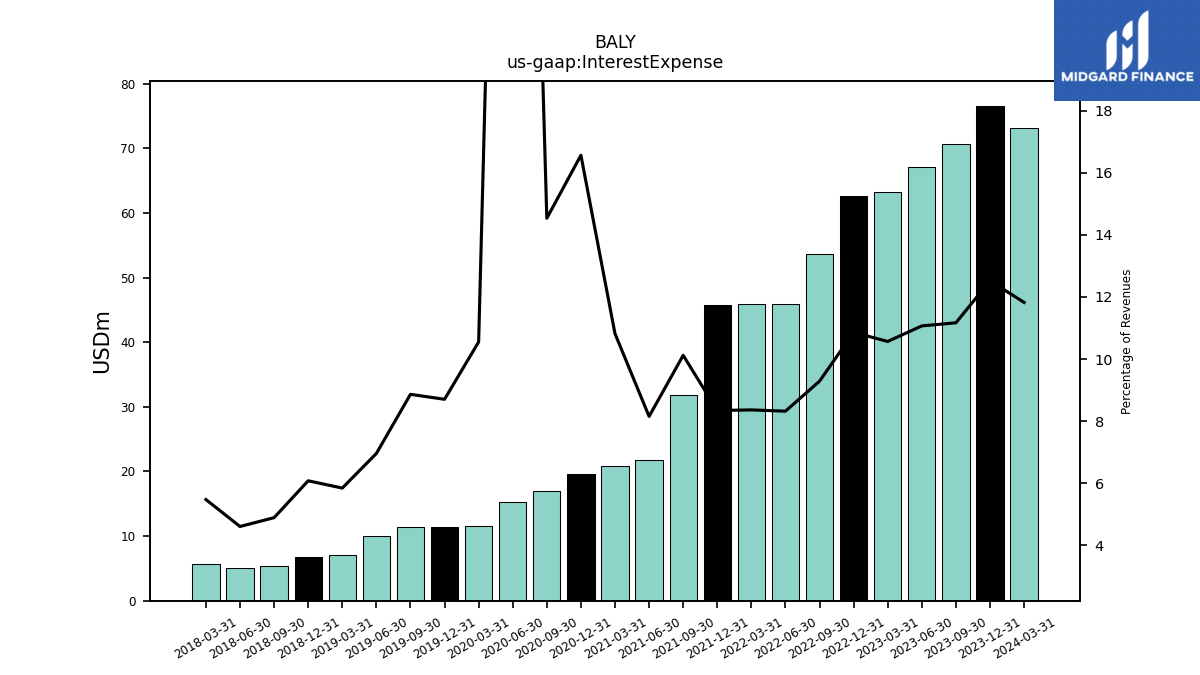
| Interest Expense | 70.63 | 67.09 | 63.26 | 62.62 | 53.71 | 45.98 | 45.85 | 45.69 | 31.85 | 21.83 | 20.80 | 19.56 | 16.95 | 15.22 | 11.52 | 11.35 | 11.46 | 9.97 | 7.05 | 6.77 | 5.41 | 5.11 | 5.74 | |
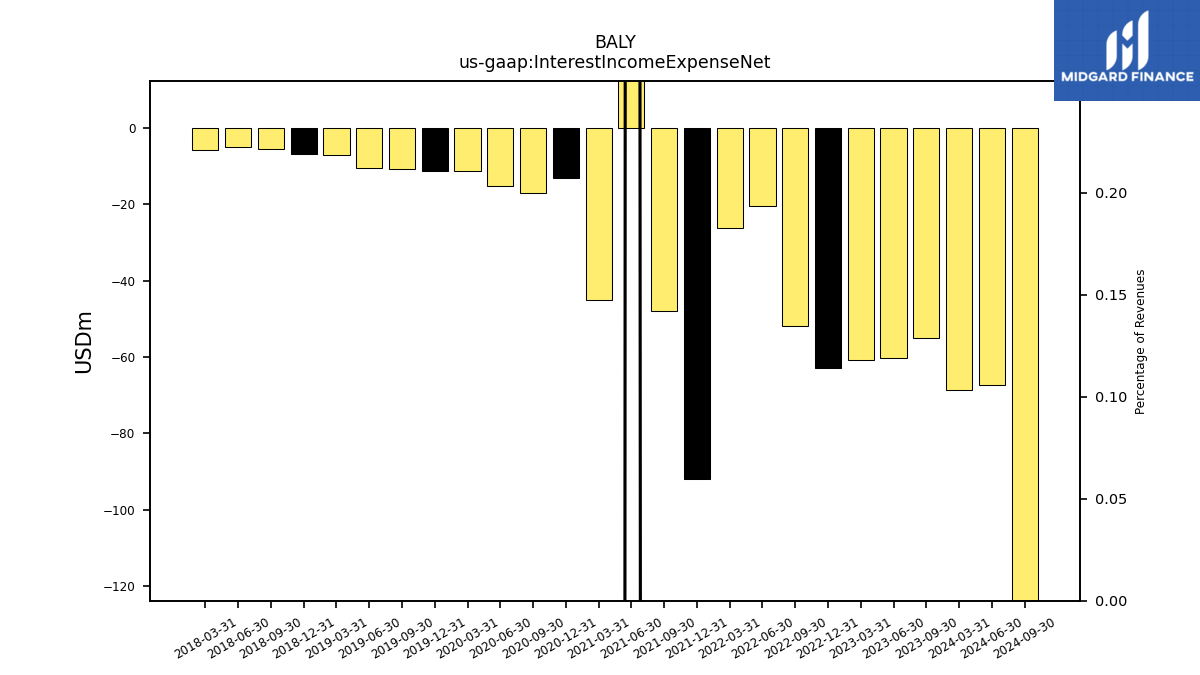
| Interest Income Expense Net | -55.10 | -60.28 | -60.65 | -62.94 | -51.93 | -20.38 | -26.21 | -92.06 | -47.88 | 15.39 | -45.01 | -13.03 | -16.91 | -15.11 | -11.37 | -11.24 | -10.65 | -10.52 | -7.04 | -6.72 | -5.36 | -5.07 | -5.70 | |
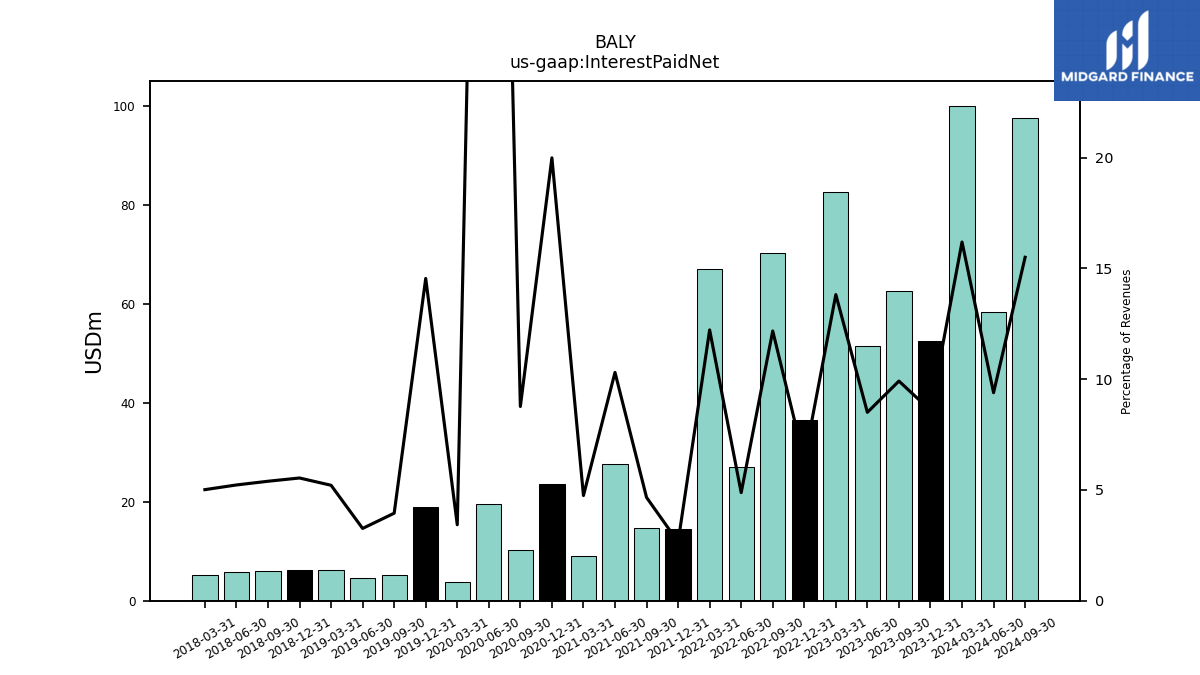
| Interest Paid Net | 62.71 | 51.54 | 82.72 | 36.52 | 70.40 | 26.96 | 67.02 | 14.53 | 14.68 | 27.59 | 9.13 | 23.61 | 10.22 | 19.66 | 3.74 | 18.97 | 5.11 | 4.67 | 6.29 | 6.17 | 5.96 | 5.79 | 5.25 | |
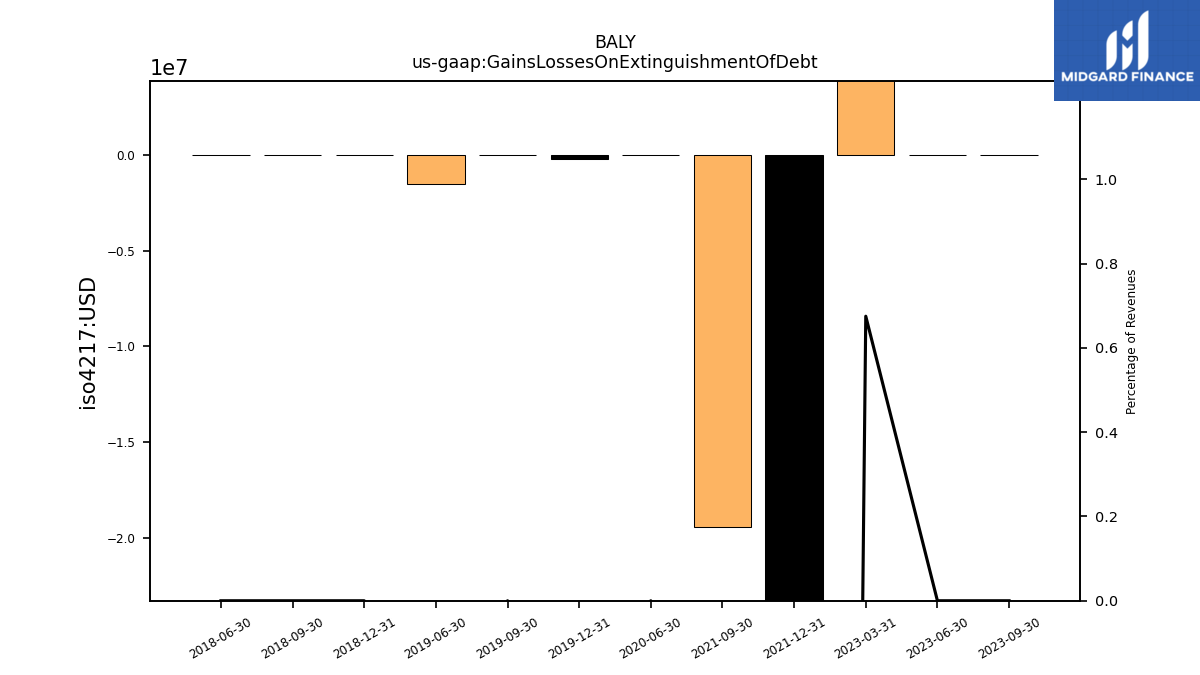
| Gains Losses On Extinguishment Of Debt | 0.00 | 0.00 | 4.04 | NA | NA | NA | NA | -83.59 | -19.42 | NA | NA | NA | NA | 0.00 | NA | -0.21 | 0.00 | -1.49 | NA | 0.00 | 0.00 | 0.00 | NA | |
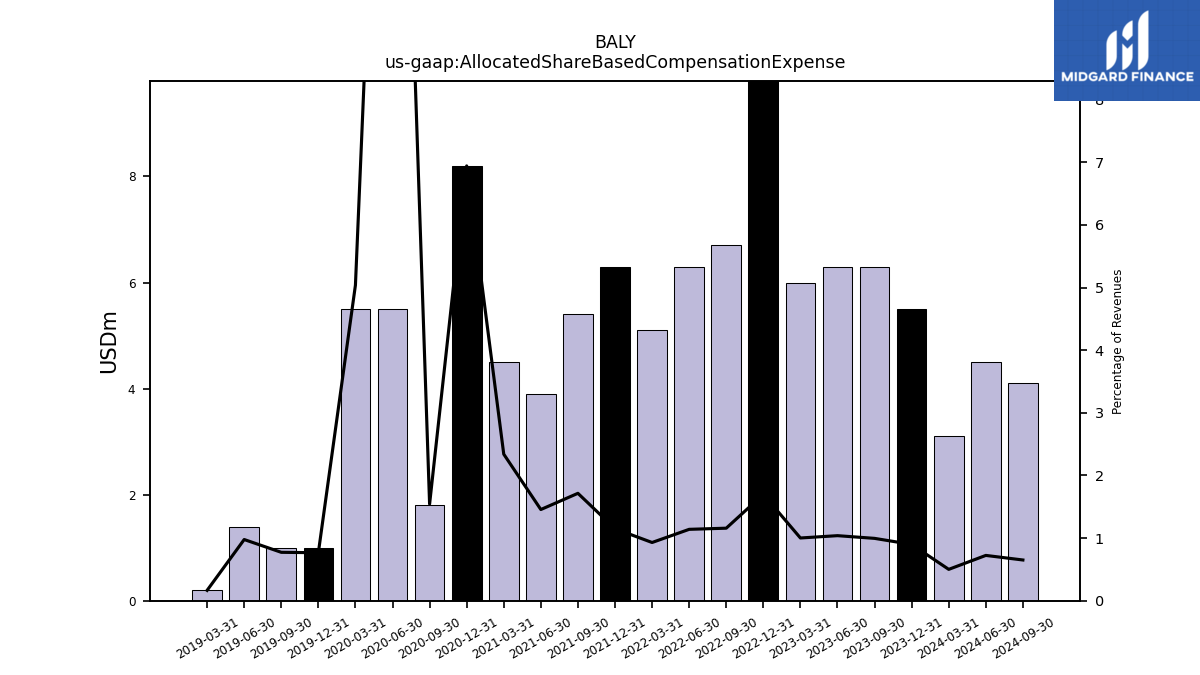
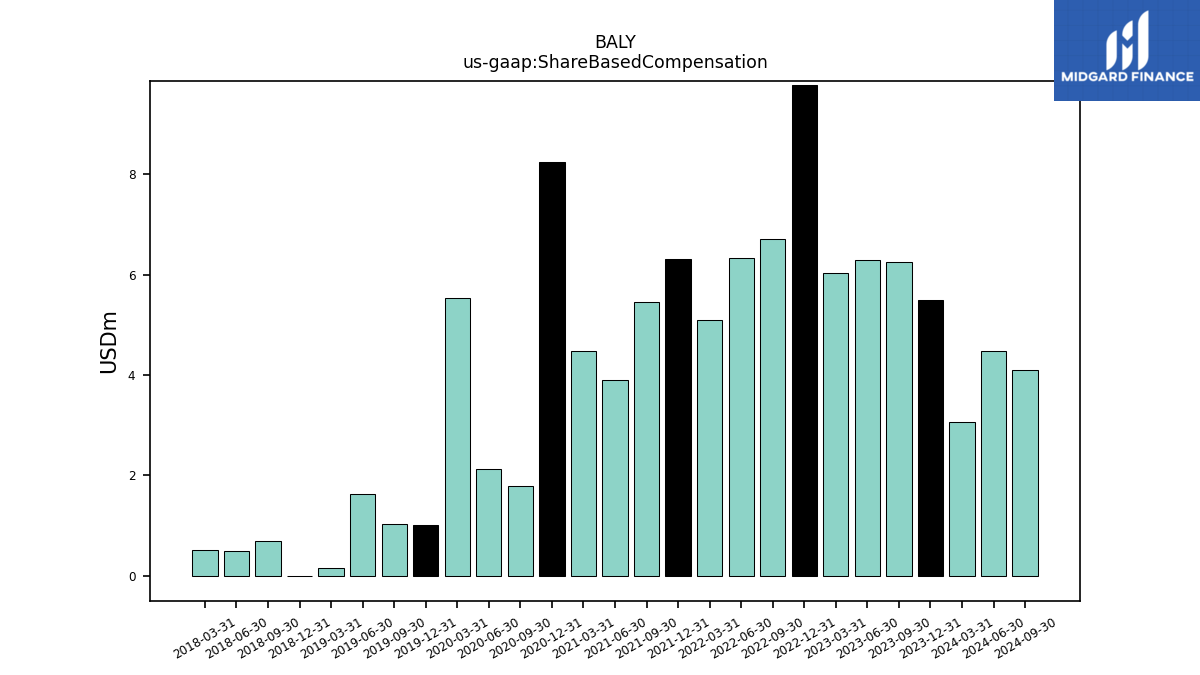
| Allocated Share Based Compensation Expense | 6.30 | 6.30 | 6.00 | 9.80 | 6.70 | 6.30 | 5.10 | 6.30 | 5.40 | 3.90 | 4.50 | 8.20 | 1.80 | 5.50 | 5.50 | 1.00 | 1.00 | 1.40 | 0.20 | NA | NA | NA | NA | |
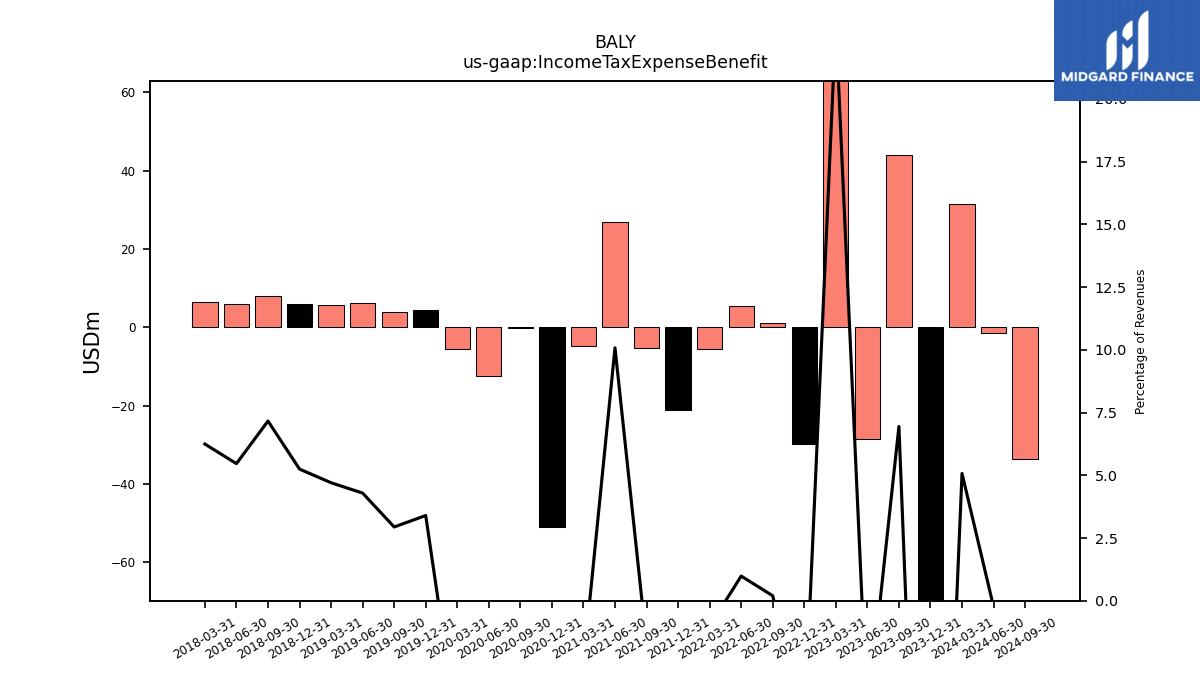
| Income Tax Expense Benefit | 43.94 | -28.65 | 137.74 | -29.92 | 1.14 | 5.43 | -5.58 | -21.13 | -5.40 | 26.98 | -4.83 | -50.89 | -0.25 | -12.52 | -5.66 | 4.43 | 3.80 | 6.14 | 5.67 | 5.85 | 7.91 | 6.06 | 6.54 | |
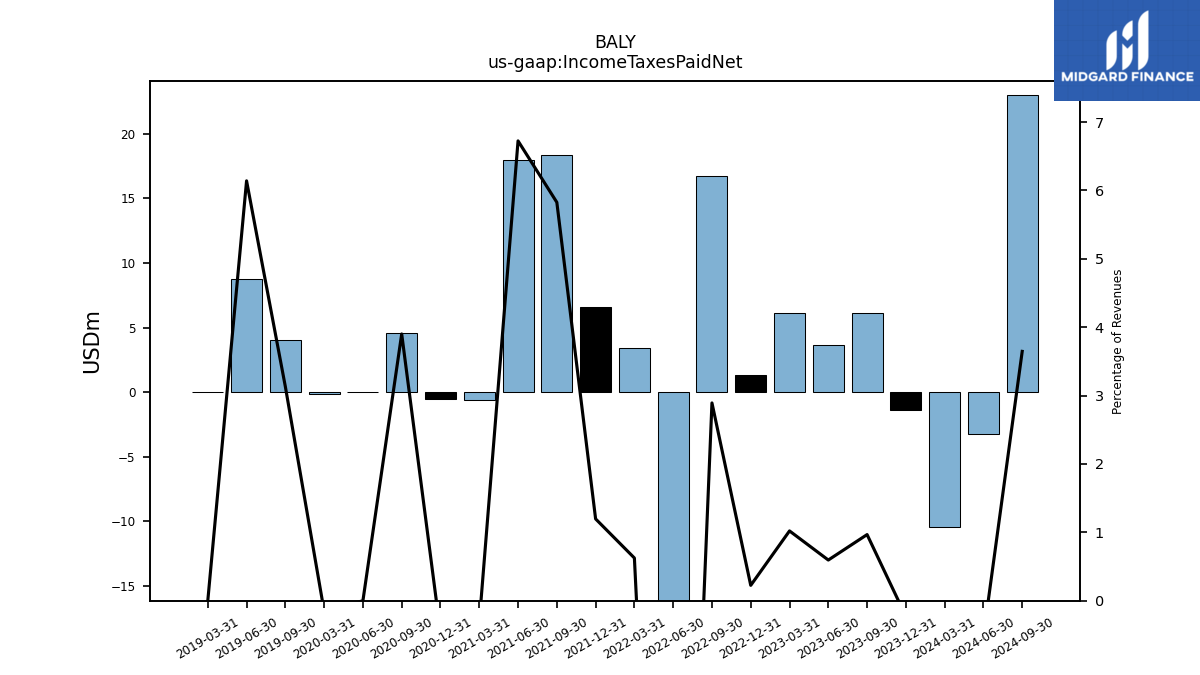
| Income Taxes Paid Net | 6.12 | 3.61 | 6.11 | 1.30 | 16.73 | -59.65 | 3.43 | 6.55 | 18.34 | 18.00 | -0.61 | -0.55 | 4.55 | 0.00 | -0.17 | NA | 4.05 | 8.79 | 0.00 | NA | NA | NA | NA | |
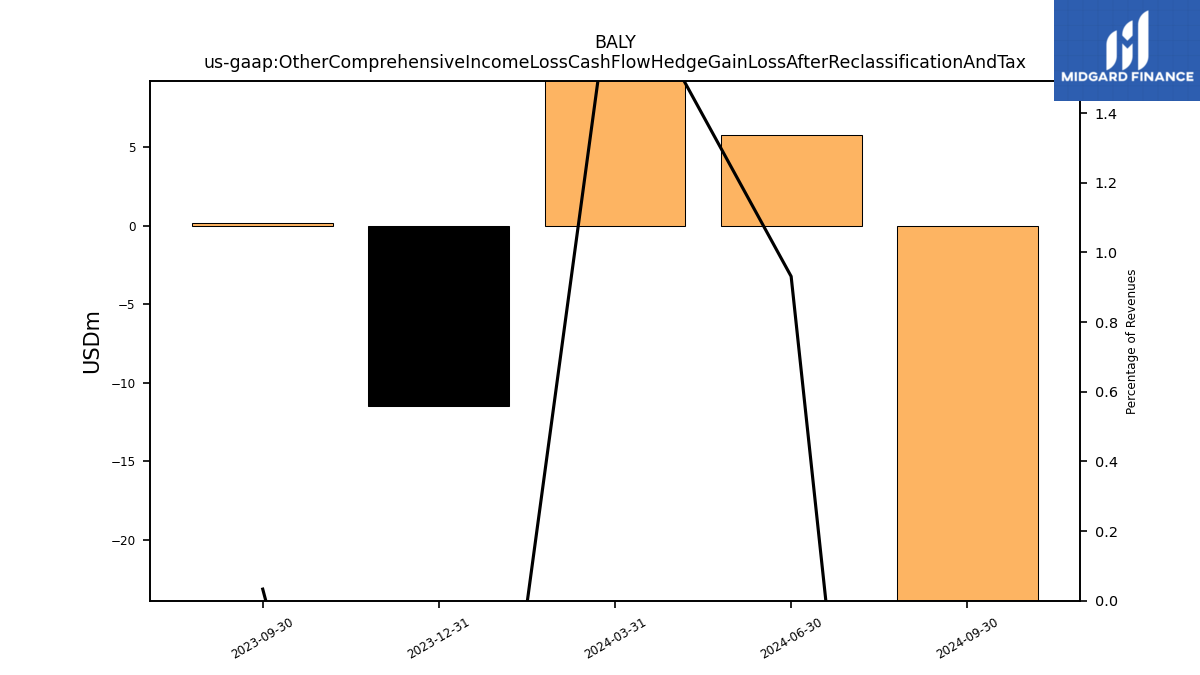
| Other Comprehensive Income Loss Cash Flow Hedge Gain Loss After Reclassification And Tax | 0.21 | NA | NA | NA | NA | NA | NA | NA | NA | NA | NA | NA | NA | NA | NA | NA | NA | NA | NA | NA | NA | NA | NA | |
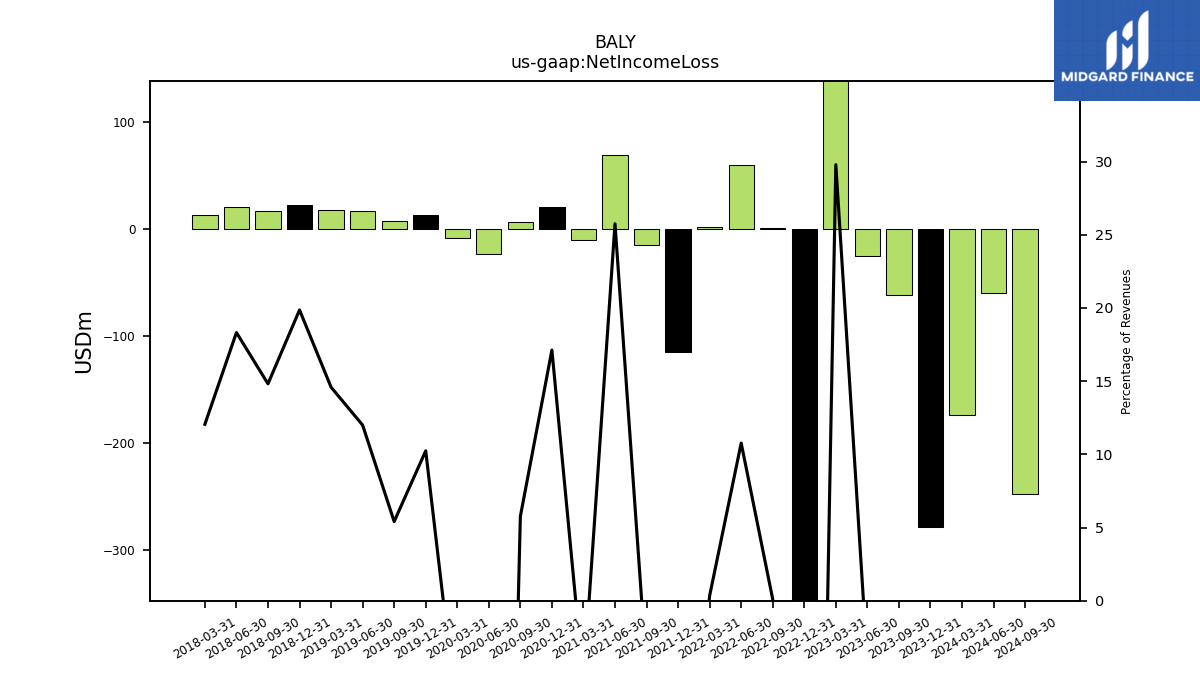
| Net Income Loss | -61.80 | -25.65 | 178.34 | -487.53 | 0.59 | 59.50 | 1.89 | -115.29 | -14.75 | 68.94 | -10.71 | 20.22 | 6.72 | -23.55 | -8.88 | 13.36 | 7.00 | 17.18 | 17.60 | 22.13 | 16.37 | 20.30 | 12.63 | |
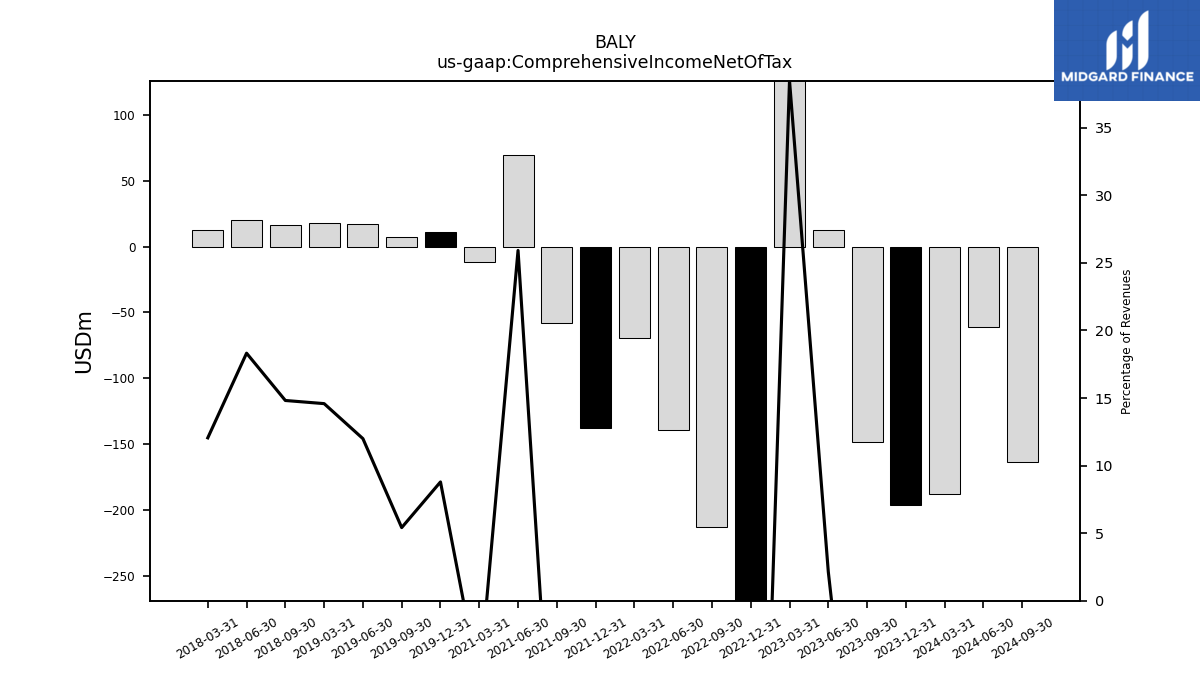
| Comprehensive Income Net Of Tax | -148.16 | 12.97 | 230.41 | -272.81 | -212.60 | -139.31 | -69.65 | -137.66 | -58.38 | 69.40 | -11.72 | NA | NA | NA | NA | 11.47 | 7.00 | 17.18 | 17.60 | NA | 16.37 | 20.30 | 12.63 | |
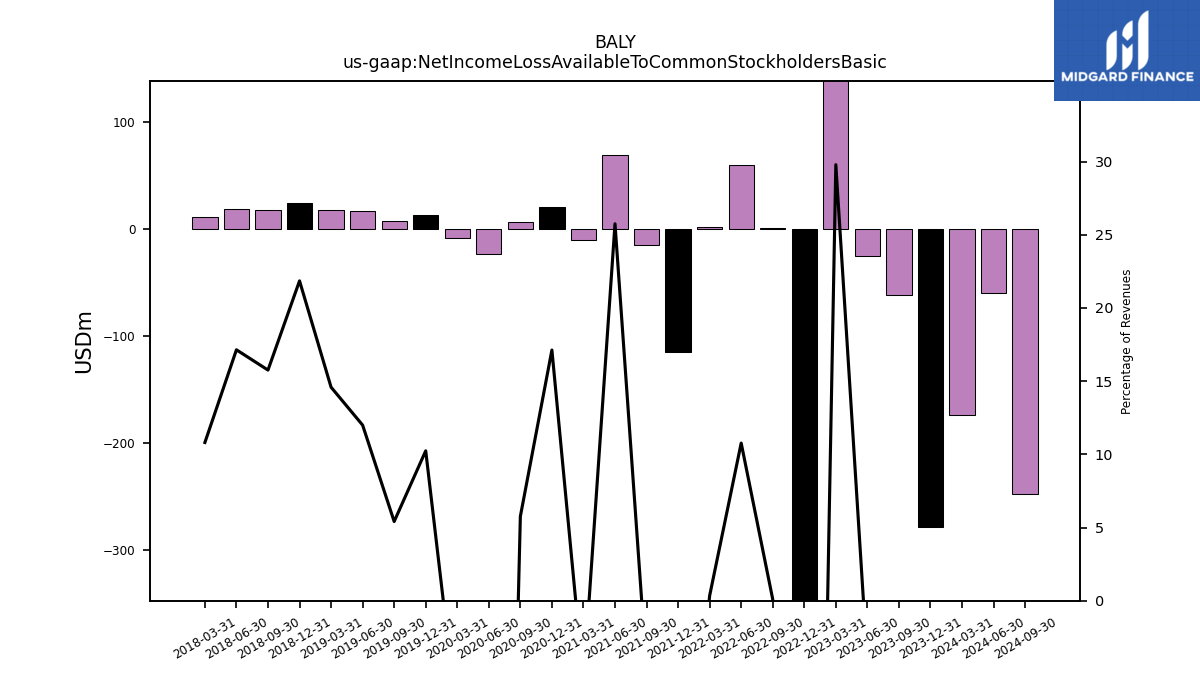
| Net Income Loss Available To Common Stockholders Basic | -61.80 | -25.65 | 178.34 | -487.53 | 0.59 | 59.50 | 1.89 | -115.29 | -14.75 | 68.94 | -10.71 | 20.22 | 6.72 | -23.55 | -8.88 | 13.36 | 7.00 | 17.18 | 17.60 | 24.34 | 17.41 | 19.00 | 11.33 | |
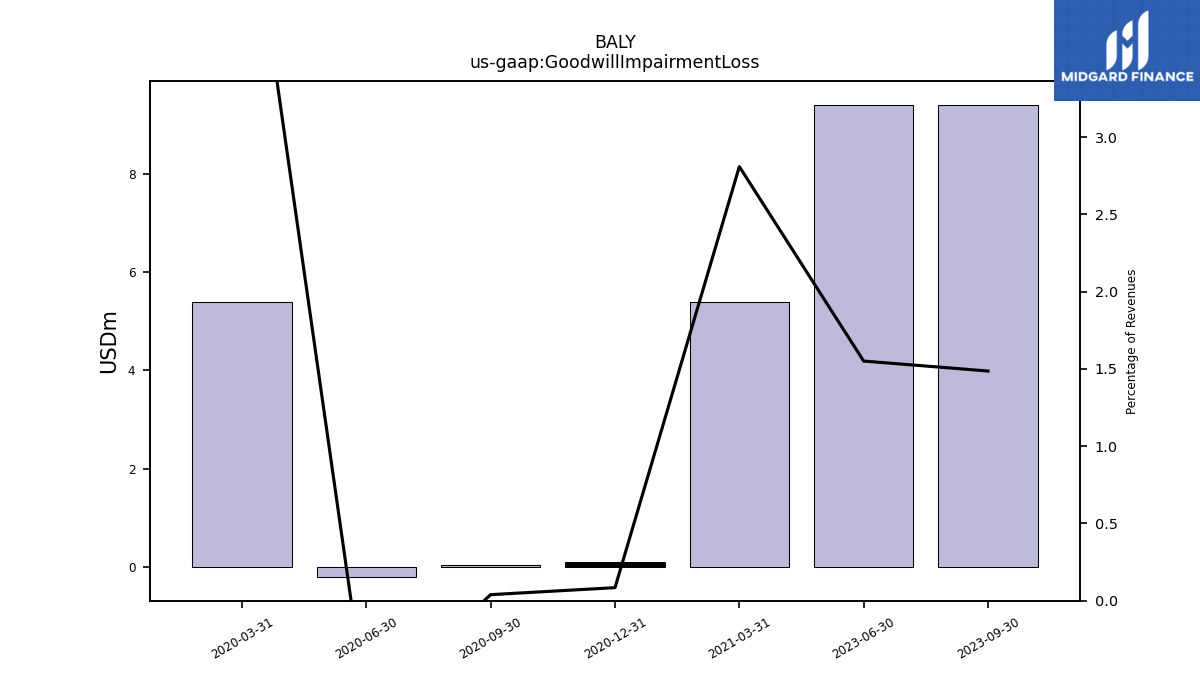
| Goodwill Impairment Loss | 9.40 | 9.40 | NA | NA | NA | NA | NA | NA | NA | NA | 5.40 | 0.10 | 0.05 | -0.20 | 5.40 | NA | NA | NA | NA | NA | NA | NA | NA |
| 2023-09-30 | 2023-06-30 | 2023-03-31 | 2022-12-31 | 2022-09-30 | 2022-06-30 | 2022-03-31 | 2021-12-31 | 2021-09-30 | 2021-06-30 | 2021-03-31 | 2020-12-31 | 2020-09-30 | 2020-06-30 | 2020-03-31 | 2019-12-31 | 2019-09-30 | 2019-06-30 | 2019-03-31 | 2018-12-31 | 2018-09-30 | 2018-06-30 | 2018-03-31 | ||
|---|---|---|---|---|---|---|---|---|---|---|---|---|---|---|---|---|---|---|---|---|---|---|---|---|
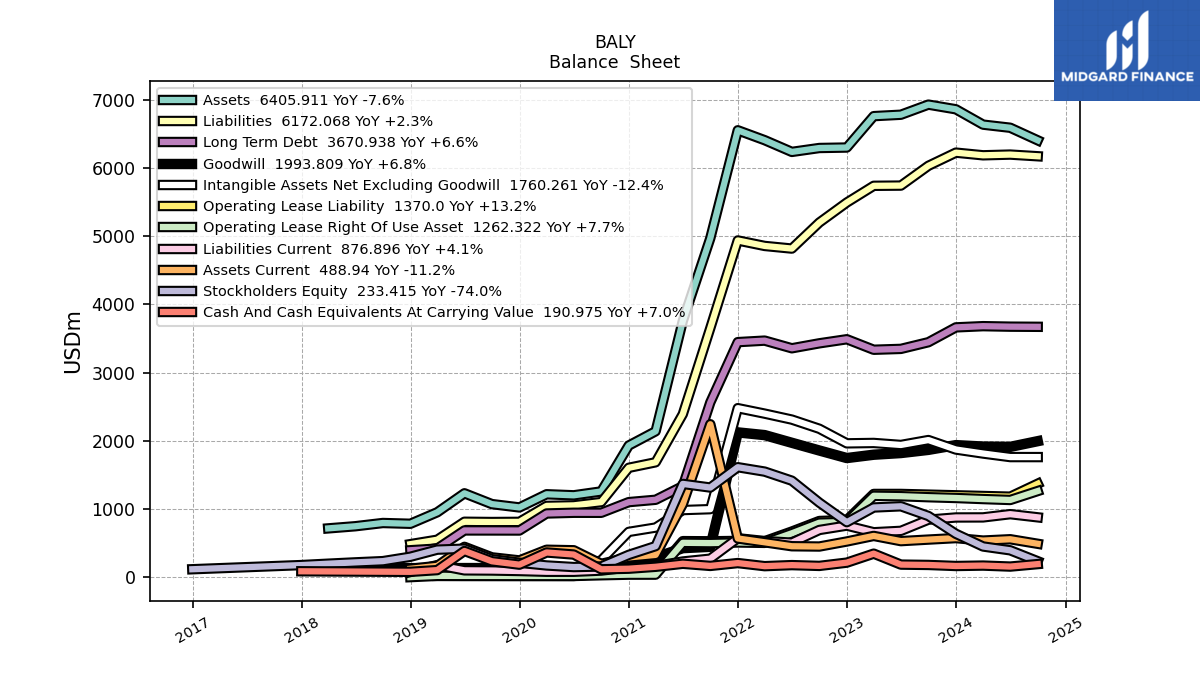
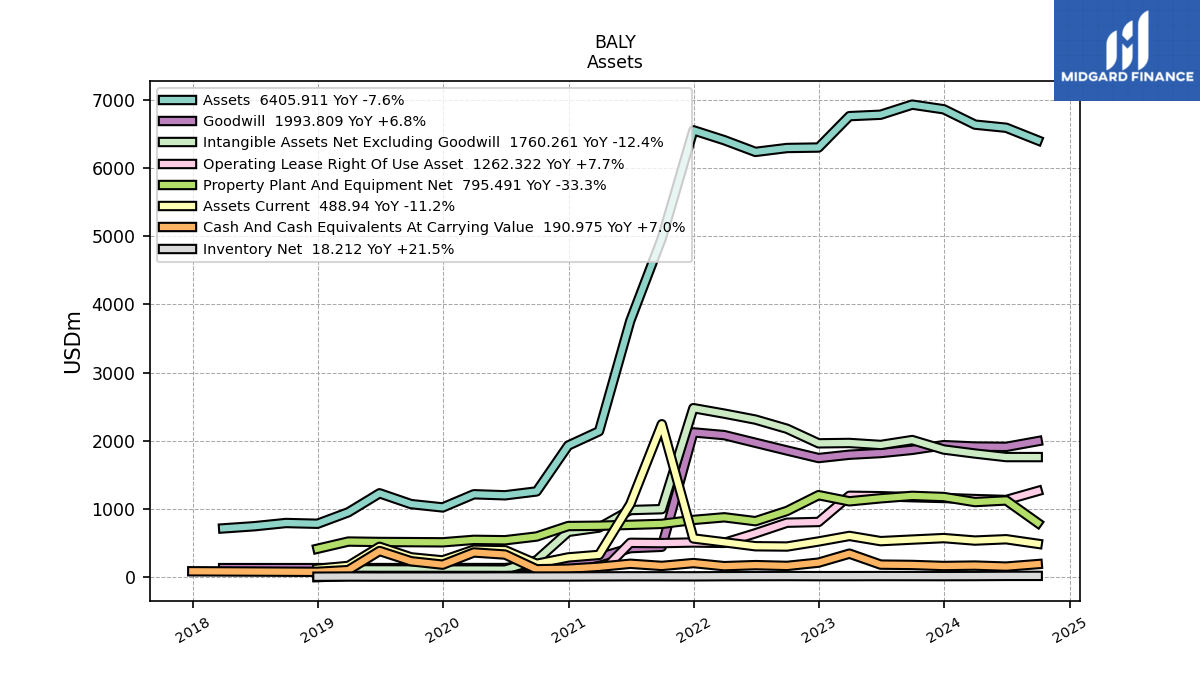
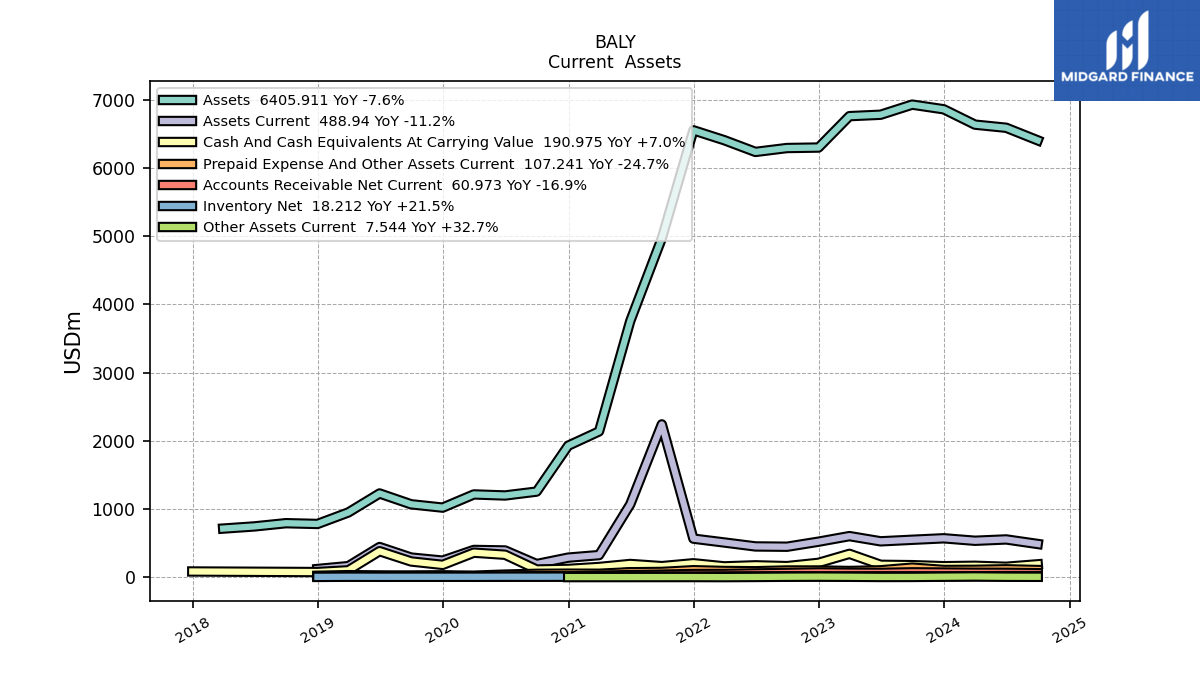
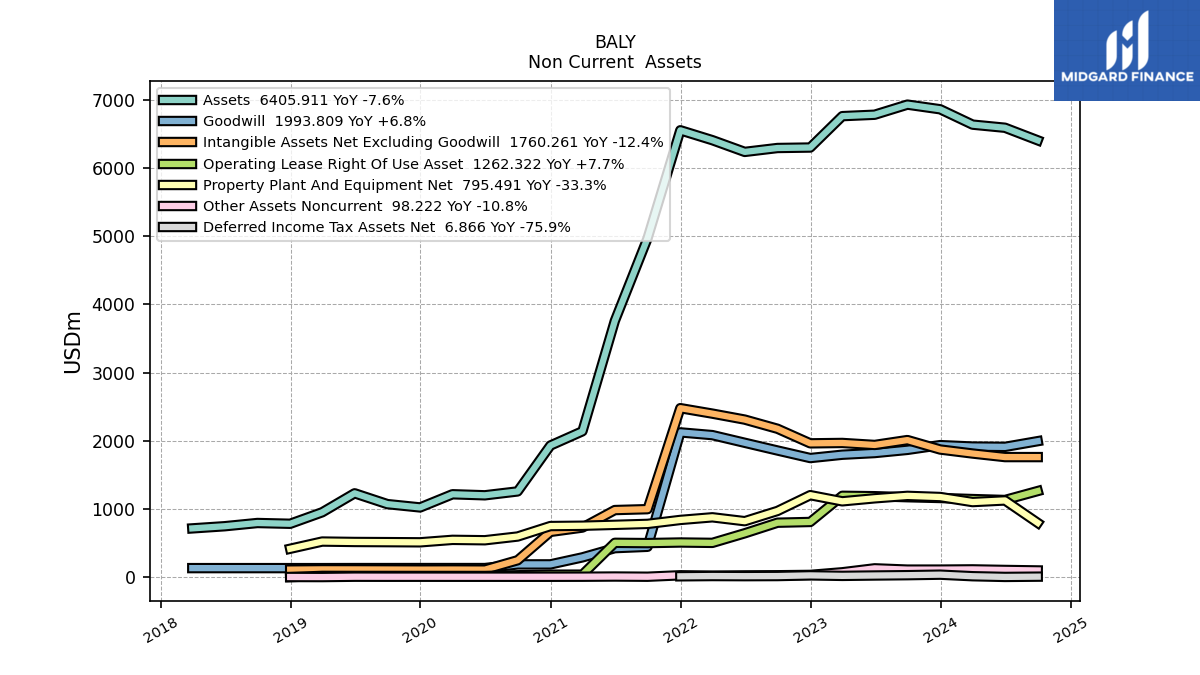
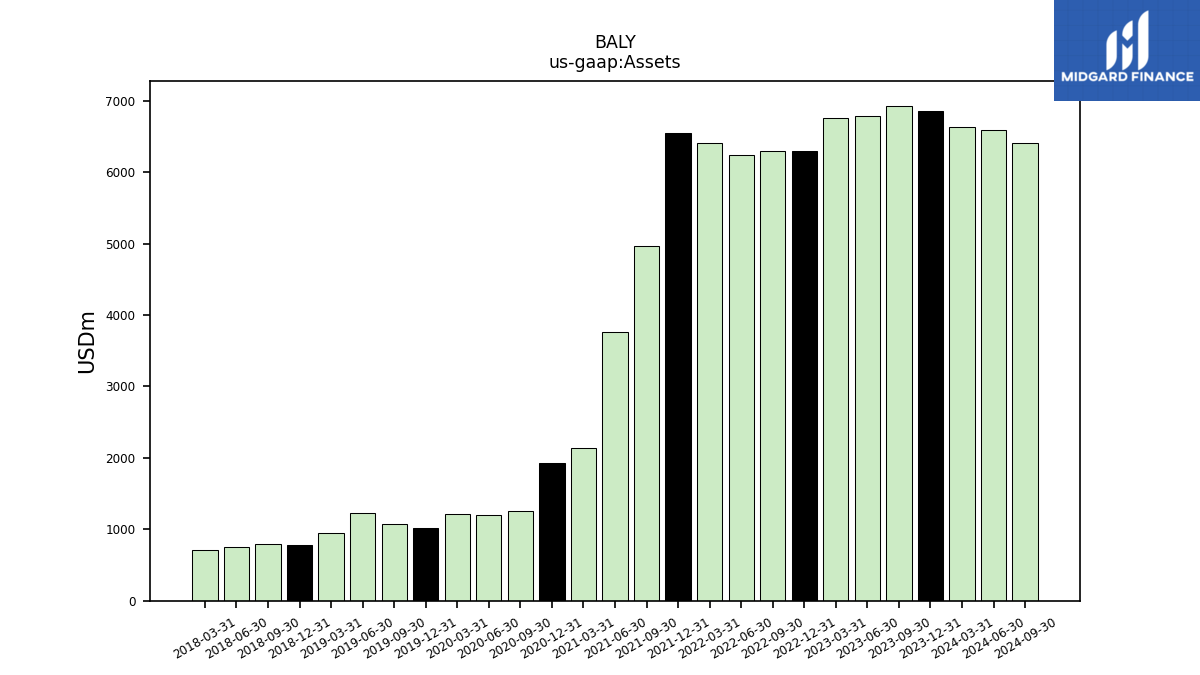
| Assets | 6929.37 | 6781.19 | 6760.40 | 6300.11 | 6293.19 | 6235.99 | 6408.03 | 6553.22 | 4969.70 | 3757.31 | 2138.80 | 1929.86 | 1256.88 | 1199.96 | 1215.32 | 1021.89 | 1070.92 | 1229.46 | 951.08 | 782.35 | 793.71 | 746.33 | 714.77 | |
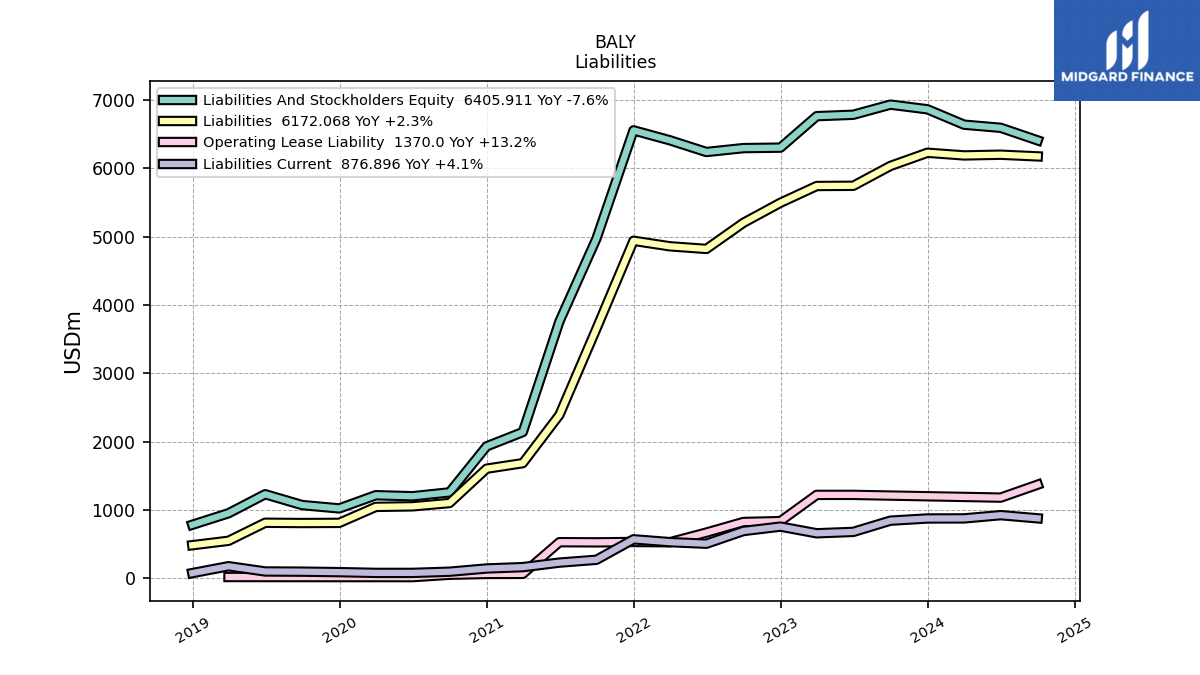
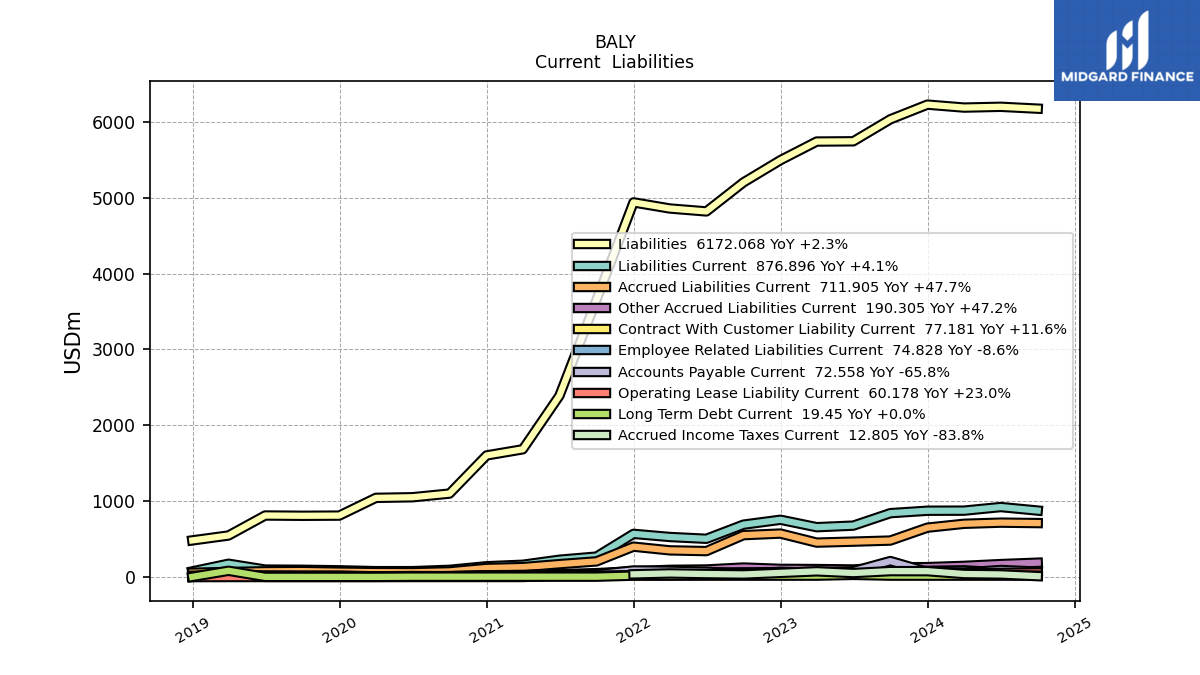
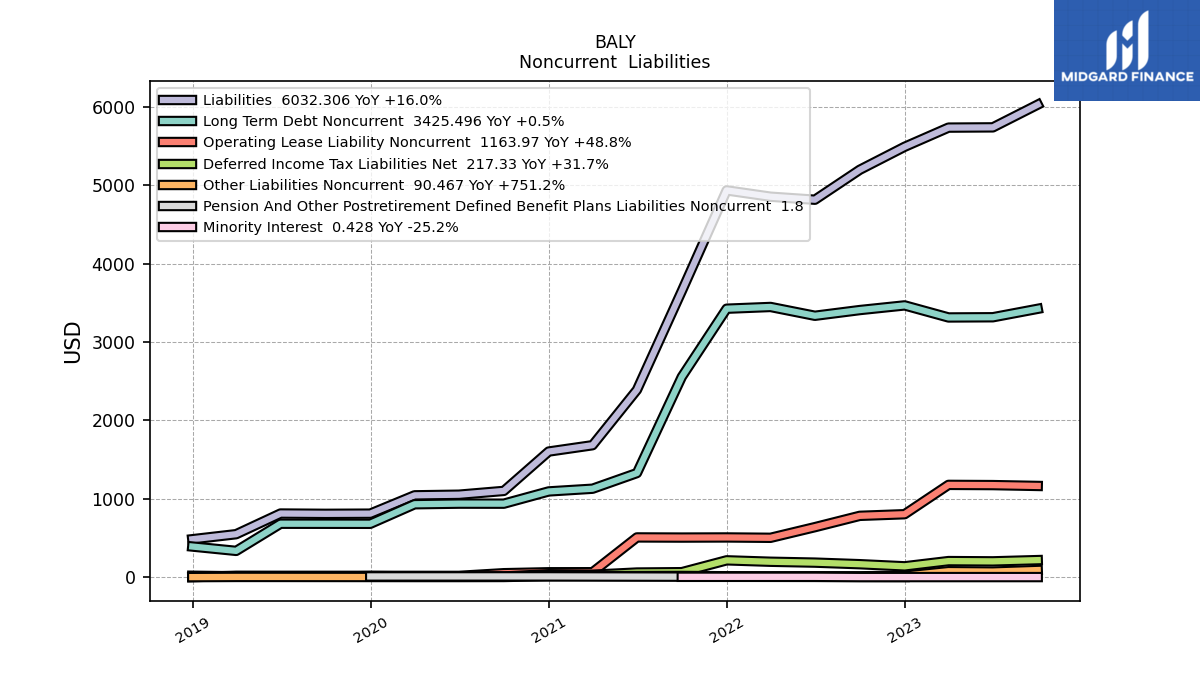
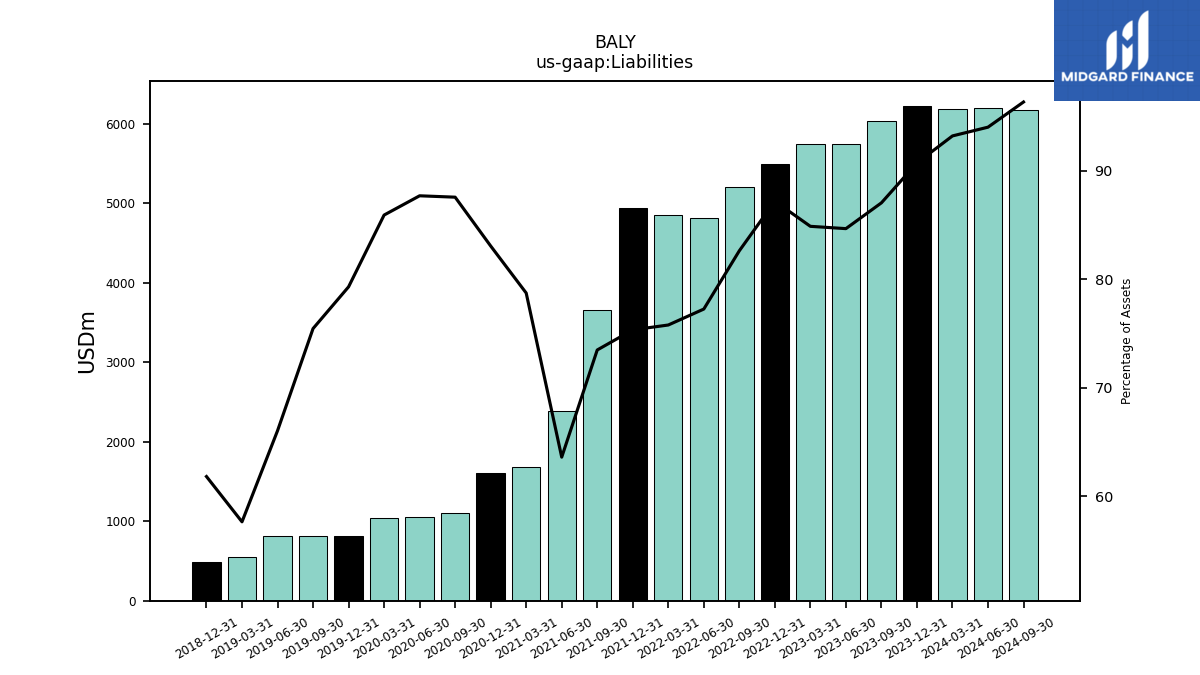
| Liabilities | 6032.31 | 5742.03 | 5738.79 | 5493.87 | 5200.45 | 4818.07 | 4856.81 | 4937.41 | 3652.25 | 2390.09 | 1684.10 | 1603.26 | 1100.72 | 1052.40 | 1044.30 | 810.48 | 808.15 | 812.02 | 548.30 | 483.69 | NA | NA | NA | |
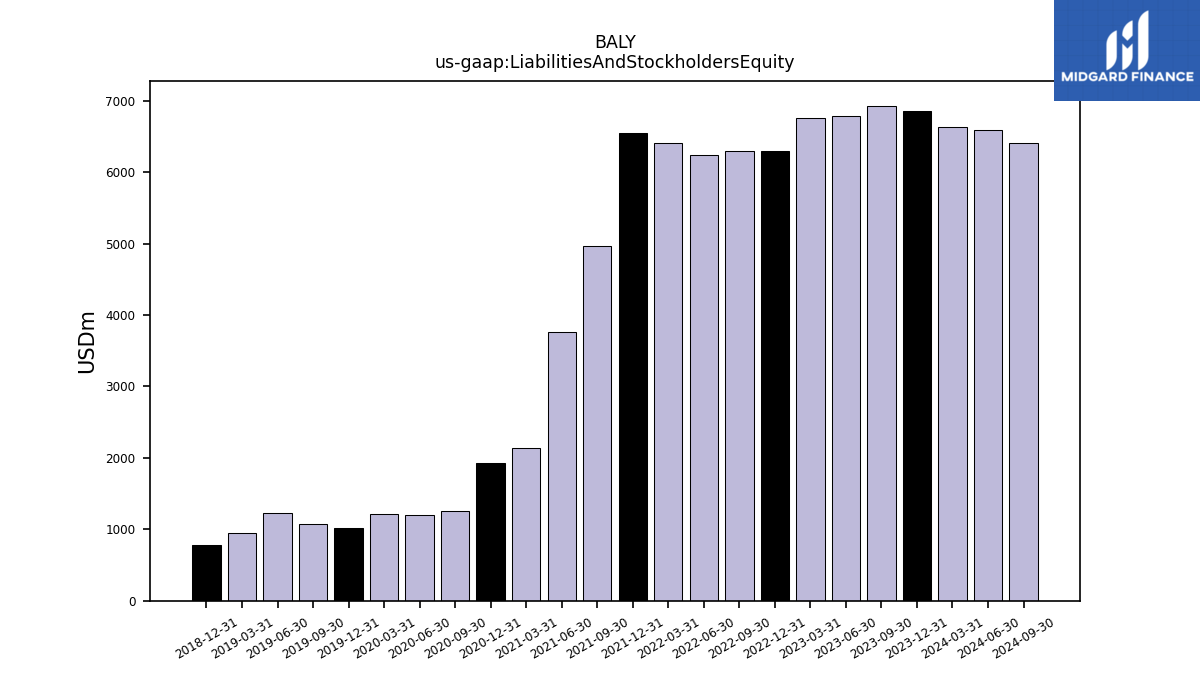
| Liabilities And Stockholders Equity | 6929.37 | 6781.19 | 6760.40 | 6300.11 | 6293.19 | 6235.99 | 6408.03 | 6553.22 | 4969.70 | 3757.31 | 2138.80 | 1929.86 | 1256.88 | 1199.96 | 1215.32 | 1021.89 | 1070.92 | 1229.46 | 951.08 | 782.35 | NA | NA | NA | |
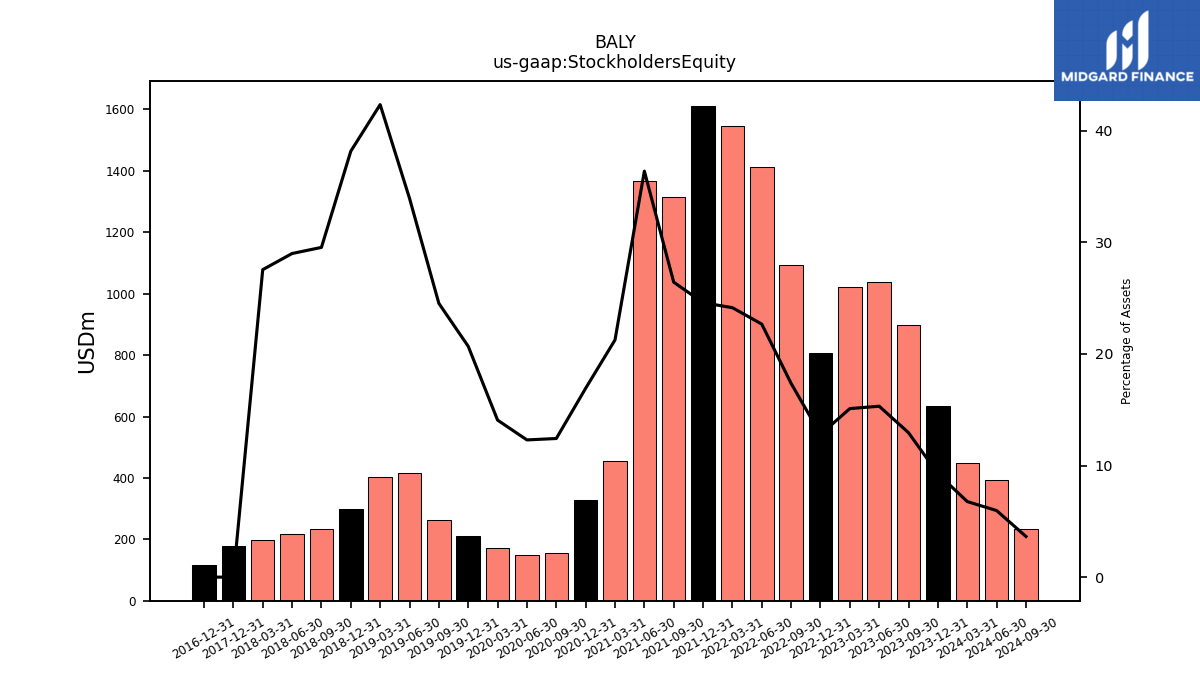
| Stockholders Equity | 896.64 | 1038.73 | 1021.18 | 805.82 | 1092.17 | 1414.16 | 1547.46 | 1612.04 | 1313.69 | 1367.22 | 454.70 | 326.60 | 156.16 | 147.56 | 171.02 | 211.41 | 262.76 | 417.44 | 402.78 | 298.66 | 234.57 | 216.47 | 196.97 |
| 2023-09-30 | 2023-06-30 | 2023-03-31 | 2022-12-31 | 2022-09-30 | 2022-06-30 | 2022-03-31 | 2021-12-31 | 2021-09-30 | 2021-06-30 | 2021-03-31 | 2020-12-31 | 2020-09-30 | 2020-06-30 | 2020-03-31 | 2019-12-31 | 2019-09-30 | 2019-06-30 | 2019-03-31 | 2018-12-31 | 2018-09-30 | 2018-06-30 | 2018-03-31 | ||
|---|---|---|---|---|---|---|---|---|---|---|---|---|---|---|---|---|---|---|---|---|---|---|---|---|
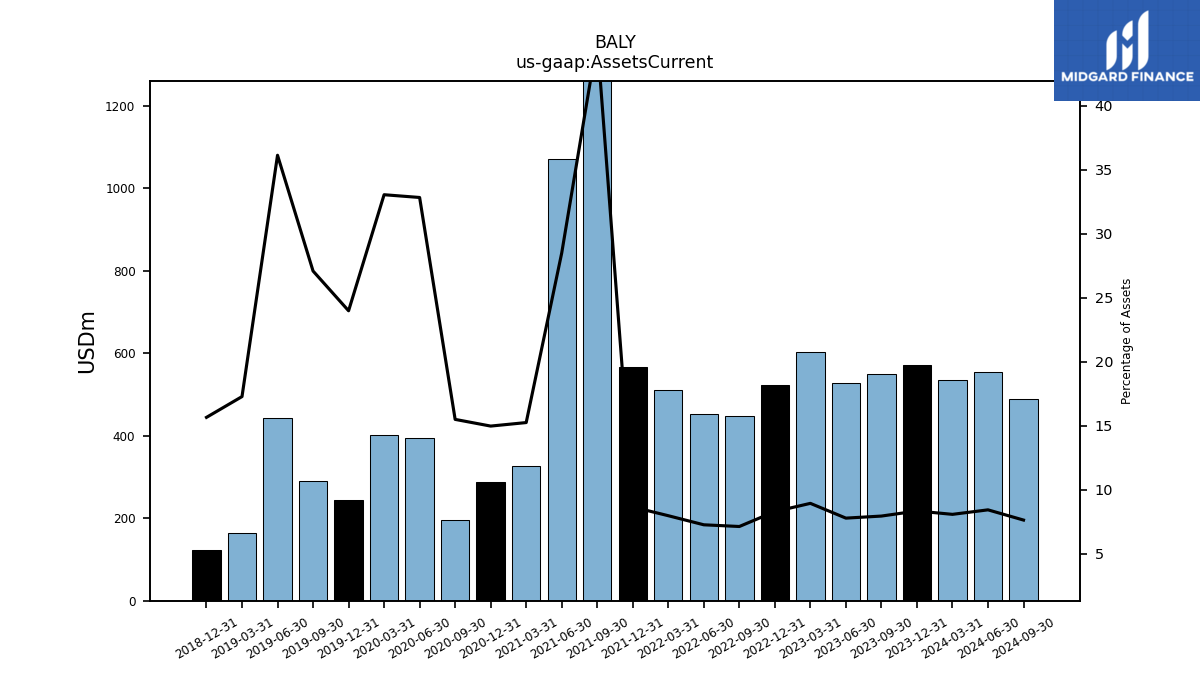
| Assets Current | 550.55 | 527.85 | 604.21 | 522.71 | 448.72 | 452.94 | 510.91 | 567.19 | 2242.48 | 1070.44 | 326.11 | 288.95 | 194.76 | 393.91 | 401.57 | 245.03 | 290.05 | 444.14 | 164.31 | 122.46 | NA | NA | NA | |
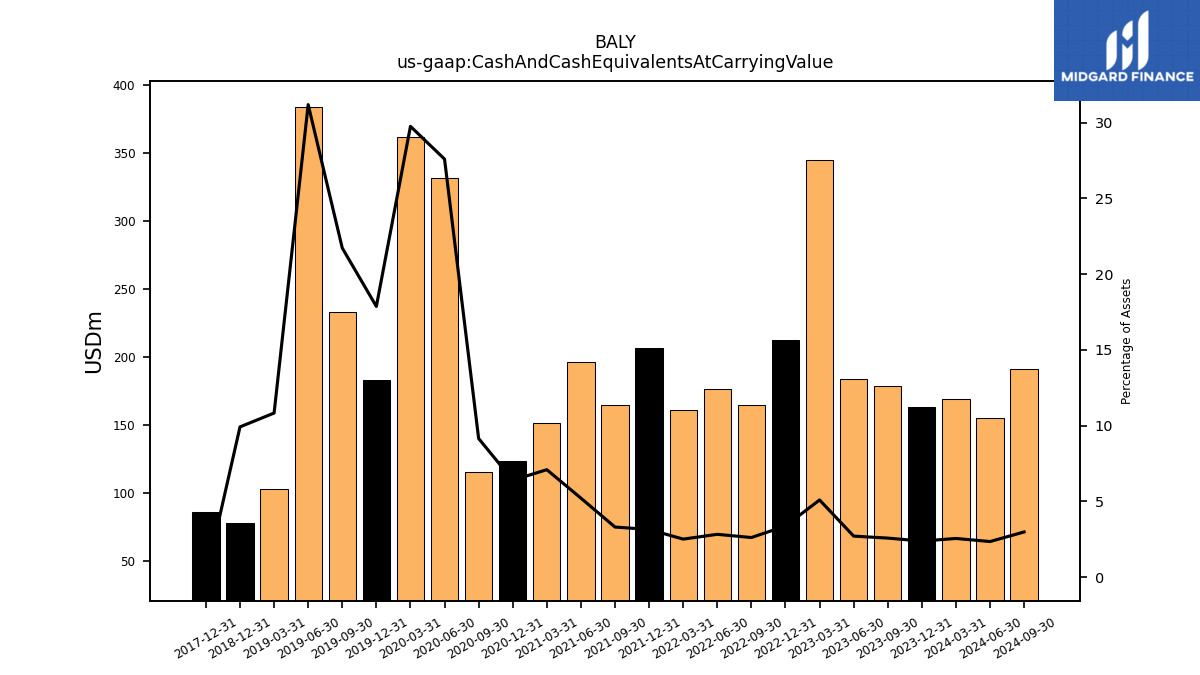
| Cash And Cash Equivalents At Carrying Value | 178.53 | 183.61 | 344.27 | 212.51 | 164.46 | 176.16 | 160.78 | 206.19 | 164.26 | 195.83 | 151.65 | 123.44 | 115.00 | 331.08 | 361.59 | 182.58 | 232.60 | 383.43 | 103.00 | 77.58 | NA | NA | NA | |
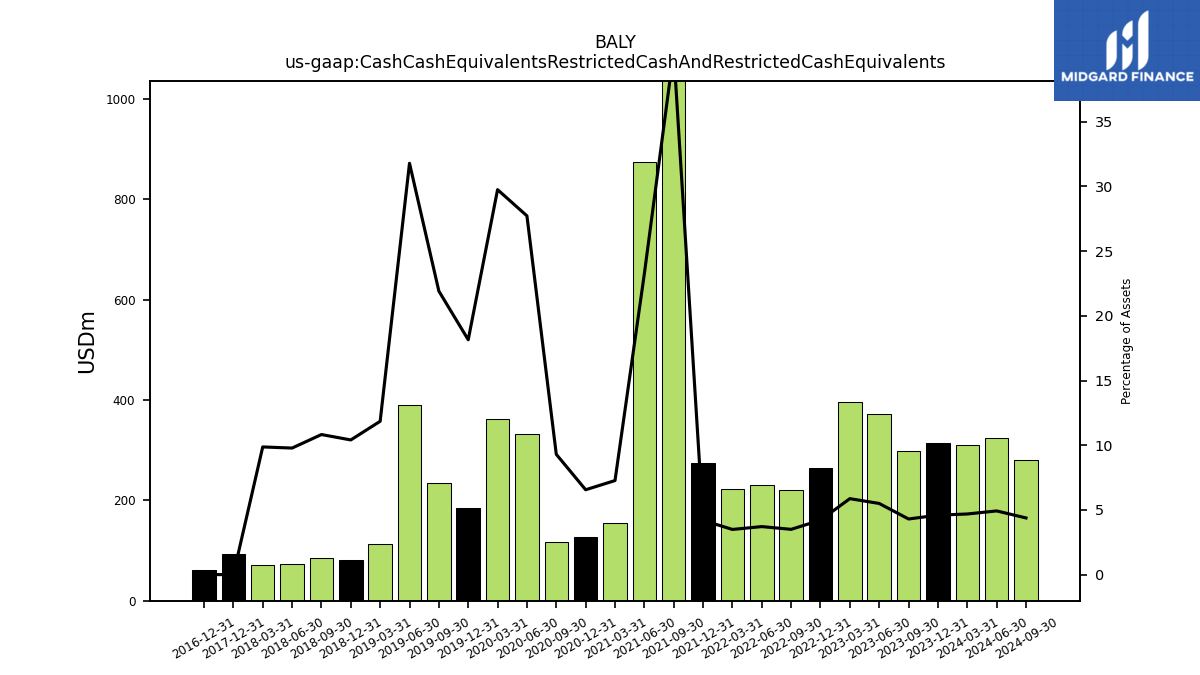
| Cash Cash Equivalents Restricted Cash And Restricted Cash Equivalents | 297.84 | 372.85 | 396.86 | 265.18 | 220.13 | 231.36 | 223.67 | 274.84 | 2009.02 | 873.68 | 155.47 | 126.56 | 116.85 | 332.73 | 361.59 | 185.50 | 234.66 | 390.89 | 112.70 | 81.43 | 85.92 | 73.00 | 70.53 | |
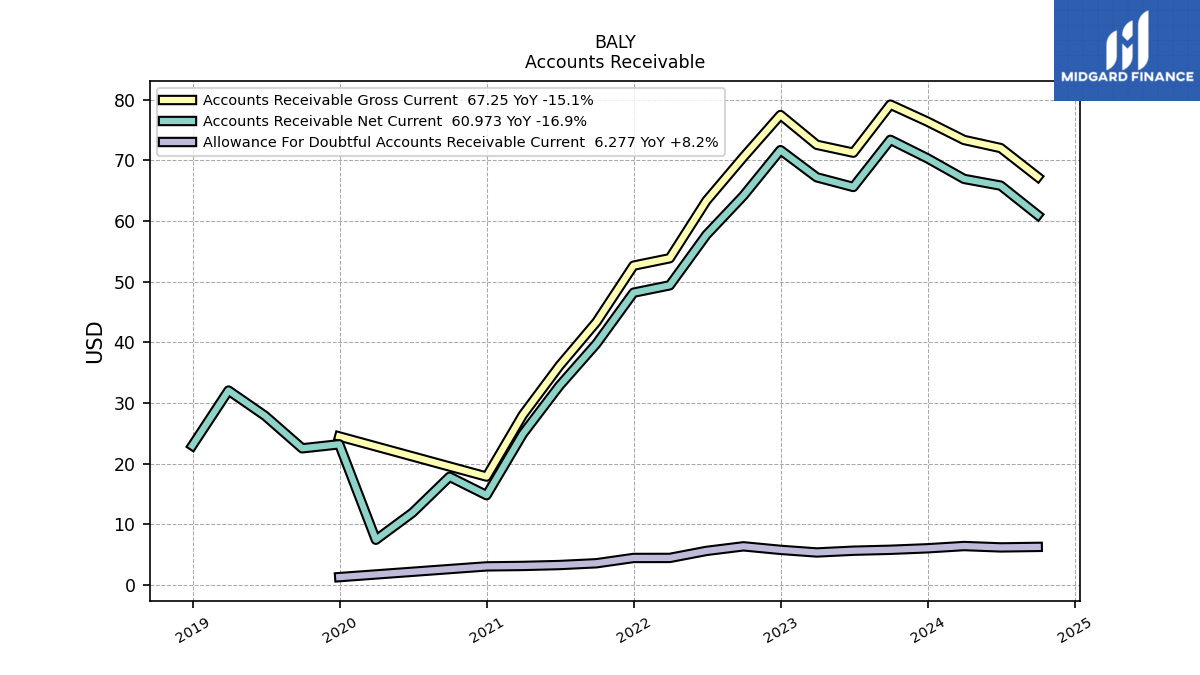
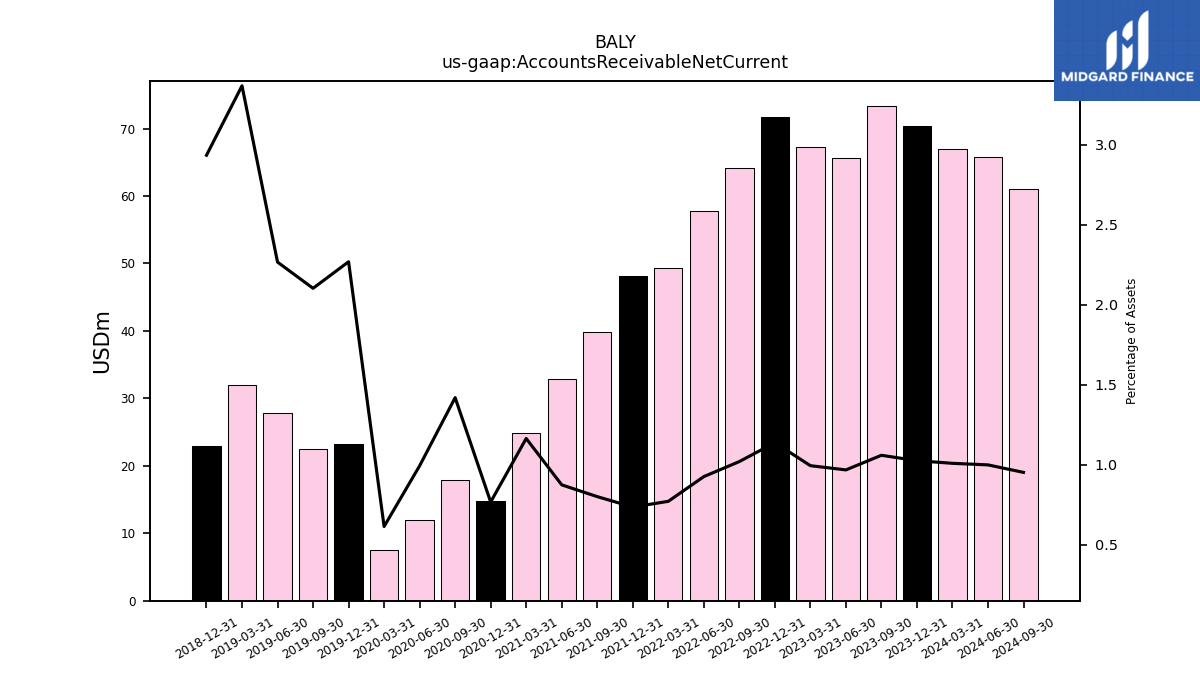
| Accounts Receivable Net Current | 73.37 | 65.60 | 67.20 | 71.67 | 64.16 | 57.71 | 49.39 | 48.18 | 39.77 | 32.84 | 24.89 | 14.80 | 17.84 | 11.92 | 7.46 | 23.19 | 22.52 | 27.87 | 32.05 | 22.97 | NA | NA | NA | |
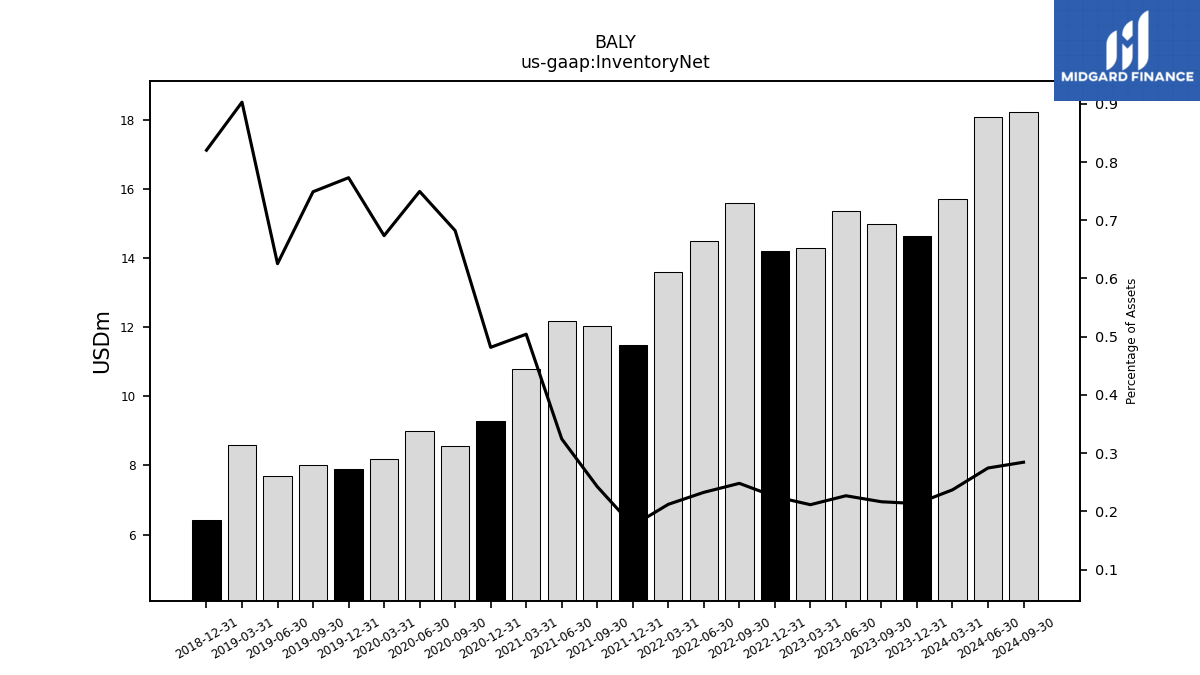
| Inventory Net | 14.99 | 15.37 | 14.29 | 14.19 | 15.61 | 14.50 | 13.58 | 11.49 | 12.05 | 12.19 | 10.78 | 9.30 | 8.57 | 8.99 | 8.19 | 7.90 | 8.02 | 7.69 | 8.59 | 6.42 | NA | NA | NA | |
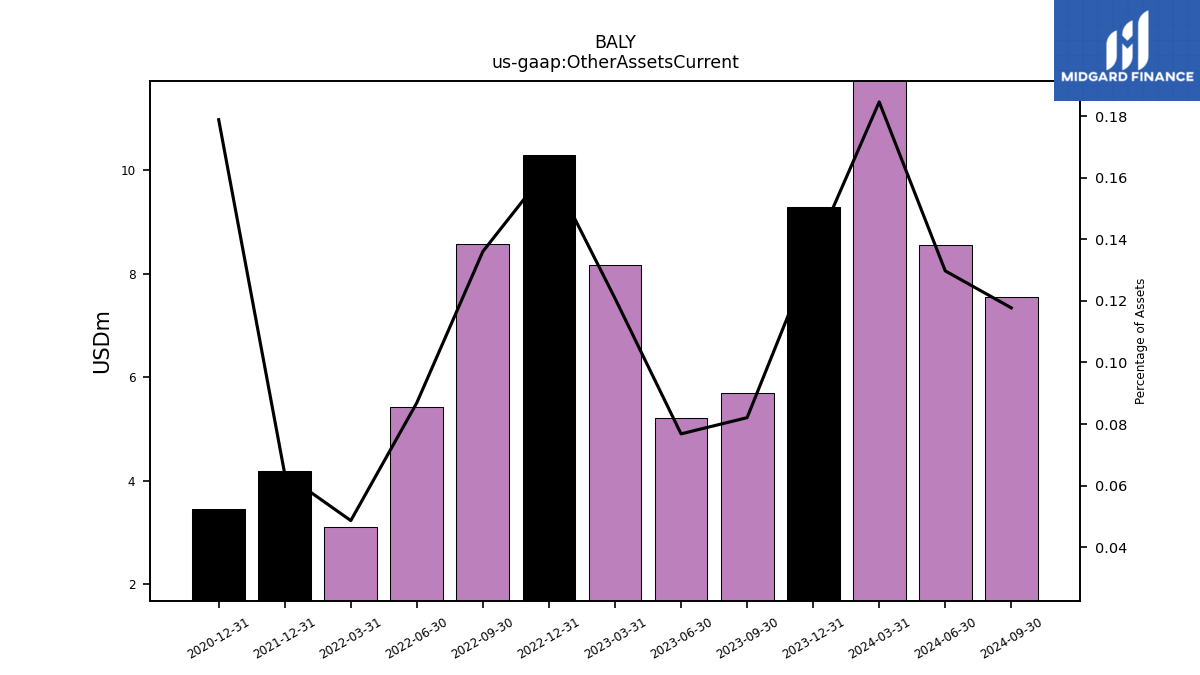
| Other Assets Current | 5.69 | 5.21 | 8.17 | 10.29 | 8.57 | 5.42 | 3.12 | 4.18 | NA | NA | NA | 3.45 | NA | NA | NA | NA | NA | NA | NA | NA | NA | NA | NA | |
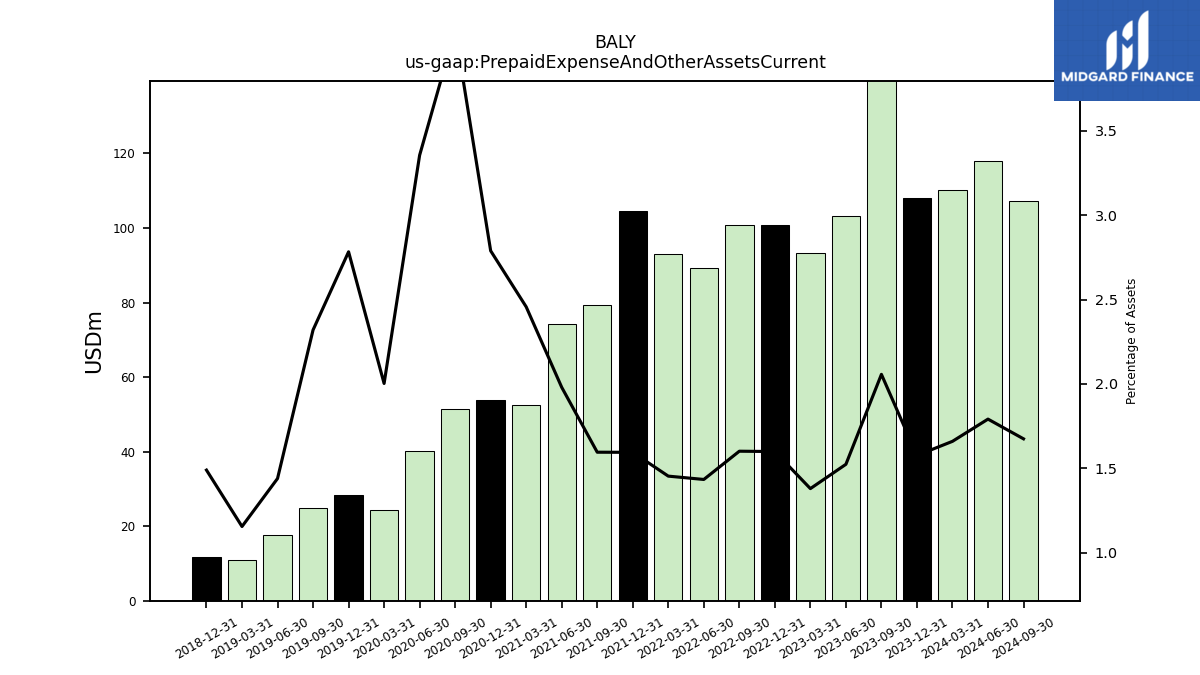
| Prepaid Expense And Other Assets Current | 142.49 | 103.28 | 93.22 | 100.72 | 100.73 | 89.37 | 93.10 | 104.46 | 79.25 | 74.38 | 52.54 | 53.82 | 51.49 | 40.27 | 24.34 | 28.44 | 24.84 | 17.69 | 10.98 | 11.65 | NA | NA | NA | |
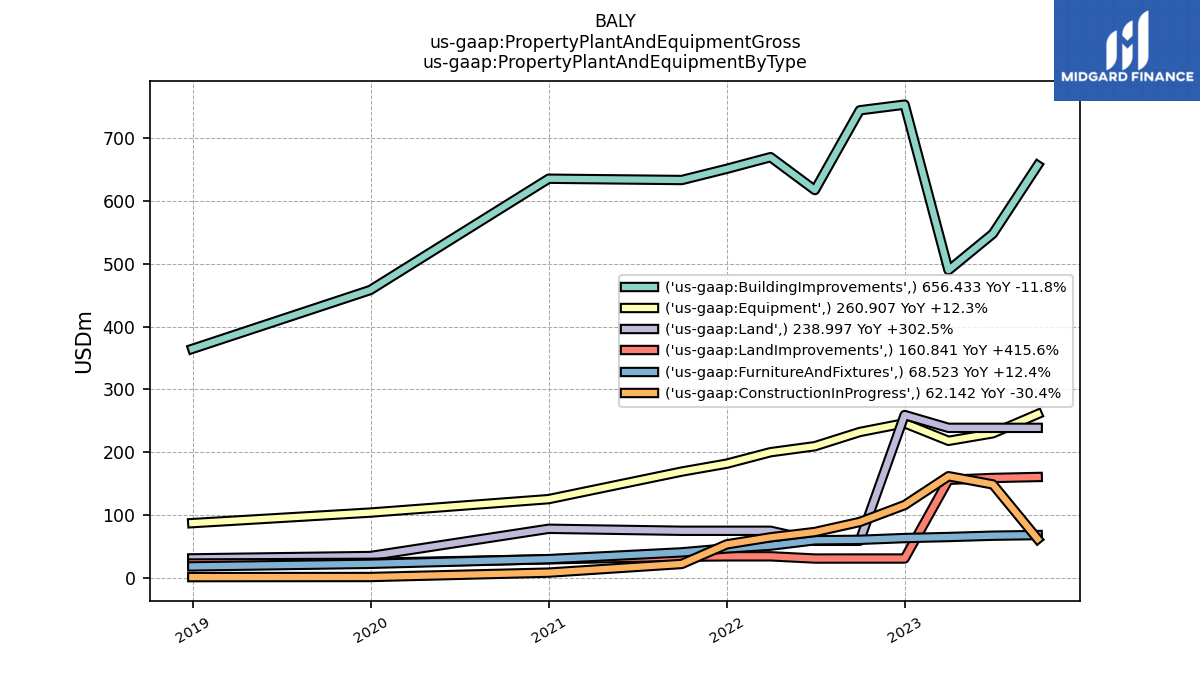
| Land | NA | NA | NA | 200.00 | NA | NA | NA | NA | NA | NA | NA | NA | NA | NA | NA | NA | NA | NA | NA | NA | NA | NA | NA |
| 2023-09-30 | 2023-06-30 | 2023-03-31 | 2022-12-31 | 2022-09-30 | 2022-06-30 | 2022-03-31 | 2021-12-31 | 2021-09-30 | 2021-06-30 | 2021-03-31 | 2020-12-31 | 2020-09-30 | 2020-06-30 | 2020-03-31 | 2019-12-31 | 2019-09-30 | 2019-06-30 | 2019-03-31 | 2018-12-31 | 2018-09-30 | 2018-06-30 | 2018-03-31 | ||
|---|---|---|---|---|---|---|---|---|---|---|---|---|---|---|---|---|---|---|---|---|---|---|---|---|
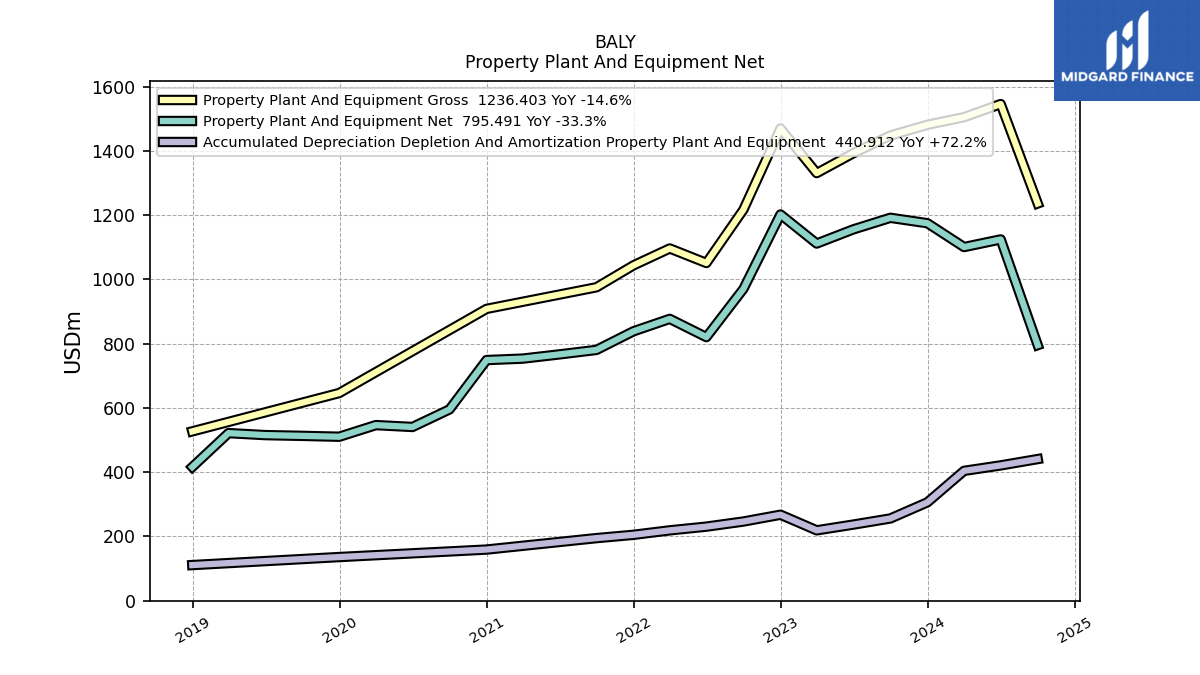
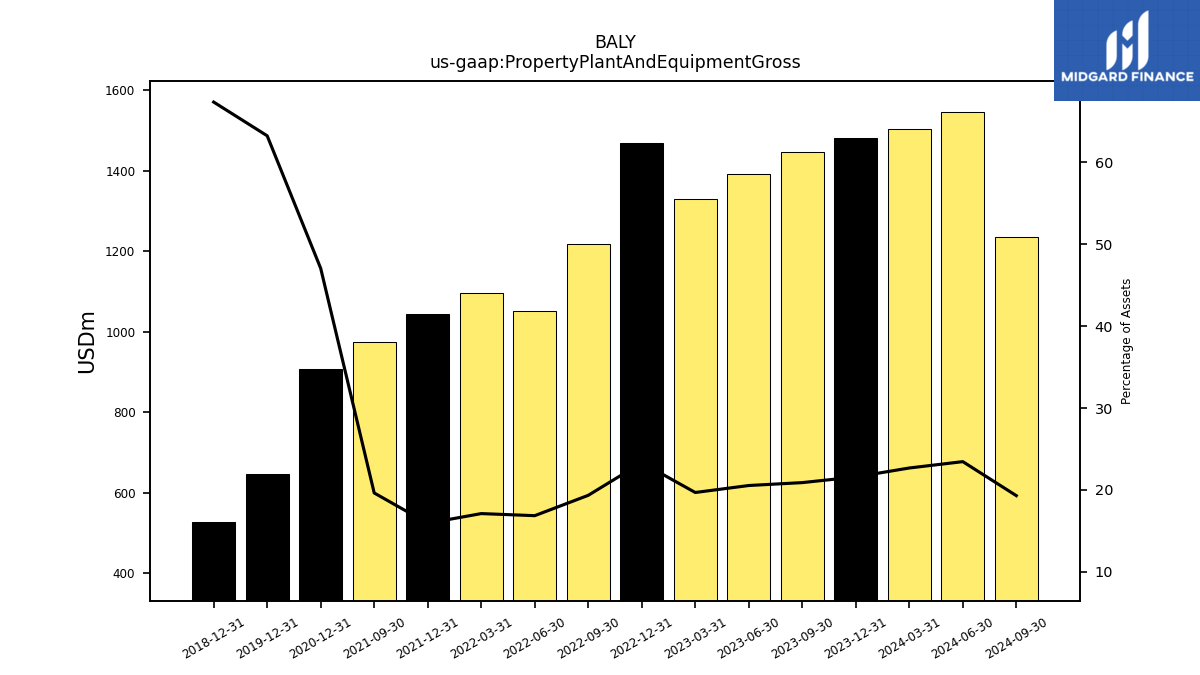
| Property Plant And Equipment Gross | 1447.84 | 1392.80 | 1330.88 | 1469.81 | 1217.17 | 1051.12 | 1096.37 | 1043.85 | 975.55 | NA | NA | 908.36 | NA | NA | NA | 646.44 | NA | NA | NA | 527.15 | NA | NA | NA | |
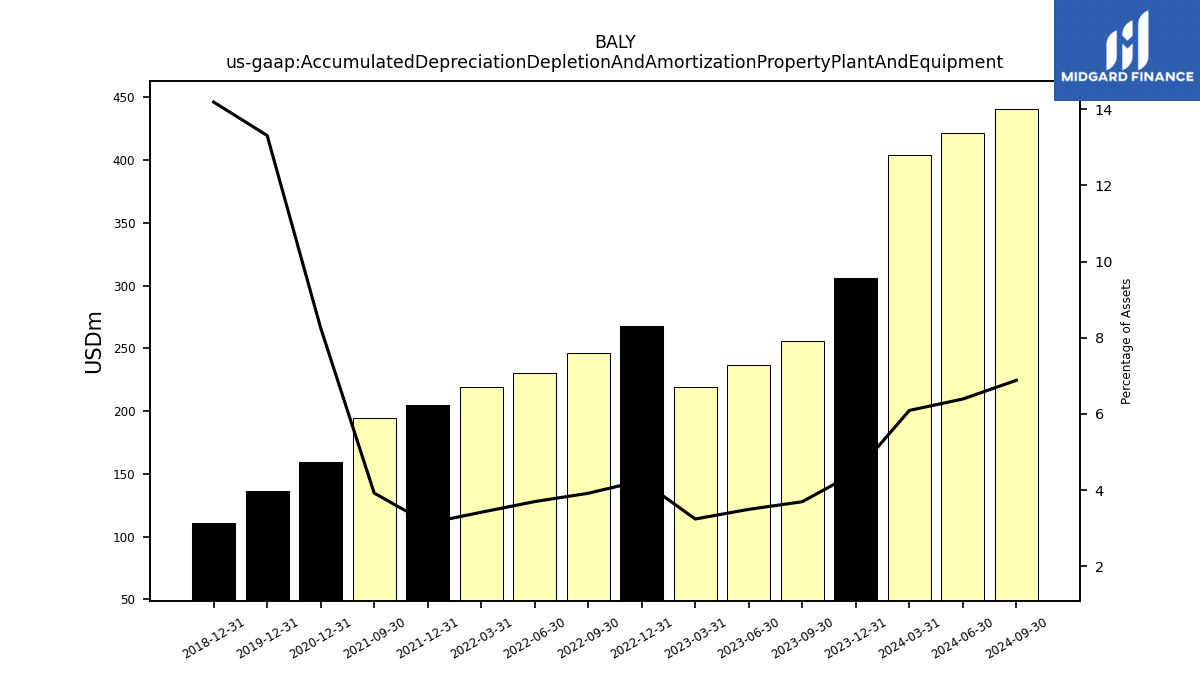
| Accumulated Depreciation Depletion And Amortization Property Plant And Equipment | 256.09 | 237.04 | 219.16 | 267.71 | 246.57 | 230.66 | 219.09 | 205.20 | 194.90 | NA | NA | 159.33 | NA | NA | NA | 136.01 | NA | NA | NA | 111.00 | NA | NA | NA | |
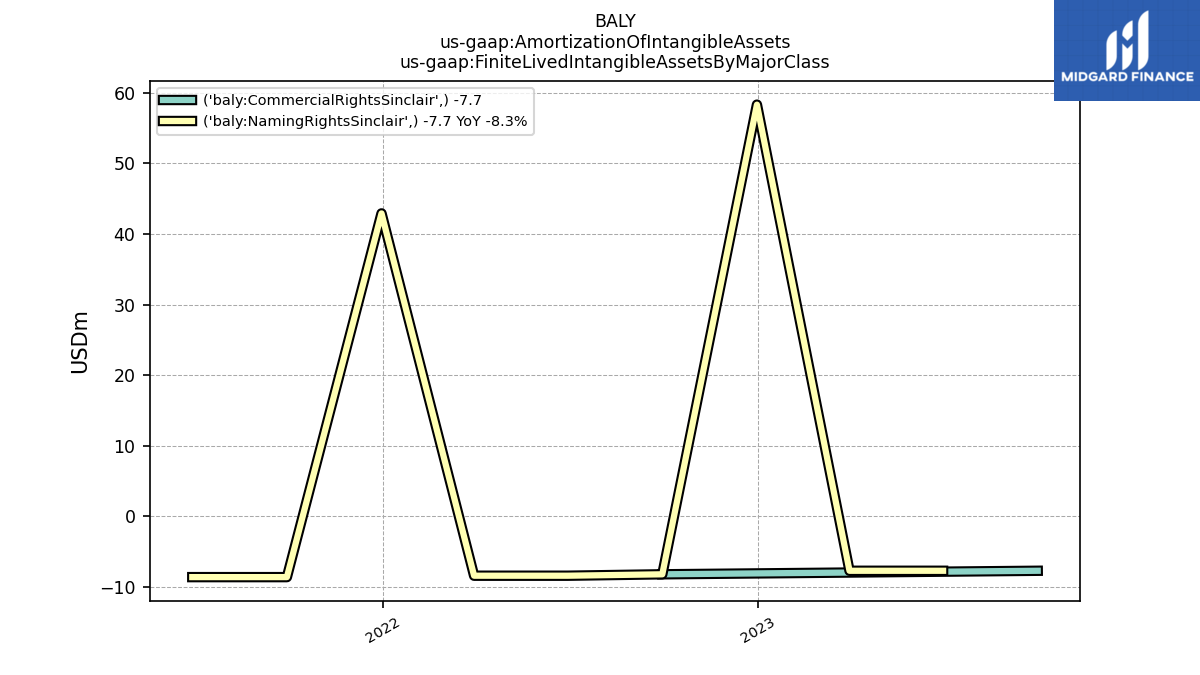
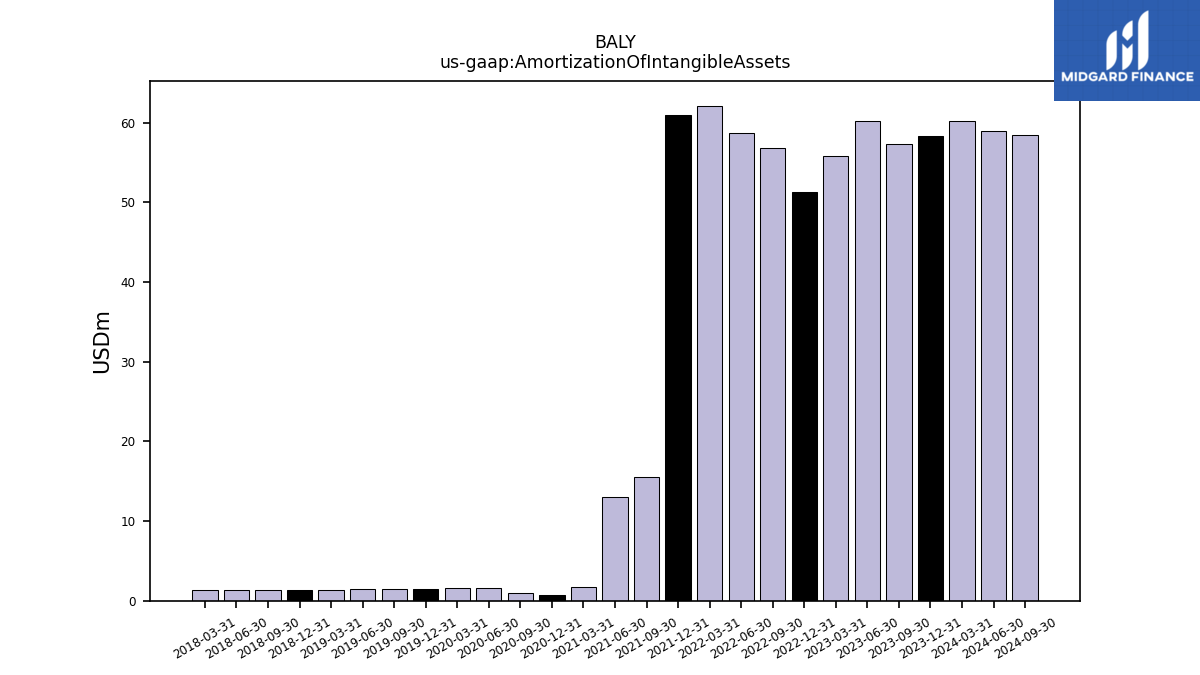
| Amortization Of Intangible Assets | 57.30 | 60.20 | 55.88 | 51.27 | 56.80 | 58.70 | 62.14 | 60.98 | 15.50 | 13.00 | 1.69 | 0.70 | 1.03 | 1.59 | 1.58 | 1.52 | 1.52 | 1.52 | 1.37 | 1.37 | 1.37 | 1.37 | 1.37 | |
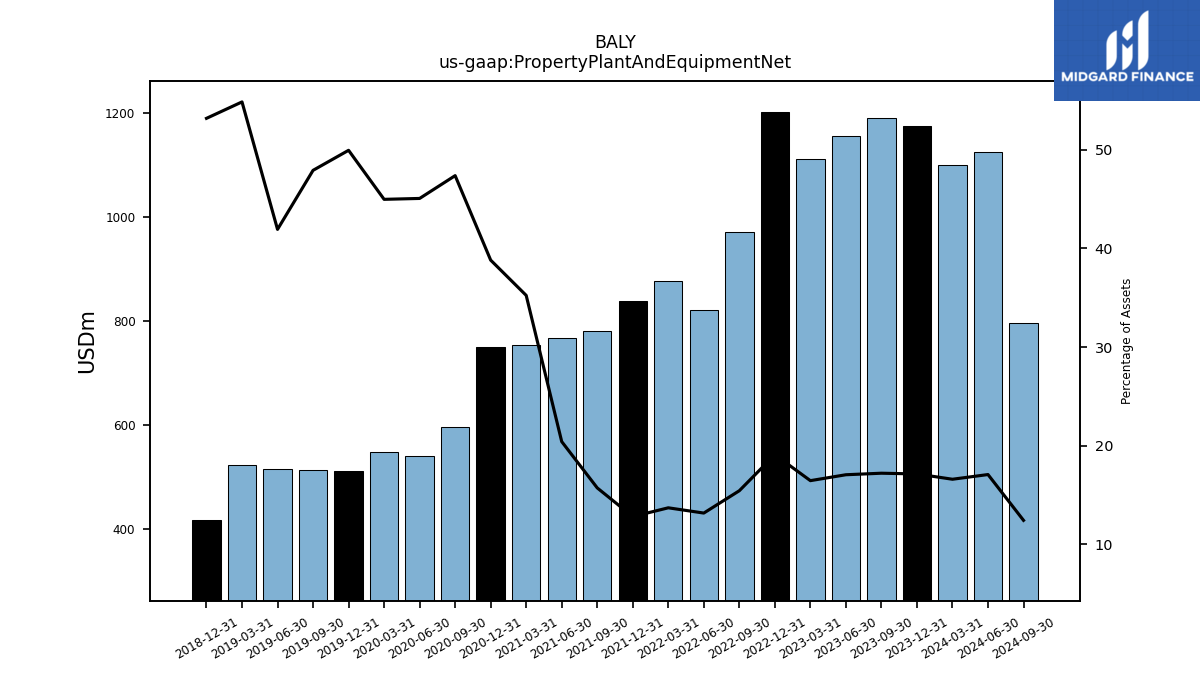
| Property Plant And Equipment Net | 1191.76 | 1155.76 | 1111.71 | 1202.10 | 970.60 | 820.45 | 877.27 | 838.65 | 780.66 | 766.69 | 753.60 | 749.03 | 595.52 | 540.80 | 546.62 | 510.44 | 513.16 | 515.52 | 521.74 | 416.15 | NA | NA | NA | |
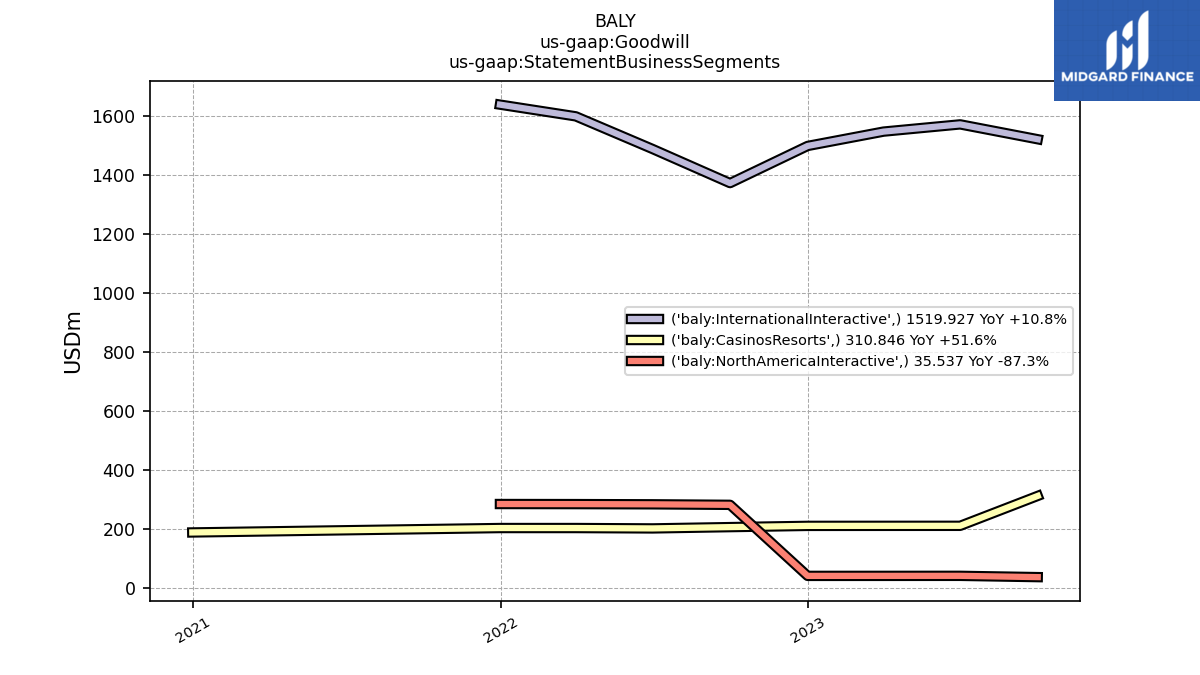
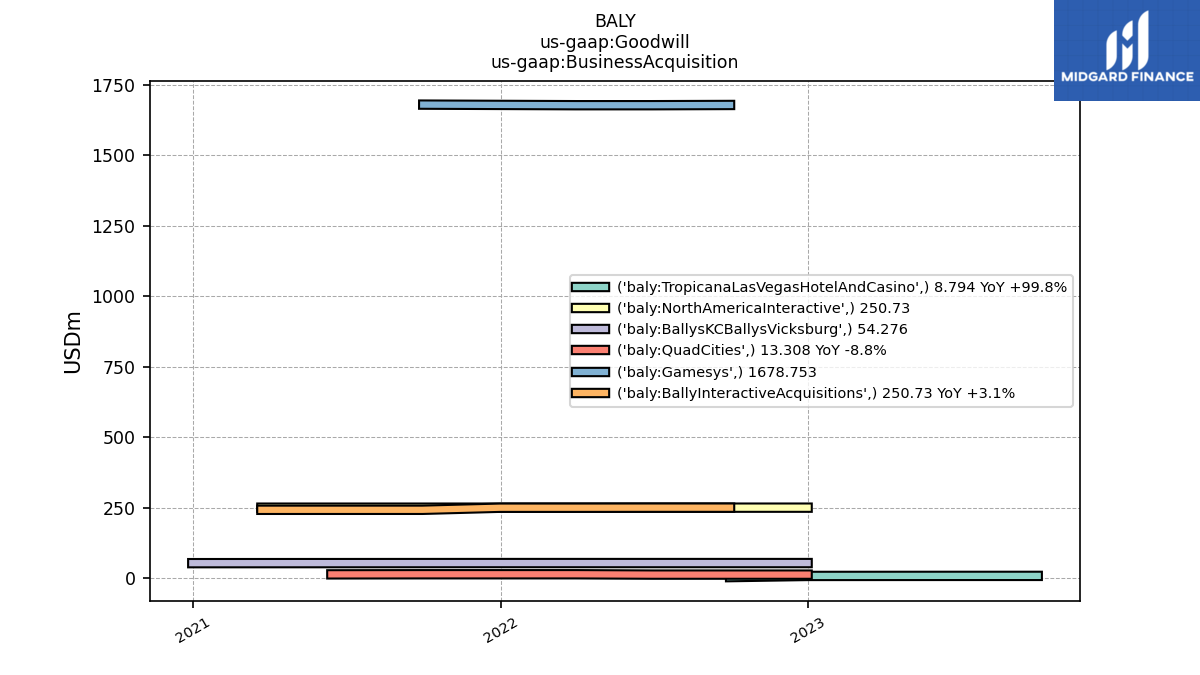
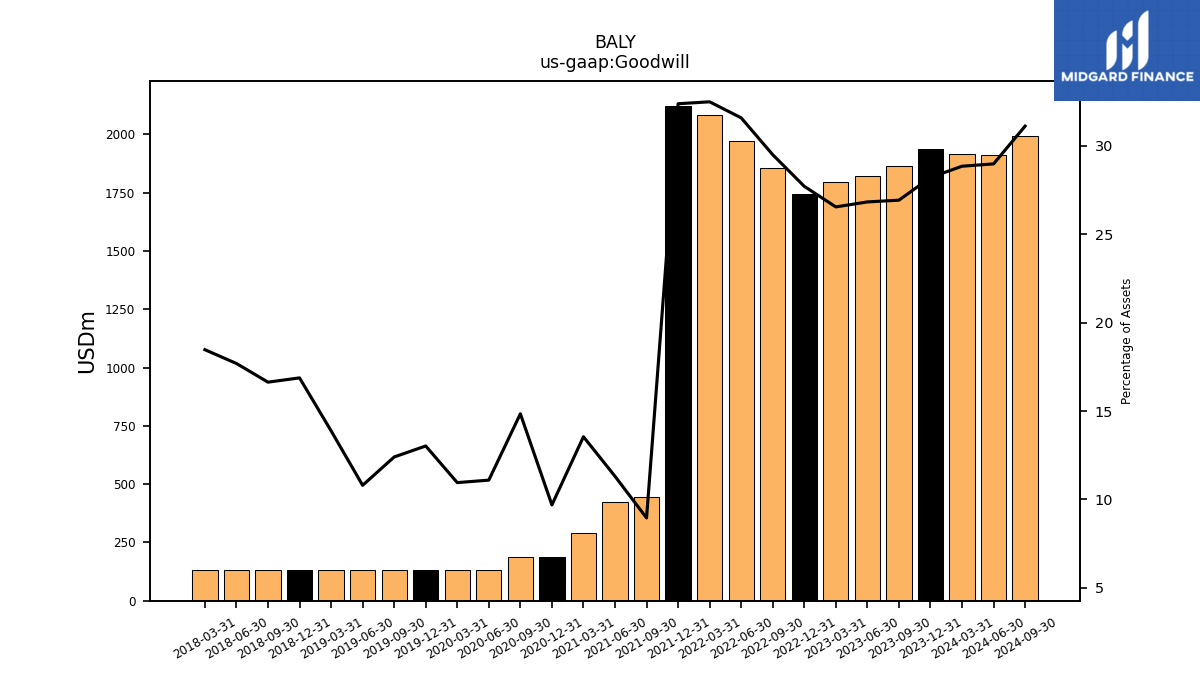
| Goodwill | 1866.31 | 1819.72 | 1795.04 | 1746.20 | 1856.92 | 1970.06 | 2082.63 | 2122.65 | 444.91 | 424.87 | 289.73 | 186.98 | 186.57 | 133.08 | 133.08 | 133.08 | 132.81 | 132.75 | 132.03 | 132.03 | 132.03 | 132.03 | 132.03 | |
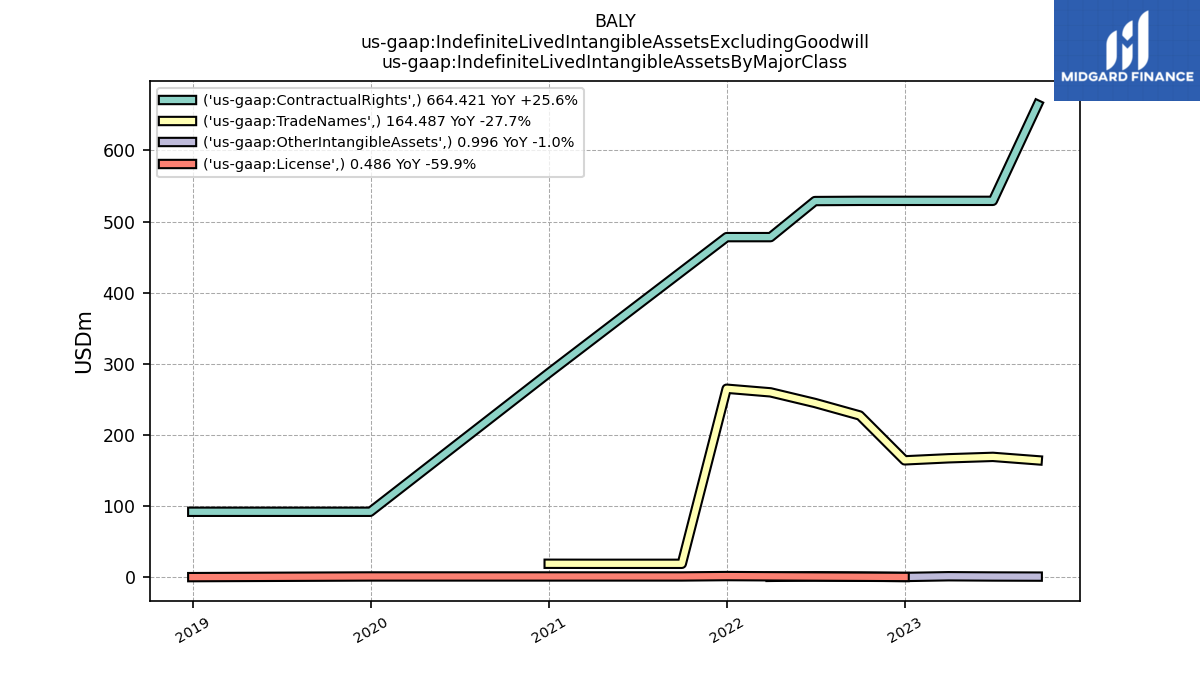
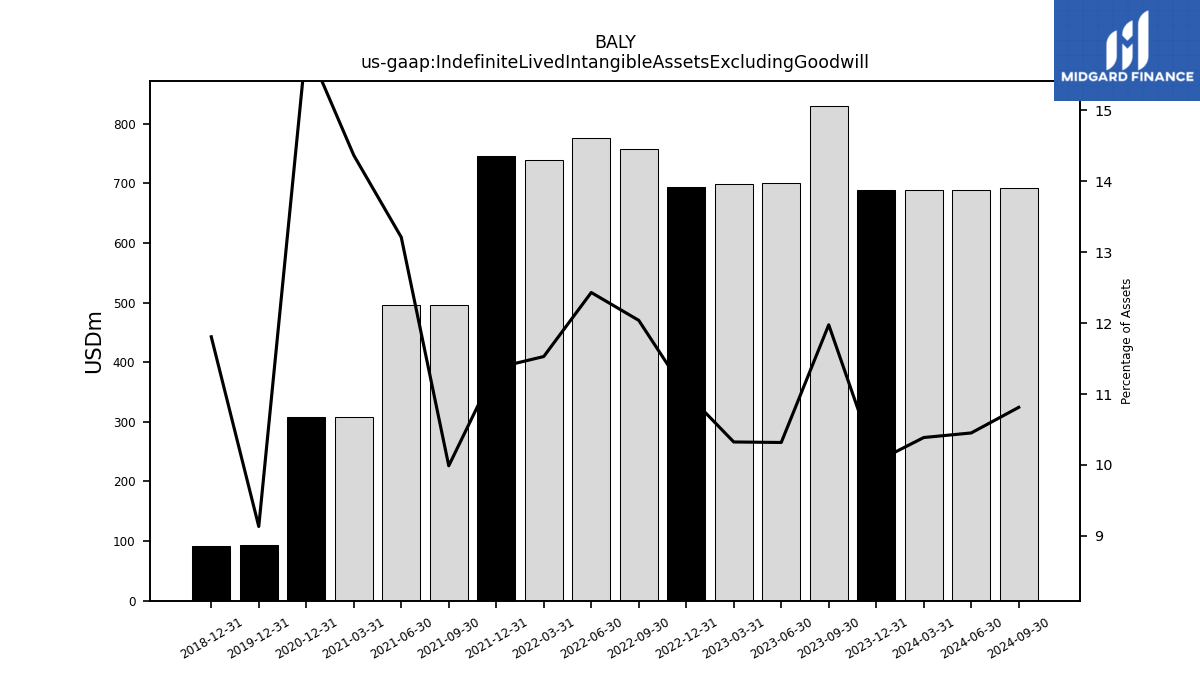
| Indefinite Lived Intangible Assets Excluding Goodwill | 829.90 | 699.63 | 697.97 | 694.05 | 757.66 | 775.28 | 738.80 | 745.01 | 496.40 | 496.40 | 307.30 | 307.37 | NA | NA | NA | 93.32 | NA | NA | NA | 92.38 | NA | NA | NA | |
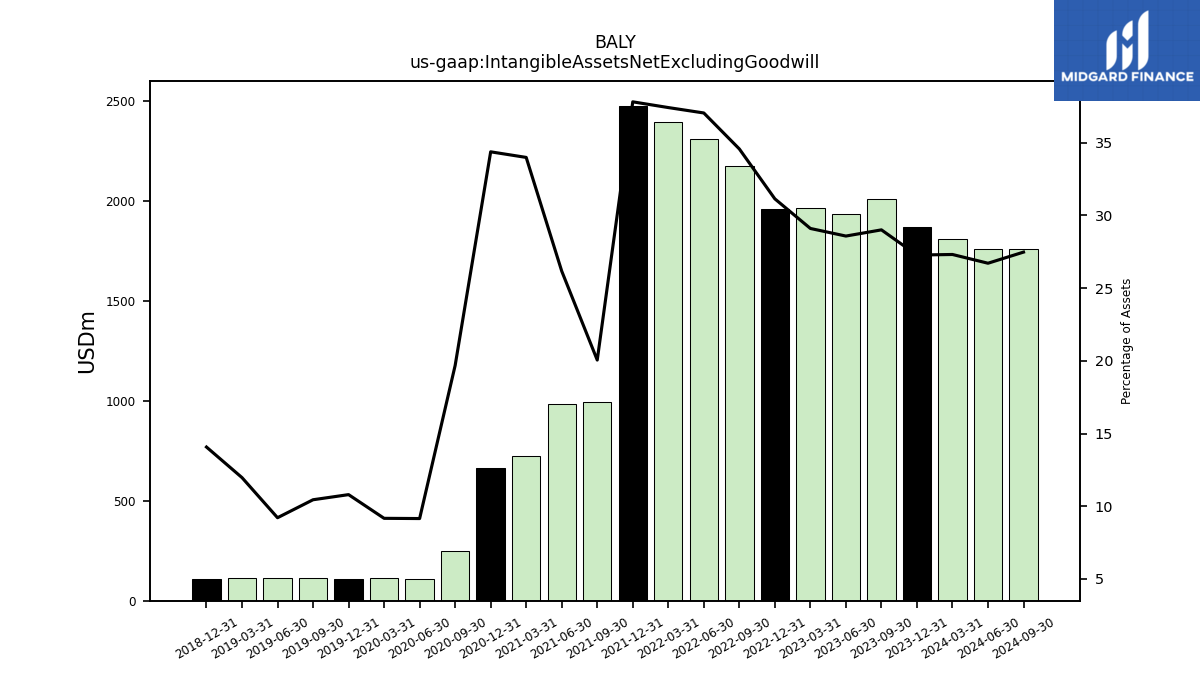
| Intangible Assets Net Excluding Goodwill | 2010.11 | 1938.25 | 1967.59 | 1961.94 | 2175.76 | 2310.25 | 2397.83 | 2477.95 | 996.69 | 983.42 | 726.99 | 663.39 | 247.39 | 109.86 | 111.45 | 110.37 | 111.90 | 113.27 | 113.85 | 110.10 | NA | NA | NA | |
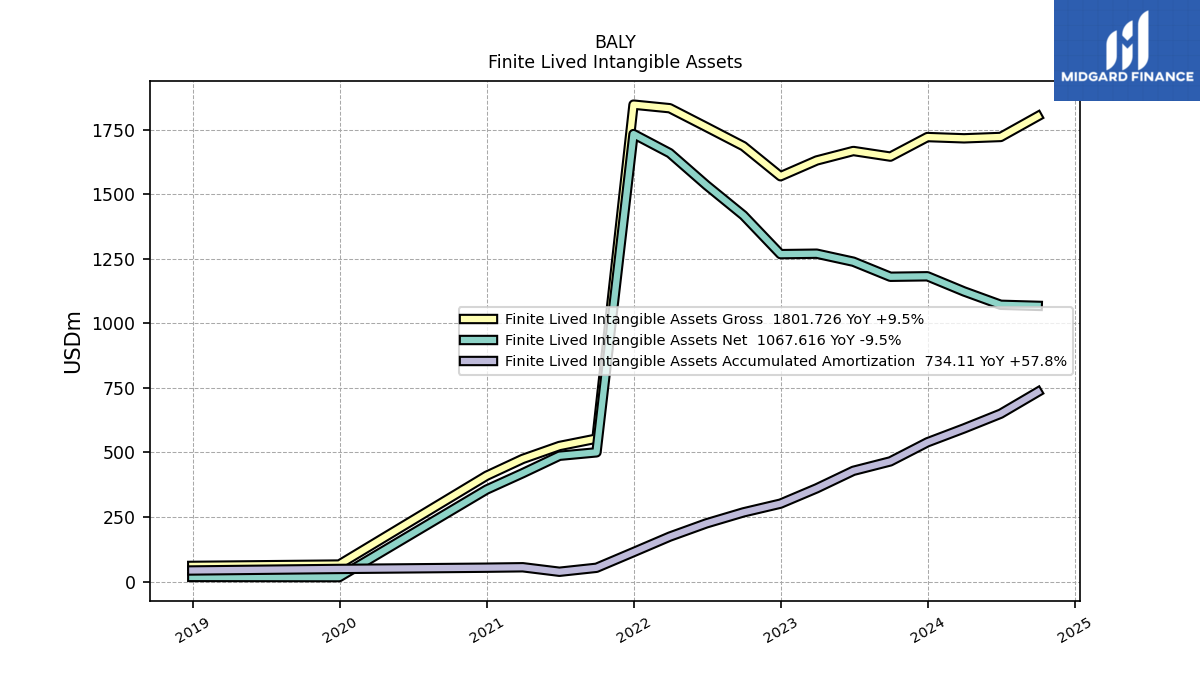
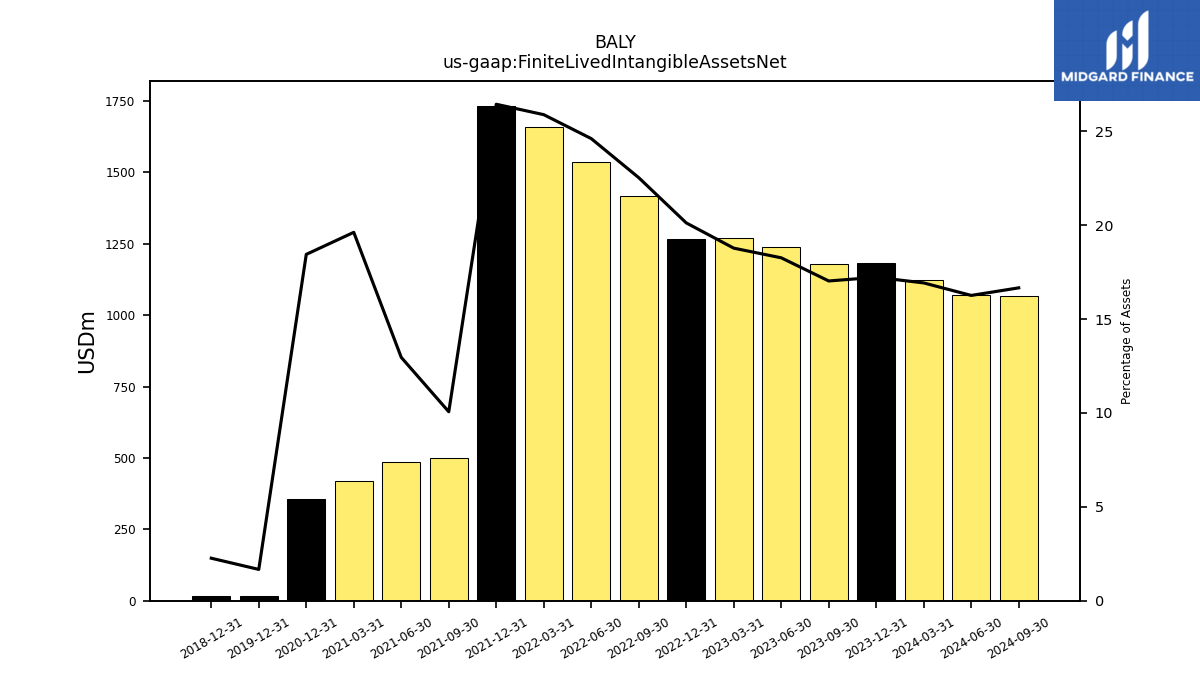
| Finite Lived Intangible Assets Net | 1180.21 | 1238.62 | 1269.62 | 1267.89 | 1418.10 | 1534.97 | 1659.03 | 1732.94 | 500.28 | 487.02 | 419.69 | 356.02 | NA | NA | NA | 17.05 | NA | NA | NA | 17.73 | NA | NA | NA | |
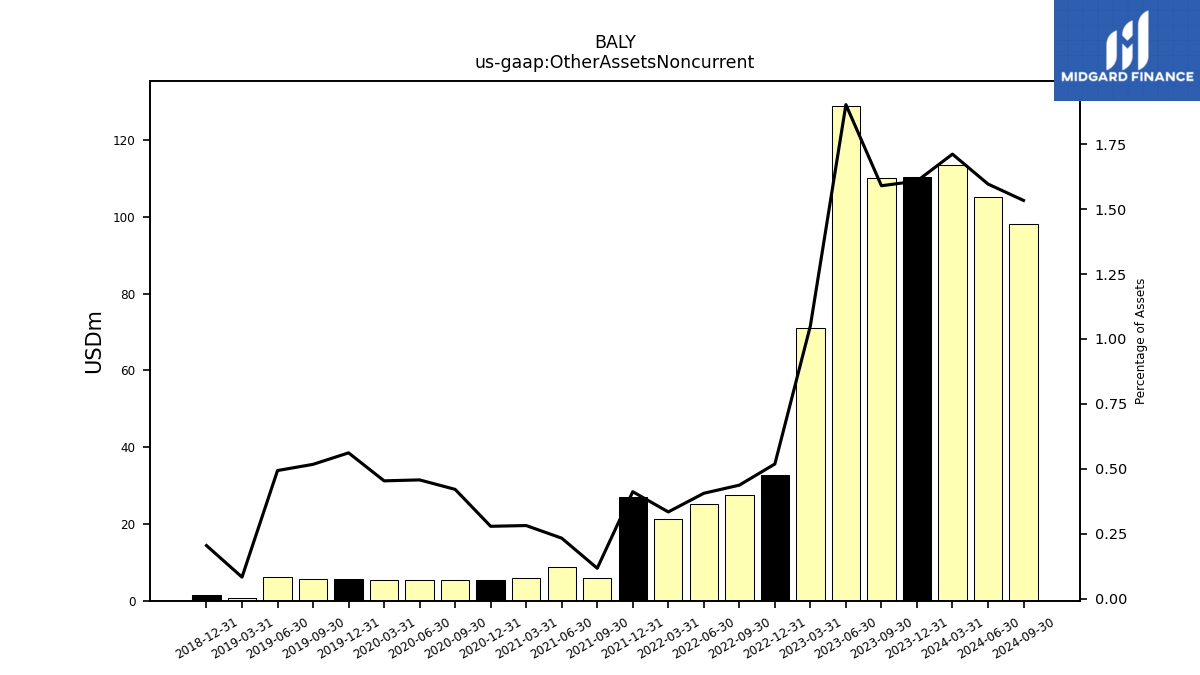
| Other Assets Noncurrent | 110.16 | 128.98 | 71.02 | 32.69 | 27.53 | 25.32 | 21.42 | 27.01 | 5.84 | 8.77 | 6.03 | 5.38 | 5.29 | 5.49 | 5.52 | 5.74 | 5.54 | 6.07 | 0.79 | 1.60 | NA | NA | NA |
| 2023-09-30 | 2023-06-30 | 2023-03-31 | 2022-12-31 | 2022-09-30 | 2022-06-30 | 2022-03-31 | 2021-12-31 | 2021-09-30 | 2021-06-30 | 2021-03-31 | 2020-12-31 | 2020-09-30 | 2020-06-30 | 2020-03-31 | 2019-12-31 | 2019-09-30 | 2019-06-30 | 2019-03-31 | 2018-12-31 | 2018-09-30 | 2018-06-30 | 2018-03-31 | ||
|---|---|---|---|---|---|---|---|---|---|---|---|---|---|---|---|---|---|---|---|---|---|---|---|---|
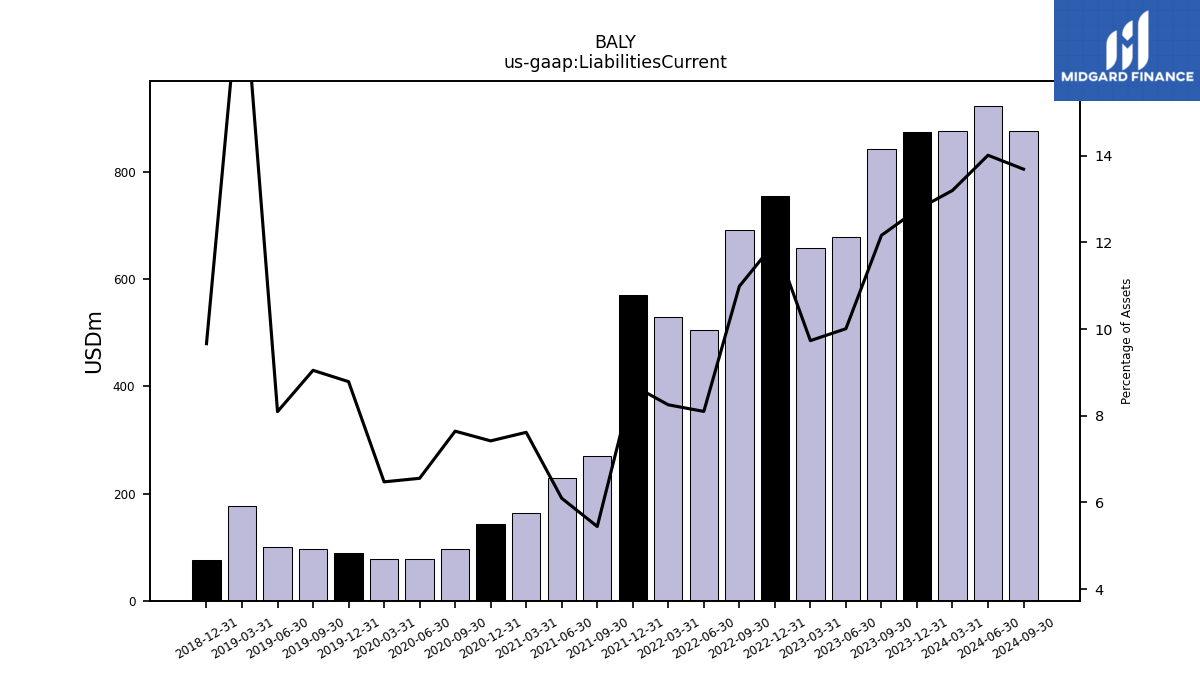
| Liabilities Current | 842.69 | 678.63 | 657.96 | 755.80 | 691.32 | 505.08 | 528.79 | 570.13 | 270.58 | 229.07 | 162.91 | 143.19 | 96.08 | 78.67 | 78.69 | 89.78 | 96.89 | 99.52 | 176.38 | 75.59 | NA | NA | NA | |
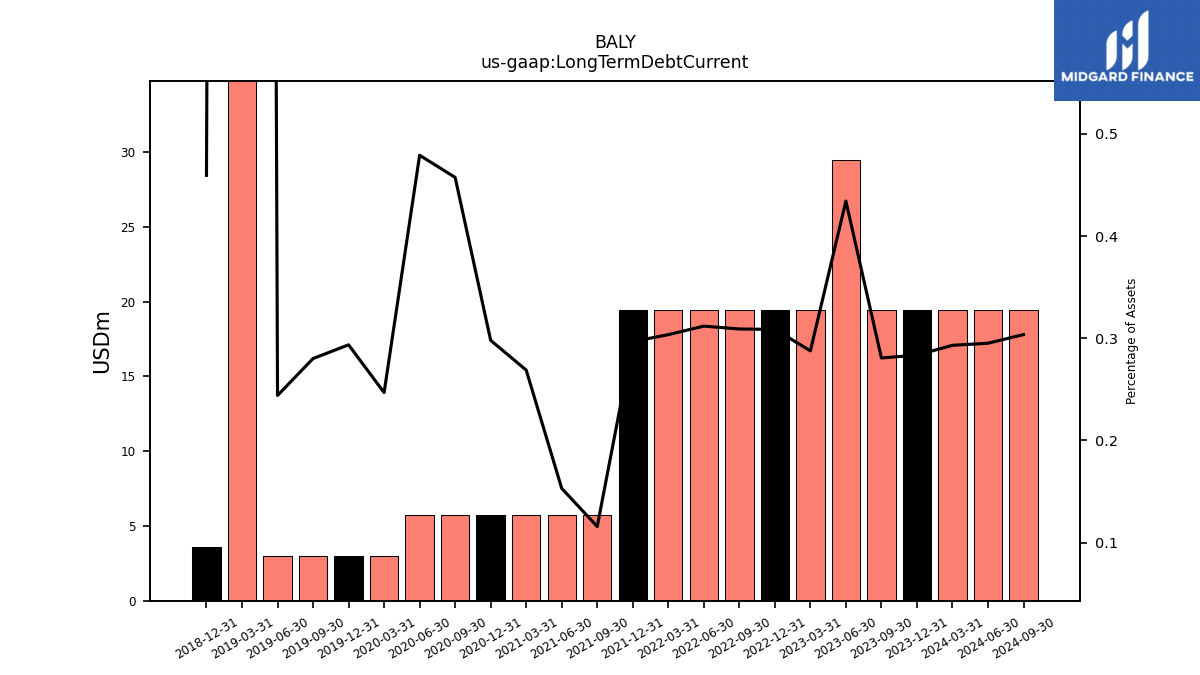
| Long Term Debt Current | 19.45 | 29.45 | 19.45 | 19.45 | 19.45 | 19.45 | 19.45 | 19.45 | 5.75 | 5.75 | 5.75 | 5.75 | 5.75 | 5.75 | 3.00 | 3.00 | 3.00 | 3.00 | 83.59 | 3.60 | NA | NA | NA | |
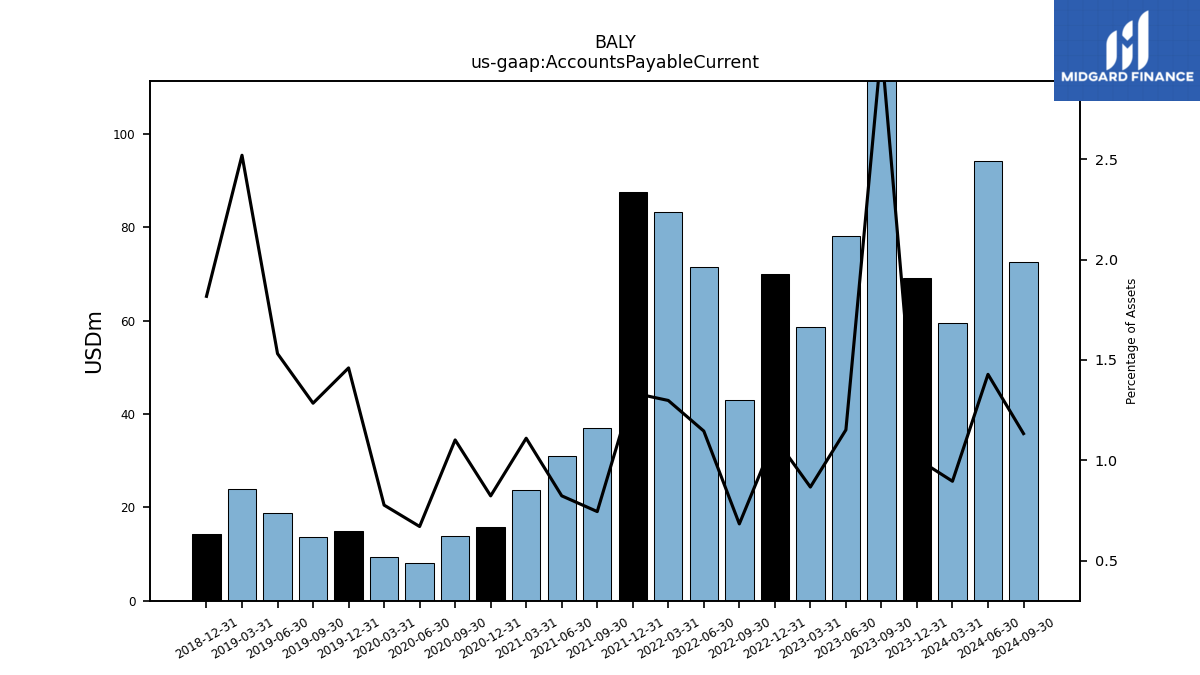
| Accounts Payable Current | 211.91 | 78.07 | 58.56 | 70.07 | 42.96 | 71.42 | 83.17 | 87.54 | 36.98 | 30.90 | 23.73 | 15.87 | 13.84 | 8.04 | 9.43 | 14.92 | 13.75 | 18.83 | 23.97 | 14.21 | NA | NA | NA | |
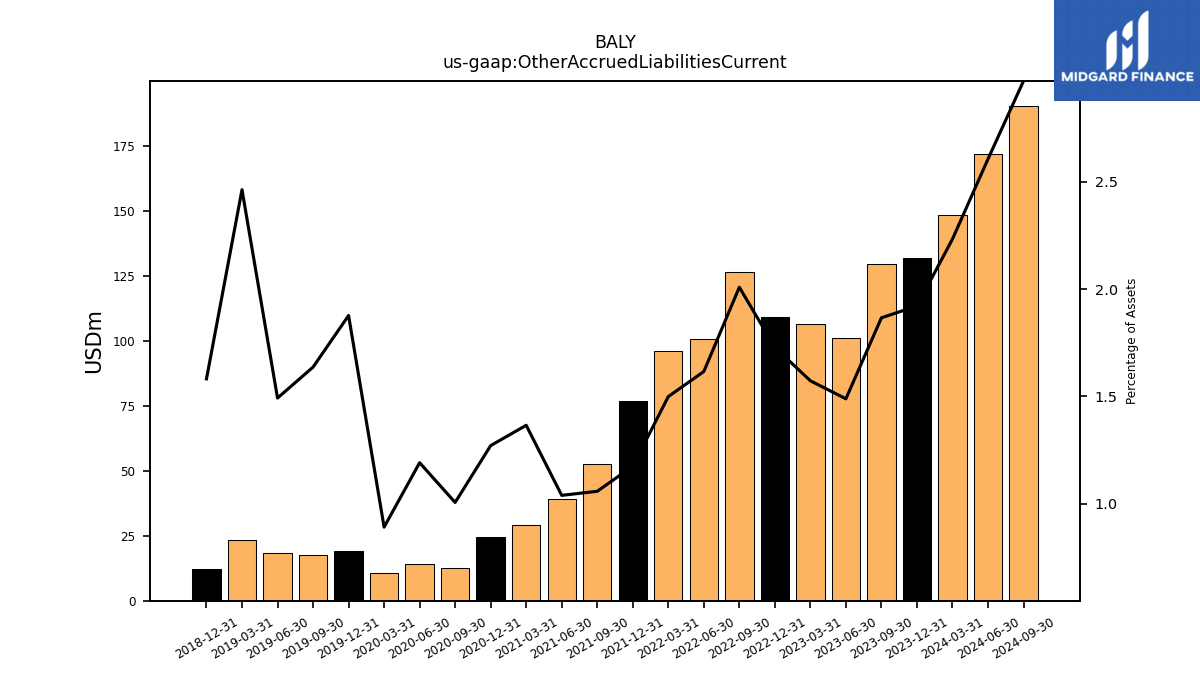
| Other Accrued Liabilities Current | 129.32 | 100.94 | 106.31 | 108.91 | 126.42 | 100.75 | 96.04 | 76.94 | 52.54 | 39.01 | 29.19 | 24.52 | 12.63 | 14.28 | 10.82 | 19.18 | 17.52 | 18.34 | 23.43 | 12.37 | NA | NA | NA | |
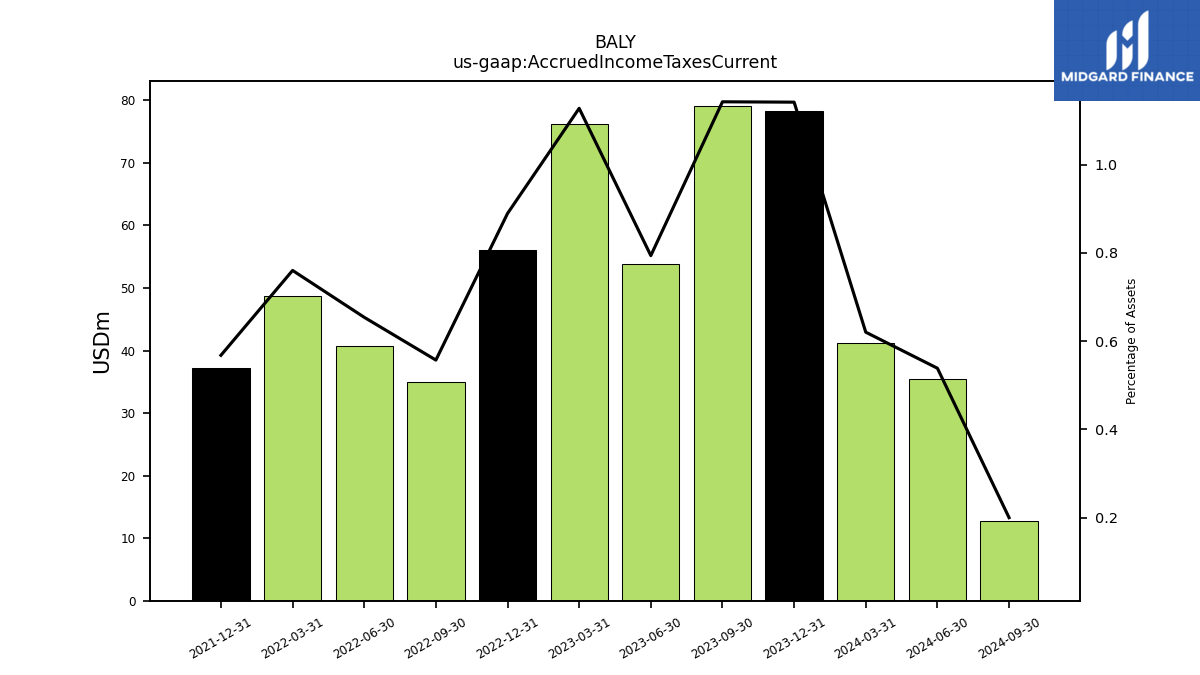
| Accrued Income Taxes Current | 79.14 | 53.82 | 76.21 | 56.01 | 35.05 | 40.77 | 48.70 | 37.21 | NA | NA | NA | NA | NA | NA | NA | NA | NA | NA | NA | NA | NA | NA | NA | |
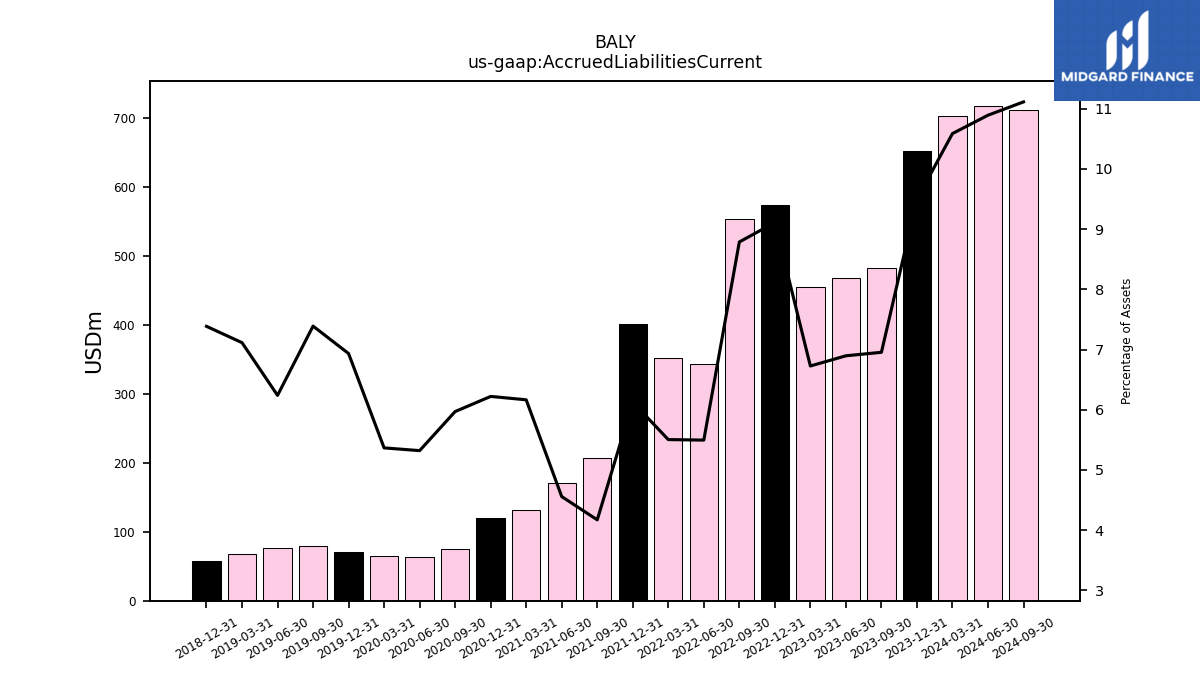
| Accrued Liabilities Current | 481.86 | 467.60 | 454.73 | 573.93 | 552.95 | 342.69 | 352.69 | 401.43 | 207.28 | 171.22 | 131.85 | 120.06 | 75.03 | 63.84 | 65.21 | 70.85 | 79.13 | 76.70 | 67.66 | 57.78 | NA | NA | NA | |
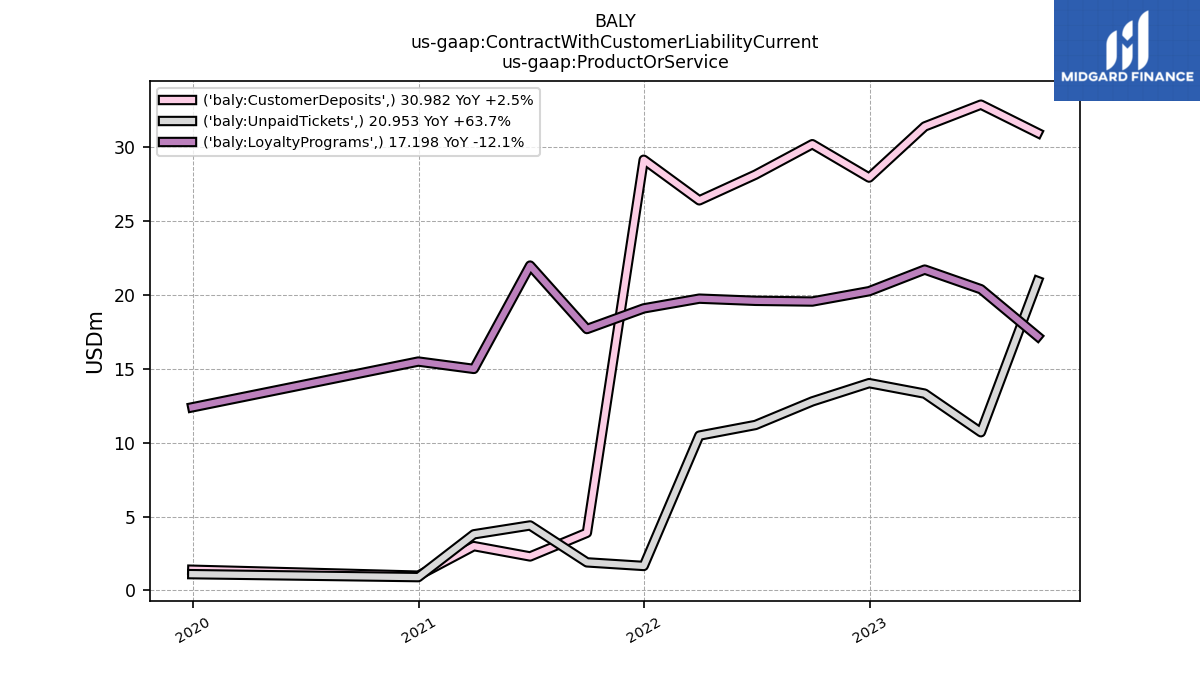
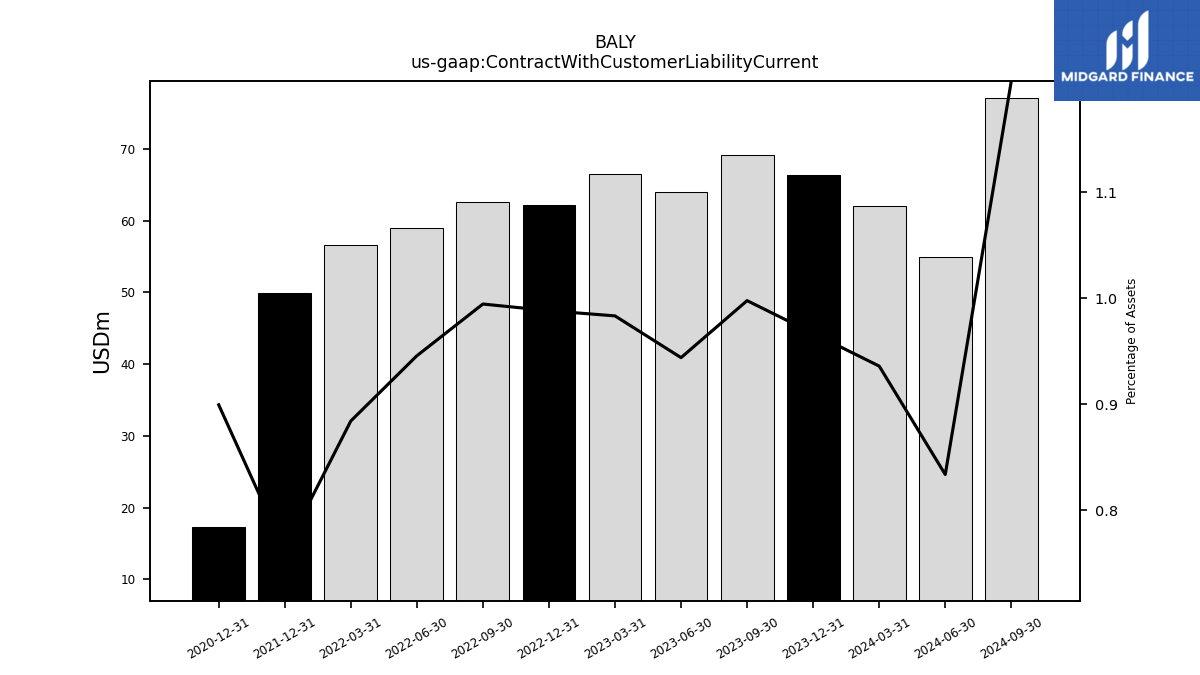
| Contract With Customer Liability Current | 69.13 | 64.01 | 66.47 | 62.26 | 62.59 | 58.97 | 56.66 | 49.92 | NA | NA | NA | 17.36 | NA | NA | NA | NA | NA | NA | NA | NA | NA | NA | NA |
| 2023-09-30 | 2023-06-30 | 2023-03-31 | 2022-12-31 | 2022-09-30 | 2022-06-30 | 2022-03-31 | 2021-12-31 | 2021-09-30 | 2021-06-30 | 2021-03-31 | 2020-12-31 | 2020-09-30 | 2020-06-30 | 2020-03-31 | 2019-12-31 | 2019-09-30 | 2019-06-30 | 2019-03-31 | 2018-12-31 | 2018-09-30 | 2018-06-30 | 2018-03-31 | ||
|---|---|---|---|---|---|---|---|---|---|---|---|---|---|---|---|---|---|---|---|---|---|---|---|---|
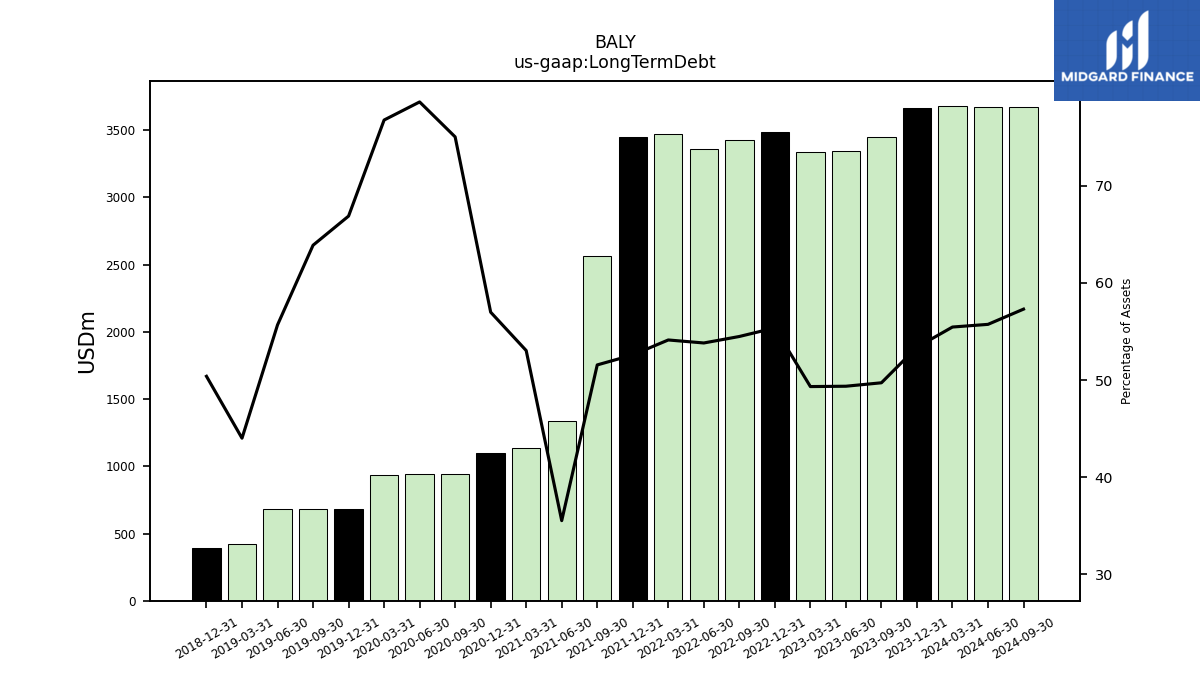
| Long Term Debt | 3444.95 | 3347.17 | 3334.51 | 3488.55 | 3428.92 | 3356.07 | 3468.50 | 3446.23 | 2562.17 | 1334.14 | 1134.35 | 1099.86 | 943.38 | 943.89 | 933.30 | 683.60 | 684.22 | 684.58 | 418.51 | 394.17 | NA | NA | NA | |
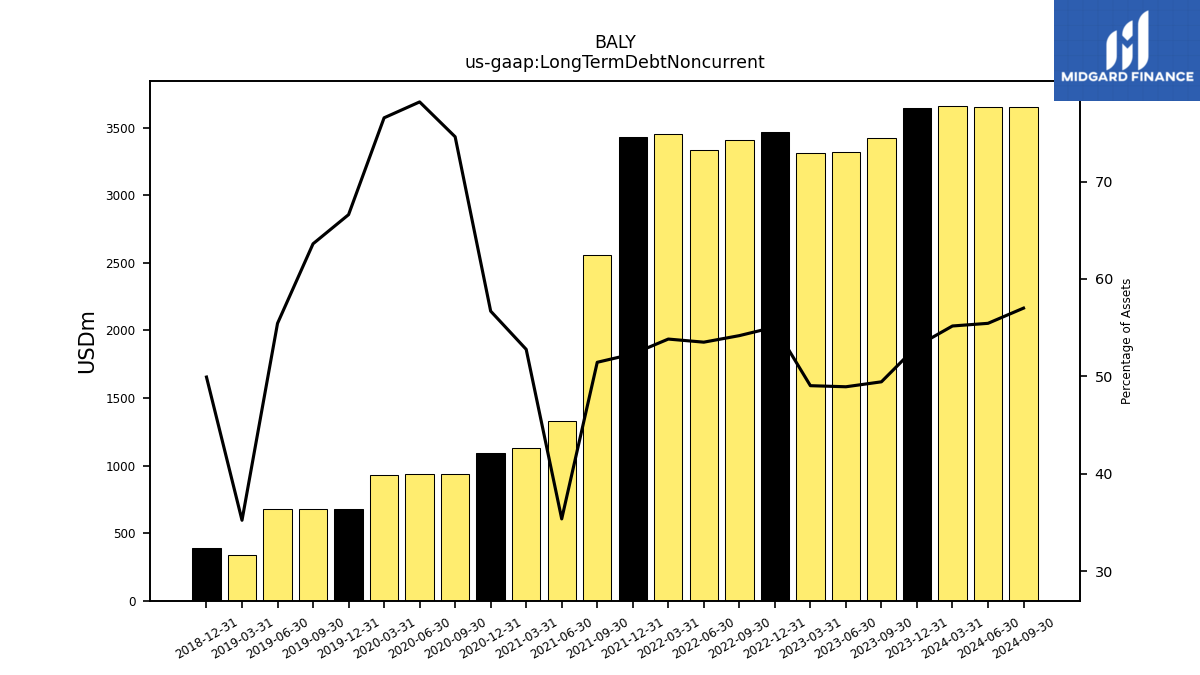
| Long Term Debt Noncurrent | 3425.50 | 3317.72 | 3315.06 | 3469.11 | 3409.47 | 3336.62 | 3449.05 | 3426.78 | 2556.42 | 1328.39 | 1128.60 | 1094.11 | 937.63 | 938.14 | 930.30 | 680.60 | 681.22 | 681.58 | 334.92 | 390.58 | NA | NA | NA | |
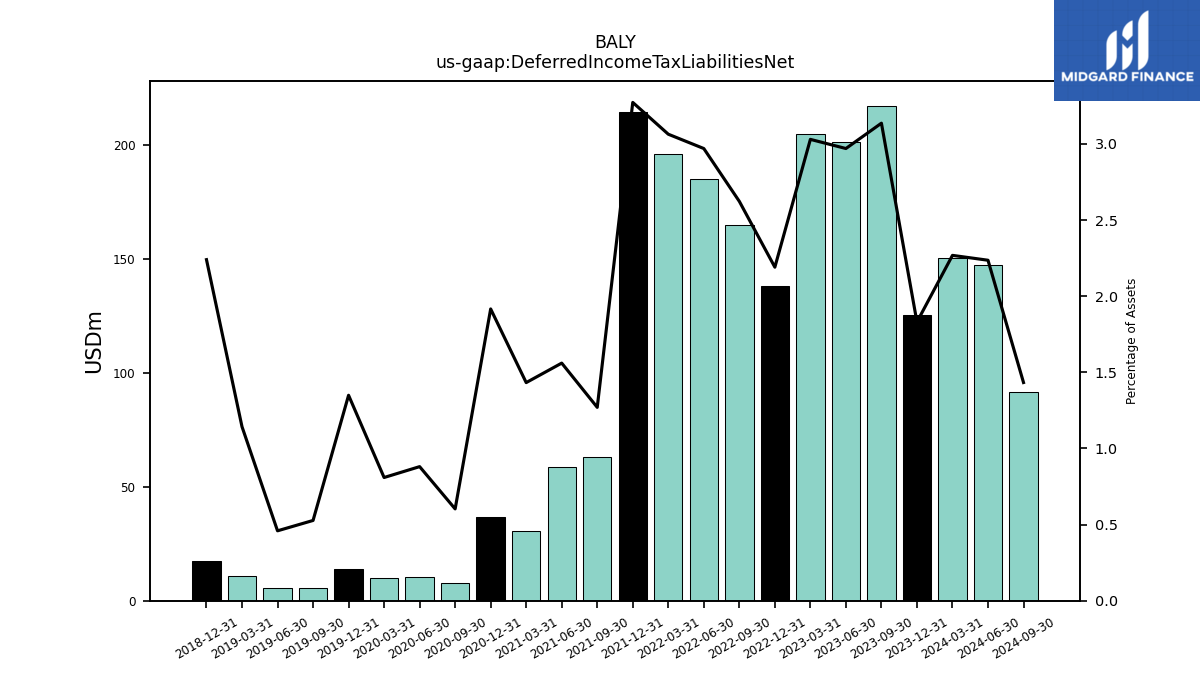
| Deferred Income Tax Liabilities Net | 217.33 | 201.40 | 204.84 | 138.02 | 165.06 | 185.20 | 196.34 | 214.47 | 63.12 | 58.64 | 30.64 | 36.98 | 7.58 | 10.57 | 9.84 | 13.79 | 5.65 | 5.65 | 10.87 | 17.53 | NA | NA | NA | |
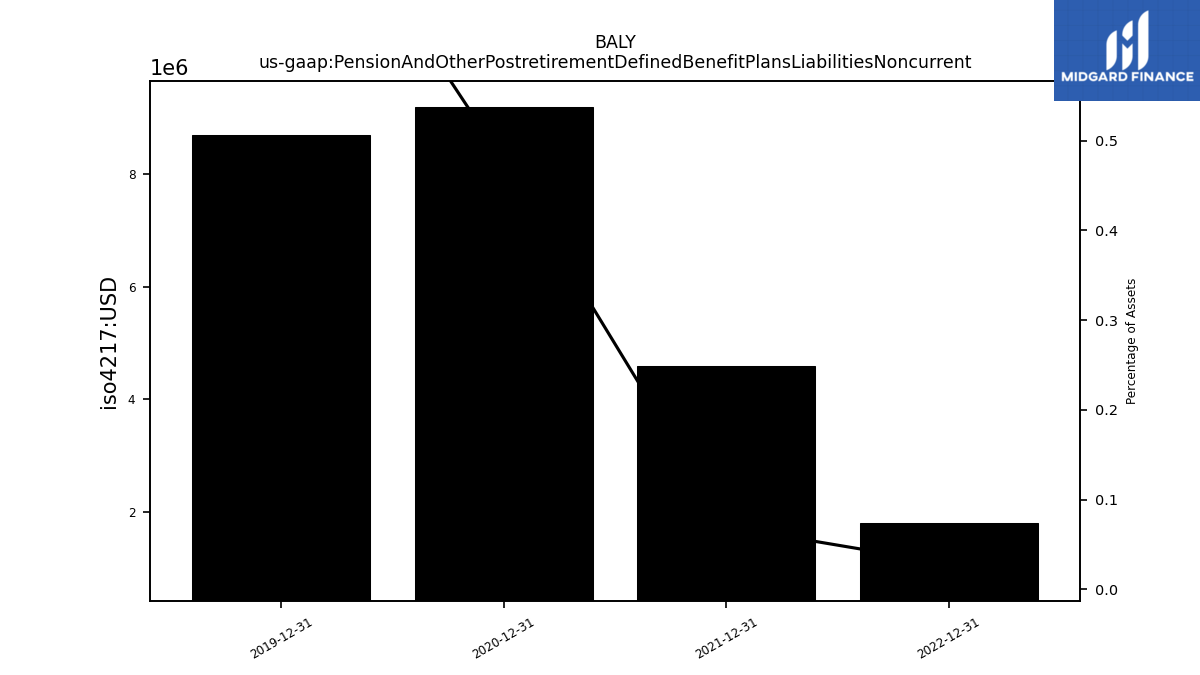
| Pension And Other Postretirement Defined Benefit Plans Liabilities Noncurrent | NA | NA | NA | 1.80 | NA | NA | NA | 4.60 | NA | NA | NA | 9.20 | NA | NA | NA | 8.70 | NA | NA | NA | NA | NA | NA | NA | |
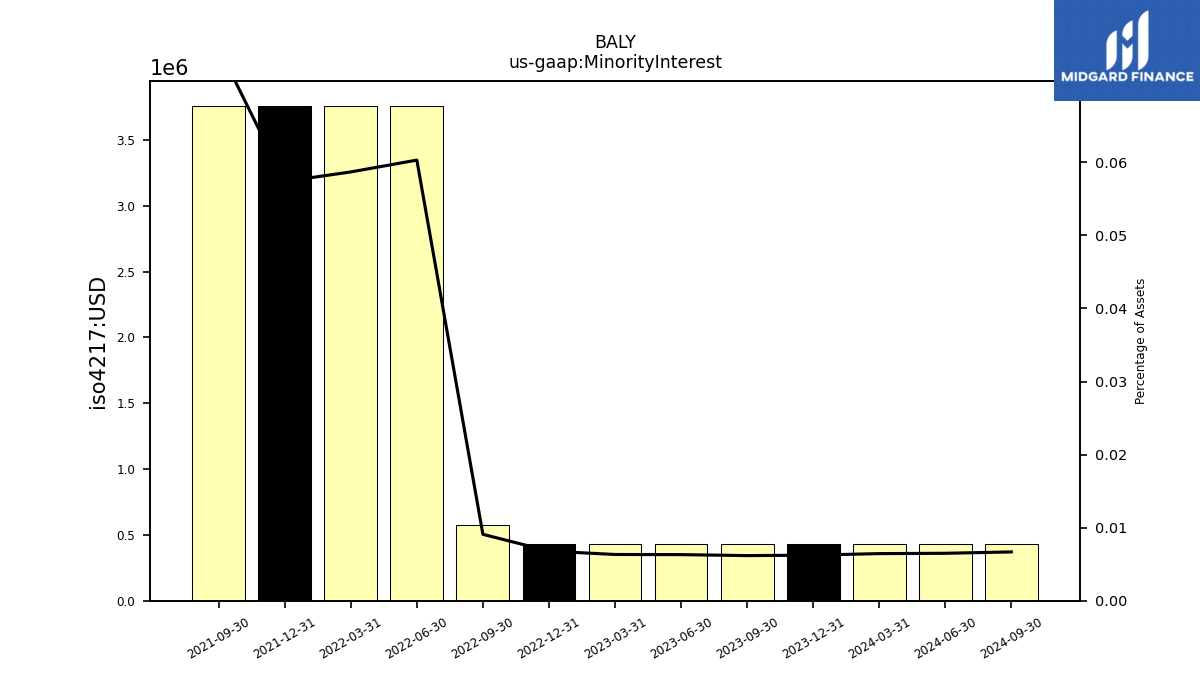
| Minority Interest | 0.43 | 0.43 | 0.43 | 0.43 | 0.57 | 3.76 | 3.76 | 3.76 | 3.76 | NA | NA | NA | NA | NA | NA | NA | NA | NA | NA | NA | NA | NA | NA | |
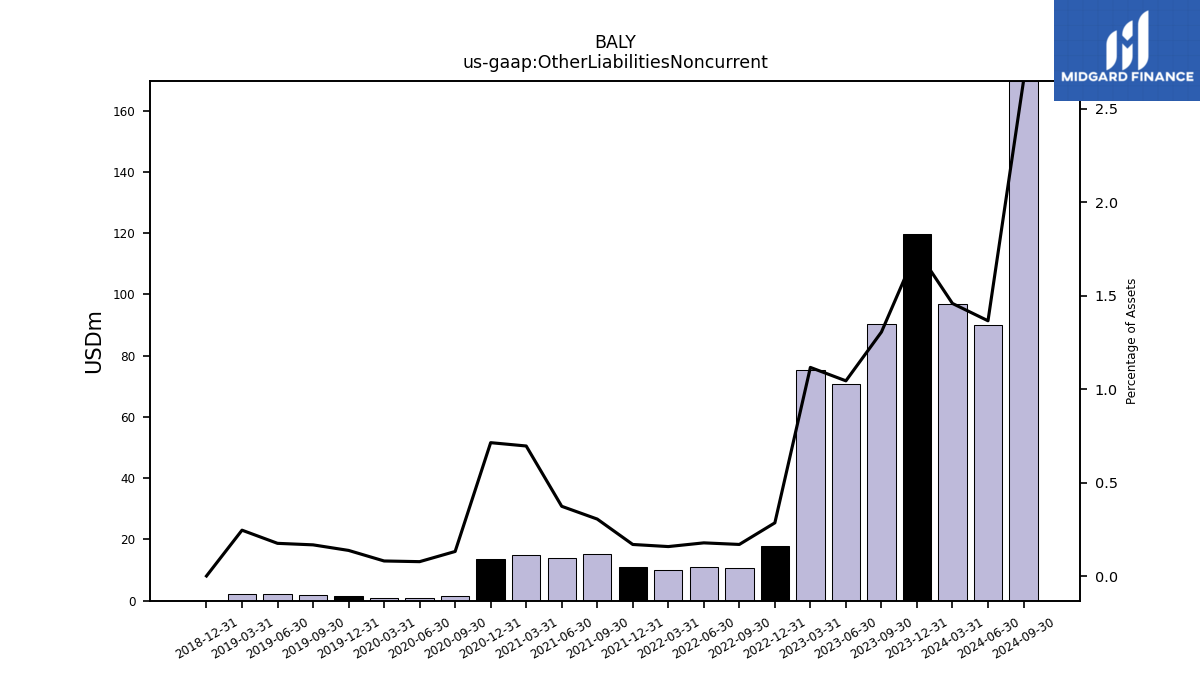
| Other Liabilities Noncurrent | 90.47 | 70.83 | 75.46 | 17.92 | 10.63 | 11.06 | 10.09 | 11.06 | 15.14 | 14.02 | 14.88 | 13.77 | 1.65 | 0.92 | 0.98 | 1.40 | 1.78 | 2.15 | 2.33 | 0.00 | NA | NA | NA | |
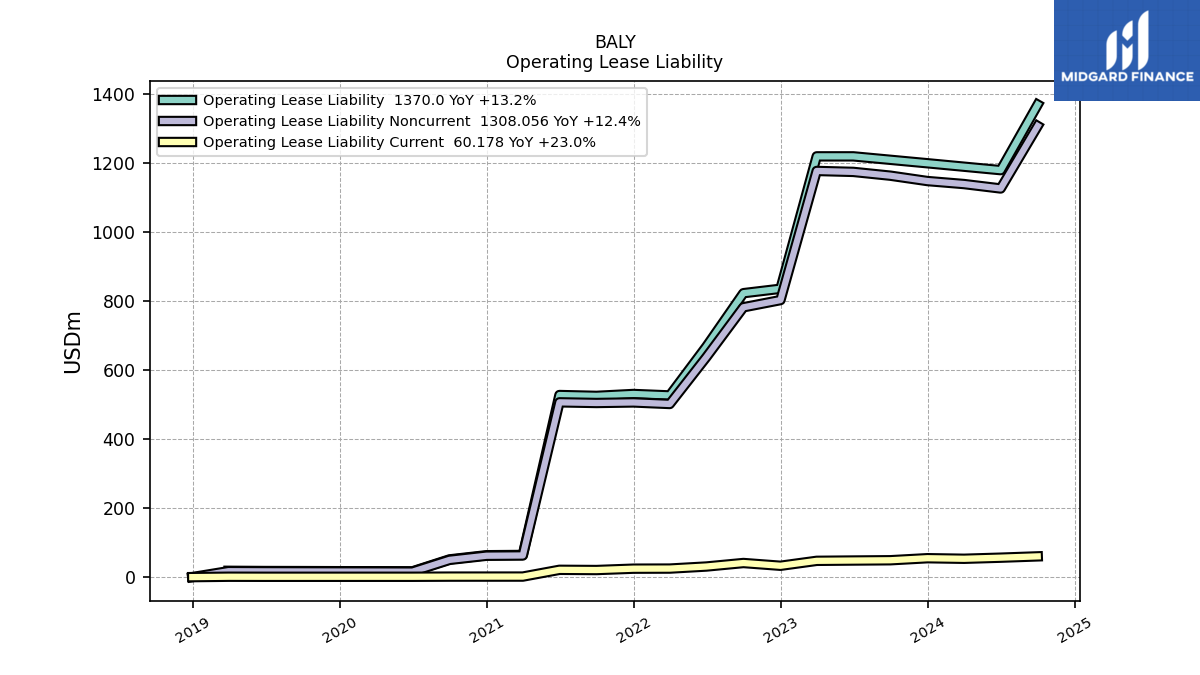
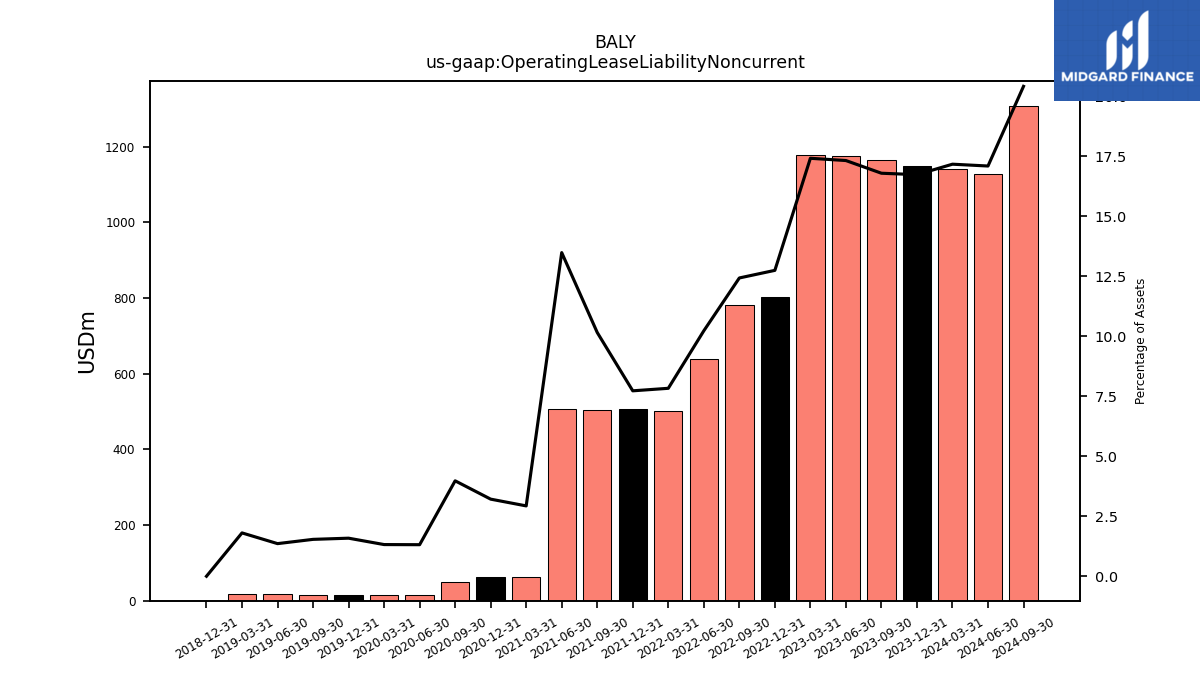
| Operating Lease Liability Noncurrent | 1163.97 | 1174.94 | 1177.70 | 803.21 | 782.39 | 637.95 | 501.98 | 506.48 | 504.88 | 506.82 | 62.72 | 62.02 | 49.99 | 15.78 | 16.05 | 16.21 | 16.47 | 16.72 | 17.18 | 0.00 | NA | NA | NA |
| 2023-09-30 | 2023-06-30 | 2023-03-31 | 2022-12-31 | 2022-09-30 | 2022-06-30 | 2022-03-31 | 2021-12-31 | 2021-09-30 | 2021-06-30 | 2021-03-31 | 2020-12-31 | 2020-09-30 | 2020-06-30 | 2020-03-31 | 2019-12-31 | 2019-09-30 | 2019-06-30 | 2019-03-31 | 2018-12-31 | 2018-09-30 | 2018-06-30 | 2018-03-31 | ||
|---|---|---|---|---|---|---|---|---|---|---|---|---|---|---|---|---|---|---|---|---|---|---|---|---|
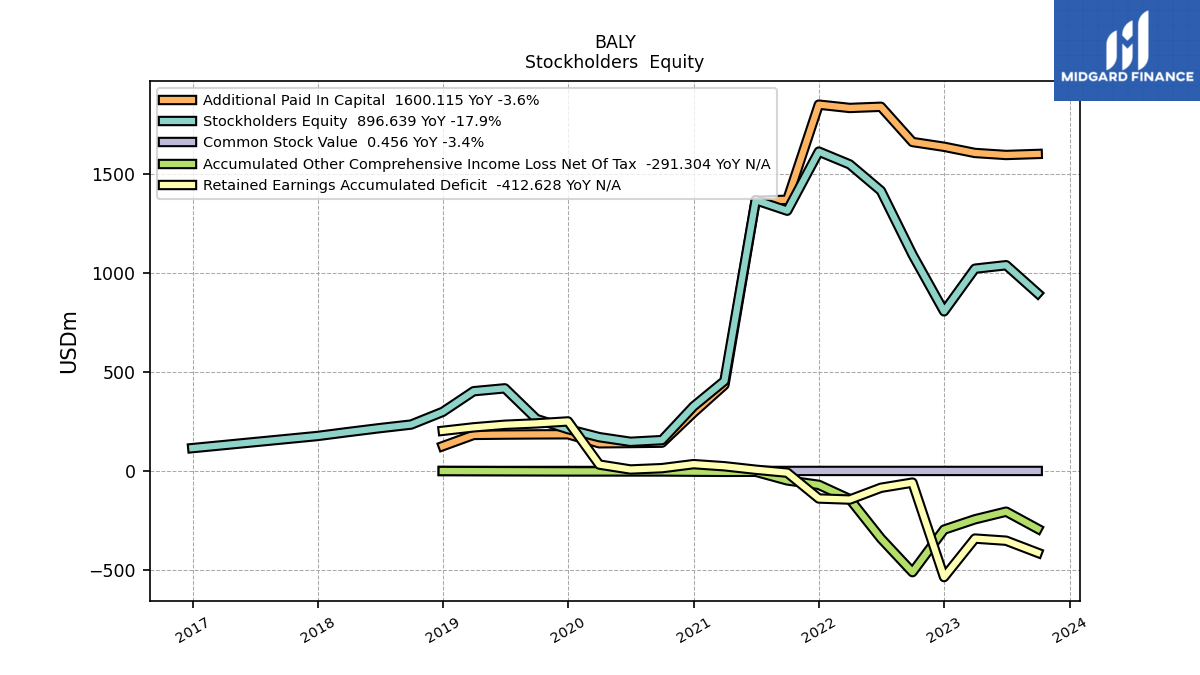
| Stockholders Equity | 896.64 | 1038.73 | 1021.18 | 805.82 | 1092.17 | 1414.16 | 1547.46 | 1612.04 | 1313.69 | 1367.22 | 454.70 | 326.60 | 156.16 | 147.56 | 171.02 | 211.41 | 262.76 | 417.44 | 402.78 | 298.66 | 234.57 | 216.47 | 196.97 | |
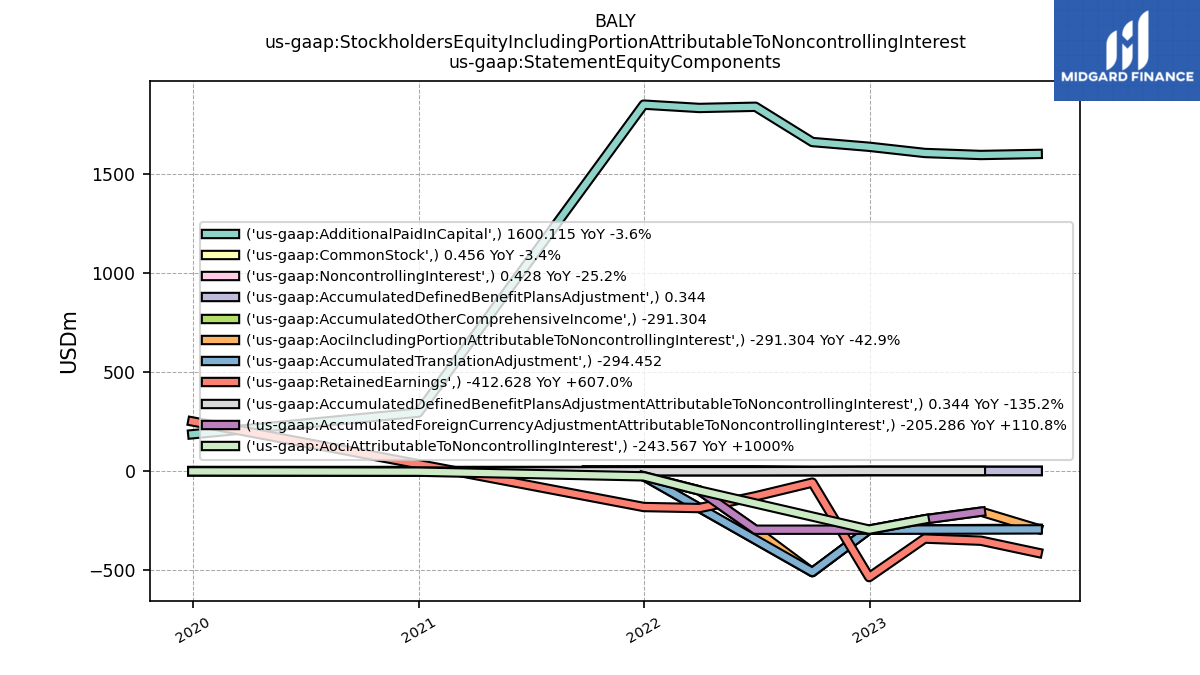
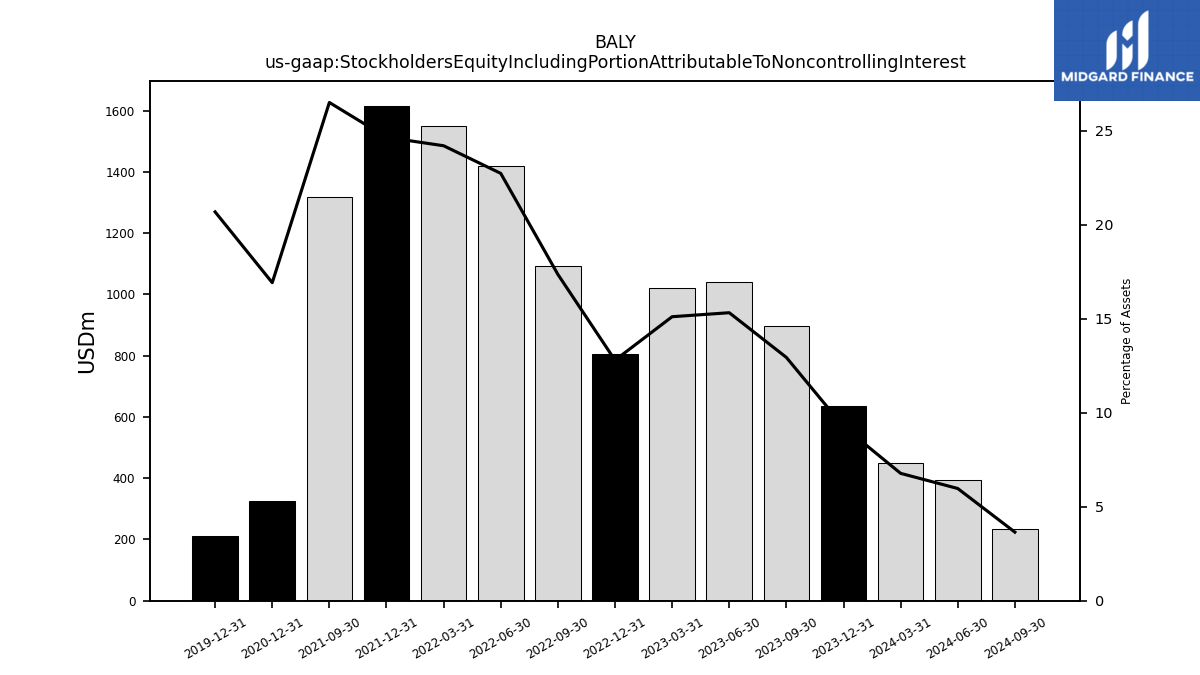
| Stockholders Equity Including Portion Attributable To Noncontrolling Interest | 897.07 | 1039.16 | 1021.61 | 806.25 | 1092.74 | 1417.92 | 1551.22 | 1615.80 | 1317.45 | NA | NA | 326.60 | NA | NA | NA | 211.41 | NA | NA | NA | NA | NA | NA | NA | |
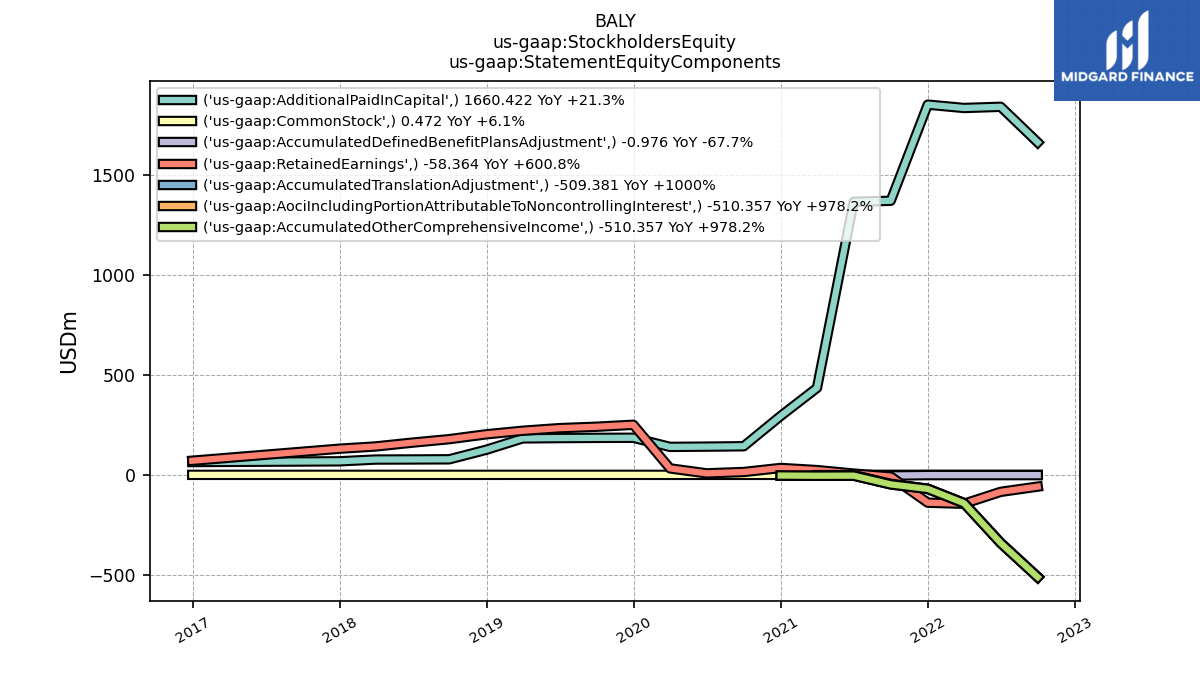
| Common Stock Value | 0.46 | 0.46 | 0.46 | 0.47 | 0.47 | 0.53 | 0.53 | 0.53 | 0.45 | 0.45 | 0.32 | 0.31 | 0.30 | 0.30 | 0.31 | 0.41 | 0.41 | 0.41 | 0.41 | 0.38 | NA | NA | NA | |
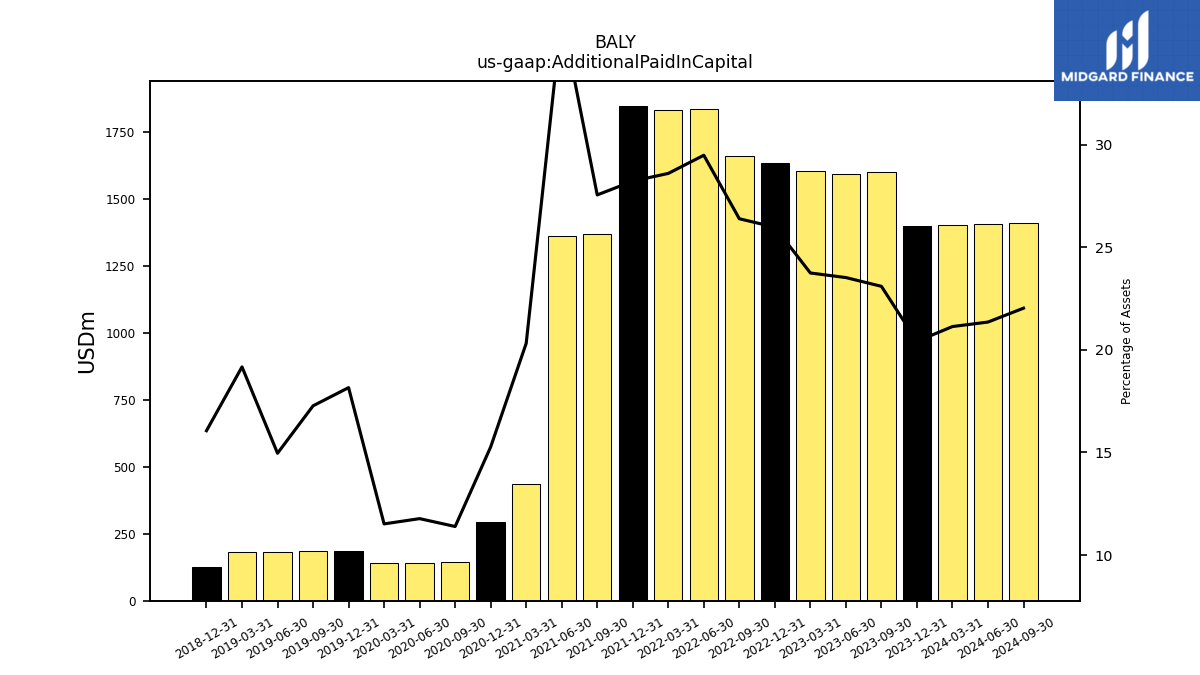
| Additional Paid In Capital | 1600.12 | 1594.86 | 1605.09 | 1636.37 | 1660.42 | 1838.24 | 1832.22 | 1849.07 | 1368.91 | 1363.78 | 434.46 | 294.64 | 143.18 | 141.30 | 139.98 | 185.54 | 184.95 | 183.93 | 182.30 | 125.63 | NA | NA | NA | |
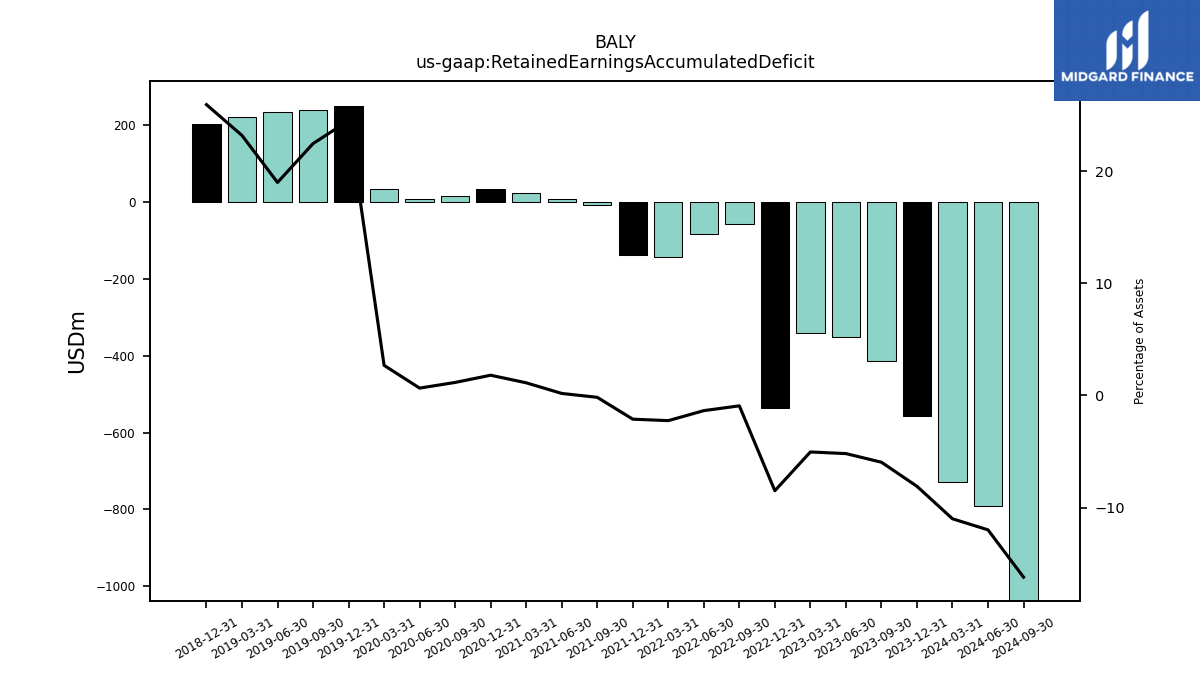
| Retained Earnings Accumulated Deficit | -412.63 | -351.64 | -340.79 | -535.37 | -58.36 | -84.54 | -144.04 | -138.68 | -8.33 | 6.70 | 24.09 | 34.79 | 14.57 | 7.85 | 32.62 | 250.42 | 240.51 | 233.52 | 220.48 | 202.88 | NA | NA | NA | |
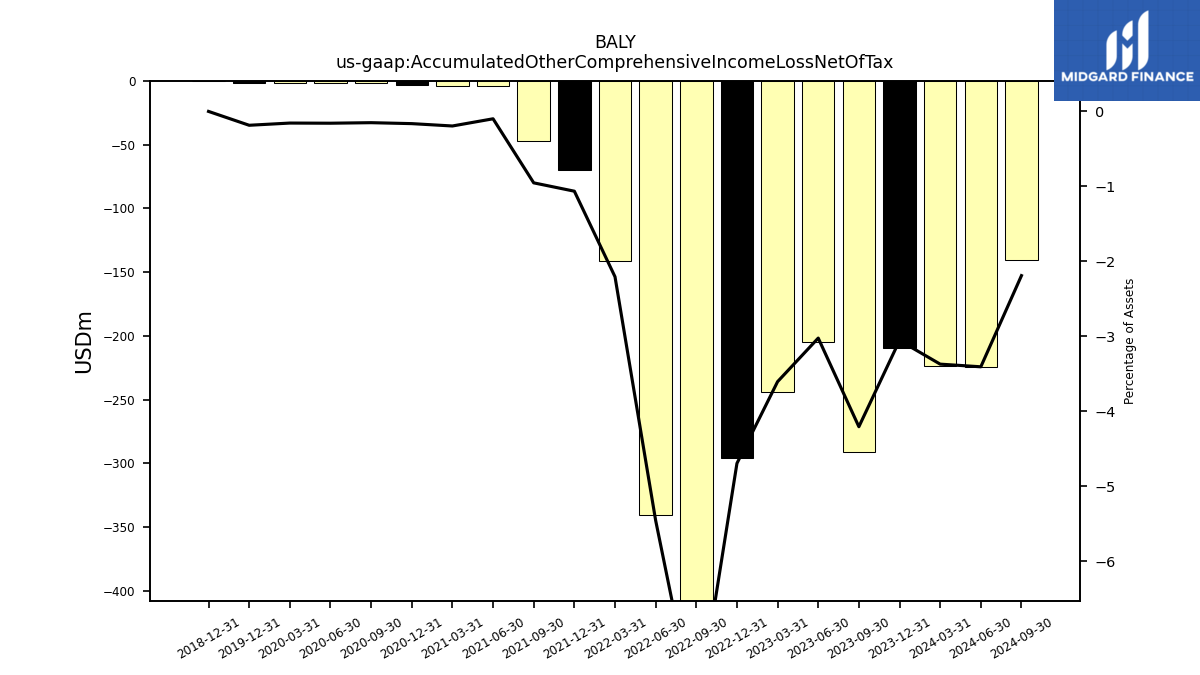
| Accumulated Other Comprehensive Income Loss Net Of Tax | -291.30 | -204.94 | -243.57 | -295.64 | -510.36 | -340.06 | -141.25 | -69.71 | -47.33 | -3.70 | -4.16 | -3.14 | -1.89 | -1.89 | -1.89 | -1.89 | NA | NA | NA | 0.00 | NA | NA | NA | |
| Minority Interest | 0.43 | 0.43 | 0.43 | 0.43 | 0.57 | 3.76 | 3.76 | 3.76 | 3.76 | NA | NA | NA | NA | NA | NA | NA | NA | NA | NA | NA | NA | NA | NA | |
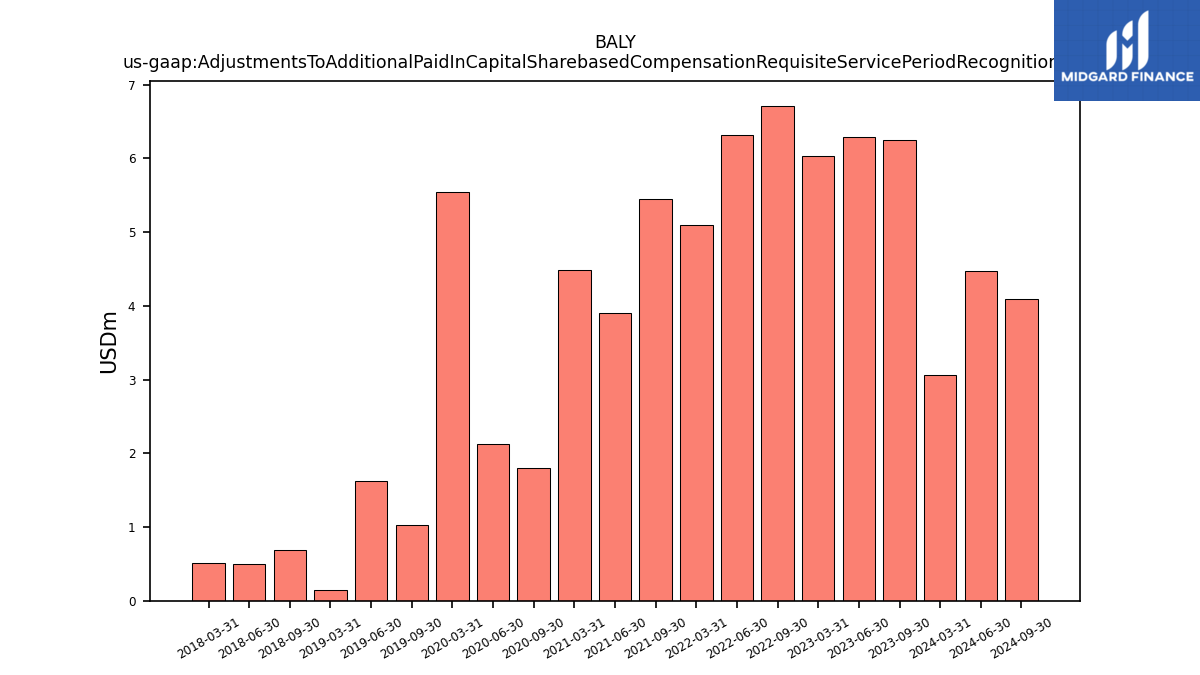
| Adjustments To Additional Paid In Capital Sharebased Compensation Requisite Service Period Recognition Value | 6.26 | 6.29 | 6.04 | NA | 6.71 | 6.32 | 5.09 | NA | 5.45 | 3.90 | 4.48 | NA | 1.80 | 2.13 | 5.54 | NA | 1.03 | 1.63 | 0.15 | NA | 0.69 | 0.50 | 0.51 |
| 2023-09-30 | 2023-06-30 | 2023-03-31 | 2022-12-31 | 2022-09-30 | 2022-06-30 | 2022-03-31 | 2021-12-31 | 2021-09-30 | 2021-06-30 | 2021-03-31 | 2020-12-31 | 2020-09-30 | 2020-06-30 | 2020-03-31 | 2019-12-31 | 2019-09-30 | 2019-06-30 | 2019-03-31 | 2018-12-31 | 2018-09-30 | 2018-06-30 | 2018-03-31 | ||
|---|---|---|---|---|---|---|---|---|---|---|---|---|---|---|---|---|---|---|---|---|---|---|---|---|
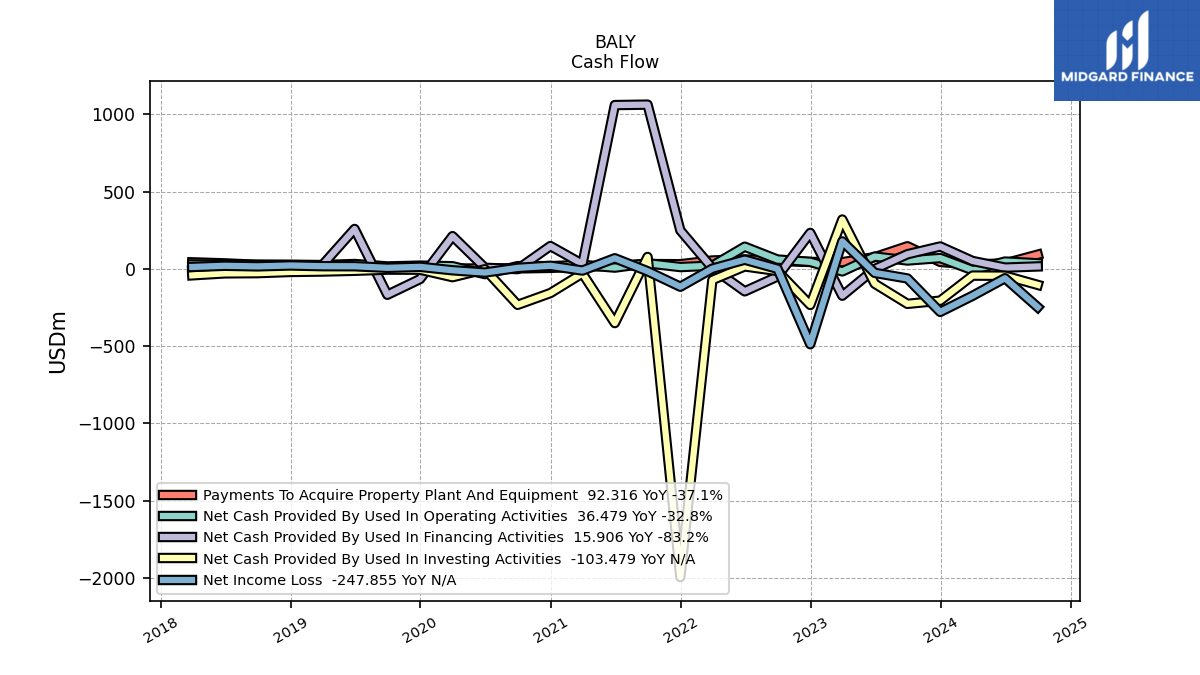
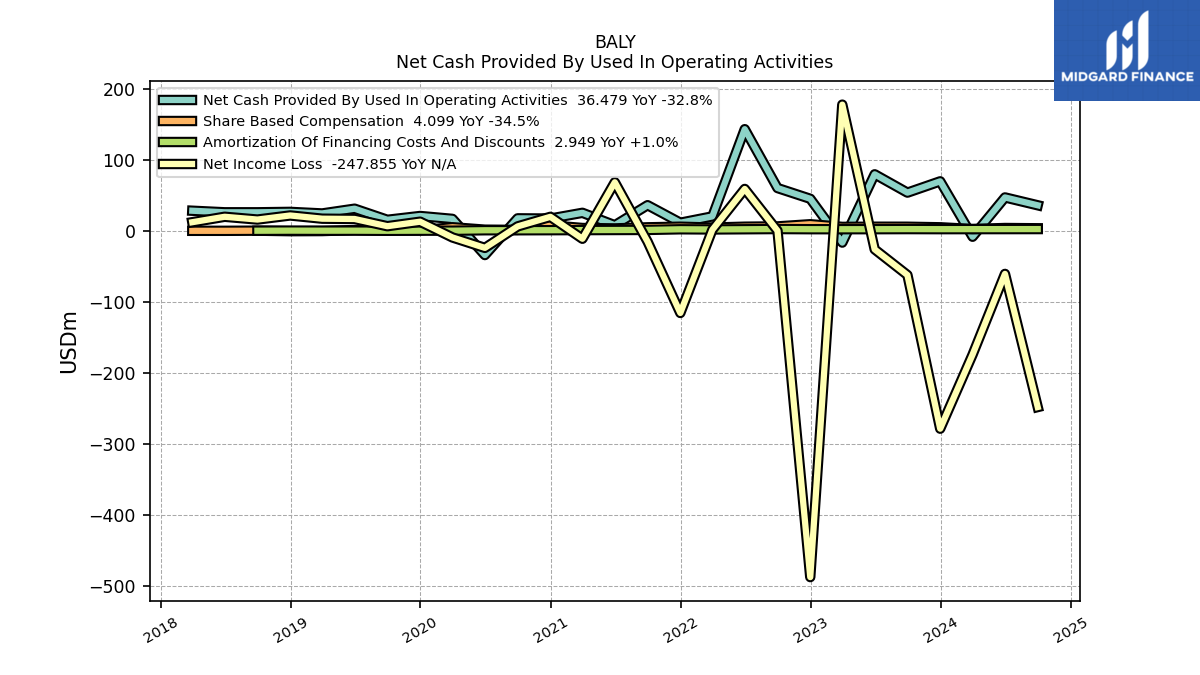
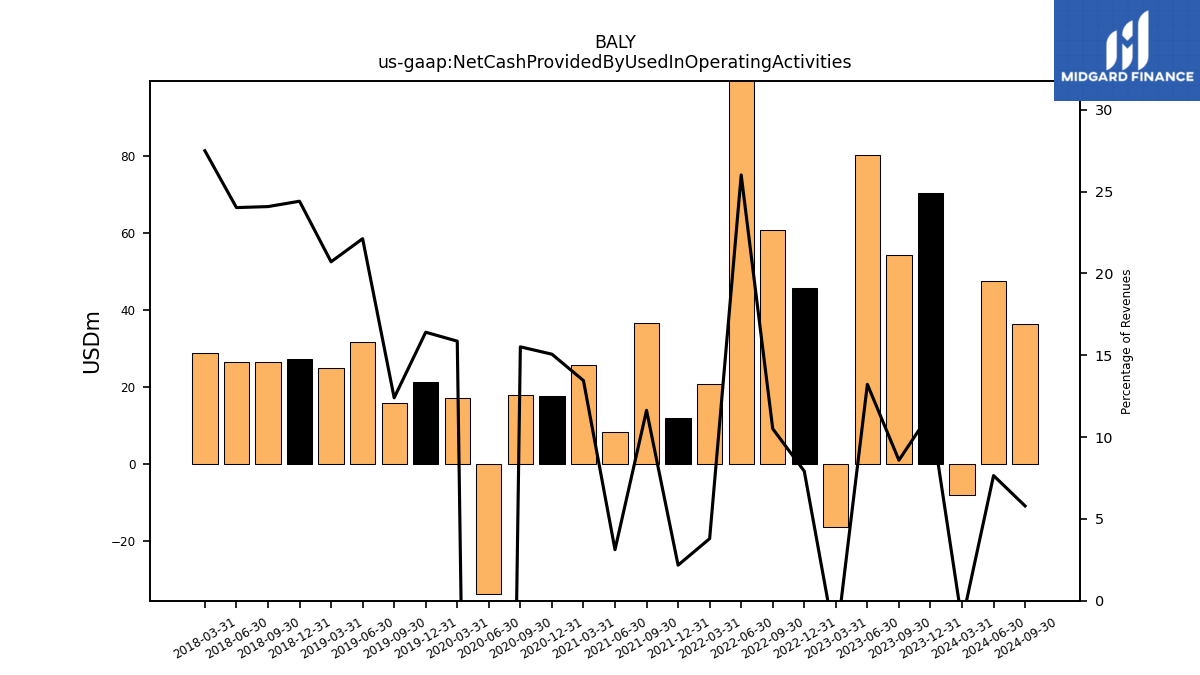
| Net Cash Provided By Used In Operating Activities | 54.31 | 80.16 | -16.11 | 45.66 | 60.77 | 143.73 | 20.81 | 11.91 | 36.62 | 8.36 | 25.87 | 17.79 | 18.09 | -33.69 | 17.31 | 21.40 | 16.04 | 31.68 | 24.98 | 27.20 | 26.61 | 26.62 | 28.82 | |
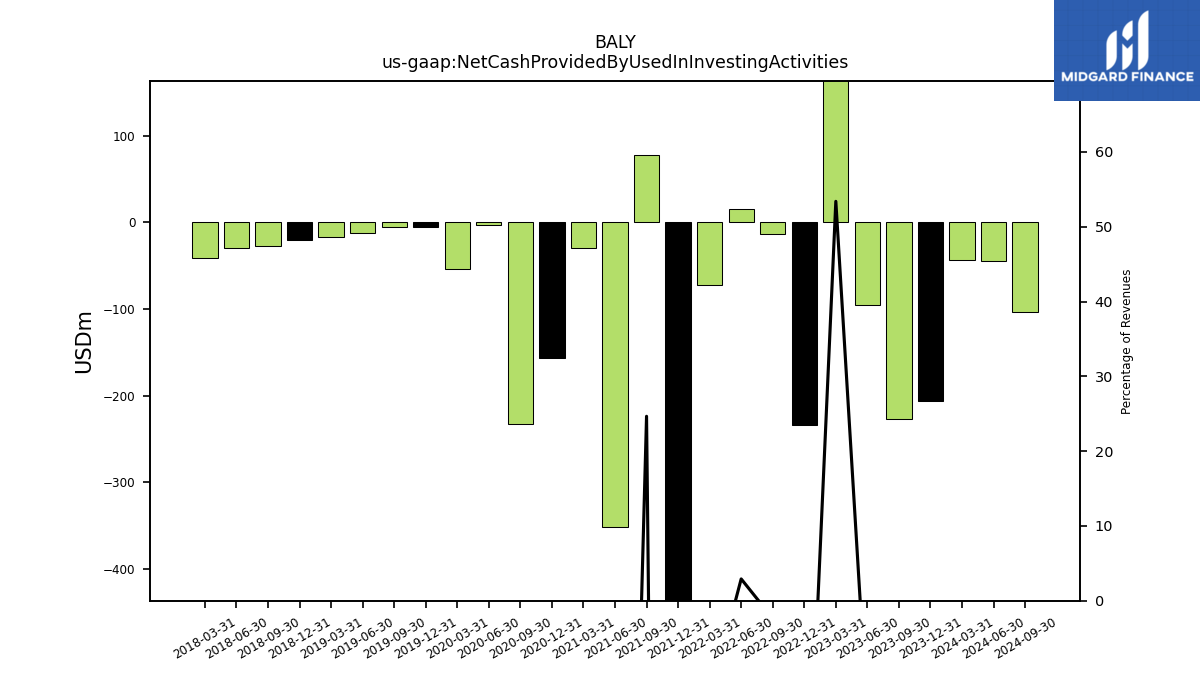
| Net Cash Provided By Used In Investing Activities | -226.22 | -95.66 | 319.64 | -233.47 | -13.62 | 16.12 | -71.95 | -1994.78 | 77.60 | -350.84 | -28.88 | -156.33 | -232.61 | -2.45 | -53.45 | -5.00 | -4.71 | -12.12 | -17.11 | -19.70 | -27.48 | -28.95 | -41.47 | |
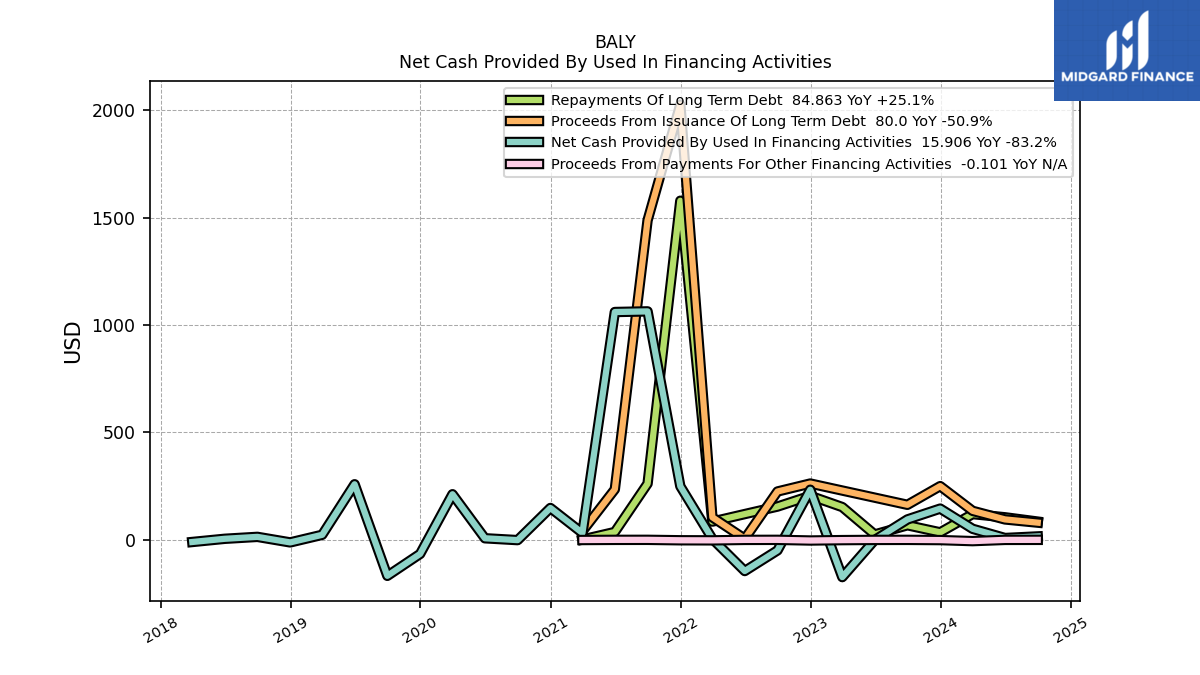
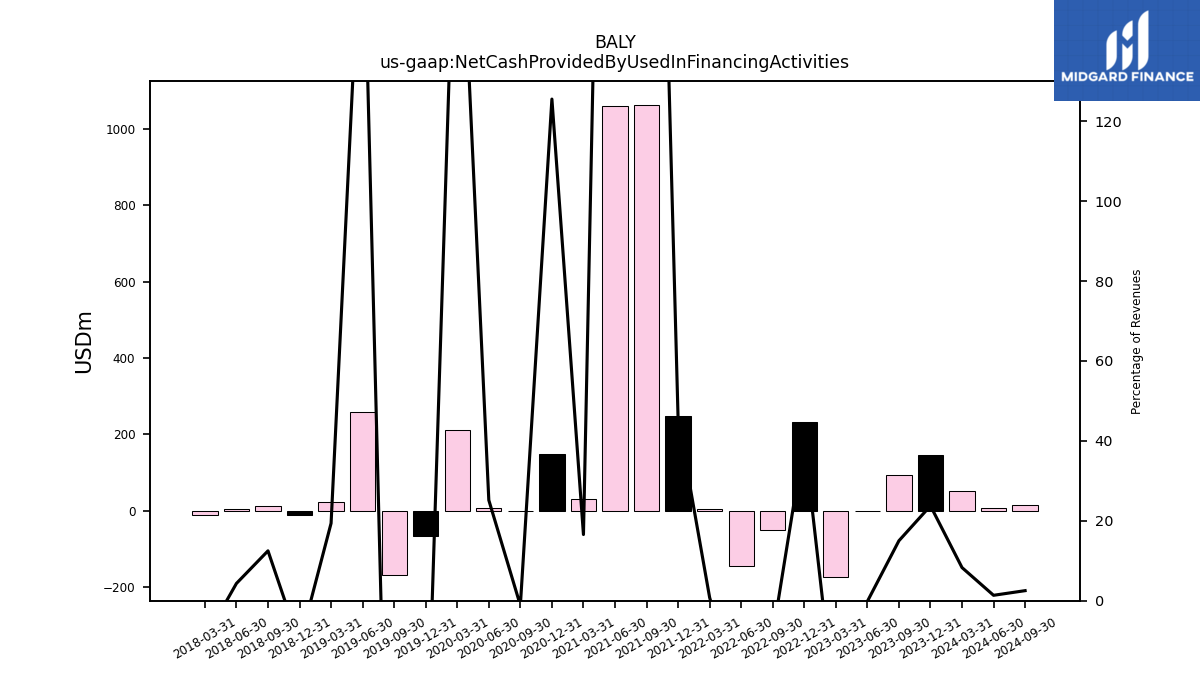
| Net Cash Provided By Used In Financing Activities | 94.96 | -0.95 | -173.57 | 233.19 | -49.16 | -145.19 | 4.41 | 249.20 | 1063.25 | 1060.29 | 31.86 | 148.24 | -1.35 | 7.28 | 212.23 | -65.56 | -167.56 | 258.62 | 23.39 | -11.99 | 13.80 | 4.80 | -10.04 |
| 2023-09-30 | 2023-06-30 | 2023-03-31 | 2022-12-31 | 2022-09-30 | 2022-06-30 | 2022-03-31 | 2021-12-31 | 2021-09-30 | 2021-06-30 | 2021-03-31 | 2020-12-31 | 2020-09-30 | 2020-06-30 | 2020-03-31 | 2019-12-31 | 2019-09-30 | 2019-06-30 | 2019-03-31 | 2018-12-31 | 2018-09-30 | 2018-06-30 | 2018-03-31 | ||
|---|---|---|---|---|---|---|---|---|---|---|---|---|---|---|---|---|---|---|---|---|---|---|---|---|
| Net Cash Provided By Used In Operating Activities | 54.31 | 80.16 | -16.11 | 45.66 | 60.77 | 143.73 | 20.81 | 11.91 | 36.62 | 8.36 | 25.87 | 17.79 | 18.09 | -33.69 | 17.31 | 21.40 | 16.04 | 31.68 | 24.98 | 27.20 | 26.61 | 26.62 | 28.82 | |
| Net Income Loss | -61.80 | -25.65 | 178.34 | -487.53 | 0.59 | 59.50 | 1.89 | -115.29 | -14.75 | 68.94 | -10.71 | 20.22 | 6.72 | -23.55 | -8.88 | 13.36 | 7.00 | 17.18 | 17.60 | 22.13 | 16.37 | 20.30 | 12.63 | |
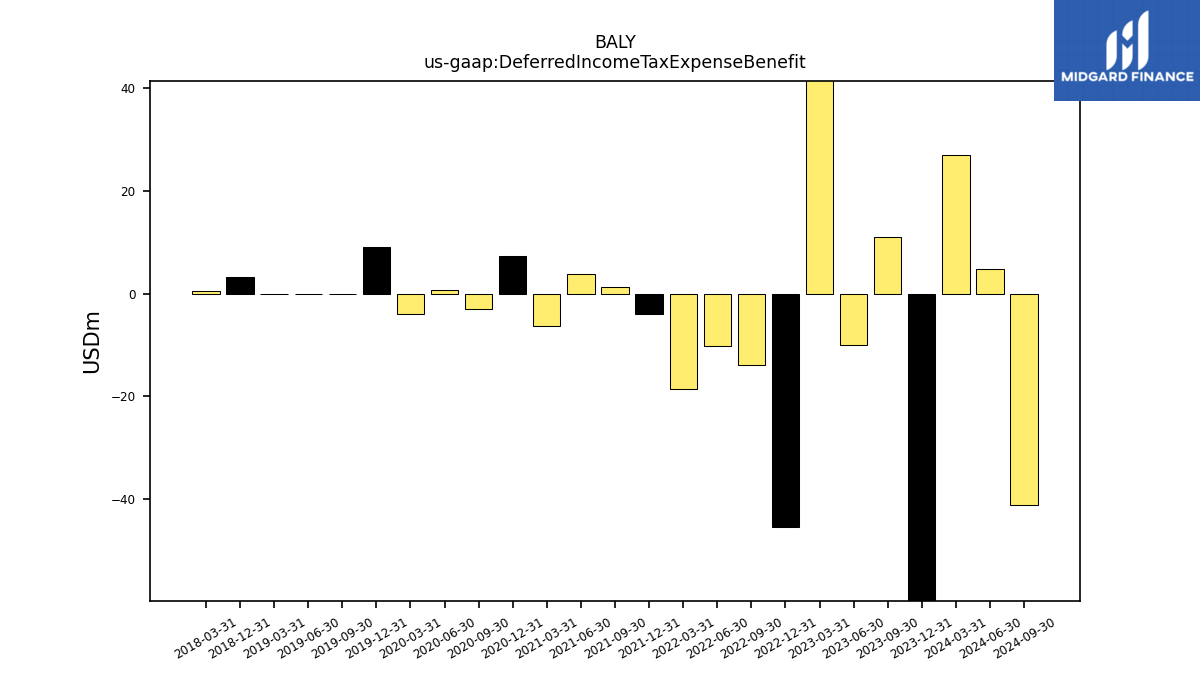
| Deferred Income Tax Expense Benefit | 10.90 | -9.95 | 58.82 | -45.28 | -13.97 | -10.29 | -18.59 | -3.92 | 1.23 | 3.82 | -6.34 | 7.40 | -2.99 | 0.73 | -3.95 | 8.99 | 0.00 | 0.00 | 0.00 | 3.23 | NA | NA | 0.45 | |
| Share Based Compensation | 6.26 | 6.29 | 6.04 | 9.78 | 6.71 | 6.32 | 5.09 | 6.31 | 5.45 | 3.90 | 4.48 | 8.24 | 1.80 | 2.13 | 5.54 | 1.02 | 1.03 | 1.63 | 0.15 | -0.01 | 0.69 | 0.50 | 0.51 |
| 2023-09-30 | 2023-06-30 | 2023-03-31 | 2022-12-31 | 2022-09-30 | 2022-06-30 | 2022-03-31 | 2021-12-31 | 2021-09-30 | 2021-06-30 | 2021-03-31 | 2020-12-31 | 2020-09-30 | 2020-06-30 | 2020-03-31 | 2019-12-31 | 2019-09-30 | 2019-06-30 | 2019-03-31 | 2018-12-31 | 2018-09-30 | 2018-06-30 | 2018-03-31 | ||
|---|---|---|---|---|---|---|---|---|---|---|---|---|---|---|---|---|---|---|---|---|---|---|---|---|
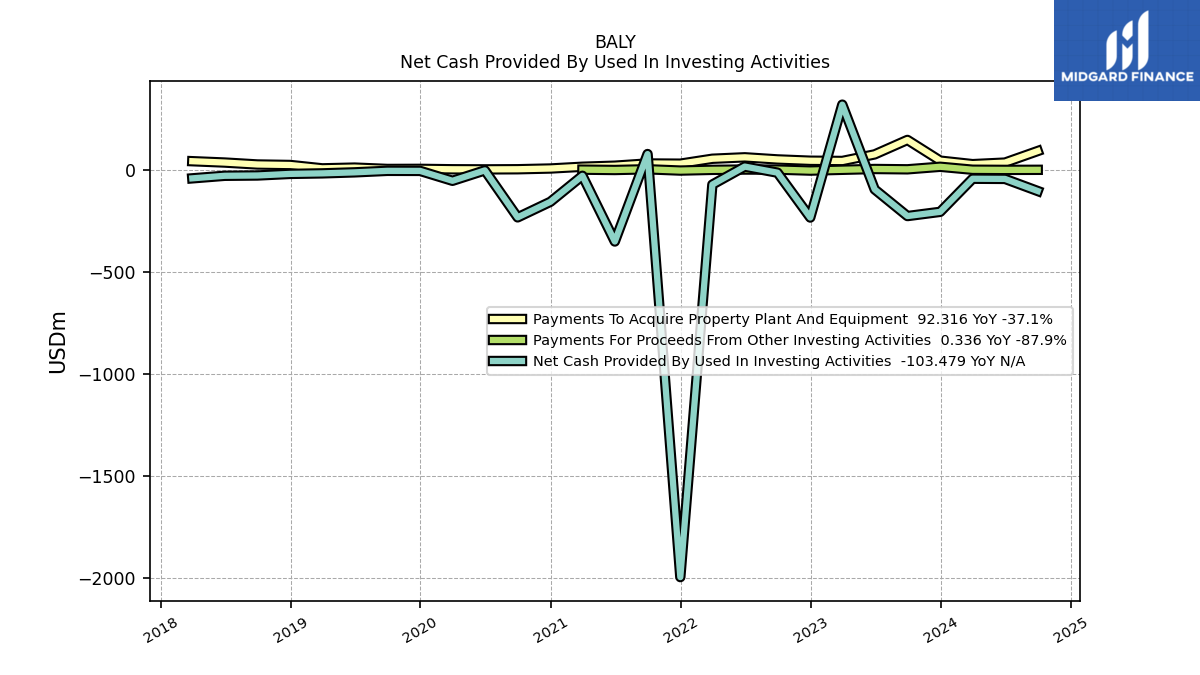
| Net Cash Provided By Used In Investing Activities | -226.22 | -95.66 | 319.64 | -233.47 | -13.62 | 16.12 | -71.95 | -1994.78 | 77.60 | -350.84 | -28.88 | -156.33 | -232.61 | -2.45 | -53.45 | -5.00 | -4.71 | -12.12 | -17.11 | -19.70 | -27.48 | -28.95 | -41.47 | |
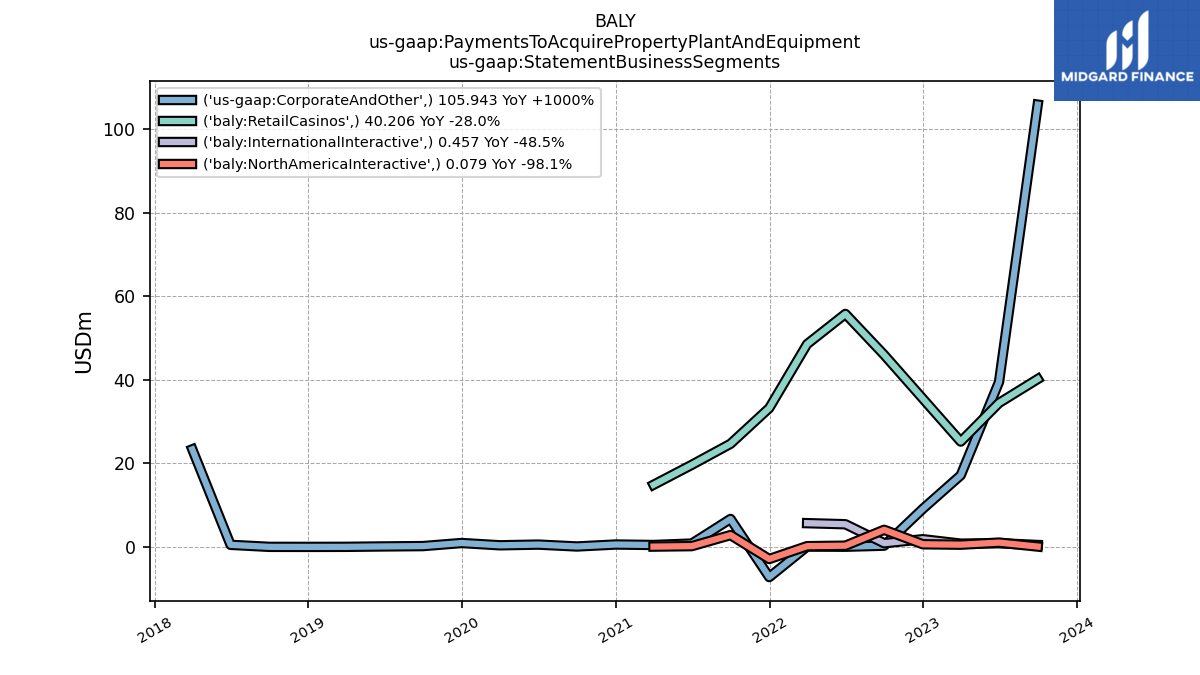
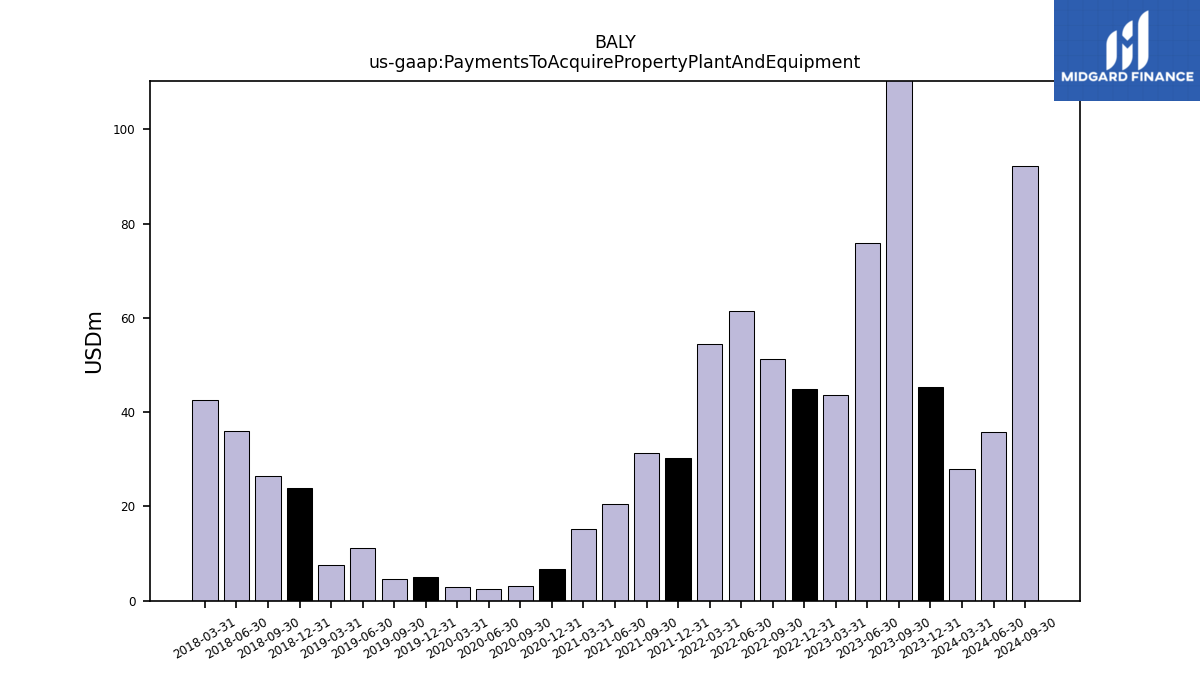
| Payments To Acquire Property Plant And Equipment | 146.69 | 75.87 | 43.68 | 44.89 | 51.28 | 61.56 | 54.52 | 30.37 | 31.37 | 20.46 | 15.33 | 6.72 | 3.12 | 2.45 | 3.00 | 5.00 | 4.55 | 11.18 | 7.50 | 23.99 | 26.45 | 35.94 | 42.51 |
| 2023-09-30 | 2023-06-30 | 2023-03-31 | 2022-12-31 | 2022-09-30 | 2022-06-30 | 2022-03-31 | 2021-12-31 | 2021-09-30 | 2021-06-30 | 2021-03-31 | 2020-12-31 | 2020-09-30 | 2020-06-30 | 2020-03-31 | 2019-12-31 | 2019-09-30 | 2019-06-30 | 2019-03-31 | 2018-12-31 | 2018-09-30 | 2018-06-30 | 2018-03-31 | ||
|---|---|---|---|---|---|---|---|---|---|---|---|---|---|---|---|---|---|---|---|---|---|---|---|---|
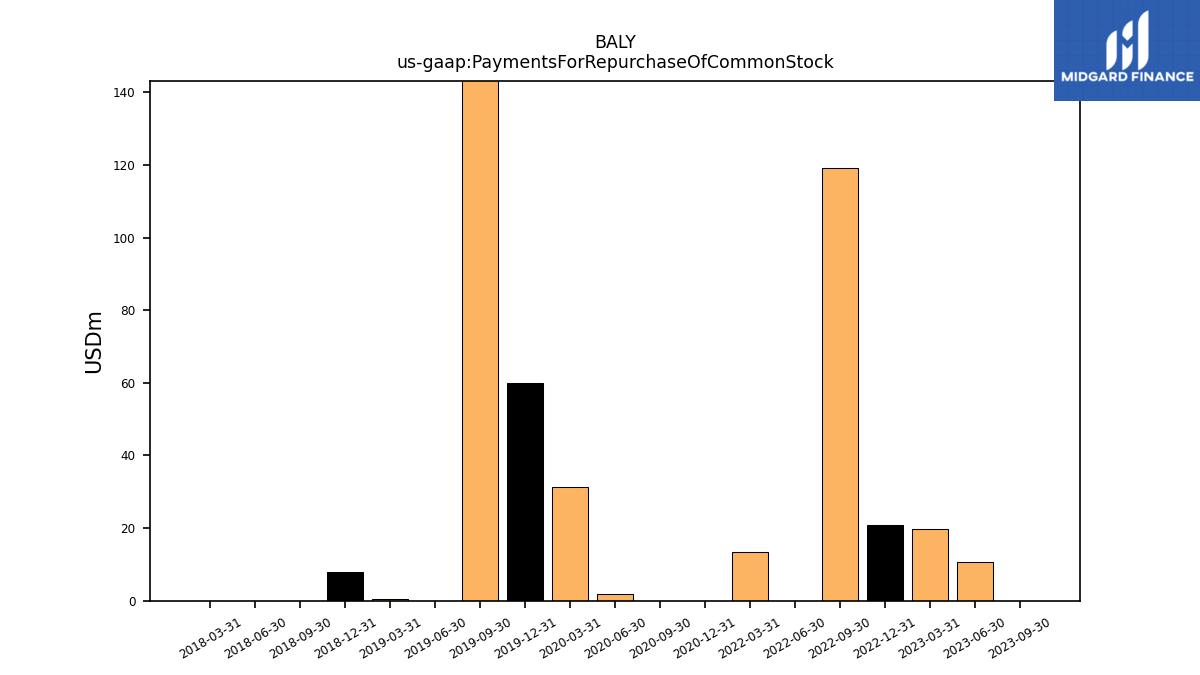
| Net Cash Provided By Used In Financing Activities | 94.96 | -0.95 | -173.57 | 233.19 | -49.16 | -145.19 | 4.41 | 249.20 | 1063.25 | 1060.29 | 31.86 | 148.24 | -1.35 | 7.28 | 212.23 | -65.56 | -167.56 | 258.62 | 23.39 | -11.99 | 13.80 | 4.80 | -10.04 | |
| Payments For Repurchase Of Common Stock | 0.00 | 10.71 | 19.75 | 20.82 | 119.25 | 0.00 | 13.29 | NA | NA | NA | NA | 0.00 | 0.00 | 1.95 | 31.34 | 59.96 | 162.71 | 0.00 | 0.41 | 7.96 | 0.00 | 0.00 | 0.00 |
| 2023-09-30 | 2023-06-30 | 2023-03-31 | 2022-12-31 | 2022-09-30 | 2022-06-30 | 2022-03-31 | 2021-12-31 | 2021-09-30 | 2021-06-30 | 2021-03-31 | 2020-12-31 | 2020-09-30 | 2020-06-30 | 2020-03-31 | 2019-12-31 | 2019-09-30 | 2019-06-30 | 2019-03-31 | 2018-12-31 | 2018-09-30 | 2018-06-30 | 2018-03-31 | ||
|---|---|---|---|---|---|---|---|---|---|---|---|---|---|---|---|---|---|---|---|---|---|---|---|---|
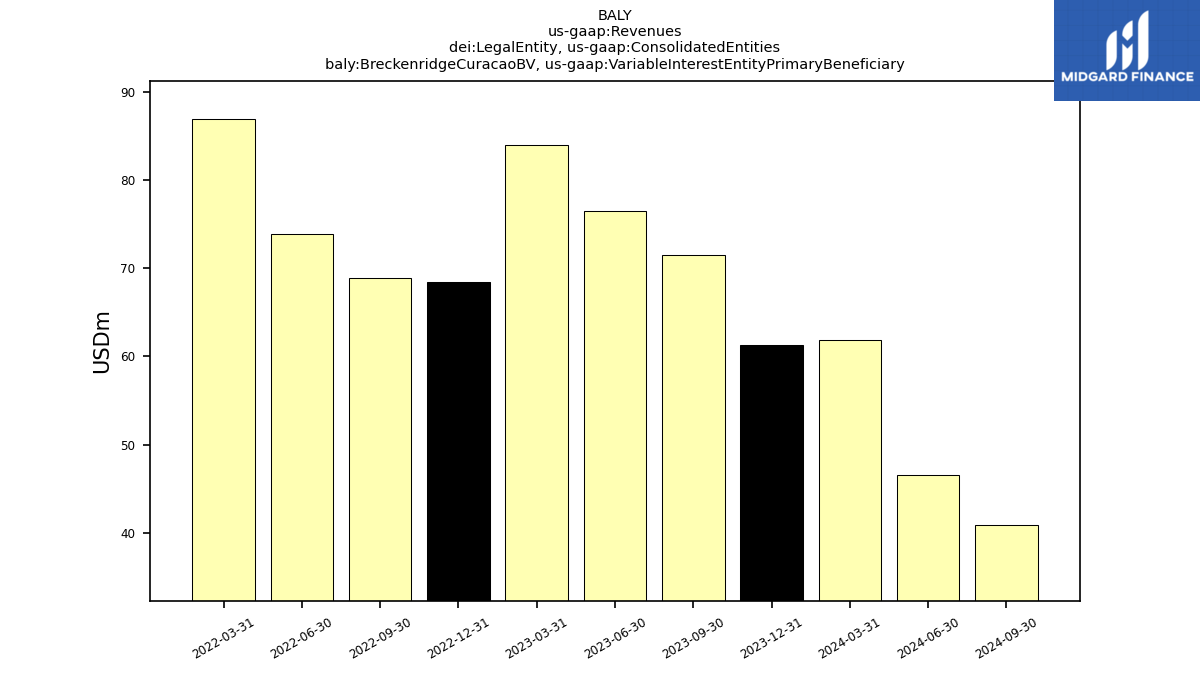
| Revenues | 632.48 | 606.21 | 598.72 | 576.69 | 578.25 | 552.50 | 548.27 | 547.66 | 314.78 | 267.73 | 192.27 | 118.10 | 116.62 | 28.92 | 109.15 | 130.42 | 129.31 | 143.22 | 120.63 | 111.42 | 110.49 | 110.81 | 104.81 | |
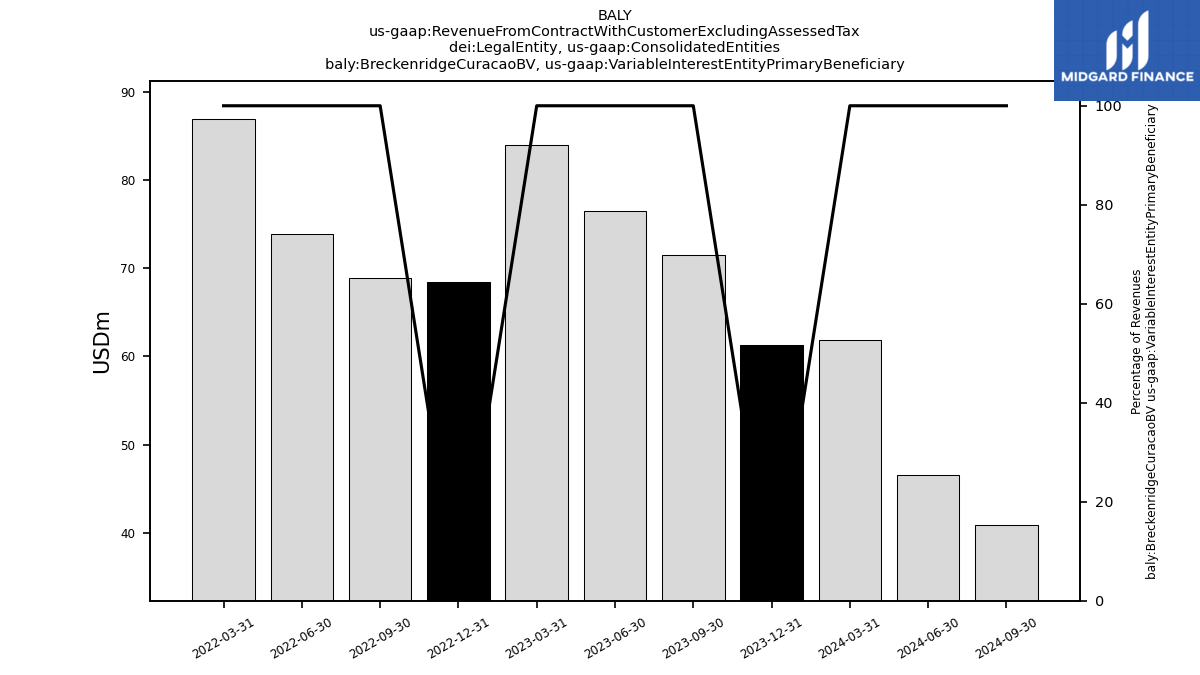
| Breckenridge Curacao B V, Variable Interest Entity Primary Beneficiary | 71.50 | 76.50 | 84.00 | 68.40 | 68.90 | 73.90 | 86.90 | NA | NA | NA | NA | NA | NA | NA | NA | NA | NA | NA | NA | NA | NA | NA | NA | |
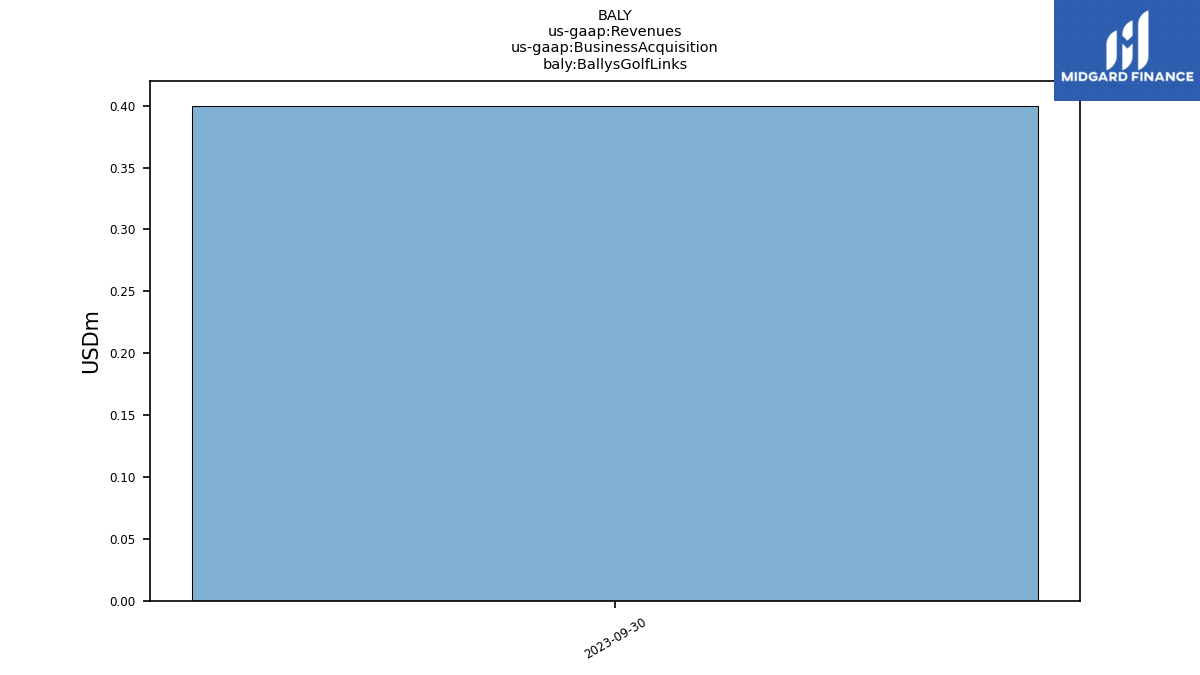
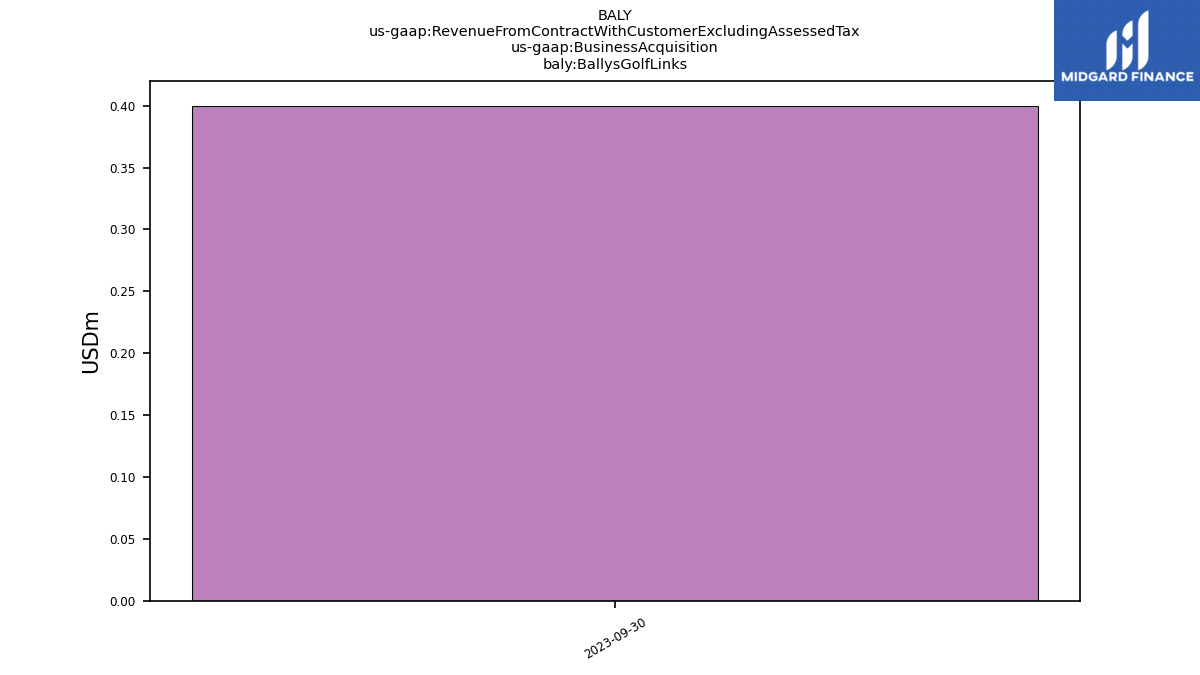
| Ballys Golf Links | 0.40 | NA | NA | NA | NA | NA | NA | NA | NA | NA | NA | NA | NA | NA | NA | NA | NA | NA | NA | NA | NA | NA | NA | |
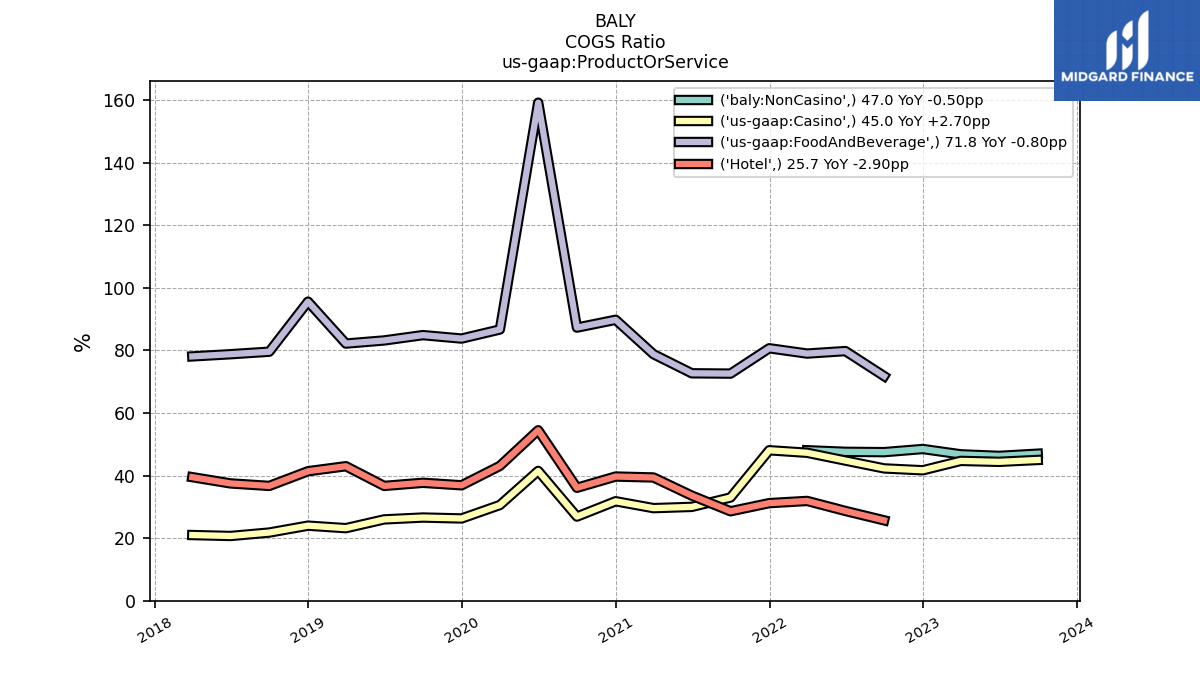
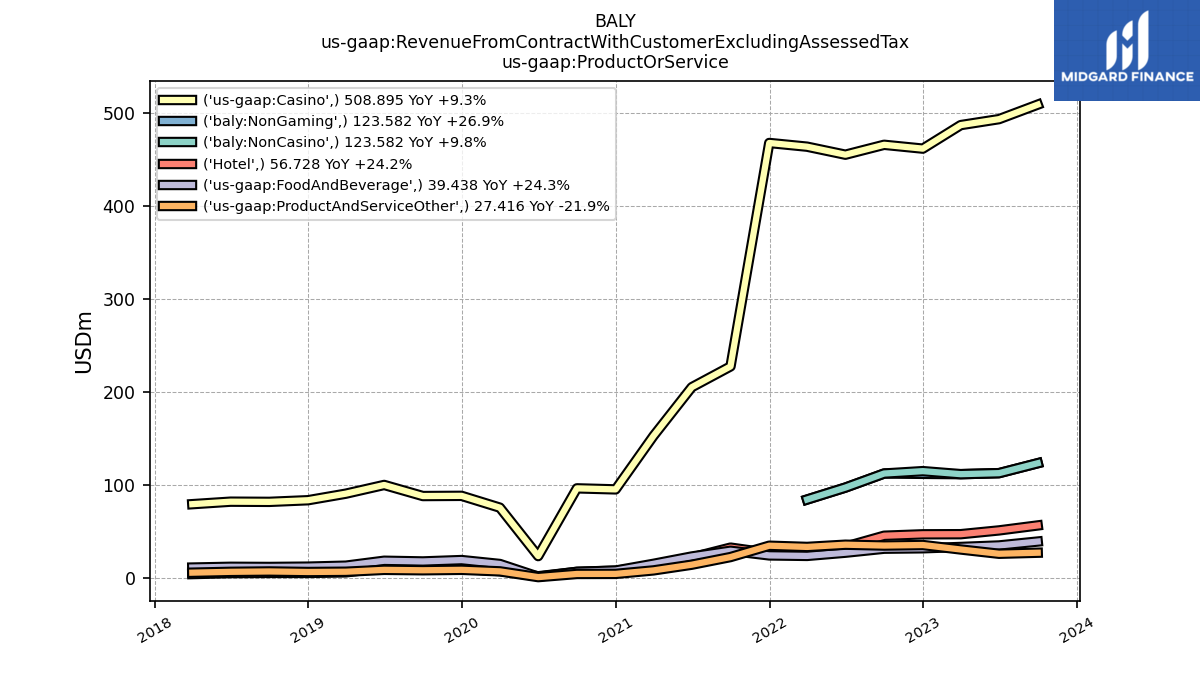
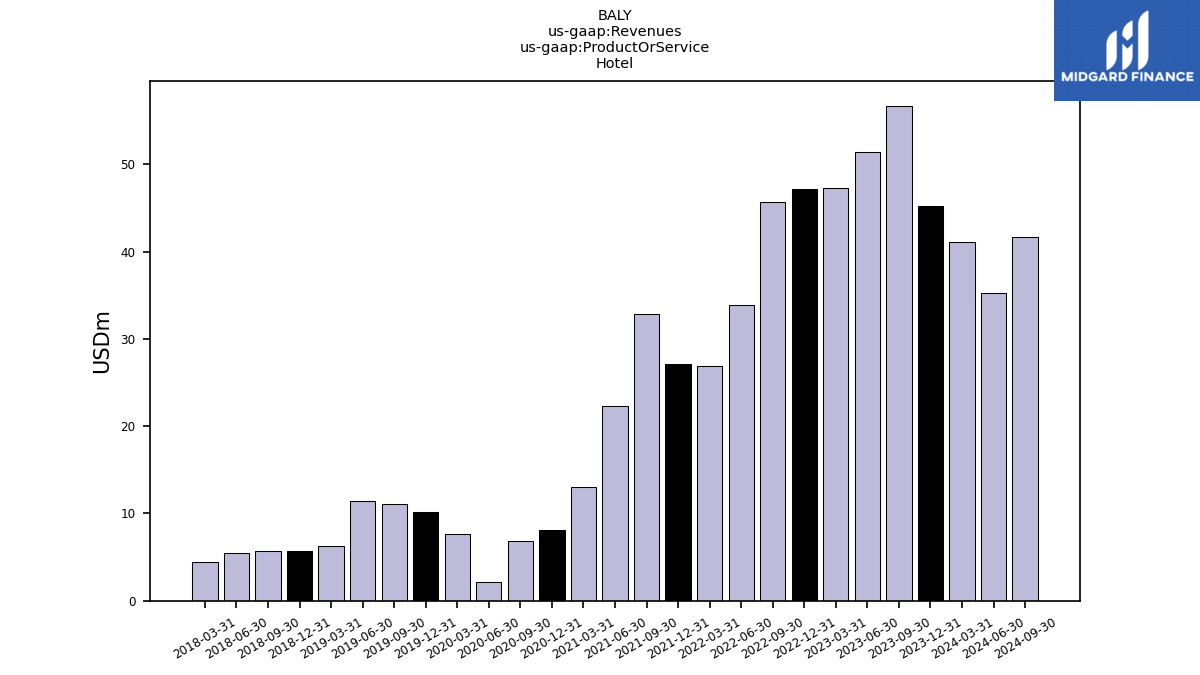
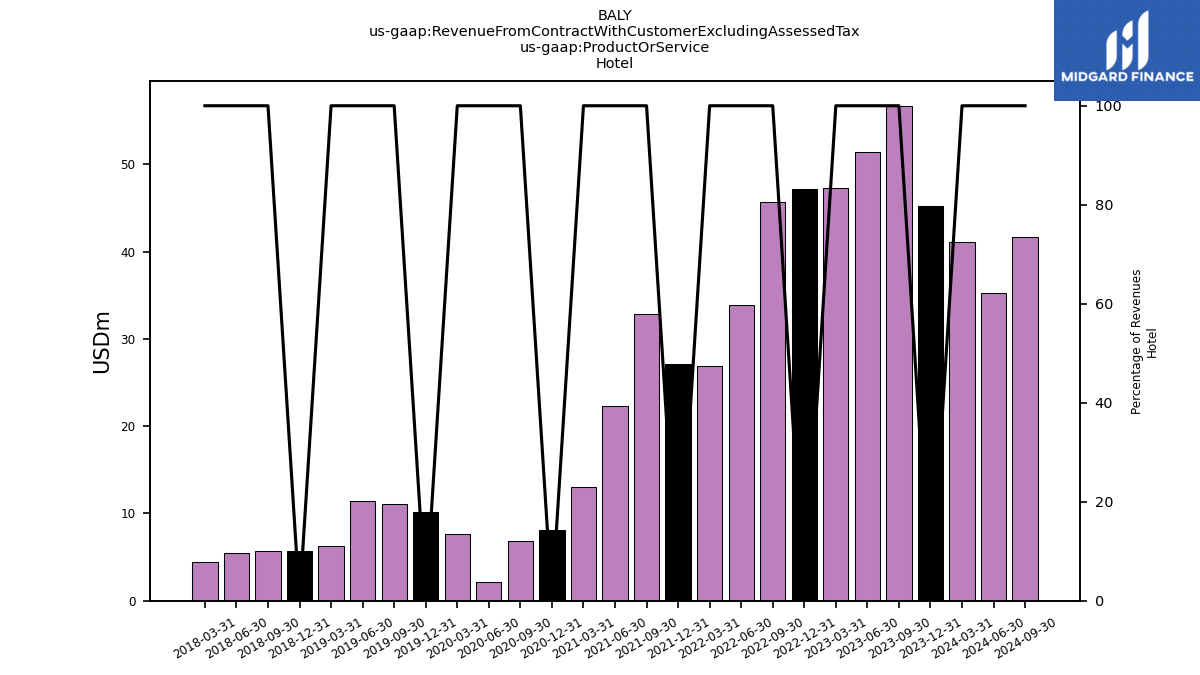
| 56.73 | 51.39 | 47.33 | 47.21 | 45.67 | 33.93 | 26.93 | 27.08 | 32.90 | 22.32 | 13.06 | 8.11 | 6.87 | 2.12 | 7.65 | 10.17 | 11.12 | 11.39 | 6.30 | 5.69 | 5.71 | 5.49 | 4.45 | ||
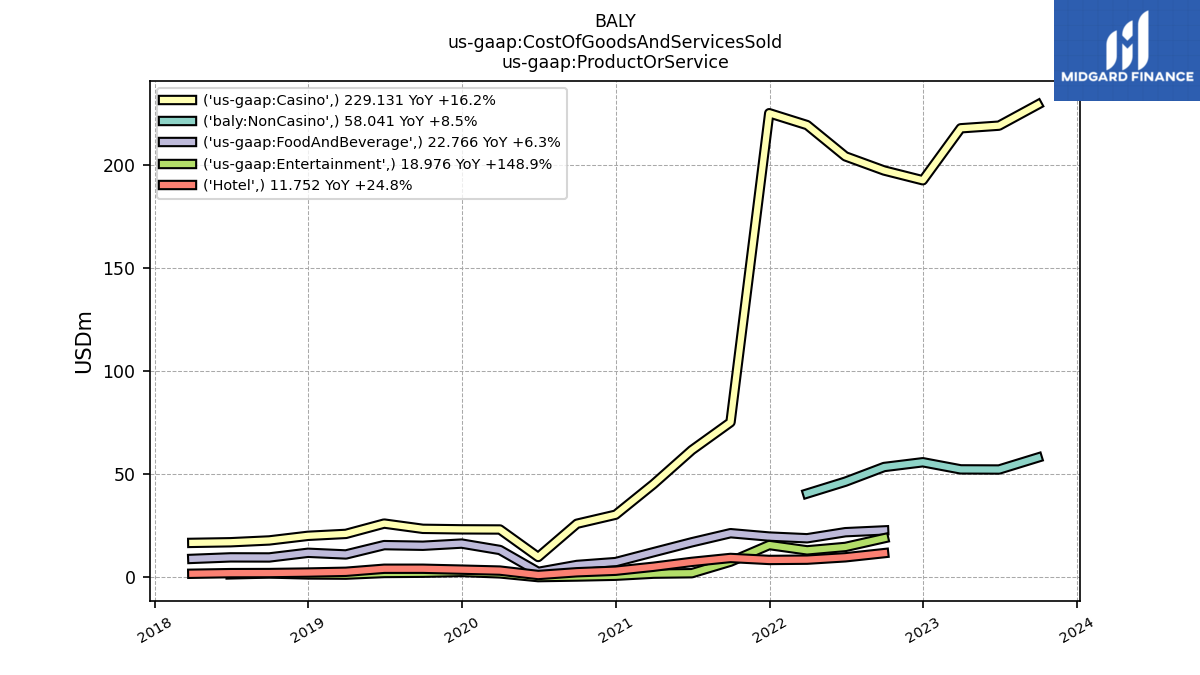
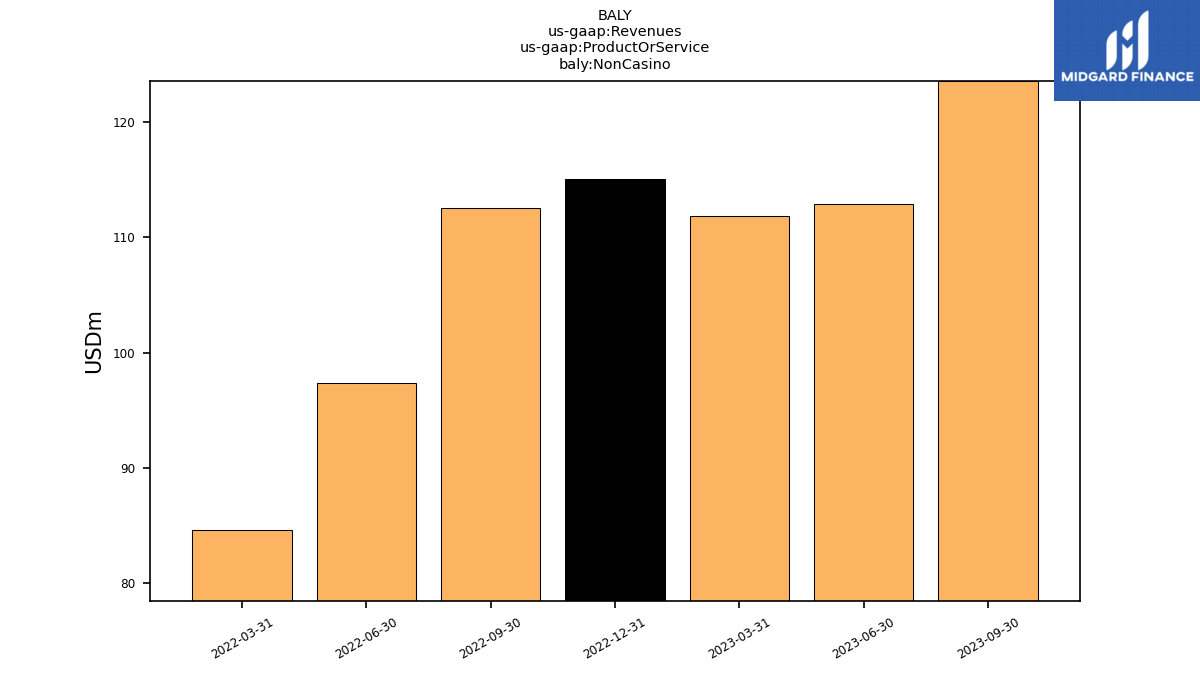
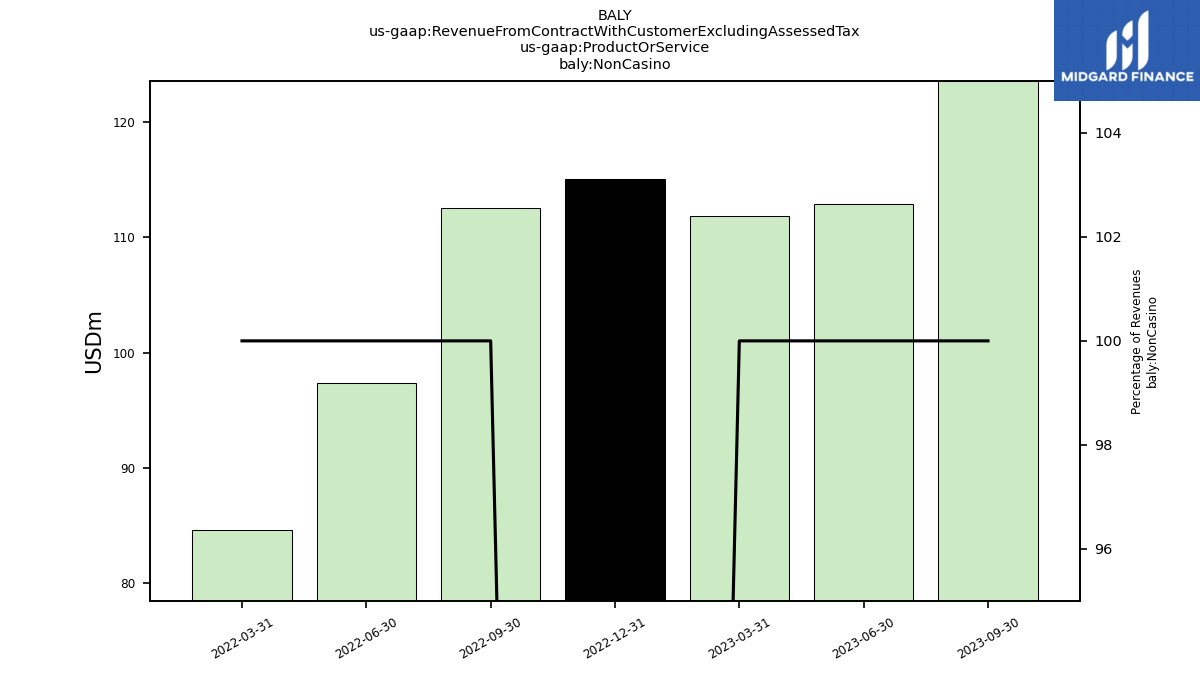
| Non Casino | 123.58 | 112.91 | 111.83 | 115.09 | 112.52 | 97.41 | 84.57 | NA | NA | NA | NA | NA | NA | NA | NA | NA | NA | NA | NA | NA | NA | NA | NA | |
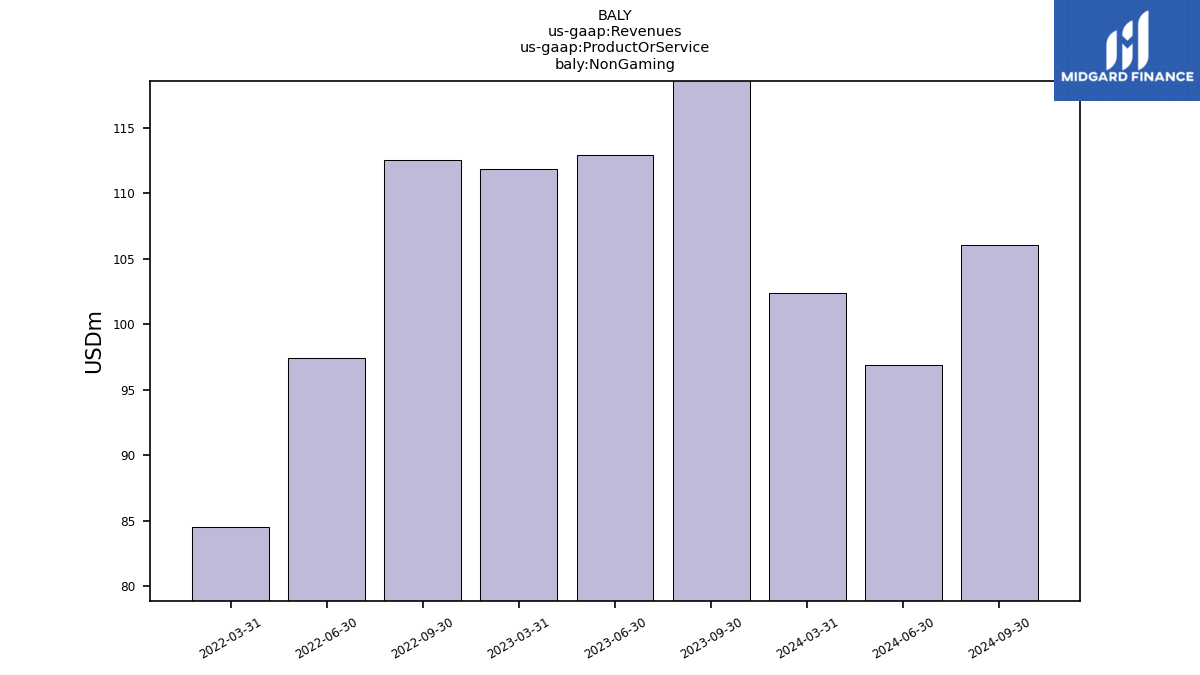
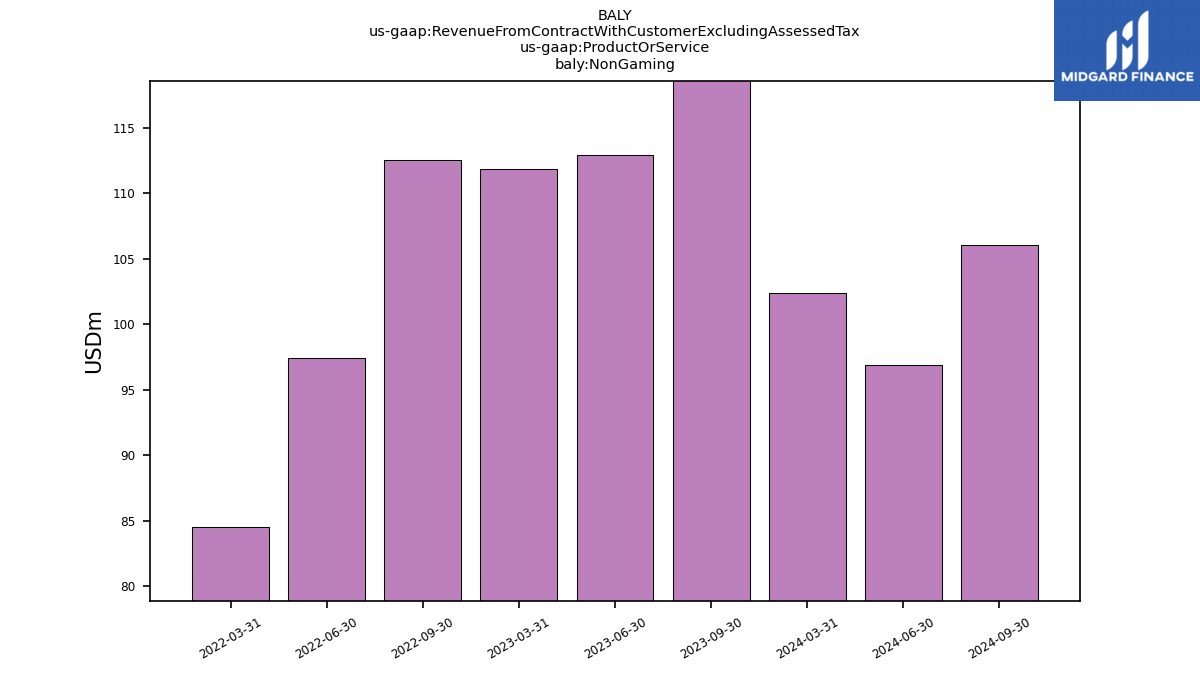
| Non Gaming | 123.58 | 112.91 | 111.83 | NA | 112.52 | 97.41 | 84.57 | NA | NA | NA | NA | NA | NA | NA | NA | NA | NA | NA | NA | NA | NA | NA | NA | |
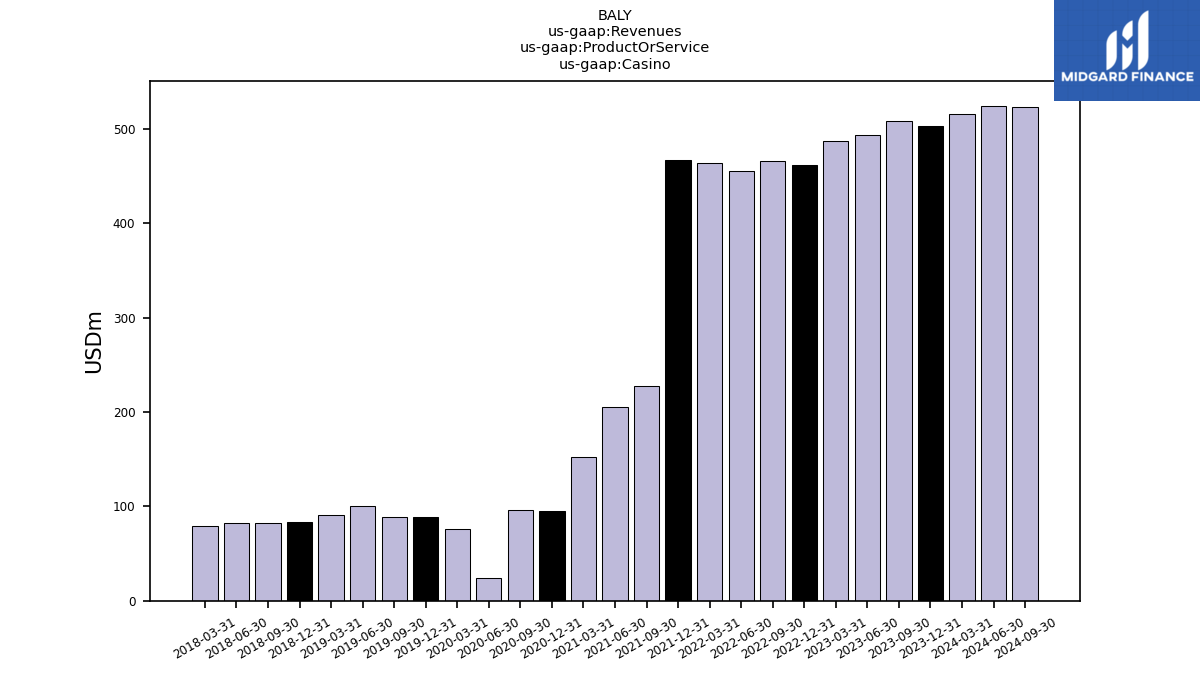
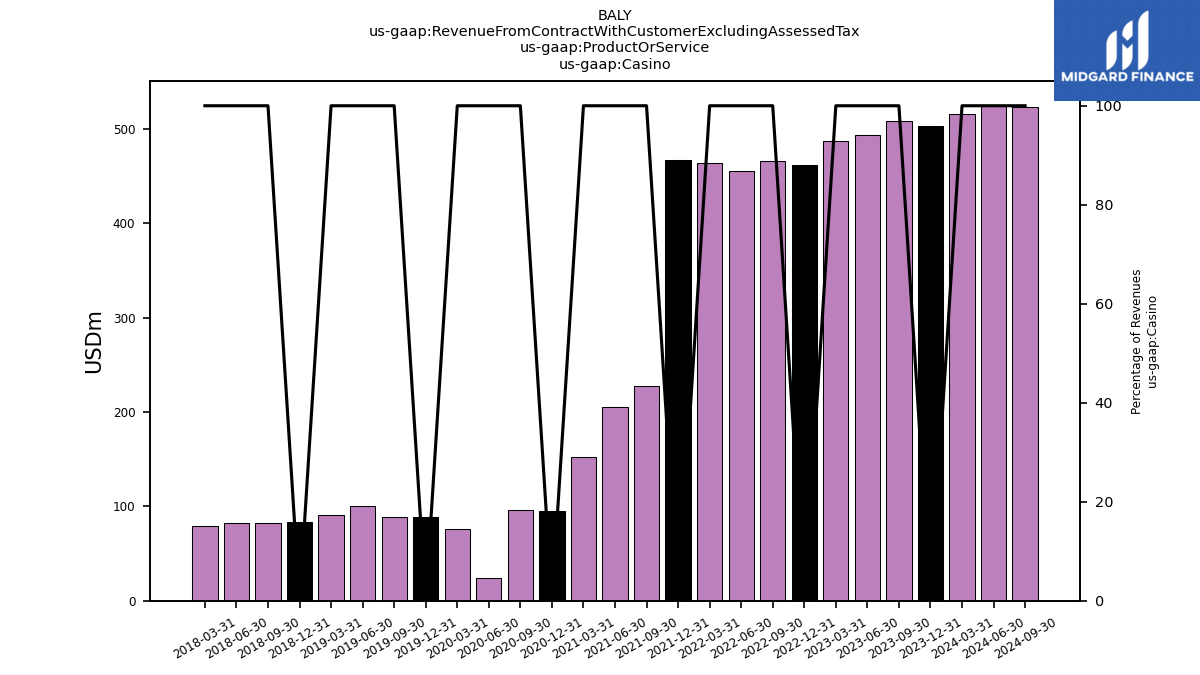
| Casino | 508.89 | 493.30 | 486.89 | 461.60 | 465.73 | 455.09 | 463.70 | 467.70 | 227.59 | 205.29 | 152.91 | 95.47 | 96.59 | 23.77 | 75.84 | 88.53 | 88.31 | 100.23 | 90.87 | 83.83 | 82.07 | 82.27 | 79.58 | |
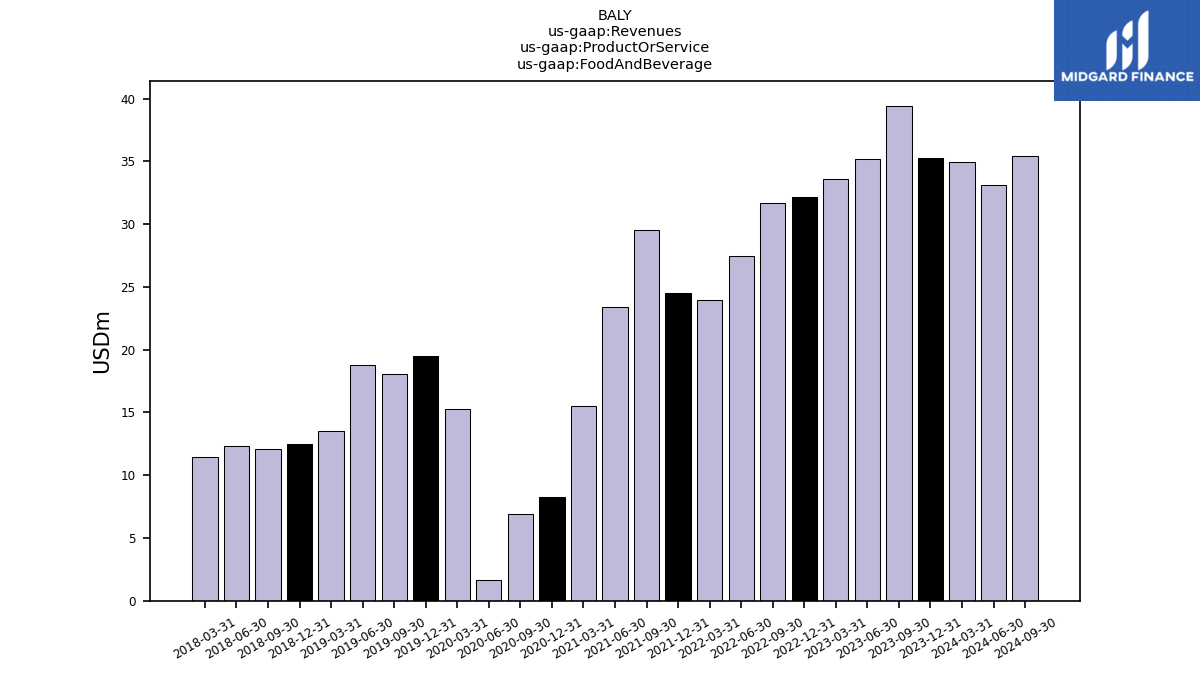
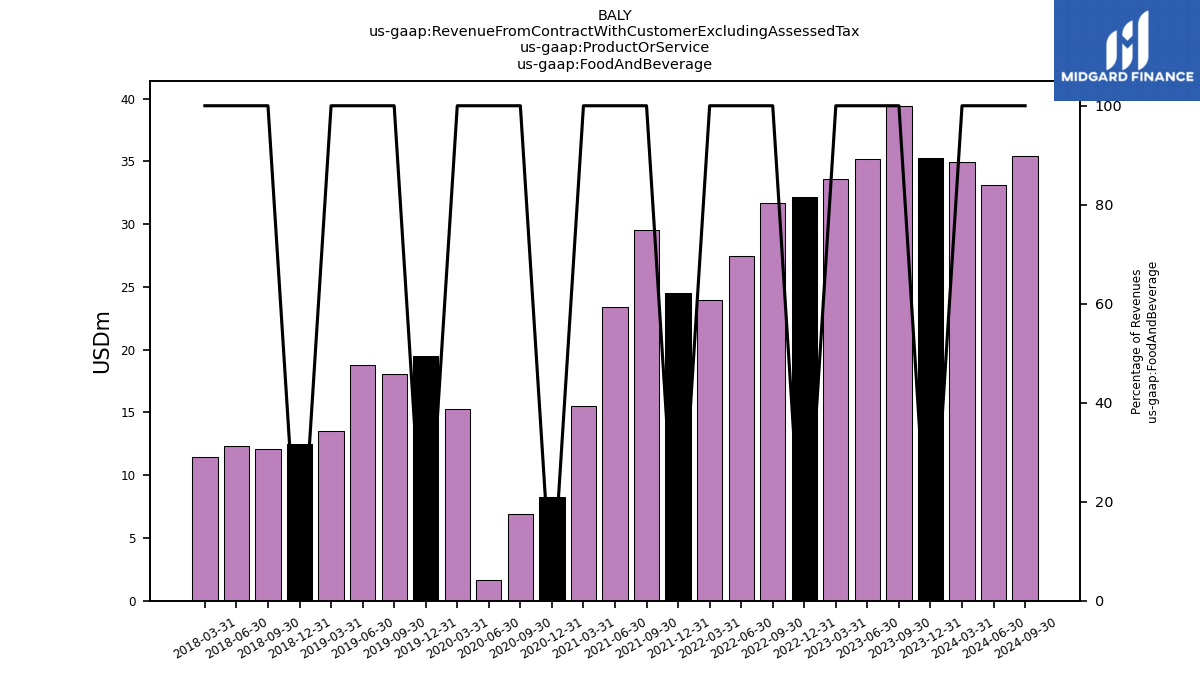
| Food And Beverage | 39.44 | 35.22 | 33.61 | 32.17 | 31.72 | 27.43 | 23.99 | 24.52 | 29.50 | 23.38 | 15.50 | 8.26 | 6.89 | 1.67 | 15.32 | 19.54 | 18.05 | 18.80 | 13.51 | 12.46 | 12.13 | 12.30 | 11.49 | |
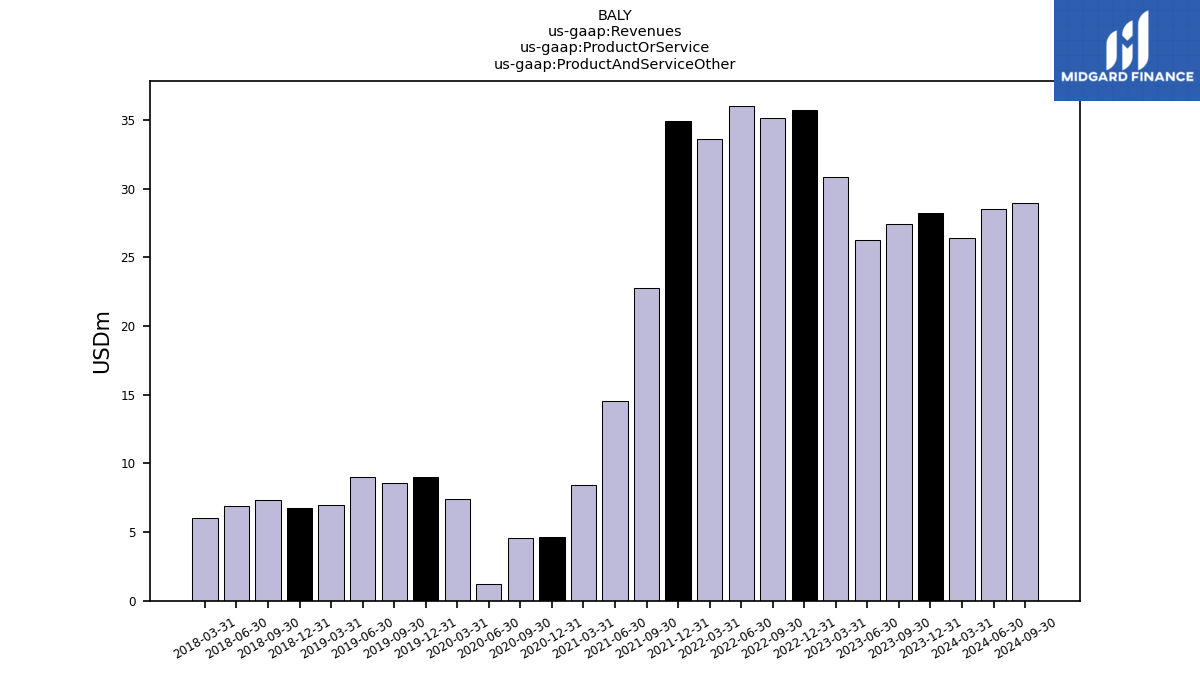
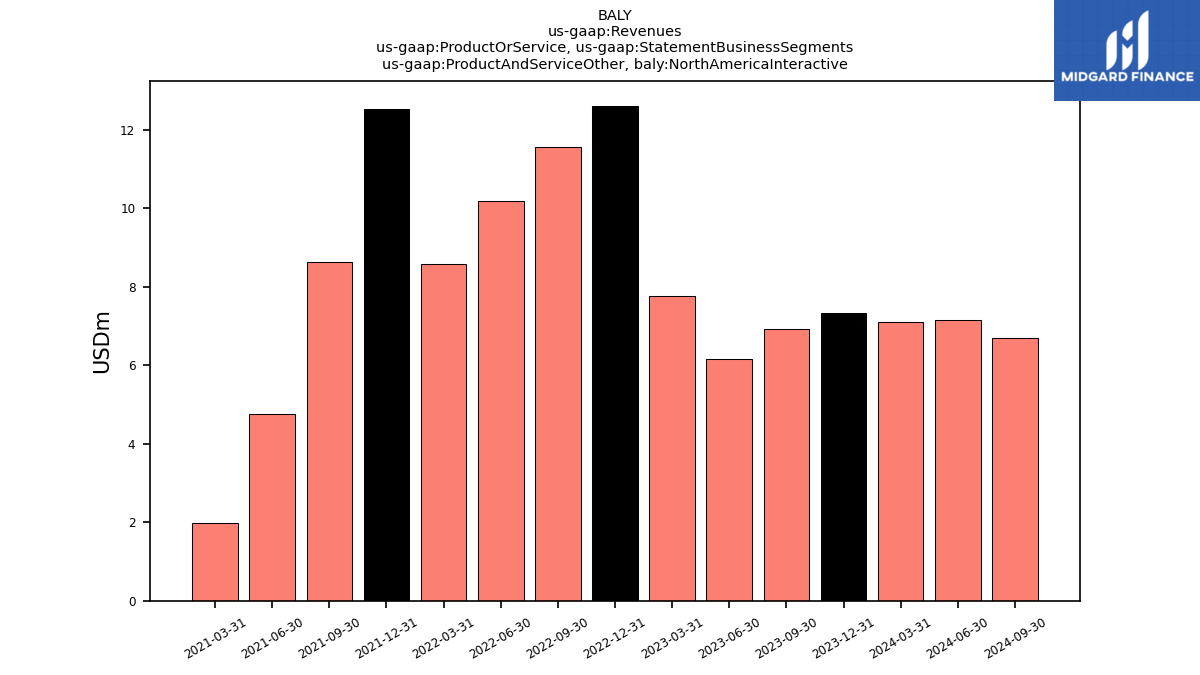
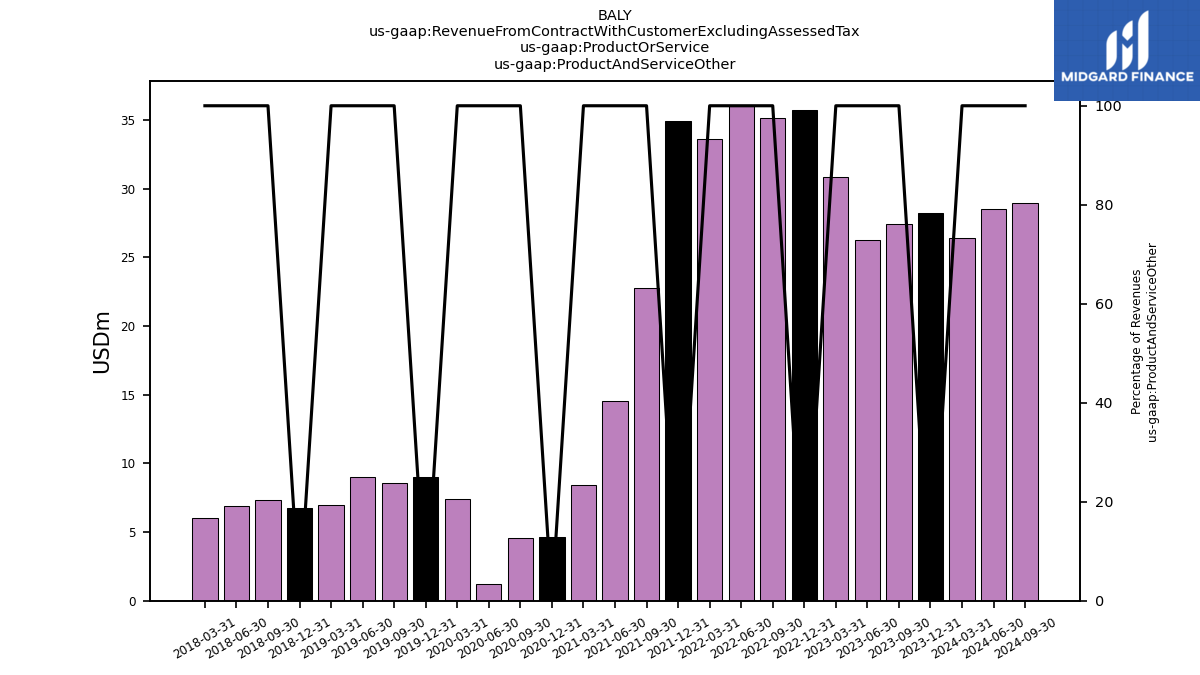
| Product And Service Other | 27.42 | 26.30 | 30.89 | 35.70 | 35.12 | 36.04 | 33.65 | 34.96 | 22.76 | 14.55 | 8.43 | 4.67 | 4.59 | 1.20 | 7.39 | 9.04 | 8.57 | 9.01 | 7.01 | 6.73 | 7.30 | 6.89 | 6.00 | |
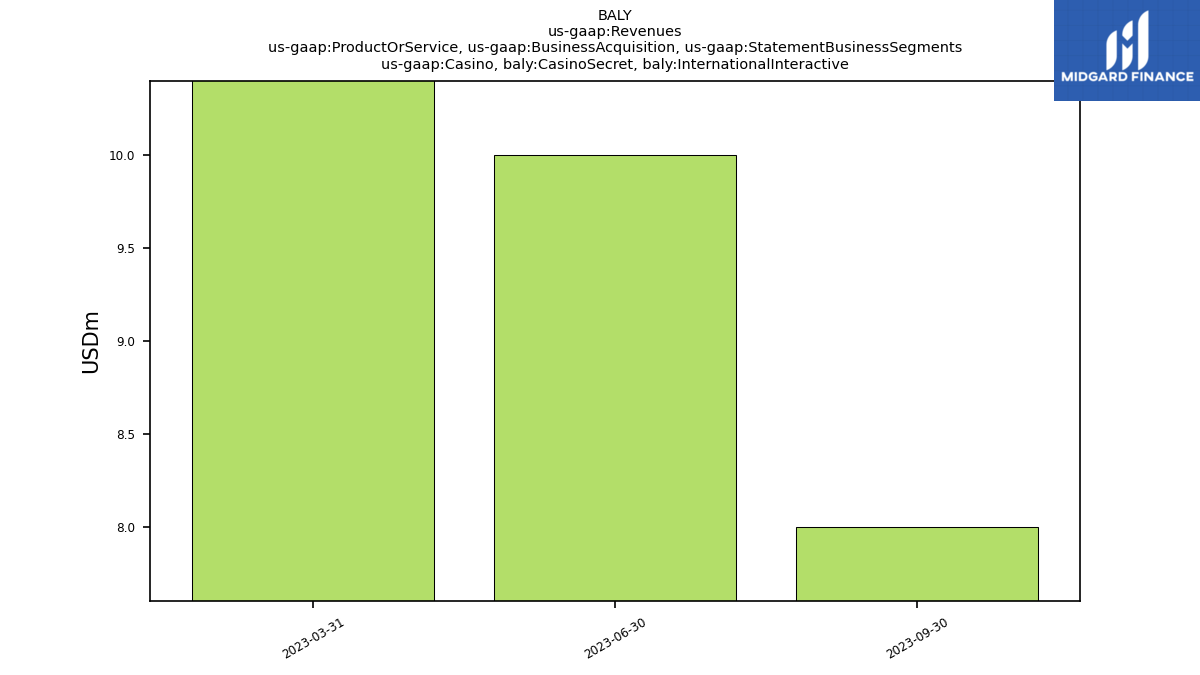
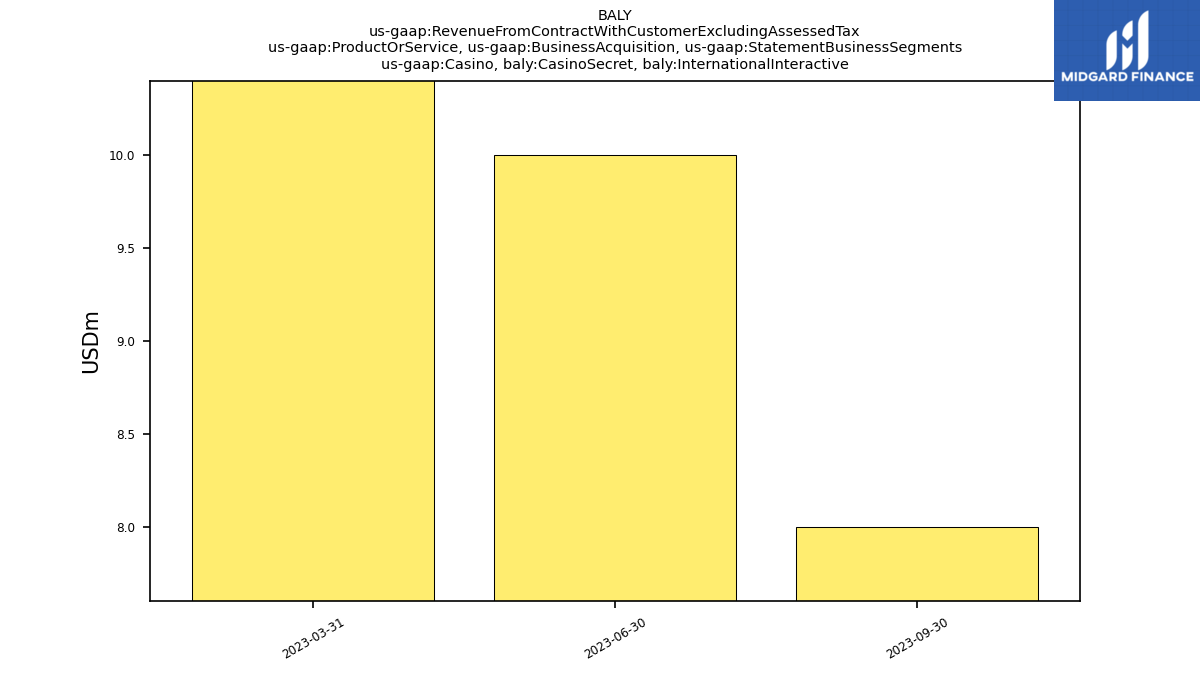
| Casino, Casino Secret, International Interactive | 8.00 | 10.00 | 11.30 | NA | NA | NA | NA | NA | NA | NA | NA | NA | NA | NA | NA | NA | NA | NA | NA | NA | NA | NA | NA | |
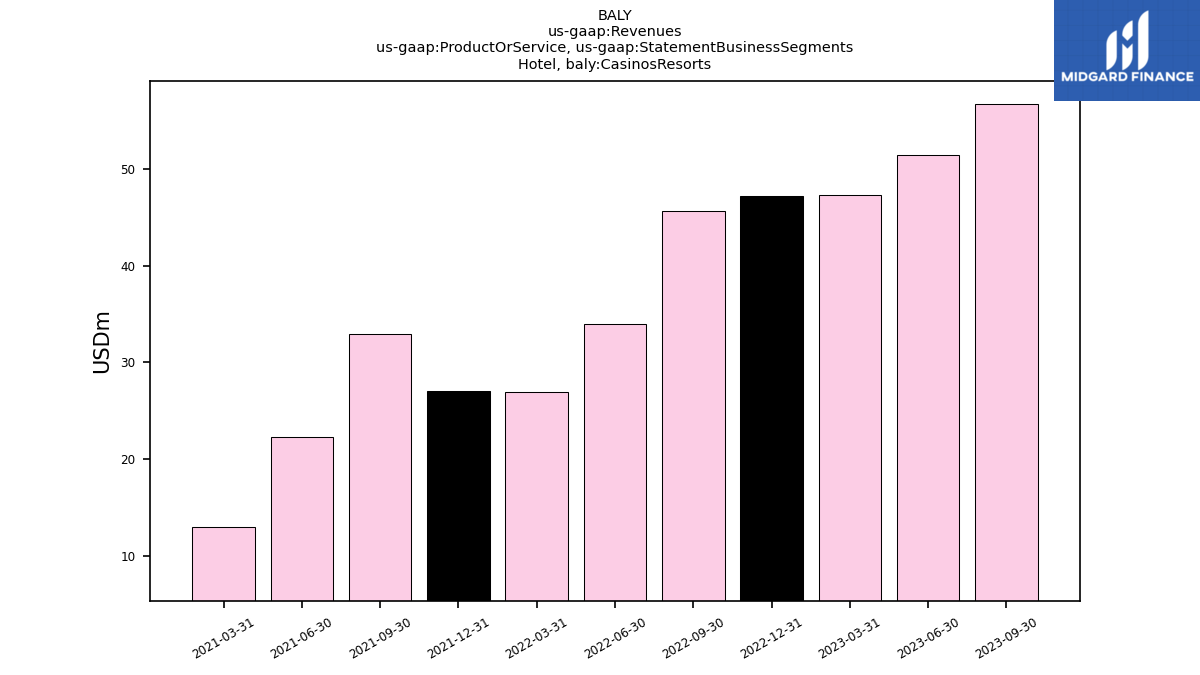
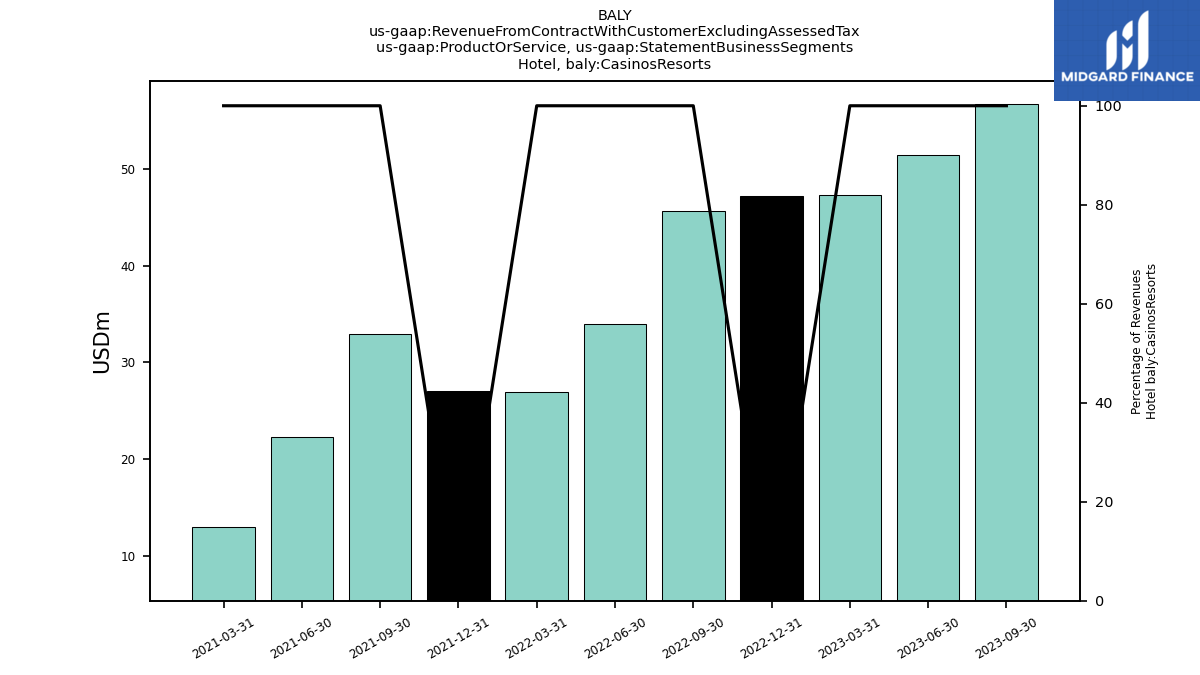
| , Casinos Resorts | 56.73 | 51.39 | 47.33 | 47.21 | 45.67 | 33.93 | 26.93 | 27.08 | 32.90 | 22.32 | 13.06 | NA | NA | NA | NA | NA | NA | NA | NA | NA | NA | NA | NA | |
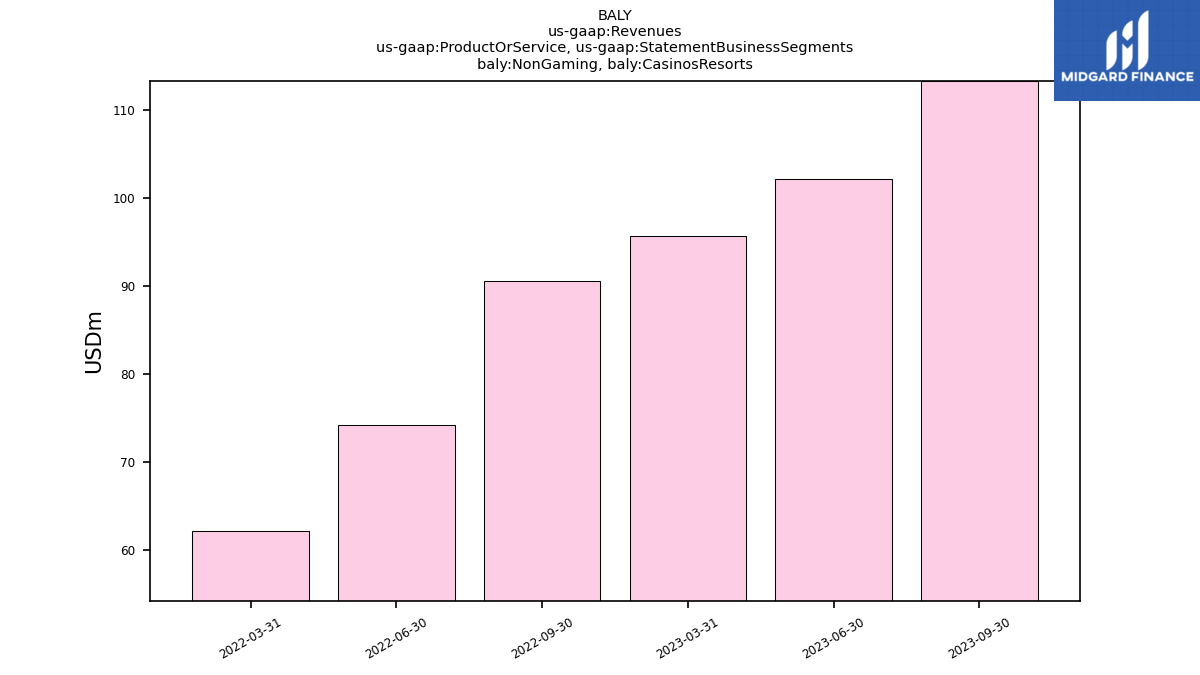
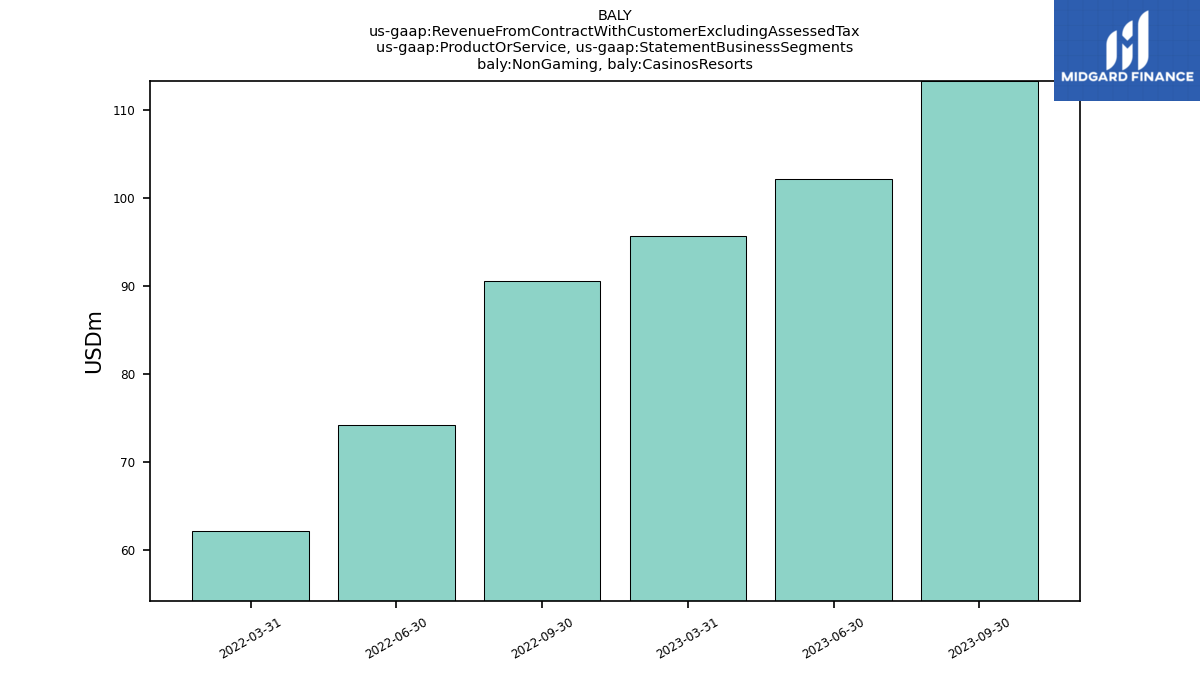
| Non Gaming, Casinos Resorts | 113.34 | 102.14 | 95.68 | NA | 90.59 | 74.16 | 62.16 | NA | NA | NA | NA | NA | NA | NA | NA | NA | NA | NA | NA | NA | NA | NA | NA | |
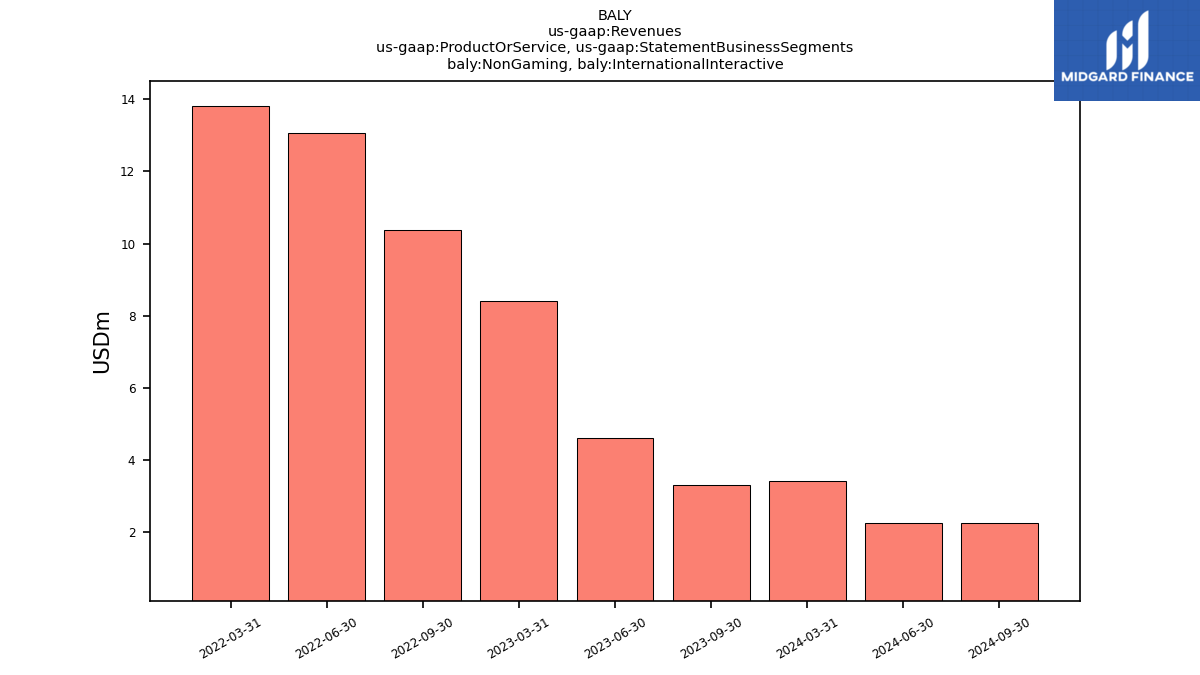
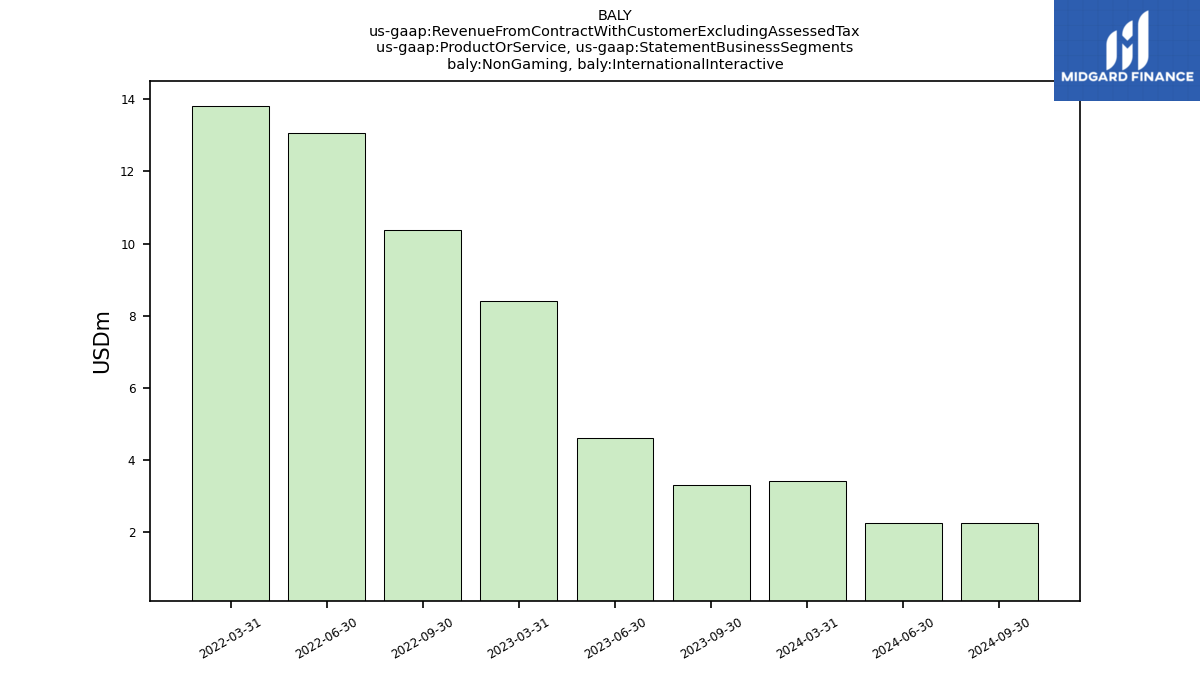
| Non Gaming, International Interactive | 3.31 | 4.61 | 8.39 | NA | 10.36 | 13.07 | 13.82 | NA | NA | NA | NA | NA | NA | NA | NA | NA | NA | NA | NA | NA | NA | NA | NA | |
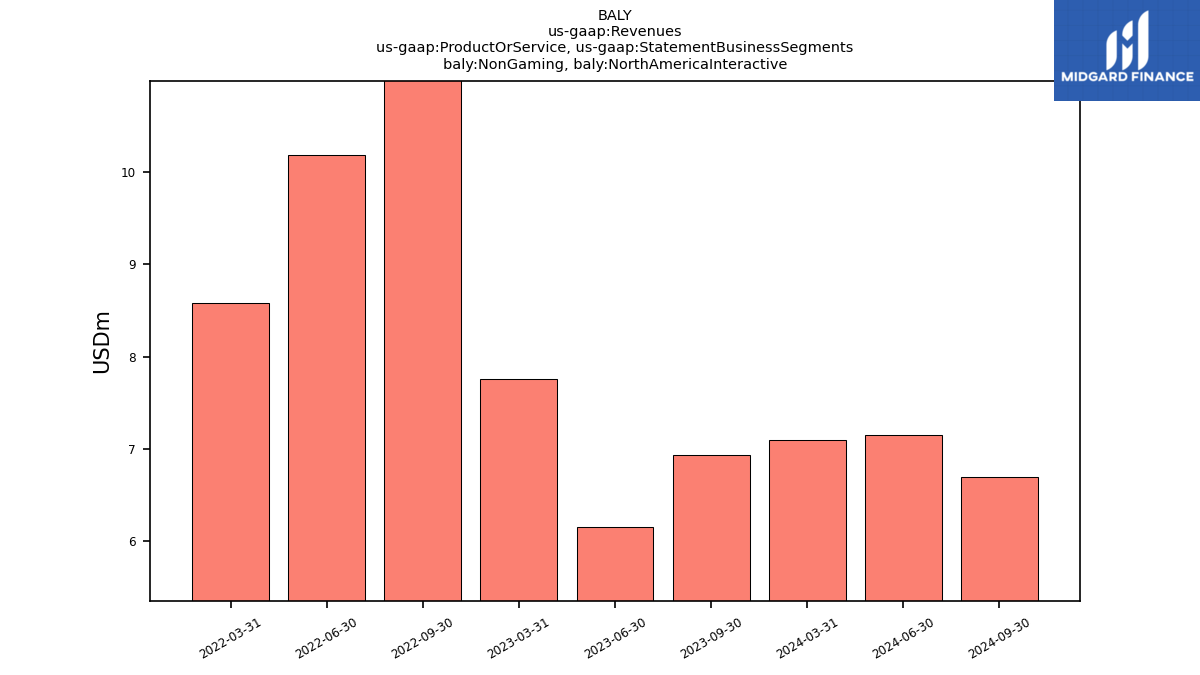
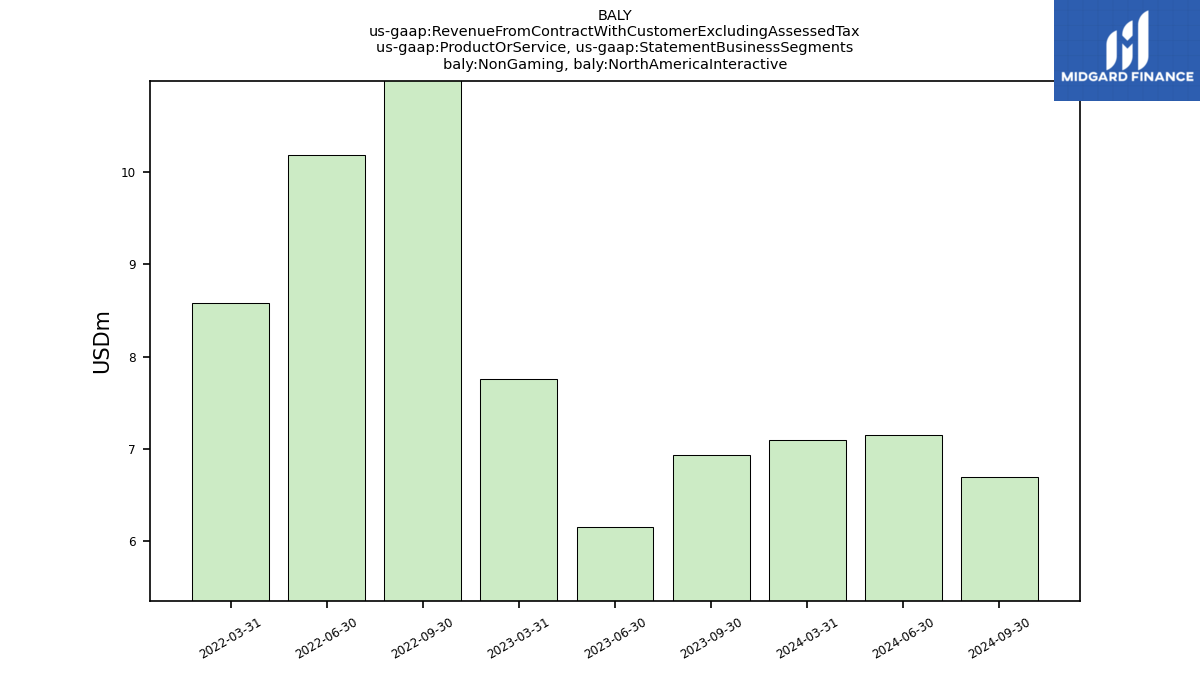
| Non Gaming, North America Interactive | 6.94 | 6.16 | 7.75 | NA | 11.56 | 10.18 | 8.58 | NA | NA | NA | NA | NA | NA | NA | NA | NA | NA | NA | NA | NA | NA | NA | NA | |
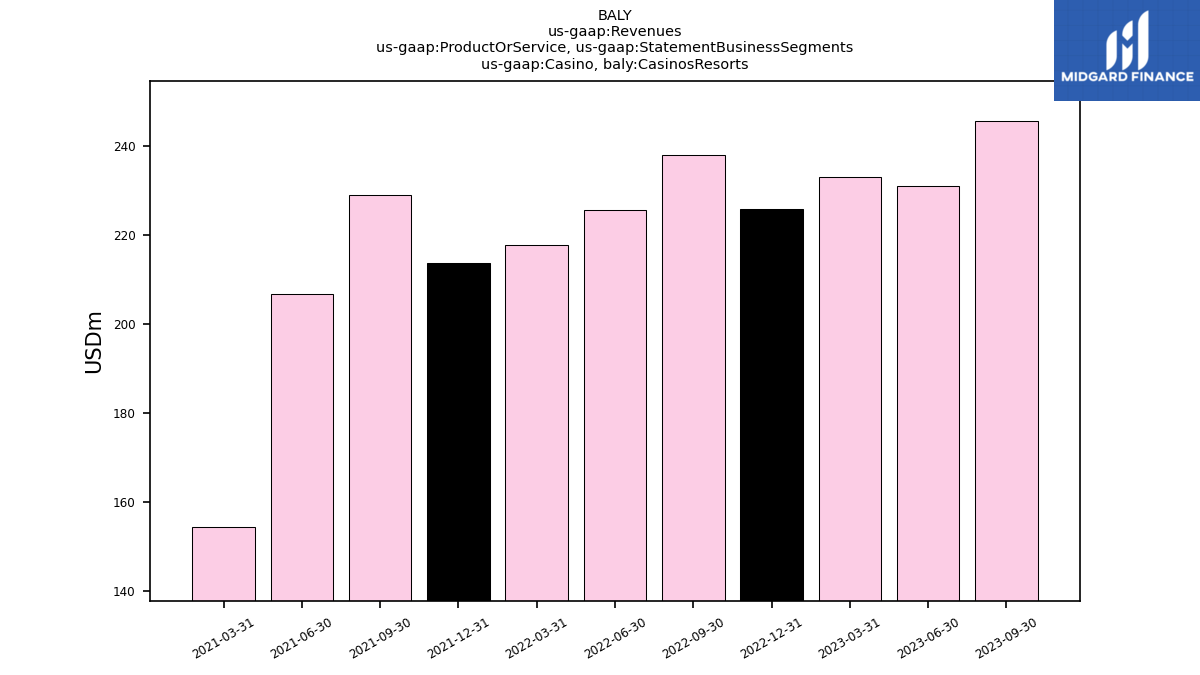
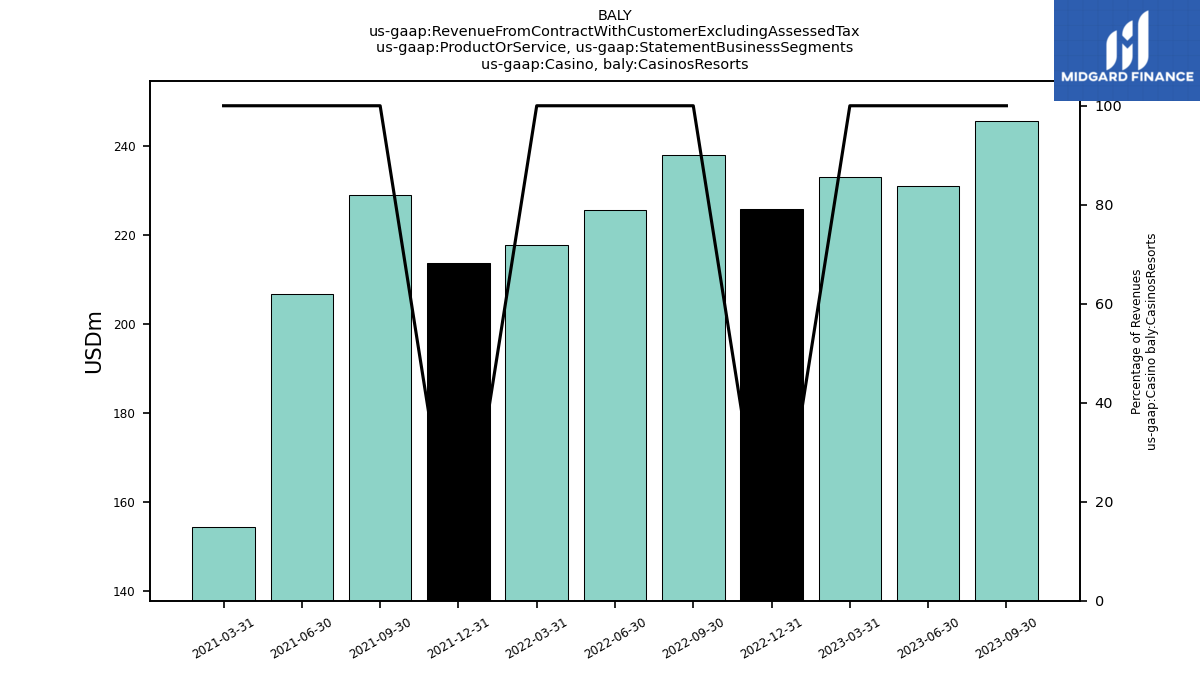
| Casino, Casinos Resorts | 245.69 | 231.02 | 233.11 | 225.96 | 237.95 | 225.72 | 217.81 | 213.78 | 229.03 | 206.70 | 154.43 | NA | NA | NA | NA | NA | NA | NA | NA | NA | NA | NA | NA | |
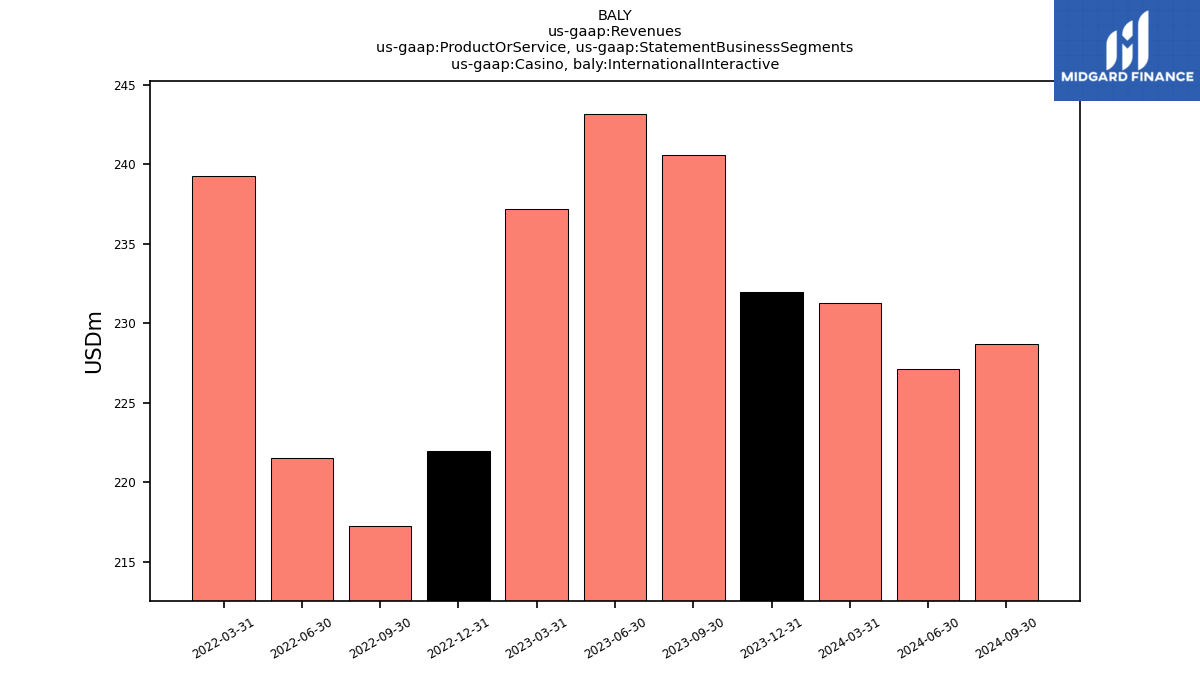
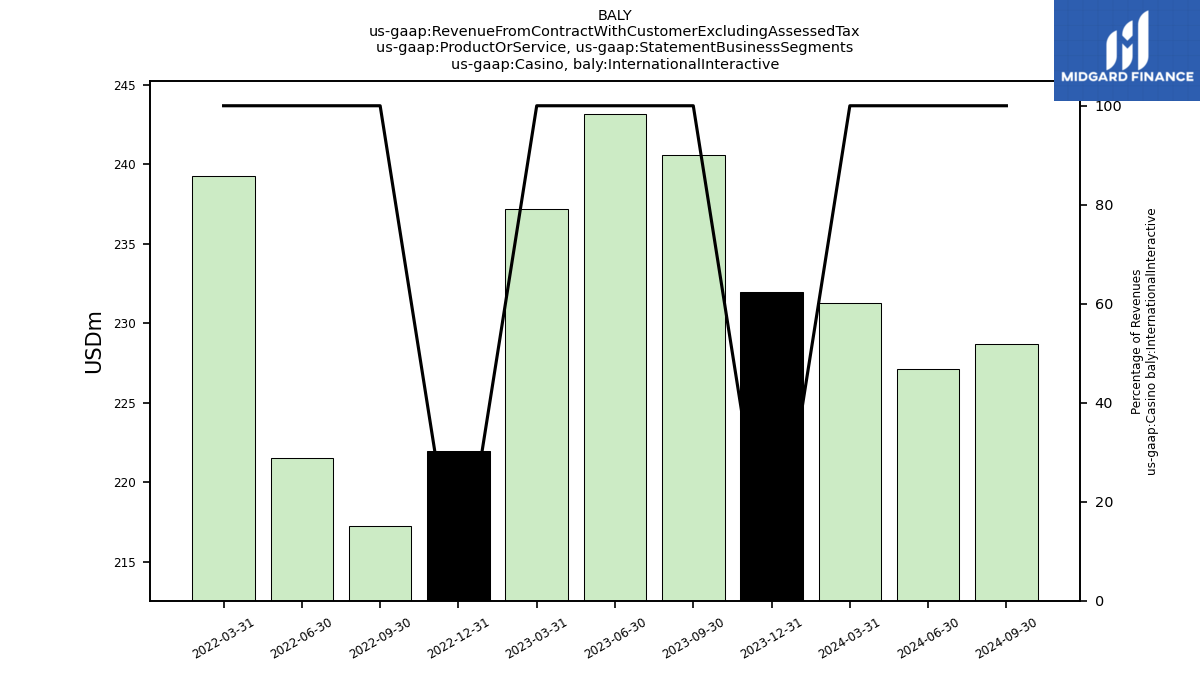
| Casino, International Interactive | 240.58 | 243.17 | 237.18 | 221.96 | 217.22 | 221.50 | 239.25 | NA | NA | NA | NA | NA | NA | NA | NA | NA | NA | NA | NA | NA | NA | NA | NA | |
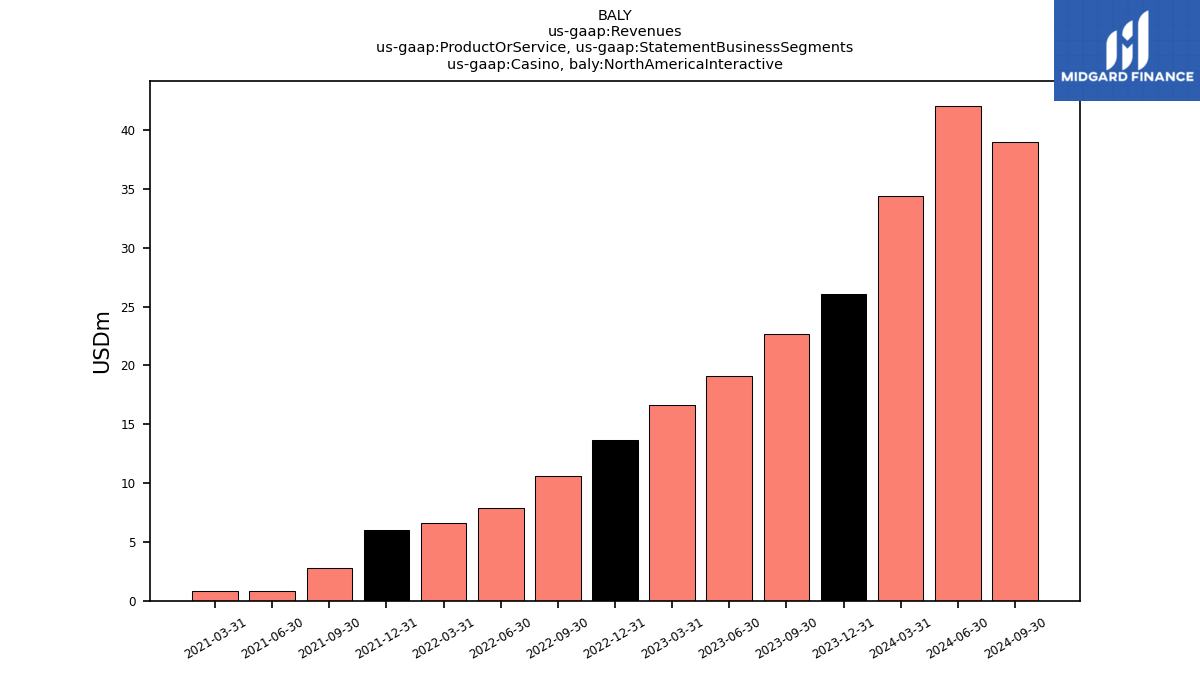
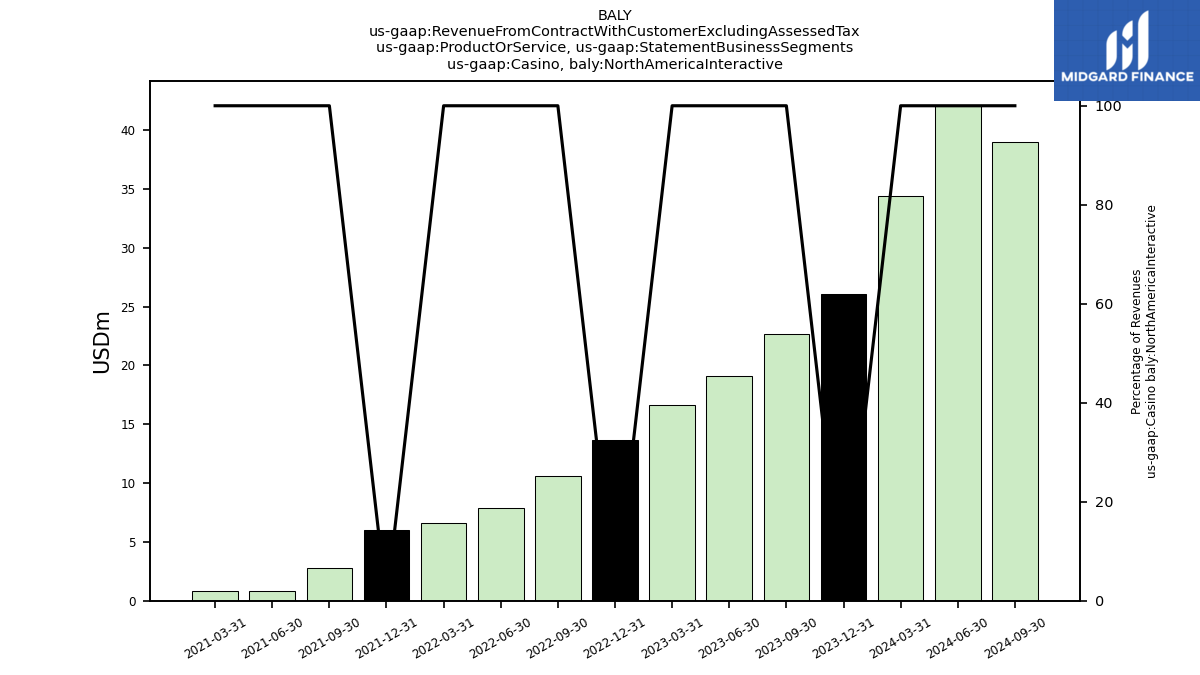
| Casino, North America Interactive | 22.63 | 19.11 | 16.61 | 13.68 | 10.57 | 7.87 | 6.64 | 6.04 | 2.76 | 0.79 | 0.85 | NA | NA | NA | NA | NA | NA | NA | NA | NA | NA | NA | NA | |
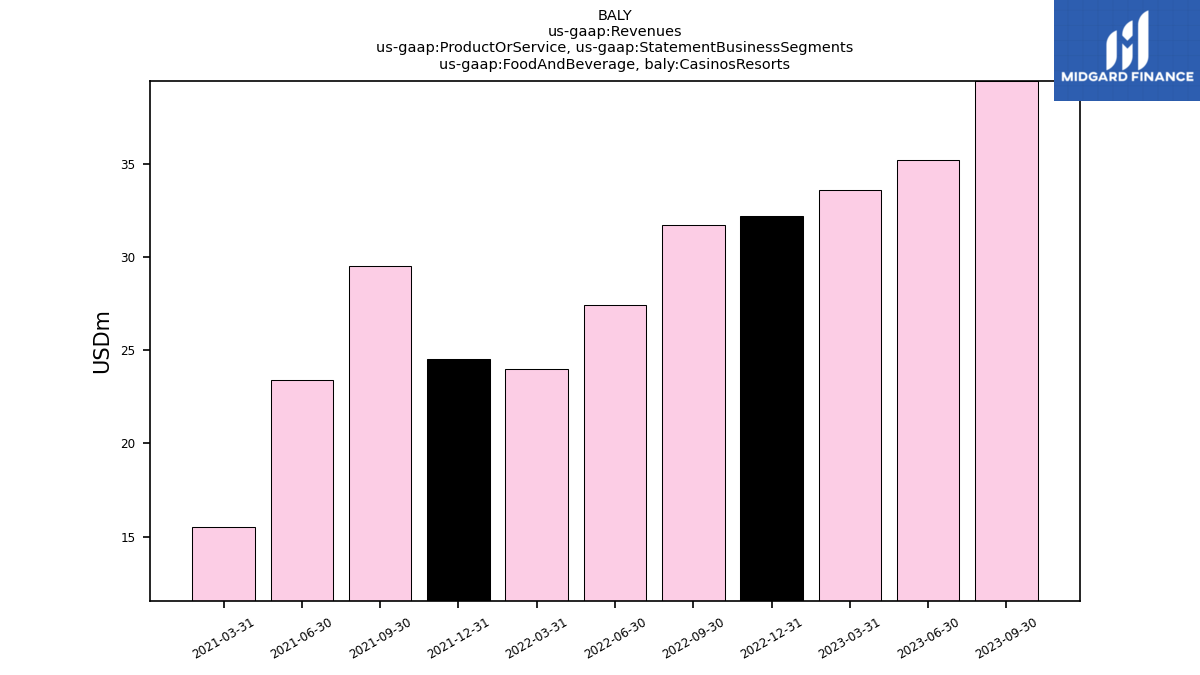
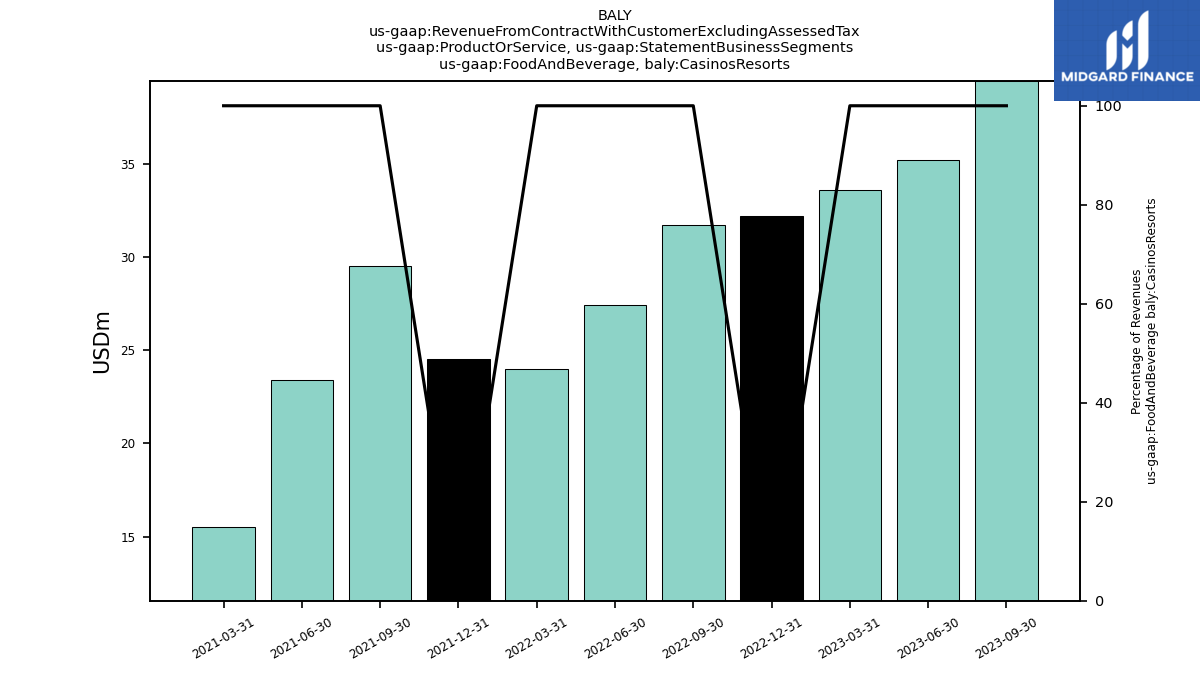
| Food And Beverage, Casinos Resorts | 39.44 | 35.22 | 33.61 | 32.17 | 31.72 | 27.43 | 23.99 | 24.52 | 29.50 | 23.38 | 15.50 | NA | NA | NA | NA | NA | NA | NA | NA | NA | NA | NA | NA | |
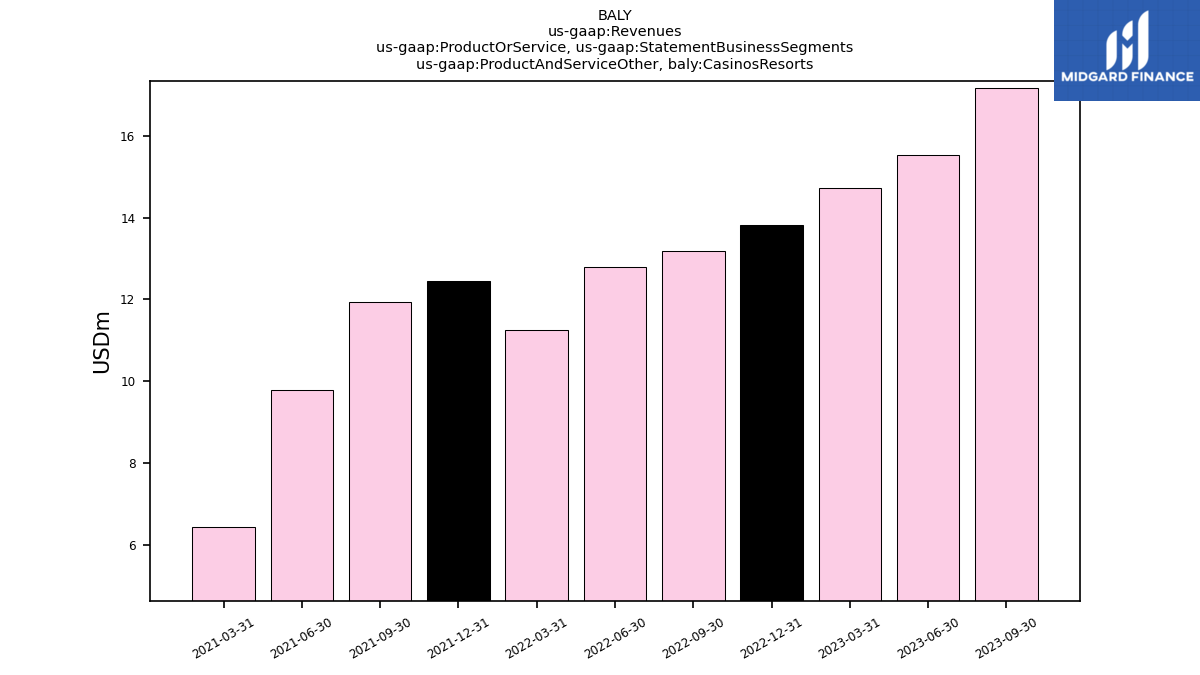
| Product And Service Other, Casinos Resorts | 17.17 | 15.53 | 14.74 | 13.83 | 13.19 | 12.79 | 11.24 | 12.46 | 11.93 | 9.79 | 6.45 | NA | NA | NA | NA | NA | NA | NA | NA | NA | NA | NA | NA | |
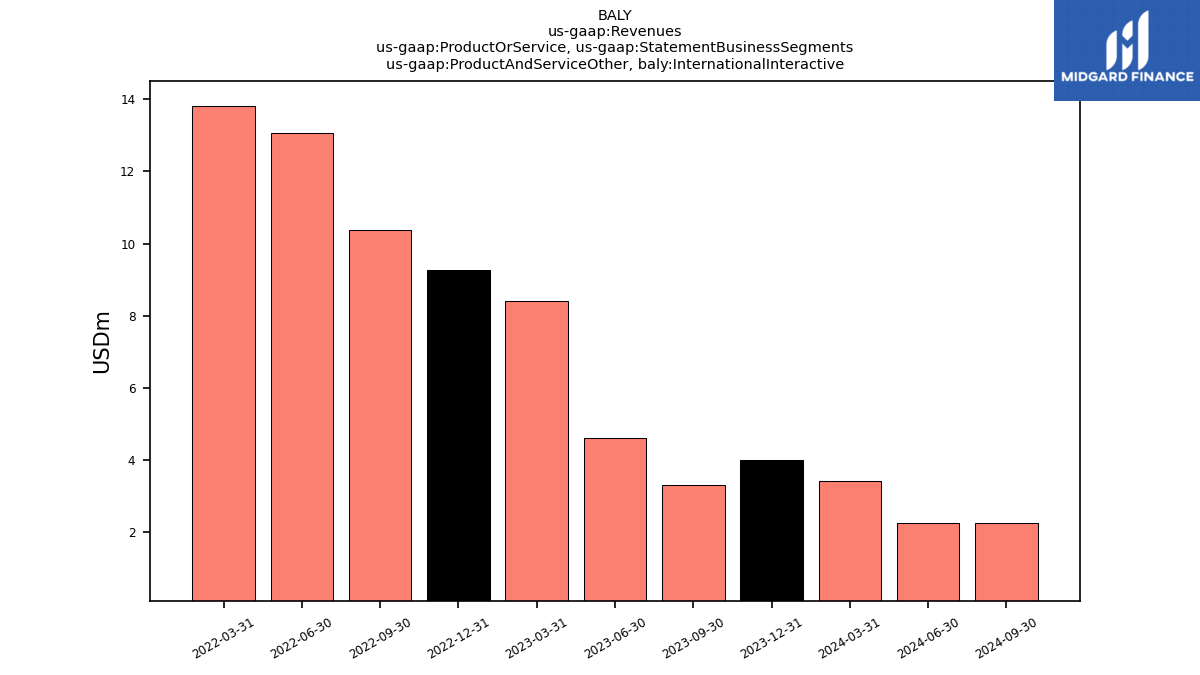
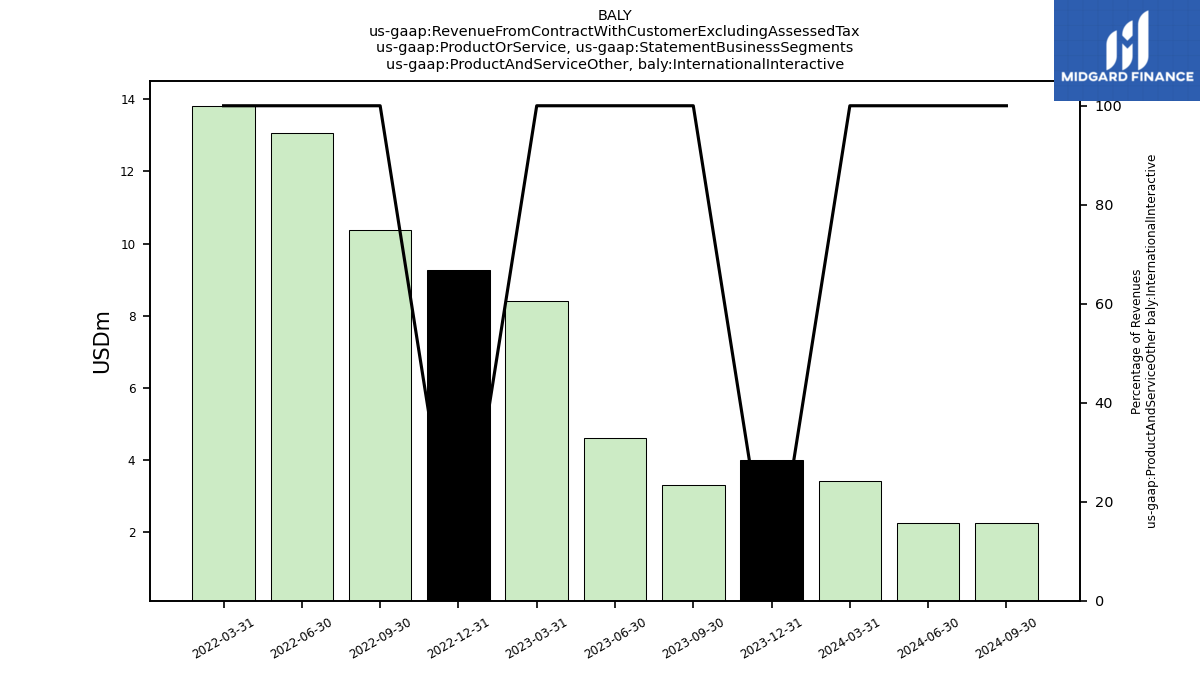
| Product And Service Other, International Interactive | 3.31 | 4.61 | 8.39 | 9.26 | 10.36 | 13.07 | 13.82 | NA | NA | NA | NA | NA | NA | NA | NA | NA | NA | NA | NA | NA | NA | NA | NA | |
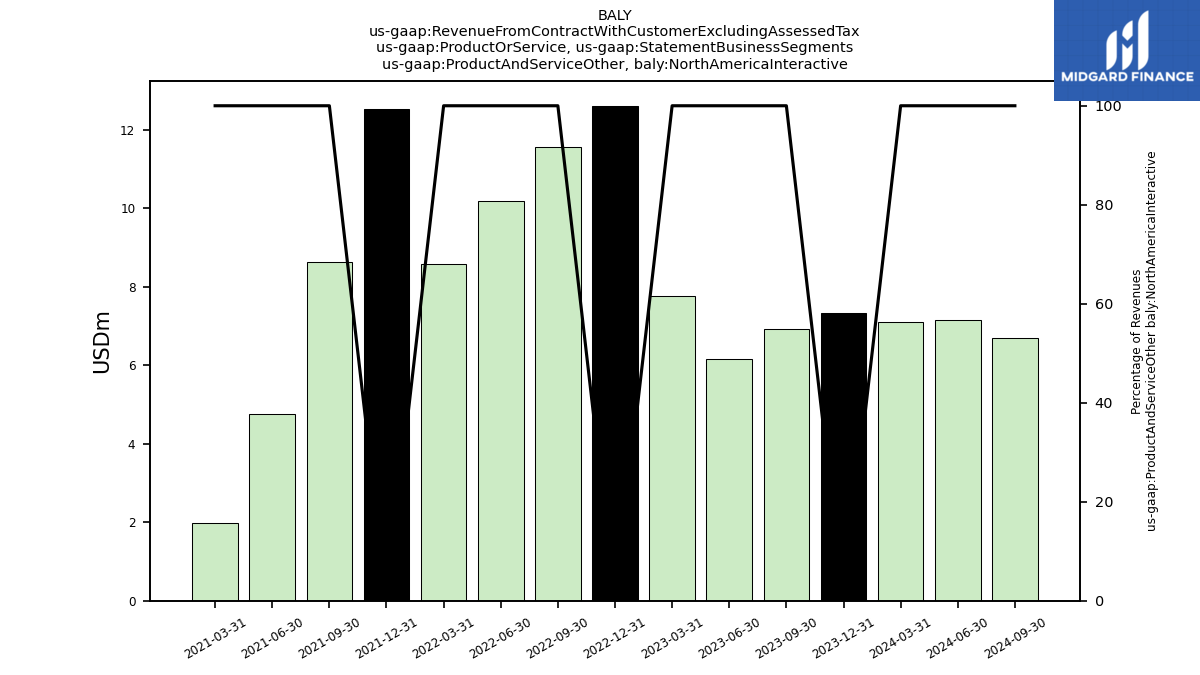
| Product And Service Other, North America Interactive | 6.94 | 6.16 | 7.75 | 12.61 | 11.56 | 10.18 | 8.58 | 12.53 | 8.64 | 4.75 | 1.98 | NA | NA | NA | NA | NA | NA | NA | NA | NA | NA | NA | NA | |
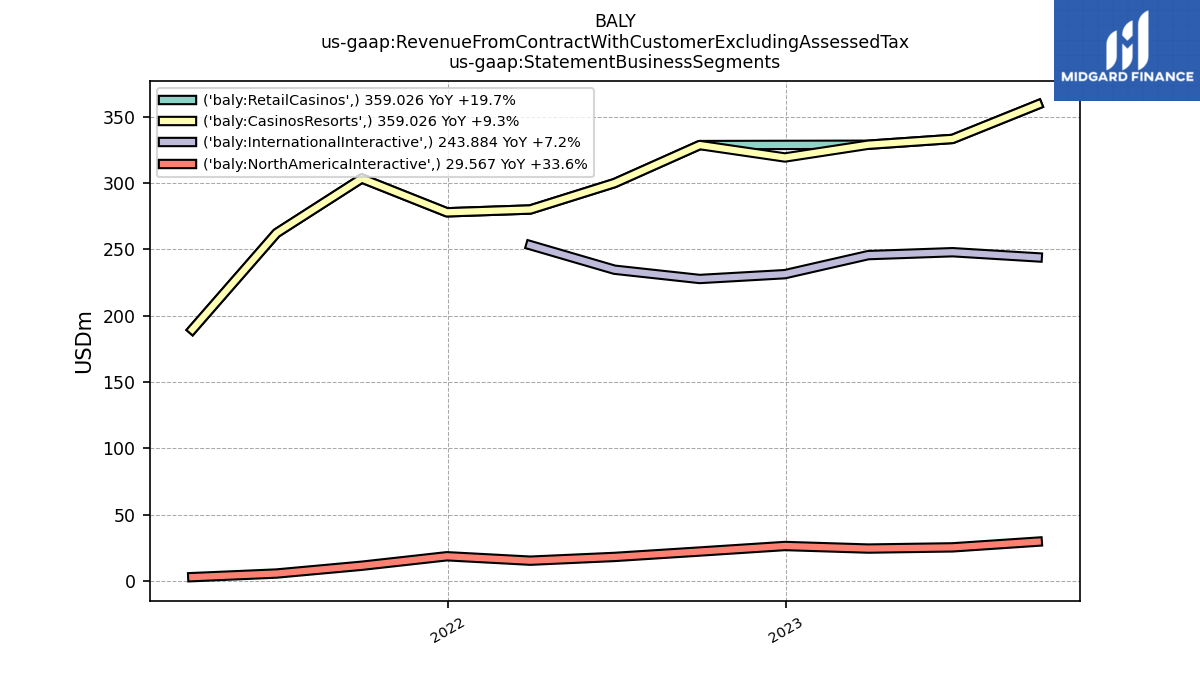
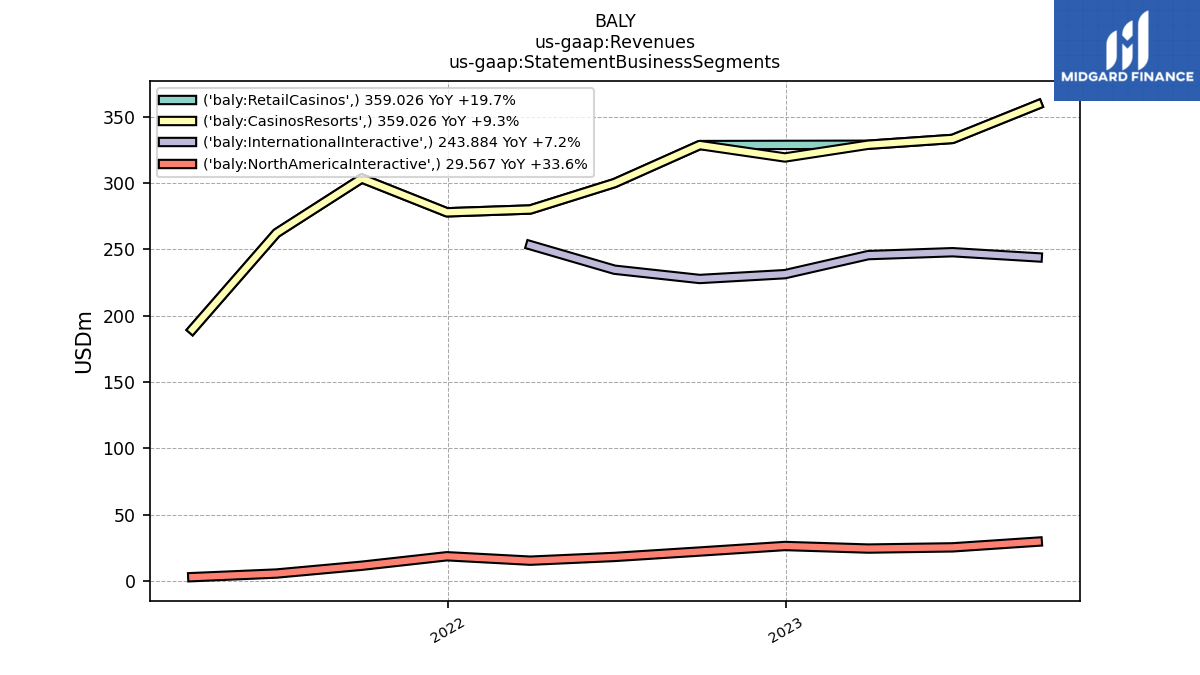
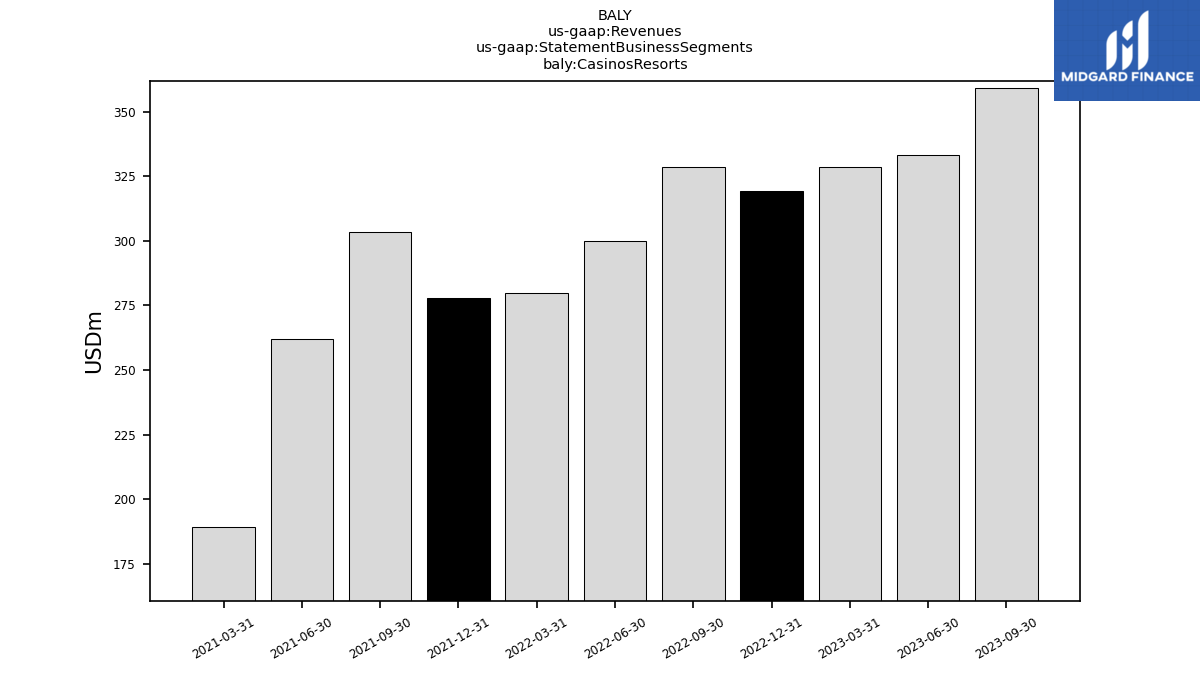
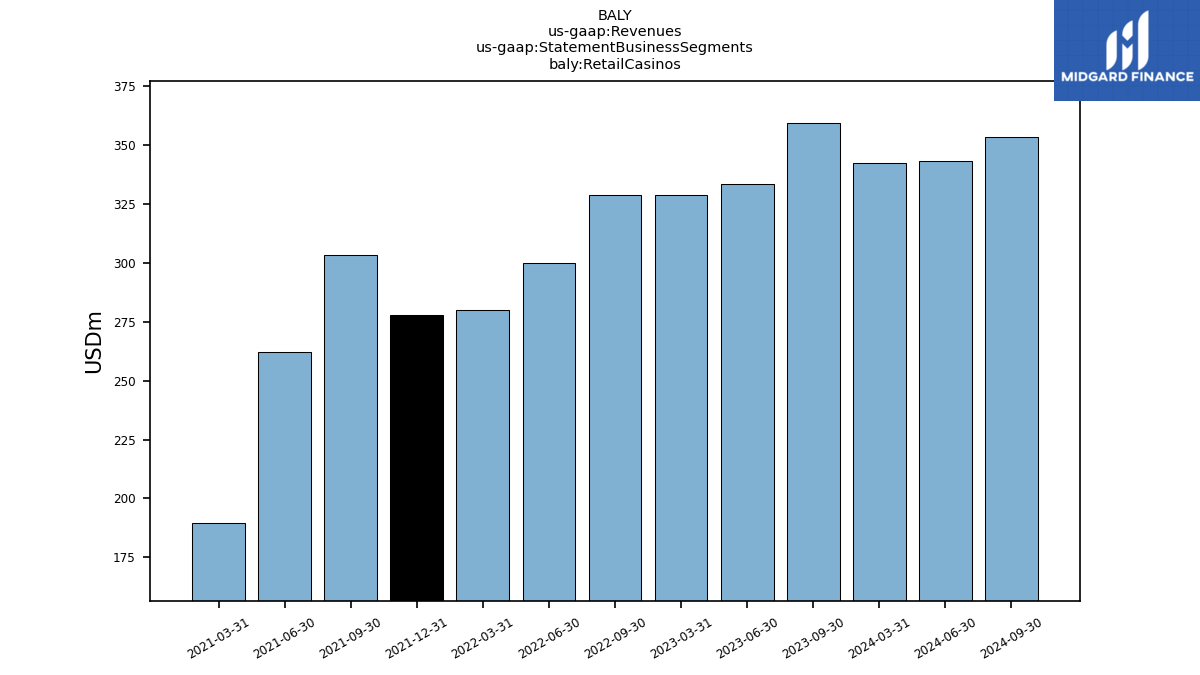
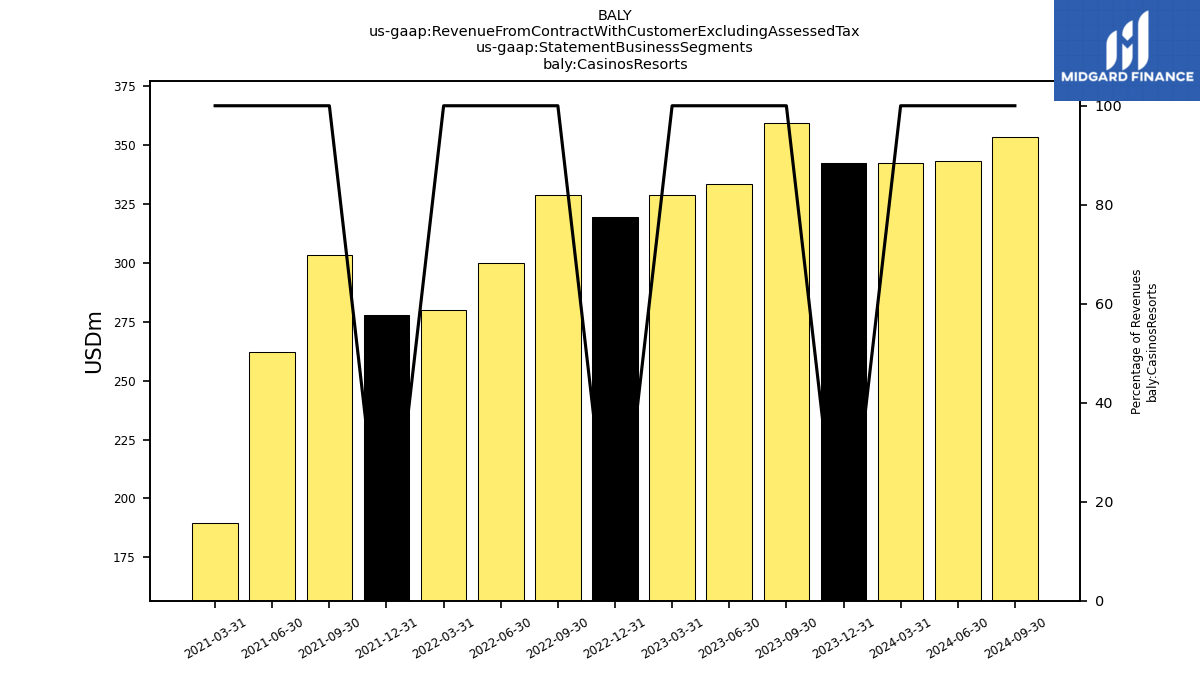
| Casinos Resorts | 359.03 | 333.16 | 328.79 | 319.18 | 328.54 | 299.88 | 279.97 | 277.84 | 303.37 | 262.19 | 189.43 | NA | NA | NA | NA | NA | NA | NA | NA | NA | NA | NA | NA | |
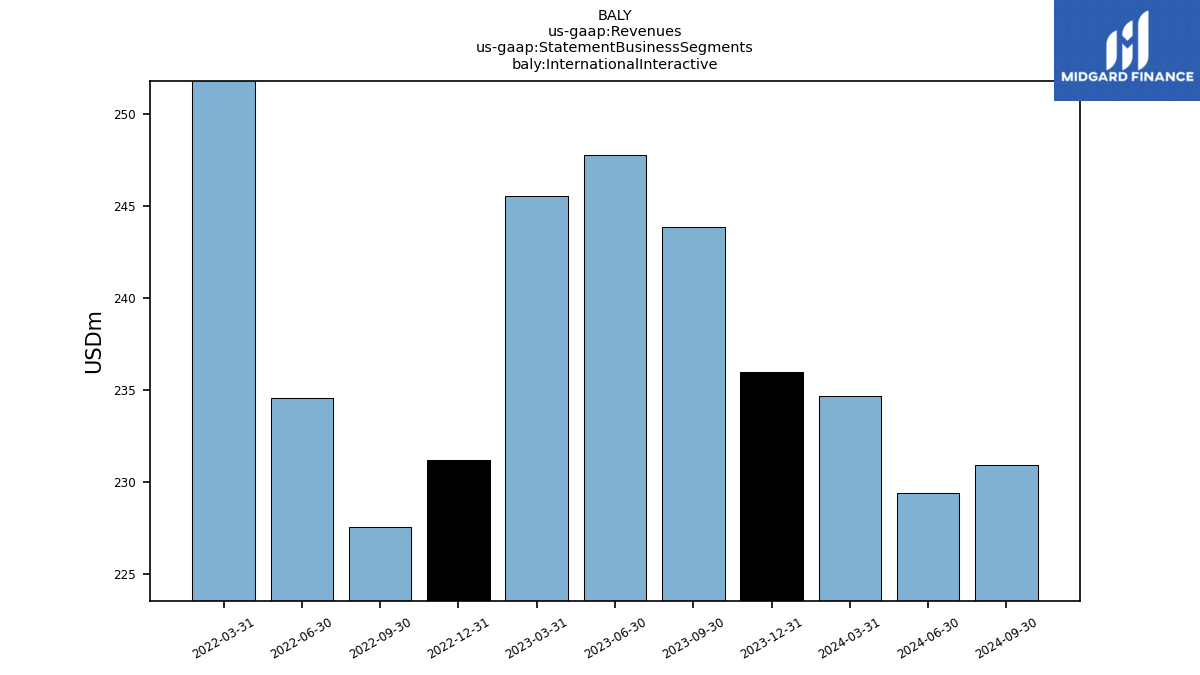
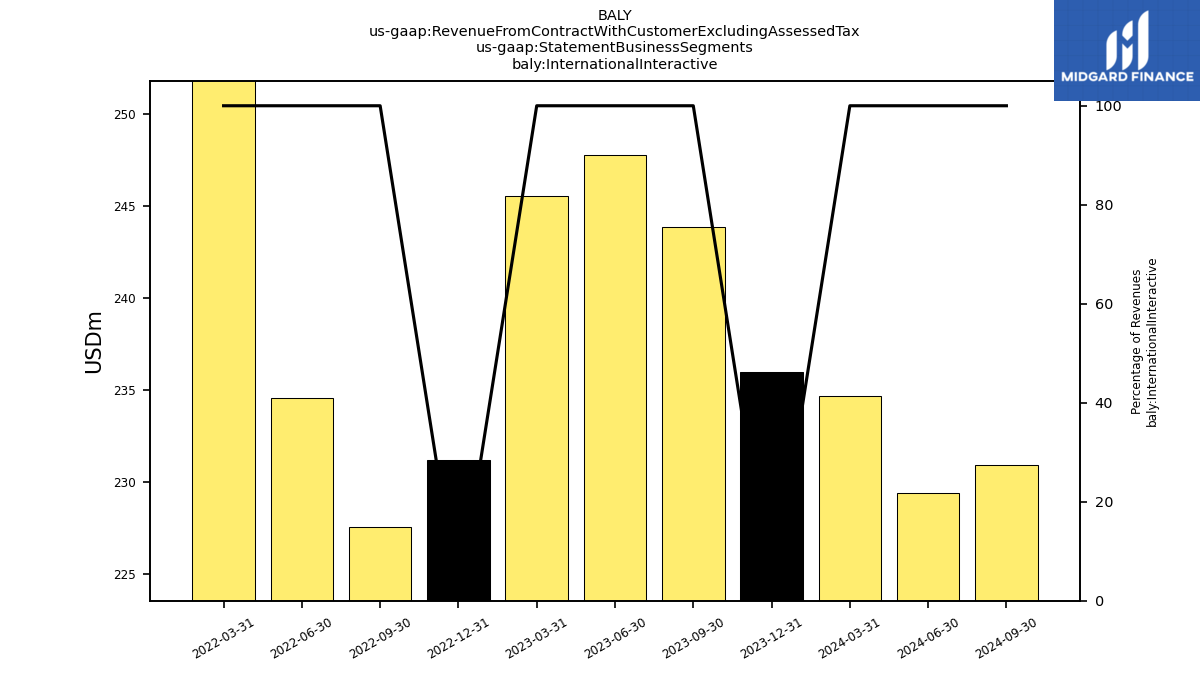
| International Interactive | 243.88 | 247.77 | 245.57 | 231.22 | 227.58 | 234.57 | 253.07 | NA | NA | NA | NA | NA | NA | NA | NA | NA | NA | NA | NA | NA | NA | NA | NA | |
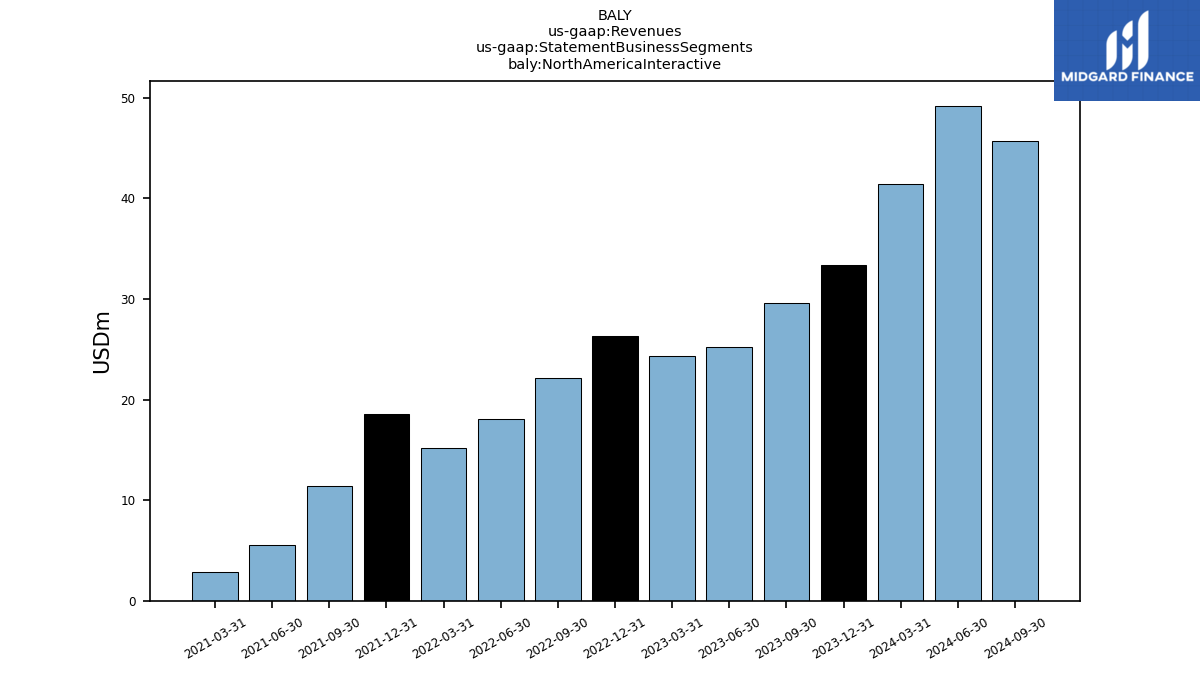
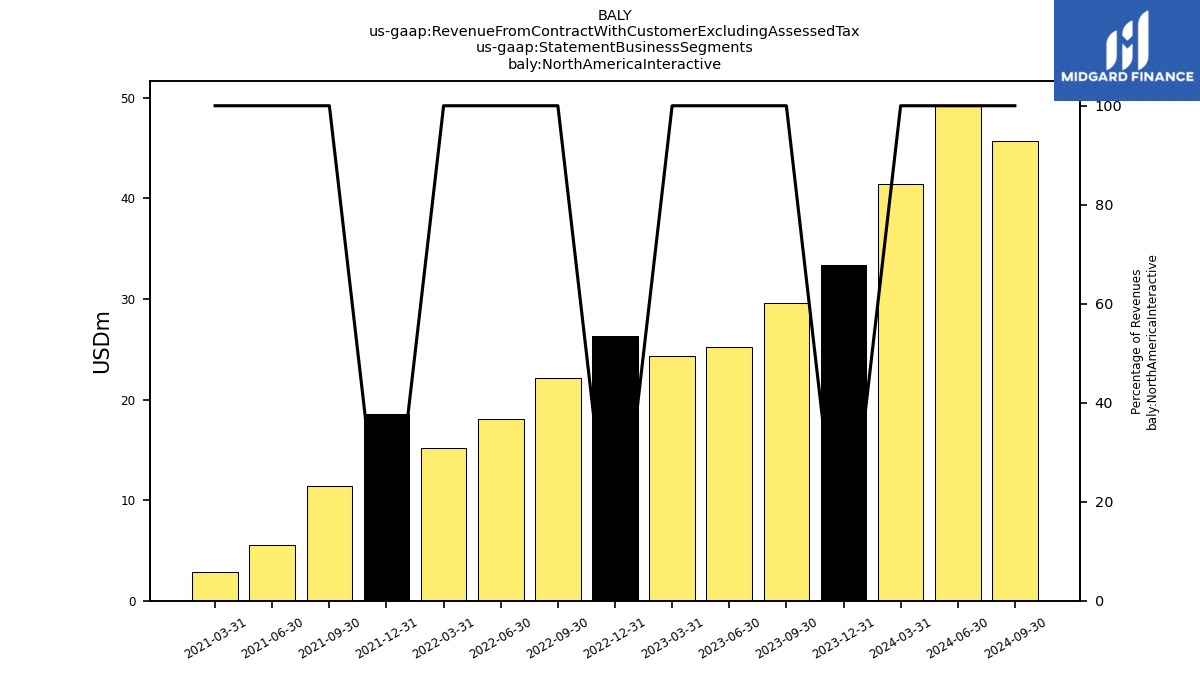
| North America Interactive | 29.57 | 25.27 | 24.36 | 26.29 | 22.13 | 18.05 | 15.23 | 18.57 | 11.41 | 5.54 | 2.83 | NA | NA | NA | NA | NA | NA | NA | NA | NA | NA | NA | NA | |
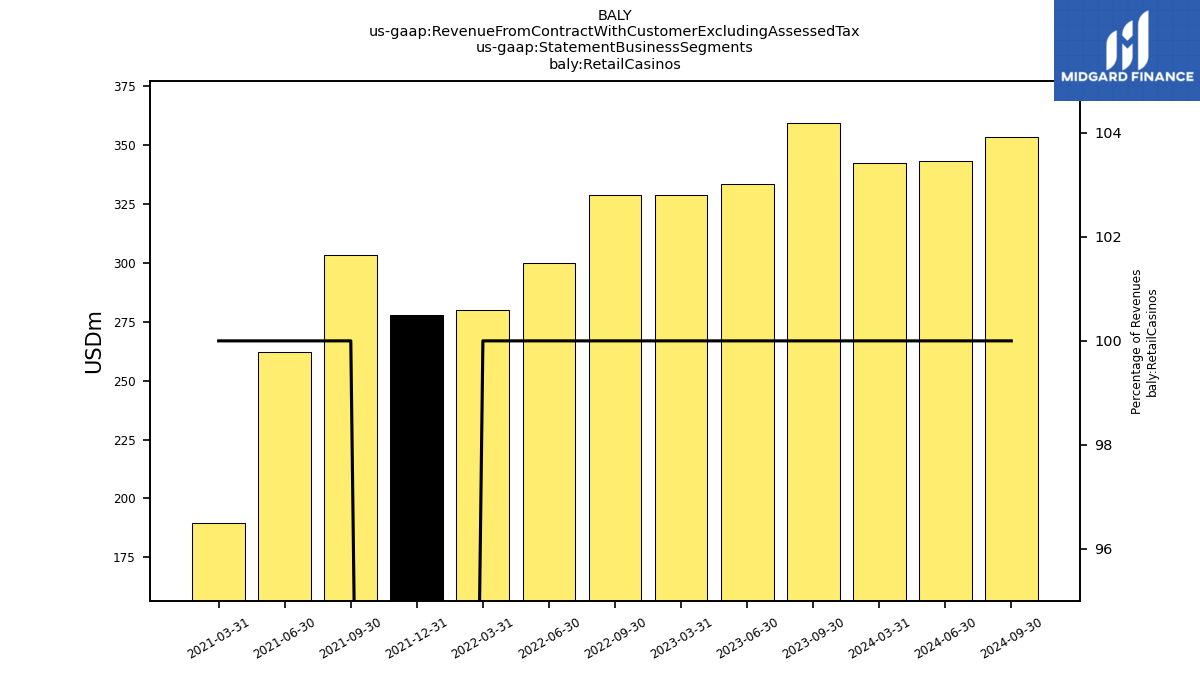
| Retail Casinos | 359.03 | 333.16 | 328.79 | NA | 328.54 | 299.88 | 279.97 | 277.84 | 303.37 | 262.19 | 189.43 | NA | NA | NA | NA | NA | NA | NA | NA | NA | NA | NA | NA | |
| Revenue From Contract With Customer Excluding Assessed Tax | 632.48 | 606.21 | 598.72 | 576.69 | 578.25 | 552.50 | 548.27 | 547.66 | 314.78 | 267.73 | 192.27 | 118.10 | 116.62 | 28.92 | 109.15 | 130.42 | 129.31 | 143.22 | 120.63 | 111.42 | 110.49 | 110.81 | 104.81 | |
| Breckenridge Curacao B V, Variable Interest Entity Primary Beneficiary | 71.50 | 76.50 | 84.00 | 68.40 | 68.90 | 73.90 | 86.90 | NA | NA | NA | NA | NA | NA | NA | NA | NA | NA | NA | NA | NA | NA | NA | NA | |
| Ballys Golf Links | 0.40 | NA | NA | NA | NA | NA | NA | NA | NA | NA | NA | NA | NA | NA | NA | NA | NA | NA | NA | NA | NA | NA | NA | |
| 56.73 | 51.39 | 47.33 | 47.21 | 45.67 | 33.93 | 26.93 | 27.08 | 32.90 | 22.32 | 13.06 | 8.11 | 6.87 | 2.12 | 7.65 | 10.17 | 11.12 | 11.39 | 6.30 | 5.69 | 5.71 | 5.49 | 4.45 | ||
| Non Casino | 123.58 | 112.91 | 111.83 | 115.09 | 112.52 | 97.41 | 84.57 | NA | NA | NA | NA | NA | NA | NA | NA | NA | NA | NA | NA | NA | NA | NA | NA | |
| Non Gaming | 123.58 | 112.91 | 111.83 | NA | 112.52 | 97.41 | 84.57 | NA | NA | NA | NA | NA | NA | NA | NA | NA | NA | NA | NA | NA | NA | NA | NA | |
| Casino | 508.89 | 493.30 | 486.89 | 461.60 | 465.73 | 455.09 | 463.70 | 467.70 | 227.59 | 205.29 | 152.91 | 95.47 | 96.59 | 23.77 | 75.84 | 88.53 | 88.31 | 100.23 | 90.87 | 83.83 | 82.07 | 82.27 | 79.58 | |
| Food And Beverage | 39.44 | 35.22 | 33.61 | 32.17 | 31.72 | 27.43 | 23.99 | 24.52 | 29.50 | 23.38 | 15.50 | 8.26 | 6.89 | 1.67 | 15.32 | 19.54 | 18.05 | 18.80 | 13.51 | 12.46 | 12.13 | 12.30 | 11.49 | |
| Product And Service Other | 27.42 | 26.30 | 30.89 | 35.70 | 35.12 | 36.04 | 33.65 | 34.96 | 22.76 | 14.55 | 8.43 | 4.67 | 4.59 | 1.20 | 7.39 | 9.04 | 8.57 | 9.01 | 7.01 | 6.73 | 7.30 | 6.89 | 6.00 | |
| Casino, Casino Secret, International Interactive | 8.00 | 10.00 | 11.30 | NA | NA | NA | NA | NA | NA | NA | NA | NA | NA | NA | NA | NA | NA | NA | NA | NA | NA | NA | NA | |
| , Casinos Resorts | 56.73 | 51.39 | 47.33 | 47.21 | 45.67 | 33.93 | 26.93 | 27.08 | 32.90 | 22.32 | 13.06 | NA | NA | NA | NA | NA | NA | NA | NA | NA | NA | NA | NA | |
| Non Gaming, Casinos Resorts | 113.34 | 102.14 | 95.68 | NA | 90.59 | 74.16 | 62.16 | NA | NA | NA | NA | NA | NA | NA | NA | NA | NA | NA | NA | NA | NA | NA | NA | |
| Non Gaming, International Interactive | 3.31 | 4.61 | 8.39 | NA | 10.36 | 13.07 | 13.82 | NA | NA | NA | NA | NA | NA | NA | NA | NA | NA | NA | NA | NA | NA | NA | NA | |
| Non Gaming, North America Interactive | 6.94 | 6.16 | 7.75 | NA | 11.56 | 10.18 | 8.58 | NA | NA | NA | NA | NA | NA | NA | NA | NA | NA | NA | NA | NA | NA | NA | NA | |
| Casino, Casinos Resorts | 245.69 | 231.02 | 233.11 | 225.96 | 237.95 | 225.72 | 217.81 | 213.78 | 229.03 | 206.70 | 154.43 | NA | NA | NA | NA | NA | NA | NA | NA | NA | NA | NA | NA | |
| Casino, International Interactive | 240.58 | 243.17 | 237.18 | 221.96 | 217.22 | 221.50 | 239.25 | NA | NA | NA | NA | NA | NA | NA | NA | NA | NA | NA | NA | NA | NA | NA | NA | |
| Casino, North America Interactive | 22.63 | 19.11 | 16.61 | 13.68 | 10.57 | 7.87 | 6.64 | 6.04 | 2.76 | 0.79 | 0.85 | NA | NA | NA | NA | NA | NA | NA | NA | NA | NA | NA | NA | |
| Food And Beverage, Casinos Resorts | 39.44 | 35.22 | 33.61 | 32.17 | 31.72 | 27.43 | 23.99 | 24.52 | 29.50 | 23.38 | 15.50 | NA | NA | NA | NA | NA | NA | NA | NA | NA | NA | NA | NA | |
| Product And Service Other, Casinos Resorts | 17.17 | 15.53 | 14.74 | 13.83 | 13.19 | 12.79 | 11.24 | 12.46 | 11.93 | 9.79 | 6.45 | NA | NA | NA | NA | NA | NA | NA | NA | NA | NA | NA | NA | |
| Product And Service Other, International Interactive | 3.31 | 4.61 | 8.39 | 9.26 | 10.36 | 13.07 | 13.82 | NA | NA | NA | NA | NA | NA | NA | NA | NA | NA | NA | NA | NA | NA | NA | NA | |
| Product And Service Other, North America Interactive | 6.94 | 6.16 | 7.75 | 12.61 | 11.56 | 10.18 | 8.58 | 12.53 | 8.64 | 4.75 | 1.98 | NA | NA | NA | NA | NA | NA | NA | NA | NA | NA | NA | NA | |
| Casinos Resorts | 359.03 | 333.16 | 328.79 | 319.18 | 328.54 | 299.88 | 279.97 | 277.84 | 303.37 | 262.19 | 189.43 | NA | NA | NA | NA | NA | NA | NA | NA | NA | NA | NA | NA | |
| International Interactive | 243.88 | 247.77 | 245.57 | 231.22 | 227.58 | 234.57 | 253.07 | NA | NA | NA | NA | NA | NA | NA | NA | NA | NA | NA | NA | NA | NA | NA | NA | |
| North America Interactive | 29.57 | 25.27 | 24.36 | 26.29 | 22.13 | 18.05 | 15.23 | 18.57 | 11.41 | 5.54 | 2.83 | NA | NA | NA | NA | NA | NA | NA | NA | NA | NA | NA | NA | |
| Retail Casinos | 359.03 | 333.16 | 328.79 | NA | 328.54 | 299.88 | 279.97 | 277.84 | 303.37 | 262.19 | 189.43 | NA | NA | NA | NA | NA | NA | NA | NA | NA | NA | NA | NA |


