
| 2023-08-31 | 2023-05-31 | 2023-02-28 | 2022-11-30 | 2022-08-31 | 2022-05-31 | 2022-02-28 | 2021-11-30 | 2021-08-31 | 2021-05-31 | 2021-02-28 | 2020-11-30 | 2020-08-31 | 2020-05-31 | 2020-02-29 | 2019-11-30 | 2019-08-31 | 2019-05-31 | ||
|---|---|---|---|---|---|---|---|---|---|---|---|---|---|---|---|---|---|---|---|
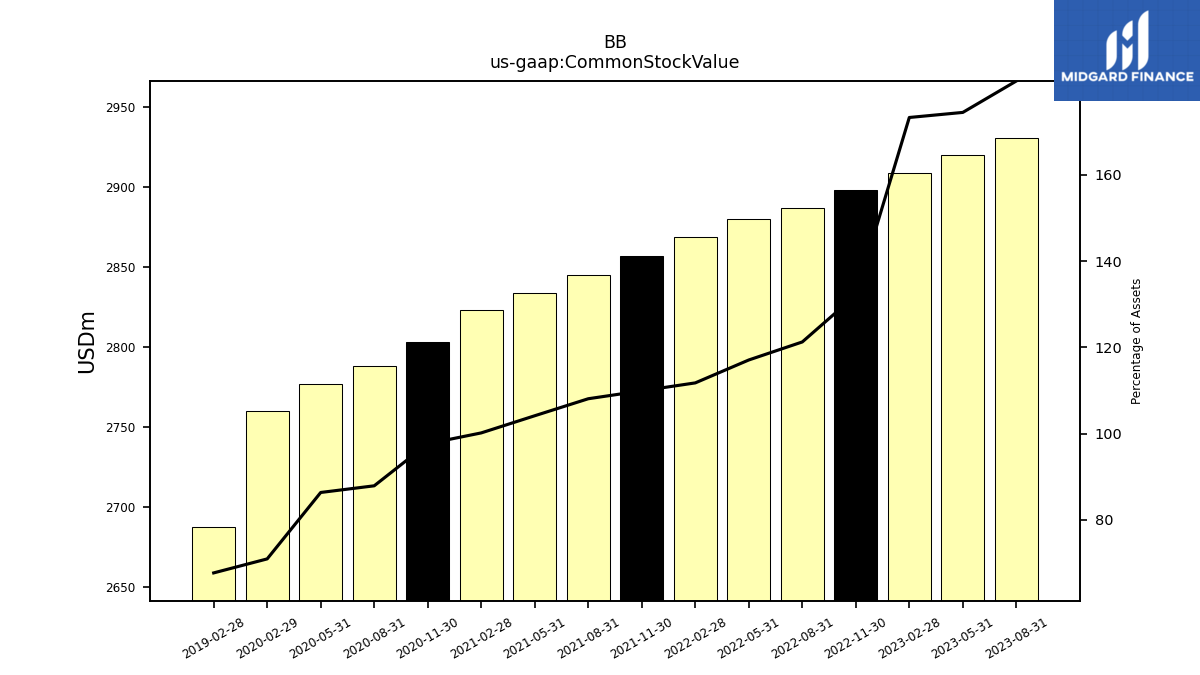
| Common Stock Value | 2931.00 | 2920.00 | 2909.00 | 2898.00 | 2887.00 | 2880.00 | 2869.00 | 2857.00 | 2845.00 | 2834.00 | 2823.00 | 2803.00 | 2788.00 | 2777.00 | 2760.00 | NA | NA | NA | |
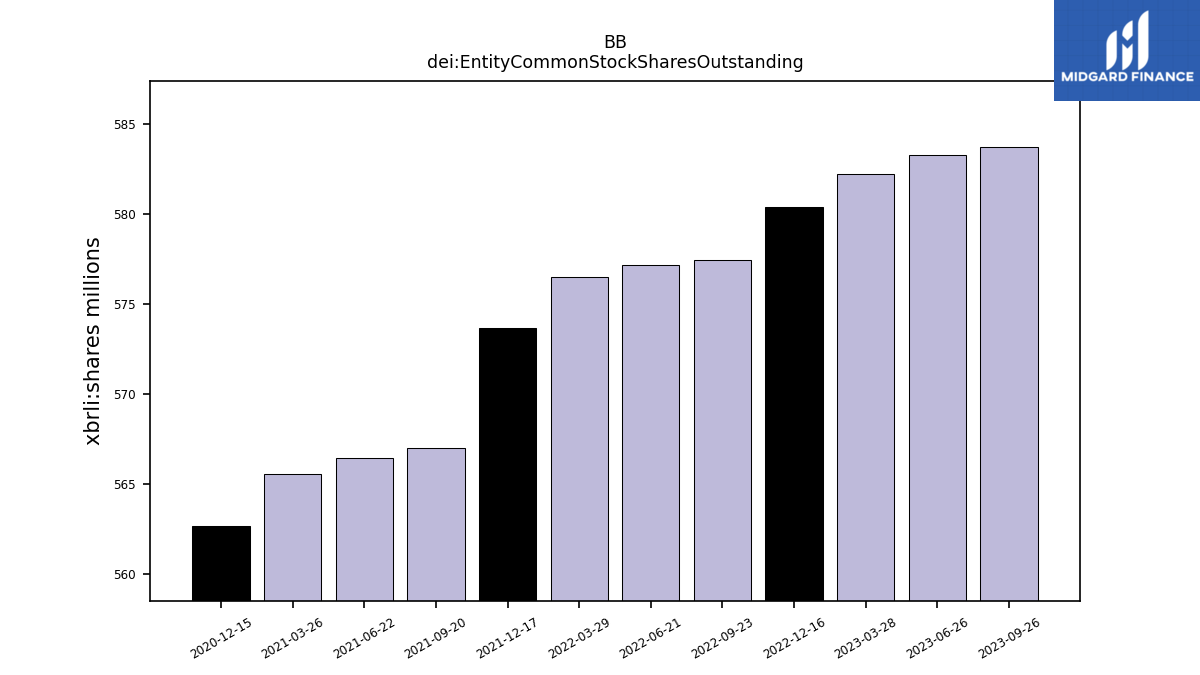
| dei: Entity Common Stock Shares Outstanding | NA | NA | NA | NA | NA | NA | NA | NA | NA | NA | NA | NA | NA | NA | NA | NA | NA | NA | |
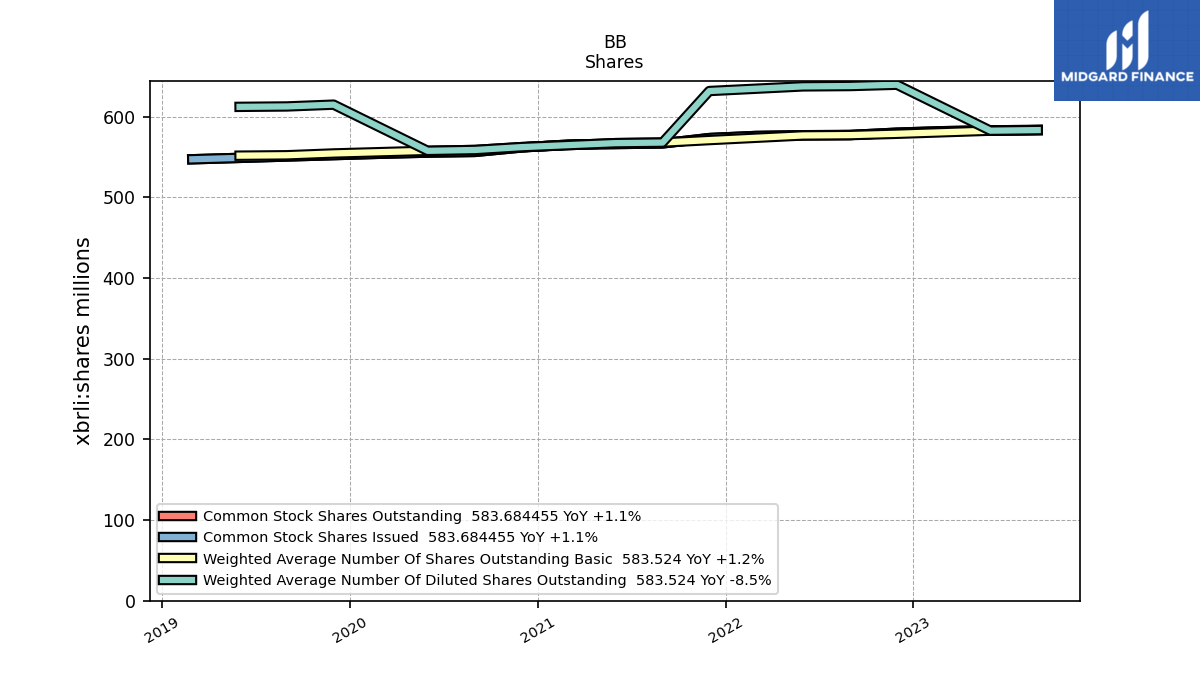
| Weighted Average Number Of Diluted Shares Outstanding | 583.52 | 582.81 | NA | 639.78 | 638.15 | 637.71 | NA | 631.97 | 568.08 | 567.36 | NA | 562.44 | 558.88 | 557.84 | NA | 615.09 | 612.84 | 612.35 | |
| Weighted Average Number Of Shares Outstanding Basic | 583.52 | 582.81 | NA | 578.95 | 577.31 | 576.88 | NA | 571.14 | 568.08 | 567.36 | NA | 562.44 | 558.88 | 557.84 | NA | 554.59 | 552.34 | 551.85 | |
| Earnings Per Share Basic | -0.07 | -0.02 | -0.86 | -0.01 | -0.09 | -0.31 | 0.25 | 0.13 | -0.25 | -0.11 | -0.56 | -0.23 | -0.04 | -1.14 | -0.07 | -0.06 | -0.08 | -0.06 | |
| Earnings Per Share Diluted | -0.07 | -0.02 | -0.81 | -0.09 | -0.10 | -0.35 | -0.03 | -0.05 | -0.25 | -0.11 | -0.56 | -0.23 | -0.04 | -1.14 | -0.05 | -0.07 | -0.10 | -0.09 |
| 2023-08-31 | 2023-05-31 | 2023-02-28 | 2022-11-30 | 2022-08-31 | 2022-05-31 | 2022-02-28 | 2021-11-30 | 2021-08-31 | 2021-05-31 | 2021-02-28 | 2020-11-30 | 2020-08-31 | 2020-05-31 | 2020-02-29 | 2019-11-30 | 2019-08-31 | 2019-05-31 | ||
|---|---|---|---|---|---|---|---|---|---|---|---|---|---|---|---|---|---|---|---|
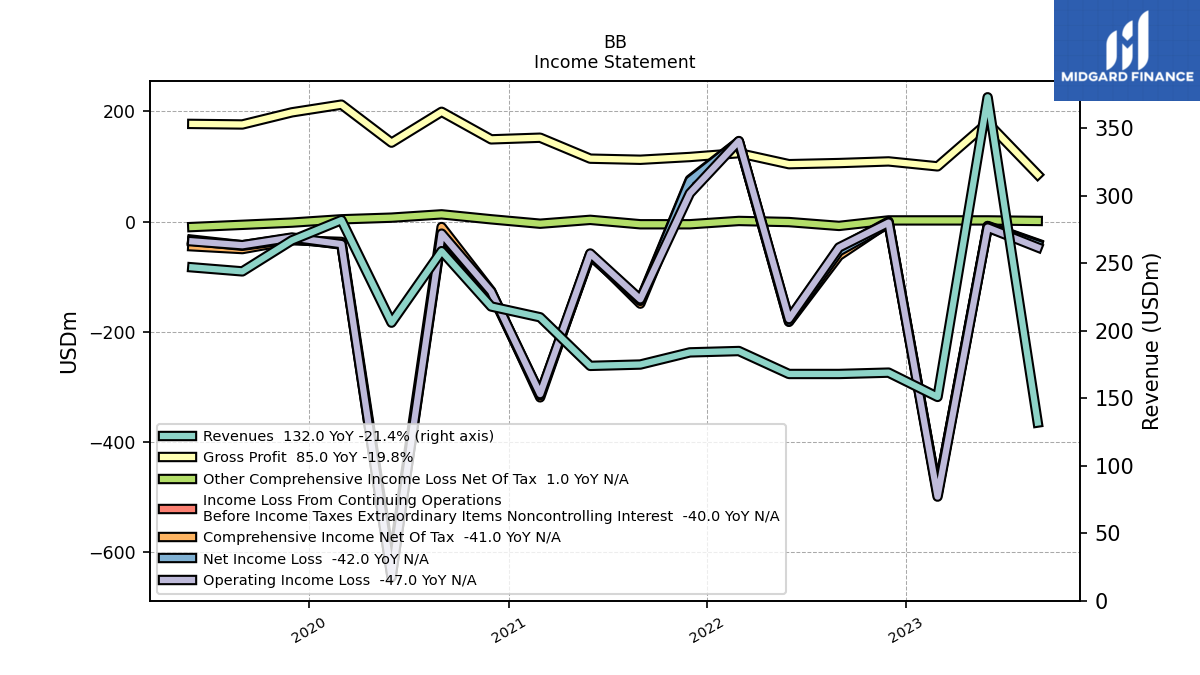
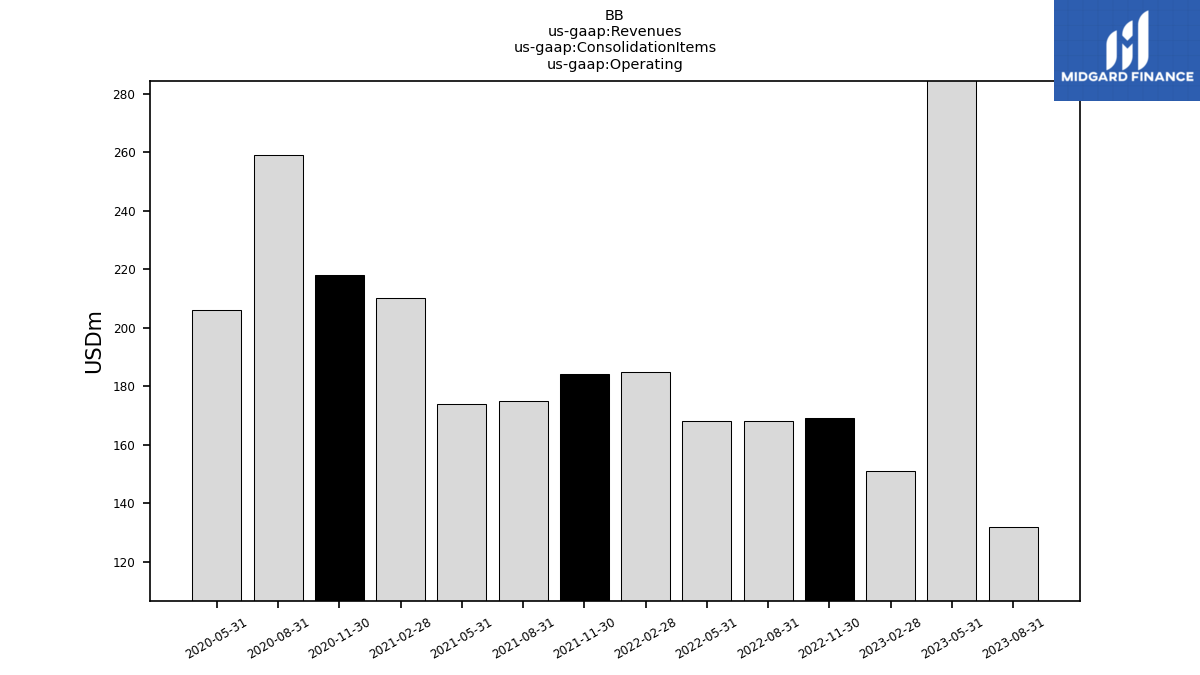
| Revenues | 132.00 | 373.00 | 151.00 | 169.00 | 168.00 | 168.00 | 185.00 | 184.00 | 175.00 | 174.00 | 210.00 | 218.00 | 259.00 | 206.00 | 282.00 | 267.00 | 244.00 | 247.00 | |
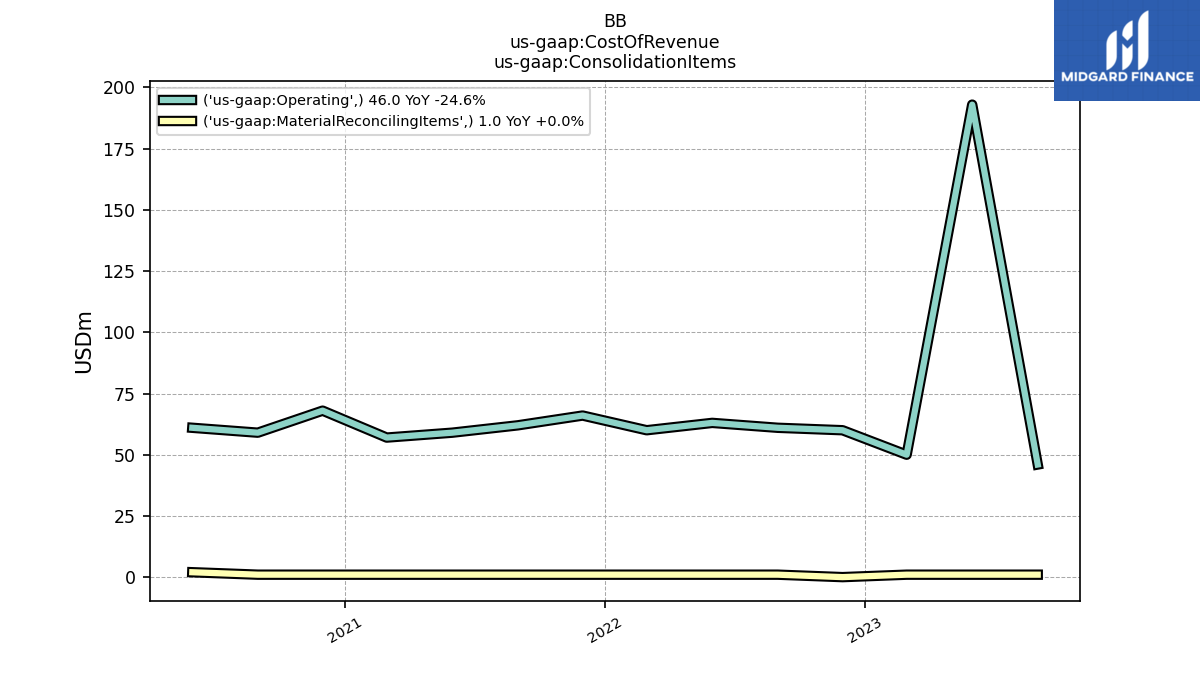
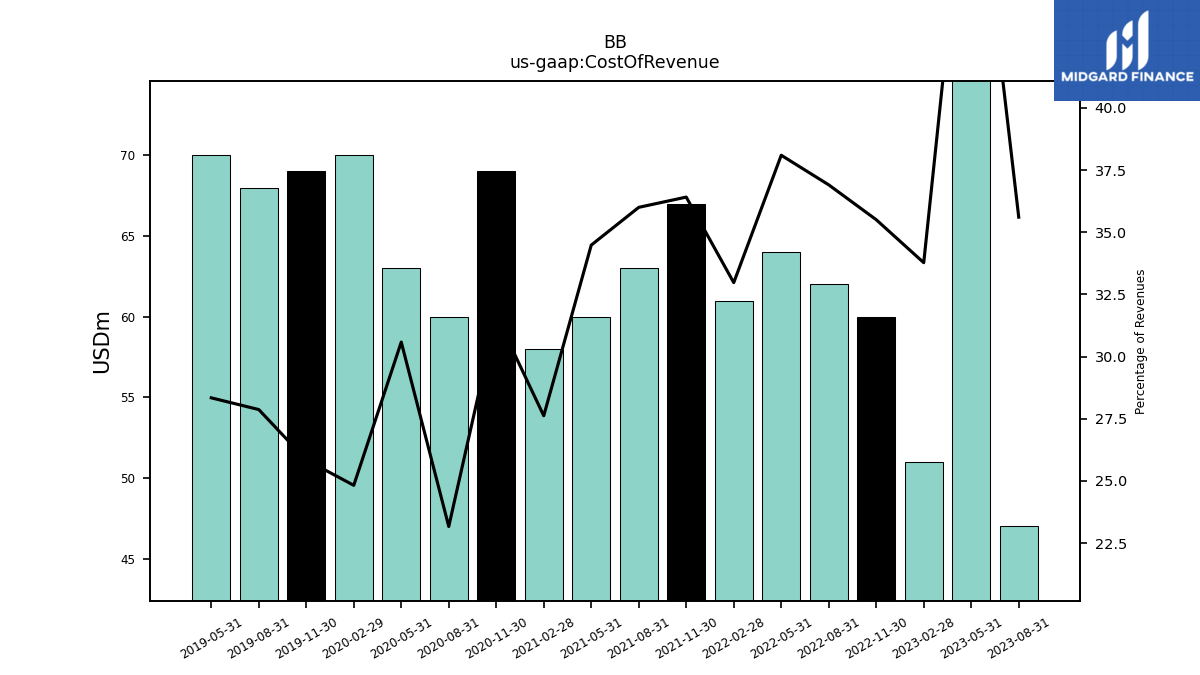
| Cost Of Revenue | 47.00 | 194.00 | 51.00 | 60.00 | 62.00 | 64.00 | 61.00 | 67.00 | 63.00 | 60.00 | 58.00 | 69.00 | 60.00 | 63.00 | 70.00 | 69.00 | 68.00 | 70.00 | |
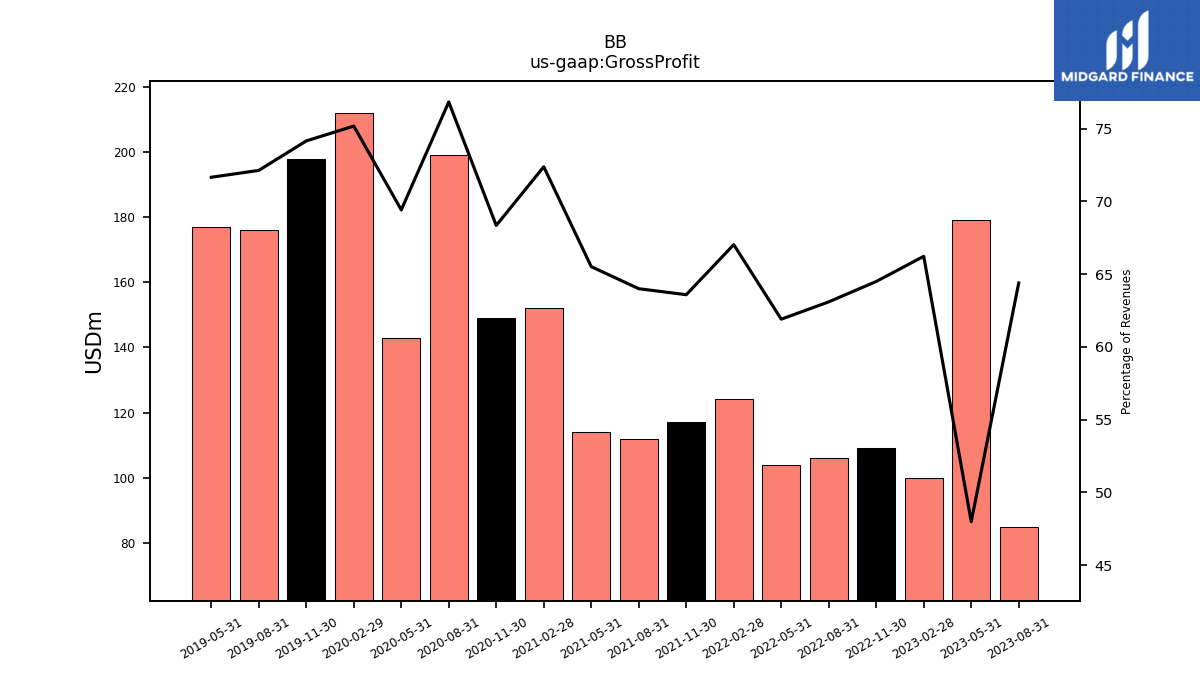
| Gross Profit | 85.00 | 179.00 | 100.00 | 109.00 | 106.00 | 104.00 | 124.00 | 117.00 | 112.00 | 114.00 | 152.00 | 149.00 | 199.00 | 143.00 | 212.00 | 198.00 | 176.00 | 177.00 | |
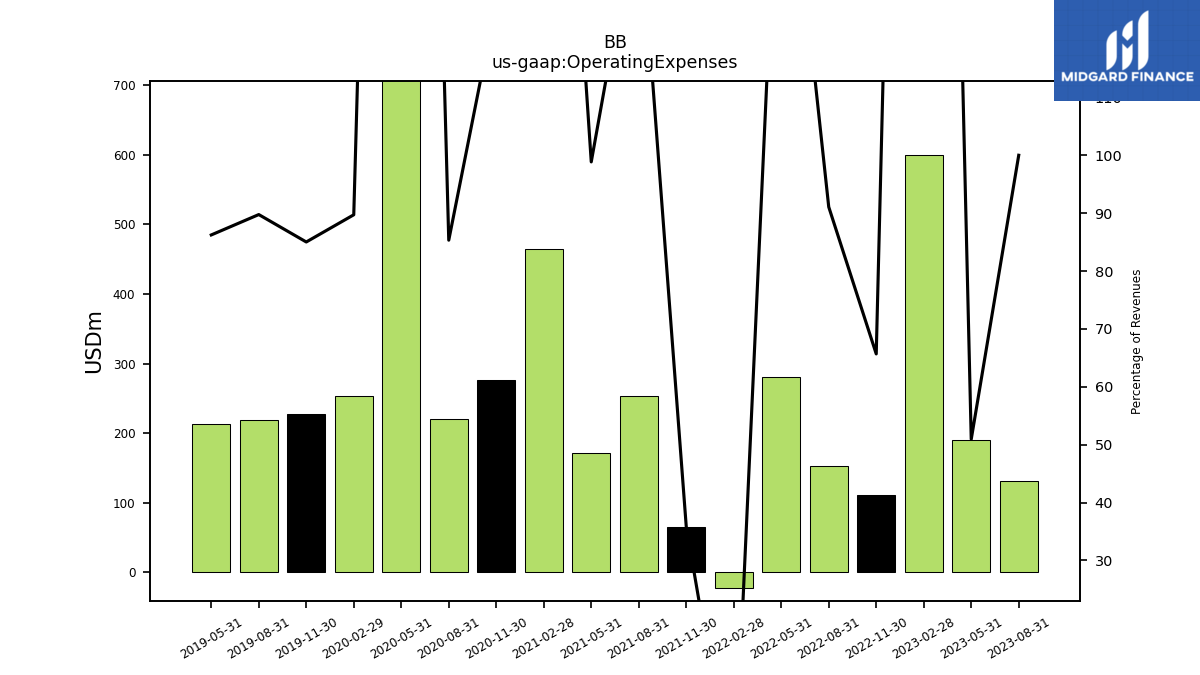
| Operating Expenses | 132.00 | 190.00 | 599.00 | 111.00 | 153.00 | 281.00 | -22.00 | 66.00 | 253.00 | 172.00 | 465.00 | 276.00 | 221.00 | 788.00 | 253.00 | 227.00 | 219.00 | 213.00 | |
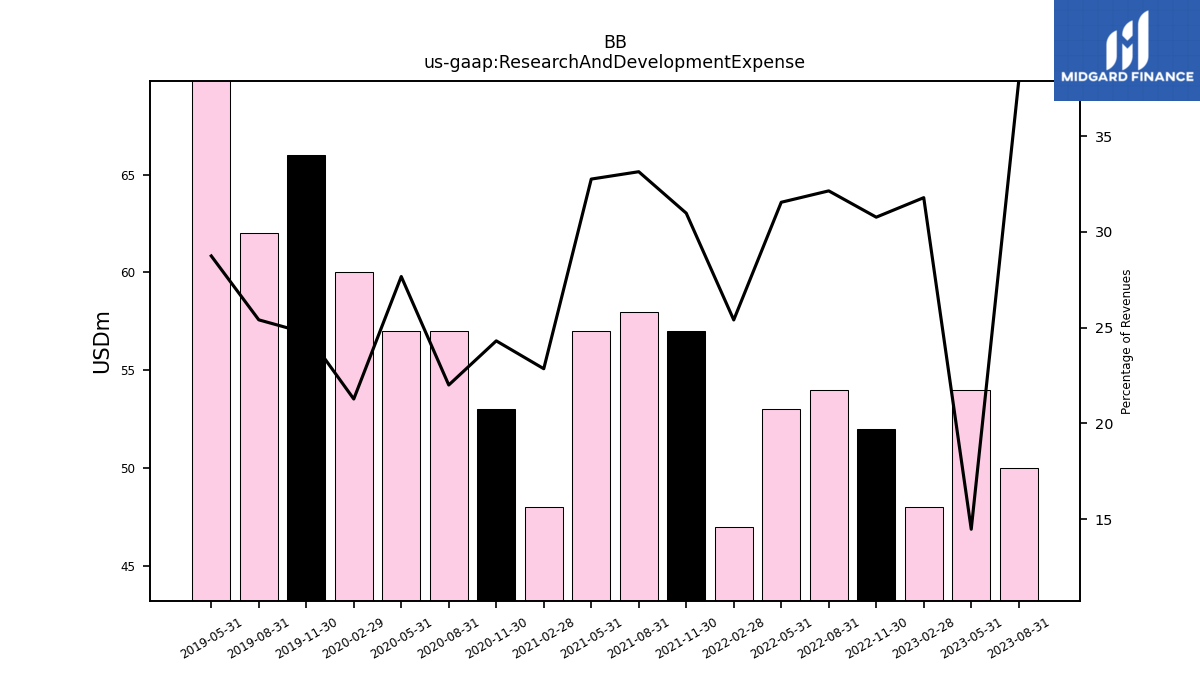
| Research And Development Expense | 50.00 | 54.00 | 48.00 | 52.00 | 54.00 | 53.00 | 47.00 | 57.00 | 58.00 | 57.00 | 48.00 | 53.00 | 57.00 | 57.00 | 60.00 | 66.00 | 62.00 | 71.00 | |
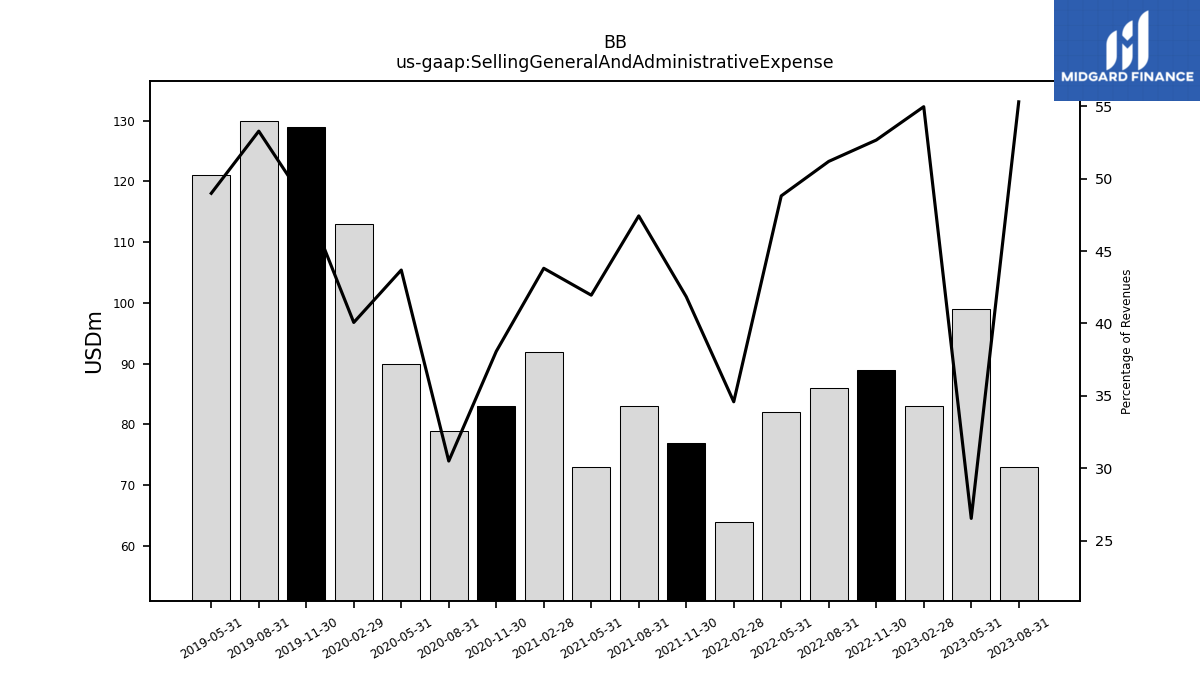
| Selling General And Administrative Expense | 73.00 | 99.00 | 83.00 | 89.00 | 86.00 | 82.00 | 64.00 | 77.00 | 83.00 | 73.00 | 92.00 | 83.00 | 79.00 | 90.00 | 113.00 | 129.00 | 130.00 | 121.00 | |
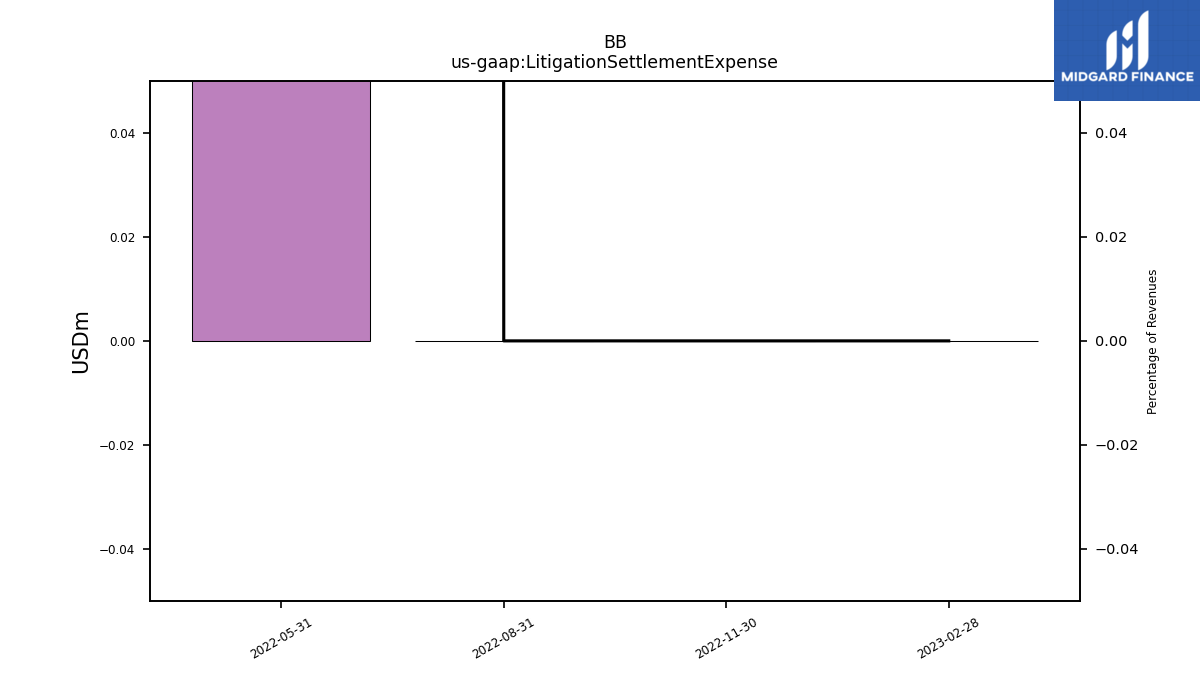
| Litigation Settlement Expense | NA | NA | 0.00 | 0.00 | 0.00 | 165.00 | NA | NA | NA | NA | NA | NA | NA | NA | NA | NA | NA | NA | |
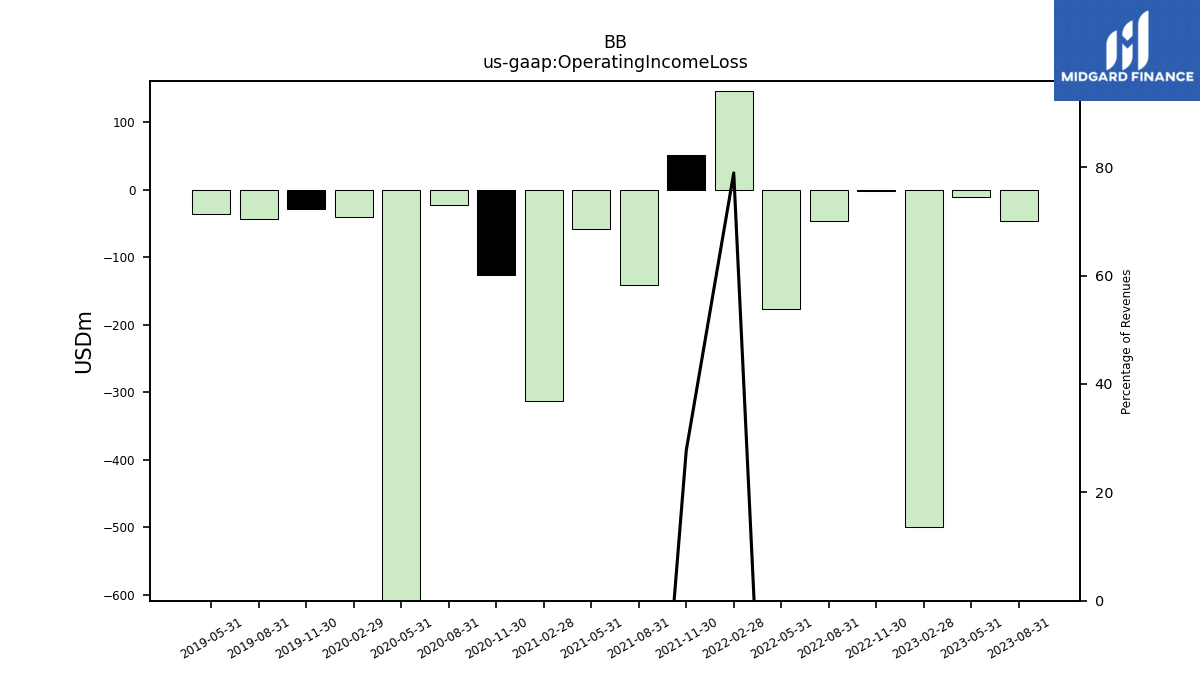
| Operating Income Loss | -47.00 | -11.00 | -499.00 | -2.00 | -47.00 | -177.00 | 146.00 | 51.00 | -141.00 | -58.00 | -313.00 | -127.00 | -22.00 | -645.00 | -41.00 | -29.00 | -43.00 | -36.00 | |
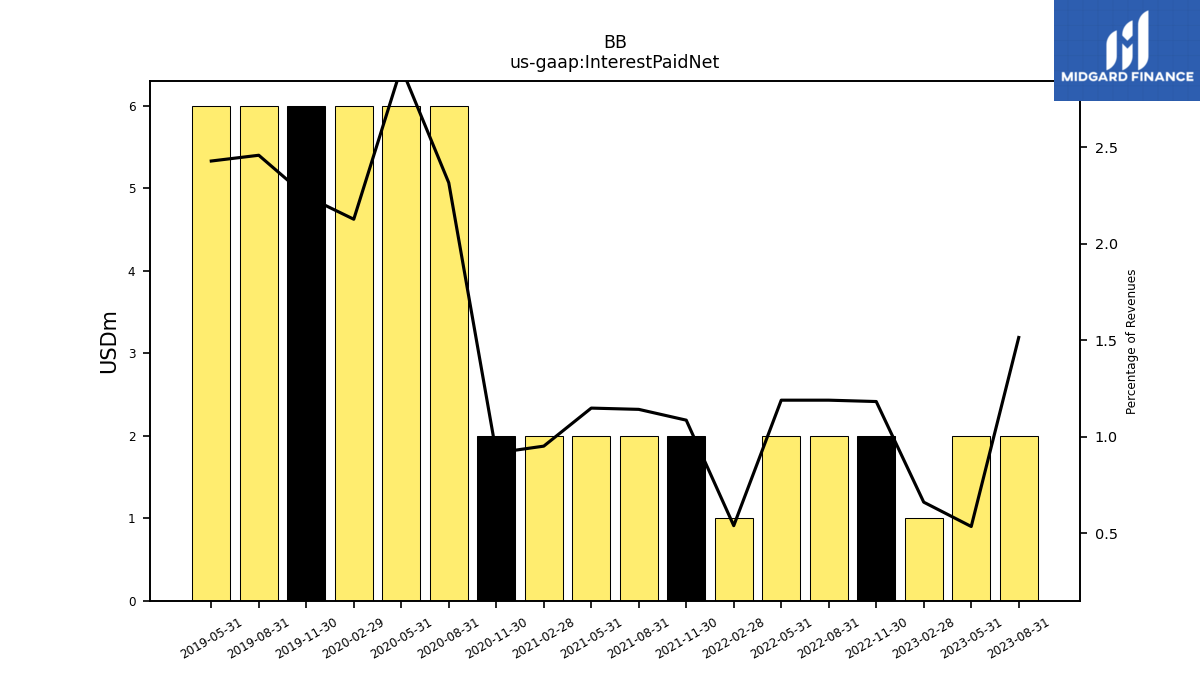
| Interest Paid Net | 2.00 | 2.00 | 1.00 | 2.00 | 2.00 | 2.00 | 1.00 | 2.00 | 2.00 | 2.00 | 2.00 | 2.00 | 6.00 | 6.00 | 6.00 | 6.00 | 6.00 | 6.00 | |
| Income Loss From Continuing Operations | -42.00 | -11.00 | -495.00 | -4.00 | -54.00 | -181.00 | 144.00 | 74.00 | -144.00 | -62.00 | -315.00 | -130.00 | -23.00 | -636.00 | -41.00 | -32.00 | -44.00 | -35.00 | |
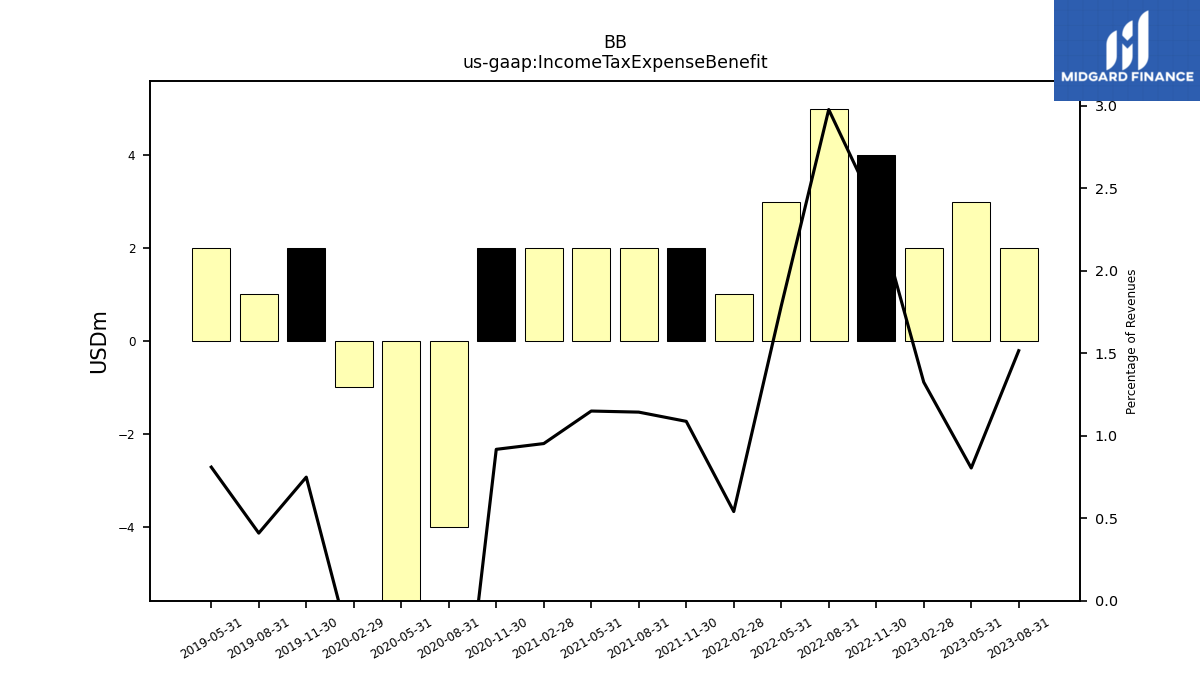
| Income Tax Expense Benefit | 2.00 | 3.00 | 2.00 | 4.00 | 5.00 | 3.00 | 1.00 | 2.00 | 2.00 | 2.00 | 2.00 | 2.00 | -4.00 | -9.00 | -1.00 | 2.00 | 1.00 | 2.00 | |
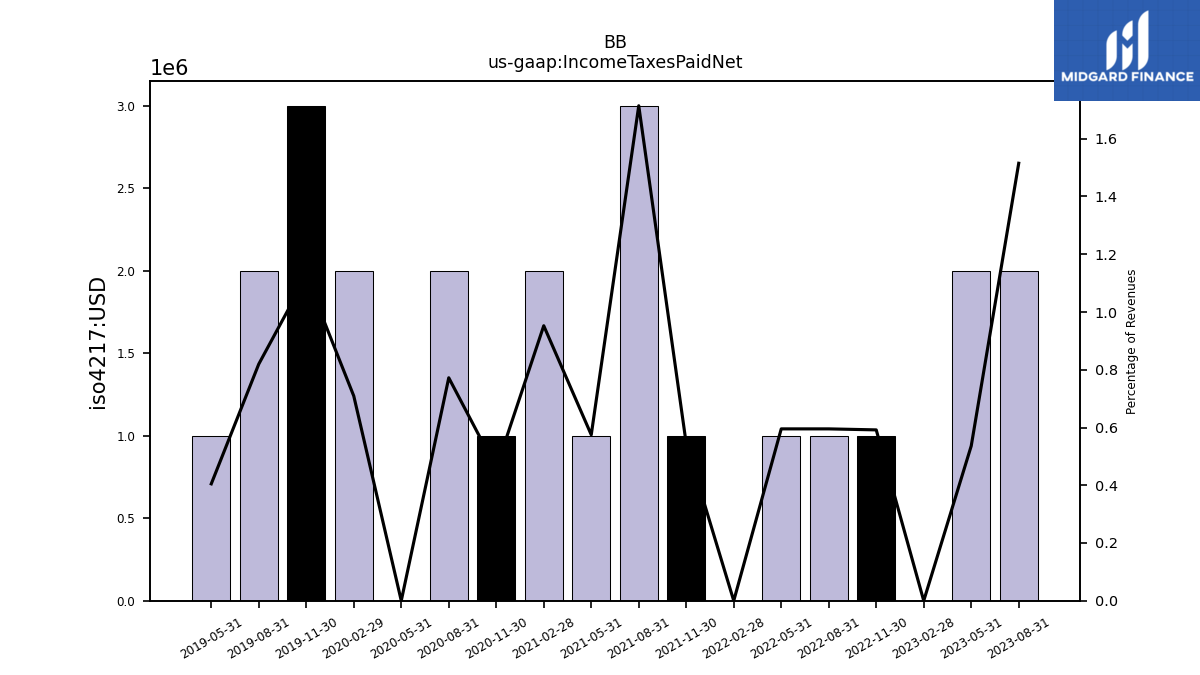
| Income Taxes Paid Net | 2.00 | 2.00 | 0.00 | 1.00 | 1.00 | 1.00 | 0.00 | 1.00 | 3.00 | 1.00 | 2.00 | 1.00 | 2.00 | 0.00 | 2.00 | 3.00 | 2.00 | 1.00 | |
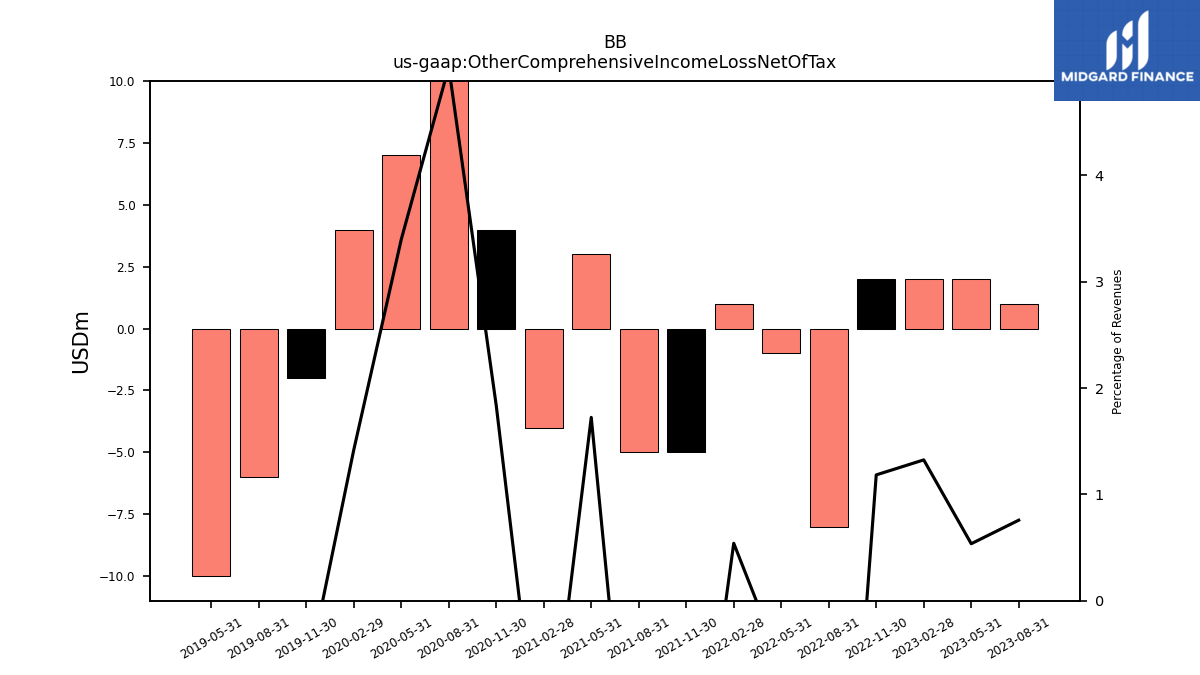
| Other Comprehensive Income Loss Net Of Tax | 1.00 | 2.00 | 2.00 | 2.00 | -8.00 | -1.00 | 1.00 | -5.00 | -5.00 | 3.00 | -4.00 | 4.00 | 13.00 | 7.00 | 4.00 | -2.00 | -6.00 | -10.00 | |
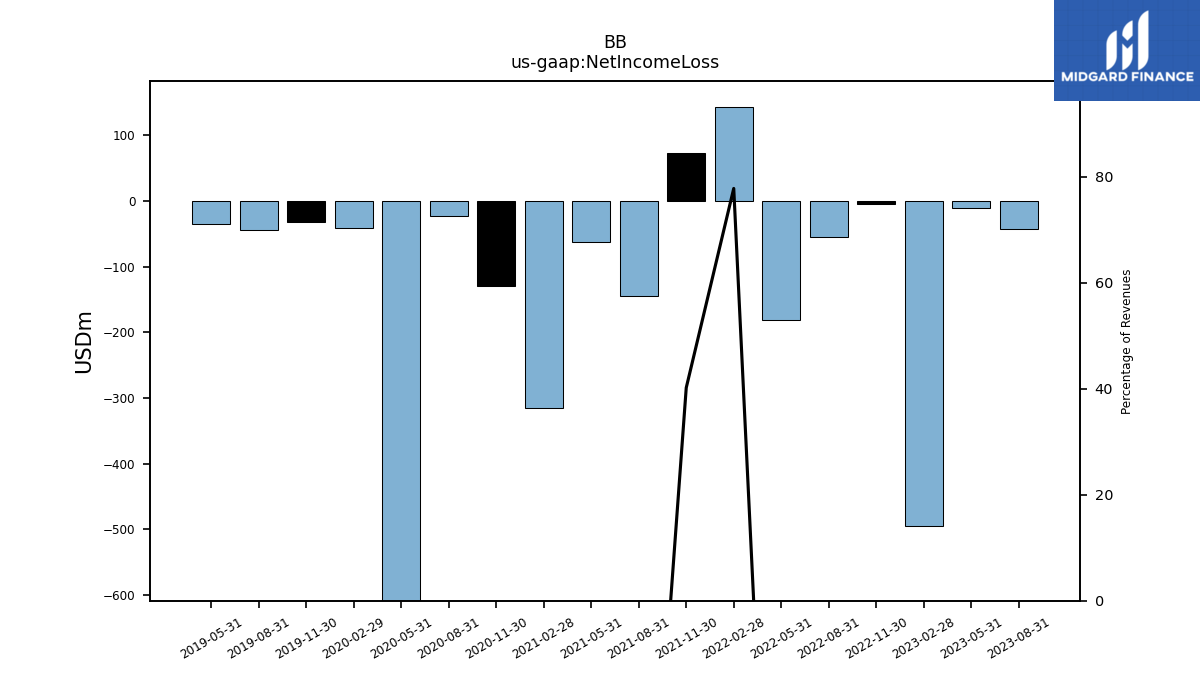
| Net Income Loss | -42.00 | -11.00 | -495.00 | -4.00 | -54.00 | -181.00 | 144.00 | 74.00 | -144.00 | -62.00 | -315.00 | -130.00 | -23.00 | -636.00 | -41.00 | -32.00 | -44.00 | -35.00 | |
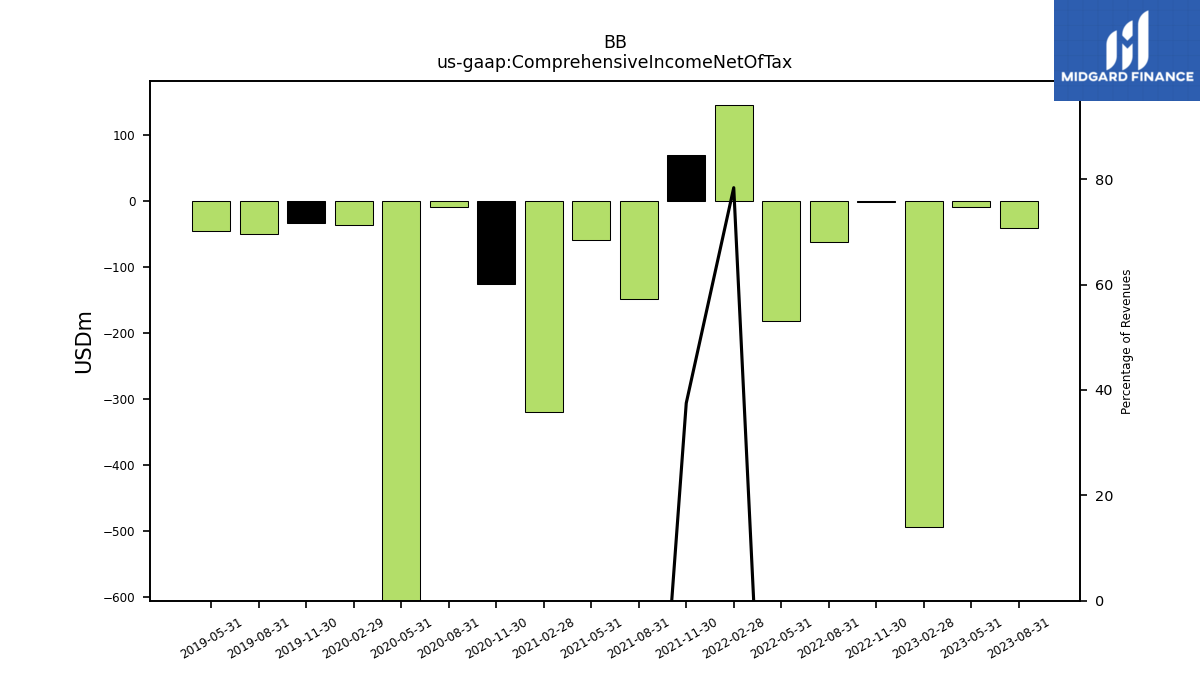
| Comprehensive Income Net Of Tax | -41.00 | -9.00 | -493.00 | -2.00 | -62.00 | -182.00 | 145.00 | 69.00 | -149.00 | -59.00 | -319.00 | -126.00 | -10.00 | -629.00 | -37.00 | -34.00 | -50.00 | -45.00 | |
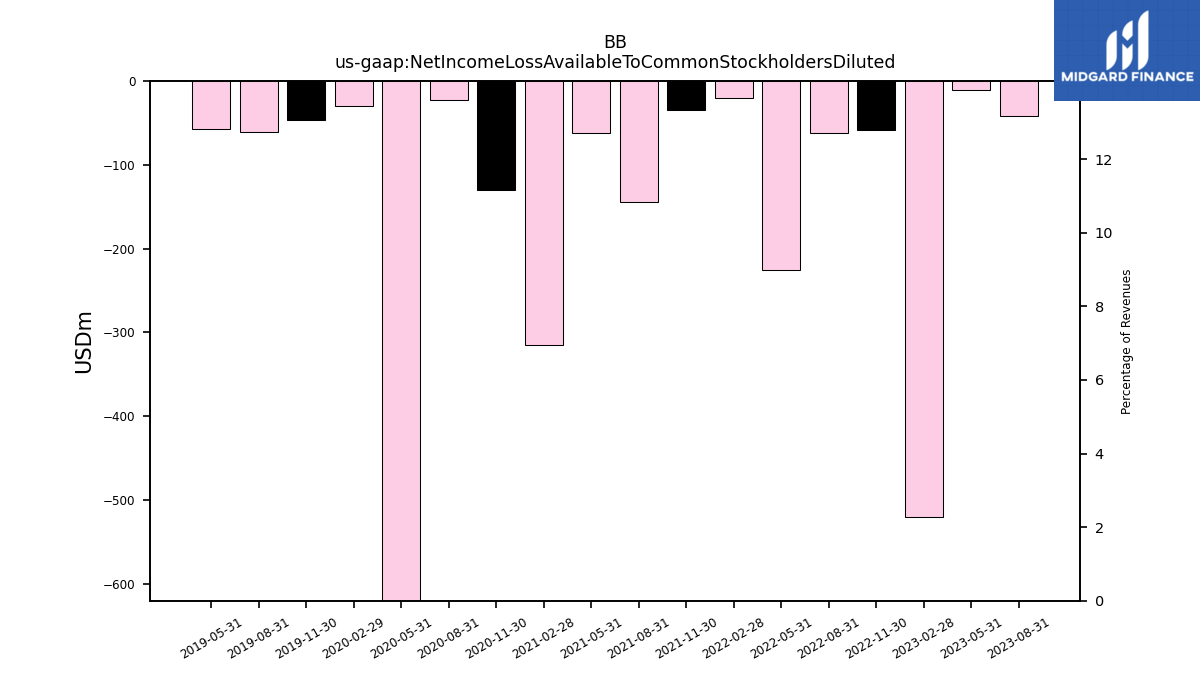
| Net Income Loss Available To Common Stockholders Diluted | -42.00 | -11.00 | -520.00 | -58.00 | -62.00 | -225.00 | -20.00 | -34.00 | -144.00 | -62.00 | -315.00 | -130.00 | -23.00 | -636.00 | -30.00 | -46.00 | -61.00 | -57.00 |
| 2023-08-31 | 2023-05-31 | 2023-02-28 | 2022-11-30 | 2022-08-31 | 2022-05-31 | 2022-02-28 | 2021-11-30 | 2021-08-31 | 2021-05-31 | 2021-02-28 | 2020-11-30 | 2020-08-31 | 2020-05-31 | 2020-02-29 | 2019-11-30 | 2019-08-31 | 2019-05-31 | ||
|---|---|---|---|---|---|---|---|---|---|---|---|---|---|---|---|---|---|---|---|
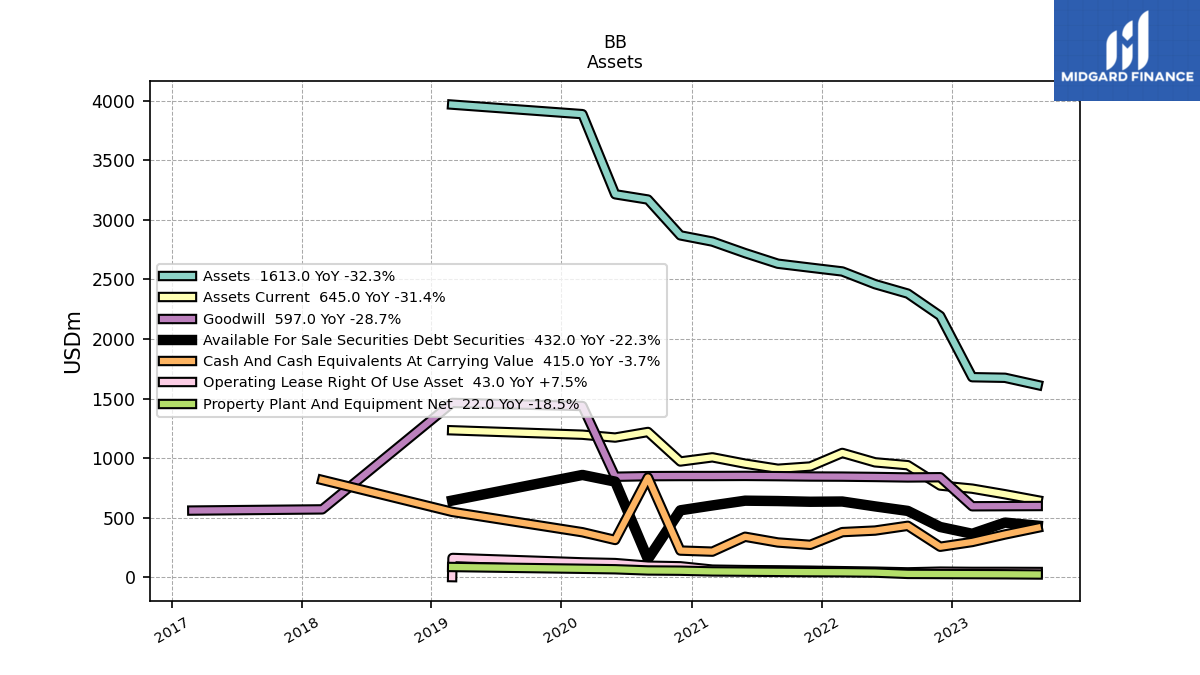
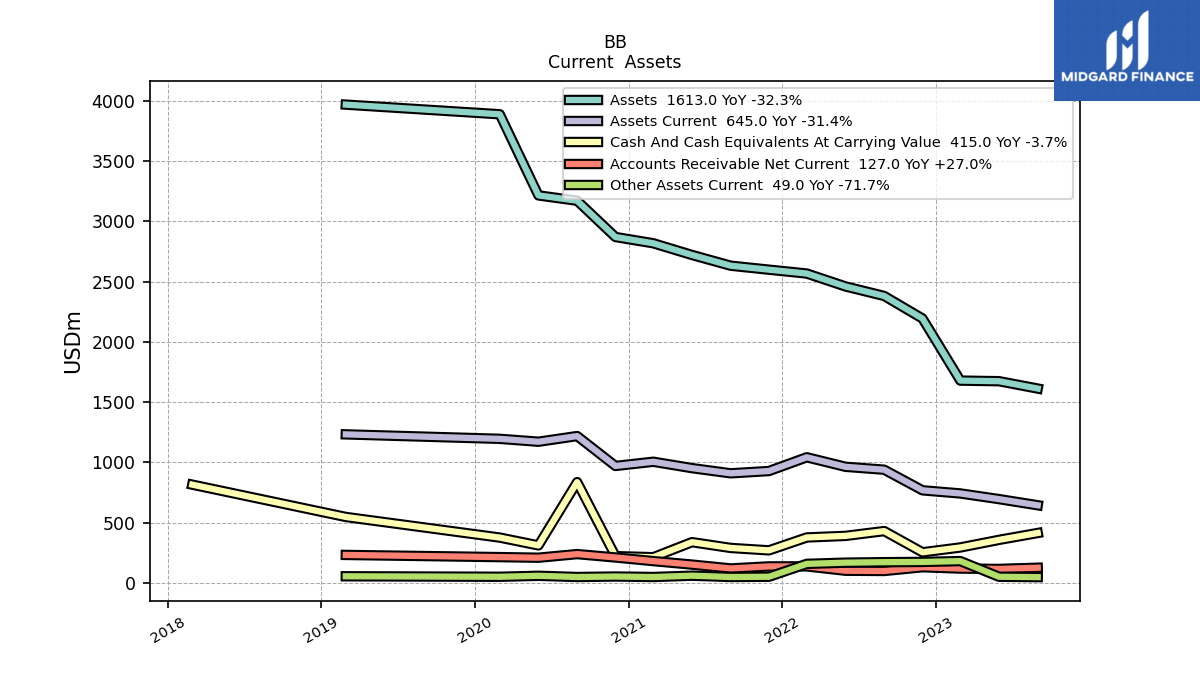
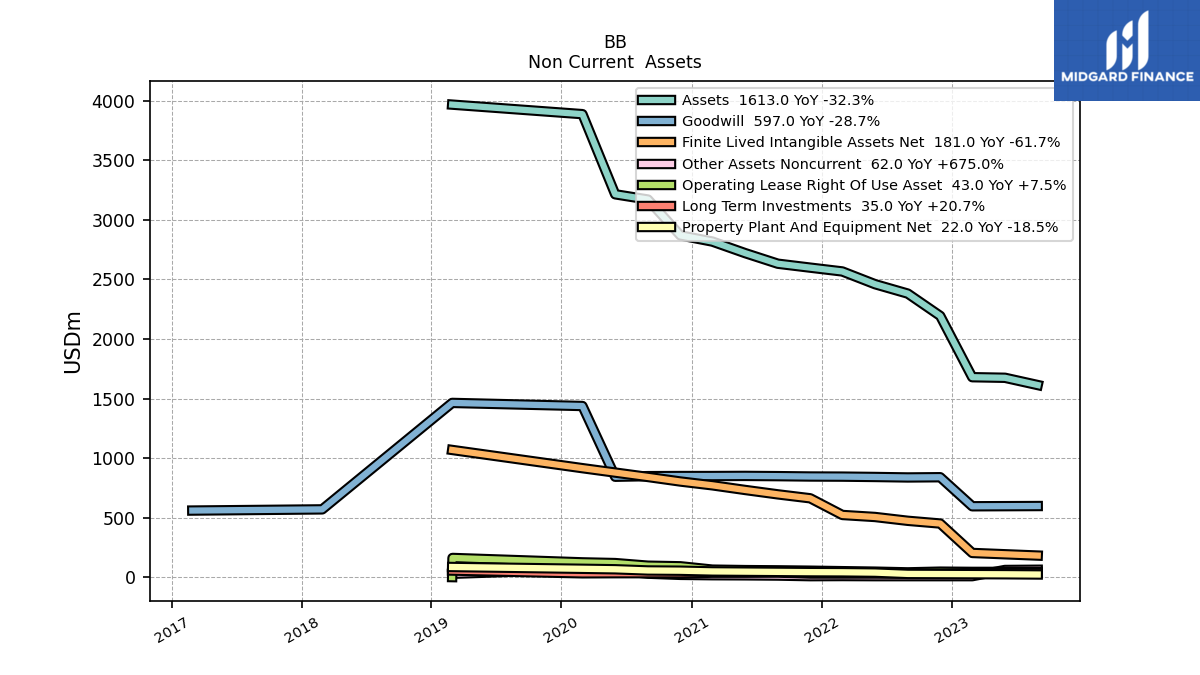
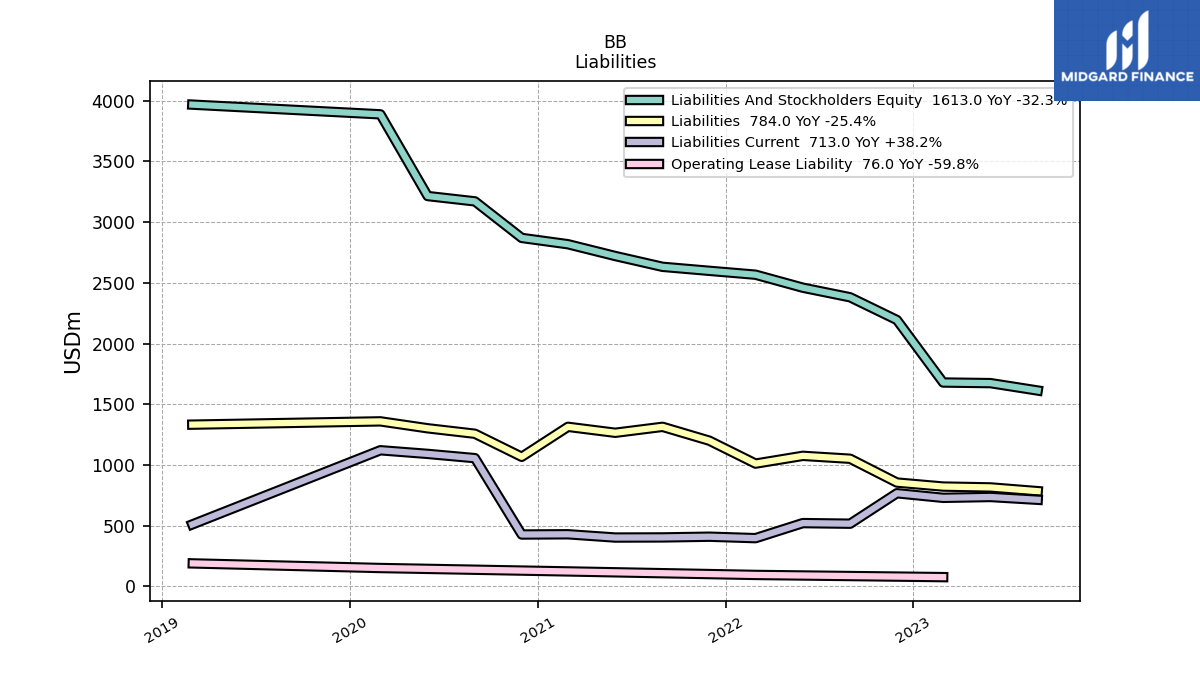
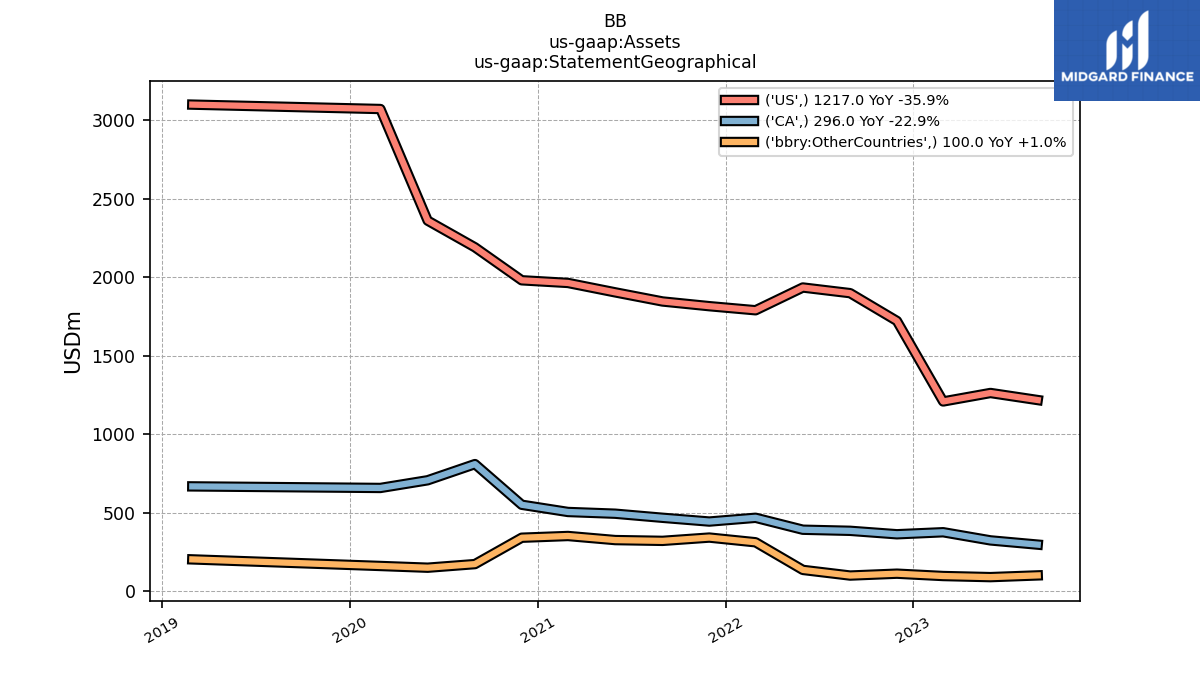
| Assets | 1613.00 | 1674.00 | 1679.00 | 2194.00 | 2381.00 | 2460.00 | 2567.00 | 2599.00 | 2632.00 | 2721.00 | 2818.00 | 2870.00 | 3171.00 | 3215.00 | 3888.00 | NA | NA | NA | |
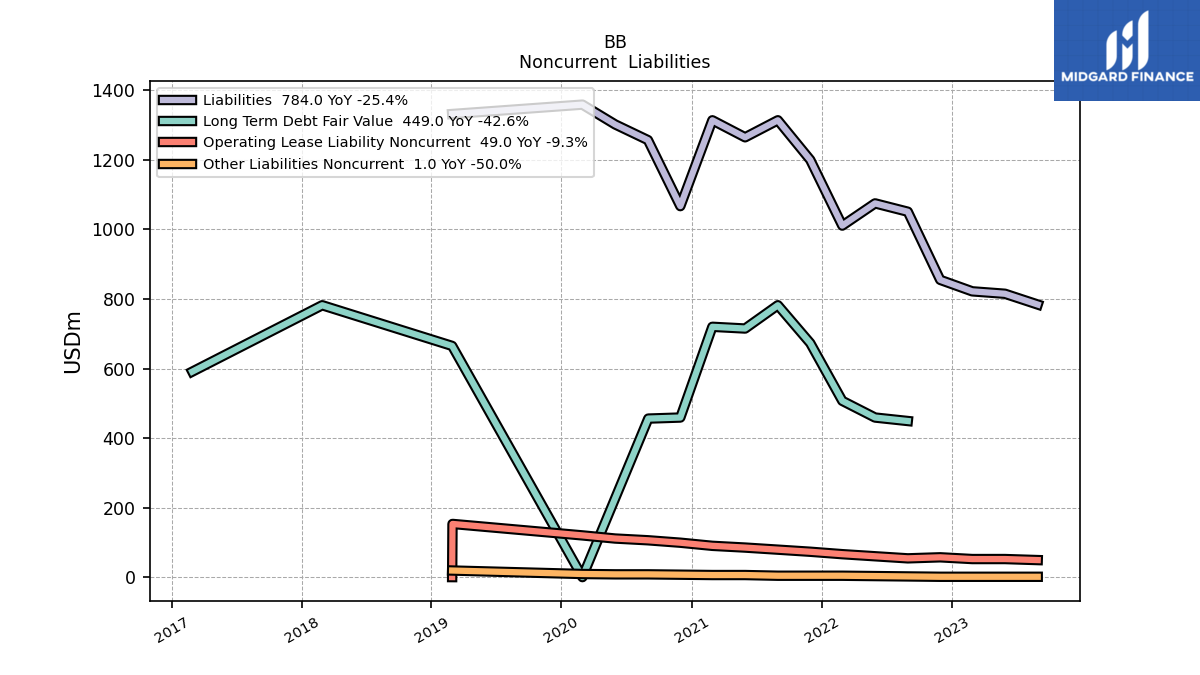
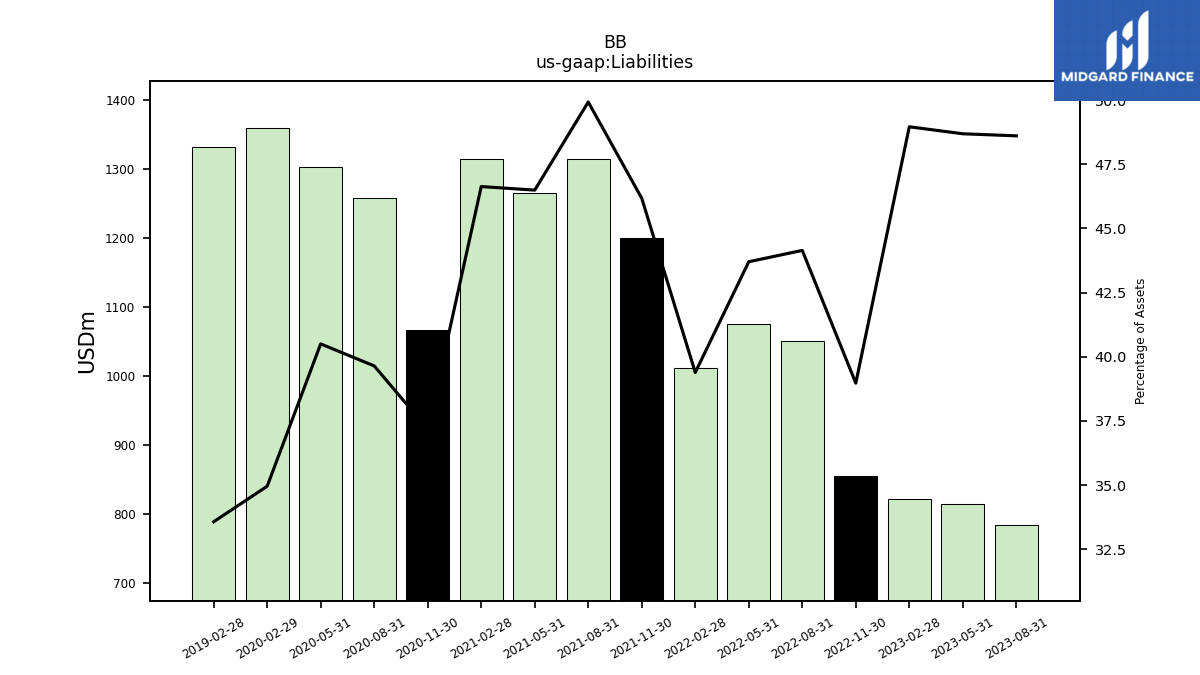
| Liabilities | 784.00 | 815.00 | 822.00 | 855.00 | 1051.00 | 1075.00 | 1011.00 | 1200.00 | 1314.00 | 1265.00 | 1314.00 | 1067.00 | 1257.00 | 1302.00 | 1359.00 | NA | NA | NA | |
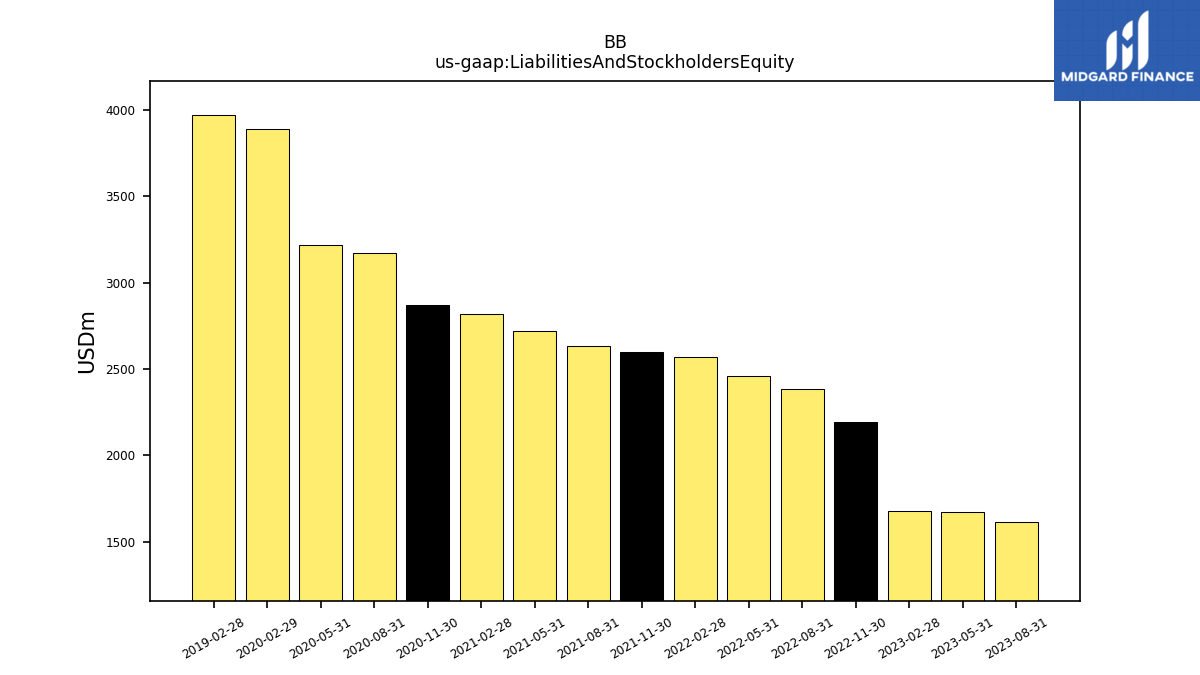
| Liabilities And Stockholders Equity | 1613.00 | 1674.00 | 1679.00 | 2194.00 | 2381.00 | 2460.00 | 2567.00 | 2599.00 | 2632.00 | 2721.00 | 2818.00 | 2870.00 | 3171.00 | 3215.00 | 3888.00 | NA | NA | NA | |
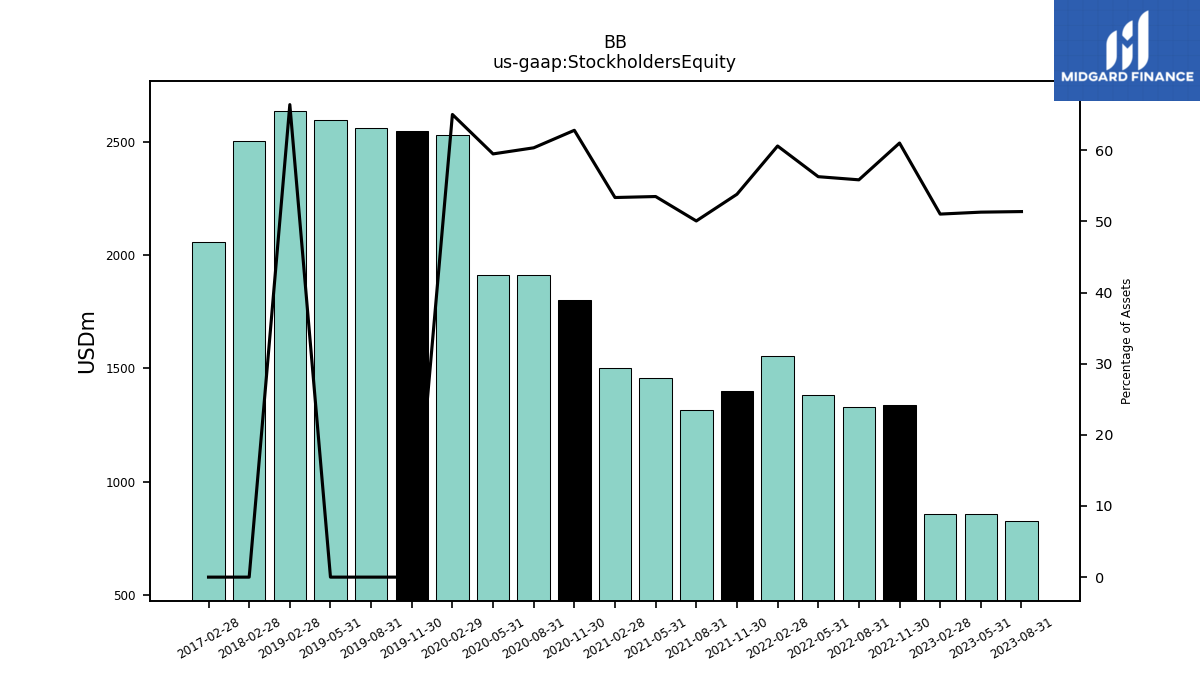
| Stockholders Equity | 829.00 | 859.00 | 857.00 | 1339.00 | 1330.00 | 1385.00 | 1556.00 | 1399.00 | 1318.00 | 1456.00 | 1504.00 | 1803.00 | 1914.00 | 1913.00 | 2529.00 | 2548.00 | 2562.00 | 2597.00 |
| 2023-08-31 | 2023-05-31 | 2023-02-28 | 2022-11-30 | 2022-08-31 | 2022-05-31 | 2022-02-28 | 2021-11-30 | 2021-08-31 | 2021-05-31 | 2021-02-28 | 2020-11-30 | 2020-08-31 | 2020-05-31 | 2020-02-29 | 2019-11-30 | 2019-08-31 | 2019-05-31 | ||
|---|---|---|---|---|---|---|---|---|---|---|---|---|---|---|---|---|---|---|---|
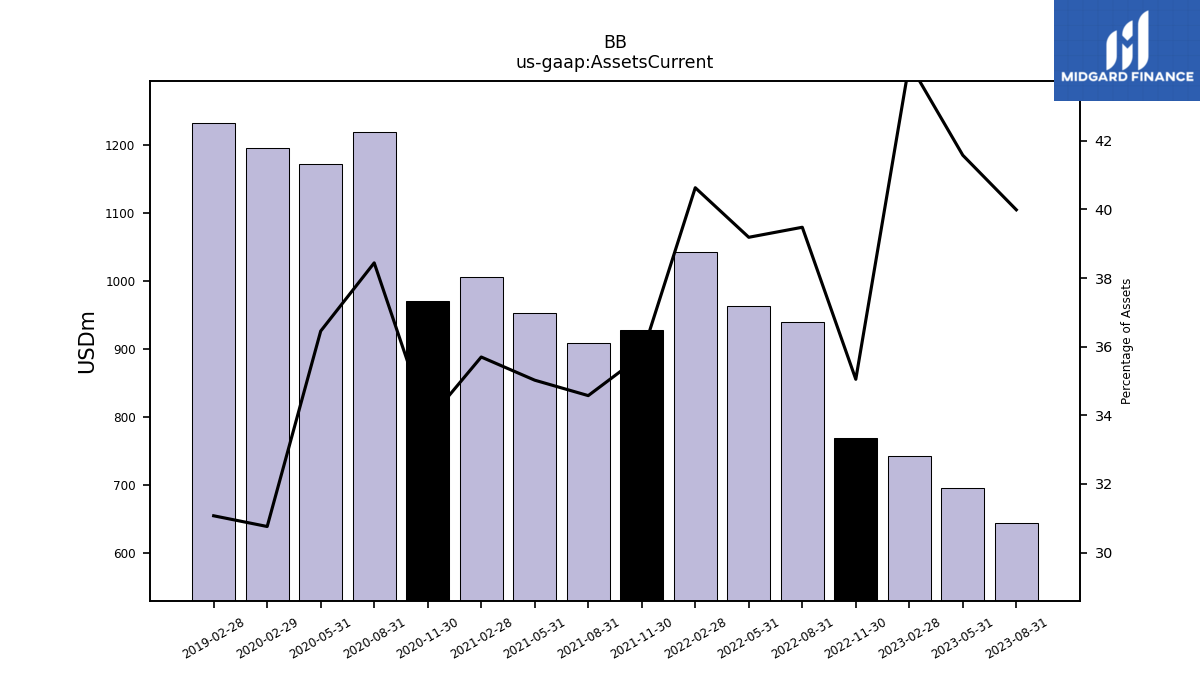
| Assets Current | 645.00 | 696.00 | 743.00 | 769.00 | 940.00 | 964.00 | 1043.00 | 929.00 | 910.00 | 953.00 | 1006.00 | 971.00 | 1219.00 | 1172.00 | 1196.00 | NA | NA | NA | |
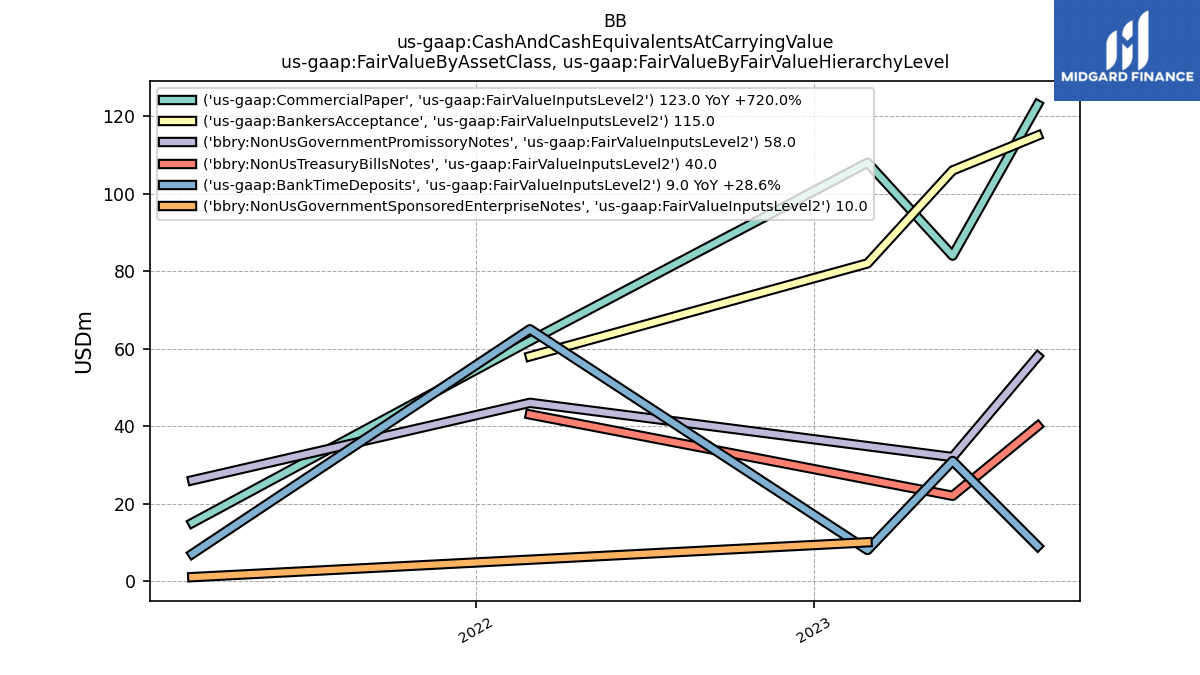
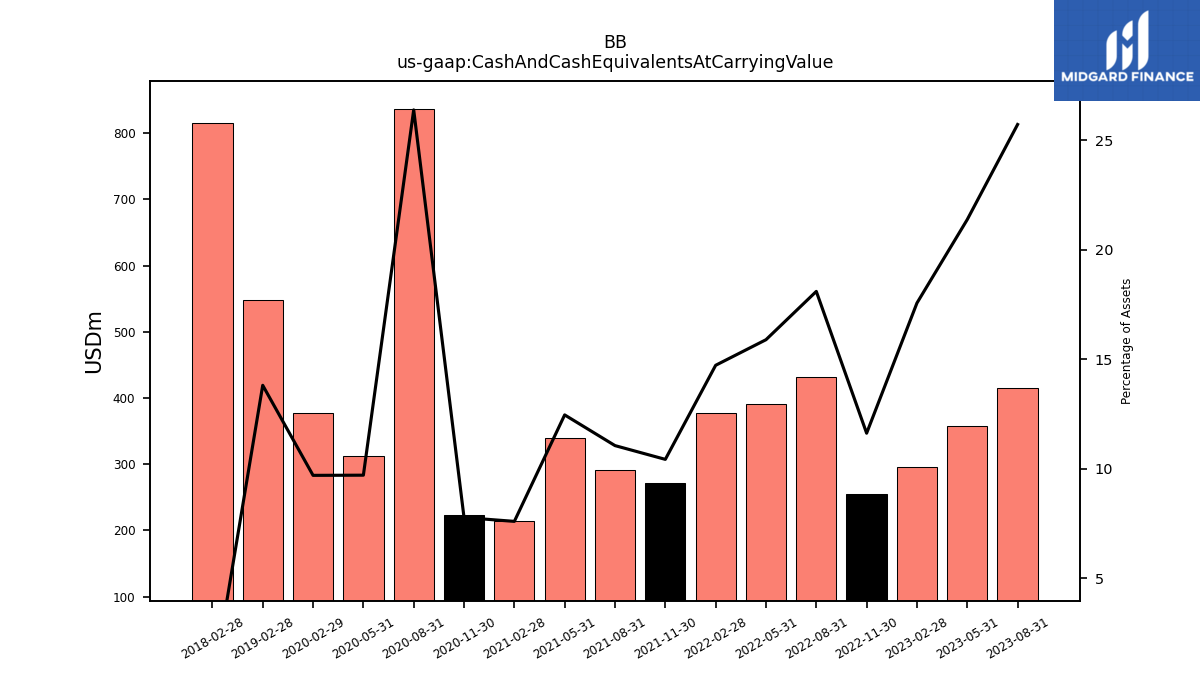
| Cash And Cash Equivalents At Carrying Value | 415.00 | 358.00 | 295.00 | 255.00 | 431.00 | 391.00 | 378.00 | 271.00 | 291.00 | 339.00 | 214.00 | 223.00 | 837.00 | 312.00 | 377.00 | NA | NA | NA | |
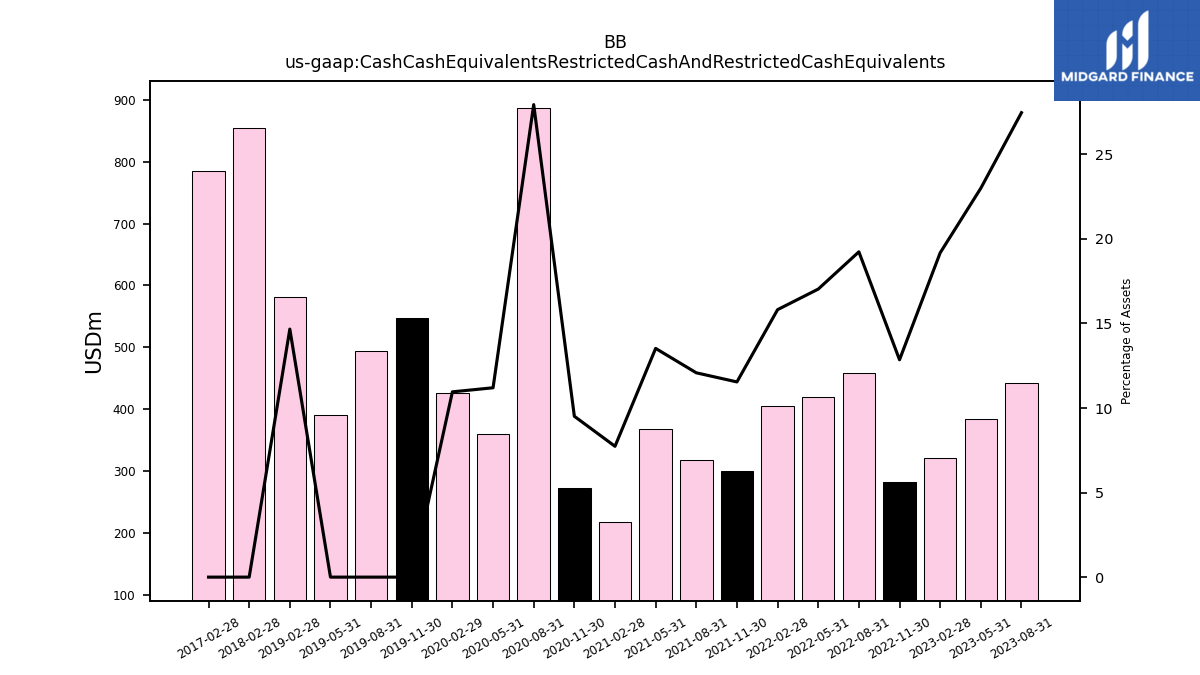
| Cash Cash Equivalents Restricted Cash And Restricted Cash Equivalents | 443.00 | 385.00 | 322.00 | 282.00 | 458.00 | 419.00 | 406.00 | 300.00 | 318.00 | 368.00 | 218.00 | 273.00 | 886.00 | 360.00 | 426.00 | 547.00 | 494.00 | 391.00 | |
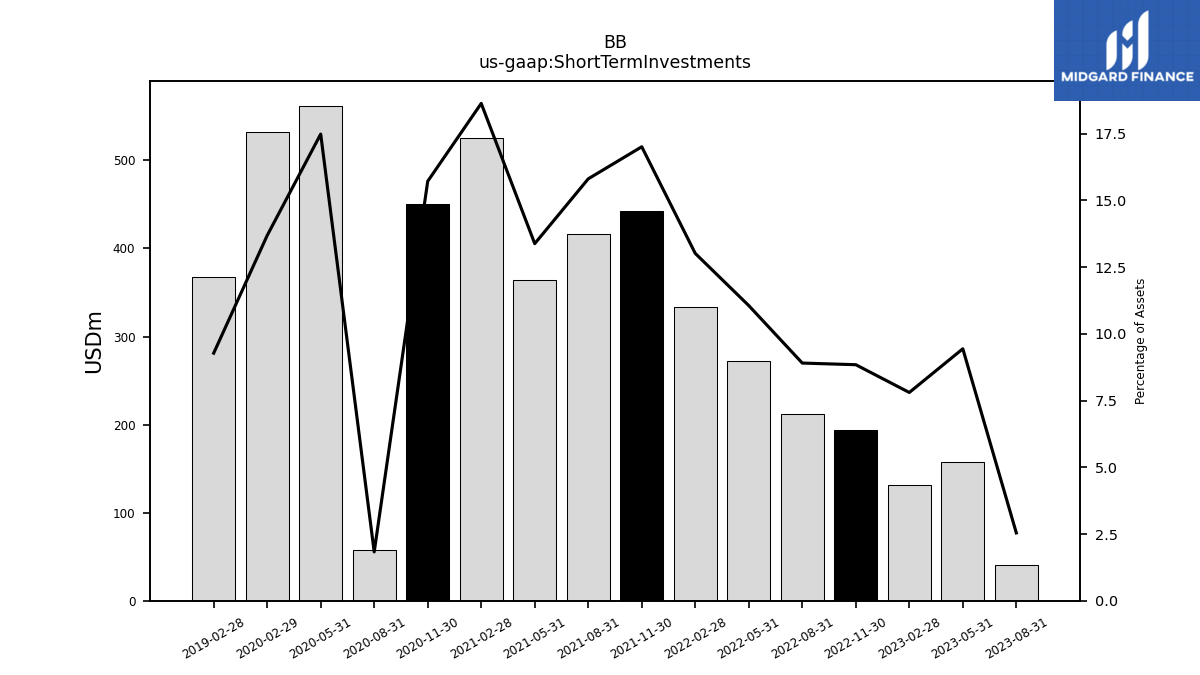
| Short Term Investments | 41.00 | 158.00 | 131.00 | 194.00 | 212.00 | 272.00 | 334.00 | 442.00 | 416.00 | 364.00 | 525.00 | 451.00 | 58.00 | 562.00 | 532.00 | NA | NA | NA | |
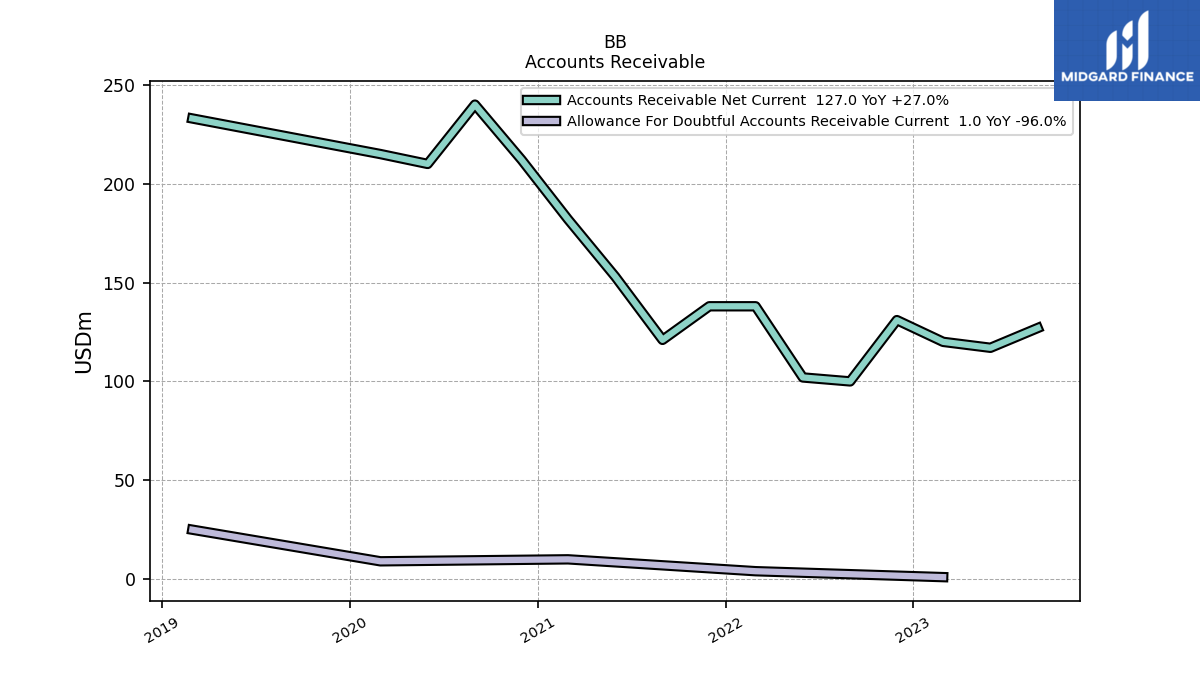
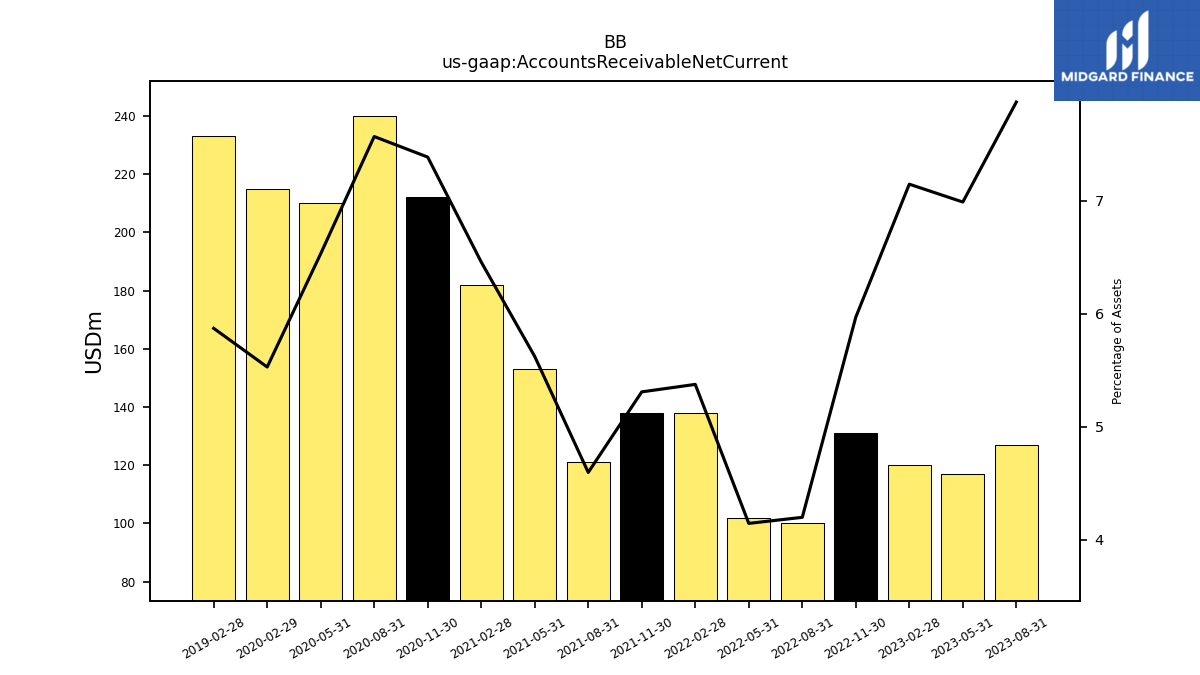
| Accounts Receivable Net Current | 127.00 | 117.00 | 120.00 | 131.00 | 100.00 | 102.00 | 138.00 | 138.00 | 121.00 | 153.00 | 182.00 | 212.00 | 240.00 | 210.00 | 215.00 | NA | NA | NA | |
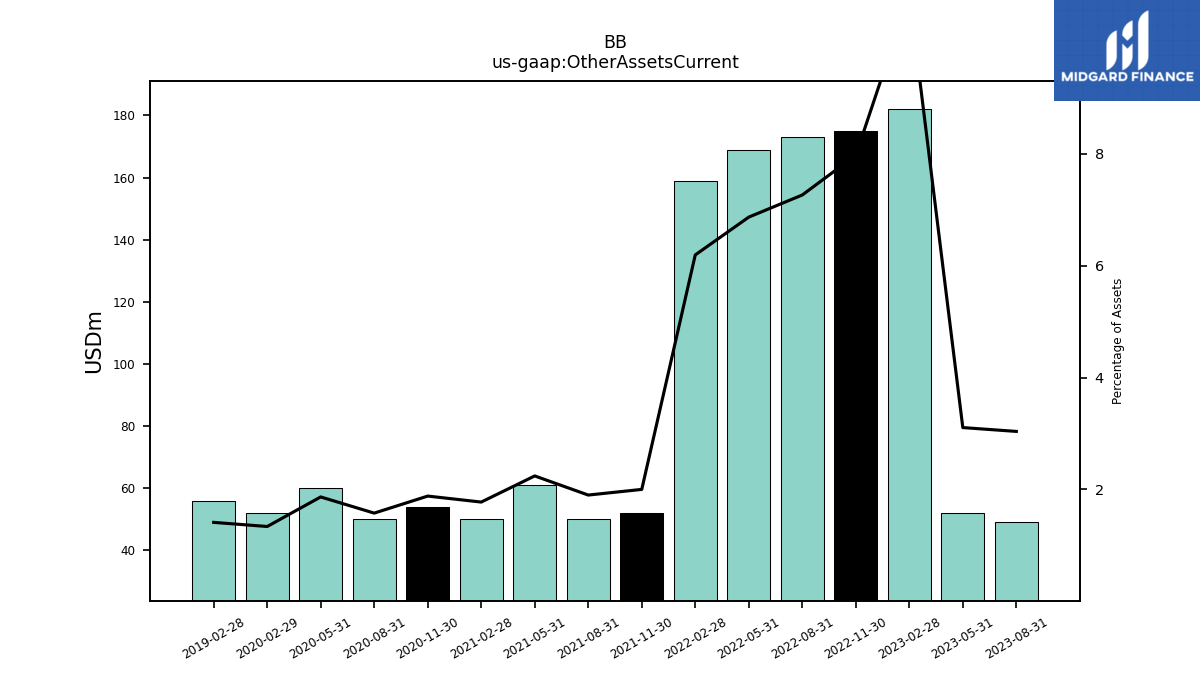
| Other Assets Current | 49.00 | 52.00 | 182.00 | 175.00 | 173.00 | 169.00 | 159.00 | 52.00 | 50.00 | 61.00 | 50.00 | 54.00 | 50.00 | 60.00 | 52.00 | NA | NA | NA | |
| Available For Sale Securities Debt Securities | 432.00 | 458.00 | 364.00 | 421.00 | 556.00 | 594.00 | 635.00 | 633.00 | 639.00 | 642.00 | 602.00 | 561.00 | 151.00 | 802.00 | 858.00 | NA | NA | NA |
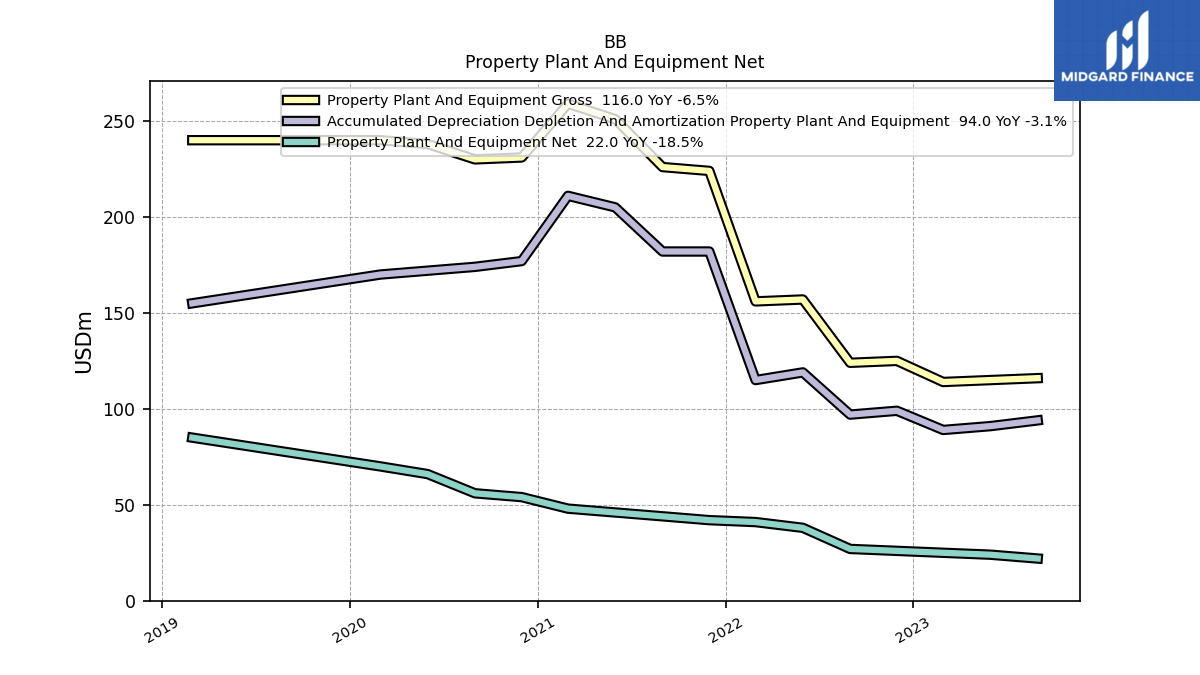
| 2023-08-31 | 2023-05-31 | 2023-02-28 | 2022-11-30 | 2022-08-31 | 2022-05-31 | 2022-02-28 | 2021-11-30 | 2021-08-31 | 2021-05-31 | 2021-02-28 | 2020-11-30 | 2020-08-31 | 2020-05-31 | 2020-02-29 | 2019-11-30 | 2019-08-31 | 2019-05-31 | ||
|---|---|---|---|---|---|---|---|---|---|---|---|---|---|---|---|---|---|---|---|
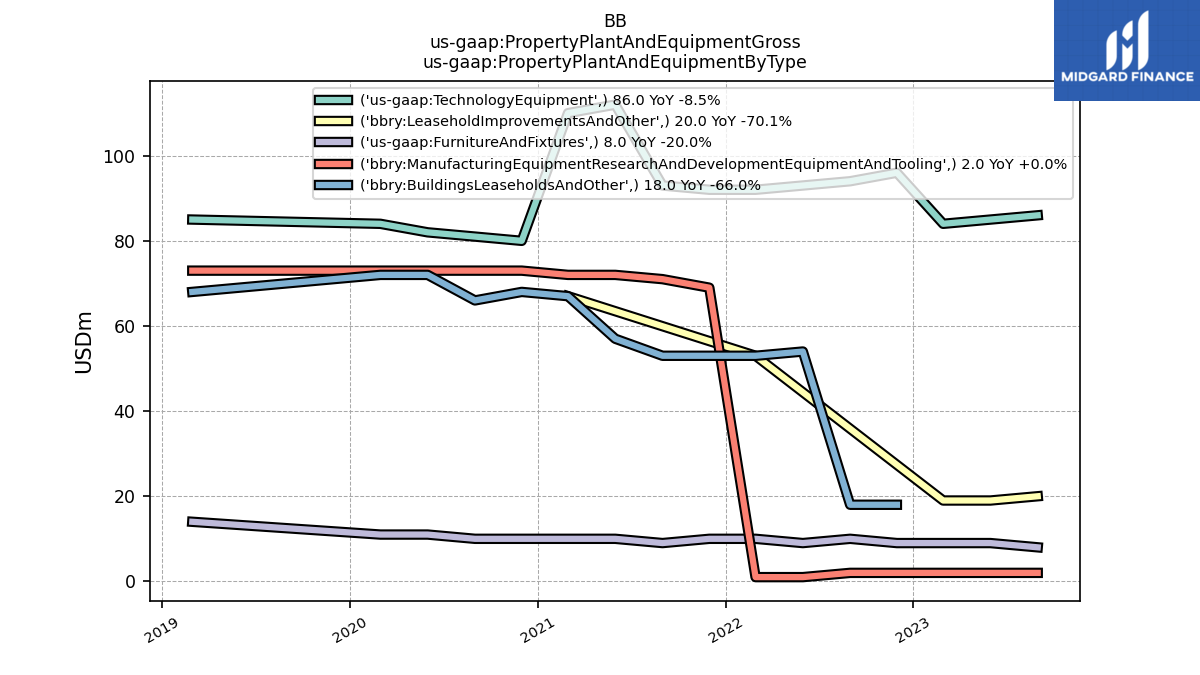
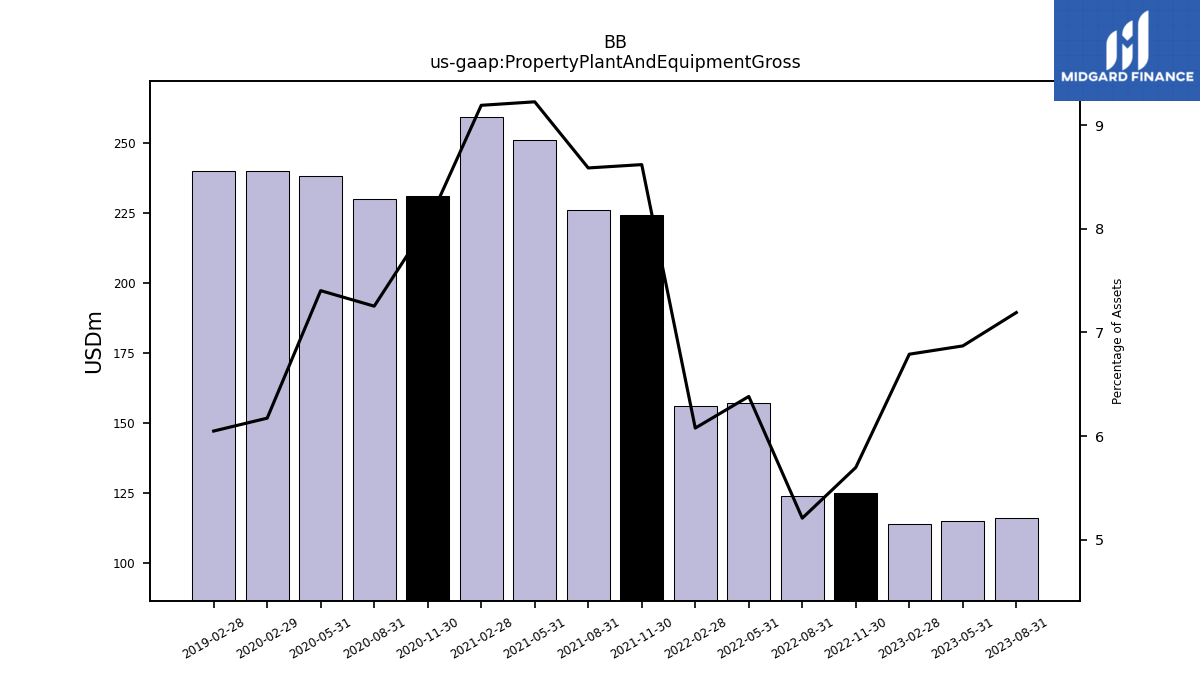
| Property Plant And Equipment Gross | 116.00 | 115.00 | 114.00 | 125.00 | 124.00 | 157.00 | 156.00 | 224.00 | 226.00 | 251.00 | 259.00 | 231.00 | 230.00 | 238.00 | 240.00 | NA | NA | NA | |
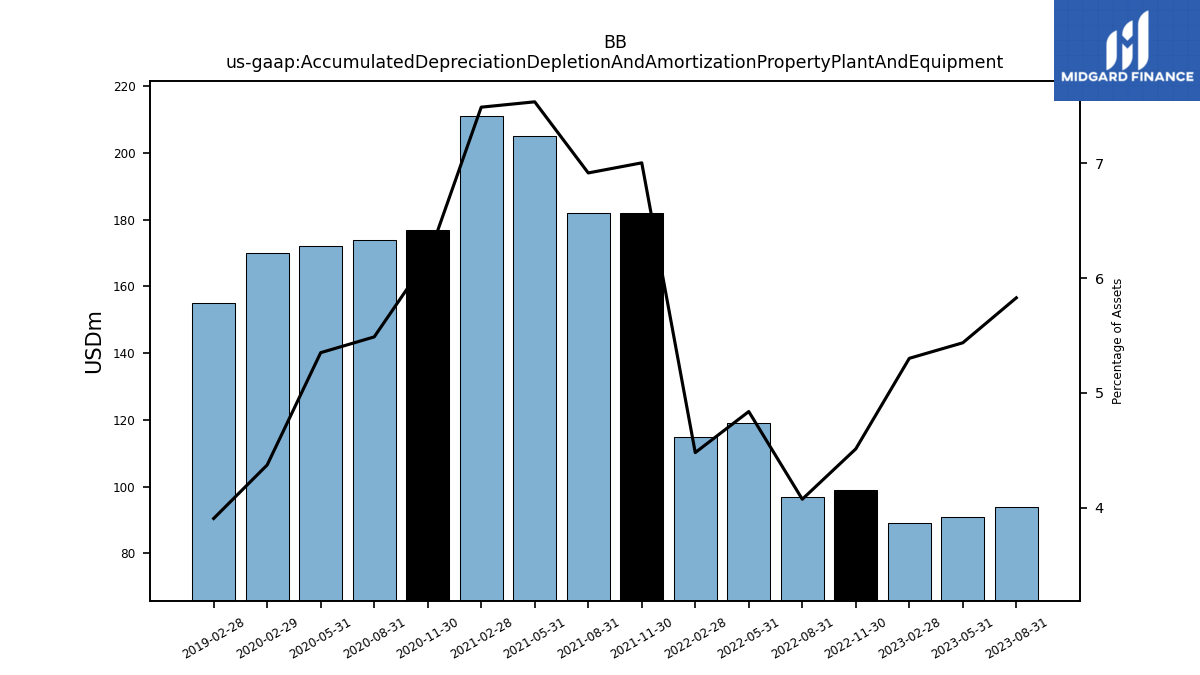
| Accumulated Depreciation Depletion And Amortization Property Plant And Equipment | 94.00 | 91.00 | 89.00 | 99.00 | 97.00 | 119.00 | 115.00 | 182.00 | 182.00 | 205.00 | 211.00 | 177.00 | 174.00 | 172.00 | 170.00 | NA | NA | NA | |
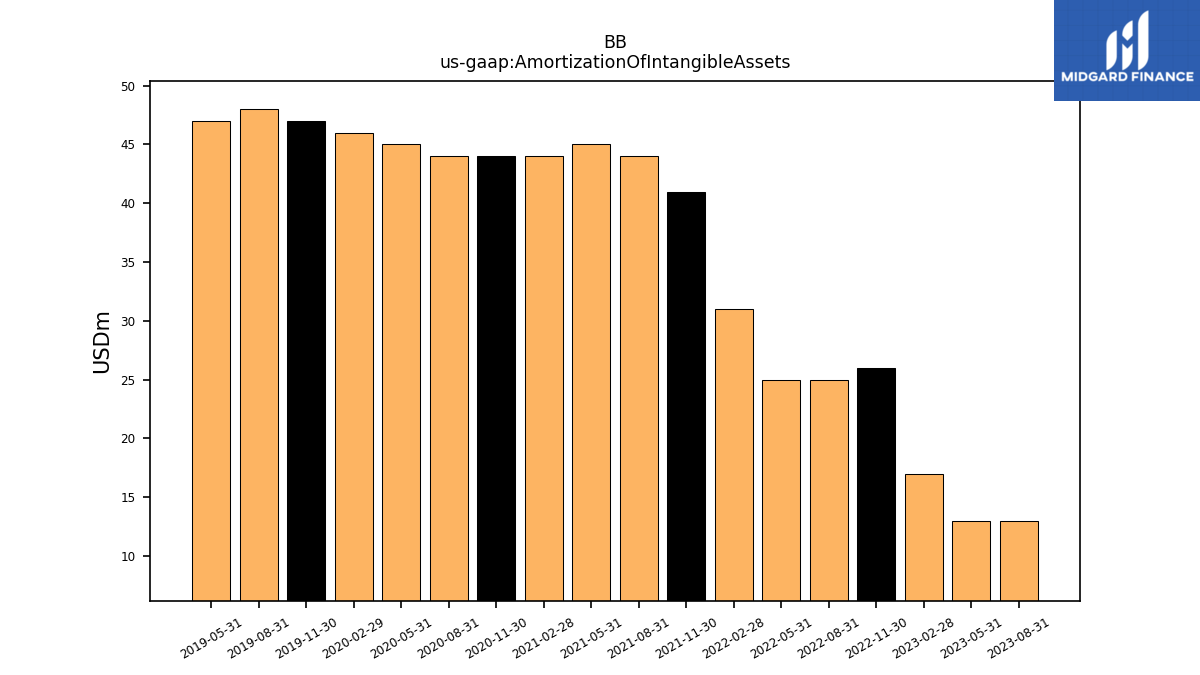
| Amortization Of Intangible Assets | 13.00 | 13.00 | 17.00 | 26.00 | 25.00 | 25.00 | 31.00 | 41.00 | 44.00 | 45.00 | 44.00 | 44.00 | 44.00 | 45.00 | 46.00 | 47.00 | 48.00 | 47.00 | |
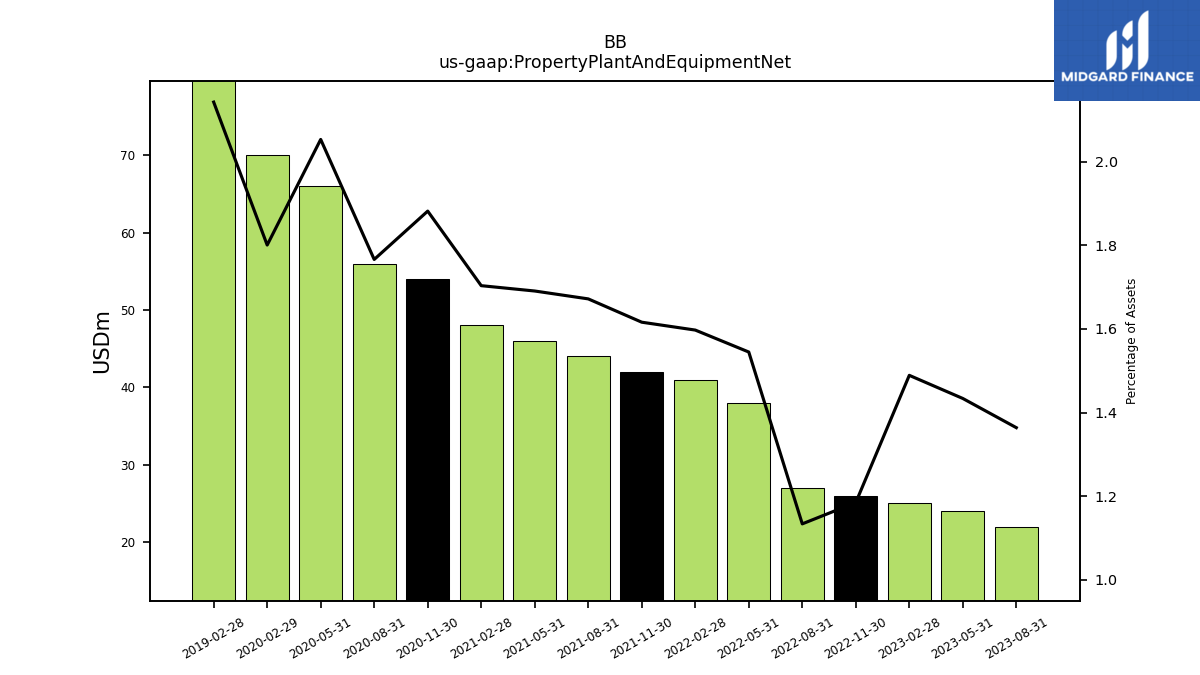
| Property Plant And Equipment Net | 22.00 | 24.00 | 25.00 | 26.00 | 27.00 | 38.00 | 41.00 | 42.00 | 44.00 | 46.00 | 48.00 | 54.00 | 56.00 | 66.00 | 70.00 | NA | NA | NA | |
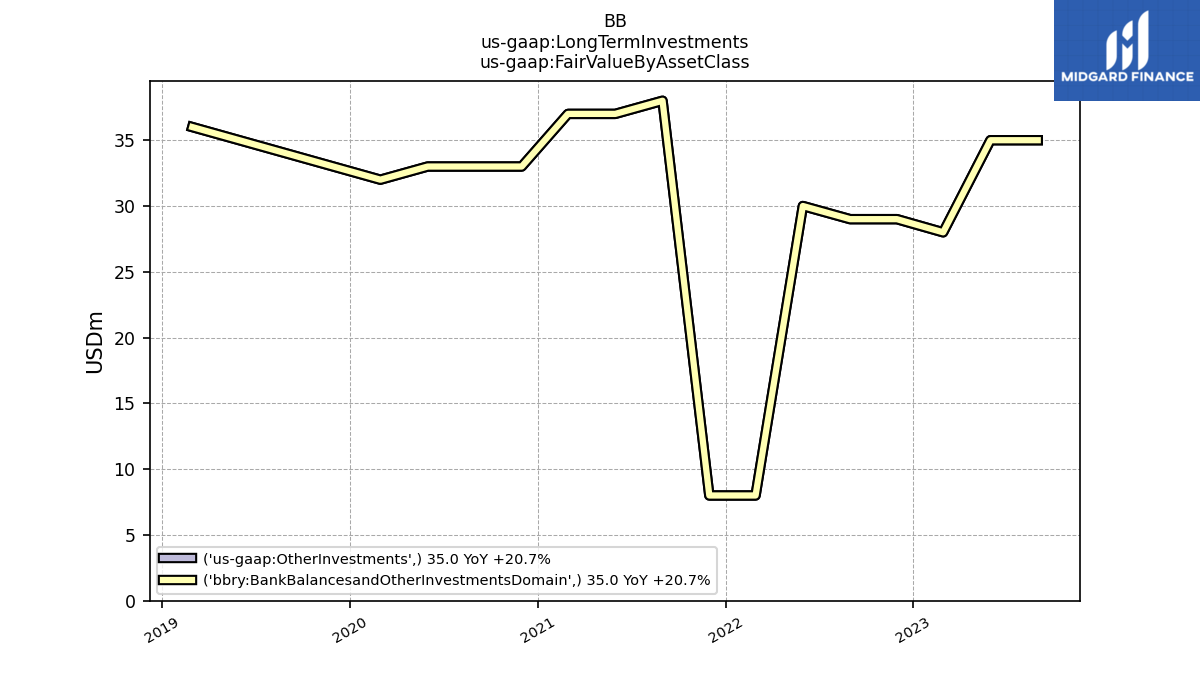
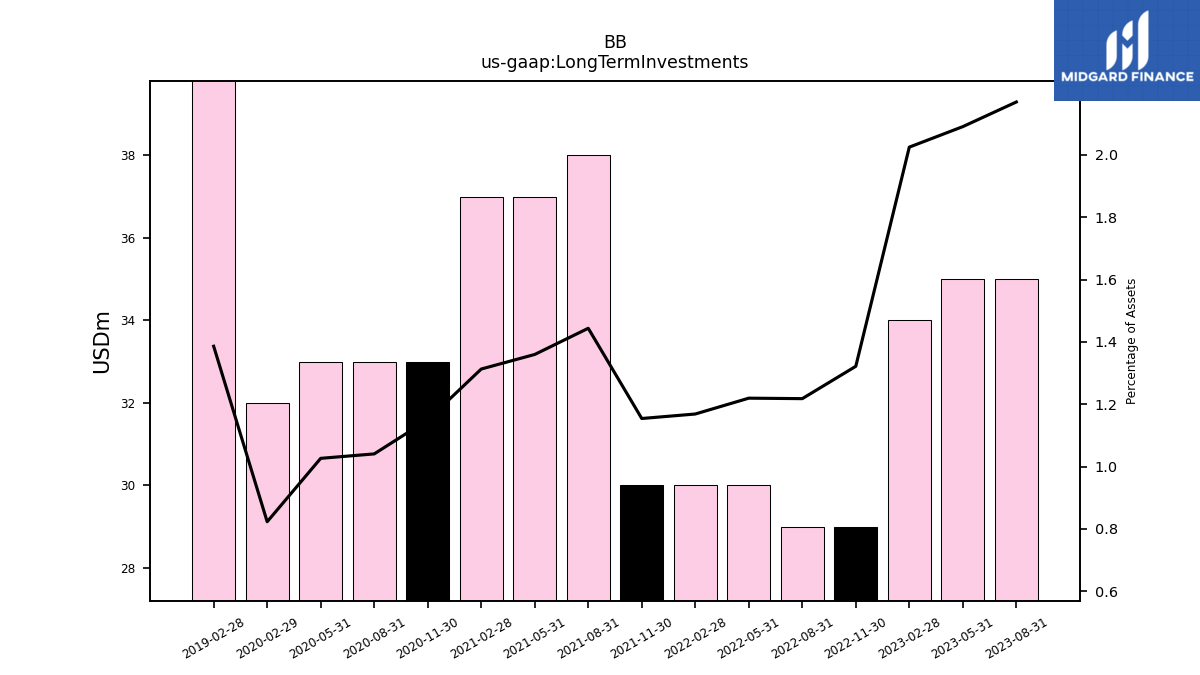
| Long Term Investments | 35.00 | 35.00 | 34.00 | 29.00 | 29.00 | 30.00 | 30.00 | 30.00 | 38.00 | 37.00 | 37.00 | 33.00 | 33.00 | 33.00 | 32.00 | NA | NA | NA | |
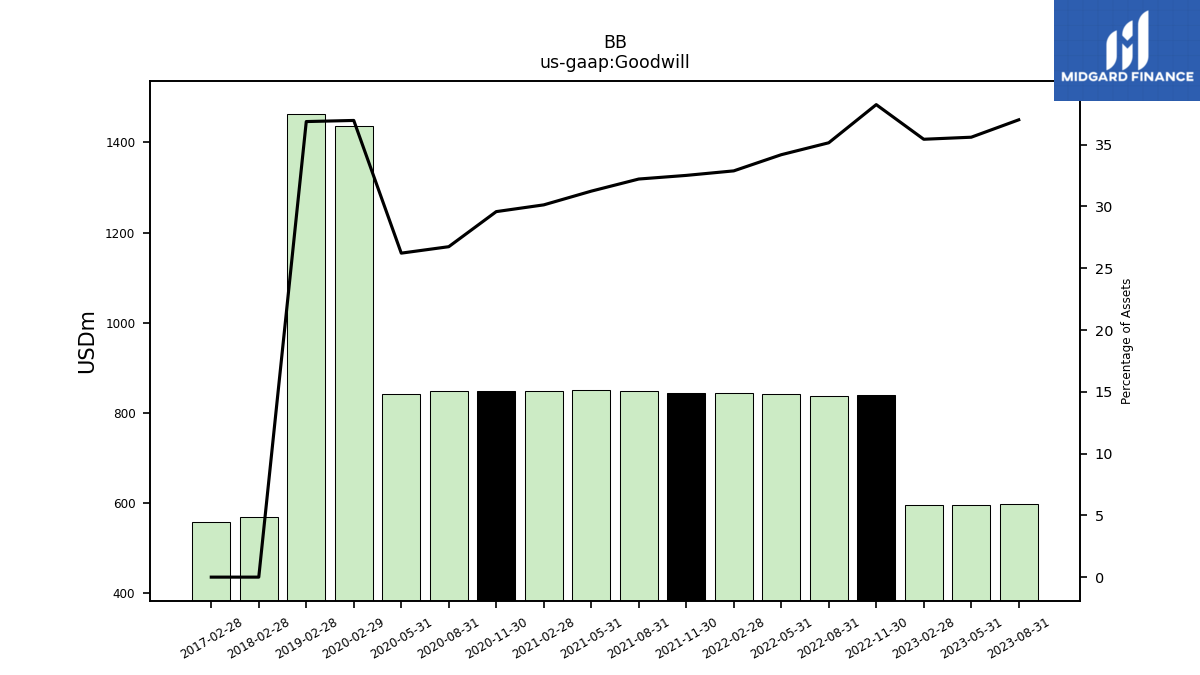
| Goodwill | 597.00 | 596.00 | 595.00 | 839.00 | 837.00 | 841.00 | 844.00 | 845.00 | 848.00 | 850.00 | 849.00 | 849.00 | 848.00 | 843.00 | 1437.00 | NA | NA | NA | |
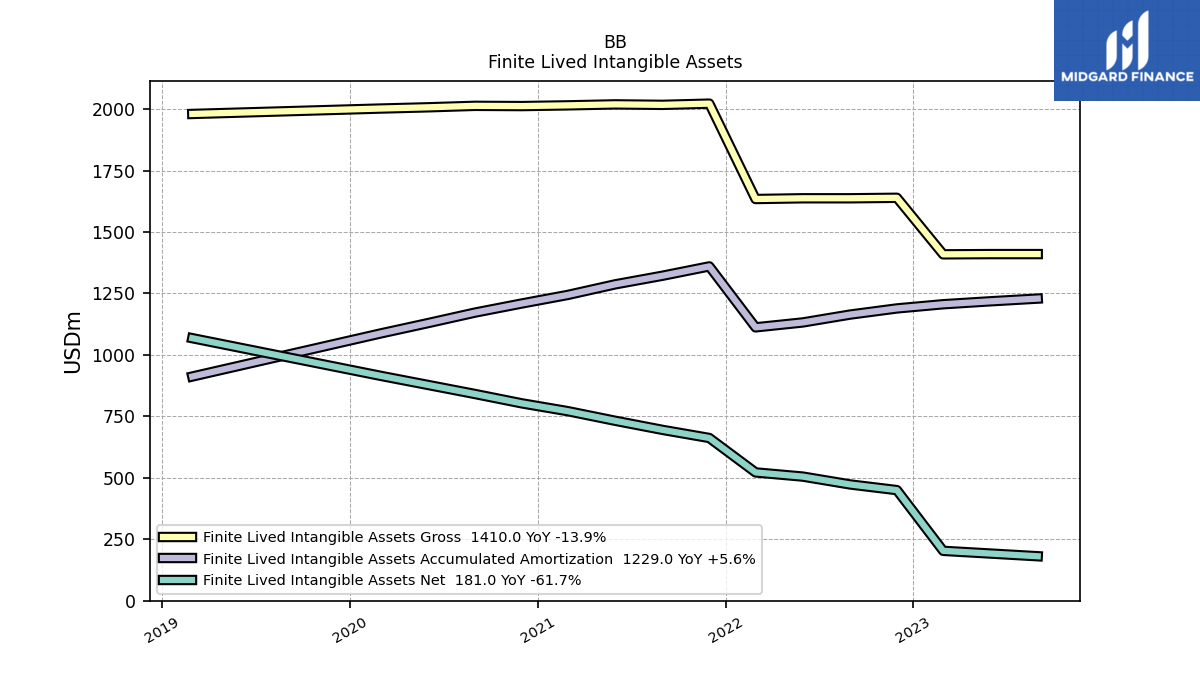
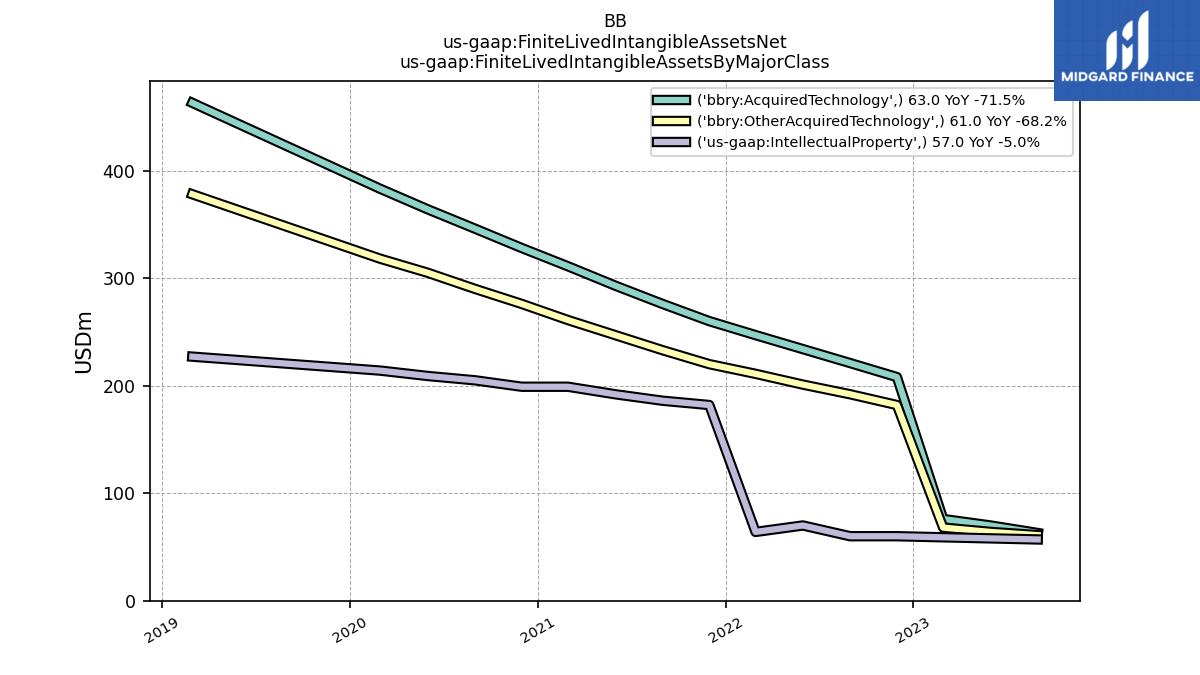
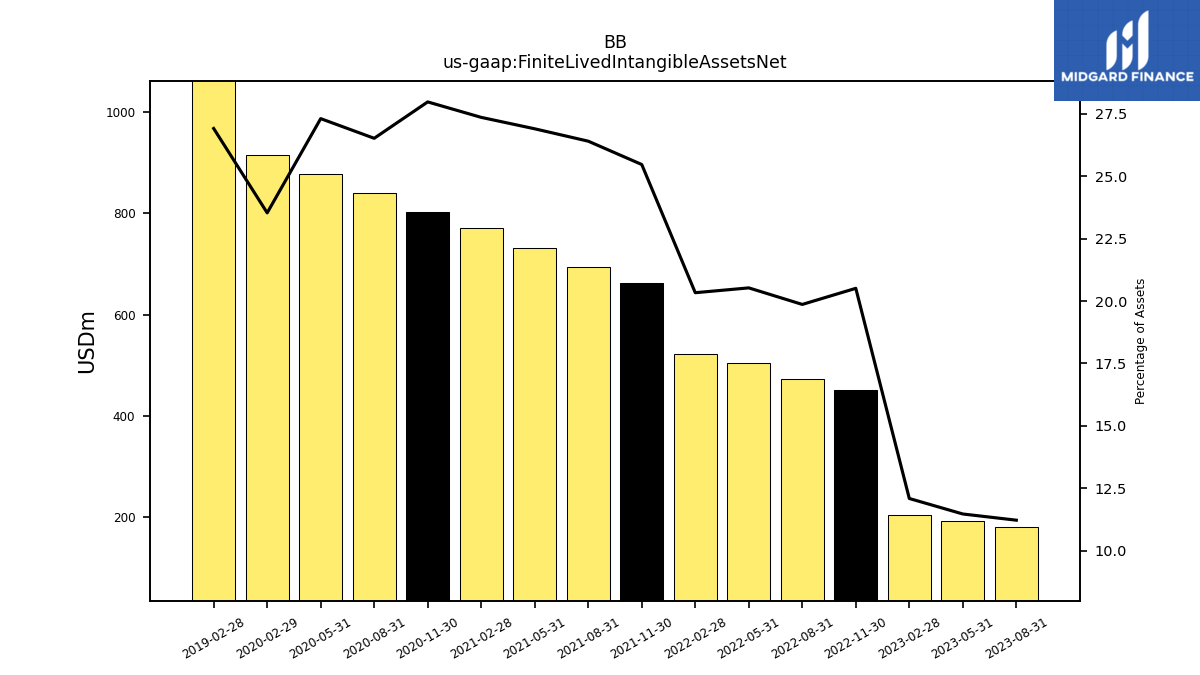
| Finite Lived Intangible Assets Net | 181.00 | 192.00 | 203.00 | 450.00 | 473.00 | 505.00 | 522.00 | 662.00 | 695.00 | 732.00 | 771.00 | 803.00 | 841.00 | 878.00 | 915.00 | NA | NA | NA | |
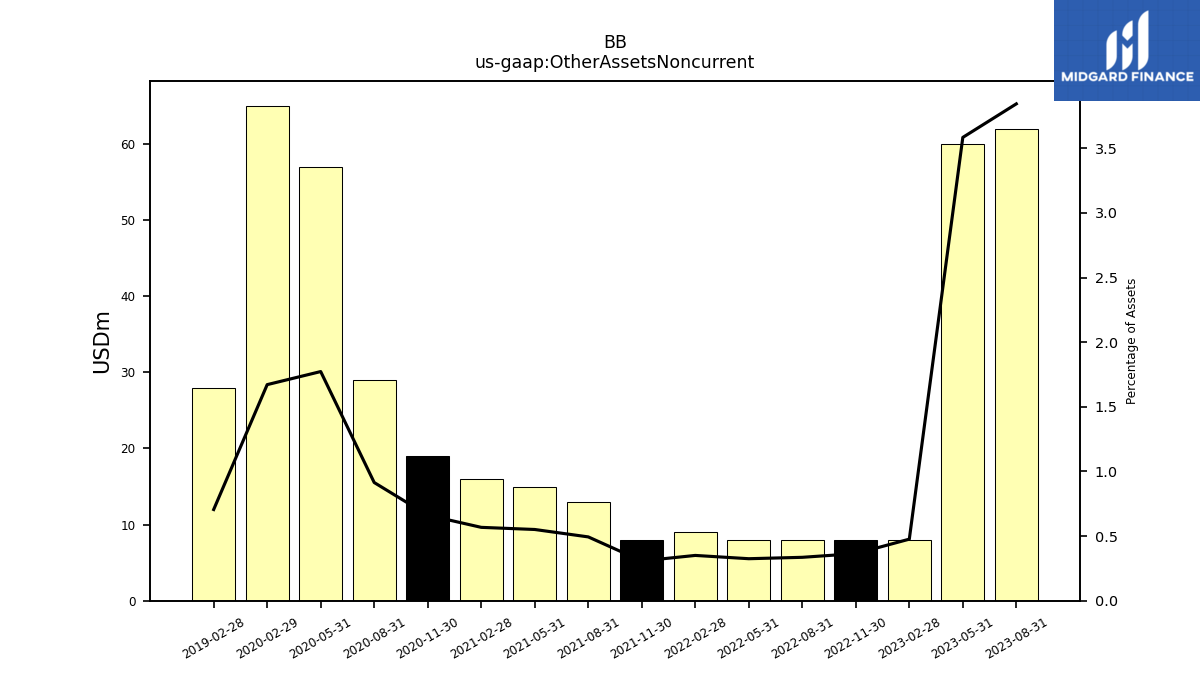
| Other Assets Noncurrent | 62.00 | 60.00 | 8.00 | 8.00 | 8.00 | 8.00 | 9.00 | 8.00 | 13.00 | 15.00 | 16.00 | 19.00 | 29.00 | 57.00 | 65.00 | NA | NA | NA | |
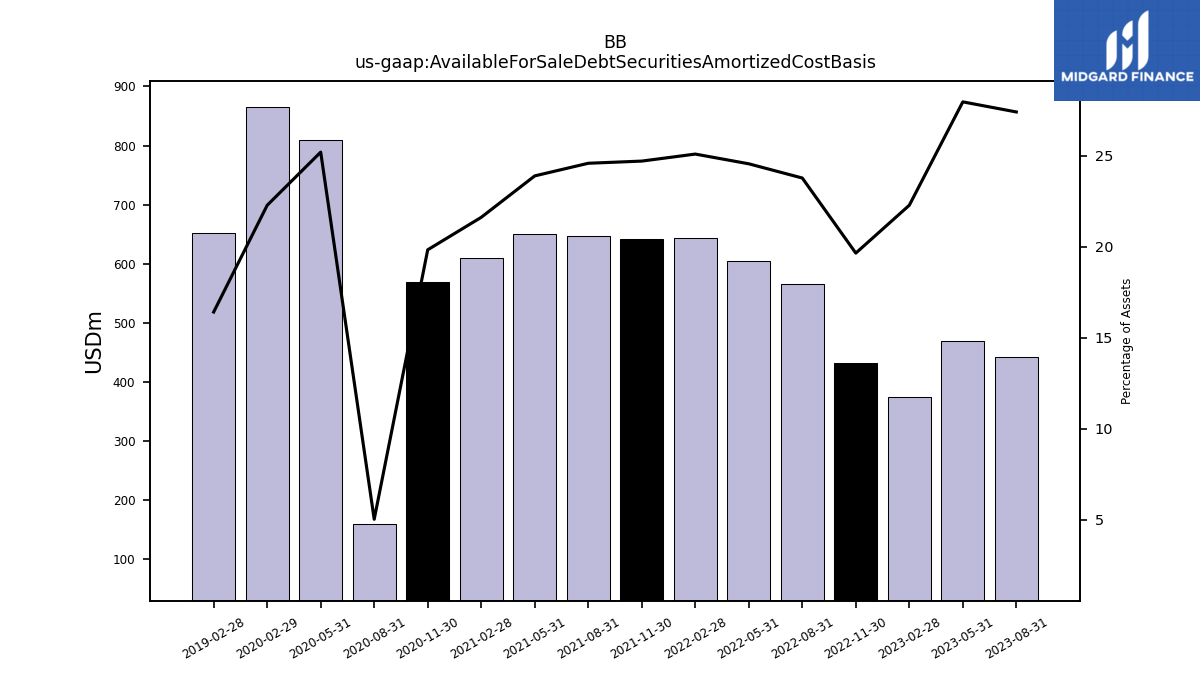
| Available For Sale Debt Securities Amortized Cost Basis | 442.00 | 468.00 | 374.00 | 431.00 | 566.00 | 604.00 | 644.00 | 642.00 | 647.00 | 650.00 | 609.00 | 569.00 | 159.00 | 810.00 | 866.00 | NA | NA | NA |
| 2023-08-31 | 2023-05-31 | 2023-02-28 | 2022-11-30 | 2022-08-31 | 2022-05-31 | 2022-02-28 | 2021-11-30 | 2021-08-31 | 2021-05-31 | 2021-02-28 | 2020-11-30 | 2020-08-31 | 2020-05-31 | 2020-02-29 | 2019-11-30 | 2019-08-31 | 2019-05-31 | ||
|---|---|---|---|---|---|---|---|---|---|---|---|---|---|---|---|---|---|---|---|
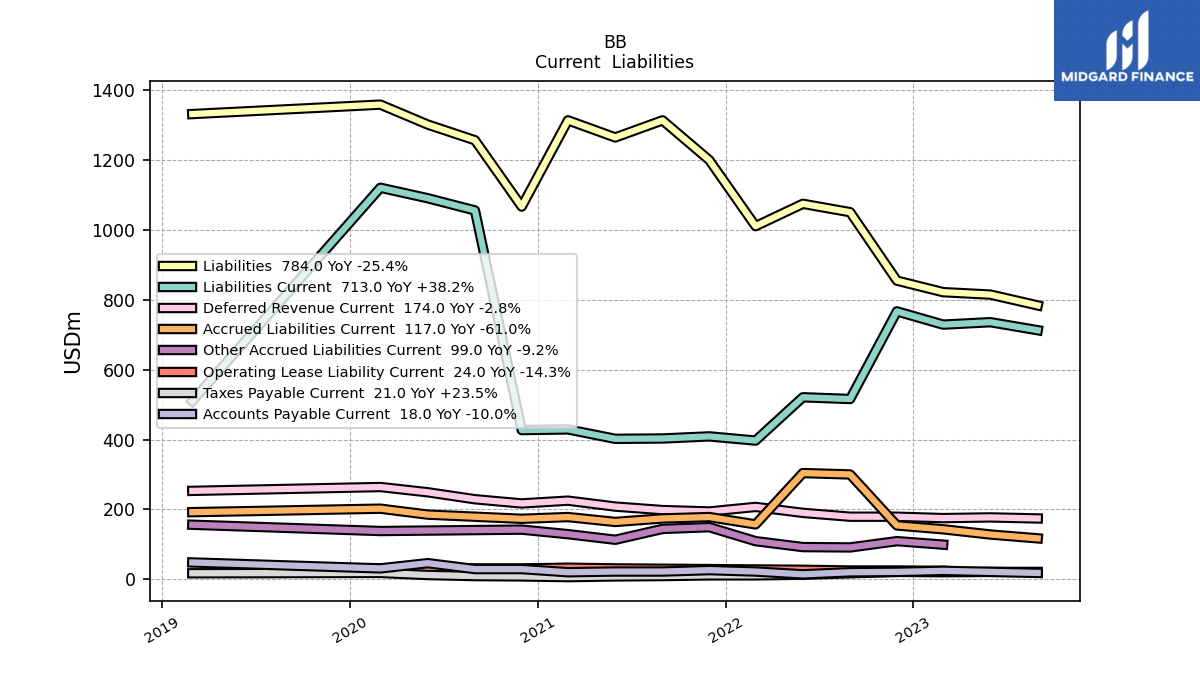
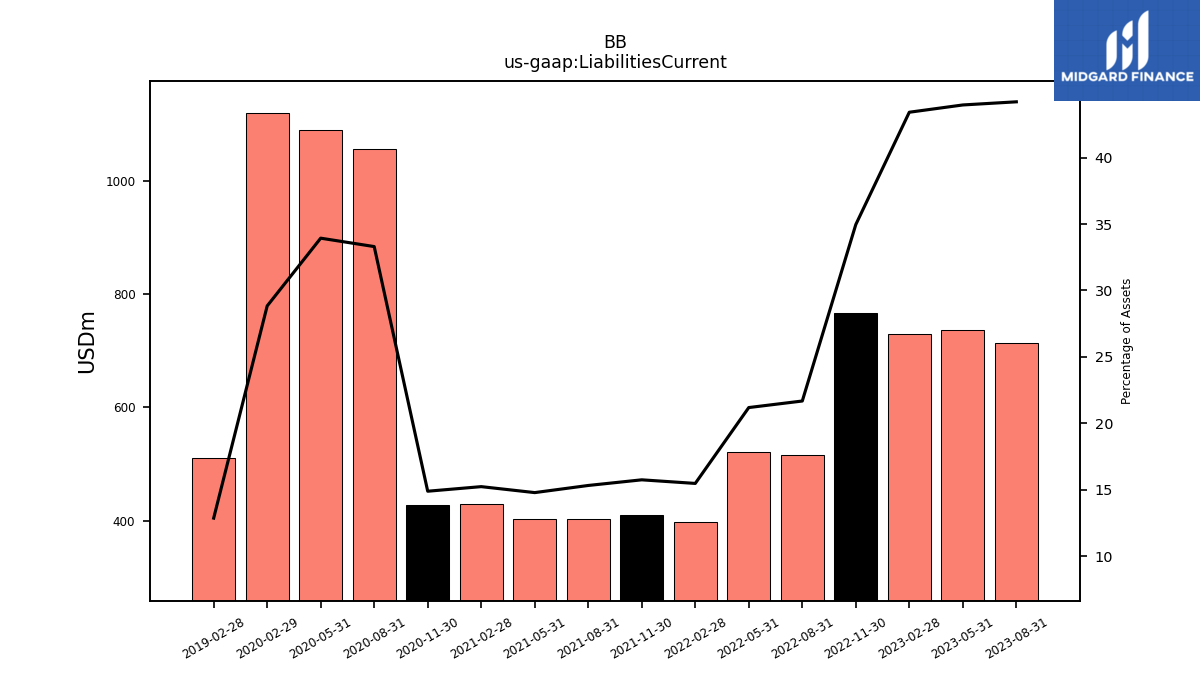
| Liabilities Current | 713.00 | 736.00 | 729.00 | 767.00 | 516.00 | 521.00 | 397.00 | 409.00 | 403.00 | 402.00 | 429.00 | 427.00 | 1056.00 | 1091.00 | 1121.00 | NA | NA | NA | |
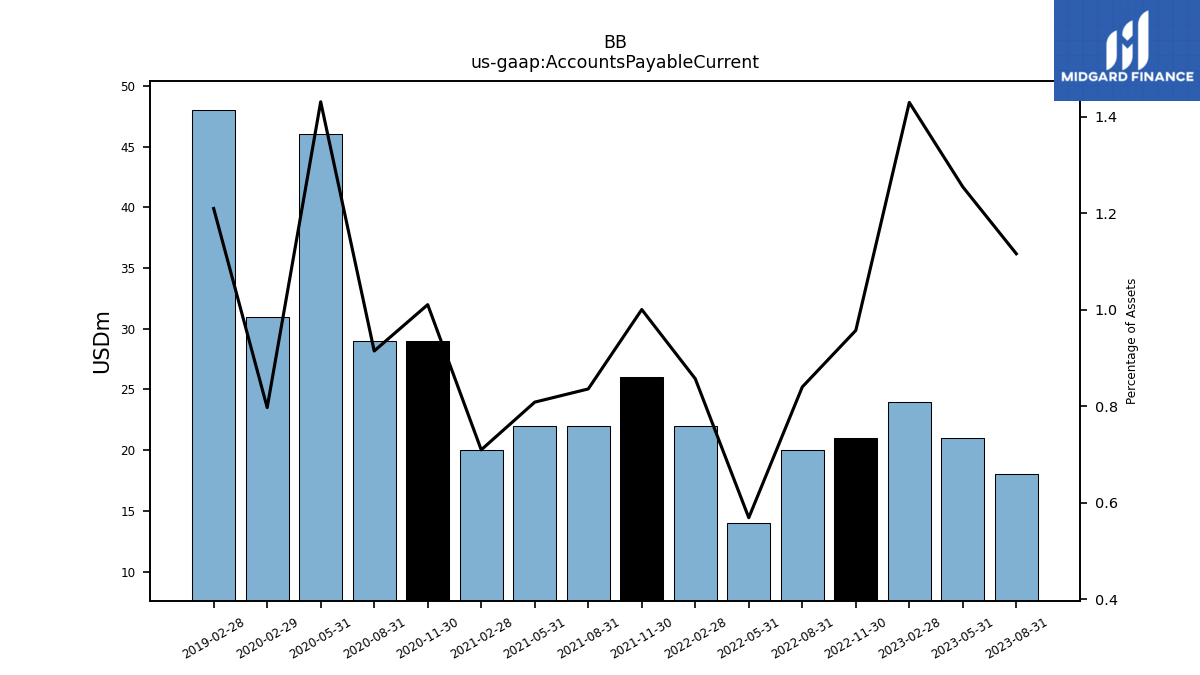
| Accounts Payable Current | 18.00 | 21.00 | 24.00 | 21.00 | 20.00 | 14.00 | 22.00 | 26.00 | 22.00 | 22.00 | 20.00 | 29.00 | 29.00 | 46.00 | 31.00 | NA | NA | NA | |
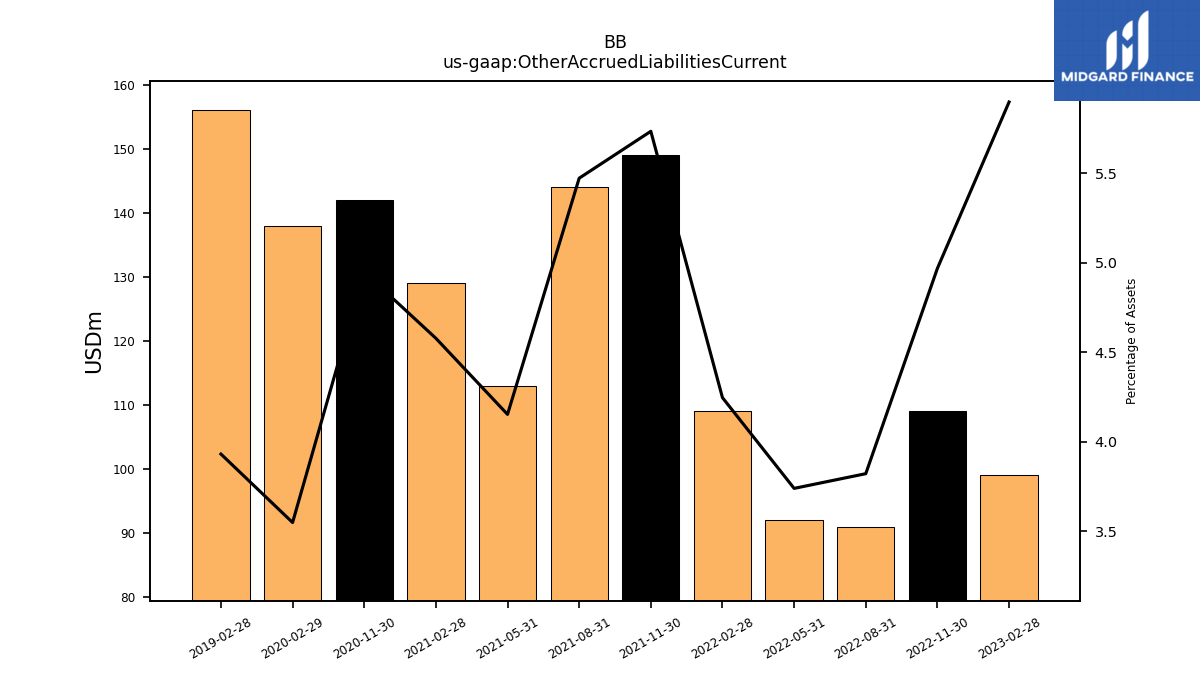
| Other Accrued Liabilities Current | NA | NA | 99.00 | 109.00 | 91.00 | 92.00 | 109.00 | 149.00 | 144.00 | 113.00 | 129.00 | 142.00 | NA | NA | 138.00 | NA | NA | NA | |
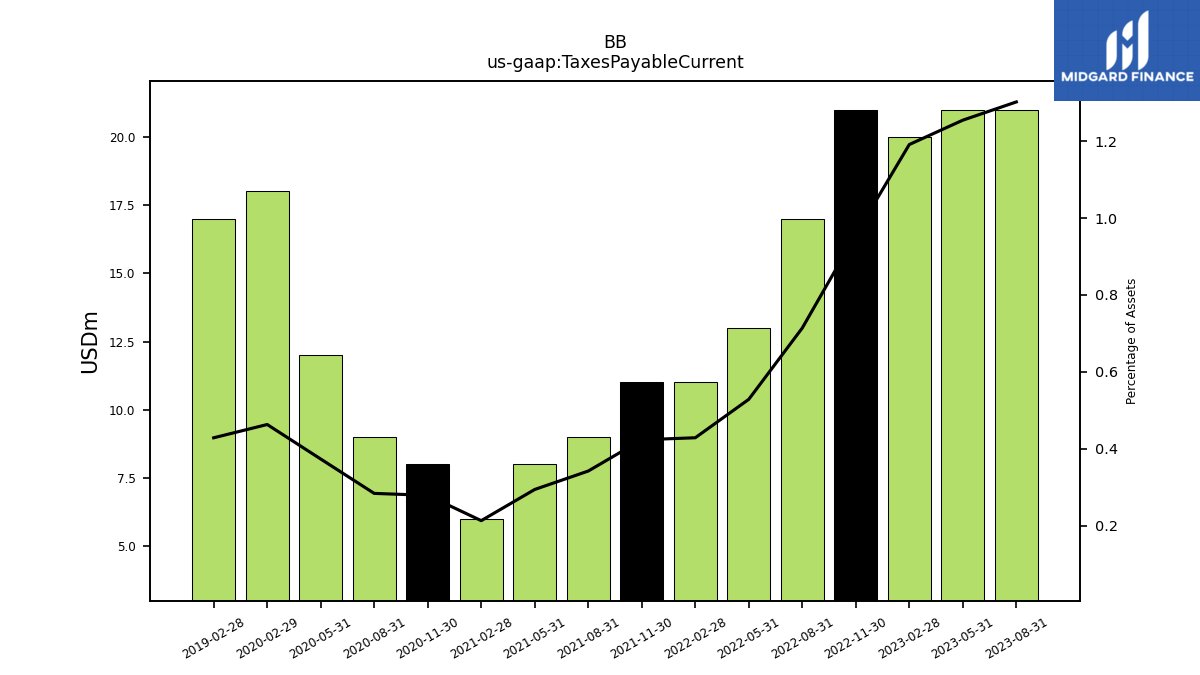
| Taxes Payable Current | 21.00 | 21.00 | 20.00 | 21.00 | 17.00 | 13.00 | 11.00 | 11.00 | 9.00 | 8.00 | 6.00 | 8.00 | 9.00 | 12.00 | 18.00 | NA | NA | NA | |
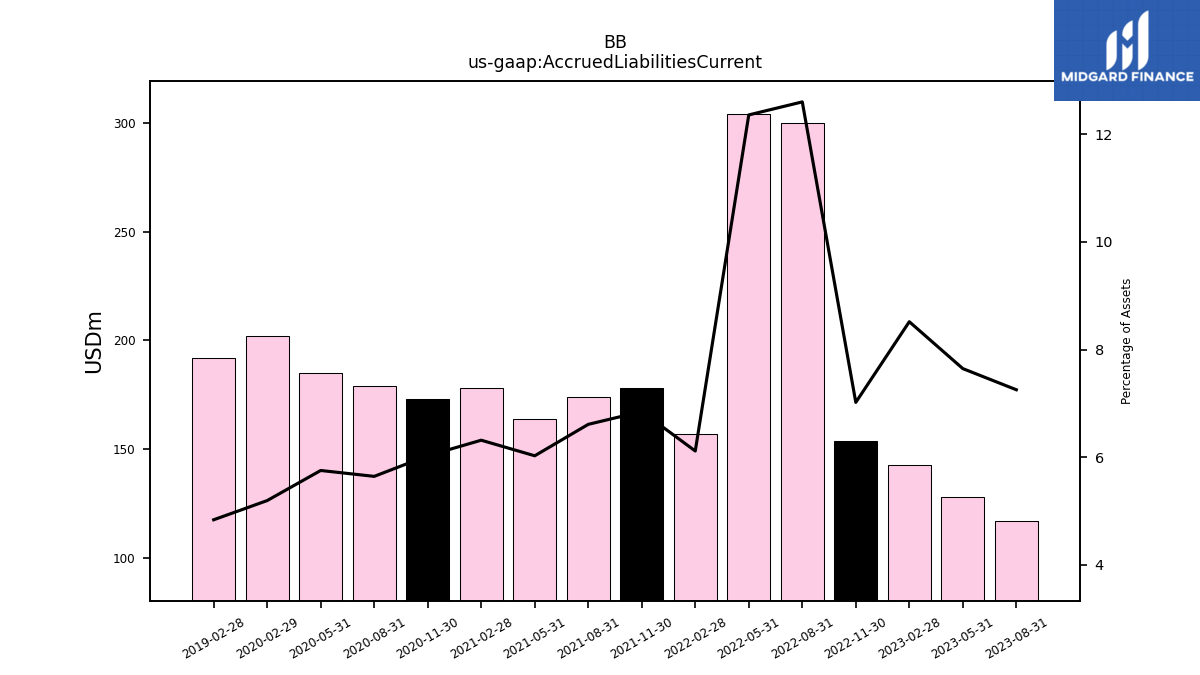
| Accrued Liabilities Current | 117.00 | 128.00 | 143.00 | 154.00 | 300.00 | 304.00 | 157.00 | 178.00 | 174.00 | 164.00 | 178.00 | 173.00 | 179.00 | 185.00 | 202.00 | NA | NA | NA |
| 2023-08-31 | 2023-05-31 | 2023-02-28 | 2022-11-30 | 2022-08-31 | 2022-05-31 | 2022-02-28 | 2021-11-30 | 2021-08-31 | 2021-05-31 | 2021-02-28 | 2020-11-30 | 2020-08-31 | 2020-05-31 | 2020-02-29 | 2019-11-30 | 2019-08-31 | 2019-05-31 | ||
|---|---|---|---|---|---|---|---|---|---|---|---|---|---|---|---|---|---|---|---|
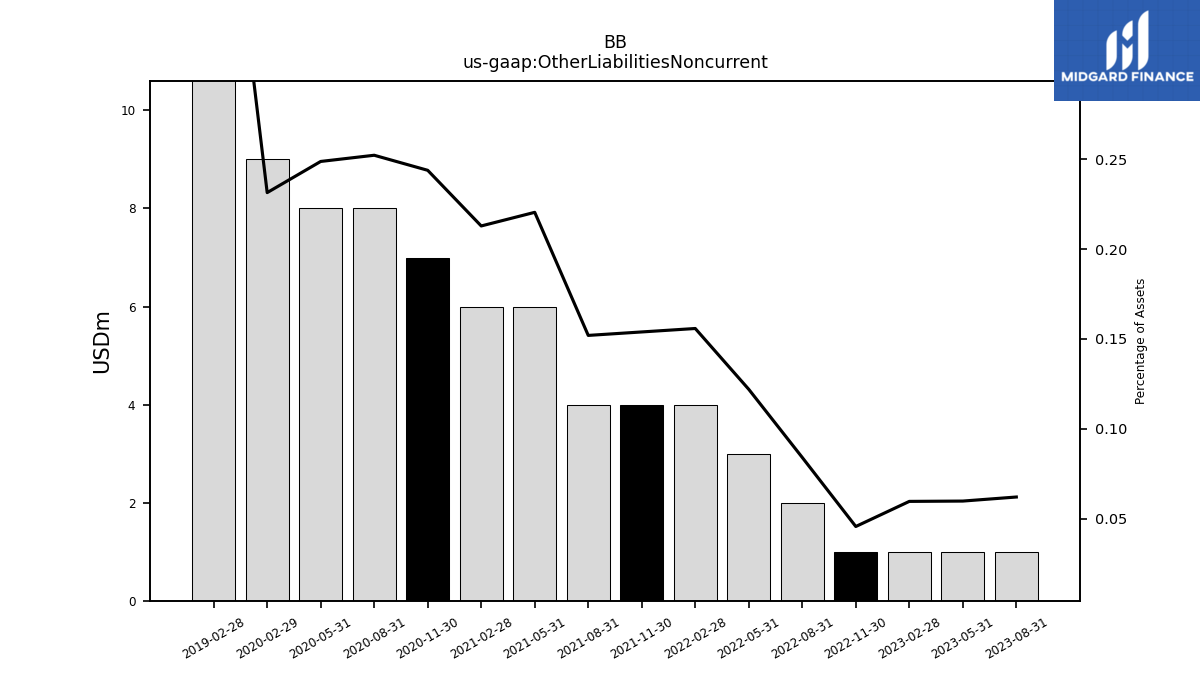
| Other Liabilities Noncurrent | 1.00 | 1.00 | 1.00 | 1.00 | 2.00 | 3.00 | 4.00 | 4.00 | 4.00 | 6.00 | 6.00 | 7.00 | 8.00 | 8.00 | 9.00 | NA | NA | NA | |
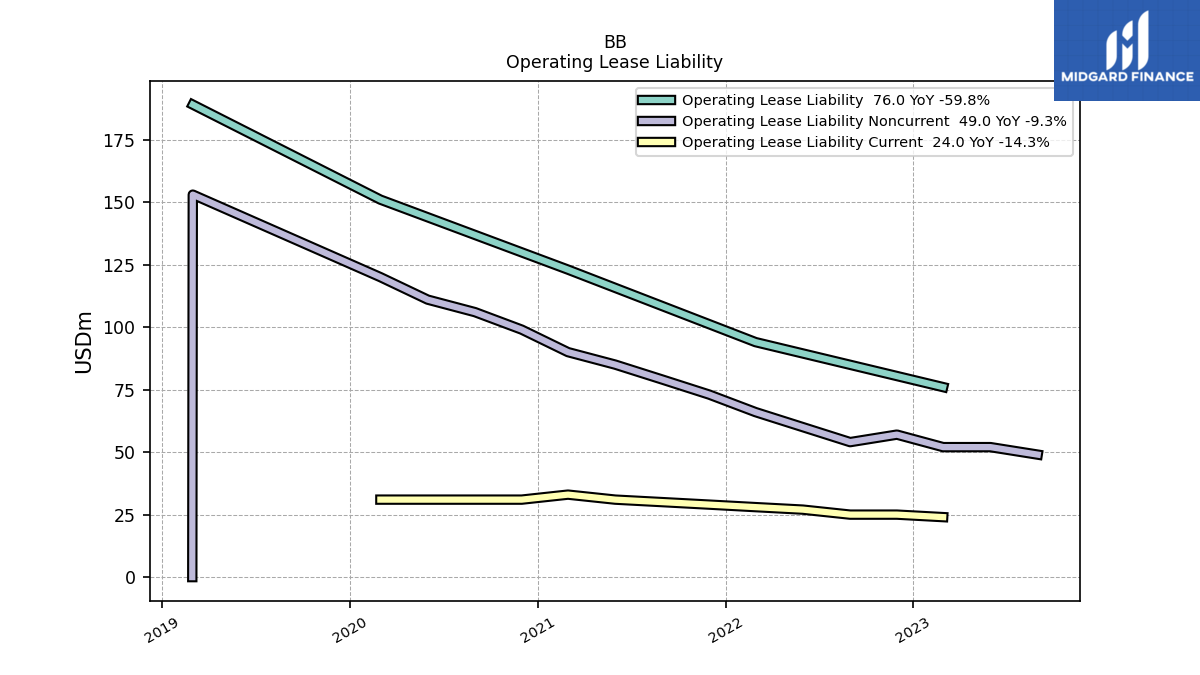
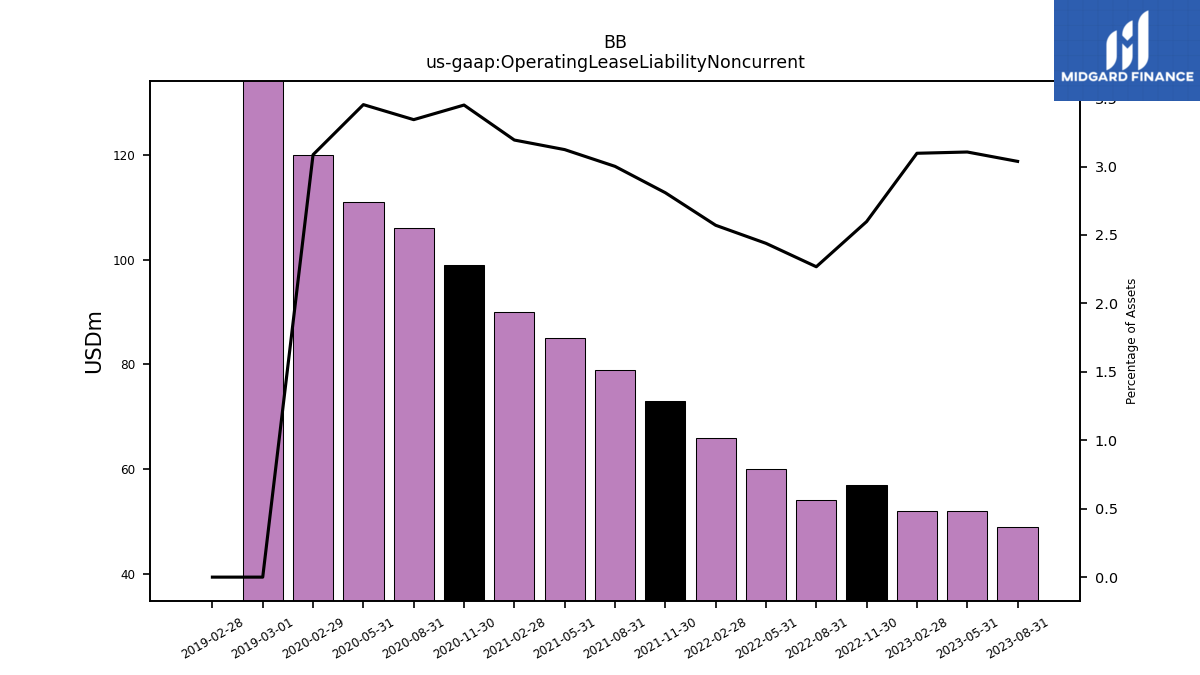
| Operating Lease Liability Noncurrent | 49.00 | 52.00 | 52.00 | 57.00 | 54.00 | 60.00 | 66.00 | 73.00 | 79.00 | 85.00 | 90.00 | 99.00 | 106.00 | 111.00 | 120.00 | NA | NA | NA |
| 2023-08-31 | 2023-05-31 | 2023-02-28 | 2022-11-30 | 2022-08-31 | 2022-05-31 | 2022-02-28 | 2021-11-30 | 2021-08-31 | 2021-05-31 | 2021-02-28 | 2020-11-30 | 2020-08-31 | 2020-05-31 | 2020-02-29 | 2019-11-30 | 2019-08-31 | 2019-05-31 | ||
|---|---|---|---|---|---|---|---|---|---|---|---|---|---|---|---|---|---|---|---|
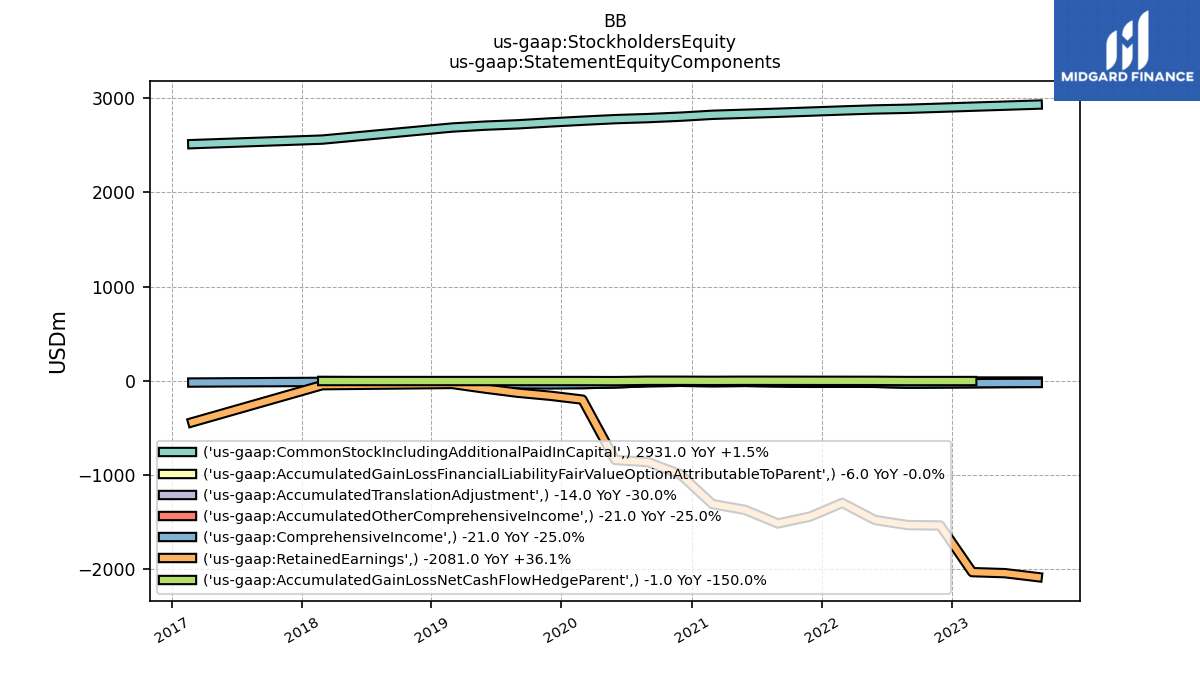
| Stockholders Equity | 829.00 | 859.00 | 857.00 | 1339.00 | 1330.00 | 1385.00 | 1556.00 | 1399.00 | 1318.00 | 1456.00 | 1504.00 | 1803.00 | 1914.00 | 1913.00 | 2529.00 | 2548.00 | 2562.00 | 2597.00 | |
| Common Stock Value | 2931.00 | 2920.00 | 2909.00 | 2898.00 | 2887.00 | 2880.00 | 2869.00 | 2857.00 | 2845.00 | 2834.00 | 2823.00 | 2803.00 | 2788.00 | 2777.00 | 2760.00 | NA | NA | NA | |
| Retained Earnings Accumulated Deficit | -2081.00 | -2039.00 | -2028.00 | -1533.00 | -1529.00 | -1475.00 | -1294.00 | -1438.00 | -1512.00 | -1368.00 | -1306.00 | -991.00 | -861.00 | -838.00 | -198.00 | NA | NA | NA | |
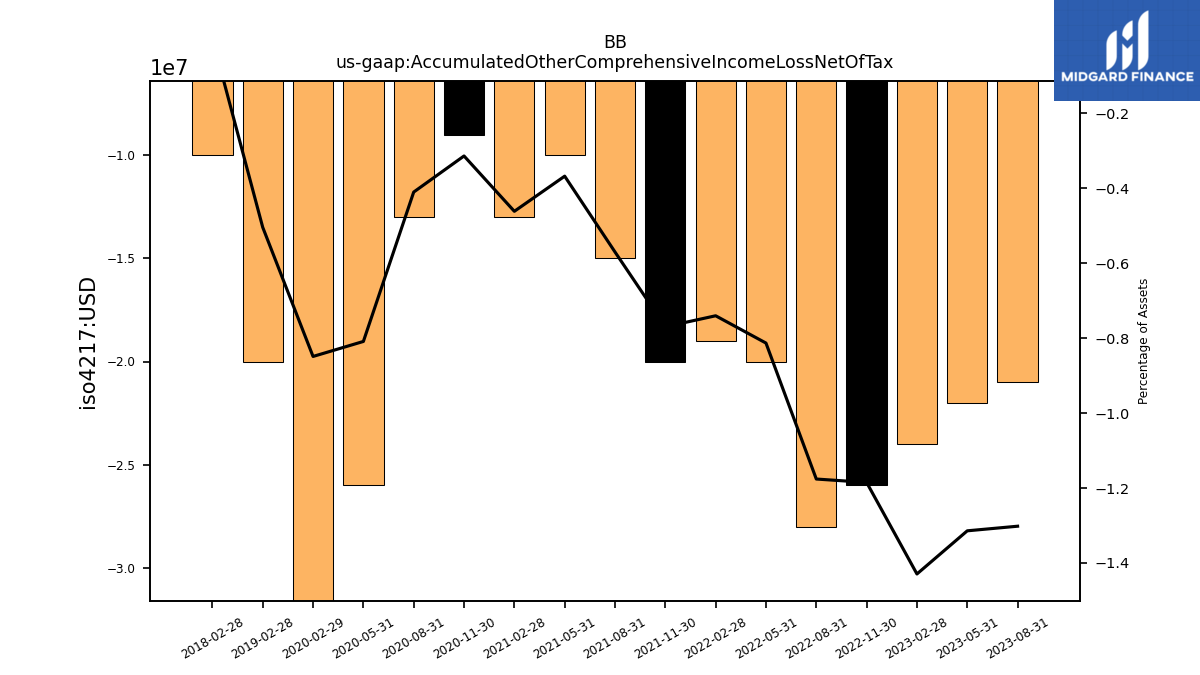
| Accumulated Other Comprehensive Income Loss Net Of Tax | -21.00 | -22.00 | -24.00 | -26.00 | -28.00 | -20.00 | -19.00 | -20.00 | -15.00 | -10.00 | -13.00 | -9.00 | -13.00 | -26.00 | -33.00 | NA | NA | NA | |
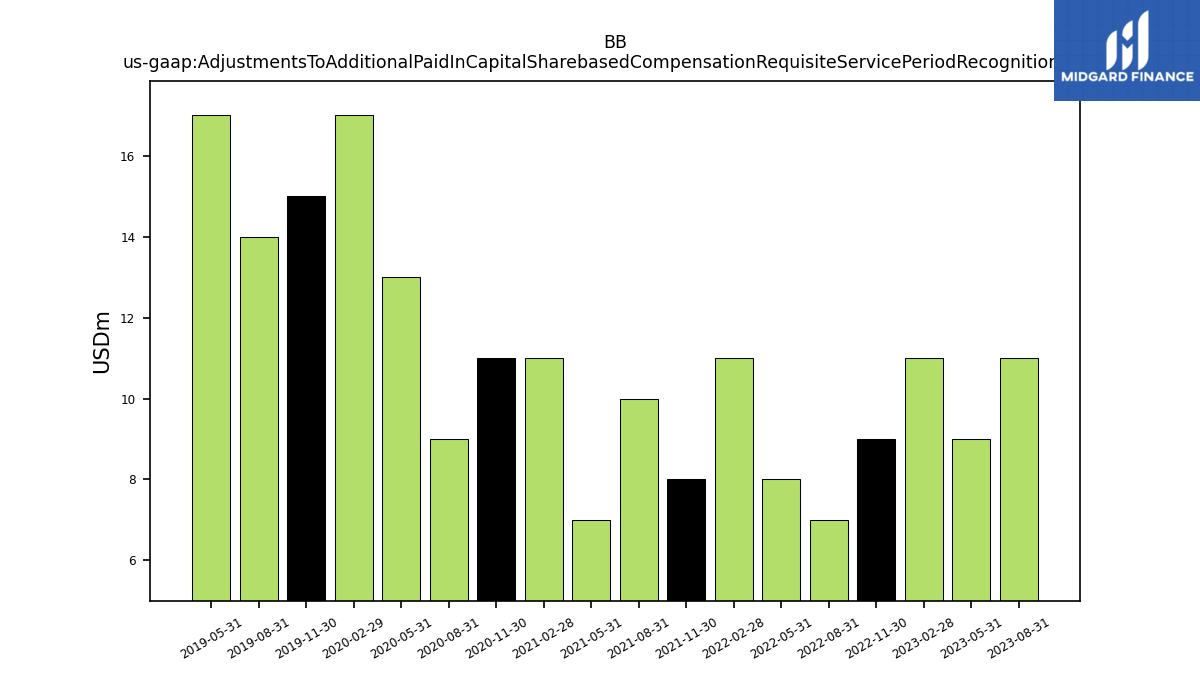
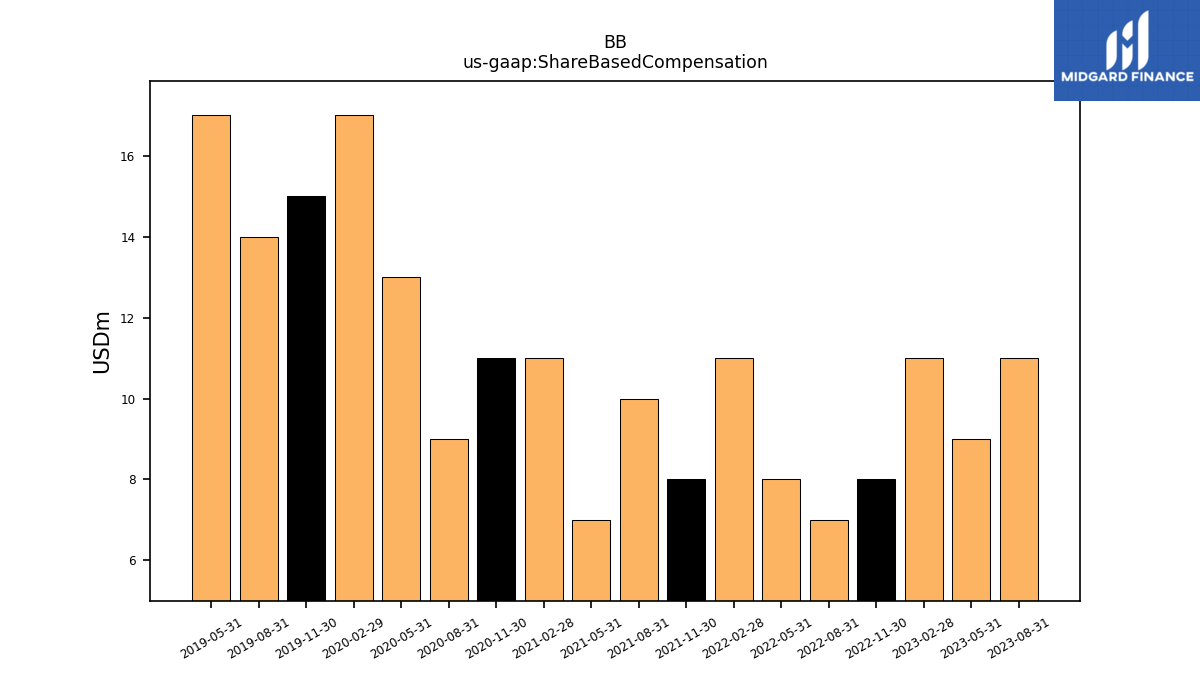
| Adjustments To Additional Paid In Capital Sharebased Compensation Requisite Service Period Recognition Value | 11.00 | 9.00 | 11.00 | 9.00 | 7.00 | 8.00 | 11.00 | 8.00 | 10.00 | 7.00 | 11.00 | 11.00 | 9.00 | 13.00 | 17.00 | 15.00 | 14.00 | 17.00 |
| 2023-08-31 | 2023-05-31 | 2023-02-28 | 2022-11-30 | 2022-08-31 | 2022-05-31 | 2022-02-28 | 2021-11-30 | 2021-08-31 | 2021-05-31 | 2021-02-28 | 2020-11-30 | 2020-08-31 | 2020-05-31 | 2020-02-29 | 2019-11-30 | 2019-08-31 | 2019-05-31 | ||
|---|---|---|---|---|---|---|---|---|---|---|---|---|---|---|---|---|---|---|---|
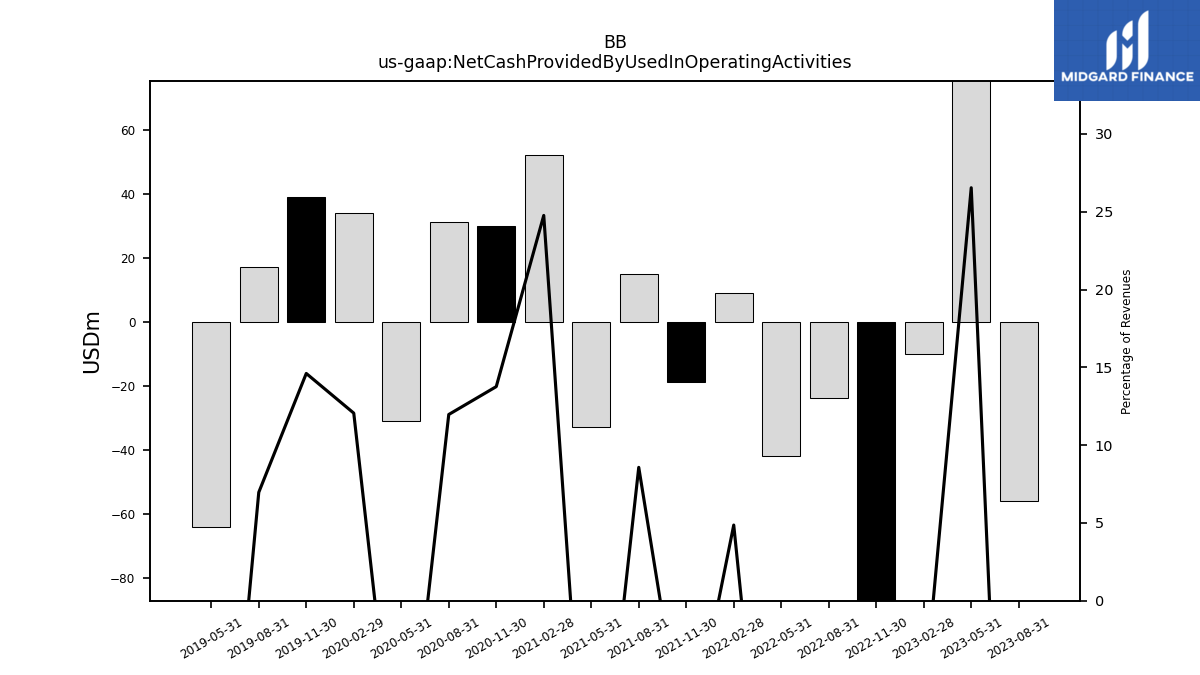
| Net Cash Provided By Used In Operating Activities | -56.00 | 99.00 | -10.00 | -187.00 | -24.00 | -42.00 | 9.00 | -19.00 | 15.00 | -33.00 | 52.00 | 30.00 | 31.00 | -31.00 | 34.00 | 39.00 | 17.00 | -64.00 | |
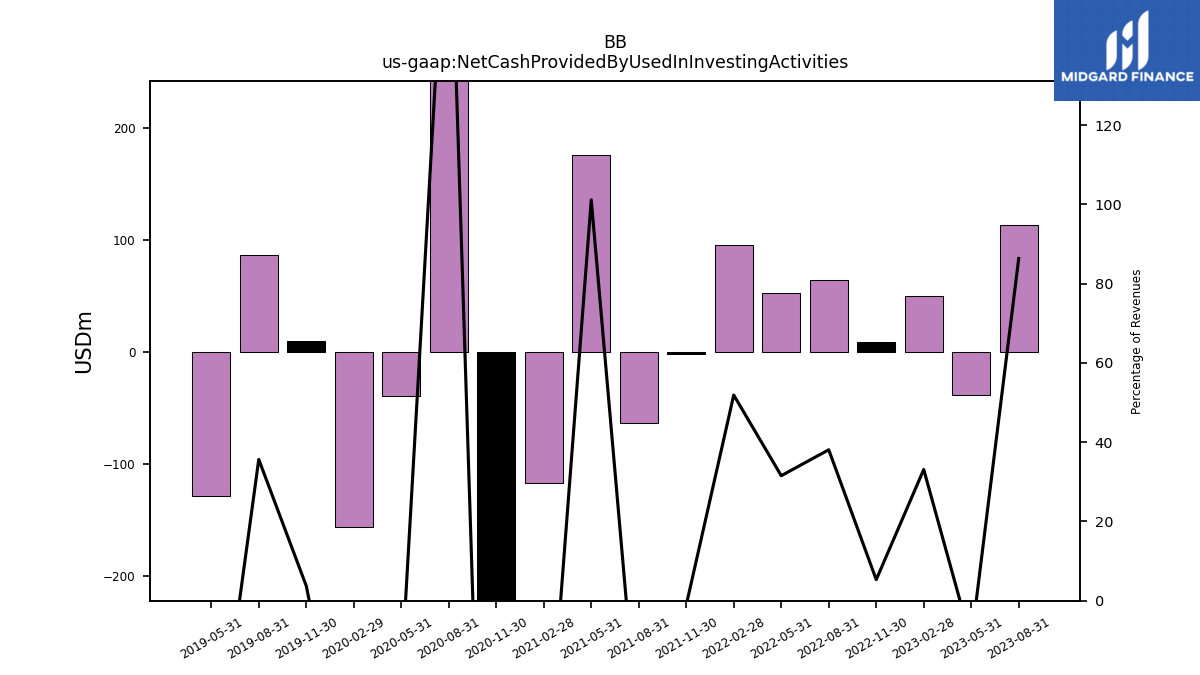
| Net Cash Provided By Used In Investing Activities | 114.00 | -38.00 | 50.00 | 9.00 | 64.00 | 53.00 | 96.00 | -2.00 | -63.00 | 176.00 | -117.00 | -402.00 | 493.00 | -39.00 | -156.00 | 10.00 | 87.00 | -129.00 | |
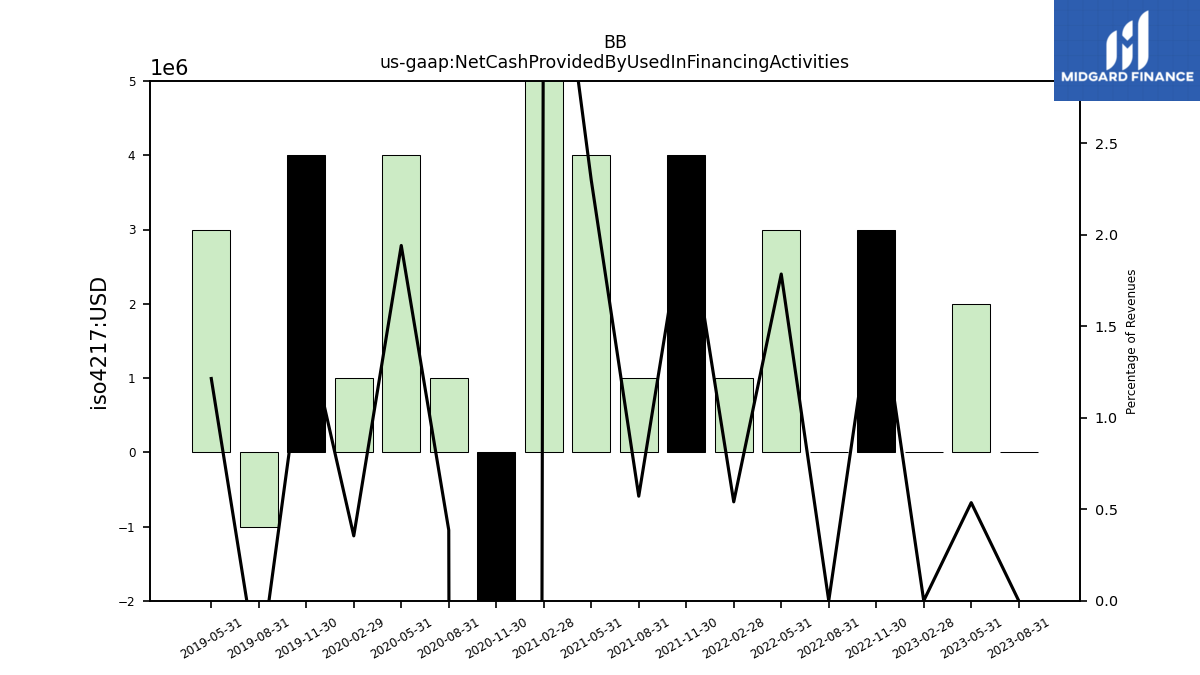
| Net Cash Provided By Used In Financing Activities | 0.00 | 2.00 | 0.00 | 3.00 | 0.00 | 3.00 | 1.00 | 4.00 | 1.00 | 4.00 | 9.00 | -241.00 | 1.00 | 4.00 | 1.00 | 4.00 | -1.00 | 3.00 |
| 2023-08-31 | 2023-05-31 | 2023-02-28 | 2022-11-30 | 2022-08-31 | 2022-05-31 | 2022-02-28 | 2021-11-30 | 2021-08-31 | 2021-05-31 | 2021-02-28 | 2020-11-30 | 2020-08-31 | 2020-05-31 | 2020-02-29 | 2019-11-30 | 2019-08-31 | 2019-05-31 | ||
|---|---|---|---|---|---|---|---|---|---|---|---|---|---|---|---|---|---|---|---|
| Net Cash Provided By Used In Operating Activities | -56.00 | 99.00 | -10.00 | -187.00 | -24.00 | -42.00 | 9.00 | -19.00 | 15.00 | -33.00 | 52.00 | 30.00 | 31.00 | -31.00 | 34.00 | 39.00 | 17.00 | -64.00 | |
| Net Income Loss | -42.00 | -11.00 | -495.00 | -4.00 | -54.00 | -181.00 | 144.00 | 74.00 | -144.00 | -62.00 | -315.00 | -130.00 | -23.00 | -636.00 | -41.00 | -32.00 | -44.00 | -35.00 | |
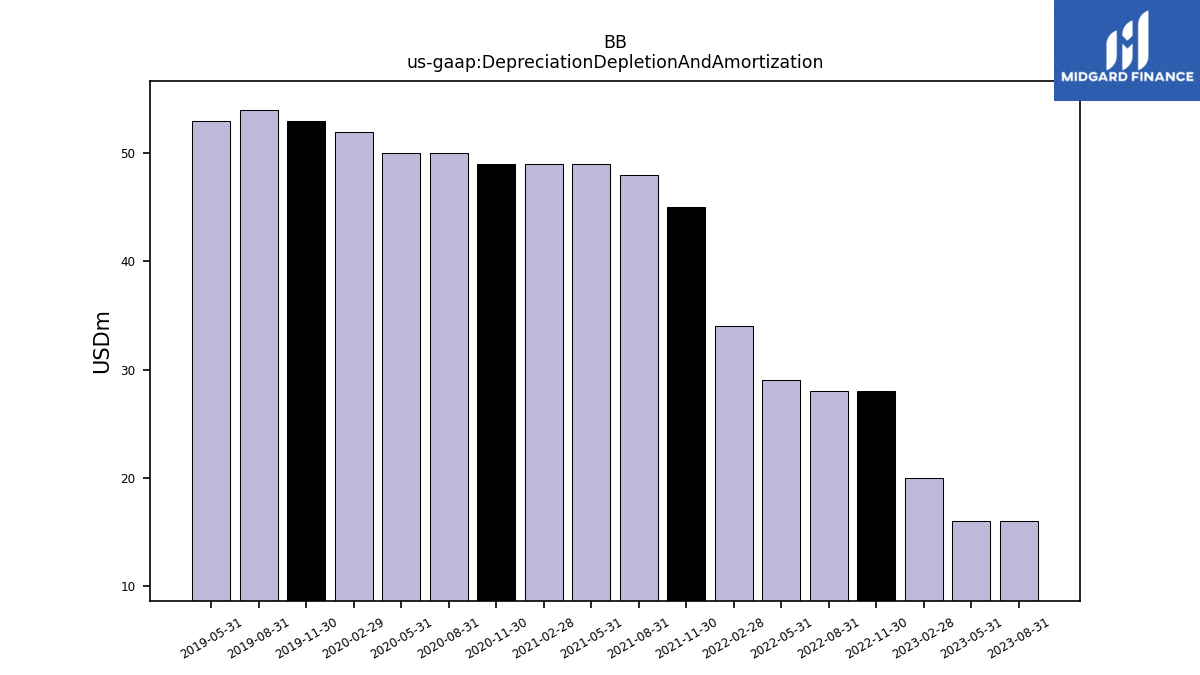
| Depreciation Depletion And Amortization | 16.00 | 16.00 | 20.00 | 28.00 | 28.00 | 29.00 | 34.00 | 45.00 | 48.00 | 49.00 | 49.00 | 49.00 | 50.00 | 50.00 | 52.00 | 53.00 | 54.00 | 53.00 | |
| Increase Decrease In Accounts Receivable | 10.00 | -3.00 | -11.00 | 31.00 | -2.00 | -36.00 | 0.00 | 17.00 | -32.00 | -29.00 | -30.00 | -28.00 | 30.00 | -1.00 | -1.00 | -6.00 | -41.00 | 30.00 | |
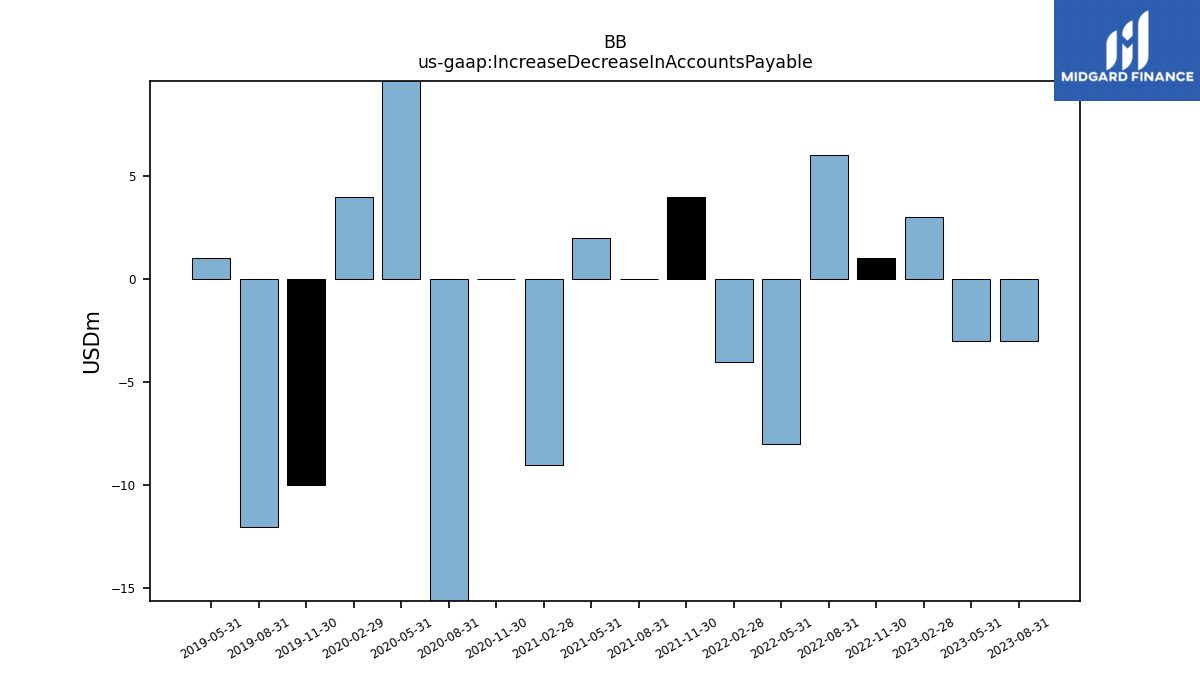
| Increase Decrease In Accounts Payable | -3.00 | -3.00 | 3.00 | 1.00 | 6.00 | -8.00 | -4.00 | 4.00 | 0.00 | 2.00 | -9.00 | 0.00 | -17.00 | 15.00 | 4.00 | -10.00 | -12.00 | 1.00 | |
| Share Based Compensation | 11.00 | 9.00 | 11.00 | 8.00 | 7.00 | 8.00 | 11.00 | 8.00 | 10.00 | 7.00 | 11.00 | 11.00 | 9.00 | 13.00 | 17.00 | 15.00 | 14.00 | 17.00 |
| 2023-08-31 | 2023-05-31 | 2023-02-28 | 2022-11-30 | 2022-08-31 | 2022-05-31 | 2022-02-28 | 2021-11-30 | 2021-08-31 | 2021-05-31 | 2021-02-28 | 2020-11-30 | 2020-08-31 | 2020-05-31 | 2020-02-29 | 2019-11-30 | 2019-08-31 | 2019-05-31 | ||
|---|---|---|---|---|---|---|---|---|---|---|---|---|---|---|---|---|---|---|---|
| Net Cash Provided By Used In Investing Activities | 114.00 | -38.00 | 50.00 | 9.00 | 64.00 | 53.00 | 96.00 | -2.00 | -63.00 | 176.00 | -117.00 | -402.00 | 493.00 | -39.00 | -156.00 | 10.00 | 87.00 | -129.00 | |
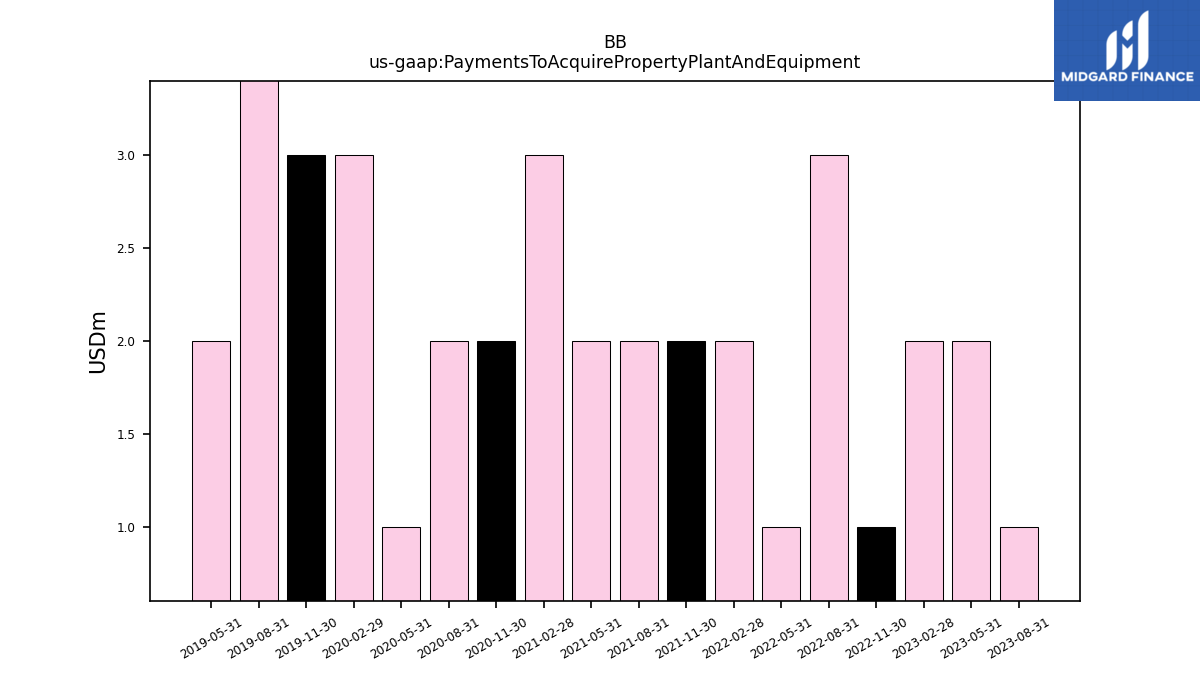
| Payments To Acquire Property Plant And Equipment | 1.00 | 2.00 | 2.00 | 1.00 | 3.00 | 1.00 | 2.00 | 2.00 | 2.00 | 2.00 | 3.00 | 2.00 | 2.00 | 1.00 | 3.00 | 3.00 | 4.00 | 2.00 |
| 2023-08-31 | 2023-05-31 | 2023-02-28 | 2022-11-30 | 2022-08-31 | 2022-05-31 | 2022-02-28 | 2021-11-30 | 2021-08-31 | 2021-05-31 | 2021-02-28 | 2020-11-30 | 2020-08-31 | 2020-05-31 | 2020-02-29 | 2019-11-30 | 2019-08-31 | 2019-05-31 | ||
|---|---|---|---|---|---|---|---|---|---|---|---|---|---|---|---|---|---|---|---|
| Net Cash Provided By Used In Financing Activities | 0.00 | 2.00 | 0.00 | 3.00 | 0.00 | 3.00 | 1.00 | 4.00 | 1.00 | 4.00 | 9.00 | -241.00 | 1.00 | 4.00 | 1.00 | 4.00 | -1.00 | 3.00 |
| 2023-08-31 | 2023-05-31 | 2023-02-28 | 2022-11-30 | 2022-08-31 | 2022-05-31 | 2022-02-28 | 2021-11-30 | 2021-08-31 | 2021-05-31 | 2021-02-28 | 2020-11-30 | 2020-08-31 | 2020-05-31 | 2020-02-29 | 2019-11-30 | 2019-08-31 | 2019-05-31 | ||
|---|---|---|---|---|---|---|---|---|---|---|---|---|---|---|---|---|---|---|---|
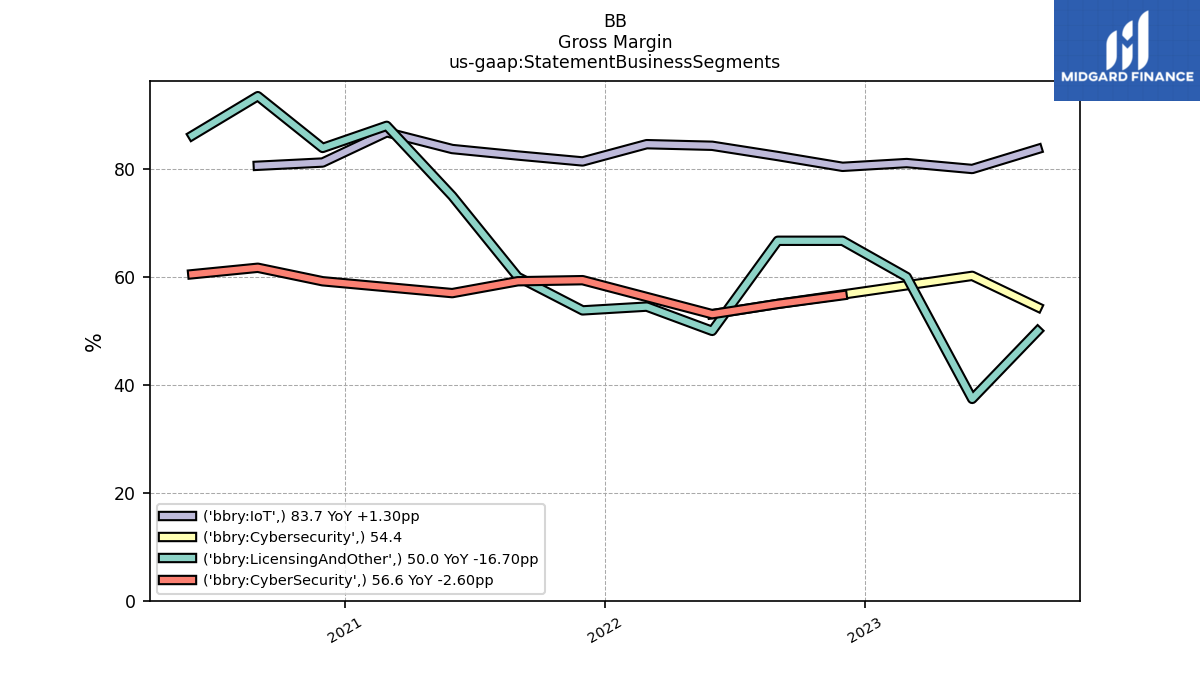
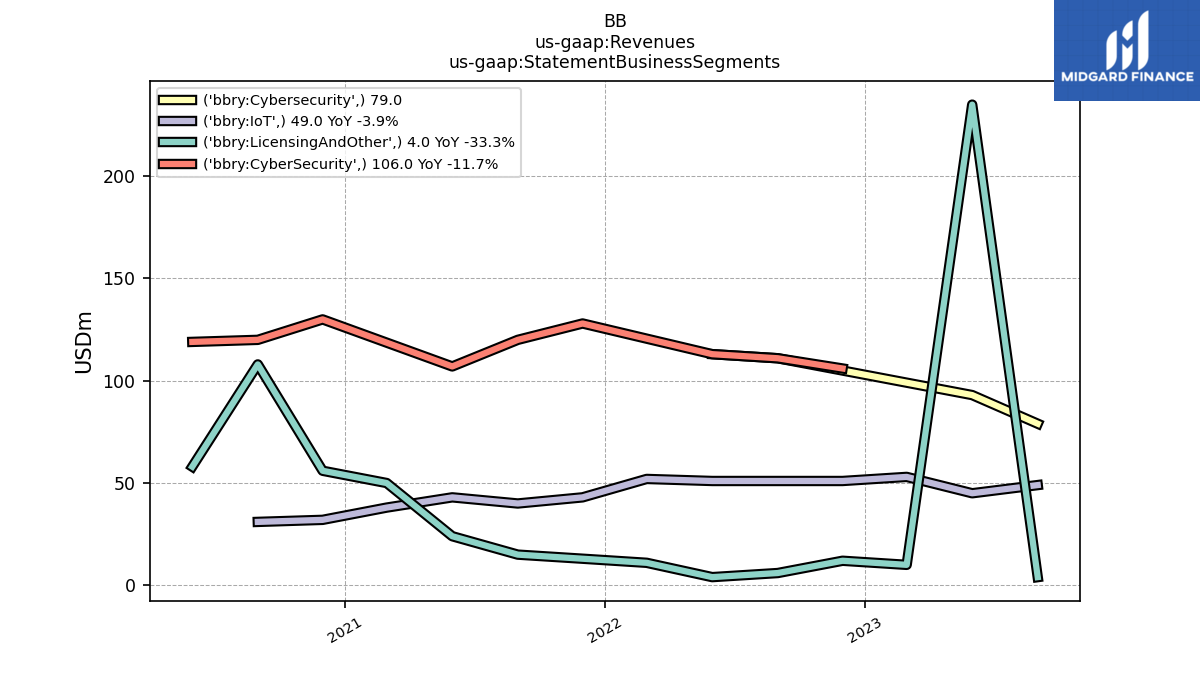
| Revenues | 132.00 | 373.00 | 151.00 | 169.00 | 168.00 | 168.00 | 185.00 | 184.00 | 175.00 | 174.00 | 210.00 | 218.00 | 259.00 | 206.00 | 282.00 | 267.00 | 244.00 | 247.00 | |
| Operating | 132.00 | 373.00 | 151.00 | 169.00 | 168.00 | 168.00 | 185.00 | 184.00 | 175.00 | 174.00 | 210.00 | 218.00 | 259.00 | 206.00 | NA | NA | NA | NA | |
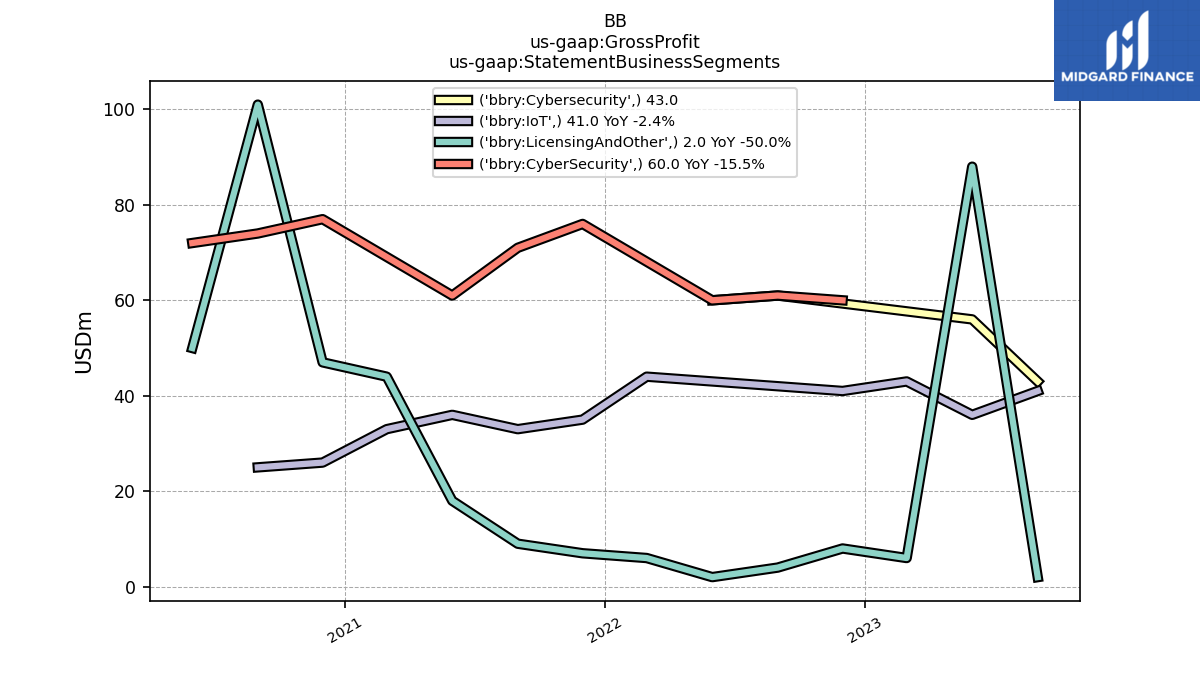
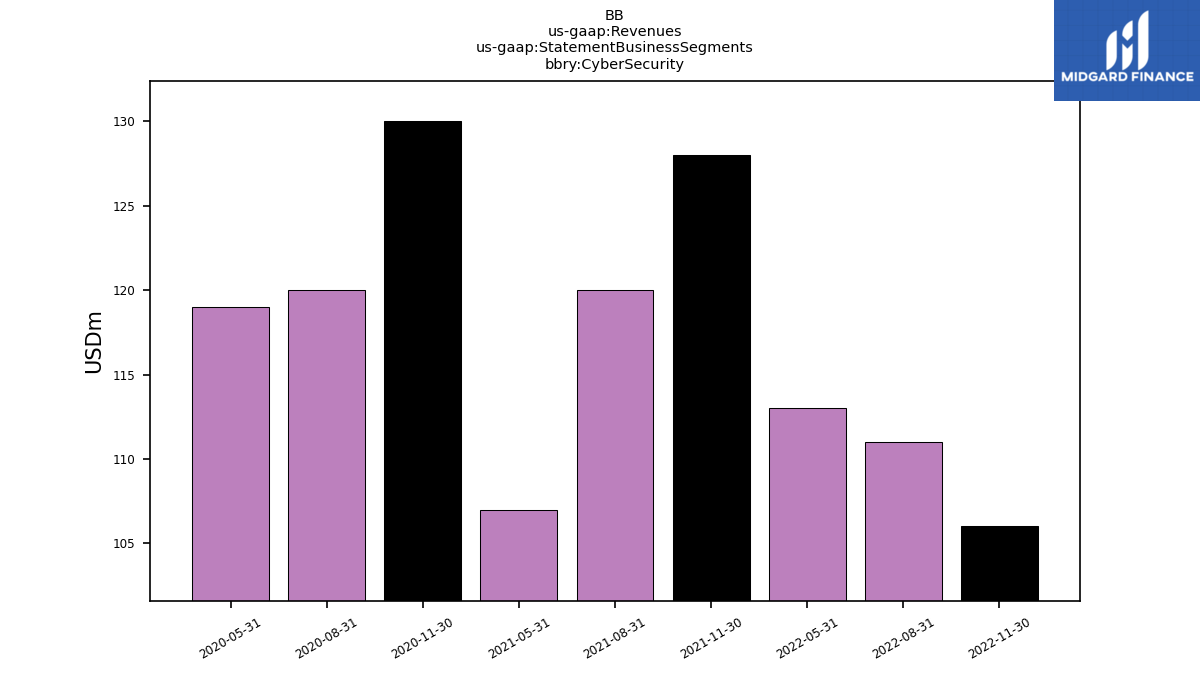
| Cyber Security | NA | NA | NA | 106.00 | 111.00 | 113.00 | NA | 128.00 | 120.00 | 107.00 | NA | 130.00 | 120.00 | 119.00 | NA | NA | NA | NA | |
| Cybersecurity | 79.00 | 93.00 | NA | NA | 111.00 | 113.00 | NA | NA | NA | NA | NA | NA | NA | NA | NA | NA | NA | NA | |
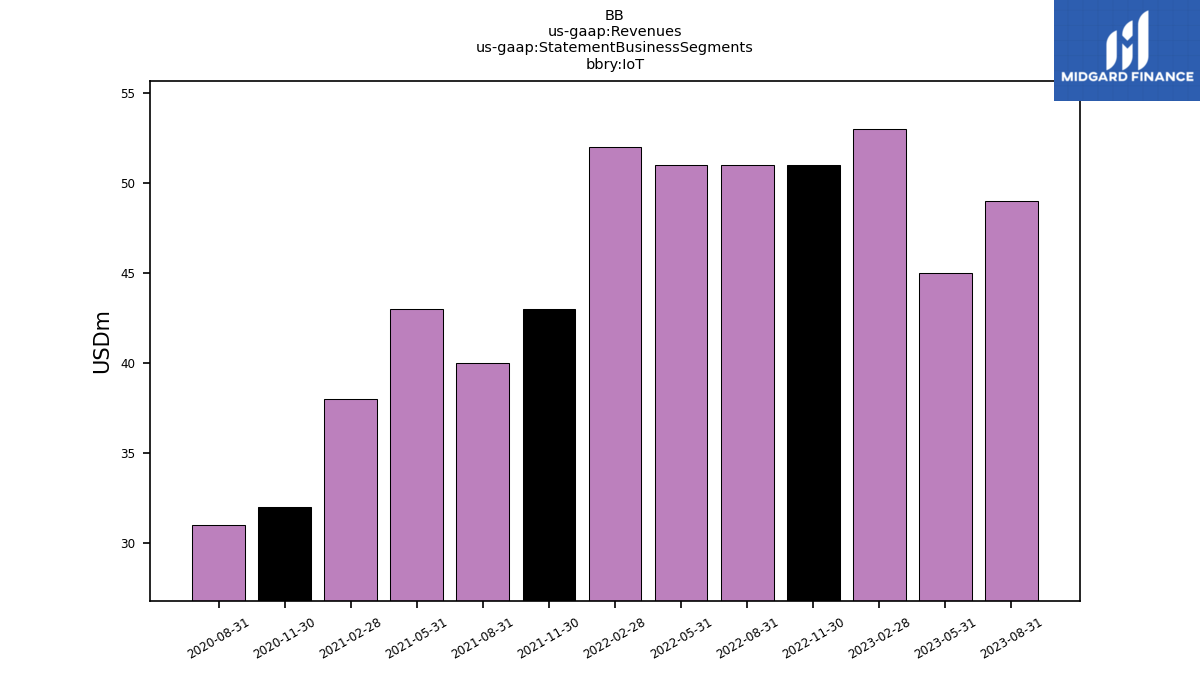
| Io T | 49.00 | 45.00 | 53.00 | 51.00 | 51.00 | 51.00 | 52.00 | 43.00 | 40.00 | 43.00 | 38.00 | 32.00 | 31.00 | NA | NA | NA | NA | NA | |
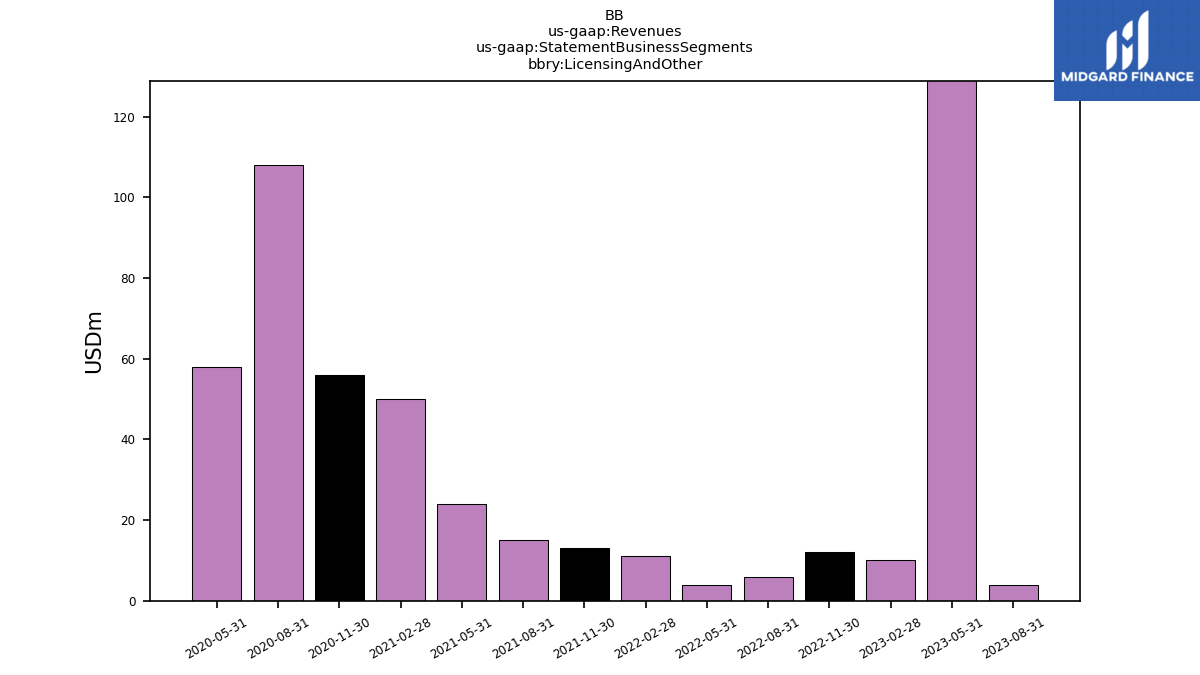
| Licensing And Other | 4.00 | 235.00 | 10.00 | 12.00 | 6.00 | 4.00 | 11.00 | 13.00 | 15.00 | 24.00 | 50.00 | 56.00 | 108.00 | 58.00 | NA | NA | NA | NA | |
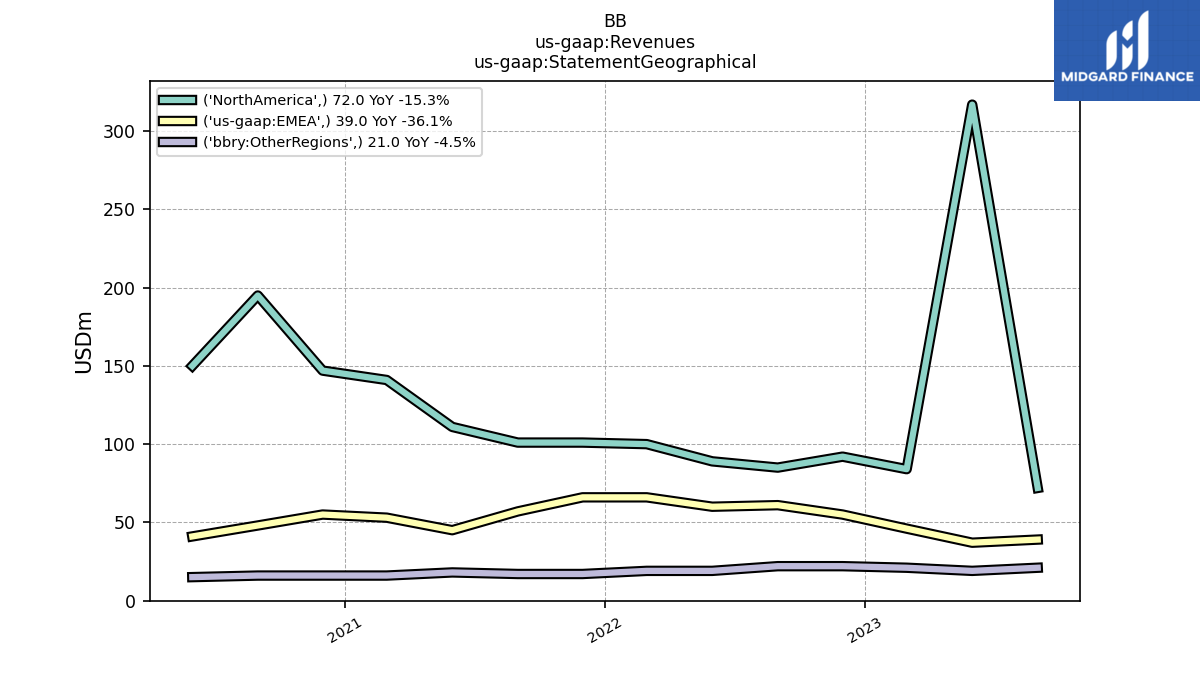
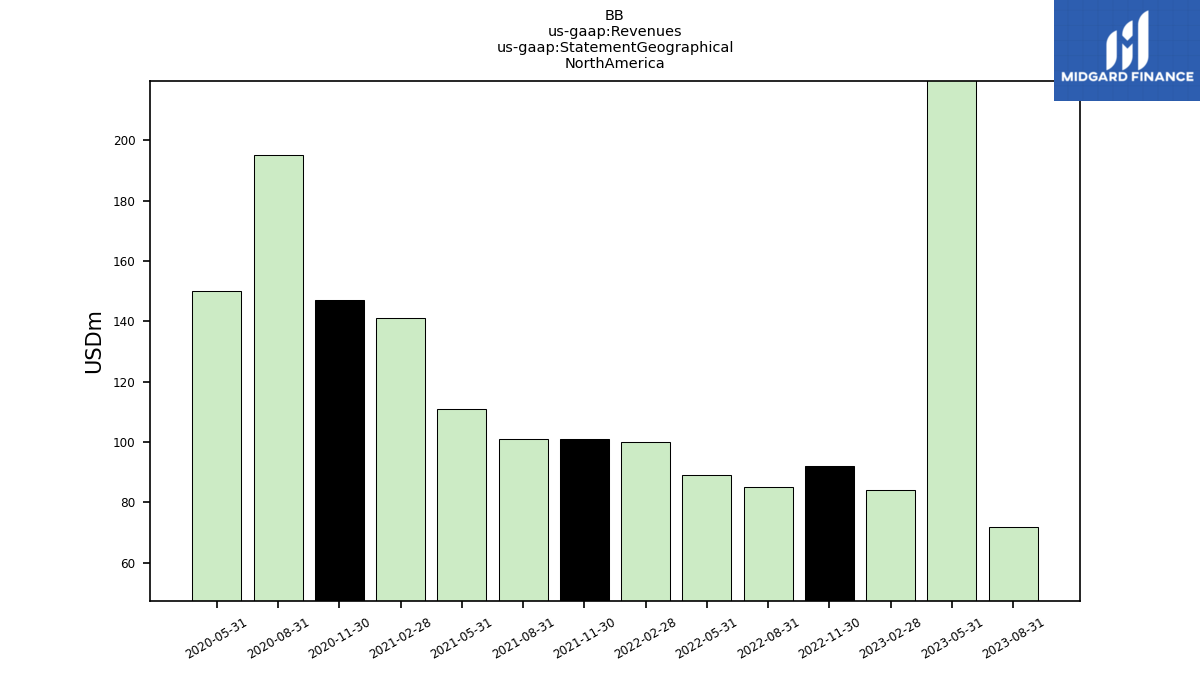
| 72.00 | 317.00 | 84.00 | 92.00 | 85.00 | 89.00 | 100.00 | 101.00 | 101.00 | 111.00 | 141.00 | 147.00 | 195.00 | 150.00 | NA | NA | NA | NA | ||
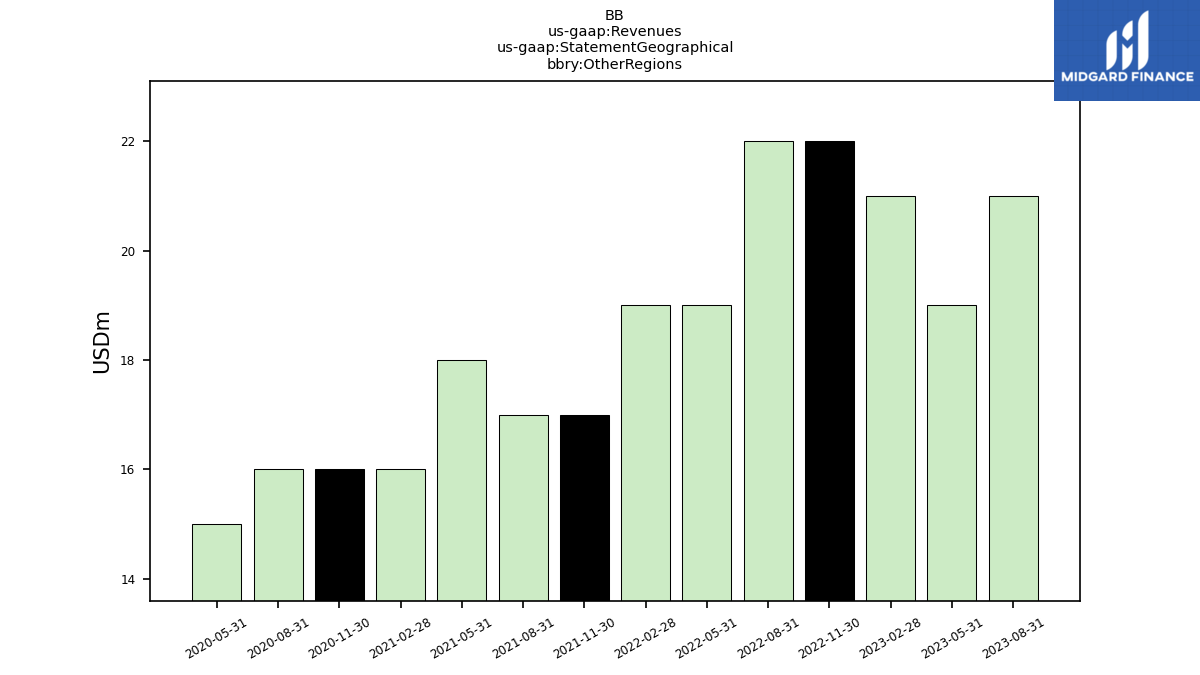
| Other Regions | 21.00 | 19.00 | 21.00 | 22.00 | 22.00 | 19.00 | 19.00 | 17.00 | 17.00 | 18.00 | 16.00 | 16.00 | 16.00 | 15.00 | NA | NA | NA | NA | |
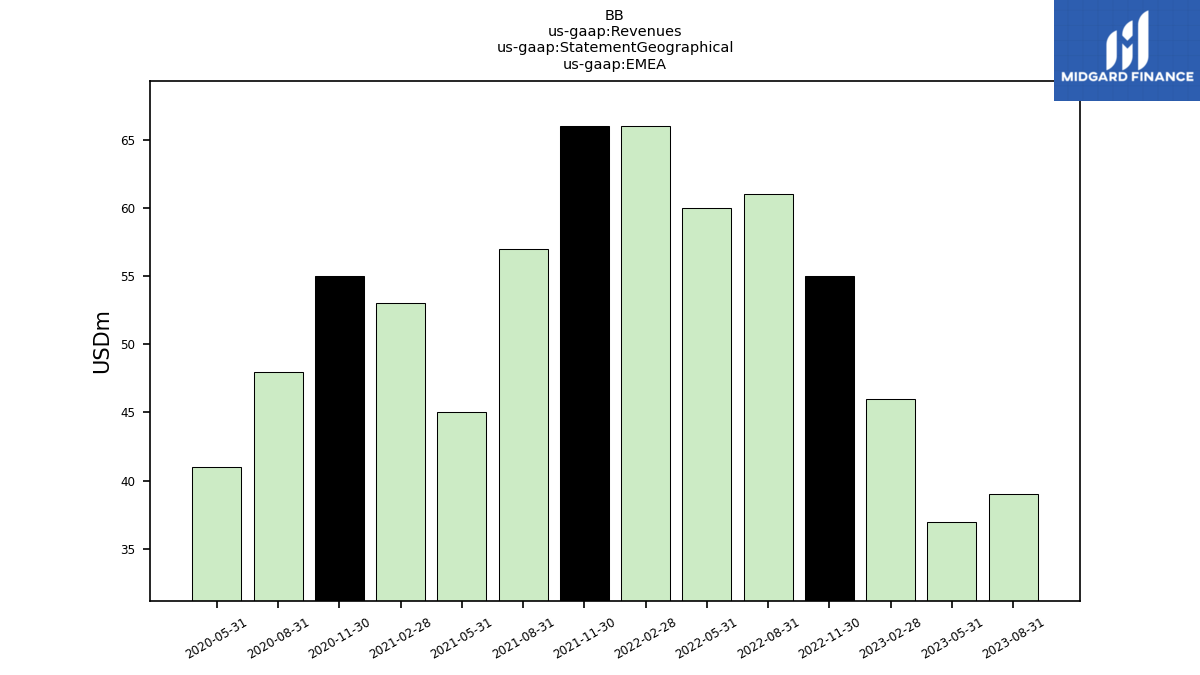
| EMEA | 39.00 | 37.00 | 46.00 | 55.00 | 61.00 | 60.00 | 66.00 | 66.00 | 57.00 | 45.00 | 53.00 | 55.00 | 48.00 | 41.00 | NA | NA | NA | NA | |
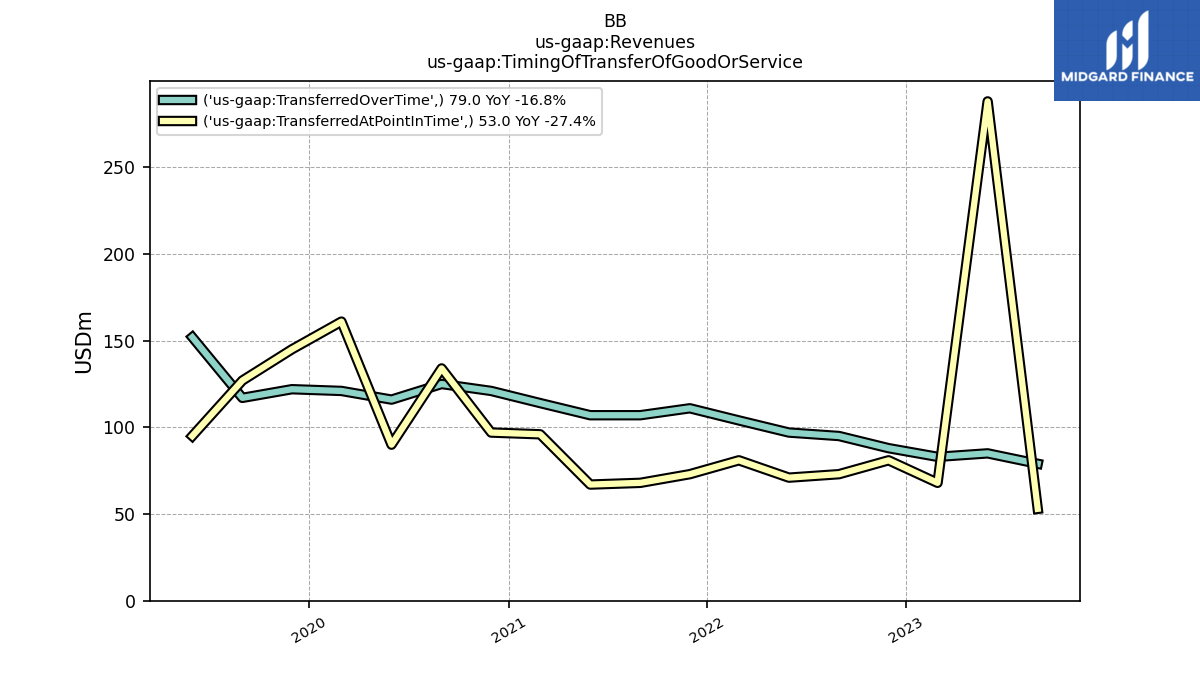
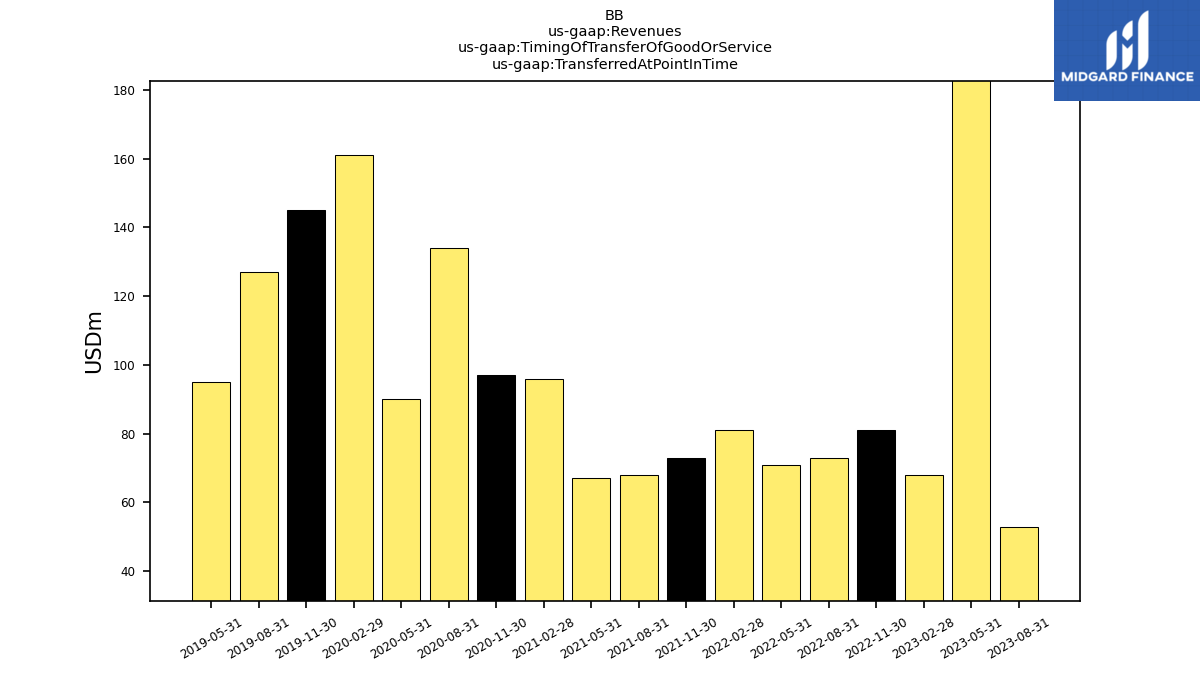
| Transferred At Point In Time | 53.00 | 288.00 | 68.00 | 81.00 | 73.00 | 71.00 | 81.00 | 73.00 | 68.00 | 67.00 | 96.00 | 97.00 | 134.00 | 90.00 | 161.00 | 145.00 | 127.00 | 95.00 | |
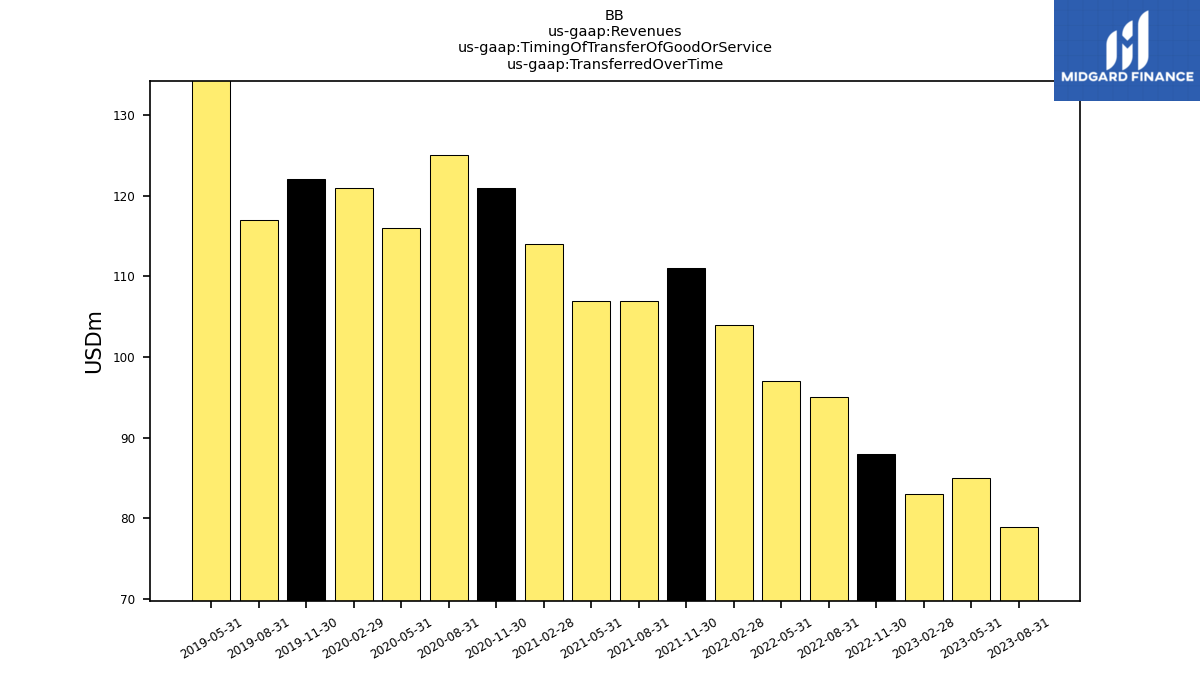
| Transferred Over Time | 79.00 | 85.00 | 83.00 | 88.00 | 95.00 | 97.00 | 104.00 | 111.00 | 107.00 | 107.00 | 114.00 | 121.00 | 125.00 | 116.00 | 121.00 | 122.00 | 117.00 | 152.00 |


