
| 2023-09-30 | 2023-06-30 | 2023-03-31 | 2022-12-31 | 2022-09-30 | 2022-06-30 | 2022-03-31 | 2021-12-31 | 2021-09-30 | 2021-06-30 | 2021-03-31 | 2020-12-31 | 2020-09-30 | 2019-12-31 | 2019-09-30 | ||
|---|---|---|---|---|---|---|---|---|---|---|---|---|---|---|---|---|
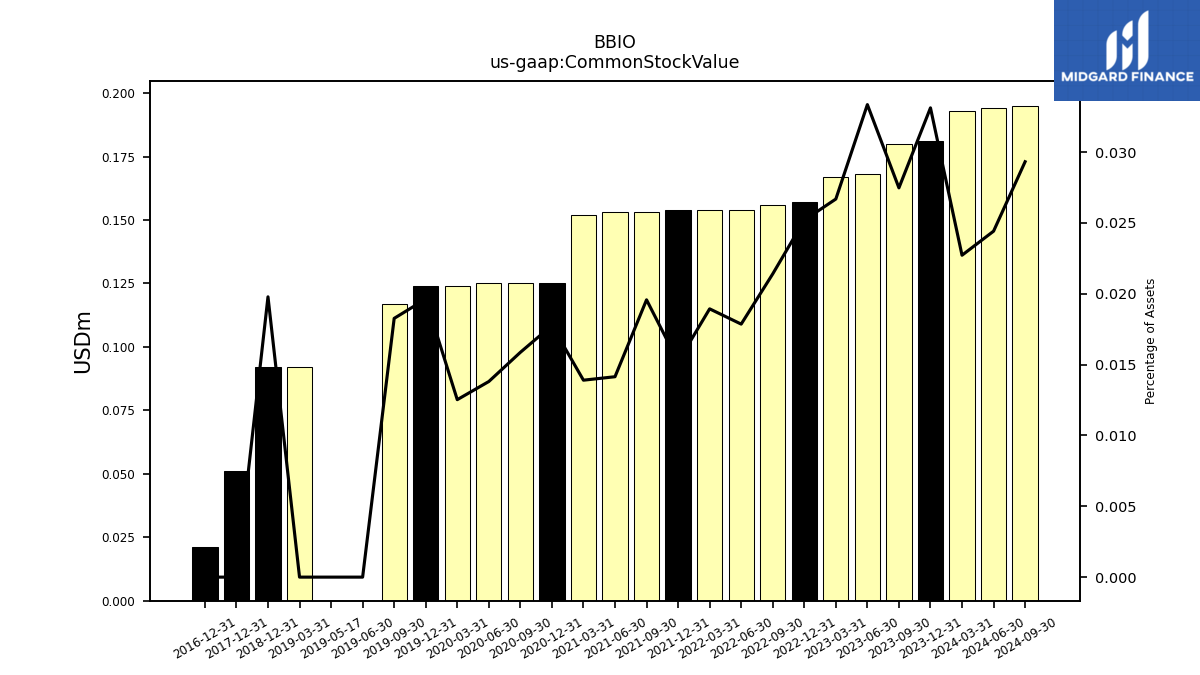
| Common Stock Value | 0.18 | 0.17 | 0.17 | 0.16 | 0.16 | 0.15 | 0.15 | 0.15 | 0.15 | 0.15 | 0.15 | 0.12 | 0.12 | 0.12 | 0.12 | |
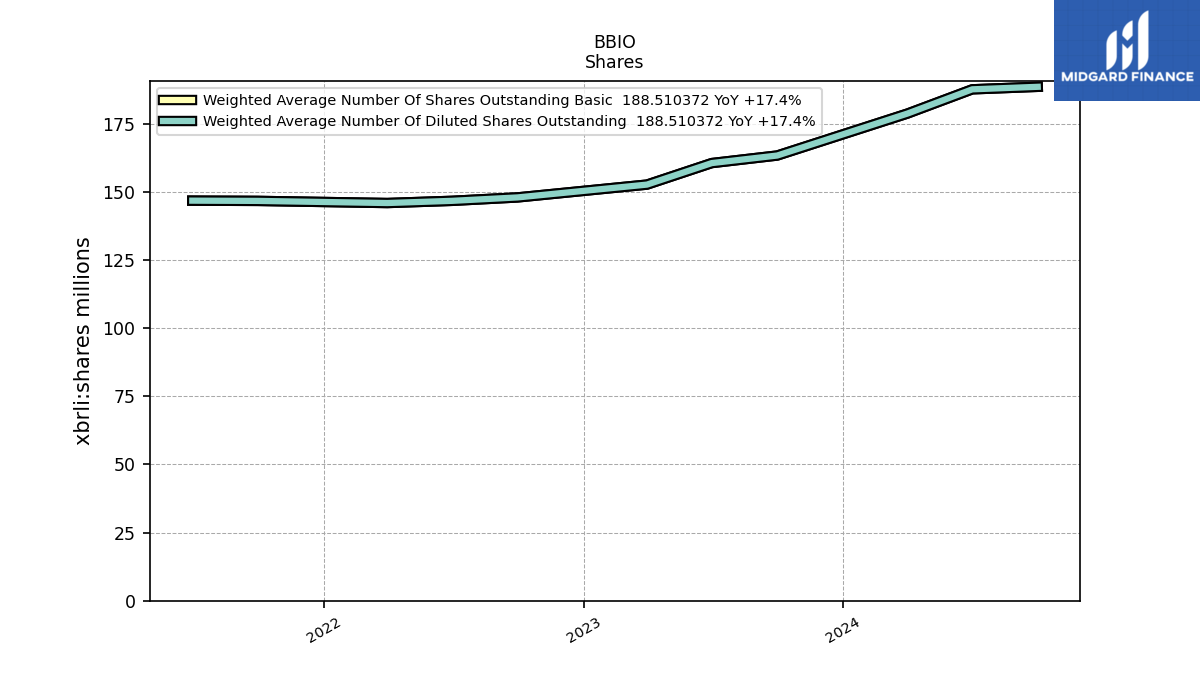
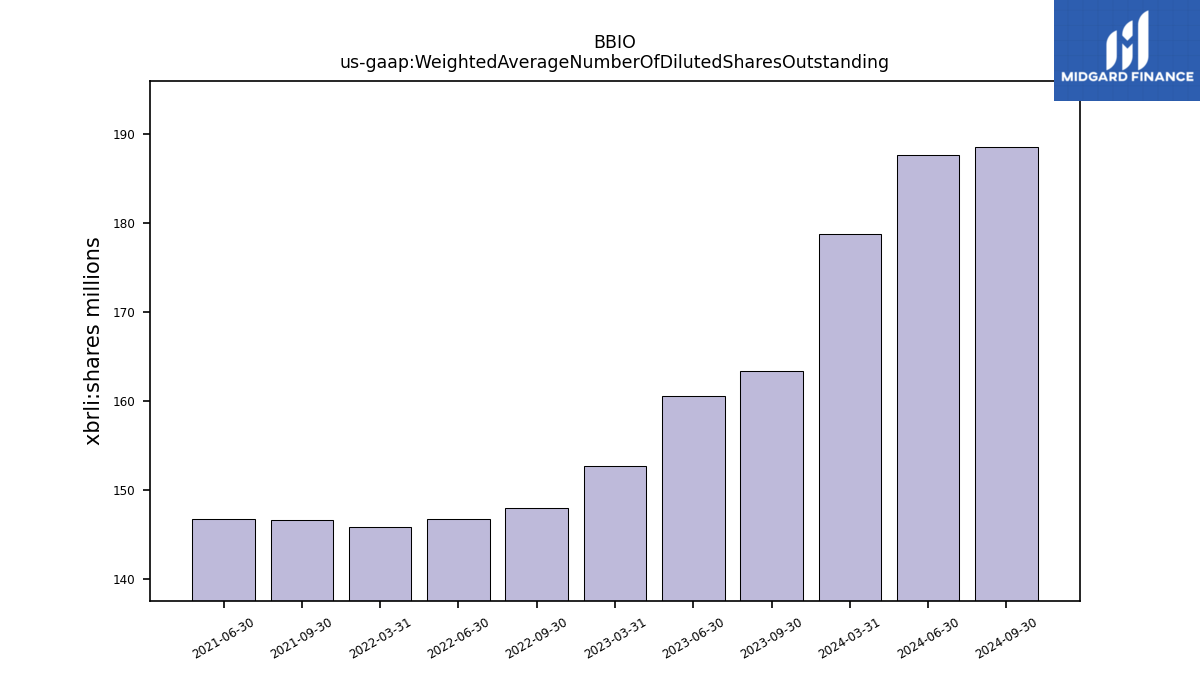
| Weighted Average Number Of Diluted Shares Outstanding | 163.31 | 160.54 | 152.65 | NA | 147.94 | 146.68 | 145.88 | NA | 146.66 | 146.75 | NA | NA | NA | NA | NA | |
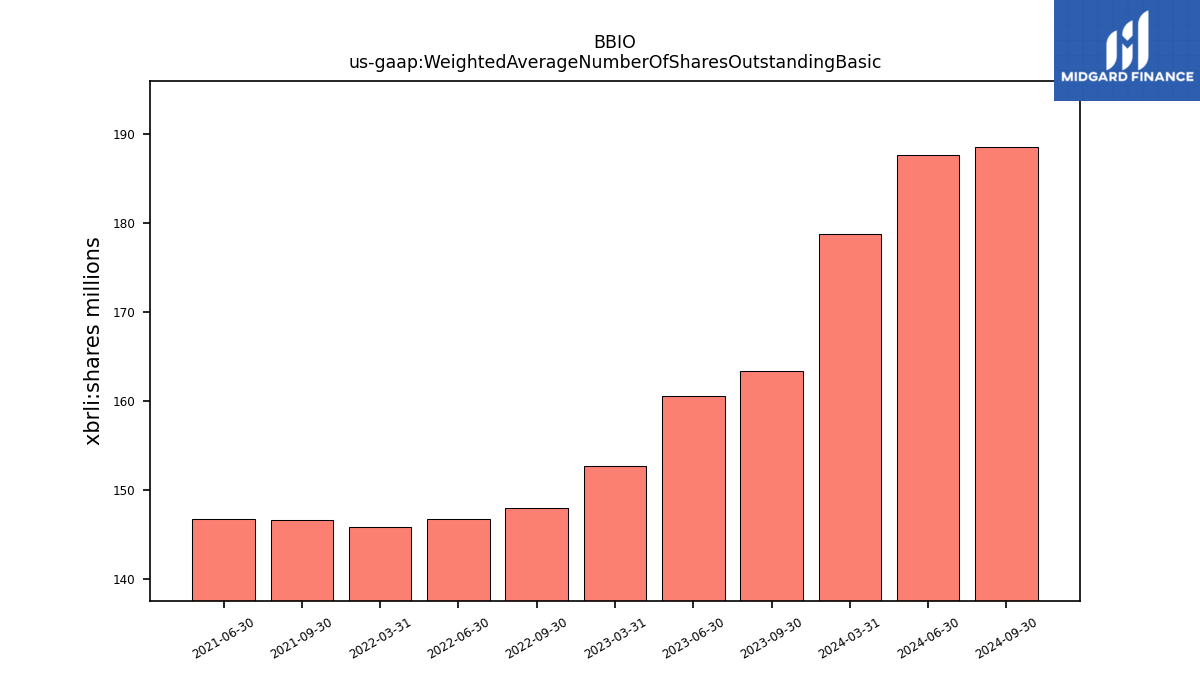
| Weighted Average Number Of Shares Outstanding Basic | 163.31 | 160.54 | 152.65 | NA | 147.94 | 146.68 | 145.88 | NA | 146.66 | 146.75 | NA | NA | NA | NA | NA | |
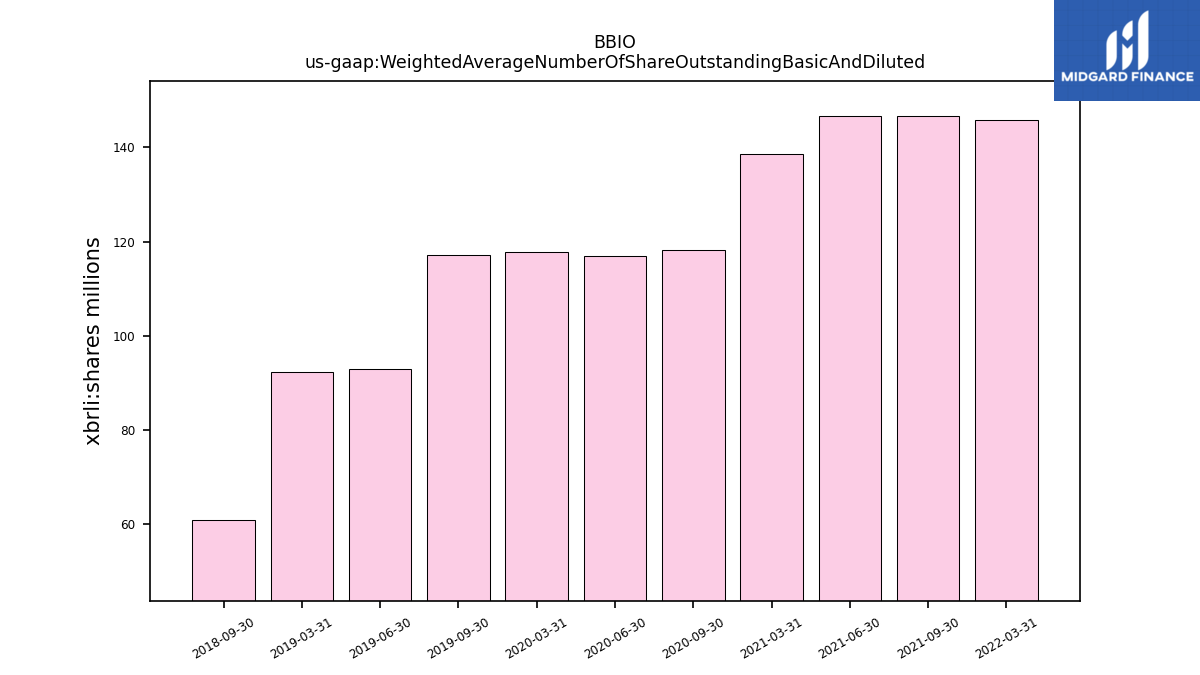
| Weighted Average Number Of Share Outstanding Basic And Diluted | NA | NA | NA | NA | NA | NA | 145.88 | NA | 146.66 | 146.75 | 138.63 | NA | 118.17 | NA | 117.07 | |
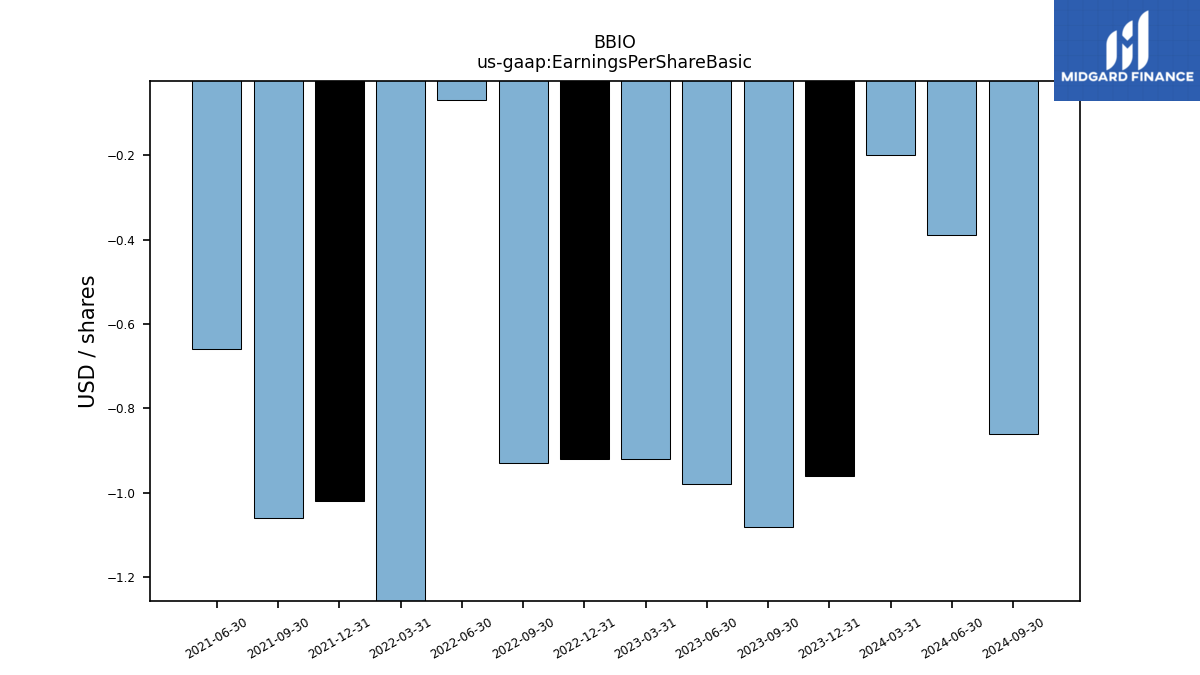
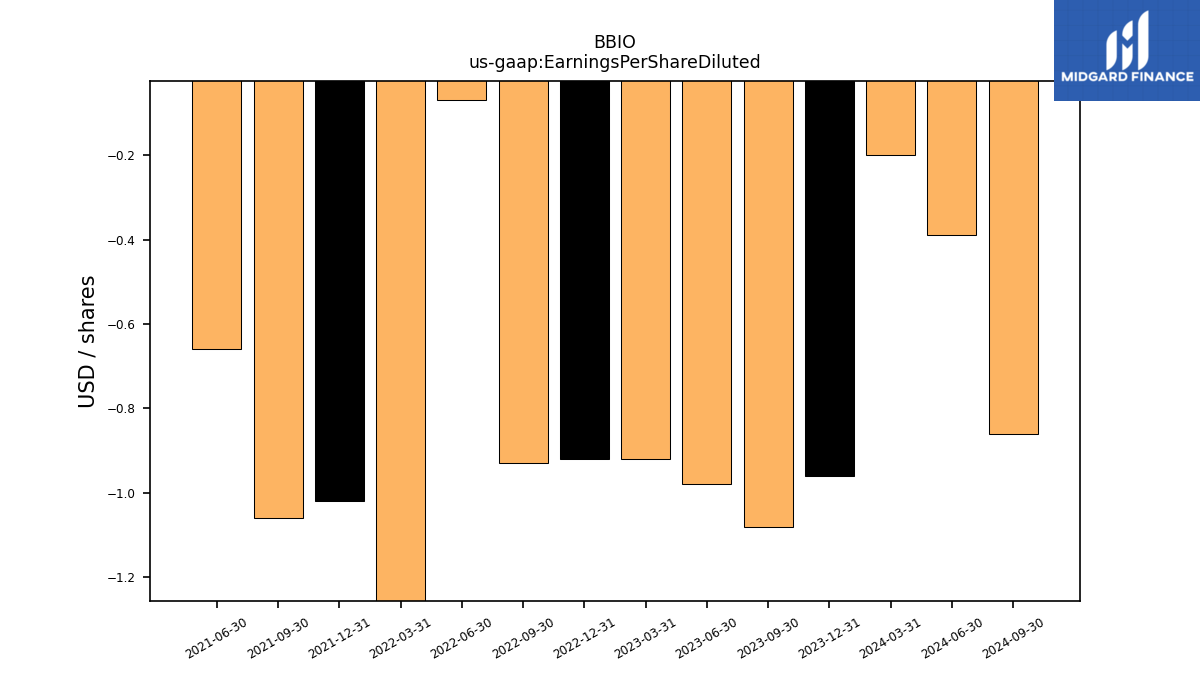
| Earnings Per Share Basic | -1.08 | -0.98 | -0.92 | -0.92 | -0.93 | -0.07 | -1.35 | -1.02 | -1.06 | -0.66 | NA | NA | NA | NA | NA | |
| Earnings Per Share Diluted | -1.08 | -0.98 | -0.92 | -0.92 | -0.93 | -0.07 | -1.35 | -1.02 | -1.06 | -0.66 | NA | NA | NA | NA | NA | |
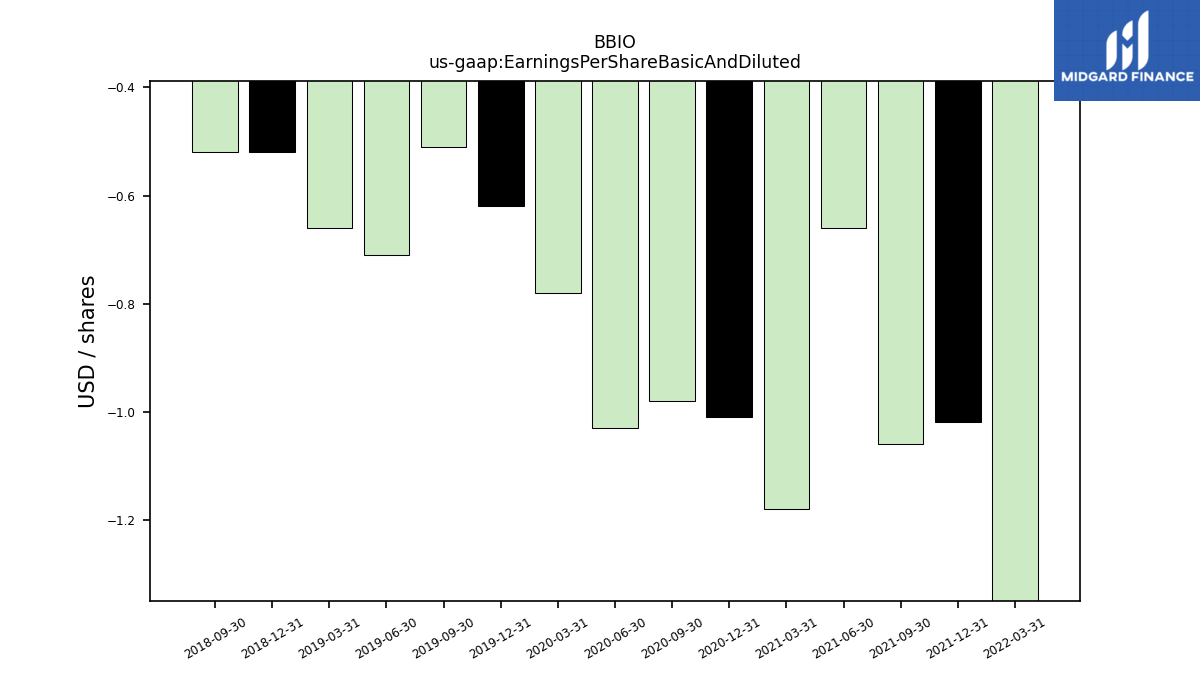
| Earnings Per Share Basic And Diluted | NA | NA | NA | NA | NA | NA | -1.35 | -1.02 | -1.06 | -0.66 | -1.18 | -1.01 | -0.98 | -0.62 | -0.51 |
| 2023-09-30 | 2023-06-30 | 2023-03-31 | 2022-12-31 | 2022-09-30 | 2022-06-30 | 2022-03-31 | 2021-12-31 | 2021-09-30 | 2021-06-30 | 2021-03-31 | 2020-12-31 | 2020-09-30 | 2019-12-31 | 2019-09-30 | ||
|---|---|---|---|---|---|---|---|---|---|---|---|---|---|---|---|---|
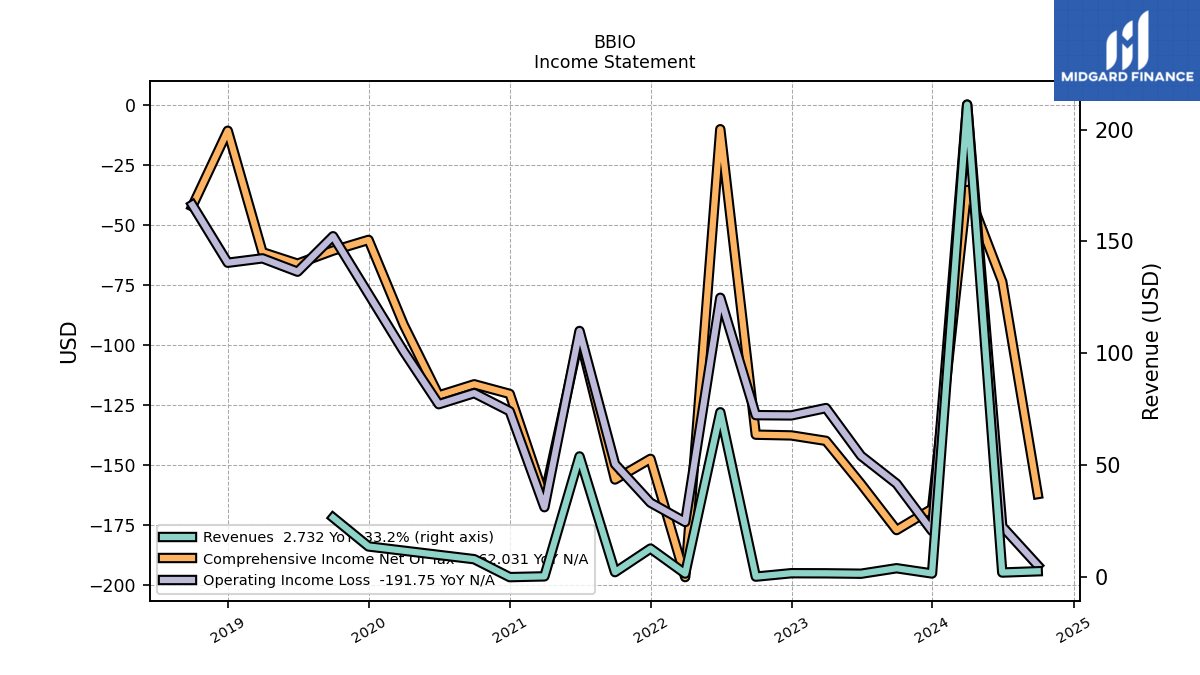
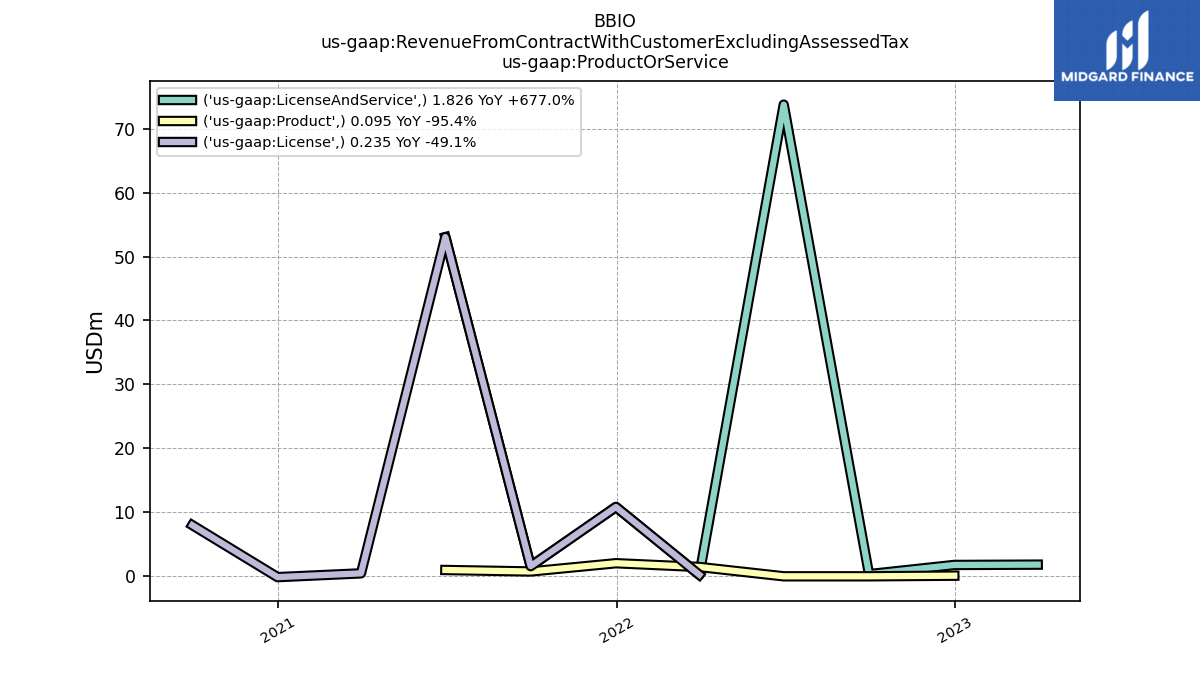
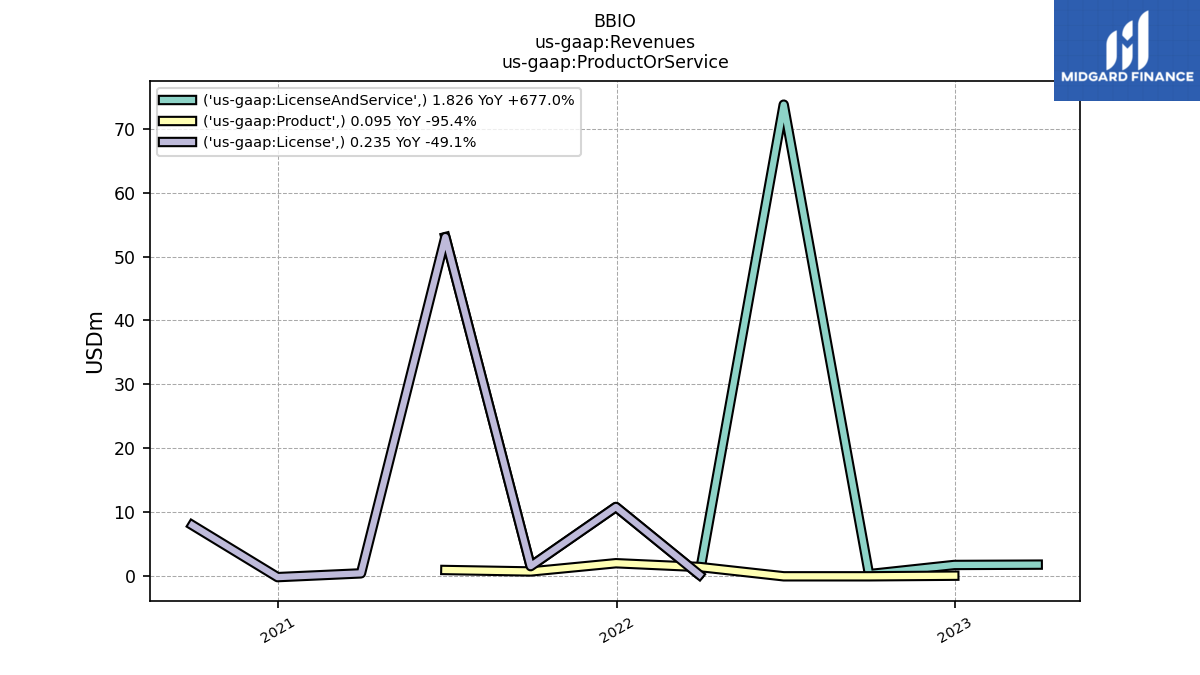
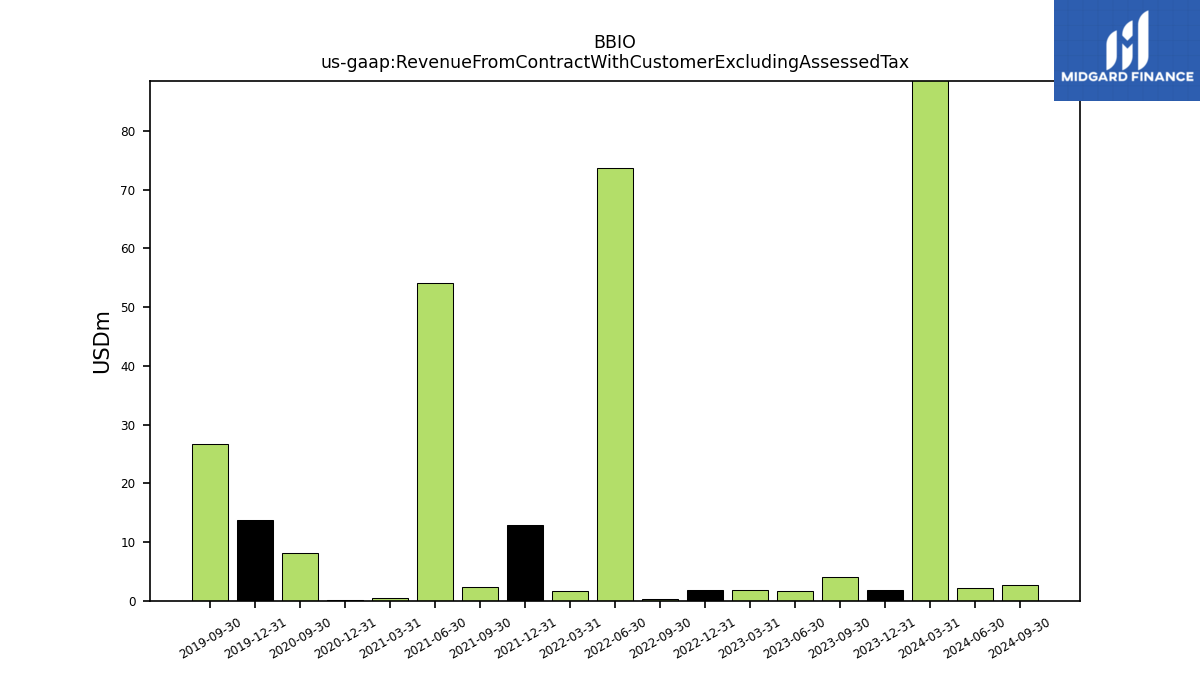
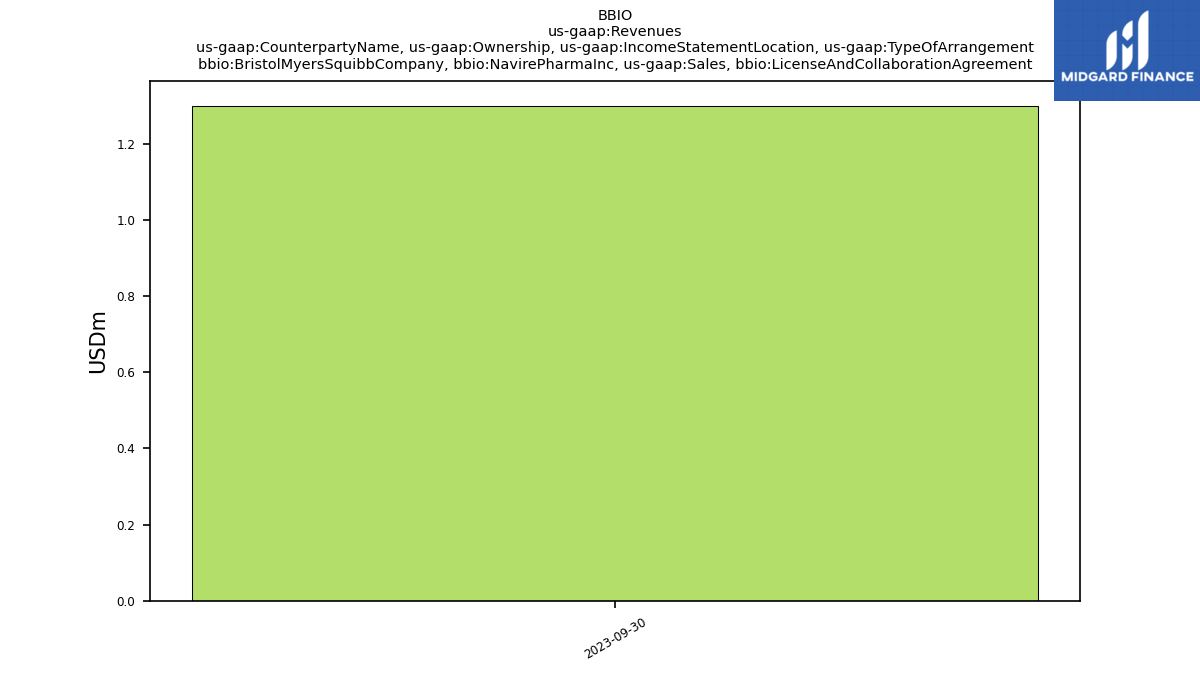
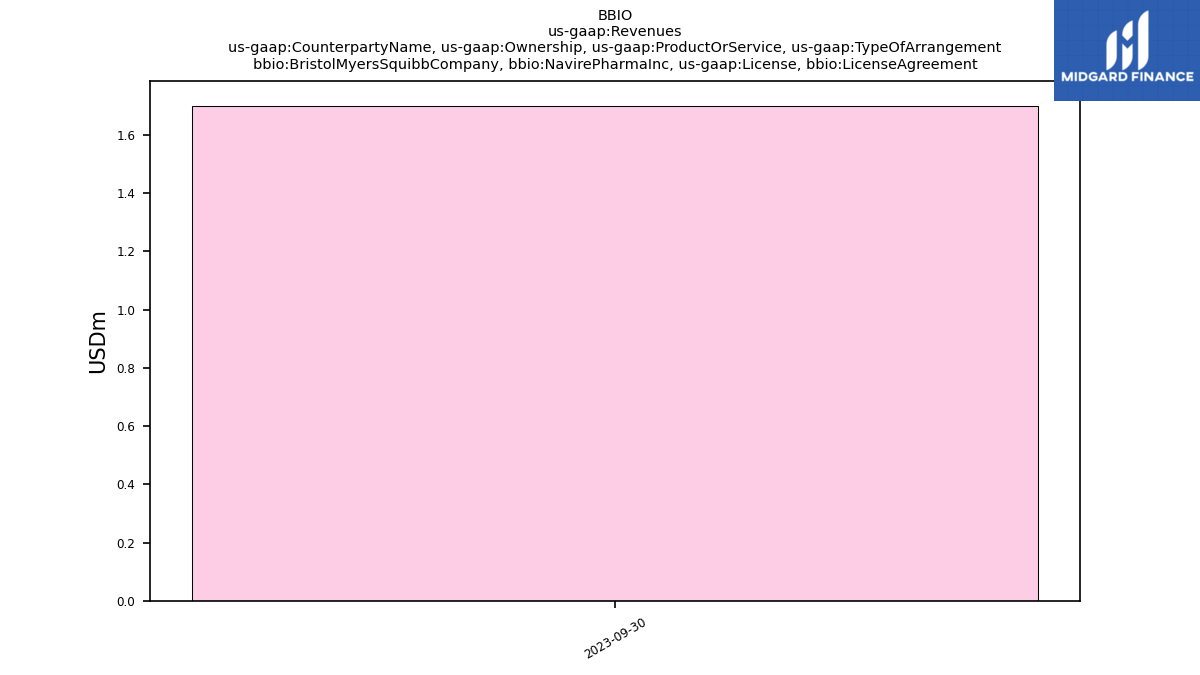
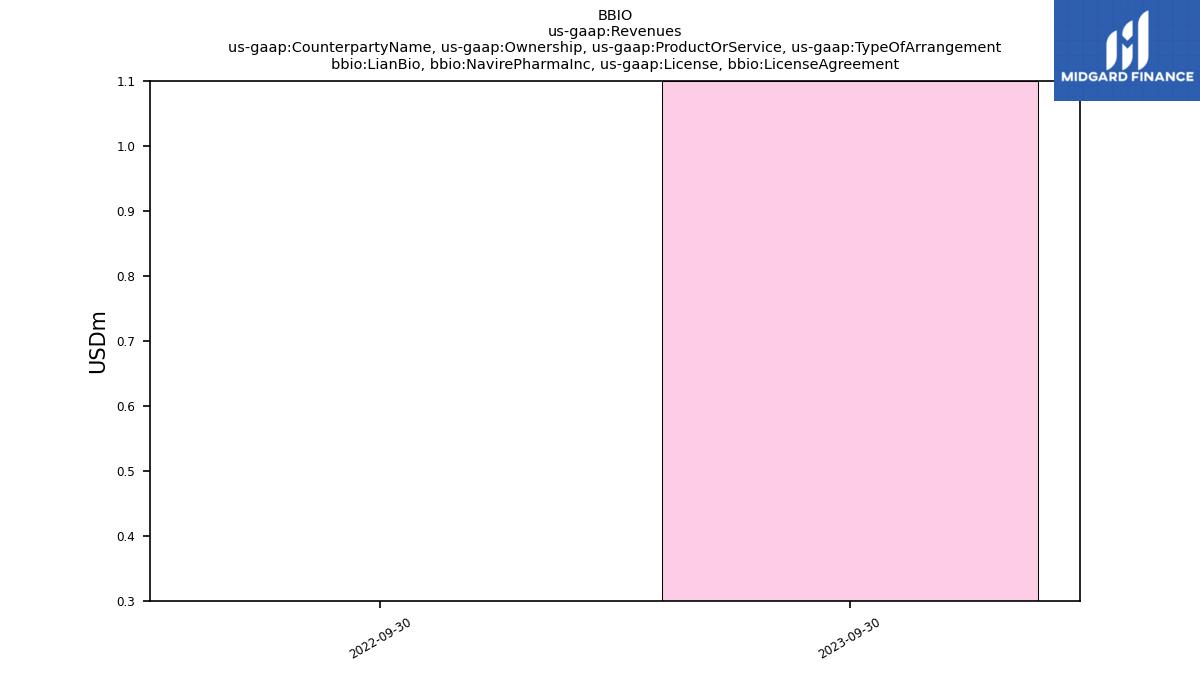
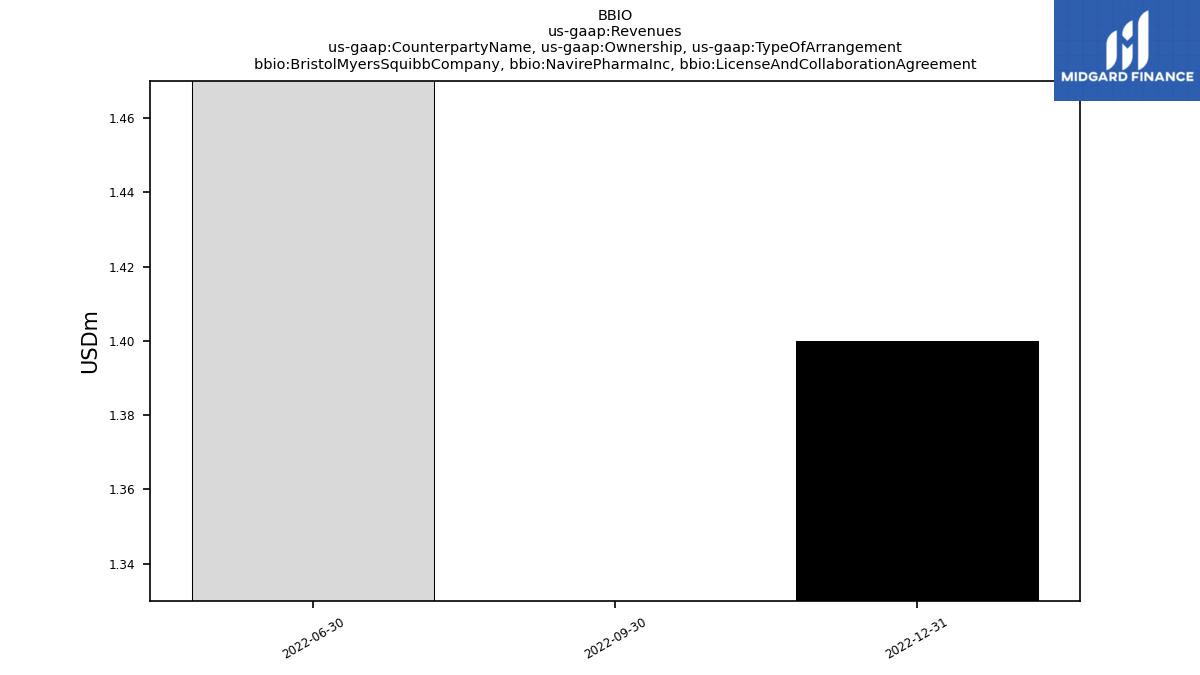
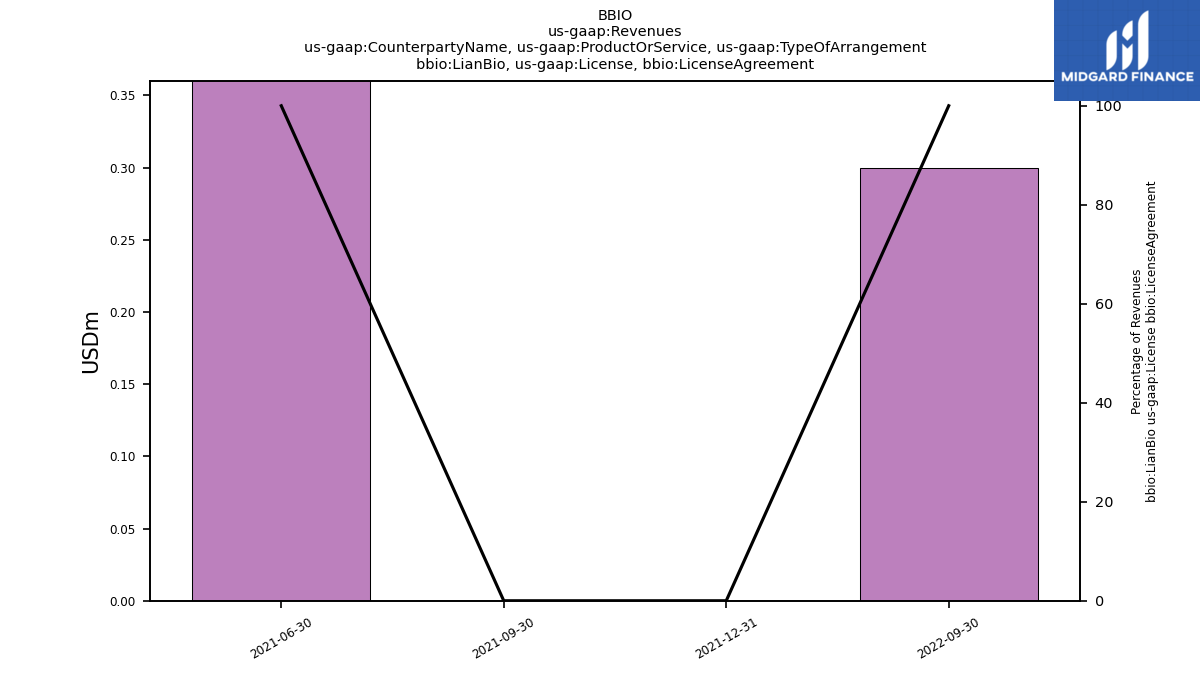
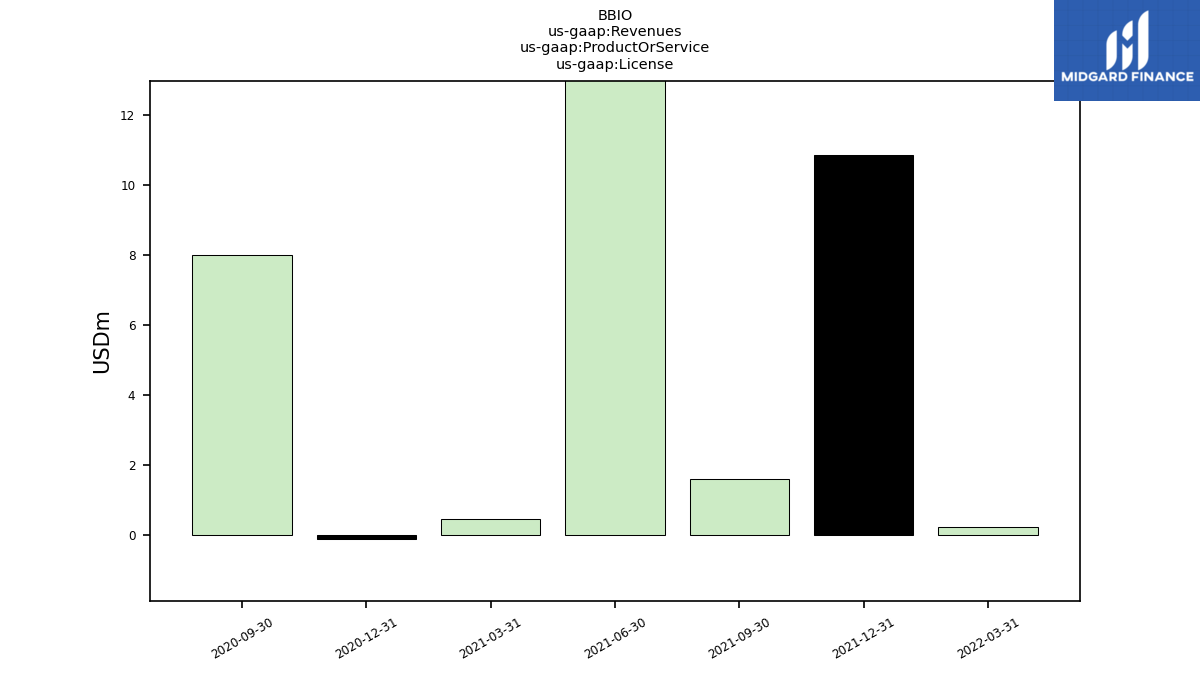
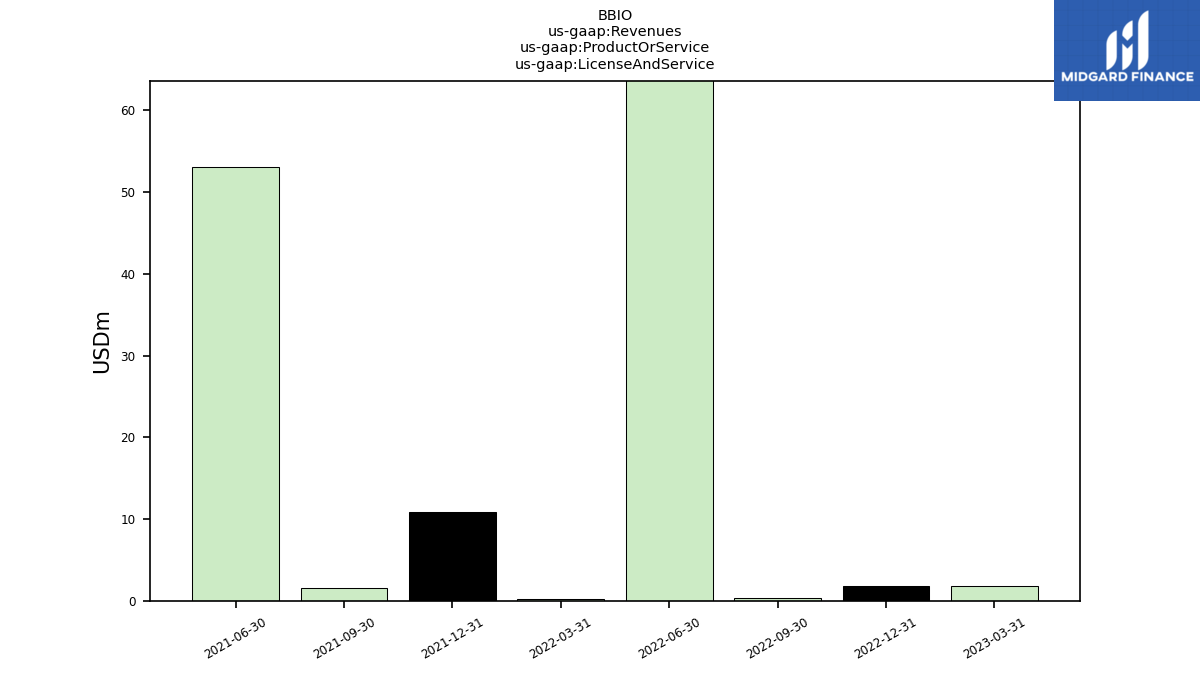
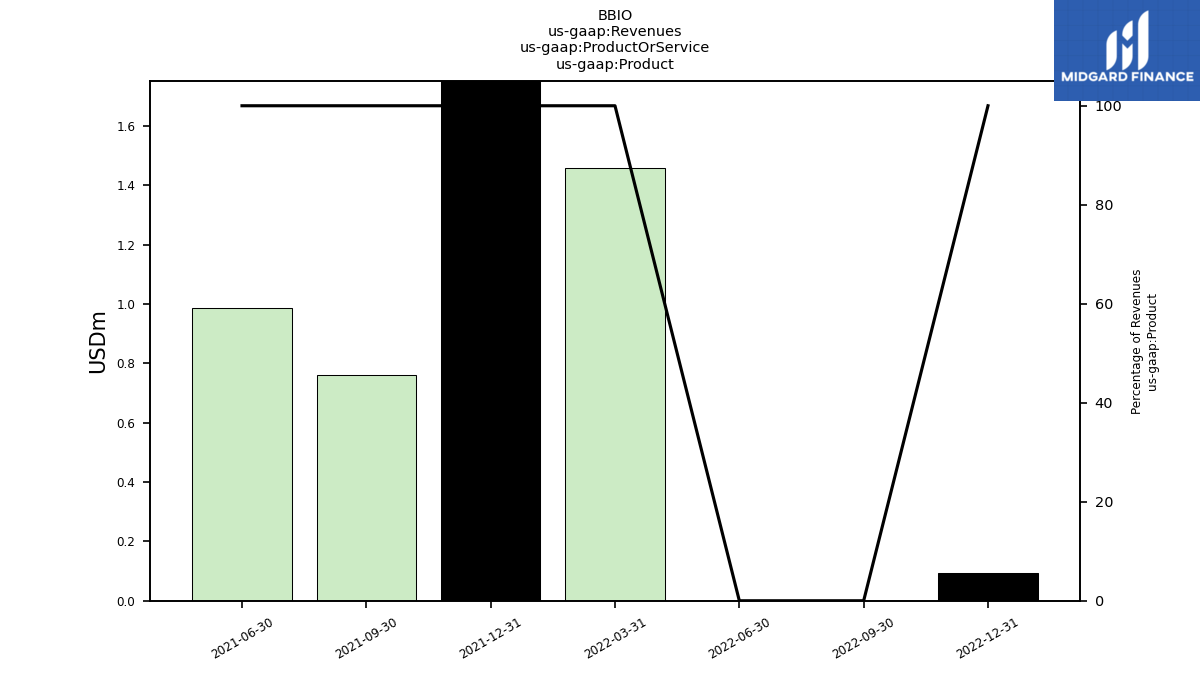
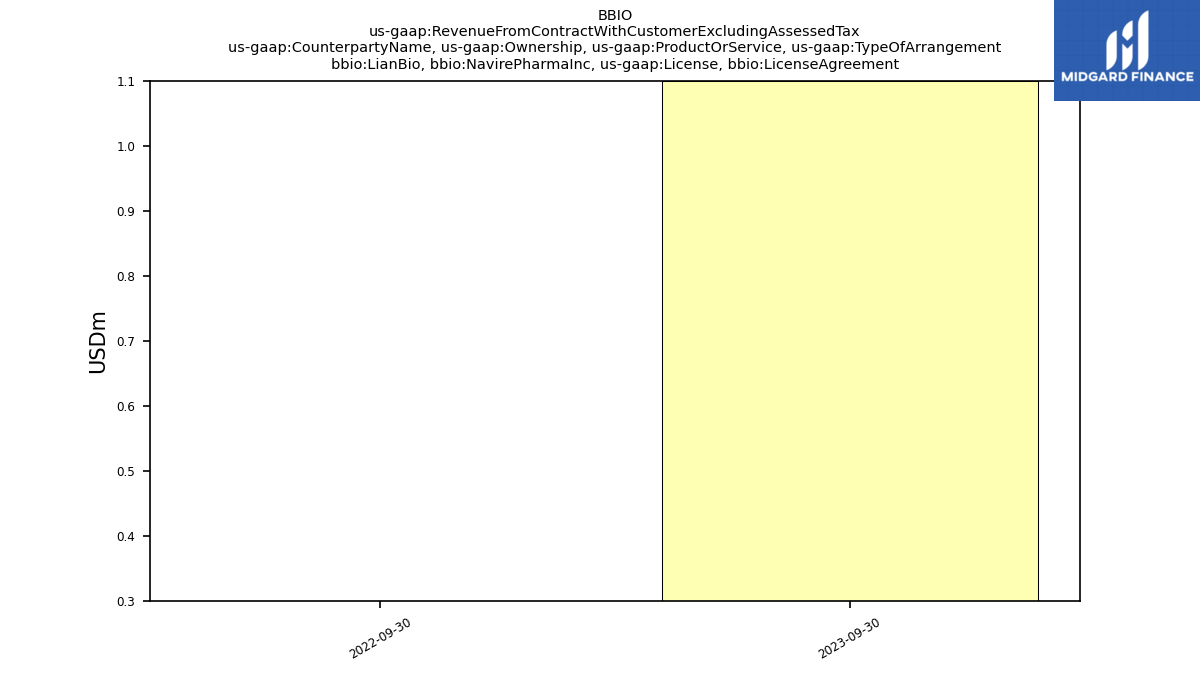
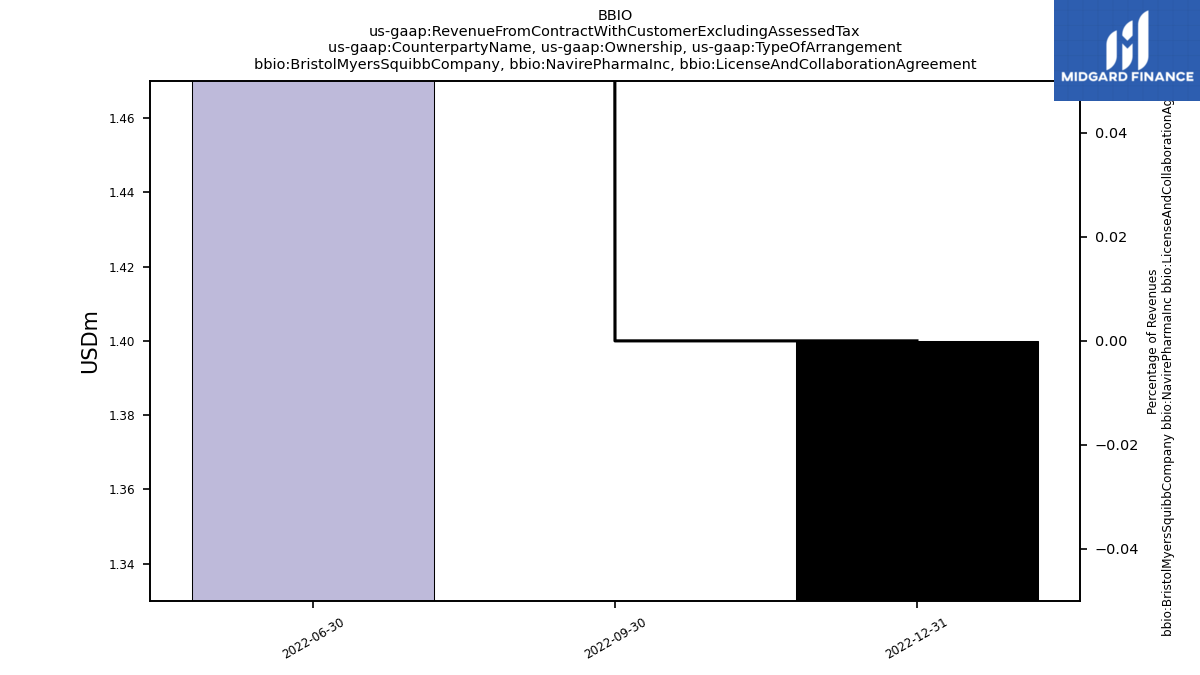
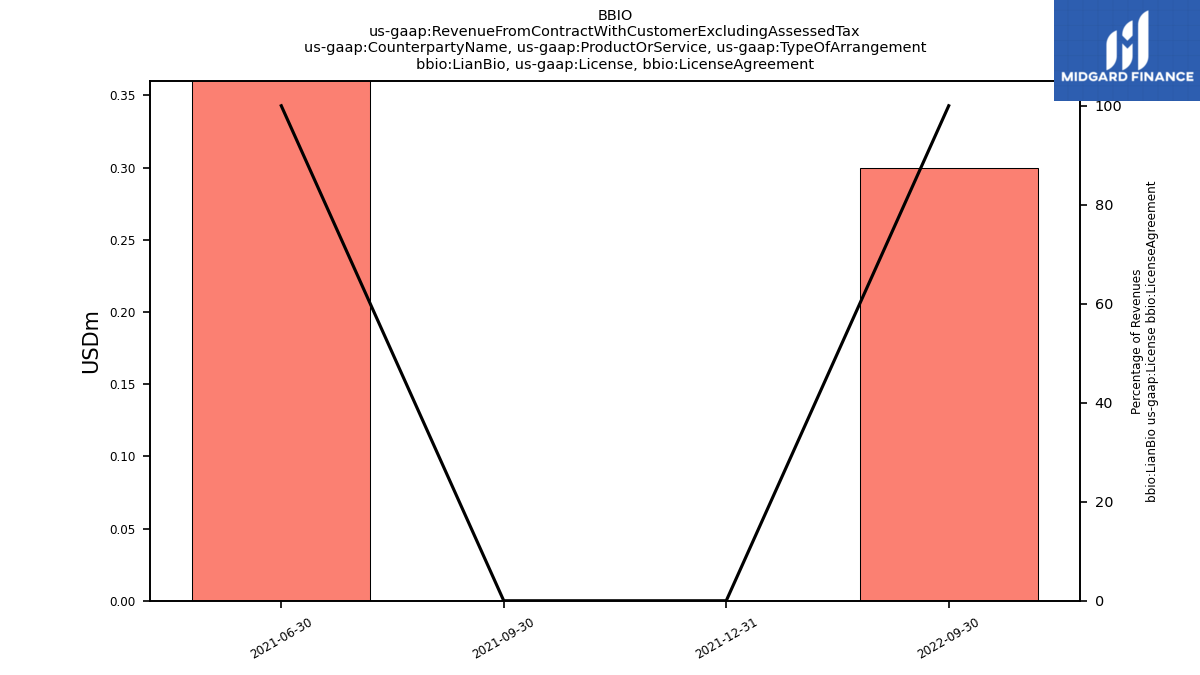
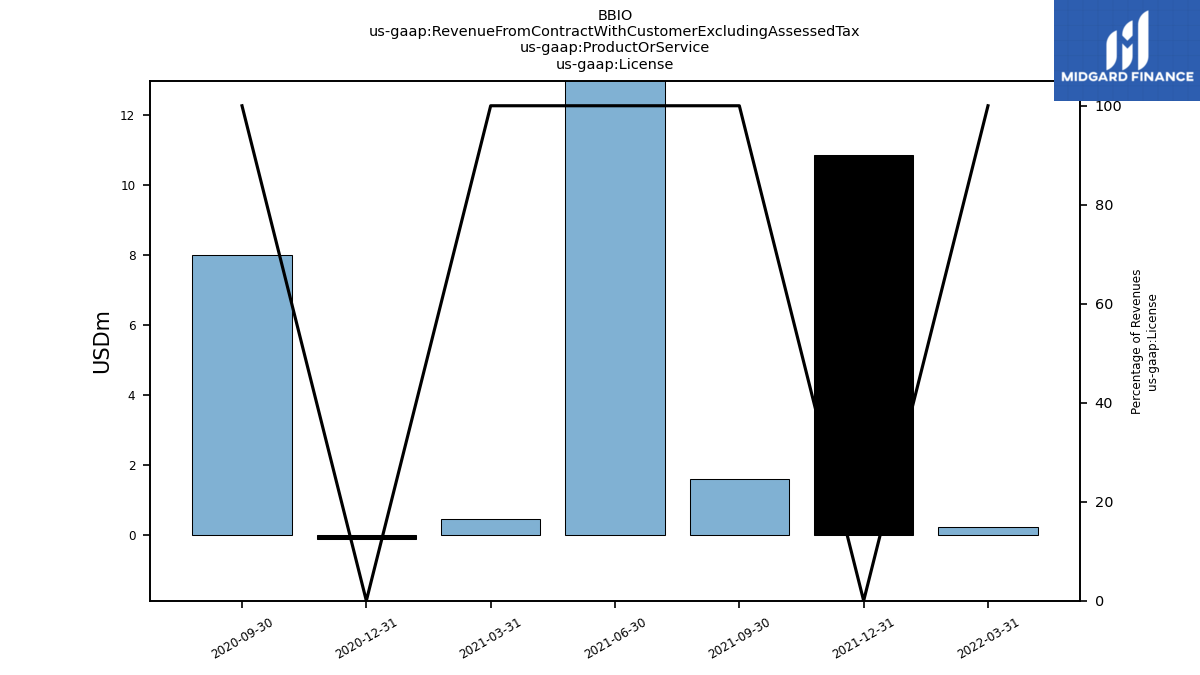
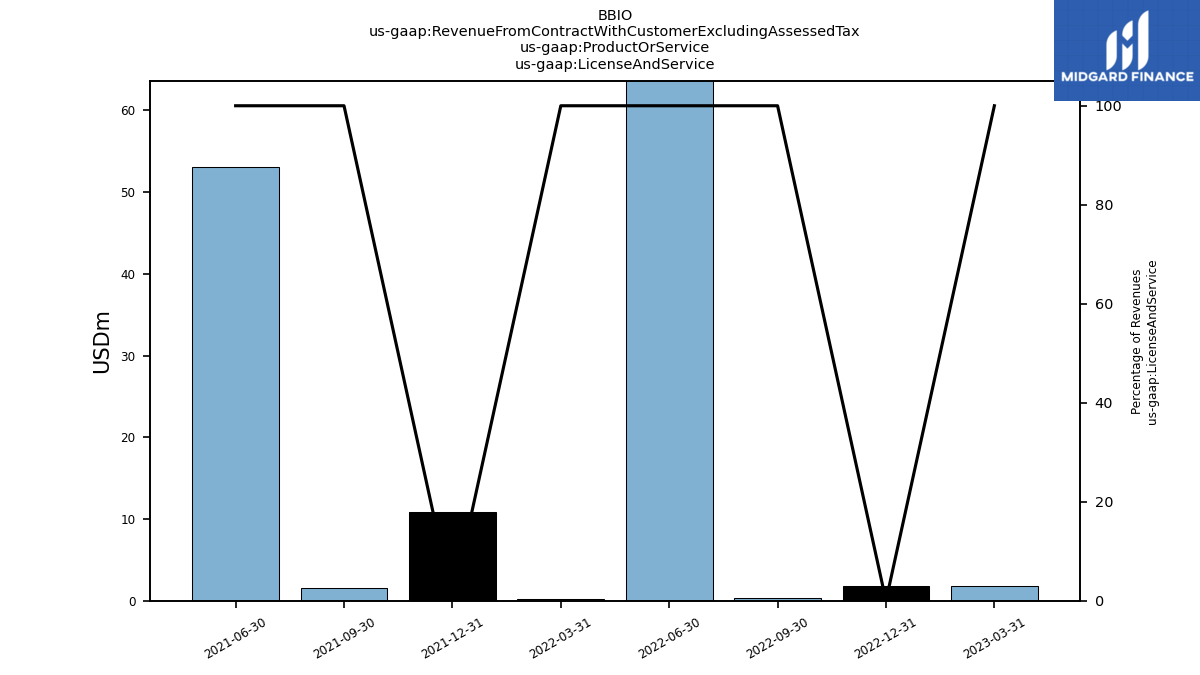
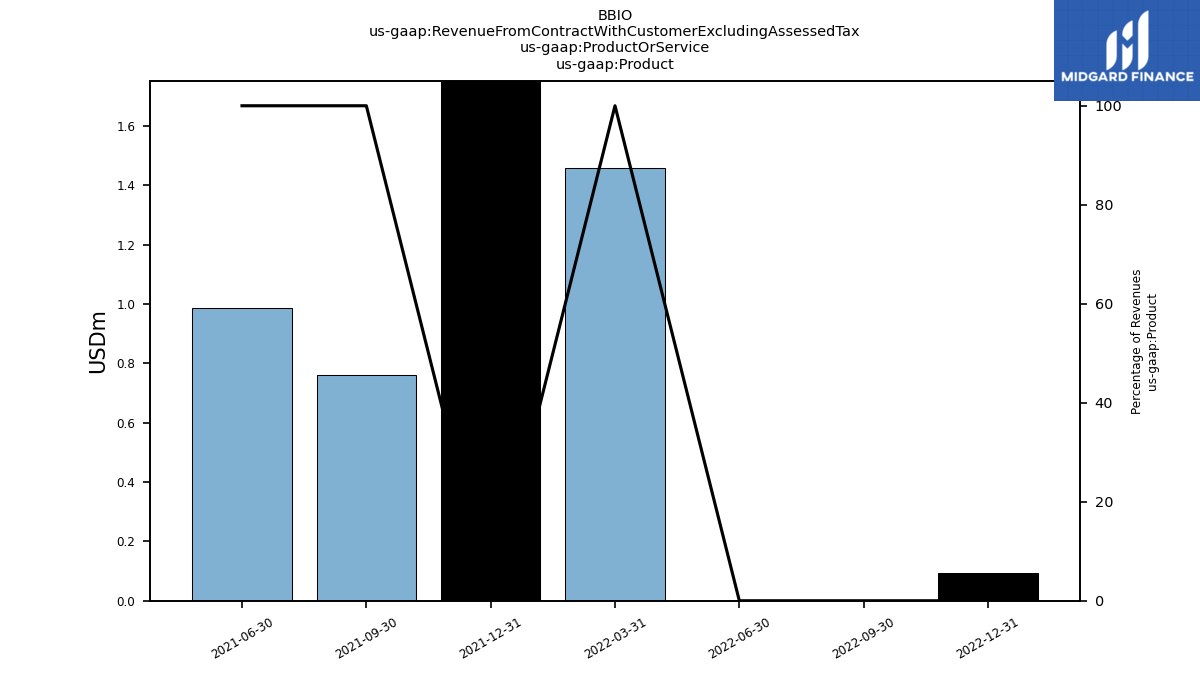
| Revenue From Contract With Customer Excluding Assessed Tax | 4.09 | 1.64 | 1.83 | 1.87 | 0.34 | 73.75 | 1.69 | 12.89 | 2.34 | 54.02 | 0.46 | 0.12 | 8.13 | 13.82 | 26.74 | |
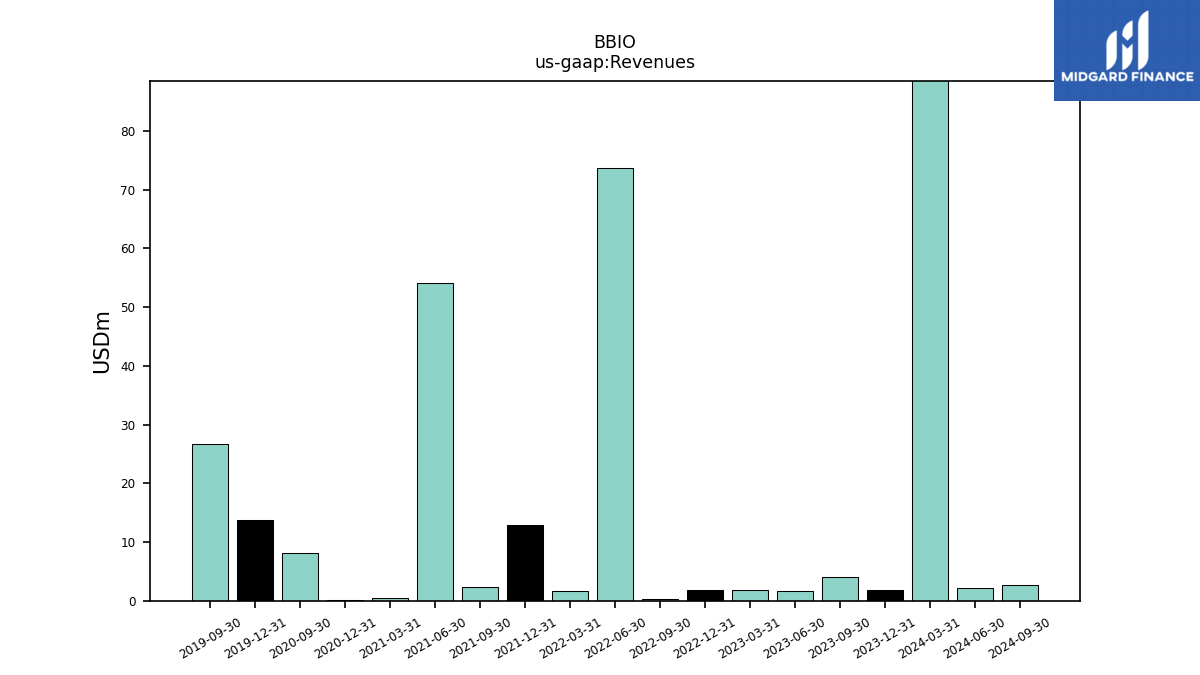
| Revenues | 4.09 | 1.64 | 1.83 | 1.87 | 0.34 | 73.75 | 1.69 | 12.89 | 2.34 | 54.02 | 0.46 | 0.12 | 8.13 | 13.82 | 26.74 | |
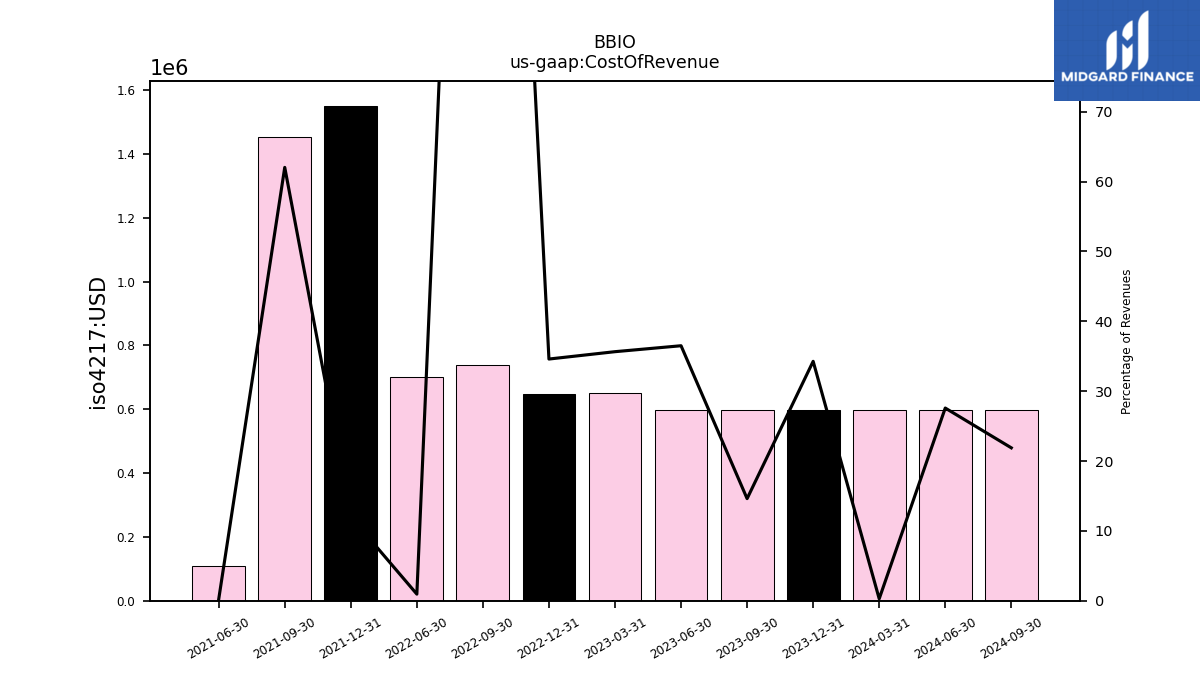
| Cost Of Revenue | 0.60 | 0.60 | NA | NA | 0.74 | 0.70 | NA | 1.17 | 1.45 | 0.11 | NA | NA | NA | NA | NA | |
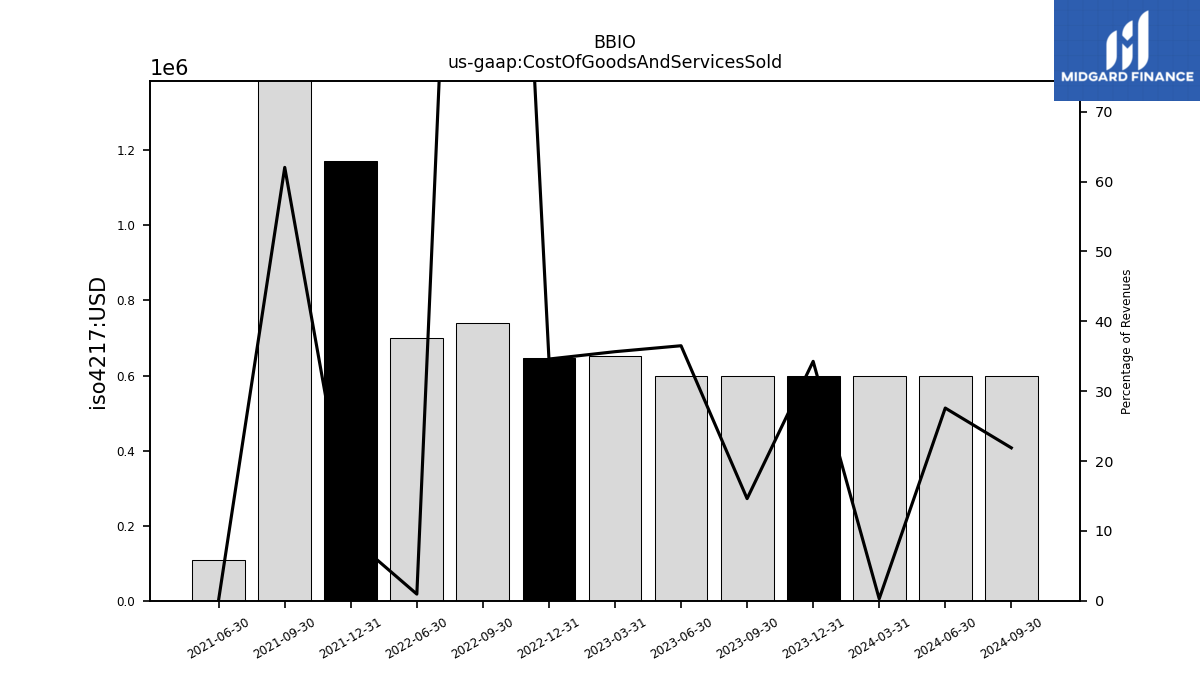
| Cost Of Goods And Services Sold | 0.60 | 0.60 | NA | NA | 0.74 | 0.70 | NA | 1.17 | 1.45 | 0.11 | NA | NA | NA | NA | NA | |
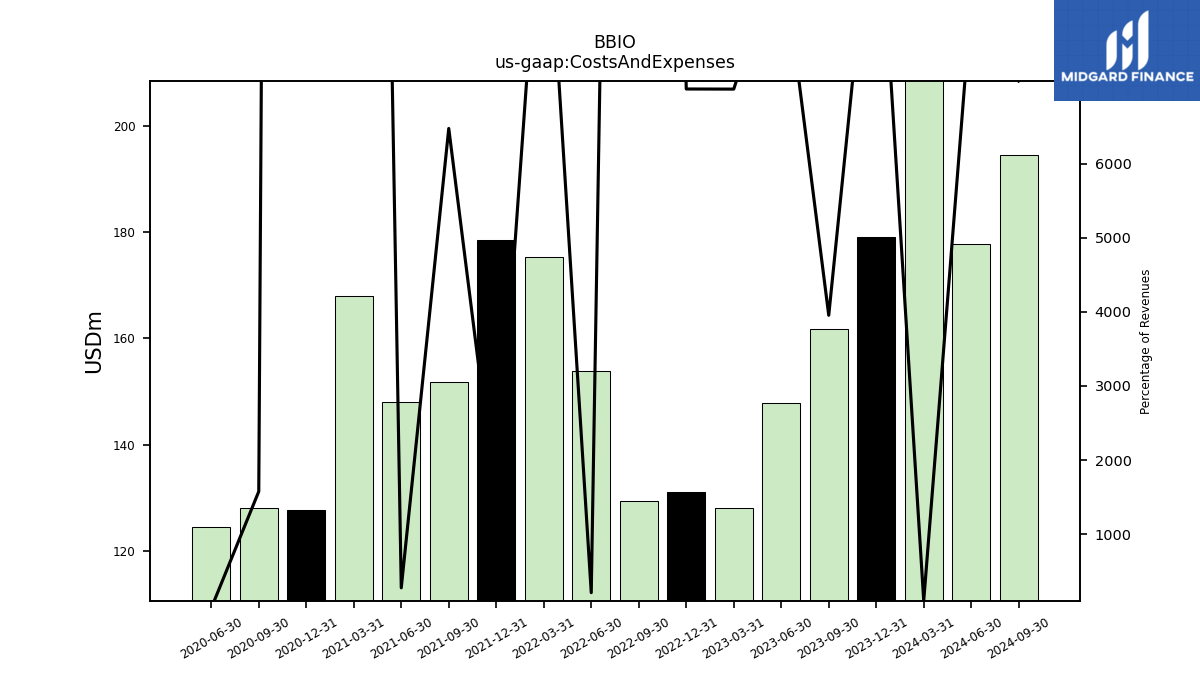
| Costs And Expenses | 161.78 | 147.74 | 127.99 | 131.10 | 129.45 | 153.92 | 175.37 | 178.50 | 151.84 | 148.04 | 167.97 | 127.61 | 128.07 | NA | NA | |
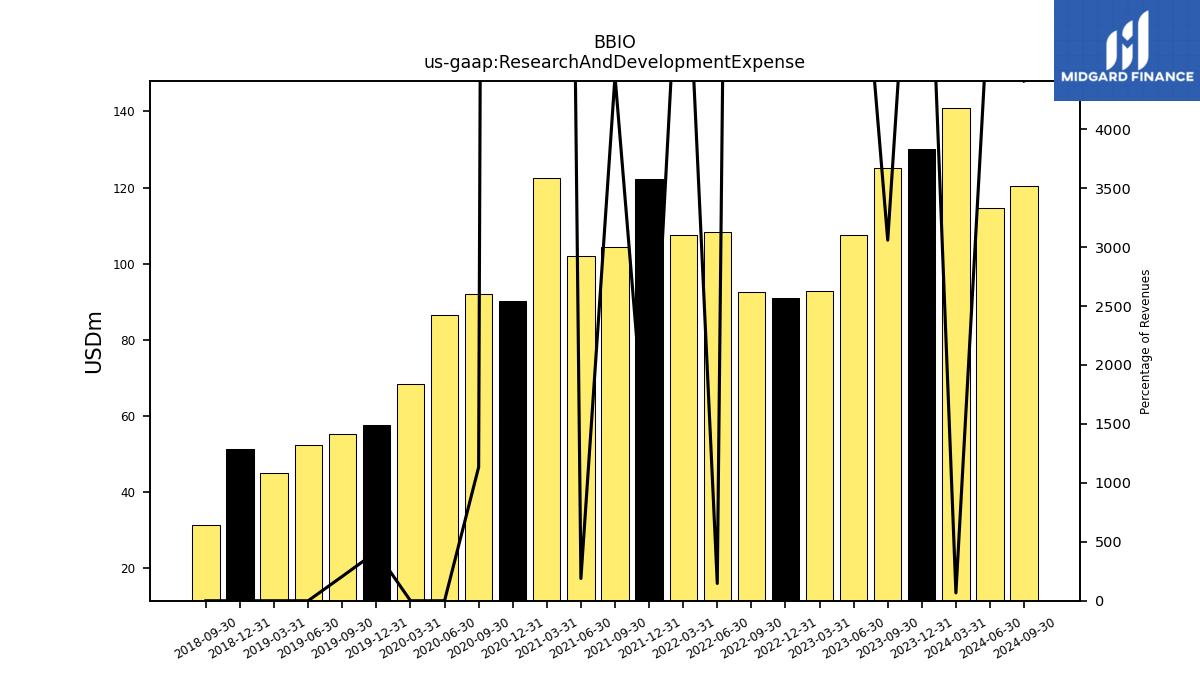
| Research And Development Expense | 125.14 | 107.49 | 92.86 | 90.90 | 92.51 | 108.40 | 107.65 | 122.20 | 104.31 | 101.96 | 122.56 | 90.17 | 92.05 | 57.48 | 55.28 | |
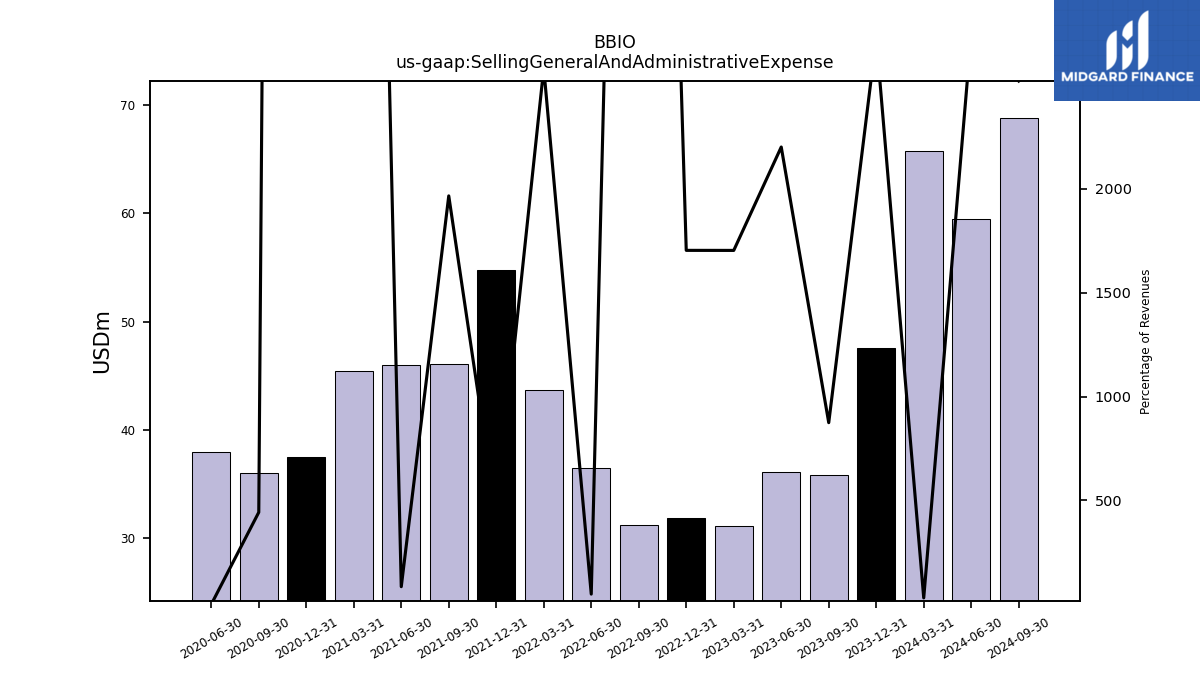
| Selling General And Administrative Expense | 35.78 | 36.12 | 31.11 | 31.86 | 31.19 | 36.43 | 43.71 | 54.75 | 46.08 | 45.97 | 45.41 | 37.44 | 36.02 | NA | NA | |
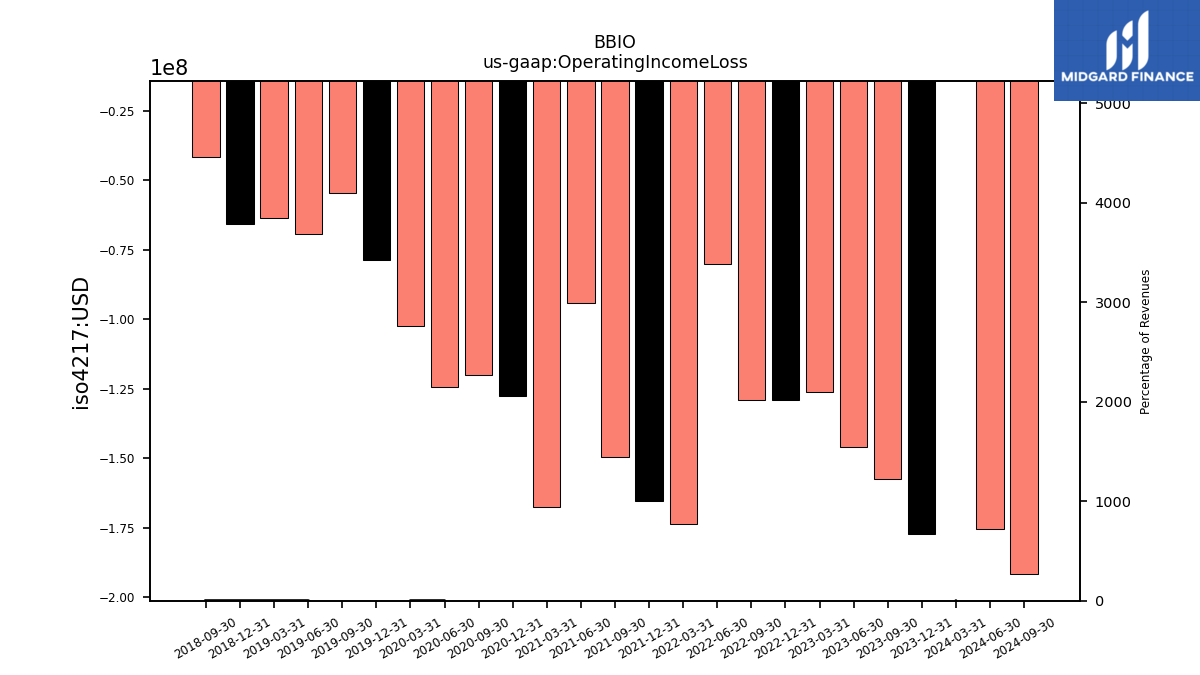
| Operating Income Loss | -157.69 | -146.10 | -126.16 | -129.23 | -129.12 | -80.18 | -173.68 | -165.61 | -149.50 | -94.02 | -167.50 | -127.49 | -119.94 | -78.64 | -54.53 | |
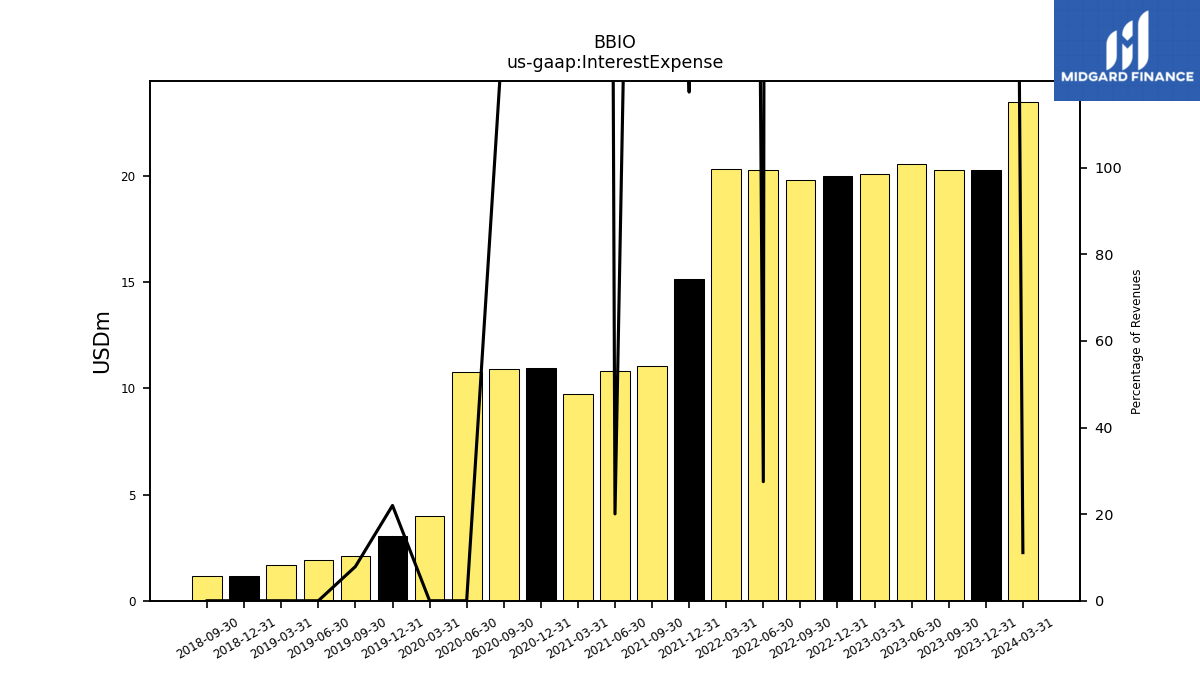
| Interest Expense | 20.31 | 20.59 | 20.12 | 19.99 | 19.82 | 20.28 | 20.34 | 15.13 | 11.07 | 10.84 | 9.74 | 10.96 | 10.93 | 3.04 | 2.11 | |
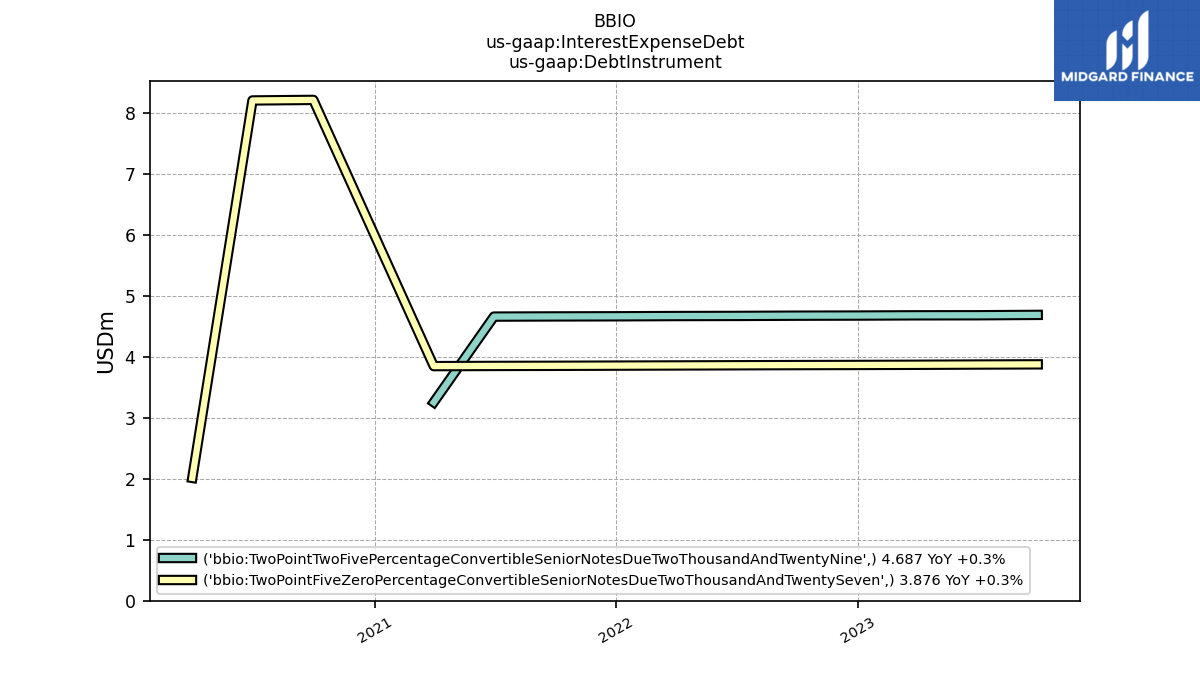
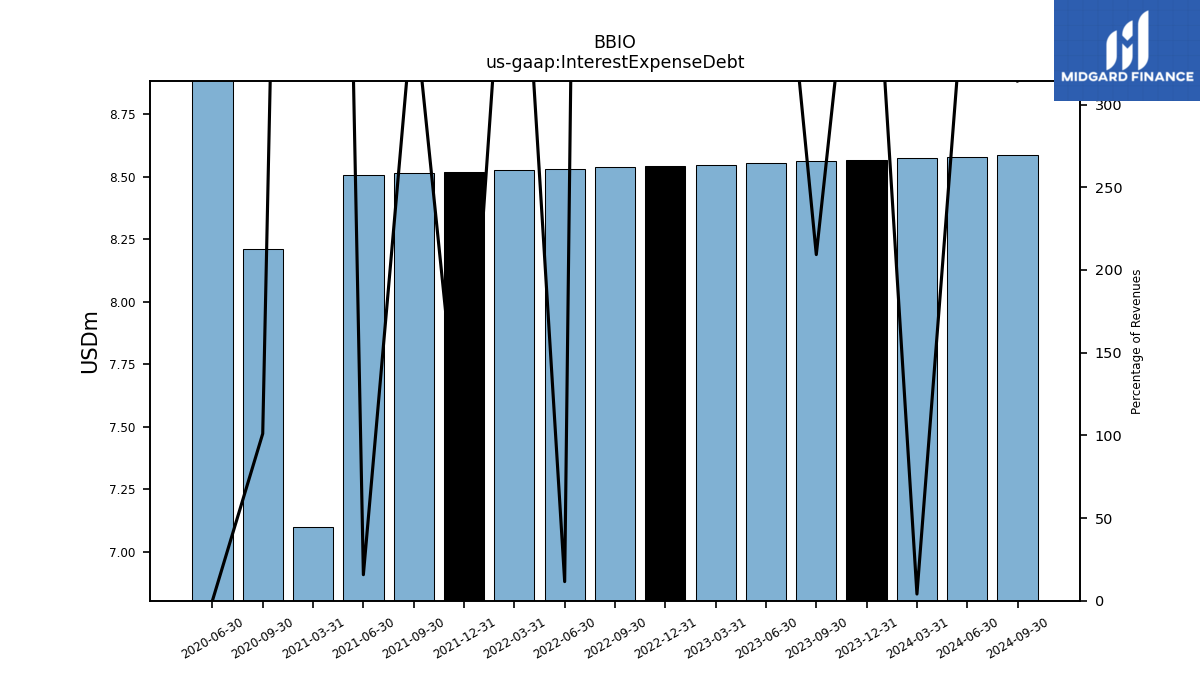
| Interest Expense Debt | 8.56 | 8.55 | 8.55 | 8.54 | 8.54 | 8.53 | 8.53 | 8.52 | 8.51 | 8.51 | 7.10 | NA | 8.21 | NA | NA | |
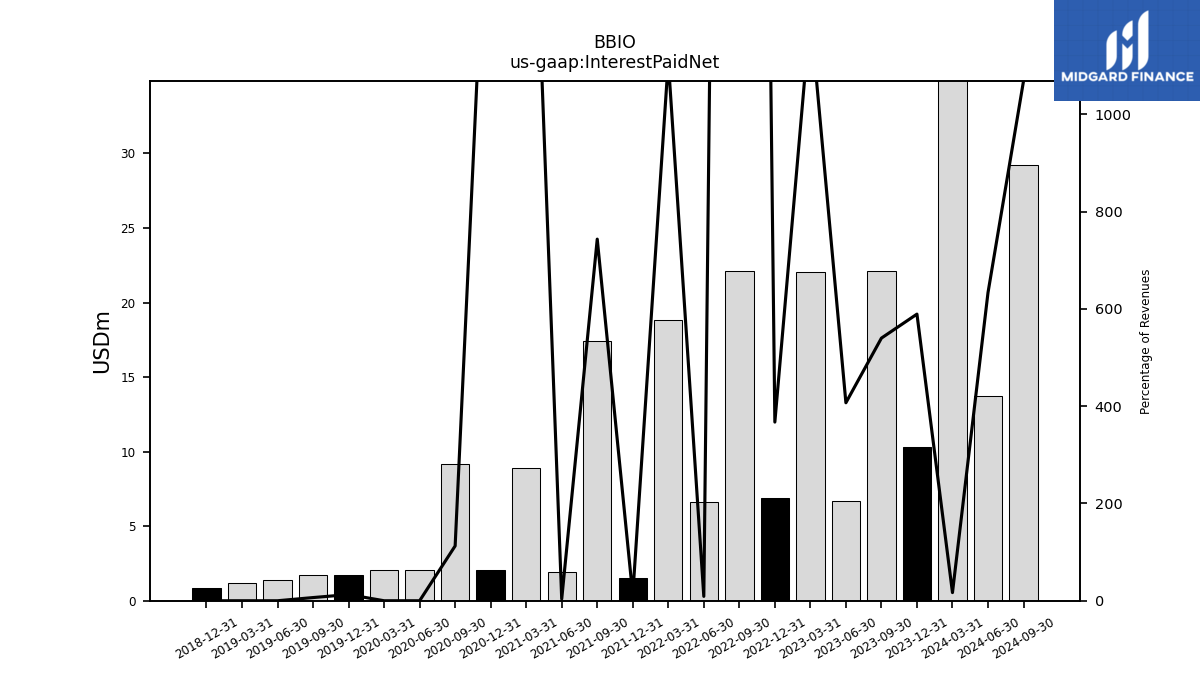
| Interest Paid Net | 22.09 | 6.68 | 22.06 | 6.87 | 22.14 | 6.63 | 18.81 | 1.53 | 17.43 | 1.90 | 8.91 | 2.04 | 9.16 | 1.76 | 1.75 | |
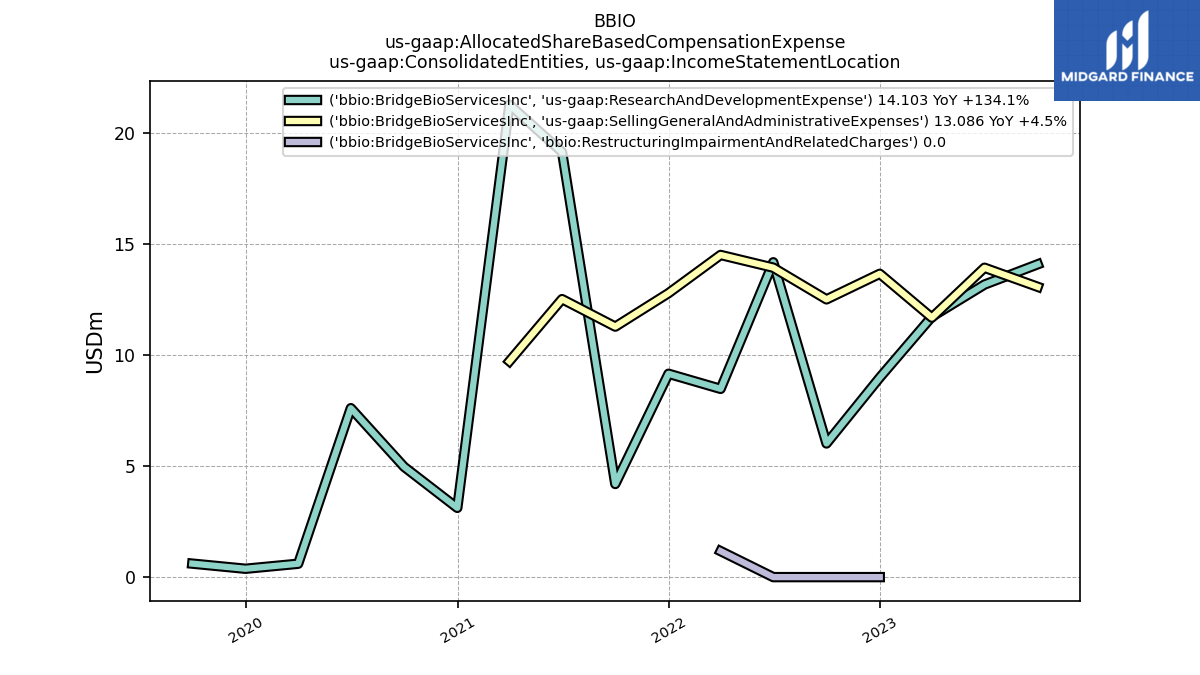
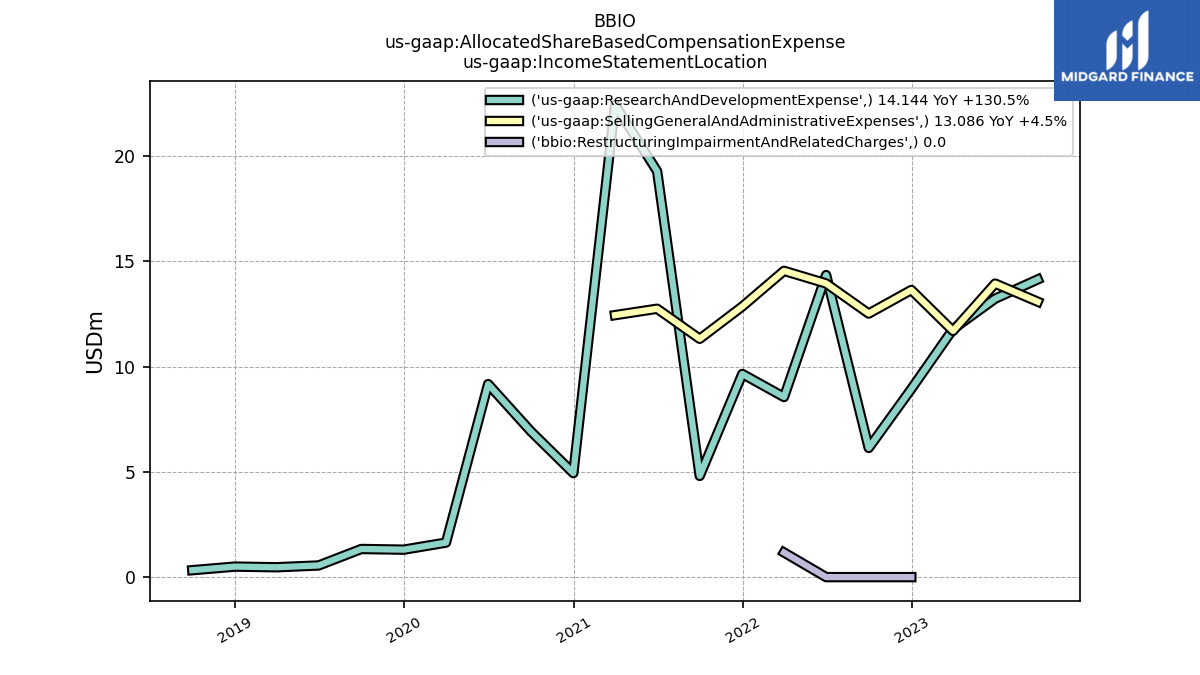
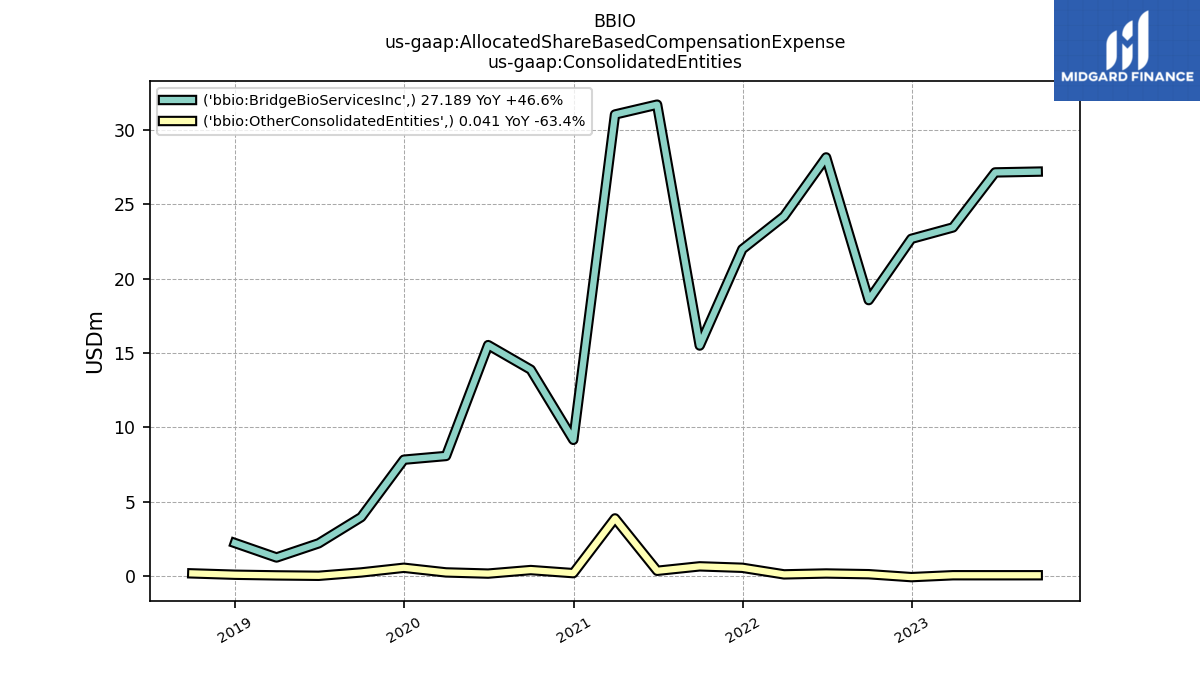
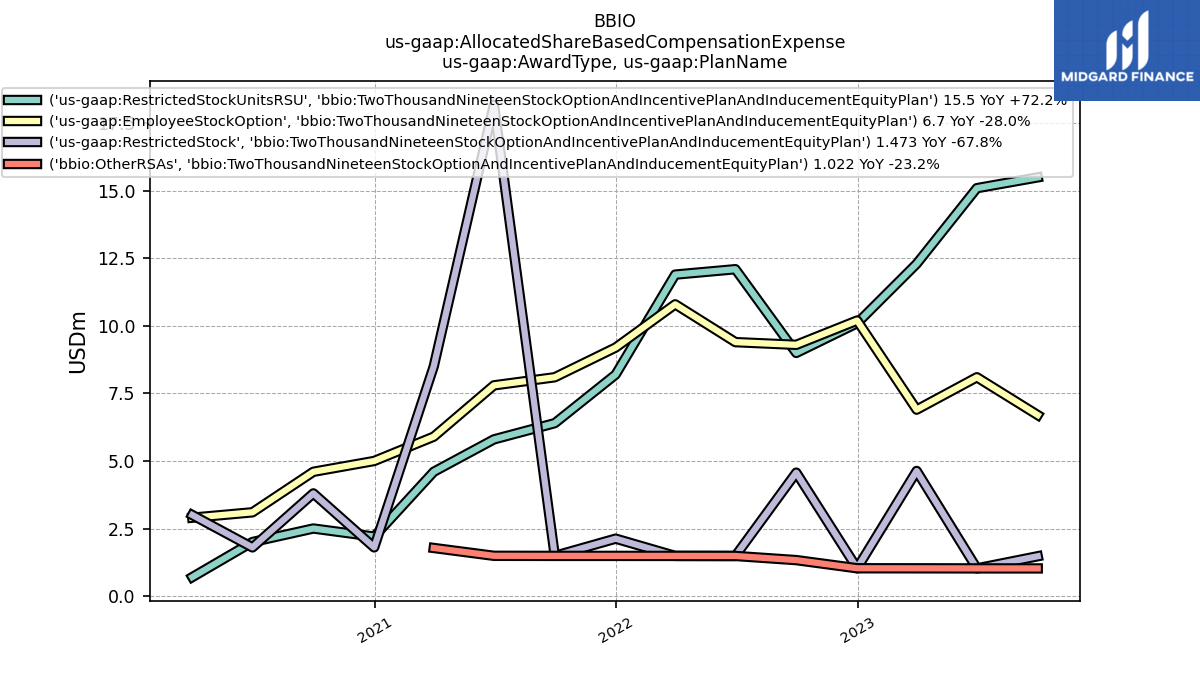
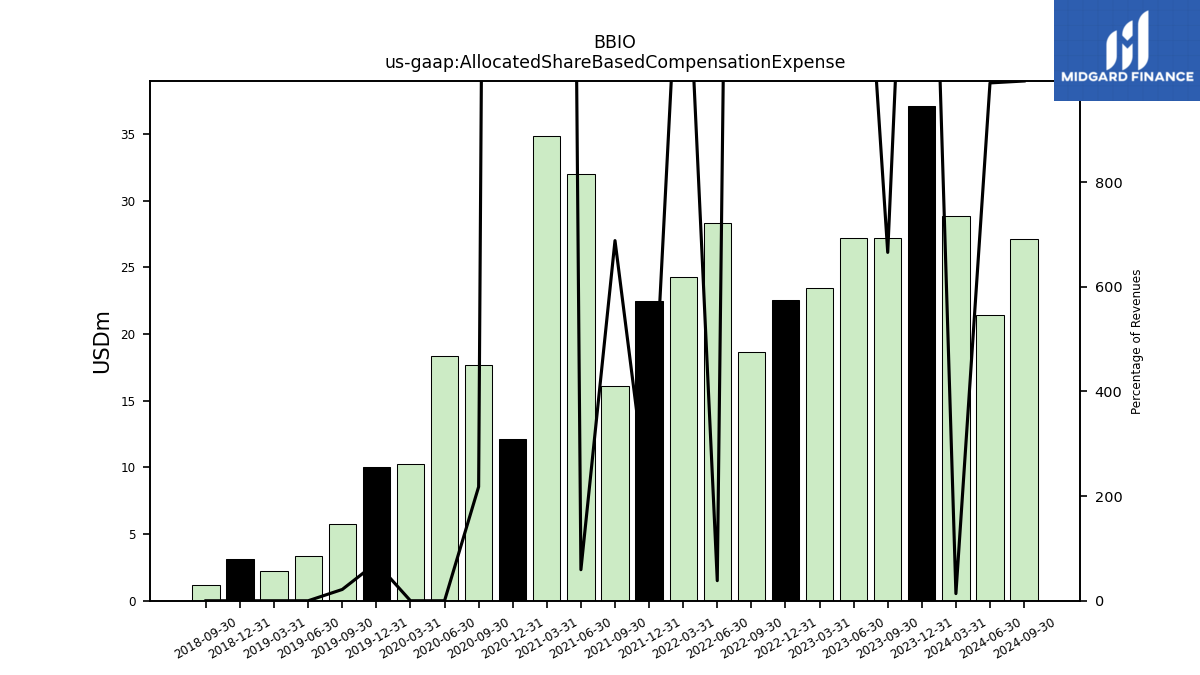
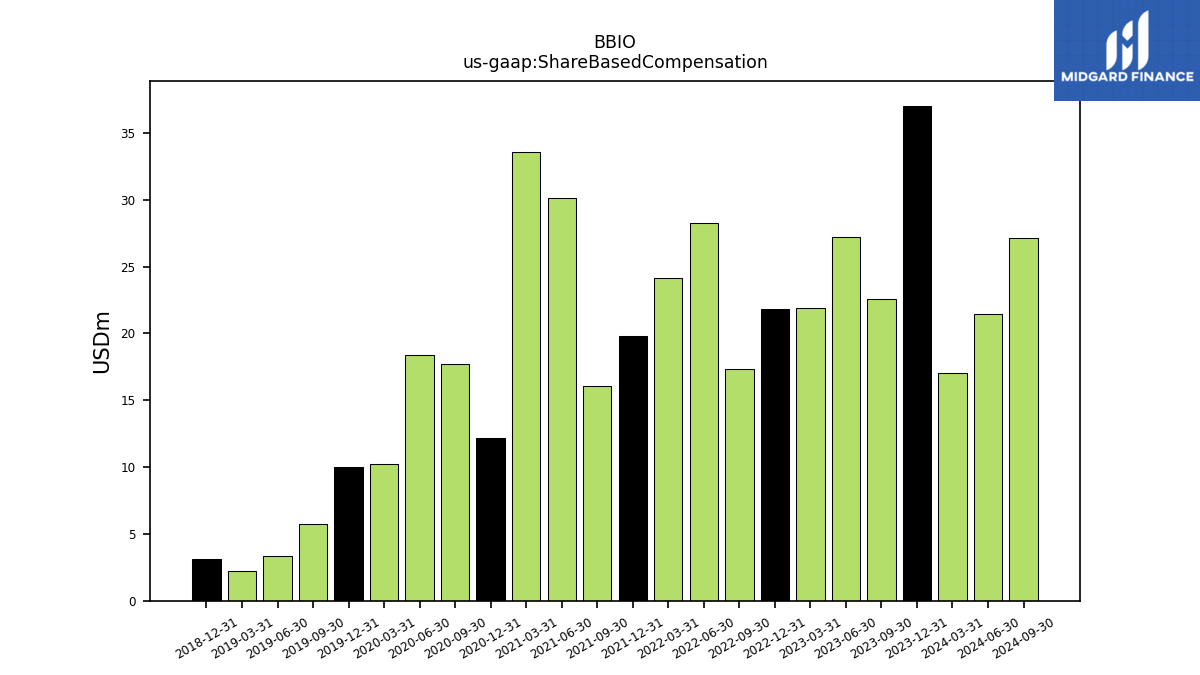
| Allocated Share Based Compensation Expense | 27.23 | 27.18 | 23.48 | 22.58 | 18.66 | 28.30 | 24.28 | 22.51 | 16.13 | 32.03 | 34.90 | 12.15 | 17.70 | 10.01 | 5.78 | |
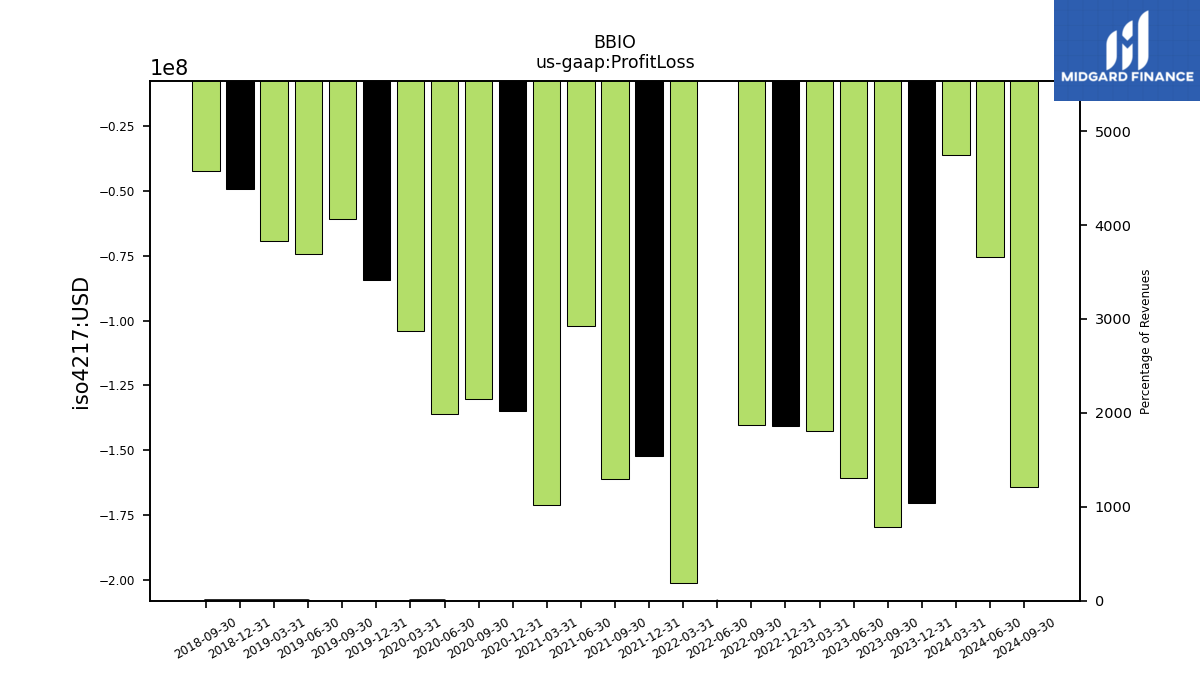
| Profit Loss | -179.49 | -160.70 | -142.73 | -140.57 | -140.19 | -2.56 | -201.33 | -152.28 | -161.02 | -102.07 | -171.08 | -135.03 | -130.17 | -84.15 | -60.66 | |
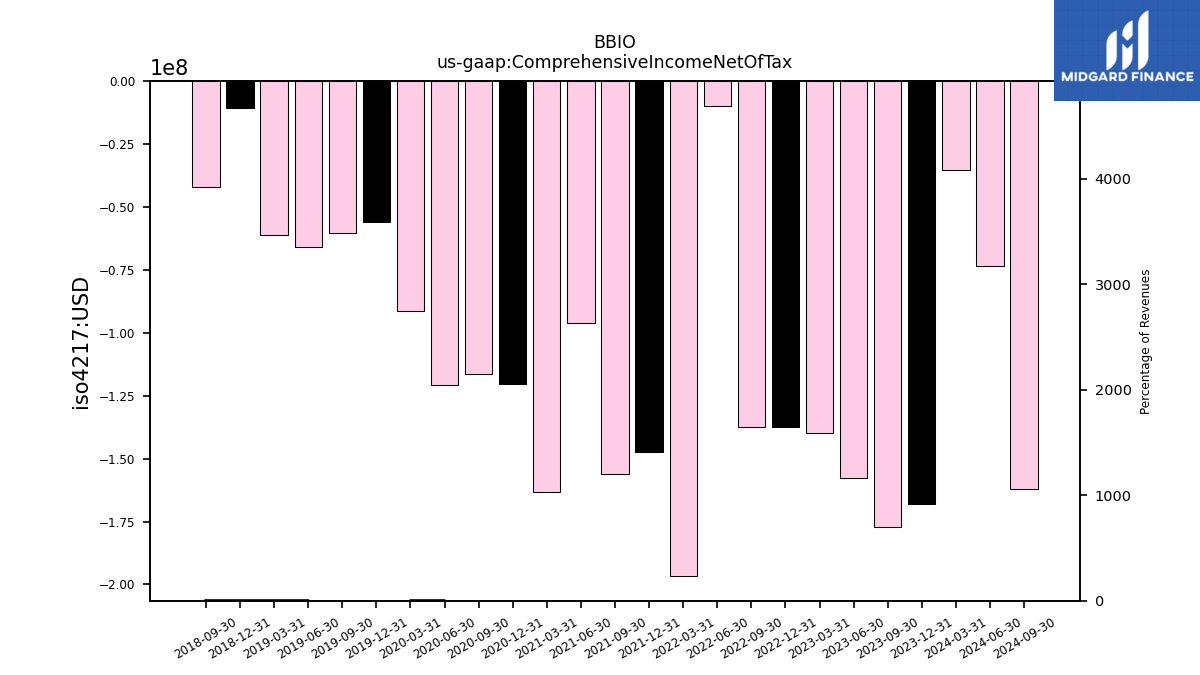
| Comprehensive Income Net Of Tax | -177.03 | -157.82 | -139.84 | -137.57 | -137.26 | -9.90 | -196.65 | -147.33 | -155.95 | -96.25 | -163.33 | -120.25 | -116.26 | -56.05 | -60.51 | |
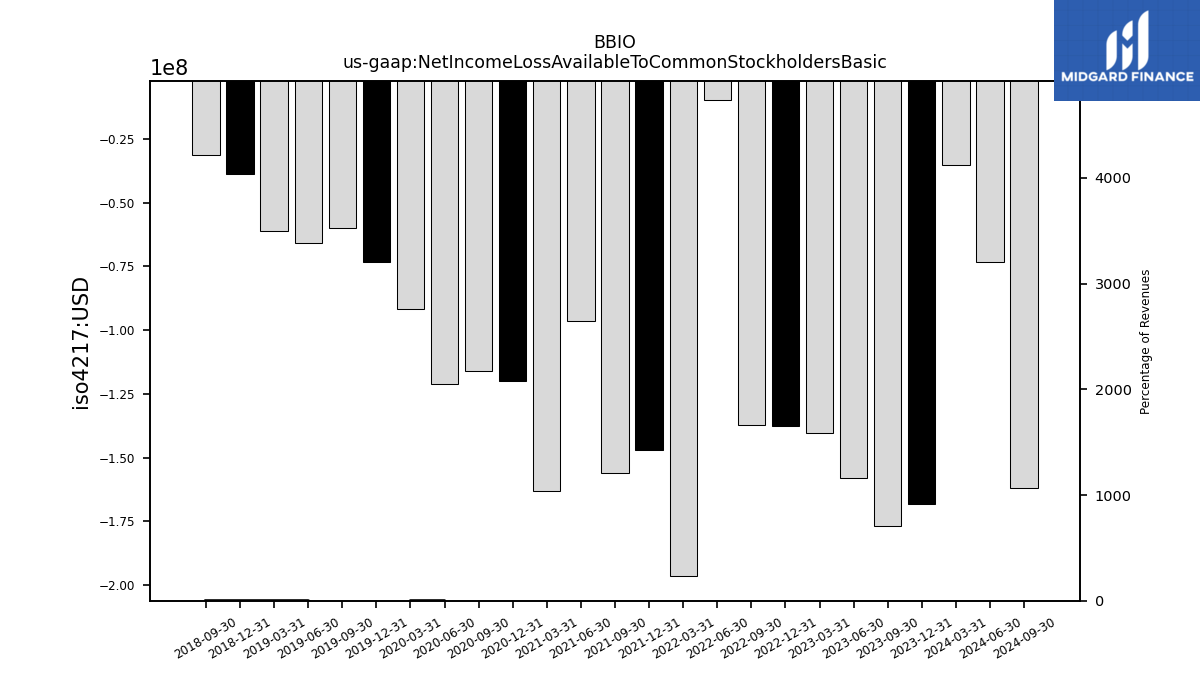
| Net Income Loss Available To Common Stockholders Basic | -177.00 | -157.90 | -140.16 | -137.59 | -137.34 | -9.86 | -196.40 | -147.18 | -155.94 | -96.35 | -163.08 | -119.98 | -115.86 | -73.46 | -59.98 |
| 2023-09-30 | 2023-06-30 | 2023-03-31 | 2022-12-31 | 2022-09-30 | 2022-06-30 | 2022-03-31 | 2021-12-31 | 2021-09-30 | 2021-06-30 | 2021-03-31 | 2020-12-31 | 2020-09-30 | 2019-12-31 | 2019-09-30 | ||
|---|---|---|---|---|---|---|---|---|---|---|---|---|---|---|---|---|
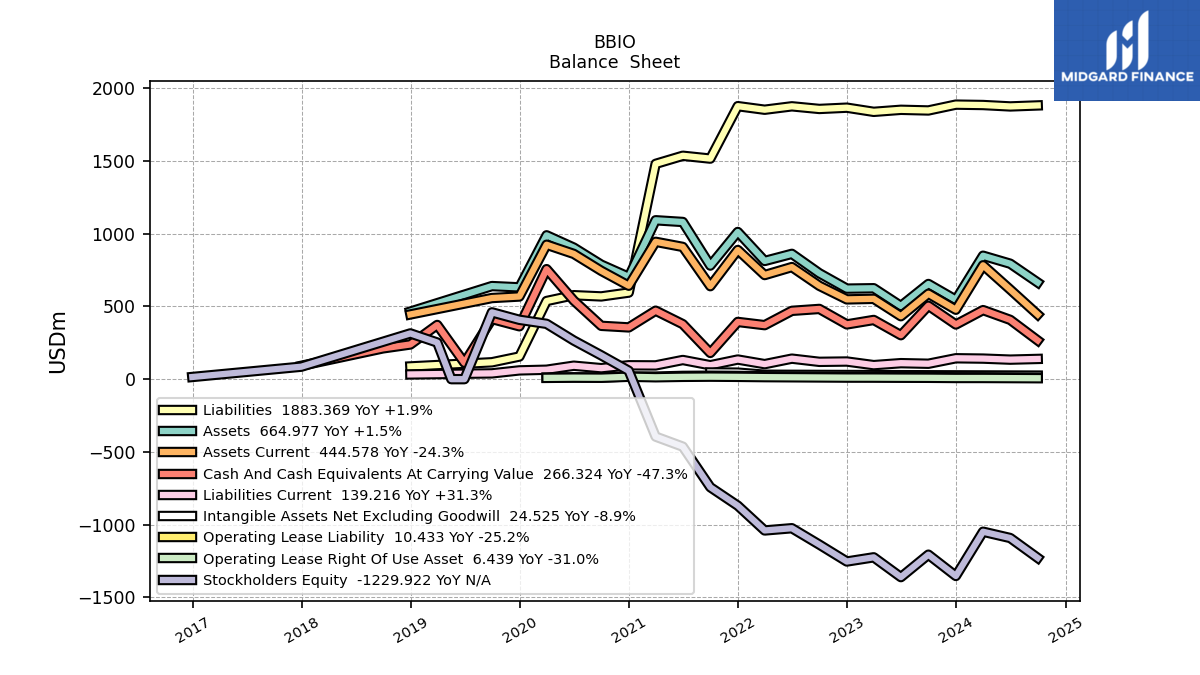
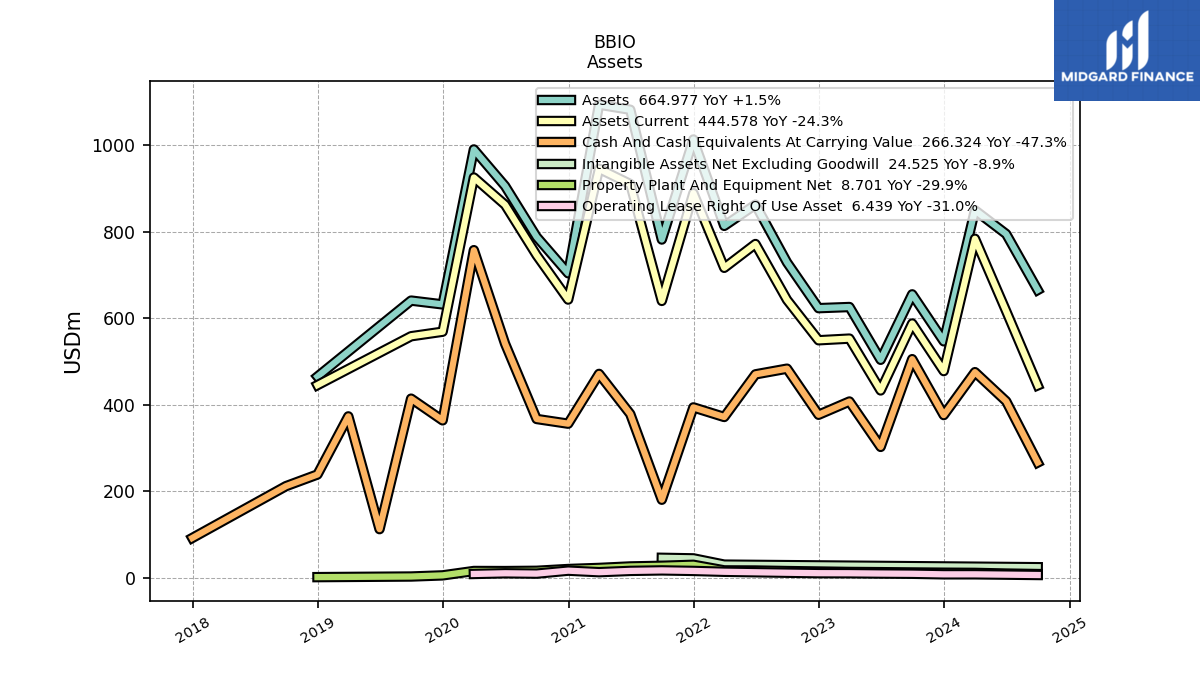
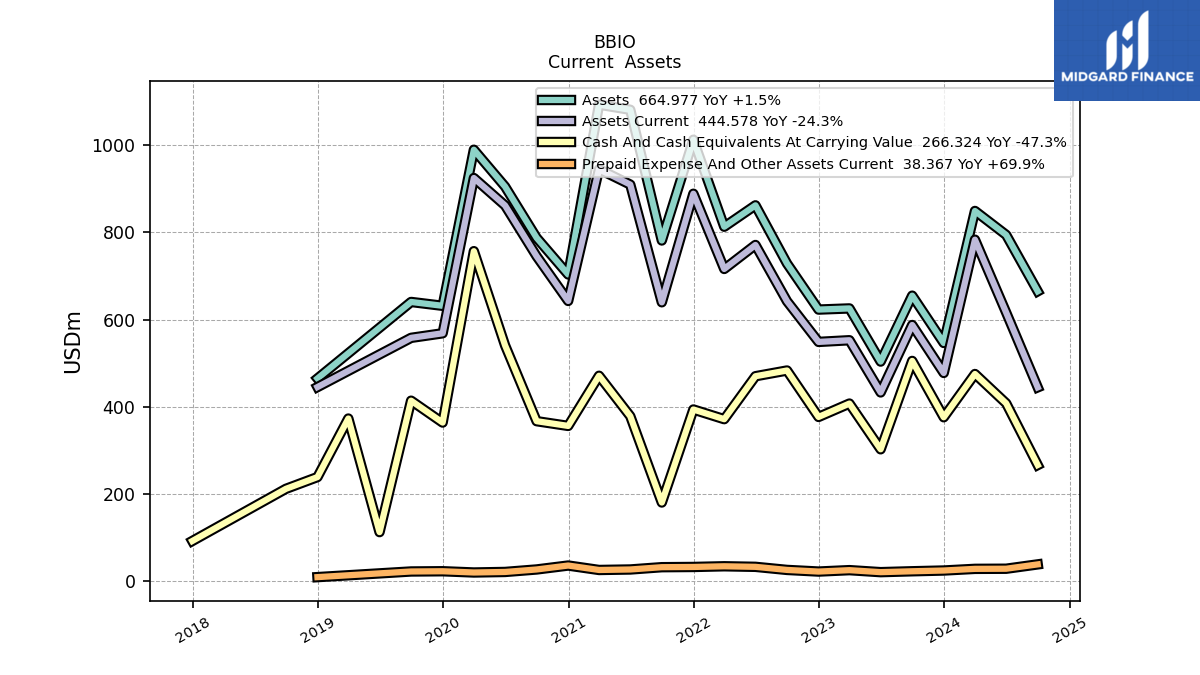
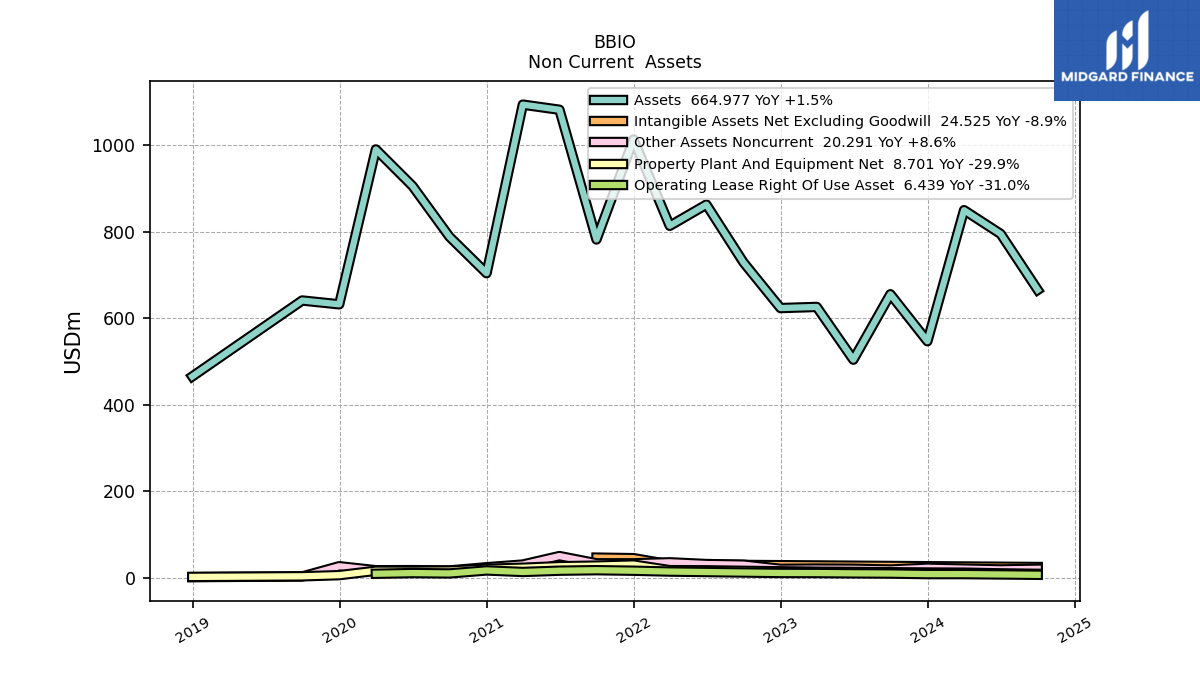
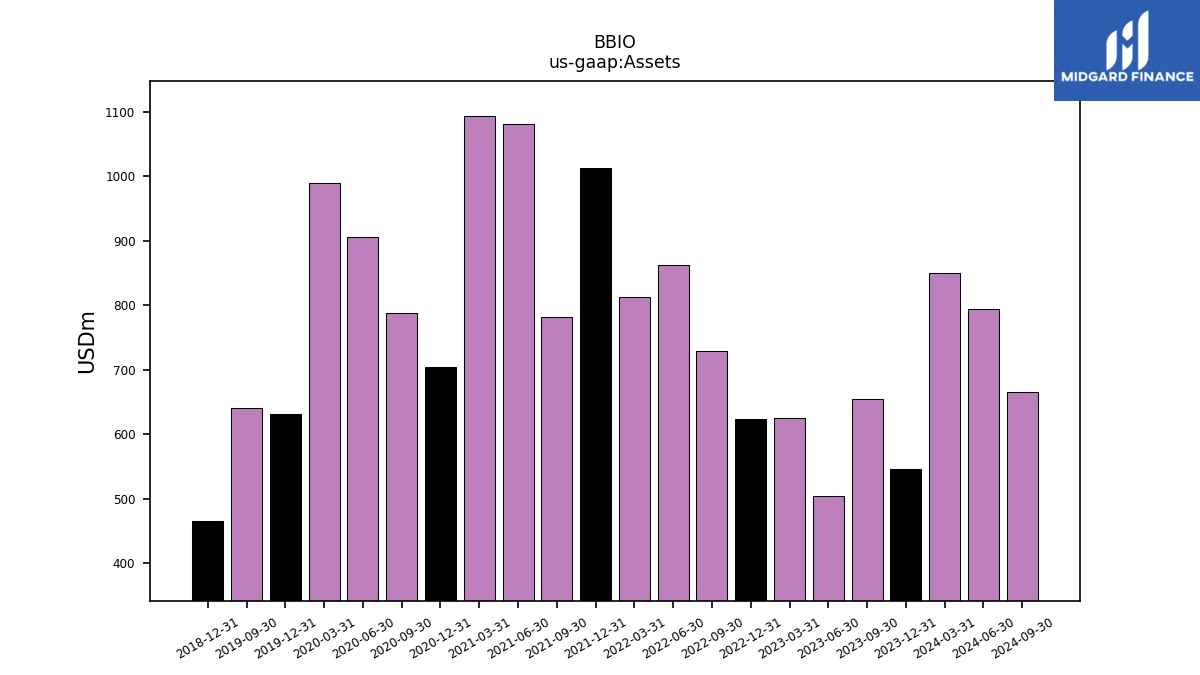
| Assets | 655.01 | 503.66 | 625.68 | 623.04 | 728.74 | 862.23 | 813.15 | 1012.79 | 781.52 | 1081.49 | 1093.31 | 703.59 | 787.69 | 631.68 | 640.53 | |
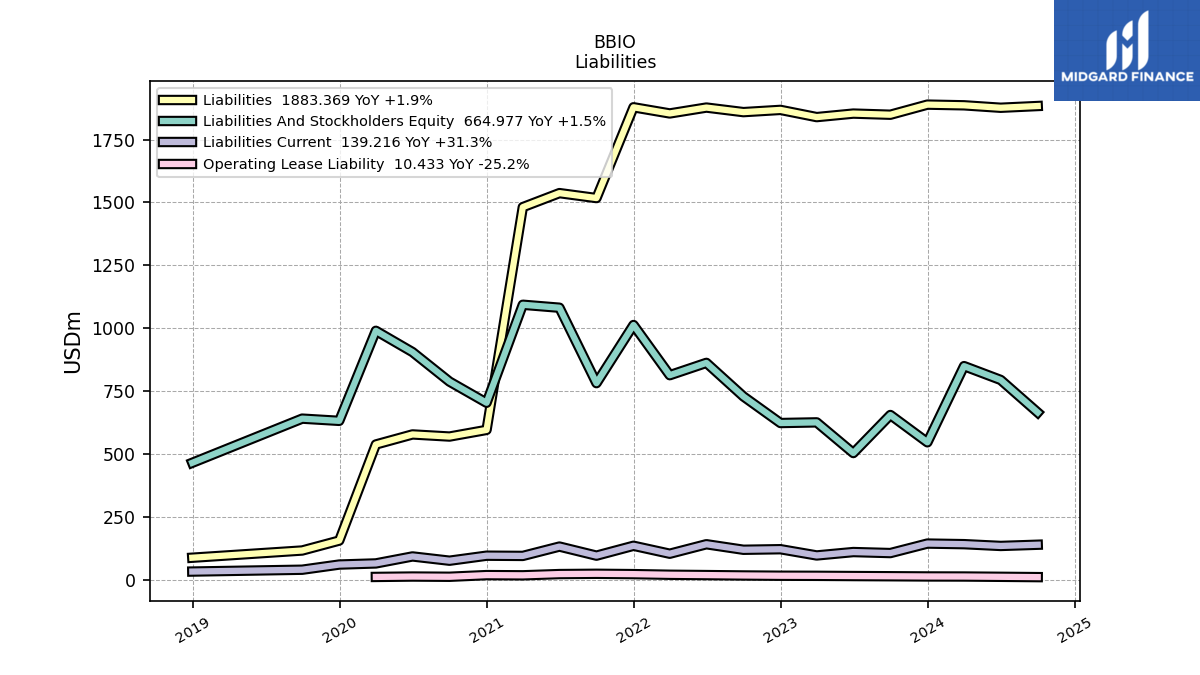
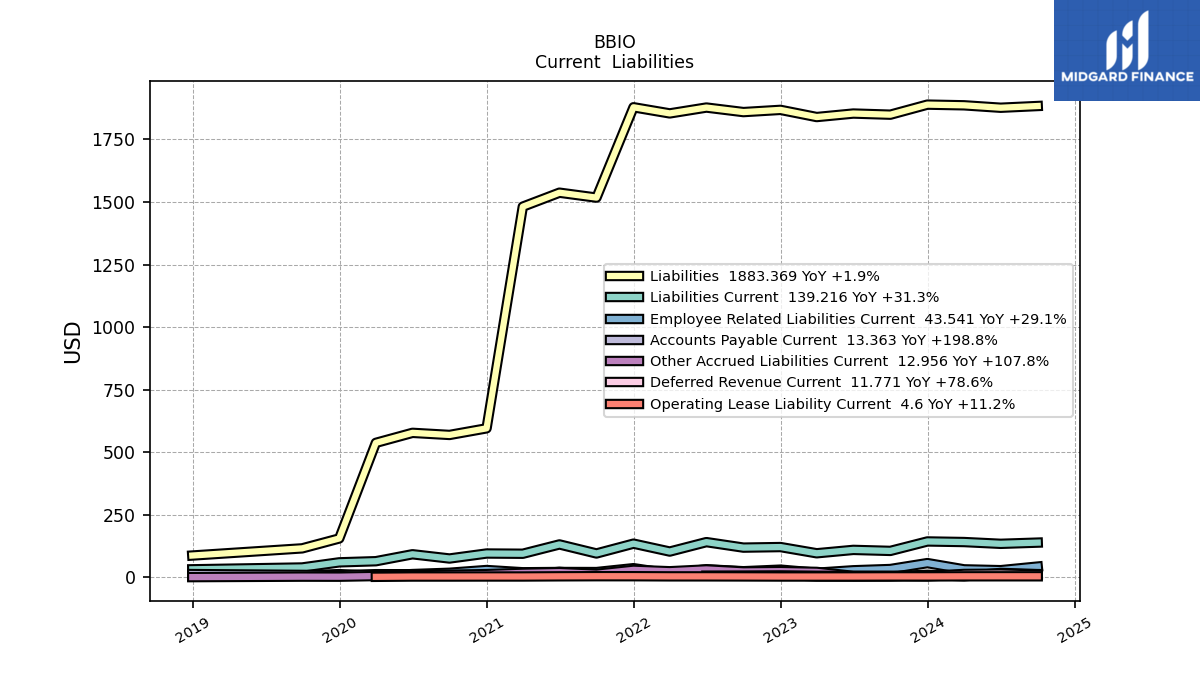
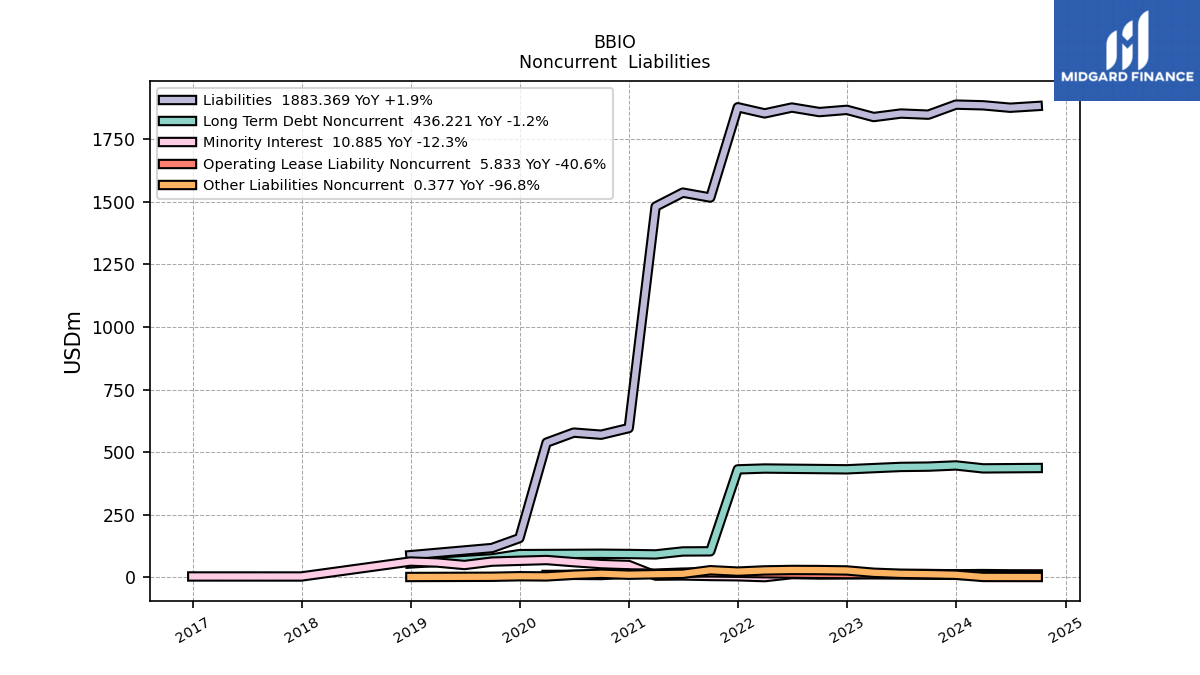
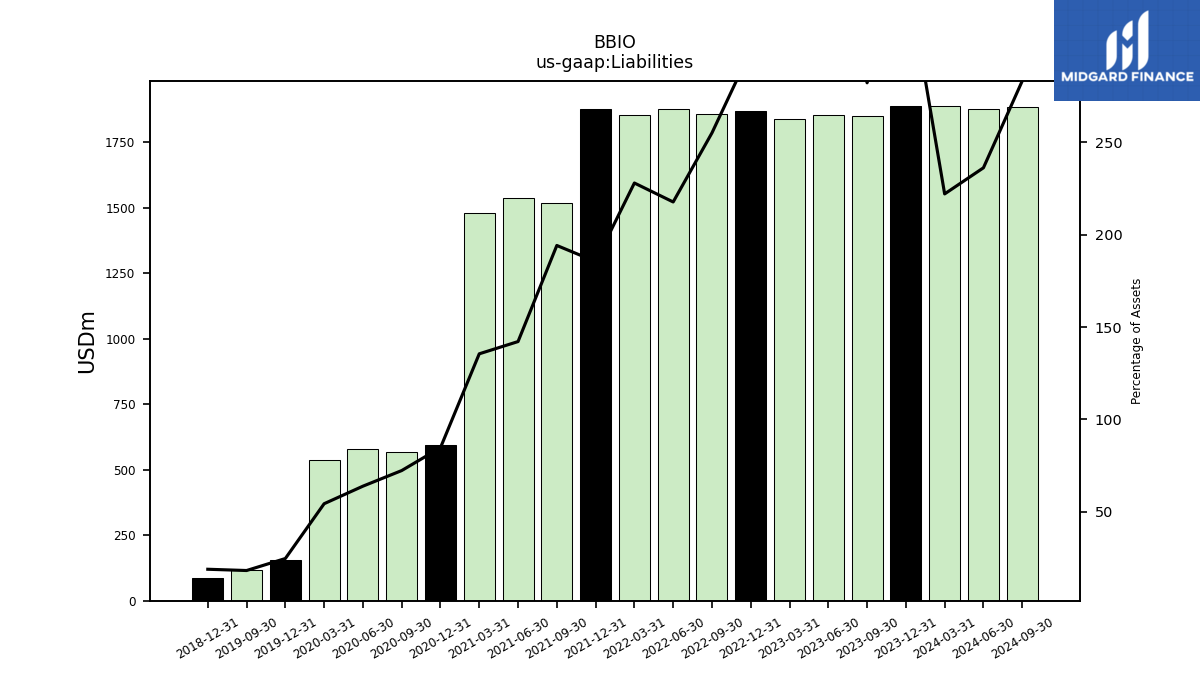
| Liabilities | 1848.74 | 1853.30 | 1839.29 | 1867.96 | 1859.11 | 1877.25 | 1853.84 | 1878.37 | 1517.40 | 1537.11 | 1481.40 | 595.70 | 569.31 | 155.70 | 116.26 | |
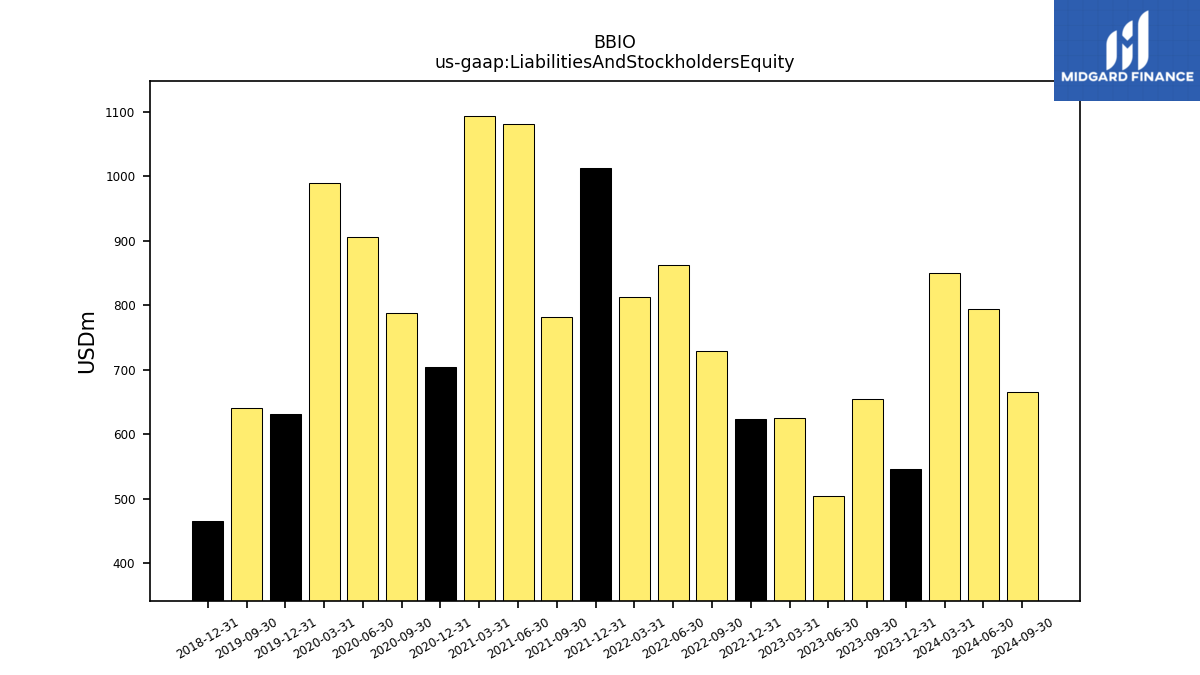
| Liabilities And Stockholders Equity | 655.01 | 503.66 | 625.68 | 623.04 | 728.74 | 862.23 | 813.15 | 1012.79 | 781.52 | 1081.49 | 1093.31 | 703.59 | 787.69 | 631.68 | 640.53 | |
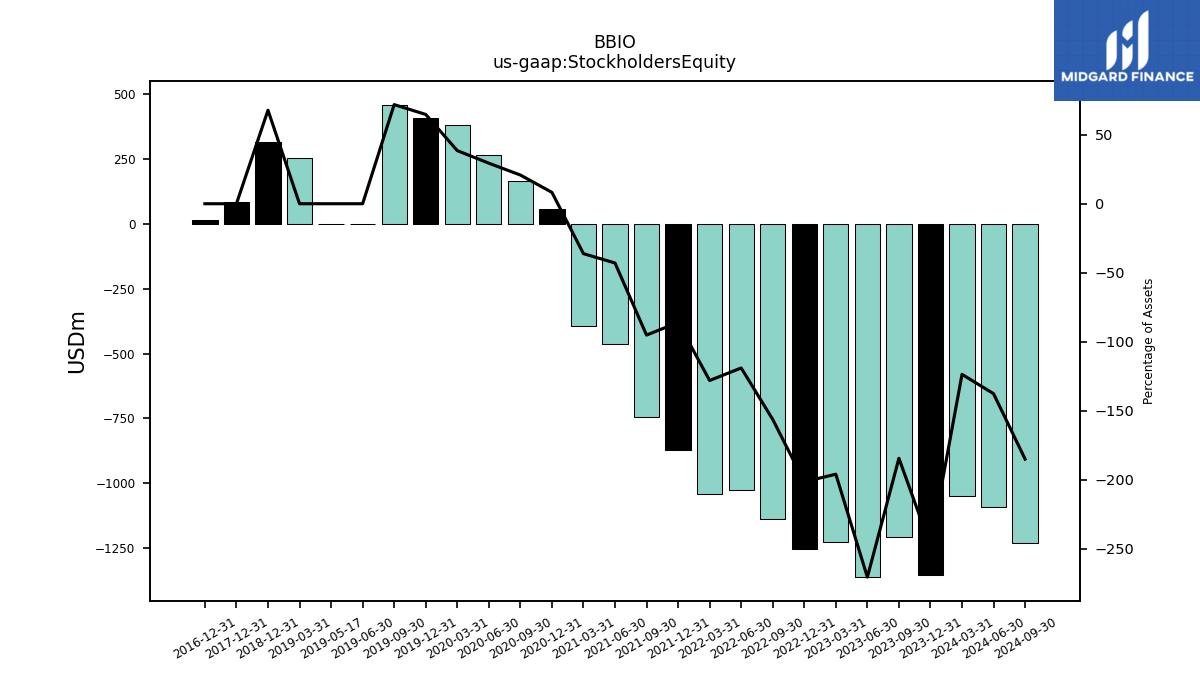
| Stockholders Equity | -1207.54 | -1362.02 | -1225.66 | -1254.62 | -1138.42 | -1025.53 | -1041.00 | -870.41 | -743.40 | -464.29 | -395.29 | 57.91 | 163.76 | 408.45 | 459.76 |
| 2023-09-30 | 2023-06-30 | 2023-03-31 | 2022-12-31 | 2022-09-30 | 2022-06-30 | 2022-03-31 | 2021-12-31 | 2021-09-30 | 2021-06-30 | 2021-03-31 | 2020-12-31 | 2020-09-30 | 2019-12-31 | 2019-09-30 | ||
|---|---|---|---|---|---|---|---|---|---|---|---|---|---|---|---|---|
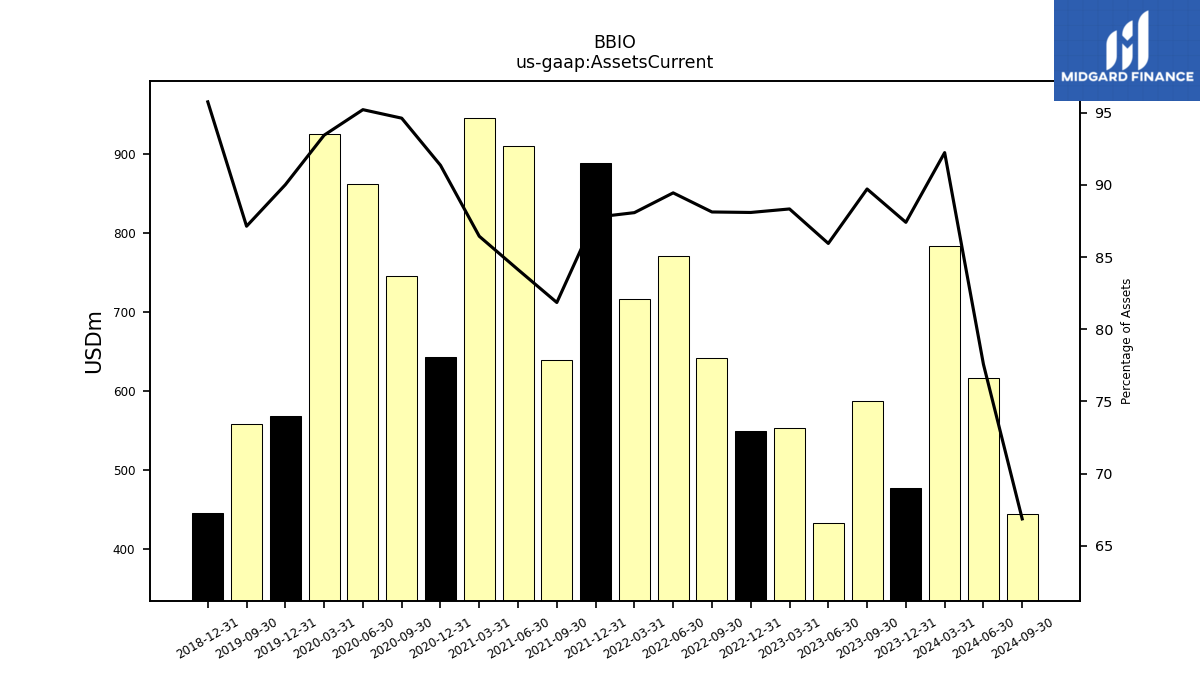
| Assets Current | 587.67 | 432.88 | 552.70 | 548.85 | 642.22 | 771.28 | 716.23 | 888.86 | 639.71 | 909.87 | 945.11 | 642.82 | 745.38 | 568.62 | 558.15 | |
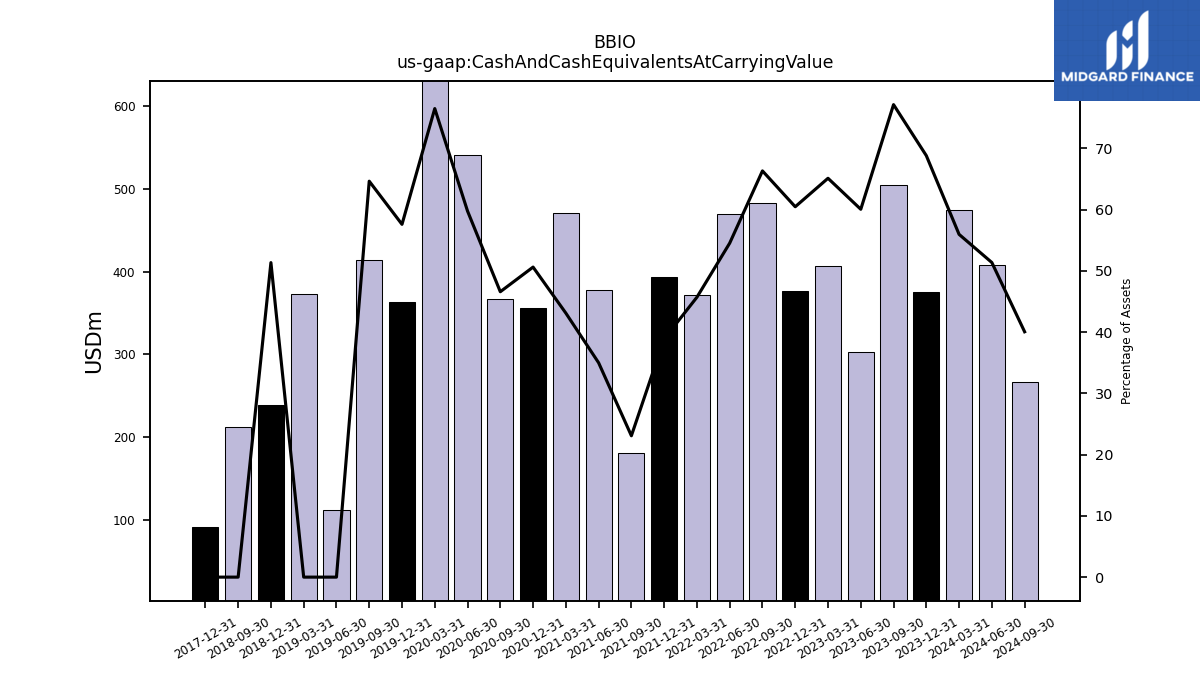
| Cash And Cash Equivalents At Carrying Value | 505.21 | 302.44 | 407.37 | 376.69 | 483.24 | 470.10 | 371.55 | 393.77 | 180.35 | 378.42 | 471.18 | 356.08 | 366.97 | 363.77 | 413.97 | |
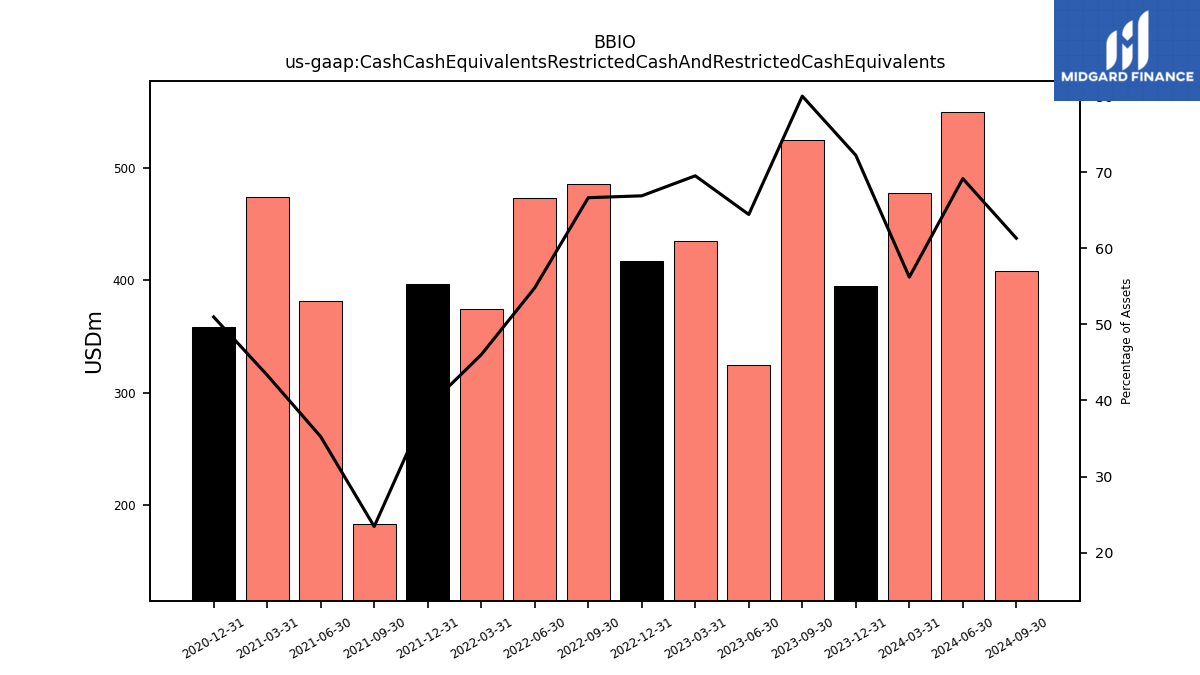
| Cash Cash Equivalents Restricted Cash And Restricted Cash Equivalents | 524.14 | 324.64 | 435.11 | 416.88 | 485.79 | 472.65 | 374.19 | 396.37 | 183.08 | 381.13 | 473.77 | 358.68 | NA | NA | NA | |
| Marketable Securities Current | NA | 30.87 | 34.12 | 51.58 | 75.08 | 218.47 | 261.90 | 393.74 | 419.26 | 459.24 | 447.94 | 251.01 | 343.71 | 182.22 | NA | |
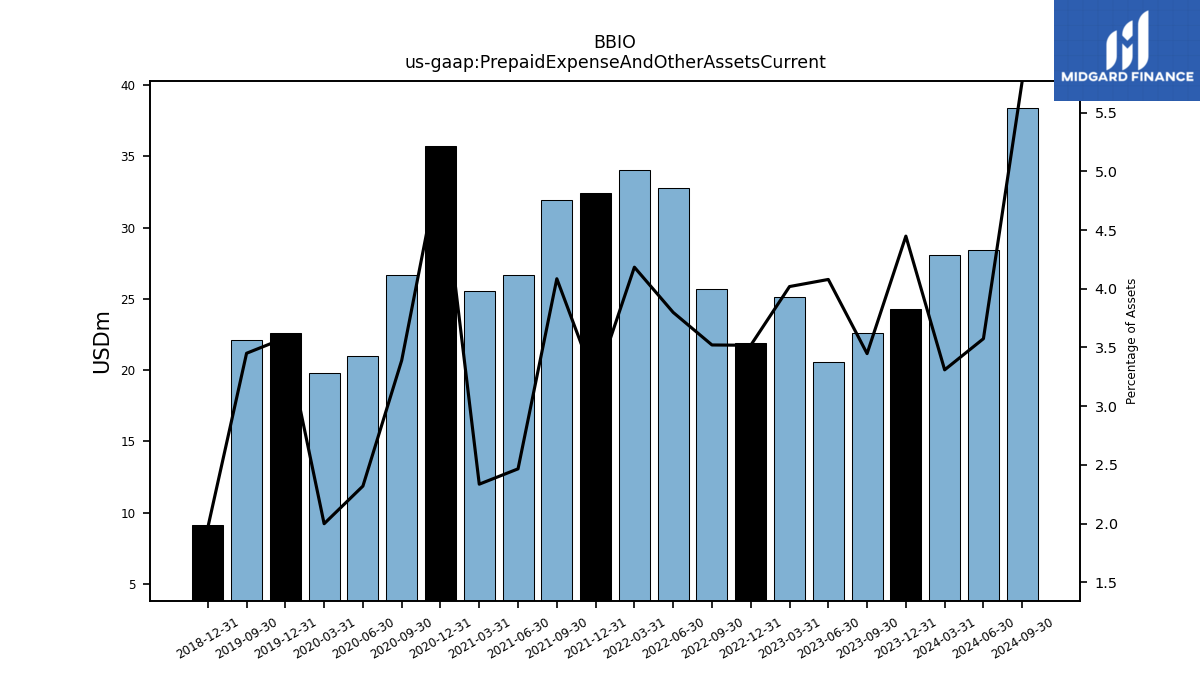
| Prepaid Expense And Other Assets Current | 22.58 | 20.55 | 25.14 | 21.92 | 25.66 | 32.75 | 34.02 | 32.45 | 31.93 | 26.67 | 25.53 | 35.73 | 26.70 | 22.63 | 22.10 | |
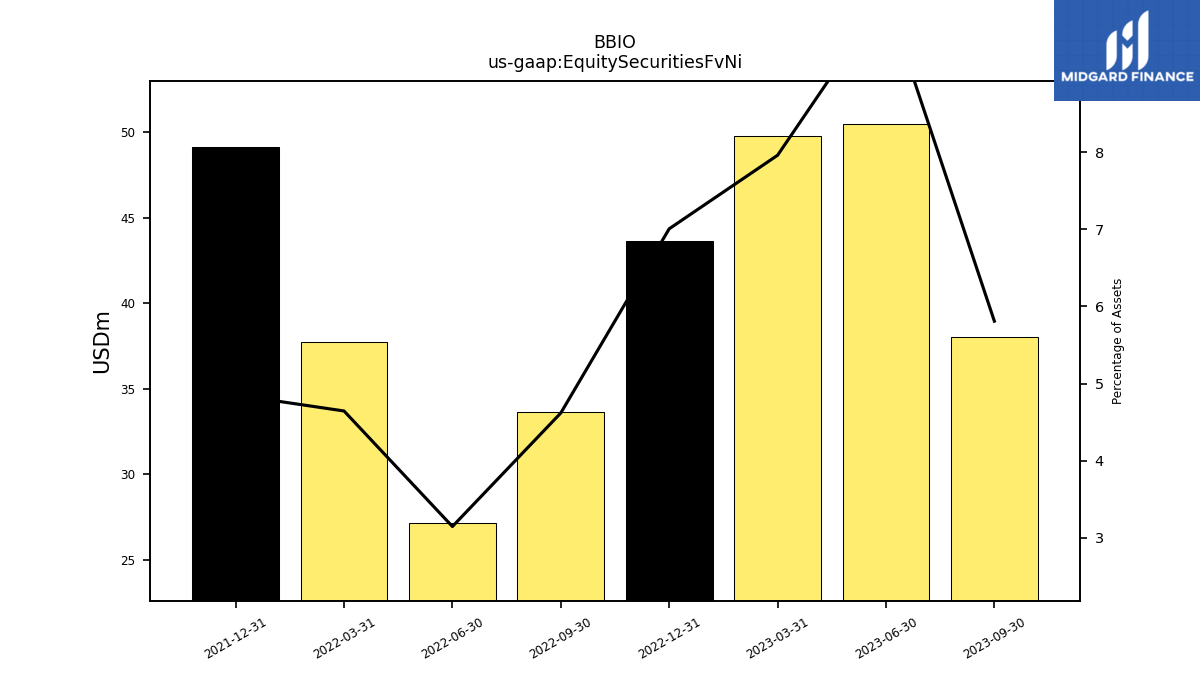
| Equity Securities Fv Ni | 38.05 | 50.49 | 49.80 | 43.65 | 33.66 | 27.14 | 37.77 | 49.15 | NA | NA | NA | NA | NA | NA | NA | |
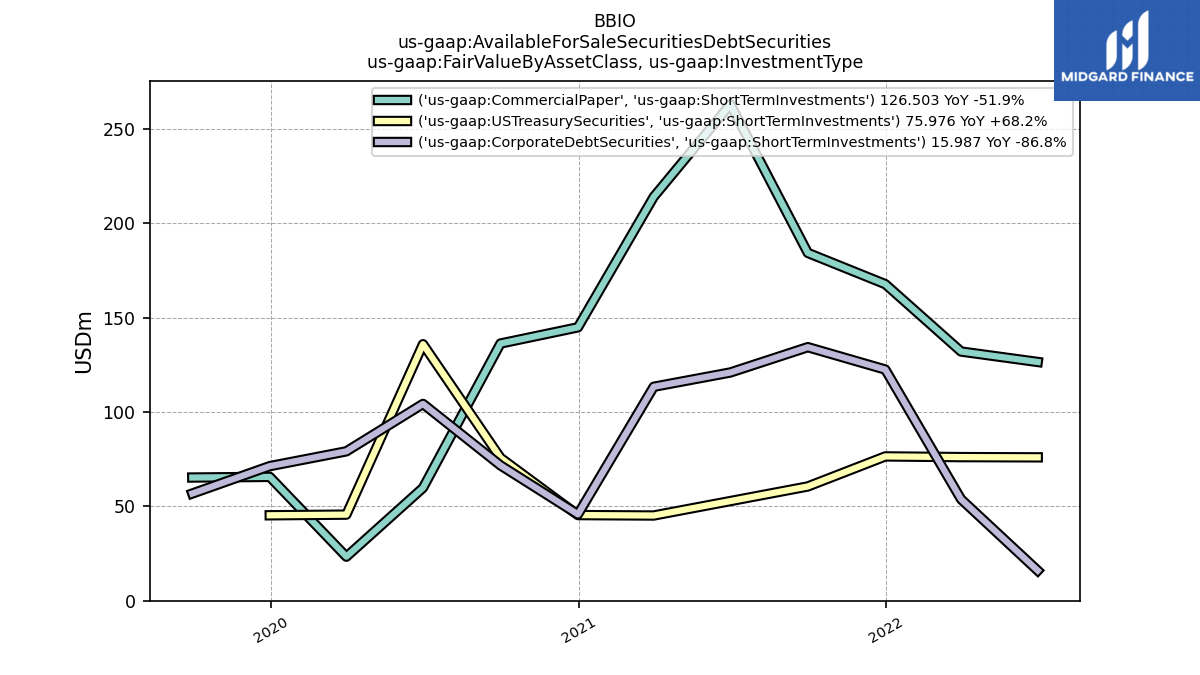
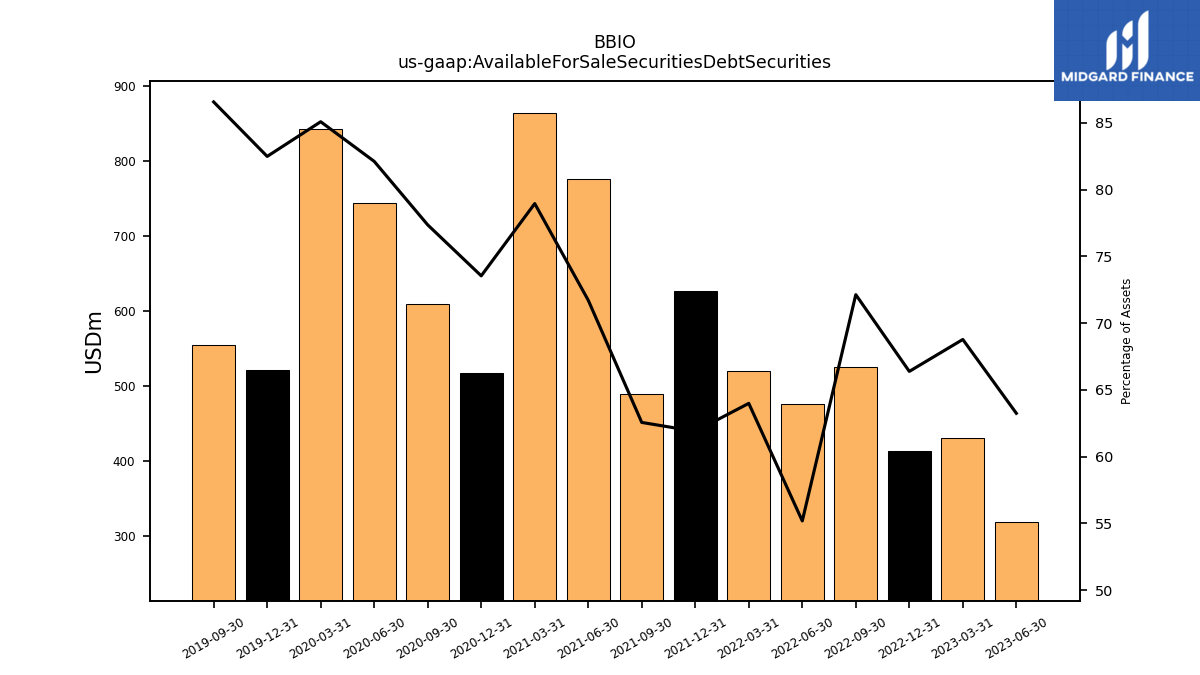
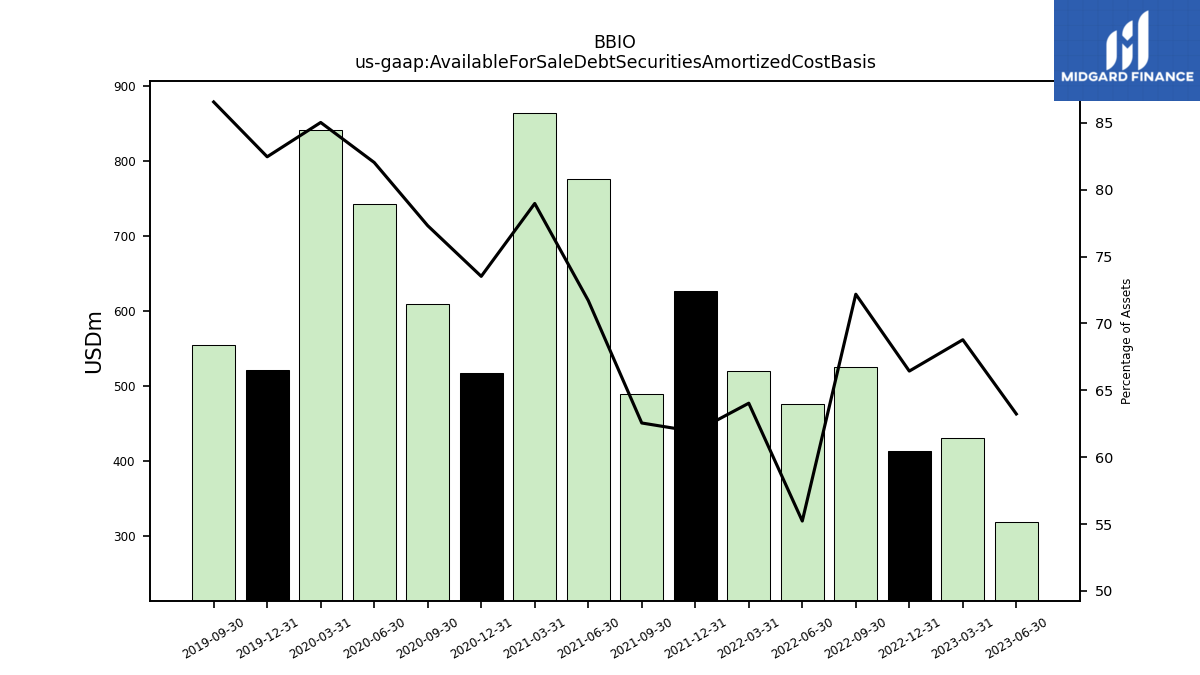
| Available For Sale Securities Debt Securities | NA | 318.54 | 430.32 | 413.59 | 525.67 | 475.76 | 520.31 | 626.84 | 488.91 | 775.59 | 863.27 | 517.45 | 609.39 | 521.10 | 554.55 |
| 2023-09-30 | 2023-06-30 | 2023-03-31 | 2022-12-31 | 2022-09-30 | 2022-06-30 | 2022-03-31 | 2021-12-31 | 2021-09-30 | 2021-06-30 | 2021-03-31 | 2020-12-31 | 2020-09-30 | 2019-12-31 | 2019-09-30 | ||
|---|---|---|---|---|---|---|---|---|---|---|---|---|---|---|---|---|
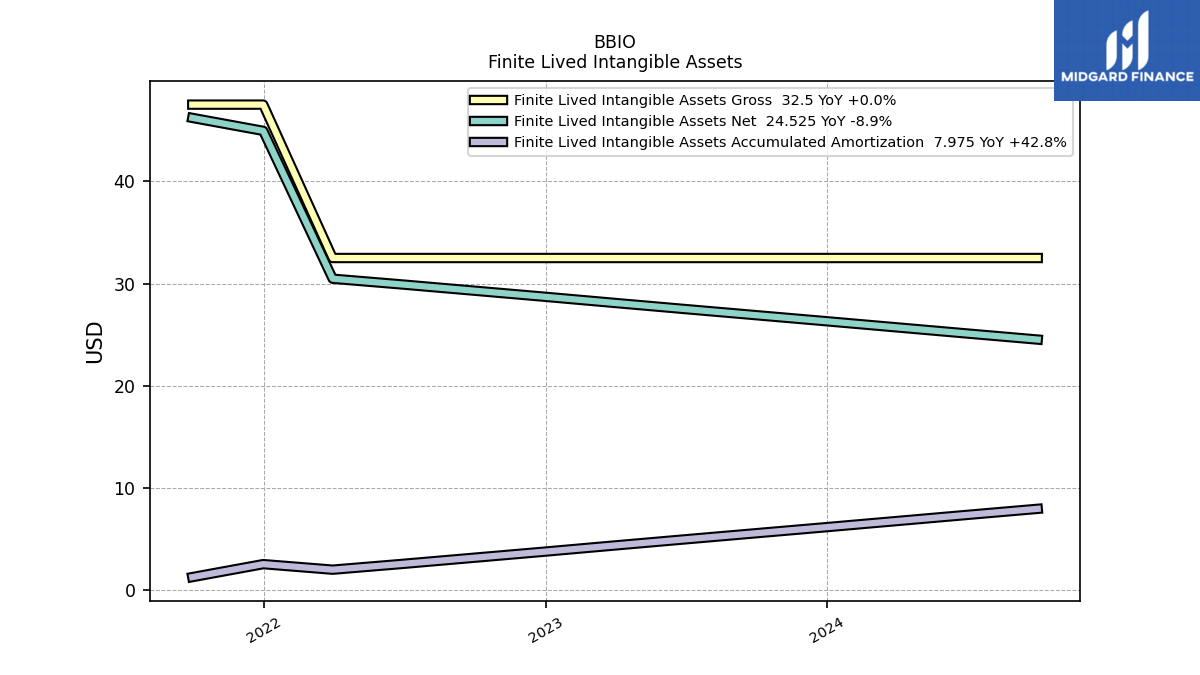
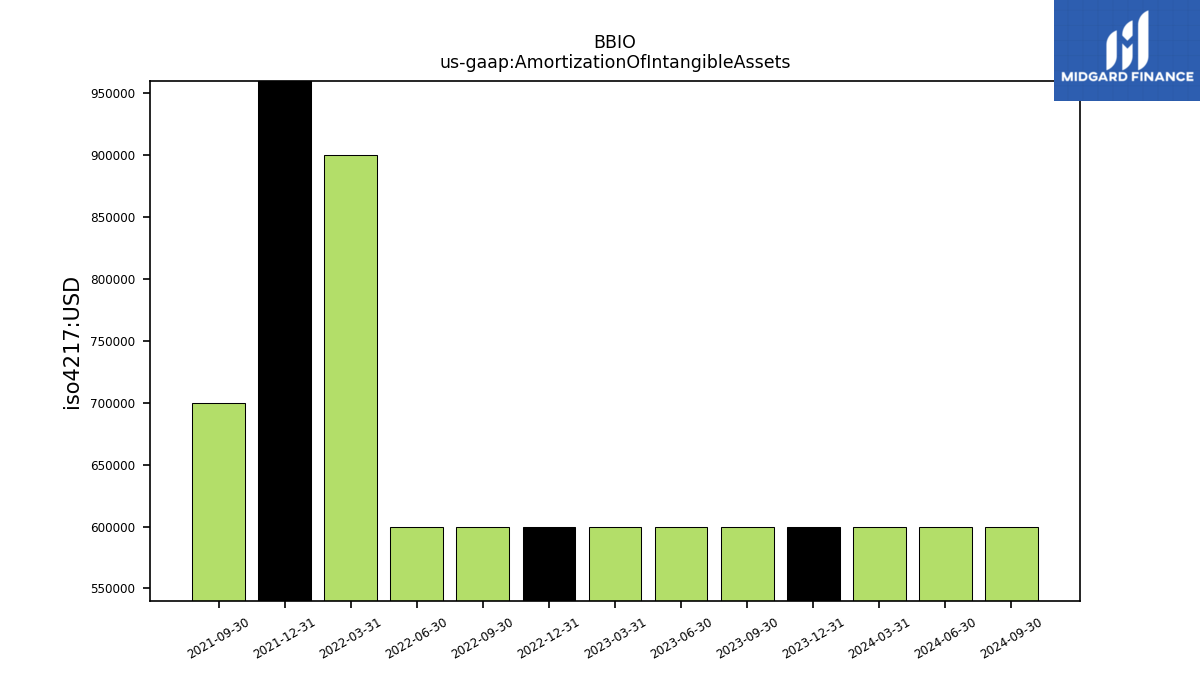
| Amortization Of Intangible Assets | 0.60 | 0.60 | 0.60 | 0.60 | 0.60 | 0.60 | 0.90 | 1.30 | 0.70 | NA | NA | NA | NA | NA | NA | |
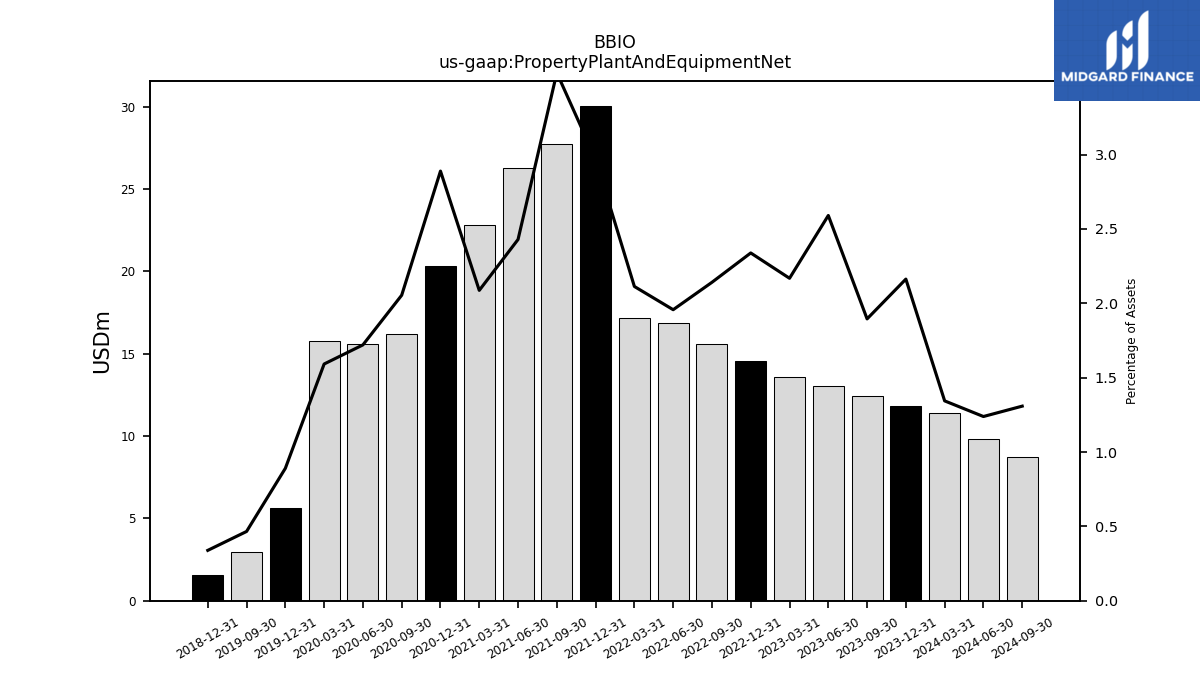
| Property Plant And Equipment Net | 12.41 | 13.05 | 13.57 | 14.57 | 15.60 | 16.87 | 17.18 | 30.07 | 27.74 | 26.27 | 22.82 | 20.32 | 16.18 | 5.62 | 2.98 | |
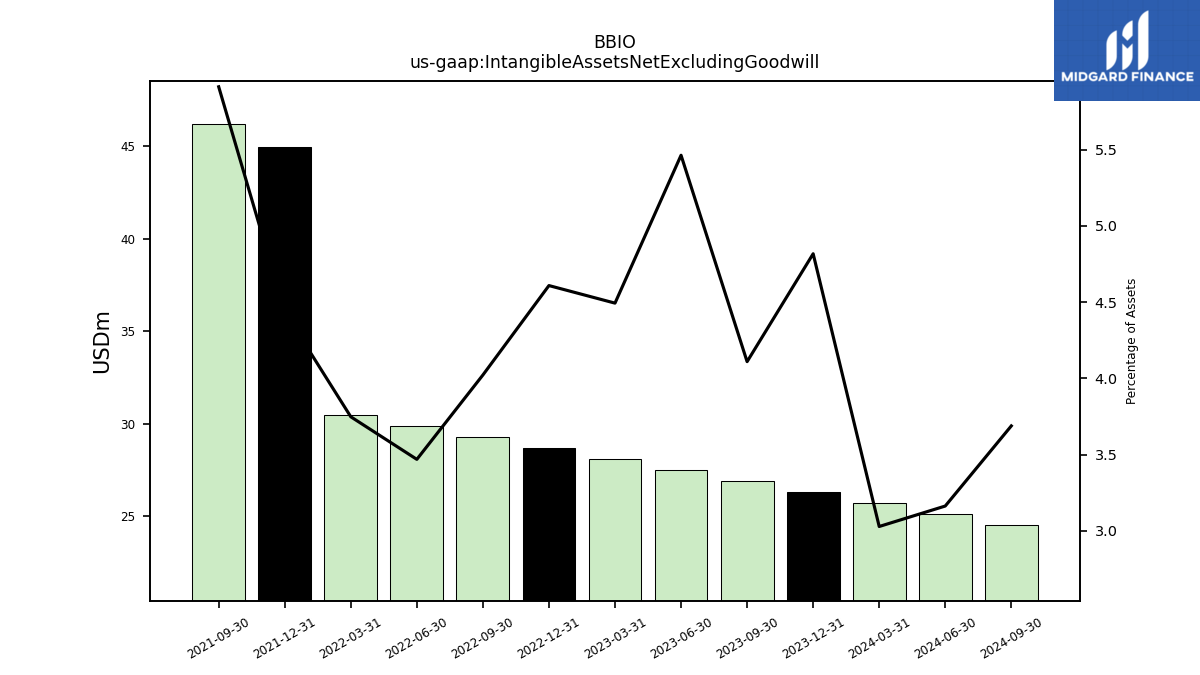
| Intangible Assets Net Excluding Goodwill | 26.92 | 27.52 | 28.11 | 28.71 | 29.31 | 29.91 | 30.48 | 44.93 | 46.20 | NA | NA | NA | NA | NA | NA | |
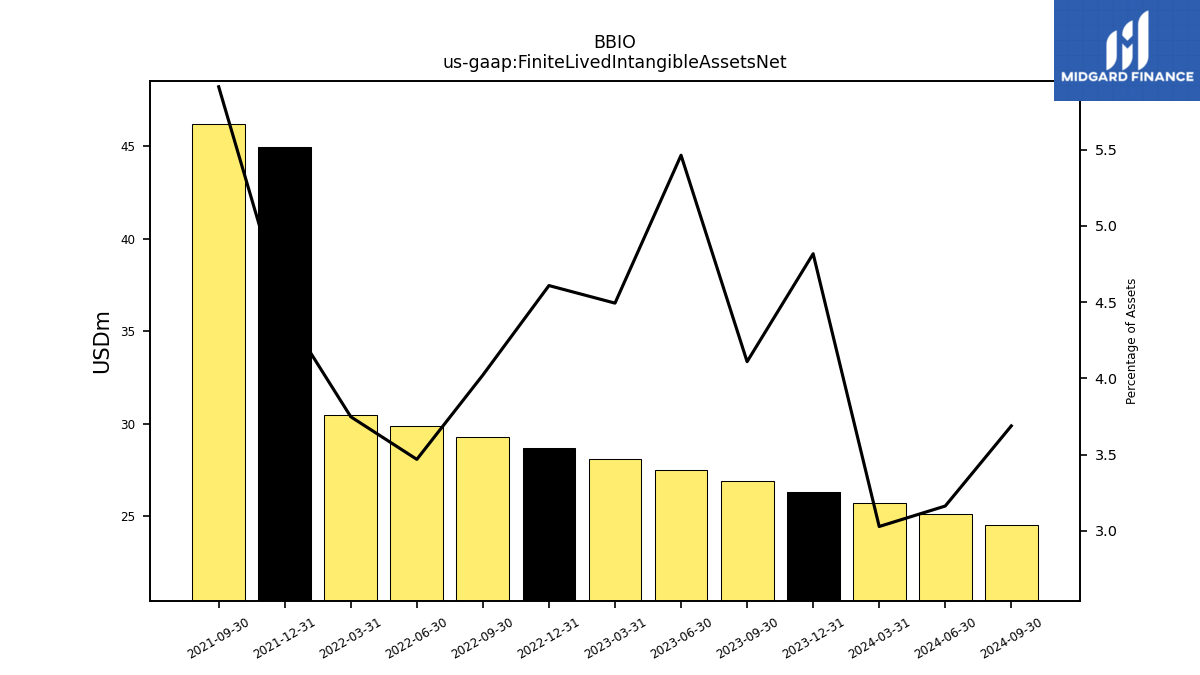
| Finite Lived Intangible Assets Net | 26.92 | 27.52 | 28.11 | 28.71 | 29.31 | 29.91 | 30.48 | 44.93 | 46.20 | NA | NA | NA | NA | NA | NA | |
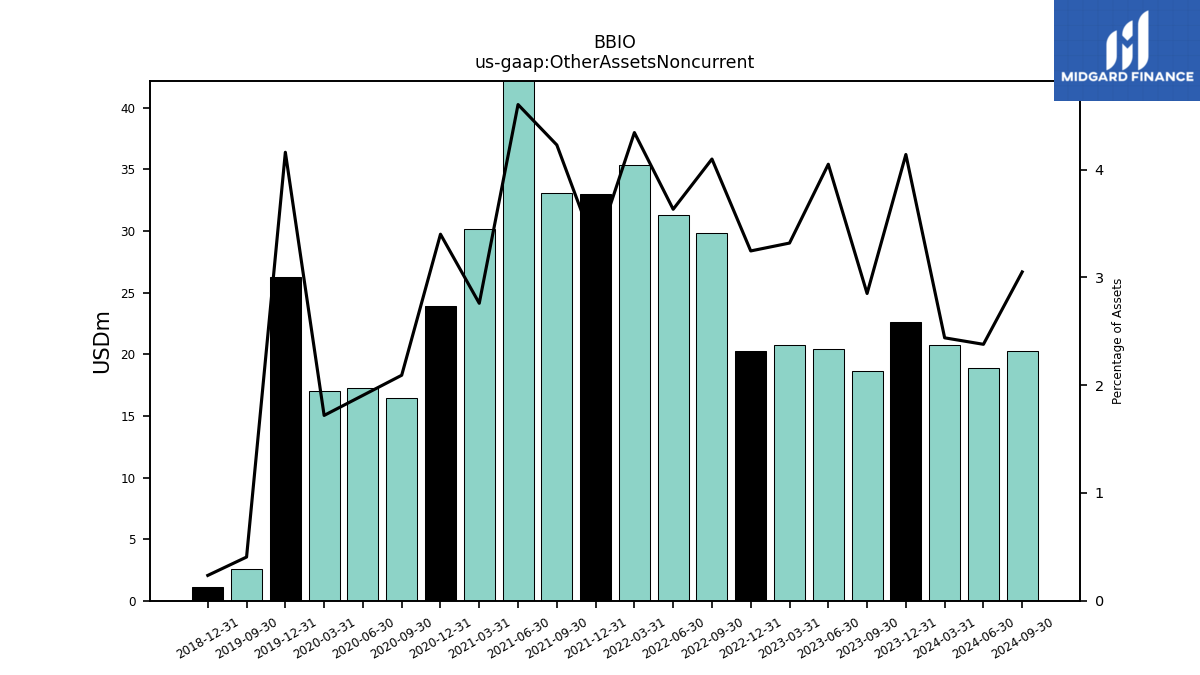
| Other Assets Noncurrent | 18.68 | 20.40 | 20.77 | 20.22 | 29.87 | 31.32 | 35.33 | 33.03 | 33.05 | 49.80 | 30.18 | 23.93 | 16.48 | 26.29 | 2.60 | |
| Equity Securities Fv Ni | 38.05 | 50.49 | 49.80 | 43.65 | 33.66 | 27.14 | 37.77 | 49.15 | NA | NA | NA | NA | NA | NA | NA | |
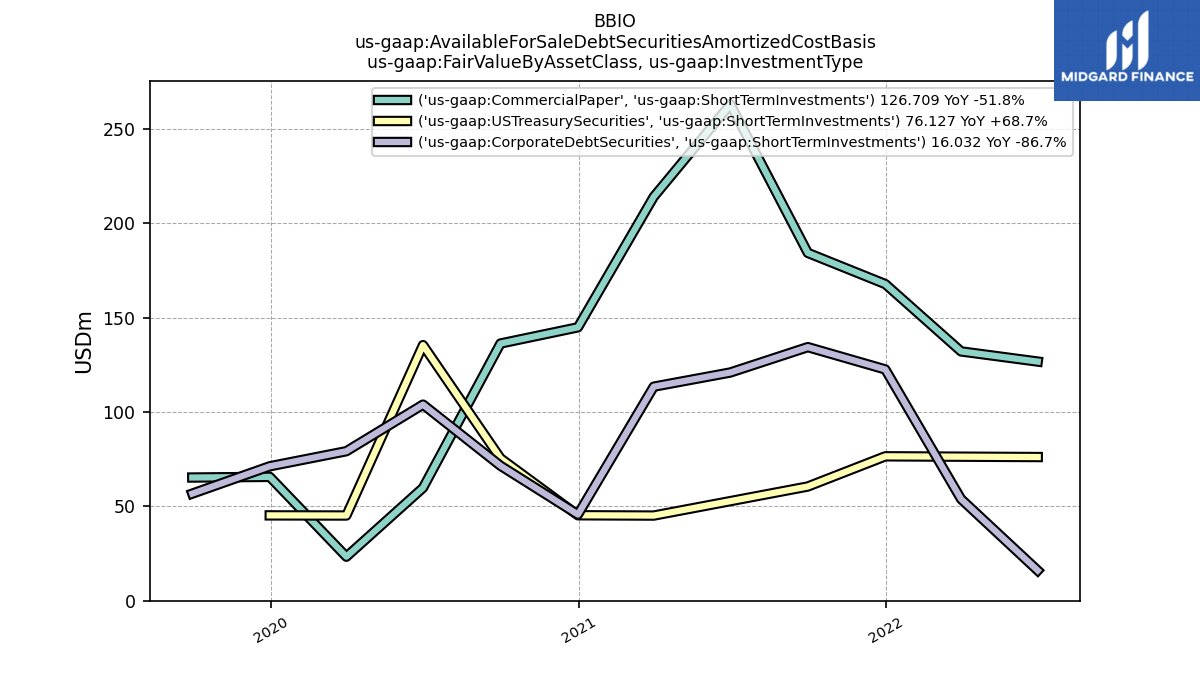
| Available For Sale Debt Securities Amortized Cost Basis | NA | 318.47 | 430.33 | 413.92 | 526.02 | 476.19 | 520.69 | 626.98 | 488.89 | 775.56 | 863.32 | 517.26 | 608.93 | 520.85 | 554.39 |
| 2023-09-30 | 2023-06-30 | 2023-03-31 | 2022-12-31 | 2022-09-30 | 2022-06-30 | 2022-03-31 | 2021-12-31 | 2021-09-30 | 2021-06-30 | 2021-03-31 | 2020-12-31 | 2020-09-30 | 2019-12-31 | 2019-09-30 | ||
|---|---|---|---|---|---|---|---|---|---|---|---|---|---|---|---|---|
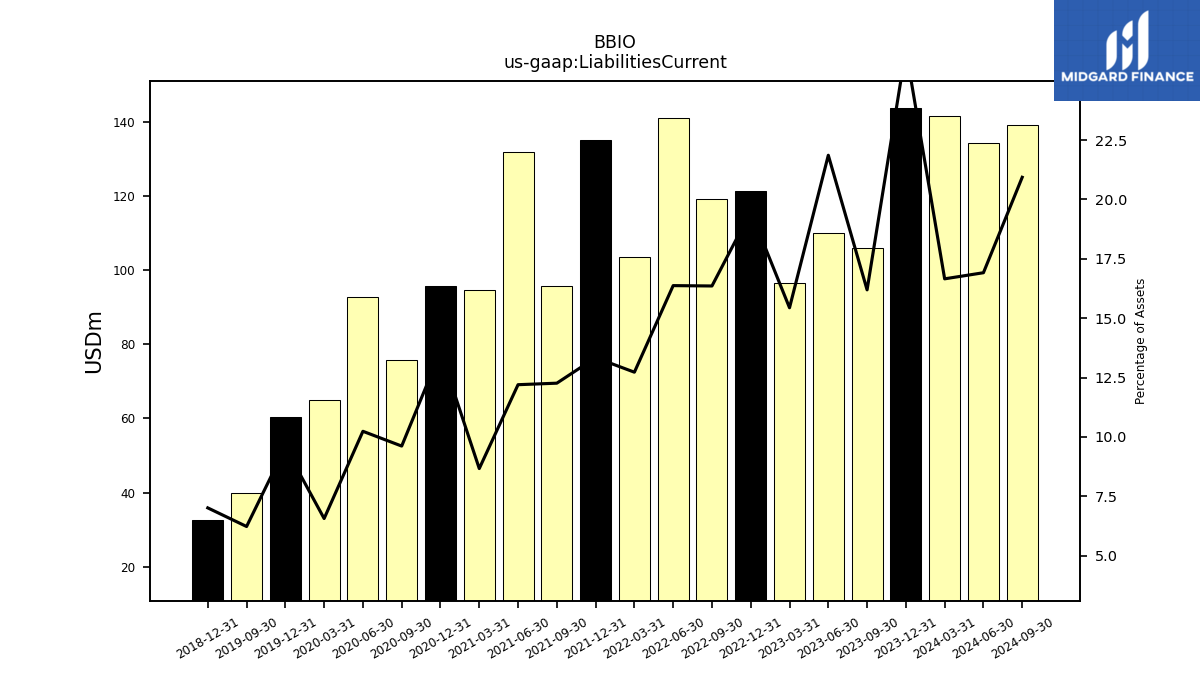
| Liabilities Current | 106.06 | 110.12 | 96.60 | 121.43 | 119.19 | 141.16 | 103.46 | 135.07 | 95.82 | 131.91 | 94.73 | 95.65 | 75.71 | 60.38 | 39.86 | |
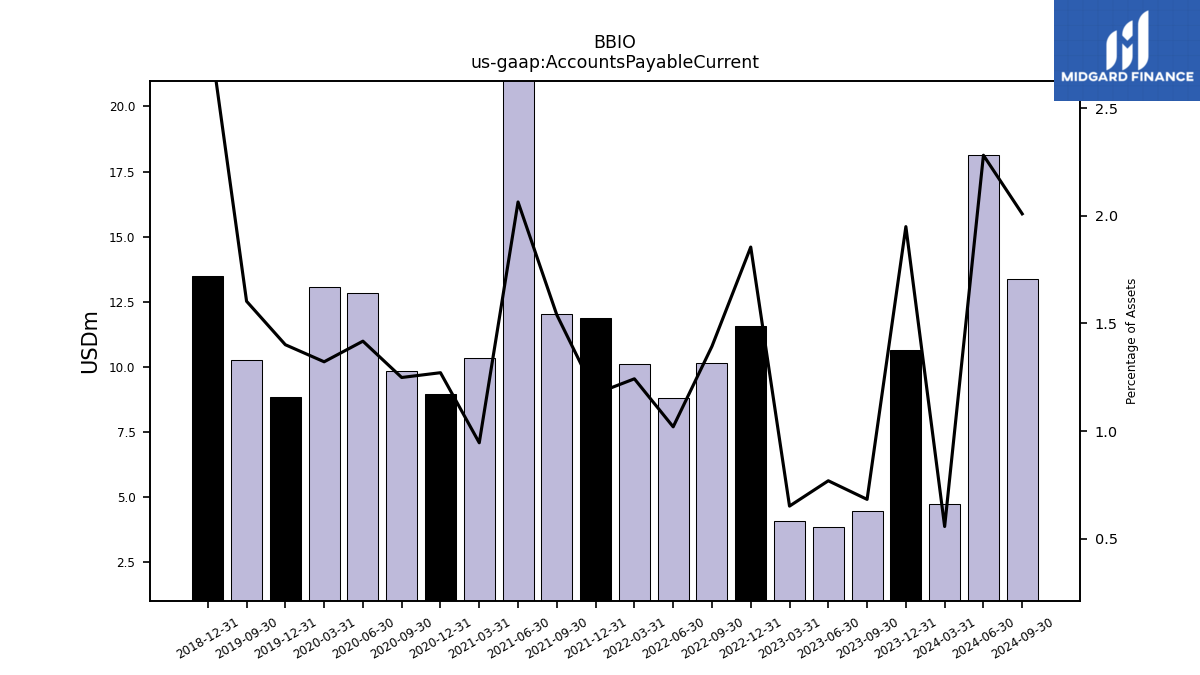
| Accounts Payable Current | 4.47 | 3.87 | 4.08 | 11.56 | 10.16 | 8.79 | 10.11 | 11.88 | 12.04 | 22.33 | 10.34 | 8.95 | 9.84 | 8.85 | 10.27 | |
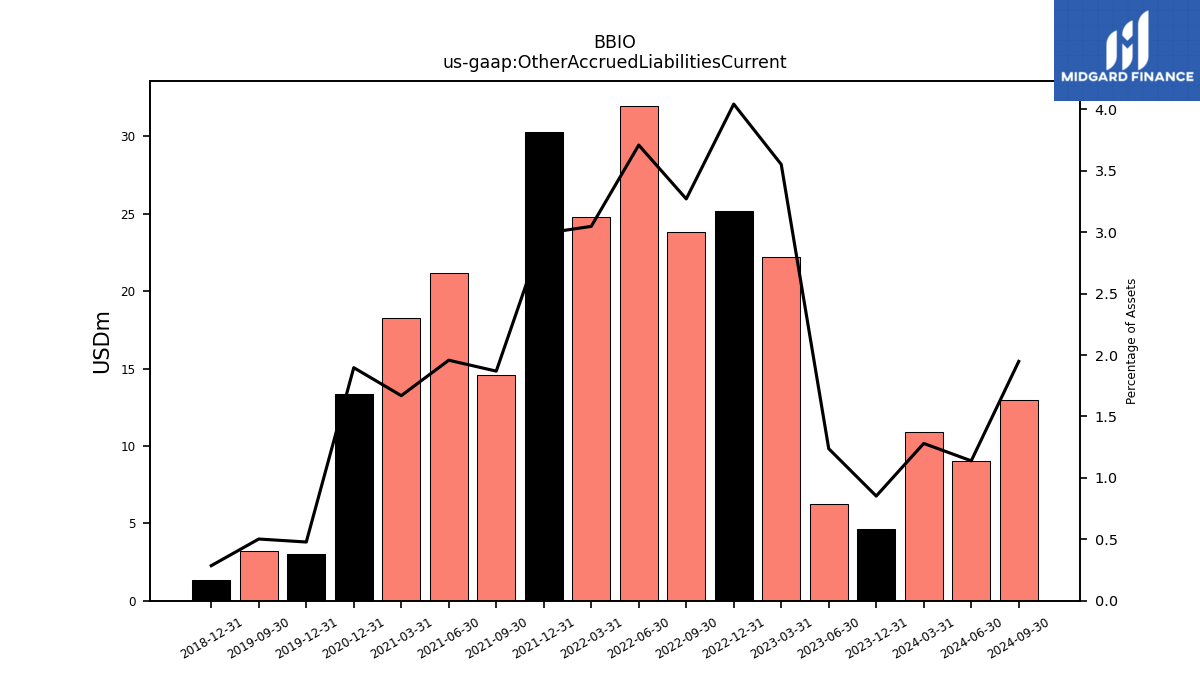
| Other Accrued Liabilities Current | NA | 6.23 | 22.22 | 25.19 | 23.84 | 31.98 | 24.78 | 30.28 | 14.61 | 21.18 | 18.25 | 13.35 | NA | 3.02 | 3.22 |
| 2023-09-30 | 2023-06-30 | 2023-03-31 | 2022-12-31 | 2022-09-30 | 2022-06-30 | 2022-03-31 | 2021-12-31 | 2021-09-30 | 2021-06-30 | 2021-03-31 | 2020-12-31 | 2020-09-30 | 2019-12-31 | 2019-09-30 | ||
|---|---|---|---|---|---|---|---|---|---|---|---|---|---|---|---|---|
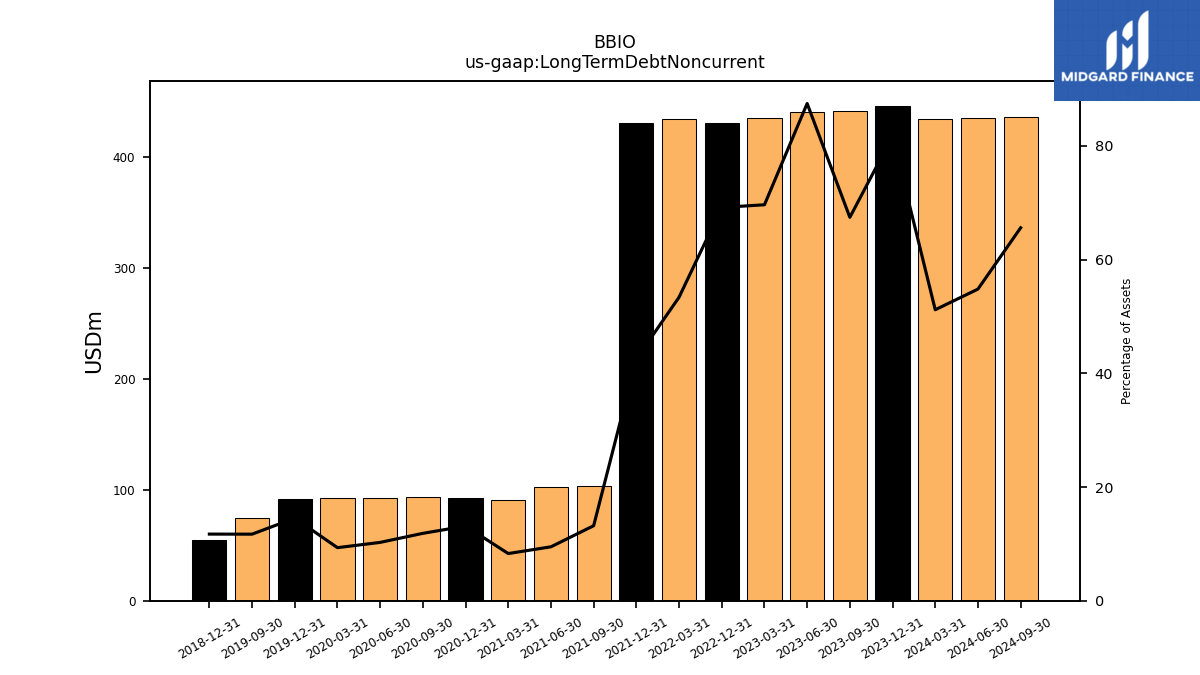
| Long Term Debt Noncurrent | 441.72 | 440.50 | 435.76 | 430.99 | NA | NA | 434.11 | 430.75 | 103.14 | 102.61 | 90.76 | 92.42 | 93.39 | 91.79 | 75.02 | |
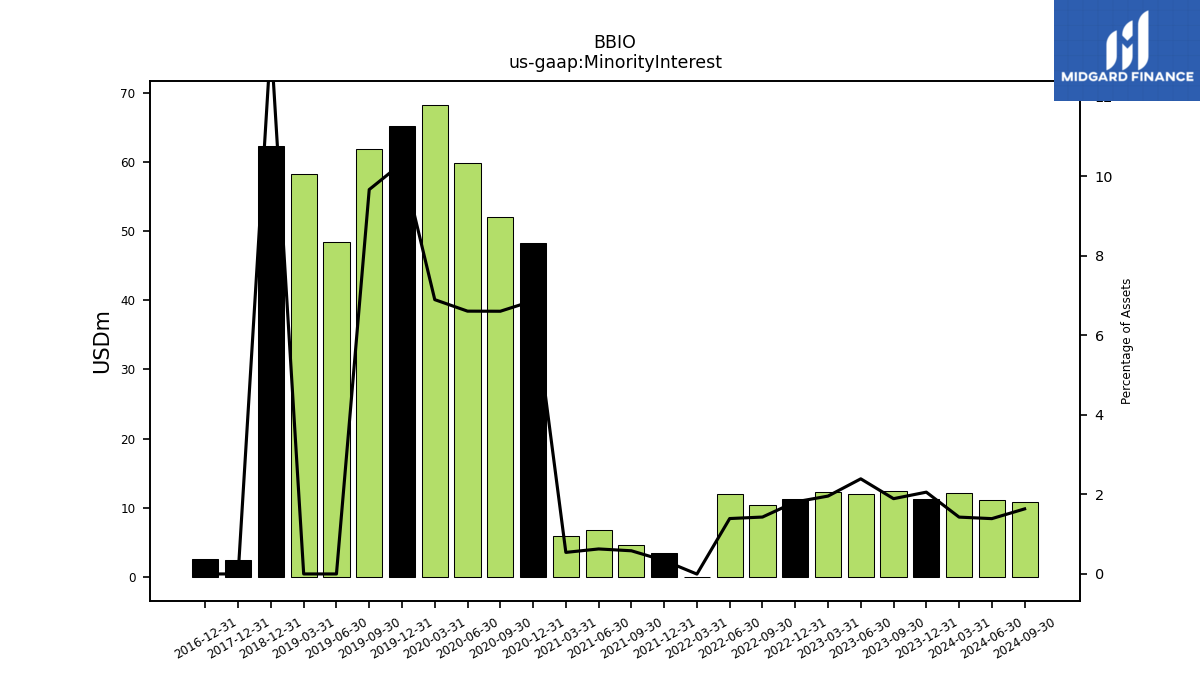
| Minority Interest | 12.40 | 12.05 | 12.26 | 11.28 | 10.43 | 12.02 | -0.03 | 3.41 | 4.56 | 6.80 | 5.93 | 48.35 | 52.06 | 65.28 | 61.94 | |
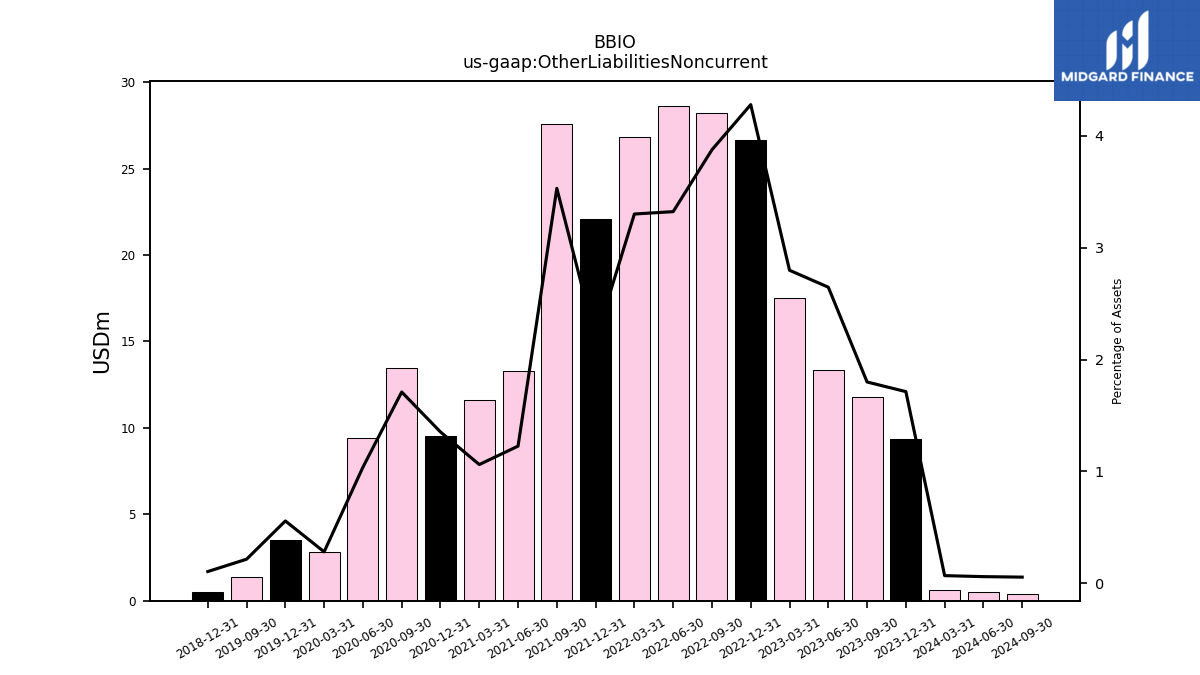
| Other Liabilities Noncurrent | 11.79 | 13.33 | 17.50 | 26.64 | 28.23 | 28.63 | 26.83 | 22.07 | 27.58 | 13.27 | 11.61 | 9.52 | 13.47 | 3.53 | 1.39 | |
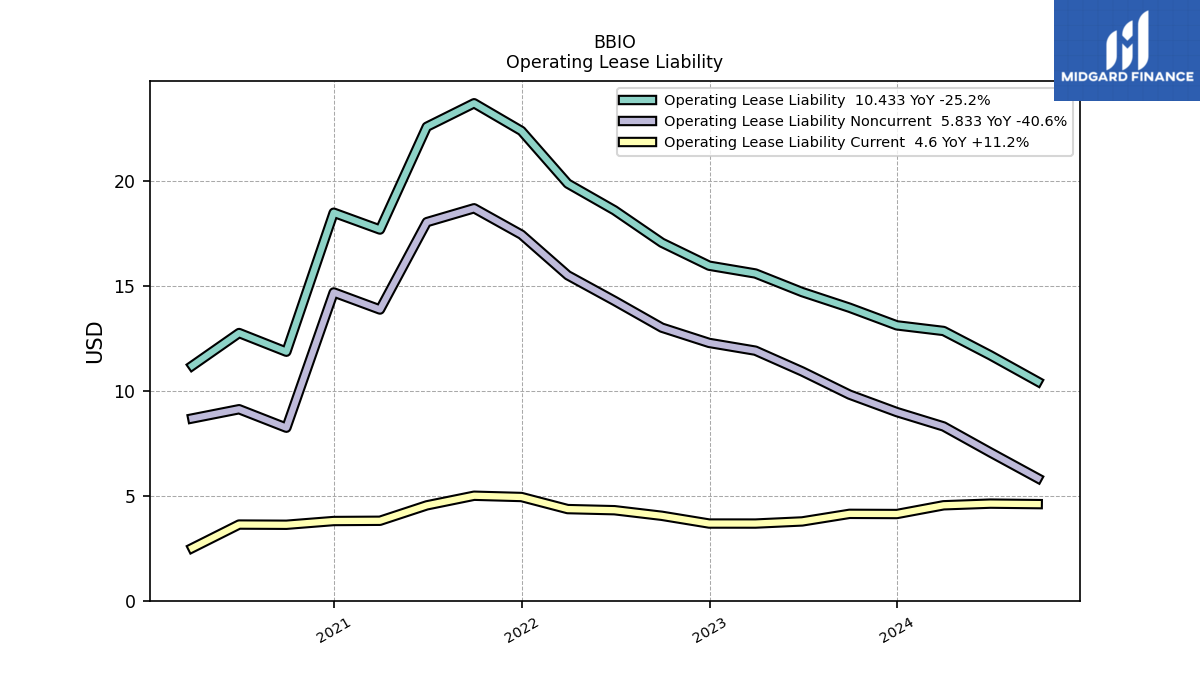
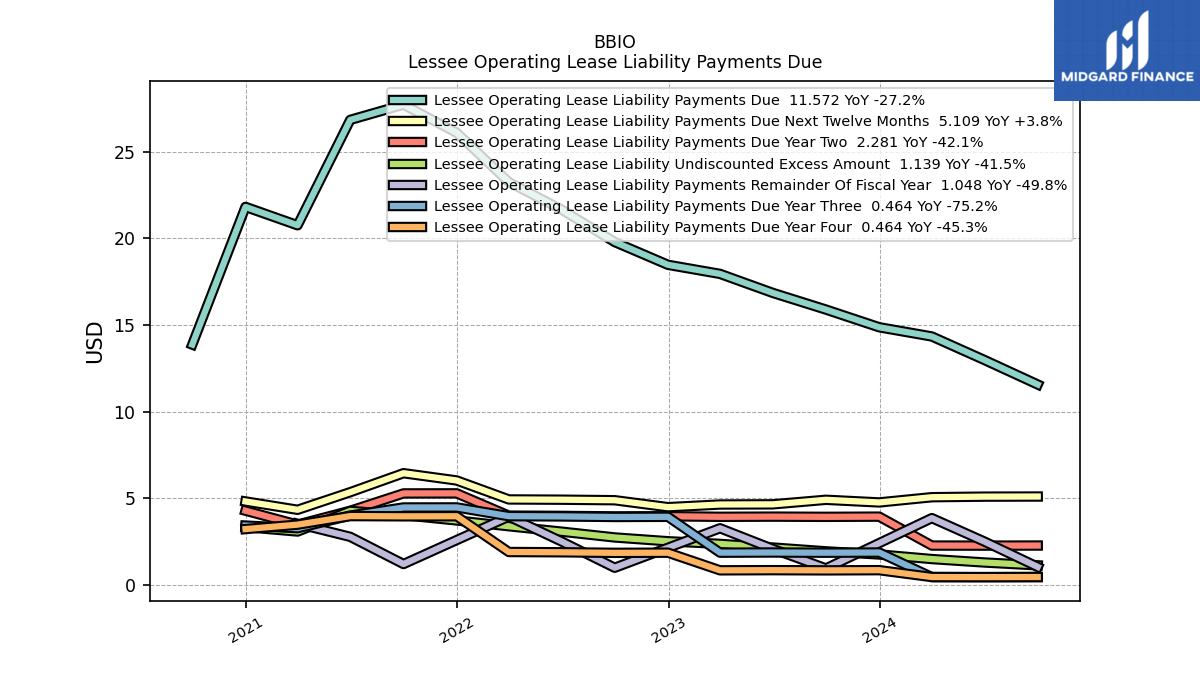
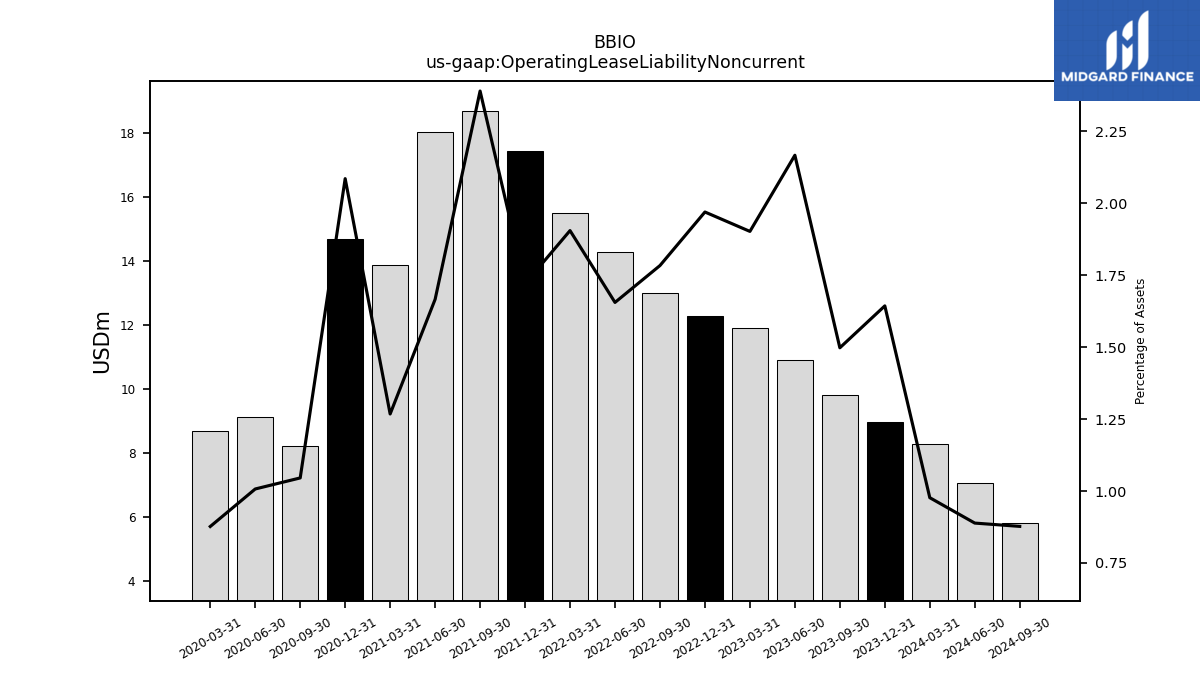
| Operating Lease Liability Noncurrent | 9.81 | 10.92 | 11.90 | 12.27 | 13.00 | 14.28 | 15.49 | 17.43 | 18.68 | 18.02 | 13.86 | 14.68 | 8.24 | NA | NA |
| 2023-09-30 | 2023-06-30 | 2023-03-31 | 2022-12-31 | 2022-09-30 | 2022-06-30 | 2022-03-31 | 2021-12-31 | 2021-09-30 | 2021-06-30 | 2021-03-31 | 2020-12-31 | 2020-09-30 | 2019-12-31 | 2019-09-30 | ||
|---|---|---|---|---|---|---|---|---|---|---|---|---|---|---|---|---|
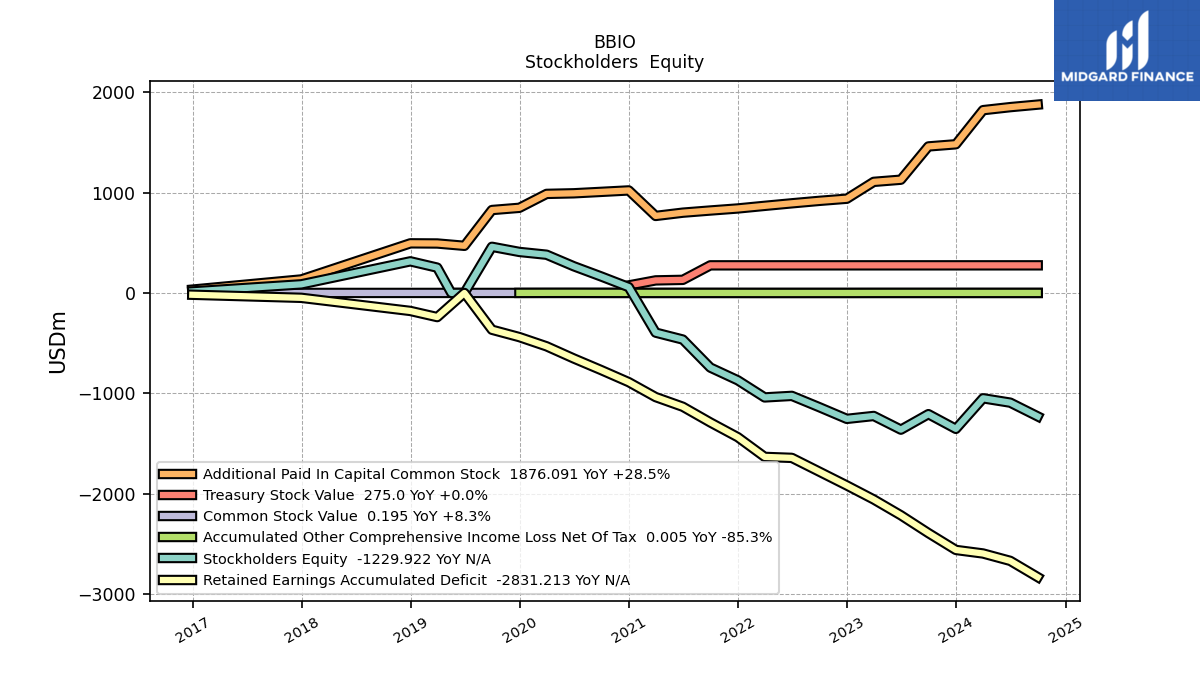
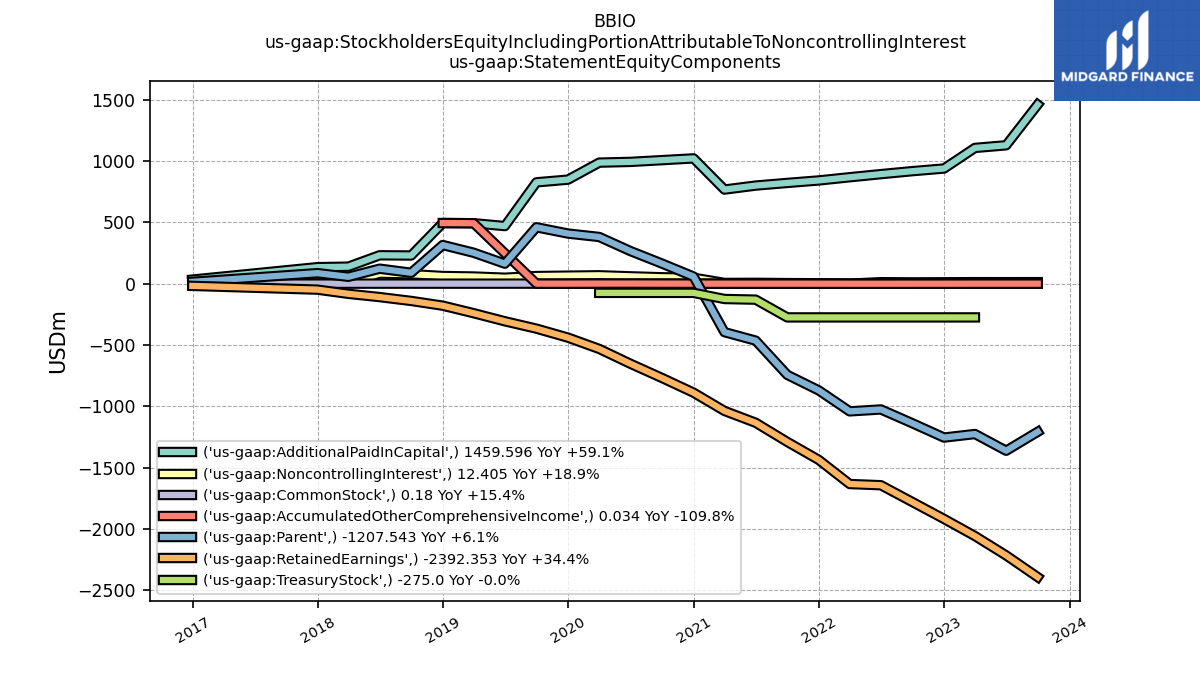
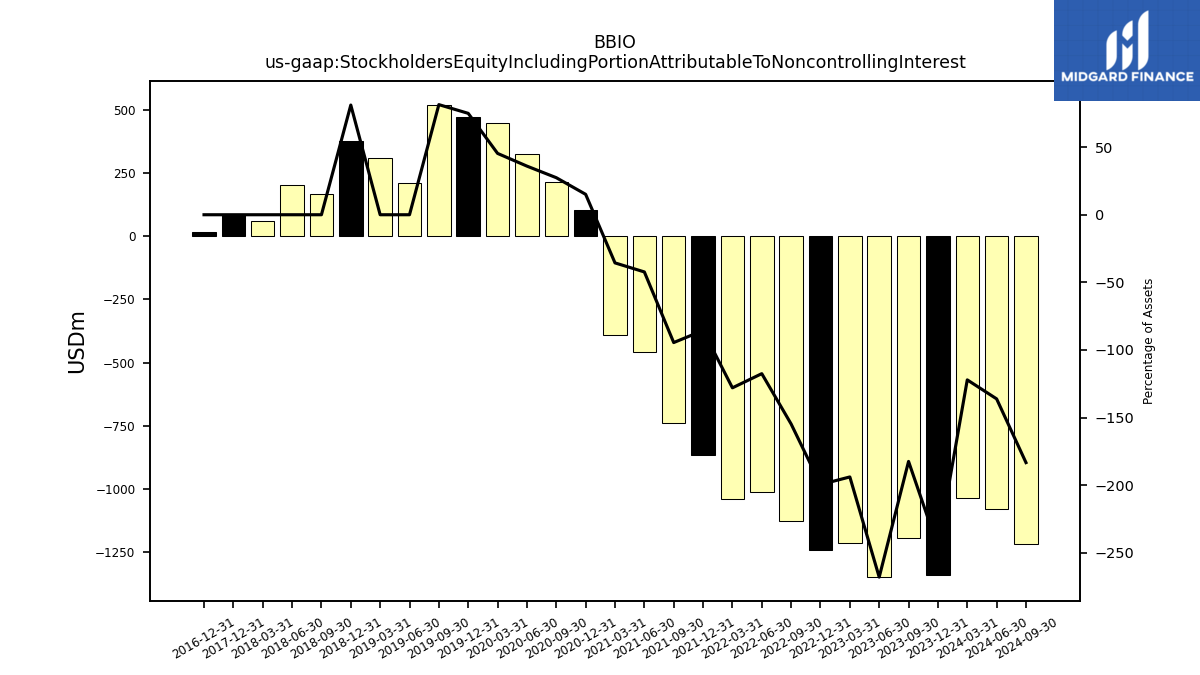
| Stockholders Equity | -1207.54 | -1362.02 | -1225.66 | -1254.62 | -1138.42 | -1025.53 | -1041.00 | -870.41 | -743.40 | -464.29 | -395.29 | 57.91 | 163.76 | 408.45 | 459.76 | |
| Stockholders Equity Including Portion Attributable To Noncontrolling Interest | -1195.14 | -1349.97 | -1213.41 | -1243.34 | -1127.98 | -1013.51 | -1041.02 | -867.00 | -738.84 | -457.49 | -389.37 | 106.26 | 215.81 | 473.73 | 521.70 | |
| Common Stock Value | 0.18 | 0.17 | 0.17 | 0.16 | 0.16 | 0.15 | 0.15 | 0.15 | 0.15 | 0.15 | 0.15 | 0.12 | 0.12 | 0.12 | 0.12 | |
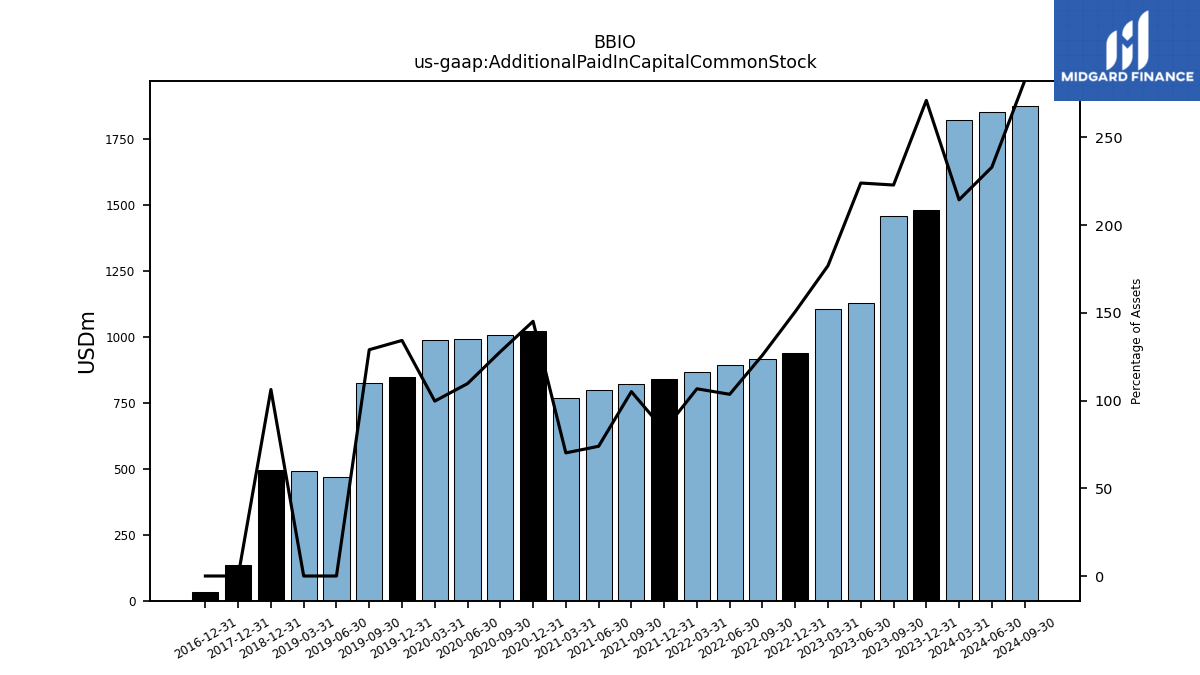
| Additional Paid In Capital Common Stock | 1459.60 | 1128.10 | 1106.63 | 938.70 | 917.33 | 892.96 | 867.60 | 841.53 | 821.22 | 799.68 | 767.12 | 1021.34 | 1006.94 | 848.11 | 826.06 | |
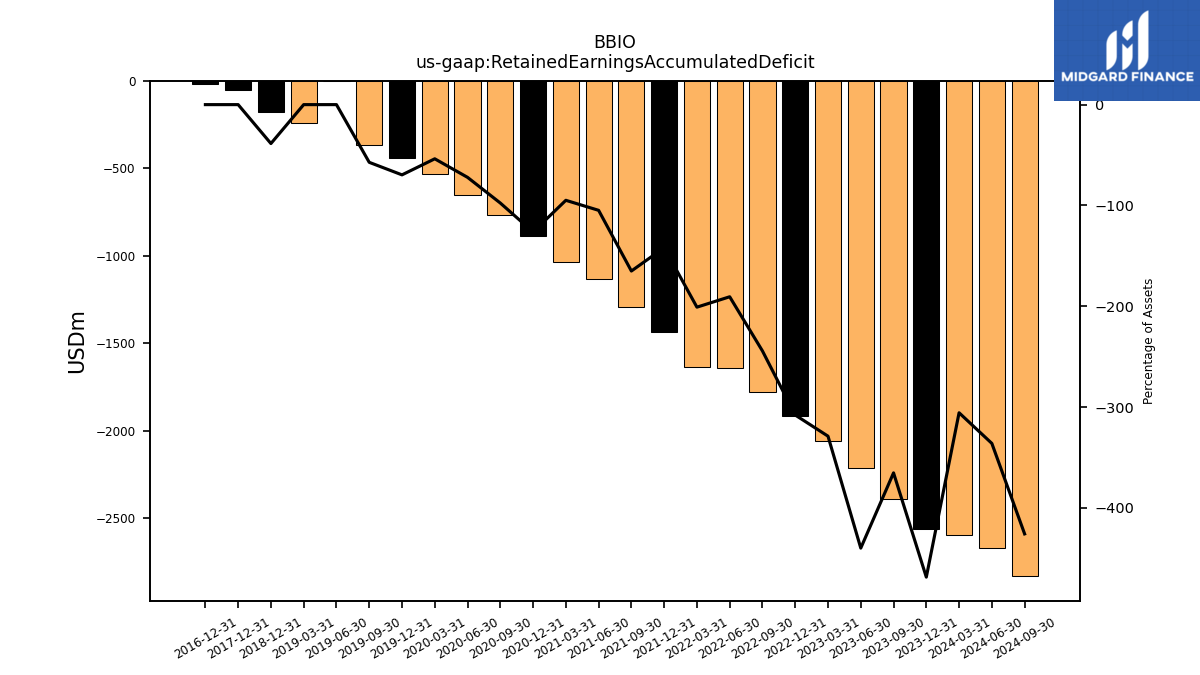
| Retained Earnings Accumulated Deficit | -2392.35 | -2215.35 | -2057.45 | -1918.15 | -1780.56 | -1643.22 | -1633.36 | -1436.97 | -1289.79 | -1133.85 | -1037.51 | -888.75 | -768.77 | -440.03 | -366.57 | |
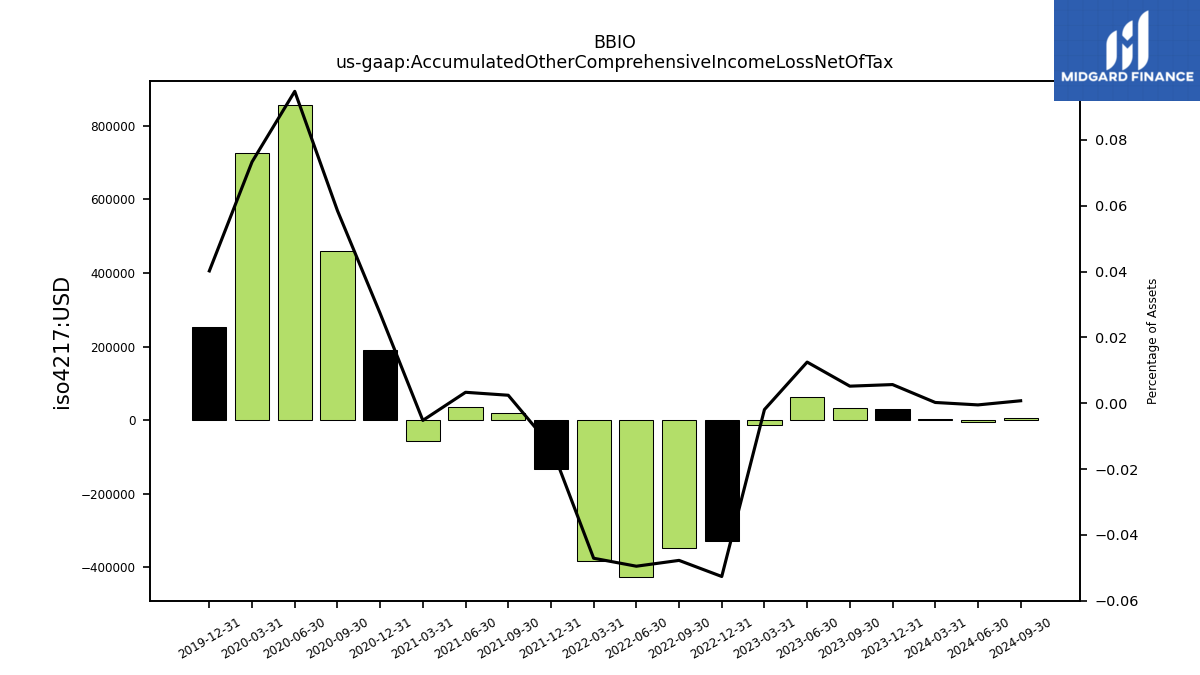
| Accumulated Other Comprehensive Income Loss Net Of Tax | 0.03 | 0.06 | -0.01 | -0.33 | -0.35 | -0.43 | -0.38 | -0.13 | 0.02 | 0.04 | -0.06 | 0.19 | 0.46 | 0.25 | NA | |
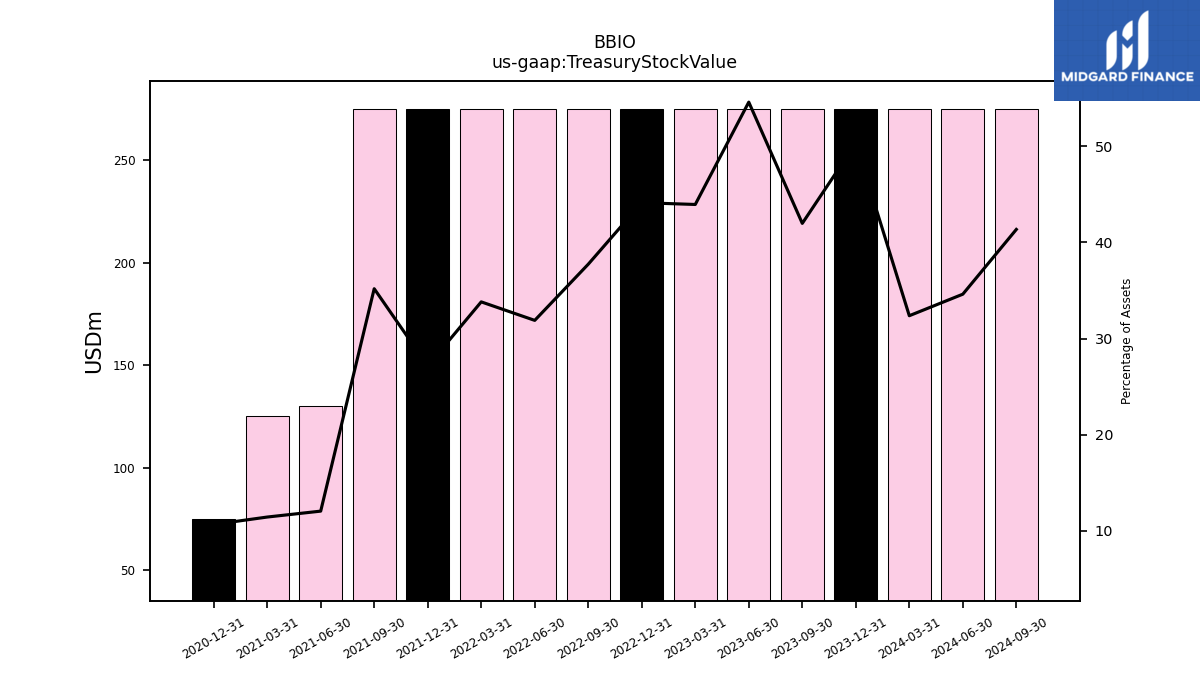
| Treasury Stock Value | 275.00 | 275.00 | 275.00 | 275.00 | 275.00 | 275.00 | 275.00 | 275.00 | 275.00 | 130.31 | 125.00 | 75.00 | NA | NA | NA | |
| Minority Interest | 12.40 | 12.05 | 12.26 | 11.28 | 10.43 | 12.02 | -0.03 | 3.41 | 4.56 | 6.80 | 5.93 | 48.35 | 52.06 | 65.28 | 61.94 | |
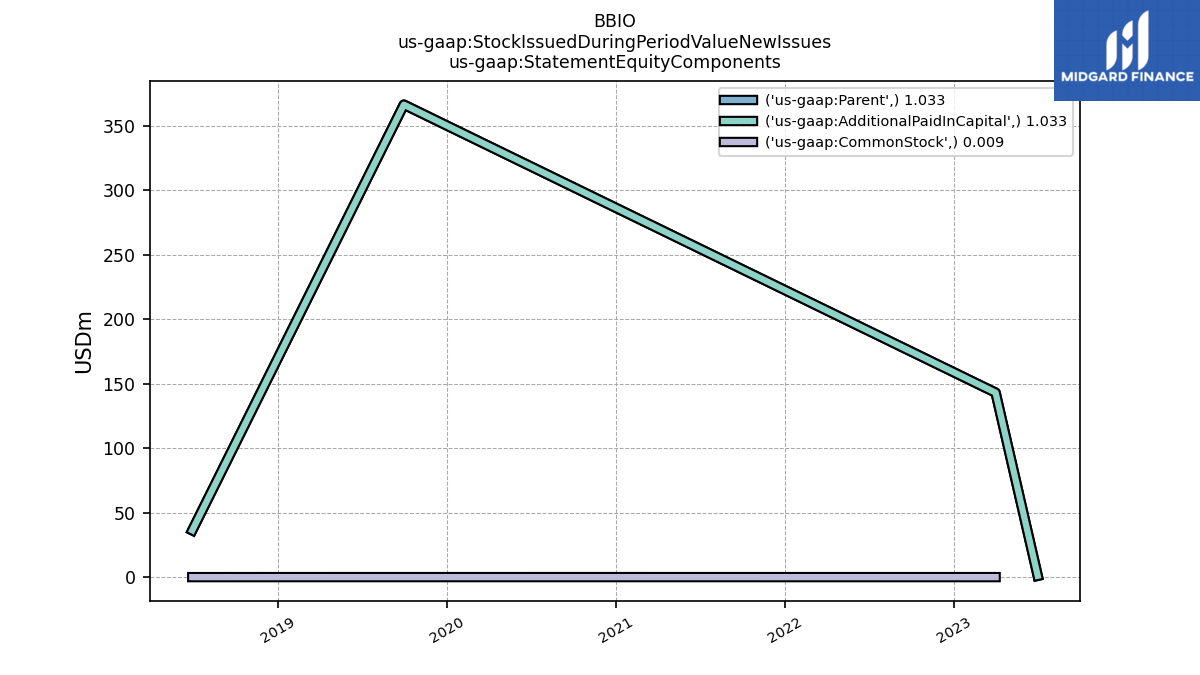
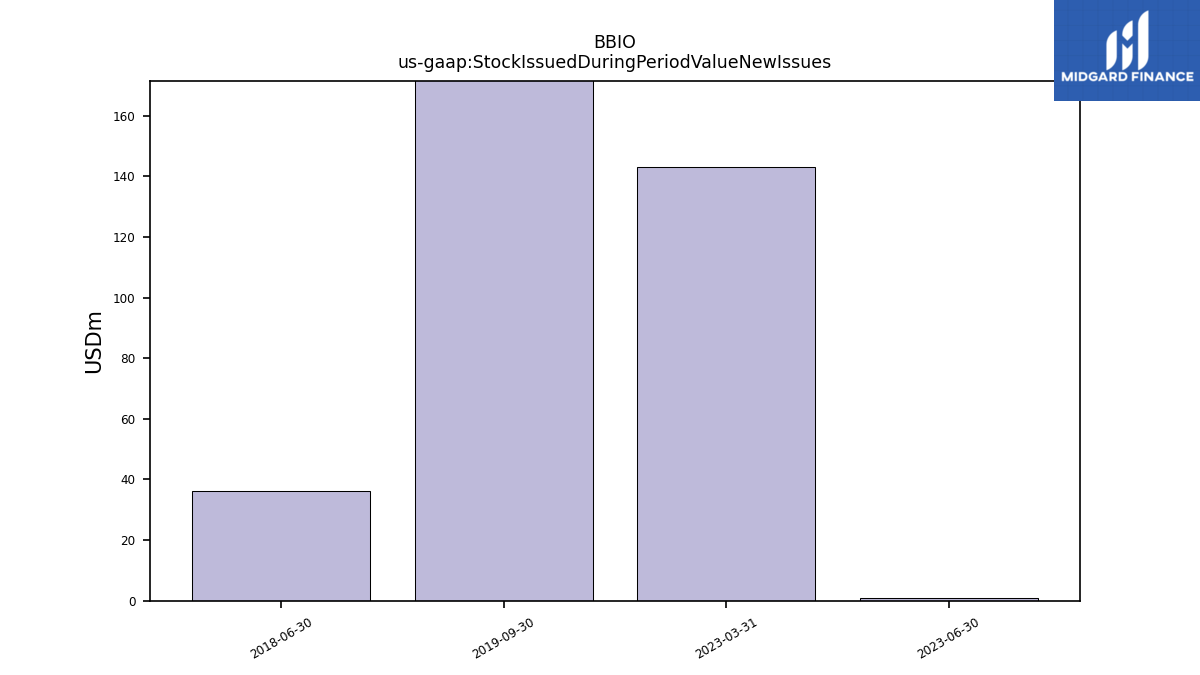
| Stock Issued During Period Value New Issues | NA | 1.03 | 143.02 | NA | NA | NA | NA | NA | NA | NA | NA | NA | NA | NA | 366.24 | |
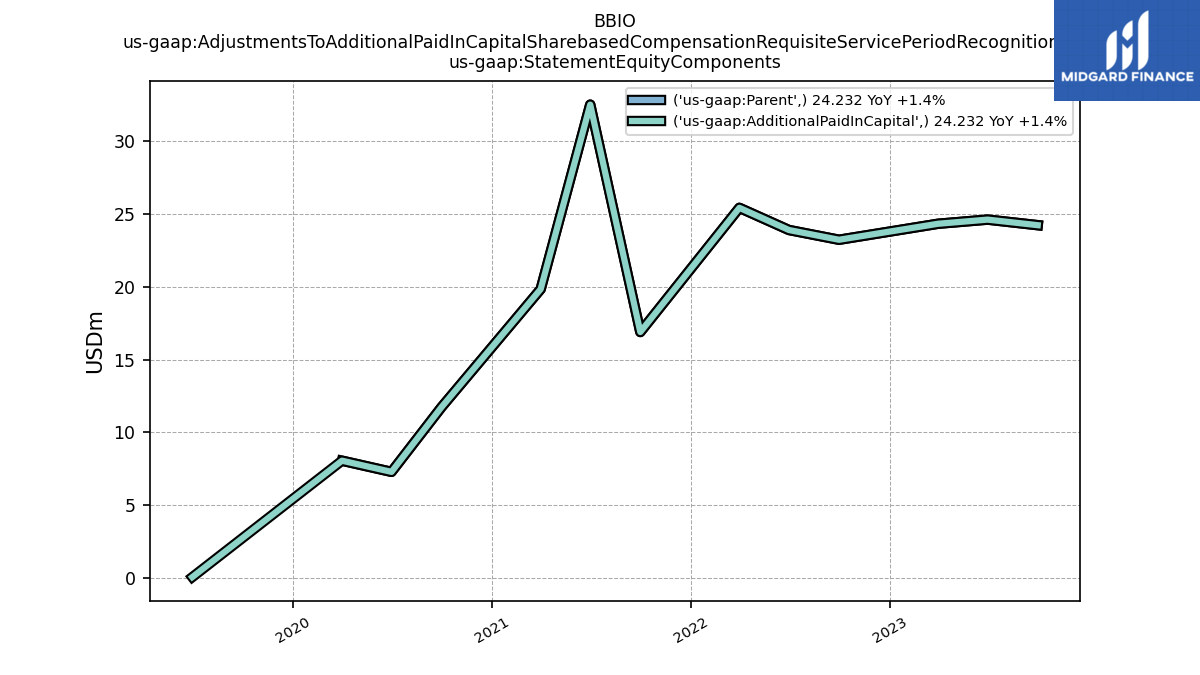
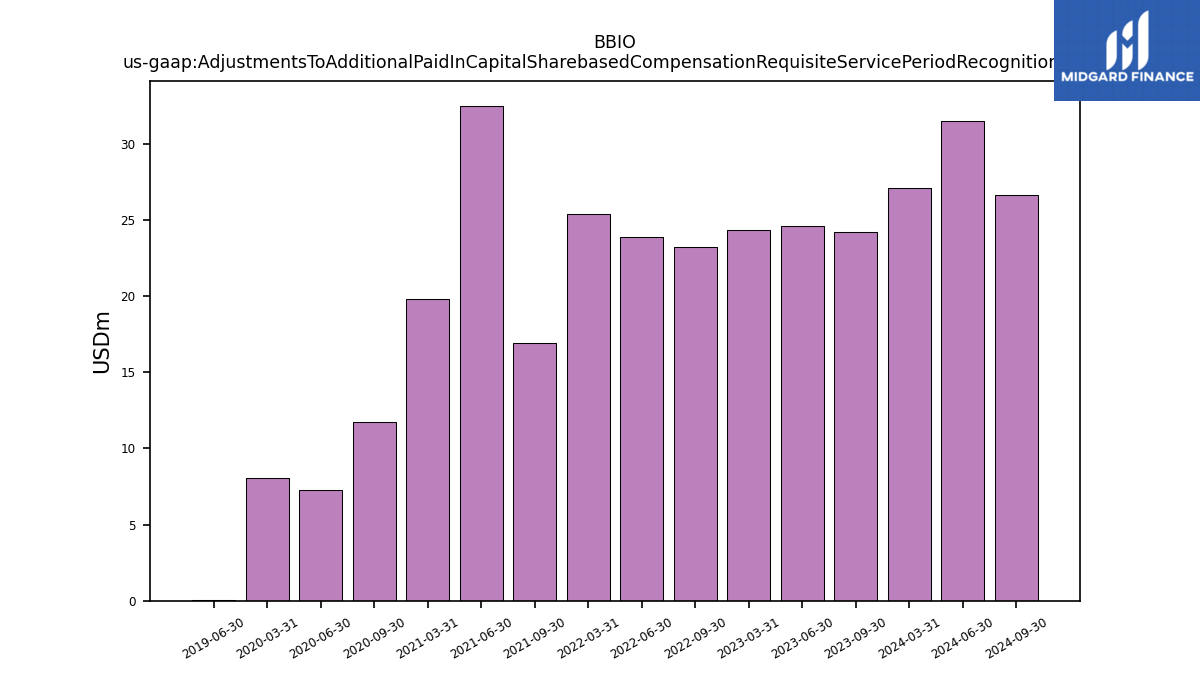
| Adjustments To Additional Paid In Capital Sharebased Compensation Requisite Service Period Recognition Value | 24.23 | 24.61 | 24.33 | NA | 23.23 | 23.90 | 25.42 | NA | 16.90 | 32.51 | 19.84 | NA | 11.75 | NA | NA |
| 2023-09-30 | 2023-06-30 | 2023-03-31 | 2022-12-31 | 2022-09-30 | 2022-06-30 | 2022-03-31 | 2021-12-31 | 2021-09-30 | 2021-06-30 | 2021-03-31 | 2020-12-31 | 2020-09-30 | 2019-12-31 | 2019-09-30 | ||
|---|---|---|---|---|---|---|---|---|---|---|---|---|---|---|---|---|
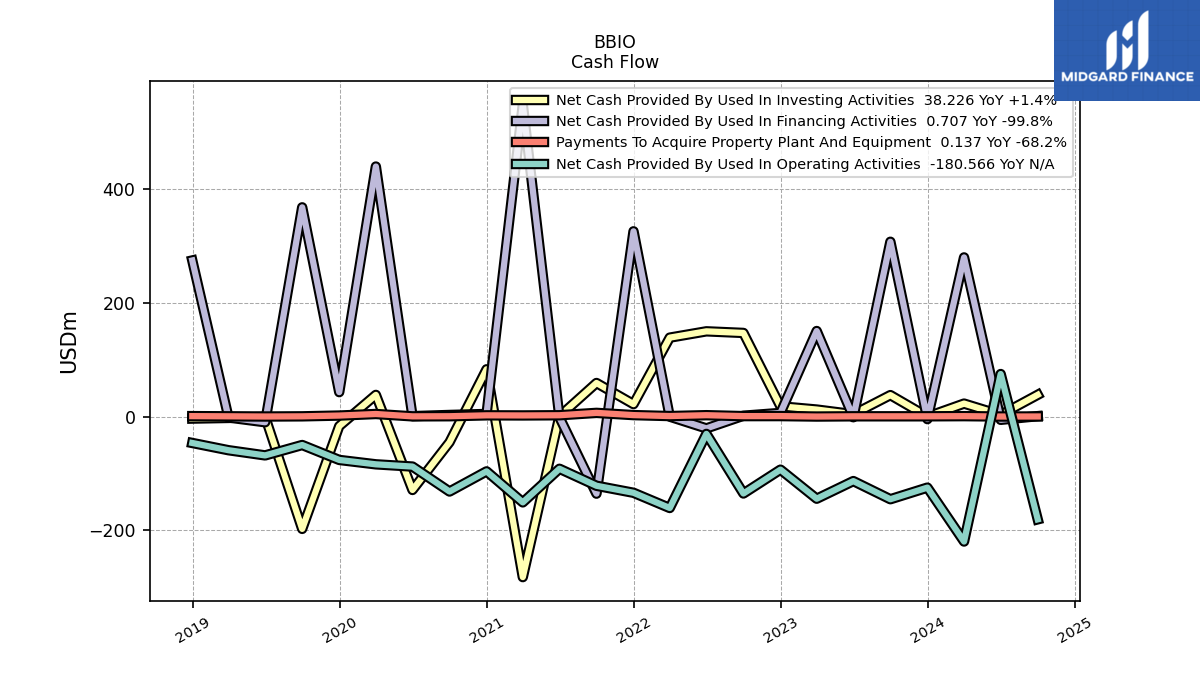
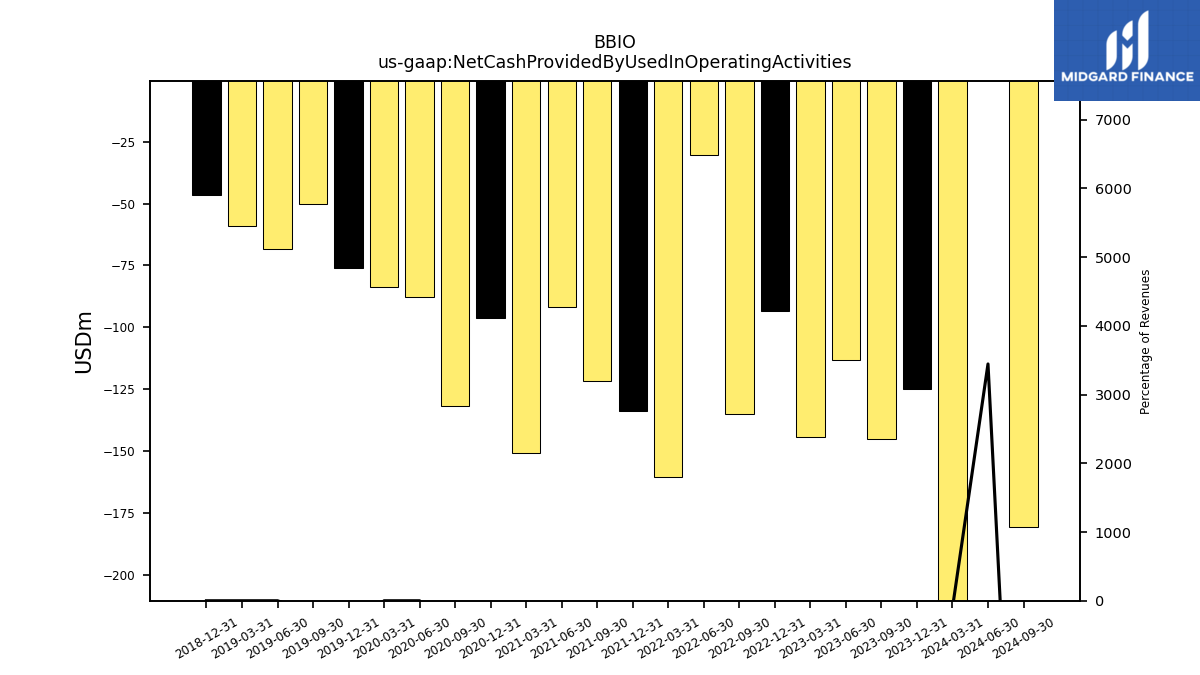
| Net Cash Provided By Used In Operating Activities | -145.23 | -113.35 | -144.32 | -93.24 | -135.16 | -30.45 | -160.63 | -133.90 | -121.56 | -91.71 | -150.76 | -96.26 | -131.68 | -76.20 | -50.00 | |
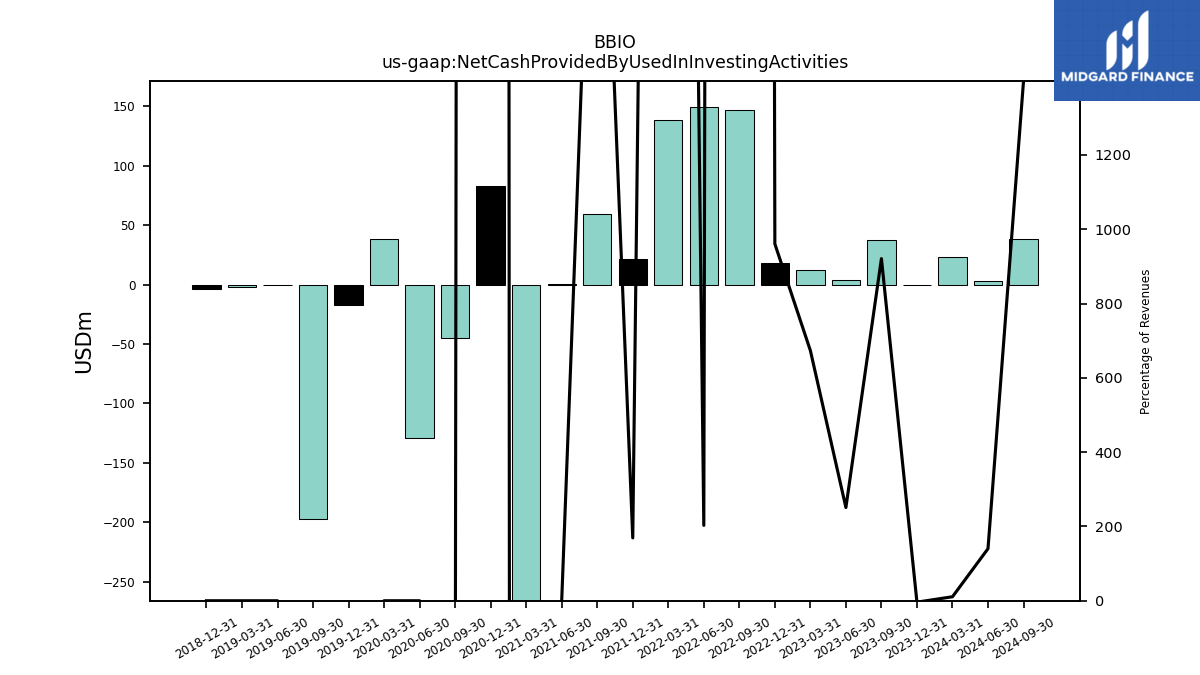
| Net Cash Provided By Used In Investing Activities | 37.68 | 4.12 | 12.30 | 17.96 | 146.86 | 149.70 | 138.62 | 21.80 | 58.97 | 0.46 | -282.05 | 83.02 | -45.05 | -16.90 | -197.34 | |
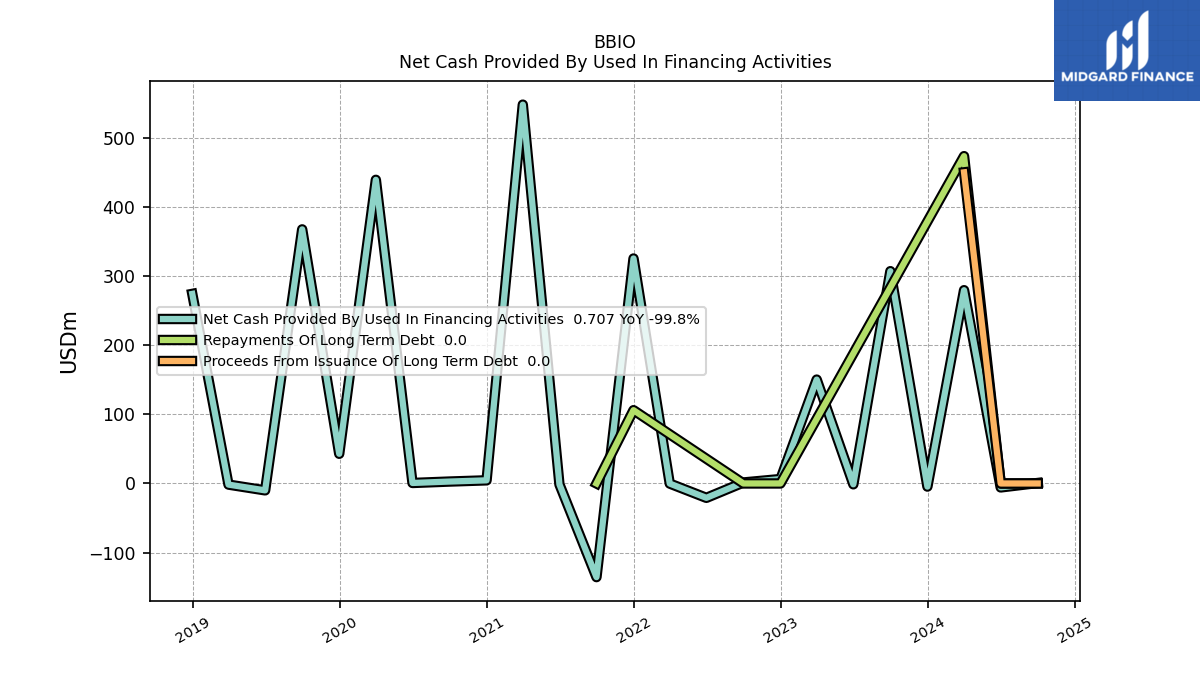
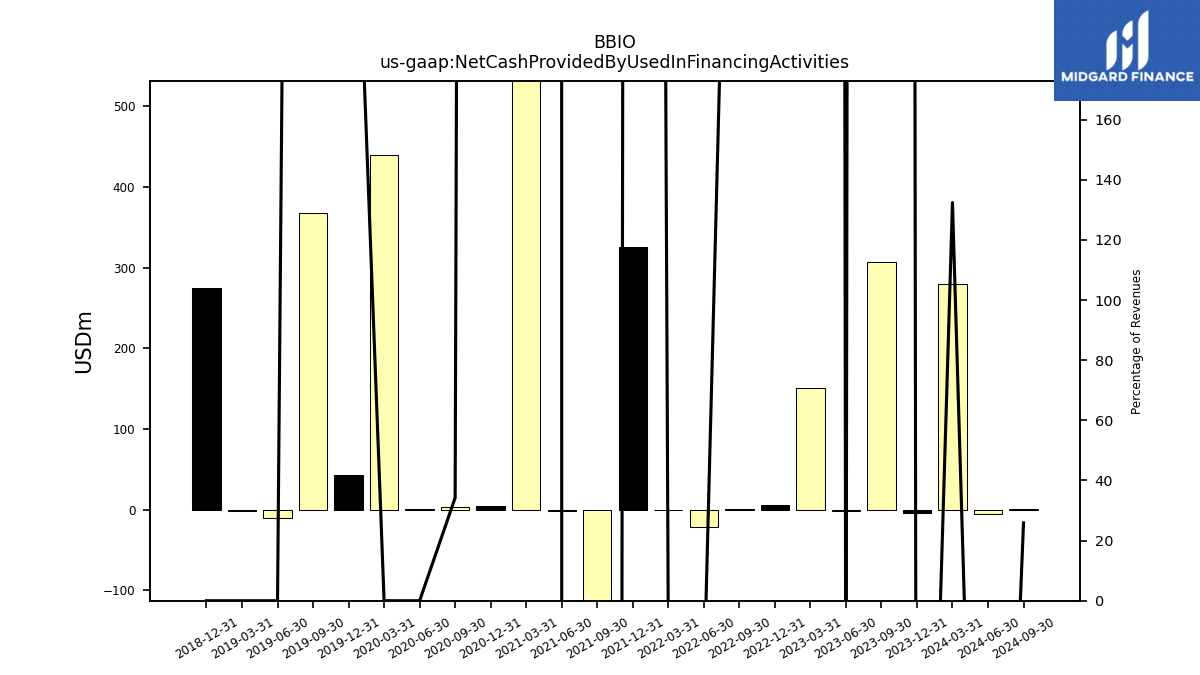
| Net Cash Provided By Used In Financing Activities | 307.04 | -1.23 | 150.25 | 6.38 | 1.45 | -20.80 | -0.16 | 325.38 | -135.46 | -1.39 | 547.91 | 4.53 | 2.78 | 42.90 | 367.51 |
| 2023-09-30 | 2023-06-30 | 2023-03-31 | 2022-12-31 | 2022-09-30 | 2022-06-30 | 2022-03-31 | 2021-12-31 | 2021-09-30 | 2021-06-30 | 2021-03-31 | 2020-12-31 | 2020-09-30 | 2019-12-31 | 2019-09-30 | ||
|---|---|---|---|---|---|---|---|---|---|---|---|---|---|---|---|---|
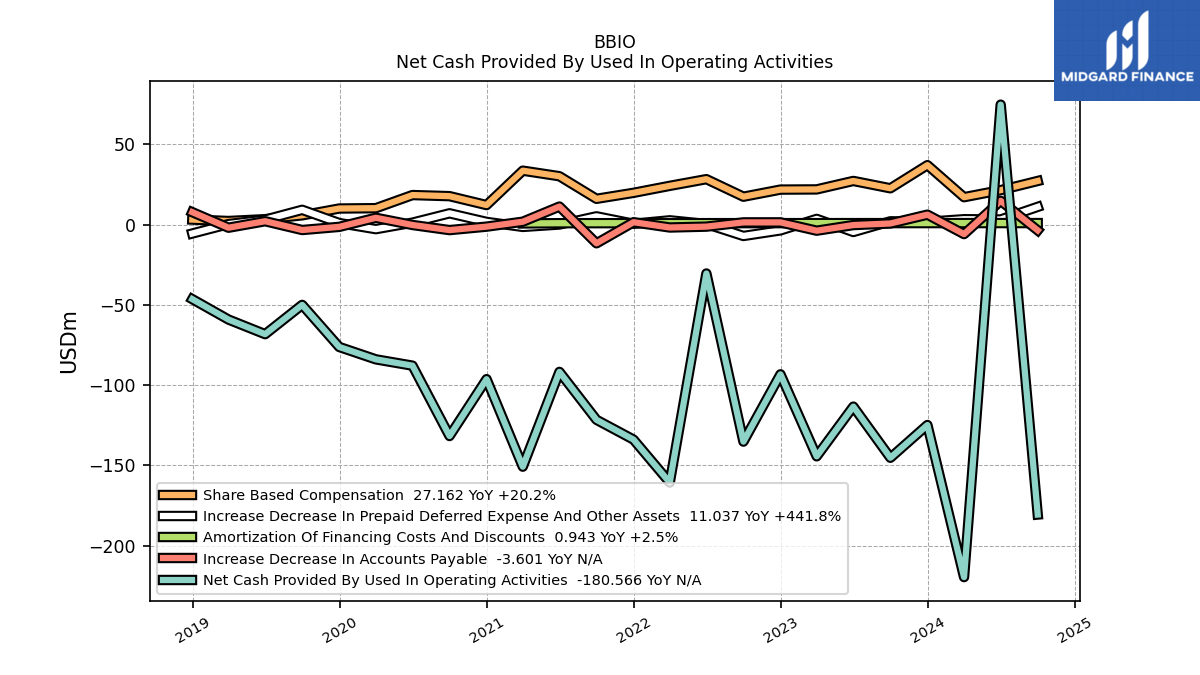
| Net Cash Provided By Used In Operating Activities | -145.23 | -113.35 | -144.32 | -93.24 | -135.16 | -30.45 | -160.63 | -133.90 | -121.56 | -91.71 | -150.76 | -96.26 | -131.68 | -76.20 | -50.00 | |
| Profit Loss | -179.49 | -160.70 | -142.73 | -140.57 | -140.19 | -2.56 | -201.33 | -152.28 | -161.02 | -102.07 | -171.08 | -135.03 | -130.17 | -84.15 | -60.66 | |
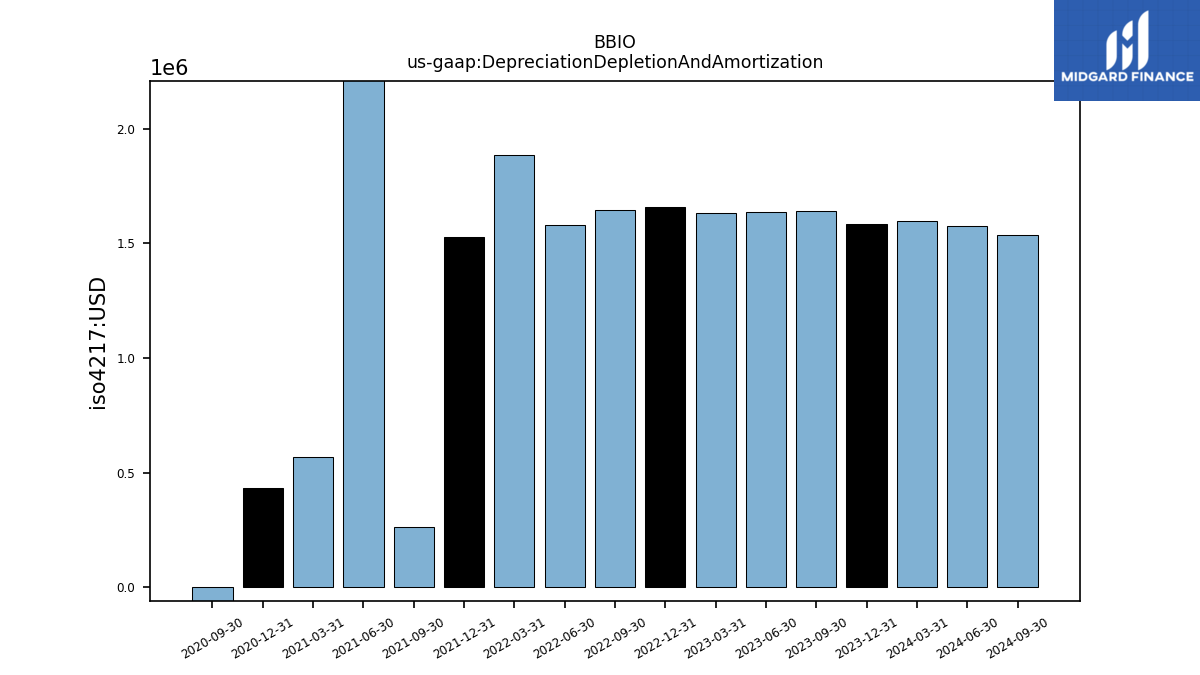
| Depreciation Depletion And Amortization | 1.64 | 1.64 | 1.63 | 1.66 | 1.65 | 1.58 | 1.88 | 1.53 | 0.27 | 3.49 | 0.57 | 0.43 | -1.01 | NA | NA | |
| Increase Decrease In Accounts Payable | 0.69 | -0.30 | -3.80 | 1.38 | 1.36 | -1.28 | -1.81 | 1.47 | -11.66 | 11.23 | 1.79 | -1.28 | -3.44 | -1.42 | -3.38 | |
| Share Based Compensation | 22.60 | 27.18 | 21.91 | 21.79 | 17.36 | 28.29 | 24.12 | 19.77 | 16.04 | 30.11 | 33.58 | 12.15 | 17.70 | 10.01 | 5.78 |
| 2023-09-30 | 2023-06-30 | 2023-03-31 | 2022-12-31 | 2022-09-30 | 2022-06-30 | 2022-03-31 | 2021-12-31 | 2021-09-30 | 2021-06-30 | 2021-03-31 | 2020-12-31 | 2020-09-30 | 2019-12-31 | 2019-09-30 | ||
|---|---|---|---|---|---|---|---|---|---|---|---|---|---|---|---|---|
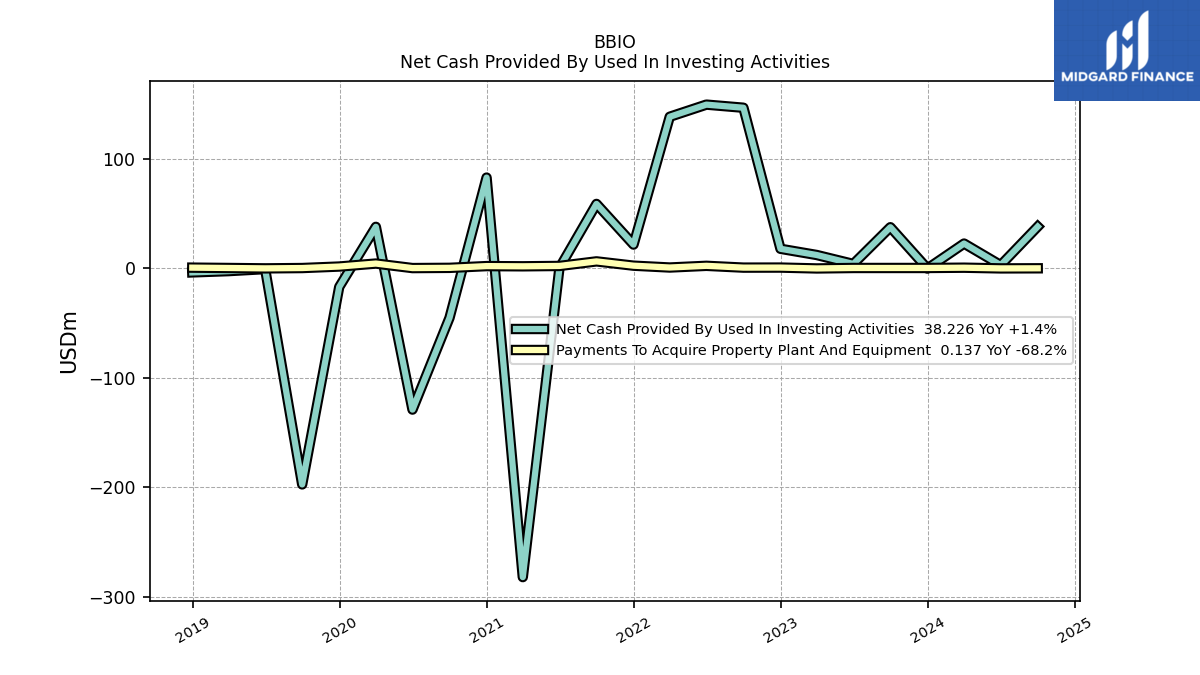
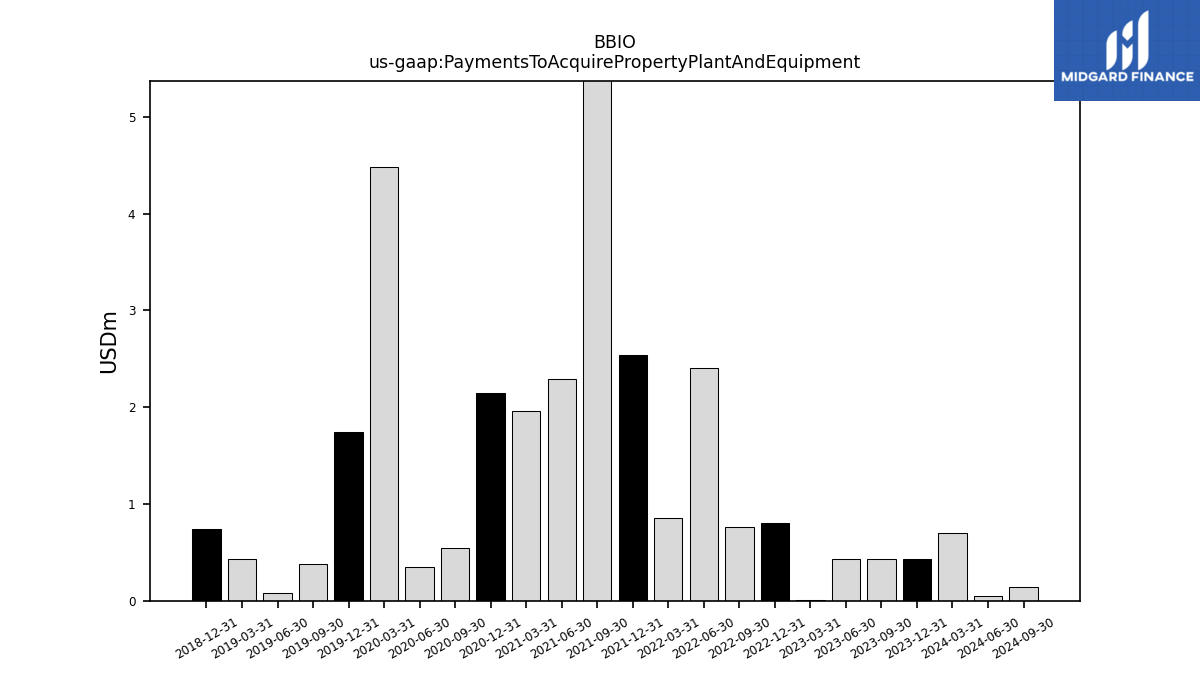
| Net Cash Provided By Used In Investing Activities | 37.68 | 4.12 | 12.30 | 17.96 | 146.86 | 149.70 | 138.62 | 21.80 | 58.97 | 0.46 | -282.05 | 83.02 | -45.05 | -16.90 | -197.34 | |
| Payments To Acquire Property Plant And Equipment | 0.43 | 0.43 | 0.01 | 0.80 | 0.76 | 2.40 | 0.86 | 2.54 | 6.46 | 2.29 | 1.96 | 2.15 | 0.55 | 1.75 | 0.38 |
| 2023-09-30 | 2023-06-30 | 2023-03-31 | 2022-12-31 | 2022-09-30 | 2022-06-30 | 2022-03-31 | 2021-12-31 | 2021-09-30 | 2021-06-30 | 2021-03-31 | 2020-12-31 | 2020-09-30 | 2019-12-31 | 2019-09-30 | ||
|---|---|---|---|---|---|---|---|---|---|---|---|---|---|---|---|---|
| Net Cash Provided By Used In Financing Activities | 307.04 | -1.23 | 150.25 | 6.38 | 1.45 | -20.80 | -0.16 | 325.38 | -135.46 | -1.39 | 547.91 | 4.53 | 2.78 | 42.90 | 367.51 |