
| 2023-12-31 | 2023-09-30 | 2023-06-30 | 2023-03-31 | 2022-12-31 | 2022-09-30 | 2022-06-30 | 2022-03-31 | 2021-12-31 | 2021-09-30 | 2021-06-30 | 2021-03-31 | 2020-12-31 | 2020-09-30 | 2020-06-30 | 2020-03-31 | 2019-12-31 | 2019-09-30 | 2019-06-30 | 2019-03-31 | 2018-12-31 | 2018-09-30 | 2018-06-30 | 2018-03-31 | 2017-12-31 | 2017-09-30 | 2017-06-30 | 2017-03-31 | 2016-12-31 | 2016-09-30 | 2016-06-30 | 2016-03-31 | 2015-12-31 | 2015-09-30 | 2015-06-30 | 2015-03-31 | 2014-12-31 | 2014-09-30 | 2014-06-30 | 2014-03-31 | 2013-12-31 | 2013-09-30 | 2013-06-30 | 2013-03-31 | 2012-12-31 | 2012-09-30 | 2012-06-30 | 2012-03-31 | ||
|---|---|---|---|---|---|---|---|---|---|---|---|---|---|---|---|---|---|---|---|---|---|---|---|---|---|---|---|---|---|---|---|---|---|---|---|---|---|---|---|---|---|---|---|---|---|---|---|---|---|
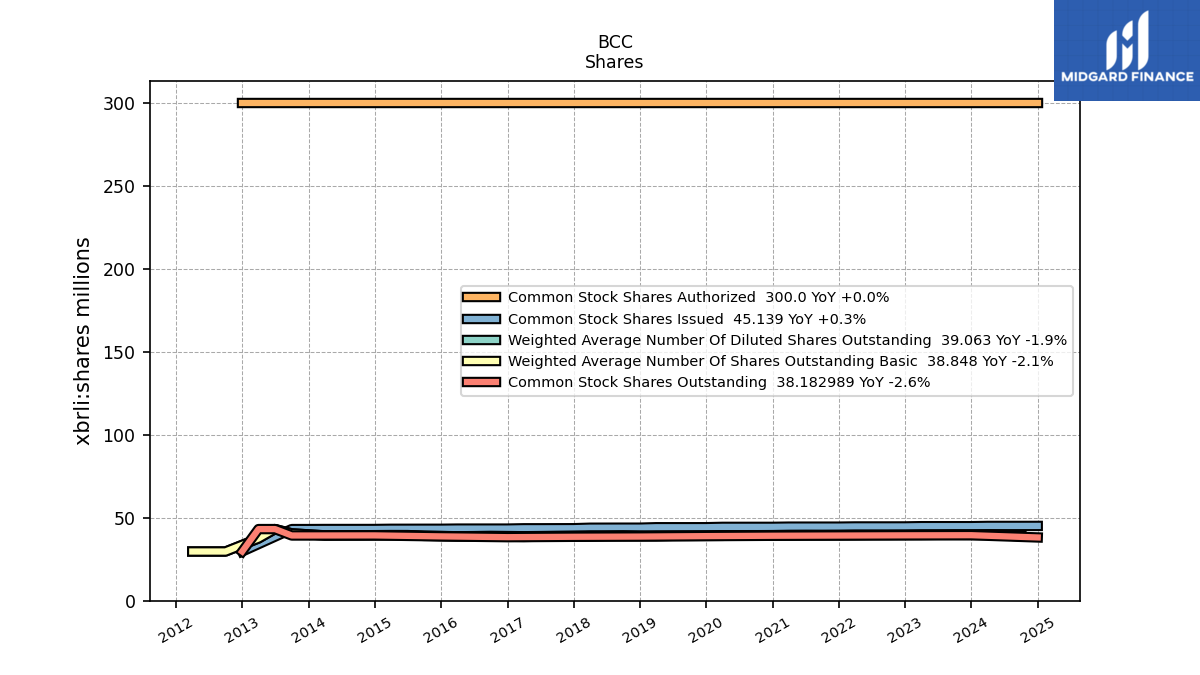
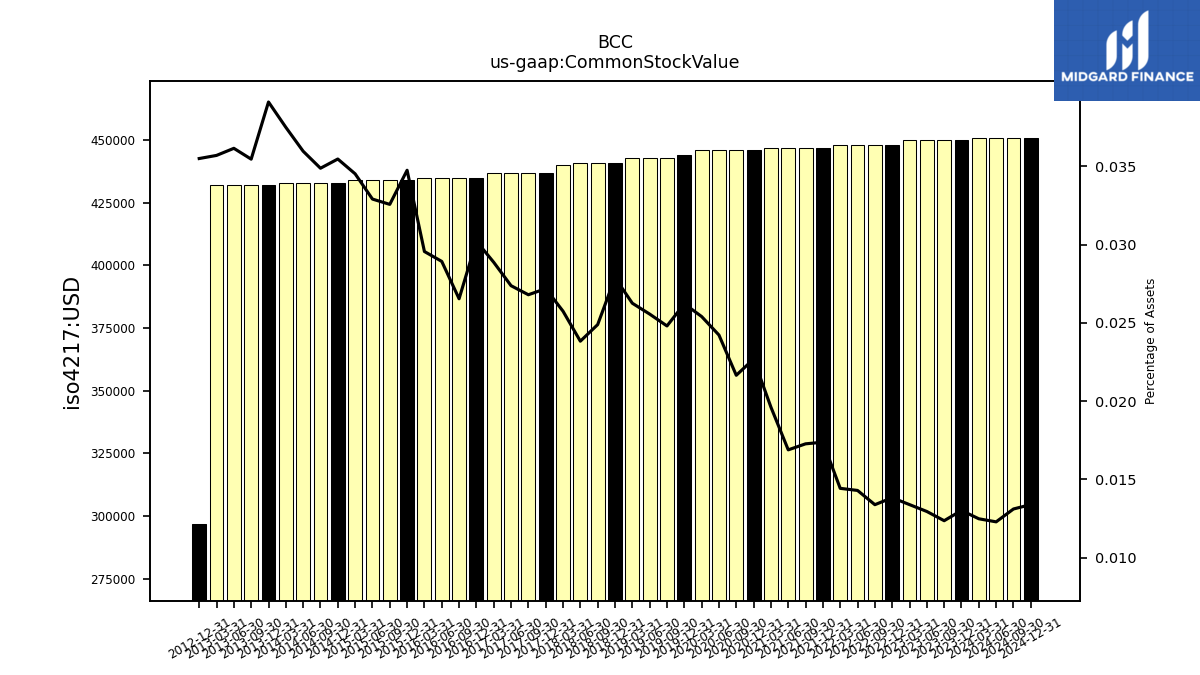
| Common Stock Value | 0.45 | 0.45 | 0.45 | 0.45 | 0.45 | 0.45 | 0.45 | 0.45 | 0.45 | 0.45 | 0.45 | 0.45 | 0.45 | 0.45 | 0.45 | 0.45 | 0.44 | 0.44 | 0.44 | 0.44 | 0.44 | 0.44 | 0.44 | 0.44 | 0.44 | 0.44 | 0.44 | 0.44 | 0.43 | 0.43 | 0.43 | 0.43 | 0.43 | 0.43 | 0.43 | 0.43 | 0.43 | 0.43 | 0.43 | 0.43 | 0.43 | 0.43 | 0.43 | 0.43 | 0.30 | NA | NA | NA | |
| dei: Entity Common Stock Shares Outstanding | NA | NA | NA | NA | NA | NA | NA | NA | NA | NA | NA | NA | NA | NA | NA | NA | NA | NA | NA | NA | NA | NA | NA | NA | NA | NA | NA | NA | NA | NA | NA | NA | NA | NA | NA | NA | NA | NA | NA | NA | NA | NA | NA | NA | NA | NA | NA | NA | |
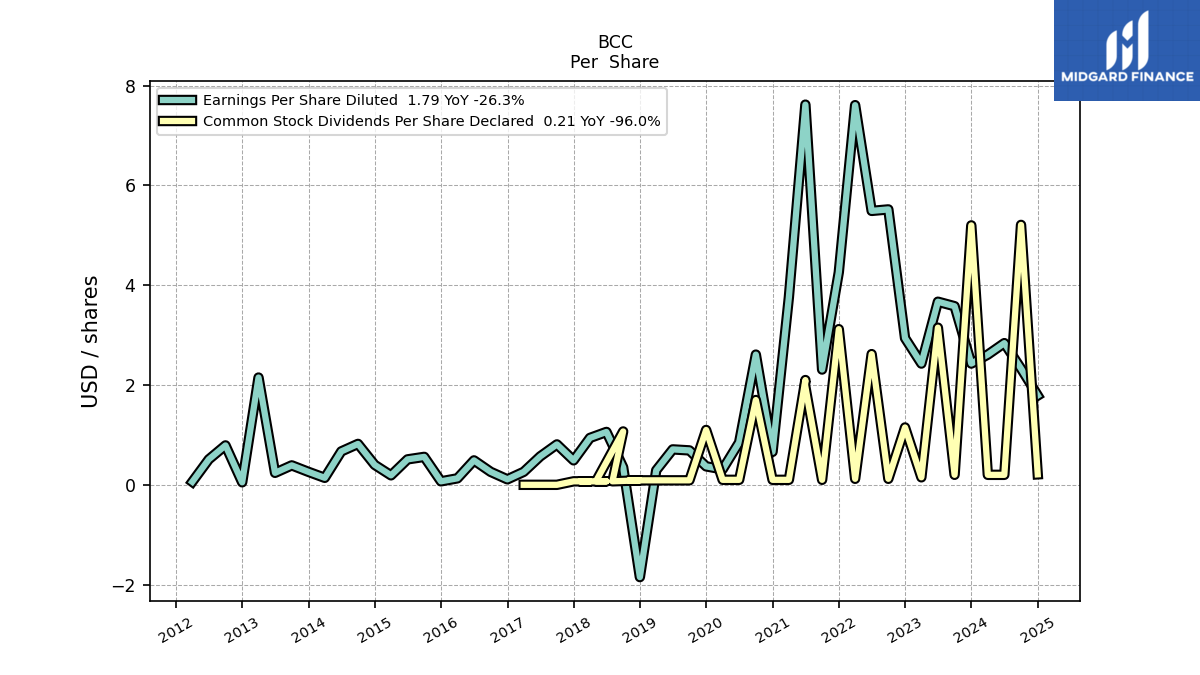
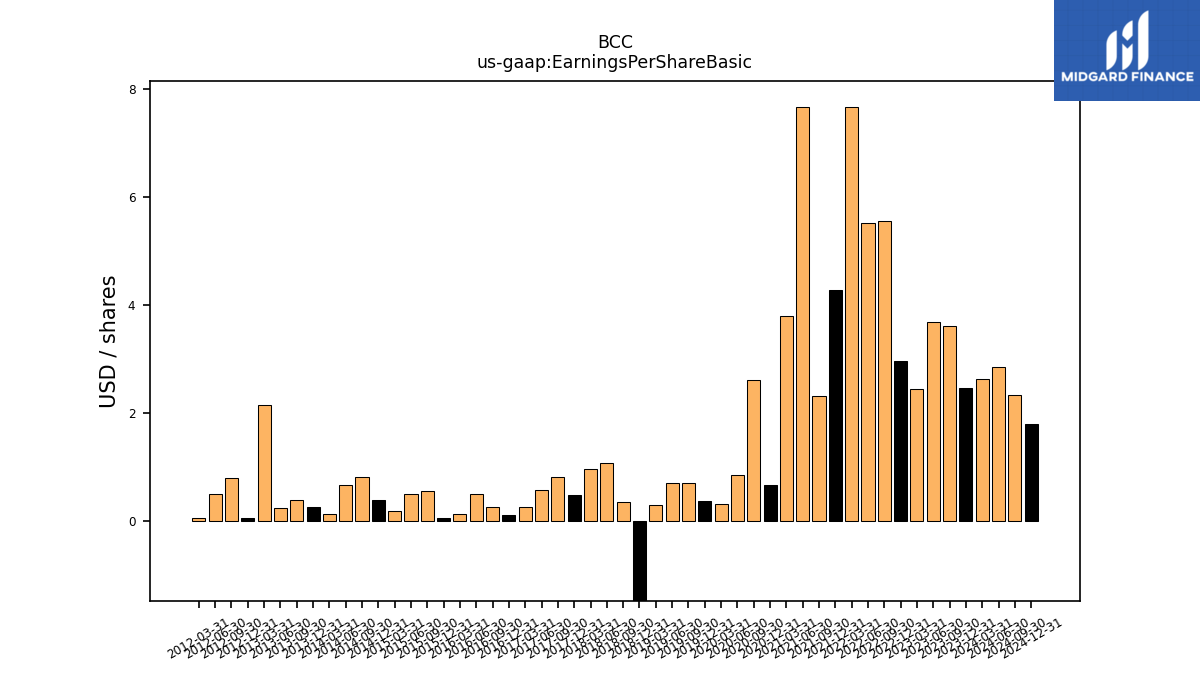
| Earnings Per Share Basic | 2.46 | 3.61 | 3.69 | 2.44 | 2.97 | 5.55 | 5.52 | 7.67 | 4.28 | 2.32 | 7.67 | 3.79 | 0.66 | 2.62 | 0.85 | 0.31 | 0.37 | 0.70 | 0.71 | 0.29 | -1.85 | 0.36 | 1.07 | 0.96 | 0.49 | 0.82 | 0.57 | 0.26 | 0.11 | 0.26 | 0.50 | 0.13 | 0.06 | 0.56 | 0.51 | 0.19 | 0.40 | 0.82 | 0.67 | 0.14 | 0.26 | 0.39 | 0.24 | 2.15 | 0.05 | 0.79 | 0.51 | 0.06 | |
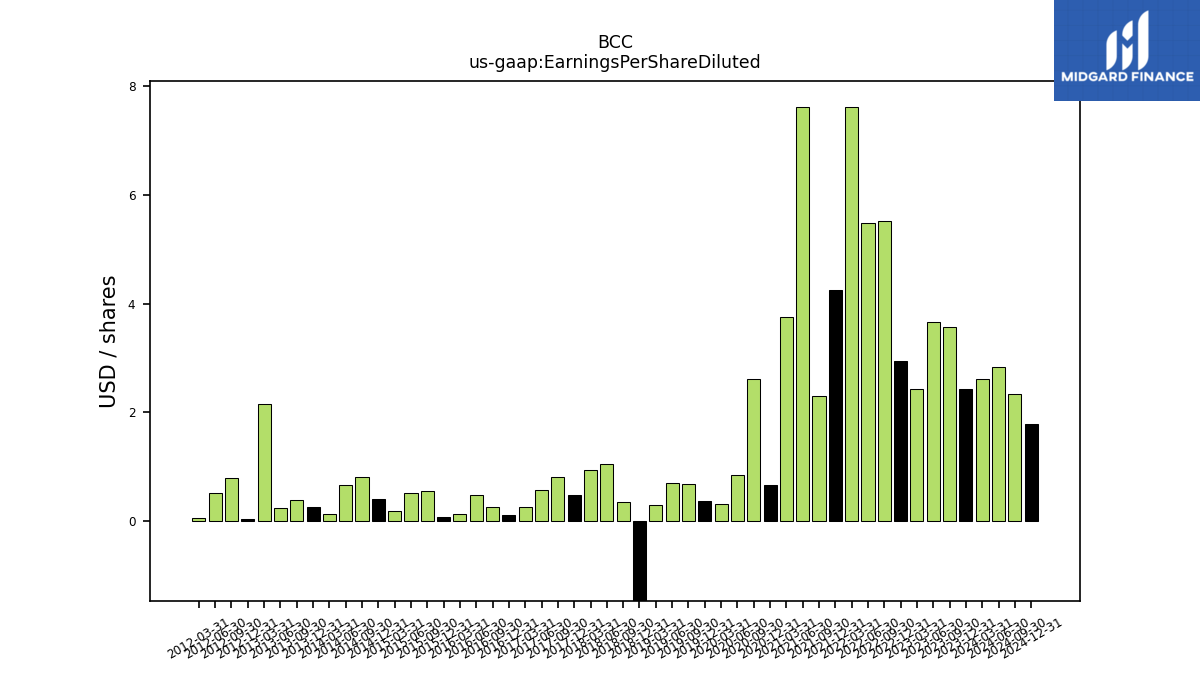
| Earnings Per Share Diluted | 2.43 | 3.58 | 3.67 | 2.43 | 2.94 | 5.52 | 5.49 | 7.61 | 4.26 | 2.31 | 7.62 | 3.76 | 0.66 | 2.61 | 0.85 | 0.31 | 0.37 | 0.69 | 0.71 | 0.29 | -1.85 | 0.35 | 1.06 | 0.94 | 0.49 | 0.81 | 0.57 | 0.26 | 0.11 | 0.26 | 0.49 | 0.13 | 0.07 | 0.56 | 0.51 | 0.19 | 0.40 | 0.82 | 0.67 | 0.14 | 0.26 | 0.39 | 0.24 | 2.15 | 0.05 | 0.79 | 0.51 | 0.06 |
| 2023-12-31 | 2023-09-30 | 2023-06-30 | 2023-03-31 | 2022-12-31 | 2022-09-30 | 2022-06-30 | 2022-03-31 | 2021-12-31 | 2021-09-30 | 2021-06-30 | 2021-03-31 | 2020-12-31 | 2020-09-30 | 2020-06-30 | 2020-03-31 | 2019-12-31 | 2019-09-30 | 2019-06-30 | 2019-03-31 | 2018-12-31 | 2018-09-30 | 2018-06-30 | 2018-03-31 | 2017-12-31 | 2017-09-30 | 2017-06-30 | 2017-03-31 | 2016-12-31 | 2016-09-30 | 2016-06-30 | 2016-03-31 | 2015-12-31 | 2015-09-30 | 2015-06-30 | 2015-03-31 | 2014-12-31 | 2014-09-30 | 2014-06-30 | 2014-03-31 | 2013-12-31 | 2013-09-30 | 2013-06-30 | 2013-03-31 | 2012-12-31 | 2012-09-30 | 2012-06-30 | 2012-03-31 | ||
|---|---|---|---|---|---|---|---|---|---|---|---|---|---|---|---|---|---|---|---|---|---|---|---|---|---|---|---|---|---|---|---|---|---|---|---|---|---|---|---|---|---|---|---|---|---|---|---|---|---|
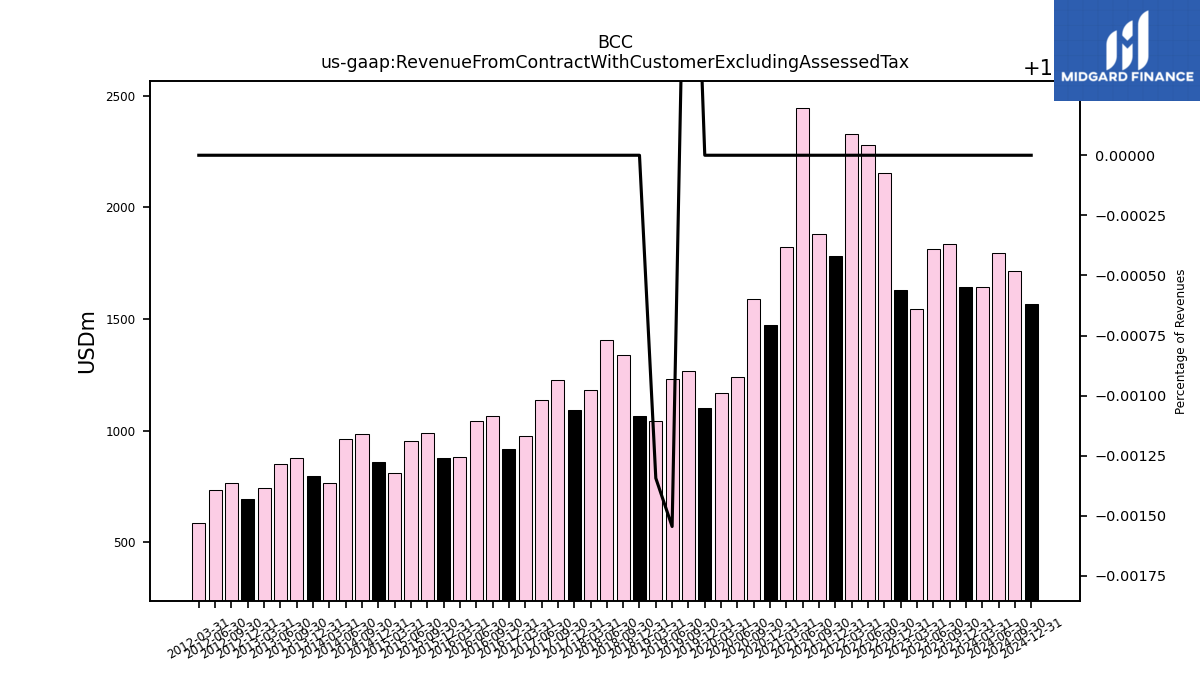
| Revenue From Contract With Customer Excluding Assessed Tax | 1644.26 | 1834.44 | 1815.22 | 1544.33 | 1628.31 | 2154.65 | 2278.07 | 2326.28 | 1782.18 | 1879.45 | 2443.16 | 1821.32 | 1472.20 | 1589.31 | 1242.76 | 1170.53 | 1101.70 | 1269.52 | 1230.08 | 1042.09 | 1065.80 | 1338.51 | 1408.13 | 1182.84 | 1092.00 | 1226.64 | 1138.94 | 974.44 | 919.50 | 1067.21 | 1043.77 | 880.70 | 876.50 | 991.58 | 955.40 | 809.90 | 862.00 | 983.32 | 961.19 | 767.18 | 798.30 | 877.98 | 852.29 | 744.88 | 694.60 | 764.60 | 732.90 | 586.99 | |
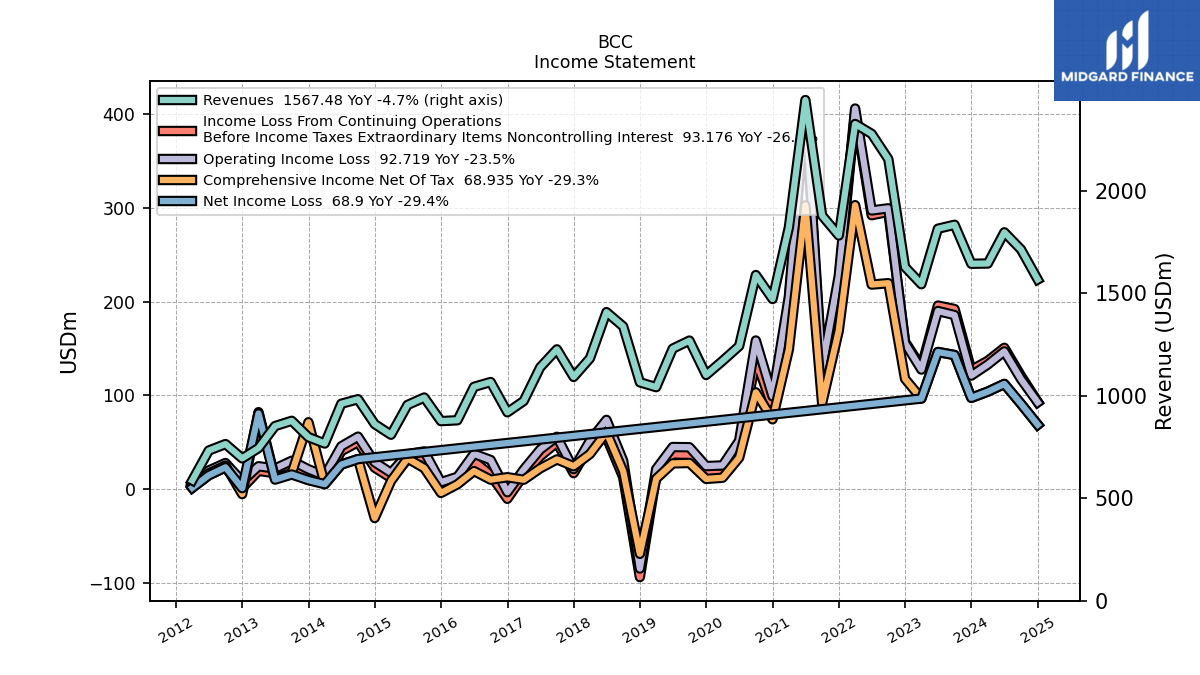
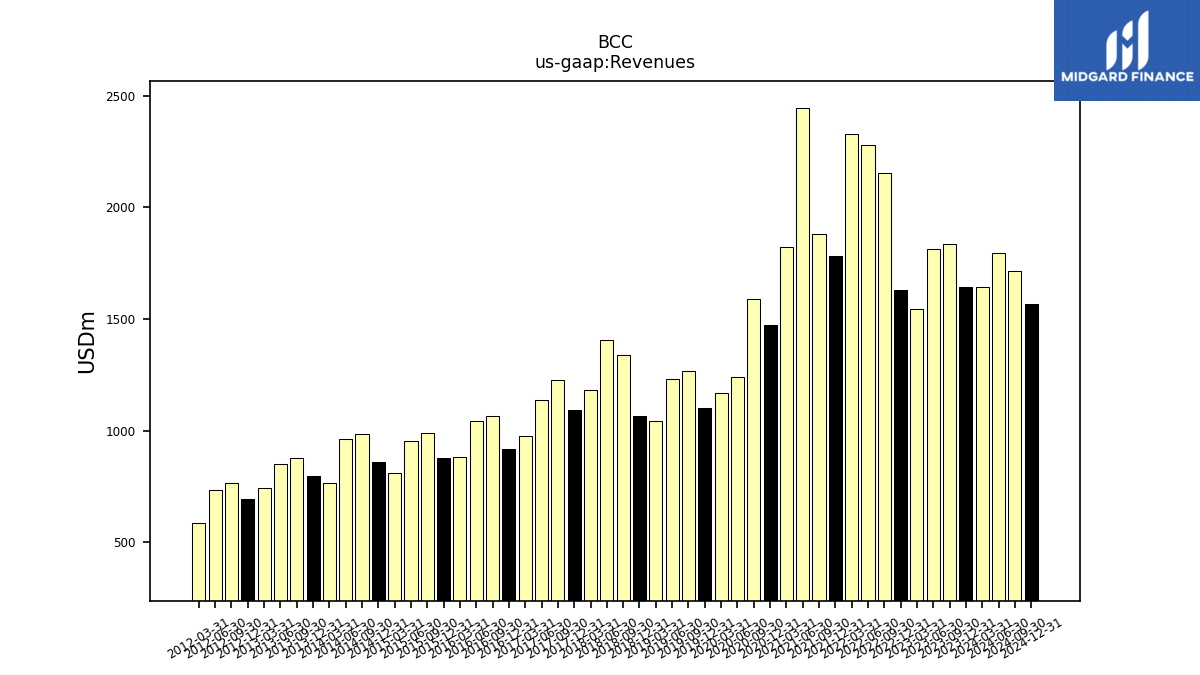
| Revenues | 1644.26 | 1834.44 | 1815.22 | 1544.33 | 1628.31 | 2154.65 | 2278.07 | 2326.28 | 1782.18 | 1879.45 | 2443.16 | 1821.32 | 1472.20 | 1589.31 | 1242.76 | 1170.53 | 1101.70 | 1269.50 | 1230.10 | 1042.10 | 1065.80 | 1338.51 | 1408.13 | 1182.84 | 1092.00 | 1226.64 | 1138.94 | 974.44 | 919.50 | 1067.21 | 1043.77 | 880.70 | 876.50 | 991.58 | 955.40 | 809.90 | 862.00 | 983.32 | 961.19 | 767.18 | 798.30 | 877.98 | 852.29 | 744.88 | 694.60 | 764.60 | 732.90 | 586.99 | |
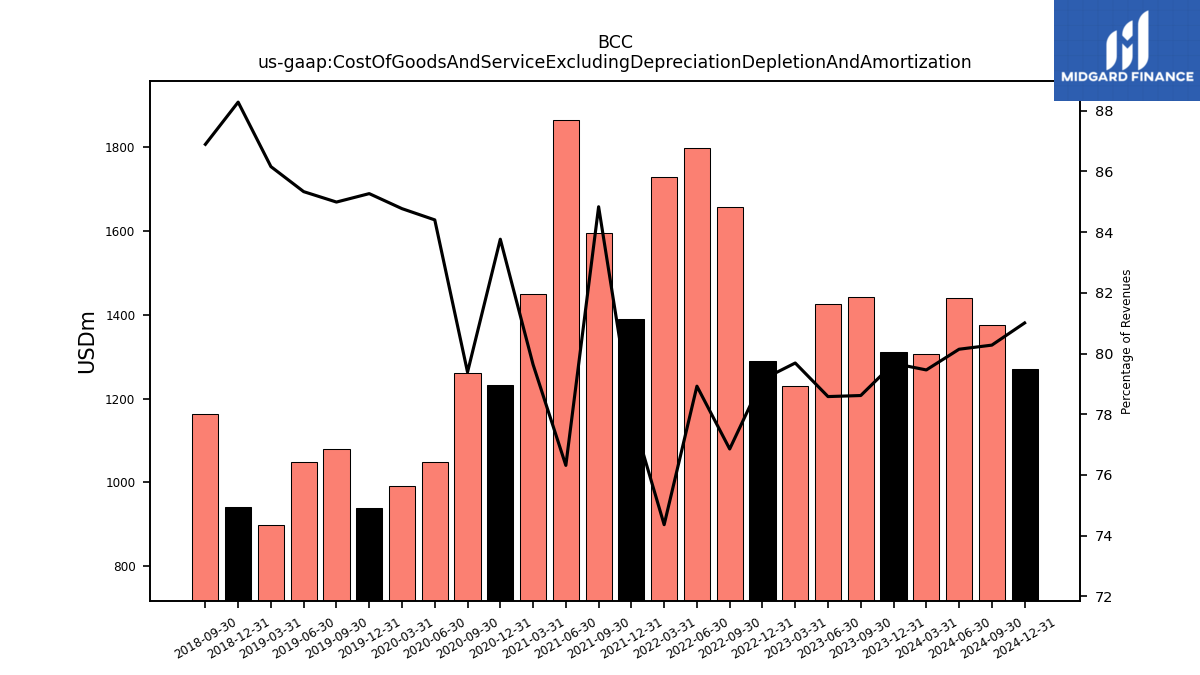
| Cost Of Goods And Service Excluding Depreciation Depletion And Amortization | 1310.06 | 1442.18 | 1426.44 | 1230.63 | 1288.72 | 1655.98 | 1797.95 | 1729.90 | 1390.71 | 1594.40 | 1864.52 | 1450.43 | 1233.18 | 1261.70 | 1048.90 | 992.27 | 939.38 | 1078.92 | 1049.65 | 897.82 | 940.88 | 1163.02 | NA | NA | NA | NA | NA | NA | NA | NA | NA | NA | NA | NA | NA | NA | NA | NA | NA | NA | NA | NA | NA | NA | NA | NA | NA | NA | |
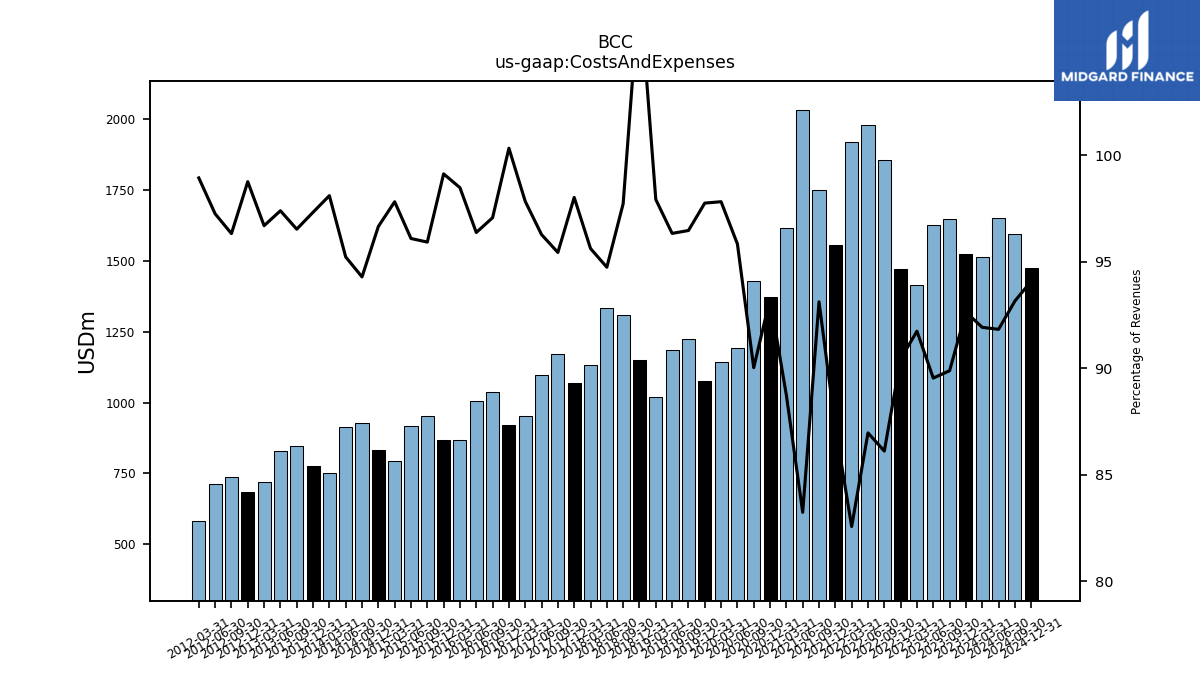
| Costs And Expenses | 1523.08 | 1648.81 | 1625.24 | 1416.73 | 1472.53 | 1855.28 | 1981.00 | 1920.65 | 1554.80 | 1750.07 | 2033.39 | 1616.06 | 1373.09 | 1430.74 | 1190.99 | 1144.99 | 1076.94 | 1224.63 | 1184.95 | 1020.43 | 1150.08 | 1308.06 | 1334.08 | 1131.04 | 1070.36 | 1170.64 | 1096.49 | 953.35 | 922.53 | 1035.91 | 1005.91 | 867.29 | 868.83 | 951.14 | 918.04 | 792.22 | 833.15 | 927.13 | 915.28 | 752.62 | 776.92 | 847.50 | 830.08 | 720.24 | 685.98 | 736.46 | 712.75 | 580.74 | |
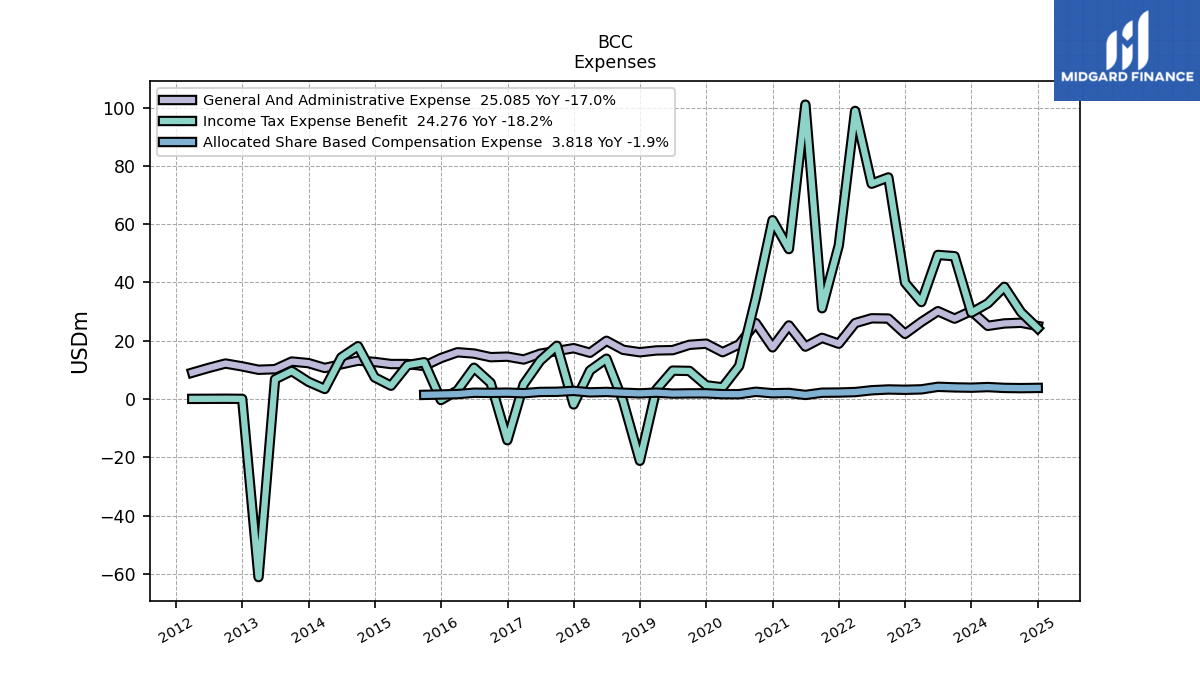
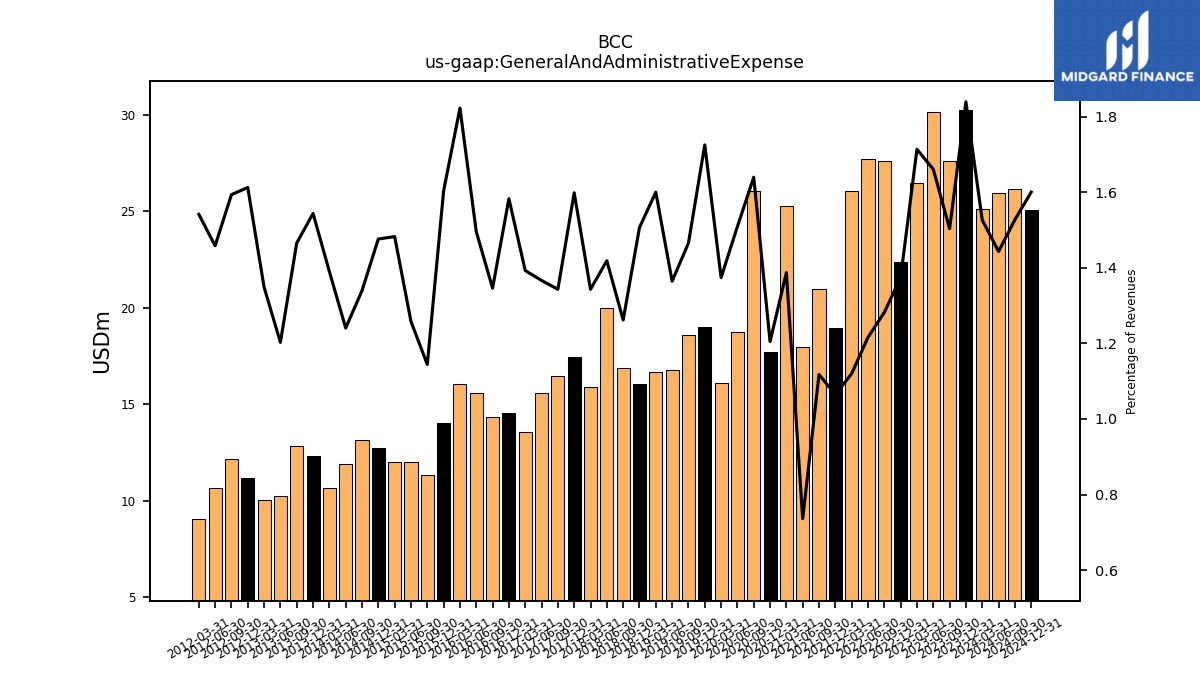
| General And Administrative Expense | 30.24 | 27.58 | 30.15 | 26.46 | 22.38 | 27.62 | 27.70 | 26.05 | 18.98 | 21.00 | 17.99 | 25.26 | 17.74 | 26.06 | 18.75 | 16.08 | 19.01 | 18.60 | 16.79 | 16.68 | 16.06 | 16.89 | 19.98 | 15.89 | 17.45 | 16.48 | 15.56 | 13.57 | 14.55 | 14.37 | 15.61 | 16.05 | 14.05 | 11.35 | 12.02 | 12.01 | 12.73 | 13.17 | 11.93 | 10.66 | 12.32 | 12.87 | 10.25 | 10.05 | 11.20 | 12.19 | 10.69 | 9.05 | |
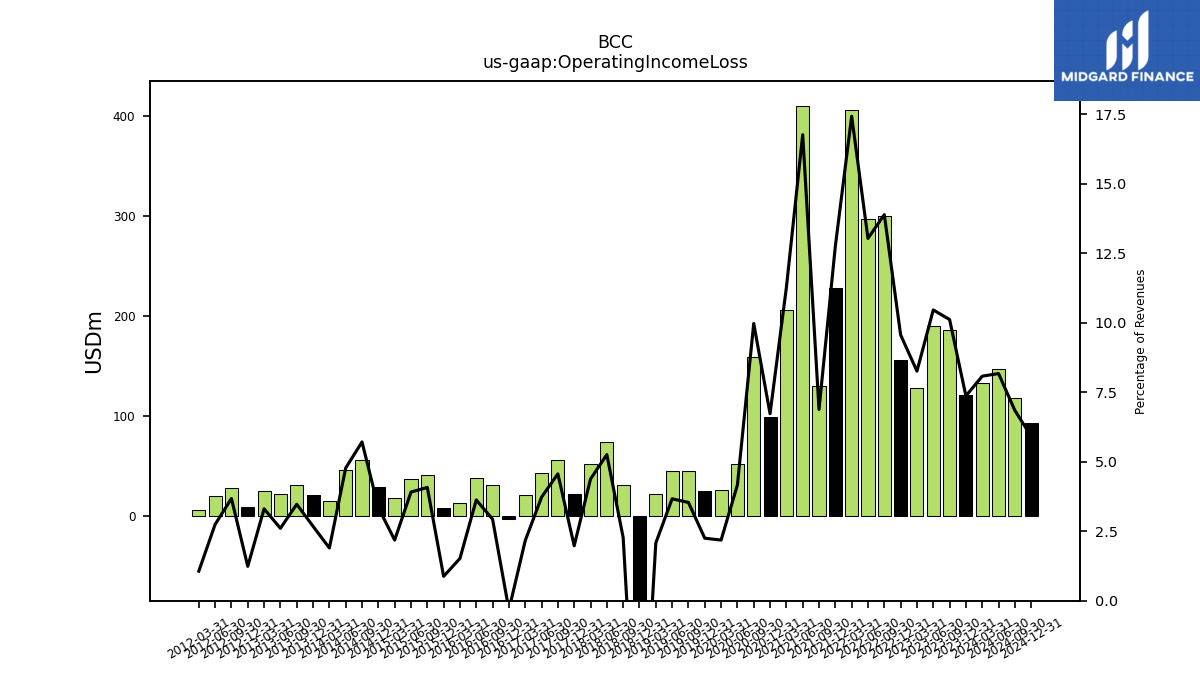
| Operating Income Loss | 121.18 | 185.63 | 189.97 | 127.60 | 155.78 | 299.37 | 297.07 | 405.63 | 227.38 | 129.39 | 409.77 | 205.26 | 99.10 | 158.57 | 51.77 | 25.55 | 24.80 | 44.90 | 45.13 | 21.65 | -84.30 | 30.45 | 74.06 | 51.80 | 21.60 | 56.01 | 42.45 | 21.09 | -3.00 | 31.31 | 37.87 | 13.40 | 7.70 | 40.44 | 37.36 | 17.69 | 28.90 | 56.19 | 45.90 | 14.56 | 21.40 | 30.48 | 22.22 | 24.64 | 8.60 | 28.13 | 20.14 | 6.25 | |
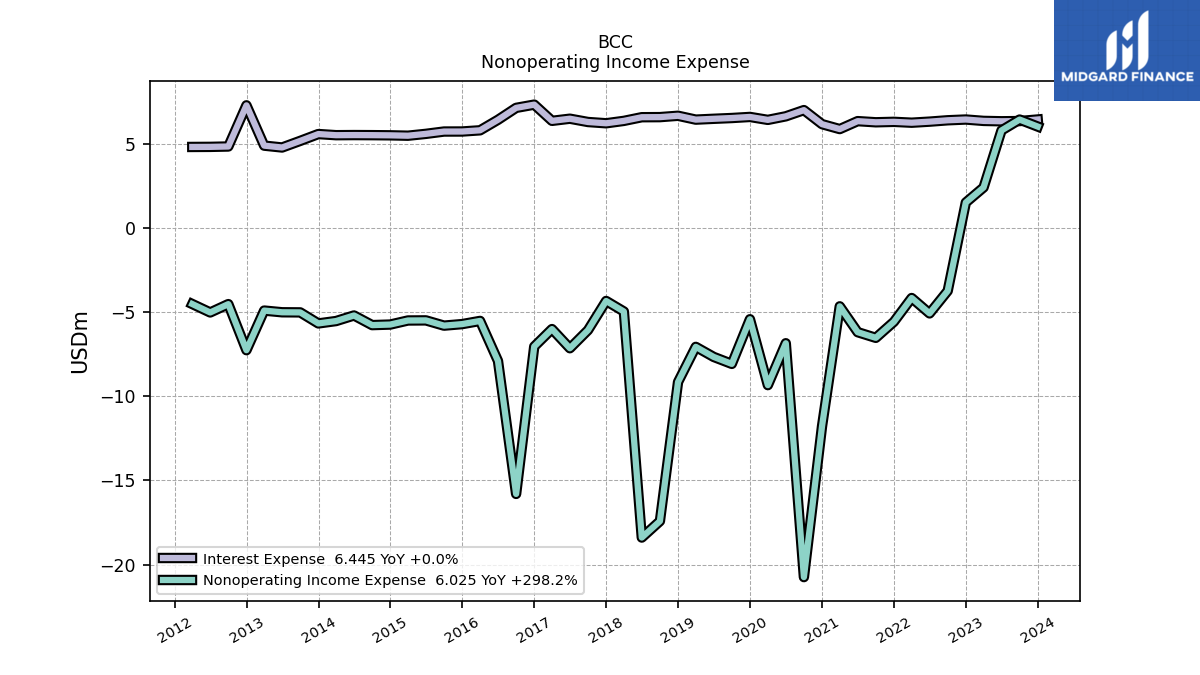
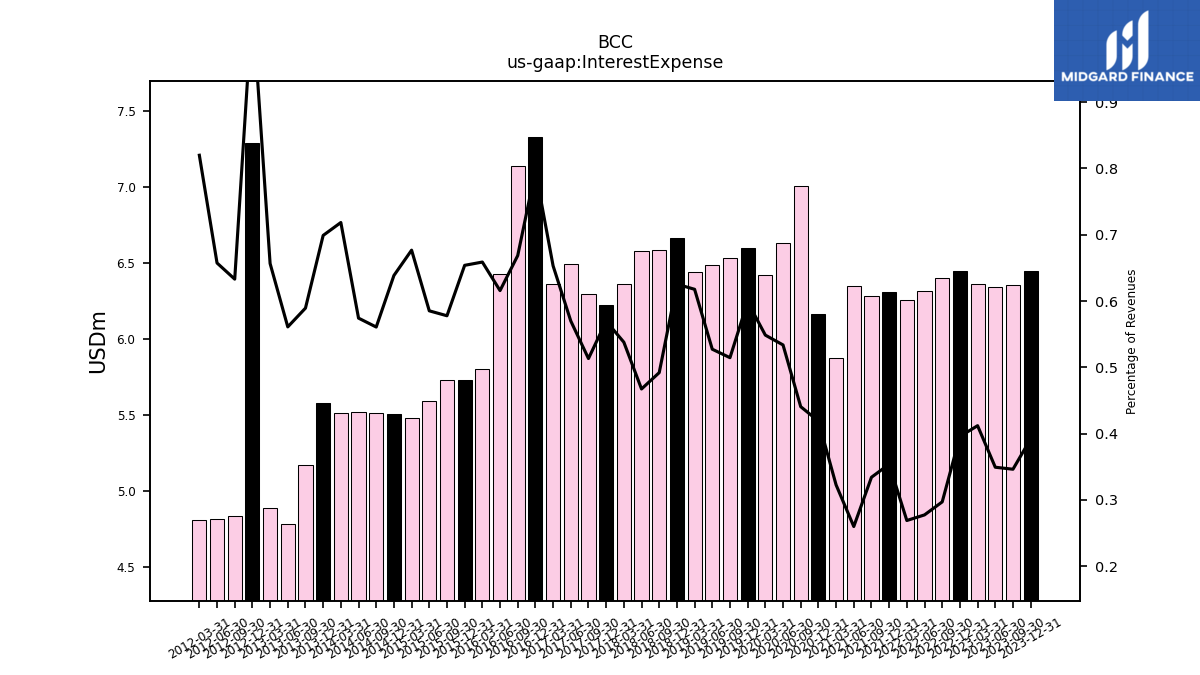
| Interest Expense | 6.45 | 6.35 | 6.34 | 6.36 | 6.44 | 6.40 | 6.32 | 6.25 | 6.30 | 6.28 | 6.35 | 5.88 | 6.17 | 7.00 | 6.63 | 6.42 | 6.60 | 6.53 | 6.49 | 6.44 | 6.67 | 6.58 | 6.58 | 6.36 | 6.22 | 6.29 | 6.49 | 6.36 | 7.33 | 7.13 | 6.43 | 5.80 | 5.73 | 5.73 | 5.59 | 5.48 | 5.50 | 5.51 | 5.52 | 5.51 | 5.58 | 5.17 | 4.78 | 4.89 | 7.29 | 4.84 | 4.82 | 4.81 | |
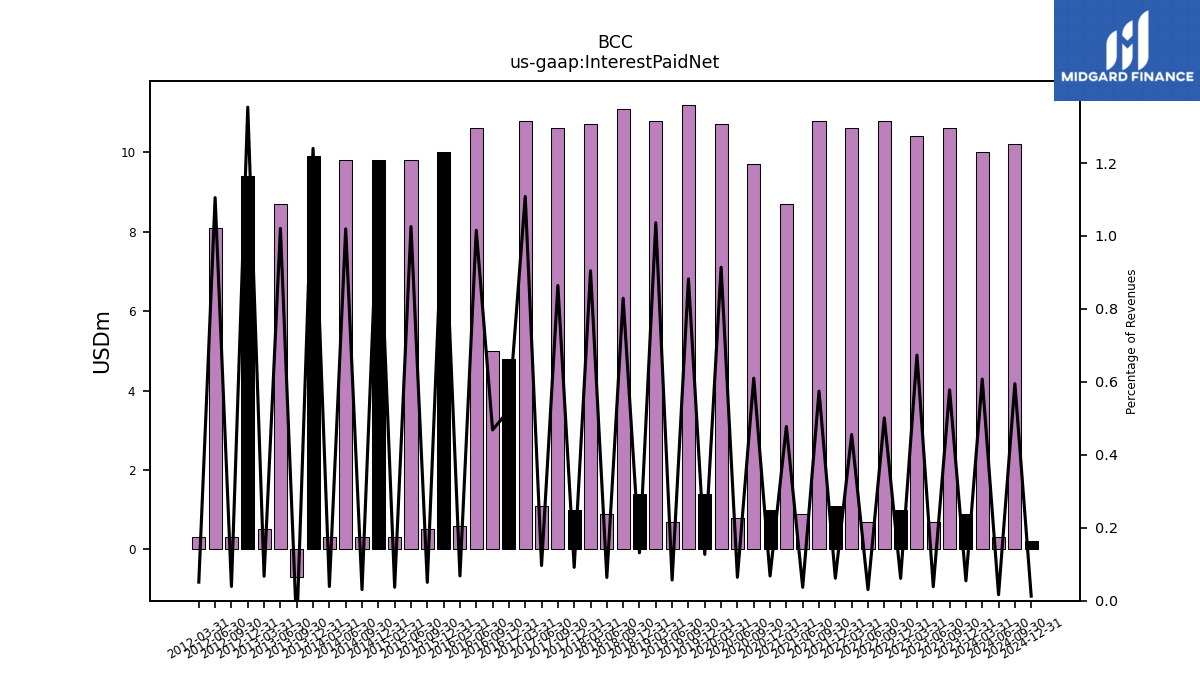
| Interest Paid Net | 0.90 | 10.60 | 0.70 | 10.40 | 1.00 | 10.80 | 0.70 | 10.60 | 1.10 | 10.80 | 0.90 | 8.70 | 1.00 | 9.70 | 0.80 | 10.70 | 1.40 | 11.20 | 0.70 | 10.80 | 1.40 | 11.10 | 0.90 | 10.70 | 1.00 | 10.60 | 1.10 | 10.80 | 4.80 | 5.00 | 10.60 | 0.60 | 10.00 | 0.50 | 9.80 | 0.30 | 9.80 | 0.30 | 9.80 | 0.30 | 9.90 | -0.70 | 8.70 | 0.50 | 9.40 | 0.30 | 8.10 | 0.30 | |
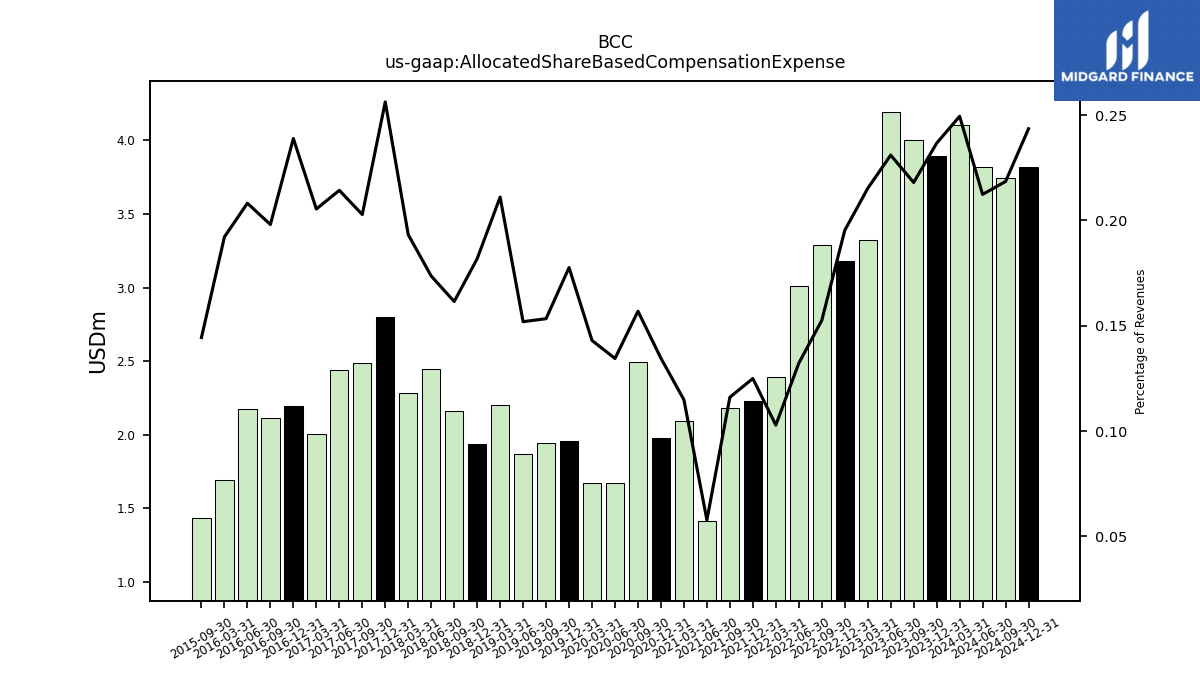
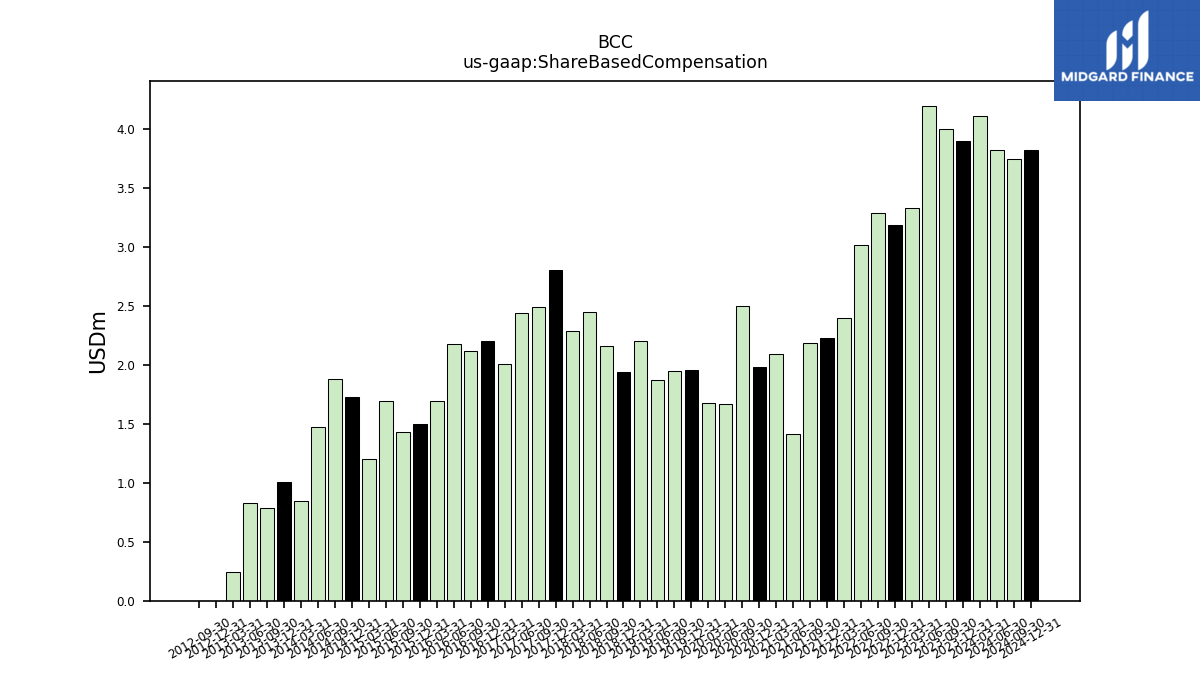
| Allocated Share Based Compensation Expense | 3.89 | 4.00 | 4.19 | 3.32 | 3.18 | 3.29 | 3.01 | 2.39 | 2.23 | 2.18 | 1.41 | 2.09 | 1.98 | 2.49 | 1.67 | 1.67 | 1.96 | 1.95 | 1.87 | 2.20 | 1.94 | 2.16 | 2.44 | 2.29 | 2.80 | 2.49 | 2.44 | 2.00 | 2.20 | 2.11 | 2.17 | 1.69 | NA | 1.43 | NA | NA | NA | NA | NA | NA | NA | NA | NA | NA | NA | NA | NA | NA | |
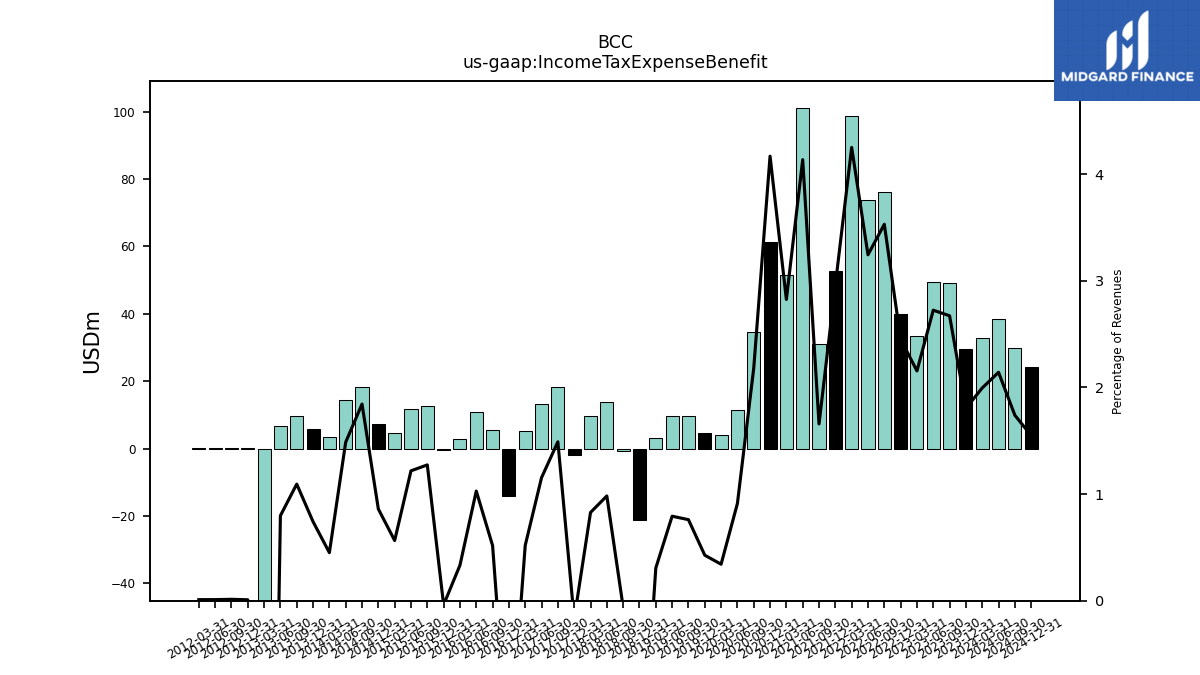
| Income Tax Expense Benefit | 29.67 | 49.01 | 49.45 | 33.27 | 39.93 | 76.04 | 73.89 | 98.87 | 52.73 | 31.16 | 101.03 | 51.45 | 61.36 | 34.63 | 11.33 | 4.01 | 4.71 | 9.65 | 9.75 | 3.20 | -21.19 | -0.81 | 13.84 | 9.79 | -1.86 | 18.28 | 13.15 | 5.07 | -14.14 | 5.52 | 10.73 | 2.93 | -0.34 | 12.63 | 11.64 | 4.57 | 7.42 | 18.13 | 14.29 | 3.46 | 5.92 | 9.60 | 6.80 | -61.11 | 0.06 | 0.10 | 0.08 | 0.06 | |
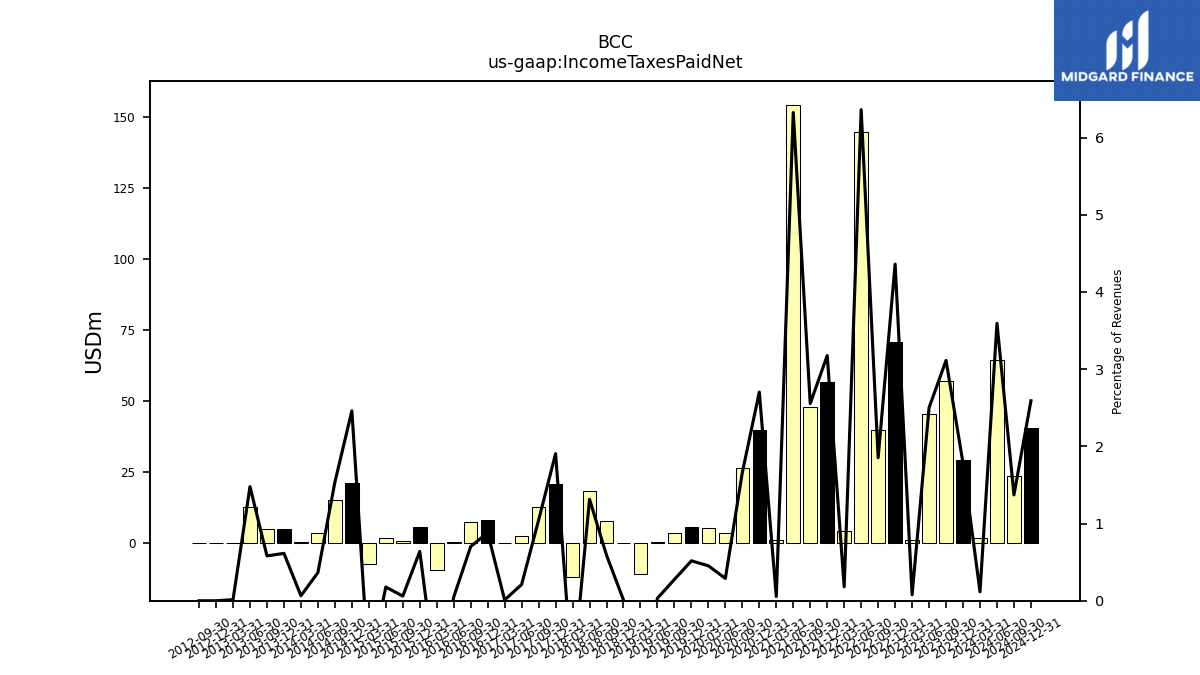
| Income Taxes Paid Net | 29.30 | 57.10 | 45.40 | 1.20 | 71.00 | 39.90 | 144.90 | 4.20 | 56.60 | 48.00 | 154.50 | 1.00 | 39.80 | 26.40 | 3.60 | 5.30 | 5.70 | 3.50 | 0.40 | -11.00 | 0.10 | 7.90 | 18.50 | -12.00 | 20.80 | 12.80 | 2.40 | 0.10 | 8.10 | 7.50 | 0.50 | -9.40 | 5.60 | 0.60 | 1.70 | -7.20 | 21.20 | 15.10 | 3.50 | 0.50 | 4.90 | 5.10 | 12.60 | 0.10 | 0.00 | 0.00 | NA | NA | |
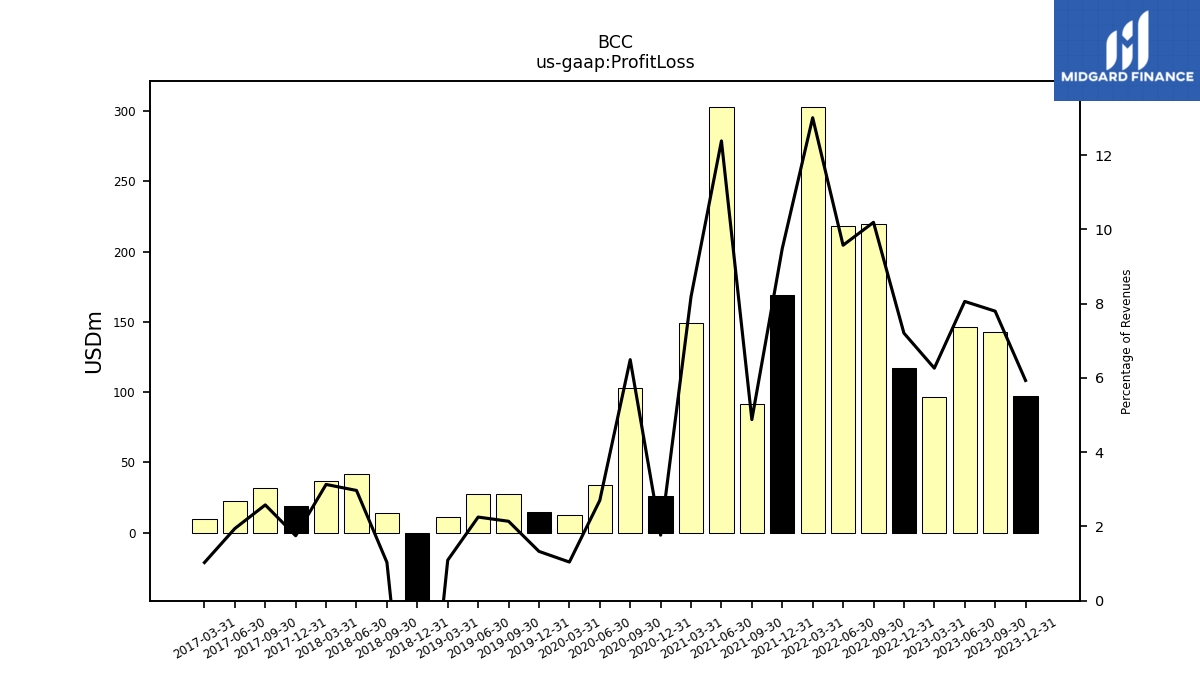
| Profit Loss | 97.53 | 143.07 | 146.32 | 96.73 | 117.36 | 219.59 | 218.11 | 302.60 | 169.07 | 91.70 | 302.56 | 149.16 | 26.00 | 103.19 | 33.59 | 12.20 | 14.65 | 27.17 | 27.72 | 11.39 | -72.25 | 13.85 | 41.83 | 37.05 | 19.12 | 31.66 | 22.15 | 10.02 | NA | NA | NA | NA | NA | NA | NA | NA | NA | NA | NA | NA | NA | NA | NA | NA | NA | NA | NA | NA | |
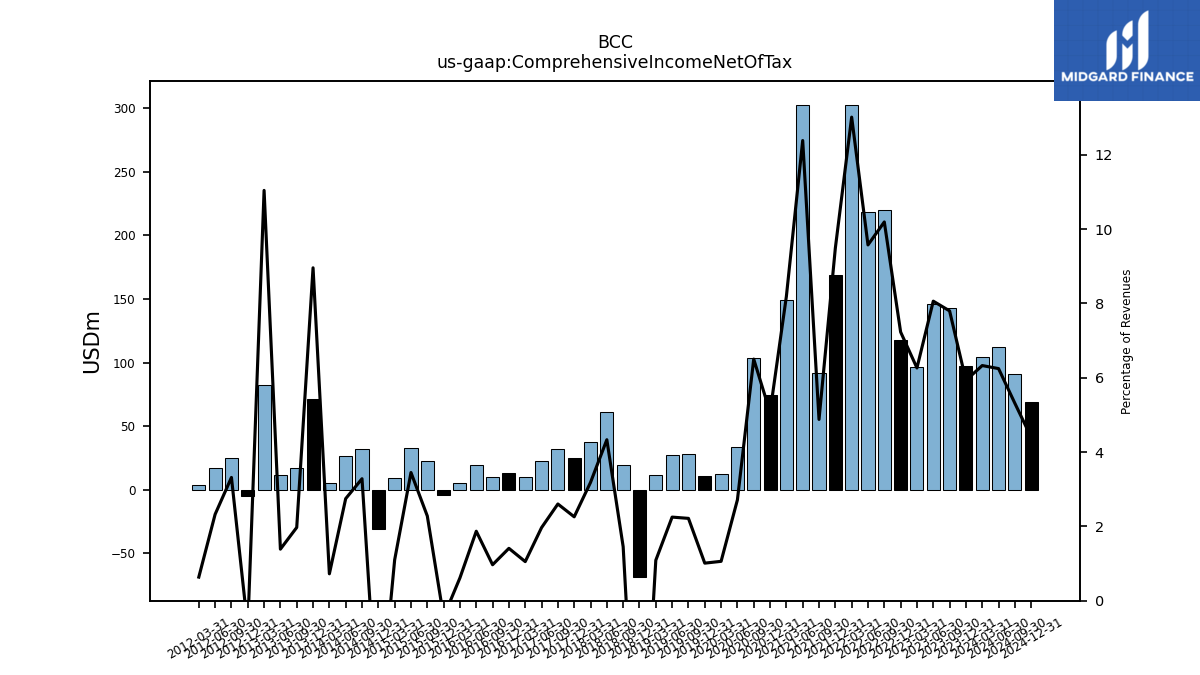
| Comprehensive Income Net Of Tax | 97.52 | 143.07 | 146.33 | 96.74 | 117.74 | 219.60 | 218.13 | 302.71 | 169.12 | 91.70 | 302.55 | 149.15 | 74.66 | 103.34 | 33.74 | 12.41 | 11.15 | 28.14 | 27.68 | 11.36 | -68.61 | 19.47 | 61.01 | 37.66 | 24.67 | 31.93 | 22.41 | 10.26 | 12.97 | 10.34 | 19.52 | 5.43 | -3.82 | 22.61 | 32.96 | 8.91 | -30.50 | 32.28 | 26.41 | 5.56 | 71.52 | 17.32 | 11.84 | 82.25 | -5.04 | 25.37 | 17.05 | 3.73 | |
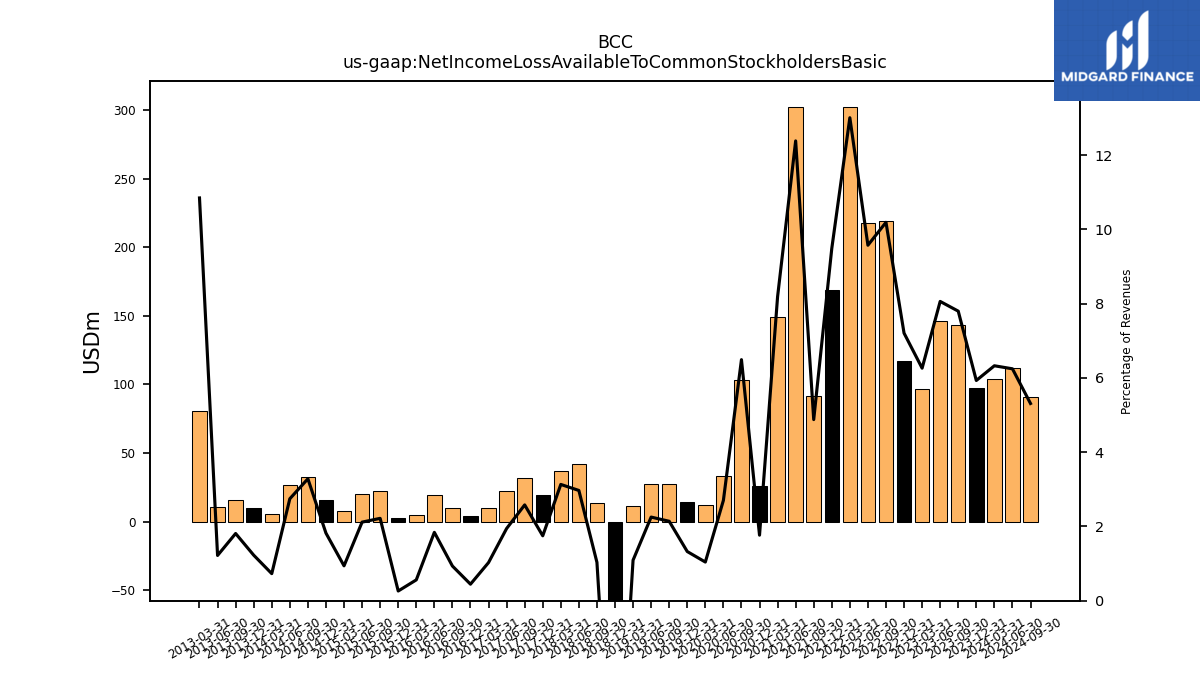
| Net Income Loss Available To Common Stockholders Basic | 97.53 | 143.07 | 146.32 | 96.73 | 117.36 | 219.59 | 218.11 | 302.60 | 169.07 | 91.70 | 302.56 | 149.16 | 26.00 | 103.19 | 33.59 | 12.20 | 14.60 | 27.17 | 27.72 | 11.39 | -72.20 | 13.85 | 41.83 | 37.05 | 19.10 | 31.66 | 22.15 | 10.02 | 4.10 | 9.98 | 19.23 | 4.95 | 2.30 | 22.01 | 20.23 | 7.62 | 15.70 | 32.30 | 26.40 | 5.60 | 9.80 | 15.90 | 10.40 | 80.80 | NA | NA | NA | NA |
| 2023-12-31 | 2023-09-30 | 2023-06-30 | 2023-03-31 | 2022-12-31 | 2022-09-30 | 2022-06-30 | 2022-03-31 | 2021-12-31 | 2021-09-30 | 2021-06-30 | 2021-03-31 | 2020-12-31 | 2020-09-30 | 2020-06-30 | 2020-03-31 | 2019-12-31 | 2019-09-30 | 2019-06-30 | 2019-03-31 | 2018-12-31 | 2018-09-30 | 2018-06-30 | 2018-03-31 | 2017-12-31 | 2017-09-30 | 2017-06-30 | 2017-03-31 | 2016-12-31 | 2016-09-30 | 2016-06-30 | 2016-03-31 | 2015-12-31 | 2015-09-30 | 2015-06-30 | 2015-03-31 | 2014-12-31 | 2014-09-30 | 2014-06-30 | 2014-03-31 | 2013-12-31 | 2013-09-30 | 2013-06-30 | 2013-03-31 | 2012-12-31 | 2012-09-30 | 2012-06-30 | 2012-03-31 | ||
|---|---|---|---|---|---|---|---|---|---|---|---|---|---|---|---|---|---|---|---|---|---|---|---|---|---|---|---|---|---|---|---|---|---|---|---|---|---|---|---|---|---|---|---|---|---|---|---|---|---|
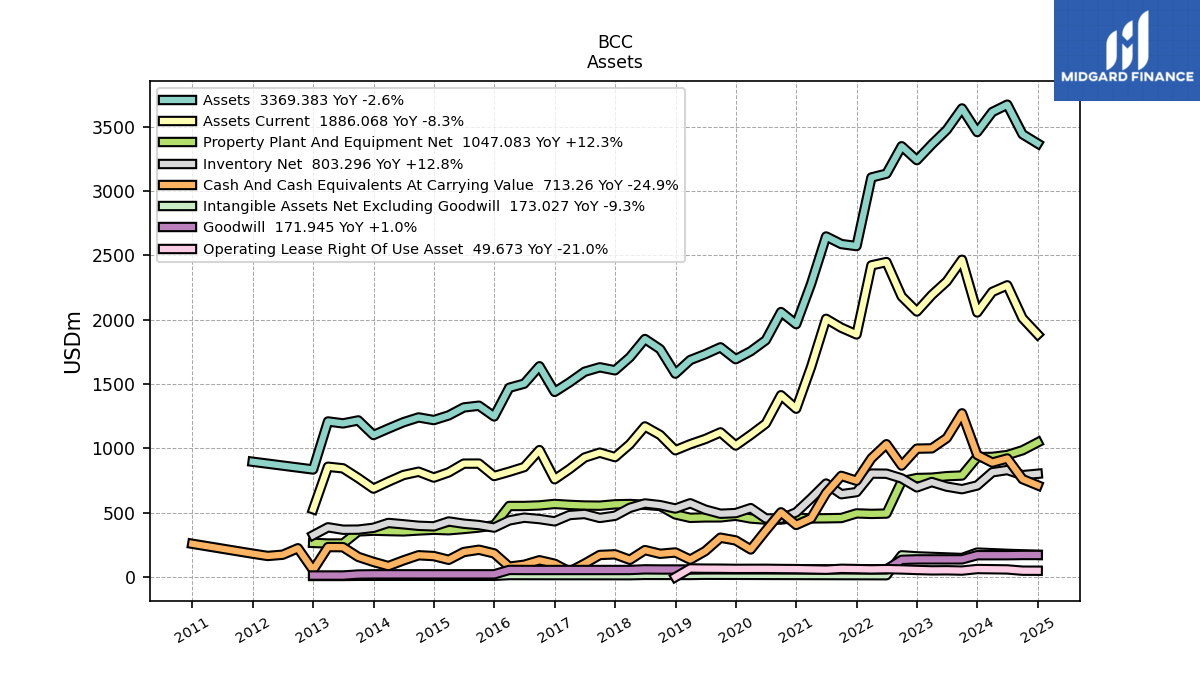
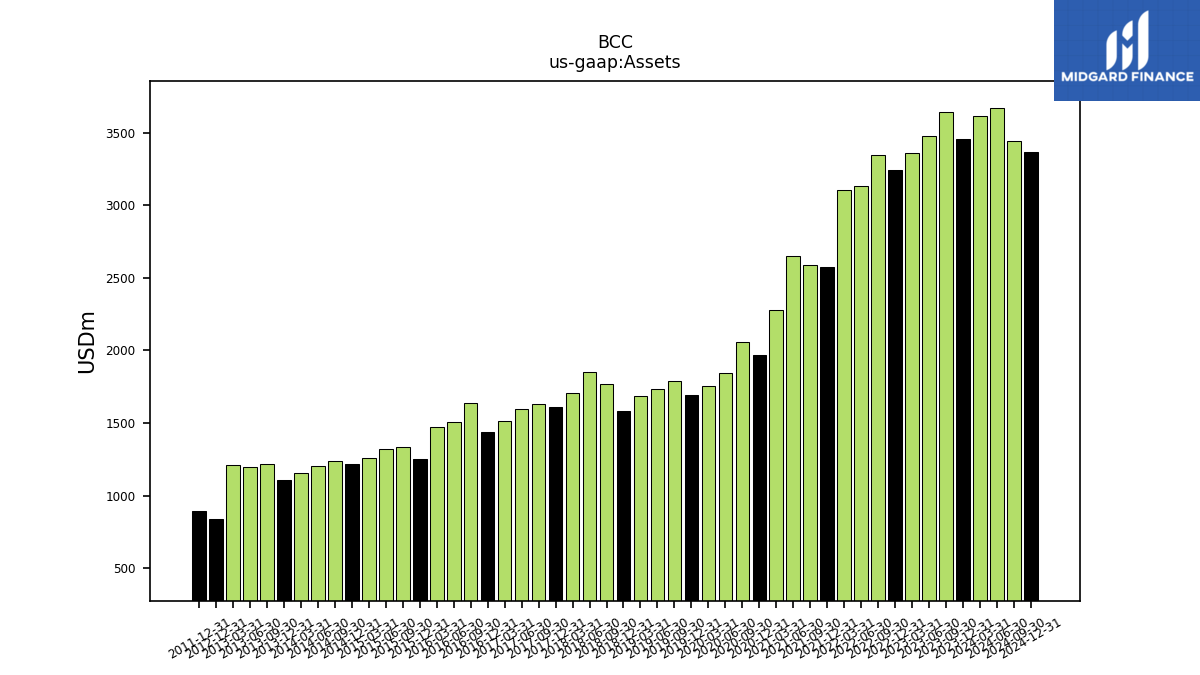
| Assets | 3458.65 | 3642.43 | 3476.39 | 3362.19 | 3240.51 | 3348.53 | 3135.17 | 3105.93 | 2572.64 | 2588.36 | 2647.44 | 2278.74 | 1965.72 | 2059.84 | 1841.08 | 1755.37 | 1693.35 | 1785.92 | 1732.81 | 1687.05 | 1581.25 | 1771.63 | 1850.45 | 1708.85 | 1607.19 | 1630.55 | 1596.09 | 1513.37 | 1439.20 | 1638.81 | 1503.49 | 1471.37 | 1248.61 | 1332.17 | 1318.44 | 1256.79 | 1220.48 | 1241.10 | 1203.57 | 1154.51 | 1104.19 | 1217.96 | 1194.62 | 1209.80 | 836.40 | NA | NA | NA | |
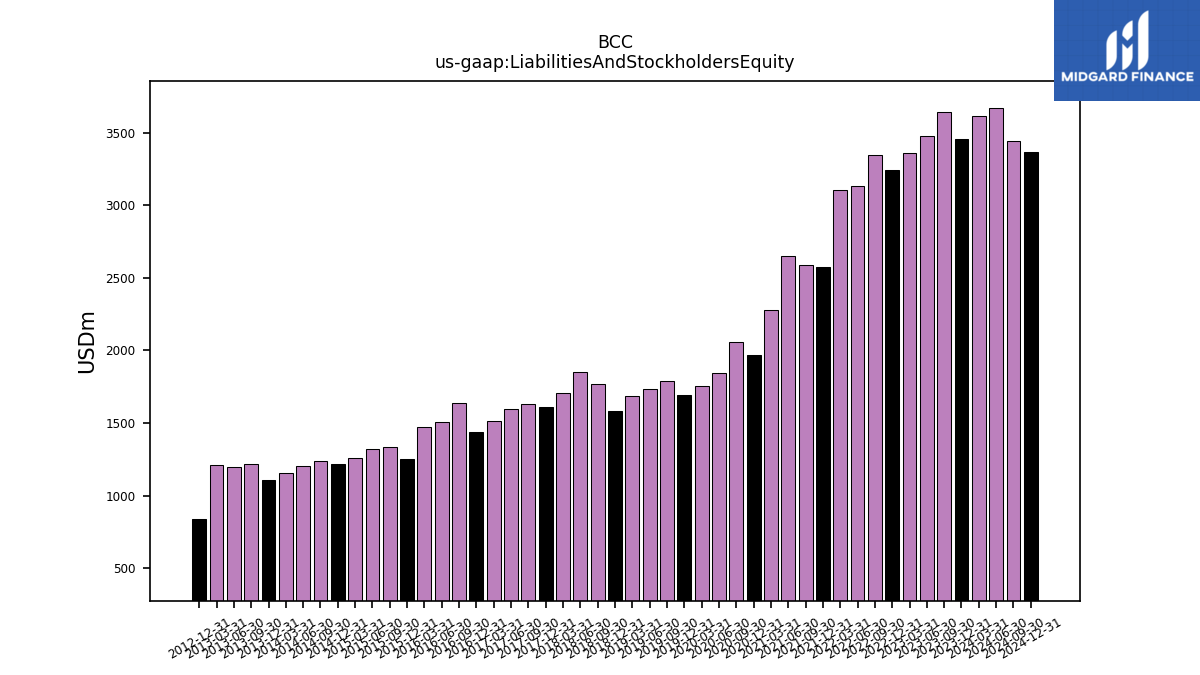
| Liabilities And Stockholders Equity | 3458.65 | 3642.43 | 3476.39 | 3362.19 | 3240.51 | 3348.53 | 3135.17 | 3105.93 | 2572.64 | 2588.36 | 2647.44 | 2278.74 | 1965.72 | 2059.84 | 1841.08 | 1755.37 | 1693.35 | 1785.92 | 1732.81 | 1687.05 | 1581.25 | 1771.63 | 1850.45 | 1708.85 | 1607.19 | 1630.55 | 1596.09 | 1513.37 | 1439.20 | 1638.81 | 1503.49 | 1471.37 | 1248.61 | 1332.17 | 1318.44 | 1256.79 | 1220.48 | 1241.10 | 1203.57 | 1154.51 | 1104.19 | 1217.96 | 1194.62 | 1209.80 | 836.40 | NA | NA | NA | |
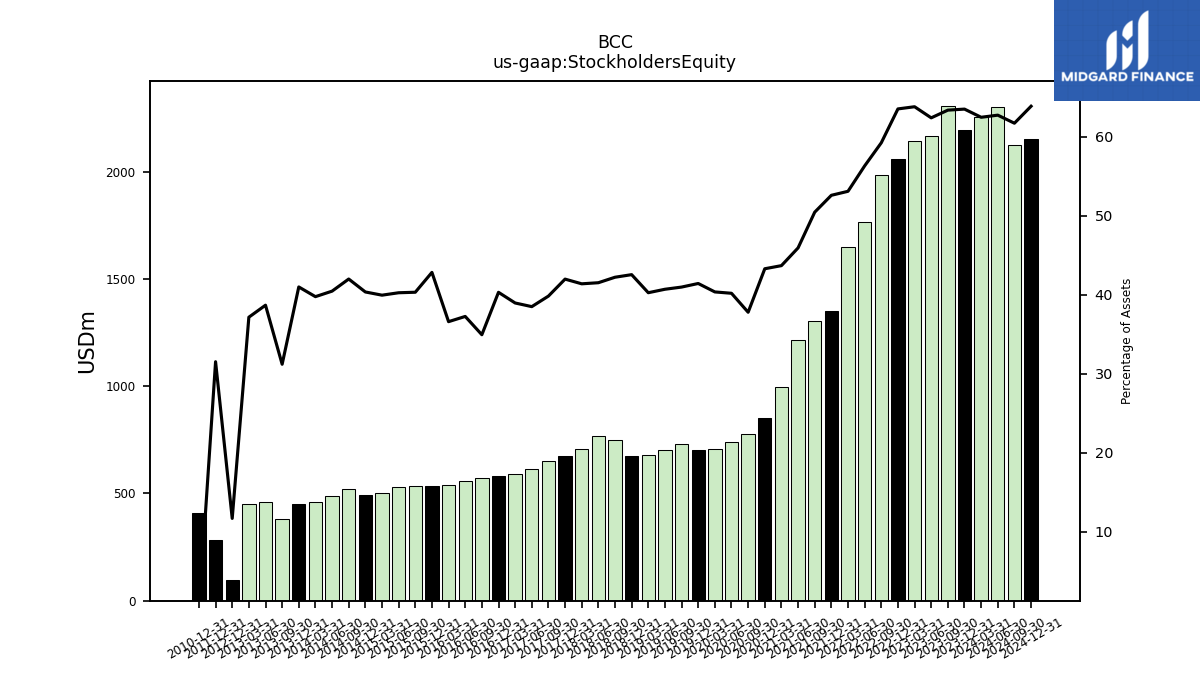
| Stockholders Equity | 2195.66 | 2307.59 | 2168.52 | 2144.52 | 2057.97 | 1983.07 | 1764.98 | 1648.69 | 1352.62 | 1305.61 | 1215.71 | 995.26 | 850.80 | 778.14 | 739.71 | 708.27 | 701.33 | 731.57 | 705.02 | 679.02 | 672.59 | 747.76 | 768.19 | 707.05 | 674.55 | 649.31 | 614.30 | 589.45 | 580.00 | 572.47 | 560.02 | 538.32 | 534.67 | 536.98 | 530.60 | 501.94 | 492.39 | 521.02 | 486.81 | 458.92 | 452.48 | 379.96 | 461.96 | 449.43 | 97.76 | NA | NA | NA |
| 2023-12-31 | 2023-09-30 | 2023-06-30 | 2023-03-31 | 2022-12-31 | 2022-09-30 | 2022-06-30 | 2022-03-31 | 2021-12-31 | 2021-09-30 | 2021-06-30 | 2021-03-31 | 2020-12-31 | 2020-09-30 | 2020-06-30 | 2020-03-31 | 2019-12-31 | 2019-09-30 | 2019-06-30 | 2019-03-31 | 2018-12-31 | 2018-09-30 | 2018-06-30 | 2018-03-31 | 2017-12-31 | 2017-09-30 | 2017-06-30 | 2017-03-31 | 2016-12-31 | 2016-09-30 | 2016-06-30 | 2016-03-31 | 2015-12-31 | 2015-09-30 | 2015-06-30 | 2015-03-31 | 2014-12-31 | 2014-09-30 | 2014-06-30 | 2014-03-31 | 2013-12-31 | 2013-09-30 | 2013-06-30 | 2013-03-31 | 2012-12-31 | 2012-09-30 | 2012-06-30 | 2012-03-31 | ||
|---|---|---|---|---|---|---|---|---|---|---|---|---|---|---|---|---|---|---|---|---|---|---|---|---|---|---|---|---|---|---|---|---|---|---|---|---|---|---|---|---|---|---|---|---|---|---|---|---|---|
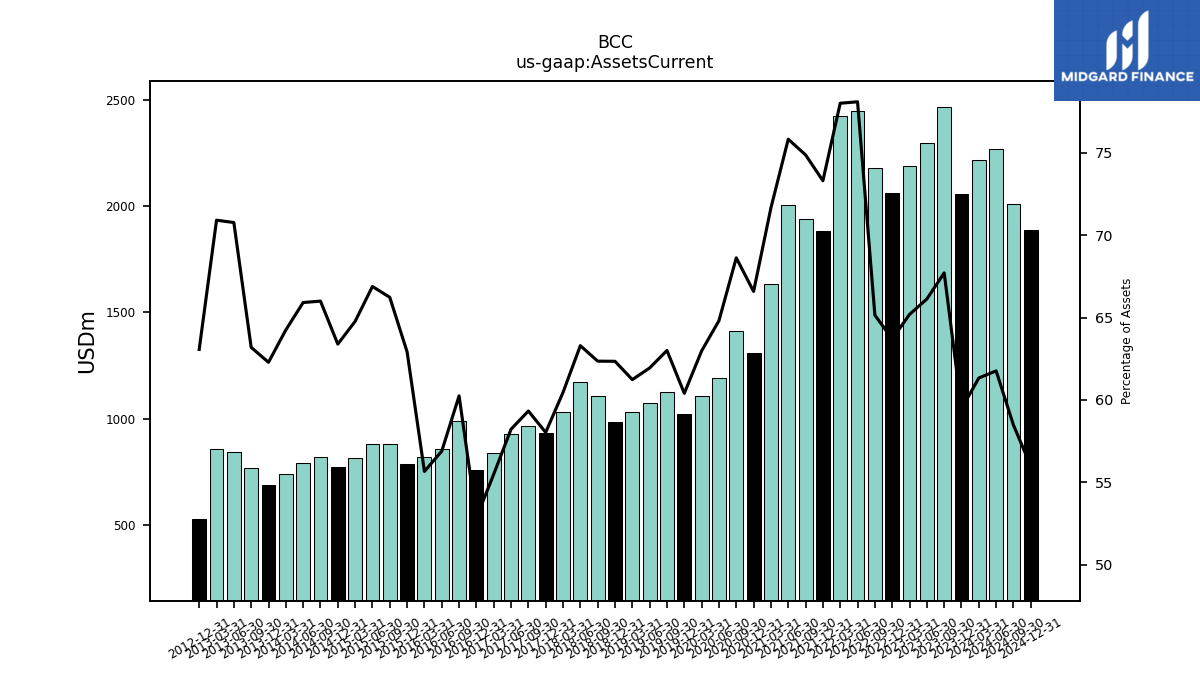
| Assets Current | 2056.81 | 2466.24 | 2298.64 | 2191.72 | 2064.05 | 2181.44 | 2448.46 | 2422.91 | 1885.88 | 1937.99 | 2007.43 | 1632.86 | 1308.86 | 1413.52 | 1193.14 | 1105.39 | 1022.76 | 1125.13 | 1073.27 | 1032.97 | 985.78 | 1104.64 | 1171.19 | 1033.06 | 932.57 | 967.30 | 929.26 | 839.75 | 760.46 | 987.26 | 855.31 | 818.89 | 785.57 | 882.24 | 881.85 | 813.97 | 773.62 | 819.08 | 793.27 | 741.72 | 687.71 | 769.57 | 845.38 | 857.86 | 527.46 | NA | NA | NA | |
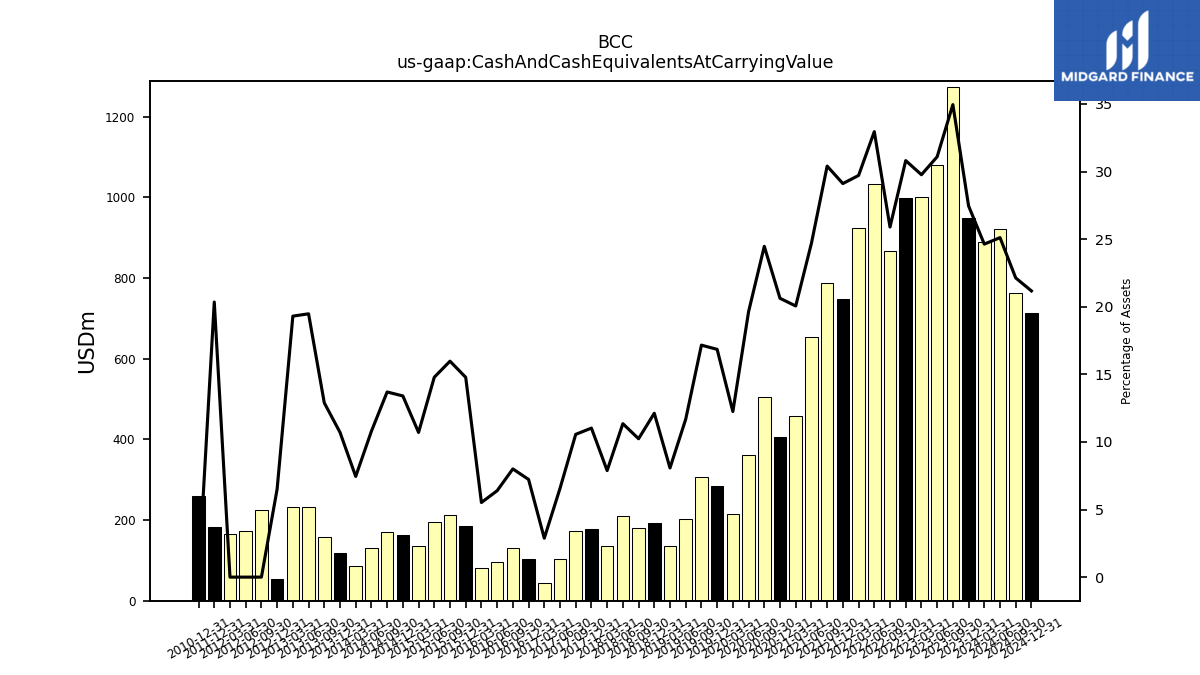
| Cash And Cash Equivalents At Carrying Value | 949.57 | 1272.96 | 1080.86 | 1000.72 | 998.34 | 867.06 | 1032.99 | 922.72 | 748.91 | 786.89 | 653.77 | 456.98 | 405.38 | 503.94 | 361.44 | 214.99 | 285.24 | 306.44 | 202.41 | 136.20 | 191.67 | 181.34 | 210.01 | 134.68 | 177.14 | 172.19 | 104.71 | 43.57 | 103.98 | 131.18 | 96.09 | 81.19 | 184.50 | 212.78 | 194.93 | 134.52 | 163.55 | 169.97 | 129.92 | 85.98 | 118.25 | 157.02 | 232.67 | 233.55 | 54.51 | 224.42 | 174.07 | 164.44 | |
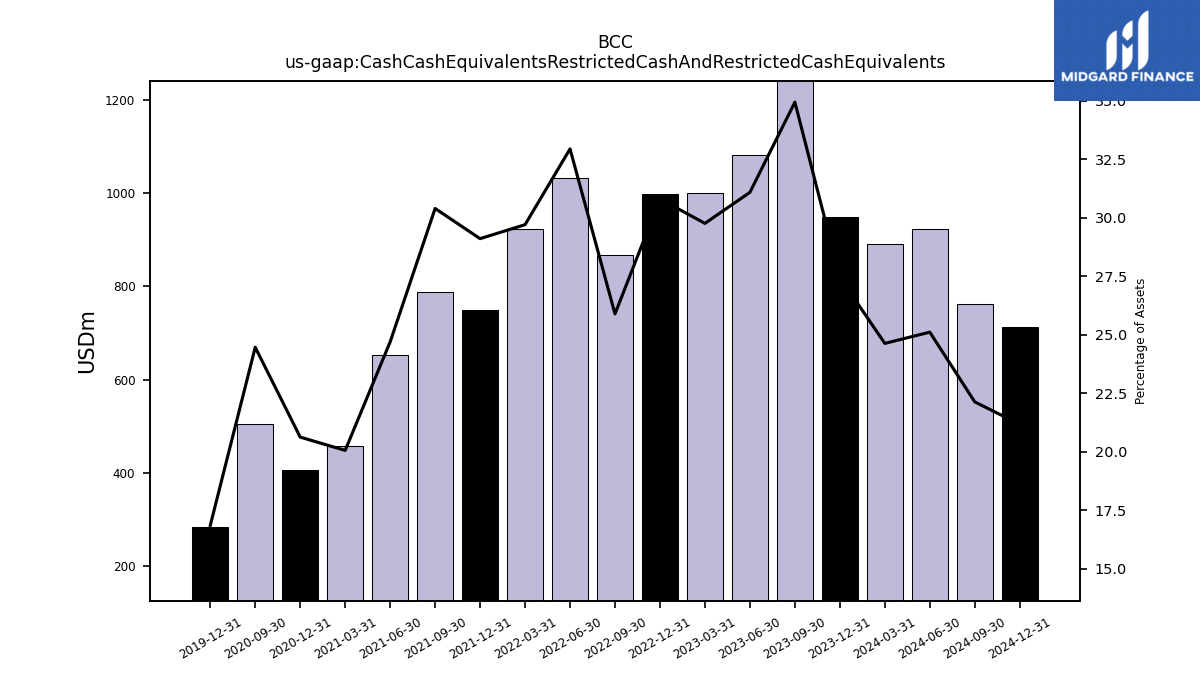
| Cash Cash Equivalents Restricted Cash And Restricted Cash Equivalents | 949.57 | 1272.96 | 1080.86 | 1000.72 | 998.34 | 867.06 | 1032.99 | 922.72 | 748.91 | 786.89 | 653.77 | 456.98 | 405.38 | 503.94 | NA | NA | 285.24 | NA | NA | NA | NA | NA | NA | NA | NA | NA | NA | NA | NA | NA | NA | NA | NA | NA | NA | NA | NA | NA | NA | NA | NA | NA | NA | NA | NA | NA | NA | NA | |
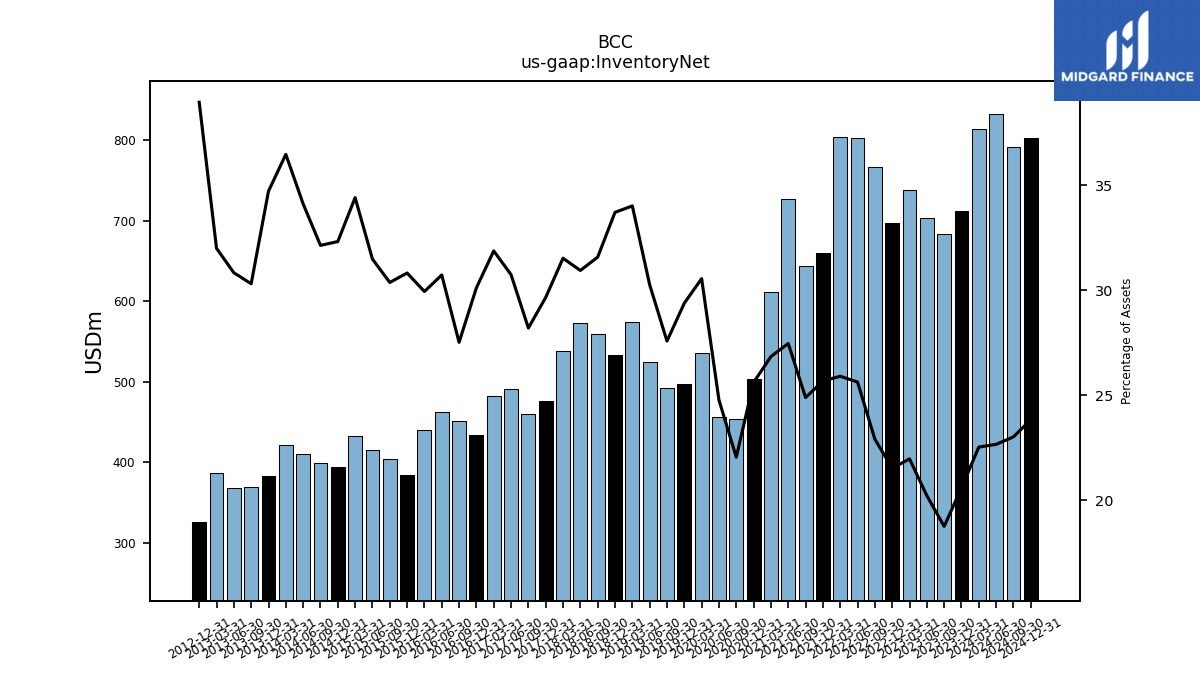
| Inventory Net | 712.37 | 683.41 | 703.03 | 738.80 | 697.55 | 767.19 | 803.61 | 804.67 | 660.67 | 644.37 | 727.21 | 611.70 | 503.48 | 454.33 | 456.13 | 536.31 | 497.60 | 492.59 | 524.45 | 573.86 | 533.05 | 559.44 | 572.61 | 538.72 | 476.67 | 459.86 | 490.71 | 482.37 | 433.45 | 451.06 | 462.00 | 440.56 | 384.86 | 404.62 | 415.11 | 432.47 | 394.46 | 398.87 | 410.56 | 421.06 | 383.36 | 369.18 | 368.35 | 387.10 | 325.81 | NA | NA | NA | |
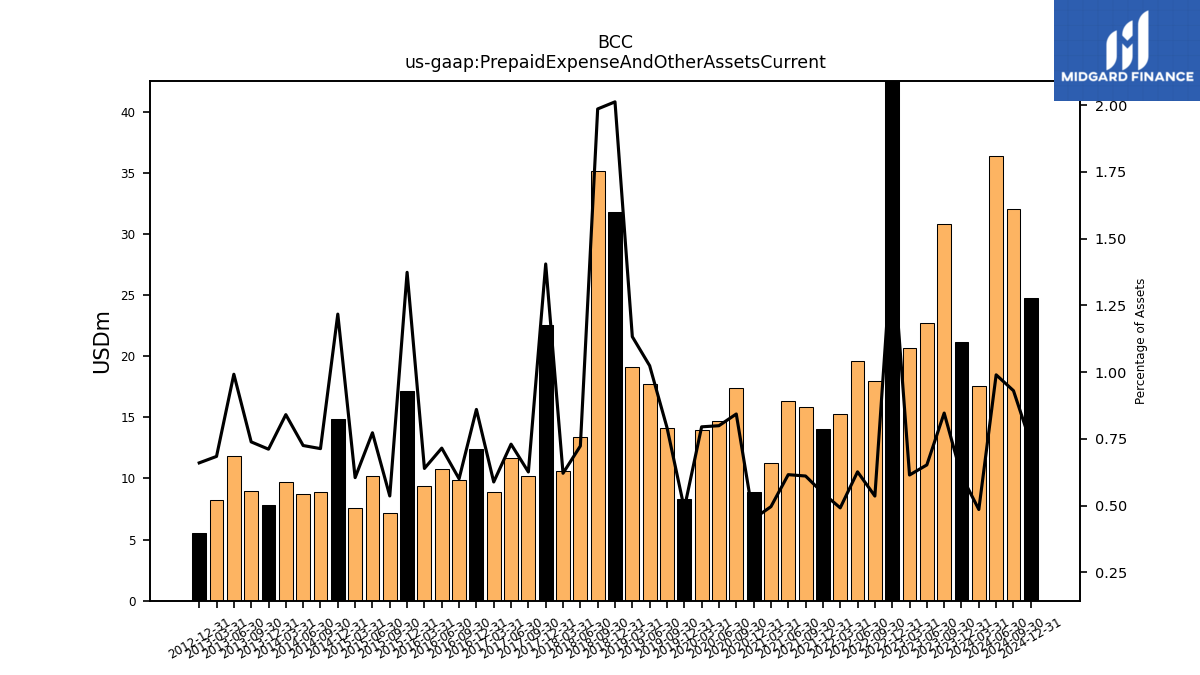
| Prepaid Expense And Other Assets Current | 21.17 | 30.84 | 22.68 | 20.67 | 47.88 | 17.94 | 19.64 | 15.27 | 14.07 | 15.81 | 16.31 | 11.30 | 8.86 | 17.37 | 14.72 | 13.96 | 8.29 | 14.16 | 17.75 | 19.11 | 31.82 | 35.18 | 13.38 | 10.62 | 22.58 | 10.21 | 11.65 | 8.91 | 12.38 | 9.84 | 10.76 | 9.41 | 17.15 | 7.14 | 10.19 | 7.60 | 14.86 | 8.86 | 8.73 | 9.71 | 7.86 | 9.00 | 11.85 | 8.28 | 5.52 | NA | NA | NA |
| 2023-12-31 | 2023-09-30 | 2023-06-30 | 2023-03-31 | 2022-12-31 | 2022-09-30 | 2022-06-30 | 2022-03-31 | 2021-12-31 | 2021-09-30 | 2021-06-30 | 2021-03-31 | 2020-12-31 | 2020-09-30 | 2020-06-30 | 2020-03-31 | 2019-12-31 | 2019-09-30 | 2019-06-30 | 2019-03-31 | 2018-12-31 | 2018-09-30 | 2018-06-30 | 2018-03-31 | 2017-12-31 | 2017-09-30 | 2017-06-30 | 2017-03-31 | 2016-12-31 | 2016-09-30 | 2016-06-30 | 2016-03-31 | 2015-12-31 | 2015-09-30 | 2015-06-30 | 2015-03-31 | 2014-12-31 | 2014-09-30 | 2014-06-30 | 2014-03-31 | 2013-12-31 | 2013-09-30 | 2013-06-30 | 2013-03-31 | 2012-12-31 | 2012-09-30 | 2012-06-30 | 2012-03-31 | ||
|---|---|---|---|---|---|---|---|---|---|---|---|---|---|---|---|---|---|---|---|---|---|---|---|---|---|---|---|---|---|---|---|---|---|---|---|---|---|---|---|---|---|---|---|---|---|---|---|---|---|
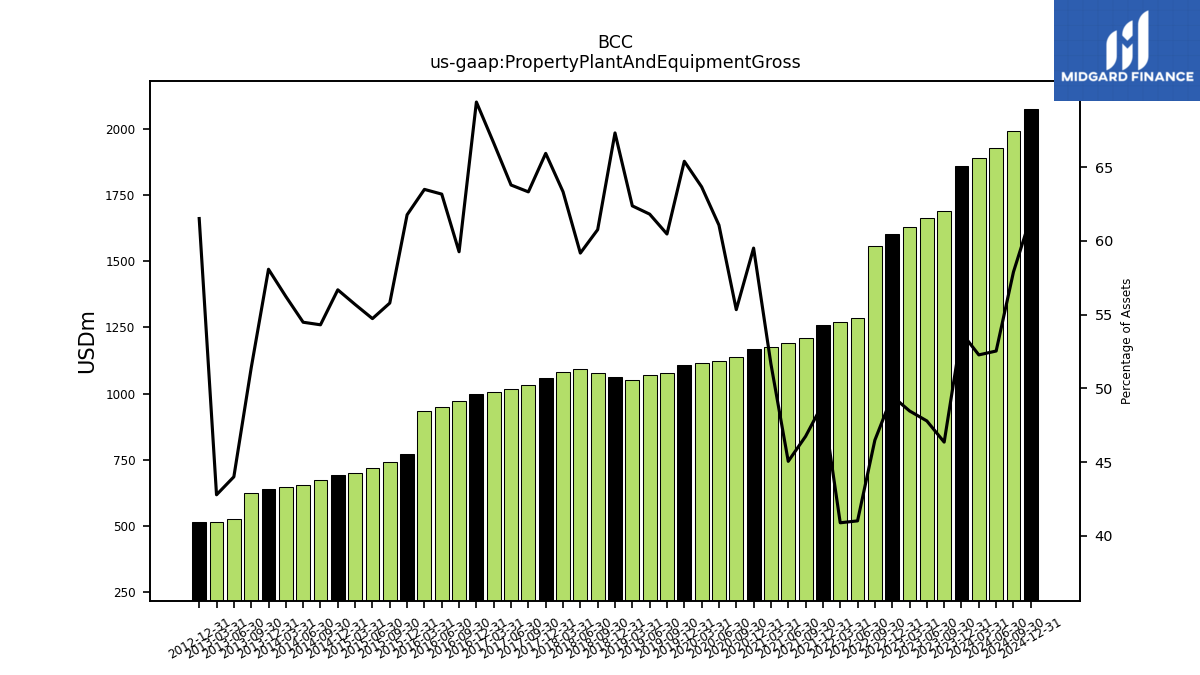
| Property Plant And Equipment Gross | 1859.65 | 1688.19 | 1661.22 | 1629.42 | 1603.03 | 1556.50 | 1285.71 | 1269.70 | 1259.40 | 1209.75 | 1192.59 | 1176.95 | 1169.64 | 1139.69 | 1124.16 | 1117.38 | 1107.26 | 1079.71 | 1070.96 | 1052.11 | 1064.34 | 1076.34 | 1094.79 | 1082.13 | 1059.53 | 1032.37 | 1017.97 | 1008.29 | 998.87 | 971.05 | 949.63 | 934.07 | 771.15 | 743.03 | 721.48 | 699.78 | 691.69 | 673.94 | 655.66 | 649.10 | 641.17 | 625.68 | 525.59 | 517.51 | 514.43 | NA | NA | NA | |
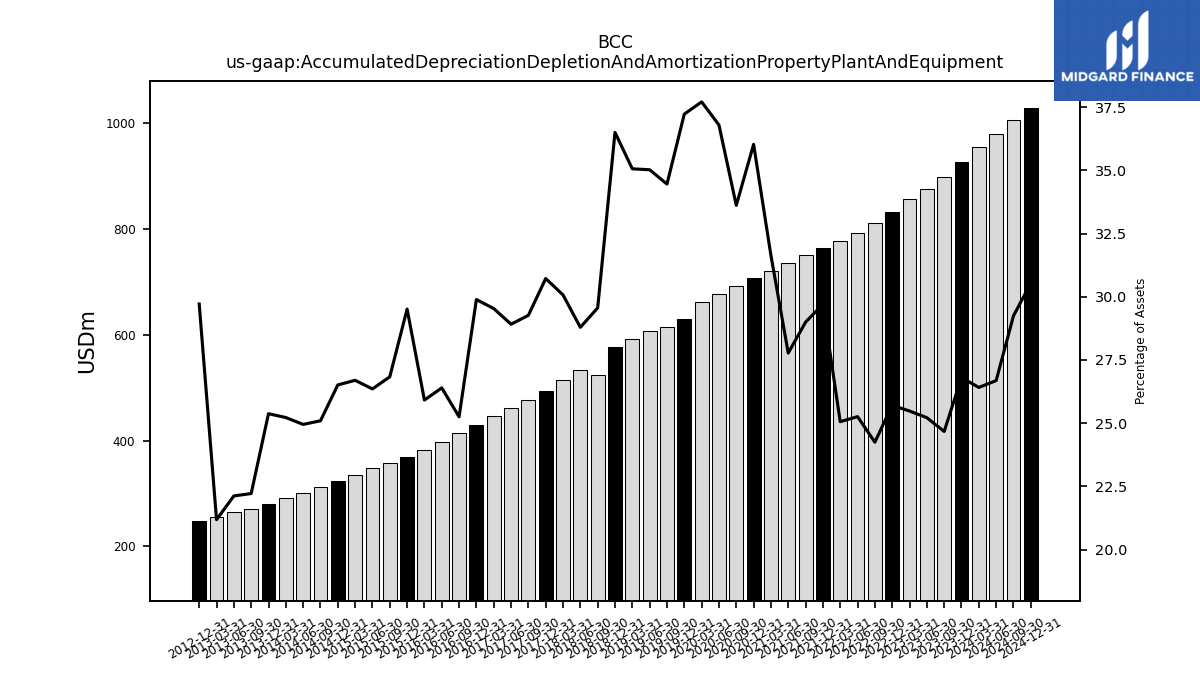
| Accumulated Depreciation Depletion And Amortization Property Plant And Equipment | 927.01 | 898.65 | 876.65 | 856.68 | 833.01 | 811.95 | 791.89 | 778.31 | 764.16 | 750.50 | 735.30 | 720.88 | 708.18 | 692.36 | 677.38 | 661.87 | 630.31 | 615.34 | 606.87 | 591.46 | 577.12 | 523.67 | 532.76 | 513.87 | 493.74 | 477.17 | 461.48 | 446.94 | 430.16 | 413.84 | 396.86 | 381.28 | 368.48 | 357.46 | 347.46 | 335.50 | 323.56 | 311.44 | 300.30 | 291.20 | 280.19 | 270.59 | 264.28 | 256.29 | 248.51 | NA | NA | NA | |
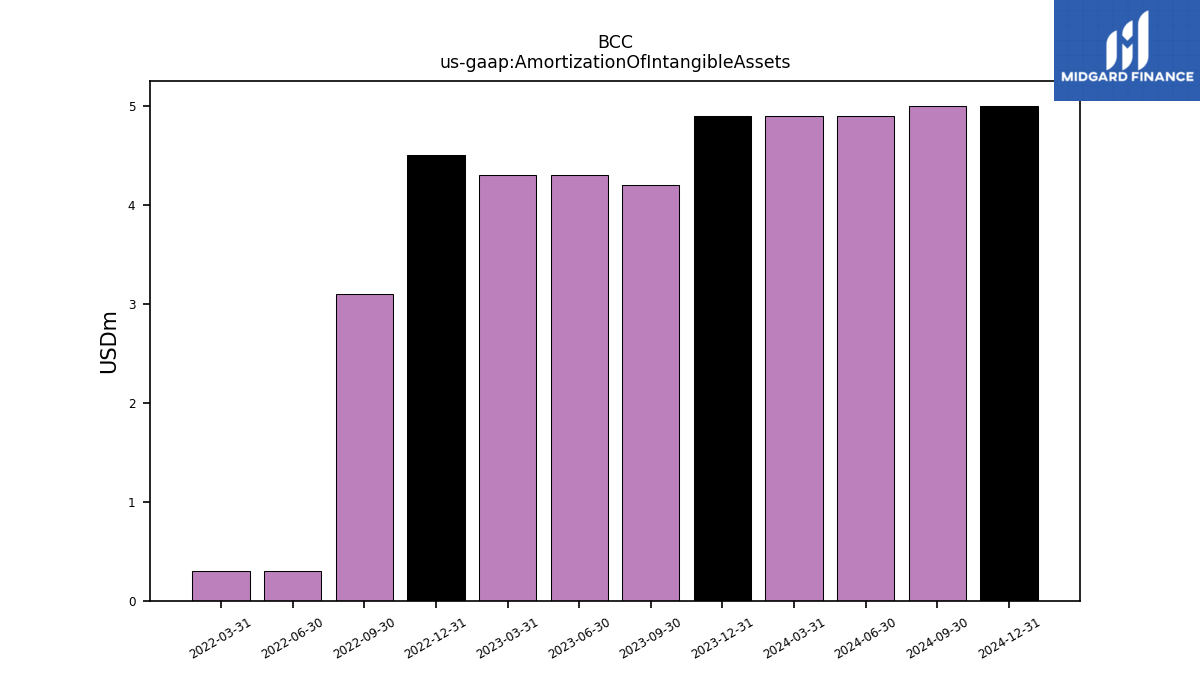
| Amortization Of Intangible Assets | 4.90 | 4.20 | 4.30 | 4.30 | 4.50 | 3.10 | 0.30 | 0.30 | NA | NA | NA | NA | NA | NA | NA | NA | NA | NA | NA | NA | NA | NA | NA | NA | NA | NA | NA | NA | NA | NA | NA | NA | NA | NA | NA | NA | NA | NA | NA | NA | NA | NA | NA | NA | NA | NA | NA | NA | |
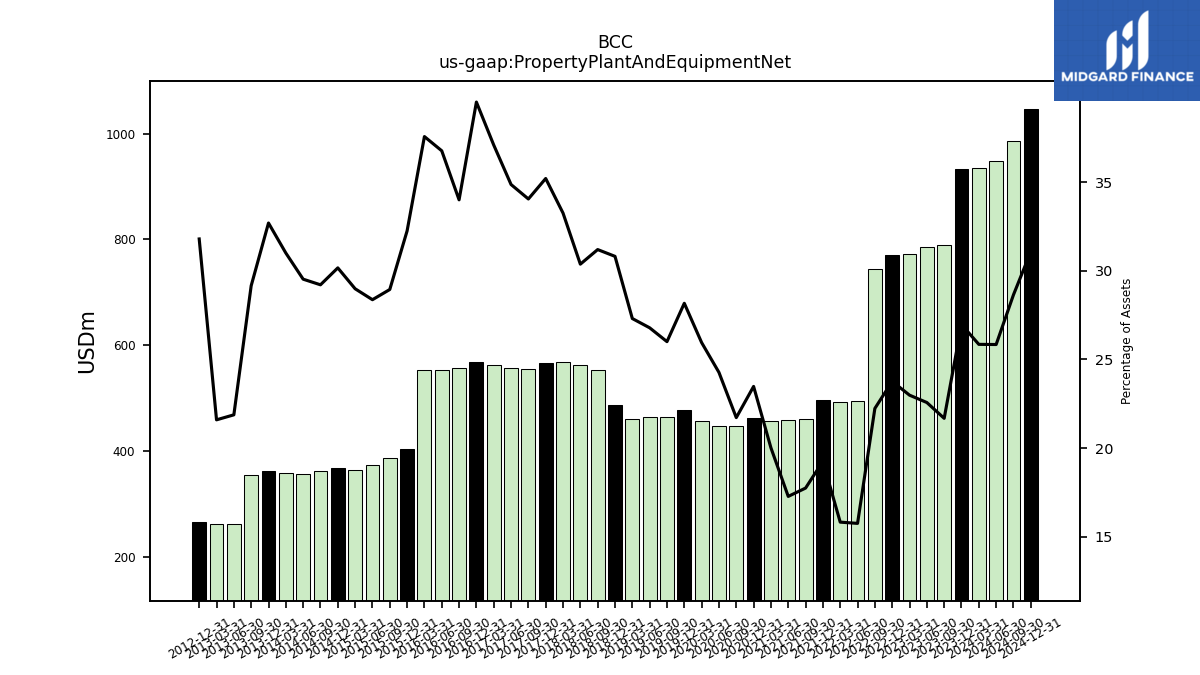
| Property Plant And Equipment Net | 932.63 | 789.54 | 784.56 | 772.73 | 770.02 | 744.55 | 493.82 | 491.39 | 495.24 | 459.25 | 457.29 | 456.07 | 461.46 | 447.33 | 446.77 | 455.51 | 476.95 | 464.37 | 464.10 | 460.65 | 487.22 | 552.67 | 562.02 | 568.25 | 565.79 | 555.20 | 556.48 | 561.35 | 568.70 | 557.21 | 552.78 | 552.78 | 402.67 | 385.57 | 374.01 | 364.28 | 368.13 | 362.50 | 355.36 | 357.91 | 360.99 | 355.09 | 261.31 | 261.22 | 265.92 | NA | NA | NA | |
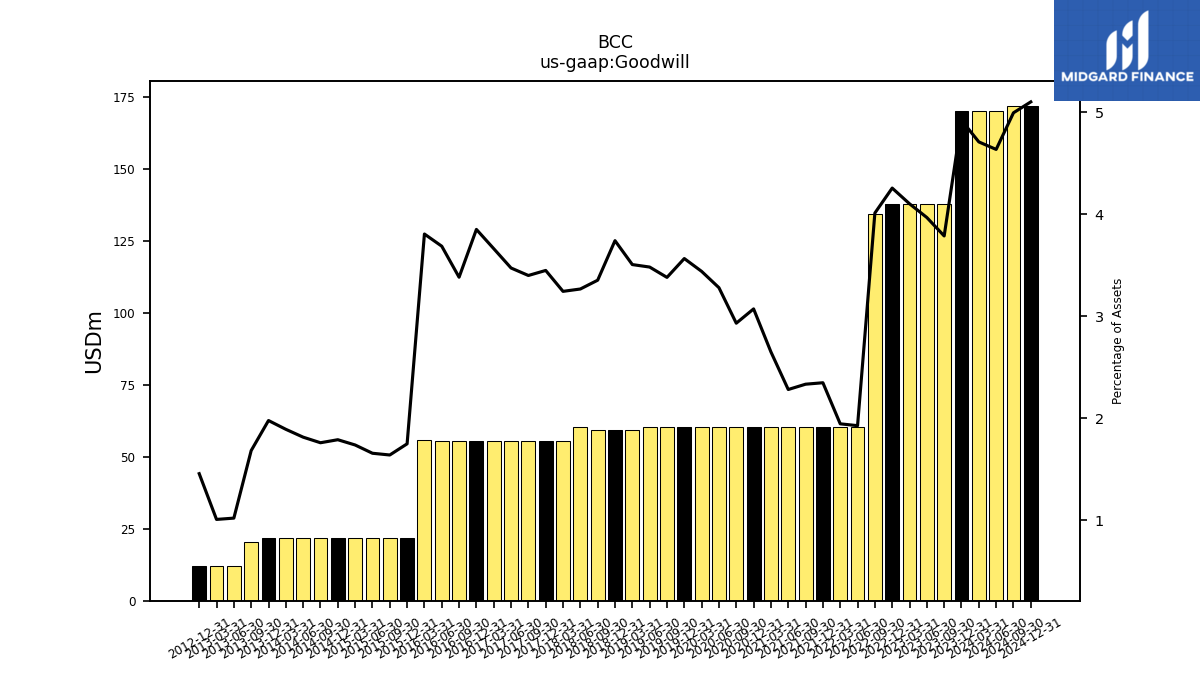
| Goodwill | 170.25 | 137.96 | 137.96 | 137.96 | 137.96 | 134.36 | 60.38 | 60.38 | 60.38 | 60.38 | 60.38 | 60.38 | 60.38 | 60.38 | 60.38 | 60.38 | 60.38 | 60.38 | 60.34 | 59.16 | 59.16 | 59.41 | 60.45 | 55.43 | 55.43 | 55.43 | 55.43 | 55.43 | 55.43 | 55.43 | 55.43 | 56.01 | 21.82 | 21.82 | 21.82 | 21.82 | 21.82 | 21.82 | 21.82 | 21.82 | 21.82 | 20.48 | 12.17 | 12.17 | 12.17 | NA | NA | NA | |
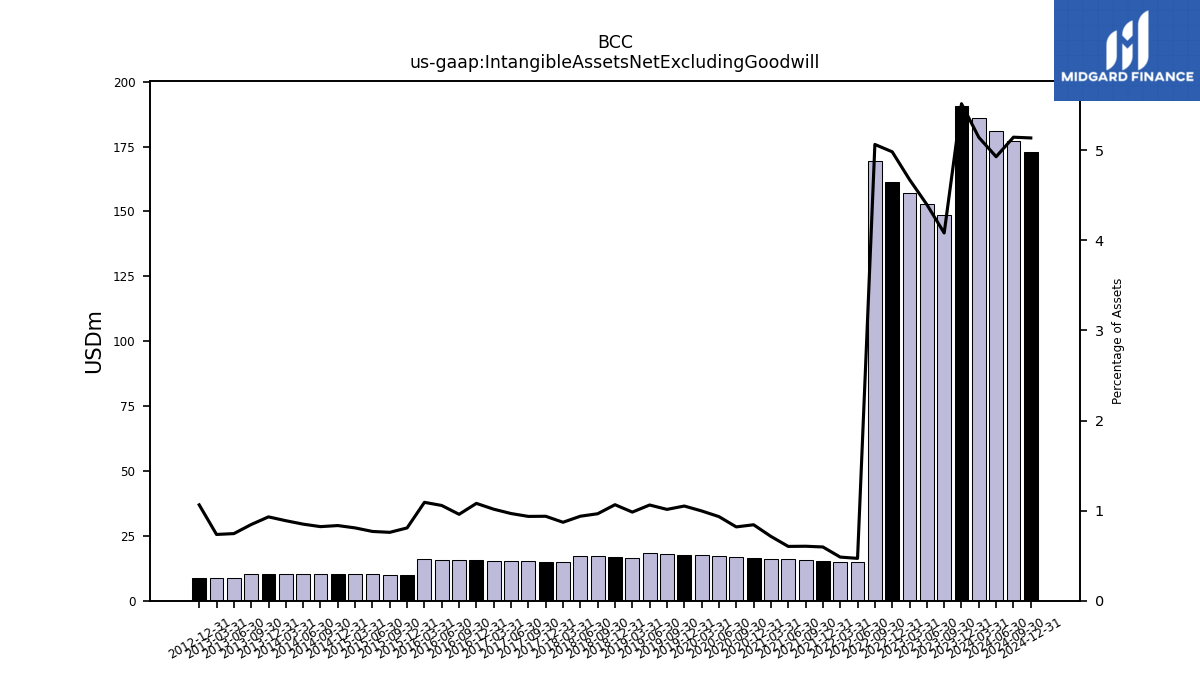
| Intangible Assets Net Excluding Goodwill | 190.74 | 148.65 | 152.83 | 157.13 | 161.43 | 169.54 | 14.74 | 15.04 | 15.35 | 15.66 | 15.96 | 16.27 | 16.57 | 16.88 | 17.19 | 17.49 | 17.80 | 18.10 | 18.41 | 16.60 | 16.85 | 17.10 | 17.36 | 14.88 | 15.07 | 15.26 | 15.45 | 15.37 | 15.55 | 15.72 | 15.89 | 16.07 | 10.09 | 10.11 | 10.14 | 10.16 | 10.18 | 10.21 | 10.23 | 10.25 | 10.28 | 10.30 | 8.90 | 8.90 | 8.90 | NA | NA | NA | |
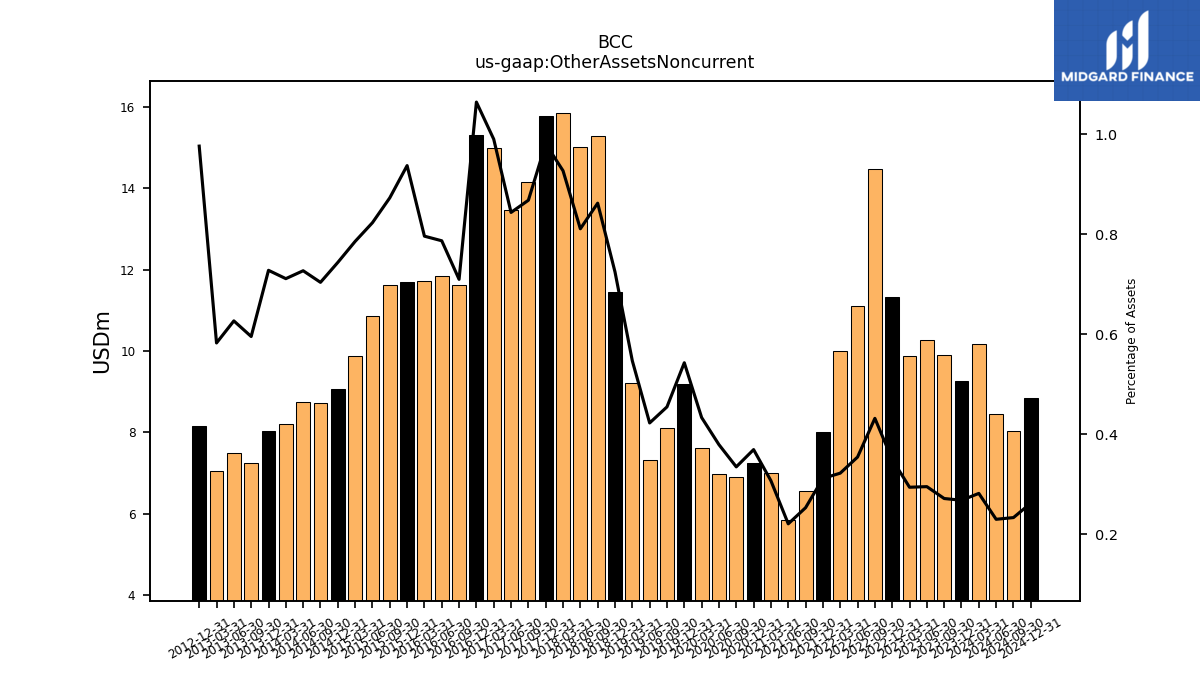
| Other Assets Noncurrent | 9.27 | 9.89 | 10.27 | 9.89 | 11.33 | 14.46 | 11.11 | 10.01 | 8.02 | 6.55 | 5.85 | 7.00 | 7.26 | 6.90 | 6.98 | 7.61 | 9.19 | 8.12 | 7.32 | 9.22 | 11.46 | 15.27 | 15.00 | 15.84 | 15.76 | 14.15 | 13.46 | 14.98 | 15.31 | 11.63 | 11.83 | 11.71 | 11.70 | 11.63 | 10.85 | 9.87 | 9.07 | 8.73 | 8.75 | 8.21 | 8.04 | 7.25 | 7.49 | 7.05 | 8.16 | NA | NA | NA |
| 2023-12-31 | 2023-09-30 | 2023-06-30 | 2023-03-31 | 2022-12-31 | 2022-09-30 | 2022-06-30 | 2022-03-31 | 2021-12-31 | 2021-09-30 | 2021-06-30 | 2021-03-31 | 2020-12-31 | 2020-09-30 | 2020-06-30 | 2020-03-31 | 2019-12-31 | 2019-09-30 | 2019-06-30 | 2019-03-31 | 2018-12-31 | 2018-09-30 | 2018-06-30 | 2018-03-31 | 2017-12-31 | 2017-09-30 | 2017-06-30 | 2017-03-31 | 2016-12-31 | 2016-09-30 | 2016-06-30 | 2016-03-31 | 2015-12-31 | 2015-09-30 | 2015-06-30 | 2015-03-31 | 2014-12-31 | 2014-09-30 | 2014-06-30 | 2014-03-31 | 2013-12-31 | 2013-09-30 | 2013-06-30 | 2013-03-31 | 2012-12-31 | 2012-09-30 | 2012-06-30 | 2012-03-31 | ||
|---|---|---|---|---|---|---|---|---|---|---|---|---|---|---|---|---|---|---|---|---|---|---|---|---|---|---|---|---|---|---|---|---|---|---|---|---|---|---|---|---|---|---|---|---|---|---|---|---|---|
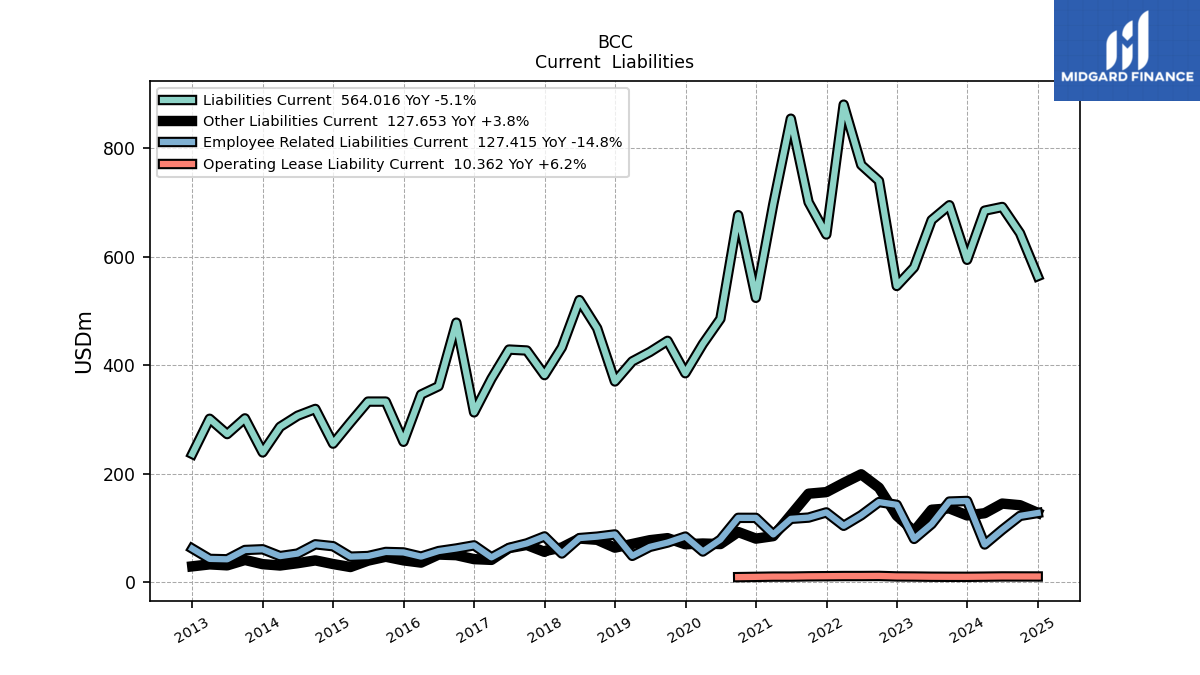
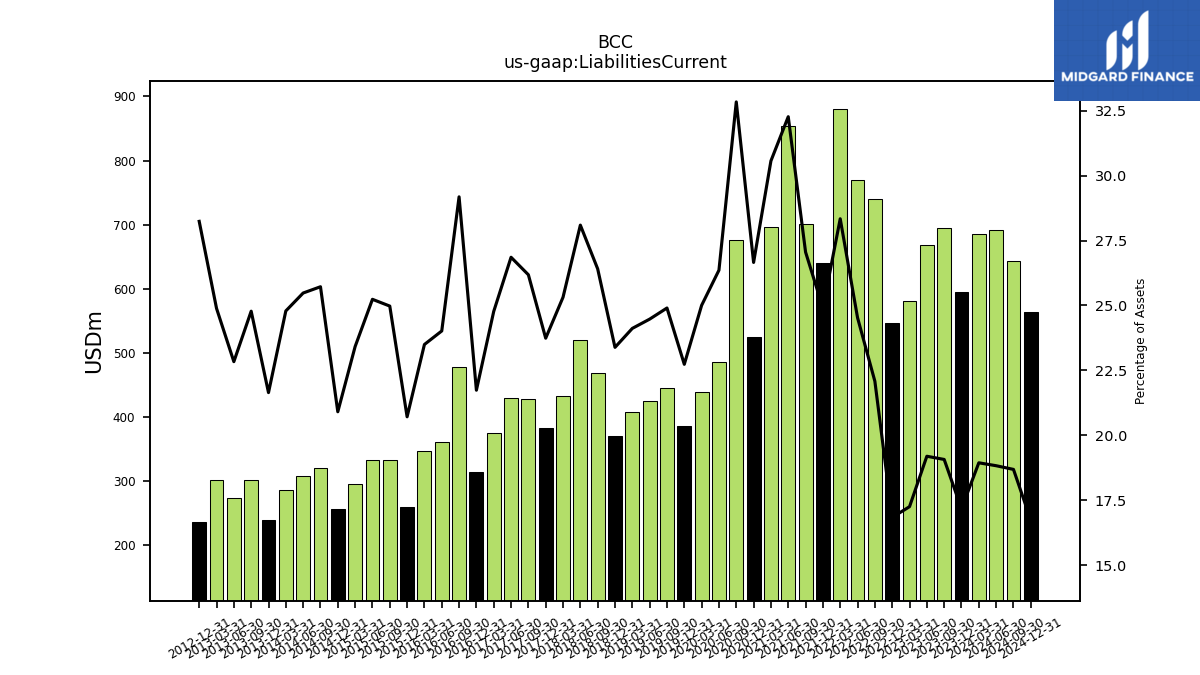
| Liabilities Current | 594.12 | 694.72 | 667.34 | 580.15 | 545.83 | 739.46 | 769.08 | 880.16 | 640.75 | 700.29 | 854.26 | 696.51 | 524.00 | 676.39 | 485.29 | 438.94 | 384.99 | 444.75 | 424.11 | 406.89 | 369.82 | 467.90 | 519.86 | 432.63 | 381.56 | 426.93 | 428.66 | 374.89 | 312.86 | 478.25 | 361.13 | 345.76 | 258.65 | 332.75 | 332.74 | 294.33 | 255.19 | 319.23 | 306.67 | 286.21 | 239.02 | 301.81 | 272.82 | 301.11 | 236.19 | NA | NA | NA | |
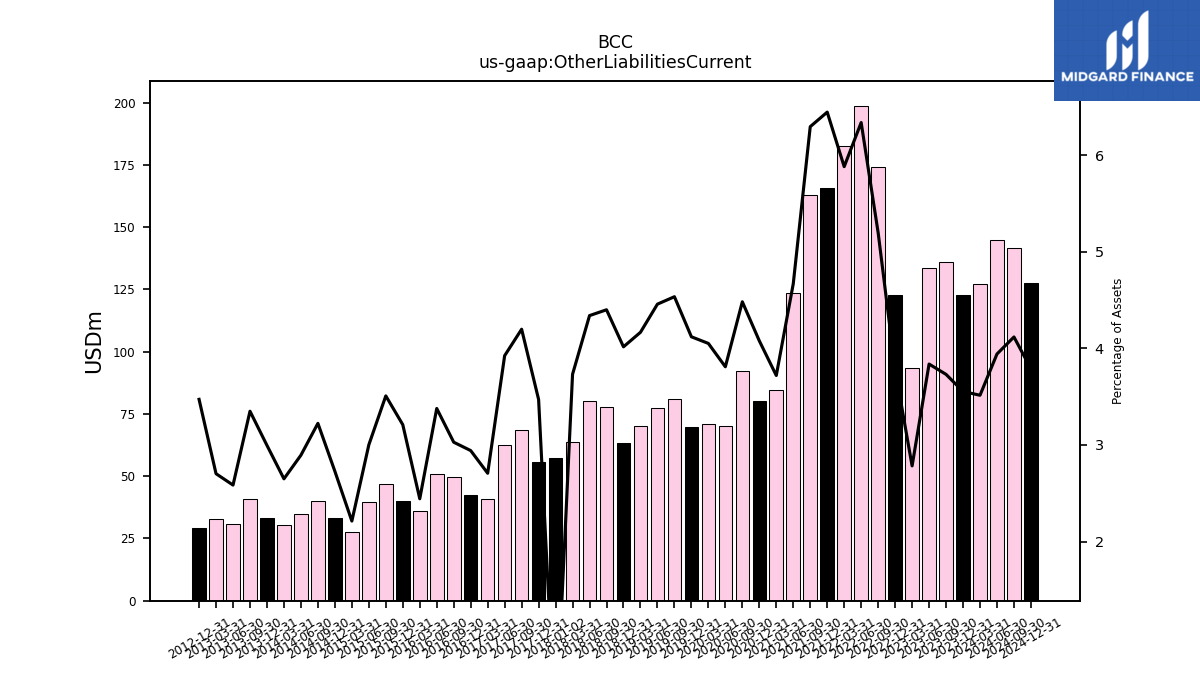
| Other Liabilities Current | 122.92 | 135.90 | 133.42 | 93.58 | 122.61 | 174.08 | 198.74 | 182.71 | 165.86 | 162.97 | 123.61 | 84.76 | 80.17 | 92.33 | 70.14 | 71.12 | 69.77 | 81.00 | 77.26 | 70.30 | 63.51 | 77.95 | 80.31 | 63.78 | 55.79 | 68.46 | 62.64 | 40.97 | 42.34 | 49.63 | 50.79 | 35.94 | 40.08 | 46.74 | 39.57 | 27.80 | 33.29 | 40.01 | 34.83 | 30.59 | 33.08 | 40.79 | 30.88 | 32.69 | 29.04 | NA | NA | NA |
| 2023-12-31 | 2023-09-30 | 2023-06-30 | 2023-03-31 | 2022-12-31 | 2022-09-30 | 2022-06-30 | 2022-03-31 | 2021-12-31 | 2021-09-30 | 2021-06-30 | 2021-03-31 | 2020-12-31 | 2020-09-30 | 2020-06-30 | 2020-03-31 | 2019-12-31 | 2019-09-30 | 2019-06-30 | 2019-03-31 | 2018-12-31 | 2018-09-30 | 2018-06-30 | 2018-03-31 | 2017-12-31 | 2017-09-30 | 2017-06-30 | 2017-03-31 | 2016-12-31 | 2016-09-30 | 2016-06-30 | 2016-03-31 | 2015-12-31 | 2015-09-30 | 2015-06-30 | 2015-03-31 | 2014-12-31 | 2014-09-30 | 2014-06-30 | 2014-03-31 | 2013-12-31 | 2013-09-30 | 2013-06-30 | 2013-03-31 | 2012-12-31 | 2012-09-30 | 2012-06-30 | 2012-03-31 | ||
|---|---|---|---|---|---|---|---|---|---|---|---|---|---|---|---|---|---|---|---|---|---|---|---|---|---|---|---|---|---|---|---|---|---|---|---|---|---|---|---|---|---|---|---|---|---|---|---|---|---|
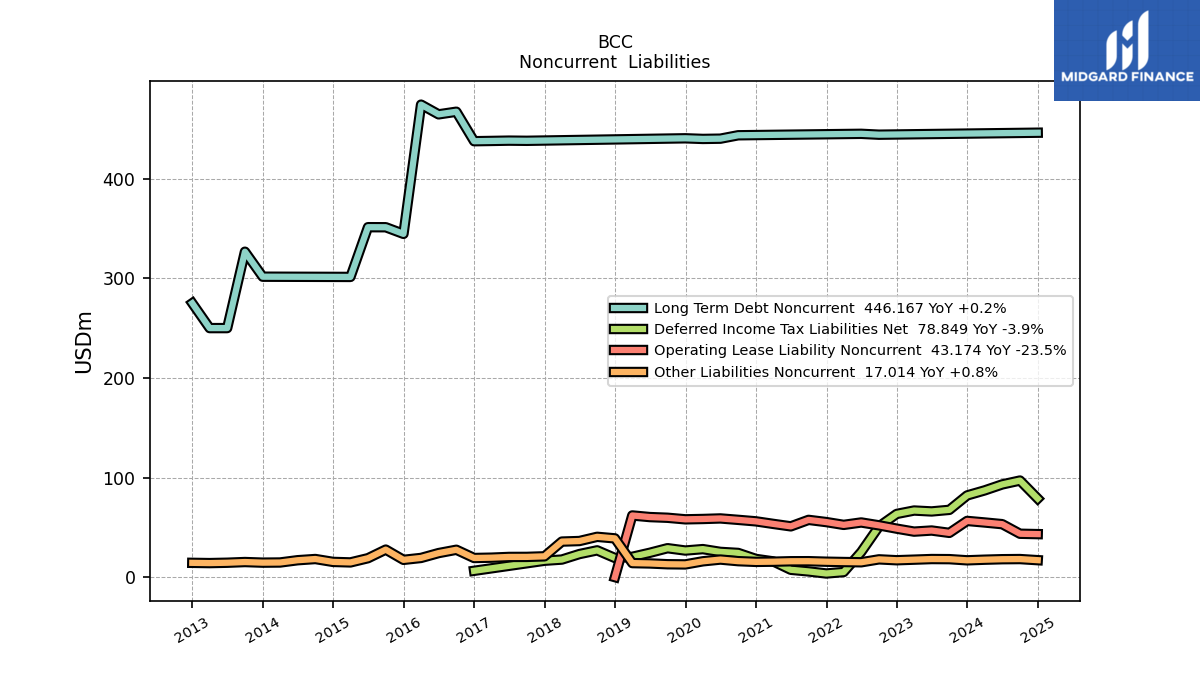
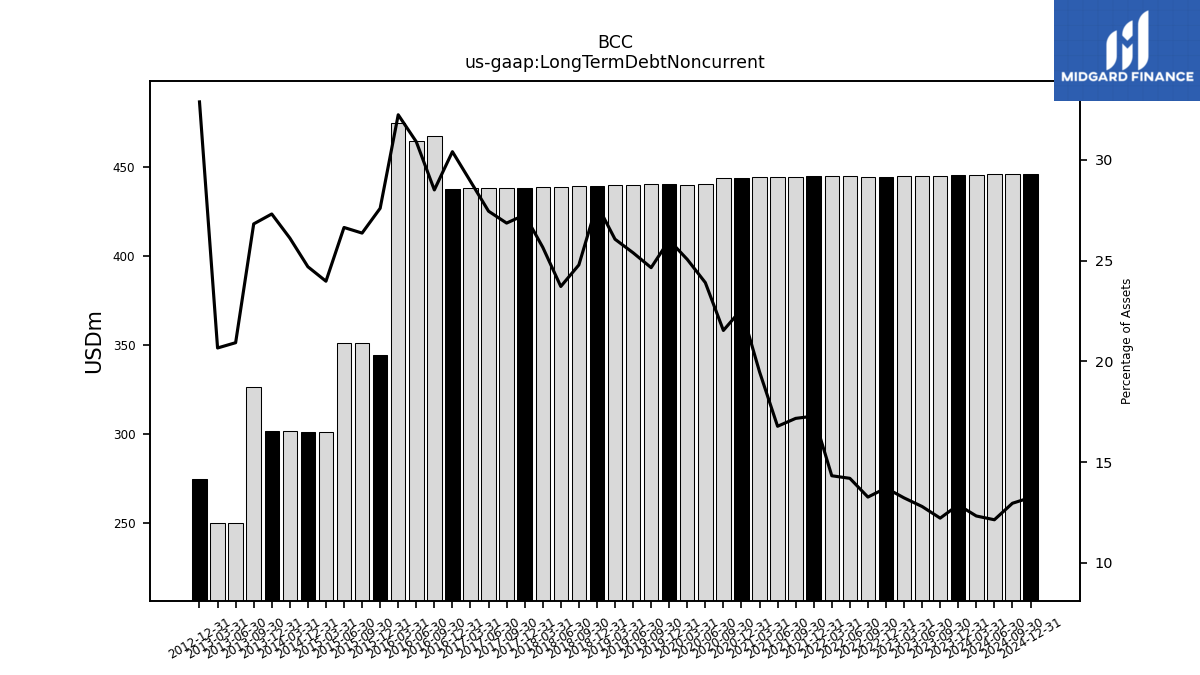
| Long Term Debt Noncurrent | 445.28 | 445.06 | 444.84 | 444.61 | 444.39 | 444.18 | 445.05 | 444.84 | 444.63 | 444.42 | 444.21 | 444.00 | 443.79 | 443.58 | 440.18 | 439.92 | 440.54 | 440.26 | 439.99 | 439.71 | 439.43 | 439.15 | 438.87 | 438.59 | 438.31 | 438.03 | 438.20 | 437.90 | 437.63 | 467.23 | 464.59 | 474.36 | 344.59 | 351.26 | 351.31 | 301.36 | 301.42 | NA | NA | 301.56 | 301.61 | 326.69 | 250.00 | 250.00 | 275.00 | NA | NA | NA | |
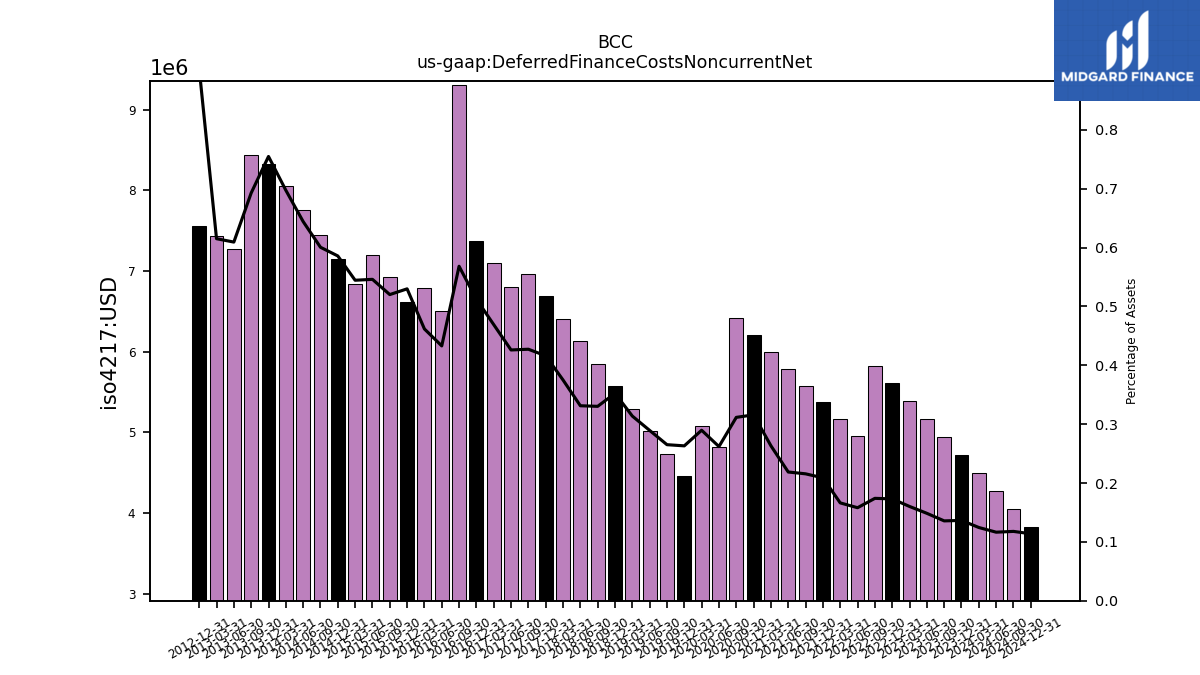
| Deferred Finance Costs Noncurrent Net | 4.72 | 4.94 | 5.16 | 5.39 | 5.61 | 5.83 | 4.96 | 5.16 | 5.37 | 5.58 | 5.79 | 6.00 | 6.21 | 6.42 | 4.82 | 5.08 | 4.46 | 4.74 | 5.01 | 5.29 | 5.57 | 5.85 | 6.13 | 6.41 | 6.69 | 6.97 | 6.80 | 7.10 | 7.37 | 9.31 | 6.51 | 6.79 | 6.62 | 6.93 | 7.20 | 6.84 | 7.15 | 7.45 | 7.75 | 8.05 | 8.33 | 8.44 | 7.28 | 7.44 | 7.56 | NA | NA | NA | |
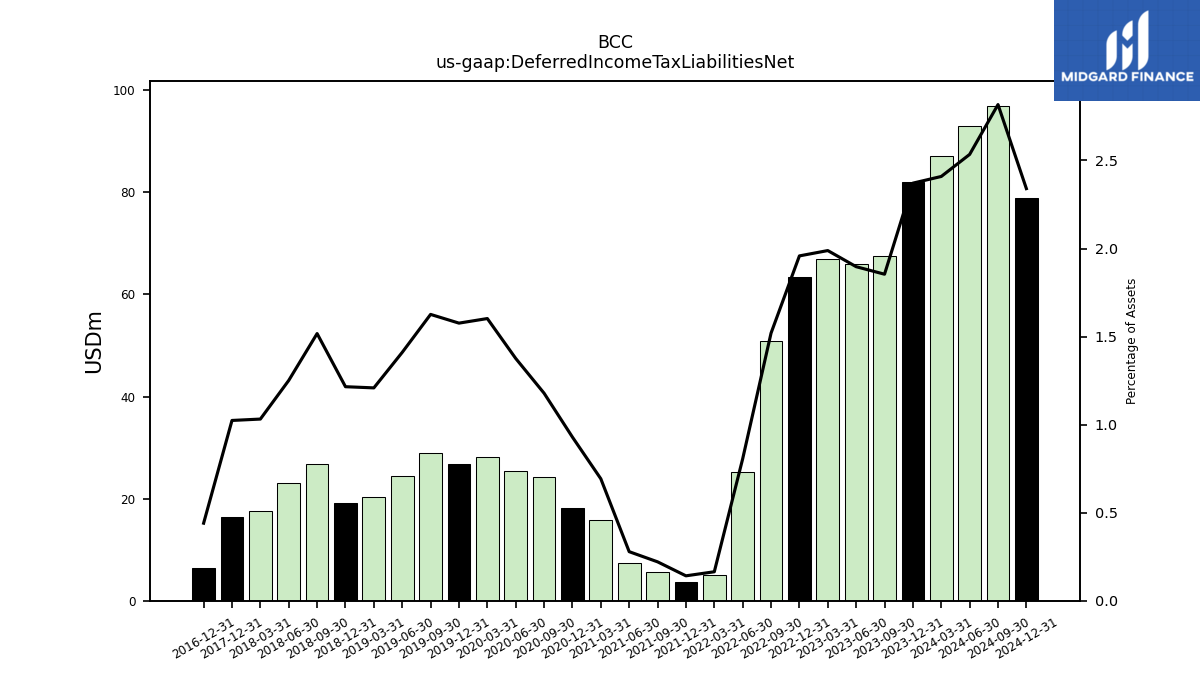
| Deferred Income Tax Liabilities Net | 82.01 | 67.53 | 65.94 | 66.86 | 63.45 | 50.88 | 25.26 | 5.11 | 3.64 | 5.72 | 7.38 | 15.78 | 18.26 | 24.27 | 25.33 | 28.13 | 26.69 | 29.04 | 24.44 | 20.39 | 19.22 | 26.88 | 23.15 | 17.63 | 16.45 | NA | NA | NA | 6.34 | NA | NA | NA | NA | NA | NA | NA | NA | NA | NA | NA | NA | NA | NA | NA | NA | NA | NA | NA | |
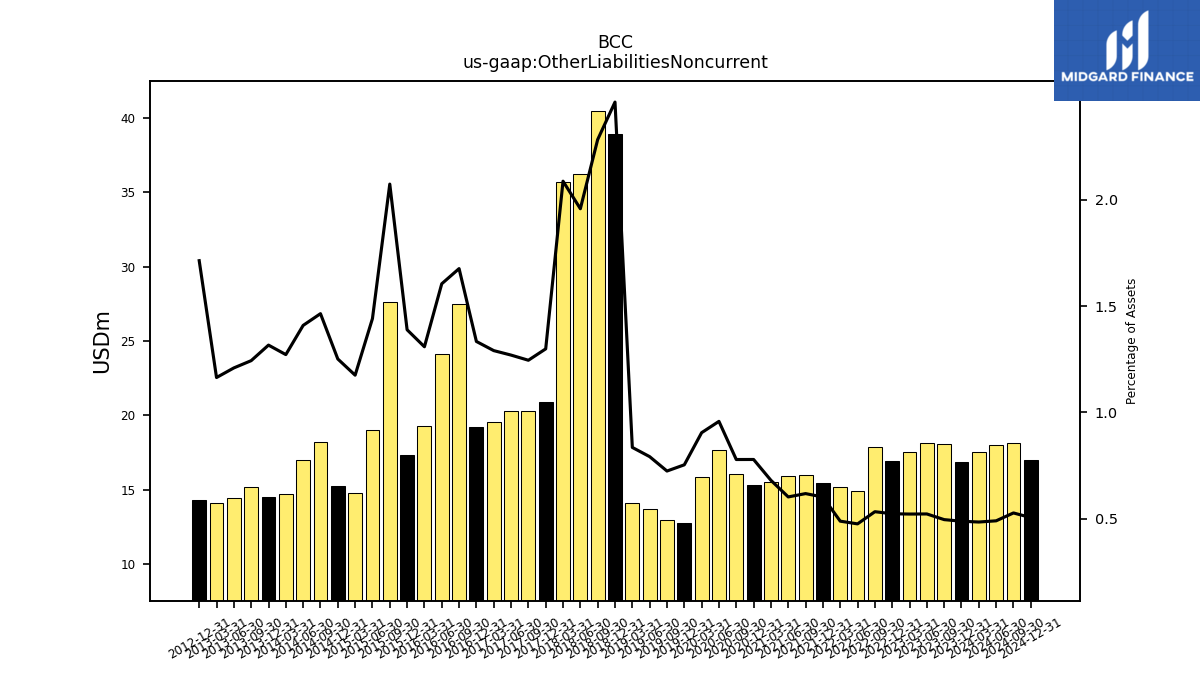
| Other Liabilities Noncurrent | 16.87 | 18.05 | 18.15 | 17.54 | 16.95 | 17.84 | 14.90 | 15.16 | 15.48 | 15.99 | 15.95 | 15.51 | 15.30 | 16.03 | 17.64 | 15.88 | 12.76 | 12.93 | 13.72 | 14.09 | 38.90 | 40.46 | 36.24 | 35.68 | 20.88 | 20.31 | 20.27 | 19.54 | 19.20 | 27.48 | 24.14 | 19.26 | 17.34 | 27.64 | 19.00 | 14.77 | 15.27 | 18.18 | 16.96 | 14.69 | 14.54 | 15.15 | 14.45 | 14.08 | 14.34 | NA | NA | NA | |
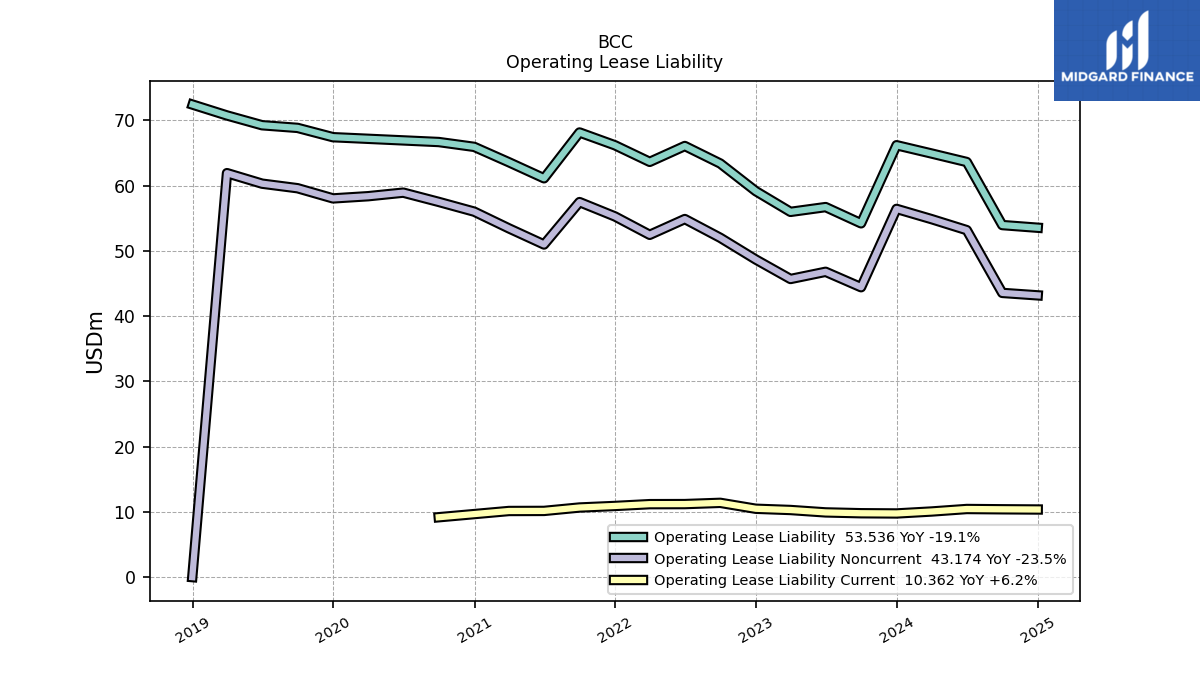
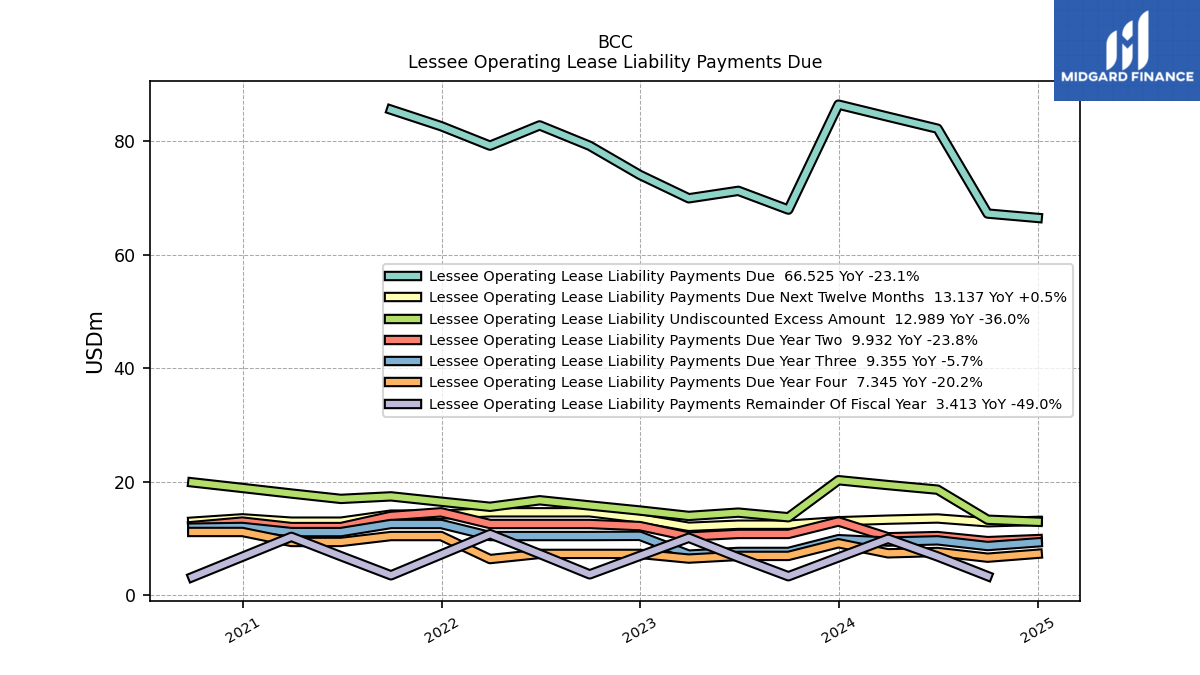
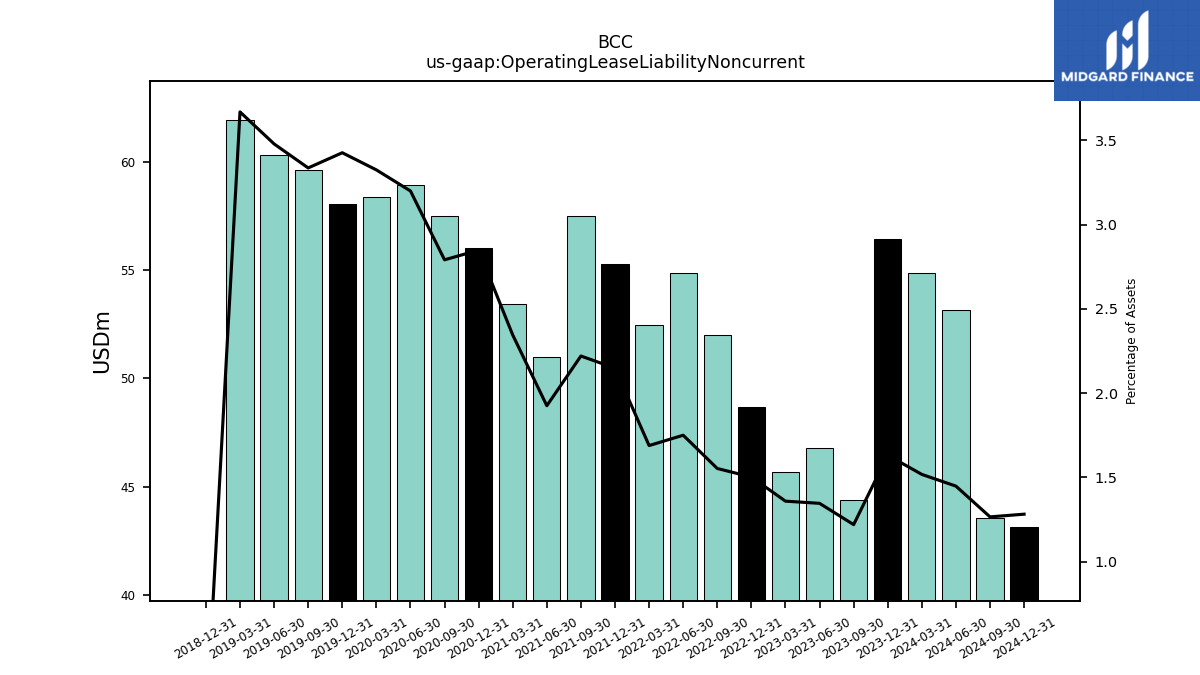
| Operating Lease Liability Noncurrent | 56.42 | 44.42 | 46.78 | 45.68 | 48.67 | 51.99 | 54.87 | 52.45 | 55.26 | 57.47 | 50.97 | 53.44 | 56.00 | 57.49 | 58.91 | 58.37 | 58.03 | 59.59 | 60.29 | 61.90 | 0.00 | NA | NA | NA | NA | NA | NA | NA | NA | NA | NA | NA | NA | NA | NA | NA | NA | NA | NA | NA | NA | NA | NA | NA | NA | NA | NA | NA |
| 2023-12-31 | 2023-09-30 | 2023-06-30 | 2023-03-31 | 2022-12-31 | 2022-09-30 | 2022-06-30 | 2022-03-31 | 2021-12-31 | 2021-09-30 | 2021-06-30 | 2021-03-31 | 2020-12-31 | 2020-09-30 | 2020-06-30 | 2020-03-31 | 2019-12-31 | 2019-09-30 | 2019-06-30 | 2019-03-31 | 2018-12-31 | 2018-09-30 | 2018-06-30 | 2018-03-31 | 2017-12-31 | 2017-09-30 | 2017-06-30 | 2017-03-31 | 2016-12-31 | 2016-09-30 | 2016-06-30 | 2016-03-31 | 2015-12-31 | 2015-09-30 | 2015-06-30 | 2015-03-31 | 2014-12-31 | 2014-09-30 | 2014-06-30 | 2014-03-31 | 2013-12-31 | 2013-09-30 | 2013-06-30 | 2013-03-31 | 2012-12-31 | 2012-09-30 | 2012-06-30 | 2012-03-31 | ||
|---|---|---|---|---|---|---|---|---|---|---|---|---|---|---|---|---|---|---|---|---|---|---|---|---|---|---|---|---|---|---|---|---|---|---|---|---|---|---|---|---|---|---|---|---|---|---|---|---|---|
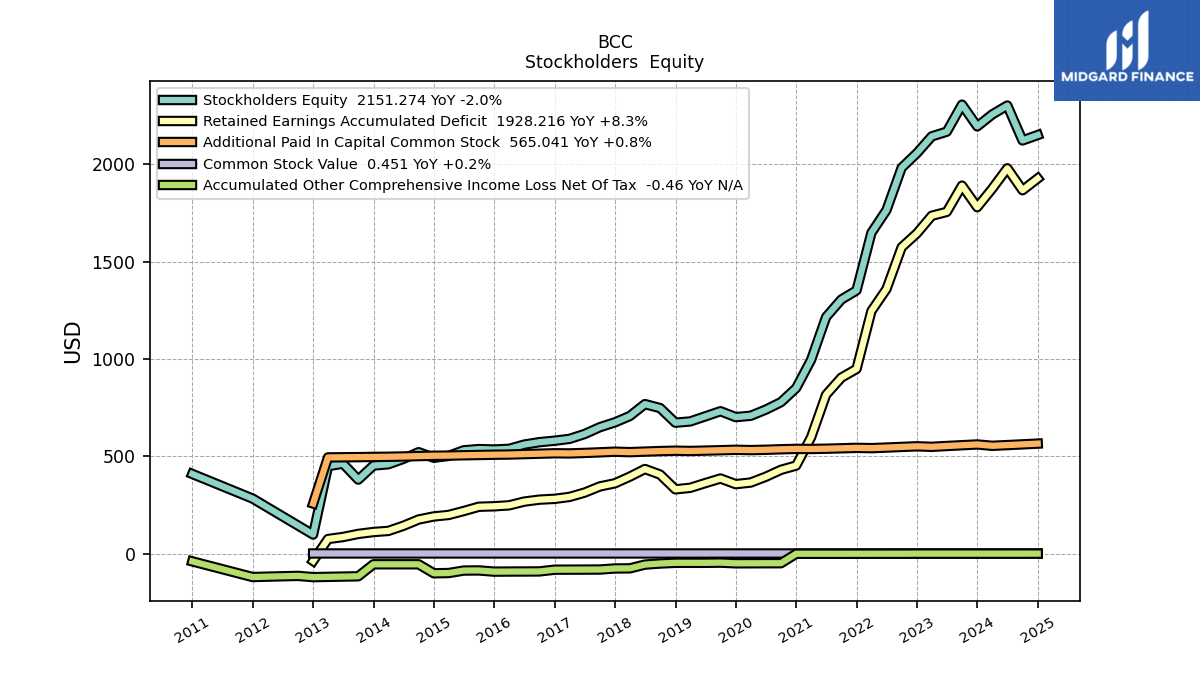
| Stockholders Equity | 2195.66 | 2307.59 | 2168.52 | 2144.52 | 2057.97 | 1983.07 | 1764.98 | 1648.69 | 1352.62 | 1305.61 | 1215.71 | 995.26 | 850.80 | 778.14 | 739.71 | 708.27 | 701.33 | 731.57 | 705.02 | 679.02 | 672.59 | 747.76 | 768.19 | 707.05 | 674.55 | 649.31 | 614.30 | 589.45 | 580.00 | 572.47 | 560.02 | 538.32 | 534.67 | 536.98 | 530.60 | 501.94 | 492.39 | 521.02 | 486.81 | 458.92 | 452.48 | 379.96 | 461.96 | 449.43 | 97.76 | NA | NA | NA | |
| Common Stock Value | 0.45 | 0.45 | 0.45 | 0.45 | 0.45 | 0.45 | 0.45 | 0.45 | 0.45 | 0.45 | 0.45 | 0.45 | 0.45 | 0.45 | 0.45 | 0.45 | 0.44 | 0.44 | 0.44 | 0.44 | 0.44 | 0.44 | 0.44 | 0.44 | 0.44 | 0.44 | 0.44 | 0.44 | 0.43 | 0.43 | 0.43 | 0.43 | 0.43 | 0.43 | 0.43 | 0.43 | 0.43 | 0.43 | 0.43 | 0.43 | 0.43 | 0.43 | 0.43 | 0.43 | 0.30 | NA | NA | NA | |
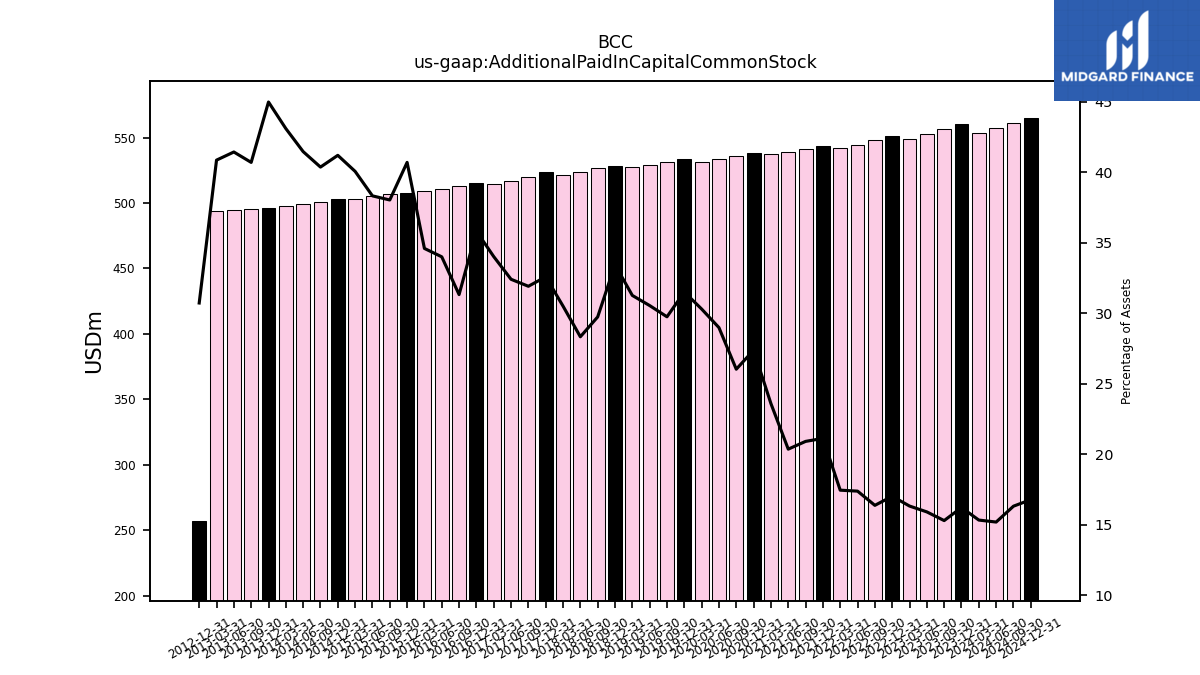
| Additional Paid In Capital Common Stock | 560.70 | 556.80 | 552.80 | 548.61 | 551.22 | 548.03 | 544.75 | 541.74 | 543.25 | 541.02 | 538.84 | 537.43 | 538.01 | 536.02 | 533.41 | 531.74 | 533.35 | 531.12 | 529.15 | 527.28 | 528.65 | 526.72 | 524.10 | 521.18 | 523.55 | 520.22 | 517.14 | 514.70 | 515.41 | 513.21 | 511.10 | 508.92 | 508.07 | 506.56 | 505.19 | 503.38 | 502.74 | 500.88 | 498.94 | 497.47 | 496.59 | 495.59 | 494.91 | 494.22 | 256.93 | NA | NA | NA | |
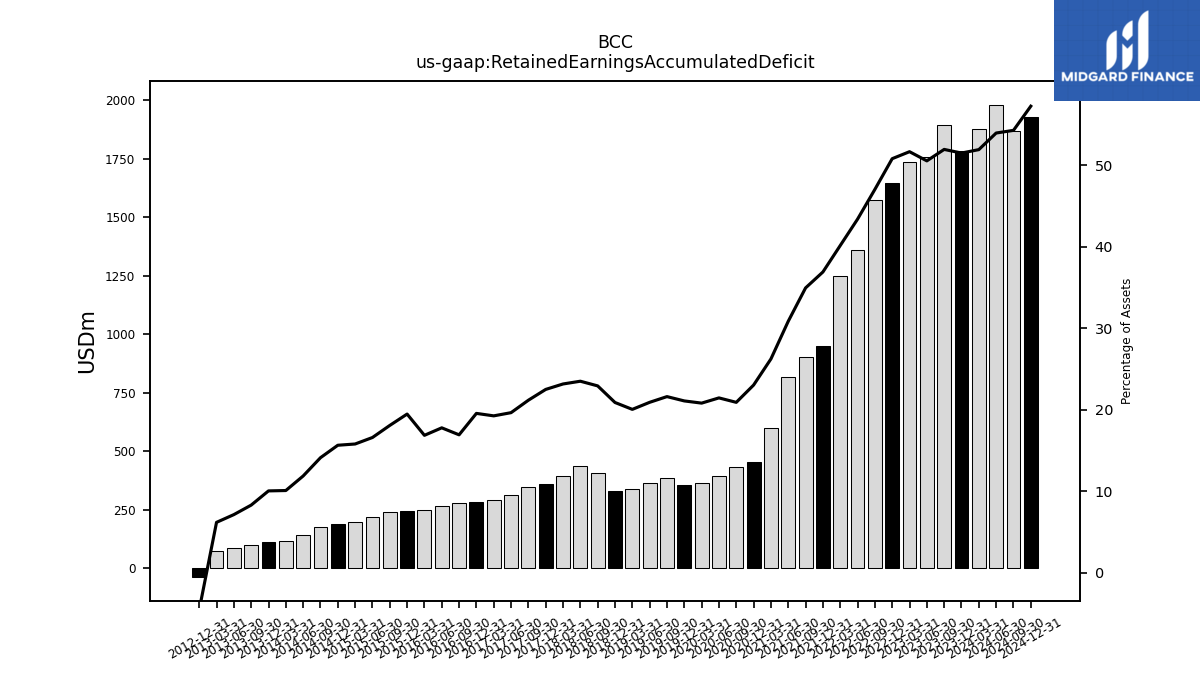
| Retained Earnings Accumulated Deficit | 1780.37 | 1891.29 | 1756.22 | 1736.36 | 1645.74 | 1574.40 | 1359.62 | 1246.35 | 948.88 | 904.13 | 816.42 | 597.37 | 452.33 | 430.31 | 394.65 | 365.03 | 356.70 | 385.66 | 362.06 | 337.88 | 330.06 | 405.87 | 434.53 | 395.50 | 361.24 | 344.88 | 313.22 | 291.07 | 281.15 | 277.06 | 267.07 | 247.85 | 242.90 | 240.57 | 218.56 | 198.33 | 190.71 | 174.97 | 142.69 | 116.27 | 110.70 | 100.88 | 85.02 | 74.61 | -38.23 | NA | NA | NA | |
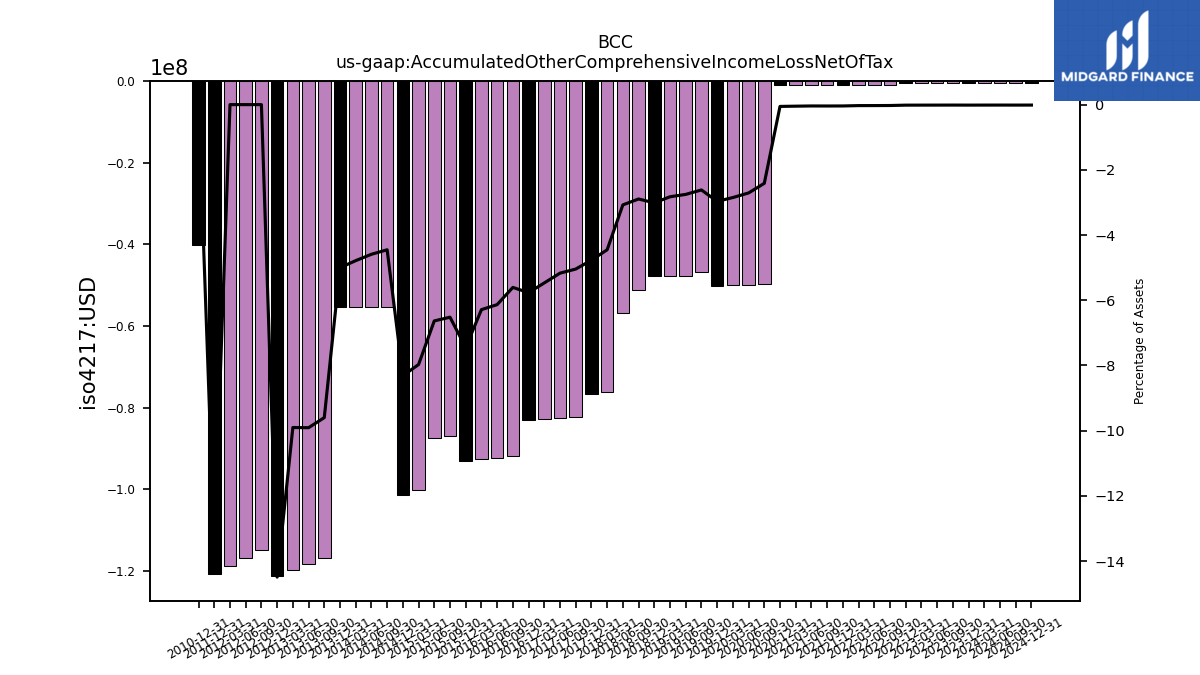
| Accumulated Other Comprehensive Income Loss Net Of Tax | -0.52 | -0.50 | -0.51 | -0.51 | -0.52 | -0.90 | -0.92 | -0.93 | -1.05 | -1.09 | -1.08 | -1.08 | -1.08 | -49.73 | -49.88 | -50.03 | -50.25 | -46.75 | -47.72 | -47.68 | -47.65 | -51.29 | -56.91 | -76.09 | -76.70 | -82.25 | -82.52 | -82.77 | -83.01 | -91.89 | -92.24 | -92.54 | -93.02 | -86.86 | -87.47 | -100.20 | -101.50 | -55.26 | -55.26 | -55.25 | -55.25 | -116.94 | -118.39 | -119.82 | -121.23 | -114.91 | -116.78 | -118.78 |
| 2023-12-31 | 2023-09-30 | 2023-06-30 | 2023-03-31 | 2022-12-31 | 2022-09-30 | 2022-06-30 | 2022-03-31 | 2021-12-31 | 2021-09-30 | 2021-06-30 | 2021-03-31 | 2020-12-31 | 2020-09-30 | 2020-06-30 | 2020-03-31 | 2019-12-31 | 2019-09-30 | 2019-06-30 | 2019-03-31 | 2018-12-31 | 2018-09-30 | 2018-06-30 | 2018-03-31 | 2017-12-31 | 2017-09-30 | 2017-06-30 | 2017-03-31 | 2016-12-31 | 2016-09-30 | 2016-06-30 | 2016-03-31 | 2015-12-31 | 2015-09-30 | 2015-06-30 | 2015-03-31 | 2014-12-31 | 2014-09-30 | 2014-06-30 | 2014-03-31 | 2013-12-31 | 2013-09-30 | 2013-06-30 | 2013-03-31 | 2012-12-31 | 2012-09-30 | 2012-06-30 | 2012-03-31 | ||
|---|---|---|---|---|---|---|---|---|---|---|---|---|---|---|---|---|---|---|---|---|---|---|---|---|---|---|---|---|---|---|---|---|---|---|---|---|---|---|---|---|---|---|---|---|---|---|---|---|---|
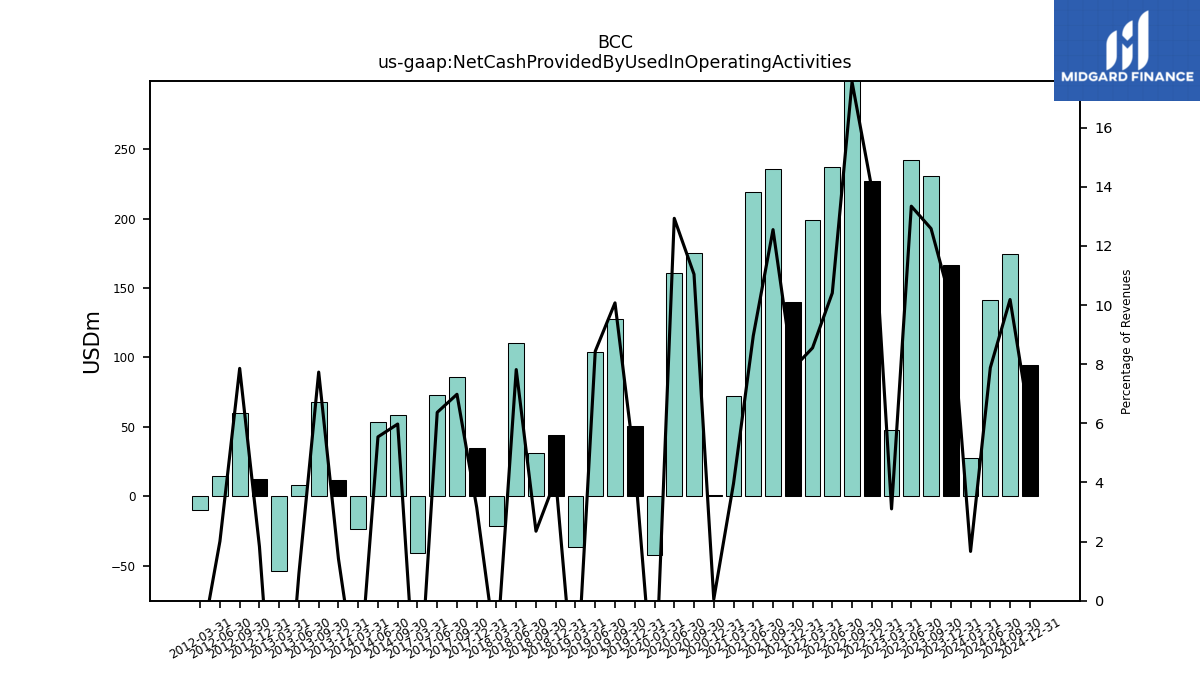
| Net Cash Provided By Used In Operating Activities | 166.33 | 230.91 | 242.23 | 47.99 | 227.09 | 378.07 | 237.11 | 198.94 | 139.89 | 235.91 | 218.93 | 72.25 | 0.74 | 175.50 | 160.74 | -42.47 | 50.90 | 127.90 | 103.81 | -36.96 | 43.79 | 31.48 | 110.09 | -21.76 | 34.43 | 85.66 | 72.56 | -41.09 | NA | NA | NA | NA | NA | NA | NA | NA | NA | 58.77 | 53.27 | -23.95 | 11.35 | 67.90 | 7.92 | -53.74 | 12.74 | 60.09 | 14.74 | -9.96 | |
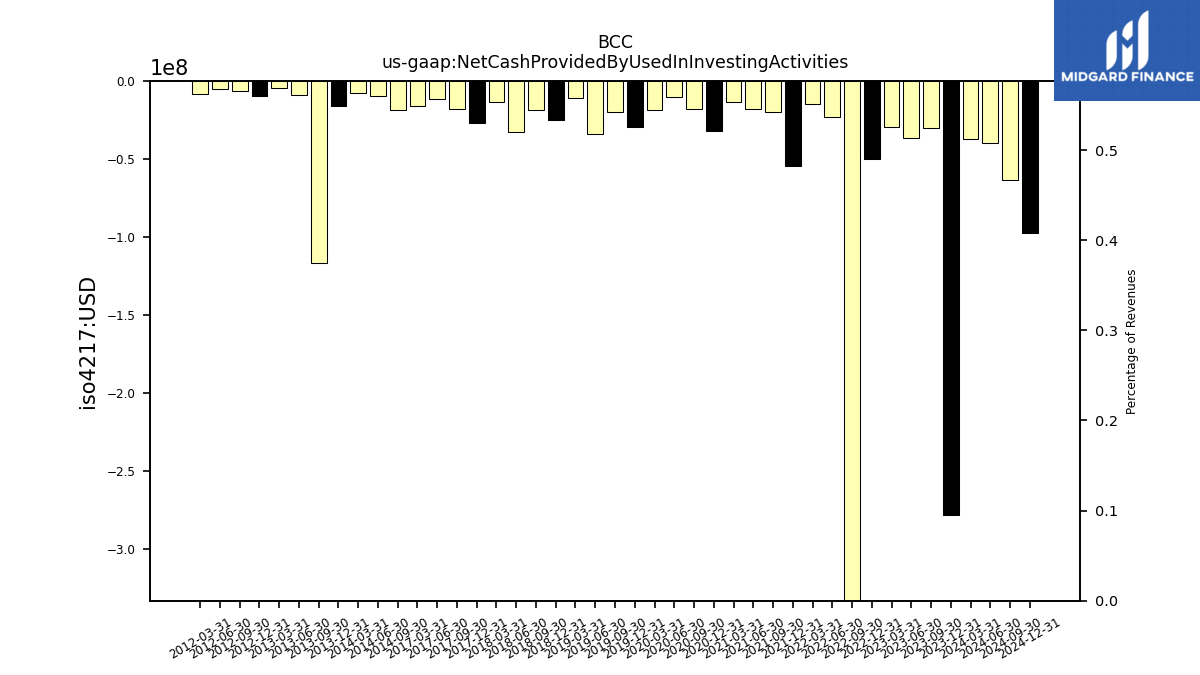
| Net Cash Provided By Used In Investing Activities | -278.75 | -30.43 | -36.87 | -29.50 | -49.83 | -537.68 | -23.08 | -14.87 | -54.76 | -19.82 | -17.84 | -13.16 | -32.28 | -17.99 | -9.98 | -18.46 | -29.28 | -20.18 | -33.91 | -10.71 | -24.86 | -18.82 | -32.40 | -13.18 | -27.24 | -18.26 | -11.36 | -16.35 | NA | NA | NA | NA | NA | NA | NA | NA | NA | -18.79 | -9.34 | -7.96 | -16.29 | -116.91 | -8.68 | -4.80 | -9.56 | -6.71 | -5.11 | -8.05 | |
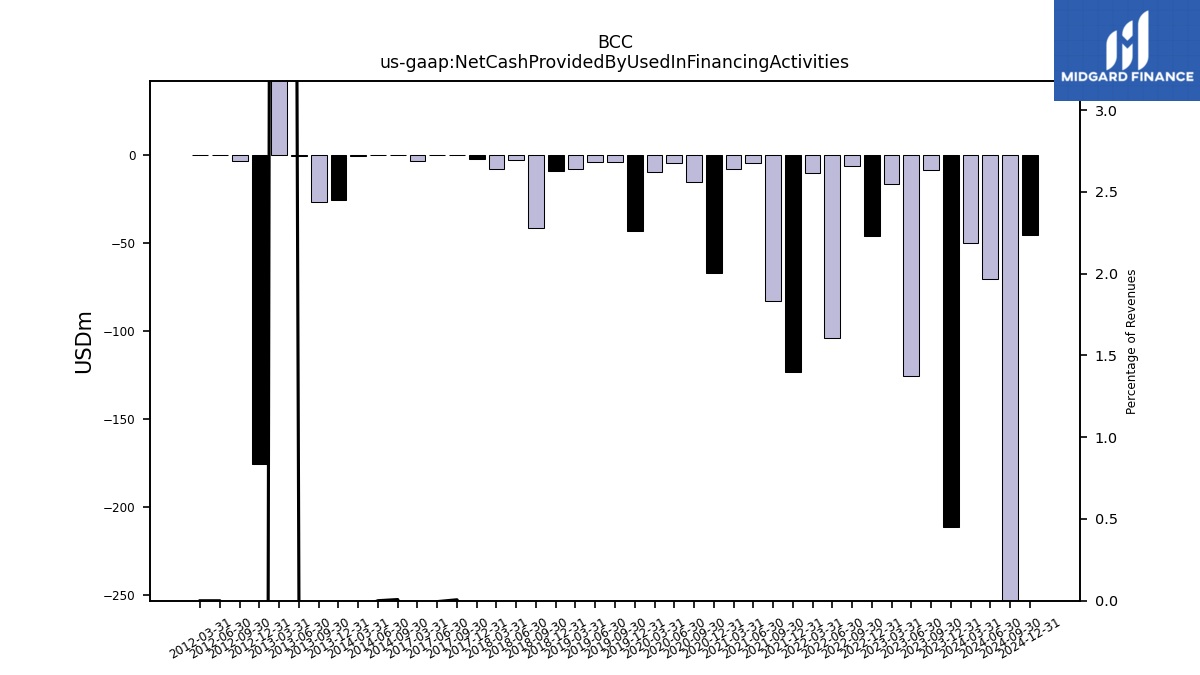
| Net Cash Provided By Used In Financing Activities | -210.97 | -8.37 | -125.22 | -16.12 | -45.98 | -6.31 | -103.77 | -10.26 | -123.11 | -82.97 | -4.31 | -7.49 | -67.01 | -15.01 | -4.32 | -9.32 | -42.83 | -3.69 | -3.70 | -7.80 | -8.61 | -41.34 | -2.36 | -7.52 | -2.23 | 0.07 | -0.06 | -2.97 | NA | NA | NA | NA | NA | NA | NA | NA | NA | 0.07 | 0.00 | -0.36 | -25.22 | -26.64 | -0.12 | 237.59 | -175.61 | -3.04 | 0.00 | 0.00 |
| 2023-12-31 | 2023-09-30 | 2023-06-30 | 2023-03-31 | 2022-12-31 | 2022-09-30 | 2022-06-30 | 2022-03-31 | 2021-12-31 | 2021-09-30 | 2021-06-30 | 2021-03-31 | 2020-12-31 | 2020-09-30 | 2020-06-30 | 2020-03-31 | 2019-12-31 | 2019-09-30 | 2019-06-30 | 2019-03-31 | 2018-12-31 | 2018-09-30 | 2018-06-30 | 2018-03-31 | 2017-12-31 | 2017-09-30 | 2017-06-30 | 2017-03-31 | 2016-12-31 | 2016-09-30 | 2016-06-30 | 2016-03-31 | 2015-12-31 | 2015-09-30 | 2015-06-30 | 2015-03-31 | 2014-12-31 | 2014-09-30 | 2014-06-30 | 2014-03-31 | 2013-12-31 | 2013-09-30 | 2013-06-30 | 2013-03-31 | 2012-12-31 | 2012-09-30 | 2012-06-30 | 2012-03-31 | ||
|---|---|---|---|---|---|---|---|---|---|---|---|---|---|---|---|---|---|---|---|---|---|---|---|---|---|---|---|---|---|---|---|---|---|---|---|---|---|---|---|---|---|---|---|---|---|---|---|---|---|
| Net Cash Provided By Used In Operating Activities | 166.33 | 230.91 | 242.23 | 47.99 | 227.09 | 378.07 | 237.11 | 198.94 | 139.89 | 235.91 | 218.93 | 72.25 | 0.74 | 175.50 | 160.74 | -42.47 | 50.90 | 127.90 | 103.81 | -36.96 | 43.79 | 31.48 | 110.09 | -21.76 | 34.43 | 85.66 | 72.56 | -41.09 | NA | NA | NA | NA | NA | NA | NA | NA | NA | 58.77 | 53.27 | -23.95 | 11.35 | 67.90 | 7.92 | -53.74 | 12.74 | 60.09 | 14.74 | -9.96 | |
| Profit Loss | 97.53 | 143.07 | 146.32 | 96.73 | 117.36 | 219.59 | 218.11 | 302.60 | 169.07 | 91.70 | 302.56 | 149.16 | 26.00 | 103.19 | 33.59 | 12.20 | 14.65 | 27.17 | 27.72 | 11.39 | -72.25 | 13.85 | 41.83 | 37.05 | 19.12 | 31.66 | 22.15 | 10.02 | NA | NA | NA | NA | NA | NA | NA | NA | NA | NA | NA | NA | NA | NA | NA | NA | NA | NA | NA | NA | |
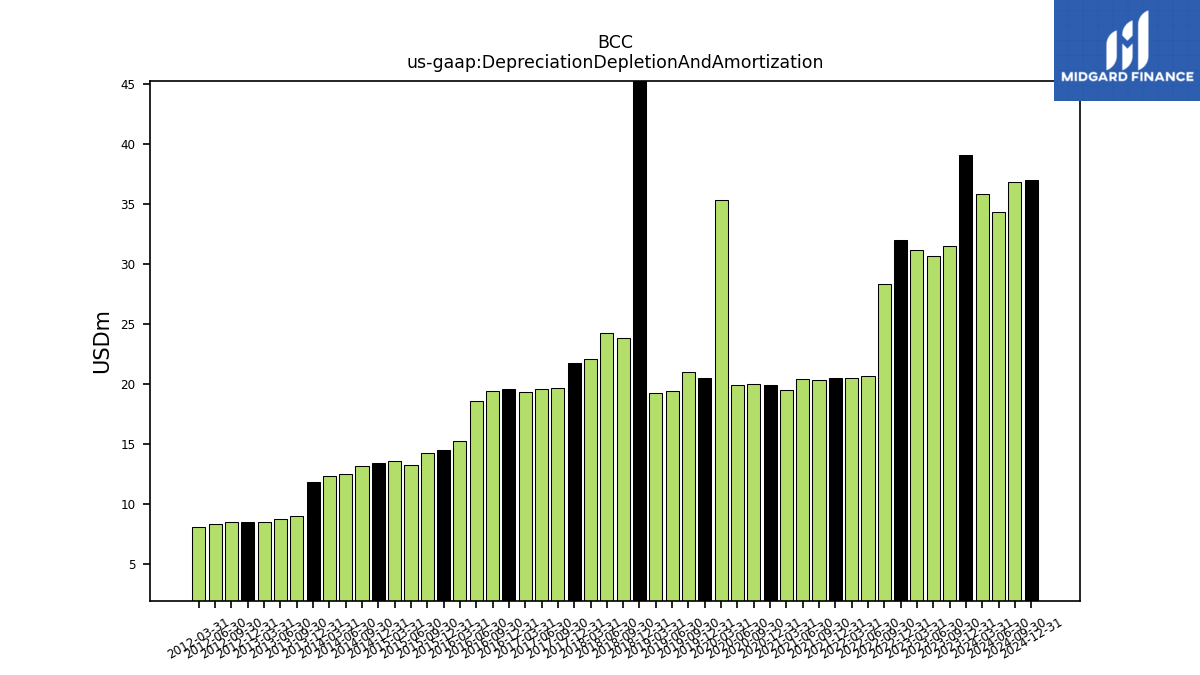
| Depreciation Depletion And Amortization | 39.09 | 31.47 | 30.72 | 31.19 | 31.98 | 28.37 | 20.69 | 20.54 | 20.50 | 20.30 | 20.42 | 19.54 | 19.91 | 20.03 | 19.90 | 35.33 | 20.50 | 20.97 | 19.45 | 19.22 | 76.55 | 23.88 | 24.30 | 22.11 | 21.75 | 19.69 | 19.60 | 19.34 | 19.60 | 19.46 | 18.55 | 15.24 | 14.46 | 14.25 | 13.28 | 13.59 | 13.43 | 13.20 | 12.48 | 12.32 | 11.83 | 8.96 | 8.77 | 8.48 | 8.49 | 8.46 | 8.34 | 8.12 | |
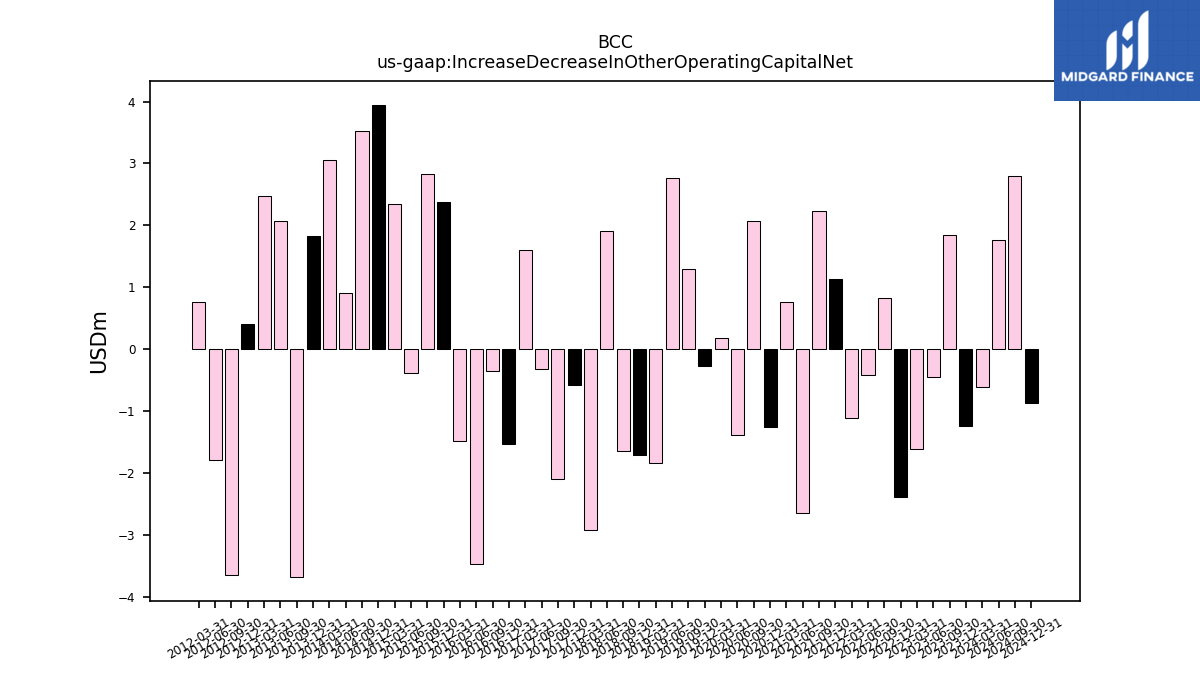
| Increase Decrease In Other Operating Capital Net | -1.25 | 1.84 | -0.46 | -1.61 | -2.39 | 0.83 | -0.42 | -1.12 | 1.14 | 2.24 | -2.65 | 0.76 | -1.27 | 2.08 | -1.39 | 0.17 | -0.27 | 1.30 | 2.76 | -1.83 | -1.72 | -1.65 | 1.91 | -2.92 | -0.58 | -2.10 | -0.32 | 1.60 | -1.53 | -0.35 | -3.47 | -1.49 | 2.38 | 2.83 | -0.39 | 2.34 | 3.95 | 3.53 | 0.91 | 3.05 | 1.83 | -3.68 | 2.07 | 2.47 | 0.41 | -3.65 | -1.80 | 0.76 | |
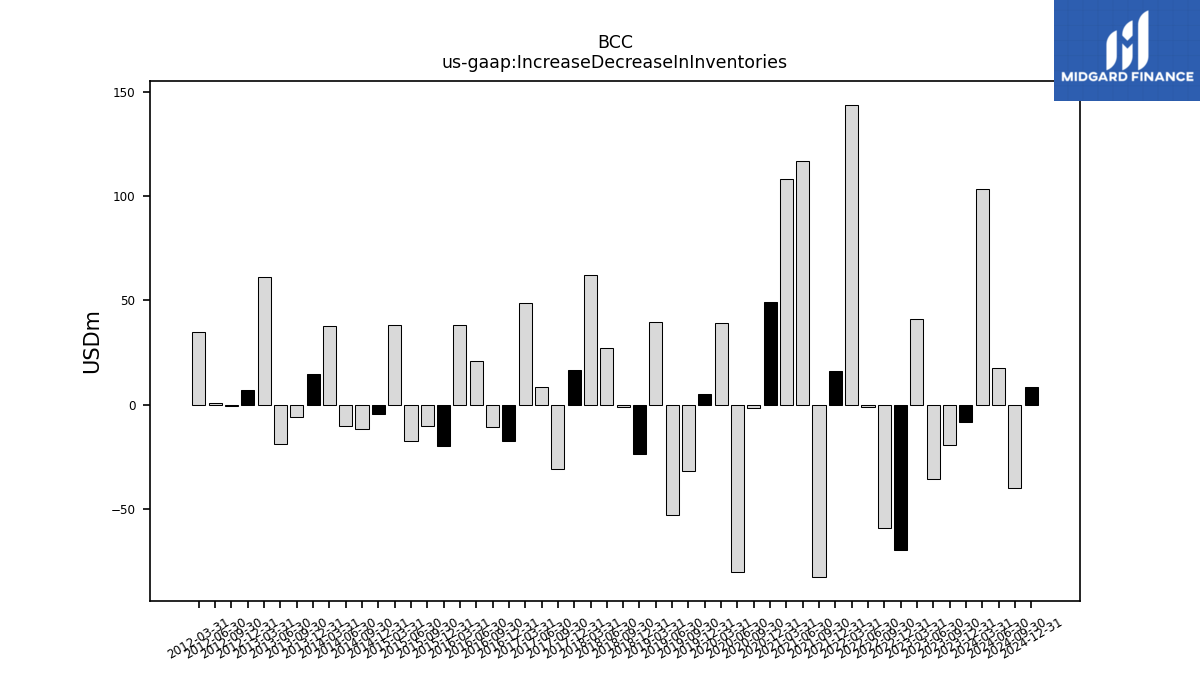
| Increase Decrease In Inventories | -8.14 | -19.63 | -35.77 | 41.25 | -69.64 | -59.40 | -1.06 | 144.00 | 16.30 | -82.83 | 116.79 | 108.22 | 49.15 | -1.80 | -80.15 | 39.05 | 5.01 | -31.86 | -52.81 | 39.48 | -23.88 | -0.98 | 27.00 | 62.05 | 16.81 | -30.85 | 8.35 | 48.91 | -17.61 | -10.94 | 20.94 | 38.37 | -19.76 | -10.50 | -17.35 | 38.01 | -4.41 | -11.69 | -10.49 | 37.70 | 14.52 | -6.10 | -18.75 | 61.30 | 7.23 | -0.56 | 0.54 | 34.62 | |
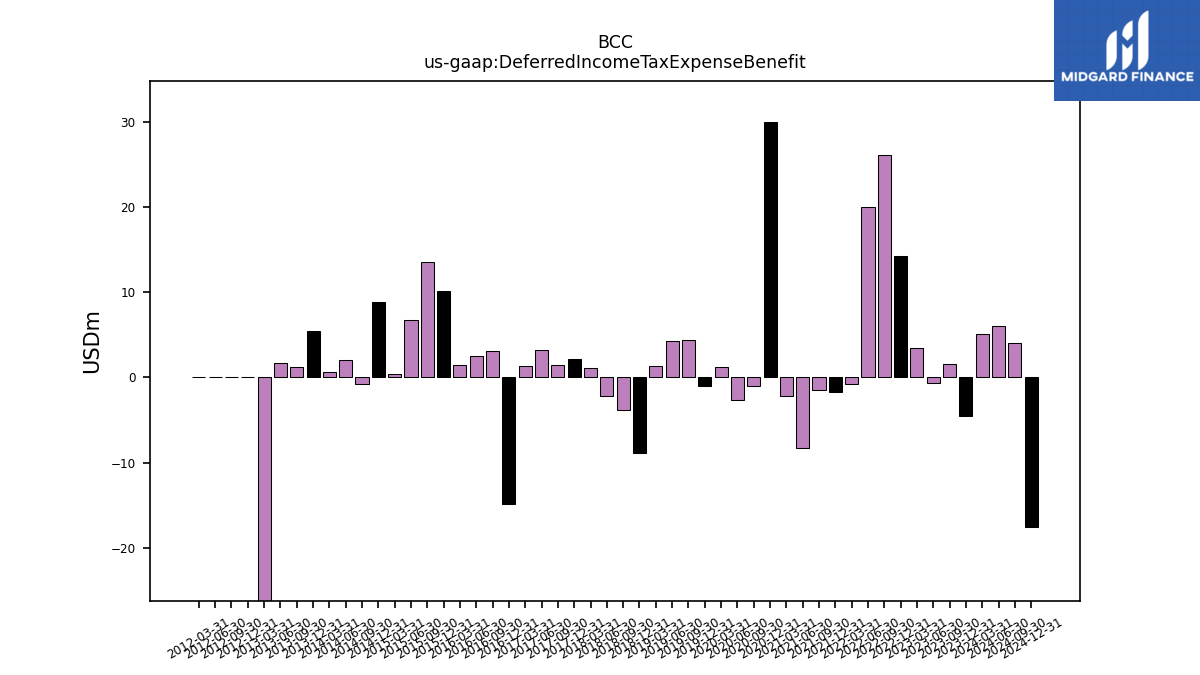
| Deferred Income Tax Expense Benefit | -4.53 | 1.60 | -0.64 | 3.39 | 14.30 | 26.08 | 20.02 | -0.73 | -1.69 | -1.54 | -8.24 | -2.24 | 29.96 | -0.96 | -2.70 | 1.20 | -0.98 | 4.38 | 4.32 | 1.31 | -8.85 | -3.80 | -2.22 | 1.12 | 2.10 | 1.48 | 3.26 | 1.28 | -14.83 | 3.11 | 2.45 | 1.45 | 10.16 | 13.54 | 6.78 | 0.41 | 8.79 | -0.81 | 2.08 | 0.64 | 5.50 | 1.22 | 1.70 | -68.02 | 0.00 | 0.00 | 0.00 | 0.00 | |
| Share Based Compensation | 3.89 | 4.00 | 4.19 | 3.32 | 3.18 | 3.29 | 3.01 | 2.39 | 2.23 | 2.18 | 1.41 | 2.09 | 1.98 | 2.49 | 1.67 | 1.67 | 1.96 | 1.95 | 1.87 | 2.20 | 1.94 | 2.16 | 2.44 | 2.29 | 2.80 | 2.49 | 2.44 | 2.00 | 2.20 | 2.11 | 2.17 | 1.69 | 1.50 | 1.43 | 1.69 | 1.21 | 1.73 | 1.88 | 1.47 | 0.84 | 1.01 | 0.79 | 0.83 | 0.24 | 0.00 | 0.00 | NA | NA |
| 2023-12-31 | 2023-09-30 | 2023-06-30 | 2023-03-31 | 2022-12-31 | 2022-09-30 | 2022-06-30 | 2022-03-31 | 2021-12-31 | 2021-09-30 | 2021-06-30 | 2021-03-31 | 2020-12-31 | 2020-09-30 | 2020-06-30 | 2020-03-31 | 2019-12-31 | 2019-09-30 | 2019-06-30 | 2019-03-31 | 2018-12-31 | 2018-09-30 | 2018-06-30 | 2018-03-31 | 2017-12-31 | 2017-09-30 | 2017-06-30 | 2017-03-31 | 2016-12-31 | 2016-09-30 | 2016-06-30 | 2016-03-31 | 2015-12-31 | 2015-09-30 | 2015-06-30 | 2015-03-31 | 2014-12-31 | 2014-09-30 | 2014-06-30 | 2014-03-31 | 2013-12-31 | 2013-09-30 | 2013-06-30 | 2013-03-31 | 2012-12-31 | 2012-09-30 | 2012-06-30 | 2012-03-31 | ||
|---|---|---|---|---|---|---|---|---|---|---|---|---|---|---|---|---|---|---|---|---|---|---|---|---|---|---|---|---|---|---|---|---|---|---|---|---|---|---|---|---|---|---|---|---|---|---|---|---|---|
| Net Cash Provided By Used In Investing Activities | -278.75 | -30.43 | -36.87 | -29.50 | -49.83 | -537.68 | -23.08 | -14.87 | -54.76 | -19.82 | -17.84 | -13.16 | -32.28 | -17.99 | -9.98 | -18.46 | -29.28 | -20.18 | -33.91 | -10.71 | -24.86 | -18.82 | -32.40 | -13.18 | -27.24 | -18.26 | -11.36 | -16.35 | NA | NA | NA | NA | NA | NA | NA | NA | NA | -18.79 | -9.34 | -7.96 | -16.29 | -116.91 | -8.68 | -4.80 | -9.56 | -6.71 | -5.11 | -8.05 | |
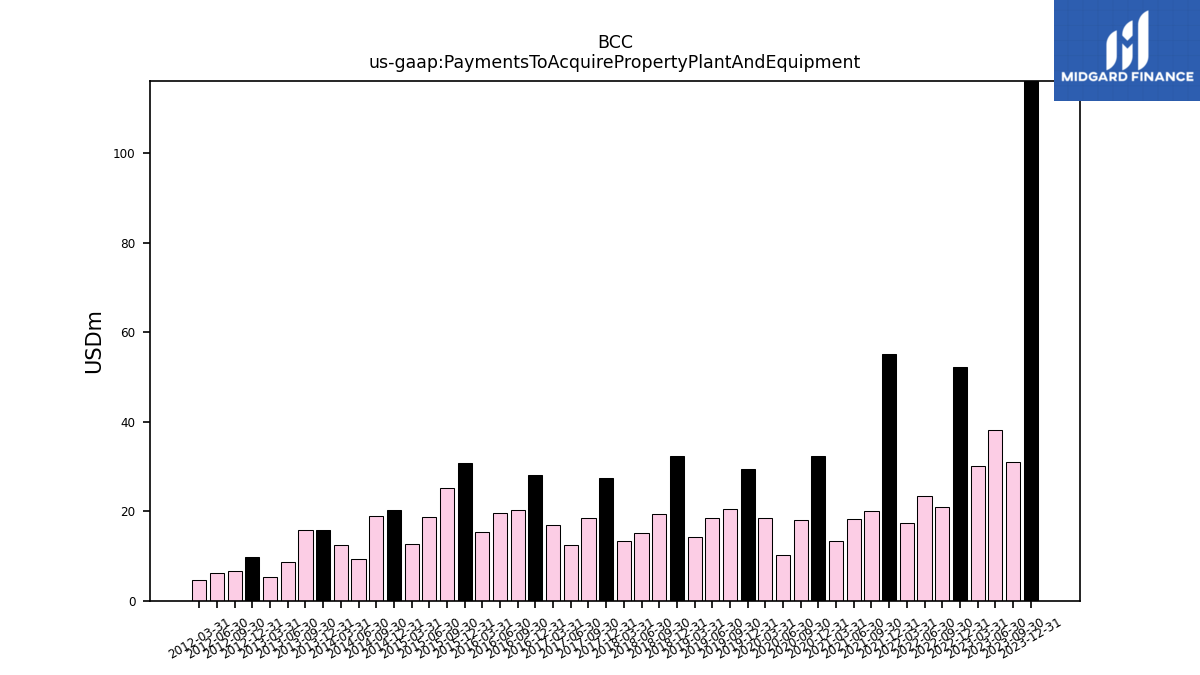
| Payments To Acquire Property Plant And Equipment | 116.19 | 30.96 | 38.22 | 30.06 | 52.28 | 21.03 | 23.36 | 17.45 | 55.06 | 19.96 | 18.20 | 13.30 | 32.44 | 18.14 | 10.29 | 18.56 | 29.47 | 20.43 | 18.48 | 14.35 | 32.28 | 19.38 | 15.05 | 13.27 | 27.39 | 18.51 | 12.55 | 17.00 | 28.16 | 20.32 | 19.64 | 15.46 | 30.83 | 25.27 | 18.82 | 12.62 | 20.36 | 18.89 | 9.43 | 12.54 | 15.82 | 15.89 | 8.73 | 5.32 | 9.70 | 6.73 | 6.22 | 4.73 |
| 2023-12-31 | 2023-09-30 | 2023-06-30 | 2023-03-31 | 2022-12-31 | 2022-09-30 | 2022-06-30 | 2022-03-31 | 2021-12-31 | 2021-09-30 | 2021-06-30 | 2021-03-31 | 2020-12-31 | 2020-09-30 | 2020-06-30 | 2020-03-31 | 2019-12-31 | 2019-09-30 | 2019-06-30 | 2019-03-31 | 2018-12-31 | 2018-09-30 | 2018-06-30 | 2018-03-31 | 2017-12-31 | 2017-09-30 | 2017-06-30 | 2017-03-31 | 2016-12-31 | 2016-09-30 | 2016-06-30 | 2016-03-31 | 2015-12-31 | 2015-09-30 | 2015-06-30 | 2015-03-31 | 2014-12-31 | 2014-09-30 | 2014-06-30 | 2014-03-31 | 2013-12-31 | 2013-09-30 | 2013-06-30 | 2013-03-31 | 2012-12-31 | 2012-09-30 | 2012-06-30 | 2012-03-31 | ||
|---|---|---|---|---|---|---|---|---|---|---|---|---|---|---|---|---|---|---|---|---|---|---|---|---|---|---|---|---|---|---|---|---|---|---|---|---|---|---|---|---|---|---|---|---|---|---|---|---|---|
| Net Cash Provided By Used In Financing Activities | -210.97 | -8.37 | -125.22 | -16.12 | -45.98 | -6.31 | -103.77 | -10.26 | -123.11 | -82.97 | -4.31 | -7.49 | -67.01 | -15.01 | -4.32 | -9.32 | -42.83 | -3.69 | -3.70 | -7.80 | -8.61 | -41.34 | -2.36 | -7.52 | -2.23 | 0.07 | -0.06 | -2.97 | NA | NA | NA | NA | NA | NA | NA | NA | NA | 0.07 | 0.00 | -0.36 | -25.22 | -26.64 | -0.12 | 237.59 | -175.61 | -3.04 | 0.00 | 0.00 | |
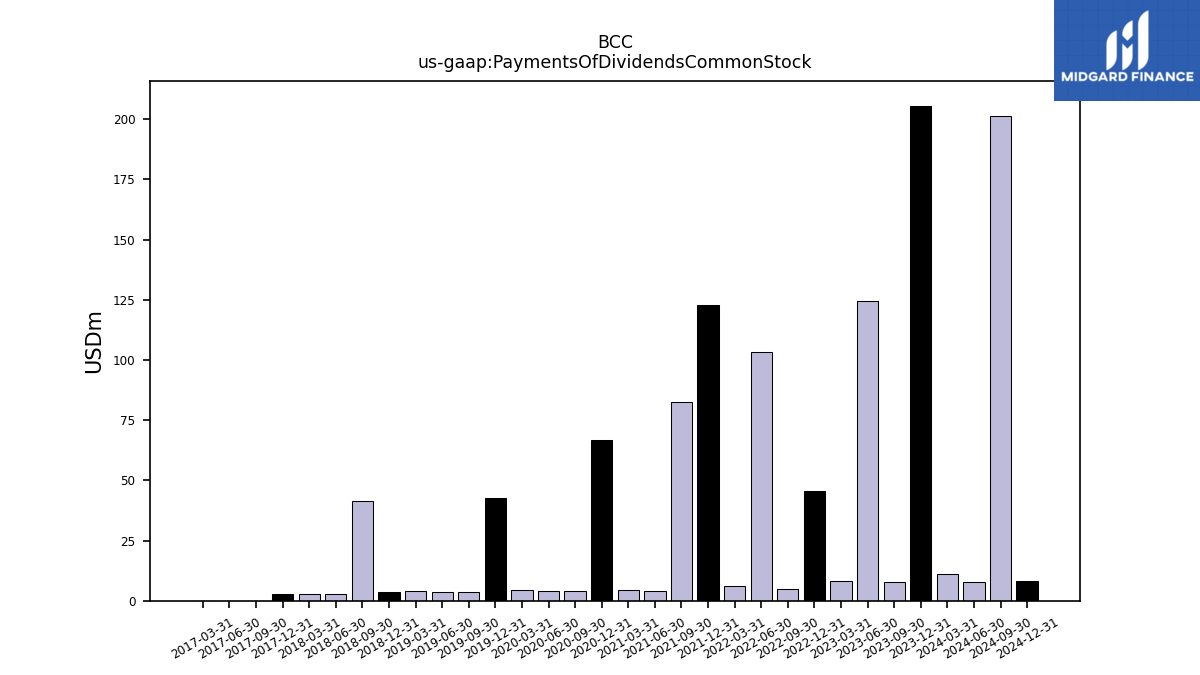
| Payments Of Dividends Common Stock | 205.61 | 7.92 | 124.71 | 8.26 | 45.54 | 4.73 | 103.35 | 5.94 | 122.71 | 82.60 | 3.93 | 4.44 | 66.64 | 3.99 | 3.92 | 4.64 | 42.88 | 3.51 | 3.51 | 4.05 | 3.50 | 41.63 | 2.72 | 2.76 | 2.70 | 0.00 | 0.00 | 0.00 | NA | NA | NA | NA | NA | NA | NA | NA | NA | NA | NA | NA | NA | NA | NA | NA | NA | NA | NA | NA | |
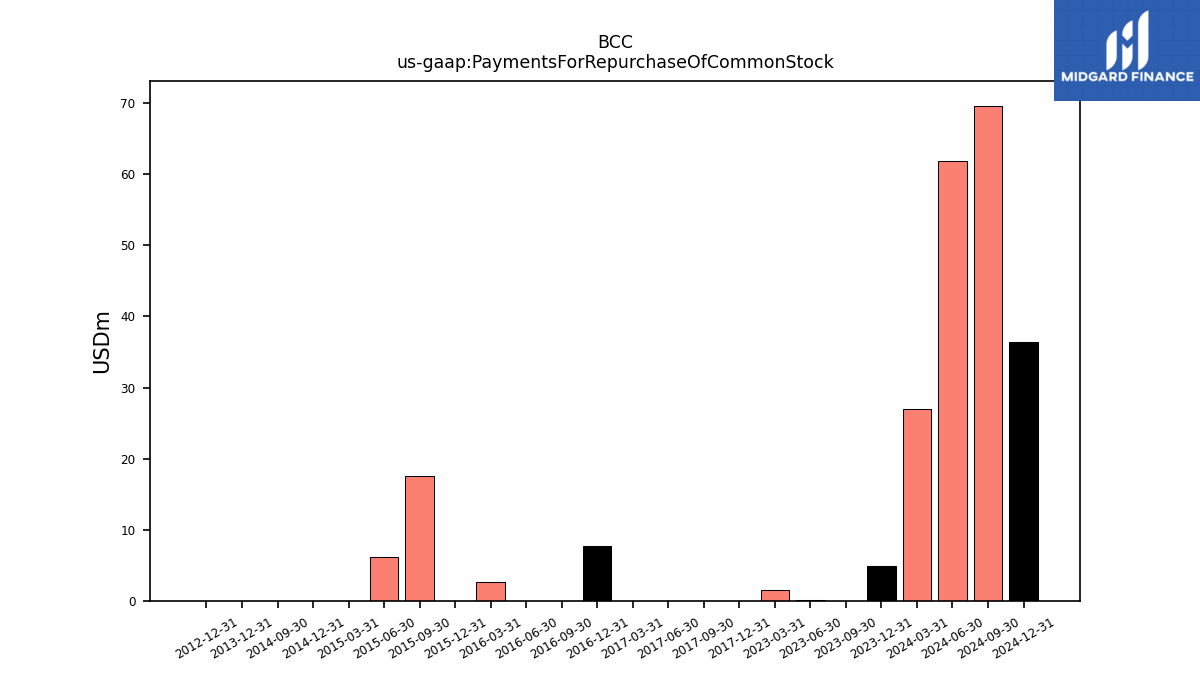
| Payments For Repurchase Of Common Stock | 4.89 | 0.00 | 0.06 | 1.48 | NA | NA | NA | NA | NA | NA | NA | NA | NA | NA | NA | NA | NA | NA | NA | NA | NA | NA | NA | NA | 0.00 | 0.00 | 0.00 | 0.00 | 7.64 | 0.00 | 0.00 | 2.63 | 0.00 | 17.60 | 6.11 | 0.00 | 0.00 | 0.00 | NA | NA | 0.00 | NA | NA | NA | 0.00 | NA | NA | NA |
| 2023-12-31 | 2023-09-30 | 2023-06-30 | 2023-03-31 | 2022-12-31 | 2022-09-30 | 2022-06-30 | 2022-03-31 | 2021-12-31 | 2021-09-30 | 2021-06-30 | 2021-03-31 | 2020-12-31 | 2020-09-30 | 2020-06-30 | 2020-03-31 | 2019-12-31 | 2019-09-30 | 2019-06-30 | 2019-03-31 | 2018-12-31 | 2018-09-30 | 2018-06-30 | 2018-03-31 | 2017-12-31 | 2017-09-30 | 2017-06-30 | 2017-03-31 | 2016-12-31 | 2016-09-30 | 2016-06-30 | 2016-03-31 | 2015-12-31 | 2015-09-30 | 2015-06-30 | 2015-03-31 | 2014-12-31 | 2014-09-30 | 2014-06-30 | 2014-03-31 | 2013-12-31 | 2013-09-30 | 2013-06-30 | 2013-03-31 | 2012-12-31 | 2012-09-30 | 2012-06-30 | 2012-03-31 | ||
|---|---|---|---|---|---|---|---|---|---|---|---|---|---|---|---|---|---|---|---|---|---|---|---|---|---|---|---|---|---|---|---|---|---|---|---|---|---|---|---|---|---|---|---|---|---|---|---|---|---|
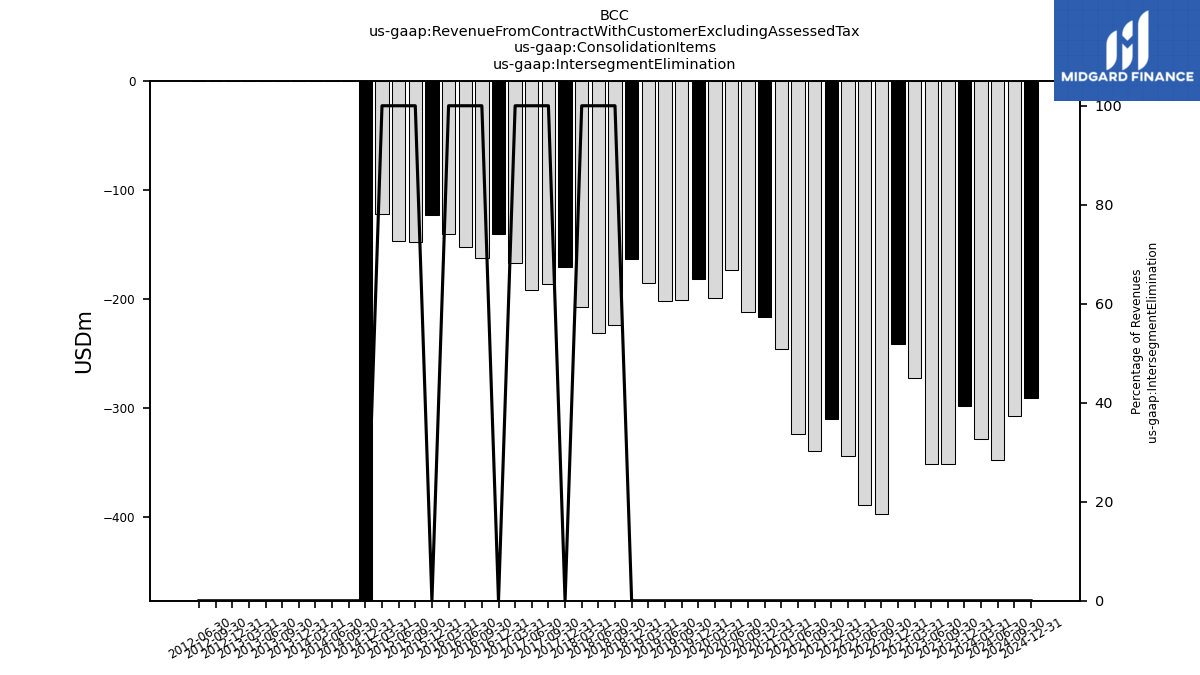
| Revenues | 1644.26 | 1834.44 | 1815.22 | 1544.33 | 1628.31 | 2154.65 | 2278.07 | 2326.28 | 1782.18 | 1879.45 | 2443.16 | 1821.32 | 1472.20 | 1589.31 | 1242.76 | 1170.53 | 1101.70 | 1269.50 | 1230.10 | 1042.10 | 1065.80 | 1338.51 | 1408.13 | 1182.84 | 1092.00 | 1226.64 | 1138.94 | 974.44 | 919.50 | 1067.21 | 1043.77 | 880.70 | 876.50 | 991.58 | 955.40 | 809.90 | 862.00 | 983.32 | 961.19 | 767.18 | 798.30 | 877.98 | 852.29 | 744.88 | 694.60 | 764.60 | 732.90 | 586.99 | |
| Revenue From Contract With Customer Excluding Assessed Tax | 1644.26 | 1834.44 | 1815.22 | 1544.33 | 1628.31 | 2154.65 | 2278.07 | 2326.28 | 1782.18 | 1879.45 | 2443.16 | 1821.32 | 1472.20 | 1589.31 | 1242.76 | 1170.53 | 1101.70 | 1269.52 | 1230.08 | 1042.09 | 1065.80 | 1338.51 | 1408.13 | 1182.84 | 1092.00 | 1226.64 | 1138.94 | 974.44 | 919.50 | 1067.21 | 1043.77 | 880.70 | 876.50 | 991.58 | 955.40 | 809.90 | 862.00 | 983.32 | 961.19 | 767.18 | 798.30 | 877.98 | 852.29 | 744.88 | 694.60 | 764.60 | 732.90 | 586.99 | |
| Intersegment Elimination | -298.03 | -351.08 | -351.59 | -272.34 | -241.08 | -397.48 | -389.16 | -344.50 | -309.91 | -339.11 | -324.15 | -245.80 | -216.51 | -212.04 | -173.00 | -199.52 | -181.54 | -201.20 | -201.60 | -185.15 | -163.55 | -223.46 | -231.13 | -207.53 | -170.72 | -185.92 | -192.04 | -166.90 | -140.71 | -162.80 | -152.70 | -140.20 | -123.10 | -148.00 | -146.60 | -122.30 | -529.90 | 0.00 | 0.00 | 0.00 | 0.00 | 0.00 | 0.00 | 0.00 | 0.00 | 0.00 | 0.00 | NA | |
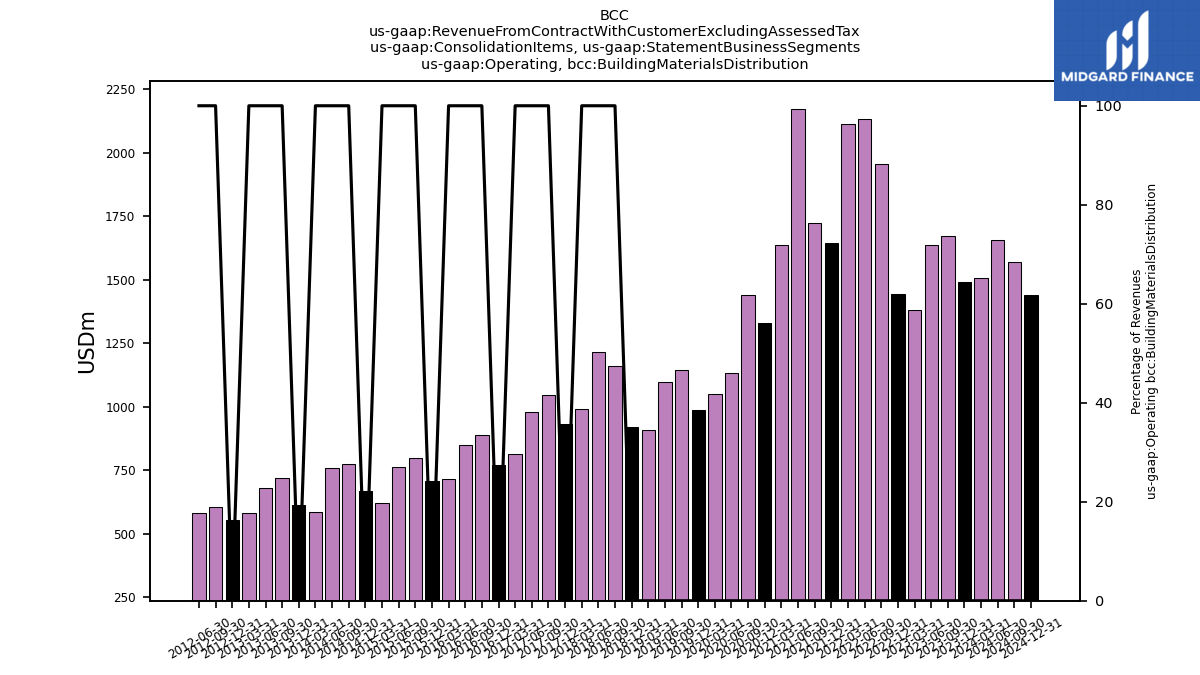
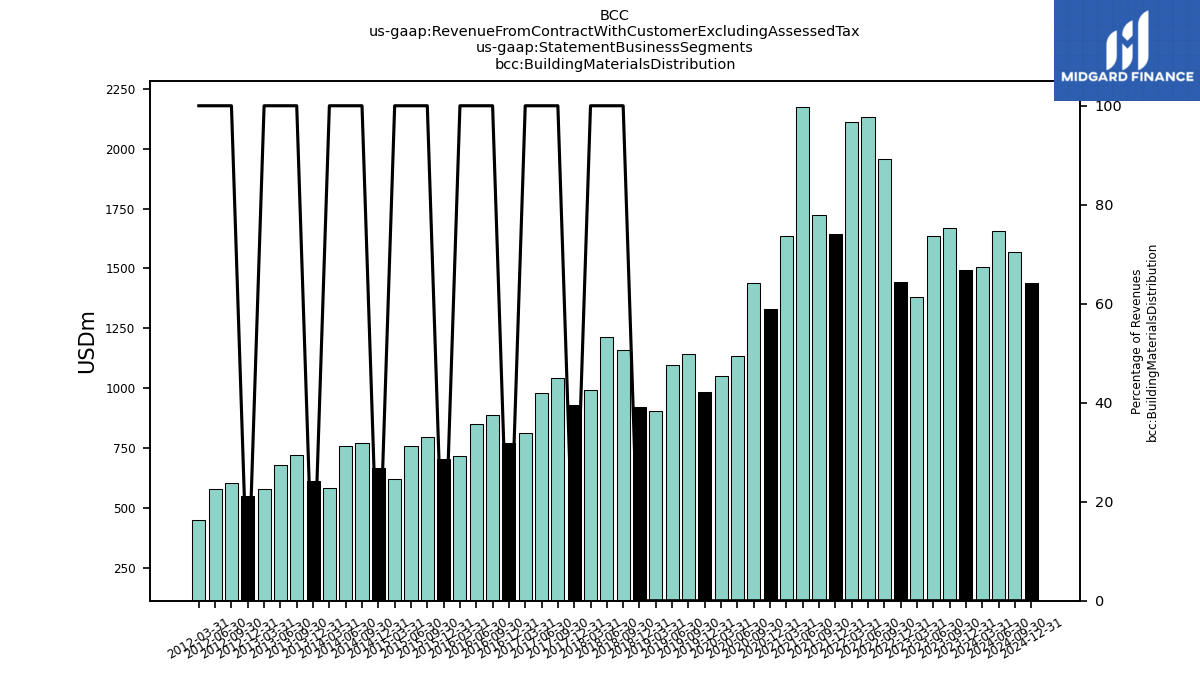
| Operating, Building Materials Distribution | 1492.61 | 1670.30 | 1636.54 | 1379.24 | 1443.78 | 1956.80 | 2131.20 | 2111.83 | 1645.51 | 1721.24 | 2172.74 | 1634.78 | 1330.08 | 1437.68 | 1134.26 | 1050.00 | 986.97 | 1145.62 | 1097.42 | 907.71 | 922.23 | 1159.30 | 1213.78 | 992.38 | 931.77 | 1045.65 | 980.71 | 815.68 | 770.91 | 889.00 | 850.00 | 717.30 | 707.30 | 799.00 | 762.10 | 622.90 | 669.50 | 773.40 | 758.30 | 585.50 | 615.40 | 721.50 | 681.50 | 581.10 | 552.60 | 605.20 | 580.50 | NA | |
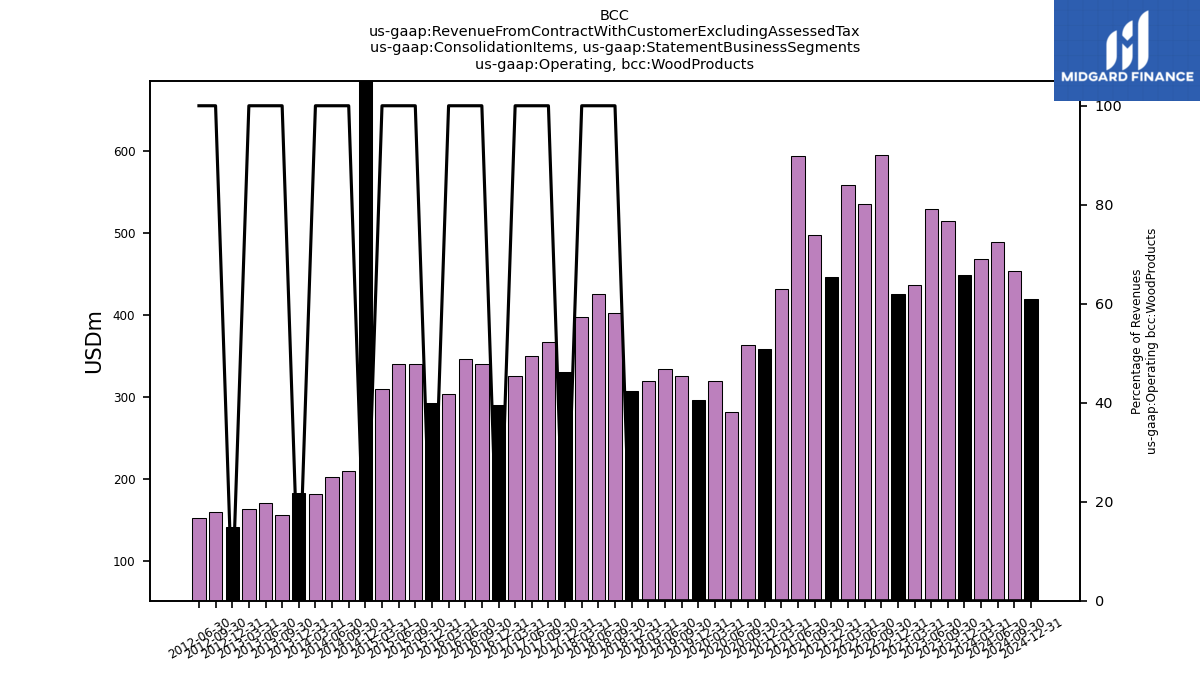
| Operating, Wood Products | 449.68 | 515.23 | 530.27 | 437.43 | 425.60 | 595.32 | 536.03 | 558.94 | 446.58 | 497.32 | 594.57 | 432.33 | 358.66 | 363.67 | 281.50 | 320.06 | 296.29 | 325.10 | 334.26 | 319.52 | 307.12 | 402.67 | 425.48 | 397.99 | 330.91 | 366.92 | 350.28 | 325.66 | 289.71 | 340.90 | 346.40 | 303.50 | 292.30 | 340.60 | 339.90 | 309.30 | 722.50 | 210.00 | 202.90 | 181.70 | 182.90 | 156.50 | 170.80 | 163.80 | 141.90 | 159.40 | 152.40 | NA | |
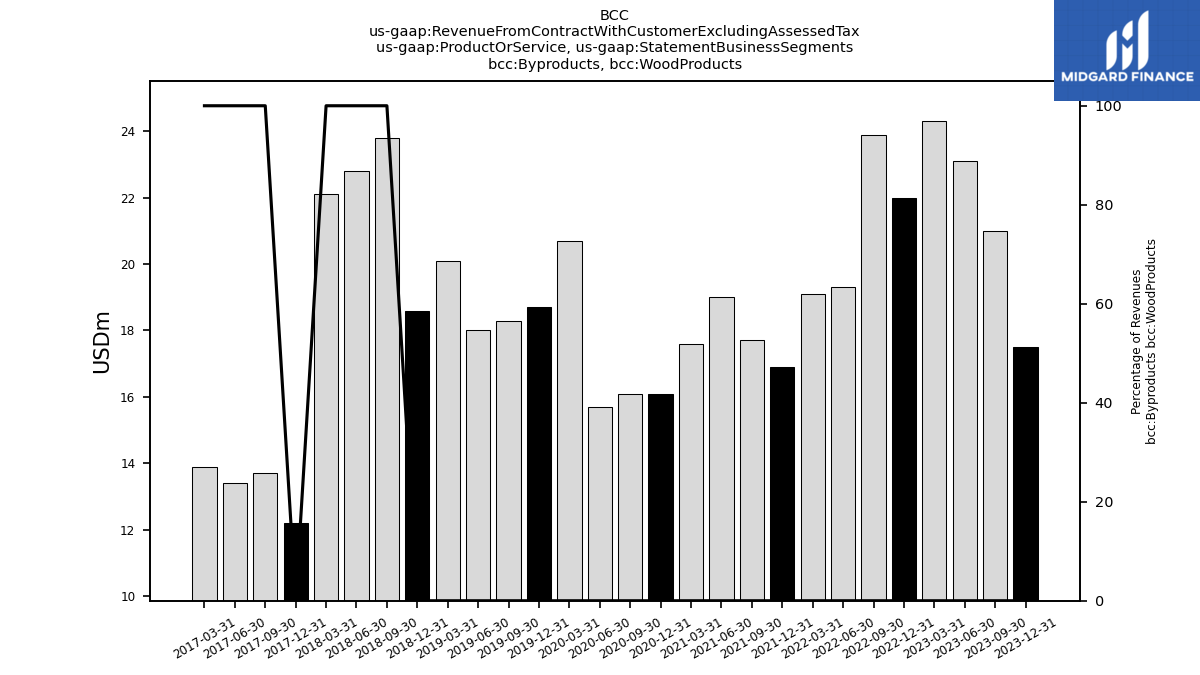
| Byproducts, Wood Products | 17.50 | 21.00 | 23.10 | 24.30 | 22.00 | 23.90 | 19.30 | 19.10 | 16.90 | 17.70 | 19.00 | 17.60 | 16.10 | 16.10 | 15.70 | 20.70 | 18.70 | 18.30 | 18.00 | 20.10 | 18.60 | 23.80 | 22.80 | 22.10 | 12.20 | 13.70 | 13.40 | 13.90 | NA | NA | NA | NA | NA | NA | NA | NA | NA | NA | NA | NA | NA | NA | NA | NA | NA | NA | NA | NA | |
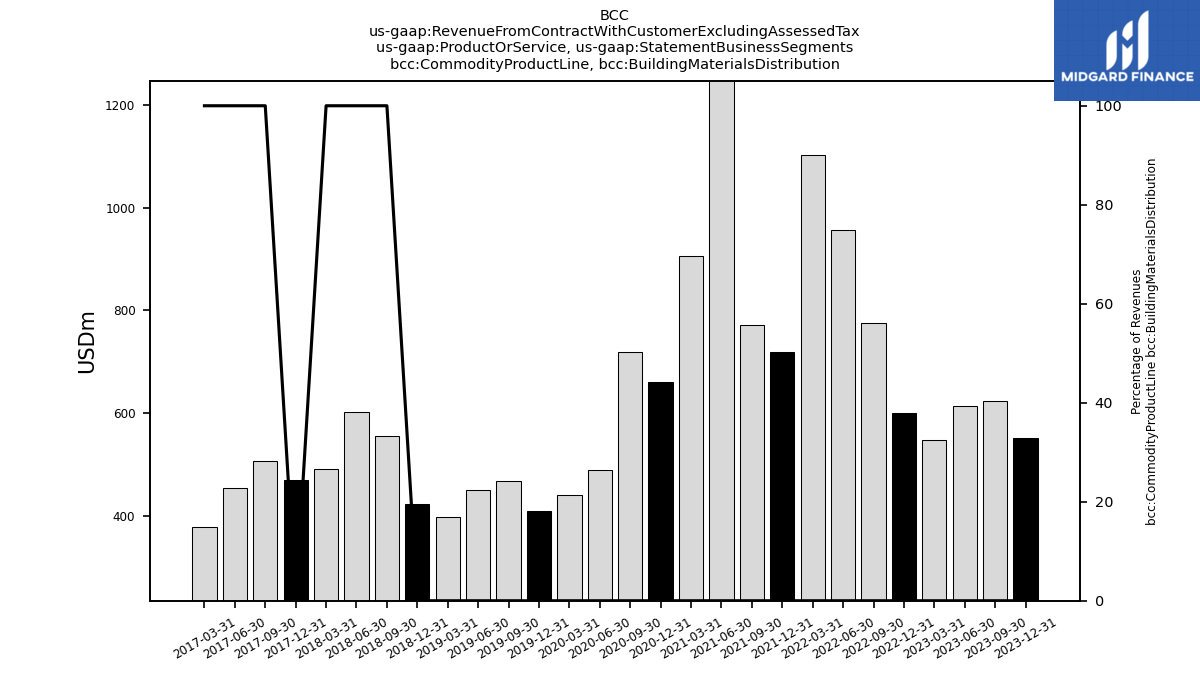
| Commodity Product Line, Building Materials Distribution | 550.70 | 623.90 | 613.70 | 547.50 | 599.20 | 775.00 | 956.30 | 1102.00 | 719.40 | 770.90 | 1308.80 | 906.20 | 660.80 | 718.90 | 490.00 | 440.30 | 408.70 | 467.90 | 450.70 | 398.40 | 422.10 | 554.80 | 602.70 | 490.60 | 469.80 | 505.60 | 453.80 | 379.00 | NA | NA | NA | NA | NA | NA | NA | NA | NA | NA | NA | NA | NA | NA | NA | NA | NA | NA | NA | NA | |
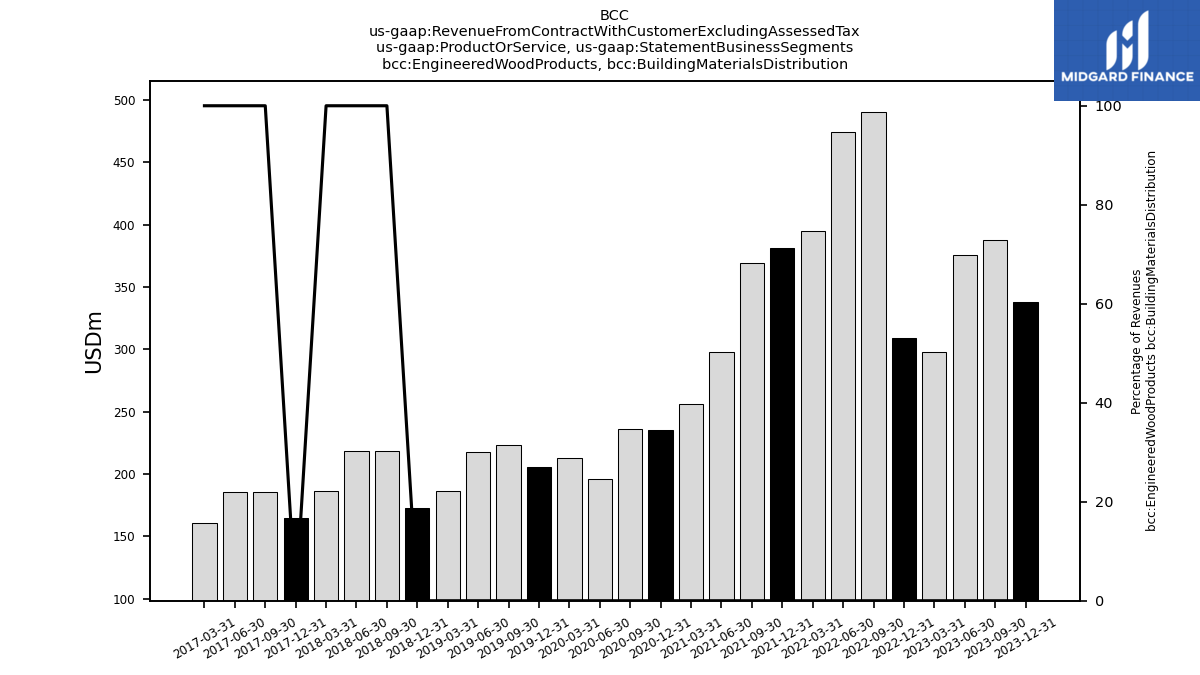
| Engineered Wood Products, Building Materials Distribution | 338.20 | 387.80 | 375.40 | 298.10 | 308.70 | 490.70 | 474.40 | 394.70 | 381.50 | 369.50 | 297.40 | 255.90 | 235.60 | 235.80 | 196.20 | 212.40 | 205.20 | 223.30 | 217.20 | 185.90 | 172.60 | 218.60 | 218.20 | 186.60 | 164.20 | 185.70 | 185.30 | 160.90 | NA | NA | NA | NA | NA | NA | NA | NA | NA | NA | NA | NA | NA | NA | NA | NA | NA | NA | NA | NA | |
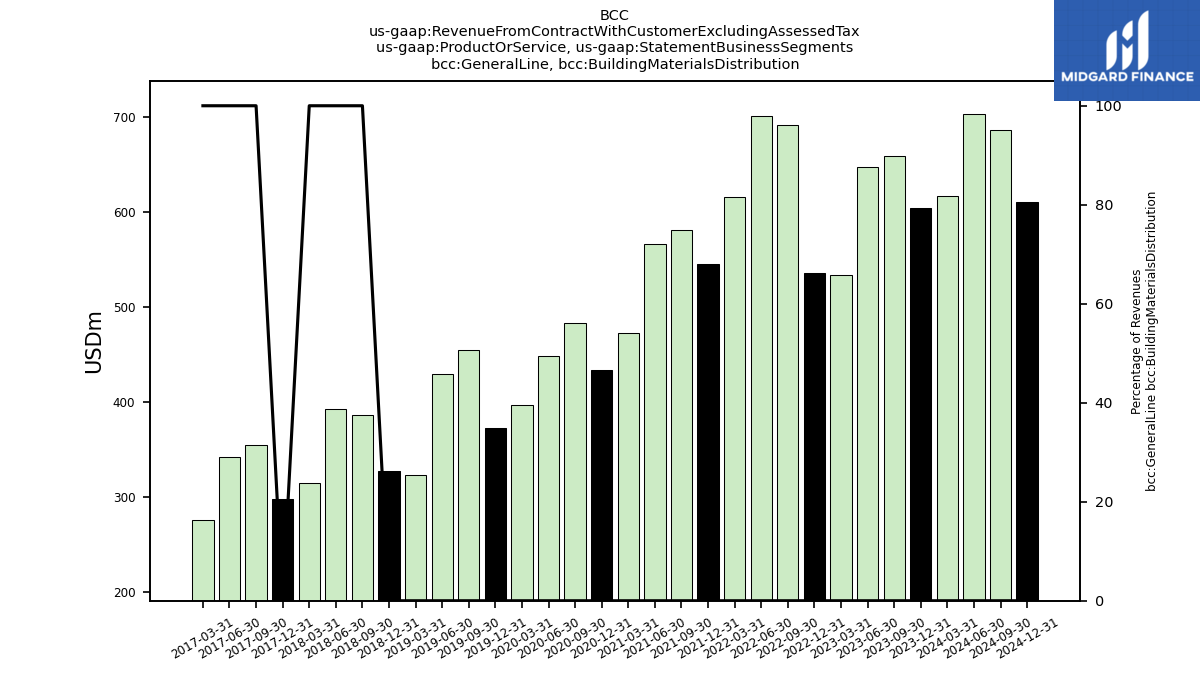
| General Line, Building Materials Distribution | 603.60 | 658.60 | 647.50 | 533.60 | 535.90 | 691.00 | 700.50 | 615.10 | 544.60 | 580.80 | 566.50 | 472.70 | 433.80 | 483.00 | 448.10 | 397.30 | 373.00 | 454.50 | 429.60 | 323.40 | 327.60 | 385.80 | 392.90 | 315.20 | 297.80 | 354.40 | 341.60 | 275.80 | NA | NA | NA | NA | NA | NA | NA | NA | NA | NA | NA | NA | NA | NA | NA | NA | NA | NA | NA | NA | |
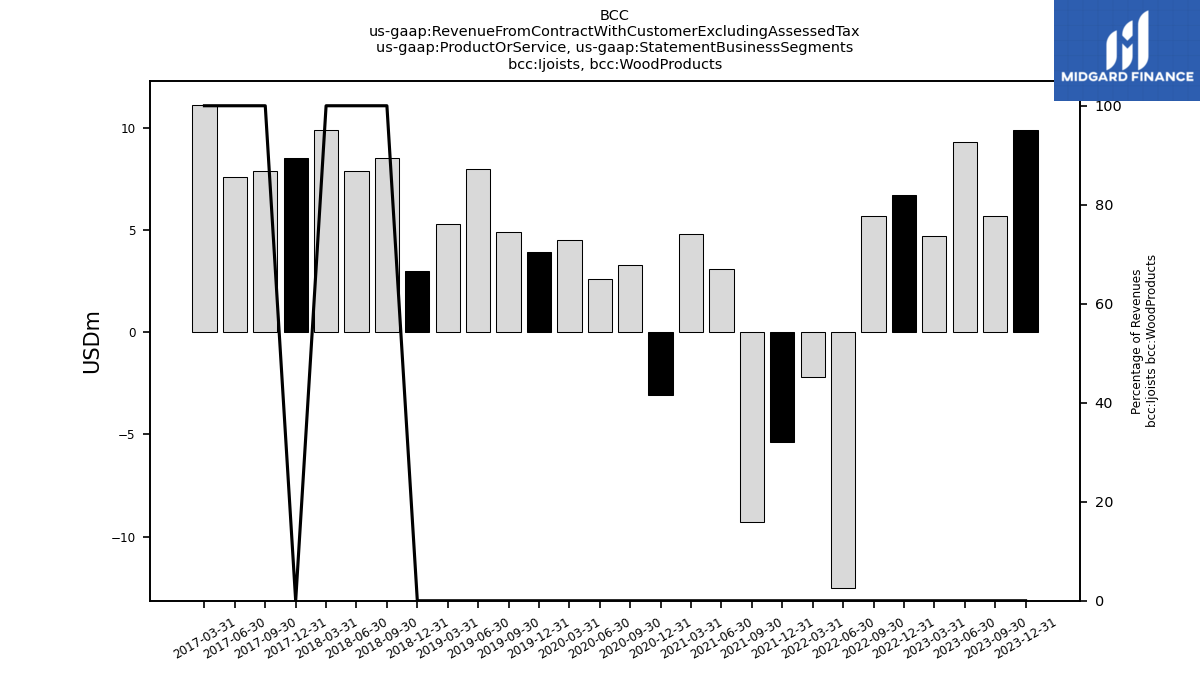
| Ijoists, Wood Products | 9.90 | 5.70 | 9.30 | 4.70 | 6.70 | 5.70 | -12.50 | -2.20 | -5.40 | -9.30 | 3.10 | 4.80 | -3.10 | 3.30 | 2.60 | 4.50 | 3.90 | 4.90 | 8.00 | 5.30 | 3.00 | 8.50 | 7.90 | 9.90 | 8.50 | 7.90 | 7.60 | 11.10 | NA | NA | NA | NA | NA | NA | NA | NA | NA | NA | NA | NA | NA | NA | NA | NA | NA | NA | NA | NA | |
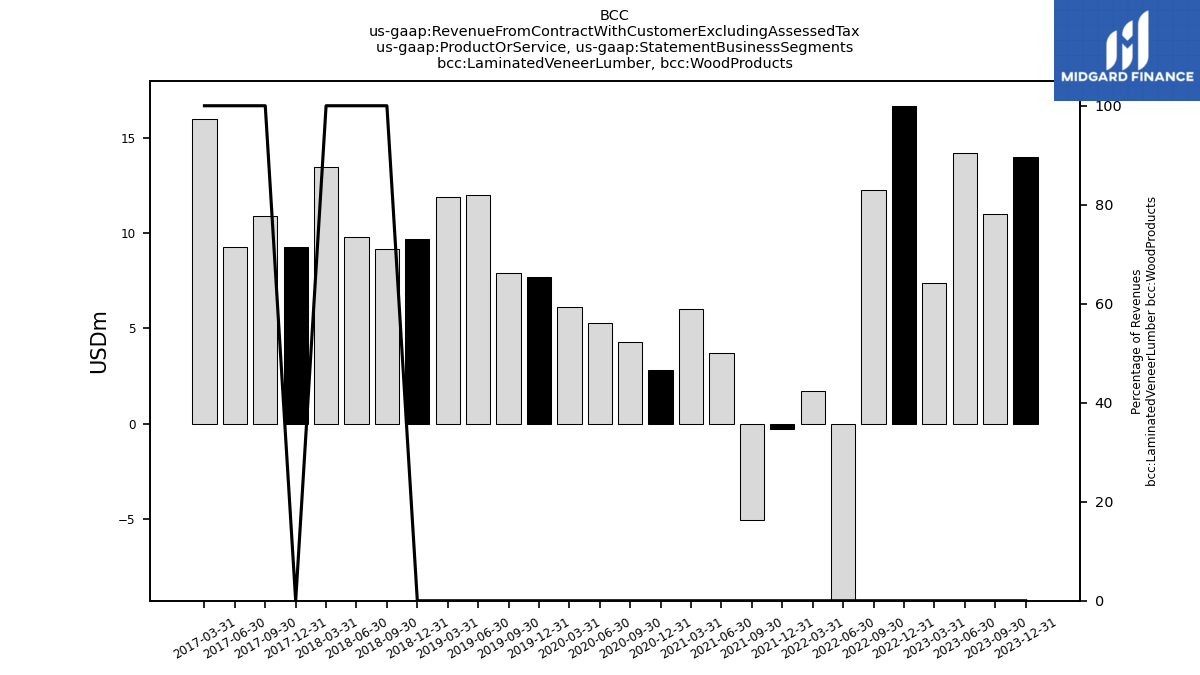
| Laminated Veneer Lumber, Wood Products | 14.00 | 11.00 | 14.20 | 7.40 | 16.70 | 12.30 | -9.50 | 1.70 | -0.30 | -5.10 | 3.70 | 6.00 | 2.80 | 4.30 | 5.30 | 6.10 | 7.70 | 7.90 | 12.00 | 11.90 | 9.70 | 9.20 | 9.80 | 13.50 | 9.30 | 10.90 | 9.30 | 16.00 | NA | NA | NA | NA | NA | NA | NA | NA | NA | NA | NA | NA | NA | NA | NA | NA | NA | NA | NA | NA | |
| Lumber, Wood Products | 17.80 | 21.00 | 23.70 | 23.60 | 18.70 | 21.70 | 20.90 | 17.70 | 15.90 | 21.30 | 25.70 | 18.90 | 16.80 | 13.30 | 12.30 | 12.30 | 11.80 | 13.50 | 14.00 | 13.20 | 15.80 | 20.30 | 25.00 | 24.90 | 21.20 | 22.90 | 22.50 | 21.00 | NA | NA | NA | NA | NA | NA | NA | NA | NA | NA | NA | NA | NA | NA | NA | NA | NA | NA | NA | NA | |
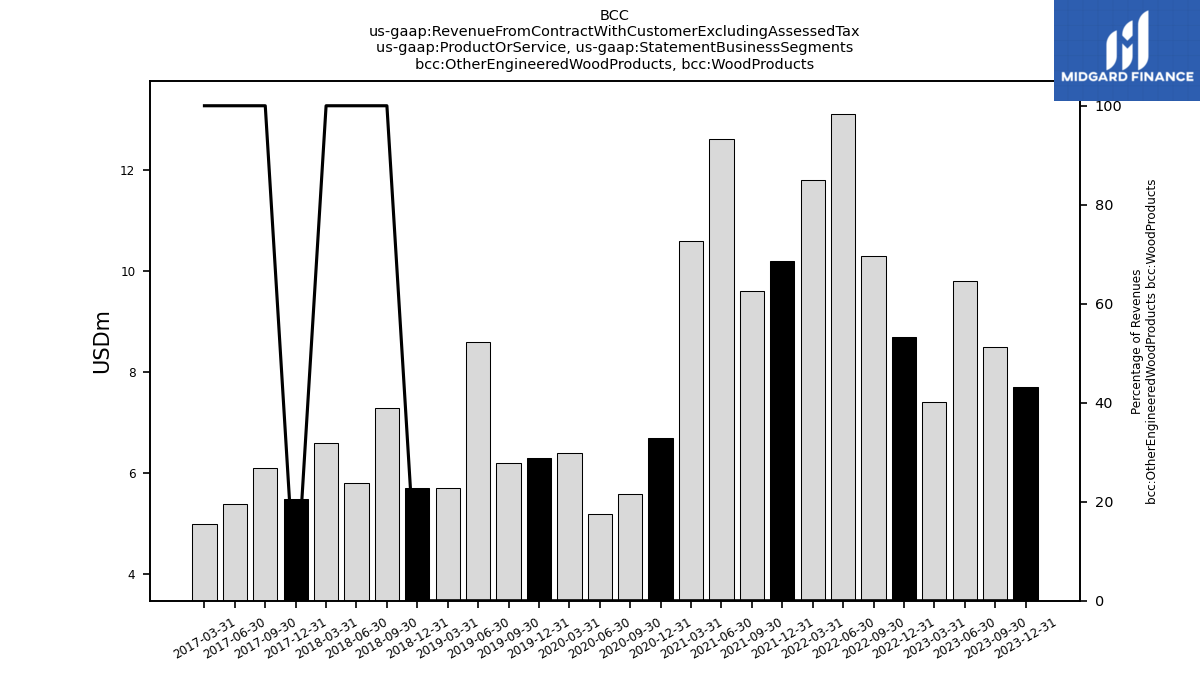
| Other Engineered Wood Products, Wood Products | 7.70 | 8.50 | 9.80 | 7.40 | 8.70 | 10.30 | 13.10 | 11.80 | 10.20 | 9.60 | 12.60 | 10.60 | 6.70 | 5.60 | 5.20 | 6.40 | 6.30 | 6.20 | 8.60 | 5.70 | 5.70 | 7.30 | 5.80 | 6.60 | 5.50 | 6.10 | 5.40 | 5.00 | NA | NA | NA | NA | NA | NA | NA | NA | NA | NA | NA | NA | NA | NA | NA | NA | NA | NA | NA | NA | |
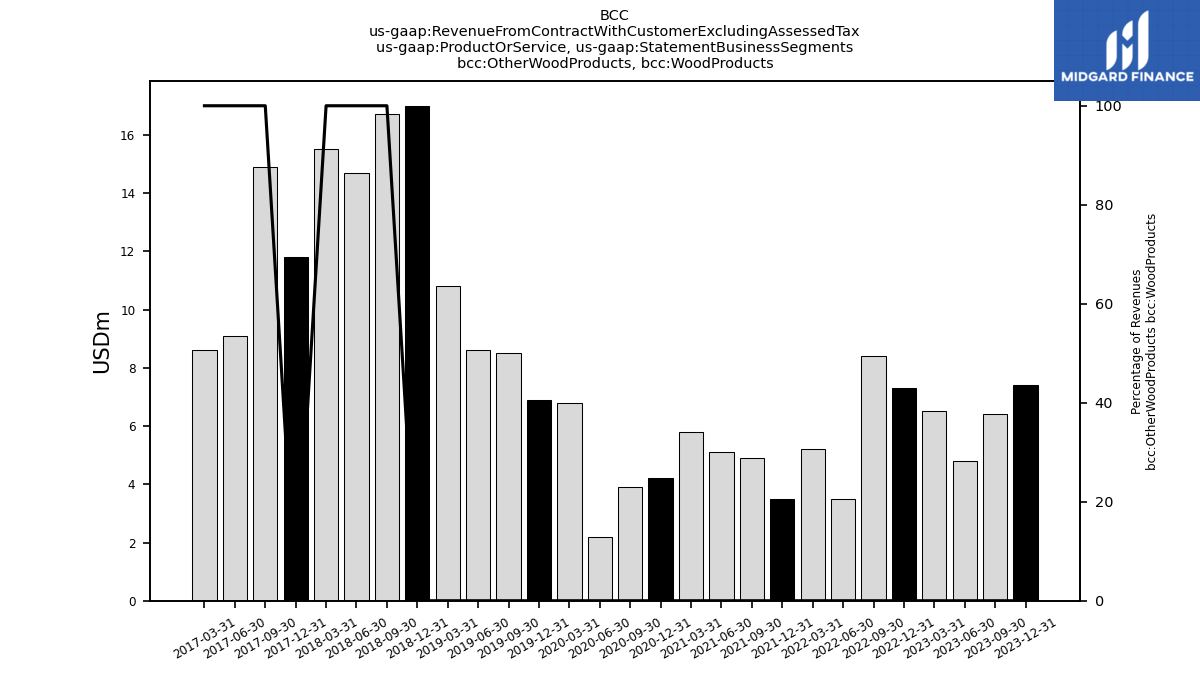
| Other Wood Products, Wood Products | 7.40 | 6.40 | 4.80 | 6.50 | 7.30 | 8.40 | 3.50 | 5.20 | 3.50 | 4.90 | 5.10 | 5.80 | 4.20 | 3.90 | 2.20 | 6.80 | 6.90 | 8.50 | 8.60 | 10.80 | 17.00 | 16.70 | 14.70 | 15.50 | 11.80 | 14.90 | 9.10 | 8.60 | NA | NA | NA | NA | NA | NA | NA | NA | NA | NA | NA | NA | NA | NA | NA | NA | NA | NA | NA | NA | |
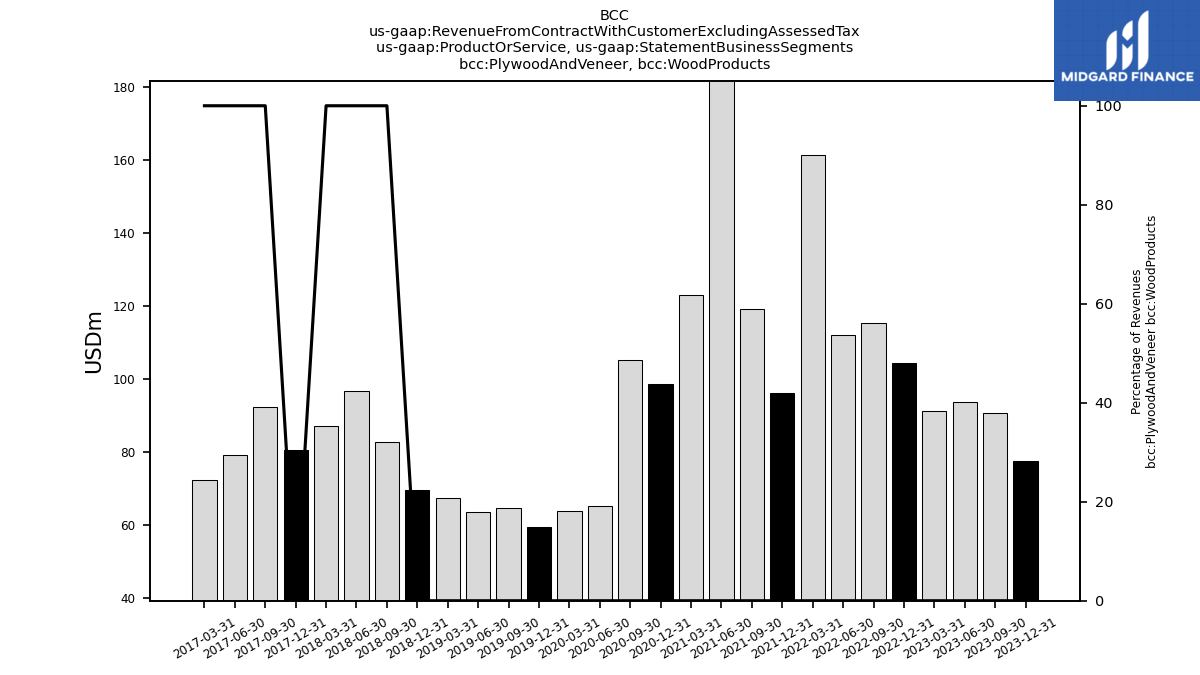
| Plywood And Veneer, Wood Products | 77.50 | 90.60 | 93.80 | 91.30 | 104.40 | 115.40 | 112.10 | 161.20 | 96.10 | 119.20 | 201.20 | 122.90 | 98.50 | 105.10 | 65.20 | 63.80 | 59.60 | 64.60 | 63.50 | 67.40 | 69.70 | 82.80 | 96.70 | 87.10 | 80.40 | 92.40 | 79.20 | 72.40 | NA | NA | NA | NA | NA | NA | NA | NA | NA | NA | NA | NA | NA | NA | NA | NA | NA | NA | NA | NA | |
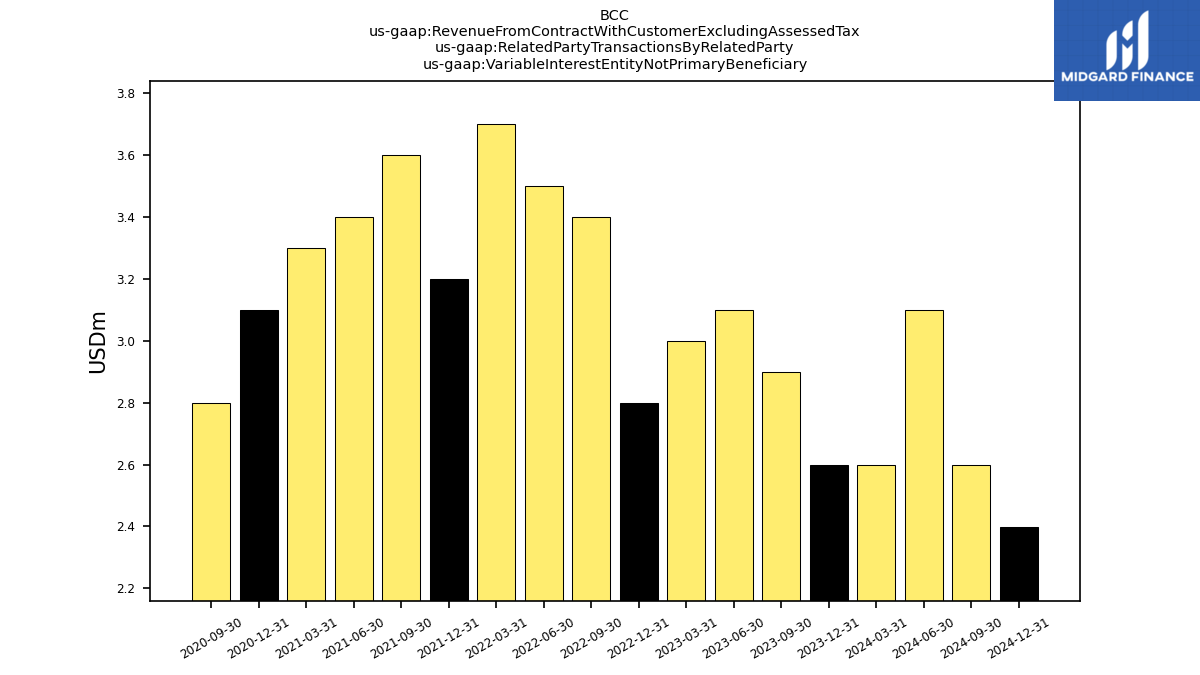
| Variable Interest Entity Not Primary Beneficiary | 2.60 | 2.90 | 3.10 | 3.00 | 2.80 | 3.40 | 3.50 | 3.70 | 3.20 | 3.60 | 3.40 | 3.30 | 3.10 | 2.80 | NA | NA | NA | NA | NA | NA | NA | NA | NA | NA | NA | NA | NA | NA | NA | NA | NA | NA | NA | NA | NA | NA | NA | NA | NA | NA | NA | NA | NA | NA | NA | NA | NA | NA | |
| Building Materials Distribution | 1492.50 | 1670.30 | 1636.50 | 1379.20 | 1443.80 | 1956.80 | 2131.20 | 2111.80 | 1645.50 | 1721.10 | 2172.70 | 1634.80 | 1330.10 | 1437.70 | 1134.30 | 1050.00 | 987.00 | 1145.60 | 1097.40 | 907.70 | 922.20 | 1159.30 | 1213.80 | 992.40 | 931.70 | 1045.60 | 980.70 | 815.70 | 770.90 | 889.00 | 850.00 | 717.30 | 707.30 | 799.00 | 761.90 | 622.90 | 669.20 | 773.40 | 758.40 | 585.50 | 615.50 | 721.50 | 681.50 | 581.10 | 553.00 | 605.20 | 580.50 | 451.40 | |
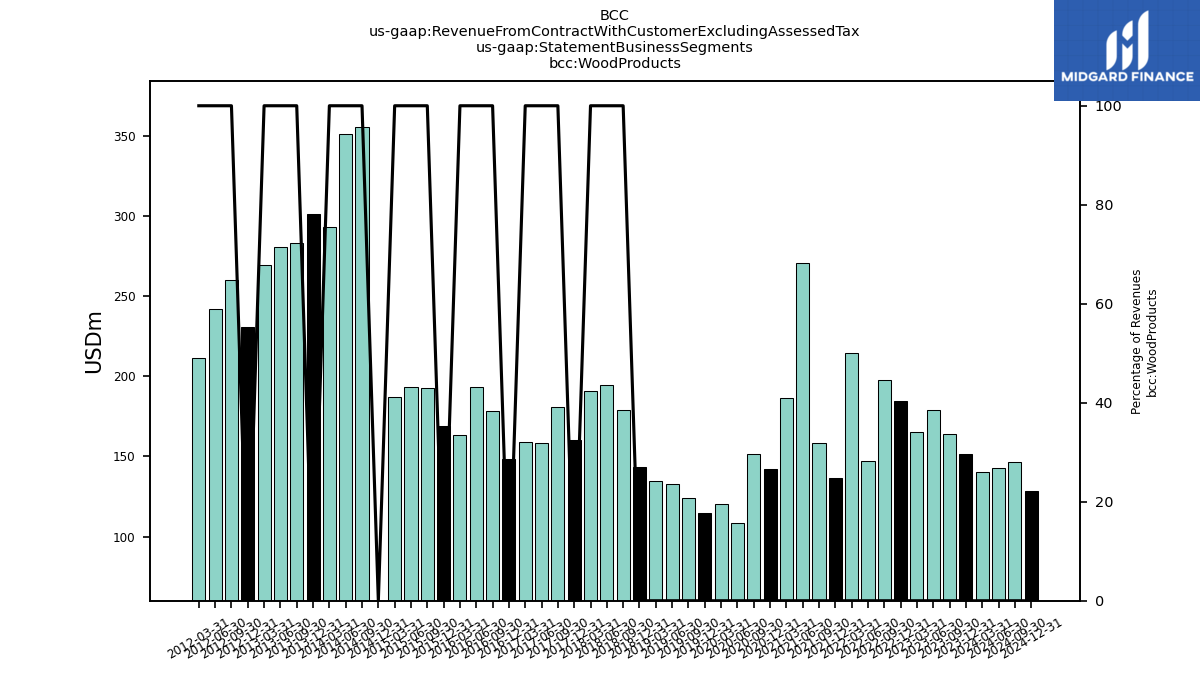
| Wood Products | 151.70 | 164.20 | 178.70 | 165.10 | 184.50 | 197.80 | 146.90 | 214.50 | 136.70 | 158.30 | 270.50 | 186.50 | 142.10 | 151.60 | 108.50 | 120.50 | 114.70 | 123.90 | 132.70 | 134.40 | 143.60 | 179.20 | 194.30 | 190.50 | 160.20 | 181.00 | 158.20 | 158.80 | 148.60 | 178.10 | 193.60 | 163.30 | 169.20 | 192.60 | 193.50 | 187.00 | -212.80 | 355.70 | 351.00 | 293.30 | 301.30 | 283.20 | 280.40 | 269.20 | 230.60 | 259.80 | 241.80 | 211.10 |