
| 2024-01-31 | 2023-10-31 | 2023-07-31 | 2023-04-30 | 2023-01-31 | 2022-10-31 | 2022-07-31 | 2022-04-30 | 2022-01-31 | 2021-10-31 | 2021-07-31 | 2021-04-30 | 2021-01-31 | 2020-10-31 | 2020-07-31 | 2020-04-30 | 2020-01-31 | 2019-10-31 | 2019-07-31 | 2019-04-30 | 2019-01-31 | 2018-10-31 | 2018-07-31 | 2018-04-30 | 2018-01-31 | 2017-10-31 | 2017-07-31 | ||
|---|---|---|---|---|---|---|---|---|---|---|---|---|---|---|---|---|---|---|---|---|---|---|---|---|---|---|---|---|
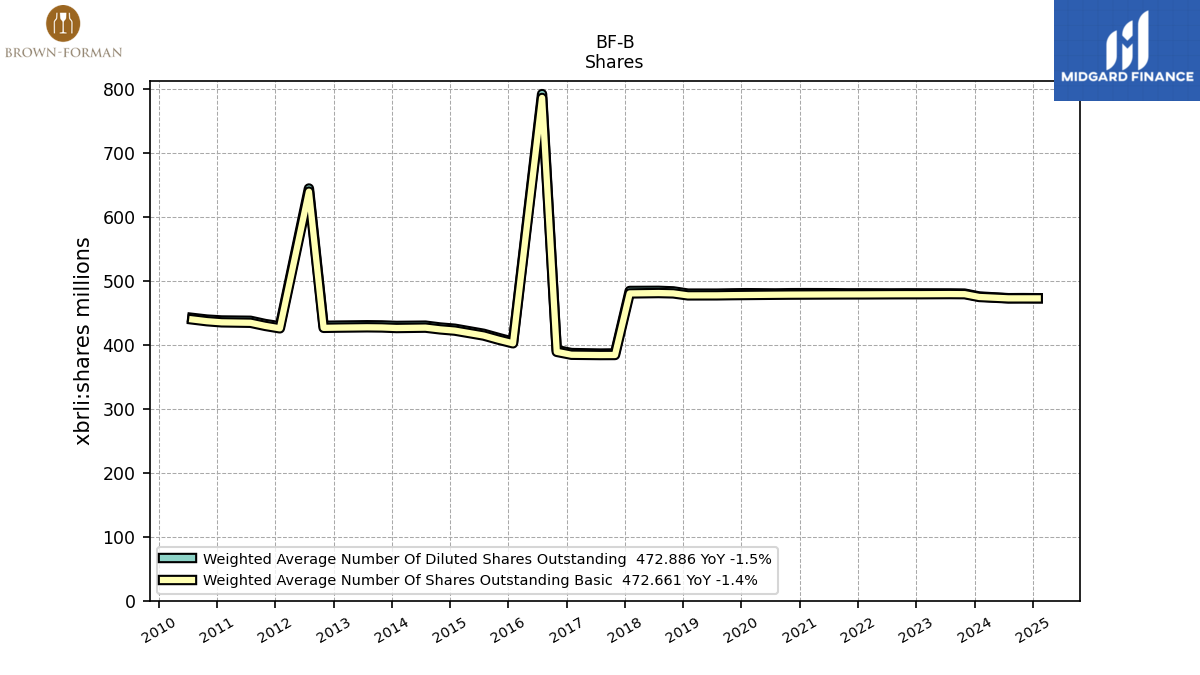
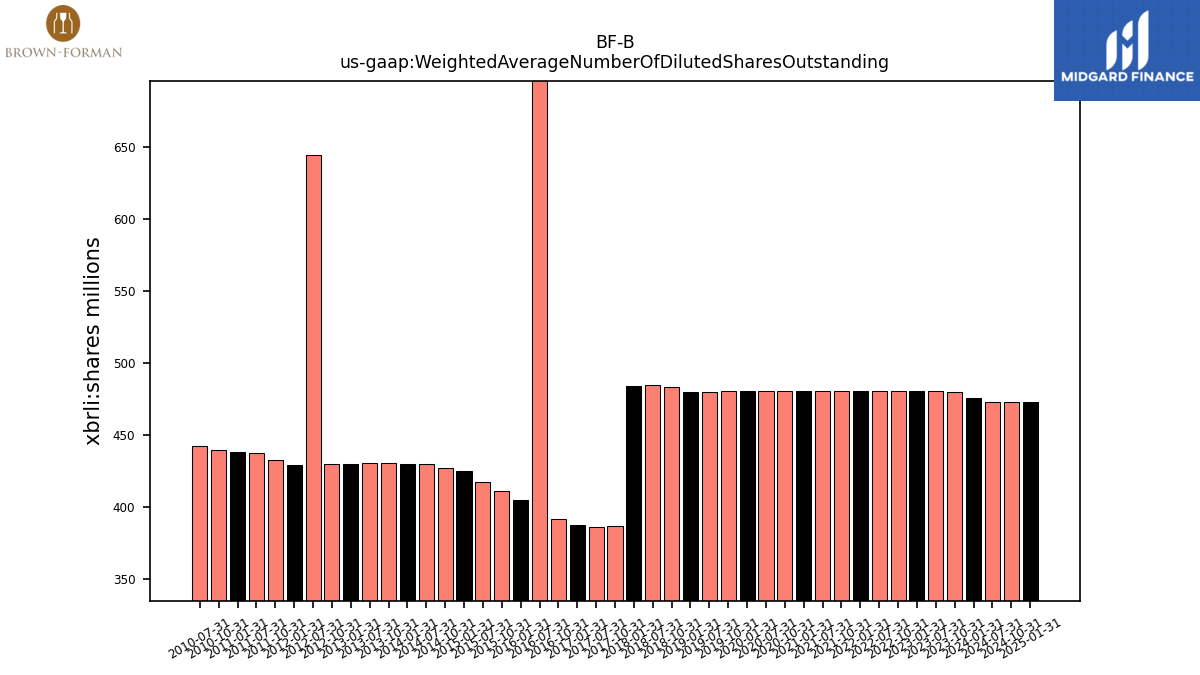
| Weighted Average Number Of Diluted Shares Outstanding | 475.57 | 480.12 | 480.38 | NA | 480.46 | 480.55 | 480.44 | NA | 480.57 | 480.52 | 480.72 | NA | 480.84 | 480.75 | 480.43 | NA | 480.76 | 480.48 | 480.09 | NA | 480.10 | 483.59 | 484.44 | NA | 484.24 | 386.63 | 386.39 | |
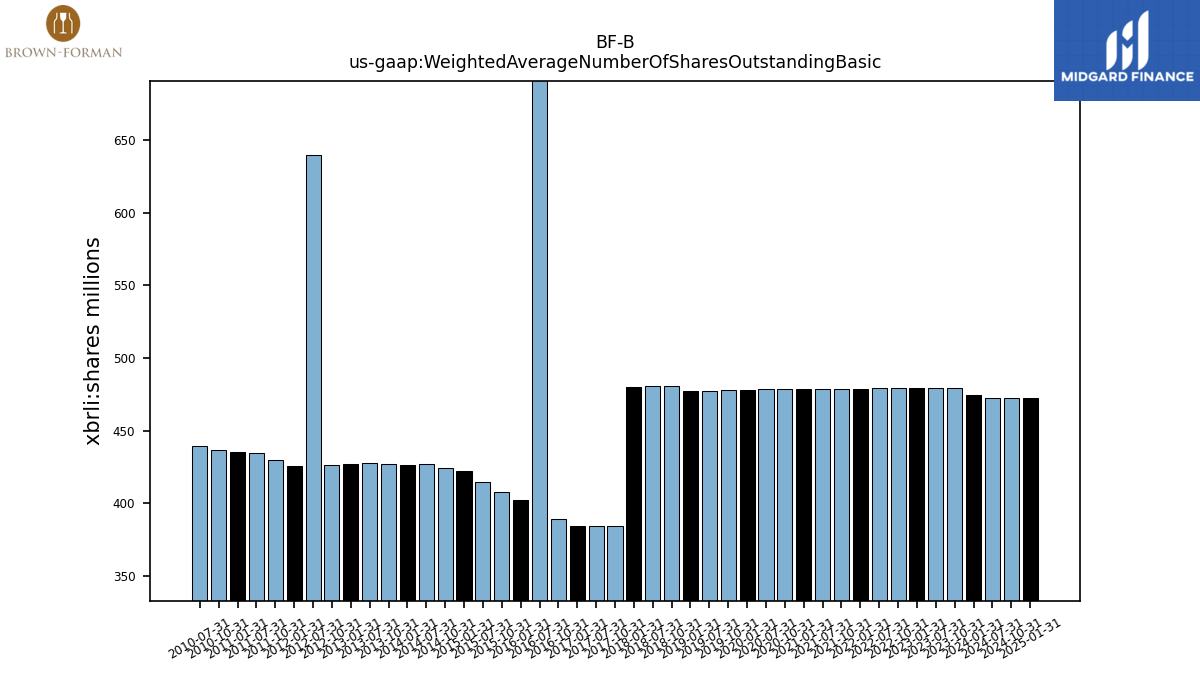
| Weighted Average Number Of Shares Outstanding Basic | 474.81 | 479.20 | 479.35 | NA | 479.15 | 479.14 | 479.08 | NA | 478.89 | 478.86 | 478.79 | NA | 478.60 | 478.51 | 478.33 | NA | 477.90 | 477.68 | 477.37 | NA | 477.30 | 480.44 | 480.96 | NA | 480.36 | 384.12 | 384.04 | |
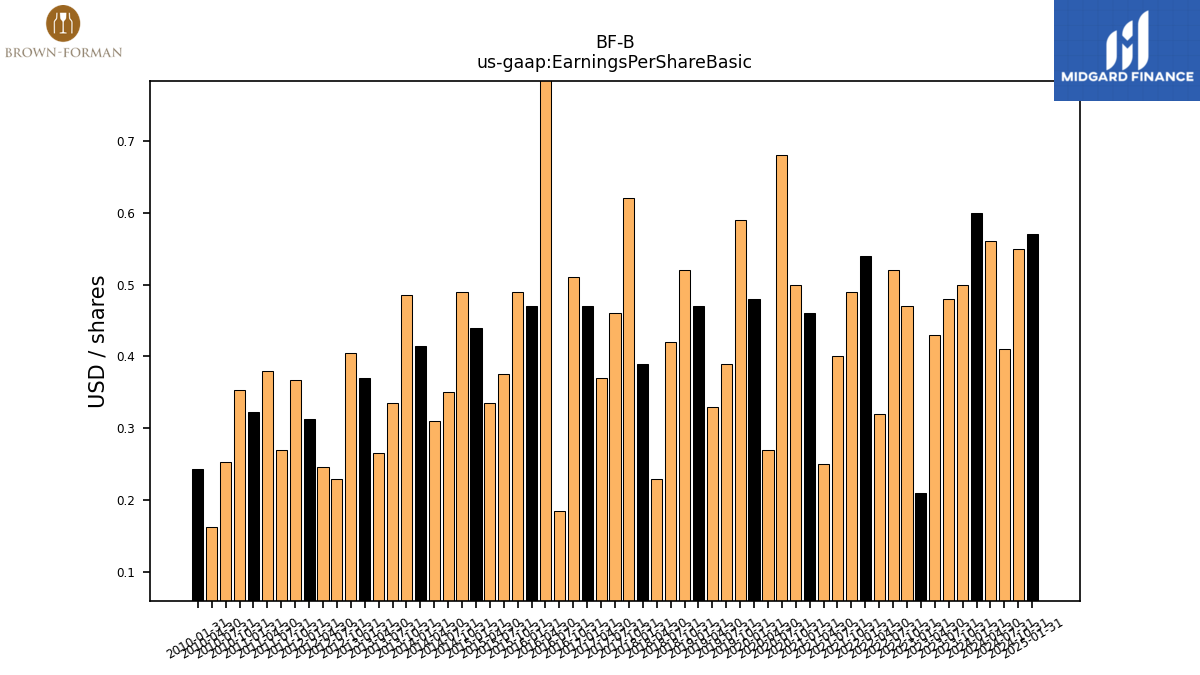
| Earnings Per Share Basic | 0.60 | 0.50 | 0.48 | 0.43 | 0.21 | 0.47 | 0.52 | 0.32 | 0.54 | 0.49 | 0.40 | 0.25 | 0.46 | 0.50 | 0.68 | 0.27 | 0.48 | 0.59 | 0.39 | 0.33 | 0.47 | 0.52 | 0.42 | 0.23 | 0.39 | 0.62 | 0.46 | |
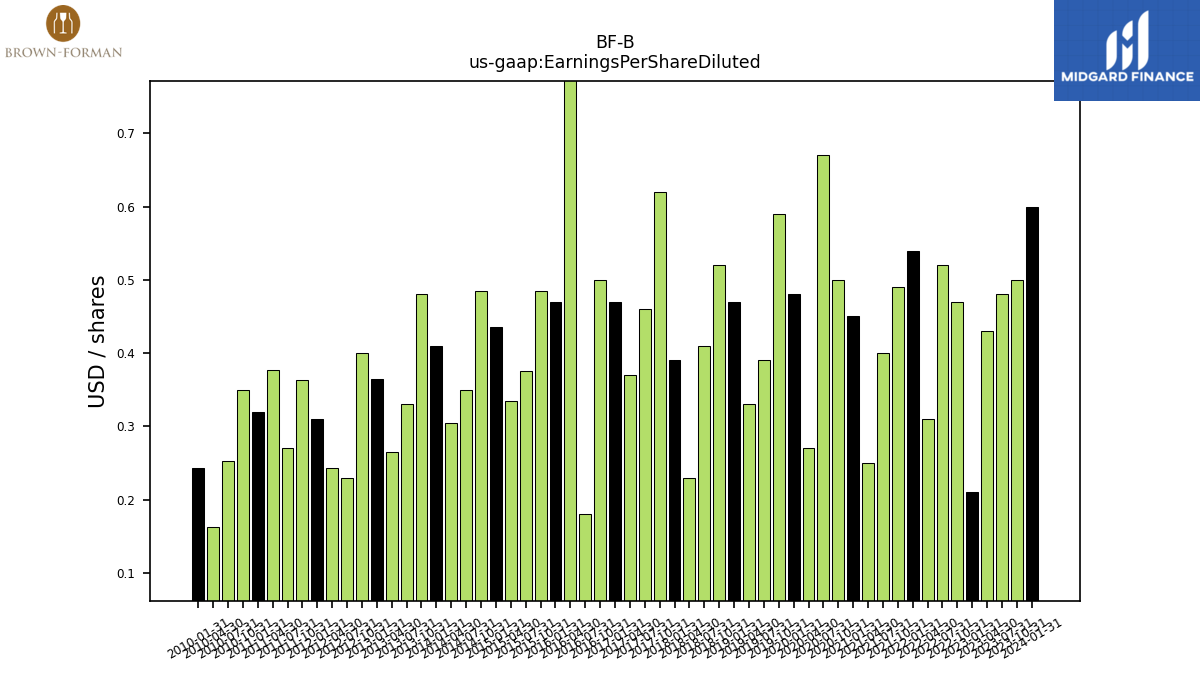
| Earnings Per Share Diluted | 0.60 | 0.50 | 0.48 | 0.43 | 0.21 | 0.47 | 0.52 | 0.31 | 0.54 | 0.49 | 0.40 | 0.25 | 0.45 | 0.50 | 0.67 | 0.27 | 0.48 | 0.59 | 0.39 | 0.33 | 0.47 | 0.52 | 0.41 | 0.23 | 0.39 | 0.62 | 0.46 |
| 2024-01-31 | 2023-10-31 | 2023-07-31 | 2023-04-30 | 2023-01-31 | 2022-10-31 | 2022-07-31 | 2022-04-30 | 2022-01-31 | 2021-10-31 | 2021-07-31 | 2021-04-30 | 2021-01-31 | 2020-10-31 | 2020-07-31 | 2020-04-30 | 2020-01-31 | 2019-10-31 | 2019-07-31 | 2019-04-30 | 2019-01-31 | 2018-10-31 | 2018-07-31 | 2018-04-30 | 2018-01-31 | 2017-10-31 | 2017-07-31 | ||
|---|---|---|---|---|---|---|---|---|---|---|---|---|---|---|---|---|---|---|---|---|---|---|---|---|---|---|---|---|
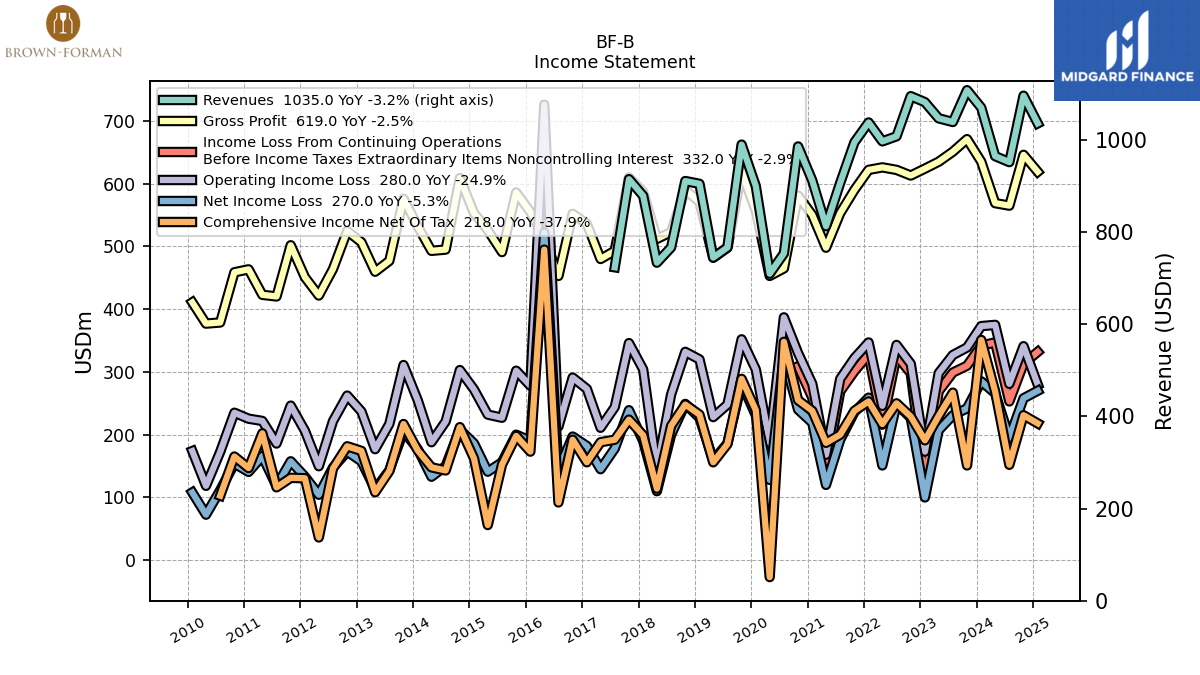
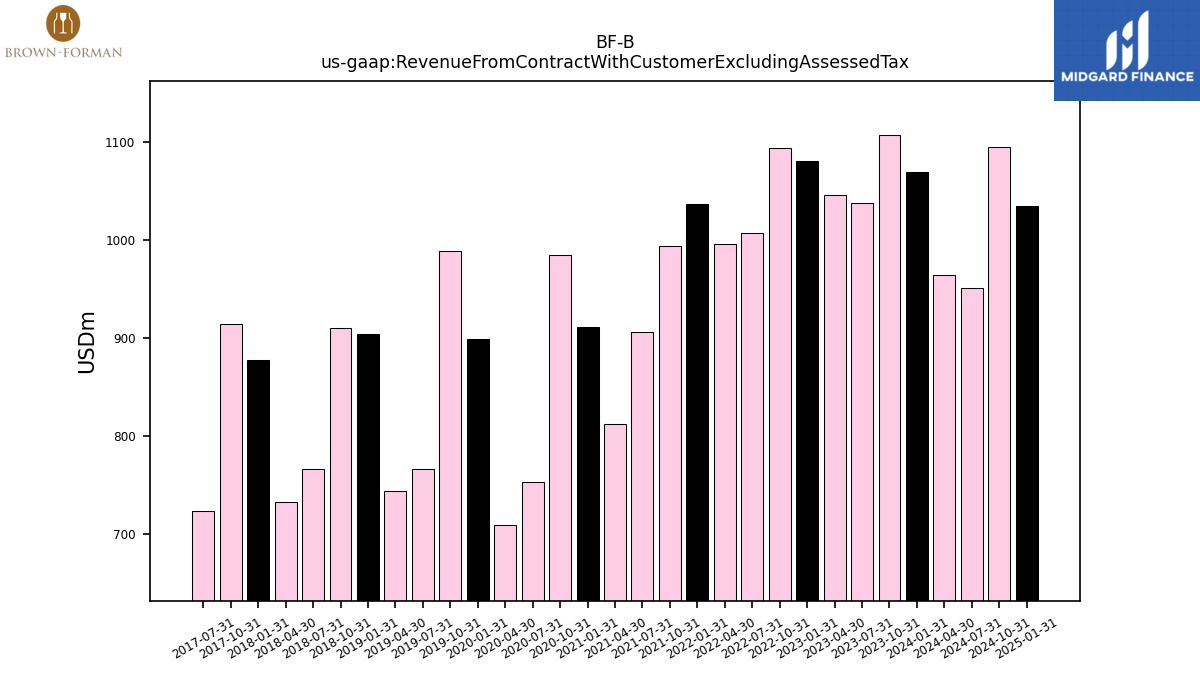
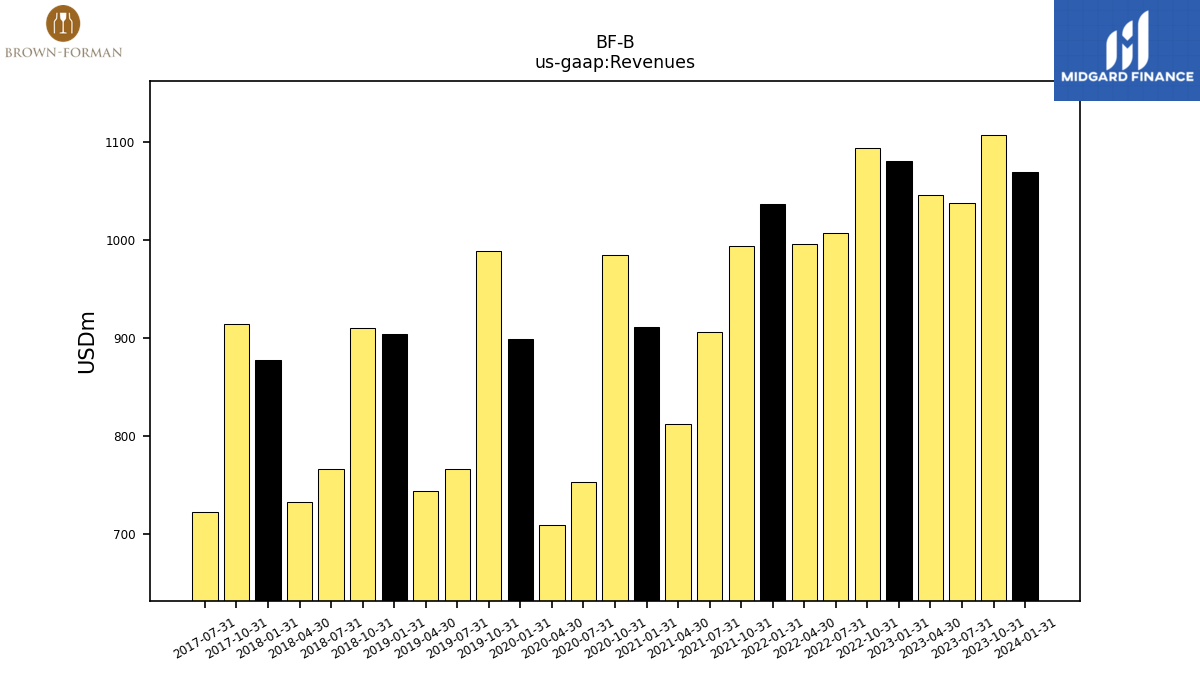
| Revenue From Contract With Customer Excluding Assessed Tax | 1069.00 | 1107.00 | 1038.00 | 1046.00 | 1081.00 | 1094.00 | 1007.00 | 996.00 | 1037.00 | 994.00 | 906.00 | 812.00 | 911.00 | 985.00 | 753.00 | 709.00 | 899.00 | 989.00 | 766.00 | 744.00 | 904.00 | 910.00 | 766.00 | 733.00 | 878.00 | 914.00 | 723.00 | |
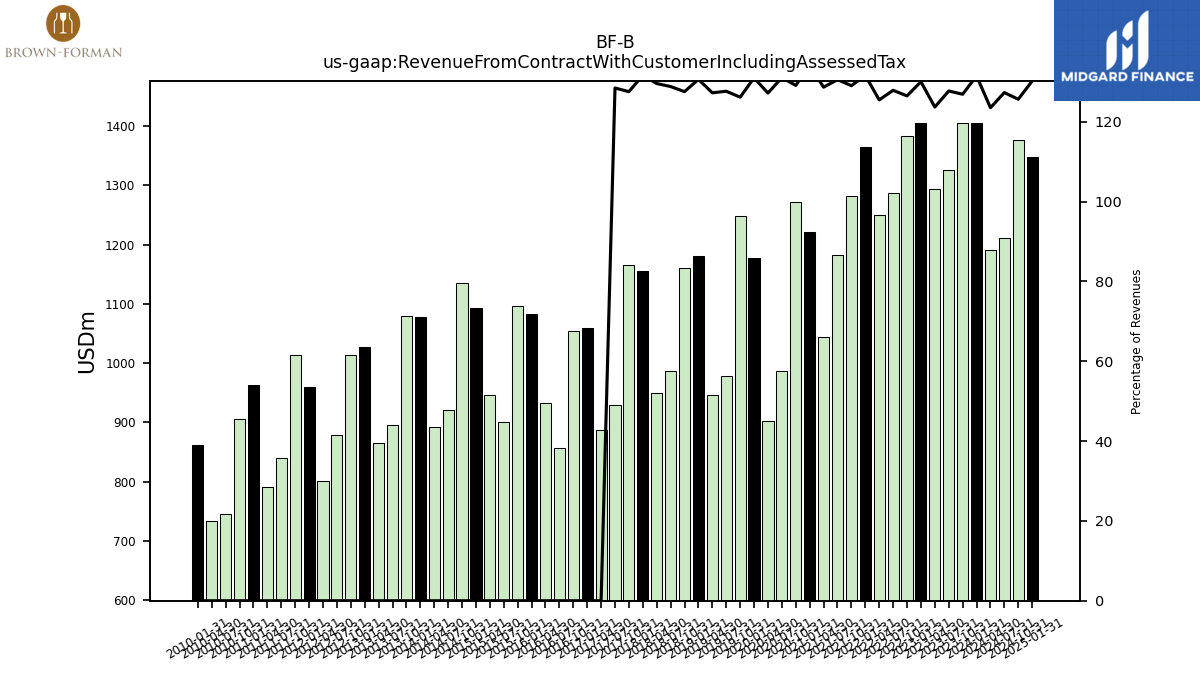
| Revenue From Contract With Customer Including Assessed Tax | 1406.00 | 1405.00 | 1326.00 | 1294.00 | 1406.00 | 1384.00 | 1288.00 | 1250.00 | 1365.00 | 1283.00 | 1183.00 | 1045.00 | 1222.00 | 1272.00 | 987.00 | 902.00 | 1178.00 | 1248.00 | 978.00 | 947.00 | 1181.00 | 1161.00 | 987.00 | 950.00 | 1156.00 | 1166.00 | 929.00 | |
| Revenues | 1069.00 | 1107.00 | 1038.00 | 1046.00 | 1081.00 | 1094.00 | 1007.00 | 996.00 | 1037.00 | 994.00 | 906.00 | 812.00 | 911.00 | 985.00 | 753.00 | 709.00 | 899.00 | 989.00 | 766.00 | 744.00 | 904.00 | 910.00 | 766.00 | 733.00 | 878.00 | 914.00 | 723.00 | |
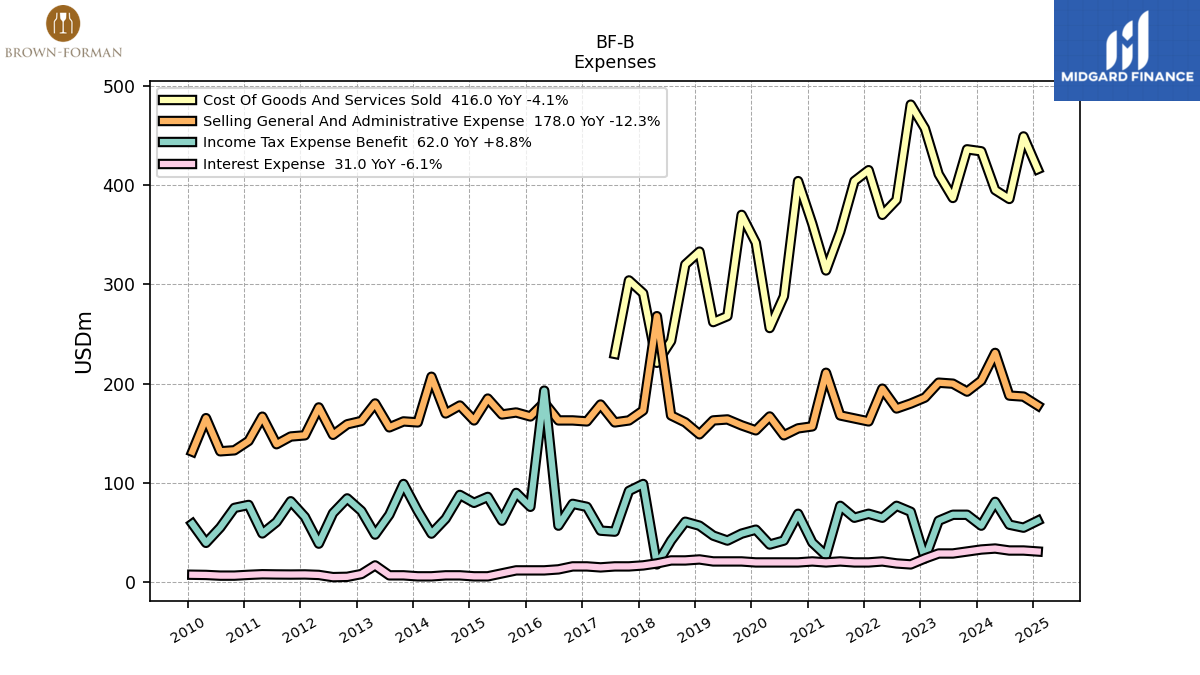
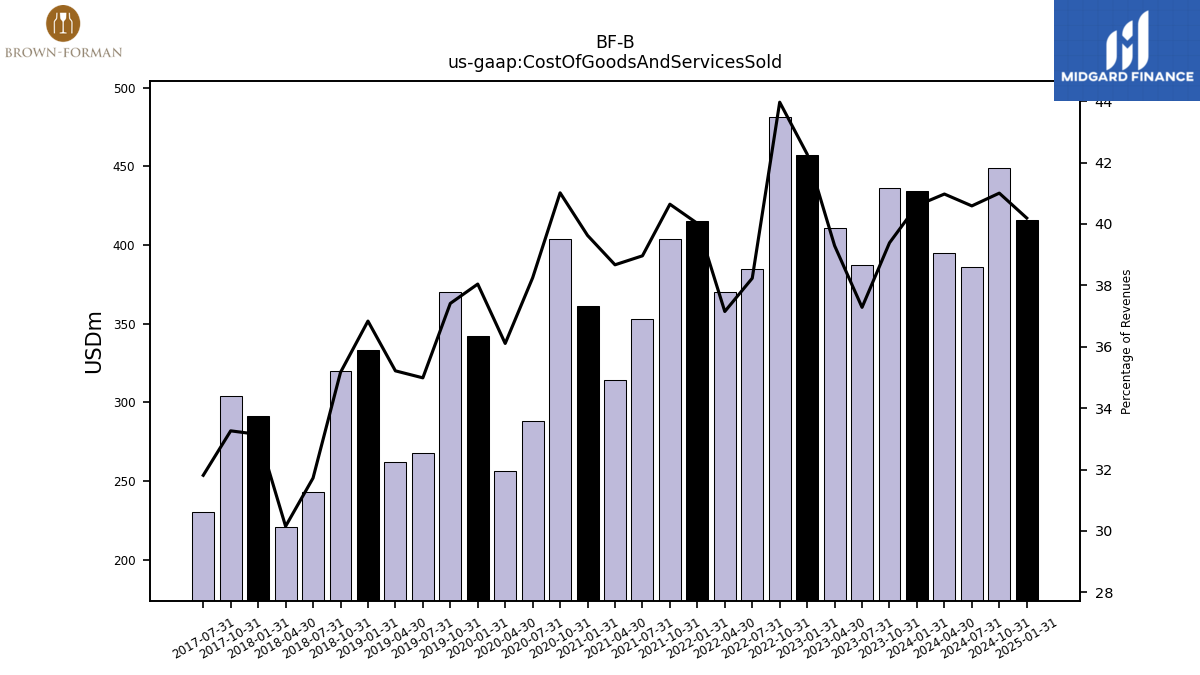
| Cost Of Goods And Services Sold | 434.00 | 436.00 | 387.00 | 411.00 | 457.00 | 481.00 | 385.00 | 370.00 | 415.00 | 404.00 | 353.00 | 314.00 | 361.00 | 404.00 | 288.00 | 256.00 | 342.00 | 370.00 | 268.00 | 262.00 | 333.00 | 320.00 | 243.00 | 221.00 | 291.00 | 304.00 | 230.00 | |
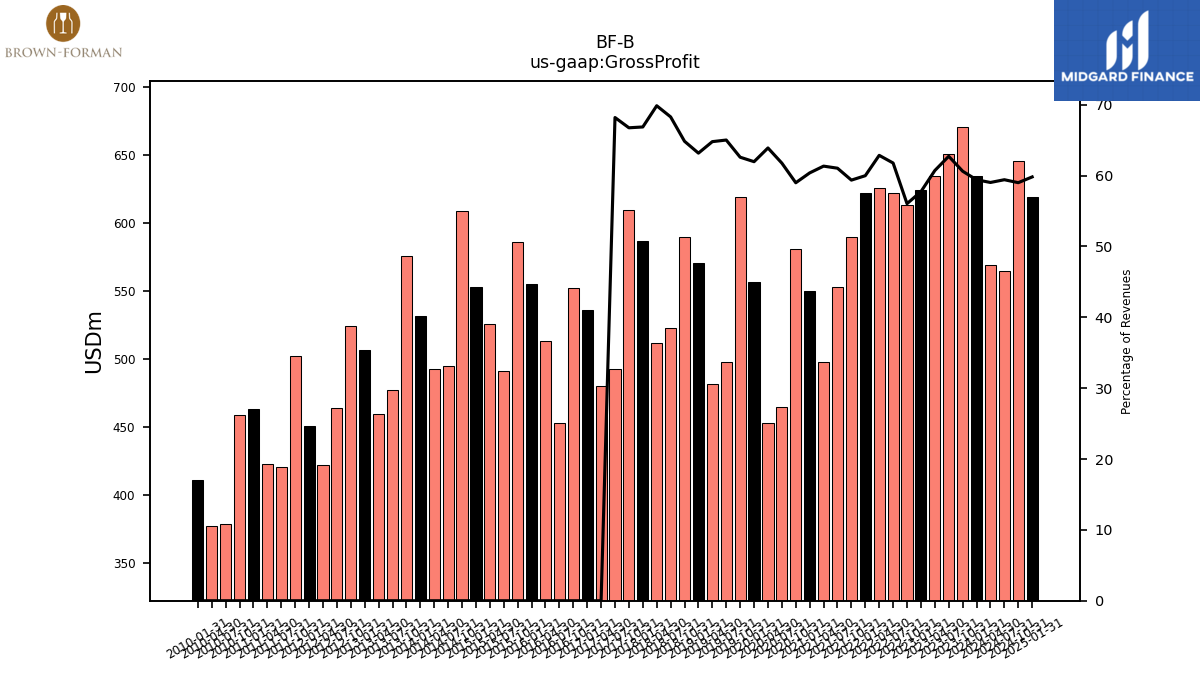
| Gross Profit | 635.00 | 671.00 | 651.00 | 635.00 | 624.00 | 613.00 | 622.00 | 626.00 | 622.00 | 590.00 | 553.00 | 498.00 | 550.00 | 581.00 | 465.00 | 453.00 | 557.00 | 619.00 | 498.00 | 482.00 | 571.00 | 590.00 | 523.00 | 512.00 | 587.00 | 610.00 | 493.00 | |
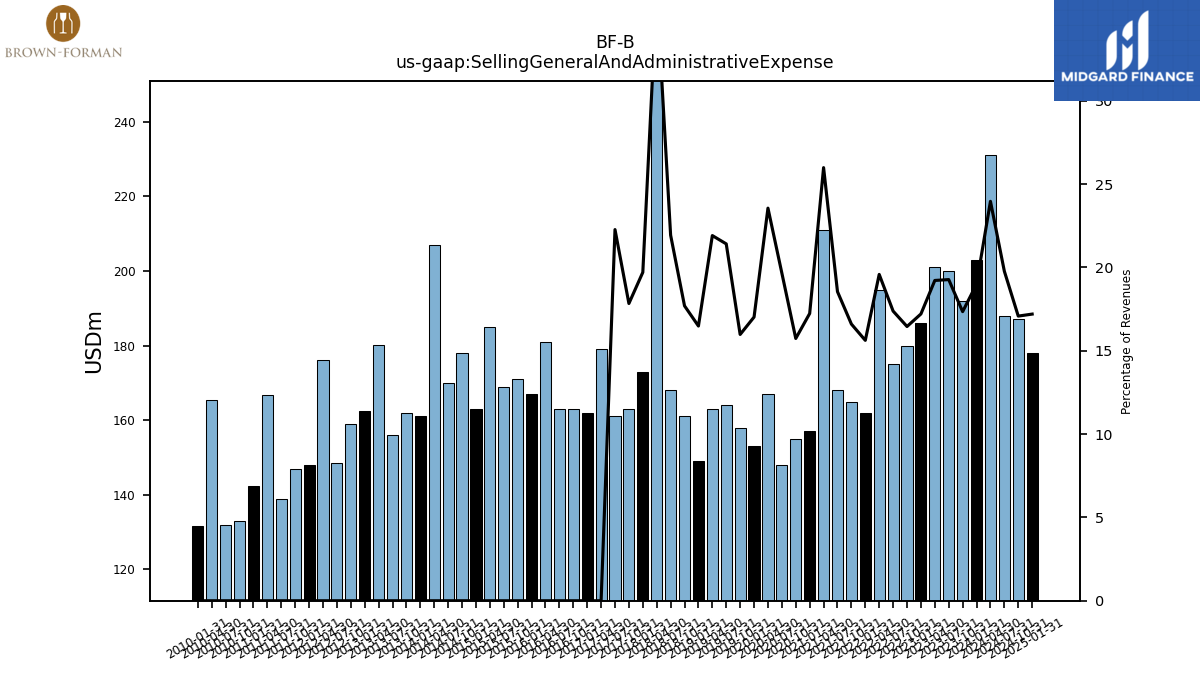
| Selling General And Administrative Expense | 203.00 | 192.00 | 200.00 | 201.00 | 186.00 | 180.00 | 175.00 | 195.00 | 162.00 | 165.00 | 168.00 | 211.00 | 157.00 | 155.00 | 148.00 | 167.00 | 153.00 | 158.00 | 164.00 | 163.00 | 149.00 | 161.00 | 168.00 | 268.00 | 173.00 | 163.00 | 161.00 | |
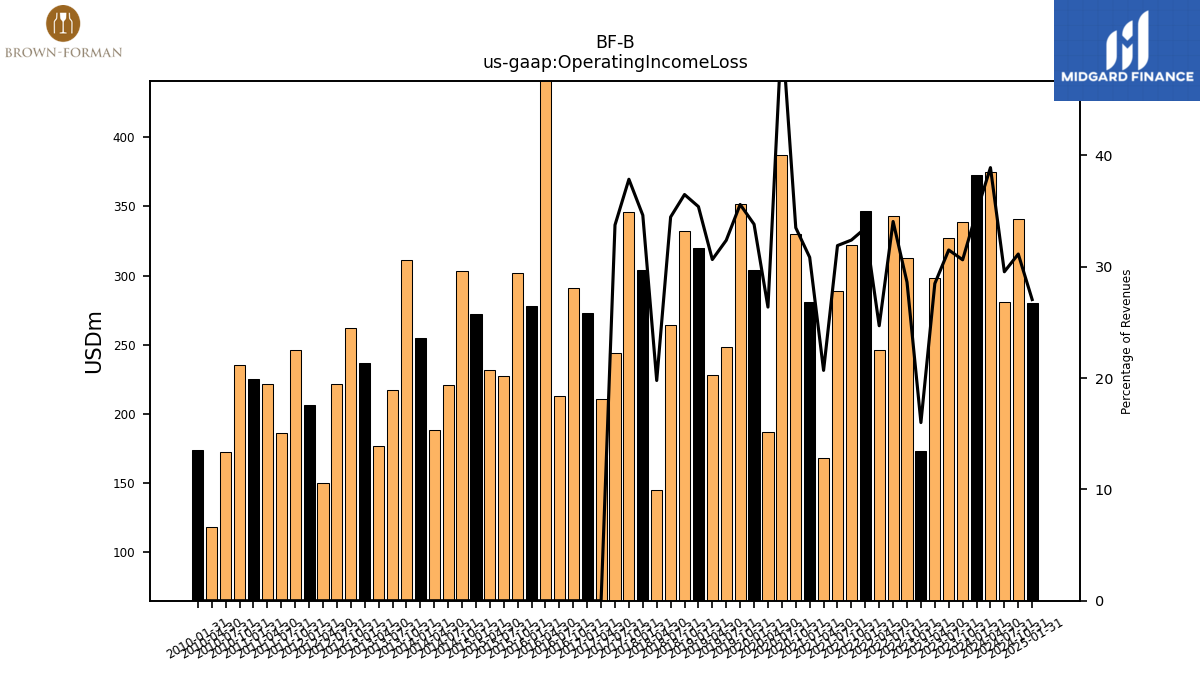
| Operating Income Loss | 373.00 | 339.00 | 327.00 | 298.00 | 173.00 | 313.00 | 343.00 | 246.00 | 347.00 | 322.00 | 289.00 | 168.00 | 281.00 | 330.00 | 387.00 | 187.00 | 304.00 | 352.00 | 248.00 | 228.00 | 320.00 | 332.00 | 264.00 | 145.00 | 304.00 | 346.00 | 244.00 | |
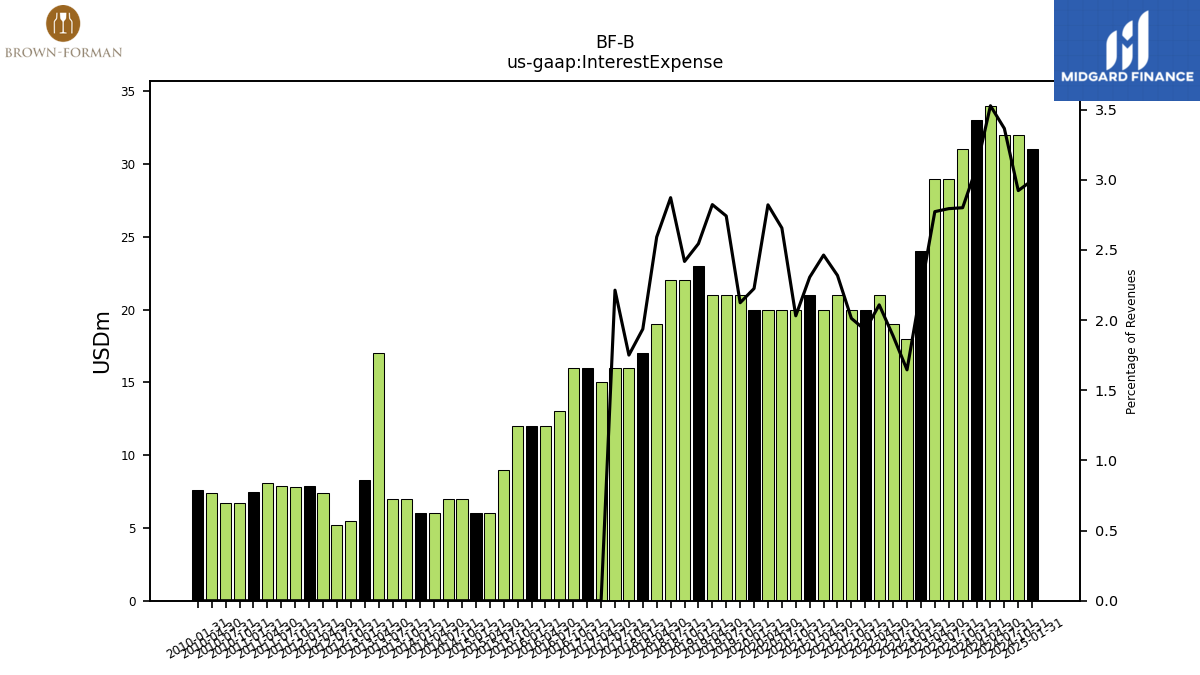
| Interest Expense | 33.00 | 31.00 | 29.00 | 29.00 | 24.00 | 18.00 | 19.00 | 21.00 | 20.00 | 20.00 | 21.00 | 20.00 | 21.00 | 20.00 | 20.00 | 20.00 | 20.00 | 21.00 | 21.00 | 21.00 | 23.00 | 22.00 | 22.00 | 19.00 | 17.00 | 16.00 | 16.00 | |
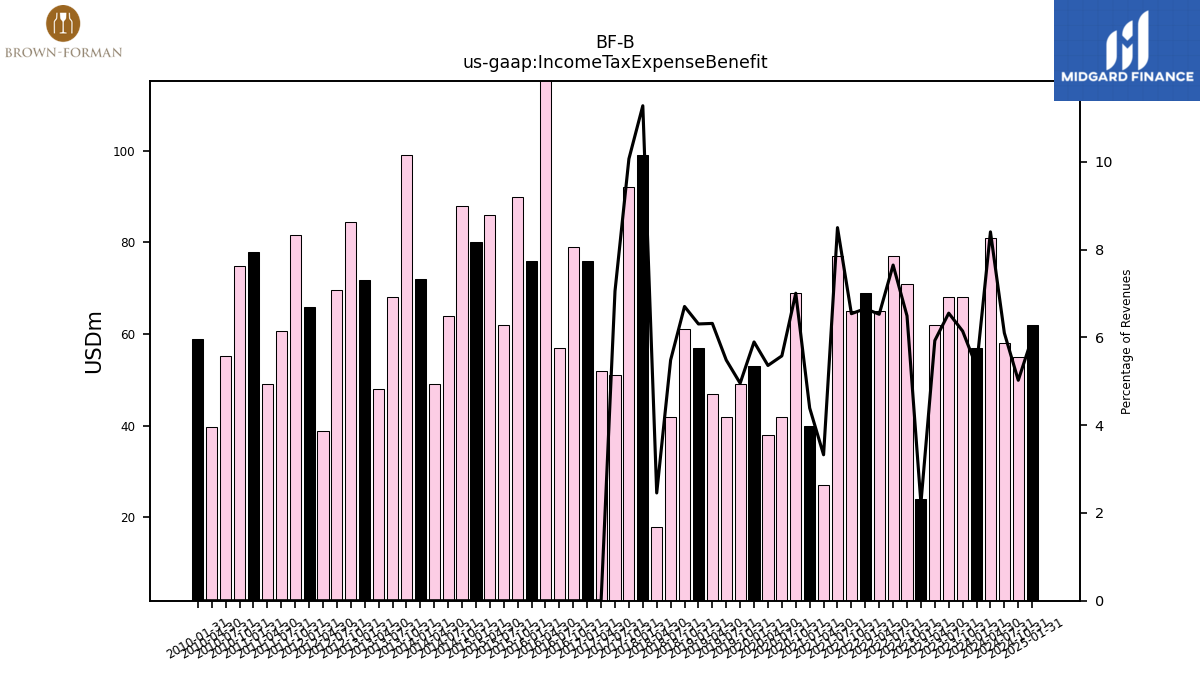
| Income Tax Expense Benefit | 57.00 | 68.00 | 68.00 | 62.00 | 24.00 | 71.00 | 77.00 | 65.00 | 69.00 | 65.00 | 77.00 | 27.00 | 40.00 | 69.00 | 42.00 | 38.00 | 53.00 | 49.00 | 42.00 | 47.00 | 57.00 | 61.00 | 42.00 | 18.00 | 99.00 | 92.00 | 51.00 | |
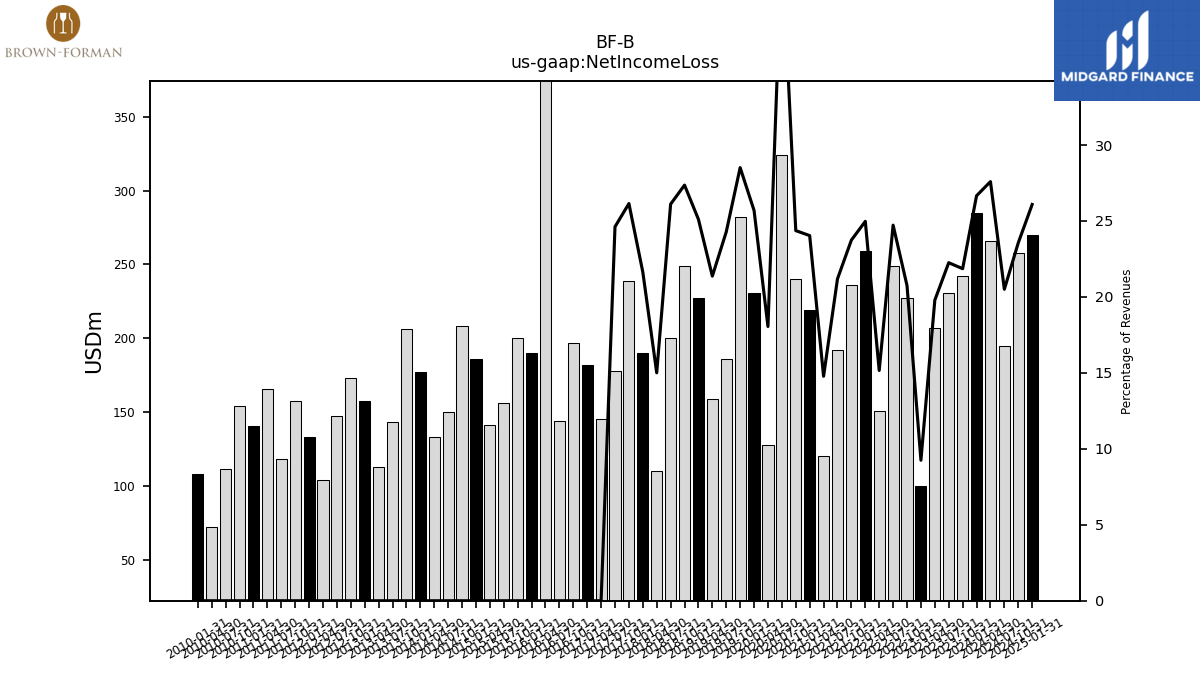
| Net Income Loss | 285.00 | 242.00 | 231.00 | 207.00 | 100.00 | 227.00 | 249.00 | 151.00 | 259.00 | 236.00 | 192.00 | 120.00 | 219.00 | 240.00 | 324.00 | 128.00 | 231.00 | 282.00 | 186.00 | 159.00 | 227.00 | 249.00 | 200.00 | 110.00 | 190.00 | 239.00 | 178.00 | |
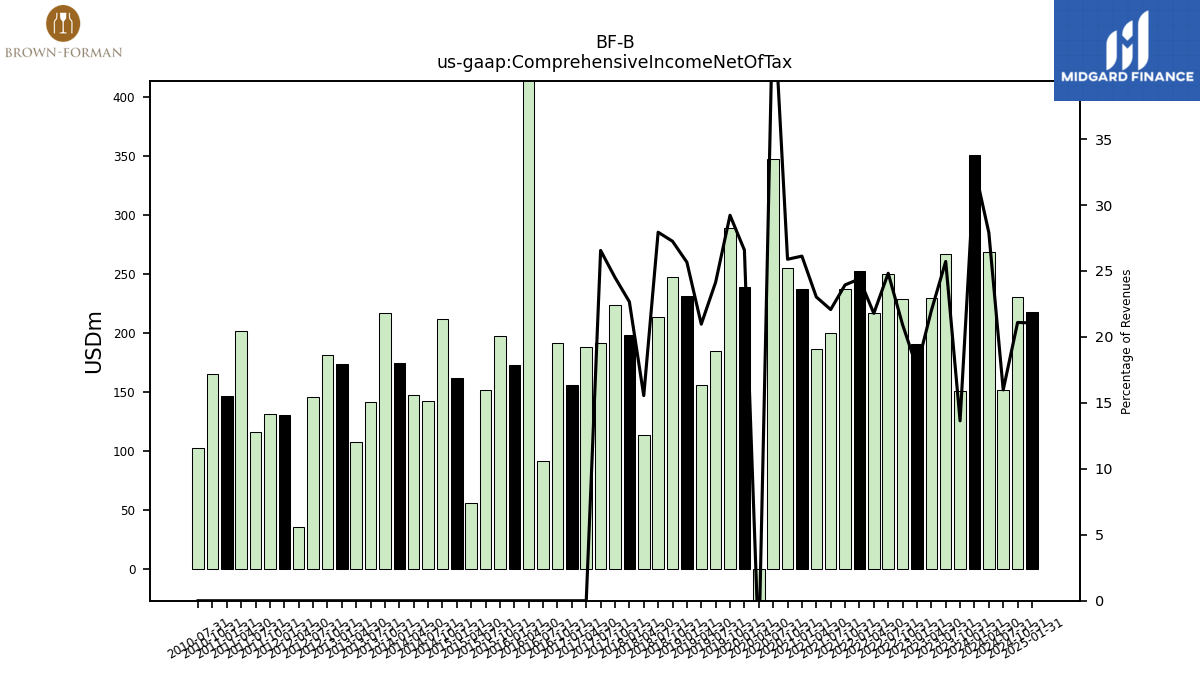
| Comprehensive Income Net Of Tax | 351.00 | 151.00 | 267.00 | 230.00 | 191.00 | 229.00 | 250.00 | 217.00 | 253.00 | 238.00 | 200.00 | 187.00 | 238.00 | 255.00 | 348.00 | -27.00 | 239.00 | 289.00 | 185.00 | 156.00 | 232.00 | 248.00 | 214.00 | 114.00 | 199.00 | 224.00 | 192.00 | |
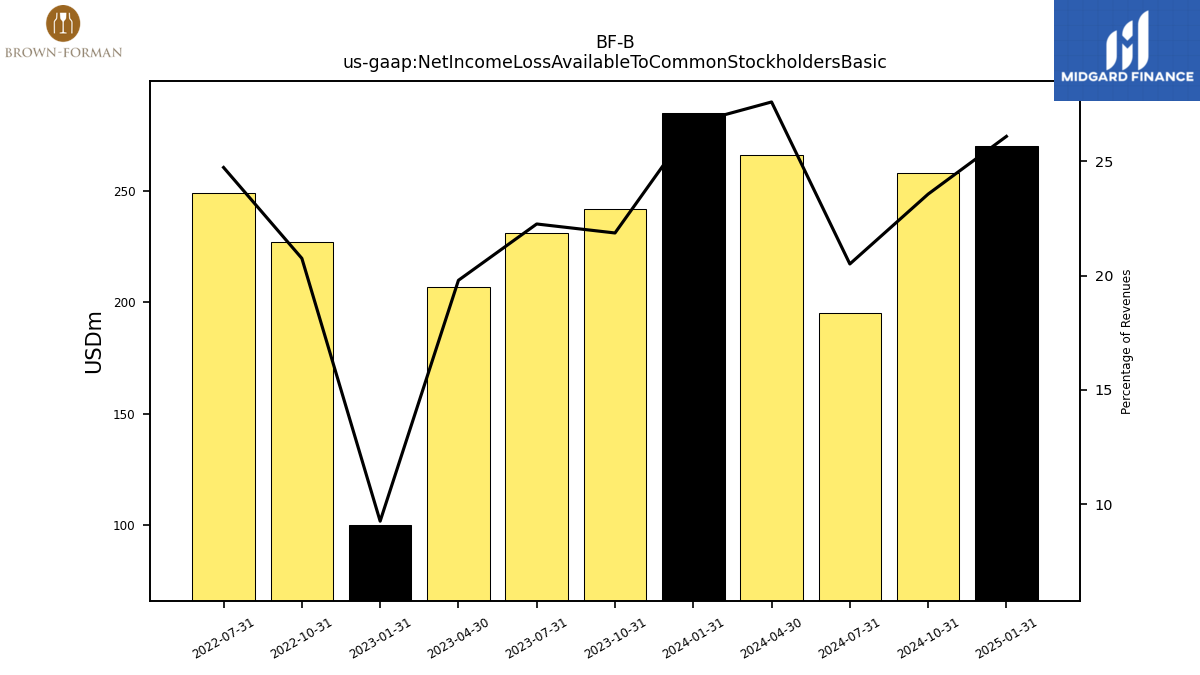
| Net Income Loss Available To Common Stockholders Basic | 285.00 | 242.00 | 231.00 | NA | 100.00 | 227.00 | 249.00 | NA | NA | NA | NA | NA | NA | NA | NA | NA | NA | NA | NA | NA | NA | NA | NA | NA | NA | NA | NA | |
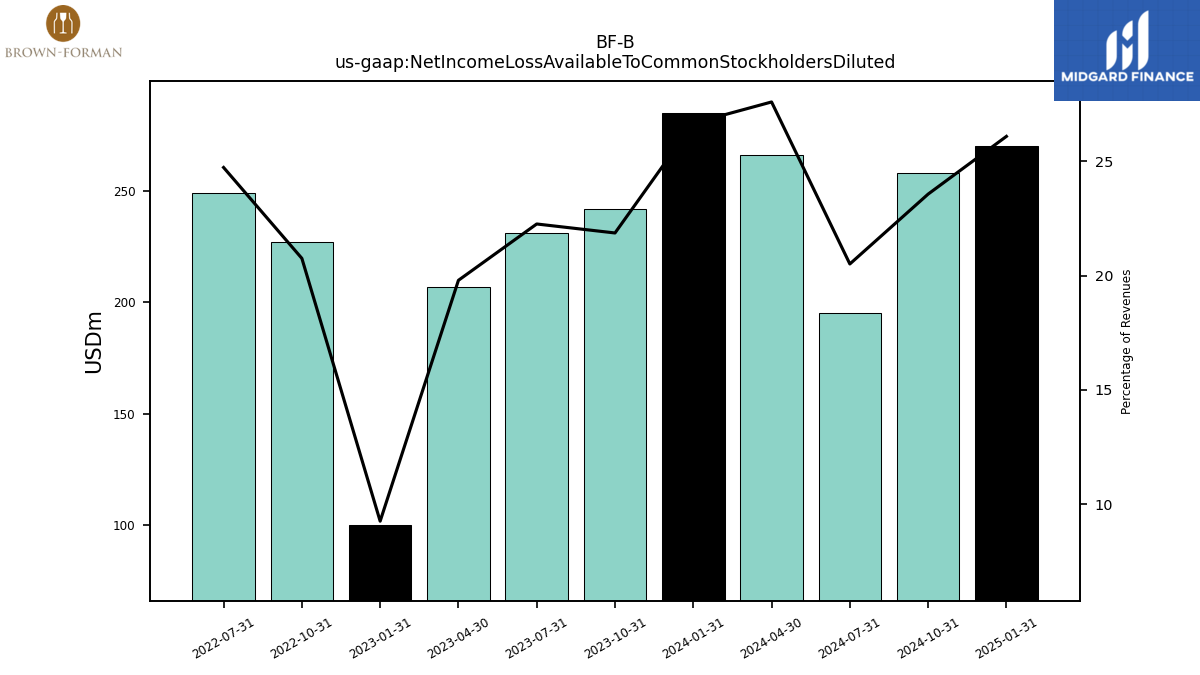
| Net Income Loss Available To Common Stockholders Diluted | 285.00 | 242.00 | 231.00 | NA | 100.00 | 227.00 | 249.00 | NA | NA | NA | NA | NA | NA | NA | NA | NA | NA | NA | NA | NA | NA | NA | NA | NA | NA | NA | NA |
| 2024-01-31 | 2023-10-31 | 2023-07-31 | 2023-04-30 | 2023-01-31 | 2022-10-31 | 2022-07-31 | 2022-04-30 | 2022-01-31 | 2021-10-31 | 2021-07-31 | 2021-04-30 | 2021-01-31 | 2020-10-31 | 2020-07-31 | 2020-04-30 | 2020-01-31 | 2019-10-31 | 2019-07-31 | 2019-04-30 | 2019-01-31 | 2018-10-31 | 2018-07-31 | 2018-04-30 | 2018-01-31 | 2017-10-31 | 2017-07-31 | ||
|---|---|---|---|---|---|---|---|---|---|---|---|---|---|---|---|---|---|---|---|---|---|---|---|---|---|---|---|---|
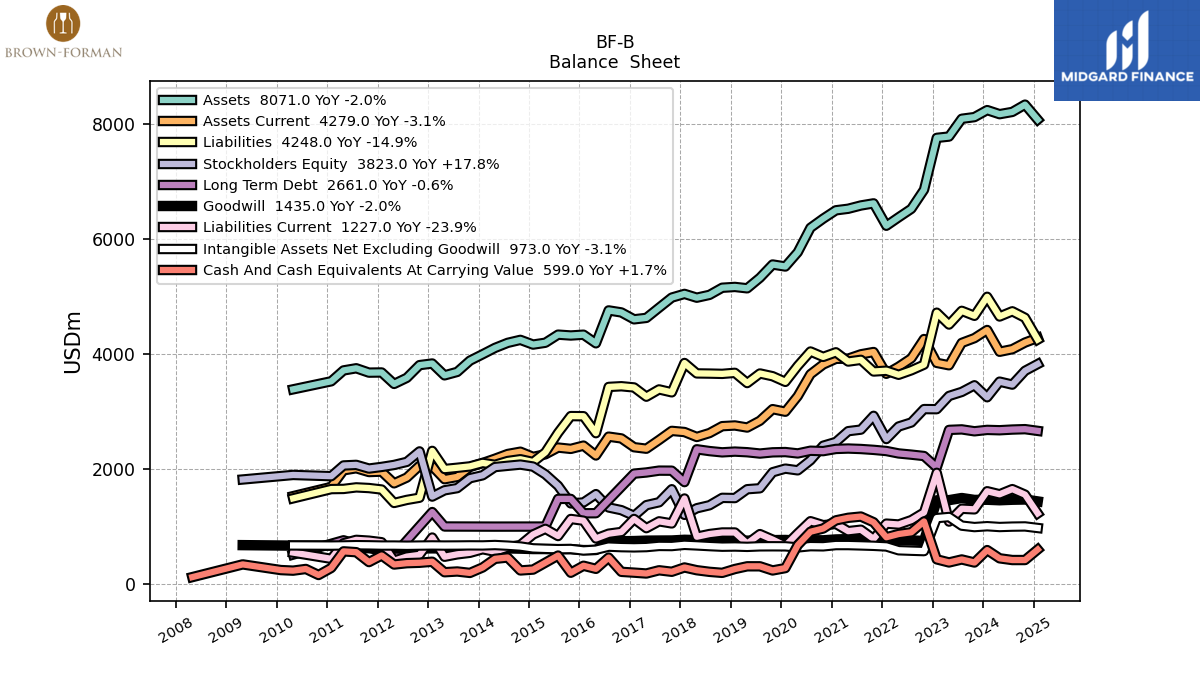
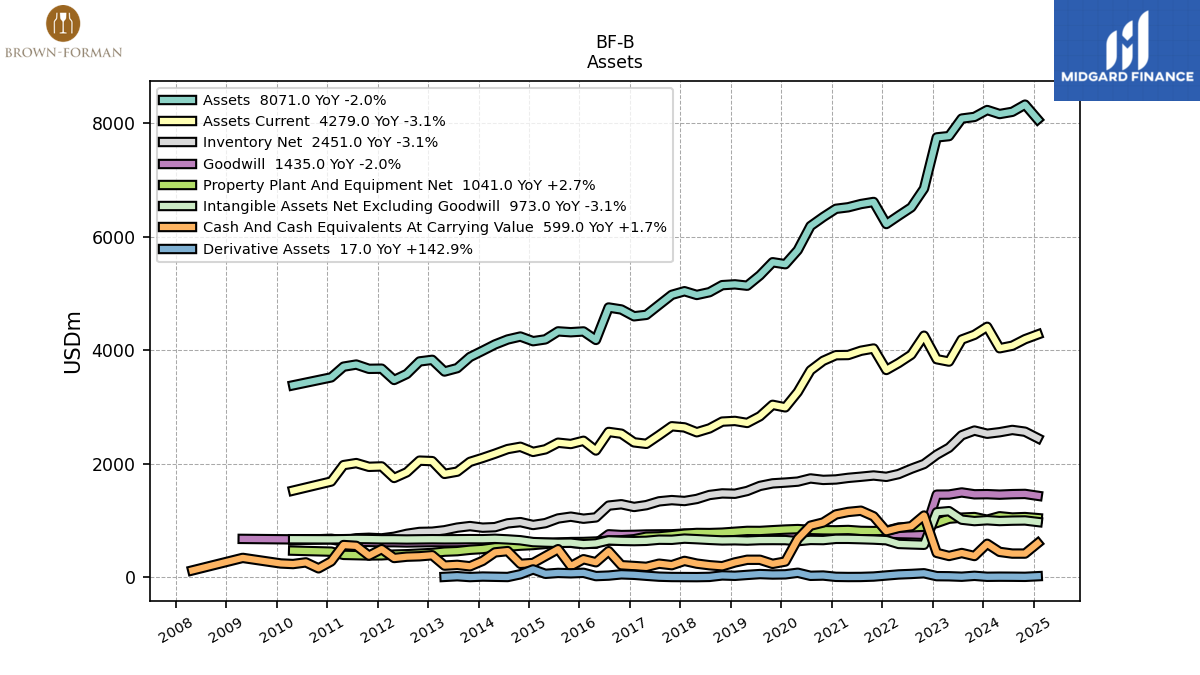
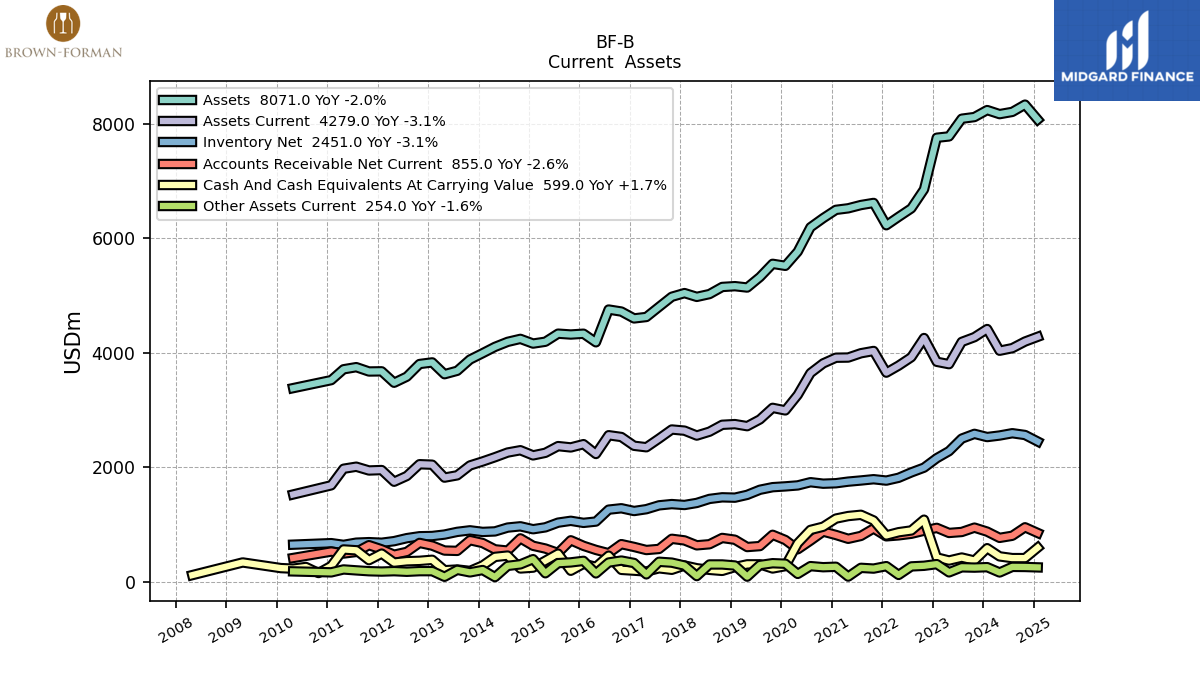
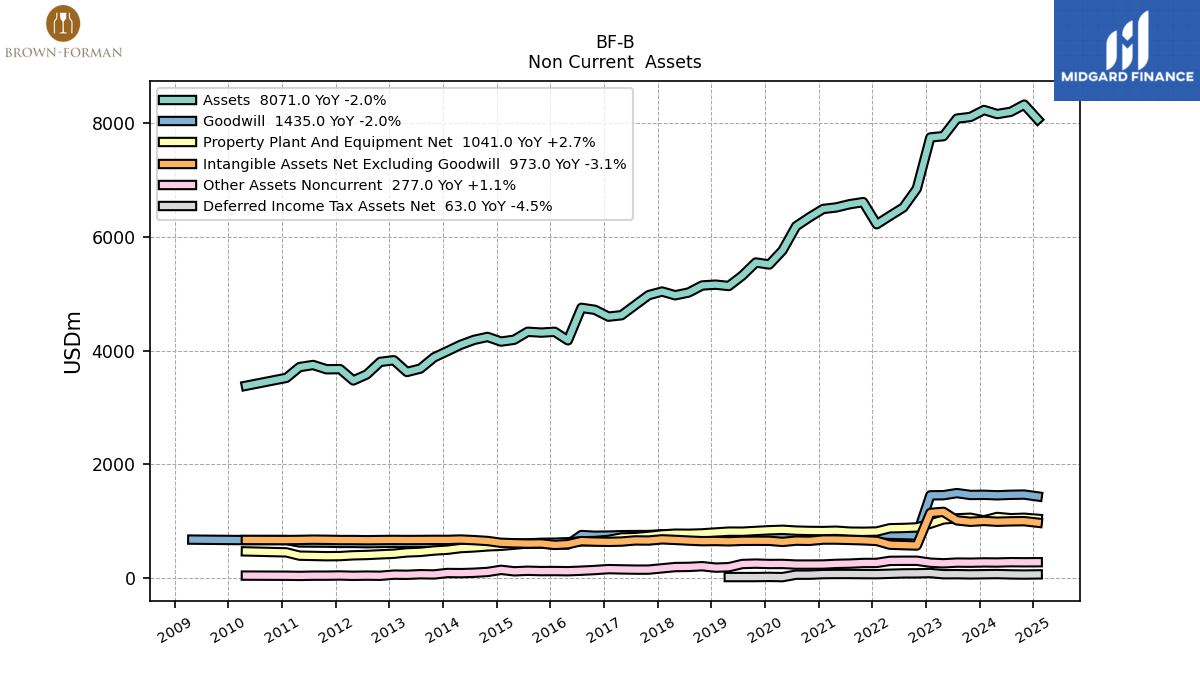
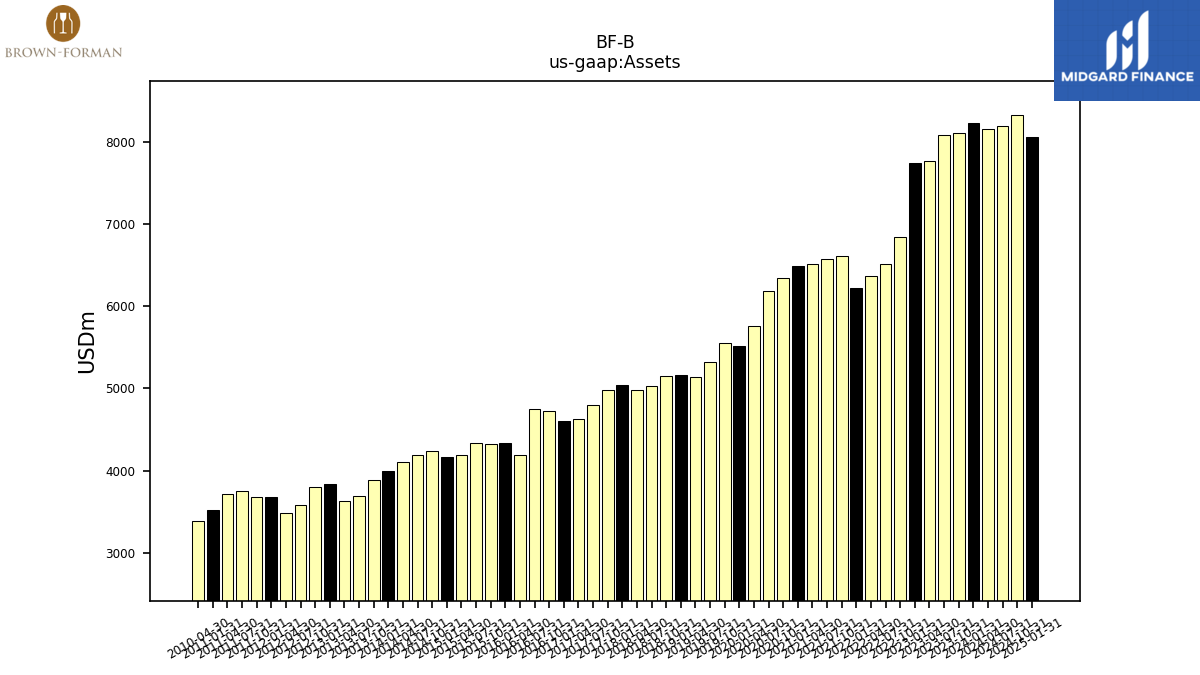
| Assets | 8237.00 | 8115.00 | 8086.00 | 7777.00 | 7754.00 | 6852.00 | 6521.00 | 6373.00 | 6226.00 | 6616.00 | 6579.00 | 6522.00 | 6495.00 | 6350.00 | 6191.00 | 5766.00 | 5518.00 | 5553.00 | 5322.00 | 5139.00 | 5163.00 | 5149.00 | 5025.00 | 4976.00 | 5042.00 | 4978.00 | 4802.00 | |
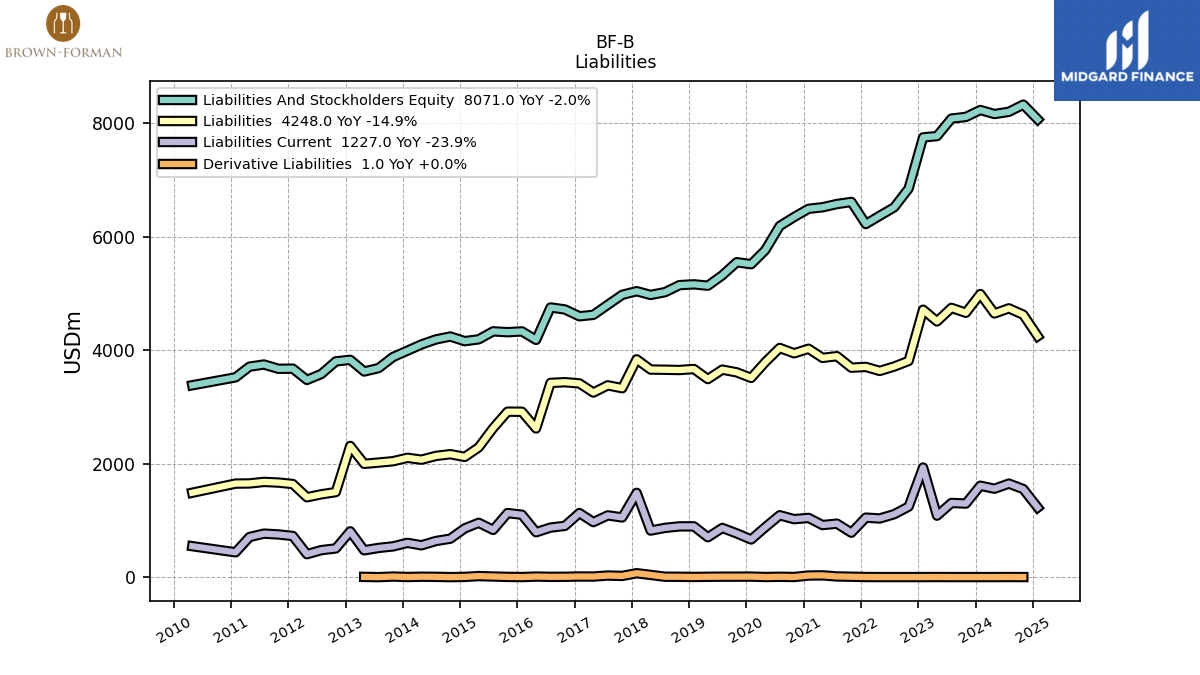
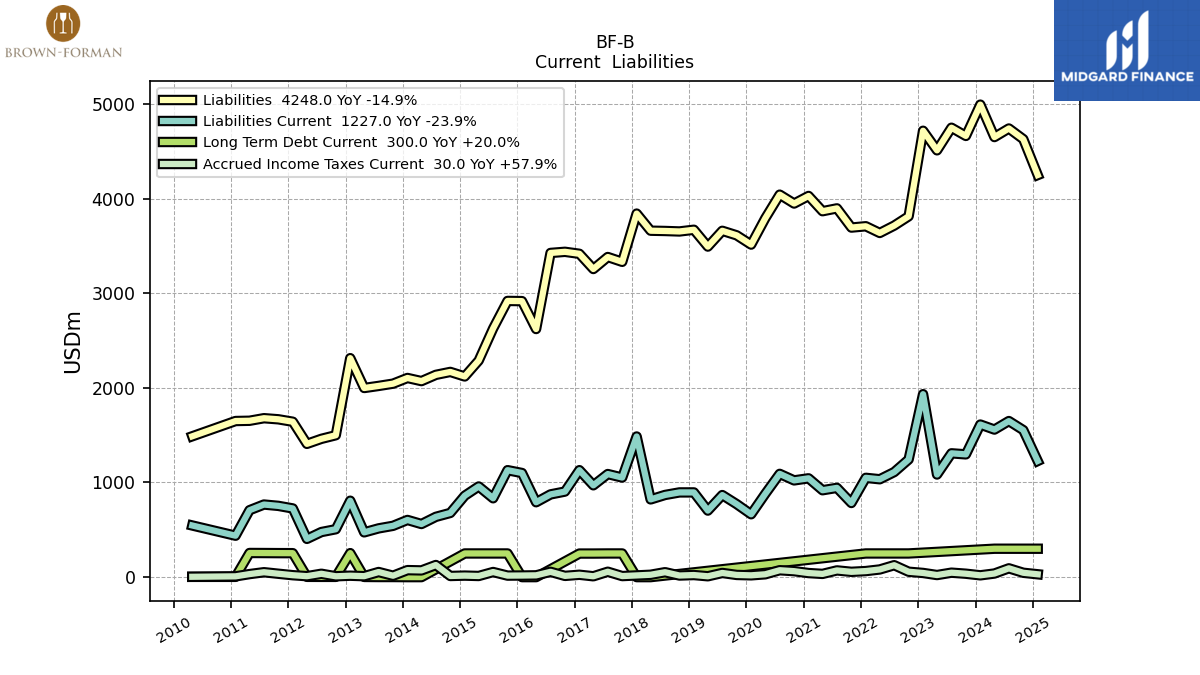
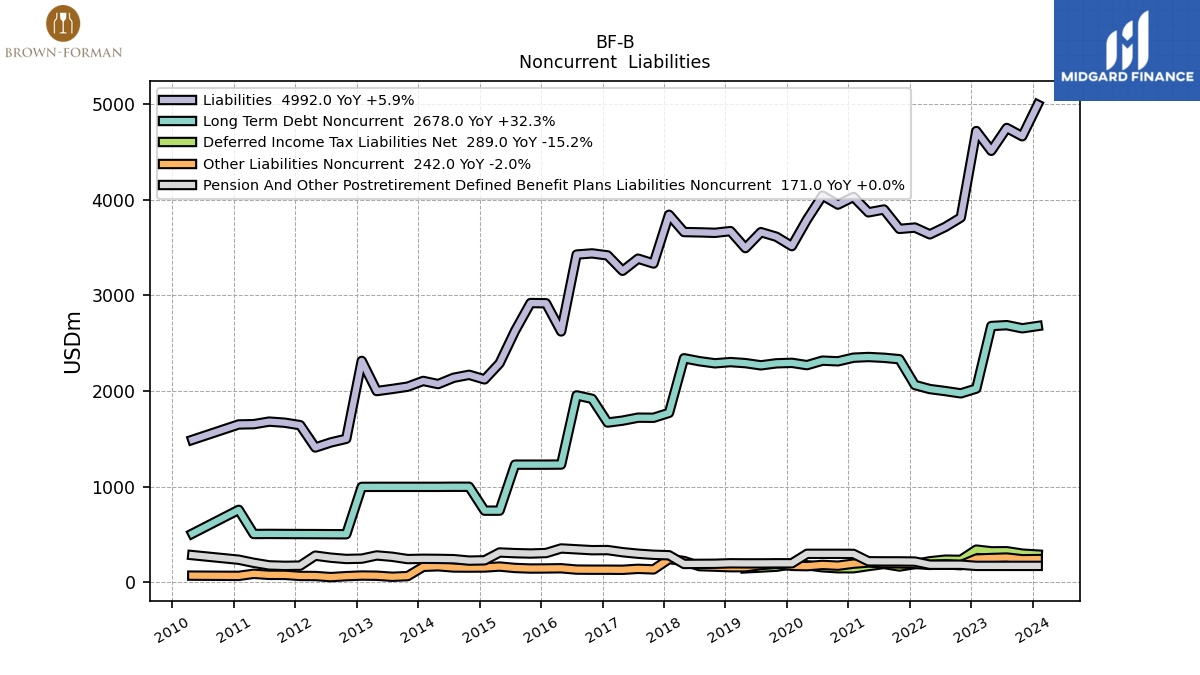
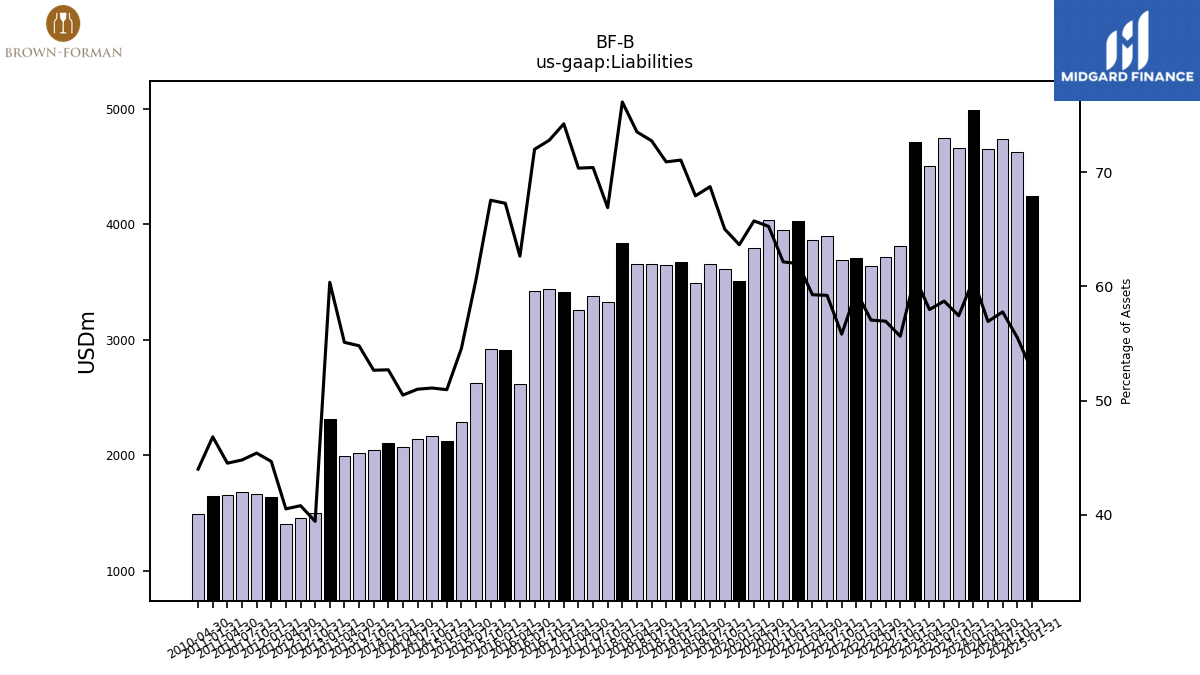
| Liabilities | 4992.00 | 4661.00 | 4748.00 | 4509.00 | 4716.00 | 3812.00 | 3714.00 | 3636.00 | 3707.00 | 3693.00 | 3896.00 | 3866.00 | 4027.00 | 3947.00 | 4041.00 | 3791.00 | 3513.00 | 3611.00 | 3659.00 | 3492.00 | 3670.00 | 3652.00 | 3657.00 | 3660.00 | 3841.00 | 3331.00 | 3382.00 | |
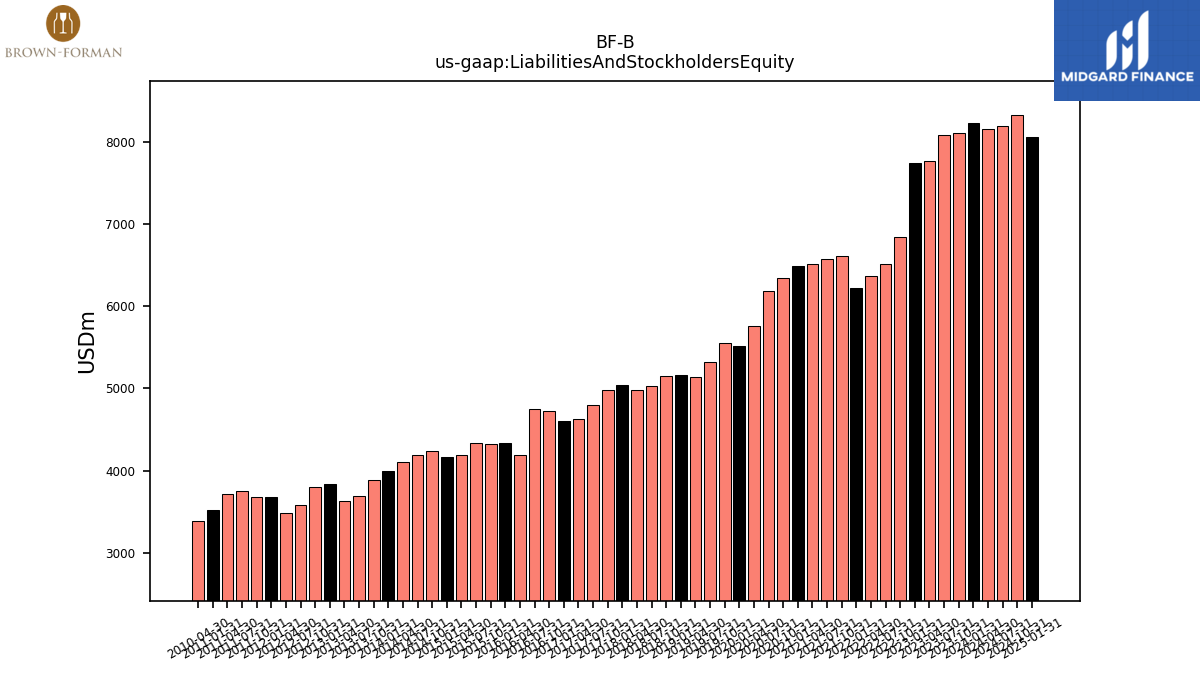
| Liabilities And Stockholders Equity | 8237.00 | 8115.00 | 8086.00 | 7777.00 | 7754.00 | 6852.00 | 6521.00 | 6373.00 | 6226.00 | 6616.00 | 6579.00 | 6522.00 | 6495.00 | 6350.00 | 6191.00 | 5766.00 | 5518.00 | 5553.00 | 5322.00 | 5139.00 | 5163.00 | 5149.00 | 5025.00 | 4976.00 | 5042.00 | 4978.00 | 4802.00 | |
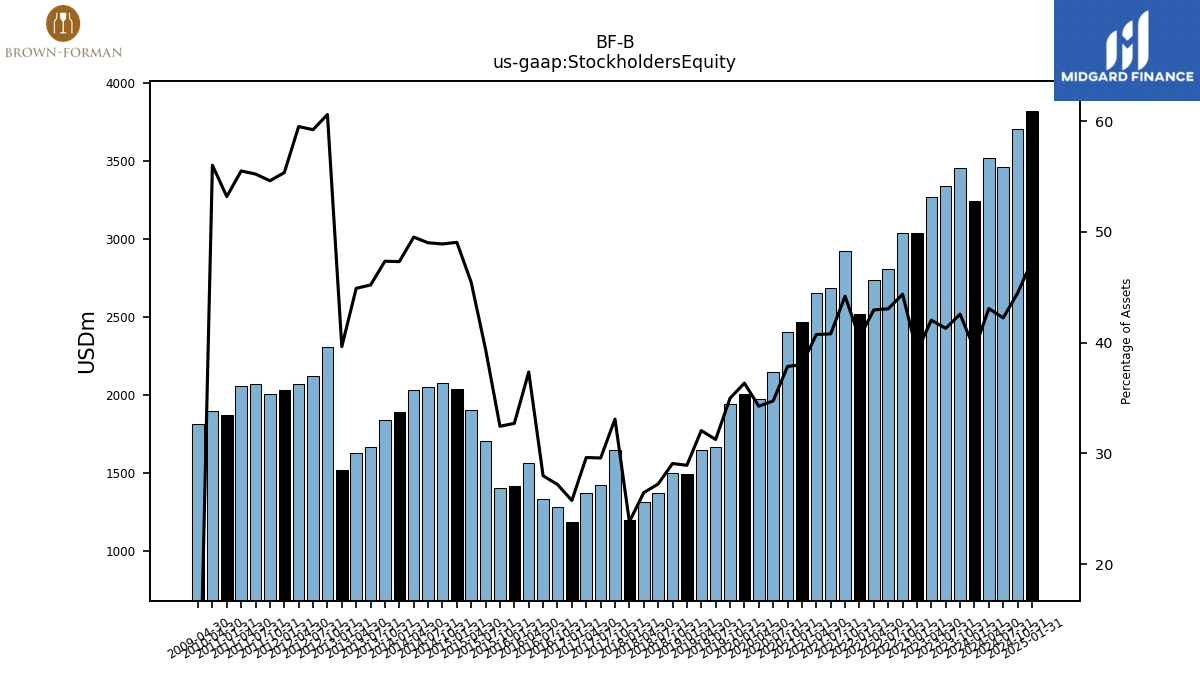
| Stockholders Equity | 3245.00 | 3454.00 | 3338.00 | 3268.00 | 3038.00 | 3040.00 | 2807.00 | 2737.00 | 2519.00 | 2923.00 | 2683.00 | 2656.00 | 2468.00 | 2403.00 | 2150.00 | 1975.00 | 2005.00 | 1942.00 | 1663.00 | 1647.00 | 1493.00 | 1497.00 | 1368.00 | 1316.00 | 1201.00 | 1647.00 | 1420.00 |
| 2024-01-31 | 2023-10-31 | 2023-07-31 | 2023-04-30 | 2023-01-31 | 2022-10-31 | 2022-07-31 | 2022-04-30 | 2022-01-31 | 2021-10-31 | 2021-07-31 | 2021-04-30 | 2021-01-31 | 2020-10-31 | 2020-07-31 | 2020-04-30 | 2020-01-31 | 2019-10-31 | 2019-07-31 | 2019-04-30 | 2019-01-31 | 2018-10-31 | 2018-07-31 | 2018-04-30 | 2018-01-31 | 2017-10-31 | 2017-07-31 | ||
|---|---|---|---|---|---|---|---|---|---|---|---|---|---|---|---|---|---|---|---|---|---|---|---|---|---|---|---|---|
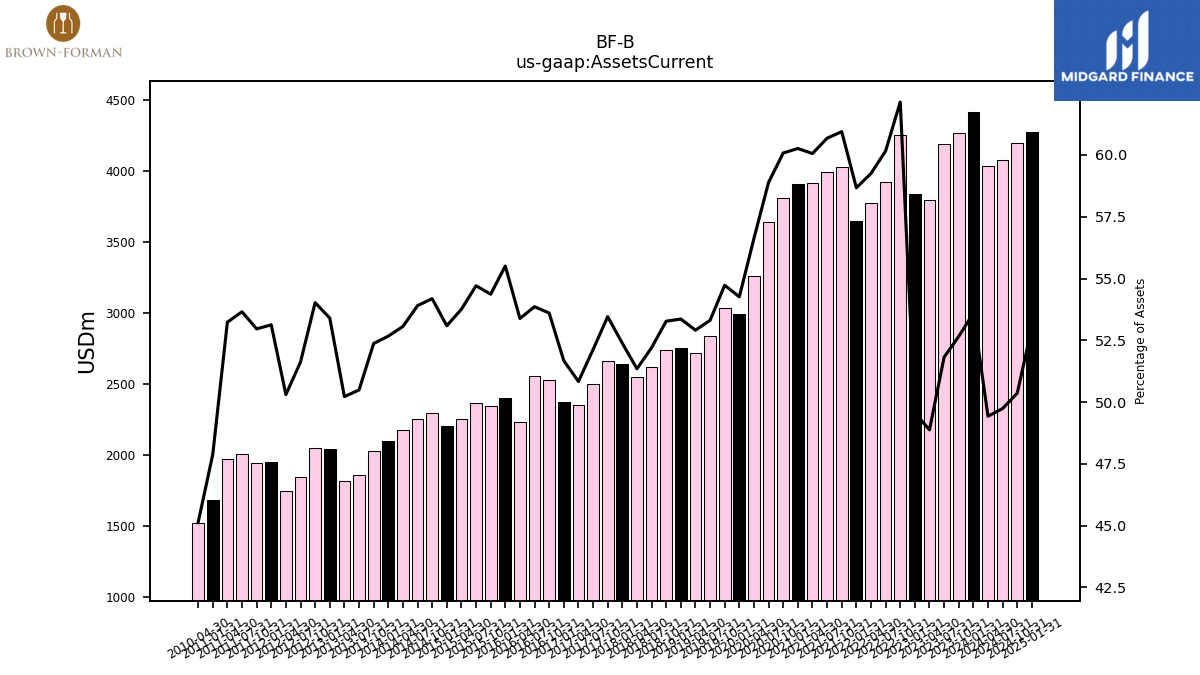
| Assets Current | 4415.00 | 4273.00 | 4190.00 | 3801.00 | 3843.00 | 4258.00 | 3923.00 | 3776.00 | 3653.00 | 4032.00 | 3992.00 | 3917.00 | 3914.00 | 3815.00 | 3646.00 | 3265.00 | 2994.00 | 3039.00 | 2837.00 | 2719.00 | 2755.00 | 2743.00 | 2623.00 | 2555.00 | 2641.00 | 2661.00 | 2503.00 | |
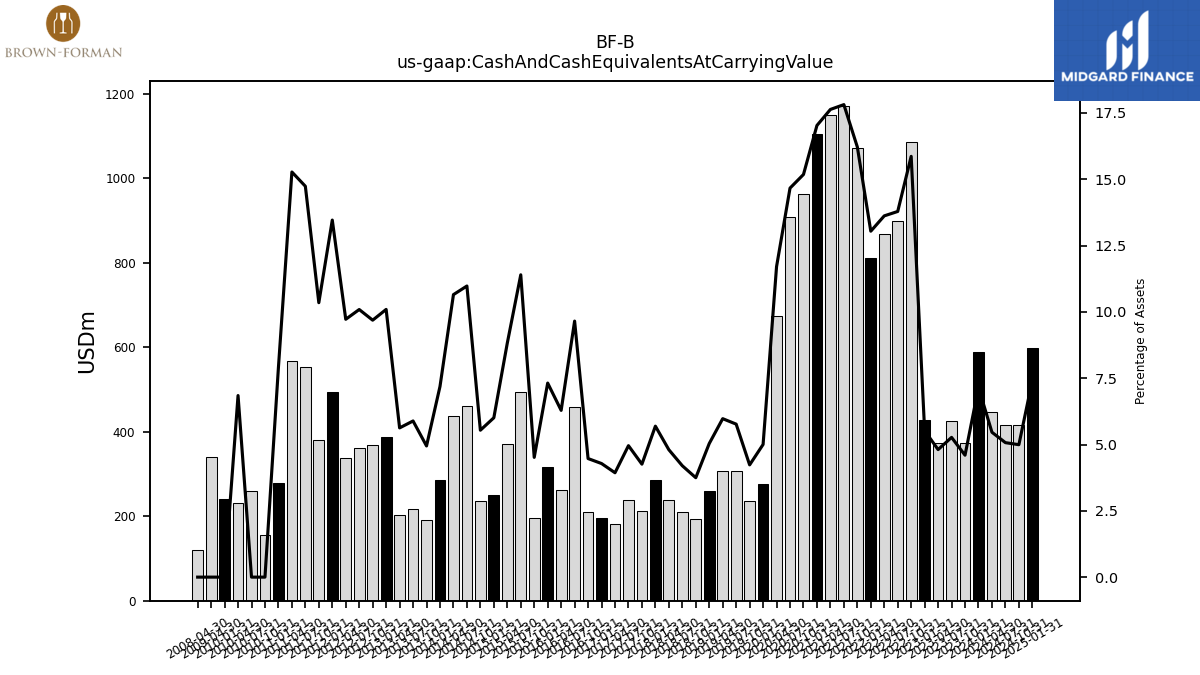
| Cash And Cash Equivalents At Carrying Value | 589.00 | 373.00 | 426.00 | 374.00 | 428.00 | 1087.00 | 899.00 | 868.00 | 812.00 | 1073.00 | 1172.00 | 1150.00 | 1106.00 | 964.00 | 908.00 | 675.00 | 276.00 | 235.00 | 307.00 | 307.00 | 260.00 | 193.00 | 211.00 | 239.00 | 287.00 | 212.00 | 238.00 | |
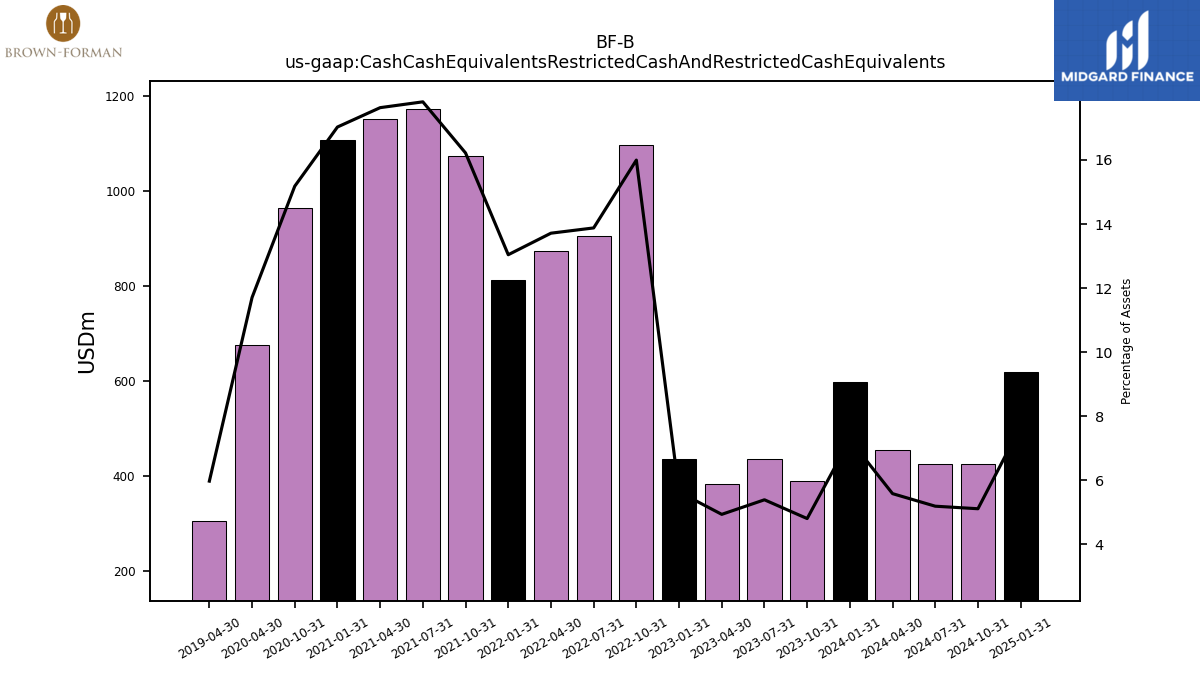
| Cash Cash Equivalents Restricted Cash And Restricted Cash Equivalents | 599.00 | 390.00 | 436.00 | 384.00 | 437.00 | 1096.00 | 905.00 | 874.00 | 812.00 | 1073.00 | 1172.00 | 1150.00 | 1106.00 | 964.00 | NA | 675.00 | NA | NA | NA | 307.00 | NA | NA | NA | NA | NA | NA | NA | |
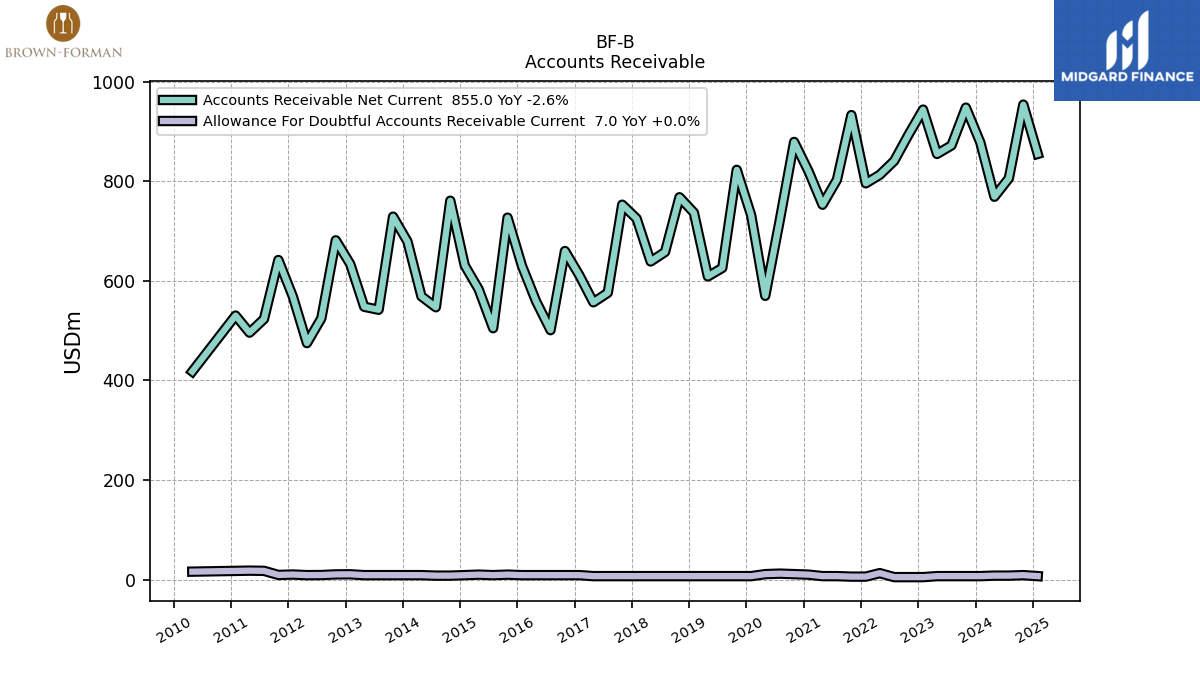
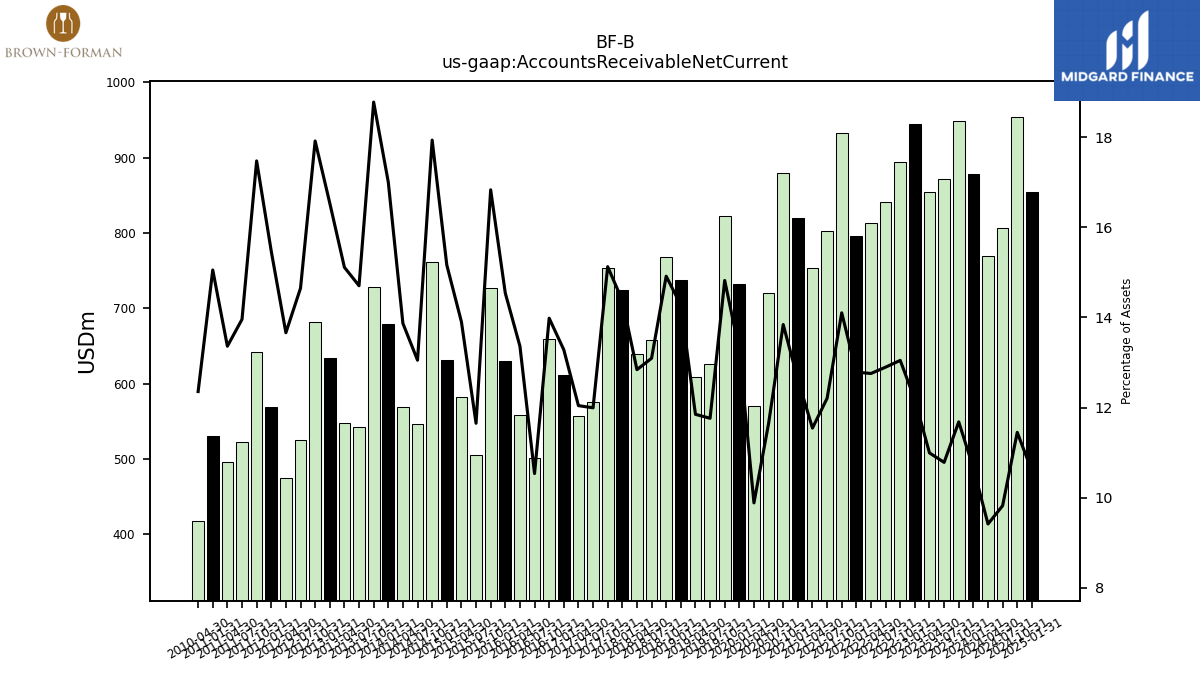
| Accounts Receivable Net Current | 878.00 | 948.00 | 872.00 | 855.00 | 944.00 | 894.00 | 841.00 | 813.00 | 796.00 | 933.00 | 803.00 | 753.00 | 820.00 | 879.00 | 721.00 | 570.00 | 732.00 | 823.00 | 626.00 | 609.00 | 737.00 | 768.00 | 658.00 | 639.00 | 725.00 | 753.00 | 576.00 | |
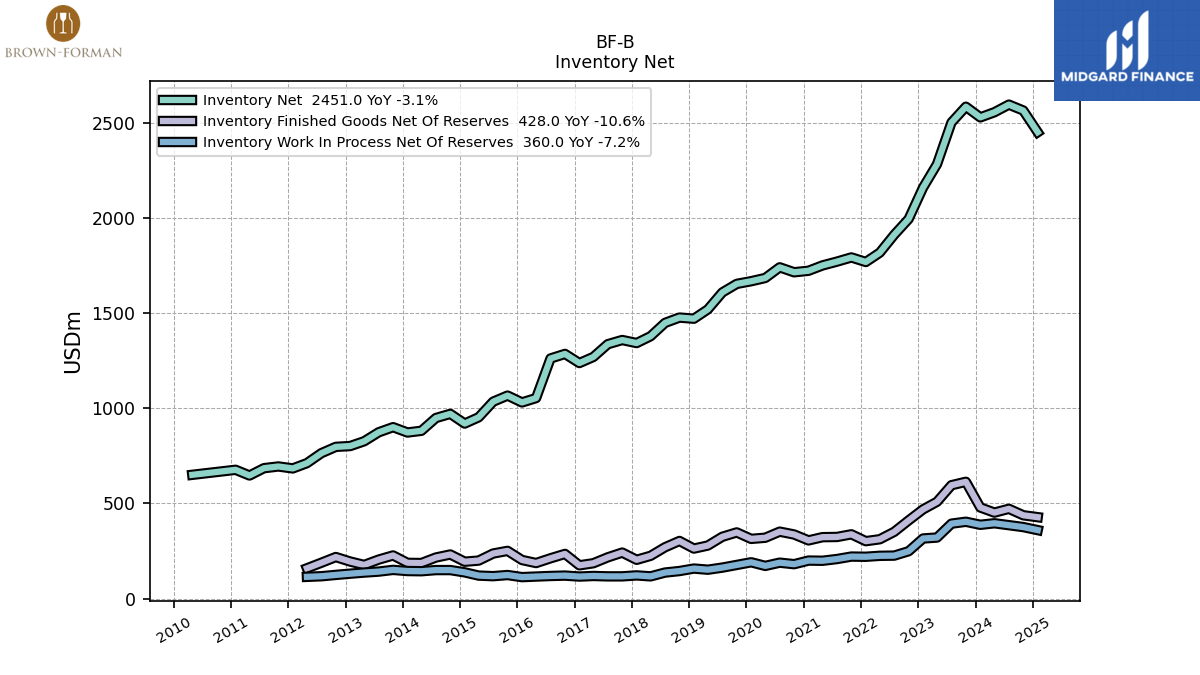
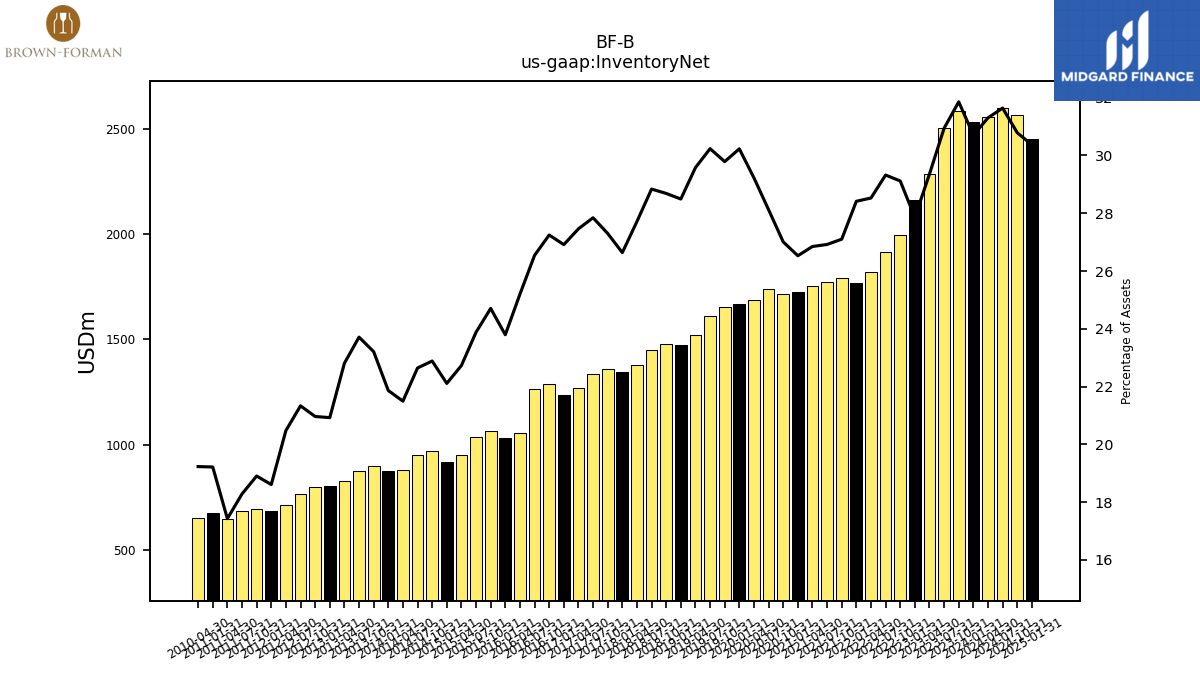
| Inventory Net | 2529.00 | 2585.00 | 2502.00 | 2283.00 | 2160.00 | 1995.00 | 1912.00 | 1818.00 | 1769.00 | 1793.00 | 1771.00 | 1751.00 | 1723.00 | 1715.00 | 1741.00 | 1685.00 | 1668.00 | 1654.00 | 1609.00 | 1520.00 | 1471.00 | 1477.00 | 1449.00 | 1379.00 | 1343.00 | 1359.00 | 1337.00 | |
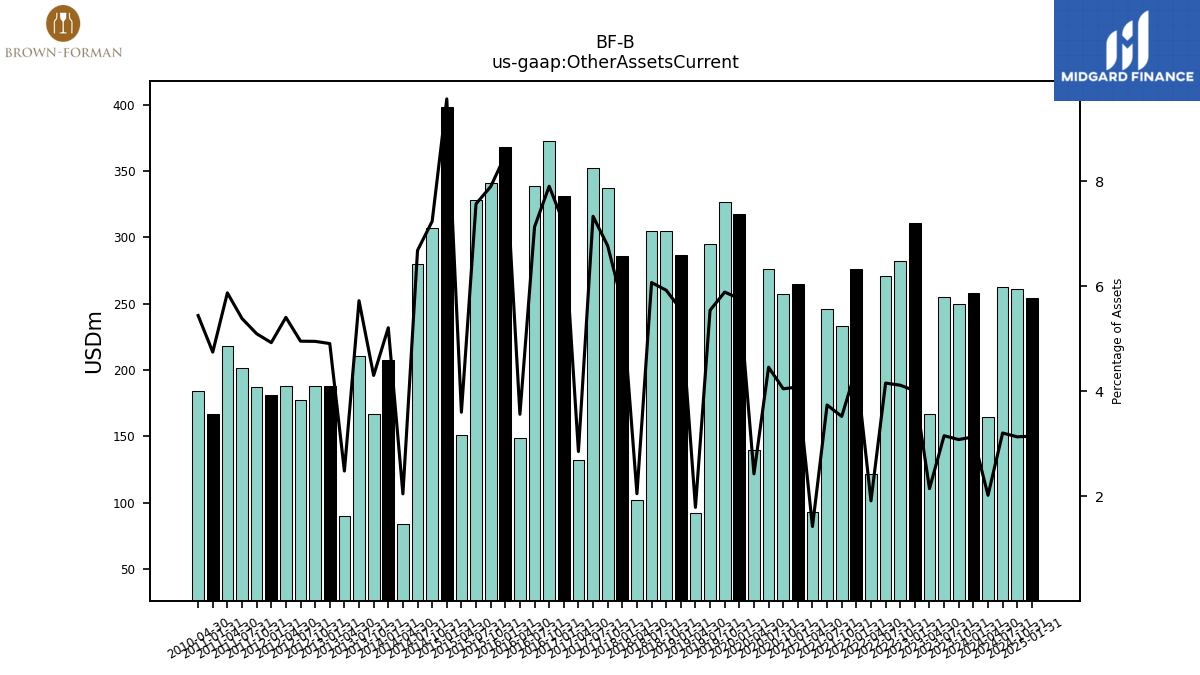
| Other Assets Current | 258.00 | 250.00 | 255.00 | 167.00 | 311.00 | 282.00 | 271.00 | 122.00 | 276.00 | 233.00 | 246.00 | 93.00 | 265.00 | 257.00 | 276.00 | 140.00 | 318.00 | 327.00 | 295.00 | 92.00 | 287.00 | 305.00 | 305.00 | 102.00 | 286.00 | 337.00 | 352.00 |
| 2024-01-31 | 2023-10-31 | 2023-07-31 | 2023-04-30 | 2023-01-31 | 2022-10-31 | 2022-07-31 | 2022-04-30 | 2022-01-31 | 2021-10-31 | 2021-07-31 | 2021-04-30 | 2021-01-31 | 2020-10-31 | 2020-07-31 | 2020-04-30 | 2020-01-31 | 2019-10-31 | 2019-07-31 | 2019-04-30 | 2019-01-31 | 2018-10-31 | 2018-07-31 | 2018-04-30 | 2018-01-31 | 2017-10-31 | 2017-07-31 | ||
|---|---|---|---|---|---|---|---|---|---|---|---|---|---|---|---|---|---|---|---|---|---|---|---|---|---|---|---|---|
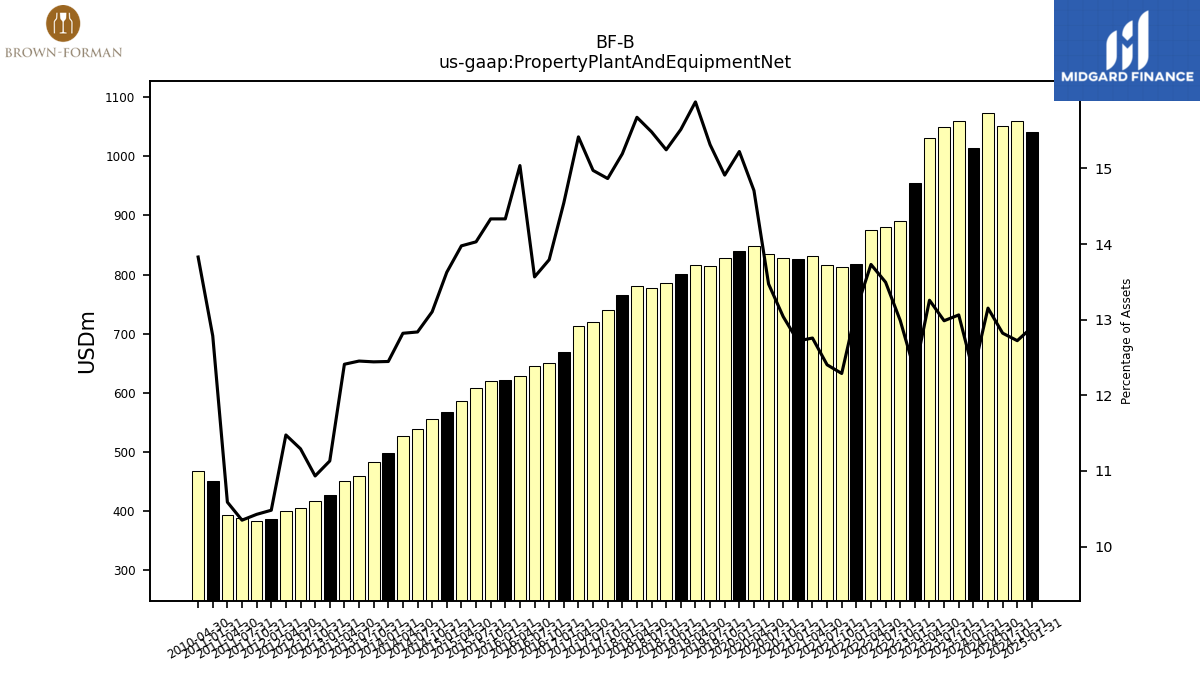
| Property Plant And Equipment Net | 1014.00 | 1060.00 | 1050.00 | 1031.00 | 955.00 | 890.00 | 880.00 | 875.00 | 818.00 | 813.00 | 816.00 | 832.00 | 826.00 | 828.00 | 834.00 | 848.00 | 840.00 | 828.00 | 815.00 | 816.00 | 801.00 | 785.00 | 778.00 | 780.00 | 766.00 | 740.00 | 719.00 | |
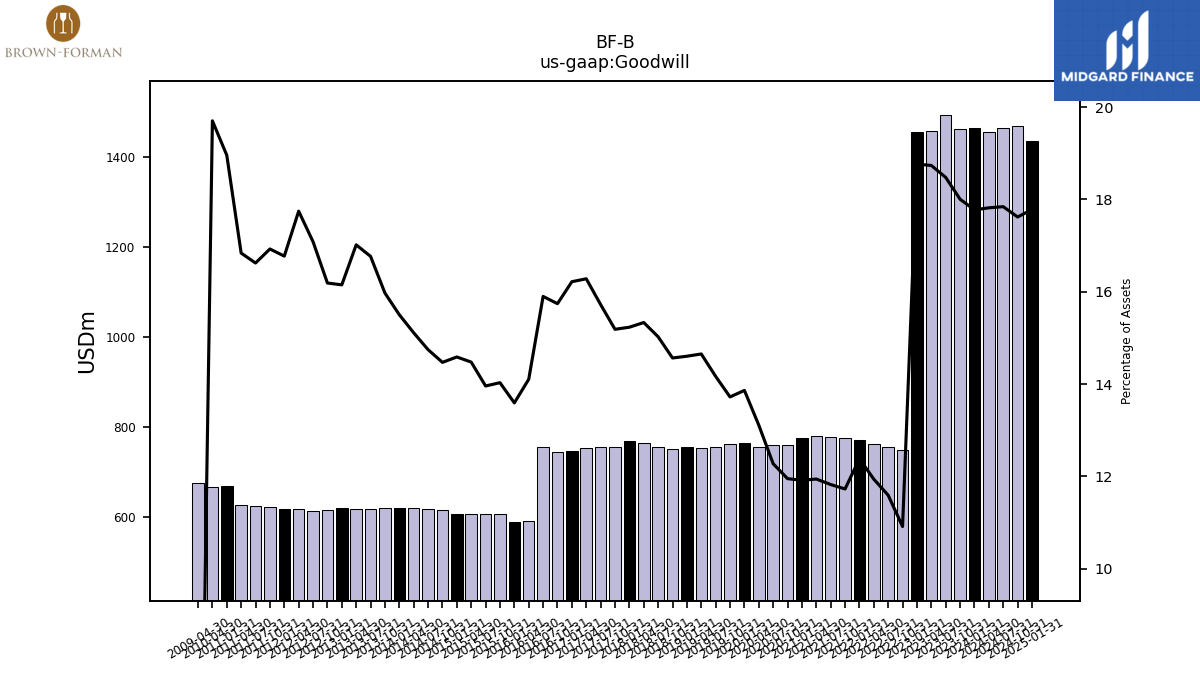
| Goodwill | 1464.00 | 1461.00 | 1494.00 | 1457.00 | 1455.00 | 748.00 | 756.00 | 761.00 | 771.00 | 776.00 | 778.00 | 779.00 | 774.00 | 759.00 | 760.00 | 756.00 | 765.00 | 762.00 | 754.00 | 753.00 | 754.00 | 750.00 | 755.00 | 763.00 | 768.00 | 756.00 | 755.00 | |
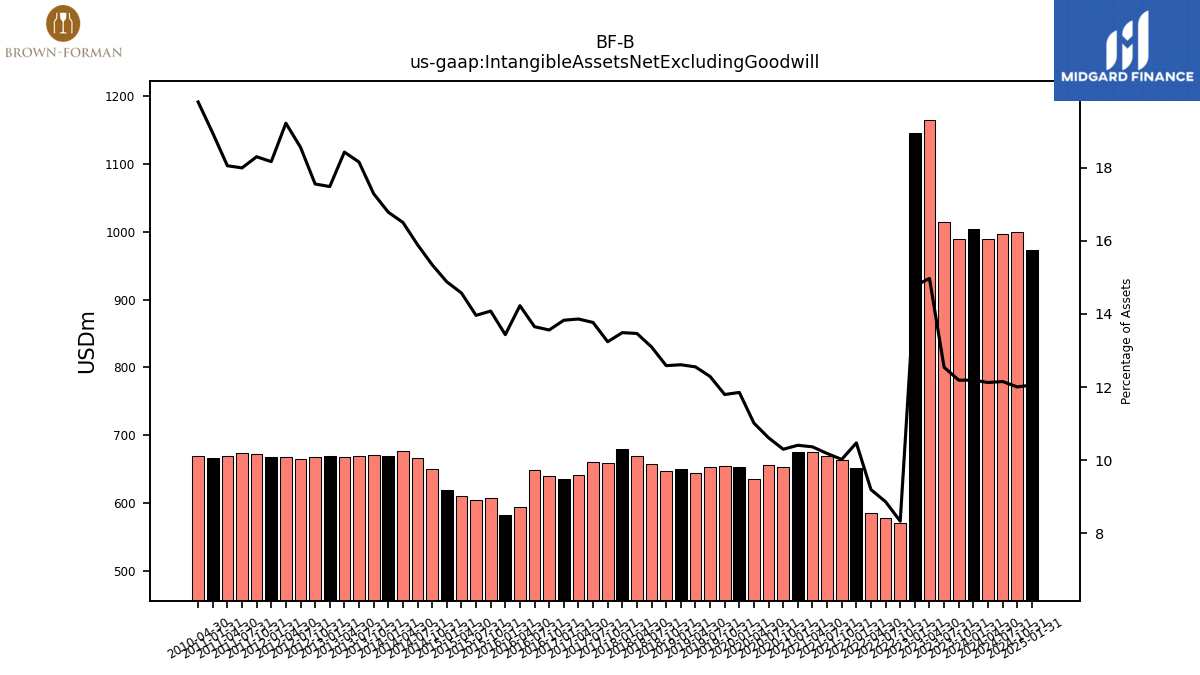
| Intangible Assets Net Excluding Goodwill | 1004.00 | 989.00 | 1014.00 | 1164.00 | 1145.00 | 571.00 | 578.00 | 586.00 | 652.00 | 663.00 | 670.00 | 676.00 | 676.00 | 654.00 | 657.00 | 635.00 | 654.00 | 655.00 | 654.00 | 645.00 | 651.00 | 648.00 | 658.00 | 670.00 | 680.00 | 659.00 | 661.00 | |
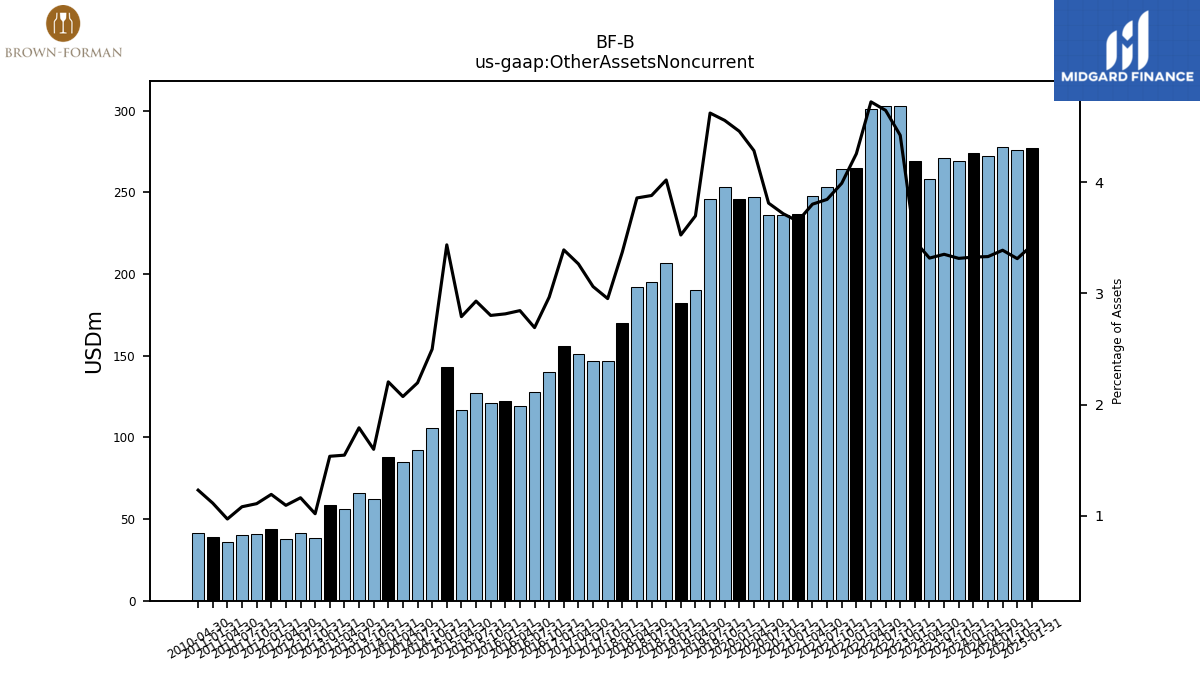
| Other Assets Noncurrent | 274.00 | 269.00 | 271.00 | 258.00 | 269.00 | 303.00 | 303.00 | 301.00 | 265.00 | 264.00 | 253.00 | 248.00 | 237.00 | 236.00 | 236.00 | 247.00 | 246.00 | 253.00 | 246.00 | 190.00 | 182.00 | 207.00 | 195.00 | 192.00 | 170.00 | 147.00 | 147.00 |
| 2024-01-31 | 2023-10-31 | 2023-07-31 | 2023-04-30 | 2023-01-31 | 2022-10-31 | 2022-07-31 | 2022-04-30 | 2022-01-31 | 2021-10-31 | 2021-07-31 | 2021-04-30 | 2021-01-31 | 2020-10-31 | 2020-07-31 | 2020-04-30 | 2020-01-31 | 2019-10-31 | 2019-07-31 | 2019-04-30 | 2019-01-31 | 2018-10-31 | 2018-07-31 | 2018-04-30 | 2018-01-31 | 2017-10-31 | 2017-07-31 | ||
|---|---|---|---|---|---|---|---|---|---|---|---|---|---|---|---|---|---|---|---|---|---|---|---|---|---|---|---|---|
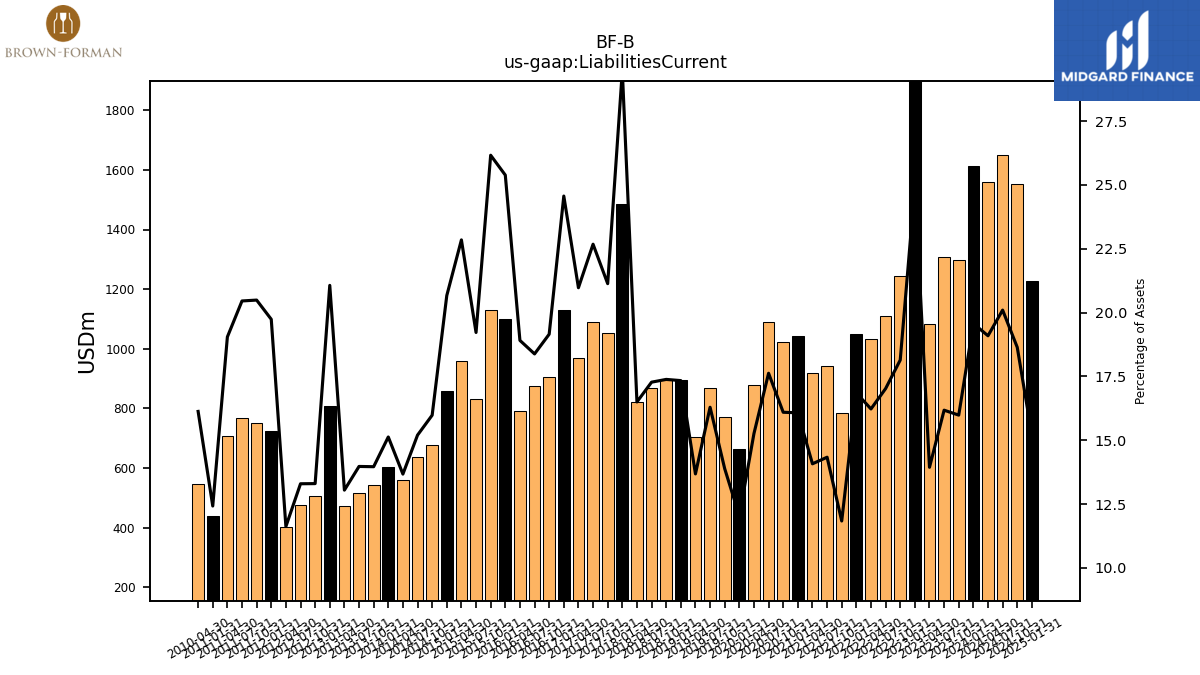
| Liabilities Current | 1612.00 | 1297.00 | 1308.00 | 1084.00 | 1933.00 | 1243.00 | 1110.00 | 1034.00 | 1049.00 | 783.00 | 943.00 | 918.00 | 1044.00 | 1022.00 | 1091.00 | 880.00 | 664.00 | 771.00 | 867.00 | 703.00 | 895.00 | 895.00 | 868.00 | 821.00 | 1486.00 | 1052.00 | 1089.00 | |
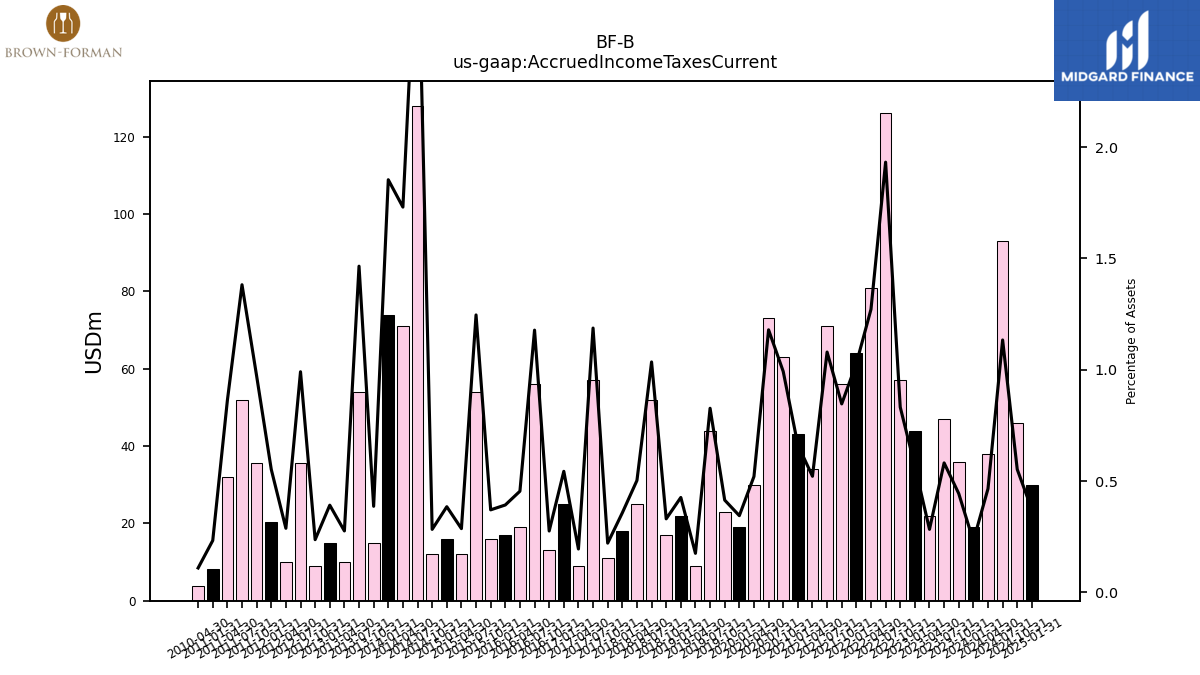
| Accrued Income Taxes Current | 19.00 | 36.00 | 47.00 | 22.00 | 44.00 | 57.00 | 126.00 | 81.00 | 64.00 | 56.00 | 71.00 | 34.00 | 43.00 | 63.00 | 73.00 | 30.00 | 19.00 | 23.00 | 44.00 | 9.00 | 22.00 | 17.00 | 52.00 | 25.00 | 18.00 | 11.00 | 57.00 | |
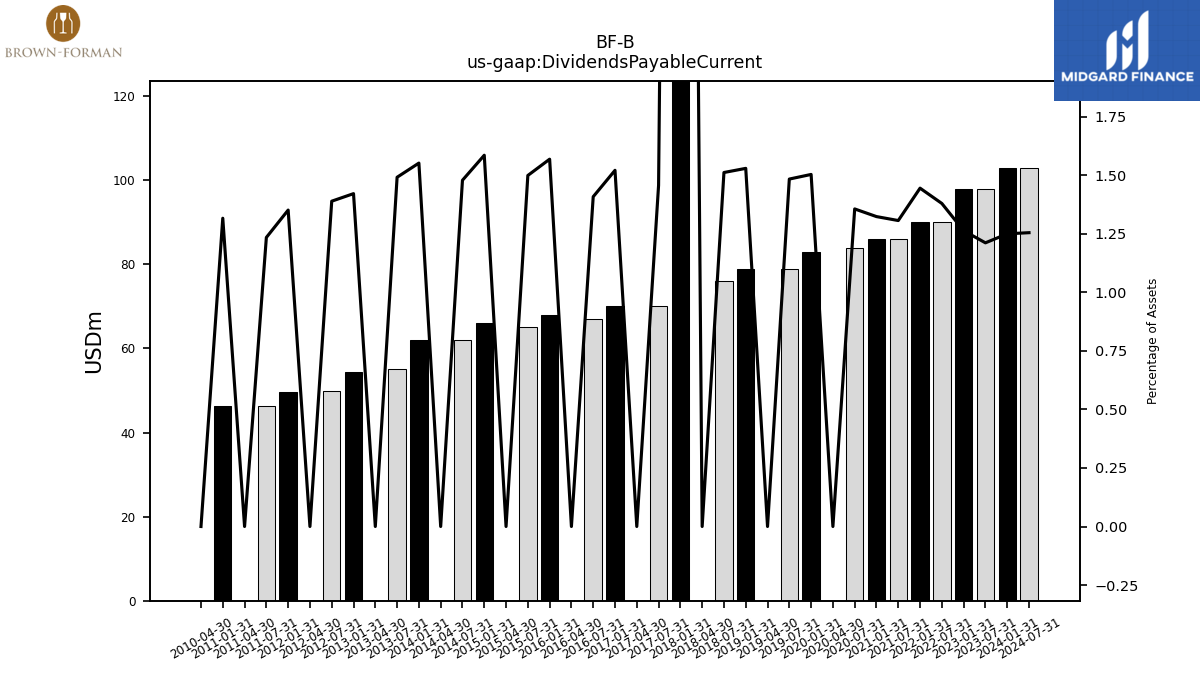
| Dividends Payable Current | 103.00 | NA | 98.00 | NA | 98.00 | NA | 90.00 | NA | 90.00 | NA | 86.00 | NA | 86.00 | NA | 84.00 | 0.00 | 83.00 | NA | 79.00 | 0.00 | 79.00 | NA | 76.00 | 0.00 | 557.00 | NA | 70.00 |
| 2024-01-31 | 2023-10-31 | 2023-07-31 | 2023-04-30 | 2023-01-31 | 2022-10-31 | 2022-07-31 | 2022-04-30 | 2022-01-31 | 2021-10-31 | 2021-07-31 | 2021-04-30 | 2021-01-31 | 2020-10-31 | 2020-07-31 | 2020-04-30 | 2020-01-31 | 2019-10-31 | 2019-07-31 | 2019-04-30 | 2019-01-31 | 2018-10-31 | 2018-07-31 | 2018-04-30 | 2018-01-31 | 2017-10-31 | 2017-07-31 | ||
|---|---|---|---|---|---|---|---|---|---|---|---|---|---|---|---|---|---|---|---|---|---|---|---|---|---|---|---|---|
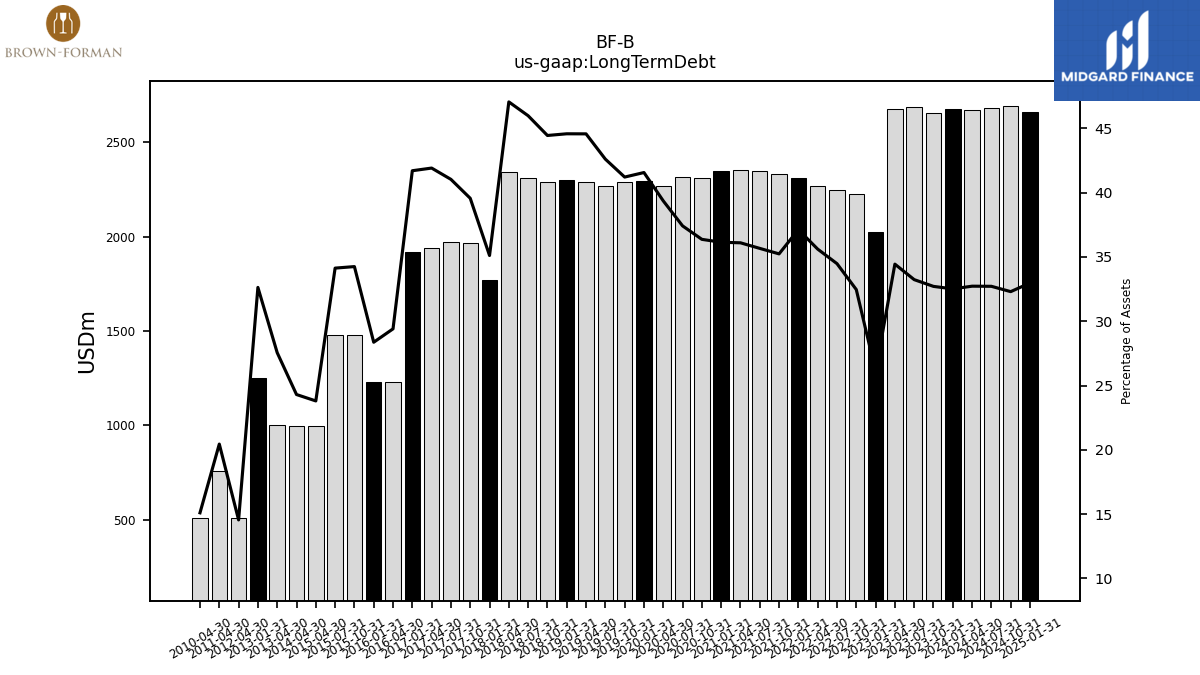
| Long Term Debt | 2678.00 | 2654.00 | 2687.00 | 2678.00 | 2024.00 | 2224.00 | 2248.00 | 2269.00 | 2311.00 | 2331.00 | 2346.00 | 2354.00 | 2347.00 | 2309.00 | 2316.00 | 2269.00 | 2293.00 | 2288.00 | 2267.00 | 2290.00 | 2301.00 | 2288.00 | 2310.00 | 2341.00 | 1770.00 | 1969.00 | 1970.00 | |
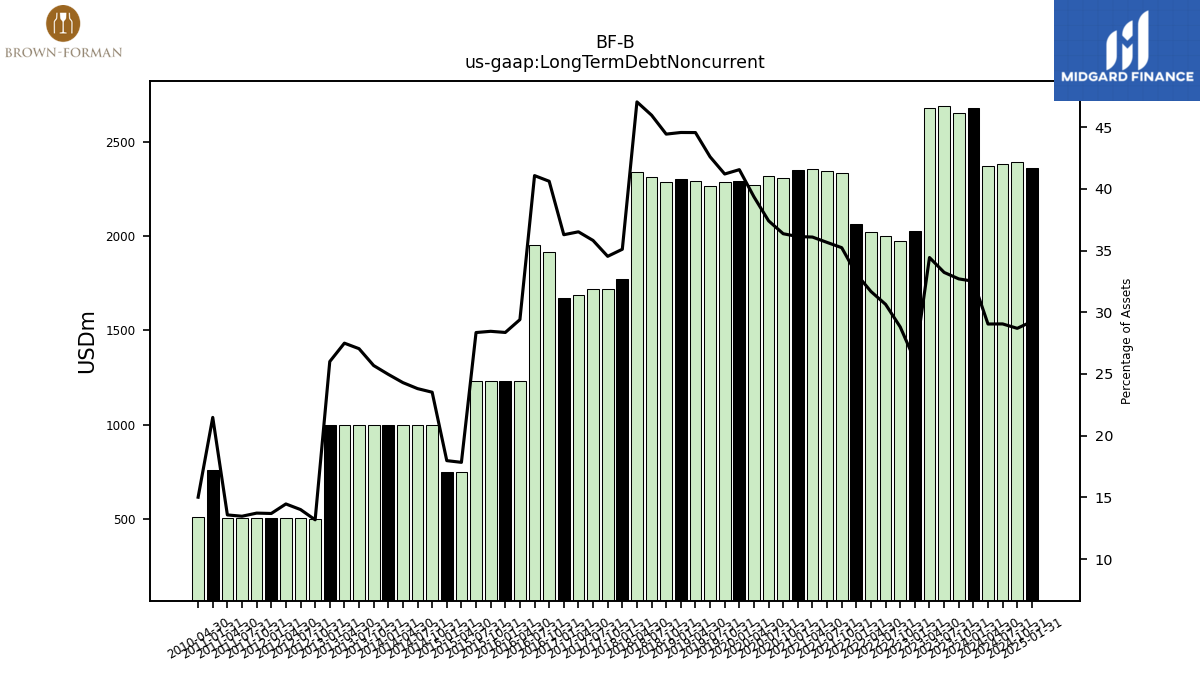
| Long Term Debt Noncurrent | 2678.00 | 2654.00 | 2687.00 | 2678.00 | 2024.00 | 1974.00 | 1998.00 | 2019.00 | 2061.00 | 2331.00 | 2346.00 | 2354.00 | 2347.00 | 2309.00 | 2316.00 | 2269.00 | 2293.00 | 2288.00 | 2267.00 | 2290.00 | 2301.00 | 2288.00 | 2310.00 | 2341.00 | 1770.00 | 1719.00 | 1720.00 | |
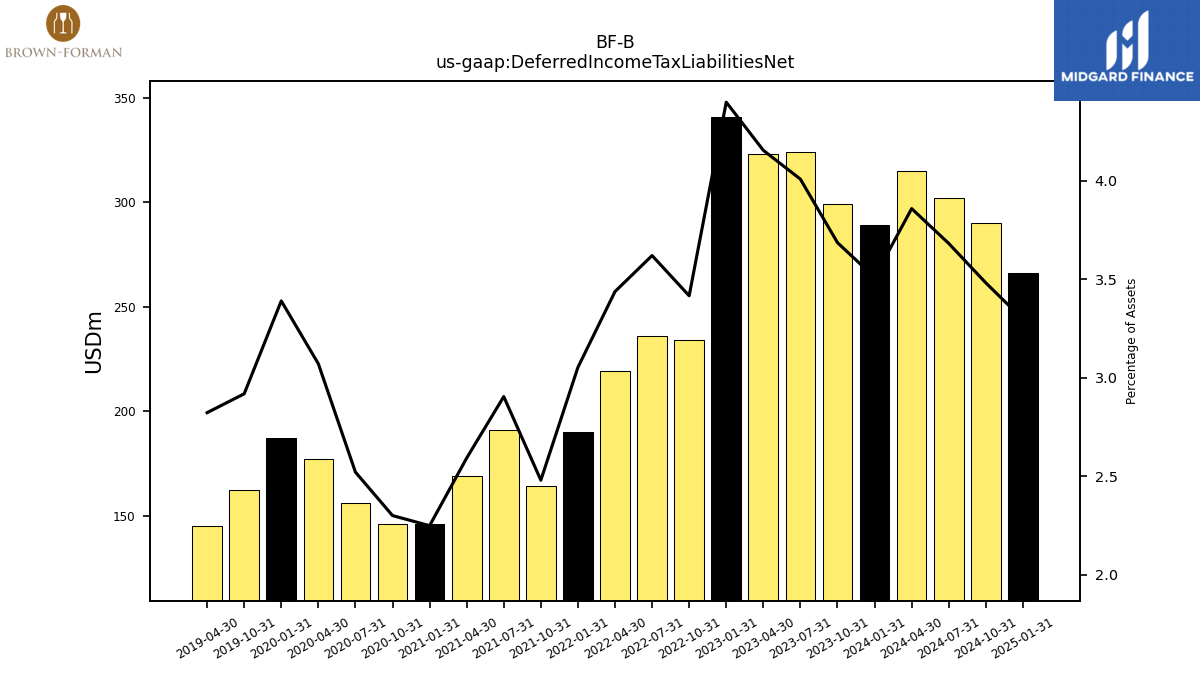
| Deferred Income Tax Liabilities Net | 289.00 | 299.00 | 324.00 | 323.00 | 341.00 | 234.00 | 236.00 | 219.00 | 190.00 | 164.00 | 191.00 | 169.00 | 146.00 | 146.00 | 156.00 | 177.00 | 187.00 | 162.00 | NA | 145.00 | NA | NA | NA | NA | NA | NA | NA | |
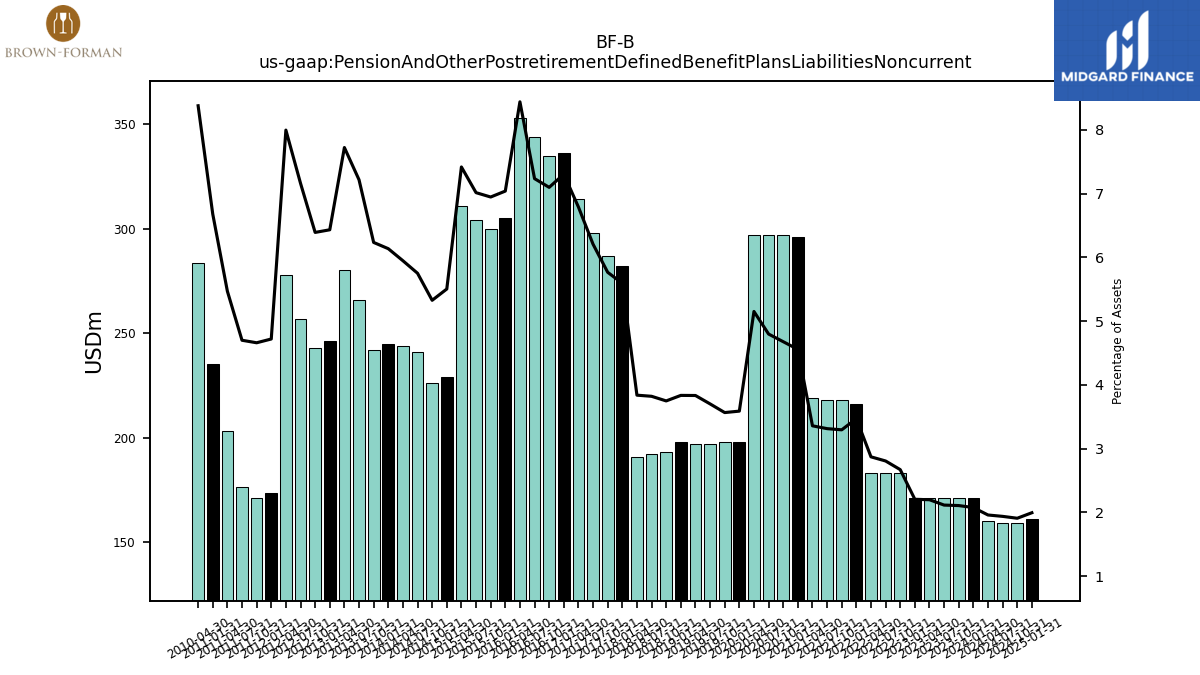
| Pension And Other Postretirement Defined Benefit Plans Liabilities Noncurrent | 171.00 | 171.00 | 171.00 | 171.00 | 171.00 | 183.00 | 183.00 | 183.00 | 216.00 | 218.00 | 218.00 | 219.00 | 296.00 | 297.00 | 297.00 | 297.00 | 198.00 | 198.00 | 197.00 | 197.00 | 198.00 | 193.00 | 192.00 | 191.00 | 282.00 | 287.00 | 298.00 | |
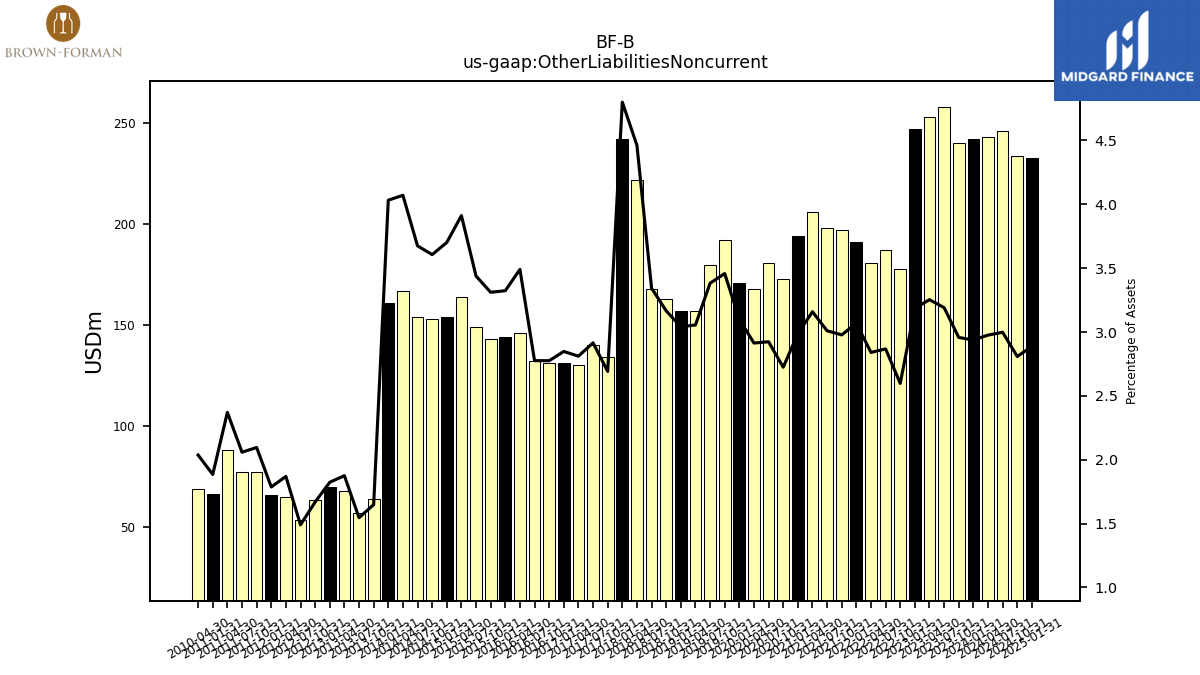
| Other Liabilities Noncurrent | 242.00 | 240.00 | 258.00 | 253.00 | 247.00 | 178.00 | 187.00 | 181.00 | 191.00 | 197.00 | 198.00 | 206.00 | 194.00 | 173.00 | 181.00 | 168.00 | 171.00 | 192.00 | 180.00 | 157.00 | 157.00 | 163.00 | 168.00 | 222.00 | 242.00 | 134.00 | 140.00 |
| 2024-01-31 | 2023-10-31 | 2023-07-31 | 2023-04-30 | 2023-01-31 | 2022-10-31 | 2022-07-31 | 2022-04-30 | 2022-01-31 | 2021-10-31 | 2021-07-31 | 2021-04-30 | 2021-01-31 | 2020-10-31 | 2020-07-31 | 2020-04-30 | 2020-01-31 | 2019-10-31 | 2019-07-31 | 2019-04-30 | 2019-01-31 | 2018-10-31 | 2018-07-31 | 2018-04-30 | 2018-01-31 | 2017-10-31 | 2017-07-31 | ||
|---|---|---|---|---|---|---|---|---|---|---|---|---|---|---|---|---|---|---|---|---|---|---|---|---|---|---|---|---|
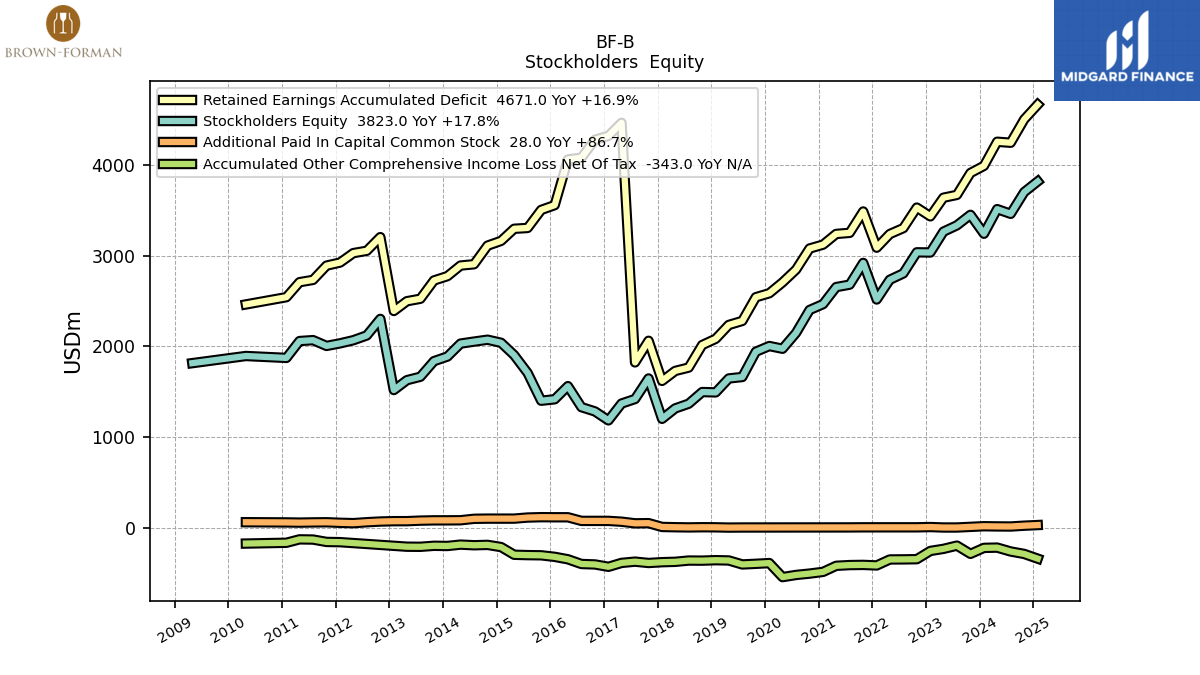
| Stockholders Equity | 3245.00 | 3454.00 | 3338.00 | 3268.00 | 3038.00 | 3040.00 | 2807.00 | 2737.00 | 2519.00 | 2923.00 | 2683.00 | 2656.00 | 2468.00 | 2403.00 | 2150.00 | 1975.00 | 2005.00 | 1942.00 | 1663.00 | 1647.00 | 1493.00 | 1497.00 | 1368.00 | 1316.00 | 1201.00 | 1647.00 | 1420.00 | |
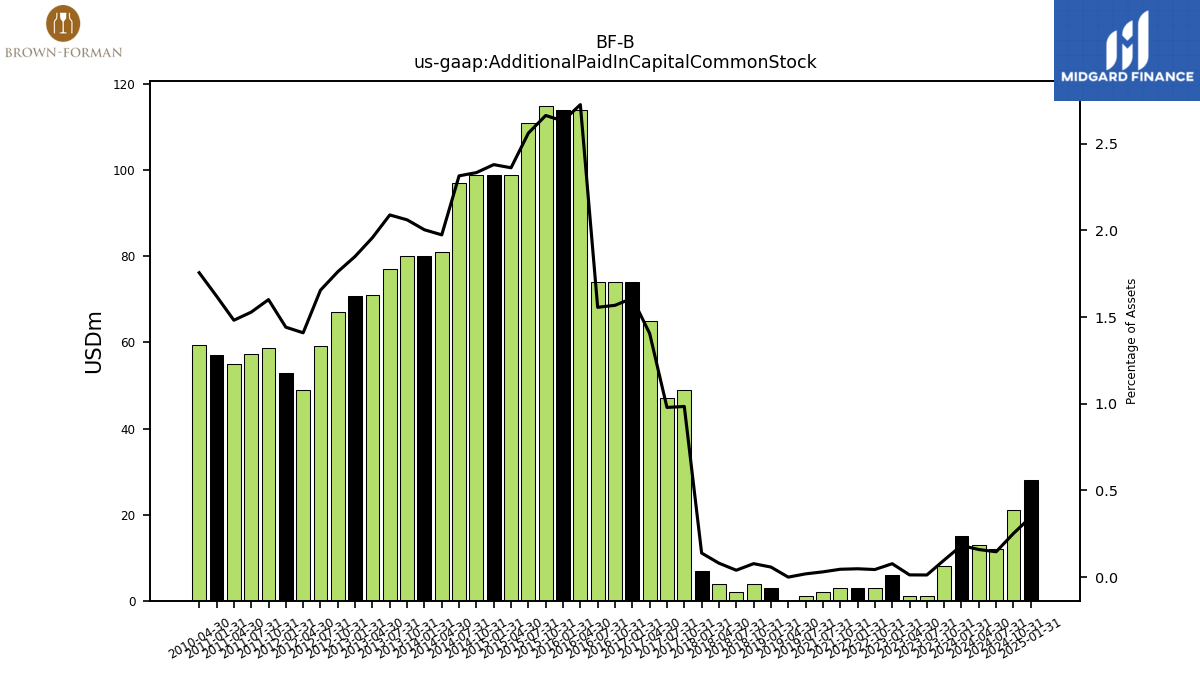
| Additional Paid In Capital Common Stock | 15.00 | 8.00 | 1.00 | 1.00 | 6.00 | 3.00 | NA | NA | 3.00 | 3.00 | 2.00 | NA | NA | NA | NA | NA | NA | NA | 1.00 | 0.00 | 3.00 | 4.00 | 2.00 | 4.00 | 7.00 | 49.00 | 47.00 | |
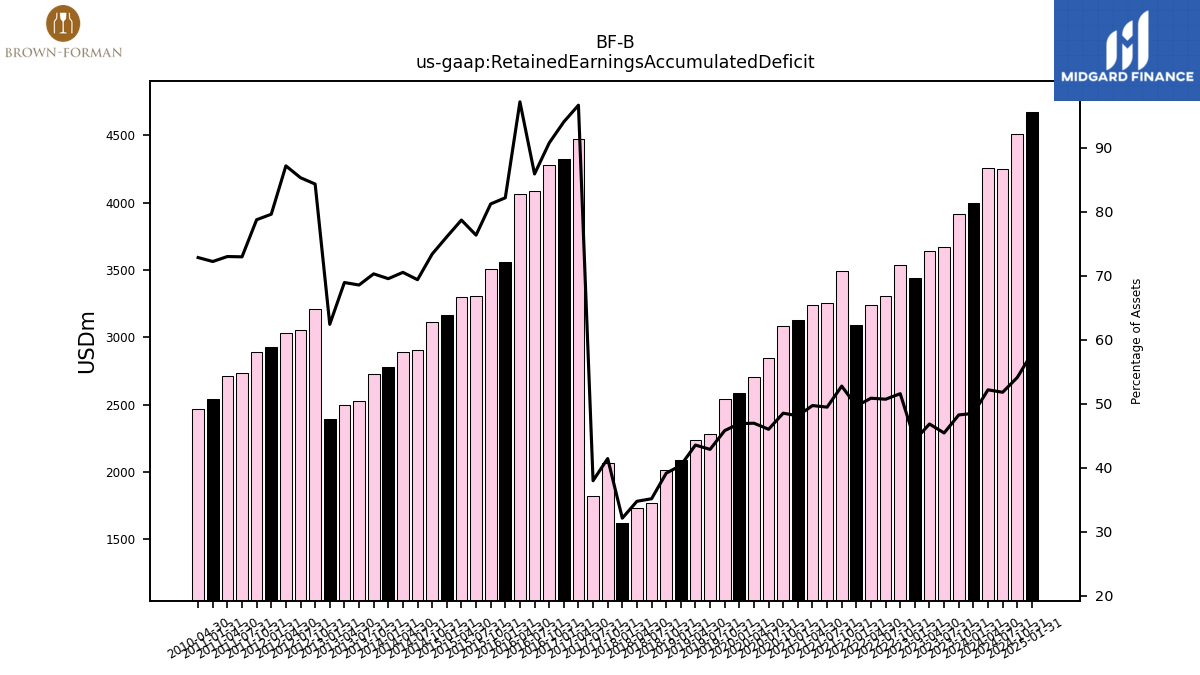
| Retained Earnings Accumulated Deficit | 3995.00 | 3916.00 | 3674.00 | 3643.00 | 3437.00 | 3534.00 | 3307.00 | 3242.00 | 3091.00 | 3491.00 | 3255.00 | 3243.00 | 3125.00 | 3082.00 | 2849.00 | 2708.00 | 2588.00 | 2544.00 | 2282.00 | 2238.00 | 2085.00 | 2016.00 | 1767.00 | 1730.00 | 1620.00 | 2063.00 | 1824.00 | |
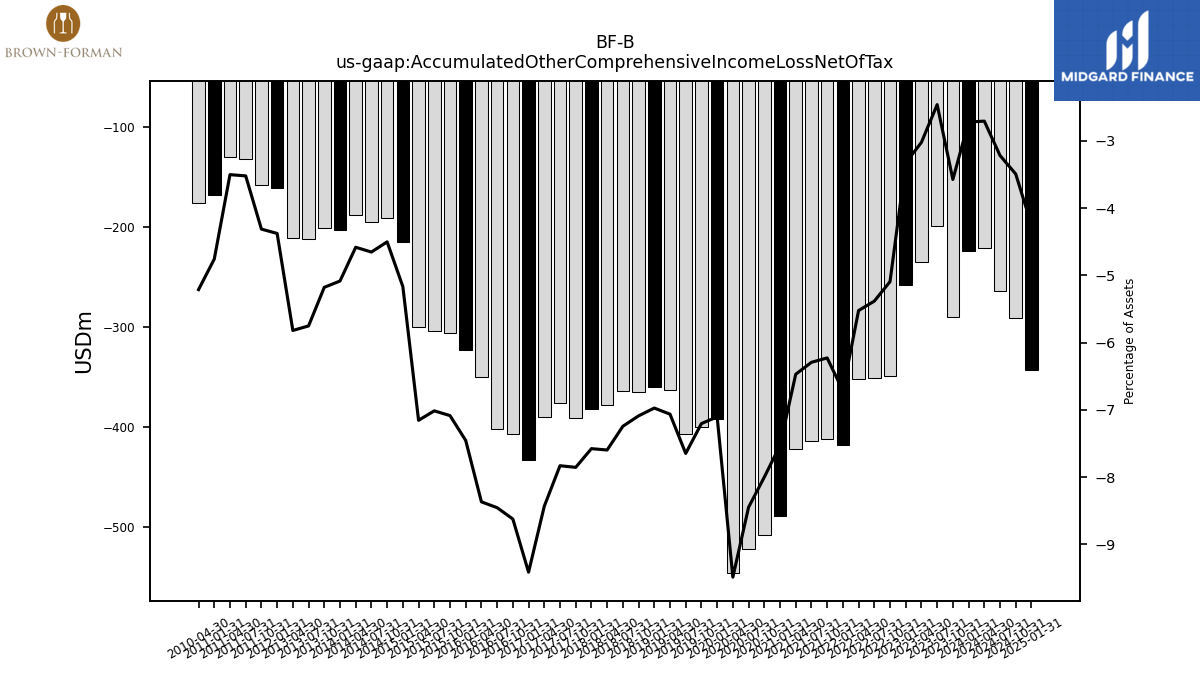
| Accumulated Other Comprehensive Income Loss Net Of Tax | -224.00 | -290.00 | -199.00 | -235.00 | -258.00 | -349.00 | -351.00 | -352.00 | -418.00 | -412.00 | -414.00 | -422.00 | -489.00 | -508.00 | -523.00 | -547.00 | -392.00 | -400.00 | -407.00 | -363.00 | -360.00 | -365.00 | -364.00 | -378.00 | -382.00 | -391.00 | -376.00 | |
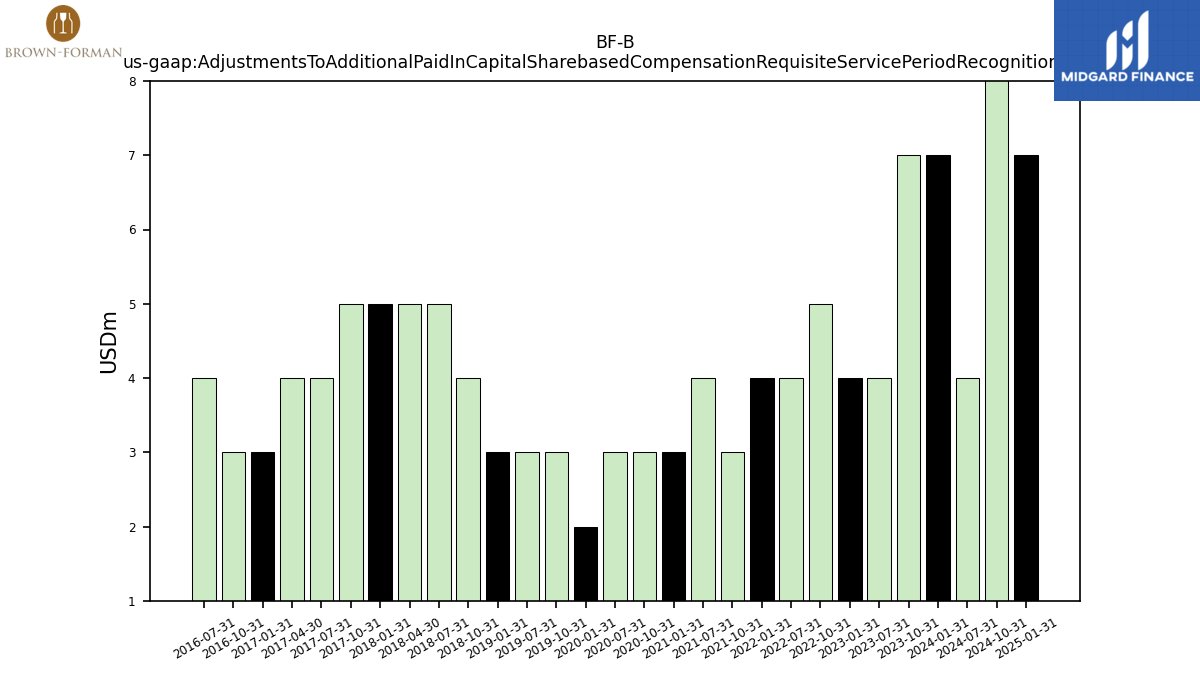
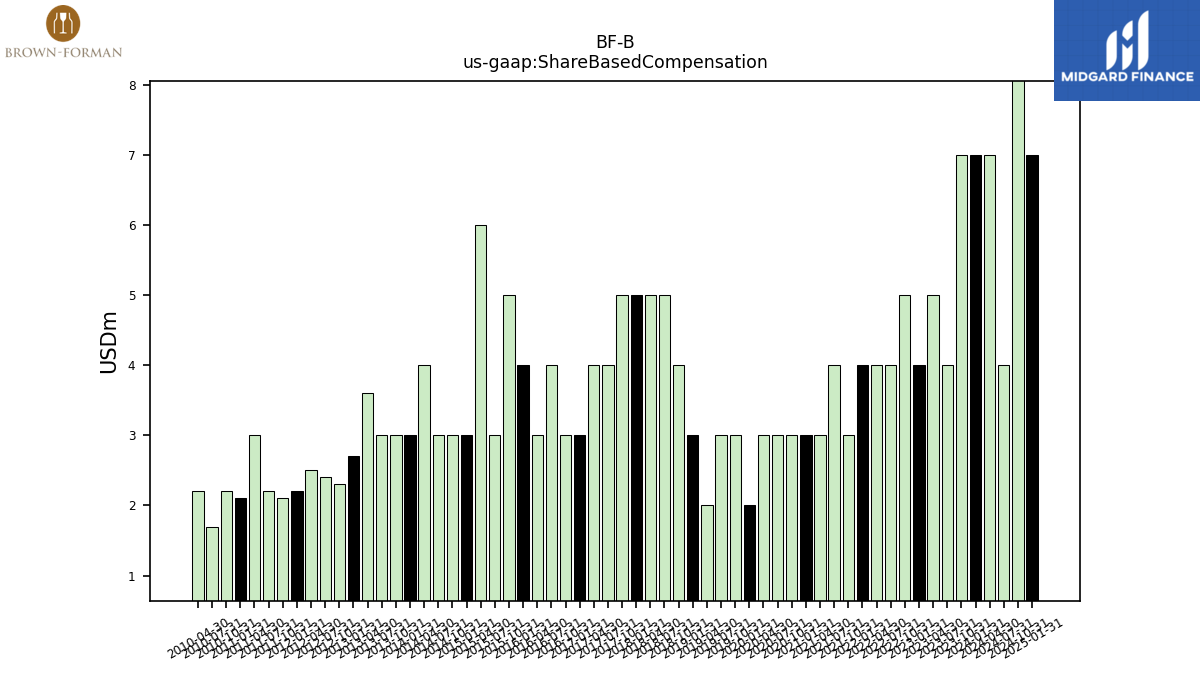
| Adjustments To Additional Paid In Capital Sharebased Compensation Requisite Service Period Recognition Value | 7.00 | 7.00 | 4.00 | NA | 4.00 | 5.00 | 4.00 | NA | 4.00 | 3.00 | 4.00 | NA | 3.00 | 3.00 | 3.00 | NA | 2.00 | 3.00 | 3.00 | NA | 3.00 | 4.00 | 5.00 | 5.00 | 5.00 | 5.00 | 4.00 |
| 2024-01-31 | 2023-10-31 | 2023-07-31 | 2023-04-30 | 2023-01-31 | 2022-10-31 | 2022-07-31 | 2022-04-30 | 2022-01-31 | 2021-10-31 | 2021-07-31 | 2021-04-30 | 2021-01-31 | 2020-10-31 | 2020-07-31 | 2020-04-30 | 2020-01-31 | 2019-10-31 | 2019-07-31 | 2019-04-30 | 2019-01-31 | 2018-10-31 | 2018-07-31 | 2018-04-30 | 2018-01-31 | 2017-10-31 | 2017-07-31 | ||
|---|---|---|---|---|---|---|---|---|---|---|---|---|---|---|---|---|---|---|---|---|---|---|---|---|---|---|---|---|
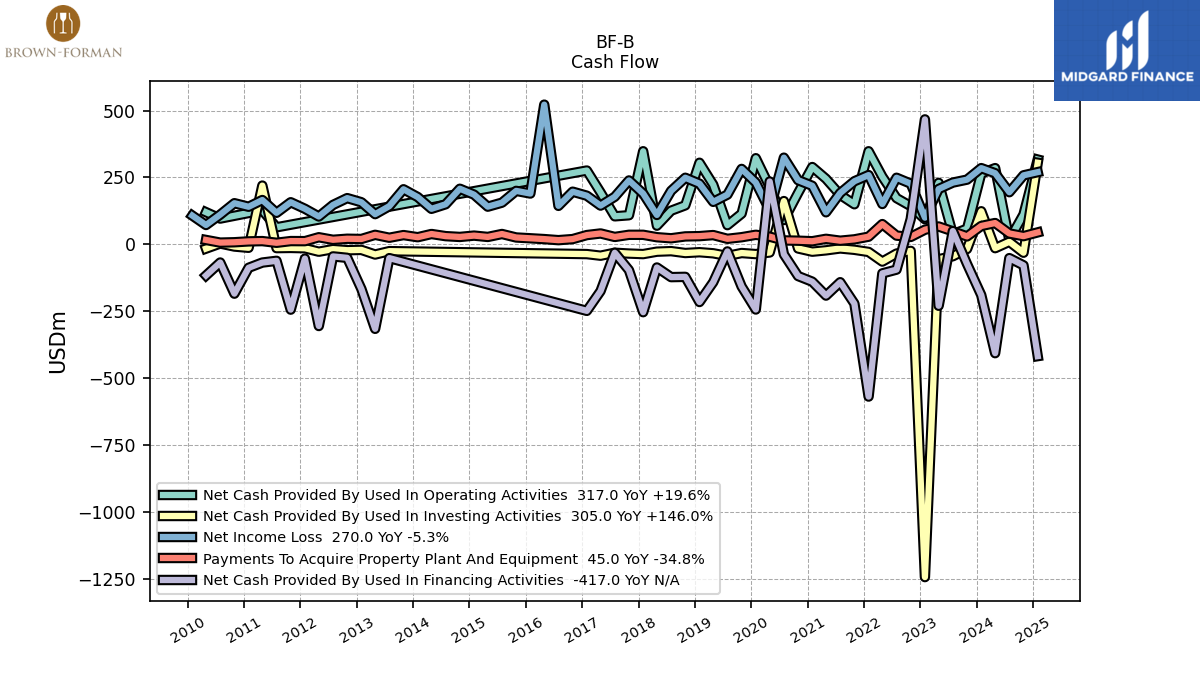
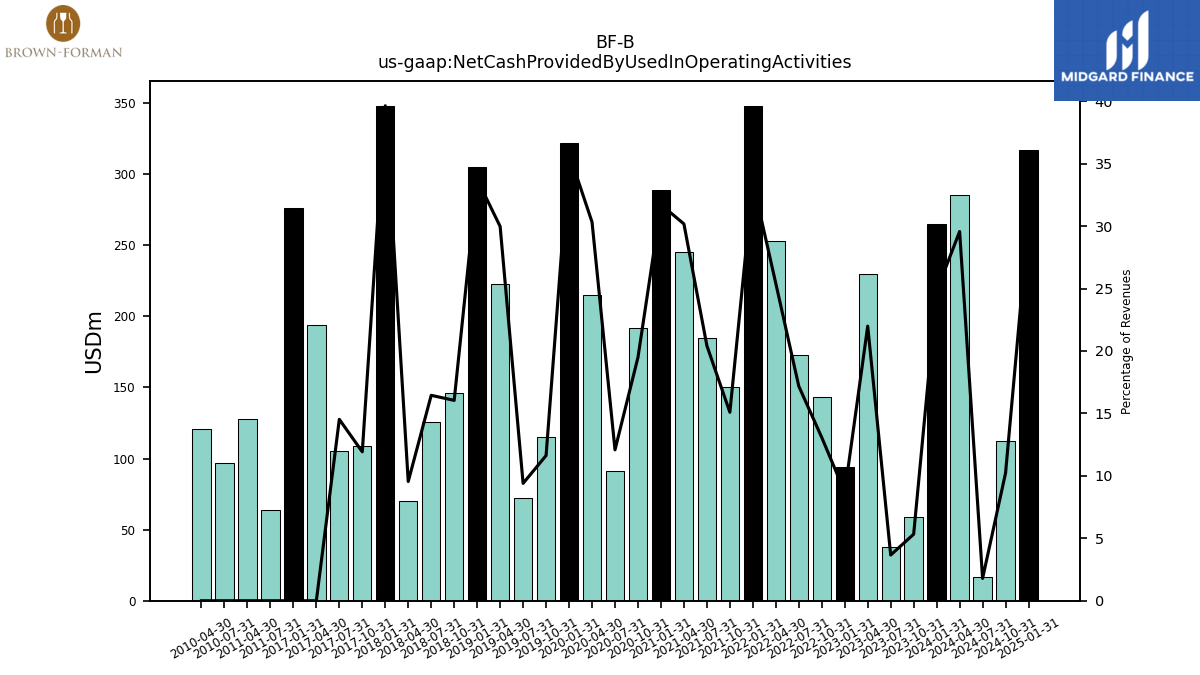
| Net Cash Provided By Used In Operating Activities | 265.00 | 59.00 | 38.00 | 230.00 | 94.00 | 143.00 | 173.00 | 253.00 | 348.00 | 150.00 | 185.00 | 245.00 | 289.00 | 192.00 | 91.00 | 215.00 | 322.00 | 115.00 | 72.00 | 223.00 | 305.00 | 146.00 | 126.00 | 70.00 | 348.00 | 109.00 | 105.00 | |
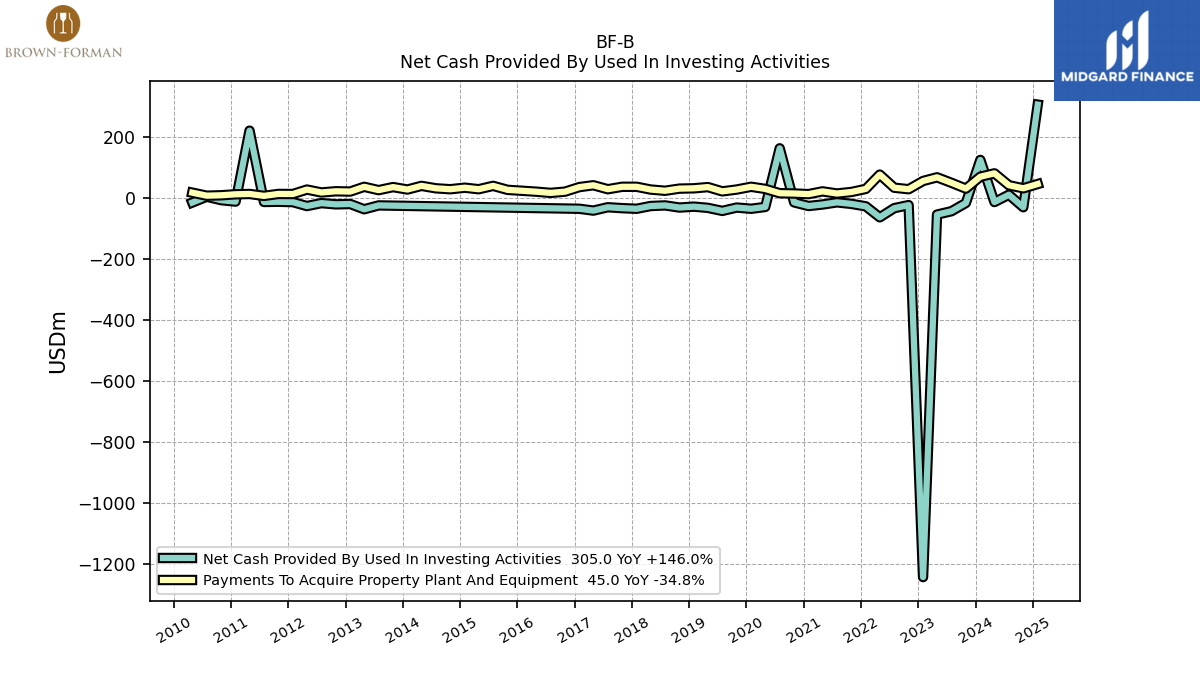
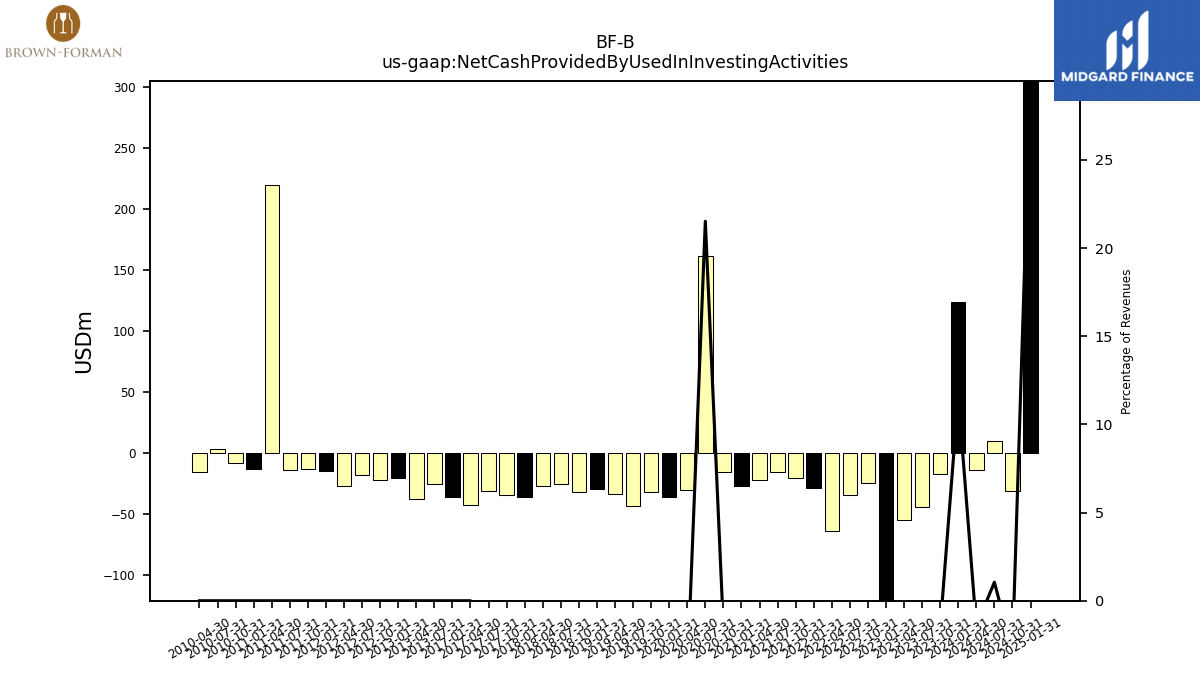
| Net Cash Provided By Used In Investing Activities | 124.00 | -17.00 | -44.00 | -55.00 | -1242.00 | -24.00 | -34.00 | -64.00 | -28.00 | -20.00 | -15.00 | -22.00 | -27.00 | -15.00 | 162.00 | -30.00 | -36.00 | -32.00 | -43.00 | -33.00 | -29.00 | -32.00 | -25.00 | -27.00 | -36.00 | -34.00 | -31.00 | |
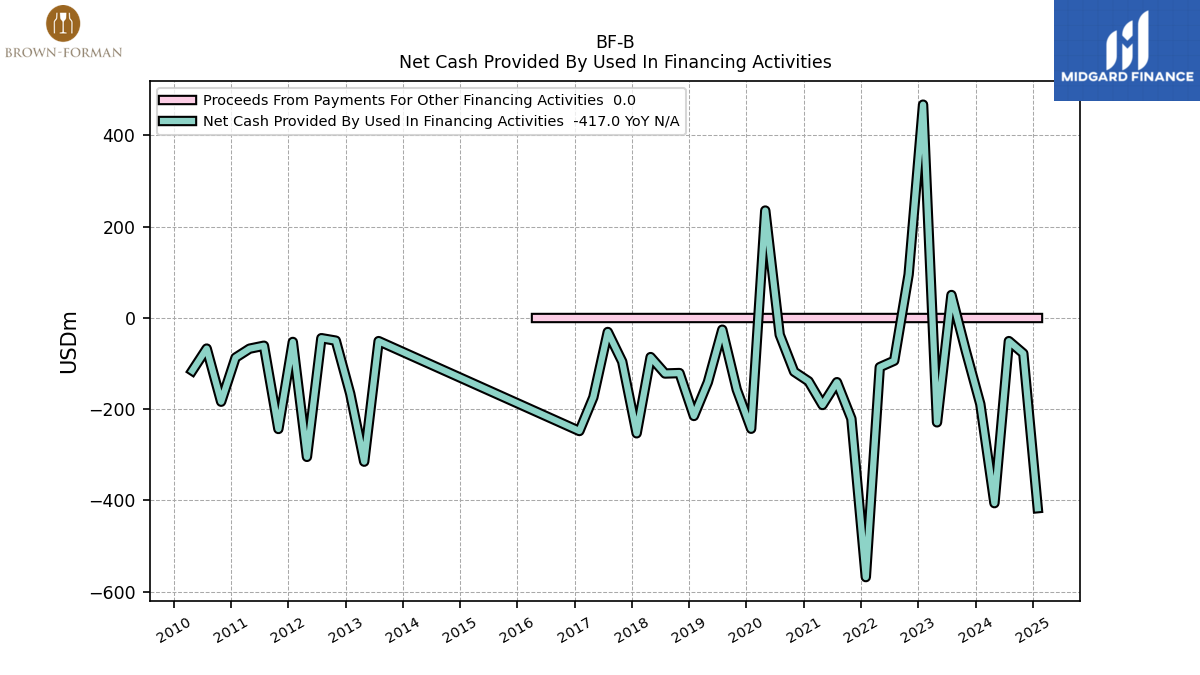
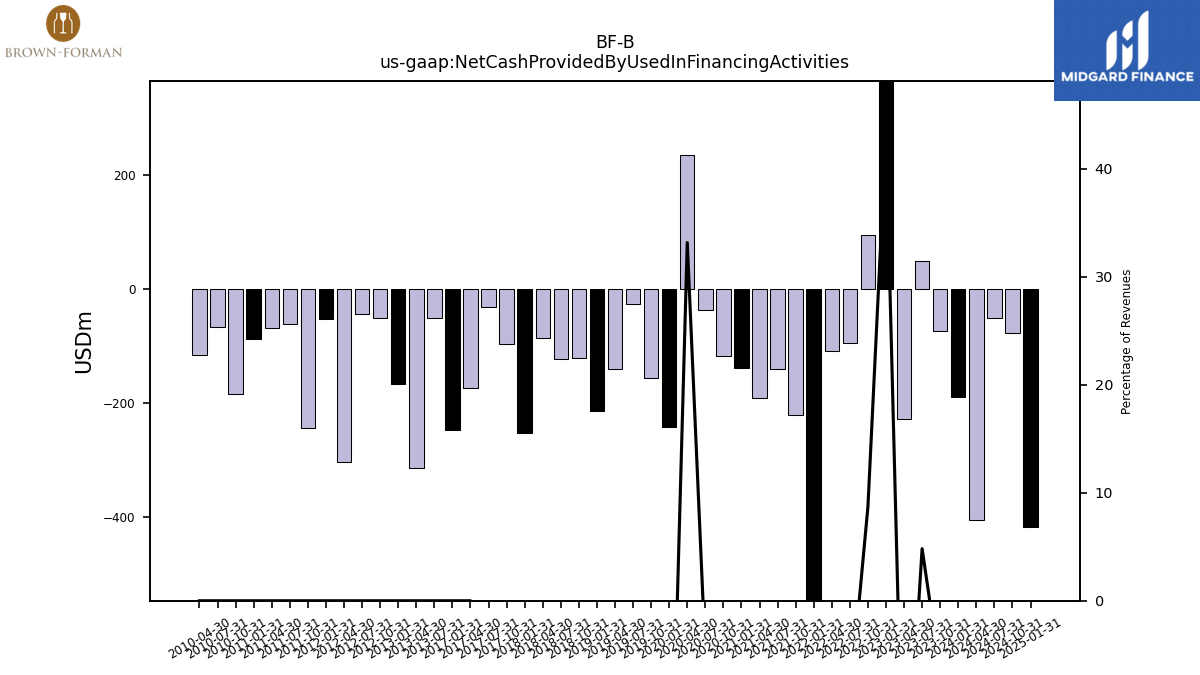
| Net Cash Provided By Used In Financing Activities | -189.00 | -73.00 | 50.00 | -229.00 | 467.00 | 95.00 | -94.00 | -108.00 | -568.00 | -221.00 | -141.00 | -191.00 | -139.00 | -118.00 | -37.00 | 235.00 | -243.00 | -157.00 | -26.00 | -141.00 | -215.00 | -121.00 | -122.00 | -86.00 | -253.00 | -96.00 | -31.00 |
| 2024-01-31 | 2023-10-31 | 2023-07-31 | 2023-04-30 | 2023-01-31 | 2022-10-31 | 2022-07-31 | 2022-04-30 | 2022-01-31 | 2021-10-31 | 2021-07-31 | 2021-04-30 | 2021-01-31 | 2020-10-31 | 2020-07-31 | 2020-04-30 | 2020-01-31 | 2019-10-31 | 2019-07-31 | 2019-04-30 | 2019-01-31 | 2018-10-31 | 2018-07-31 | 2018-04-30 | 2018-01-31 | 2017-10-31 | 2017-07-31 | ||
|---|---|---|---|---|---|---|---|---|---|---|---|---|---|---|---|---|---|---|---|---|---|---|---|---|---|---|---|---|
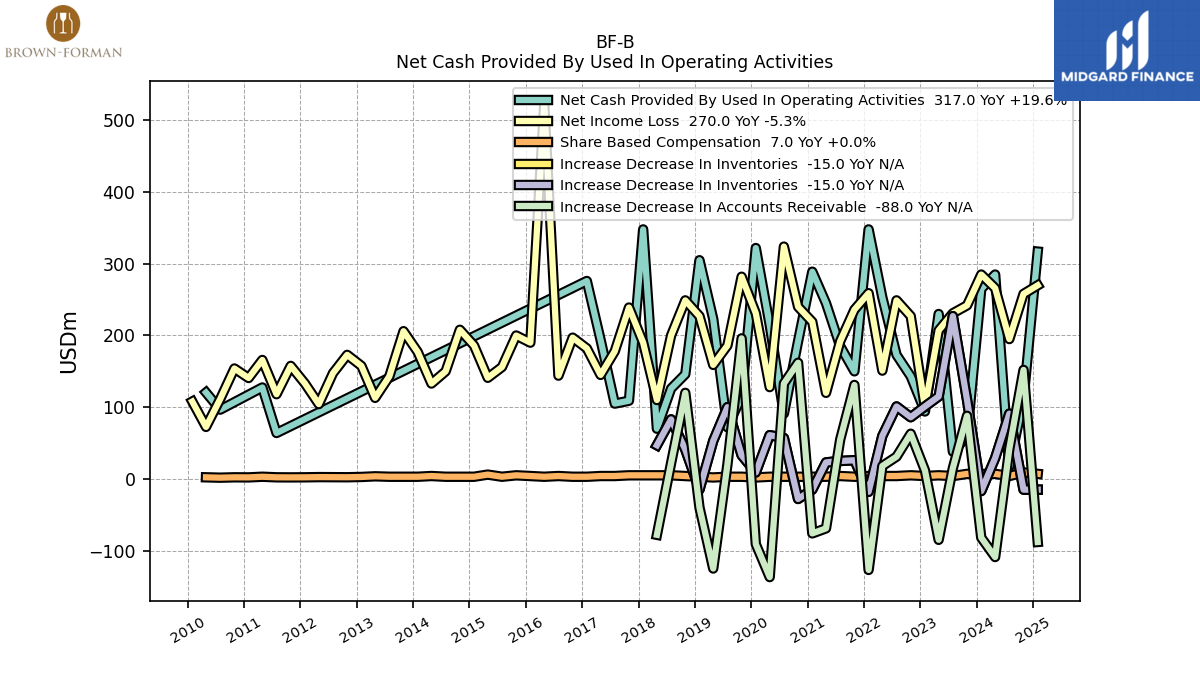
| Net Cash Provided By Used In Operating Activities | 265.00 | 59.00 | 38.00 | 230.00 | 94.00 | 143.00 | 173.00 | 253.00 | 348.00 | 150.00 | 185.00 | 245.00 | 289.00 | 192.00 | 91.00 | 215.00 | 322.00 | 115.00 | 72.00 | 223.00 | 305.00 | 146.00 | 126.00 | 70.00 | 348.00 | 109.00 | 105.00 | |
| Net Income Loss | 285.00 | 242.00 | 231.00 | 207.00 | 100.00 | 227.00 | 249.00 | 151.00 | 259.00 | 236.00 | 192.00 | 120.00 | 219.00 | 240.00 | 324.00 | 128.00 | 231.00 | 282.00 | 186.00 | 159.00 | 227.00 | 249.00 | 200.00 | 110.00 | 190.00 | 239.00 | 178.00 | |
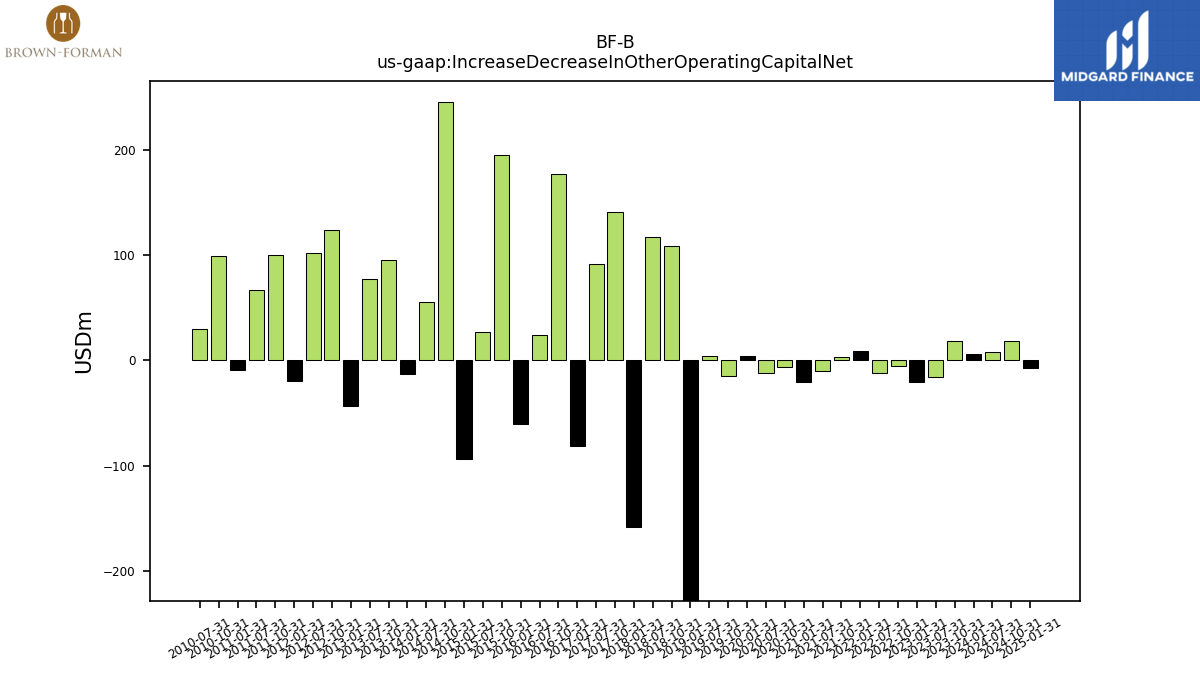
| Increase Decrease In Other Operating Capital Net | 6.00 | 18.00 | -16.00 | NA | -21.00 | -5.00 | -12.00 | NA | 9.00 | 3.00 | -10.00 | NA | -21.00 | -6.00 | -12.00 | NA | 4.00 | -15.00 | 4.00 | NA | -243.00 | 109.00 | 117.00 | NA | -158.00 | 141.00 | 92.00 | |
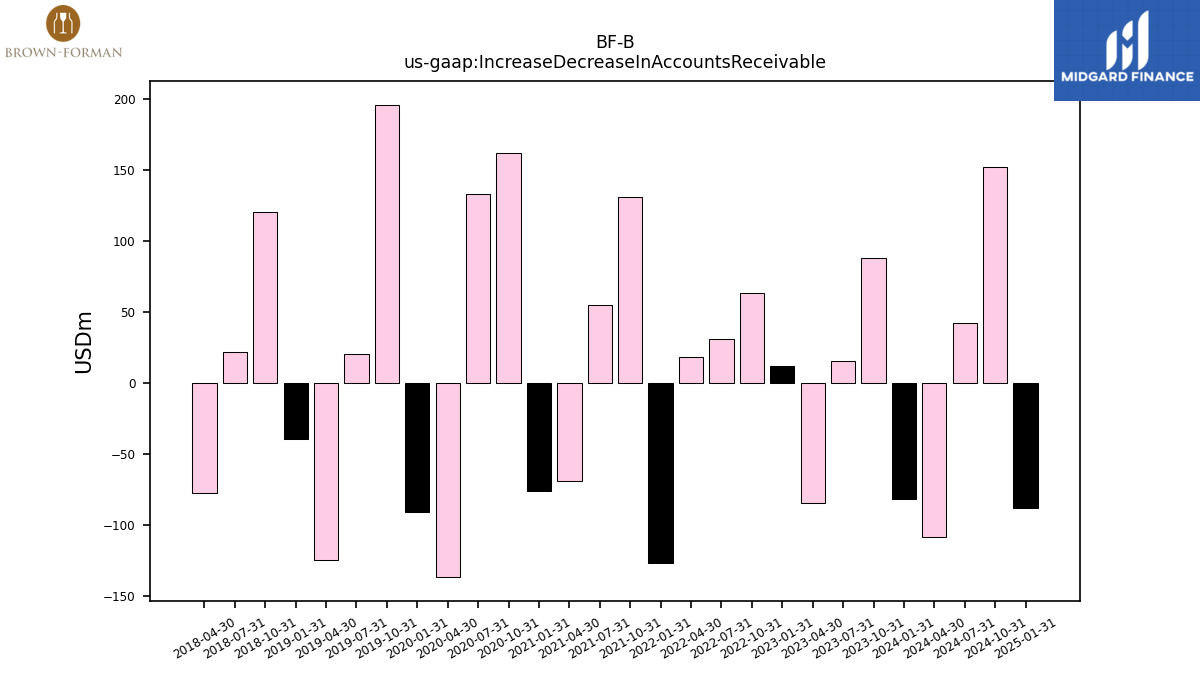
| Increase Decrease In Accounts Receivable | -82.00 | 88.00 | 15.00 | -85.00 | 12.00 | 63.00 | 31.00 | 18.00 | -127.00 | 131.00 | 55.00 | -69.00 | -76.00 | 162.00 | 133.00 | -137.00 | -91.00 | 196.00 | 20.00 | -125.00 | -40.00 | 120.00 | 22.00 | -78.00 | NA | NA | NA | |
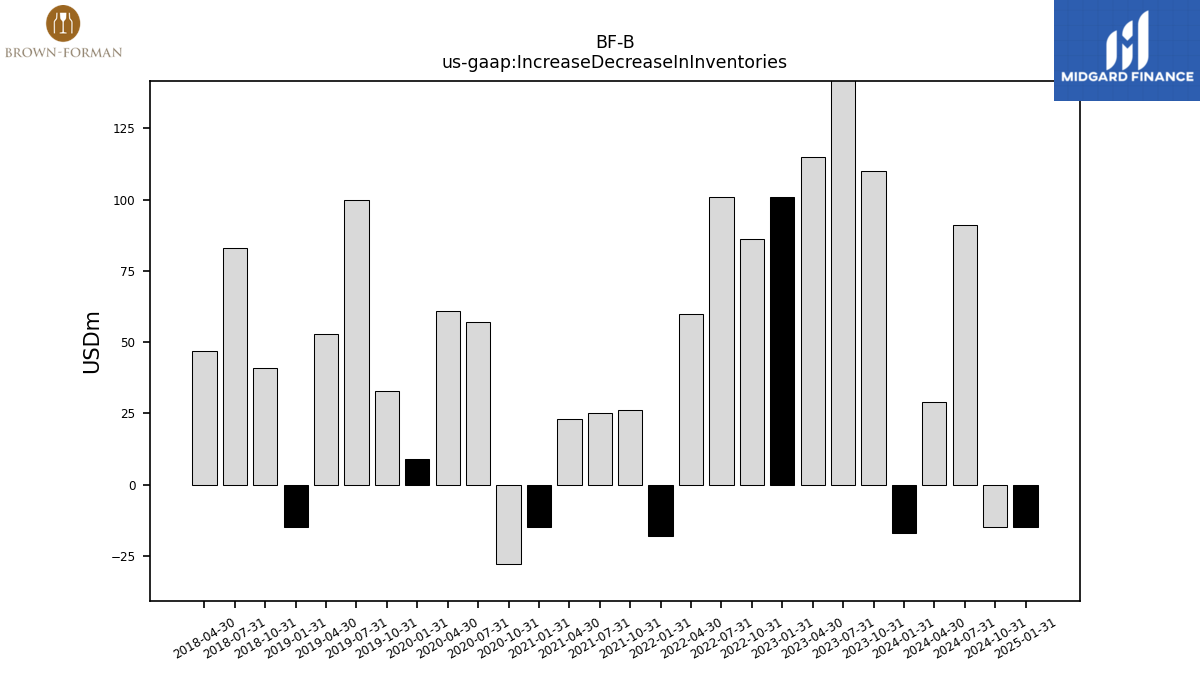
| Increase Decrease In Inventories | -17.00 | 110.00 | 227.00 | 115.00 | 101.00 | 86.00 | 101.00 | 60.00 | -18.00 | 26.00 | 25.00 | 23.00 | -15.00 | -28.00 | 57.00 | 61.00 | 9.00 | 33.00 | 100.00 | 53.00 | -15.00 | 41.00 | 83.00 | 47.00 | NA | NA | NA | |
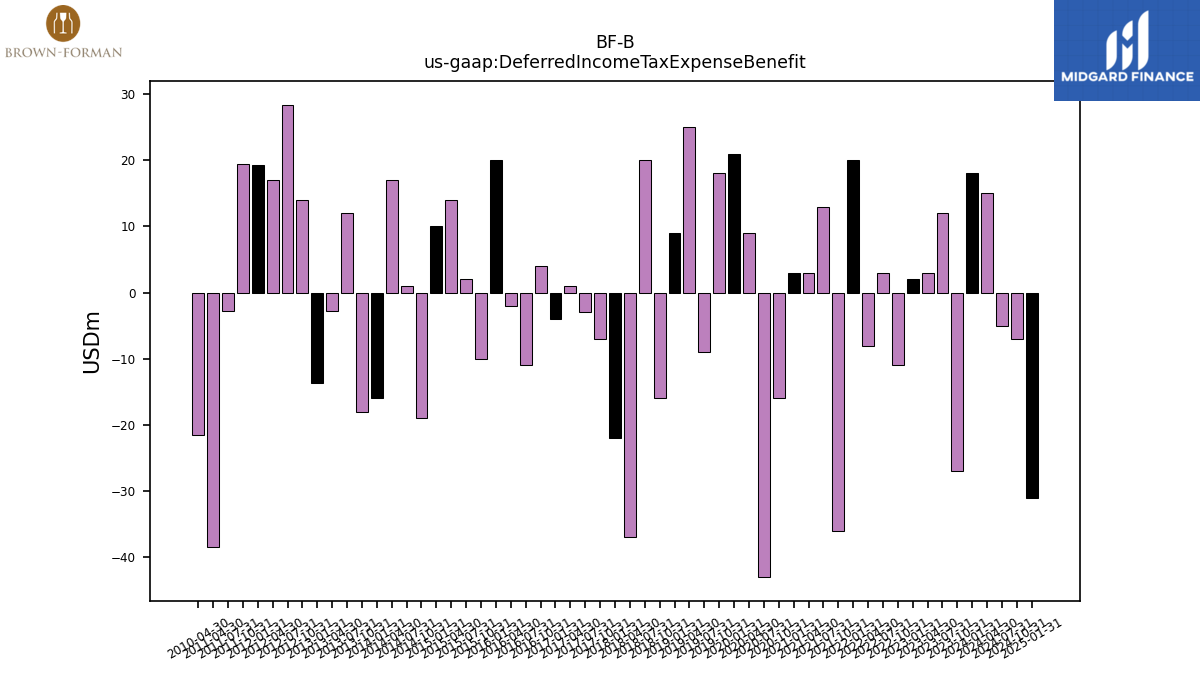
| Deferred Income Tax Expense Benefit | 18.00 | -27.00 | 12.00 | 3.00 | 2.00 | -11.00 | 3.00 | -8.00 | 20.00 | -36.00 | 13.00 | 3.00 | 3.00 | -16.00 | -43.00 | 9.00 | 21.00 | 18.00 | -9.00 | 25.00 | 9.00 | -16.00 | 20.00 | -37.00 | -22.00 | -7.00 | -3.00 | |
| Share Based Compensation | 7.00 | 7.00 | 4.00 | 5.00 | 4.00 | 5.00 | 4.00 | 4.00 | 4.00 | 3.00 | 4.00 | 3.00 | 3.00 | 3.00 | 3.00 | 3.00 | 2.00 | 3.00 | 3.00 | 2.00 | 3.00 | 4.00 | 5.00 | 5.00 | 5.00 | 5.00 | 4.00 |
| 2024-01-31 | 2023-10-31 | 2023-07-31 | 2023-04-30 | 2023-01-31 | 2022-10-31 | 2022-07-31 | 2022-04-30 | 2022-01-31 | 2021-10-31 | 2021-07-31 | 2021-04-30 | 2021-01-31 | 2020-10-31 | 2020-07-31 | 2020-04-30 | 2020-01-31 | 2019-10-31 | 2019-07-31 | 2019-04-30 | 2019-01-31 | 2018-10-31 | 2018-07-31 | 2018-04-30 | 2018-01-31 | 2017-10-31 | 2017-07-31 | ||
|---|---|---|---|---|---|---|---|---|---|---|---|---|---|---|---|---|---|---|---|---|---|---|---|---|---|---|---|---|
| Net Cash Provided By Used In Investing Activities | 124.00 | -17.00 | -44.00 | -55.00 | -1242.00 | -24.00 | -34.00 | -64.00 | -28.00 | -20.00 | -15.00 | -22.00 | -27.00 | -15.00 | 162.00 | -30.00 | -36.00 | -32.00 | -43.00 | -33.00 | -29.00 | -32.00 | -25.00 | -27.00 | -36.00 | -34.00 | -31.00 | |
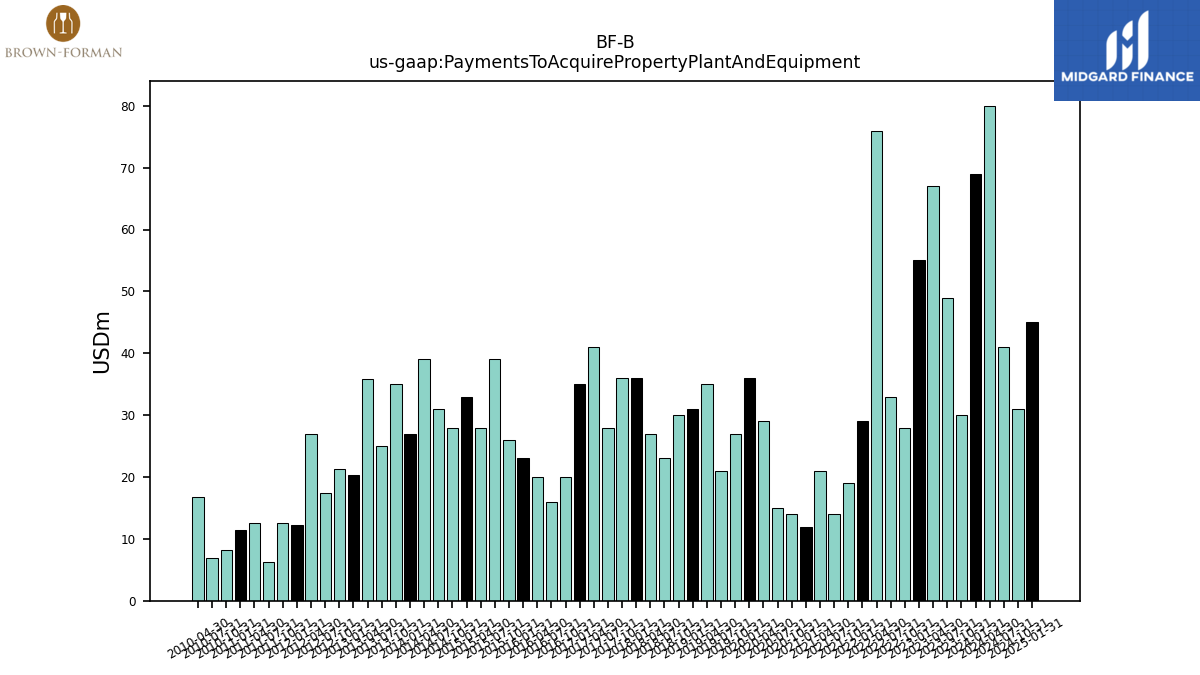
| Payments To Acquire Property Plant And Equipment | 69.00 | 30.00 | 49.00 | 67.00 | 55.00 | 28.00 | 33.00 | 76.00 | 29.00 | 19.00 | 14.00 | 21.00 | 12.00 | 14.00 | 15.00 | 29.00 | 36.00 | 27.00 | 21.00 | 35.00 | 31.00 | 30.00 | 23.00 | 27.00 | 36.00 | 36.00 | 28.00 |
| 2024-01-31 | 2023-10-31 | 2023-07-31 | 2023-04-30 | 2023-01-31 | 2022-10-31 | 2022-07-31 | 2022-04-30 | 2022-01-31 | 2021-10-31 | 2021-07-31 | 2021-04-30 | 2021-01-31 | 2020-10-31 | 2020-07-31 | 2020-04-30 | 2020-01-31 | 2019-10-31 | 2019-07-31 | 2019-04-30 | 2019-01-31 | 2018-10-31 | 2018-07-31 | 2018-04-30 | 2018-01-31 | 2017-10-31 | 2017-07-31 | ||
|---|---|---|---|---|---|---|---|---|---|---|---|---|---|---|---|---|---|---|---|---|---|---|---|---|---|---|---|---|
| Net Cash Provided By Used In Financing Activities | -189.00 | -73.00 | 50.00 | -229.00 | 467.00 | 95.00 | -94.00 | -108.00 | -568.00 | -221.00 | -141.00 | -191.00 | -139.00 | -118.00 | -37.00 | 235.00 | -243.00 | -157.00 | -26.00 | -141.00 | -215.00 | -121.00 | -122.00 | -86.00 | -253.00 | -96.00 | -31.00 | |
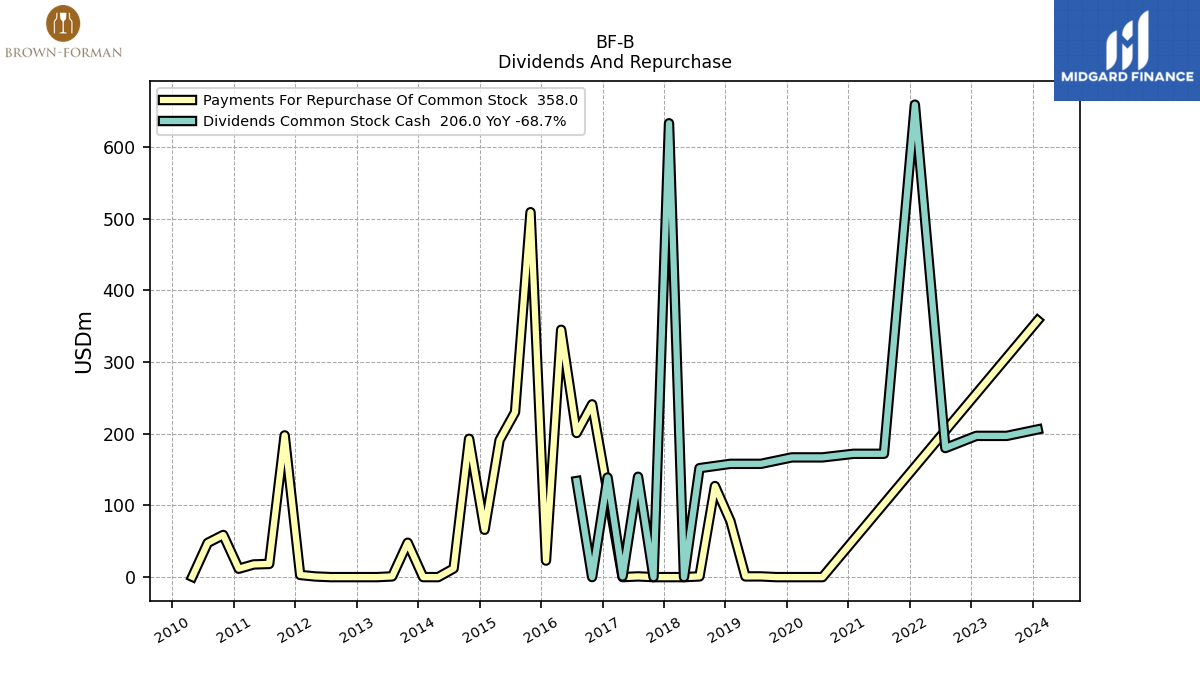
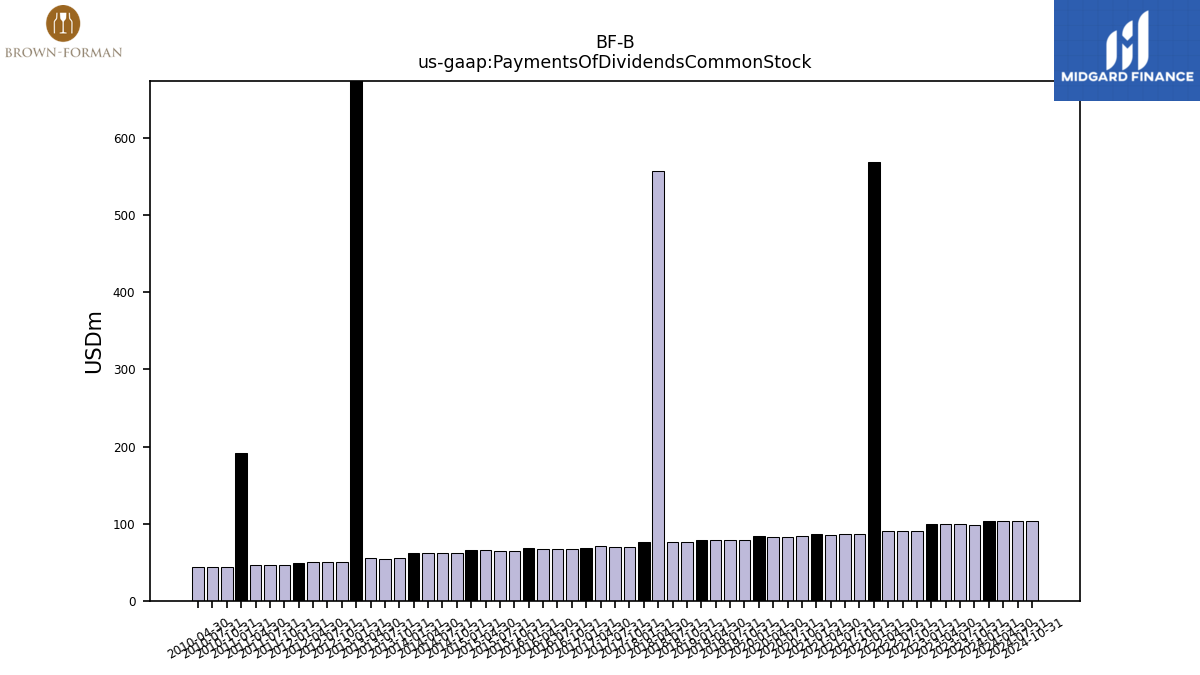
| Payments Of Dividends Common Stock | 103.00 | 98.00 | 99.00 | 99.00 | 99.00 | 90.00 | 90.00 | 90.00 | 569.00 | 86.00 | 86.00 | 85.00 | 86.00 | 84.00 | 83.00 | 83.00 | 84.00 | 79.00 | 79.00 | 79.00 | 79.00 | 76.00 | 76.00 | 557.00 | 76.00 | 70.00 | 70.00 | |
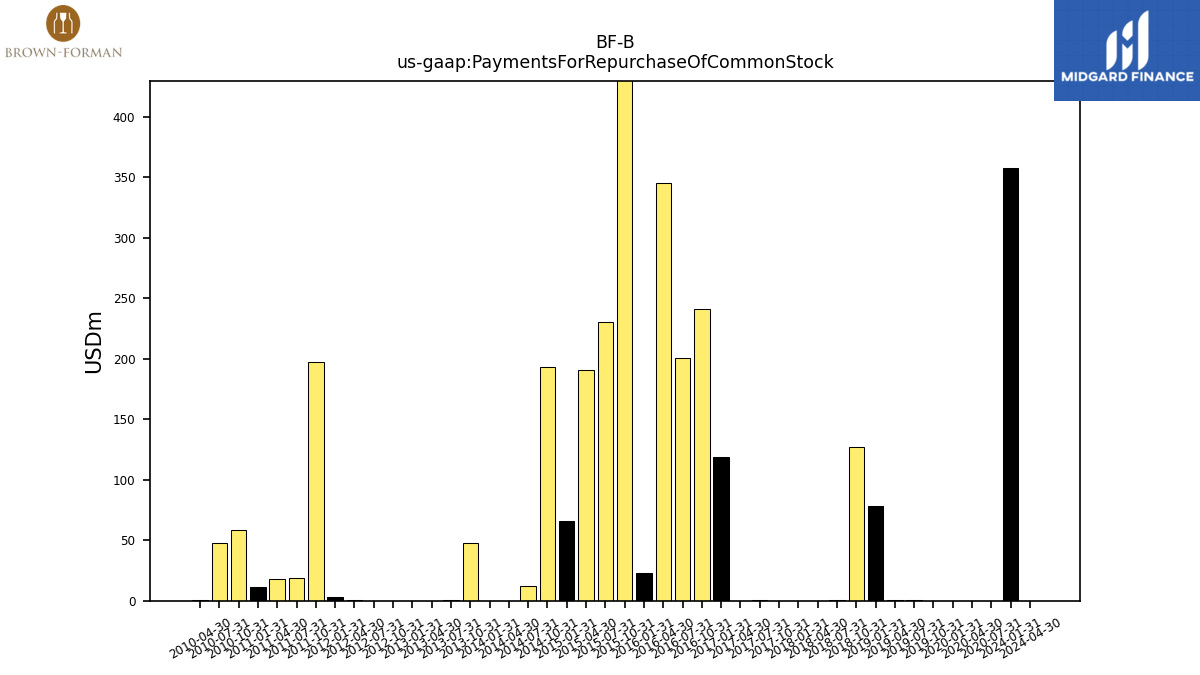
| Payments For Repurchase Of Common Stock | 358.00 | NA | NA | NA | NA | NA | NA | NA | NA | NA | NA | NA | NA | NA | 0.00 | 0.00 | 0.00 | 0.00 | 1.00 | 1.00 | 78.00 | 127.00 | 1.00 | 0.00 | 0.00 | 0.00 | 1.00 |
| 2024-01-31 | 2023-10-31 | 2023-07-31 | 2023-04-30 | 2023-01-31 | 2022-10-31 | 2022-07-31 | 2022-04-30 | 2022-01-31 | 2021-10-31 | 2021-07-31 | 2021-04-30 | 2021-01-31 | 2020-10-31 | 2020-07-31 | 2020-04-30 | 2020-01-31 | 2019-10-31 | 2019-07-31 | 2019-04-30 | 2019-01-31 | 2018-10-31 | 2018-07-31 | 2018-04-30 | 2018-01-31 | 2017-10-31 | 2017-07-31 | ||
|---|---|---|---|---|---|---|---|---|---|---|---|---|---|---|---|---|---|---|---|---|---|---|---|---|---|---|---|---|
| Revenues | 1069.00 | 1107.00 | 1038.00 | 1046.00 | 1081.00 | 1094.00 | 1007.00 | 996.00 | 1037.00 | 994.00 | 906.00 | 812.00 | 911.00 | 985.00 | 753.00 | 709.00 | 899.00 | 989.00 | 766.00 | 744.00 | 904.00 | 910.00 | 766.00 | 733.00 | 878.00 | 914.00 | 723.00 | |
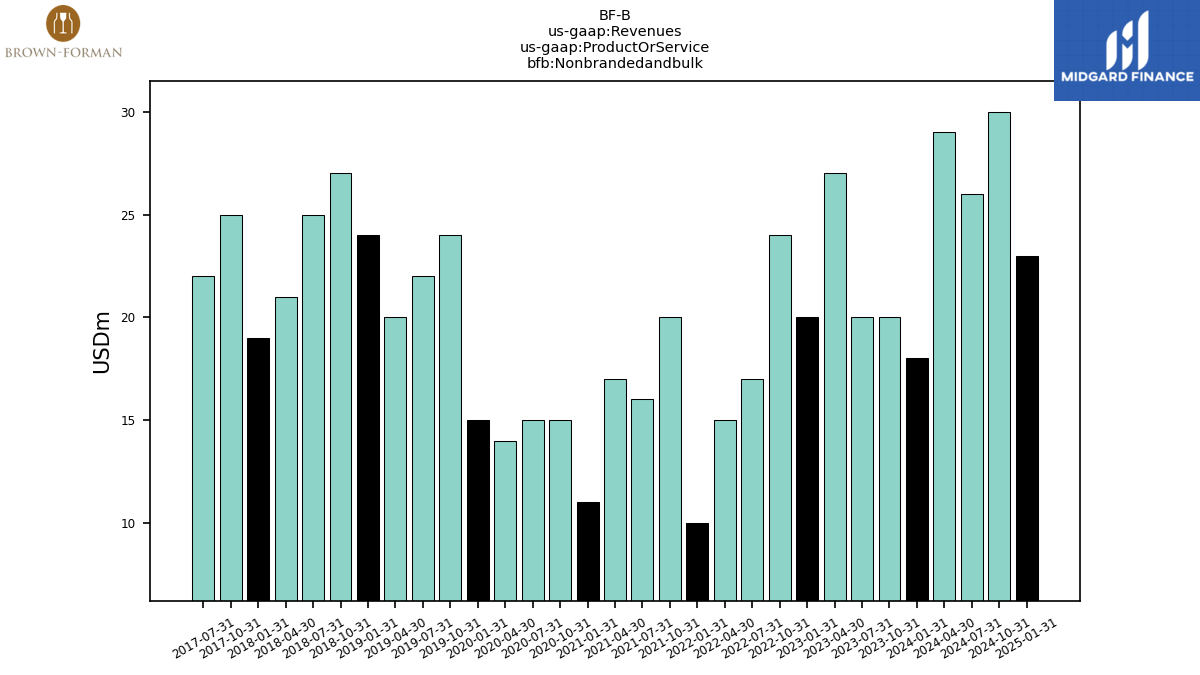
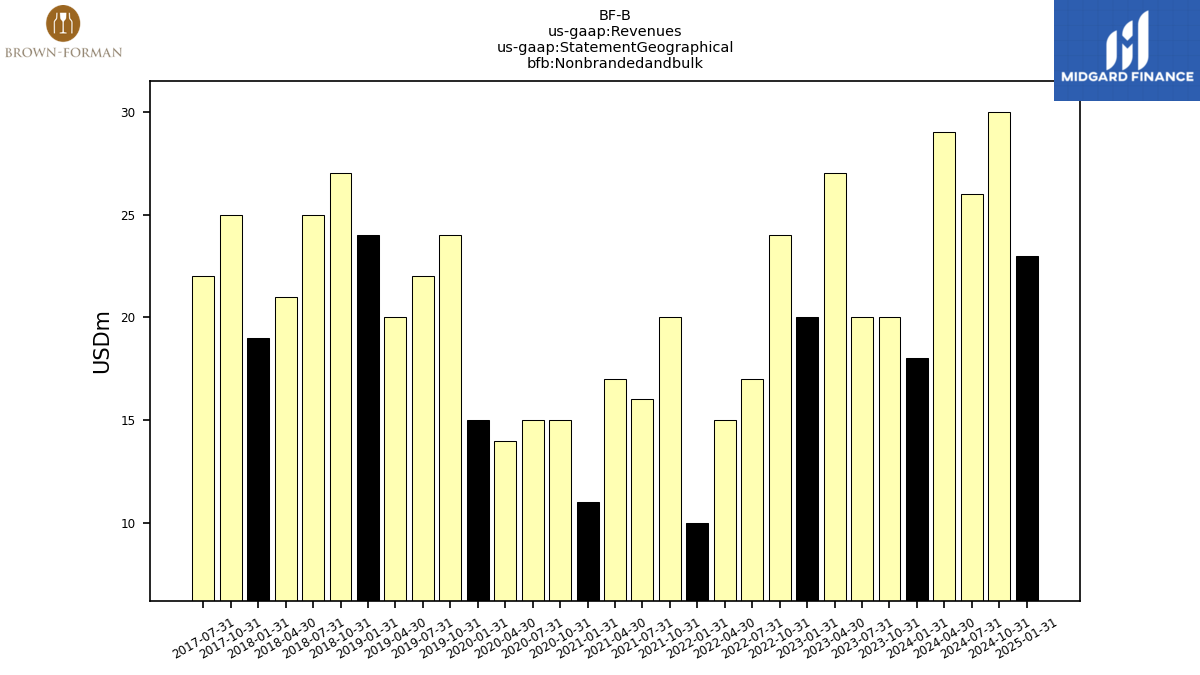
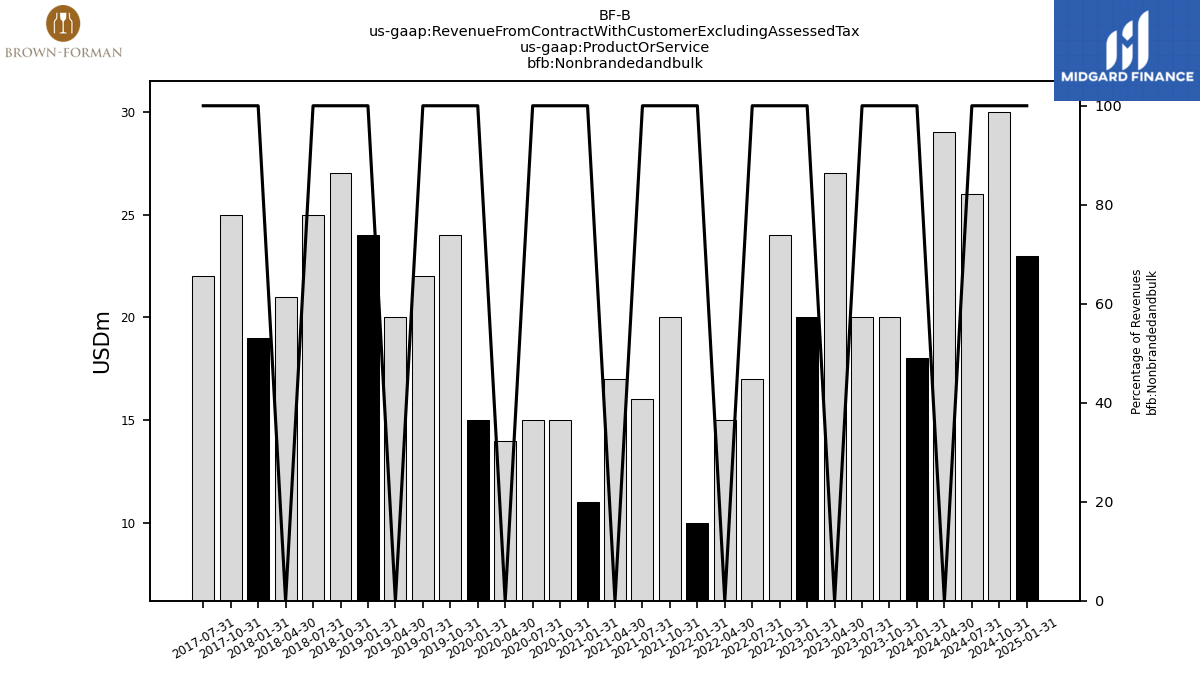
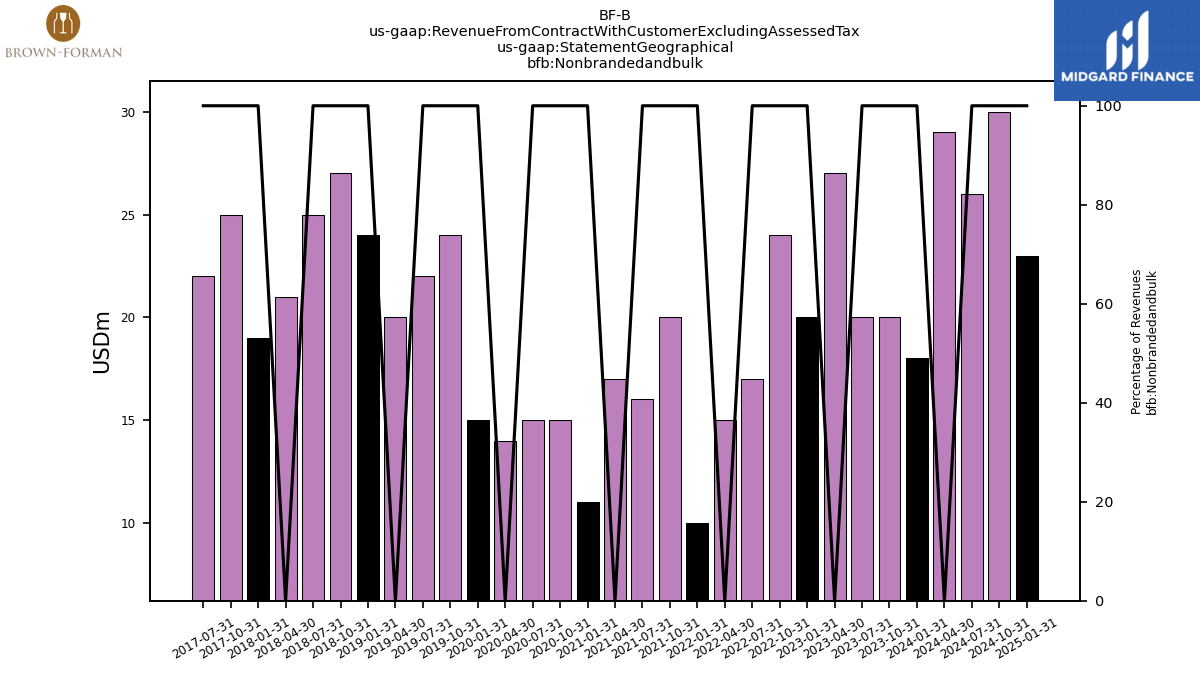
| Nonbrandedandbulk | 18.00 | 20.00 | 20.00 | 27.00 | 20.00 | 24.00 | 17.00 | 15.00 | 10.00 | 20.00 | 16.00 | 17.00 | 11.00 | 15.00 | 15.00 | 14.00 | 15.00 | 24.00 | 22.00 | 20.00 | 24.00 | 27.00 | 25.00 | 21.00 | 19.00 | 25.00 | 22.00 | |
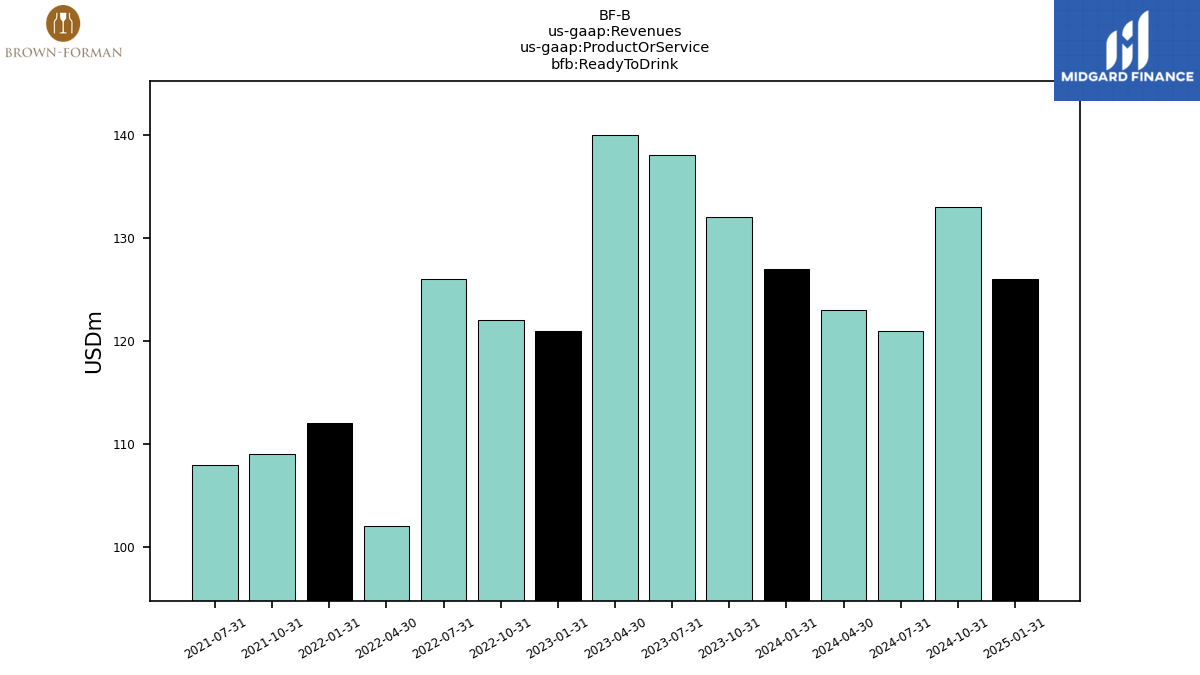
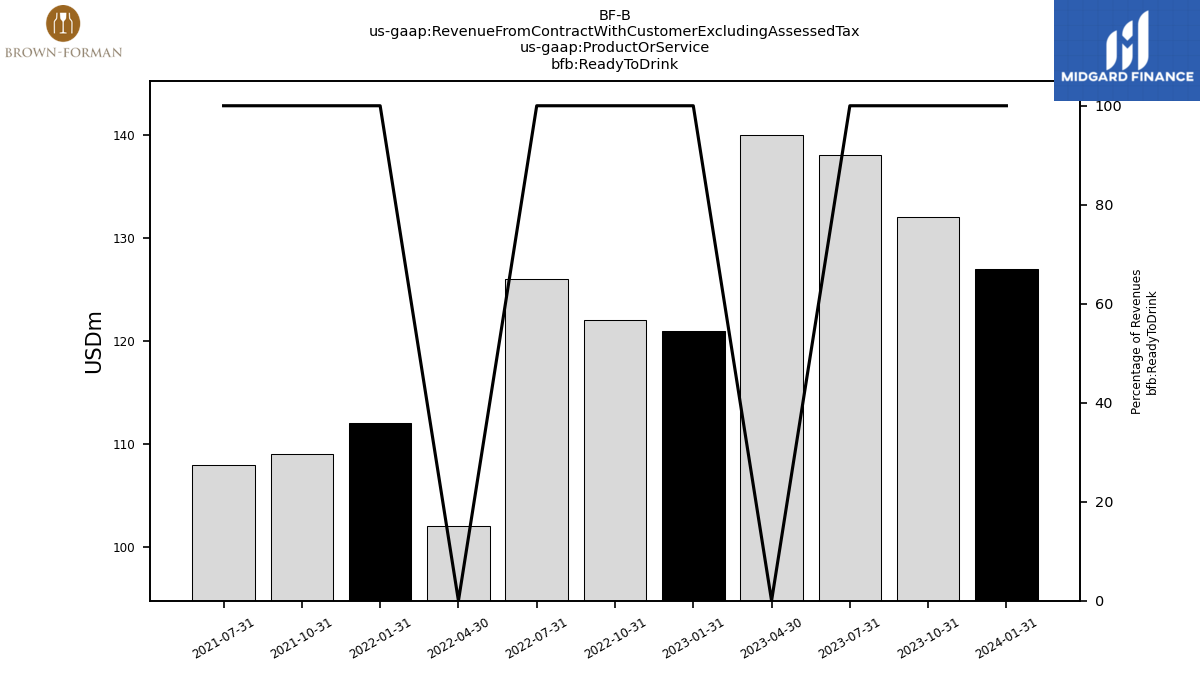
| Ready To Drink | 127.00 | 132.00 | 138.00 | 140.00 | 121.00 | 122.00 | 126.00 | 102.00 | 112.00 | 109.00 | 108.00 | NA | NA | NA | NA | NA | NA | NA | NA | NA | NA | NA | NA | NA | NA | NA | NA | |
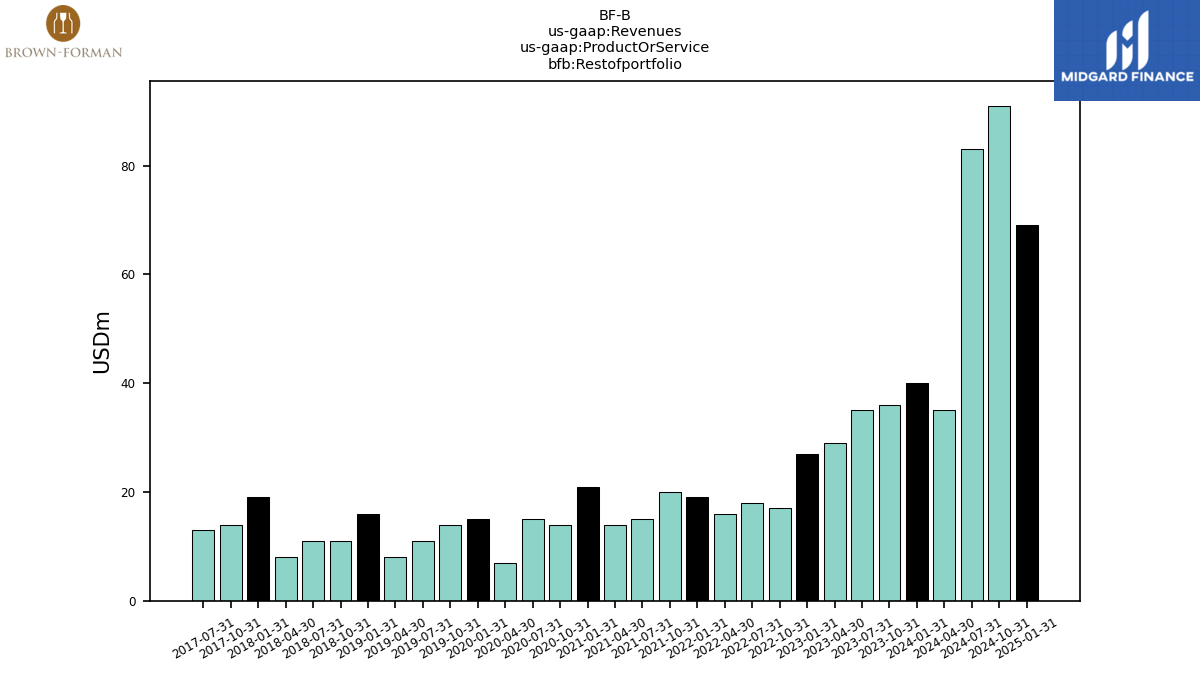
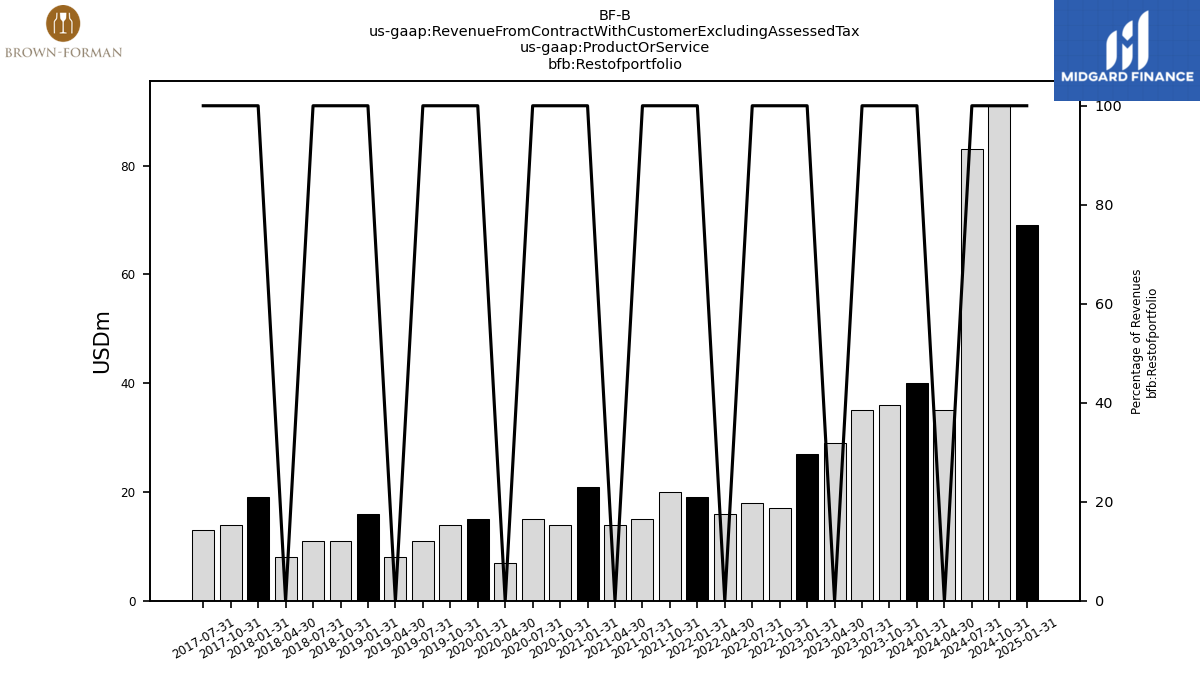
| Restofportfolio | 40.00 | 36.00 | 35.00 | 29.00 | 27.00 | 17.00 | 18.00 | 16.00 | 19.00 | 20.00 | 15.00 | 14.00 | 21.00 | 14.00 | 15.00 | 7.00 | 15.00 | 14.00 | 11.00 | 8.00 | 16.00 | 11.00 | 11.00 | 8.00 | 19.00 | 14.00 | 13.00 | |
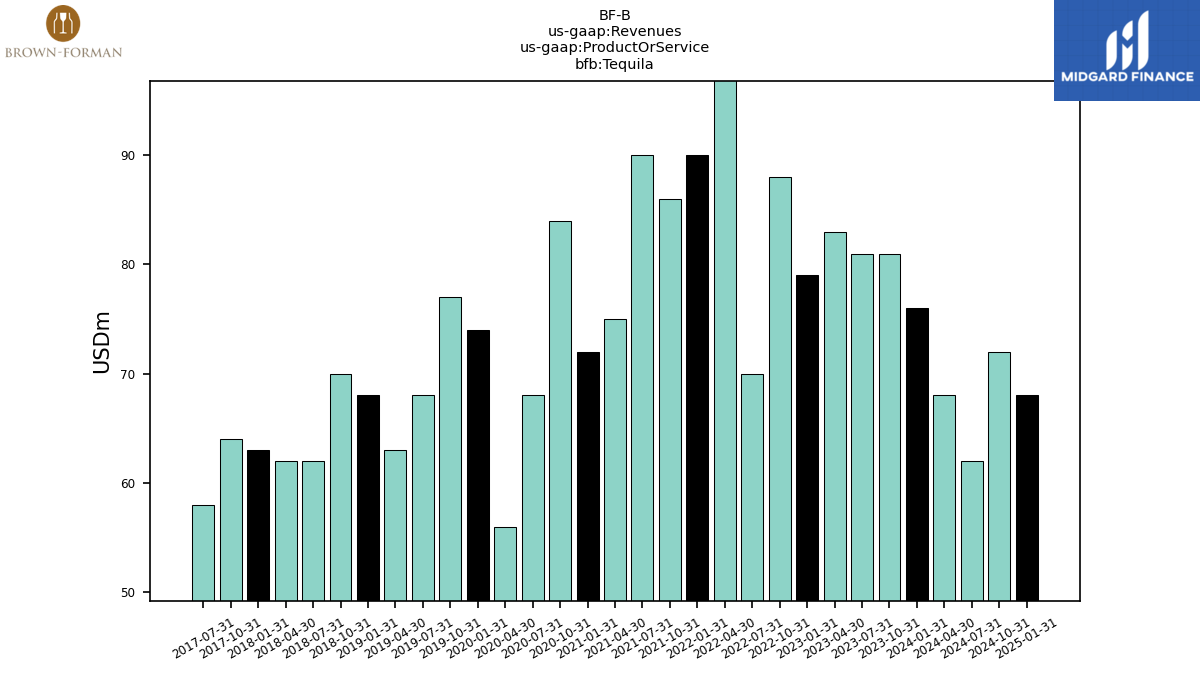
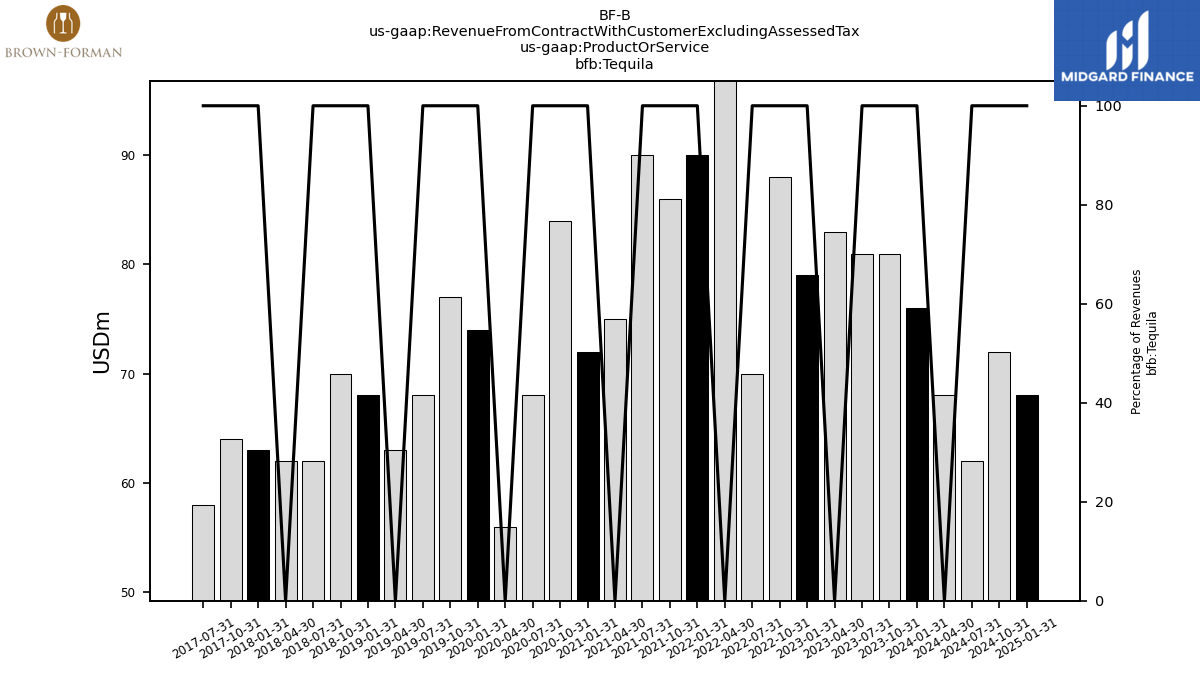
| Tequila | 76.00 | 81.00 | 81.00 | 83.00 | 79.00 | 88.00 | 70.00 | 98.00 | 90.00 | 86.00 | 90.00 | 75.00 | 72.00 | 84.00 | 68.00 | 56.00 | 74.00 | 77.00 | 68.00 | 63.00 | 68.00 | 70.00 | 62.00 | 62.00 | 63.00 | 64.00 | 58.00 | |
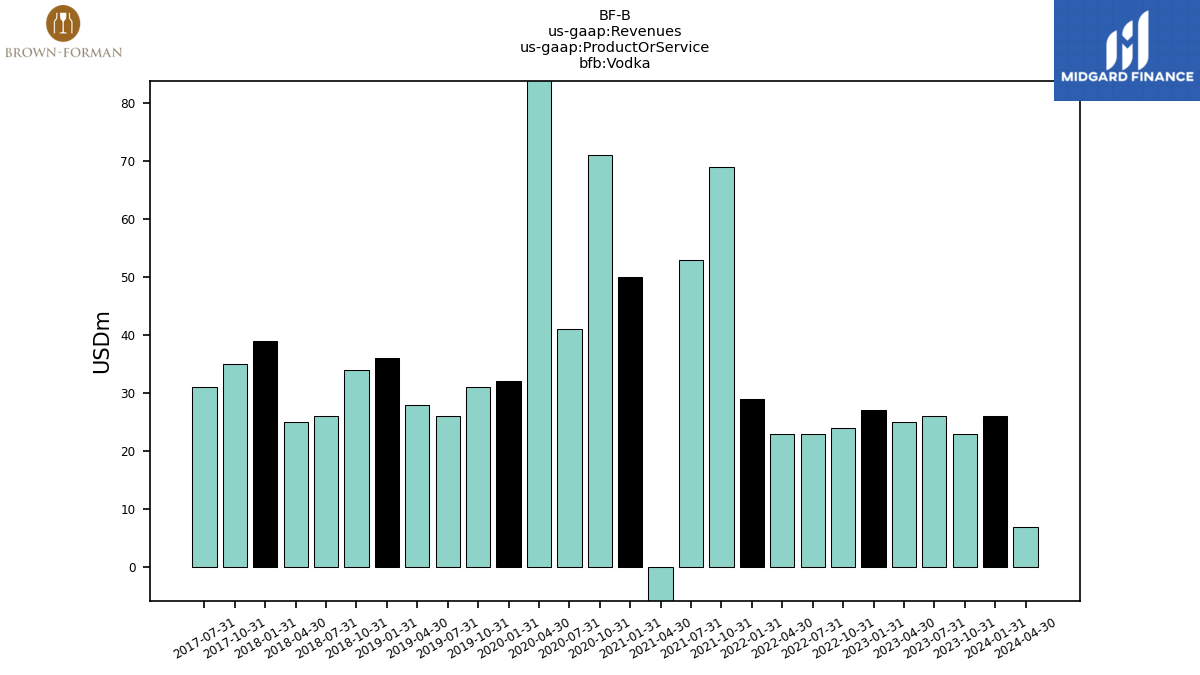
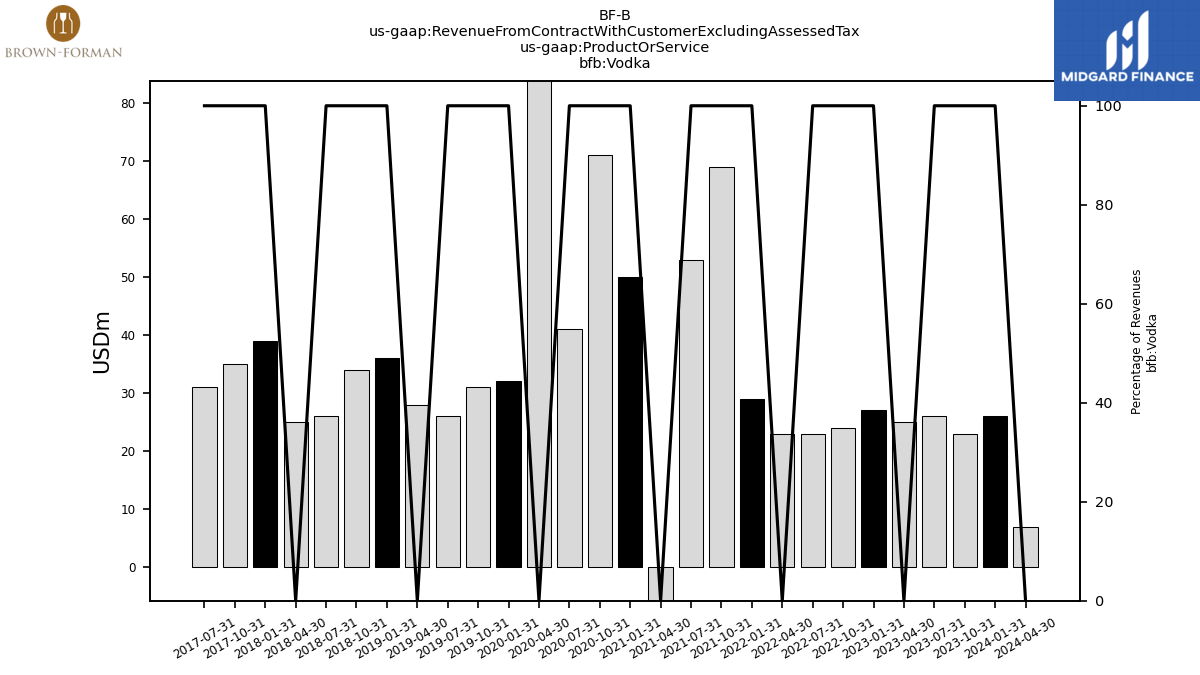
| Vodka | 26.00 | 23.00 | 26.00 | 25.00 | 27.00 | 24.00 | 23.00 | 23.00 | 29.00 | 69.00 | 53.00 | -72.00 | 50.00 | 71.00 | 41.00 | 97.00 | 32.00 | 31.00 | 26.00 | 28.00 | 36.00 | 34.00 | 26.00 | 25.00 | 39.00 | 35.00 | 31.00 | |
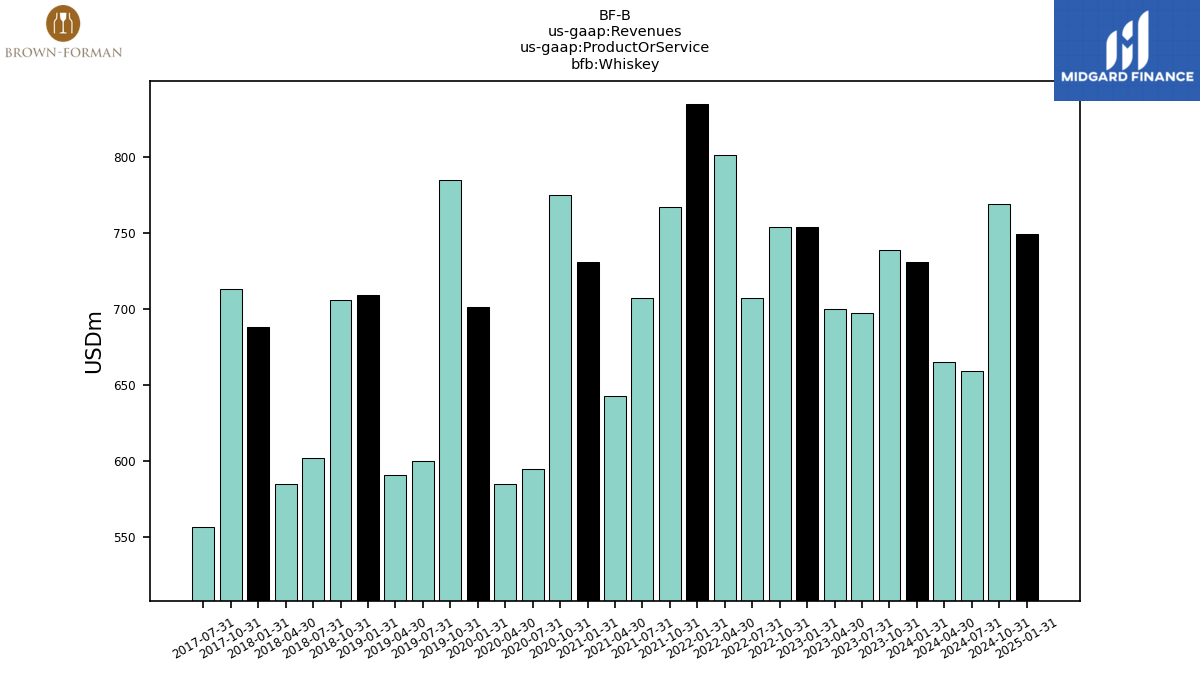
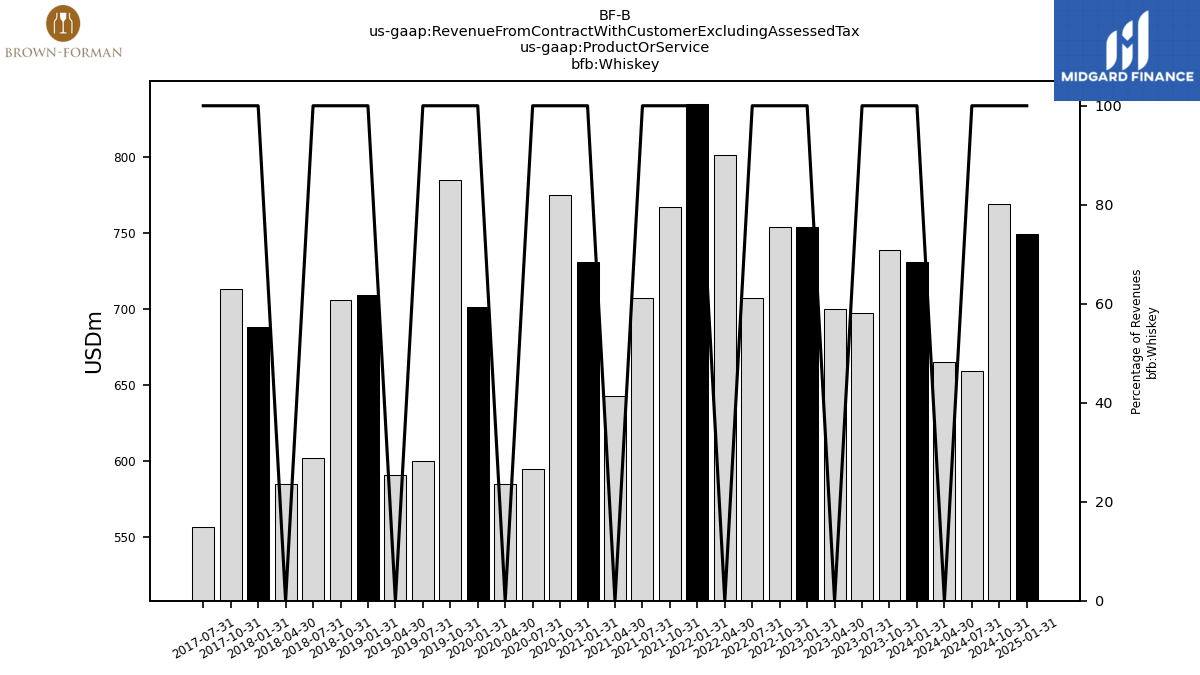
| Whiskey | 731.00 | 739.00 | 697.00 | 700.00 | 754.00 | 754.00 | 707.00 | 801.00 | 835.00 | 767.00 | 707.00 | 643.00 | 731.00 | 775.00 | 595.00 | 585.00 | 701.00 | 785.00 | 600.00 | 591.00 | 709.00 | 706.00 | 602.00 | 585.00 | 688.00 | 713.00 | 557.00 | |
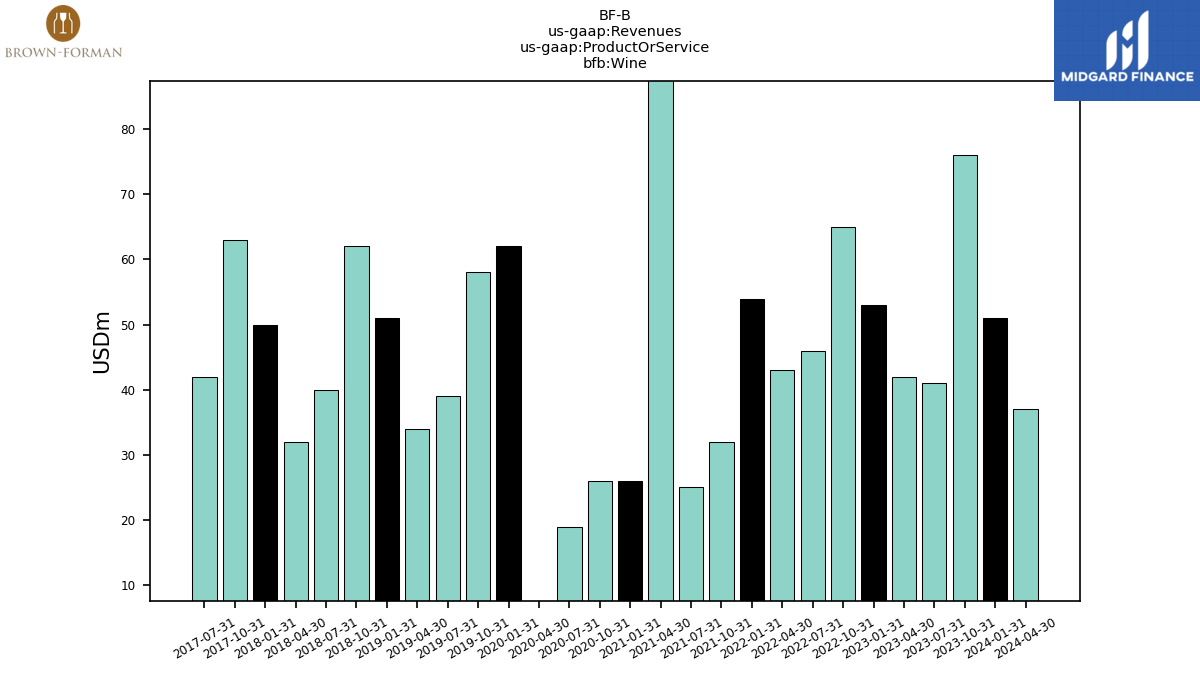
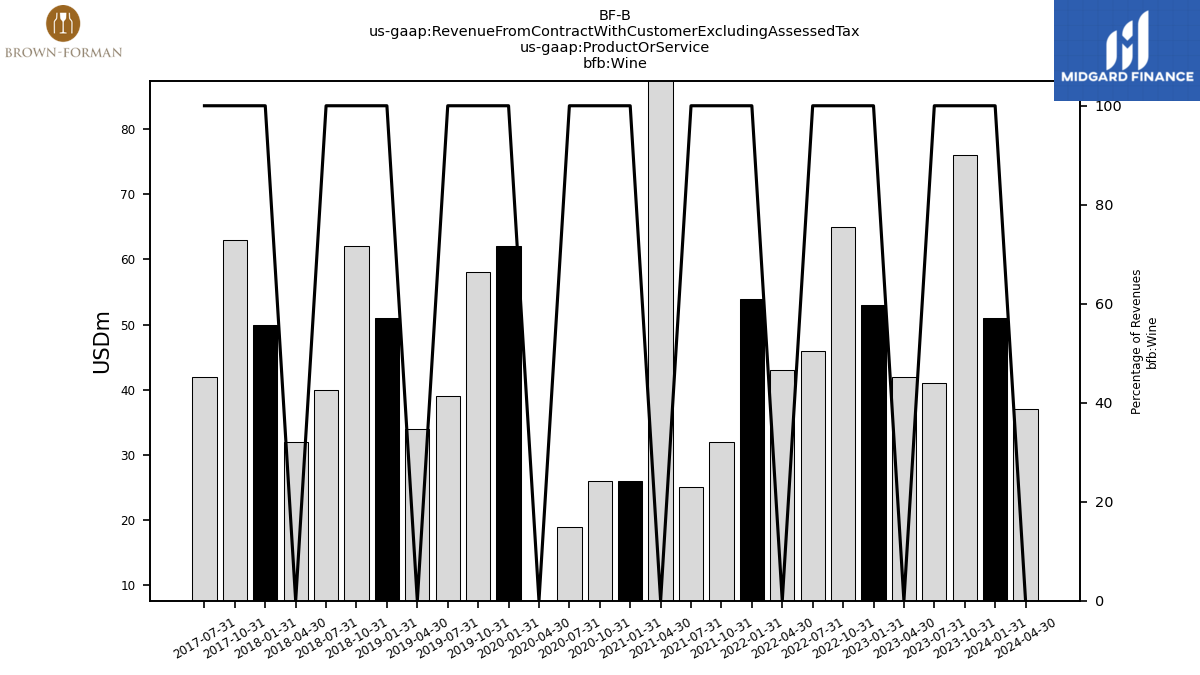
| Wine | 51.00 | 76.00 | 41.00 | 42.00 | 53.00 | 65.00 | 46.00 | 43.00 | 54.00 | 32.00 | 25.00 | 135.00 | 26.00 | 26.00 | 19.00 | -50.00 | 62.00 | 58.00 | 39.00 | 34.00 | 51.00 | 62.00 | 40.00 | 32.00 | 50.00 | 63.00 | 42.00 | |
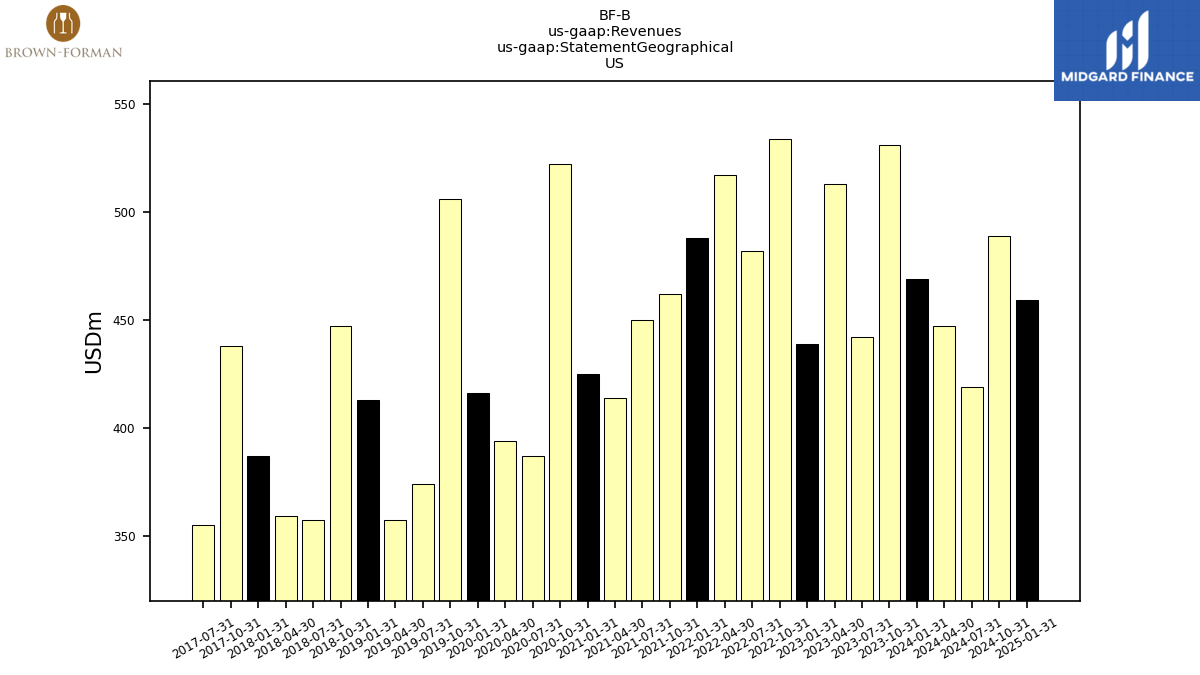
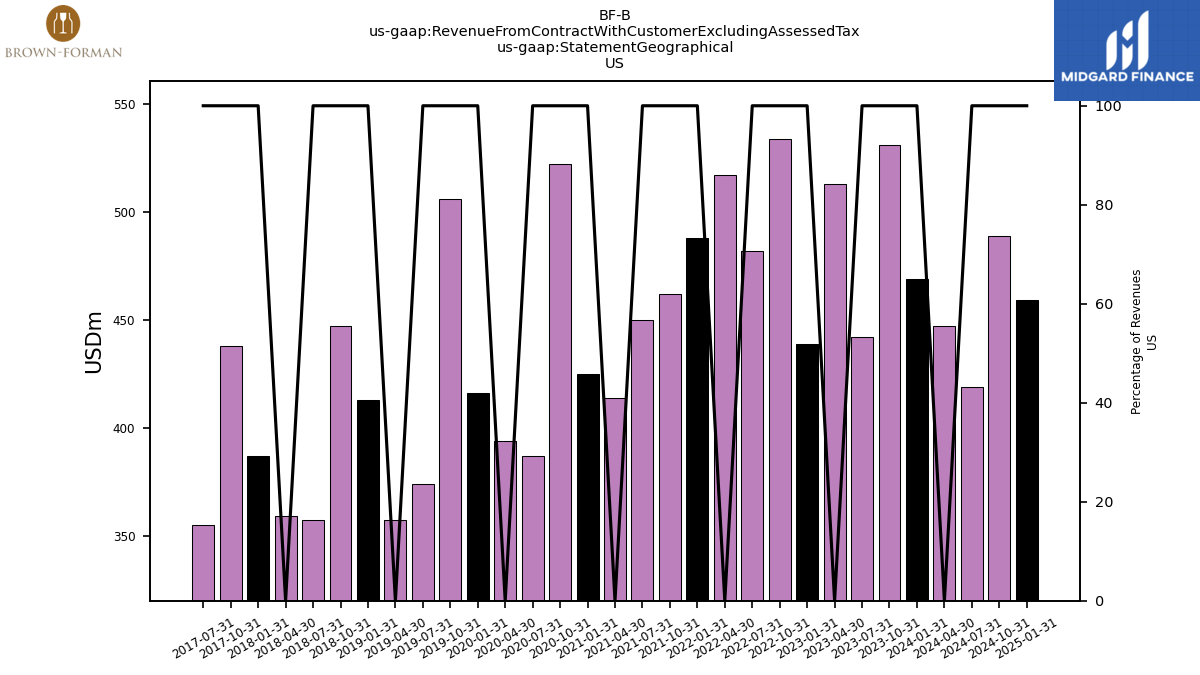
| US | 469.00 | 531.00 | 442.00 | 513.00 | 439.00 | 534.00 | 482.00 | 517.00 | 488.00 | 462.00 | 450.00 | 414.00 | 425.00 | 522.00 | 387.00 | 394.00 | 416.00 | 506.00 | 374.00 | 357.00 | 413.00 | 447.00 | 357.00 | 359.00 | 387.00 | 438.00 | 355.00 | |
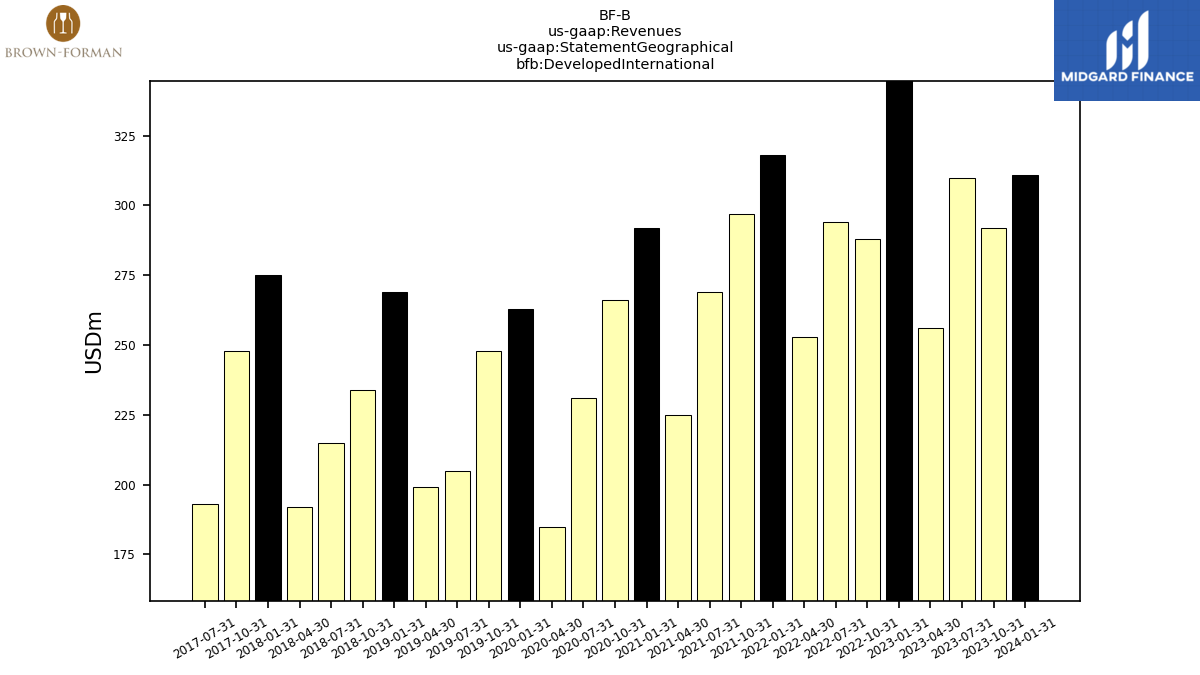
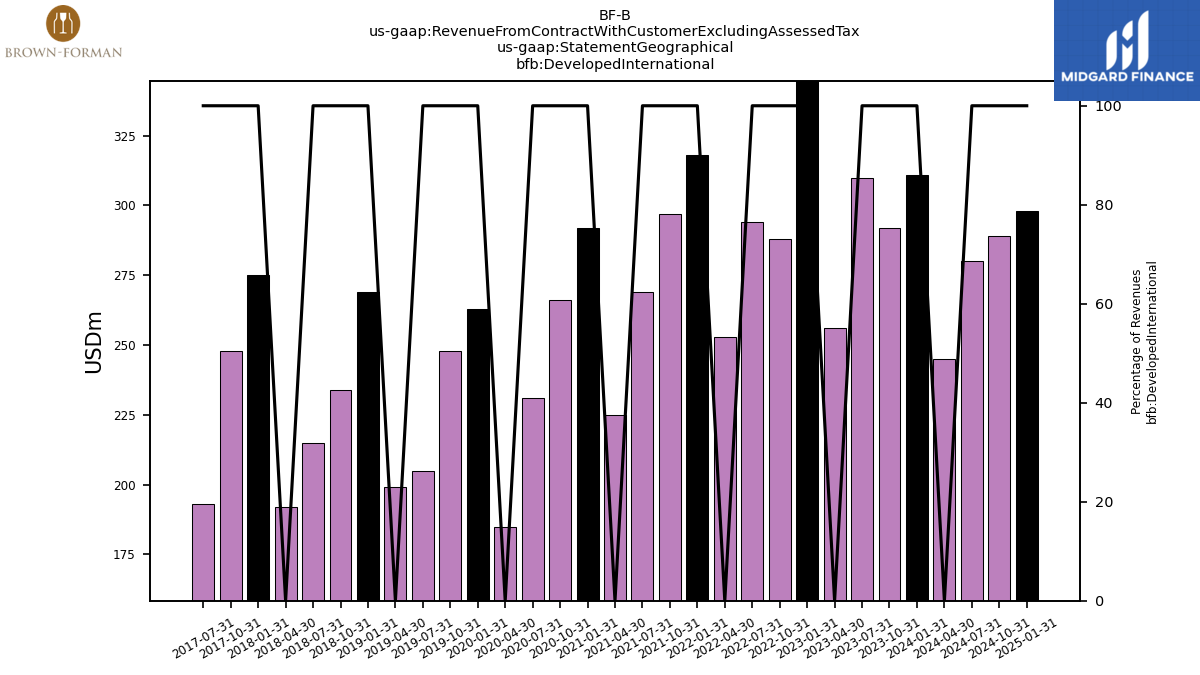
| Developed International | 311.00 | 292.00 | 310.00 | 256.00 | 345.00 | 288.00 | 294.00 | 253.00 | 318.00 | 297.00 | 269.00 | 225.00 | 292.00 | 266.00 | 231.00 | 185.00 | 263.00 | 248.00 | 205.00 | 199.00 | 269.00 | 234.00 | 215.00 | 192.00 | 275.00 | 248.00 | 193.00 | |
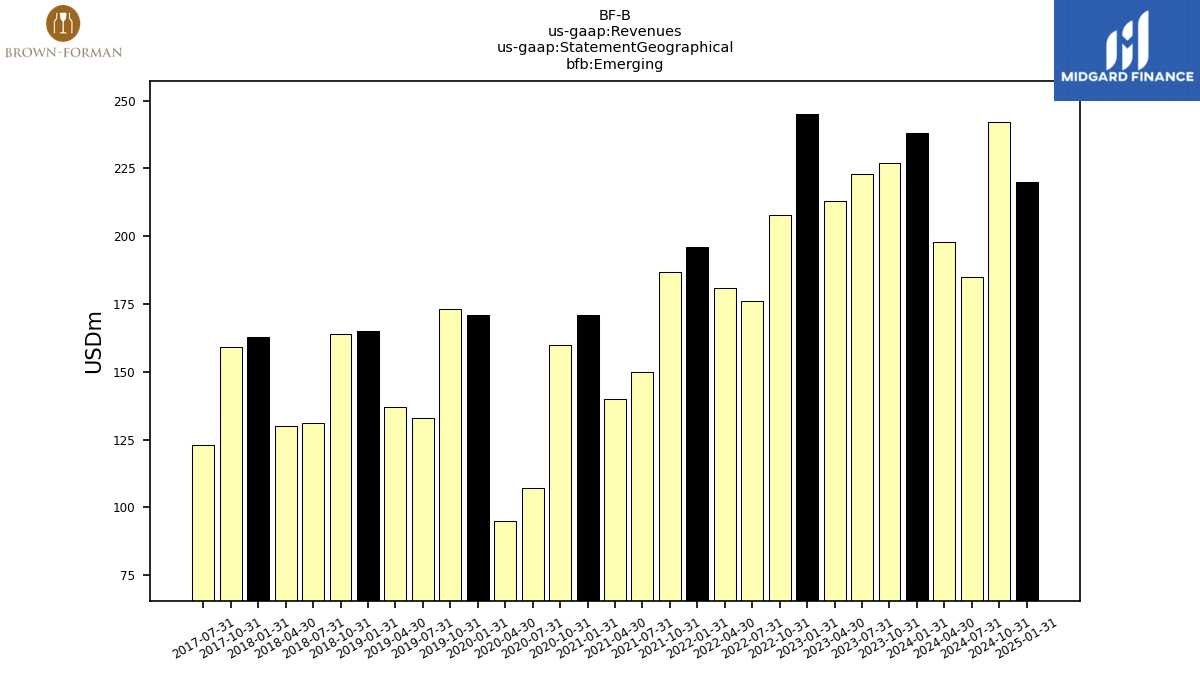
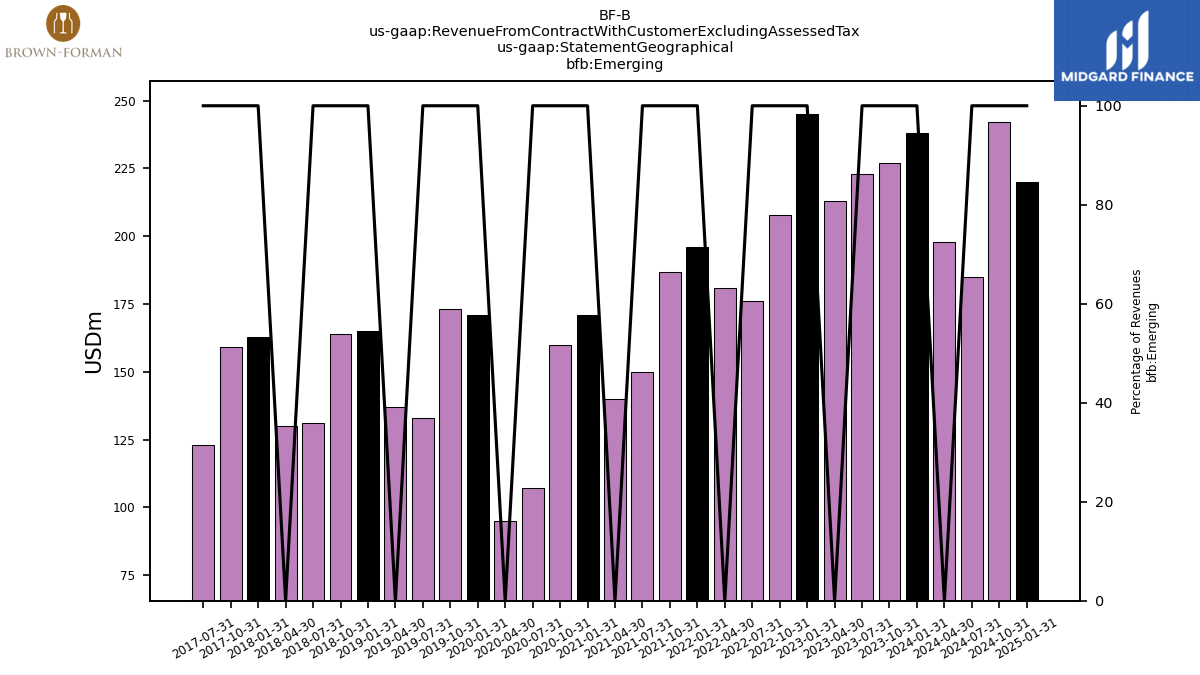
| Emerging | 238.00 | 227.00 | 223.00 | 213.00 | 245.00 | 208.00 | 176.00 | 181.00 | 196.00 | 187.00 | 150.00 | 140.00 | 171.00 | 160.00 | 107.00 | 95.00 | 171.00 | 173.00 | 133.00 | 137.00 | 165.00 | 164.00 | 131.00 | 130.00 | 163.00 | 159.00 | 123.00 | |
| Nonbrandedandbulk | 18.00 | 20.00 | 20.00 | 27.00 | 20.00 | 24.00 | 17.00 | 15.00 | 10.00 | 20.00 | 16.00 | 17.00 | 11.00 | 15.00 | 15.00 | 14.00 | 15.00 | 24.00 | 22.00 | 20.00 | 24.00 | 27.00 | 25.00 | 21.00 | 19.00 | 25.00 | 22.00 | |
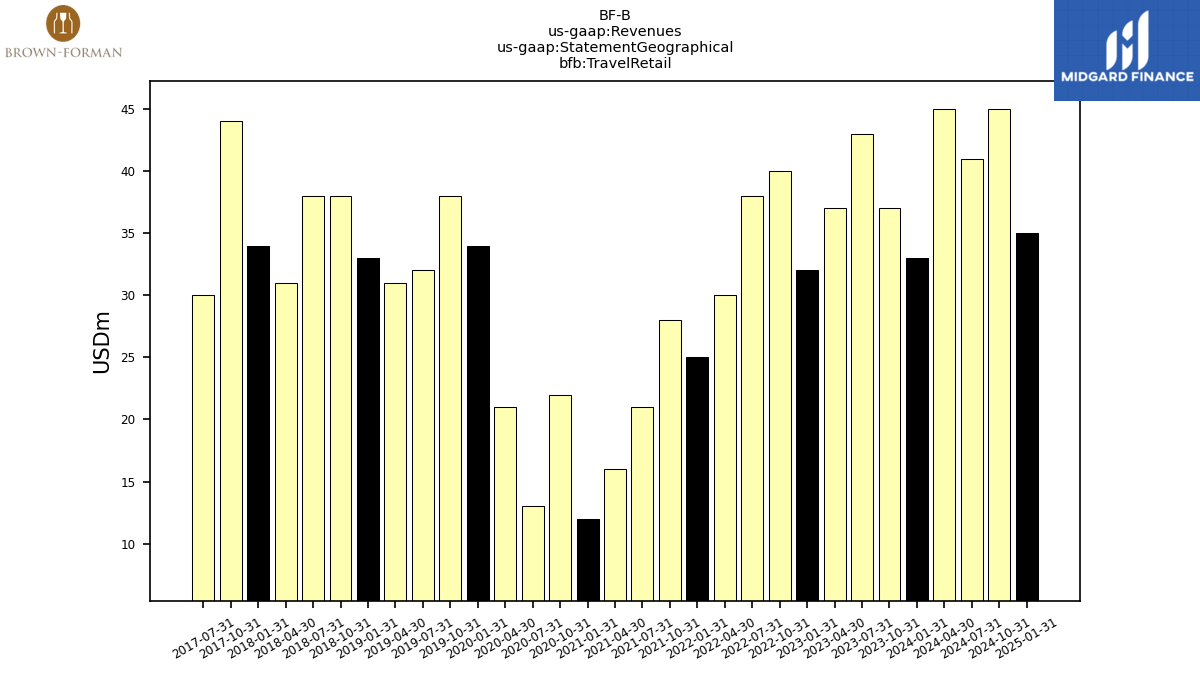
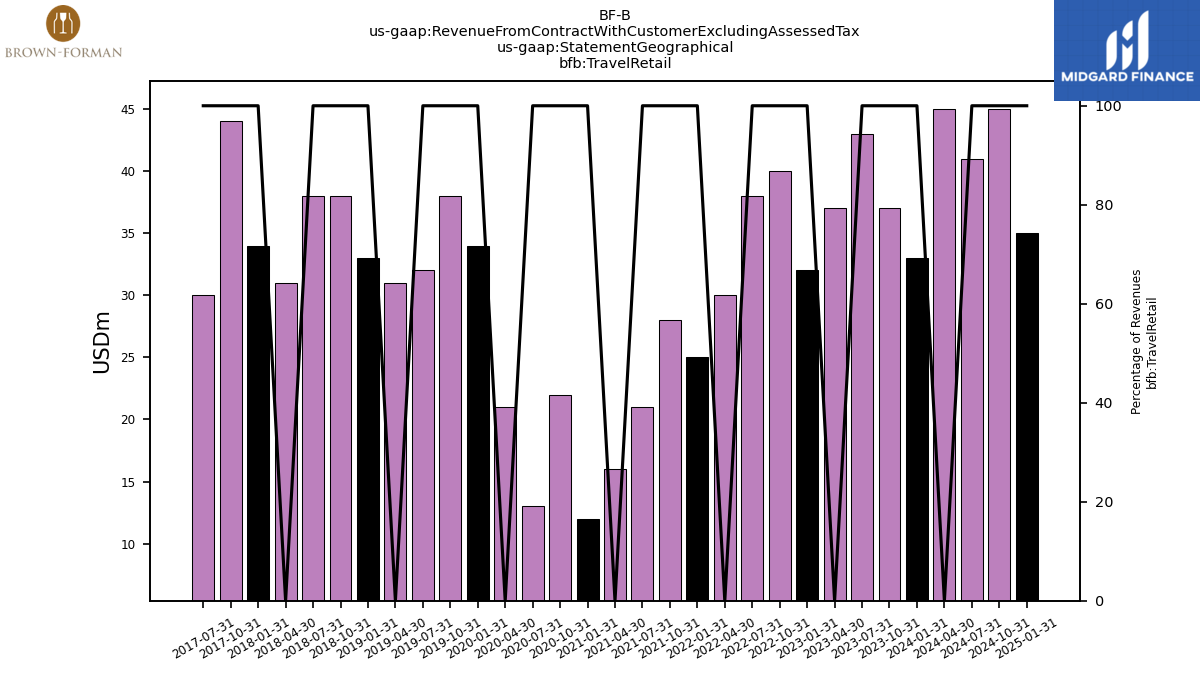
| Travel Retail | 33.00 | 37.00 | 43.00 | 37.00 | 32.00 | 40.00 | 38.00 | 30.00 | 25.00 | 28.00 | 21.00 | 16.00 | 12.00 | 22.00 | 13.00 | 21.00 | 34.00 | 38.00 | 32.00 | 31.00 | 33.00 | 38.00 | 38.00 | 31.00 | 34.00 | 44.00 | 30.00 | |
| Revenue From Contract With Customer Excluding Assessed Tax | 1069.00 | 1107.00 | 1038.00 | 1046.00 | 1081.00 | 1094.00 | 1007.00 | 996.00 | 1037.00 | 994.00 | 906.00 | 812.00 | 911.00 | 985.00 | 753.00 | 709.00 | 899.00 | 989.00 | 766.00 | 744.00 | 904.00 | 910.00 | 766.00 | 733.00 | 878.00 | 914.00 | 723.00 | |
| Nonbrandedandbulk | 18.00 | 20.00 | 20.00 | 27.00 | 20.00 | 24.00 | 17.00 | 15.00 | 10.00 | 20.00 | 16.00 | 17.00 | 11.00 | 15.00 | 15.00 | 14.00 | 15.00 | 24.00 | 22.00 | 20.00 | 24.00 | 27.00 | 25.00 | 21.00 | 19.00 | 25.00 | 22.00 | |
| Ready To Drink | 127.00 | 132.00 | 138.00 | 140.00 | 121.00 | 122.00 | 126.00 | 102.00 | 112.00 | 109.00 | 108.00 | NA | NA | NA | NA | NA | NA | NA | NA | NA | NA | NA | NA | NA | NA | NA | NA | |
| Restofportfolio | 40.00 | 36.00 | 35.00 | 29.00 | 27.00 | 17.00 | 18.00 | 16.00 | 19.00 | 20.00 | 15.00 | 14.00 | 21.00 | 14.00 | 15.00 | 7.00 | 15.00 | 14.00 | 11.00 | 8.00 | 16.00 | 11.00 | 11.00 | 8.00 | 19.00 | 14.00 | 13.00 | |
| Tequila | 76.00 | 81.00 | 81.00 | 83.00 | 79.00 | 88.00 | 70.00 | 98.00 | 90.00 | 86.00 | 90.00 | 75.00 | 72.00 | 84.00 | 68.00 | 56.00 | 74.00 | 77.00 | 68.00 | 63.00 | 68.00 | 70.00 | 62.00 | 62.00 | 63.00 | 64.00 | 58.00 | |
| Vodka | 26.00 | 23.00 | 26.00 | 25.00 | 27.00 | 24.00 | 23.00 | 23.00 | 29.00 | 69.00 | 53.00 | -72.00 | 50.00 | 71.00 | 41.00 | 97.00 | 32.00 | 31.00 | 26.00 | 28.00 | 36.00 | 34.00 | 26.00 | 25.00 | 39.00 | 35.00 | 31.00 | |
| Whiskey | 731.00 | 739.00 | 697.00 | 700.00 | 754.00 | 754.00 | 707.00 | 801.00 | 835.00 | 767.00 | 707.00 | 643.00 | 731.00 | 775.00 | 595.00 | 585.00 | 701.00 | 785.00 | 600.00 | 591.00 | 709.00 | 706.00 | 602.00 | 585.00 | 688.00 | 713.00 | 557.00 | |
| Wine | 51.00 | 76.00 | 41.00 | 42.00 | 53.00 | 65.00 | 46.00 | 43.00 | 54.00 | 32.00 | 25.00 | 135.00 | 26.00 | 26.00 | 19.00 | -50.00 | 62.00 | 58.00 | 39.00 | 34.00 | 51.00 | 62.00 | 40.00 | 32.00 | 50.00 | 63.00 | 42.00 | |
| US | 469.00 | 531.00 | 442.00 | 513.00 | 439.00 | 534.00 | 482.00 | 517.00 | 488.00 | 462.00 | 450.00 | 414.00 | 425.00 | 522.00 | 387.00 | 394.00 | 416.00 | 506.00 | 374.00 | 357.00 | 413.00 | 447.00 | 357.00 | 359.00 | 387.00 | 438.00 | 355.00 | |
| Developed International | 311.00 | 292.00 | 310.00 | 256.00 | 345.00 | 288.00 | 294.00 | 253.00 | 318.00 | 297.00 | 269.00 | 225.00 | 292.00 | 266.00 | 231.00 | 185.00 | 263.00 | 248.00 | 205.00 | 199.00 | 269.00 | 234.00 | 215.00 | 192.00 | 275.00 | 248.00 | 193.00 | |
| Emerging | 238.00 | 227.00 | 223.00 | 213.00 | 245.00 | 208.00 | 176.00 | 181.00 | 196.00 | 187.00 | 150.00 | 140.00 | 171.00 | 160.00 | 107.00 | 95.00 | 171.00 | 173.00 | 133.00 | 137.00 | 165.00 | 164.00 | 131.00 | 130.00 | 163.00 | 159.00 | 123.00 | |
| Nonbrandedandbulk | 18.00 | 20.00 | 20.00 | 27.00 | 20.00 | 24.00 | 17.00 | 15.00 | 10.00 | 20.00 | 16.00 | 17.00 | 11.00 | 15.00 | 15.00 | 14.00 | 15.00 | 24.00 | 22.00 | 20.00 | 24.00 | 27.00 | 25.00 | 21.00 | 19.00 | 25.00 | 22.00 | |
| Travel Retail | 33.00 | 37.00 | 43.00 | 37.00 | 32.00 | 40.00 | 38.00 | 30.00 | 25.00 | 28.00 | 21.00 | 16.00 | 12.00 | 22.00 | 13.00 | 21.00 | 34.00 | 38.00 | 32.00 | 31.00 | 33.00 | 38.00 | 38.00 | 31.00 | 34.00 | 44.00 | 30.00 | |
| Revenue From Contract With Customer Including Assessed Tax | 1406.00 | 1405.00 | 1326.00 | 1294.00 | 1406.00 | 1384.00 | 1288.00 | 1250.00 | 1365.00 | 1283.00 | 1183.00 | 1045.00 | 1222.00 | 1272.00 | 987.00 | 902.00 | 1178.00 | 1248.00 | 978.00 | 947.00 | 1181.00 | 1161.00 | 987.00 | 950.00 | 1156.00 | 1166.00 | 929.00 |