
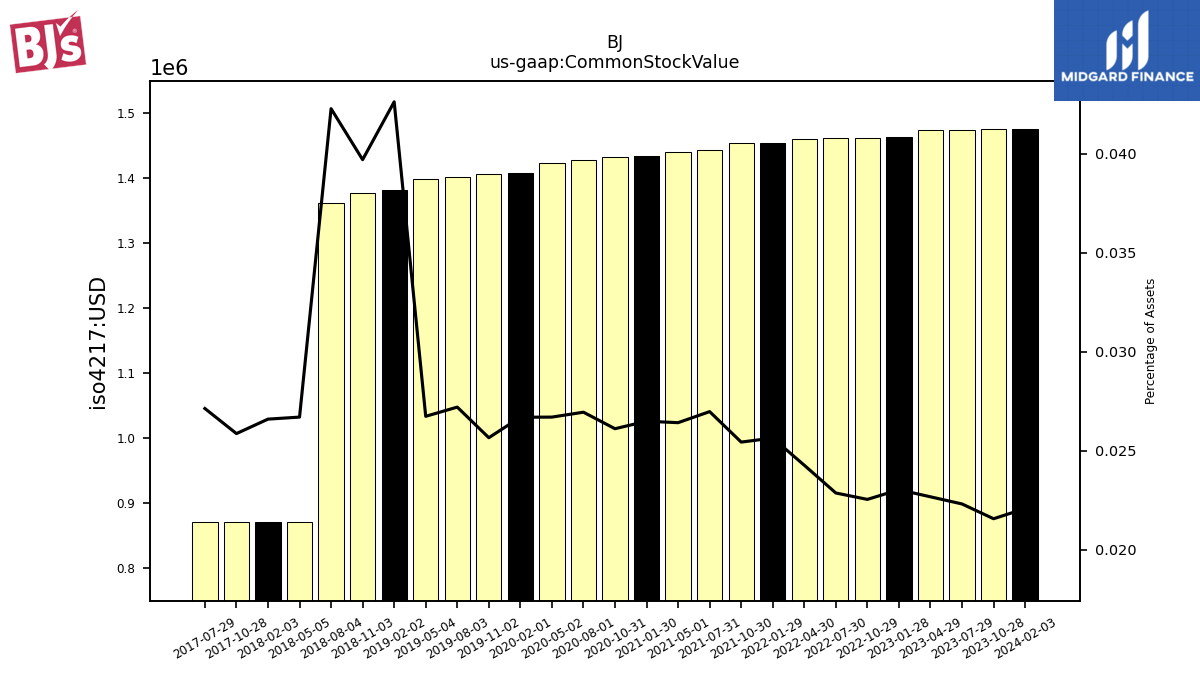
| 2024-02-03 | 2023-10-28 | 2023-07-29 | 2023-04-29 | 2023-01-28 | 2022-10-29 | 2022-07-30 | 2022-04-30 | 2022-01-29 | 2021-10-30 | 2021-07-31 | 2021-05-01 | 2021-01-30 | 2020-10-31 | 2020-08-01 | 2020-05-02 | 2020-02-01 | 2019-11-02 | 2019-08-03 | 2019-05-04 | 2019-02-02 | 2018-11-03 | 2018-08-04 | 2018-05-05 | 2018-02-03 | 2017-10-28 | 2017-07-29 | ||
|---|---|---|---|---|---|---|---|---|---|---|---|---|---|---|---|---|---|---|---|---|---|---|---|---|---|---|---|---|
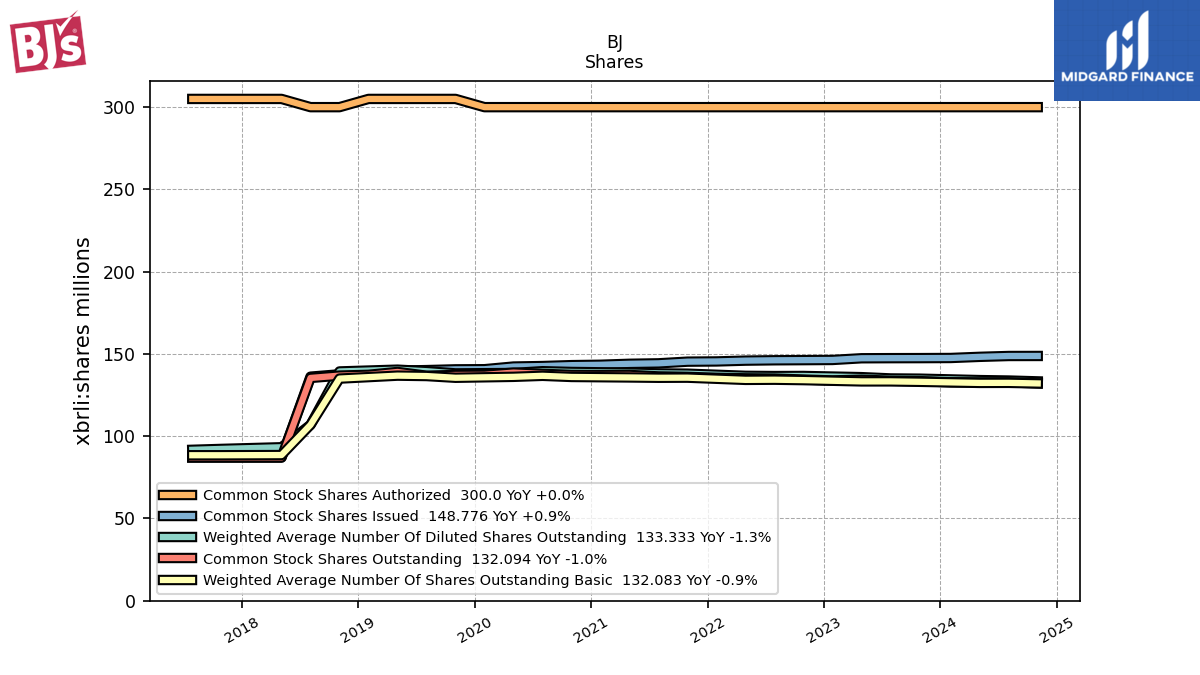
| Common Stock Value | 1.48 | 1.48 | 1.47 | 1.47 | 1.46 | 1.46 | 1.46 | 1.46 | 1.45 | 1.45 | 1.44 | 1.44 | 1.43 | 1.43 | 1.43 | 1.42 | 1.41 | 1.41 | 1.40 | 1.40 | 1.38 | 1.38 | 1.36 | 0.87 | 0.87 | 0.87 | 0.87 |
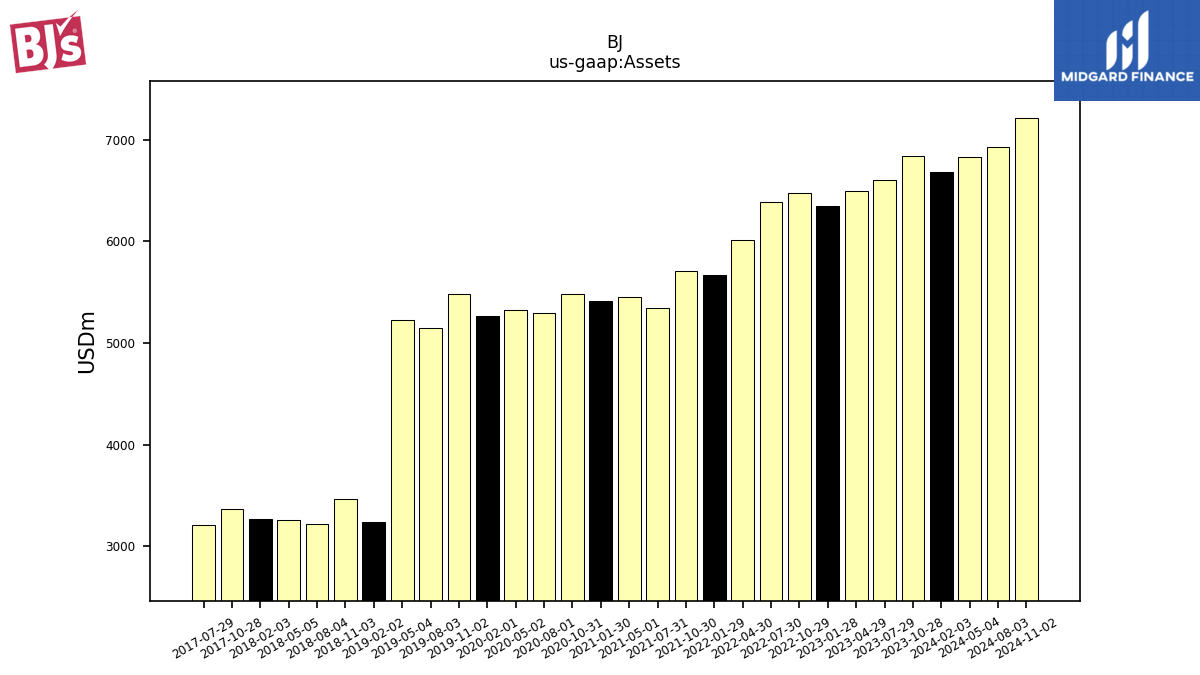
| 2024-02-03 | 2023-10-28 | 2023-07-29 | 2023-04-29 | 2023-01-28 | 2022-10-29 | 2022-07-30 | 2022-04-30 | 2022-01-29 | 2021-10-30 | 2021-07-31 | 2021-05-01 | 2021-01-30 | 2020-10-31 | 2020-08-01 | 2020-05-02 | 2020-02-01 | 2019-11-02 | 2019-08-03 | 2019-05-04 | 2019-02-02 | 2018-11-03 | 2018-08-04 | 2018-05-05 | 2018-02-03 | 2017-10-28 | 2017-07-29 | ||
|---|---|---|---|---|---|---|---|---|---|---|---|---|---|---|---|---|---|---|---|---|---|---|---|---|---|---|---|---|
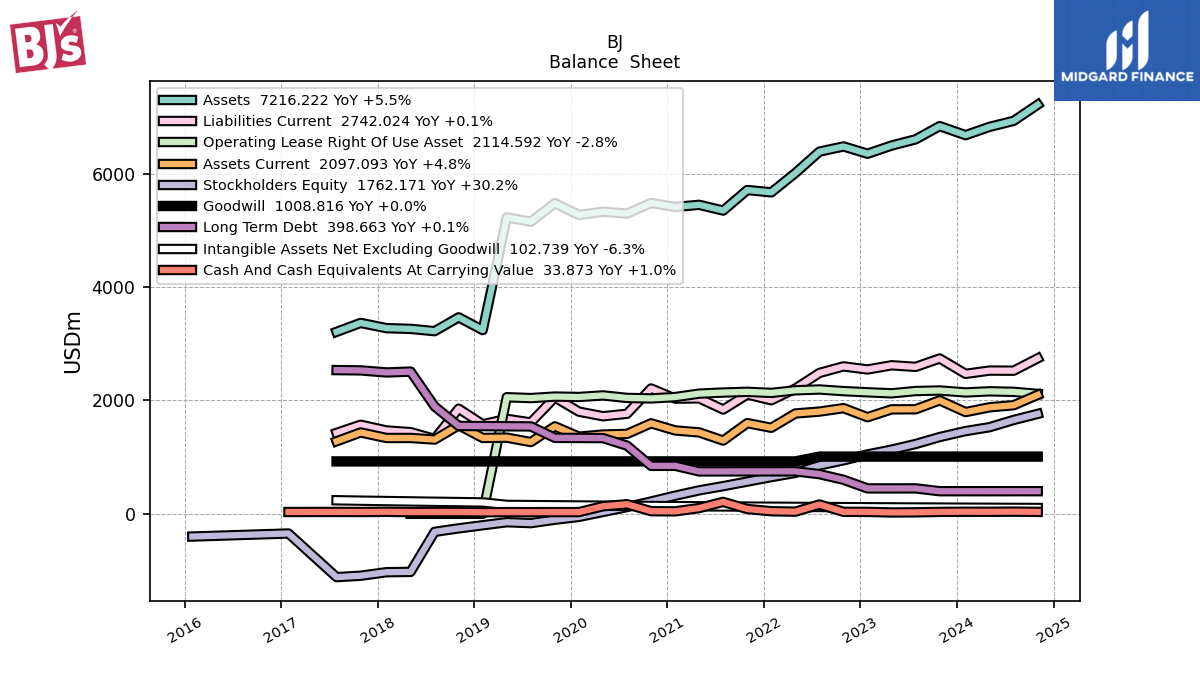
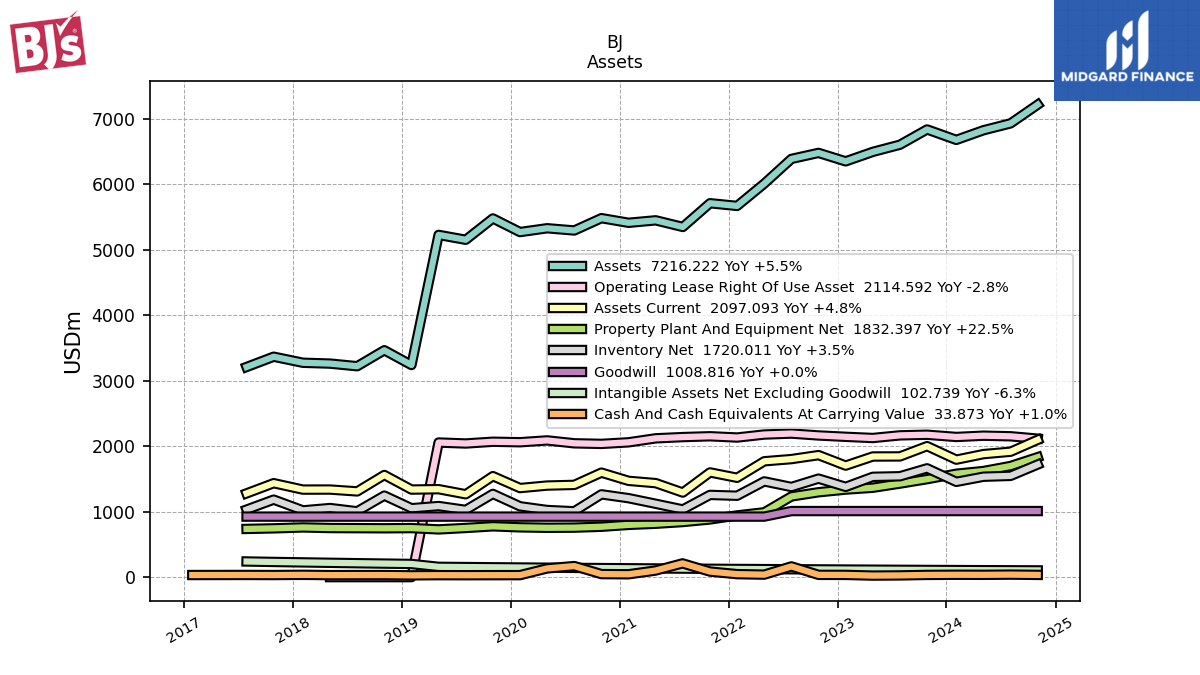
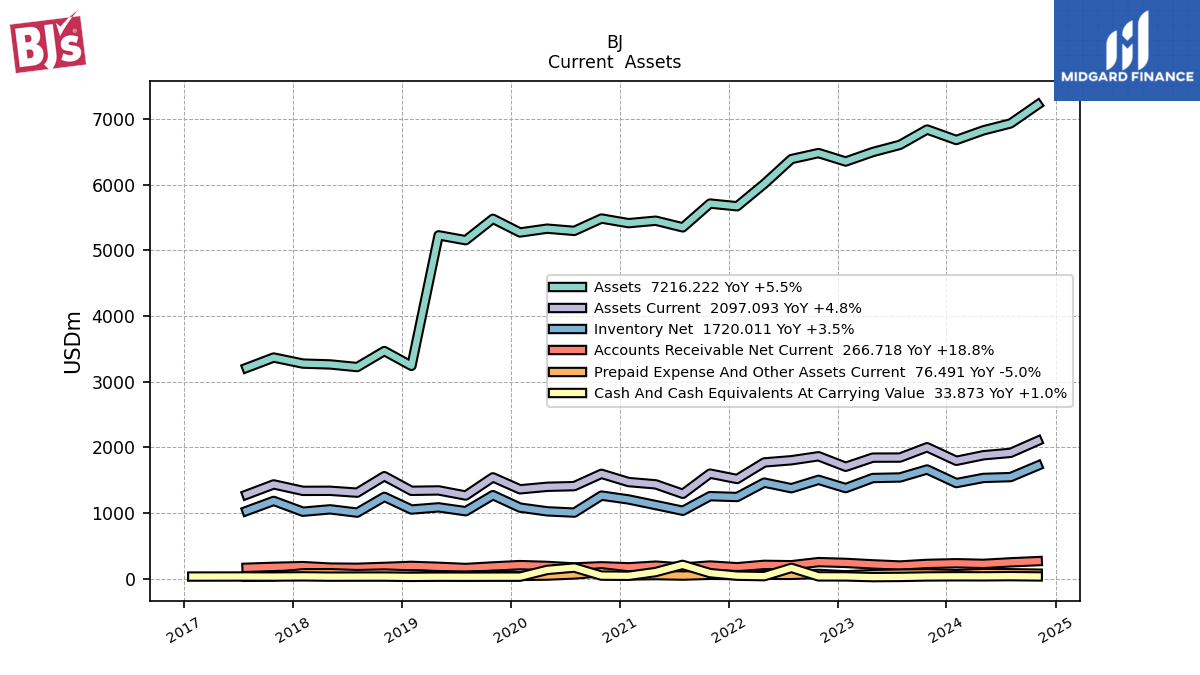
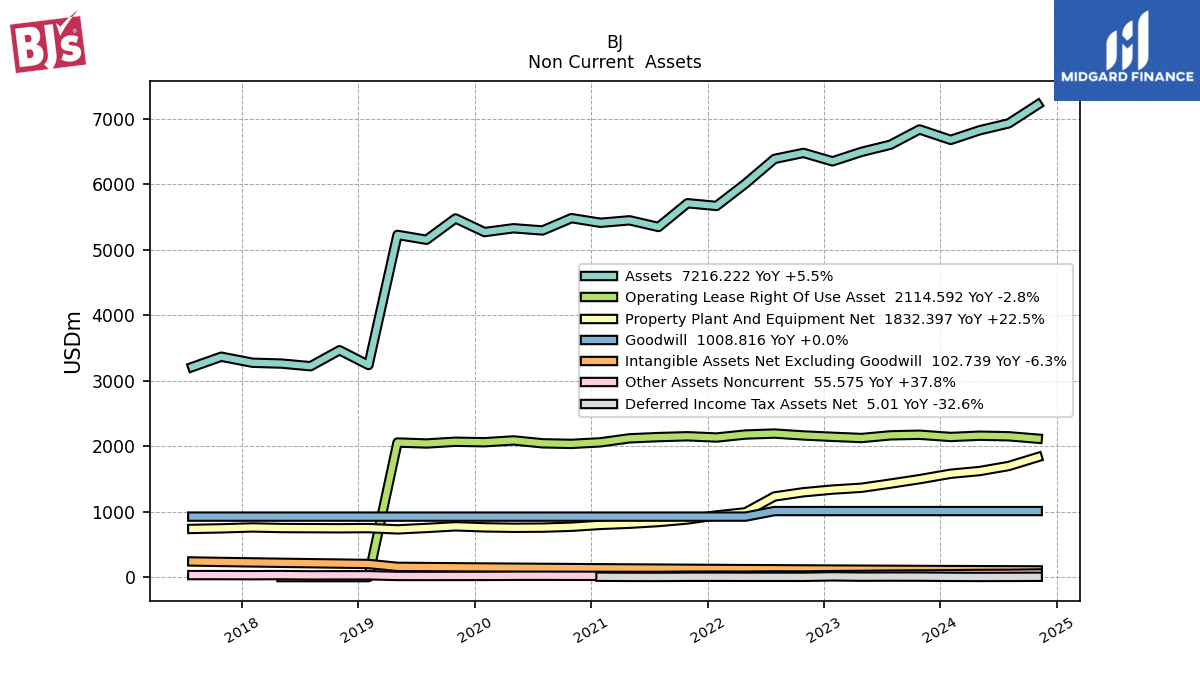
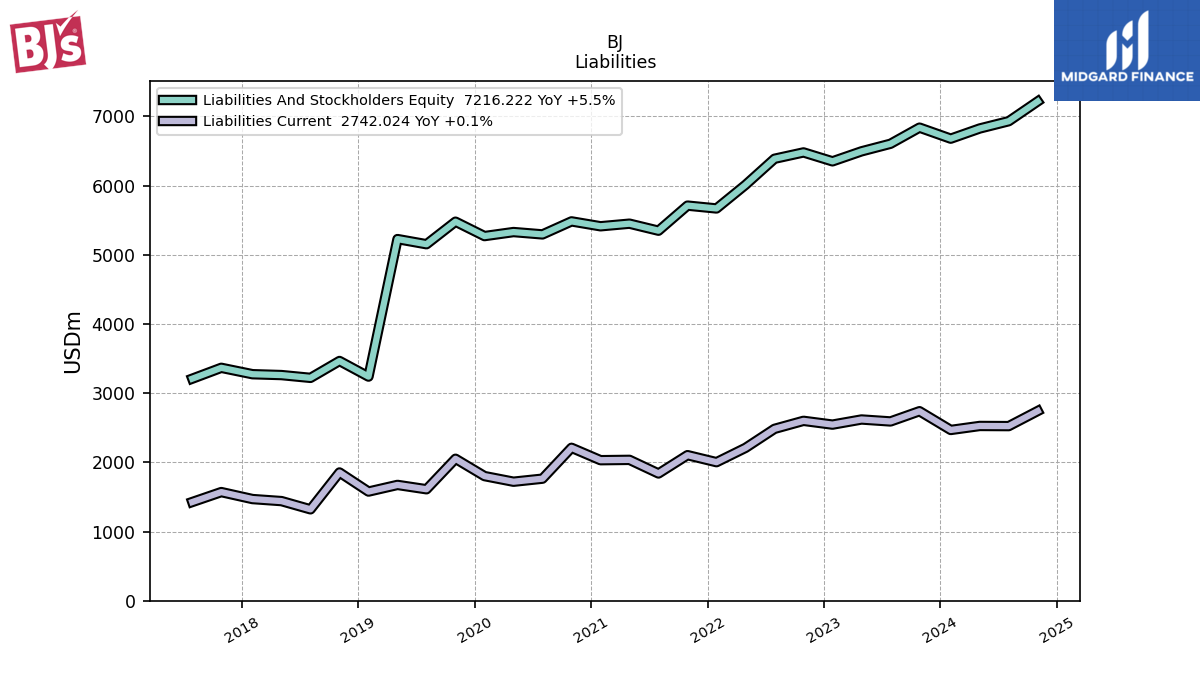
| Assets | 6677.62 | 6837.24 | 6603.90 | 6494.49 | 6349.96 | 6478.90 | 6387.24 | 6010.01 | 5668.89 | 5710.24 | 5347.60 | 5449.21 | 5411.53 | 5482.28 | 5294.02 | 5328.07 | 5269.78 | 5478.08 | 5152.09 | 5226.72 | 3239.28 | 3464.95 | 3220.86 | 3261.27 | 3273.86 | 3366.20 | 3209.09 | |
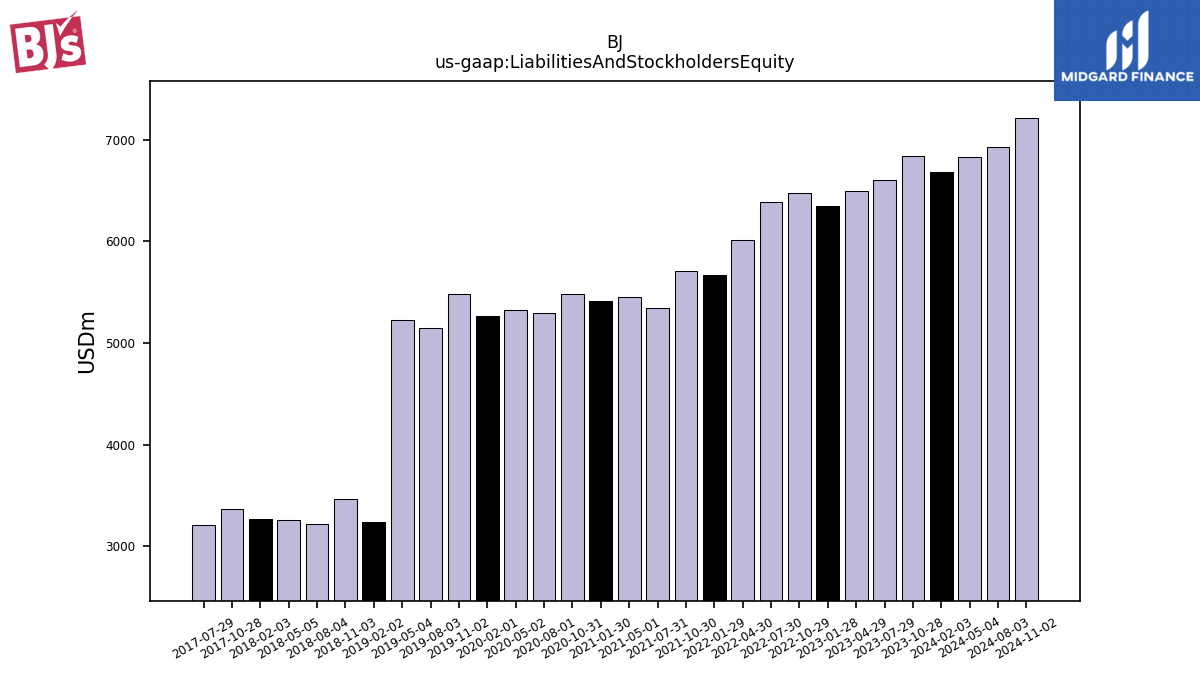
| Liabilities And Stockholders Equity | 6677.62 | 6837.24 | 6603.90 | 6494.49 | 6349.96 | 6478.90 | 6387.24 | 6010.01 | 5668.89 | 5710.24 | 5347.60 | 5449.21 | 5411.53 | 5482.28 | 5294.02 | 5328.07 | 5269.78 | 5478.08 | 5152.09 | 5226.72 | 3239.28 | 3464.95 | 3220.86 | 3261.27 | 3273.86 | 3366.20 | 3209.09 | |
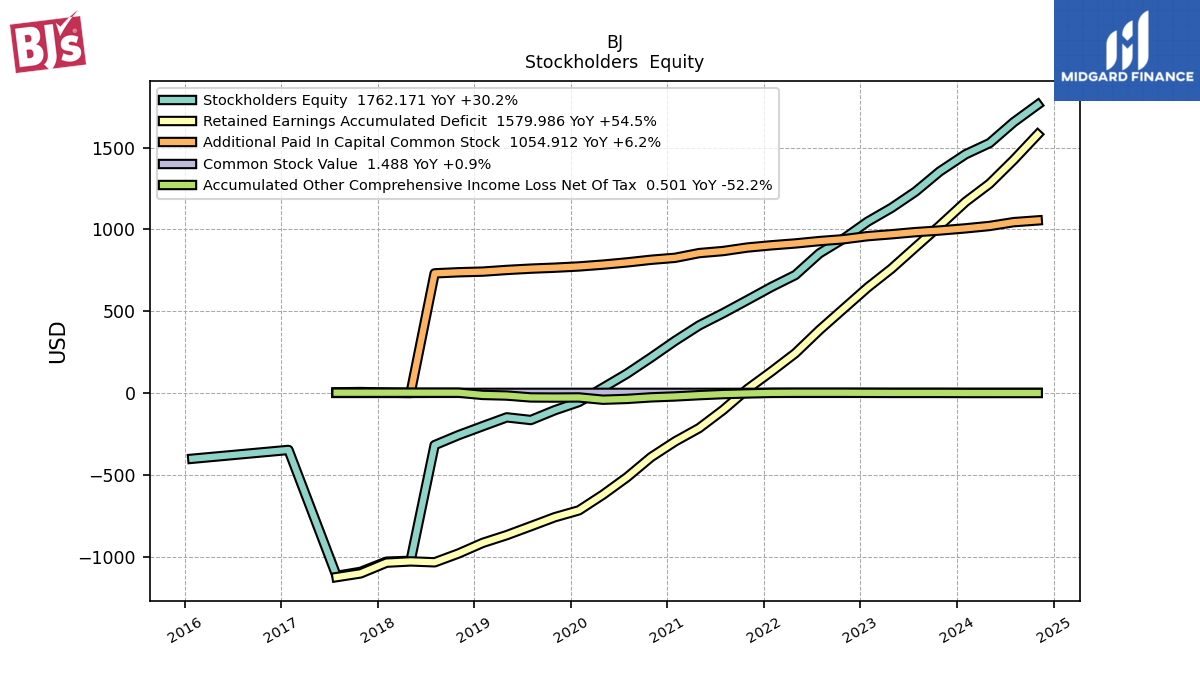
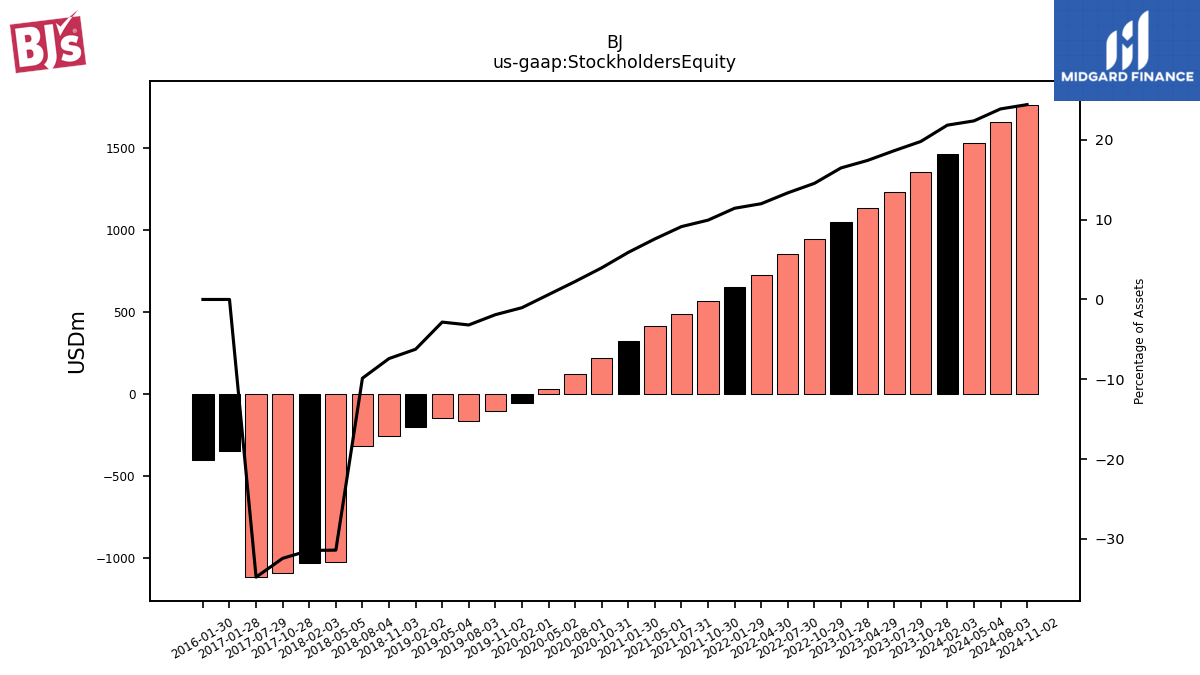
| Stockholders Equity | 1458.85 | 1353.70 | 1231.29 | 1131.73 | 1046.84 | 942.88 | 853.59 | 721.34 | 648.11 | 567.74 | 488.35 | 413.52 | 319.33 | 217.38 | 119.10 | 32.50 | -54.34 | -104.49 | -164.59 | -148.31 | -202.08 | -256.62 | -317.87 | -1024.61 | -1029.86 | -1092.06 | -1116.74 |
| 2024-02-03 | 2023-10-28 | 2023-07-29 | 2023-04-29 | 2023-01-28 | 2022-10-29 | 2022-07-30 | 2022-04-30 | 2022-01-29 | 2021-10-30 | 2021-07-31 | 2021-05-01 | 2021-01-30 | 2020-10-31 | 2020-08-01 | 2020-05-02 | 2020-02-01 | 2019-11-02 | 2019-08-03 | 2019-05-04 | 2019-02-02 | 2018-11-03 | 2018-08-04 | 2018-05-05 | 2018-02-03 | 2017-10-28 | 2017-07-29 | ||
|---|---|---|---|---|---|---|---|---|---|---|---|---|---|---|---|---|---|---|---|---|---|---|---|---|---|---|---|---|
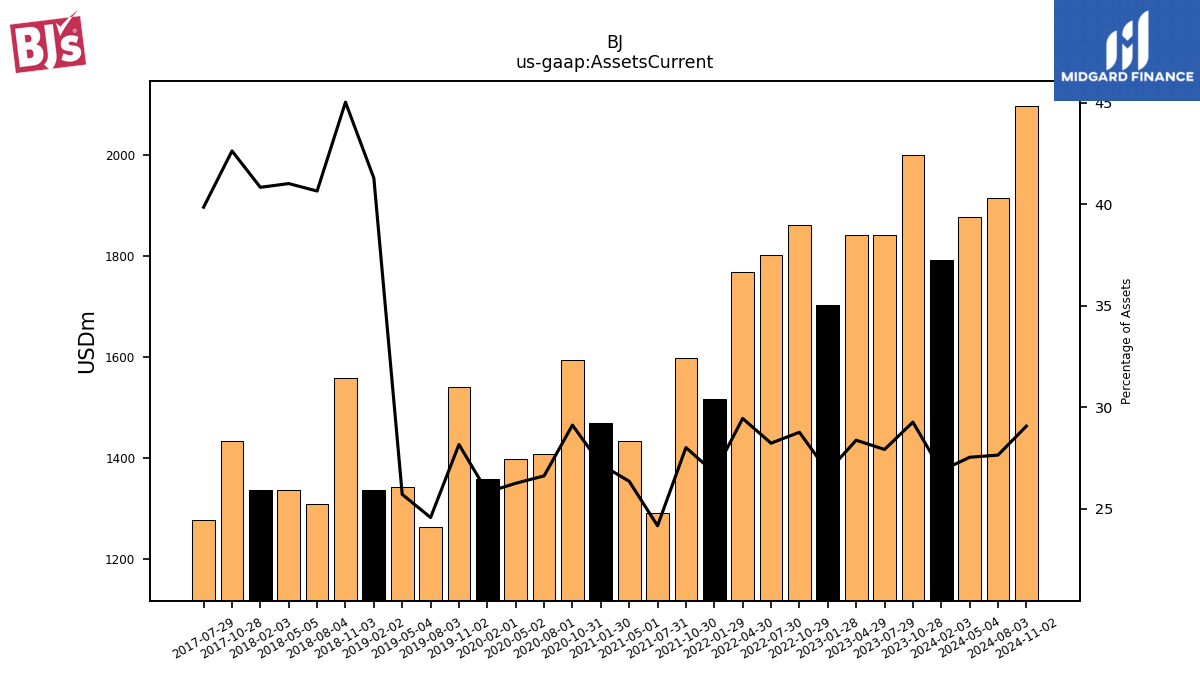
| Assets Current | 1794.01 | 2000.46 | 1843.31 | 1842.31 | 1703.24 | 1863.28 | 1802.55 | 1769.27 | 1517.06 | 1599.29 | 1291.55 | 1435.54 | 1470.58 | 1595.97 | 1408.75 | 1398.37 | 1360.02 | 1542.41 | 1265.26 | 1343.22 | 1337.21 | 1559.96 | 1309.04 | 1337.46 | 1336.60 | 1434.66 | 1278.74 | |
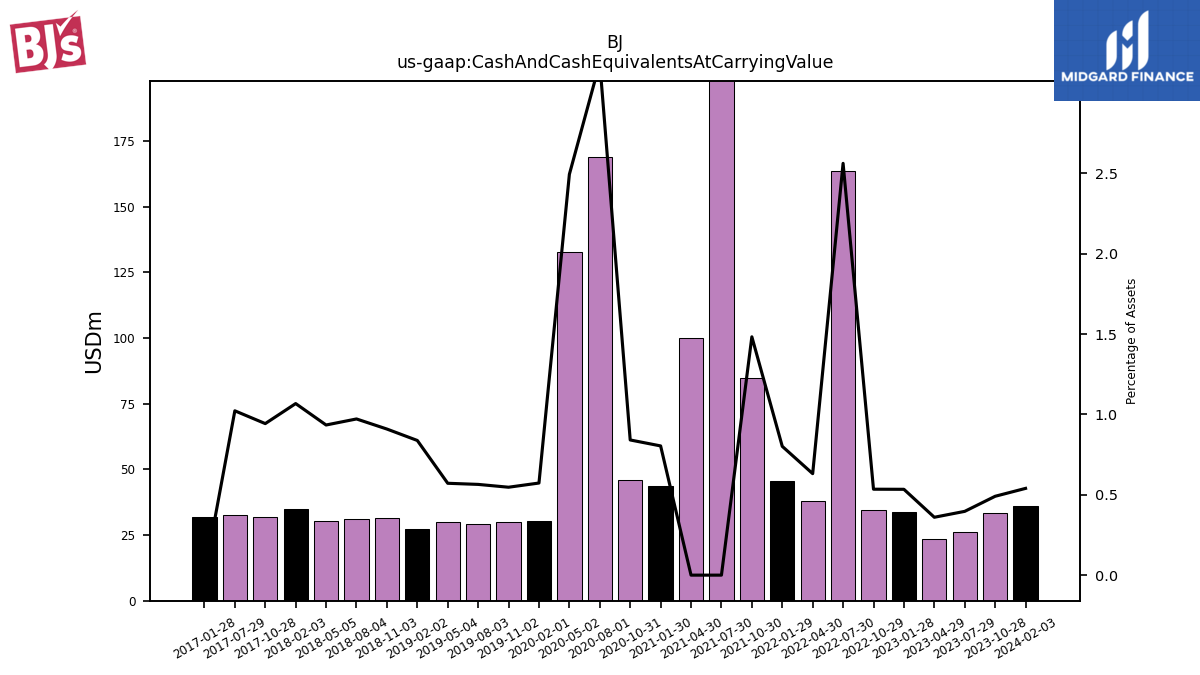
| Cash And Cash Equivalents At Carrying Value | 36.05 | 33.55 | 26.21 | 23.39 | 33.91 | 34.64 | 163.68 | 37.95 | 45.44 | 84.69 | NA | NA | 43.52 | 46.12 | 168.81 | 132.91 | 30.20 | 29.97 | 29.09 | 29.88 | 27.15 | 31.50 | 31.30 | 30.47 | 34.95 | 31.75 | 32.82 | |
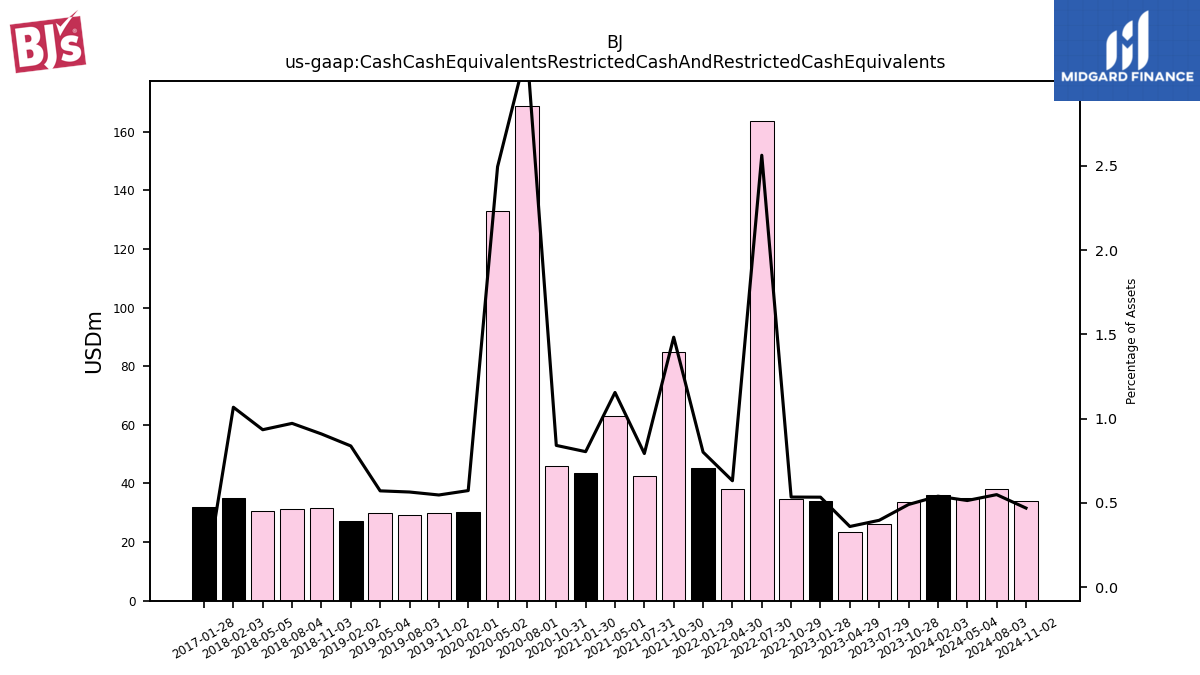
| Cash Cash Equivalents Restricted Cash And Restricted Cash Equivalents | 36.05 | 33.55 | 26.21 | 23.39 | 33.91 | 34.64 | 163.68 | 37.95 | 45.44 | 84.69 | 42.41 | 62.95 | 43.52 | 46.12 | 168.81 | 132.91 | 30.20 | 29.97 | 29.09 | 29.88 | 27.15 | 31.50 | 31.30 | 30.47 | 34.95 | NA | NA | |
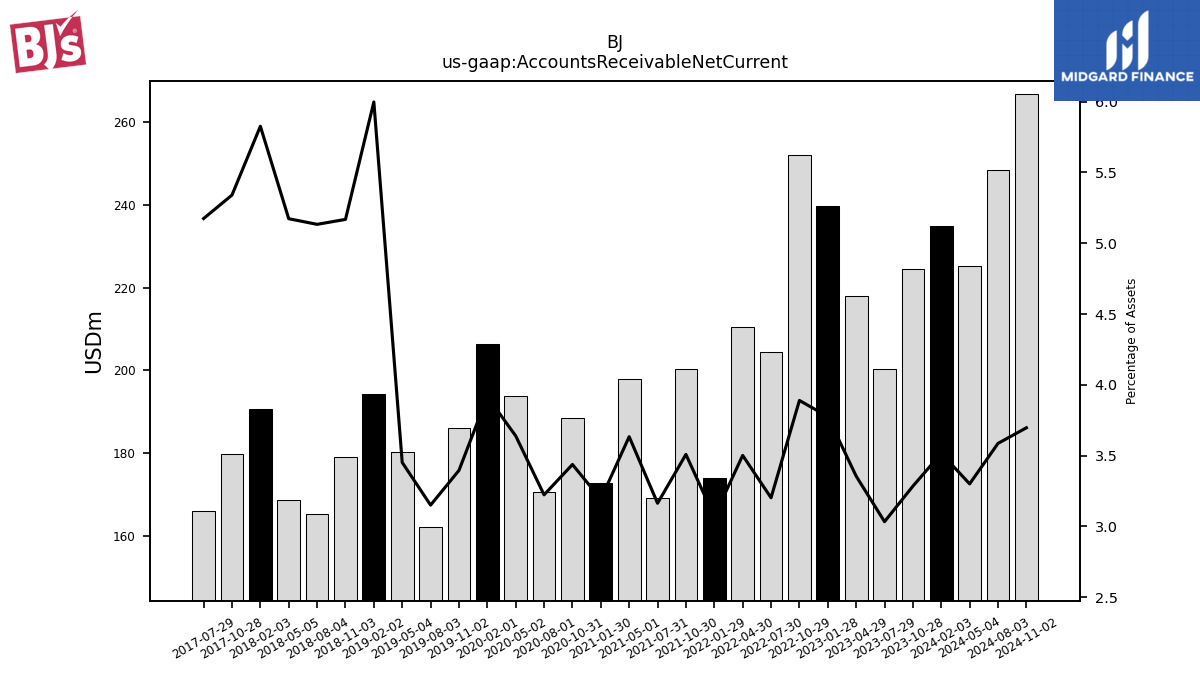
| Accounts Receivable Net Current | 234.77 | 224.50 | 200.28 | 217.87 | 239.75 | 251.98 | 204.50 | 210.41 | 173.95 | 200.31 | 169.13 | 197.99 | 172.72 | 188.41 | 170.59 | 193.88 | 206.35 | 185.98 | 162.28 | 180.38 | 194.30 | 179.09 | 165.35 | 168.72 | 190.76 | 179.78 | 166.06 | |
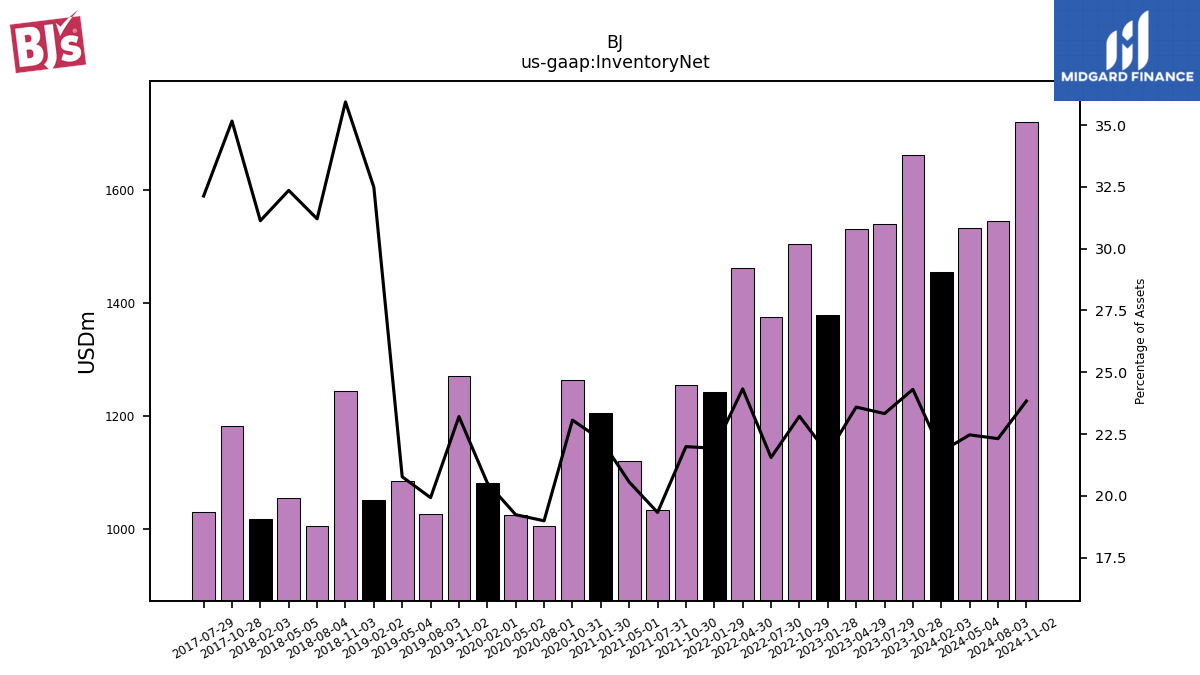
| Inventory Net | 1454.82 | 1661.85 | 1540.51 | 1532.01 | 1378.55 | 1504.37 | 1376.53 | 1462.10 | 1242.93 | 1255.66 | 1033.56 | 1120.33 | 1205.69 | 1264.32 | 1005.27 | 1024.94 | 1081.50 | 1271.17 | 1026.54 | 1085.57 | 1052.31 | 1245.11 | 1005.04 | 1055.23 | 1019.14 | 1183.56 | 1031.05 | |
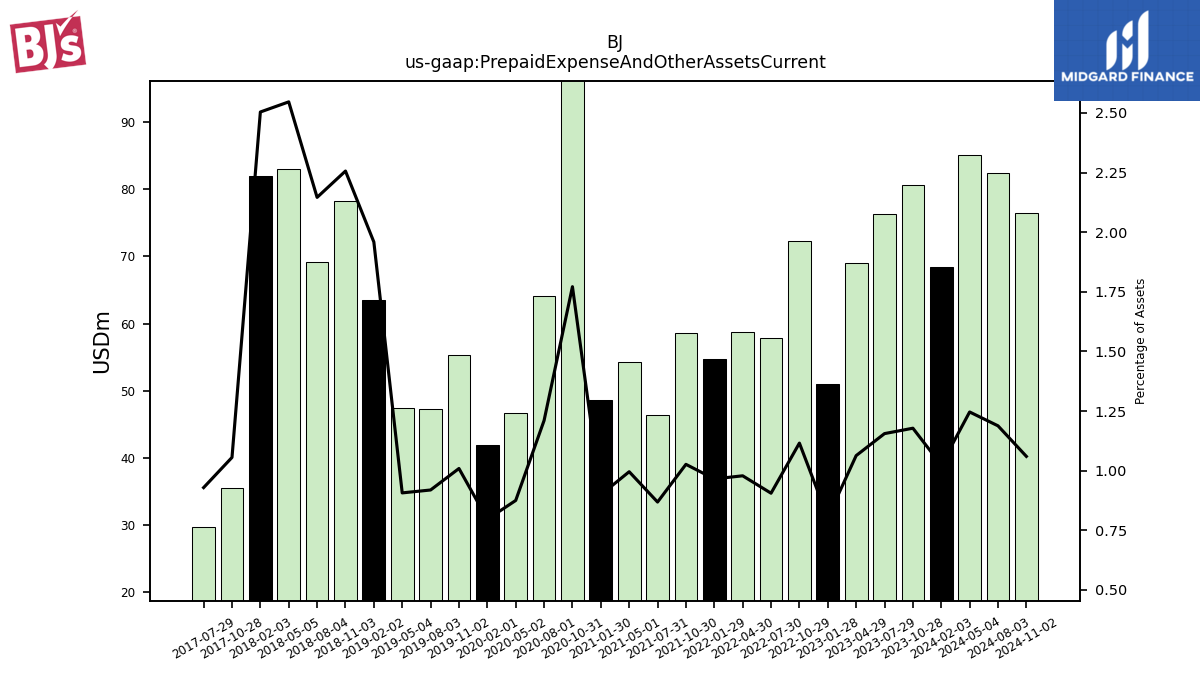
| Prepaid Expense And Other Assets Current | 68.37 | 80.55 | 76.31 | 69.05 | 51.03 | 72.28 | 57.84 | 58.81 | 54.73 | 58.62 | 46.45 | 54.26 | 48.65 | 97.12 | 64.07 | 46.63 | 41.96 | 55.28 | 47.35 | 47.40 | 63.45 | 78.18 | 69.12 | 83.04 | 81.97 | 35.53 | 29.82 |
| 2024-02-03 | 2023-10-28 | 2023-07-29 | 2023-04-29 | 2023-01-28 | 2022-10-29 | 2022-07-30 | 2022-04-30 | 2022-01-29 | 2021-10-30 | 2021-07-31 | 2021-05-01 | 2021-01-30 | 2020-10-31 | 2020-08-01 | 2020-05-02 | 2020-02-01 | 2019-11-02 | 2019-08-03 | 2019-05-04 | 2019-02-02 | 2018-11-03 | 2018-08-04 | 2018-05-05 | 2018-02-03 | 2017-10-28 | 2017-07-29 | ||
|---|---|---|---|---|---|---|---|---|---|---|---|---|---|---|---|---|---|---|---|---|---|---|---|---|---|---|---|---|
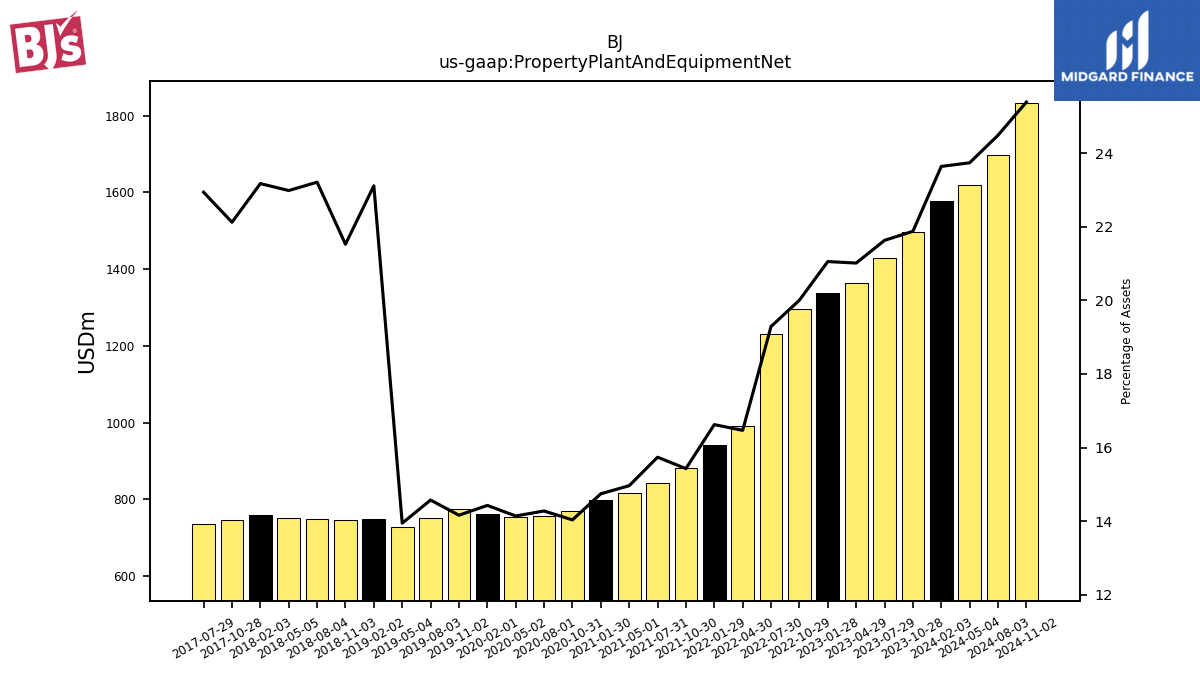
| Property Plant And Equipment Net | 1578.79 | 1495.91 | 1428.58 | 1364.82 | 1337.03 | 1296.15 | 1232.10 | 989.66 | 942.33 | 880.90 | 841.52 | 815.30 | 797.79 | 769.26 | 755.68 | 753.30 | 760.21 | 775.66 | 750.72 | 728.76 | 748.78 | 745.89 | 747.68 | 749.67 | 758.75 | 744.76 | 736.20 | |
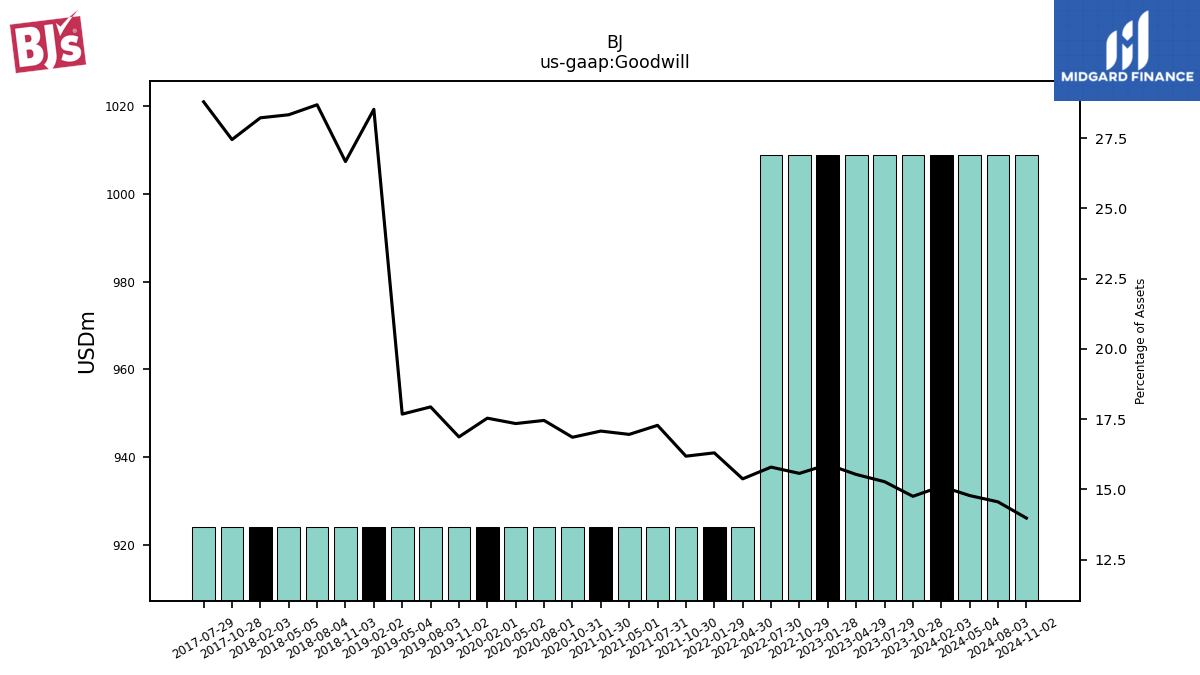
| Goodwill | 1008.82 | 1008.82 | 1008.82 | 1008.82 | 1008.82 | 1008.82 | 1008.82 | 924.13 | 924.13 | 924.13 | 924.13 | 924.13 | 924.13 | 924.13 | 924.13 | 924.13 | 924.13 | 924.13 | 924.13 | 924.13 | 924.13 | 924.13 | 924.13 | 924.13 | 924.13 | 924.13 | 924.13 | |
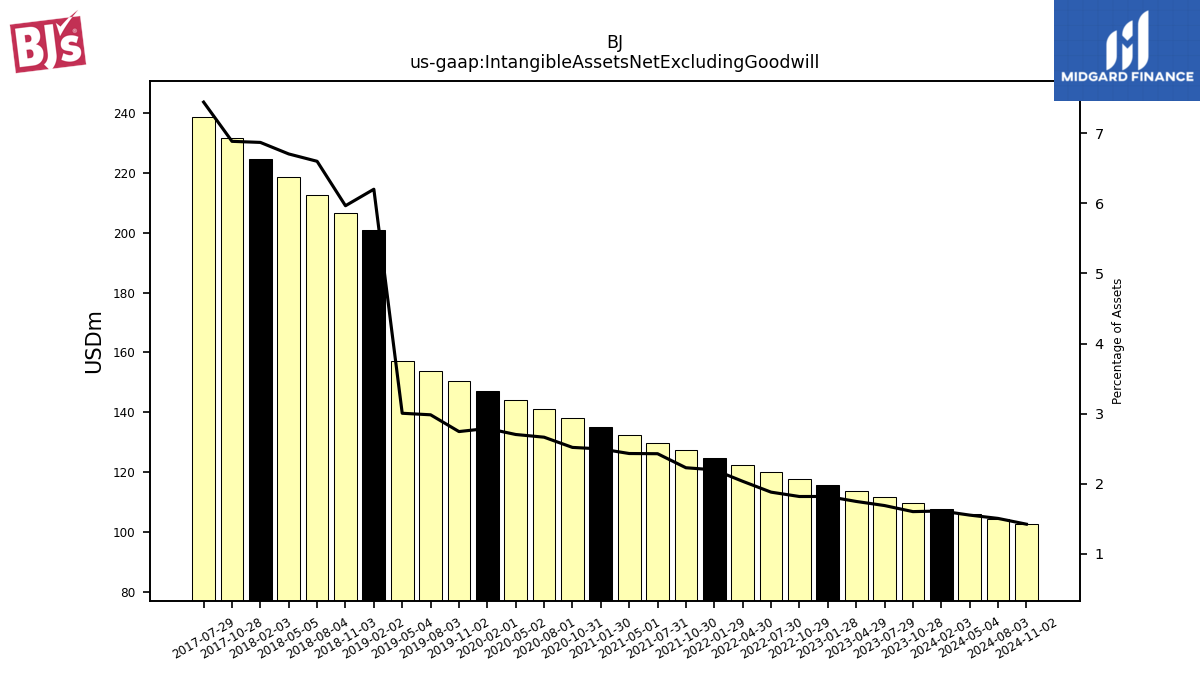
| Intangible Assets Net Excluding Goodwill | 107.63 | 109.60 | 111.57 | 113.54 | 115.50 | 117.81 | 120.12 | 122.33 | 124.64 | 127.26 | 129.88 | 132.50 | 135.12 | 138.09 | 141.05 | 144.02 | 146.99 | 150.36 | 153.73 | 157.10 | 200.87 | 206.71 | 212.56 | 218.65 | 224.88 | 231.74 | 238.88 | |
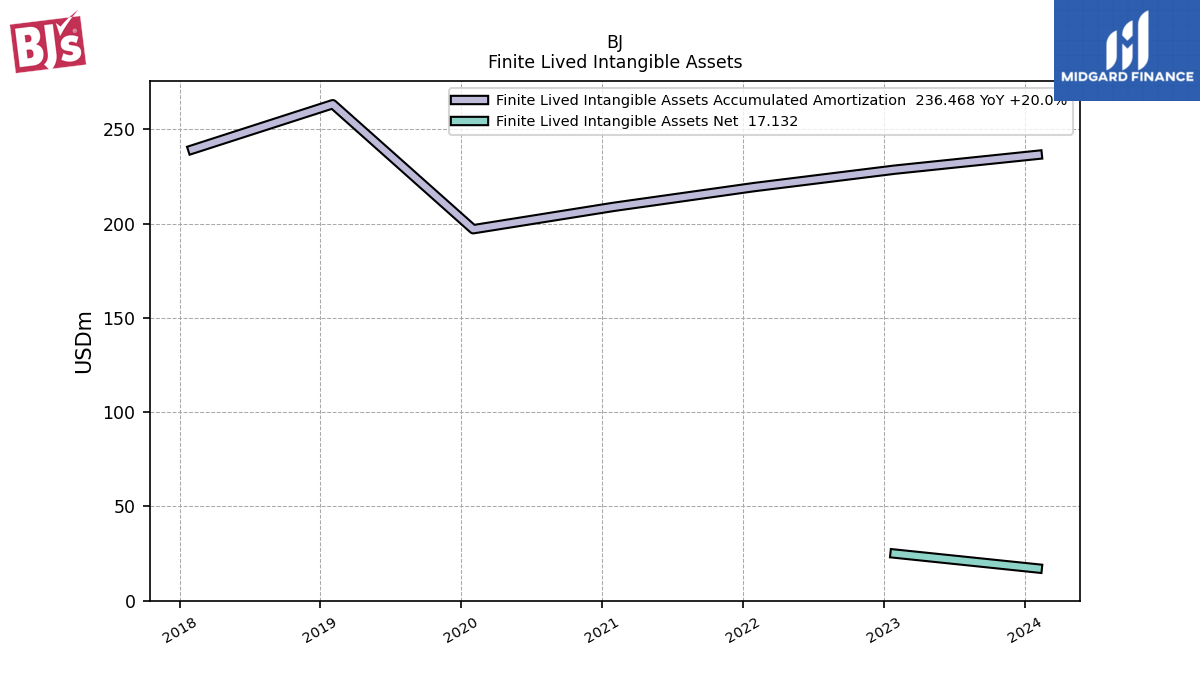
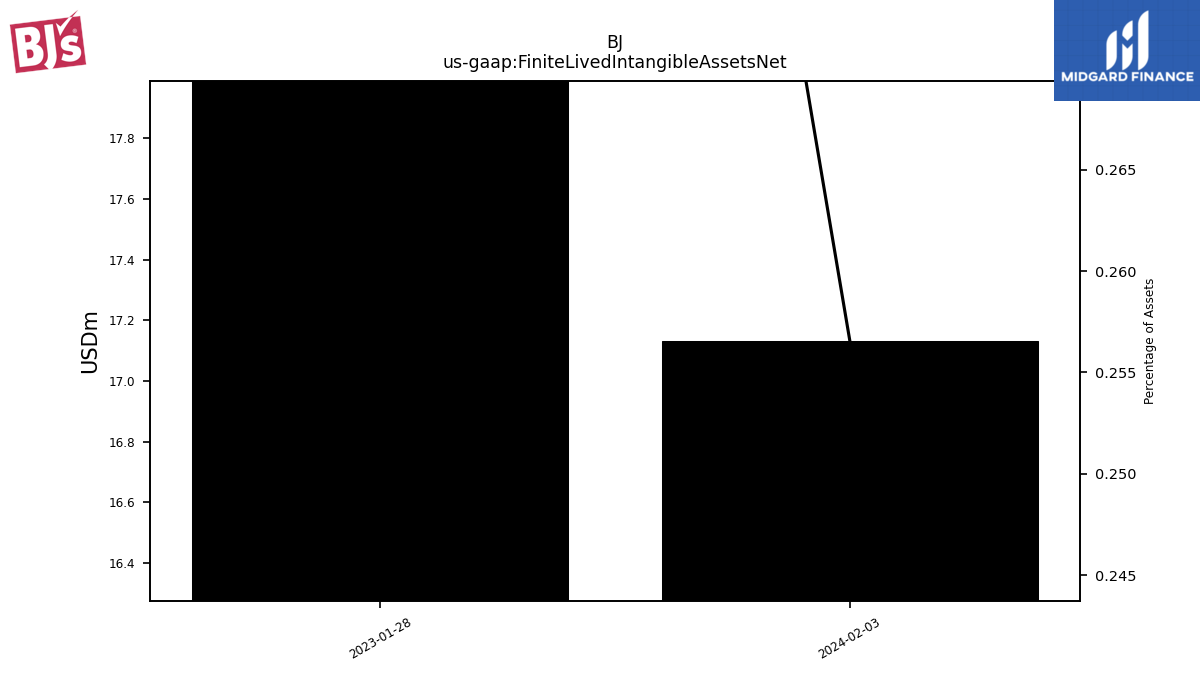
| Finite Lived Intangible Assets Net | 17.13 | NA | NA | NA | 25.00 | NA | NA | NA | NA | NA | NA | NA | NA | NA | NA | NA | NA | NA | NA | NA | NA | NA | NA | NA | NA | NA | NA | |
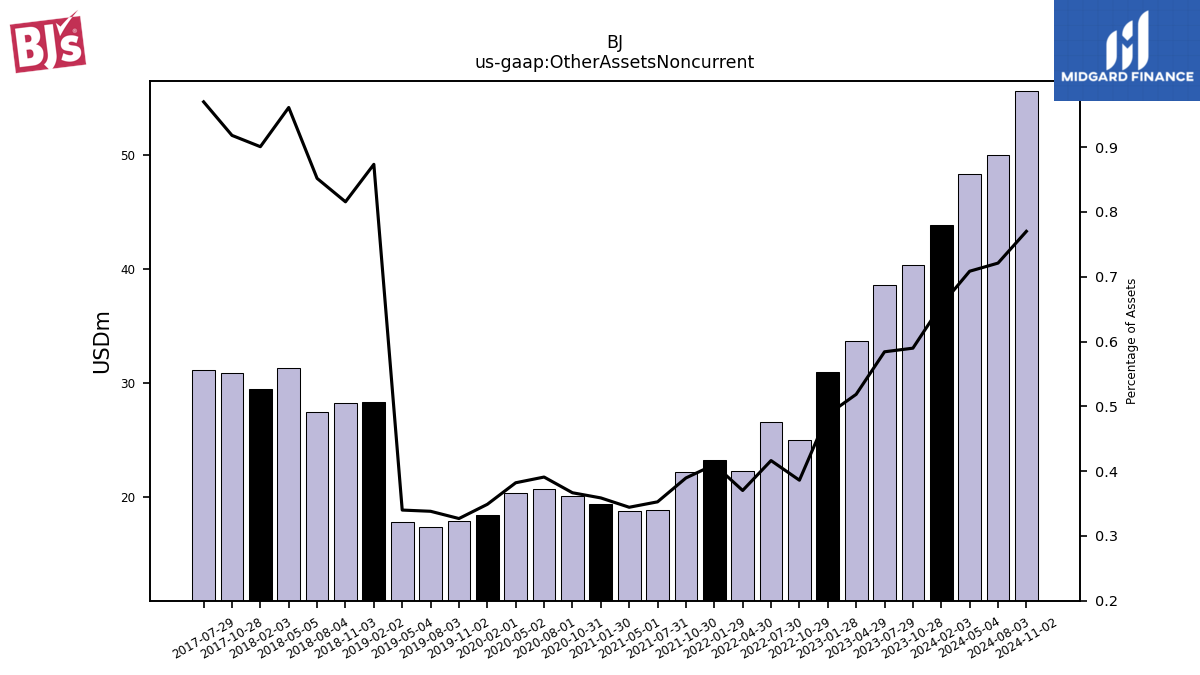
| Other Assets Noncurrent | 43.82 | 40.32 | 38.58 | 33.67 | 30.94 | 25.00 | 26.58 | 22.24 | 23.24 | 22.23 | 18.85 | 18.75 | 19.40 | 20.09 | 20.69 | 20.35 | 18.37 | 17.90 | 17.41 | 17.76 | 28.30 | 28.27 | 27.44 | 31.35 | 29.49 | 30.91 | 31.13 |
| 2024-02-03 | 2023-10-28 | 2023-07-29 | 2023-04-29 | 2023-01-28 | 2022-10-29 | 2022-07-30 | 2022-04-30 | 2022-01-29 | 2021-10-30 | 2021-07-31 | 2021-05-01 | 2021-01-30 | 2020-10-31 | 2020-08-01 | 2020-05-02 | 2020-02-01 | 2019-11-02 | 2019-08-03 | 2019-05-04 | 2019-02-02 | 2018-11-03 | 2018-08-04 | 2018-05-05 | 2018-02-03 | 2017-10-28 | 2017-07-29 | ||
|---|---|---|---|---|---|---|---|---|---|---|---|---|---|---|---|---|---|---|---|---|---|---|---|---|---|---|---|---|
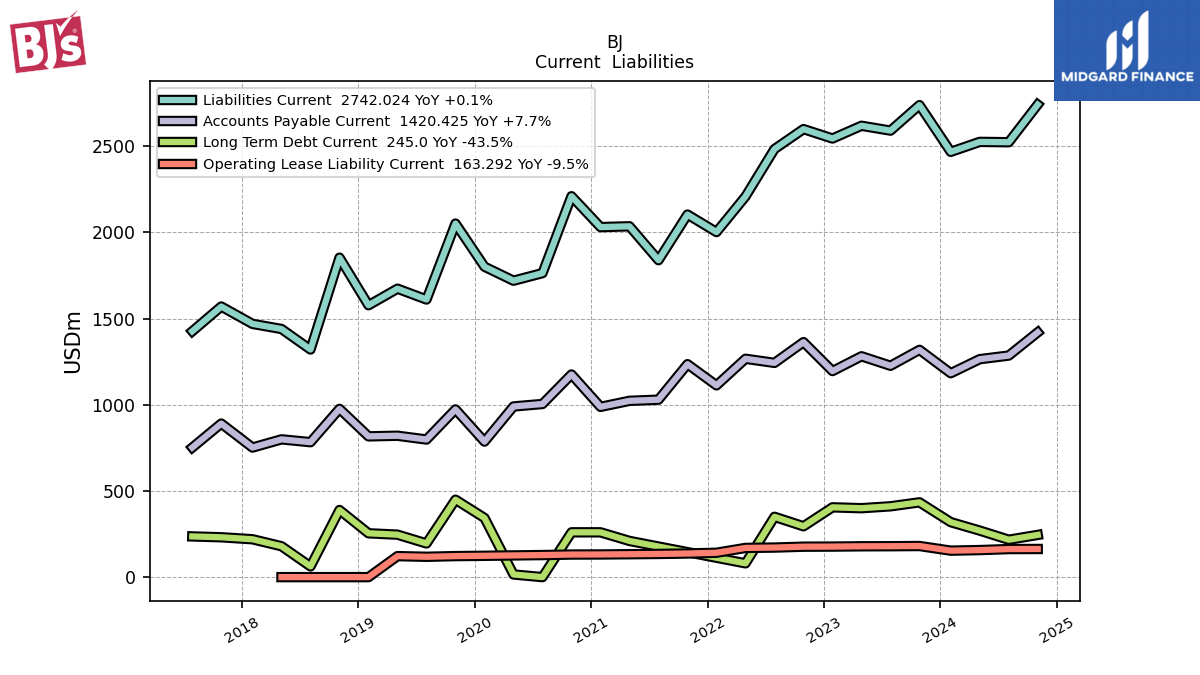
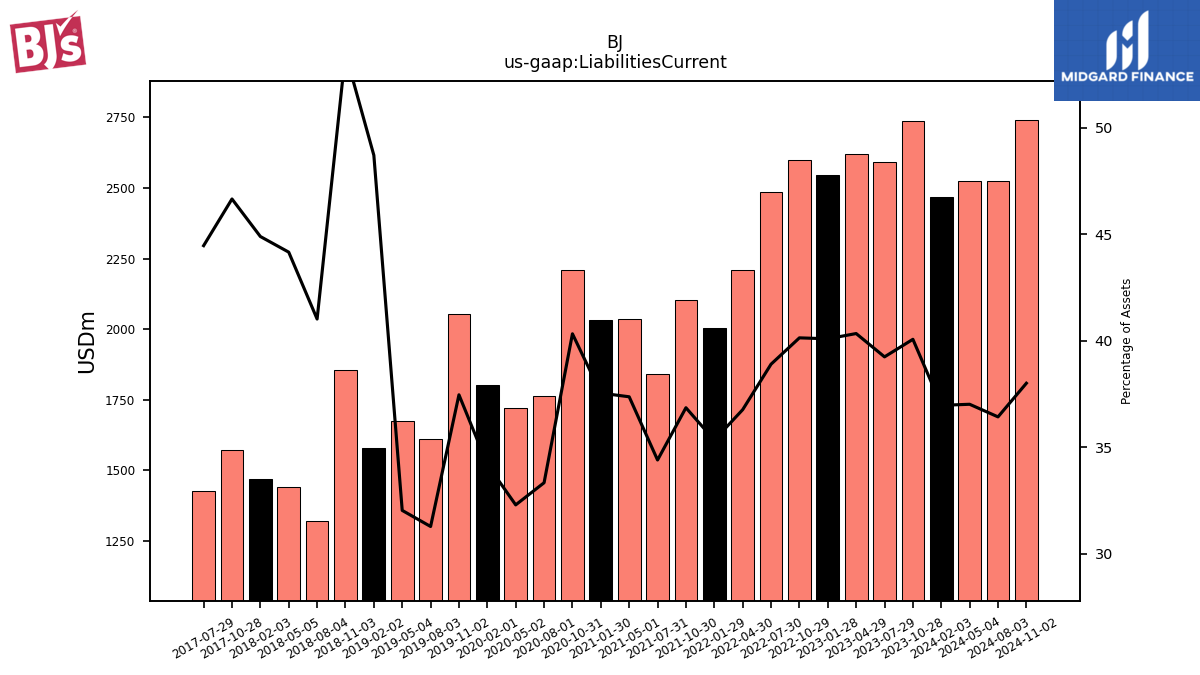
| Liabilities Current | 2468.05 | 2739.06 | 2591.15 | 2619.34 | 2545.34 | 2599.97 | 2484.14 | 2209.05 | 2002.48 | 2104.10 | 1839.20 | 2035.93 | 2031.21 | 2210.44 | 1764.23 | 1720.20 | 1801.42 | 2051.81 | 1611.07 | 1673.91 | 1577.69 | 1853.81 | 1320.98 | 1439.97 | 1469.59 | 1570.37 | 1426.72 | |
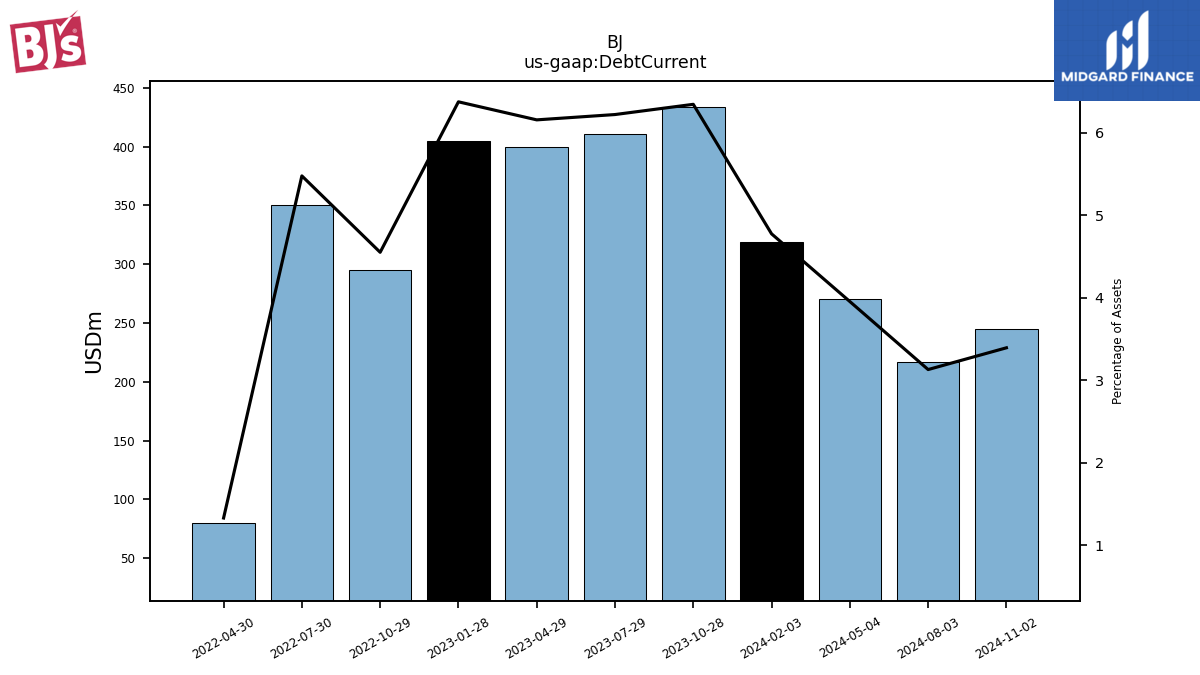
| Debt Current | 319.00 | 434.00 | 411.00 | 400.00 | 405.00 | 295.00 | 350.00 | 80.00 | NA | NA | NA | NA | NA | NA | NA | NA | NA | NA | NA | NA | NA | NA | NA | NA | NA | NA | NA | |
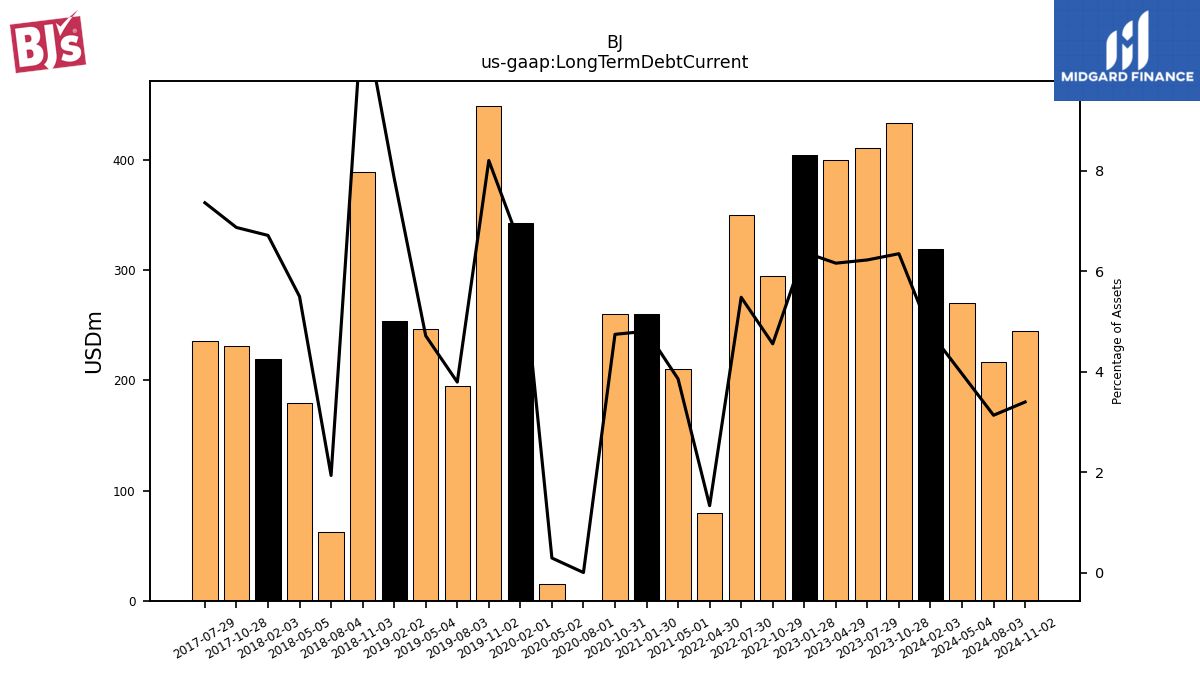
| Long Term Debt Current | 319.00 | 434.00 | 411.00 | 400.00 | 405.00 | 295.00 | 350.00 | 80.00 | NA | NA | NA | 210.00 | 260.00 | 260.00 | 0.00 | 15.38 | 343.38 | 449.38 | 195.38 | 246.38 | 254.38 | 389.38 | 62.25 | 179.25 | 219.75 | 231.25 | 236.25 | |
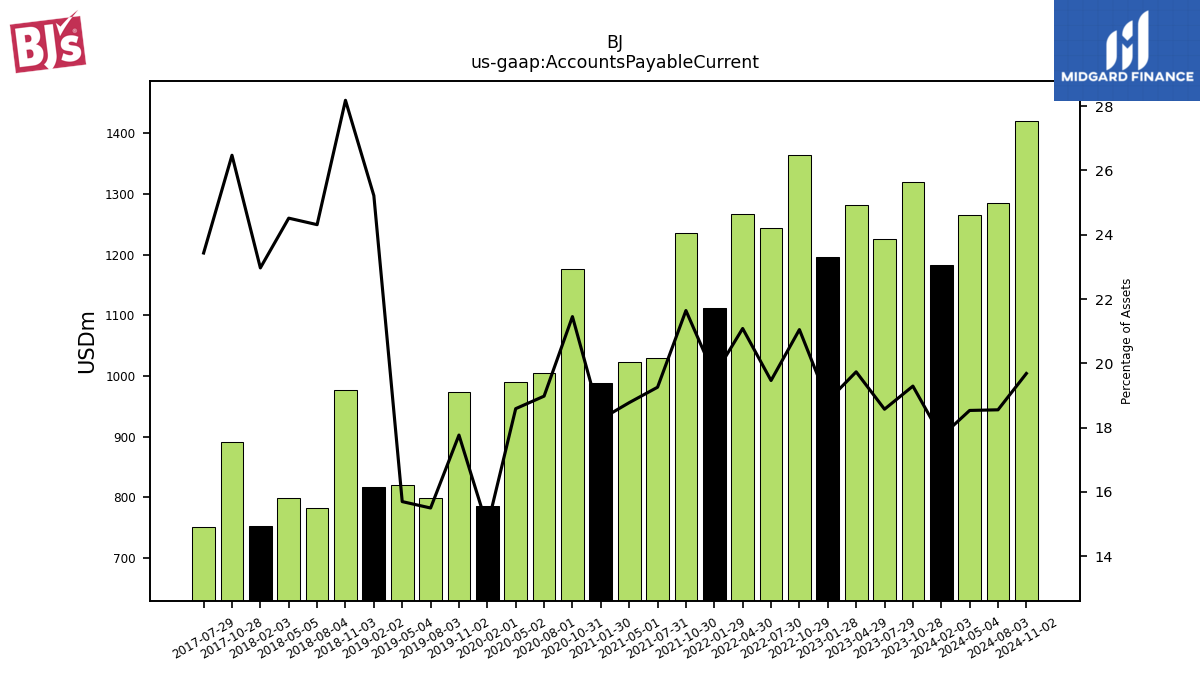
| Accounts Payable Current | 1183.28 | 1318.96 | 1226.49 | 1281.68 | 1195.70 | 1363.73 | 1243.29 | 1267.10 | 1112.78 | 1235.76 | 1029.73 | 1023.14 | 988.07 | 1176.10 | 1004.73 | 990.42 | 786.41 | 973.33 | 798.50 | 820.49 | 816.88 | 976.52 | 783.11 | 799.52 | 751.95 | 891.13 | 751.94 | |
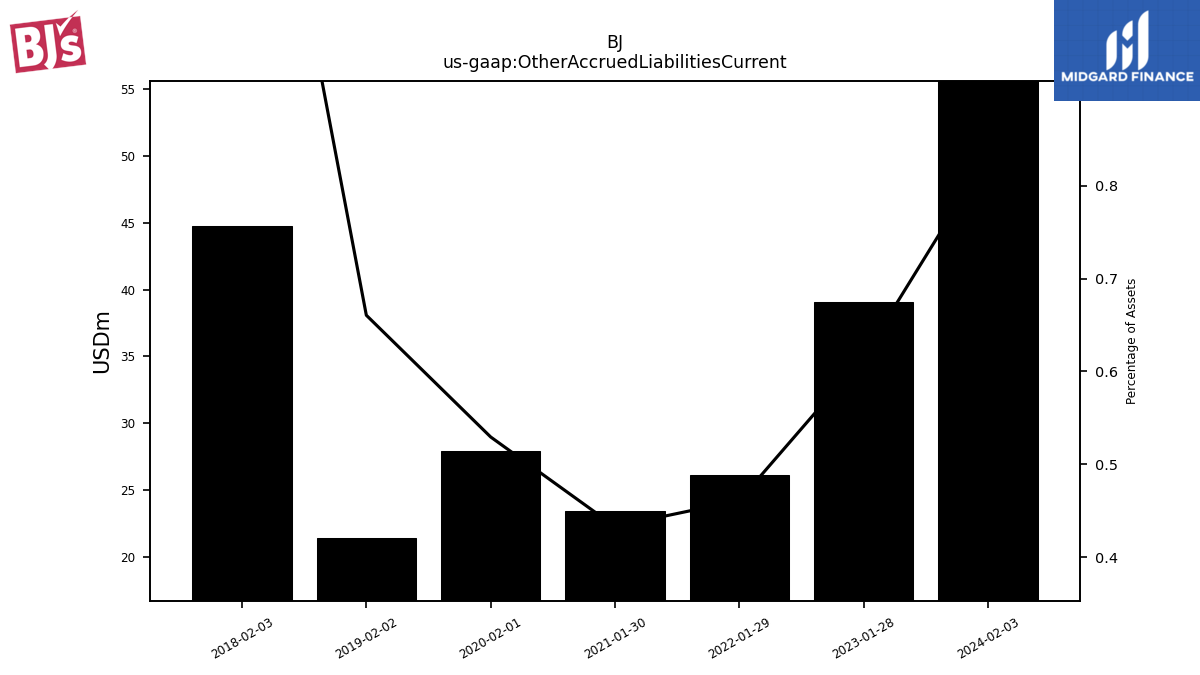
| Other Accrued Liabilities Current | 55.61 | NA | NA | NA | 39.10 | NA | NA | NA | 26.13 | NA | NA | NA | 23.43 | NA | NA | NA | 27.90 | NA | NA | NA | 21.39 | NA | NA | NA | 44.77 | NA | NA |
| 2024-02-03 | 2023-10-28 | 2023-07-29 | 2023-04-29 | 2023-01-28 | 2022-10-29 | 2022-07-30 | 2022-04-30 | 2022-01-29 | 2021-10-30 | 2021-07-31 | 2021-05-01 | 2021-01-30 | 2020-10-31 | 2020-08-01 | 2020-05-02 | 2020-02-01 | 2019-11-02 | 2019-08-03 | 2019-05-04 | 2019-02-02 | 2018-11-03 | 2018-08-04 | 2018-05-05 | 2018-02-03 | 2017-10-28 | 2017-07-29 | ||
|---|---|---|---|---|---|---|---|---|---|---|---|---|---|---|---|---|---|---|---|---|---|---|---|---|---|---|---|---|
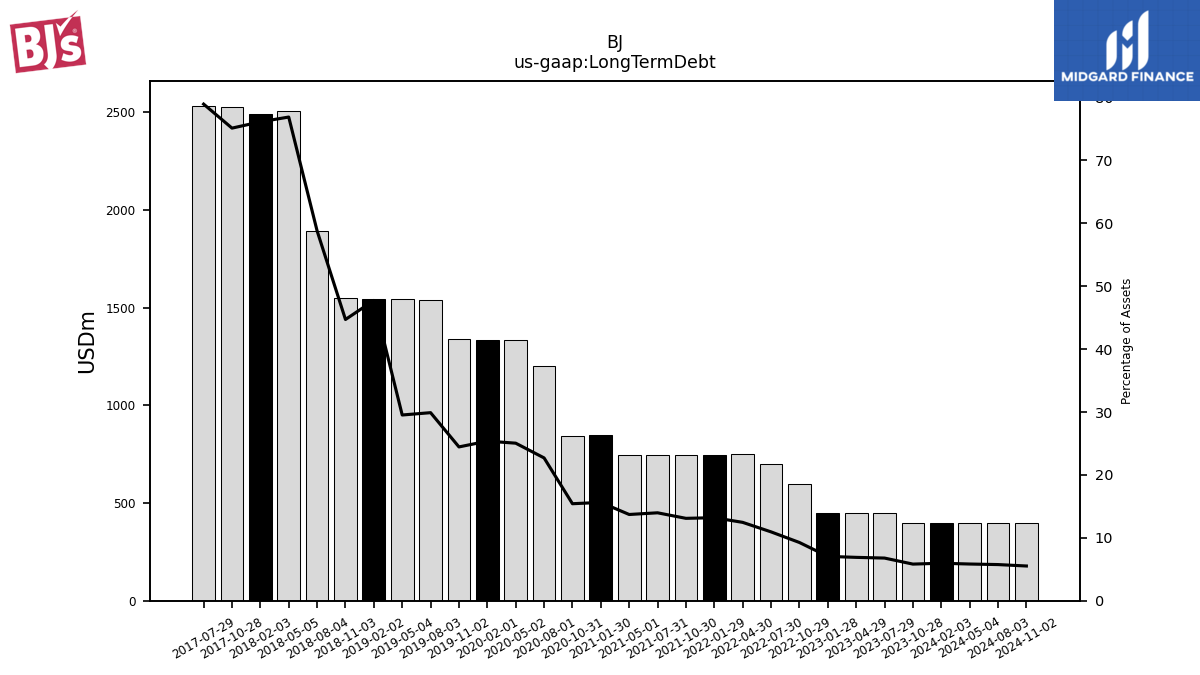
| Long Term Debt | 398.43 | 398.36 | 448.13 | 448.00 | 447.88 | 600.12 | 699.41 | 748.99 | 748.57 | 748.15 | 747.73 | 747.31 | 846.17 | 845.70 | 1202.21 | 1334.80 | 1337.31 | 1339.70 | 1540.60 | 1543.54 | 1546.47 | 1549.41 | 1894.07 | 2507.96 | 2492.66 | 2529.38 | 2533.91 | |
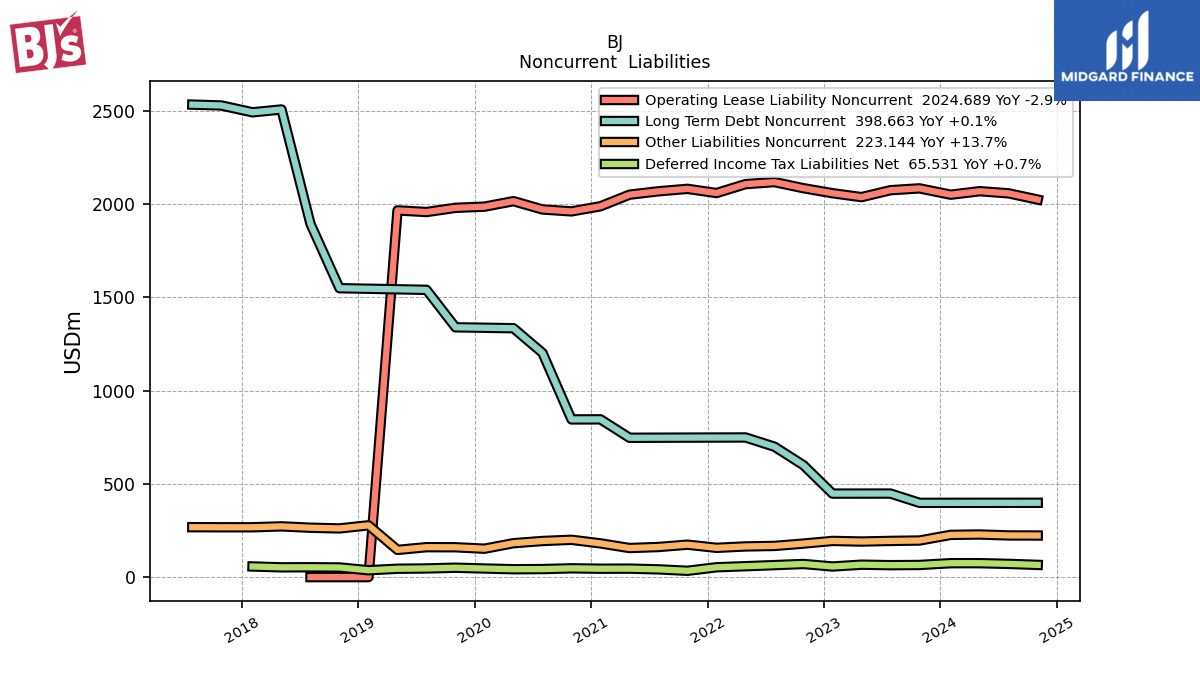
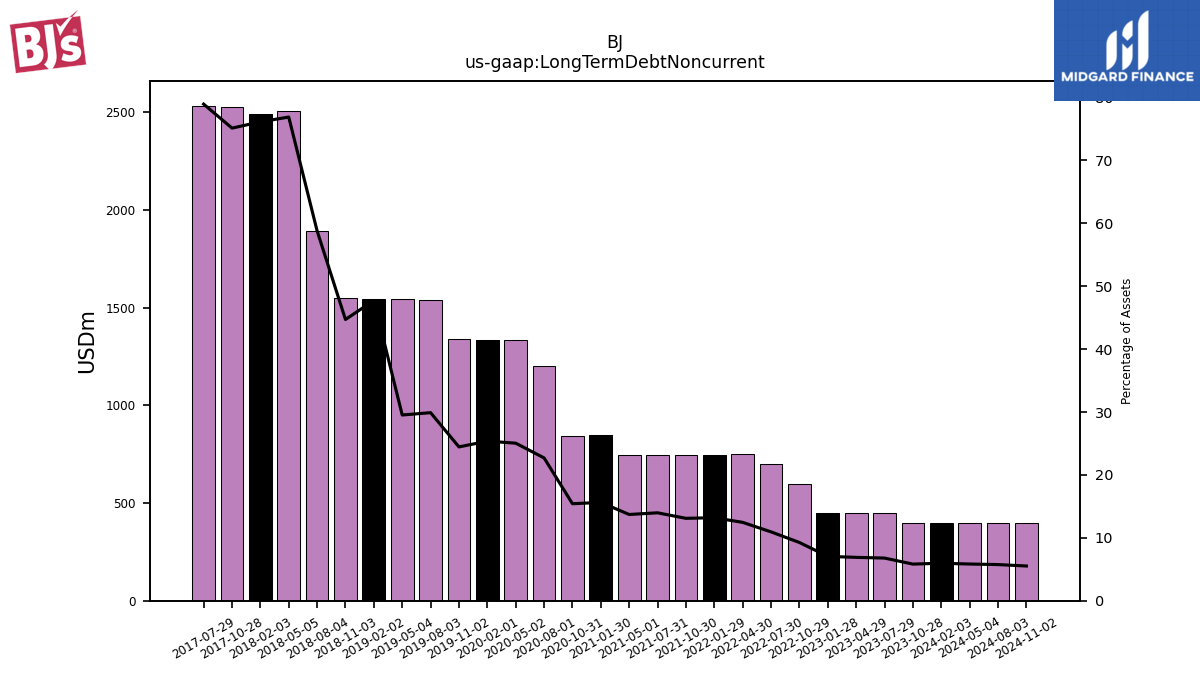
| Long Term Debt Noncurrent | 398.43 | 398.36 | 448.13 | 448.00 | 447.88 | 600.12 | 699.41 | 748.99 | 748.57 | 748.15 | 747.73 | 747.31 | 846.17 | 845.70 | 1202.21 | 1334.80 | 1337.31 | 1339.70 | 1540.60 | 1543.54 | 1546.47 | 1549.41 | 1894.07 | 2507.96 | 2492.66 | 2529.38 | 2533.91 | |
| Deferred Income Tax Liabilities Net | 74.77 | 65.10 | 64.09 | 66.70 | 57.02 | 70.43 | 64.35 | 58.51 | 52.85 | 33.99 | 41.63 | 45.53 | 45.10 | 47.24 | 43.11 | 42.37 | 46.20 | 50.49 | 46.51 | 44.93 | 36.94 | 51.81 | 52.99 | 52.53 | 57.07 | NA | NA | |
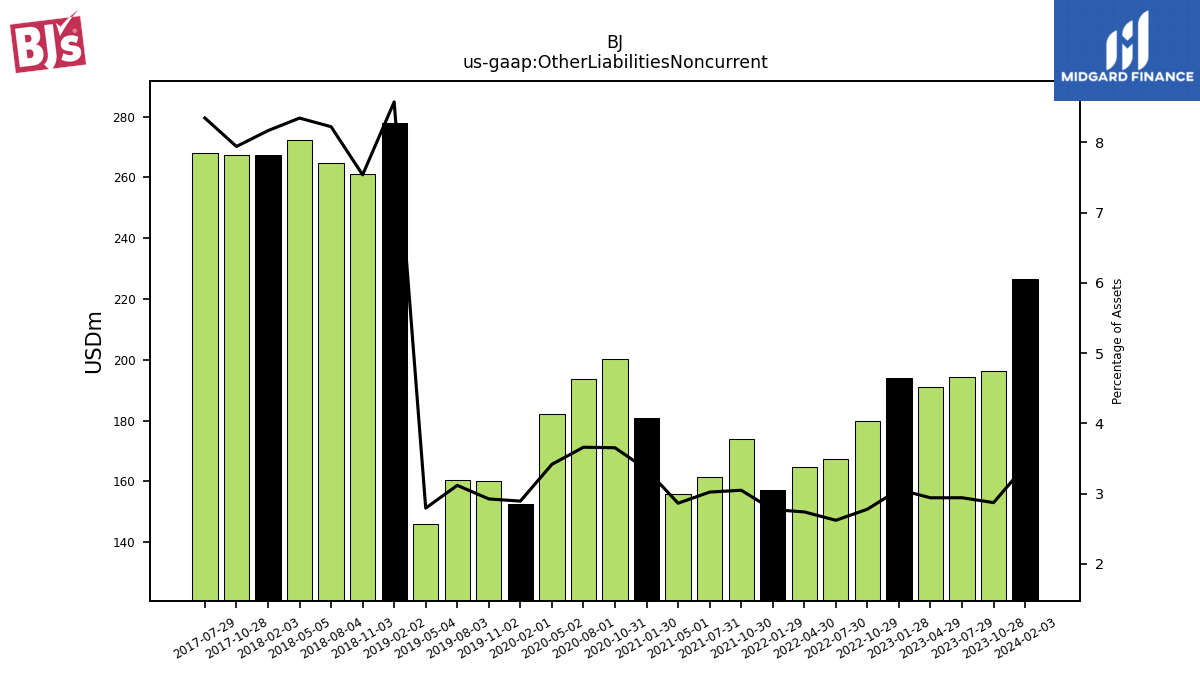
| Other Liabilities Noncurrent | 226.63 | 196.29 | 194.17 | 190.88 | 194.08 | 179.88 | 167.28 | 164.58 | 157.13 | 173.98 | 161.54 | 155.96 | 180.88 | 200.21 | 193.73 | 182.00 | 152.41 | 160.13 | 160.56 | 145.95 | 277.82 | 261.21 | 264.87 | 272.20 | 267.39 | 267.35 | 267.88 | |
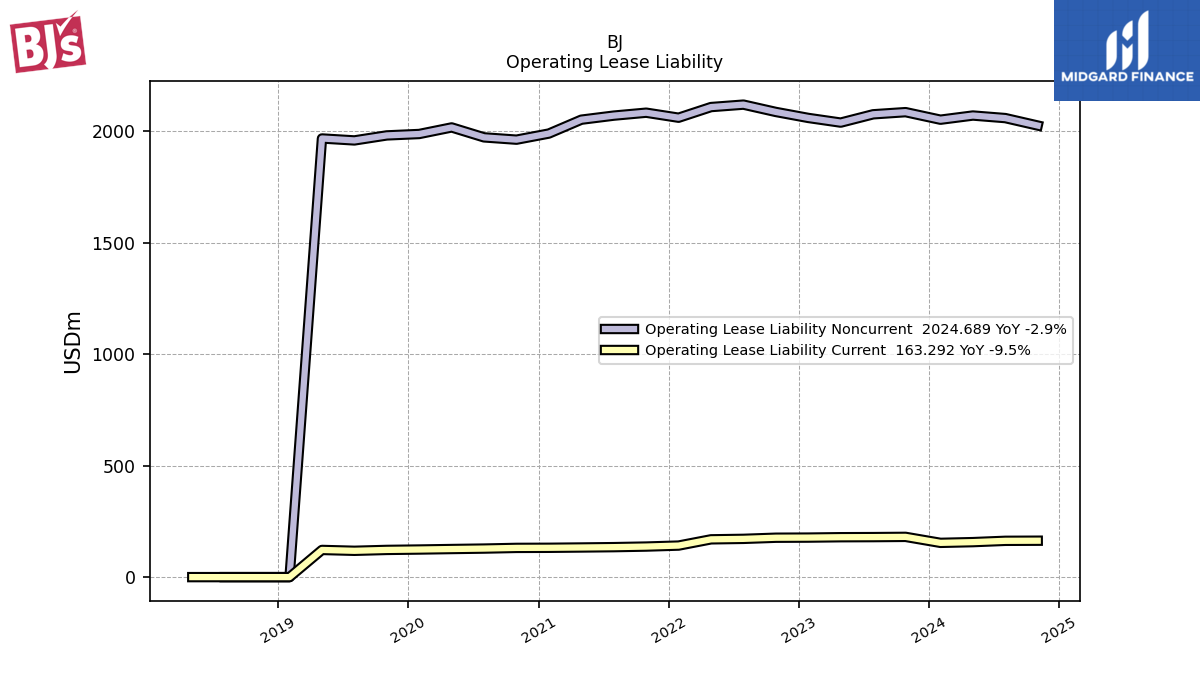
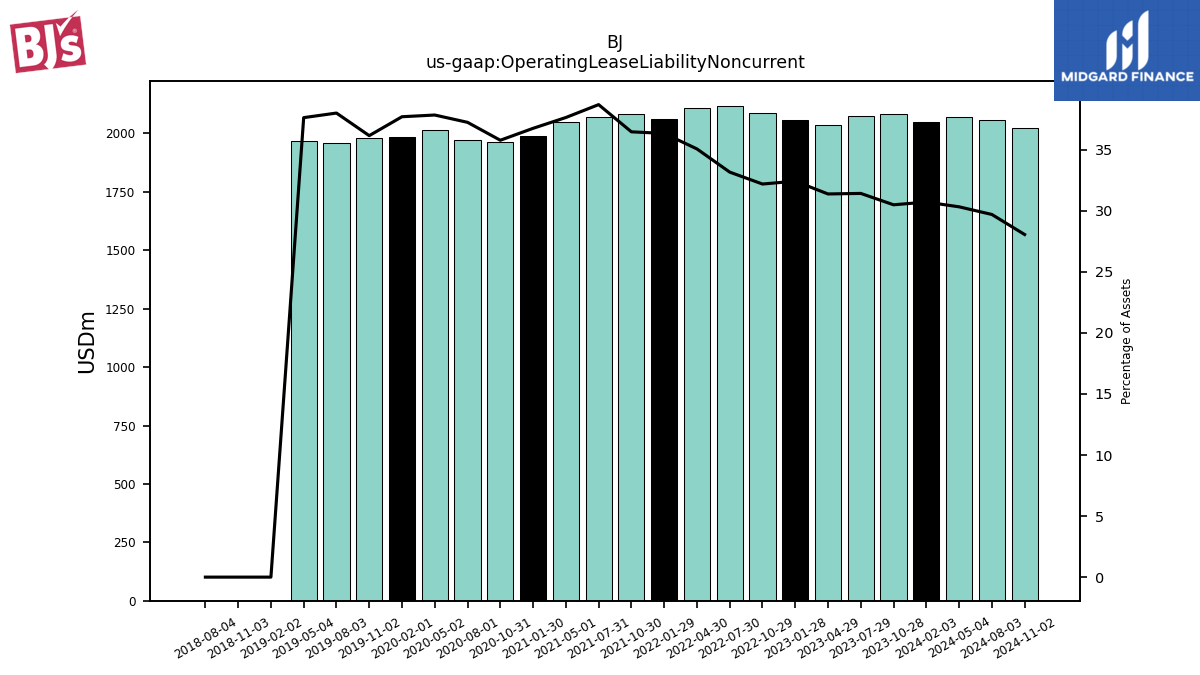
| Operating Lease Liability Noncurrent | 2050.88 | 2084.74 | 2075.06 | 2037.84 | 2058.80 | 2085.62 | 2118.47 | 2107.53 | 2059.76 | 2082.29 | 2069.15 | 2050.95 | 1988.84 | 1961.32 | 1971.63 | 2016.21 | 1986.79 | 1980.45 | 1957.93 | 1966.69 | 0.00 | 0.00 | 0.00 | NA | NA | NA | NA |
| 2024-02-03 | 2023-10-28 | 2023-07-29 | 2023-04-29 | 2023-01-28 | 2022-10-29 | 2022-07-30 | 2022-04-30 | 2022-01-29 | 2021-10-30 | 2021-07-31 | 2021-05-01 | 2021-01-30 | 2020-10-31 | 2020-08-01 | 2020-05-02 | 2020-02-01 | 2019-11-02 | 2019-08-03 | 2019-05-04 | 2019-02-02 | 2018-11-03 | 2018-08-04 | 2018-05-05 | 2018-02-03 | 2017-10-28 | 2017-07-29 | ||
|---|---|---|---|---|---|---|---|---|---|---|---|---|---|---|---|---|---|---|---|---|---|---|---|---|---|---|---|---|
| Stockholders Equity | 1458.85 | 1353.70 | 1231.29 | 1131.73 | 1046.84 | 942.88 | 853.59 | 721.34 | 648.11 | 567.74 | 488.35 | 413.52 | 319.33 | 217.38 | 119.10 | 32.50 | -54.34 | -104.49 | -164.59 | -148.31 | -202.08 | -256.62 | -317.87 | -1024.61 | -1029.86 | -1092.06 | -1116.74 | |
| Common Stock Value | 1.48 | 1.48 | 1.47 | 1.47 | 1.46 | 1.46 | 1.46 | 1.46 | 1.45 | 1.45 | 1.44 | 1.44 | 1.43 | 1.43 | 1.43 | 1.42 | 1.41 | 1.41 | 1.40 | 1.40 | 1.38 | 1.38 | 1.36 | 0.87 | 0.87 | 0.87 | 0.87 | |
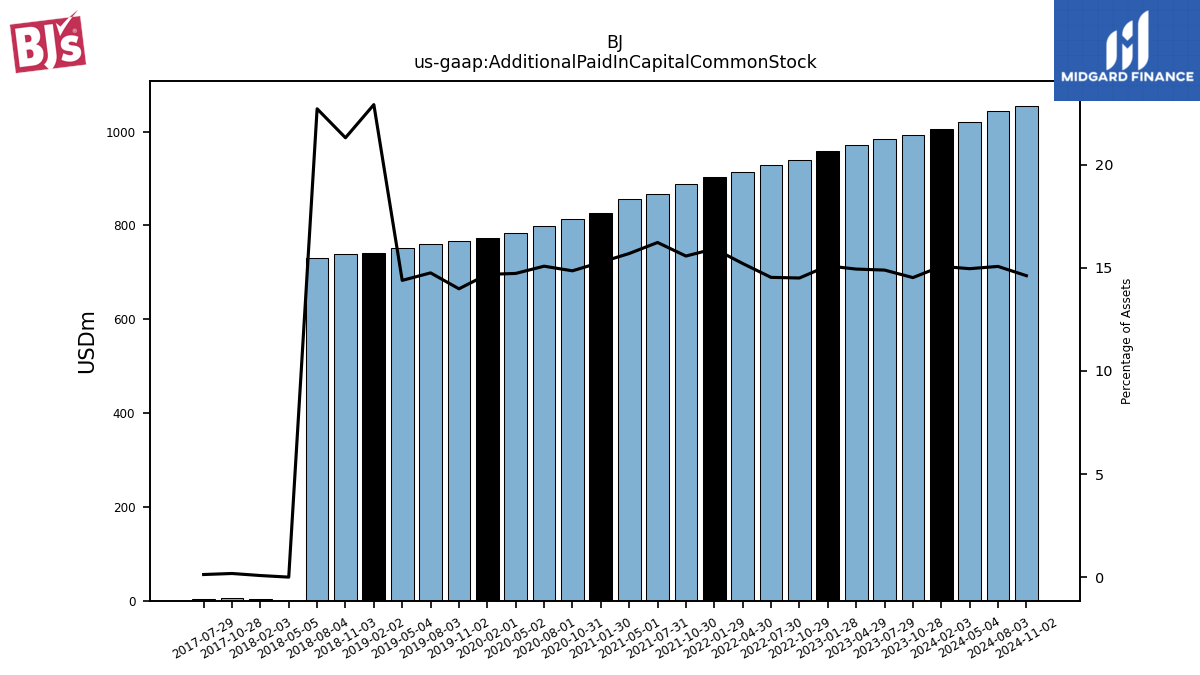
| Additional Paid In Capital Common Stock | 1006.41 | 993.18 | 983.37 | 970.23 | 958.55 | 939.86 | 928.55 | 914.12 | 902.70 | 889.14 | 867.79 | 855.17 | 826.38 | 814.38 | 798.29 | 784.72 | 773.62 | 766.05 | 760.19 | 752.22 | 742.07 | 738.13 | 731.32 | 0.36 | 2.88 | 6.30 | 4.40 | |
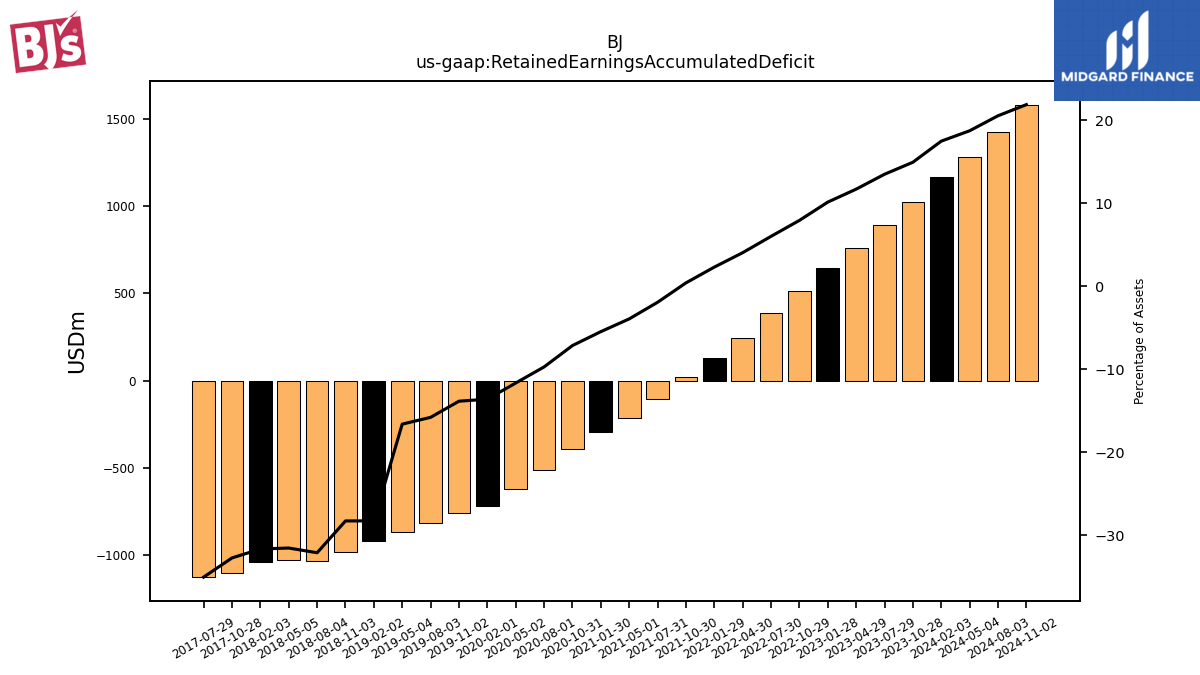
| Retained Earnings Accumulated Deficit | 1168.23 | 1022.36 | 891.89 | 760.57 | 644.49 | 514.71 | 384.77 | 243.76 | 131.31 | 23.75 | -102.77 | -213.76 | -295.34 | -391.22 | -514.02 | -620.63 | -716.37 | -758.13 | -813.22 | -867.75 | -915.11 | -979.42 | -1033.85 | -1028.24 | -1036.01 | -1101.52 | -1124.29 | |
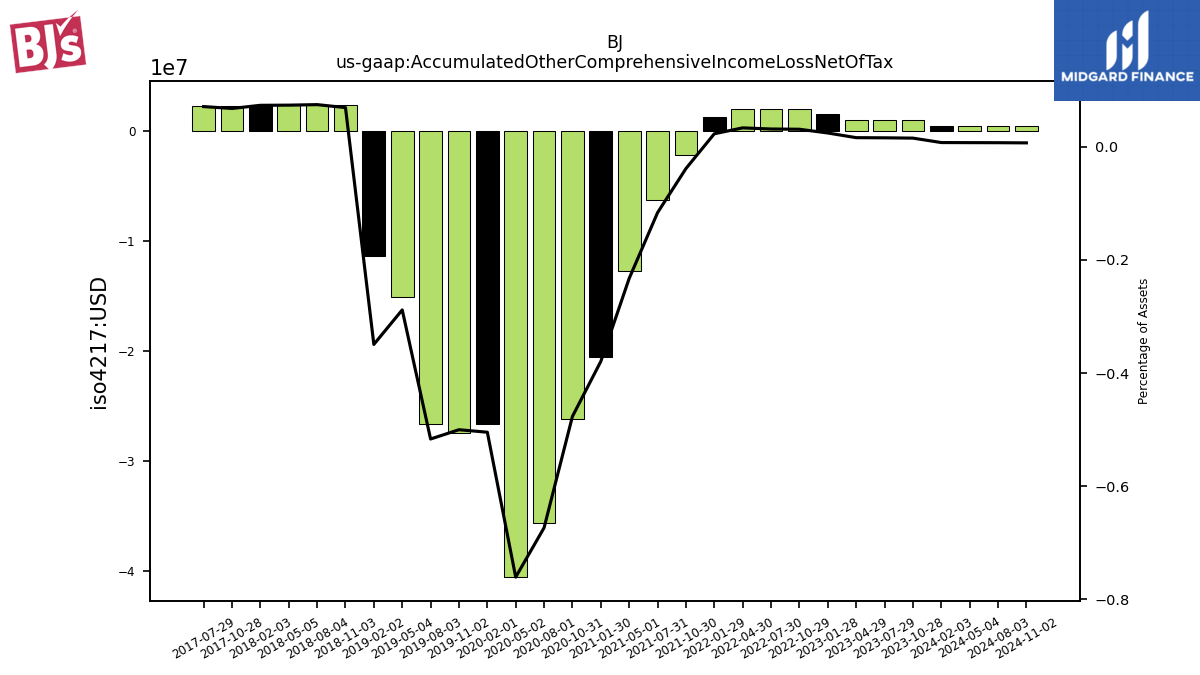
| Accumulated Other Comprehensive Income Loss Net Of Tax | 0.50 | 1.05 | 1.05 | 1.05 | 1.55 | 2.01 | 2.01 | 2.01 | 1.30 | -2.20 | -6.22 | -12.68 | -20.53 | -26.12 | -35.65 | -40.53 | -26.59 | -27.40 | -26.61 | -15.07 | -11.31 | 2.40 | 2.40 | 2.40 | 2.40 | 2.28 | 2.28 |