
| 2024-02-03 | 2023-10-28 | 2023-07-29 | 2023-04-29 | 2023-01-28 | 2022-10-29 | 2022-07-30 | 2022-04-30 | 2022-01-29 | 2021-10-30 | 2021-07-31 | 2021-05-01 | 2021-01-30 | 2020-10-31 | 2020-08-01 | 2020-05-02 | 2020-02-01 | 2019-11-02 | 2019-08-03 | 2019-05-04 | 2019-02-02 | 2018-11-03 | 2018-08-04 | 2018-05-05 | 2018-02-03 | 2017-10-28 | 2017-07-29 | 2017-04-29 | 2017-01-28 | 2016-10-29 | 2016-07-30 | 2016-04-30 | 2016-01-30 | 2015-10-31 | 2015-08-01 | 2015-05-02 | 2015-01-31 | 2014-11-01 | 2014-08-02 | 2014-05-03 | 2014-02-01 | 2013-11-02 | 2013-08-03 | 2013-05-04 | 2013-02-02 | 2012-10-27 | 2012-07-28 | 2012-04-28 | 2012-01-28 | 2011-10-29 | 2011-07-30 | 2011-04-30 | 2011-01-29 | 2010-01-30 | ||
|---|---|---|---|---|---|---|---|---|---|---|---|---|---|---|---|---|---|---|---|---|---|---|---|---|---|---|---|---|---|---|---|---|---|---|---|---|---|---|---|---|---|---|---|---|---|---|---|---|---|---|---|---|---|---|---|
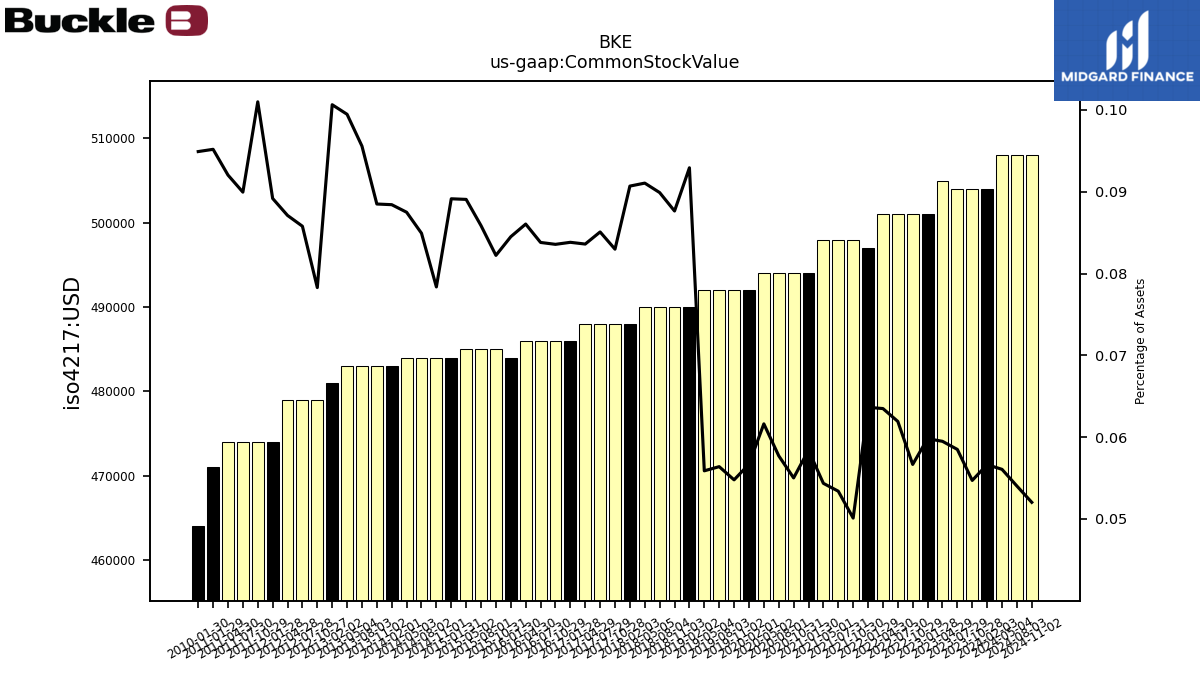
| Common Stock Value | 0.50 | 0.50 | 0.50 | 0.51 | 0.50 | 0.50 | 0.50 | 0.50 | 0.50 | 0.50 | 0.50 | 0.50 | 0.49 | 0.49 | 0.49 | 0.49 | 0.49 | 0.49 | 0.49 | 0.49 | 0.49 | 0.49 | 0.49 | 0.49 | 0.49 | 0.49 | 0.49 | 0.49 | 0.49 | 0.49 | 0.49 | 0.49 | 0.48 | 0.48 | 0.48 | 0.48 | 0.48 | 0.48 | 0.48 | 0.48 | 0.48 | 0.48 | 0.48 | 0.48 | 0.48 | 0.48 | 0.48 | 0.48 | 0.47 | 0.47 | 0.47 | 0.47 | 0.47 | 0.46 |
| 2024-02-03 | 2023-10-28 | 2023-07-29 | 2023-04-29 | 2023-01-28 | 2022-10-29 | 2022-07-30 | 2022-04-30 | 2022-01-29 | 2021-10-30 | 2021-07-31 | 2021-05-01 | 2021-01-30 | 2020-10-31 | 2020-08-01 | 2020-05-02 | 2020-02-01 | 2019-11-02 | 2019-08-03 | 2019-05-04 | 2019-02-02 | 2018-11-03 | 2018-08-04 | 2018-05-05 | 2018-02-03 | 2017-10-28 | 2017-07-29 | 2017-04-29 | 2017-01-28 | 2016-10-29 | 2016-07-30 | 2016-04-30 | 2016-01-30 | 2015-10-31 | 2015-08-01 | 2015-05-02 | 2015-01-31 | 2014-11-01 | 2014-08-02 | 2014-05-03 | 2014-02-01 | 2013-11-02 | 2013-08-03 | 2013-05-04 | 2013-02-02 | 2012-10-27 | 2012-07-28 | 2012-04-28 | 2012-01-28 | 2011-10-29 | 2011-07-30 | 2011-04-30 | 2011-01-29 | 2010-01-30 | ||
|---|---|---|---|---|---|---|---|---|---|---|---|---|---|---|---|---|---|---|---|---|---|---|---|---|---|---|---|---|---|---|---|---|---|---|---|---|---|---|---|---|---|---|---|---|---|---|---|---|---|---|---|---|---|---|---|
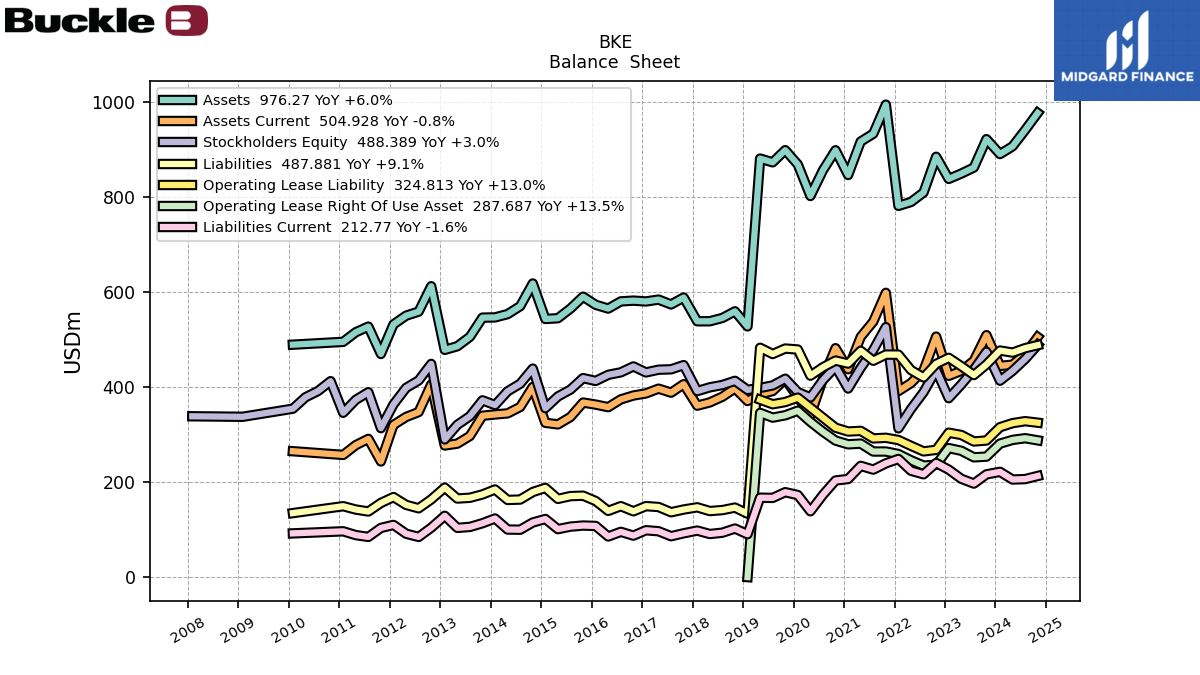
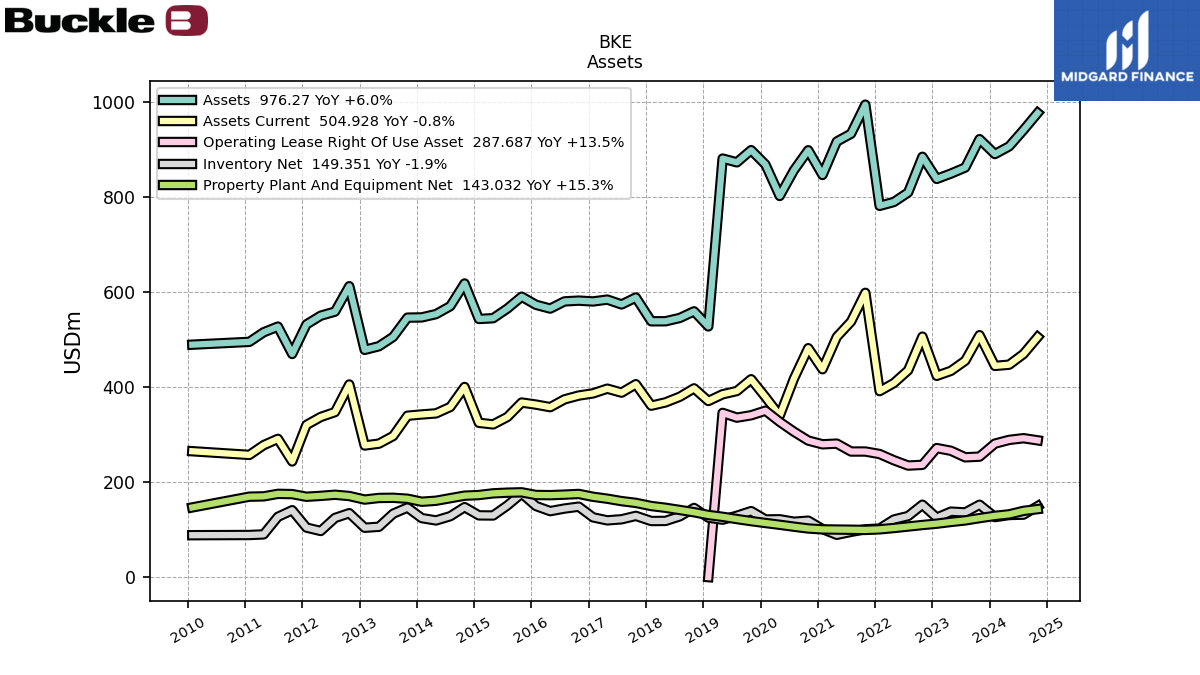
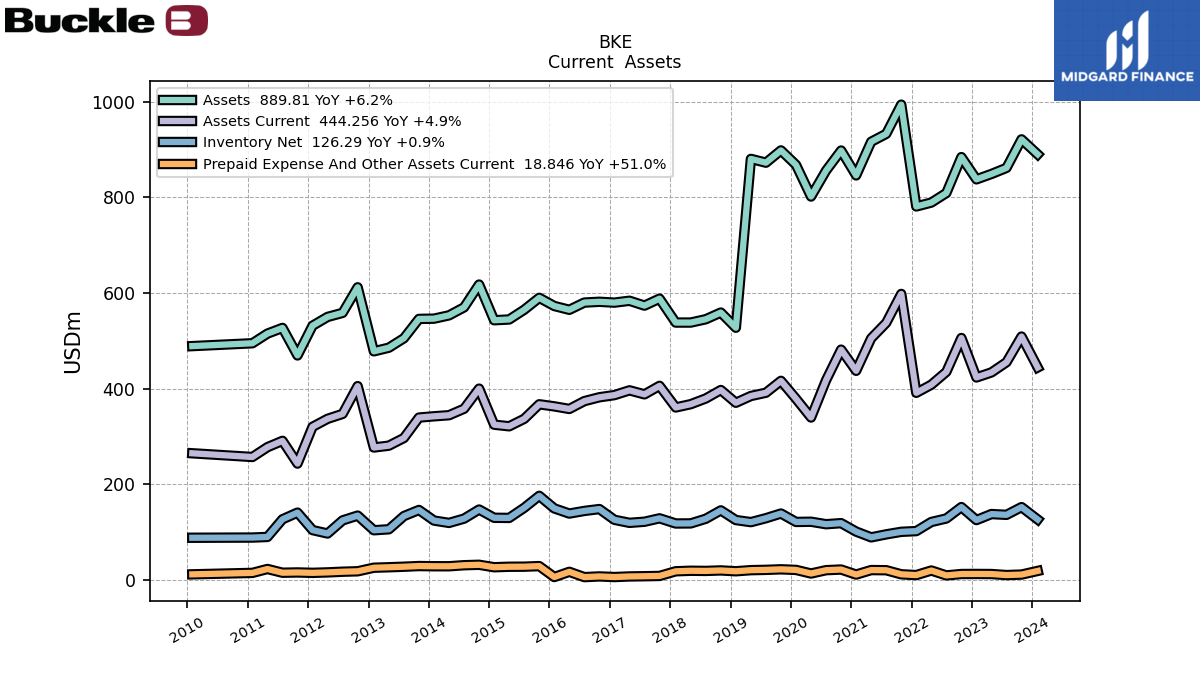
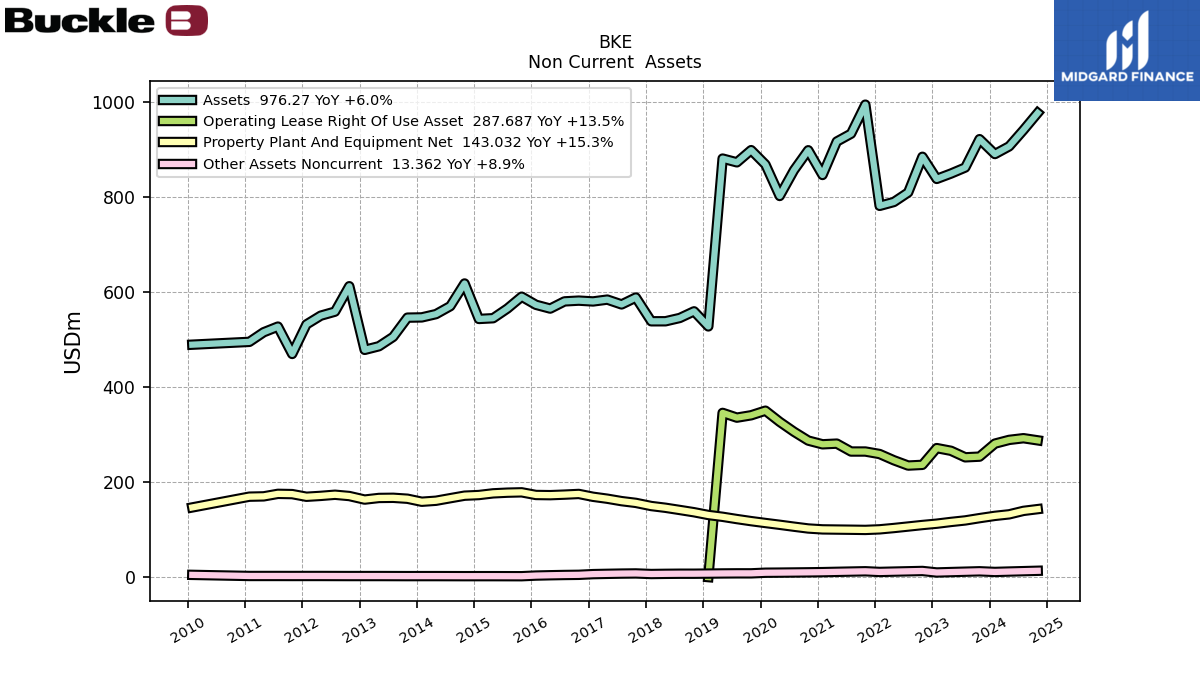
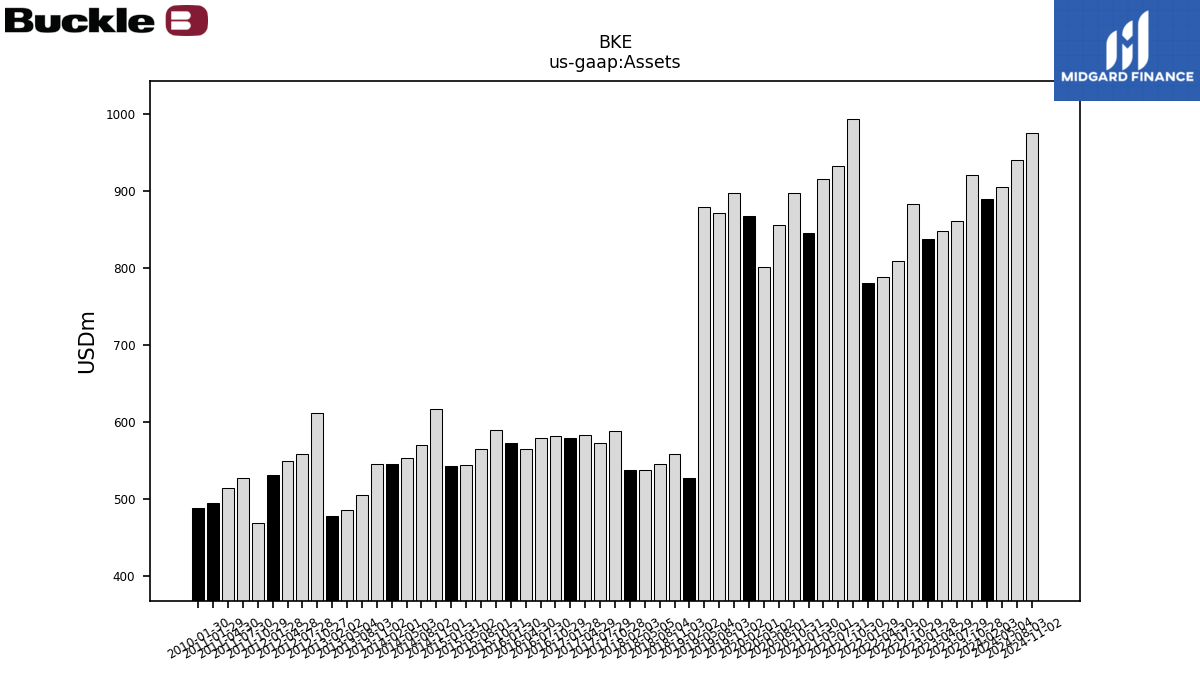
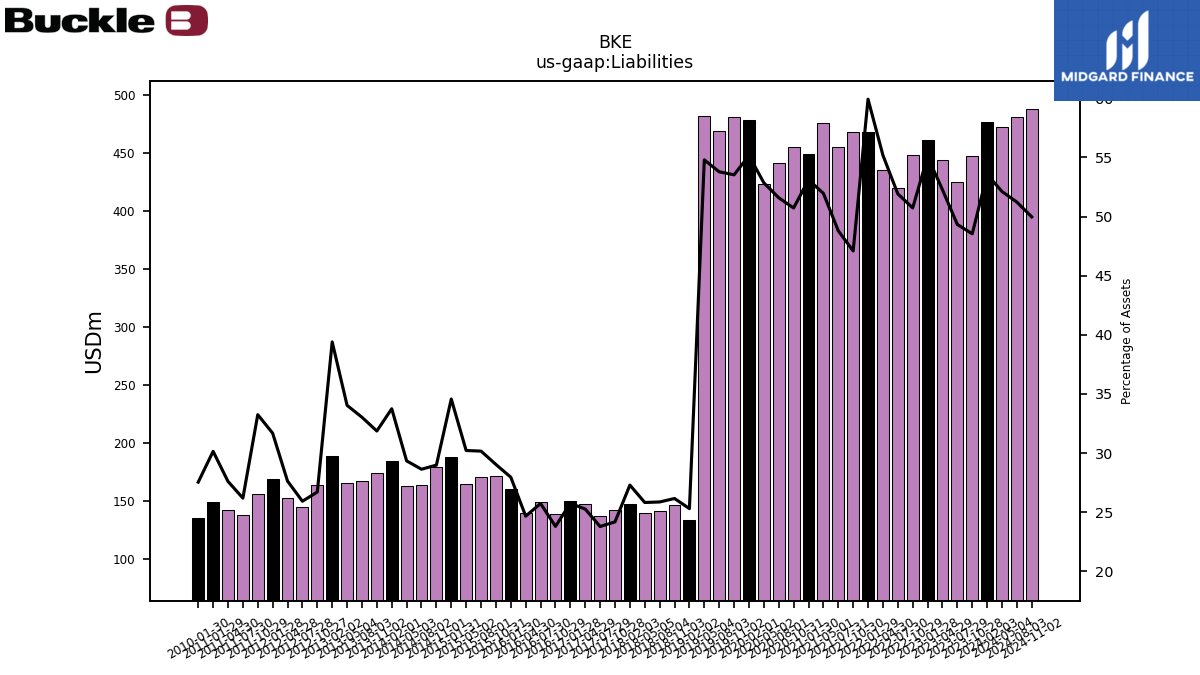
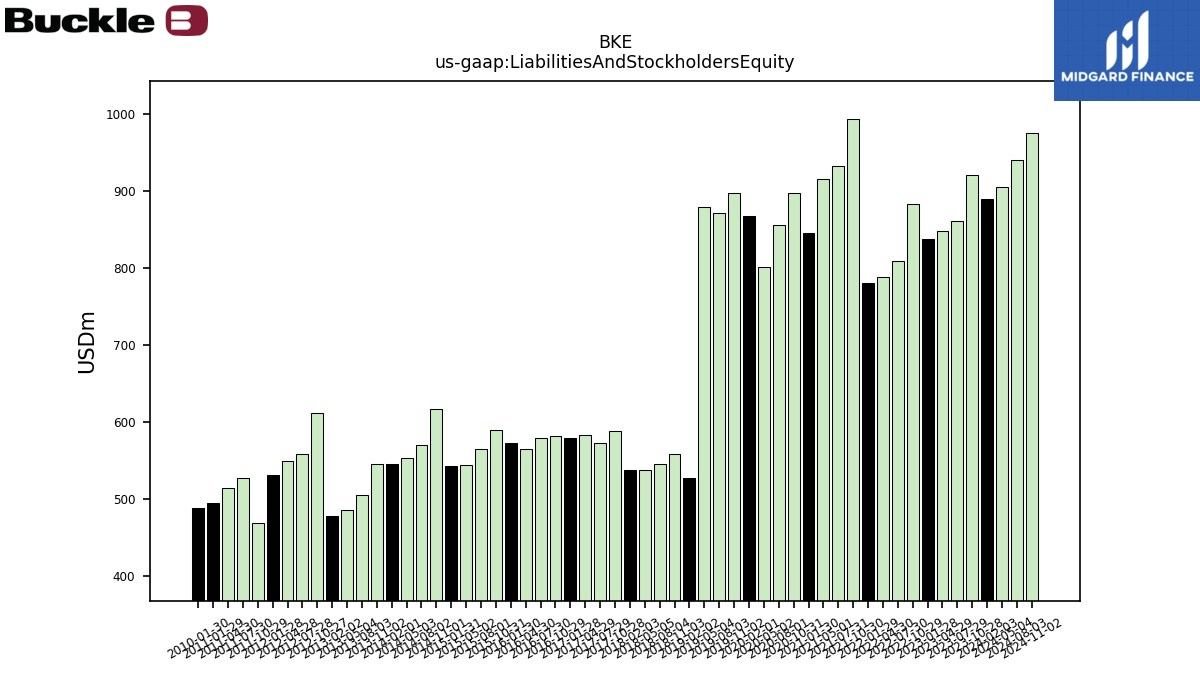
| Assets | 889.81 | 921.21 | 861.55 | 848.86 | 837.58 | 884.15 | 809.06 | 789.03 | 780.88 | 993.83 | 932.68 | 916.21 | 845.81 | 897.88 | 855.82 | 801.65 | 867.89 | 898.12 | 872.43 | 880.37 | 527.30 | 559.10 | 545.09 | 538.16 | 538.12 | 588.12 | 573.56 | 583.72 | 579.85 | 581.57 | 579.97 | 564.82 | 572.77 | 589.89 | 564.92 | 544.58 | 542.99 | 617.65 | 569.93 | 553.20 | 546.29 | 545.78 | 505.37 | 485.61 | 477.97 | 611.90 | 558.41 | 549.94 | 531.54 | 469.36 | 526.98 | 515.03 | 494.84 | 488.90 | |
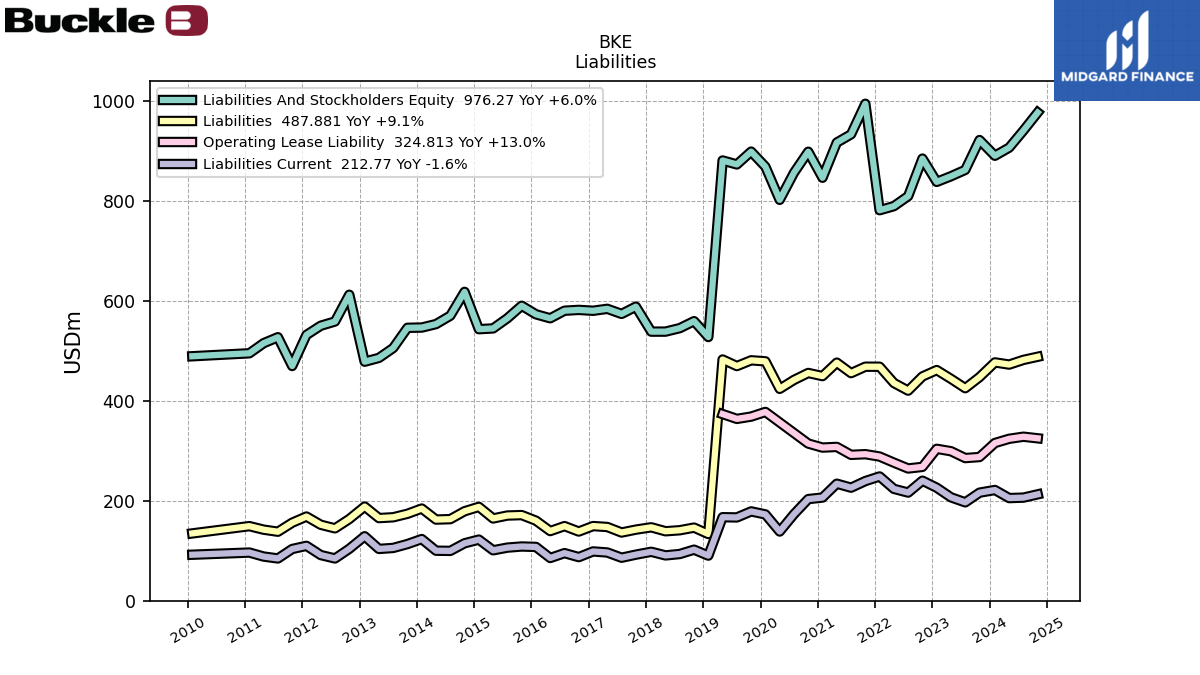
| Liabilities | 476.59 | 447.19 | 425.01 | 443.69 | 461.26 | 448.54 | 420.09 | 435.44 | 467.96 | 468.03 | 455.13 | 476.11 | 449.19 | 455.48 | 441.52 | 423.70 | 478.74 | 480.78 | 469.24 | 482.41 | 133.43 | 146.25 | 140.99 | 138.96 | 146.87 | 142.21 | 136.45 | 147.47 | 149.31 | 138.42 | 149.24 | 139.32 | 160.13 | 171.29 | 170.40 | 164.55 | 187.72 | 179.00 | 163.18 | 162.31 | 184.36 | 173.92 | 166.92 | 165.28 | 188.32 | 163.41 | 144.77 | 151.95 | 168.39 | 156.05 | 138.02 | 142.16 | 149.18 | 134.64 | |
| Liabilities And Stockholders Equity | 889.81 | 921.21 | 861.55 | 848.86 | 837.58 | 884.15 | 809.06 | 789.03 | 780.88 | 993.83 | 932.68 | 916.21 | 845.81 | 897.88 | 855.82 | 801.65 | 867.89 | 898.12 | 872.43 | 880.37 | 527.30 | 559.10 | 545.09 | 538.16 | 538.12 | 588.12 | 573.56 | 583.72 | 579.85 | 581.57 | 579.97 | 564.82 | 572.77 | 589.89 | 564.92 | 544.58 | 542.99 | 617.65 | 569.93 | 553.20 | 546.29 | 545.78 | 505.37 | 485.61 | 477.97 | 611.90 | 558.41 | 549.94 | 531.54 | 469.36 | 526.98 | 515.03 | 494.84 | 488.90 | |
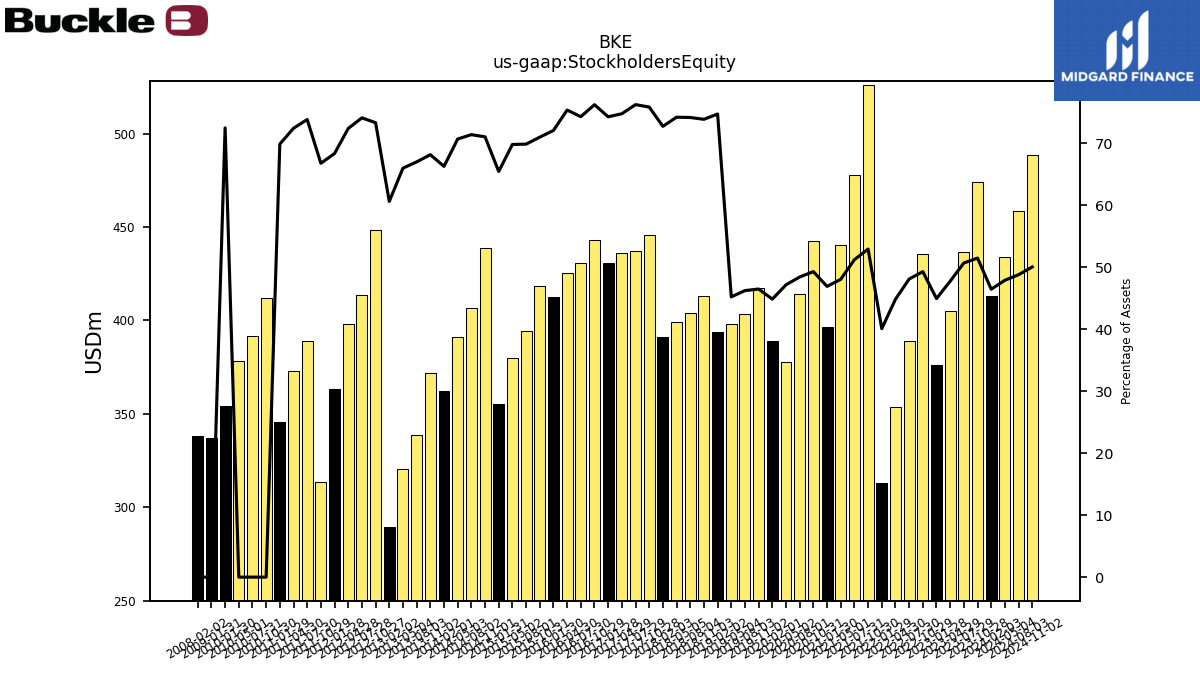
| Stockholders Equity | 413.22 | 474.02 | 436.54 | 405.17 | 376.31 | 435.61 | 388.98 | 353.59 | 312.92 | 525.80 | 477.55 | 440.10 | 396.63 | 442.40 | 414.31 | 377.95 | 389.15 | 417.34 | 403.19 | 397.96 | 393.88 | 412.85 | 404.11 | 399.20 | 391.25 | 445.91 | 437.11 | 436.26 | 430.54 | 443.15 | 430.73 | 425.50 | 412.64 | 418.60 | 394.52 | 380.02 | 355.28 | 438.65 | 406.74 | 390.90 | 361.93 | 371.86 | 338.45 | 320.32 | 289.65 | 448.49 | 413.64 | 397.99 | 363.15 | 313.31 | 388.95 | 372.87 | 345.67 | 354.26 |
| 2024-02-03 | 2023-10-28 | 2023-07-29 | 2023-04-29 | 2023-01-28 | 2022-10-29 | 2022-07-30 | 2022-04-30 | 2022-01-29 | 2021-10-30 | 2021-07-31 | 2021-05-01 | 2021-01-30 | 2020-10-31 | 2020-08-01 | 2020-05-02 | 2020-02-01 | 2019-11-02 | 2019-08-03 | 2019-05-04 | 2019-02-02 | 2018-11-03 | 2018-08-04 | 2018-05-05 | 2018-02-03 | 2017-10-28 | 2017-07-29 | 2017-04-29 | 2017-01-28 | 2016-10-29 | 2016-07-30 | 2016-04-30 | 2016-01-30 | 2015-10-31 | 2015-08-01 | 2015-05-02 | 2015-01-31 | 2014-11-01 | 2014-08-02 | 2014-05-03 | 2014-02-01 | 2013-11-02 | 2013-08-03 | 2013-05-04 | 2013-02-02 | 2012-10-27 | 2012-07-28 | 2012-04-28 | 2012-01-28 | 2011-10-29 | 2011-07-30 | 2011-04-30 | 2011-01-29 | 2010-01-30 | ||
|---|---|---|---|---|---|---|---|---|---|---|---|---|---|---|---|---|---|---|---|---|---|---|---|---|---|---|---|---|---|---|---|---|---|---|---|---|---|---|---|---|---|---|---|---|---|---|---|---|---|---|---|---|---|---|---|
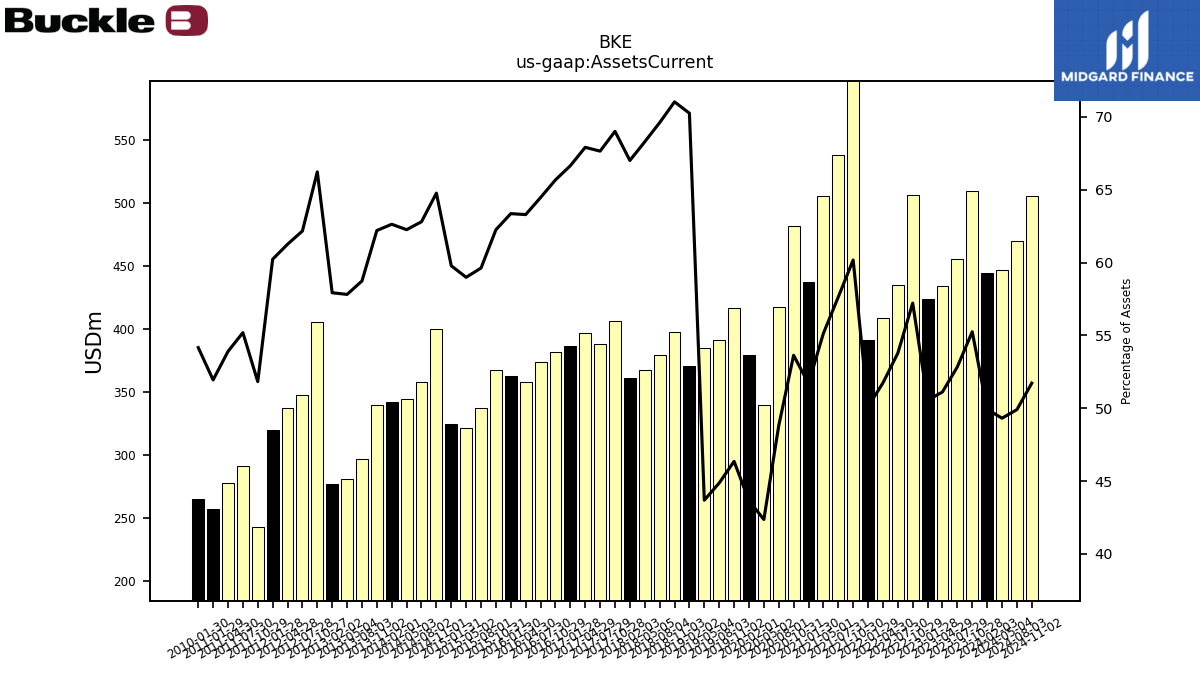
| Assets Current | 444.26 | 508.94 | 455.23 | 433.92 | 423.34 | 505.86 | 435.08 | 408.21 | 391.21 | 598.03 | 537.54 | 505.15 | 437.22 | 481.55 | 417.61 | 339.58 | 378.83 | 416.29 | 391.43 | 384.60 | 370.43 | 397.12 | 379.41 | 367.51 | 360.58 | 405.83 | 388.00 | 396.40 | 386.46 | 381.93 | 373.87 | 357.49 | 362.90 | 367.24 | 336.83 | 321.23 | 324.59 | 400.02 | 357.92 | 344.41 | 342.14 | 339.47 | 296.82 | 280.74 | 276.87 | 405.23 | 347.15 | 336.87 | 320.13 | 243.25 | 290.83 | 277.58 | 257.04 | 264.81 | |
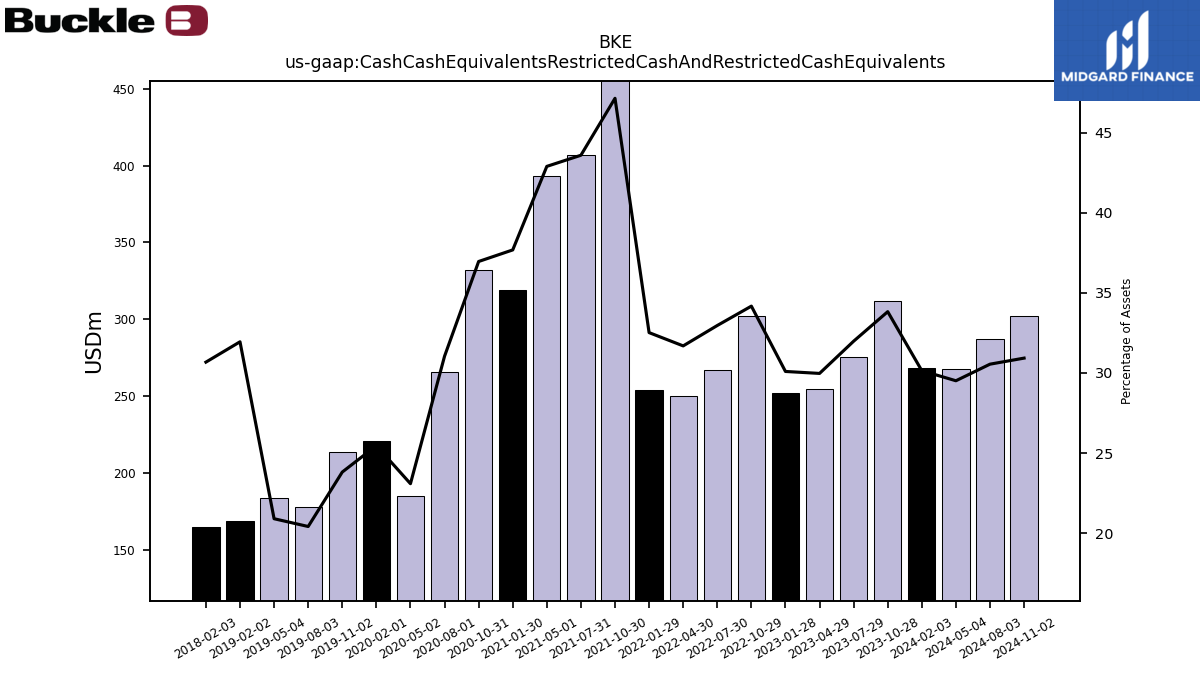
| Cash Cash Equivalents Restricted Cash And Restricted Cash Equivalents | 268.21 | 311.66 | 275.58 | 254.43 | 252.08 | 302.18 | 266.73 | 250.07 | 253.97 | 468.73 | 406.71 | 393.15 | 318.79 | 331.92 | 265.71 | 185.04 | 220.97 | 213.84 | 178.04 | 183.94 | 168.47 | NA | NA | NA | 165.09 | NA | NA | NA | NA | NA | NA | NA | NA | NA | NA | NA | NA | NA | NA | NA | NA | NA | NA | NA | NA | NA | NA | NA | NA | NA | NA | NA | NA | NA | |
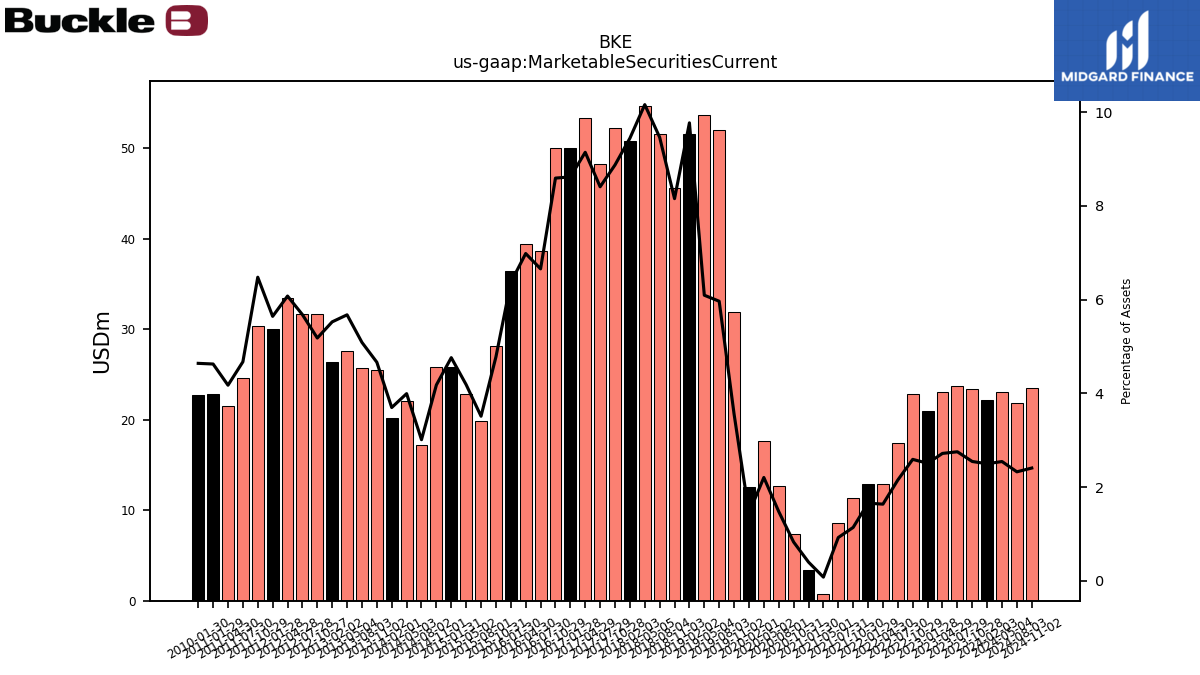
| Marketable Securities Current | 22.21 | 23.45 | 23.71 | 23.07 | 21.00 | 22.90 | 17.39 | 12.89 | 12.93 | 11.30 | 8.59 | 0.70 | 3.36 | 7.41 | 12.64 | 17.66 | 12.53 | 31.95 | 52.05 | 53.66 | 51.55 | 45.60 | 51.60 | 54.70 | 50.83 | 52.20 | 48.24 | 53.39 | 49.99 | 49.99 | 38.61 | 39.45 | 36.47 | 28.18 | 19.84 | 22.79 | 25.86 | 25.81 | 17.16 | 22.09 | 20.20 | 25.45 | 25.71 | 27.57 | 26.41 | 31.70 | 31.72 | 33.42 | 30.00 | 30.41 | 24.63 | 21.50 | 22.89 | 22.69 | |
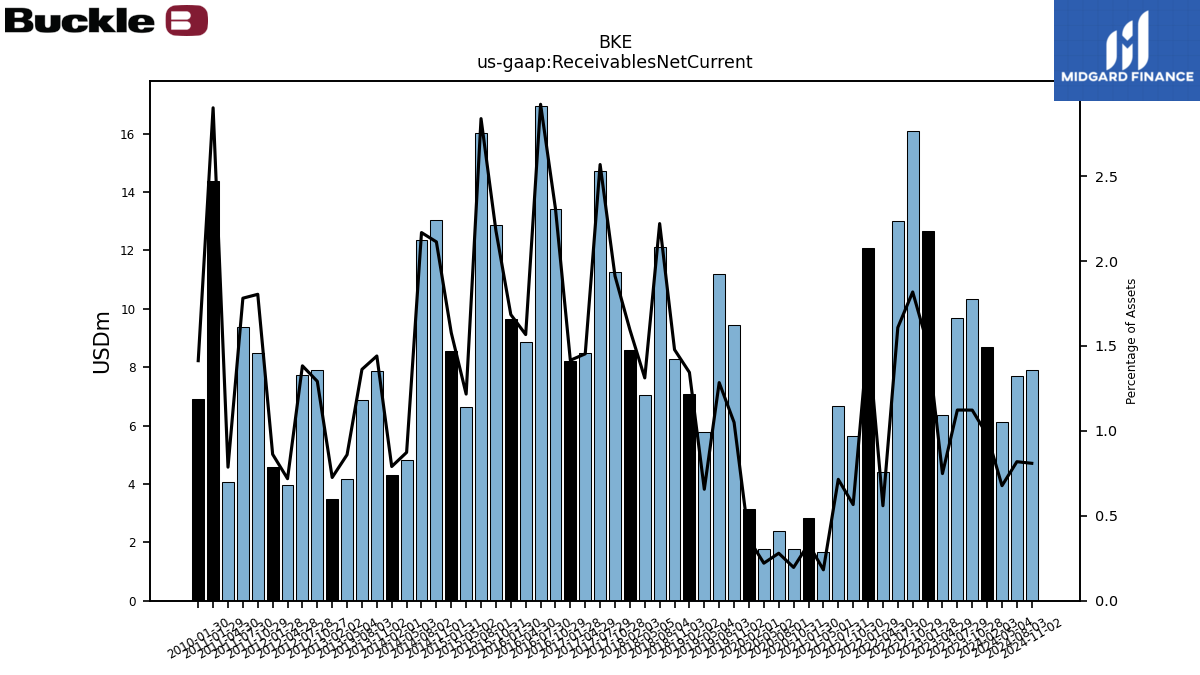
| Receivables Net Current | 8.70 | 10.34 | 9.68 | 6.36 | 12.65 | 16.07 | 13.02 | 4.41 | 12.09 | 5.63 | 6.67 | 1.67 | 2.82 | 1.76 | 2.39 | 1.77 | 3.14 | 9.43 | 11.21 | 5.78 | 7.09 | 8.27 | 12.11 | 7.06 | 8.59 | 11.25 | 14.73 | 8.49 | 8.21 | 13.43 | 16.95 | 8.85 | 9.65 | 12.86 | 16.04 | 6.63 | 8.57 | 13.05 | 12.36 | 4.83 | 4.32 | 7.87 | 6.88 | 4.18 | 3.47 | 7.91 | 7.72 | 3.95 | 4.58 | 8.47 | 9.39 | 4.05 | 14.36 | 6.91 | |
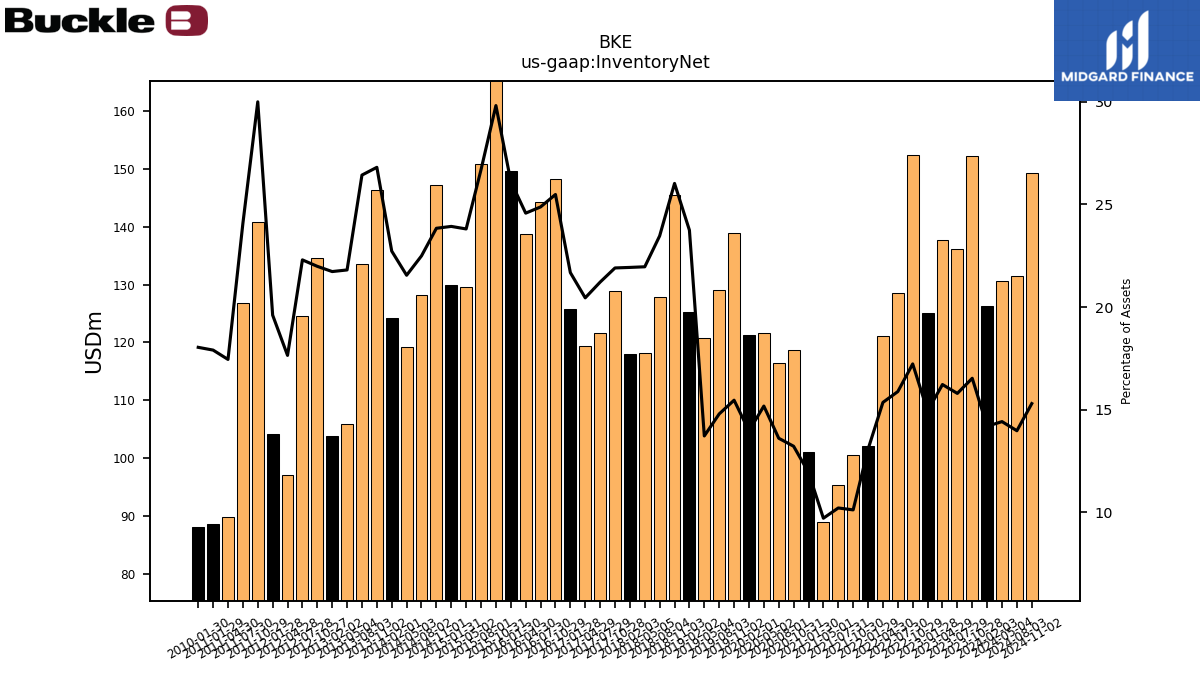
| Inventory Net | 126.29 | 152.29 | 136.07 | 137.74 | 125.13 | 152.34 | 128.50 | 121.17 | 102.09 | 100.59 | 95.28 | 89.02 | 101.06 | 118.71 | 116.48 | 121.67 | 121.26 | 138.88 | 129.07 | 120.81 | 125.19 | 145.47 | 127.90 | 118.18 | 118.01 | 128.82 | 121.67 | 119.36 | 125.69 | 148.19 | 144.27 | 138.79 | 149.57 | 175.85 | 150.79 | 129.63 | 129.92 | 147.22 | 128.18 | 119.21 | 124.14 | 146.29 | 133.55 | 105.89 | 103.85 | 134.51 | 124.51 | 97.04 | 104.21 | 140.78 | 126.84 | 89.87 | 88.59 | 88.19 | |
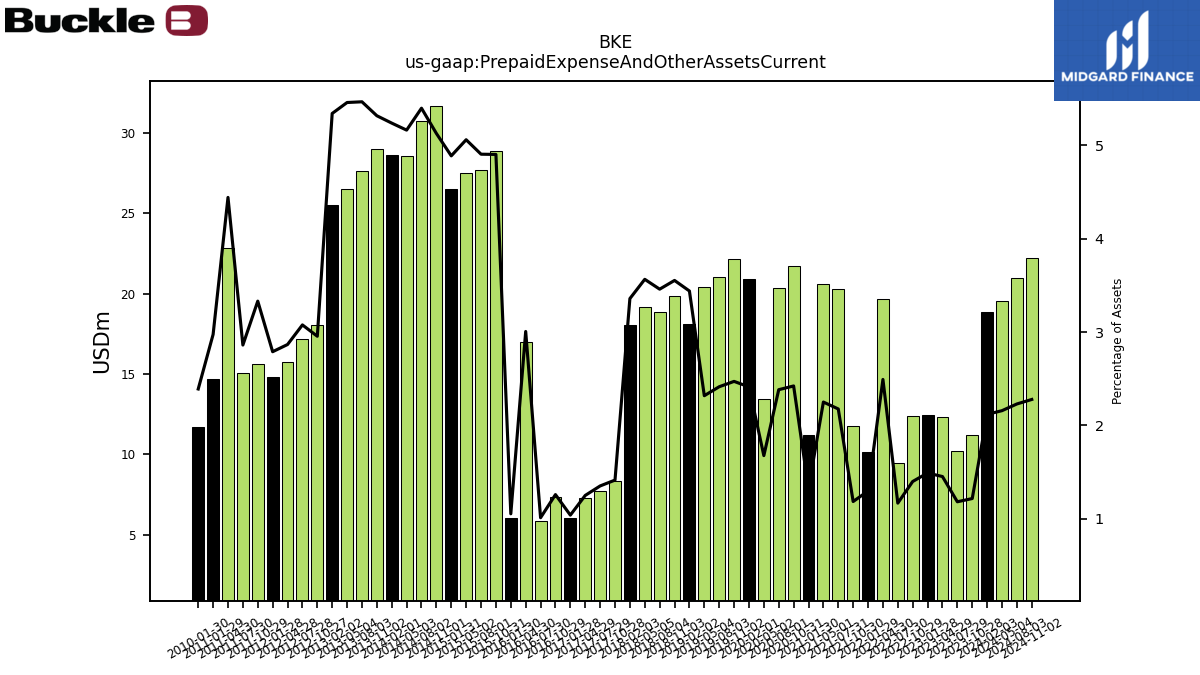
| Prepaid Expense And Other Assets Current | 18.85 | 11.21 | 10.18 | 12.32 | 12.48 | 12.37 | 9.45 | 19.66 | 10.13 | 11.77 | 20.29 | 20.61 | 11.19 | 21.75 | 20.39 | 13.44 | 20.93 | 22.20 | 21.06 | 20.41 | 18.14 | 19.86 | 18.86 | 19.18 | 18.07 | 8.32 | 7.75 | 7.29 | 6.02 | 7.32 | 5.86 | 16.98 | 6.03 | 28.92 | 27.71 | 27.55 | 26.54 | 31.67 | 30.76 | 28.56 | 28.61 | 29.02 | 27.62 | 26.51 | 25.53 | 18.08 | 17.18 | 15.76 | 14.82 | 15.63 | 15.07 | 22.88 | 14.72 | 11.68 |
| 2024-02-03 | 2023-10-28 | 2023-07-29 | 2023-04-29 | 2023-01-28 | 2022-10-29 | 2022-07-30 | 2022-04-30 | 2022-01-29 | 2021-10-30 | 2021-07-31 | 2021-05-01 | 2021-01-30 | 2020-10-31 | 2020-08-01 | 2020-05-02 | 2020-02-01 | 2019-11-02 | 2019-08-03 | 2019-05-04 | 2019-02-02 | 2018-11-03 | 2018-08-04 | 2018-05-05 | 2018-02-03 | 2017-10-28 | 2017-07-29 | 2017-04-29 | 2017-01-28 | 2016-10-29 | 2016-07-30 | 2016-04-30 | 2016-01-30 | 2015-10-31 | 2015-08-01 | 2015-05-02 | 2015-01-31 | 2014-11-01 | 2014-08-02 | 2014-05-03 | 2014-02-01 | 2013-11-02 | 2013-08-03 | 2013-05-04 | 2013-02-02 | 2012-10-27 | 2012-07-28 | 2012-04-28 | 2012-01-28 | 2011-10-29 | 2011-07-30 | 2011-04-30 | 2011-01-29 | 2010-01-30 | ||
|---|---|---|---|---|---|---|---|---|---|---|---|---|---|---|---|---|---|---|---|---|---|---|---|---|---|---|---|---|---|---|---|---|---|---|---|---|---|---|---|---|---|---|---|---|---|---|---|---|---|---|---|---|---|---|---|
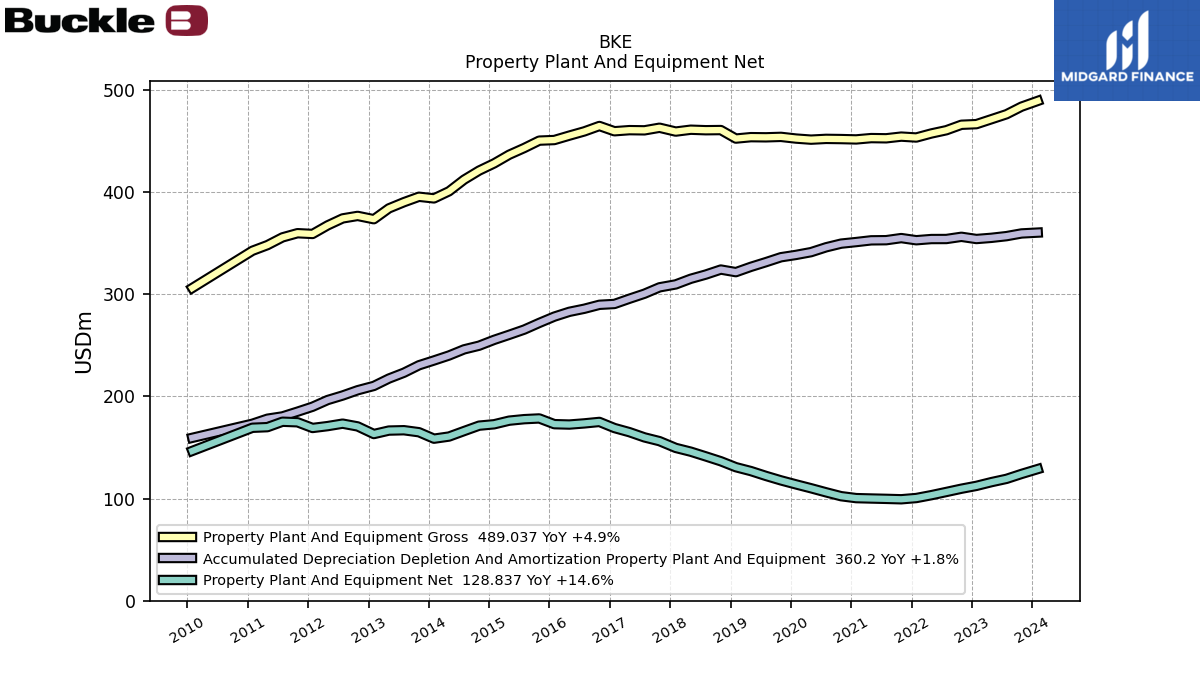
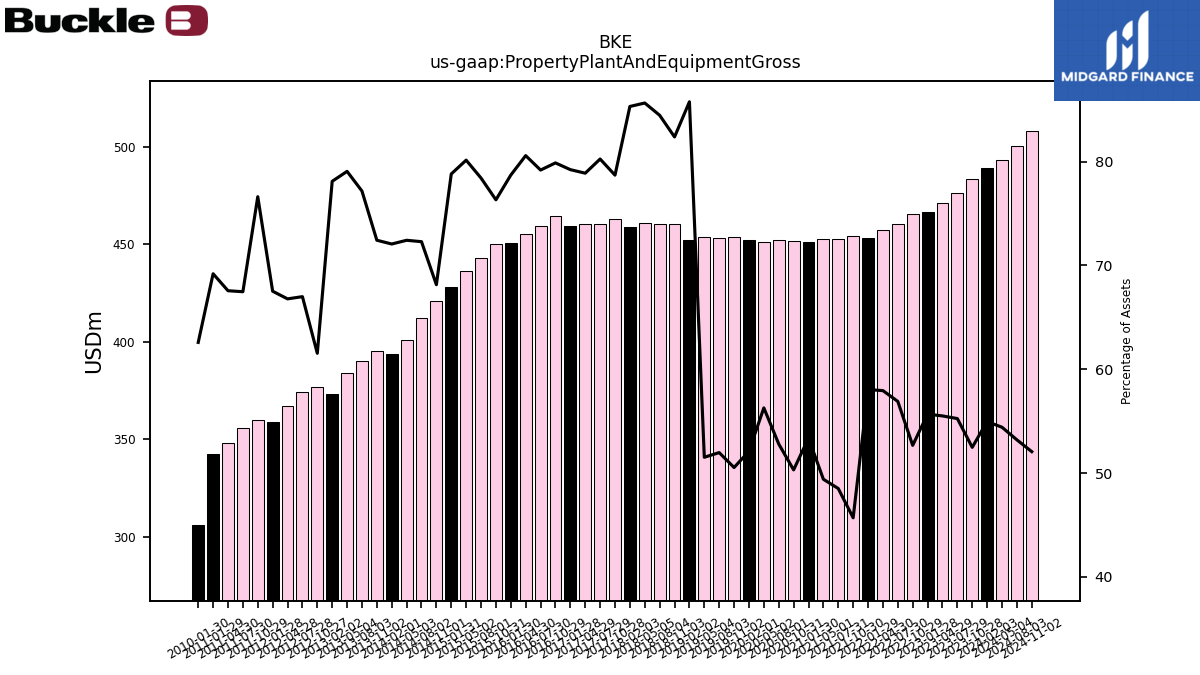
| Property Plant And Equipment Gross | 489.04 | 483.44 | 476.00 | 471.15 | 466.32 | 465.69 | 460.36 | 457.18 | 453.23 | 454.12 | 452.46 | 452.66 | 451.36 | 451.71 | 451.90 | 451.14 | 452.20 | 453.86 | 453.42 | 453.58 | 452.19 | 460.52 | 460.37 | 460.87 | 459.04 | 462.80 | 460.25 | 460.44 | 459.36 | 464.51 | 459.23 | 455.09 | 450.76 | 450.19 | 442.95 | 436.39 | 427.92 | 420.87 | 411.97 | 400.62 | 393.66 | 395.27 | 389.94 | 383.90 | 373.29 | 376.53 | 374.08 | 367.24 | 358.87 | 359.61 | 355.52 | 347.96 | 342.41 | 305.97 | |
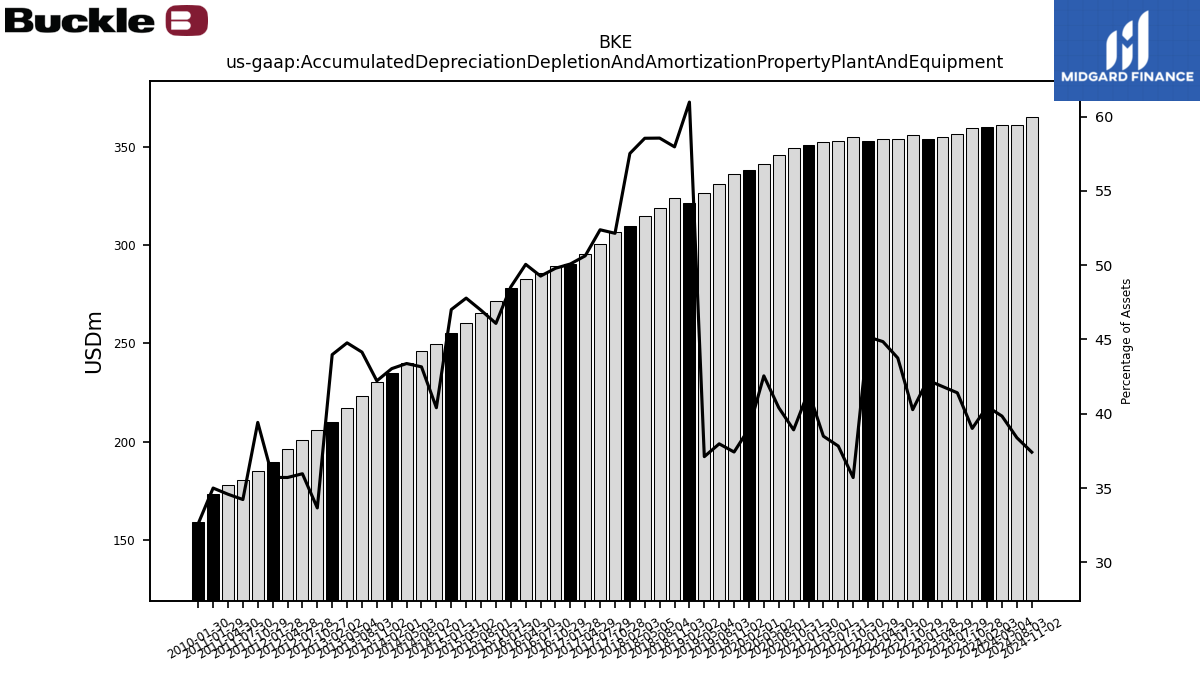
| Accumulated Depreciation Depletion And Amortization Property Plant And Equipment | 360.20 | 359.37 | 356.74 | 355.09 | 353.92 | 356.08 | 353.93 | 353.89 | 352.72 | 354.83 | 352.77 | 352.63 | 350.94 | 349.41 | 345.82 | 341.07 | 338.36 | 336.10 | 331.29 | 326.70 | 321.50 | 324.04 | 319.14 | 315.02 | 309.50 | 306.65 | 300.42 | 295.51 | 290.36 | 289.55 | 285.70 | 282.69 | 277.98 | 271.81 | 265.30 | 260.19 | 255.25 | 249.56 | 245.94 | 239.96 | 235.09 | 230.39 | 223.09 | 217.40 | 210.18 | 205.97 | 200.80 | 196.37 | 189.83 | 185.00 | 180.36 | 178.10 | 173.18 | 159.39 | |
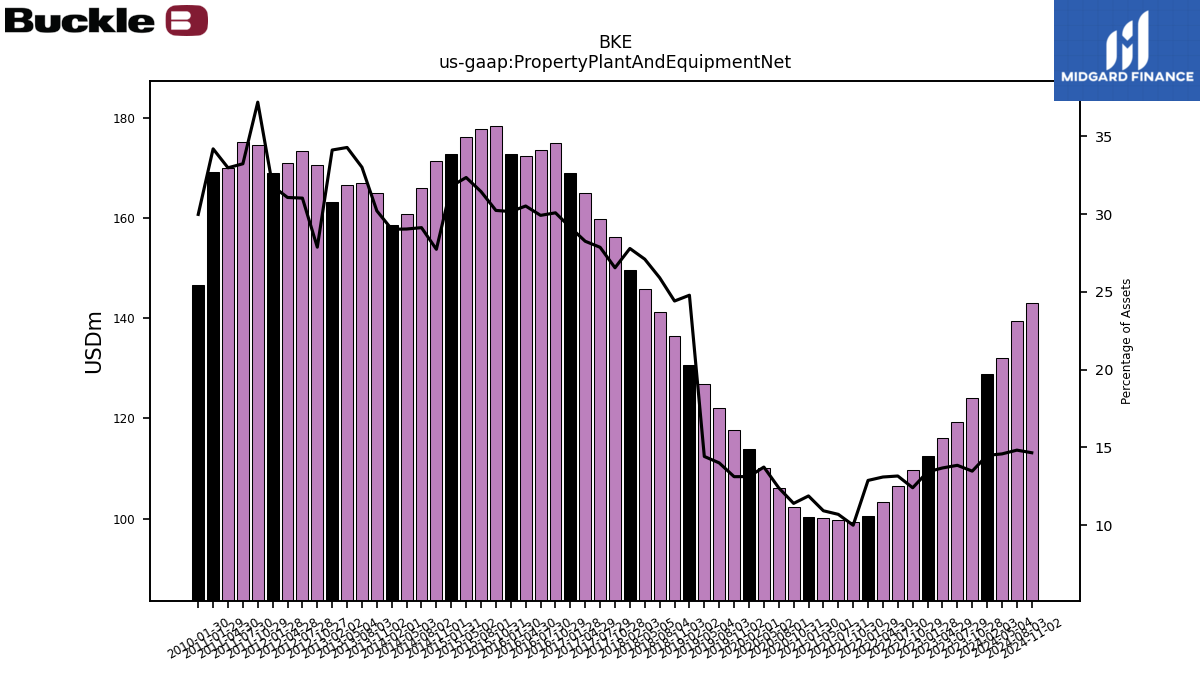
| Property Plant And Equipment Net | 128.84 | 124.07 | 119.26 | 116.06 | 112.40 | 109.61 | 106.43 | 103.29 | 100.50 | 99.28 | 99.69 | 100.03 | 100.42 | 102.30 | 106.08 | 110.07 | 113.85 | 117.76 | 122.13 | 126.87 | 130.68 | 136.48 | 141.23 | 145.85 | 149.55 | 156.14 | 159.83 | 164.93 | 169.00 | 174.96 | 173.53 | 172.39 | 172.78 | 178.37 | 177.66 | 176.20 | 172.66 | 171.31 | 166.02 | 160.66 | 158.57 | 164.89 | 166.85 | 166.50 | 163.10 | 170.56 | 173.27 | 170.87 | 169.03 | 174.62 | 175.16 | 169.86 | 169.23 | 146.58 | |
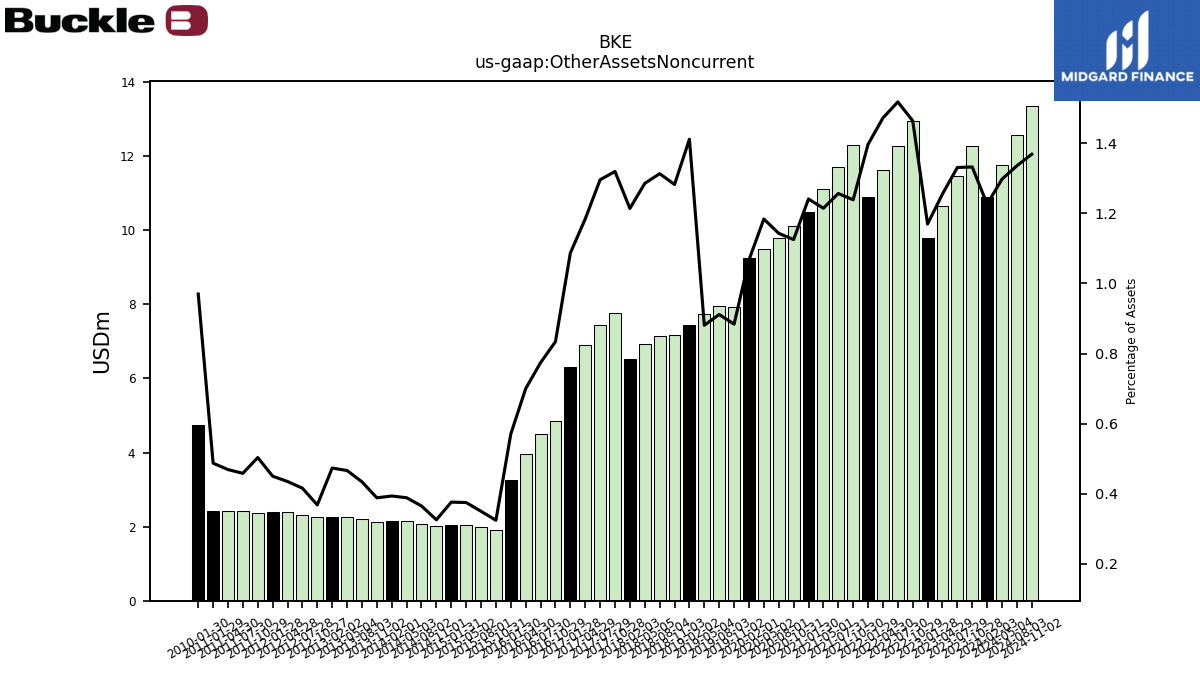
| Other Assets Noncurrent | 10.91 | 12.27 | 11.47 | 10.66 | 9.80 | 12.95 | 12.28 | 11.62 | 10.91 | 12.31 | 11.72 | 11.13 | 10.50 | 10.10 | 9.78 | 9.49 | 9.26 | 7.94 | 7.95 | 7.75 | 7.44 | 7.17 | 7.16 | 6.92 | 6.53 | 7.76 | 7.43 | 6.91 | 6.30 | 4.85 | 4.49 | 3.95 | 3.27 | 1.91 | 1.98 | 2.04 | 2.04 | 2.01 | 2.08 | 2.15 | 2.15 | 2.12 | 2.19 | 2.27 | 2.26 | 2.25 | 2.32 | 2.39 | 2.39 | 2.36 | 2.42 | 2.42 | 2.41 | 4.74 | |
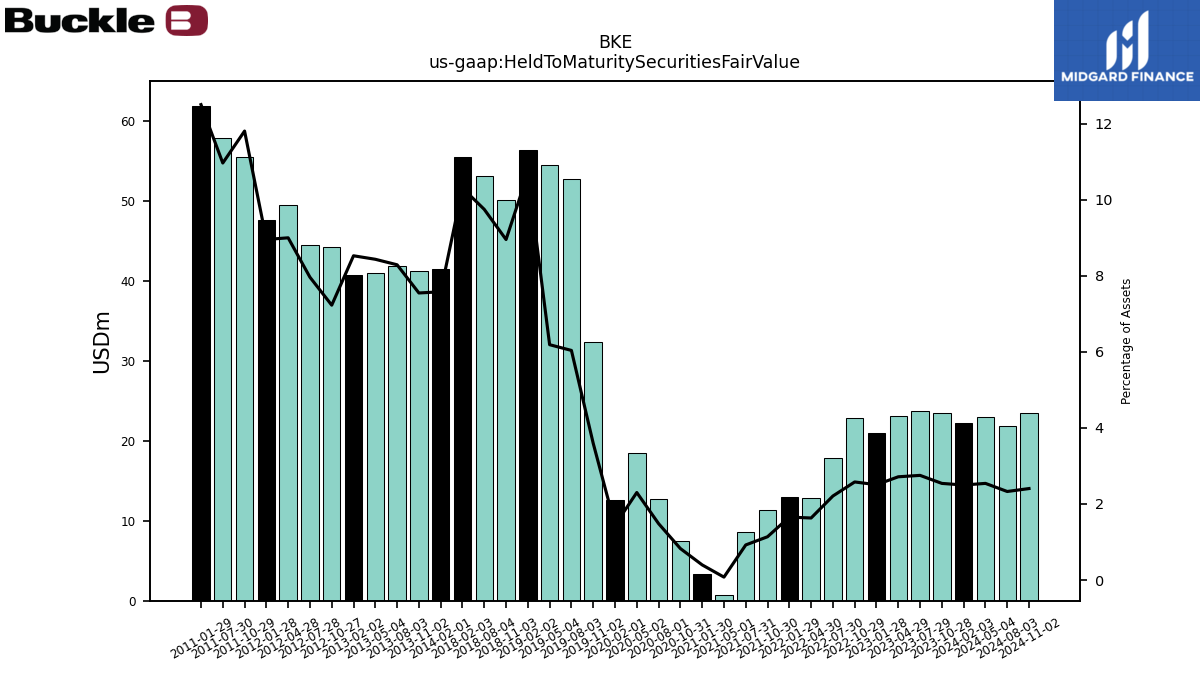
| Held To Maturity Securities Fair Value | 22.22 | 23.40 | 23.71 | 23.04 | 20.99 | 22.80 | 17.87 | 12.87 | 12.92 | 11.31 | 8.60 | 0.70 | 3.37 | 7.43 | 12.69 | 18.45 | 12.54 | 32.29 | 52.67 | 54.48 | 56.37 | 50.06 | 53.12 | NA | 55.46 | NA | NA | NA | NA | NA | NA | NA | NA | NA | NA | NA | NA | NA | NA | NA | 41.40 | 41.19 | 41.89 | 40.95 | 40.75 | 44.22 | 44.46 | 49.48 | 47.59 | 55.41 | 57.78 | NA | 61.86 | NA | |
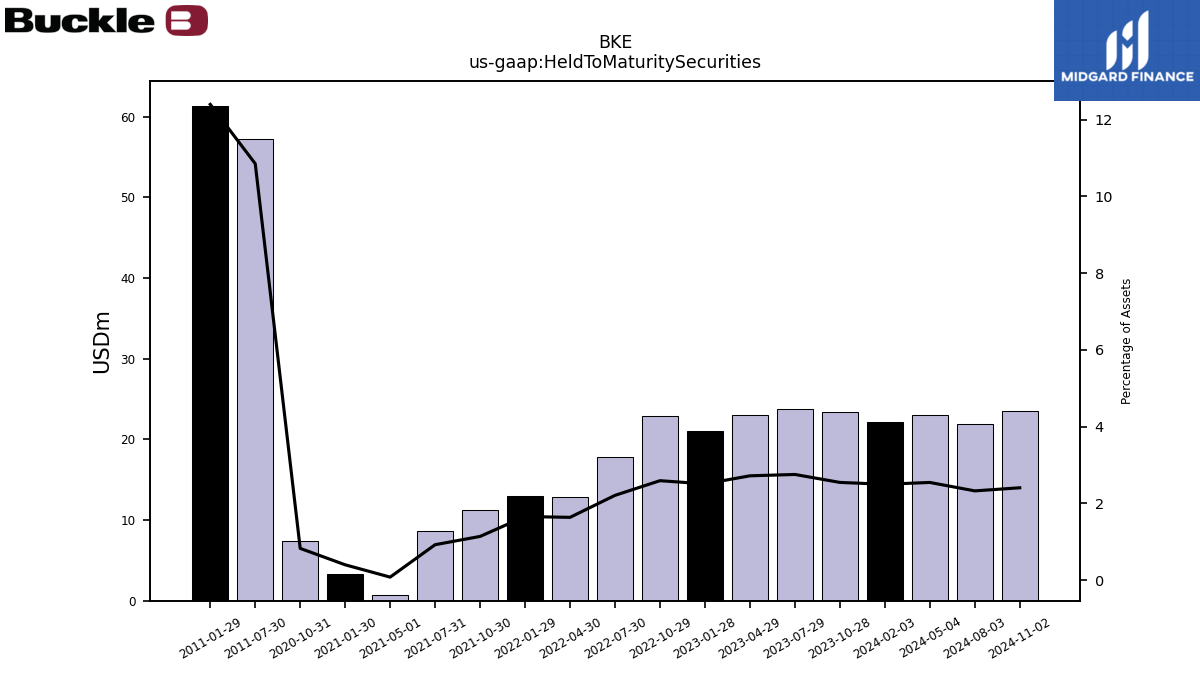
| Held To Maturity Securities | 22.21 | 23.45 | 23.71 | 23.07 | 21.00 | 22.90 | 17.86 | 12.89 | 12.93 | 11.30 | 8.59 | 0.70 | 3.36 | 7.41 | NA | NA | NA | NA | NA | NA | NA | NA | NA | NA | NA | NA | NA | NA | NA | NA | NA | NA | NA | NA | NA | NA | NA | NA | NA | NA | NA | NA | NA | NA | NA | NA | NA | NA | NA | NA | 57.20 | NA | 61.37 | NA | |
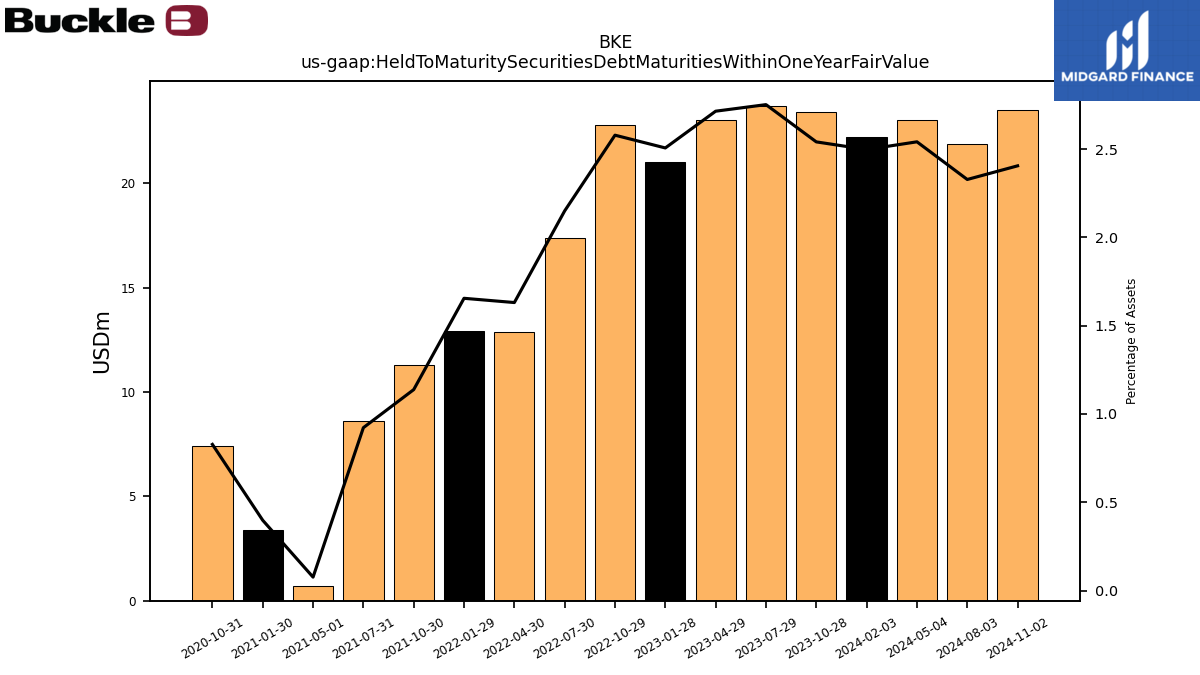
| Held To Maturity Securities Debt Maturities Within One Year Fair Value | 22.22 | 23.40 | 23.71 | 23.04 | 20.99 | 22.80 | 17.39 | 12.87 | 12.92 | 11.31 | 8.60 | 0.70 | 3.37 | 7.43 | NA | NA | NA | NA | NA | NA | NA | NA | NA | NA | NA | NA | NA | NA | NA | NA | NA | NA | NA | NA | NA | NA | NA | NA | NA | NA | NA | NA | NA | NA | NA | NA | NA | NA | NA | NA | NA | NA | NA | NA |
| 2024-02-03 | 2023-10-28 | 2023-07-29 | 2023-04-29 | 2023-01-28 | 2022-10-29 | 2022-07-30 | 2022-04-30 | 2022-01-29 | 2021-10-30 | 2021-07-31 | 2021-05-01 | 2021-01-30 | 2020-10-31 | 2020-08-01 | 2020-05-02 | 2020-02-01 | 2019-11-02 | 2019-08-03 | 2019-05-04 | 2019-02-02 | 2018-11-03 | 2018-08-04 | 2018-05-05 | 2018-02-03 | 2017-10-28 | 2017-07-29 | 2017-04-29 | 2017-01-28 | 2016-10-29 | 2016-07-30 | 2016-04-30 | 2016-01-30 | 2015-10-31 | 2015-08-01 | 2015-05-02 | 2015-01-31 | 2014-11-01 | 2014-08-02 | 2014-05-03 | 2014-02-01 | 2013-11-02 | 2013-08-03 | 2013-05-04 | 2013-02-02 | 2012-10-27 | 2012-07-28 | 2012-04-28 | 2012-01-28 | 2011-10-29 | 2011-07-30 | 2011-04-30 | 2011-01-29 | 2010-01-30 | ||
|---|---|---|---|---|---|---|---|---|---|---|---|---|---|---|---|---|---|---|---|---|---|---|---|---|---|---|---|---|---|---|---|---|---|---|---|---|---|---|---|---|---|---|---|---|---|---|---|---|---|---|---|---|---|---|---|
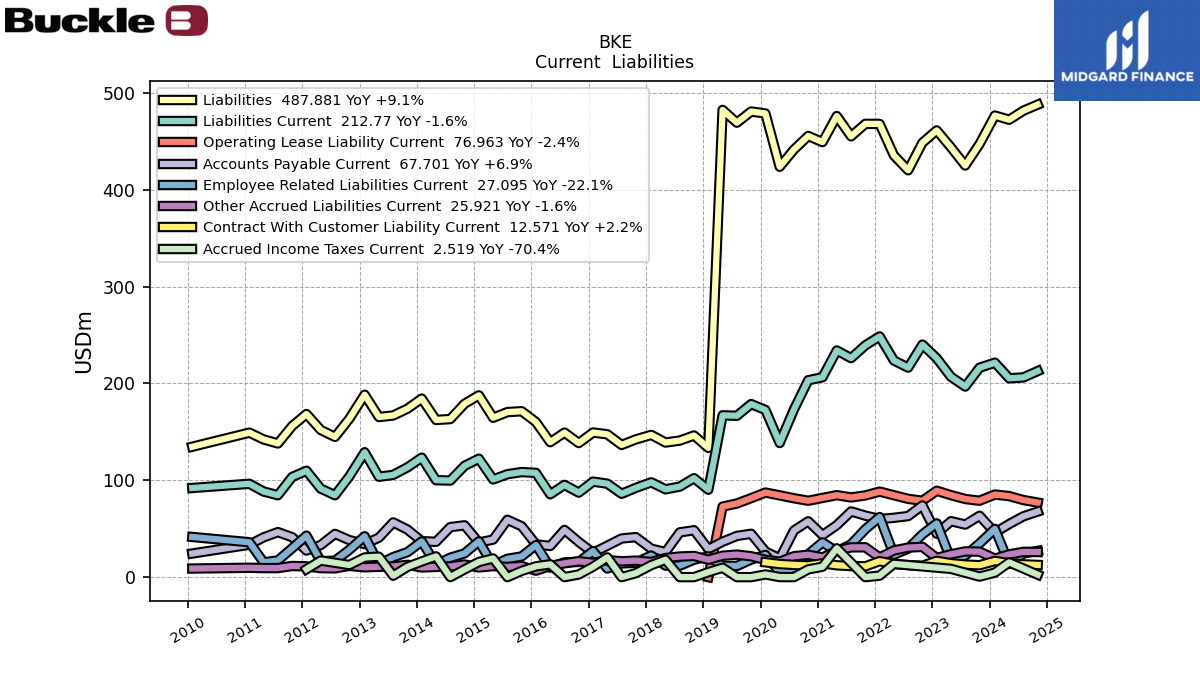
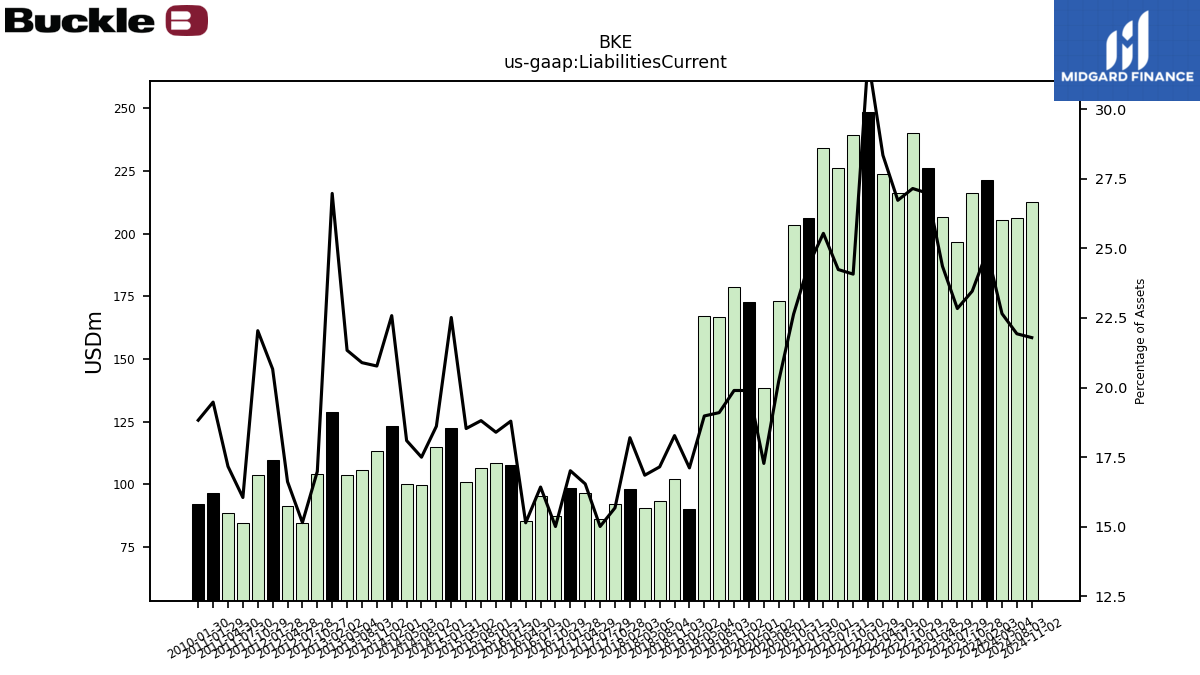
| Liabilities Current | 221.46 | 216.16 | 196.78 | 206.80 | 226.04 | 240.10 | 216.28 | 223.71 | 248.54 | 239.29 | 226.10 | 234.04 | 206.36 | 203.28 | 173.15 | 138.44 | 172.64 | 178.66 | 166.61 | 167.06 | 90.22 | 102.15 | 93.46 | 90.66 | 97.91 | 92.18 | 86.05 | 96.51 | 98.62 | 87.24 | 95.23 | 85.48 | 107.63 | 108.49 | 106.25 | 100.88 | 122.27 | 114.92 | 99.70 | 100.08 | 123.38 | 113.37 | 105.59 | 103.62 | 128.96 | 103.90 | 84.56 | 91.36 | 109.83 | 103.46 | 84.55 | 88.39 | 96.37 | 92.03 | |
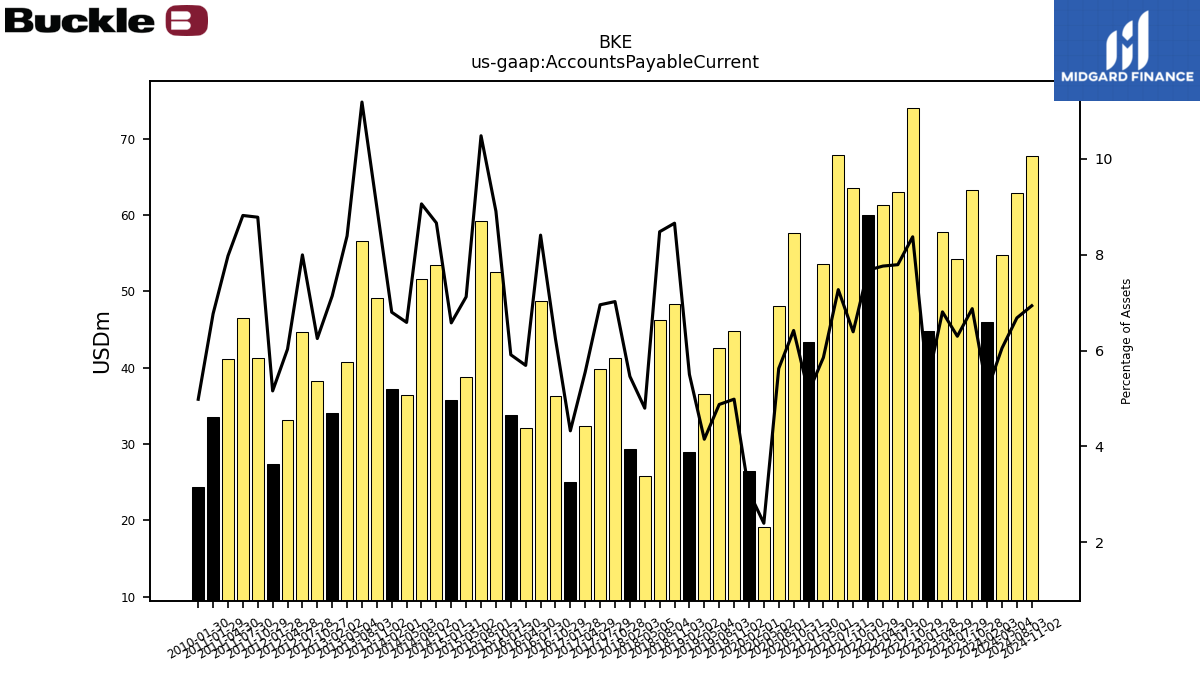
| Accounts Payable Current | 45.96 | 63.32 | 54.26 | 57.77 | 44.84 | 74.03 | 63.04 | 61.25 | 59.95 | 63.52 | 67.81 | 53.63 | 43.40 | 57.63 | 48.14 | 19.21 | 26.49 | 44.77 | 42.53 | 36.53 | 29.01 | 48.40 | 46.22 | 25.82 | 29.39 | 41.29 | 39.89 | 32.42 | 25.08 | 36.31 | 48.76 | 32.14 | 33.86 | 52.54 | 59.21 | 38.78 | 35.71 | 53.50 | 51.63 | 36.44 | 37.15 | 49.08 | 56.52 | 40.75 | 34.12 | 38.25 | 44.65 | 33.16 | 27.42 | 41.22 | 46.47 | 41.08 | 33.49 | 24.36 | |
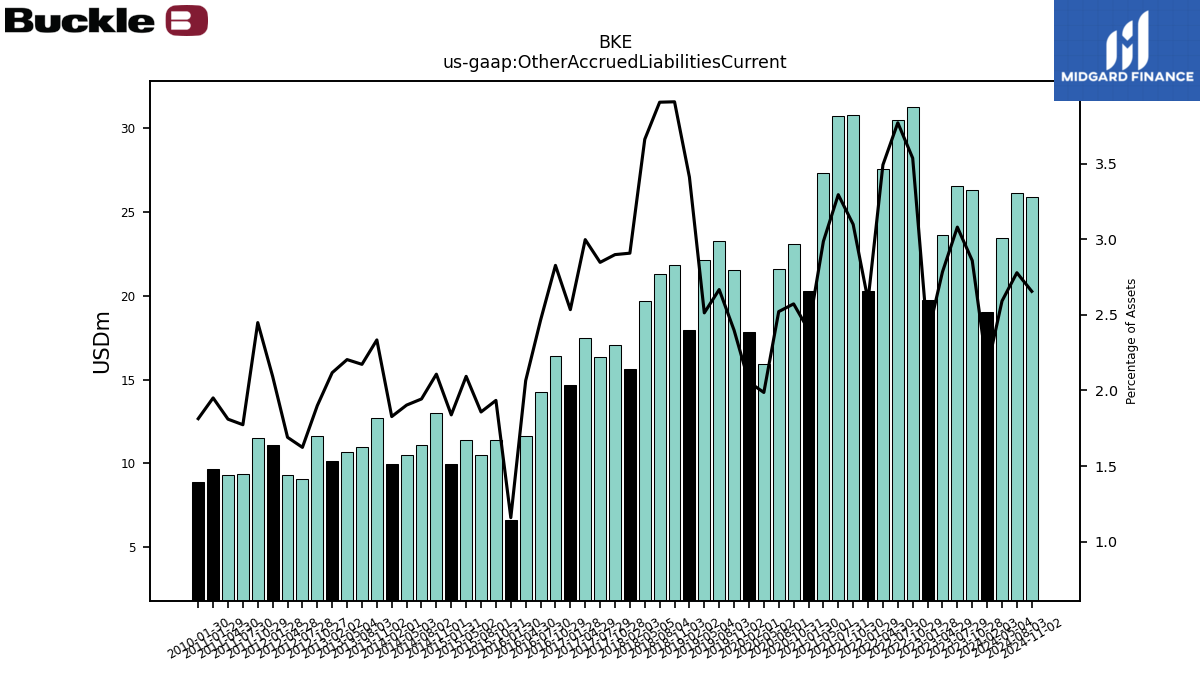
| Other Accrued Liabilities Current | 19.07 | 26.34 | 26.53 | 23.63 | 19.75 | 31.26 | 30.50 | 27.55 | 20.26 | 30.79 | 30.72 | 27.36 | 20.30 | 23.10 | 21.58 | 15.93 | 17.84 | 21.54 | 23.27 | 22.12 | 17.98 | 21.85 | 21.29 | 19.70 | 15.65 | 17.04 | 16.33 | 17.49 | 14.70 | 16.44 | 14.29 | 11.66 | 6.64 | 11.41 | 10.49 | 11.40 | 9.98 | 13.02 | 11.08 | 10.53 | 9.98 | 12.74 | 10.98 | 10.70 | 10.12 | 11.62 | 9.07 | 9.29 | 11.12 | 11.49 | 9.35 | 9.32 | 9.65 | 8.87 | |
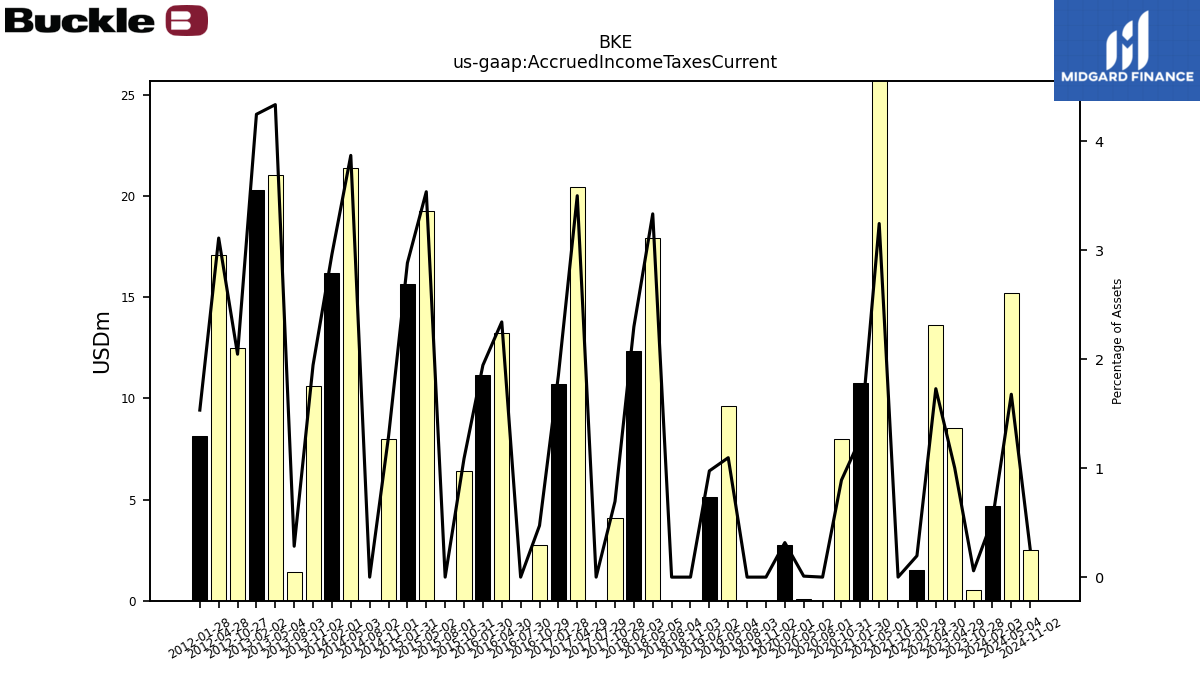
| Accrued Income Taxes Current | 4.67 | 0.54 | NA | 8.52 | NA | NA | NA | 13.65 | 1.53 | 0.00 | NA | 29.74 | 10.75 | 7.99 | 0.00 | 0.07 | 2.75 | 0.00 | 0.00 | 9.65 | 5.14 | 0.00 | 0.00 | 17.95 | 12.36 | 4.09 | 0.00 | 20.44 | 10.74 | 2.75 | 0.00 | 13.23 | 11.14 | 6.42 | 0.00 | 19.27 | 15.66 | 7.98 | 0.00 | 21.41 | 16.19 | 10.62 | 1.43 | 21.06 | 20.31 | 12.52 | NA | 17.12 | 8.15 | NA | NA | NA | NA | NA | |
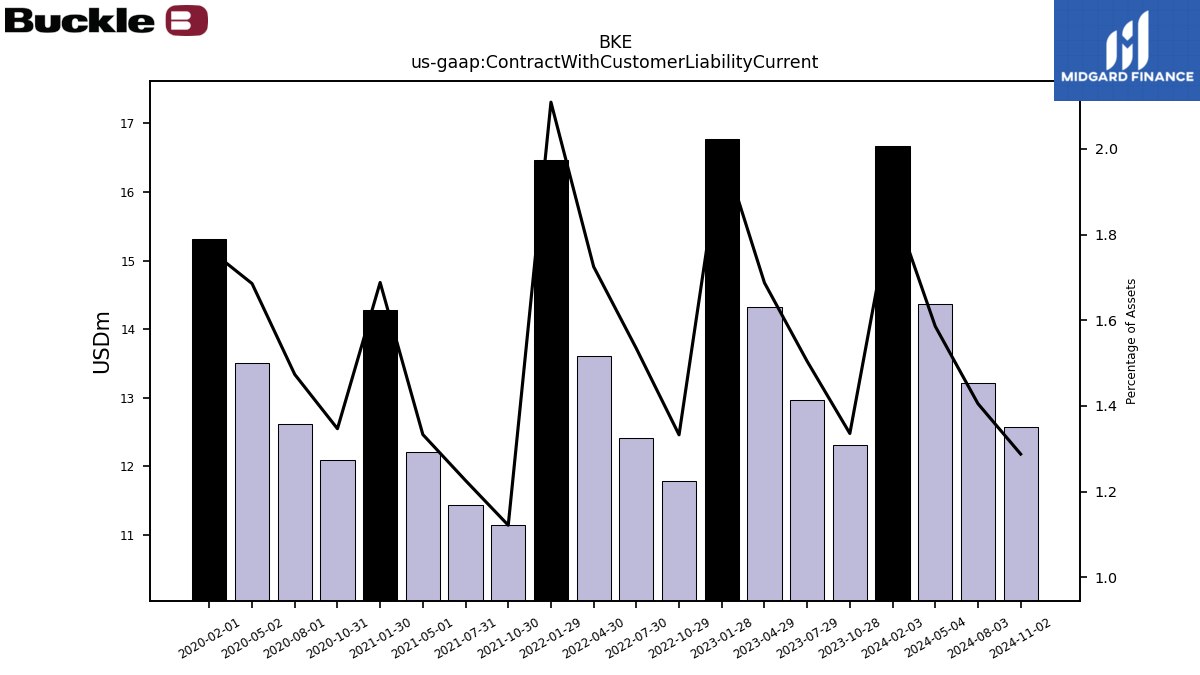
| Contract With Customer Liability Current | 16.67 | 12.30 | 12.96 | 14.32 | 16.78 | 11.78 | 12.41 | 13.61 | 16.47 | 11.15 | 11.43 | 12.21 | 14.28 | 12.09 | 12.61 | 13.51 | 15.32 | NA | NA | NA | NA | NA | NA | NA | NA | NA | NA | NA | NA | NA | NA | NA | NA | NA | NA | NA | NA | NA | NA | NA | NA | NA | NA | NA | NA | NA | NA | NA | NA | NA | NA | NA | NA | NA |
| 2024-02-03 | 2023-10-28 | 2023-07-29 | 2023-04-29 | 2023-01-28 | 2022-10-29 | 2022-07-30 | 2022-04-30 | 2022-01-29 | 2021-10-30 | 2021-07-31 | 2021-05-01 | 2021-01-30 | 2020-10-31 | 2020-08-01 | 2020-05-02 | 2020-02-01 | 2019-11-02 | 2019-08-03 | 2019-05-04 | 2019-02-02 | 2018-11-03 | 2018-08-04 | 2018-05-05 | 2018-02-03 | 2017-10-28 | 2017-07-29 | 2017-04-29 | 2017-01-28 | 2016-10-29 | 2016-07-30 | 2016-04-30 | 2016-01-30 | 2015-10-31 | 2015-08-01 | 2015-05-02 | 2015-01-31 | 2014-11-01 | 2014-08-02 | 2014-05-03 | 2014-02-01 | 2013-11-02 | 2013-08-03 | 2013-05-04 | 2013-02-02 | 2012-10-27 | 2012-07-28 | 2012-04-28 | 2012-01-28 | 2011-10-29 | 2011-07-30 | 2011-04-30 | 2011-01-29 | 2010-01-30 | ||
|---|---|---|---|---|---|---|---|---|---|---|---|---|---|---|---|---|---|---|---|---|---|---|---|---|---|---|---|---|---|---|---|---|---|---|---|---|---|---|---|---|---|---|---|---|---|---|---|---|---|---|---|---|---|---|---|
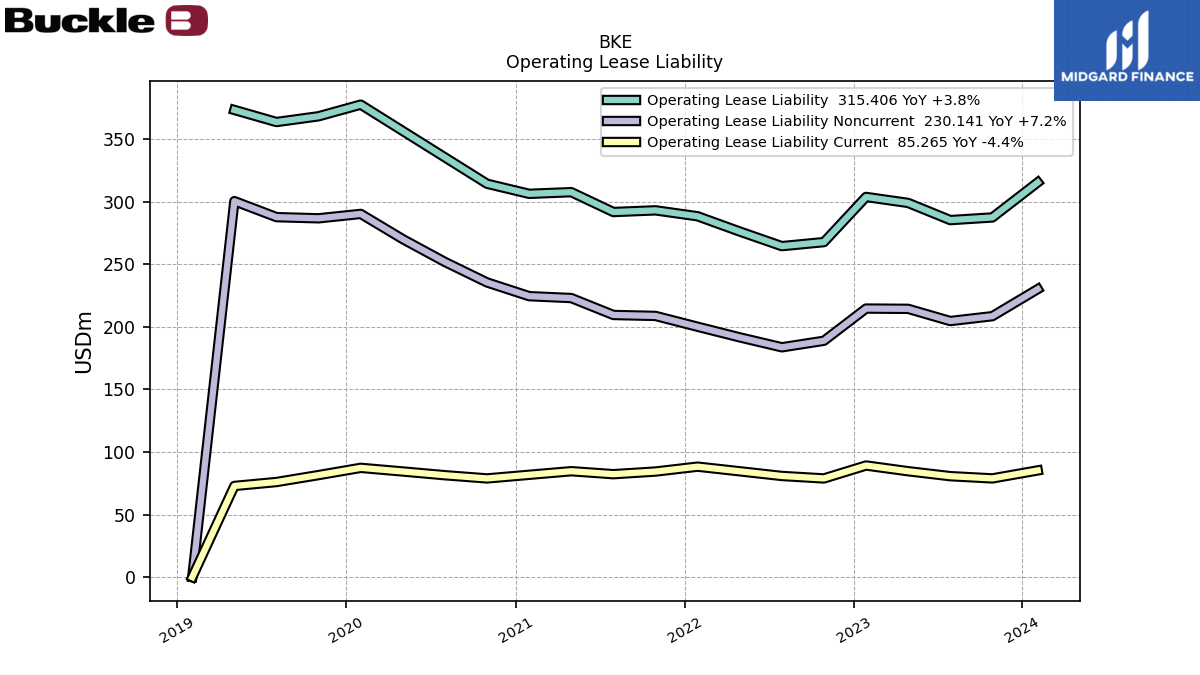
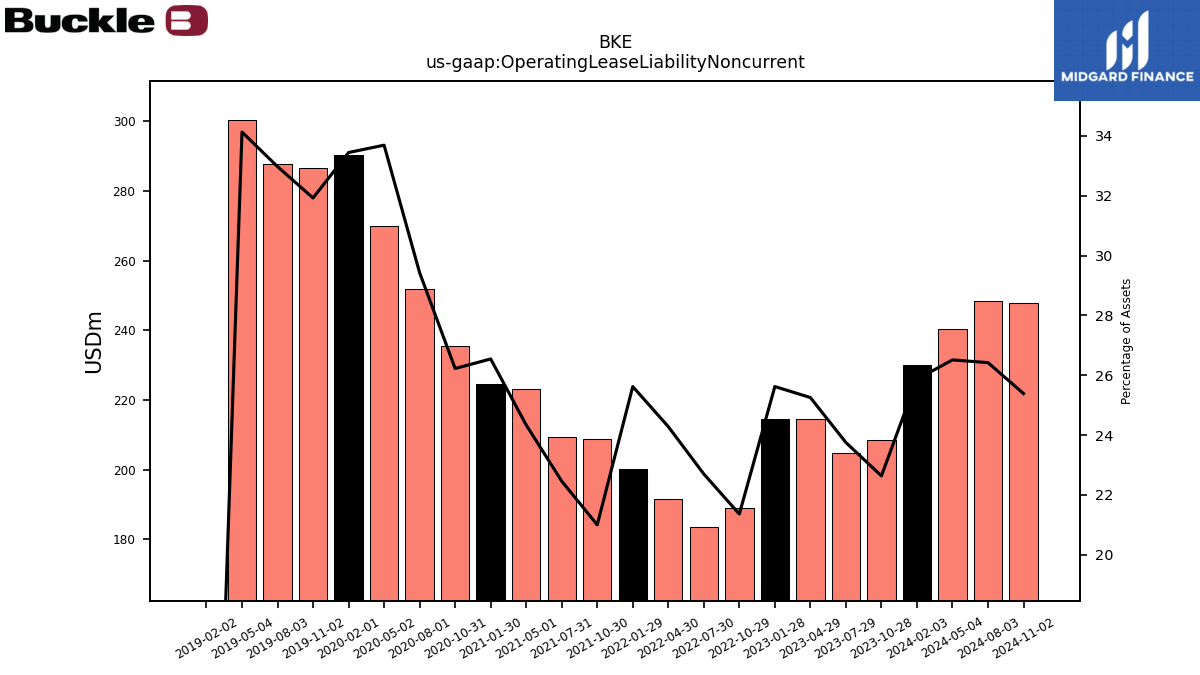
| Operating Lease Liability Noncurrent | 230.14 | 208.52 | 204.62 | 214.37 | 214.60 | 188.86 | 183.64 | 191.59 | 200.07 | 208.71 | 209.47 | 222.98 | 224.51 | 235.46 | 251.83 | 270.05 | 290.24 | 286.71 | 287.65 | 300.43 | 0.00 | NA | NA | NA | NA | NA | NA | NA | NA | NA | NA | NA | NA | NA | NA | NA | NA | NA | NA | NA | NA | NA | NA | NA | NA | NA | NA | NA | NA | NA | NA | NA | NA | NA |
| 2024-02-03 | 2023-10-28 | 2023-07-29 | 2023-04-29 | 2023-01-28 | 2022-10-29 | 2022-07-30 | 2022-04-30 | 2022-01-29 | 2021-10-30 | 2021-07-31 | 2021-05-01 | 2021-01-30 | 2020-10-31 | 2020-08-01 | 2020-05-02 | 2020-02-01 | 2019-11-02 | 2019-08-03 | 2019-05-04 | 2019-02-02 | 2018-11-03 | 2018-08-04 | 2018-05-05 | 2018-02-03 | 2017-10-28 | 2017-07-29 | 2017-04-29 | 2017-01-28 | 2016-10-29 | 2016-07-30 | 2016-04-30 | 2016-01-30 | 2015-10-31 | 2015-08-01 | 2015-05-02 | 2015-01-31 | 2014-11-01 | 2014-08-02 | 2014-05-03 | 2014-02-01 | 2013-11-02 | 2013-08-03 | 2013-05-04 | 2013-02-02 | 2012-10-27 | 2012-07-28 | 2012-04-28 | 2012-01-28 | 2011-10-29 | 2011-07-30 | 2011-04-30 | 2011-01-29 | 2010-01-30 | ||
|---|---|---|---|---|---|---|---|---|---|---|---|---|---|---|---|---|---|---|---|---|---|---|---|---|---|---|---|---|---|---|---|---|---|---|---|---|---|---|---|---|---|---|---|---|---|---|---|---|---|---|---|---|---|---|---|
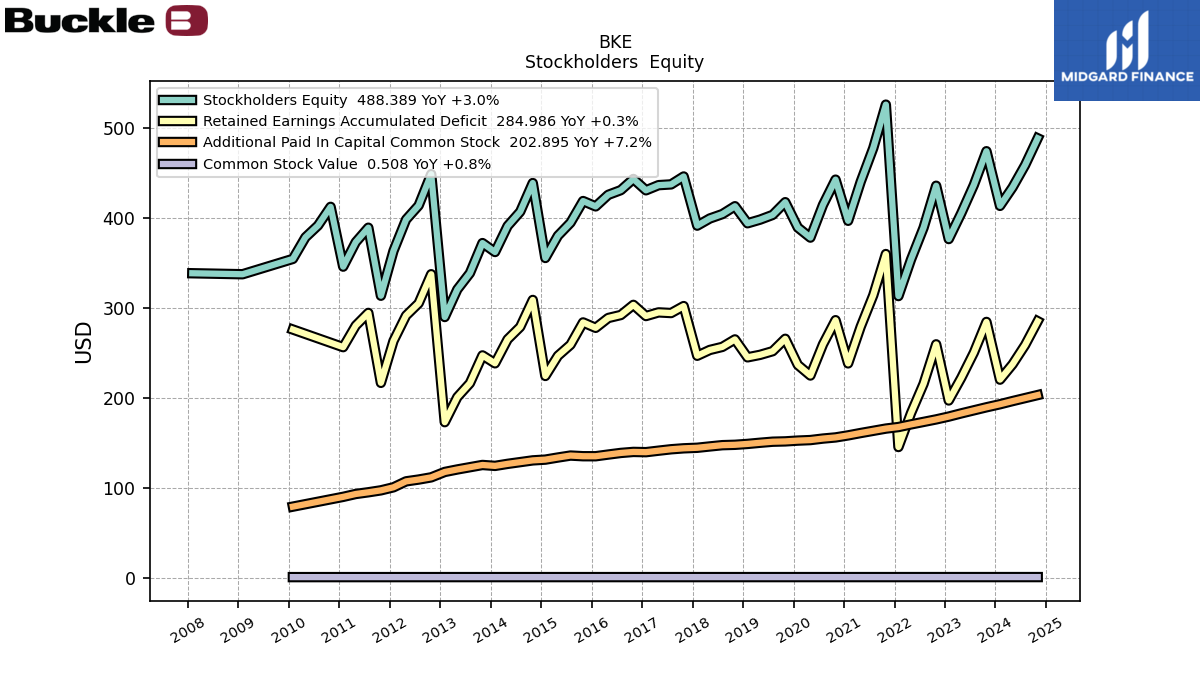
| Stockholders Equity | 413.22 | 474.02 | 436.54 | 405.17 | 376.31 | 435.61 | 388.98 | 353.59 | 312.92 | 525.80 | 477.55 | 440.10 | 396.63 | 442.40 | 414.31 | 377.95 | 389.15 | 417.34 | 403.19 | 397.96 | 393.88 | 412.85 | 404.11 | 399.20 | 391.25 | 445.91 | 437.11 | 436.26 | 430.54 | 443.15 | 430.73 | 425.50 | 412.64 | 418.60 | 394.52 | 380.02 | 355.28 | 438.65 | 406.74 | 390.90 | 361.93 | 371.86 | 338.45 | 320.32 | 289.65 | 448.49 | 413.64 | 397.99 | 363.15 | 313.31 | 388.95 | 372.87 | 345.67 | 354.26 | |
| Common Stock Value | 0.50 | 0.50 | 0.50 | 0.51 | 0.50 | 0.50 | 0.50 | 0.50 | 0.50 | 0.50 | 0.50 | 0.50 | 0.49 | 0.49 | 0.49 | 0.49 | 0.49 | 0.49 | 0.49 | 0.49 | 0.49 | 0.49 | 0.49 | 0.49 | 0.49 | 0.49 | 0.49 | 0.49 | 0.49 | 0.49 | 0.49 | 0.49 | 0.48 | 0.48 | 0.48 | 0.48 | 0.48 | 0.48 | 0.48 | 0.48 | 0.48 | 0.48 | 0.48 | 0.48 | 0.48 | 0.48 | 0.48 | 0.48 | 0.47 | 0.47 | 0.47 | 0.47 | 0.47 | 0.46 | |
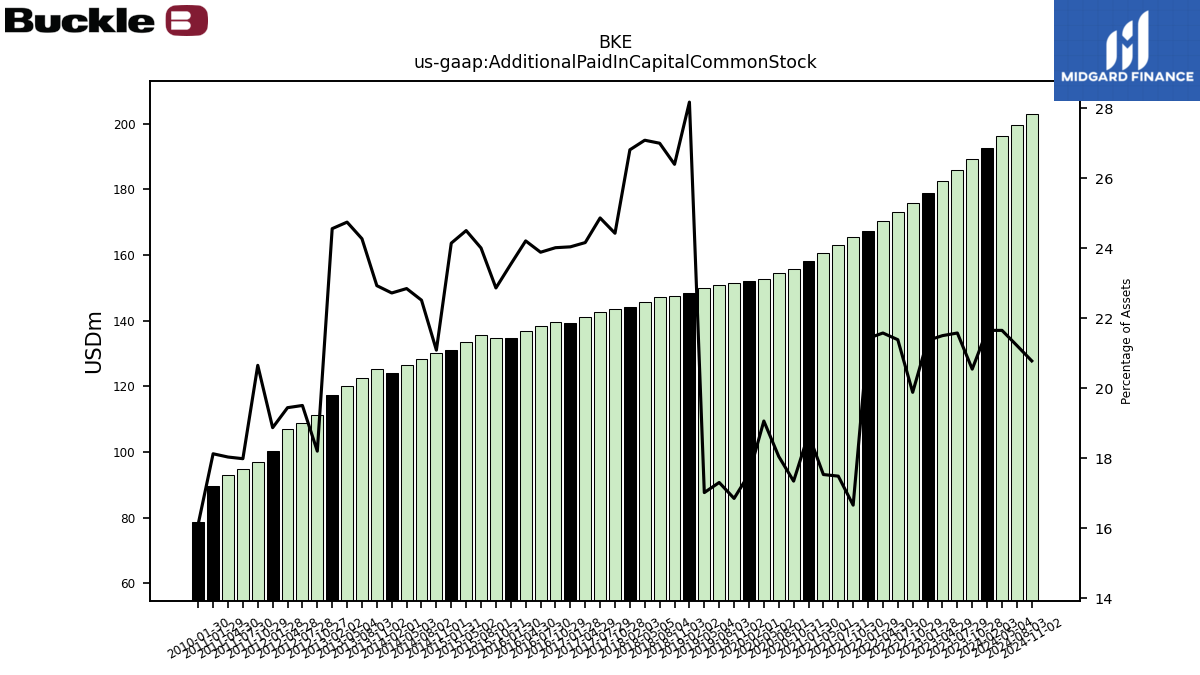
| Additional Paid In Capital Common Stock | 192.69 | 189.30 | 185.92 | 182.54 | 178.96 | 175.82 | 173.05 | 170.27 | 167.33 | 165.61 | 163.15 | 160.68 | 158.06 | 155.78 | 154.52 | 152.84 | 152.26 | 151.38 | 151.03 | 149.86 | 148.56 | 147.58 | 147.17 | 145.76 | 144.28 | 143.67 | 142.62 | 141.04 | 139.40 | 139.67 | 138.53 | 136.74 | 134.86 | 134.89 | 135.62 | 133.45 | 131.11 | 130.27 | 128.33 | 126.40 | 124.13 | 125.16 | 122.66 | 120.17 | 117.39 | 111.40 | 108.95 | 106.95 | 100.33 | 96.95 | 94.80 | 92.90 | 89.72 | 78.84 | |
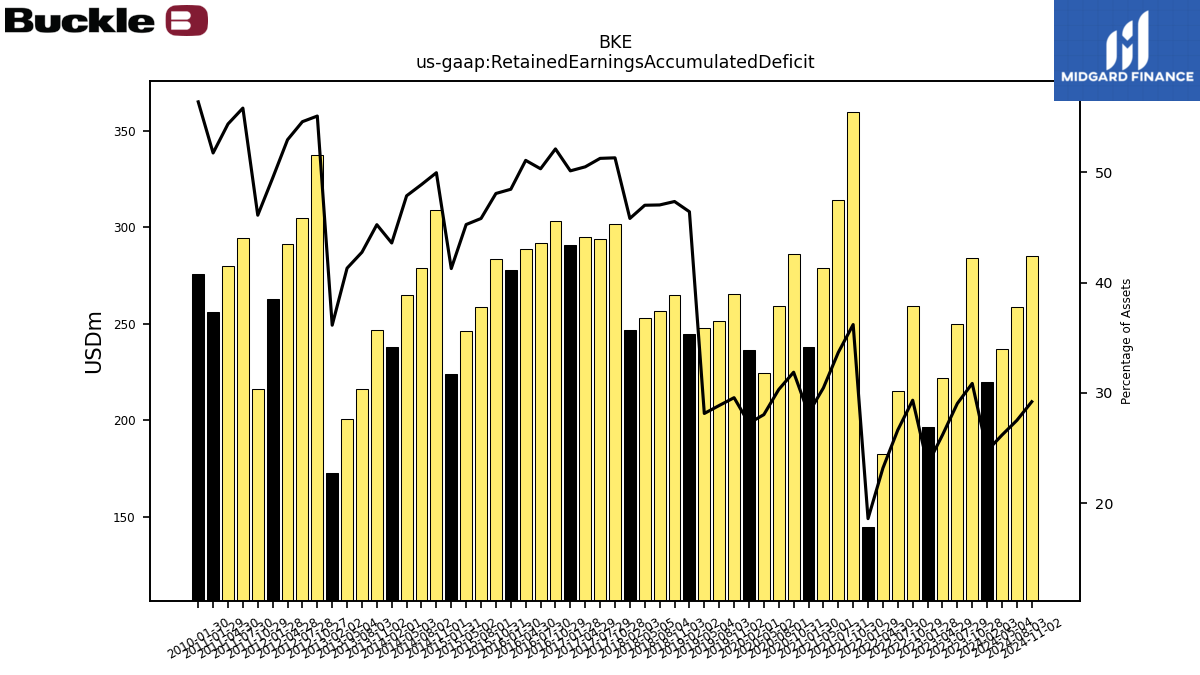
| Retained Earnings Accumulated Deficit | 220.03 | 284.22 | 250.11 | 222.12 | 196.85 | 259.29 | 215.43 | 182.82 | 145.10 | 359.69 | 313.91 | 278.92 | 238.08 | 286.13 | 259.30 | 224.61 | 236.40 | 265.46 | 251.67 | 247.61 | 244.82 | 264.78 | 256.44 | 253.04 | 246.57 | 301.83 | 294.08 | 294.81 | 290.74 | 303.18 | 291.88 | 288.57 | 277.63 | 283.66 | 258.84 | 246.52 | 224.11 | 308.65 | 278.68 | 264.85 | 238.15 | 247.00 | 216.08 | 200.60 | 172.71 | 337.23 | 304.90 | 291.26 | 263.04 | 216.44 | 294.24 | 280.15 | 256.15 | 275.75 |