
| 2023-12-31 | 2023-09-30 | 2023-06-30 | 2023-03-31 | 2022-12-31 | 2022-09-30 | 2022-06-30 | 2022-03-31 | 2021-12-31 | 2021-09-30 | 2021-06-30 | 2021-03-31 | 2020-12-31 | 2020-09-30 | 2020-06-30 | 2020-03-31 | 2019-12-31 | 2019-09-30 | 2019-06-30 | 2019-03-31 | 2018-12-31 | 2018-09-30 | 2018-06-30 | 2018-03-31 | 2017-12-31 | 2017-09-30 | 2017-06-30 | 2017-03-31 | 2016-12-31 | 2016-09-30 | 2016-06-30 | 2016-03-31 | 2015-12-31 | 2015-09-30 | 2015-06-30 | 2015-03-31 | ||
|---|---|---|---|---|---|---|---|---|---|---|---|---|---|---|---|---|---|---|---|---|---|---|---|---|---|---|---|---|---|---|---|---|---|---|---|---|---|
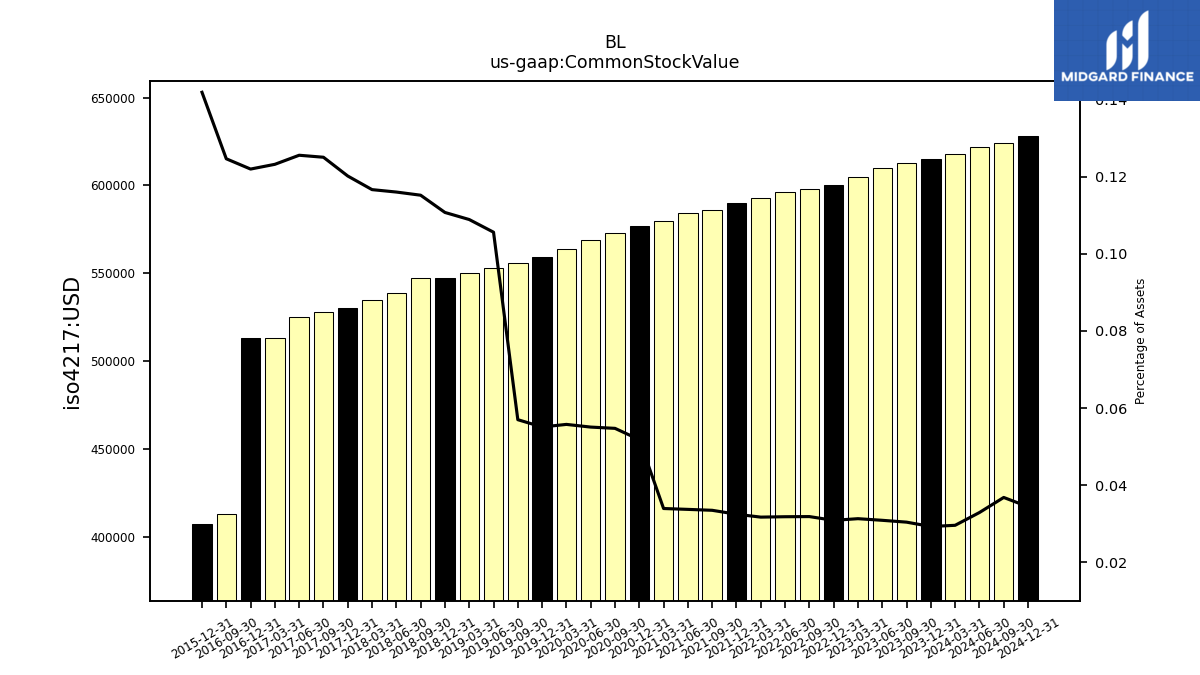
| Common Stock Value | 0.61 | 0.61 | 0.61 | 0.60 | 0.60 | 0.60 | 0.60 | 0.59 | 0.59 | 0.59 | 0.58 | 0.58 | 0.58 | 0.57 | 0.57 | 0.56 | 0.56 | 0.56 | 0.55 | 0.55 | 0.55 | 0.55 | 0.54 | 0.54 | 0.53 | 0.53 | 0.53 | 0.51 | 0.51 | 0.41 | NA | NA | 0.41 | NA | NA | NA | |
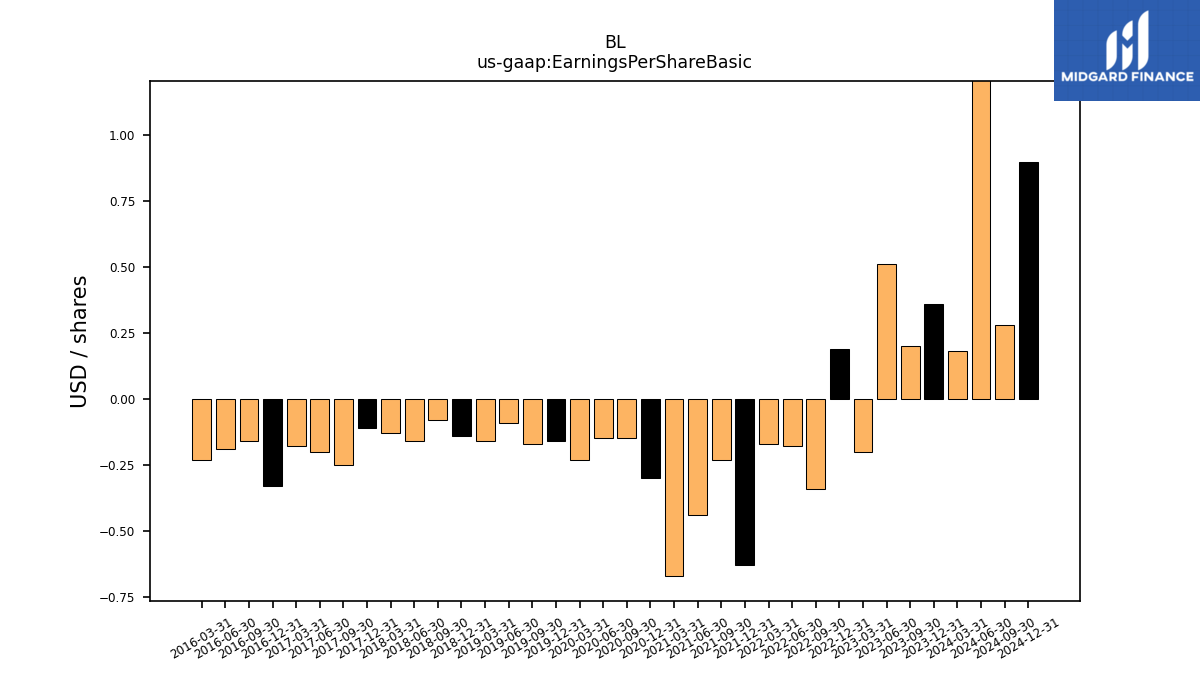
| Earnings Per Share Basic | 0.36 | 0.20 | 0.51 | -0.20 | 0.19 | -0.34 | -0.18 | -0.17 | -0.63 | -0.23 | -0.44 | -0.67 | -0.30 | -0.15 | -0.15 | -0.23 | -0.16 | -0.17 | -0.09 | -0.16 | -0.14 | -0.08 | -0.16 | -0.13 | -0.11 | -0.25 | -0.20 | -0.18 | -0.33 | -0.16 | -0.19 | -0.23 | NA | NA | NA | NA | |
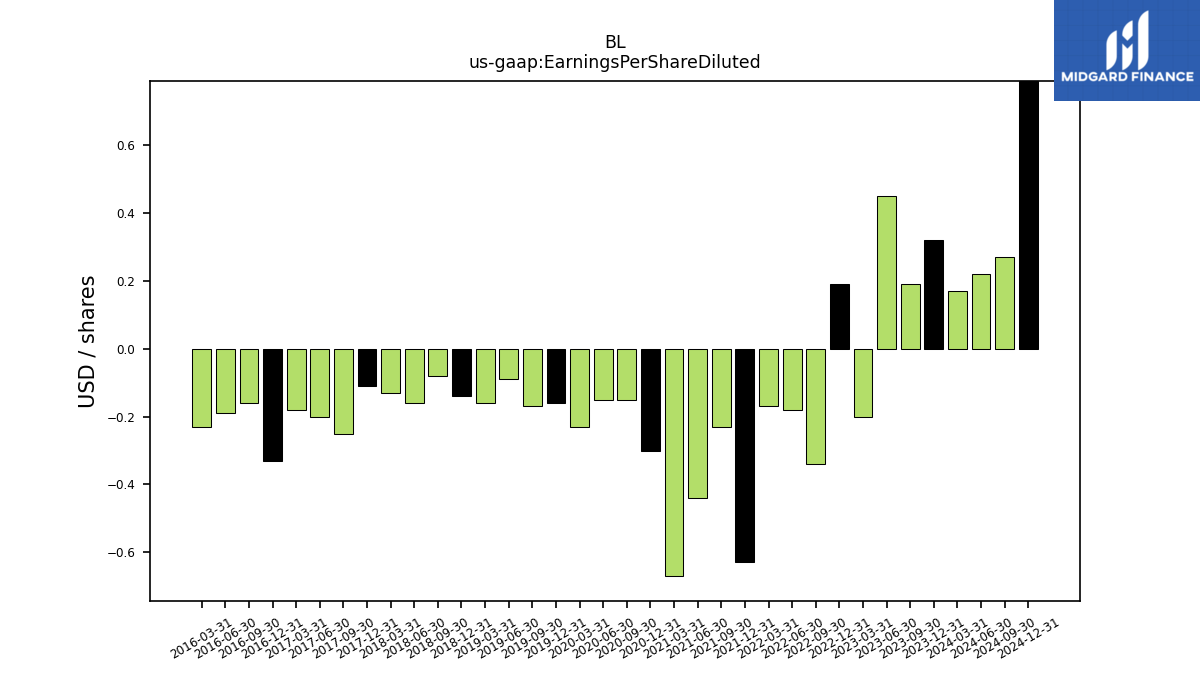
| Earnings Per Share Diluted | 0.32 | 0.19 | 0.45 | -0.20 | 0.19 | -0.34 | -0.18 | -0.17 | -0.63 | -0.23 | -0.44 | -0.67 | -0.30 | -0.15 | -0.15 | -0.23 | -0.16 | -0.17 | -0.09 | -0.16 | -0.14 | -0.08 | -0.16 | -0.13 | -0.11 | -0.25 | -0.20 | -0.18 | -0.33 | -0.16 | -0.19 | -0.23 | NA | NA | NA | NA |
| 2023-12-31 | 2023-09-30 | 2023-06-30 | 2023-03-31 | 2022-12-31 | 2022-09-30 | 2022-06-30 | 2022-03-31 | 2021-12-31 | 2021-09-30 | 2021-06-30 | 2021-03-31 | 2020-12-31 | 2020-09-30 | 2020-06-30 | 2020-03-31 | 2019-12-31 | 2019-09-30 | 2019-06-30 | 2019-03-31 | 2018-12-31 | 2018-09-30 | 2018-06-30 | 2018-03-31 | 2017-12-31 | 2017-09-30 | 2017-06-30 | 2017-03-31 | 2016-12-31 | 2016-09-30 | 2016-06-30 | 2016-03-31 | 2015-12-31 | 2015-09-30 | 2015-06-30 | 2015-03-31 | ||
|---|---|---|---|---|---|---|---|---|---|---|---|---|---|---|---|---|---|---|---|---|---|---|---|---|---|---|---|---|---|---|---|---|---|---|---|---|---|
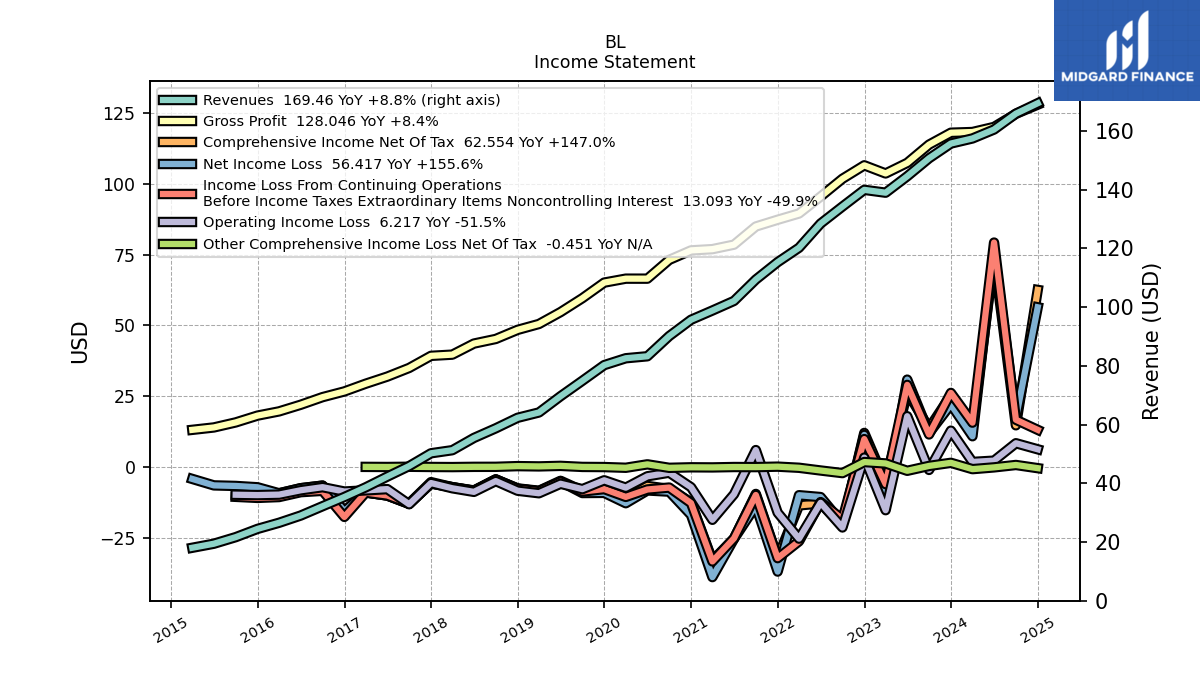
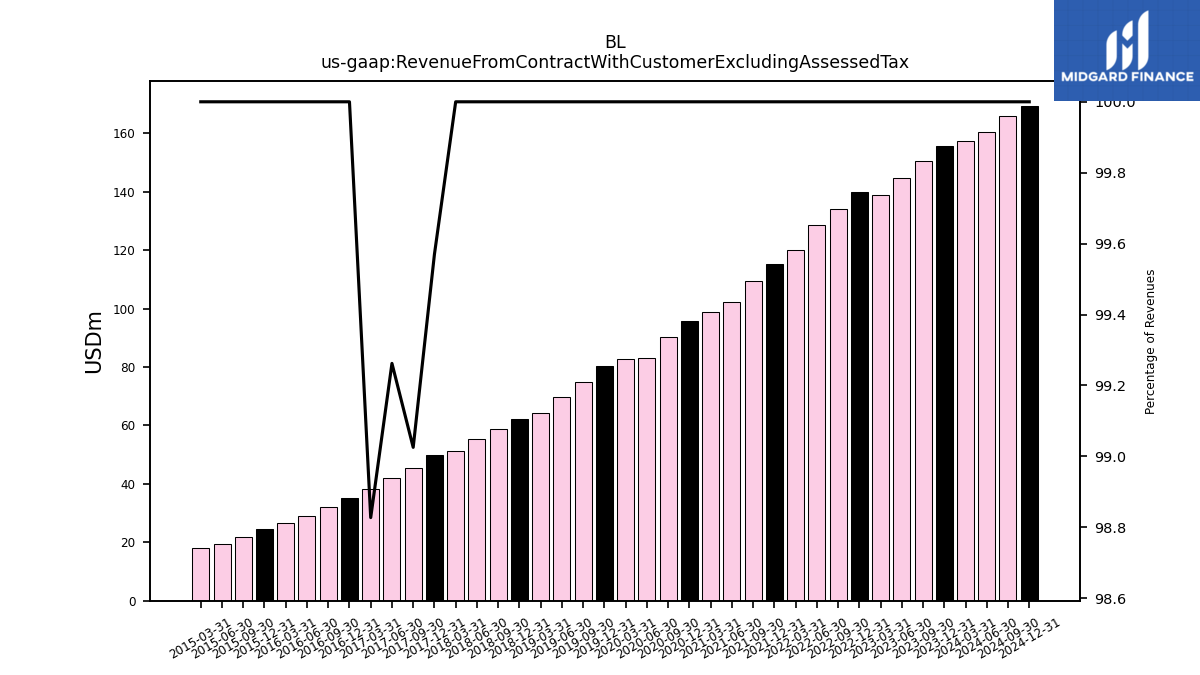
| Revenue From Contract With Customer Excluding Assessed Tax | 155.73 | 150.71 | 144.57 | 138.98 | 139.96 | 134.27 | 128.48 | 120.24 | 115.33 | 109.40 | 102.12 | 98.86 | 95.71 | 90.16 | 83.27 | 82.60 | 80.26 | 74.92 | 69.66 | 64.13 | 62.32 | 58.73 | 55.45 | 51.28 | 50.02 | 45.42 | 41.98 | 38.18 | 35.34 | 32.20 | 29.03 | 26.56 | 24.47 | 21.66 | 19.43 | 18.05 | |
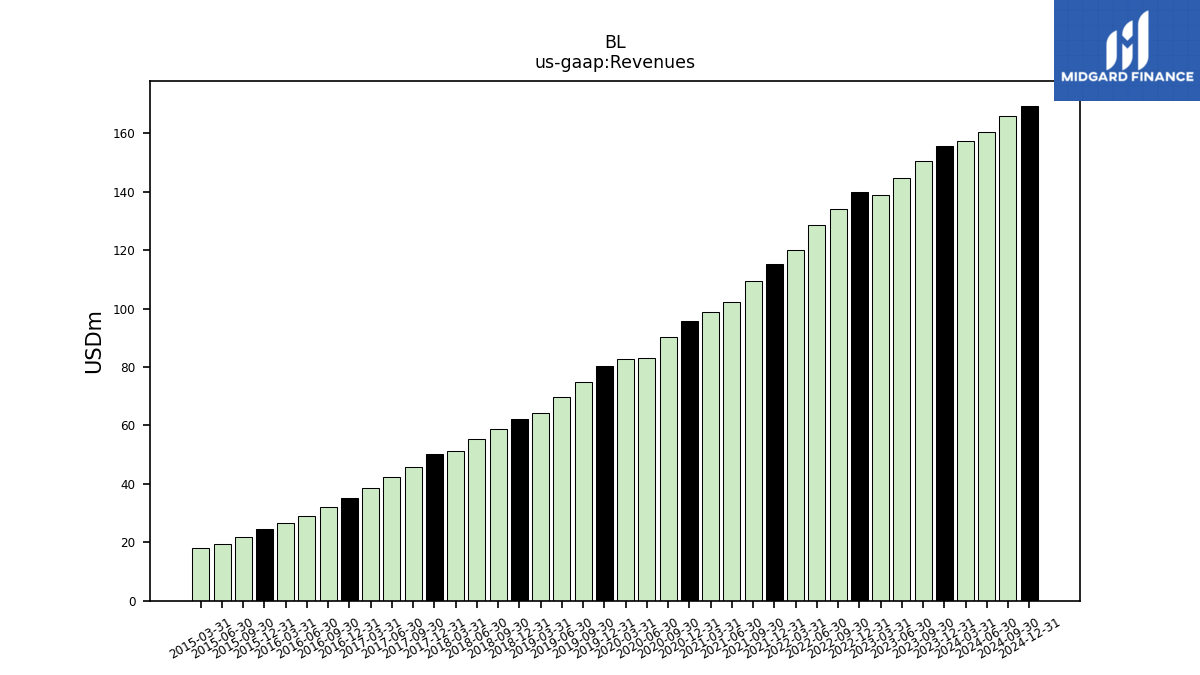
| Revenues | 155.73 | 150.71 | 144.57 | 138.98 | 139.96 | 134.27 | 128.48 | 120.24 | 115.33 | 109.40 | 102.12 | 98.86 | 95.71 | 90.16 | 83.27 | 82.60 | 80.26 | 74.92 | 69.66 | 64.13 | 62.32 | 58.73 | 55.45 | 51.28 | 50.23 | 45.87 | 42.29 | 38.63 | 35.34 | 32.20 | 29.03 | 26.56 | 24.47 | 21.66 | 19.43 | 18.05 | |
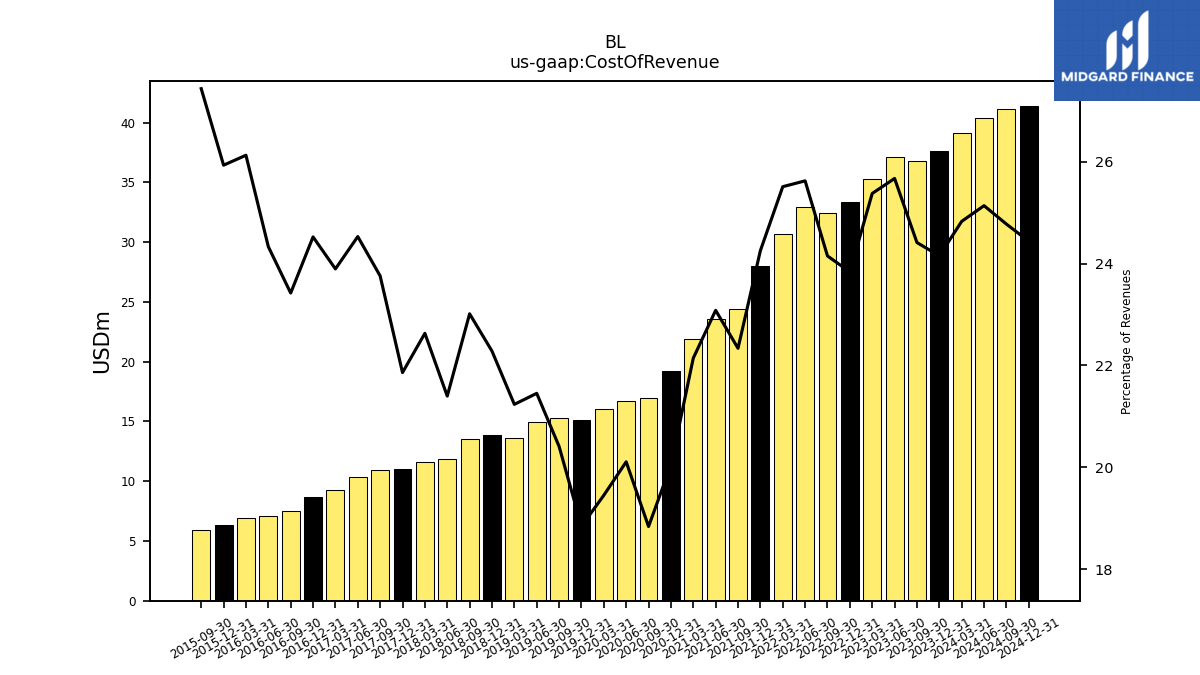
| Cost Of Revenue | 37.61 | 36.79 | 37.12 | 35.27 | 33.36 | 32.43 | 32.92 | 30.67 | 27.97 | 24.44 | 23.57 | 21.89 | 19.18 | 16.98 | 16.74 | 16.07 | 15.12 | 15.29 | 14.94 | 13.62 | 13.88 | 13.52 | 11.87 | 11.61 | 10.98 | 10.90 | 10.38 | 9.23 | 8.67 | 7.54 | 7.06 | 6.94 | 6.35 | 5.94 | NA | NA | |
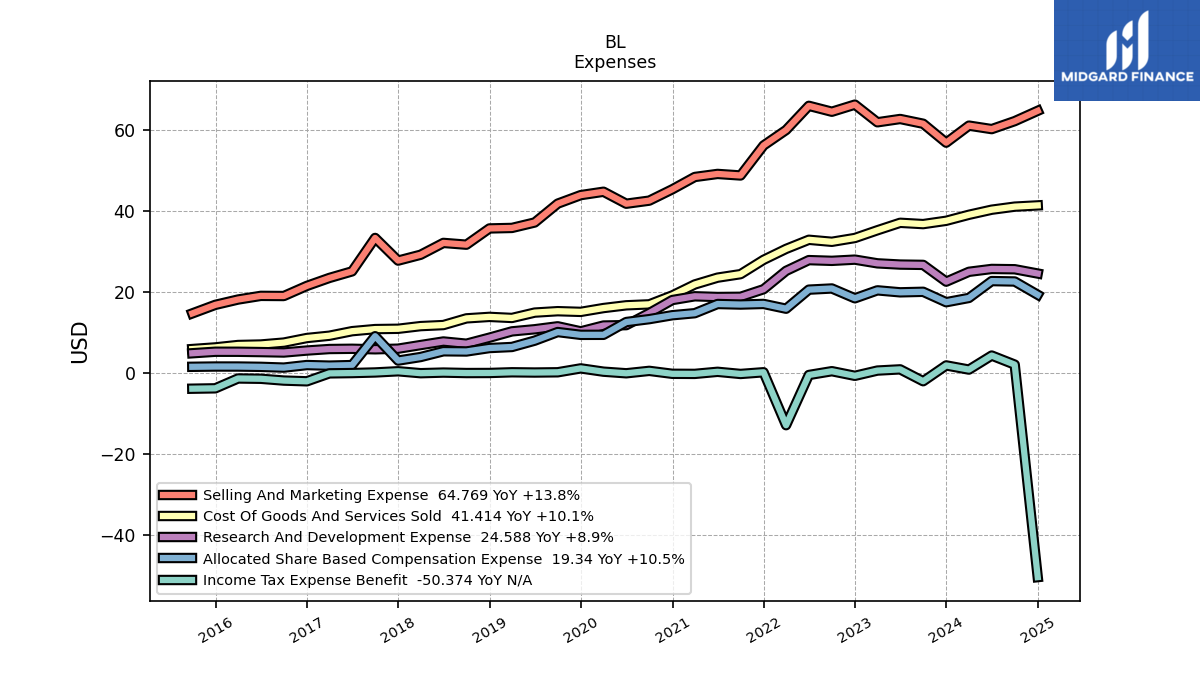
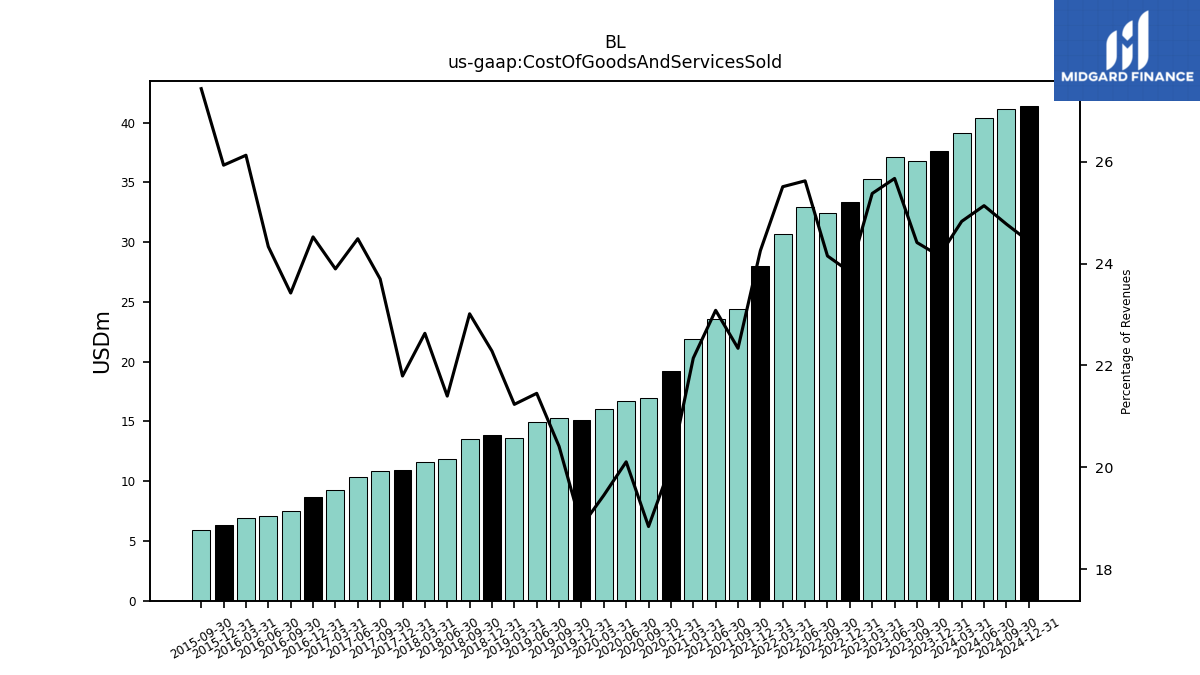
| Cost Of Goods And Services Sold | 37.61 | 36.79 | 37.12 | 35.27 | 33.36 | 32.43 | 32.92 | 30.67 | 27.97 | 24.44 | 23.57 | 21.89 | 19.18 | 16.98 | 16.74 | 16.07 | 15.12 | 15.29 | 14.94 | 13.62 | 13.88 | 13.52 | 11.87 | 11.61 | 10.95 | 10.87 | 10.36 | 9.23 | 8.67 | 7.54 | 7.06 | 6.94 | 6.35 | 5.94 | NA | NA | |
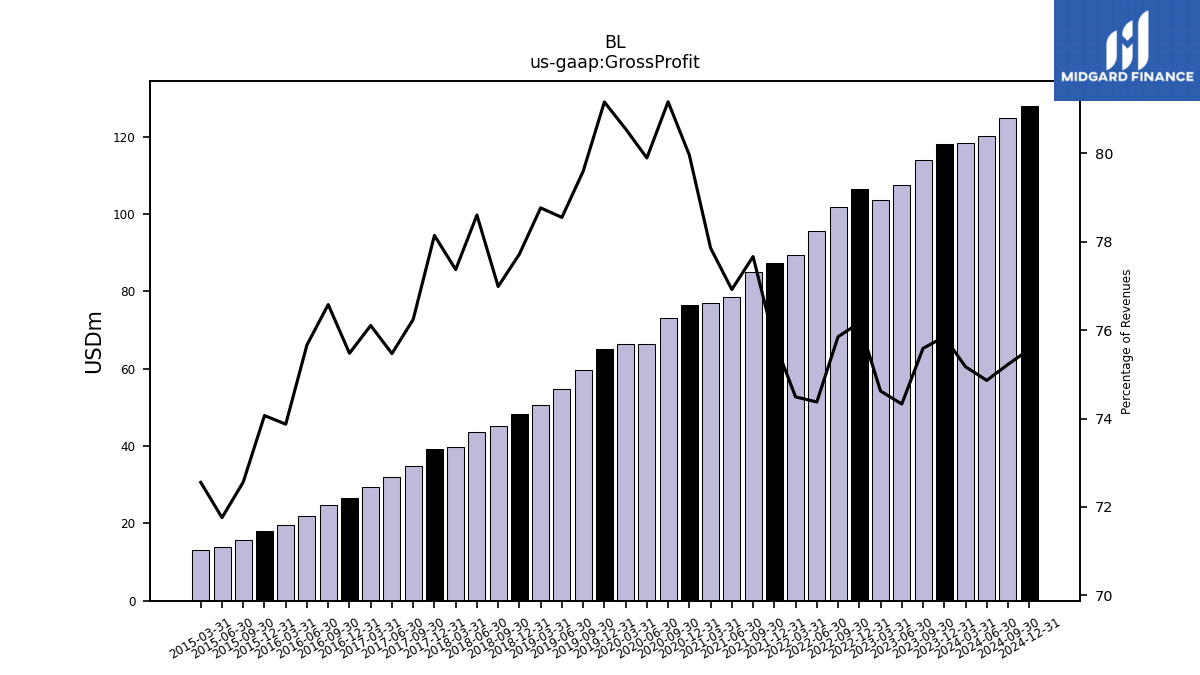
| Gross Profit | 118.12 | 113.91 | 107.46 | 103.71 | 106.59 | 101.84 | 95.55 | 89.56 | 87.35 | 84.97 | 78.55 | 76.97 | 76.53 | 73.17 | 66.53 | 66.53 | 65.14 | 59.63 | 54.72 | 50.51 | 48.43 | 45.22 | 43.59 | 39.68 | 39.25 | 34.97 | 31.92 | 29.40 | 26.67 | 24.66 | 21.96 | 19.62 | 18.13 | 15.72 | 13.94 | 13.09 | |
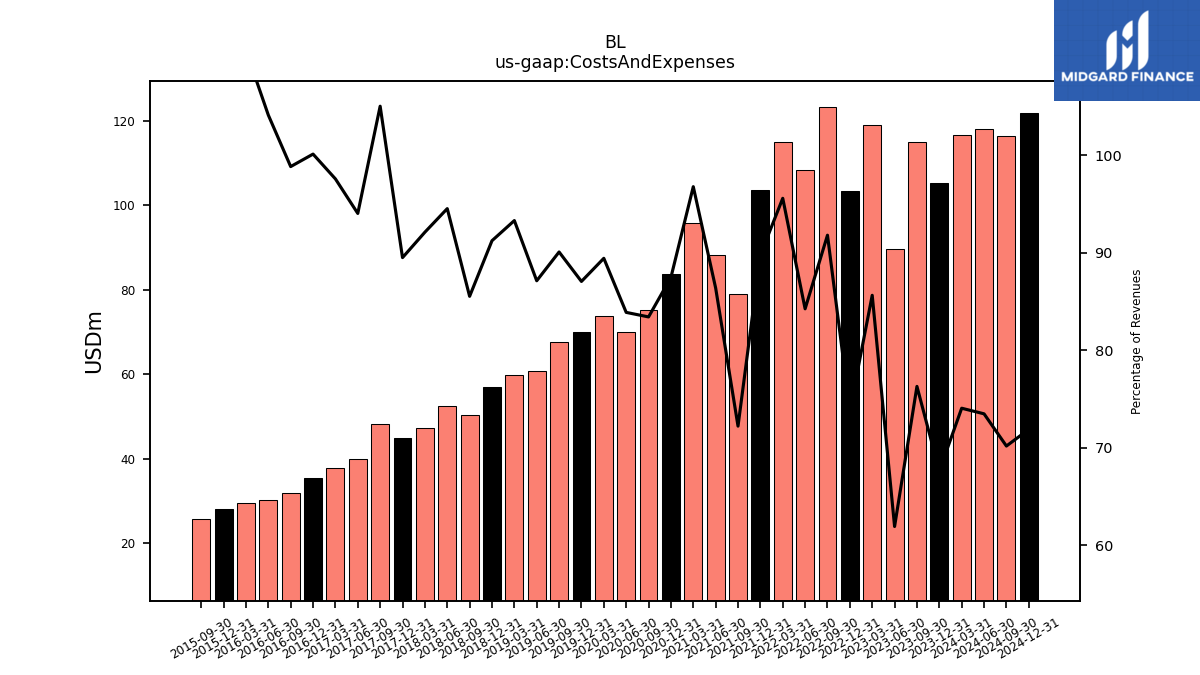
| Costs And Expenses | 105.30 | 114.99 | 89.54 | 119.03 | 103.32 | 123.26 | 108.25 | 114.93 | 103.54 | 79.01 | 88.22 | 95.67 | 83.72 | 75.21 | 69.86 | 73.87 | 69.87 | 67.49 | 60.70 | 59.83 | 56.85 | 50.24 | 52.42 | 47.24 | 44.96 | 48.18 | 39.77 | 37.70 | 35.38 | 31.82 | 30.22 | 29.42 | 28.09 | 25.56 | NA | NA | |
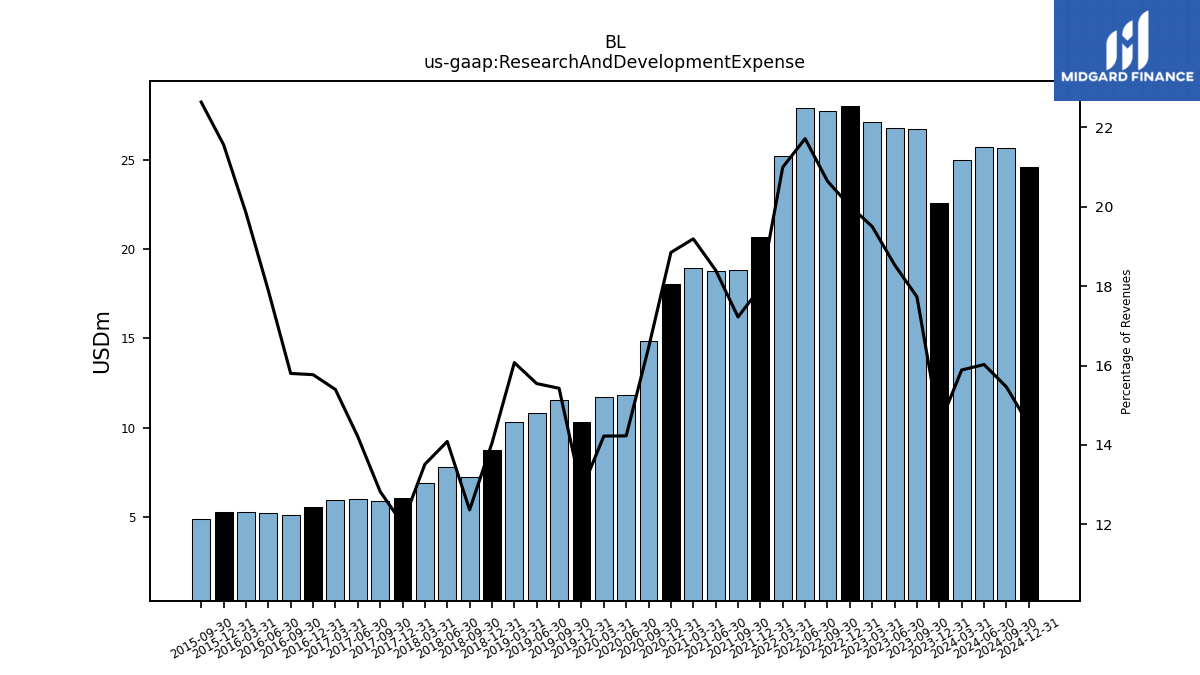
| Research And Development Expense | 22.58 | 26.72 | 26.80 | 27.11 | 28.02 | 27.72 | 27.90 | 25.25 | 20.71 | 18.84 | 18.80 | 18.97 | 18.04 | 14.83 | 11.85 | 11.75 | 10.31 | 11.56 | 10.83 | 10.31 | 8.75 | 7.26 | 7.81 | 6.93 | 6.03 | 5.88 | 6.01 | 5.95 | 5.57 | 5.09 | 5.19 | 5.27 | 5.28 | 4.90 | NA | NA | |
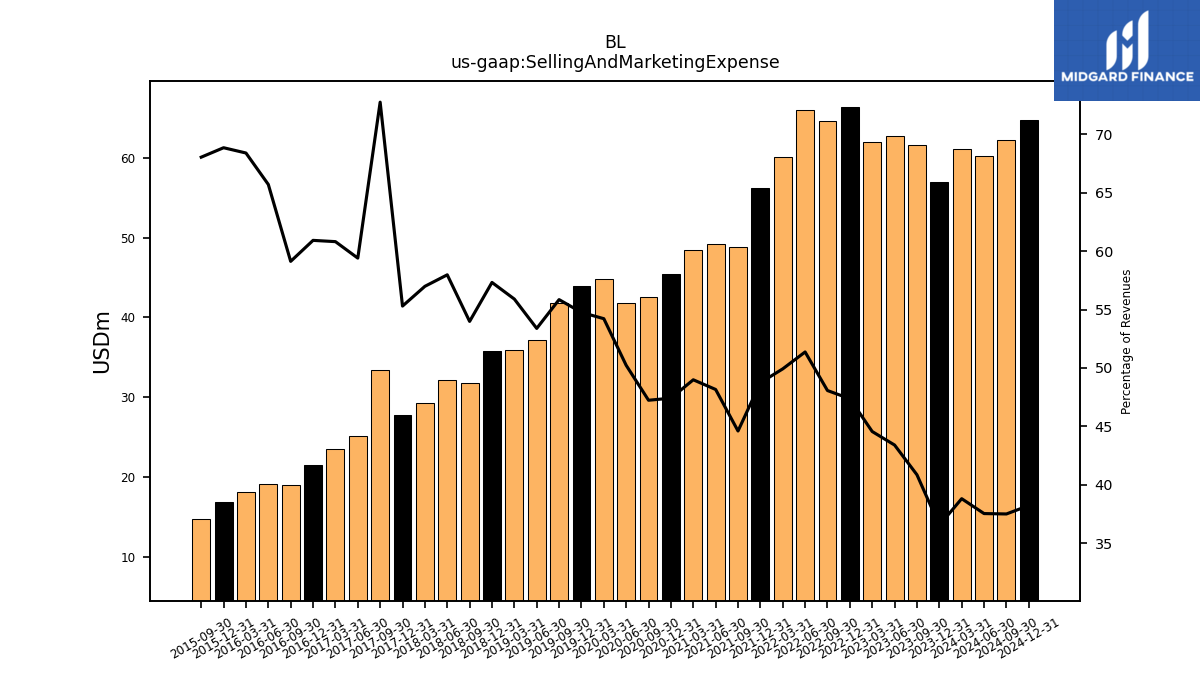
| Selling And Marketing Expense | 56.90 | 61.58 | 62.75 | 61.93 | 66.30 | 64.54 | 66.00 | 60.03 | 56.21 | 48.80 | 49.18 | 48.43 | 45.38 | 42.59 | 41.83 | 44.78 | 43.95 | 41.85 | 37.19 | 35.85 | 35.72 | 31.71 | 32.15 | 29.23 | 27.78 | 33.38 | 25.12 | 23.50 | 21.53 | 19.04 | 19.07 | 18.17 | 16.85 | 14.74 | NA | NA | |
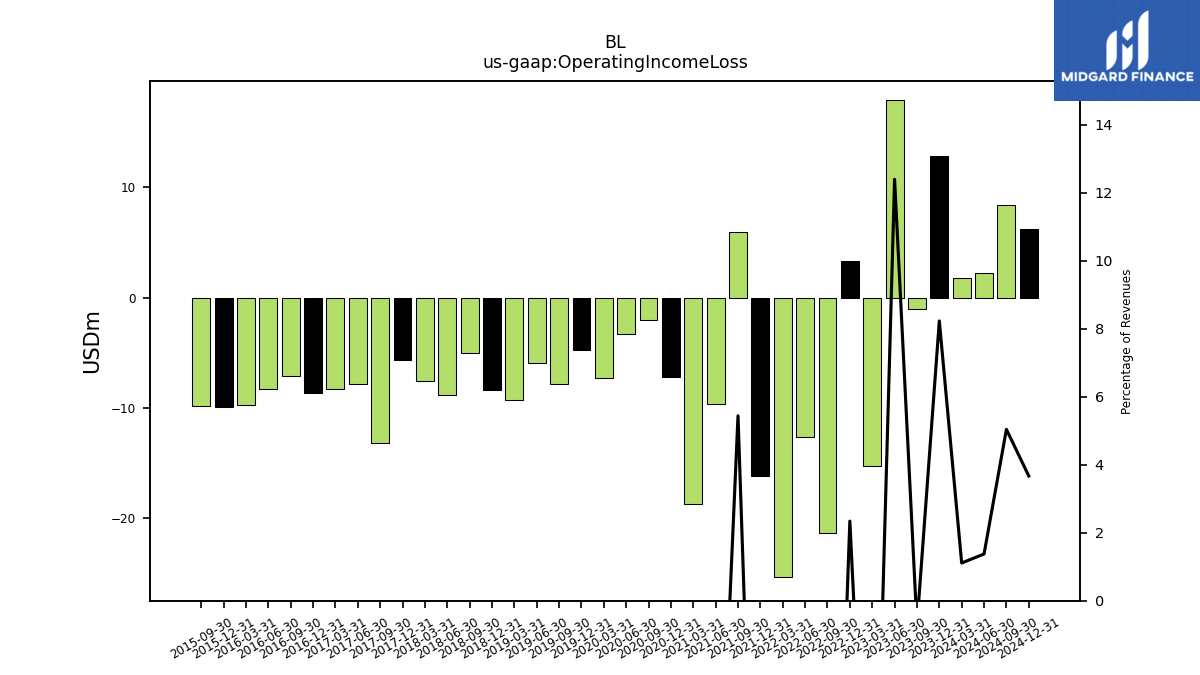
| Operating Income Loss | 12.81 | -1.07 | 17.92 | -15.31 | 3.28 | -21.42 | -12.69 | -25.36 | -16.19 | 5.95 | -9.67 | -18.70 | -7.19 | -2.04 | -3.33 | -7.34 | -4.74 | -7.86 | -5.98 | -9.32 | -8.42 | -5.02 | -8.83 | -7.56 | -5.71 | -13.21 | -7.85 | -8.29 | -8.71 | -7.17 | -8.26 | -9.80 | -9.96 | -9.84 | NA | NA | |
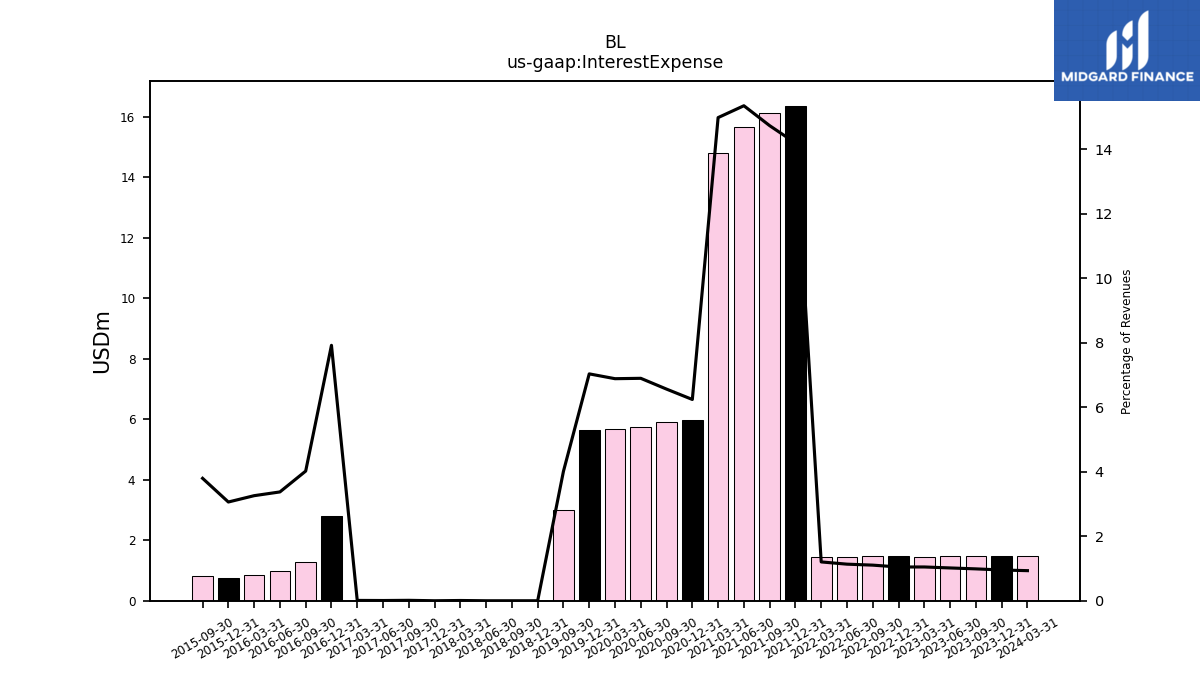
| Interest Expense | 1.48 | 1.49 | 1.47 | 1.46 | 1.46 | 1.48 | 1.46 | 1.45 | 16.36 | 16.11 | 15.67 | 14.80 | 5.97 | 5.91 | 5.74 | 5.68 | 5.64 | 3.01 | NA | NA | 0.00 | 0.00 | 0.00 | 0.00 | 0.00 | 0.01 | 0.00 | 0.00 | 2.80 | 1.29 | 0.98 | 0.86 | 0.75 | 0.82 | NA | NA | |
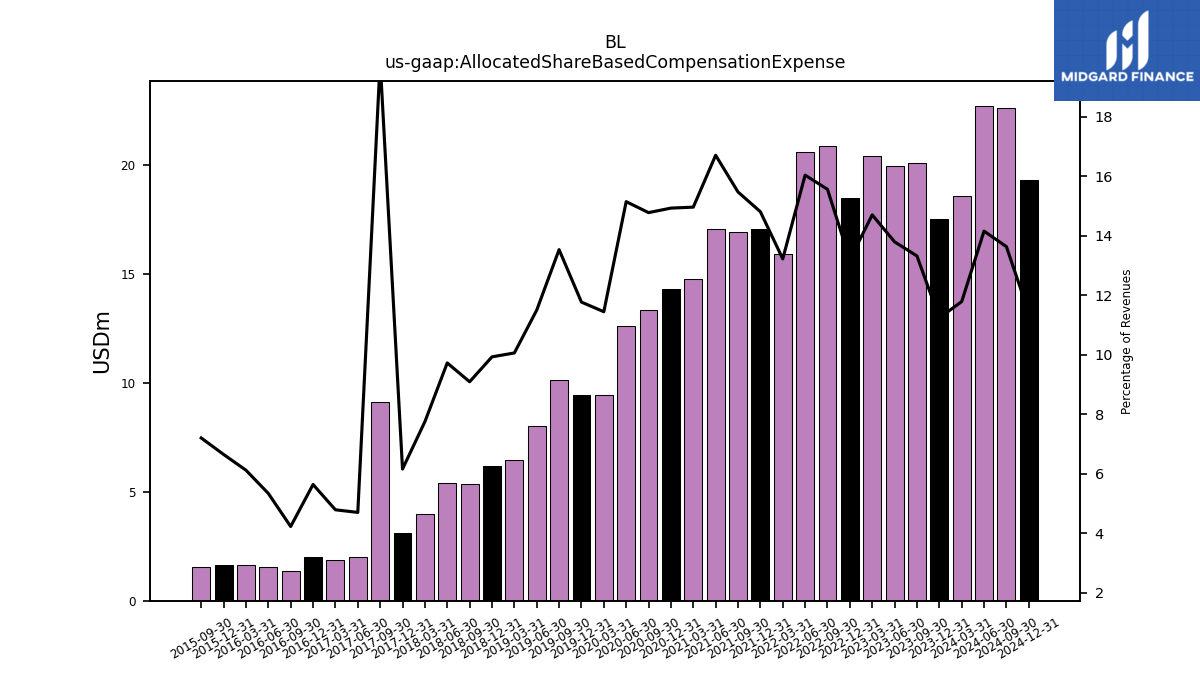
| Allocated Share Based Compensation Expense | 17.50 | 20.08 | 19.95 | 20.44 | 18.47 | 20.90 | 20.61 | 15.90 | 17.08 | 16.93 | 17.07 | 14.79 | 14.29 | 13.33 | 12.62 | 9.46 | 9.45 | 10.14 | 8.01 | 6.45 | 6.19 | 5.34 | 5.39 | 3.97 | 3.09 | 9.12 | 1.99 | 1.85 | 1.99 | 1.36 | 1.55 | 1.62 | 1.63 | 1.56 | NA | NA | |
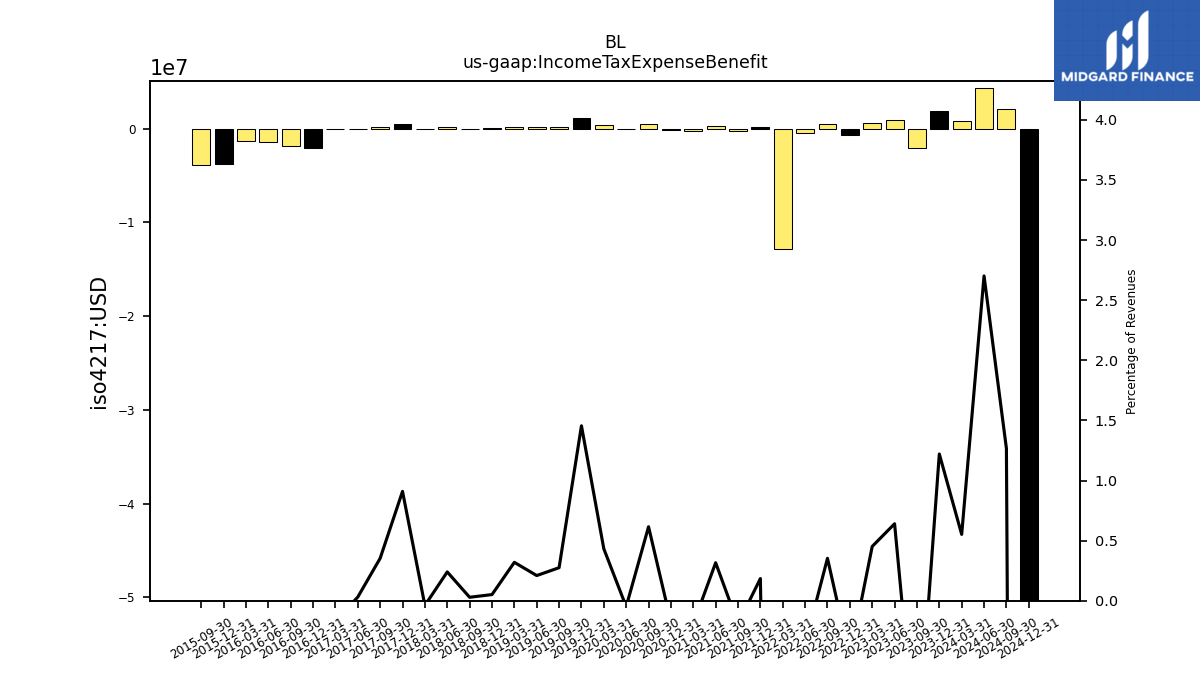
| Income Tax Expense Benefit | 1.90 | -2.00 | 0.93 | 0.63 | -0.67 | 0.47 | -0.46 | -12.86 | 0.21 | -0.21 | 0.32 | -0.19 | -0.17 | 0.56 | -0.04 | 0.36 | 1.17 | 0.21 | 0.15 | 0.20 | 0.03 | 0.02 | 0.13 | -0.02 | 0.46 | 0.16 | 0.01 | -0.07 | -2.02 | -1.84 | -1.40 | -1.32 | -3.75 | -3.85 | NA | NA | |
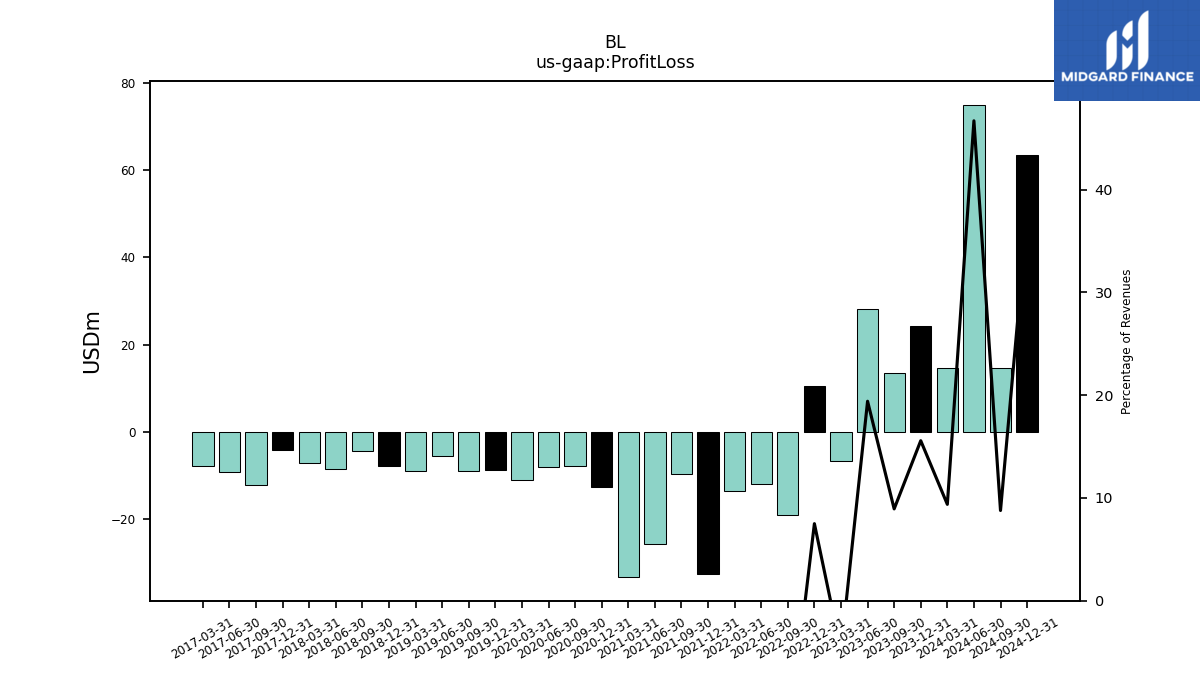
| Profit Loss | 24.25 | 13.47 | 28.07 | -6.73 | 10.50 | -18.99 | -11.97 | -13.43 | -32.48 | -9.72 | -25.58 | -33.22 | -12.63 | -7.86 | -7.94 | -10.97 | -8.71 | -8.91 | -5.39 | -8.83 | -7.79 | -4.46 | -8.46 | -7.16 | -4.17 | -12.07 | -9.13 | -7.68 | NA | NA | NA | NA | NA | NA | NA | NA | |
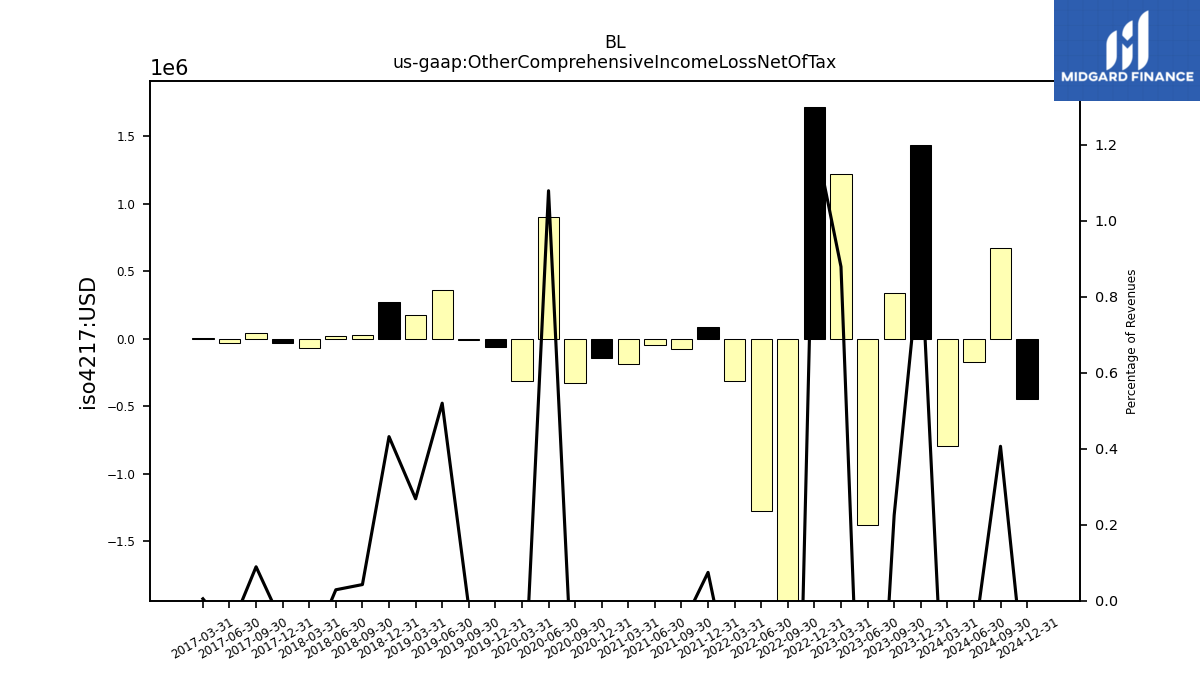
| Other Comprehensive Income Loss Net Of Tax | 1.44 | 0.34 | -1.38 | 1.22 | 1.71 | -2.20 | -1.27 | -0.31 | 0.09 | -0.08 | -0.05 | -0.19 | -0.15 | -0.33 | 0.90 | -0.31 | -0.06 | -0.01 | 0.36 | 0.17 | 0.27 | 0.03 | 0.02 | -0.07 | -0.03 | 0.04 | -0.03 | 0.00 | NA | NA | NA | NA | NA | NA | NA | NA | |
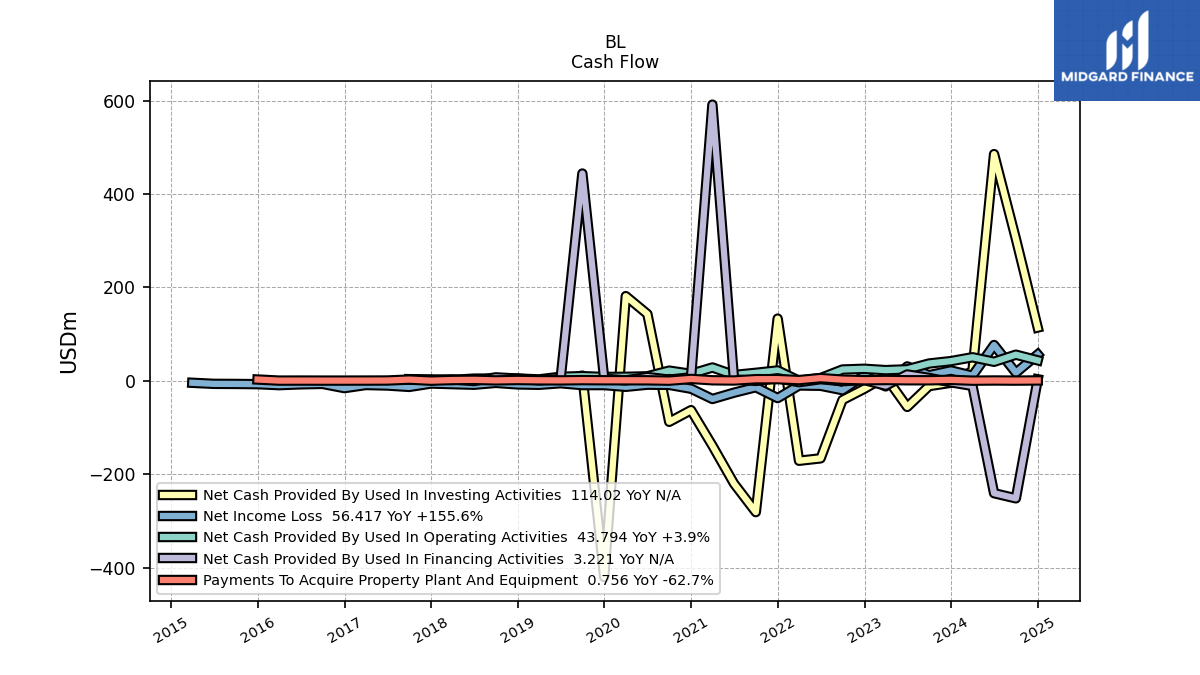
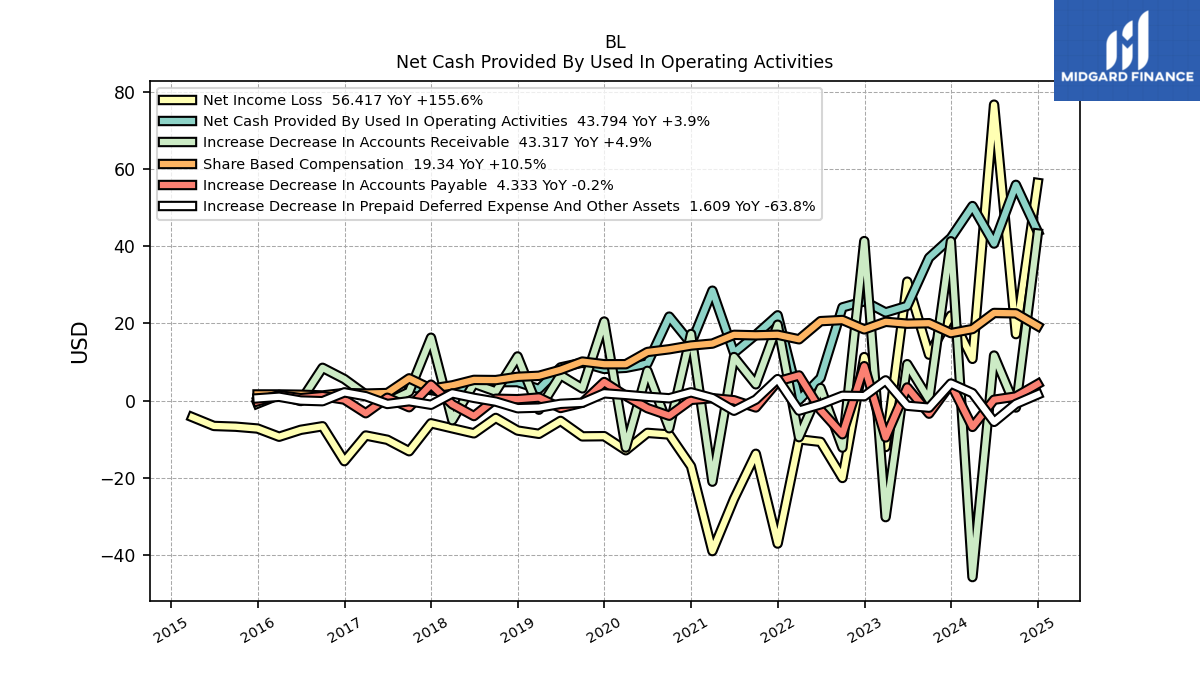
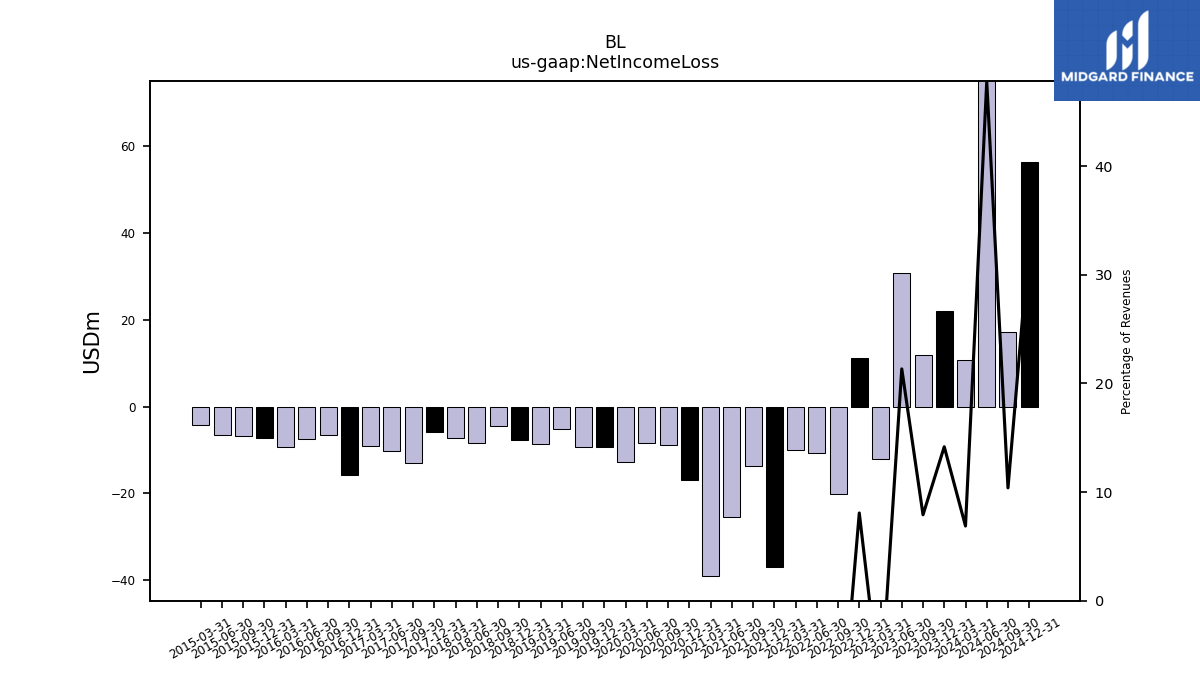
| Net Income Loss | 22.07 | 11.92 | 30.85 | -12.01 | 11.30 | -20.02 | -10.66 | -10.01 | -37.01 | -13.74 | -25.45 | -38.96 | -16.98 | -8.75 | -8.33 | -12.84 | -9.19 | -9.24 | -5.22 | -8.58 | -7.73 | -4.46 | -8.46 | -7.16 | -5.84 | -13.09 | -10.11 | -9.01 | -15.66 | -6.62 | -7.54 | -9.34 | -7.21 | -6.74 | -6.54 | -4.25 | |
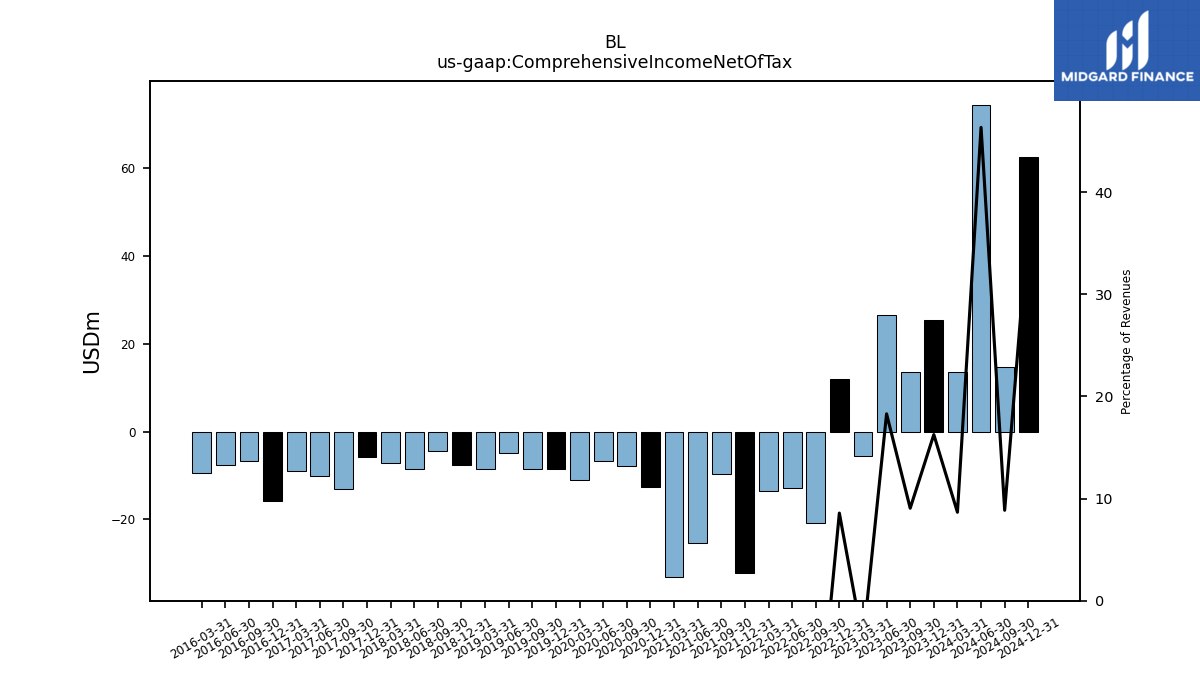
| Comprehensive Income Net Of Tax | 25.32 | 13.65 | 26.45 | -5.58 | 12.01 | -20.77 | -12.91 | -13.61 | -32.16 | -9.55 | -25.34 | -33.11 | -12.56 | -7.81 | -6.74 | -10.95 | -8.58 | -8.42 | -4.92 | -8.45 | -7.59 | -4.43 | -8.44 | -7.22 | -5.88 | -13.05 | -10.15 | -9.01 | -15.71 | -6.62 | -7.54 | -9.34 | NA | NA | NA | NA |
| 2023-12-31 | 2023-09-30 | 2023-06-30 | 2023-03-31 | 2022-12-31 | 2022-09-30 | 2022-06-30 | 2022-03-31 | 2021-12-31 | 2021-09-30 | 2021-06-30 | 2021-03-31 | 2020-12-31 | 2020-09-30 | 2020-06-30 | 2020-03-31 | 2019-12-31 | 2019-09-30 | 2019-06-30 | 2019-03-31 | 2018-12-31 | 2018-09-30 | 2018-06-30 | 2018-03-31 | 2017-12-31 | 2017-09-30 | 2017-06-30 | 2017-03-31 | 2016-12-31 | 2016-09-30 | 2016-06-30 | 2016-03-31 | 2015-12-31 | 2015-09-30 | 2015-06-30 | 2015-03-31 | ||
|---|---|---|---|---|---|---|---|---|---|---|---|---|---|---|---|---|---|---|---|---|---|---|---|---|---|---|---|---|---|---|---|---|---|---|---|---|---|
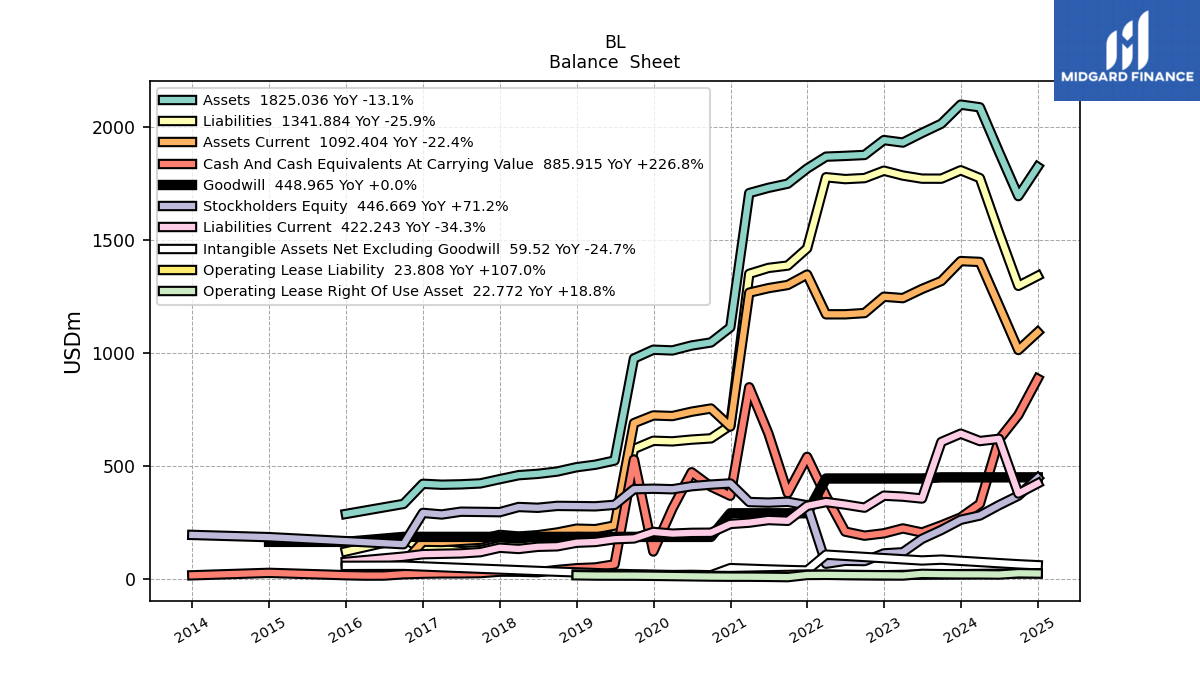
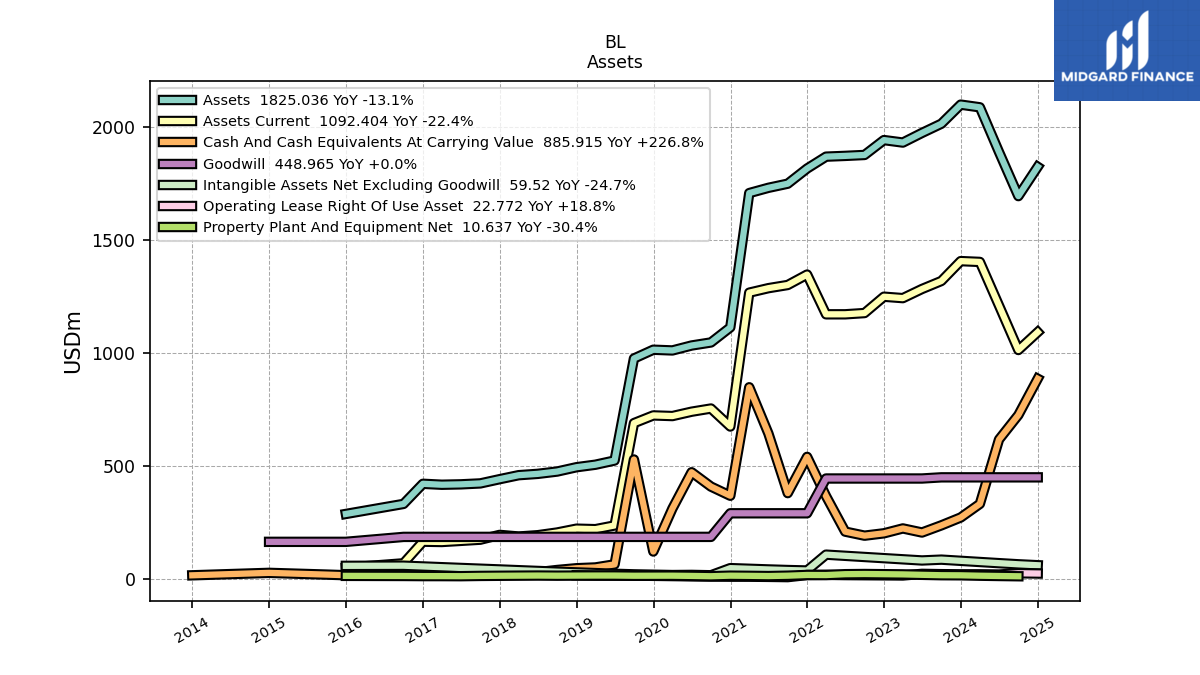
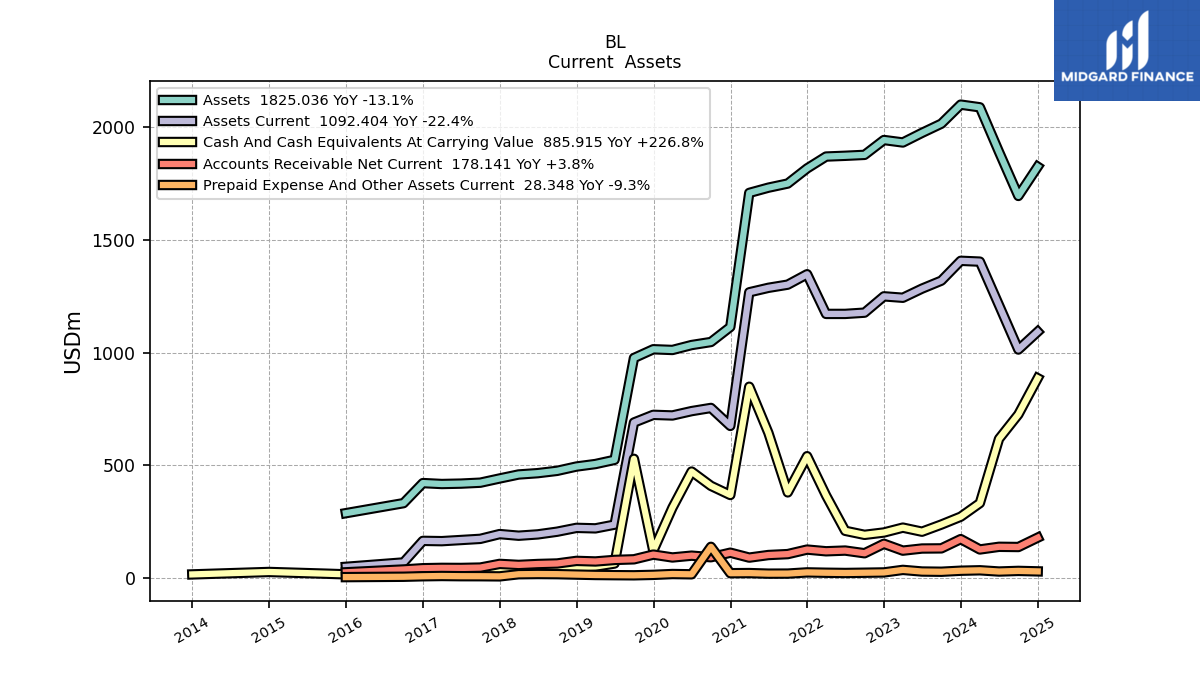
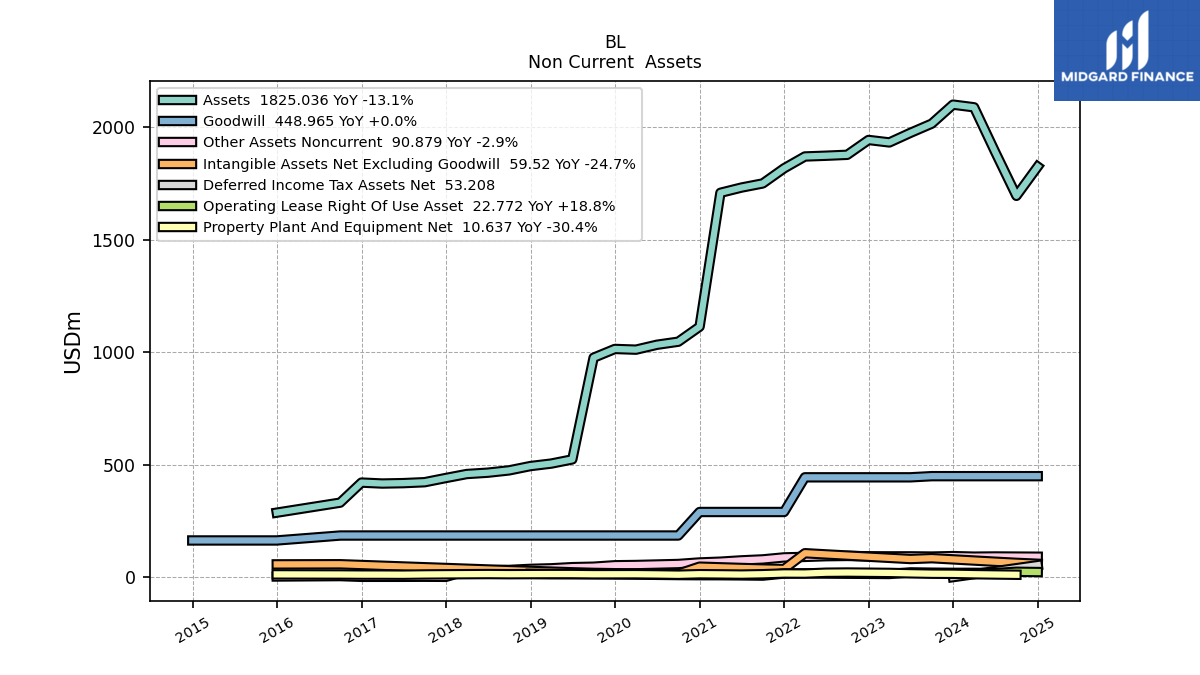
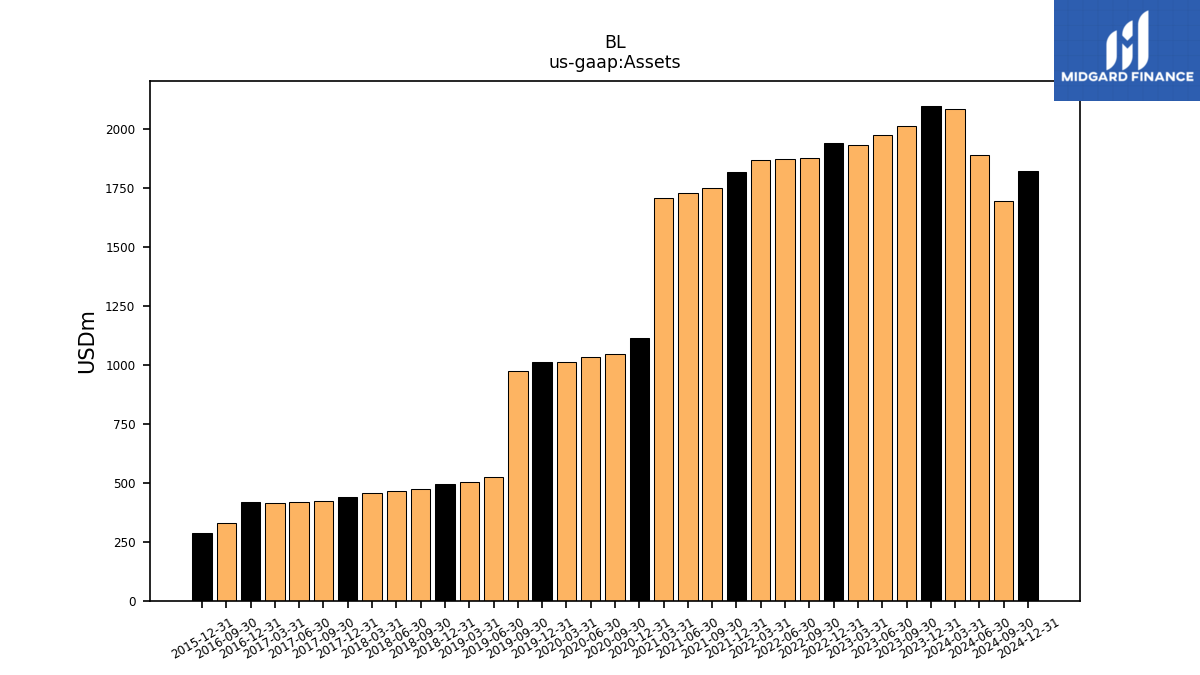
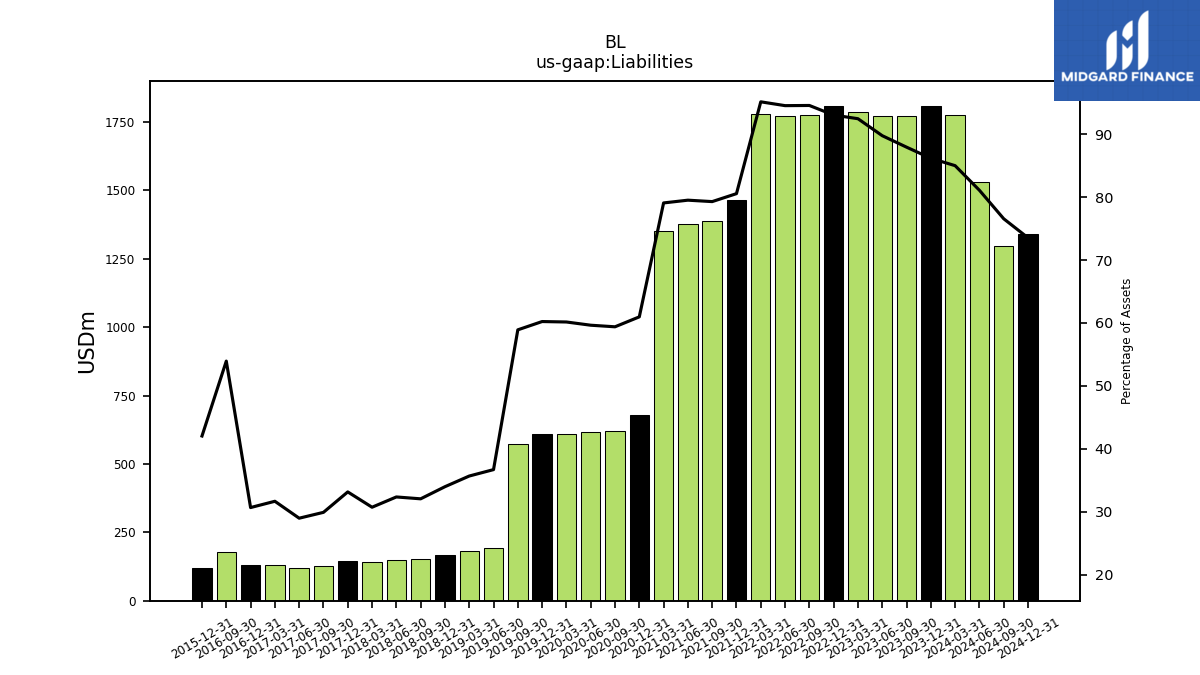
| Assets | 2100.76 | 2016.13 | 1975.37 | 1932.65 | 1943.66 | 1877.66 | 1873.57 | 1870.23 | 1817.58 | 1750.39 | 1732.07 | 1708.80 | 1113.51 | 1046.77 | 1033.25 | 1011.37 | 1014.55 | 975.64 | 523.50 | 504.95 | 493.87 | 474.69 | 464.44 | 458.51 | 440.88 | 422.12 | 417.99 | 416.24 | 420.44 | 331.24 | NA | NA | 286.75 | NA | NA | NA | |
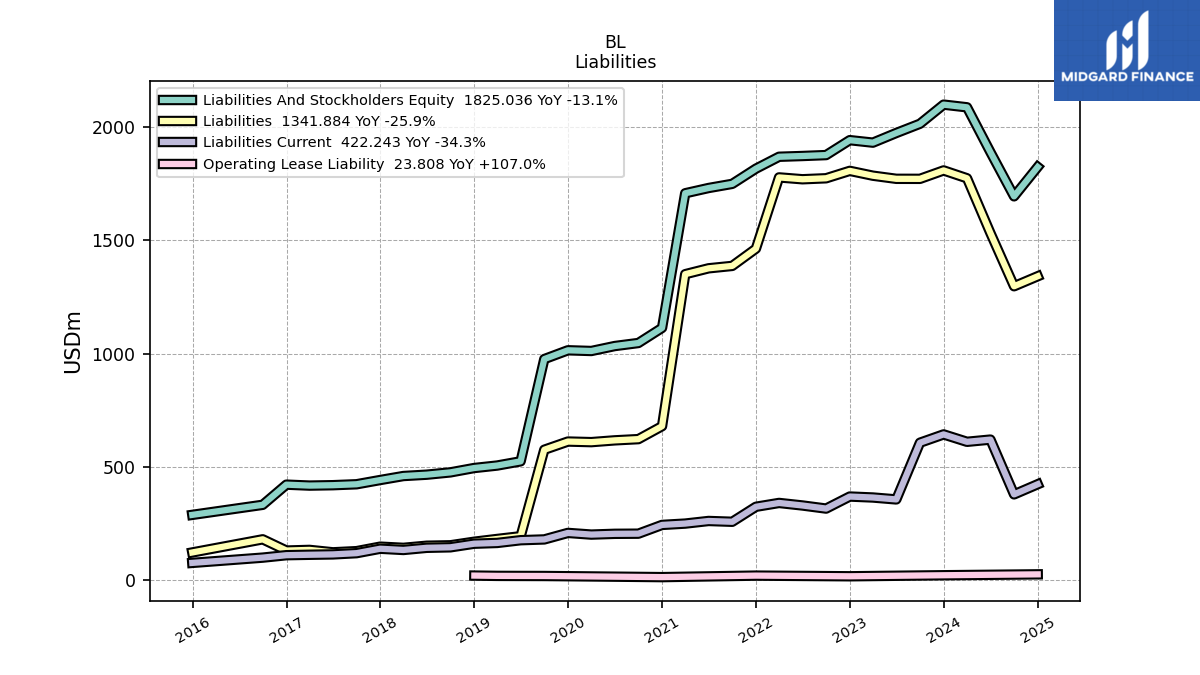
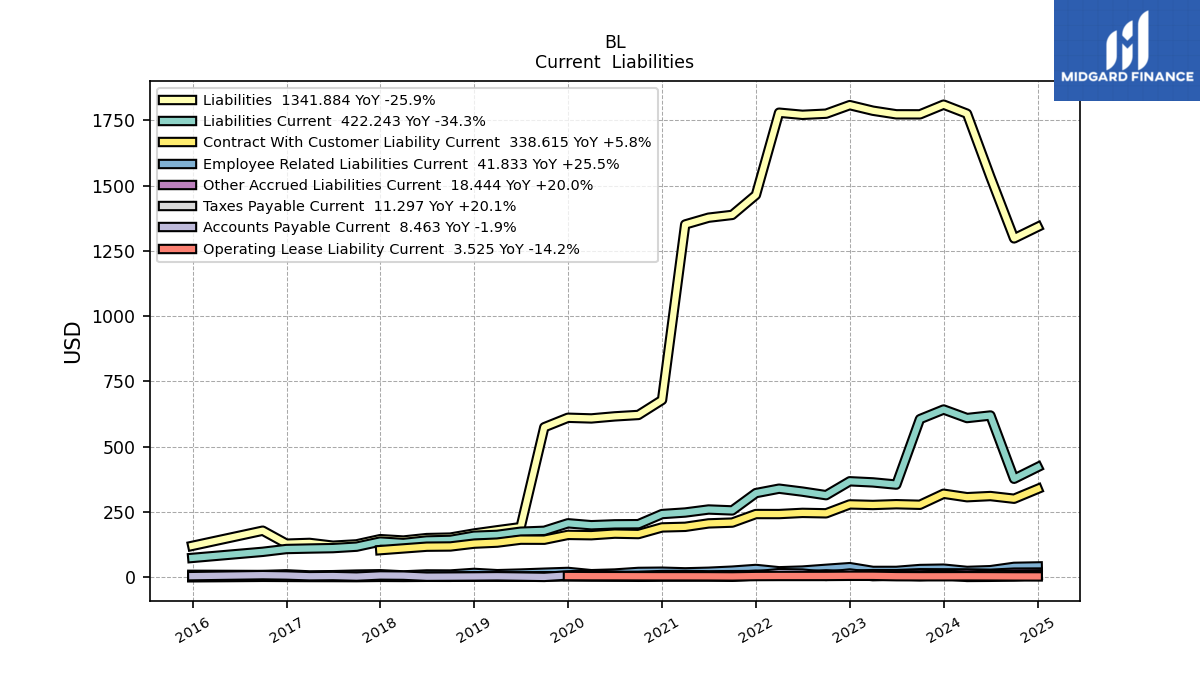
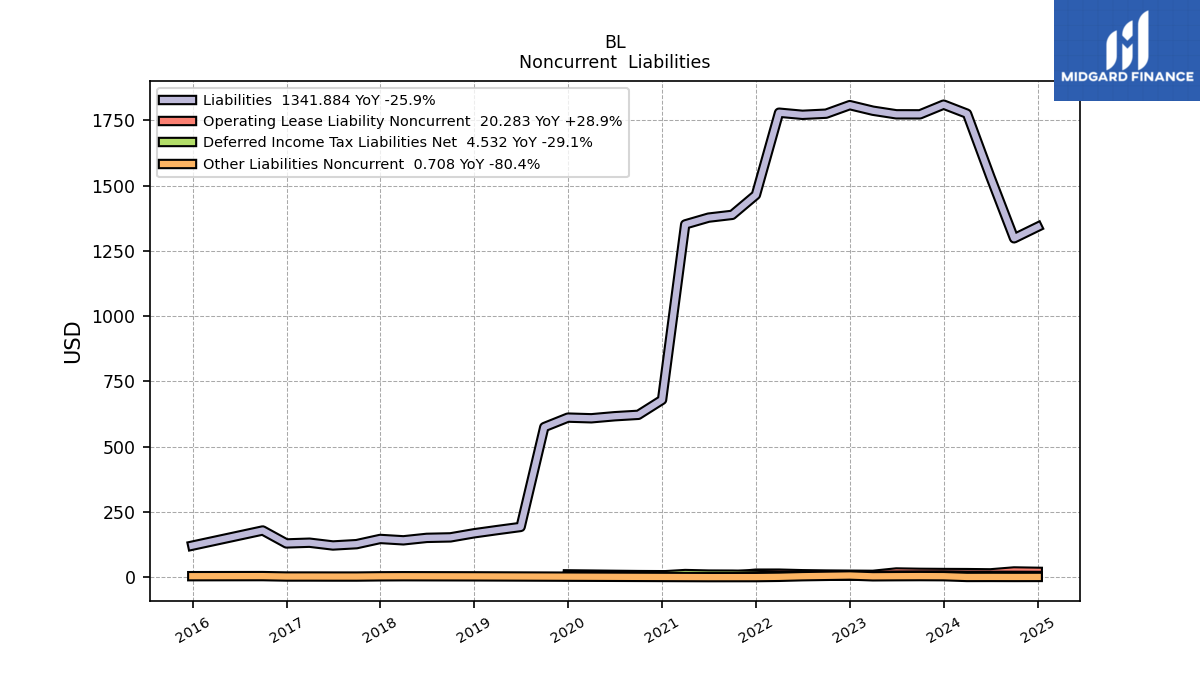
| Liabilities | 1809.82 | 1772.60 | 1772.72 | 1786.51 | 1807.89 | 1775.13 | 1770.76 | 1778.95 | 1463.84 | 1387.60 | 1376.99 | 1351.01 | 678.91 | 621.70 | 616.28 | 608.41 | 611.03 | 574.76 | 192.20 | 180.24 | 167.91 | 152.26 | 150.35 | 140.95 | 146.26 | 126.33 | 121.21 | 131.89 | 129.03 | 178.69 | NA | NA | 120.58 | NA | NA | NA | |
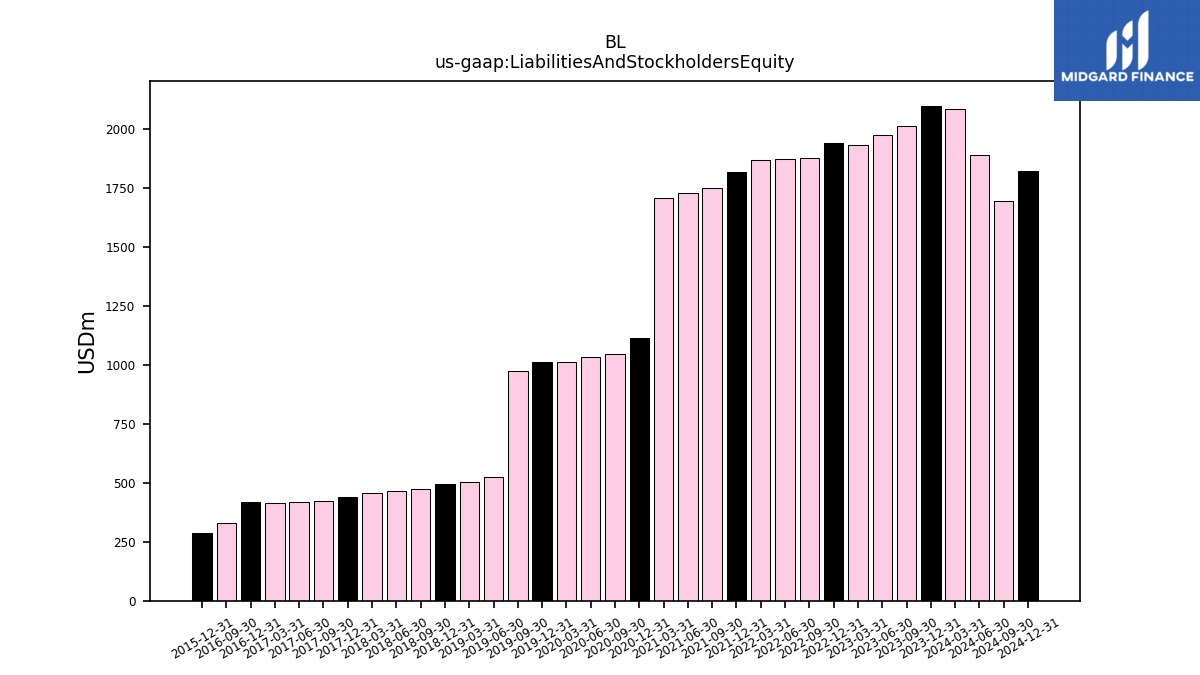
| Liabilities And Stockholders Equity | 2100.76 | 2016.13 | 1975.37 | 1932.65 | 1943.66 | 1877.66 | 1873.57 | 1870.23 | 1817.58 | 1750.39 | 1732.07 | 1708.80 | 1113.51 | 1046.77 | 1033.25 | 1011.37 | 1014.55 | 975.64 | 523.50 | 504.95 | 493.87 | 474.69 | 464.44 | 458.51 | 440.88 | 422.12 | 417.99 | 416.24 | 420.44 | 331.24 | NA | NA | 286.75 | NA | NA | NA | |
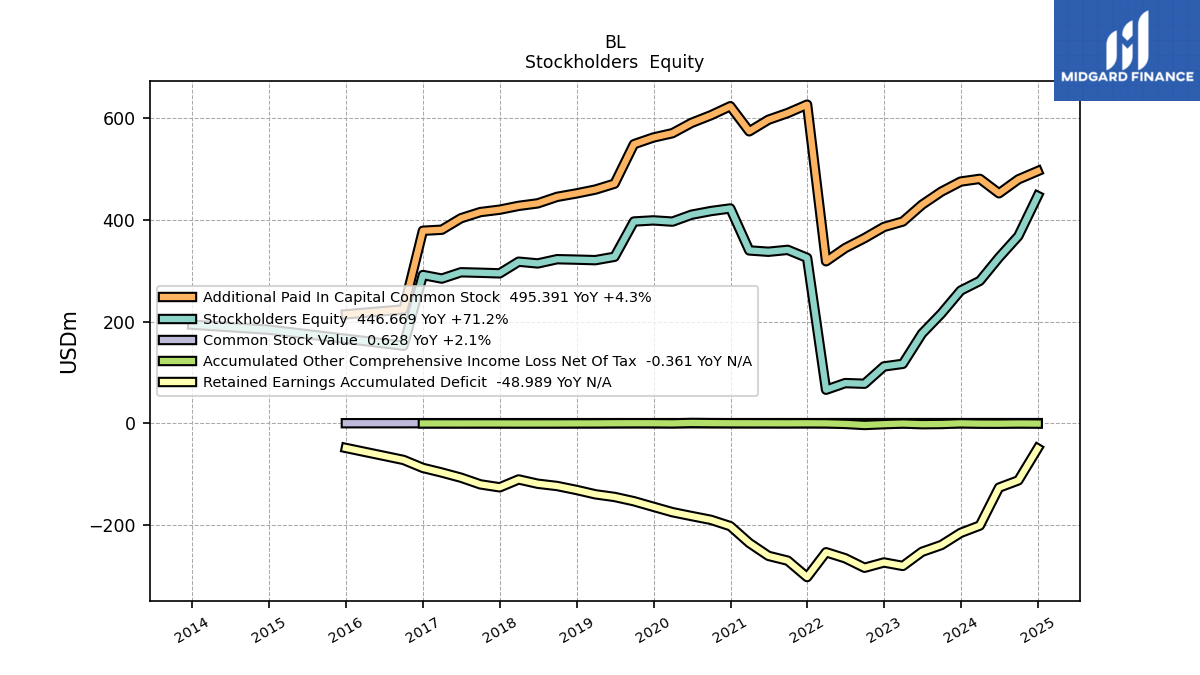
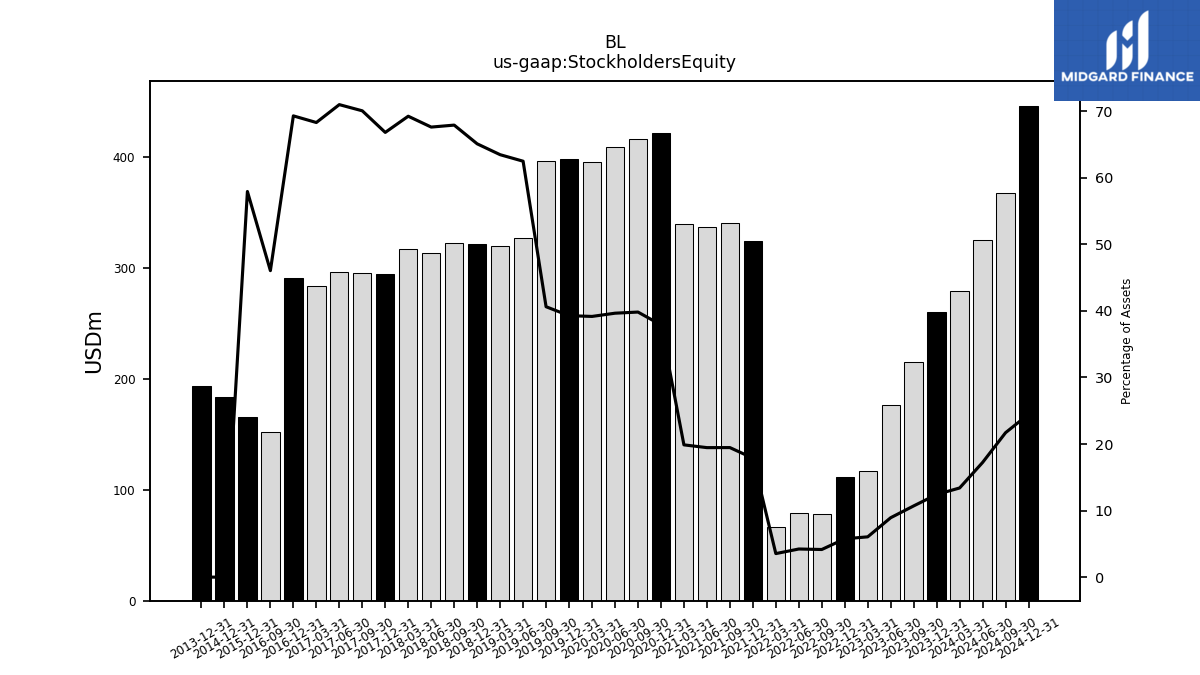
| Stockholders Equity | 260.88 | 215.73 | 176.36 | 116.99 | 111.87 | 77.93 | 79.18 | 66.13 | 325.04 | 340.74 | 337.04 | 339.63 | 422.07 | 416.93 | 409.78 | 396.19 | 398.61 | 396.42 | 327.19 | 320.54 | 321.57 | 322.43 | 314.09 | 317.56 | 294.63 | 295.79 | 296.78 | 284.35 | 291.41 | 152.55 | NA | NA | 166.17 | NA | NA | NA |
| 2023-12-31 | 2023-09-30 | 2023-06-30 | 2023-03-31 | 2022-12-31 | 2022-09-30 | 2022-06-30 | 2022-03-31 | 2021-12-31 | 2021-09-30 | 2021-06-30 | 2021-03-31 | 2020-12-31 | 2020-09-30 | 2020-06-30 | 2020-03-31 | 2019-12-31 | 2019-09-30 | 2019-06-30 | 2019-03-31 | 2018-12-31 | 2018-09-30 | 2018-06-30 | 2018-03-31 | 2017-12-31 | 2017-09-30 | 2017-06-30 | 2017-03-31 | 2016-12-31 | 2016-09-30 | 2016-06-30 | 2016-03-31 | 2015-12-31 | 2015-09-30 | 2015-06-30 | 2015-03-31 | ||
|---|---|---|---|---|---|---|---|---|---|---|---|---|---|---|---|---|---|---|---|---|---|---|---|---|---|---|---|---|---|---|---|---|---|---|---|---|---|
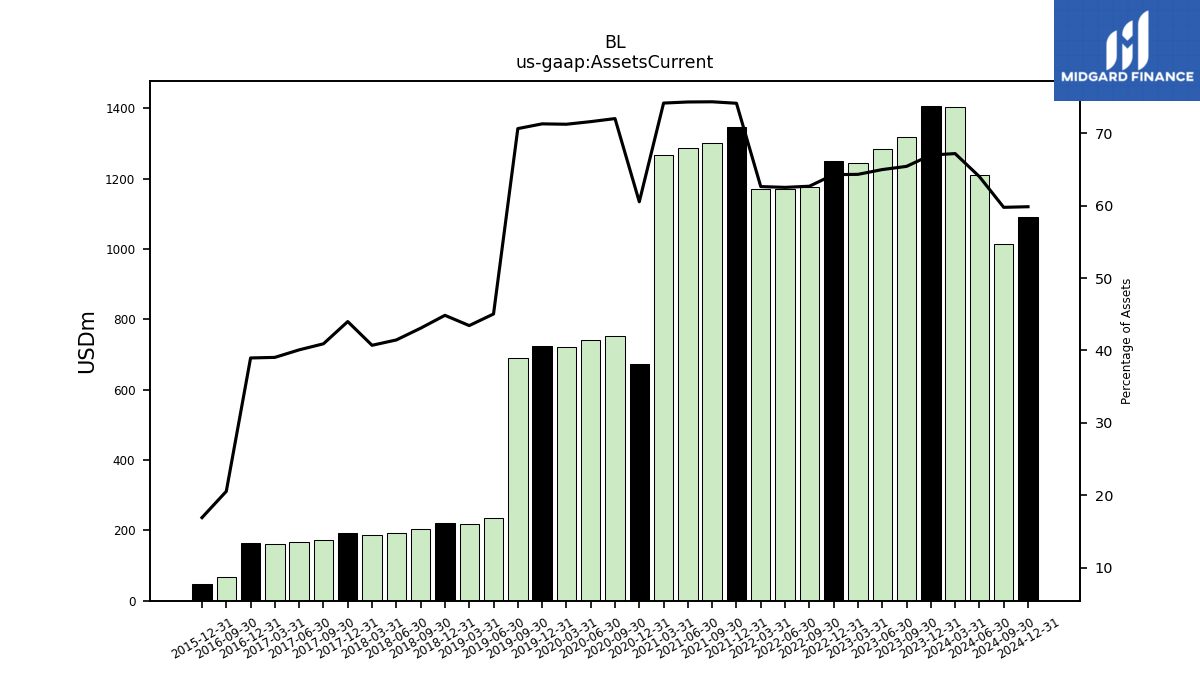
| Assets Current | 1407.32 | 1319.14 | 1283.75 | 1243.20 | 1249.57 | 1177.08 | 1171.52 | 1171.48 | 1347.69 | 1301.43 | 1287.36 | 1267.49 | 674.12 | 754.00 | 739.91 | 720.60 | 723.41 | 689.26 | 235.78 | 219.34 | 221.52 | 204.49 | 192.53 | 186.68 | 193.95 | 172.74 | 167.55 | 162.51 | 163.82 | 68.03 | NA | NA | 48.49 | NA | NA | NA | |
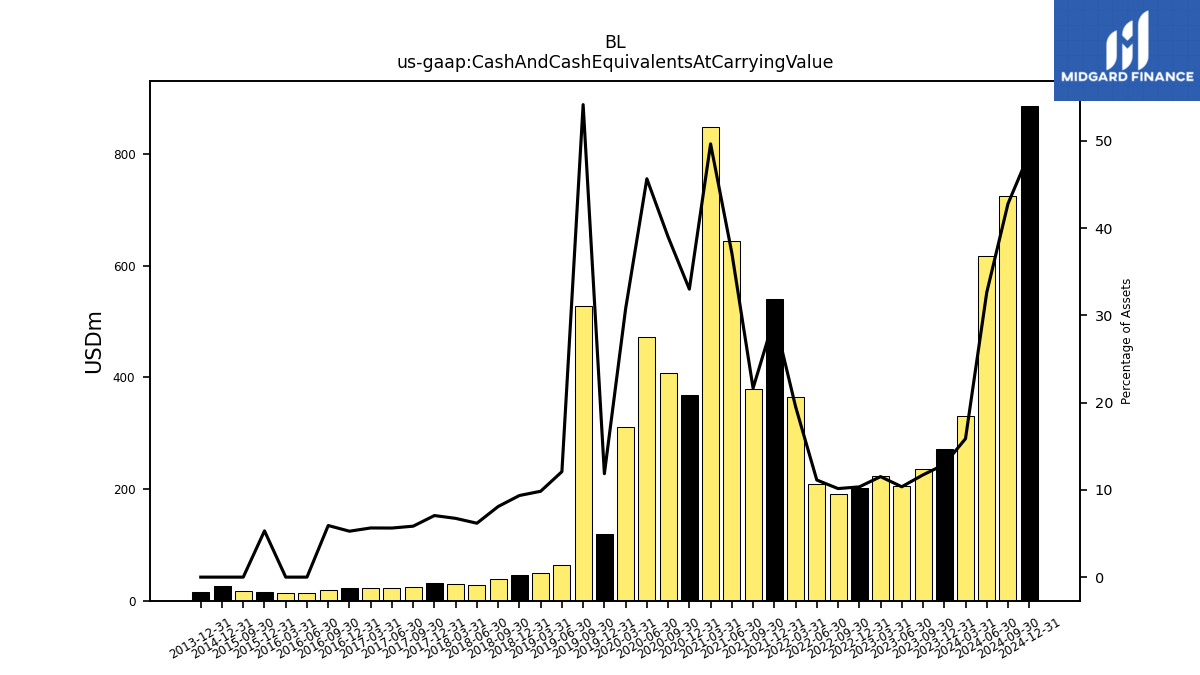
| Cash And Cash Equivalents At Carrying Value | 271.12 | 236.25 | 204.51 | 222.56 | 200.97 | 190.51 | 208.45 | 365.52 | 539.74 | 378.98 | 643.34 | 848.27 | 367.41 | 408.07 | 471.62 | 310.99 | 120.23 | 528.20 | 63.26 | 49.68 | 46.18 | 38.40 | 28.68 | 30.86 | 31.10 | 24.64 | 23.51 | 23.45 | 22.12 | 19.59 | 13.65 | 13.46 | 15.21 | 18.02 | NA | NA | |
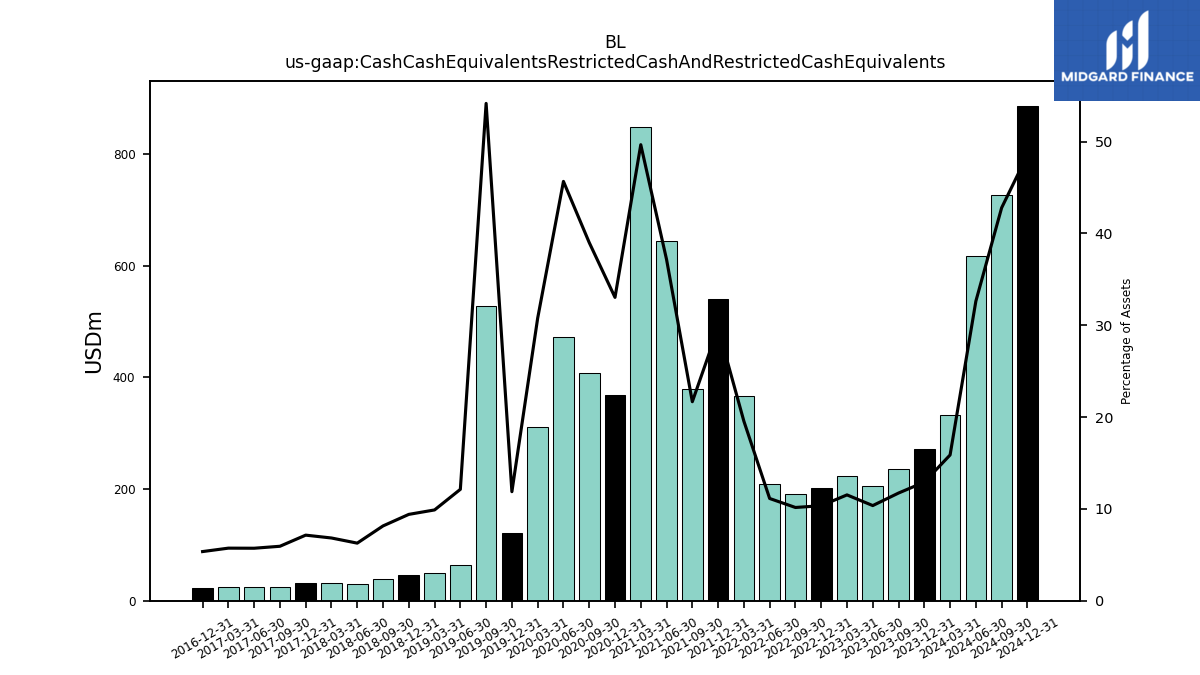
| Cash Cash Equivalents Restricted Cash And Restricted Cash Equivalents | 271.36 | 236.48 | 204.75 | 222.80 | 201.21 | 190.73 | 208.69 | 365.77 | 539.99 | 379.44 | 643.82 | 848.74 | 367.91 | 408.35 | 471.89 | 311.25 | 120.50 | 528.46 | 63.53 | 49.95 | 46.45 | 38.68 | 29.14 | 31.34 | 31.50 | 25.05 | 23.91 | 23.85 | 22.52 | NA | NA | NA | NA | NA | NA | NA | |
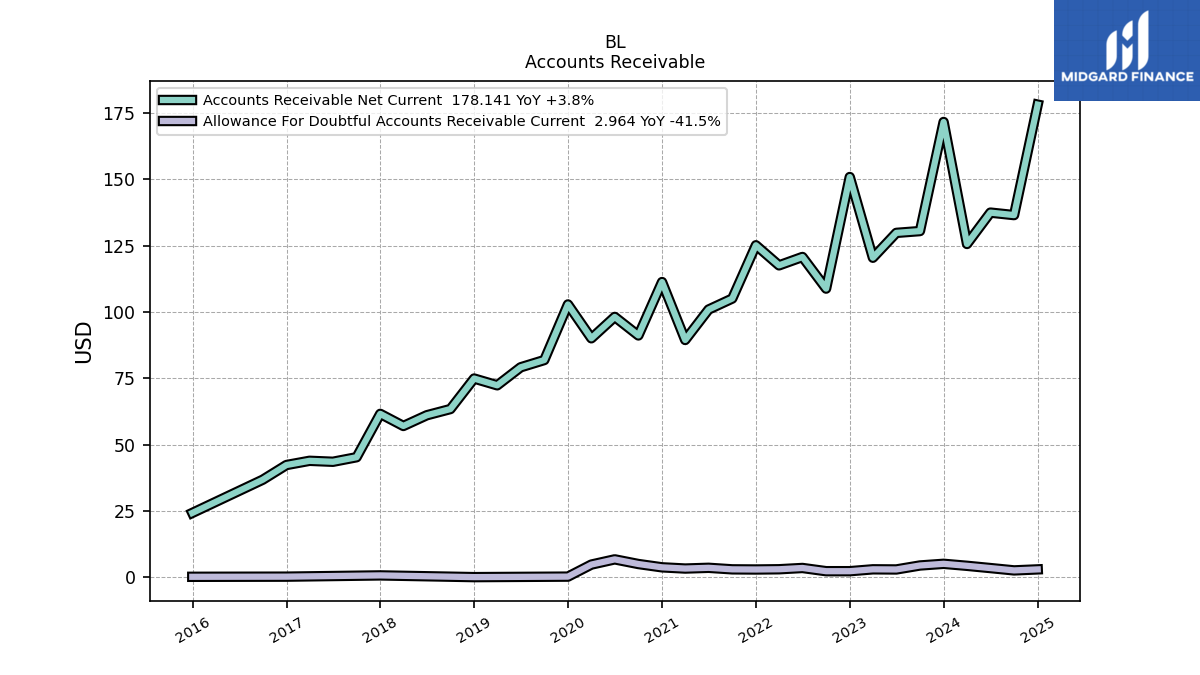
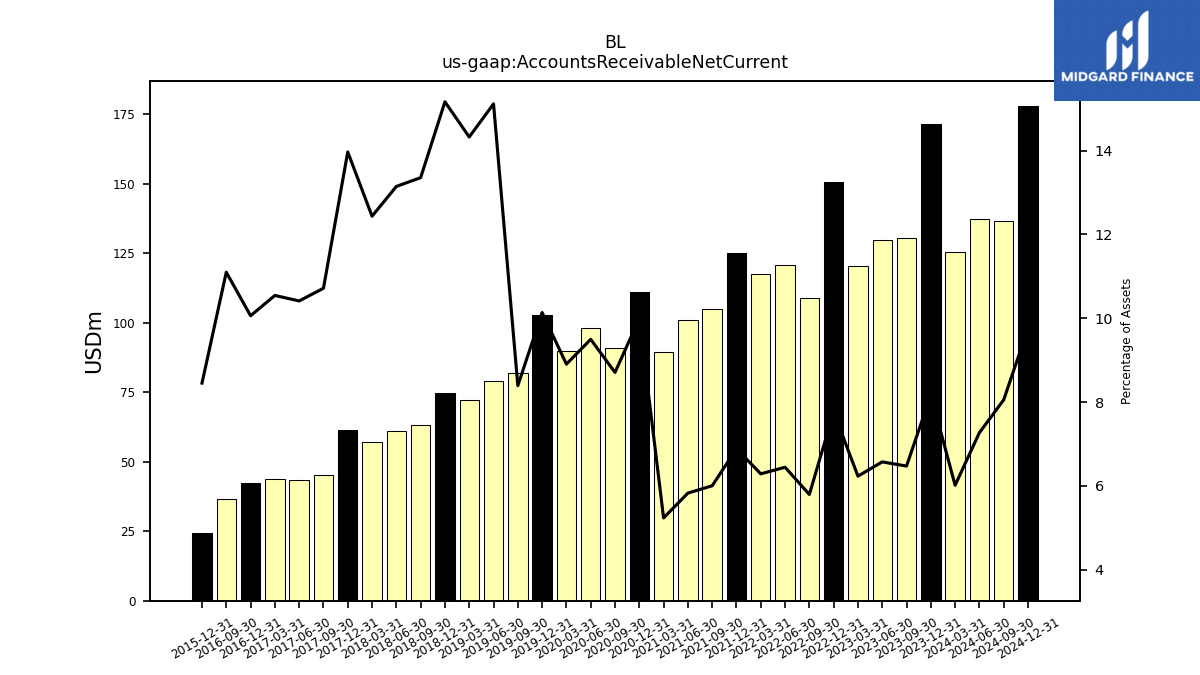
| Accounts Receivable Net Current | 171.61 | 130.48 | 129.80 | 120.42 | 150.86 | 108.79 | 120.72 | 117.55 | 125.13 | 105.04 | 100.91 | 89.42 | 111.27 | 91.14 | 98.12 | 90.06 | 102.83 | 81.86 | 79.14 | 72.34 | 74.90 | 63.40 | 61.06 | 57.02 | 61.59 | 45.23 | 43.52 | 43.89 | 42.29 | 36.76 | NA | NA | 24.23 | NA | NA | NA | |
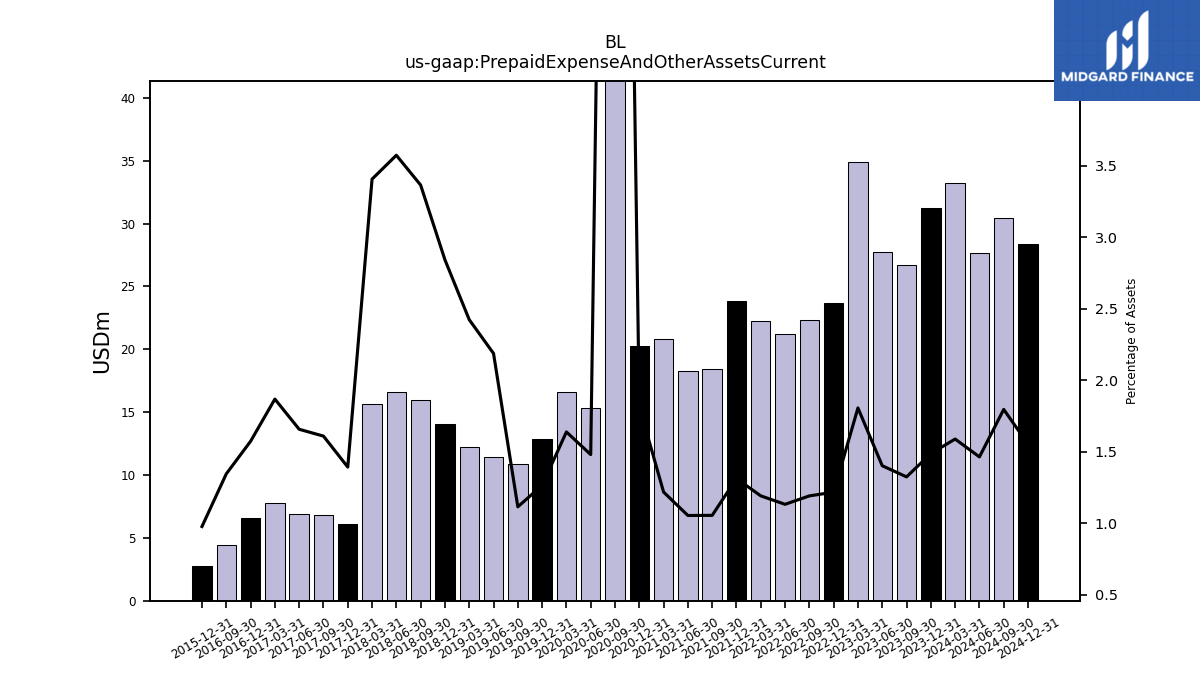
| Prepaid Expense And Other Assets Current | 31.24 | 26.69 | 27.70 | 34.91 | 23.66 | 22.36 | 21.21 | 22.28 | 23.86 | 18.46 | 18.25 | 20.81 | 20.23 | 137.36 | 15.29 | 16.57 | 12.83 | 10.87 | 11.45 | 12.24 | 14.04 | 15.98 | 16.60 | 15.62 | 6.14 | 6.79 | 6.93 | 7.78 | 6.61 | 4.46 | NA | NA | 2.80 | NA | NA | NA |
| 2023-12-31 | 2023-09-30 | 2023-06-30 | 2023-03-31 | 2022-12-31 | 2022-09-30 | 2022-06-30 | 2022-03-31 | 2021-12-31 | 2021-09-30 | 2021-06-30 | 2021-03-31 | 2020-12-31 | 2020-09-30 | 2020-06-30 | 2020-03-31 | 2019-12-31 | 2019-09-30 | 2019-06-30 | 2019-03-31 | 2018-12-31 | 2018-09-30 | 2018-06-30 | 2018-03-31 | 2017-12-31 | 2017-09-30 | 2017-06-30 | 2017-03-31 | 2016-12-31 | 2016-09-30 | 2016-06-30 | 2016-03-31 | 2015-12-31 | 2015-09-30 | 2015-06-30 | 2015-03-31 | ||
|---|---|---|---|---|---|---|---|---|---|---|---|---|---|---|---|---|---|---|---|---|---|---|---|---|---|---|---|---|---|---|---|---|---|---|---|---|---|
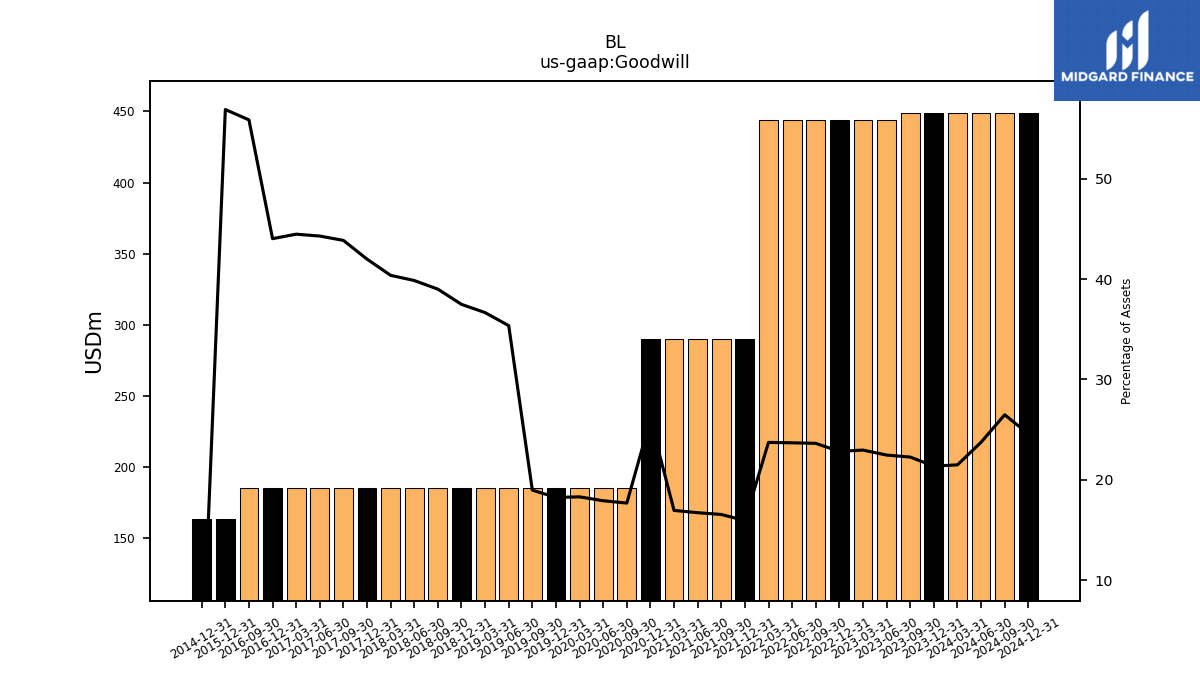
| Goodwill | 448.96 | 448.99 | 443.86 | 443.86 | 443.86 | 443.86 | 443.86 | 443.86 | 289.71 | 289.71 | 289.71 | 289.71 | 289.71 | 185.14 | 185.14 | 185.14 | 185.14 | 185.14 | 185.14 | 185.14 | 185.14 | 185.14 | 185.14 | 185.14 | 185.14 | 185.14 | 185.14 | 185.14 | 185.14 | 185.05 | NA | NA | 163.15 | NA | NA | NA | |
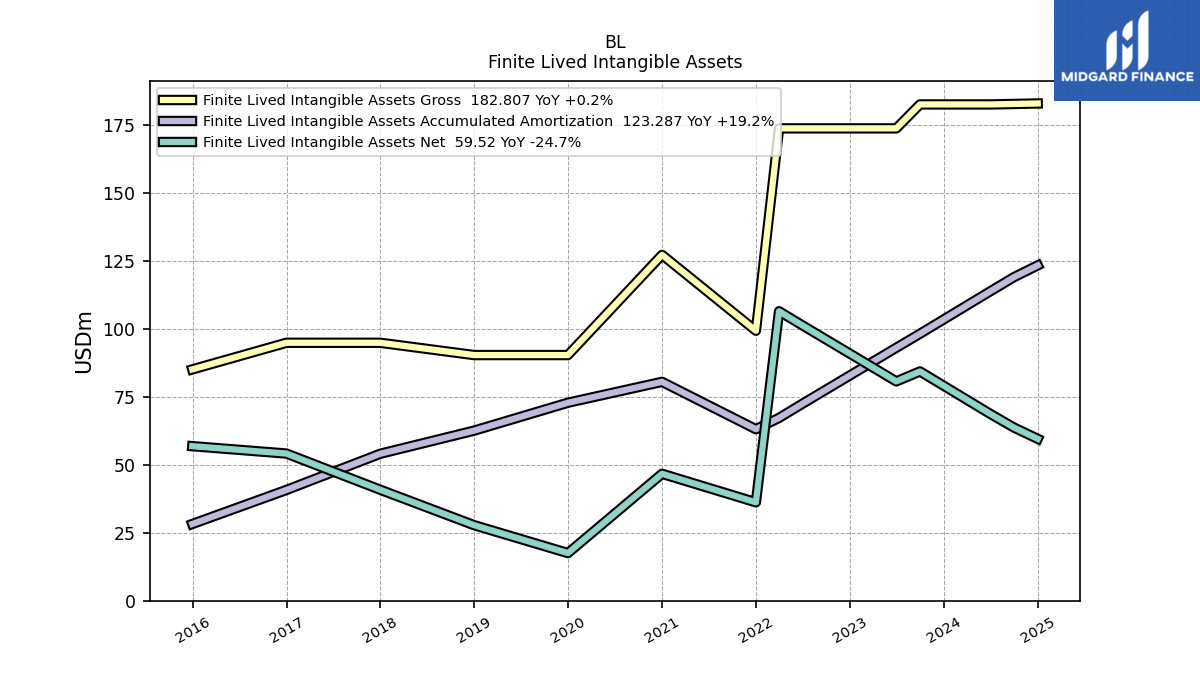
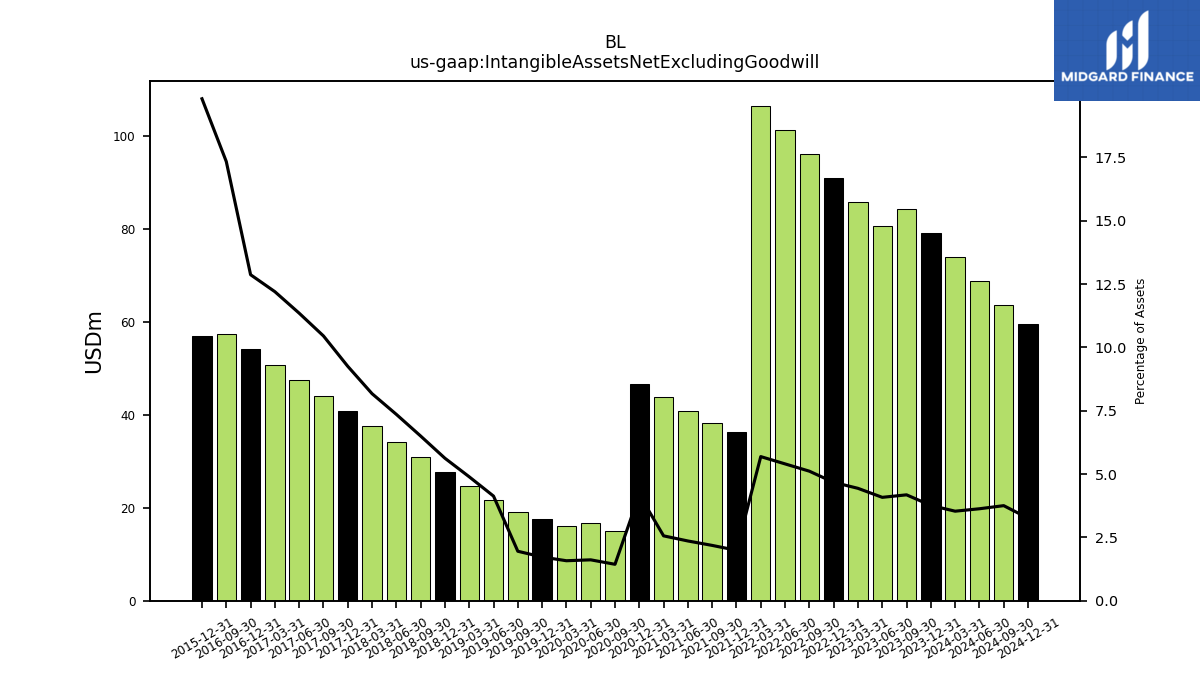
| Intangible Assets Net Excluding Goodwill | 79.06 | 84.31 | 80.64 | 85.78 | 90.86 | 96.05 | 101.23 | 106.43 | 36.20 | 38.24 | 40.87 | 43.78 | 46.67 | 15.07 | 16.69 | 15.98 | 17.52 | 19.06 | 21.63 | 24.71 | 27.79 | 30.87 | 34.17 | 37.48 | 40.81 | 44.13 | 47.45 | 50.79 | 54.12 | 57.43 | NA | NA | 56.83 | NA | NA | NA | |
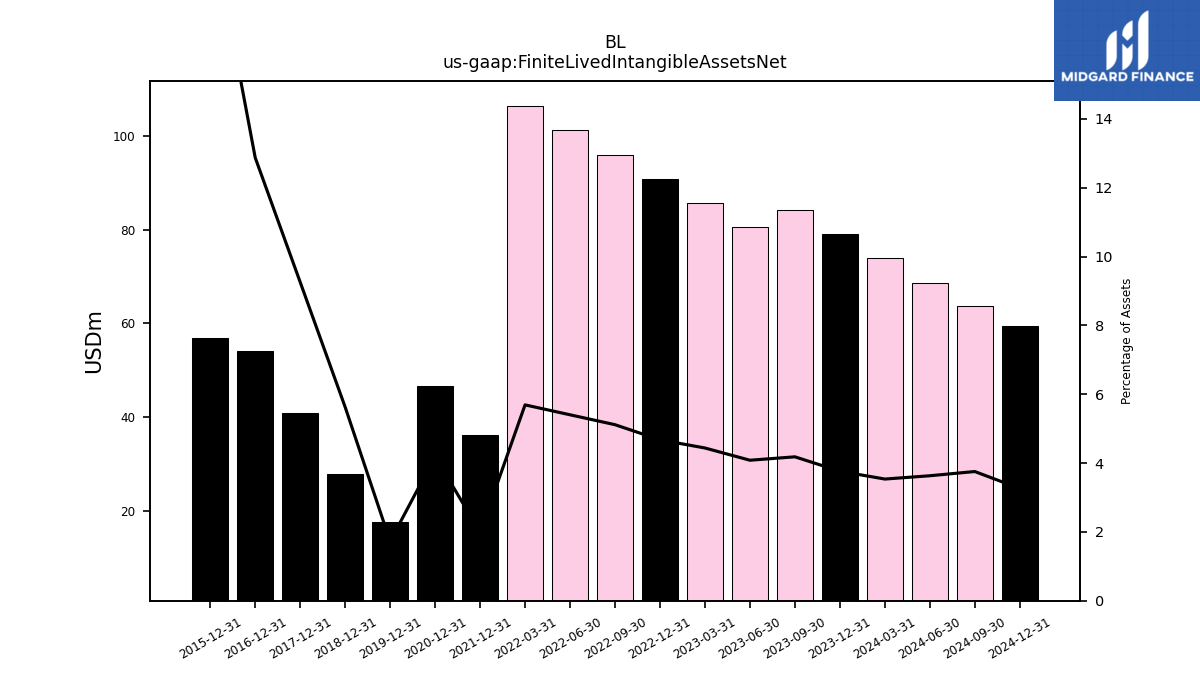
| Finite Lived Intangible Assets Net | 79.06 | 84.31 | 80.64 | 85.78 | 90.86 | 96.05 | 101.23 | 106.43 | 36.20 | NA | NA | NA | 46.67 | NA | NA | NA | 17.52 | NA | NA | NA | 27.79 | NA | NA | NA | 40.81 | NA | NA | NA | 54.12 | NA | NA | NA | 56.83 | NA | NA | NA | |
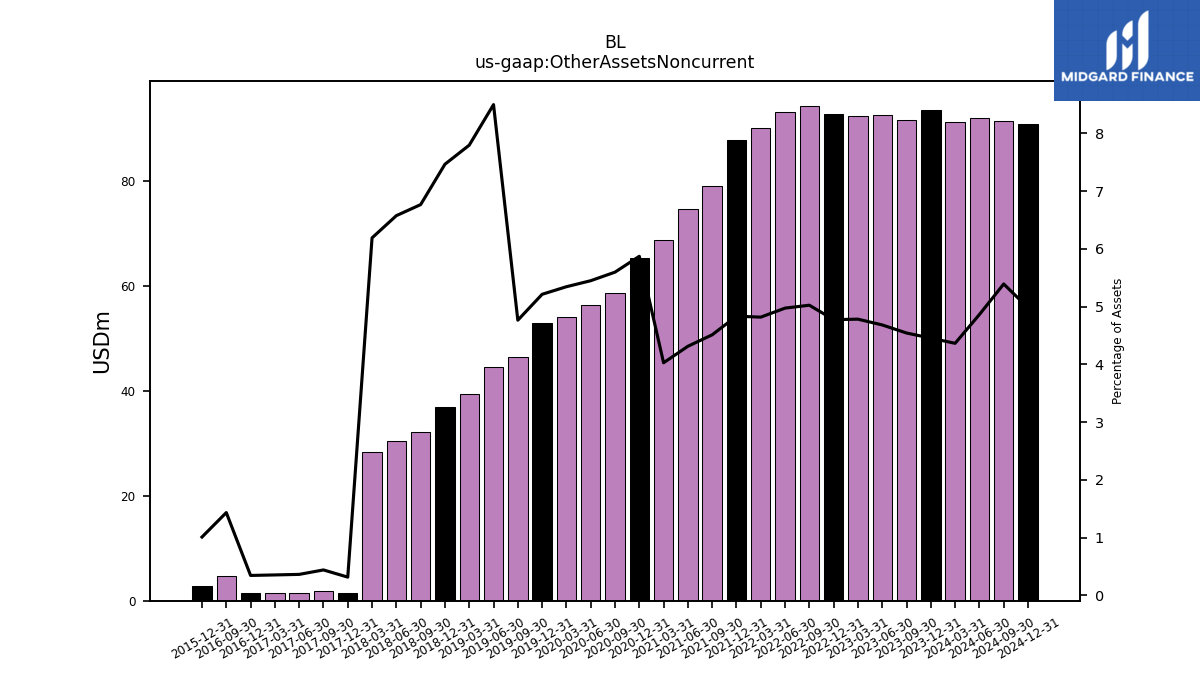
| Other Assets Noncurrent | 93.55 | 91.58 | 92.48 | 92.42 | 92.78 | 94.32 | 93.18 | 90.09 | 87.85 | 78.96 | 74.69 | 68.81 | 65.37 | 58.58 | 56.29 | 54.04 | 52.88 | 46.48 | 44.48 | 39.36 | 36.87 | 32.12 | 30.53 | 28.38 | 1.39 | 1.86 | 1.52 | 1.47 | 1.45 | 4.75 | NA | NA | 2.90 | NA | NA | NA | |
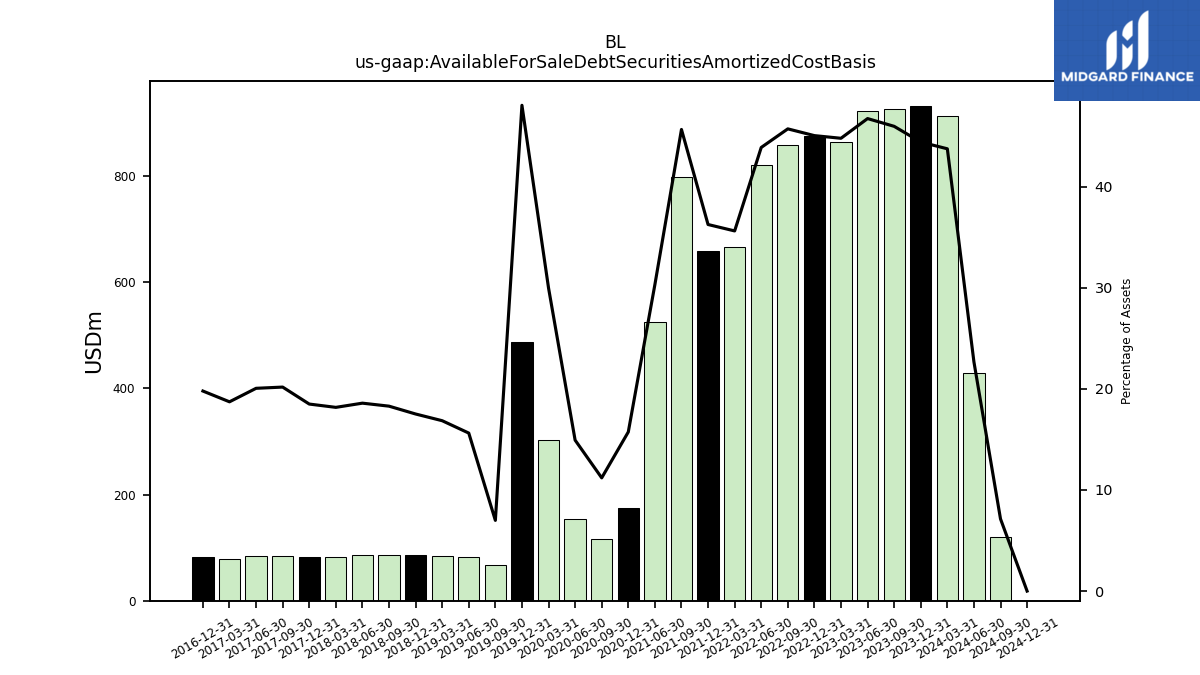
| Available For Sale Debt Securities Amortized Cost Basis | 932.85 | 926.62 | 923.04 | 865.42 | 875.46 | 858.27 | 821.95 | 666.09 | 658.89 | 799.07 | 524.88 | NA | 175.21 | 117.20 | 154.22 | 303.18 | 487.40 | 68.20 | 81.79 | 85.07 | 86.48 | 86.81 | 86.31 | 83.30 | 81.54 | 85.16 | 83.82 | 77.91 | 83.17 | NA | NA | NA | NA | NA | NA | NA |
| 2023-12-31 | 2023-09-30 | 2023-06-30 | 2023-03-31 | 2022-12-31 | 2022-09-30 | 2022-06-30 | 2022-03-31 | 2021-12-31 | 2021-09-30 | 2021-06-30 | 2021-03-31 | 2020-12-31 | 2020-09-30 | 2020-06-30 | 2020-03-31 | 2019-12-31 | 2019-09-30 | 2019-06-30 | 2019-03-31 | 2018-12-31 | 2018-09-30 | 2018-06-30 | 2018-03-31 | 2017-12-31 | 2017-09-30 | 2017-06-30 | 2017-03-31 | 2016-12-31 | 2016-09-30 | 2016-06-30 | 2016-03-31 | 2015-12-31 | 2015-09-30 | 2015-06-30 | 2015-03-31 | ||
|---|---|---|---|---|---|---|---|---|---|---|---|---|---|---|---|---|---|---|---|---|---|---|---|---|---|---|---|---|---|---|---|---|---|---|---|---|---|
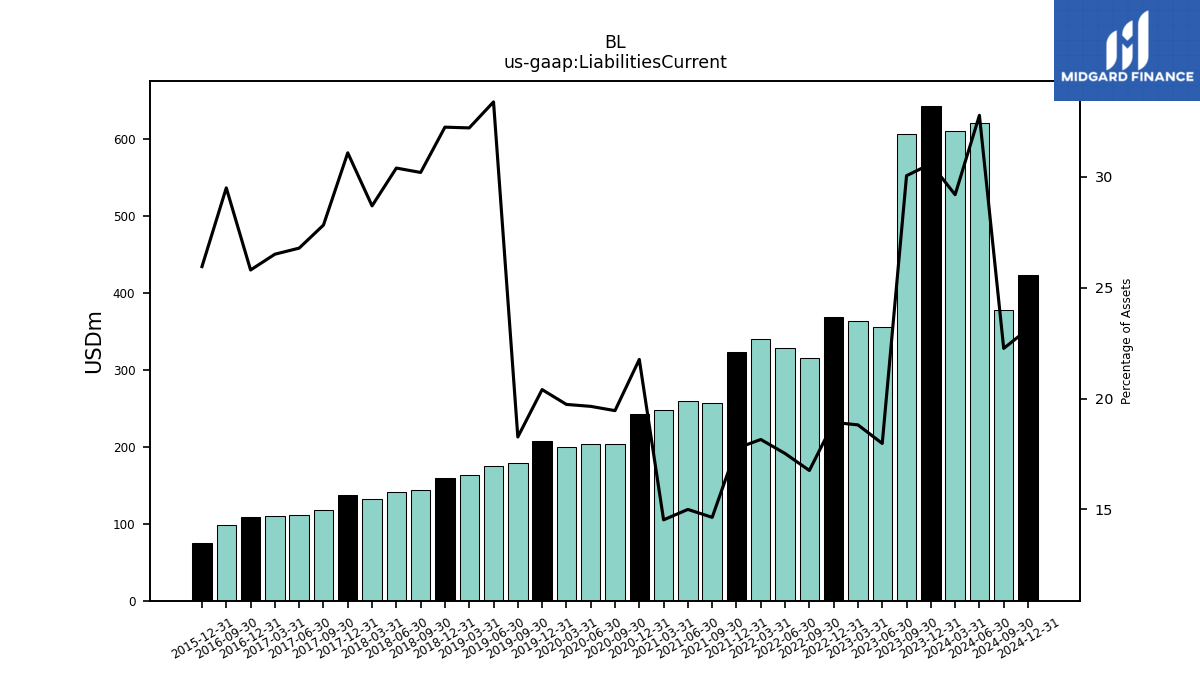
| Liabilities Current | 642.57 | 605.86 | 355.04 | 363.55 | 367.82 | 314.58 | 328.26 | 339.49 | 322.58 | 256.25 | 259.77 | 248.24 | 242.33 | 203.63 | 203.00 | 199.59 | 207.00 | 178.21 | 174.75 | 162.63 | 159.23 | 143.34 | 141.17 | 131.55 | 137.04 | 117.45 | 111.96 | 110.34 | 108.46 | 97.72 | NA | NA | 74.42 | NA | NA | NA | |
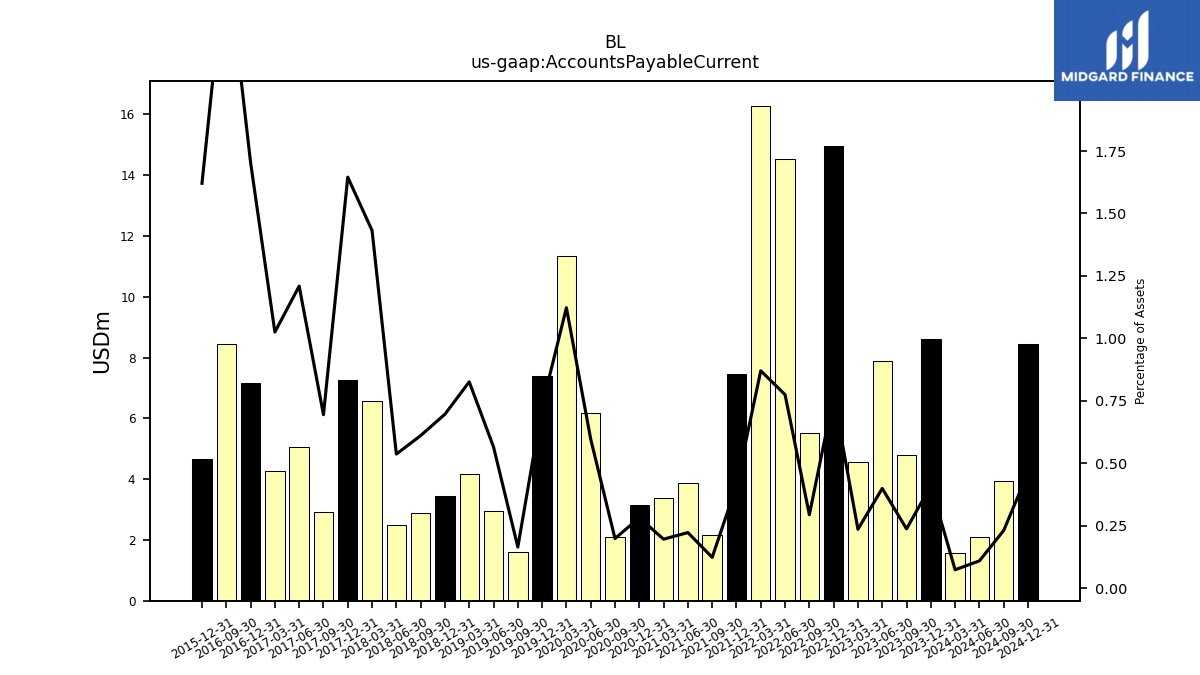
| Accounts Payable Current | 8.62 | 4.80 | 7.90 | 4.57 | 14.96 | 5.53 | 14.52 | 16.29 | 7.47 | 2.17 | 3.87 | 3.37 | 3.15 | 2.09 | 6.17 | 11.36 | 7.40 | 1.61 | 2.96 | 4.17 | 3.44 | 2.90 | 2.50 | 6.57 | 7.25 | 2.93 | 5.05 | 4.27 | 7.17 | 8.46 | NA | NA | 4.65 | NA | NA | NA | |
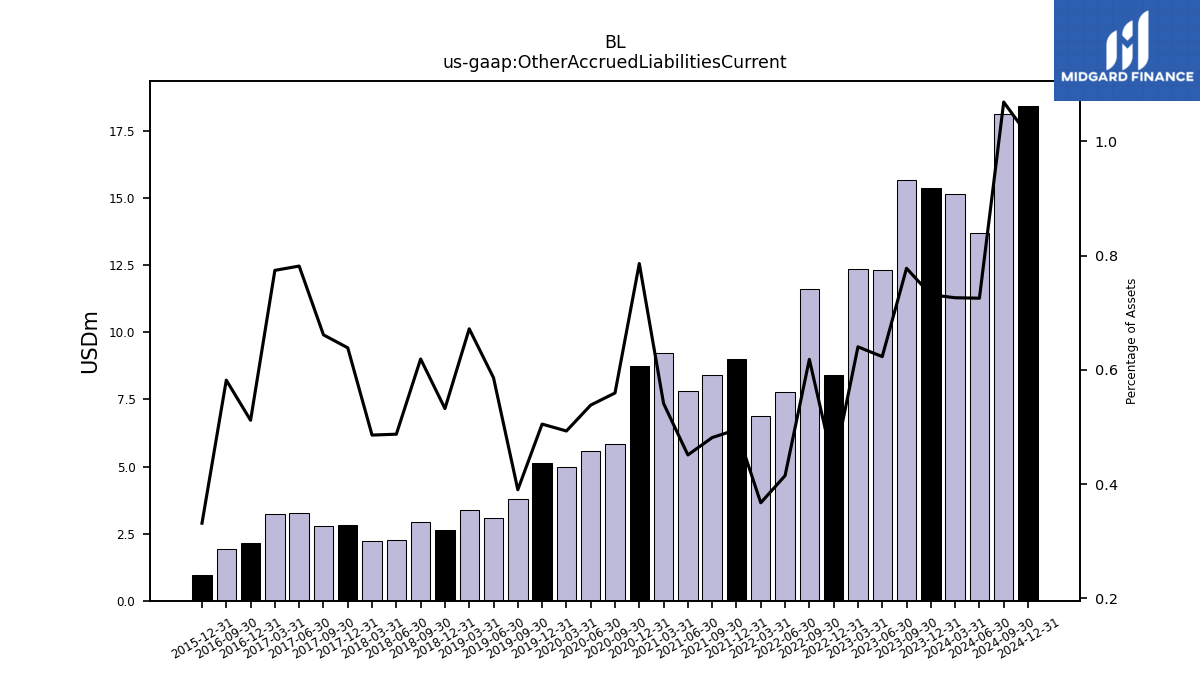
| Other Accrued Liabilities Current | 15.37 | 15.69 | 12.31 | 12.38 | 8.40 | 11.61 | 7.77 | 6.87 | 9.00 | 8.43 | 7.81 | 9.25 | 8.76 | 5.86 | 5.56 | 4.99 | 5.12 | 3.81 | 3.07 | 3.39 | 2.63 | 2.94 | 2.26 | 2.23 | 2.82 | 2.79 | 3.27 | 3.22 | 2.15 | 1.93 | NA | NA | 0.95 | NA | NA | NA | |
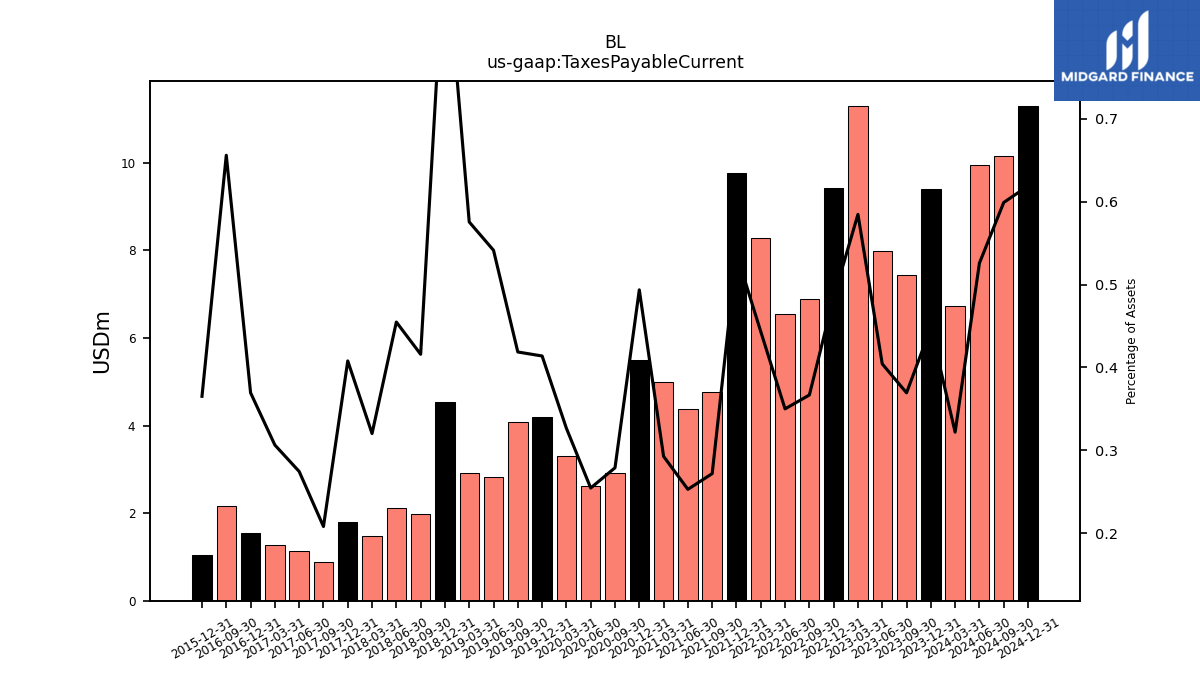
| Taxes Payable Current | 9.41 | 7.45 | 7.99 | 11.30 | 9.41 | 6.88 | 6.56 | 8.29 | 9.77 | 4.76 | 4.38 | 5.00 | 5.50 | 2.92 | 2.63 | 3.30 | 4.20 | 4.08 | 2.83 | 2.91 | 4.55 | 1.97 | 2.11 | 1.47 | 1.80 | 0.88 | 1.15 | 1.27 | 1.55 | 2.17 | NA | NA | 1.05 | NA | NA | NA | |
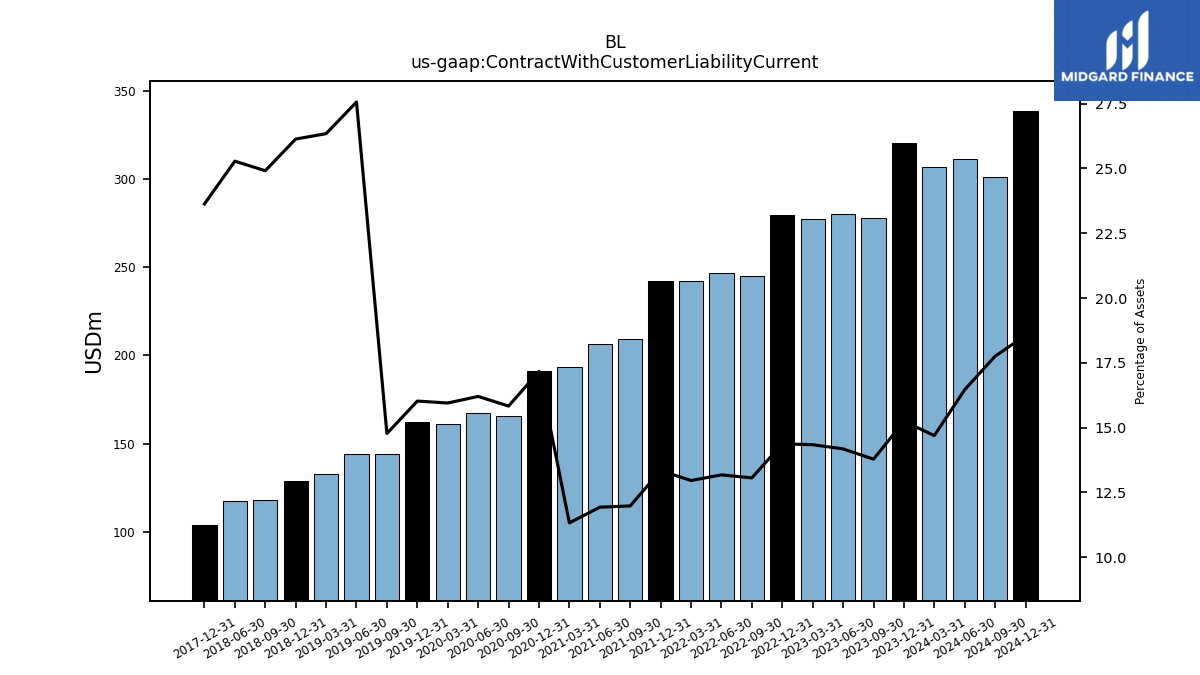
| Contract With Customer Liability Current | 320.13 | 277.80 | 280.05 | 277.11 | 279.32 | 245.16 | 246.81 | 242.30 | 242.43 | 209.61 | 206.56 | 193.43 | 191.14 | 165.70 | 167.40 | 161.29 | 162.55 | 144.10 | 144.30 | 133.02 | 129.07 | 118.26 | 117.42 | NA | 104.18 | NA | NA | NA | NA | NA | NA | NA | NA | NA | NA | NA |
| 2023-12-31 | 2023-09-30 | 2023-06-30 | 2023-03-31 | 2022-12-31 | 2022-09-30 | 2022-06-30 | 2022-03-31 | 2021-12-31 | 2021-09-30 | 2021-06-30 | 2021-03-31 | 2020-12-31 | 2020-09-30 | 2020-06-30 | 2020-03-31 | 2019-12-31 | 2019-09-30 | 2019-06-30 | 2019-03-31 | 2018-12-31 | 2018-09-30 | 2018-06-30 | 2018-03-31 | 2017-12-31 | 2017-09-30 | 2017-06-30 | 2017-03-31 | 2016-12-31 | 2016-09-30 | 2016-06-30 | 2016-03-31 | 2015-12-31 | 2015-09-30 | 2015-06-30 | 2015-03-31 | ||
|---|---|---|---|---|---|---|---|---|---|---|---|---|---|---|---|---|---|---|---|---|---|---|---|---|---|---|---|---|---|---|---|---|---|---|---|---|---|
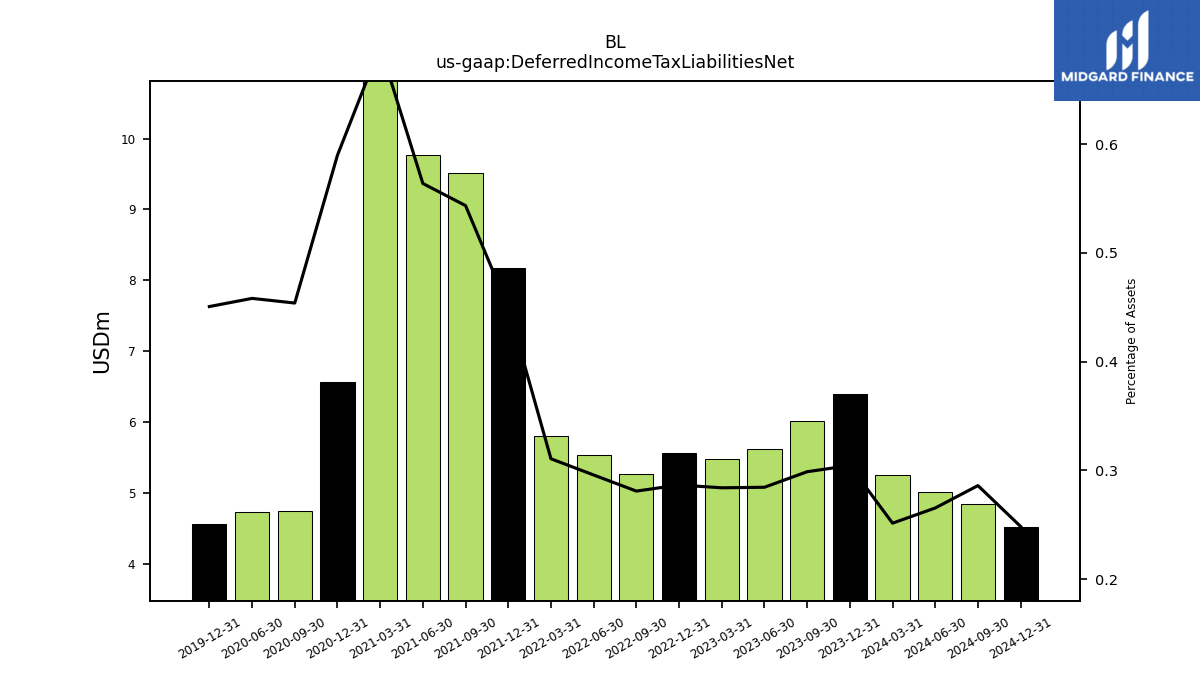
| Deferred Income Tax Liabilities Net | 6.39 | 6.02 | 5.62 | 5.49 | 5.57 | 5.27 | 5.54 | 5.81 | 8.18 | 9.51 | 9.76 | 11.79 | 6.57 | 4.75 | 4.73 | NA | 4.57 | NA | NA | NA | NA | NA | NA | NA | NA | NA | NA | NA | NA | NA | NA | NA | NA | NA | NA | NA | |
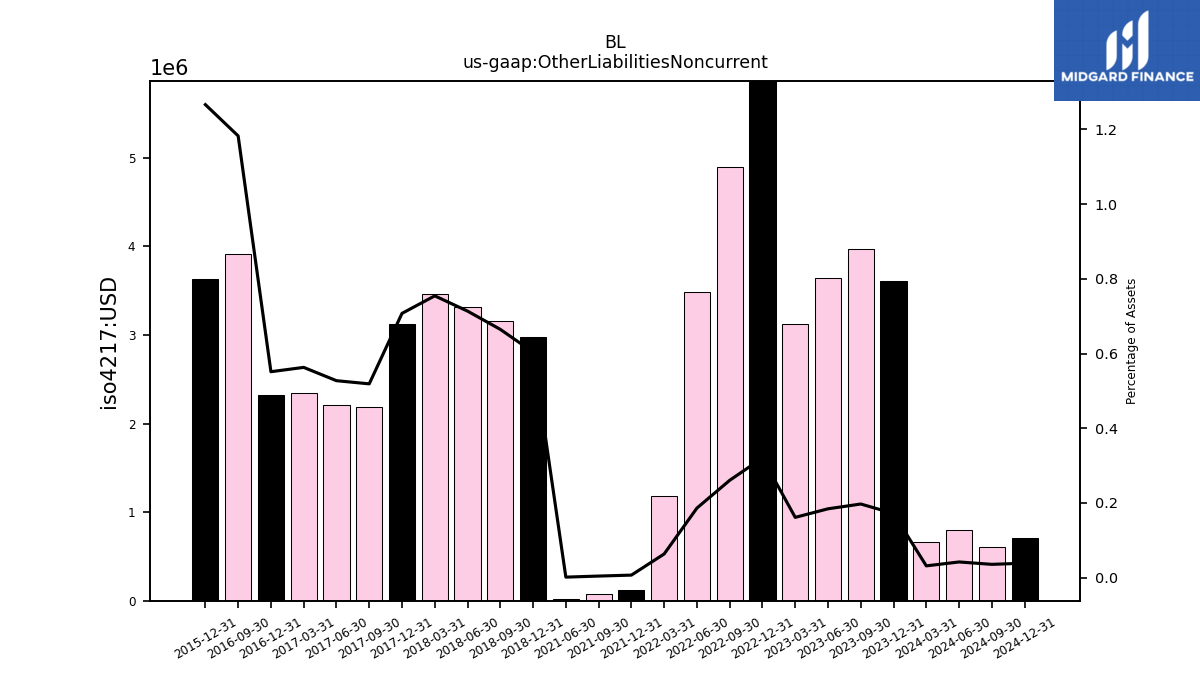
| Other Liabilities Noncurrent | 3.61 | 3.98 | 3.64 | 3.12 | 6.23 | 4.89 | 3.49 | 1.19 | 0.12 | 0.07 | 0.03 | NA | NA | NA | NA | NA | NA | NA | NA | NA | 2.98 | 3.15 | 3.31 | 3.46 | 3.12 | 2.19 | 2.20 | 2.34 | 2.32 | 3.92 | NA | NA | 3.63 | NA | NA | NA | |
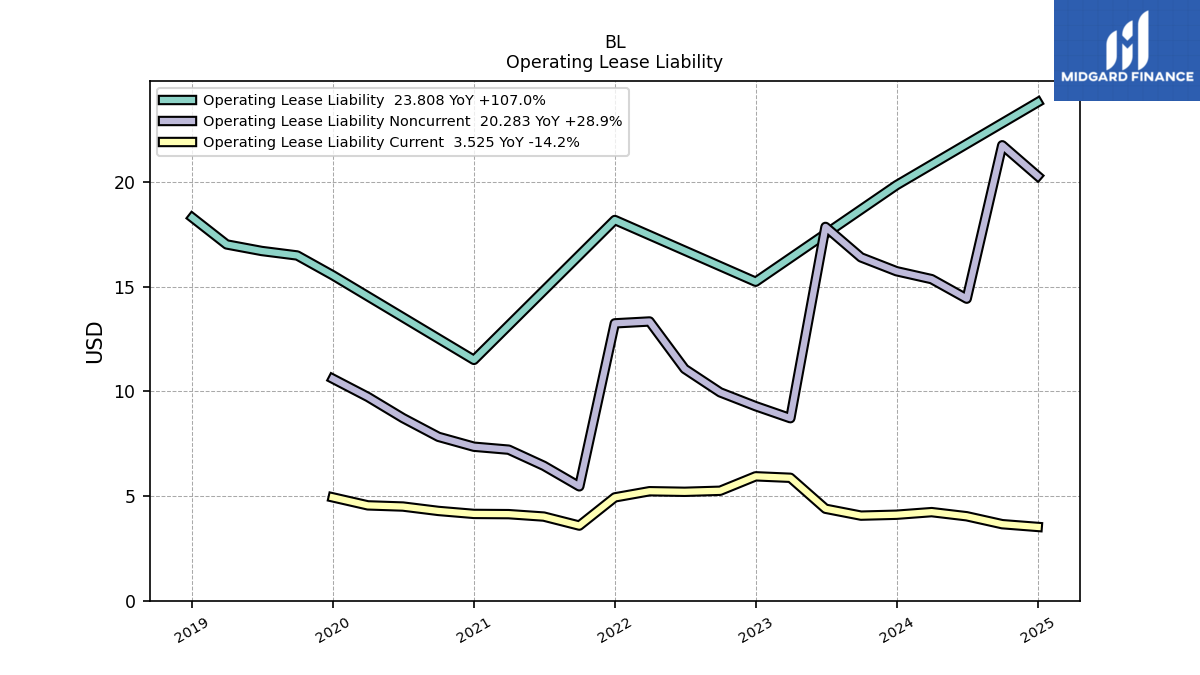
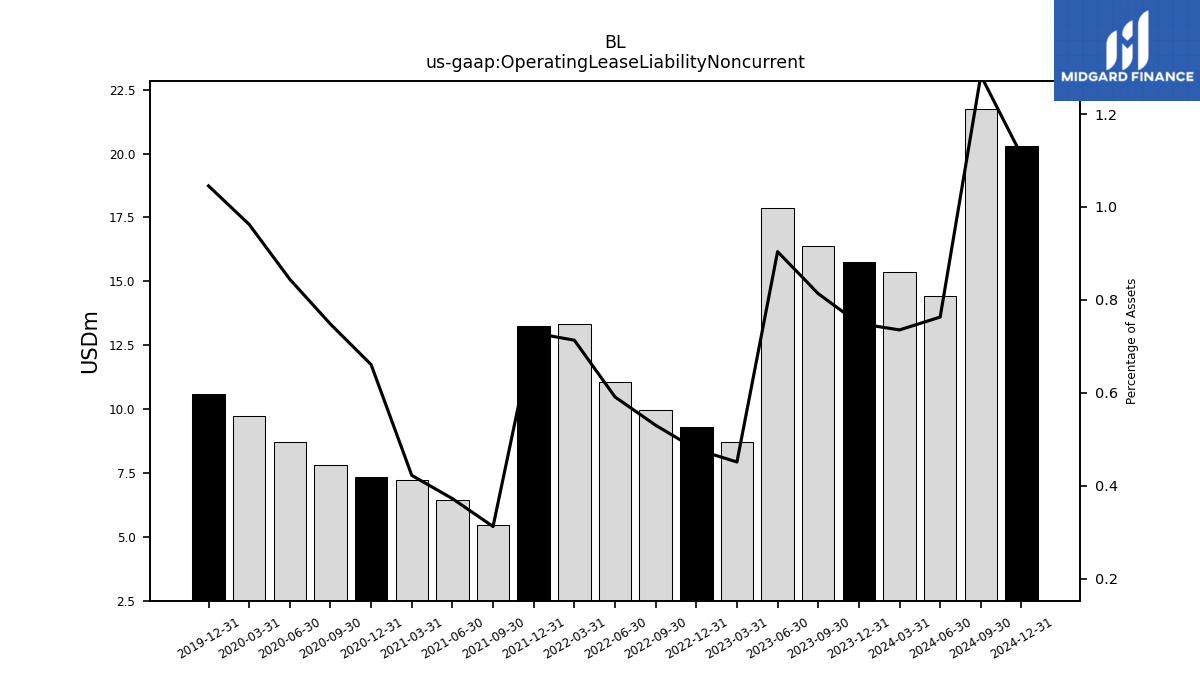
| Operating Lease Liability Noncurrent | 15.74 | 16.40 | 17.86 | 8.72 | 9.29 | 9.95 | 11.07 | 13.34 | 13.25 | 5.46 | 6.45 | 7.21 | 7.36 | 7.83 | 8.72 | 9.73 | 10.61 | NA | NA | NA | NA | NA | NA | NA | NA | NA | NA | NA | NA | NA | NA | NA | NA | NA | NA | NA |
| 2023-12-31 | 2023-09-30 | 2023-06-30 | 2023-03-31 | 2022-12-31 | 2022-09-30 | 2022-06-30 | 2022-03-31 | 2021-12-31 | 2021-09-30 | 2021-06-30 | 2021-03-31 | 2020-12-31 | 2020-09-30 | 2020-06-30 | 2020-03-31 | 2019-12-31 | 2019-09-30 | 2019-06-30 | 2019-03-31 | 2018-12-31 | 2018-09-30 | 2018-06-30 | 2018-03-31 | 2017-12-31 | 2017-09-30 | 2017-06-30 | 2017-03-31 | 2016-12-31 | 2016-09-30 | 2016-06-30 | 2016-03-31 | 2015-12-31 | 2015-09-30 | 2015-06-30 | 2015-03-31 | ||
|---|---|---|---|---|---|---|---|---|---|---|---|---|---|---|---|---|---|---|---|---|---|---|---|---|---|---|---|---|---|---|---|---|---|---|---|---|---|
| Stockholders Equity | 260.88 | 215.73 | 176.36 | 116.99 | 111.87 | 77.93 | 79.18 | 66.13 | 325.04 | 340.74 | 337.04 | 339.63 | 422.07 | 416.93 | 409.78 | 396.19 | 398.61 | 396.42 | 327.19 | 320.54 | 321.57 | 322.43 | 314.09 | 317.56 | 294.63 | 295.79 | 296.78 | 284.35 | 291.41 | 152.55 | NA | NA | 166.17 | NA | NA | NA | |
| Common Stock Value | 0.61 | 0.61 | 0.61 | 0.60 | 0.60 | 0.60 | 0.60 | 0.59 | 0.59 | 0.59 | 0.58 | 0.58 | 0.58 | 0.57 | 0.57 | 0.56 | 0.56 | 0.56 | 0.55 | 0.55 | 0.55 | 0.55 | 0.54 | 0.54 | 0.53 | 0.53 | 0.53 | 0.51 | 0.51 | 0.41 | NA | NA | 0.41 | NA | NA | NA | |
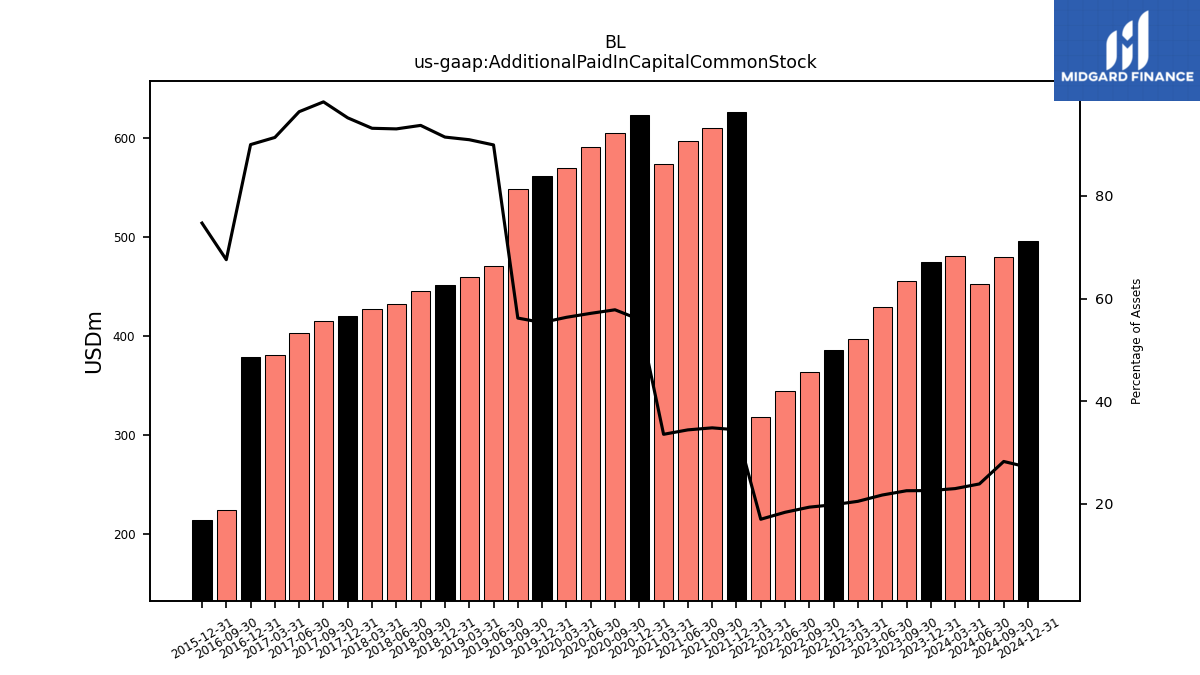
| Additional Paid In Capital Common Stock | 474.86 | 455.04 | 429.32 | 396.40 | 385.71 | 363.78 | 344.26 | 318.30 | 625.88 | 609.43 | 596.18 | 573.43 | 622.77 | 605.08 | 590.12 | 569.80 | 561.27 | 548.20 | 470.68 | 459.12 | 451.57 | 444.84 | 432.07 | 427.10 | 419.63 | 414.92 | 402.86 | 380.29 | 378.27 | 223.81 | NA | NA | 214.17 | NA | NA | NA | |
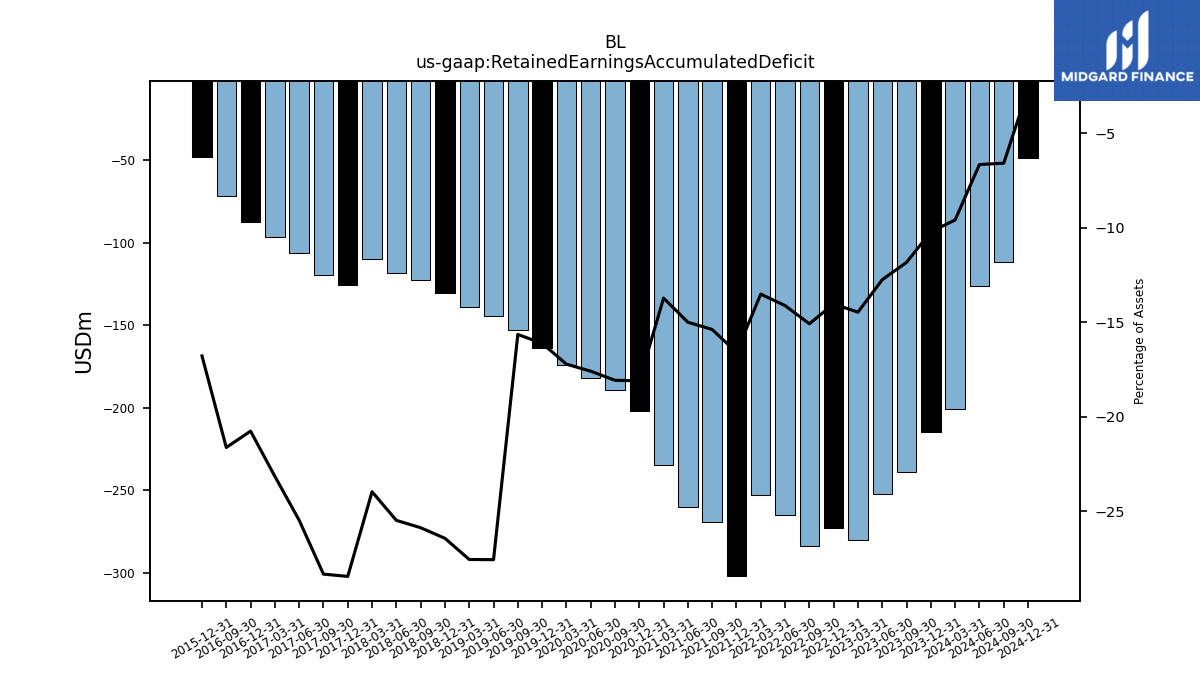
| Retained Earnings Accumulated Deficit | -214.80 | -238.76 | -252.04 | -279.79 | -272.97 | -283.37 | -264.73 | -252.88 | -301.74 | -269.44 | -259.97 | -234.68 | -201.65 | -189.28 | -181.85 | -174.24 | -163.60 | -152.75 | -144.35 | -139.18 | -130.59 | -122.86 | -118.40 | -109.94 | -125.47 | -119.62 | -106.53 | -96.42 | -87.33 | -71.67 | NA | NA | -48.16 | NA | NA | NA | |
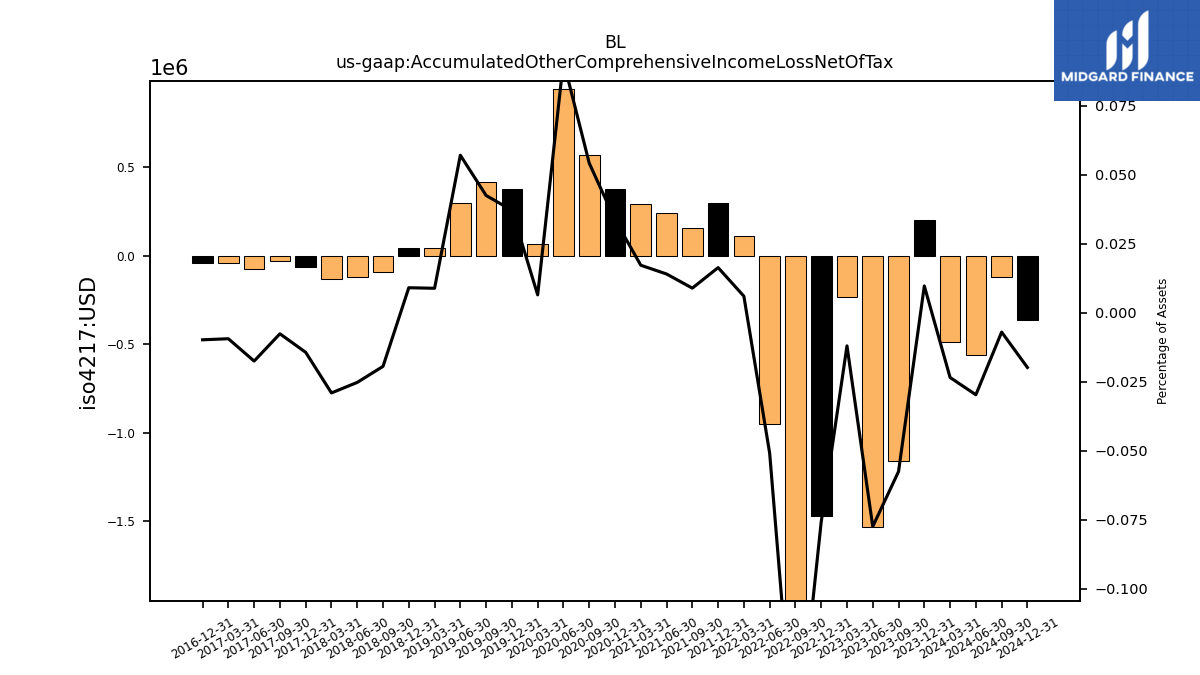
| Accumulated Other Comprehensive Income Loss Net Of Tax | 0.20 | -1.16 | -1.53 | -0.23 | -1.47 | -3.08 | -0.95 | 0.11 | 0.30 | 0.16 | 0.24 | 0.29 | 0.38 | 0.57 | 0.94 | 0.07 | 0.38 | 0.41 | 0.30 | 0.04 | 0.04 | -0.09 | -0.12 | -0.13 | -0.06 | -0.03 | -0.07 | -0.04 | -0.04 | NA | NA | NA | NA | NA | NA | NA | |
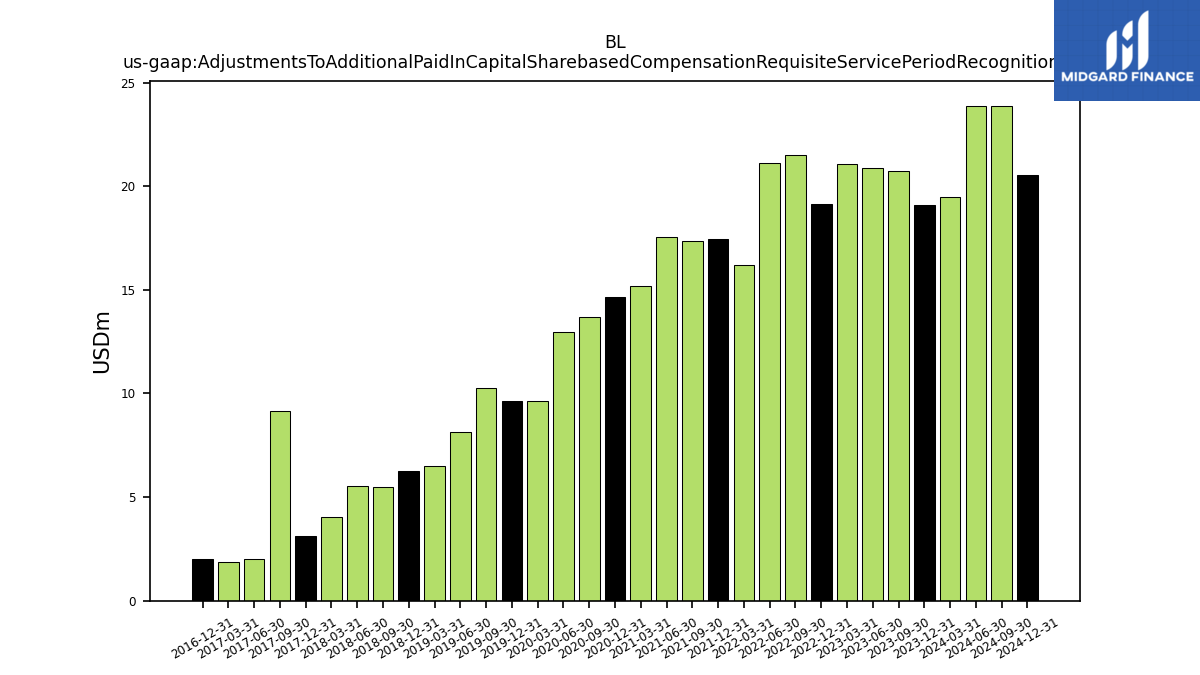
| Adjustments To Additional Paid In Capital Sharebased Compensation Requisite Service Period Recognition Value | 19.11 | 20.73 | 20.85 | 21.07 | 19.16 | 21.51 | 21.10 | 16.22 | 17.47 | 17.37 | 17.55 | 15.20 | 14.66 | 13.68 | 12.97 | 9.64 | 9.64 | 10.26 | 8.13 | 6.51 | 6.28 | 5.48 | 5.51 | 4.04 | 3.13 | 9.15 | 2.02 | 1.88 | 2.02 | NA | NA | NA | NA | NA | NA | NA |
| 2023-12-31 | 2023-09-30 | 2023-06-30 | 2023-03-31 | 2022-12-31 | 2022-09-30 | 2022-06-30 | 2022-03-31 | 2021-12-31 | 2021-09-30 | 2021-06-30 | 2021-03-31 | 2020-12-31 | 2020-09-30 | 2020-06-30 | 2020-03-31 | 2019-12-31 | 2019-09-30 | 2019-06-30 | 2019-03-31 | 2018-12-31 | 2018-09-30 | 2018-06-30 | 2018-03-31 | 2017-12-31 | 2017-09-30 | 2017-06-30 | 2017-03-31 | 2016-12-31 | 2016-09-30 | 2016-06-30 | 2016-03-31 | 2015-12-31 | 2015-09-30 | 2015-06-30 | 2015-03-31 | ||
|---|---|---|---|---|---|---|---|---|---|---|---|---|---|---|---|---|---|---|---|---|---|---|---|---|---|---|---|---|---|---|---|---|---|---|---|---|---|
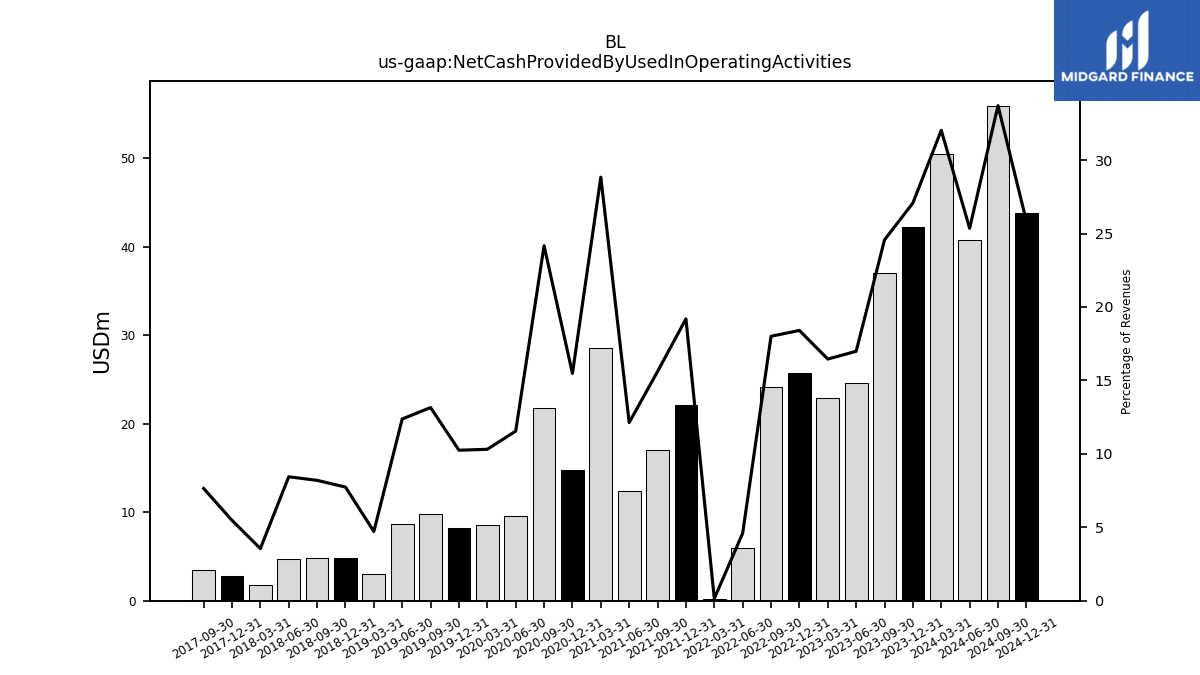
| Net Cash Provided By Used In Operating Activities | 42.17 | 37.03 | 24.55 | 22.87 | 25.75 | 24.18 | 5.91 | 0.18 | 22.13 | 17.07 | 12.39 | 28.50 | 14.81 | 21.79 | 9.62 | 8.52 | 8.22 | 9.85 | 8.62 | 3.03 | 4.82 | 4.81 | 4.68 | 1.82 | 2.75 | 3.51 | NA | NA | NA | NA | NA | NA | NA | NA | NA | NA | |
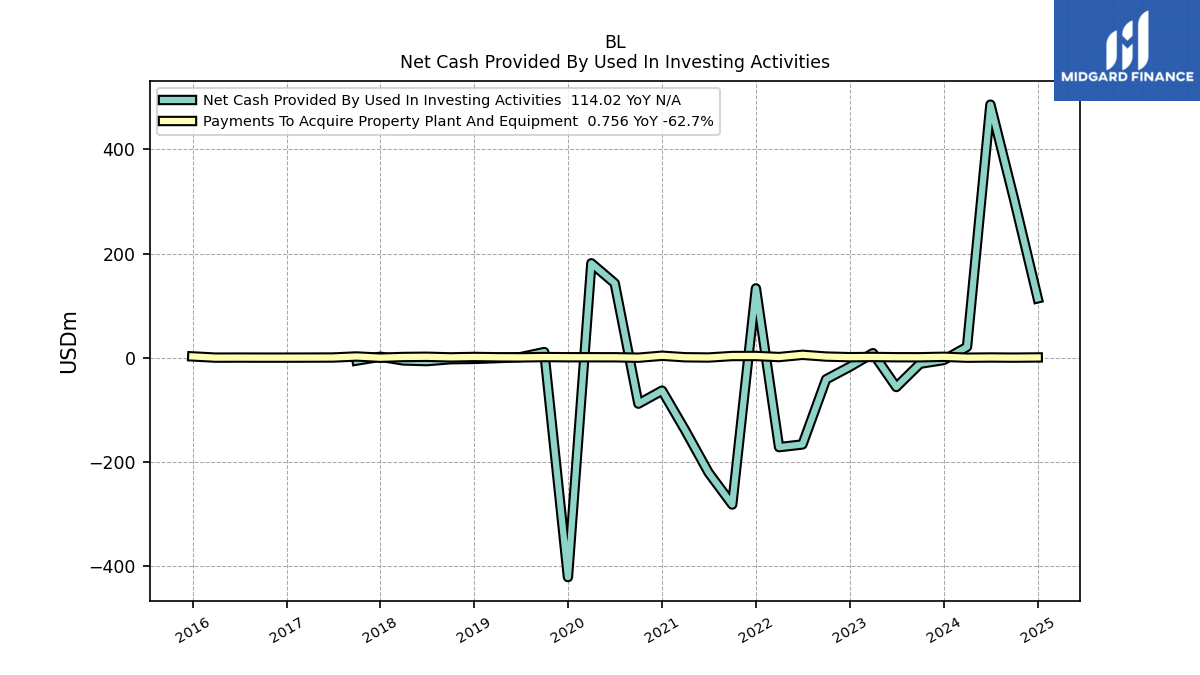
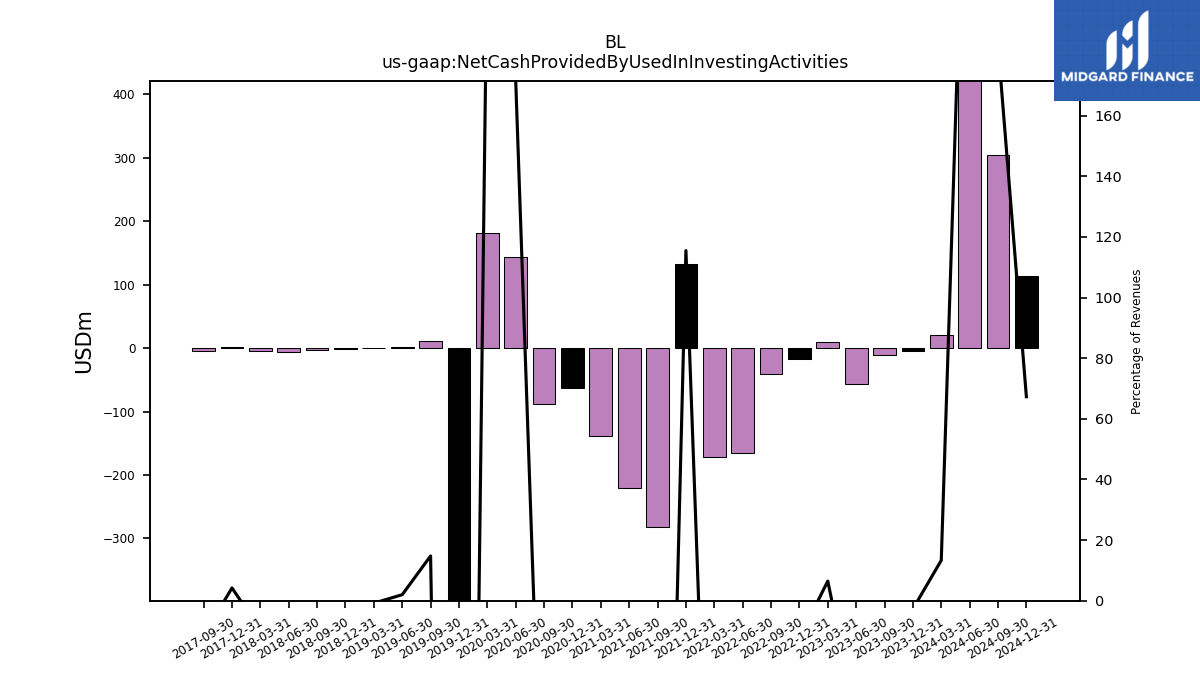
| Net Cash Provided By Used In Investing Activities | -4.19 | -11.33 | -55.97 | 9.00 | -17.12 | -41.18 | -166.08 | -171.22 | 133.19 | -281.25 | -220.04 | -138.84 | -62.83 | -87.84 | 142.96 | 181.31 | -420.40 | 11.07 | 1.39 | -0.52 | -2.08 | -2.62 | -6.29 | -4.98 | 2.13 | -5.28 | NA | NA | NA | NA | NA | NA | NA | NA | NA | NA | |
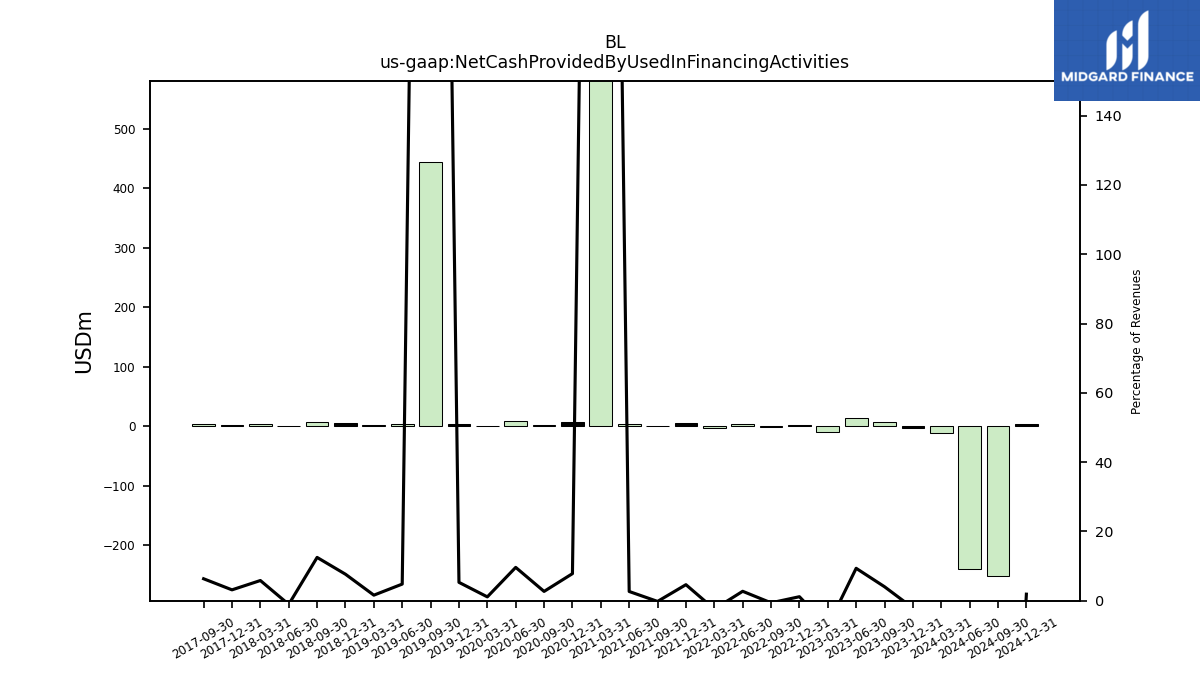
| Net Cash Provided By Used In Financing Activities | -3.25 | 6.09 | 13.54 | -10.23 | 1.63 | -0.80 | 3.51 | -2.90 | 5.35 | -0.21 | 2.73 | 591.37 | 7.49 | 2.43 | 8.02 | 0.93 | 4.26 | 443.87 | 3.35 | 1.03 | 4.77 | 7.34 | -0.58 | 2.99 | 1.58 | 2.91 | NA | NA | NA | NA | NA | NA | NA | NA | NA | NA |
| 2023-12-31 | 2023-09-30 | 2023-06-30 | 2023-03-31 | 2022-12-31 | 2022-09-30 | 2022-06-30 | 2022-03-31 | 2021-12-31 | 2021-09-30 | 2021-06-30 | 2021-03-31 | 2020-12-31 | 2020-09-30 | 2020-06-30 | 2020-03-31 | 2019-12-31 | 2019-09-30 | 2019-06-30 | 2019-03-31 | 2018-12-31 | 2018-09-30 | 2018-06-30 | 2018-03-31 | 2017-12-31 | 2017-09-30 | 2017-06-30 | 2017-03-31 | 2016-12-31 | 2016-09-30 | 2016-06-30 | 2016-03-31 | 2015-12-31 | 2015-09-30 | 2015-06-30 | 2015-03-31 | ||
|---|---|---|---|---|---|---|---|---|---|---|---|---|---|---|---|---|---|---|---|---|---|---|---|---|---|---|---|---|---|---|---|---|---|---|---|---|---|
| Net Cash Provided By Used In Operating Activities | 42.17 | 37.03 | 24.55 | 22.87 | 25.75 | 24.18 | 5.91 | 0.18 | 22.13 | 17.07 | 12.39 | 28.50 | 14.81 | 21.79 | 9.62 | 8.52 | 8.22 | 9.85 | 8.62 | 3.03 | 4.82 | 4.81 | 4.68 | 1.82 | 2.75 | 3.51 | NA | NA | NA | NA | NA | NA | NA | NA | NA | NA | |
| Net Income Loss | 22.07 | 11.92 | 30.85 | -12.01 | 11.30 | -20.02 | -10.66 | -10.01 | -37.01 | -13.74 | -25.45 | -38.96 | -16.98 | -8.75 | -8.33 | -12.84 | -9.19 | -9.24 | -5.22 | -8.58 | -7.73 | -4.46 | -8.46 | -7.16 | -5.84 | -13.09 | -10.11 | -9.01 | -15.66 | -6.62 | -7.54 | -9.34 | -7.21 | -6.74 | -6.54 | -4.25 | |
| Profit Loss | 24.25 | 13.47 | 28.07 | -6.73 | 10.50 | -18.99 | -11.97 | -13.43 | -32.48 | -9.72 | -25.58 | -33.22 | -12.63 | -7.86 | -7.94 | -10.97 | -8.71 | -8.91 | -5.39 | -8.83 | -7.79 | -4.46 | -8.46 | -7.16 | -4.17 | -12.07 | -9.13 | -7.68 | NA | NA | NA | NA | NA | NA | NA | NA | |
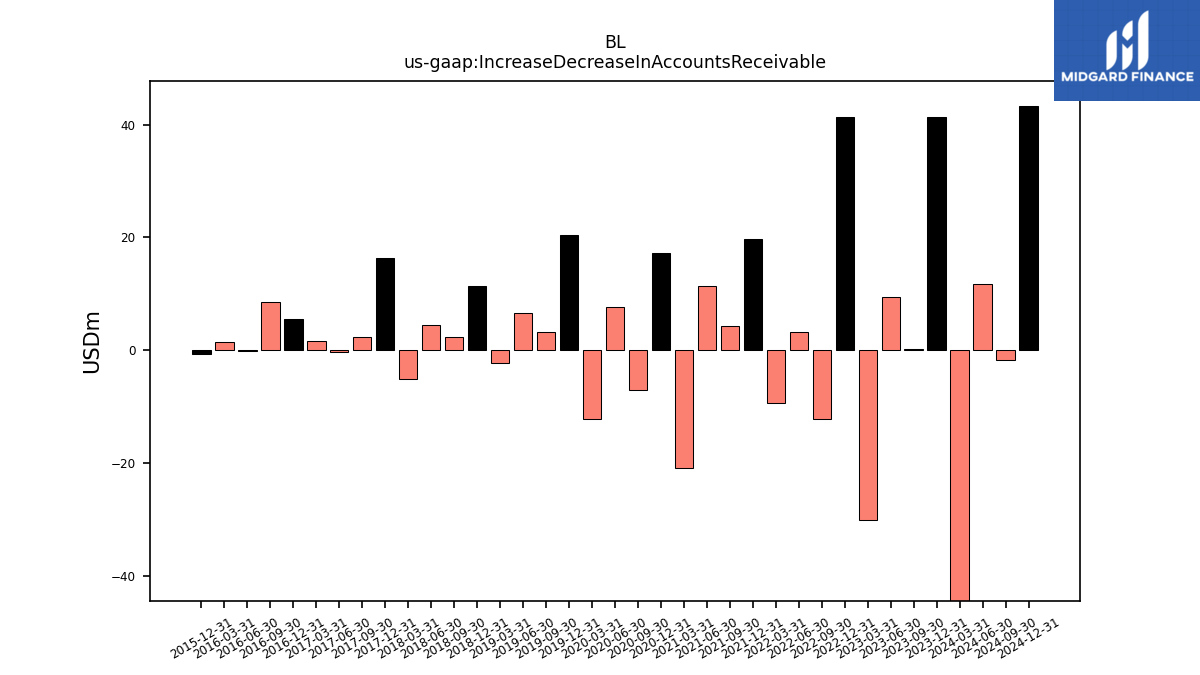
| Increase Decrease In Accounts Receivable | 41.30 | 0.26 | 9.46 | -30.17 | 41.35 | -12.15 | 3.29 | -9.46 | 19.69 | 4.23 | 11.31 | -20.98 | 17.29 | -7.15 | 7.74 | -12.15 | 20.51 | 3.18 | 6.60 | -2.33 | 11.47 | 2.39 | 4.41 | -5.06 | 16.32 | 2.31 | -0.36 | 1.59 | 5.61 | 8.53 | -0.09 | 1.50 | -0.74 | NA | NA | NA | |
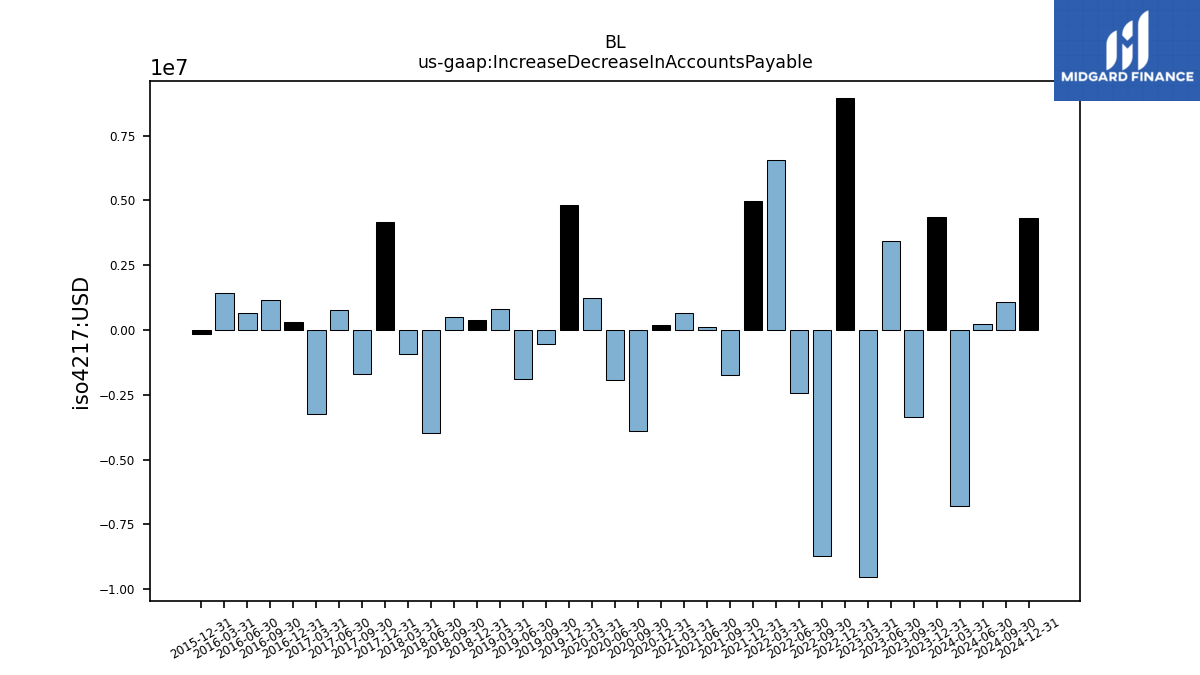
| Increase Decrease In Accounts Payable | 4.34 | -3.36 | 3.44 | -9.52 | 8.95 | -8.70 | -2.43 | 6.55 | 4.98 | -1.75 | 0.11 | 0.65 | 0.21 | -3.89 | -1.93 | 1.25 | 4.83 | -0.53 | -1.89 | 0.83 | 0.39 | 0.51 | -3.98 | -0.93 | 4.16 | -1.70 | 0.77 | -3.25 | 0.29 | 1.18 | 0.65 | 1.42 | -0.15 | NA | NA | NA | |
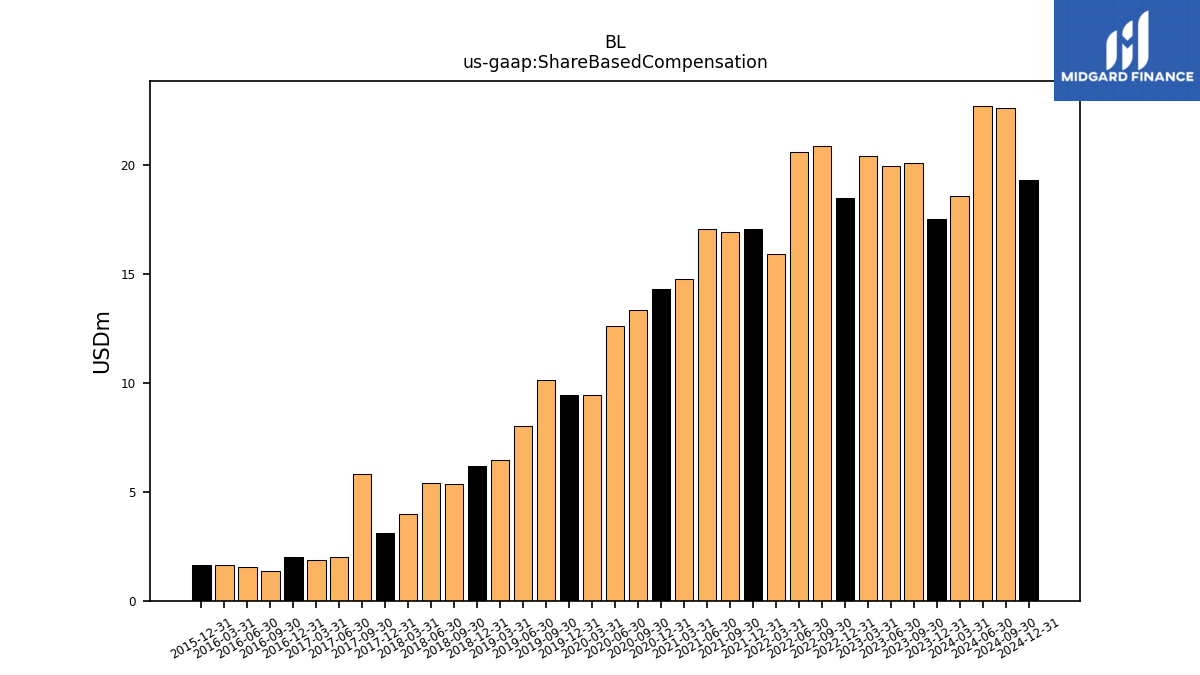
| Share Based Compensation | 17.50 | 20.08 | 19.95 | 20.44 | 18.47 | 20.90 | 20.61 | 15.90 | 17.08 | 16.93 | 17.07 | 14.79 | 14.29 | 13.33 | 12.62 | 9.46 | 9.45 | 10.14 | 8.01 | 6.45 | 6.19 | 5.34 | 5.39 | 3.97 | 3.09 | 5.80 | 1.99 | 1.85 | 1.99 | 1.36 | 1.55 | 1.62 | 1.63 | NA | NA | NA |
| 2023-12-31 | 2023-09-30 | 2023-06-30 | 2023-03-31 | 2022-12-31 | 2022-09-30 | 2022-06-30 | 2022-03-31 | 2021-12-31 | 2021-09-30 | 2021-06-30 | 2021-03-31 | 2020-12-31 | 2020-09-30 | 2020-06-30 | 2020-03-31 | 2019-12-31 | 2019-09-30 | 2019-06-30 | 2019-03-31 | 2018-12-31 | 2018-09-30 | 2018-06-30 | 2018-03-31 | 2017-12-31 | 2017-09-30 | 2017-06-30 | 2017-03-31 | 2016-12-31 | 2016-09-30 | 2016-06-30 | 2016-03-31 | 2015-12-31 | 2015-09-30 | 2015-06-30 | 2015-03-31 | ||
|---|---|---|---|---|---|---|---|---|---|---|---|---|---|---|---|---|---|---|---|---|---|---|---|---|---|---|---|---|---|---|---|---|---|---|---|---|---|
| Net Cash Provided By Used In Investing Activities | -4.19 | -11.33 | -55.97 | 9.00 | -17.12 | -41.18 | -166.08 | -171.22 | 133.19 | -281.25 | -220.04 | -138.84 | -62.83 | -87.84 | 142.96 | 181.31 | -420.40 | 11.07 | 1.39 | -0.52 | -2.08 | -2.62 | -6.29 | -4.98 | 2.13 | -5.28 | NA | NA | NA | NA | NA | NA | NA | NA | NA | NA | |
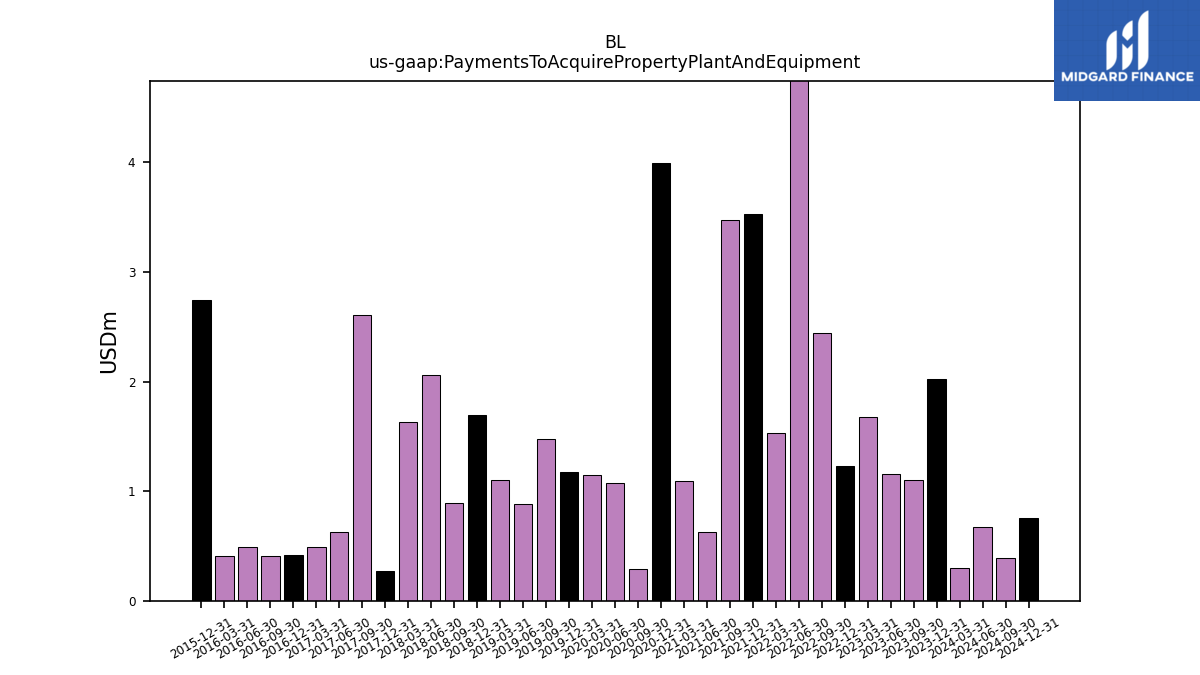
| Payments To Acquire Property Plant And Equipment | 2.03 | 1.10 | 1.15 | 1.68 | 1.23 | 2.44 | 5.78 | 1.53 | 3.53 | 3.48 | 0.63 | 1.10 | 4.00 | 0.29 | 1.07 | 1.15 | 1.17 | 1.47 | 0.89 | 1.10 | 1.70 | 0.89 | 2.06 | 1.63 | 0.27 | 2.61 | 0.63 | 0.49 | 0.42 | 0.41 | 0.49 | 0.41 | 2.75 | NA | NA | NA |
| 2023-12-31 | 2023-09-30 | 2023-06-30 | 2023-03-31 | 2022-12-31 | 2022-09-30 | 2022-06-30 | 2022-03-31 | 2021-12-31 | 2021-09-30 | 2021-06-30 | 2021-03-31 | 2020-12-31 | 2020-09-30 | 2020-06-30 | 2020-03-31 | 2019-12-31 | 2019-09-30 | 2019-06-30 | 2019-03-31 | 2018-12-31 | 2018-09-30 | 2018-06-30 | 2018-03-31 | 2017-12-31 | 2017-09-30 | 2017-06-30 | 2017-03-31 | 2016-12-31 | 2016-09-30 | 2016-06-30 | 2016-03-31 | 2015-12-31 | 2015-09-30 | 2015-06-30 | 2015-03-31 | ||
|---|---|---|---|---|---|---|---|---|---|---|---|---|---|---|---|---|---|---|---|---|---|---|---|---|---|---|---|---|---|---|---|---|---|---|---|---|---|
| Net Cash Provided By Used In Financing Activities | -3.25 | 6.09 | 13.54 | -10.23 | 1.63 | -0.80 | 3.51 | -2.90 | 5.35 | -0.21 | 2.73 | 591.37 | 7.49 | 2.43 | 8.02 | 0.93 | 4.26 | 443.87 | 3.35 | 1.03 | 4.77 | 7.34 | -0.58 | 2.99 | 1.58 | 2.91 | NA | NA | NA | NA | NA | NA | NA | NA | NA | NA |
| 2023-12-31 | 2023-09-30 | 2023-06-30 | 2023-03-31 | 2022-12-31 | 2022-09-30 | 2022-06-30 | 2022-03-31 | 2021-12-31 | 2021-09-30 | 2021-06-30 | 2021-03-31 | 2020-12-31 | 2020-09-30 | 2020-06-30 | 2020-03-31 | 2019-12-31 | 2019-09-30 | 2019-06-30 | 2019-03-31 | 2018-12-31 | 2018-09-30 | 2018-06-30 | 2018-03-31 | 2017-12-31 | 2017-09-30 | 2017-06-30 | 2017-03-31 | 2016-12-31 | 2016-09-30 | 2016-06-30 | 2016-03-31 | 2015-12-31 | 2015-09-30 | 2015-06-30 | 2015-03-31 | ||
|---|---|---|---|---|---|---|---|---|---|---|---|---|---|---|---|---|---|---|---|---|---|---|---|---|---|---|---|---|---|---|---|---|---|---|---|---|---|
| Revenues | 155.73 | 150.71 | 144.57 | 138.98 | 139.96 | 134.27 | 128.48 | 120.24 | 115.33 | 109.40 | 102.12 | 98.86 | 95.71 | 90.16 | 83.27 | 82.60 | 80.26 | 74.92 | 69.66 | 64.13 | 62.32 | 58.73 | 55.45 | 51.28 | 50.23 | 45.87 | 42.29 | 38.63 | 35.34 | 32.20 | 29.03 | 26.56 | 24.47 | 21.66 | 19.43 | 18.05 | |
| Revenue From Contract With Customer Excluding Assessed Tax | 155.73 | 150.71 | 144.57 | 138.98 | 139.96 | 134.27 | 128.48 | 120.24 | 115.33 | 109.40 | 102.12 | 98.86 | 95.71 | 90.16 | 83.27 | 82.60 | 80.26 | 74.92 | 69.66 | 64.13 | 62.32 | 58.73 | 55.45 | 51.28 | 50.02 | 45.42 | 41.98 | 38.18 | 35.34 | 32.20 | 29.03 | 26.56 | 24.47 | 21.66 | 19.43 | 18.05 | |
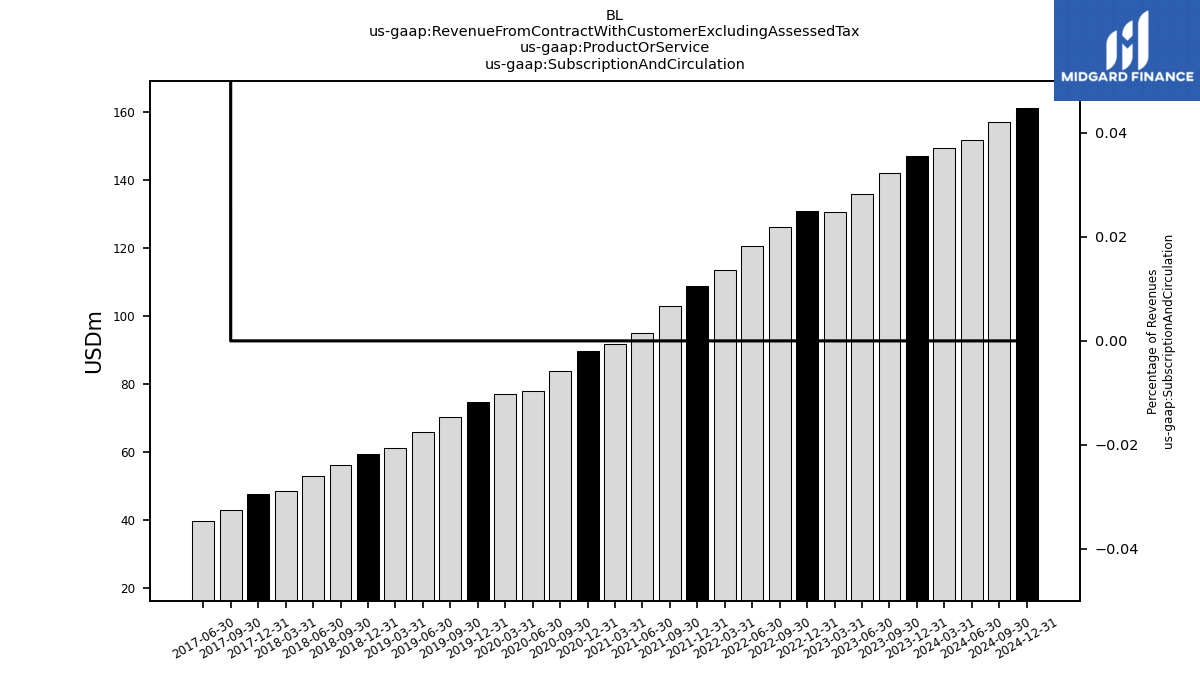
| Subscription And Circulation | 147.16 | 142.05 | 135.88 | 130.43 | 130.90 | 126.08 | 120.68 | 113.53 | 108.88 | 102.92 | 95.17 | 91.66 | 89.78 | 83.88 | 77.87 | 77.03 | 74.80 | 70.31 | 66.07 | 61.27 | 59.56 | 56.17 | 53.05 | 48.62 | 47.66 | 43.03 | 39.83 | NA | NA | NA | NA | NA | NA | NA | NA | NA | |
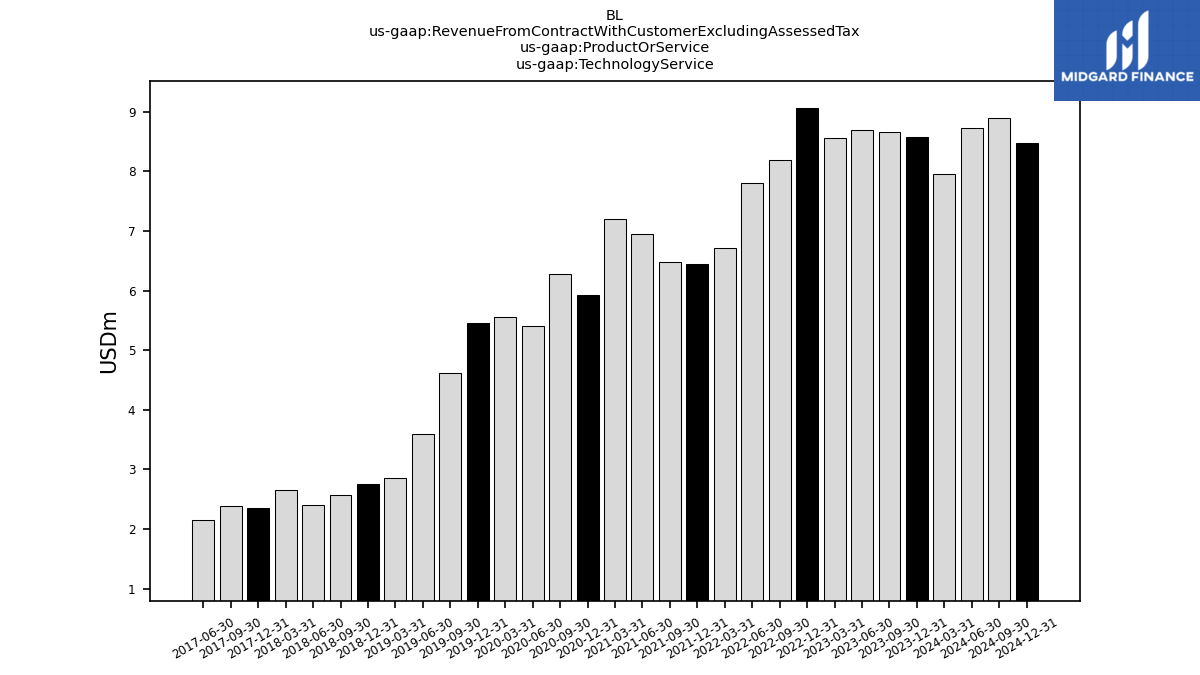
| Technology Service | 8.57 | 8.65 | 8.69 | 8.56 | 9.06 | 8.19 | 7.79 | 6.71 | 6.44 | 6.48 | 6.95 | 7.20 | 5.93 | 6.28 | 5.41 | 5.56 | 5.46 | 4.61 | 3.60 | 2.85 | 2.75 | 2.56 | 2.41 | 2.66 | 2.36 | 2.39 | 2.15 | NA | NA | NA | NA | NA | NA | NA | NA | NA | |
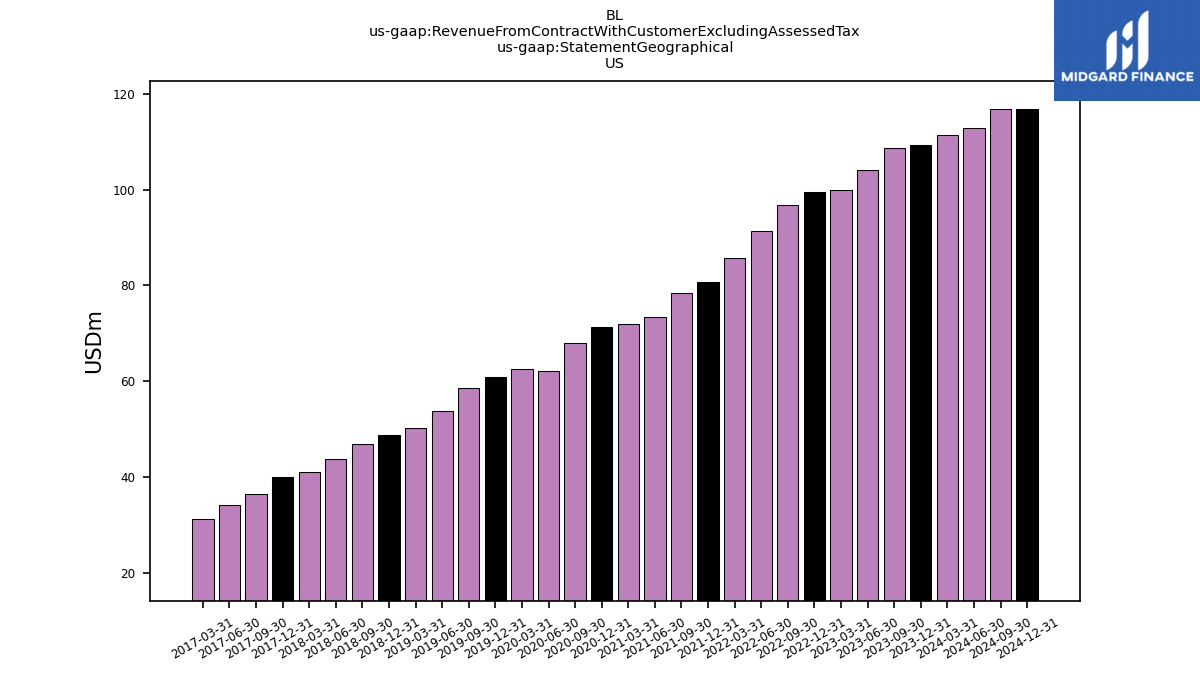
| US | 109.37 | 108.76 | 104.05 | 100.01 | 99.49 | 96.77 | 91.48 | 85.68 | 80.75 | 78.33 | 73.47 | 72.04 | 71.23 | 68.06 | 62.13 | 62.59 | 60.89 | 58.59 | 53.73 | 50.17 | 48.70 | 46.78 | 43.66 | 41.01 | 39.89 | 36.33 | 34.06 | 31.21 | NA | NA | NA | NA | NA | NA | NA | NA | |
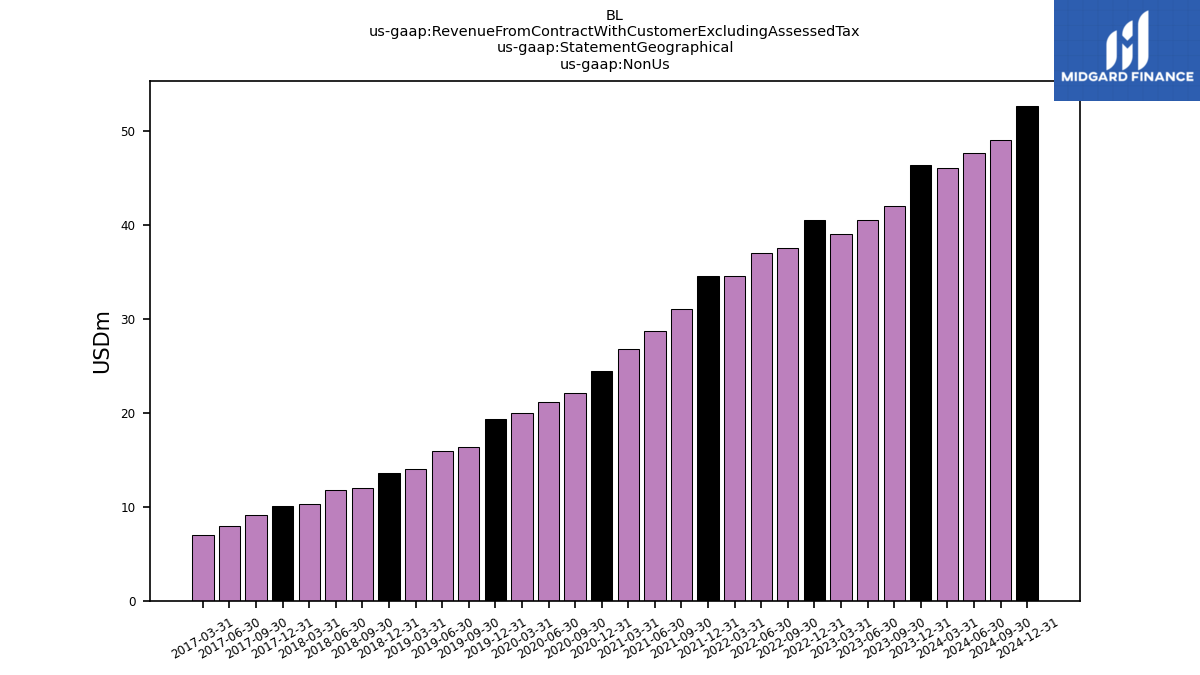
| Non Us | 46.36 | 41.95 | 40.52 | 38.97 | 40.47 | 37.50 | 36.99 | 34.55 | 34.57 | 31.07 | 28.65 | 26.82 | 24.48 | 22.10 | 21.14 | 20.00 | 19.37 | 16.34 | 15.93 | 13.96 | 13.62 | 11.95 | 11.79 | 10.27 | 10.13 | 9.09 | 7.92 | 6.97 | NA | NA | NA | NA | NA | NA | NA | NA |