
| 2023-09-30 | 2023-06-30 | 2023-03-31 | 2022-12-31 | 2022-09-30 | 2022-06-30 | 2022-03-31 | 2021-12-31 | 2021-09-30 | 2021-06-30 | 2021-03-31 | 2020-12-31 | 2020-09-30 | 2020-06-30 | 2020-03-31 | 2019-12-31 | 2019-09-30 | 2019-06-30 | 2019-03-31 | 2018-12-31 | 2018-09-30 | 2018-06-30 | 2018-03-31 | 2017-12-31 | 2017-09-30 | 2017-06-30 | 2017-03-31 | 2016-12-31 | 2016-09-30 | 2016-06-30 | 2016-03-31 | ||
|---|---|---|---|---|---|---|---|---|---|---|---|---|---|---|---|---|---|---|---|---|---|---|---|---|---|---|---|---|---|---|---|---|
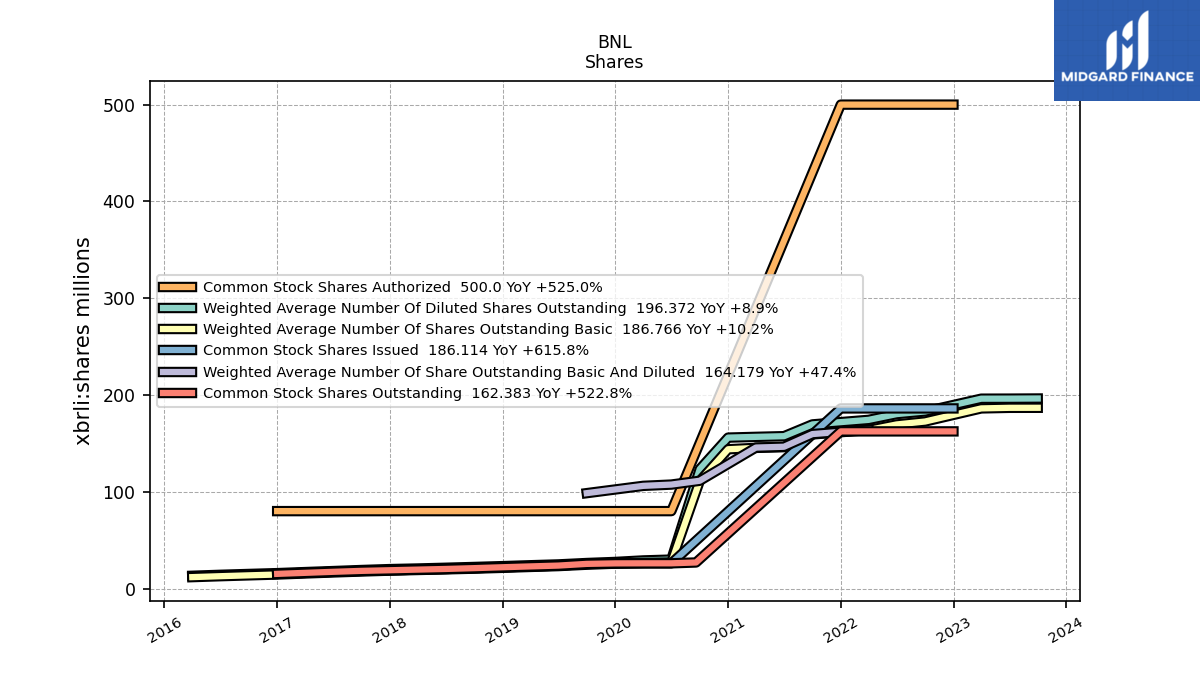
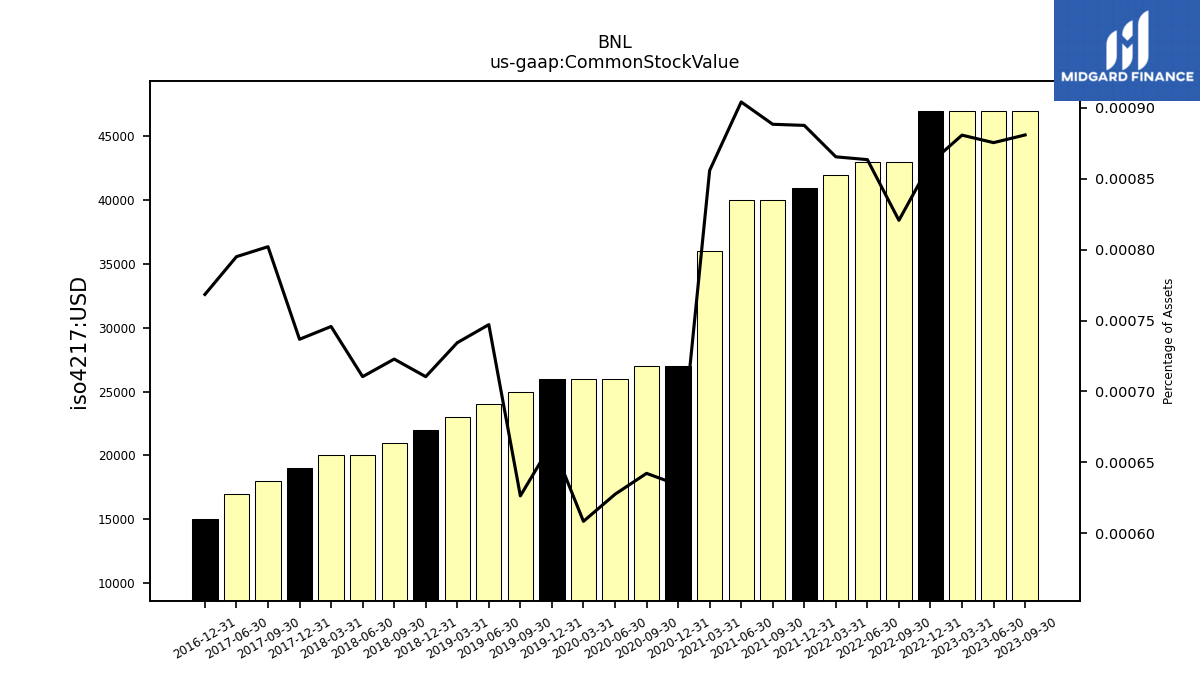
| Common Stock Value | 0.05 | 0.05 | 0.05 | 0.05 | 0.04 | 0.04 | 0.04 | 0.04 | 0.04 | 0.04 | 0.04 | 0.03 | 0.03 | 0.03 | 0.03 | 0.03 | 0.03 | 0.02 | 0.02 | 0.02 | 0.02 | 0.02 | 0.02 | 0.02 | 0.02 | 0.02 | NA | 0.01 | NA | NA | NA | |
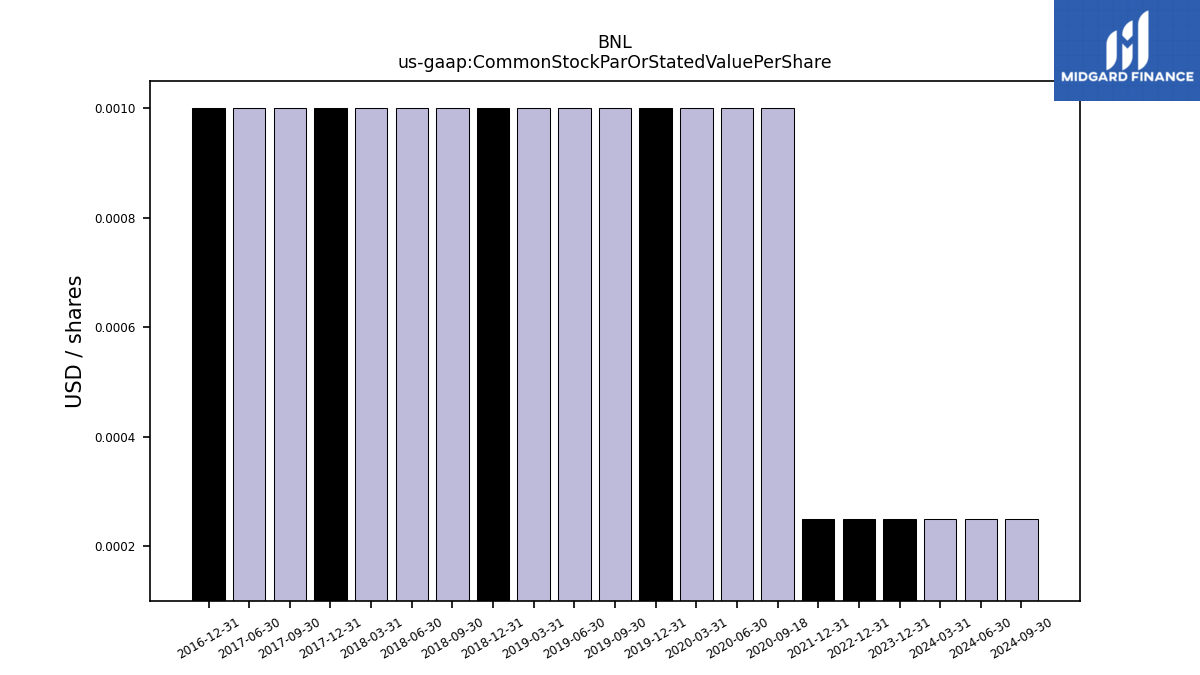
| Common Stock Par Or Stated Value Per Share | NA | NA | NA | 0.00 | NA | NA | NA | 0.00 | NA | NA | NA | NA | NA | 0.00 | 0.00 | 0.00 | 0.00 | 0.00 | 0.00 | 0.00 | 0.00 | 0.00 | 0.00 | 0.00 | 0.00 | 0.00 | NA | 0.00 | NA | NA | NA | |
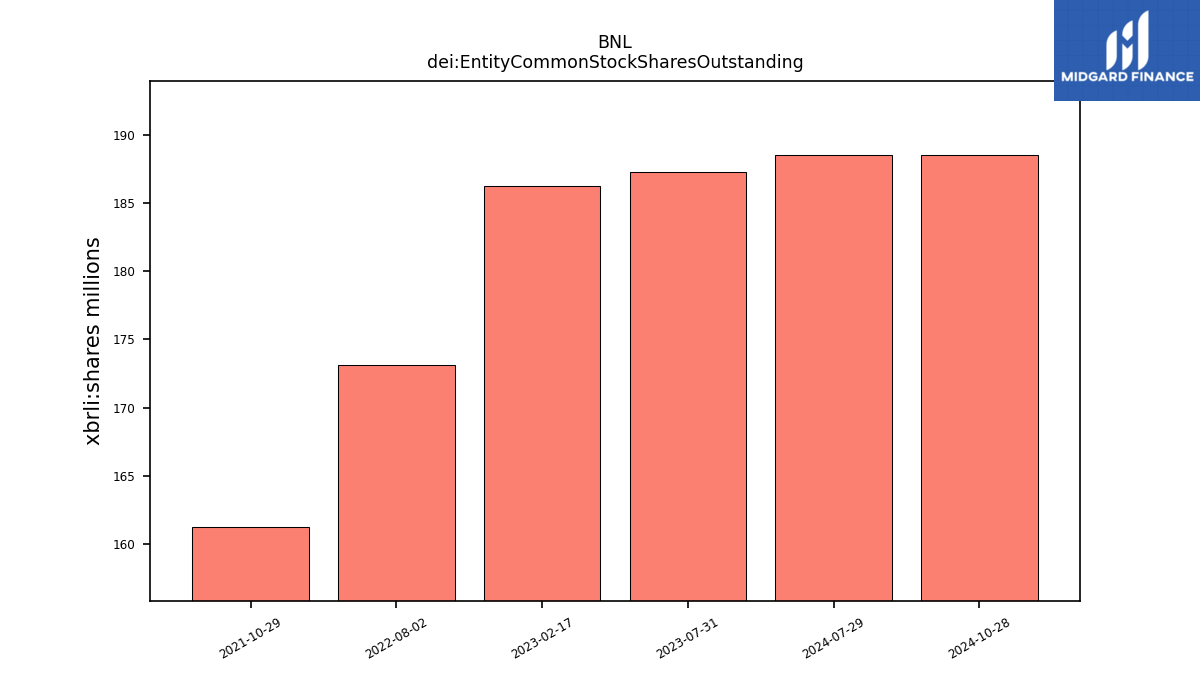
| dei: Entity Common Stock Shares Outstanding | NA | NA | NA | NA | NA | NA | NA | NA | NA | NA | NA | NA | NA | NA | NA | NA | NA | NA | NA | NA | NA | NA | NA | NA | NA | NA | NA | NA | NA | NA | NA | |
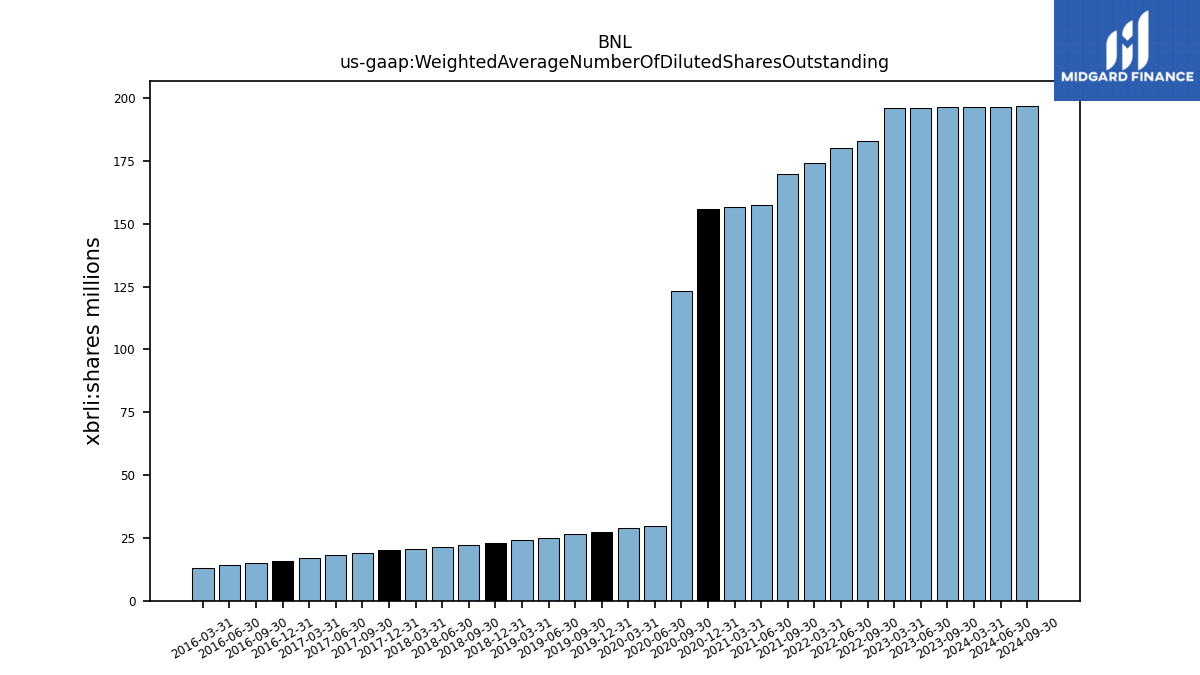
| Weighted Average Number Of Diluted Shares Outstanding | 196.37 | 196.23 | 196.18 | NA | 182.97 | 180.26 | 174.29 | NA | 169.59 | 157.43 | 156.72 | 155.96 | 123.38 | 29.91 | 29.05 | 27.47 | 26.38 | 24.94 | 24.07 | 23.15 | 22.29 | 21.48 | 20.72 | 20.10 | 19.15 | 18.05 | 17.01 | 15.92 | 15.07 | 14.19 | 13.20 | |
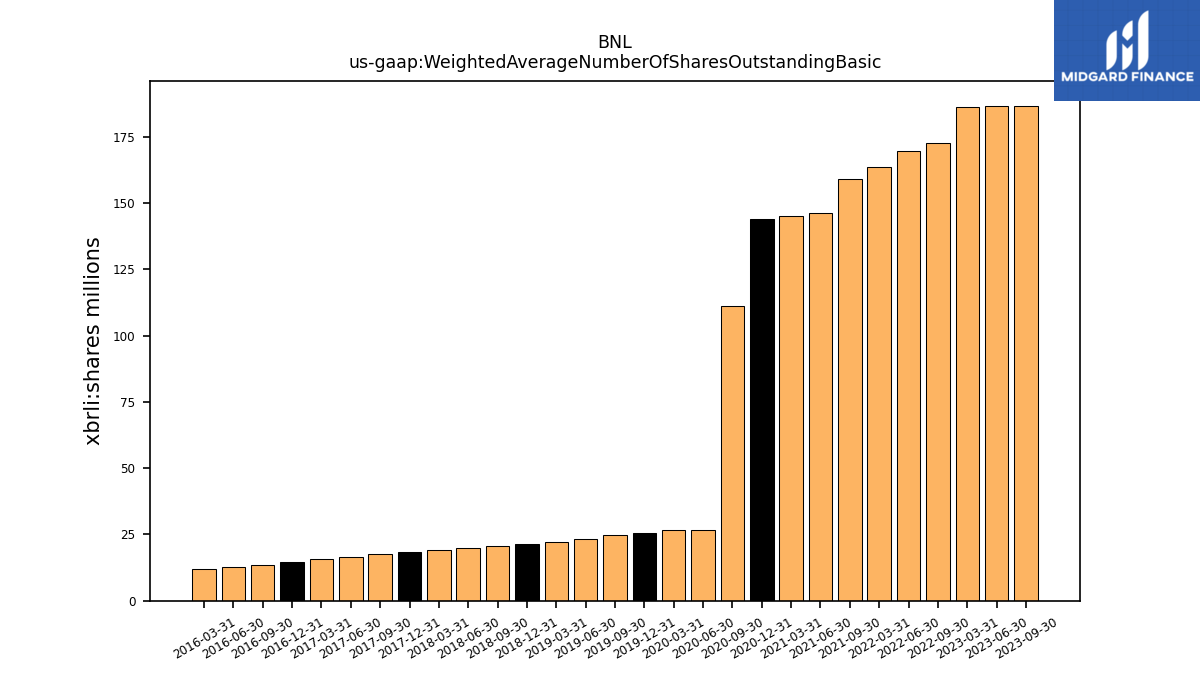
| Weighted Average Number Of Shares Outstanding Basic | 186.77 | 186.73 | 186.13 | NA | 172.58 | 169.56 | 163.81 | NA | 159.23 | 146.12 | 145.34 | 143.92 | 111.16 | 26.86 | 26.53 | 25.73 | 24.64 | 23.20 | 22.34 | 21.42 | 20.55 | 19.83 | 19.17 | 18.52 | 17.62 | 16.62 | 15.58 | 14.50 | 13.65 | 12.77 | 11.80 | |
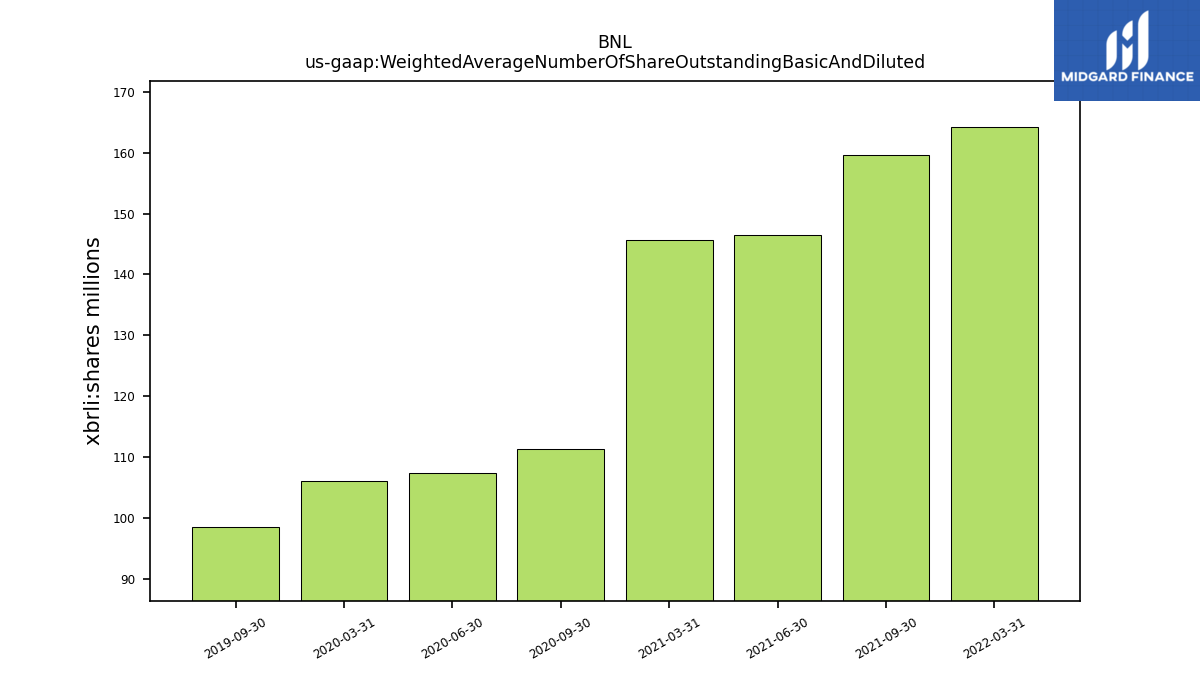
| Weighted Average Number Of Share Outstanding Basic And Diluted | NA | NA | NA | NA | NA | NA | 164.18 | NA | 159.60 | 146.51 | 145.67 | NA | 111.37 | 107.42 | 106.11 | NA | 98.57 | NA | NA | NA | NA | NA | NA | NA | NA | NA | NA | NA | NA | NA | NA | |
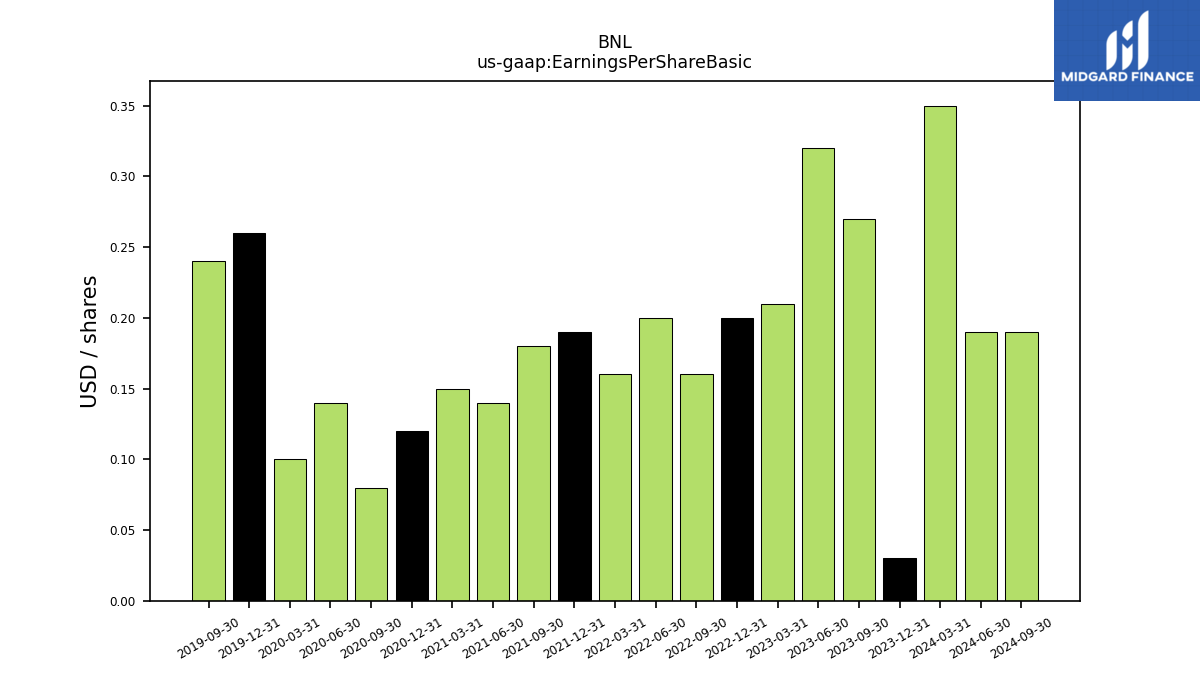
| Earnings Per Share Basic | 0.27 | 0.32 | 0.21 | 0.20 | 0.16 | 0.20 | 0.16 | 0.19 | 0.18 | 0.14 | 0.15 | 0.12 | 0.08 | 0.14 | 0.10 | 0.26 | 0.24 | NA | NA | NA | NA | NA | NA | NA | NA | NA | NA | NA | NA | NA | NA | |
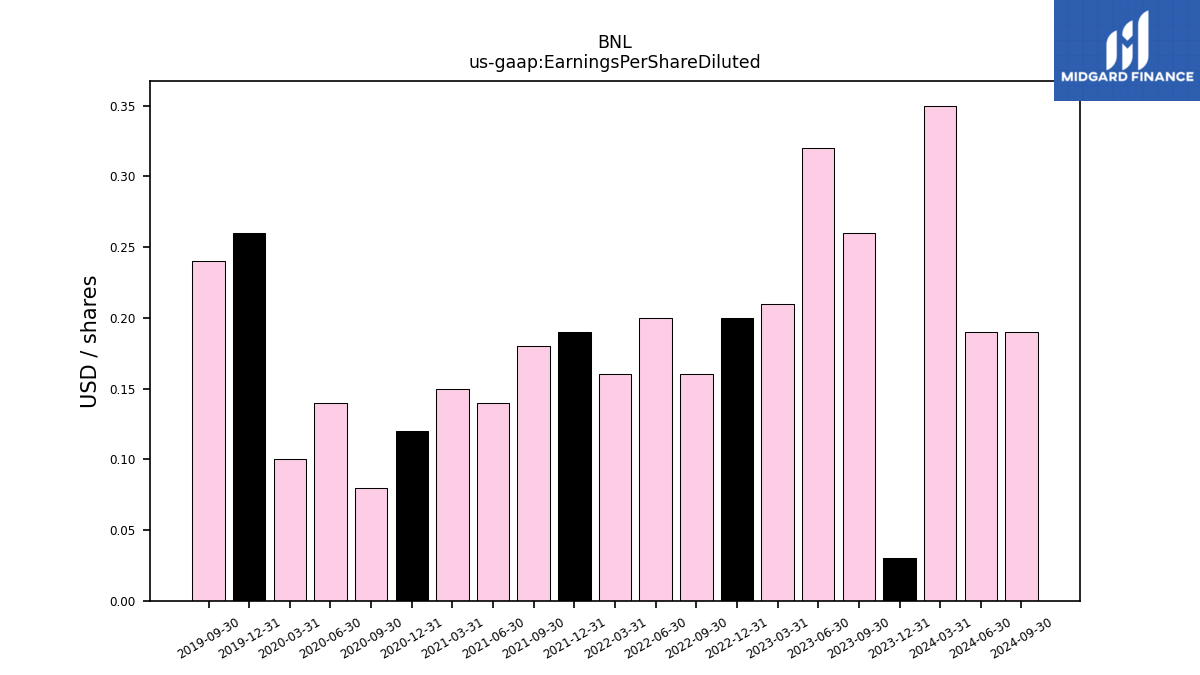
| Earnings Per Share Diluted | 0.26 | 0.32 | 0.21 | 0.20 | 0.16 | 0.20 | 0.16 | 0.19 | 0.18 | 0.14 | 0.15 | 0.12 | 0.08 | 0.14 | 0.10 | 0.26 | 0.24 | NA | NA | NA | NA | NA | NA | NA | NA | NA | NA | NA | NA | NA | NA | |
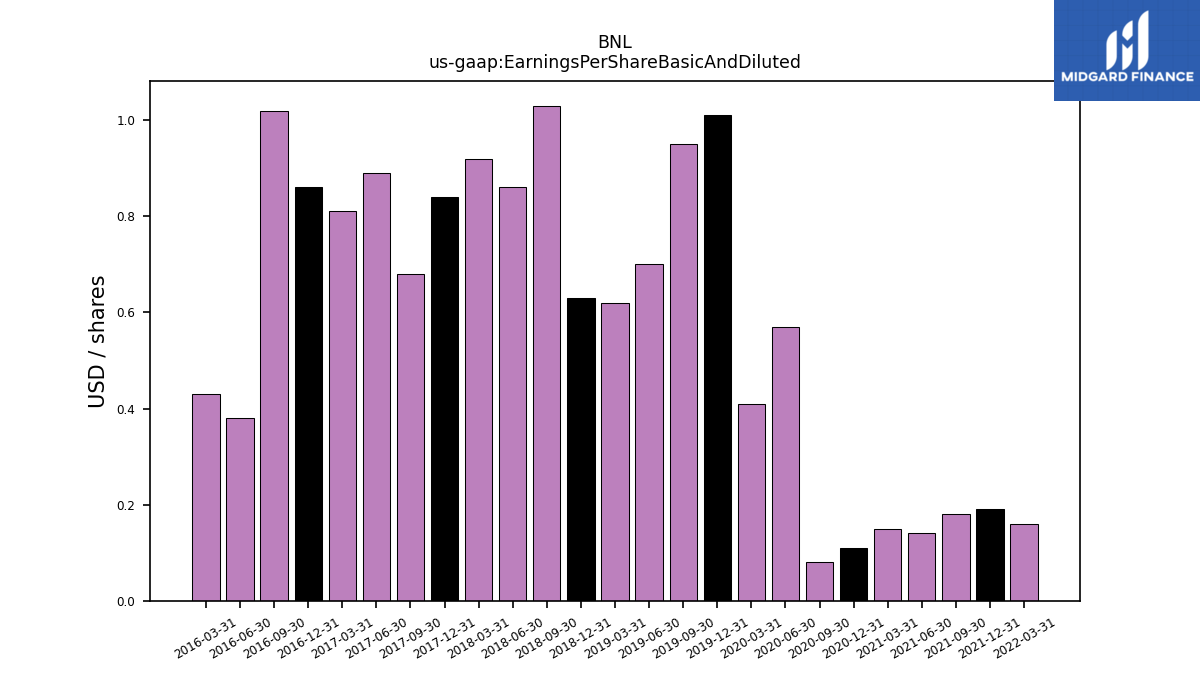
| Earnings Per Share Basic And Diluted | NA | NA | NA | NA | NA | NA | 0.16 | 0.19 | 0.18 | 0.14 | 0.15 | 0.11 | 0.08 | 0.57 | 0.41 | 1.01 | 0.95 | 0.70 | 0.62 | 0.63 | 1.03 | 0.86 | 0.92 | 0.84 | 0.68 | 0.89 | 0.81 | 0.86 | 1.02 | 0.38 | 0.43 |
| 2023-09-30 | 2023-06-30 | 2023-03-31 | 2022-12-31 | 2022-09-30 | 2022-06-30 | 2022-03-31 | 2021-12-31 | 2021-09-30 | 2021-06-30 | 2021-03-31 | 2020-12-31 | 2020-09-30 | 2020-06-30 | 2020-03-31 | 2019-12-31 | 2019-09-30 | 2019-06-30 | 2019-03-31 | 2018-12-31 | 2018-09-30 | 2018-06-30 | 2018-03-31 | 2017-12-31 | 2017-09-30 | 2017-06-30 | 2017-03-31 | 2016-12-31 | 2016-09-30 | 2016-06-30 | 2016-03-31 | ||
|---|---|---|---|---|---|---|---|---|---|---|---|---|---|---|---|---|---|---|---|---|---|---|---|---|---|---|---|---|---|---|---|---|
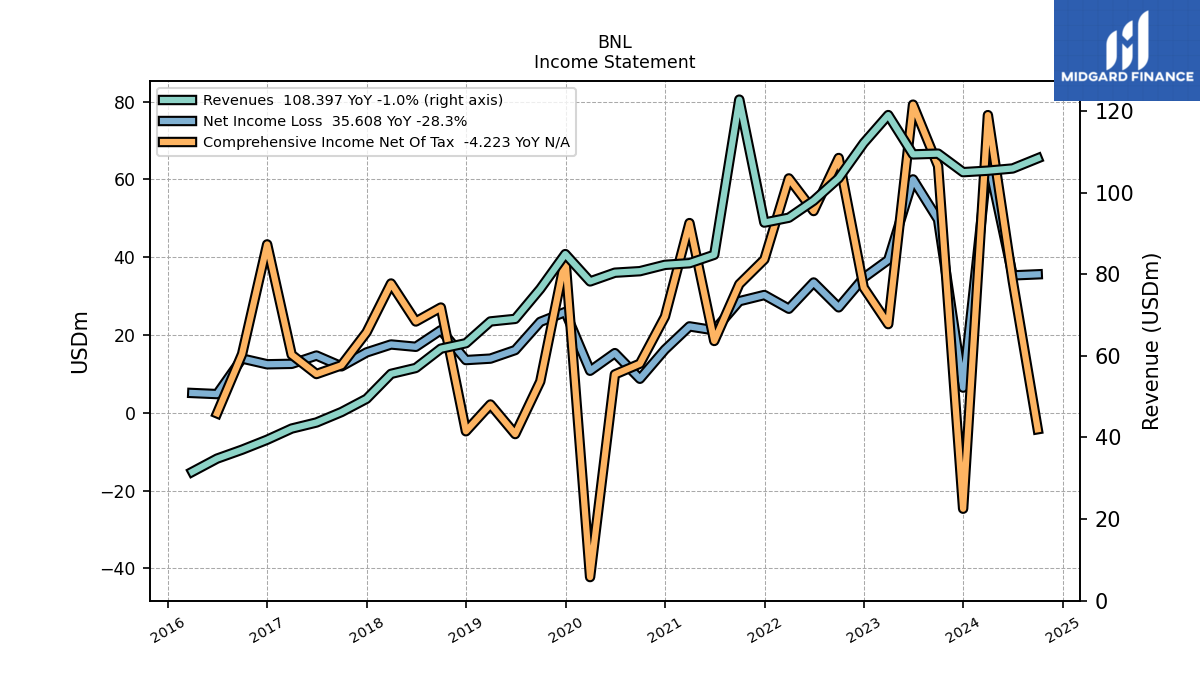
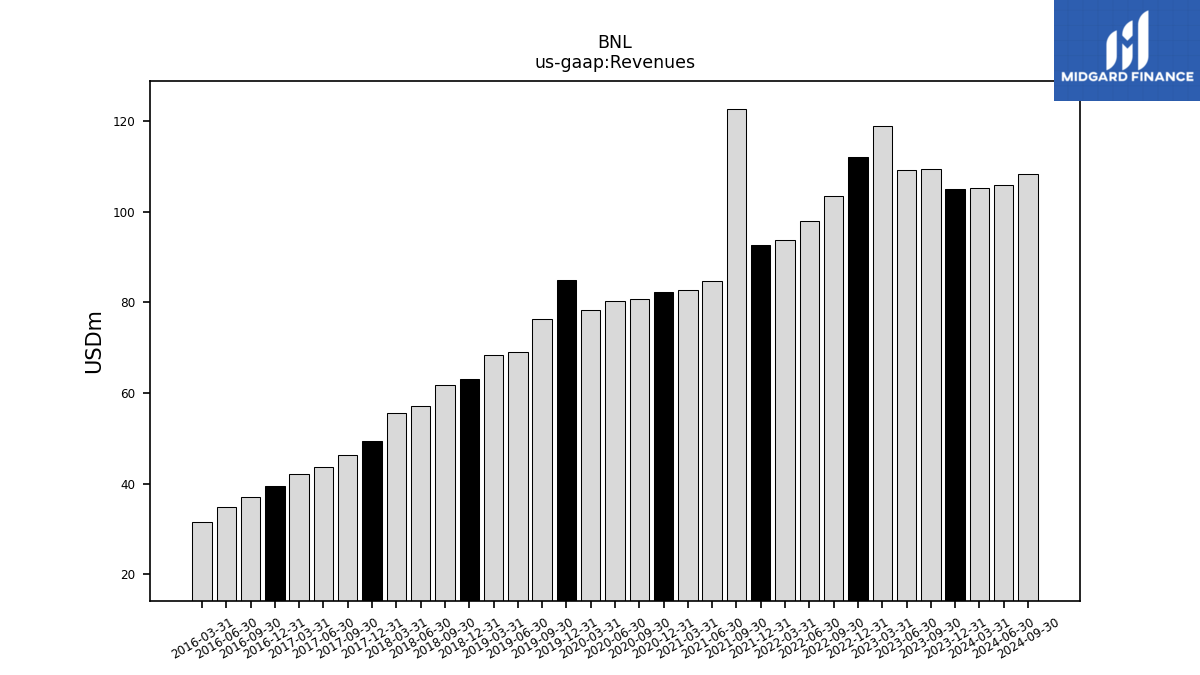
| Revenues | 109.54 | 109.35 | 118.99 | 112.14 | 103.52 | 98.01 | 93.84 | 92.64 | 122.78 | 84.76 | 82.70 | 82.29 | 80.74 | 80.37 | 78.23 | 84.93 | 76.40 | 69.05 | 68.43 | 63.09 | 61.76 | 57.03 | 55.59 | 49.47 | 46.23 | 43.67 | 42.19 | 39.45 | 37.01 | 34.82 | 31.59 | |
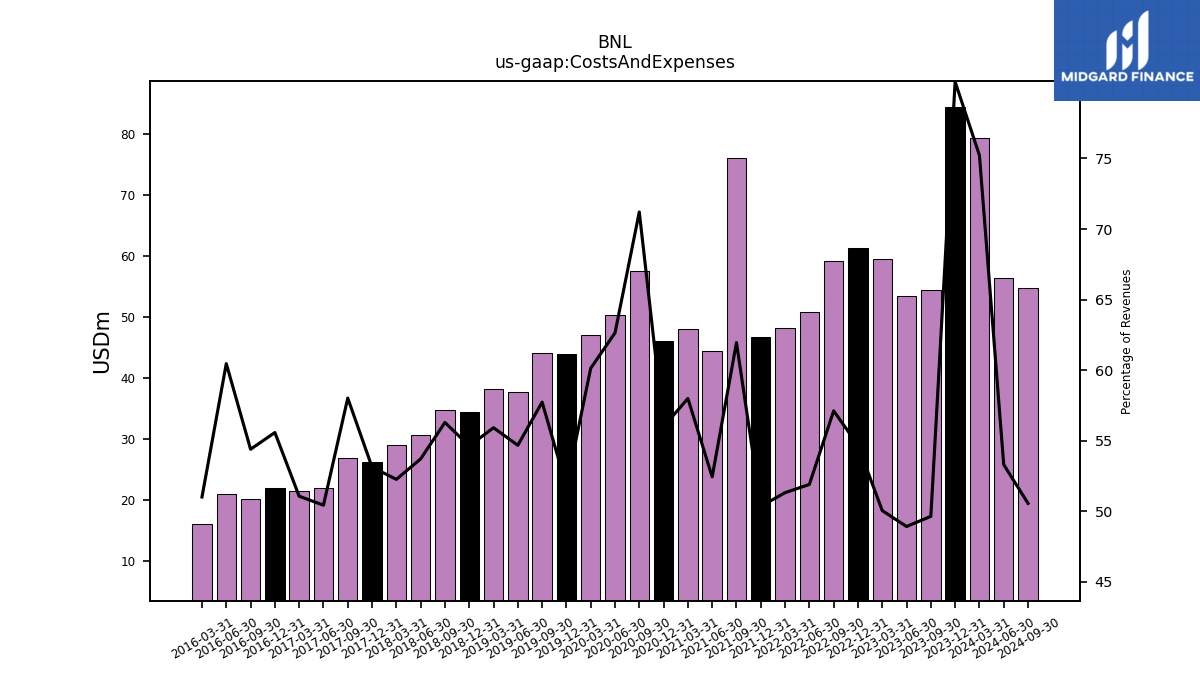
| Costs And Expenses | 54.38 | 53.50 | 59.56 | 61.32 | 59.13 | 50.88 | 48.16 | 46.65 | 76.06 | 44.45 | 47.96 | 46.08 | 57.50 | 50.34 | 47.05 | 43.97 | 44.11 | 37.76 | 38.27 | 34.47 | 34.77 | 30.64 | 29.05 | 26.28 | 26.83 | 22.03 | 21.54 | 21.93 | 20.13 | 21.06 | 16.11 | |
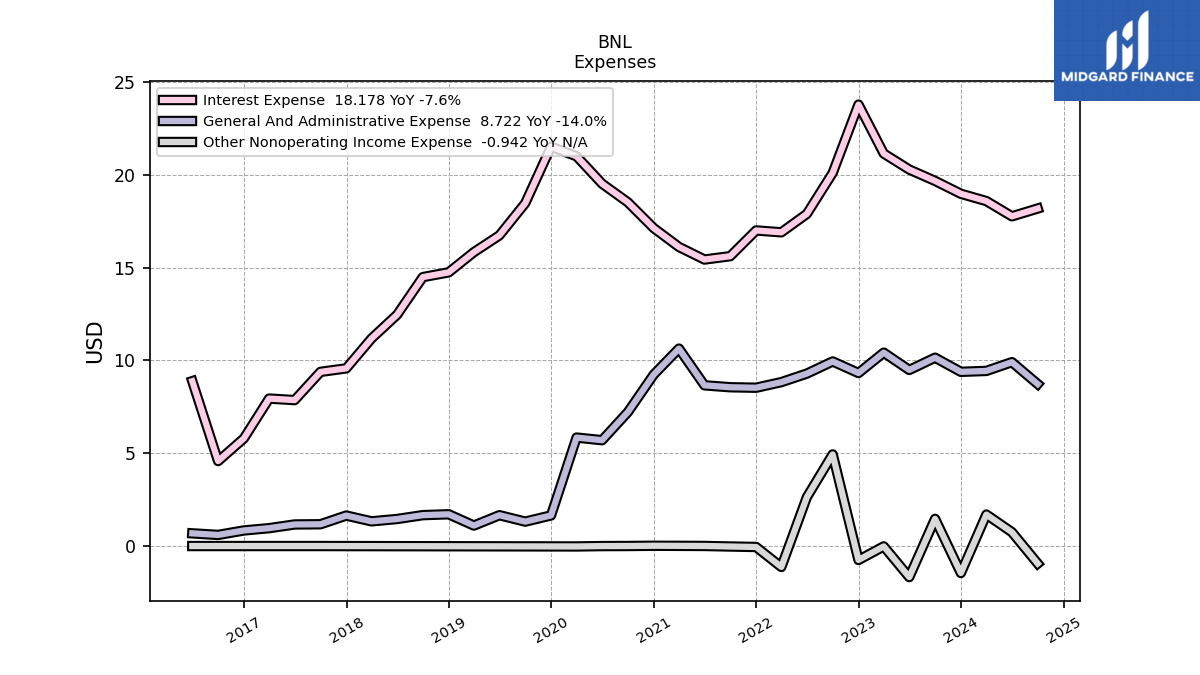
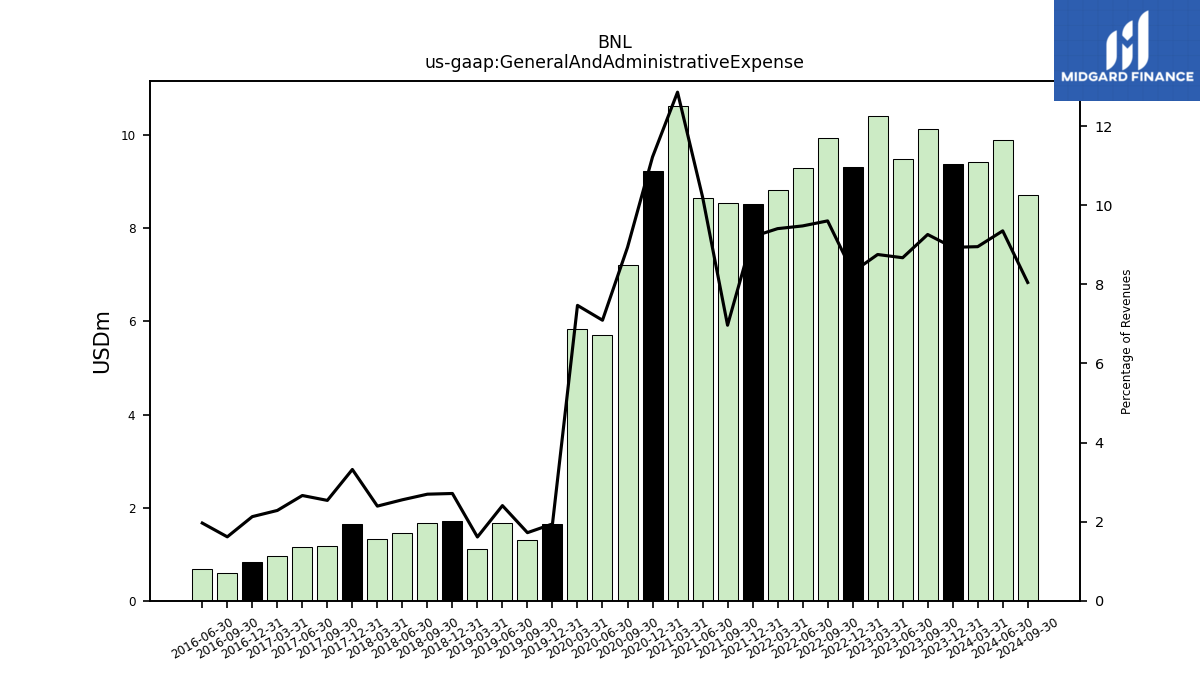
| General And Administrative Expense | 10.14 | 9.48 | 10.42 | 9.32 | 9.94 | 9.29 | 8.83 | 8.53 | 8.55 | 8.65 | 10.63 | 9.23 | 7.21 | 5.70 | 5.84 | 1.65 | 1.31 | 1.66 | 1.10 | 1.71 | 1.66 | 1.46 | 1.33 | 1.64 | 1.17 | 1.16 | 0.96 | 0.84 | 0.60 | 0.68 | NA | |
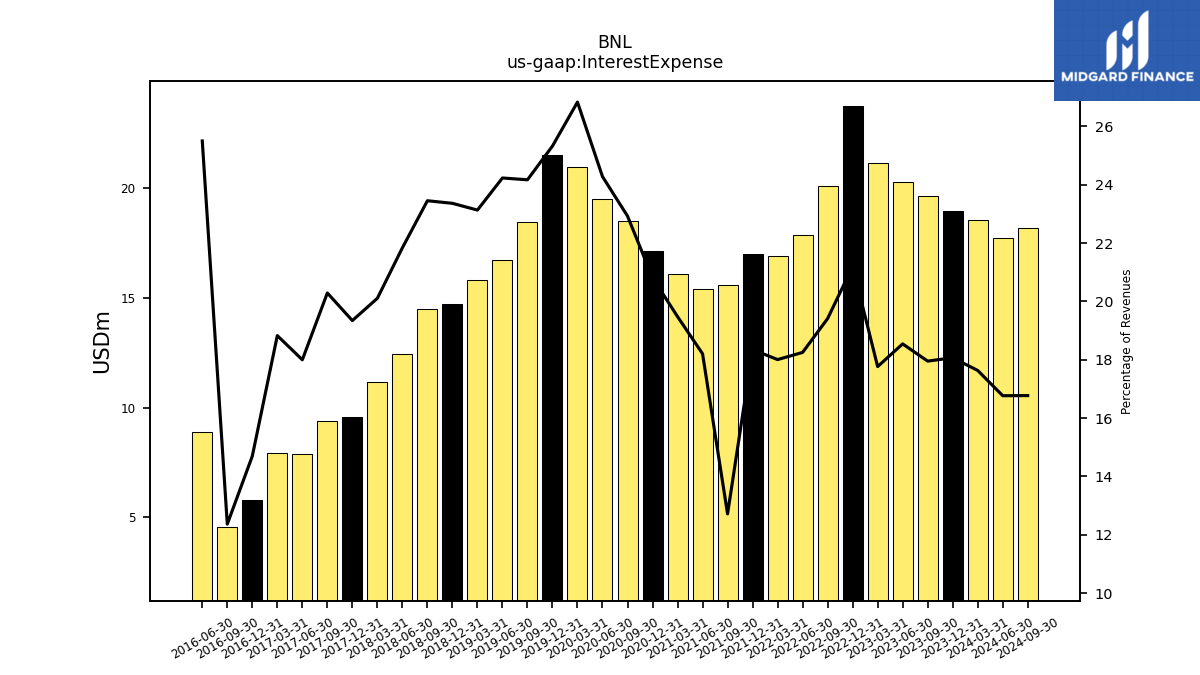
| Interest Expense | 19.66 | 20.28 | 21.14 | 23.77 | 20.09 | 17.89 | 16.90 | 17.00 | 15.61 | 15.43 | 16.11 | 17.12 | 18.51 | 19.51 | 20.99 | 21.51 | 18.46 | 16.73 | 15.83 | 14.74 | 14.48 | 12.45 | 11.18 | 9.57 | 9.38 | 7.86 | 7.94 | 5.80 | 4.58 | 8.88 | NA | |
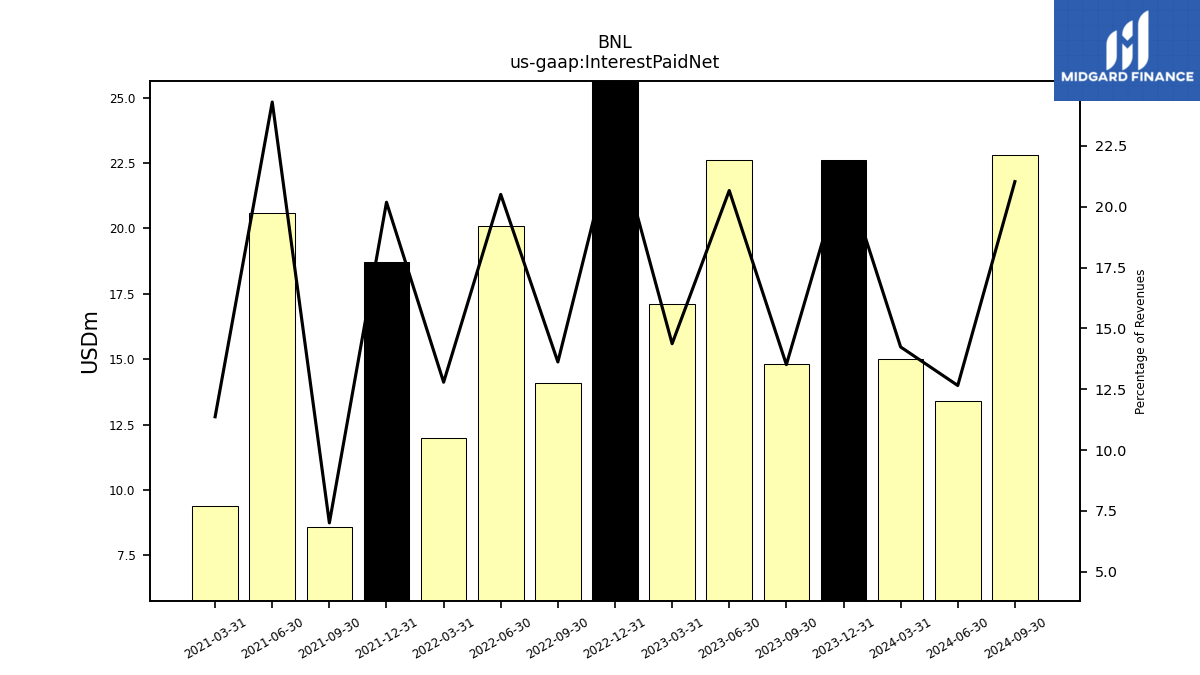
| Interest Paid Net | 14.80 | 22.60 | 17.10 | 25.80 | 14.10 | 20.10 | 12.00 | 18.70 | 8.60 | 20.60 | 9.40 | NA | NA | NA | NA | NA | NA | NA | NA | NA | NA | NA | NA | NA | NA | NA | NA | NA | NA | NA | NA | |
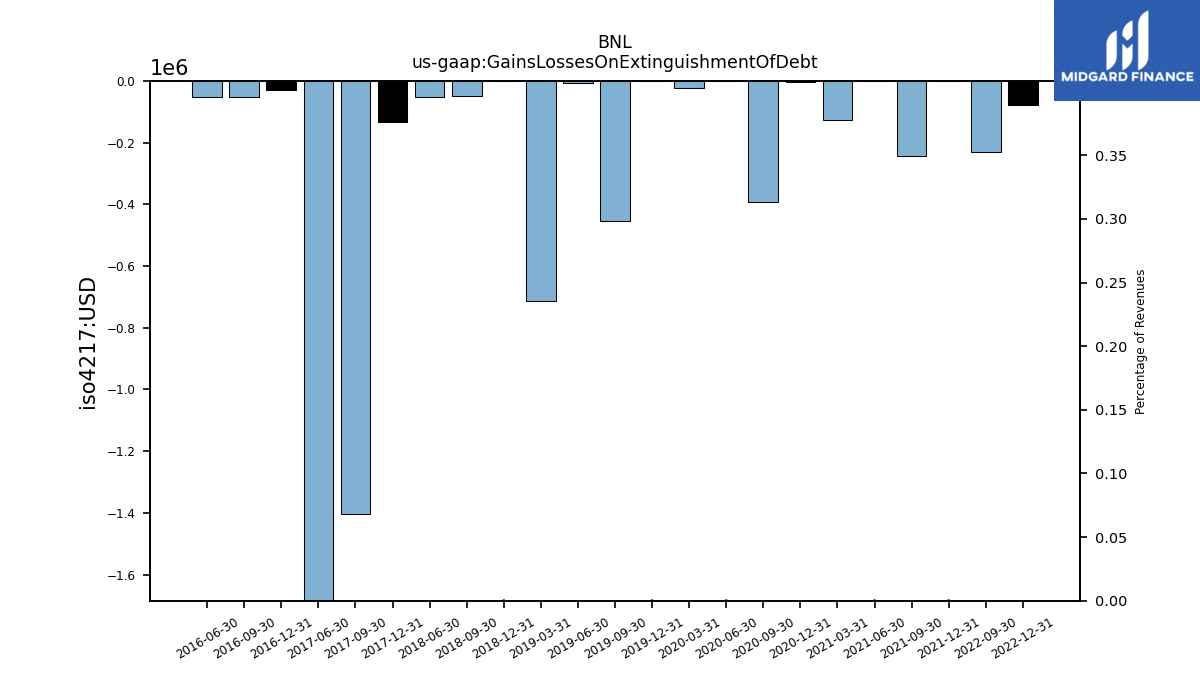
| Gains Losses On Extinguishment Of Debt | NA | NA | NA | -0.08 | -0.23 | NA | NA | 0.00 | -0.24 | 0.00 | -0.13 | -0.00 | -0.39 | 0.00 | -0.02 | 0.00 | -0.46 | -0.01 | -0.71 | 0.00 | -0.05 | -0.05 | NA | -0.13 | -1.40 | -3.57 | NA | -0.03 | -0.05 | -0.05 | NA | |
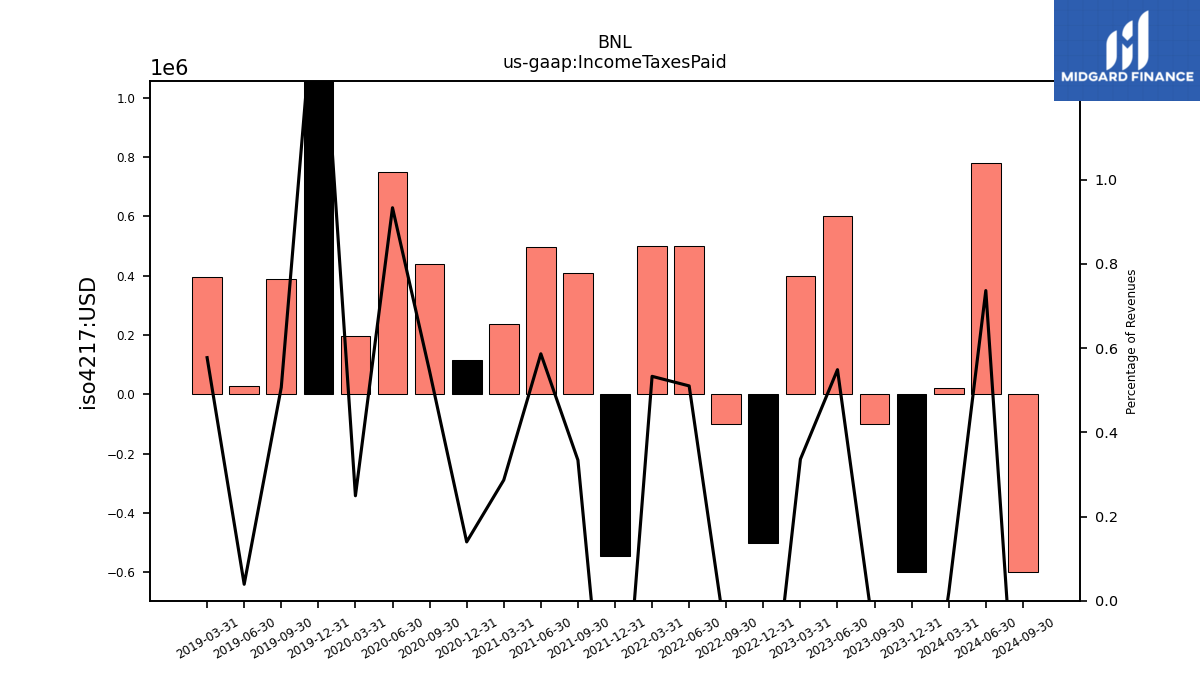
| Income Taxes Paid | -0.10 | 0.60 | 0.40 | -0.50 | -0.10 | 0.50 | 0.50 | -0.54 | 0.41 | 0.50 | 0.24 | 0.12 | 0.44 | 0.75 | 0.20 | 1.32 | 0.39 | 0.03 | 0.40 | NA | NA | NA | NA | NA | NA | NA | NA | NA | NA | NA | NA | |
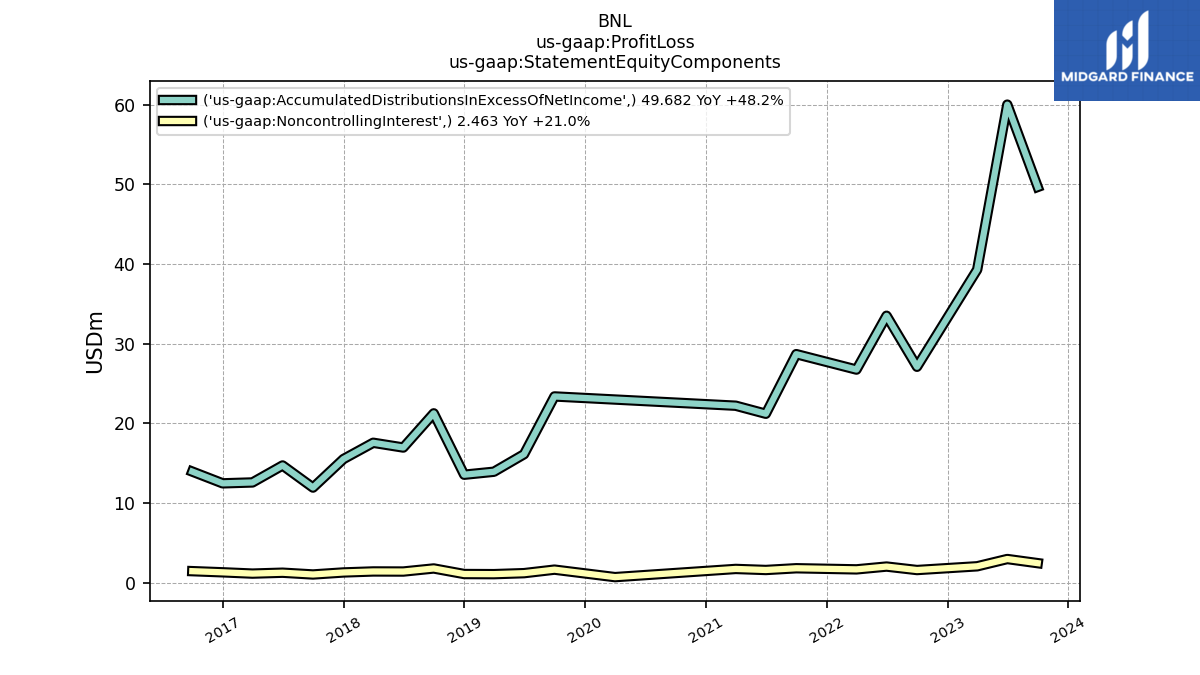
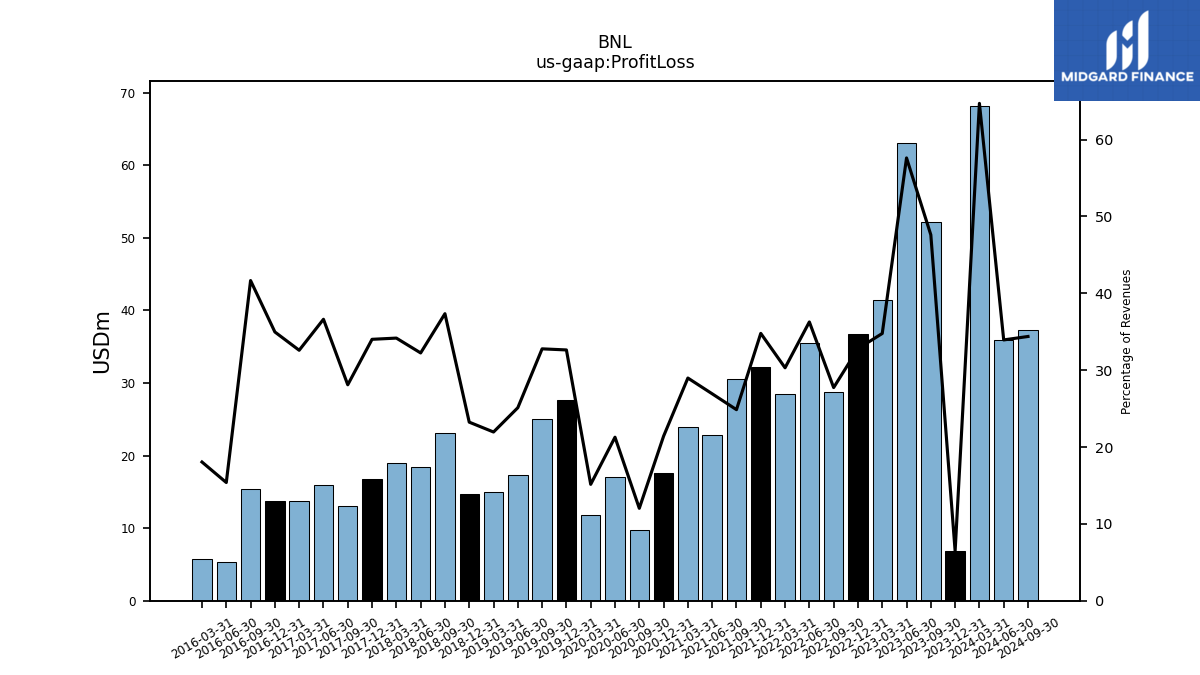
| Profit Loss | 52.15 | 63.00 | 41.37 | 36.77 | 28.71 | 35.55 | 28.44 | 32.23 | 30.52 | 22.82 | 23.96 | 17.62 | 9.71 | 17.10 | 11.85 | 27.71 | 25.04 | 17.34 | 15.02 | 14.66 | 23.06 | 18.39 | 19.00 | 16.83 | 12.99 | 15.99 | 13.75 | 13.79 | 15.42 | 5.36 | 5.70 | |
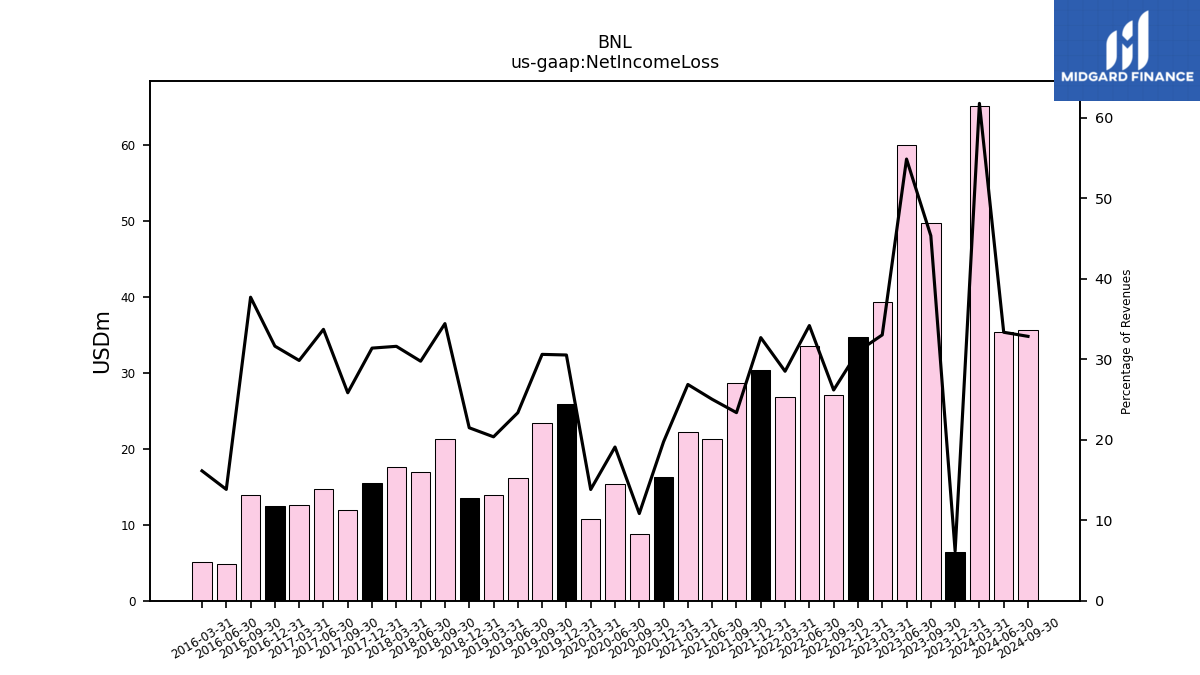
| Net Income Loss | 49.68 | 60.01 | 39.30 | 34.73 | 27.11 | 33.52 | 26.76 | 30.29 | 28.70 | 21.21 | 22.22 | 16.26 | 8.75 | 15.35 | 10.82 | 25.93 | 23.39 | 16.13 | 13.94 | 13.56 | 21.27 | 16.97 | 17.57 | 15.53 | 11.95 | 14.73 | 12.59 | 12.48 | 13.96 | 4.82 | 5.10 | |
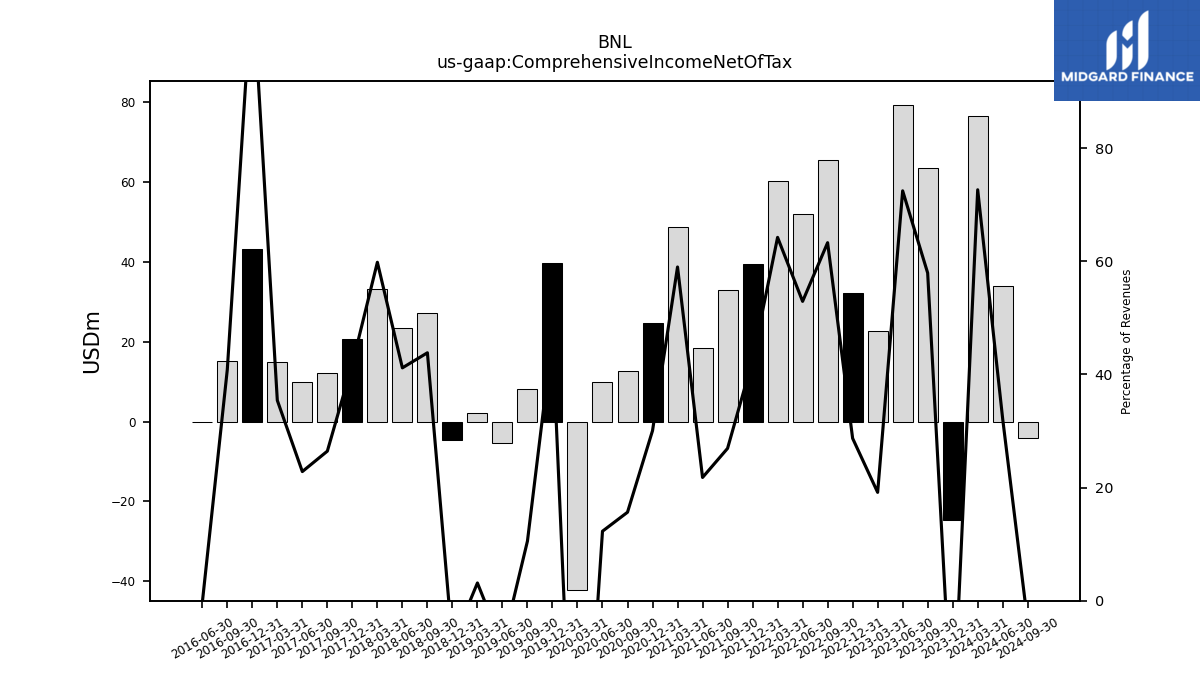
| Comprehensive Income Net Of Tax | 63.46 | 79.23 | 22.80 | 32.19 | 65.52 | 51.87 | 60.27 | 39.43 | 33.06 | 18.47 | 48.79 | 24.74 | 12.63 | 9.88 | -42.24 | 39.76 | 8.06 | -5.47 | 2.15 | -4.75 | 27.07 | 23.48 | 33.26 | 20.69 | 12.23 | 9.97 | 14.94 | 43.31 | 15.12 | -0.14 | NA | |
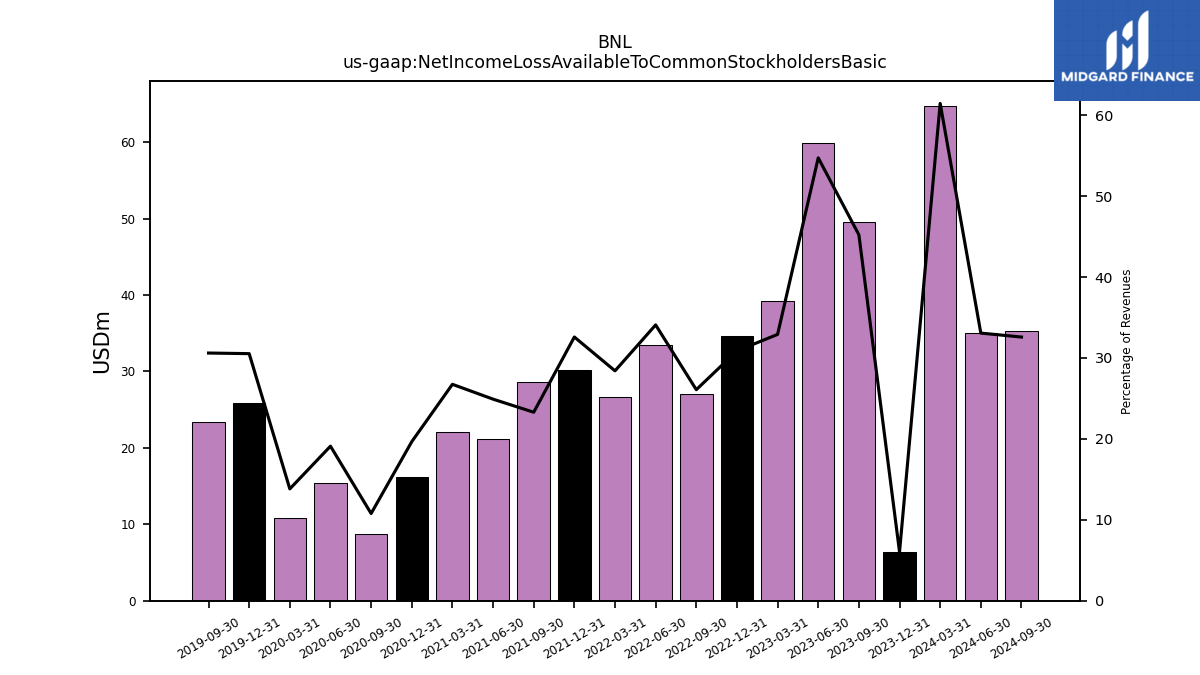
| Net Income Loss Available To Common Stockholders Basic | 49.54 | 59.85 | 39.17 | 34.62 | 27.00 | 33.41 | 26.66 | 30.19 | 28.60 | 21.12 | 22.12 | 16.18 | 8.70 | 15.35 | 10.82 | 25.93 | 23.39 | NA | NA | NA | NA | NA | NA | NA | NA | NA | NA | NA | NA | NA | NA | |
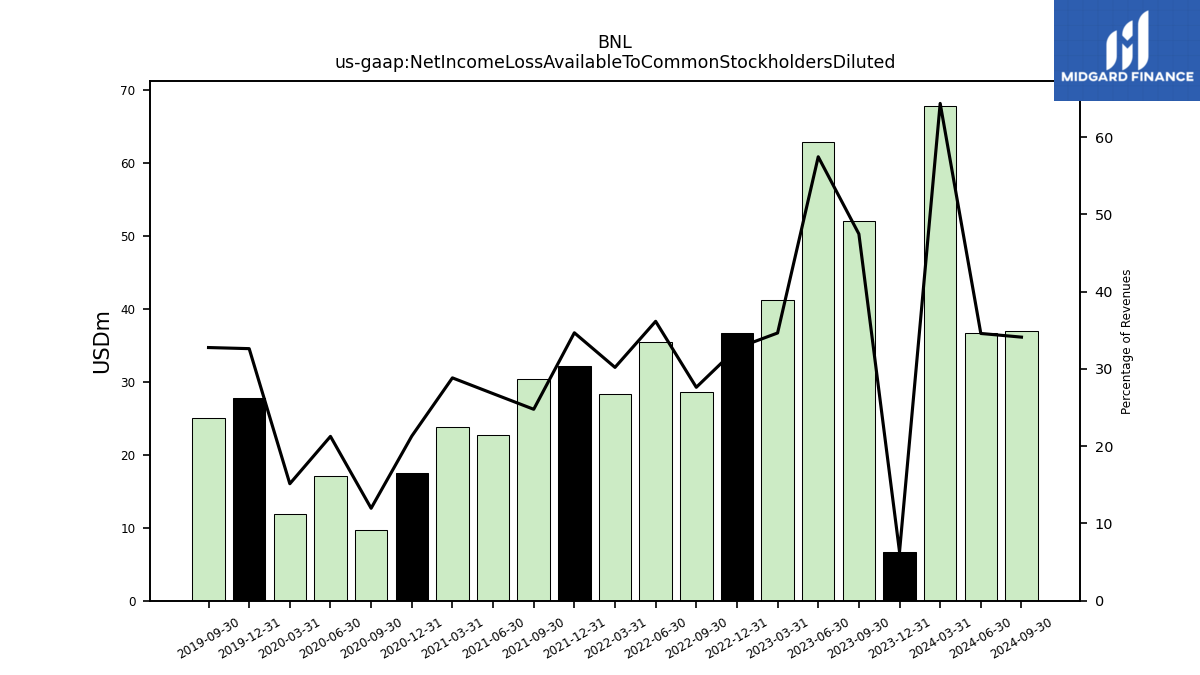
| Net Income Loss Available To Common Stockholders Diluted | 52.00 | 62.84 | 41.24 | 36.66 | 28.60 | 35.45 | 28.34 | 32.13 | 30.43 | 22.72 | 23.86 | 17.53 | 9.66 | 17.10 | 11.85 | 27.71 | 25.04 | NA | NA | NA | NA | NA | NA | NA | NA | NA | NA | NA | NA | NA | NA |
| 2023-09-30 | 2023-06-30 | 2023-03-31 | 2022-12-31 | 2022-09-30 | 2022-06-30 | 2022-03-31 | 2021-12-31 | 2021-09-30 | 2021-06-30 | 2021-03-31 | 2020-12-31 | 2020-09-30 | 2020-06-30 | 2020-03-31 | 2019-12-31 | 2019-09-30 | 2019-06-30 | 2019-03-31 | 2018-12-31 | 2018-09-30 | 2018-06-30 | 2018-03-31 | 2017-12-31 | 2017-09-30 | 2017-06-30 | 2017-03-31 | 2016-12-31 | 2016-09-30 | 2016-06-30 | 2016-03-31 | ||
|---|---|---|---|---|---|---|---|---|---|---|---|---|---|---|---|---|---|---|---|---|---|---|---|---|---|---|---|---|---|---|---|---|
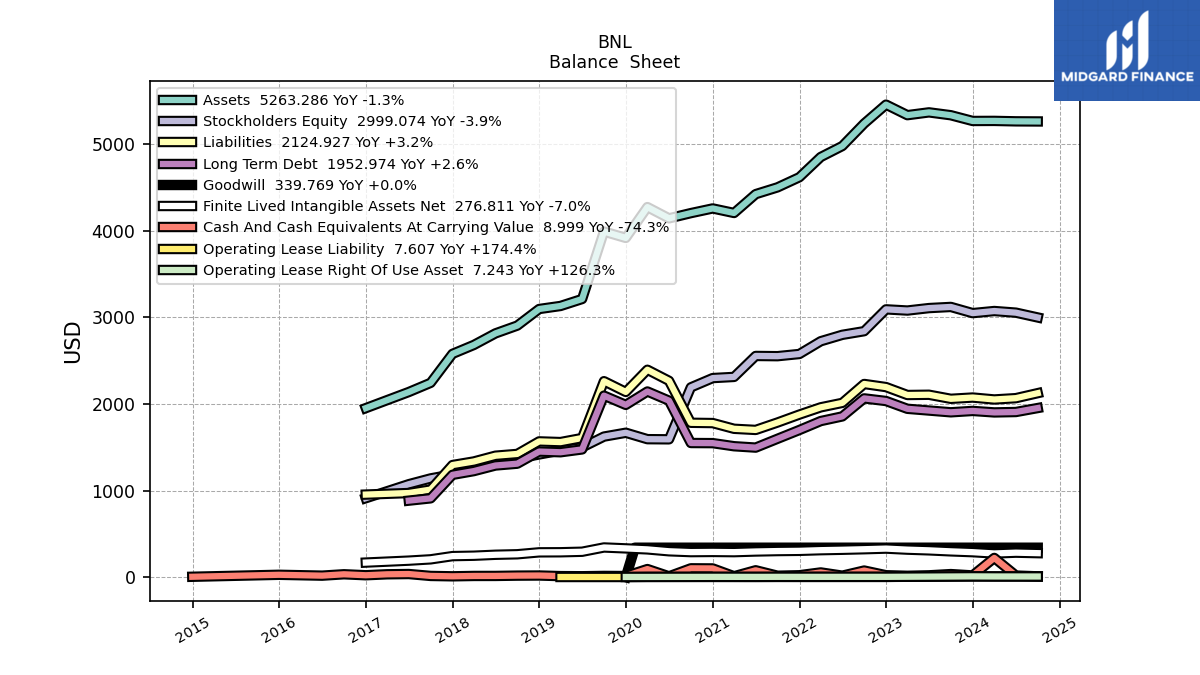
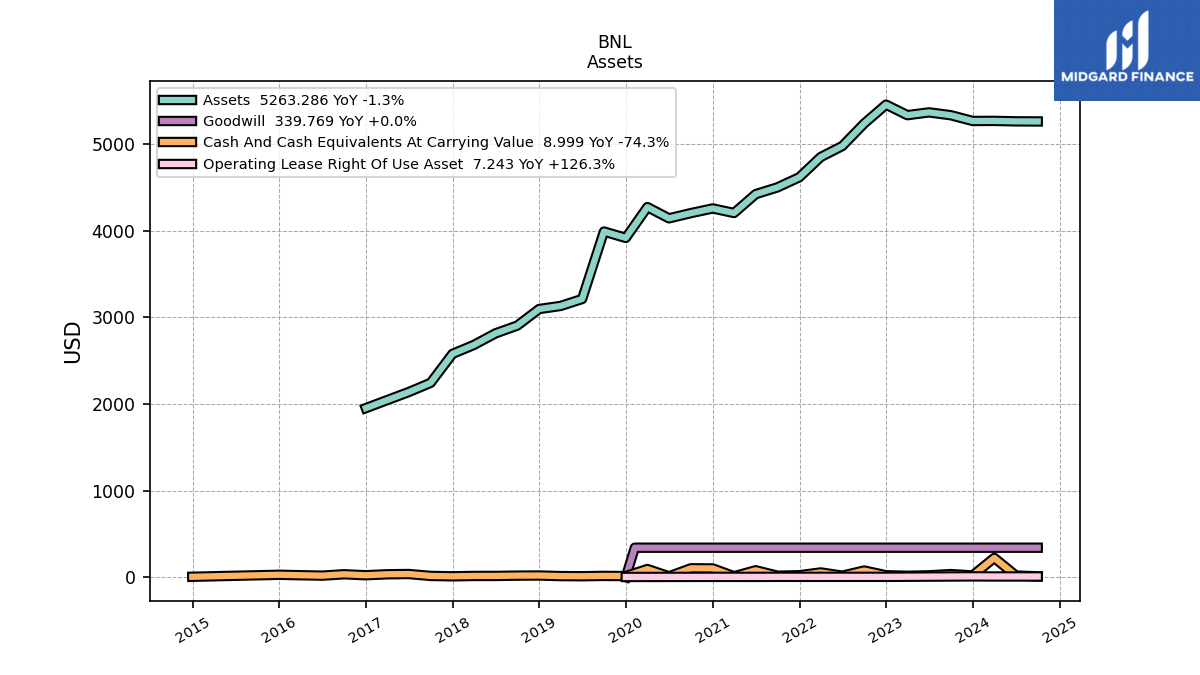
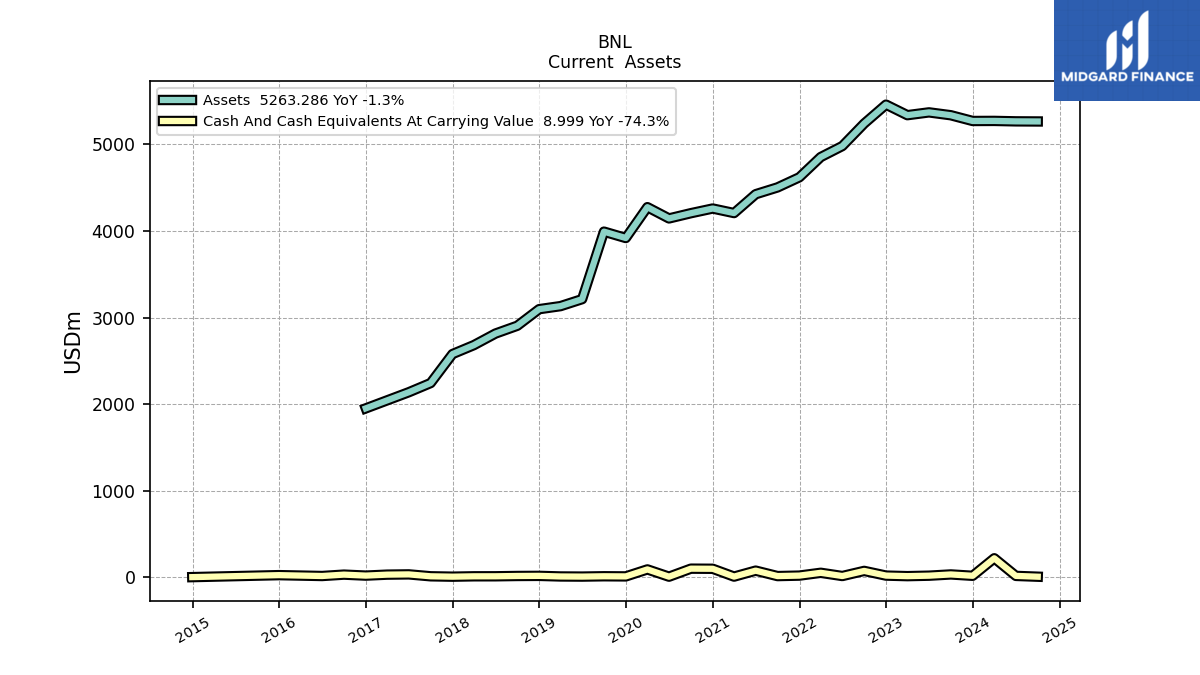
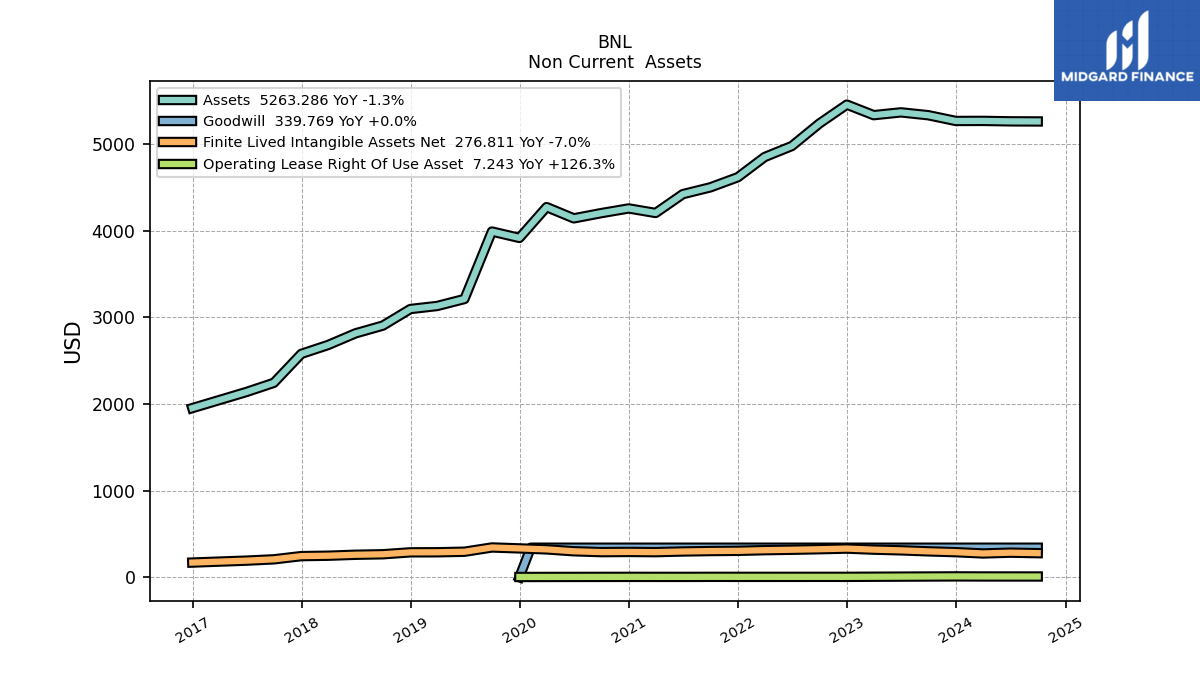
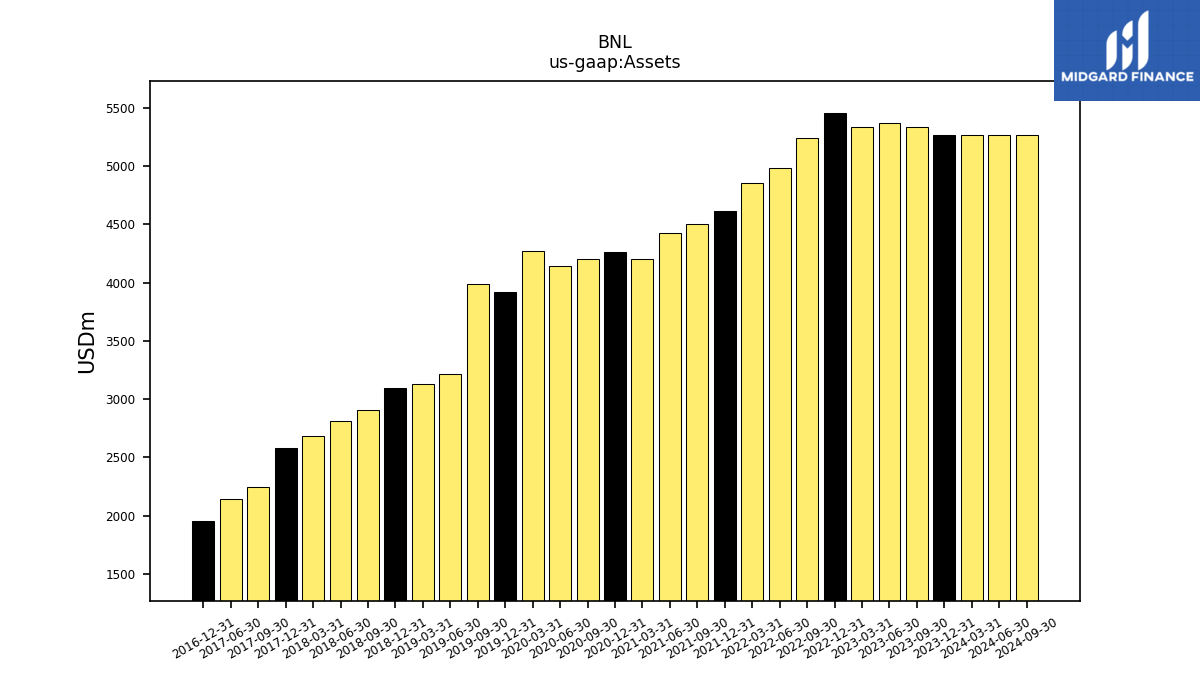
| Assets | 5335.04 | 5368.15 | 5335.87 | 5457.61 | 5239.19 | 4979.44 | 4852.52 | 4618.65 | 4501.97 | 4423.61 | 4206.05 | 4258.48 | 4204.47 | 4144.06 | 4274.05 | 3917.86 | 3991.79 | 3212.32 | 3131.94 | 3096.80 | 2905.34 | 2815.26 | 2681.67 | 2578.76 | 2244.10 | 2138.18 | NA | 1952.05 | NA | NA | NA | |
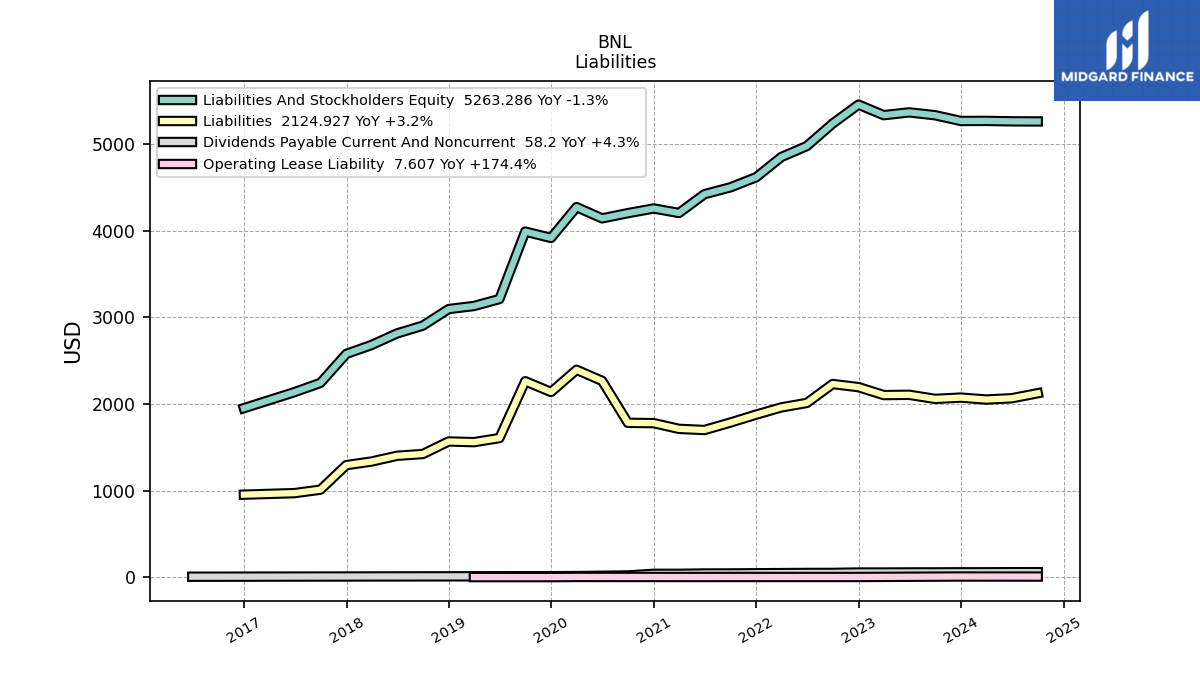
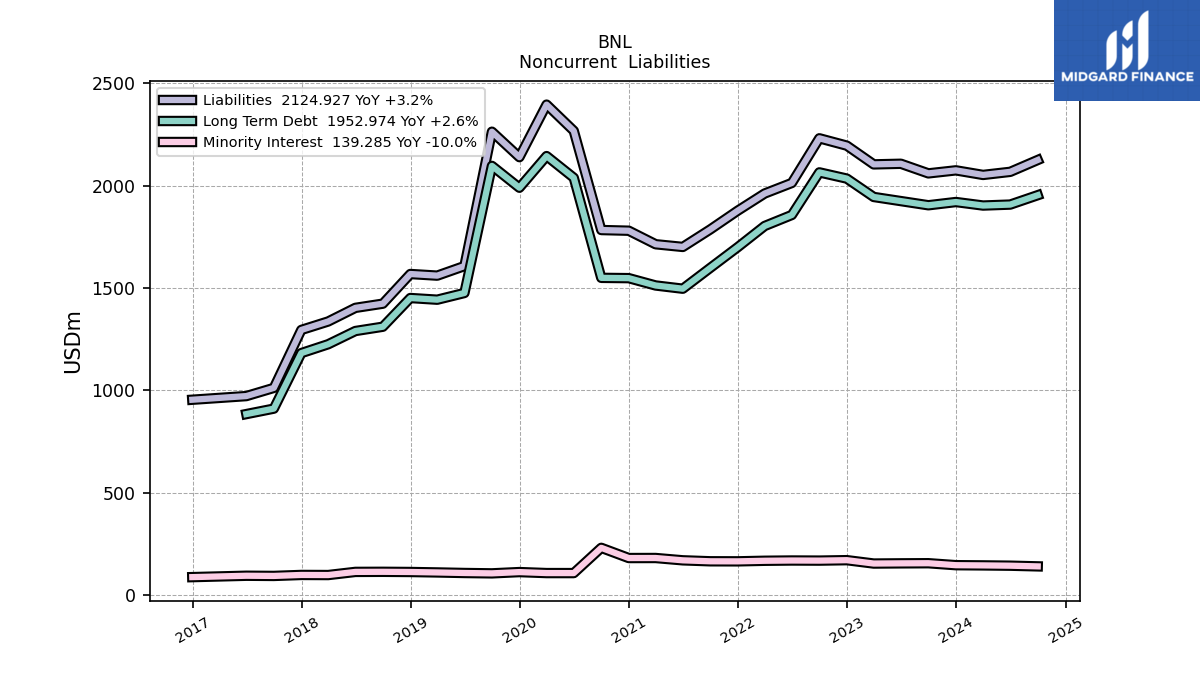
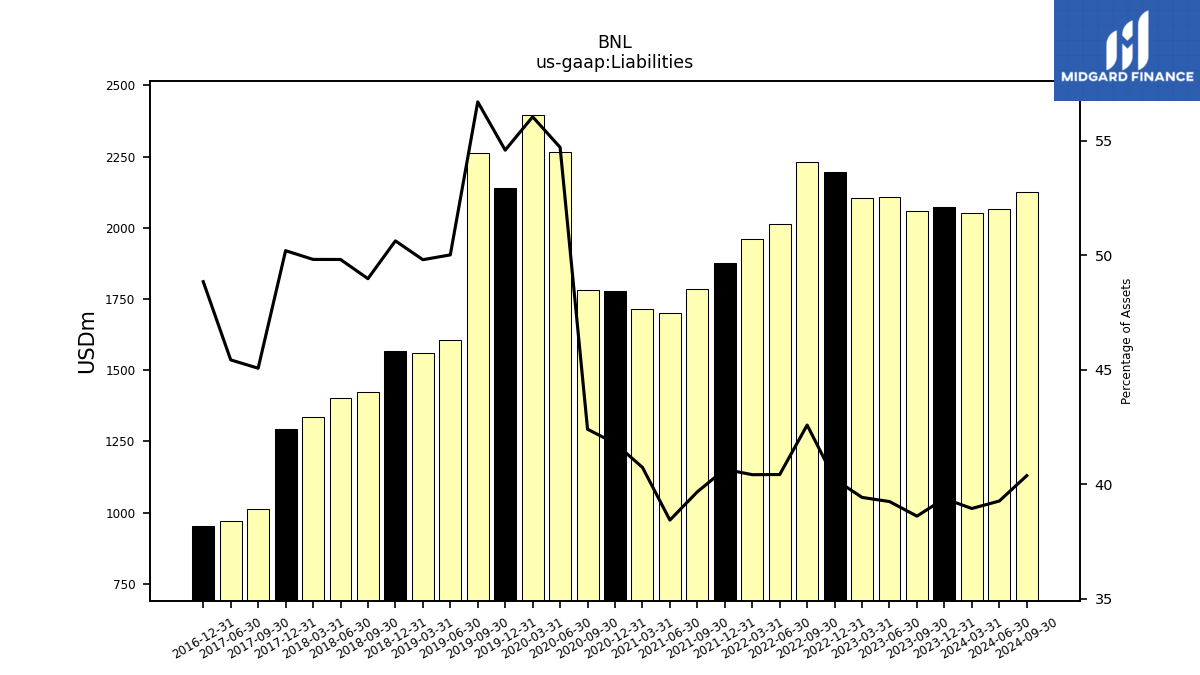
| Liabilities | 2059.57 | 2106.55 | 2103.55 | 2195.10 | 2231.05 | 2012.80 | 1961.20 | 1877.51 | 1785.85 | 1700.10 | 1713.35 | 1779.40 | 1782.76 | 2267.41 | 2395.54 | 2138.84 | 2263.29 | 1606.68 | 1559.92 | 1567.88 | 1422.97 | 1402.44 | 1335.99 | 1294.56 | 1011.33 | 971.38 | NA | 953.52 | NA | NA | NA | |
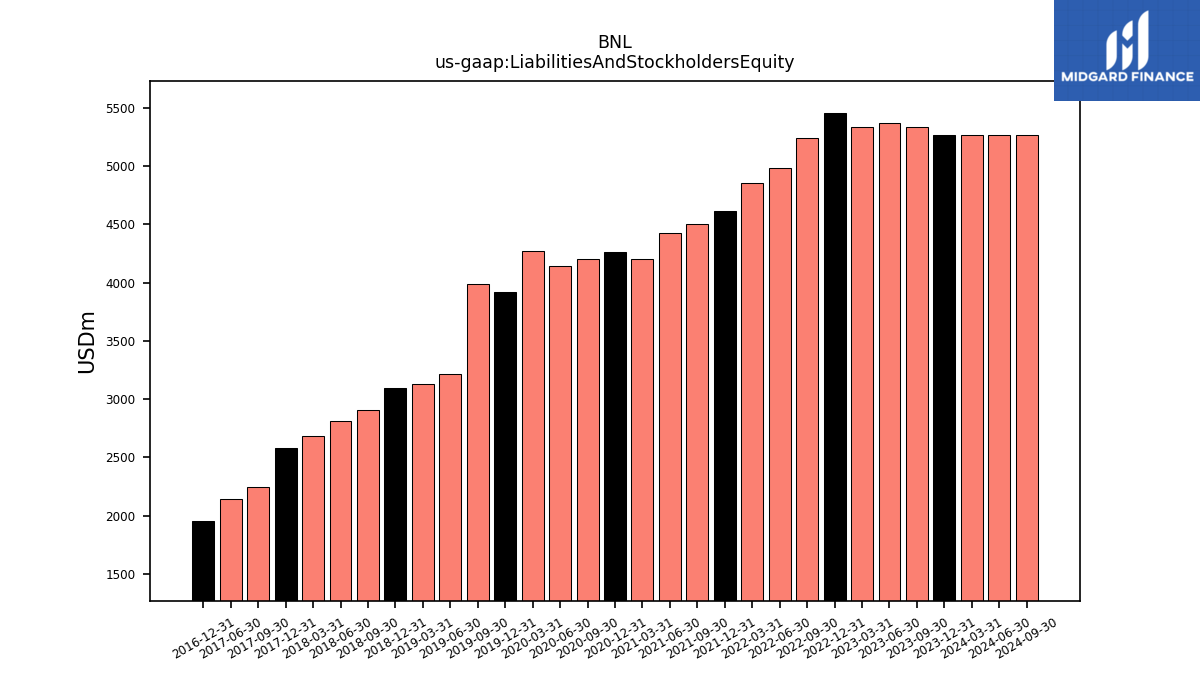
| Liabilities And Stockholders Equity | 5335.04 | 5368.15 | 5335.87 | 5457.61 | 5239.19 | 4979.44 | 4852.52 | 4618.65 | 4501.97 | 4423.61 | 4206.05 | 4258.48 | 4204.47 | 4144.06 | 4274.05 | 3917.86 | 3991.79 | 3212.32 | 3131.94 | 3096.80 | 2905.34 | 2815.26 | 2681.67 | 2578.76 | 2244.10 | 2138.18 | NA | 1952.05 | NA | NA | NA | |
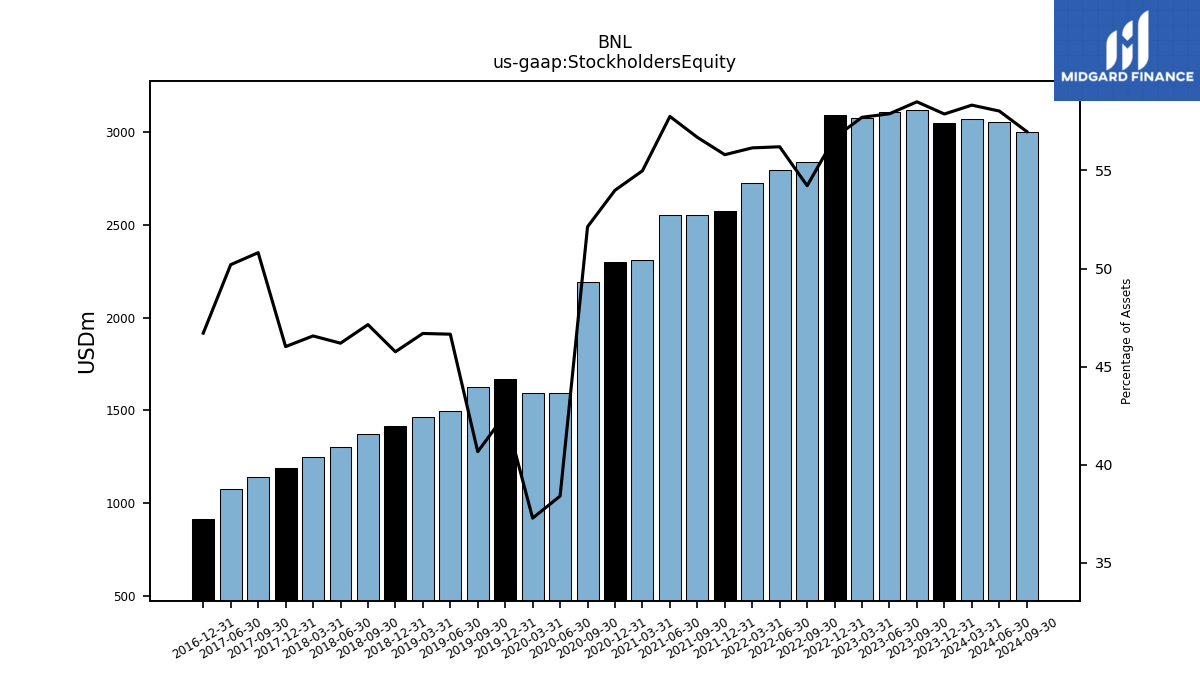
| Stockholders Equity | 3120.78 | 3107.54 | 3079.21 | 3092.92 | 2840.69 | 2798.69 | 2724.64 | 2577.29 | 2552.00 | 2554.65 | 2312.53 | 2299.11 | 2191.79 | 1591.63 | 1593.44 | 1667.61 | 1623.36 | 1498.70 | 1462.39 | 1417.10 | 1369.67 | 1300.54 | 1248.77 | 1186.83 | 1140.21 | 1073.31 | NA | 911.79 | NA | NA | NA |
| 2023-09-30 | 2023-06-30 | 2023-03-31 | 2022-12-31 | 2022-09-30 | 2022-06-30 | 2022-03-31 | 2021-12-31 | 2021-09-30 | 2021-06-30 | 2021-03-31 | 2020-12-31 | 2020-09-30 | 2020-06-30 | 2020-03-31 | 2019-12-31 | 2019-09-30 | 2019-06-30 | 2019-03-31 | 2018-12-31 | 2018-09-30 | 2018-06-30 | 2018-03-31 | 2017-12-31 | 2017-09-30 | 2017-06-30 | 2017-03-31 | 2016-12-31 | 2016-09-30 | 2016-06-30 | 2016-03-31 | ||
|---|---|---|---|---|---|---|---|---|---|---|---|---|---|---|---|---|---|---|---|---|---|---|---|---|---|---|---|---|---|---|---|---|
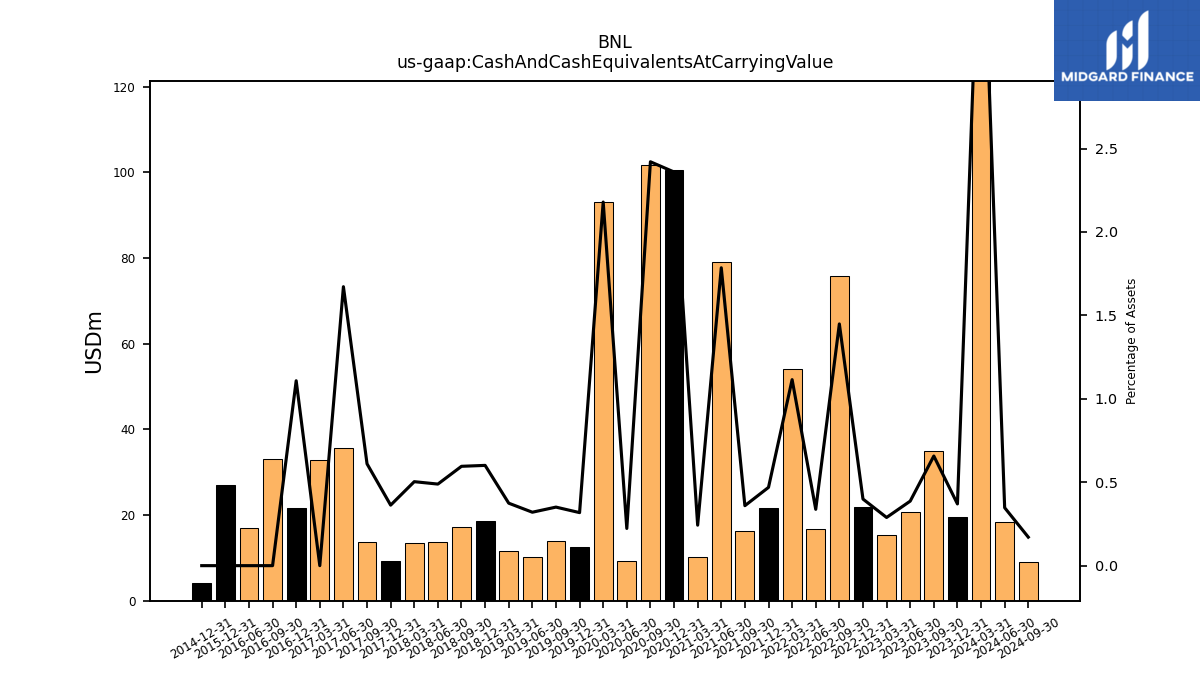
| Cash And Cash Equivalents At Carrying Value | 35.06 | 20.76 | 15.41 | 21.79 | 75.91 | 16.81 | 54.10 | 21.67 | 16.18 | 78.99 | 10.21 | 100.49 | 101.79 | 9.24 | 93.15 | 12.46 | 14.01 | 10.29 | 11.73 | 18.61 | 17.30 | 13.77 | 13.50 | 9.36 | 13.70 | 35.75 | 32.80 | 21.64 | 33.00 | 17.01 | NA | |
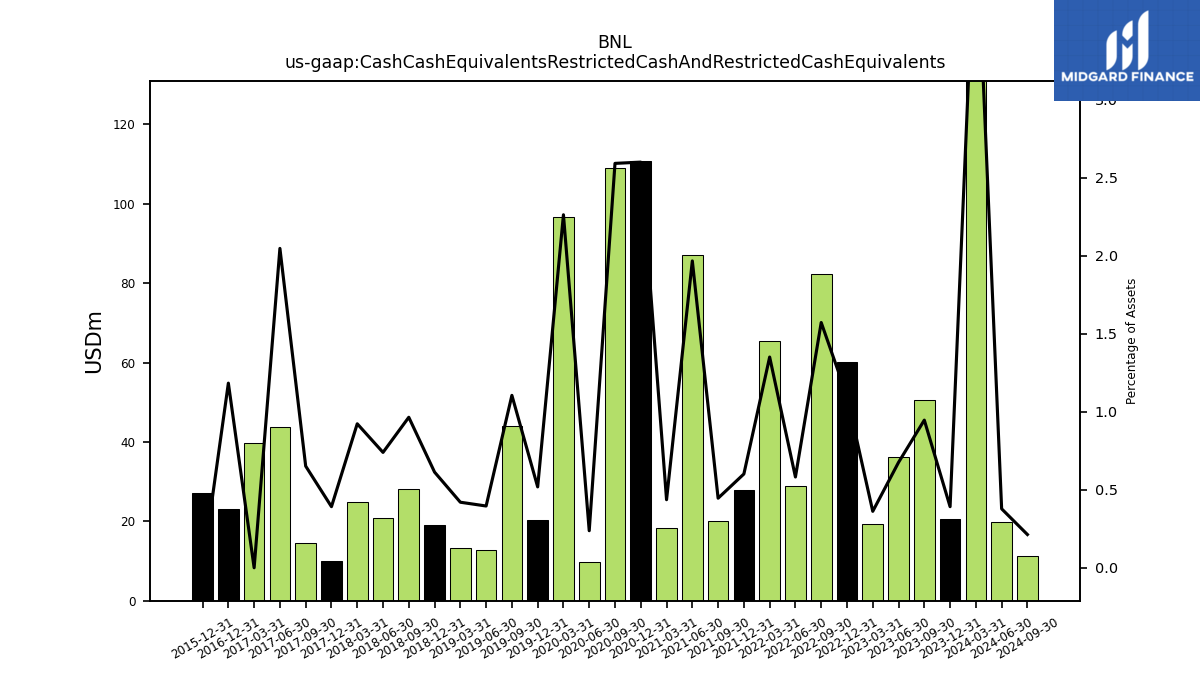
| Cash Cash Equivalents Restricted Cash And Restricted Cash Equivalents | 50.50 | 36.27 | 19.31 | 60.04 | 82.36 | 28.98 | 65.55 | 27.77 | 20.08 | 87.01 | 18.35 | 110.73 | 108.99 | 9.84 | 96.71 | 20.31 | 44.12 | 12.72 | 13.16 | 18.99 | 28.03 | 20.82 | 24.75 | 10.10 | 14.62 | 43.77 | 39.64 | 23.10 | NA | NA | NA |
| 2023-09-30 | 2023-06-30 | 2023-03-31 | 2022-12-31 | 2022-09-30 | 2022-06-30 | 2022-03-31 | 2021-12-31 | 2021-09-30 | 2021-06-30 | 2021-03-31 | 2020-12-31 | 2020-09-30 | 2020-06-30 | 2020-03-31 | 2019-12-31 | 2019-09-30 | 2019-06-30 | 2019-03-31 | 2018-12-31 | 2018-09-30 | 2018-06-30 | 2018-03-31 | 2017-12-31 | 2017-09-30 | 2017-06-30 | 2017-03-31 | 2016-12-31 | 2016-09-30 | 2016-06-30 | 2016-03-31 | ||
|---|---|---|---|---|---|---|---|---|---|---|---|---|---|---|---|---|---|---|---|---|---|---|---|---|---|---|---|---|---|---|---|---|
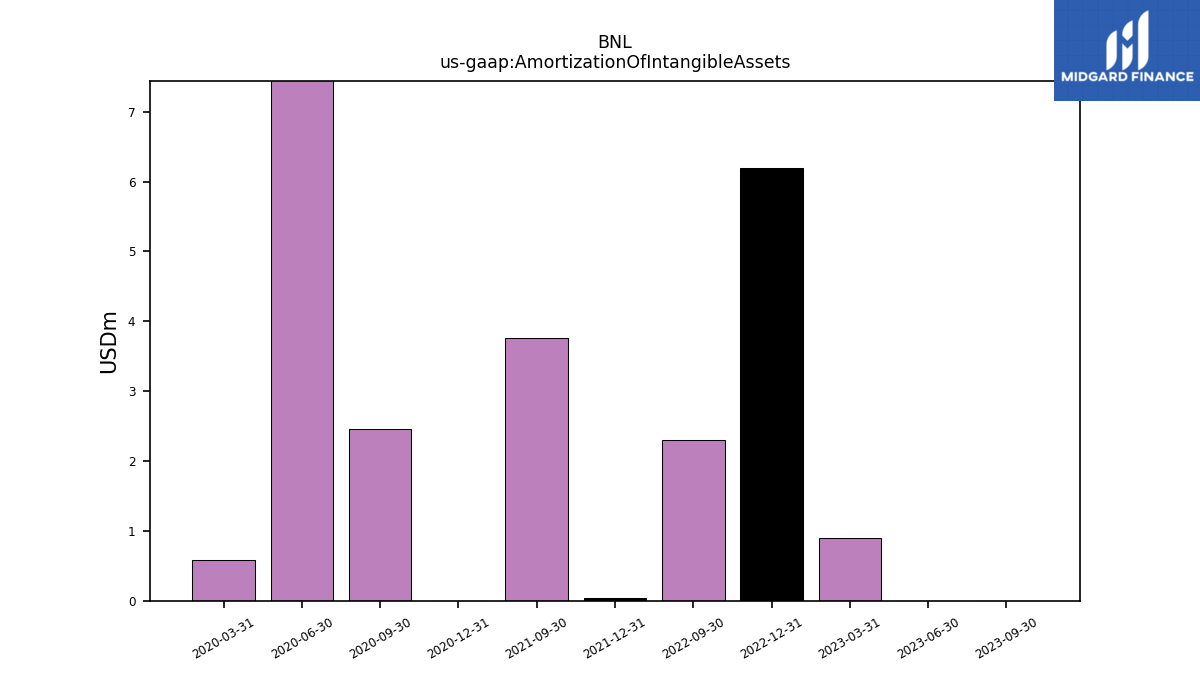
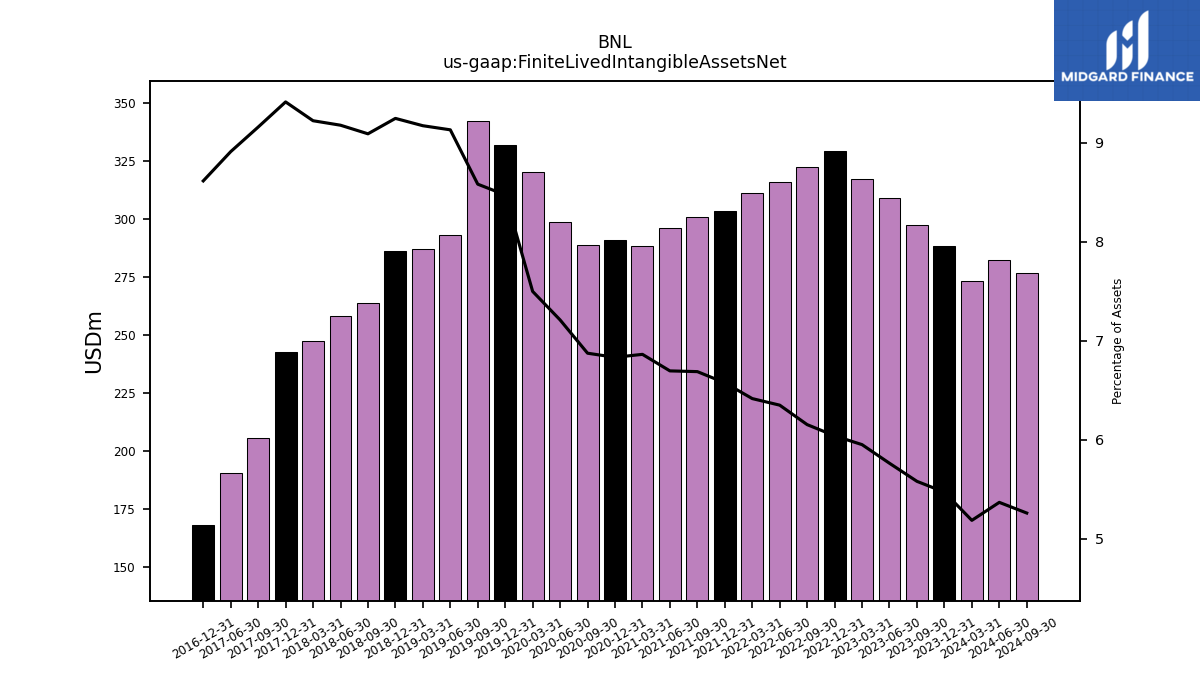
| Amortization Of Intangible Assets | 0.00 | 0.00 | 0.90 | 6.20 | 2.30 | NA | NA | 0.04 | 3.76 | NA | NA | 0.00 | 2.46 | 11.48 | 0.58 | NA | NA | NA | NA | NA | NA | NA | NA | NA | NA | NA | NA | NA | NA | NA | NA | |
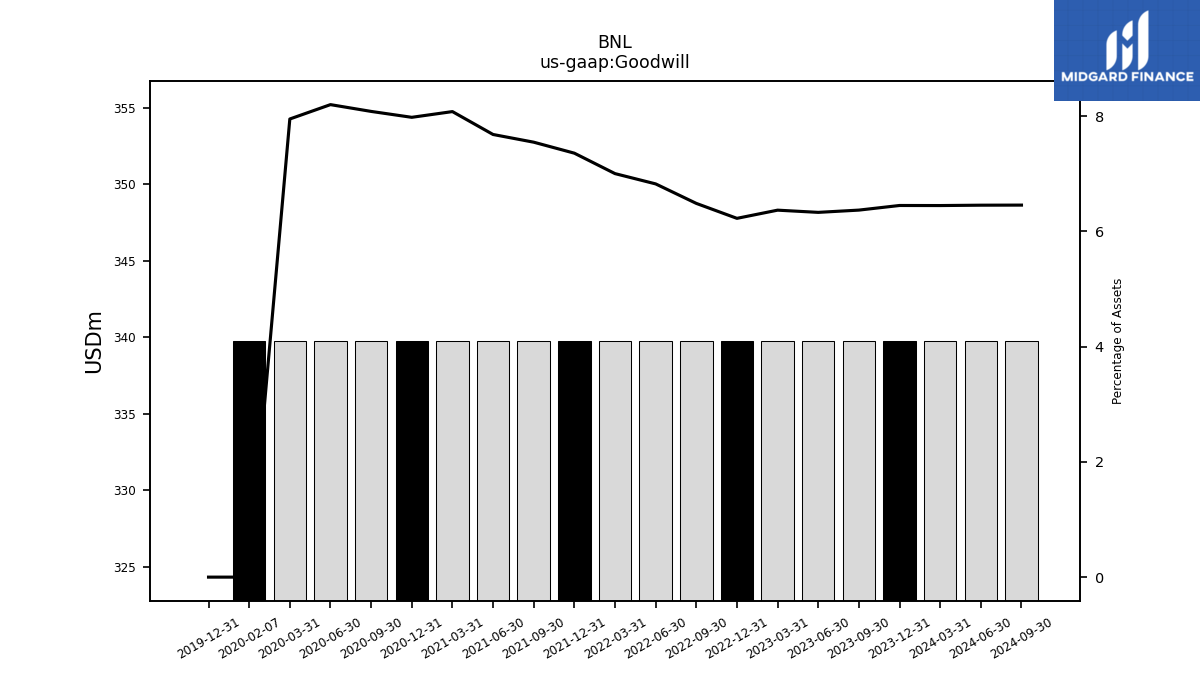
| Goodwill | 339.77 | 339.77 | 339.77 | 339.77 | 339.77 | 339.77 | 339.77 | 339.77 | 339.77 | 339.77 | 339.77 | 339.77 | 339.77 | 339.77 | 339.77 | 0.00 | NA | NA | NA | NA | NA | NA | NA | NA | NA | NA | NA | NA | NA | NA | NA | |
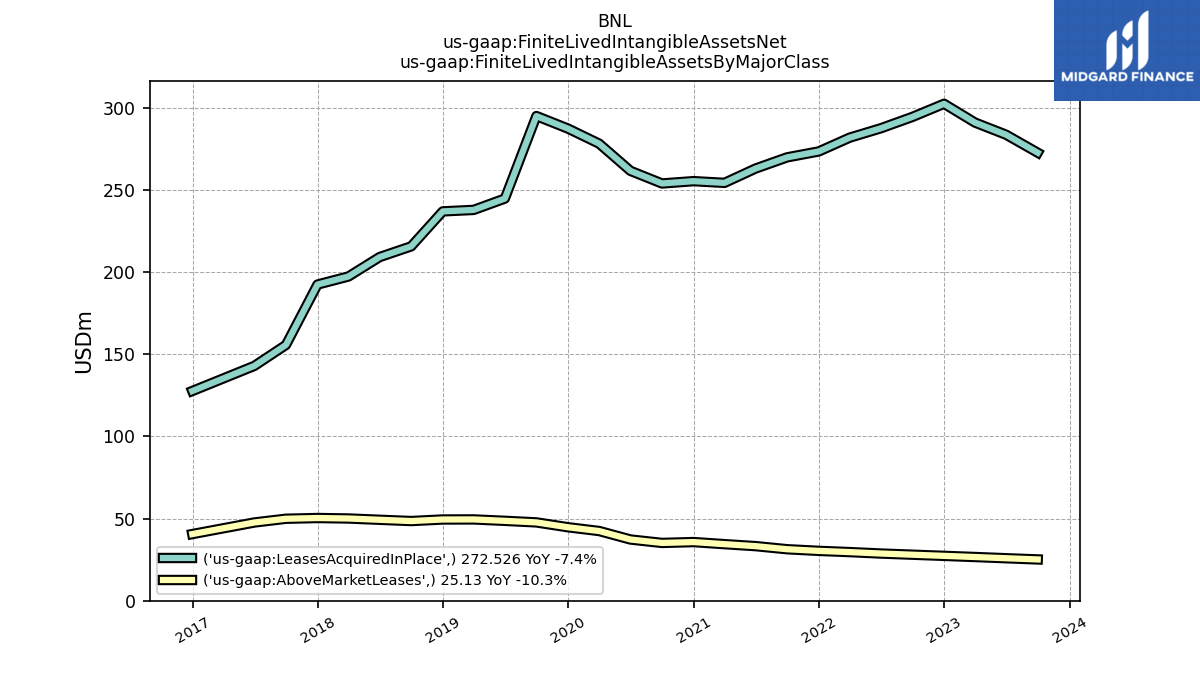
| Finite Lived Intangible Assets Net | 297.66 | 309.30 | 317.48 | 329.58 | 322.31 | 316.12 | 311.28 | 303.64 | 301.05 | 296.13 | 288.59 | 290.91 | 288.97 | 298.74 | 320.42 | 331.89 | 342.48 | 293.23 | 287.19 | 286.26 | 264.04 | 258.29 | 247.25 | 242.66 | 205.47 | 190.47 | NA | 168.12 | NA | NA | NA |
| 2023-09-30 | 2023-06-30 | 2023-03-31 | 2022-12-31 | 2022-09-30 | 2022-06-30 | 2022-03-31 | 2021-12-31 | 2021-09-30 | 2021-06-30 | 2021-03-31 | 2020-12-31 | 2020-09-30 | 2020-06-30 | 2020-03-31 | 2019-12-31 | 2019-09-30 | 2019-06-30 | 2019-03-31 | 2018-12-31 | 2018-09-30 | 2018-06-30 | 2018-03-31 | 2017-12-31 | 2017-09-30 | 2017-06-30 | 2017-03-31 | 2016-12-31 | 2016-09-30 | 2016-06-30 | 2016-03-31 | ||
|---|---|---|---|---|---|---|---|---|---|---|---|---|---|---|---|---|---|---|---|---|---|---|---|---|---|---|---|---|---|---|---|---|
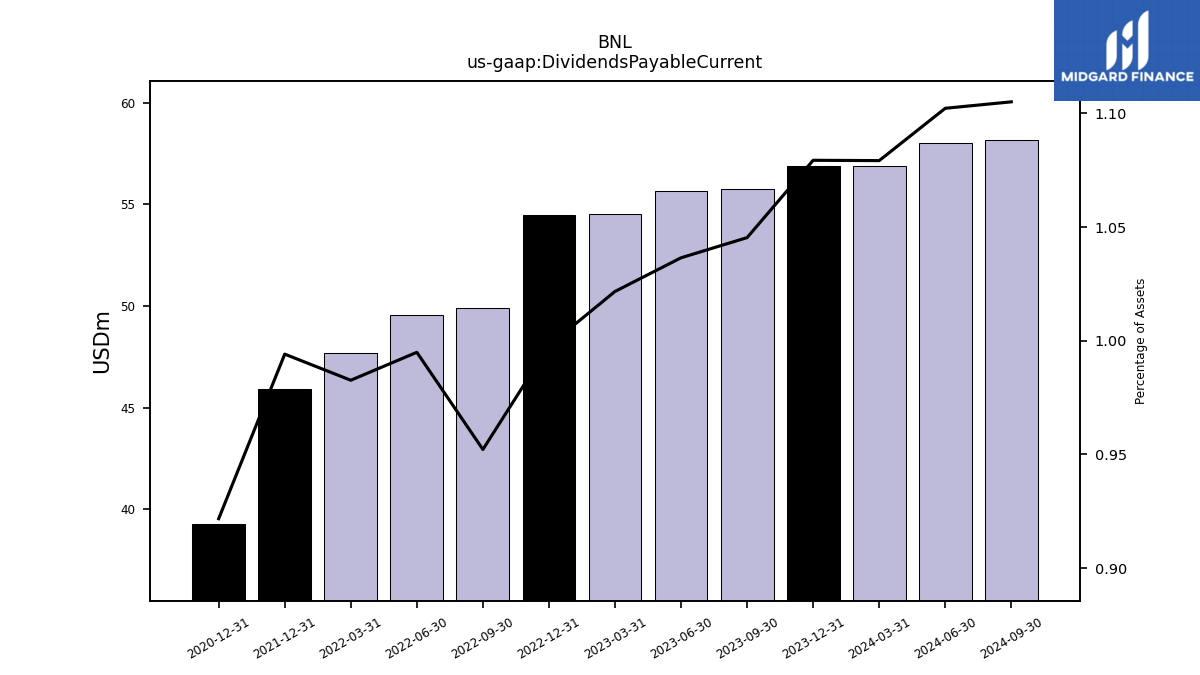
| Dividends Payable Current | 55.77 | 55.64 | 54.52 | 54.46 | 49.89 | 49.54 | 47.68 | 45.91 | NA | NA | NA | 39.25 | NA | NA | NA | NA | NA | NA | NA | NA | NA | NA | NA | NA | NA | NA | NA | NA | NA | NA | NA |
| 2023-09-30 | 2023-06-30 | 2023-03-31 | 2022-12-31 | 2022-09-30 | 2022-06-30 | 2022-03-31 | 2021-12-31 | 2021-09-30 | 2021-06-30 | 2021-03-31 | 2020-12-31 | 2020-09-30 | 2020-06-30 | 2020-03-31 | 2019-12-31 | 2019-09-30 | 2019-06-30 | 2019-03-31 | 2018-12-31 | 2018-09-30 | 2018-06-30 | 2018-03-31 | 2017-12-31 | 2017-09-30 | 2017-06-30 | 2017-03-31 | 2016-12-31 | 2016-09-30 | 2016-06-30 | 2016-03-31 | ||
|---|---|---|---|---|---|---|---|---|---|---|---|---|---|---|---|---|---|---|---|---|---|---|---|---|---|---|---|---|---|---|---|---|
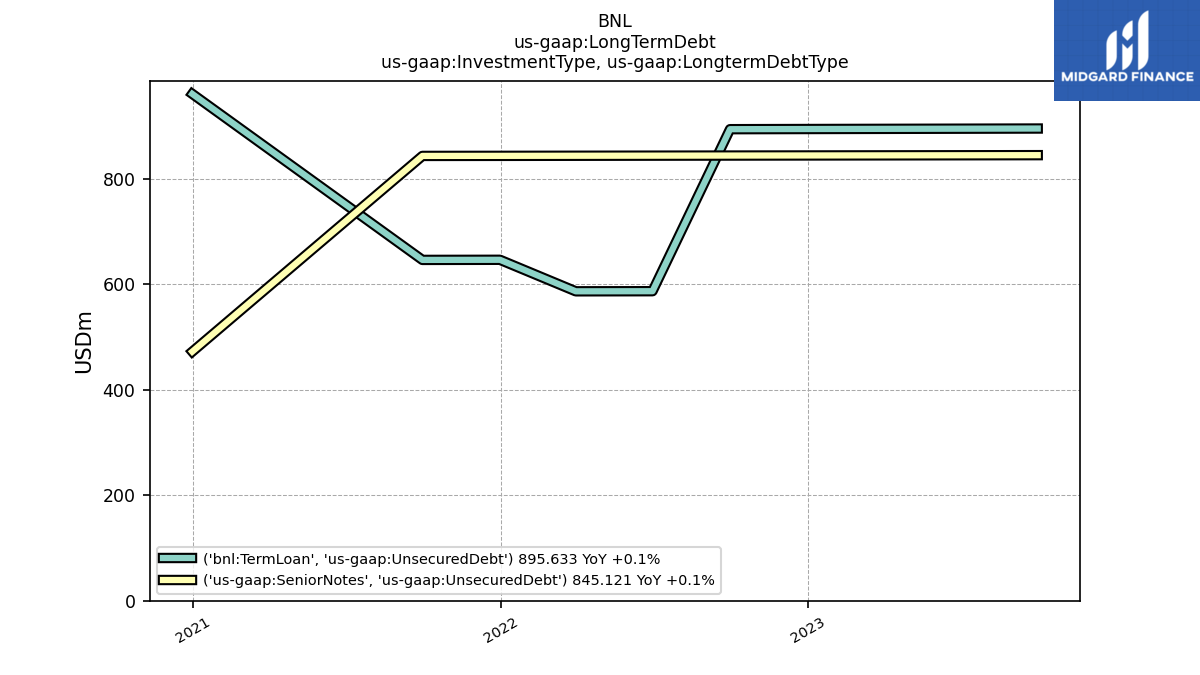
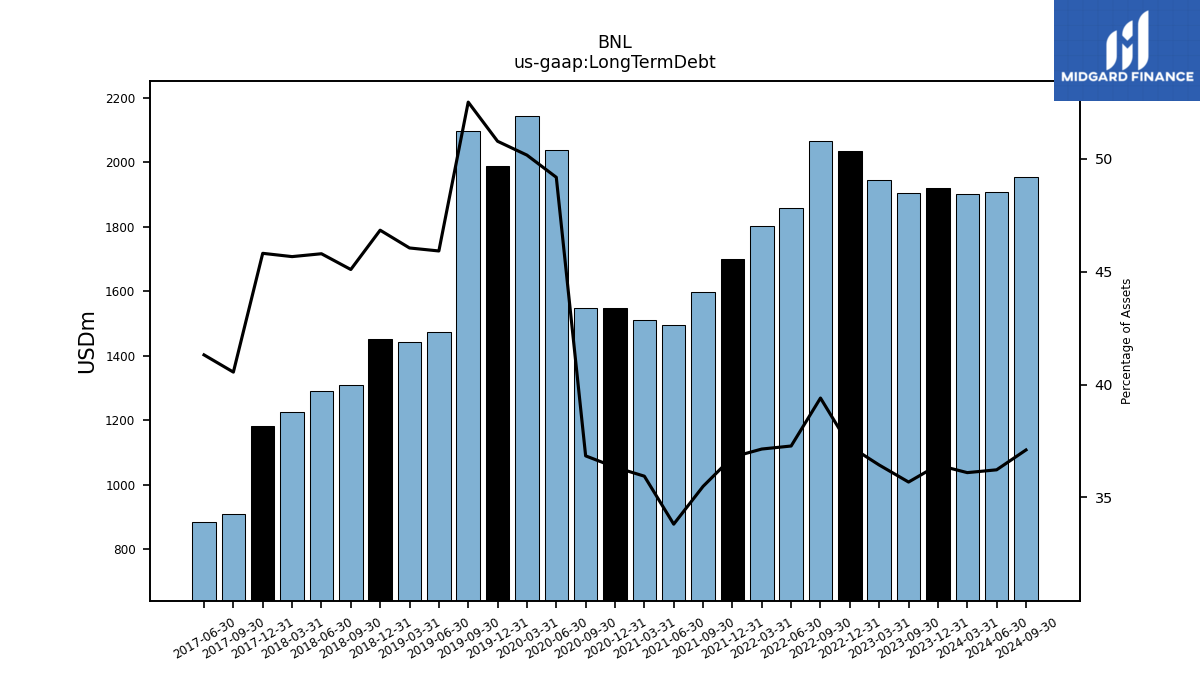
| Long Term Debt | 1903.79 | NA | 1944.32 | 2034.08 | 2064.53 | 1856.38 | 1802.55 | 1699.16 | 1597.87 | 1496.00 | 1511.83 | 1547.67 | 1549.08 | 2038.17 | 2144.12 | 1989.45 | 2096.24 | 1475.09 | 1442.35 | 1450.55 | 1310.28 | 1289.30 | 1224.71 | 1181.47 | 910.07 | 883.43 | NA | NA | NA | NA | NA | |
| Unsecured Long Term Debt | NA | NA | NA | NA | NA | NA | NA | NA | NA | NA | NA | NA | NA | NA | NA | NA | NA | NA | NA | NA | NA | NA | NA | NA | NA | NA | NA | NA | NA | NA | NA | |
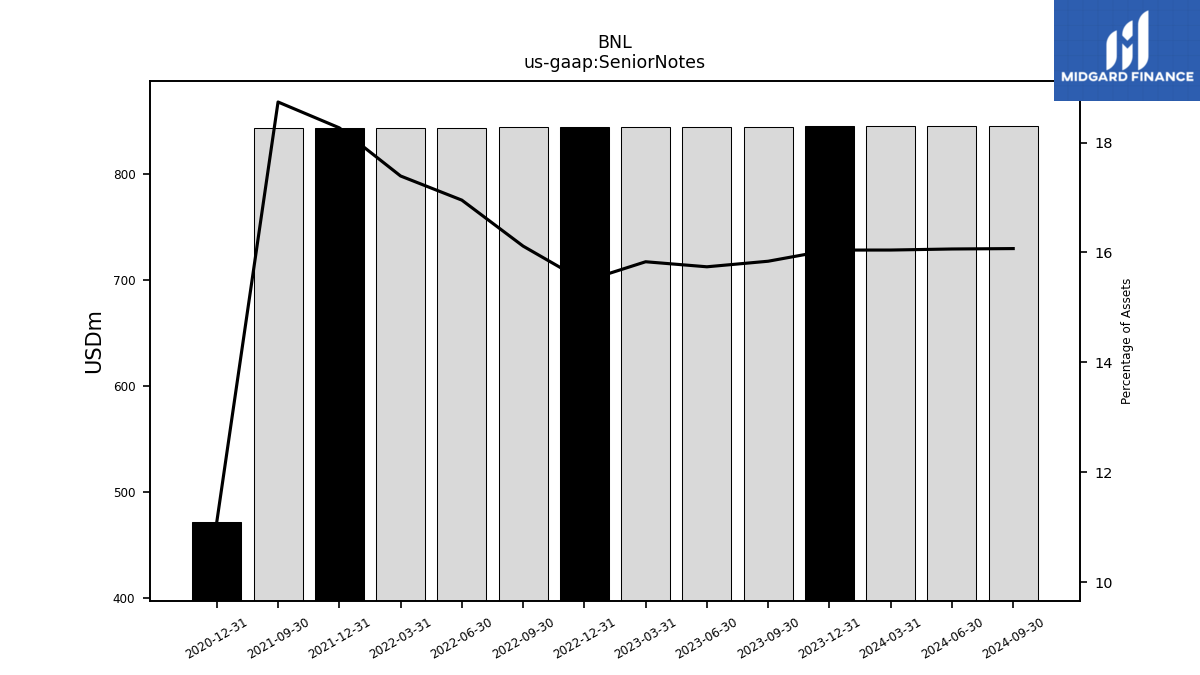
| Senior Notes | 845.12 | 844.93 | 844.74 | 844.55 | 844.37 | 844.18 | 843.99 | 843.80 | 843.66 | NA | NA | 472.47 | NA | NA | NA | NA | NA | NA | NA | NA | NA | NA | NA | NA | NA | NA | NA | NA | NA | NA | NA | |
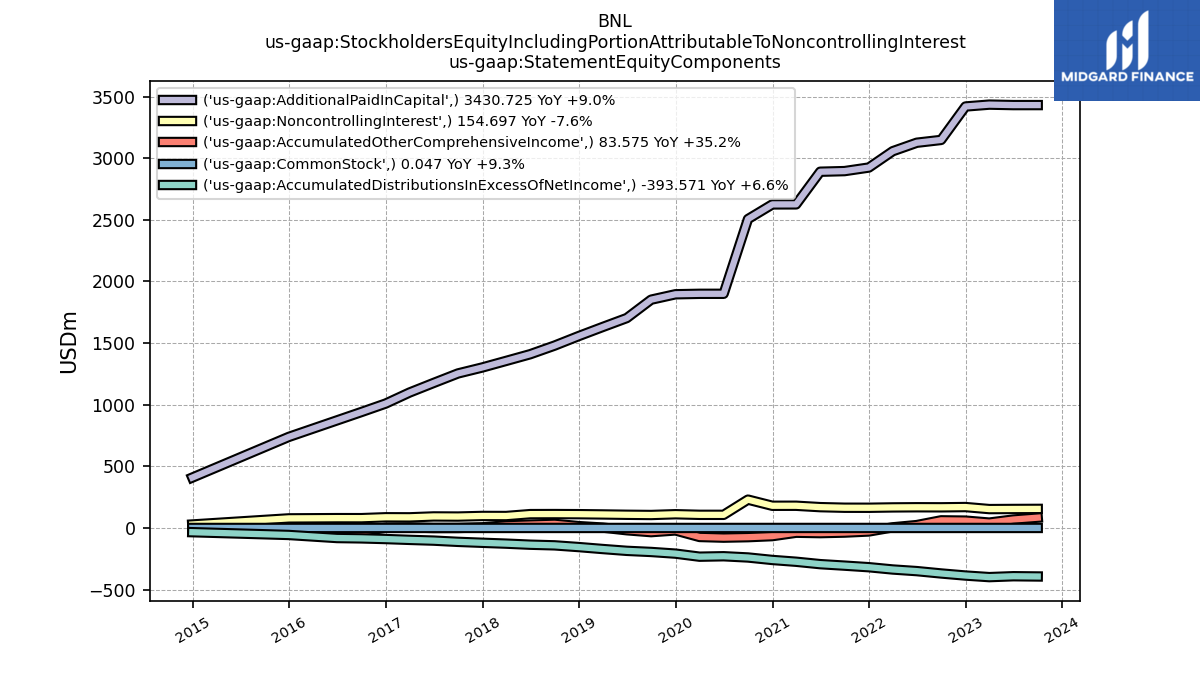
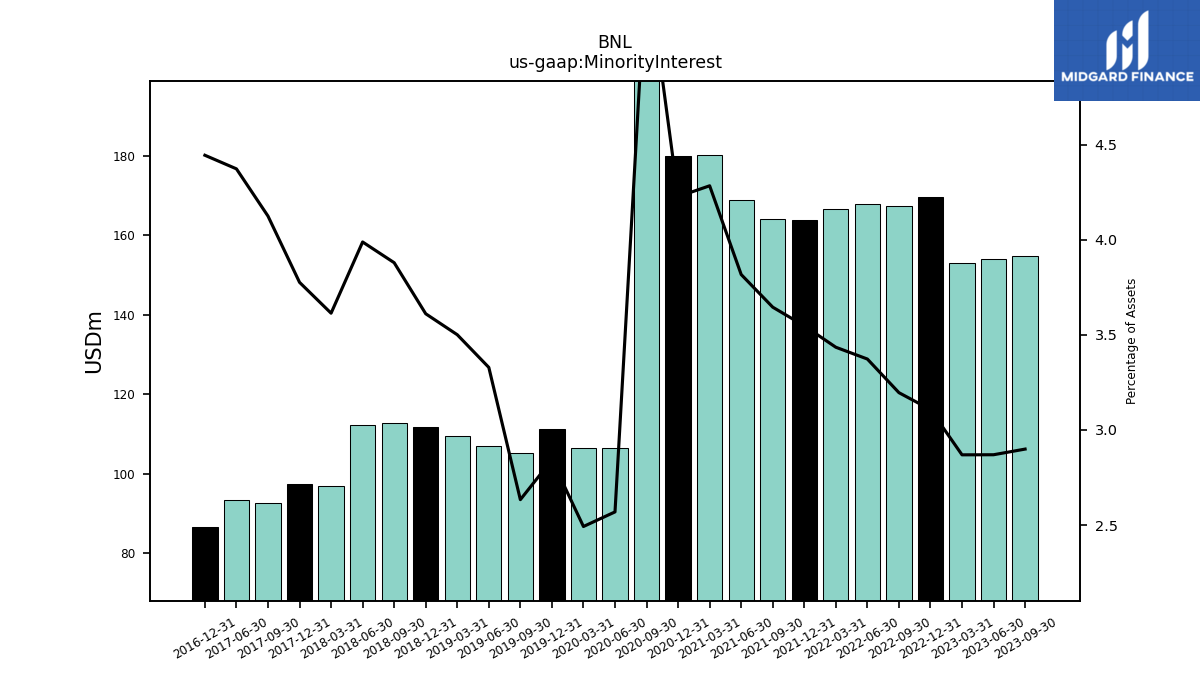
| Minority Interest | 154.70 | 154.06 | 153.11 | 169.59 | 167.46 | 167.95 | 166.68 | 163.85 | 164.12 | 168.85 | 180.16 | 179.98 | 229.91 | 106.48 | 106.54 | 111.41 | 105.14 | 106.93 | 109.64 | 111.82 | 112.70 | 112.28 | 96.91 | 97.38 | 92.55 | 93.49 | NA | 86.75 | NA | NA | NA |
| 2023-09-30 | 2023-06-30 | 2023-03-31 | 2022-12-31 | 2022-09-30 | 2022-06-30 | 2022-03-31 | 2021-12-31 | 2021-09-30 | 2021-06-30 | 2021-03-31 | 2020-12-31 | 2020-09-30 | 2020-06-30 | 2020-03-31 | 2019-12-31 | 2019-09-30 | 2019-06-30 | 2019-03-31 | 2018-12-31 | 2018-09-30 | 2018-06-30 | 2018-03-31 | 2017-12-31 | 2017-09-30 | 2017-06-30 | 2017-03-31 | 2016-12-31 | 2016-09-30 | 2016-06-30 | 2016-03-31 | ||
|---|---|---|---|---|---|---|---|---|---|---|---|---|---|---|---|---|---|---|---|---|---|---|---|---|---|---|---|---|---|---|---|---|
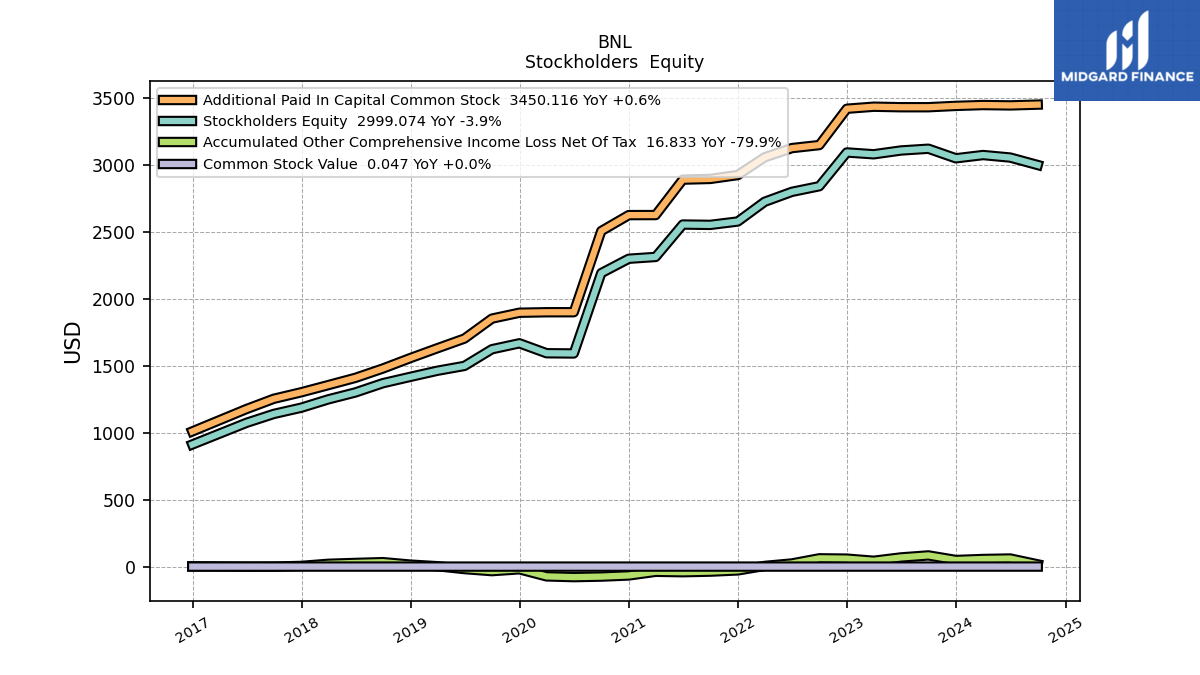
| Stockholders Equity | 3120.78 | 3107.54 | 3079.21 | 3092.92 | 2840.69 | 2798.69 | 2724.64 | 2577.29 | 2552.00 | 2554.65 | 2312.53 | 2299.11 | 2191.79 | 1591.63 | 1593.44 | 1667.61 | 1623.36 | 1498.70 | 1462.39 | 1417.10 | 1369.67 | 1300.54 | 1248.77 | 1186.83 | 1140.21 | 1073.31 | NA | 911.79 | NA | NA | NA | |
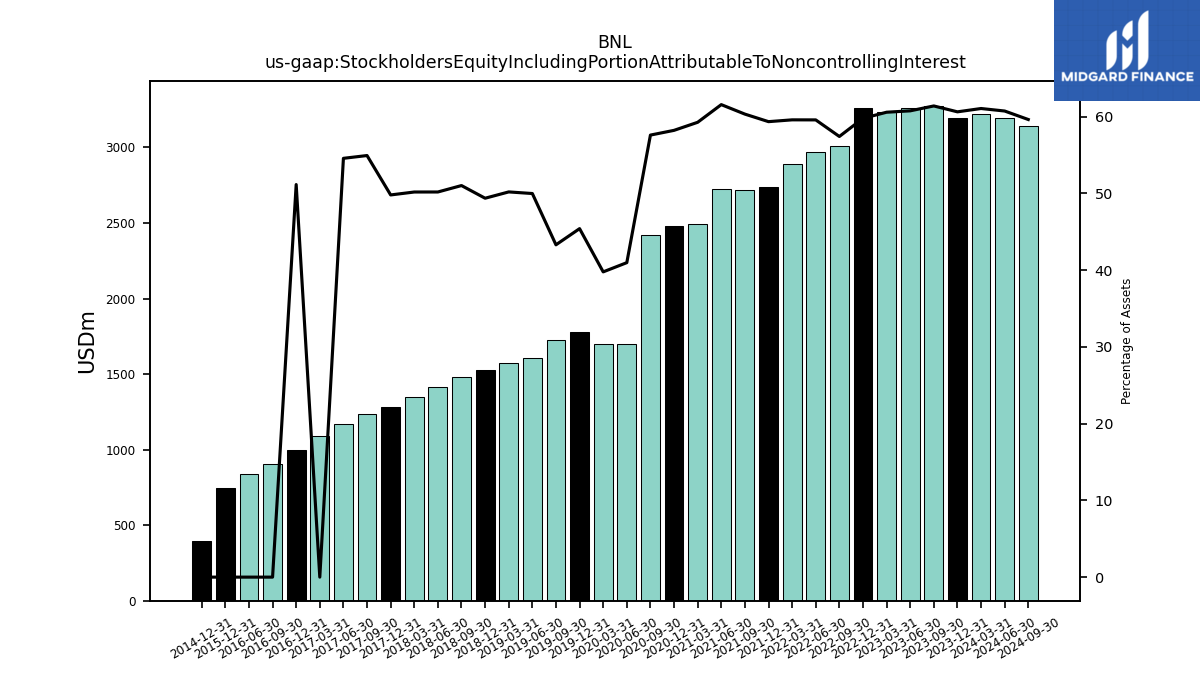
| Stockholders Equity Including Portion Attributable To Noncontrolling Interest | 3275.47 | 3261.60 | 3232.32 | 3262.51 | 3008.15 | 2966.64 | 2891.32 | 2741.14 | 2716.12 | 2723.51 | 2492.70 | 2479.08 | 2421.71 | 1698.11 | 1699.98 | 1779.02 | 1728.50 | 1605.64 | 1572.03 | 1528.92 | 1482.37 | 1412.82 | 1345.68 | 1284.20 | 1232.77 | 1166.80 | 1092.38 | 998.54 | 903.25 | 836.50 | NA | |
| Common Stock Value | 0.05 | 0.05 | 0.05 | 0.05 | 0.04 | 0.04 | 0.04 | 0.04 | 0.04 | 0.04 | 0.04 | 0.03 | 0.03 | 0.03 | 0.03 | 0.03 | 0.03 | 0.02 | 0.02 | 0.02 | 0.02 | 0.02 | 0.02 | 0.02 | 0.02 | 0.02 | NA | 0.01 | NA | NA | NA | |
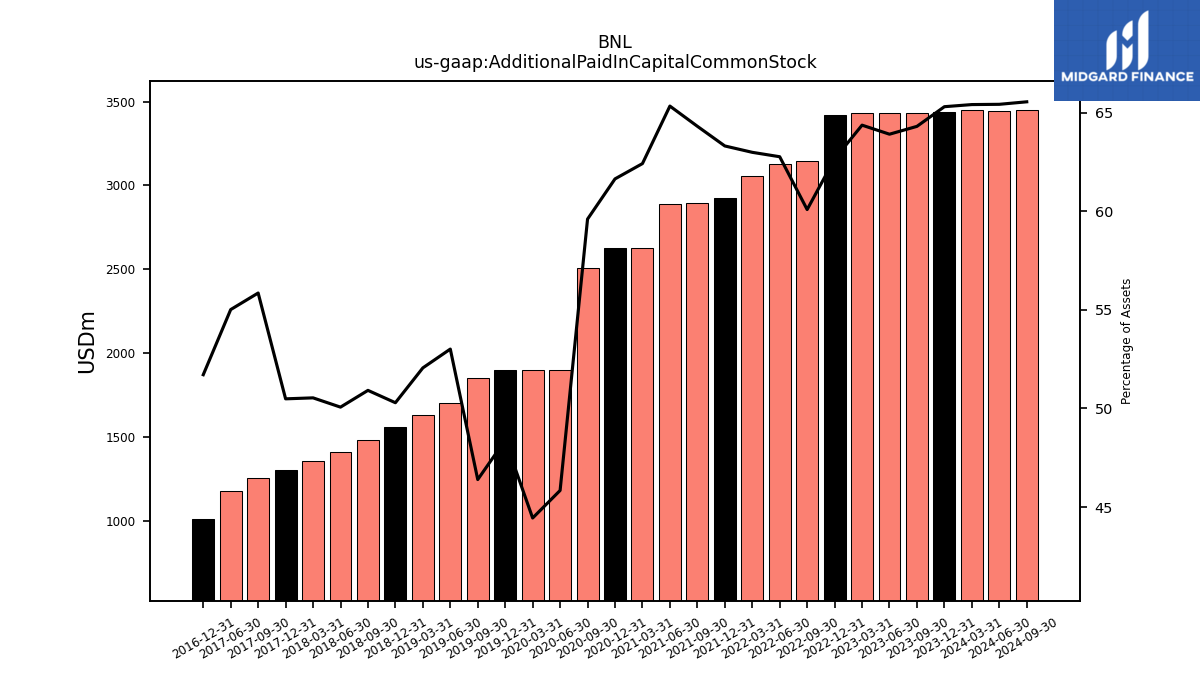
| Additional Paid In Capital Common Stock | 3430.72 | 3430.69 | 3434.53 | 3419.39 | 3148.07 | 3125.38 | 3056.56 | 2924.17 | 2895.22 | 2890.13 | 2625.32 | 2625.00 | 2506.01 | 1899.75 | 1899.62 | 1895.93 | 1852.04 | 1702.91 | 1630.42 | 1557.42 | 1479.34 | 1409.54 | 1355.27 | 1301.98 | 1253.43 | 1176.32 | NA | 1009.43 | NA | NA | NA | |
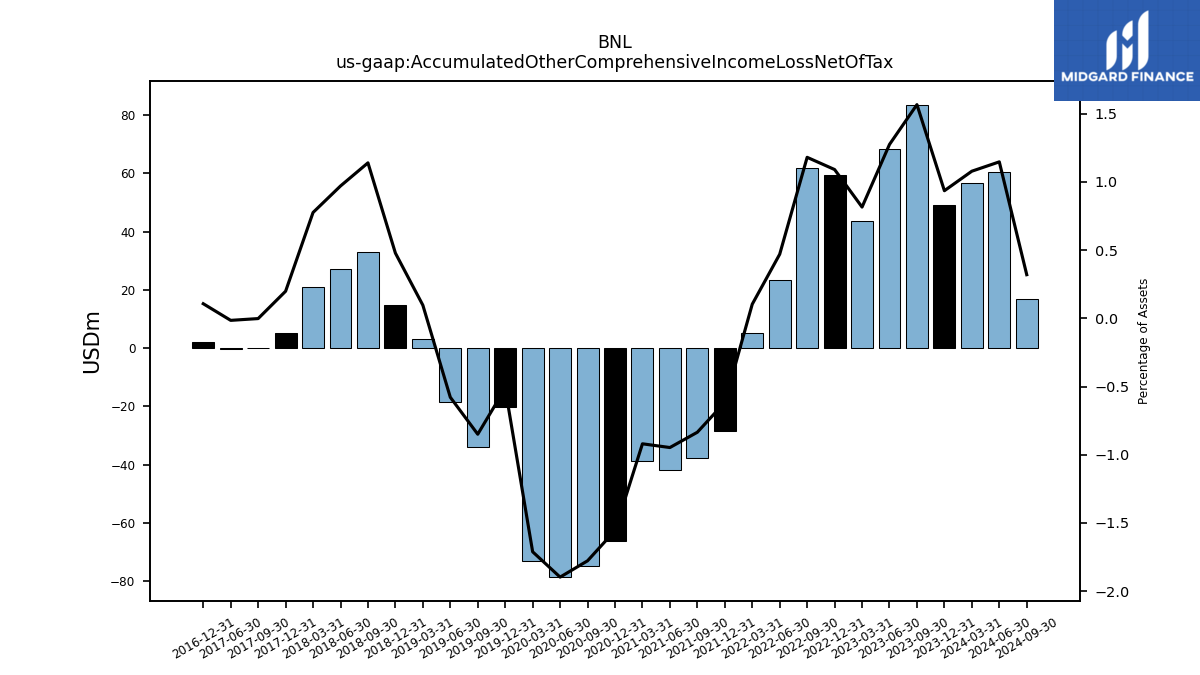
| Accumulated Other Comprehensive Income Loss Net Of Tax | 83.58 | 68.43 | 43.52 | 59.52 | 61.83 | 23.40 | 5.03 | -28.44 | -37.59 | -41.90 | -38.68 | -66.25 | -74.73 | -78.61 | -73.14 | -20.09 | -33.91 | -18.58 | 3.02 | 14.81 | 33.11 | 27.31 | 20.81 | 5.12 | -0.04 | -0.32 | NA | 2.09 | NA | NA | NA | |
| Minority Interest | 154.70 | 154.06 | 153.11 | 169.59 | 167.46 | 167.95 | 166.68 | 163.85 | 164.12 | 168.85 | 180.16 | 179.98 | 229.91 | 106.48 | 106.54 | 111.41 | 105.14 | 106.93 | 109.64 | 111.82 | 112.70 | 112.28 | 96.91 | 97.38 | 92.55 | 93.49 | NA | 86.75 | NA | NA | NA | |
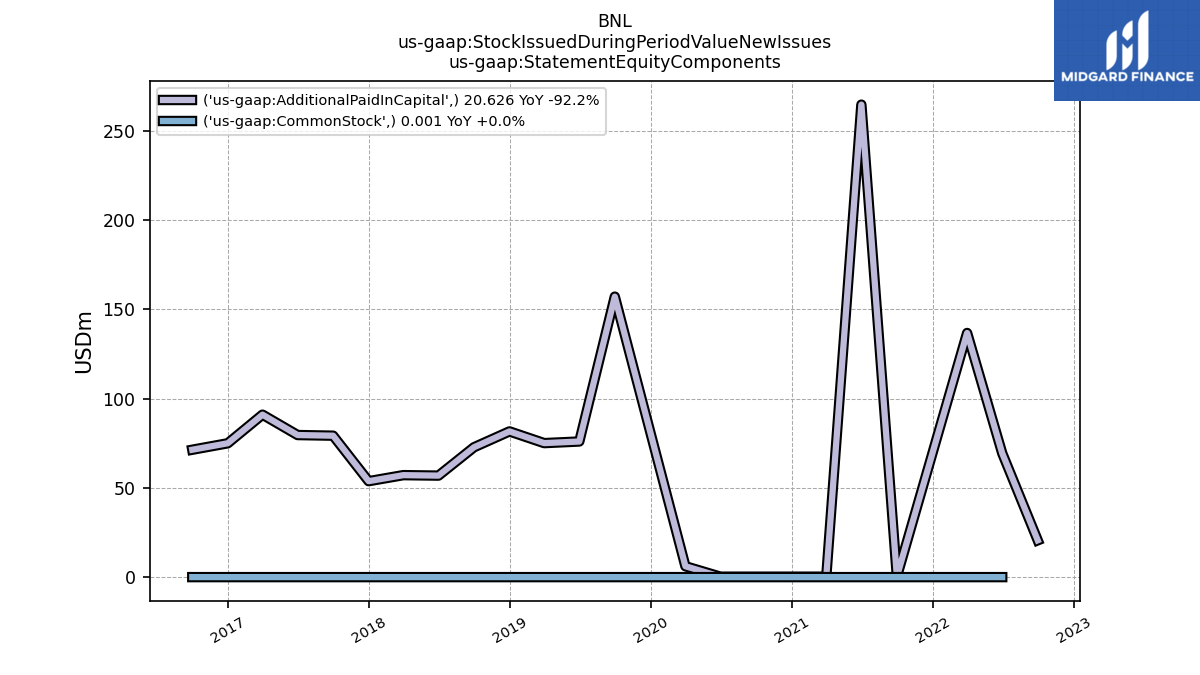
| Stock Issued During Period Value New Issues | NA | NA | NA | NA | 20.63 | 69.42 | 136.83 | NA | 0.28 | 264.80 | 0.23 | NA | NA | 0.23 | 6.10 | NA | 157.19 | 76.23 | 74.88 | 83.36 | 71.58 | 56.53 | 57.03 | 54.23 | 78.79 | 79.88 | 100.60 | 68.71 | 72.34 | NA | NA | |
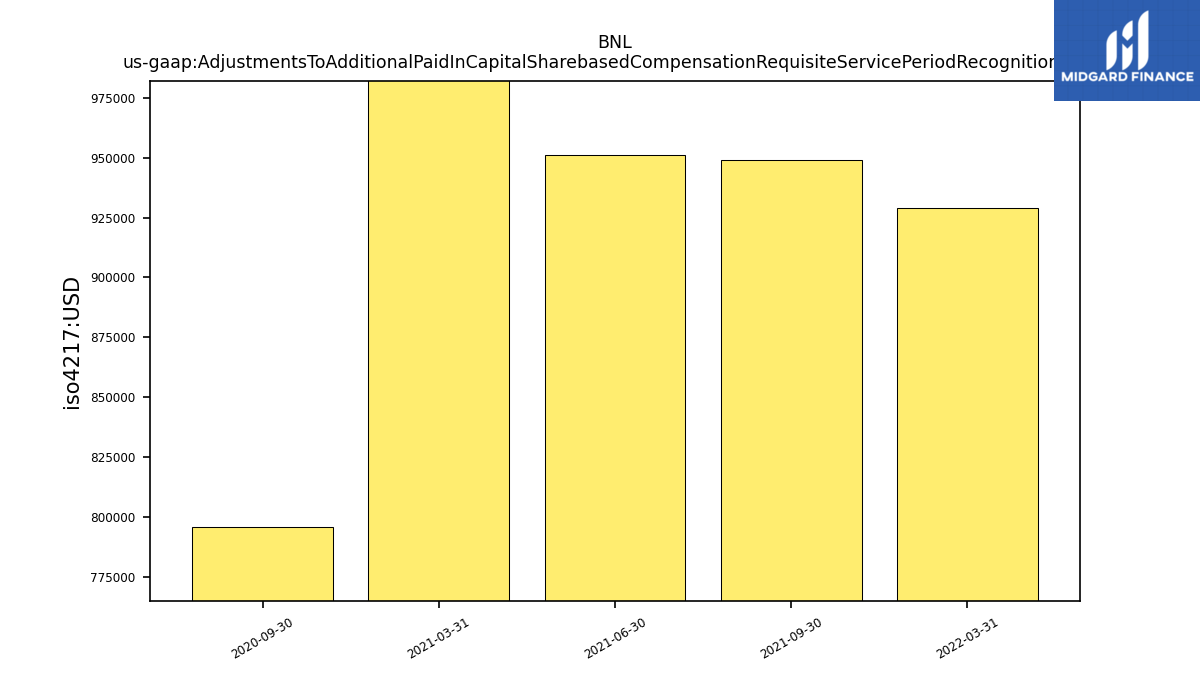
| Adjustments To Additional Paid In Capital Sharebased Compensation Requisite Service Period Recognition Value | NA | NA | NA | NA | NA | NA | 0.93 | NA | 0.95 | 0.95 | 1.77 | NA | 0.80 | NA | NA | NA | NA | NA | NA | NA | NA | NA | NA | NA | NA | NA | NA | NA | NA | NA | NA |
| 2023-09-30 | 2023-06-30 | 2023-03-31 | 2022-12-31 | 2022-09-30 | 2022-06-30 | 2022-03-31 | 2021-12-31 | 2021-09-30 | 2021-06-30 | 2021-03-31 | 2020-12-31 | 2020-09-30 | 2020-06-30 | 2020-03-31 | 2019-12-31 | 2019-09-30 | 2019-06-30 | 2019-03-31 | 2018-12-31 | 2018-09-30 | 2018-06-30 | 2018-03-31 | 2017-12-31 | 2017-09-30 | 2017-06-30 | 2017-03-31 | 2016-12-31 | 2016-09-30 | 2016-06-30 | 2016-03-31 | ||
|---|---|---|---|---|---|---|---|---|---|---|---|---|---|---|---|---|---|---|---|---|---|---|---|---|---|---|---|---|---|---|---|---|
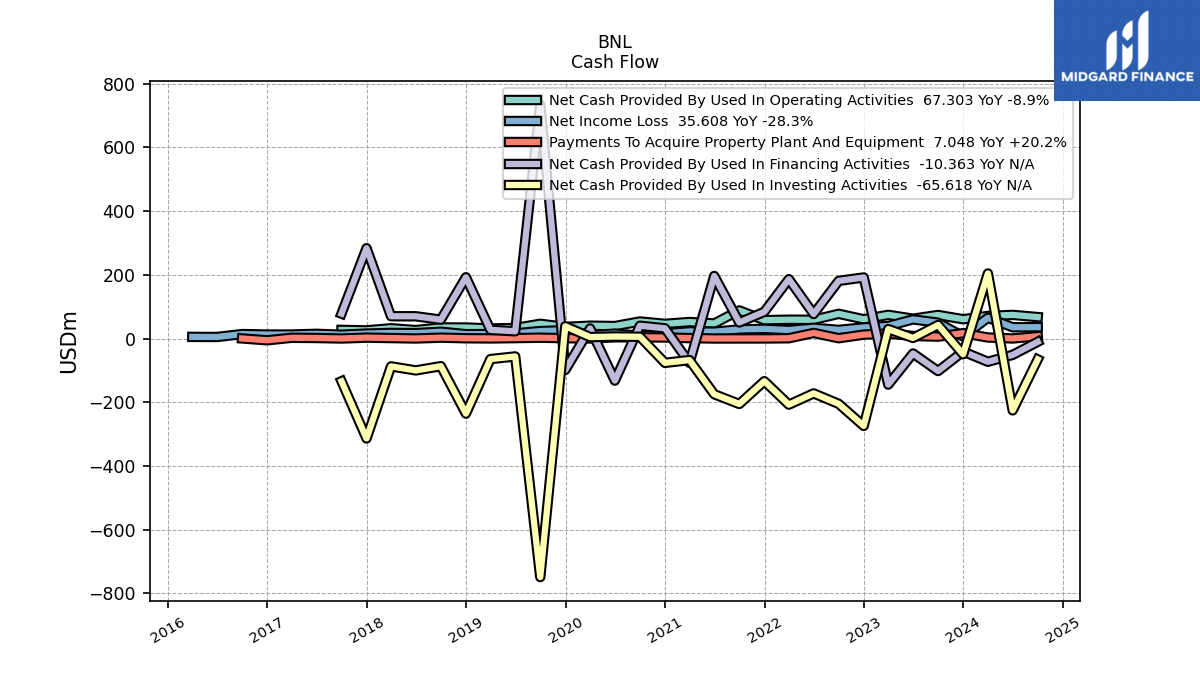
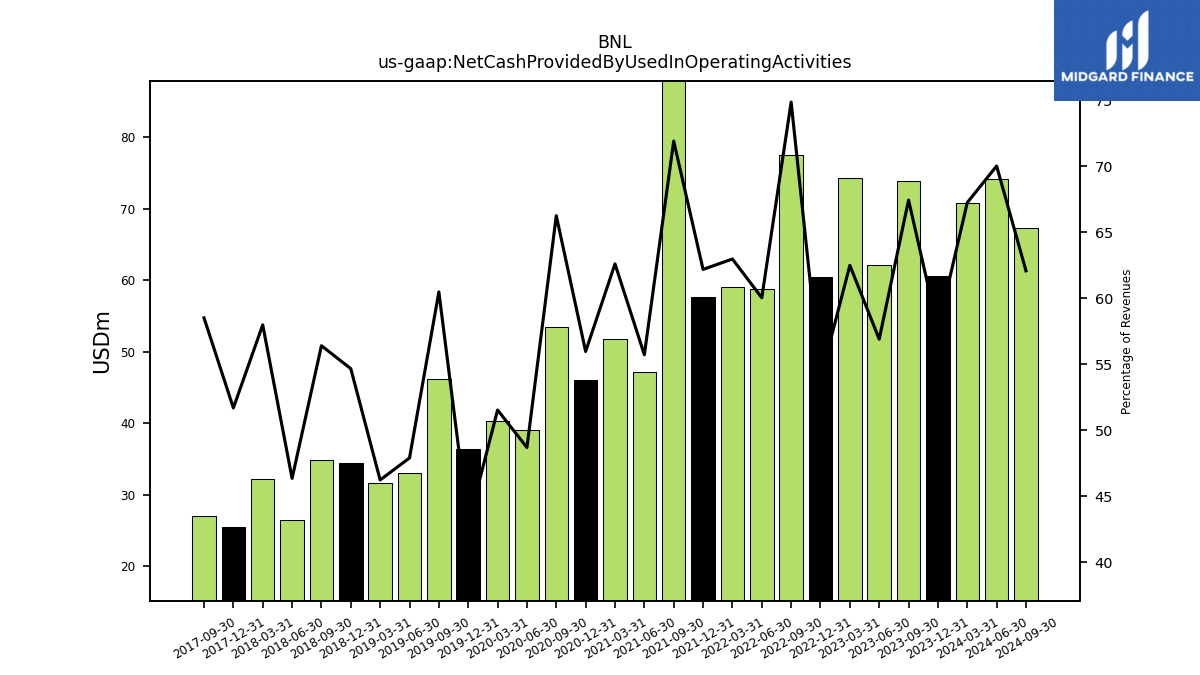
| Net Cash Provided By Used In Operating Activities | 73.89 | 62.23 | 74.38 | 60.44 | 77.52 | 58.85 | 59.10 | 57.62 | 88.30 | 47.23 | 51.78 | 46.06 | 53.51 | 39.14 | 40.32 | 36.42 | 46.21 | 33.08 | 31.64 | 34.49 | 34.84 | 26.44 | 32.24 | 25.57 | 27.06 | NA | NA | NA | NA | NA | NA | |
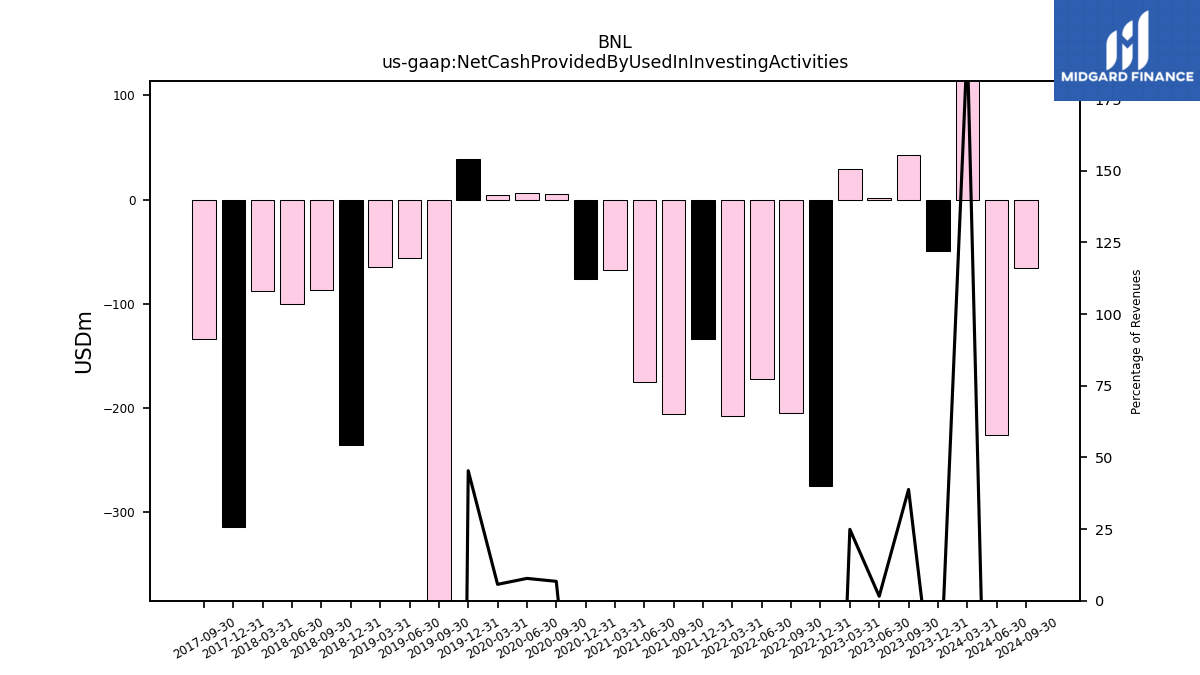
| Net Cash Provided By Used In Investing Activities | 42.53 | 1.71 | 29.63 | -274.49 | -205.19 | -172.29 | -207.68 | -133.93 | -205.67 | -175.05 | -67.66 | -76.44 | 5.47 | 6.26 | 4.47 | 38.52 | -749.33 | -56.26 | -64.64 | -235.87 | -86.87 | -100.20 | -87.52 | -313.80 | -134.29 | NA | NA | NA | NA | NA | NA | |
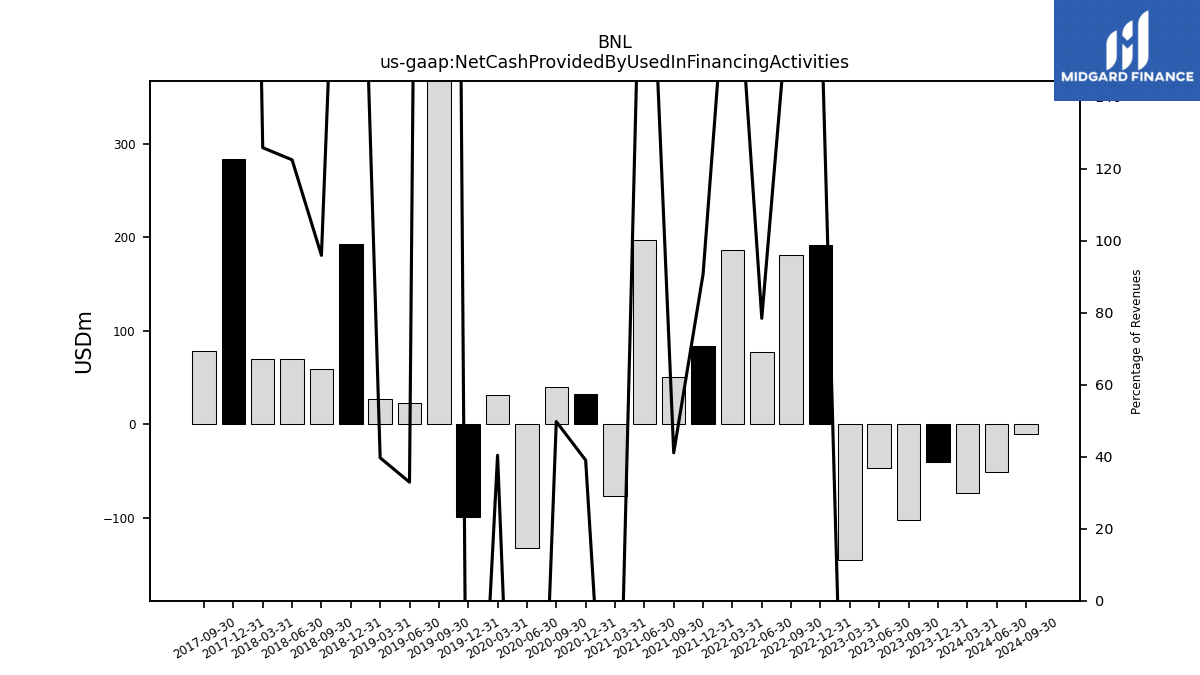
| Net Cash Provided By Used In Financing Activities | -102.18 | -46.99 | -144.74 | 191.72 | 181.06 | 76.87 | 186.35 | 84.00 | 50.43 | 196.47 | -76.50 | 32.12 | 40.17 | -132.27 | 31.61 | -98.75 | 734.52 | 22.73 | 27.17 | 192.34 | 59.23 | 69.83 | 69.94 | 283.70 | 78.09 | NA | NA | NA | NA | NA | NA |
| 2023-09-30 | 2023-06-30 | 2023-03-31 | 2022-12-31 | 2022-09-30 | 2022-06-30 | 2022-03-31 | 2021-12-31 | 2021-09-30 | 2021-06-30 | 2021-03-31 | 2020-12-31 | 2020-09-30 | 2020-06-30 | 2020-03-31 | 2019-12-31 | 2019-09-30 | 2019-06-30 | 2019-03-31 | 2018-12-31 | 2018-09-30 | 2018-06-30 | 2018-03-31 | 2017-12-31 | 2017-09-30 | 2017-06-30 | 2017-03-31 | 2016-12-31 | 2016-09-30 | 2016-06-30 | 2016-03-31 | ||
|---|---|---|---|---|---|---|---|---|---|---|---|---|---|---|---|---|---|---|---|---|---|---|---|---|---|---|---|---|---|---|---|---|
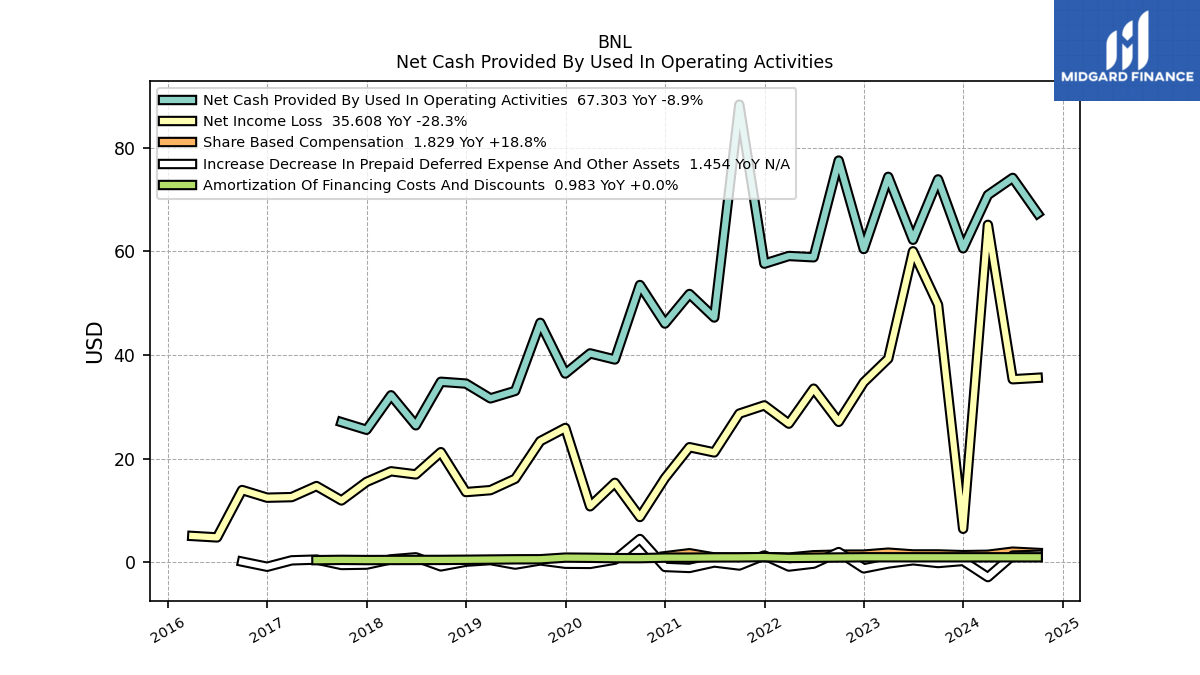
| Net Cash Provided By Used In Operating Activities | 73.89 | 62.23 | 74.38 | 60.44 | 77.52 | 58.85 | 59.10 | 57.62 | 88.30 | 47.23 | 51.78 | 46.06 | 53.51 | 39.14 | 40.32 | 36.42 | 46.21 | 33.08 | 31.64 | 34.49 | 34.84 | 26.44 | 32.24 | 25.57 | 27.06 | NA | NA | NA | NA | NA | NA | |
| Net Income Loss | 49.68 | 60.01 | 39.30 | 34.73 | 27.11 | 33.52 | 26.76 | 30.29 | 28.70 | 21.21 | 22.22 | 16.26 | 8.75 | 15.35 | 10.82 | 25.93 | 23.39 | 16.13 | 13.94 | 13.56 | 21.27 | 16.97 | 17.57 | 15.53 | 11.95 | 14.73 | 12.59 | 12.48 | 13.96 | 4.82 | 5.10 | |
| Profit Loss | 52.15 | 63.00 | 41.37 | 36.77 | 28.71 | 35.55 | 28.44 | 32.23 | 30.52 | 22.82 | 23.96 | 17.62 | 9.71 | 17.10 | 11.85 | 27.71 | 25.04 | 17.34 | 15.02 | 14.66 | 23.06 | 18.39 | 19.00 | 16.83 | 12.99 | 15.99 | 13.75 | 13.79 | 15.42 | 5.36 | 5.70 | |
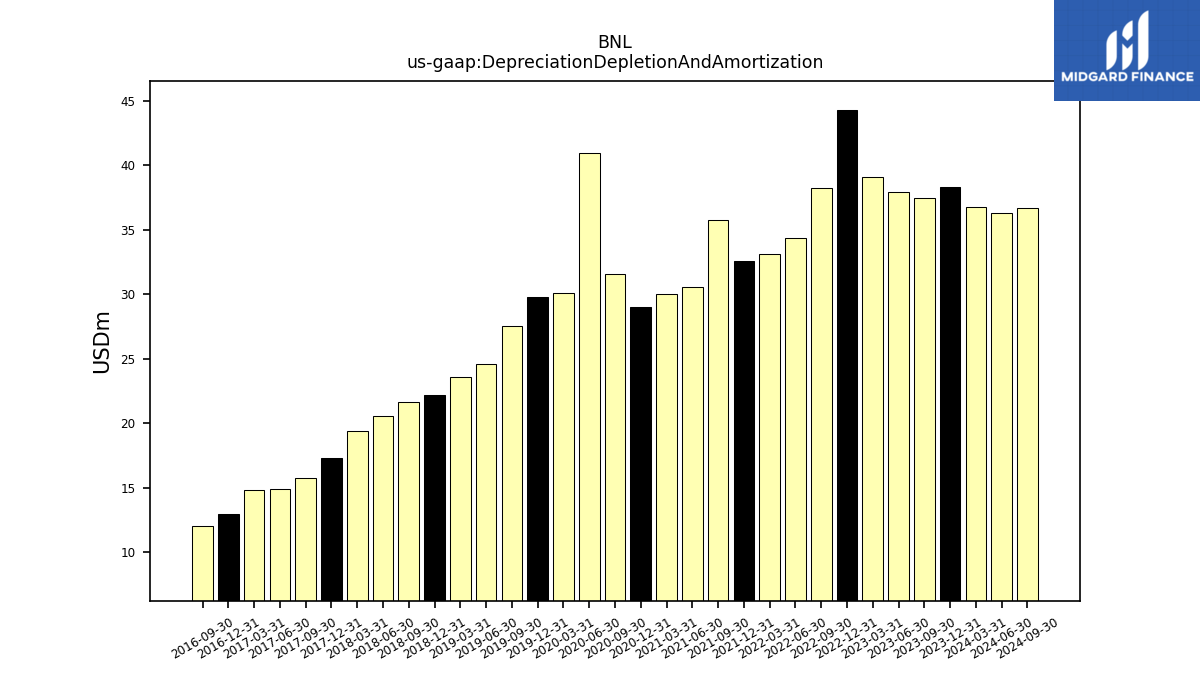
| Depreciation Depletion And Amortization | 37.48 | 37.95 | 39.09 | 44.30 | 38.22 | 34.34 | 33.13 | 32.58 | 35.74 | 30.59 | 29.98 | 29.03 | 31.52 | 40.94 | 30.08 | 29.75 | 27.52 | 24.57 | 23.57 | 22.18 | 21.61 | 20.52 | 19.38 | 17.30 | 15.74 | 14.92 | 14.79 | 12.94 | 12.01 | NA | NA | |
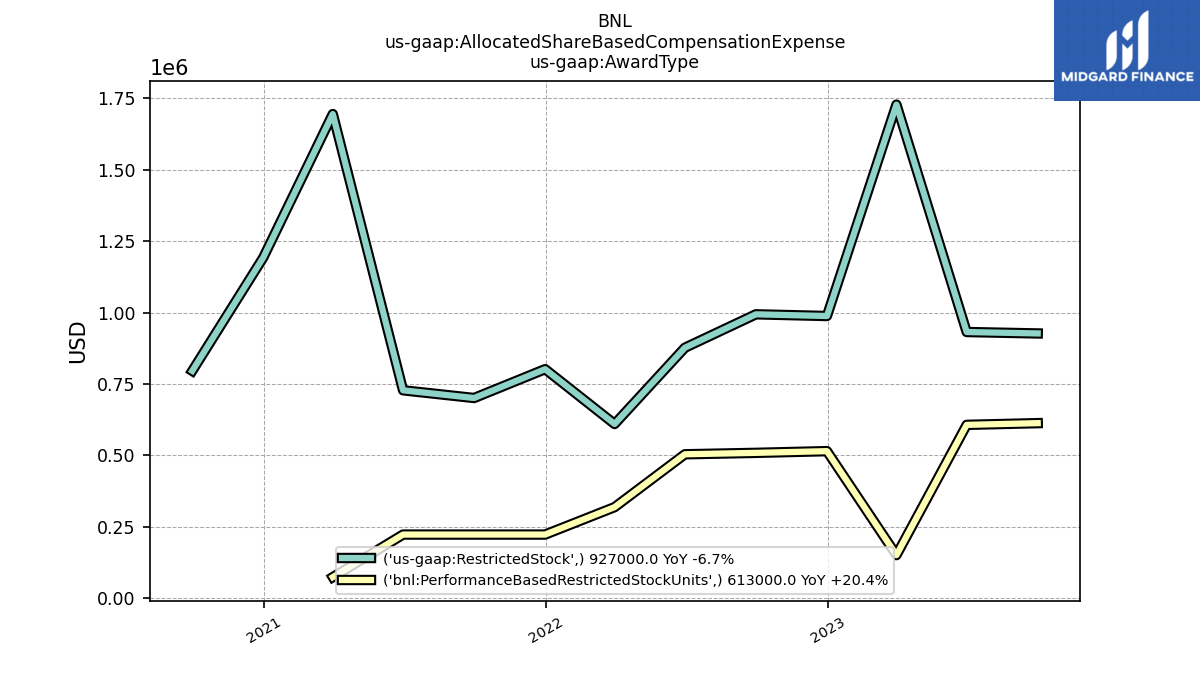
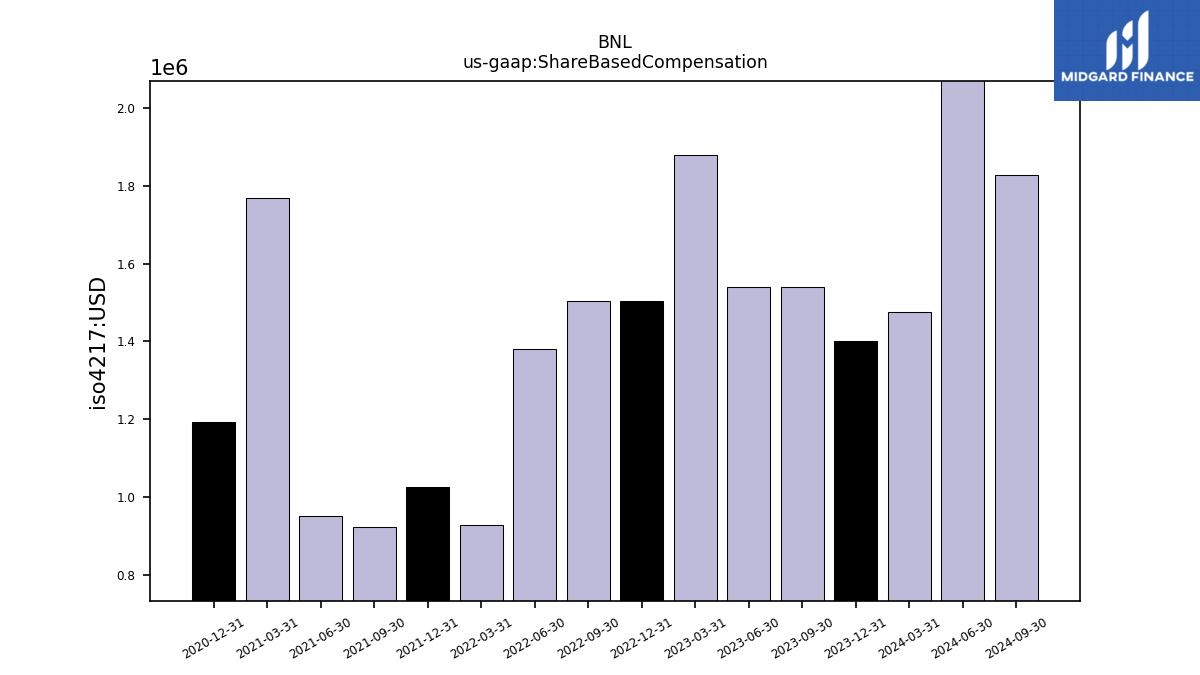
| Share Based Compensation | 1.54 | 1.54 | 1.88 | 1.50 | 1.50 | 1.38 | 0.93 | 1.02 | 0.92 | 0.95 | 1.77 | 1.19 | NA | NA | NA | NA | NA | NA | NA | NA | NA | NA | NA | NA | NA | NA | NA | NA | NA | NA | NA | |
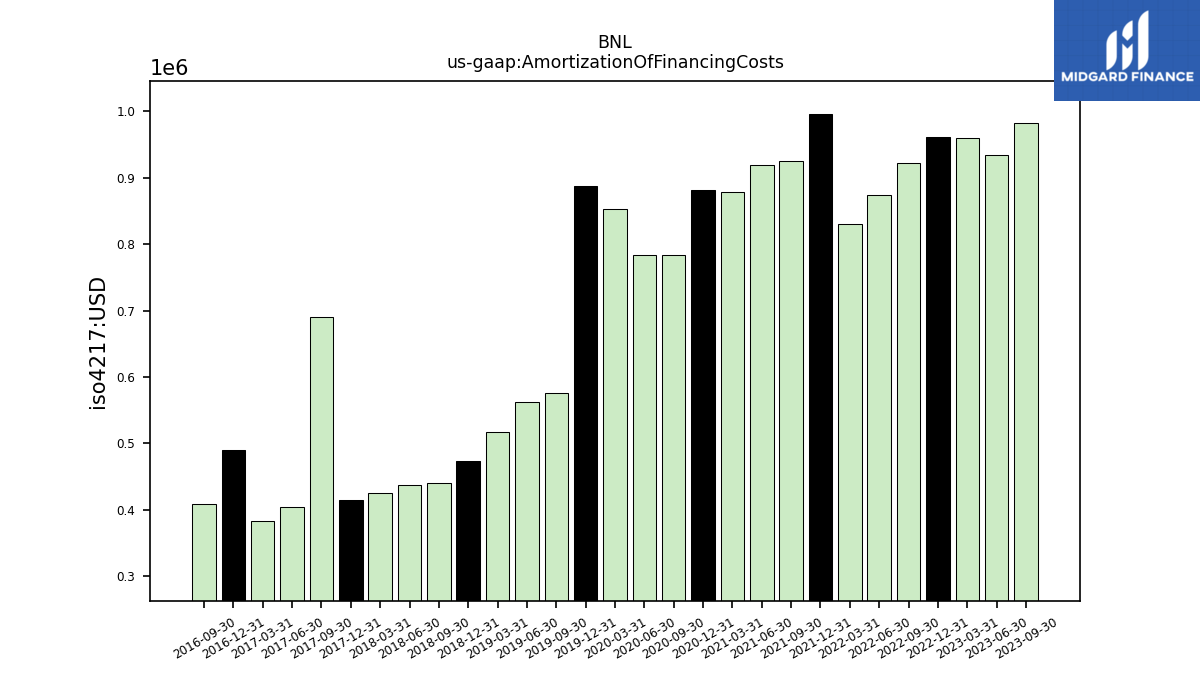
| Amortization Of Financing Costs | 0.98 | 0.93 | 0.96 | 0.96 | 0.92 | 0.87 | 0.83 | 1.00 | 0.93 | 0.92 | 0.88 | 0.88 | 0.78 | 0.78 | 0.85 | 0.89 | 0.58 | 0.56 | 0.52 | 0.47 | 0.44 | 0.44 | 0.42 | 0.41 | 0.69 | 0.40 | 0.38 | 0.49 | 0.41 | NA | NA |
| 2023-09-30 | 2023-06-30 | 2023-03-31 | 2022-12-31 | 2022-09-30 | 2022-06-30 | 2022-03-31 | 2021-12-31 | 2021-09-30 | 2021-06-30 | 2021-03-31 | 2020-12-31 | 2020-09-30 | 2020-06-30 | 2020-03-31 | 2019-12-31 | 2019-09-30 | 2019-06-30 | 2019-03-31 | 2018-12-31 | 2018-09-30 | 2018-06-30 | 2018-03-31 | 2017-12-31 | 2017-09-30 | 2017-06-30 | 2017-03-31 | 2016-12-31 | 2016-09-30 | 2016-06-30 | 2016-03-31 | ||
|---|---|---|---|---|---|---|---|---|---|---|---|---|---|---|---|---|---|---|---|---|---|---|---|---|---|---|---|---|---|---|---|---|
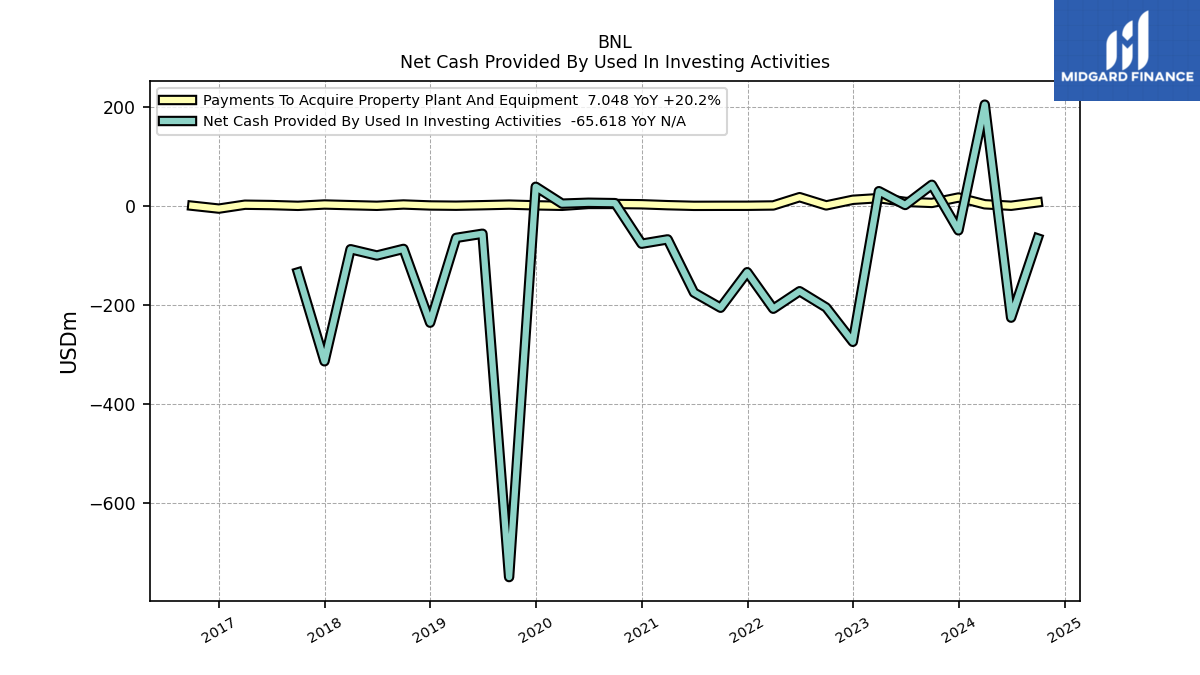
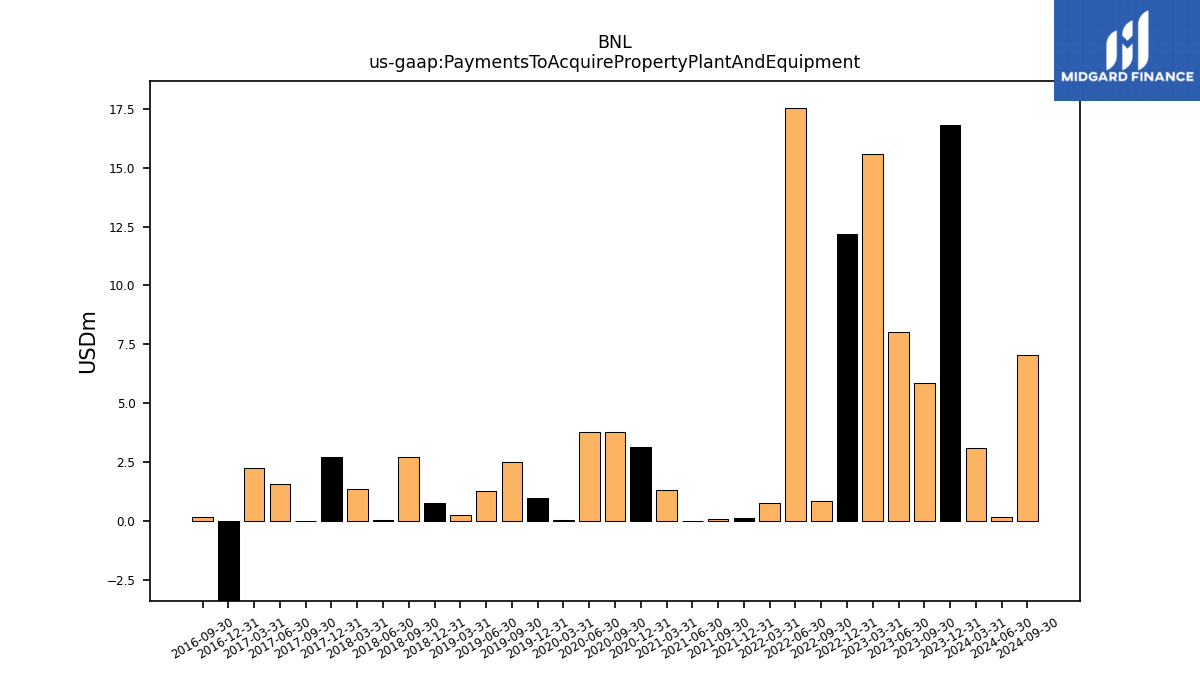
| Net Cash Provided By Used In Investing Activities | 42.53 | 1.71 | 29.63 | -274.49 | -205.19 | -172.29 | -207.68 | -133.93 | -205.67 | -175.05 | -67.66 | -76.44 | 5.47 | 6.26 | 4.47 | 38.52 | -749.33 | -56.26 | -64.64 | -235.87 | -86.87 | -100.20 | -87.52 | -313.80 | -134.29 | NA | NA | NA | NA | NA | NA | |
| Payments To Acquire Property Plant And Equipment | 5.86 | 8.01 | 15.58 | 12.20 | 0.88 | 17.51 | 0.78 | 0.15 | 0.12 | 0.00 | 1.33 | 3.18 | 3.81 | 3.78 | 0.05 | 1.01 | 2.50 | 1.29 | 0.26 | 0.78 | 2.74 | 0.07 | 1.38 | 2.73 | 0.00 | 1.58 | 2.29 | -5.59 | 0.21 | NA | NA |
| 2023-09-30 | 2023-06-30 | 2023-03-31 | 2022-12-31 | 2022-09-30 | 2022-06-30 | 2022-03-31 | 2021-12-31 | 2021-09-30 | 2021-06-30 | 2021-03-31 | 2020-12-31 | 2020-09-30 | 2020-06-30 | 2020-03-31 | 2019-12-31 | 2019-09-30 | 2019-06-30 | 2019-03-31 | 2018-12-31 | 2018-09-30 | 2018-06-30 | 2018-03-31 | 2017-12-31 | 2017-09-30 | 2017-06-30 | 2017-03-31 | 2016-12-31 | 2016-09-30 | 2016-06-30 | 2016-03-31 | ||
|---|---|---|---|---|---|---|---|---|---|---|---|---|---|---|---|---|---|---|---|---|---|---|---|---|---|---|---|---|---|---|---|---|
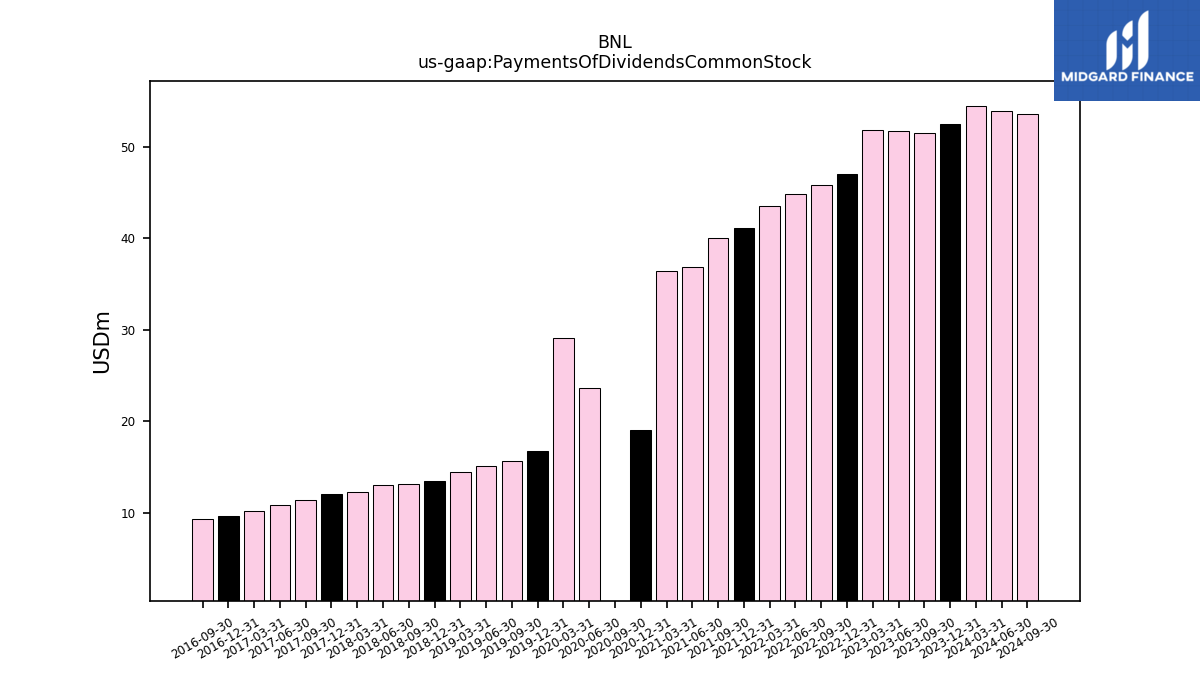
| Net Cash Provided By Used In Financing Activities | -102.18 | -46.99 | -144.74 | 191.72 | 181.06 | 76.87 | 186.35 | 84.00 | 50.43 | 196.47 | -76.50 | 32.12 | 40.17 | -132.27 | 31.61 | -98.75 | 734.52 | 22.73 | 27.17 | 192.34 | 59.23 | 69.83 | 69.94 | 283.70 | 78.09 | NA | NA | NA | NA | NA | NA | |
| Payments Of Dividends Common Stock | 51.49 | 51.68 | 51.84 | 47.00 | 45.87 | 44.86 | 43.50 | 41.16 | 40.03 | 36.88 | 36.40 | 19.09 | -0.33 | 23.63 | 29.15 | 16.74 | 15.65 | 15.08 | 14.49 | 13.44 | 13.16 | 12.99 | 12.26 | 12.01 | 11.44 | 10.88 | 10.21 | 9.67 | 9.30 | NA | NA |
| 2023-09-30 | 2023-06-30 | 2023-03-31 | 2022-12-31 | 2022-09-30 | 2022-06-30 | 2022-03-31 | 2021-12-31 | 2021-09-30 | 2021-06-30 | 2021-03-31 | 2020-12-31 | 2020-09-30 | 2020-06-30 | 2020-03-31 | 2019-12-31 | 2019-09-30 | 2019-06-30 | 2019-03-31 | 2018-12-31 | 2018-09-30 | 2018-06-30 | 2018-03-31 | 2017-12-31 | 2017-09-30 | 2017-06-30 | 2017-03-31 | 2016-12-31 | 2016-09-30 | 2016-06-30 | 2016-03-31 | ||
|---|---|---|---|---|---|---|---|---|---|---|---|---|---|---|---|---|---|---|---|---|---|---|---|---|---|---|---|---|---|---|---|---|
| Revenues | 109.54 | 109.35 | 118.99 | 112.14 | 103.52 | 98.01 | 93.84 | 92.64 | 122.78 | 84.76 | 82.70 | 82.29 | 80.74 | 80.37 | 78.23 | 84.93 | 76.40 | 69.05 | 68.43 | 63.09 | 61.76 | 57.03 | 55.59 | 49.47 | 46.23 | 43.67 | 42.19 | 39.45 | 37.01 | 34.82 | 31.59 |