
| 2023-10-31 | 2023-07-31 | 2023-04-30 | 2023-01-31 | 2022-10-31 | 2022-07-31 | 2022-04-30 | 2022-01-31 | 2021-10-31 | 2021-07-31 | 2021-04-30 | 2021-01-31 | 2020-10-31 | 2020-07-31 | 2020-04-30 | 2020-01-31 | 2019-10-31 | 2019-07-31 | 2019-04-30 | 2019-01-31 | 2018-10-31 | 2018-07-31 | 2018-04-30 | 2018-01-31 | 2017-10-31 | 2017-07-31 | 2017-04-30 | 2017-01-31 | 2016-10-31 | 2016-07-31 | 2016-04-30 | 2016-01-31 | 2015-10-31 | 2015-07-31 | 2015-04-30 | 2015-01-31 | 2014-10-31 | 2014-07-31 | 2014-04-30 | ||
|---|---|---|---|---|---|---|---|---|---|---|---|---|---|---|---|---|---|---|---|---|---|---|---|---|---|---|---|---|---|---|---|---|---|---|---|---|---|---|---|---|
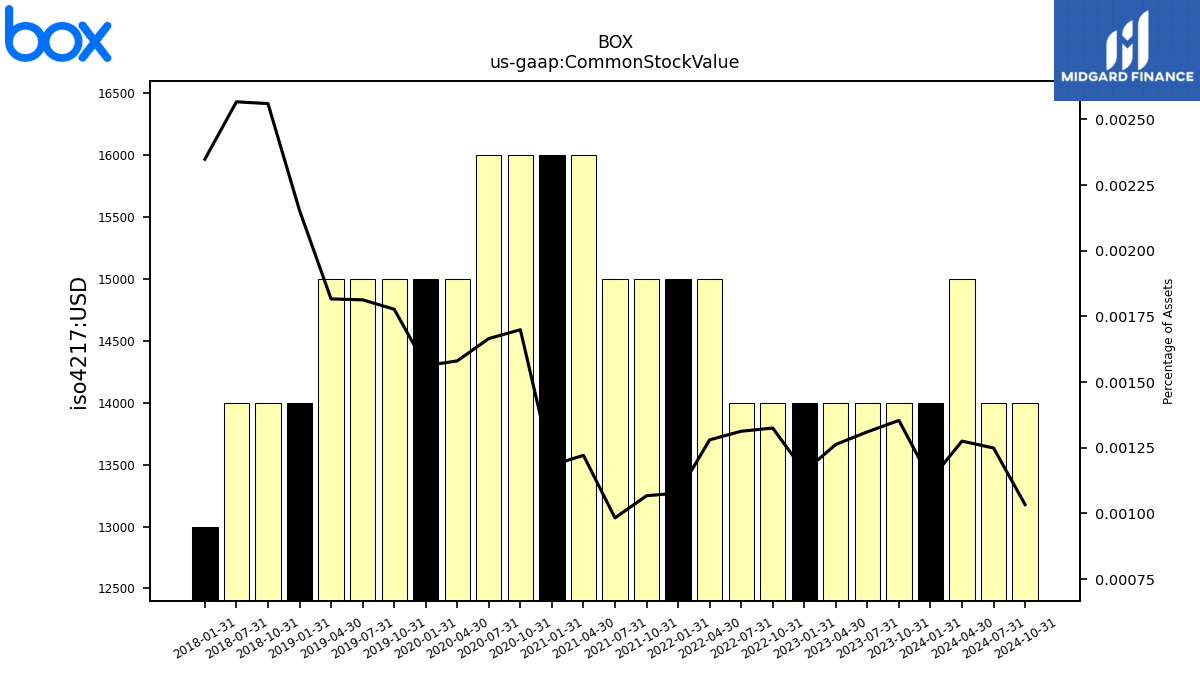
| Common Stock Value | 0.01 | 0.01 | 0.01 | 0.01 | 0.01 | 0.01 | 0.01 | 0.01 | 0.01 | 0.01 | 0.02 | 0.02 | 0.02 | 0.02 | 0.01 | 0.01 | 0.01 | 0.01 | 0.01 | 0.01 | 0.01 | 0.01 | NA | 0.01 | NA | NA | NA | NA | NA | NA | NA | NA | NA | NA | NA | NA | NA | NA | NA | |
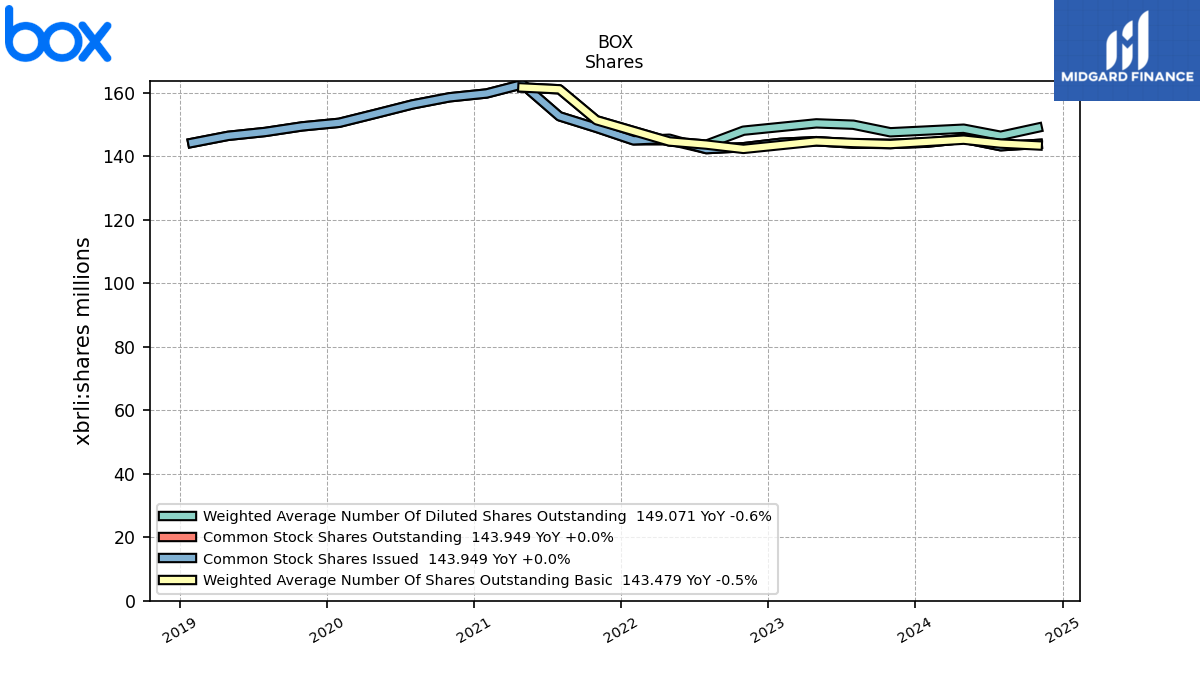
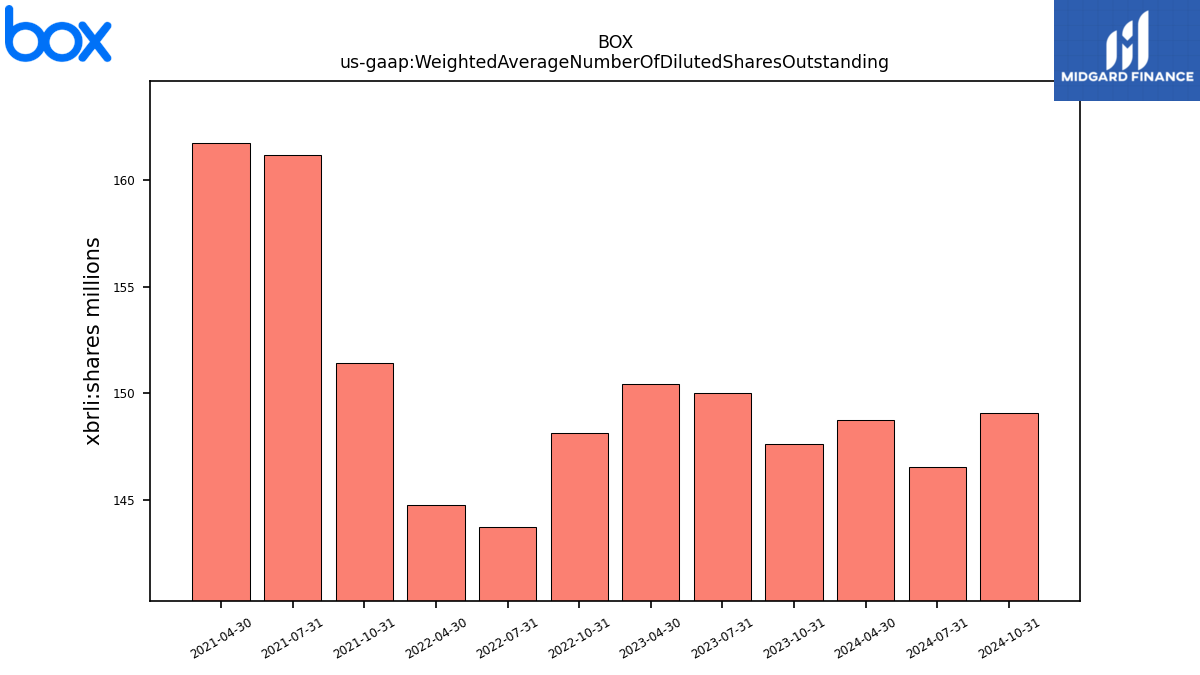
| Weighted Average Number Of Diluted Shares Outstanding | 147.62 | 150.01 | 150.44 | NA | 148.13 | 143.74 | 144.72 | NA | 151.43 | 161.16 | 161.73 | NA | NA | NA | NA | NA | NA | NA | NA | NA | NA | NA | NA | NA | NA | NA | NA | NA | NA | NA | NA | NA | NA | NA | NA | NA | NA | NA | NA | |
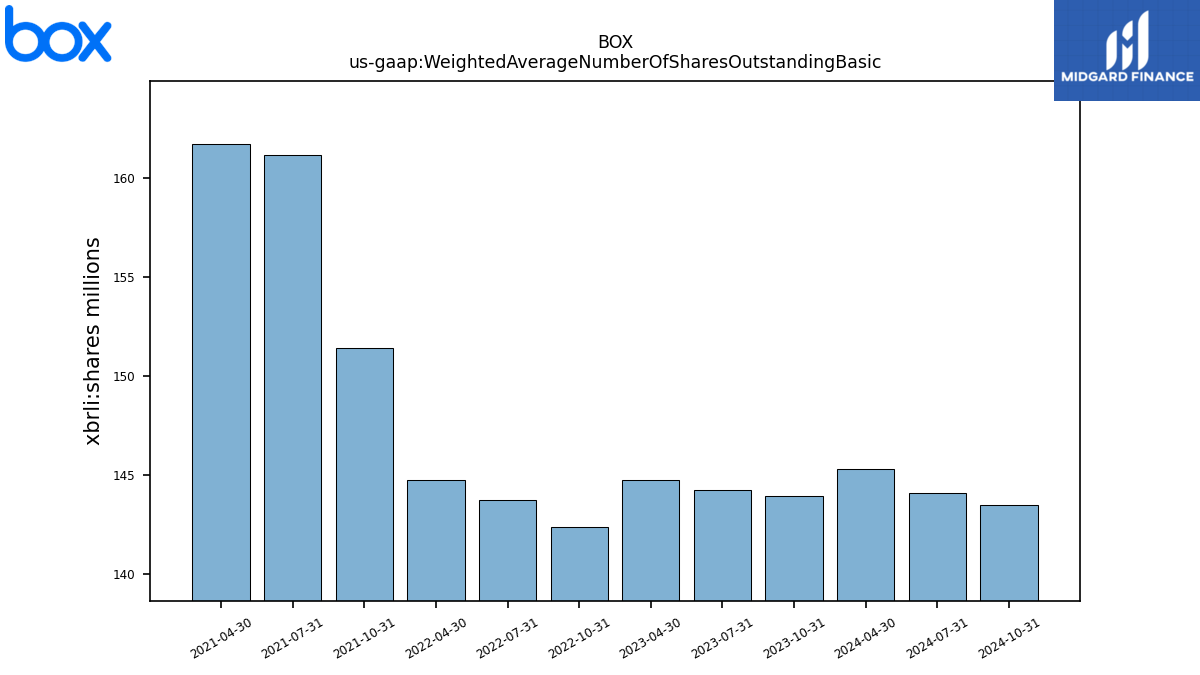
| Weighted Average Number Of Shares Outstanding Basic | 143.91 | 144.25 | 144.74 | NA | 142.38 | 143.74 | 144.72 | NA | 151.43 | 161.16 | 161.73 | NA | NA | NA | NA | NA | NA | NA | NA | NA | NA | NA | NA | NA | NA | NA | NA | NA | NA | NA | NA | NA | NA | NA | NA | NA | NA | NA | NA | |
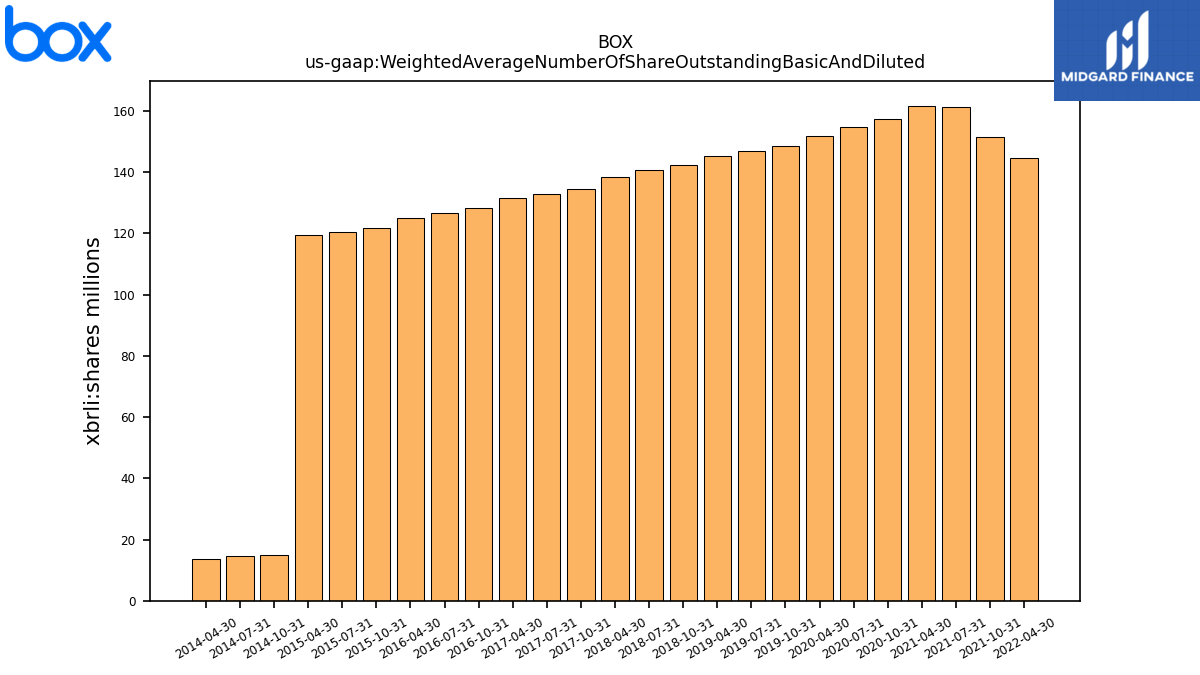
| Weighted Average Number Of Share Outstanding Basic And Diluted | NA | NA | NA | NA | NA | NA | 144.72 | NA | 151.43 | 161.16 | 161.73 | NA | 157.47 | 154.73 | 151.94 | NA | 148.56 | 147.03 | 145.28 | NA | 142.37 | 140.72 | 138.52 | NA | 134.64 | 132.98 | 131.47 | NA | 128.28 | 126.78 | 124.93 | NA | 121.80 | 120.40 | 119.38 | NA | 15.04 | 14.53 | 13.73 | |
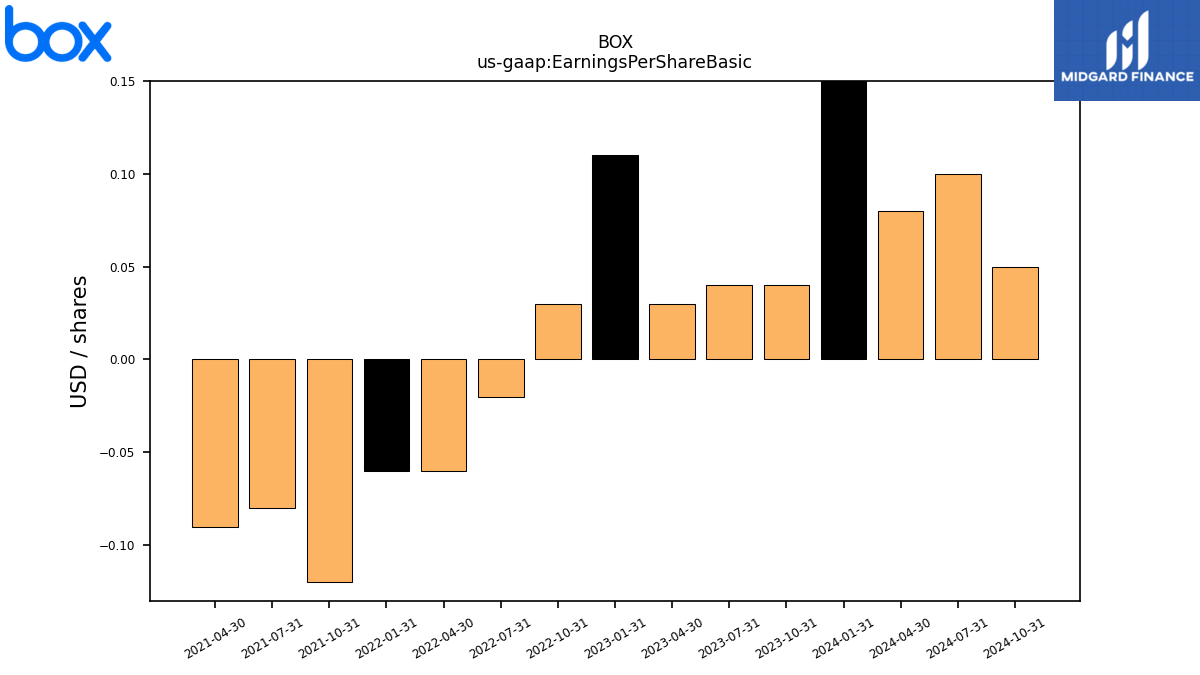
| Earnings Per Share Basic | 0.04 | 0.04 | 0.03 | 0.11 | 0.03 | -0.02 | -0.06 | -0.06 | -0.12 | -0.08 | -0.09 | NA | NA | NA | NA | NA | NA | NA | NA | NA | NA | NA | NA | NA | NA | NA | NA | NA | NA | NA | NA | NA | NA | NA | NA | NA | NA | NA | NA | |
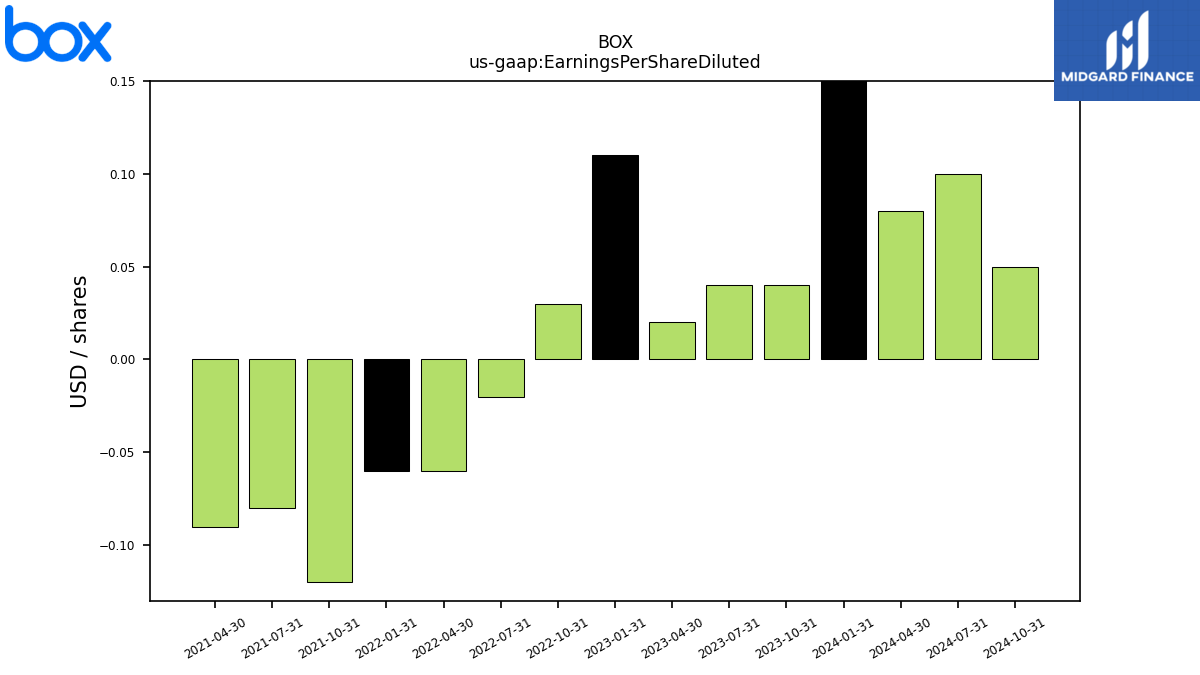
| Earnings Per Share Diluted | 0.04 | 0.04 | 0.02 | 0.11 | 0.03 | -0.02 | -0.06 | -0.06 | -0.12 | -0.08 | -0.09 | NA | NA | NA | NA | NA | NA | NA | NA | NA | NA | NA | NA | NA | NA | NA | NA | NA | NA | NA | NA | NA | NA | NA | NA | NA | NA | NA | NA | |
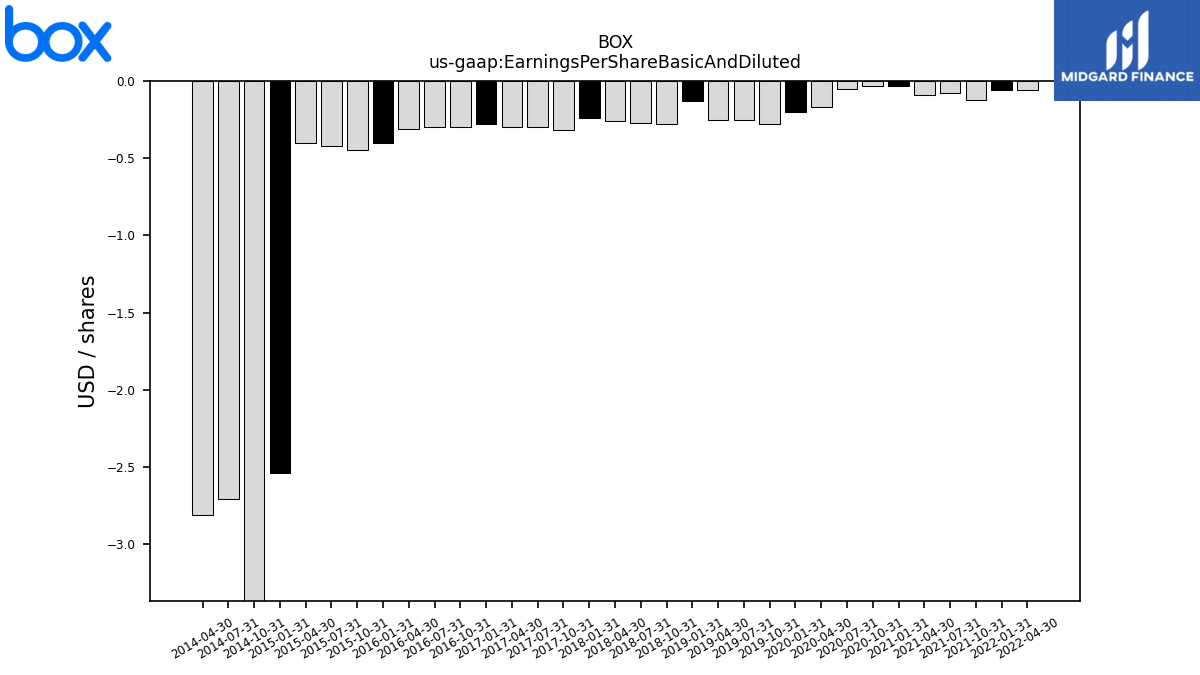
| Earnings Per Share Basic And Diluted | NA | NA | NA | NA | NA | NA | -0.06 | -0.06 | -0.12 | -0.08 | -0.09 | -0.03 | -0.03 | -0.05 | -0.17 | -0.20 | -0.28 | -0.25 | -0.25 | -0.13 | -0.28 | -0.27 | -0.26 | -0.24 | -0.32 | -0.30 | -0.30 | -0.28 | -0.30 | -0.30 | -0.31 | -0.40 | -0.45 | -0.42 | -0.40 | -2.54 | -3.40 | -2.71 | -2.81 |
| 2023-10-31 | 2023-07-31 | 2023-04-30 | 2023-01-31 | 2022-10-31 | 2022-07-31 | 2022-04-30 | 2022-01-31 | 2021-10-31 | 2021-07-31 | 2021-04-30 | 2021-01-31 | 2020-10-31 | 2020-07-31 | 2020-04-30 | 2020-01-31 | 2019-10-31 | 2019-07-31 | 2019-04-30 | 2019-01-31 | 2018-10-31 | 2018-07-31 | 2018-04-30 | 2018-01-31 | 2017-10-31 | 2017-07-31 | 2017-04-30 | 2017-01-31 | 2016-10-31 | 2016-07-31 | 2016-04-30 | 2016-01-31 | 2015-10-31 | 2015-07-31 | 2015-04-30 | 2015-01-31 | 2014-10-31 | 2014-07-31 | 2014-04-30 | ||
|---|---|---|---|---|---|---|---|---|---|---|---|---|---|---|---|---|---|---|---|---|---|---|---|---|---|---|---|---|---|---|---|---|---|---|---|---|---|---|---|---|
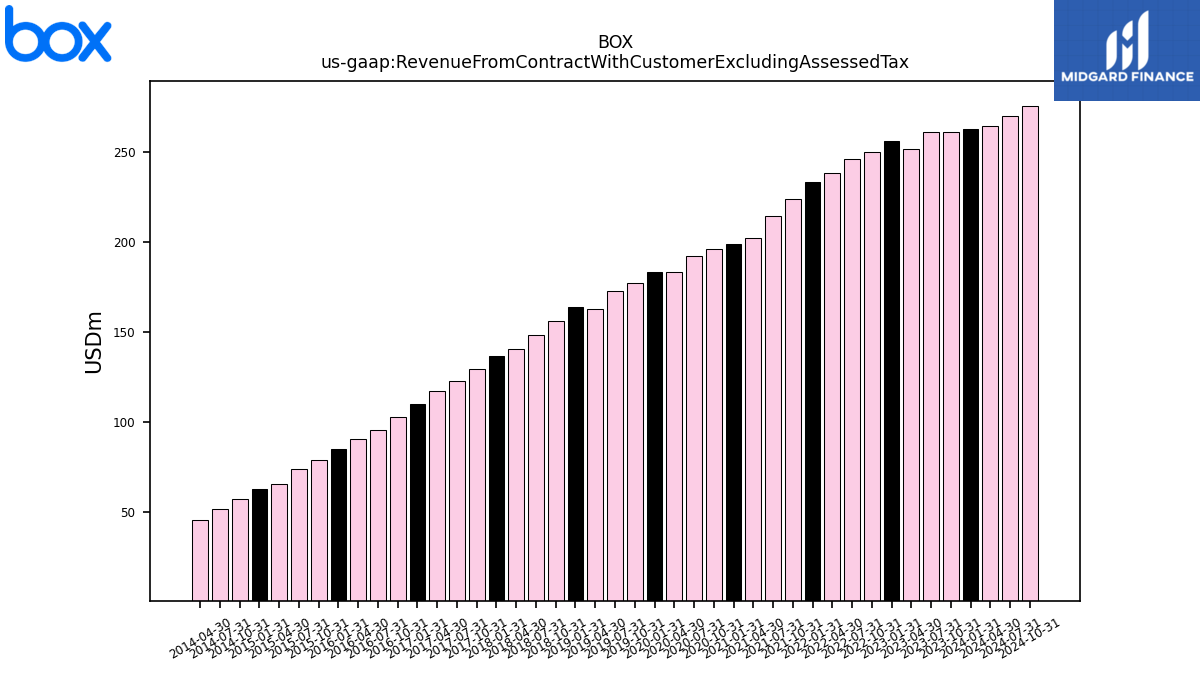
| Revenue From Contract With Customer Excluding Assessed Tax | 261.54 | 261.43 | 251.90 | 256.48 | 249.95 | 246.01 | 238.43 | 233.36 | 224.04 | 214.49 | 202.44 | 198.91 | 196.00 | 192.29 | 183.56 | 183.59 | 177.16 | 172.55 | 162.97 | 163.71 | 155.94 | 148.22 | 140.51 | 136.68 | 129.30 | 122.94 | 117.22 | 109.93 | 102.81 | 95.71 | 90.16 | 84.98 | 78.65 | 73.45 | 65.62 | 62.64 | 57.05 | 51.42 | 45.33 | |
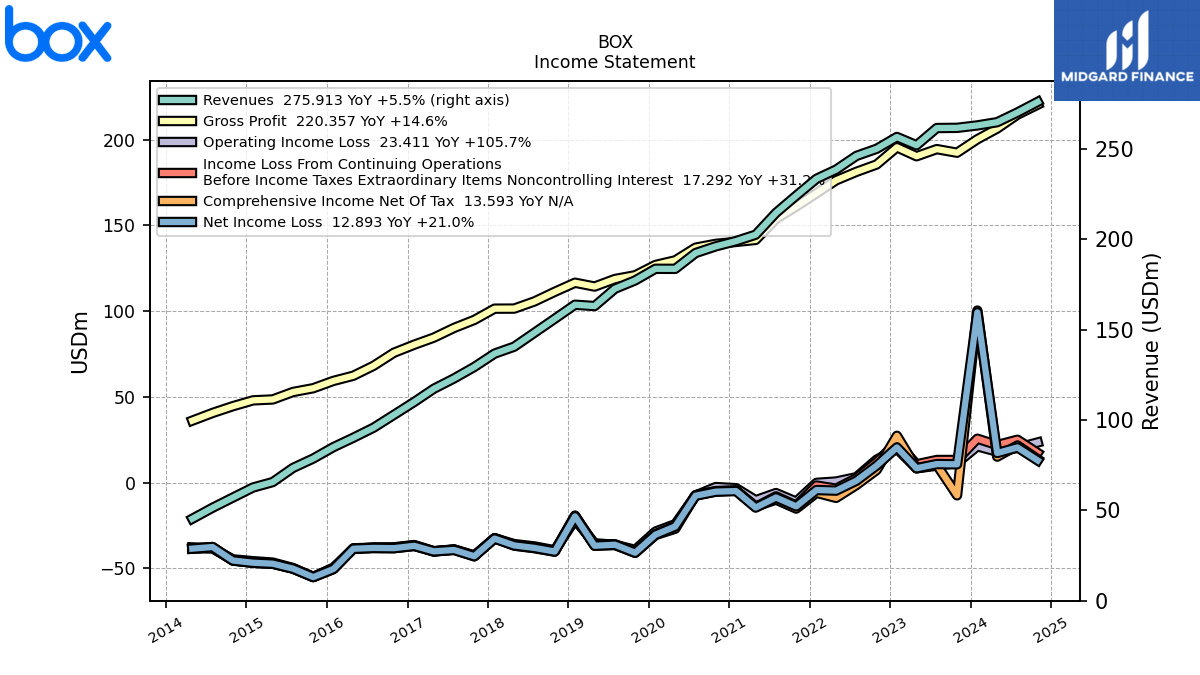
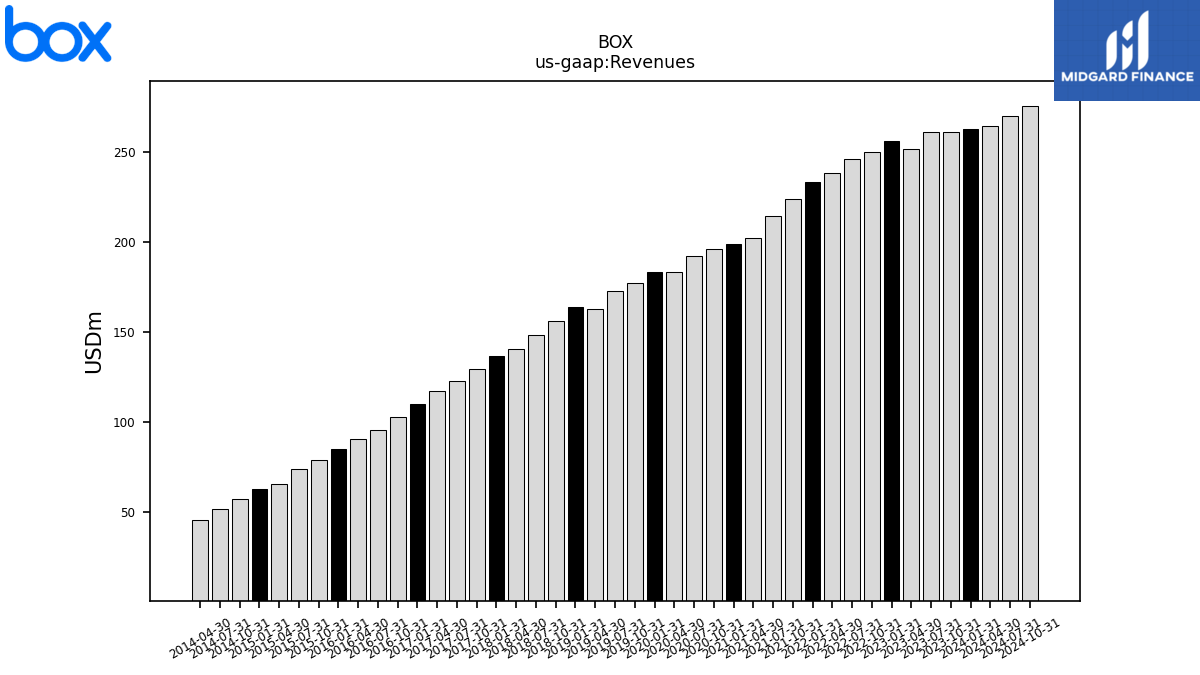
| Revenues | 261.54 | 261.43 | 251.90 | 256.48 | 249.95 | 246.01 | 238.43 | 233.36 | 224.04 | 214.49 | 202.44 | 198.91 | 196.00 | 192.29 | 183.56 | 183.59 | 177.16 | 172.55 | 162.97 | 163.71 | 155.94 | 148.22 | 140.51 | 136.68 | 129.30 | 122.94 | 117.22 | 109.93 | 102.81 | 95.71 | 90.16 | 84.98 | 78.65 | 73.45 | 65.62 | 62.64 | 57.05 | 51.42 | 45.33 | |
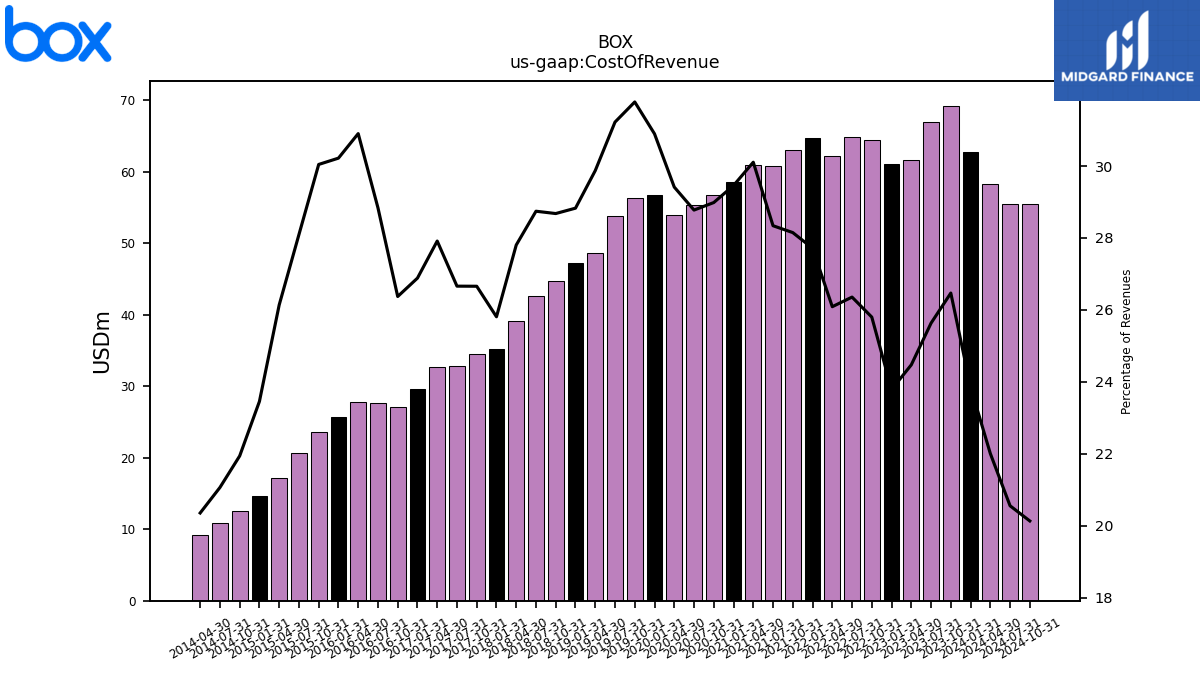
| Cost Of Revenue | 69.23 | 67.01 | 61.65 | 61.01 | 64.49 | 64.84 | 62.21 | 64.68 | 63.07 | 60.79 | 60.95 | 58.60 | 56.81 | 55.33 | 53.99 | 56.72 | 56.30 | 53.87 | 48.68 | 47.20 | 44.72 | 42.60 | 39.07 | 35.28 | 34.47 | 32.78 | 32.72 | 29.55 | 27.11 | 27.60 | 27.86 | 25.68 | 23.63 | 20.64 | 17.15 | 14.69 | 12.52 | 10.83 | 9.23 | |
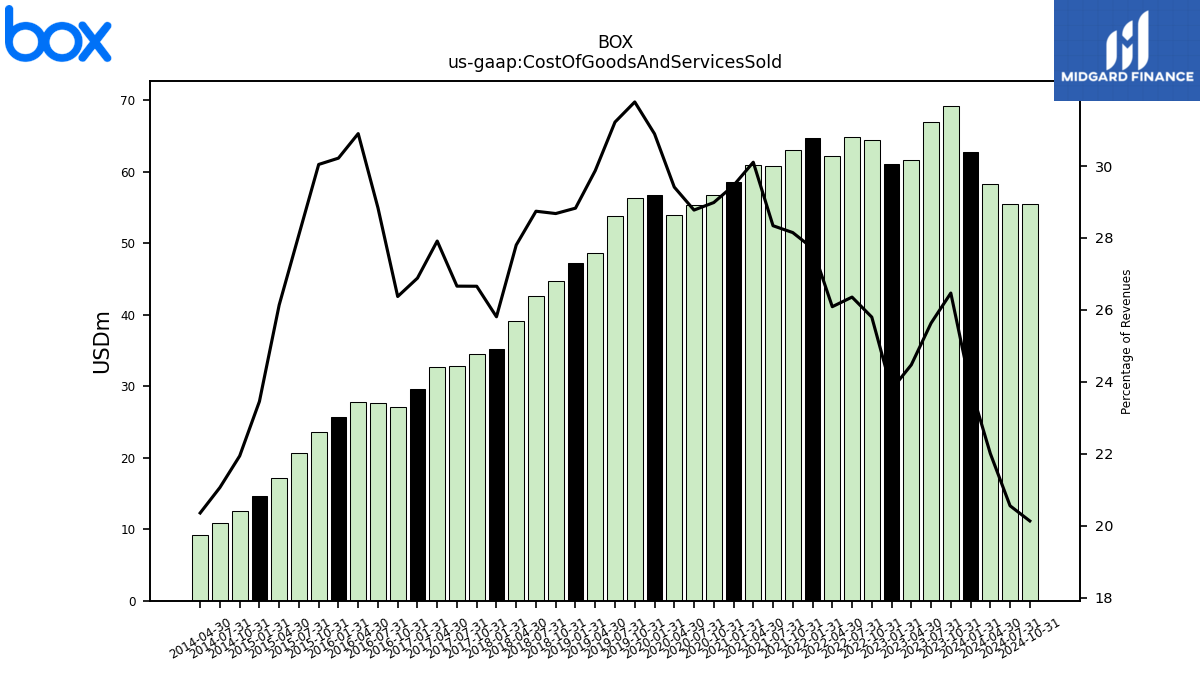
| Cost Of Goods And Services Sold | 69.23 | 67.01 | 61.65 | 61.01 | 64.49 | 64.84 | 62.21 | 64.68 | 63.07 | 60.79 | 60.95 | 58.60 | 56.81 | 55.33 | 53.99 | 56.72 | 56.30 | 53.87 | 48.68 | 47.20 | 44.72 | 42.60 | 39.07 | 35.28 | 34.47 | 32.78 | 32.72 | 29.55 | 27.11 | 27.60 | 27.86 | 25.68 | 23.63 | 20.64 | 17.15 | 14.69 | 12.52 | 10.83 | 9.23 | |
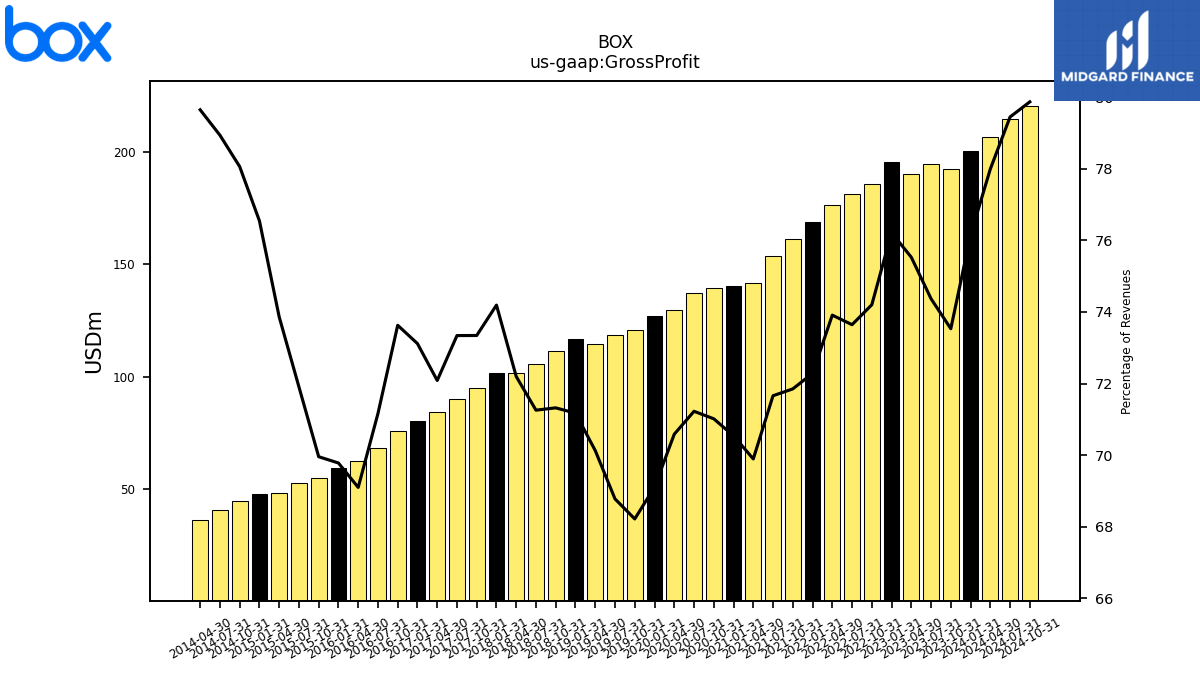
| Gross Profit | 192.31 | 194.41 | 190.25 | 195.46 | 185.46 | 181.17 | 176.22 | 168.68 | 160.97 | 153.70 | 141.49 | 140.32 | 139.19 | 136.96 | 129.57 | 126.87 | 120.85 | 118.68 | 114.29 | 116.52 | 111.22 | 105.62 | 101.44 | 101.40 | 94.83 | 90.16 | 84.50 | 80.37 | 75.70 | 68.11 | 62.30 | 59.30 | 55.02 | 52.81 | 48.47 | 47.95 | 44.53 | 40.59 | 36.10 | |
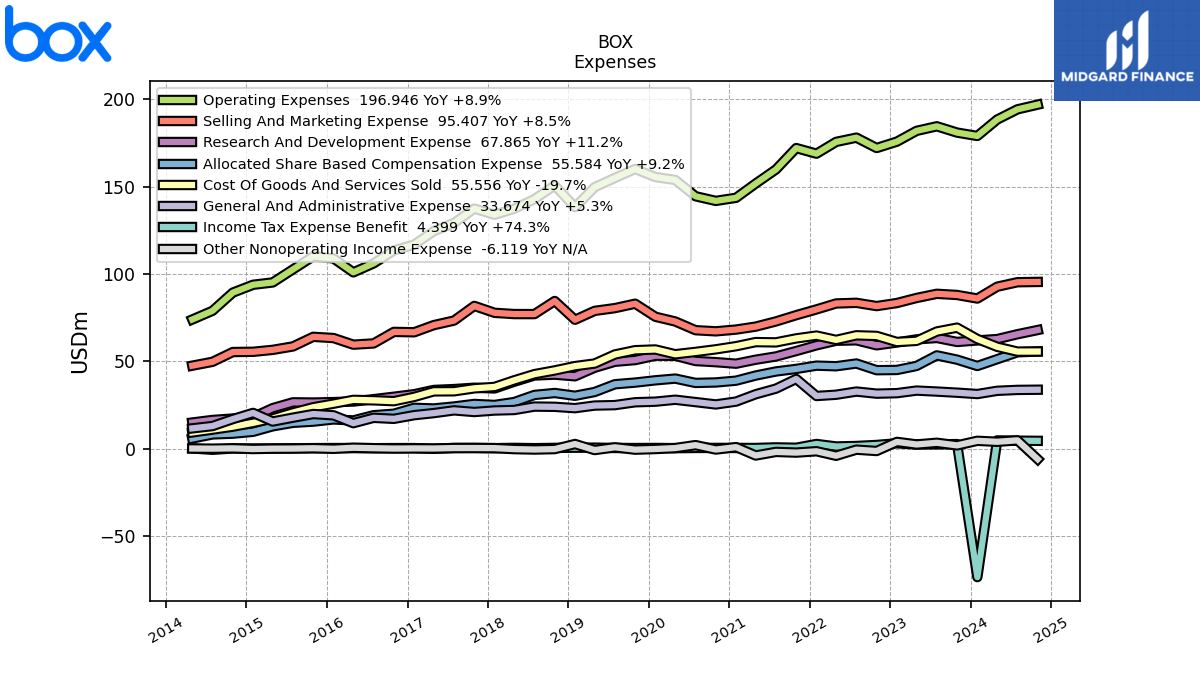
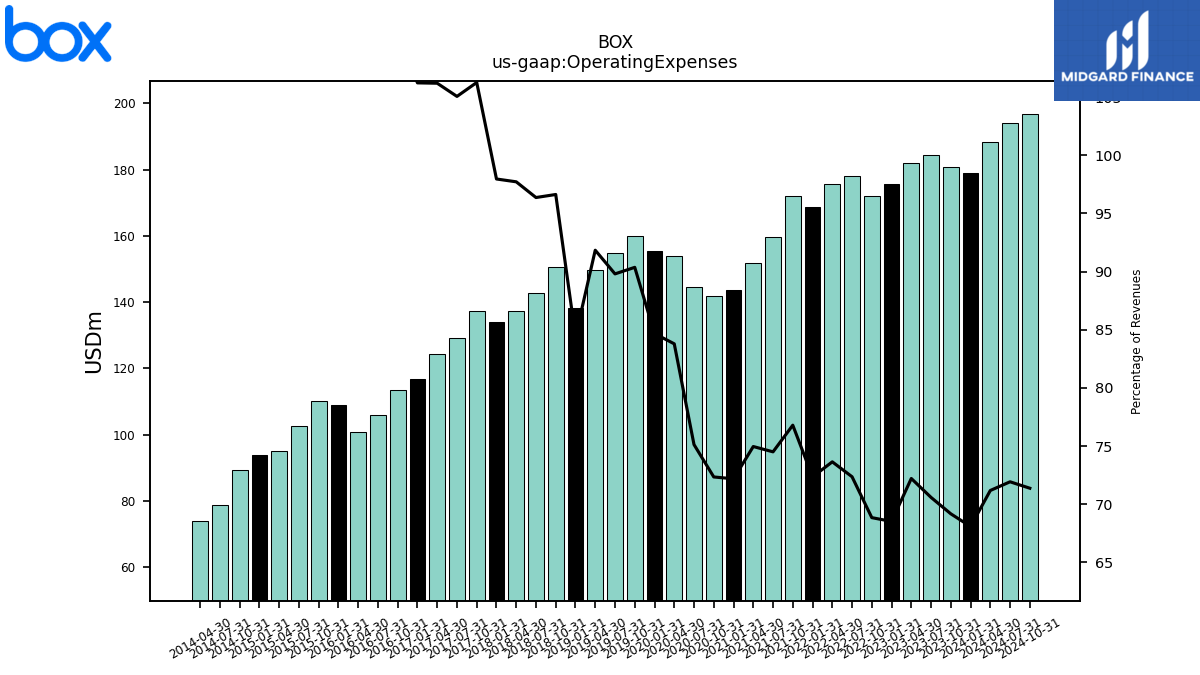
| Operating Expenses | 180.93 | 184.54 | 181.91 | 175.75 | 172.09 | 178.03 | 175.60 | 168.85 | 172.06 | 159.81 | 151.76 | 143.59 | 141.81 | 144.47 | 153.81 | 155.45 | 160.09 | 154.95 | 149.67 | 138.21 | 150.68 | 142.84 | 137.30 | 133.89 | 137.39 | 129.16 | 124.48 | 116.77 | 113.45 | 106.03 | 100.89 | 108.86 | 110.05 | 102.59 | 95.10 | 93.78 | 89.28 | 78.88 | 73.88 | |
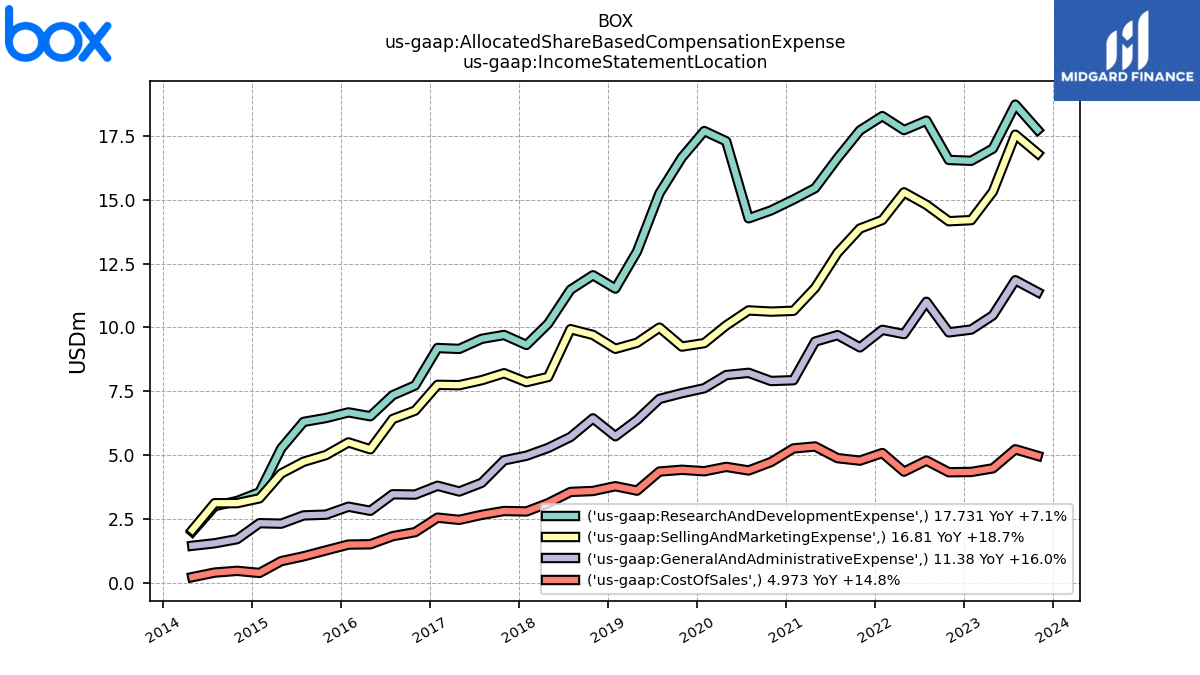
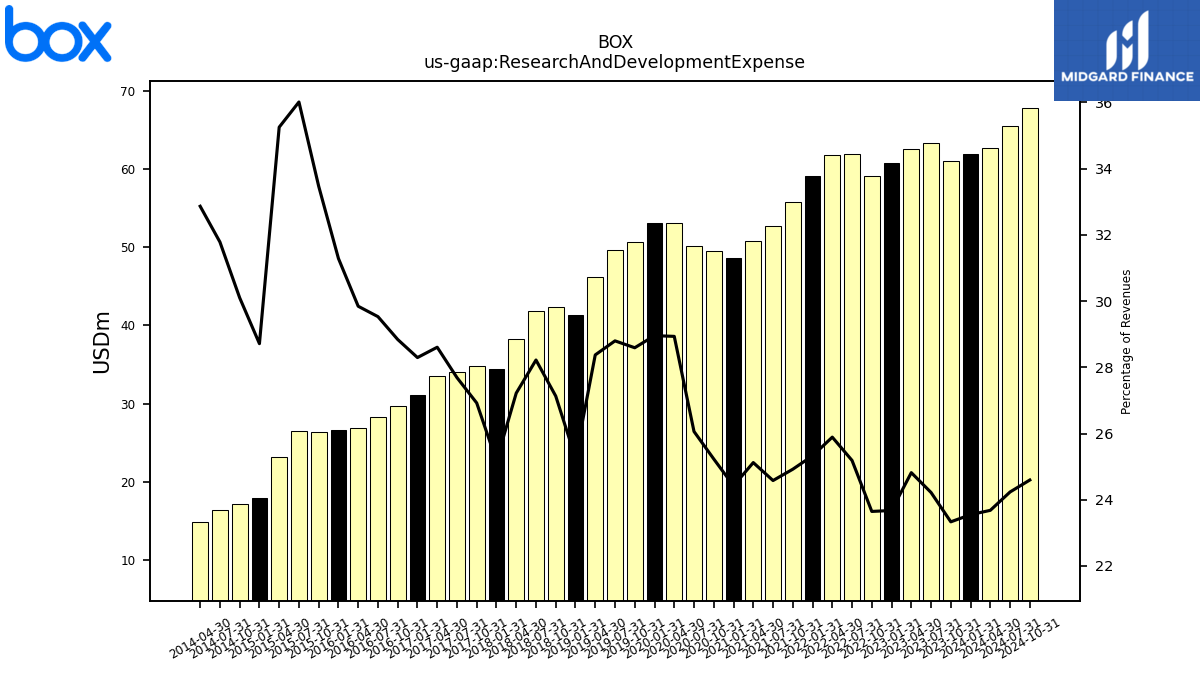
| Research And Development Expense | 61.03 | 63.32 | 62.52 | 60.72 | 59.11 | 61.97 | 61.73 | 59.10 | 55.84 | 52.72 | 50.86 | 48.58 | 49.45 | 50.12 | 53.11 | 53.16 | 50.65 | 49.69 | 46.24 | 41.36 | 42.31 | 41.83 | 38.25 | 34.40 | 34.81 | 34.04 | 33.53 | 31.10 | 29.65 | 28.27 | 26.91 | 26.59 | 26.32 | 26.45 | 23.13 | 17.99 | 17.17 | 16.34 | 14.90 | |
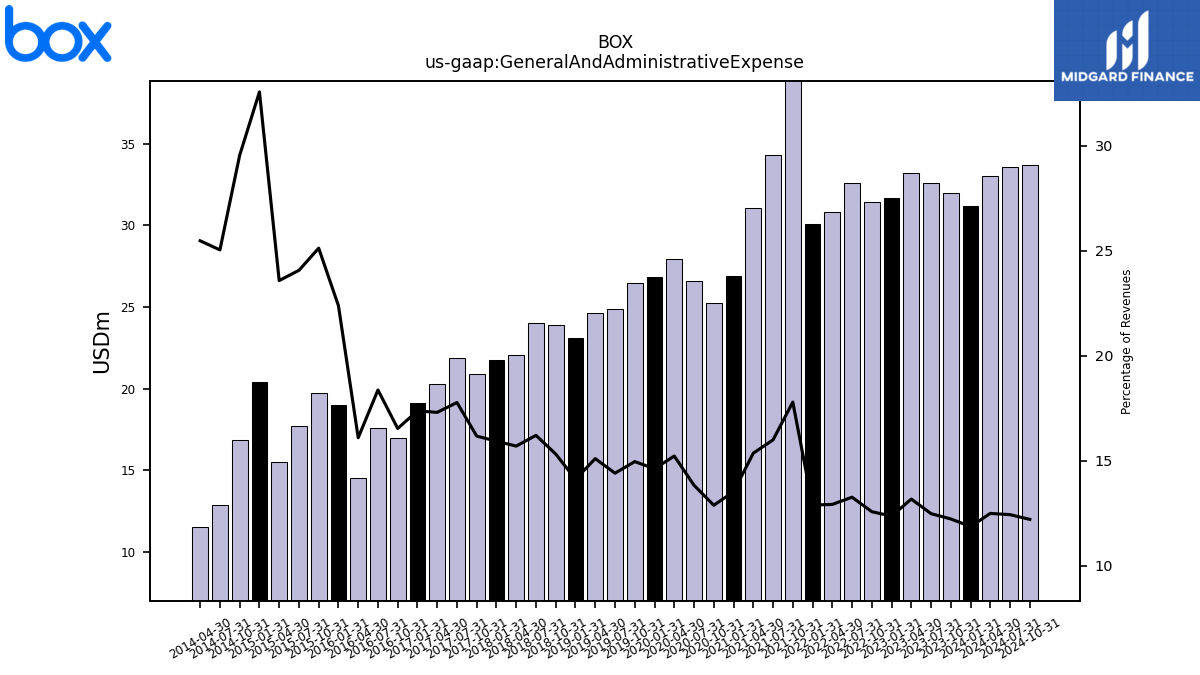
| General And Administrative Expense | 31.98 | 32.62 | 33.18 | 31.70 | 31.42 | 32.62 | 30.80 | 30.07 | 39.86 | 34.30 | 31.09 | 26.89 | 25.24 | 26.60 | 27.94 | 26.84 | 26.50 | 24.86 | 24.61 | 23.11 | 23.88 | 24.02 | 22.05 | 21.77 | 20.91 | 21.85 | 20.28 | 19.09 | 17.00 | 17.58 | 14.51 | 19.02 | 19.76 | 17.68 | 15.47 | 20.40 | 16.86 | 12.88 | 11.55 | |
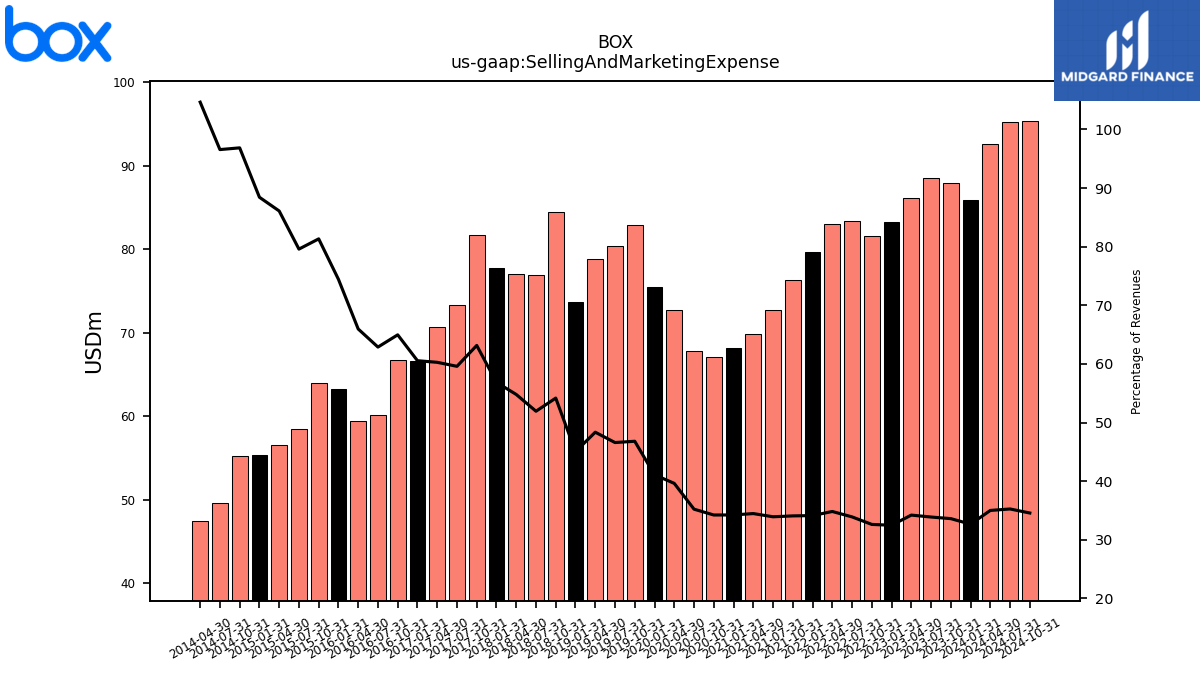
| Selling And Marketing Expense | 87.93 | 88.61 | 86.21 | 83.33 | 81.57 | 83.44 | 83.07 | 79.67 | 76.37 | 72.79 | 69.81 | 68.12 | 67.11 | 67.76 | 72.75 | 75.45 | 82.94 | 80.41 | 78.82 | 73.74 | 84.49 | 76.98 | 77.00 | 77.72 | 81.67 | 73.27 | 70.66 | 66.57 | 66.80 | 60.19 | 59.47 | 63.26 | 63.97 | 58.46 | 56.49 | 55.40 | 55.26 | 49.66 | 47.44 | |
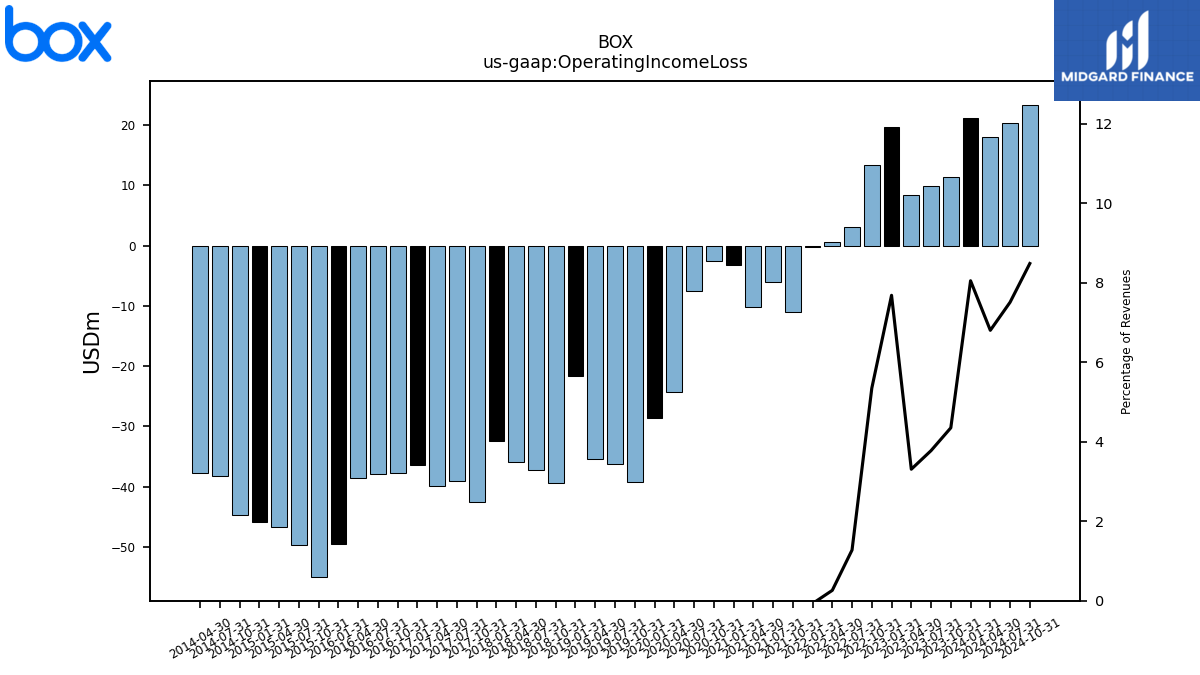
| Operating Income Loss | 11.38 | 9.88 | 8.34 | 19.71 | 13.37 | 3.14 | 0.62 | -0.17 | -11.09 | -6.11 | -10.26 | -3.28 | -2.61 | -7.51 | -24.24 | -28.58 | -39.23 | -36.28 | -35.38 | -21.69 | -39.46 | -37.22 | -35.86 | -32.49 | -42.56 | -39.00 | -39.98 | -36.39 | -37.75 | -37.92 | -38.59 | -49.56 | -55.03 | -49.77 | -46.63 | -45.83 | -44.75 | -38.29 | -37.78 | |
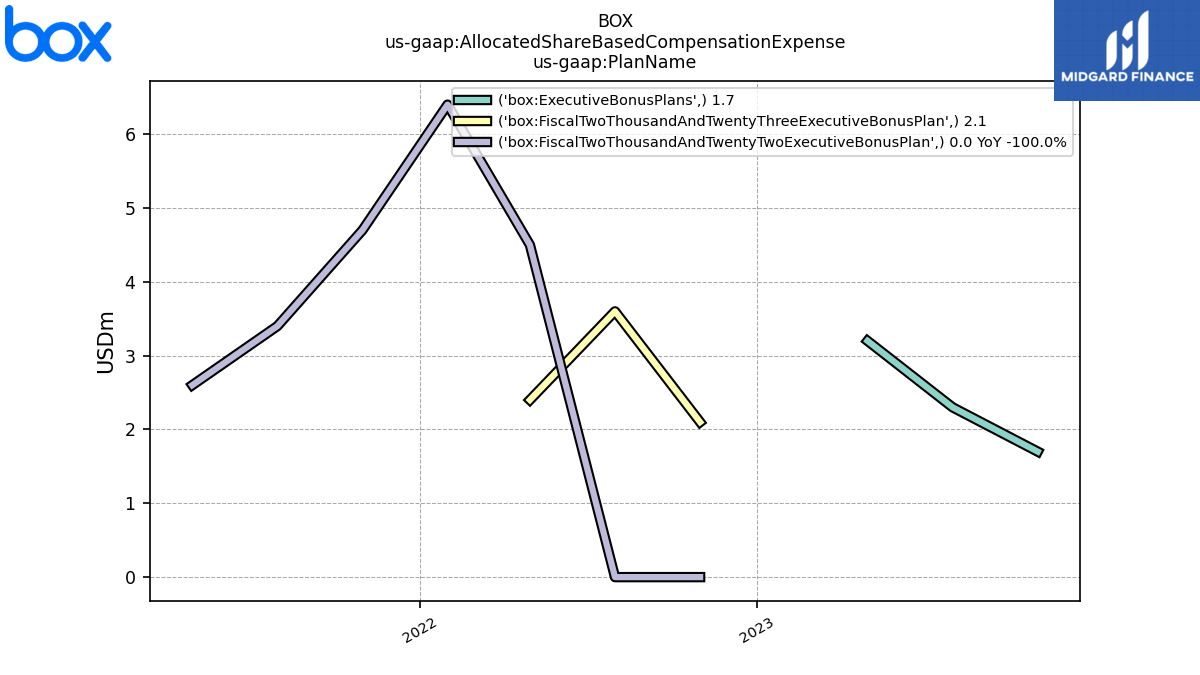
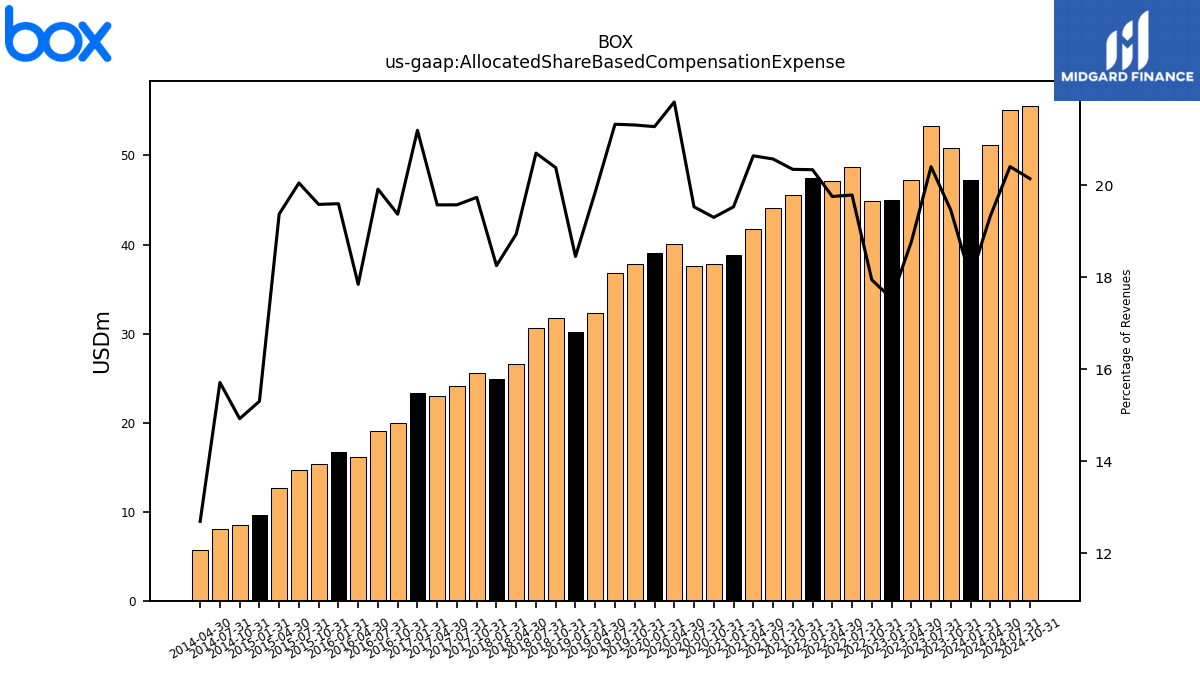
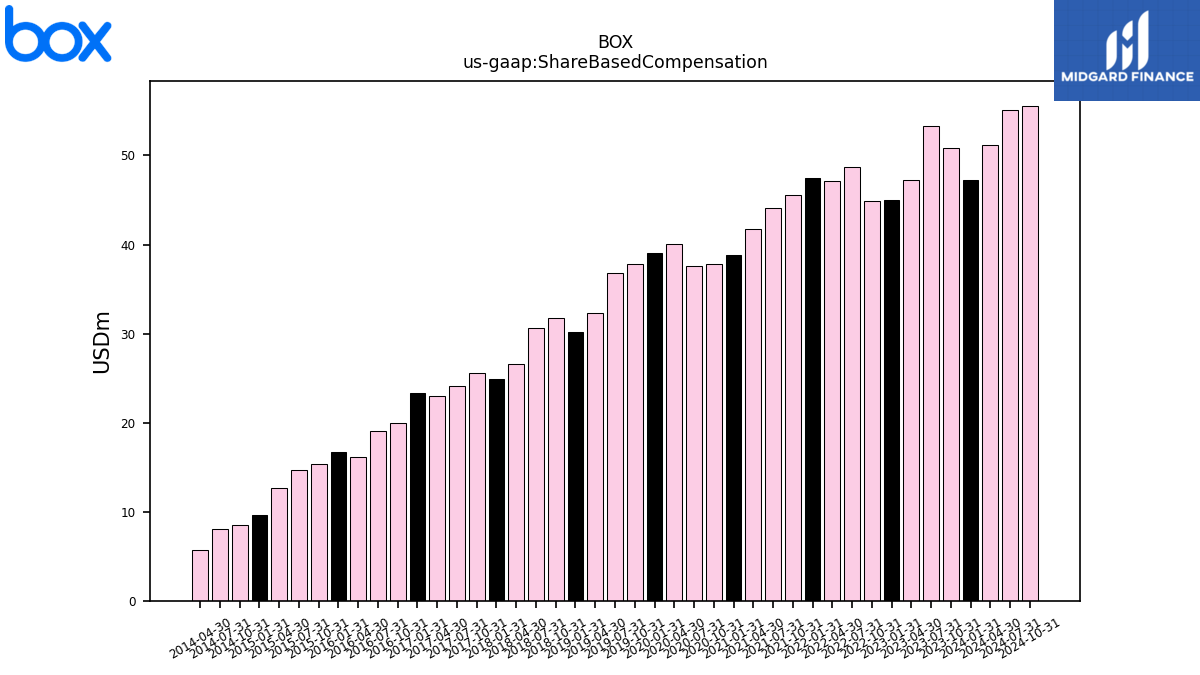
| Allocated Share Based Compensation Expense | 50.89 | 53.35 | 47.28 | 44.98 | 44.85 | 48.69 | 47.11 | 47.47 | 45.59 | 44.13 | 41.79 | 38.85 | 37.83 | 37.56 | 40.04 | 39.06 | 37.76 | 36.80 | 32.36 | 30.21 | 31.79 | 30.68 | 26.61 | 24.95 | 25.52 | 24.07 | 22.95 | 23.30 | 19.92 | 19.06 | 16.09 | 16.66 | 15.40 | 14.73 | 12.71 | 9.59 | 8.51 | 8.08 | 5.75 | |
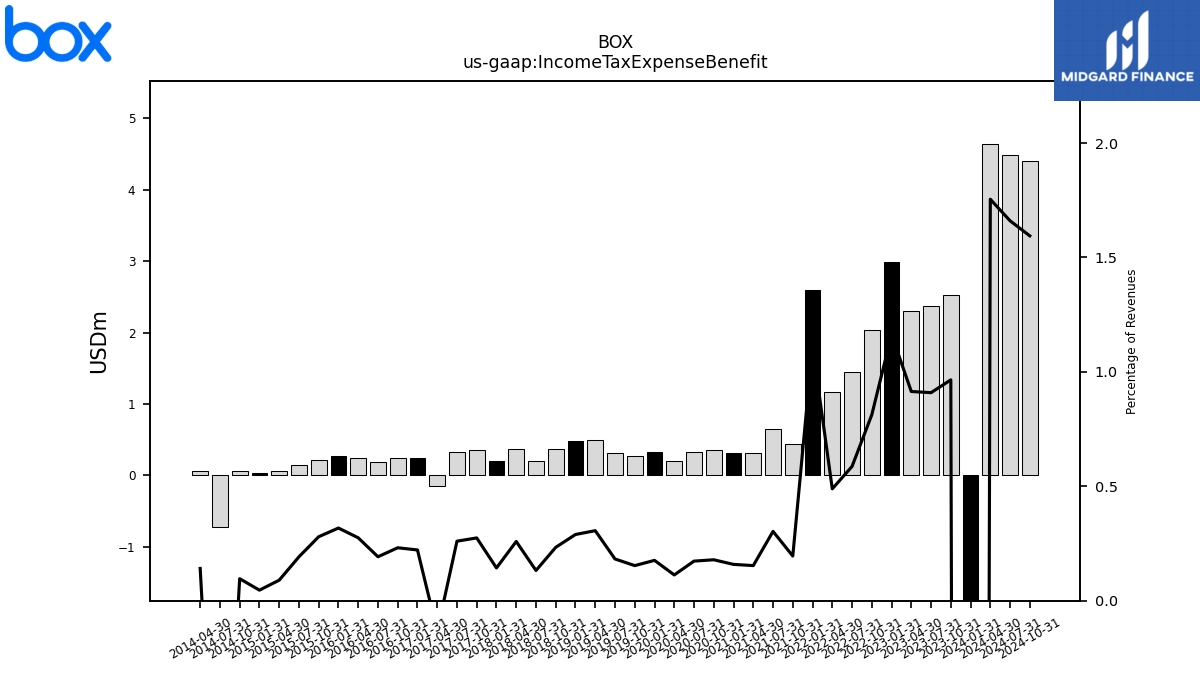
| Income Tax Expense Benefit | 2.52 | 2.38 | 2.30 | 2.98 | 2.03 | 1.44 | 1.17 | 2.60 | 0.44 | 0.65 | 0.31 | 0.32 | 0.35 | 0.33 | 0.21 | 0.32 | 0.27 | 0.32 | 0.50 | 0.47 | 0.36 | 0.20 | 0.36 | 0.20 | 0.35 | 0.32 | -0.16 | 0.24 | 0.24 | 0.18 | 0.25 | 0.27 | 0.22 | 0.14 | 0.06 | 0.03 | 0.06 | -0.72 | 0.06 | |
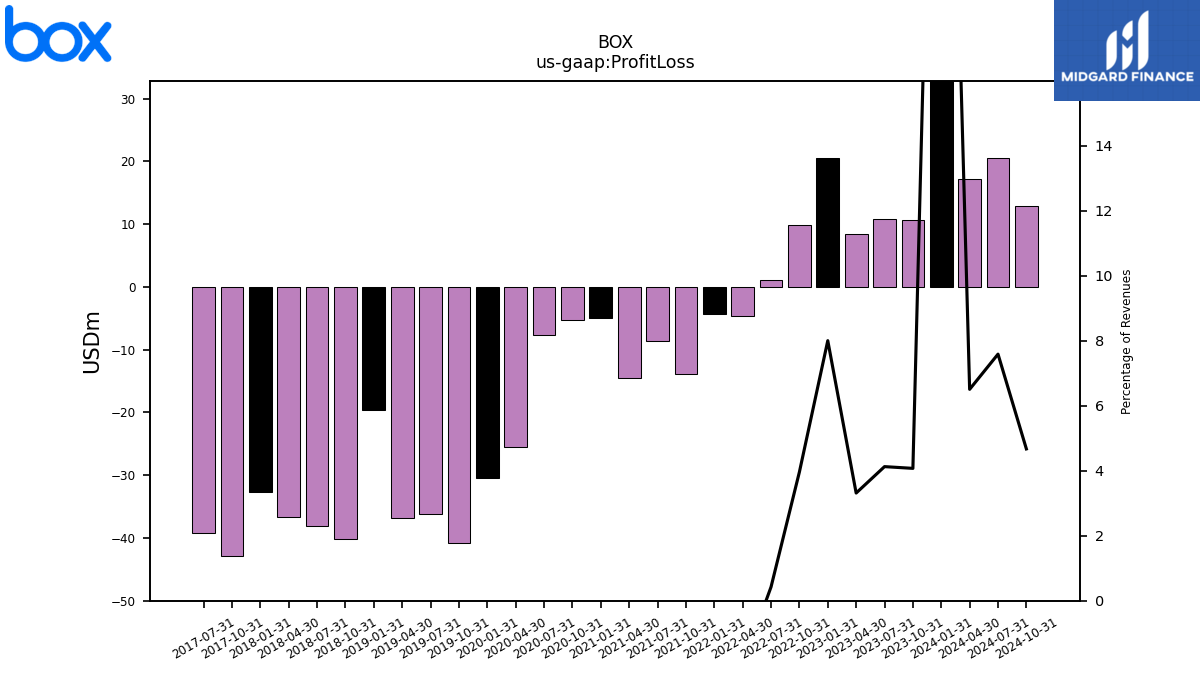
| Profit Loss | 10.66 | 10.79 | 8.35 | 20.53 | 9.91 | 1.04 | -4.70 | -4.33 | -13.86 | -8.70 | -14.57 | -4.94 | -5.28 | -7.66 | -25.55 | -30.39 | -40.90 | -36.23 | -36.83 | -19.69 | -40.20 | -38.09 | -36.64 | -32.66 | -42.92 | -39.28 | NA | NA | NA | NA | NA | NA | NA | NA | NA | NA | NA | NA | NA | |
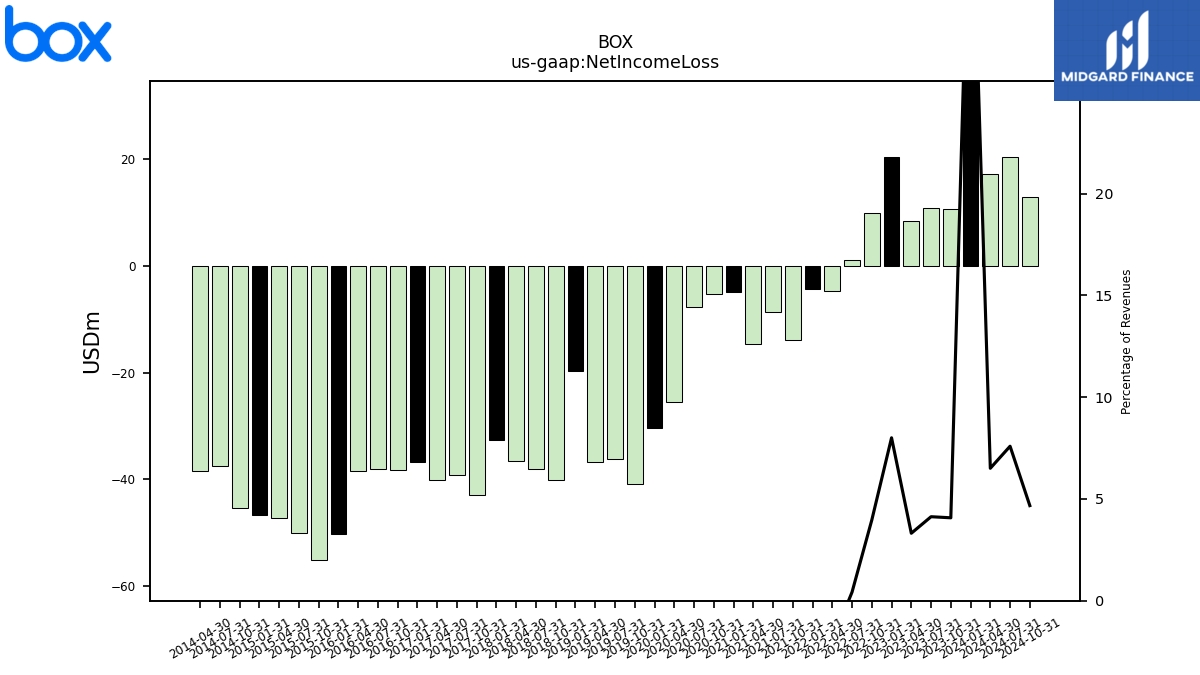
| Net Income Loss | 10.66 | 10.79 | 8.35 | 20.53 | 9.91 | 1.04 | -4.70 | -4.33 | -13.86 | -8.70 | -14.57 | -4.94 | -5.28 | -7.66 | -25.55 | -30.39 | -40.90 | -36.23 | -36.83 | -19.69 | -40.20 | -38.09 | -36.64 | -32.66 | -42.92 | -39.28 | -40.09 | -36.88 | -38.23 | -38.10 | -38.58 | -50.37 | -55.12 | -50.17 | -47.28 | -46.73 | -45.42 | -37.56 | -38.51 | |
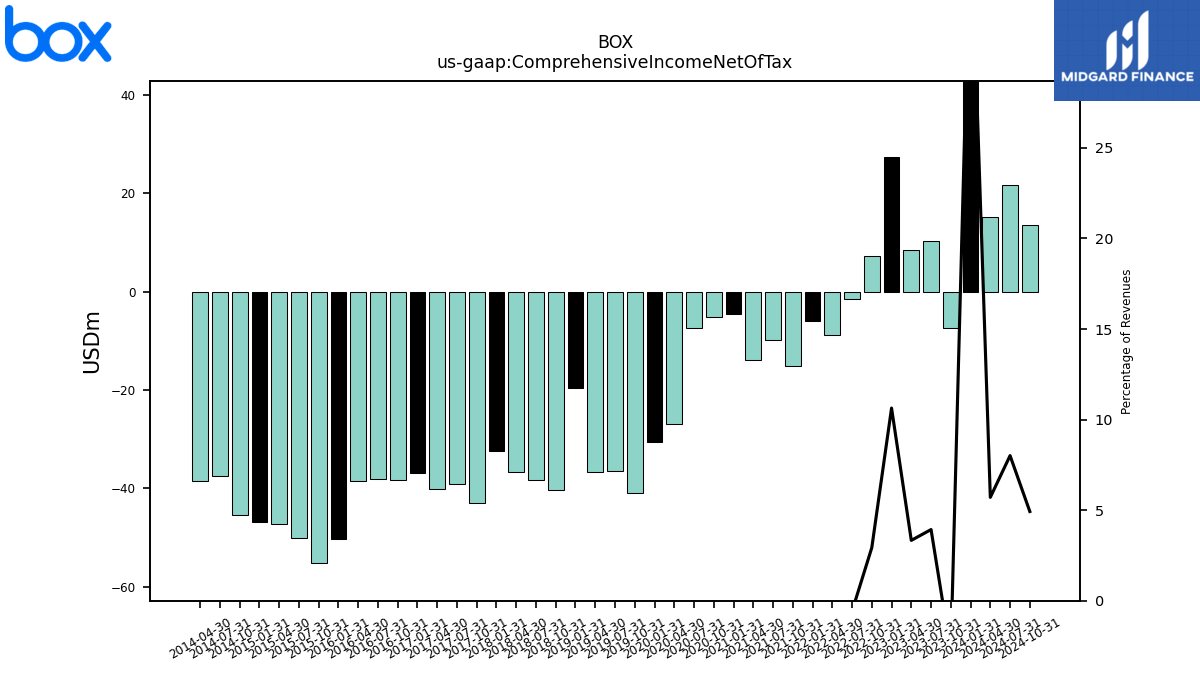
| Comprehensive Income Net Of Tax | -7.45 | 10.28 | 8.40 | 27.28 | 7.32 | -1.42 | -8.93 | -5.95 | -15.16 | -9.94 | -14.01 | -4.58 | -5.21 | -7.39 | -26.88 | -30.59 | -40.95 | -36.40 | -36.74 | -19.58 | -40.28 | -38.25 | -36.76 | -32.35 | -43.01 | -39.14 | -40.06 | -36.97 | -38.24 | -38.15 | -38.46 | -50.38 | -55.10 | -50.20 | -47.29 | -46.78 | -45.44 | -37.57 | -38.51 | |
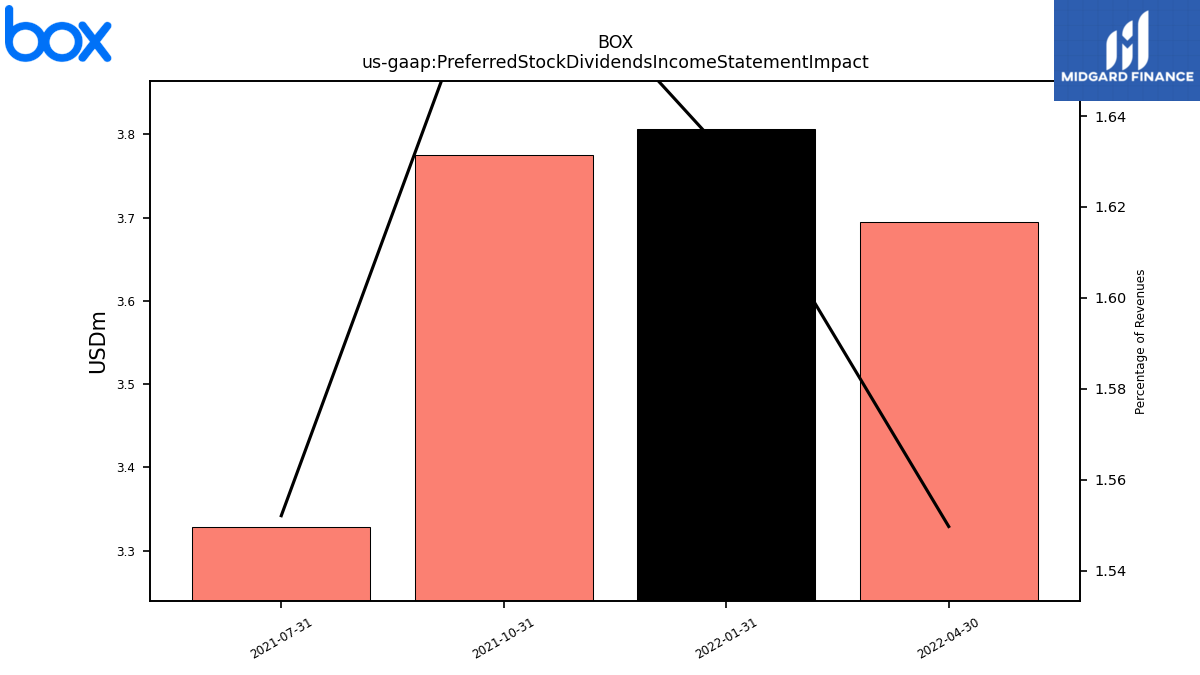
| Preferred Stock Dividends Income Statement Impact | NA | NA | NA | NA | NA | NA | 3.69 | 3.81 | 3.77 | 3.33 | NA | NA | NA | NA | NA | NA | NA | NA | NA | NA | NA | NA | NA | NA | NA | NA | NA | NA | NA | NA | NA | NA | NA | NA | NA | NA | NA | NA | NA | |
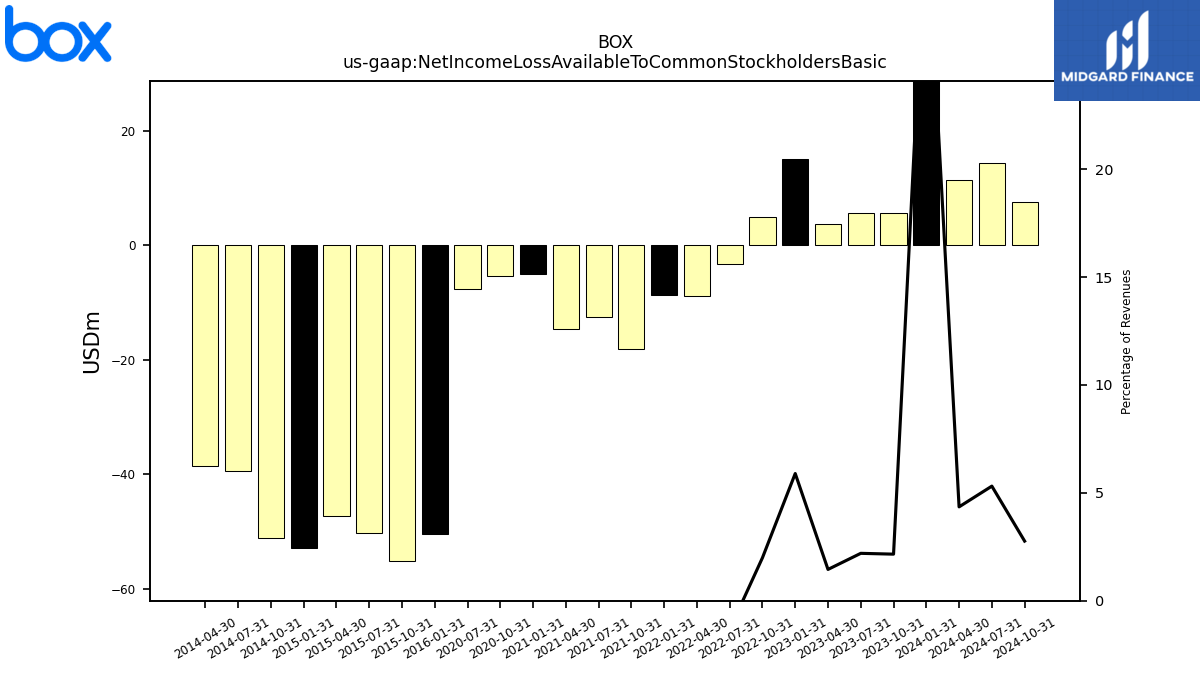
| Net Income Loss Available To Common Stockholders Basic | 5.65 | 5.74 | 3.66 | 15.12 | 4.98 | -3.26 | -8.92 | -8.66 | -18.16 | -12.48 | -14.57 | -4.94 | -5.28 | -7.66 | NA | NA | NA | NA | NA | NA | NA | NA | NA | NA | NA | NA | NA | NA | NA | NA | NA | -50.37 | -55.12 | -50.17 | -47.28 | -52.92 | -51.16 | -39.35 | -38.55 | |
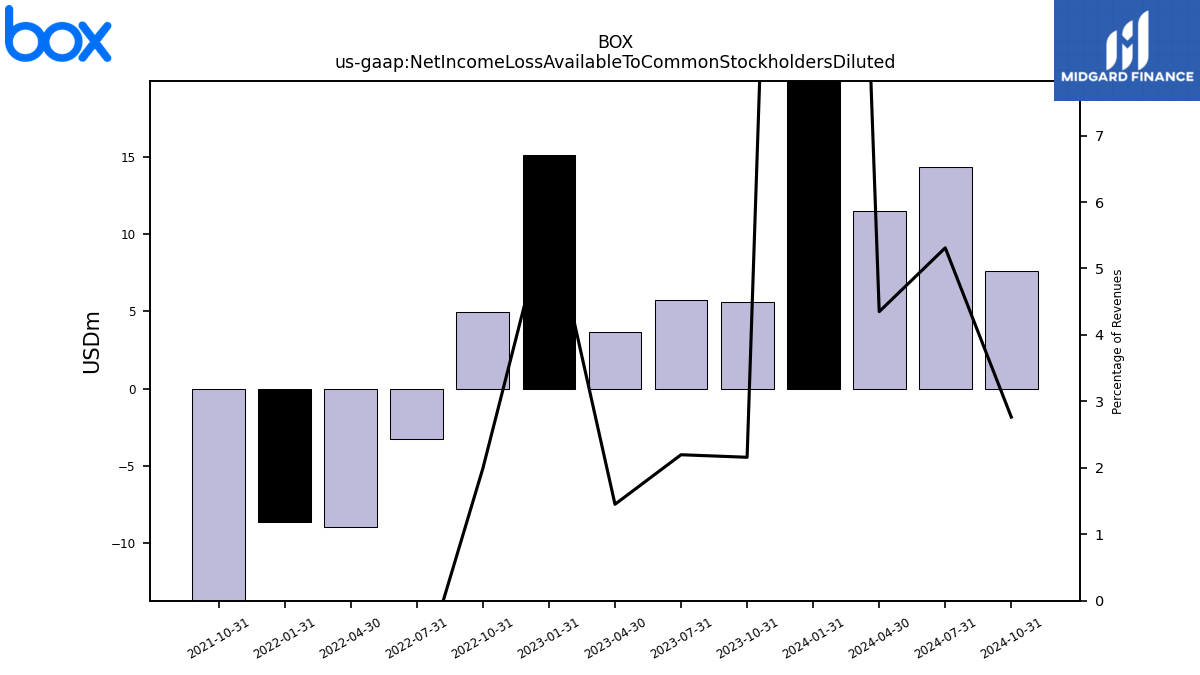
| Net Income Loss Available To Common Stockholders Diluted | 5.65 | 5.74 | 3.66 | NA | 4.98 | -3.26 | -8.92 | NA | -18.16 | NA | NA | NA | NA | NA | NA | NA | NA | NA | NA | NA | NA | NA | NA | NA | NA | NA | NA | NA | NA | NA | NA | NA | NA | NA | NA | NA | NA | NA | NA |
| 2023-10-31 | 2023-07-31 | 2023-04-30 | 2023-01-31 | 2022-10-31 | 2022-07-31 | 2022-04-30 | 2022-01-31 | 2021-10-31 | 2021-07-31 | 2021-04-30 | 2021-01-31 | 2020-10-31 | 2020-07-31 | 2020-04-30 | 2020-01-31 | 2019-10-31 | 2019-07-31 | 2019-04-30 | 2019-01-31 | 2018-10-31 | 2018-07-31 | 2018-04-30 | 2018-01-31 | 2017-10-31 | 2017-07-31 | 2017-04-30 | 2017-01-31 | 2016-10-31 | 2016-07-31 | 2016-04-30 | 2016-01-31 | 2015-10-31 | 2015-07-31 | 2015-04-30 | 2015-01-31 | 2014-10-31 | 2014-07-31 | 2014-04-30 | ||
|---|---|---|---|---|---|---|---|---|---|---|---|---|---|---|---|---|---|---|---|---|---|---|---|---|---|---|---|---|---|---|---|---|---|---|---|---|---|---|---|---|
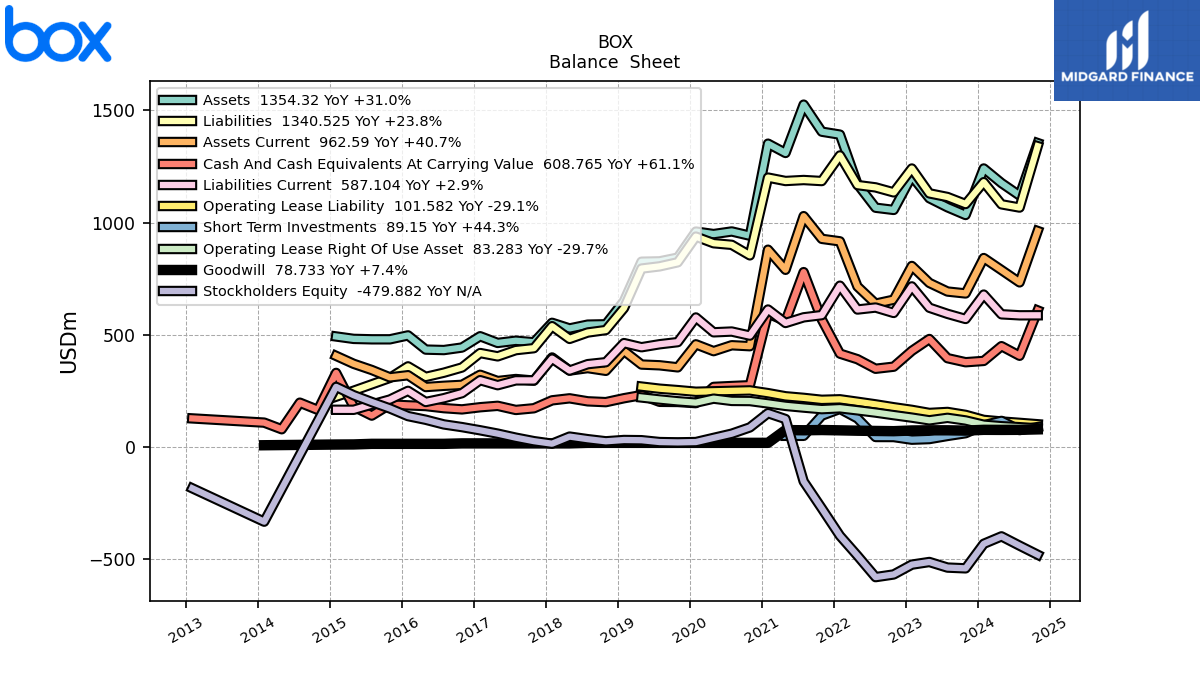
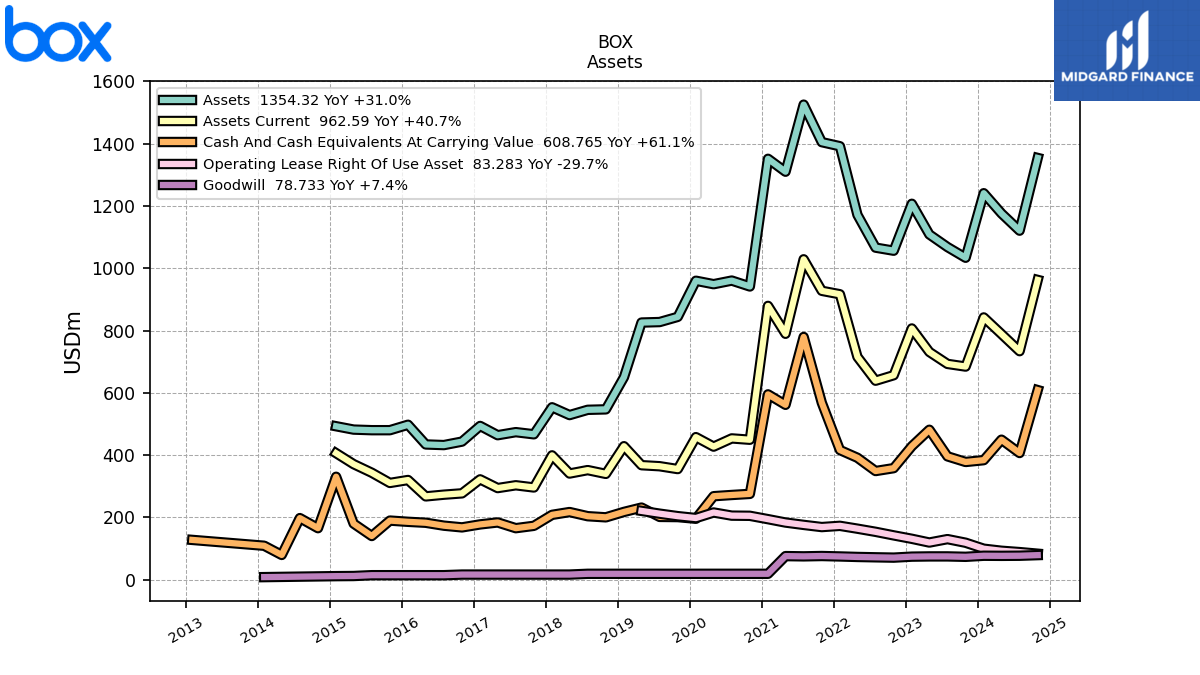
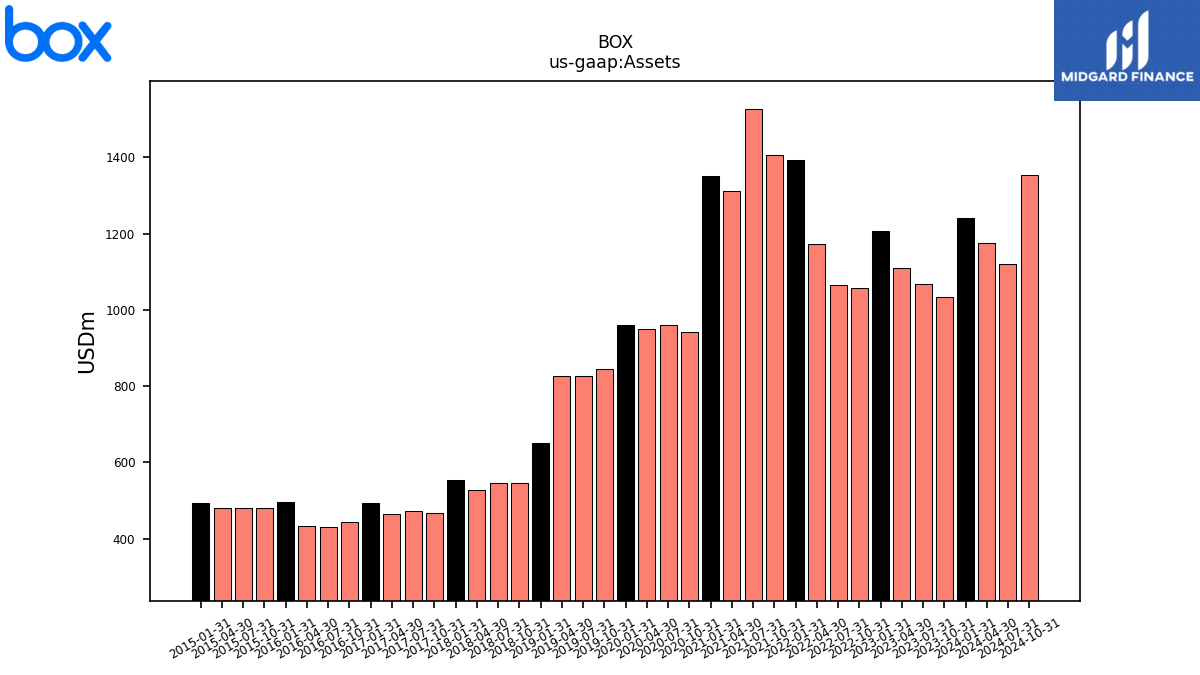
| Assets | 1033.82 | 1068.14 | 1108.67 | 1207.16 | 1056.45 | 1066.31 | 1171.59 | 1392.01 | 1405.08 | 1525.61 | 1310.13 | 1351.68 | 941.56 | 960.51 | 948.91 | 959.99 | 843.92 | 827.32 | 825.72 | 650.16 | 546.89 | 545.42 | 528.48 | 553.57 | 466.77 | 473.71 | 463.88 | 493.67 | 443.37 | 432.15 | 434.19 | 497.49 | 479.99 | 480.00 | 481.91 | 492.67 | NA | NA | NA | |
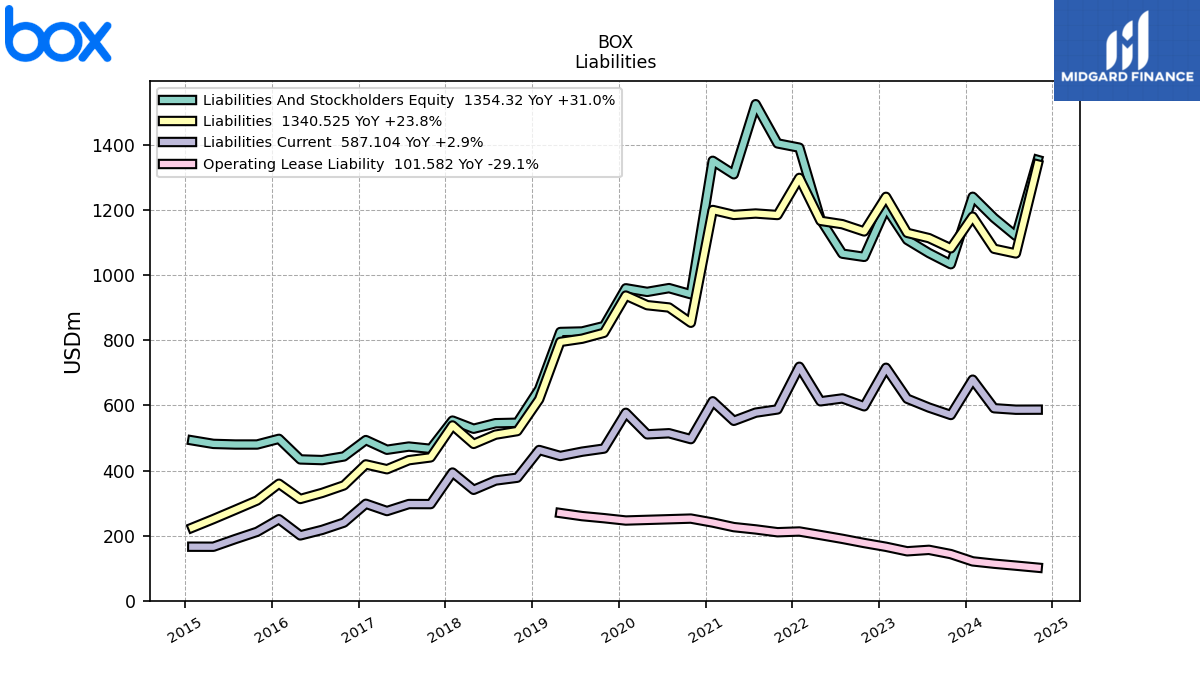
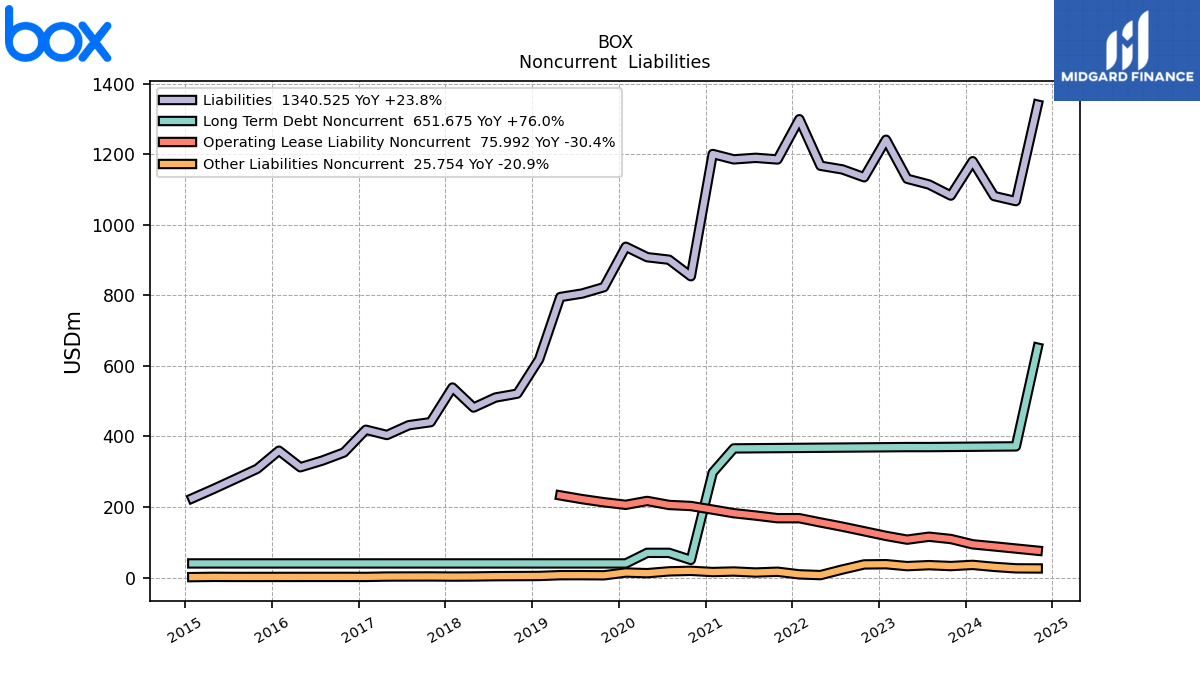
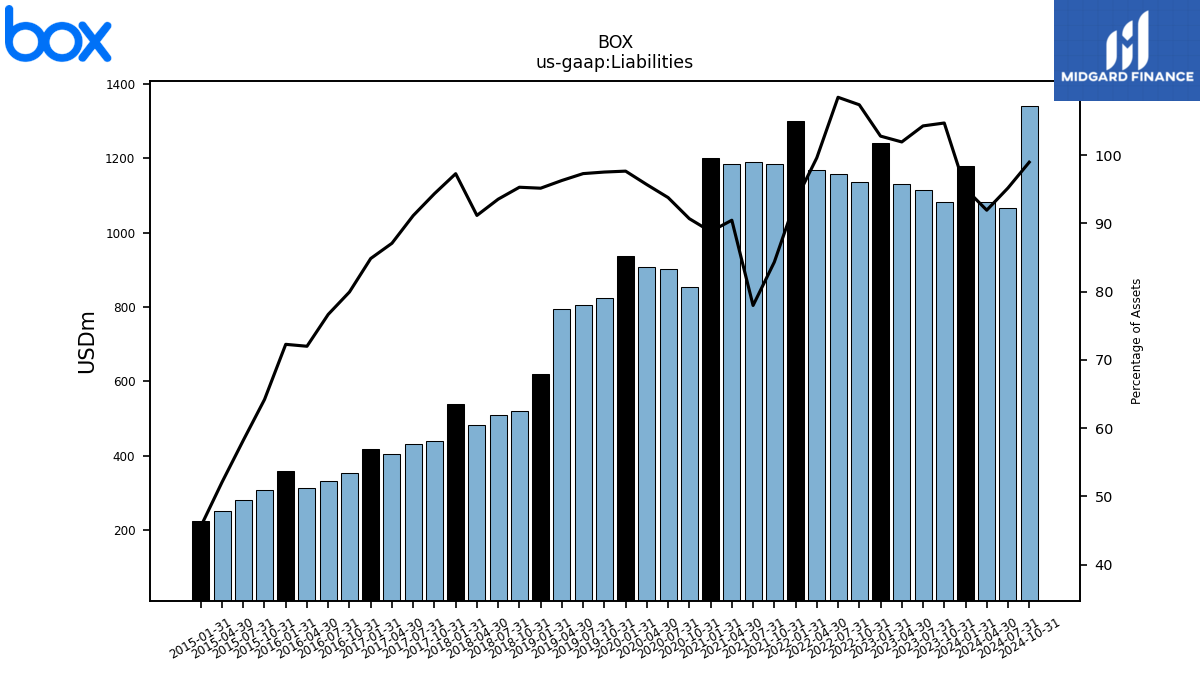
| Liabilities | 1082.69 | 1114.09 | 1130.29 | 1241.03 | 1134.61 | 1156.91 | 1167.20 | 1299.22 | 1185.06 | 1189.70 | 1185.32 | 1200.62 | 854.00 | 900.92 | 908.07 | 937.63 | 823.14 | 805.05 | 795.18 | 618.76 | 521.24 | 510.30 | 481.86 | 538.60 | 440.47 | 431.80 | 404.03 | 418.94 | 354.50 | 331.33 | 312.62 | 359.59 | 308.10 | 279.36 | 250.92 | 224.54 | NA | NA | NA | |
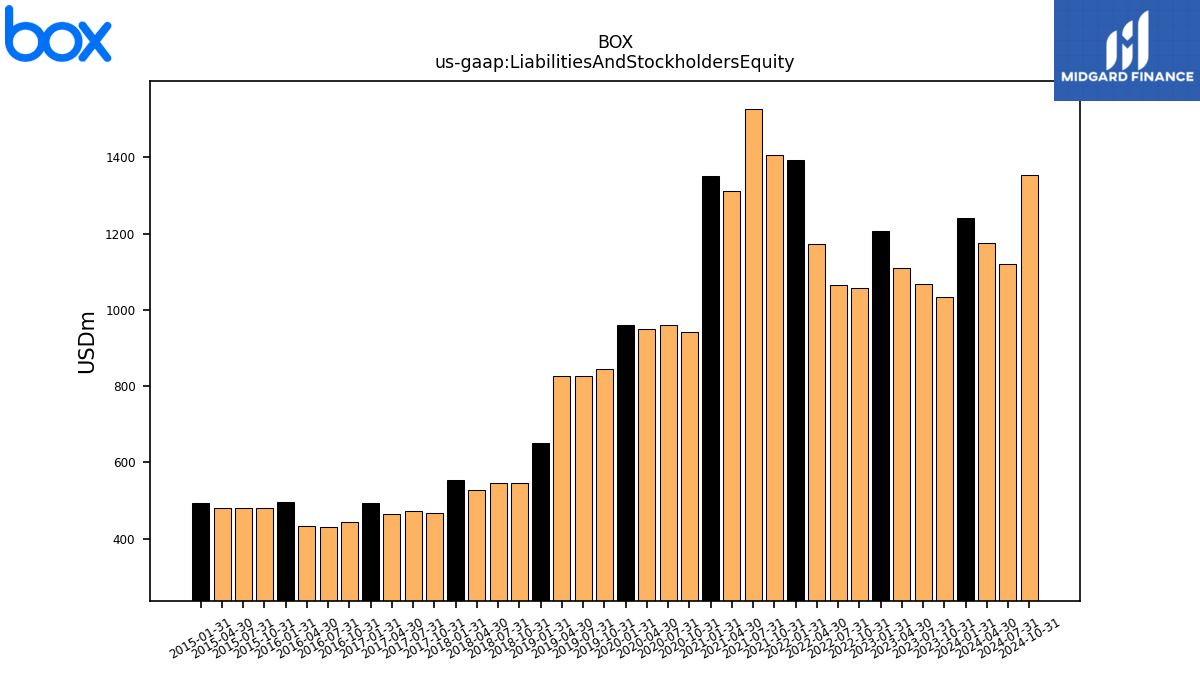
| Liabilities And Stockholders Equity | 1033.82 | 1068.14 | 1108.67 | 1207.16 | 1056.45 | 1066.31 | 1171.59 | 1392.01 | 1405.08 | 1525.61 | 1310.13 | 1351.68 | 941.56 | 960.51 | 948.91 | 959.99 | 843.92 | 827.32 | 825.72 | 650.16 | 546.89 | 545.42 | 528.48 | 553.57 | 466.77 | 473.71 | 463.88 | 493.67 | 443.37 | 432.15 | 434.19 | 497.49 | 479.99 | 480.00 | 481.91 | 492.67 | NA | NA | NA | |
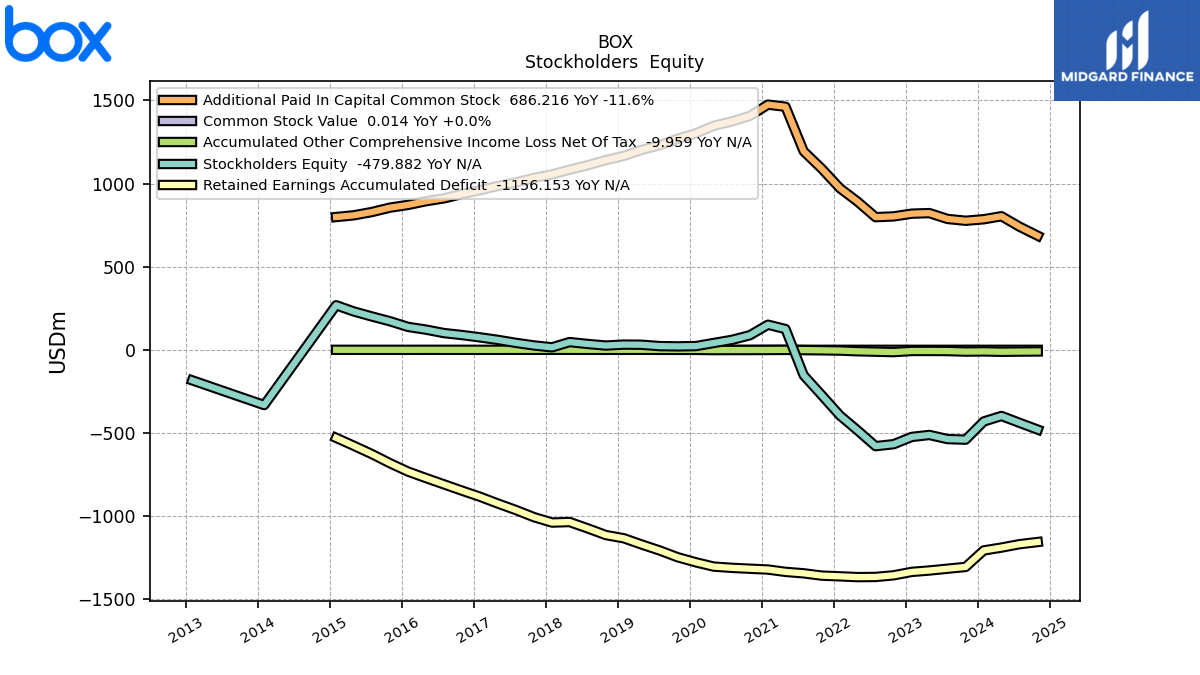
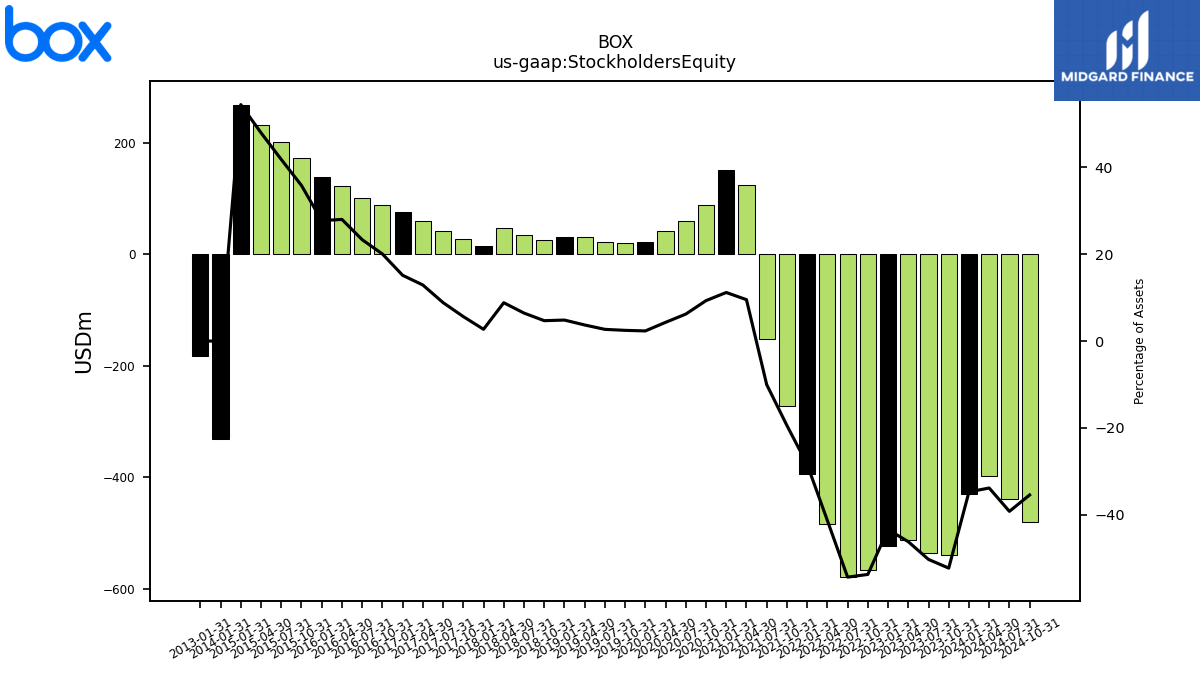
| Stockholders Equity | -540.41 | -536.96 | -512.09 | -523.85 | -567.59 | -579.50 | -483.96 | -395.09 | -273.15 | -152.99 | 124.81 | 151.06 | 87.56 | 59.59 | 40.85 | 22.36 | 20.77 | 22.27 | 30.54 | 31.41 | 25.65 | 35.13 | 46.62 | 14.97 | 26.30 | 41.91 | 59.84 | 74.73 | 88.87 | 100.82 | 121.58 | 137.90 | 171.89 | 200.64 | 230.99 | 268.13 | NA | NA | NA |
| 2023-10-31 | 2023-07-31 | 2023-04-30 | 2023-01-31 | 2022-10-31 | 2022-07-31 | 2022-04-30 | 2022-01-31 | 2021-10-31 | 2021-07-31 | 2021-04-30 | 2021-01-31 | 2020-10-31 | 2020-07-31 | 2020-04-30 | 2020-01-31 | 2019-10-31 | 2019-07-31 | 2019-04-30 | 2019-01-31 | 2018-10-31 | 2018-07-31 | 2018-04-30 | 2018-01-31 | 2017-10-31 | 2017-07-31 | 2017-04-30 | 2017-01-31 | 2016-10-31 | 2016-07-31 | 2016-04-30 | 2016-01-31 | 2015-10-31 | 2015-07-31 | 2015-04-30 | 2015-01-31 | 2014-10-31 | 2014-07-31 | 2014-04-30 | ||
|---|---|---|---|---|---|---|---|---|---|---|---|---|---|---|---|---|---|---|---|---|---|---|---|---|---|---|---|---|---|---|---|---|---|---|---|---|---|---|---|---|
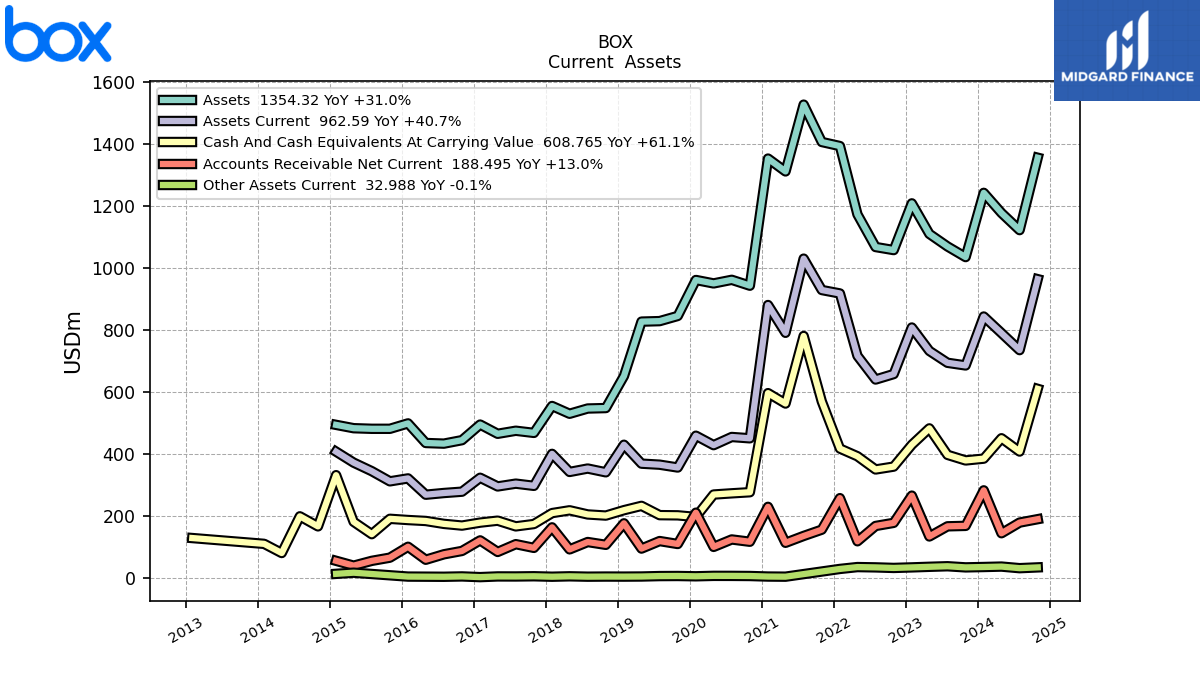
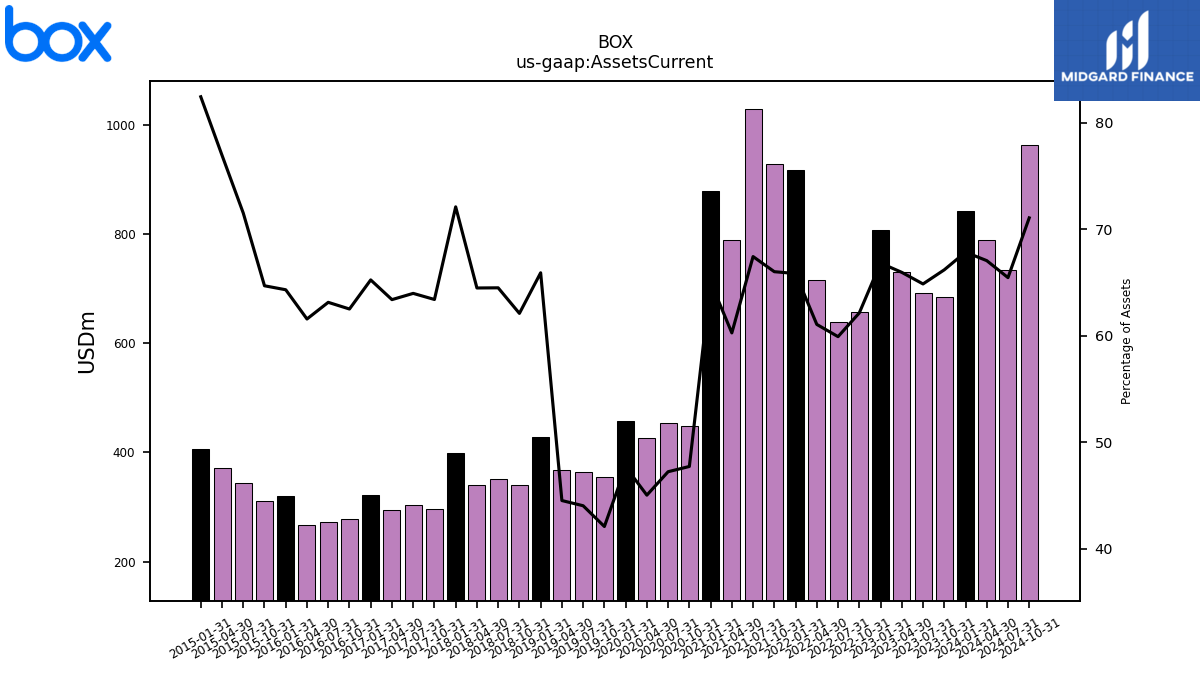
| Assets Current | 684.33 | 692.88 | 731.24 | 806.76 | 656.53 | 638.88 | 715.42 | 916.56 | 927.62 | 1028.86 | 789.60 | 879.29 | 449.29 | 453.58 | 427.23 | 457.73 | 355.09 | 364.24 | 367.57 | 428.55 | 339.63 | 351.82 | 340.81 | 399.19 | 295.97 | 303.08 | 294.07 | 322.10 | 277.16 | 272.86 | 267.35 | 319.99 | 310.53 | 343.35 | 370.88 | 406.23 | NA | NA | NA | |
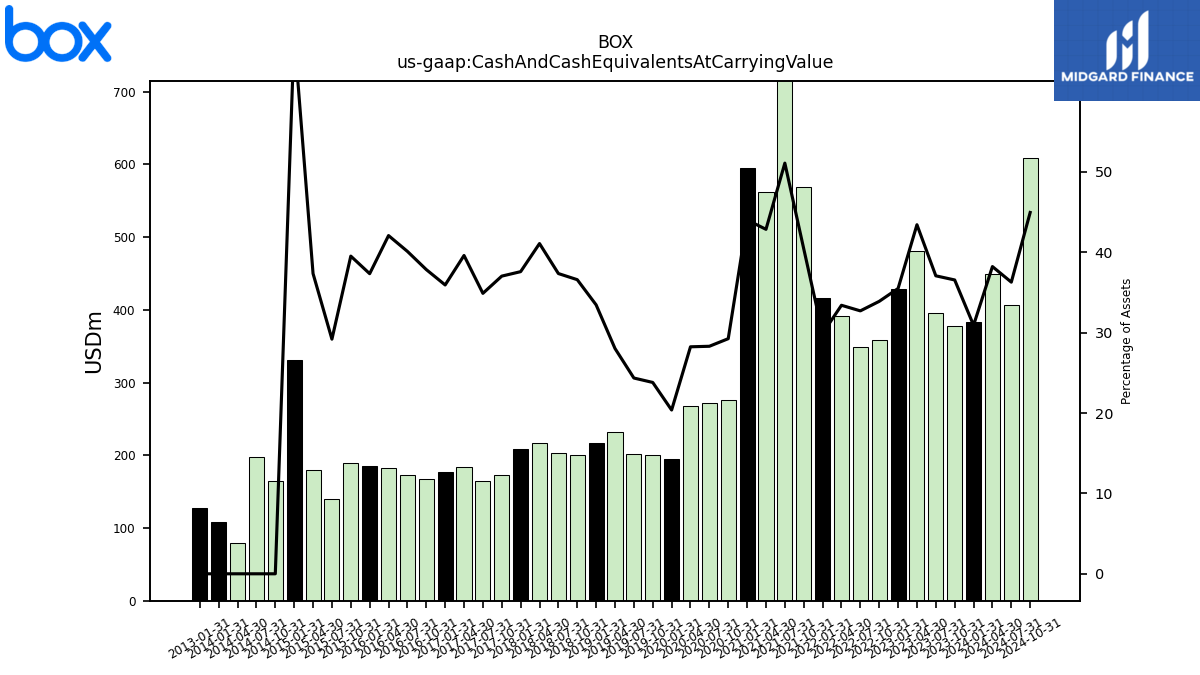
| Cash And Cash Equivalents At Carrying Value | 377.91 | 395.96 | 481.44 | 428.46 | 358.06 | 348.78 | 391.38 | 416.27 | 568.26 | 779.42 | 561.46 | 595.08 | 275.40 | 271.87 | 267.97 | 195.59 | 200.89 | 201.49 | 231.44 | 217.52 | 200.10 | 203.73 | 217.12 | 208.08 | 172.86 | 165.28 | 183.69 | 177.39 | 167.80 | 173.33 | 182.69 | 185.74 | 189.69 | 140.12 | 179.99 | 330.44 | 165.27 | 197.72 | 79.27 | |
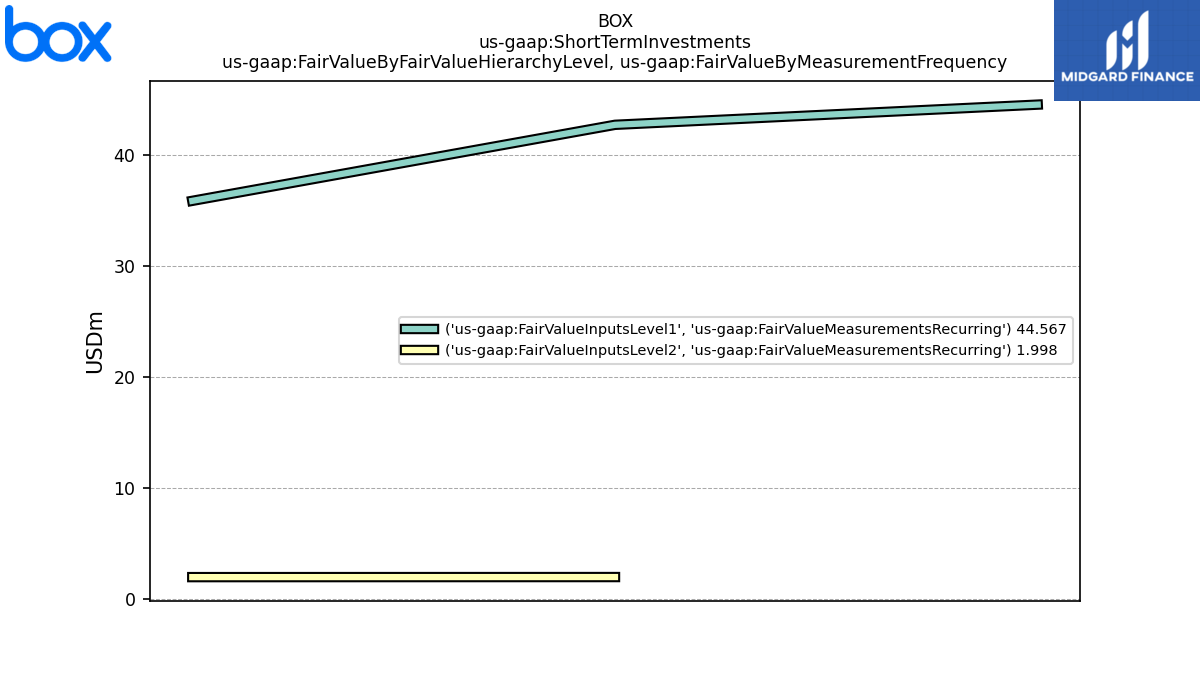
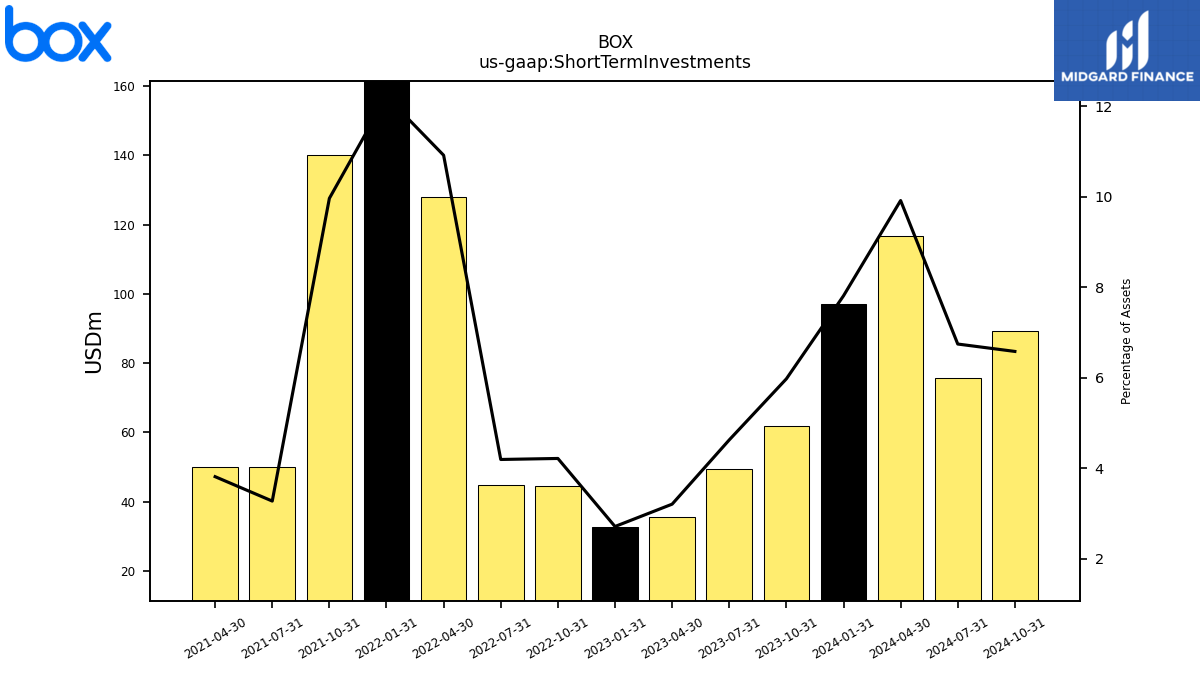
| Short Term Investments | 61.80 | 49.44 | 35.58 | 32.78 | 44.57 | 44.74 | 127.89 | 170.00 | 140.00 | 50.00 | 50.00 | NA | NA | NA | NA | NA | NA | NA | NA | NA | NA | NA | NA | NA | NA | NA | NA | NA | NA | NA | NA | NA | NA | NA | NA | NA | NA | NA | NA | |
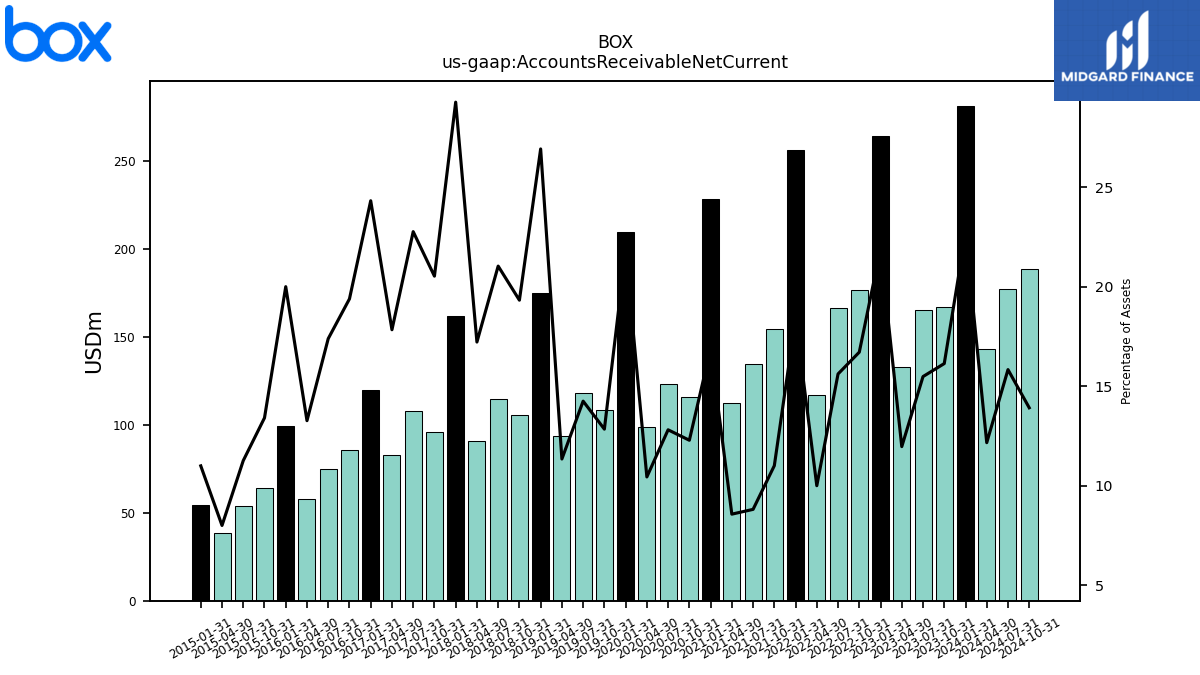
| Accounts Receivable Net Current | 166.88 | 165.43 | 132.65 | 264.51 | 176.59 | 166.55 | 117.15 | 256.31 | 154.62 | 134.39 | 112.25 | 228.31 | 115.66 | 123.04 | 99.07 | 209.43 | 108.39 | 117.90 | 93.66 | 175.13 | 105.71 | 114.78 | 91.03 | 162.13 | 95.87 | 107.89 | 82.77 | 120.11 | 86.00 | 75.17 | 57.62 | 99.54 | 64.37 | 54.05 | 38.55 | 54.17 | NA | NA | NA | |
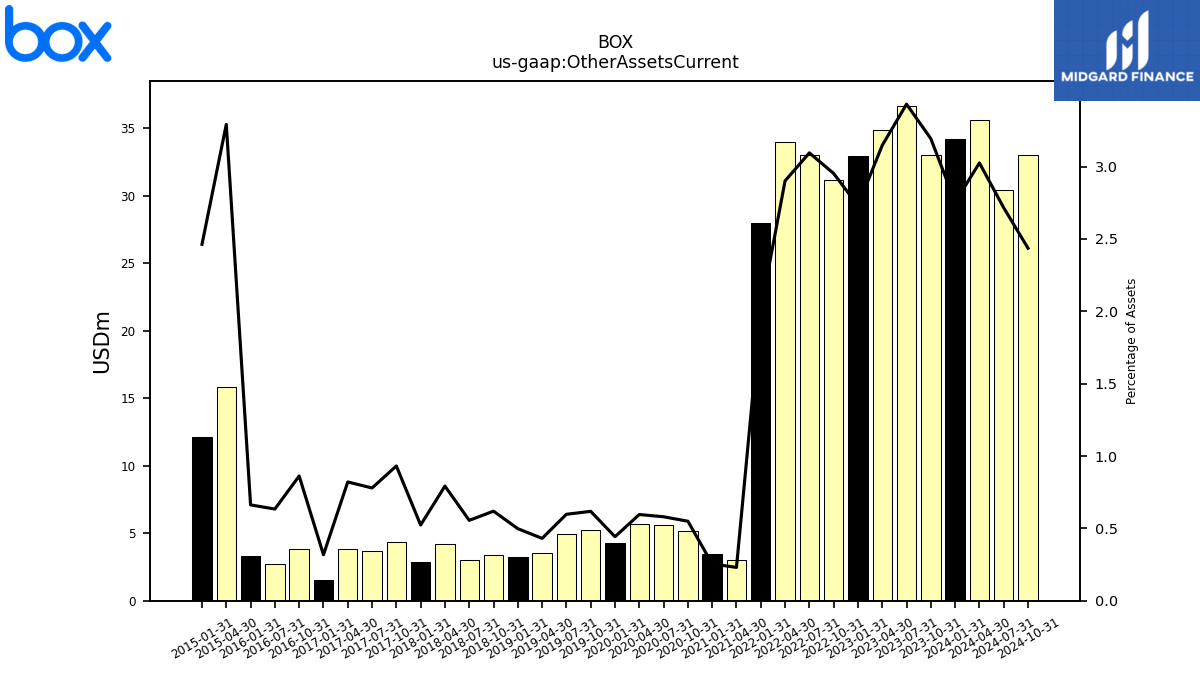
| Other Assets Current | 33.01 | 36.65 | 34.88 | 32.96 | 31.19 | 33.00 | 33.99 | 27.95 | NA | NA | 3.02 | 3.44 | 5.17 | 5.57 | 5.65 | 4.25 | 5.21 | 4.94 | 3.56 | 3.24 | 3.38 | 3.03 | 4.19 | 2.90 | 4.35 | 3.69 | 3.81 | 1.57 | 3.82 | 2.74 | NA | 3.29 | NA | NA | 15.86 | 12.13 | NA | NA | NA |
| 2023-10-31 | 2023-07-31 | 2023-04-30 | 2023-01-31 | 2022-10-31 | 2022-07-31 | 2022-04-30 | 2022-01-31 | 2021-10-31 | 2021-07-31 | 2021-04-30 | 2021-01-31 | 2020-10-31 | 2020-07-31 | 2020-04-30 | 2020-01-31 | 2019-10-31 | 2019-07-31 | 2019-04-30 | 2019-01-31 | 2018-10-31 | 2018-07-31 | 2018-04-30 | 2018-01-31 | 2017-10-31 | 2017-07-31 | 2017-04-30 | 2017-01-31 | 2016-10-31 | 2016-07-31 | 2016-04-30 | 2016-01-31 | 2015-10-31 | 2015-07-31 | 2015-04-30 | 2015-01-31 | 2014-10-31 | 2014-07-31 | 2014-04-30 | ||
|---|---|---|---|---|---|---|---|---|---|---|---|---|---|---|---|---|---|---|---|---|---|---|---|---|---|---|---|---|---|---|---|---|---|---|---|---|---|---|---|---|
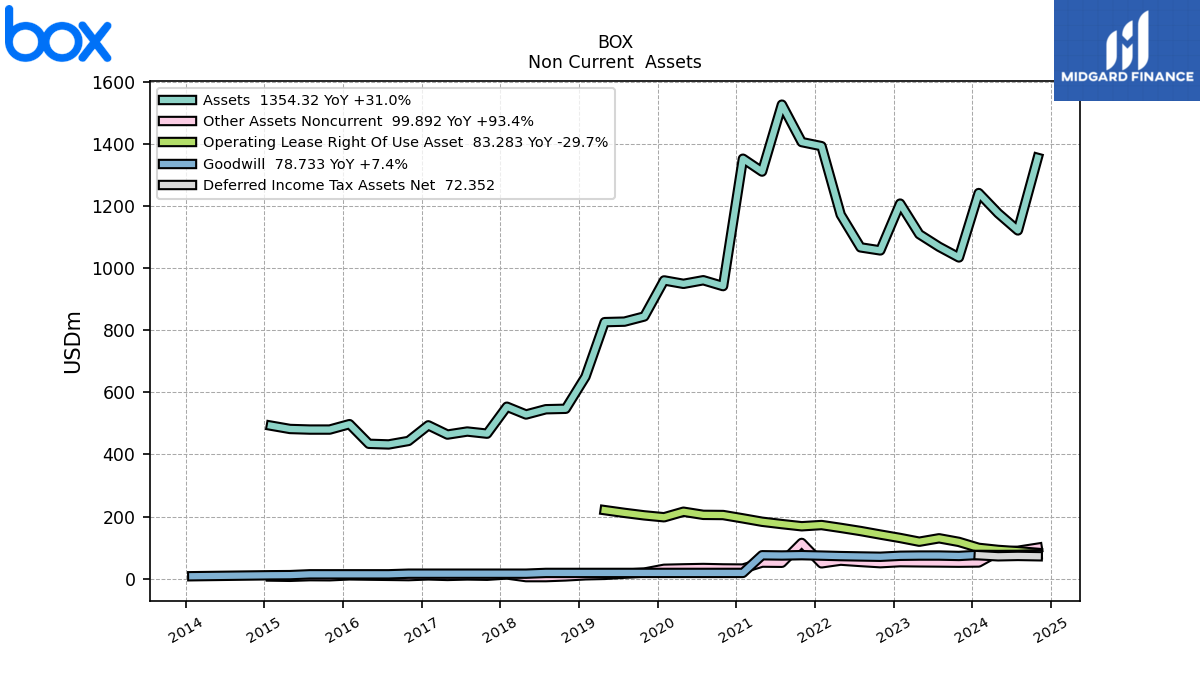
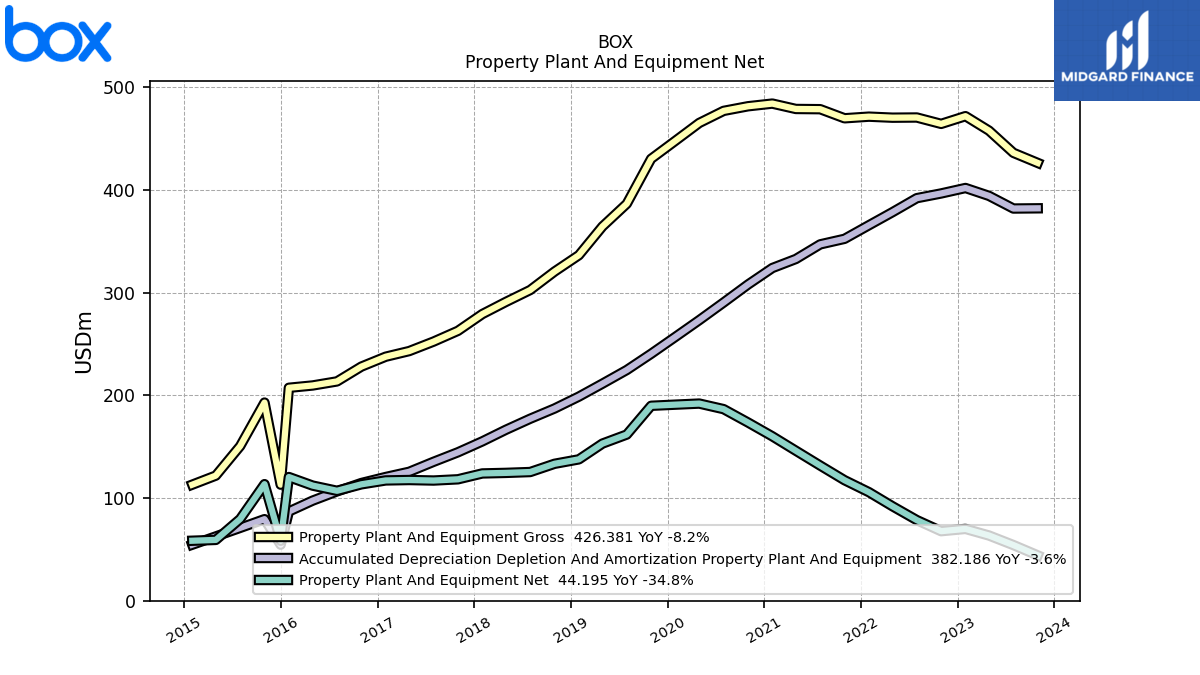
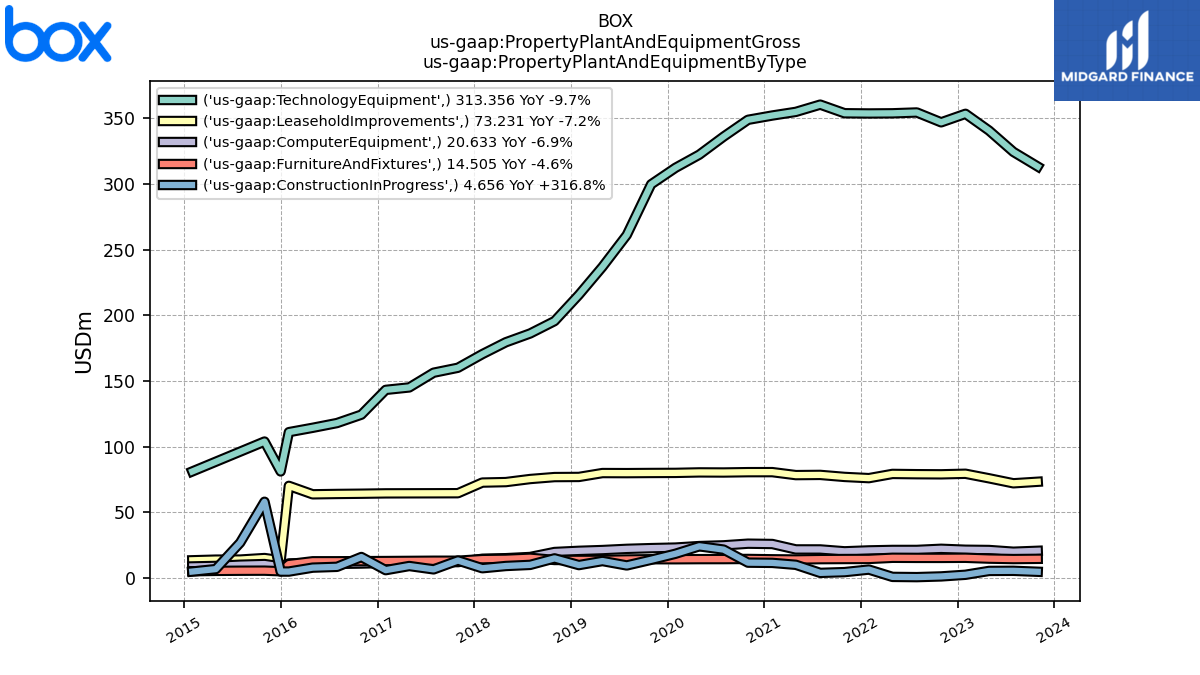
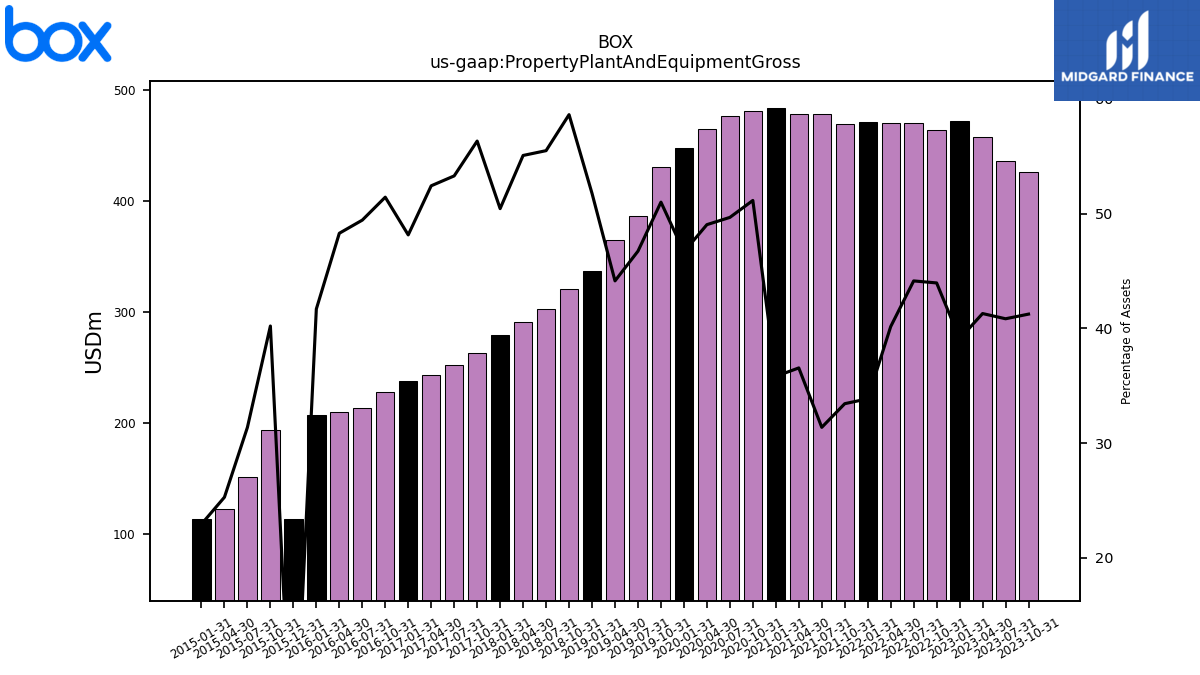
| Property Plant And Equipment Gross | 426.38 | 436.22 | 457.80 | 471.94 | 464.41 | 470.62 | 470.45 | 471.45 | 469.86 | 478.72 | 478.93 | 484.17 | 481.56 | 477.07 | 465.32 | 448.00 | 430.38 | 386.59 | 364.46 | 336.53 | 320.59 | 302.62 | 291.00 | 279.18 | 262.88 | 252.41 | 243.17 | 237.68 | 228.03 | 213.62 | 209.65 | 207.40 | 192.99 | 150.61 | 121.89 | 113.05 | NA | NA | NA | |
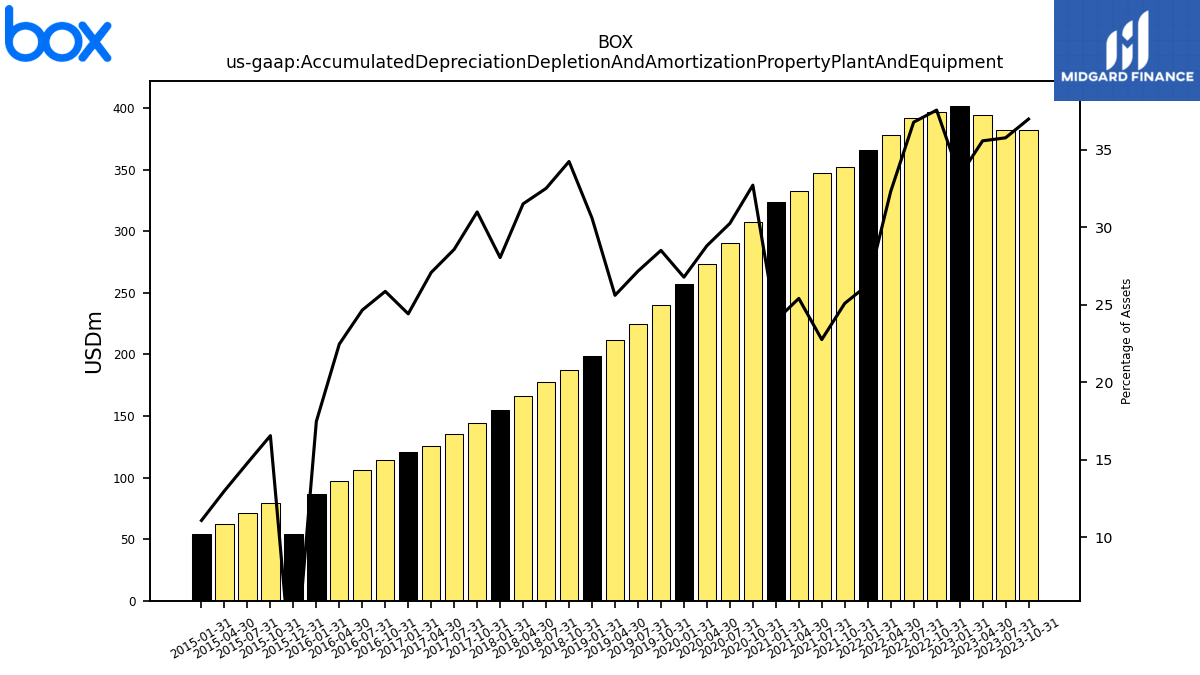
| Accumulated Depreciation Depletion And Amortization Property Plant And Equipment | 382.19 | 381.97 | 394.28 | 401.96 | 396.66 | 392.06 | 378.40 | 365.69 | 352.46 | 347.08 | 332.83 | 324.02 | 307.94 | 290.46 | 273.29 | 257.02 | 240.51 | 224.72 | 211.41 | 198.82 | 187.21 | 177.26 | 166.49 | 155.20 | 144.60 | 135.33 | 125.60 | 120.50 | 114.65 | 106.53 | 97.51 | 86.91 | 79.45 | 70.98 | 62.63 | 54.61 | NA | NA | NA | |
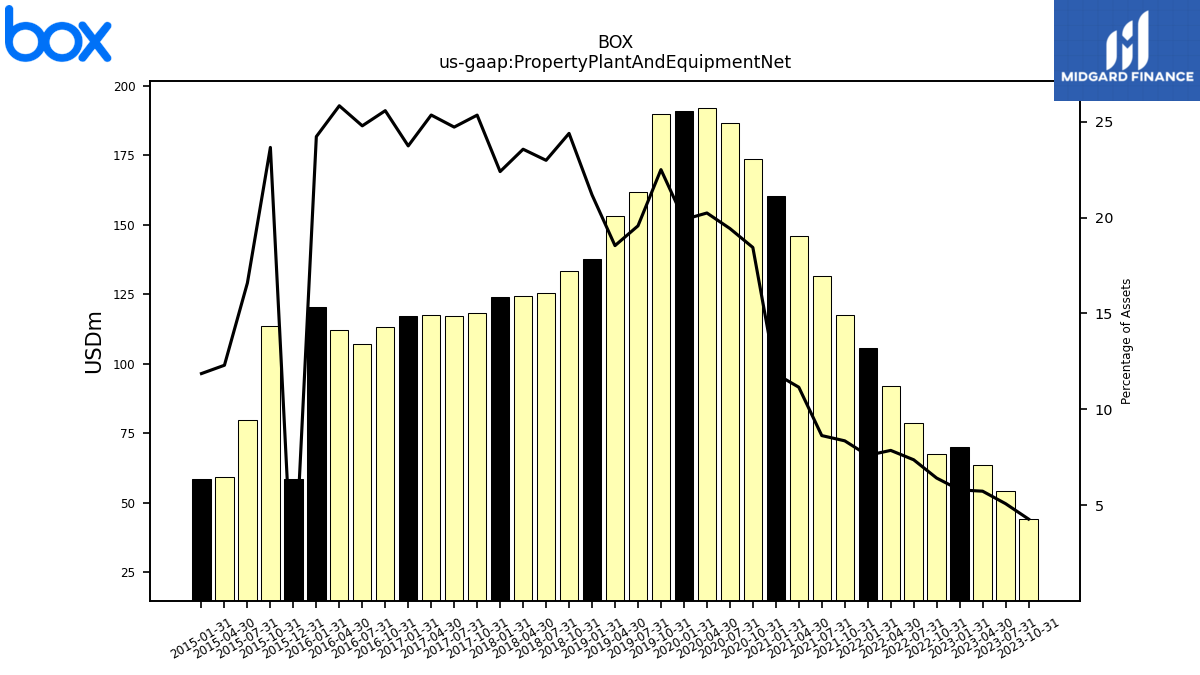
| Property Plant And Equipment Net | 44.20 | 54.25 | 63.52 | 69.97 | 67.75 | 78.56 | 92.04 | 105.75 | 117.40 | 131.64 | 146.10 | 160.15 | 173.62 | 186.61 | 192.03 | 190.98 | 189.87 | 161.87 | 153.05 | 137.70 | 133.37 | 125.36 | 124.52 | 123.98 | 118.28 | 117.08 | 117.57 | 117.18 | 113.38 | 107.09 | 112.14 | 120.49 | 113.54 | 79.63 | 59.26 | 58.45 | NA | NA | NA | |
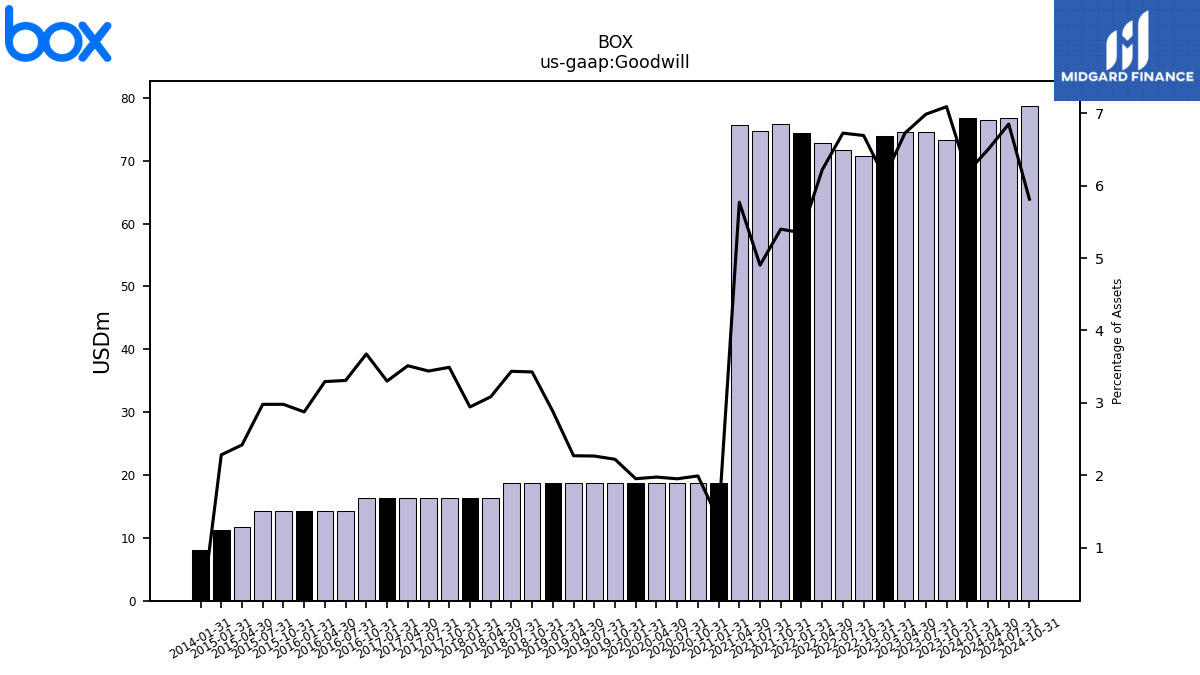
| Goodwill | 73.31 | 74.62 | 74.59 | 73.86 | 70.70 | 71.71 | 72.86 | 74.47 | 75.86 | 74.78 | 75.60 | 18.74 | 18.74 | 18.74 | 18.74 | 18.74 | 18.74 | 18.74 | 18.74 | 18.74 | 18.74 | 18.74 | 16.29 | 16.29 | 16.29 | 16.29 | 16.29 | 16.29 | 16.29 | 14.30 | 14.30 | 14.30 | 14.30 | 14.30 | 11.66 | 11.24 | NA | NA | NA | |
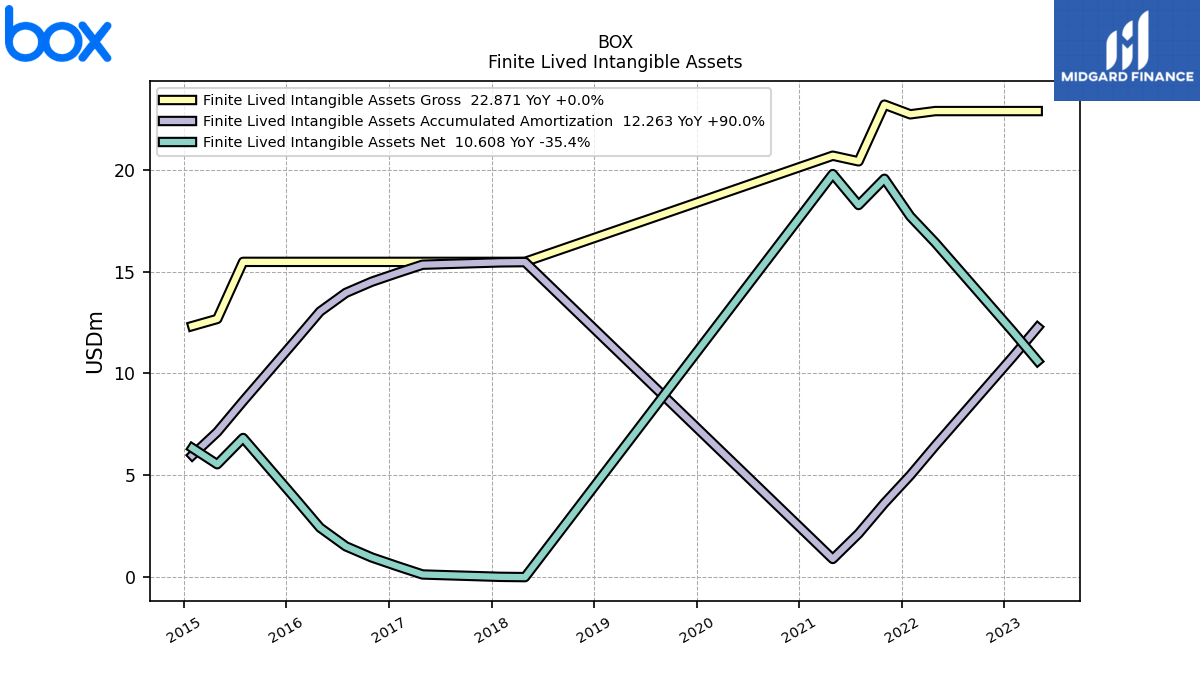
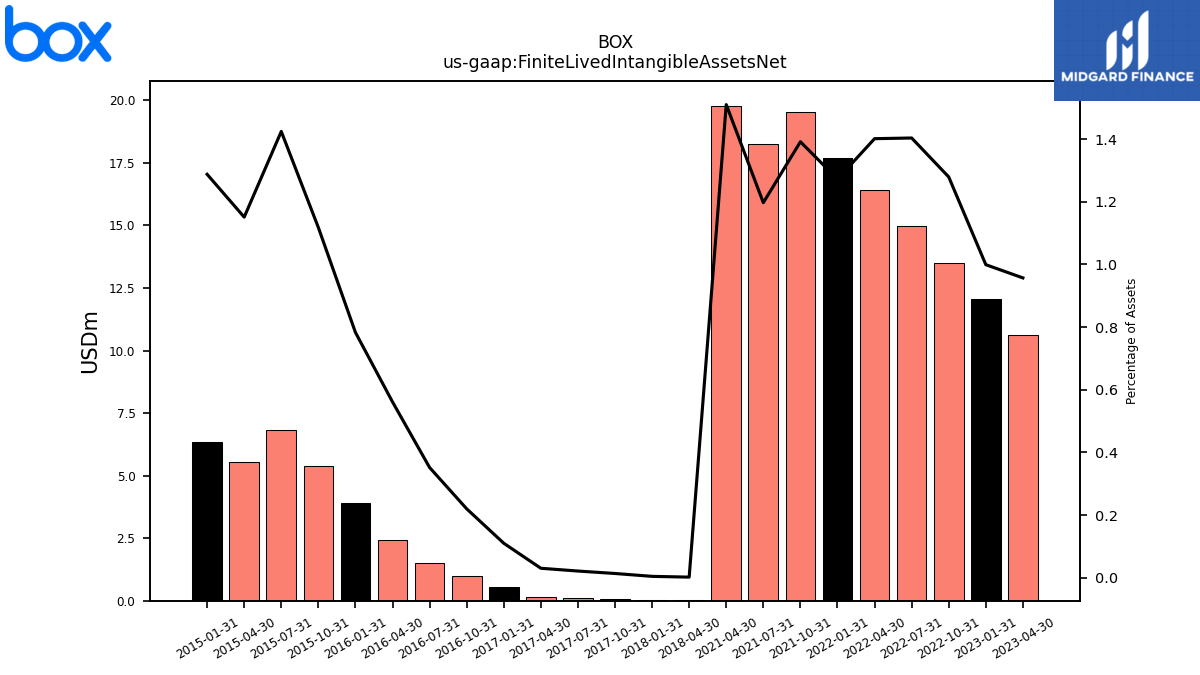
| Finite Lived Intangible Assets Net | NA | NA | 10.61 | 12.06 | 13.51 | 14.96 | 16.42 | 17.71 | 19.55 | 18.26 | 19.78 | NA | NA | NA | NA | NA | NA | NA | NA | NA | NA | NA | 0.01 | 0.02 | 0.06 | 0.10 | 0.14 | 0.54 | 0.97 | 1.52 | 2.44 | 3.90 | 5.37 | 6.84 | 5.55 | 6.34 | NA | NA | NA | |
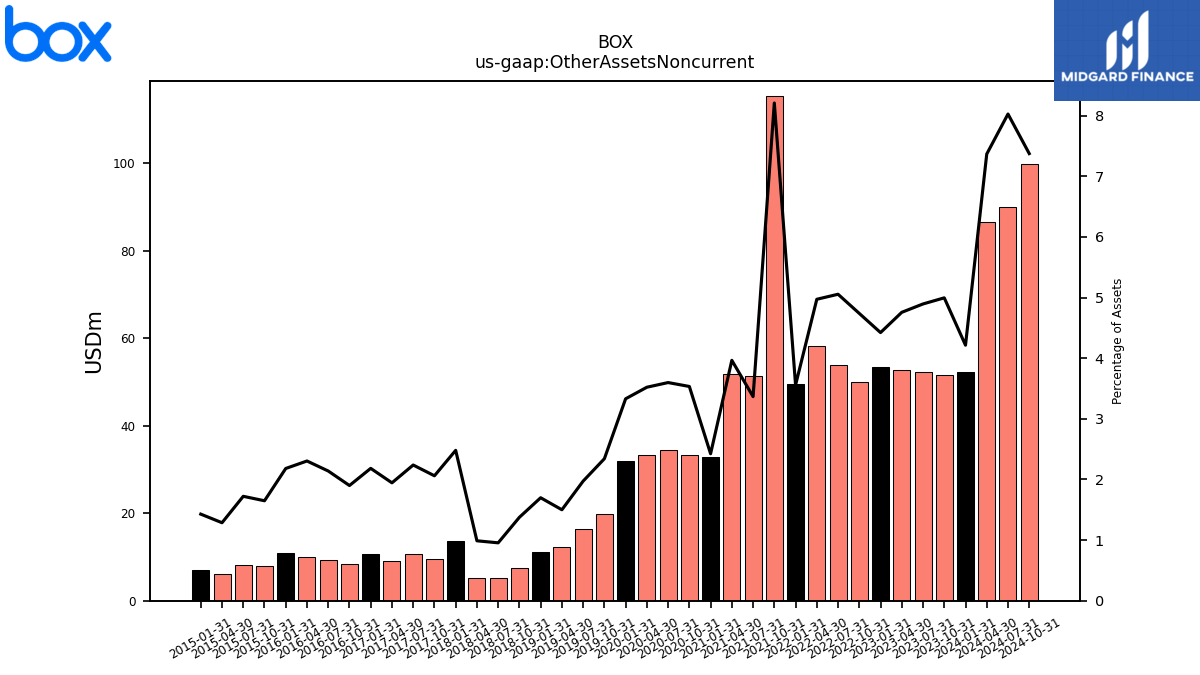
| Other Assets Noncurrent | 51.65 | 52.29 | 52.75 | 53.40 | 50.07 | 53.91 | 58.26 | 49.53 | 115.36 | 51.37 | 51.95 | 32.77 | 33.28 | 34.57 | 33.42 | 31.98 | 19.77 | 16.32 | 12.39 | 11.05 | 7.53 | 5.21 | 5.23 | 13.73 | 9.62 | 10.61 | 9.02 | 10.78 | 8.43 | 9.25 | 10.01 | 10.85 | 7.92 | 8.27 | 6.20 | 7.04 | NA | NA | NA |
| 2023-10-31 | 2023-07-31 | 2023-04-30 | 2023-01-31 | 2022-10-31 | 2022-07-31 | 2022-04-30 | 2022-01-31 | 2021-10-31 | 2021-07-31 | 2021-04-30 | 2021-01-31 | 2020-10-31 | 2020-07-31 | 2020-04-30 | 2020-01-31 | 2019-10-31 | 2019-07-31 | 2019-04-30 | 2019-01-31 | 2018-10-31 | 2018-07-31 | 2018-04-30 | 2018-01-31 | 2017-10-31 | 2017-07-31 | 2017-04-30 | 2017-01-31 | 2016-10-31 | 2016-07-31 | 2016-04-30 | 2016-01-31 | 2015-10-31 | 2015-07-31 | 2015-04-30 | 2015-01-31 | 2014-10-31 | 2014-07-31 | 2014-04-30 | ||
|---|---|---|---|---|---|---|---|---|---|---|---|---|---|---|---|---|---|---|---|---|---|---|---|---|---|---|---|---|---|---|---|---|---|---|---|---|---|---|---|---|
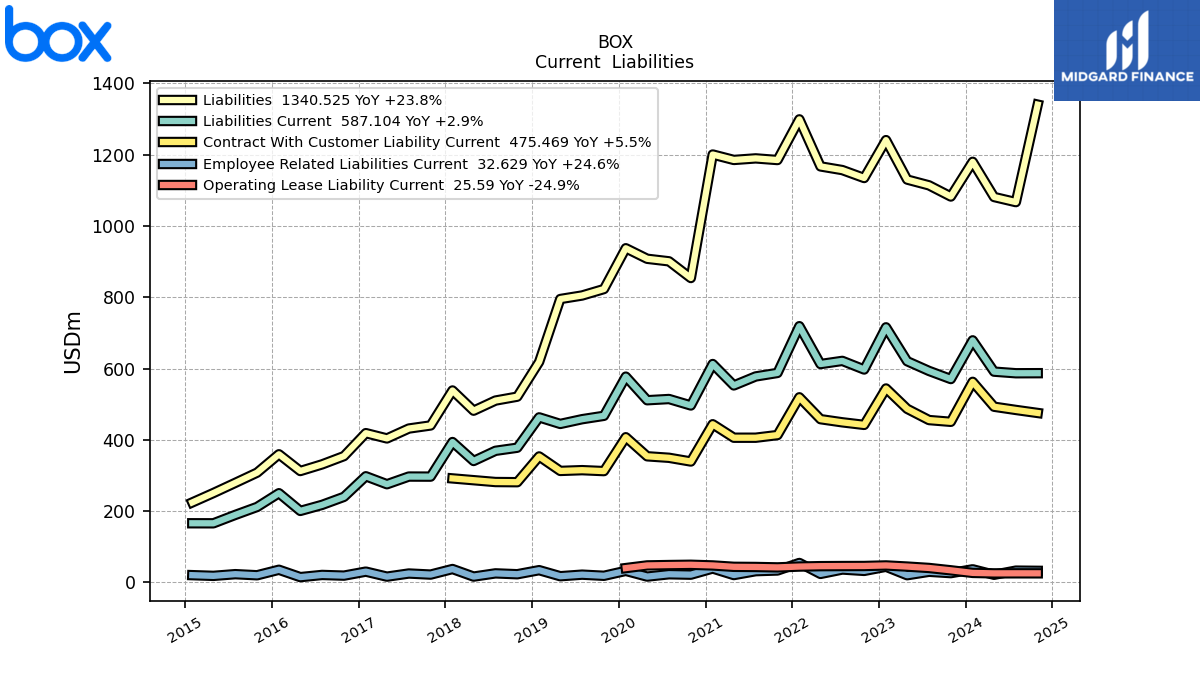
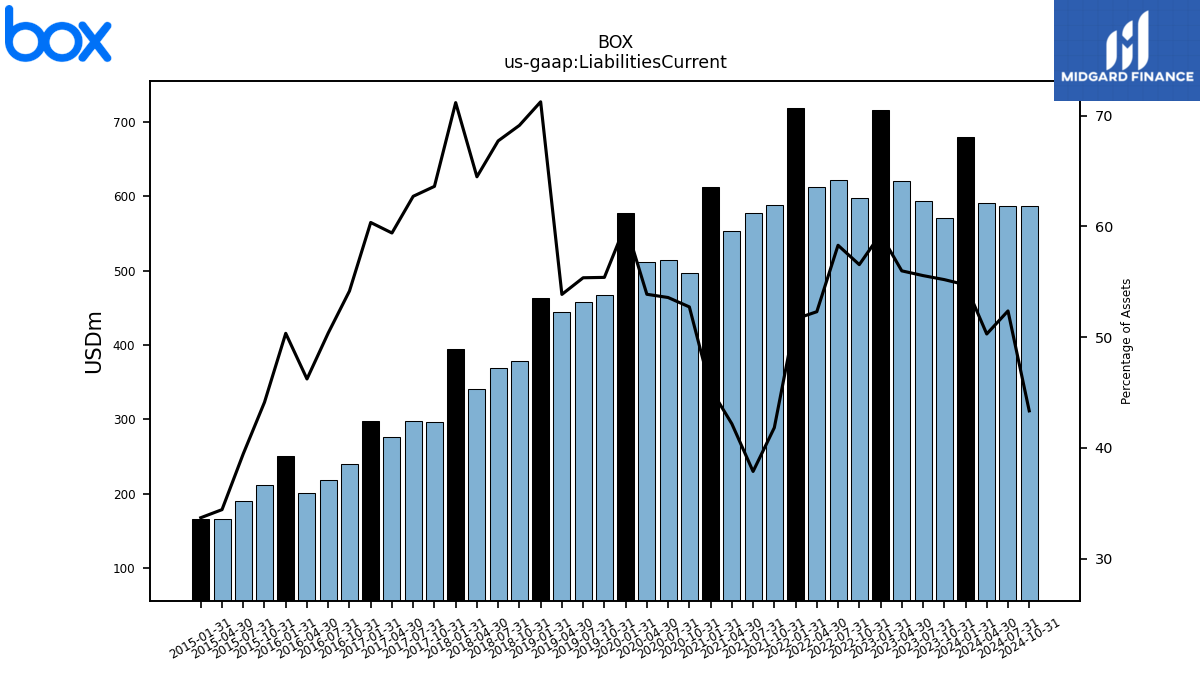
| Liabilities Current | 570.63 | 593.45 | 620.70 | 715.83 | 597.40 | 621.60 | 612.71 | 718.98 | 587.79 | 577.93 | 552.71 | 612.84 | 496.51 | 514.64 | 511.20 | 577.43 | 467.51 | 458.02 | 444.73 | 463.20 | 377.99 | 369.34 | 340.75 | 393.97 | 296.92 | 297.09 | 275.55 | 297.94 | 240.16 | 217.70 | 200.72 | 250.47 | 211.81 | 189.47 | 165.95 | 166.05 | NA | NA | NA | |
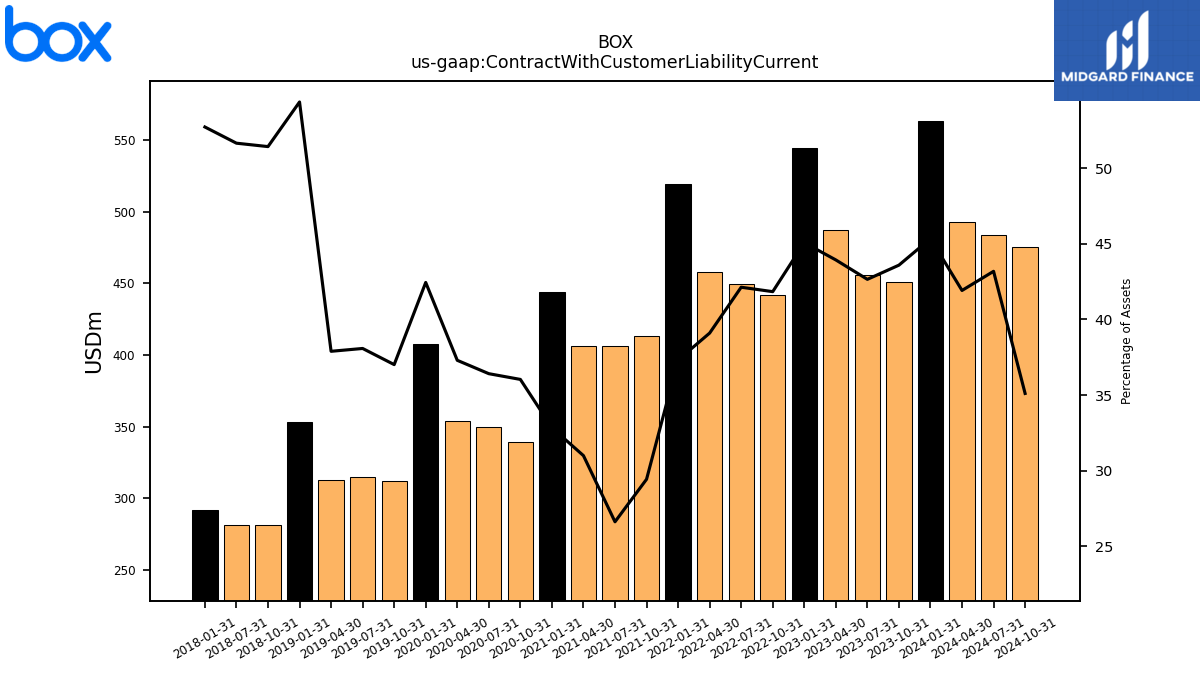
| Contract With Customer Liability Current | 450.67 | 455.61 | 487.12 | 544.18 | 442.01 | 449.27 | 458.08 | 519.49 | 413.51 | 406.07 | 406.05 | 443.93 | 339.29 | 349.76 | 353.93 | 407.49 | 312.38 | 315.06 | 312.90 | 353.59 | 281.29 | 281.76 | NA | 291.90 | NA | NA | NA | NA | NA | NA | NA | NA | NA | NA | NA | NA | NA | NA | NA |
| 2023-10-31 | 2023-07-31 | 2023-04-30 | 2023-01-31 | 2022-10-31 | 2022-07-31 | 2022-04-30 | 2022-01-31 | 2021-10-31 | 2021-07-31 | 2021-04-30 | 2021-01-31 | 2020-10-31 | 2020-07-31 | 2020-04-30 | 2020-01-31 | 2019-10-31 | 2019-07-31 | 2019-04-30 | 2019-01-31 | 2018-10-31 | 2018-07-31 | 2018-04-30 | 2018-01-31 | 2017-10-31 | 2017-07-31 | 2017-04-30 | 2017-01-31 | 2016-10-31 | 2016-07-31 | 2016-04-30 | 2016-01-31 | 2015-10-31 | 2015-07-31 | 2015-04-30 | 2015-01-31 | 2014-10-31 | 2014-07-31 | 2014-04-30 | ||
|---|---|---|---|---|---|---|---|---|---|---|---|---|---|---|---|---|---|---|---|---|---|---|---|---|---|---|---|---|---|---|---|---|---|---|---|---|---|---|---|---|
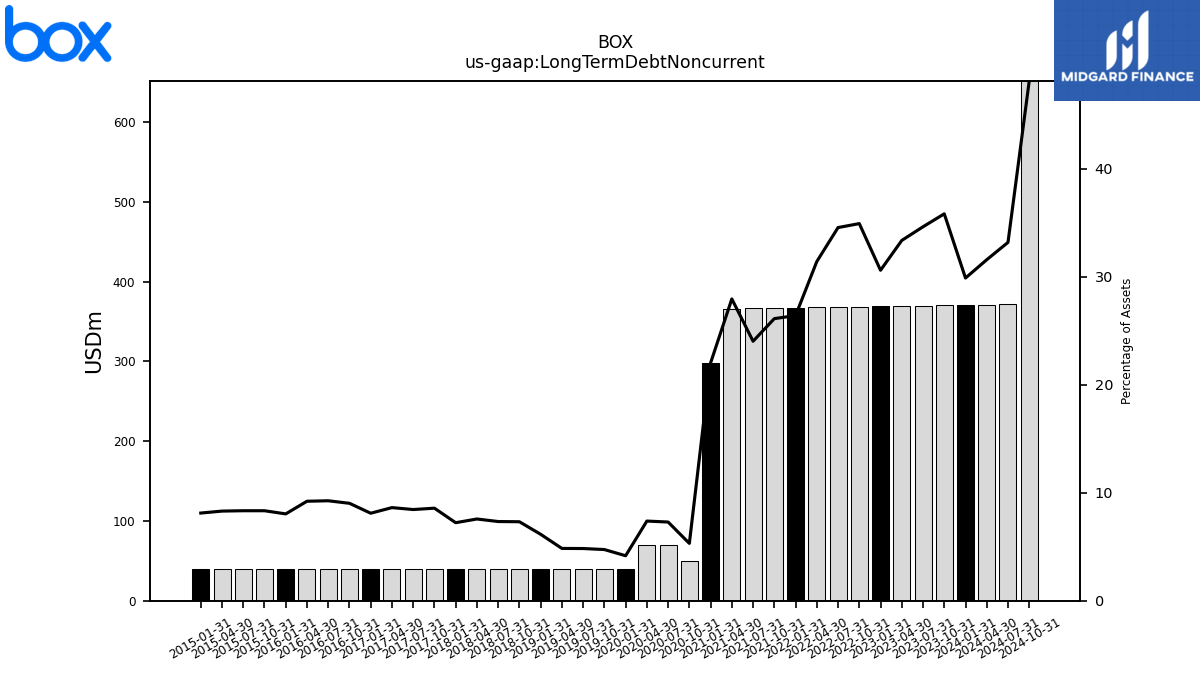
| Long Term Debt Noncurrent | 370.32 | 369.82 | 369.82 | 369.35 | 368.88 | 368.41 | 367.93 | 367.46 | 366.99 | 366.53 | 366.06 | 297.61 | 50.00 | 70.00 | 70.00 | 40.00 | 40.00 | 40.00 | 40.00 | 40.00 | 40.00 | 40.00 | 40.00 | 40.00 | 40.00 | 40.00 | 40.00 | 40.00 | 40.00 | 40.00 | 40.00 | 40.00 | 40.00 | 40.00 | 40.00 | 40.00 | NA | NA | NA | |
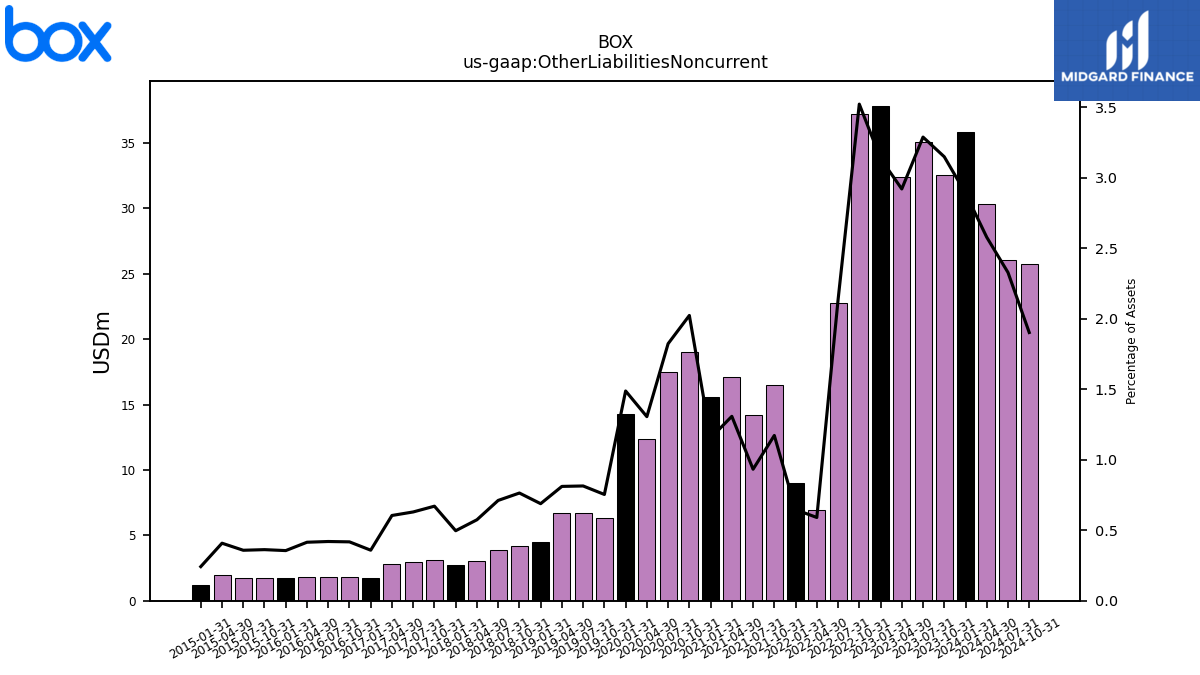
| Other Liabilities Noncurrent | 32.54 | 35.11 | 32.36 | 37.85 | 37.19 | 22.73 | 6.92 | 8.99 | 16.46 | 14.22 | 17.13 | 15.60 | 19.04 | 17.50 | 12.38 | 14.28 | 6.36 | 6.73 | 6.69 | 4.47 | 4.18 | 3.88 | 3.03 | 2.75 | 3.13 | 2.98 | 2.80 | 1.77 | 1.85 | 1.81 | 1.80 | 1.77 | 1.74 | 1.72 | 1.97 | 1.19 | NA | NA | NA | |
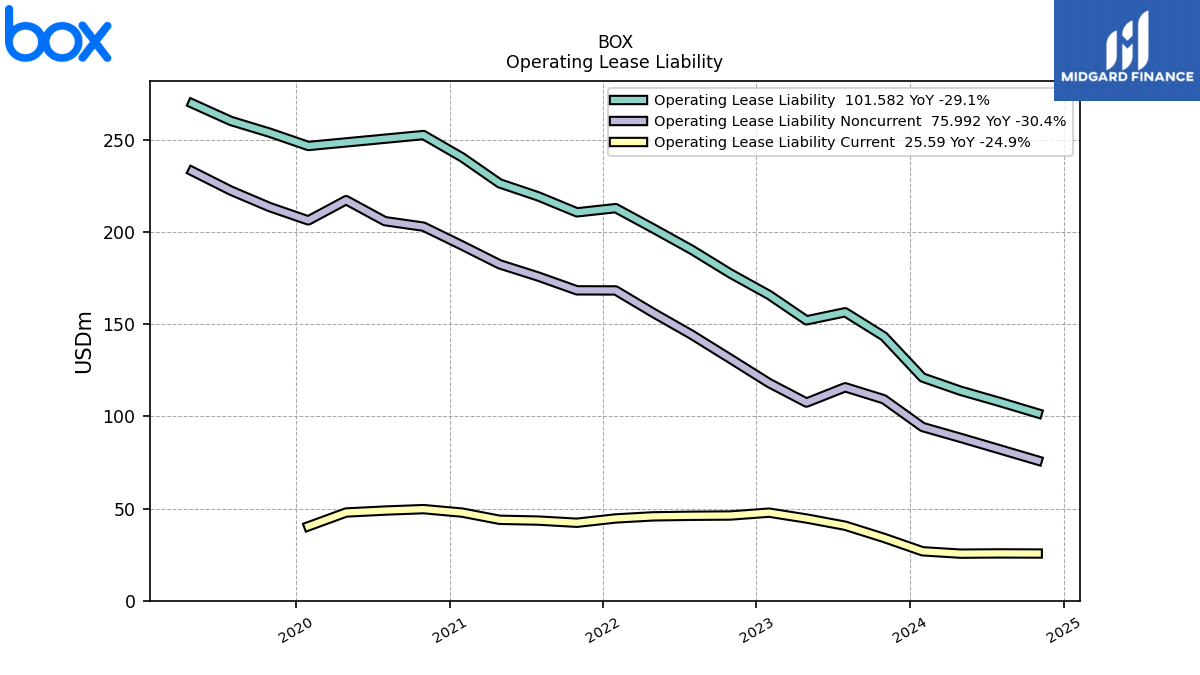
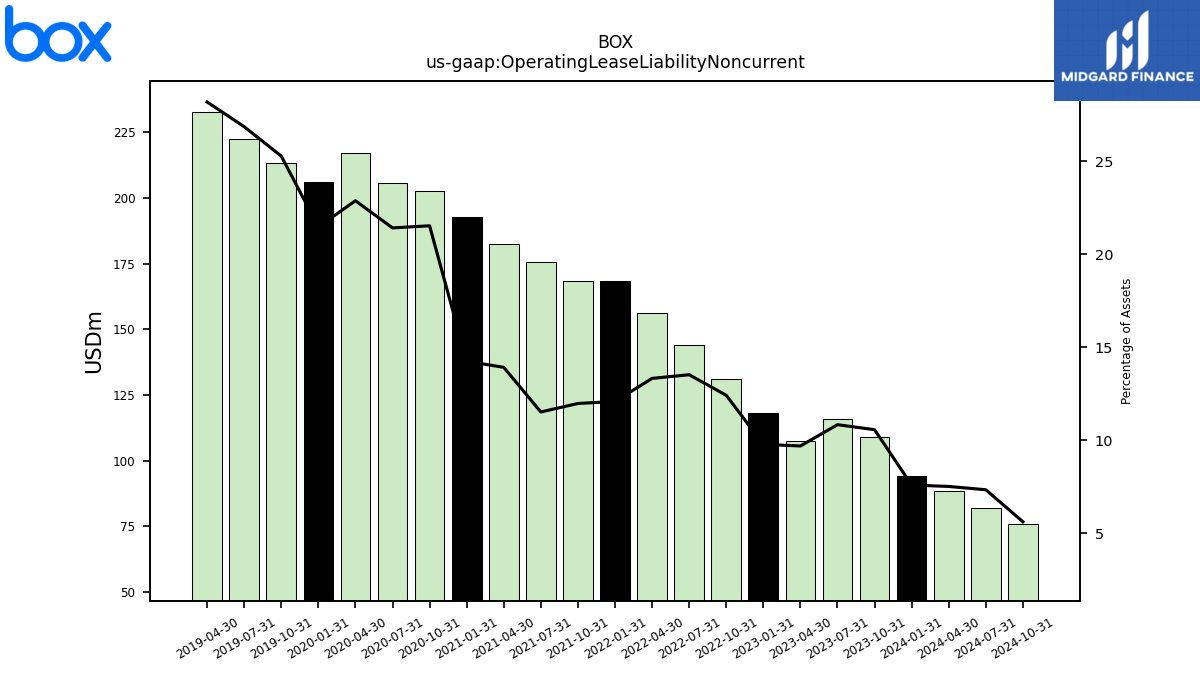
| Operating Lease Liability Noncurrent | 109.20 | 115.70 | 107.40 | 118.00 | 131.14 | 144.17 | 156.10 | 168.19 | 168.24 | 175.71 | 182.35 | 192.53 | 202.75 | 205.75 | 217.13 | 206.14 | 213.37 | 222.26 | 232.81 | NA | NA | NA | NA | NA | NA | NA | NA | NA | NA | NA | NA | NA | NA | NA | NA | NA | NA | NA | NA |
| 2023-10-31 | 2023-07-31 | 2023-04-30 | 2023-01-31 | 2022-10-31 | 2022-07-31 | 2022-04-30 | 2022-01-31 | 2021-10-31 | 2021-07-31 | 2021-04-30 | 2021-01-31 | 2020-10-31 | 2020-07-31 | 2020-04-30 | 2020-01-31 | 2019-10-31 | 2019-07-31 | 2019-04-30 | 2019-01-31 | 2018-10-31 | 2018-07-31 | 2018-04-30 | 2018-01-31 | 2017-10-31 | 2017-07-31 | 2017-04-30 | 2017-01-31 | 2016-10-31 | 2016-07-31 | 2016-04-30 | 2016-01-31 | 2015-10-31 | 2015-07-31 | 2015-04-30 | 2015-01-31 | 2014-10-31 | 2014-07-31 | 2014-04-30 | ||
|---|---|---|---|---|---|---|---|---|---|---|---|---|---|---|---|---|---|---|---|---|---|---|---|---|---|---|---|---|---|---|---|---|---|---|---|---|---|---|---|---|
| Stockholders Equity | -540.41 | -536.96 | -512.09 | -523.85 | -567.59 | -579.50 | -483.96 | -395.09 | -273.15 | -152.99 | 124.81 | 151.06 | 87.56 | 59.59 | 40.85 | 22.36 | 20.77 | 22.27 | 30.54 | 31.41 | 25.65 | 35.13 | 46.62 | 14.97 | 26.30 | 41.91 | 59.84 | 74.73 | 88.87 | 100.82 | 121.58 | 137.90 | 171.89 | 200.64 | 230.99 | 268.13 | NA | NA | NA | |
| Common Stock Value | 0.01 | 0.01 | 0.01 | 0.01 | 0.01 | 0.01 | 0.01 | 0.01 | 0.01 | 0.01 | 0.02 | 0.02 | 0.02 | 0.02 | 0.01 | 0.01 | 0.01 | 0.01 | 0.01 | 0.01 | 0.01 | 0.01 | NA | 0.01 | NA | NA | NA | NA | NA | NA | NA | NA | NA | NA | NA | NA | NA | NA | NA | |
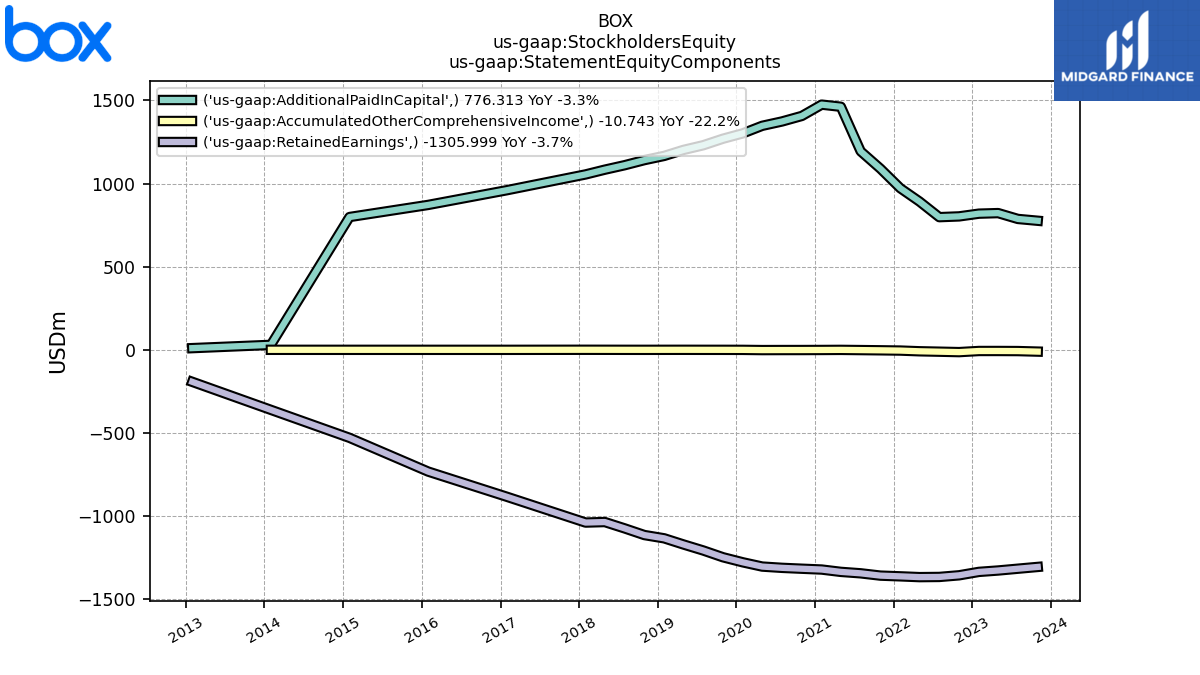
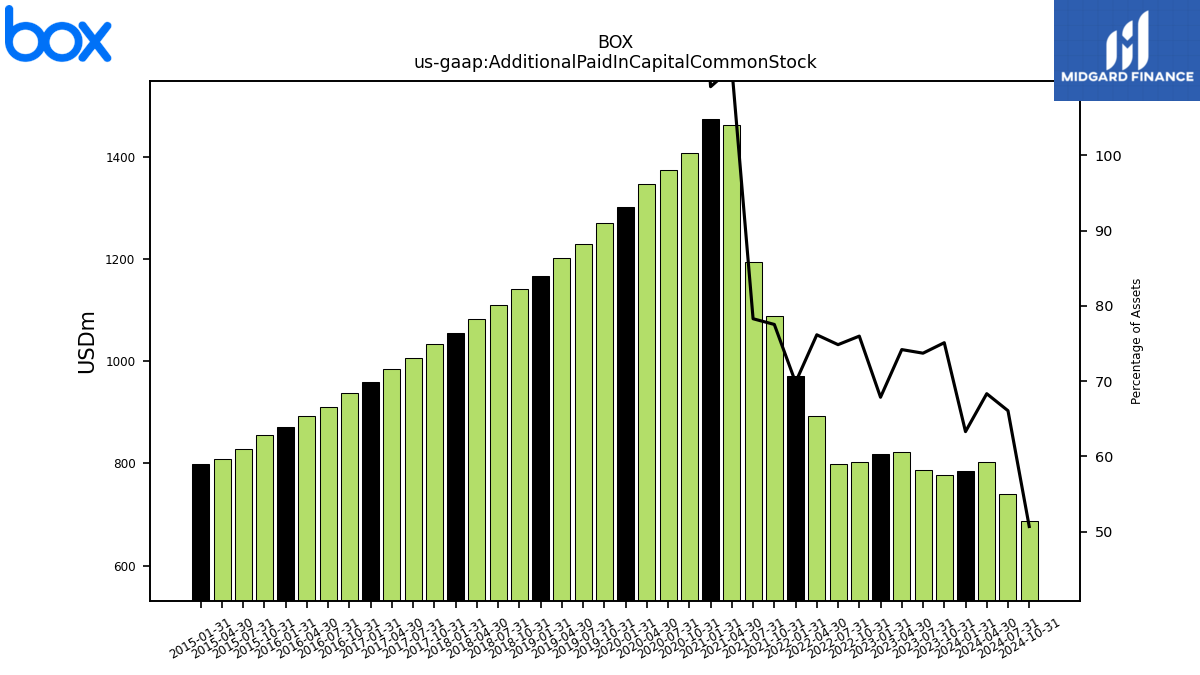
| Additional Paid In Capital Common Stock | 776.31 | 787.21 | 822.37 | 819.00 | 802.53 | 797.95 | 892.07 | 972.02 | 1089.18 | 1194.18 | 1462.04 | 1474.84 | 1406.76 | 1373.58 | 1347.44 | 1302.07 | 1269.90 | 1230.44 | 1202.32 | 1166.44 | 1141.10 | 1110.30 | 1083.54 | 1054.93 | 1033.92 | 1006.52 | 985.31 | 960.14 | 937.32 | 911.02 | 893.62 | 871.49 | 855.09 | 828.75 | 808.89 | 798.74 | NA | NA | NA | |
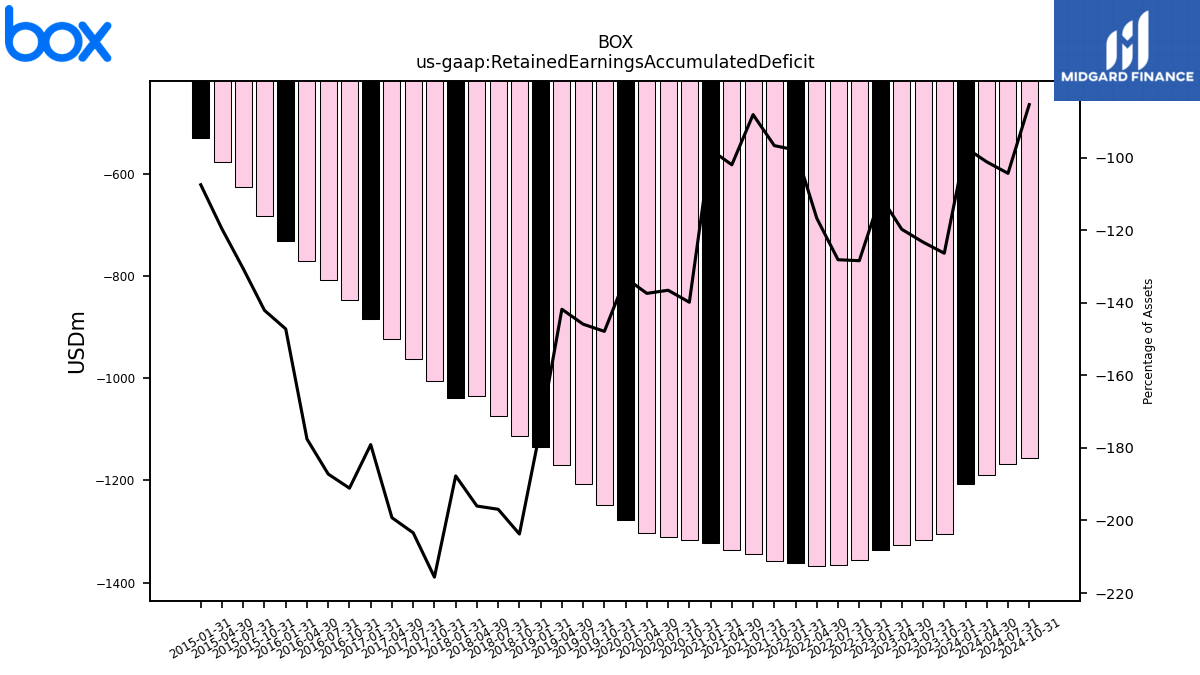
| Retained Earnings Accumulated Deficit | -1306.00 | -1316.65 | -1327.45 | -1335.80 | -1356.33 | -1366.23 | -1367.28 | -1362.58 | -1358.25 | -1344.39 | -1335.69 | -1321.68 | -1316.74 | -1311.45 | -1303.80 | -1278.25 | -1247.86 | -1206.96 | -1170.73 | -1133.90 | -1114.20 | -1074.01 | -1035.92 | -1039.09 | -1006.42 | -963.50 | -924.21 | -884.13 | -847.25 | -809.02 | -770.92 | -732.34 | -681.97 | -626.85 | -576.68 | -529.39 | NA | NA | NA | |
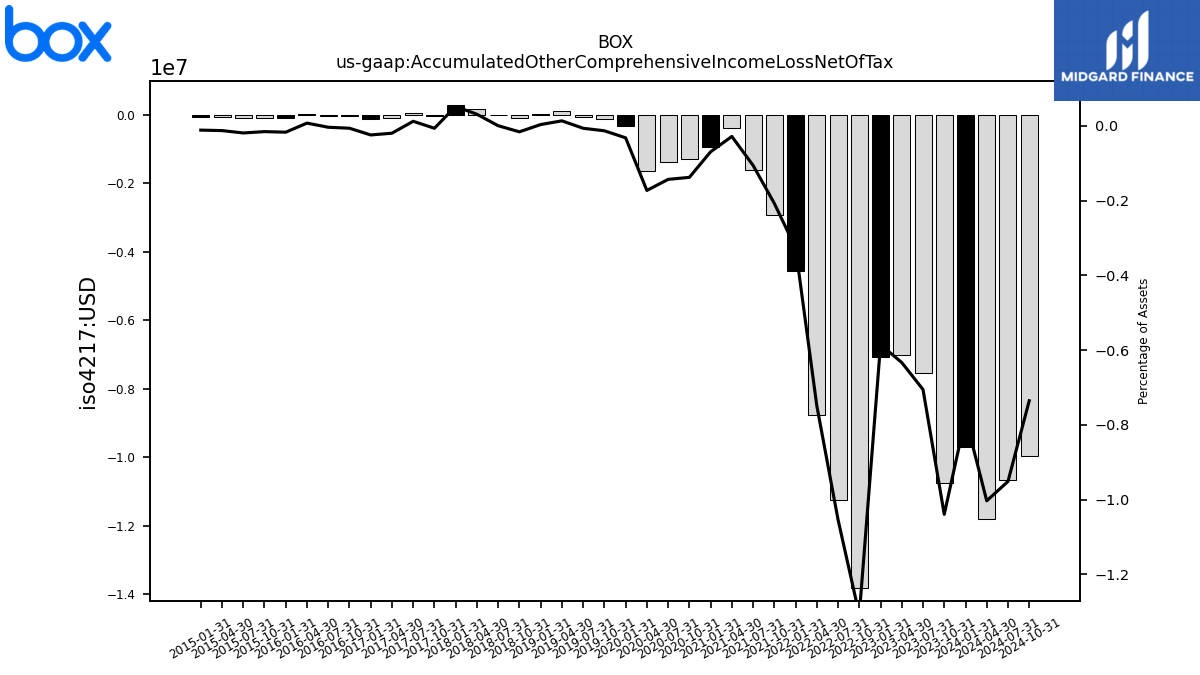
| Accumulated Other Comprehensive Income Loss Net Of Tax | -10.74 | -7.53 | -7.02 | -7.07 | -13.82 | -11.23 | -8.77 | -4.54 | -2.91 | -1.61 | -0.37 | -0.94 | -1.30 | -1.38 | -1.64 | -0.31 | -0.11 | -0.05 | 0.11 | 0.02 | -0.09 | 0.00 | 0.16 | 0.29 | -0.03 | 0.06 | -0.09 | -0.12 | -0.03 | -0.02 | 0.03 | -0.08 | -0.07 | -0.09 | -0.06 | -0.06 | NA | NA | NA | |
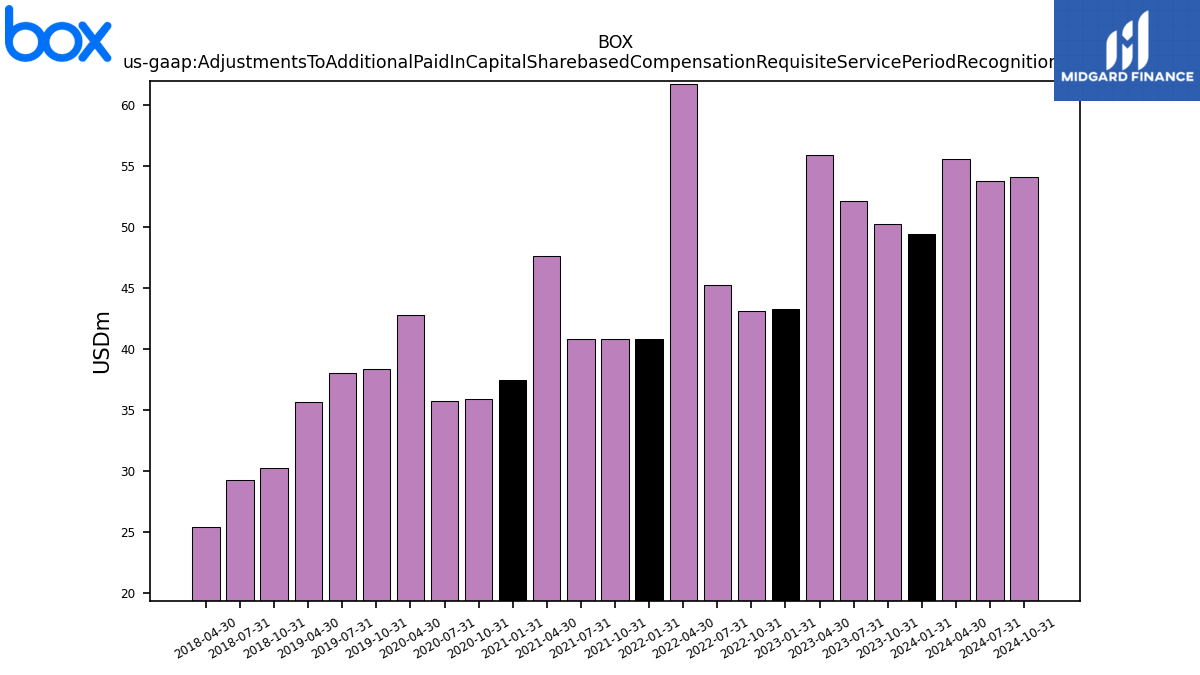
| Adjustments To Additional Paid In Capital Sharebased Compensation Requisite Service Period Recognition Value | 50.24 | 52.15 | 55.91 | 43.30 | 43.16 | 45.23 | 61.78 | 40.83 | 40.83 | 40.84 | 47.65 | 37.44 | 35.90 | 35.77 | 42.77 | NA | 38.37 | 38.03 | 35.68 | NA | 30.24 | 29.25 | 25.44 | NA | NA | NA | NA | NA | NA | NA | NA | NA | NA | NA | NA | NA | NA | NA | NA |
| 2023-10-31 | 2023-07-31 | 2023-04-30 | 2023-01-31 | 2022-10-31 | 2022-07-31 | 2022-04-30 | 2022-01-31 | 2021-10-31 | 2021-07-31 | 2021-04-30 | 2021-01-31 | 2020-10-31 | 2020-07-31 | 2020-04-30 | 2020-01-31 | 2019-10-31 | 2019-07-31 | 2019-04-30 | 2019-01-31 | 2018-10-31 | 2018-07-31 | 2018-04-30 | 2018-01-31 | 2017-10-31 | 2017-07-31 | 2017-04-30 | 2017-01-31 | 2016-10-31 | 2016-07-31 | 2016-04-30 | 2016-01-31 | 2015-10-31 | 2015-07-31 | 2015-04-30 | 2015-01-31 | 2014-10-31 | 2014-07-31 | 2014-04-30 | ||
|---|---|---|---|---|---|---|---|---|---|---|---|---|---|---|---|---|---|---|---|---|---|---|---|---|---|---|---|---|---|---|---|---|---|---|---|---|---|---|---|---|
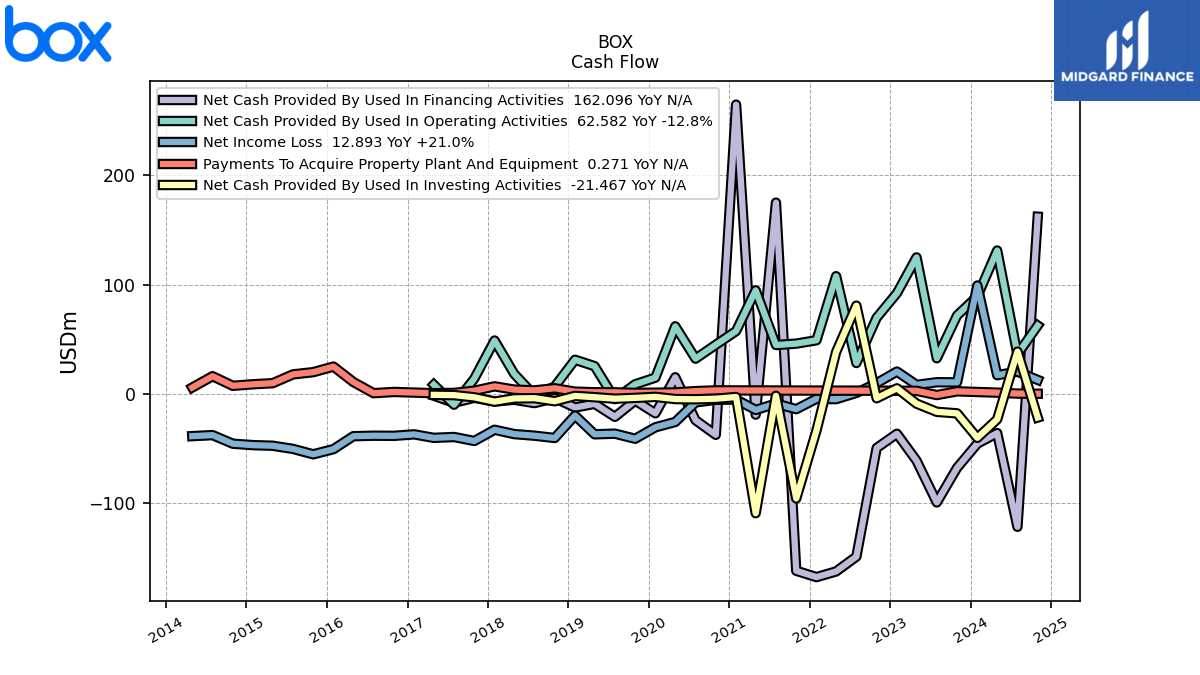
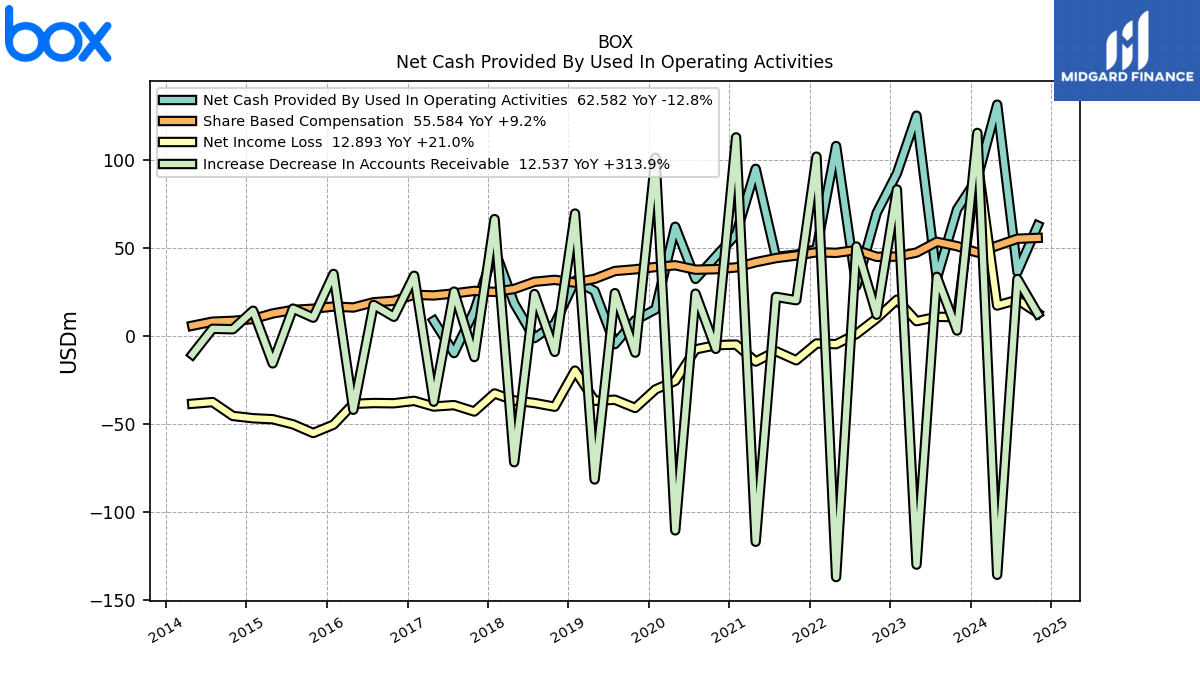
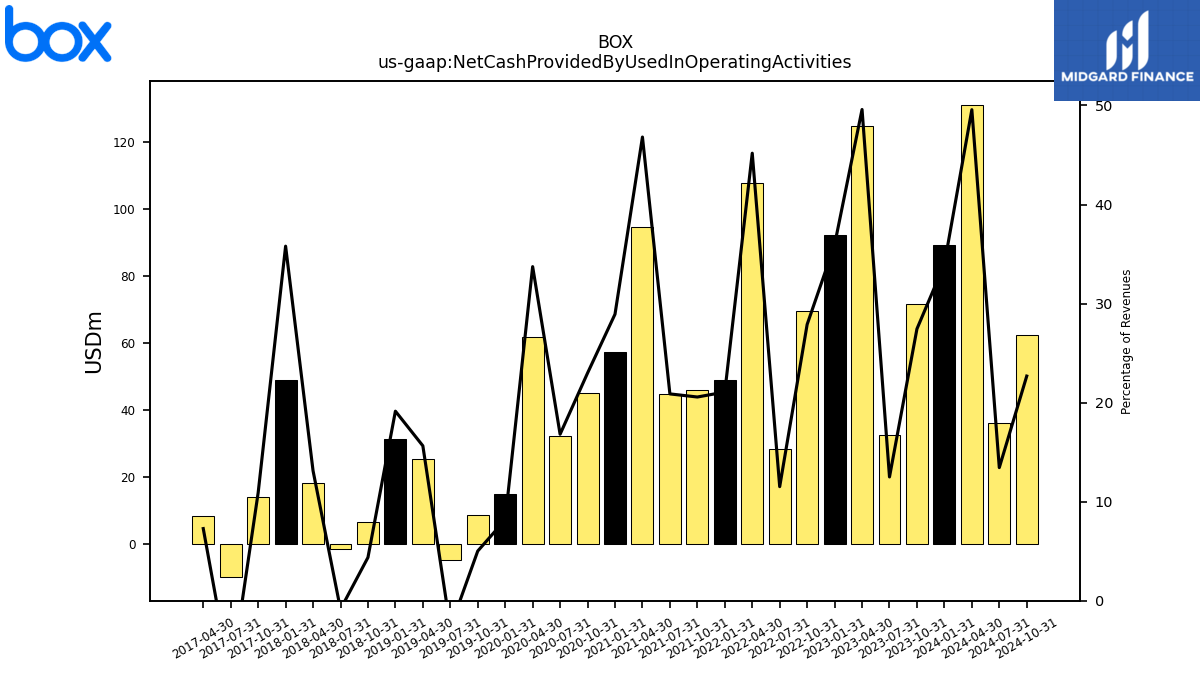
| Net Cash Provided By Used In Operating Activities | 71.78 | 32.68 | 124.93 | 92.19 | 69.73 | 28.34 | 107.73 | 49.17 | 46.08 | 44.79 | 94.77 | 57.54 | 45.05 | 32.33 | 61.92 | 15.01 | 8.89 | -4.68 | 25.49 | 31.33 | 6.82 | -1.27 | 18.44 | 48.93 | 14.09 | -9.76 | 8.54 | NA | NA | NA | NA | NA | NA | NA | NA | NA | NA | NA | NA | |
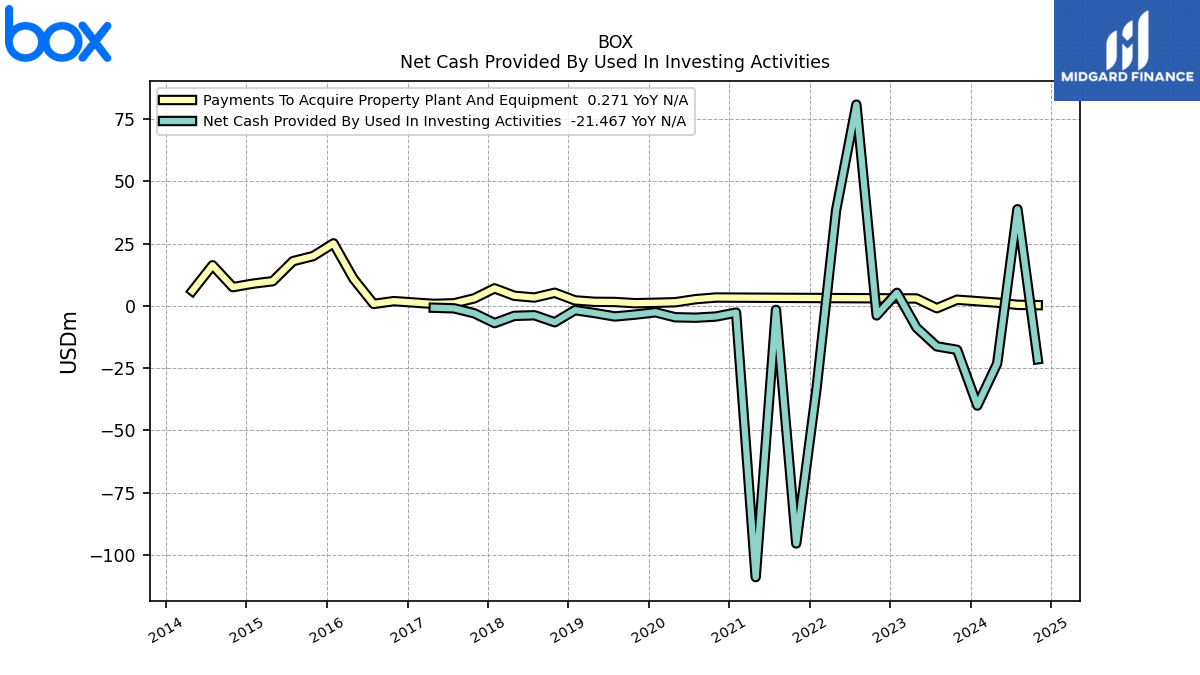
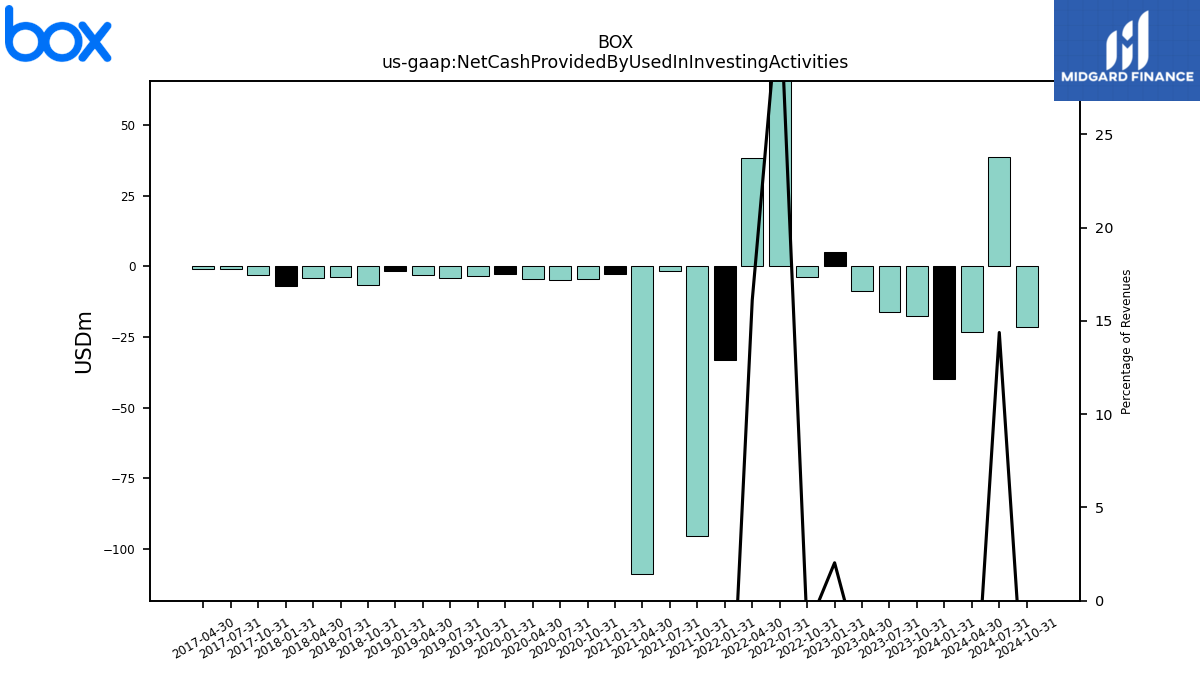
| Net Cash Provided By Used In Investing Activities | -17.67 | -16.28 | -8.78 | 5.22 | -3.85 | 80.82 | 38.41 | -33.32 | -95.46 | -1.62 | -108.97 | -2.72 | -4.30 | -4.77 | -4.59 | -2.60 | -3.52 | -4.28 | -2.90 | -1.74 | -6.59 | -3.78 | -4.04 | -6.95 | -3.00 | -1.01 | -0.76 | NA | NA | NA | NA | NA | NA | NA | NA | NA | NA | NA | NA | |
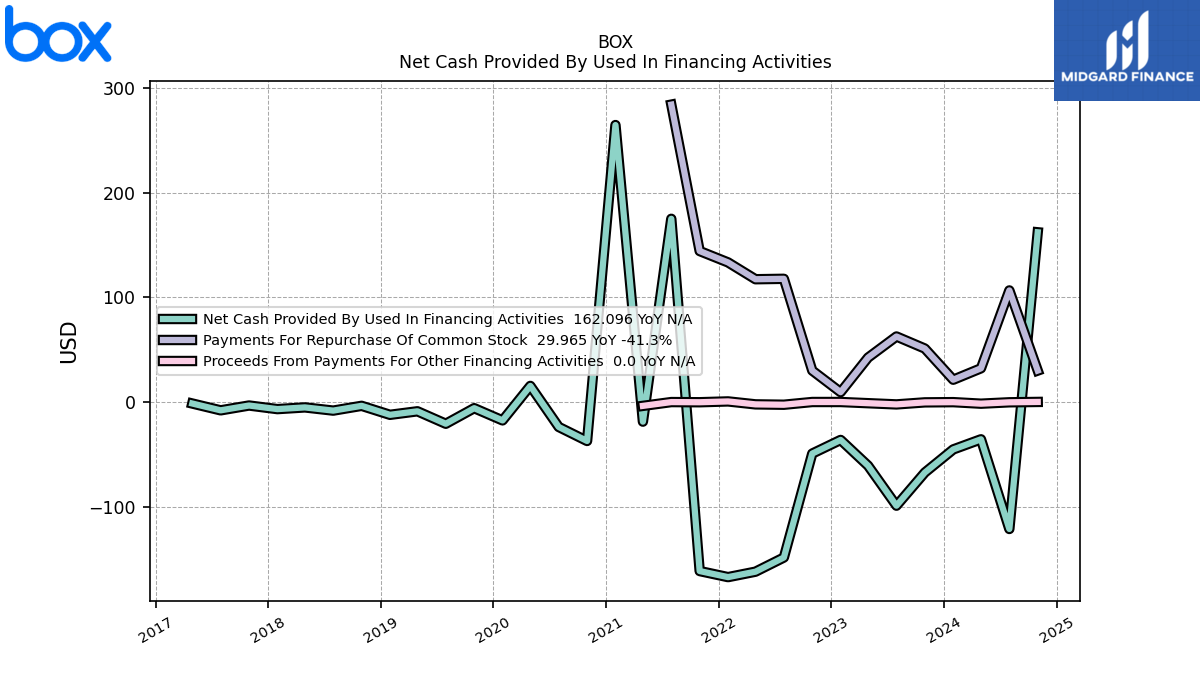
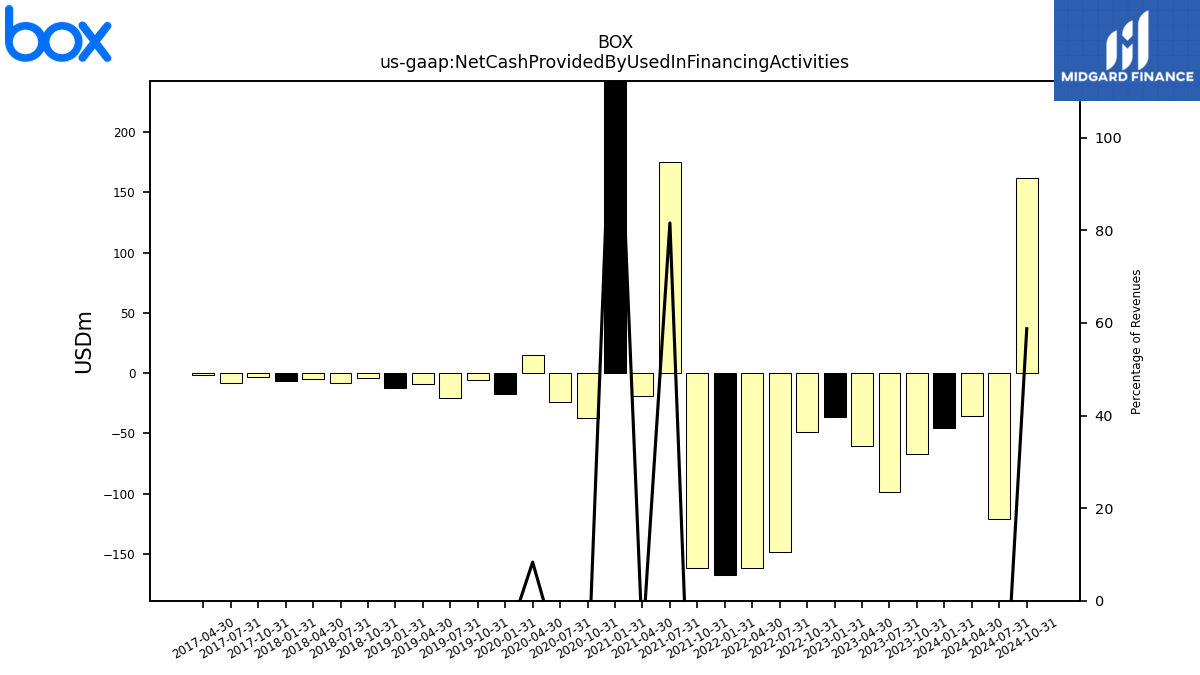
| Net Cash Provided By Used In Financing Activities | -67.46 | -99.14 | -60.92 | -36.31 | -49.34 | -148.65 | -162.19 | -167.40 | -161.60 | 174.99 | -18.85 | 264.59 | -37.31 | -23.91 | 15.30 | -17.66 | -5.96 | -20.85 | -8.94 | -12.31 | -3.73 | -8.29 | -5.24 | -6.86 | -3.42 | -8.03 | -1.51 | NA | NA | NA | NA | NA | NA | NA | NA | NA | NA | NA | NA |
| 2023-10-31 | 2023-07-31 | 2023-04-30 | 2023-01-31 | 2022-10-31 | 2022-07-31 | 2022-04-30 | 2022-01-31 | 2021-10-31 | 2021-07-31 | 2021-04-30 | 2021-01-31 | 2020-10-31 | 2020-07-31 | 2020-04-30 | 2020-01-31 | 2019-10-31 | 2019-07-31 | 2019-04-30 | 2019-01-31 | 2018-10-31 | 2018-07-31 | 2018-04-30 | 2018-01-31 | 2017-10-31 | 2017-07-31 | 2017-04-30 | 2017-01-31 | 2016-10-31 | 2016-07-31 | 2016-04-30 | 2016-01-31 | 2015-10-31 | 2015-07-31 | 2015-04-30 | 2015-01-31 | 2014-10-31 | 2014-07-31 | 2014-04-30 | ||
|---|---|---|---|---|---|---|---|---|---|---|---|---|---|---|---|---|---|---|---|---|---|---|---|---|---|---|---|---|---|---|---|---|---|---|---|---|---|---|---|---|
| Net Cash Provided By Used In Operating Activities | 71.78 | 32.68 | 124.93 | 92.19 | 69.73 | 28.34 | 107.73 | 49.17 | 46.08 | 44.79 | 94.77 | 57.54 | 45.05 | 32.33 | 61.92 | 15.01 | 8.89 | -4.68 | 25.49 | 31.33 | 6.82 | -1.27 | 18.44 | 48.93 | 14.09 | -9.76 | 8.54 | NA | NA | NA | NA | NA | NA | NA | NA | NA | NA | NA | NA | |
| Net Income Loss | 10.66 | 10.79 | 8.35 | 20.53 | 9.91 | 1.04 | -4.70 | -4.33 | -13.86 | -8.70 | -14.57 | -4.94 | -5.28 | -7.66 | -25.55 | -30.39 | -40.90 | -36.23 | -36.83 | -19.69 | -40.20 | -38.09 | -36.64 | -32.66 | -42.92 | -39.28 | -40.09 | -36.88 | -38.23 | -38.10 | -38.58 | -50.37 | -55.12 | -50.17 | -47.28 | -46.73 | -45.42 | -37.56 | -38.51 | |
| Profit Loss | 10.66 | 10.79 | 8.35 | 20.53 | 9.91 | 1.04 | -4.70 | -4.33 | -13.86 | -8.70 | -14.57 | -4.94 | -5.28 | -7.66 | -25.55 | -30.39 | -40.90 | -36.23 | -36.83 | -19.69 | -40.20 | -38.09 | -36.64 | -32.66 | -42.92 | -39.28 | NA | NA | NA | NA | NA | NA | NA | NA | NA | NA | NA | NA | NA | |
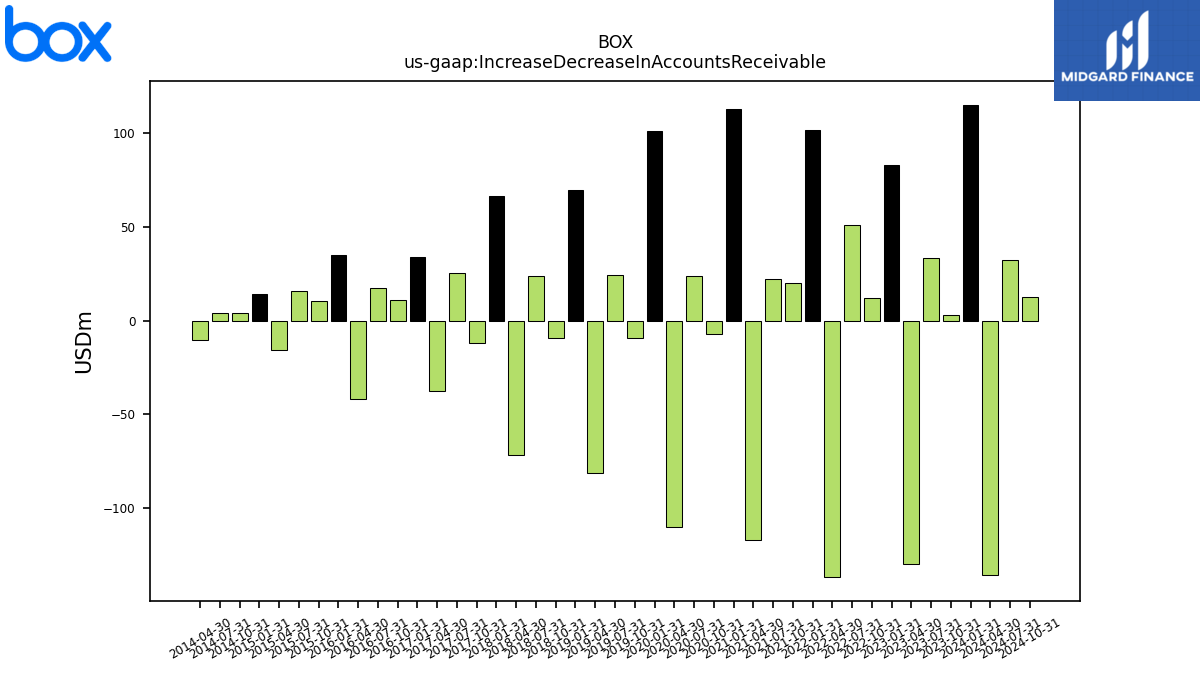
| Increase Decrease In Accounts Receivable | 3.03 | 33.50 | -129.81 | 83.09 | 12.01 | 50.70 | -136.88 | 101.69 | 20.24 | 22.13 | -116.83 | 112.64 | -7.38 | 23.97 | -110.37 | 101.04 | -9.51 | 24.25 | -81.47 | 69.42 | -9.06 | 23.75 | -71.69 | 66.27 | -12.02 | 25.12 | -37.35 | 34.12 | 10.82 | 17.55 | -41.93 | 35.17 | 10.32 | 15.50 | -15.62 | 14.28 | 3.76 | 4.03 | -10.59 | |
| Share Based Compensation | 50.89 | 53.35 | 47.28 | 44.98 | 44.85 | 48.69 | 47.11 | 47.47 | 45.59 | 44.13 | 41.79 | 38.85 | 37.83 | 37.56 | 40.04 | 39.06 | 37.76 | 36.80 | 32.36 | 30.21 | 31.79 | 30.68 | 26.61 | 24.95 | 25.52 | 24.07 | 22.95 | 23.30 | 19.92 | 19.06 | 16.09 | 16.66 | 15.40 | 14.73 | 12.71 | 9.59 | 8.51 | 8.08 | 5.75 |
| 2023-10-31 | 2023-07-31 | 2023-04-30 | 2023-01-31 | 2022-10-31 | 2022-07-31 | 2022-04-30 | 2022-01-31 | 2021-10-31 | 2021-07-31 | 2021-04-30 | 2021-01-31 | 2020-10-31 | 2020-07-31 | 2020-04-30 | 2020-01-31 | 2019-10-31 | 2019-07-31 | 2019-04-30 | 2019-01-31 | 2018-10-31 | 2018-07-31 | 2018-04-30 | 2018-01-31 | 2017-10-31 | 2017-07-31 | 2017-04-30 | 2017-01-31 | 2016-10-31 | 2016-07-31 | 2016-04-30 | 2016-01-31 | 2015-10-31 | 2015-07-31 | 2015-04-30 | 2015-01-31 | 2014-10-31 | 2014-07-31 | 2014-04-30 | ||
|---|---|---|---|---|---|---|---|---|---|---|---|---|---|---|---|---|---|---|---|---|---|---|---|---|---|---|---|---|---|---|---|---|---|---|---|---|---|---|---|---|
| Net Cash Provided By Used In Investing Activities | -17.67 | -16.28 | -8.78 | 5.22 | -3.85 | 80.82 | 38.41 | -33.32 | -95.46 | -1.62 | -108.97 | -2.72 | -4.30 | -4.77 | -4.59 | -2.60 | -3.52 | -4.28 | -2.90 | -1.74 | -6.59 | -3.78 | -4.04 | -6.95 | -3.00 | -1.01 | -0.76 | NA | NA | NA | NA | NA | NA | NA | NA | NA | NA | NA | NA |
| 2023-10-31 | 2023-07-31 | 2023-04-30 | 2023-01-31 | 2022-10-31 | 2022-07-31 | 2022-04-30 | 2022-01-31 | 2021-10-31 | 2021-07-31 | 2021-04-30 | 2021-01-31 | 2020-10-31 | 2020-07-31 | 2020-04-30 | 2020-01-31 | 2019-10-31 | 2019-07-31 | 2019-04-30 | 2019-01-31 | 2018-10-31 | 2018-07-31 | 2018-04-30 | 2018-01-31 | 2017-10-31 | 2017-07-31 | 2017-04-30 | 2017-01-31 | 2016-10-31 | 2016-07-31 | 2016-04-30 | 2016-01-31 | 2015-10-31 | 2015-07-31 | 2015-04-30 | 2015-01-31 | 2014-10-31 | 2014-07-31 | 2014-04-30 | ||
|---|---|---|---|---|---|---|---|---|---|---|---|---|---|---|---|---|---|---|---|---|---|---|---|---|---|---|---|---|---|---|---|---|---|---|---|---|---|---|---|---|
| Net Cash Provided By Used In Financing Activities | -67.46 | -99.14 | -60.92 | -36.31 | -49.34 | -148.65 | -162.19 | -167.40 | -161.60 | 174.99 | -18.85 | 264.59 | -37.31 | -23.91 | 15.30 | -17.66 | -5.96 | -20.85 | -8.94 | -12.31 | -3.73 | -8.29 | -5.24 | -6.86 | -3.42 | -8.03 | -1.51 | NA | NA | NA | NA | NA | NA | NA | NA | NA | NA | NA | NA | |
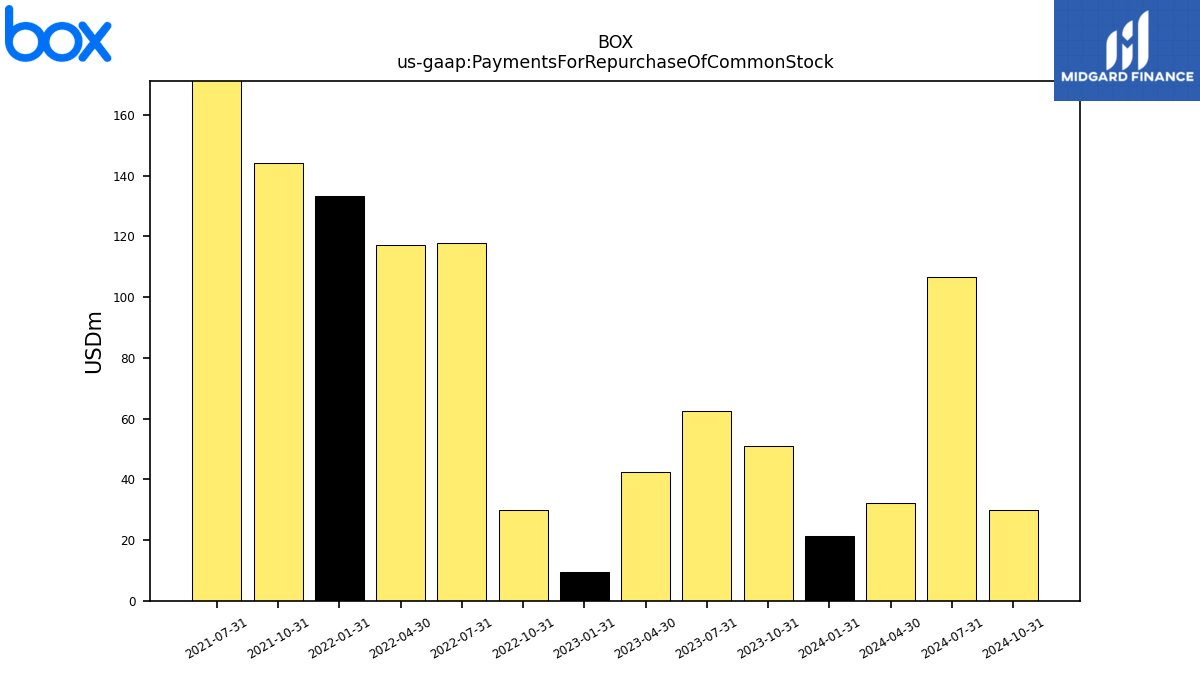
| Payments For Repurchase Of Common Stock | 51.02 | 62.53 | 42.37 | 9.32 | 29.97 | 117.65 | 117.24 | 133.32 | 144.17 | 284.08 | NA | NA | NA | NA | NA | NA | NA | NA | NA | NA | NA | NA | NA | NA | NA | NA | NA | NA | NA | NA | NA | NA | NA | NA | NA | NA | NA | NA | NA |
| 2023-10-31 | 2023-07-31 | 2023-04-30 | 2023-01-31 | 2022-10-31 | 2022-07-31 | 2022-04-30 | 2022-01-31 | 2021-10-31 | 2021-07-31 | 2021-04-30 | 2021-01-31 | 2020-10-31 | 2020-07-31 | 2020-04-30 | 2020-01-31 | 2019-10-31 | 2019-07-31 | 2019-04-30 | 2019-01-31 | 2018-10-31 | 2018-07-31 | 2018-04-30 | 2018-01-31 | 2017-10-31 | 2017-07-31 | 2017-04-30 | 2017-01-31 | 2016-10-31 | 2016-07-31 | 2016-04-30 | 2016-01-31 | 2015-10-31 | 2015-07-31 | 2015-04-30 | 2015-01-31 | 2014-10-31 | 2014-07-31 | 2014-04-30 | ||
|---|---|---|---|---|---|---|---|---|---|---|---|---|---|---|---|---|---|---|---|---|---|---|---|---|---|---|---|---|---|---|---|---|---|---|---|---|---|---|---|---|
| Revenues | 261.54 | 261.43 | 251.90 | 256.48 | 249.95 | 246.01 | 238.43 | 233.36 | 224.04 | 214.49 | 202.44 | 198.91 | 196.00 | 192.29 | 183.56 | 183.59 | 177.16 | 172.55 | 162.97 | 163.71 | 155.94 | 148.22 | 140.51 | 136.68 | 129.30 | 122.94 | 117.22 | 109.93 | 102.81 | 95.71 | 90.16 | 84.98 | 78.65 | 73.45 | 65.62 | 62.64 | 57.05 | 51.42 | 45.33 | |
| Revenue From Contract With Customer Excluding Assessed Tax | 261.54 | 261.43 | 251.90 | 256.48 | 249.95 | 246.01 | 238.43 | 233.36 | 224.04 | 214.49 | 202.44 | 198.91 | 196.00 | 192.29 | 183.56 | 183.59 | 177.16 | 172.55 | 162.97 | 163.71 | 155.94 | 148.22 | 140.51 | 136.68 | 129.30 | 122.94 | 117.22 | 109.93 | 102.81 | 95.71 | 90.16 | 84.98 | 78.65 | 73.45 | 65.62 | 62.64 | 57.05 | 51.42 | 45.33 |
