
| 2023-12-31 | 2023-09-30 | 2023-06-30 | 2023-03-31 | 2022-12-31 | 2022-09-30 | 2022-06-30 | 2022-03-31 | 2021-12-31 | 2021-09-30 | 2021-06-30 | 2021-03-31 | 2020-12-31 | 2020-09-30 | 2020-06-30 | 2020-03-31 | 2019-12-31 | 2019-09-30 | 2019-06-30 | 2019-03-31 | 2018-12-31 | 2018-09-30 | 2018-06-30 | 2018-03-31 | ||
|---|---|---|---|---|---|---|---|---|---|---|---|---|---|---|---|---|---|---|---|---|---|---|---|---|---|
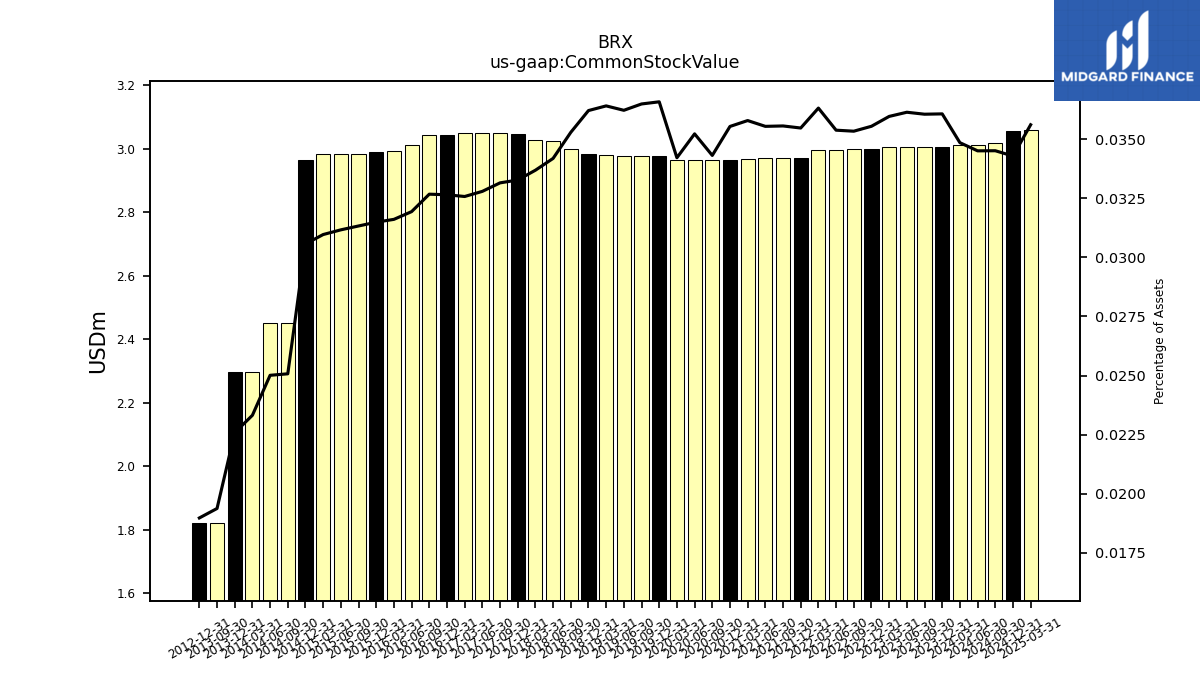
| Common Stock Value | 3.01 | 3.01 | 3.01 | 3.00 | 3.00 | 3.00 | 3.00 | 3.00 | 2.97 | 2.97 | 2.97 | 2.97 | 2.96 | 2.96 | 2.96 | 2.96 | 2.98 | 2.98 | 2.98 | 2.98 | 2.98 | 3.00 | 3.03 | 3.03 | |
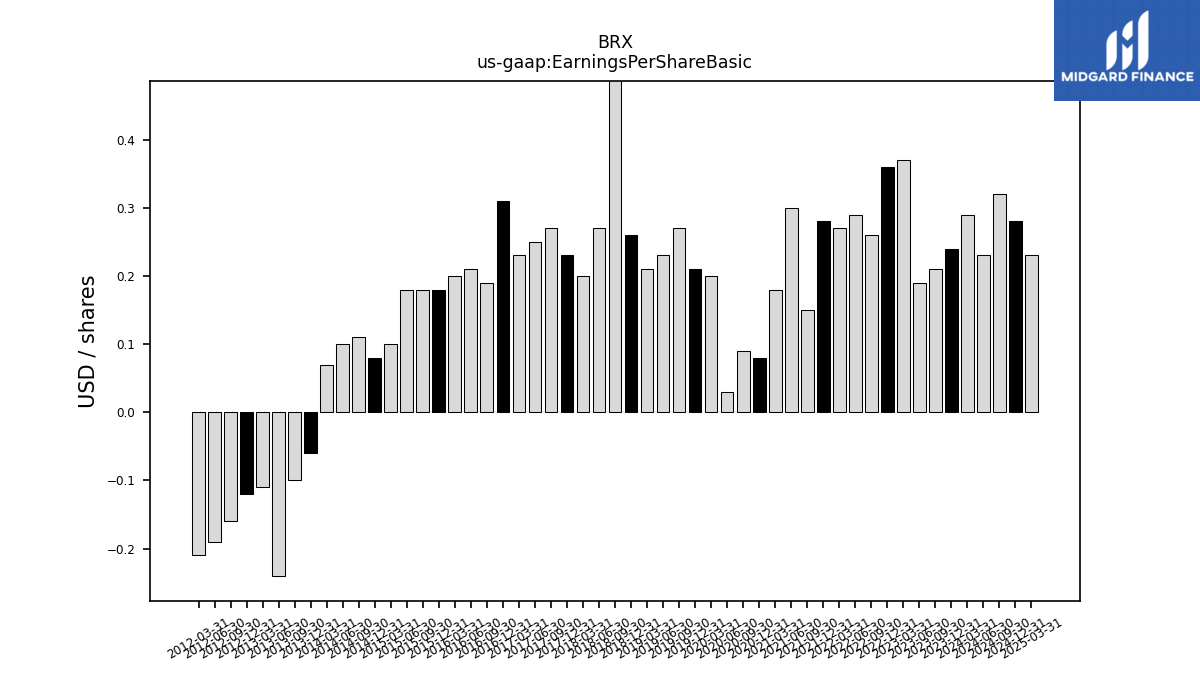
| Earnings Per Share Basic | 0.24 | 0.21 | 0.19 | 0.37 | 0.36 | 0.26 | 0.29 | 0.27 | 0.28 | 0.15 | 0.30 | 0.18 | 0.08 | 0.09 | 0.03 | 0.20 | 0.21 | 0.27 | 0.23 | 0.21 | 0.26 | 0.49 | 0.27 | 0.20 | |
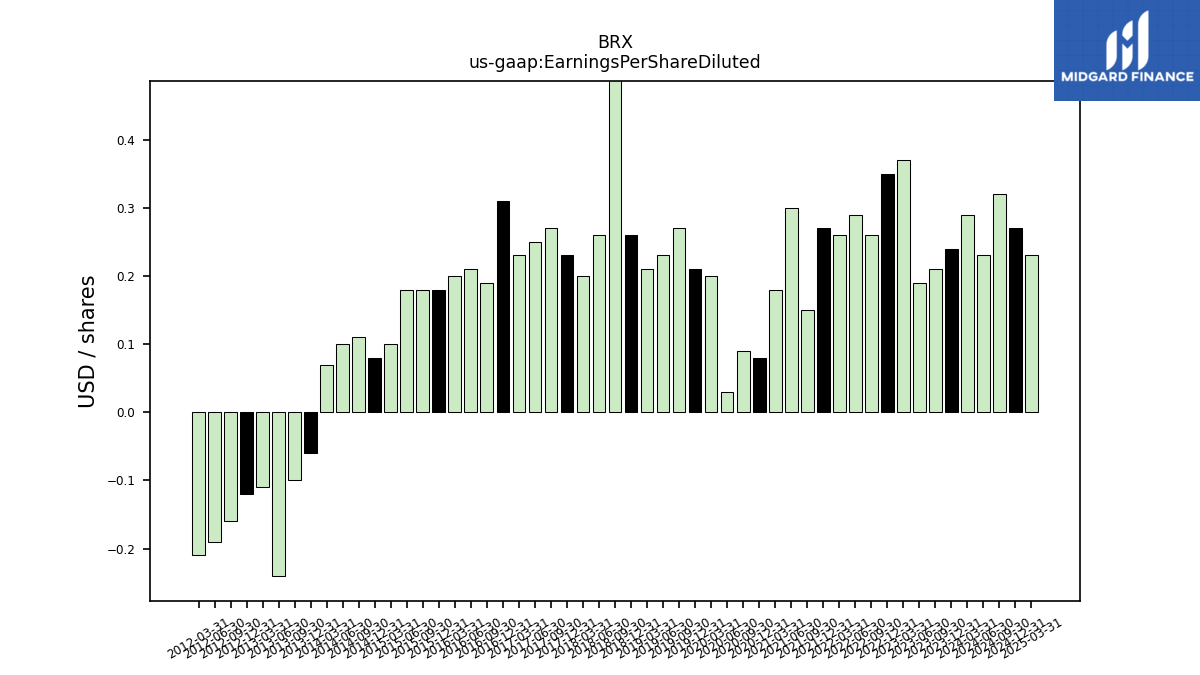
| Earnings Per Share Diluted | 0.24 | 0.21 | 0.19 | 0.37 | 0.35 | 0.26 | 0.29 | 0.26 | 0.27 | 0.15 | 0.30 | 0.18 | 0.08 | 0.09 | 0.03 | 0.20 | 0.21 | 0.27 | 0.23 | 0.21 | 0.26 | 0.49 | 0.26 | 0.20 |
| 2023-12-31 | 2023-09-30 | 2023-06-30 | 2023-03-31 | 2022-12-31 | 2022-09-30 | 2022-06-30 | 2022-03-31 | 2021-12-31 | 2021-09-30 | 2021-06-30 | 2021-03-31 | 2020-12-31 | 2020-09-30 | 2020-06-30 | 2020-03-31 | 2019-12-31 | 2019-09-30 | 2019-06-30 | 2019-03-31 | 2018-12-31 | 2018-09-30 | 2018-06-30 | 2018-03-31 | ||
|---|---|---|---|---|---|---|---|---|---|---|---|---|---|---|---|---|---|---|---|---|---|---|---|---|---|
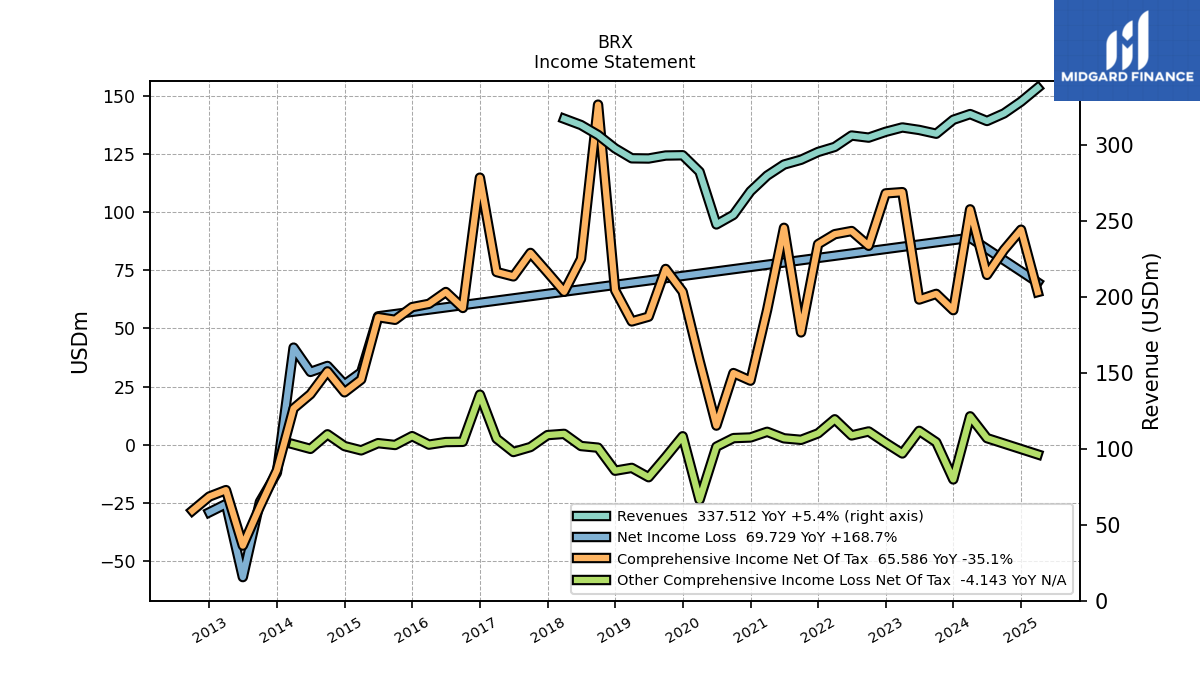
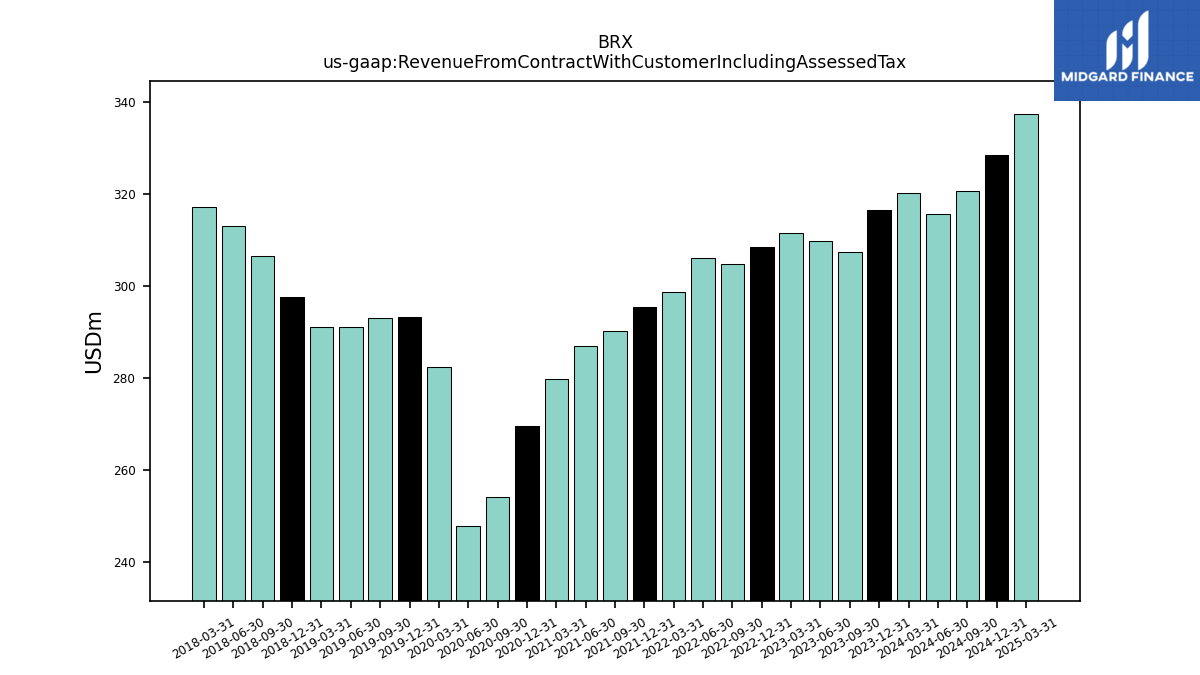
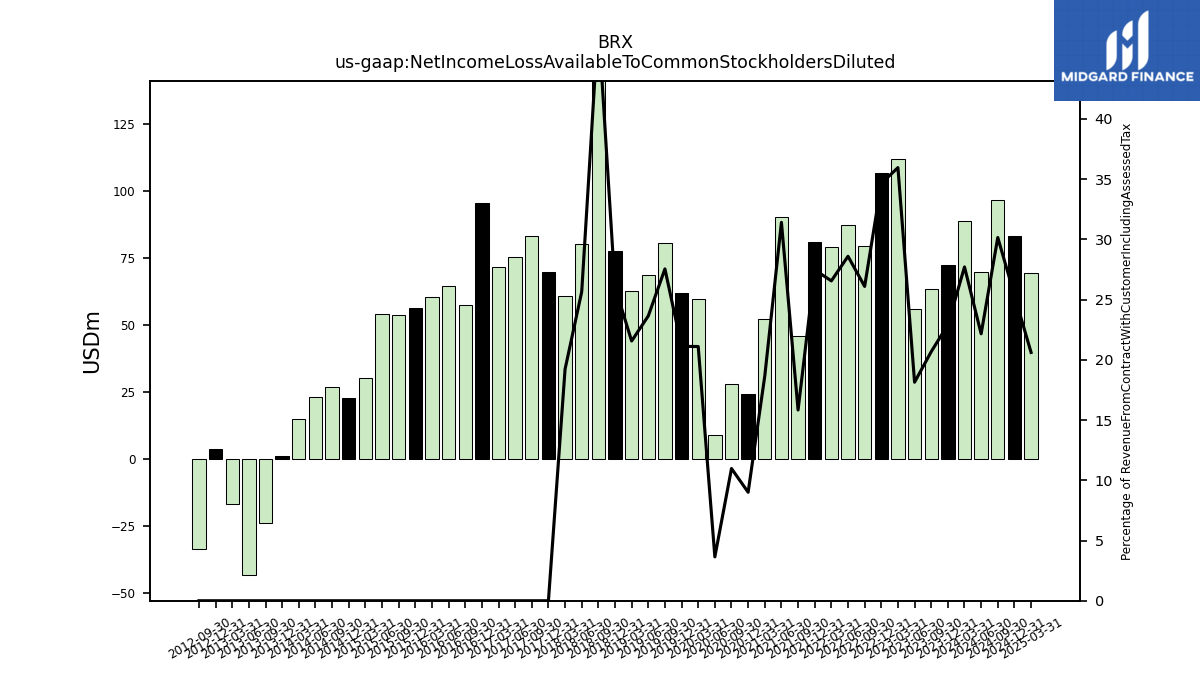
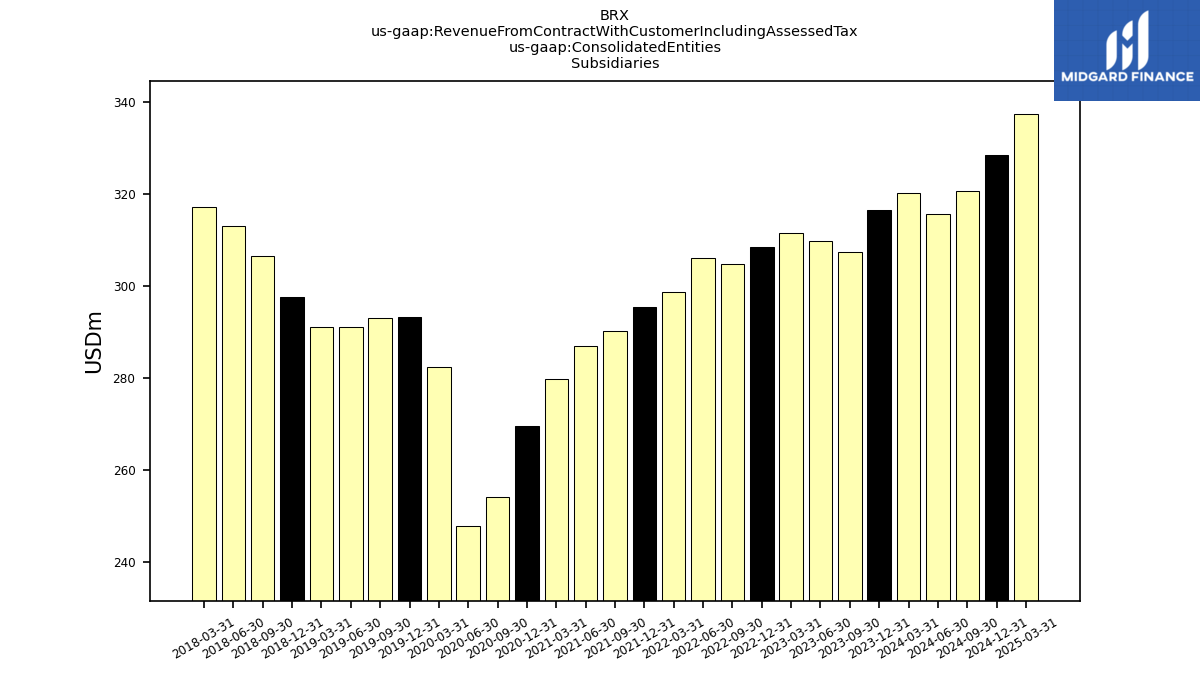
| Revenue From Contract With Customer Including Assessed Tax | 316.49 | 307.31 | 309.79 | 311.44 | 308.57 | 304.75 | 306.13 | 298.63 | 295.32 | 290.19 | 287.02 | 279.75 | 269.41 | 253.94 | 247.62 | 282.30 | 293.15 | 292.96 | 291.00 | 291.14 | 297.65 | 306.48 | 313.03 | 317.18 | |
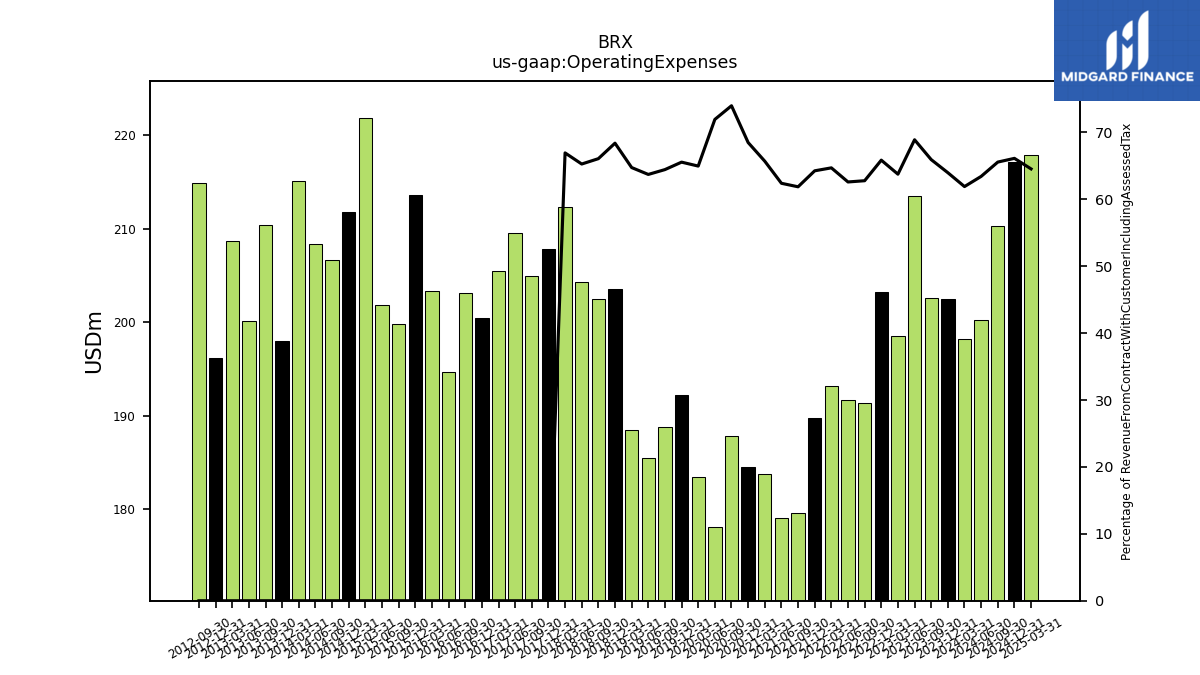
| Operating Expenses | 202.51 | 202.65 | 213.48 | 198.60 | 203.23 | 191.34 | 191.65 | 193.25 | 189.80 | 179.57 | 179.12 | 183.81 | 184.53 | 187.90 | 178.17 | 183.43 | 192.20 | 188.82 | 185.45 | 188.53 | 203.60 | 202.54 | 204.36 | 212.34 | |
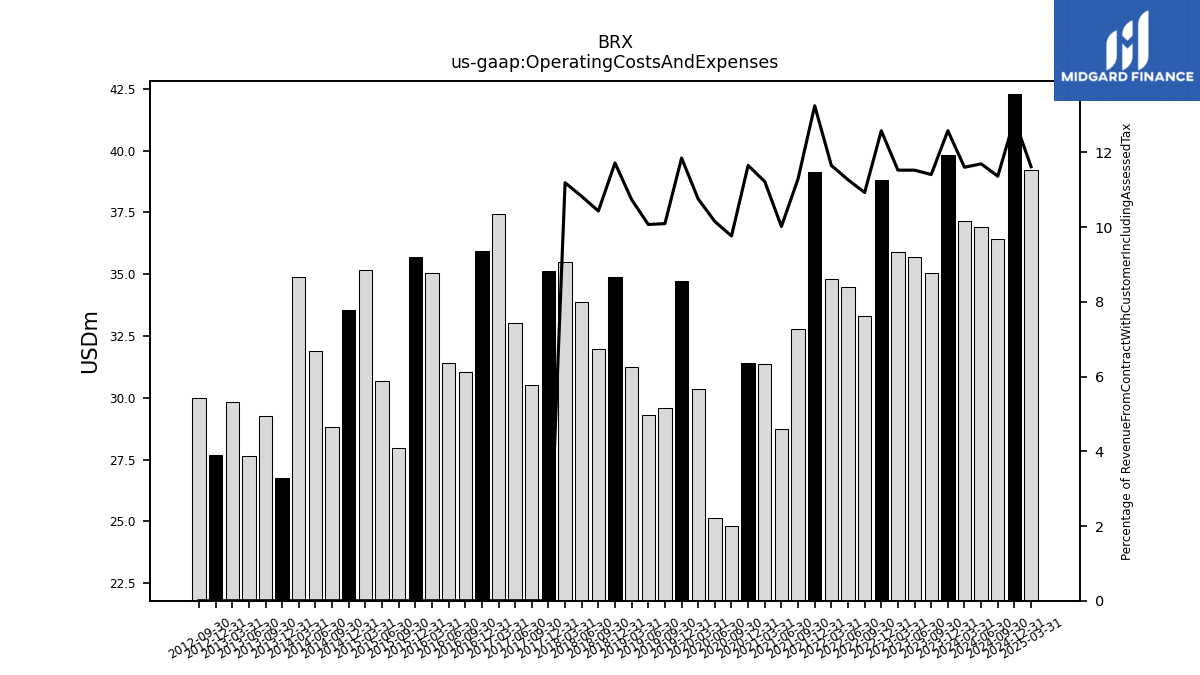
| Operating Costs And Expenses | 39.81 | 35.06 | 35.70 | 35.90 | 38.82 | 33.30 | 34.50 | 34.80 | 39.13 | 32.77 | 28.75 | 31.39 | 31.39 | 24.79 | 25.14 | 30.36 | 34.74 | 29.57 | 29.31 | 31.26 | 34.88 | 31.97 | 33.88 | 35.49 | |
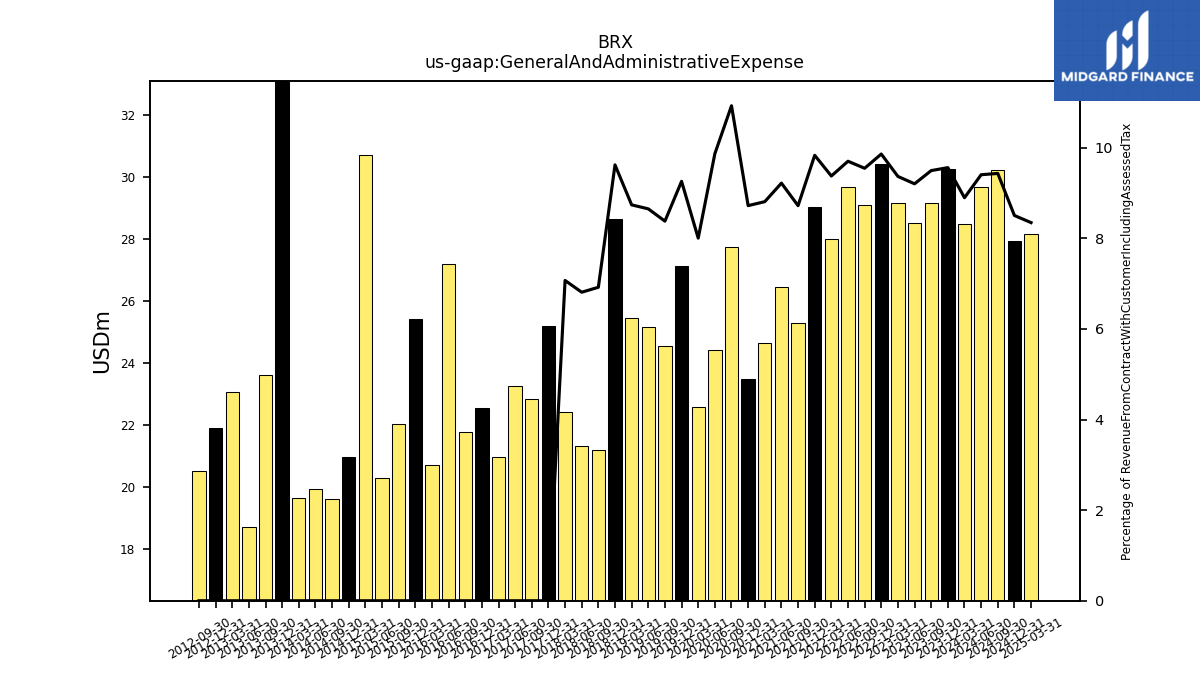
| General And Administrative Expense | 30.26 | 29.18 | 28.51 | 29.17 | 30.43 | 29.09 | 29.70 | 28.00 | 29.04 | 25.31 | 26.46 | 24.64 | 23.50 | 27.75 | 24.44 | 22.60 | 27.14 | 24.55 | 25.18 | 25.44 | 28.64 | 21.21 | 21.32 | 22.43 | |
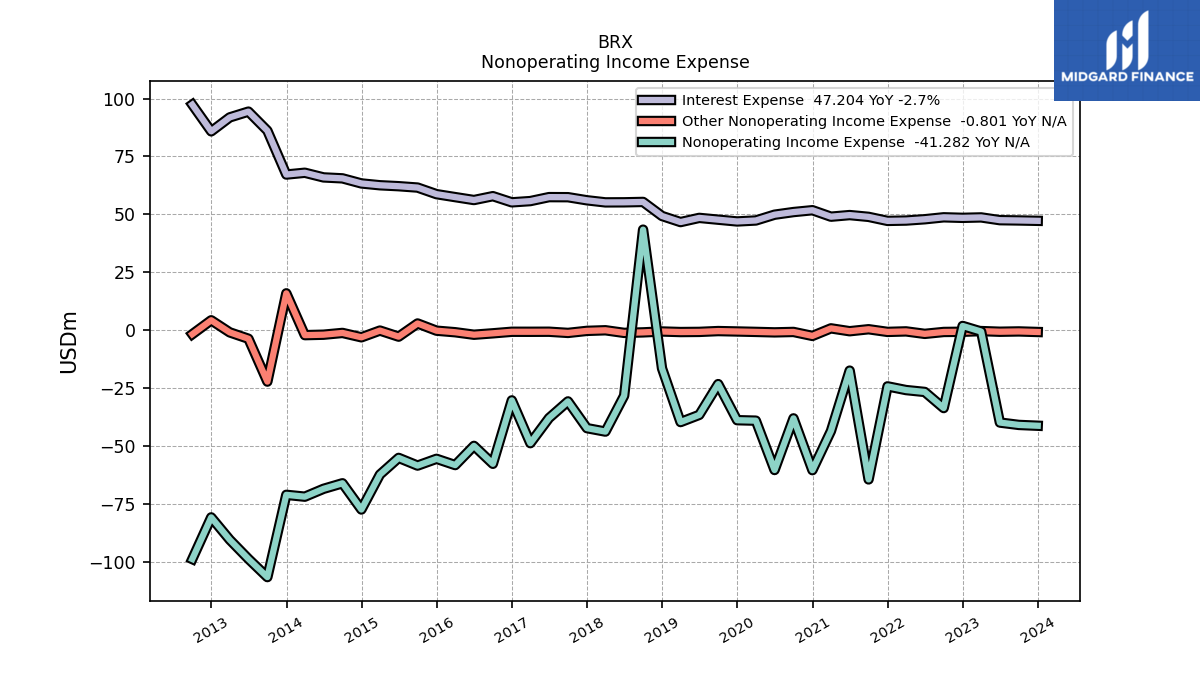
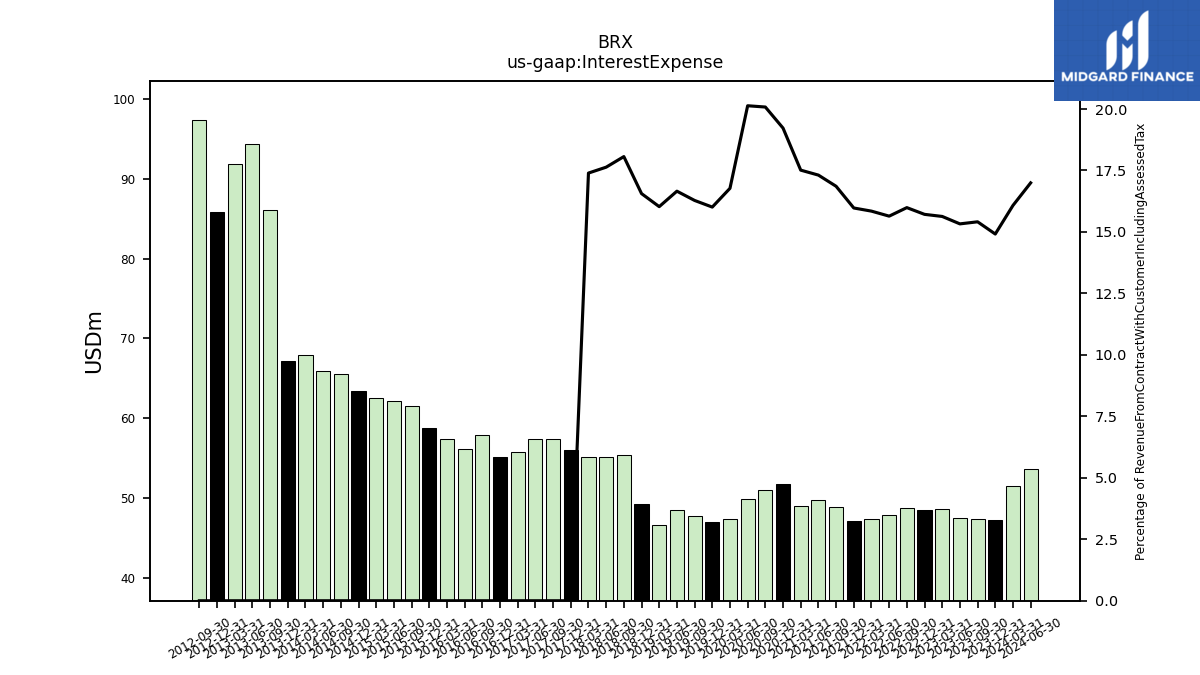
| Interest Expense | 47.20 | 47.36 | 47.48 | 48.68 | 48.49 | 48.73 | 47.89 | 47.32 | 47.17 | 48.92 | 49.69 | 48.99 | 51.79 | 50.99 | 49.85 | 47.35 | 46.94 | 47.70 | 48.48 | 46.67 | 49.29 | 55.36 | 55.20 | 55.17 | |
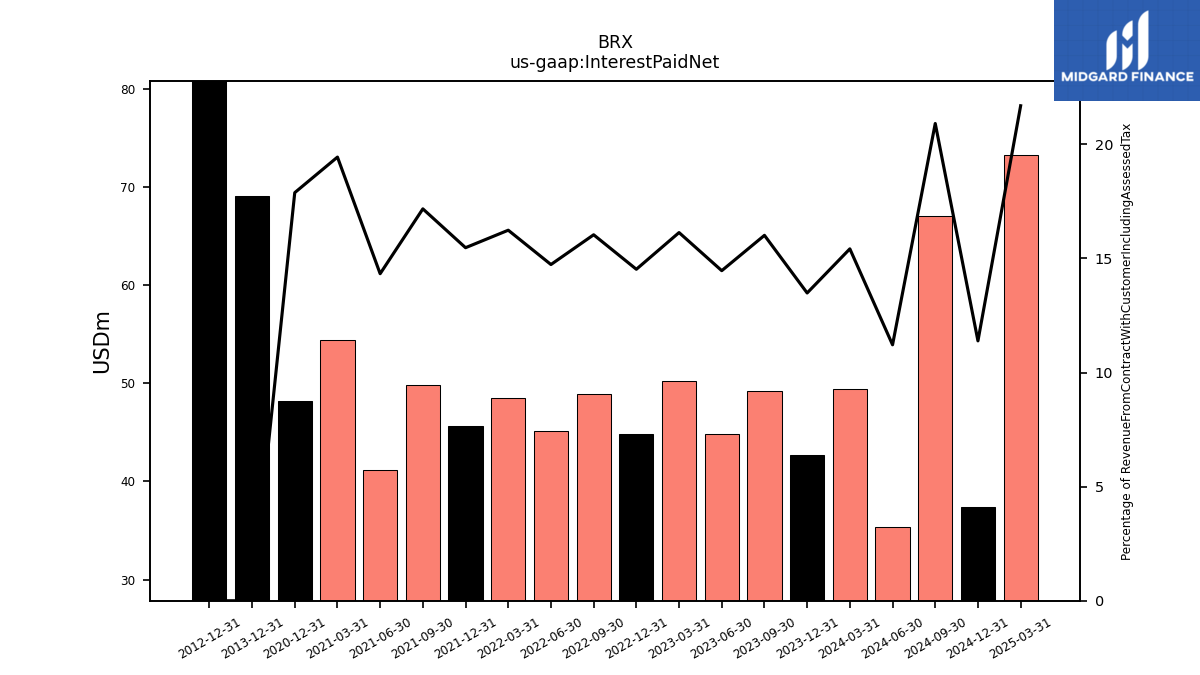
| Interest Paid Net | 42.69 | 49.21 | 44.81 | 50.25 | 44.82 | 48.87 | 45.10 | 48.49 | 45.69 | 49.84 | 41.13 | 54.39 | 48.18 | NA | NA | NA | NA | NA | NA | NA | NA | NA | NA | NA | |
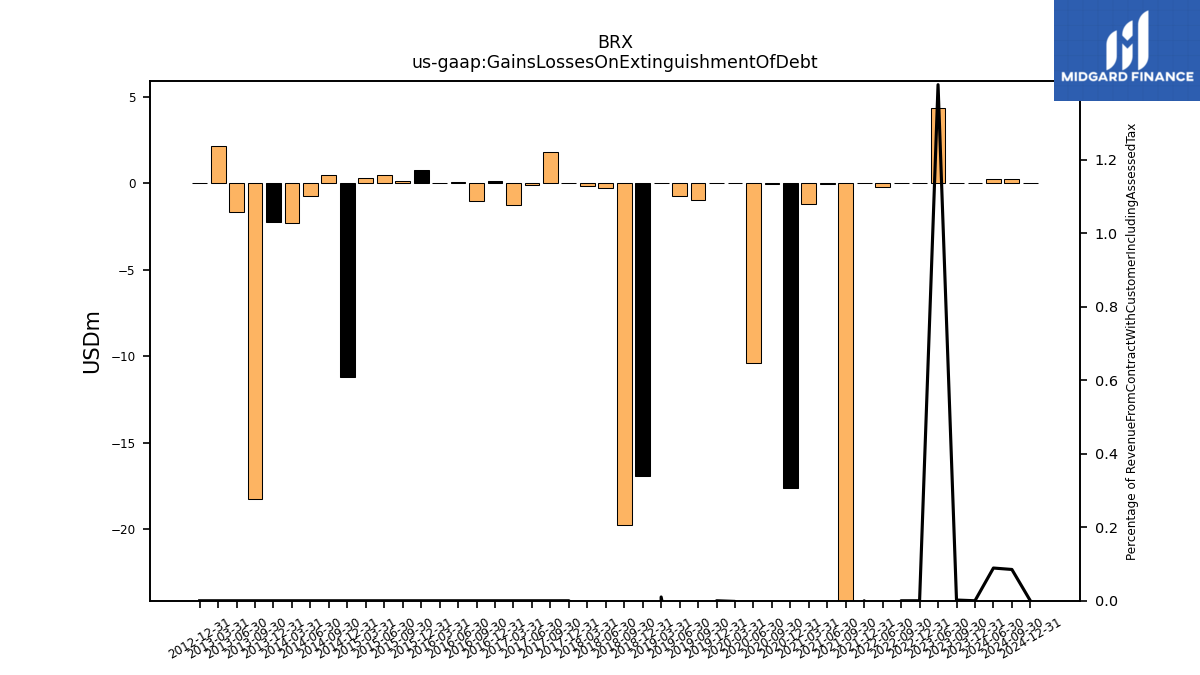
| Gains Losses On Extinguishment Of Debt | 0.00 | 0.01 | 4.35 | NA | 0.00 | 0.00 | -0.22 | NA | 0.00 | -27.12 | -0.03 | -1.20 | -17.61 | -0.05 | -10.39 | -0.01 | 0.00 | -0.94 | -0.71 | 0.03 | -16.90 | -19.76 | -0.29 | -0.13 | |
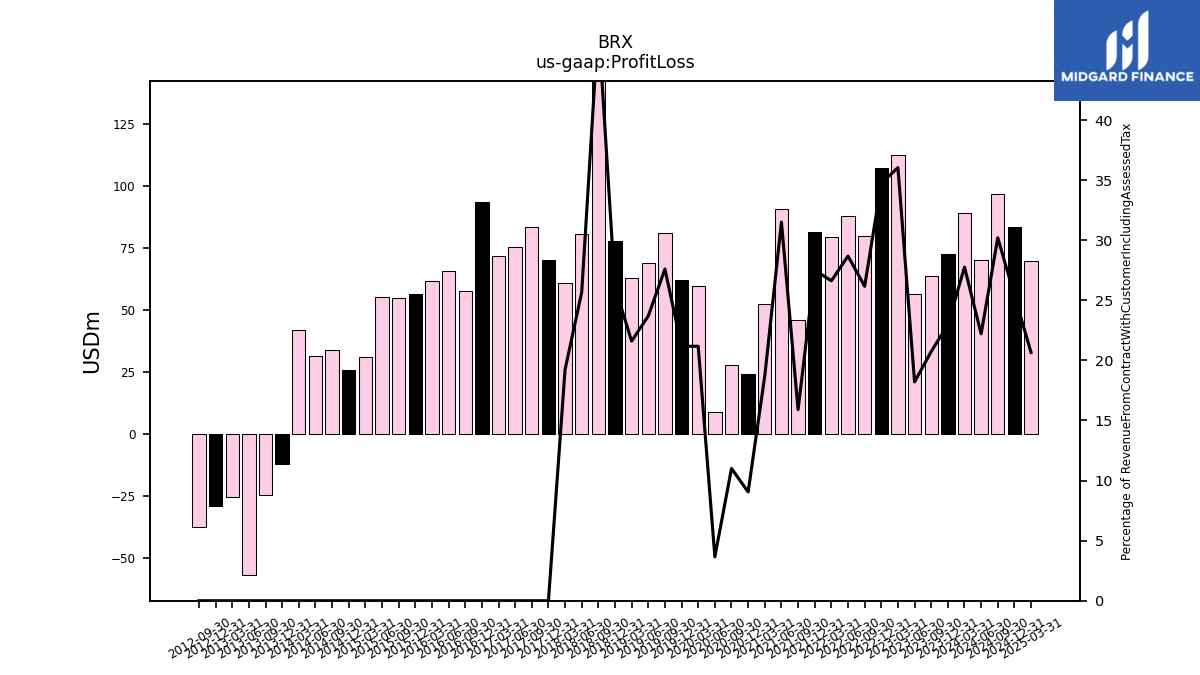
| Profit Loss | 72.70 | 63.74 | 56.41 | 112.25 | 107.16 | 79.74 | 87.79 | 79.51 | 81.24 | 46.15 | 90.43 | 52.37 | 24.40 | 27.94 | 9.04 | 59.78 | 62.06 | 80.85 | 68.96 | 62.90 | 77.55 | 147.35 | 80.36 | 61.02 | |
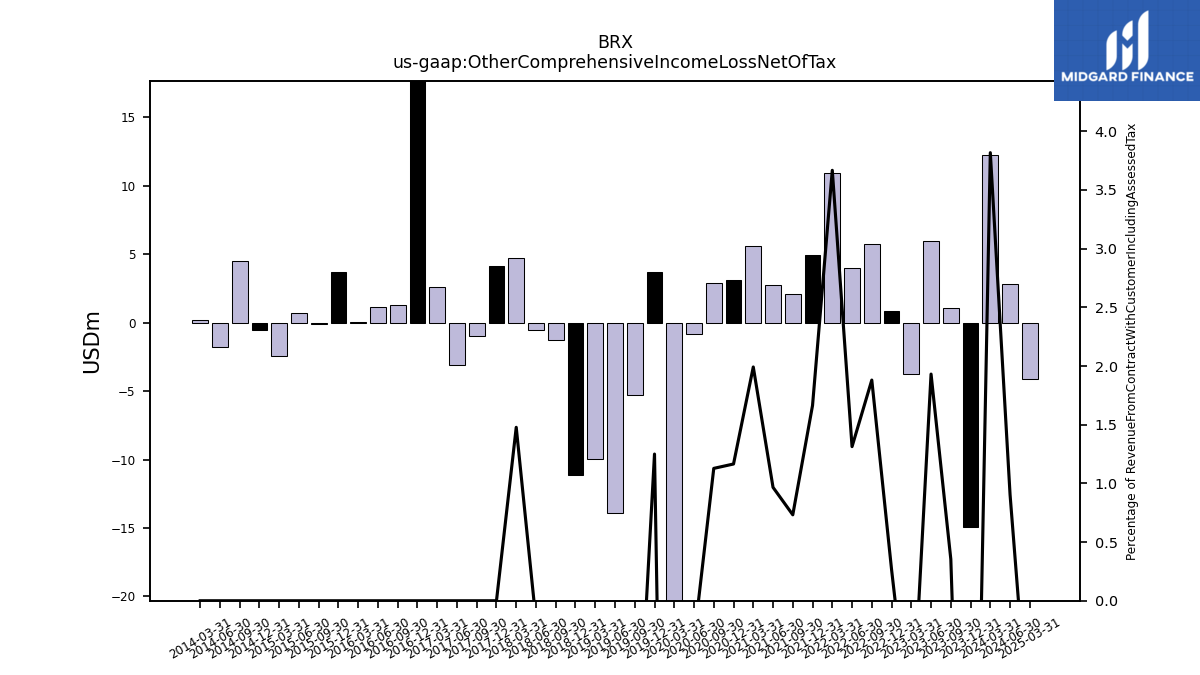
| Other Comprehensive Income Loss Net Of Tax | -14.89 | 1.09 | 5.98 | -3.73 | 0.82 | 5.73 | 4.02 | 10.95 | 4.91 | 2.12 | 2.77 | 5.57 | 3.14 | 2.86 | -0.82 | -23.70 | 3.66 | -5.32 | -13.94 | -9.93 | -11.15 | -1.24 | -0.54 | 4.69 | |
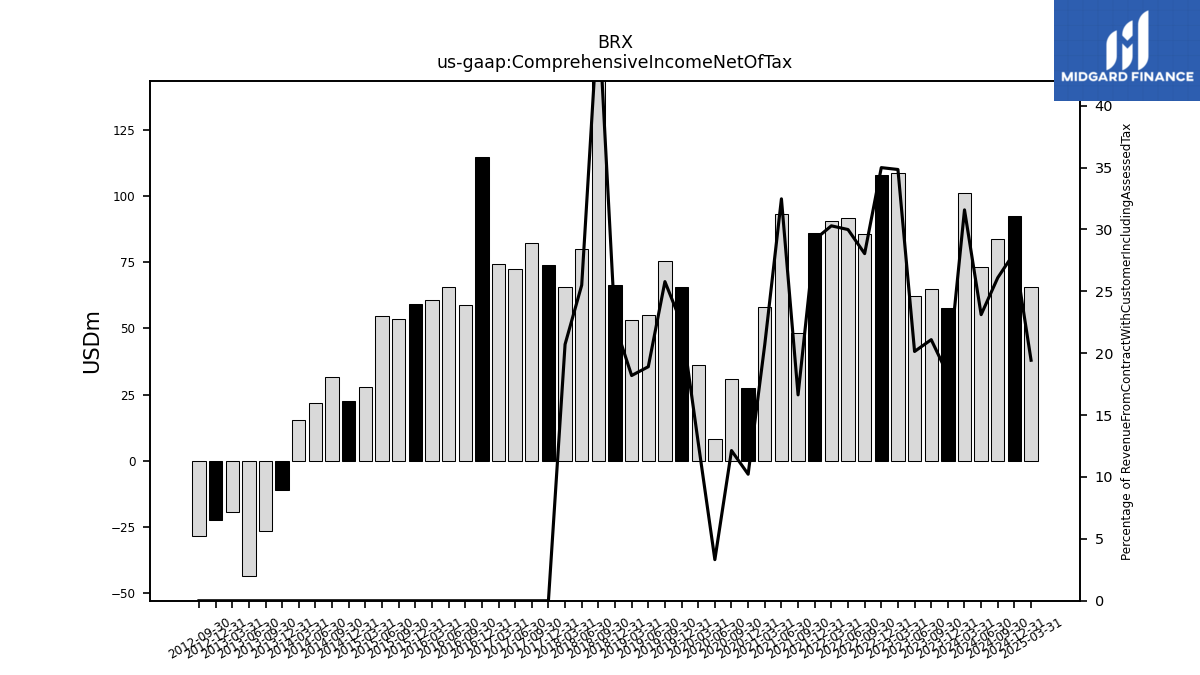
| Comprehensive Income Net Of Tax | 57.80 | 64.83 | 62.39 | 108.52 | 107.98 | 85.47 | 91.81 | 90.46 | 86.16 | 48.27 | 93.20 | 57.94 | 27.54 | 30.81 | 8.22 | 36.08 | 65.72 | 75.53 | 55.02 | 52.98 | 66.41 | 146.10 | 79.83 | 65.71 | |
| Net Income Loss Available To Common Stockholders Diluted | 72.49 | 63.52 | 56.19 | 111.95 | 106.86 | 79.50 | 87.52 | 79.28 | 81.09 | 45.94 | 90.14 | 52.19 | 24.26 | 27.86 | 9.02 | 59.56 | 61.89 | 80.68 | 68.79 | 62.76 | 77.49 | 147.18 | 80.27 | 60.97 |
| 2023-12-31 | 2023-09-30 | 2023-06-30 | 2023-03-31 | 2022-12-31 | 2022-09-30 | 2022-06-30 | 2022-03-31 | 2021-12-31 | 2021-09-30 | 2021-06-30 | 2021-03-31 | 2020-12-31 | 2020-09-30 | 2020-06-30 | 2020-03-31 | 2019-12-31 | 2019-09-30 | 2019-06-30 | 2019-03-31 | 2018-12-31 | 2018-09-30 | 2018-06-30 | 2018-03-31 | ||
|---|---|---|---|---|---|---|---|---|---|---|---|---|---|---|---|---|---|---|---|---|---|---|---|---|---|
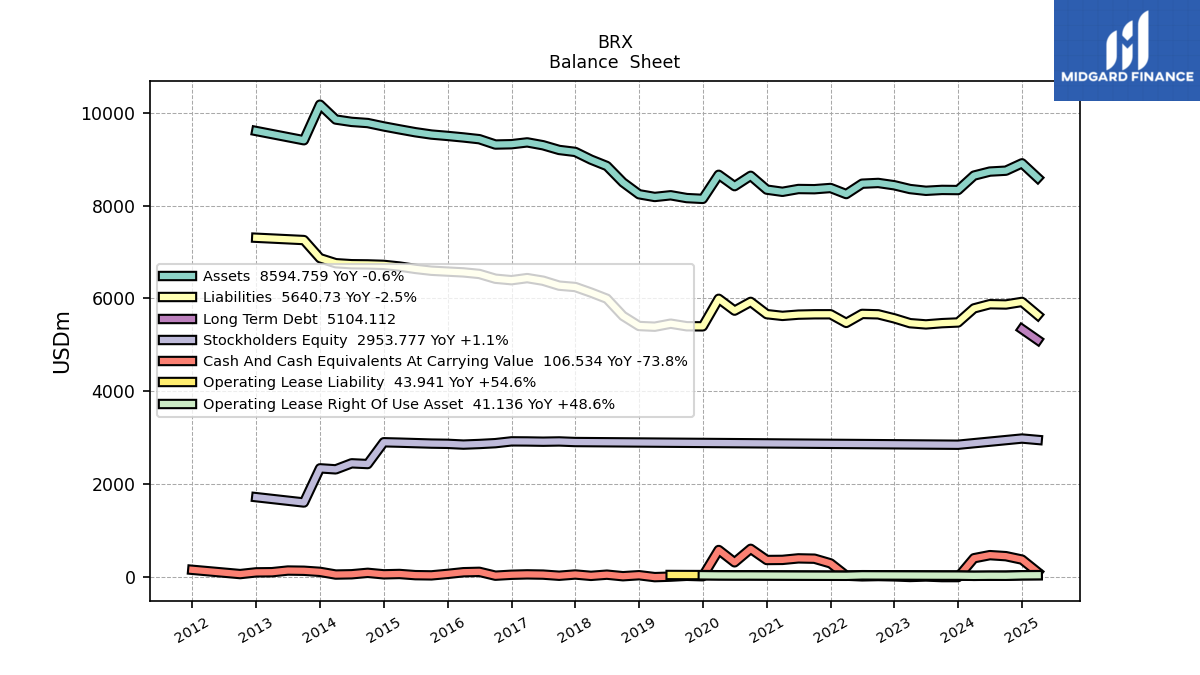
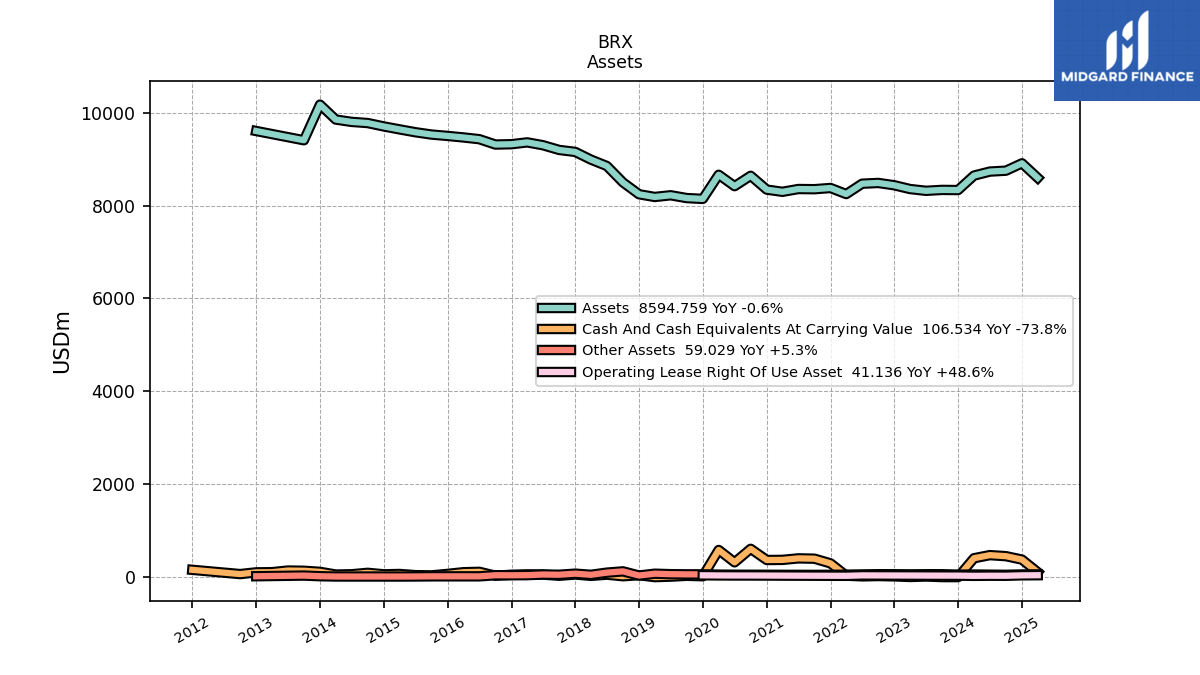
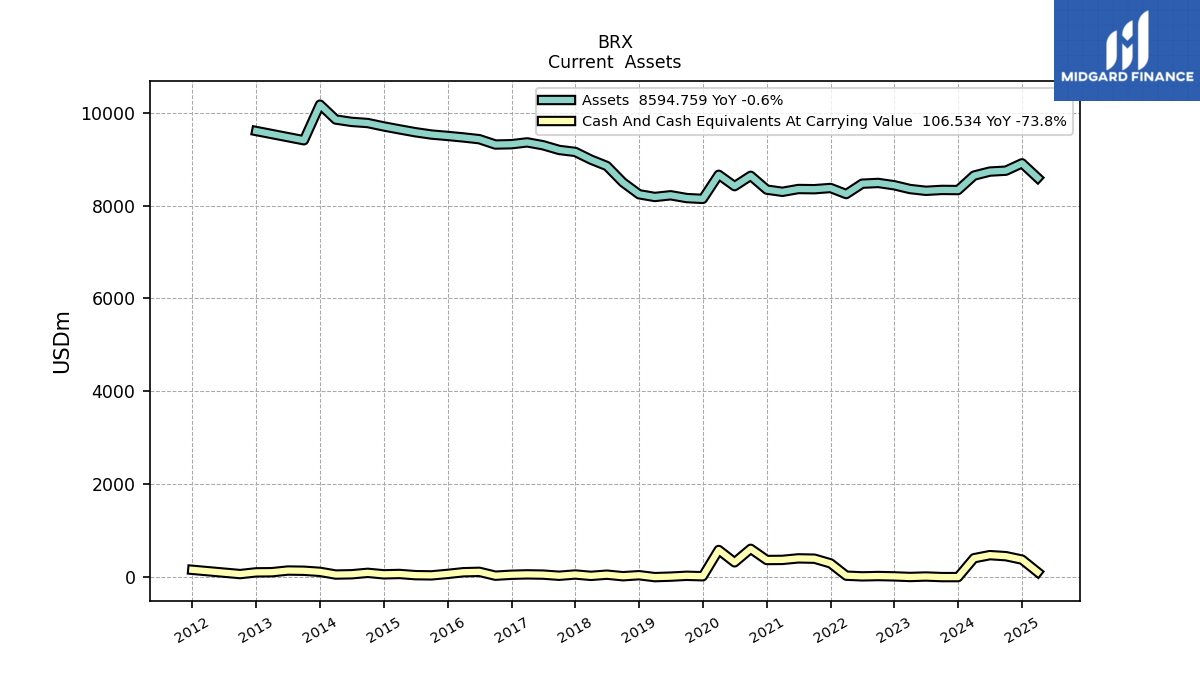
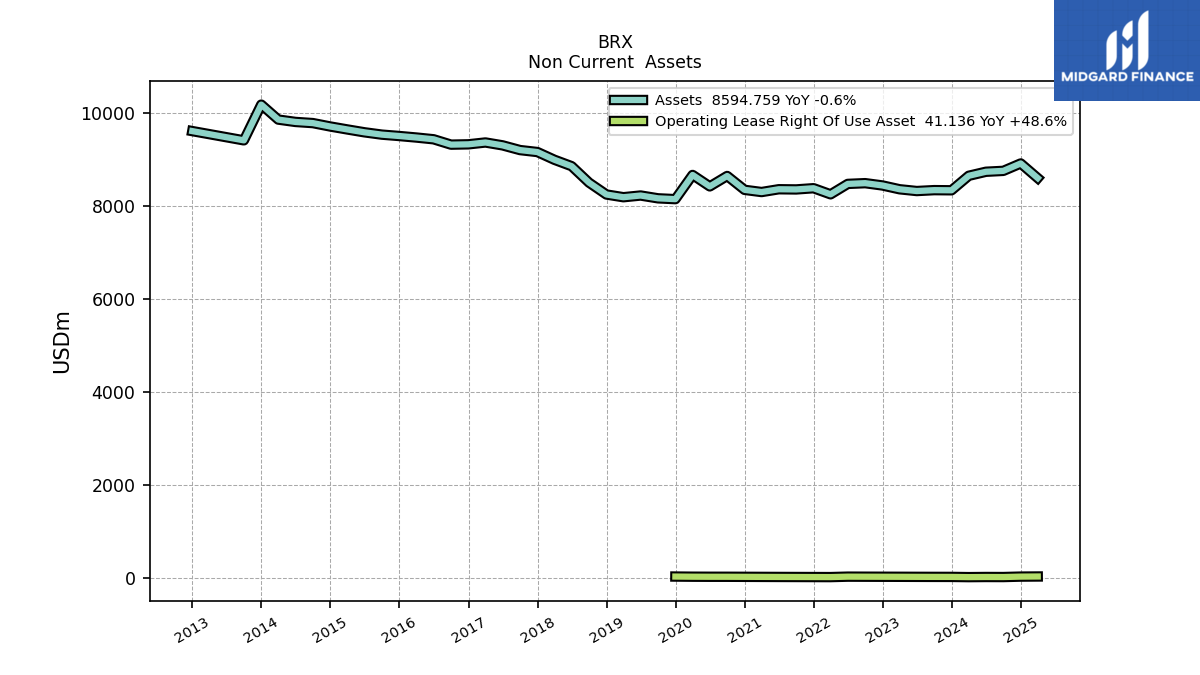
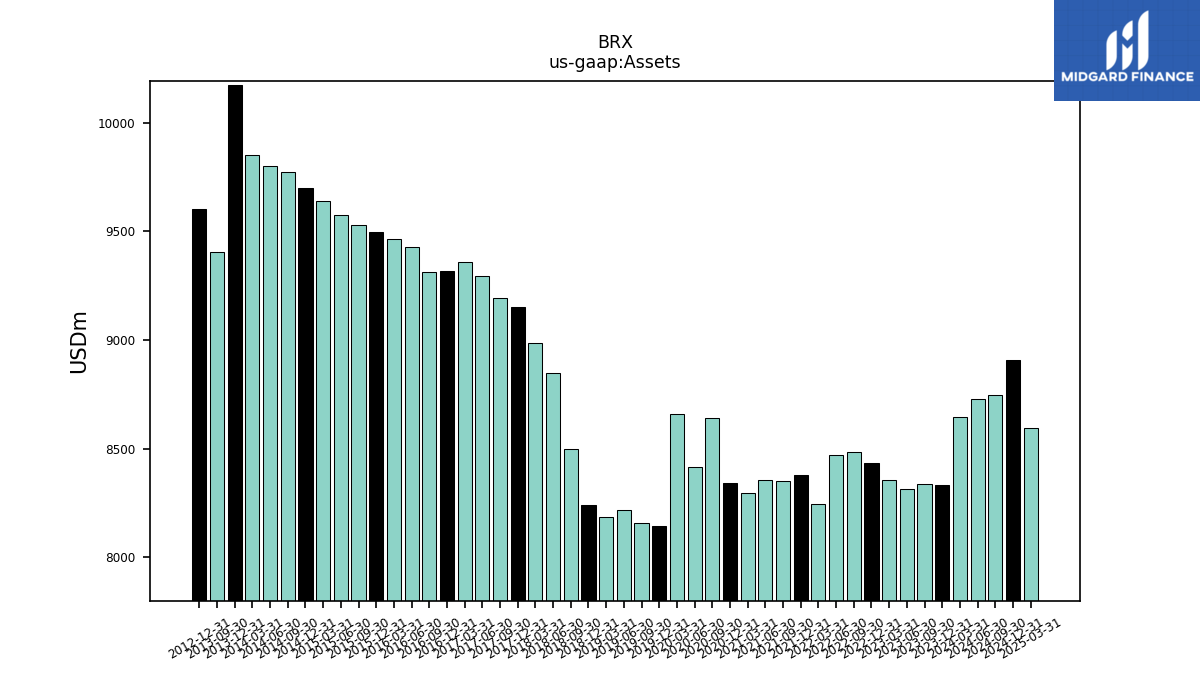
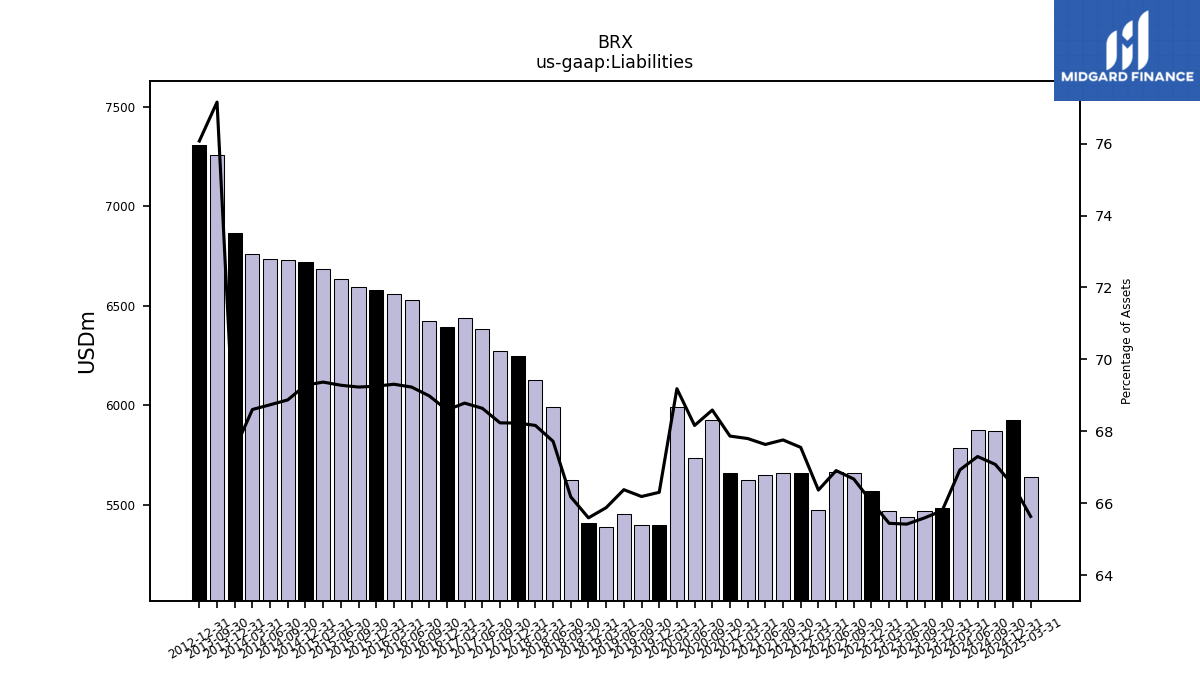
| Assets | 8332.72 | 8335.89 | 8316.66 | 8354.80 | 8435.93 | 8485.72 | 8469.73 | 8246.18 | 8377.39 | 8351.11 | 8355.17 | 8295.09 | 8342.15 | 8640.16 | 8416.28 | 8662.08 | 8142.50 | 8160.16 | 8220.52 | 8183.93 | 8242.42 | 8497.44 | 8850.55 | 8987.86 | |
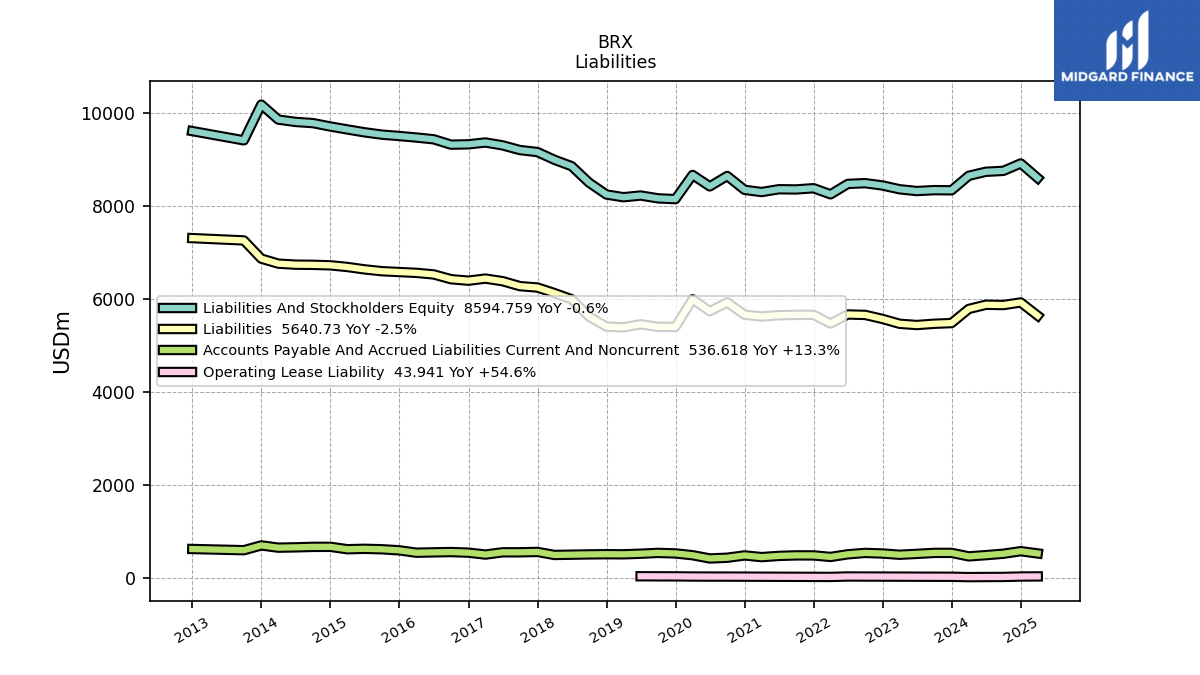
| Liabilities | 5482.41 | 5467.51 | 5440.49 | 5467.28 | 5570.92 | 5657.54 | 5666.73 | 5472.52 | 5659.05 | 5658.60 | 5650.83 | 5623.88 | 5661.45 | 5926.27 | 5736.66 | 5992.73 | 5398.64 | 5400.80 | 5456.34 | 5391.16 | 5406.32 | 5623.18 | 5993.58 | 6126.28 | |
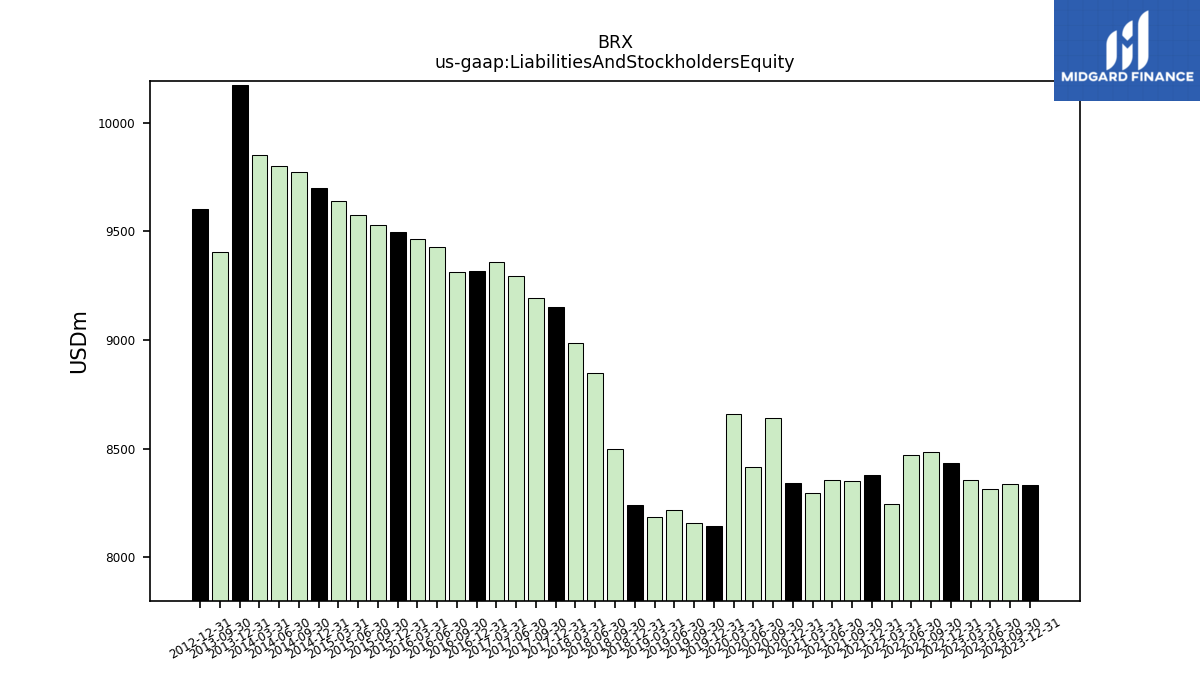
| Liabilities And Stockholders Equity | 8332.72 | 8335.89 | 8316.66 | 8354.80 | 8435.93 | 8485.72 | 8469.73 | 8246.18 | 8377.39 | 8351.11 | 8355.17 | 8295.09 | 8342.15 | 8640.16 | 8416.28 | 8662.08 | 8142.50 | 8160.16 | 8220.52 | 8183.93 | 8242.42 | 8497.44 | 8850.55 | 8987.86 |
| 2023-12-31 | 2023-09-30 | 2023-06-30 | 2023-03-31 | 2022-12-31 | 2022-09-30 | 2022-06-30 | 2022-03-31 | 2021-12-31 | 2021-09-30 | 2021-06-30 | 2021-03-31 | 2020-12-31 | 2020-09-30 | 2020-06-30 | 2020-03-31 | 2019-12-31 | 2019-09-30 | 2019-06-30 | 2019-03-31 | 2018-12-31 | 2018-09-30 | 2018-06-30 | 2018-03-31 | ||
|---|---|---|---|---|---|---|---|---|---|---|---|---|---|---|---|---|---|---|---|---|---|---|---|---|---|
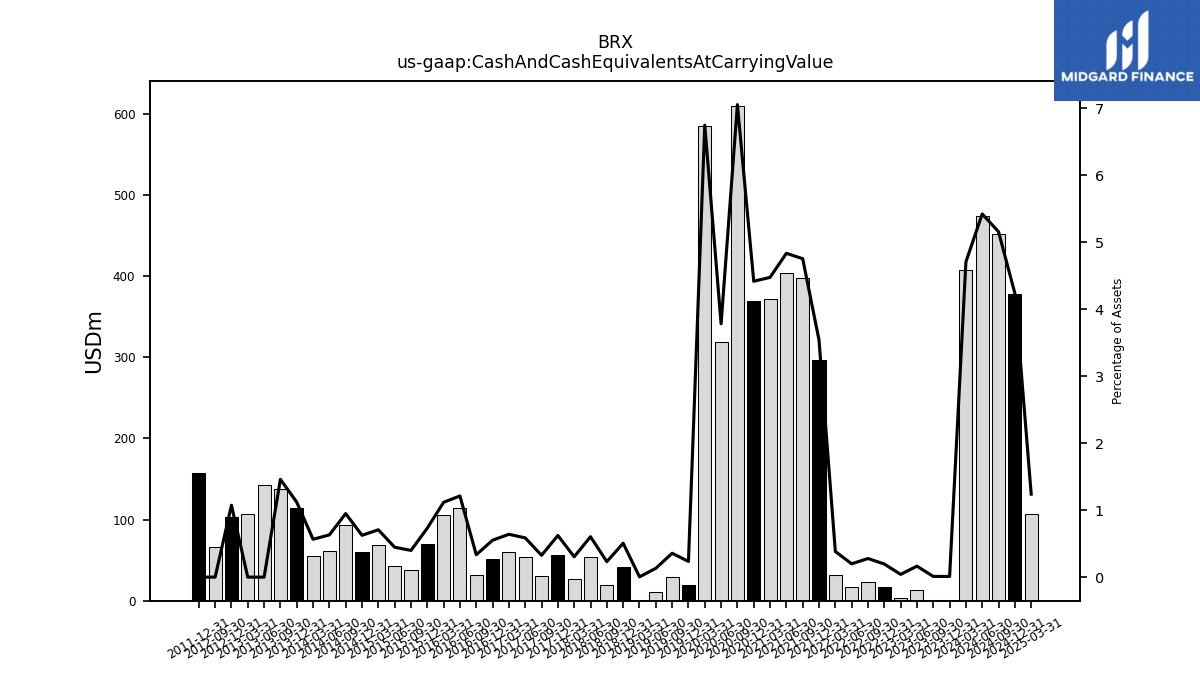
| Cash And Cash Equivalents At Carrying Value | 0.87 | 0.86 | 13.65 | 3.43 | 16.49 | 23.59 | 16.83 | 31.57 | 296.63 | 397.20 | 404.14 | 371.40 | 368.68 | 609.81 | 318.54 | 584.83 | 19.10 | 29.07 | 10.81 | 0.35 | 41.74 | 19.61 | 53.42 | 27.33 | |
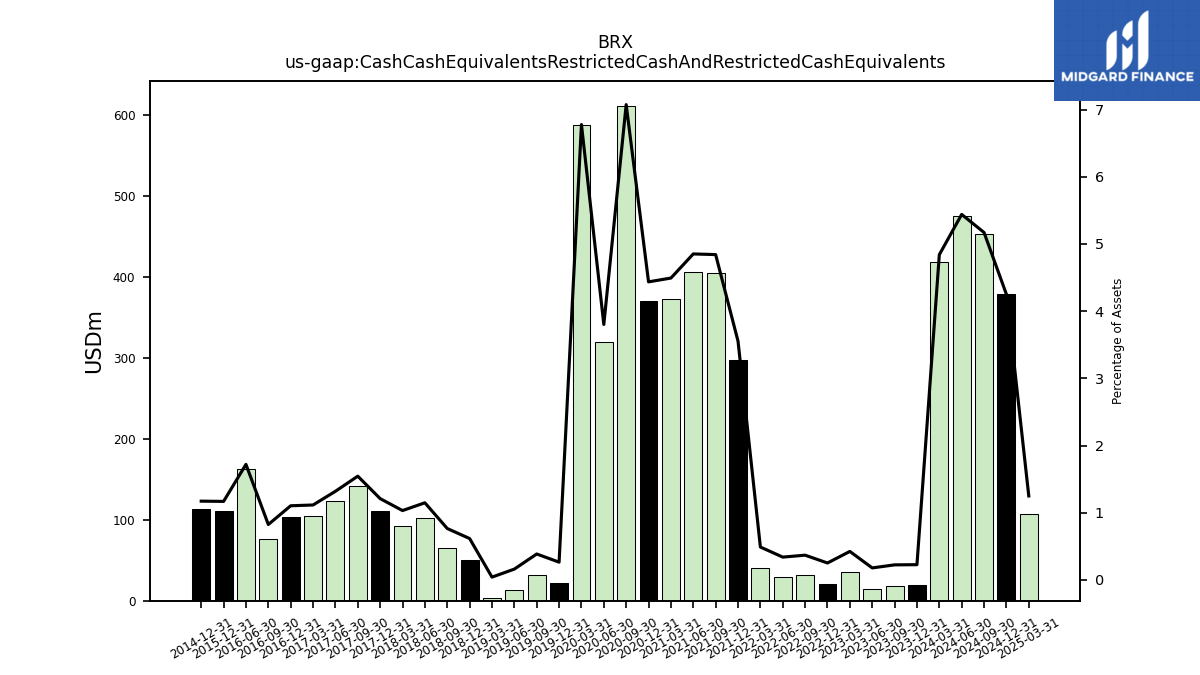
| Cash Cash Equivalents Restricted Cash And Restricted Cash Equivalents | 18.90 | 18.68 | 14.86 | 35.43 | 21.26 | 31.25 | 28.76 | 40.38 | 297.74 | 404.36 | 405.39 | 372.68 | 370.09 | 611.22 | 319.99 | 587.09 | 21.52 | 31.48 | 13.26 | 3.41 | 50.77 | 65.02 | 101.62 | 92.77 | |
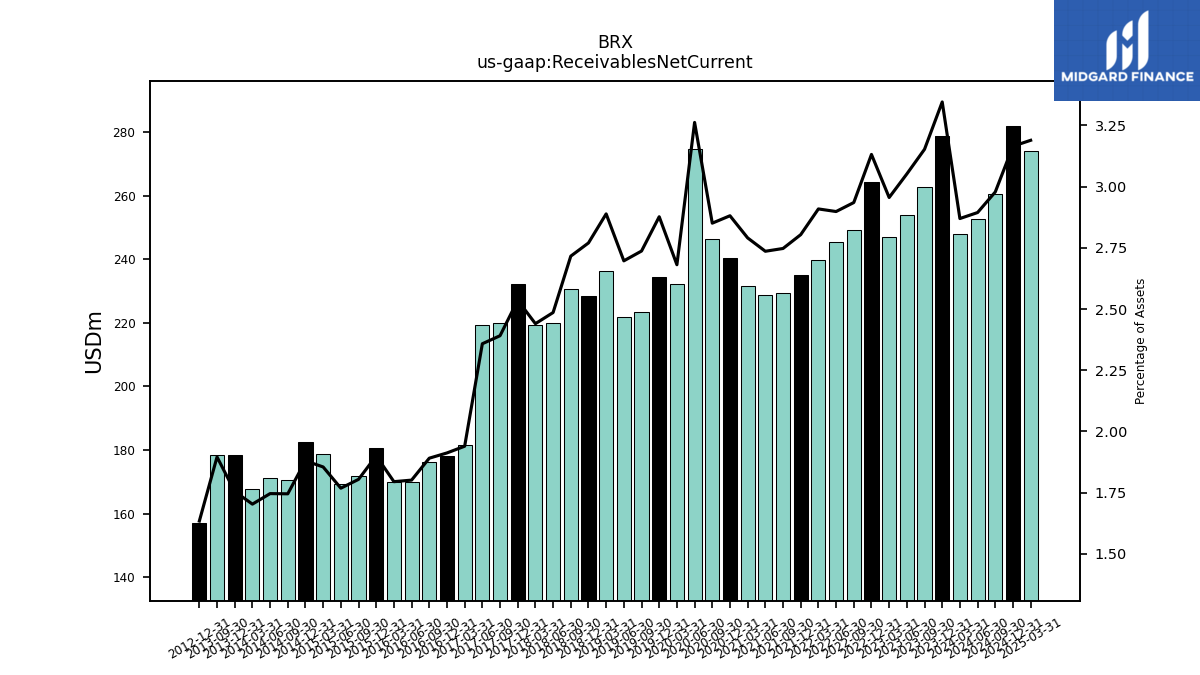
| Receivables Net Current | 278.77 | 262.77 | 253.79 | 246.91 | 264.15 | 249.04 | 245.46 | 239.86 | 234.87 | 229.42 | 228.58 | 231.46 | 240.32 | 246.29 | 274.53 | 232.22 | 234.25 | 223.32 | 221.68 | 236.39 | 228.30 | 230.78 | 219.99 | 219.31 | |
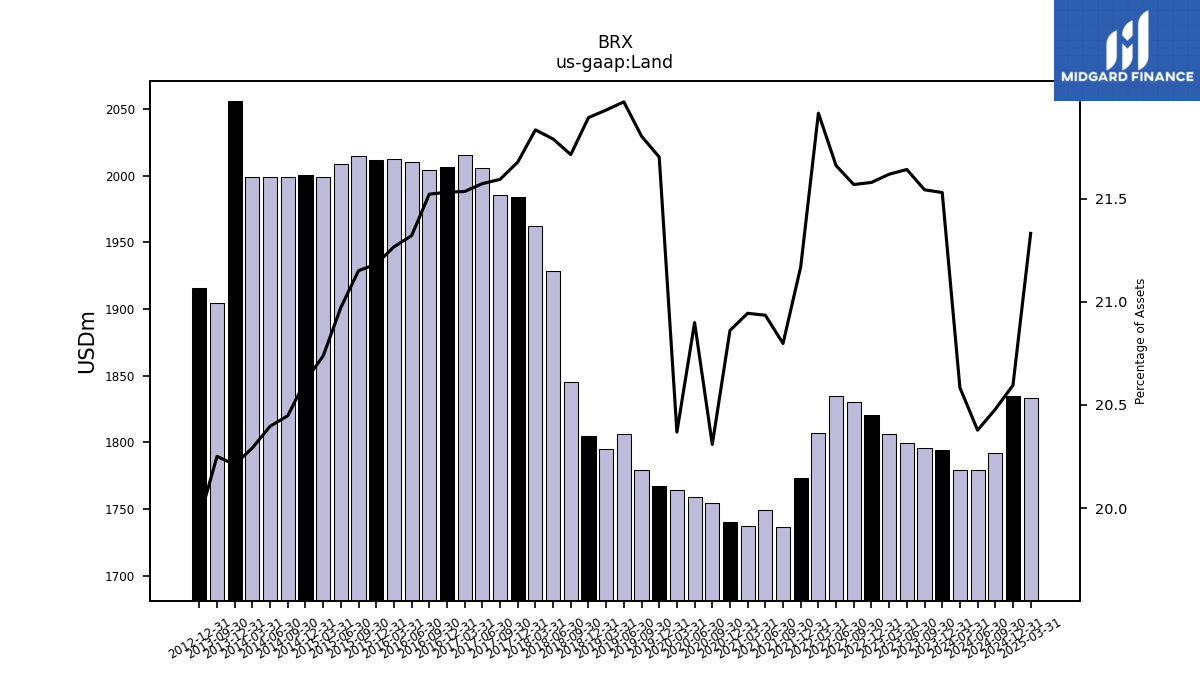
| Land | 1794.01 | 1795.81 | 1799.84 | 1806.19 | 1820.36 | 1830.25 | 1834.56 | 1807.11 | 1773.45 | 1736.88 | 1749.14 | 1737.34 | 1740.26 | 1754.71 | 1758.95 | 1764.32 | 1767.03 | 1779.16 | 1805.99 | 1794.71 | 1804.50 | 1845.11 | 1928.47 | 1962.36 |
| 2023-12-31 | 2023-09-30 | 2023-06-30 | 2023-03-31 | 2022-12-31 | 2022-09-30 | 2022-06-30 | 2022-03-31 | 2021-12-31 | 2021-09-30 | 2021-06-30 | 2021-03-31 | 2020-12-31 | 2020-09-30 | 2020-06-30 | 2020-03-31 | 2019-12-31 | 2019-09-30 | 2019-06-30 | 2019-03-31 | 2018-12-31 | 2018-09-30 | 2018-06-30 | 2018-03-31 | ||
|---|---|---|---|---|---|---|---|---|---|---|---|---|---|---|---|---|---|---|---|---|---|---|---|---|---|
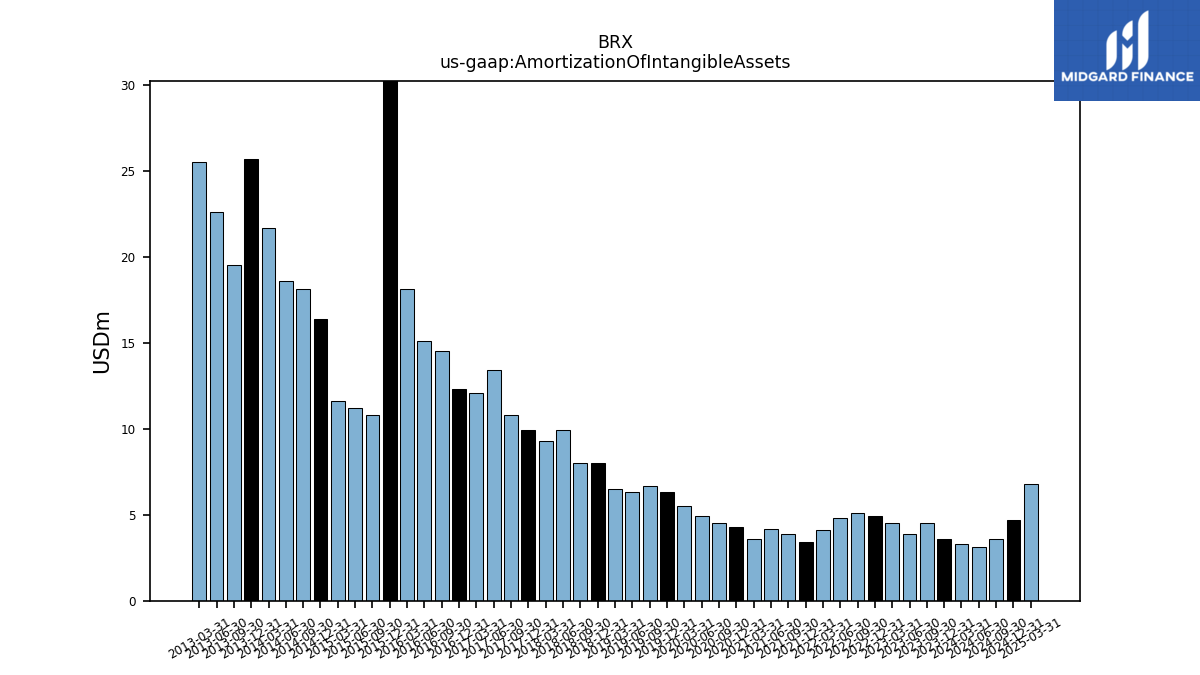
| Amortization Of Intangible Assets | 3.60 | 4.50 | 3.90 | 4.50 | 4.90 | 5.10 | 4.80 | 4.10 | 3.40 | 3.90 | 4.20 | 3.60 | 4.30 | 4.50 | 4.90 | 5.50 | 6.30 | 6.70 | 6.30 | 6.50 | 8.00 | 8.00 | 9.90 | 9.30 |
| 2023-12-31 | 2023-09-30 | 2023-06-30 | 2023-03-31 | 2022-12-31 | 2022-09-30 | 2022-06-30 | 2022-03-31 | 2021-12-31 | 2021-09-30 | 2021-06-30 | 2021-03-31 | 2020-12-31 | 2020-09-30 | 2020-06-30 | 2020-03-31 | 2019-12-31 | 2019-09-30 | 2019-06-30 | 2019-03-31 | 2018-12-31 | 2018-09-30 | 2018-06-30 | 2018-03-31 | ||
|---|---|---|---|---|---|---|---|---|---|---|---|---|---|---|---|---|---|---|---|---|---|---|---|---|---|
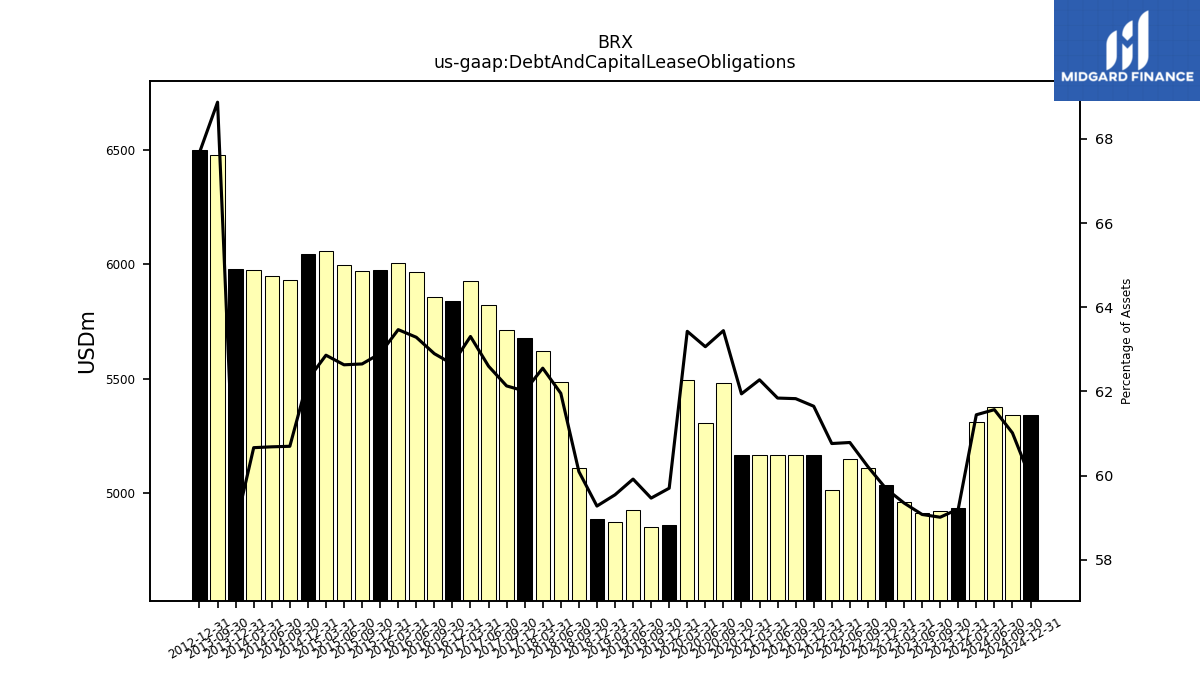
| Debt And Capital Lease Obligations | 4933.52 | 4919.16 | 4913.21 | 4958.48 | 5035.50 | 5109.45 | 5148.48 | 5010.57 | 5164.52 | 5163.38 | 5167.04 | 5165.86 | 5167.33 | 5481.66 | 5307.53 | 5494.20 | 4861.19 | 4852.51 | 4925.54 | 4873.06 | 4885.86 | 5106.71 | 5483.35 | 5622.11 |
| 2023-12-31 | 2023-09-30 | 2023-06-30 | 2023-03-31 | 2022-12-31 | 2022-09-30 | 2022-06-30 | 2022-03-31 | 2021-12-31 | 2021-09-30 | 2021-06-30 | 2021-03-31 | 2020-12-31 | 2020-09-30 | 2020-06-30 | 2020-03-31 | 2019-12-31 | 2019-09-30 | 2019-06-30 | 2019-03-31 | 2018-12-31 | 2018-09-30 | 2018-06-30 | 2018-03-31 | ||
|---|---|---|---|---|---|---|---|---|---|---|---|---|---|---|---|---|---|---|---|---|---|---|---|---|---|
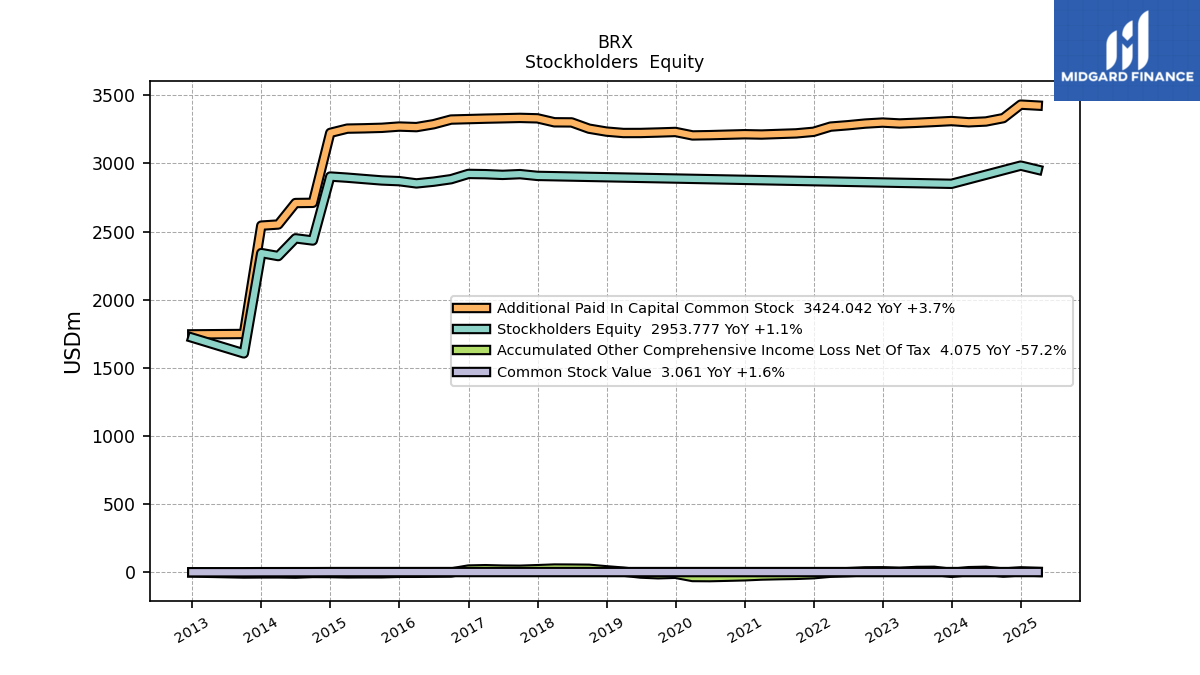
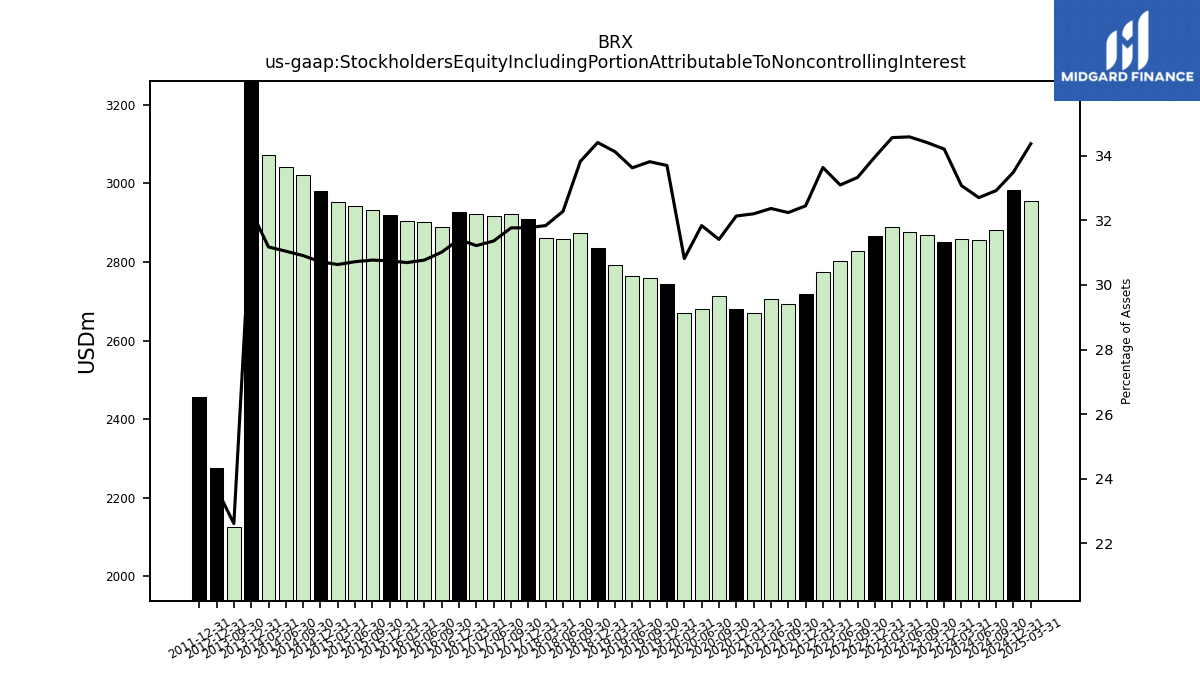
| Stockholders Equity Including Portion Attributable To Noncontrolling Interest | 2850.30 | 2868.38 | 2876.17 | 2887.52 | 2865.01 | 2828.18 | 2802.99 | 2773.66 | 2718.35 | 2692.51 | 2704.34 | 2671.20 | 2680.70 | 2713.89 | 2679.62 | 2669.35 | 2743.86 | 2759.36 | 2764.18 | 2792.77 | 2836.10 | 2874.26 | 2856.97 | 2861.58 | |
| Common Stock Value | 3.01 | 3.01 | 3.01 | 3.00 | 3.00 | 3.00 | 3.00 | 3.00 | 2.97 | 2.97 | 2.97 | 2.97 | 2.96 | 2.96 | 2.96 | 2.96 | 2.98 | 2.98 | 2.98 | 2.98 | 2.98 | 3.00 | 3.03 | 3.03 | |
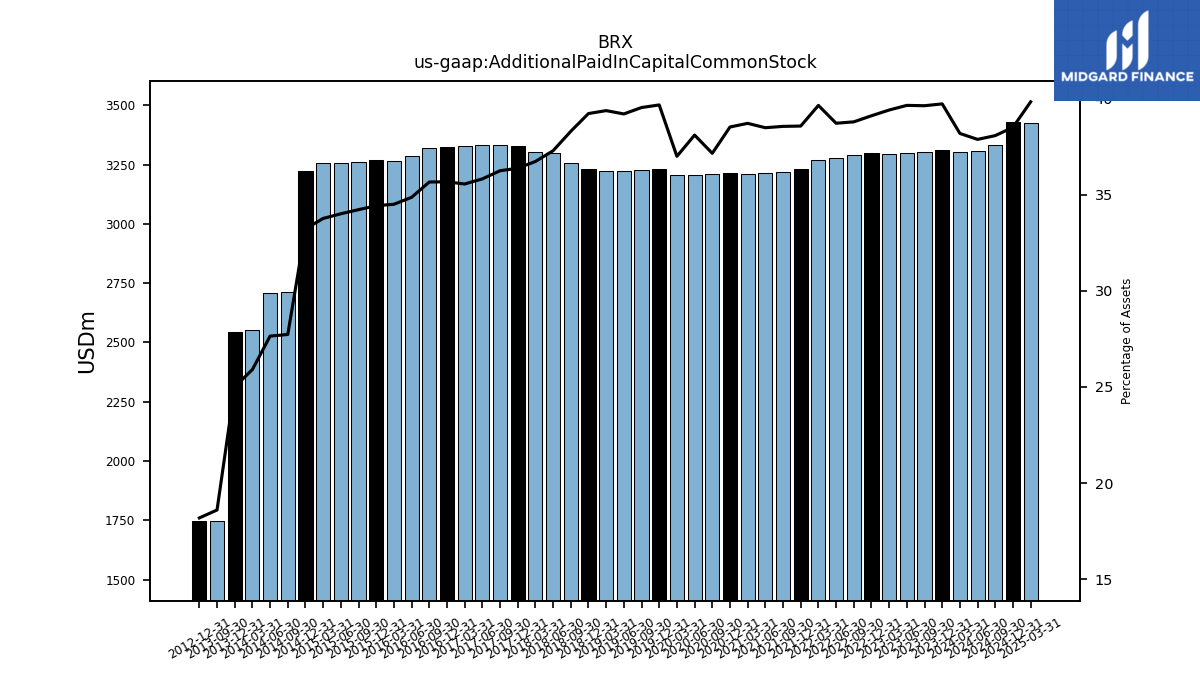
| Additional Paid In Capital Common Stock | 3310.59 | 3303.93 | 3297.80 | 3292.78 | 3299.50 | 3292.05 | 3279.78 | 3269.72 | 3231.73 | 3220.18 | 3215.95 | 3211.66 | 3213.99 | 3210.58 | 3207.12 | 3205.07 | 3230.62 | 3226.53 | 3223.06 | 3222.84 | 3233.33 | 3254.72 | 3300.64 | 3301.48 | |
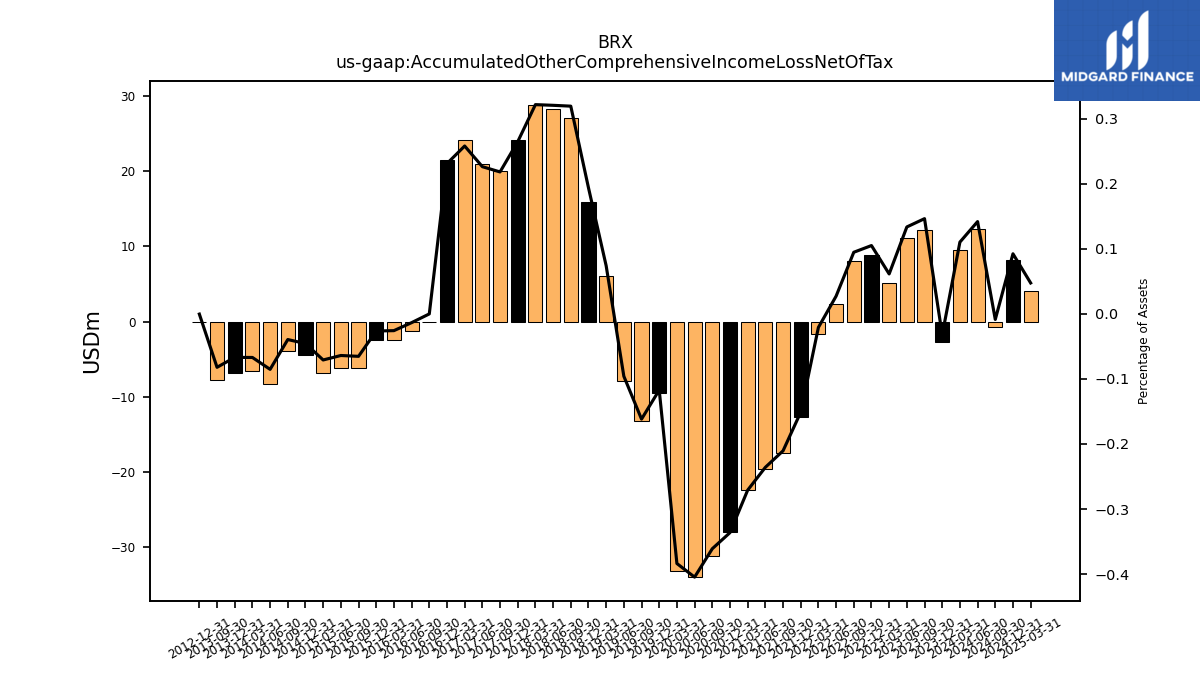
| Accumulated Other Comprehensive Income Loss Net Of Tax | -2.70 | 12.19 | 11.10 | 5.12 | 8.85 | 8.03 | 2.30 | -1.72 | -12.67 | -17.59 | -19.71 | -22.49 | -28.06 | -31.20 | -34.06 | -33.24 | -9.54 | -13.21 | -7.89 | 6.05 | 15.97 | 27.12 | 28.36 | 28.90 |
| 2023-12-31 | 2023-09-30 | 2023-06-30 | 2023-03-31 | 2022-12-31 | 2022-09-30 | 2022-06-30 | 2022-03-31 | 2021-12-31 | 2021-09-30 | 2021-06-30 | 2021-03-31 | 2020-12-31 | 2020-09-30 | 2020-06-30 | 2020-03-31 | 2019-12-31 | 2019-09-30 | 2019-06-30 | 2019-03-31 | 2018-12-31 | 2018-09-30 | 2018-06-30 | 2018-03-31 | ||
|---|---|---|---|---|---|---|---|---|---|---|---|---|---|---|---|---|---|---|---|---|---|---|---|---|---|
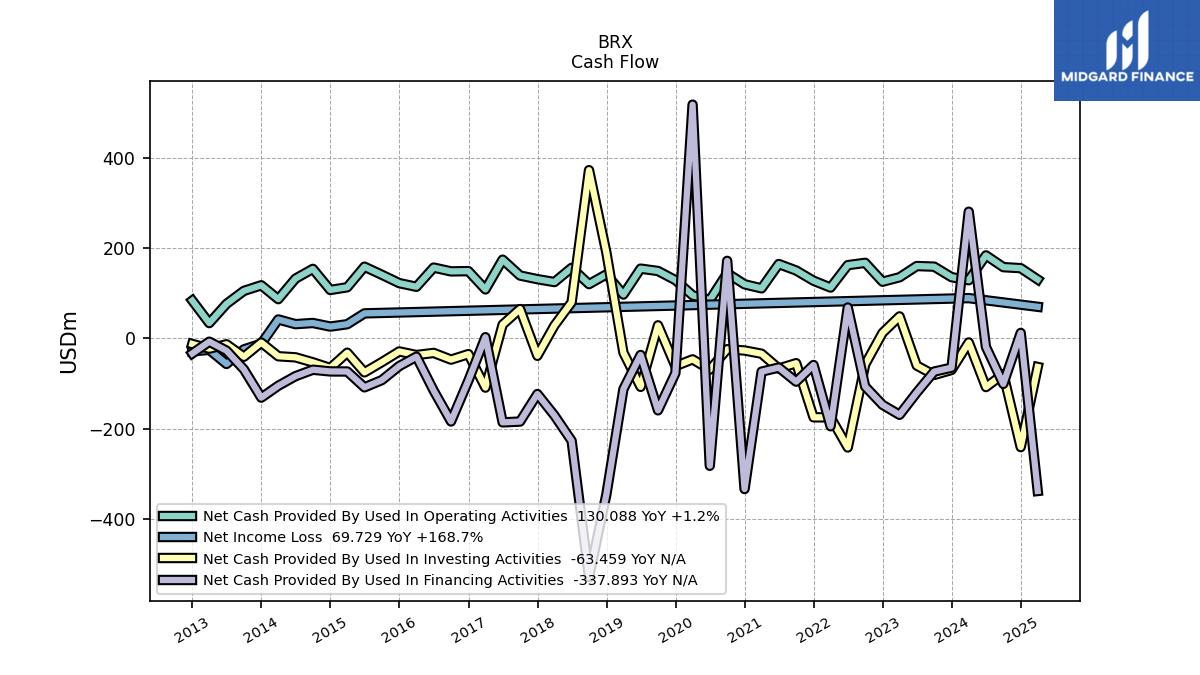
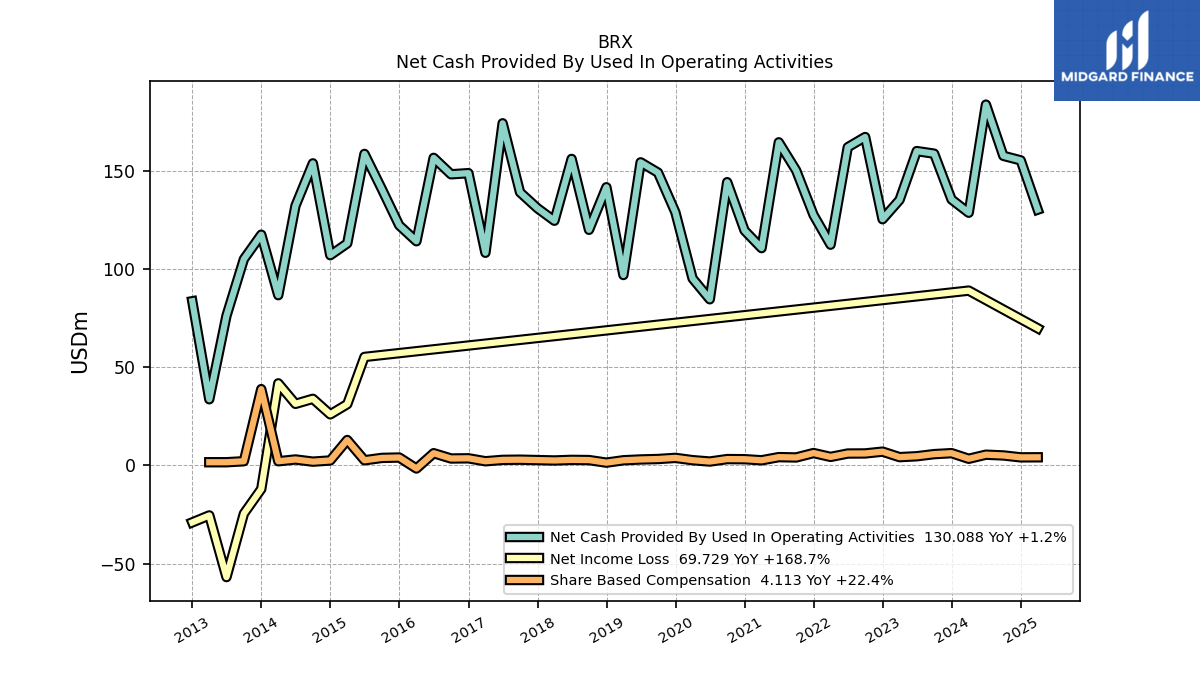
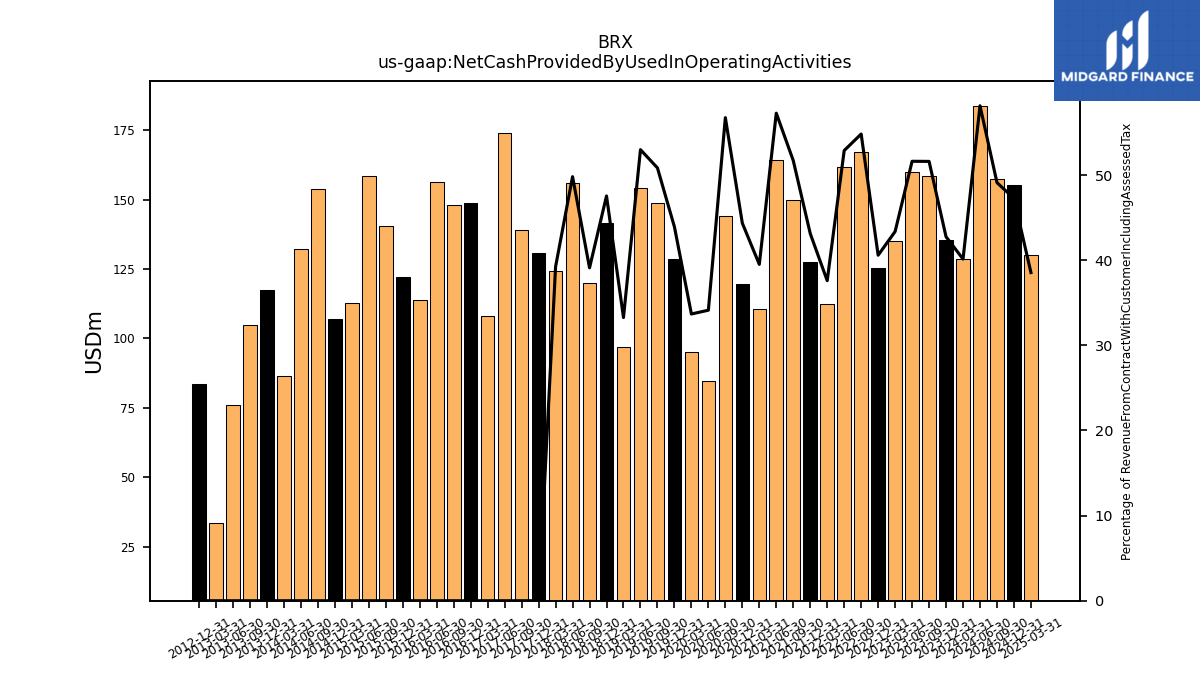
| Net Cash Provided By Used In Operating Activities | 135.28 | 158.57 | 159.89 | 135.05 | 125.22 | 167.04 | 161.86 | 112.26 | 127.36 | 150.02 | 164.35 | 110.51 | 119.47 | 144.07 | 84.49 | 95.07 | 128.74 | 148.93 | 154.17 | 96.84 | 141.51 | 119.83 | 155.90 | 124.45 | |
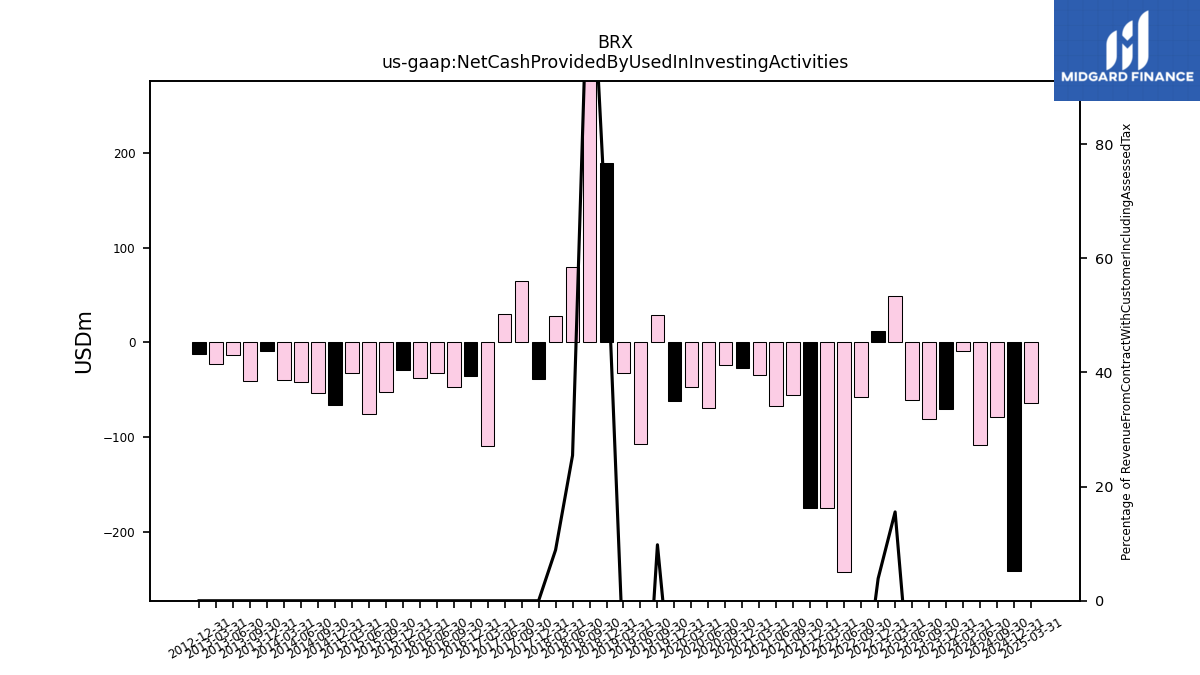
| Net Cash Provided By Used In Investing Activities | -70.06 | -81.11 | -60.39 | 48.48 | 12.03 | -57.90 | -241.64 | -174.94 | -174.89 | -55.08 | -66.91 | -34.12 | -27.00 | -24.23 | -69.41 | -46.61 | -61.52 | 28.74 | -107.45 | -31.83 | 189.53 | 372.08 | 79.75 | 28.24 | |
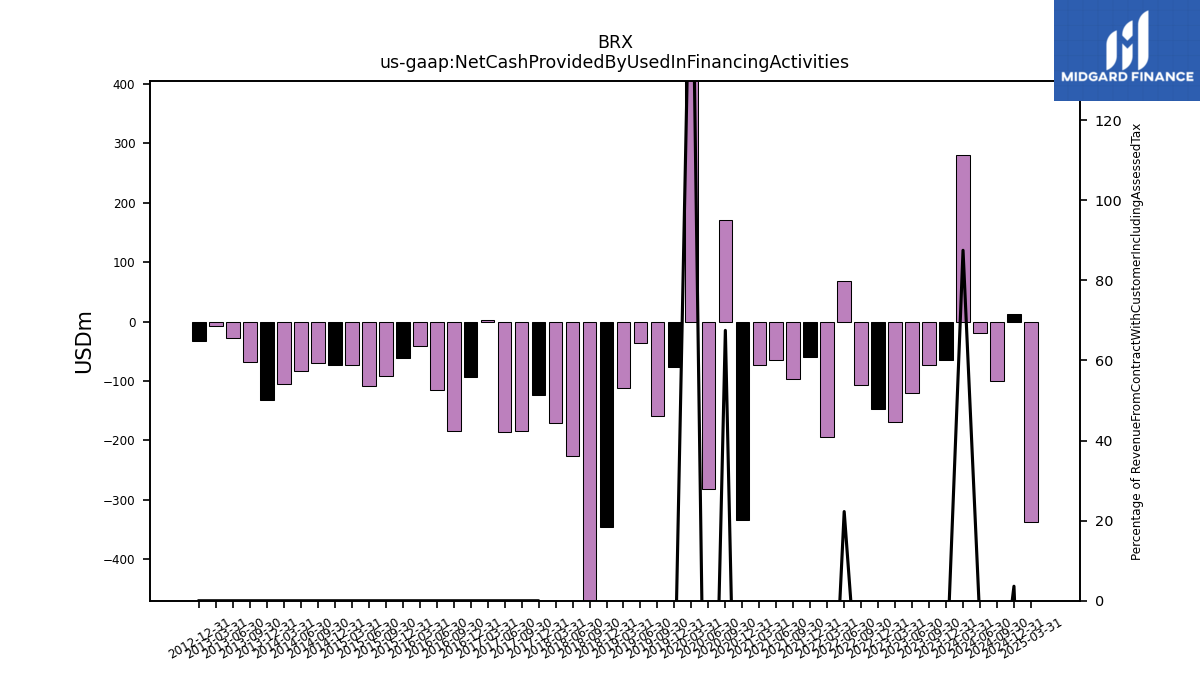
| Net Cash Provided By Used In Financing Activities | -65.00 | -73.64 | -120.06 | -169.37 | -147.24 | -106.65 | 68.16 | -194.68 | -59.09 | -95.96 | -64.74 | -73.79 | -333.61 | 171.39 | -282.19 | 517.11 | -77.18 | -159.44 | -36.87 | -112.36 | -345.29 | -528.52 | -226.80 | -170.69 |
| 2023-12-31 | 2023-09-30 | 2023-06-30 | 2023-03-31 | 2022-12-31 | 2022-09-30 | 2022-06-30 | 2022-03-31 | 2021-12-31 | 2021-09-30 | 2021-06-30 | 2021-03-31 | 2020-12-31 | 2020-09-30 | 2020-06-30 | 2020-03-31 | 2019-12-31 | 2019-09-30 | 2019-06-30 | 2019-03-31 | 2018-12-31 | 2018-09-30 | 2018-06-30 | 2018-03-31 | ||
|---|---|---|---|---|---|---|---|---|---|---|---|---|---|---|---|---|---|---|---|---|---|---|---|---|---|
| Net Cash Provided By Used In Operating Activities | 135.28 | 158.57 | 159.89 | 135.05 | 125.22 | 167.04 | 161.86 | 112.26 | 127.36 | 150.02 | 164.35 | 110.51 | 119.47 | 144.07 | 84.49 | 95.07 | 128.74 | 148.93 | 154.17 | 96.84 | 141.51 | 119.83 | 155.90 | 124.45 | |
| Profit Loss | 72.70 | 63.74 | 56.41 | 112.25 | 107.16 | 79.74 | 87.79 | 79.51 | 81.24 | 46.15 | 90.43 | 52.37 | 24.40 | 27.94 | 9.04 | 59.78 | 62.06 | 80.85 | 68.96 | 62.90 | 77.55 | 147.35 | 80.36 | 61.02 | |
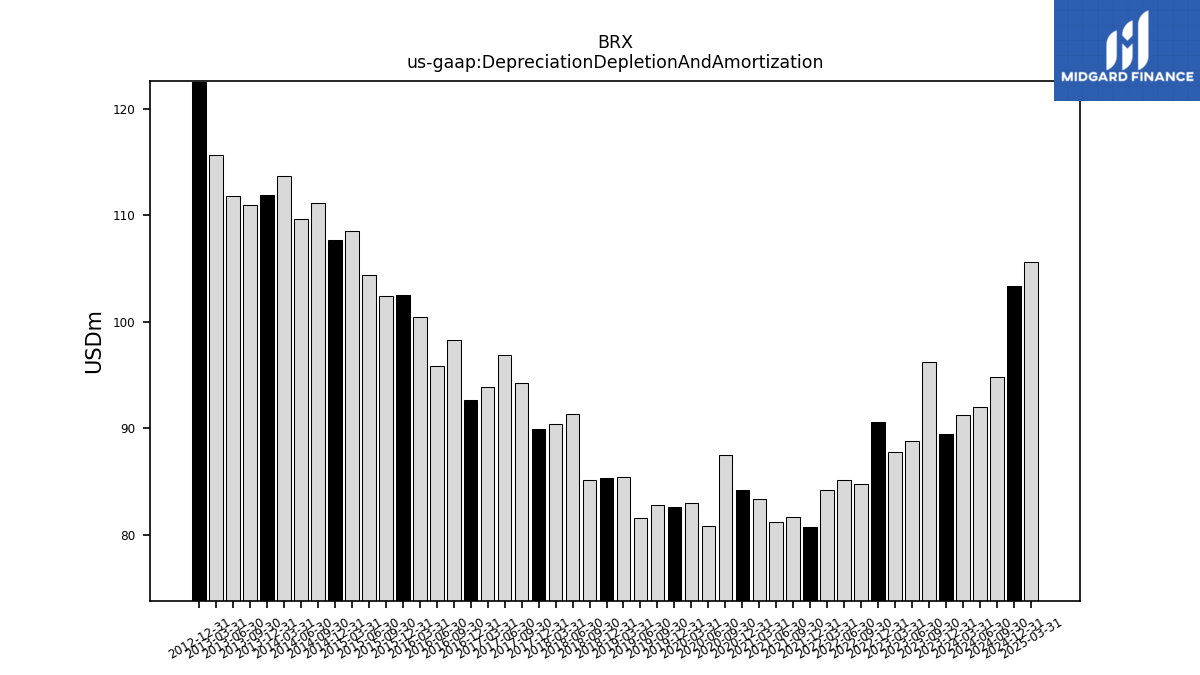
| Depreciation Depletion And Amortization | 89.47 | 96.25 | 88.81 | 87.74 | 90.60 | 84.77 | 85.14 | 84.22 | 80.80 | 81.72 | 81.21 | 83.42 | 84.25 | 87.49 | 80.83 | 83.02 | 82.61 | 82.84 | 81.59 | 85.39 | 85.34 | 85.18 | 91.33 | 90.38 | |
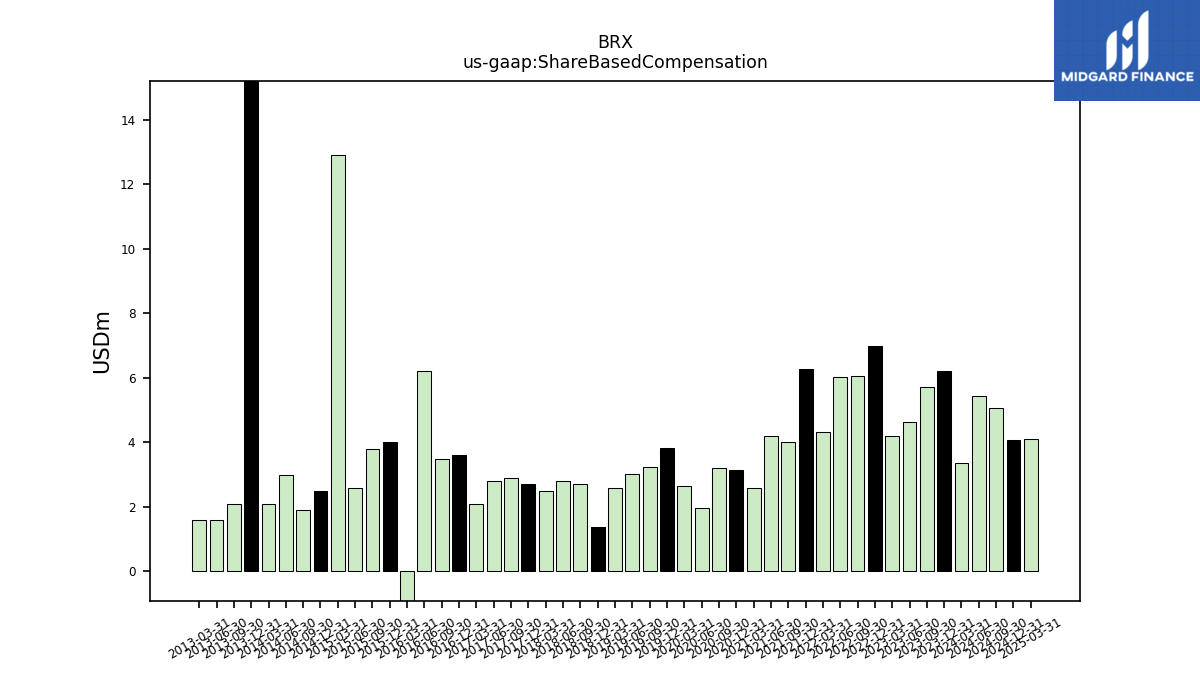
| Share Based Compensation | 6.22 | 5.72 | 4.64 | 4.19 | 6.99 | 6.07 | 6.03 | 4.32 | 6.27 | 4.03 | 4.20 | 2.59 | 3.14 | 3.20 | 1.96 | 2.65 | 3.81 | 3.24 | 3.01 | 2.60 | 1.39 | 2.70 | 2.80 | 2.50 | |
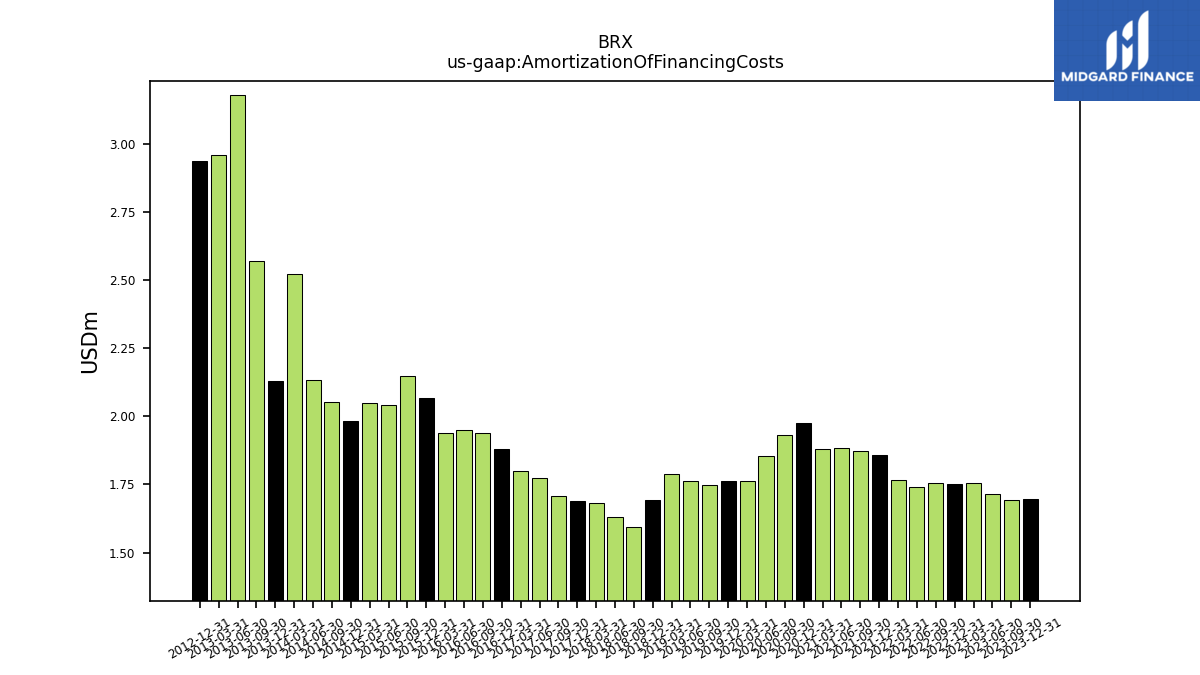
| Amortization Of Financing Costs | 1.70 | 1.69 | 1.71 | 1.75 | 1.75 | 1.76 | 1.74 | 1.77 | 1.86 | 1.87 | 1.88 | 1.88 | 1.98 | 1.93 | 1.86 | 1.76 | 1.76 | 1.75 | 1.76 | 1.79 | 1.69 | 1.60 | 1.63 | 1.68 |
| 2023-12-31 | 2023-09-30 | 2023-06-30 | 2023-03-31 | 2022-12-31 | 2022-09-30 | 2022-06-30 | 2022-03-31 | 2021-12-31 | 2021-09-30 | 2021-06-30 | 2021-03-31 | 2020-12-31 | 2020-09-30 | 2020-06-30 | 2020-03-31 | 2019-12-31 | 2019-09-30 | 2019-06-30 | 2019-03-31 | 2018-12-31 | 2018-09-30 | 2018-06-30 | 2018-03-31 | ||
|---|---|---|---|---|---|---|---|---|---|---|---|---|---|---|---|---|---|---|---|---|---|---|---|---|---|
| Net Cash Provided By Used In Investing Activities | -70.06 | -81.11 | -60.39 | 48.48 | 12.03 | -57.90 | -241.64 | -174.94 | -174.89 | -55.08 | -66.91 | -34.12 | -27.00 | -24.23 | -69.41 | -46.61 | -61.52 | 28.74 | -107.45 | -31.83 | 189.53 | 372.08 | 79.75 | 28.24 |
| 2023-12-31 | 2023-09-30 | 2023-06-30 | 2023-03-31 | 2022-12-31 | 2022-09-30 | 2022-06-30 | 2022-03-31 | 2021-12-31 | 2021-09-30 | 2021-06-30 | 2021-03-31 | 2020-12-31 | 2020-09-30 | 2020-06-30 | 2020-03-31 | 2019-12-31 | 2019-09-30 | 2019-06-30 | 2019-03-31 | 2018-12-31 | 2018-09-30 | 2018-06-30 | 2018-03-31 | ||
|---|---|---|---|---|---|---|---|---|---|---|---|---|---|---|---|---|---|---|---|---|---|---|---|---|---|
| Net Cash Provided By Used In Financing Activities | -65.00 | -73.64 | -120.06 | -169.37 | -147.24 | -106.65 | 68.16 | -194.68 | -59.09 | -95.96 | -64.74 | -73.79 | -333.61 | 171.39 | -282.19 | 517.11 | -77.18 | -159.44 | -36.87 | -112.36 | -345.29 | -528.52 | -226.80 | -170.69 |
| 2023-12-31 | 2023-09-30 | 2023-06-30 | 2023-03-31 | 2022-12-31 | 2022-09-30 | 2022-06-30 | 2022-03-31 | 2021-12-31 | 2021-09-30 | 2021-06-30 | 2021-03-31 | 2020-12-31 | 2020-09-30 | 2020-06-30 | 2020-03-31 | 2019-12-31 | 2019-09-30 | 2019-06-30 | 2019-03-31 | 2018-12-31 | 2018-09-30 | 2018-06-30 | 2018-03-31 | ||
|---|---|---|---|---|---|---|---|---|---|---|---|---|---|---|---|---|---|---|---|---|---|---|---|---|---|
| Revenue From Contract With Customer Including Assessed Tax | 316.49 | 307.31 | 309.79 | 311.44 | 308.57 | 304.75 | 306.13 | 298.63 | 295.32 | 290.19 | 287.02 | 279.75 | 269.41 | 253.94 | 247.62 | 282.30 | 293.15 | 292.96 | 291.00 | 291.14 | 297.65 | 306.48 | 313.03 | 317.18 | |
| 316.49 | 307.31 | 309.79 | 311.44 | 308.57 | 304.75 | 306.13 | 298.63 | 295.32 | 290.19 | 287.02 | 279.75 | 269.41 | 253.94 | 247.62 | 282.30 | 293.15 | 292.96 | 291.00 | 291.14 | 297.65 | 306.48 | 313.03 | 317.18 |