
| 2023-12-31 | 2023-09-30 | 2023-06-30 | 2023-03-31 | 2022-12-31 | 2022-09-30 | 2022-06-30 | 2022-03-31 | 2021-12-31 | 2021-09-30 | 2021-06-30 | 2021-03-31 | 2020-12-31 | 2020-09-30 | 2020-06-30 | 2020-03-31 | 2019-12-31 | 2019-09-30 | 2019-06-30 | 2019-03-31 | 2018-12-31 | 2018-09-30 | 2018-06-30 | 2018-03-31 | 2017-12-31 | 2017-09-30 | 2017-06-30 | 2017-03-31 | ||
|---|---|---|---|---|---|---|---|---|---|---|---|---|---|---|---|---|---|---|---|---|---|---|---|---|---|---|---|---|---|
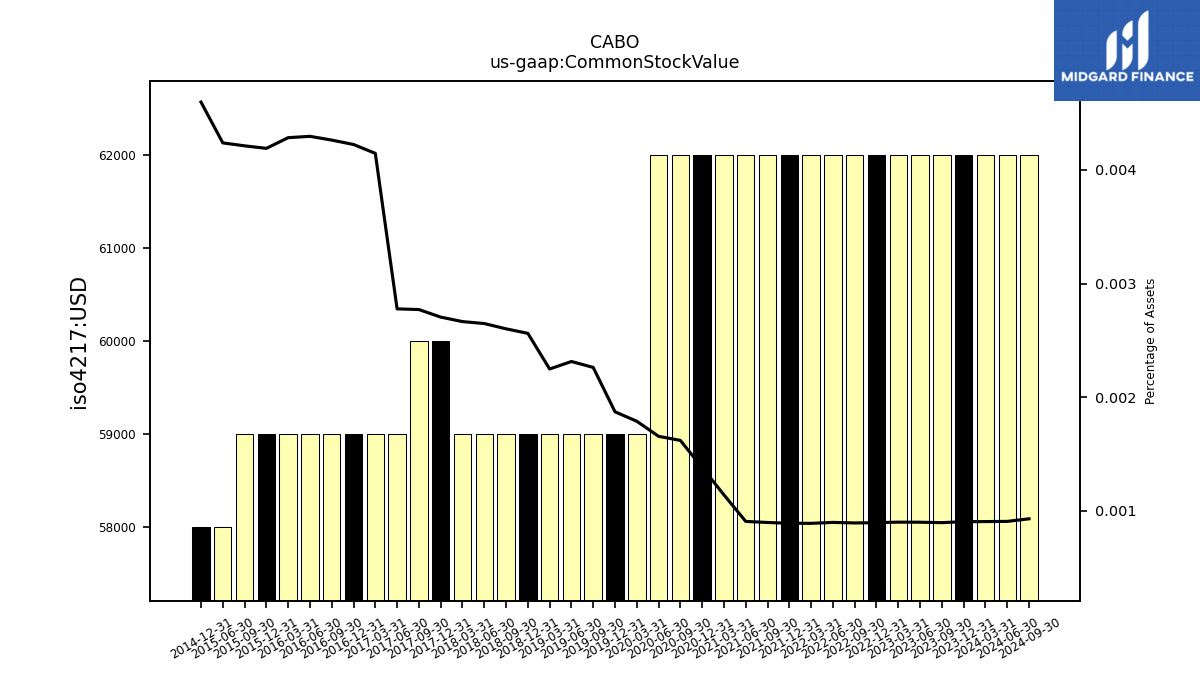
| Common Stock Value | 0.06 | 0.06 | 0.06 | 0.06 | 0.06 | 0.06 | 0.06 | 0.06 | 0.06 | 0.06 | 0.06 | 0.06 | 0.06 | 0.06 | 0.06 | 0.06 | 0.06 | 0.06 | 0.06 | 0.06 | 0.06 | 0.06 | 0.06 | 0.06 | 0.06 | 0.06 | 0.06 | 0.06 | |
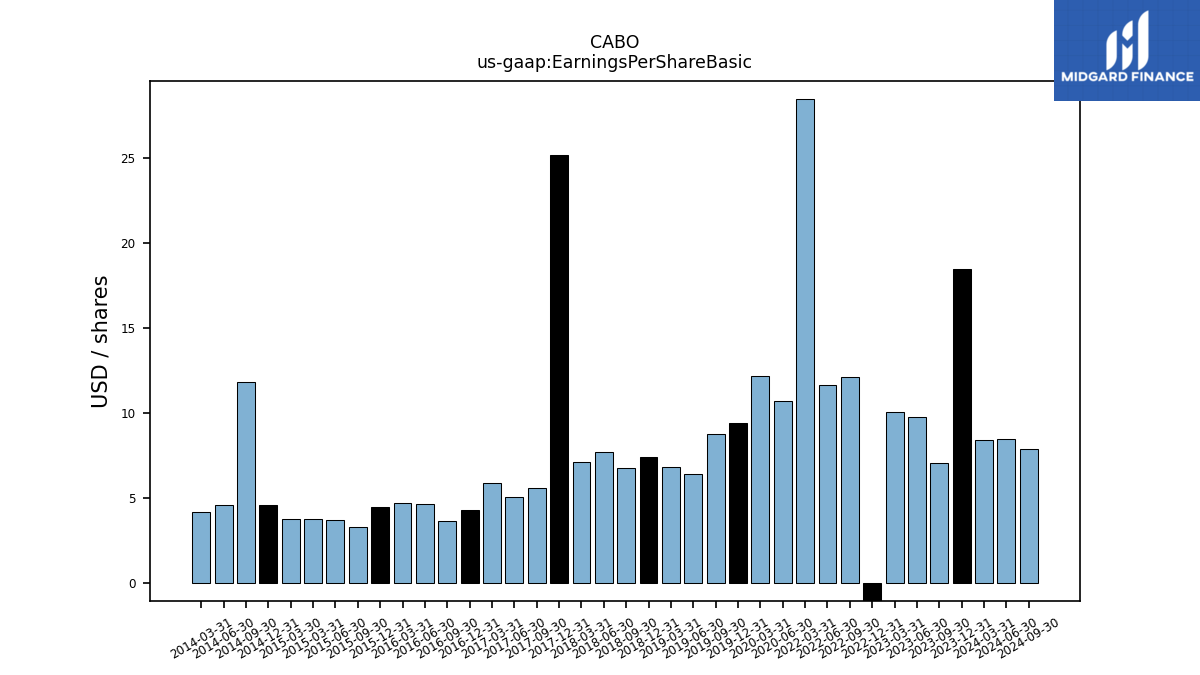
| Earnings Per Share Basic | 20.47 | 7.03 | 9.76 | 10.04 | -12.74 | 12.10 | 11.64 | 28.49 | NA | NA | NA | NA | NA | NA | 10.72 | 12.17 | 9.43 | 8.77 | 6.41 | 6.83 | 7.40 | 6.75 | 7.70 | 7.13 | 25.18 | 5.55 | 5.03 | 5.86 | |
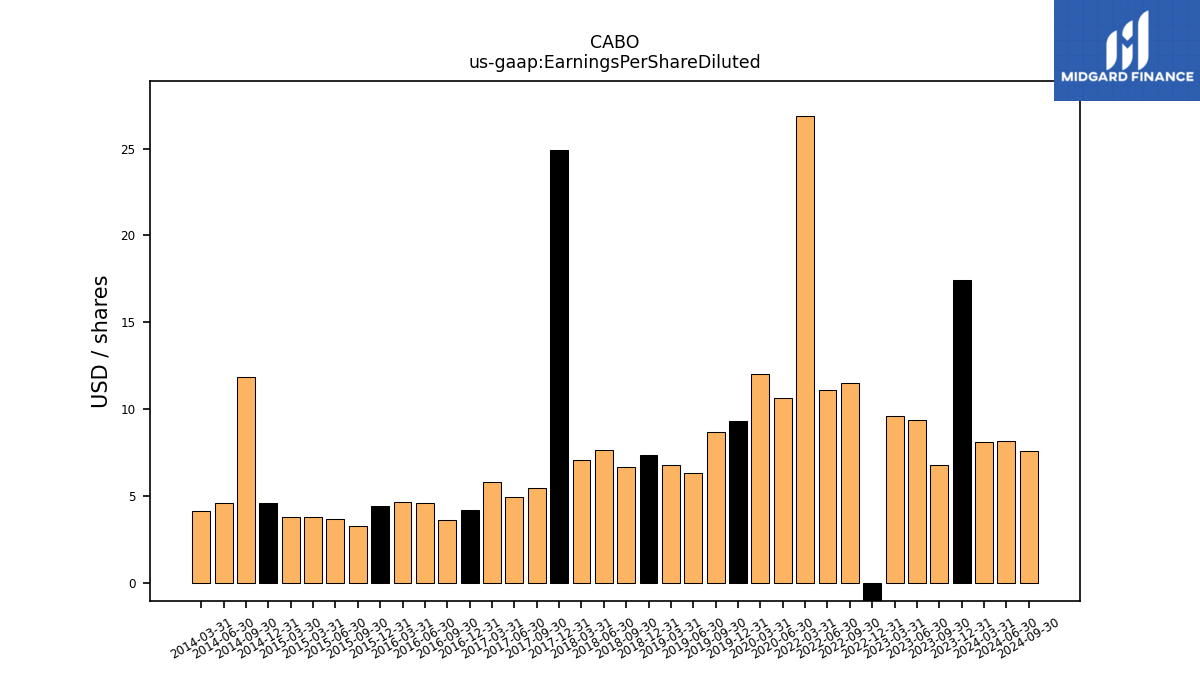
| Earnings Per Share Diluted | 19.33 | 6.81 | 9.36 | 9.62 | -11.64 | 11.53 | 11.11 | 26.85 | NA | NA | NA | NA | NA | NA | 10.63 | 12.05 | 9.32 | 8.68 | 6.35 | 6.78 | 7.34 | 6.70 | 7.65 | 7.08 | 24.89 | 5.48 | 4.97 | 5.80 |
| 2023-12-31 | 2023-09-30 | 2023-06-30 | 2023-03-31 | 2022-12-31 | 2022-09-30 | 2022-06-30 | 2022-03-31 | 2021-12-31 | 2021-09-30 | 2021-06-30 | 2021-03-31 | 2020-12-31 | 2020-09-30 | 2020-06-30 | 2020-03-31 | 2019-12-31 | 2019-09-30 | 2019-06-30 | 2019-03-31 | 2018-12-31 | 2018-09-30 | 2018-06-30 | 2018-03-31 | 2017-12-31 | 2017-09-30 | 2017-06-30 | 2017-03-31 | ||
|---|---|---|---|---|---|---|---|---|---|---|---|---|---|---|---|---|---|---|---|---|---|---|---|---|---|---|---|---|---|
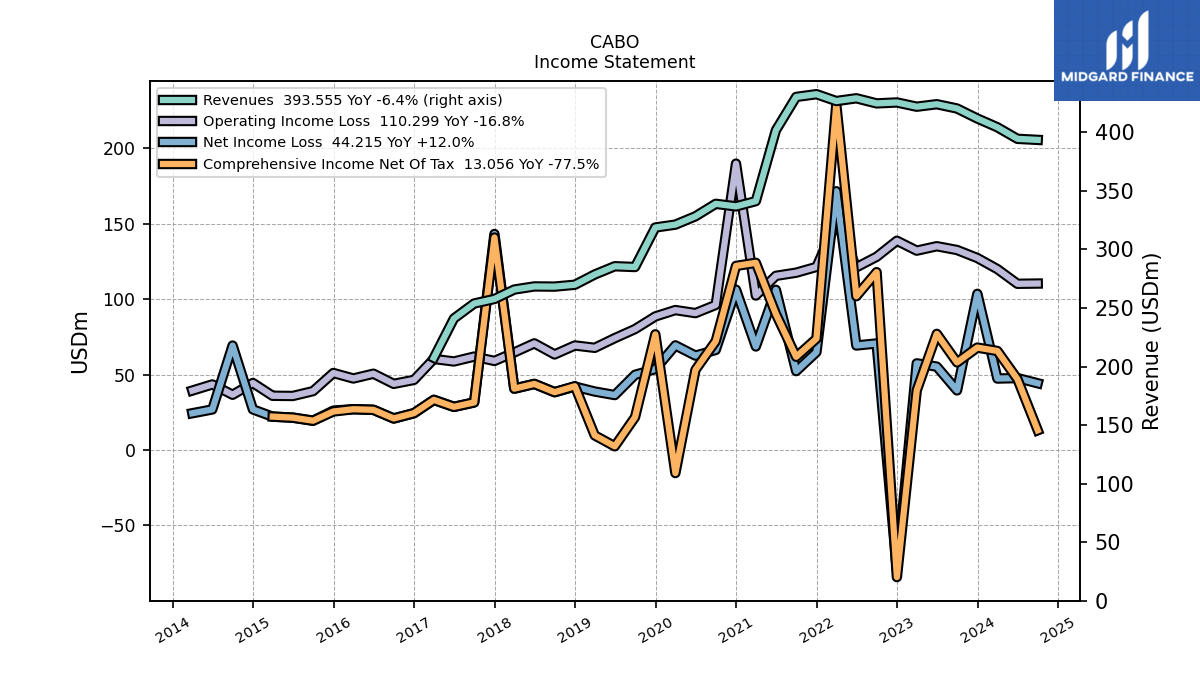
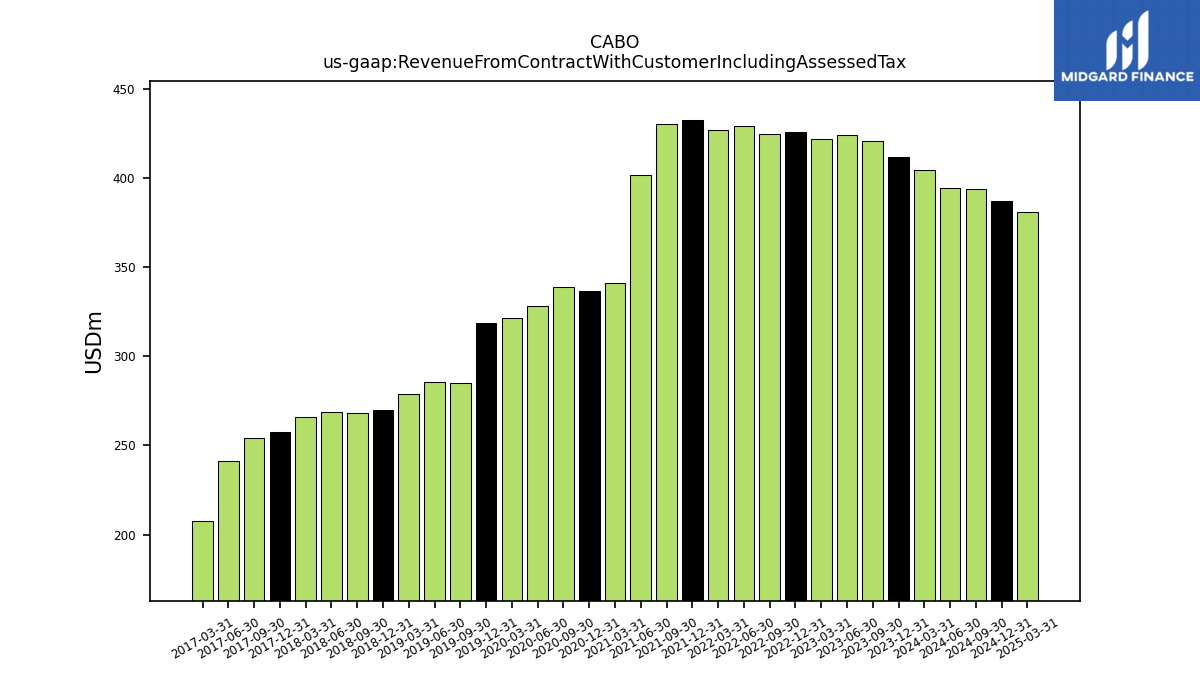
| Revenue From Contract With Customer Including Assessed Tax | 411.81 | 420.35 | 424.02 | 421.89 | 425.51 | 424.72 | 429.08 | 426.73 | 432.59 | 430.24 | 401.75 | 341.26 | 336.77 | 338.96 | 328.30 | 321.20 | 318.75 | 284.99 | 285.65 | 278.61 | 269.85 | 268.27 | 268.41 | 265.76 | 257.70 | 253.83 | 240.99 | 207.43 | |
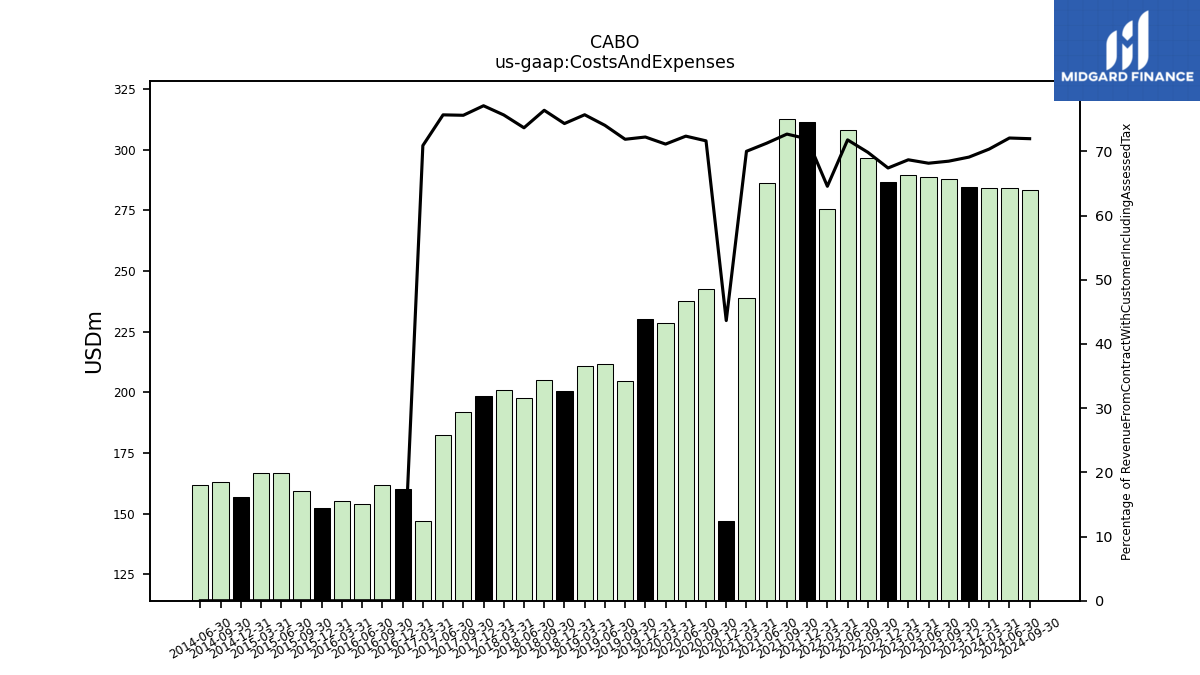
| Costs And Expenses | 284.59 | 287.82 | 288.98 | 289.79 | 286.84 | 296.68 | 308.03 | 275.51 | 311.27 | 312.74 | 286.34 | 238.92 | 146.98 | 242.83 | 237.59 | 228.47 | 230.24 | 204.86 | 211.54 | 210.91 | 200.59 | 204.95 | 197.75 | 201.10 | 198.70 | 191.95 | 182.40 | 147.07 | |
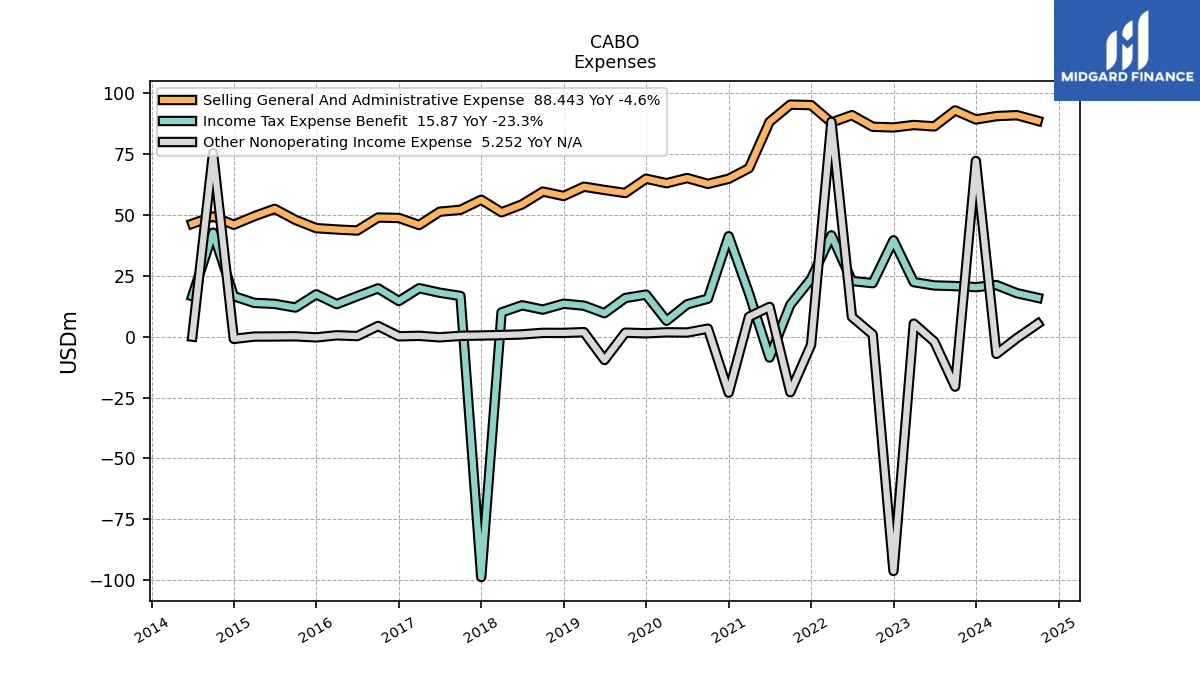
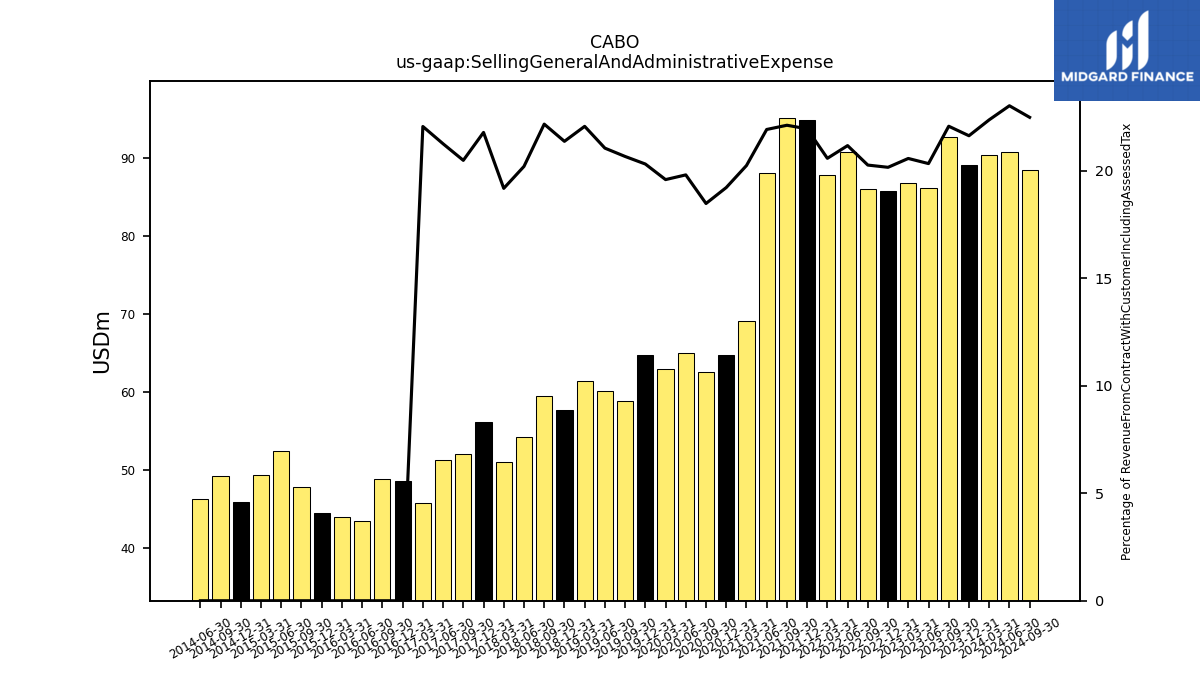
| Selling General And Administrative Expense | 89.02 | 92.73 | 86.17 | 86.75 | 85.74 | 86.02 | 90.79 | 87.77 | 94.90 | 95.10 | 88.02 | 69.04 | 64.69 | 62.60 | 64.99 | 62.88 | 64.71 | 58.86 | 60.10 | 61.44 | 57.63 | 59.44 | 54.20 | 50.95 | 56.10 | 51.97 | 51.19 | 45.73 | |
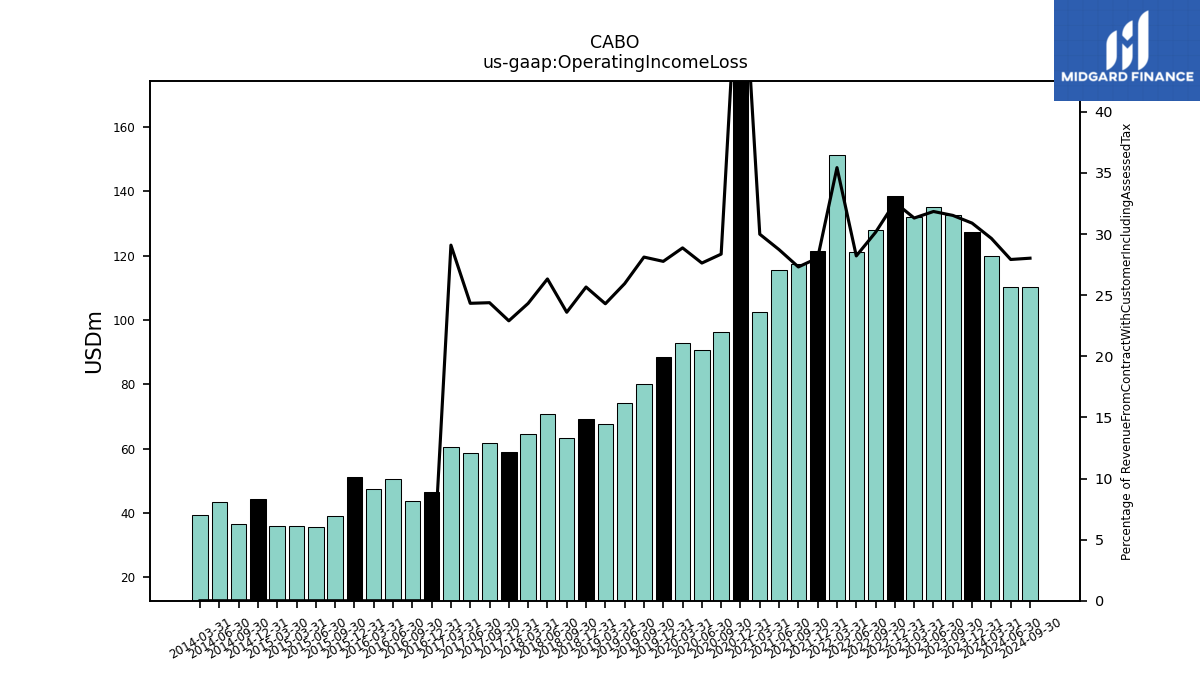
| Operating Income Loss | 127.23 | 132.53 | 135.04 | 132.10 | 138.68 | 128.04 | 121.06 | 151.22 | 121.32 | 117.50 | 115.41 | 102.35 | 189.78 | 96.13 | 90.71 | 92.73 | 88.51 | 80.13 | 74.11 | 67.70 | 69.26 | 63.32 | 70.67 | 64.66 | 59.02 | 61.90 | 58.65 | 60.35 | |
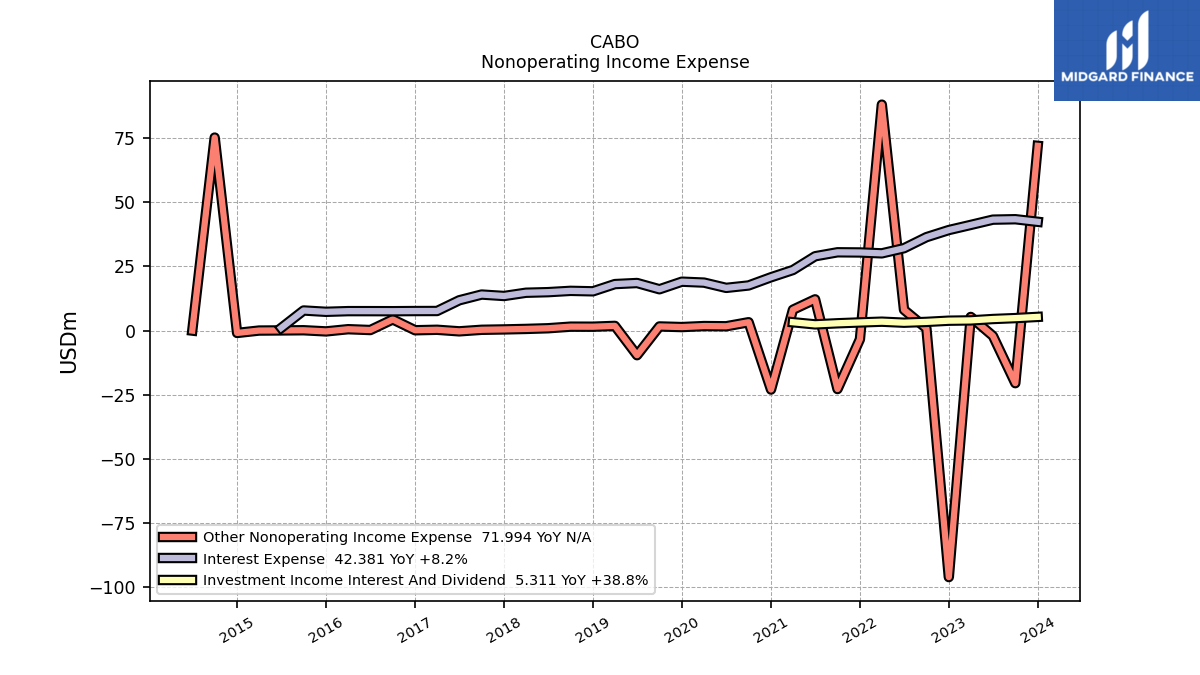
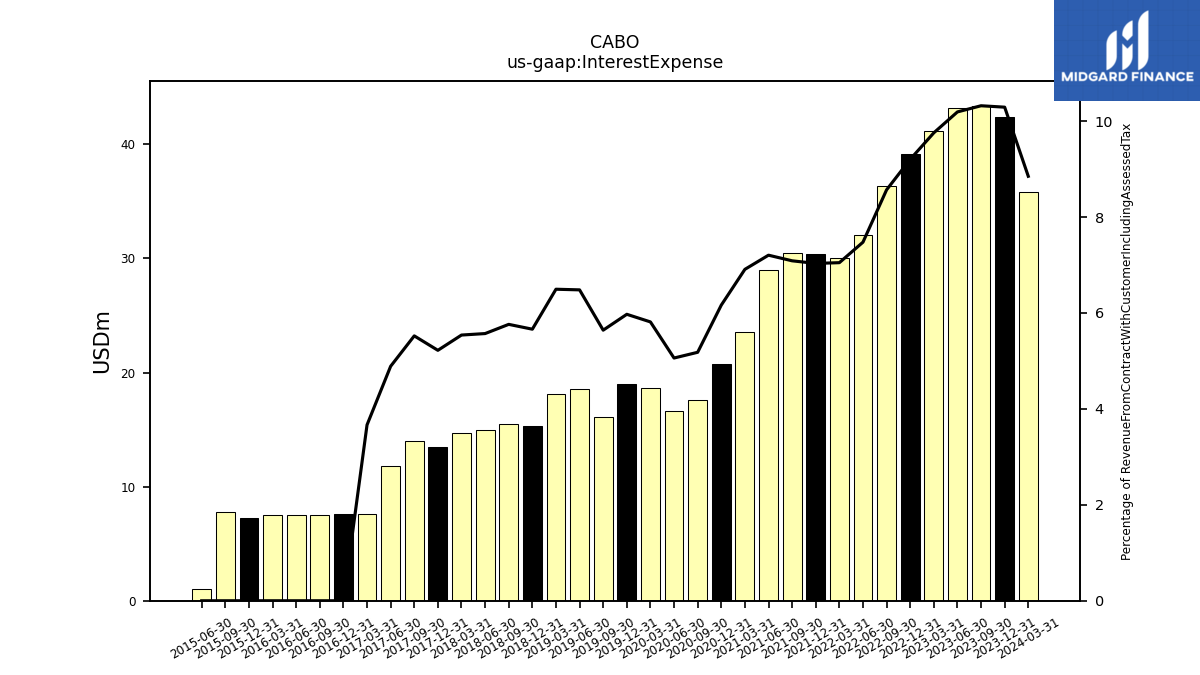
| Interest Expense | 42.38 | 43.38 | 43.22 | 41.16 | 39.16 | 36.39 | 32.08 | 30.08 | 30.43 | 30.50 | 28.95 | 23.58 | 20.76 | 17.56 | 16.61 | 18.67 | 19.04 | 16.08 | 18.52 | 18.10 | 15.28 | 15.46 | 14.95 | 14.72 | 13.46 | 14.02 | 11.78 | 7.61 | |
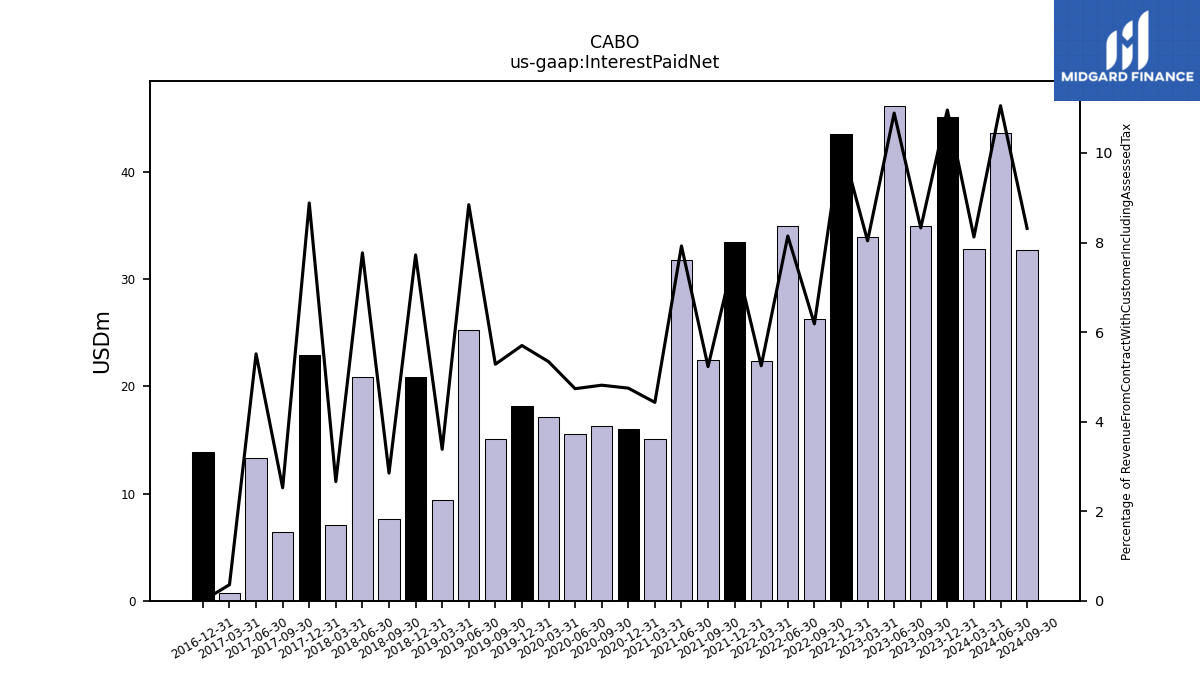
| Interest Paid Net | 45.13 | 35.00 | 46.18 | 33.91 | 43.56 | 26.26 | 34.95 | 22.39 | 33.44 | 22.50 | 31.83 | 15.12 | 15.99 | 16.32 | 15.55 | 17.15 | 18.17 | 15.05 | 25.27 | 9.42 | 20.84 | 7.65 | 20.85 | 7.07 | 22.89 | 6.41 | 13.29 | 0.74 | |
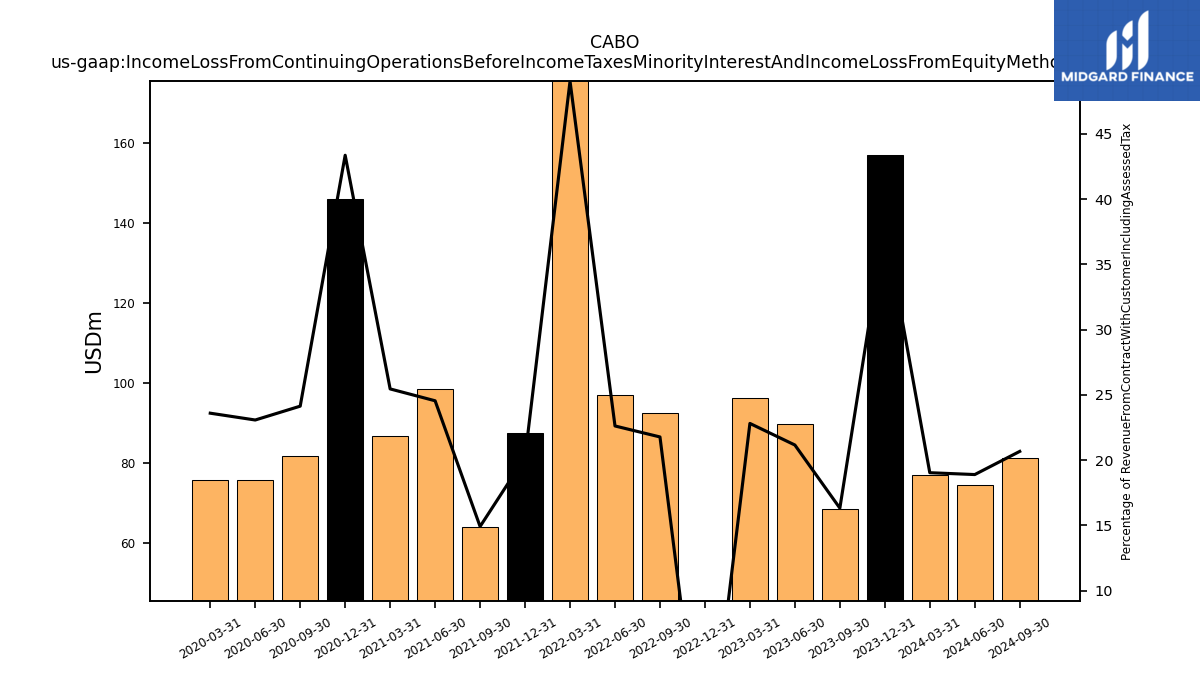
| Income Loss From Continuing Operations Before Income Taxes Minority Interest And Income Loss From Equity Method Investments | 156.84 | 68.61 | 89.71 | 96.23 | -23.36 | 92.48 | 97.04 | 209.20 | 87.47 | 64.17 | 98.61 | 86.86 | 146.00 | 81.80 | 75.75 | 75.79 | NA | NA | NA | NA | NA | NA | NA | NA | NA | NA | NA | NA | |
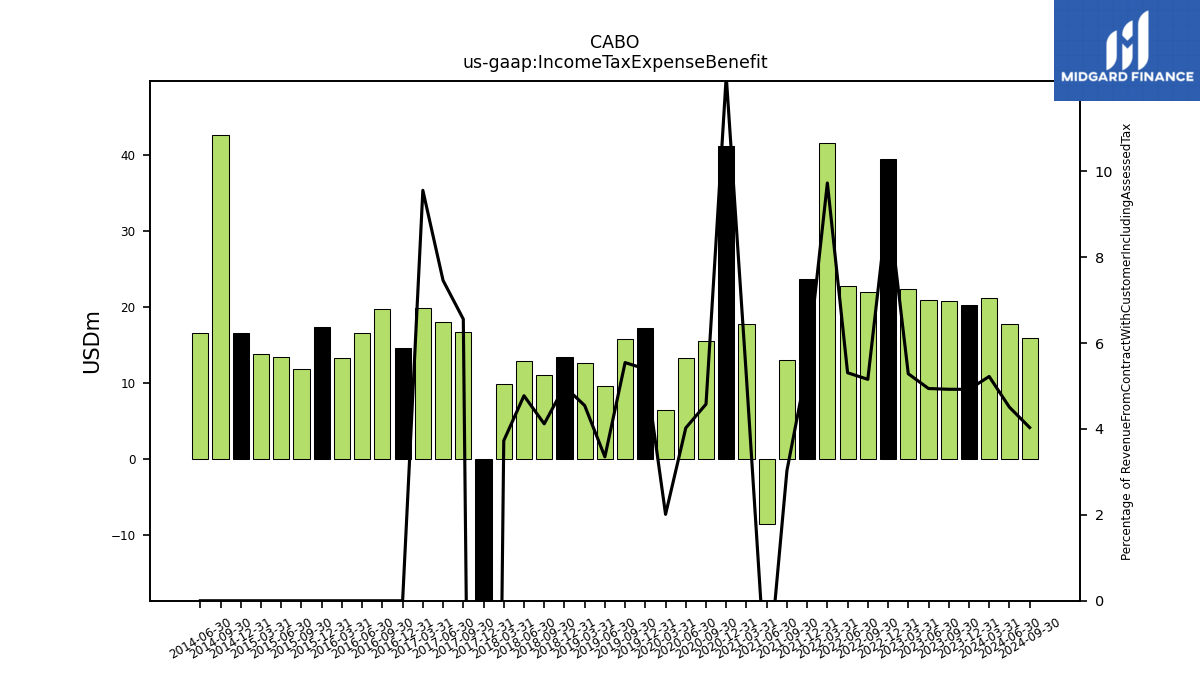
| Income Tax Expense Benefit | 25.77 | 20.69 | 20.95 | 22.30 | 40.17 | 21.89 | 22.77 | 41.50 | 23.64 | 13.03 | -8.62 | 17.71 | 41.13 | 15.52 | 13.21 | 6.46 | 17.20 | 15.80 | 9.57 | 12.66 | 13.46 | 11.05 | 12.81 | 9.90 | -98.66 | 16.64 | 17.97 | 19.82 | |
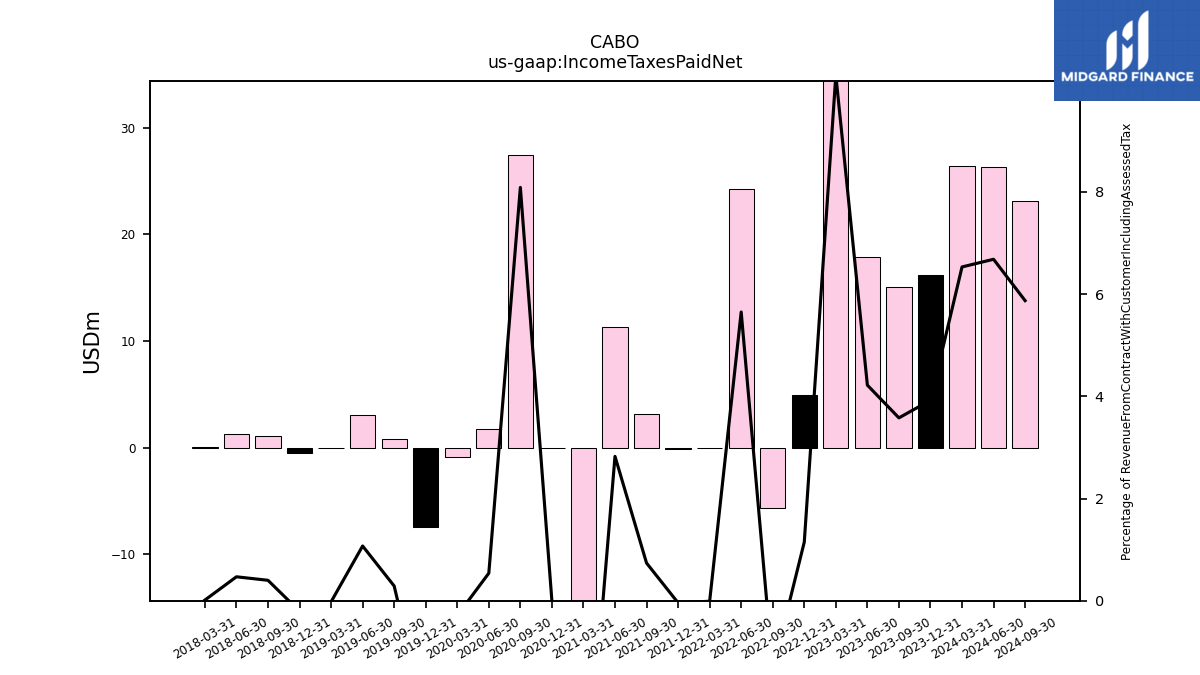
| Income Taxes Paid Net | 16.15 | 15.04 | 17.88 | 43.39 | 4.88 | -5.70 | 24.23 | -0.04 | -0.17 | 3.17 | 11.35 | -15.59 | -0.01 | 27.41 | 1.77 | -0.93 | -7.41 | 0.82 | 3.06 | -0.06 | -0.56 | 1.07 | 1.26 | 0.04 | NA | NA | NA | NA | |
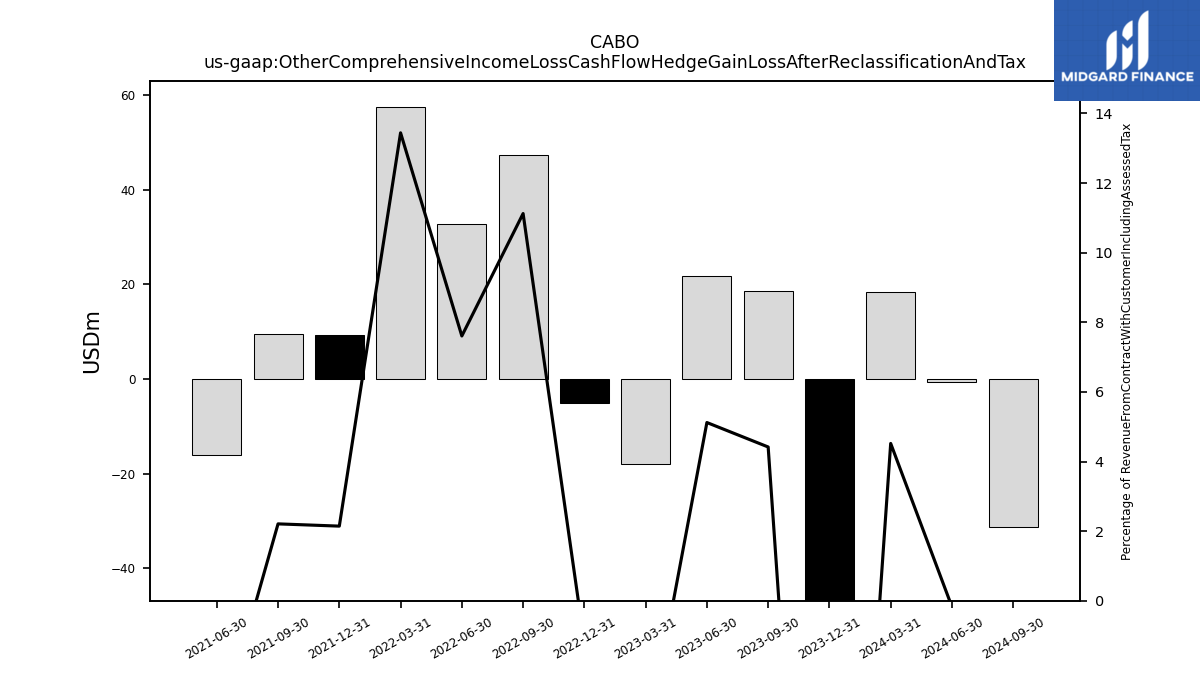
| Other Comprehensive Income Loss Cash Flow Hedge Gain Loss After Reclassification And Tax | -85.85 | 18.57 | 21.71 | -17.94 | -5.17 | 47.25 | 32.64 | 57.37 | 9.28 | 9.50 | -16.02 | NA | NA | NA | NA | NA | NA | NA | NA | NA | NA | NA | NA | NA | NA | NA | NA | NA | |
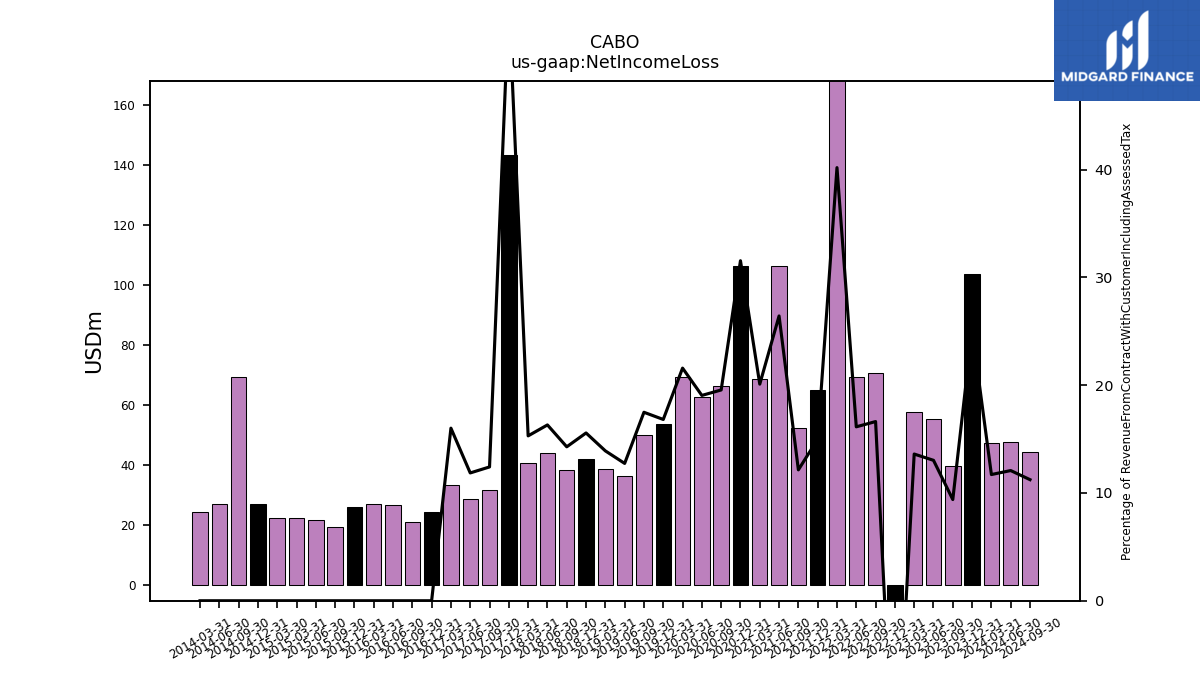
| Net Income Loss | 115.29 | 39.47 | 55.25 | 57.43 | -77.21 | 70.61 | 69.25 | 171.48 | 64.83 | 52.26 | 106.15 | 68.58 | 106.24 | 66.29 | 62.54 | 69.33 | 53.61 | 49.84 | 36.40 | 38.74 | 42.01 | 38.31 | 43.78 | 40.65 | 143.15 | 31.51 | 28.58 | 33.22 | |
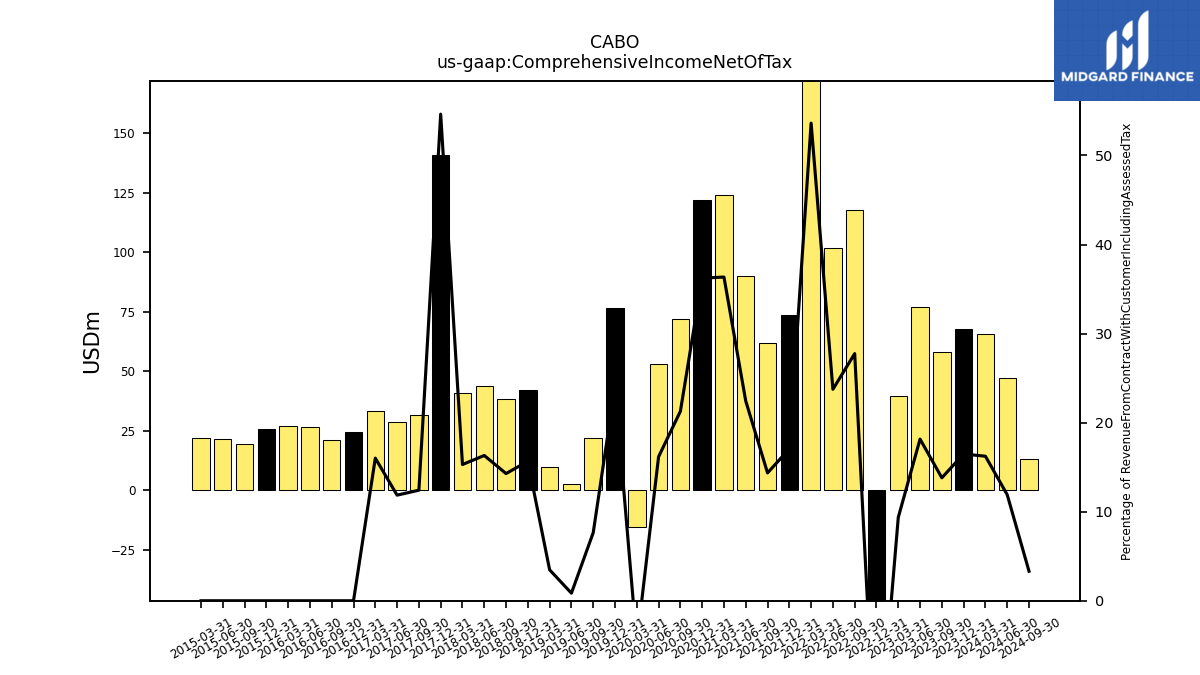
| Comprehensive Income Net Of Tax | 79.67 | 58.04 | 76.96 | 39.48 | -81.69 | 117.86 | 101.89 | 228.88 | 73.77 | 61.76 | 90.13 | 124.05 | 121.99 | 72.09 | 53.08 | -15.30 | 76.66 | 21.77 | 2.42 | 9.67 | 42.26 | 38.31 | 43.78 | 40.65 | 140.81 | 31.52 | 28.58 | 33.22 | |
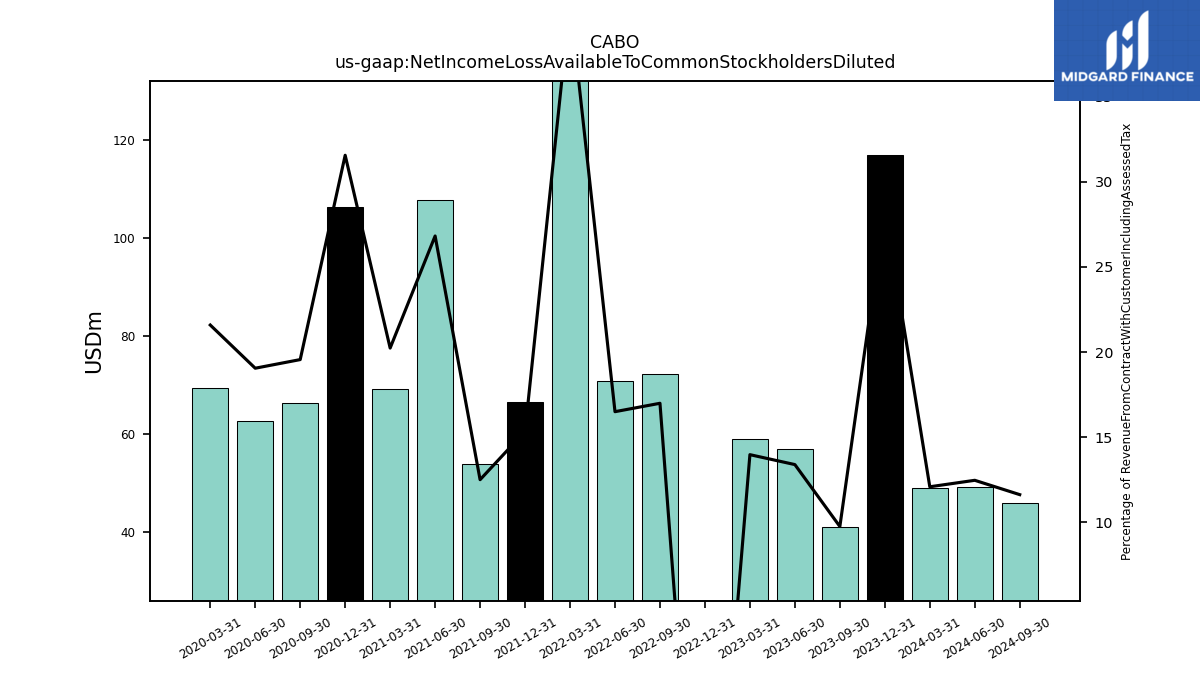
| Net Income Loss Available To Common Stockholders Diluted | 116.85 | 41.03 | 56.80 | 58.97 | -75.65 | 72.17 | 70.80 | 173.02 | 66.40 | 53.82 | 107.70 | 69.04 | 106.24 | 66.29 | 62.54 | 69.33 | NA | NA | NA | NA | NA | NA | NA | NA | NA | NA | NA | NA |
| 2023-12-31 | 2023-09-30 | 2023-06-30 | 2023-03-31 | 2022-12-31 | 2022-09-30 | 2022-06-30 | 2022-03-31 | 2021-12-31 | 2021-09-30 | 2021-06-30 | 2021-03-31 | 2020-12-31 | 2020-09-30 | 2020-06-30 | 2020-03-31 | 2019-12-31 | 2019-09-30 | 2019-06-30 | 2019-03-31 | 2018-12-31 | 2018-09-30 | 2018-06-30 | 2018-03-31 | 2017-12-31 | 2017-09-30 | 2017-06-30 | 2017-03-31 | ||
|---|---|---|---|---|---|---|---|---|---|---|---|---|---|---|---|---|---|---|---|---|---|---|---|---|---|---|---|---|---|
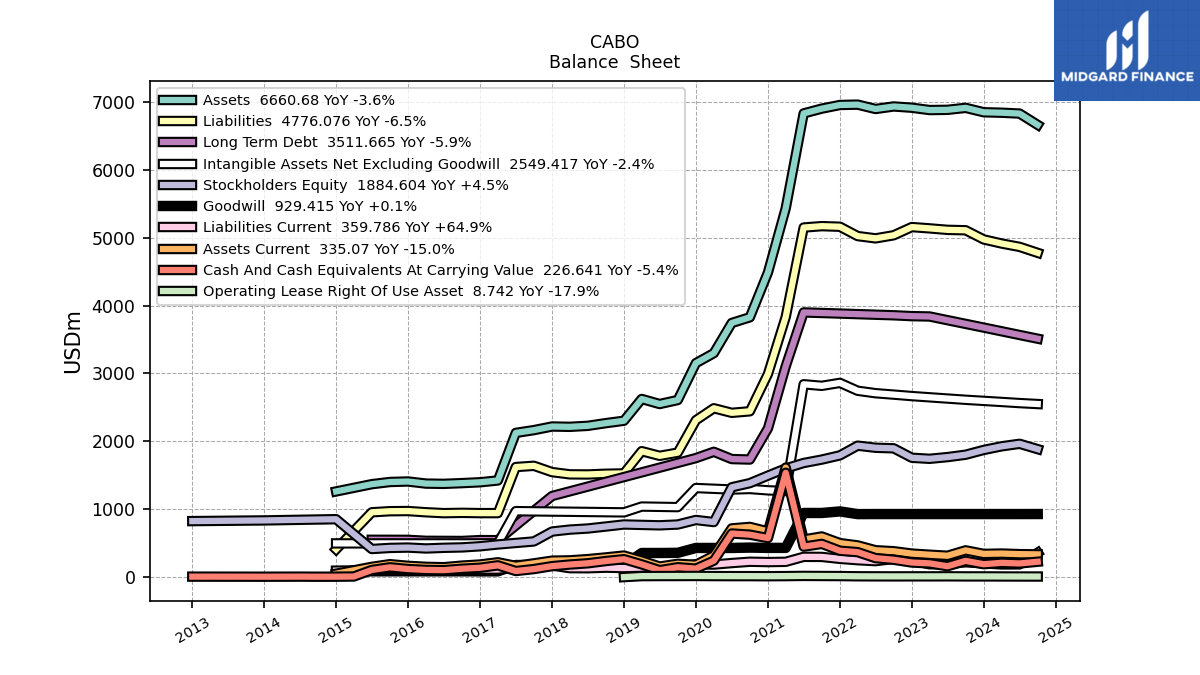
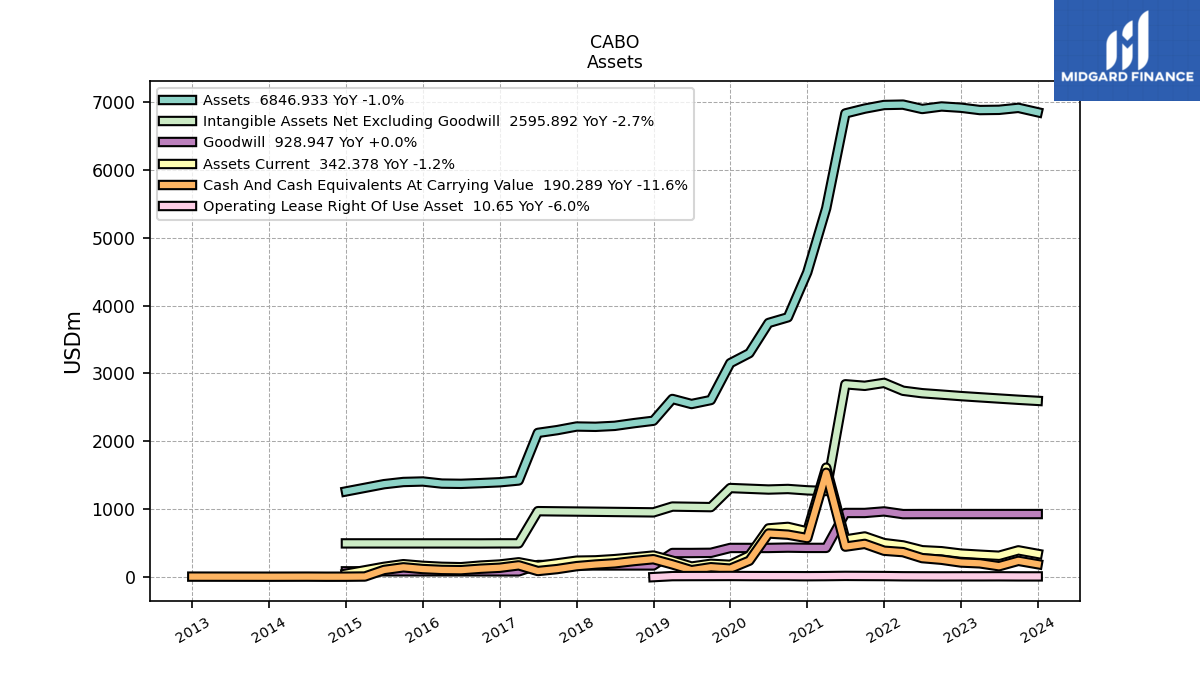
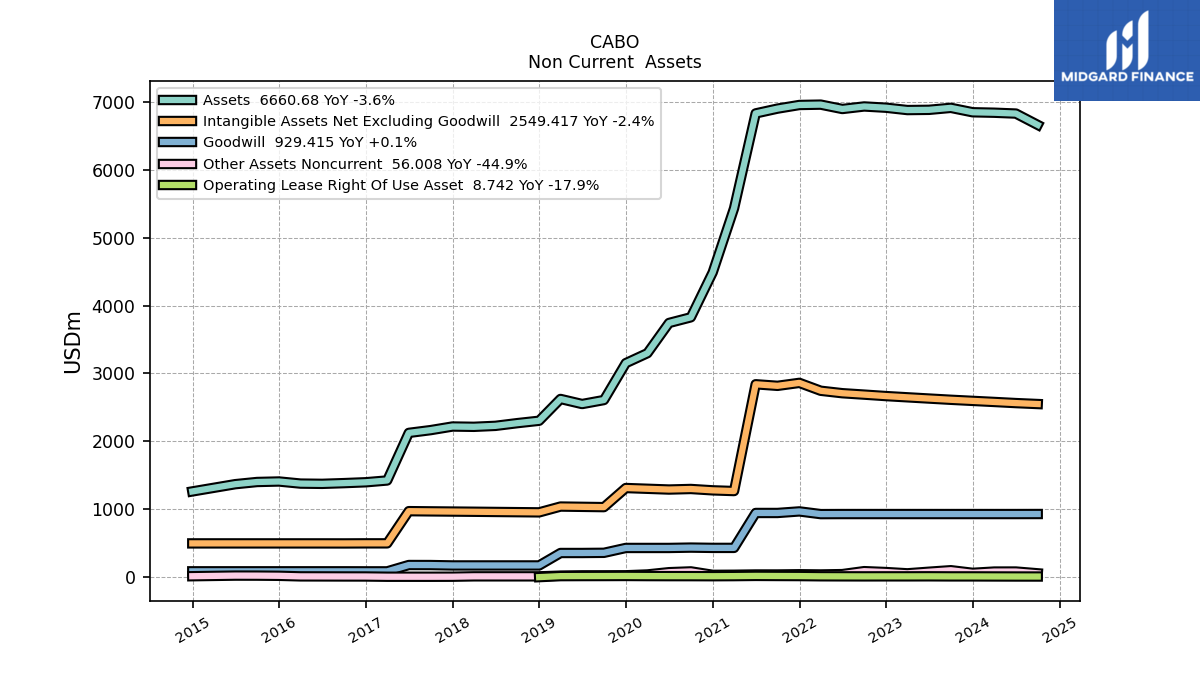
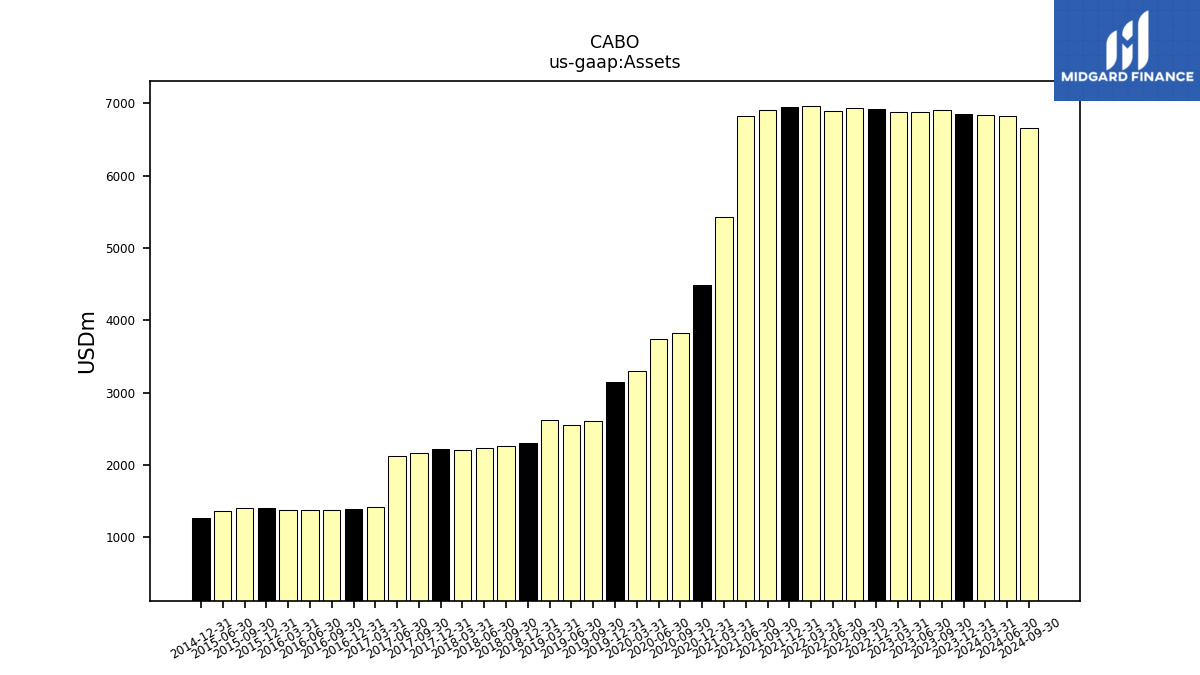
| Assets | 6846.93 | 6911.77 | 6882.74 | 6879.35 | 6913.89 | 6932.25 | 6895.08 | 6959.42 | 6953.99 | 6900.60 | 6830.00 | 5432.27 | 4488.34 | 3826.81 | 3743.45 | 3298.36 | 3151.83 | 2608.33 | 2549.45 | 2624.24 | 2303.23 | 2267.95 | 2228.06 | 2213.79 | 2218.33 | 2165.23 | 2124.49 | 1423.49 | |
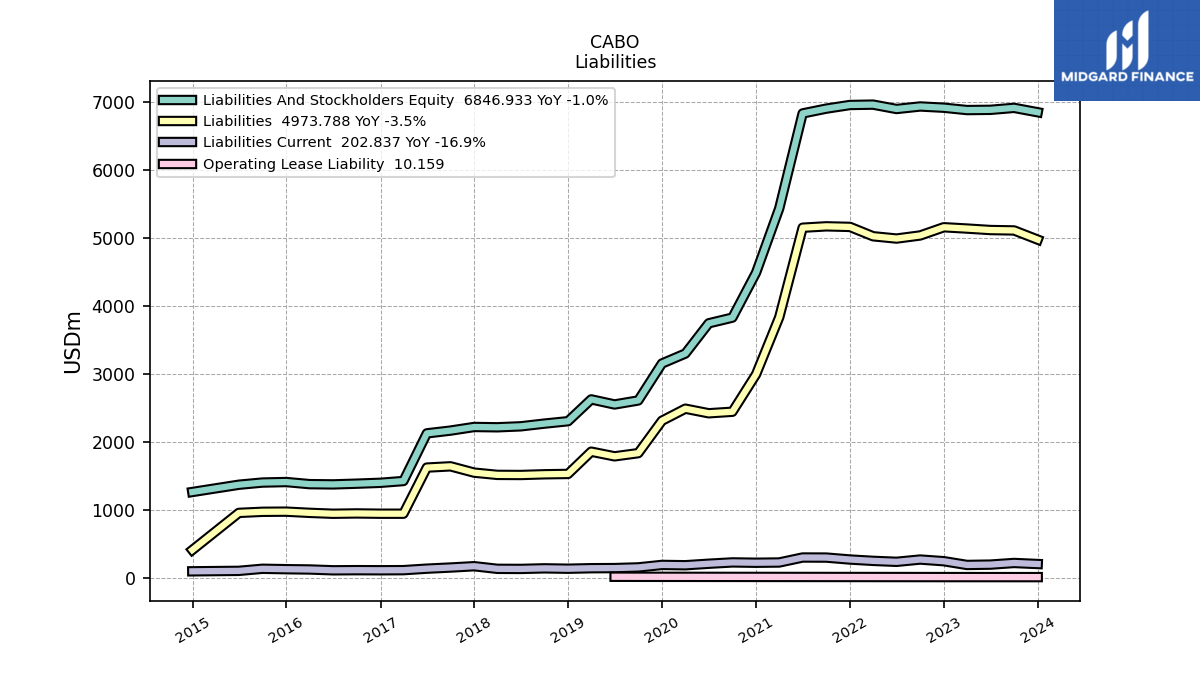
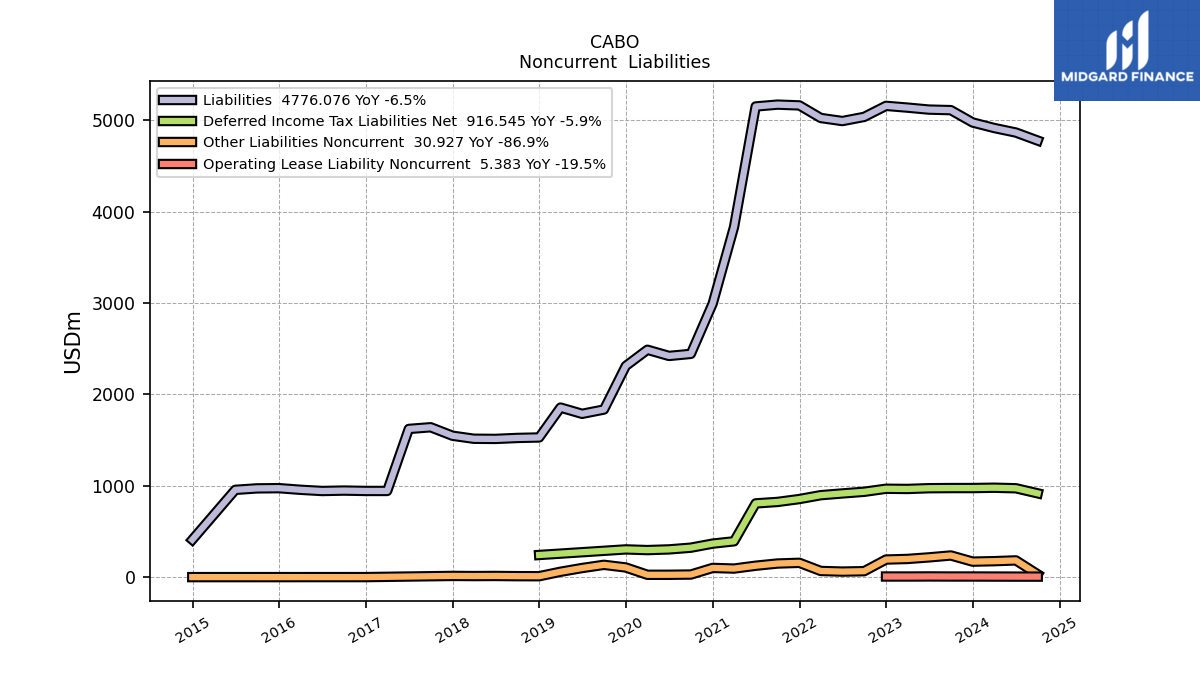
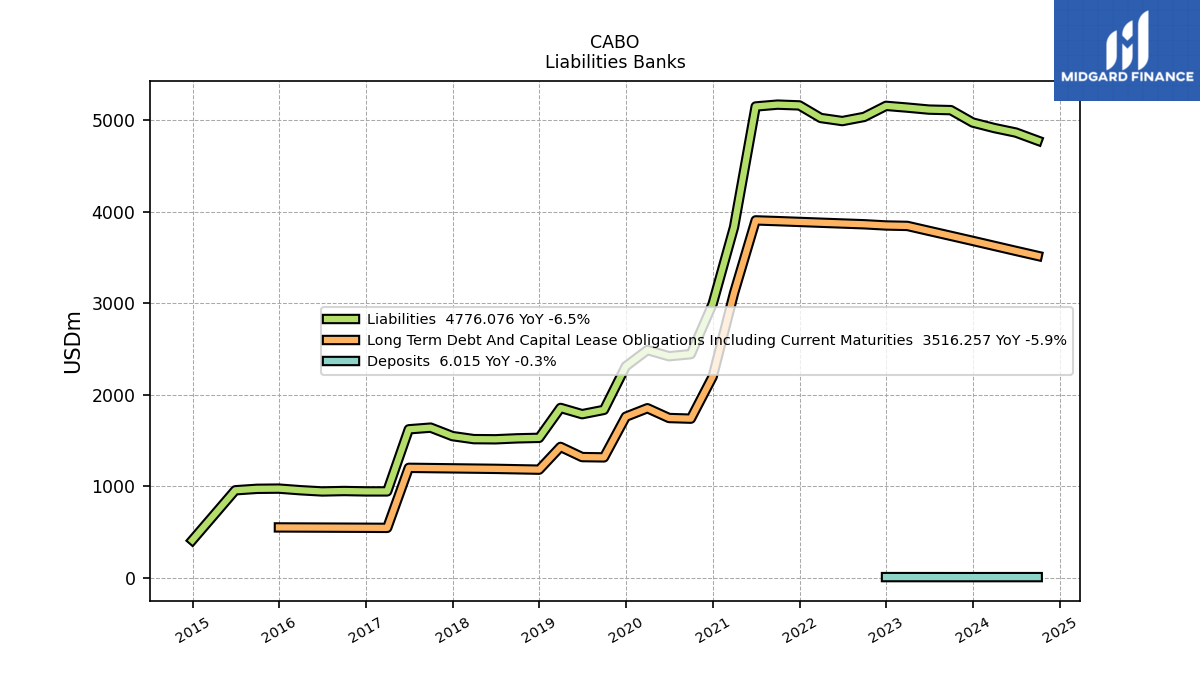
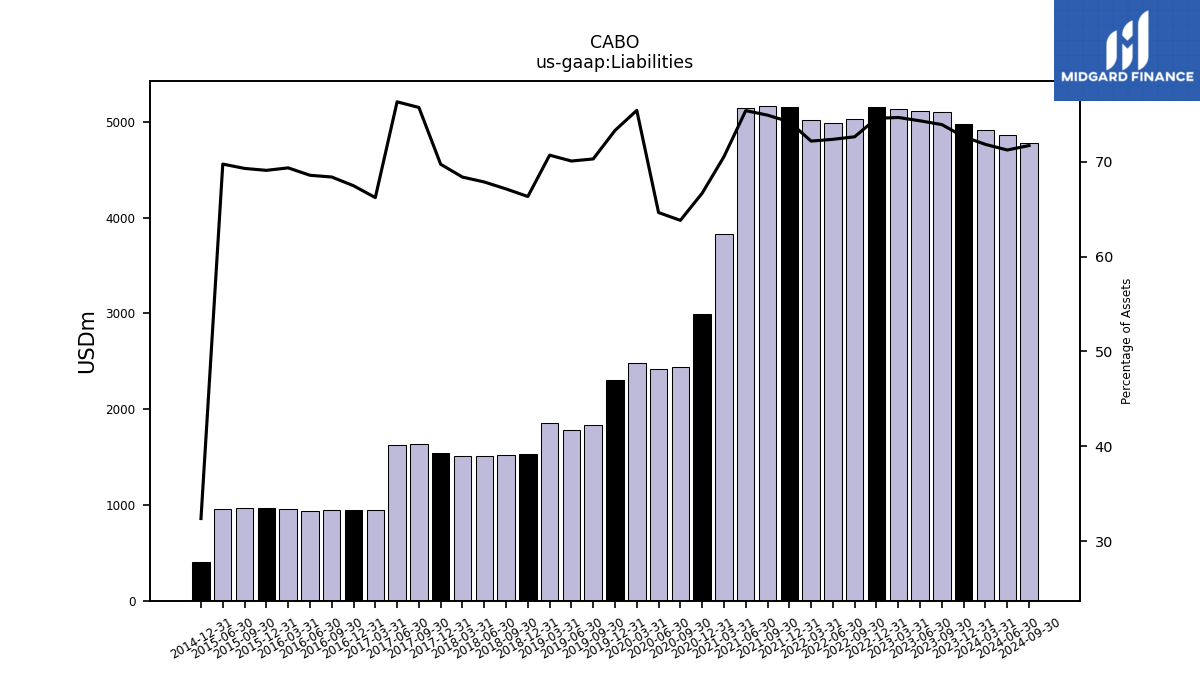
| Liabilities | 4973.79 | 5109.04 | 5115.00 | 5136.73 | 5155.92 | 5035.12 | 4989.57 | 5023.27 | 5160.90 | 5169.38 | 5149.16 | 3831.62 | 2993.04 | 2442.41 | 2419.90 | 2487.47 | 2310.26 | 1833.57 | 1786.54 | 1855.20 | 1527.88 | 1522.61 | 1512.12 | 1513.88 | 1546.91 | 1639.61 | 1621.35 | 942.65 | |
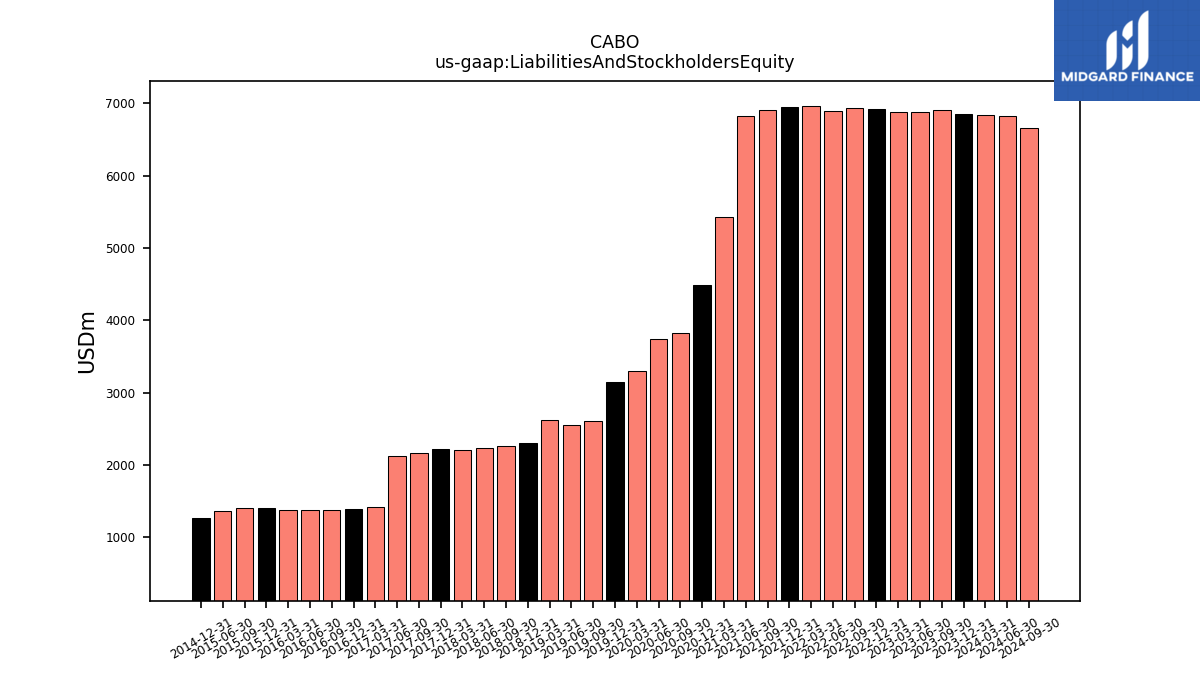
| Liabilities And Stockholders Equity | 6846.93 | 6911.77 | 6882.74 | 6879.35 | 6913.89 | 6932.25 | 6895.08 | 6959.42 | 6953.99 | 6900.60 | 6830.00 | 5432.27 | 4488.34 | 3826.81 | 3743.45 | 3298.36 | 3151.83 | 2608.33 | 2549.45 | 2624.24 | 2303.23 | 2267.95 | 2228.06 | 2213.79 | 2218.33 | 2165.23 | 2124.49 | 1423.49 | |
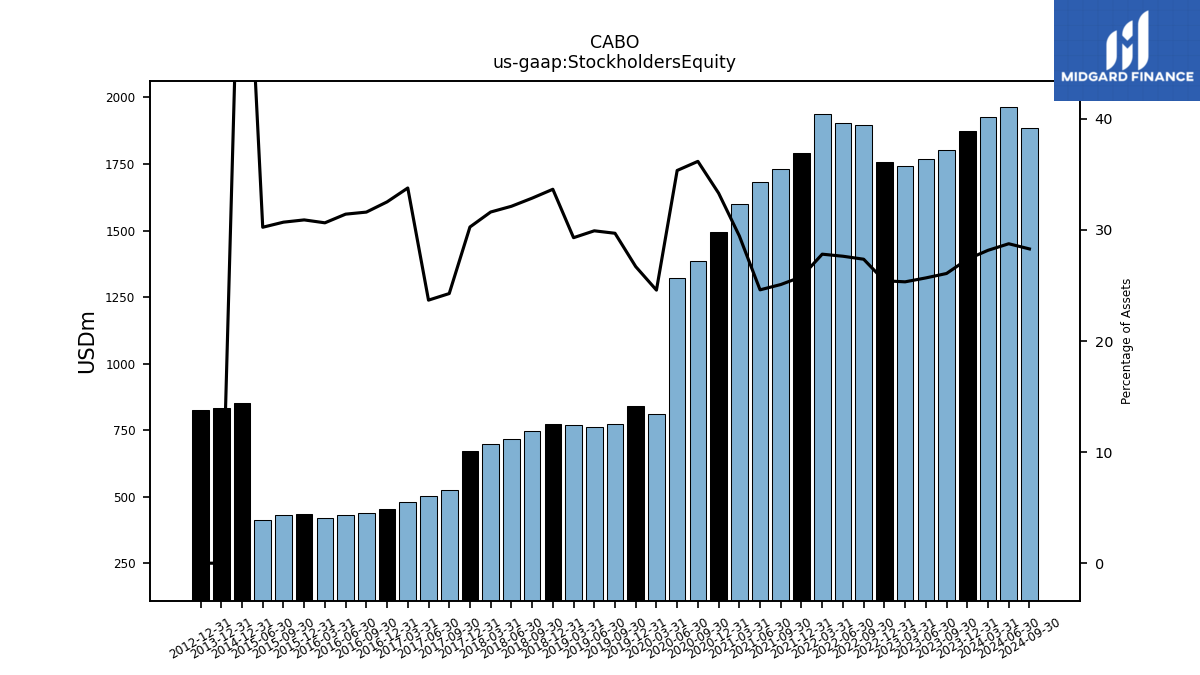
| Stockholders Equity | 1873.14 | 1802.73 | 1767.74 | 1742.61 | 1757.97 | 1897.13 | 1905.50 | 1936.15 | 1793.10 | 1731.22 | 1680.85 | 1600.65 | 1495.30 | 1384.40 | 1323.55 | 810.89 | 841.57 | 774.76 | 762.91 | 769.03 | 775.36 | 745.34 | 715.93 | 699.91 | 671.42 | 525.62 | 503.15 | 480.85 |
| 2023-12-31 | 2023-09-30 | 2023-06-30 | 2023-03-31 | 2022-12-31 | 2022-09-30 | 2022-06-30 | 2022-03-31 | 2021-12-31 | 2021-09-30 | 2021-06-30 | 2021-03-31 | 2020-12-31 | 2020-09-30 | 2020-06-30 | 2020-03-31 | 2019-12-31 | 2019-09-30 | 2019-06-30 | 2019-03-31 | 2018-12-31 | 2018-09-30 | 2018-06-30 | 2018-03-31 | 2017-12-31 | 2017-09-30 | 2017-06-30 | 2017-03-31 | ||
|---|---|---|---|---|---|---|---|---|---|---|---|---|---|---|---|---|---|---|---|---|---|---|---|---|---|---|---|---|---|
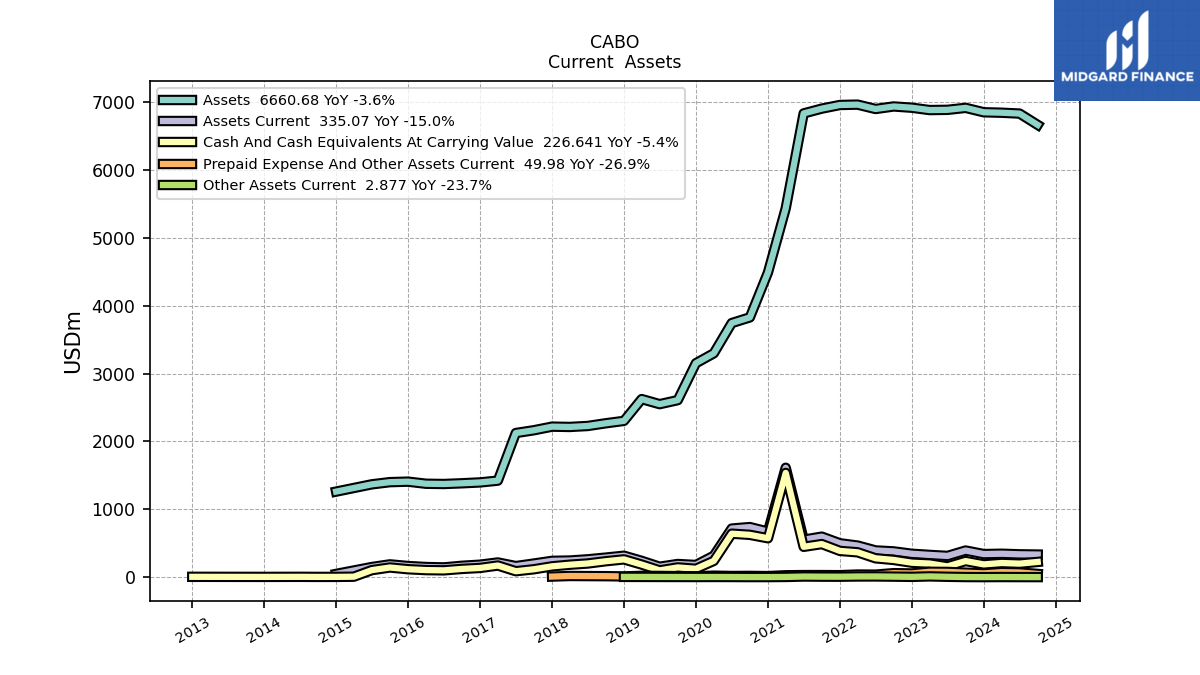
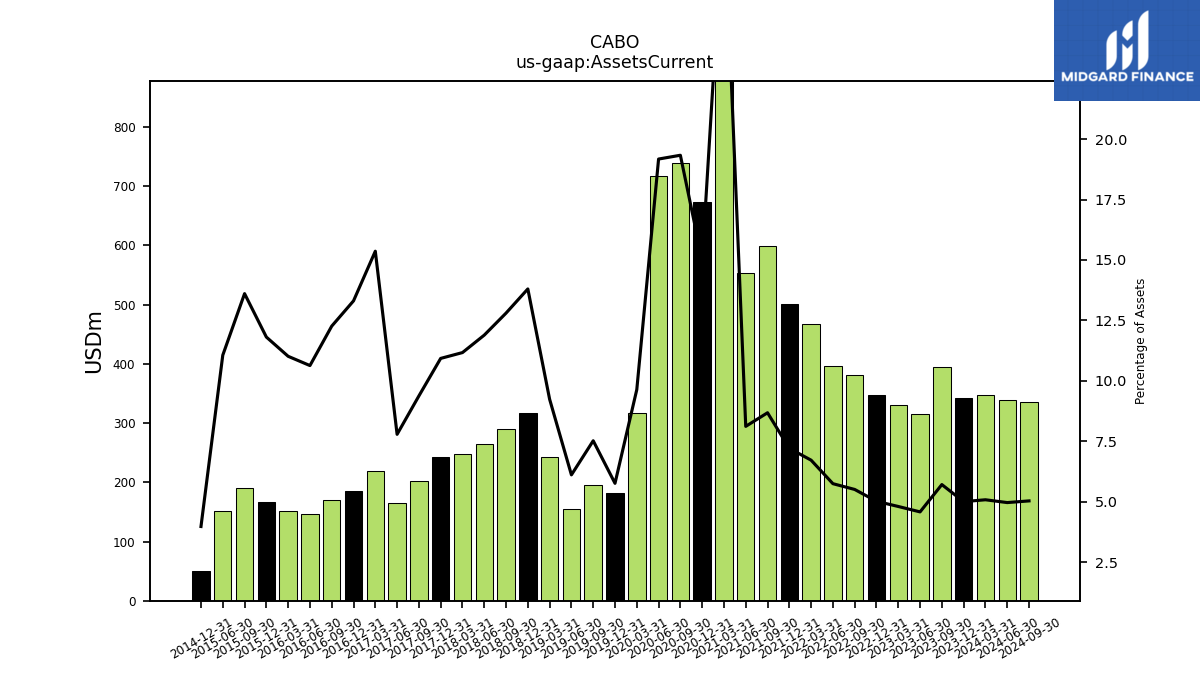
| Assets Current | 342.38 | 394.38 | 314.94 | 330.19 | 346.70 | 381.57 | 396.02 | 467.38 | 500.95 | 598.80 | 554.21 | 1613.00 | 672.81 | 739.79 | 717.80 | 317.78 | 181.49 | 196.12 | 155.72 | 242.37 | 317.86 | 290.33 | 264.92 | 247.23 | 242.38 | 202.97 | 165.40 | 218.67 | |
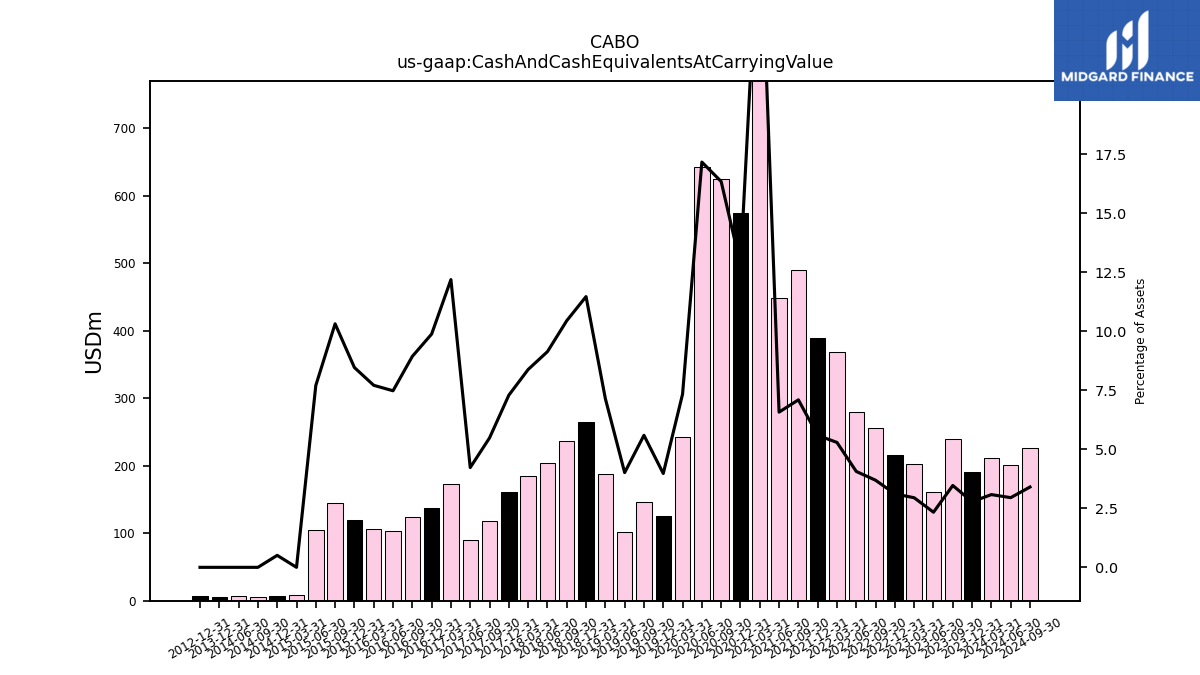
| Cash And Cash Equivalents At Carrying Value | 190.29 | 239.63 | 160.73 | 202.73 | 215.15 | 255.72 | 279.98 | 368.17 | 388.80 | 489.54 | 448.96 | 1537.30 | 574.91 | 625.33 | 642.55 | 241.89 | 125.27 | 145.85 | 102.28 | 187.56 | 264.11 | 236.90 | 203.52 | 185.49 | 161.75 | 118.70 | 89.79 | 173.47 | |
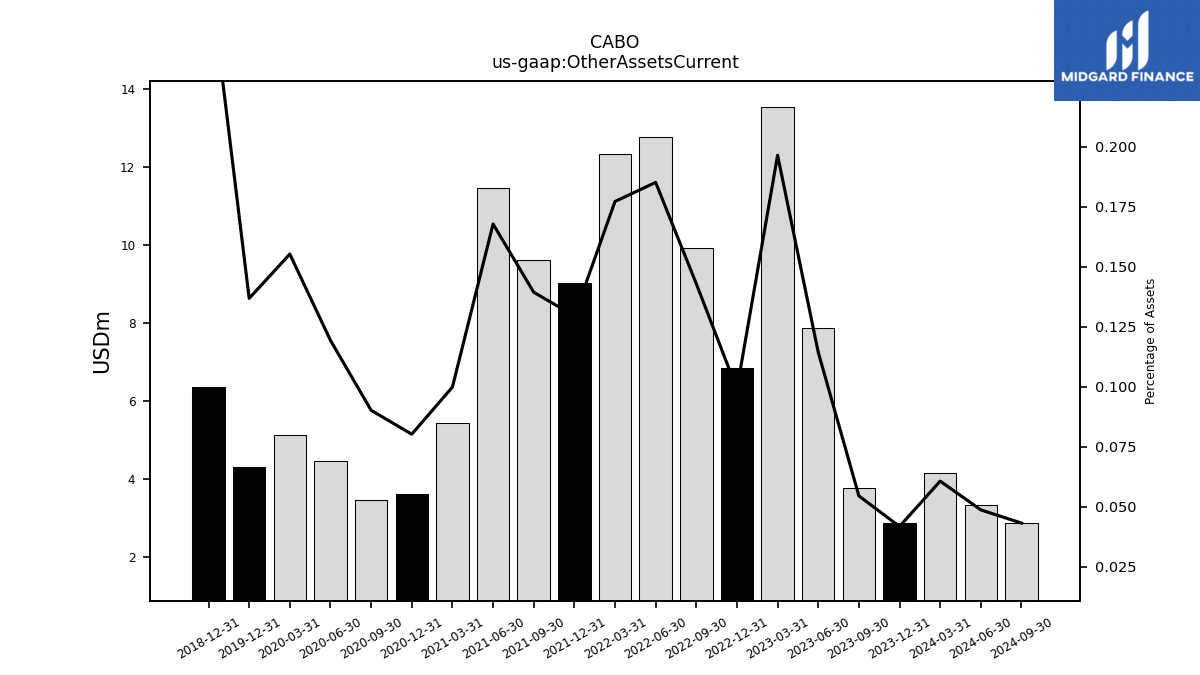
| Other Assets Current | 2.86 | 3.77 | 7.88 | 13.52 | 6.85 | 9.91 | 12.77 | 12.34 | 9.01 | 9.62 | 11.46 | 5.42 | 3.60 | 3.45 | 4.47 | 5.12 | 4.31 | NA | NA | NA | 6.35 | NA | NA | NA | NA | NA | NA | NA | |
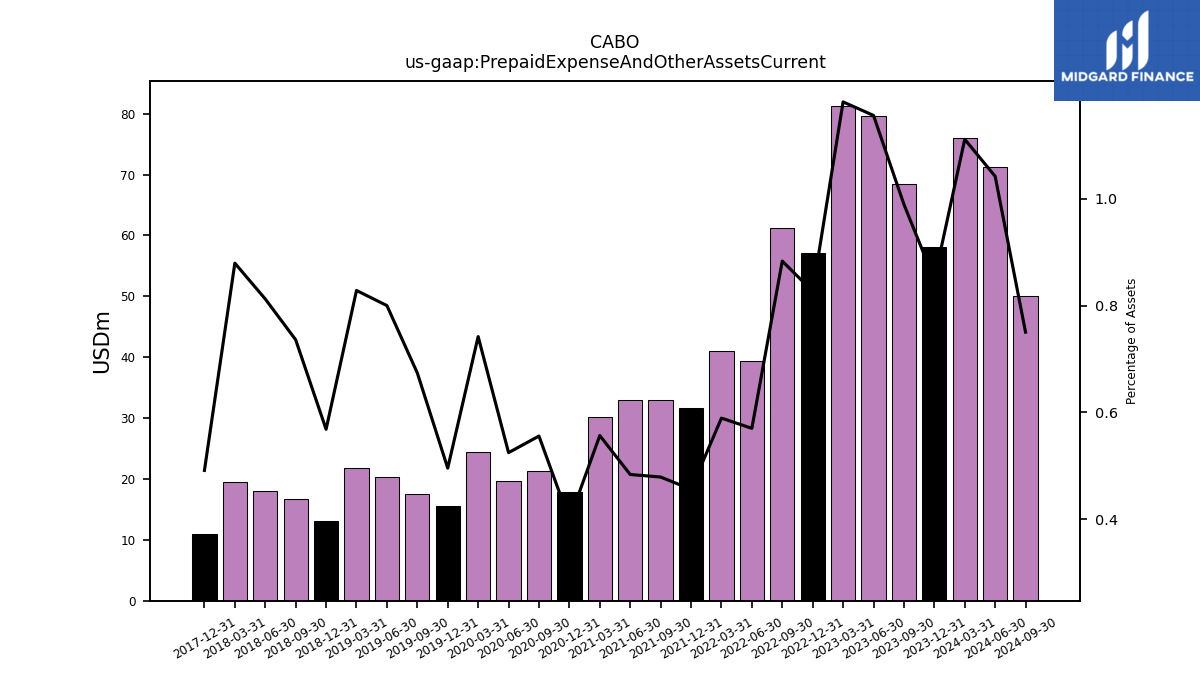
| Prepaid Expense And Other Assets Current | 58.12 | 68.42 | 79.60 | 81.31 | 57.17 | 61.25 | 39.31 | 41.02 | 31.70 | 33.05 | 33.03 | 30.24 | 17.89 | 21.26 | 19.64 | 24.48 | 15.62 | 17.58 | 20.40 | 21.74 | 13.09 | 16.69 | 18.10 | 19.47 | 10.90 | NA | NA | NA |
| 2023-12-31 | 2023-09-30 | 2023-06-30 | 2023-03-31 | 2022-12-31 | 2022-09-30 | 2022-06-30 | 2022-03-31 | 2021-12-31 | 2021-09-30 | 2021-06-30 | 2021-03-31 | 2020-12-31 | 2020-09-30 | 2020-06-30 | 2020-03-31 | 2019-12-31 | 2019-09-30 | 2019-06-30 | 2019-03-31 | 2018-12-31 | 2018-09-30 | 2018-06-30 | 2018-03-31 | 2017-12-31 | 2017-09-30 | 2017-06-30 | 2017-03-31 | ||
|---|---|---|---|---|---|---|---|---|---|---|---|---|---|---|---|---|---|---|---|---|---|---|---|---|---|---|---|---|---|
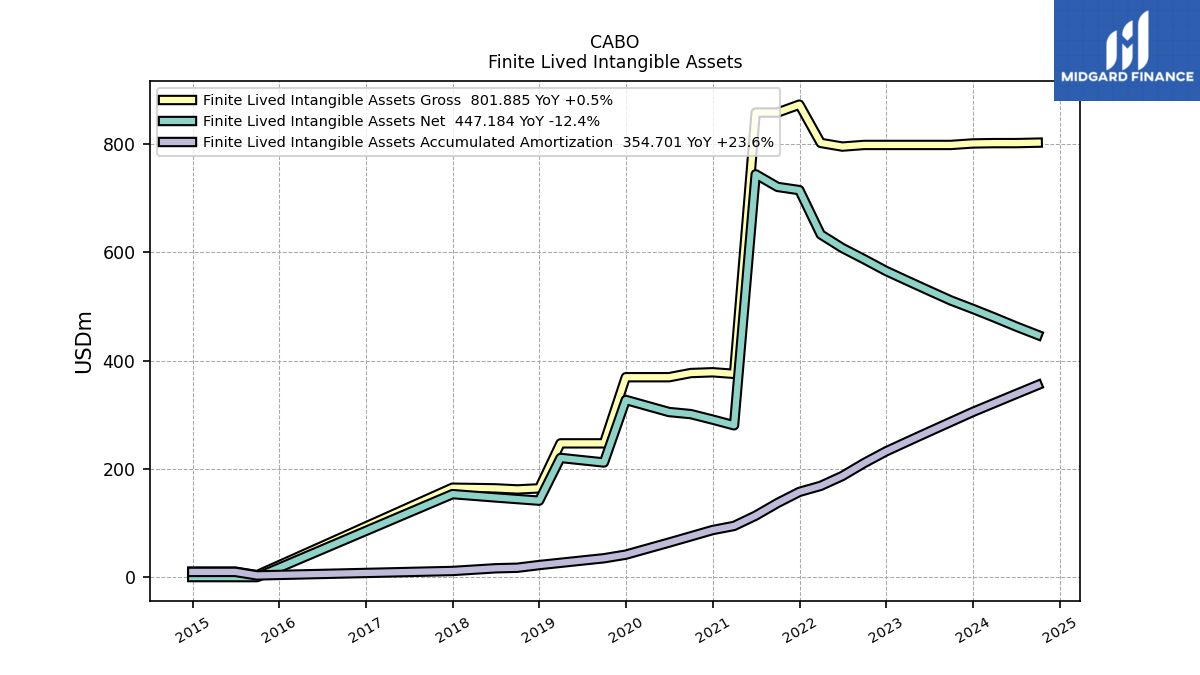
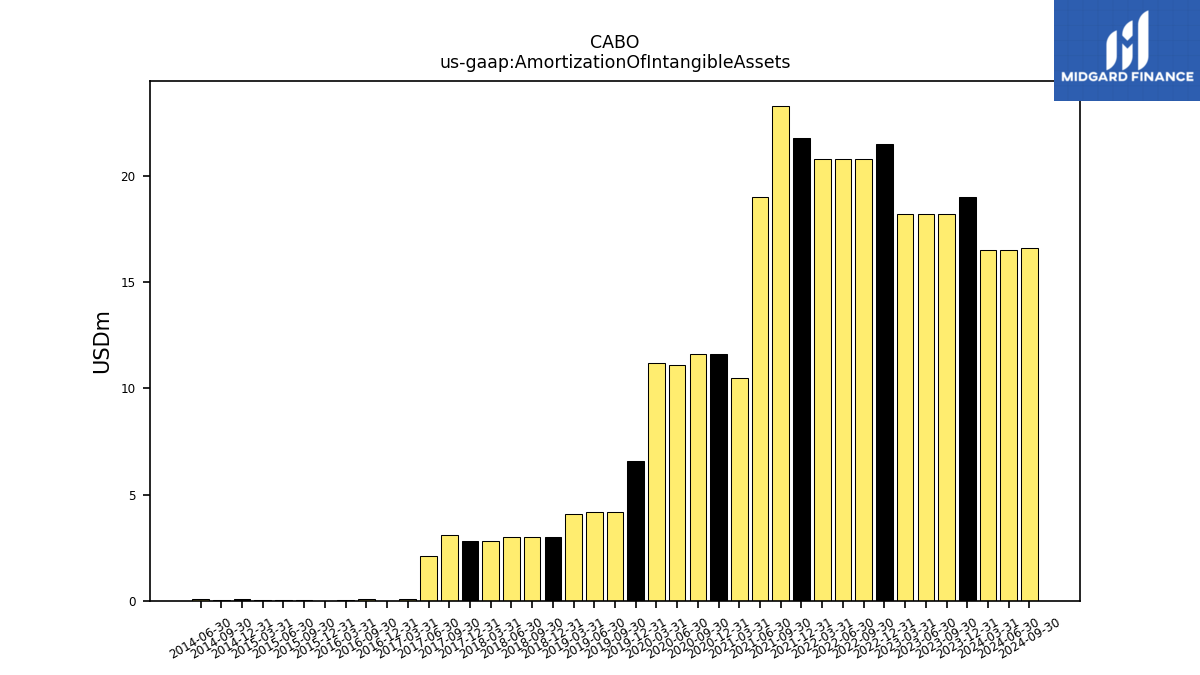
| Amortization Of Intangible Assets | 19.00 | 18.20 | 18.20 | 18.20 | 21.50 | 20.80 | 20.80 | 20.80 | 21.80 | 23.30 | 19.00 | 10.50 | 11.60 | 11.60 | 11.10 | 11.20 | 6.60 | 4.20 | 4.20 | 4.10 | 3.00 | 3.00 | 3.00 | 2.80 | 2.80 | 3.10 | 2.10 | 0.10 | |
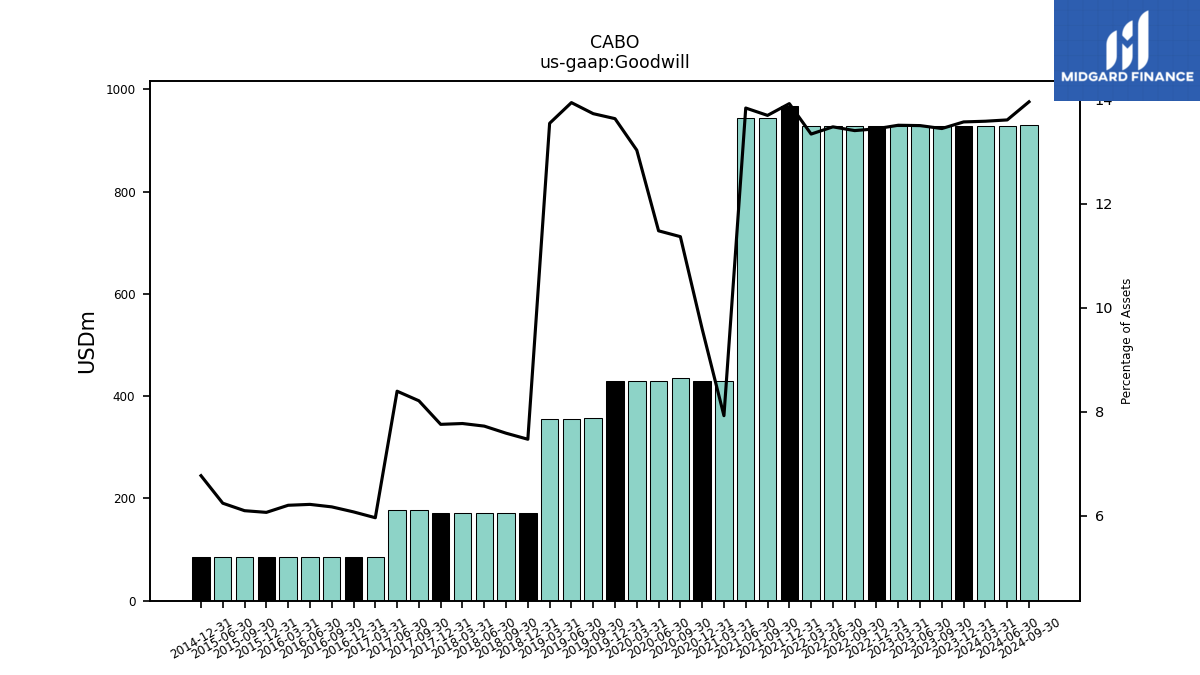
| Goodwill | 928.95 | 928.95 | 928.95 | 928.95 | 928.95 | 928.95 | 928.95 | 927.98 | 967.91 | 944.87 | 944.87 | 430.54 | 430.54 | 434.88 | 429.60 | 429.60 | 429.60 | 358.01 | 355.35 | 355.35 | 172.13 | 172.13 | 172.13 | 172.13 | 172.13 | 177.81 | 178.37 | 84.93 | |
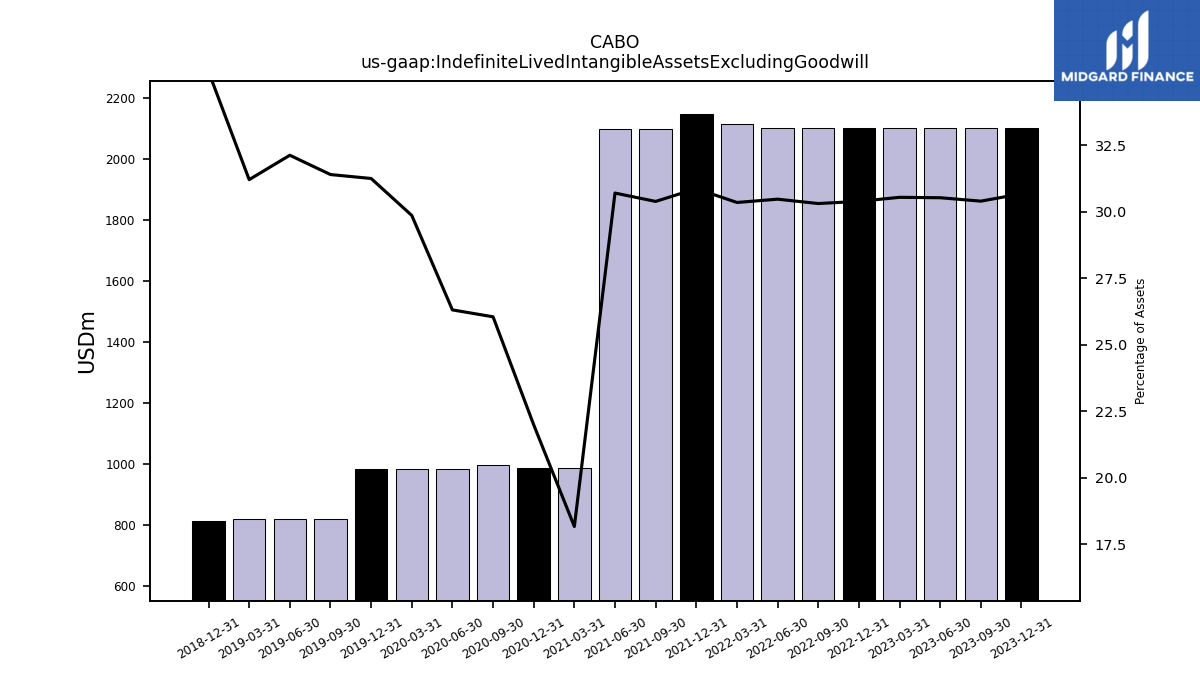
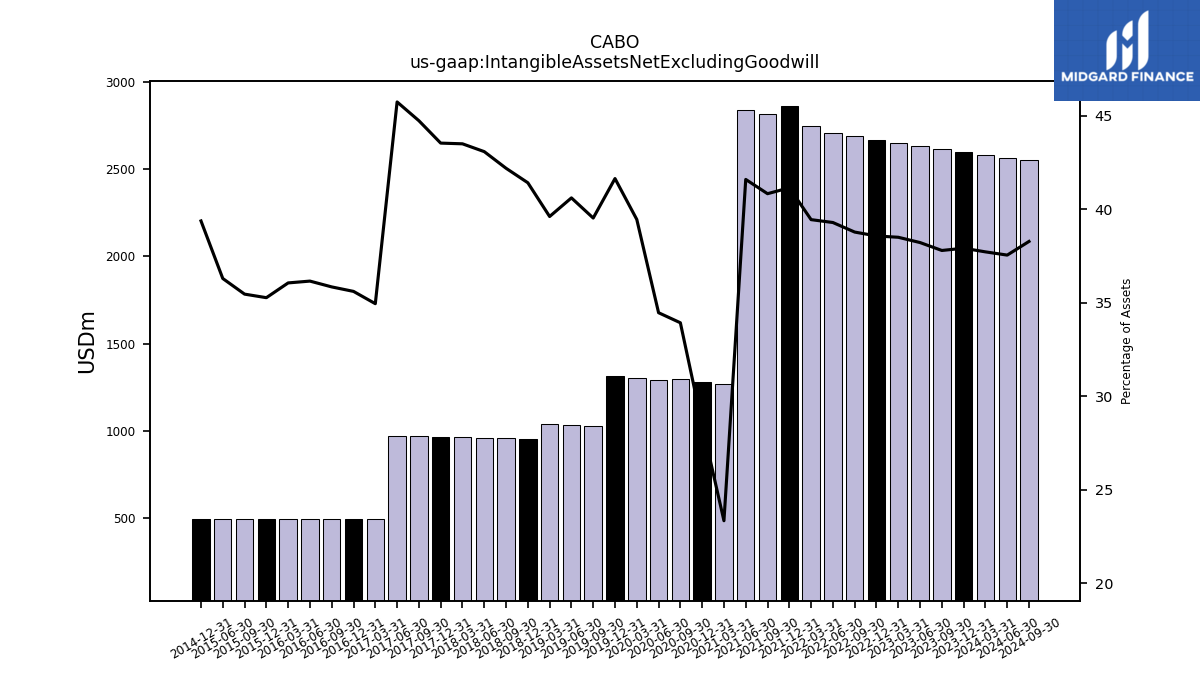
| Indefinite Lived Intangible Assets Excluding Goodwill | 2100.55 | 2101.35 | 2101.35 | 2101.35 | 2101.35 | 2101.35 | 2101.35 | 2112.37 | 2146.81 | 2097.21 | 2097.21 | 987.21 | 987.21 | 997.07 | 985.07 | 985.07 | 985.07 | 819.07 | 819.07 | 819.07 | 812.37 | NA | NA | NA | NA | NA | NA | NA | |
| Intangible Assets Net Excluding Goodwill | 2595.89 | 2612.12 | 2630.28 | 2648.43 | 2666.59 | 2688.11 | 2708.89 | 2744.91 | 2861.14 | 2817.45 | 2840.70 | 1267.70 | 1278.20 | 1298.23 | 1290.11 | 1301.23 | 1312.38 | 1030.99 | 1035.21 | 1039.43 | 953.85 | 956.83 | 959.82 | 962.93 | 965.75 | 968.56 | 971.67 | 497.46 | |
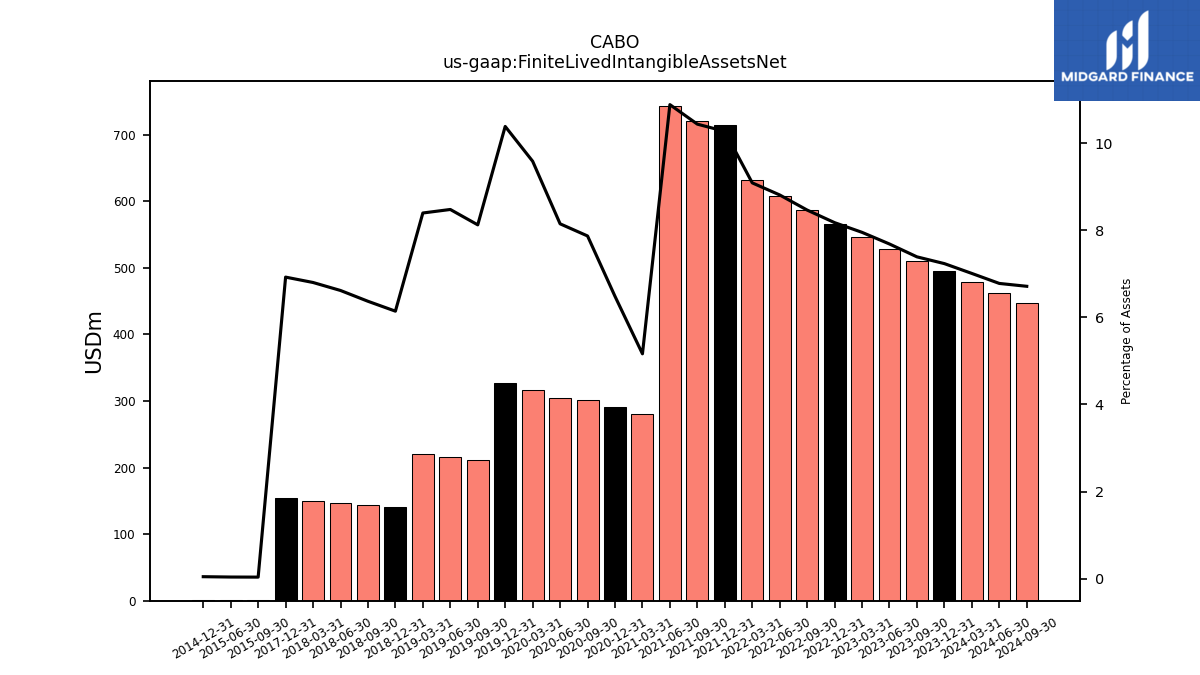
| Finite Lived Intangible Assets Net | 495.35 | 510.77 | 528.93 | 547.09 | 565.24 | 586.77 | 607.55 | 632.54 | 714.33 | 720.23 | 743.49 | 280.49 | 290.99 | 301.15 | 305.04 | 316.16 | 327.31 | 211.92 | 216.14 | 220.36 | 141.48 | 144.46 | 147.45 | 150.56 | 153.61 | NA | NA | NA | |
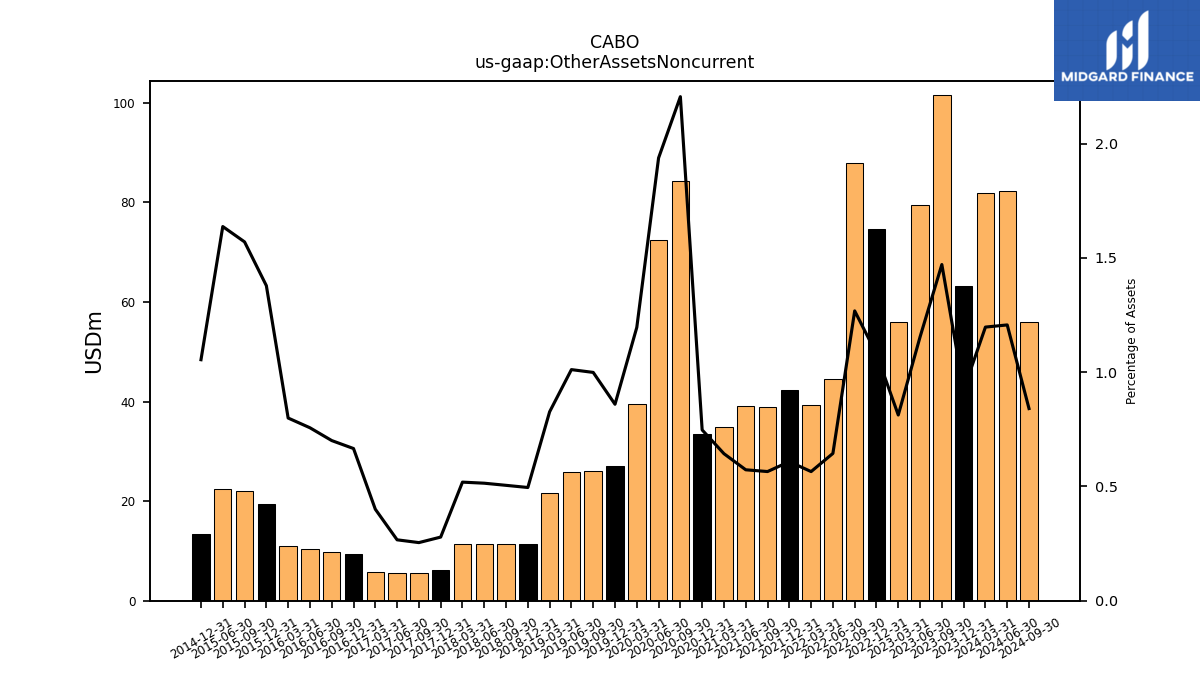
| Other Assets Noncurrent | 63.15 | 101.67 | 79.44 | 55.91 | 74.68 | 87.91 | 44.44 | 39.33 | 42.32 | 39.01 | 39.13 | 34.95 | 33.54 | 84.40 | 72.52 | 39.44 | 27.09 | 26.06 | 25.78 | 21.70 | 11.41 | 11.45 | 11.46 | 11.49 | 6.18 | 5.51 | 5.66 | 5.70 | |
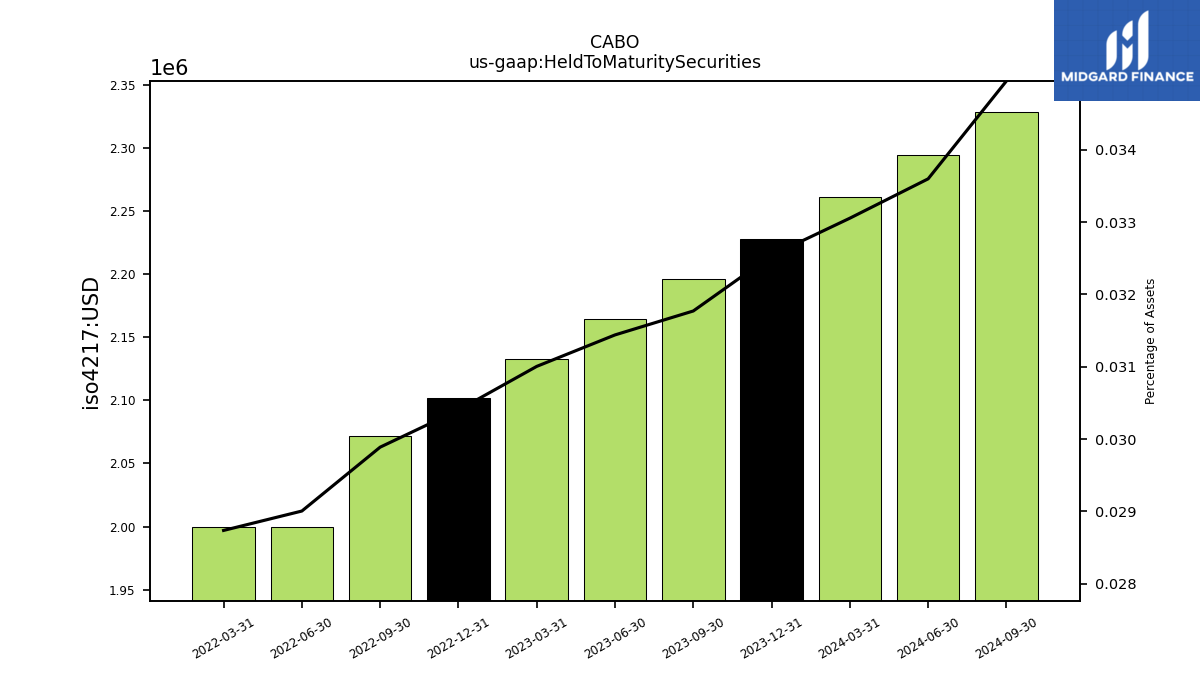
| Held To Maturity Securities | 2.23 | 2.20 | 2.16 | 2.13 | 2.10 | 2.07 | 2.00 | 2.00 | NA | NA | NA | NA | NA | NA | NA | NA | NA | NA | NA | NA | NA | NA | NA | NA | NA | NA | NA | NA |
| 2023-12-31 | 2023-09-30 | 2023-06-30 | 2023-03-31 | 2022-12-31 | 2022-09-30 | 2022-06-30 | 2022-03-31 | 2021-12-31 | 2021-09-30 | 2021-06-30 | 2021-03-31 | 2020-12-31 | 2020-09-30 | 2020-06-30 | 2020-03-31 | 2019-12-31 | 2019-09-30 | 2019-06-30 | 2019-03-31 | 2018-12-31 | 2018-09-30 | 2018-06-30 | 2018-03-31 | 2017-12-31 | 2017-09-30 | 2017-06-30 | 2017-03-31 | ||
|---|---|---|---|---|---|---|---|---|---|---|---|---|---|---|---|---|---|---|---|---|---|---|---|---|---|---|---|---|---|
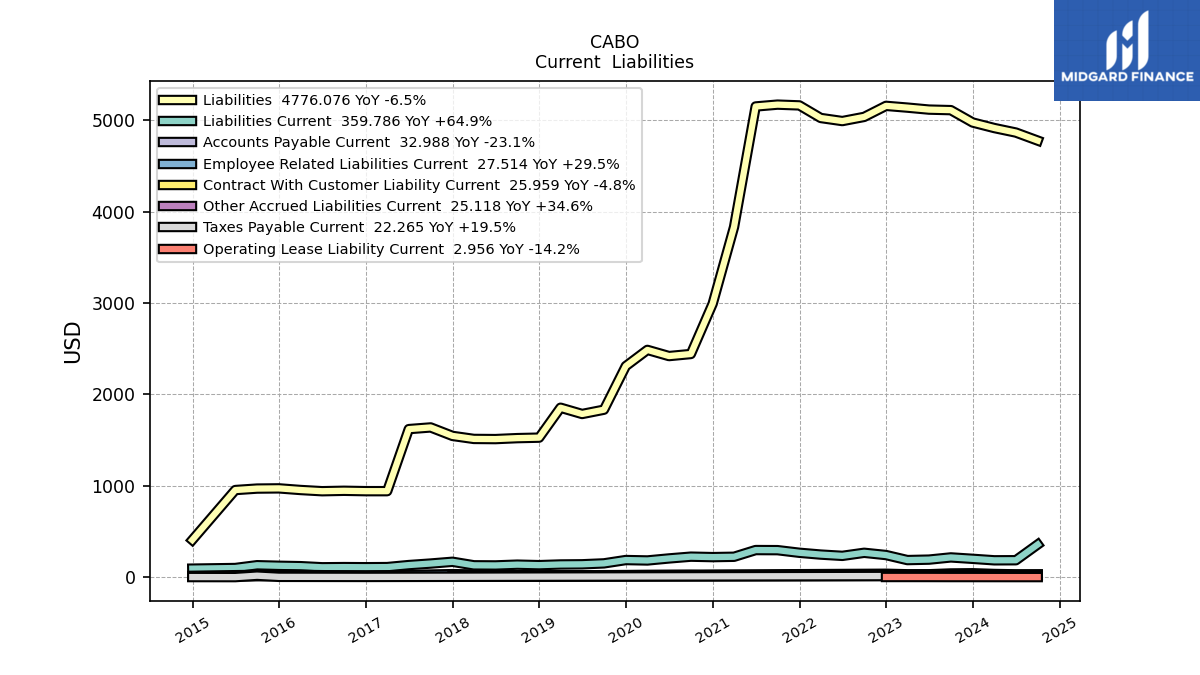
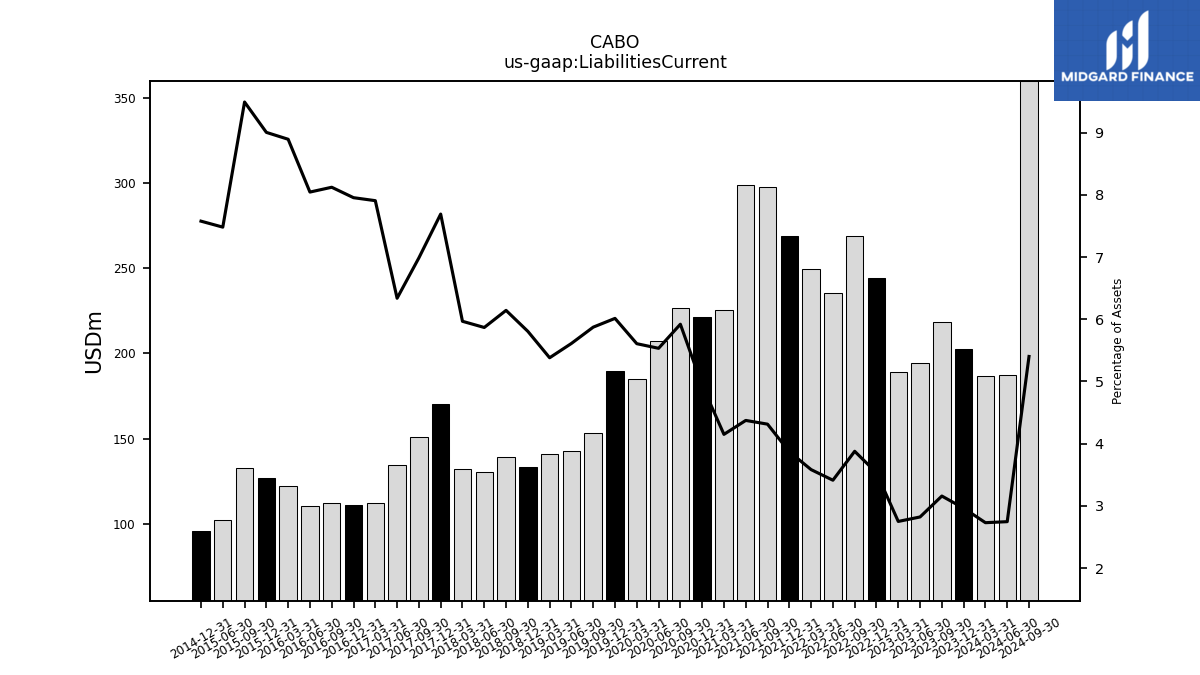
| Liabilities Current | 202.84 | 218.25 | 194.18 | 189.13 | 244.16 | 268.77 | 235.27 | 249.31 | 269.07 | 297.65 | 298.69 | 225.40 | 221.58 | 226.54 | 207.12 | 184.94 | 189.54 | 153.18 | 143.05 | 141.20 | 133.71 | 139.31 | 130.74 | 132.10 | 170.60 | 151.28 | 134.65 | 112.55 | |
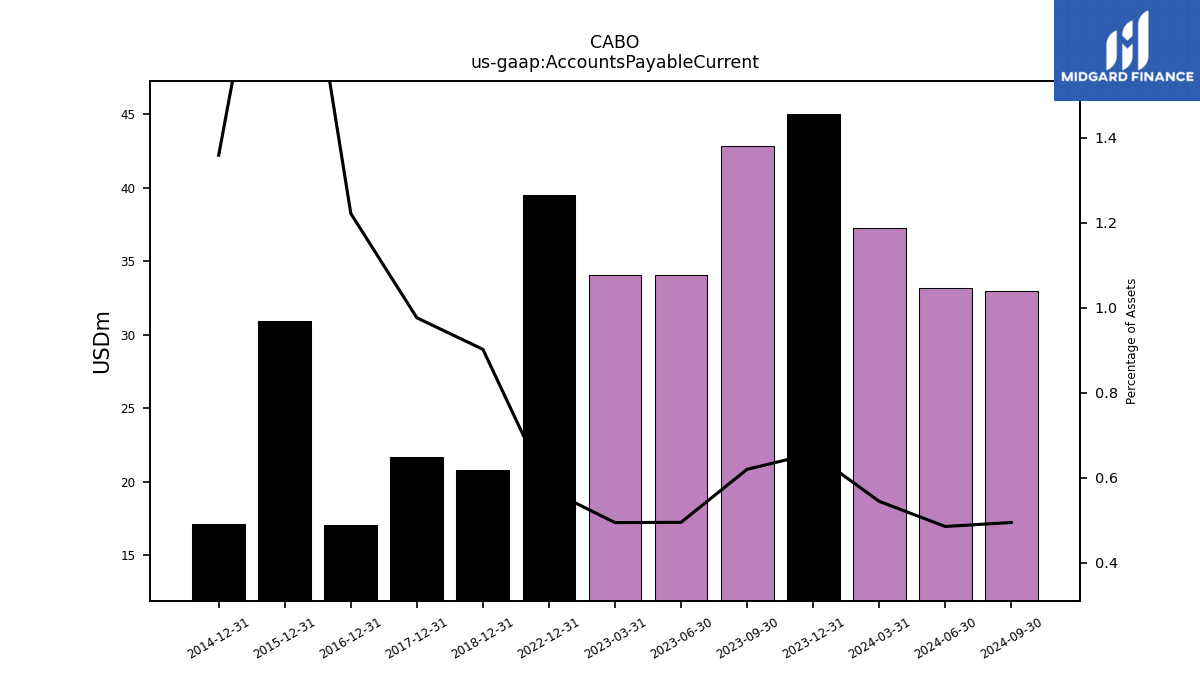
| Accounts Payable Current | 45.02 | 42.88 | 34.11 | 34.05 | 39.55 | NA | NA | NA | NA | NA | NA | NA | NA | NA | NA | NA | NA | NA | NA | NA | 20.79 | NA | NA | NA | 21.67 | NA | NA | NA | |
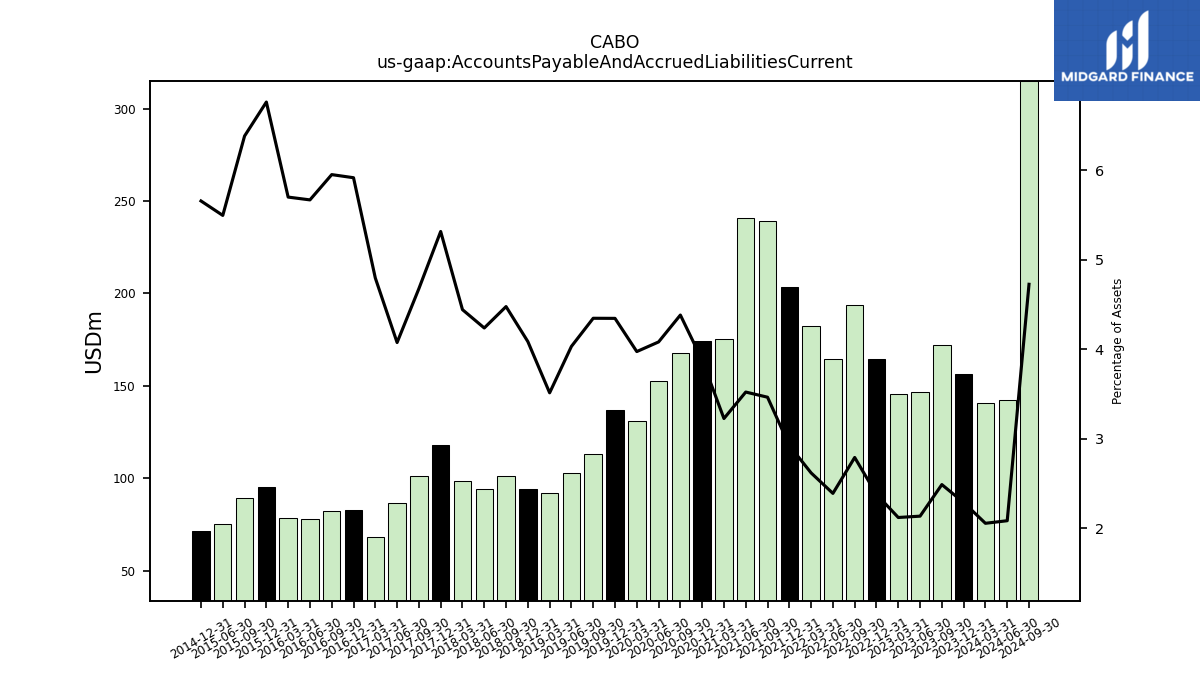
| Accounts Payable And Accrued Liabilities Current | 156.65 | 171.97 | 146.95 | 145.85 | 164.52 | 193.50 | 164.78 | 182.25 | 203.39 | 239.11 | 240.59 | 175.28 | 174.14 | 167.75 | 152.84 | 131.12 | 136.99 | 113.40 | 102.82 | 92.22 | 94.13 | 101.56 | 94.44 | 98.38 | 117.96 | 101.31 | 86.60 | 68.30 | |
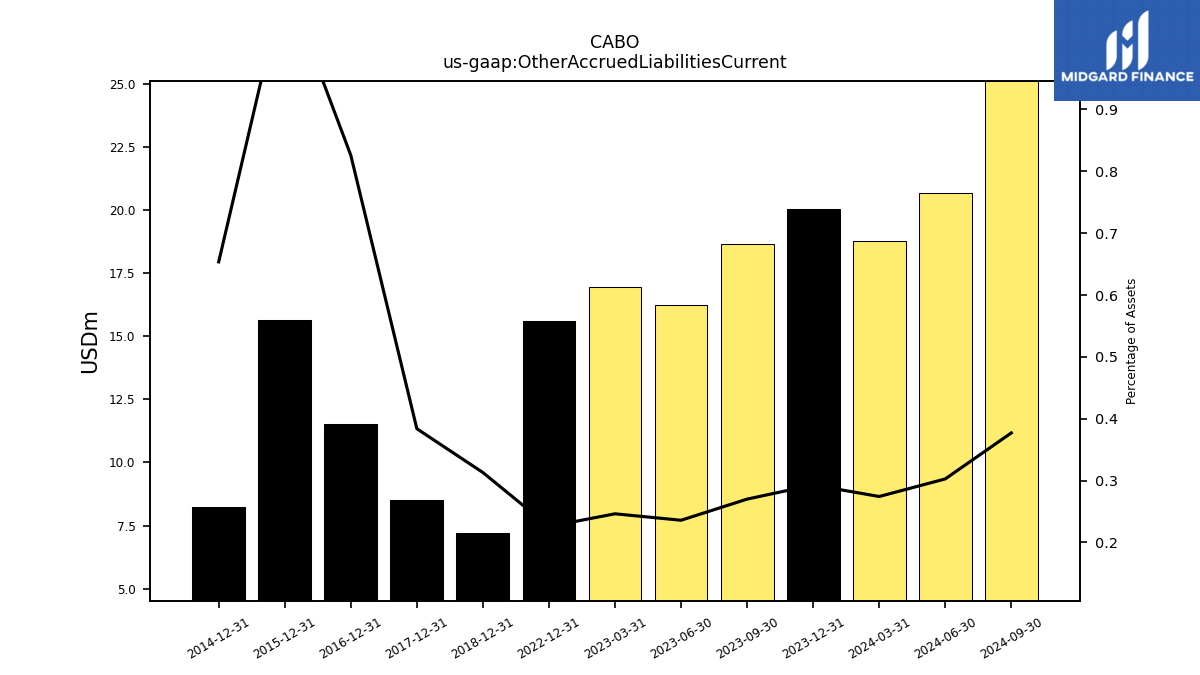
| Other Accrued Liabilities Current | 20.06 | 18.67 | 16.24 | 16.95 | 15.61 | NA | NA | NA | NA | NA | NA | NA | NA | NA | NA | NA | NA | NA | NA | NA | 7.21 | NA | NA | NA | 8.52 | NA | NA | NA | |
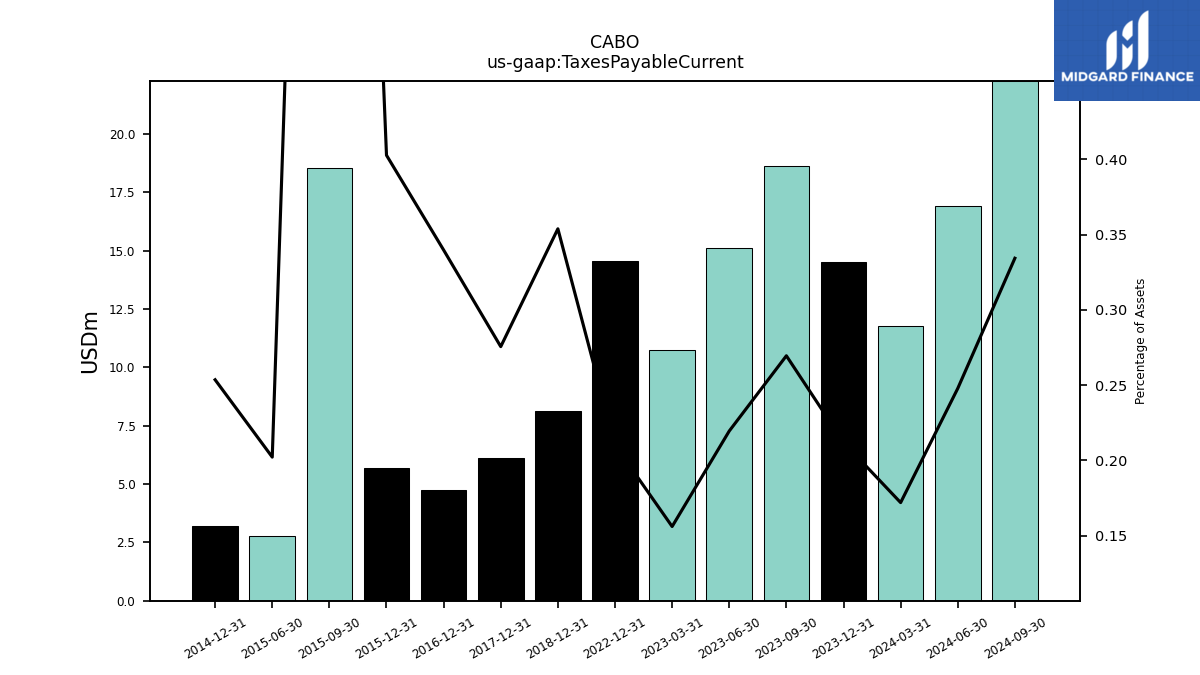
| Taxes Payable Current | 14.52 | 18.63 | 15.11 | 10.74 | 14.54 | NA | NA | NA | NA | NA | NA | NA | NA | NA | NA | NA | NA | NA | NA | NA | 8.15 | NA | NA | NA | 6.11 | NA | NA | NA | |
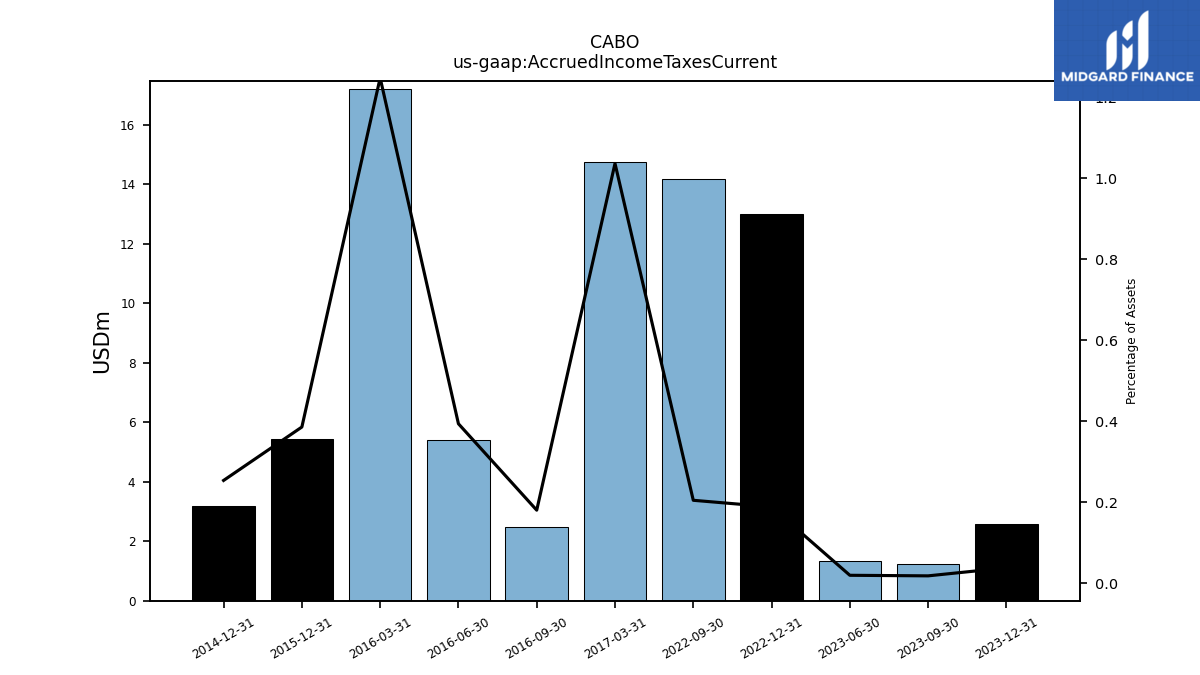
| Accrued Income Taxes Current | 2.58 | 1.23 | 1.32 | NA | 13.01 | 14.18 | NA | NA | NA | NA | NA | NA | NA | NA | NA | NA | NA | NA | NA | NA | NA | NA | NA | NA | NA | NA | NA | 14.76 | |
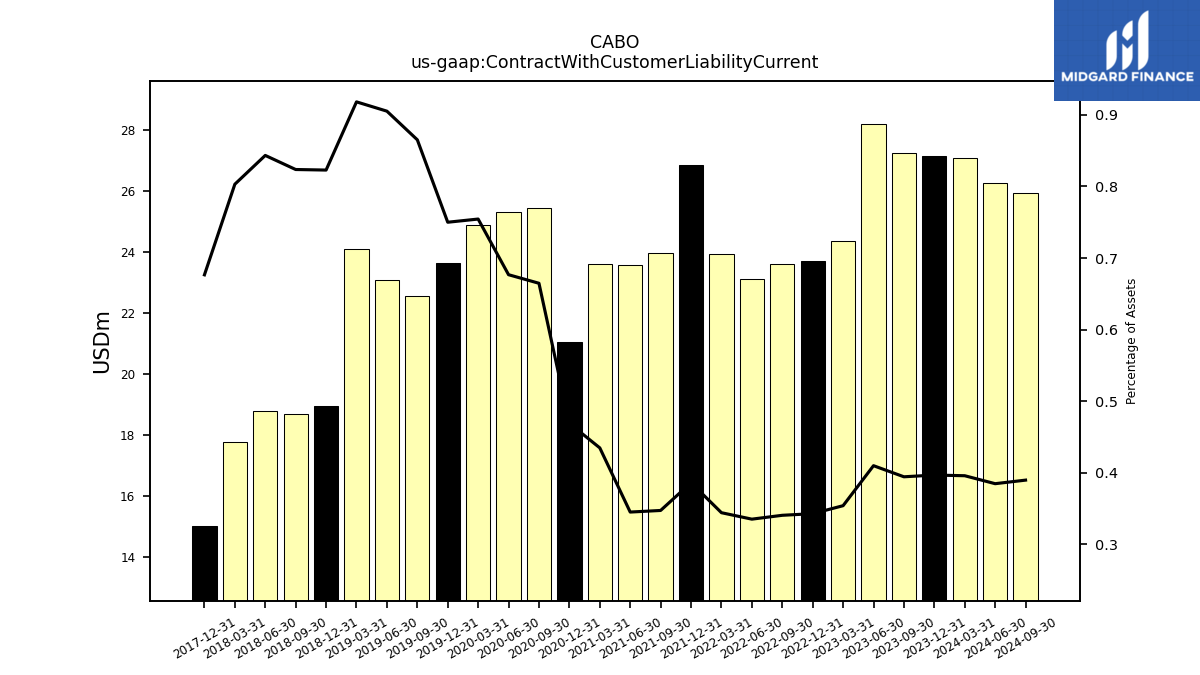
| Contract With Customer Liability Current | 27.17 | 27.26 | 28.21 | 24.35 | 23.71 | 23.61 | 23.11 | 23.96 | 26.85 | 23.97 | 23.57 | 23.62 | 21.05 | 25.44 | 25.33 | 24.89 | 23.64 | 22.57 | 23.08 | 24.10 | 18.95 | 18.68 | 18.79 | 17.78 | 15.01 | NA | NA | NA | |
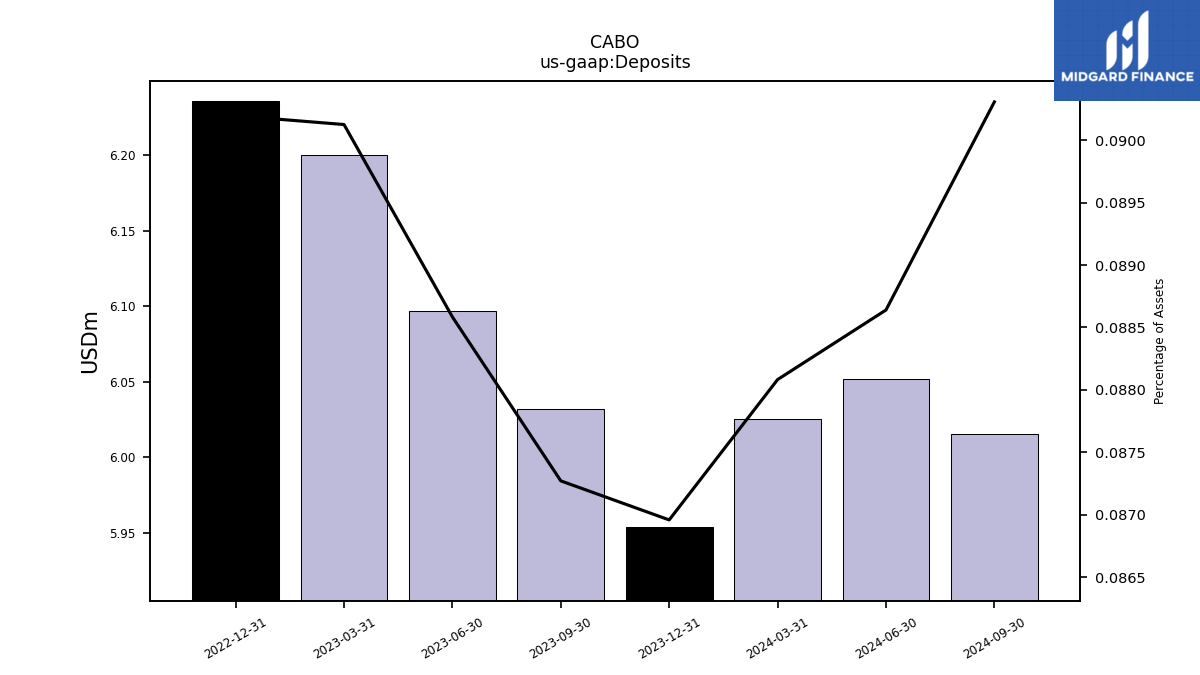
| Deposits | 5.95 | 6.03 | 6.10 | 6.20 | 6.24 | NA | NA | NA | NA | NA | NA | NA | NA | NA | NA | NA | NA | NA | NA | NA | NA | NA | NA | NA | NA | NA | NA | NA |
| 2023-12-31 | 2023-09-30 | 2023-06-30 | 2023-03-31 | 2022-12-31 | 2022-09-30 | 2022-06-30 | 2022-03-31 | 2021-12-31 | 2021-09-30 | 2021-06-30 | 2021-03-31 | 2020-12-31 | 2020-09-30 | 2020-06-30 | 2020-03-31 | 2019-12-31 | 2019-09-30 | 2019-06-30 | 2019-03-31 | 2018-12-31 | 2018-09-30 | 2018-06-30 | 2018-03-31 | 2017-12-31 | 2017-09-30 | 2017-06-30 | 2017-03-31 | ||
|---|---|---|---|---|---|---|---|---|---|---|---|---|---|---|---|---|---|---|---|---|---|---|---|---|---|---|---|---|---|
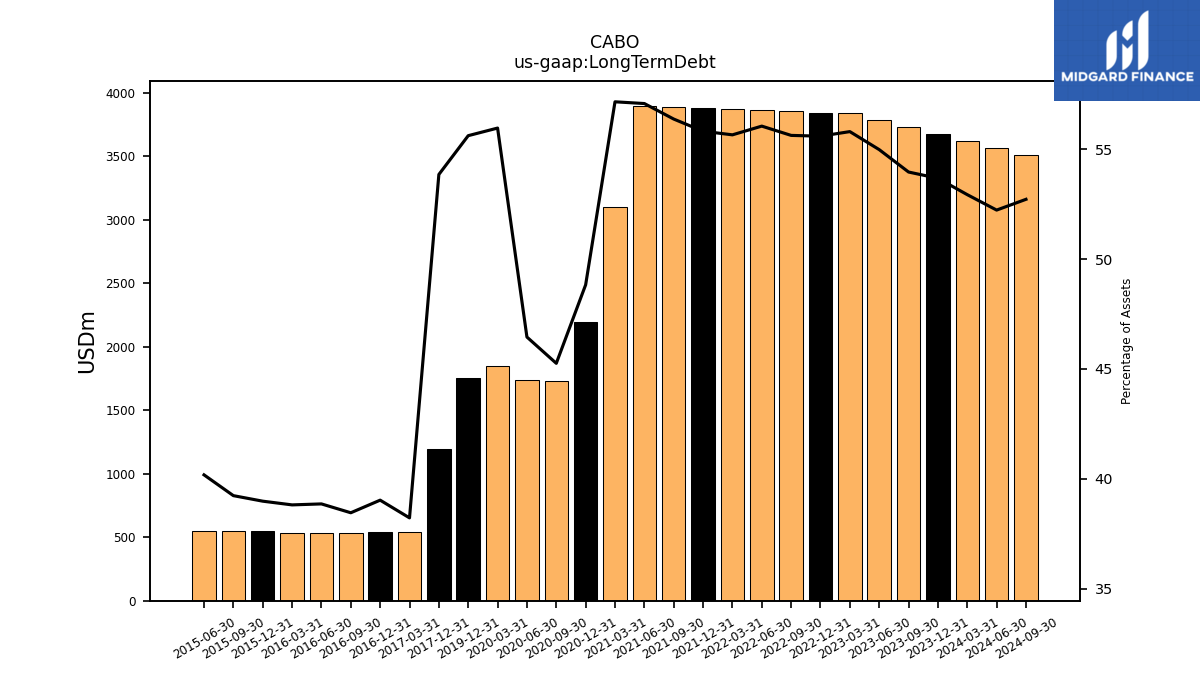
| Long Term Debt | 3675.35 | 3729.91 | 3784.47 | 3839.03 | 3843.90 | 3856.59 | 3865.03 | 3873.46 | 3881.89 | 3890.32 | 3898.76 | 3105.19 | 2191.62 | 1731.80 | 1738.88 | 1845.96 | 1753.05 | NA | NA | NA | NA | NA | NA | NA | 1194.64 | NA | NA | 544.03 | |
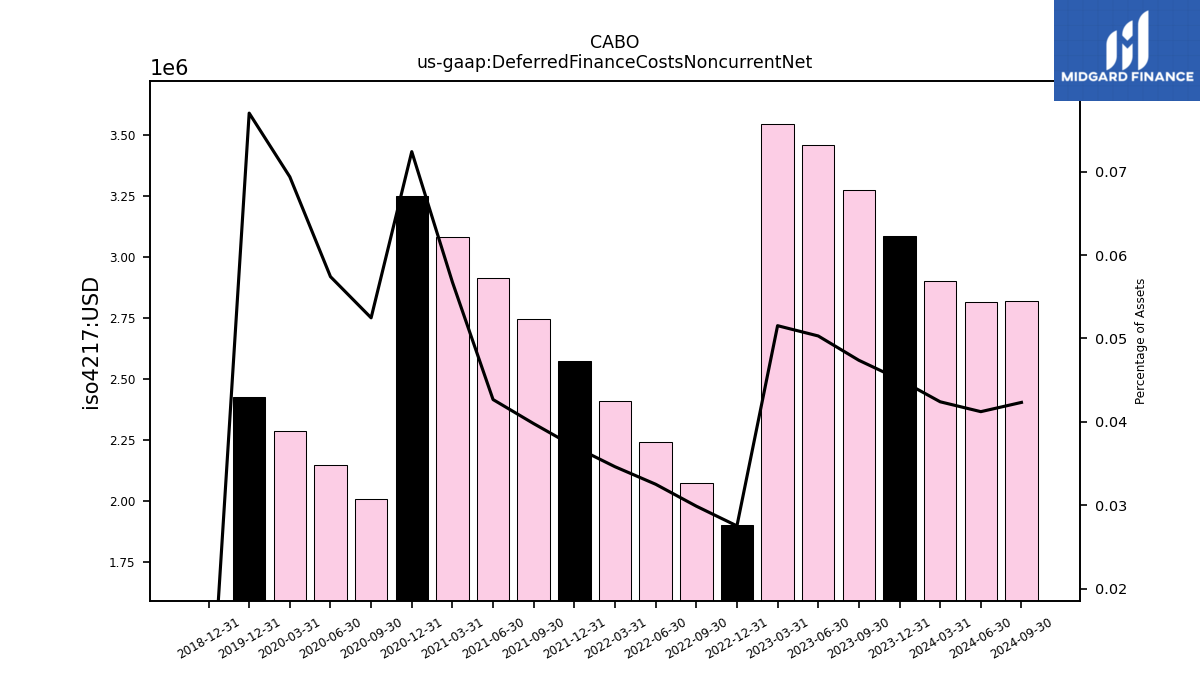
| Deferred Finance Costs Noncurrent Net | 3.09 | 3.27 | 3.46 | 3.54 | 1.90 | 2.07 | 2.24 | 2.41 | 2.58 | 2.75 | 2.92 | 3.08 | 3.25 | 2.01 | 2.15 | 2.29 | 2.43 | NA | NA | NA | 0.00 | NA | NA | NA | NA | NA | NA | NA | |
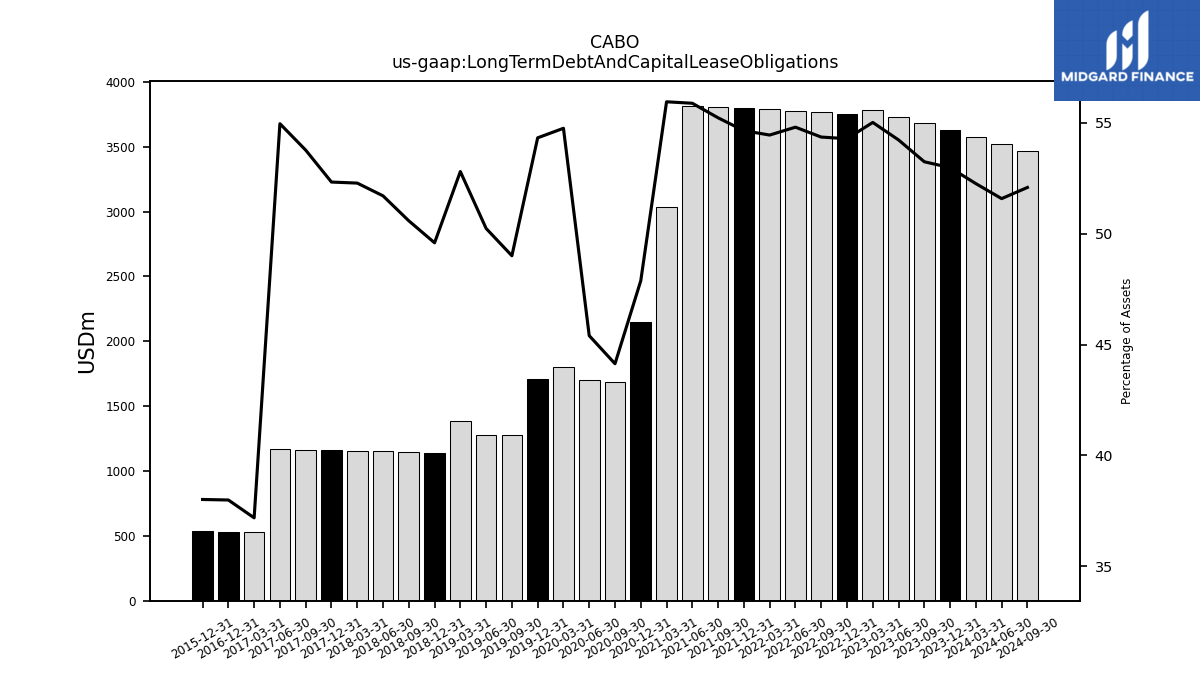
| Long Term Debt And Capital Lease Obligations | 3626.93 | 3679.62 | 3731.93 | 3784.25 | 3752.59 | 3767.68 | 3778.18 | 3788.76 | 3799.50 | 3810.32 | 3816.15 | 3038.75 | 2148.80 | 1688.97 | 1699.53 | 1805.70 | 1711.94 | 1278.11 | 1280.64 | 1385.47 | 1142.06 | 1147.05 | 1151.91 | 1157.27 | 1160.68 | 1164.07 | 1167.46 | 529.41 | |
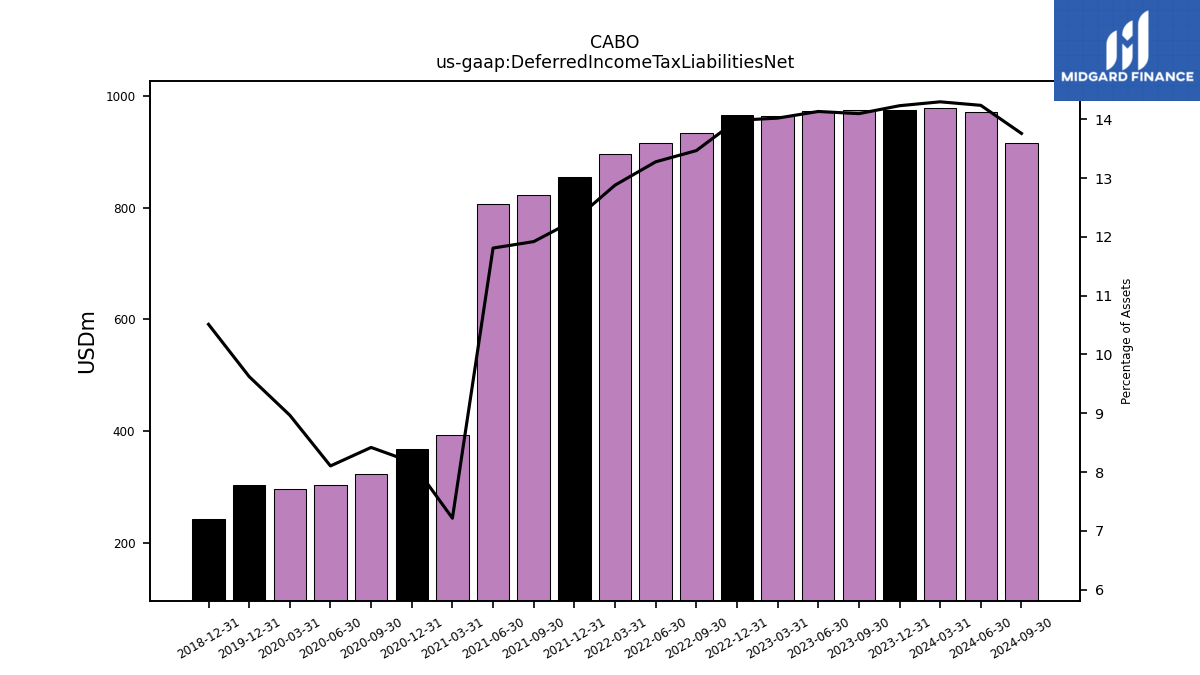
| Deferred Income Tax Liabilities Net | 974.47 | 974.34 | 972.81 | 964.55 | 966.82 | 933.65 | 915.49 | 896.37 | 854.16 | 822.58 | 806.63 | 391.92 | 366.68 | 322.15 | 303.35 | 295.73 | 303.31 | NA | NA | NA | 242.13 | NA | NA | NA | NA | NA | NA | NA | |
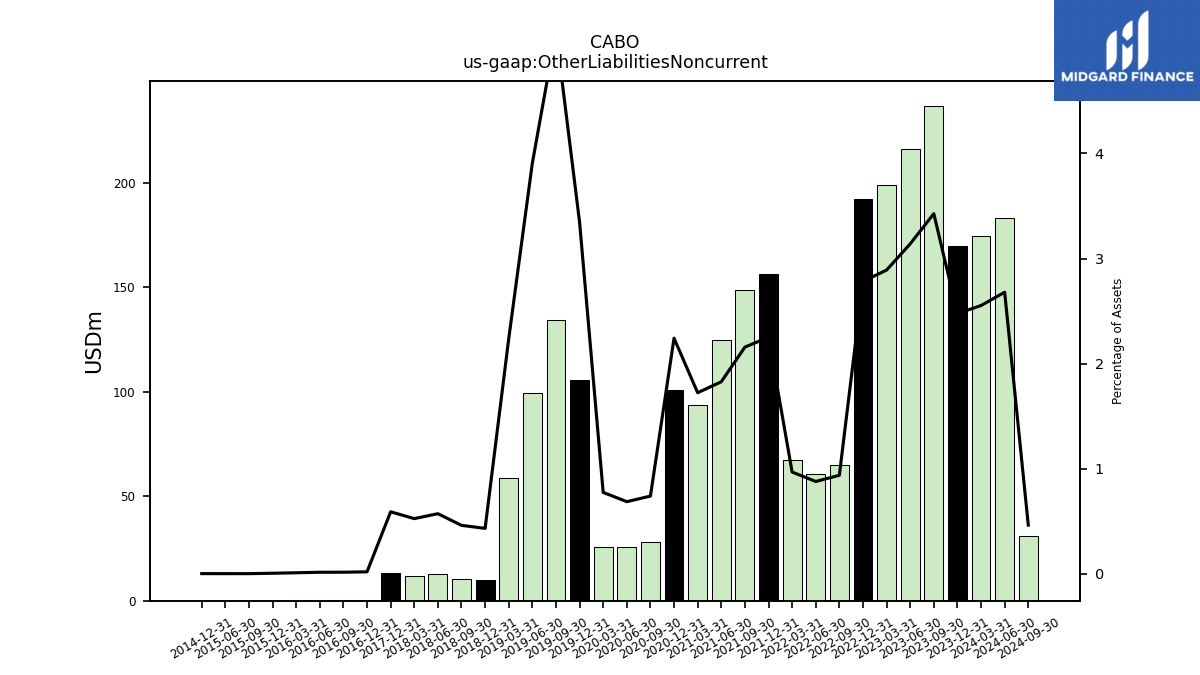
| Other Liabilities Noncurrent | 169.56 | 236.83 | 216.08 | 198.80 | 192.35 | 65.02 | 60.63 | 67.43 | 156.54 | 148.86 | 124.81 | 93.63 | 100.63 | 28.33 | 25.73 | 25.57 | 105.47 | 134.48 | 99.61 | 58.71 | 9.98 | 10.48 | 12.76 | 11.64 | 13.11 | NA | NA | NA | |
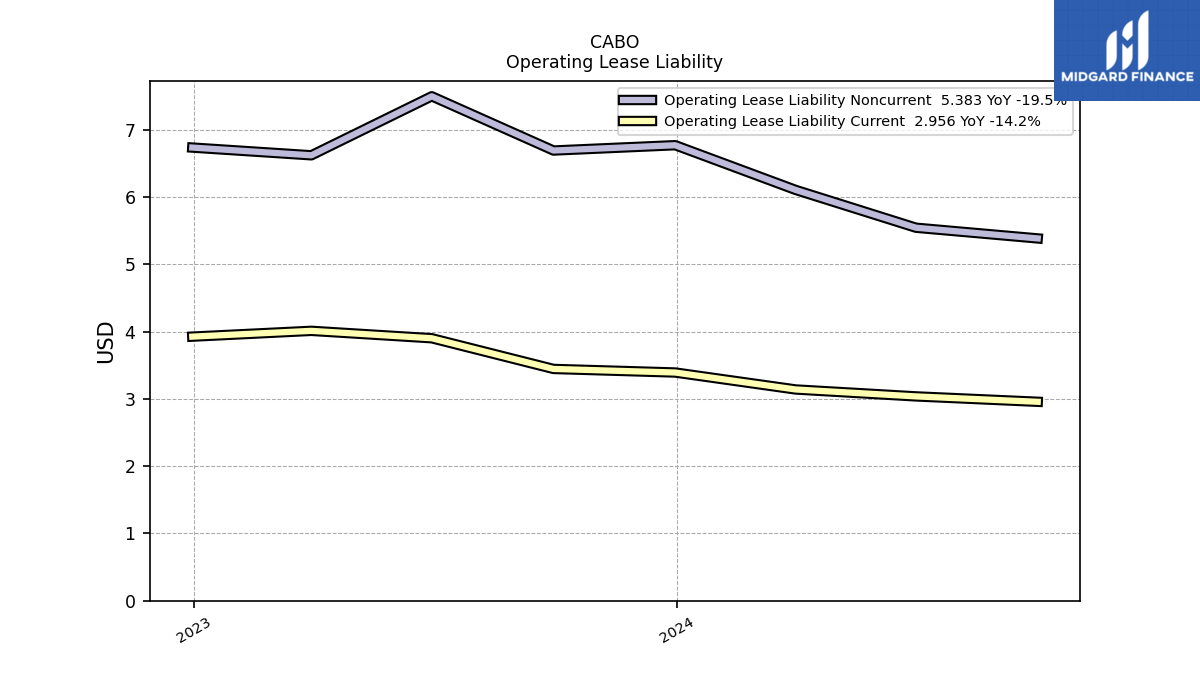
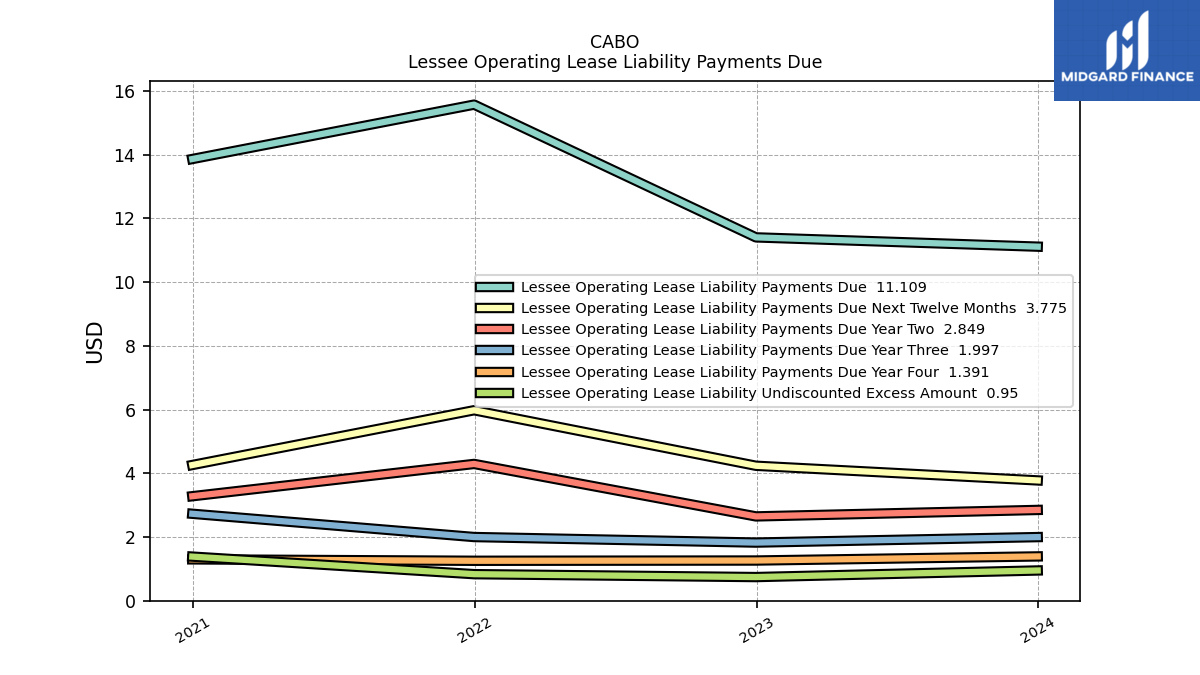
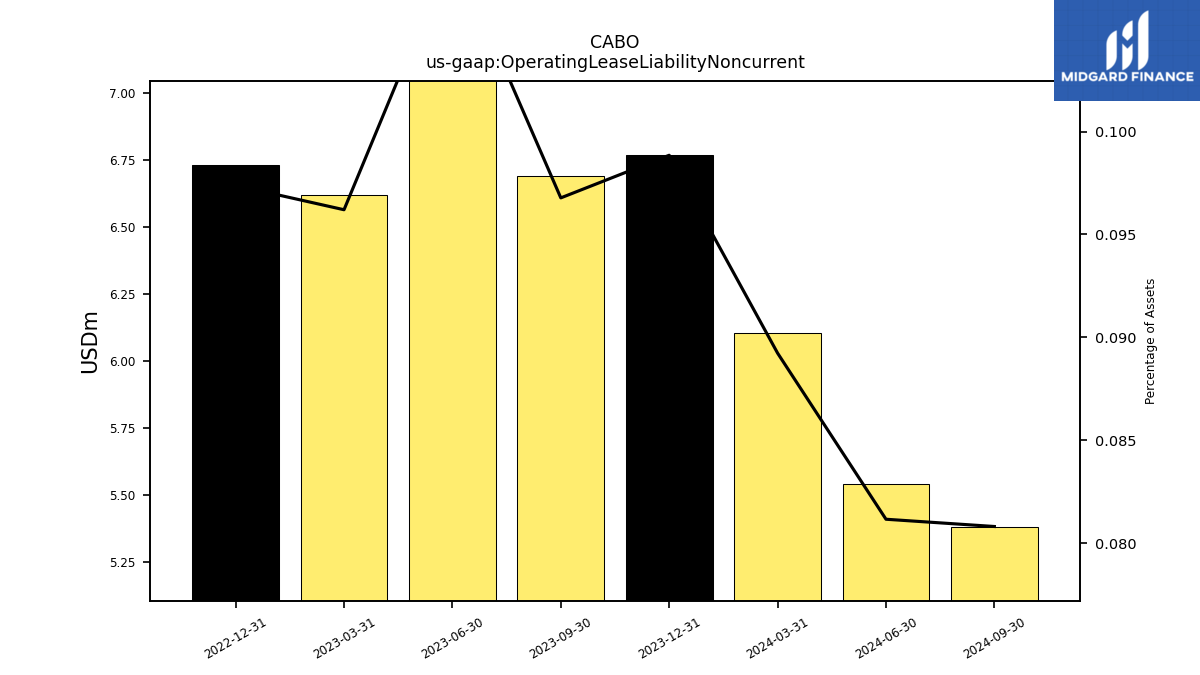
| Operating Lease Liability Noncurrent | 6.77 | 6.69 | 7.50 | 6.62 | 6.73 | NA | NA | NA | NA | NA | NA | NA | NA | NA | NA | NA | NA | NA | NA | NA | NA | NA | NA | NA | NA | NA | NA | NA |
| 2023-12-31 | 2023-09-30 | 2023-06-30 | 2023-03-31 | 2022-12-31 | 2022-09-30 | 2022-06-30 | 2022-03-31 | 2021-12-31 | 2021-09-30 | 2021-06-30 | 2021-03-31 | 2020-12-31 | 2020-09-30 | 2020-06-30 | 2020-03-31 | 2019-12-31 | 2019-09-30 | 2019-06-30 | 2019-03-31 | 2018-12-31 | 2018-09-30 | 2018-06-30 | 2018-03-31 | 2017-12-31 | 2017-09-30 | 2017-06-30 | 2017-03-31 | ||
|---|---|---|---|---|---|---|---|---|---|---|---|---|---|---|---|---|---|---|---|---|---|---|---|---|---|---|---|---|---|
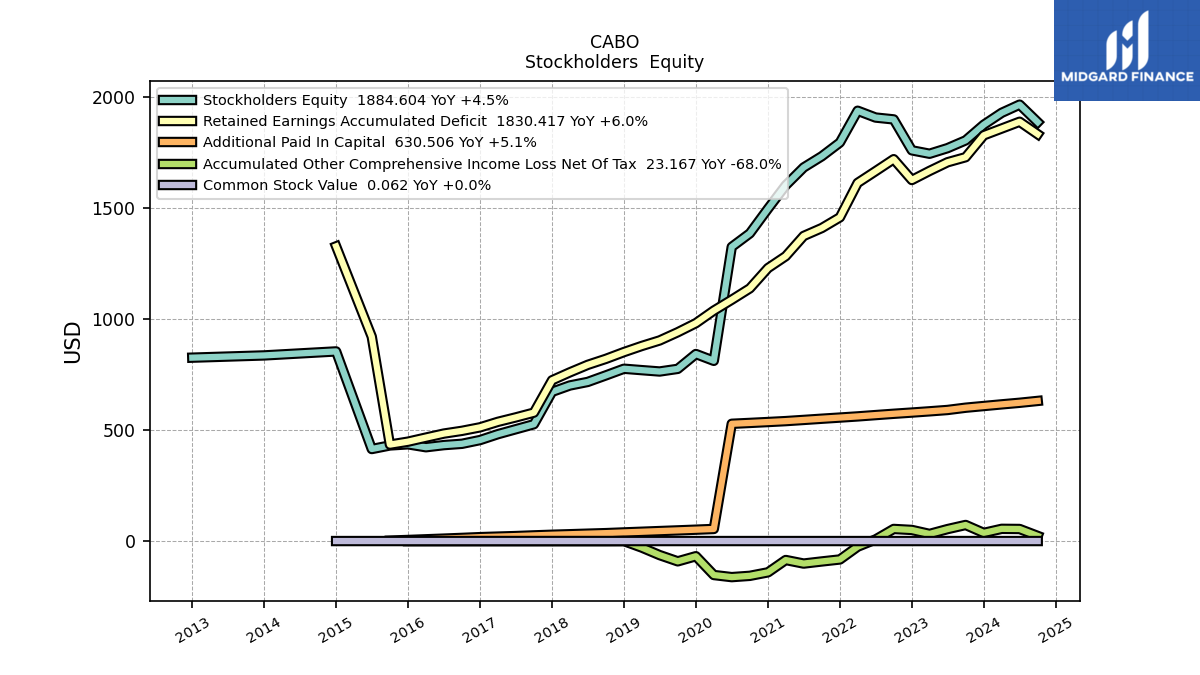
| Stockholders Equity | 1873.14 | 1802.73 | 1767.74 | 1742.61 | 1757.97 | 1897.13 | 1905.50 | 1936.15 | 1793.10 | 1731.22 | 1680.85 | 1600.65 | 1495.30 | 1384.40 | 1323.55 | 810.89 | 841.57 | 774.76 | 762.91 | 769.03 | 775.36 | 745.34 | 715.93 | 699.91 | 671.42 | 525.62 | 503.15 | 480.85 | |
| Common Stock Value | 0.06 | 0.06 | 0.06 | 0.06 | 0.06 | 0.06 | 0.06 | 0.06 | 0.06 | 0.06 | 0.06 | 0.06 | 0.06 | 0.06 | 0.06 | 0.06 | 0.06 | 0.06 | 0.06 | 0.06 | 0.06 | 0.06 | 0.06 | 0.06 | 0.06 | 0.06 | 0.06 | 0.06 | |
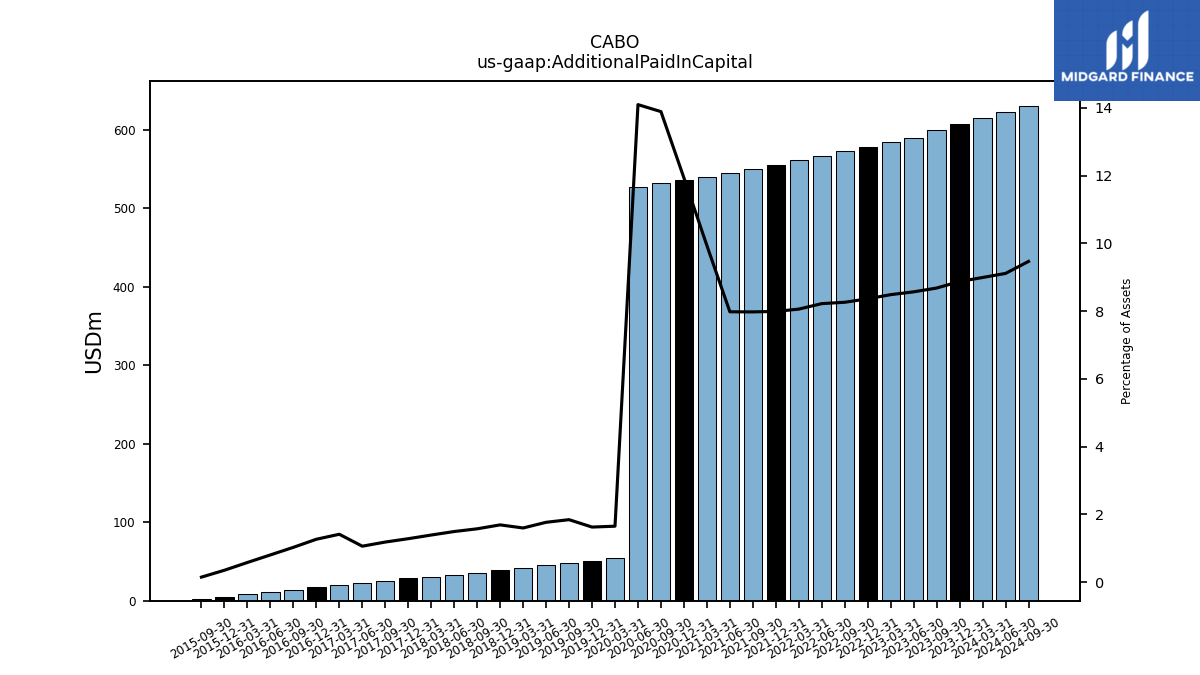
| Additional Paid In Capital | 607.57 | 599.97 | 589.74 | 583.74 | 578.15 | 572.66 | 566.80 | 560.85 | 555.64 | 550.42 | 544.99 | 539.71 | 535.59 | 531.51 | 527.64 | 54.42 | 51.20 | 48.06 | 45.00 | 41.92 | 38.90 | 35.67 | 33.26 | 30.75 | 28.41 | 25.59 | 22.51 | 20.10 | |
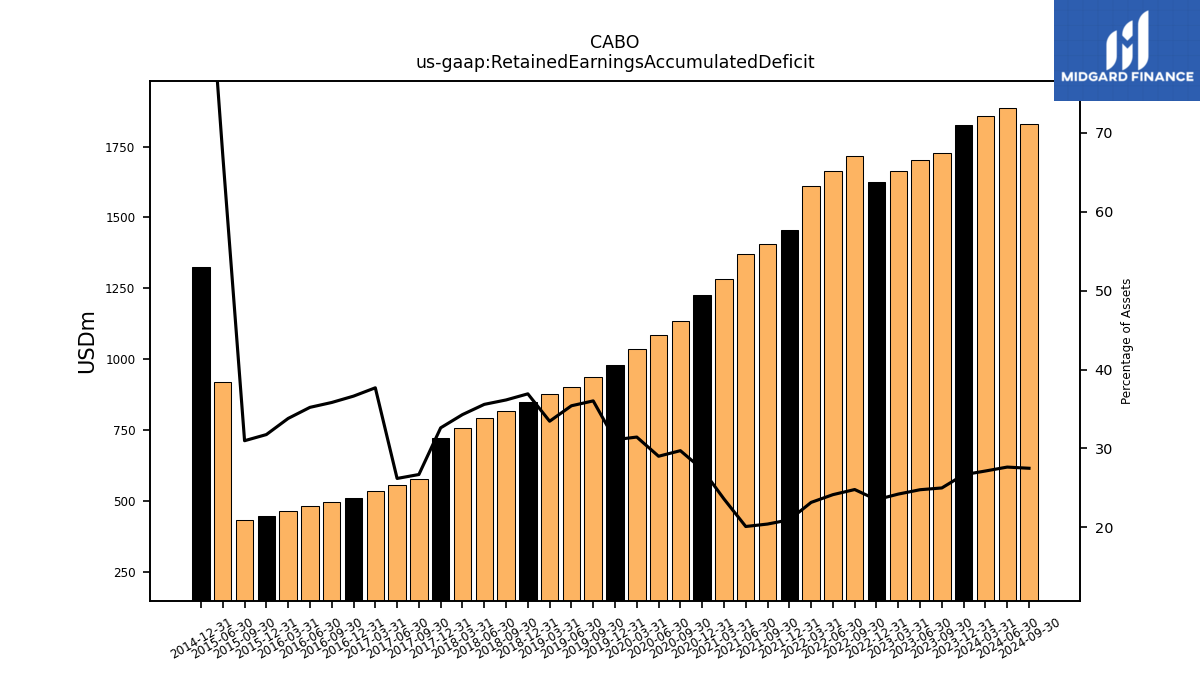
| Retained Earnings Accumulated Deficit | 1825.54 | 1727.01 | 1704.24 | 1665.33 | 1624.41 | 1718.12 | 1664.18 | 1611.36 | 1456.54 | 1408.35 | 1372.72 | 1281.67 | 1228.17 | 1137.01 | 1085.79 | 1036.88 | 980.36 | 939.60 | 902.62 | 877.64 | 850.29 | 819.69 | 792.78 | 759.00 | 723.35 | 577.89 | 556.40 | 536.41 | |
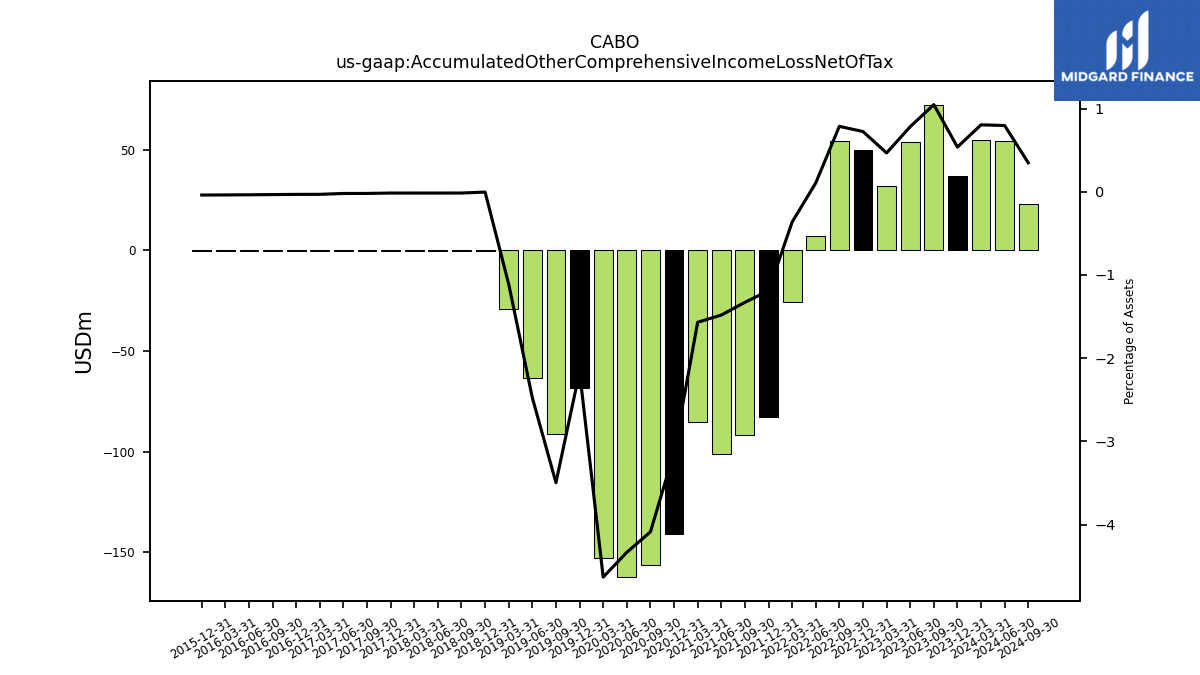
| Accumulated Other Comprehensive Income Loss Net Of Tax | 36.74 | 72.37 | 53.80 | 32.09 | 50.03 | 54.51 | 7.25 | -25.39 | -82.80 | -91.73 | -101.24 | -85.22 | -140.68 | -156.44 | -162.24 | -152.78 | -68.16 | -91.20 | -63.13 | -29.16 | -0.10 | -0.35 | -0.35 | -0.35 | -0.35 | -0.44 | -0.44 | -0.44 | |
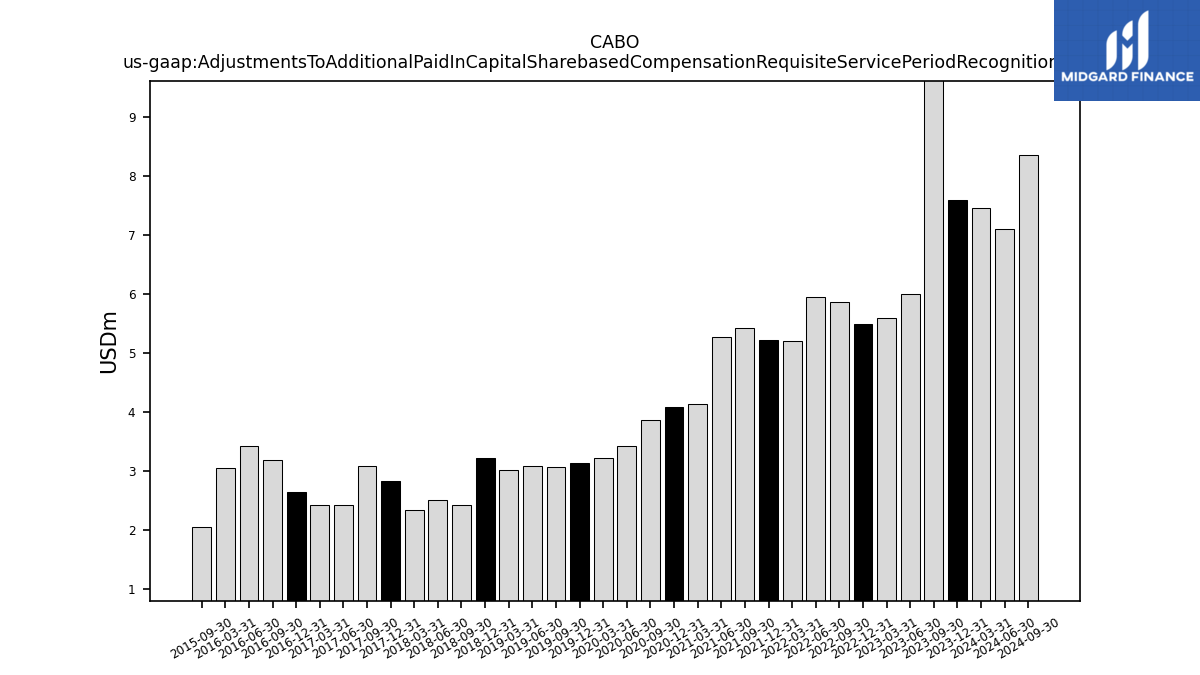
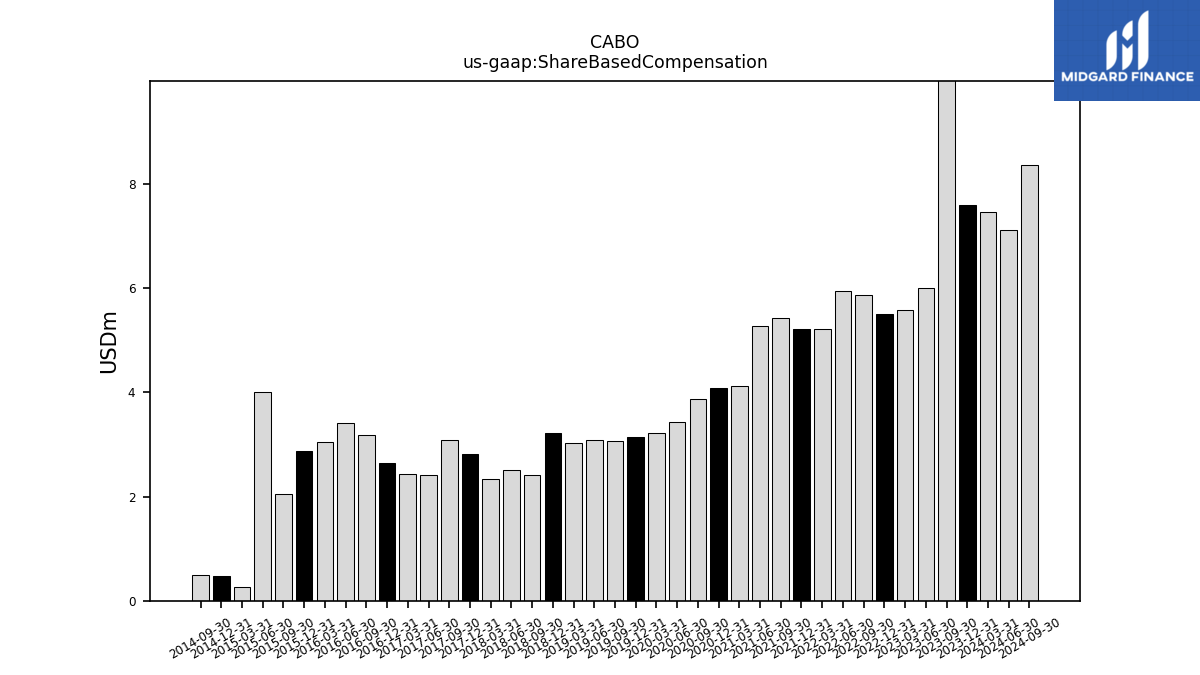
| Adjustments To Additional Paid In Capital Sharebased Compensation Requisite Service Period Recognition Value | 7.60 | 10.23 | 6.00 | 5.58 | 5.50 | 5.86 | 5.95 | 5.21 | 5.22 | 5.43 | 5.28 | 4.13 | 4.08 | 3.87 | 3.43 | 3.22 | 3.14 | 3.06 | 3.08 | 3.02 | 3.22 | 2.42 | 2.51 | 2.34 | 2.82 | 3.08 | 2.42 | 2.43 |
| 2023-12-31 | 2023-09-30 | 2023-06-30 | 2023-03-31 | 2022-12-31 | 2022-09-30 | 2022-06-30 | 2022-03-31 | 2021-12-31 | 2021-09-30 | 2021-06-30 | 2021-03-31 | 2020-12-31 | 2020-09-30 | 2020-06-30 | 2020-03-31 | 2019-12-31 | 2019-09-30 | 2019-06-30 | 2019-03-31 | 2018-12-31 | 2018-09-30 | 2018-06-30 | 2018-03-31 | 2017-12-31 | 2017-09-30 | 2017-06-30 | 2017-03-31 | ||
|---|---|---|---|---|---|---|---|---|---|---|---|---|---|---|---|---|---|---|---|---|---|---|---|---|---|---|---|---|---|
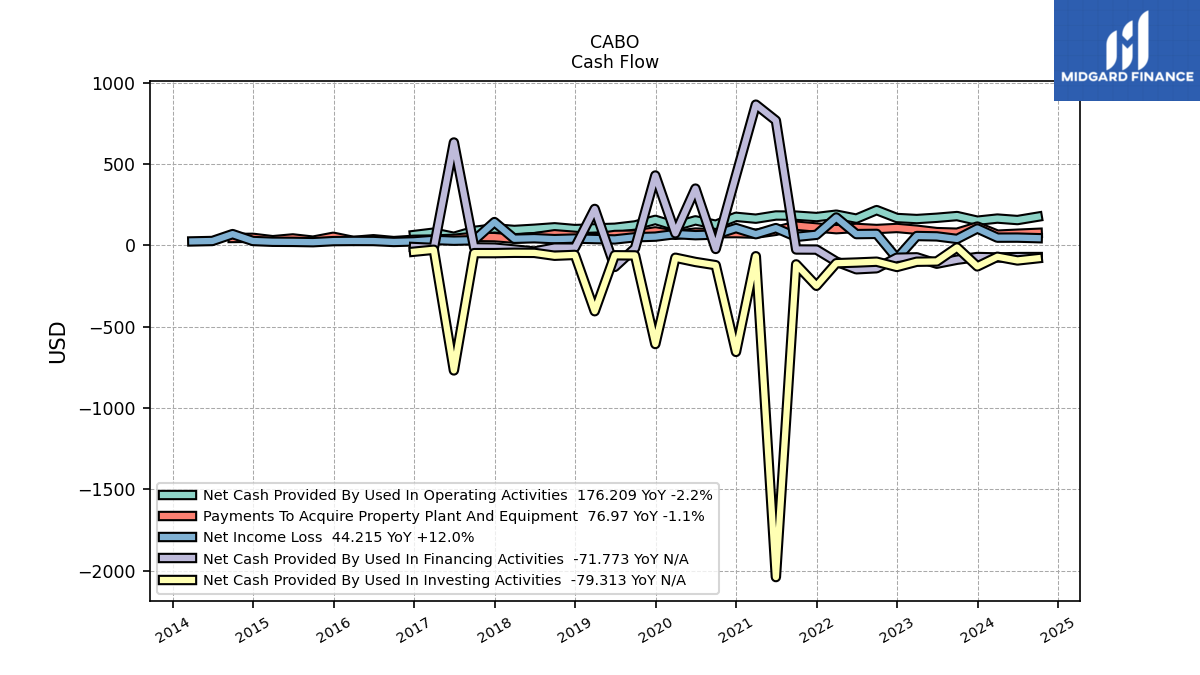
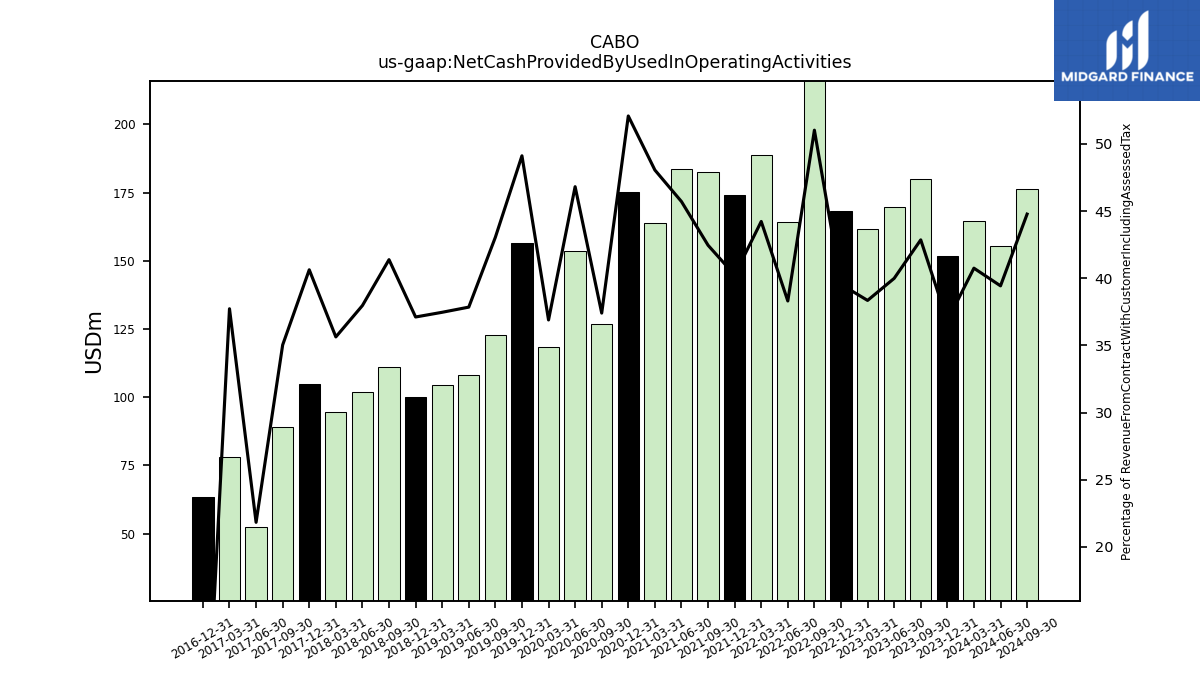
| Net Cash Provided By Used In Operating Activities | 151.67 | 180.15 | 169.56 | 161.79 | 168.25 | 216.71 | 164.37 | 188.72 | 174.06 | 182.66 | 183.63 | 163.99 | 175.39 | 126.78 | 153.69 | 118.50 | 156.56 | 122.69 | 108.12 | 104.38 | 100.15 | 111.02 | 101.91 | 94.69 | 104.70 | 88.93 | 52.60 | 78.26 | |
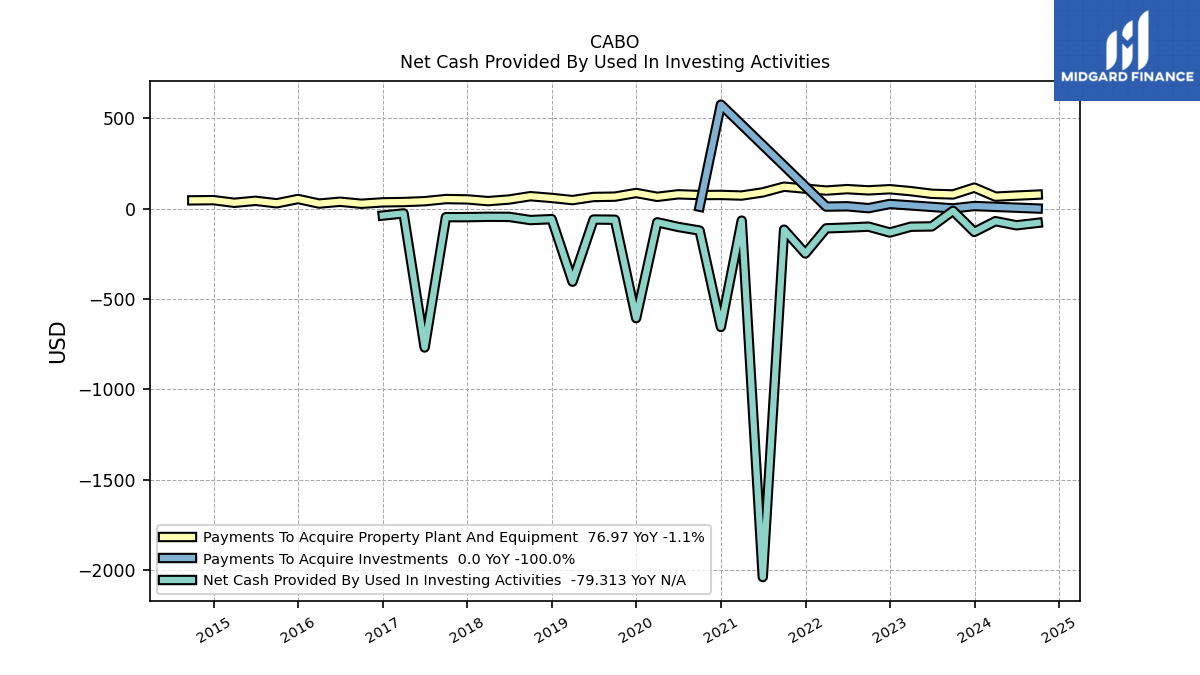
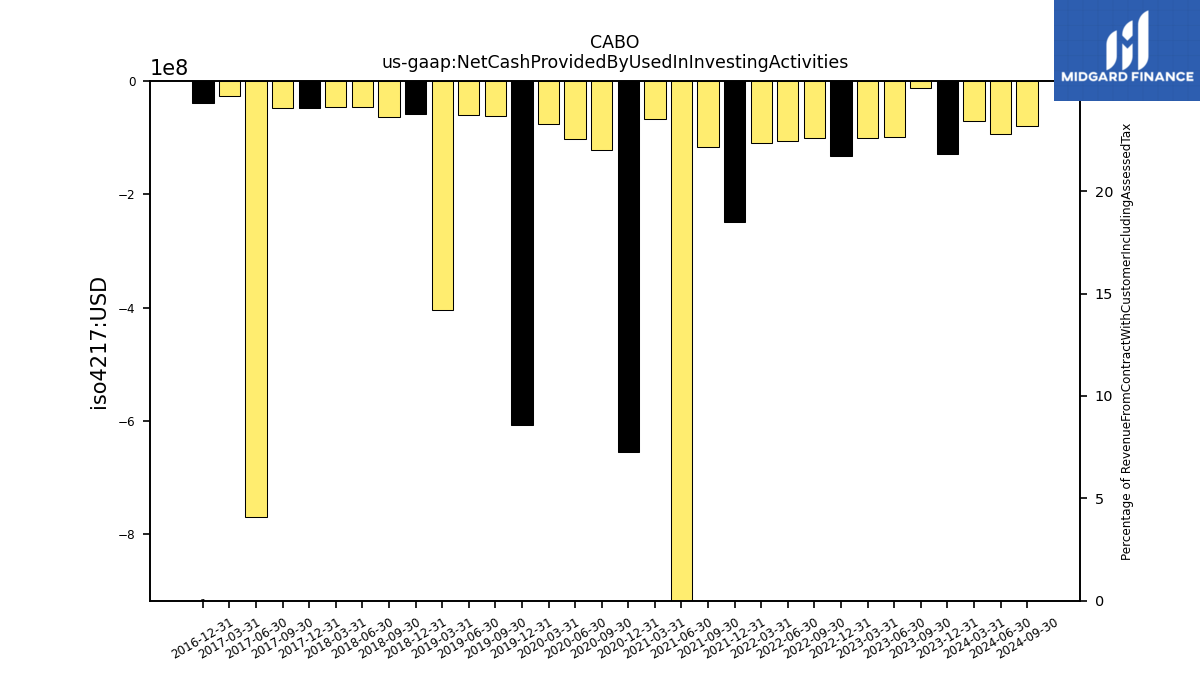
| Net Cash Provided By Used In Investing Activities | -129.44 | -12.93 | -98.82 | -100.71 | -132.76 | -100.33 | -105.53 | -109.65 | -248.85 | -116.76 | -2039.27 | -66.70 | -655.07 | -121.77 | -102.06 | -76.02 | -606.62 | -61.80 | -60.85 | -404.97 | -58.69 | -63.79 | -46.20 | -45.62 | -47.71 | -47.66 | -768.82 | -26.98 | |
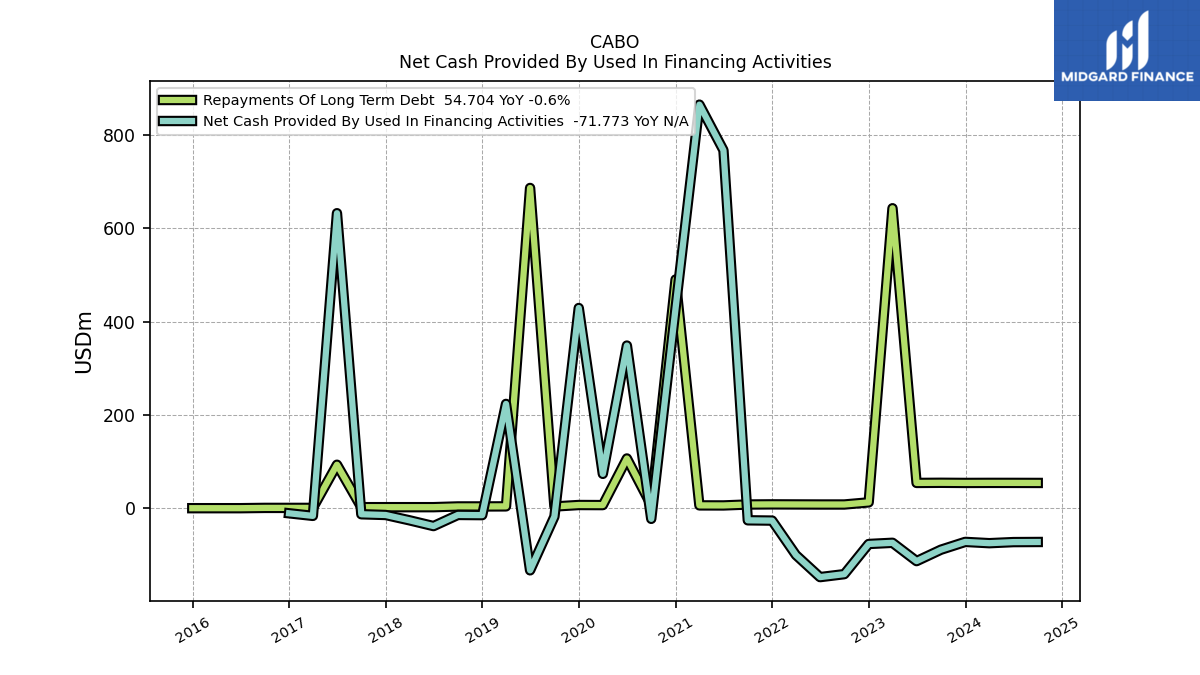
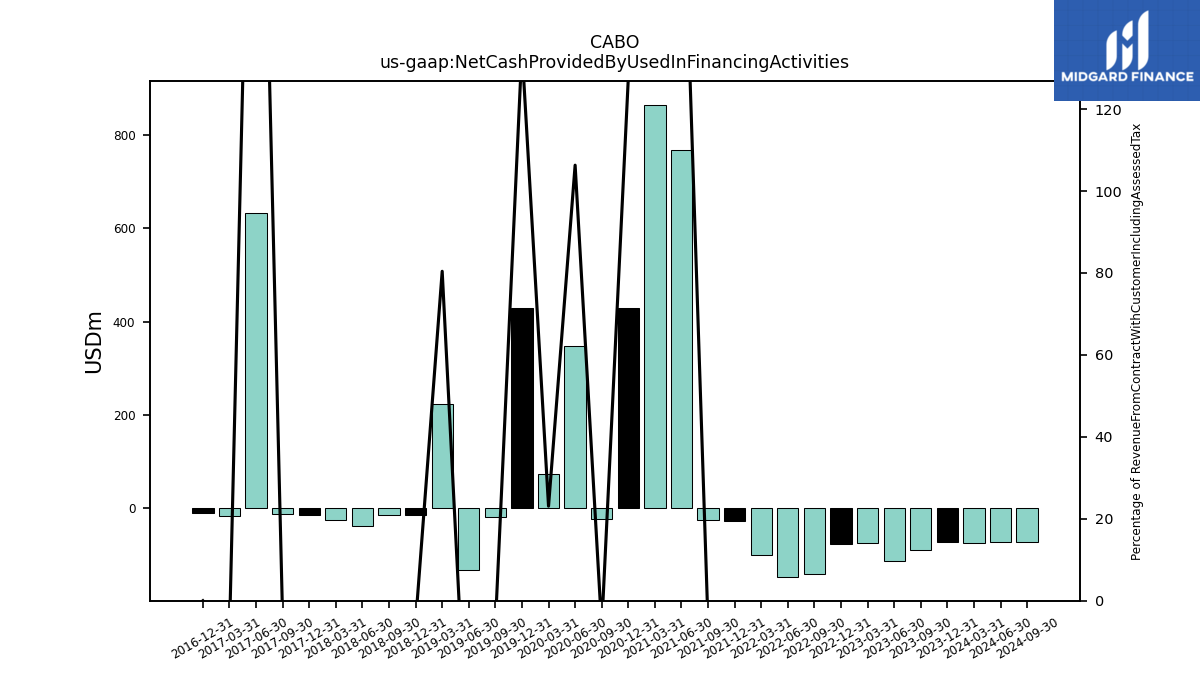
| Net Cash Provided By Used In Financing Activities | -71.57 | -88.32 | -112.75 | -73.49 | -76.06 | -140.63 | -147.03 | -99.71 | -25.94 | -25.33 | 767.30 | 865.09 | 429.25 | -22.23 | 349.02 | 74.14 | 429.49 | -17.32 | -132.54 | 224.04 | -14.25 | -13.85 | -37.68 | -25.33 | -13.94 | -12.37 | 632.55 | -15.85 |
| 2023-12-31 | 2023-09-30 | 2023-06-30 | 2023-03-31 | 2022-12-31 | 2022-09-30 | 2022-06-30 | 2022-03-31 | 2021-12-31 | 2021-09-30 | 2021-06-30 | 2021-03-31 | 2020-12-31 | 2020-09-30 | 2020-06-30 | 2020-03-31 | 2019-12-31 | 2019-09-30 | 2019-06-30 | 2019-03-31 | 2018-12-31 | 2018-09-30 | 2018-06-30 | 2018-03-31 | 2017-12-31 | 2017-09-30 | 2017-06-30 | 2017-03-31 | ||
|---|---|---|---|---|---|---|---|---|---|---|---|---|---|---|---|---|---|---|---|---|---|---|---|---|---|---|---|---|---|
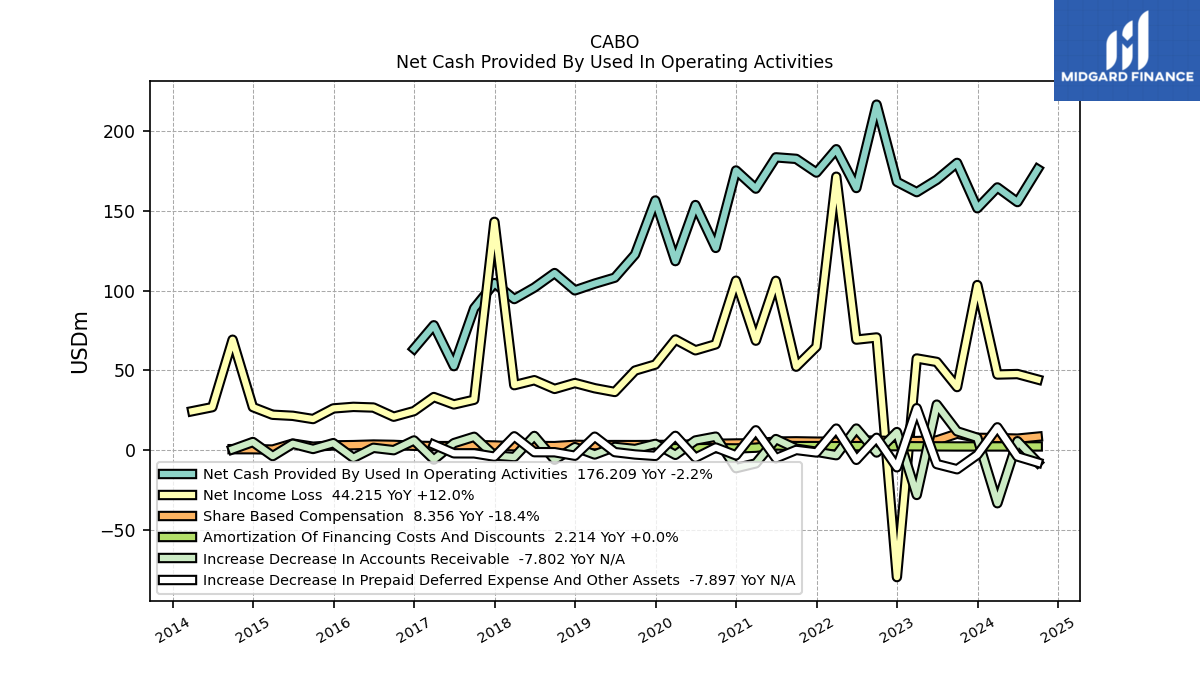
| Net Cash Provided By Used In Operating Activities | 151.67 | 180.15 | 169.56 | 161.79 | 168.25 | 216.71 | 164.37 | 188.72 | 174.06 | 182.66 | 183.63 | 163.99 | 175.39 | 126.78 | 153.69 | 118.50 | 156.56 | 122.69 | 108.12 | 104.38 | 100.15 | 111.02 | 101.91 | 94.69 | 104.70 | 88.93 | 52.60 | 78.26 | |
| Net Income Loss | 115.29 | 39.47 | 55.25 | 57.43 | -77.21 | 70.61 | 69.25 | 171.48 | 64.83 | 52.26 | 106.15 | 68.58 | 106.24 | 66.29 | 62.54 | 69.33 | 53.61 | 49.84 | 36.40 | 38.74 | 42.01 | 38.31 | 43.78 | 40.65 | 143.15 | 31.51 | 28.58 | 33.22 | |
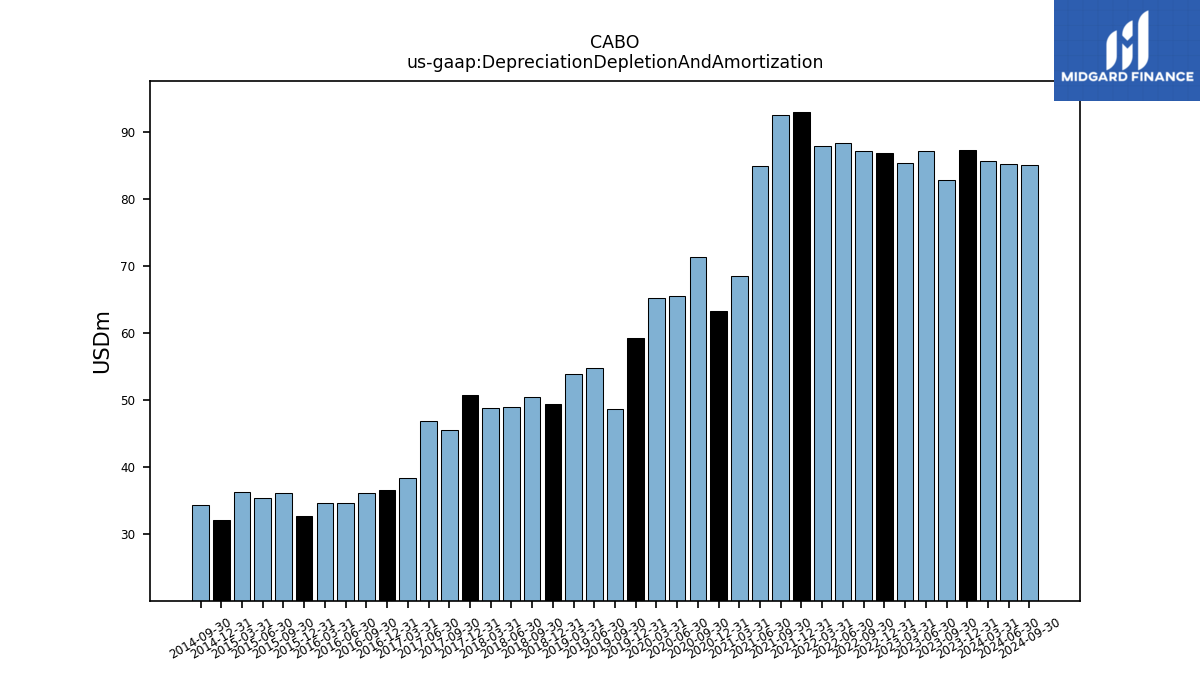
| Depreciation Depletion And Amortization | 87.31 | 82.92 | 87.24 | 85.43 | 86.90 | 87.22 | 88.42 | 87.92 | 92.98 | 92.60 | 84.92 | 68.53 | 63.37 | 71.42 | 65.58 | 65.28 | 59.27 | 48.74 | 54.84 | 53.84 | 49.51 | 50.41 | 49.03 | 48.78 | 50.74 | 45.58 | 46.89 | 38.40 | |
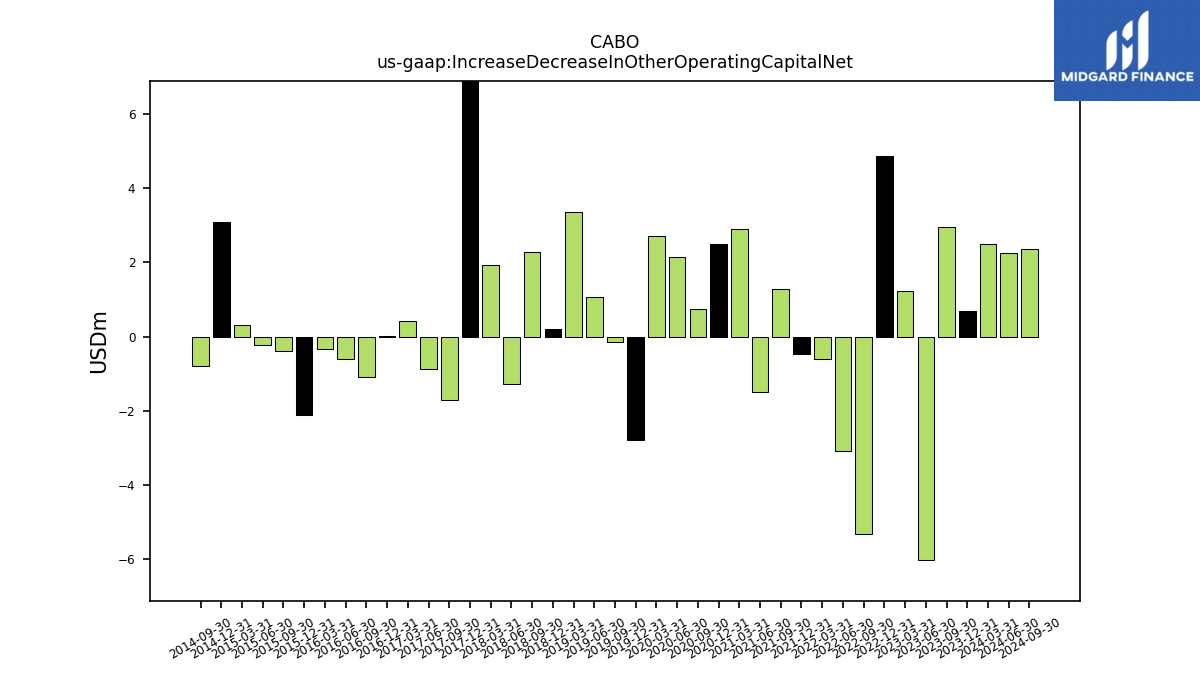
| Increase Decrease In Other Operating Capital Net | 0.69 | 2.97 | -6.04 | 1.23 | 4.86 | -5.31 | -3.09 | -0.61 | -0.48 | 1.29 | -1.48 | 2.91 | 2.49 | 0.75 | 2.15 | 2.70 | -2.79 | -0.14 | 1.07 | 3.36 | 0.20 | 2.28 | -1.28 | 1.93 | 15.71 | -1.70 | -0.88 | 0.41 | |
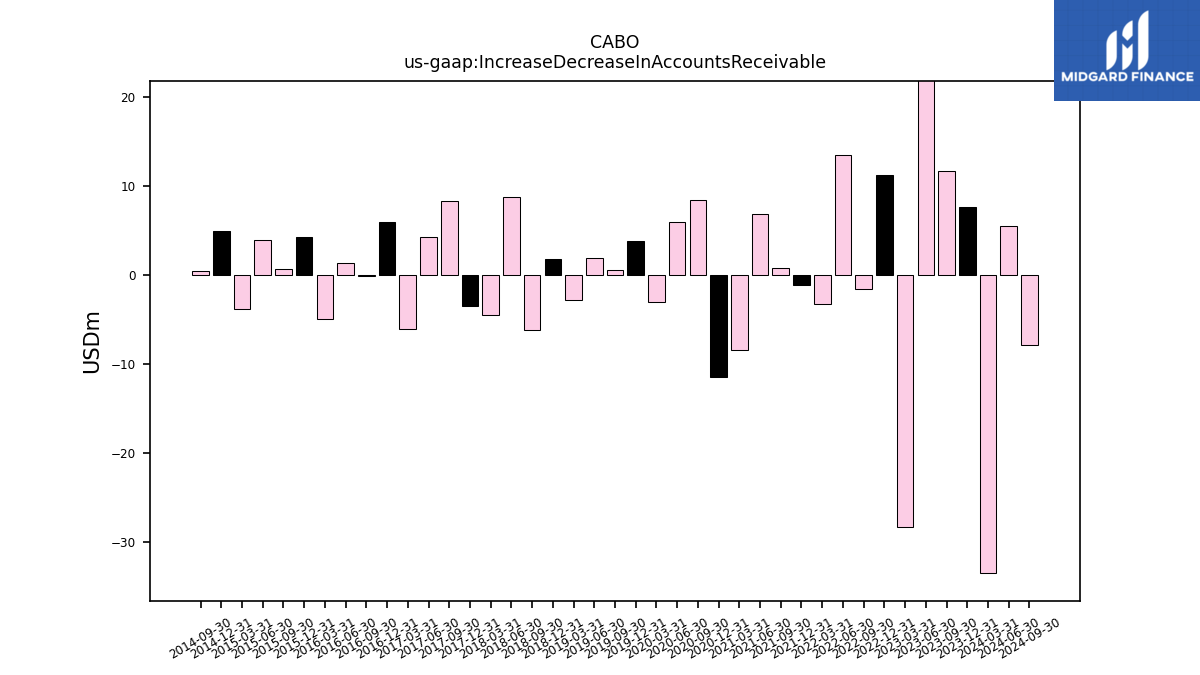
| Increase Decrease In Accounts Receivable | 7.64 | 11.72 | 28.46 | -28.23 | 11.25 | -1.60 | 13.44 | -3.29 | -1.12 | 0.81 | 6.84 | -8.42 | -11.41 | 8.37 | 5.96 | -3.07 | 3.83 | 0.59 | 1.93 | -2.83 | 1.78 | -6.11 | 8.80 | -4.45 | -3.47 | 8.27 | 4.29 | -6.03 | |
| Share Based Compensation | 7.60 | 10.23 | 6.00 | 5.58 | 5.50 | 5.86 | 5.95 | 5.21 | 5.22 | 5.43 | 5.28 | 4.13 | 4.08 | 3.87 | 3.43 | 3.22 | 3.14 | 3.06 | 3.08 | 3.02 | 3.22 | 2.42 | 2.51 | 2.34 | 2.82 | 3.08 | 2.42 | 2.43 | |
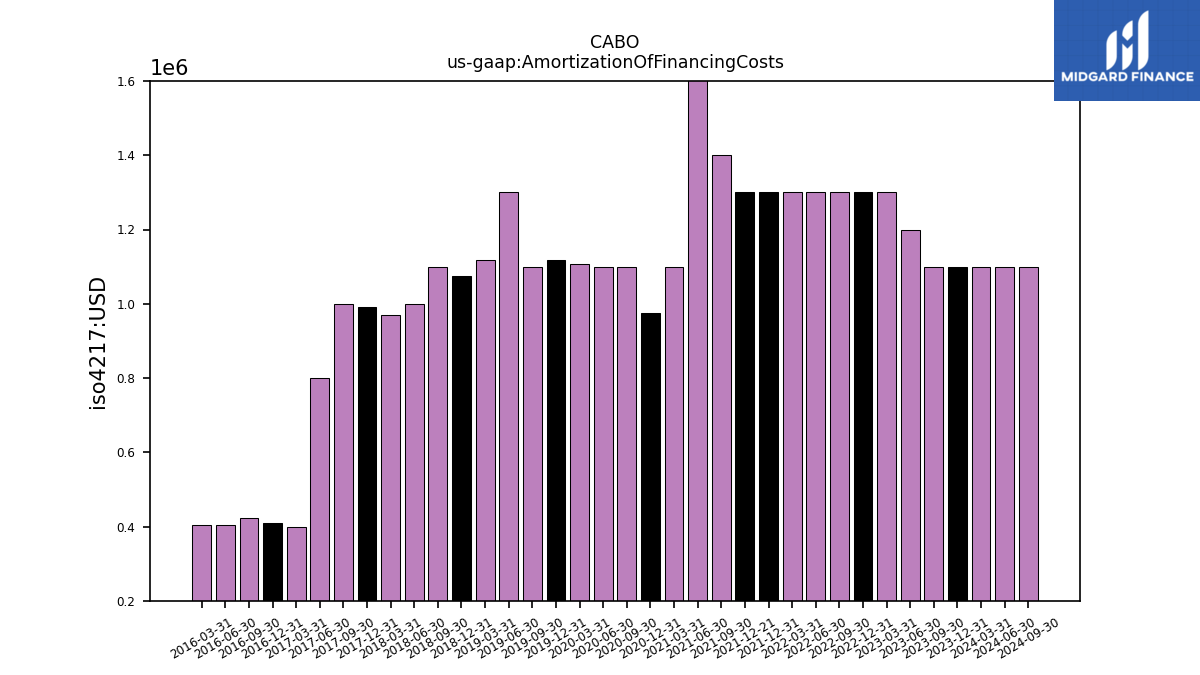
| Amortization Of Financing Costs | 1.10 | 1.10 | 1.20 | 1.30 | 1.30 | 1.30 | 1.30 | 1.30 | 1.30 | 1.40 | 1.80 | 1.10 | 0.97 | 1.10 | 1.10 | 1.11 | 1.12 | 1.10 | 1.30 | 1.12 | 1.07 | 1.10 | 1.00 | 0.97 | 0.99 | 1.00 | 0.80 | 0.40 |
| 2023-12-31 | 2023-09-30 | 2023-06-30 | 2023-03-31 | 2022-12-31 | 2022-09-30 | 2022-06-30 | 2022-03-31 | 2021-12-31 | 2021-09-30 | 2021-06-30 | 2021-03-31 | 2020-12-31 | 2020-09-30 | 2020-06-30 | 2020-03-31 | 2019-12-31 | 2019-09-30 | 2019-06-30 | 2019-03-31 | 2018-12-31 | 2018-09-30 | 2018-06-30 | 2018-03-31 | 2017-12-31 | 2017-09-30 | 2017-06-30 | 2017-03-31 | ||
|---|---|---|---|---|---|---|---|---|---|---|---|---|---|---|---|---|---|---|---|---|---|---|---|---|---|---|---|---|---|
| Net Cash Provided By Used In Investing Activities | -129.44 | -12.93 | -98.82 | -100.71 | -132.76 | -100.33 | -105.53 | -109.65 | -248.85 | -116.76 | -2039.27 | -66.70 | -655.07 | -121.77 | -102.06 | -76.02 | -606.62 | -61.80 | -60.85 | -404.97 | -58.69 | -63.79 | -46.20 | -45.62 | -47.71 | -47.66 | -768.82 | -26.98 | |
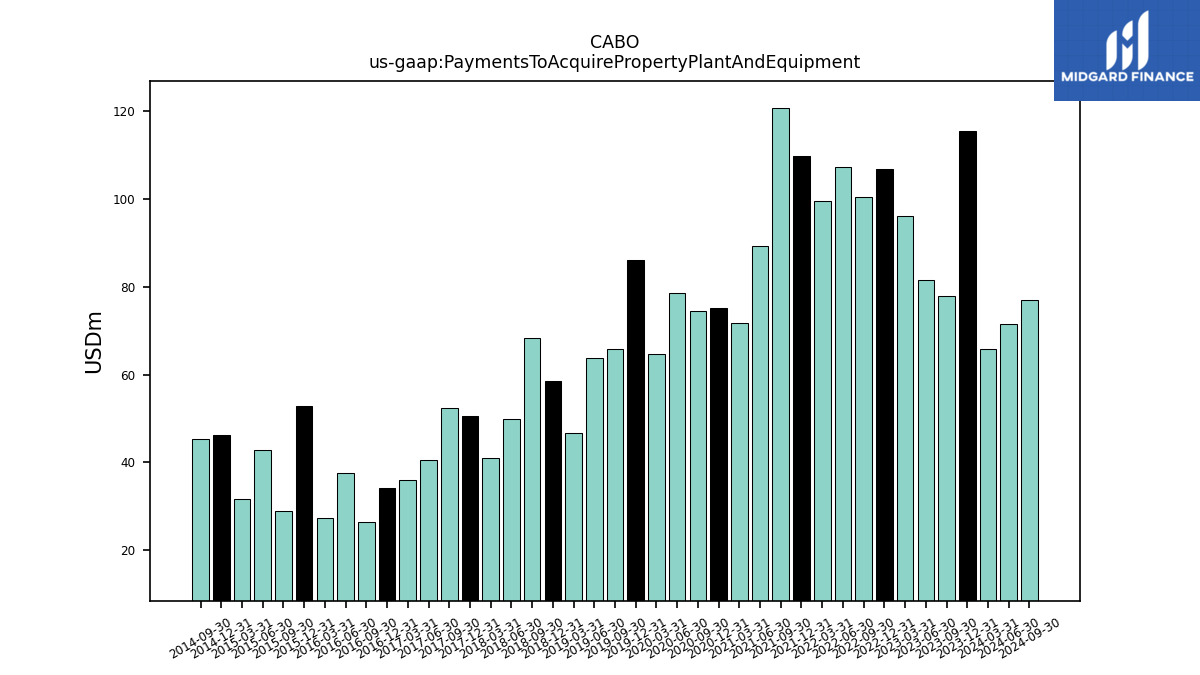
| Payments To Acquire Property Plant And Equipment | 115.60 | 77.81 | 81.51 | 96.11 | 106.84 | 100.52 | 107.29 | 99.45 | 109.91 | 120.86 | 89.31 | 71.85 | 75.23 | 74.58 | 78.66 | 64.76 | 86.03 | 65.84 | 63.86 | 46.63 | 58.60 | 68.30 | 49.85 | 41.02 | 50.53 | 52.40 | 40.51 | 35.92 | |
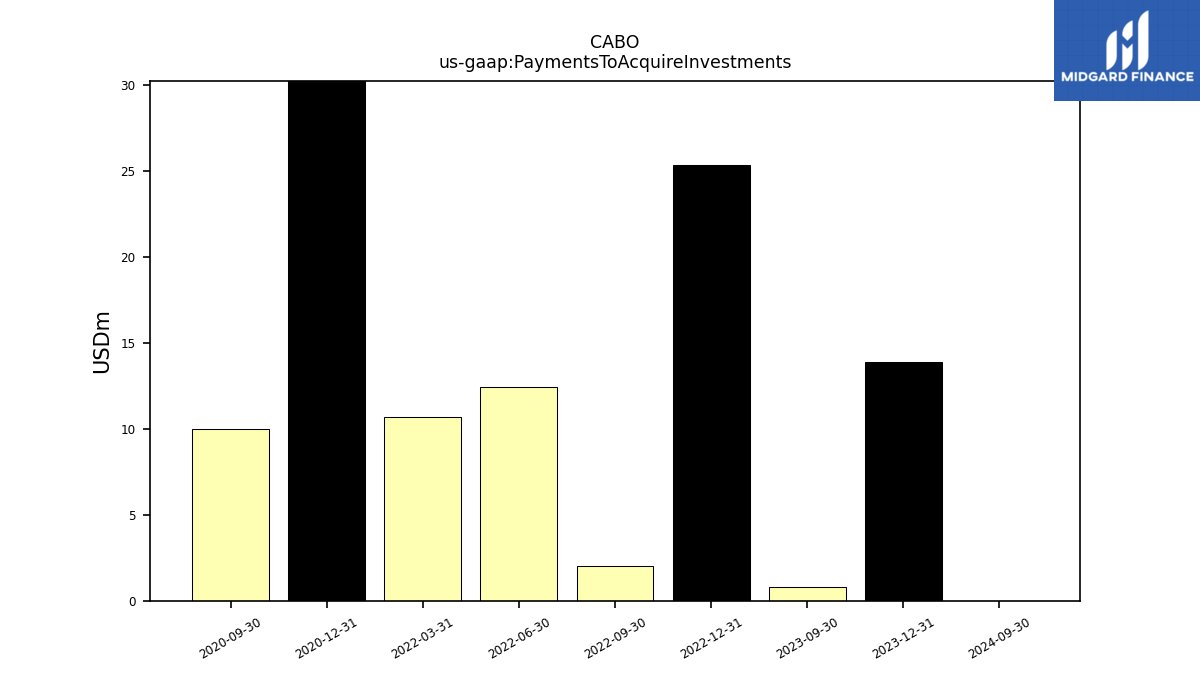
| Payments To Acquire Investments | 13.89 | 0.82 | NA | NA | 25.31 | 2.00 | 12.40 | 10.67 | NA | NA | NA | NA | 574.88 | 10.00 | NA | NA | NA | NA | NA | NA | NA | NA | NA | NA | NA | NA | NA | NA |
| 2023-12-31 | 2023-09-30 | 2023-06-30 | 2023-03-31 | 2022-12-31 | 2022-09-30 | 2022-06-30 | 2022-03-31 | 2021-12-31 | 2021-09-30 | 2021-06-30 | 2021-03-31 | 2020-12-31 | 2020-09-30 | 2020-06-30 | 2020-03-31 | 2019-12-31 | 2019-09-30 | 2019-06-30 | 2019-03-31 | 2018-12-31 | 2018-09-30 | 2018-06-30 | 2018-03-31 | 2017-12-31 | 2017-09-30 | 2017-06-30 | 2017-03-31 | ||
|---|---|---|---|---|---|---|---|---|---|---|---|---|---|---|---|---|---|---|---|---|---|---|---|---|---|---|---|---|---|
| Net Cash Provided By Used In Financing Activities | -71.57 | -88.32 | -112.75 | -73.49 | -76.06 | -140.63 | -147.03 | -99.71 | -25.94 | -25.33 | 767.30 | 865.09 | 429.25 | -22.23 | 349.02 | 74.14 | 429.49 | -17.32 | -132.54 | 224.04 | -14.25 | -13.85 | -37.68 | -25.33 | -13.94 | -12.37 | 632.55 | -15.85 | |
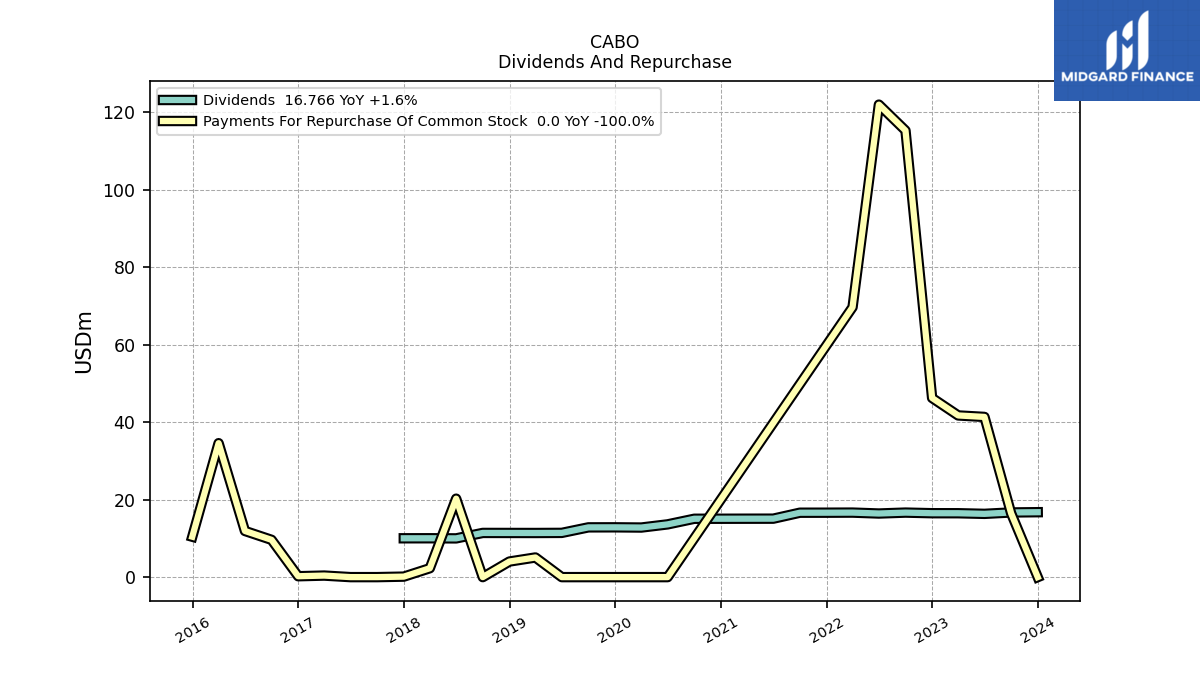
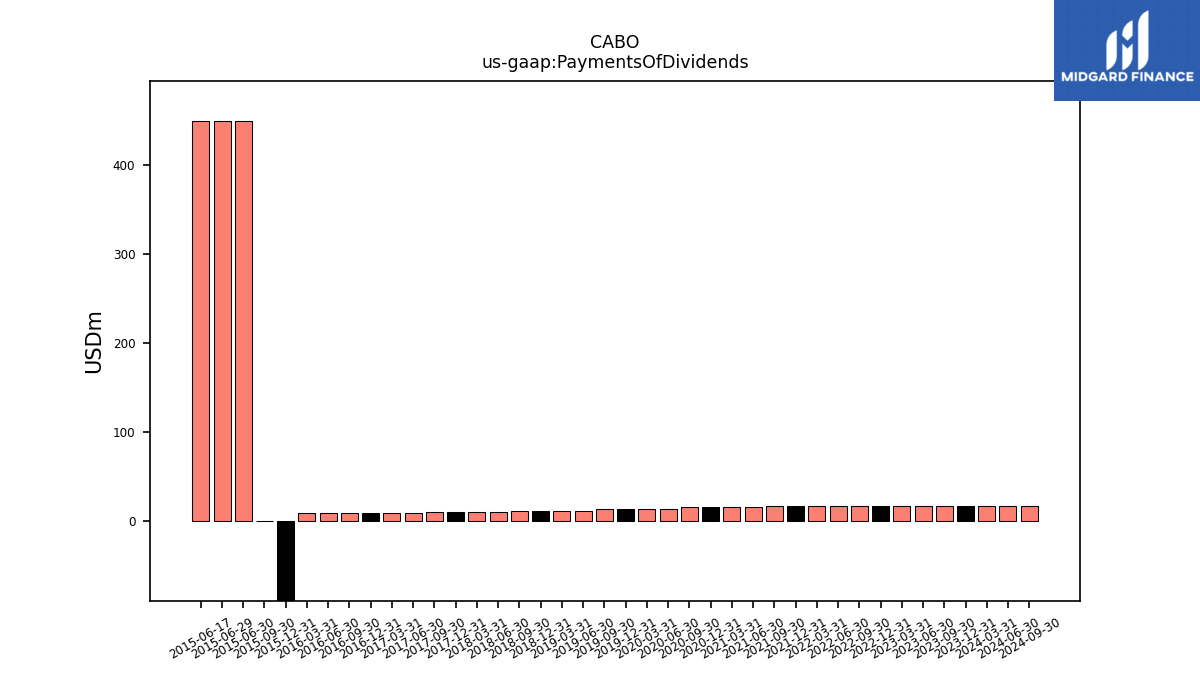
| Payments Of Dividends | 16.77 | 16.70 | 16.34 | 16.50 | 16.50 | 16.66 | 16.43 | 16.66 | 16.64 | 16.63 | 15.10 | 15.09 | 15.08 | 15.07 | 13.62 | 12.80 | 12.86 | 12.85 | 11.42 | 11.39 | 11.40 | 11.41 | 10.01 | 10.04 | 10.03 | 10.02 | 8.59 | 8.58 | |
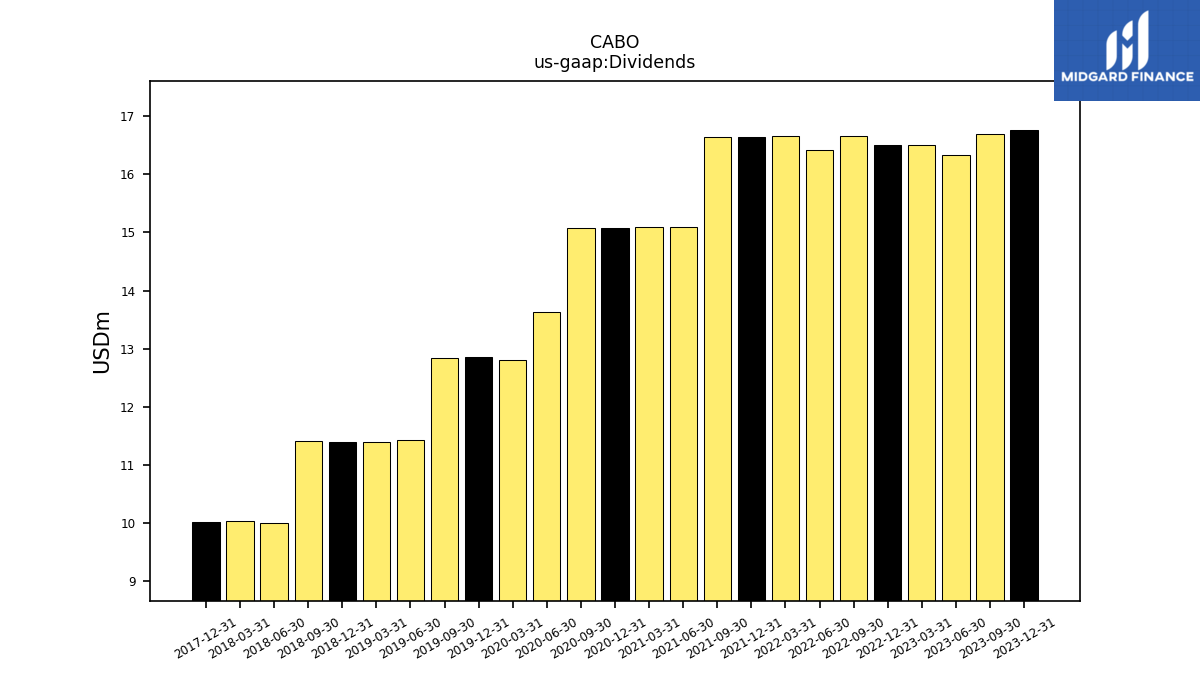
| Dividends | 16.77 | 16.70 | 16.34 | 16.50 | 16.50 | 16.66 | 16.43 | 16.66 | 16.64 | 16.63 | 15.10 | 15.09 | 15.08 | 15.07 | 13.62 | 12.80 | 12.86 | 12.85 | 11.42 | 11.39 | 11.40 | 11.41 | 10.01 | 10.04 | 10.03 | NA | NA | NA | |
| Payments For Repurchase Of Common Stock | 0.00 | 16.50 | 41.37 | 41.75 | 46.26 | 115.32 | 122.01 | 69.69 | NA | NA | NA | NA | NA | NA | 0.00 | -0.00 | 0.00 | 0.00 | 0.00 | 5.07 | 4.03 | 0.00 | 20.26 | 2.29 | 0.13 | 0.00 | 0.00 | 0.40 |
| 2023-12-31 | 2023-09-30 | 2023-06-30 | 2023-03-31 | 2022-12-31 | 2022-09-30 | 2022-06-30 | 2022-03-31 | 2021-12-31 | 2021-09-30 | 2021-06-30 | 2021-03-31 | 2020-12-31 | 2020-09-30 | 2020-06-30 | 2020-03-31 | 2019-12-31 | 2019-09-30 | 2019-06-30 | 2019-03-31 | 2018-12-31 | 2018-09-30 | 2018-06-30 | 2018-03-31 | 2017-12-31 | 2017-09-30 | 2017-06-30 | 2017-03-31 | ||
|---|---|---|---|---|---|---|---|---|---|---|---|---|---|---|---|---|---|---|---|---|---|---|---|---|---|---|---|---|---|
| Revenue From Contract With Customer Including Assessed Tax | 411.81 | 420.35 | 424.02 | 421.89 | 425.51 | 424.72 | 429.08 | 426.73 | 432.59 | 430.24 | 401.75 | 341.26 | 336.77 | 338.96 | 328.30 | 321.20 | 318.75 | 284.99 | 285.65 | 278.61 | 269.85 | 268.27 | 268.41 | 265.76 | 257.70 | 253.83 | 240.99 | 207.43 | |
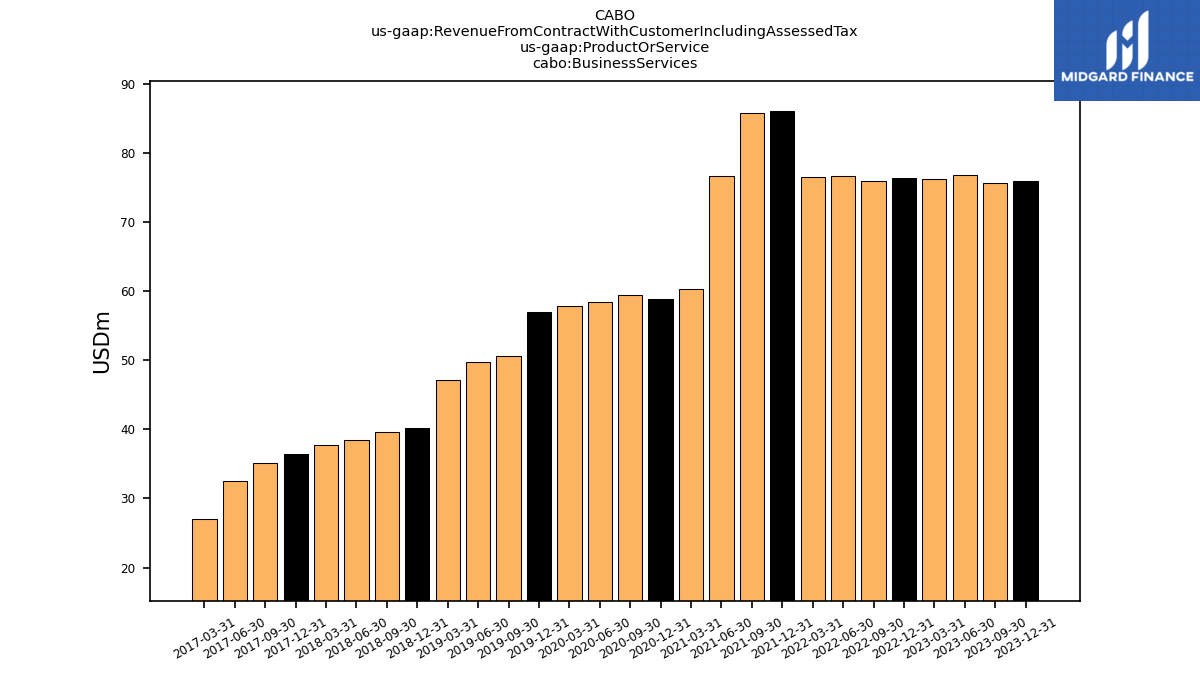
| Business Services | 75.88 | 75.58 | 76.81 | 76.26 | 76.29 | 75.85 | 76.66 | 76.50 | 86.06 | 85.73 | 76.62 | 60.36 | 58.89 | 59.44 | 58.47 | 57.86 | 56.94 | 50.66 | 49.76 | 47.14 | 40.24 | 39.58 | 38.48 | 37.69 | 36.47 | 35.16 | 32.49 | 26.97 | |
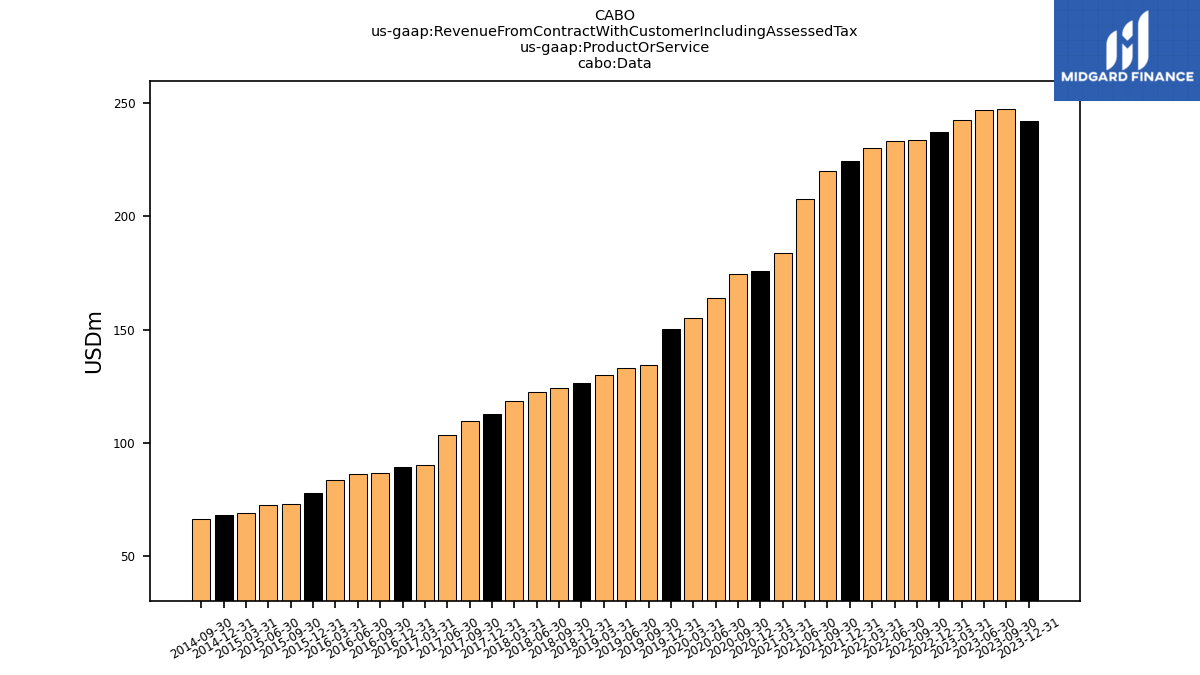
| Data | 242.34 | 247.42 | 246.84 | 242.70 | 237.25 | 233.83 | 233.33 | 230.15 | 224.53 | 219.94 | 207.65 | 183.60 | 176.01 | 174.53 | 164.01 | 154.99 | 150.28 | 134.32 | 132.82 | 129.81 | 126.40 | 124.09 | 122.47 | 118.49 | 112.56 | 109.78 | 103.50 | 90.20 | |
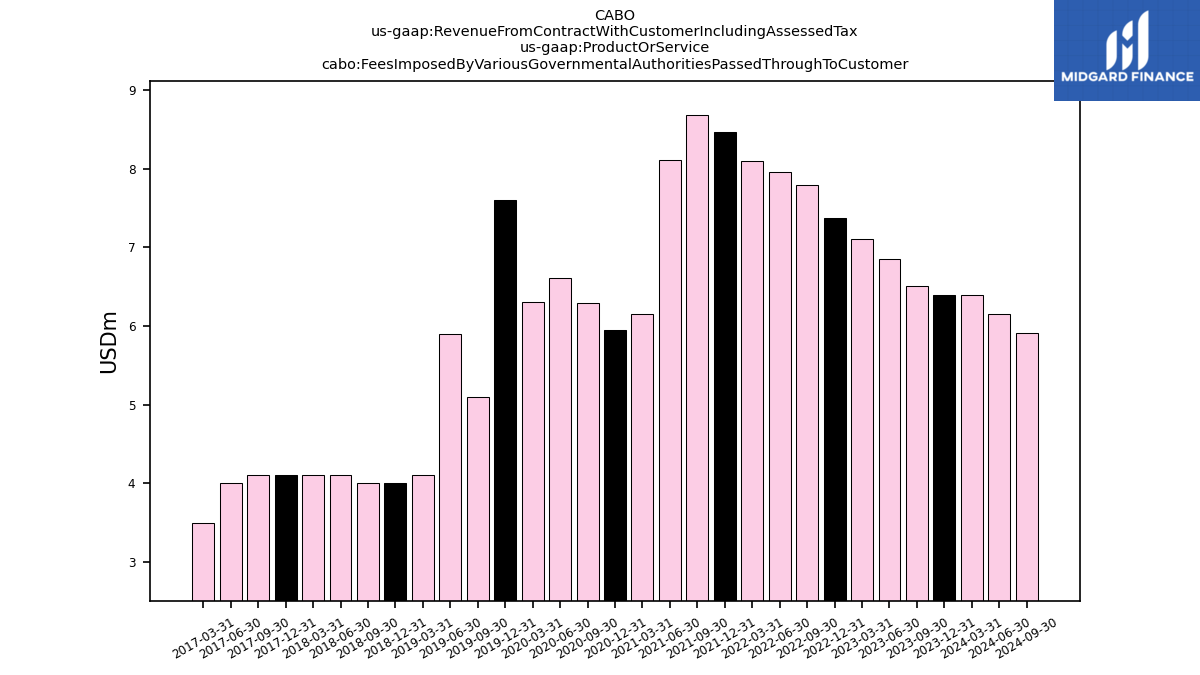
| Fees Imposed By Various Governmental Authorities Passed Through To Customer | 6.39 | 6.51 | 6.86 | 7.10 | 7.37 | 7.80 | 7.96 | 8.09 | 8.47 | 8.68 | 8.11 | 6.15 | 5.95 | 6.30 | 6.62 | 6.30 | 7.60 | 5.10 | 5.90 | 4.10 | 4.00 | 4.00 | 4.10 | 4.10 | 4.10 | 4.10 | 4.00 | 3.50 | |
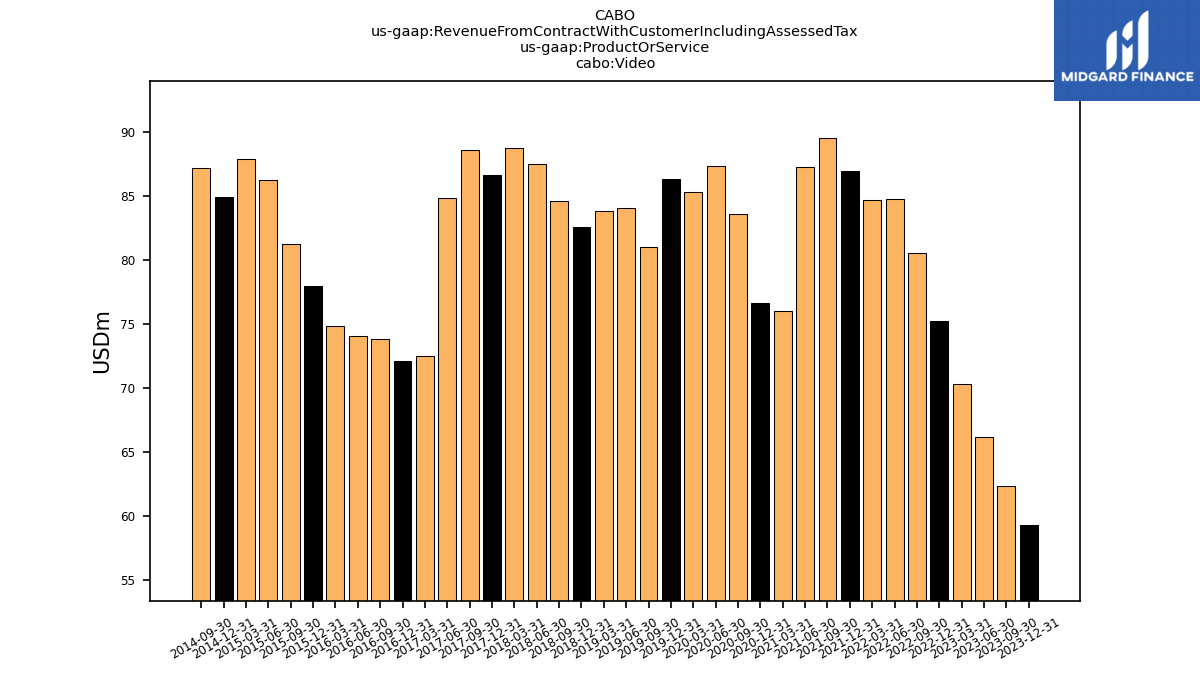
| Video | 59.25 | 62.30 | 66.14 | 70.29 | 75.26 | 80.53 | 84.76 | 84.66 | 86.94 | 89.51 | 87.24 | 76.02 | 76.65 | 83.55 | 87.33 | 85.32 | 86.36 | 81.00 | 84.03 | 83.80 | 82.56 | 84.57 | 87.46 | 88.76 | 86.61 | 88.60 | 84.87 | 72.45 | |
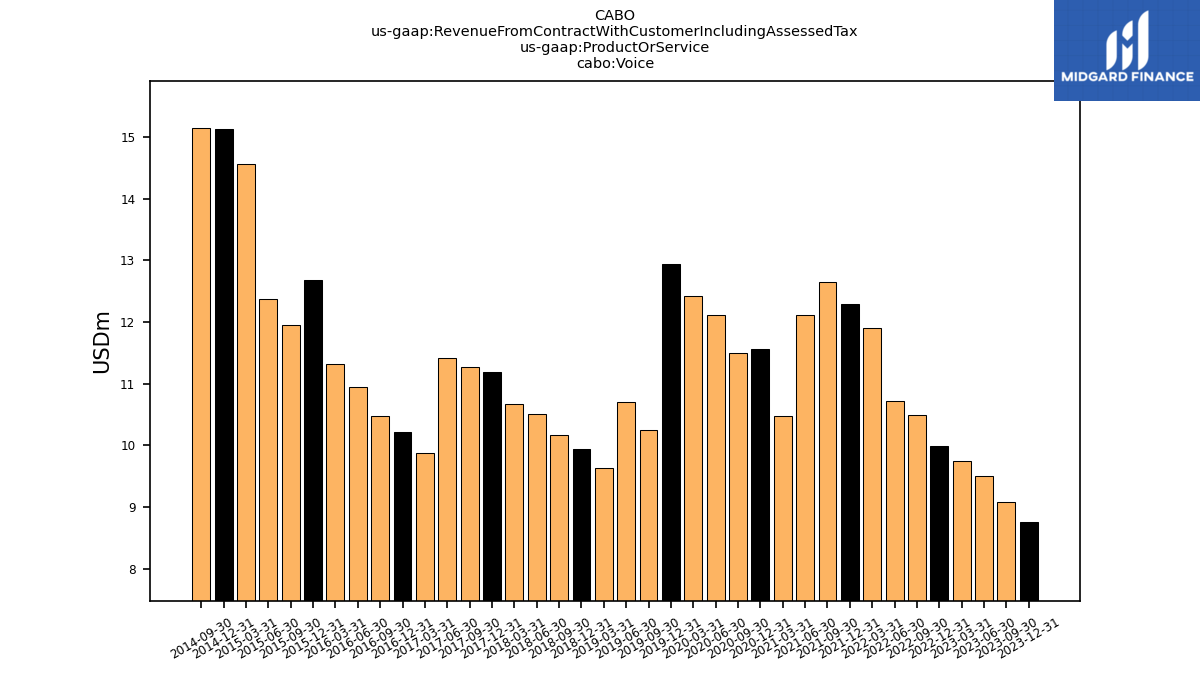
| Voice | 8.75 | 9.08 | 9.51 | 9.75 | 9.99 | 10.49 | 10.71 | 11.90 | 12.28 | 12.64 | 12.11 | 10.48 | 11.56 | 11.49 | 12.12 | 12.43 | 12.94 | 10.25 | 10.71 | 9.62 | 9.93 | 10.17 | 10.50 | 10.67 | 11.18 | 11.27 | 11.42 | 9.87 | |
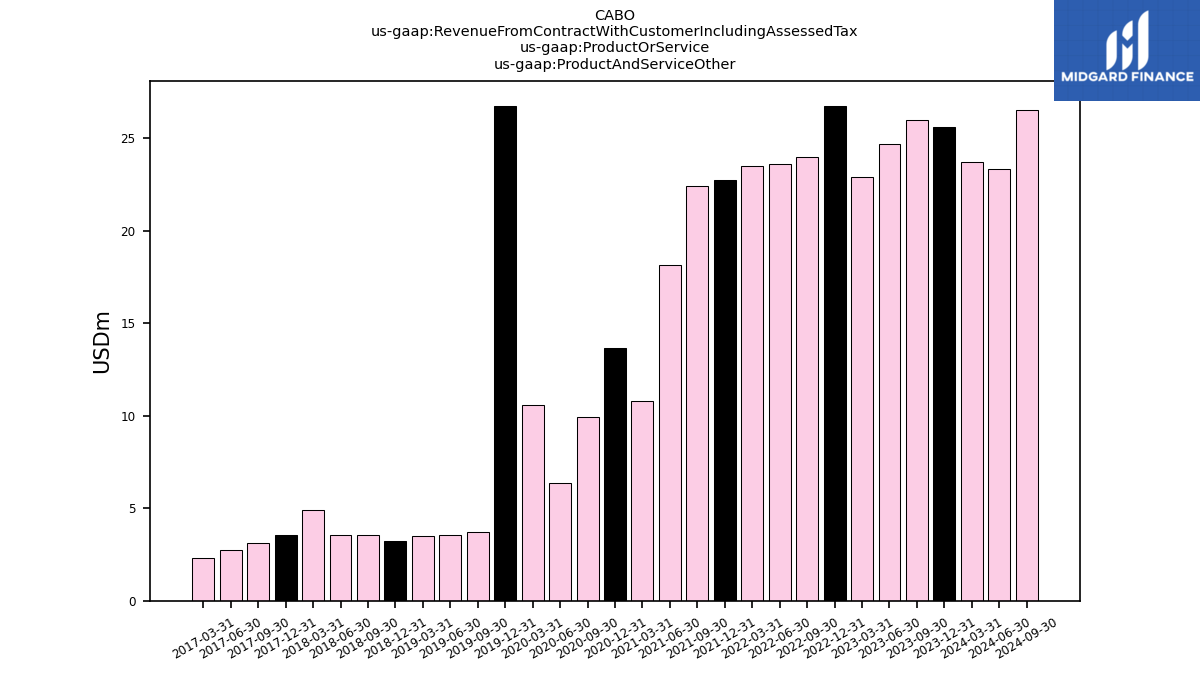
| Product And Service Other | 25.60 | 25.98 | 24.73 | 22.90 | 26.73 | 24.02 | 23.62 | 23.52 | 22.77 | 22.41 | 18.13 | 10.80 | 13.65 | 9.95 | 6.37 | 10.60 | 26.77 | 3.70 | 3.58 | 3.50 | 3.25 | 3.57 | 3.58 | 4.91 | 3.54 | 3.15 | 2.74 | 2.32 |