
| 2023-09-30 | 2023-06-30 | 2023-03-31 | 2022-12-31 | 2022-09-30 | 2022-06-30 | 2022-03-31 | 2021-12-31 | 2021-09-30 | 2021-06-30 | 2021-03-31 | 2020-12-31 | 2020-09-30 | 2020-06-30 | 2020-03-31 | 2019-12-31 | 2019-09-30 | 2019-06-30 | 2019-03-31 | 2018-12-31 | 2018-09-30 | 2018-06-30 | 2018-03-31 | 2017-12-31 | 2017-09-30 | 2017-06-30 | 2017-03-31 | 2016-12-31 | 2016-09-30 | 2016-06-30 | 2016-03-31 | 2015-12-31 | 2015-09-30 | 2015-06-30 | 2015-03-31 | 2014-12-31 | 2014-09-30 | 2014-06-30 | 2014-03-31 | 2013-12-31 | 2013-09-30 | 2013-06-30 | 2013-03-31 | 2012-12-31 | 2012-09-30 | 2012-06-30 | 2012-03-31 | 2011-12-31 | 2011-09-30 | 2011-06-30 | 2011-03-31 | 2010-12-31 | 2010-09-30 | 2010-06-30 | 2010-03-31 | 2009-12-31 | ||
|---|---|---|---|---|---|---|---|---|---|---|---|---|---|---|---|---|---|---|---|---|---|---|---|---|---|---|---|---|---|---|---|---|---|---|---|---|---|---|---|---|---|---|---|---|---|---|---|---|---|---|---|---|---|---|---|---|---|
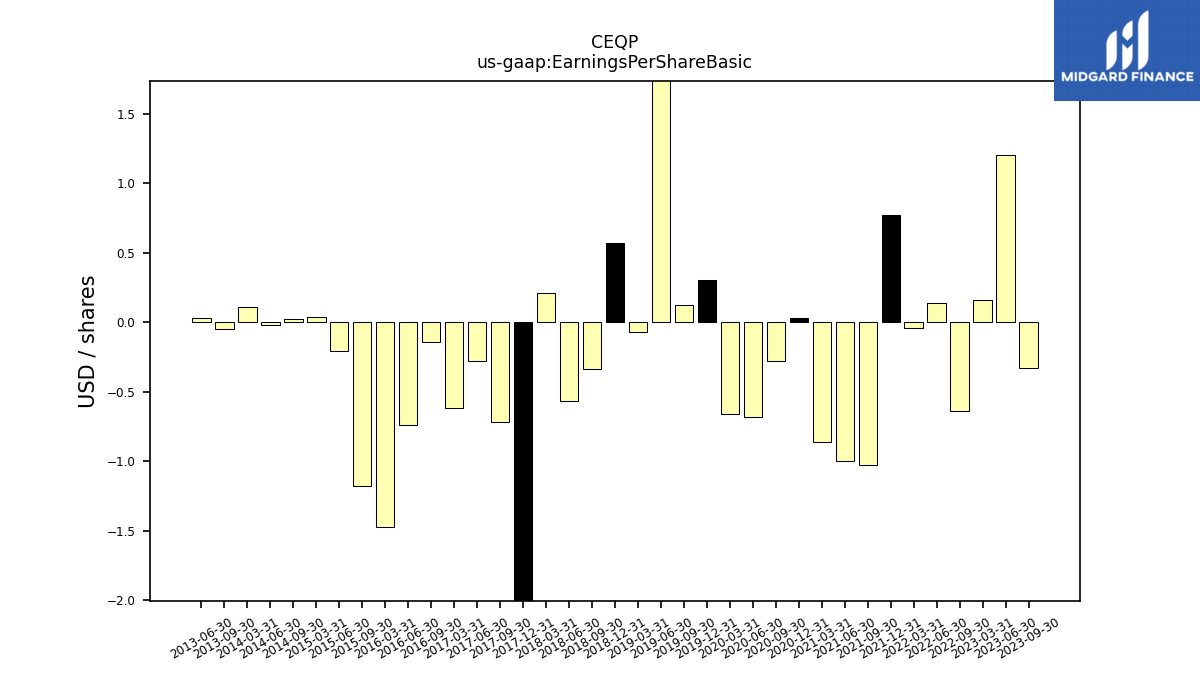
| Earnings Per Share Basic | -0.33 | 1.20 | 0.16 | NA | -0.64 | 0.14 | -0.04 | 0.77 | -1.03 | -1.00 | -0.86 | 0.03 | -0.28 | -0.68 | -0.66 | 0.30 | 0.12 | 2.76 | -0.07 | 0.57 | -0.34 | -0.57 | 0.21 | -2.01 | -0.72 | -0.28 | -0.62 | NA | -0.14 | -0.74 | -1.47 | NA | -1.18 | -0.21 | 0.04 | NA | 0.02 | -0.02 | 0.11 | NA | -0.05 | 0.03 | NA | NA | NA | NA | NA | NA | NA | NA | NA | NA | NA | NA | NA | NA | |
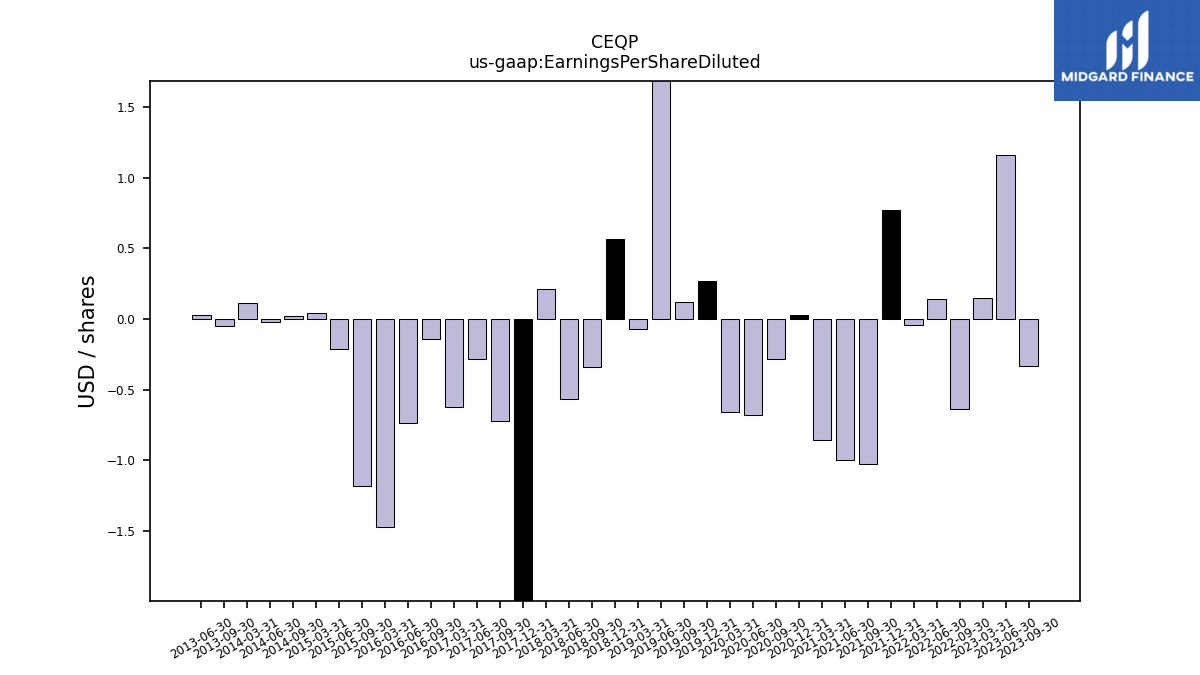
| Earnings Per Share Diluted | -0.33 | 1.16 | 0.15 | NA | -0.64 | 0.14 | -0.04 | 0.77 | -1.03 | -1.00 | -0.86 | 0.03 | -0.28 | -0.68 | -0.66 | 0.27 | 0.12 | 2.58 | -0.07 | 0.57 | -0.34 | -0.57 | 0.21 | -2.01 | -0.72 | -0.28 | -0.62 | NA | -0.14 | -0.74 | -1.47 | NA | -1.18 | -0.21 | 0.04 | NA | 0.02 | -0.02 | 0.11 | NA | -0.05 | 0.03 | NA | NA | NA | NA | NA | NA | NA | NA | NA | NA | NA | NA | NA | NA |
| 2023-09-30 | 2023-06-30 | 2023-03-31 | 2022-12-31 | 2022-09-30 | 2022-06-30 | 2022-03-31 | 2021-12-31 | 2021-09-30 | 2021-06-30 | 2021-03-31 | 2020-12-31 | 2020-09-30 | 2020-06-30 | 2020-03-31 | 2019-12-31 | 2019-09-30 | 2019-06-30 | 2019-03-31 | 2018-12-31 | 2018-09-30 | 2018-06-30 | 2018-03-31 | 2017-12-31 | 2017-09-30 | 2017-06-30 | 2017-03-31 | 2016-12-31 | 2016-09-30 | 2016-06-30 | 2016-03-31 | 2015-12-31 | 2015-09-30 | 2015-06-30 | 2015-03-31 | 2014-12-31 | 2014-09-30 | 2014-06-30 | 2014-03-31 | 2013-12-31 | 2013-09-30 | 2013-06-30 | 2013-03-31 | 2012-12-31 | 2012-09-30 | 2012-06-30 | 2012-03-31 | 2011-12-31 | 2011-09-30 | 2011-06-30 | 2011-03-31 | 2010-12-31 | 2010-09-30 | 2010-06-30 | 2010-03-31 | 2009-12-31 | ||
|---|---|---|---|---|---|---|---|---|---|---|---|---|---|---|---|---|---|---|---|---|---|---|---|---|---|---|---|---|---|---|---|---|---|---|---|---|---|---|---|---|---|---|---|---|---|---|---|---|---|---|---|---|---|---|---|---|---|
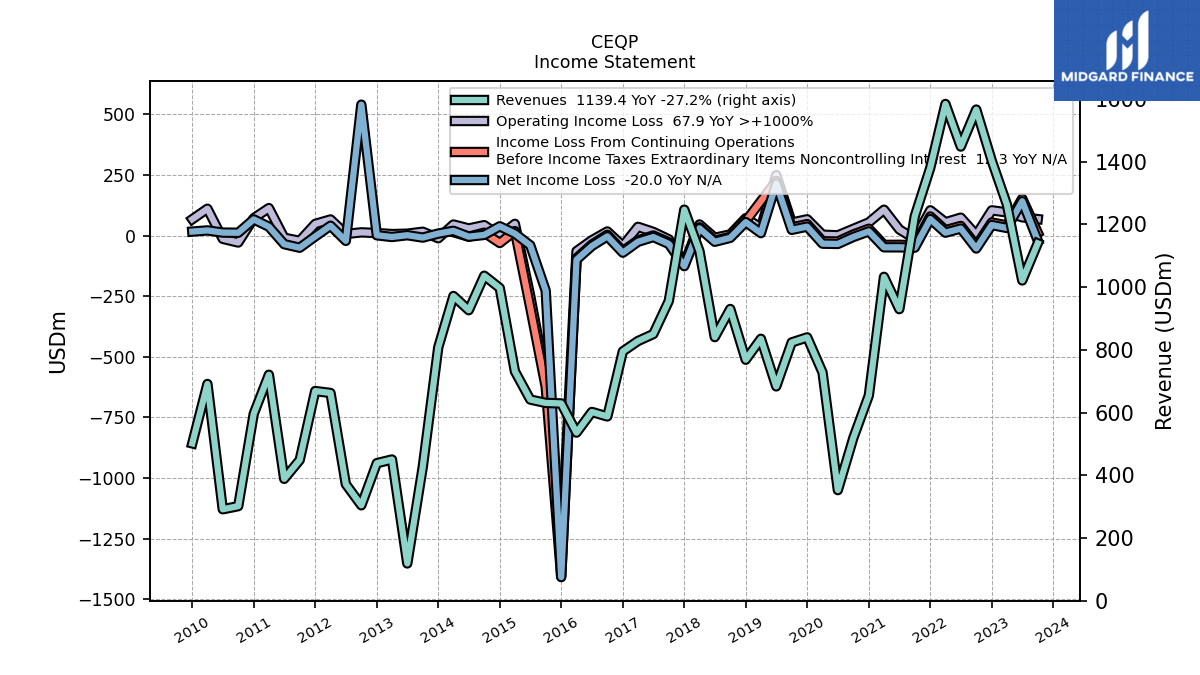
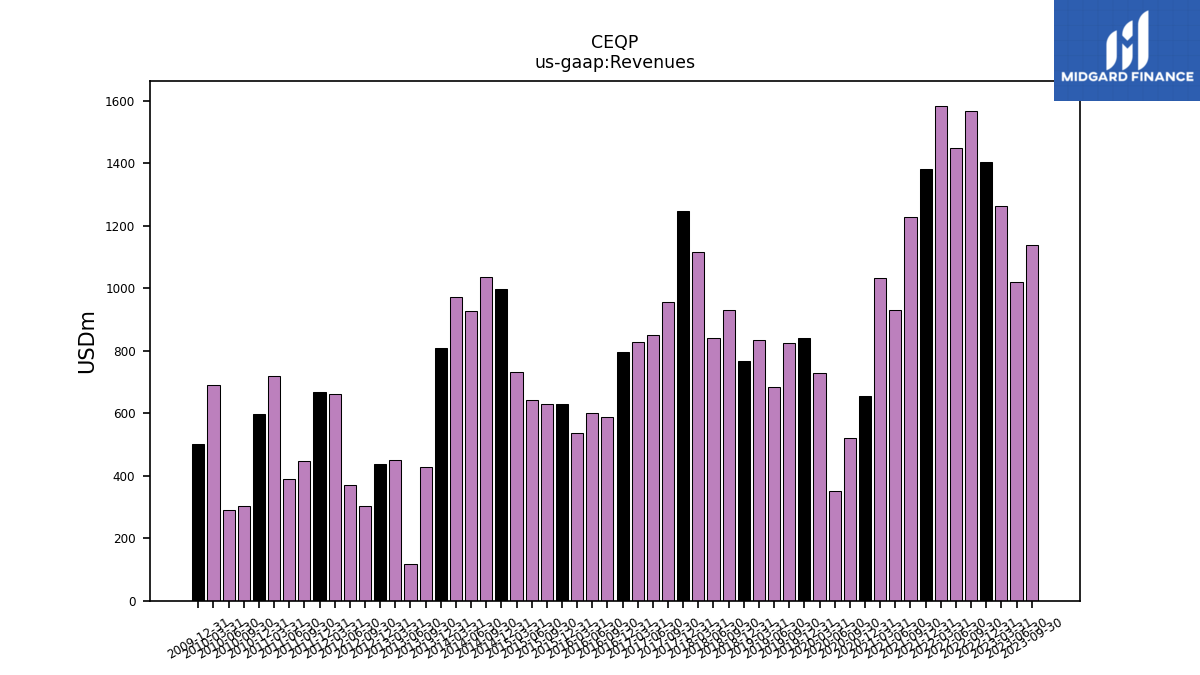
| Revenues | 1139.40 | 1021.20 | 1263.10 | 1402.90 | 1566.00 | 1448.00 | 1583.80 | 1380.40 | 1226.30 | 929.60 | 1032.70 | 654.50 | 519.20 | 352.70 | 727.90 | 839.70 | 823.60 | 683.40 | 835.20 | 768.40 | 930.20 | 840.50 | 1115.00 | 1246.90 | 955.60 | 850.30 | 828.10 | 795.00 | 587.60 | 601.90 | 536.00 | 629.10 | 630.70 | 641.50 | 731.50 | 997.20 | 1036.20 | 926.30 | 971.60 | 808.20 | 427.20 | 118.90 | 450.40 | 438.60 | 304.20 | 371.60 | 662.40 | 668.60 | 448.60 | 388.70 | 720.50 | 596.00 | 301.60 | 291.60 | 691.10 | 501.70 | |
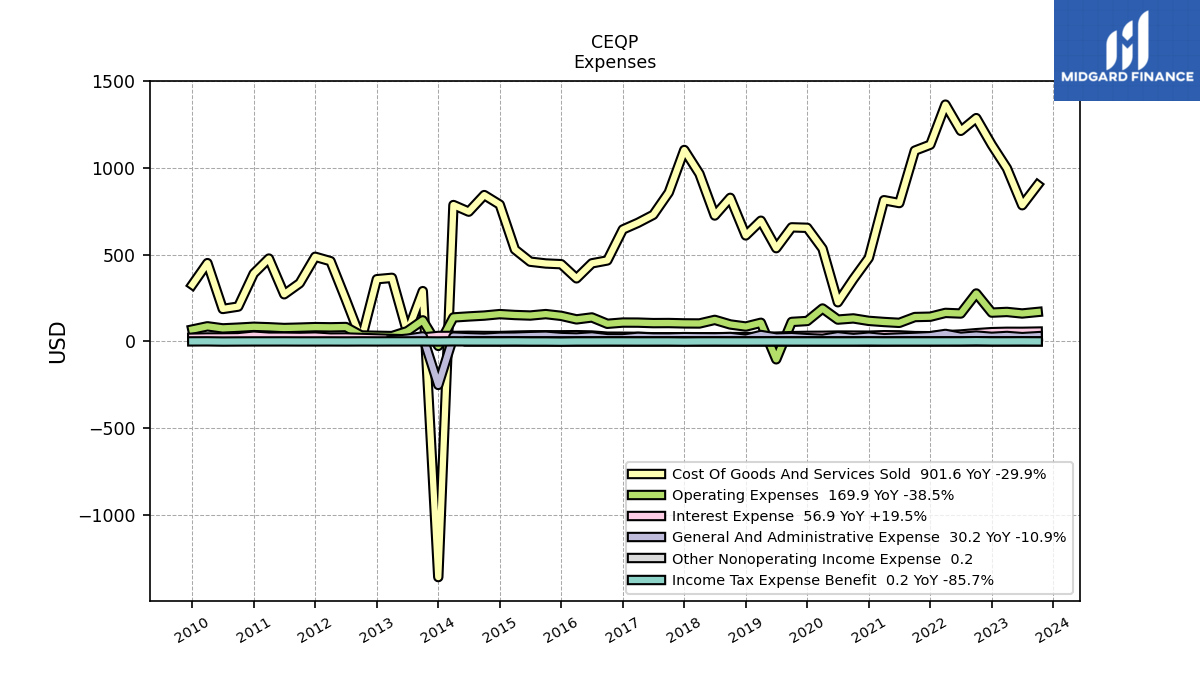
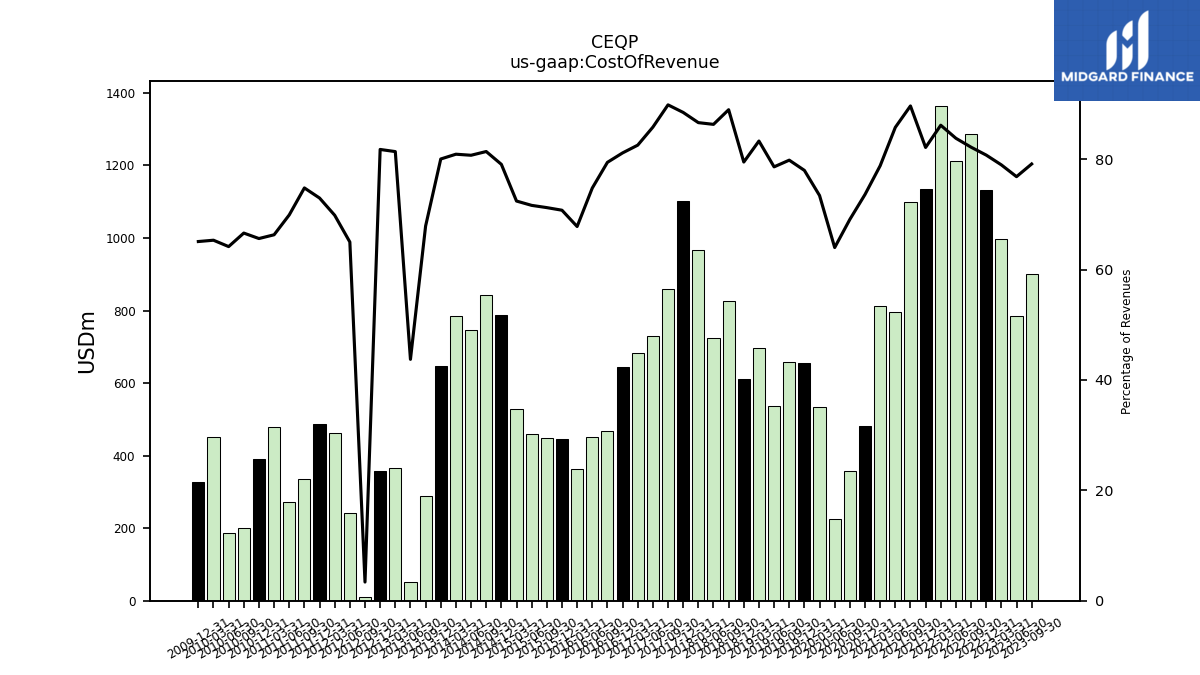
| Cost Of Revenue | 901.60 | 784.60 | 997.40 | 1132.70 | 1286.80 | 1213.20 | 1364.40 | 1133.60 | 1099.30 | 797.20 | 813.80 | 481.70 | 358.70 | 225.70 | 534.40 | 654.70 | 657.40 | 537.20 | 695.60 | 610.70 | 827.50 | 725.40 | 965.80 | 1103.10 | 858.50 | 729.60 | 683.50 | 645.00 | 466.70 | 450.00 | 363.40 | 445.10 | 449.20 | 459.50 | 529.70 | 788.40 | 843.30 | 747.60 | 786.00 | 646.80 | 290.00 | 52.00 | 366.50 | 358.60 | 10.30 | 241.50 | 462.60 | 487.80 | 335.50 | 271.70 | 477.70 | 391.10 | 200.90 | 187.10 | 451.40 | 326.50 | |
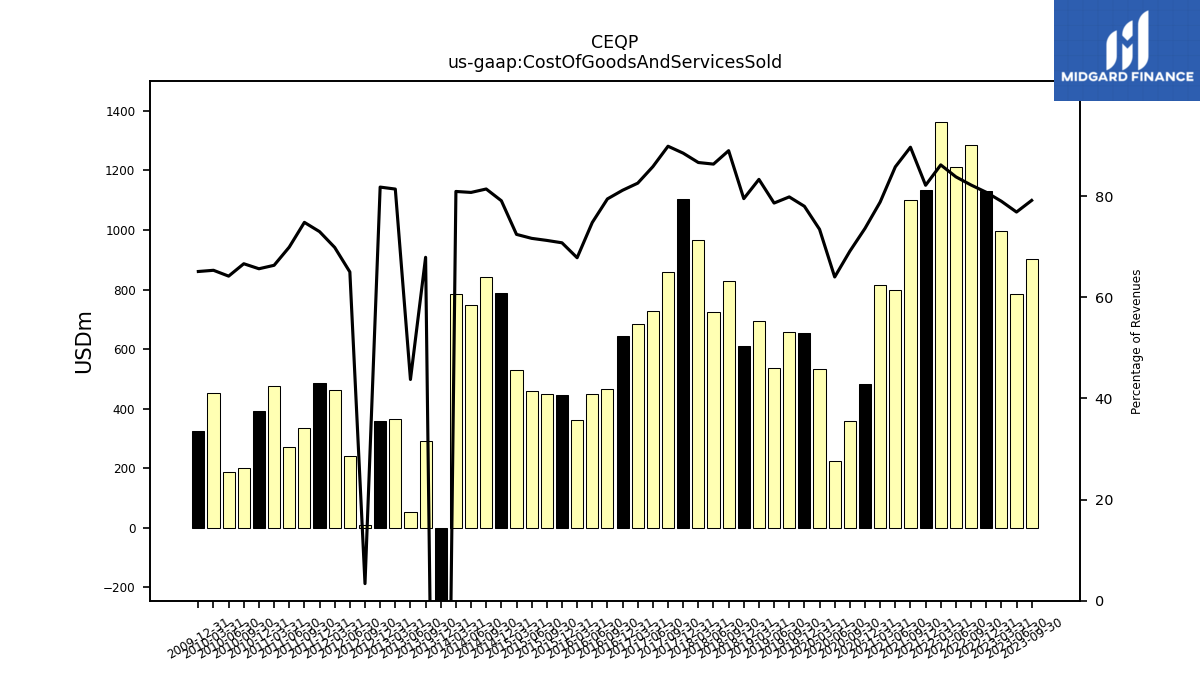
| Cost Of Goods And Services Sold | 901.60 | 784.60 | 997.40 | 1132.70 | 1286.80 | 1213.20 | 1364.40 | 1133.60 | 1099.30 | 797.20 | 813.80 | 481.70 | 358.70 | 225.70 | 534.40 | 654.70 | 657.40 | 537.20 | 695.60 | 610.70 | 827.50 | 725.40 | 965.80 | 1103.10 | 858.50 | 729.60 | 683.50 | 645.00 | 466.70 | 450.00 | 363.40 | 445.10 | 449.20 | 459.50 | 529.70 | 788.40 | 843.30 | 747.60 | 786.00 | -1357.80 | 290.00 | 52.00 | 366.50 | 358.60 | 10.30 | 241.50 | 462.60 | 487.80 | 335.50 | 271.70 | 477.70 | 391.10 | 200.90 | 187.10 | 451.40 | 326.50 | |
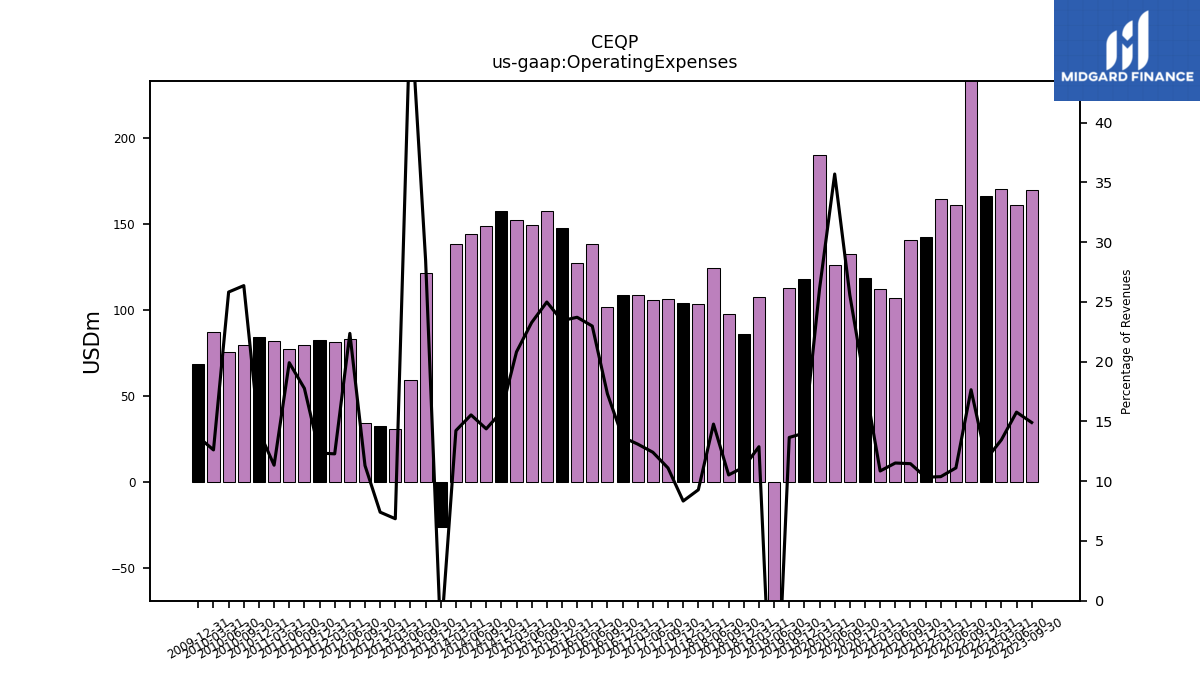
| Operating Expenses | 169.90 | 161.10 | 170.00 | 166.10 | 276.40 | 160.90 | 164.40 | 142.60 | 140.60 | 107.10 | 112.10 | 118.50 | 132.70 | 125.90 | 189.90 | 117.80 | 112.50 | -103.10 | 107.60 | 85.90 | 97.90 | 124.20 | 103.50 | 104.00 | 106.10 | 105.60 | 108.50 | 108.80 | 101.70 | 138.30 | 127.10 | 147.40 | 157.60 | 149.30 | 152.30 | 157.50 | 149.00 | 144.00 | 138.30 | -25.90 | 121.70 | 59.10 | 30.90 | 32.50 | 34.40 | 83.10 | 81.40 | 82.60 | 79.70 | 77.40 | 81.70 | 84.50 | 79.50 | 75.30 | 87.20 | 68.70 | |
| Operating Costs And Expenses | 56.90 | 53.20 | 56.60 | 52.10 | 55.00 | 46.60 | 42.40 | 30.80 | 31.60 | 25.80 | 32.80 | 31.60 | 31.00 | 31.60 | 37.60 | 39.50 | 36.00 | 34.70 | 28.60 | 29.80 | 29.60 | 31.90 | 34.50 | 32.60 | 35.50 | 34.20 | 33.70 | 38.20 | 33.10 | 45.00 | 41.80 | 46.40 | 49.30 | 43.90 | 50.60 | 54.60 | 55.90 | 48.70 | 44.10 | 39.10 | 37.20 | 15.30 | 13.00 | NA | NA | NA | NA | NA | NA | NA | NA | NA | NA | NA | NA | NA | |
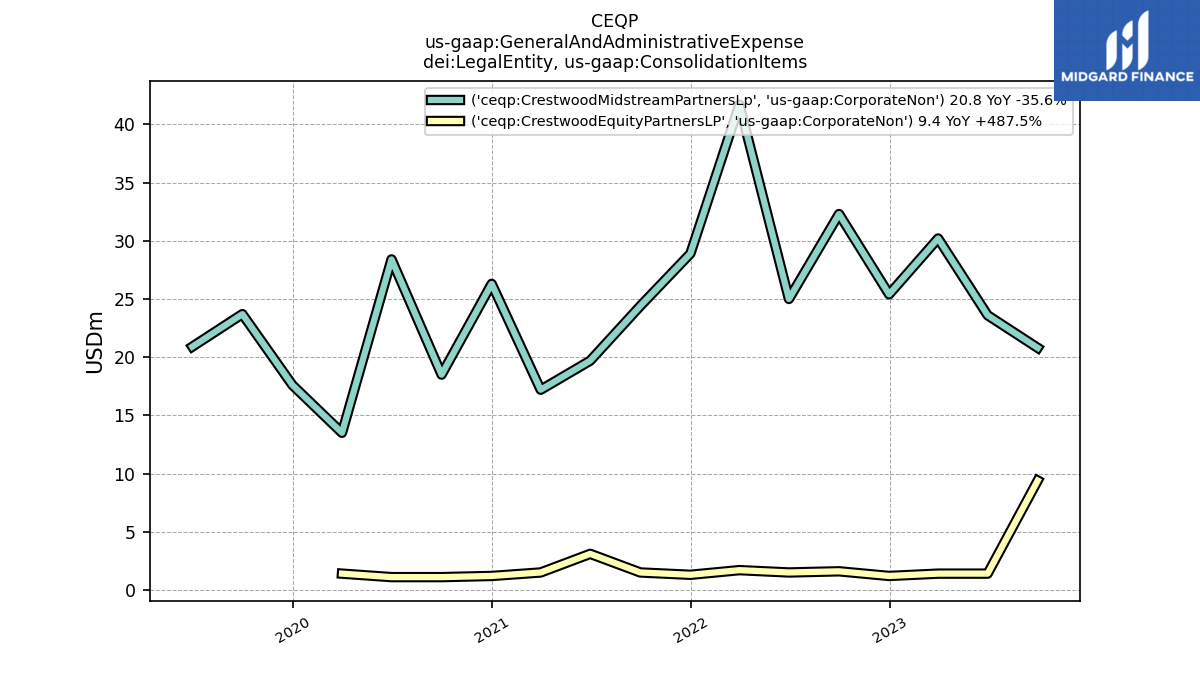
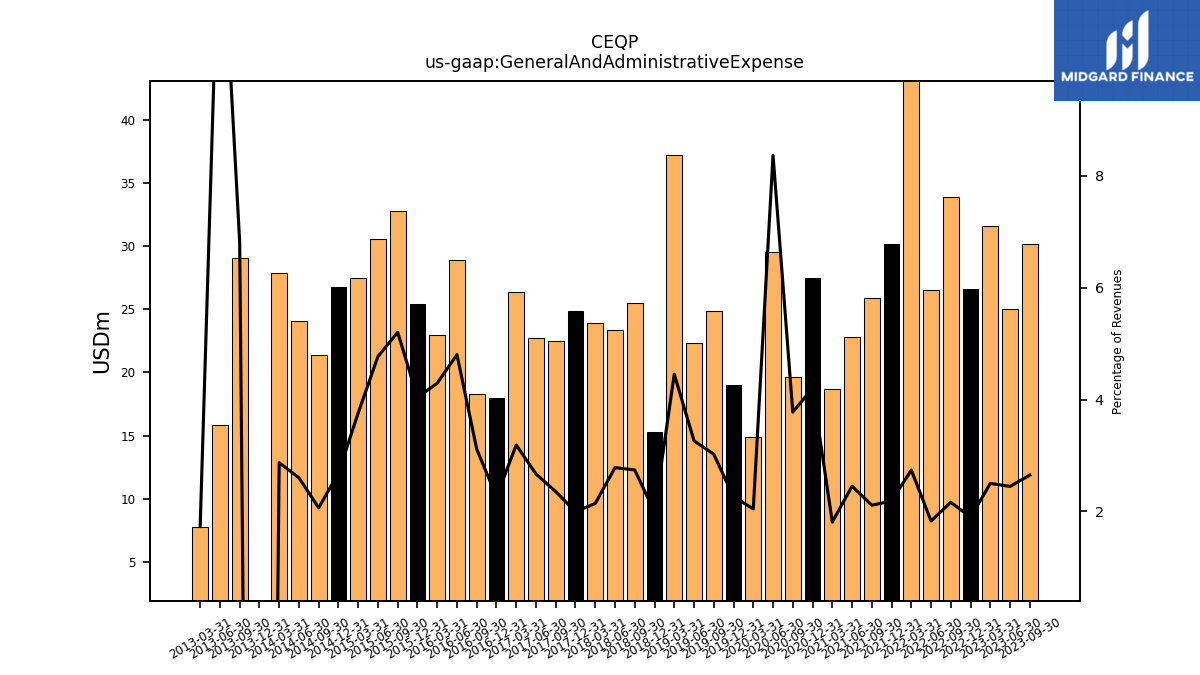
| General And Administrative Expense | 30.20 | 25.00 | 31.60 | 26.60 | 33.90 | 26.50 | 43.40 | 30.20 | 25.90 | 22.80 | 18.70 | 27.50 | 19.60 | 29.50 | 14.90 | 19.00 | 24.90 | 22.30 | 37.20 | 15.30 | 25.50 | 23.40 | 23.90 | 24.90 | 22.50 | 22.70 | 26.40 | 18.00 | 18.30 | 28.90 | 23.00 | 25.40 | 32.80 | 30.60 | 27.50 | 26.80 | 21.40 | 24.10 | 27.90 | -250.80 | 29.10 | 15.80 | 7.80 | NA | NA | NA | NA | NA | NA | NA | NA | NA | NA | NA | NA | NA | |
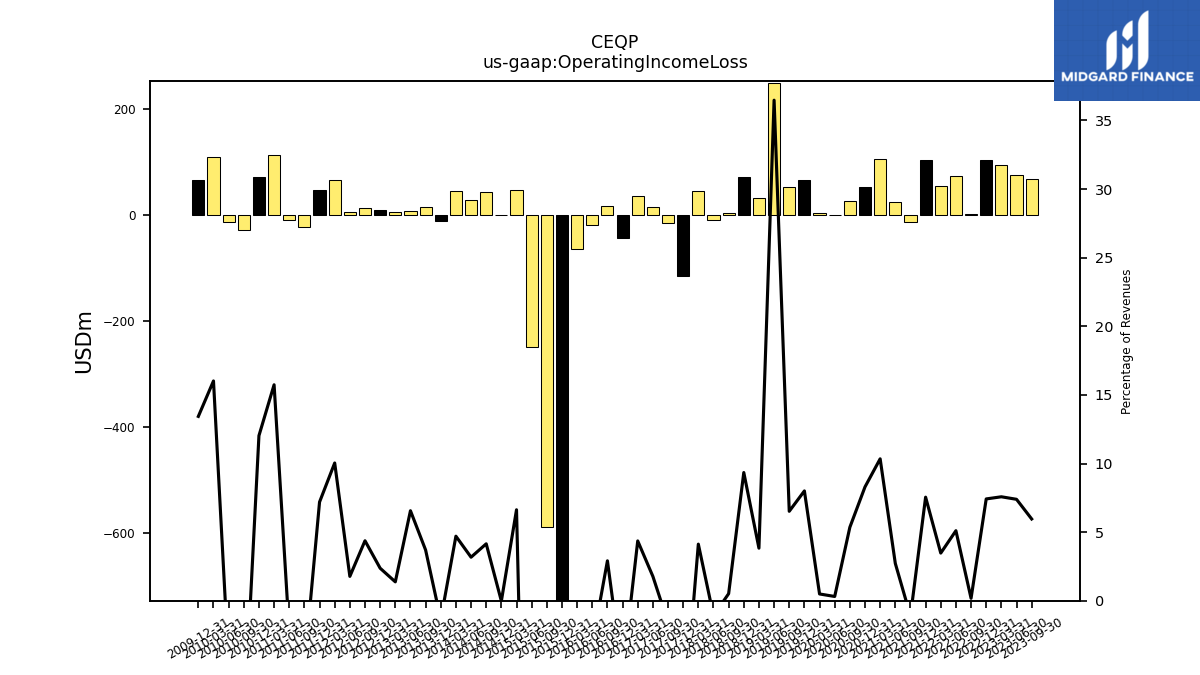
| Operating Income Loss | 67.90 | 75.50 | 95.70 | 104.10 | 2.80 | 73.90 | 55.00 | 104.20 | -13.60 | 25.30 | 106.80 | 54.30 | 27.80 | 1.10 | 3.60 | 67.20 | 53.70 | 249.30 | 32.00 | 71.80 | 4.80 | -9.10 | 46.00 | -115.30 | -15.30 | 15.10 | 36.10 | -42.50 | 17.10 | -19.10 | -64.20 | -1296.10 | -588.30 | -248.90 | 48.50 | -0.20 | 43.00 | 29.40 | 45.70 | -11.10 | 15.80 | 7.80 | 6.20 | 10.40 | 13.30 | 6.60 | 66.50 | 48.10 | -21.70 | -8.90 | 113.40 | 71.70 | -28.60 | -13.40 | 110.70 | 67.40 | |
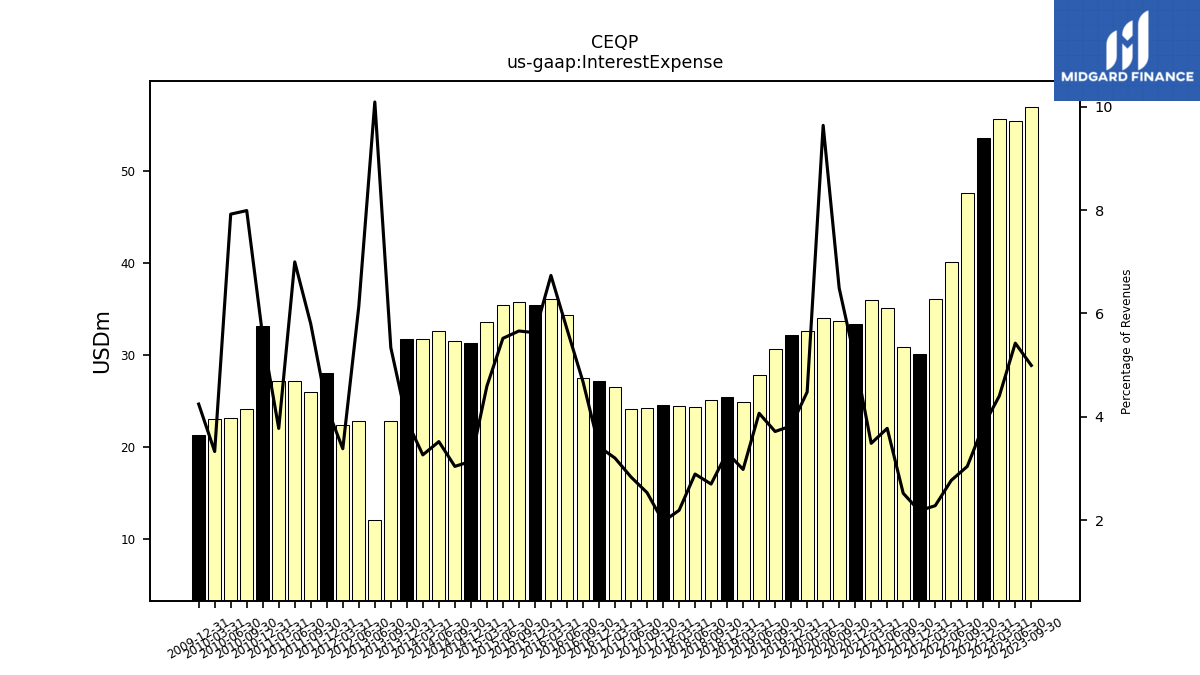
| Interest Expense | 56.90 | 55.40 | 55.60 | 53.60 | 47.60 | 40.10 | 36.10 | 30.10 | 30.90 | 35.10 | 36.00 | 33.30 | 33.70 | 34.00 | 32.60 | 32.10 | 30.60 | 27.80 | 24.90 | 25.40 | 25.10 | 24.30 | 24.40 | 24.60 | 24.20 | 24.10 | 26.50 | 27.20 | 27.50 | 34.30 | 36.10 | 35.40 | 35.70 | 35.40 | 33.60 | 31.30 | 31.50 | 32.60 | 31.70 | 31.70 | 22.80 | 12.00 | NA | NA | NA | 22.80 | 22.40 | 28.00 | 26.00 | 27.20 | 27.20 | 33.10 | 24.10 | 23.10 | 23.00 | 21.30 | |
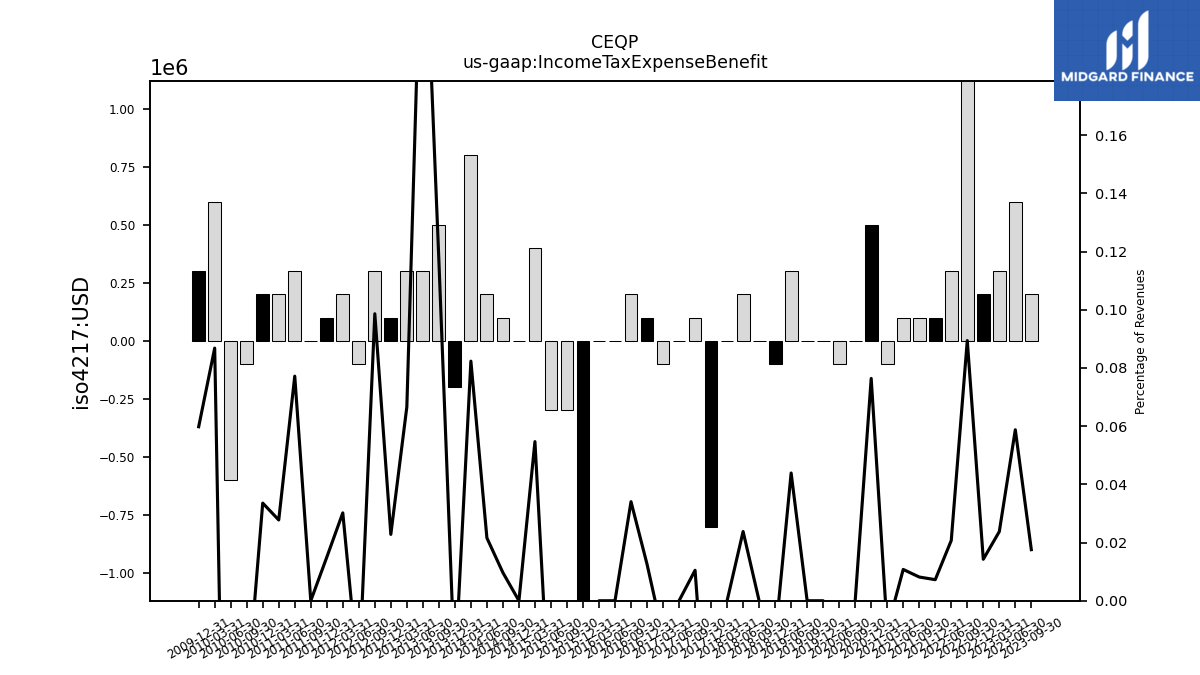
| Income Tax Expense Benefit | 0.20 | 0.60 | 0.30 | 0.20 | 1.40 | 0.30 | NA | 0.10 | 0.10 | 0.10 | -0.10 | 0.50 | 0.00 | -0.10 | NA | 0.00 | 0.00 | 0.30 | NA | -0.10 | 0.00 | 0.20 | 0.00 | -0.80 | 0.10 | 0.00 | -0.10 | 0.10 | 0.20 | 0.00 | 0.00 | -1.20 | -0.30 | -0.30 | 0.40 | 0.00 | 0.10 | 0.20 | 0.80 | -0.20 | 0.50 | 0.30 | 0.30 | 0.10 | 0.30 | -0.10 | 0.20 | 0.10 | 0.00 | 0.30 | 0.20 | 0.20 | -0.10 | -0.60 | 0.60 | 0.30 | |
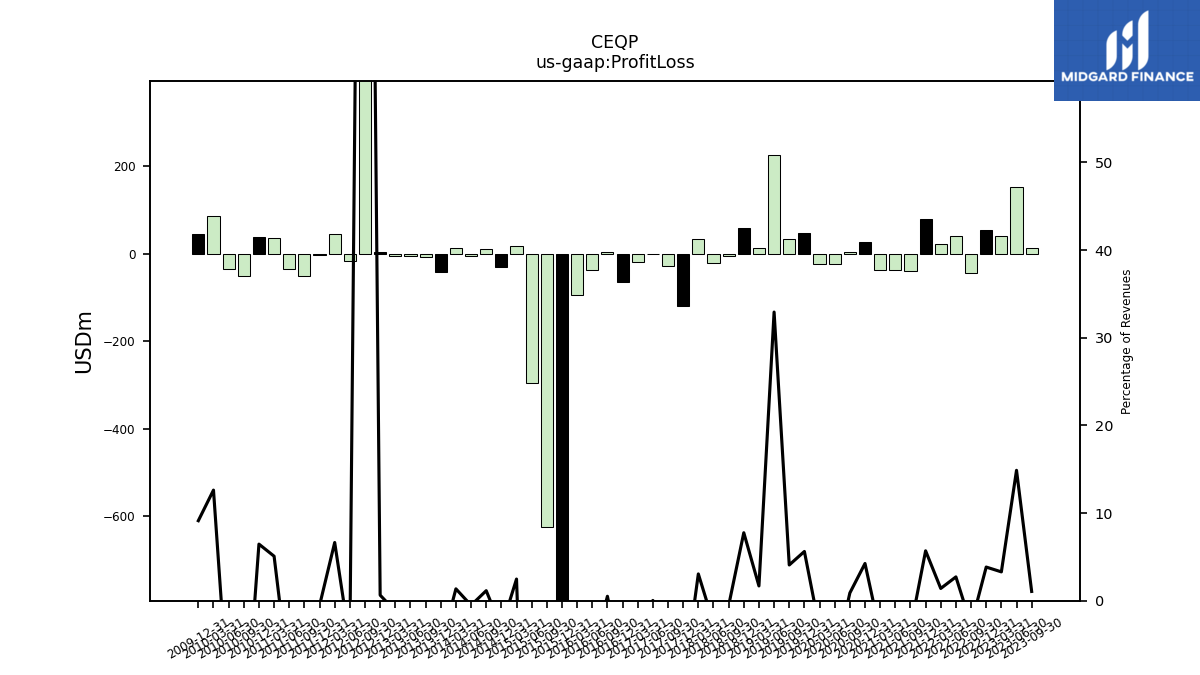
| Profit Loss | 12.10 | 151.90 | 41.60 | 53.90 | -43.00 | 39.40 | 22.20 | 78.60 | -39.60 | -38.10 | -38.30 | 27.80 | 4.60 | -24.30 | -23.40 | 47.20 | 33.60 | 225.00 | 14.10 | 59.60 | -5.20 | -21.50 | 34.10 | -119.60 | -27.90 | 0.30 | -19.40 | -64.30 | 3.00 | -37.10 | -93.70 | -1402.40 | -623.40 | -296.00 | 18.10 | -30.70 | 11.90 | -4.80 | 13.20 | -42.10 | -7.90 | -4.50 | -5.30 | 2.80 | 543.20 | -17.70 | 44.00 | -3.60 | -50.20 | -35.50 | 36.60 | 38.50 | -51.50 | -35.10 | 87.20 | 45.80 | |
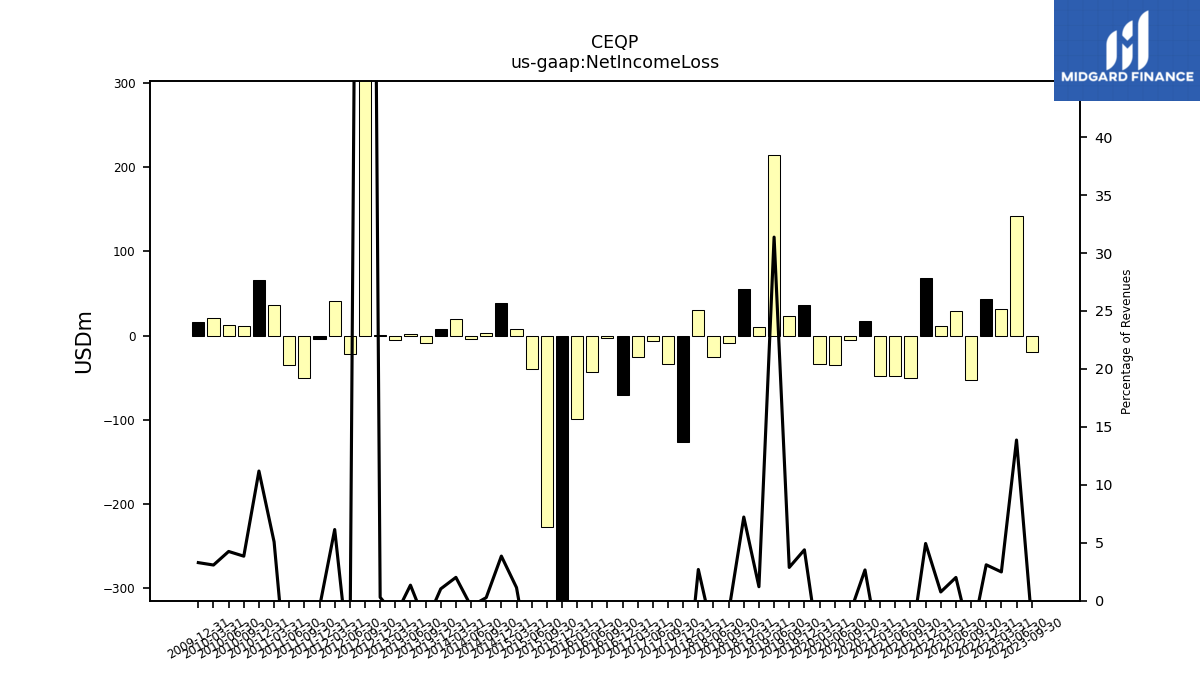
| Net Income Loss | -20.00 | 141.60 | 31.40 | 43.50 | -53.30 | 29.10 | 12.00 | 68.20 | -49.90 | -48.40 | -48.40 | 17.40 | -5.70 | -34.50 | -33.30 | 36.90 | 23.70 | 214.40 | 10.10 | 55.50 | -9.30 | -25.50 | 30.10 | -126.10 | -34.30 | -6.00 | -25.50 | -70.50 | -3.10 | -43.10 | -99.60 | -1408.30 | -226.90 | -40.00 | 8.30 | 38.40 | 2.80 | -4.40 | 19.60 | 8.30 | -8.30 | 1.60 | -5.80 | 1.30 | 540.00 | -21.80 | 40.70 | -3.70 | -50.20 | -35.50 | 36.60 | 66.70 | 11.60 | 12.40 | 21.30 | 16.50 | |
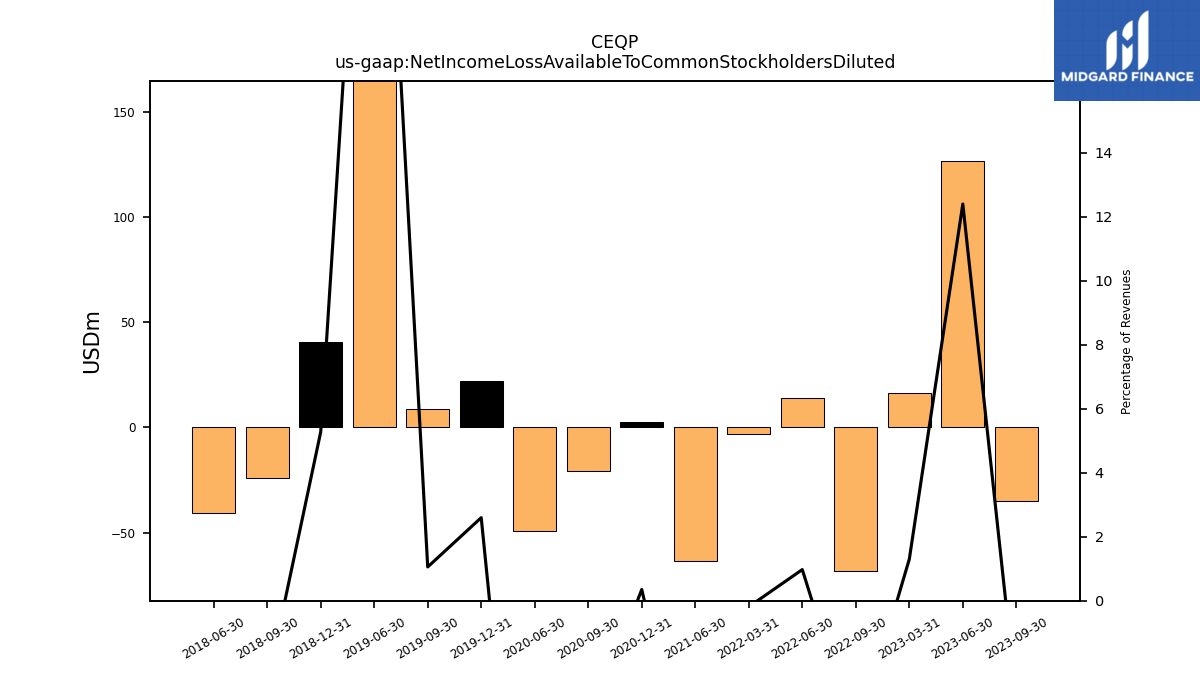
| Net Income Loss Available To Common Stockholders Diluted | -35.10 | 126.60 | 16.40 | NA | -68.30 | 14.10 | -3.00 | NA | NA | -63.40 | NA | 2.30 | -20.70 | -49.50 | NA | 21.80 | 8.70 | 214.40 | NA | 40.50 | -24.30 | -40.60 | NA | NA | NA | NA | NA | NA | NA | NA | NA | NA | NA | NA | NA | NA | NA | NA | NA | NA | NA | NA | NA | NA | NA | NA | NA | NA | NA | NA | NA | NA | NA | NA | NA | NA |
| 2023-09-30 | 2023-06-30 | 2023-03-31 | 2022-12-31 | 2022-09-30 | 2022-06-30 | 2022-03-31 | 2021-12-31 | 2021-09-30 | 2021-06-30 | 2021-03-31 | 2020-12-31 | 2020-09-30 | 2020-06-30 | 2020-03-31 | 2019-12-31 | 2019-09-30 | 2019-06-30 | 2019-03-31 | 2018-12-31 | 2018-09-30 | 2018-06-30 | 2018-03-31 | 2017-12-31 | 2017-09-30 | 2017-06-30 | 2017-03-31 | 2016-12-31 | 2016-09-30 | 2016-06-30 | 2016-03-31 | 2015-12-31 | 2015-09-30 | 2015-06-30 | 2015-03-31 | 2014-12-31 | 2014-09-30 | 2014-06-30 | 2014-03-31 | 2013-12-31 | 2013-09-30 | 2013-06-30 | 2013-03-31 | 2012-12-31 | 2012-09-30 | 2012-06-30 | 2012-03-31 | 2011-12-31 | 2011-09-30 | 2011-06-30 | 2011-03-31 | 2010-12-31 | 2010-09-30 | 2010-06-30 | 2010-03-31 | 2009-12-31 | ||
|---|---|---|---|---|---|---|---|---|---|---|---|---|---|---|---|---|---|---|---|---|---|---|---|---|---|---|---|---|---|---|---|---|---|---|---|---|---|---|---|---|---|---|---|---|---|---|---|---|---|---|---|---|---|---|---|---|---|
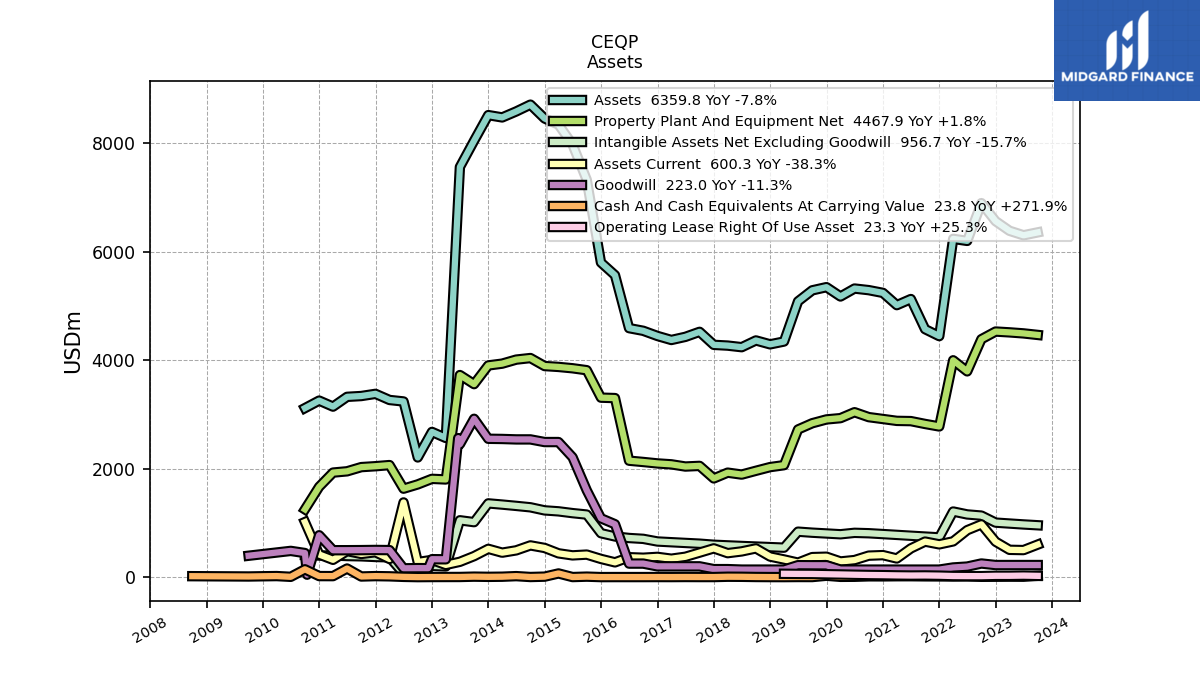
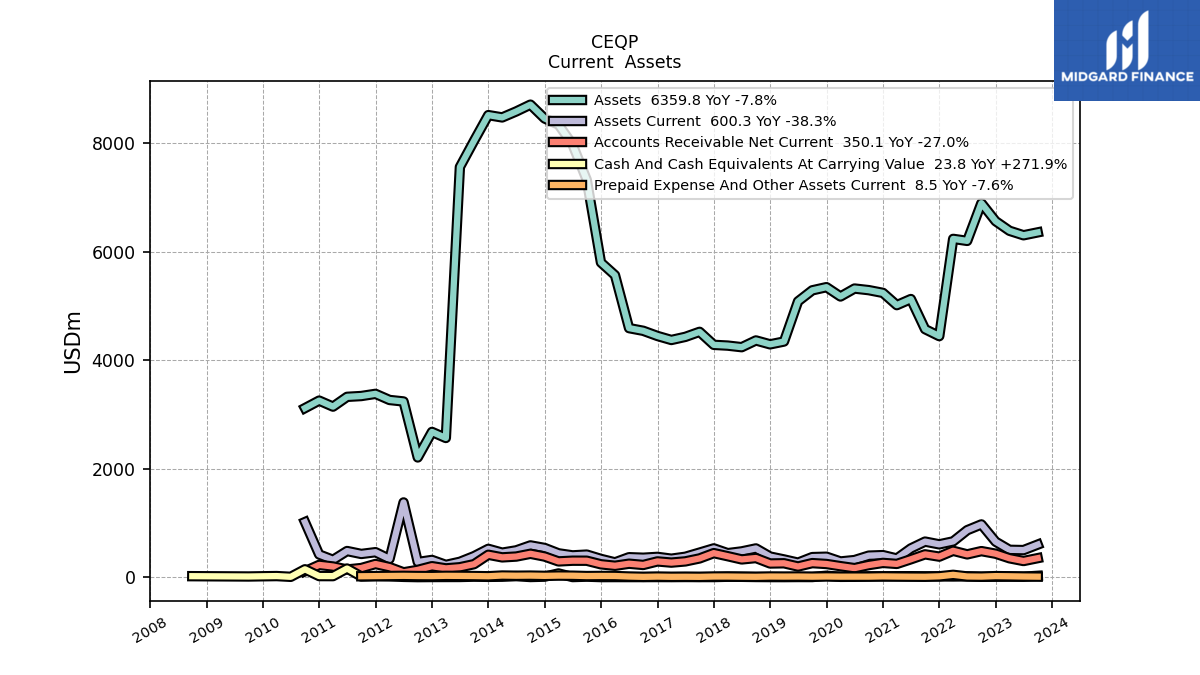
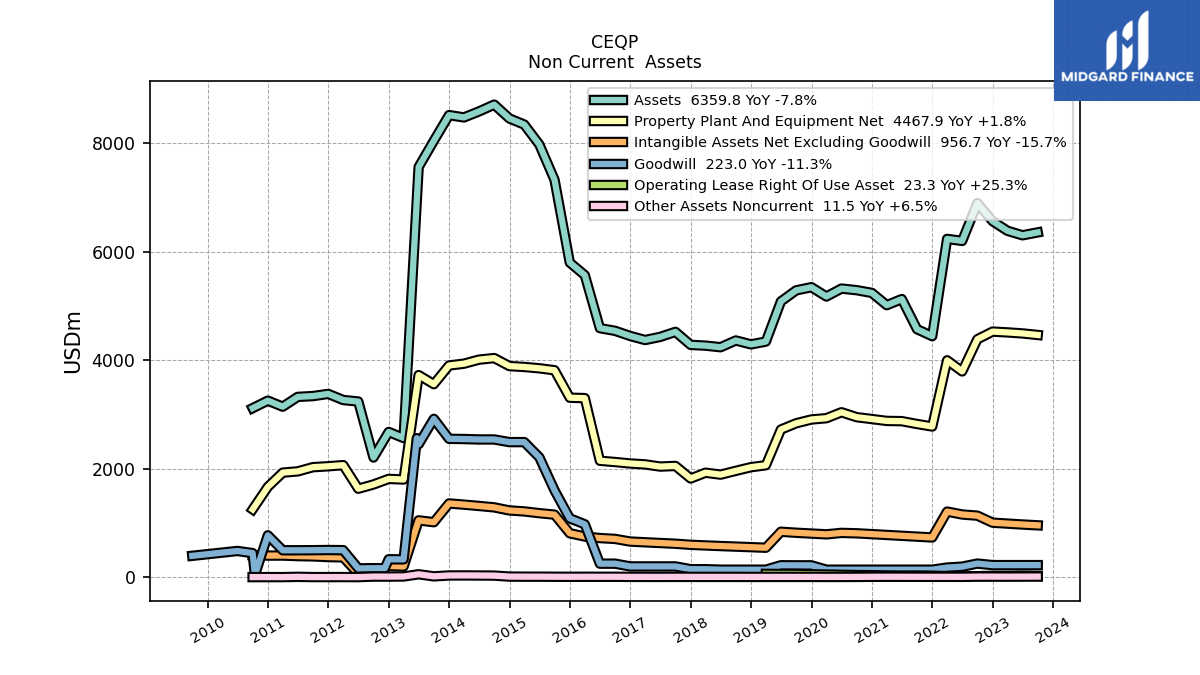
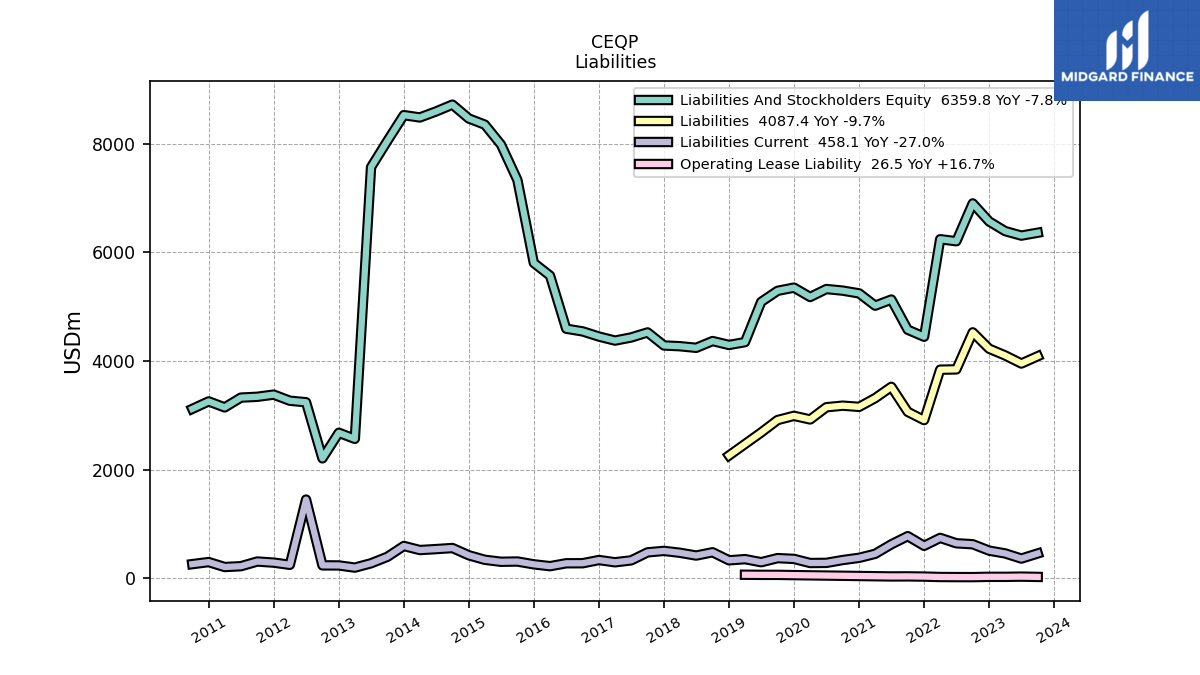
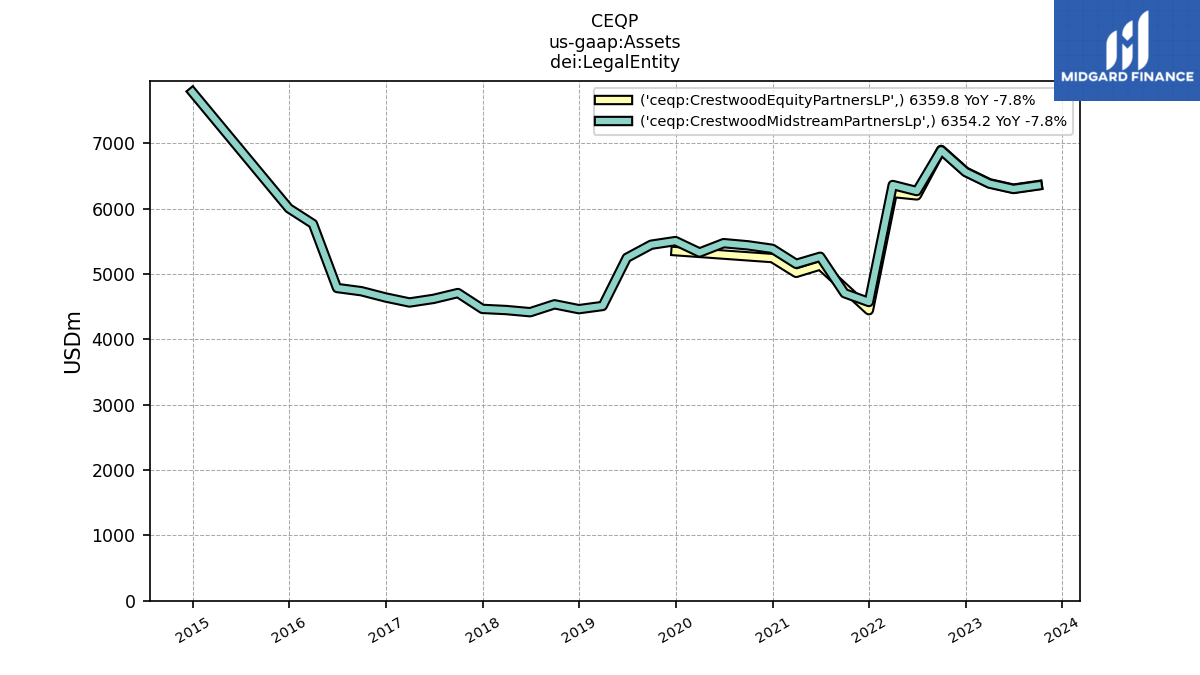
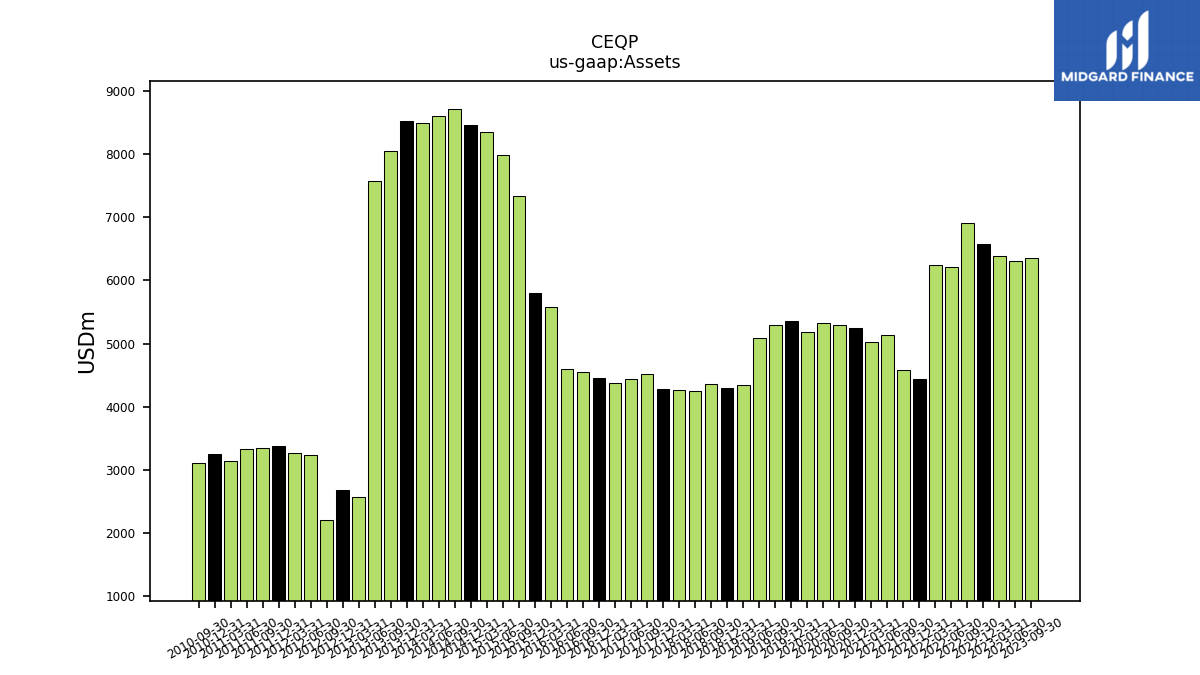
| Assets | 6359.80 | 6306.50 | 6389.30 | 6567.00 | 6899.40 | 6202.80 | 6240.10 | 4445.70 | 4574.50 | 5130.20 | 5017.30 | 5243.70 | 5294.20 | 5323.70 | 5177.10 | 5349.30 | 5290.70 | 5087.20 | 4346.40 | 4294.50 | 4366.40 | 4241.90 | 4271.20 | 4284.90 | 4525.30 | 4432.60 | 4374.80 | 4448.90 | 4544.20 | 4593.40 | 5570.00 | 5803.70 | 7328.40 | 7979.70 | 8348.20 | 8461.40 | 8716.70 | 8591.00 | 8480.50 | 8523.20 | 8050.40 | 7565.70 | 2566.80 | 2678.90 | 2207.60 | 3240.50 | 3268.10 | 3381.00 | 3340.90 | 3325.90 | 3145.40 | 3256.50 | 3117.80 | NA | NA | NA | |
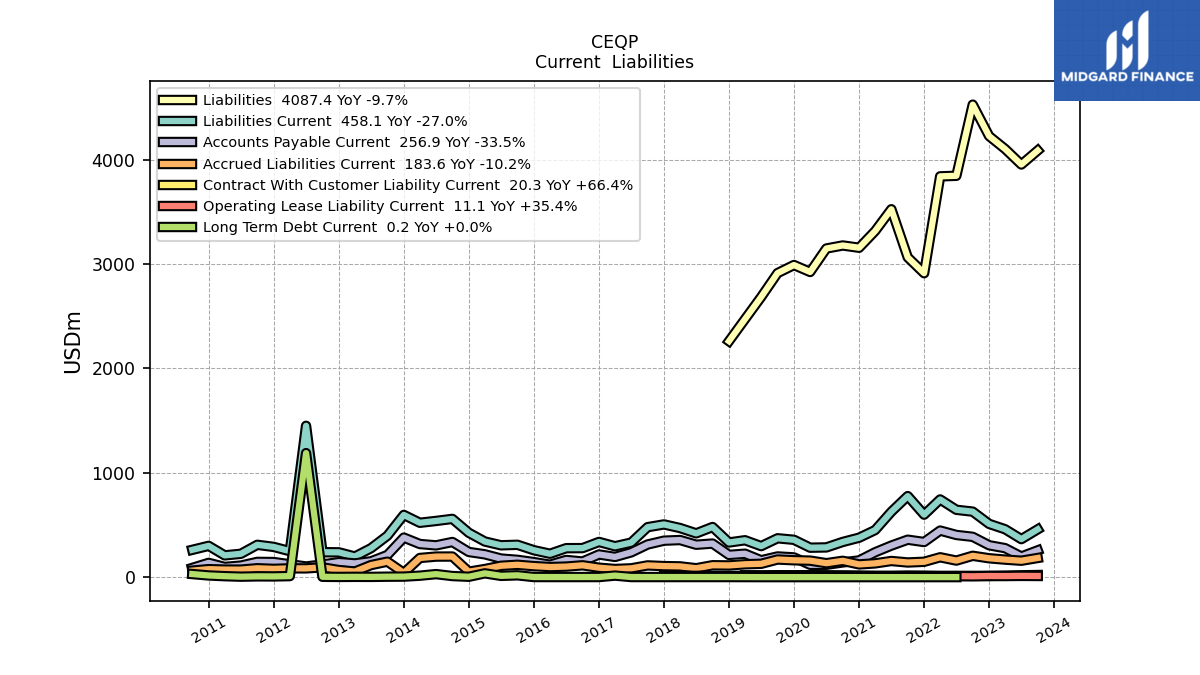
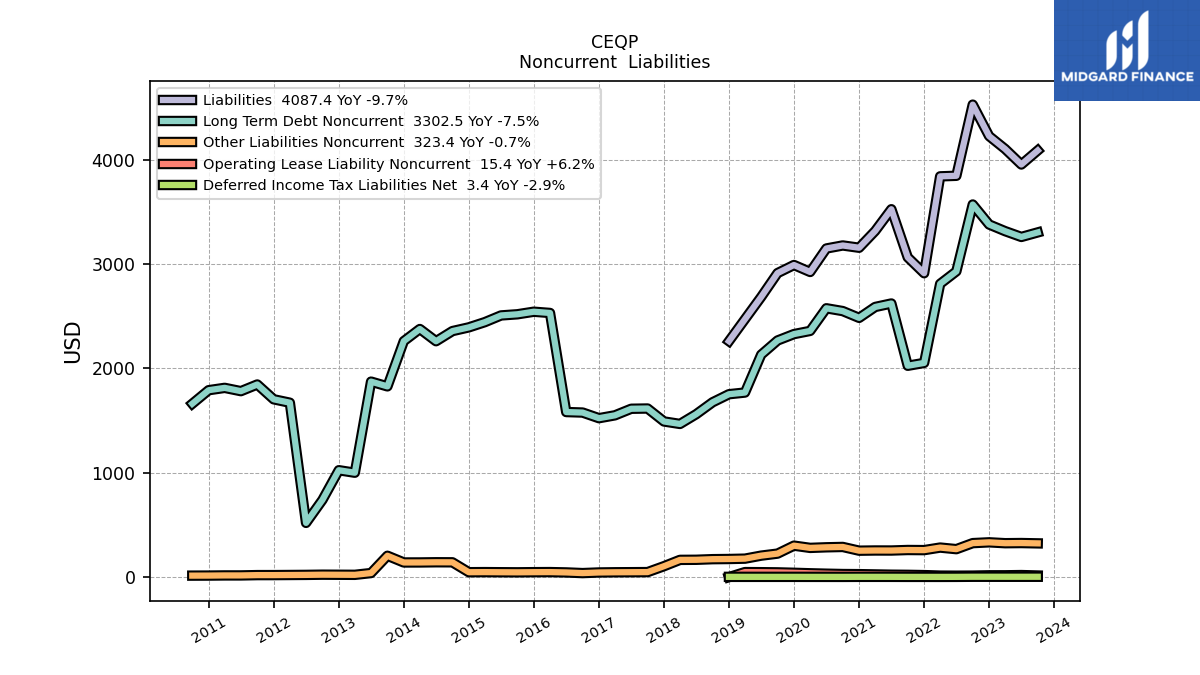
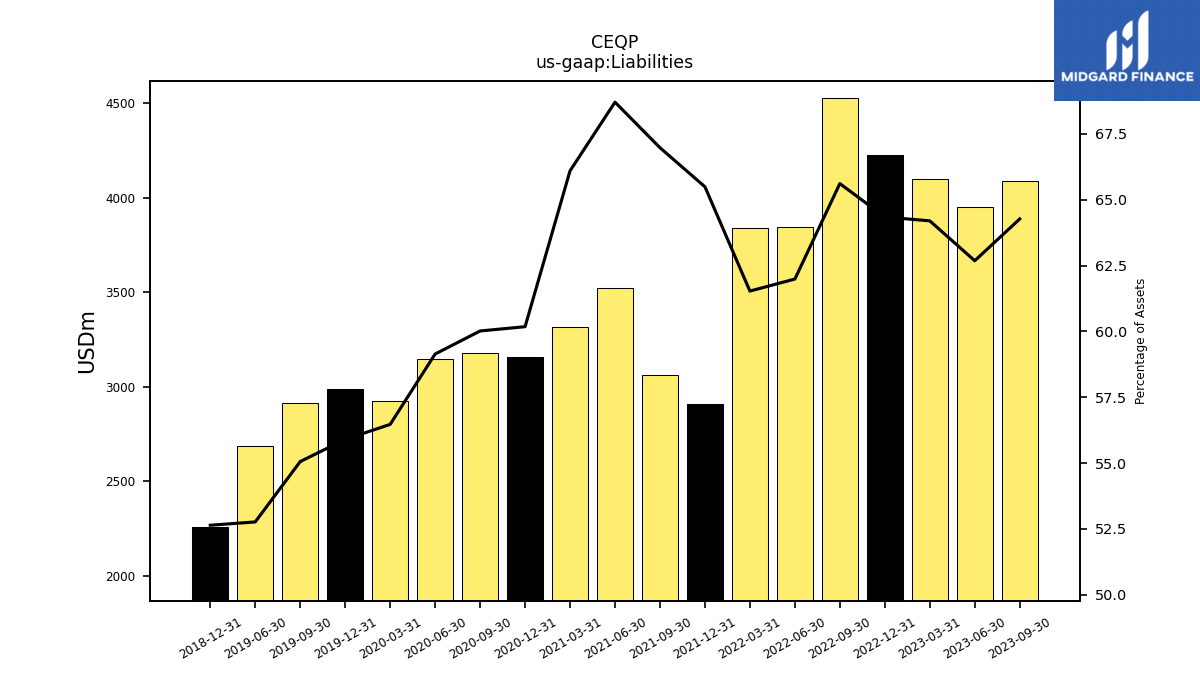
| Liabilities | 4087.40 | 3953.10 | 4101.70 | 4225.40 | 4526.80 | 3845.00 | 3839.60 | 2911.50 | 3063.70 | 3524.60 | 3316.20 | 3155.60 | 3177.40 | 3148.50 | 2923.50 | 2990.30 | 2913.00 | 2684.40 | NA | 2260.70 | NA | NA | NA | NA | NA | NA | NA | NA | NA | NA | NA | NA | NA | NA | NA | NA | NA | NA | NA | NA | NA | NA | NA | NA | NA | NA | NA | NA | NA | NA | NA | NA | NA | NA | NA | NA | |
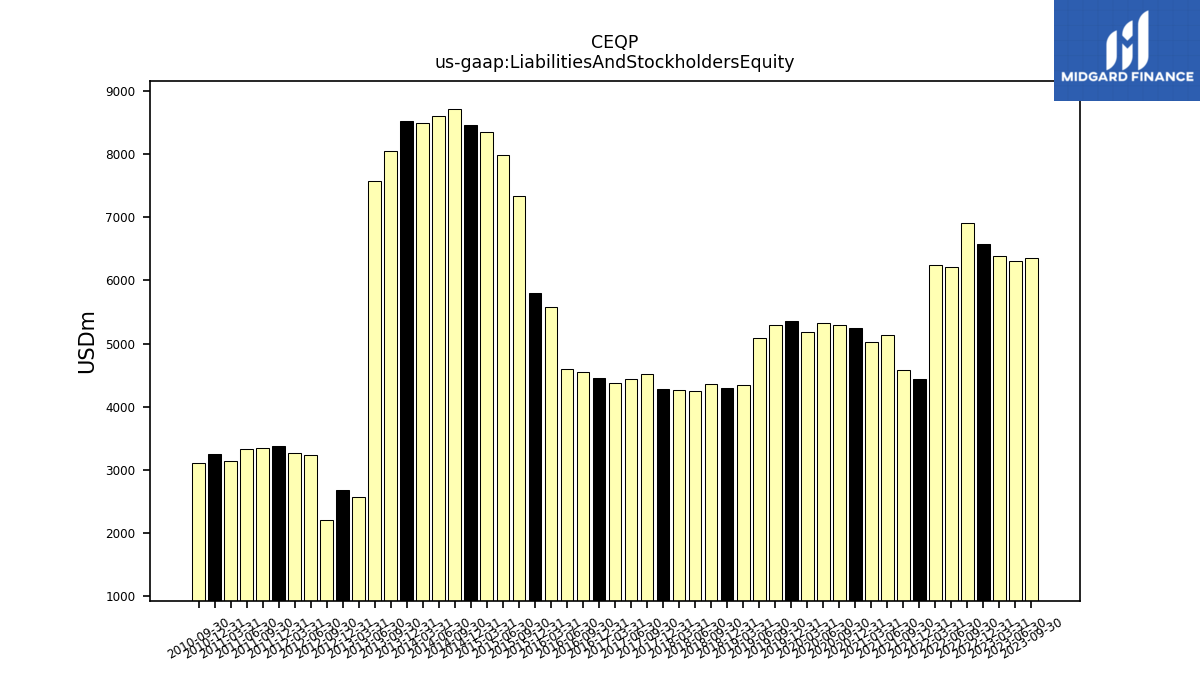
| Liabilities And Stockholders Equity | 6359.80 | 6306.50 | 6389.30 | 6567.00 | 6899.40 | 6202.80 | 6240.10 | 4445.70 | 4574.50 | 5130.20 | 5017.30 | 5243.70 | 5294.20 | 5323.70 | 5177.10 | 5349.30 | 5290.70 | 5087.20 | 4346.40 | 4294.50 | 4366.40 | 4241.90 | 4271.20 | 4284.90 | 4525.30 | 4432.60 | 4374.80 | 4448.90 | 4544.20 | 4593.40 | 5570.00 | 5803.70 | 7328.40 | 7979.70 | 8348.20 | 8461.40 | 8716.70 | 8591.00 | 8480.50 | 8523.20 | 8050.40 | 7565.70 | 2566.80 | 2678.90 | 2207.60 | 3240.50 | 3268.10 | 3381.00 | 3340.90 | 3325.90 | 3145.40 | 3256.50 | 3117.80 | NA | NA | NA |
| 2023-09-30 | 2023-06-30 | 2023-03-31 | 2022-12-31 | 2022-09-30 | 2022-06-30 | 2022-03-31 | 2021-12-31 | 2021-09-30 | 2021-06-30 | 2021-03-31 | 2020-12-31 | 2020-09-30 | 2020-06-30 | 2020-03-31 | 2019-12-31 | 2019-09-30 | 2019-06-30 | 2019-03-31 | 2018-12-31 | 2018-09-30 | 2018-06-30 | 2018-03-31 | 2017-12-31 | 2017-09-30 | 2017-06-30 | 2017-03-31 | 2016-12-31 | 2016-09-30 | 2016-06-30 | 2016-03-31 | 2015-12-31 | 2015-09-30 | 2015-06-30 | 2015-03-31 | 2014-12-31 | 2014-09-30 | 2014-06-30 | 2014-03-31 | 2013-12-31 | 2013-09-30 | 2013-06-30 | 2013-03-31 | 2012-12-31 | 2012-09-30 | 2012-06-30 | 2012-03-31 | 2011-12-31 | 2011-09-30 | 2011-06-30 | 2011-03-31 | 2010-12-31 | 2010-09-30 | 2010-06-30 | 2010-03-31 | 2009-12-31 | ||
|---|---|---|---|---|---|---|---|---|---|---|---|---|---|---|---|---|---|---|---|---|---|---|---|---|---|---|---|---|---|---|---|---|---|---|---|---|---|---|---|---|---|---|---|---|---|---|---|---|---|---|---|---|---|---|---|---|---|
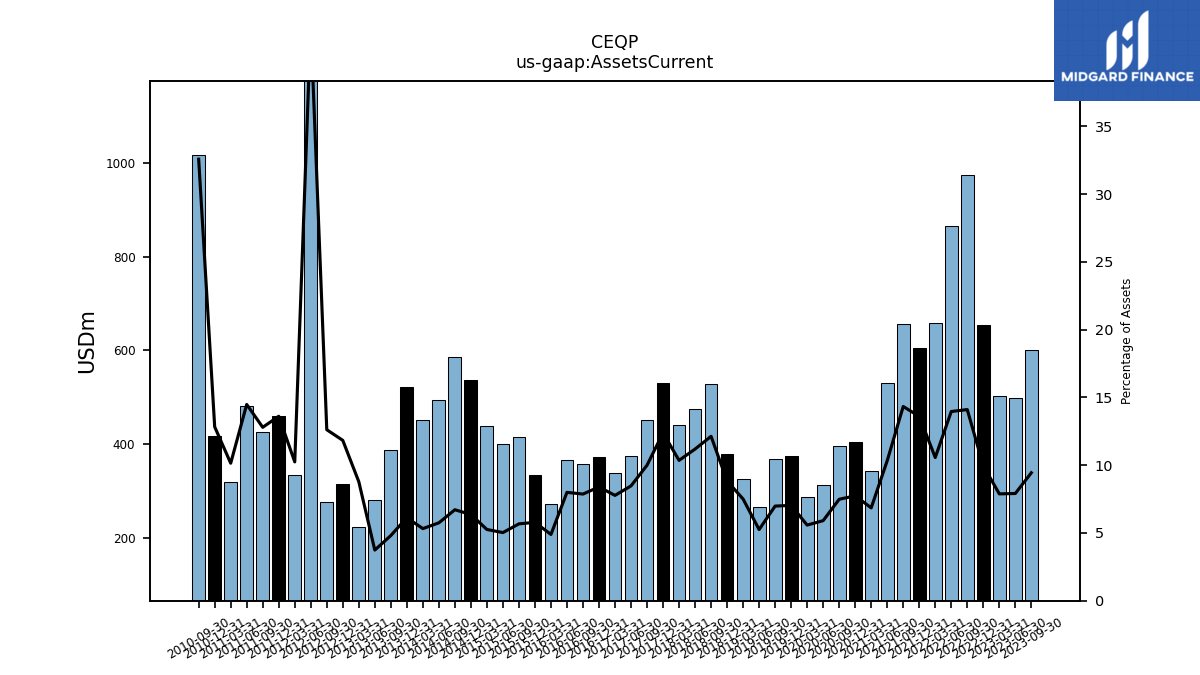
| Assets Current | 600.30 | 498.90 | 503.70 | 653.80 | 972.90 | 865.80 | 659.40 | 604.70 | 655.50 | 529.80 | 343.70 | 405.90 | 396.30 | 314.60 | 288.90 | 376.40 | 369.40 | 267.20 | 326.10 | 379.30 | 529.60 | 474.60 | 442.20 | 530.50 | 452.30 | 375.50 | 340.00 | 373.40 | 357.60 | 367.30 | 272.40 | 335.80 | 415.60 | 401.20 | 438.80 | 538.10 | 585.10 | 493.80 | 451.30 | 522.00 | 387.20 | 282.80 | 225.40 | 316.90 | 278.50 | 1378.10 | 334.70 | 460.10 | 427.40 | 481.60 | 319.10 | 417.70 | 1015.50 | NA | NA | NA | |
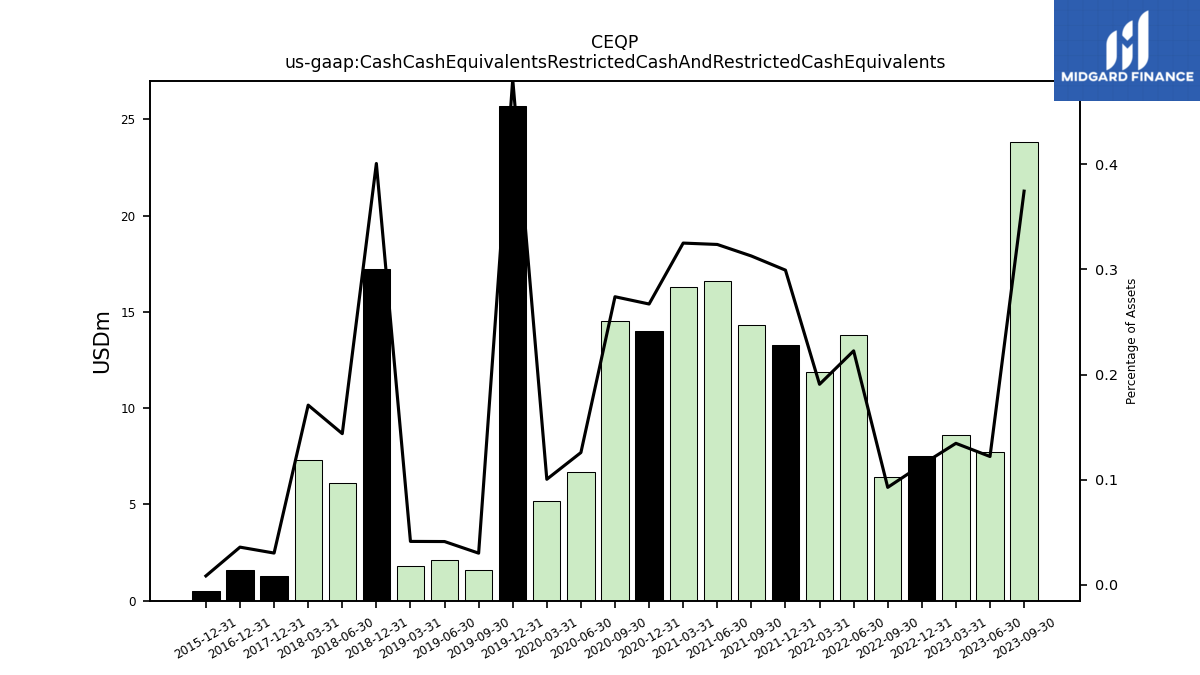
| Cash And Cash Equivalents At Carrying Value | 23.80 | 7.70 | 8.60 | 7.50 | 6.40 | 13.80 | 11.90 | 13.30 | 14.30 | 16.60 | 16.30 | 14.00 | 14.50 | 6.70 | 5.20 | 25.70 | 1.60 | 2.10 | 0.50 | 0.90 | 2.40 | 6.10 | 7.30 | 1.30 | 1.40 | 2.30 | 1.00 | 1.60 | 1.00 | 0.90 | 1.10 | 0.50 | 9.00 | 1.30 | 67.70 | 8.80 | 2.20 | 18.20 | 7.70 | 5.20 | 8.80 | 2.70 | 2.30 | 1.80 | 0.00 | 4.90 | 14.60 | 18.70 | 11.50 | 158.60 | 18.50 | 19.30 | 144.40 | 5.60 | 19.30 | 15.90 | |
| Cash Cash Equivalents Restricted Cash And Restricted Cash Equivalents | 23.80 | 7.70 | 8.60 | 7.50 | 6.40 | 13.80 | 11.90 | 13.30 | 14.30 | 16.60 | 16.30 | 14.00 | 14.50 | 6.70 | 5.20 | 25.70 | 1.60 | 2.10 | 1.80 | 17.20 | NA | 6.10 | 7.30 | 1.30 | NA | NA | NA | 1.60 | NA | NA | NA | 0.50 | NA | NA | NA | NA | NA | NA | NA | NA | NA | NA | NA | NA | NA | NA | NA | NA | NA | NA | NA | NA | NA | NA | NA | NA | |
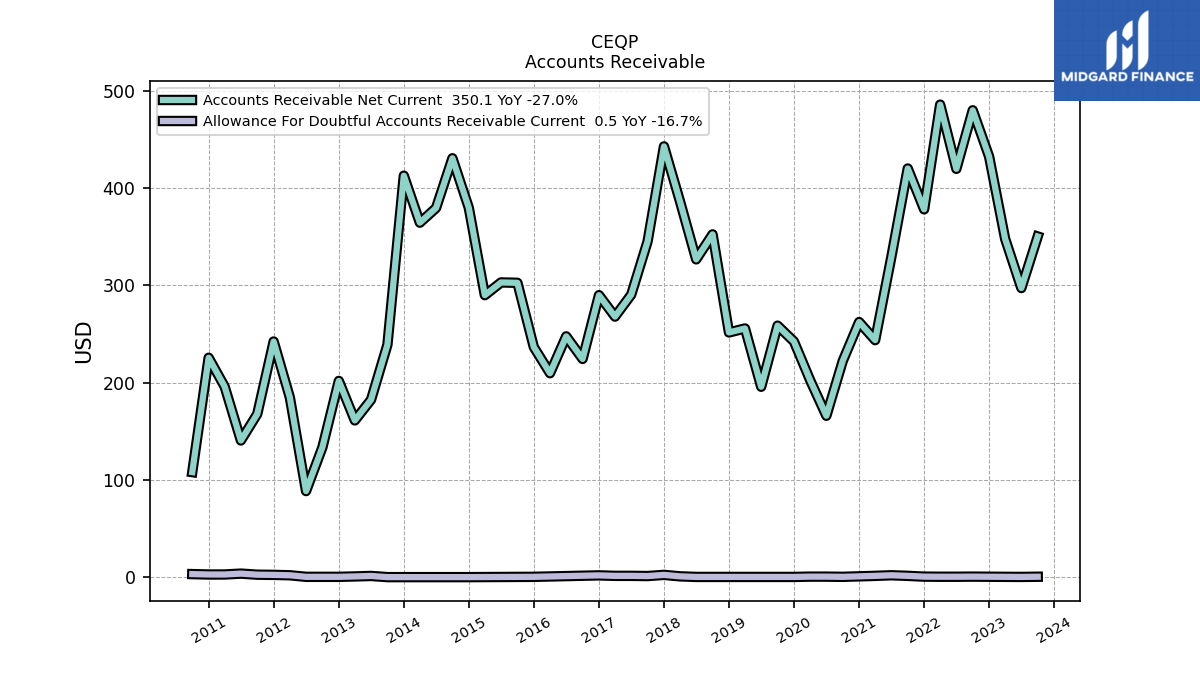
| Accounts Receivable Net Current | 350.10 | 297.10 | 347.70 | 432.20 | 479.80 | 419.60 | 485.60 | 378.00 | 420.00 | 329.10 | 243.60 | 262.20 | 222.20 | 165.90 | 202.40 | 242.20 | 258.50 | 195.70 | 255.60 | 251.50 | 352.30 | 326.60 | 386.20 | 442.70 | 345.00 | 290.30 | 267.80 | 289.80 | 224.30 | 247.50 | 209.60 | 236.50 | 302.50 | 302.90 | 289.80 | 379.60 | 430.50 | 379.40 | 364.30 | 412.60 | 238.90 | 182.40 | 161.10 | 201.70 | 133.60 | 88.50 | 184.70 | 242.20 | 167.70 | 140.50 | 195.80 | 225.50 | 108.00 | NA | NA | NA | |
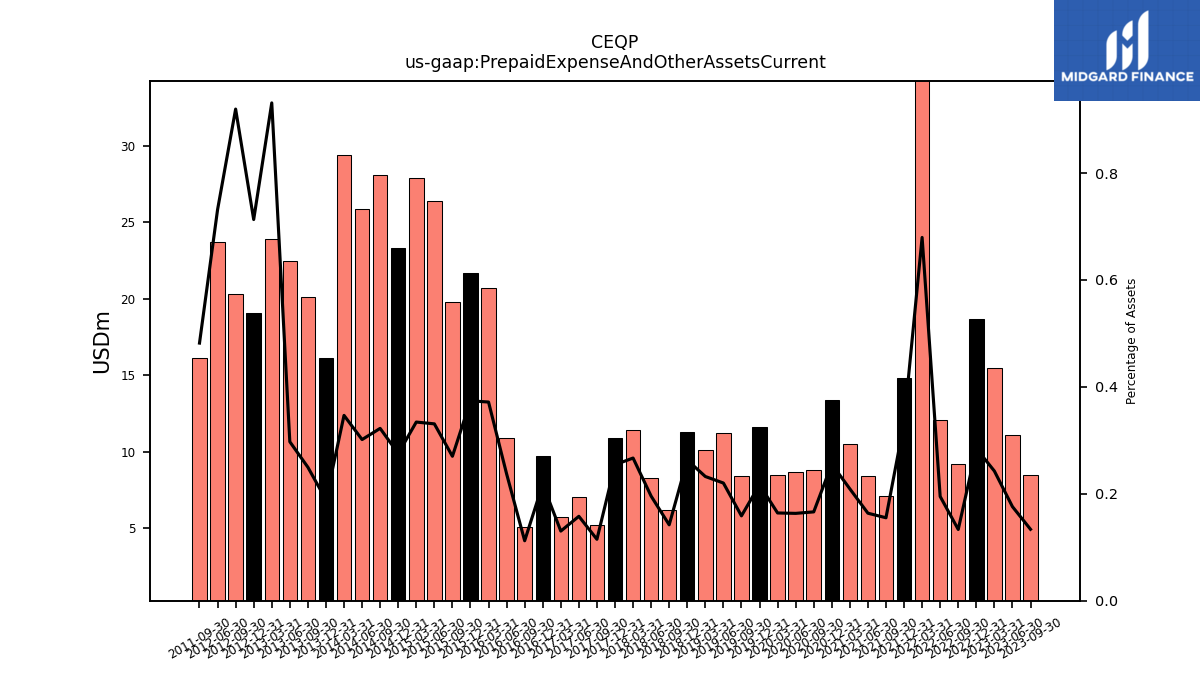
| Prepaid Expense And Other Assets Current | 8.50 | 11.10 | 15.50 | 18.70 | 9.20 | 12.10 | 42.40 | 14.80 | 7.10 | 8.40 | 10.50 | 13.40 | 8.80 | 8.70 | 8.50 | 11.60 | 8.40 | 11.20 | 10.10 | 11.30 | 6.20 | 8.30 | 11.40 | 10.90 | 5.20 | 7.00 | 5.70 | 9.70 | 5.10 | 10.90 | 20.70 | 21.70 | 19.80 | 26.40 | 27.90 | 23.30 | 28.10 | 25.90 | 29.40 | 16.10 | 20.10 | 22.50 | 23.90 | 19.10 | 20.30 | 23.70 | NA | NA | 16.10 | NA | NA | NA | NA | NA | NA | NA |
| 2023-09-30 | 2023-06-30 | 2023-03-31 | 2022-12-31 | 2022-09-30 | 2022-06-30 | 2022-03-31 | 2021-12-31 | 2021-09-30 | 2021-06-30 | 2021-03-31 | 2020-12-31 | 2020-09-30 | 2020-06-30 | 2020-03-31 | 2019-12-31 | 2019-09-30 | 2019-06-30 | 2019-03-31 | 2018-12-31 | 2018-09-30 | 2018-06-30 | 2018-03-31 | 2017-12-31 | 2017-09-30 | 2017-06-30 | 2017-03-31 | 2016-12-31 | 2016-09-30 | 2016-06-30 | 2016-03-31 | 2015-12-31 | 2015-09-30 | 2015-06-30 | 2015-03-31 | 2014-12-31 | 2014-09-30 | 2014-06-30 | 2014-03-31 | 2013-12-31 | 2013-09-30 | 2013-06-30 | 2013-03-31 | 2012-12-31 | 2012-09-30 | 2012-06-30 | 2012-03-31 | 2011-12-31 | 2011-09-30 | 2011-06-30 | 2011-03-31 | 2010-12-31 | 2010-09-30 | 2010-06-30 | 2010-03-31 | 2009-12-31 | ||
|---|---|---|---|---|---|---|---|---|---|---|---|---|---|---|---|---|---|---|---|---|---|---|---|---|---|---|---|---|---|---|---|---|---|---|---|---|---|---|---|---|---|---|---|---|---|---|---|---|---|---|---|---|---|---|---|---|---|
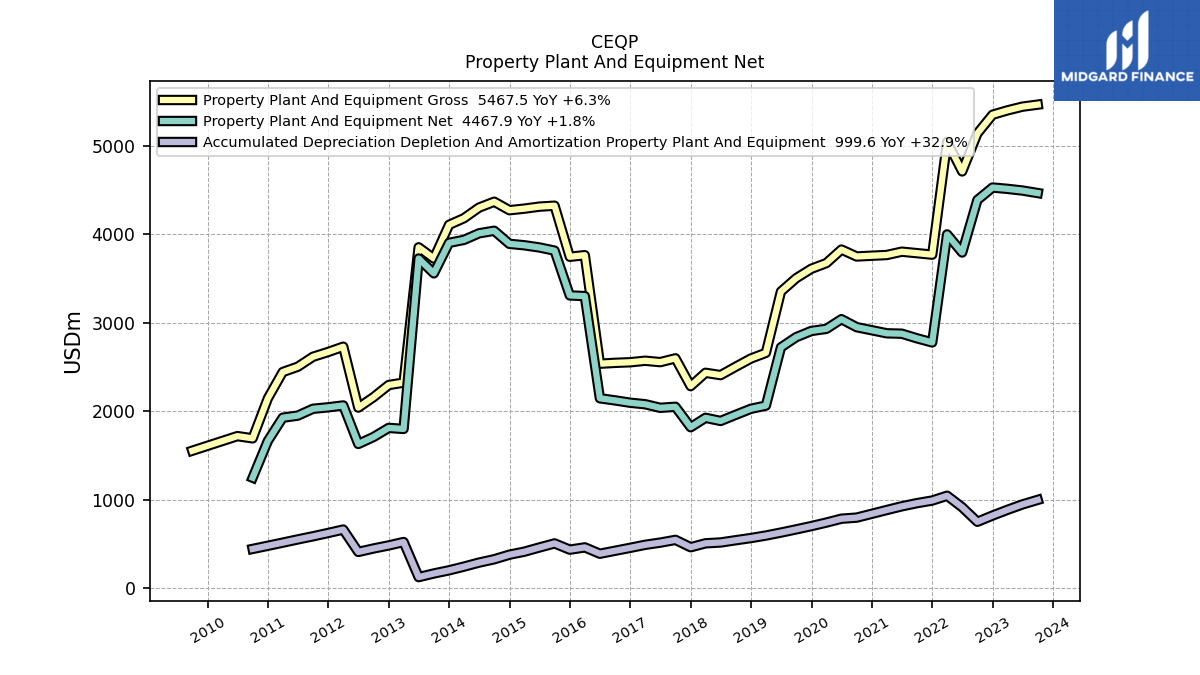
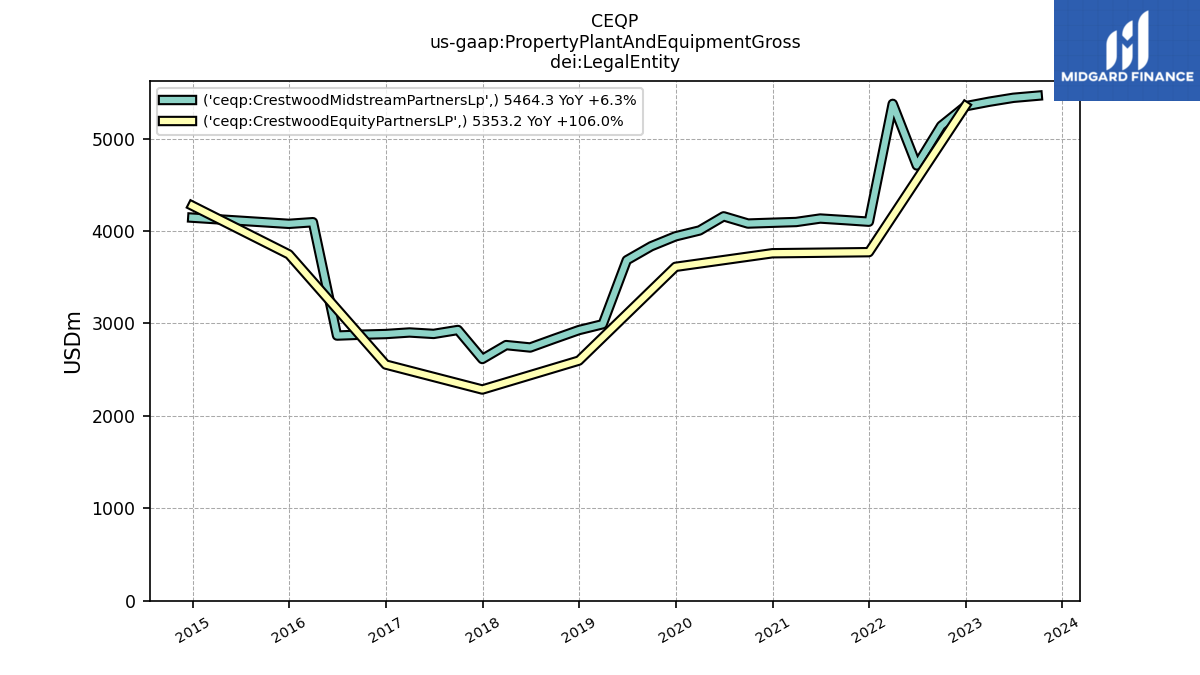
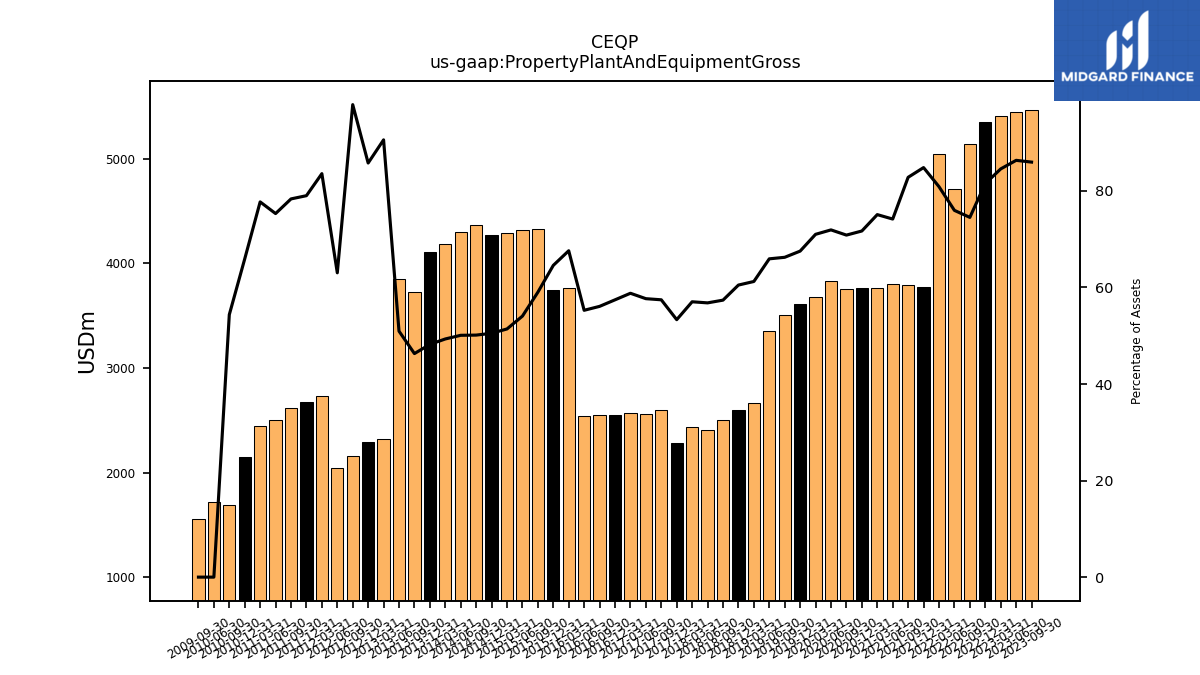
| Property Plant And Equipment Gross | 5467.50 | 5444.70 | 5402.60 | 5353.20 | 5141.40 | 4712.30 | 5047.00 | 3771.50 | 3788.50 | 3805.20 | 3767.60 | 3759.60 | 3750.90 | 3829.20 | 3676.20 | 3612.50 | 3505.10 | 3354.10 | 2661.70 | 2598.10 | 2505.20 | 2409.80 | 2436.10 | 2285.20 | 2599.60 | 2556.70 | 2572.40 | 2555.40 | 2548.60 | 2538.90 | 3765.70 | 3747.70 | 4324.90 | 4314.40 | 4291.70 | 4273.90 | 4370.00 | 4303.40 | 4183.70 | 4108.70 | 3727.90 | 3854.70 | 2324.90 | 2297.90 | 2160.70 | 2042.70 | 2731.30 | 2671.50 | 2617.40 | 2504.70 | 2444.80 | 2146.70 | 1695.20 | 1720.40 | NA | NA | |
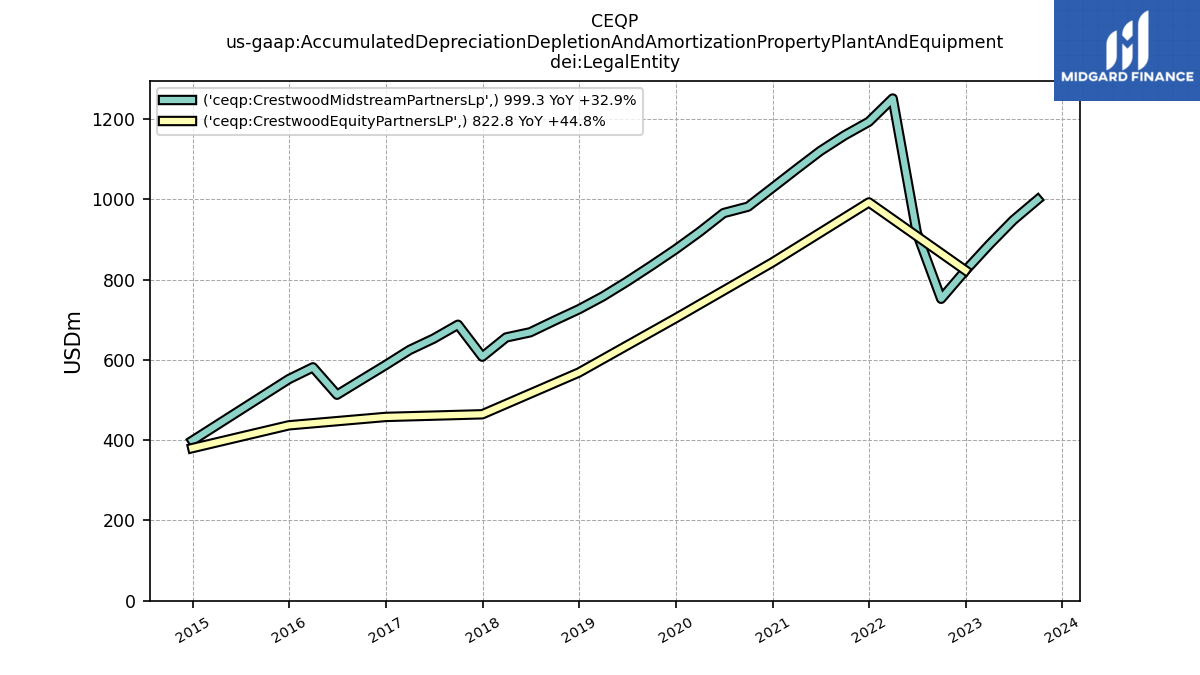
| Accumulated Depreciation Depletion And Amortization Property Plant And Equipment | 999.60 | 948.40 | 887.30 | 822.80 | 752.10 | 916.50 | 1046.60 | 992.10 | 962.70 | 927.10 | 885.00 | 842.50 | 799.20 | 786.80 | 743.30 | 703.40 | 666.10 | 630.00 | 596.60 | 568.40 | 543.70 | 518.10 | 508.80 | 464.40 | 547.50 | 516.40 | 491.70 | 457.80 | 424.40 | 390.90 | 462.70 | 436.90 | 507.70 | 461.40 | 414.00 | 380.10 | 328.30 | 290.60 | 245.30 | 203.40 | 167.80 | 126.50 | 523.30 | 484.70 | 450.20 | 411.10 | 664.30 | 625.50 | 588.00 | 552.60 | 516.20 | 480.90 | 445.10 | NA | NA | NA | |
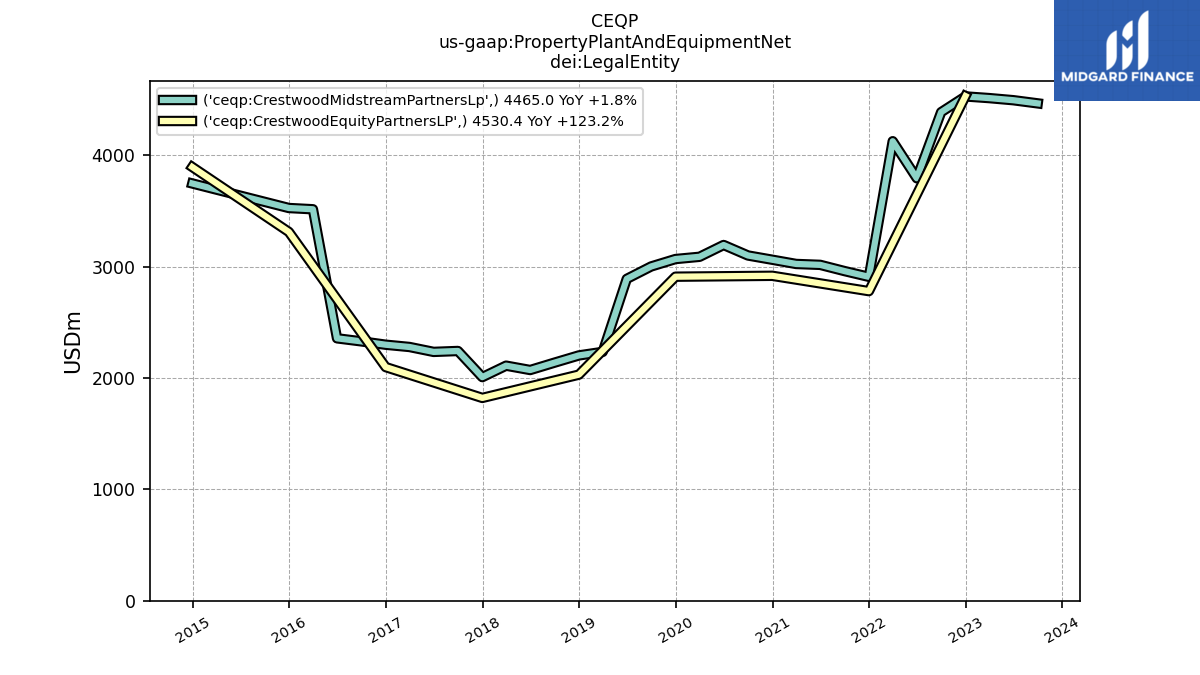
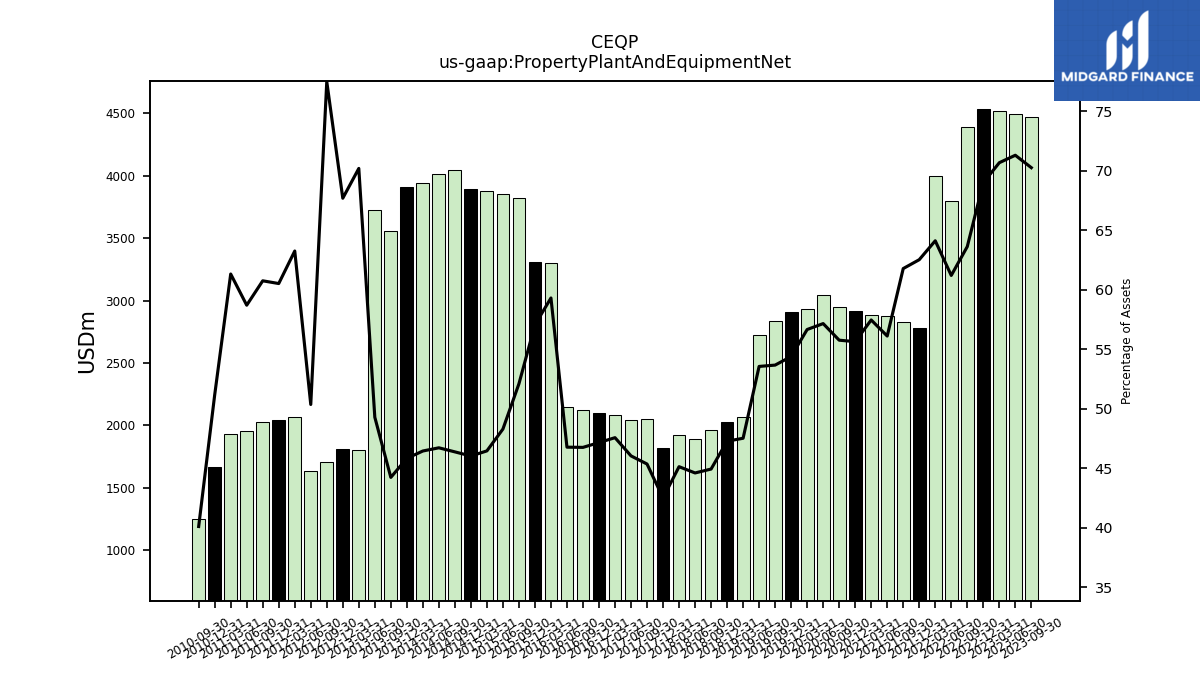
| Property Plant And Equipment Net | 4467.90 | 4496.30 | 4515.30 | 4530.40 | 4389.30 | 3795.80 | 4000.40 | 2779.40 | 2825.80 | 2878.10 | 2882.60 | 2917.10 | 2951.70 | 3042.40 | 2932.90 | 2909.10 | 2839.00 | 2724.10 | 2065.10 | 2029.70 | 1961.50 | 1891.70 | 1927.30 | 1820.80 | 2052.10 | 2040.30 | 2080.70 | 2097.60 | 2124.20 | 2148.00 | 3303.00 | 3310.80 | 3817.20 | 3853.00 | 3877.70 | 3893.80 | 4041.70 | 4012.80 | 3938.40 | 3905.30 | 3560.10 | 3728.20 | 1801.60 | 1813.20 | 1710.50 | 1631.60 | 2067.00 | 2046.00 | 2029.40 | 1952.10 | 1928.60 | 1665.80 | 1250.10 | NA | NA | NA | |
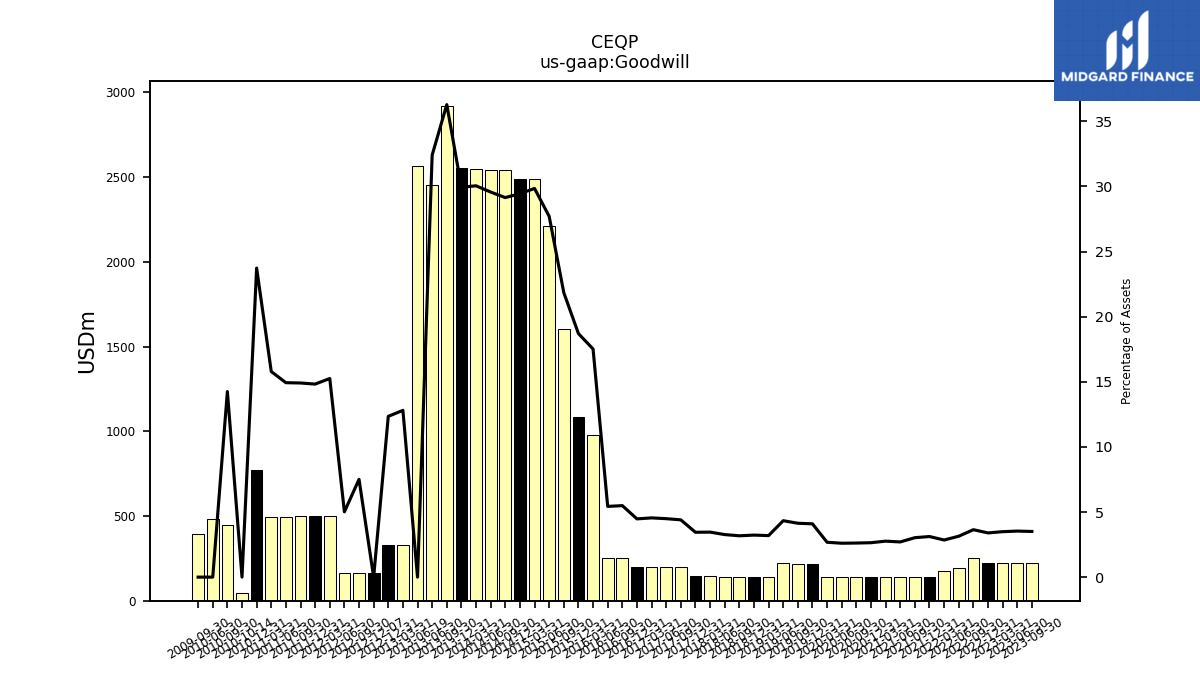
| Goodwill | 223.00 | 223.00 | 223.00 | 223.00 | 251.30 | 194.80 | 177.90 | 138.60 | 138.60 | 138.60 | 138.60 | 138.60 | 138.60 | 138.60 | 138.60 | 218.90 | 218.90 | 220.40 | 138.60 | 138.60 | 138.60 | 138.60 | 147.60 | 147.60 | 199.00 | 199.00 | 199.00 | 199.00 | 249.50 | 249.50 | 975.80 | 1085.50 | 1600.90 | 2210.80 | 2491.80 | 2491.80 | 2540.60 | 2540.60 | 2548.60 | 2552.20 | 2921.20 | 2452.30 | 328.70 | 330.80 | 165.80 | 162.40 | 498.50 | 501.20 | 498.10 | 496.60 | 496.60 | 772.90 | 444.30 | 483.70 | NA | NA | |
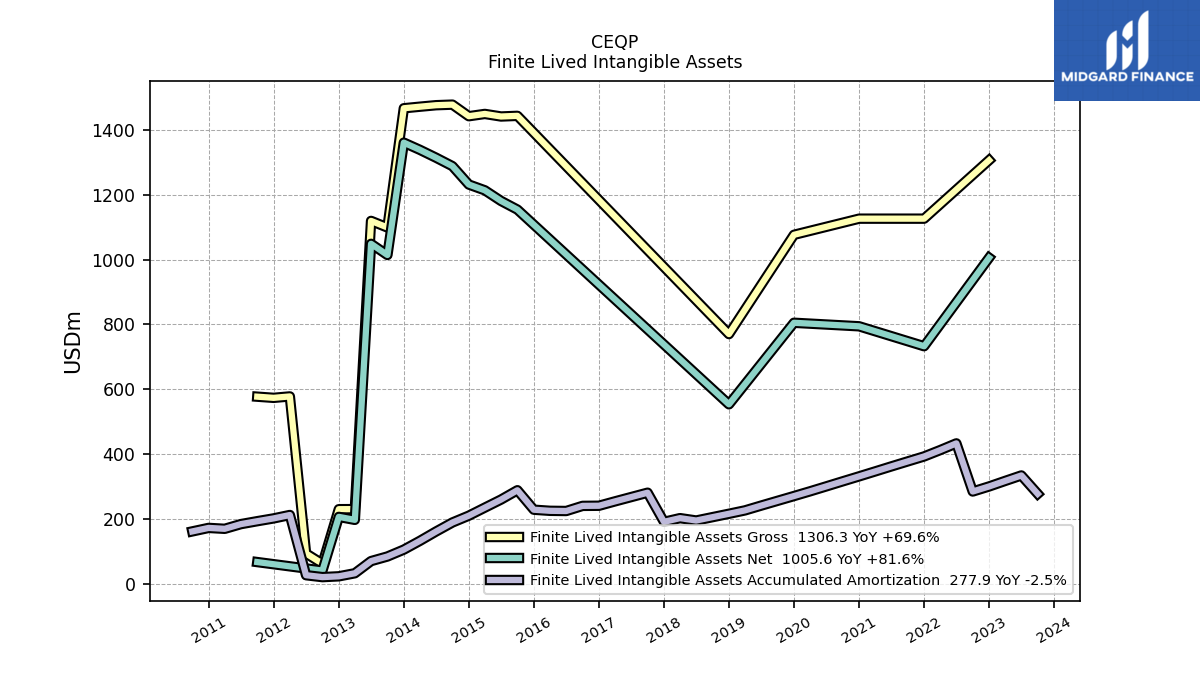
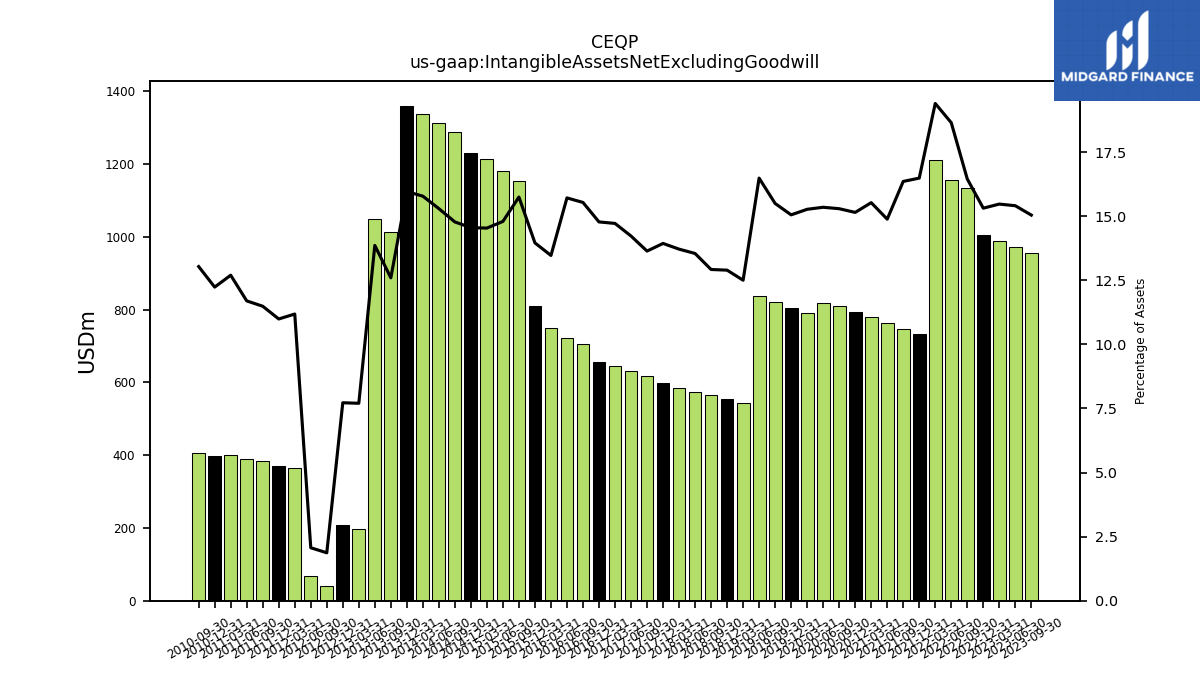
| Intangible Assets Net Excluding Goodwill | 956.70 | 971.70 | 988.60 | 1005.60 | 1135.10 | 1156.60 | 1210.40 | 732.90 | 748.20 | 763.60 | 779.10 | 794.30 | 809.60 | 817.10 | 790.50 | 805.20 | 819.90 | 838.60 | 543.40 | 553.80 | 564.20 | 574.60 | 585.80 | 597.20 | 617.20 | 630.60 | 643.90 | 657.40 | 706.00 | 721.80 | 750.20 | 810.10 | 1154.00 | 1180.70 | 1213.50 | 1231.30 | 1288.00 | 1314.00 | 1338.30 | 1360.40 | 1014.10 | 1048.60 | 197.70 | 206.90 | 41.30 | 67.00 | 365.50 | 371.60 | 383.80 | 389.00 | 399.40 | 398.40 | 406.40 | NA | NA | NA | |
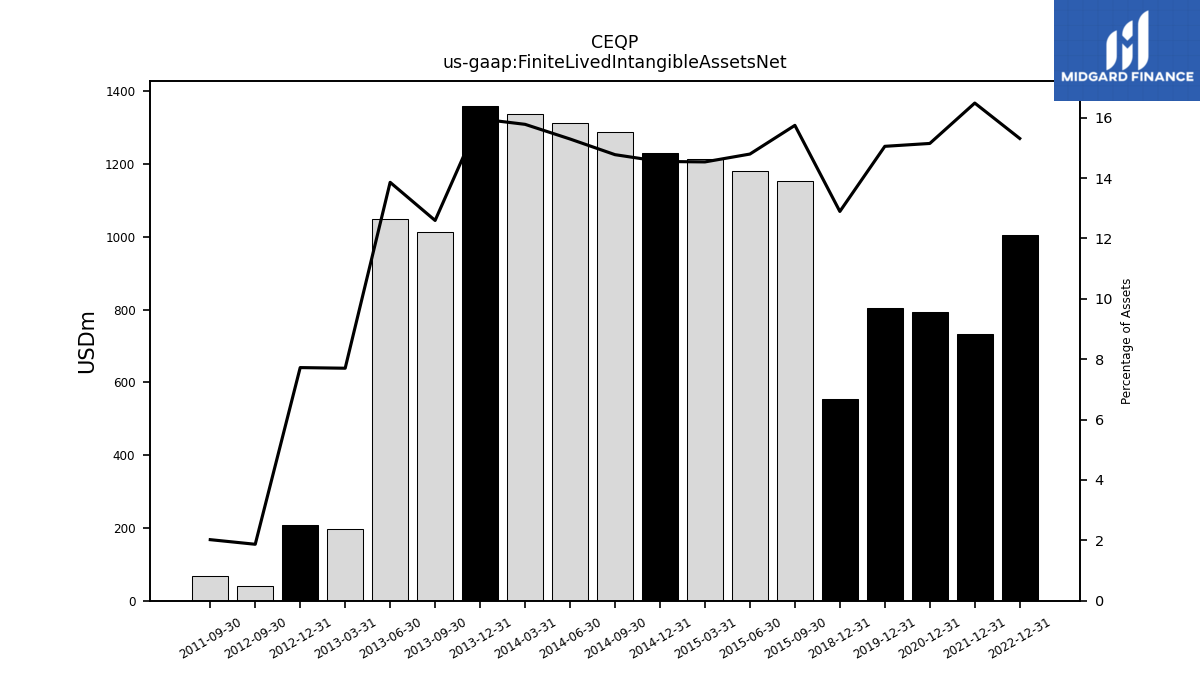
| Finite Lived Intangible Assets Net | NA | NA | NA | 1005.60 | NA | NA | NA | 732.90 | NA | NA | NA | 794.30 | NA | NA | NA | 805.20 | NA | NA | NA | 553.80 | NA | NA | NA | NA | NA | NA | NA | NA | NA | NA | NA | NA | 1154.00 | 1180.70 | 1213.50 | 1231.30 | 1288.00 | 1314.00 | 1338.30 | 1360.40 | 1014.10 | 1048.60 | 197.70 | 206.90 | 41.30 | NA | NA | NA | 67.60 | NA | NA | NA | NA | NA | NA | NA | |
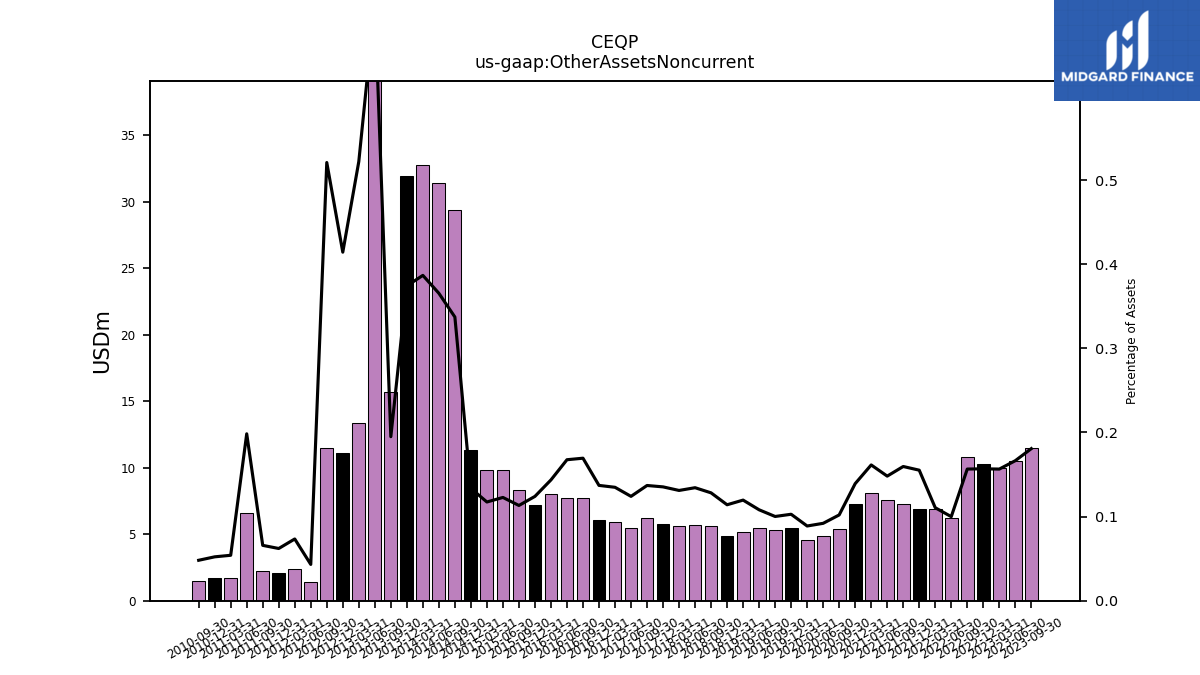
| Other Assets Noncurrent | 11.50 | 10.50 | 10.00 | 10.30 | 10.80 | 6.20 | 6.90 | 6.90 | 7.30 | 7.60 | 8.10 | 7.30 | 5.40 | 4.90 | 4.60 | 5.50 | 5.30 | 5.50 | 5.20 | 4.90 | 5.60 | 5.70 | 5.60 | 5.80 | 6.20 | 5.50 | 5.90 | 6.10 | 7.70 | 7.70 | 8.00 | 7.20 | 8.30 | 9.80 | 9.80 | 11.30 | 29.40 | 31.40 | 32.80 | 31.90 | 15.70 | 53.80 | 13.40 | 11.10 | 11.50 | 1.40 | 2.40 | 2.10 | 2.20 | 6.60 | 1.70 | 1.70 | 1.50 | NA | NA | NA |
| 2023-09-30 | 2023-06-30 | 2023-03-31 | 2022-12-31 | 2022-09-30 | 2022-06-30 | 2022-03-31 | 2021-12-31 | 2021-09-30 | 2021-06-30 | 2021-03-31 | 2020-12-31 | 2020-09-30 | 2020-06-30 | 2020-03-31 | 2019-12-31 | 2019-09-30 | 2019-06-30 | 2019-03-31 | 2018-12-31 | 2018-09-30 | 2018-06-30 | 2018-03-31 | 2017-12-31 | 2017-09-30 | 2017-06-30 | 2017-03-31 | 2016-12-31 | 2016-09-30 | 2016-06-30 | 2016-03-31 | 2015-12-31 | 2015-09-30 | 2015-06-30 | 2015-03-31 | 2014-12-31 | 2014-09-30 | 2014-06-30 | 2014-03-31 | 2013-12-31 | 2013-09-30 | 2013-06-30 | 2013-03-31 | 2012-12-31 | 2012-09-30 | 2012-06-30 | 2012-03-31 | 2011-12-31 | 2011-09-30 | 2011-06-30 | 2011-03-31 | 2010-12-31 | 2010-09-30 | 2010-06-30 | 2010-03-31 | 2009-12-31 | ||
|---|---|---|---|---|---|---|---|---|---|---|---|---|---|---|---|---|---|---|---|---|---|---|---|---|---|---|---|---|---|---|---|---|---|---|---|---|---|---|---|---|---|---|---|---|---|---|---|---|---|---|---|---|---|---|---|---|---|
| Liabilities Current | 458.10 | 364.10 | 458.80 | 510.20 | 627.60 | 645.20 | 744.40 | 598.40 | 776.70 | 626.50 | 451.10 | 377.80 | 337.20 | 284.80 | 282.20 | 357.80 | 372.30 | 297.10 | 353.50 | 332.10 | 480.30 | 419.60 | 470.60 | 505.10 | 478.70 | 331.00 | 296.00 | 337.30 | 278.20 | 277.50 | 224.10 | 258.20 | 310.00 | 305.10 | 341.40 | 424.90 | 558.20 | 538.40 | 520.90 | 596.10 | 396.90 | 277.60 | 197.60 | 237.80 | 239.00 | 1450.00 | 249.10 | 289.70 | 309.80 | 223.70 | 208.60 | 299.80 | 261.60 | NA | NA | NA | |
| Long Term Debt Current | NA | NA | NA | NA | NA | 0.20 | 0.20 | 0.20 | 0.20 | 0.20 | 0.20 | 0.20 | 0.20 | 0.20 | 0.20 | 0.20 | 0.20 | 0.20 | 0.60 | 0.90 | 0.90 | 0.90 | 0.90 | 0.90 | 0.90 | 1.00 | 14.80 | 1.00 | 0.90 | 0.90 | 0.90 | 1.10 | 17.60 | 12.30 | 36.30 | 3.70 | 10.50 | 29.00 | 14.00 | 5.10 | 4.40 | 2.50 | 2.90 | 2.10 | 3.40 | 1188.50 | 9.90 | 6.90 | 7.40 | 4.50 | 9.20 | 16.20 | 29.60 | NA | NA | NA | |
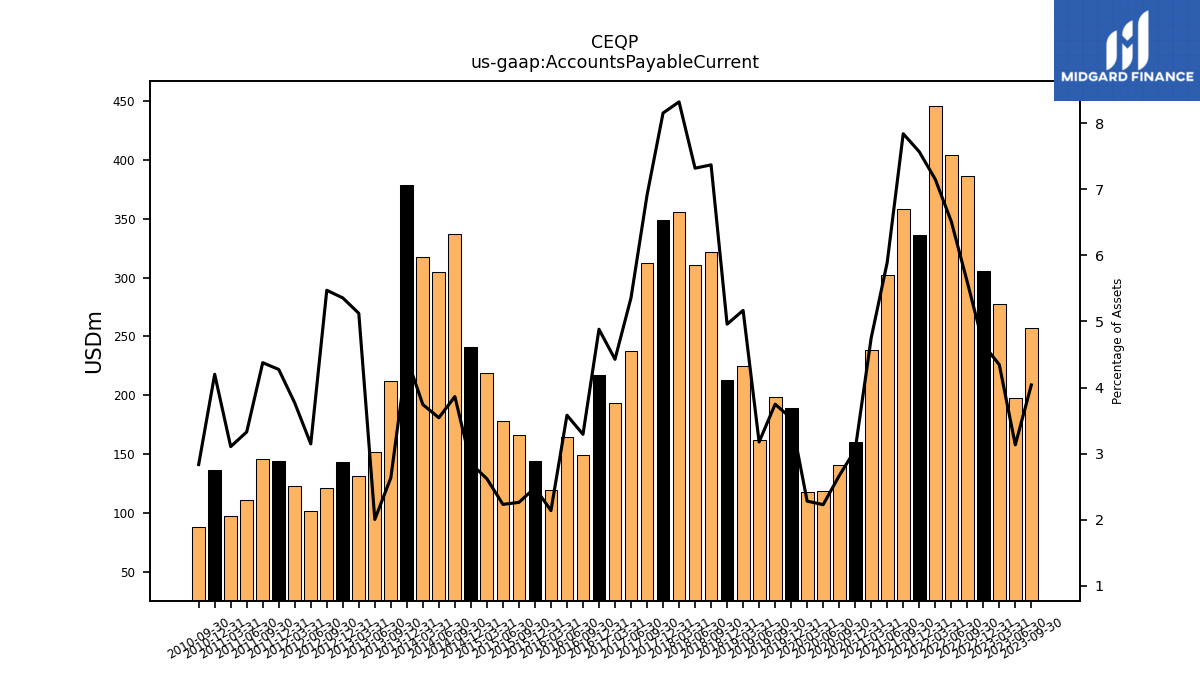
| Accounts Payable Current | 256.90 | 197.60 | 277.70 | 305.50 | 386.20 | 404.10 | 446.30 | 336.50 | 358.70 | 302.40 | 238.40 | 160.30 | 141.10 | 118.60 | 118.10 | 189.20 | 198.30 | 161.60 | 224.60 | 213.00 | 321.80 | 310.50 | 355.50 | 349.40 | 312.70 | 237.50 | 193.70 | 217.20 | 149.60 | 164.50 | 119.10 | 144.10 | 165.80 | 178.10 | 218.70 | 241.20 | 336.80 | 304.40 | 317.40 | 379.00 | 212.10 | 151.60 | 131.50 | 143.50 | 120.80 | 102.00 | 123.10 | 144.50 | 146.20 | 110.70 | 97.70 | 136.80 | 88.40 | NA | NA | NA | |
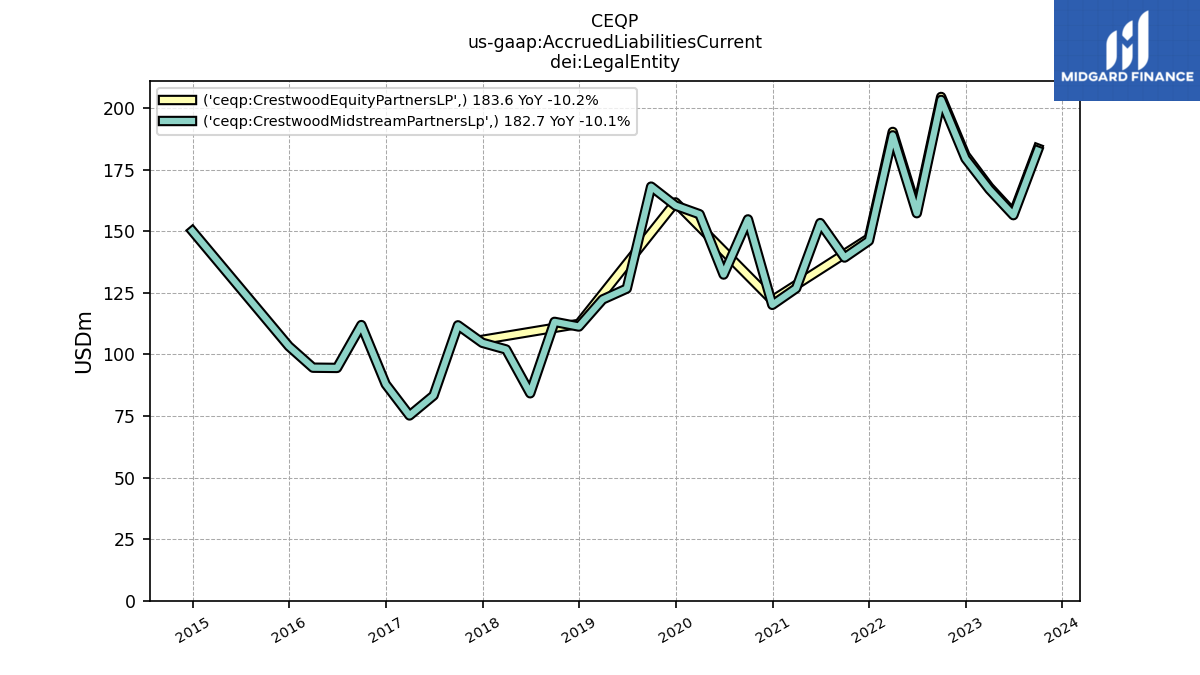
| Accrued Liabilities Current | 183.60 | 157.30 | 167.90 | 180.80 | 204.50 | 158.60 | 190.30 | 147.10 | 140.50 | 154.80 | 131.90 | 122.00 | 156.50 | 133.80 | 158.30 | 161.70 | 169.00 | 127.90 | 123.30 | 112.40 | 114.10 | 85.20 | 103.30 | 105.90 | 112.50 | 84.50 | 78.10 | 90.50 | 113.50 | 101.20 | 96.80 | 105.60 | 118.50 | 108.90 | 77.80 | 52.50 | 197.50 | 197.00 | 183.50 | 40.30 | 148.50 | 115.50 | 53.60 | 68.00 | 93.90 | 84.00 | 84.20 | 79.30 | 85.20 | 72.10 | 72.40 | 76.60 | 62.50 | NA | NA | NA | |
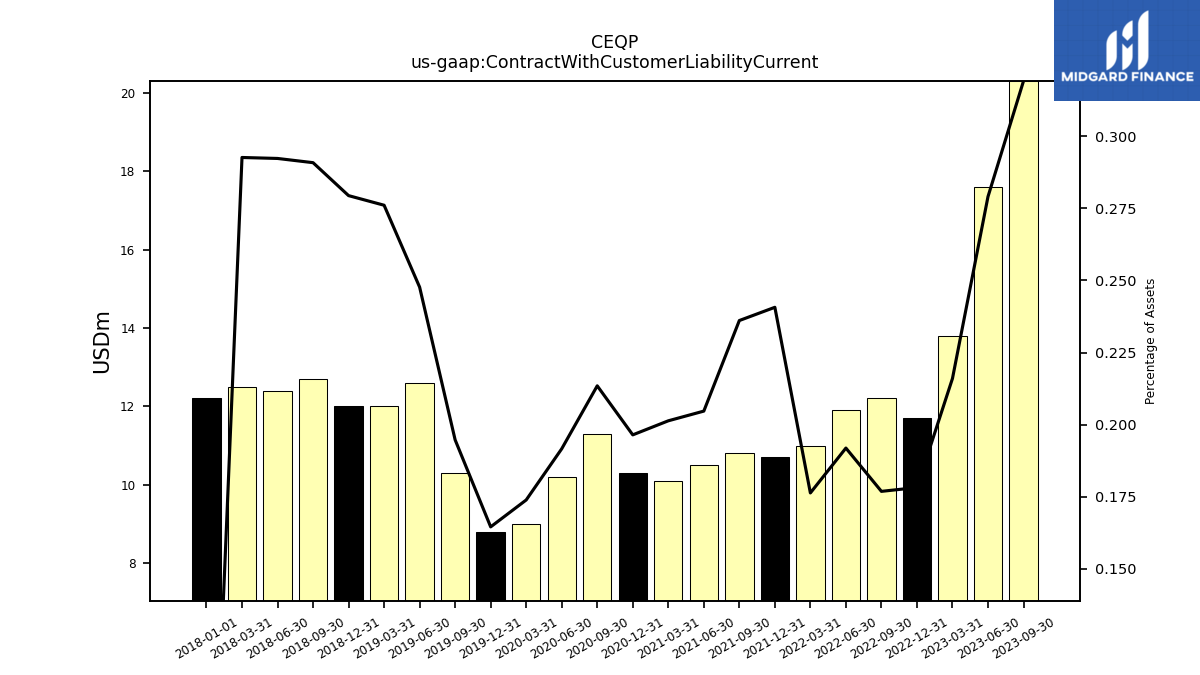
| Contract With Customer Liability Current | 20.30 | 17.60 | 13.80 | 11.70 | 12.20 | 11.90 | 11.00 | 10.70 | 10.80 | 10.50 | 10.10 | 10.30 | 11.30 | 10.20 | 9.00 | 8.80 | 10.30 | 12.60 | 12.00 | 12.00 | 12.70 | 12.40 | 12.50 | NA | NA | NA | NA | NA | NA | NA | NA | NA | NA | NA | NA | NA | NA | NA | NA | NA | NA | NA | NA | NA | NA | NA | NA | NA | NA | NA | NA | NA | NA | NA | NA | NA |
| 2023-09-30 | 2023-06-30 | 2023-03-31 | 2022-12-31 | 2022-09-30 | 2022-06-30 | 2022-03-31 | 2021-12-31 | 2021-09-30 | 2021-06-30 | 2021-03-31 | 2020-12-31 | 2020-09-30 | 2020-06-30 | 2020-03-31 | 2019-12-31 | 2019-09-30 | 2019-06-30 | 2019-03-31 | 2018-12-31 | 2018-09-30 | 2018-06-30 | 2018-03-31 | 2017-12-31 | 2017-09-30 | 2017-06-30 | 2017-03-31 | 2016-12-31 | 2016-09-30 | 2016-06-30 | 2016-03-31 | 2015-12-31 | 2015-09-30 | 2015-06-30 | 2015-03-31 | 2014-12-31 | 2014-09-30 | 2014-06-30 | 2014-03-31 | 2013-12-31 | 2013-09-30 | 2013-06-30 | 2013-03-31 | 2012-12-31 | 2012-09-30 | 2012-06-30 | 2012-03-31 | 2011-12-31 | 2011-09-30 | 2011-06-30 | 2011-03-31 | 2010-12-31 | 2010-09-30 | 2010-06-30 | 2010-03-31 | 2009-12-31 | ||
|---|---|---|---|---|---|---|---|---|---|---|---|---|---|---|---|---|---|---|---|---|---|---|---|---|---|---|---|---|---|---|---|---|---|---|---|---|---|---|---|---|---|---|---|---|---|---|---|---|---|---|---|---|---|---|---|---|---|
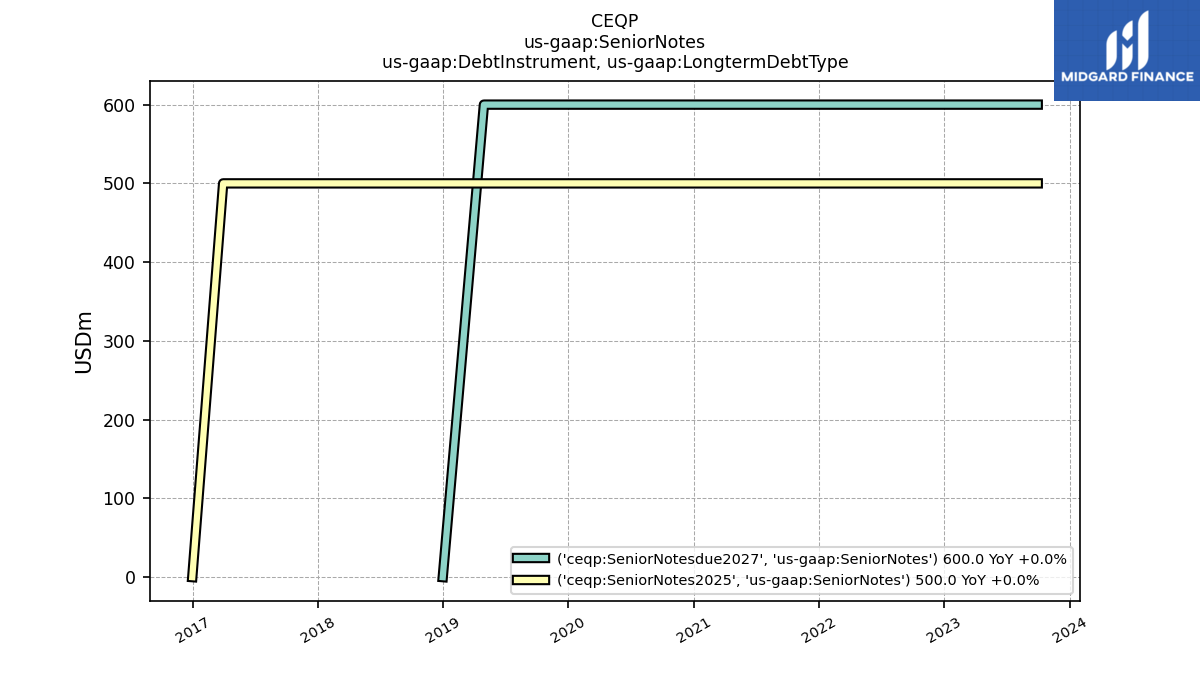
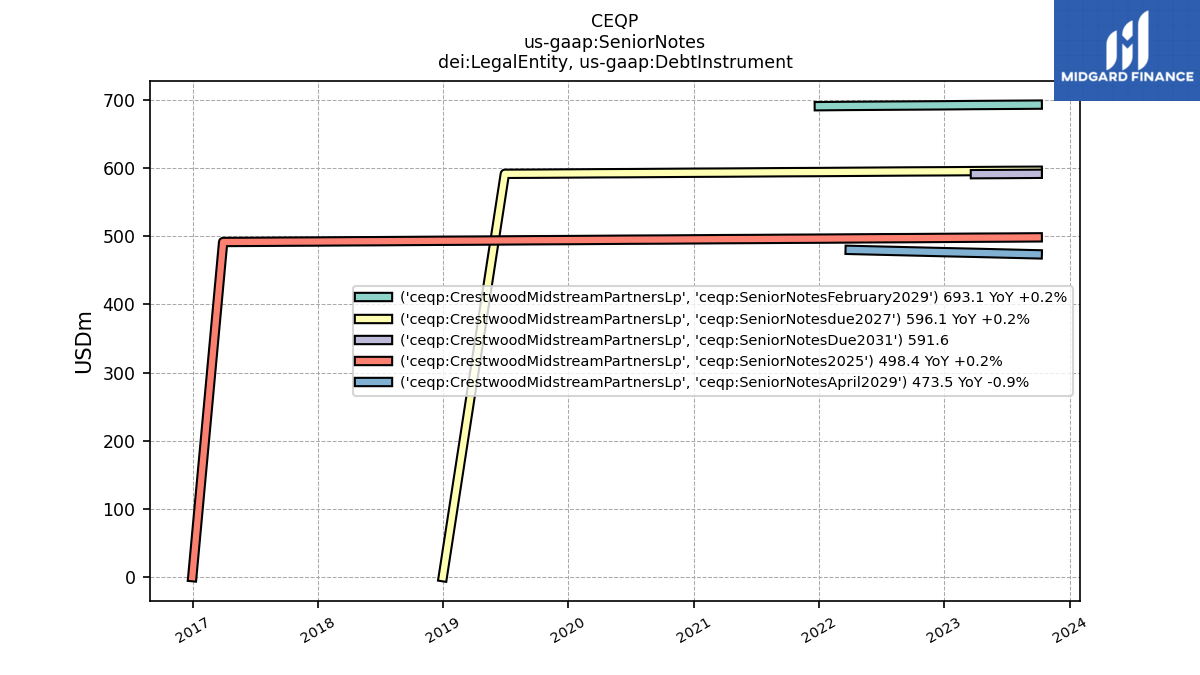
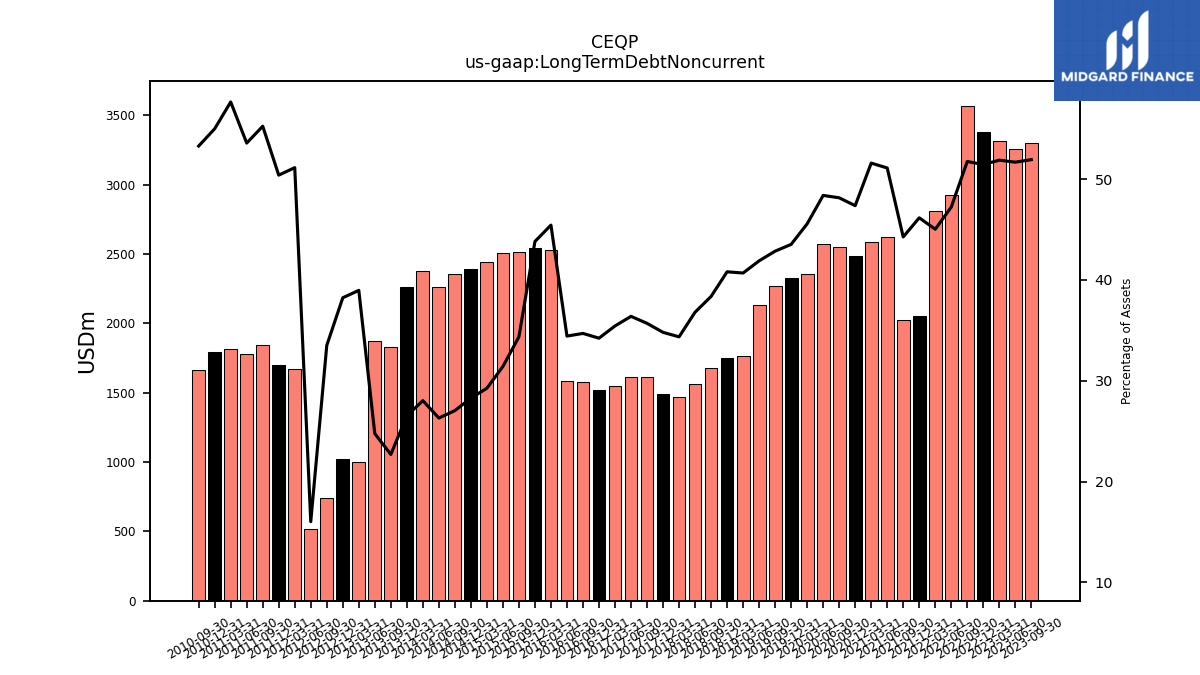
| Long Term Debt Noncurrent | 3302.50 | 3259.10 | 3314.50 | 3378.30 | 3570.00 | 2929.30 | 2809.90 | 2052.10 | 2024.90 | 2621.60 | 2588.20 | 2483.80 | 2548.90 | 2575.70 | 2358.90 | 2328.30 | 2267.20 | 2131.20 | 1768.40 | 1752.40 | 1675.10 | 1561.00 | 1467.50 | 1491.30 | 1615.40 | 1613.00 | 1550.30 | 1522.70 | 1576.70 | 1581.60 | 2530.80 | 2542.70 | 2518.20 | 2507.10 | 2442.80 | 2392.80 | 2357.20 | 2260.00 | 2377.30 | 2260.90 | 1827.40 | 1873.10 | 1000.20 | 1024.20 | 739.80 | 519.50 | 1671.10 | 1703.80 | 1845.60 | 1781.70 | 1813.20 | 1790.90 | 1661.10 | NA | NA | NA | |
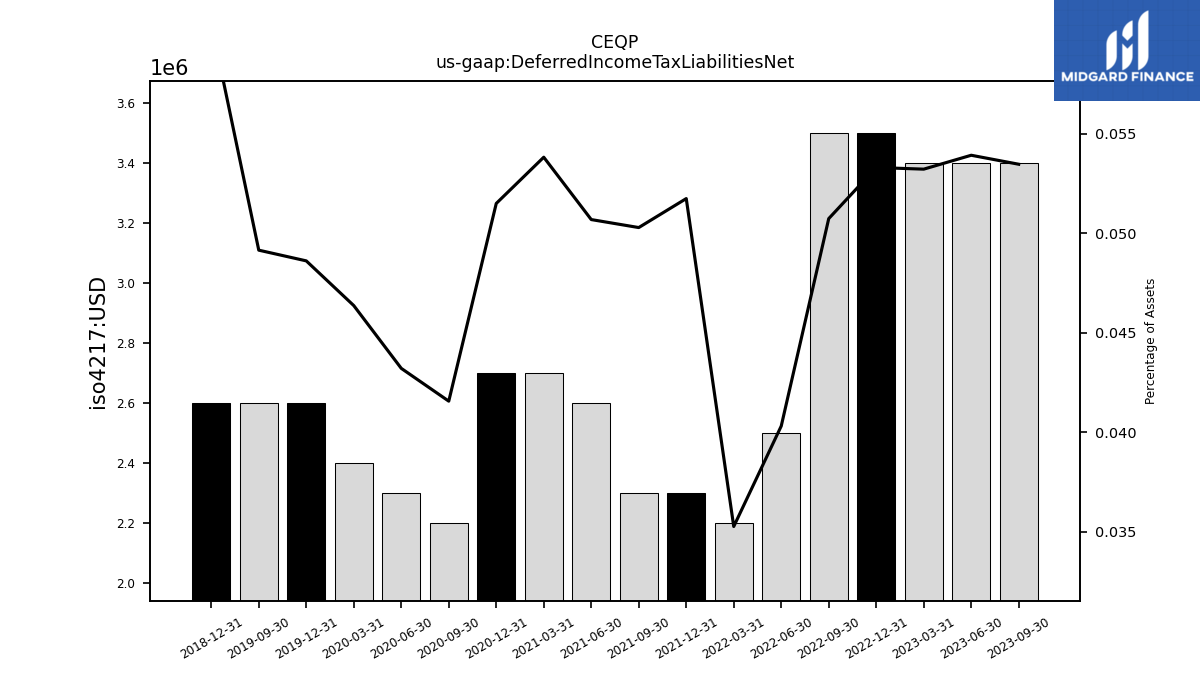
| Deferred Income Tax Liabilities Net | 3.40 | 3.40 | 3.40 | 3.50 | 3.50 | 2.50 | 2.20 | 2.30 | 2.30 | 2.60 | 2.70 | 2.70 | 2.20 | 2.30 | 2.40 | 2.60 | 2.60 | NA | NA | 2.60 | NA | NA | NA | NA | NA | NA | NA | NA | NA | NA | NA | NA | NA | NA | NA | NA | NA | NA | NA | NA | NA | NA | NA | NA | NA | NA | NA | NA | NA | NA | NA | NA | NA | NA | NA | NA | |
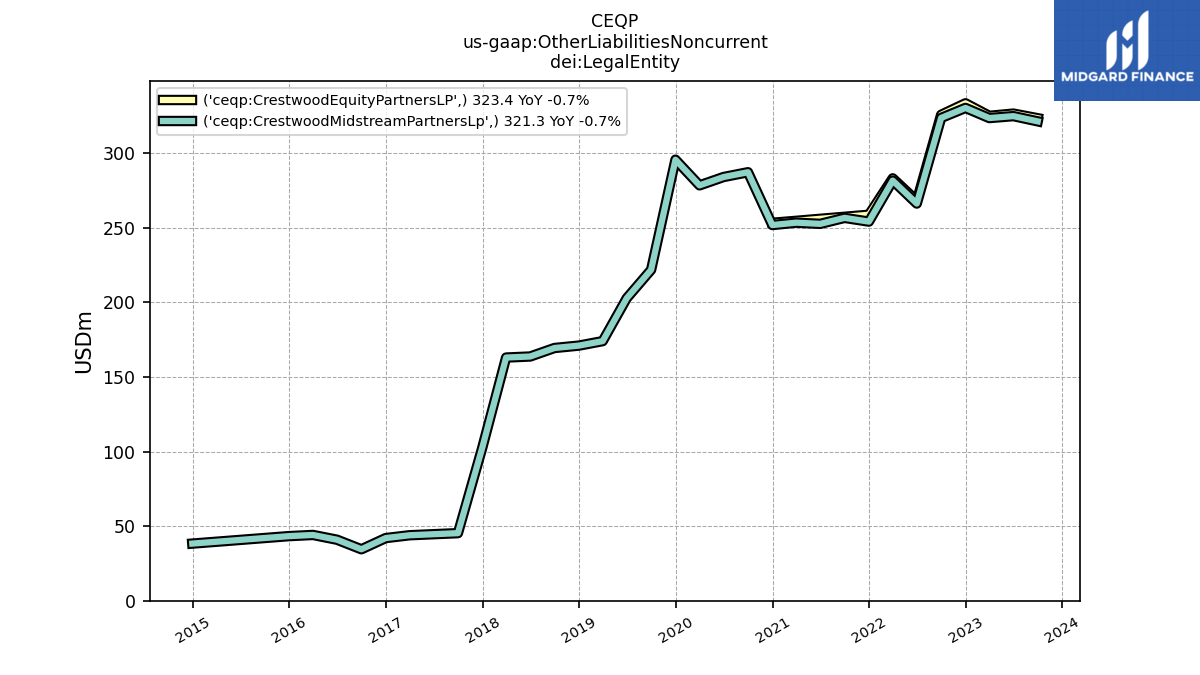
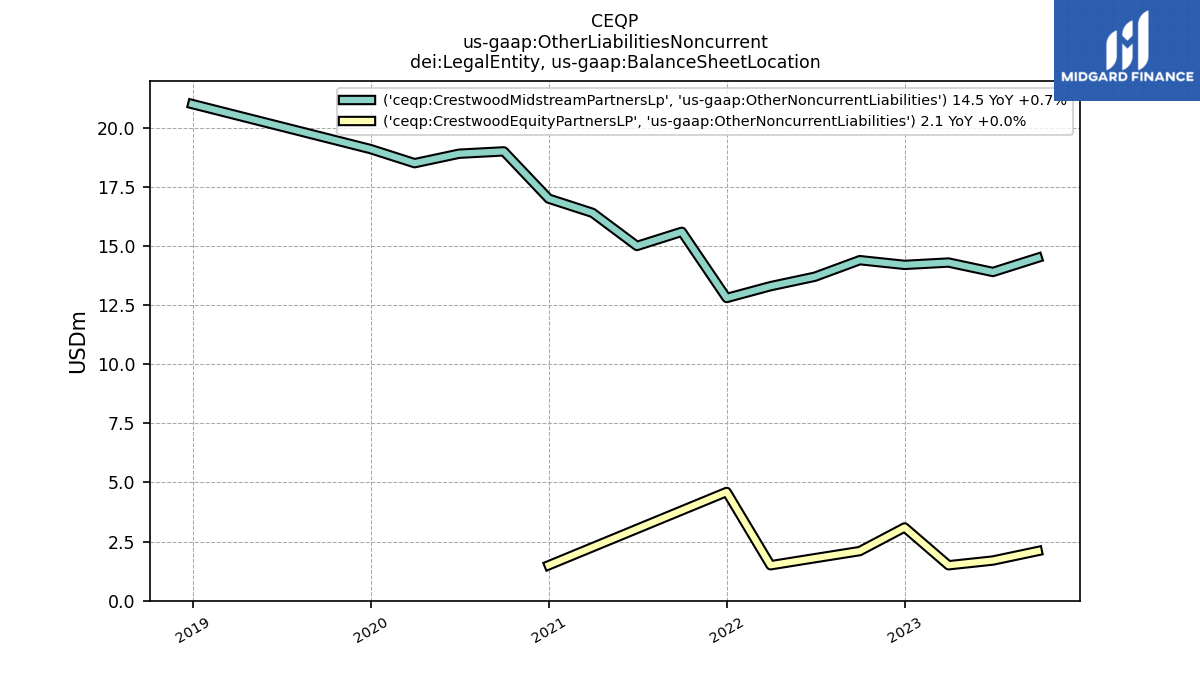
| Other Liabilities Noncurrent | 323.40 | 326.50 | 325.00 | 333.40 | 325.70 | 268.00 | 283.10 | 258.70 | 259.80 | 254.90 | 255.20 | 253.30 | 289.10 | 285.70 | 280.00 | 301.60 | 225.30 | 205.90 | 177.00 | 173.60 | 172.00 | 166.20 | 165.30 | 104.70 | 48.20 | 47.30 | 46.50 | 44.60 | 38.60 | 45.10 | 48.20 | 47.50 | 46.10 | 46.90 | 48.00 | 47.20 | 141.90 | 142.40 | 140.60 | 140.40 | 204.80 | 39.00 | 22.00 | 22.70 | 23.40 | 21.40 | 20.40 | 19.40 | 19.30 | 16.30 | 16.30 | 14.80 | 14.30 | NA | NA | NA | |
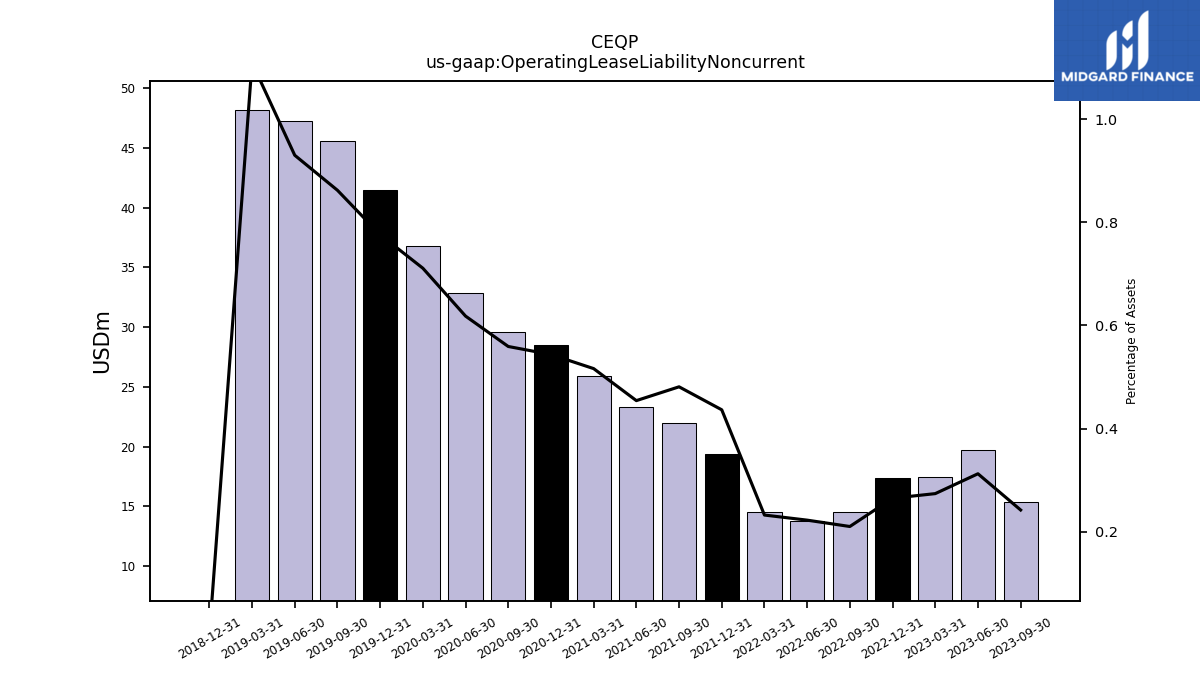
| Operating Lease Liability Noncurrent | 15.40 | 19.70 | 17.50 | 17.40 | 14.50 | 13.80 | 14.50 | 19.40 | 22.00 | 23.30 | 25.90 | 28.50 | 29.60 | 32.90 | 36.80 | 41.50 | 45.60 | 47.30 | 48.20 | 0.00 | NA | NA | NA | NA | NA | NA | NA | NA | NA | NA | NA | NA | NA | NA | NA | NA | NA | NA | NA | NA | NA | NA | NA | NA | NA | NA | NA | NA | NA | NA | NA | NA | NA | NA | NA | NA |
| 2023-09-30 | 2023-06-30 | 2023-03-31 | 2022-12-31 | 2022-09-30 | 2022-06-30 | 2022-03-31 | 2021-12-31 | 2021-09-30 | 2021-06-30 | 2021-03-31 | 2020-12-31 | 2020-09-30 | 2020-06-30 | 2020-03-31 | 2019-12-31 | 2019-09-30 | 2019-06-30 | 2019-03-31 | 2018-12-31 | 2018-09-30 | 2018-06-30 | 2018-03-31 | 2017-12-31 | 2017-09-30 | 2017-06-30 | 2017-03-31 | 2016-12-31 | 2016-09-30 | 2016-06-30 | 2016-03-31 | 2015-12-31 | 2015-09-30 | 2015-06-30 | 2015-03-31 | 2014-12-31 | 2014-09-30 | 2014-06-30 | 2014-03-31 | 2013-12-31 | 2013-09-30 | 2013-06-30 | 2013-03-31 | 2012-12-31 | 2012-09-30 | 2012-06-30 | 2012-03-31 | 2011-12-31 | 2011-09-30 | 2011-06-30 | 2011-03-31 | 2010-12-31 | 2010-09-30 | 2010-06-30 | 2010-03-31 | 2009-12-31 | ||
|---|---|---|---|---|---|---|---|---|---|---|---|---|---|---|---|---|---|---|---|---|---|---|---|---|---|---|---|---|---|---|---|---|---|---|---|---|---|---|---|---|---|---|---|---|---|---|---|---|---|---|---|---|---|---|---|---|---|
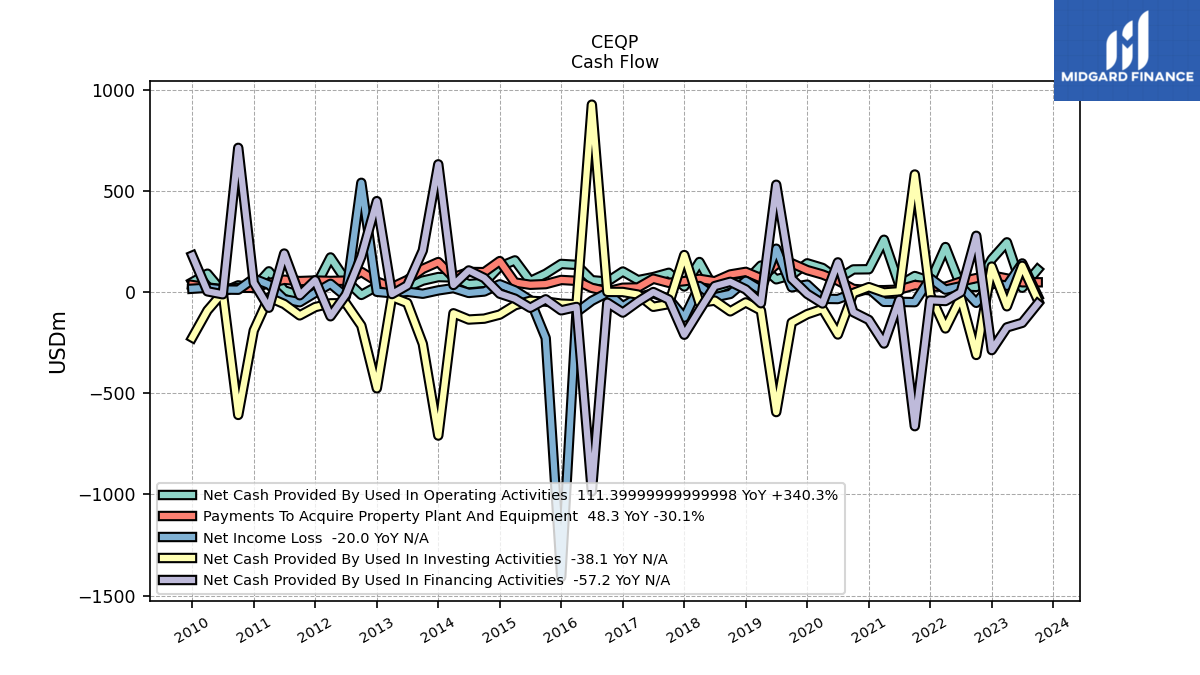
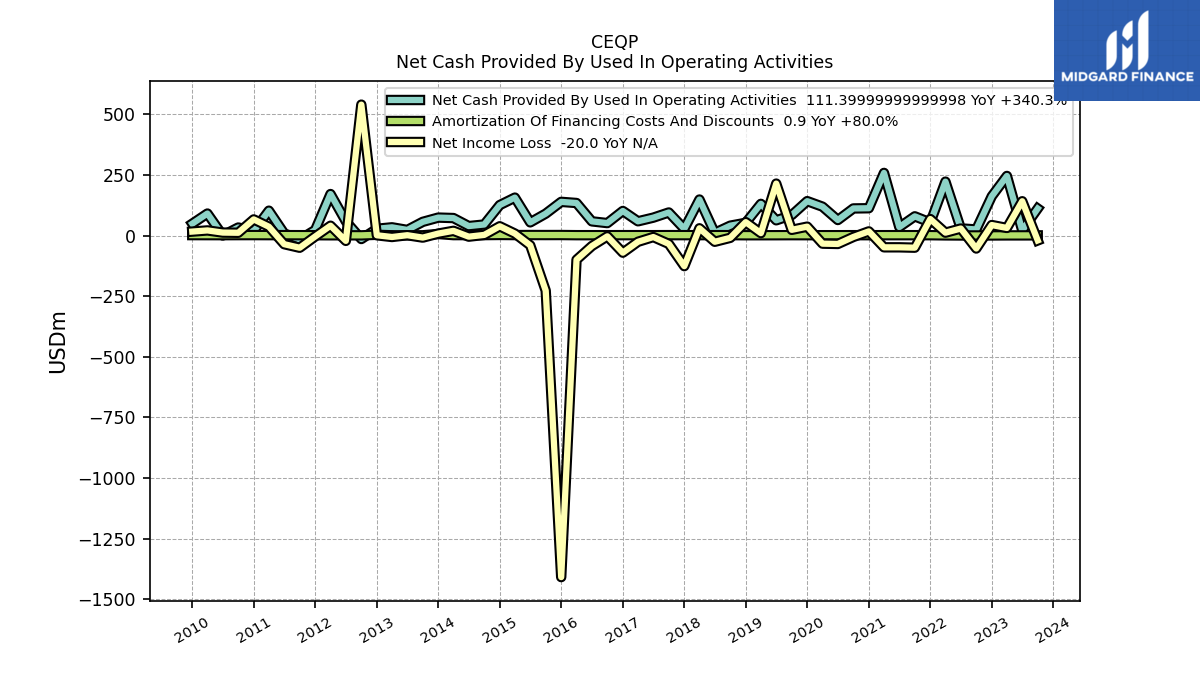
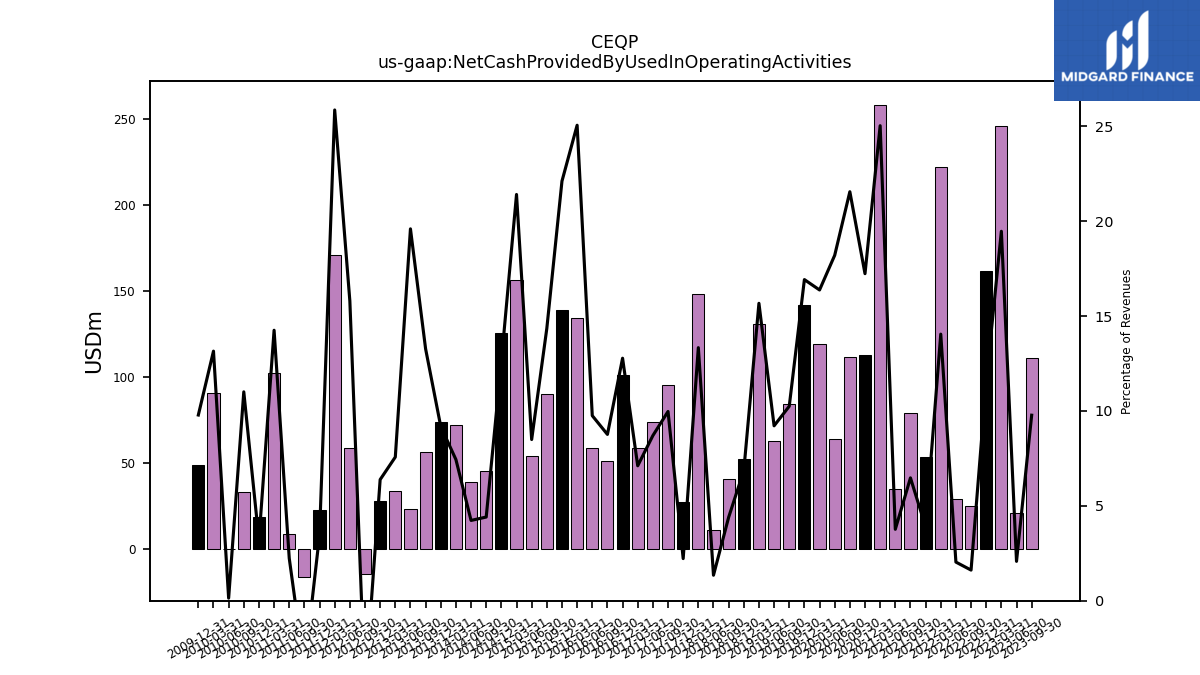
| Net Cash Provided By Used In Operating Activities | 111.40 | 21.20 | 245.90 | 161.90 | 25.30 | 29.50 | 222.50 | 53.80 | 79.40 | 35.00 | 258.50 | 112.80 | 111.90 | 64.20 | 119.20 | 142.10 | 84.40 | 63.00 | 130.90 | 52.70 | 40.90 | 11.30 | 148.70 | 27.70 | 95.30 | 74.00 | 58.90 | 101.60 | 51.50 | 58.70 | 134.30 | 139.10 | 90.50 | 54.50 | 156.60 | 125.80 | 45.70 | 39.20 | 72.30 | 74.20 | 56.70 | 23.30 | 34.10 | 28.00 | -14.20 | 58.70 | 171.30 | 23.20 | -16.10 | 8.70 | 102.70 | 19.10 | 33.20 | 0.40 | 90.90 | 49.10 | |
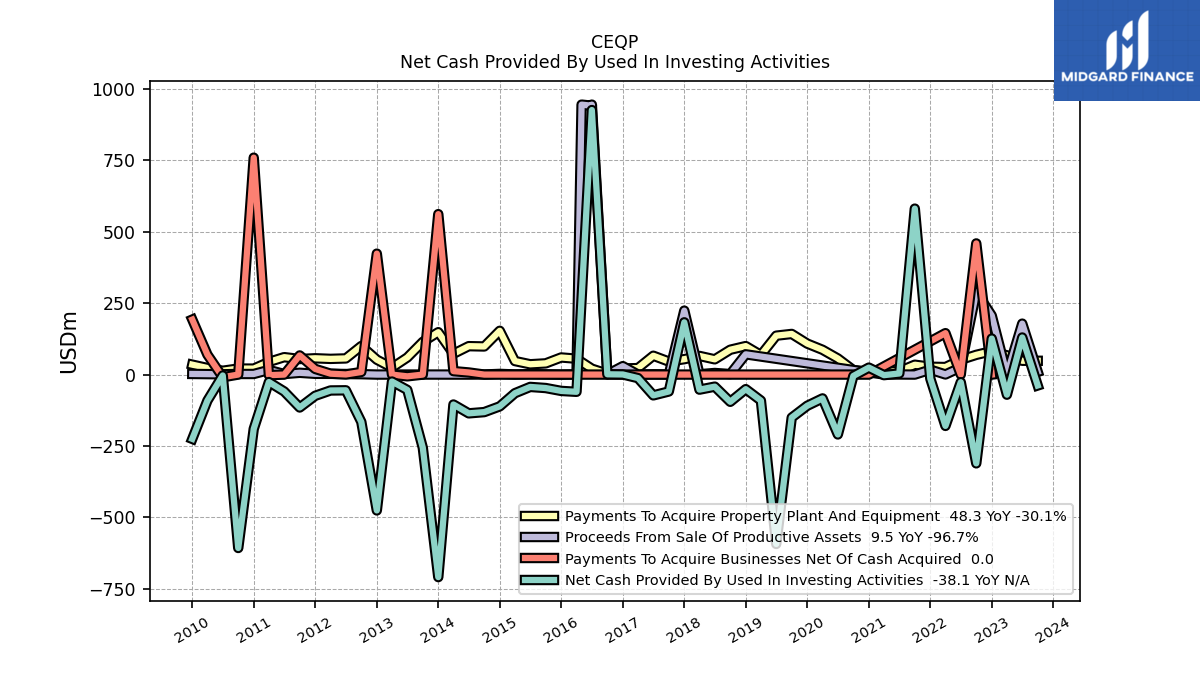
| Net Cash Provided By Used In Investing Activities | -38.10 | 129.90 | -70.40 | 126.10 | -310.80 | -26.70 | -179.70 | -14.00 | 581.00 | 3.90 | -2.00 | 24.40 | -4.80 | -209.60 | -83.30 | -109.20 | -150.50 | -593.00 | -91.00 | -51.00 | -95.30 | -42.20 | -52.70 | 183.00 | -59.20 | -72.80 | -12.30 | 0.40 | 1.00 | 926.10 | -60.30 | -57.20 | -47.10 | -43.20 | -65.20 | -111.30 | -131.30 | -135.70 | -104.70 | -709.00 | -255.90 | -53.70 | -24.30 | -475.60 | -165.80 | -55.00 | -55.60 | -74.20 | -115.20 | -59.10 | -26.10 | -190.20 | -607.10 | -3.10 | -91.10 | -225.10 | |
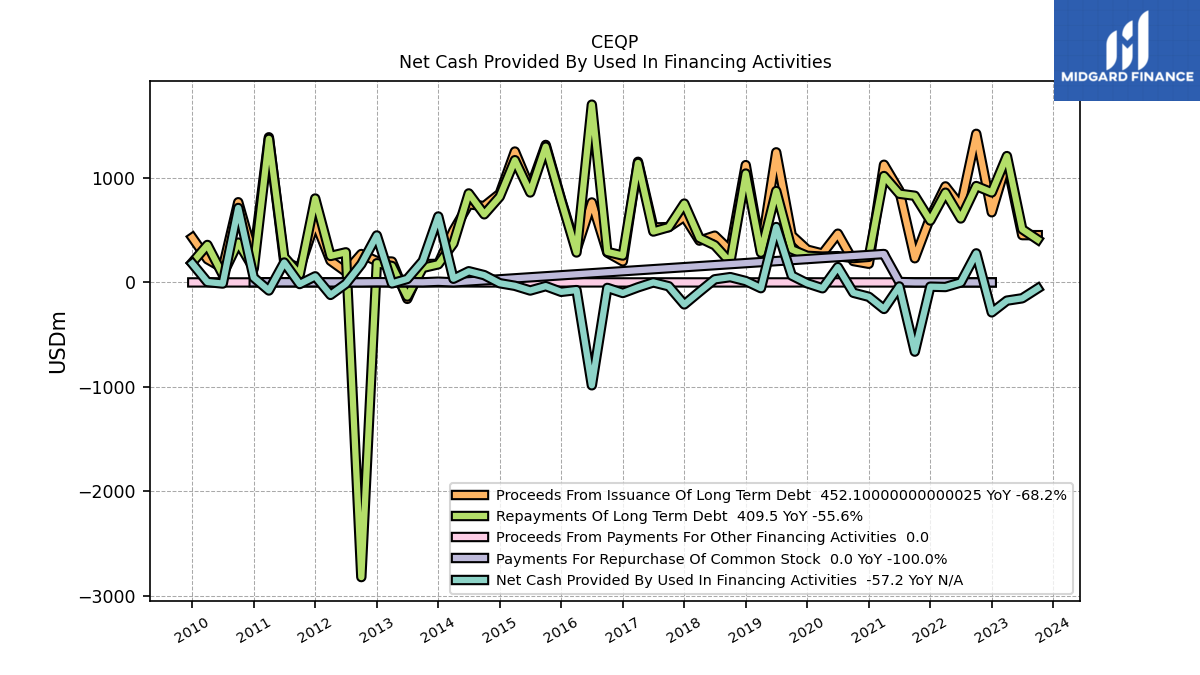
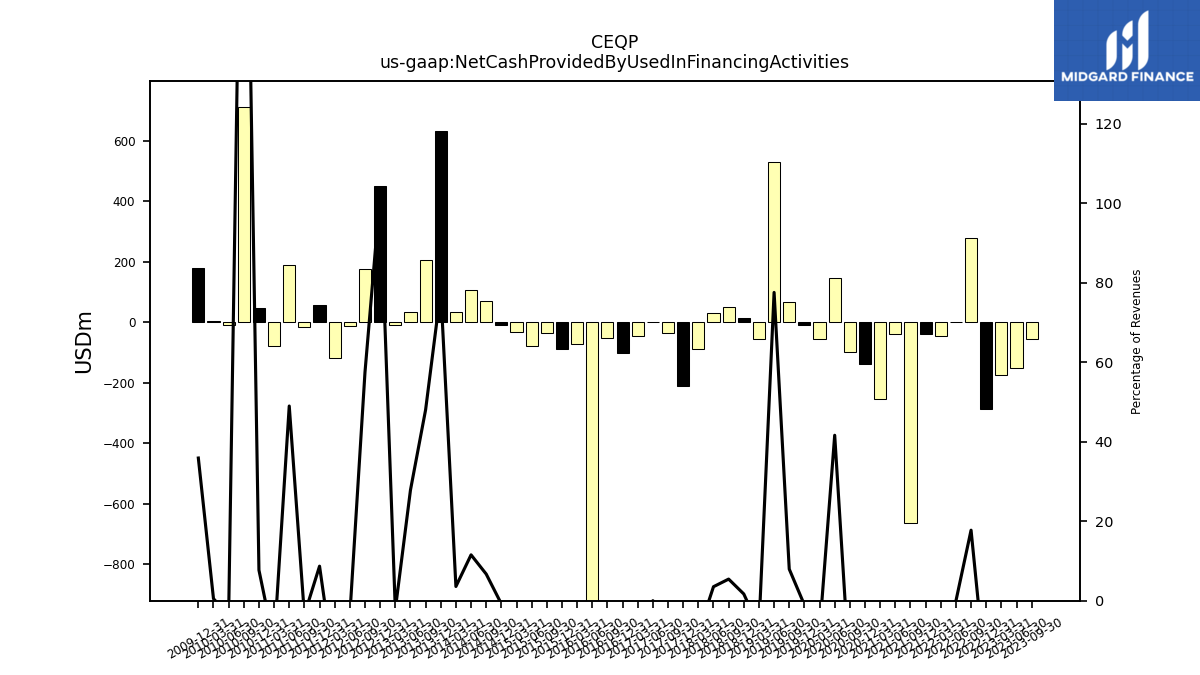
| Net Cash Provided By Used In Financing Activities | -57.20 | -152.00 | -174.40 | -286.90 | 278.10 | -0.90 | -44.20 | -40.80 | -662.70 | -38.60 | -254.20 | -137.70 | -99.30 | 146.90 | -56.40 | -8.80 | 65.60 | 530.30 | -55.30 | 13.10 | 50.70 | 29.70 | -90.00 | -210.80 | -37.00 | 0.10 | -47.20 | -101.40 | -52.40 | -985.00 | -73.40 | -90.40 | -35.70 | -77.70 | -32.50 | -7.90 | 69.60 | 107.00 | 34.90 | 631.20 | 205.30 | 33.10 | -9.90 | 449.40 | 175.10 | -13.40 | -119.80 | 58.20 | -15.80 | 190.50 | -77.40 | 46.00 | 712.70 | -11.00 | 3.60 | 180.20 |
| 2023-09-30 | 2023-06-30 | 2023-03-31 | 2022-12-31 | 2022-09-30 | 2022-06-30 | 2022-03-31 | 2021-12-31 | 2021-09-30 | 2021-06-30 | 2021-03-31 | 2020-12-31 | 2020-09-30 | 2020-06-30 | 2020-03-31 | 2019-12-31 | 2019-09-30 | 2019-06-30 | 2019-03-31 | 2018-12-31 | 2018-09-30 | 2018-06-30 | 2018-03-31 | 2017-12-31 | 2017-09-30 | 2017-06-30 | 2017-03-31 | 2016-12-31 | 2016-09-30 | 2016-06-30 | 2016-03-31 | 2015-12-31 | 2015-09-30 | 2015-06-30 | 2015-03-31 | 2014-12-31 | 2014-09-30 | 2014-06-30 | 2014-03-31 | 2013-12-31 | 2013-09-30 | 2013-06-30 | 2013-03-31 | 2012-12-31 | 2012-09-30 | 2012-06-30 | 2012-03-31 | 2011-12-31 | 2011-09-30 | 2011-06-30 | 2011-03-31 | 2010-12-31 | 2010-09-30 | 2010-06-30 | 2010-03-31 | 2009-12-31 | ||
|---|---|---|---|---|---|---|---|---|---|---|---|---|---|---|---|---|---|---|---|---|---|---|---|---|---|---|---|---|---|---|---|---|---|---|---|---|---|---|---|---|---|---|---|---|---|---|---|---|---|---|---|---|---|---|---|---|---|
| Net Cash Provided By Used In Operating Activities | 111.40 | 21.20 | 245.90 | 161.90 | 25.30 | 29.50 | 222.50 | 53.80 | 79.40 | 35.00 | 258.50 | 112.80 | 111.90 | 64.20 | 119.20 | 142.10 | 84.40 | 63.00 | 130.90 | 52.70 | 40.90 | 11.30 | 148.70 | 27.70 | 95.30 | 74.00 | 58.90 | 101.60 | 51.50 | 58.70 | 134.30 | 139.10 | 90.50 | 54.50 | 156.60 | 125.80 | 45.70 | 39.20 | 72.30 | 74.20 | 56.70 | 23.30 | 34.10 | 28.00 | -14.20 | 58.70 | 171.30 | 23.20 | -16.10 | 8.70 | 102.70 | 19.10 | 33.20 | 0.40 | 90.90 | 49.10 | |
| Net Income Loss | -20.00 | 141.60 | 31.40 | 43.50 | -53.30 | 29.10 | 12.00 | 68.20 | -49.90 | -48.40 | -48.40 | 17.40 | -5.70 | -34.50 | -33.30 | 36.90 | 23.70 | 214.40 | 10.10 | 55.50 | -9.30 | -25.50 | 30.10 | -126.10 | -34.30 | -6.00 | -25.50 | -70.50 | -3.10 | -43.10 | -99.60 | -1408.30 | -226.90 | -40.00 | 8.30 | 38.40 | 2.80 | -4.40 | 19.60 | 8.30 | -8.30 | 1.60 | -5.80 | 1.30 | 540.00 | -21.80 | 40.70 | -3.70 | -50.20 | -35.50 | 36.60 | 66.70 | 11.60 | 12.40 | 21.30 | 16.50 | |
| Profit Loss | 12.10 | 151.90 | 41.60 | 53.90 | -43.00 | 39.40 | 22.20 | 78.60 | -39.60 | -38.10 | -38.30 | 27.80 | 4.60 | -24.30 | -23.40 | 47.20 | 33.60 | 225.00 | 14.10 | 59.60 | -5.20 | -21.50 | 34.10 | -119.60 | -27.90 | 0.30 | -19.40 | -64.30 | 3.00 | -37.10 | -93.70 | -1402.40 | -623.40 | -296.00 | 18.10 | -30.70 | 11.90 | -4.80 | 13.20 | -42.10 | -7.90 | -4.50 | -5.30 | 2.80 | 543.20 | -17.70 | 44.00 | -3.60 | -50.20 | -35.50 | 36.60 | 38.50 | -51.50 | -35.10 | 87.20 | 45.80 | |
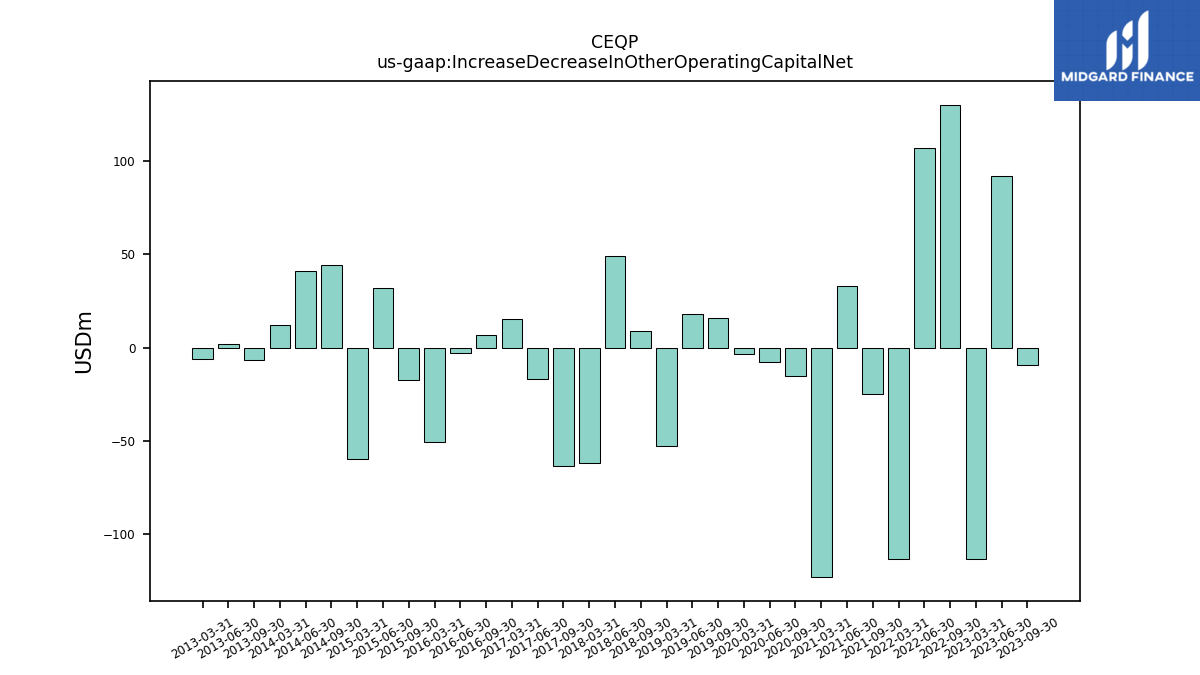
| Increase Decrease In Other Operating Capital Net | -9.10 | 91.70 | -113.10 | NA | 129.90 | 106.90 | -112.90 | NA | -25.10 | 33.10 | -122.80 | NA | -15.50 | -7.70 | -3.70 | NA | 15.80 | 17.80 | -52.80 | NA | 8.80 | 48.70 | -61.50 | NA | -63.60 | -16.80 | 15.20 | NA | 6.50 | -2.70 | -50.60 | NA | -17.60 | 31.60 | -59.60 | NA | 44.10 | 41.10 | 12.00 | NA | -6.70 | 1.70 | -6.00 | NA | NA | NA | NA | NA | NA | NA | NA | NA | NA | NA | NA | NA | |
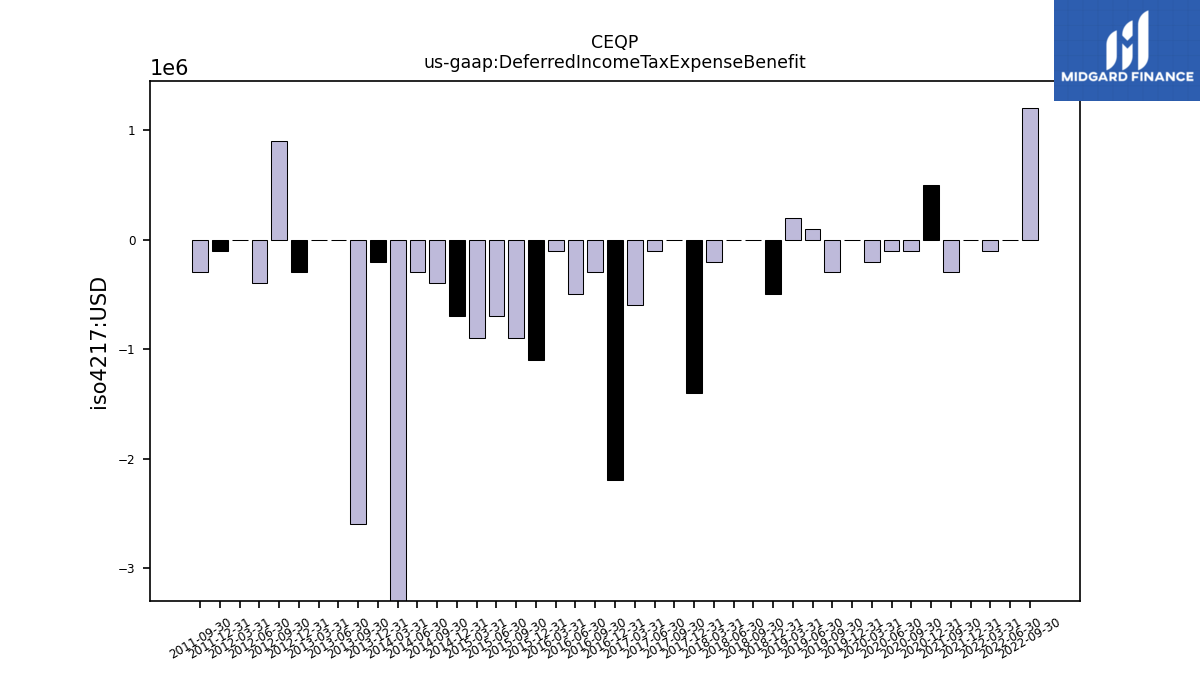
| Deferred Income Tax Expense Benefit | NA | NA | NA | NA | 1.20 | 0.00 | -0.10 | 0.00 | -0.30 | NA | NA | 0.50 | -0.10 | -0.10 | -0.20 | 0.00 | -0.30 | 0.10 | 0.20 | -0.50 | 0.00 | 0.00 | -0.20 | -1.40 | 0.00 | -0.10 | -0.60 | -2.20 | -0.30 | -0.50 | -0.10 | -1.10 | -0.90 | -0.70 | -0.90 | -0.70 | -0.40 | -0.30 | -3.80 | -0.20 | -2.60 | 0.00 | 0.00 | -0.30 | 0.90 | -0.40 | 0.00 | -0.10 | -0.30 | NA | NA | NA | NA | NA | NA | NA |
| 2023-09-30 | 2023-06-30 | 2023-03-31 | 2022-12-31 | 2022-09-30 | 2022-06-30 | 2022-03-31 | 2021-12-31 | 2021-09-30 | 2021-06-30 | 2021-03-31 | 2020-12-31 | 2020-09-30 | 2020-06-30 | 2020-03-31 | 2019-12-31 | 2019-09-30 | 2019-06-30 | 2019-03-31 | 2018-12-31 | 2018-09-30 | 2018-06-30 | 2018-03-31 | 2017-12-31 | 2017-09-30 | 2017-06-30 | 2017-03-31 | 2016-12-31 | 2016-09-30 | 2016-06-30 | 2016-03-31 | 2015-12-31 | 2015-09-30 | 2015-06-30 | 2015-03-31 | 2014-12-31 | 2014-09-30 | 2014-06-30 | 2014-03-31 | 2013-12-31 | 2013-09-30 | 2013-06-30 | 2013-03-31 | 2012-12-31 | 2012-09-30 | 2012-06-30 | 2012-03-31 | 2011-12-31 | 2011-09-30 | 2011-06-30 | 2011-03-31 | 2010-12-31 | 2010-09-30 | 2010-06-30 | 2010-03-31 | 2009-12-31 | ||
|---|---|---|---|---|---|---|---|---|---|---|---|---|---|---|---|---|---|---|---|---|---|---|---|---|---|---|---|---|---|---|---|---|---|---|---|---|---|---|---|---|---|---|---|---|---|---|---|---|---|---|---|---|---|---|---|---|---|
| Net Cash Provided By Used In Investing Activities | -38.10 | 129.90 | -70.40 | 126.10 | -310.80 | -26.70 | -179.70 | -14.00 | 581.00 | 3.90 | -2.00 | 24.40 | -4.80 | -209.60 | -83.30 | -109.20 | -150.50 | -593.00 | -91.00 | -51.00 | -95.30 | -42.20 | -52.70 | 183.00 | -59.20 | -72.80 | -12.30 | 0.40 | 1.00 | 926.10 | -60.30 | -57.20 | -47.10 | -43.20 | -65.20 | -111.30 | -131.30 | -135.70 | -104.70 | -709.00 | -255.90 | -53.70 | -24.30 | -475.60 | -165.80 | -55.00 | -55.60 | -74.20 | -115.20 | -59.10 | -26.10 | -190.20 | -607.10 | -3.10 | -91.10 | -225.10 | |
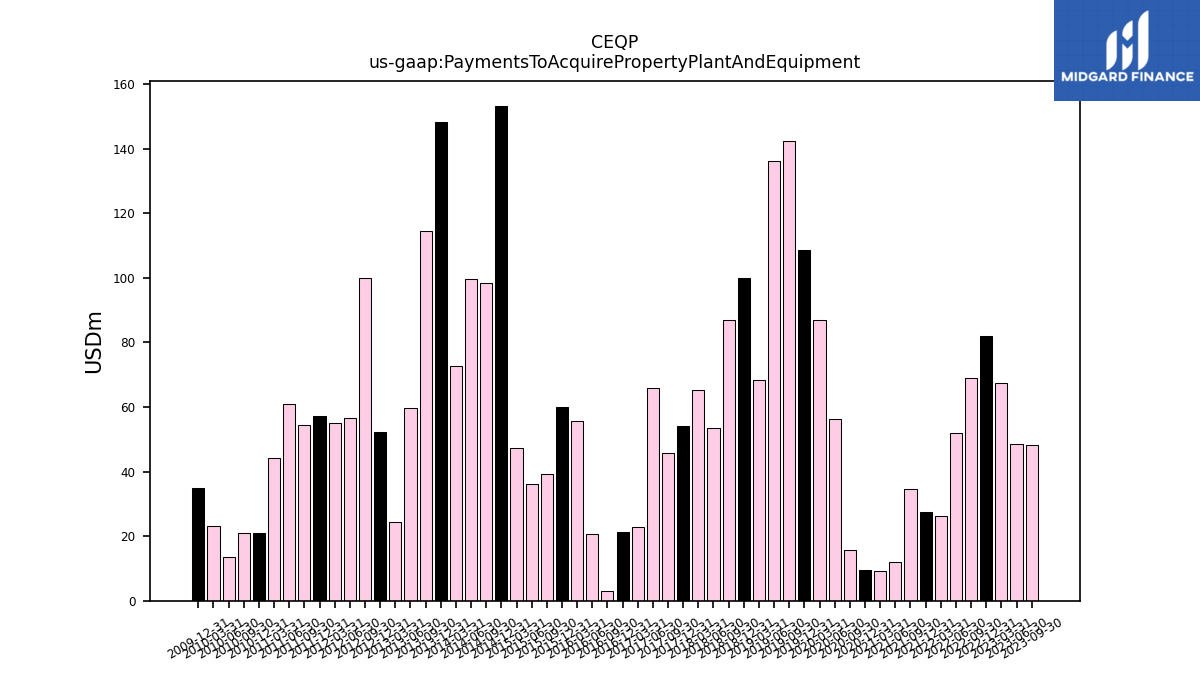
| Payments To Acquire Property Plant And Equipment | 48.30 | 48.40 | 67.30 | 82.00 | 69.10 | 51.80 | 26.40 | 27.40 | 34.50 | 12.00 | 9.30 | 9.50 | 15.60 | 56.40 | 86.80 | 108.50 | 142.30 | 136.20 | 68.50 | 99.80 | 87.00 | 53.40 | 65.30 | 54.00 | 45.70 | 66.00 | 22.70 | 21.40 | 3.10 | 20.60 | 55.60 | 59.90 | 39.30 | 36.10 | 47.40 | 153.30 | 98.40 | 99.50 | 72.80 | 148.40 | 114.50 | 59.80 | 24.30 | 52.20 | 100.00 | 56.60 | 55.00 | 57.10 | 54.40 | 61.00 | 44.30 | 20.90 | 21.10 | 13.40 | 23.00 | 34.80 |
| 2023-09-30 | 2023-06-30 | 2023-03-31 | 2022-12-31 | 2022-09-30 | 2022-06-30 | 2022-03-31 | 2021-12-31 | 2021-09-30 | 2021-06-30 | 2021-03-31 | 2020-12-31 | 2020-09-30 | 2020-06-30 | 2020-03-31 | 2019-12-31 | 2019-09-30 | 2019-06-30 | 2019-03-31 | 2018-12-31 | 2018-09-30 | 2018-06-30 | 2018-03-31 | 2017-12-31 | 2017-09-30 | 2017-06-30 | 2017-03-31 | 2016-12-31 | 2016-09-30 | 2016-06-30 | 2016-03-31 | 2015-12-31 | 2015-09-30 | 2015-06-30 | 2015-03-31 | 2014-12-31 | 2014-09-30 | 2014-06-30 | 2014-03-31 | 2013-12-31 | 2013-09-30 | 2013-06-30 | 2013-03-31 | 2012-12-31 | 2012-09-30 | 2012-06-30 | 2012-03-31 | 2011-12-31 | 2011-09-30 | 2011-06-30 | 2011-03-31 | 2010-12-31 | 2010-09-30 | 2010-06-30 | 2010-03-31 | 2009-12-31 | ||
|---|---|---|---|---|---|---|---|---|---|---|---|---|---|---|---|---|---|---|---|---|---|---|---|---|---|---|---|---|---|---|---|---|---|---|---|---|---|---|---|---|---|---|---|---|---|---|---|---|---|---|---|---|---|---|---|---|---|
| Net Cash Provided By Used In Financing Activities | -57.20 | -152.00 | -174.40 | -286.90 | 278.10 | -0.90 | -44.20 | -40.80 | -662.70 | -38.60 | -254.20 | -137.70 | -99.30 | 146.90 | -56.40 | -8.80 | 65.60 | 530.30 | -55.30 | 13.10 | 50.70 | 29.70 | -90.00 | -210.80 | -37.00 | 0.10 | -47.20 | -101.40 | -52.40 | -985.00 | -73.40 | -90.40 | -35.70 | -77.70 | -32.50 | -7.90 | 69.60 | 107.00 | 34.90 | 631.20 | 205.30 | 33.10 | -9.90 | 449.40 | 175.10 | -13.40 | -119.80 | 58.20 | -15.80 | 190.50 | -77.40 | 46.00 | 712.70 | -11.00 | 3.60 | 180.20 | |
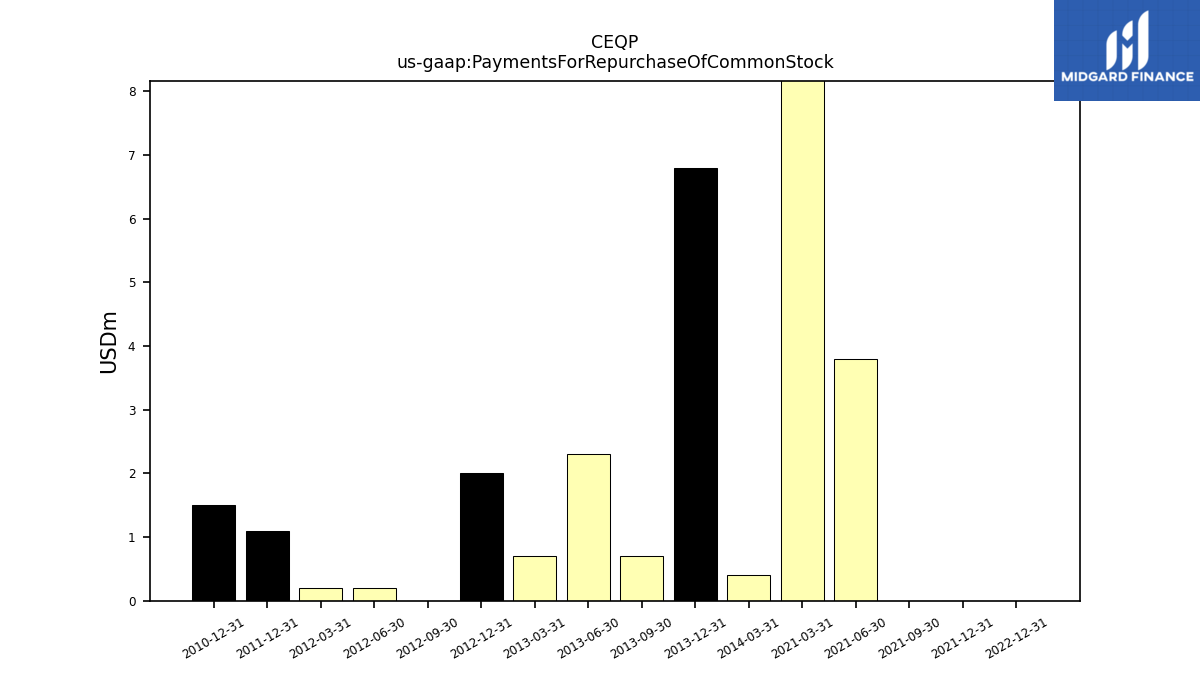
| Payments For Repurchase Of Common Stock | NA | NA | NA | 0.00 | NA | NA | NA | 0.00 | 0.00 | 3.80 | 268.00 | NA | NA | NA | NA | NA | NA | NA | NA | NA | NA | NA | NA | NA | NA | NA | NA | NA | NA | NA | NA | NA | NA | NA | NA | NA | NA | NA | 0.40 | 6.80 | 0.70 | 2.30 | 0.70 | 2.00 | 0.00 | 0.20 | 0.20 | 1.10 | NA | NA | NA | 1.50 | NA | NA | NA | NA |
| 2023-09-30 | 2023-06-30 | 2023-03-31 | 2022-12-31 | 2022-09-30 | 2022-06-30 | 2022-03-31 | 2021-12-31 | 2021-09-30 | 2021-06-30 | 2021-03-31 | 2020-12-31 | 2020-09-30 | 2020-06-30 | 2020-03-31 | 2019-12-31 | 2019-09-30 | 2019-06-30 | 2019-03-31 | 2018-12-31 | 2018-09-30 | 2018-06-30 | 2018-03-31 | 2017-12-31 | 2017-09-30 | 2017-06-30 | 2017-03-31 | 2016-12-31 | 2016-09-30 | 2016-06-30 | 2016-03-31 | 2015-12-31 | 2015-09-30 | 2015-06-30 | 2015-03-31 | 2014-12-31 | 2014-09-30 | 2014-06-30 | 2014-03-31 | 2013-12-31 | 2013-09-30 | 2013-06-30 | 2013-03-31 | 2012-12-31 | 2012-09-30 | 2012-06-30 | 2012-03-31 | 2011-12-31 | 2011-09-30 | 2011-06-30 | 2011-03-31 | 2010-12-31 | 2010-09-30 | 2010-06-30 | 2010-03-31 | 2009-12-31 | ||
|---|---|---|---|---|---|---|---|---|---|---|---|---|---|---|---|---|---|---|---|---|---|---|---|---|---|---|---|---|---|---|---|---|---|---|---|---|---|---|---|---|---|---|---|---|---|---|---|---|---|---|---|---|---|---|---|---|---|
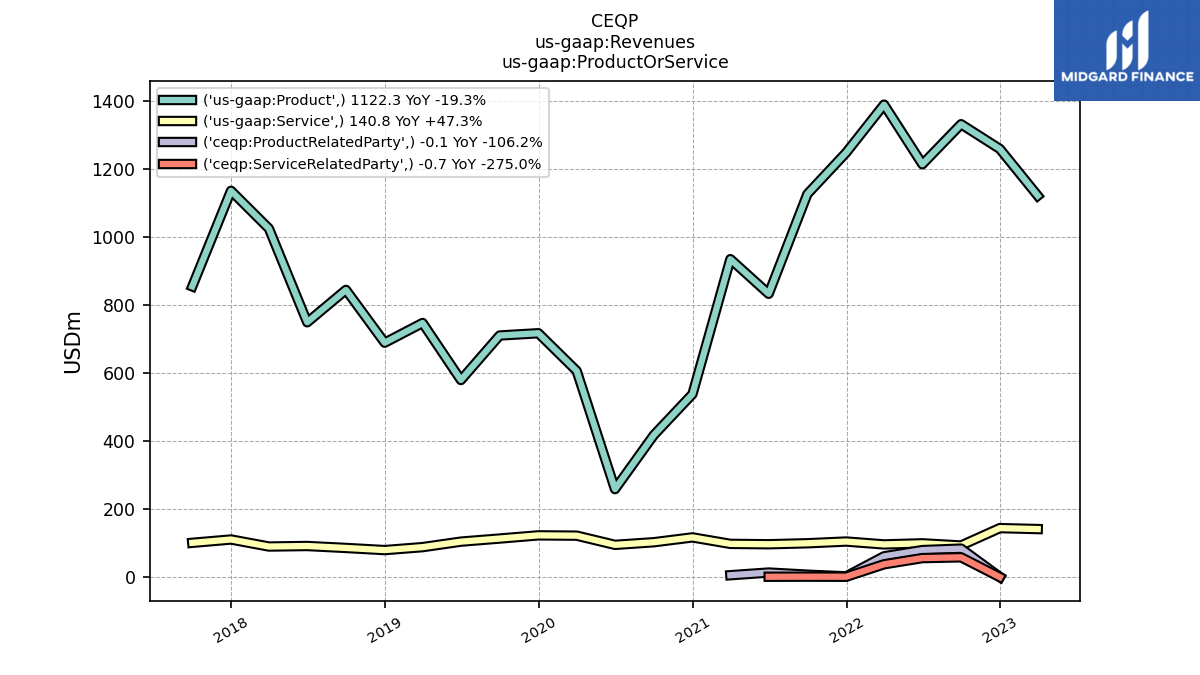
| Revenues | 1139.40 | 1021.20 | 1263.10 | 1402.90 | 1566.00 | 1448.00 | 1583.80 | 1380.40 | 1226.30 | 929.60 | 1032.70 | 654.50 | 519.20 | 352.70 | 727.90 | 839.70 | 823.60 | 683.40 | 835.20 | 768.40 | 930.20 | 840.50 | 1115.00 | 1246.90 | 955.60 | 850.30 | 828.10 | 795.00 | 587.60 | 601.90 | 536.00 | 629.10 | 630.70 | 641.50 | 731.50 | 997.20 | 1036.20 | 926.30 | 971.60 | 808.20 | 427.20 | 118.90 | 450.40 | 438.60 | 304.20 | 371.60 | 662.40 | 668.60 | 448.60 | 388.70 | 720.50 | 596.00 | 301.60 | 291.60 | 691.10 | 501.70 | |
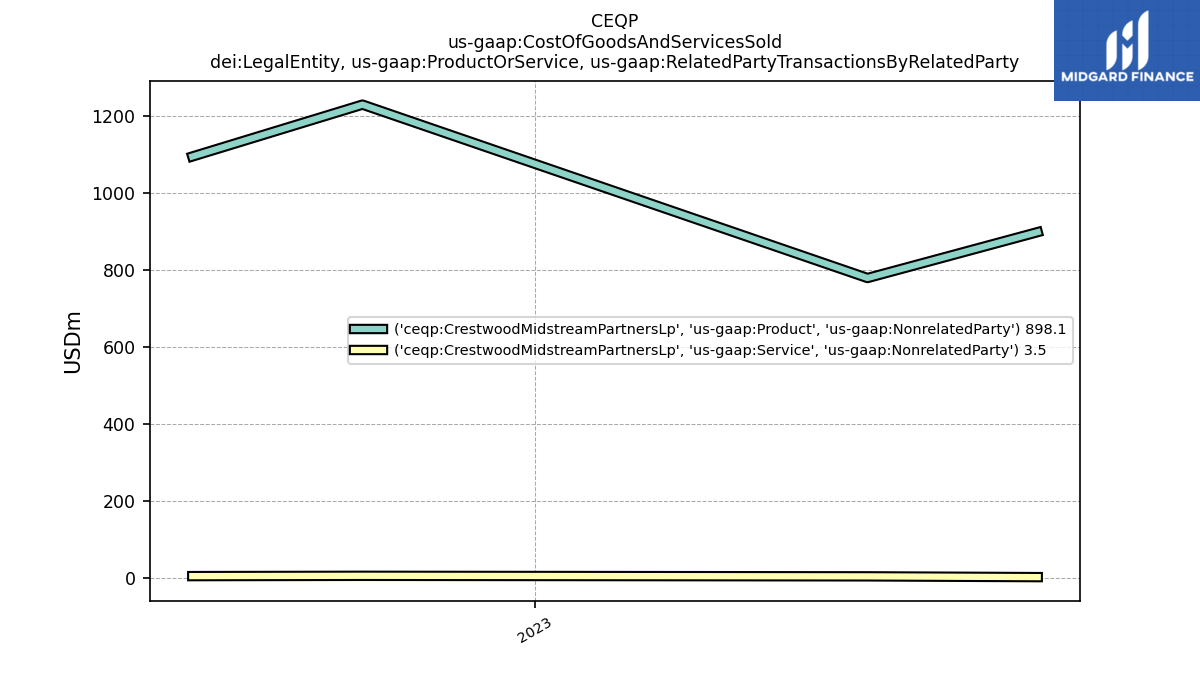
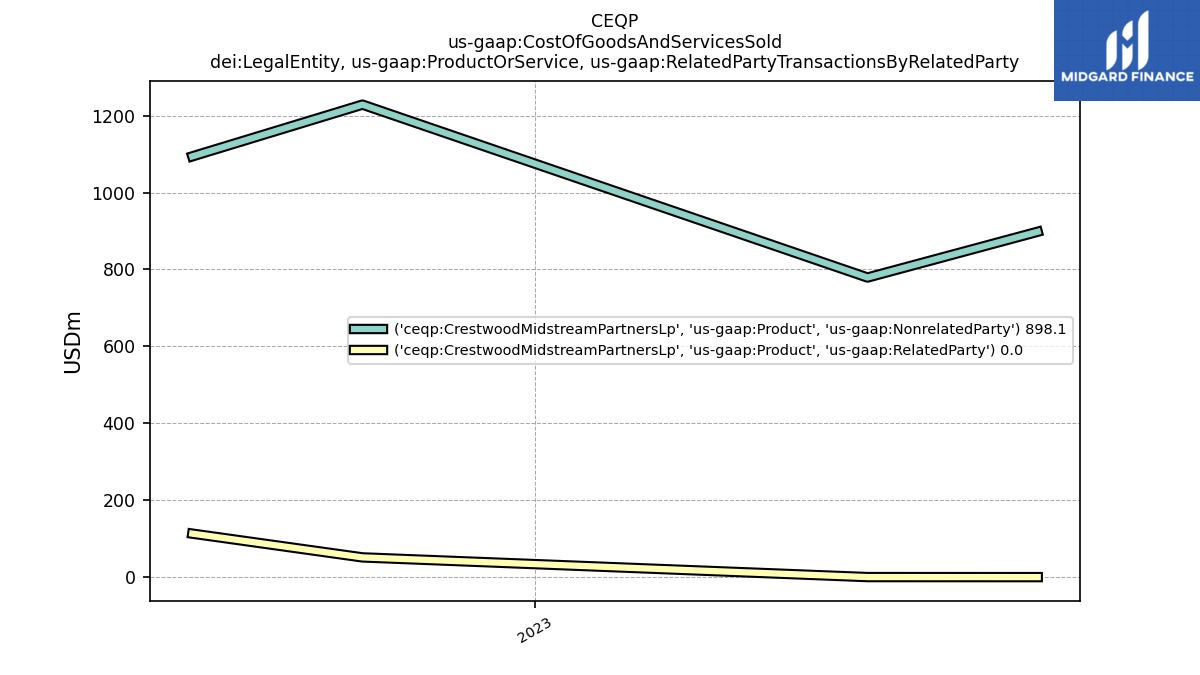
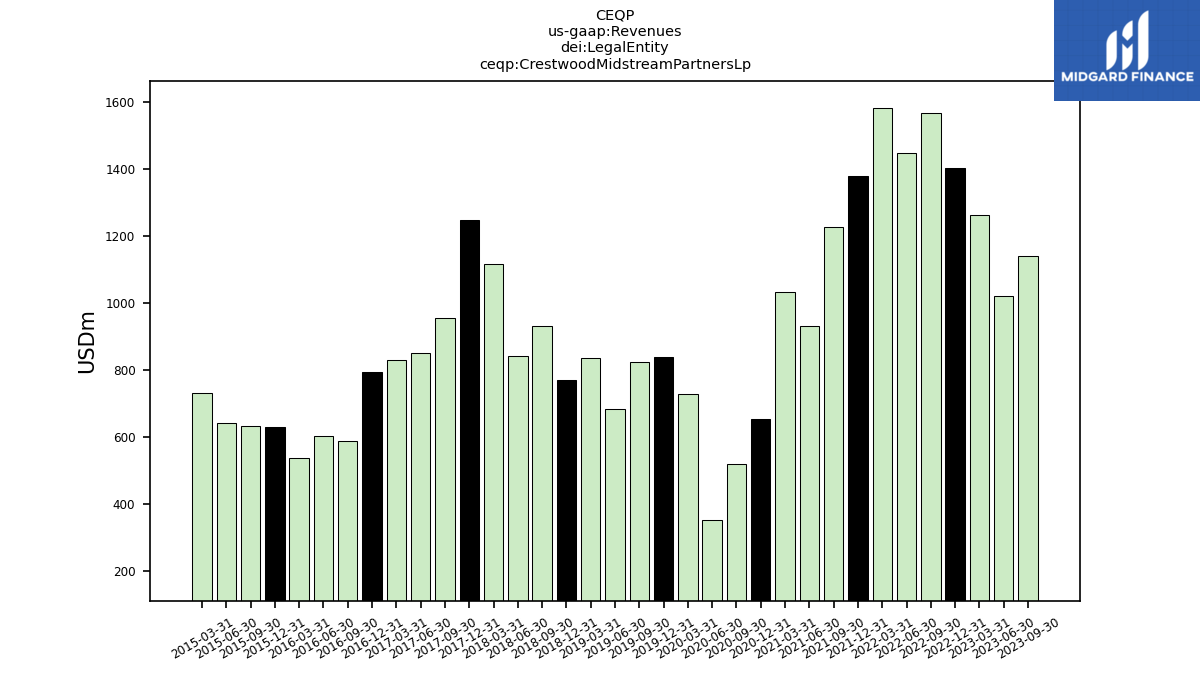
| Crestwood Midstream Partners Lp | 1139.40 | 1021.20 | 1263.10 | 1402.90 | 1566.00 | 1448.00 | 1583.80 | 1380.40 | 1226.30 | 929.60 | 1032.70 | 654.50 | 519.20 | 352.70 | 727.90 | 839.70 | 823.60 | 683.40 | 835.20 | 768.40 | 930.20 | 840.50 | 1115.00 | 1246.90 | 955.60 | 850.30 | 828.10 | 795.00 | 587.60 | 601.90 | 536.00 | 629.10 | 630.70 | 641.50 | 731.50 | NA | NA | NA | NA | NA | NA | NA | NA | NA | NA | NA | NA | NA | NA | NA | NA | NA | NA | NA | NA | NA | |
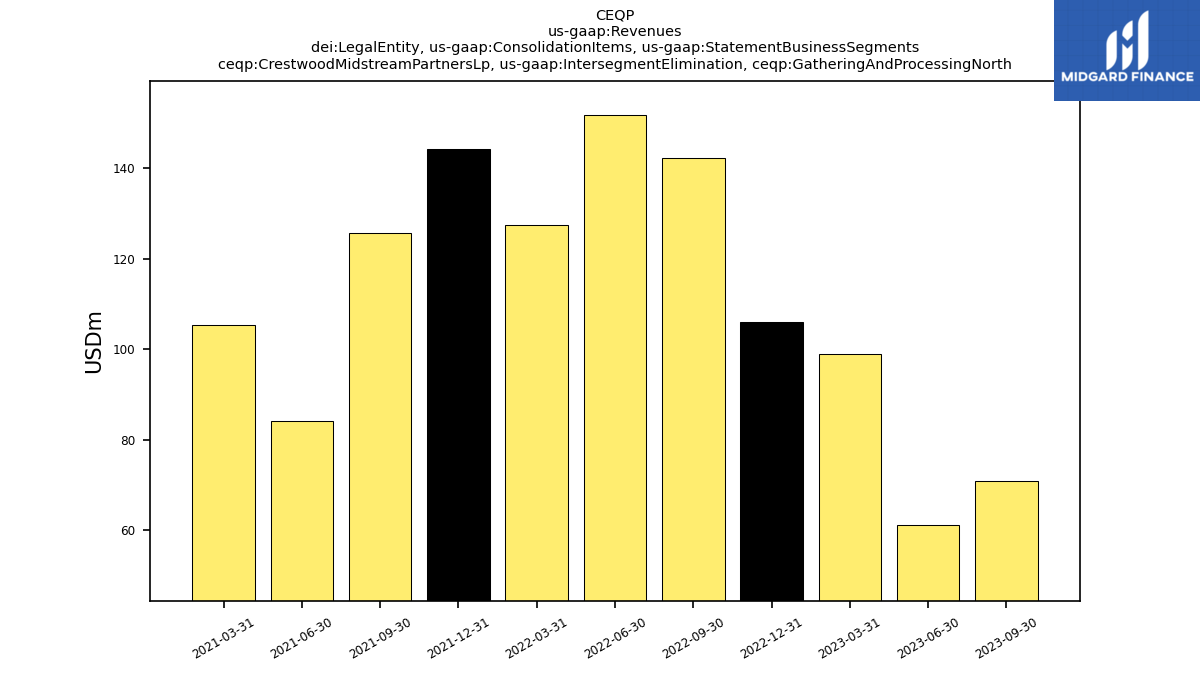
| Crestwood Midstream Partners Lp, Intersegment Elimination, Gathering And Processing North | 70.90 | 61.10 | 99.00 | 106.00 | 142.20 | 151.60 | 127.40 | 144.20 | 125.60 | 84.20 | 105.30 | NA | NA | NA | NA | NA | NA | NA | NA | NA | NA | NA | NA | NA | NA | NA | NA | NA | NA | NA | NA | NA | NA | NA | NA | NA | NA | NA | NA | NA | NA | NA | NA | NA | NA | NA | NA | NA | NA | NA | NA | NA | NA | NA | NA | NA | |
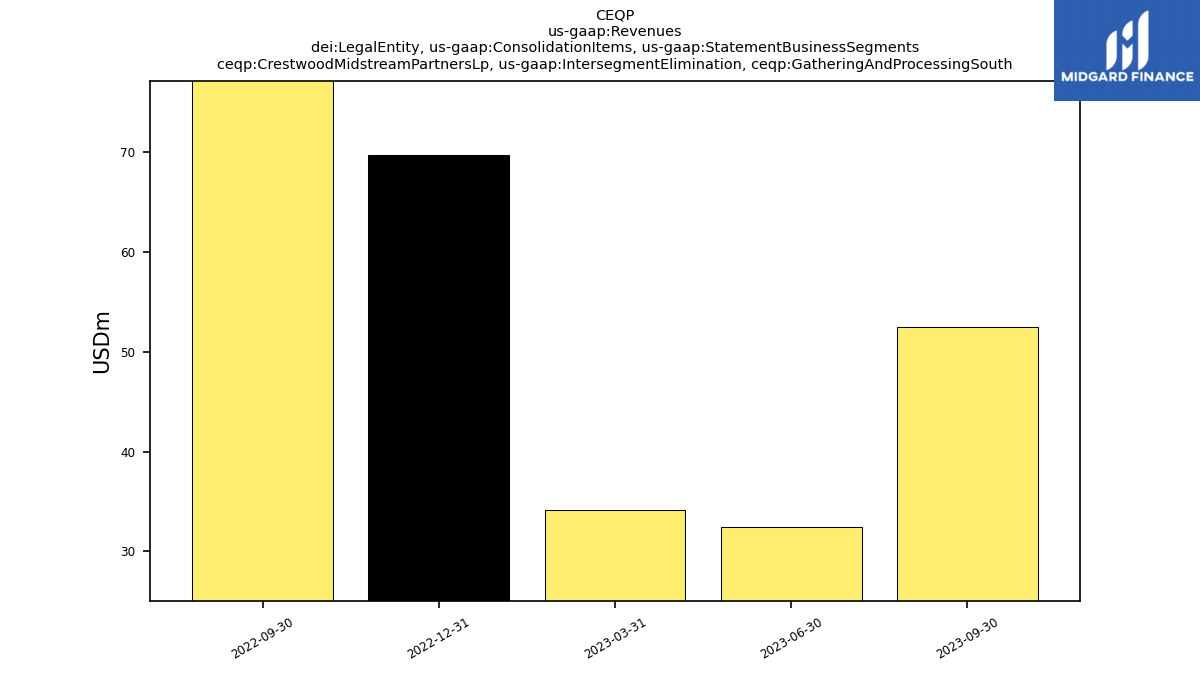
| Crestwood Midstream Partners Lp, Intersegment Elimination, Gathering And Processing South | 52.50 | 32.50 | 34.20 | 69.70 | 137.80 | NA | NA | NA | NA | NA | NA | NA | NA | NA | NA | NA | NA | NA | NA | NA | NA | NA | NA | NA | NA | NA | NA | NA | NA | NA | NA | NA | NA | NA | NA | NA | NA | NA | NA | NA | NA | NA | NA | NA | NA | NA | NA | NA | NA | NA | NA | NA | NA | NA | NA | NA | |
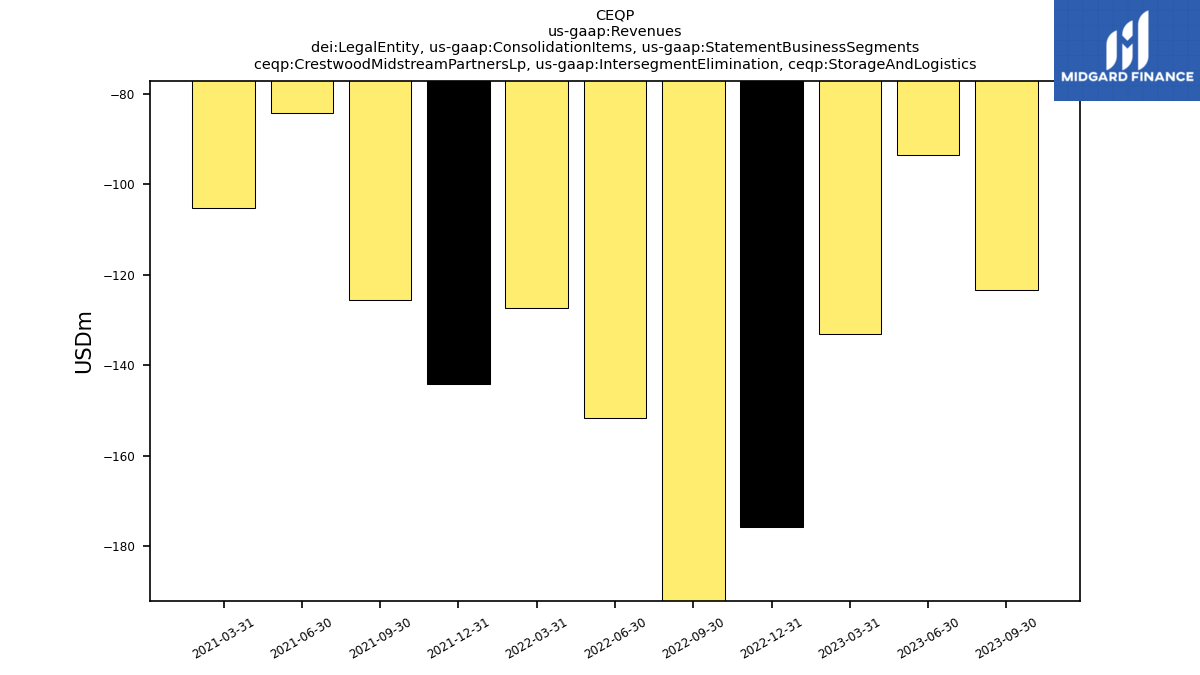
| Crestwood Midstream Partners Lp, Intersegment Elimination, Storage And Logistics | -123.40 | -93.60 | -133.20 | -175.70 | -280.00 | -151.60 | -127.40 | -144.20 | -125.60 | -84.20 | -105.30 | NA | NA | NA | NA | NA | NA | NA | NA | NA | NA | NA | NA | NA | NA | NA | NA | NA | NA | NA | NA | NA | NA | NA | NA | NA | NA | NA | NA | NA | NA | NA | NA | NA | NA | NA | NA | NA | NA | NA | NA | NA | NA | NA | NA | NA | |
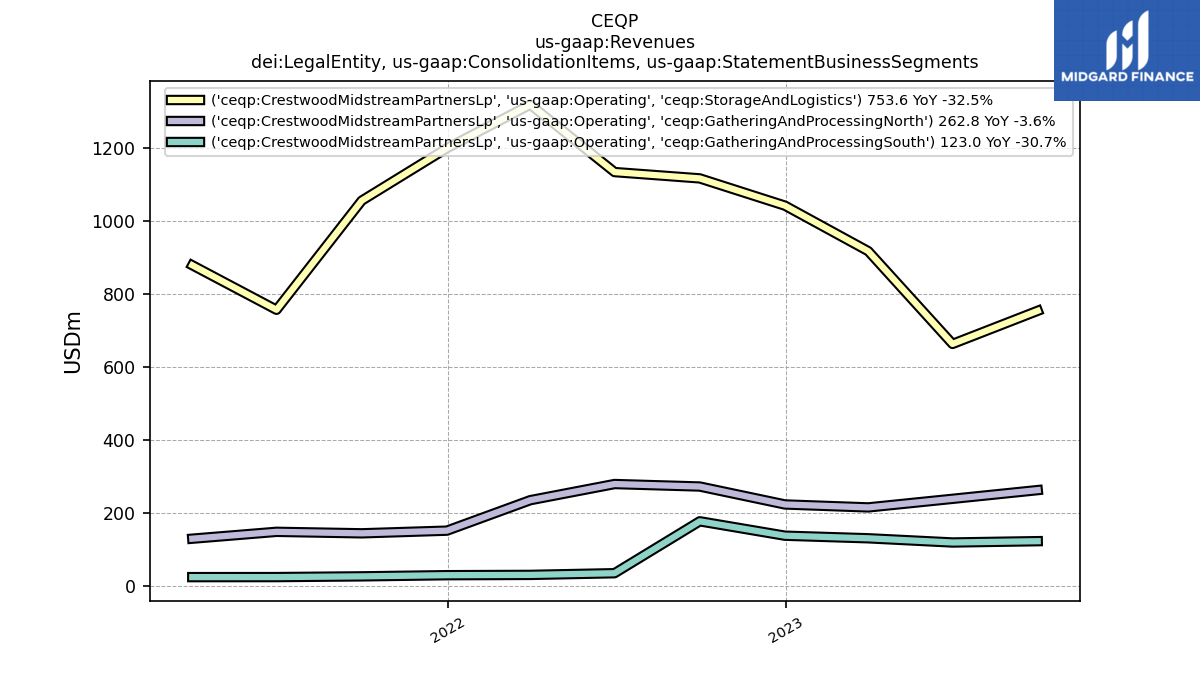
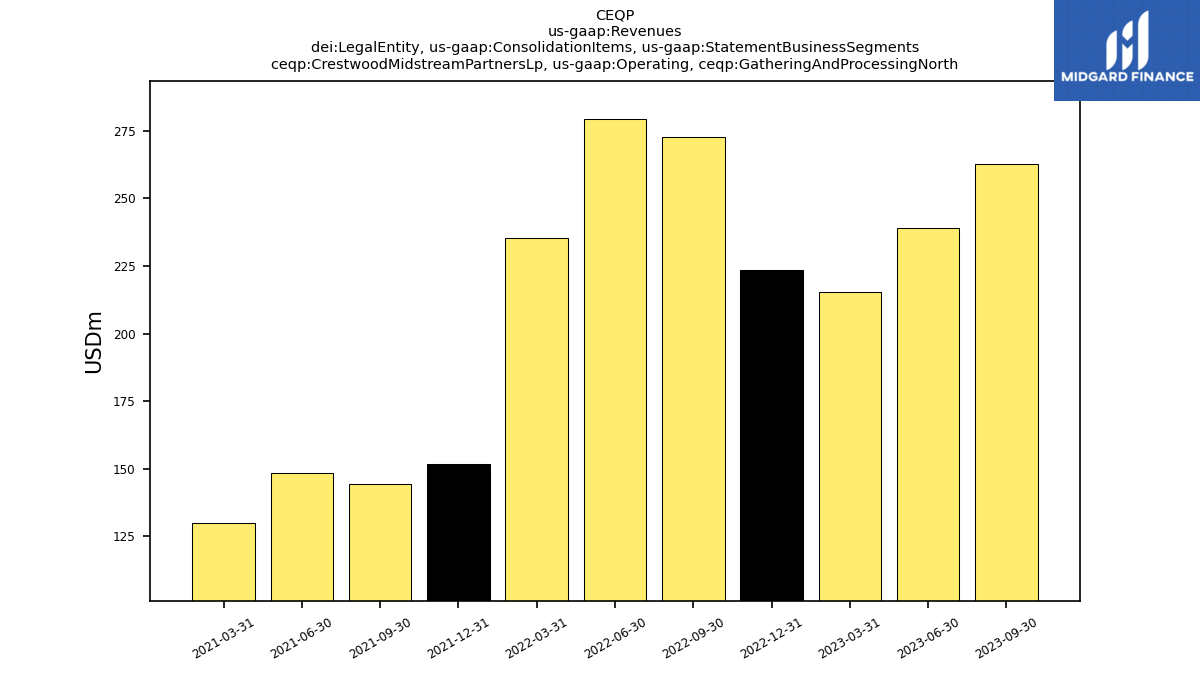
| Crestwood Midstream Partners Lp, Operating, Gathering And Processing North | 262.80 | 238.90 | 215.40 | 223.50 | 272.60 | 279.40 | 235.20 | 151.80 | 144.50 | 148.60 | 129.80 | NA | NA | NA | NA | NA | NA | NA | NA | NA | NA | NA | NA | NA | NA | NA | NA | NA | NA | NA | NA | NA | NA | NA | NA | NA | NA | NA | NA | NA | NA | NA | NA | NA | NA | NA | NA | NA | NA | NA | NA | NA | NA | NA | NA | NA | |
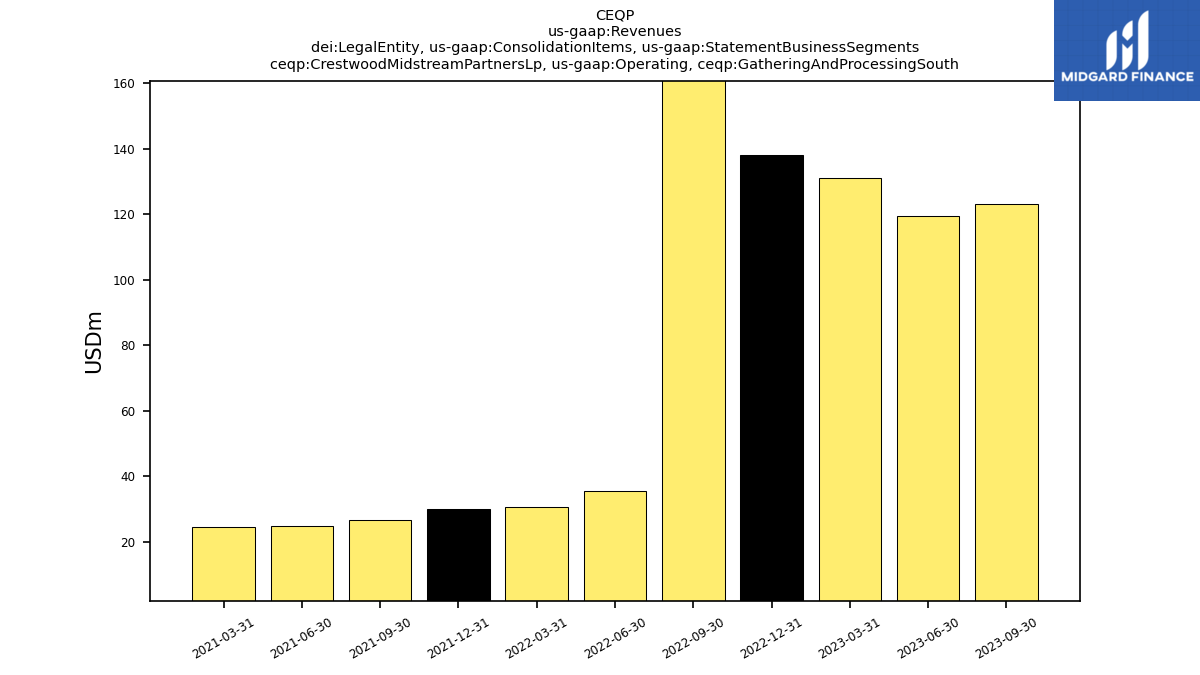
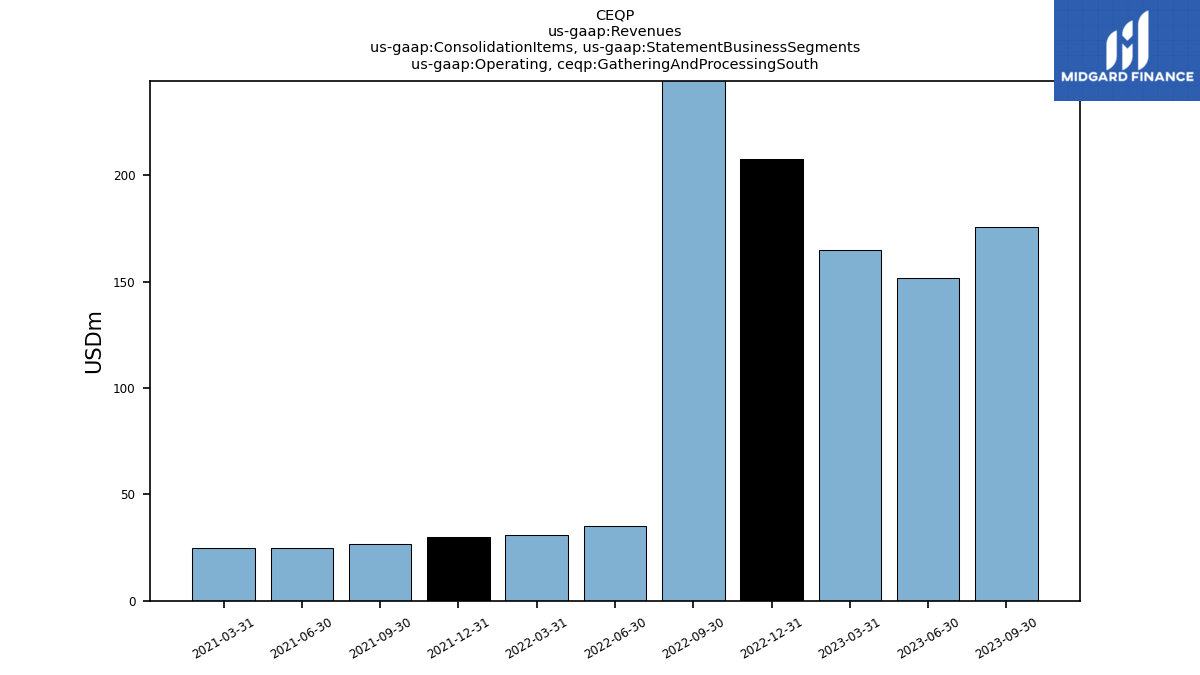
| Crestwood Midstream Partners Lp, Operating, Gathering And Processing South | 123.00 | 119.40 | 130.90 | 138.00 | 177.40 | 35.30 | 30.70 | 29.90 | 26.70 | 24.70 | 24.60 | NA | NA | NA | NA | NA | NA | NA | NA | NA | NA | NA | NA | NA | NA | NA | NA | NA | NA | NA | NA | NA | NA | NA | NA | NA | NA | NA | NA | NA | NA | NA | NA | NA | NA | NA | NA | NA | NA | NA | NA | NA | NA | NA | NA | NA | |
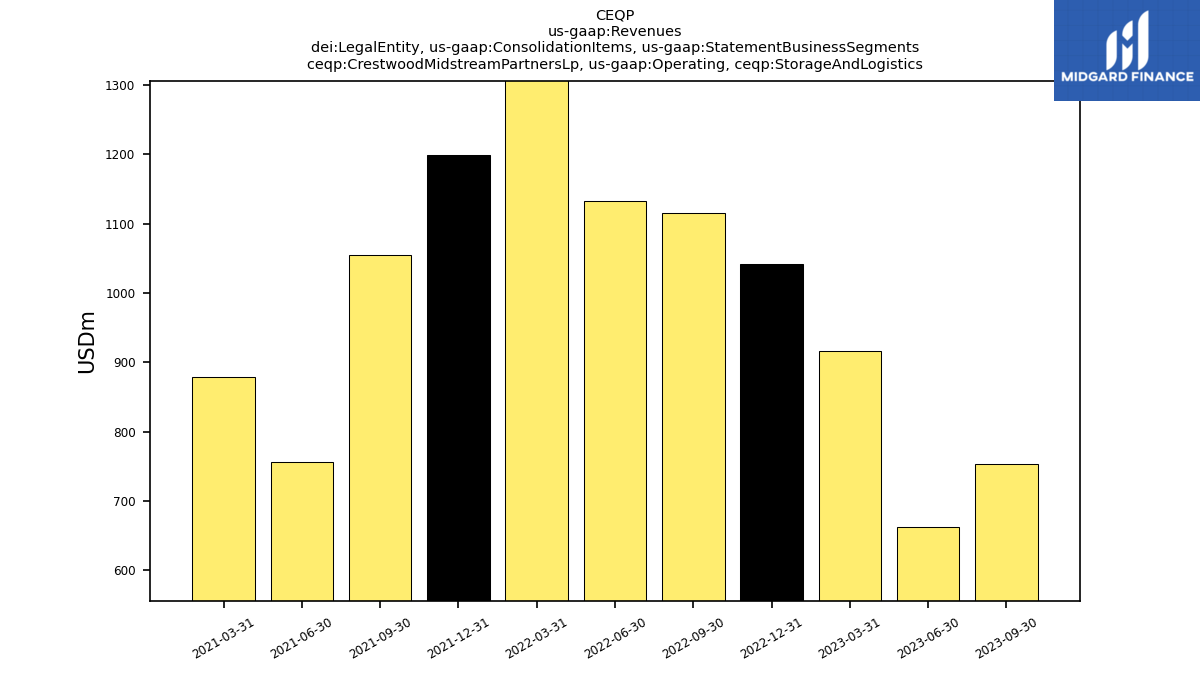
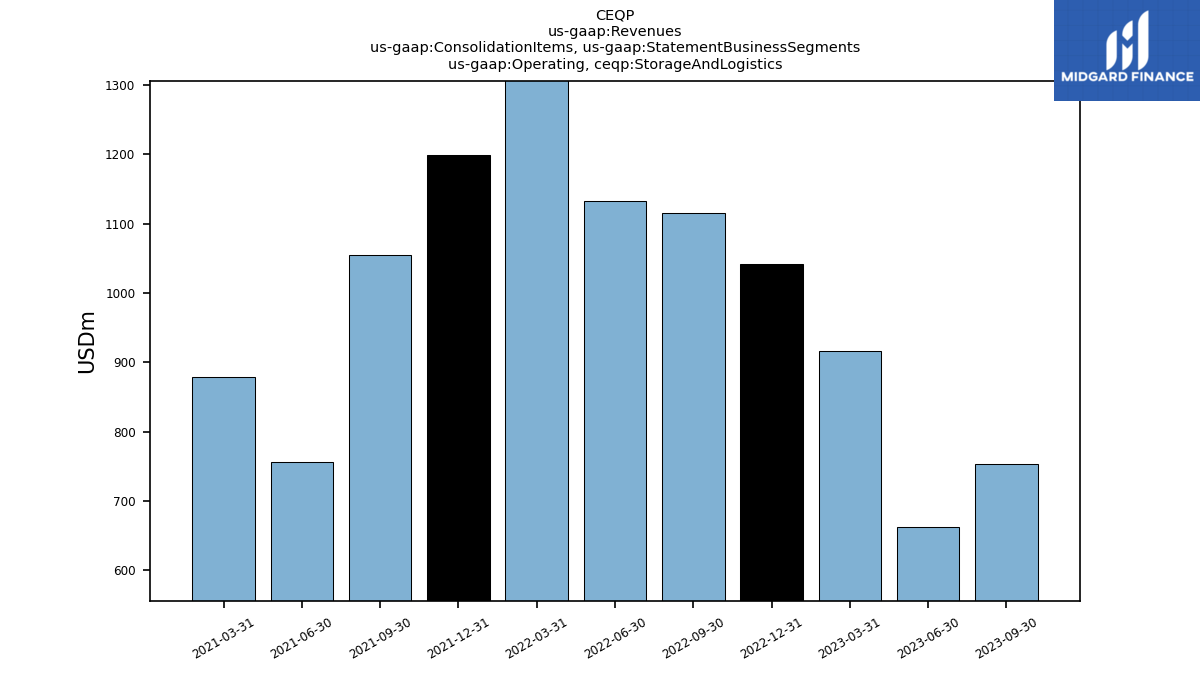
| Crestwood Midstream Partners Lp, Operating, Storage And Logistics | 753.60 | 662.90 | 916.80 | 1041.40 | 1116.00 | 1133.30 | 1317.90 | 1198.70 | 1055.10 | 756.30 | 878.30 | NA | NA | NA | NA | NA | NA | NA | NA | NA | NA | NA | NA | NA | NA | NA | NA | NA | NA | NA | NA | NA | NA | NA | NA | NA | NA | NA | NA | NA | NA | NA | NA | NA | NA | NA | NA | NA | NA | NA | NA | NA | NA | NA | NA | NA | |
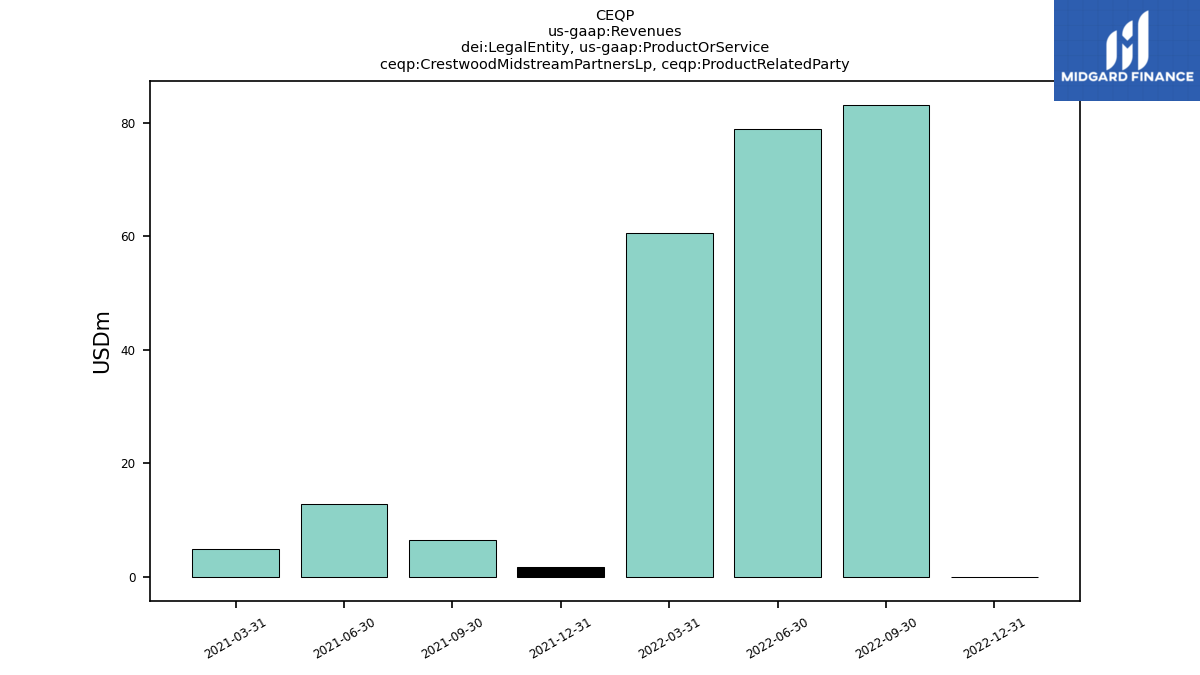
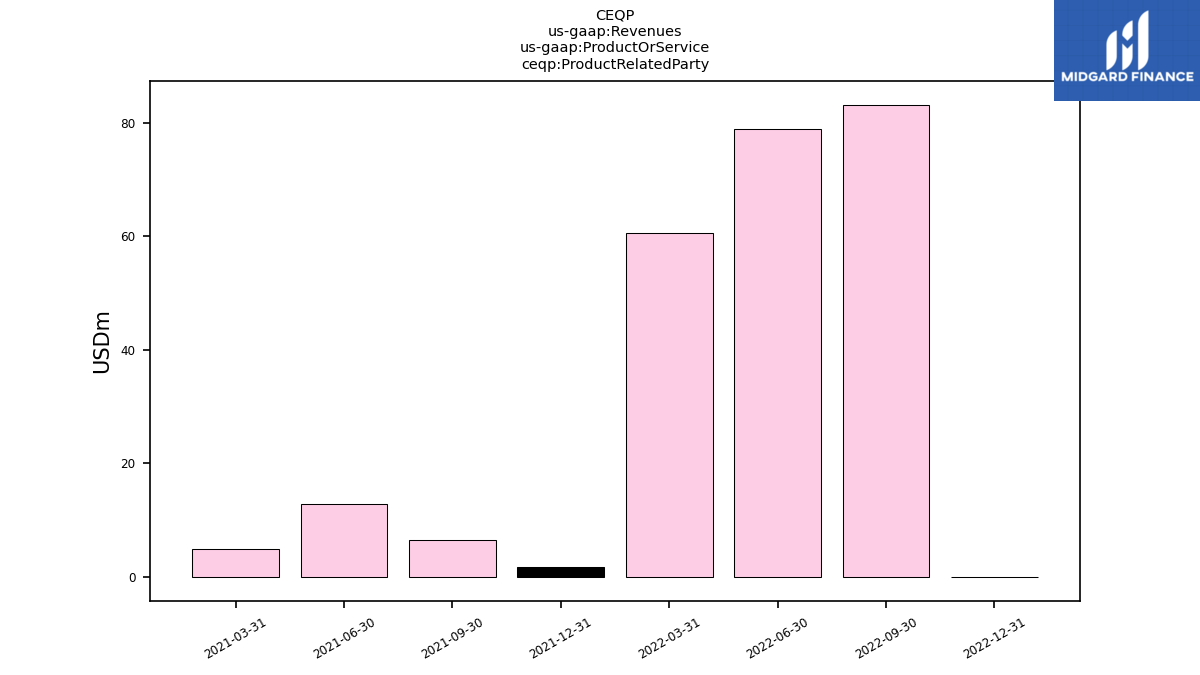
| Crestwood Midstream Partners Lp, Product Related Party | NA | NA | NA | -0.10 | 83.20 | 78.90 | 60.60 | 1.60 | 6.50 | 12.80 | 4.90 | NA | NA | NA | NA | NA | NA | NA | NA | NA | NA | NA | NA | NA | NA | NA | NA | NA | NA | NA | NA | NA | NA | NA | NA | NA | NA | NA | NA | NA | NA | NA | NA | NA | NA | NA | NA | NA | NA | NA | NA | NA | NA | NA | NA | NA | |
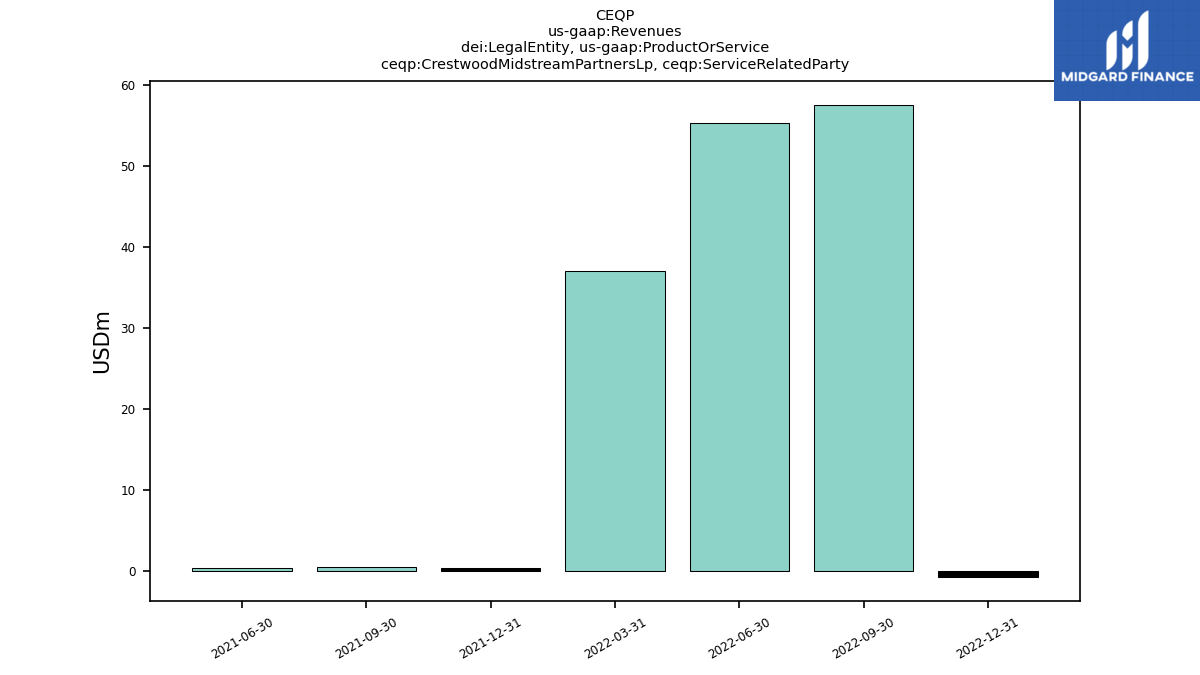
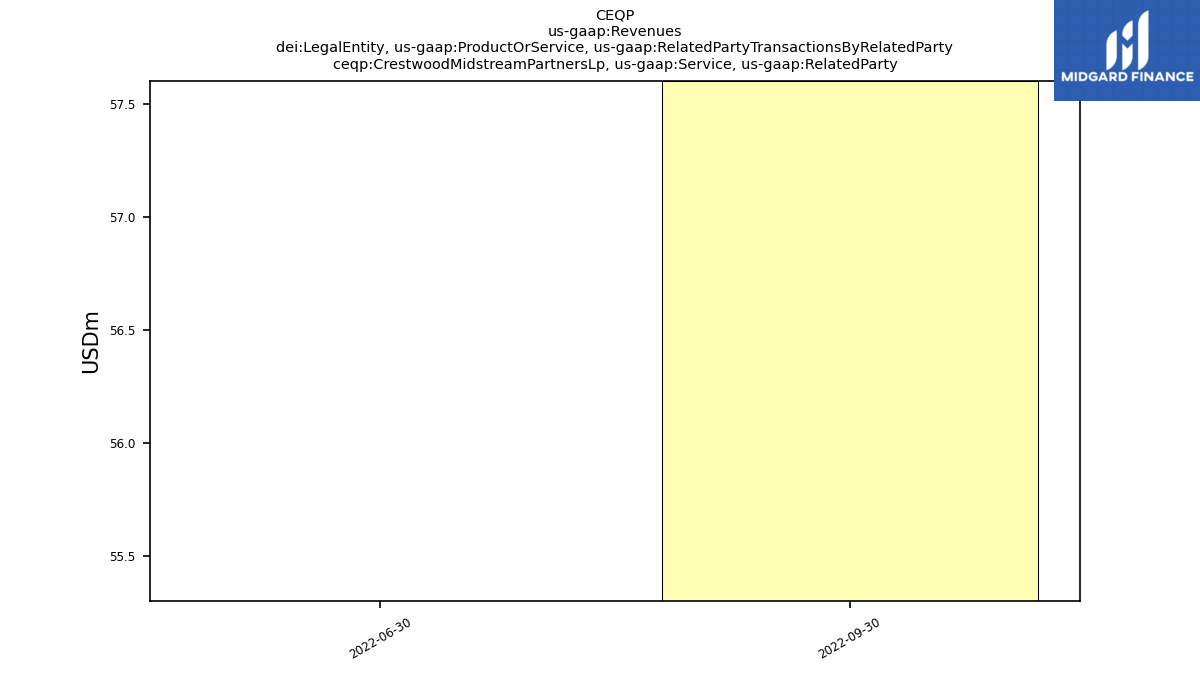
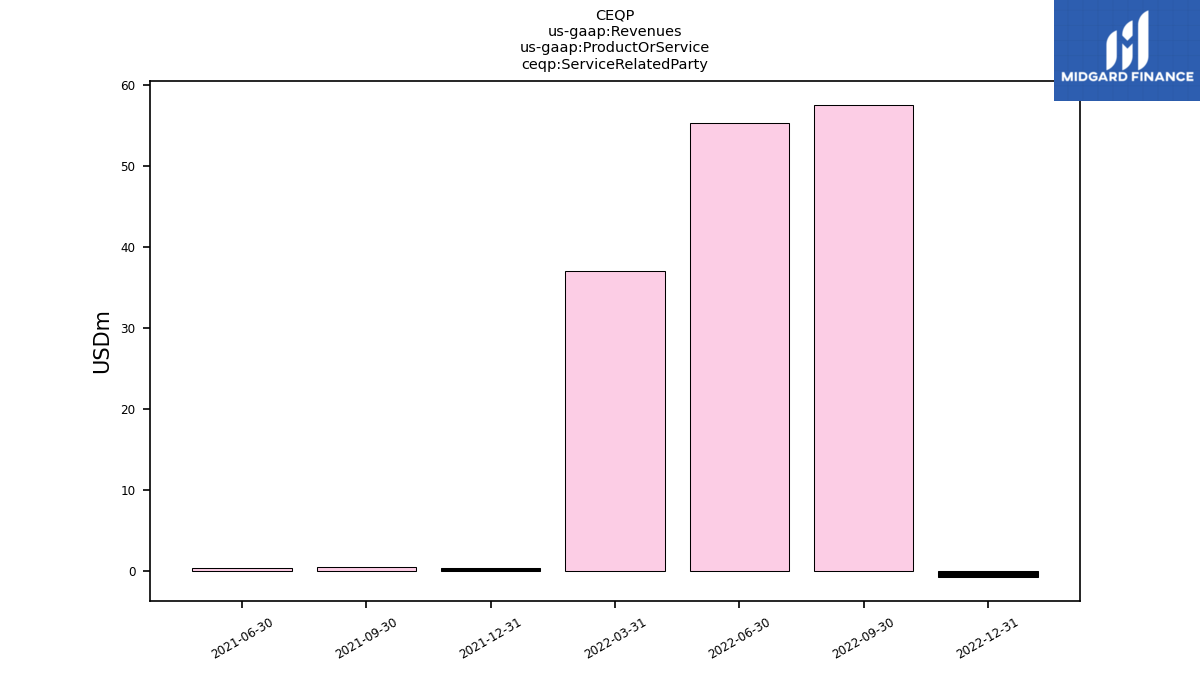
| Crestwood Midstream Partners Lp, Service Related Party | NA | NA | NA | -0.70 | 57.60 | 55.30 | 37.10 | 0.40 | 0.60 | 0.40 | NA | NA | NA | NA | NA | NA | NA | NA | NA | NA | NA | NA | NA | NA | NA | NA | NA | NA | NA | NA | NA | NA | NA | NA | NA | NA | NA | NA | NA | NA | NA | NA | NA | NA | NA | NA | NA | NA | NA | NA | NA | NA | NA | NA | NA | NA | |
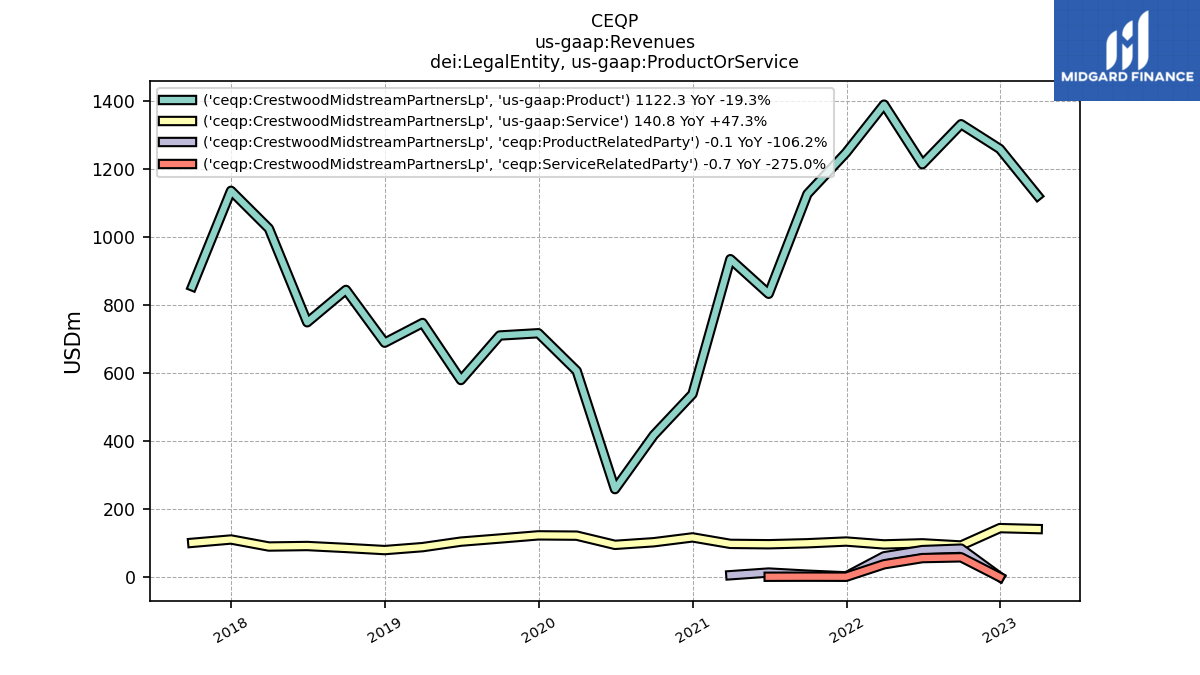
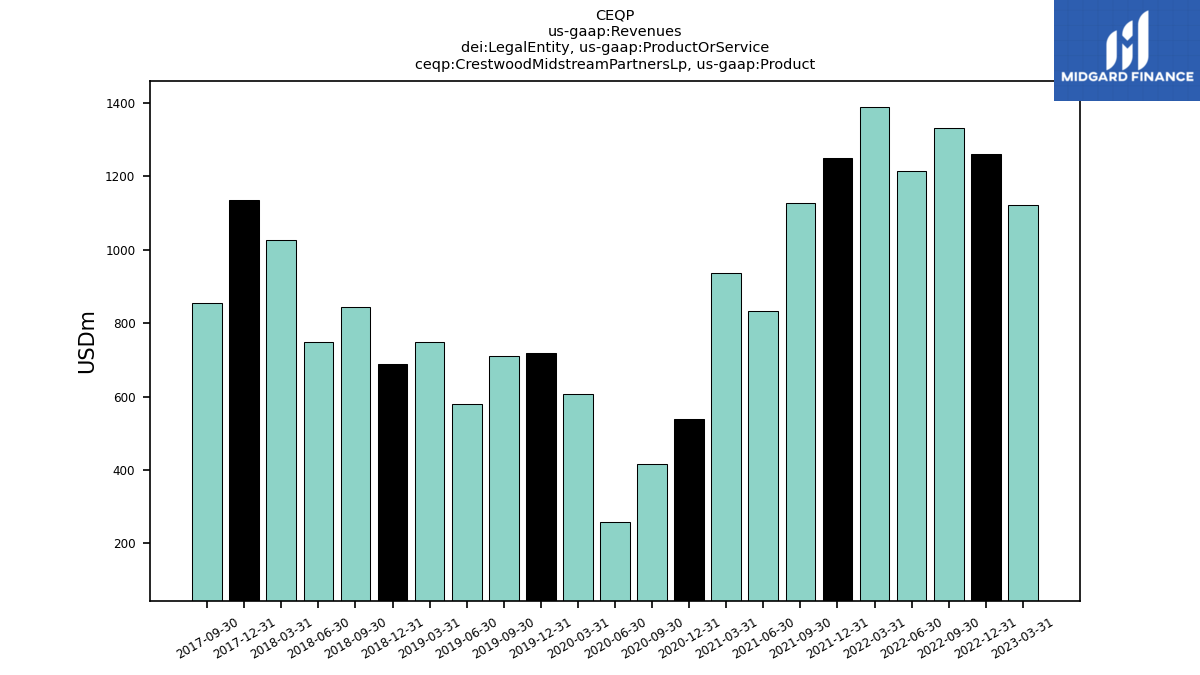
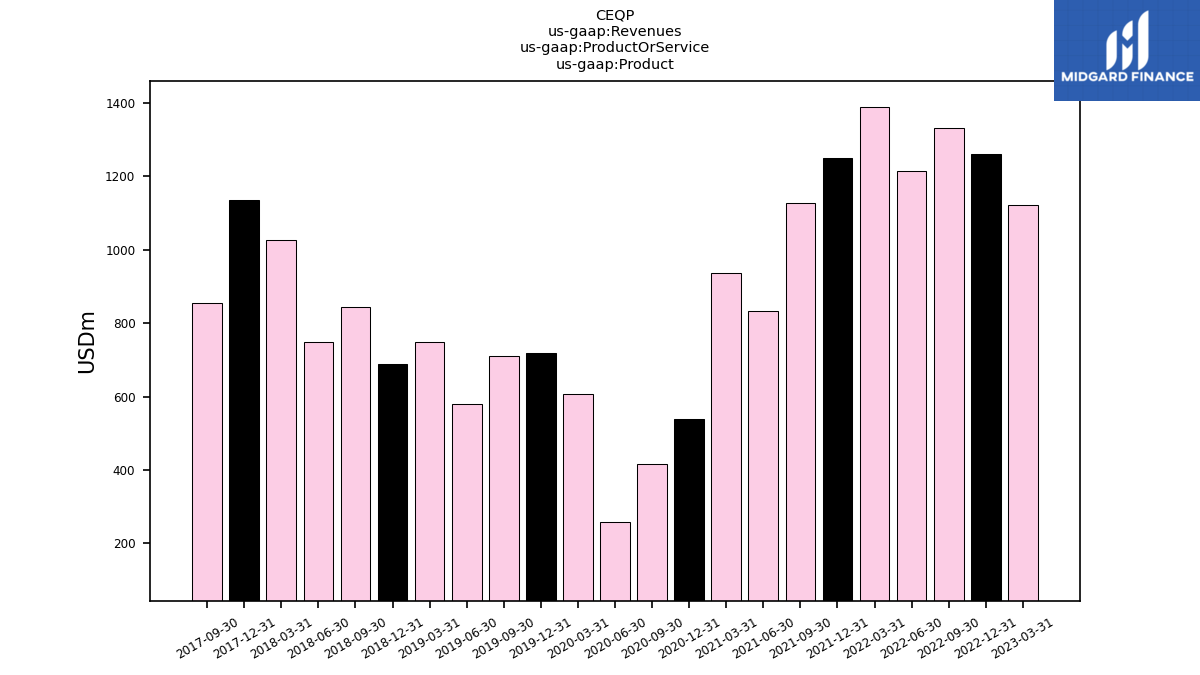
| Crestwood Midstream Partners Lp, Product | NA | NA | 1122.30 | 1260.10 | 1332.80 | 1215.00 | 1390.50 | 1249.10 | 1127.30 | 833.50 | 935.50 | 538.20 | 417.20 | 258.40 | 606.50 | 717.40 | 710.70 | 579.60 | 747.60 | 689.50 | 845.00 | 749.60 | 1025.60 | 1136.80 | 855.30 | NA | NA | NA | NA | NA | NA | NA | NA | NA | NA | NA | NA | NA | NA | NA | NA | NA | NA | NA | NA | NA | NA | NA | NA | NA | NA | NA | NA | NA | NA | NA | |
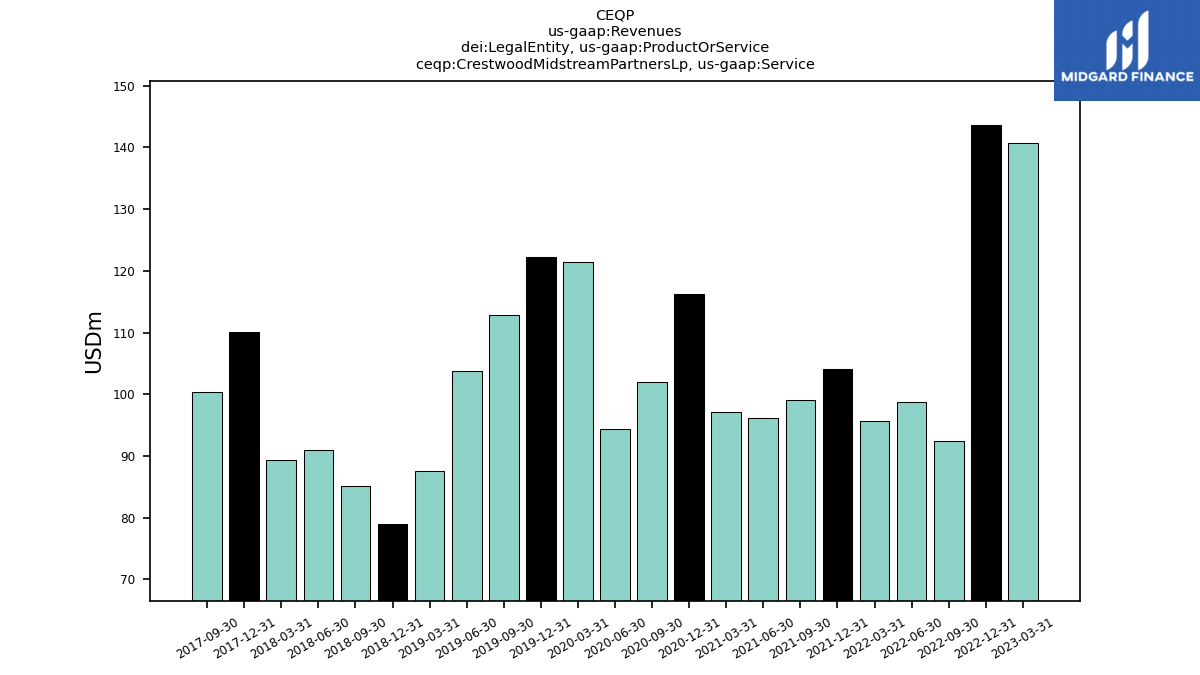
| Crestwood Midstream Partners Lp, Service | NA | NA | 140.80 | 143.60 | 92.40 | 98.80 | 95.60 | 104.10 | 99.00 | 96.10 | 97.20 | 116.30 | 102.00 | 94.30 | 121.40 | 122.30 | 112.90 | 103.80 | 87.60 | 78.90 | 85.20 | 90.90 | 89.40 | 110.10 | 100.30 | NA | NA | NA | NA | NA | NA | NA | NA | NA | NA | NA | NA | NA | NA | NA | NA | NA | NA | NA | NA | NA | NA | NA | NA | NA | NA | NA | NA | NA | NA | NA | |
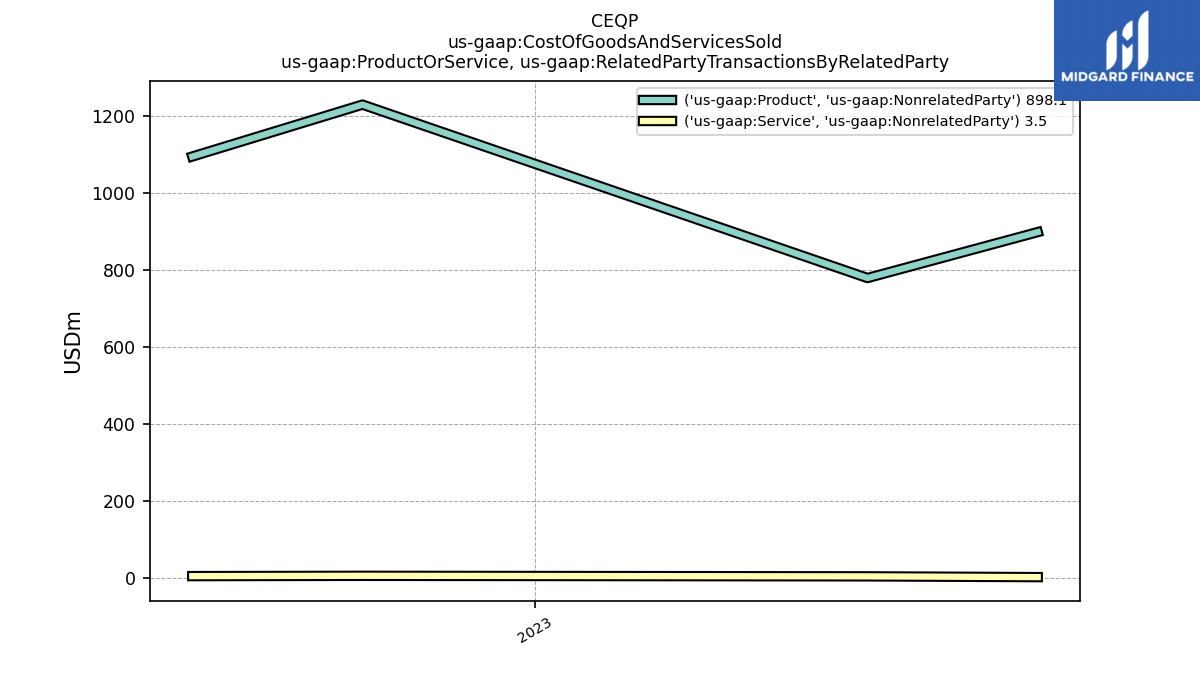
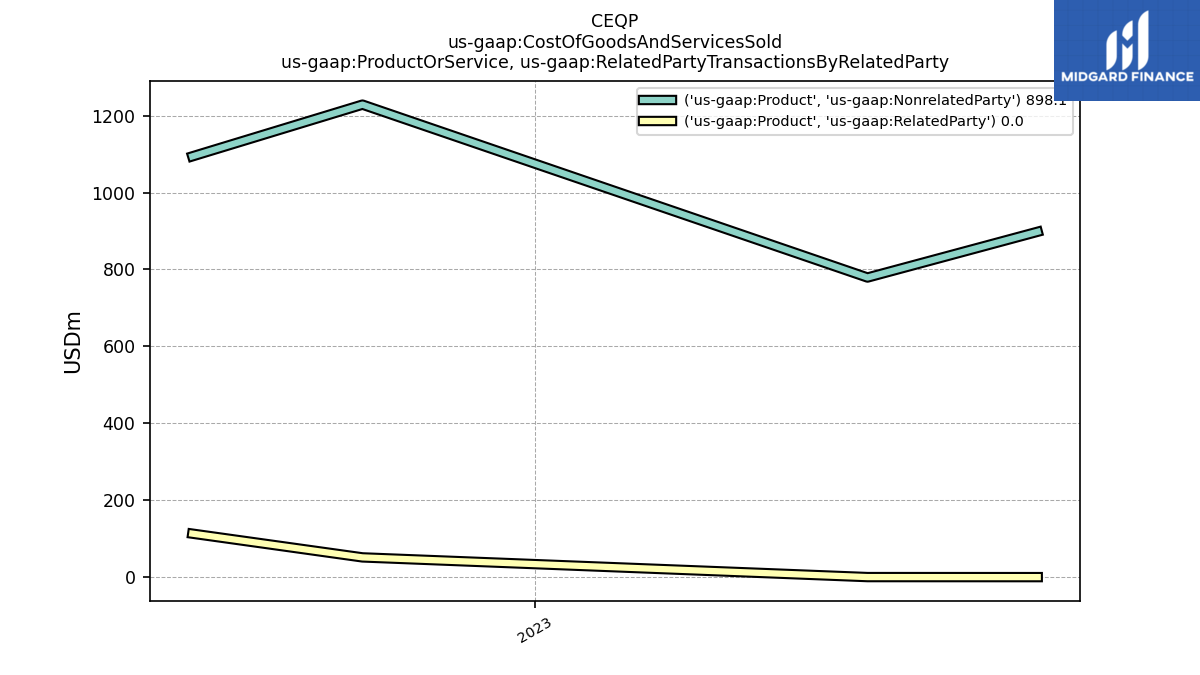
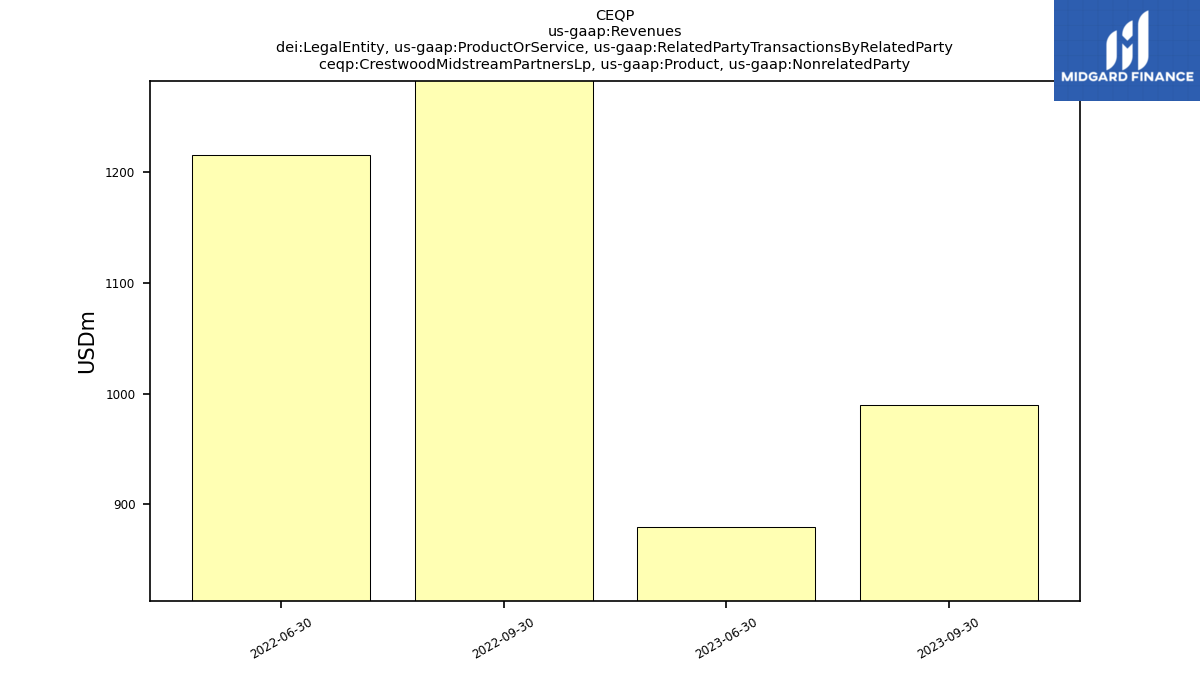
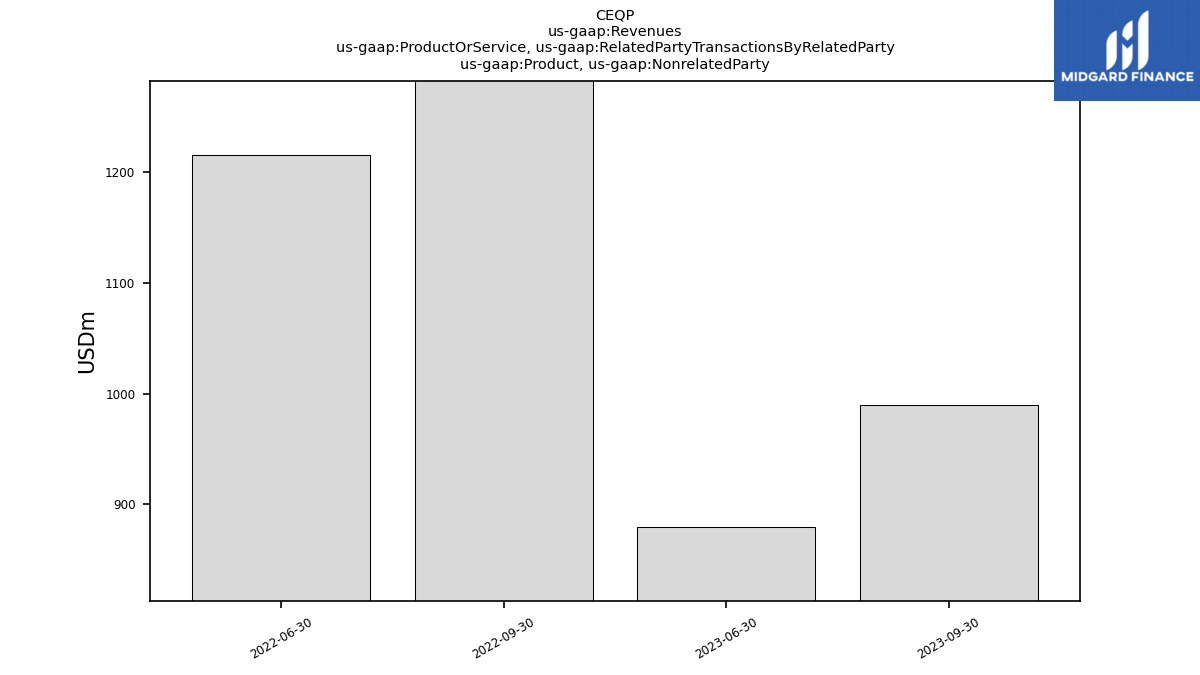
| Crestwood Midstream Partners Lp, Product, Nonrelated Party | 989.20 | 880.00 | NA | NA | 1332.80 | 1215.00 | NA | NA | NA | NA | NA | NA | NA | NA | NA | NA | NA | NA | NA | NA | NA | NA | NA | NA | NA | NA | NA | NA | NA | NA | NA | NA | NA | NA | NA | NA | NA | NA | NA | NA | NA | NA | NA | NA | NA | NA | NA | NA | NA | NA | NA | NA | NA | NA | NA | NA | |
| Crestwood Midstream Partners Lp, Product, Related Party | NA | NA | NA | NA | 83.20 | 78.90 | NA | NA | NA | NA | NA | NA | NA | NA | NA | NA | NA | NA | NA | NA | NA | NA | NA | NA | NA | NA | NA | NA | NA | NA | NA | NA | NA | NA | NA | NA | NA | NA | NA | NA | NA | NA | NA | NA | NA | NA | NA | NA | NA | NA | NA | NA | NA | NA | NA | NA | |
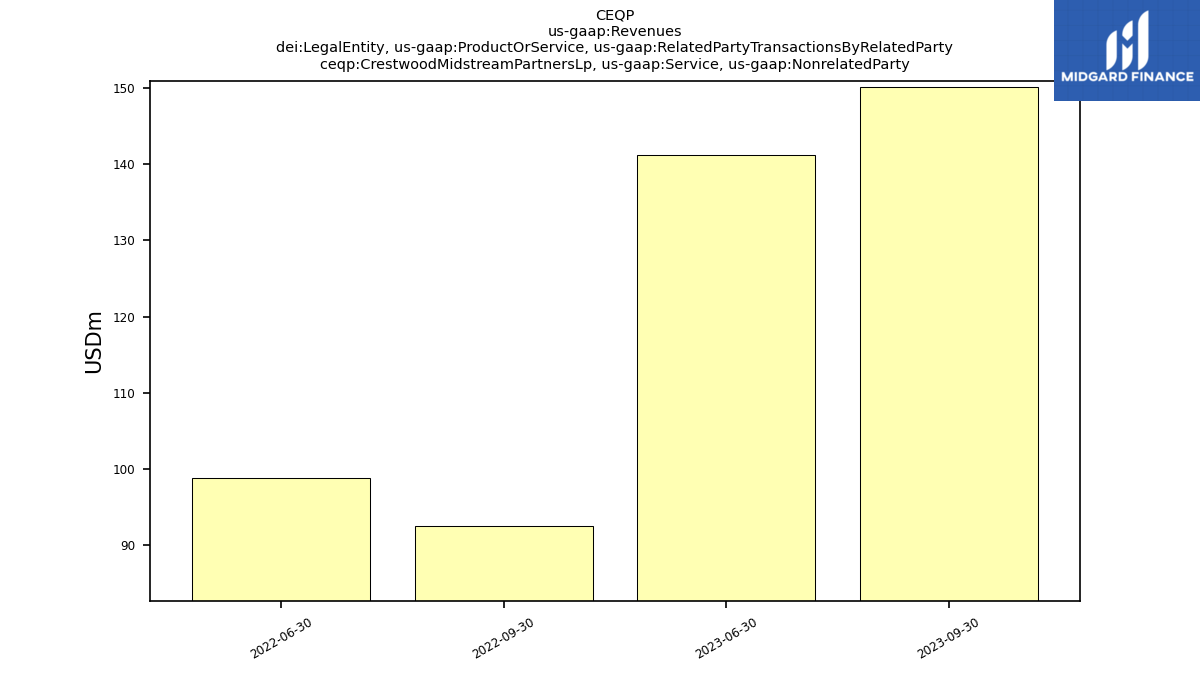
| Crestwood Midstream Partners Lp, Service, Nonrelated Party | 150.20 | 141.20 | NA | NA | 92.40 | 98.80 | NA | NA | NA | NA | NA | NA | NA | NA | NA | NA | NA | NA | NA | NA | NA | NA | NA | NA | NA | NA | NA | NA | NA | NA | NA | NA | NA | NA | NA | NA | NA | NA | NA | NA | NA | NA | NA | NA | NA | NA | NA | NA | NA | NA | NA | NA | NA | NA | NA | NA | |
| Crestwood Midstream Partners Lp, Service, Related Party | NA | NA | NA | NA | 57.60 | 55.30 | NA | NA | NA | NA | NA | NA | NA | NA | NA | NA | NA | NA | NA | NA | NA | NA | NA | NA | NA | NA | NA | NA | NA | NA | NA | NA | NA | NA | NA | NA | NA | NA | NA | NA | NA | NA | NA | NA | NA | NA | NA | NA | NA | NA | NA | NA | NA | NA | NA | NA | |
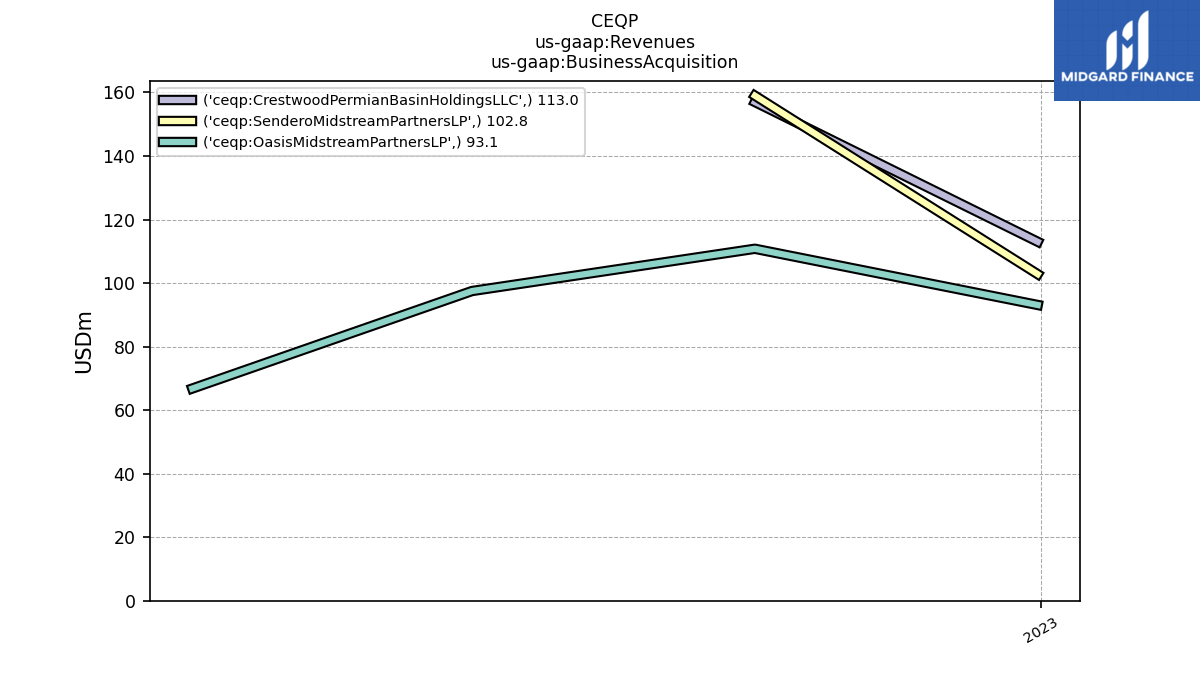
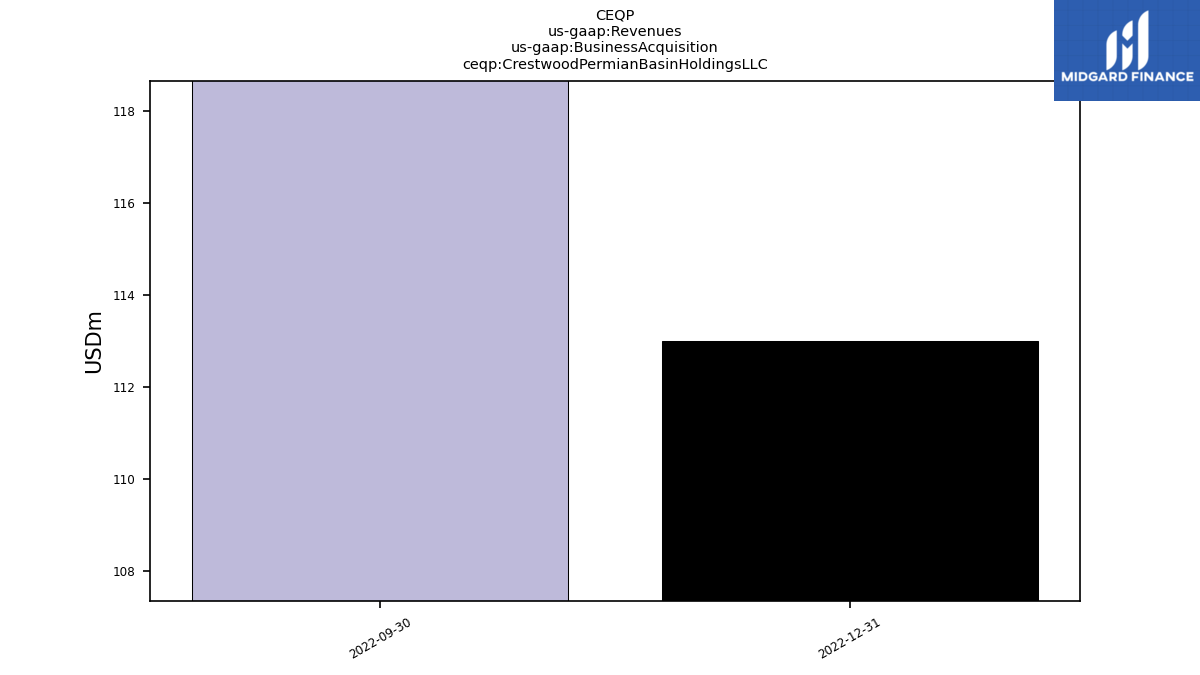
| Crestwood Permian Basin Holdings L L C | NA | NA | NA | 113.00 | 157.00 | NA | NA | NA | NA | NA | NA | NA | NA | NA | NA | NA | NA | NA | NA | NA | NA | NA | NA | NA | NA | NA | NA | NA | NA | NA | NA | NA | NA | NA | NA | NA | NA | NA | NA | NA | NA | NA | NA | NA | NA | NA | NA | NA | NA | NA | NA | NA | NA | NA | NA | NA | |
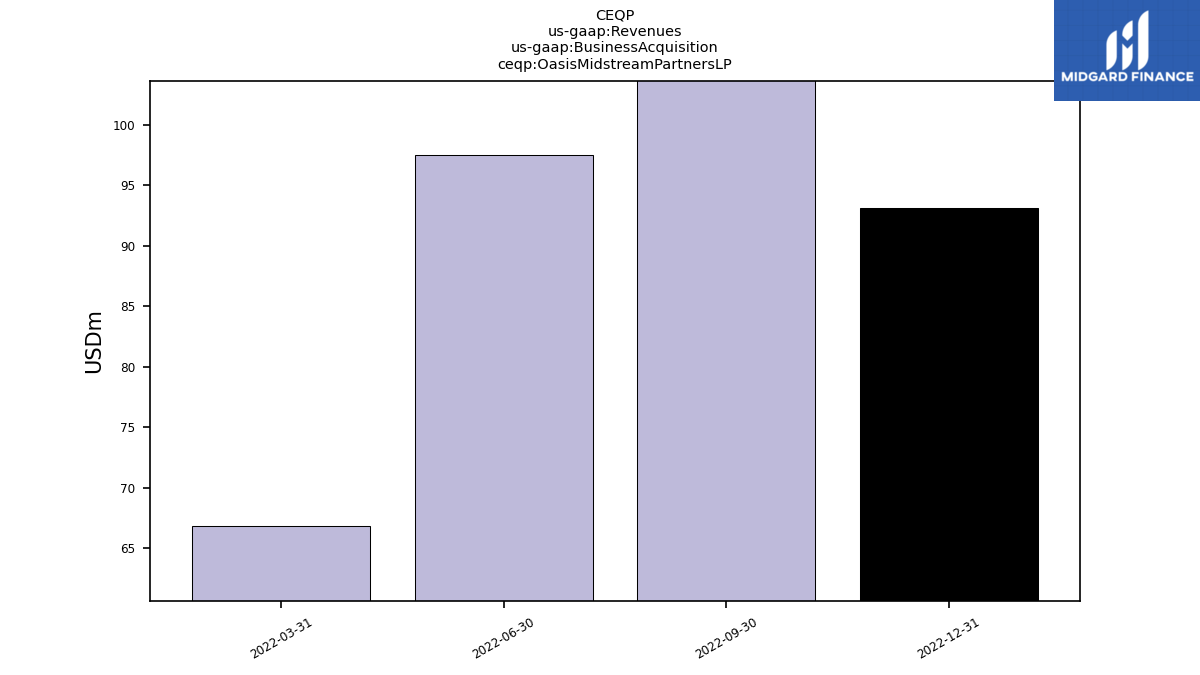
| Oasis Midstream Partners L P | NA | NA | NA | 93.10 | 110.80 | 97.50 | 66.80 | NA | NA | NA | NA | NA | NA | NA | NA | NA | NA | NA | NA | NA | NA | NA | NA | NA | NA | NA | NA | NA | NA | NA | NA | NA | NA | NA | NA | NA | NA | NA | NA | NA | NA | NA | NA | NA | NA | NA | NA | NA | NA | NA | NA | NA | NA | NA | NA | NA | |
| Sendero Midstream Partners L P | NA | NA | NA | 102.80 | 159.00 | NA | NA | NA | NA | NA | NA | NA | NA | NA | NA | NA | NA | NA | NA | NA | NA | NA | NA | NA | NA | NA | NA | NA | NA | NA | NA | NA | NA | NA | NA | NA | NA | NA | NA | NA | NA | NA | NA | NA | NA | NA | NA | NA | NA | NA | NA | NA | NA | NA | NA | NA | |
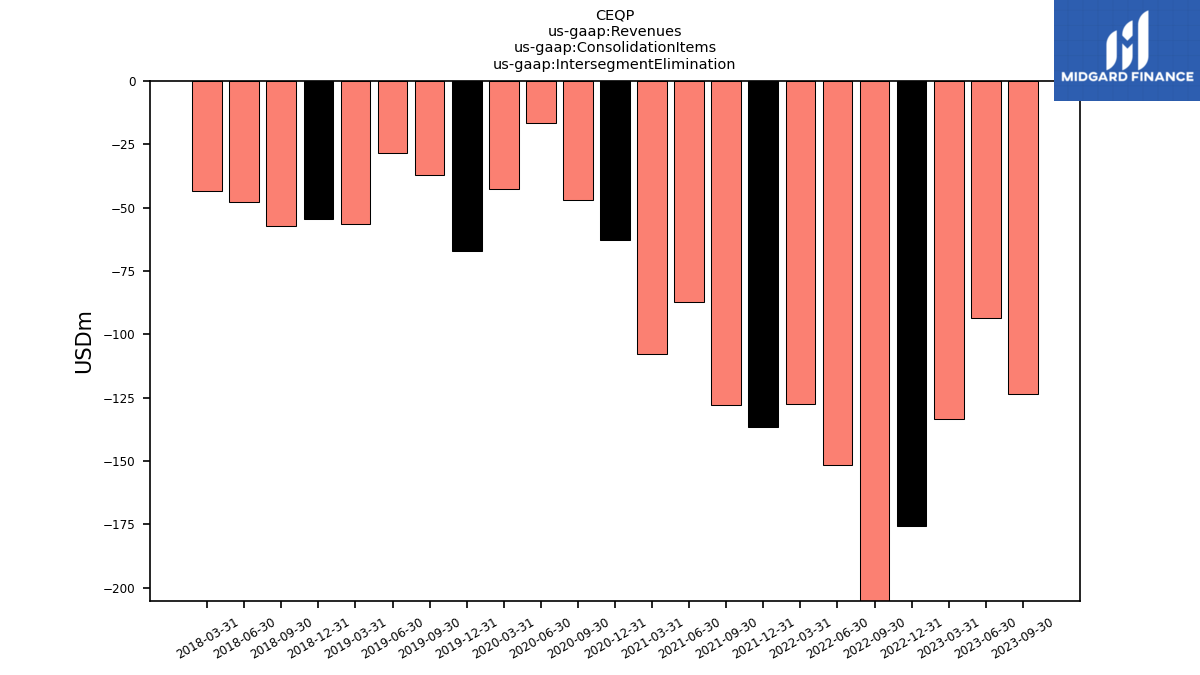
| Intersegment Elimination | -123.40 | -93.60 | -133.20 | -175.70 | -280.00 | -151.60 | -127.40 | -136.40 | -127.90 | -87.30 | -107.70 | -62.90 | -46.80 | -16.70 | -42.60 | -67.10 | -37.10 | -28.60 | -56.40 | -54.30 | -57.40 | -47.90 | -43.30 | NA | NA | NA | NA | NA | NA | NA | NA | NA | NA | NA | NA | NA | NA | NA | NA | NA | NA | NA | NA | NA | NA | NA | NA | NA | NA | NA | NA | NA | NA | NA | NA | NA | |
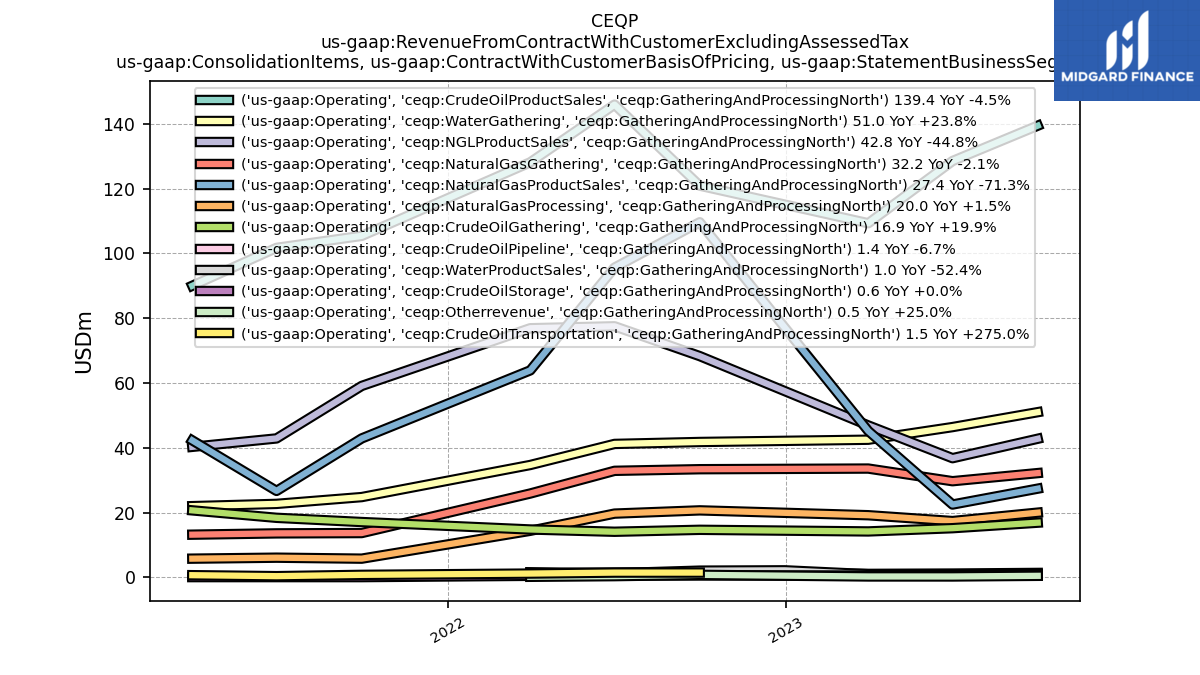
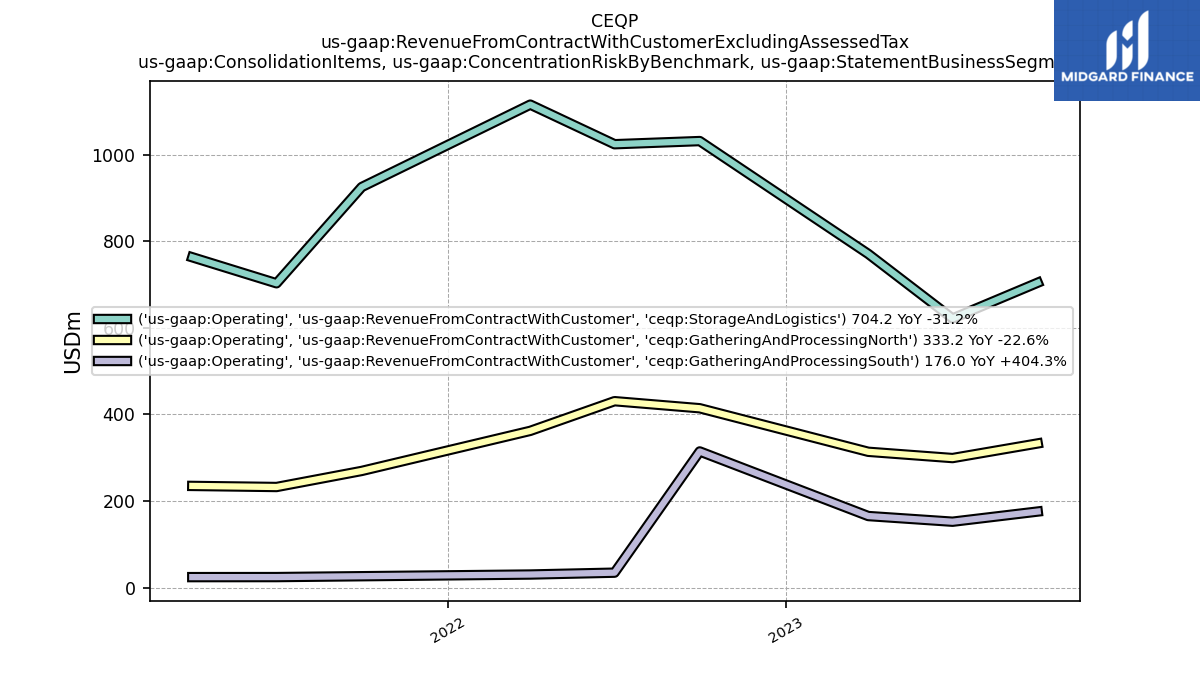
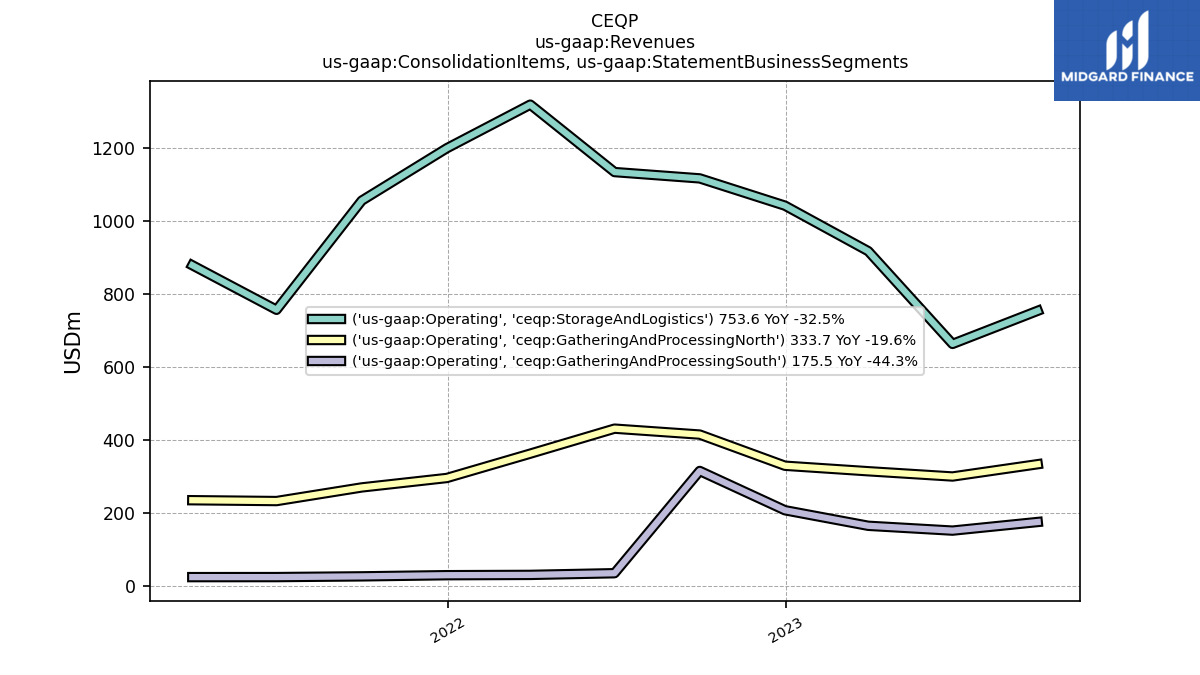
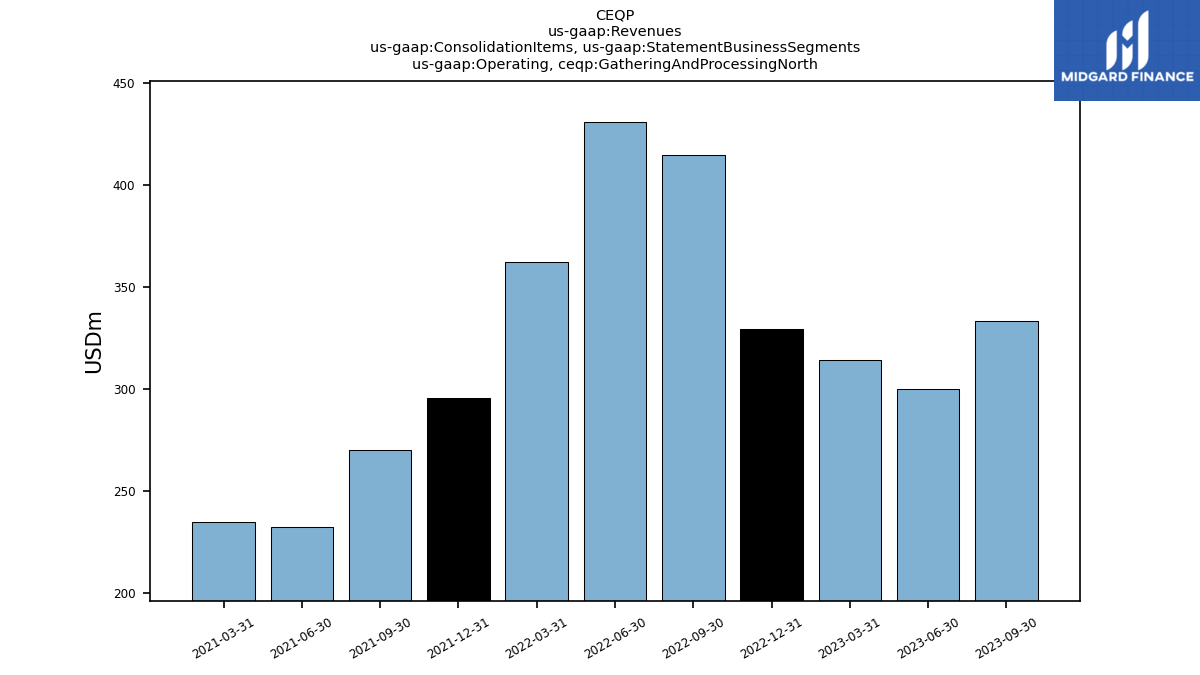
| Operating, Gathering And Processing North | 333.70 | 300.00 | 314.40 | 329.50 | 414.80 | 431.00 | 362.60 | 296.00 | 270.10 | 232.80 | 235.10 | NA | NA | NA | NA | NA | NA | NA | NA | NA | NA | NA | NA | NA | NA | NA | NA | NA | NA | NA | NA | NA | NA | NA | NA | NA | NA | NA | NA | NA | NA | NA | NA | NA | NA | NA | NA | NA | NA | NA | NA | NA | NA | NA | NA | NA | |
| Operating, Gathering And Processing South | 175.50 | 151.90 | 165.10 | 207.70 | 315.20 | 35.30 | 30.70 | 29.90 | 26.70 | 24.70 | 24.60 | NA | NA | NA | NA | NA | NA | NA | NA | NA | NA | NA | NA | NA | NA | NA | NA | NA | NA | NA | NA | NA | NA | NA | NA | NA | NA | NA | NA | NA | NA | NA | NA | NA | NA | NA | NA | NA | NA | NA | NA | NA | NA | NA | NA | NA | |
| Operating, Storage And Logistics | 753.60 | 662.90 | 916.80 | 1041.40 | 1116.00 | 1133.30 | 1317.90 | 1198.70 | 1055.10 | 756.30 | 878.30 | NA | NA | NA | NA | NA | NA | NA | NA | NA | NA | NA | NA | NA | NA | NA | NA | NA | NA | NA | NA | NA | NA | NA | NA | NA | NA | NA | NA | NA | NA | NA | NA | NA | NA | NA | NA | NA | NA | NA | NA | NA | NA | NA | NA | NA | |
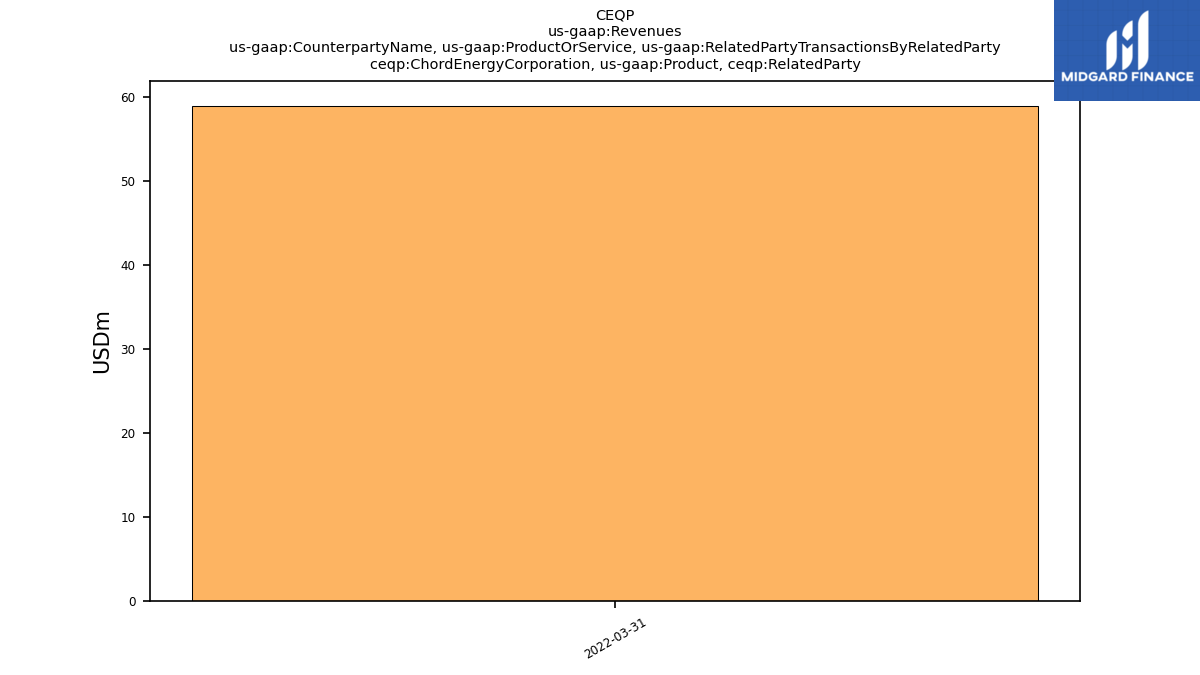
| Chord Energy Corporation, Product, Related Party | NA | NA | NA | NA | NA | NA | 59.00 | NA | NA | NA | NA | NA | NA | NA | NA | NA | NA | NA | NA | NA | NA | NA | NA | NA | NA | NA | NA | NA | NA | NA | NA | NA | NA | NA | NA | NA | NA | NA | NA | NA | NA | NA | NA | NA | NA | NA | NA | NA | NA | NA | NA | NA | NA | NA | NA | NA | |
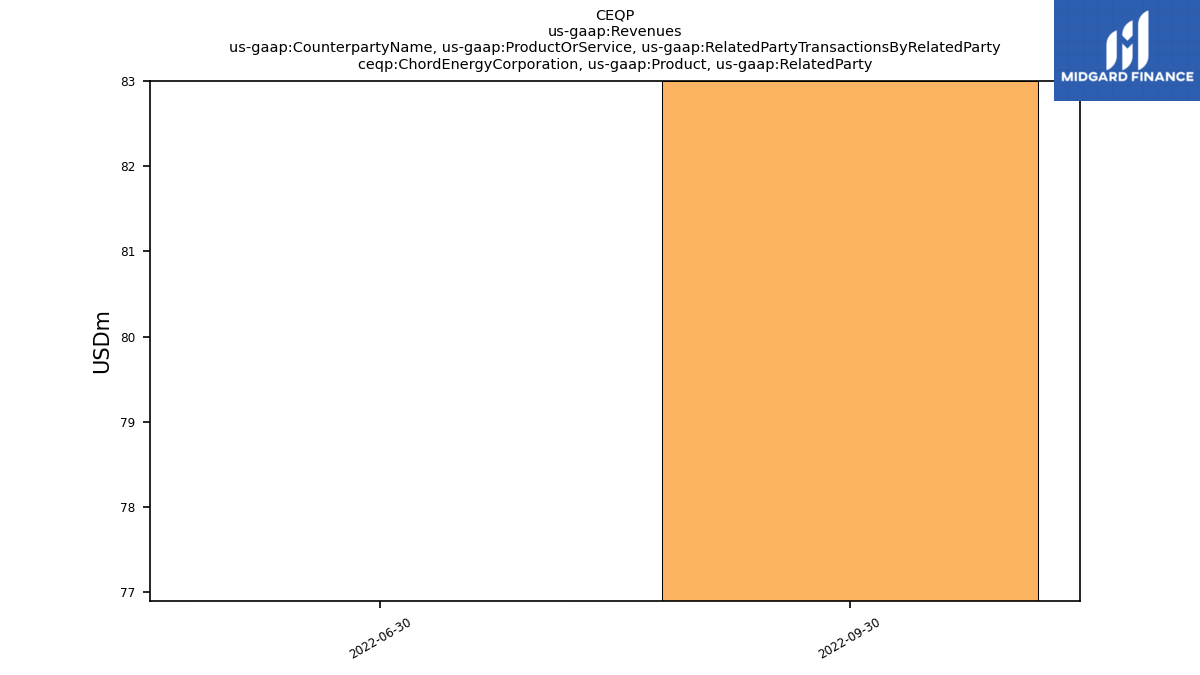
| Chord Energy Corporation, Product, Related Party | NA | NA | NA | NA | 83.00 | 76.90 | NA | NA | NA | NA | NA | NA | NA | NA | NA | NA | NA | NA | NA | NA | NA | NA | NA | NA | NA | NA | NA | NA | NA | NA | NA | NA | NA | NA | NA | NA | NA | NA | NA | NA | NA | NA | NA | NA | NA | NA | NA | NA | NA | NA | NA | NA | NA | NA | NA | NA | |
| Chord Energy Corporation, Service, Related Party | NA | NA | NA | NA | NA | NA | 36.60 | NA | NA | NA | NA | NA | NA | NA | NA | NA | NA | NA | NA | NA | NA | NA | NA | NA | NA | NA | NA | NA | NA | NA | NA | NA | NA | NA | NA | NA | NA | NA | NA | NA | NA | NA | NA | NA | NA | NA | NA | NA | NA | NA | NA | NA | NA | NA | NA | NA | |
| Chord Energy Corporation, Service, Related Party | NA | NA | NA | NA | 57.40 | 54.60 | NA | NA | NA | NA | NA | NA | NA | NA | NA | NA | NA | NA | NA | NA | NA | NA | NA | NA | NA | NA | NA | NA | NA | NA | NA | NA | NA | NA | NA | NA | NA | NA | NA | NA | NA | NA | NA | NA | NA | NA | NA | NA | NA | NA | NA | NA | NA | NA | NA | NA | |
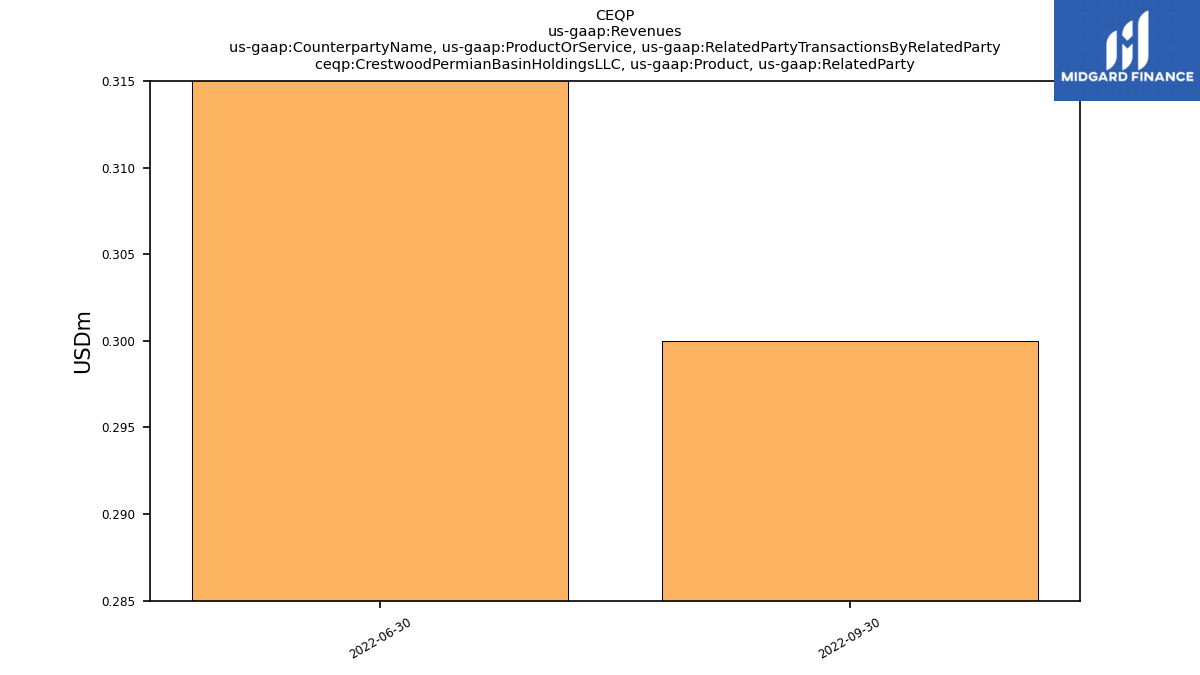
| Crestwood Permian Basin Holdings L L C, Product, Related Party | NA | NA | NA | NA | NA | NA | 1.60 | NA | NA | NA | NA | NA | NA | NA | NA | NA | NA | NA | NA | NA | NA | NA | NA | NA | NA | NA | NA | NA | NA | NA | NA | NA | NA | NA | NA | NA | NA | NA | NA | NA | NA | NA | NA | NA | NA | NA | NA | NA | NA | NA | NA | NA | NA | NA | NA | NA | |
| Crestwood Permian Basin Holdings L L C, Product, Related Party | NA | NA | NA | NA | 0.30 | 2.00 | NA | NA | NA | NA | NA | NA | NA | NA | NA | NA | NA | NA | NA | NA | NA | NA | NA | NA | NA | NA | NA | NA | NA | NA | NA | NA | NA | NA | NA | NA | NA | NA | NA | NA | NA | NA | NA | NA | NA | NA | NA | NA | NA | NA | NA | NA | NA | NA | NA | NA | |
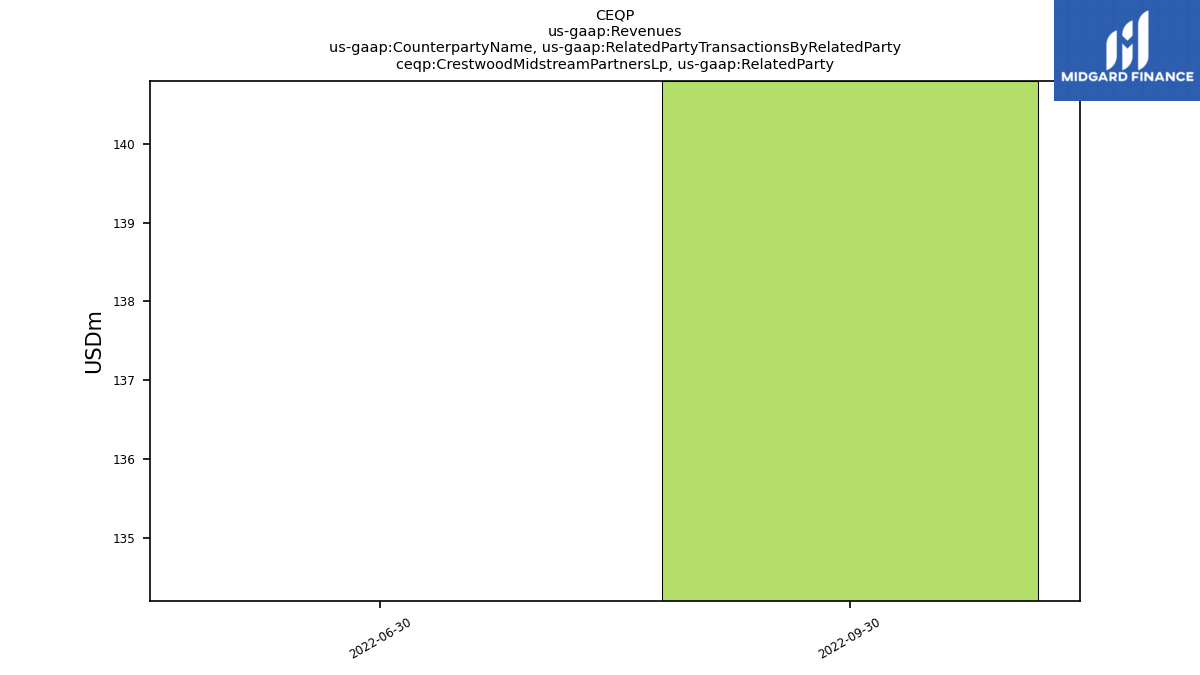
| Crestwood Midstream Partners Lp, Related Party | NA | NA | NA | NA | 140.80 | 134.20 | NA | NA | NA | NA | NA | NA | NA | NA | NA | NA | NA | NA | NA | NA | NA | NA | NA | NA | NA | NA | NA | NA | NA | NA | NA | NA | NA | NA | NA | NA | NA | NA | NA | NA | NA | NA | NA | NA | NA | NA | NA | NA | NA | NA | NA | NA | NA | NA | NA | NA | |
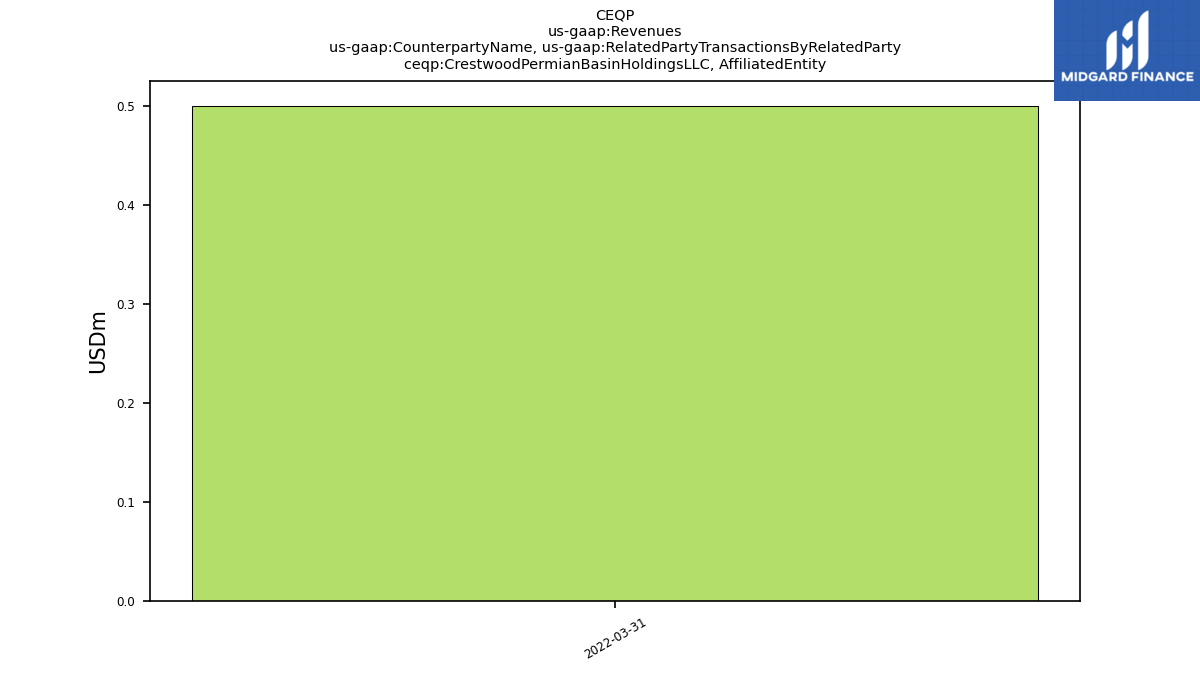
| Crestwood Permian Basin Holdings L L C, | NA | NA | NA | NA | NA | NA | 0.50 | NA | NA | NA | NA | NA | NA | NA | NA | NA | NA | NA | NA | NA | NA | NA | NA | NA | NA | NA | NA | NA | NA | NA | NA | NA | NA | NA | NA | NA | NA | NA | NA | NA | NA | NA | NA | NA | NA | NA | NA | NA | NA | NA | NA | NA | NA | NA | NA | NA | |
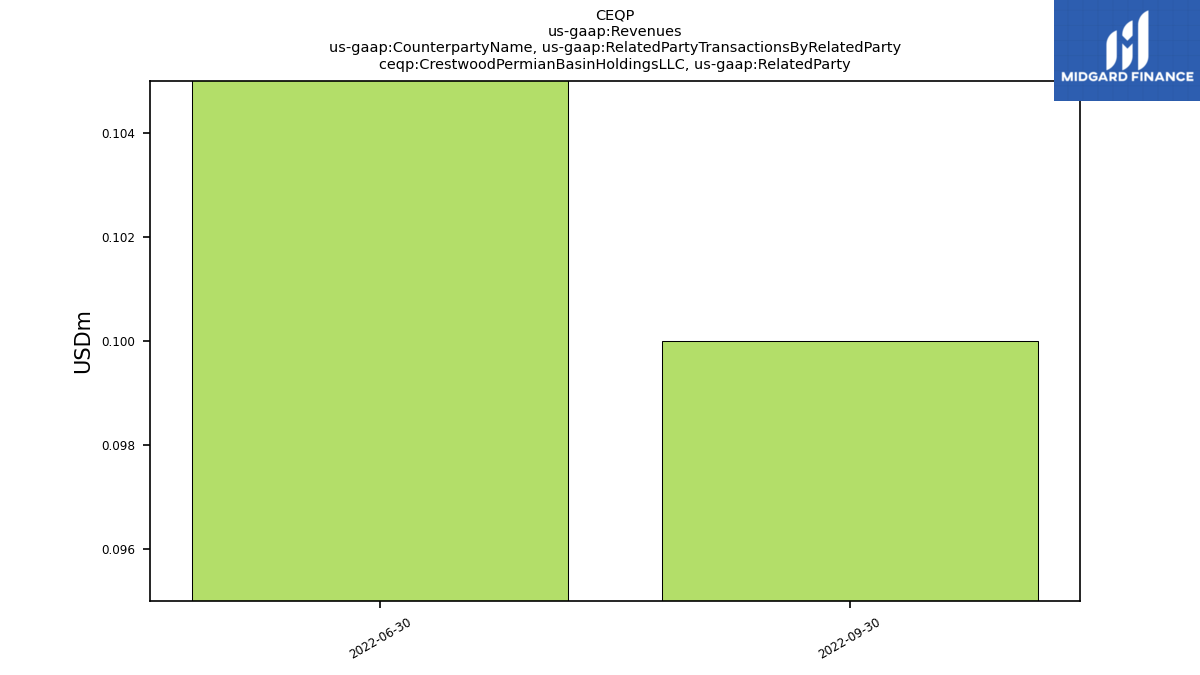
| Crestwood Permian Basin Holdings L L C, Related Party | NA | NA | NA | NA | 0.10 | 0.70 | NA | NA | NA | NA | NA | NA | NA | NA | NA | NA | NA | NA | NA | NA | NA | NA | NA | NA | NA | NA | NA | NA | NA | NA | NA | NA | NA | NA | NA | NA | NA | NA | NA | NA | NA | NA | NA | NA | NA | NA | NA | NA | NA | NA | NA | NA | NA | NA | NA | NA | |
| Product Related Party | NA | NA | NA | -0.10 | 83.20 | 78.90 | 60.60 | 1.60 | 6.50 | 12.80 | 4.90 | NA | NA | NA | NA | NA | NA | NA | NA | NA | NA | NA | NA | NA | NA | NA | NA | NA | NA | NA | NA | NA | NA | NA | NA | NA | NA | NA | NA | NA | NA | NA | NA | NA | NA | NA | NA | NA | NA | NA | NA | NA | NA | NA | NA | NA | |
| Service Related Party | NA | NA | NA | -0.70 | 57.60 | 55.30 | 37.10 | 0.40 | 0.60 | 0.40 | NA | NA | NA | NA | NA | NA | NA | NA | NA | NA | NA | NA | NA | NA | NA | NA | NA | NA | NA | NA | NA | NA | NA | NA | NA | NA | NA | NA | NA | NA | NA | NA | NA | NA | NA | NA | NA | NA | NA | NA | NA | NA | NA | NA | NA | NA | |
| Product | NA | NA | 1122.30 | 1260.10 | 1332.80 | 1215.00 | 1390.50 | 1249.10 | 1127.30 | 833.50 | 935.50 | 538.20 | 417.20 | 258.40 | 606.50 | 717.40 | 710.70 | 579.60 | 747.60 | 689.50 | 845.00 | 749.60 | 1025.60 | 1136.80 | 855.30 | NA | NA | NA | NA | NA | NA | NA | NA | NA | NA | NA | NA | NA | NA | NA | NA | NA | NA | NA | NA | NA | NA | NA | NA | NA | NA | NA | NA | NA | NA | NA | |
| Service | NA | NA | 140.80 | 143.60 | 92.40 | 98.80 | 95.60 | 104.10 | 99.00 | 96.10 | 97.20 | 116.30 | 102.00 | 94.30 | 121.40 | 122.30 | 112.90 | 103.80 | 87.60 | 78.90 | 85.20 | 90.90 | 89.40 | 110.10 | 100.30 | NA | NA | NA | NA | NA | NA | NA | NA | NA | NA | NA | NA | NA | NA | NA | NA | NA | NA | NA | NA | NA | NA | NA | NA | NA | NA | NA | NA | NA | NA | NA | |
| Product, Nonrelated Party | 989.20 | 880.00 | NA | NA | 1332.80 | 1215.00 | NA | NA | NA | NA | NA | NA | NA | NA | NA | NA | NA | NA | NA | NA | NA | NA | NA | NA | NA | NA | NA | NA | NA | NA | NA | NA | NA | NA | NA | NA | NA | NA | NA | NA | NA | NA | NA | NA | NA | NA | NA | NA | NA | NA | NA | NA | NA | NA | NA | NA | |
| Product, Related Party | NA | NA | NA | NA | 83.20 | 78.90 | NA | NA | NA | NA | NA | NA | NA | NA | NA | NA | NA | NA | NA | NA | NA | NA | NA | NA | NA | NA | NA | NA | NA | NA | NA | NA | NA | NA | NA | NA | NA | NA | NA | NA | NA | NA | NA | NA | NA | NA | NA | NA | NA | NA | NA | NA | NA | NA | NA | NA | |
| Service, Nonrelated Party | 150.20 | 141.20 | NA | NA | 92.40 | 98.80 | NA | NA | NA | NA | NA | NA | NA | NA | NA | NA | NA | NA | NA | NA | NA | NA | NA | NA | NA | NA | NA | NA | NA | NA | NA | NA | NA | NA | NA | NA | NA | NA | NA | NA | NA | NA | NA | NA | NA | NA | NA | NA | NA | NA | NA | NA | NA | NA | NA | NA | |
| Service, Related Party | NA | NA | NA | NA | 57.60 | 55.30 | NA | NA | NA | NA | NA | NA | NA | NA | NA | NA | NA | NA | NA | NA | NA | NA | NA | NA | NA | NA | NA | NA | NA | NA | NA | NA | NA | NA | NA | NA | NA | NA | NA | NA | NA | NA | NA | NA | NA | NA | NA | NA | NA | NA | NA | NA | NA | NA | NA | NA | |
| Crestwood Permian Basin Holdings L L C | NA | NA | NA | 0.00 | 0.10 | 0.70 | 0.50 | NA | NA | NA | NA | NA | NA | NA | NA | NA | NA | NA | NA | NA | NA | NA | NA | NA | NA | NA | NA | NA | NA | NA | NA | NA | NA | NA | NA | NA | NA | NA | NA | NA | NA | NA | NA | NA | NA | NA | NA | NA | NA | NA | NA | NA | NA | NA | NA | NA | |
| Related Party | NA | NA | NA | NA | NA | NA | 97.70 | NA | NA | NA | NA | NA | NA | NA | NA | NA | NA | NA | NA | NA | NA | NA | NA | NA | NA | NA | NA | NA | NA | NA | NA | NA | NA | NA | NA | NA | NA | NA | NA | NA | NA | NA | NA | NA | NA | NA | NA | NA | NA | NA | NA | NA | NA | NA | NA | NA | |
| Revenue From Contract With Customer | 1090.00 | 979.90 | 1116.90 | 1250.30 | 1480.20 | 1337.80 | 1380.60 | 1189.60 | 1095.80 | 875.90 | 917.30 | 565.00 | 486.30 | 334.40 | 652.60 | 770.50 | 784.20 | 643.00 | 730.90 | 635.80 | 850.30 | 807.50 | 1017.20 | NA | NA | NA | NA | NA | NA | NA | NA | NA | NA | NA | NA | NA | NA | NA | NA | NA | NA | NA | NA | NA | NA | NA | NA | NA | NA | NA | NA | NA | NA | NA | NA | NA | |
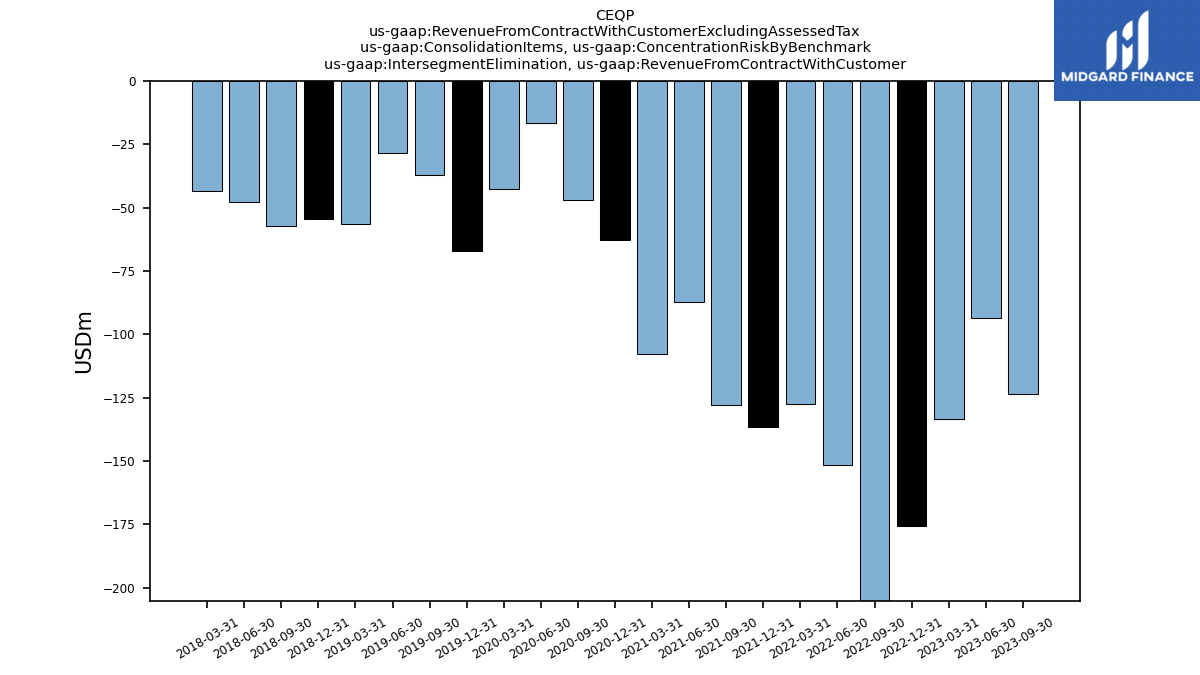
| Intersegment Elimination, Revenue From Contract With Customer | -123.40 | -93.60 | -133.20 | -175.70 | -280.00 | -151.60 | -127.40 | -136.40 | -127.90 | -87.30 | -107.70 | -62.90 | -46.80 | -16.70 | -42.60 | -67.10 | -37.10 | -28.60 | -56.40 | -54.30 | -57.40 | -47.90 | -43.30 | NA | NA | NA | NA | NA | NA | NA | NA | NA | NA | NA | NA | NA | NA | NA | NA | NA | NA | NA | NA | NA | NA | NA | NA | NA | NA | NA | NA | NA | NA | NA | NA | NA | |
| Operating, Revenue From Contract With Customer, Gathering And Processing North | 333.20 | 299.40 | 313.90 | NA | 414.40 | 430.70 | 362.20 | NA | 269.70 | 232.60 | 235.10 | NA | NA | NA | NA | NA | NA | NA | NA | NA | NA | NA | NA | NA | NA | NA | NA | NA | NA | NA | NA | NA | NA | NA | NA | NA | NA | NA | NA | NA | NA | NA | NA | NA | NA | NA | NA | NA | NA | NA | NA | NA | NA | NA | NA | NA | |
| Operating, Revenue From Contract With Customer, Gathering And Processing South | 176.00 | 152.50 | 165.60 | NA | 314.70 | 34.90 | 30.60 | NA | 26.70 | 24.70 | 24.60 | NA | NA | NA | NA | NA | NA | NA | NA | NA | NA | NA | NA | NA | NA | NA | NA | NA | NA | NA | NA | NA | NA | NA | NA | NA | NA | NA | NA | NA | NA | NA | NA | NA | NA | NA | NA | NA | NA | NA | NA | NA | NA | NA | NA | NA | |
| Operating, Revenue From Contract With Customer, Storage And Logistics | 704.20 | 621.60 | 770.60 | NA | 1031.10 | 1023.80 | 1115.20 | NA | 925.00 | 702.80 | 762.90 | NA | NA | NA | NA | NA | NA | NA | NA | NA | NA | NA | NA | NA | NA | NA | NA | NA | NA | NA | NA | NA | NA | NA | NA | NA | NA | NA | NA | NA | NA | NA | NA | NA | NA | NA | NA | NA | NA | NA | NA | NA | NA | NA | NA | NA | |
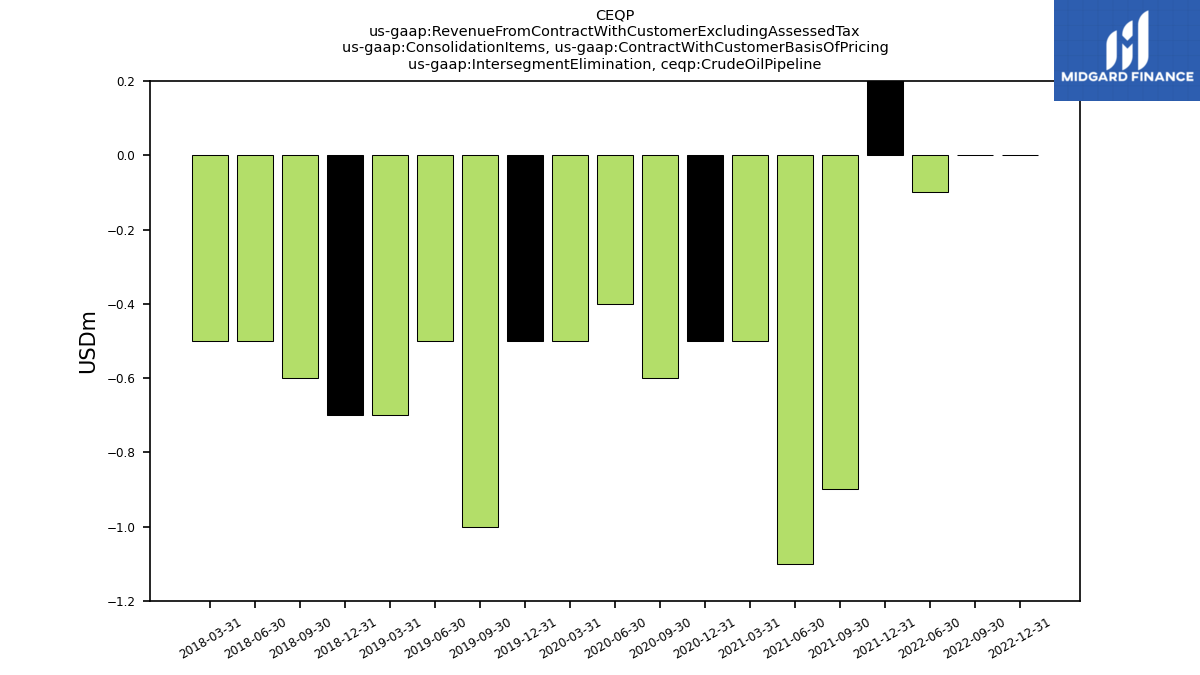
| Intersegment Elimination, Crude Oil Pipeline | NA | NA | NA | 0.00 | 0.00 | -0.10 | NA | 2.40 | -0.90 | -1.10 | -0.50 | -0.50 | -0.60 | -0.40 | -0.50 | -0.50 | -1.00 | -0.50 | -0.70 | -0.70 | -0.60 | -0.50 | -0.50 | NA | NA | NA | NA | NA | NA | NA | NA | NA | NA | NA | NA | NA | NA | NA | NA | NA | NA | NA | NA | NA | NA | NA | NA | NA | NA | NA | NA | NA | NA | NA | NA | NA | |
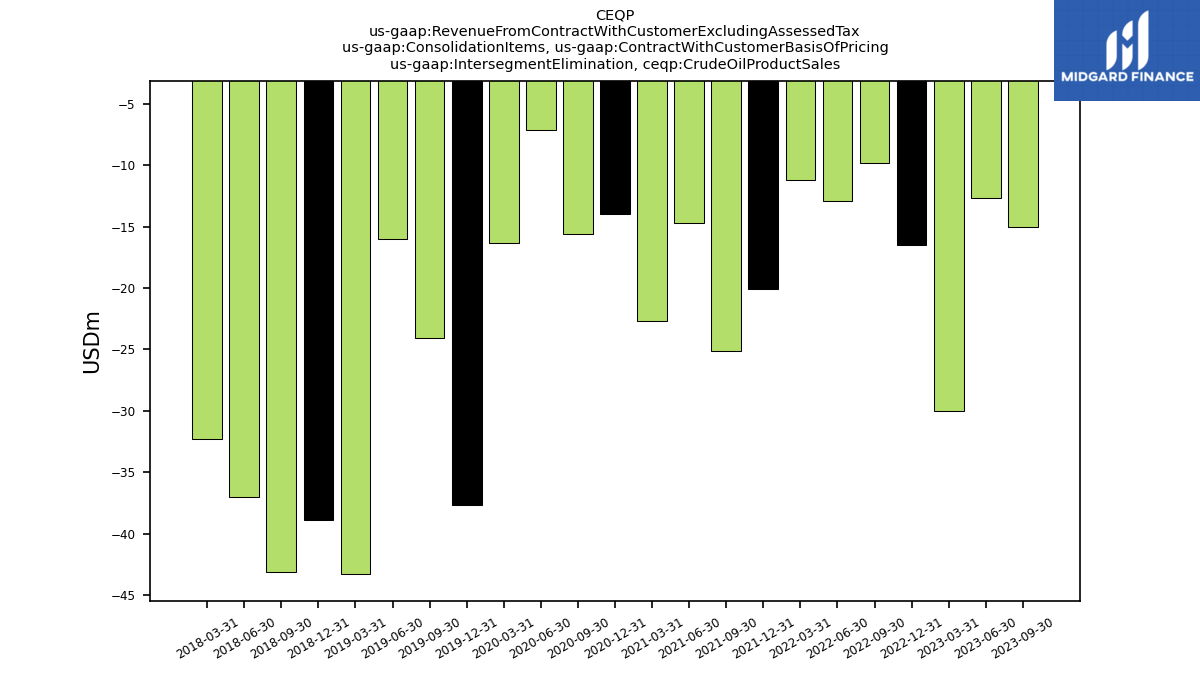
| Intersegment Elimination, Crude Oil Product Sales | -15.00 | -12.70 | -30.00 | -16.50 | -9.80 | -12.90 | -11.20 | -20.10 | -25.10 | -14.70 | -22.70 | -14.00 | -15.60 | -7.10 | -16.30 | -37.70 | -24.10 | -16.00 | -43.30 | -38.90 | -43.10 | -37.00 | -32.30 | NA | NA | NA | NA | NA | NA | NA | NA | NA | NA | NA | NA | NA | NA | NA | NA | NA | NA | NA | NA | NA | NA | NA | NA | NA | NA | NA | NA | NA | NA | NA | NA | NA | |
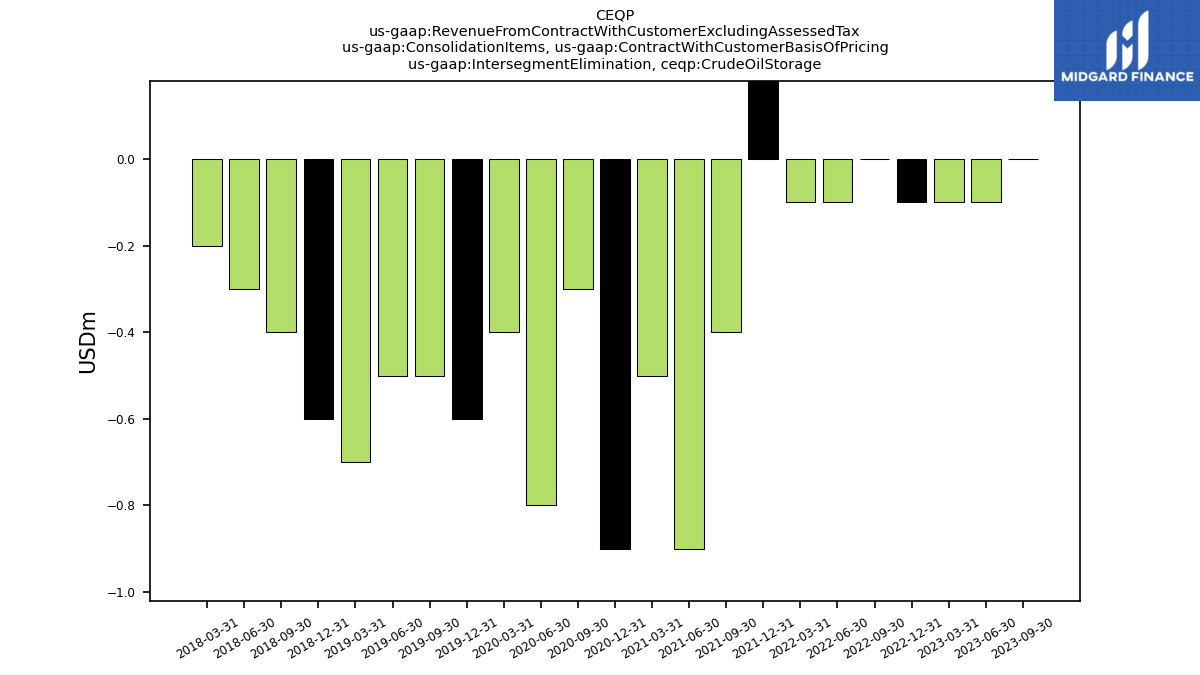
| Intersegment Elimination, Crude Oil Storage | 0.00 | -0.10 | -0.10 | -0.10 | 0.00 | -0.10 | -0.10 | 1.50 | -0.40 | -0.90 | -0.50 | -0.90 | -0.30 | -0.80 | -0.40 | -0.60 | -0.50 | -0.50 | -0.70 | -0.60 | -0.40 | -0.30 | -0.20 | NA | NA | NA | NA | NA | NA | NA | NA | NA | NA | NA | NA | NA | NA | NA | NA | NA | NA | NA | NA | NA | NA | NA | NA | NA | NA | NA | NA | NA | NA | NA | NA | NA | |
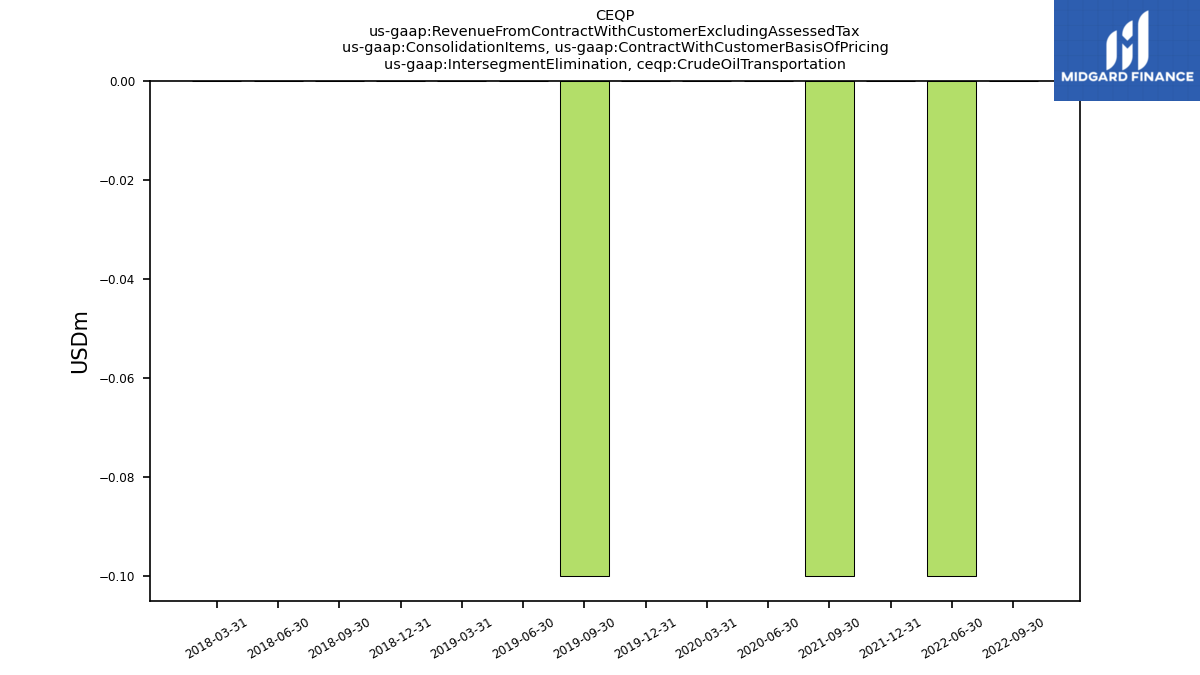
| Intersegment Elimination, Crude Oil Transportation | NA | NA | NA | NA | 0.00 | -0.10 | NA | 0.00 | -0.10 | NA | NA | NA | NA | 0.00 | 0.00 | 0.00 | -0.10 | 0.00 | 0.00 | 0.00 | 0.00 | 0.00 | 0.00 | NA | NA | NA | NA | NA | NA | NA | NA | NA | NA | NA | NA | NA | NA | NA | NA | NA | NA | NA | NA | NA | NA | NA | NA | NA | NA | NA | NA | NA | NA | NA | NA | NA | |
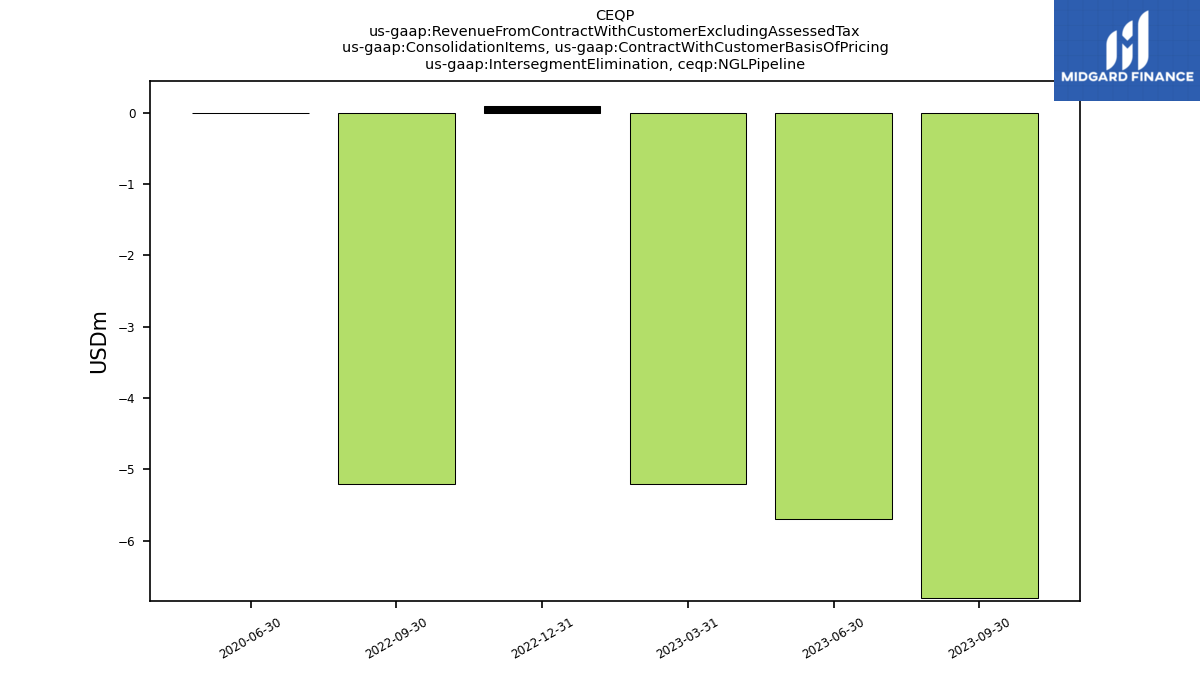
| Intersegment Elimination, N G L Pipeline | -6.80 | -5.70 | -5.20 | 0.10 | -5.20 | NA | NA | NA | NA | NA | NA | NA | NA | 0.00 | NA | NA | NA | NA | NA | NA | NA | NA | NA | NA | NA | NA | NA | NA | NA | NA | NA | NA | NA | NA | NA | NA | NA | NA | NA | NA | NA | NA | NA | NA | NA | NA | NA | NA | NA | NA | NA | NA | NA | NA | NA | NA | |
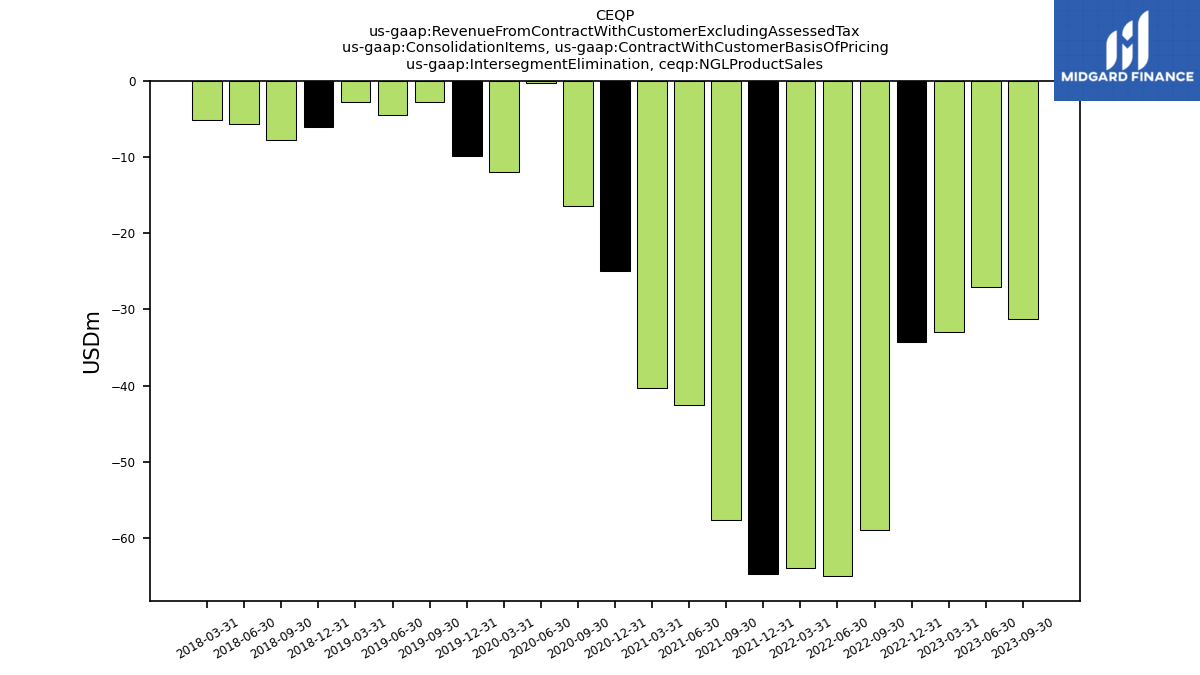
| Intersegment Elimination, N G L Product Sales | -31.30 | -27.10 | -32.90 | -34.30 | -58.90 | -65.00 | -64.00 | -64.70 | -57.60 | -42.60 | -40.30 | -25.00 | -16.40 | -0.30 | -11.90 | -9.90 | -2.80 | -4.50 | -2.80 | -6.00 | -7.80 | -5.60 | -5.10 | NA | NA | NA | NA | NA | NA | NA | NA | NA | NA | NA | NA | NA | NA | NA | NA | NA | NA | NA | NA | NA | NA | NA | NA | NA | NA | NA | NA | NA | NA | NA | NA | NA | |
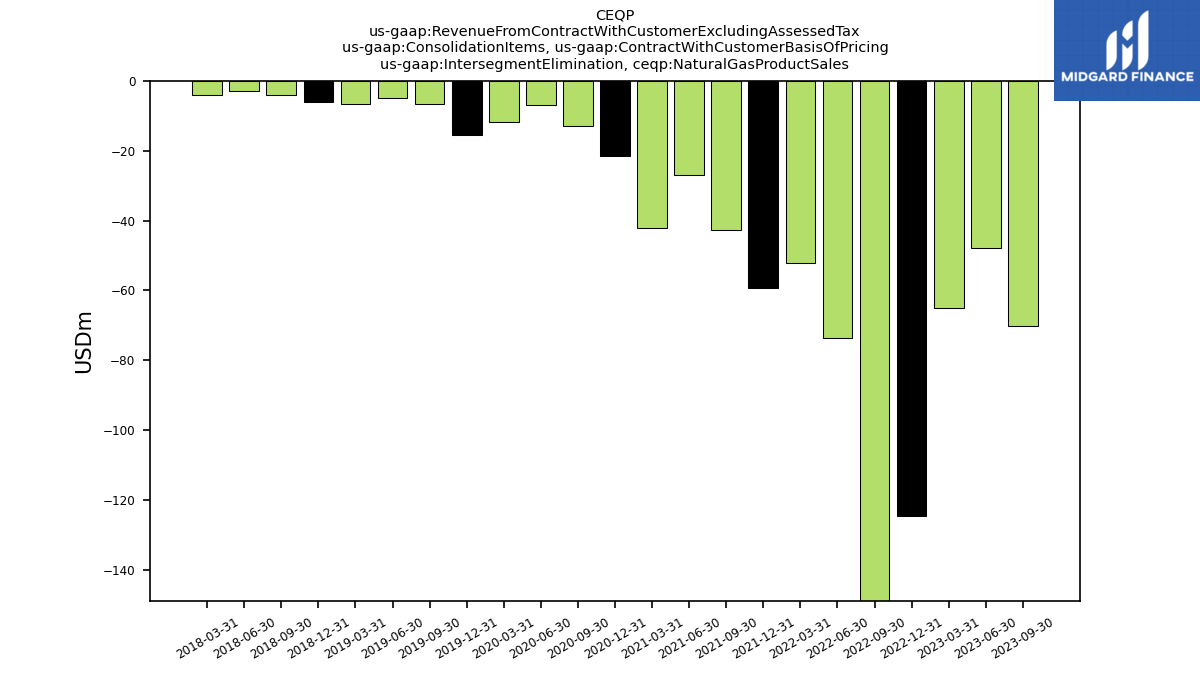
| Intersegment Elimination, Natural Gas Product Sales | -70.10 | -47.80 | -65.00 | -124.70 | -205.60 | -73.50 | -52.10 | -59.40 | -42.70 | -26.80 | -42.20 | -21.40 | -12.90 | -6.80 | -11.70 | -15.50 | -6.50 | -4.80 | -6.60 | -6.00 | -3.90 | -2.80 | -3.90 | NA | NA | NA | NA | NA | NA | NA | NA | NA | NA | NA | NA | NA | NA | NA | NA | NA | NA | NA | NA | NA | NA | NA | NA | NA | NA | NA | NA | NA | NA | NA | NA | NA | |
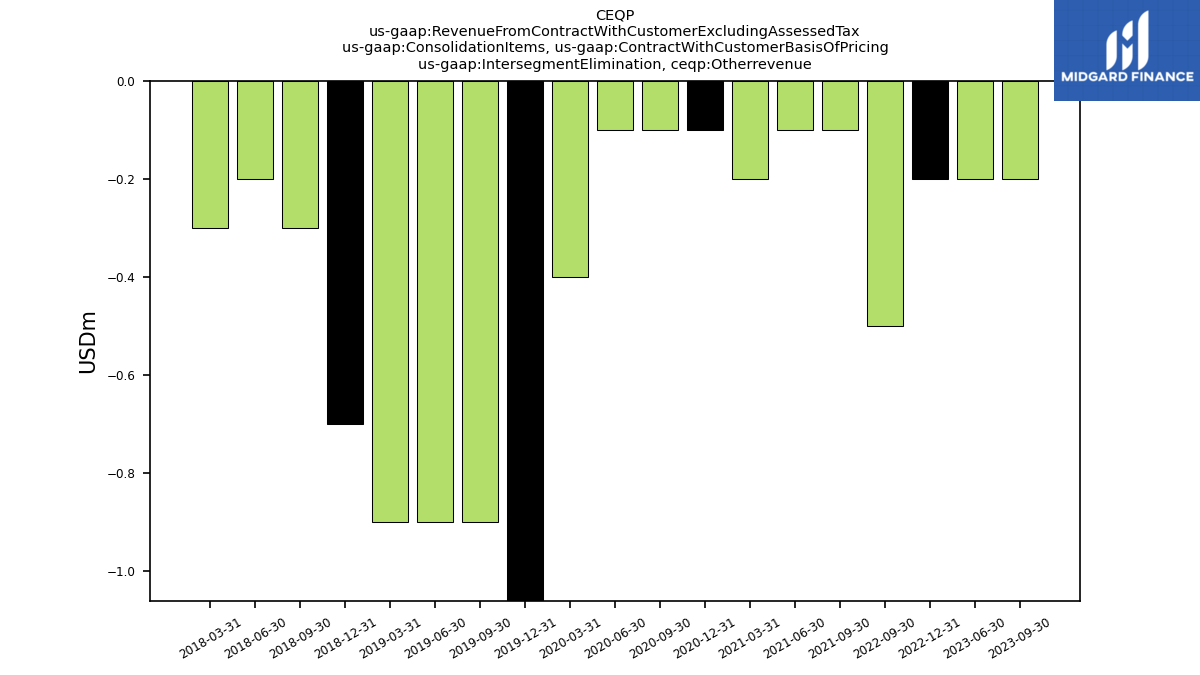
| Intersegment Elimination, Otherrevenue | -0.20 | -0.20 | NA | -0.20 | -0.50 | NA | NA | NA | -0.10 | -0.10 | -0.20 | -0.10 | -0.10 | -0.10 | -0.40 | -1.20 | -0.90 | -0.90 | -0.90 | -0.70 | -0.30 | -0.20 | -0.30 | NA | NA | NA | NA | NA | NA | NA | NA | NA | NA | NA | NA | NA | NA | NA | NA | NA | NA | NA | NA | NA | NA | NA | NA | NA | NA | NA | NA | NA | NA | NA | NA | NA | |
| Operating, Crude Oil Gathering, Gathering And Processing North | 16.90 | 15.20 | 14.20 | NA | 14.70 | 14.10 | 14.80 | NA | 17.10 | 18.40 | 20.70 | NA | NA | NA | NA | NA | NA | NA | NA | NA | NA | NA | NA | NA | NA | NA | NA | NA | NA | NA | NA | NA | NA | NA | NA | NA | NA | NA | NA | NA | NA | NA | NA | NA | NA | NA | NA | NA | NA | NA | NA | NA | NA | NA | NA | NA | |
| Operating, Crude Oil Gathering, Gathering And Processing South | 1.90 | 2.20 | 1.90 | NA | 1.70 | 1.90 | 1.00 | NA | NA | NA | NA | NA | NA | NA | NA | NA | NA | NA | NA | NA | NA | NA | NA | NA | NA | NA | NA | NA | NA | NA | NA | NA | NA | NA | NA | NA | NA | NA | NA | NA | NA | NA | NA | NA | NA | NA | NA | NA | NA | NA | NA | NA | NA | NA | NA | NA | |
| Operating, Crude Oil Pipeline, Gathering And Processing North | 1.40 | 1.20 | 1.10 | NA | 1.50 | 1.50 | 1.20 | NA | NA | NA | NA | NA | NA | NA | NA | NA | NA | NA | NA | NA | NA | NA | NA | NA | NA | NA | NA | NA | NA | NA | NA | NA | NA | NA | NA | NA | NA | NA | NA | NA | NA | NA | NA | NA | NA | NA | NA | NA | NA | NA | NA | NA | NA | NA | NA | NA | |
| Operating, Crude Oil Pipeline, Gathering And Processing South | 0.10 | 0.10 | 0.20 | NA | 0.10 | 0.30 | 0.10 | NA | NA | NA | NA | NA | NA | NA | NA | NA | NA | NA | NA | NA | NA | NA | NA | NA | NA | NA | NA | NA | NA | NA | NA | NA | NA | NA | NA | NA | NA | NA | NA | NA | NA | NA | NA | NA | NA | NA | NA | NA | NA | NA | NA | NA | NA | NA | NA | NA | |
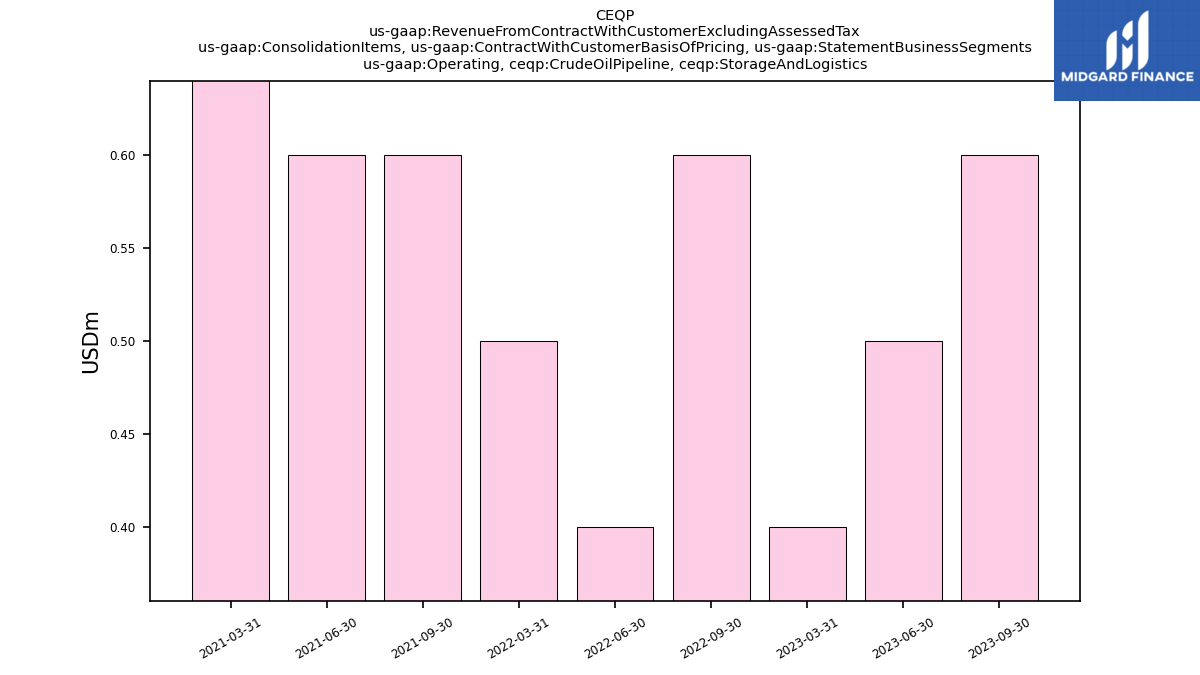
| Operating, Crude Oil Pipeline, Storage And Logistics | 0.60 | 0.50 | 0.40 | NA | 0.60 | 0.40 | 0.50 | NA | 0.60 | 0.60 | 0.80 | NA | NA | NA | NA | NA | NA | NA | NA | NA | NA | NA | NA | NA | NA | NA | NA | NA | NA | NA | NA | NA | NA | NA | NA | NA | NA | NA | NA | NA | NA | NA | NA | NA | NA | NA | NA | NA | NA | NA | NA | NA | NA | NA | NA | NA | |
| Operating, Crude Oil Product Sales, Gathering And Processing North | 139.40 | 128.50 | 109.30 | NA | 120.90 | 145.90 | 128.10 | NA | 105.40 | 101.70 | 90.00 | NA | NA | NA | NA | NA | NA | NA | NA | NA | NA | NA | NA | NA | NA | NA | NA | NA | NA | NA | NA | NA | NA | NA | NA | NA | NA | NA | NA | NA | NA | NA | NA | NA | NA | NA | NA | NA | NA | NA | NA | NA | NA | NA | NA | NA | |
| Operating, Crude Oil Product Sales, Gathering And Processing South | 0.80 | 0.20 | 0.10 | NA | NA | NA | NA | NA | NA | NA | NA | NA | NA | NA | NA | NA | NA | NA | NA | NA | NA | NA | NA | NA | NA | NA | NA | NA | NA | NA | NA | NA | NA | NA | NA | NA | NA | NA | NA | NA | NA | NA | NA | NA | NA | NA | NA | NA | NA | NA | NA | NA | NA | NA | NA | NA | |
| Operating, Crude Oil Product Sales, Storage And Logistics | 352.20 | 323.40 | 278.80 | NA | 362.80 | 393.50 | 374.00 | NA | 331.30 | 344.40 | 251.20 | NA | NA | NA | NA | NA | NA | NA | NA | NA | NA | NA | NA | NA | NA | NA | NA | NA | NA | NA | NA | NA | NA | NA | NA | NA | NA | NA | NA | NA | NA | NA | NA | NA | NA | NA | NA | NA | NA | NA | NA | NA | NA | NA | NA | NA | |
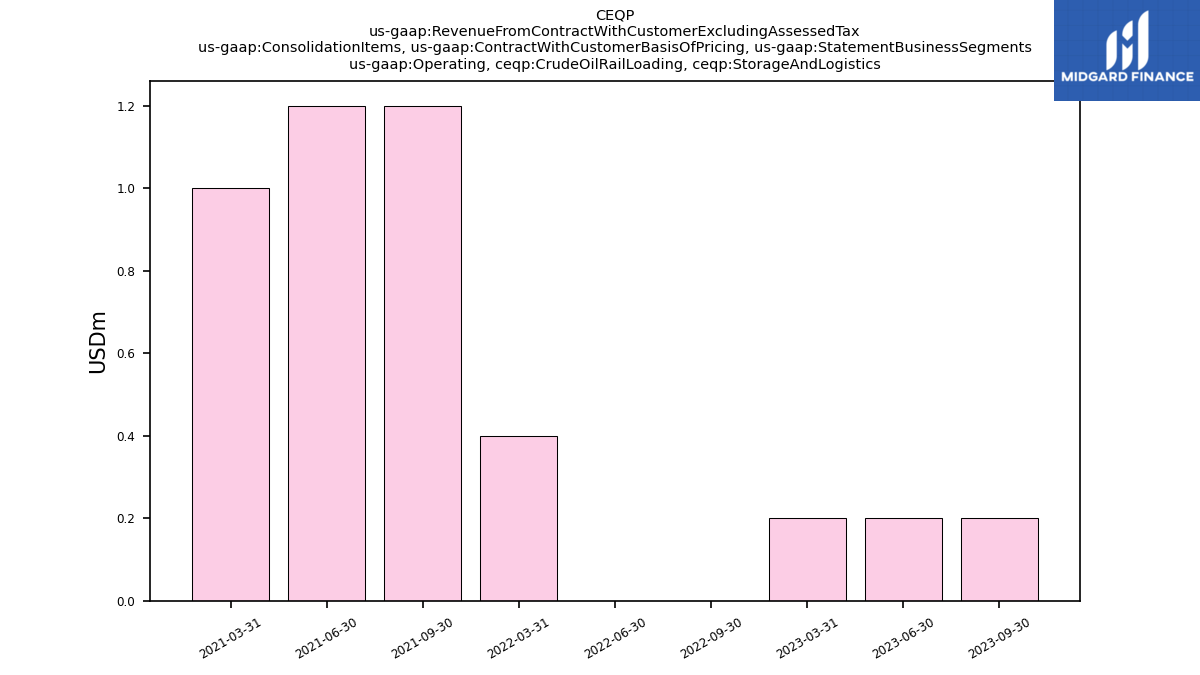
| Operating, Crude Oil Rail Loading, Storage And Logistics | 0.20 | 0.20 | 0.20 | NA | 0.00 | 0.00 | 0.40 | NA | 1.20 | 1.20 | 1.00 | NA | NA | NA | NA | NA | NA | NA | NA | NA | NA | NA | NA | NA | NA | NA | NA | NA | NA | NA | NA | NA | NA | NA | NA | NA | NA | NA | NA | NA | NA | NA | NA | NA | NA | NA | NA | NA | NA | NA | NA | NA | NA | NA | NA | NA | |
| Operating, Crude Oil Storage, Gathering And Processing North | 0.60 | 0.50 | 0.60 | NA | 0.60 | 0.60 | 0.50 | NA | 0.10 | 0.10 | 0.10 | NA | NA | NA | NA | NA | NA | NA | NA | NA | NA | NA | NA | NA | NA | NA | NA | NA | NA | NA | NA | NA | NA | NA | NA | NA | NA | NA | NA | NA | NA | NA | NA | NA | NA | NA | NA | NA | NA | NA | NA | NA | NA | NA | NA | NA | |
| Operating, Crude Oil Storage, Storage And Logistics | 0.00 | 0.10 | NA | NA | 0.10 | 0.30 | NA | NA | 0.10 | 0.10 | 0.20 | NA | NA | NA | NA | NA | NA | NA | NA | NA | NA | NA | NA | NA | NA | NA | NA | NA | NA | NA | NA | NA | NA | NA | NA | NA | NA | NA | NA | NA | NA | NA | NA | NA | NA | NA | NA | NA | NA | NA | NA | NA | NA | NA | NA | NA | |
| Operating, Crude Oil Transportation, Gathering And Processing North | NA | NA | NA | NA | 1.50 | 1.50 | 1.20 | NA | 0.80 | 0.40 | 0.70 | NA | NA | NA | NA | NA | NA | NA | NA | NA | NA | NA | NA | NA | NA | NA | NA | NA | NA | NA | NA | NA | NA | NA | NA | NA | NA | NA | NA | NA | NA | NA | NA | NA | NA | NA | NA | NA | NA | NA | NA | NA | NA | NA | NA | NA | |
| Operating, Crude Oil Transportation, Gathering And Processing South | NA | NA | NA | NA | 0.10 | 0.30 | 0.10 | NA | NA | NA | NA | NA | NA | NA | NA | NA | NA | NA | NA | NA | NA | NA | NA | NA | NA | NA | NA | NA | NA | NA | NA | NA | NA | NA | NA | NA | NA | NA | NA | NA | NA | NA | NA | NA | NA | NA | NA | NA | NA | NA | NA | NA | NA | NA | NA | NA | |
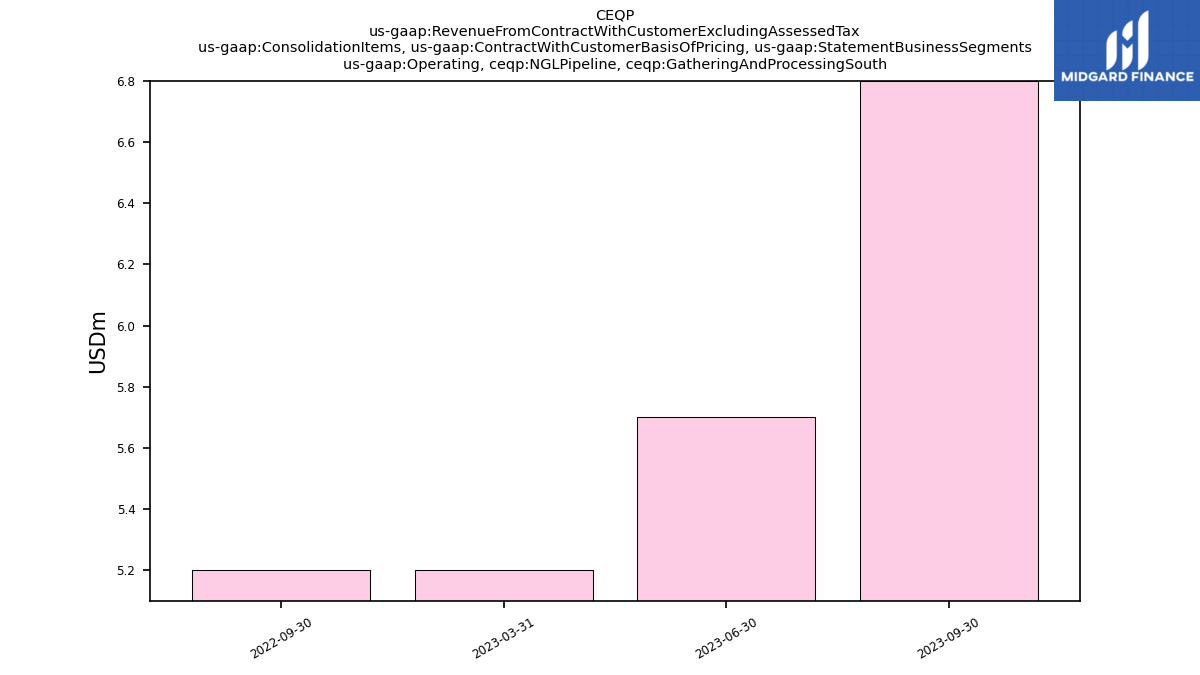
| Operating, N G L Pipeline, Gathering And Processing South | 6.80 | 5.70 | 5.20 | NA | 5.20 | NA | NA | NA | NA | NA | NA | NA | NA | NA | NA | NA | NA | NA | NA | NA | NA | NA | NA | NA | NA | NA | NA | NA | NA | NA | NA | NA | NA | NA | NA | NA | NA | NA | NA | NA | NA | NA | NA | NA | NA | NA | NA | NA | NA | NA | NA | NA | NA | NA | NA | NA | |
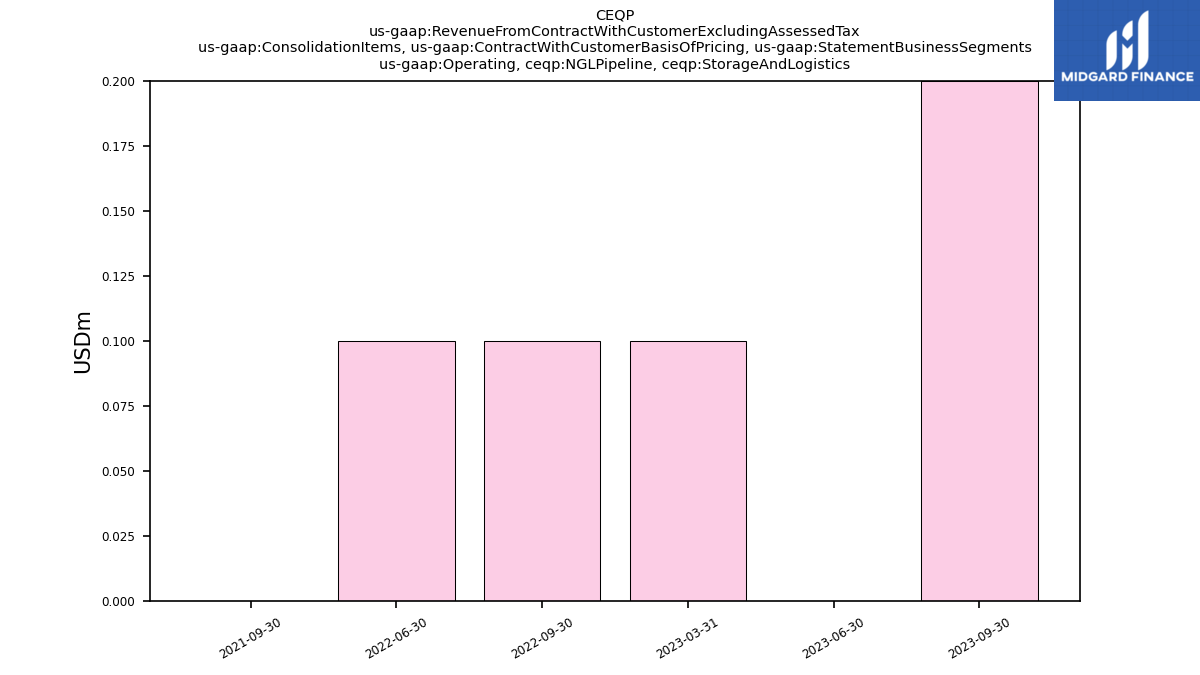
| Operating, N G L Pipeline, Storage And Logistics | 0.20 | 0.00 | 0.10 | NA | 0.10 | 0.10 | NA | NA | 0.00 | NA | NA | NA | NA | NA | NA | NA | NA | NA | NA | NA | NA | NA | NA | NA | NA | NA | NA | NA | NA | NA | NA | NA | NA | NA | NA | NA | NA | NA | NA | NA | NA | NA | NA | NA | NA | NA | NA | NA | NA | NA | NA | NA | NA | NA | NA | NA | |
| Operating, N G L Product Sales, Gathering And Processing North | 42.80 | 36.80 | 46.90 | NA | 68.30 | 77.50 | 76.90 | NA | 59.10 | 42.90 | 40.30 | NA | NA | NA | NA | NA | NA | NA | NA | NA | NA | NA | NA | NA | NA | NA | NA | NA | NA | NA | NA | NA | NA | NA | NA | NA | NA | NA | NA | NA | NA | NA | NA | NA | NA | NA | NA | NA | NA | NA | NA | NA | NA | NA | NA | NA | |
| Operating, N G L Product Sales, Gathering And Processing South | 98.80 | 92.20 | 105.90 | NA | 136.20 | NA | NA | NA | NA | NA | NA | NA | NA | NA | NA | NA | NA | NA | NA | NA | NA | NA | NA | NA | NA | NA | NA | NA | NA | NA | NA | NA | NA | NA | NA | NA | NA | NA | NA | NA | NA | NA | NA | NA | NA | NA | NA | NA | NA | NA | NA | NA | NA | NA | NA | NA | |
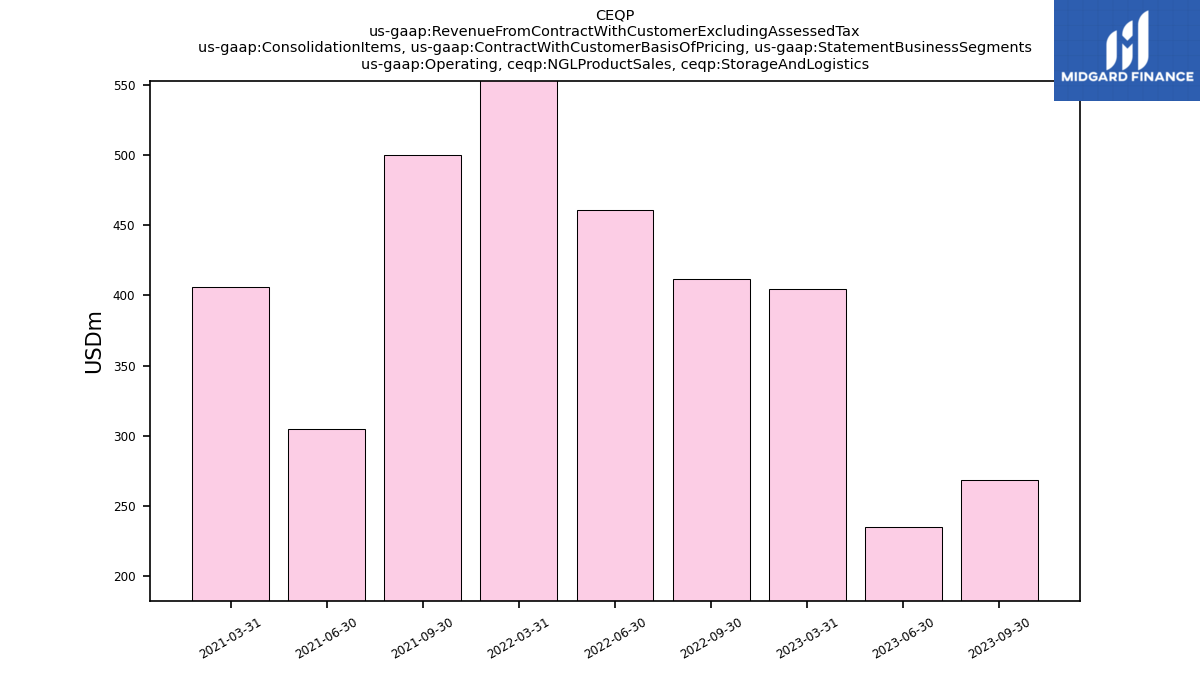
| Operating, N G L Product Sales, Storage And Logistics | 268.40 | 235.10 | 404.30 | NA | 411.70 | 461.20 | 632.70 | NA | 500.10 | 304.80 | 406.00 | NA | NA | NA | NA | NA | NA | NA | NA | NA | NA | NA | NA | NA | NA | NA | NA | NA | NA | NA | NA | NA | NA | NA | NA | NA | NA | NA | NA | NA | NA | NA | NA | NA | NA | NA | NA | NA | NA | NA | NA | NA | NA | NA | NA | NA | |
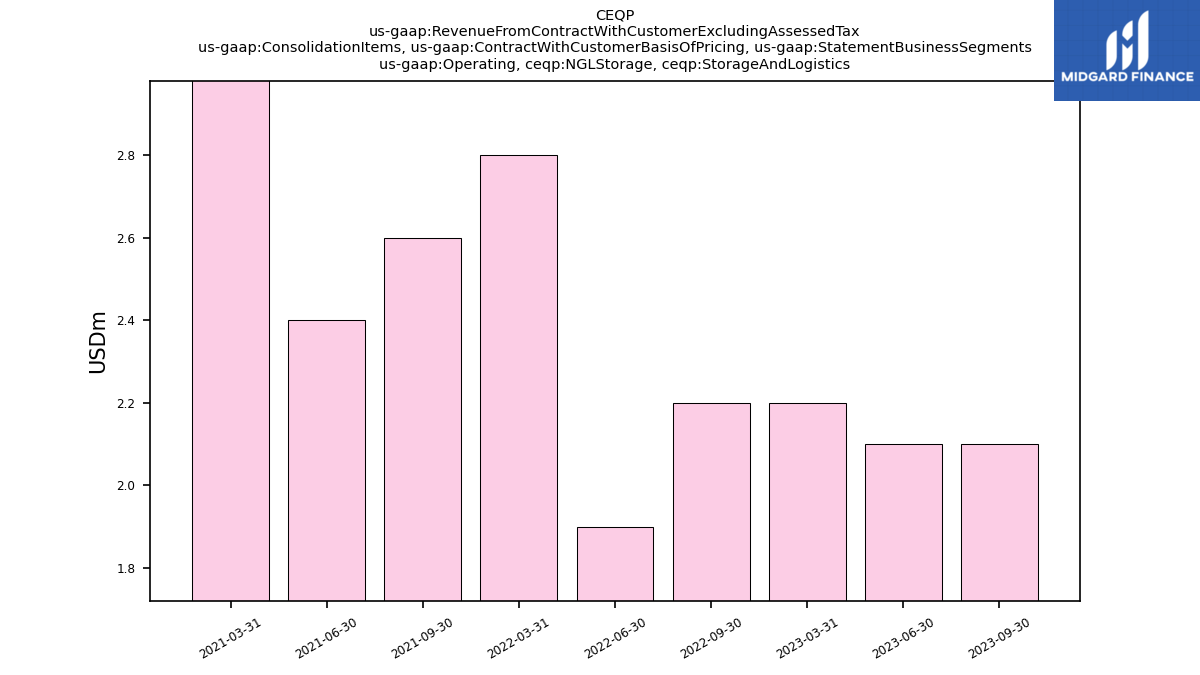
| Operating, N G L Storage, Storage And Logistics | 2.10 | 2.10 | 2.20 | NA | 2.20 | 1.90 | 2.80 | NA | 2.60 | 2.40 | 3.70 | NA | NA | NA | NA | NA | NA | NA | NA | NA | NA | NA | NA | NA | NA | NA | NA | NA | NA | NA | NA | NA | NA | NA | NA | NA | NA | NA | NA | NA | NA | NA | NA | NA | NA | NA | NA | NA | NA | NA | NA | NA | NA | NA | NA | NA | |
| Operating, N G L Transportation, Storage And Logistics | 2.20 | 4.40 | 5.80 | NA | 5.00 | 5.50 | 5.80 | NA | 4.10 | 4.20 | 4.20 | NA | NA | NA | NA | NA | NA | NA | NA | NA | NA | NA | NA | NA | NA | NA | NA | NA | NA | NA | NA | NA | NA | NA | NA | NA | NA | NA | NA | NA | NA | NA | NA | NA | NA | NA | NA | NA | NA | NA | NA | NA | NA | NA | NA | NA | |
| Operating, Natural Gas Compression, Gathering And Processing South | NA | NA | NA | NA | 4.70 | 3.10 | 3.50 | NA | 3.70 | 3.70 | 4.70 | NA | NA | NA | NA | NA | NA | NA | NA | NA | NA | NA | NA | NA | NA | NA | NA | NA | NA | NA | NA | NA | NA | NA | NA | NA | NA | NA | NA | NA | NA | NA | NA | NA | NA | NA | NA | NA | NA | NA | NA | NA | NA | NA | NA | NA | |
| Operating, Natural Gas Gathering, Gathering And Processing North | 32.20 | 29.70 | 33.60 | NA | 33.40 | 32.90 | 25.90 | NA | 13.70 | 13.60 | 13.20 | NA | NA | NA | NA | NA | NA | NA | NA | NA | NA | NA | NA | NA | NA | NA | NA | NA | NA | NA | NA | NA | NA | NA | NA | NA | NA | NA | NA | NA | NA | NA | NA | NA | NA | NA | NA | NA | NA | NA | NA | NA | NA | NA | NA | NA | |
| Operating, Natural Gas Gathering, Gathering And Processing South | 4.80 | 4.50 | 4.30 | NA | 10.10 | 24.50 | 22.40 | NA | 21.60 | 19.70 | 18.20 | NA | NA | NA | NA | NA | NA | NA | NA | NA | NA | NA | NA | NA | NA | NA | NA | NA | NA | NA | NA | NA | NA | NA | NA | NA | NA | NA | NA | NA | NA | NA | NA | NA | NA | NA | NA | NA | NA | NA | NA | NA | NA | NA | NA | NA | |
| Operating, Natural Gas Processing, Gathering And Processing North | 20.00 | 17.40 | 19.20 | NA | 20.70 | 19.70 | 14.40 | NA | 5.80 | 6.10 | 5.80 | NA | NA | NA | NA | NA | NA | NA | NA | NA | NA | NA | NA | NA | NA | NA | NA | NA | NA | NA | NA | NA | NA | NA | NA | NA | NA | NA | NA | NA | NA | NA | NA | NA | NA | NA | NA | NA | NA | NA | NA | NA | NA | NA | NA | NA | |
| Operating, Natural Gas Processing, Gathering And Processing South | 6.90 | 7.30 | 5.40 | NA | 4.80 | 1.20 | 1.10 | NA | 1.40 | 1.20 | 1.20 | NA | NA | NA | NA | NA | NA | NA | NA | NA | NA | NA | NA | NA | NA | NA | NA | NA | NA | NA | NA | NA | NA | NA | NA | NA | NA | NA | NA | NA | NA | NA | NA | NA | NA | NA | NA | NA | NA | NA | NA | NA | NA | NA | NA | NA | |
| Operating, Natural Gas Product Sales, Gathering And Processing North | 27.40 | 22.50 | 45.20 | NA | 109.60 | 95.60 | 63.90 | NA | 42.90 | 26.70 | 42.30 | NA | NA | NA | NA | NA | NA | NA | NA | NA | NA | NA | NA | NA | NA | NA | NA | NA | NA | NA | NA | NA | NA | NA | NA | NA | NA | NA | NA | NA | NA | NA | NA | NA | NA | NA | NA | NA | NA | NA | NA | NA | NA | NA | NA | NA | |
| Operating, Natural Gas Product Sales, Gathering And Processing South | 47.50 | 32.10 | 34.00 | NA | 144.40 | 0.60 | 0.30 | NA | 0.00 | 0.10 | 0.50 | NA | NA | NA | NA | NA | NA | NA | NA | NA | NA | NA | NA | NA | NA | NA | NA | NA | NA | NA | NA | NA | NA | NA | NA | NA | NA | NA | NA | NA | NA | NA | NA | NA | NA | NA | NA | NA | NA | NA | NA | NA | NA | NA | NA | NA | |
| Operating, Natural Gas Product Sales, Storage And Logistics | 78.20 | 55.00 | 78.70 | NA | 248.40 | 160.90 | 98.70 | NA | 84.50 | 44.30 | 95.60 | NA | NA | NA | NA | NA | NA | NA | NA | NA | NA | NA | NA | NA | NA | NA | NA | NA | NA | NA | NA | NA | NA | NA | NA | NA | NA | NA | NA | NA | NA | NA | NA | NA | NA | NA | NA | NA | NA | NA | NA | NA | NA | NA | NA | NA | |
| Operating, Otherrevenue, Gathering And Processing North | 0.50 | 0.30 | 0.30 | NA | 0.80 | 0.40 | 0.20 | NA | NA | NA | NA | NA | NA | NA | NA | NA | NA | NA | NA | NA | NA | NA | NA | NA | NA | NA | NA | NA | NA | NA | NA | NA | NA | NA | NA | NA | NA | NA | NA | NA | NA | NA | NA | NA | NA | NA | NA | NA | NA | NA | NA | NA | NA | NA | NA | NA | |
| Operating, Otherrevenue, Storage And Logistics | 0.10 | 0.80 | 0.10 | NA | 0.20 | 0.00 | 0.30 | NA | 0.50 | 0.70 | 0.20 | NA | NA | NA | NA | NA | NA | NA | NA | NA | NA | NA | NA | NA | NA | NA | NA | NA | NA | NA | NA | NA | NA | NA | NA | NA | NA | NA | NA | NA | NA | NA | NA | NA | NA | NA | NA | NA | NA | NA | NA | NA | NA | NA | NA | NA | |
| Operating, Water Gathering, Gathering And Processing North | 51.00 | 46.40 | 42.50 | NA | 41.80 | 41.20 | 34.70 | NA | 24.80 | 22.70 | 22.00 | NA | NA | NA | NA | NA | NA | NA | NA | NA | NA | NA | NA | NA | NA | NA | NA | NA | NA | NA | NA | NA | NA | NA | NA | NA | NA | NA | NA | NA | NA | NA | NA | NA | NA | NA | NA | NA | NA | NA | NA | NA | NA | NA | NA | NA | |
| Operating, Water Gathering, Gathering And Processing South | 8.40 | 8.20 | 8.60 | NA | 7.50 | 3.30 | 2.20 | NA | NA | NA | NA | NA | NA | NA | NA | NA | NA | NA | NA | NA | NA | NA | NA | NA | NA | NA | NA | NA | NA | NA | NA | NA | NA | NA | NA | NA | NA | NA | NA | NA | NA | NA | NA | NA | NA | NA | NA | NA | NA | NA | NA | NA | NA | NA | NA | NA | |
| Operating, Water Product Sales, Gathering And Processing North | 1.00 | 0.90 | 1.00 | 2.20 | 2.10 | 1.30 | 1.60 | NA | NA | NA | NA | NA | NA | NA | NA | NA | NA | NA | NA | NA | NA | NA | NA | NA | NA | NA | NA | NA | NA | NA | NA | NA | NA | NA | NA | NA | NA | NA | NA | NA | NA | NA | NA | NA | NA | NA | NA | NA | NA | NA | NA | NA | NA | NA | NA | NA | |
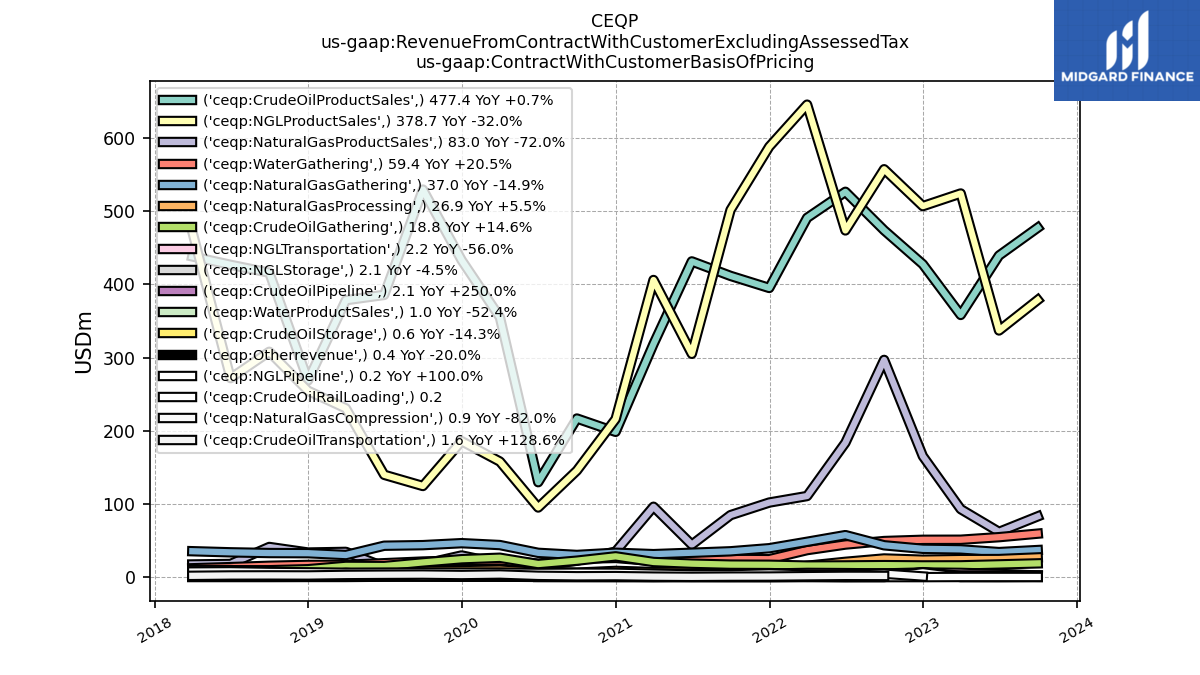
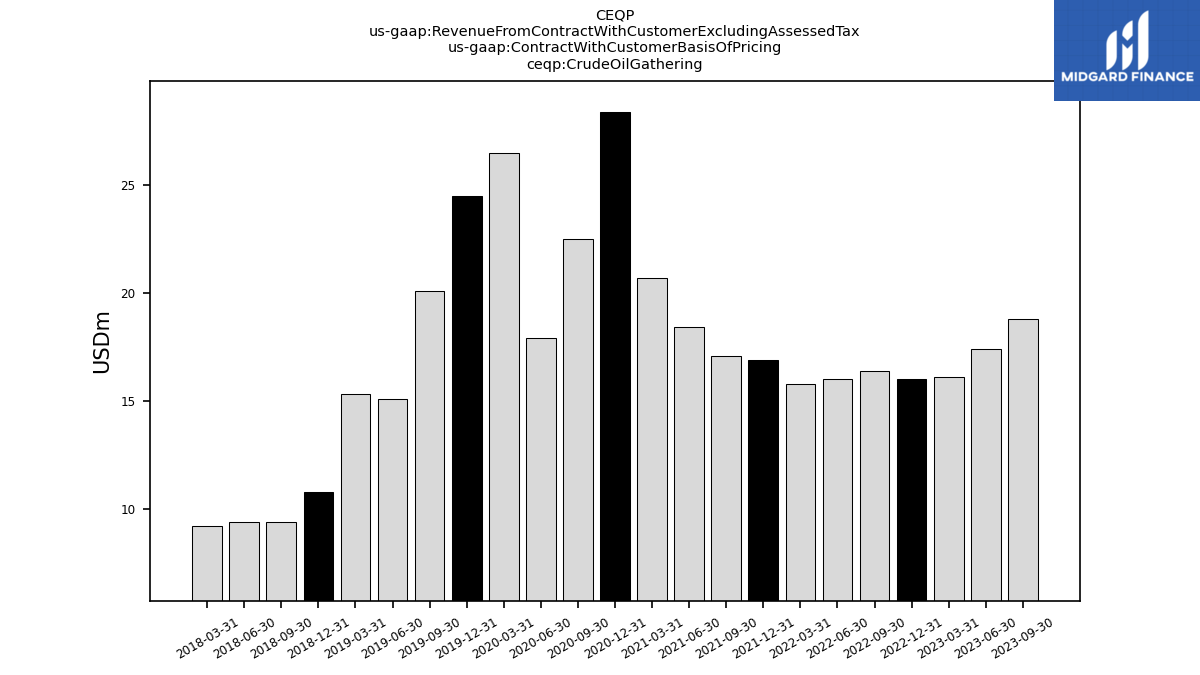
| Crude Oil Gathering | 18.80 | 17.40 | 16.10 | 16.00 | 16.40 | 16.00 | 15.80 | 16.90 | 17.10 | 18.40 | 20.70 | 28.40 | 22.50 | 17.90 | 26.50 | 24.50 | 20.10 | 15.10 | 15.30 | 10.80 | 9.40 | 9.40 | 9.20 | NA | NA | NA | NA | NA | NA | NA | NA | NA | NA | NA | NA | NA | NA | NA | NA | NA | NA | NA | NA | NA | NA | NA | NA | NA | NA | NA | NA | NA | NA | NA | NA | NA | |
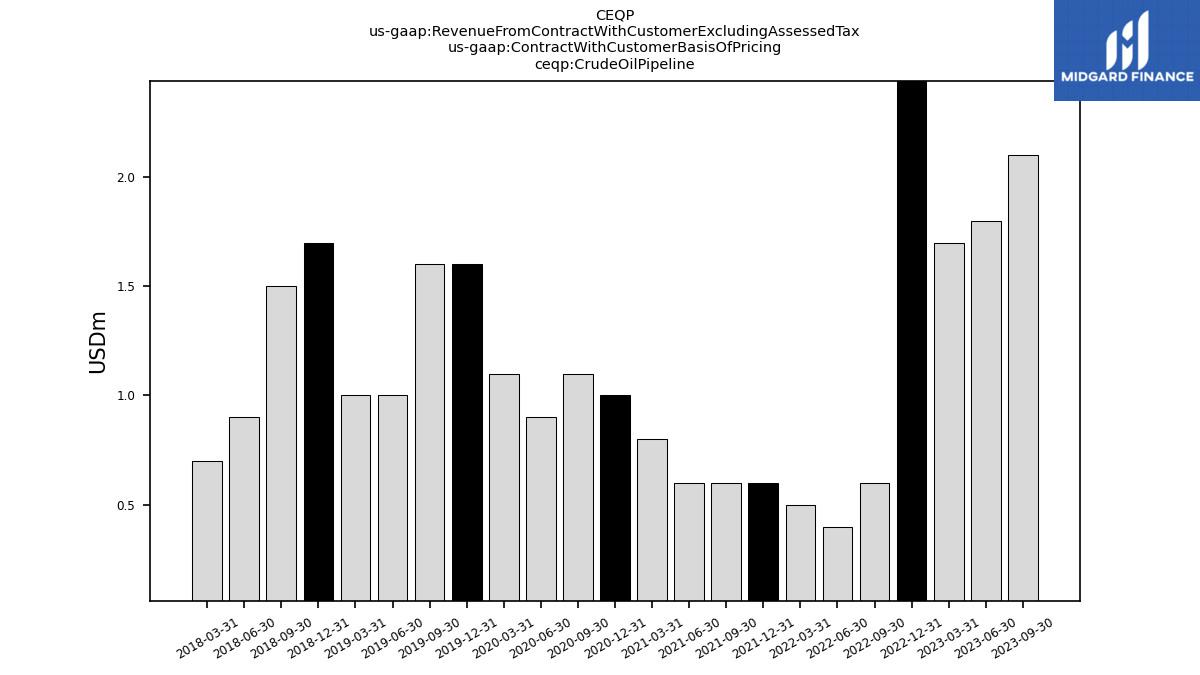
| Crude Oil Pipeline | 2.10 | 1.80 | 1.70 | 6.80 | 0.60 | 0.40 | 0.50 | 0.60 | 0.60 | 0.60 | 0.80 | 1.00 | 1.10 | 0.90 | 1.10 | 1.60 | 1.60 | 1.00 | 1.00 | 1.70 | 1.50 | 0.90 | 0.70 | NA | NA | NA | NA | NA | NA | NA | NA | NA | NA | NA | NA | NA | NA | NA | NA | NA | NA | NA | NA | NA | NA | NA | NA | NA | NA | NA | NA | NA | NA | NA | NA | NA | |
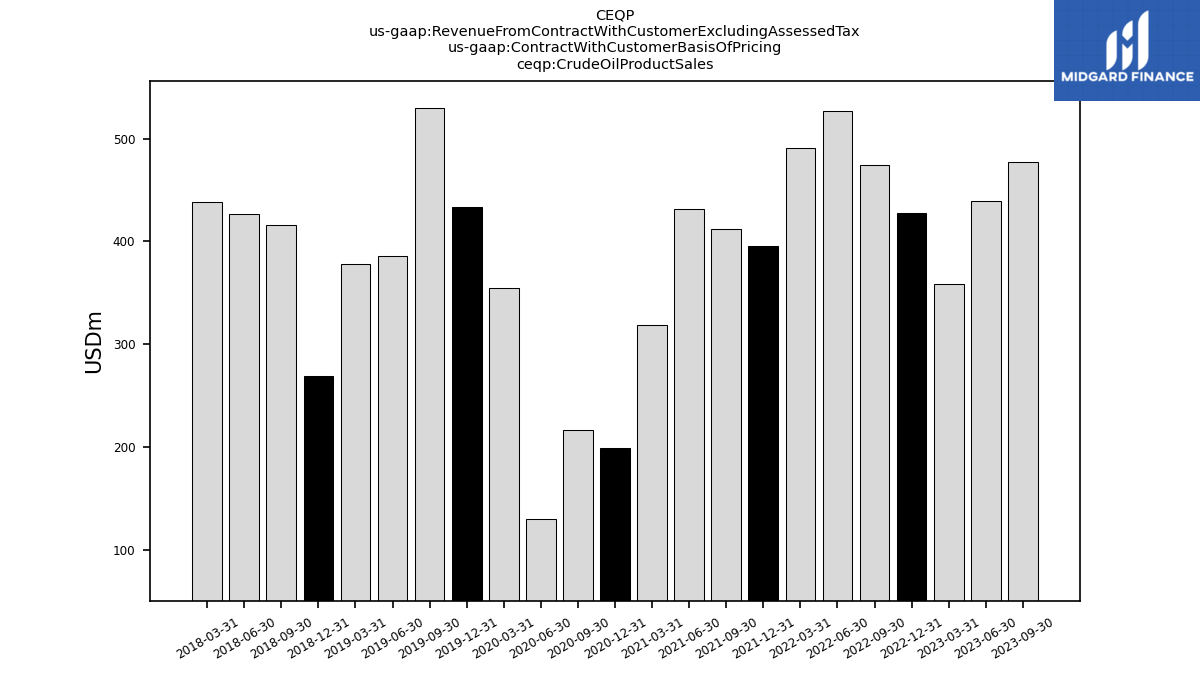
| Crude Oil Product Sales | 477.40 | 439.40 | 358.20 | 427.50 | 473.90 | 526.50 | 490.90 | 395.10 | 411.60 | 431.40 | 318.50 | 198.50 | 216.70 | 129.70 | 355.00 | 433.10 | 529.50 | 385.60 | 378.40 | 268.70 | 416.00 | 426.70 | 438.20 | NA | NA | NA | NA | NA | NA | NA | NA | NA | NA | NA | NA | NA | NA | NA | NA | NA | NA | NA | NA | NA | NA | NA | NA | NA | NA | NA | NA | NA | NA | NA | NA | NA | |
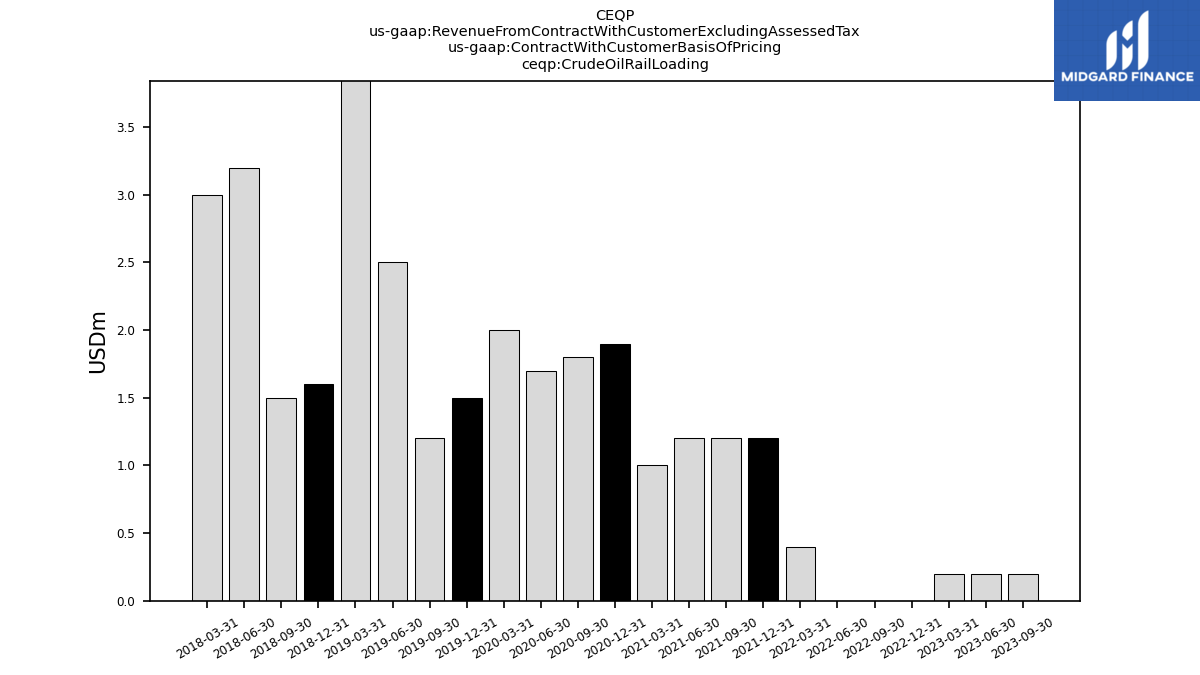
| Crude Oil Rail Loading | 0.20 | 0.20 | 0.20 | 0.00 | 0.00 | 0.00 | 0.40 | 1.20 | 1.20 | 1.20 | 1.00 | 1.90 | 1.80 | 1.70 | 2.00 | 1.50 | 1.20 | 2.50 | 5.80 | 1.60 | 1.50 | 3.20 | 3.00 | NA | NA | NA | NA | NA | NA | NA | NA | NA | NA | NA | NA | NA | NA | NA | NA | NA | NA | NA | NA | NA | NA | NA | NA | NA | NA | NA | NA | NA | NA | NA | NA | NA | |
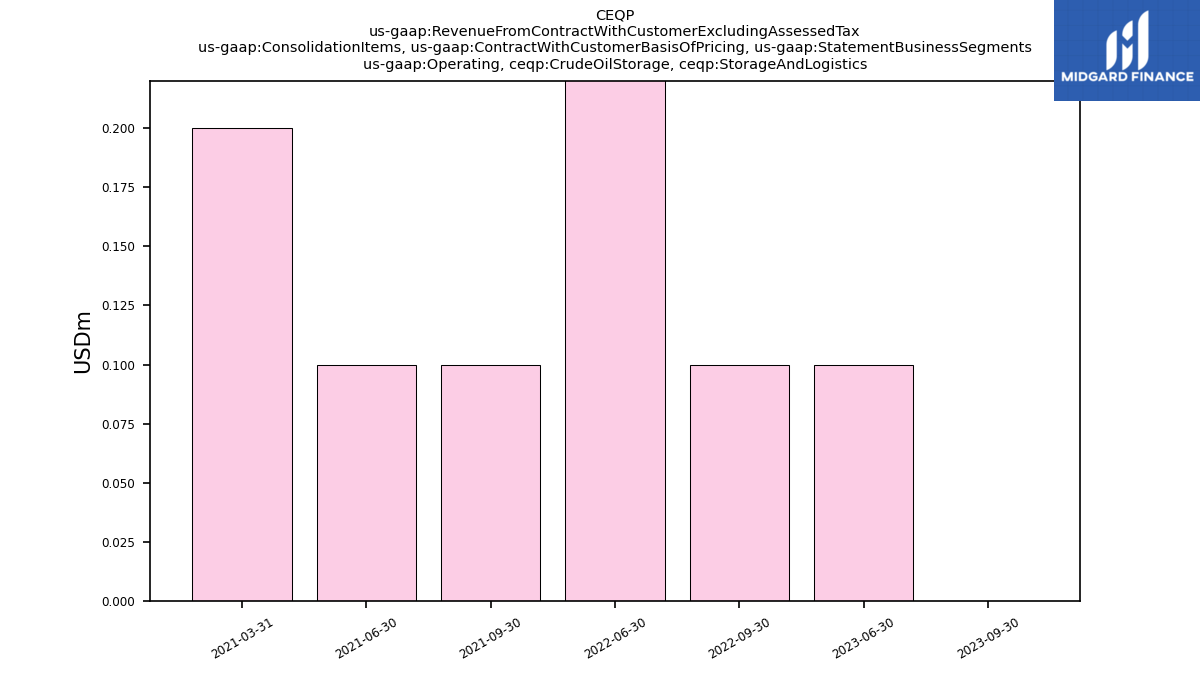
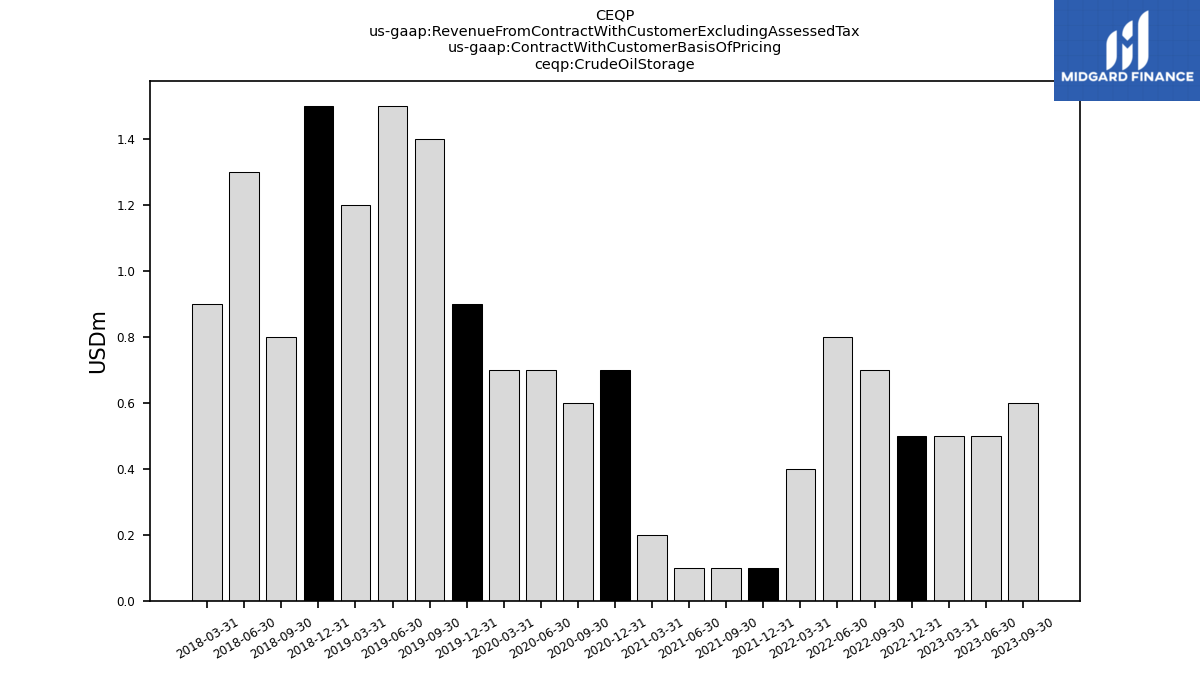
| Crude Oil Storage | 0.60 | 0.50 | 0.50 | 0.50 | 0.70 | 0.80 | 0.40 | 0.10 | 0.10 | 0.10 | 0.20 | 0.70 | 0.60 | 0.70 | 0.70 | 0.90 | 1.40 | 1.50 | 1.20 | 1.50 | 0.80 | 1.30 | 0.90 | NA | NA | NA | NA | NA | NA | NA | NA | NA | NA | NA | NA | NA | NA | NA | NA | NA | NA | NA | NA | NA | NA | NA | NA | NA | NA | NA | NA | NA | NA | NA | NA | NA | |
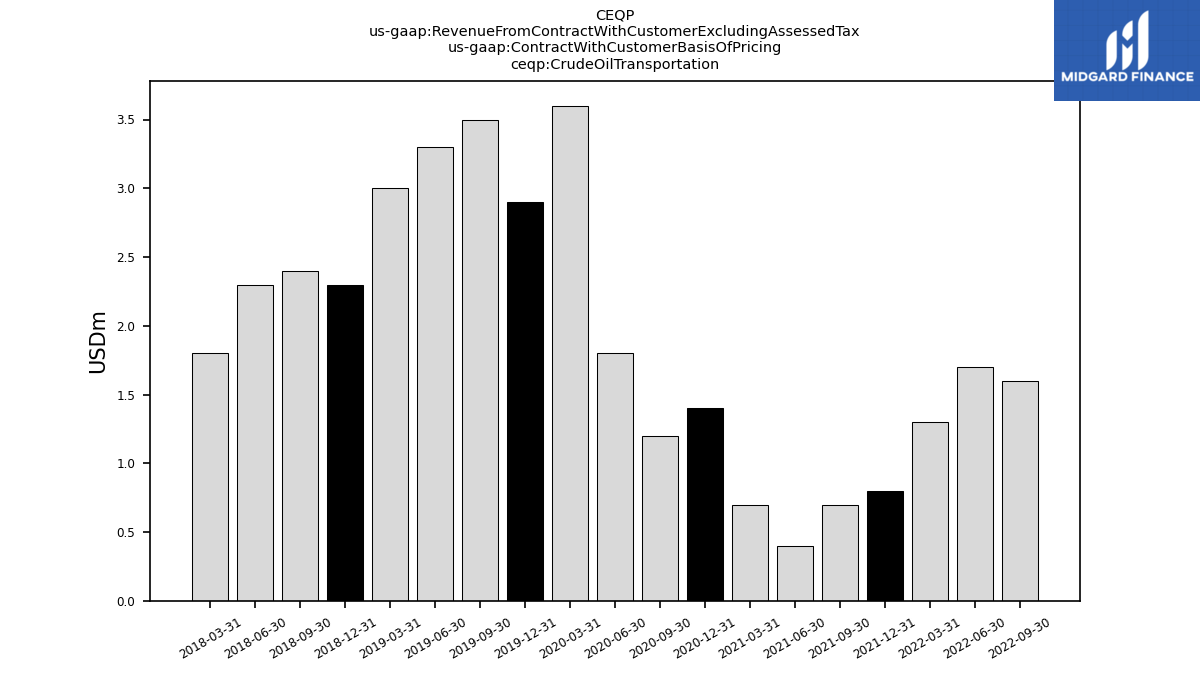
| Crude Oil Transportation | NA | NA | NA | NA | 1.60 | 1.70 | 1.30 | 0.80 | 0.70 | 0.40 | 0.70 | 1.40 | 1.20 | 1.80 | 3.60 | 2.90 | 3.50 | 3.30 | 3.00 | 2.30 | 2.40 | 2.30 | 1.80 | NA | NA | NA | NA | NA | NA | NA | NA | NA | NA | NA | NA | NA | NA | NA | NA | NA | NA | NA | NA | NA | NA | NA | NA | NA | NA | NA | NA | NA | NA | NA | NA | NA | |
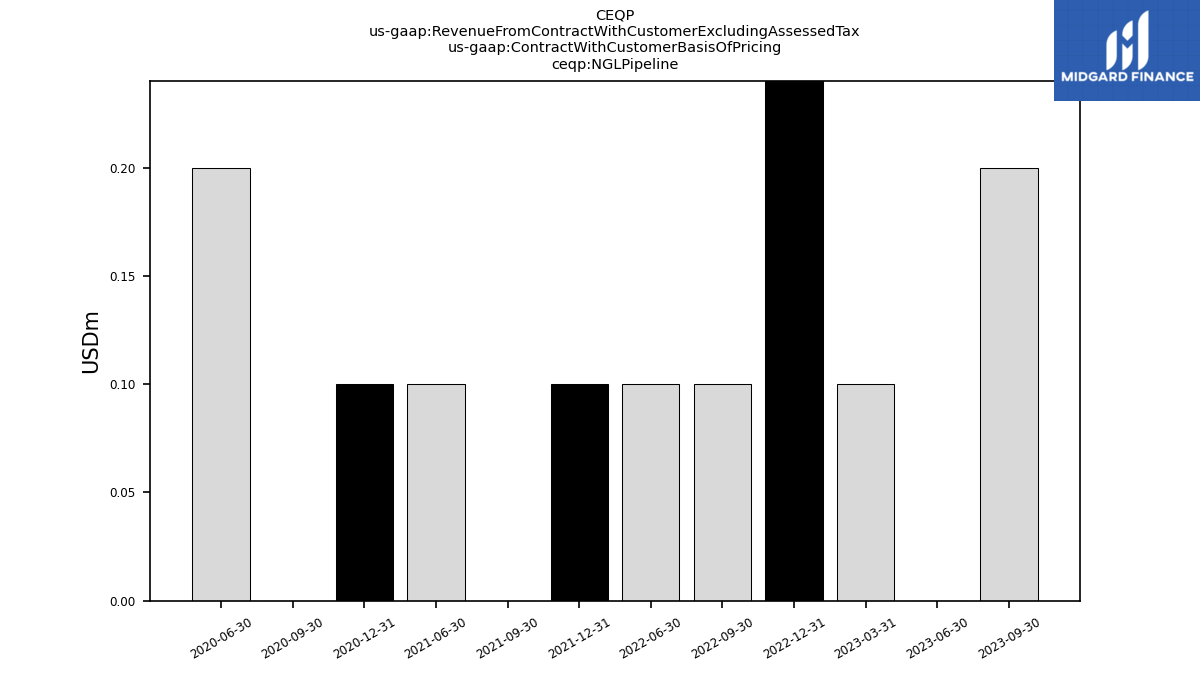
| N G L Pipeline | 0.20 | 0.00 | 0.10 | 6.50 | 0.10 | 0.10 | NA | 0.10 | 0.00 | 0.10 | NA | 0.10 | 0.00 | 0.20 | NA | NA | NA | NA | NA | NA | NA | NA | NA | NA | NA | NA | NA | NA | NA | NA | NA | NA | NA | NA | NA | NA | NA | NA | NA | NA | NA | NA | NA | NA | NA | NA | NA | NA | NA | NA | NA | NA | NA | NA | NA | NA | |
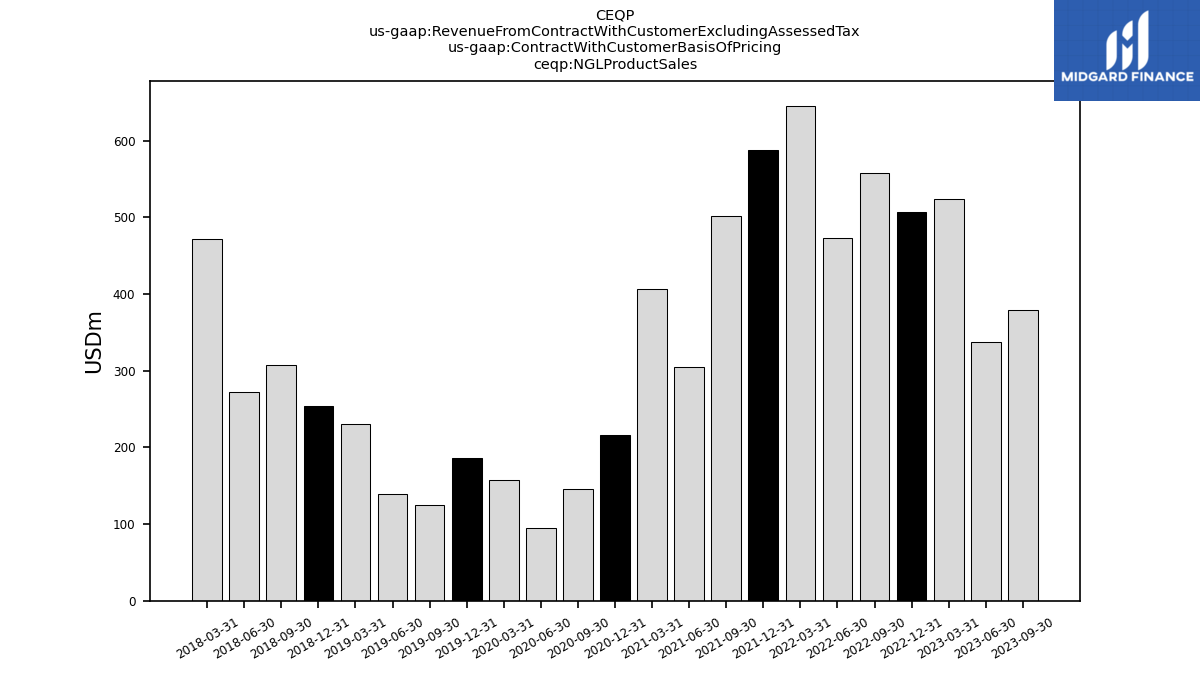
| N G L Product Sales | 378.70 | 337.00 | 524.20 | 506.90 | 557.30 | 473.70 | 645.60 | 588.10 | 501.60 | 305.10 | 406.00 | 216.00 | 145.60 | 95.10 | 157.90 | 185.80 | 124.50 | 139.80 | 230.60 | 254.60 | 307.90 | 271.90 | 472.30 | NA | NA | NA | NA | NA | NA | NA | NA | NA | NA | NA | NA | NA | NA | NA | NA | NA | NA | NA | NA | NA | NA | NA | NA | NA | NA | NA | NA | NA | NA | NA | NA | NA | |
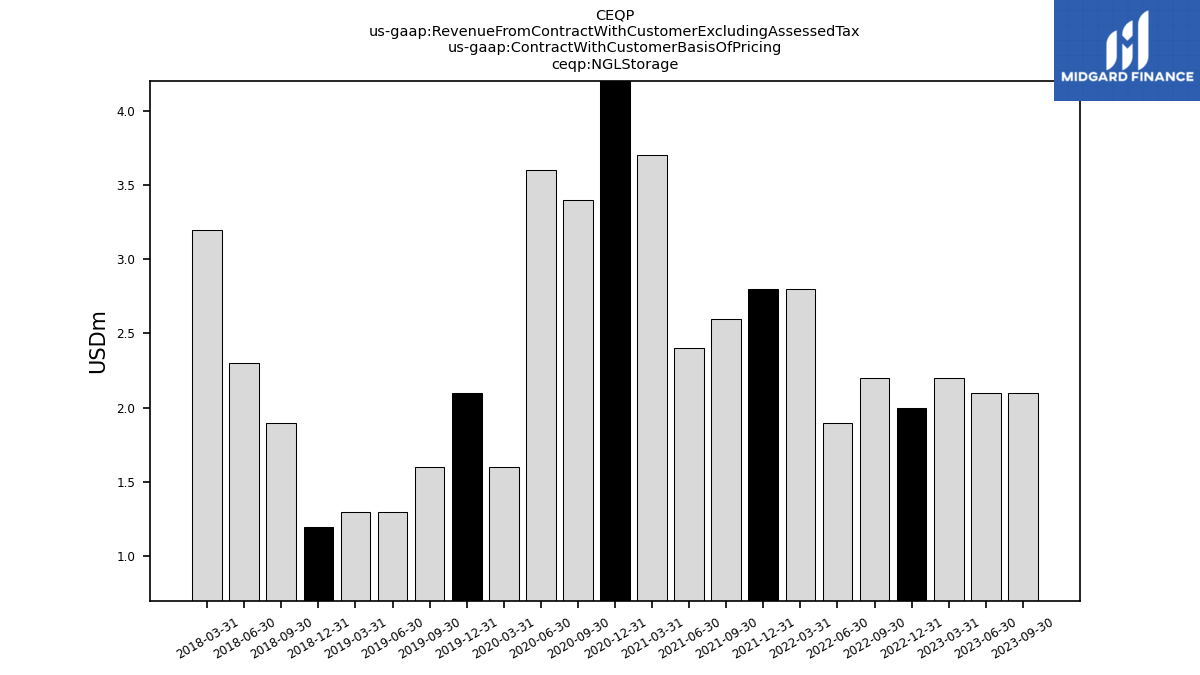
| N G L Storage | 2.10 | 2.10 | 2.20 | 2.00 | 2.20 | 1.90 | 2.80 | 2.80 | 2.60 | 2.40 | 3.70 | 4.50 | 3.40 | 3.60 | 1.60 | 2.10 | 1.60 | 1.30 | 1.30 | 1.20 | 1.90 | 2.30 | 3.20 | NA | NA | NA | NA | NA | NA | NA | NA | NA | NA | NA | NA | NA | NA | NA | NA | NA | NA | NA | NA | NA | NA | NA | NA | NA | NA | NA | NA | NA | NA | NA | NA | NA | |
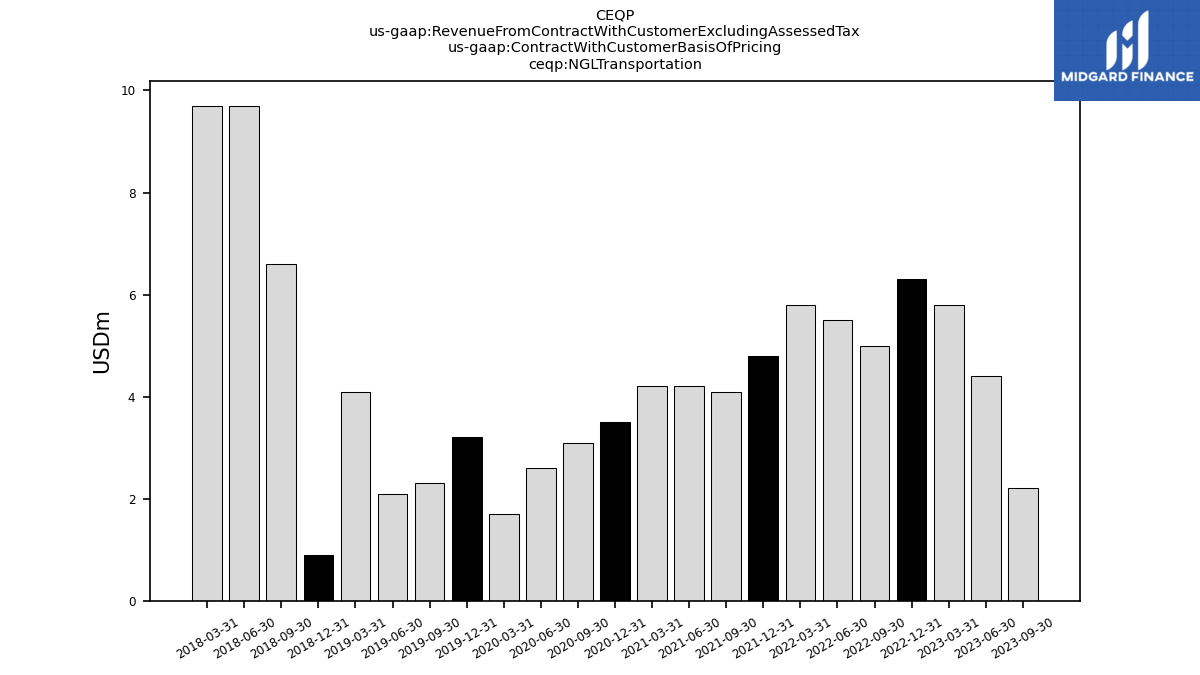
| N G L Transportation | 2.20 | 4.40 | 5.80 | 6.30 | 5.00 | 5.50 | 5.80 | 4.80 | 4.10 | 4.20 | 4.20 | 3.50 | 3.10 | 2.60 | 1.70 | 3.20 | 2.30 | 2.10 | 4.10 | 0.90 | 6.60 | 9.70 | 9.70 | NA | NA | NA | NA | NA | NA | NA | NA | NA | NA | NA | NA | NA | NA | NA | NA | NA | NA | NA | NA | NA | NA | NA | NA | NA | NA | NA | NA | NA | NA | NA | NA | NA | |
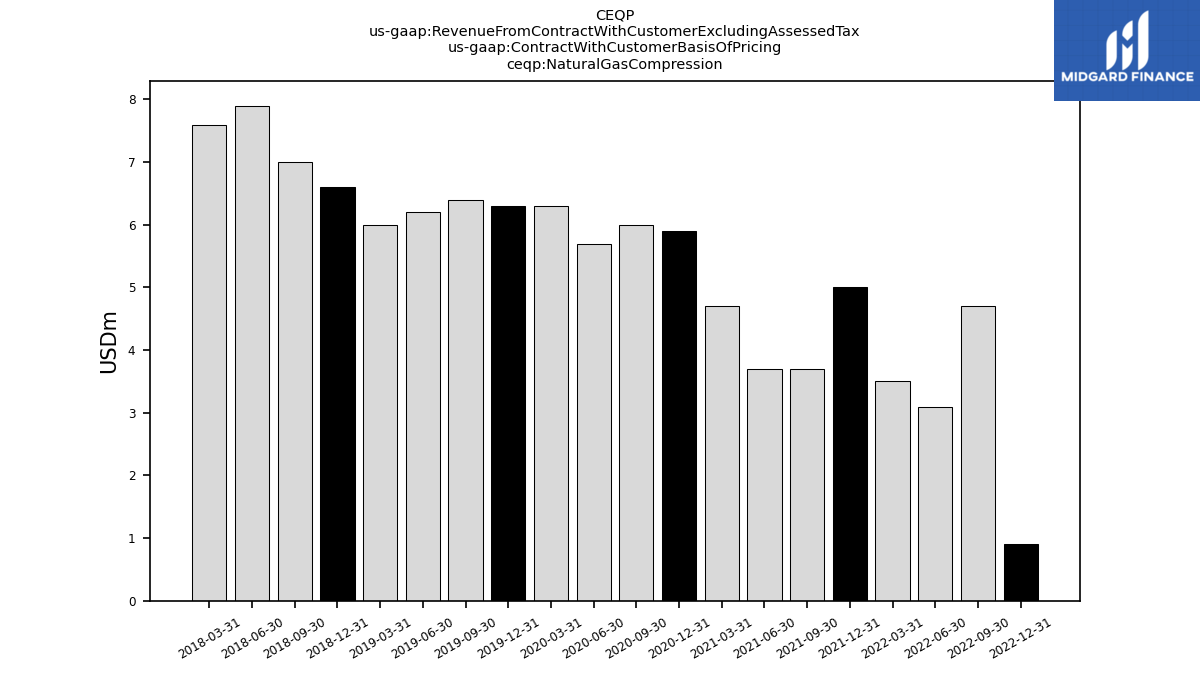
| Natural Gas Compression | NA | NA | NA | 0.90 | 4.70 | 3.10 | 3.50 | 5.00 | 3.70 | 3.70 | 4.70 | 5.90 | 6.00 | 5.70 | 6.30 | 6.30 | 6.40 | 6.20 | 6.00 | 6.60 | 7.00 | 7.90 | 7.60 | NA | NA | NA | NA | NA | NA | NA | NA | NA | NA | NA | NA | NA | NA | NA | NA | NA | NA | NA | NA | NA | NA | NA | NA | NA | NA | NA | NA | NA | NA | NA | NA | NA | |
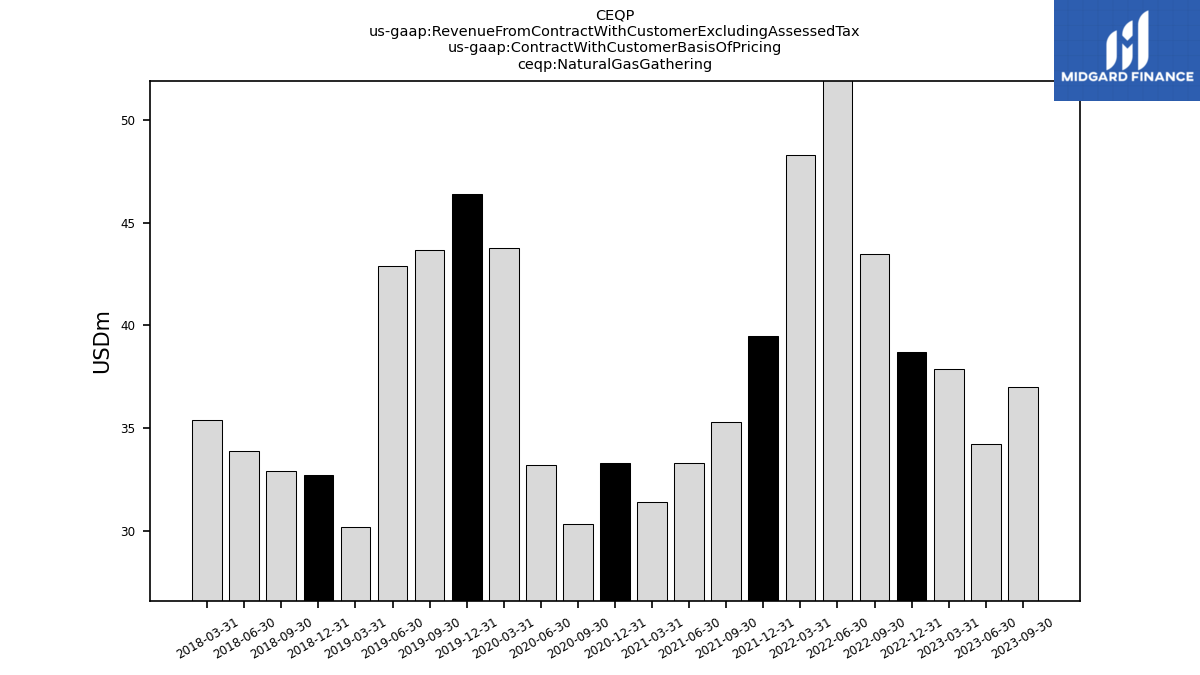
| Natural Gas Gathering | 37.00 | 34.20 | 37.90 | 38.70 | 43.50 | 57.40 | 48.30 | 39.50 | 35.30 | 33.30 | 31.40 | 33.30 | 30.30 | 33.20 | 43.80 | 46.40 | 43.70 | 42.90 | 30.20 | 32.70 | 32.90 | 33.90 | 35.40 | NA | NA | NA | NA | NA | NA | NA | NA | NA | NA | NA | NA | NA | NA | NA | NA | NA | NA | NA | NA | NA | NA | NA | NA | NA | NA | NA | NA | NA | NA | NA | NA | NA | |
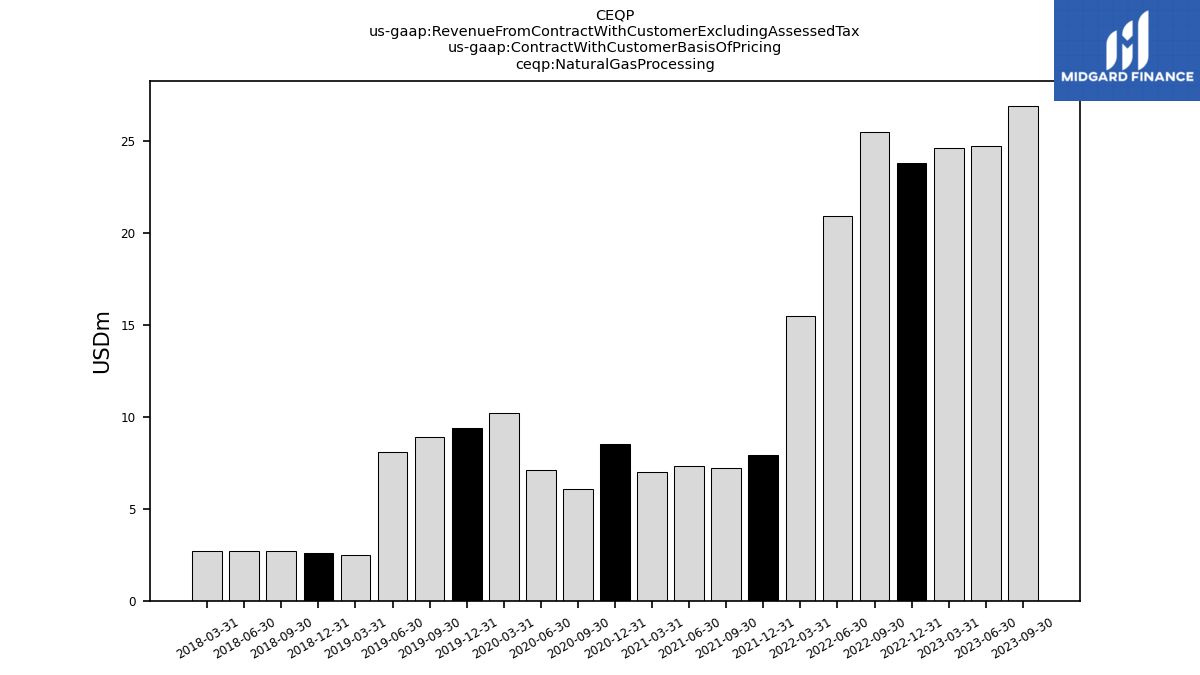
| Natural Gas Processing | 26.90 | 24.70 | 24.60 | 23.80 | 25.50 | 20.90 | 15.50 | 7.90 | 7.20 | 7.30 | 7.00 | 8.50 | 6.10 | 7.10 | 10.20 | 9.40 | 8.90 | 8.10 | 2.50 | 2.60 | 2.70 | 2.70 | 2.70 | NA | NA | NA | NA | NA | NA | NA | NA | NA | NA | NA | NA | NA | NA | NA | NA | NA | NA | NA | NA | NA | NA | NA | NA | NA | NA | NA | NA | NA | NA | NA | NA | NA | |
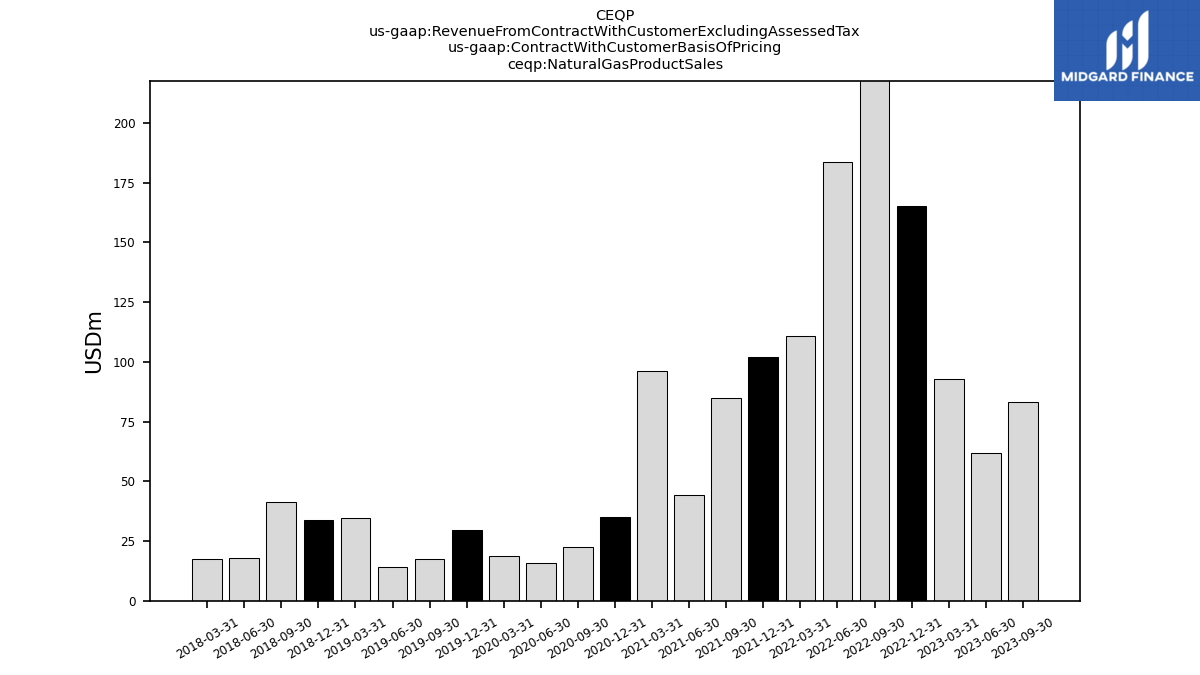
| Natural Gas Product Sales | 83.00 | 61.80 | 92.90 | 165.30 | 296.80 | 183.60 | 110.80 | 101.90 | 84.70 | 44.30 | 96.20 | 34.90 | 22.40 | 15.60 | 18.60 | 29.60 | 17.60 | 14.00 | 34.50 | 33.60 | 41.20 | 18.00 | 17.30 | NA | NA | NA | NA | NA | NA | NA | NA | NA | NA | NA | NA | NA | NA | NA | NA | NA | NA | NA | NA | NA | NA | NA | NA | NA | NA | NA | NA | NA | NA | NA | NA | NA | |
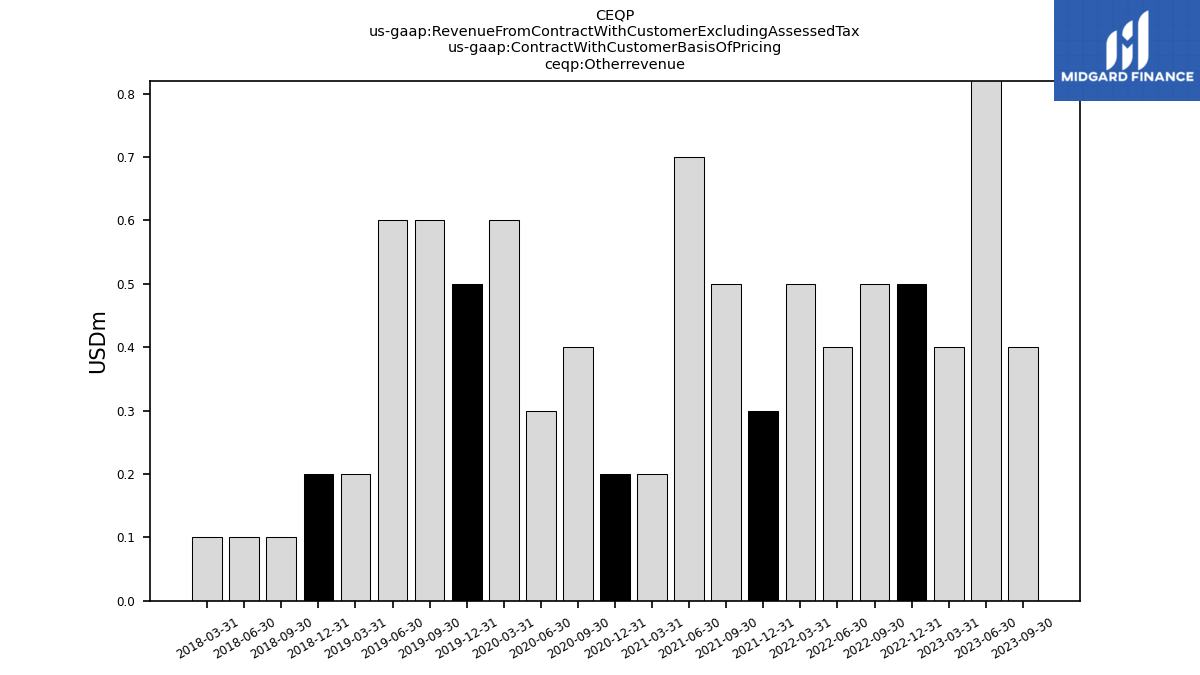
| Otherrevenue | 0.40 | 0.90 | 0.40 | 0.50 | 0.50 | 0.40 | 0.50 | 0.30 | 0.50 | 0.70 | 0.20 | 0.20 | 0.40 | 0.30 | 0.60 | 0.50 | 0.60 | 0.60 | 0.20 | 0.20 | 0.10 | 0.10 | 0.10 | NA | NA | NA | NA | NA | NA | NA | NA | NA | NA | NA | NA | NA | NA | NA | NA | NA | NA | NA | NA | NA | NA | NA | NA | NA | NA | NA | NA | NA | NA | NA | NA | NA | |
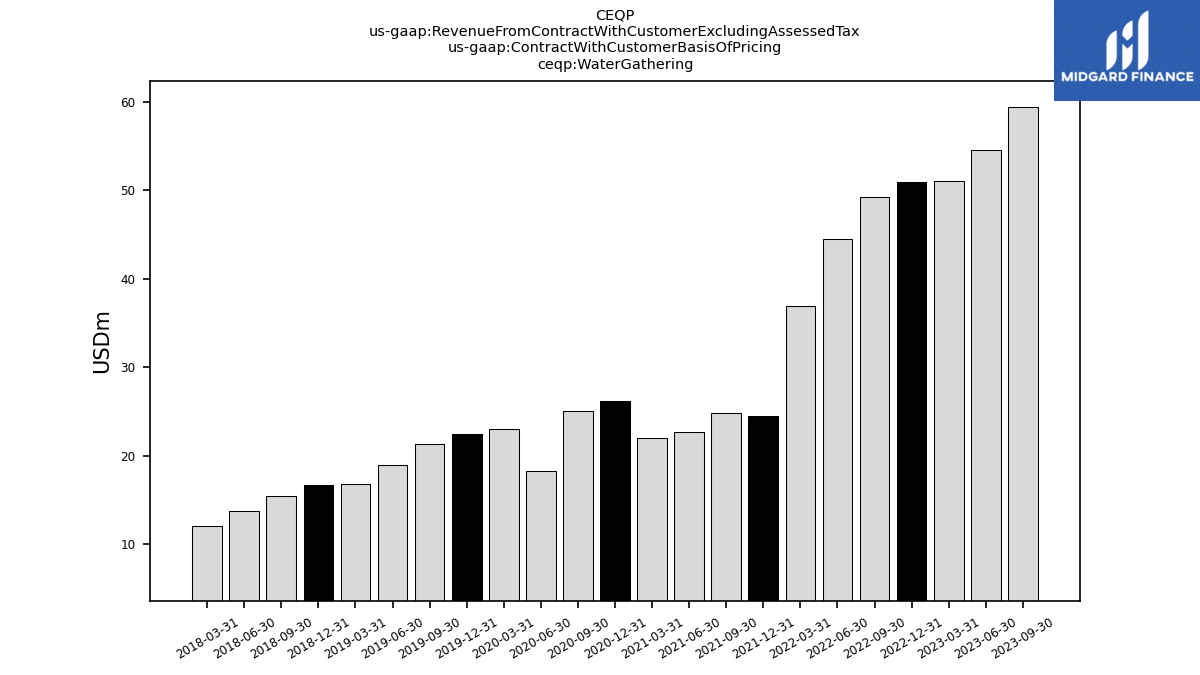
| Water Gathering | 59.40 | 54.60 | 51.10 | 51.00 | 49.30 | 44.50 | 36.90 | 24.50 | 24.80 | 22.70 | 22.00 | 26.20 | 25.10 | 18.30 | 23.00 | 22.50 | 21.30 | 19.00 | 16.80 | 16.70 | 15.50 | 13.70 | 12.10 | NA | NA | NA | NA | NA | NA | NA | NA | NA | NA | NA | NA | NA | NA | NA | NA | NA | NA | NA | NA | NA | NA | NA | NA | NA | NA | NA | NA | NA | NA | NA | NA | NA | |
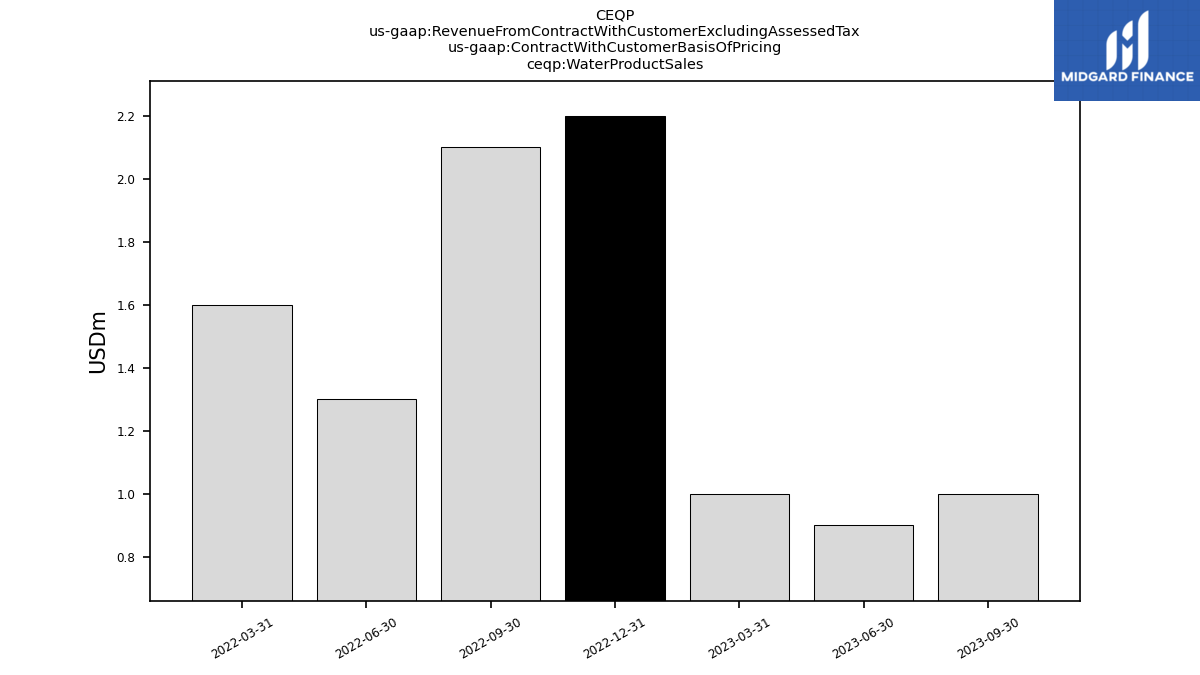
| Water Product Sales | 1.00 | 0.90 | 1.00 | 2.20 | 2.10 | 1.30 | 1.60 | NA | NA | NA | NA | NA | NA | NA | NA | NA | NA | NA | NA | NA | NA | NA | NA | NA | NA | NA | NA | NA | NA | NA | NA | NA | NA | NA | NA | NA | NA | NA | NA | NA | NA | NA | NA | NA | NA | NA | NA | NA | NA | NA | NA | NA | NA | NA | NA | NA |

