
| 2023-12-31 | 2023-09-30 | 2023-06-30 | 2022-12-31 | 2022-09-30 | 2022-06-30 | ||
|---|---|---|---|---|---|---|---|
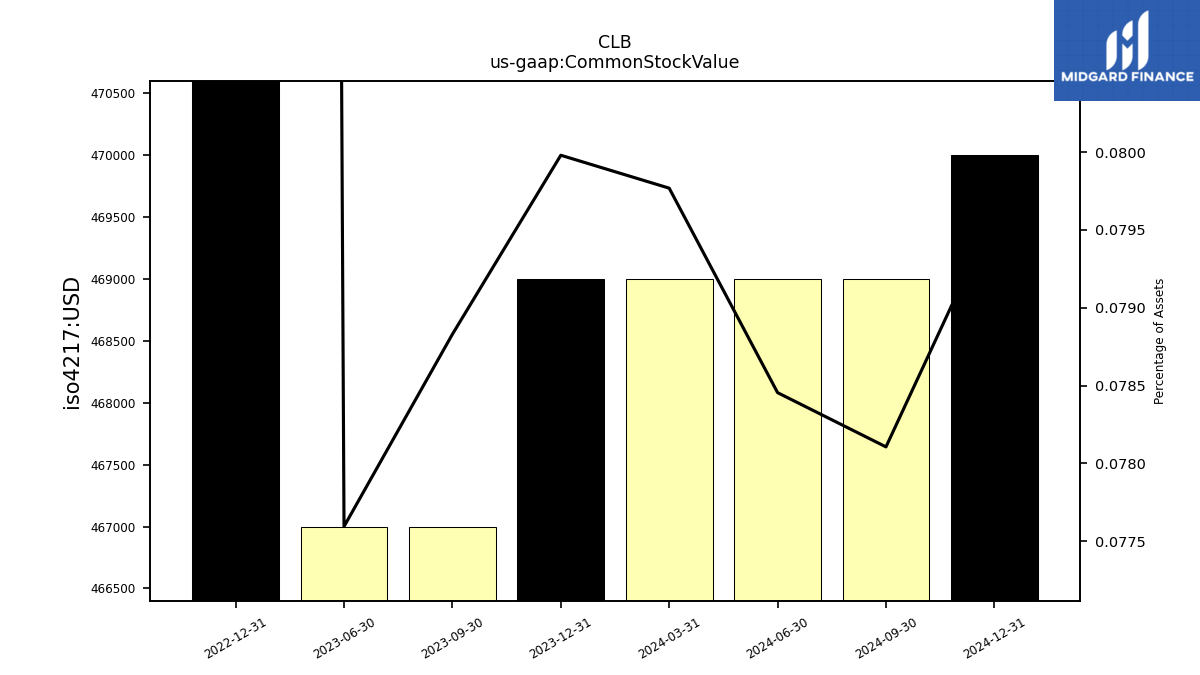
| Common Stock Value | 0.47 | 0.47 | 0.47 | 1.19 | NA | NA | |
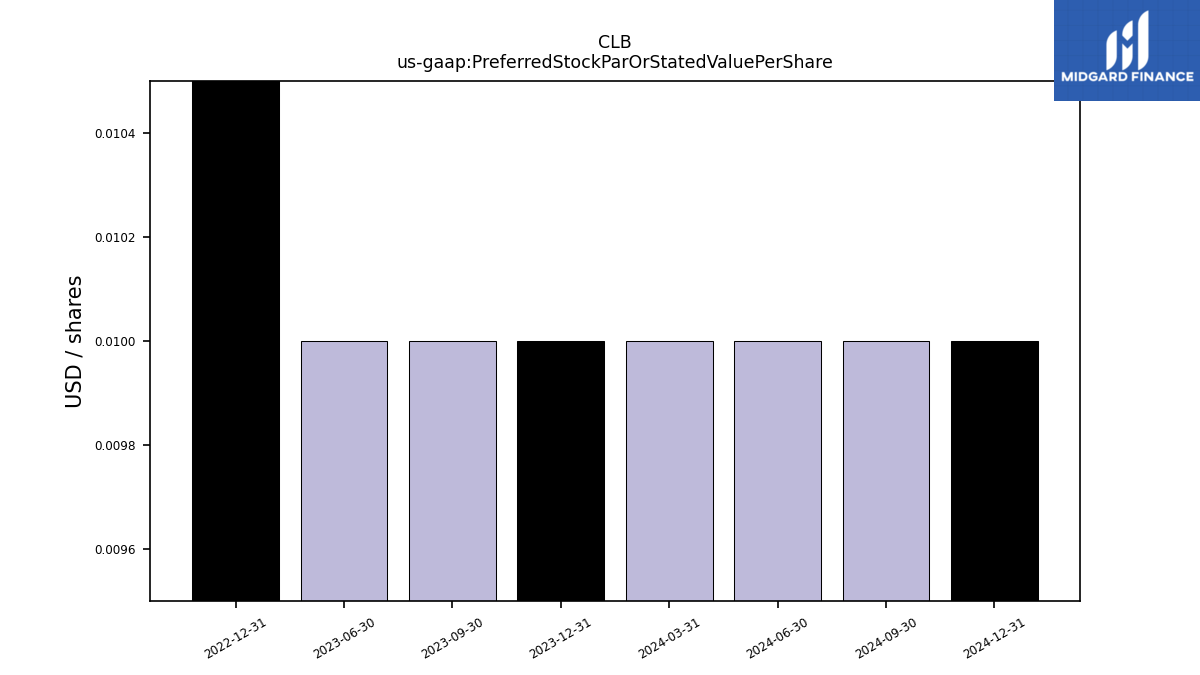
| Preferred Stock Par Or Stated Value Per Share | 0.00 | 0.00 | 0.00 | 0.00 | NA | NA | |
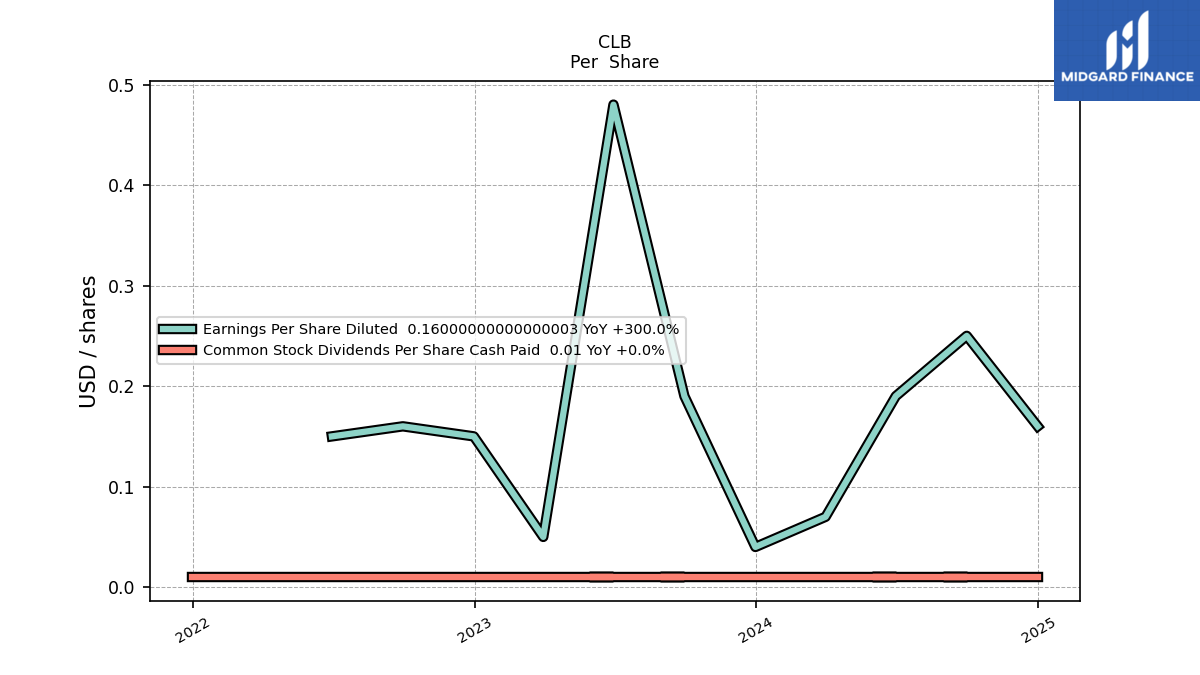
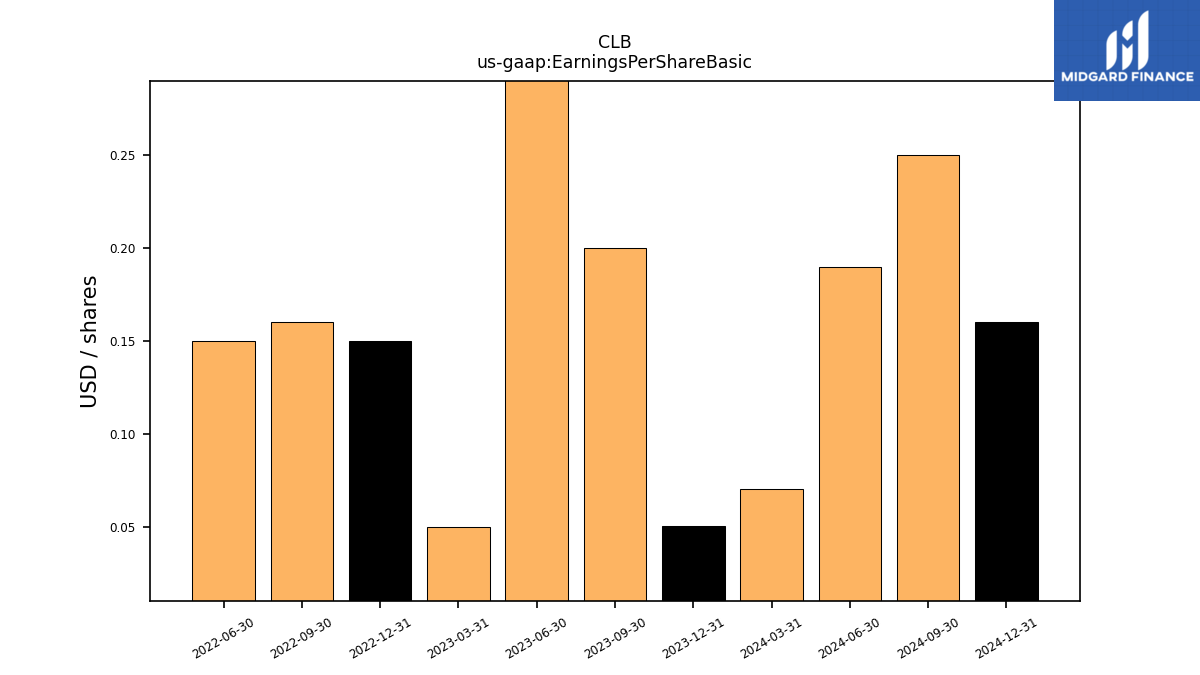
| Earnings Per Share Basic | 0.05 | 0.20 | 0.49 | 0.15 | 0.16 | 0.15 | |
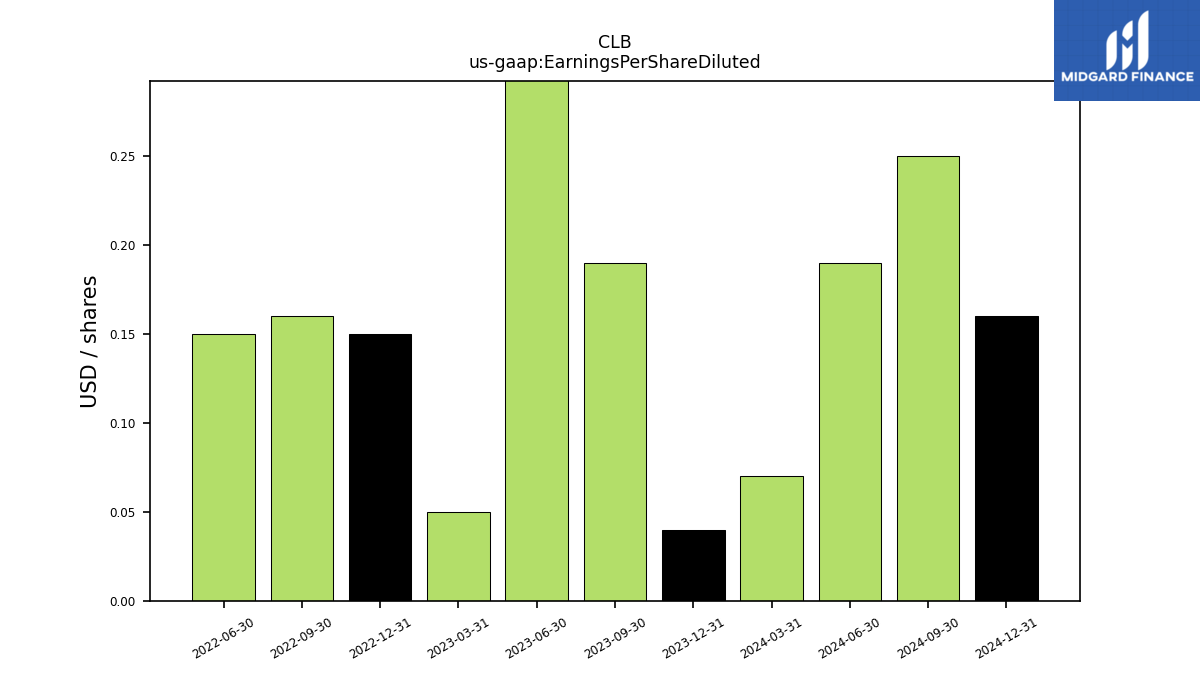
| Earnings Per Share Diluted | 0.04 | 0.19 | 0.48 | 0.15 | 0.16 | 0.15 | |
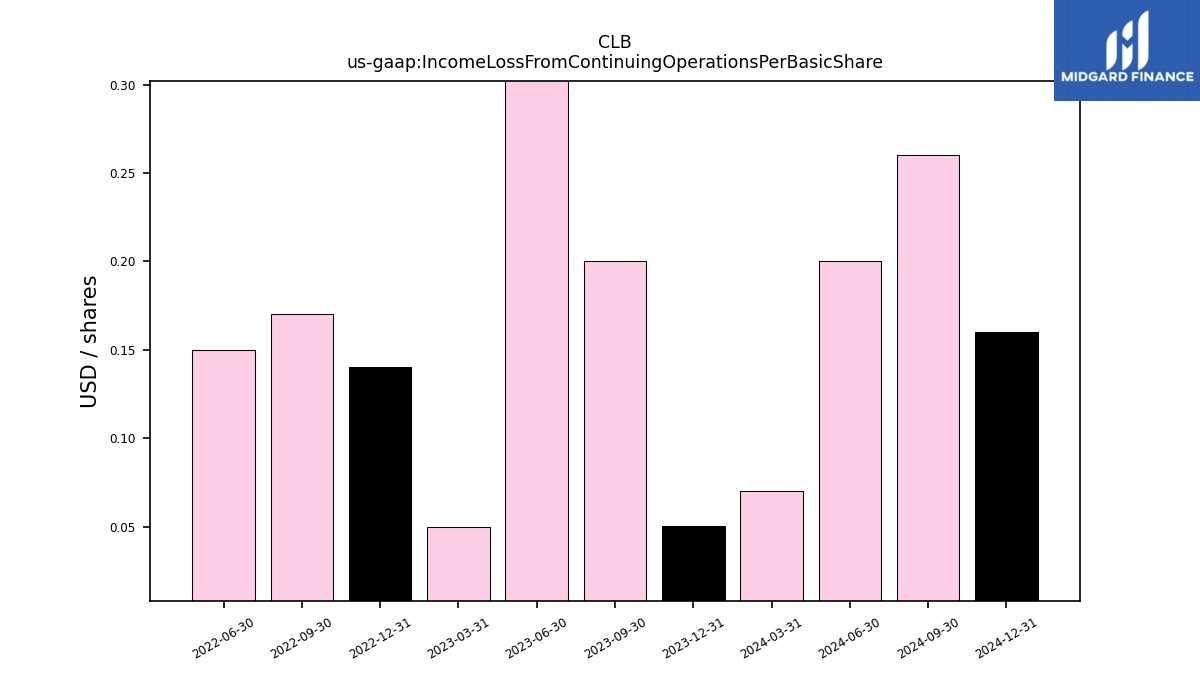
| Income Loss From Continuing Operations Per Basic Share | 0.00 | 0.00 | 0.00 | 0.00 | 0.00 | 0.00 | |
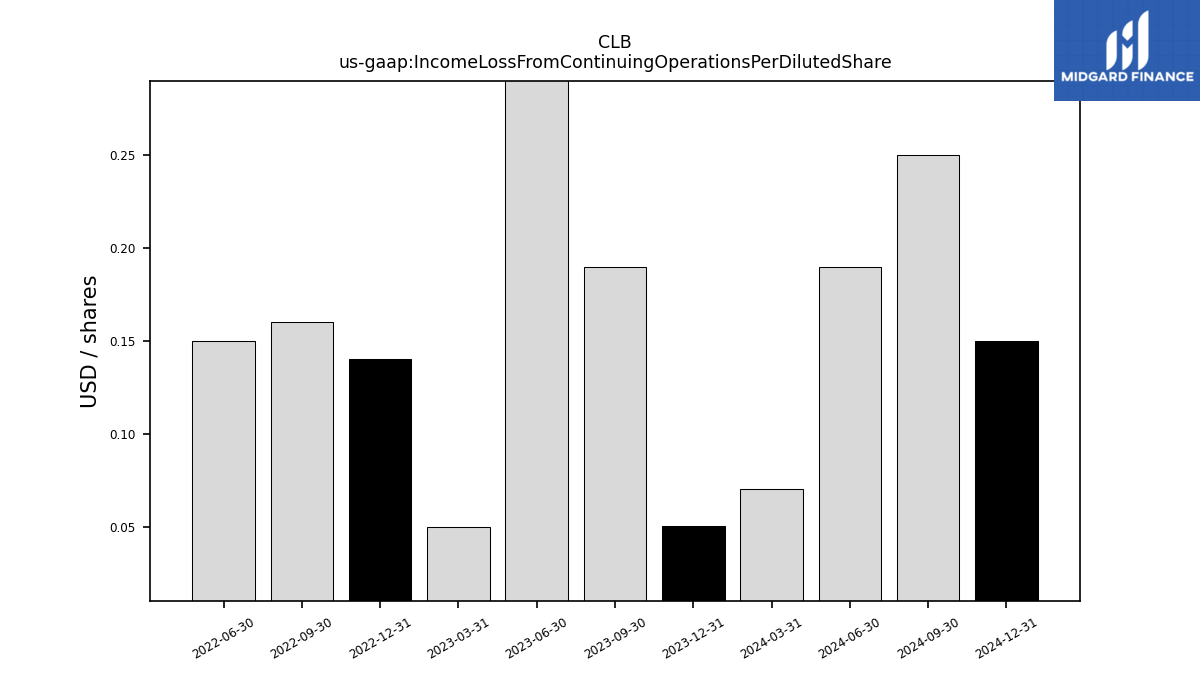
| Income Loss From Continuing Operations Per Diluted Share | 0.00 | 0.00 | 0.00 | 0.00 | 0.00 | 0.00 |
| 2023-12-31 | 2023-09-30 | 2023-06-30 | 2022-12-31 | 2022-09-30 | 2022-06-30 | ||
|---|---|---|---|---|---|---|---|
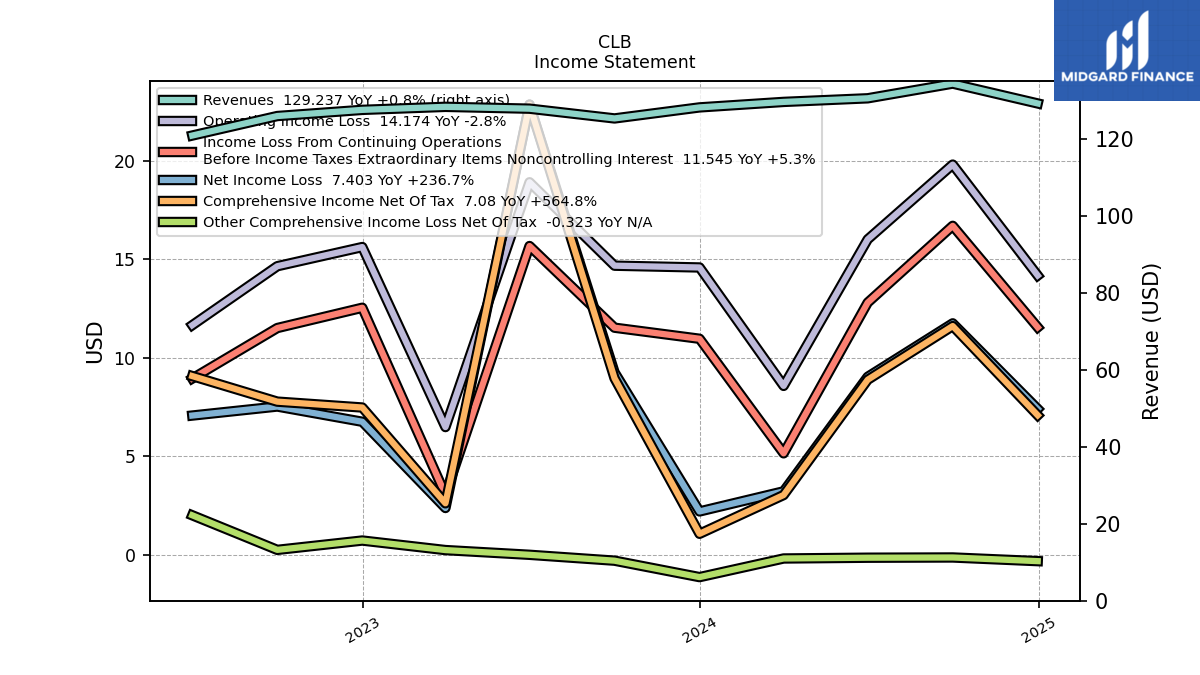
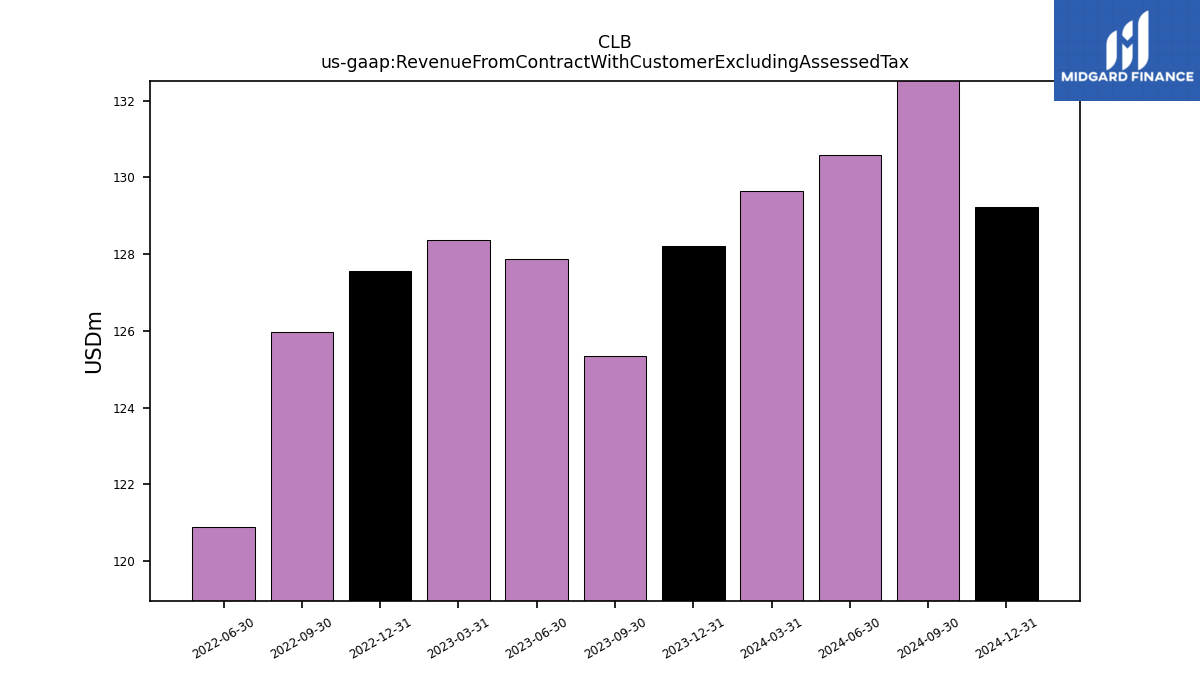
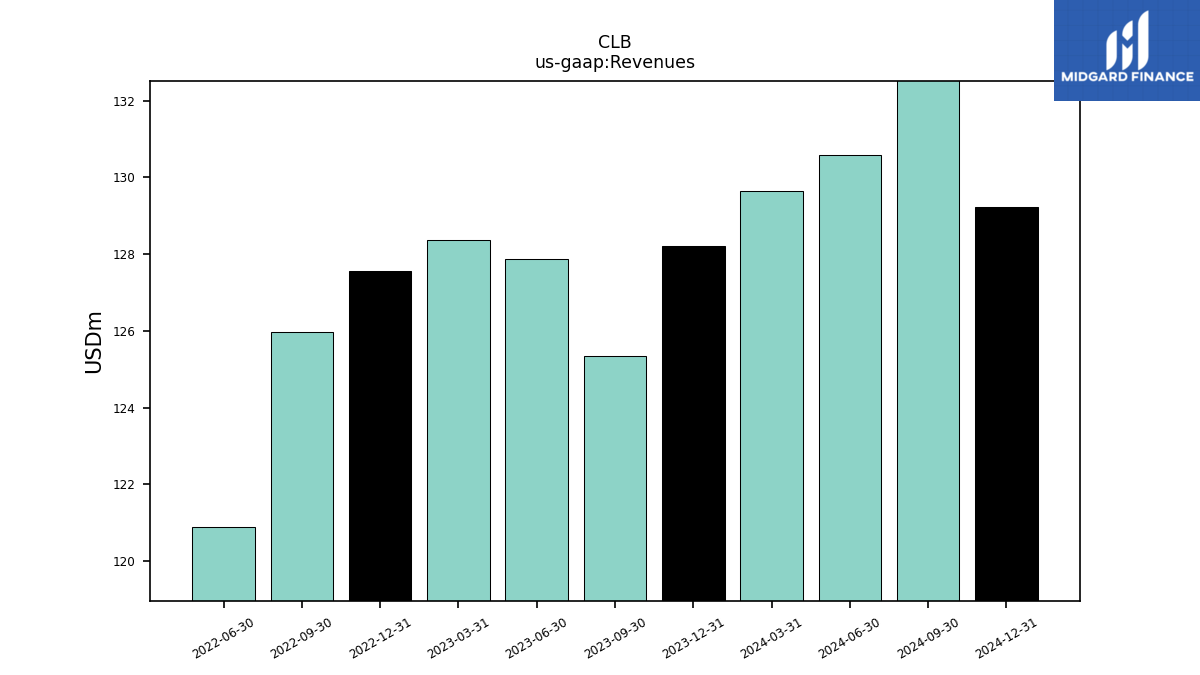
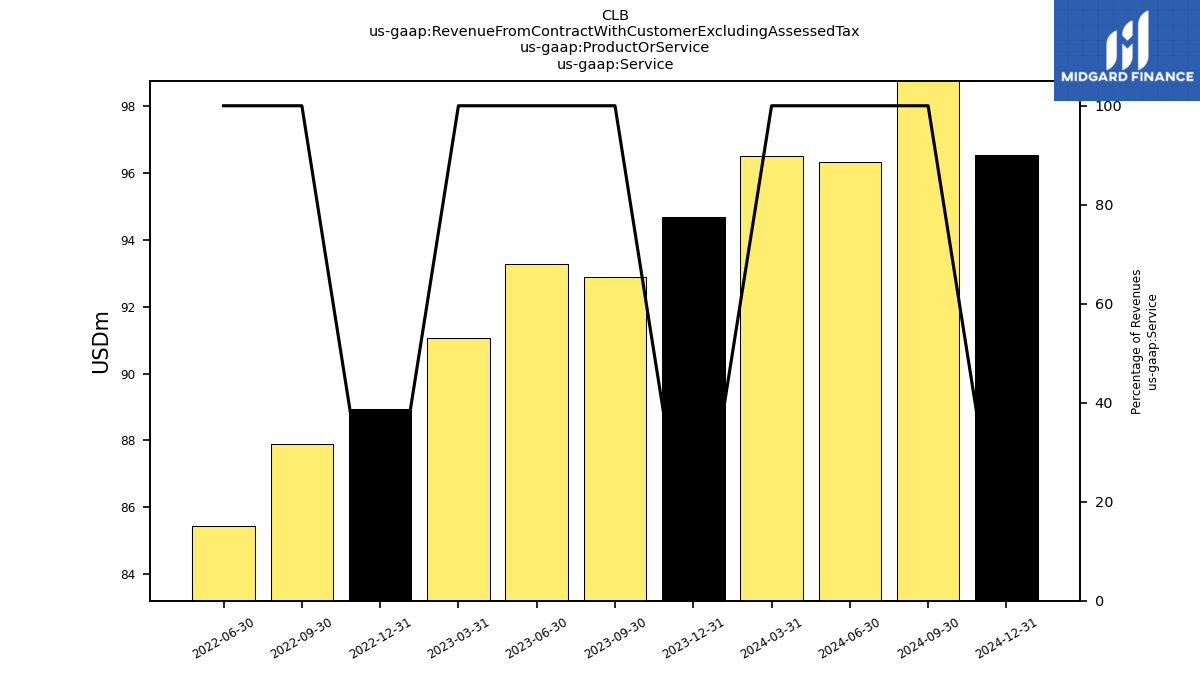
| Revenue From Contract With Customer Excluding Assessed Tax | 128.21 | 125.34 | 127.88 | 127.57 | 125.97 | 120.90 | |
| Revenues | 128.21 | 125.34 | 127.88 | 127.57 | 125.97 | 120.90 | |
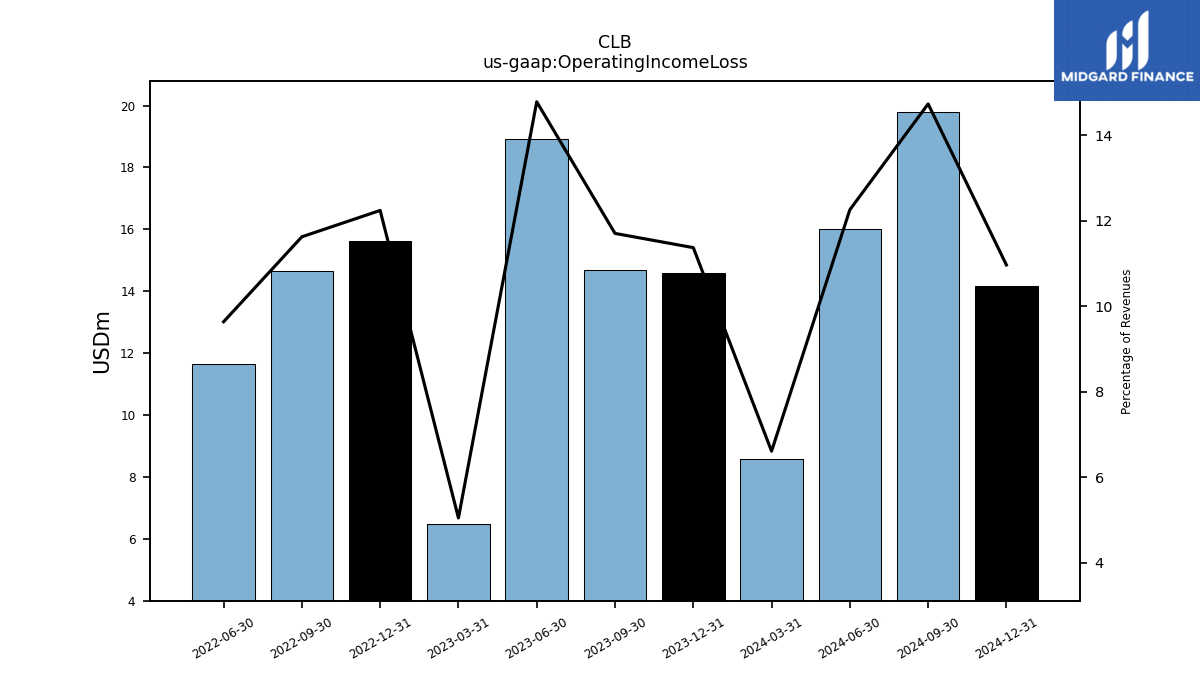
| Operating Income Loss | 14.58 | 14.67 | 18.91 | 15.62 | 14.64 | 11.65 | |
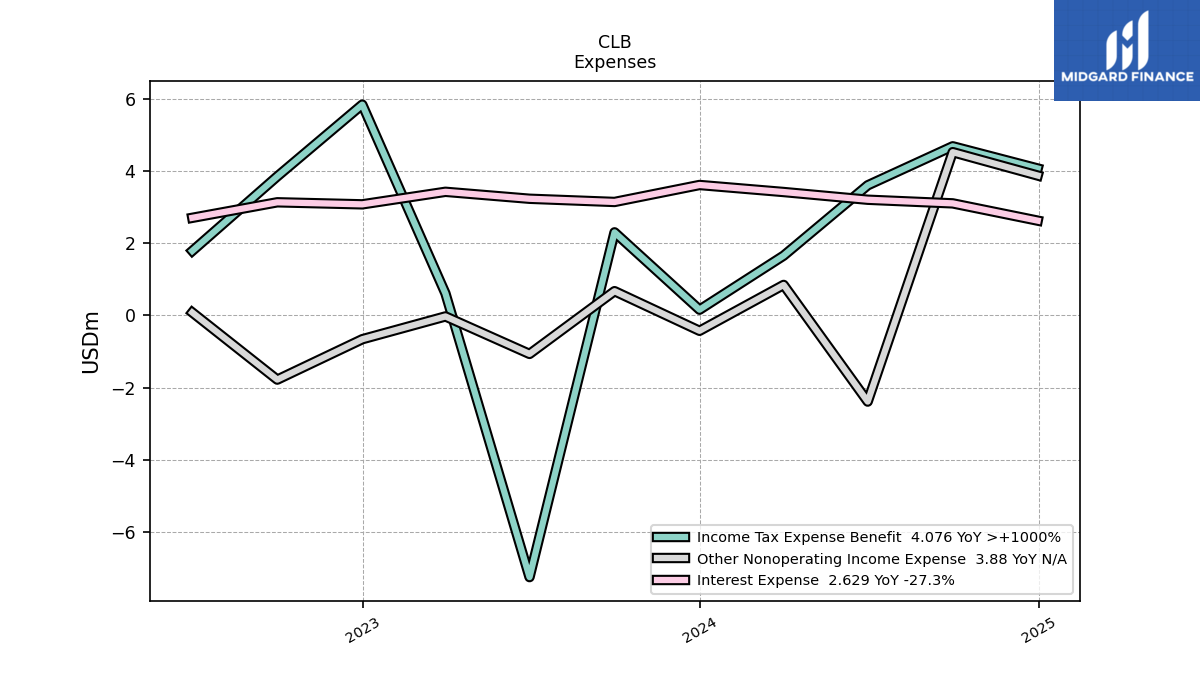
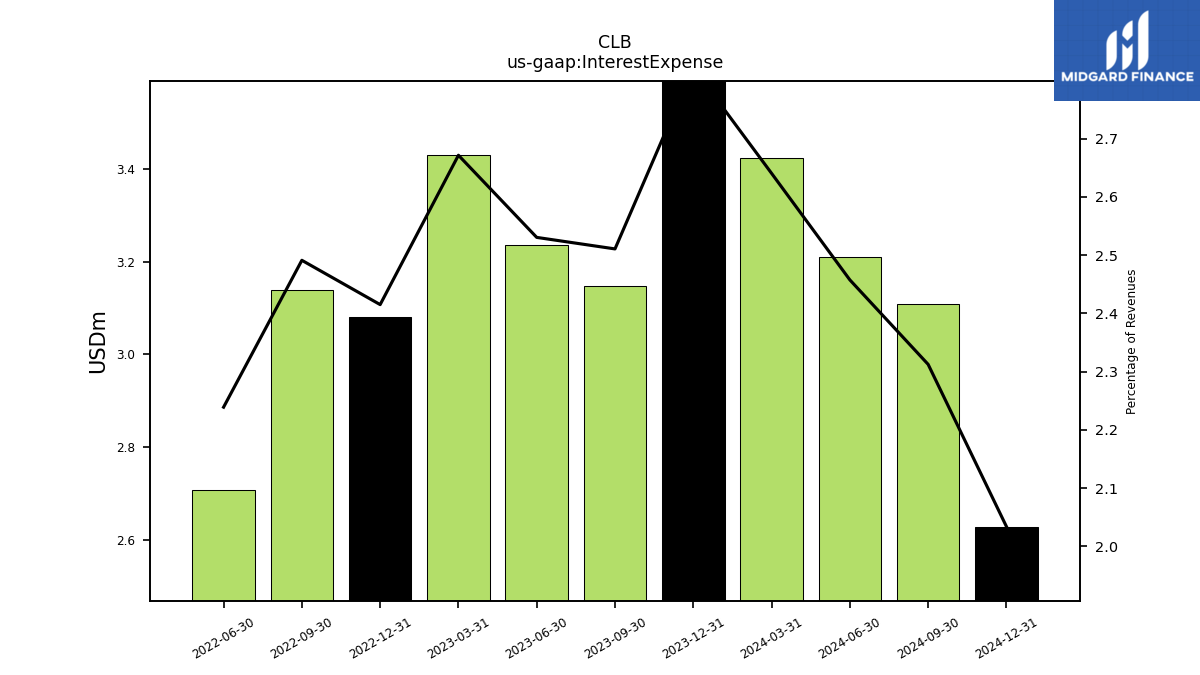
| Interest Expense | 3.62 | 3.15 | 3.24 | 3.08 | 3.14 | 2.71 | |
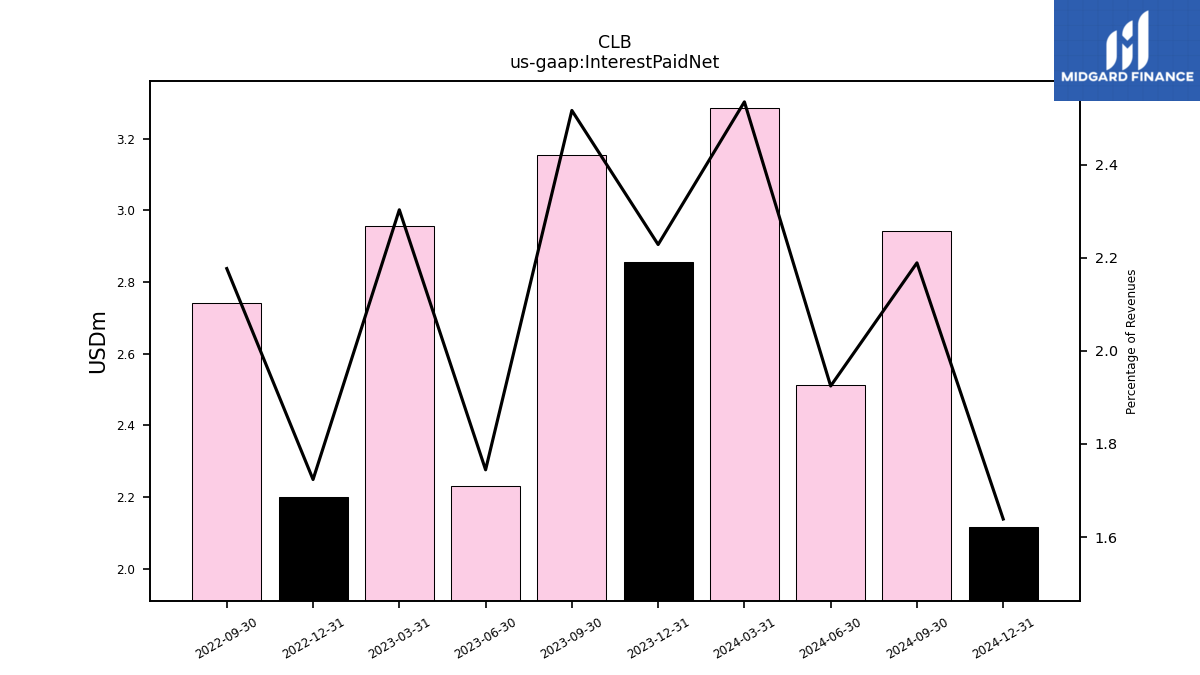
| Interest Paid Net | 2.86 | 3.15 | NA | 2.20 | 2.74 | NA | |
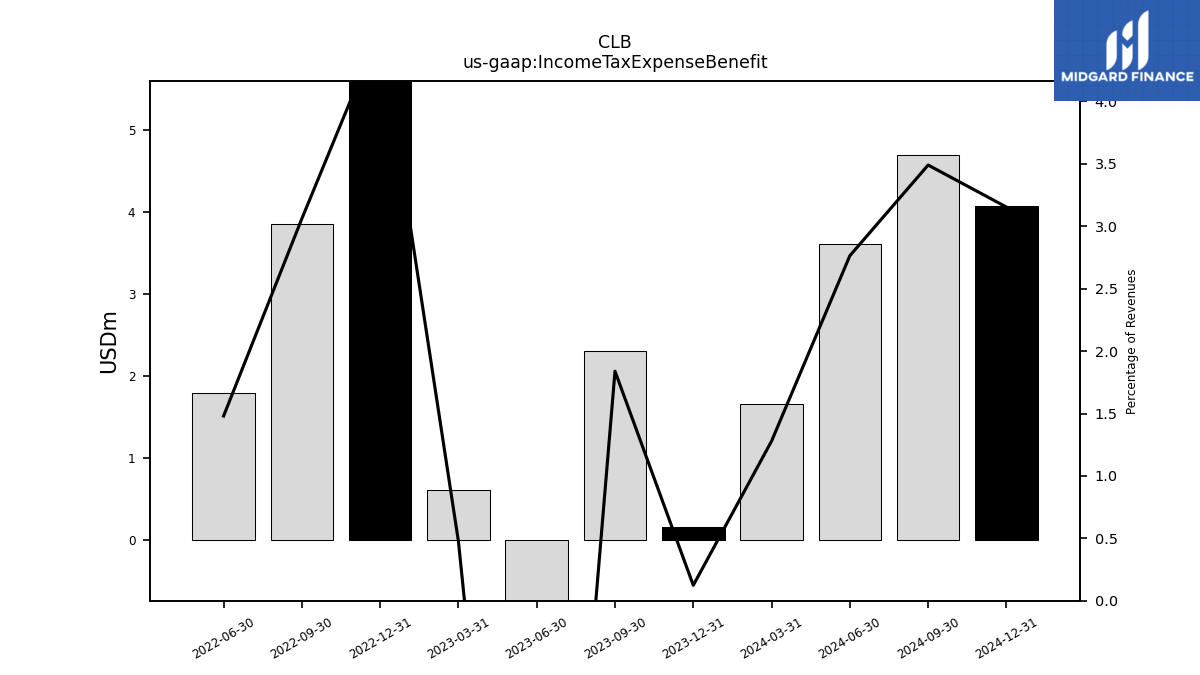
| Income Tax Expense Benefit | 0.16 | 2.31 | -7.26 | 5.85 | 3.86 | 1.79 | |
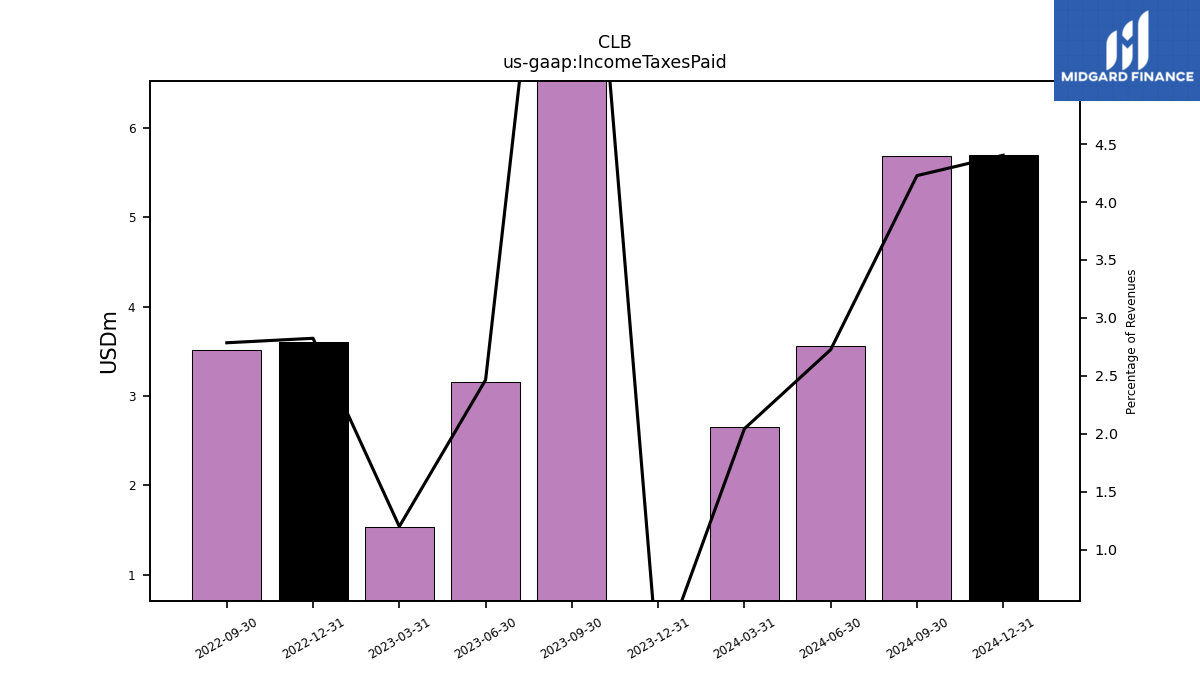
| Income Taxes Paid | 0.00 | 11.32 | NA | 3.60 | 3.51 | NA | |
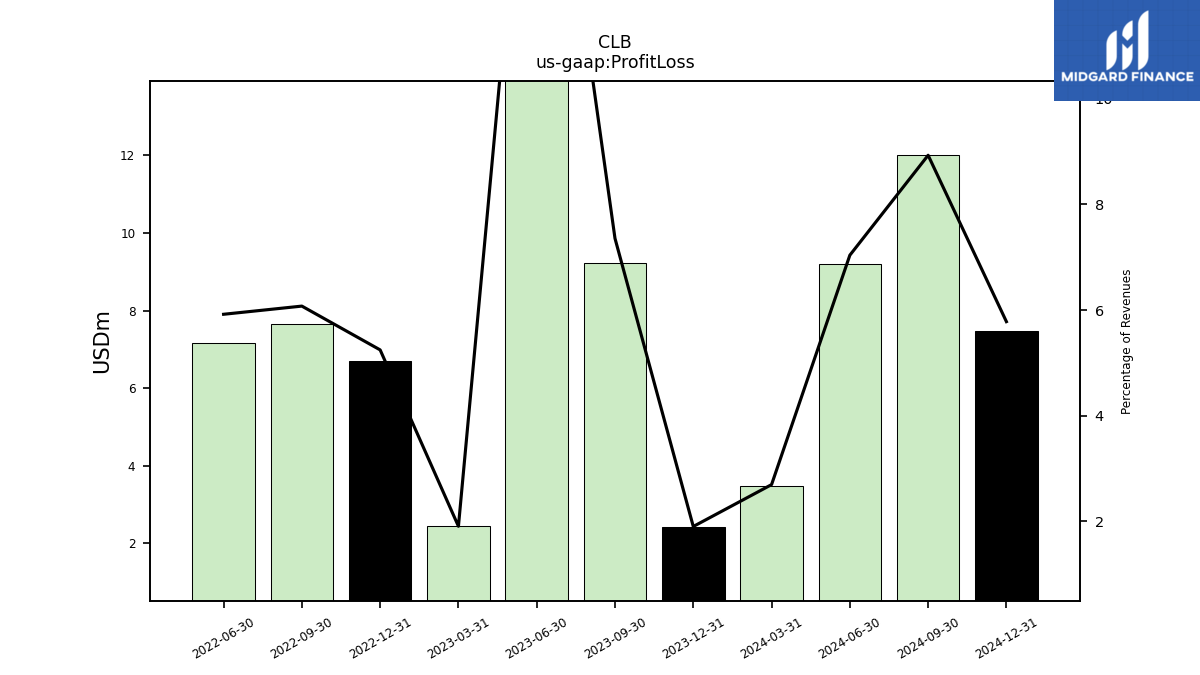
| Profit Loss | 2.43 | 9.22 | 22.93 | 6.69 | 7.65 | 7.16 | |
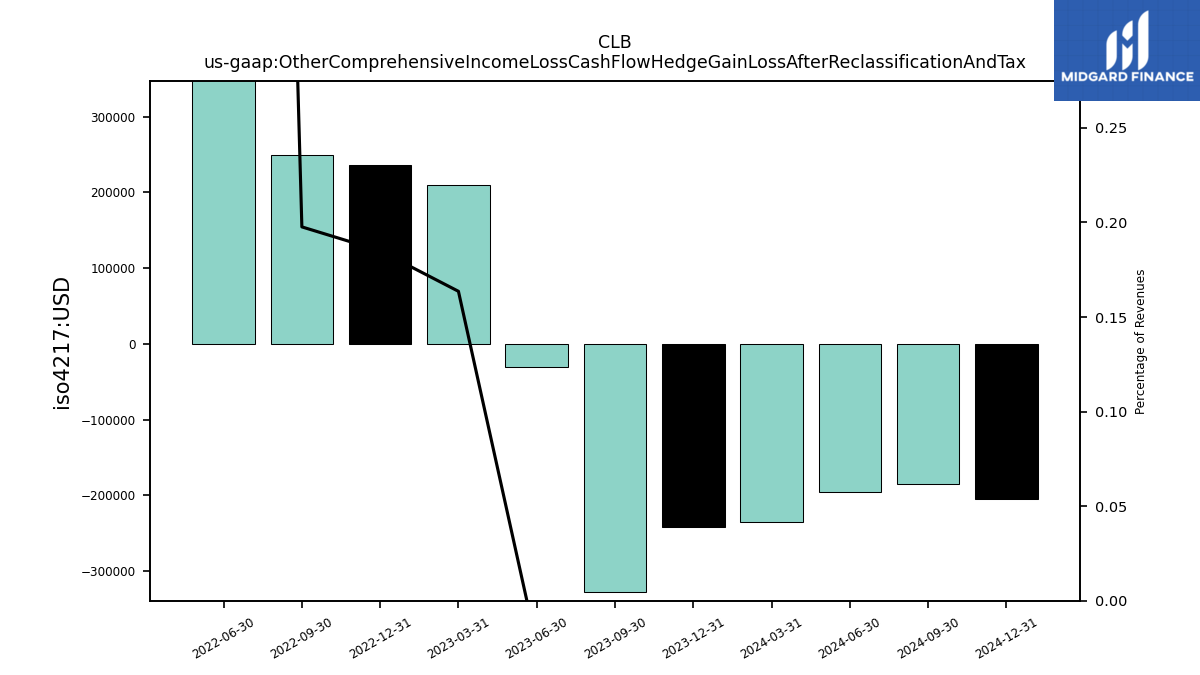
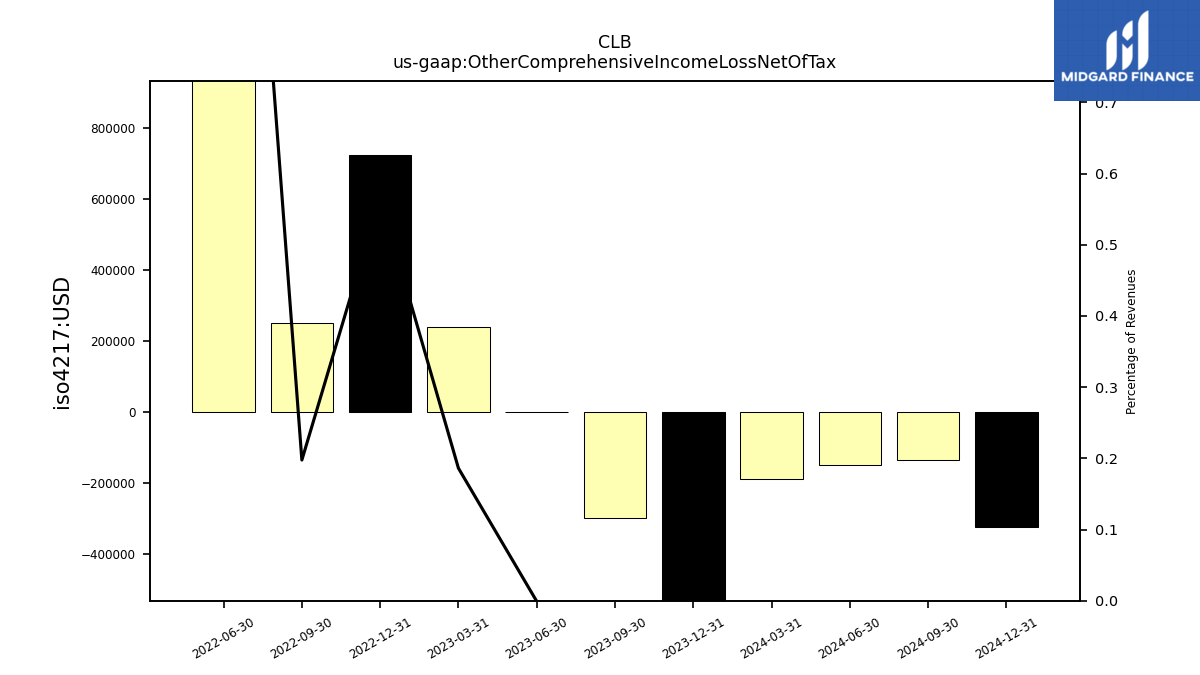
| Other Comprehensive Income Loss Cash Flow Hedge Gain Loss After Reclassification And Tax | -0.24 | -0.33 | -0.03 | 0.24 | 0.25 | 2.00 | |
| Other Comprehensive Income Loss Net Of Tax | -1.13 | -0.30 | -0.00 | 0.72 | 0.25 | 2.00 | |
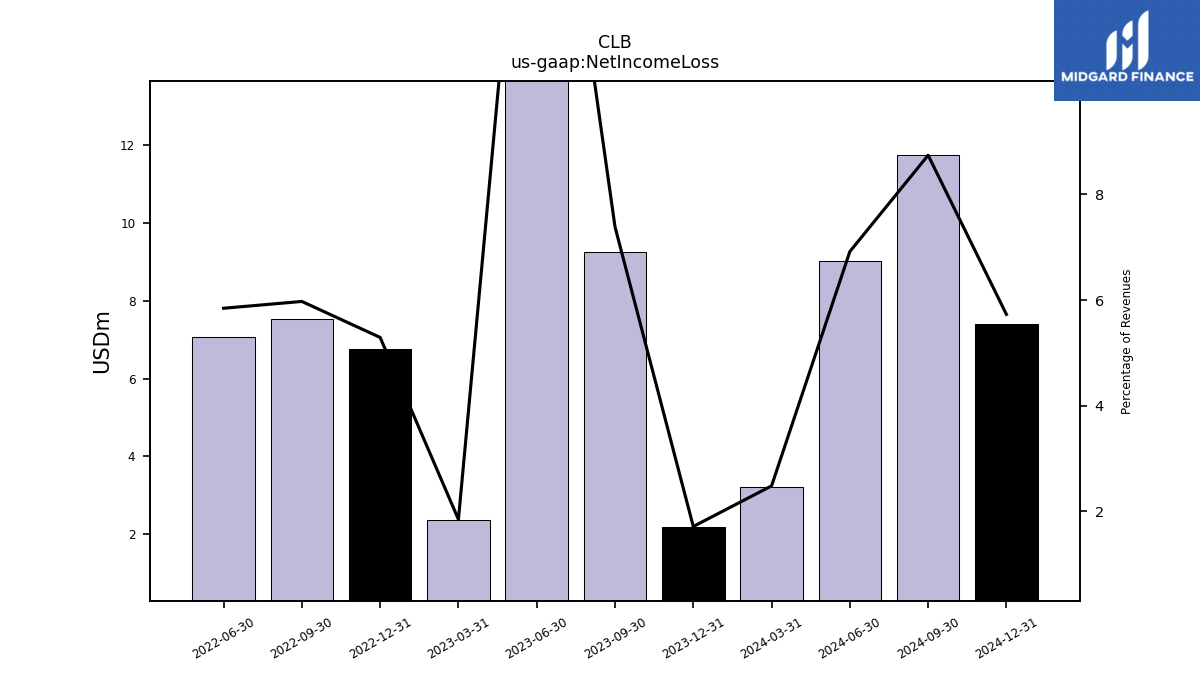
| Net Income Loss | 2.20 | 9.26 | 22.85 | 6.75 | 7.52 | 7.07 | |
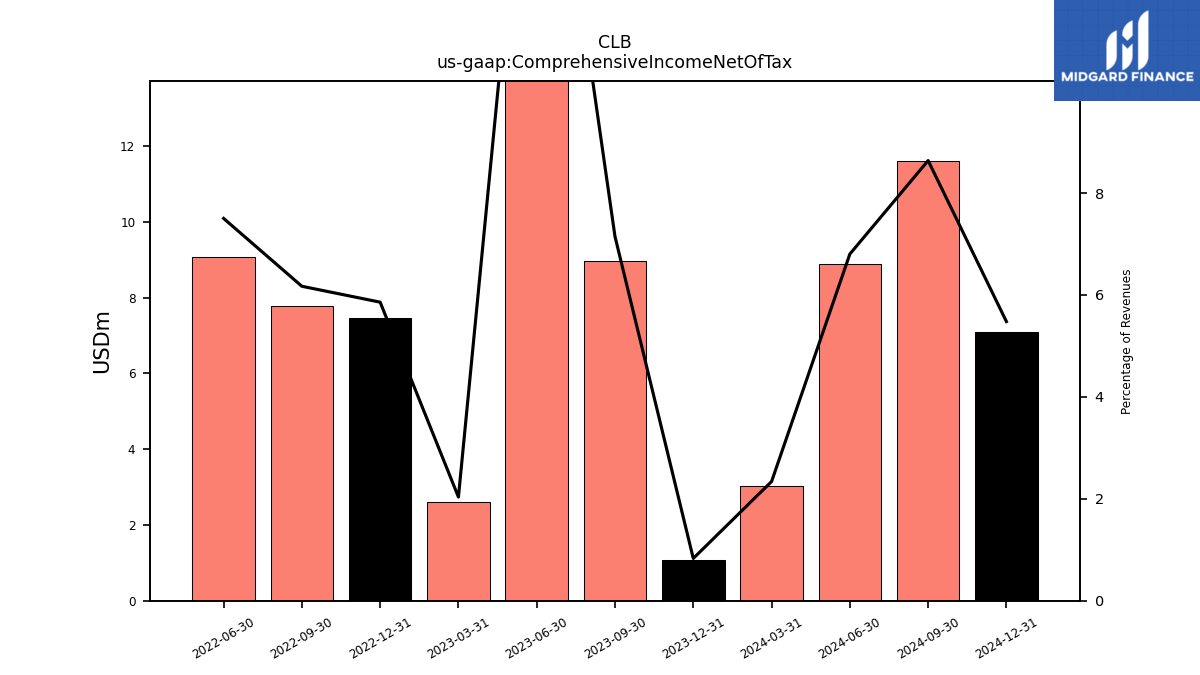
| Comprehensive Income Net Of Tax | 1.06 | 8.96 | 22.84 | 7.47 | 7.77 | 9.07 |
| 2023-12-31 | 2023-09-30 | 2023-06-30 | 2022-12-31 | 2022-09-30 | 2022-06-30 | ||
|---|---|---|---|---|---|---|---|
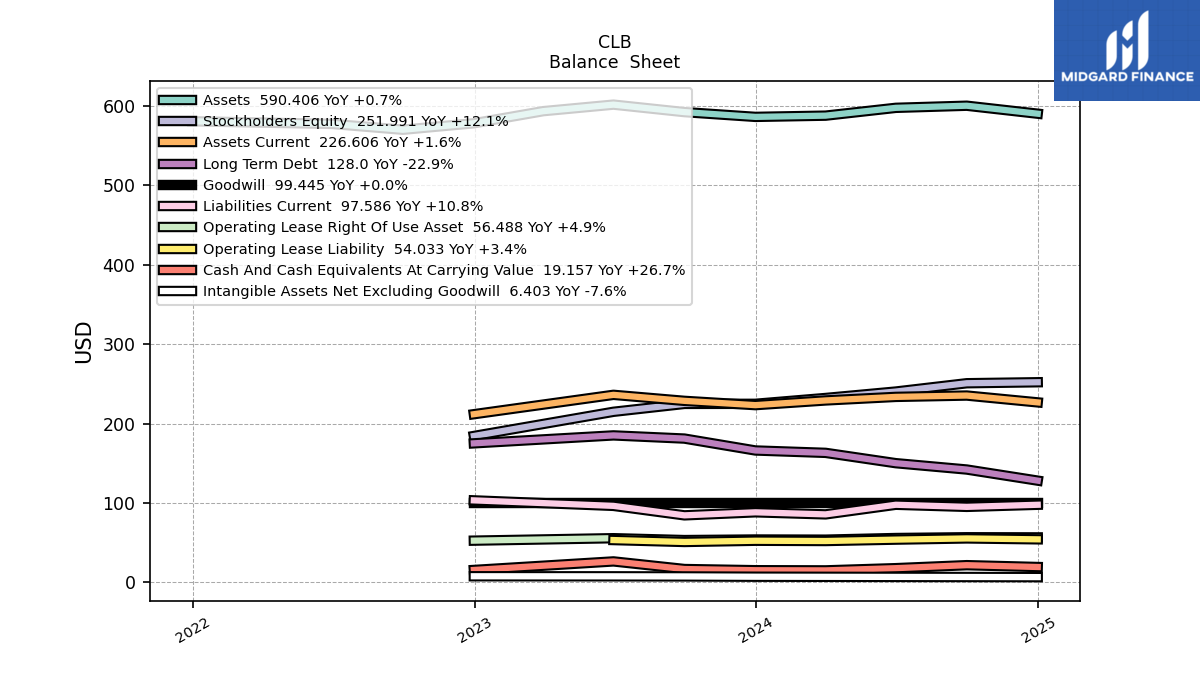
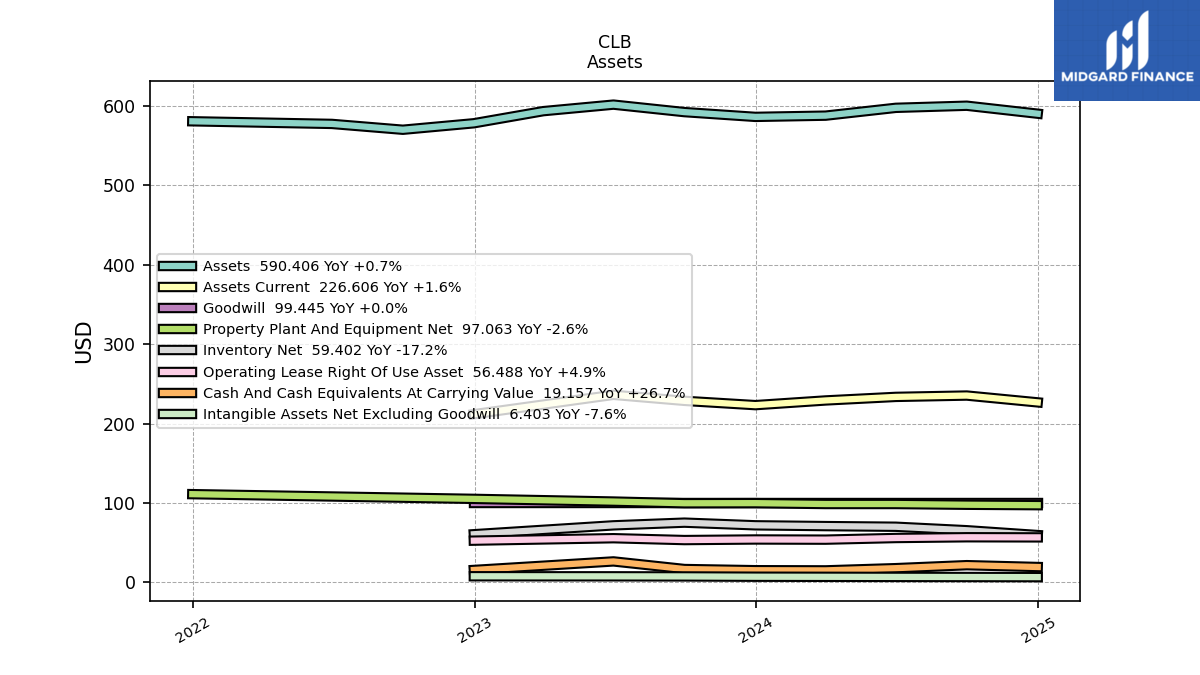
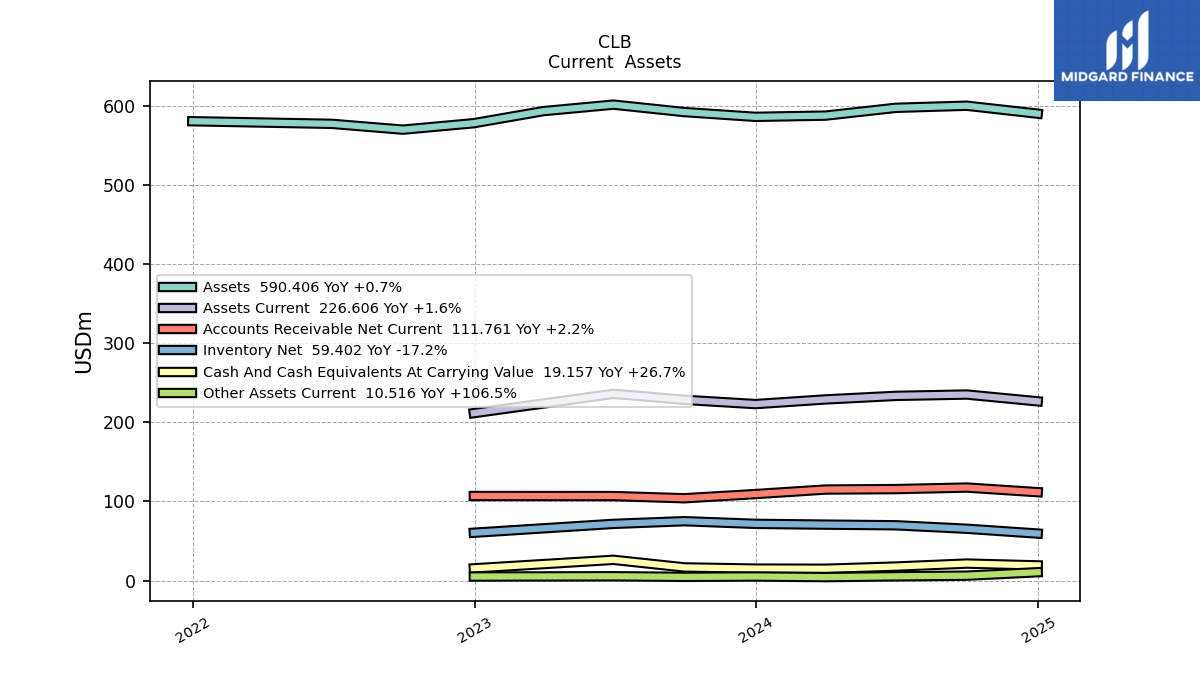
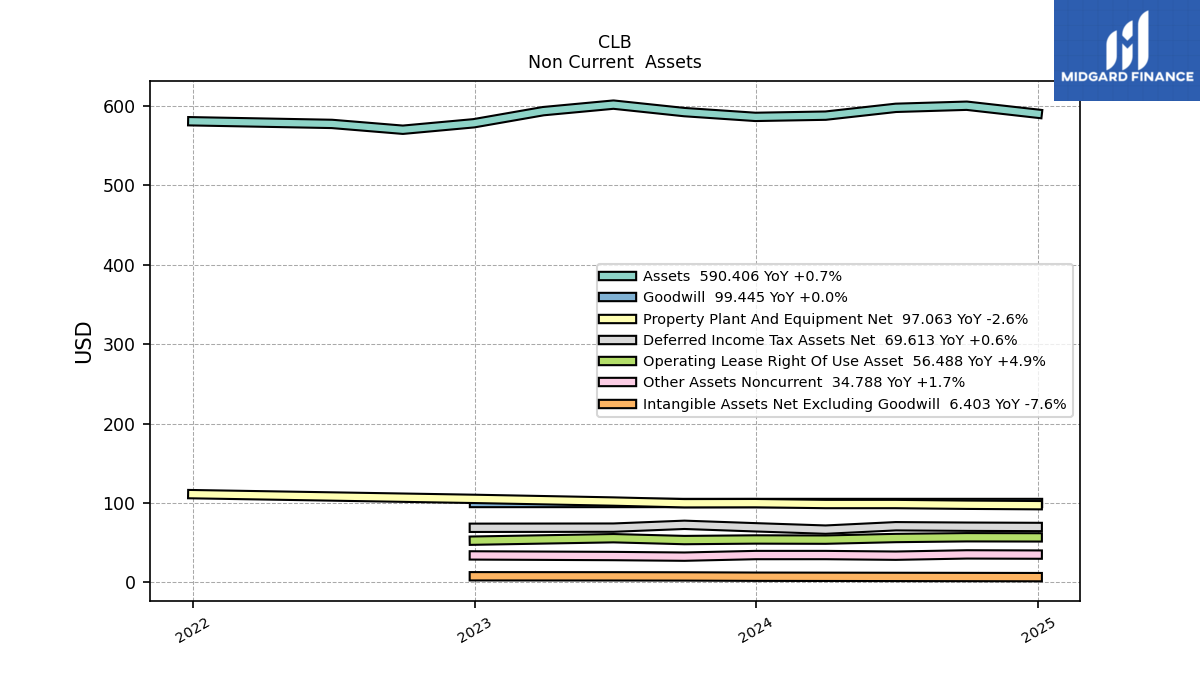
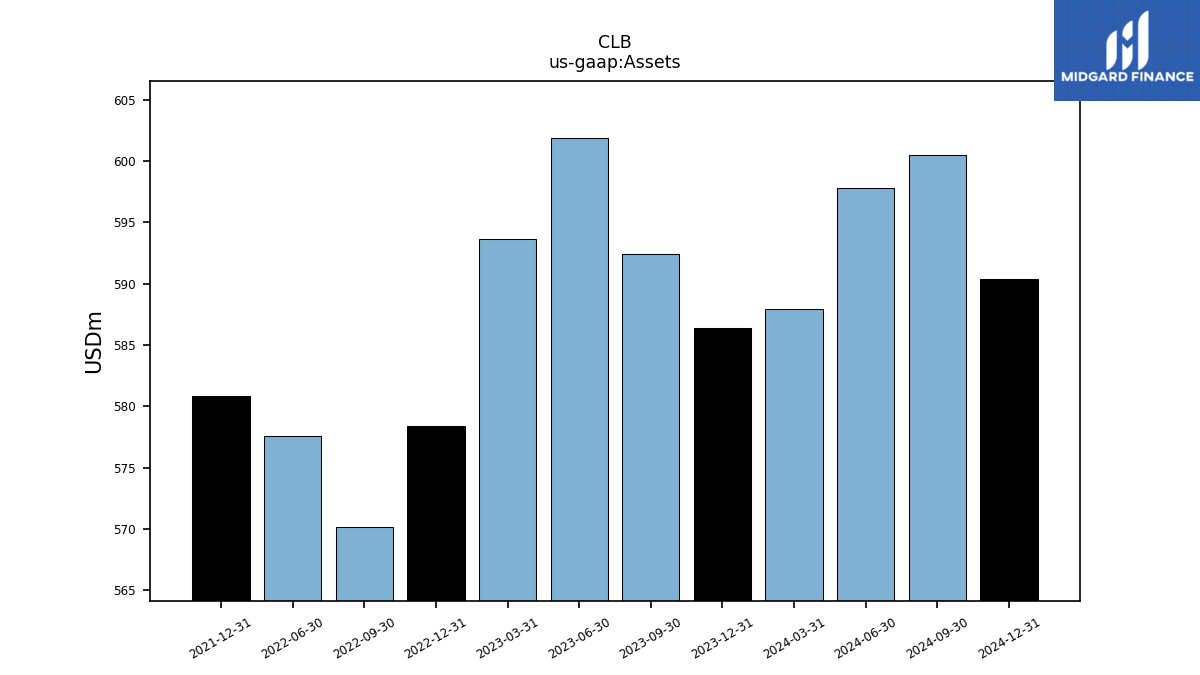
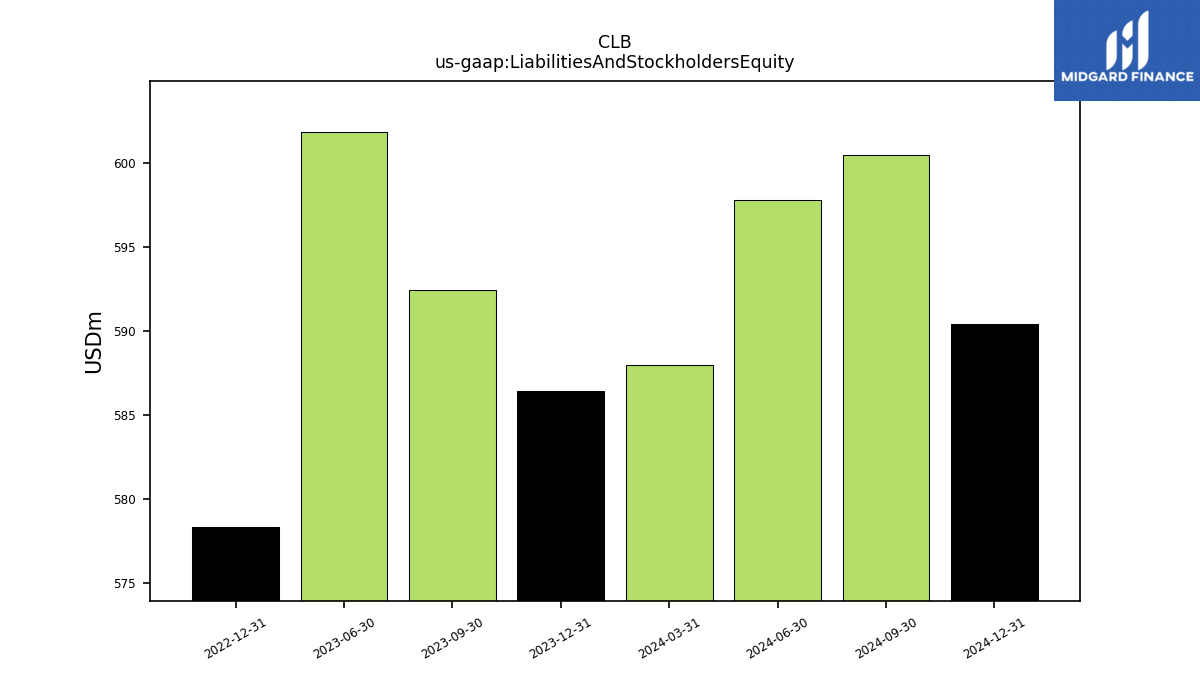
| Assets | 586.39 | 592.41 | 601.85 | 578.35 | 570.19 | 577.54 | |
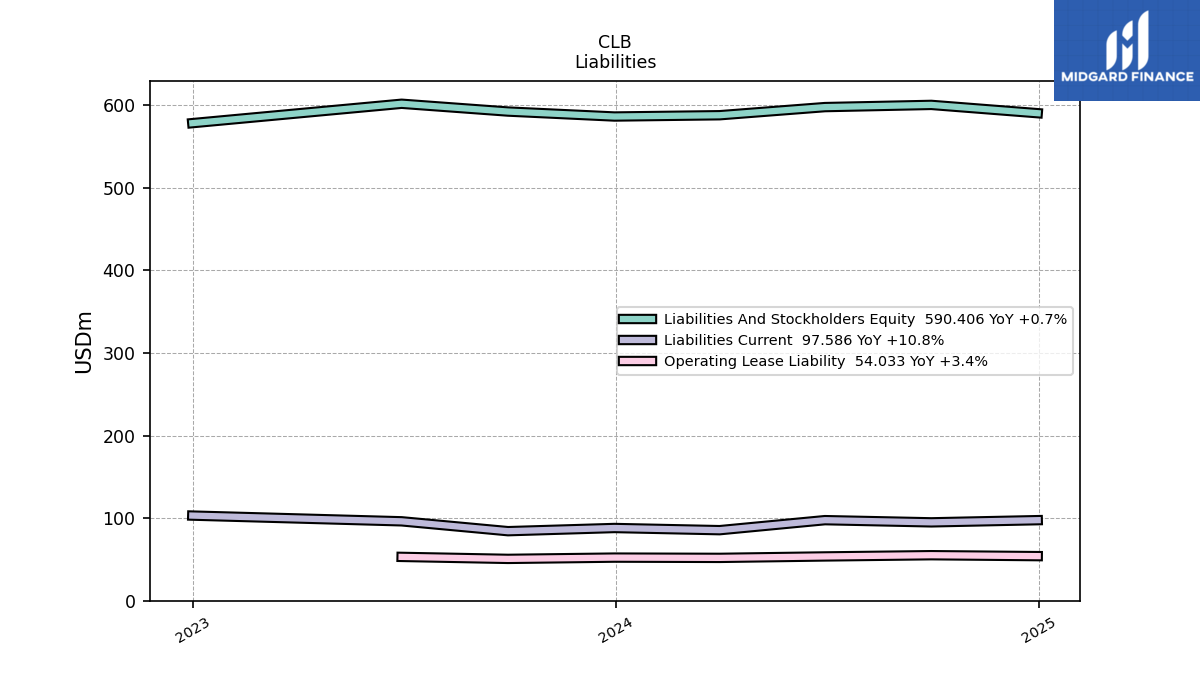
| Liabilities And Stockholders Equity | 586.39 | 592.41 | 601.85 | 578.35 | NA | NA | |
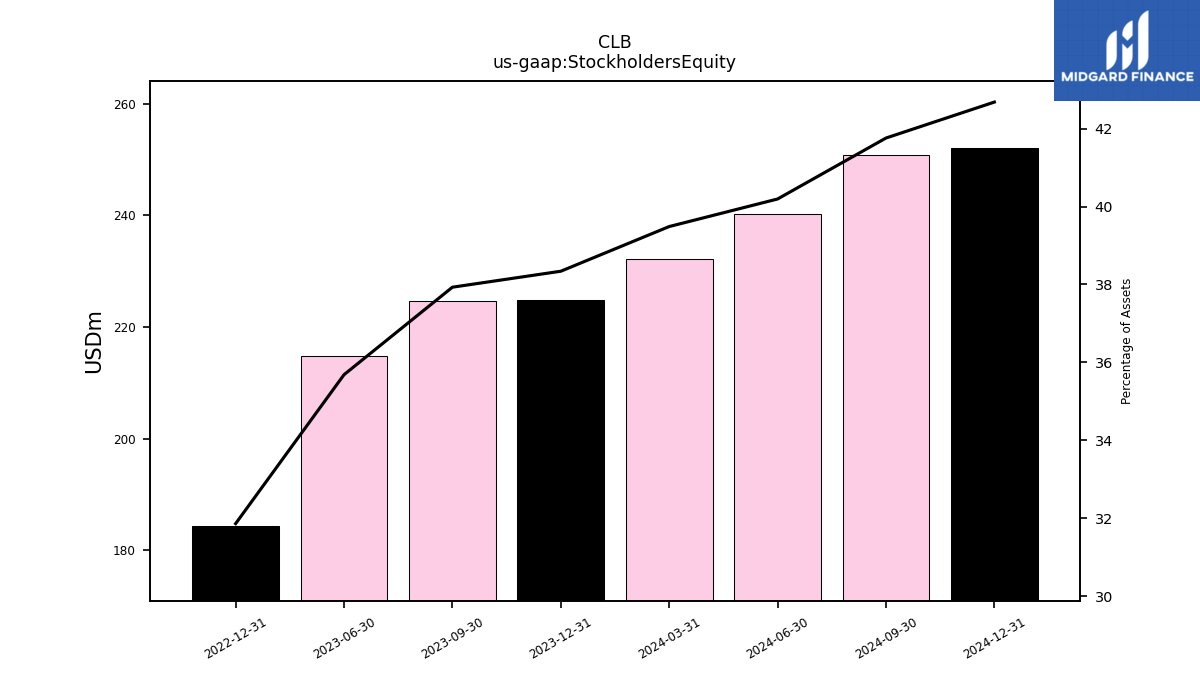
| Stockholders Equity | 224.81 | 224.69 | 214.76 | 184.26 | NA | NA |
| 2023-12-31 | 2023-09-30 | 2023-06-30 | 2022-12-31 | 2022-09-30 | 2022-06-30 | ||
|---|---|---|---|---|---|---|---|
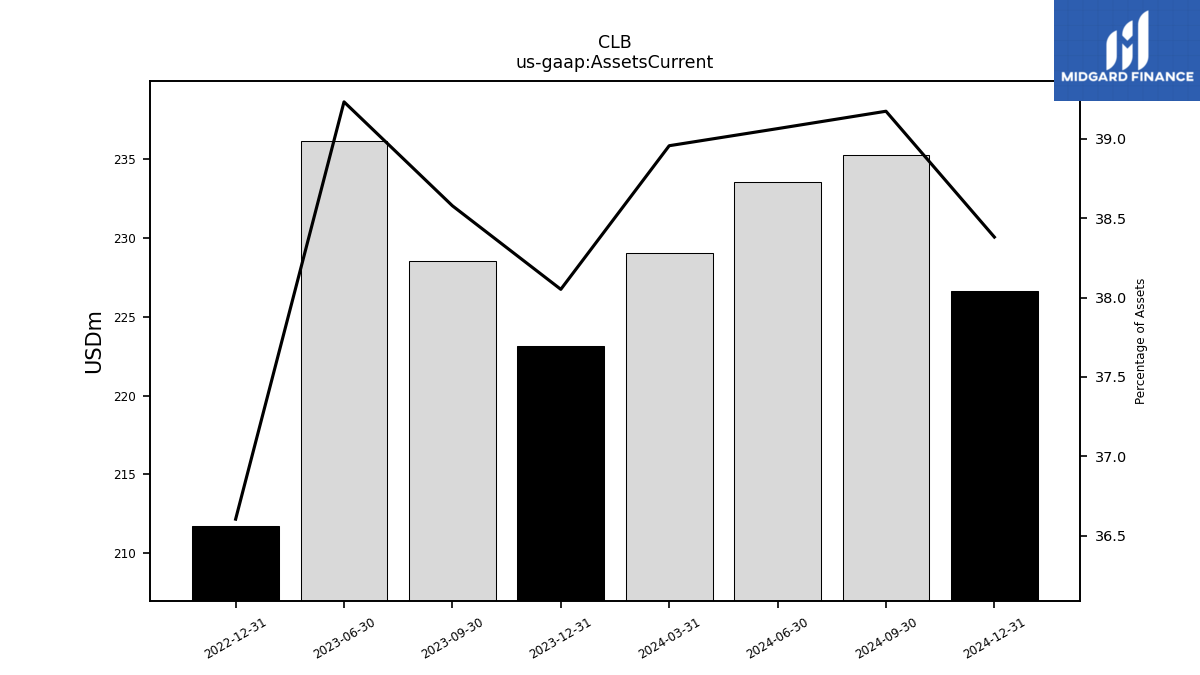
| Assets Current | 223.14 | 228.54 | 236.12 | 211.70 | NA | NA | |
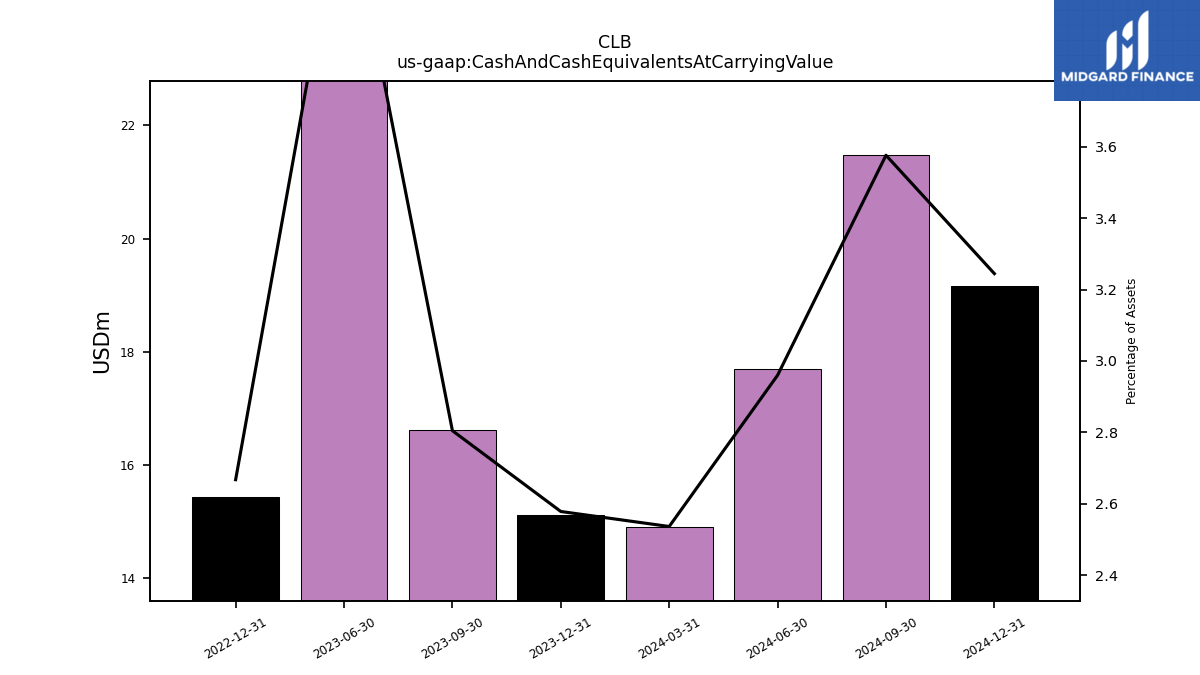
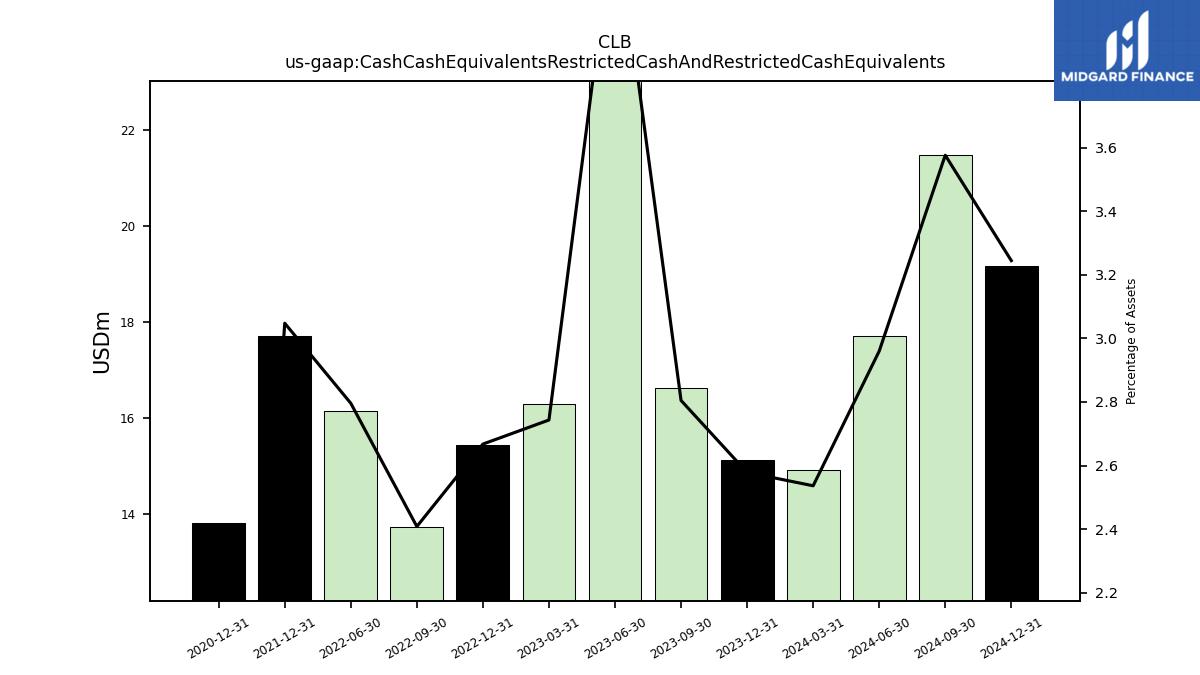
| Cash And Cash Equivalents At Carrying Value | 15.12 | 16.62 | 26.20 | 15.43 | NA | NA | |
| Cash Cash Equivalents Restricted Cash And Restricted Cash Equivalents | 15.12 | 16.62 | 26.20 | 15.43 | 13.73 | 16.15 | |
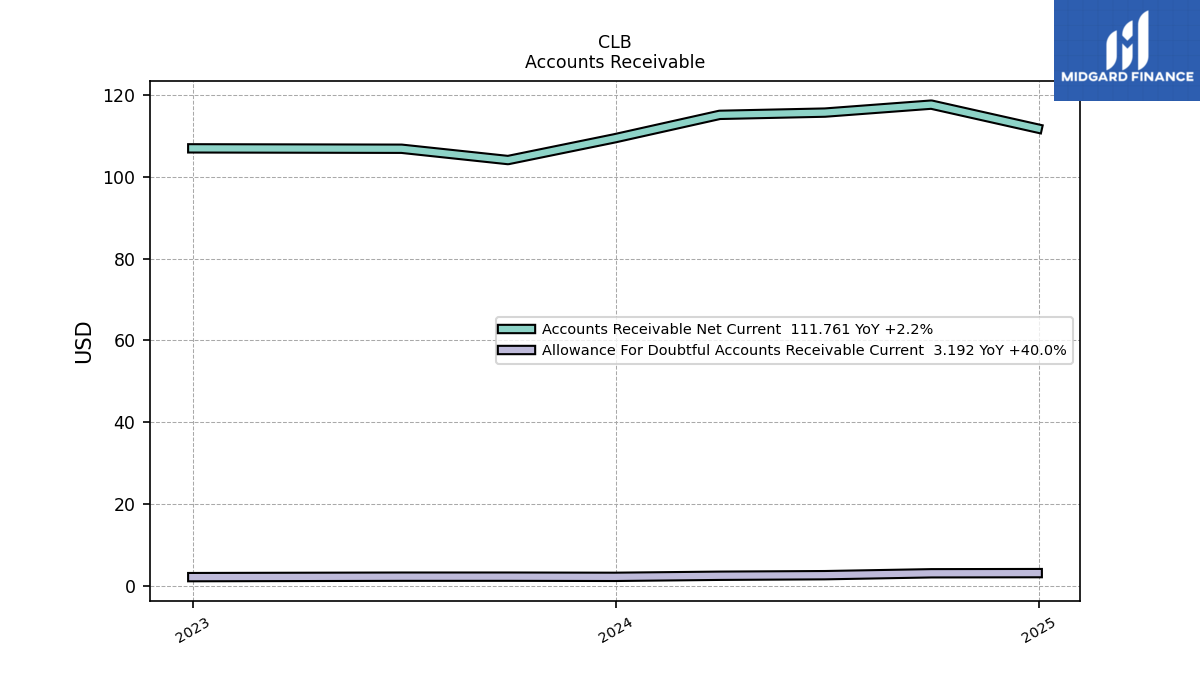
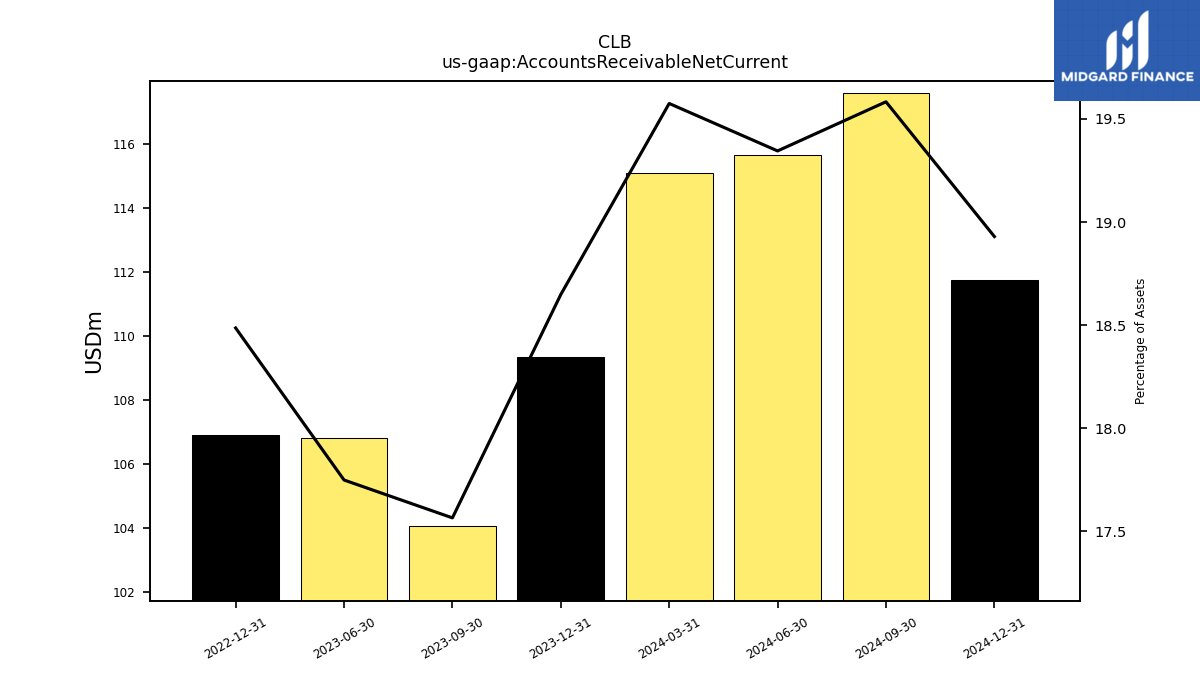
| Accounts Receivable Net Current | 109.35 | 104.05 | 106.82 | 106.91 | NA | NA | |
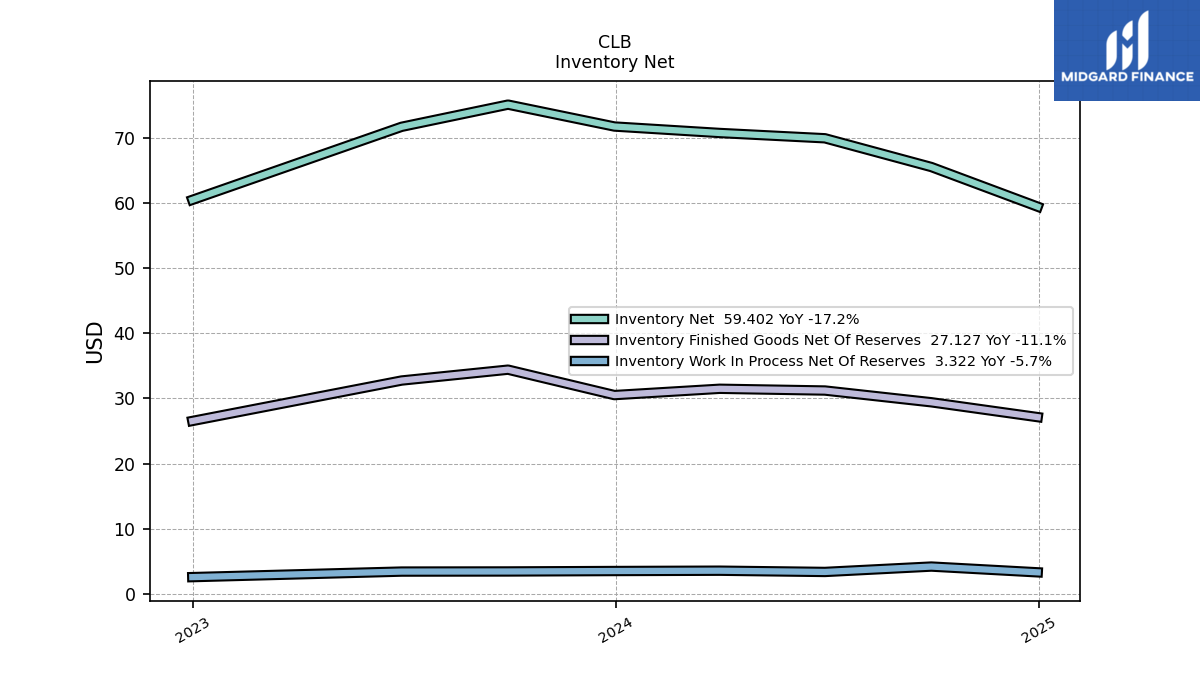
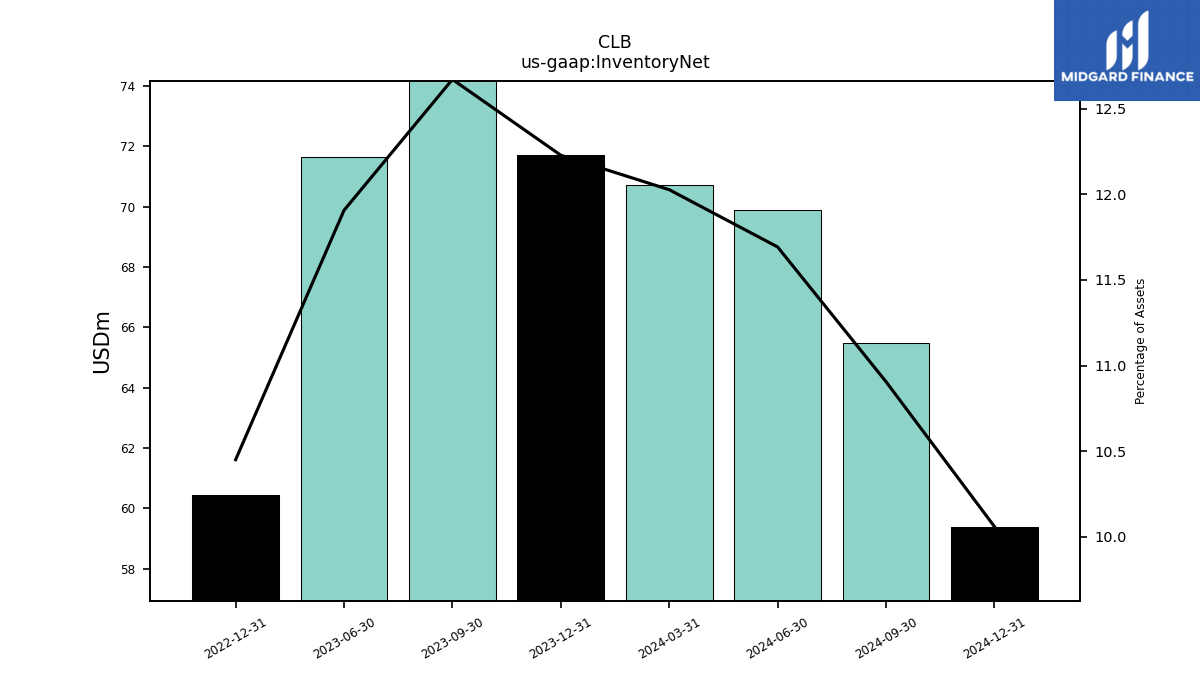
| Inventory Net | 71.70 | 75.06 | 71.66 | 60.45 | NA | NA | |
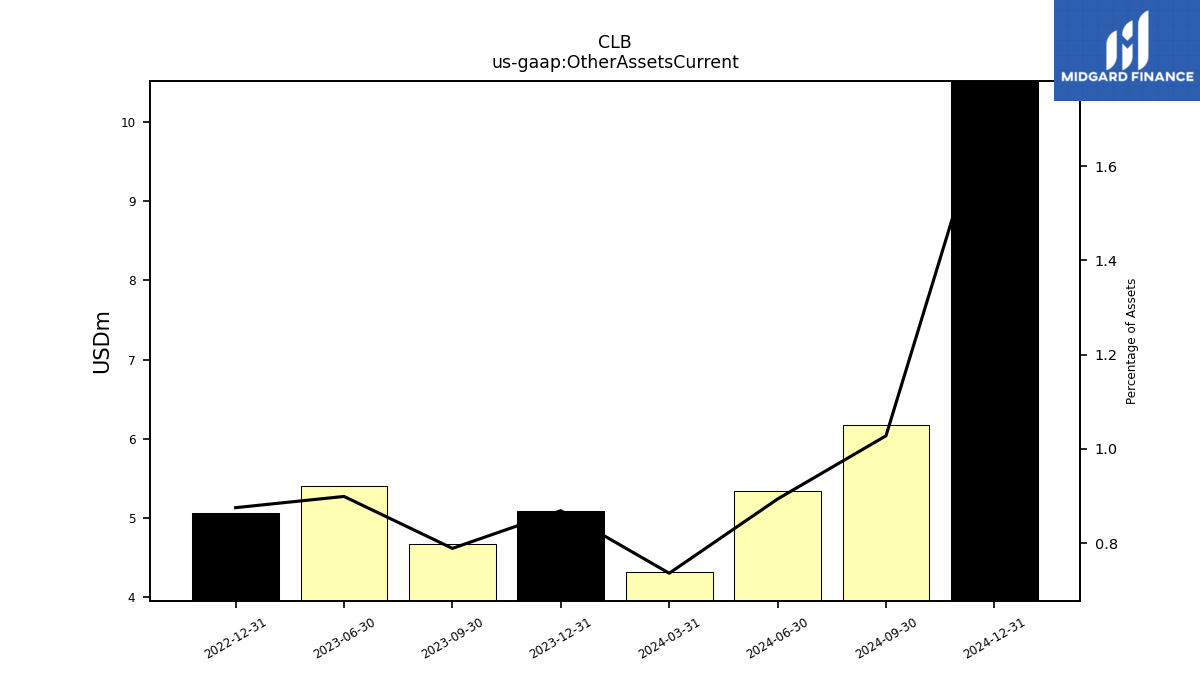
| Other Assets Current | 5.09 | 4.67 | 5.41 | 5.06 | NA | NA | |
| Machinery And Equipment Gross | 284.23 | NA | NA | 288.12 | NA | NA |
| 2023-12-31 | 2023-09-30 | 2023-06-30 | 2022-12-31 | 2022-09-30 | 2022-06-30 | ||
|---|---|---|---|---|---|---|---|
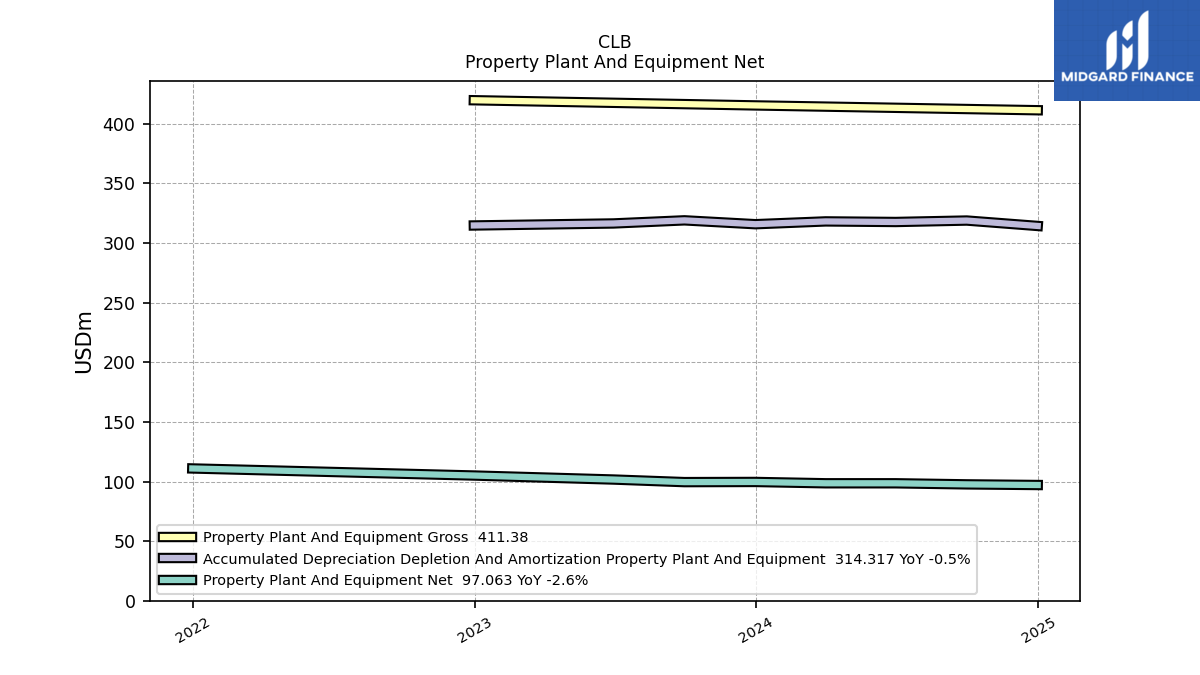
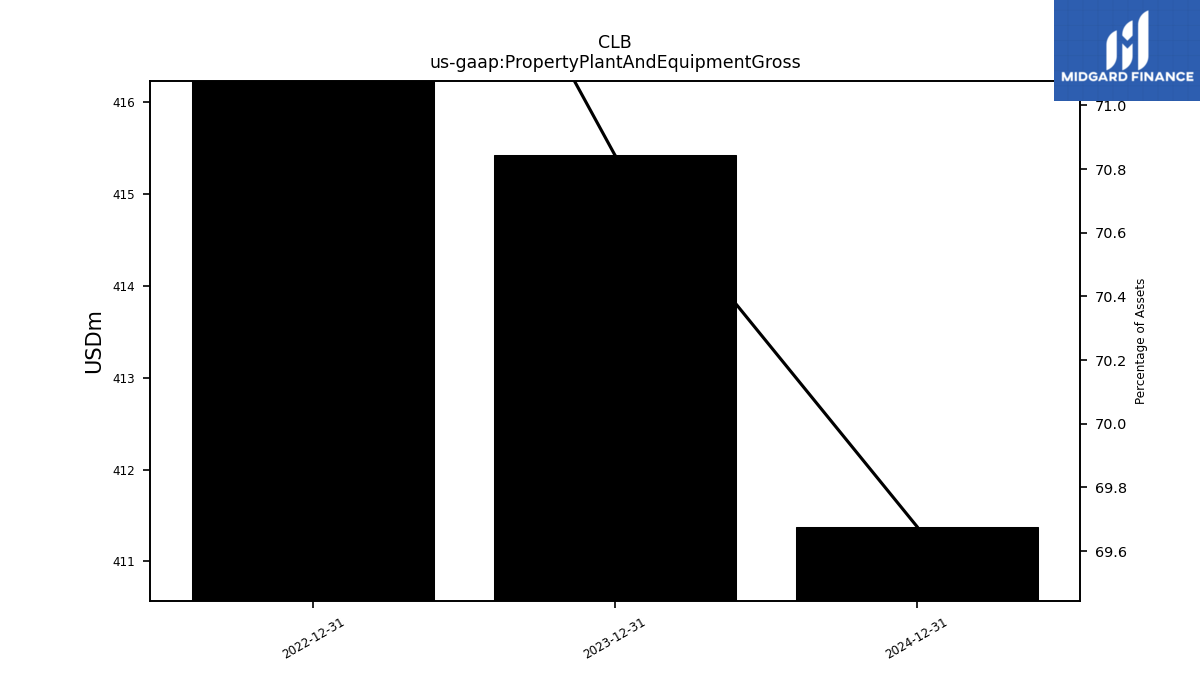
| Property Plant And Equipment Gross | 415.42 | NA | NA | 419.76 | NA | NA | |
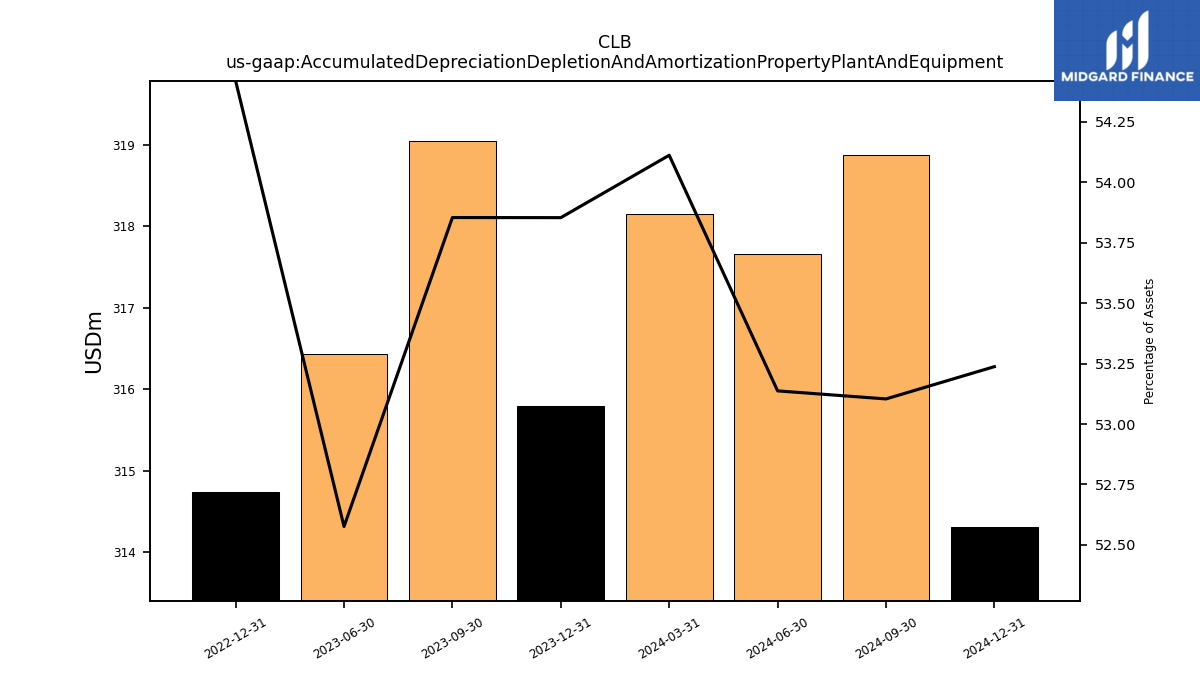
| Accumulated Depreciation Depletion And Amortization Property Plant And Equipment | 315.80 | 319.04 | 316.43 | 314.74 | NA | NA | |
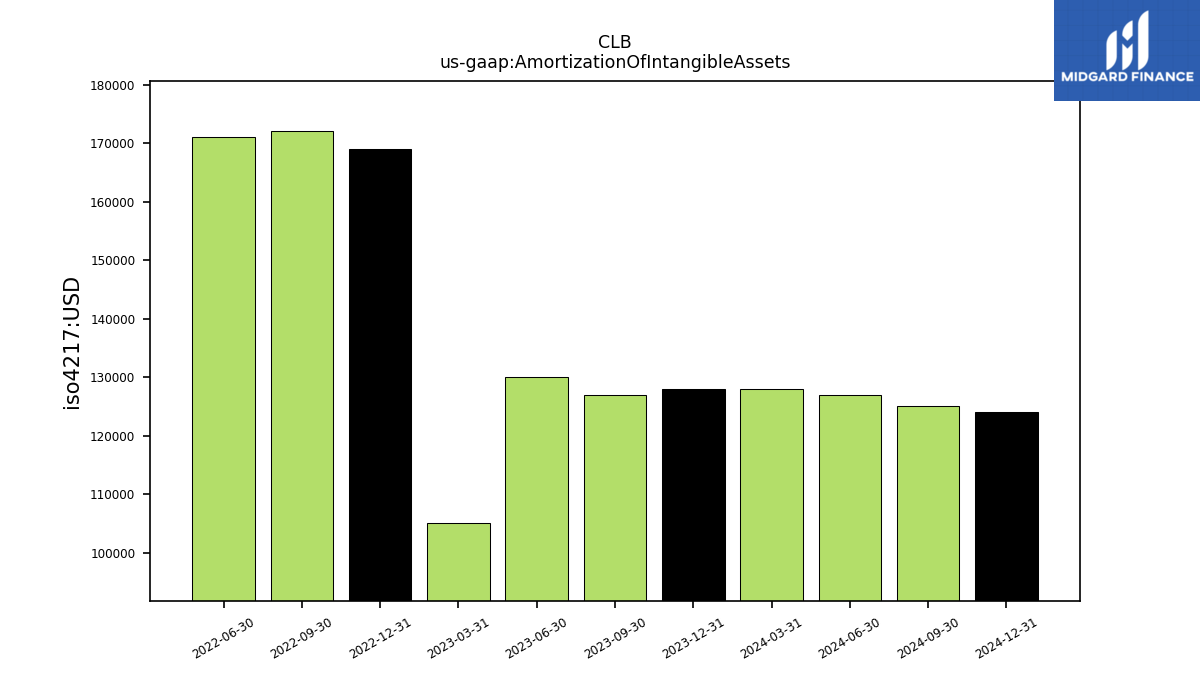
| Amortization Of Intangible Assets | 0.13 | 0.13 | 0.13 | 0.17 | 0.17 | 0.17 | |
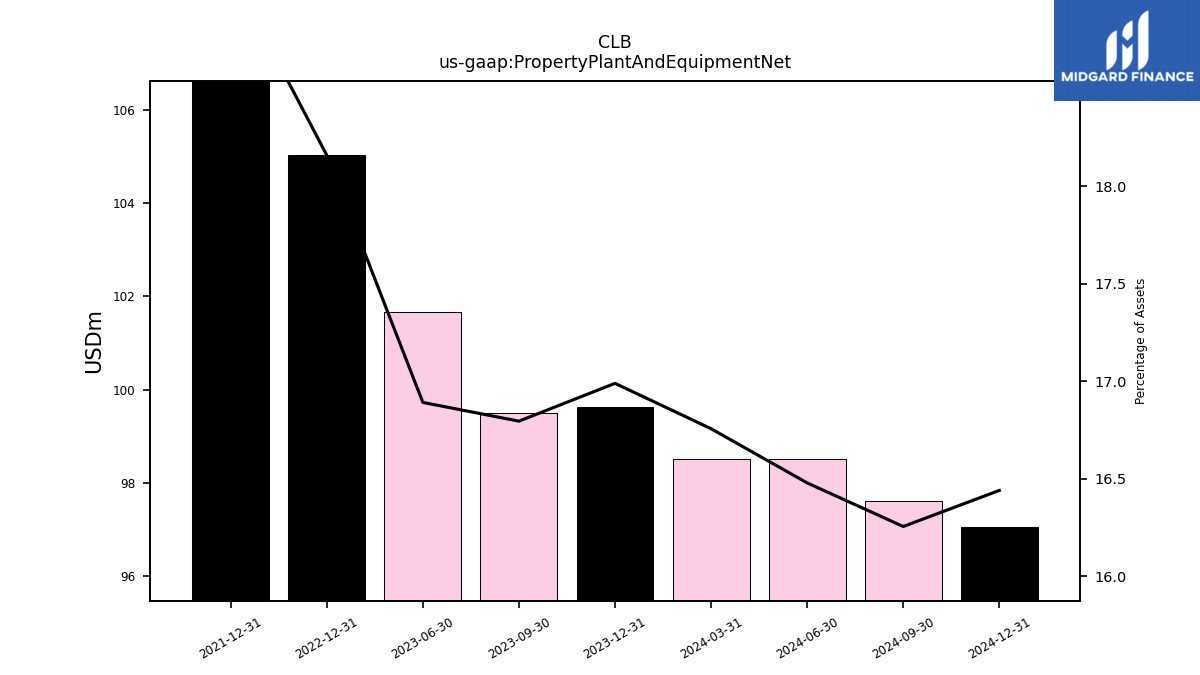
| Property Plant And Equipment Net | 99.63 | 99.50 | 101.66 | 105.03 | NA | NA | |
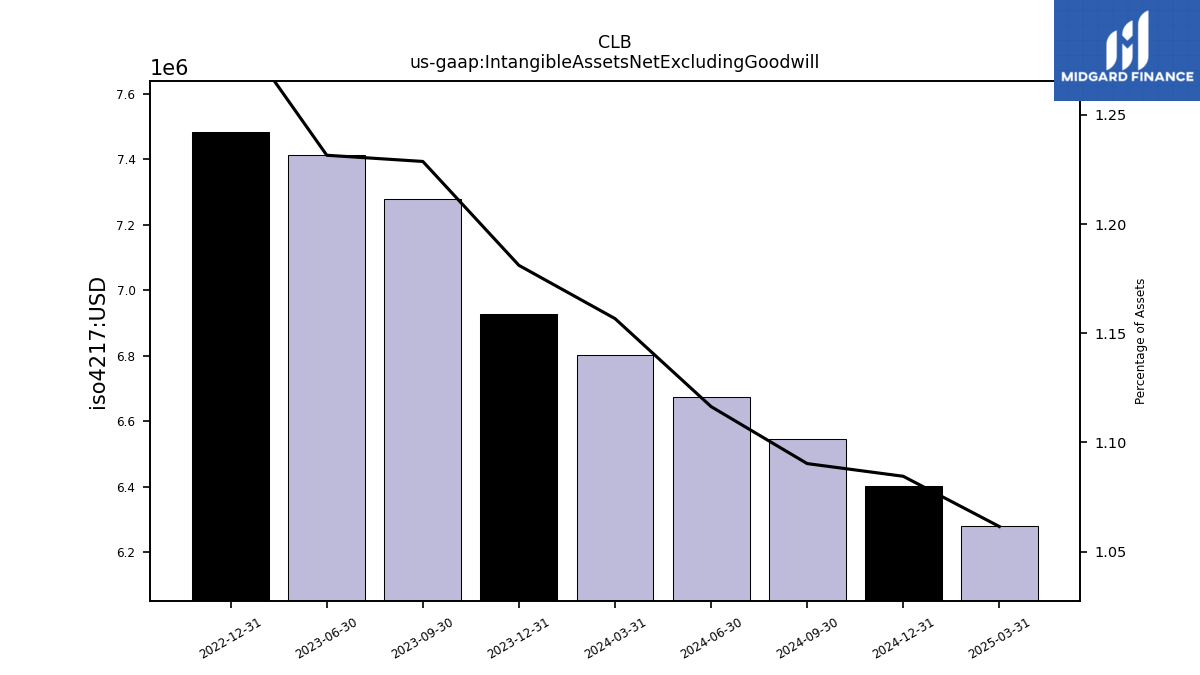
| Intangible Assets Net Excluding Goodwill | 6.93 | 7.28 | 7.41 | 7.48 | NA | NA | |
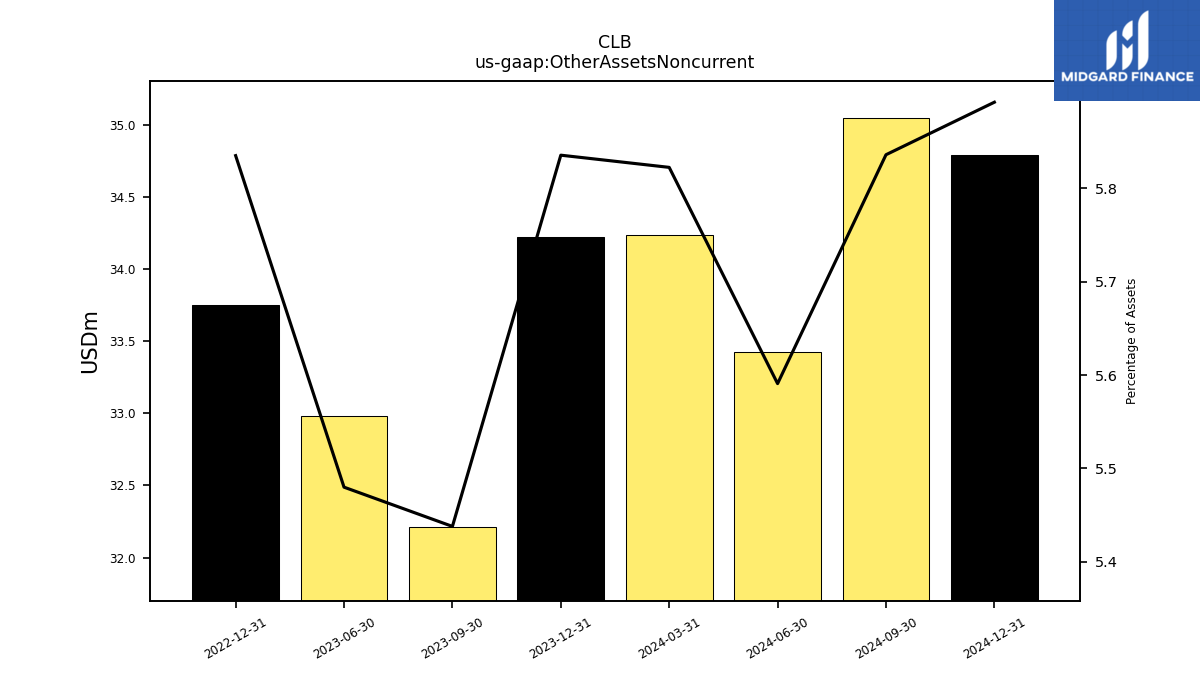
| Other Assets Noncurrent | 34.22 | 32.22 | 32.98 | 33.75 | NA | NA |
| 2023-12-31 | 2023-09-30 | 2023-06-30 | 2022-12-31 | 2022-09-30 | 2022-06-30 | ||
|---|---|---|---|---|---|---|---|
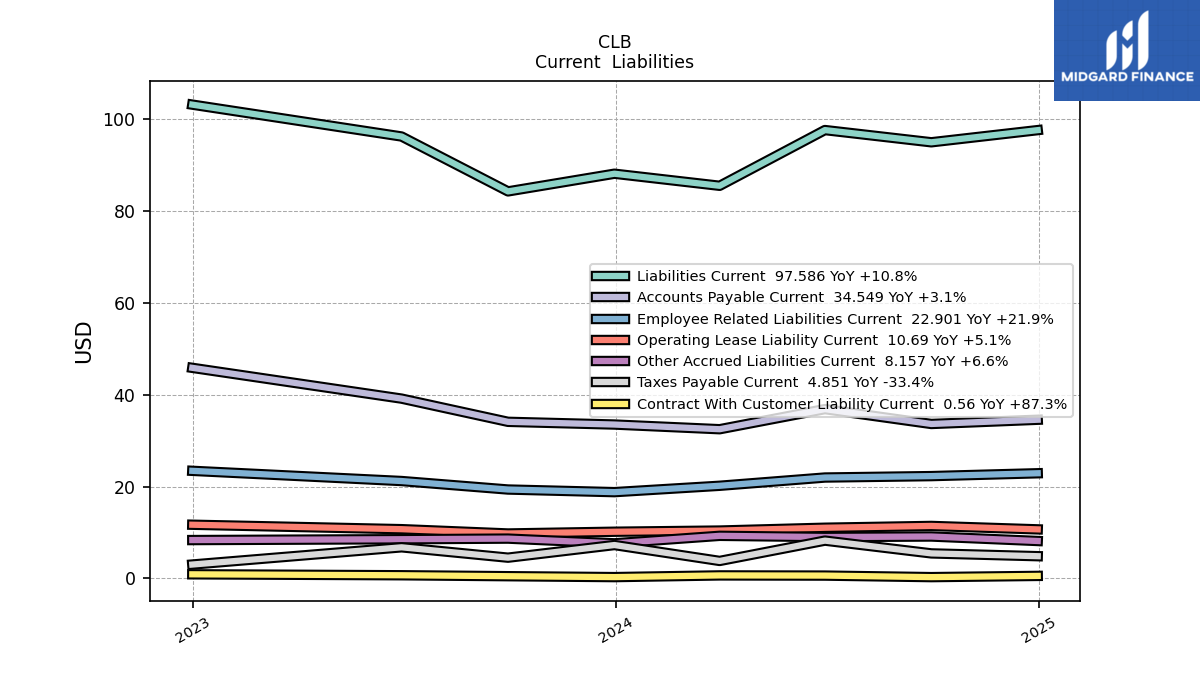
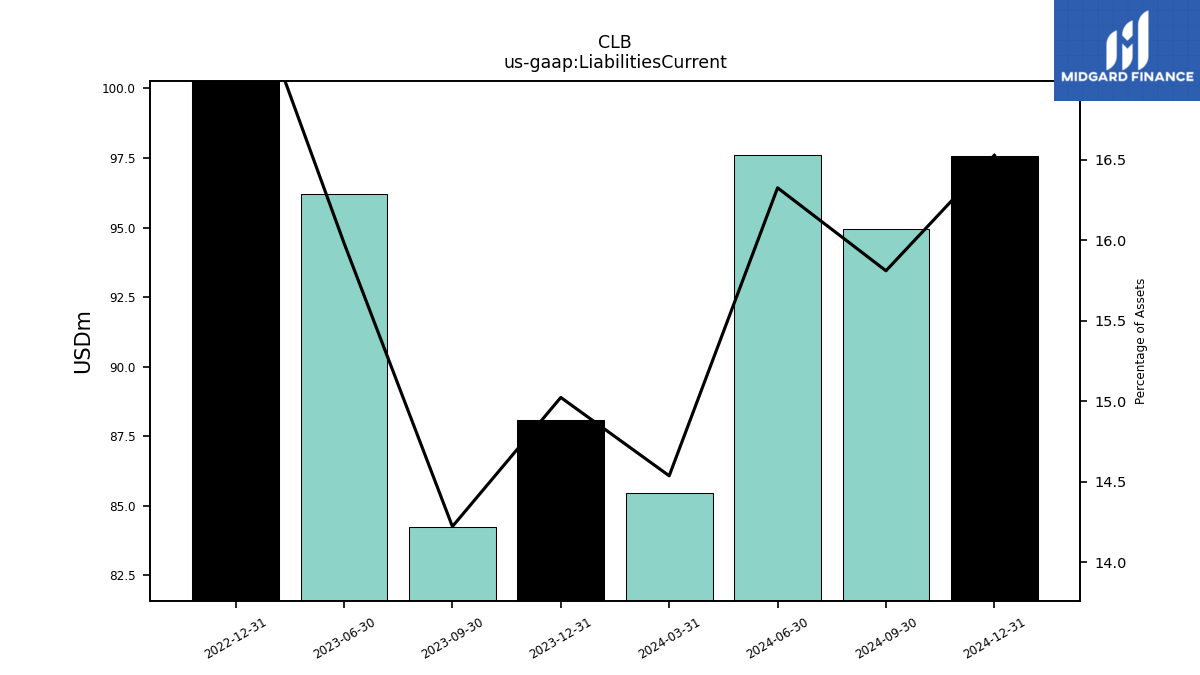
| Liabilities Current | 88.10 | 84.25 | 96.19 | 103.14 | NA | NA | |
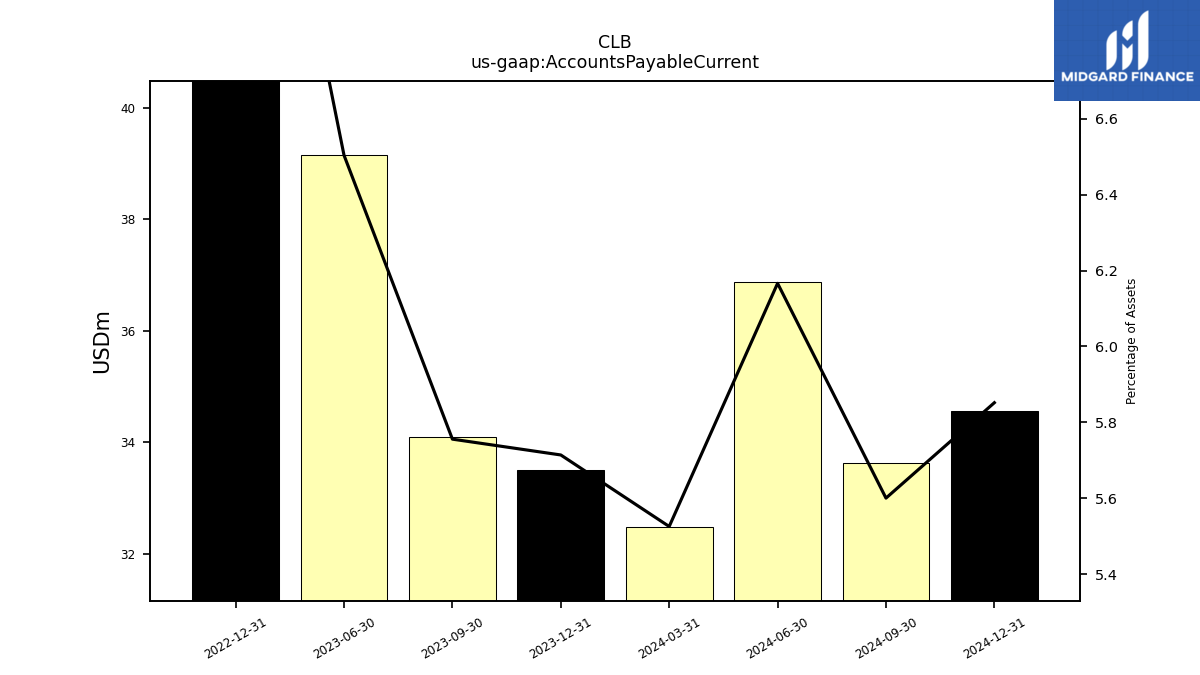
| Accounts Payable Current | 33.51 | 34.10 | 39.15 | 45.85 | NA | NA | |
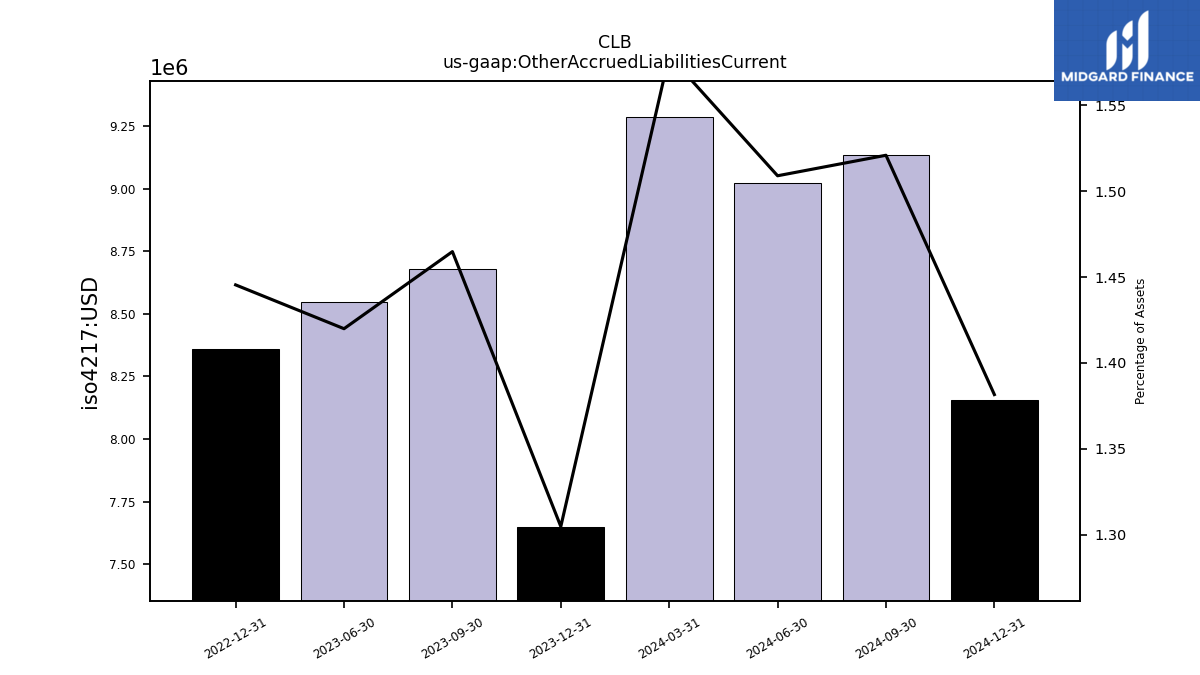
| Other Accrued Liabilities Current | 7.65 | 8.68 | 8.55 | 8.36 | NA | NA | |
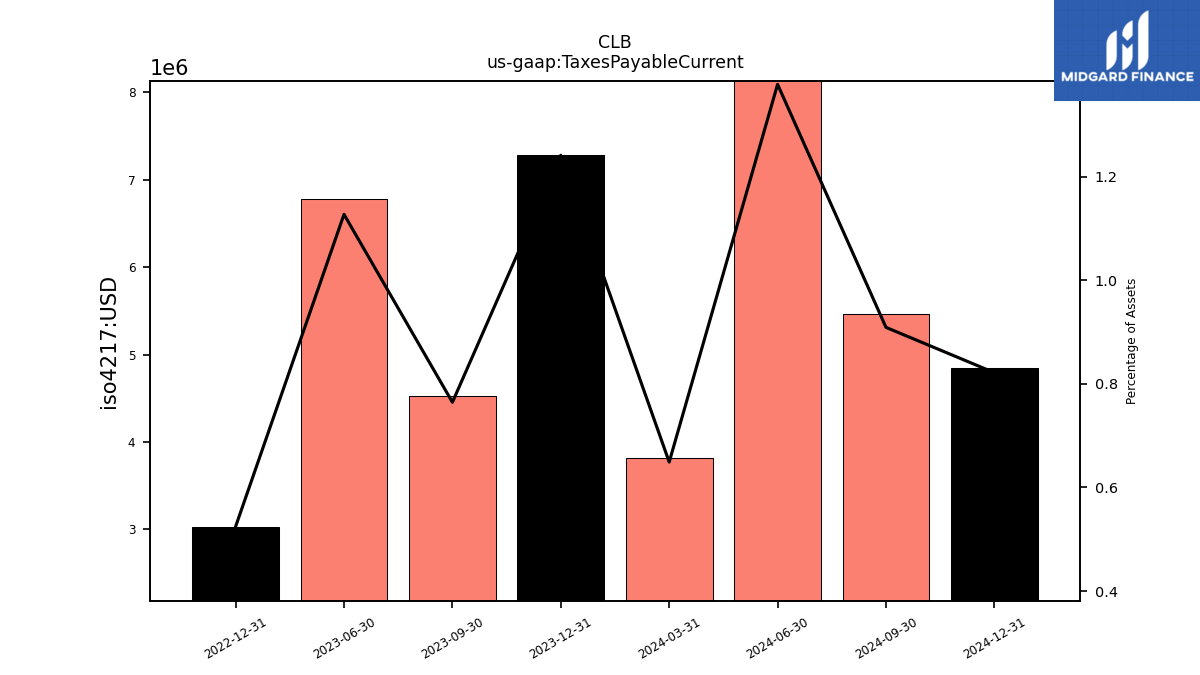
| Taxes Payable Current | 7.28 | 4.53 | 6.79 | 3.03 | NA | NA | |
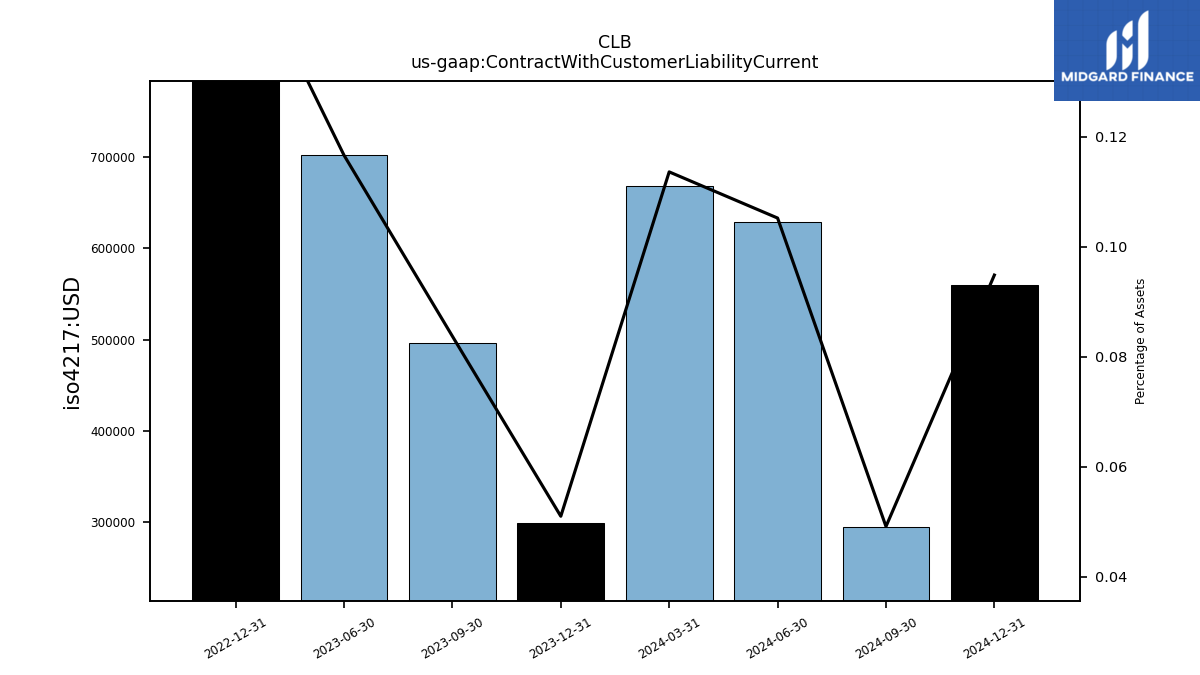
| Contract With Customer Liability Current | 0.30 | 0.50 | 0.70 | 0.91 | NA | NA |
| 2023-12-31 | 2023-09-30 | 2023-06-30 | 2022-12-31 | 2022-09-30 | 2022-06-30 | ||
|---|---|---|---|---|---|---|---|
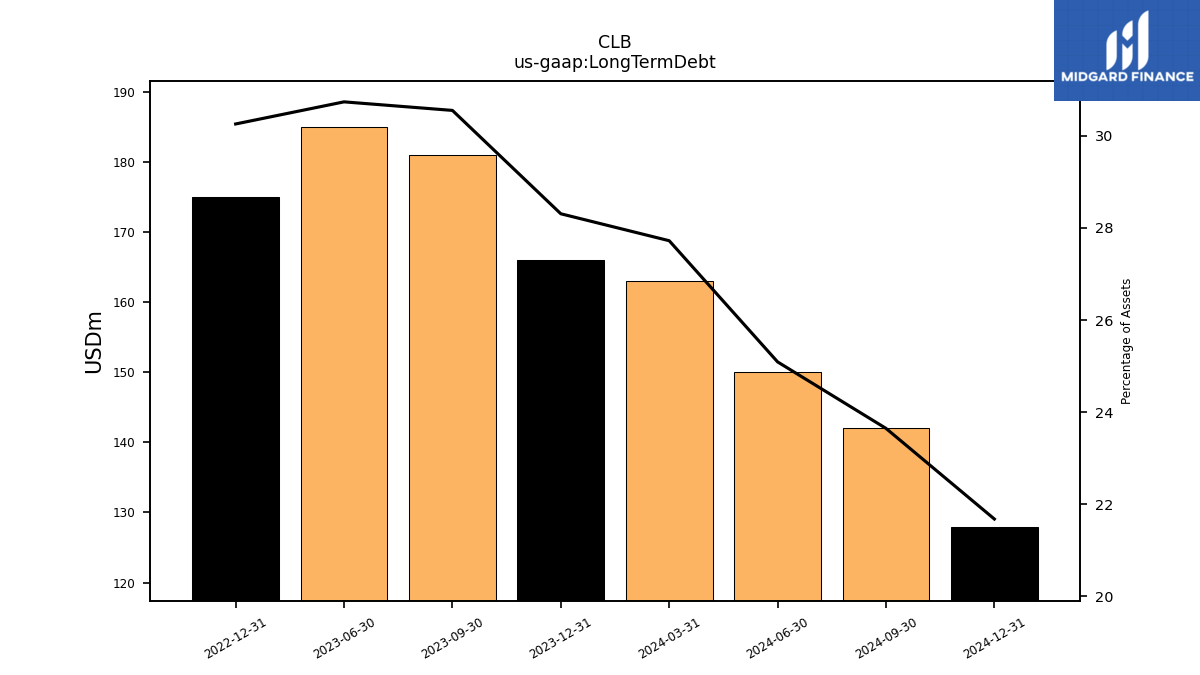
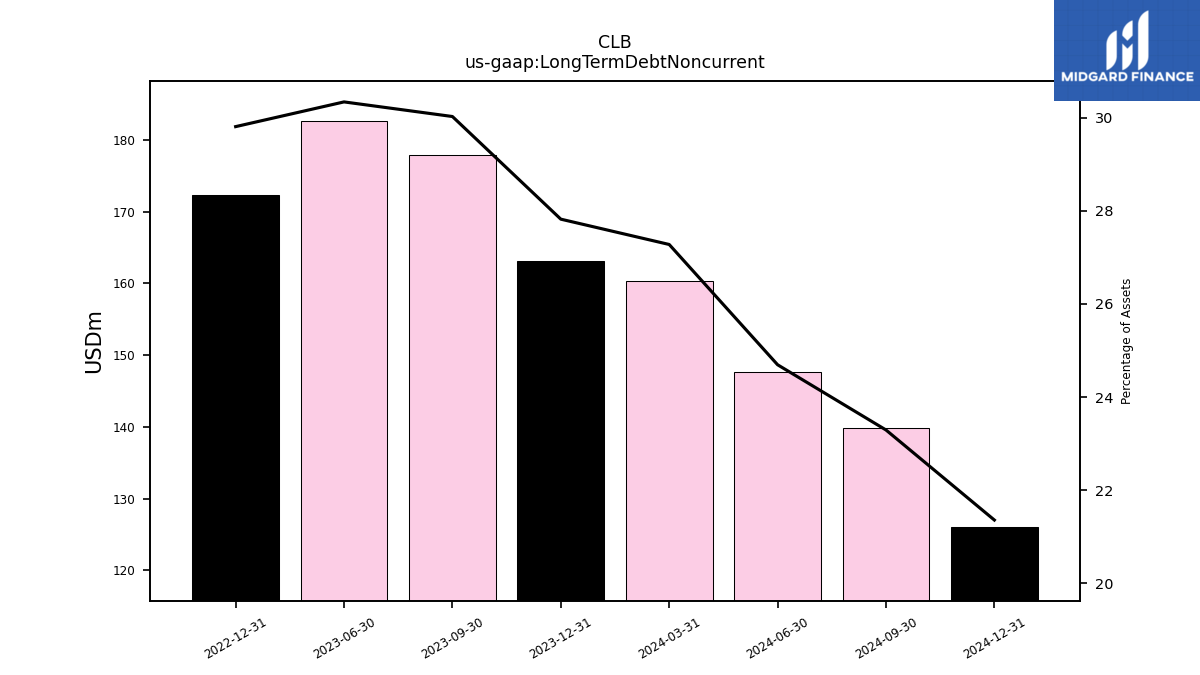
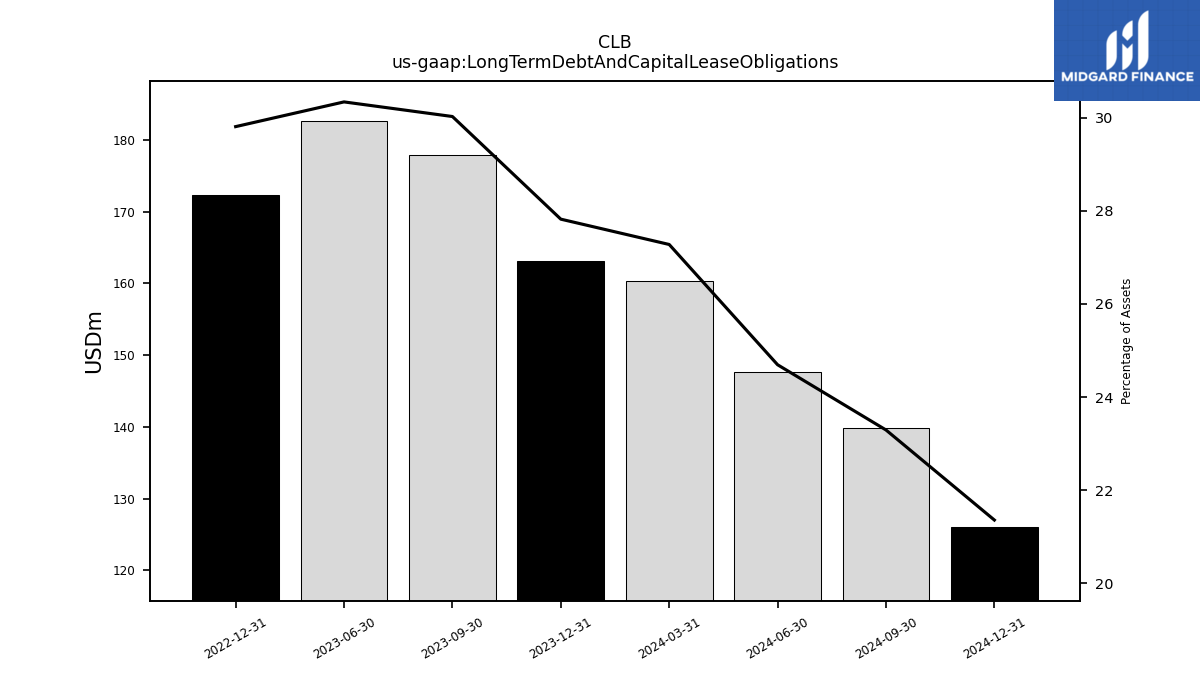
| Long Term Debt | 166.00 | 181.00 | 185.00 | 175.00 | NA | NA | |
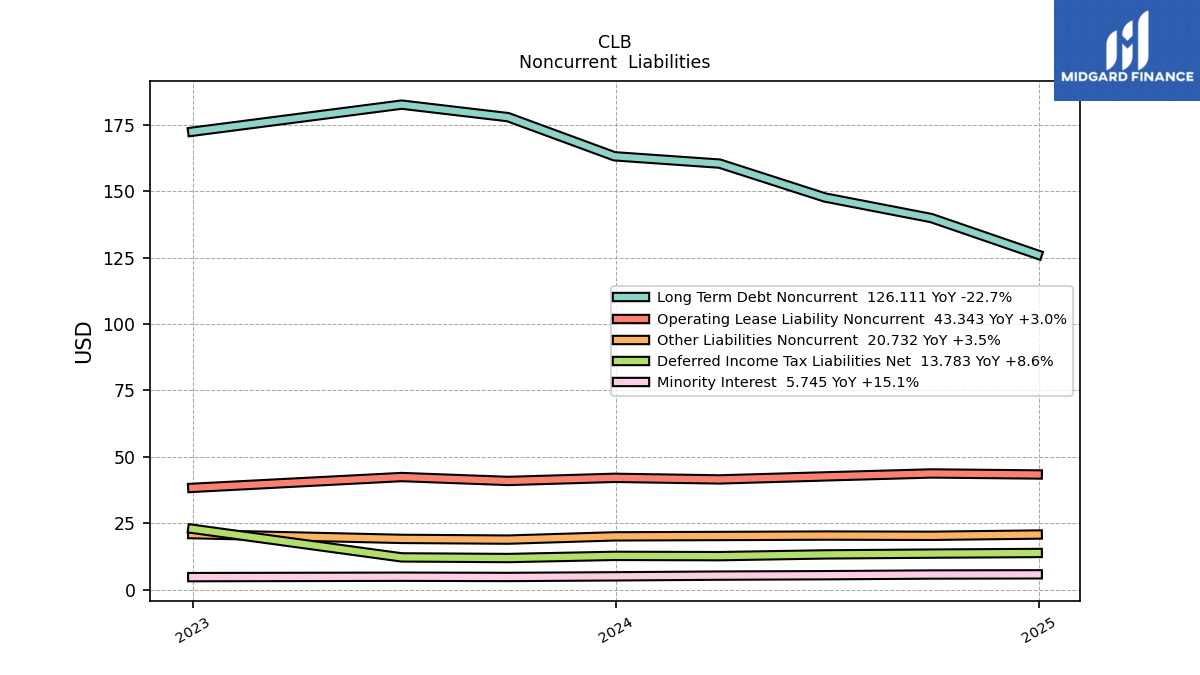
| Long Term Debt Noncurrent | 163.13 | 177.86 | 182.58 | 172.39 | NA | NA | |
| Long Term Debt And Capital Lease Obligations | 163.13 | 177.86 | 182.58 | 172.39 | NA | NA | |
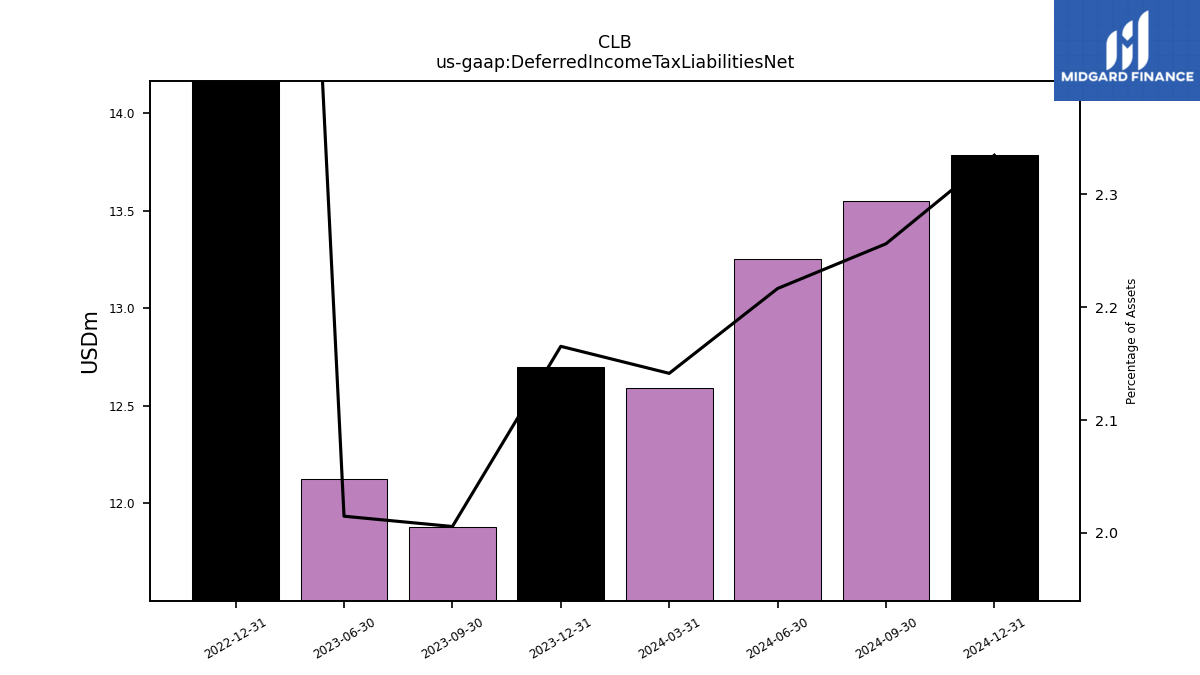
| Deferred Income Tax Liabilities Net | 12.70 | 11.88 | 12.13 | 22.88 | NA | NA | |
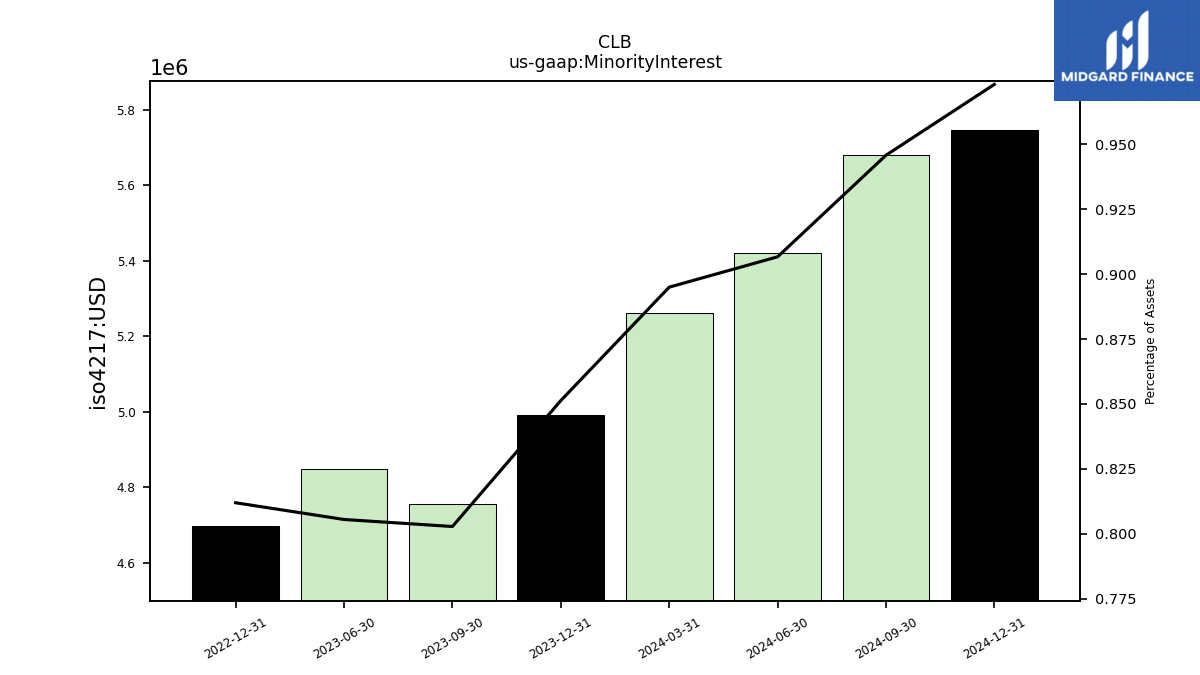
| Minority Interest | 4.99 | 4.76 | 4.85 | 4.70 | NA | NA | |
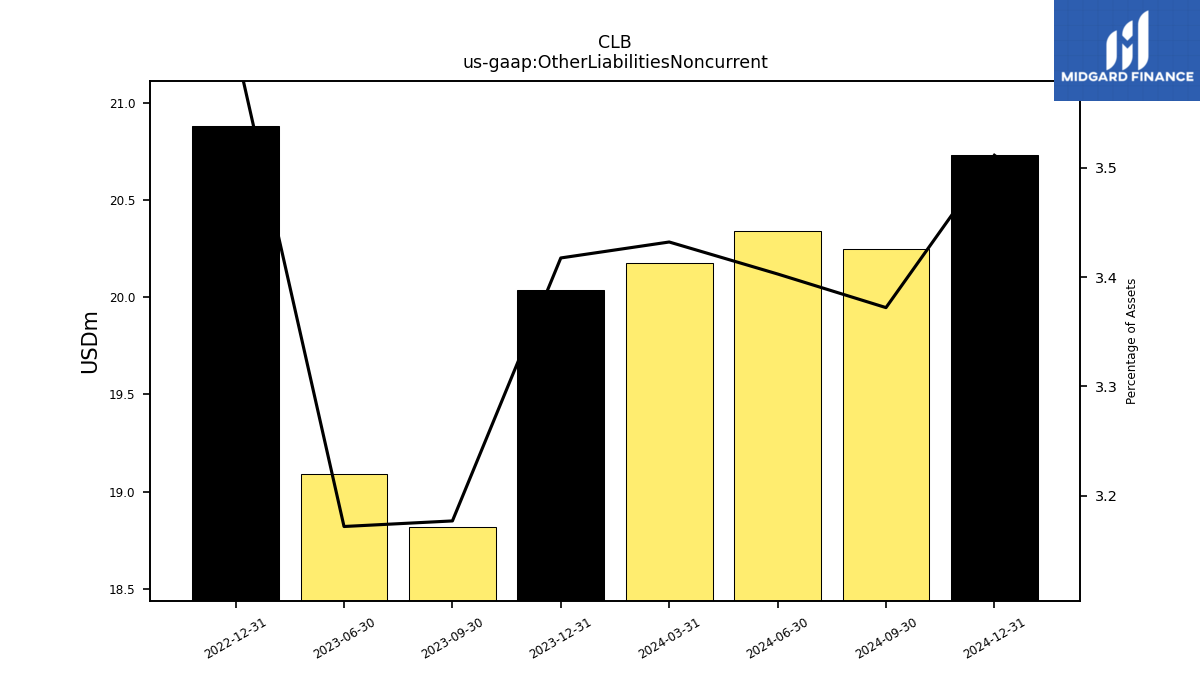
| Other Liabilities Noncurrent | 20.04 | 18.82 | 19.09 | 20.88 | NA | NA | |
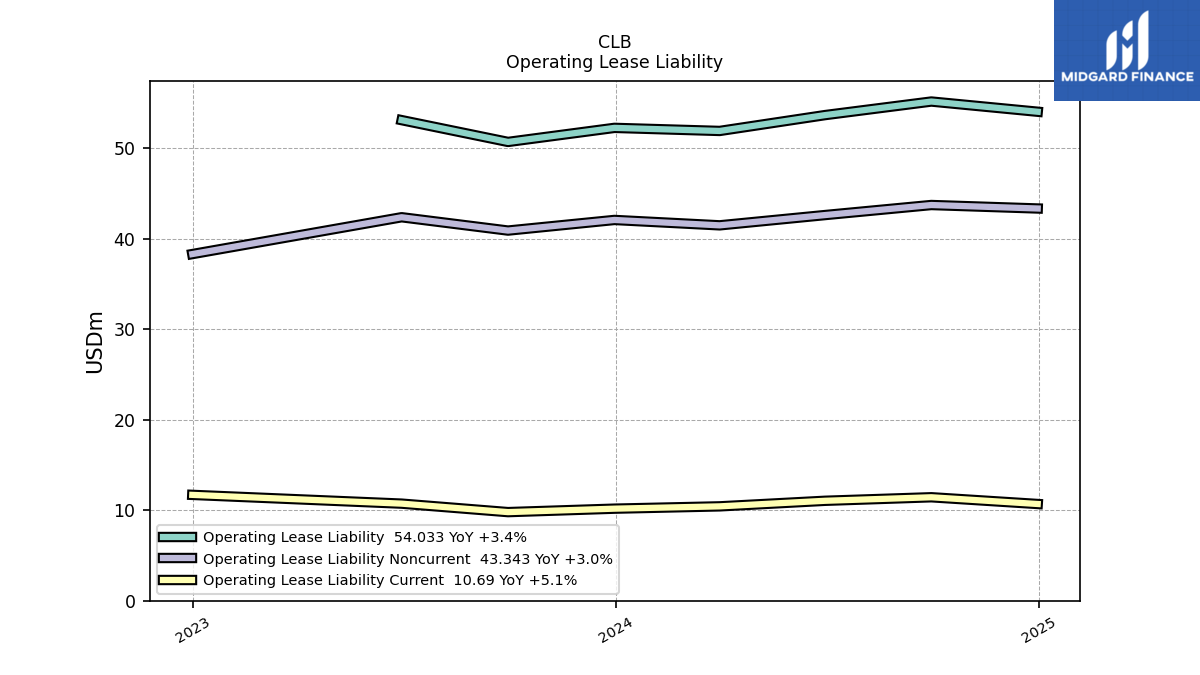
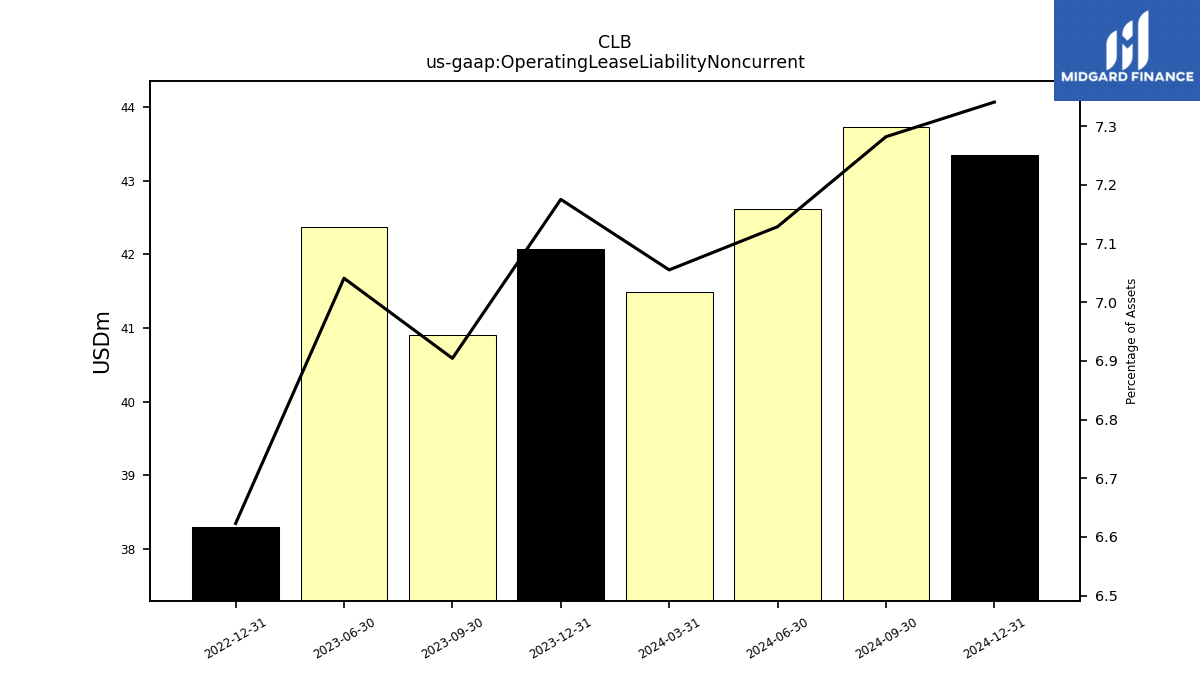
| Operating Lease Liability Noncurrent | 42.08 | 40.90 | 42.38 | 38.30 | NA | NA |
| 2023-12-31 | 2023-09-30 | 2023-06-30 | 2022-12-31 | 2022-09-30 | 2022-06-30 | ||
|---|---|---|---|---|---|---|---|
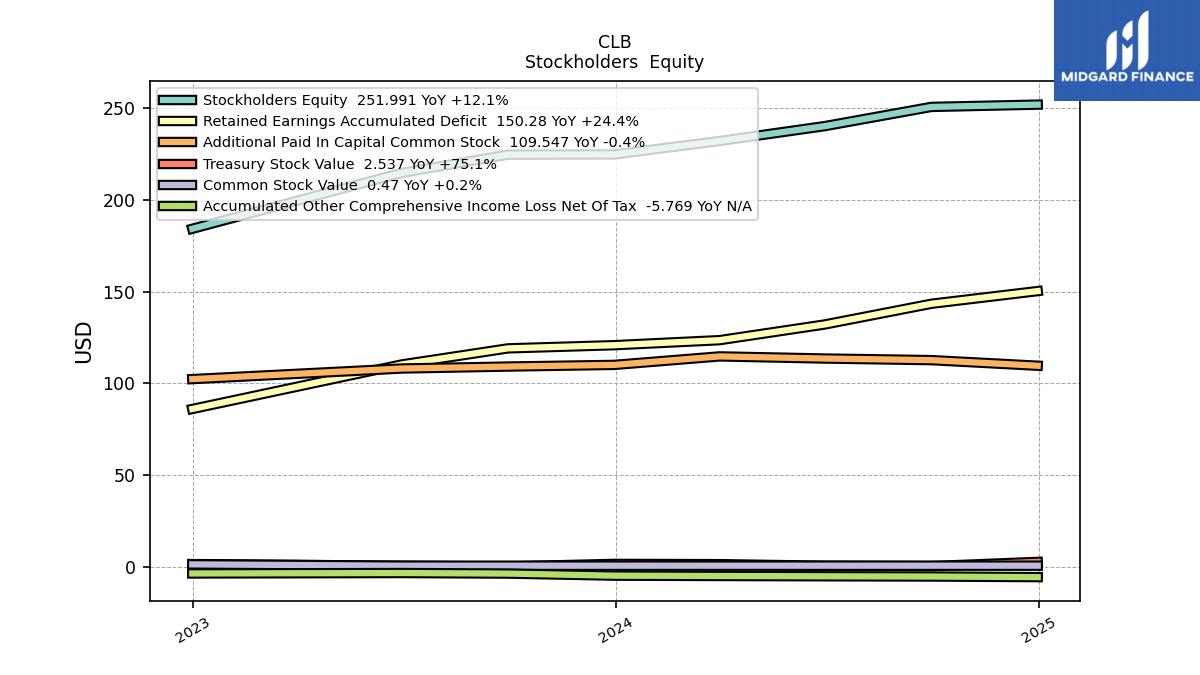
| Stockholders Equity | 224.81 | 224.69 | 214.76 | 184.26 | NA | NA | |
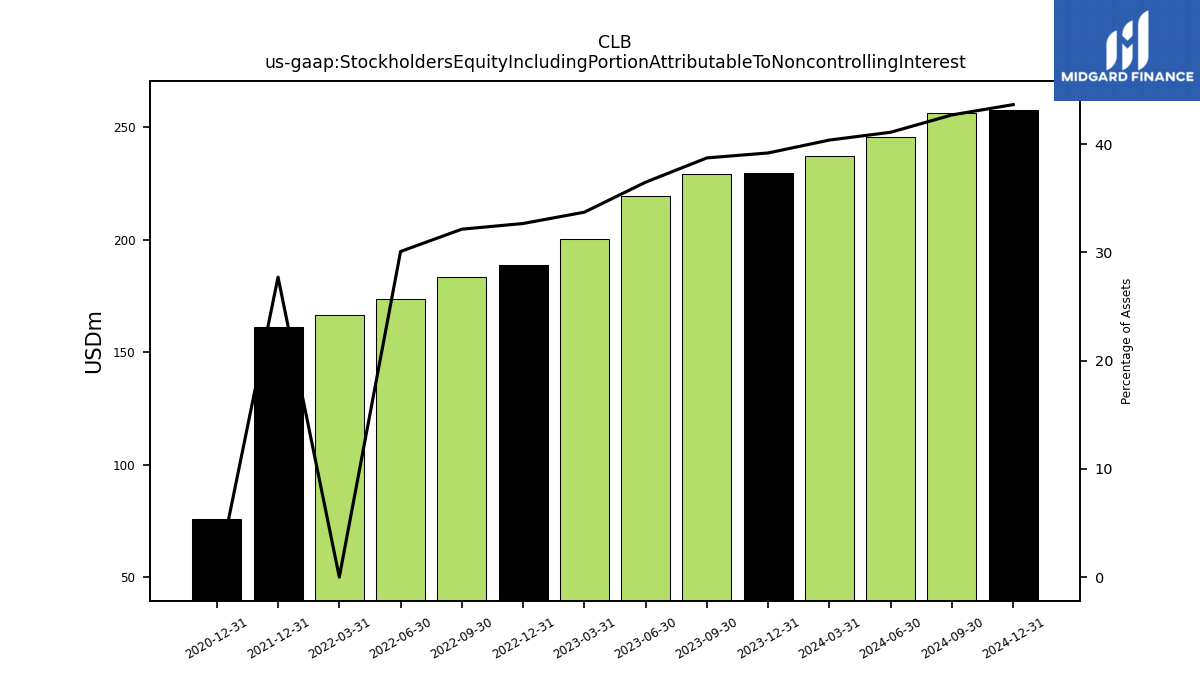
| Stockholders Equity Including Portion Attributable To Noncontrolling Interest | 229.81 | 229.45 | 219.60 | 188.95 | 183.29 | 173.77 | |
| Common Stock Value | 0.47 | 0.47 | 0.47 | 1.19 | NA | NA | |
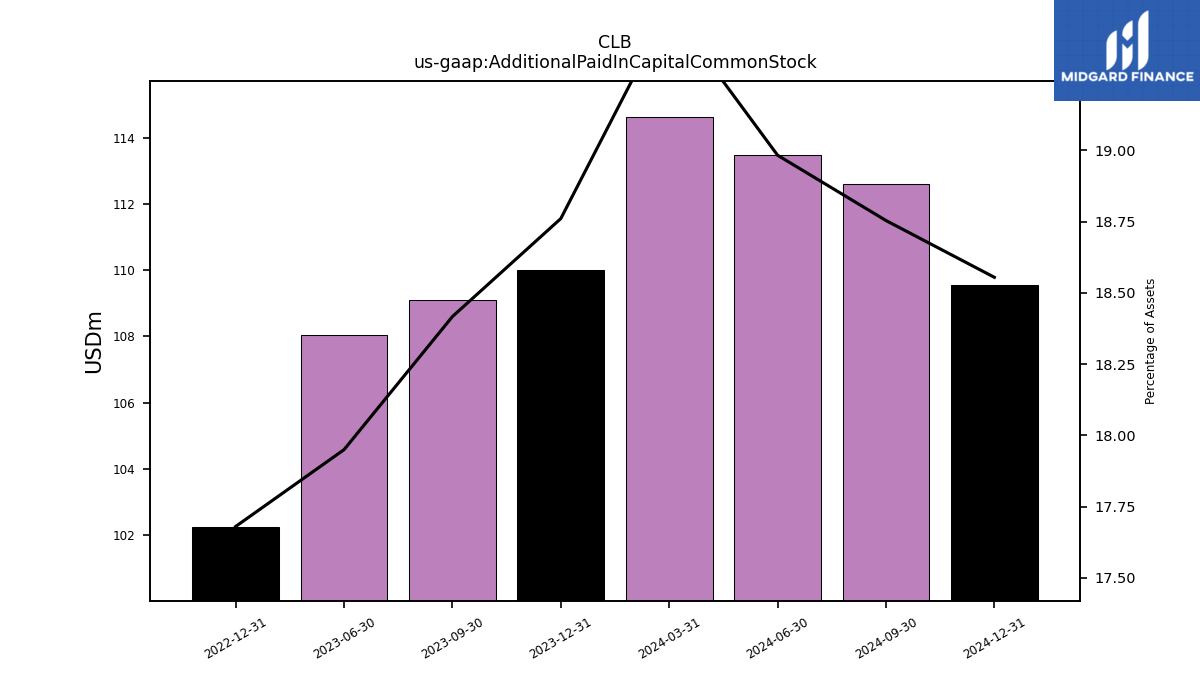
| Additional Paid In Capital Common Stock | 110.01 | 109.10 | 108.03 | 102.25 | NA | NA | |
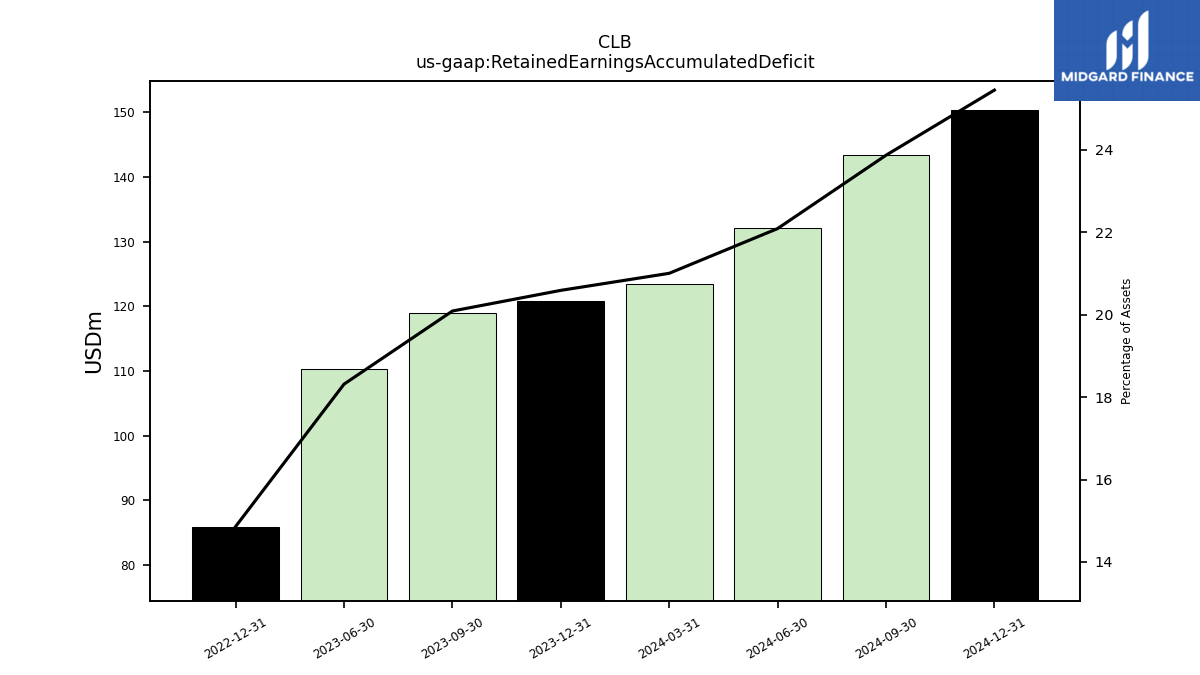
| Retained Earnings Accumulated Deficit | 120.76 | 119.02 | 110.23 | 85.95 | NA | NA | |
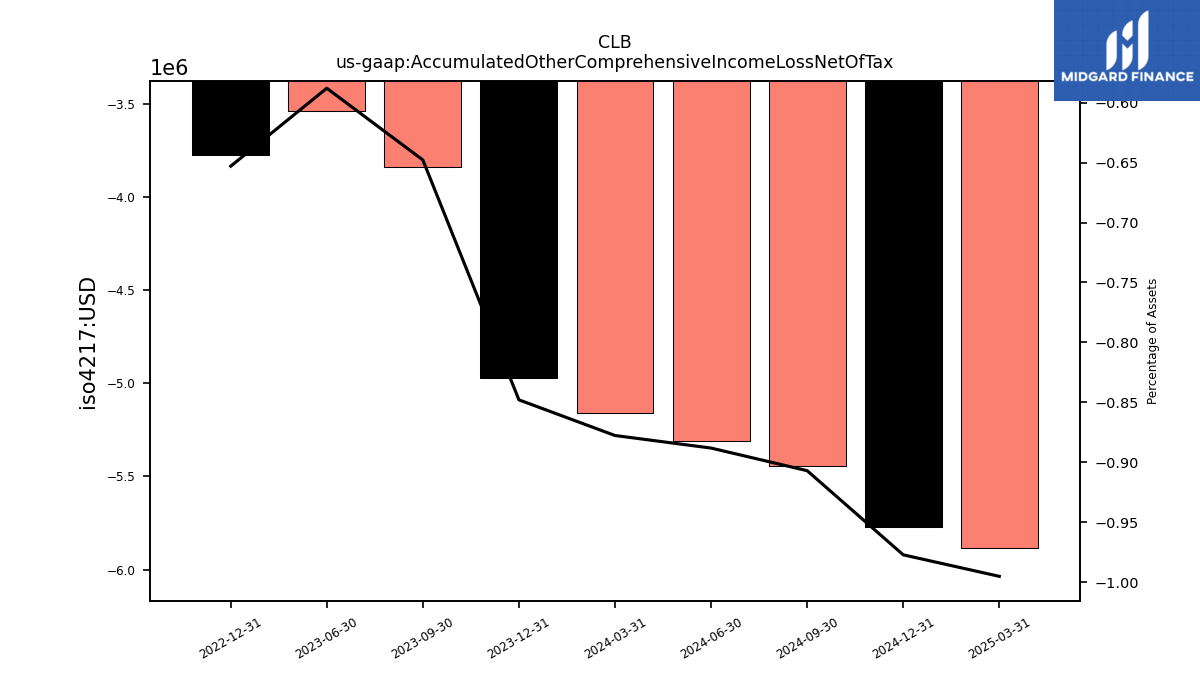
| Accumulated Other Comprehensive Income Loss Net Of Tax | -4.97 | -3.84 | -3.54 | -3.78 | NA | NA | |
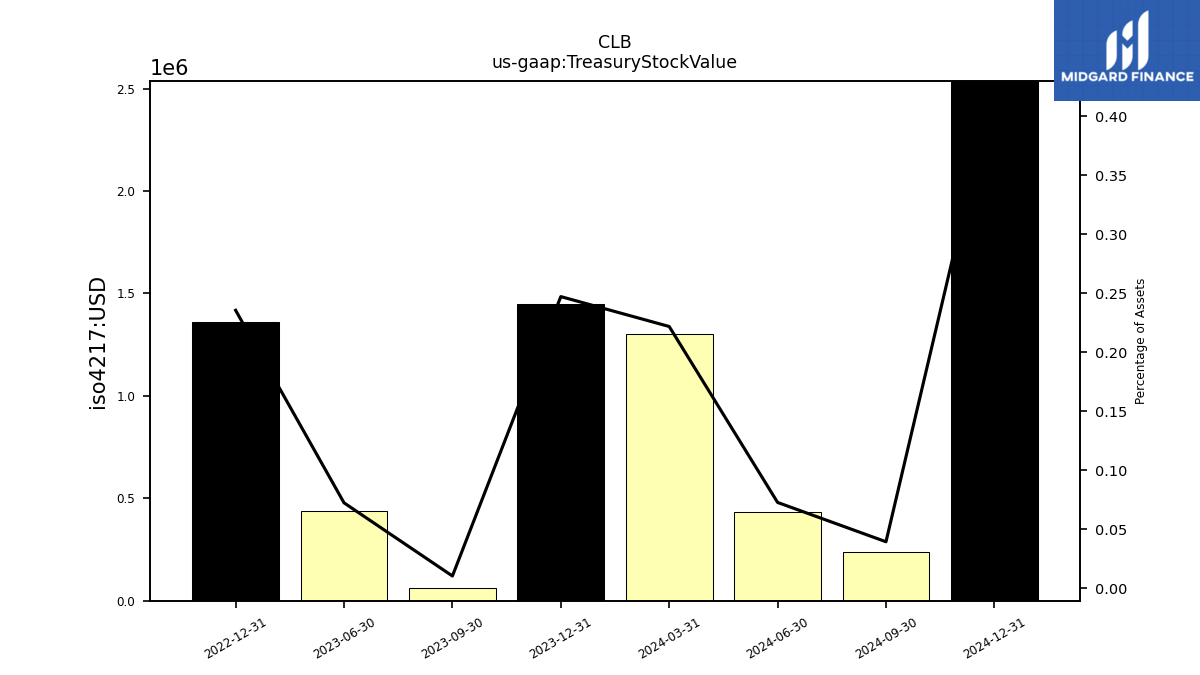
| Treasury Stock Value | 1.45 | 0.06 | 0.44 | 1.36 | NA | NA | |
| Minority Interest | 4.99 | 4.76 | 4.85 | 4.70 | NA | NA |
| 2023-12-31 | 2023-09-30 | 2023-06-30 | 2022-12-31 | 2022-09-30 | 2022-06-30 | ||
|---|---|---|---|---|---|---|---|
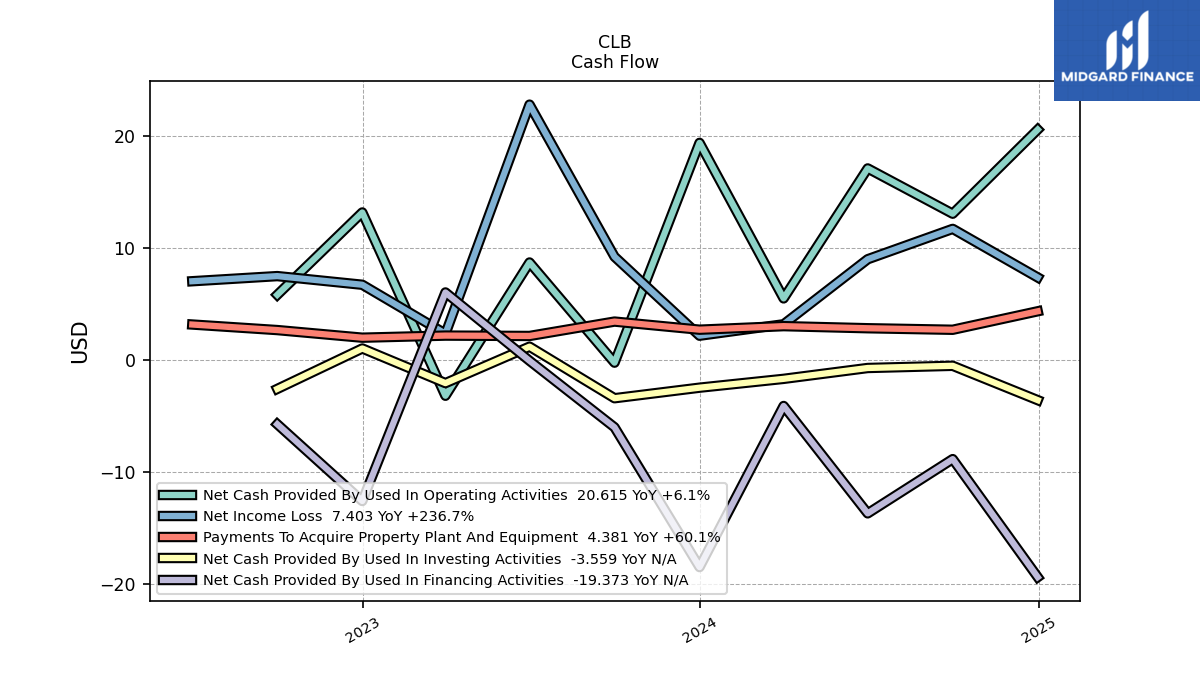
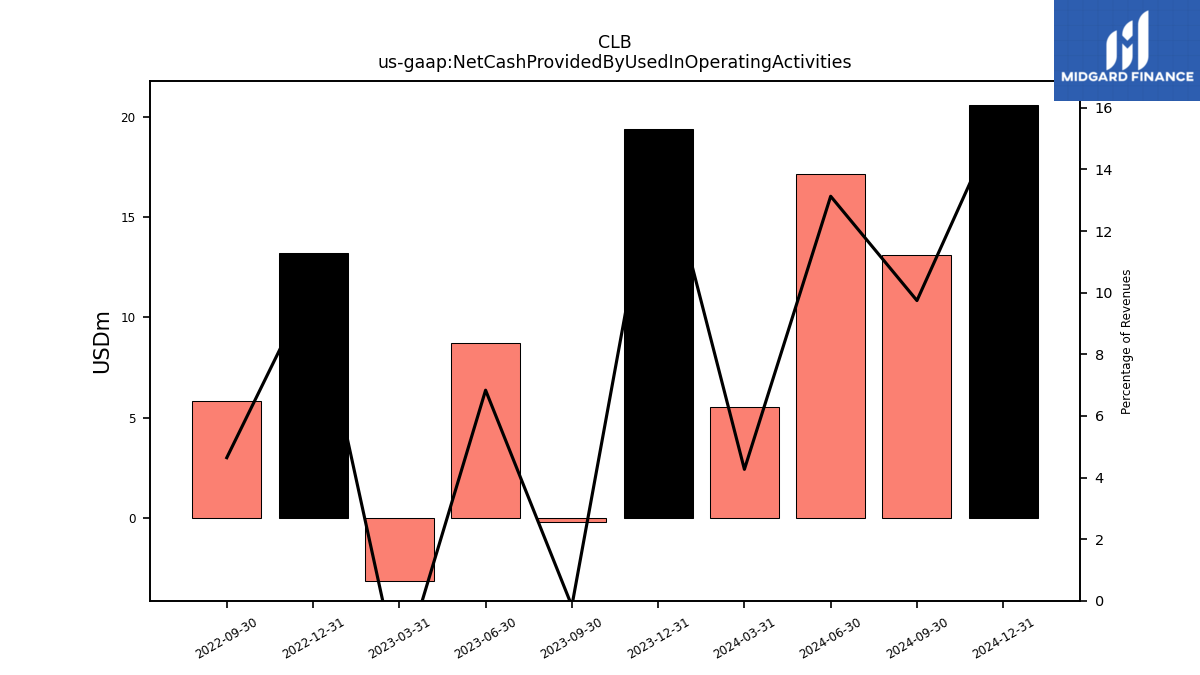
| Net Cash Provided By Used In Operating Activities | 19.43 | -0.21 | NA | 13.21 | 5.85 | NA | |
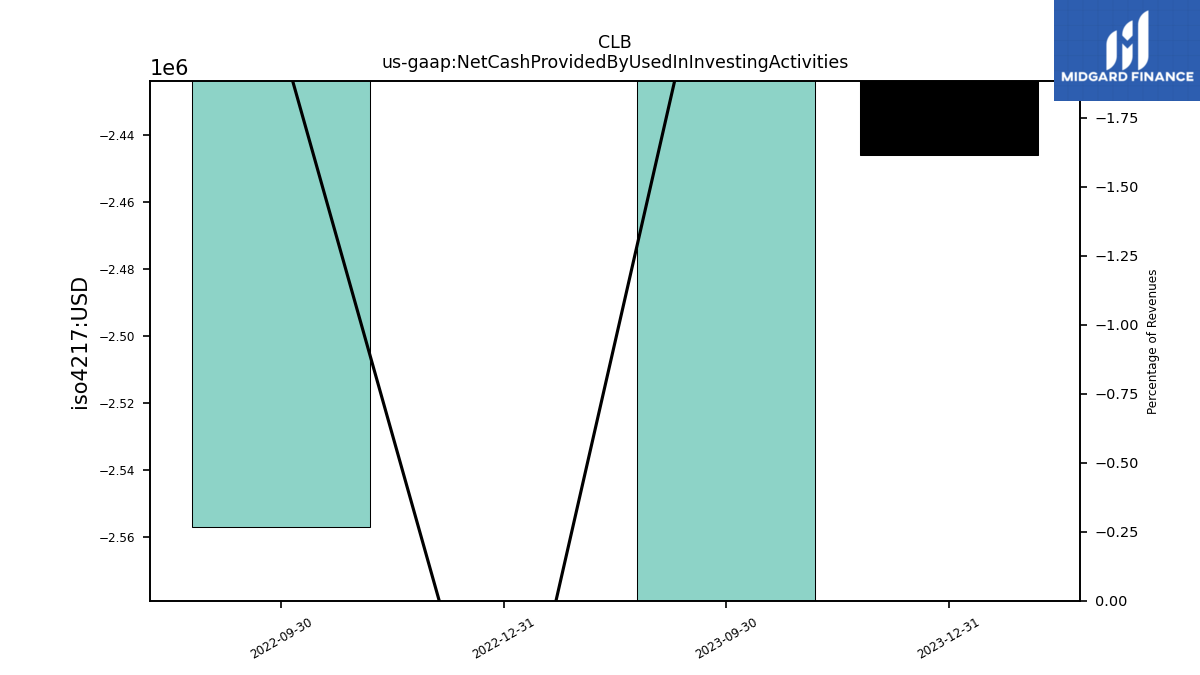
| Net Cash Provided By Used In Investing Activities | -2.45 | -3.39 | NA | 1.06 | -2.56 | NA | |
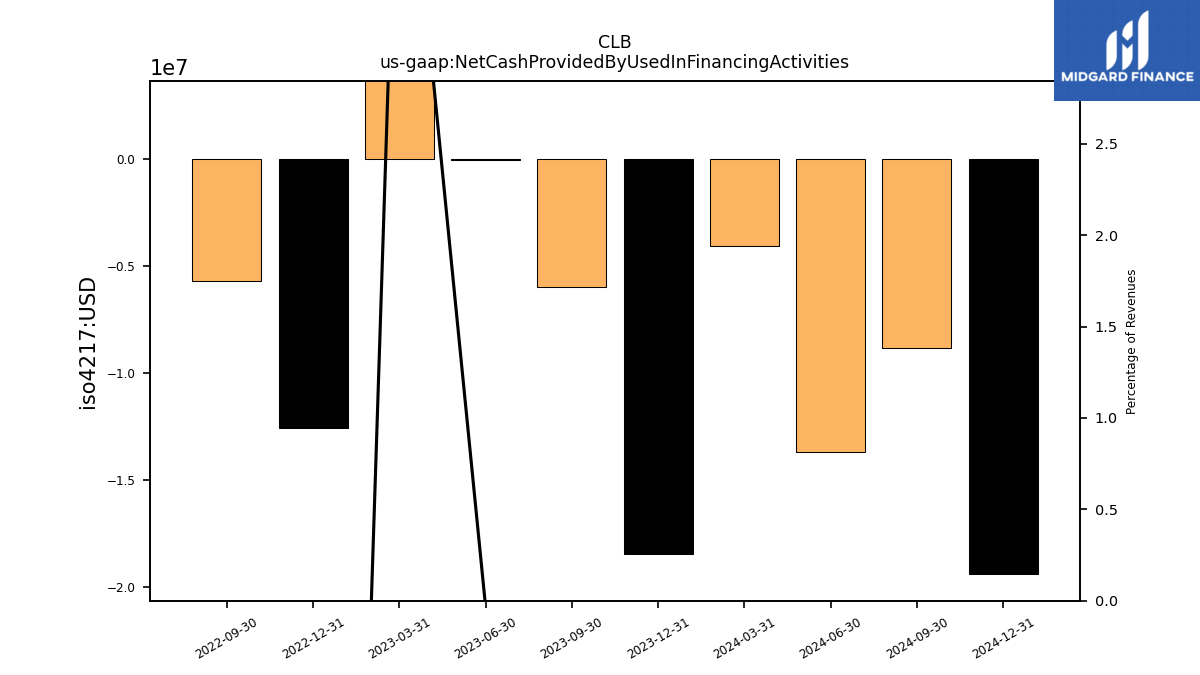
| Net Cash Provided By Used In Financing Activities | -18.48 | -5.99 | NA | -12.57 | -5.71 | NA |
| 2023-12-31 | 2023-09-30 | 2023-06-30 | 2022-12-31 | 2022-09-30 | 2022-06-30 | ||
|---|---|---|---|---|---|---|---|
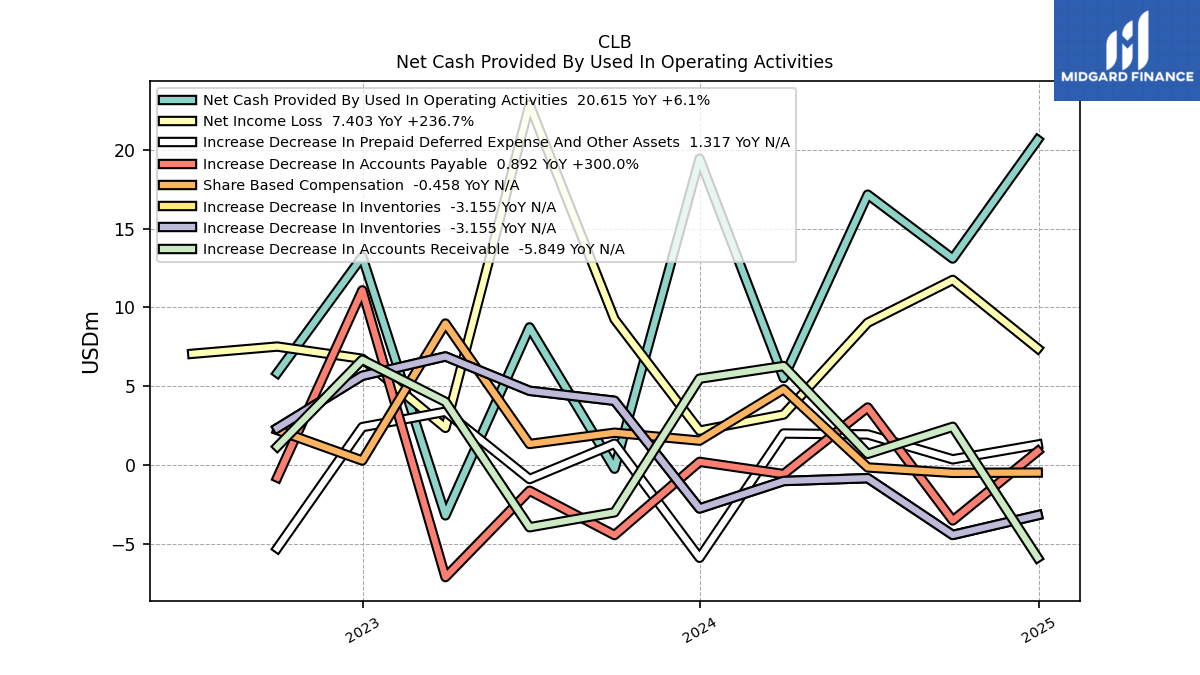
| Net Cash Provided By Used In Operating Activities | 19.43 | -0.21 | NA | 13.21 | 5.85 | NA | |
| Net Income Loss | 2.20 | 9.26 | 22.85 | 6.75 | 7.52 | 7.07 | |
| Profit Loss | 2.43 | 9.22 | 22.93 | 6.69 | 7.65 | 7.16 | |
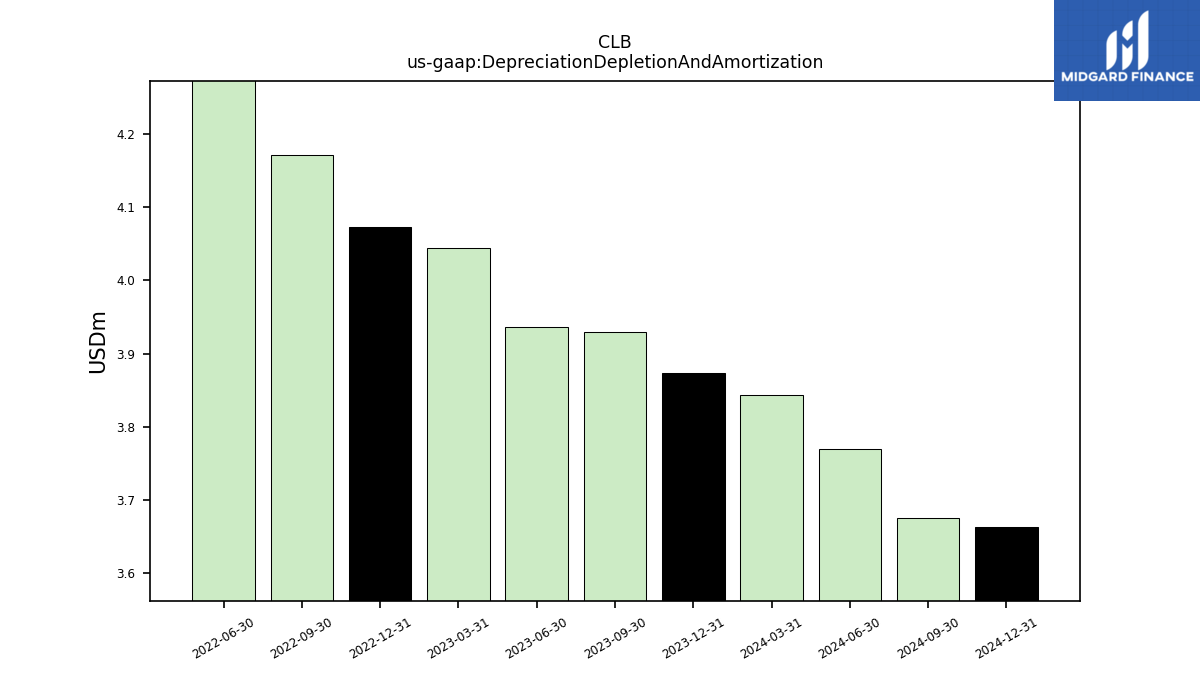
| Depreciation Depletion And Amortization | 3.87 | 3.93 | 3.94 | 4.07 | 4.17 | 4.36 | |
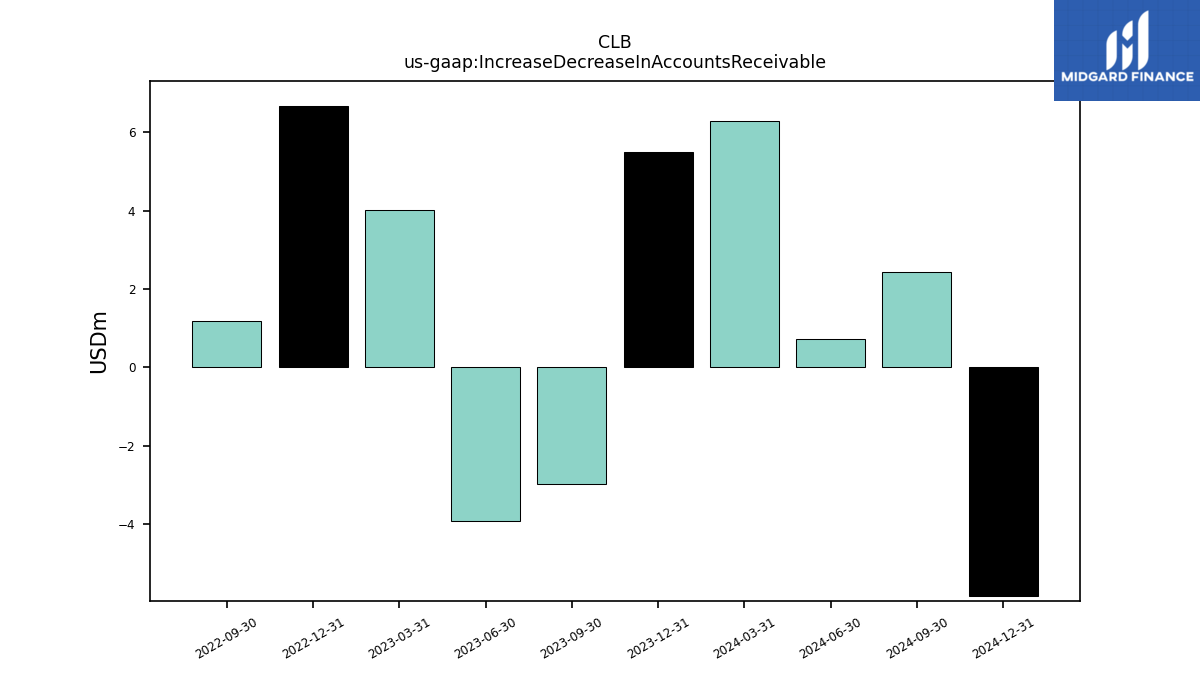
| Increase Decrease In Accounts Receivable | 5.49 | -2.98 | NA | 6.69 | 1.19 | NA | |
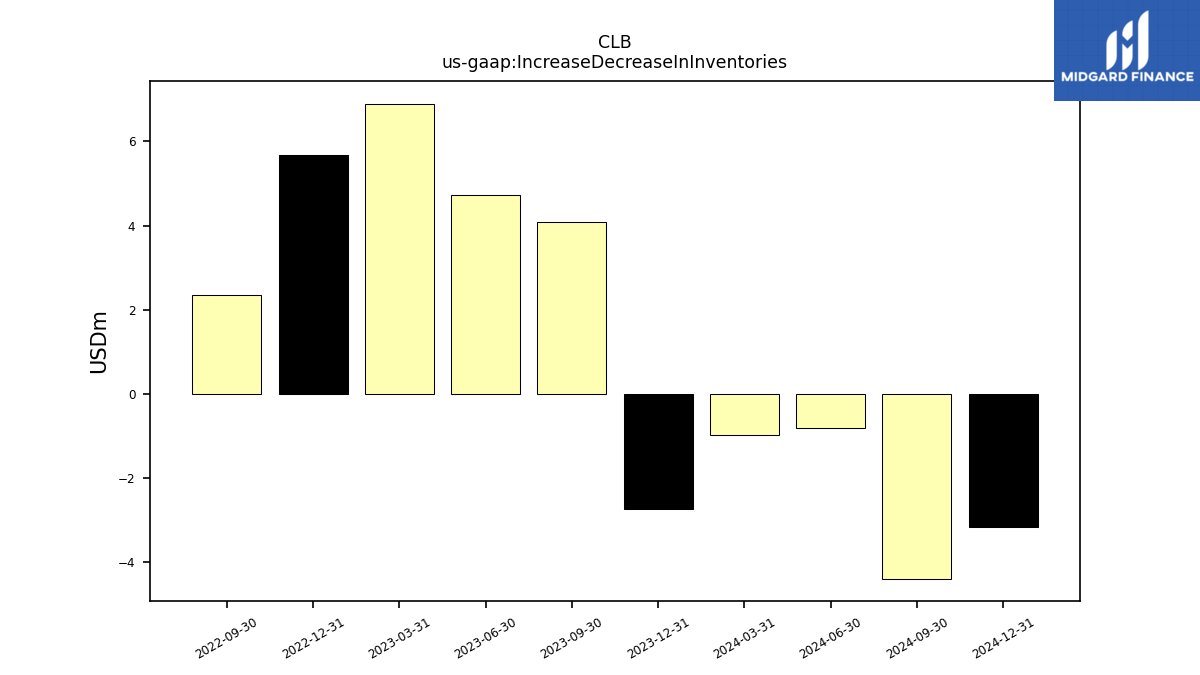
| Increase Decrease In Inventories | -2.73 | 4.09 | NA | 5.67 | 2.36 | NA | |
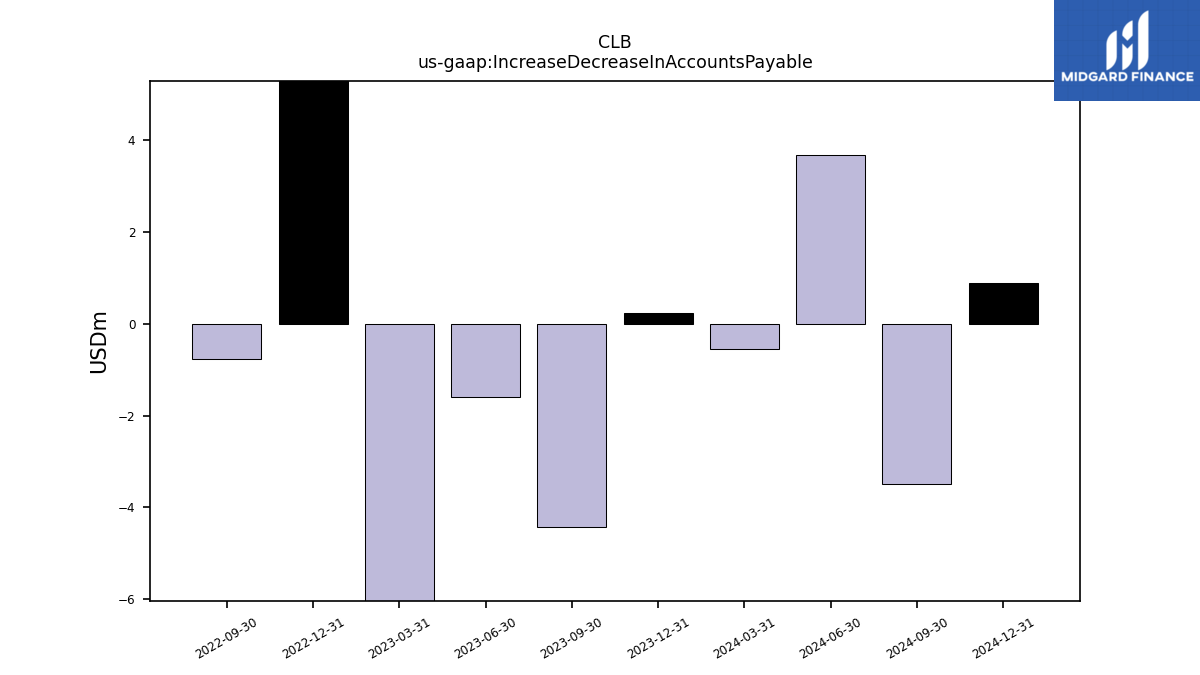
| Increase Decrease In Accounts Payable | 0.22 | -4.42 | NA | 11.09 | -0.77 | NA | |
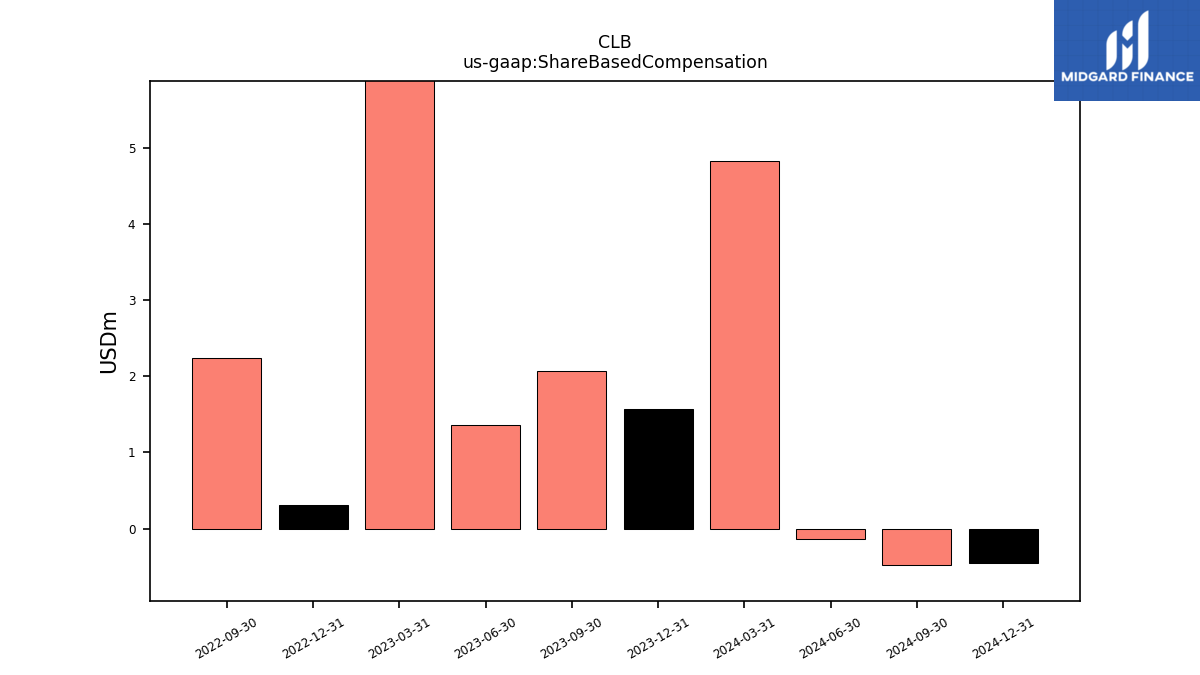
| Share Based Compensation | 1.56 | 2.07 | NA | 0.30 | 2.23 | NA |
| 2023-12-31 | 2023-09-30 | 2023-06-30 | 2022-12-31 | 2022-09-30 | 2022-06-30 | ||
|---|---|---|---|---|---|---|---|
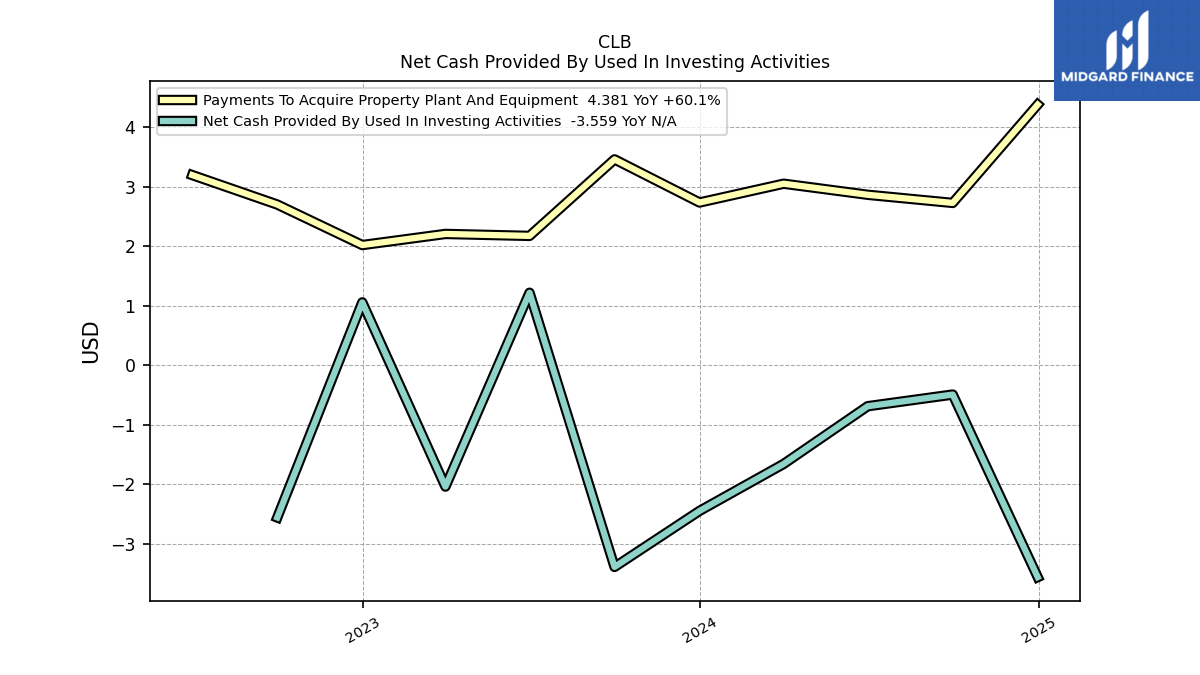
| Net Cash Provided By Used In Investing Activities | -2.45 | -3.39 | NA | 1.06 | -2.56 | NA | |
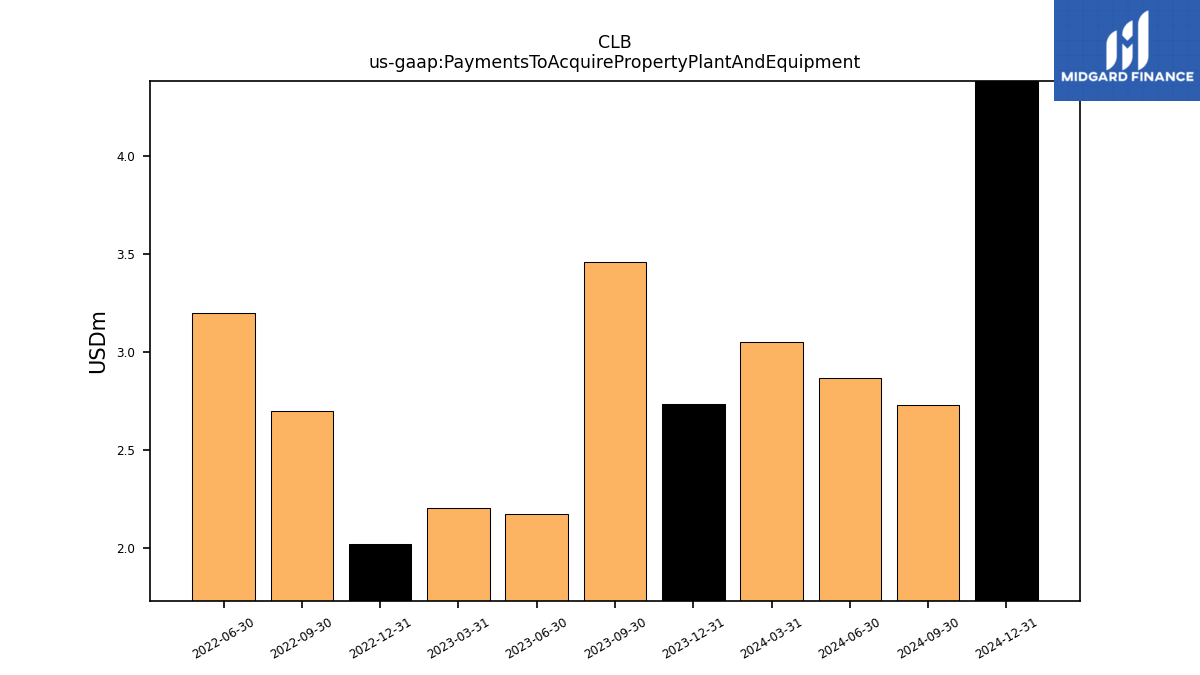
| Payments To Acquire Property Plant And Equipment | 2.74 | 3.46 | 2.17 | 2.02 | 2.70 | 3.20 |
| 2023-12-31 | 2023-09-30 | 2023-06-30 | 2022-12-31 | 2022-09-30 | 2022-06-30 | ||
|---|---|---|---|---|---|---|---|
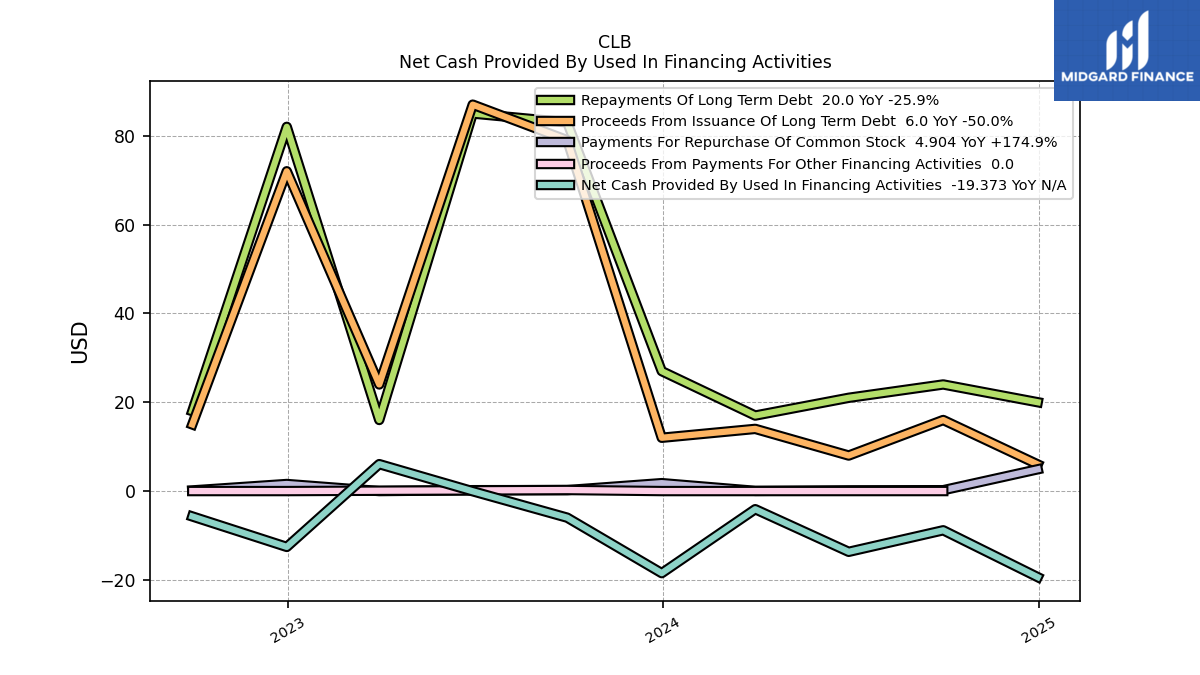
| Net Cash Provided By Used In Financing Activities | -18.48 | -5.99 | NA | -12.57 | -5.71 | NA | |
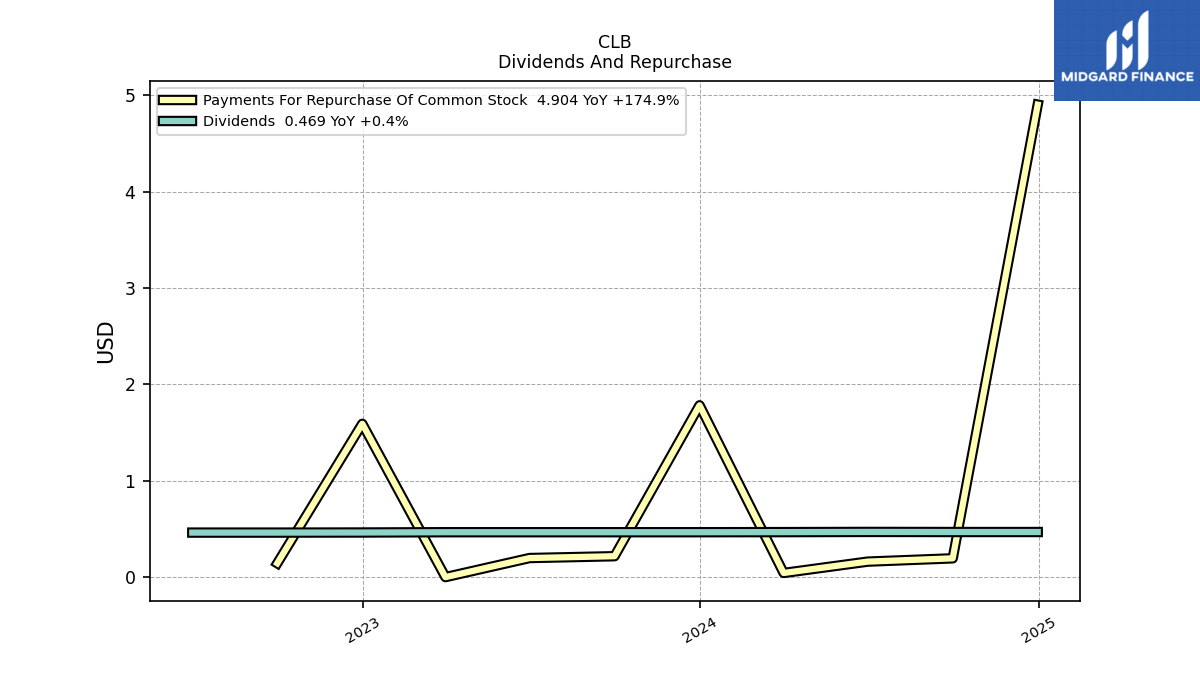
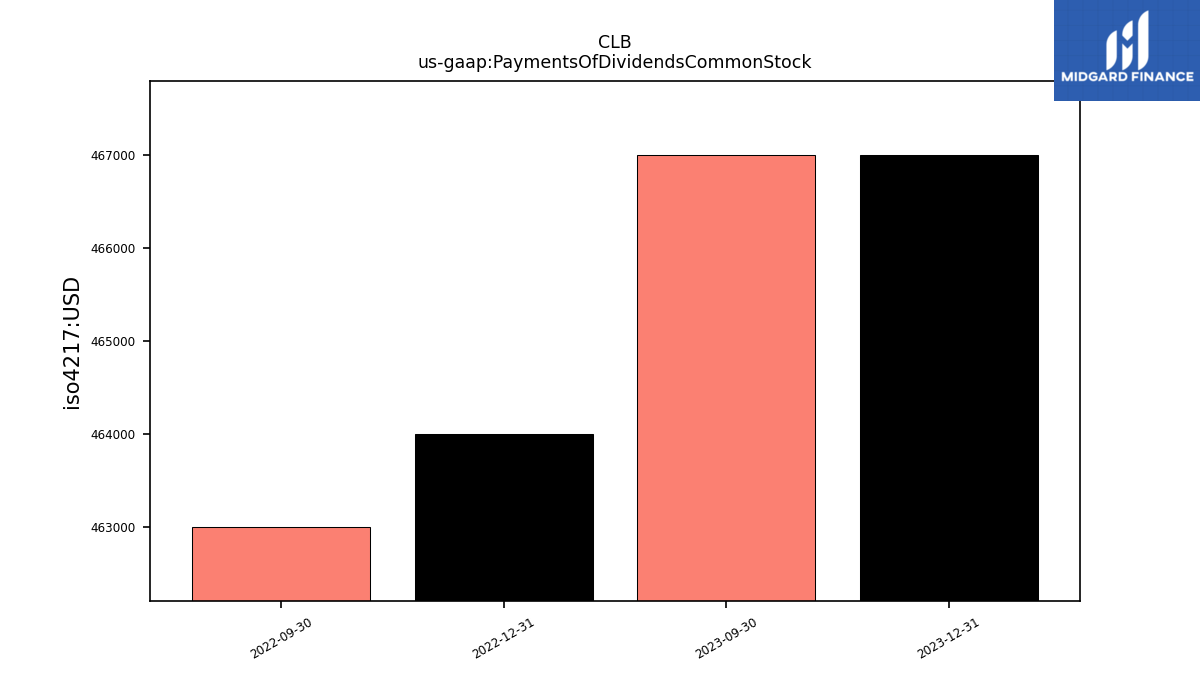
| Payments Of Dividends Common Stock | 0.47 | 0.47 | NA | 0.46 | 0.46 | NA | |
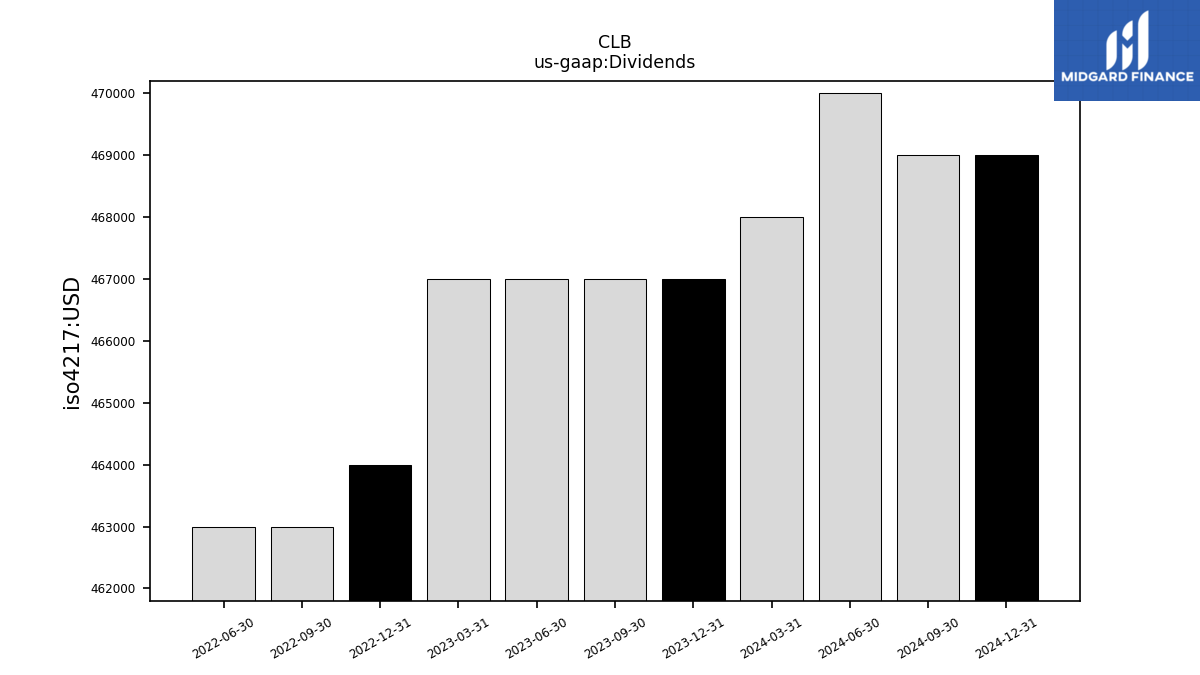
| Dividends | 0.47 | 0.47 | 0.47 | 0.46 | 0.46 | 0.46 | |
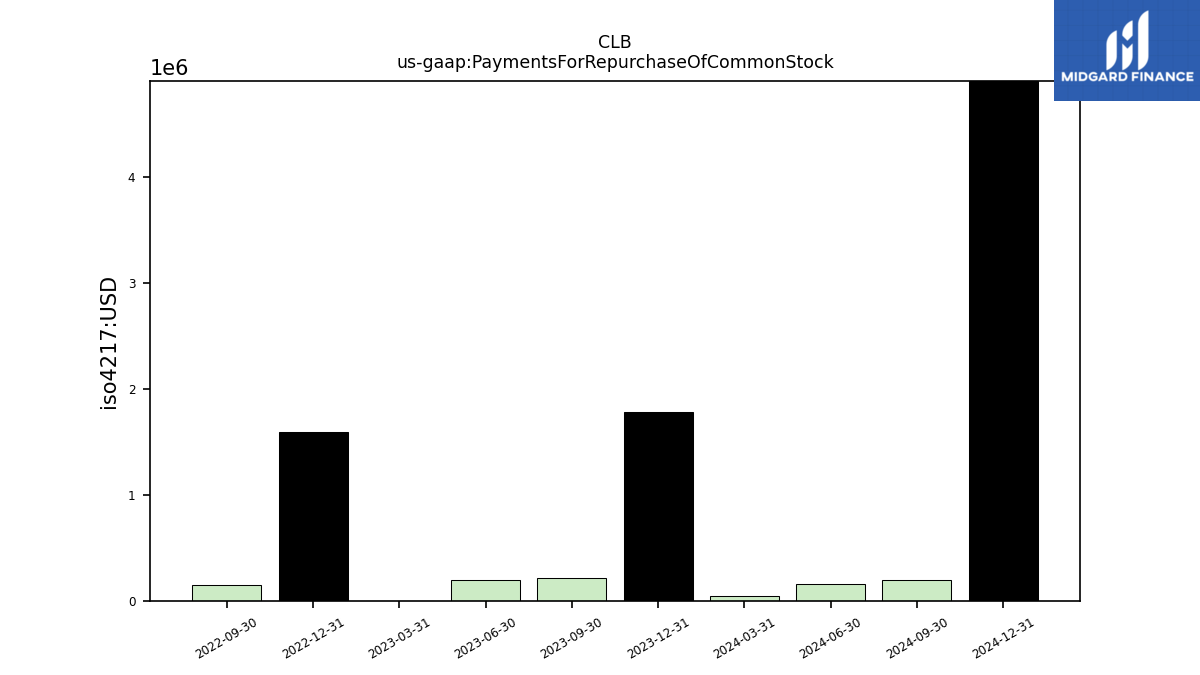
| Payments For Repurchase Of Common Stock | 1.78 | 0.22 | NA | 1.59 | 0.14 | NA |