
| 2023-12-31 | 2023-09-30 | 2023-06-30 | 2023-03-31 | 2022-12-31 | 2022-09-30 | 2022-06-30 | 2022-03-31 | 2021-12-31 | 2021-09-30 | 2021-06-30 | 2021-03-31 | 2020-12-31 | 2020-09-30 | 2020-06-30 | 2020-03-31 | 2019-12-31 | 2019-09-30 | 2019-06-30 | 2019-03-31 | 2018-12-31 | 2018-09-30 | 2018-06-30 | 2018-03-31 | 2017-12-31 | 2017-09-30 | 2017-06-30 | 2017-03-31 | 2016-12-31 | 2016-09-30 | 2016-06-30 | 2016-03-31 | 2015-12-31 | 2015-09-30 | 2015-06-30 | 2015-03-31 | 2014-12-31 | 2014-09-30 | 2014-06-30 | 2014-03-31 | 2013-12-31 | 2013-09-30 | 2013-06-30 | 2013-03-31 | 2012-12-31 | 2012-09-30 | 2012-06-30 | 2012-03-31 | 2011-12-31 | 2011-09-30 | 2011-06-30 | 2011-03-31 | 2010-12-31 | 2010-09-30 | 2010-06-30 | ||
|---|---|---|---|---|---|---|---|---|---|---|---|---|---|---|---|---|---|---|---|---|---|---|---|---|---|---|---|---|---|---|---|---|---|---|---|---|---|---|---|---|---|---|---|---|---|---|---|---|---|---|---|---|---|---|---|---|
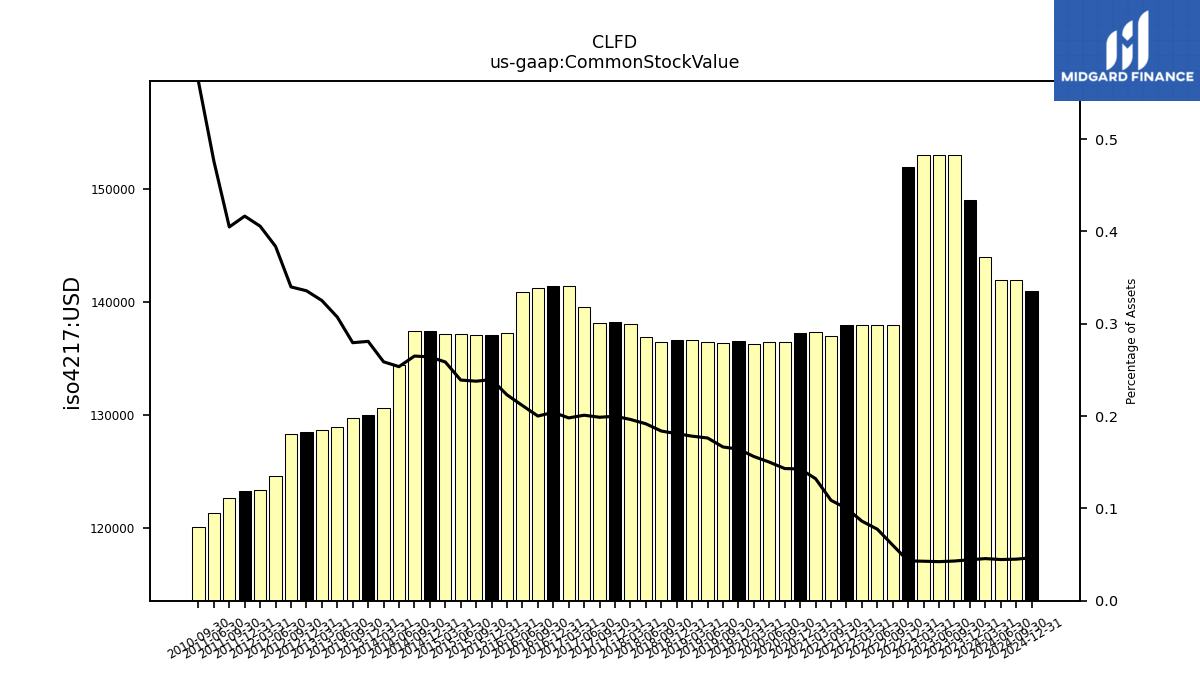
| Common Stock Value | 0.15 | 0.15 | 0.15 | 0.15 | 0.15 | 0.14 | 0.14 | 0.14 | 0.14 | 0.14 | NA | 0.14 | 0.14 | 0.14 | 0.14 | 0.14 | 0.14 | 0.14 | 0.14 | 0.14 | 0.14 | 0.14 | 0.14 | 0.14 | 0.14 | 0.14 | 0.14 | 0.14 | 0.14 | 0.14 | 0.14 | 0.14 | 0.14 | 0.14 | 0.14 | 0.14 | 0.14 | 0.14 | 0.13 | 0.13 | 0.13 | 0.13 | 0.13 | 0.13 | 0.13 | 0.13 | 0.12 | 0.12 | 0.12 | 0.12 | 0.12 | NA | NA | 0.12 | NA |
| 2023-12-31 | 2023-09-30 | 2023-06-30 | 2023-03-31 | 2022-12-31 | 2022-09-30 | 2022-06-30 | 2022-03-31 | 2021-12-31 | 2021-09-30 | 2021-06-30 | 2021-03-31 | 2020-12-31 | 2020-09-30 | 2020-06-30 | 2020-03-31 | 2019-12-31 | 2019-09-30 | 2019-06-30 | 2019-03-31 | 2018-12-31 | 2018-09-30 | 2018-06-30 | 2018-03-31 | 2017-12-31 | 2017-09-30 | 2017-06-30 | 2017-03-31 | 2016-12-31 | 2016-09-30 | 2016-06-30 | 2016-03-31 | 2015-12-31 | 2015-09-30 | 2015-06-30 | 2015-03-31 | 2014-12-31 | 2014-09-30 | 2014-06-30 | 2014-03-31 | 2013-12-31 | 2013-09-30 | 2013-06-30 | 2013-03-31 | 2012-12-31 | 2012-09-30 | 2012-06-30 | 2012-03-31 | 2011-12-31 | 2011-09-30 | 2011-06-30 | 2011-03-31 | 2010-12-31 | 2010-09-30 | 2010-06-30 | ||
|---|---|---|---|---|---|---|---|---|---|---|---|---|---|---|---|---|---|---|---|---|---|---|---|---|---|---|---|---|---|---|---|---|---|---|---|---|---|---|---|---|---|---|---|---|---|---|---|---|---|---|---|---|---|---|---|---|
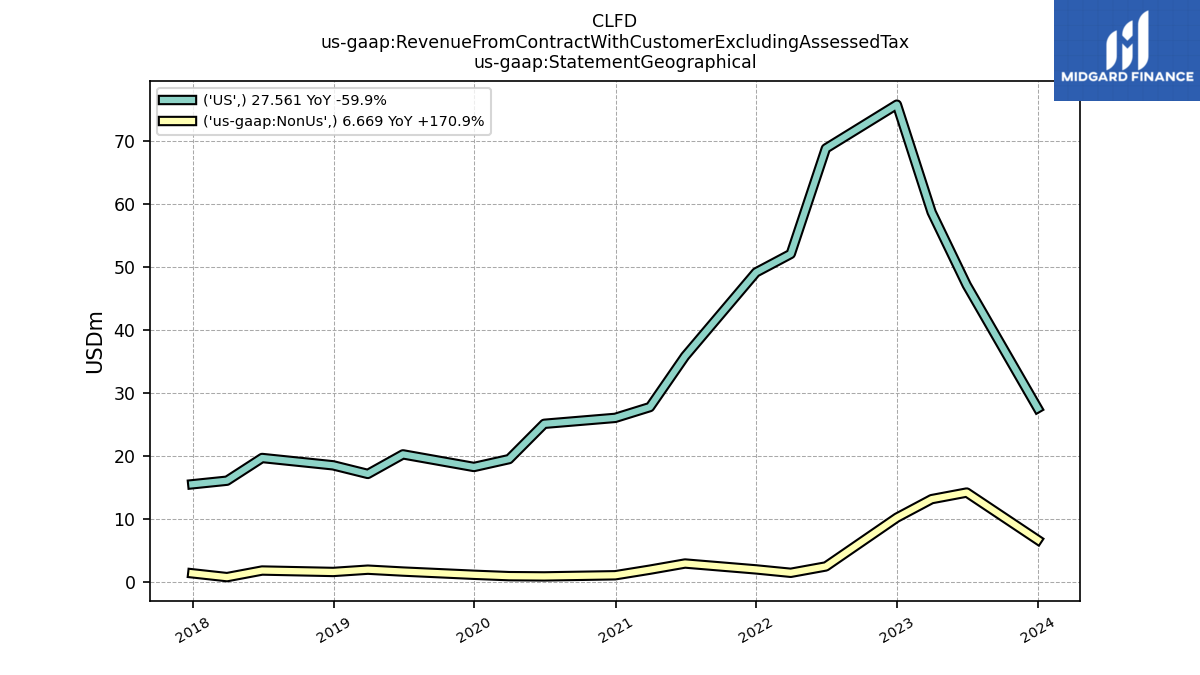
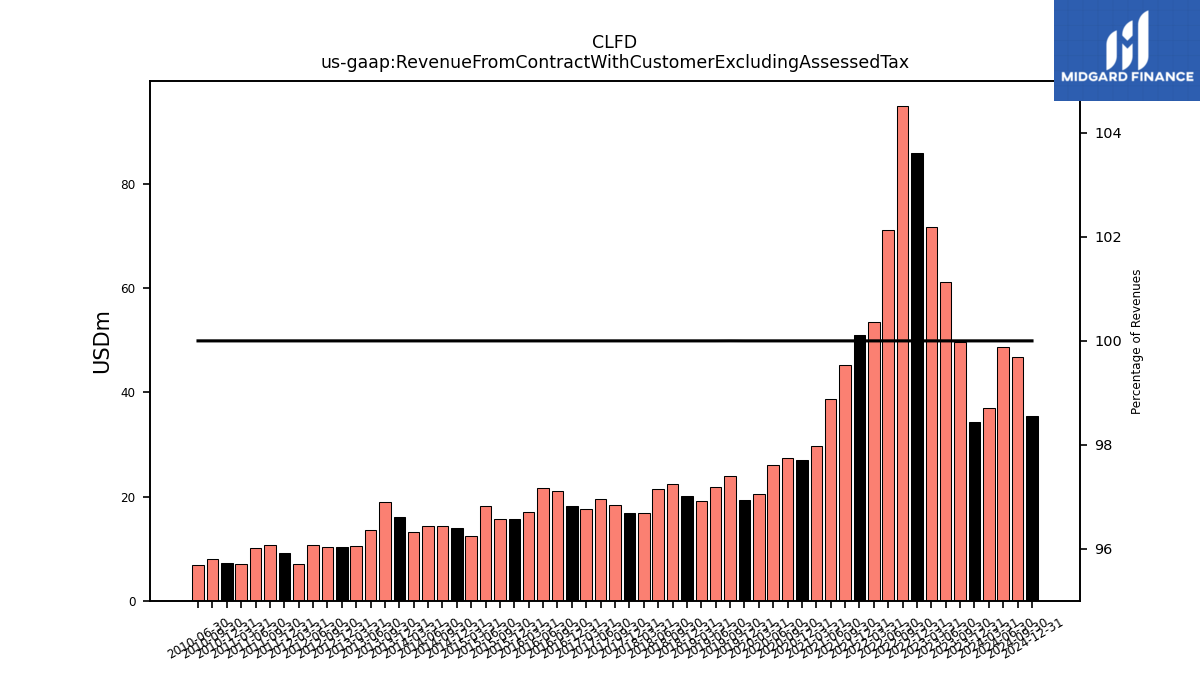
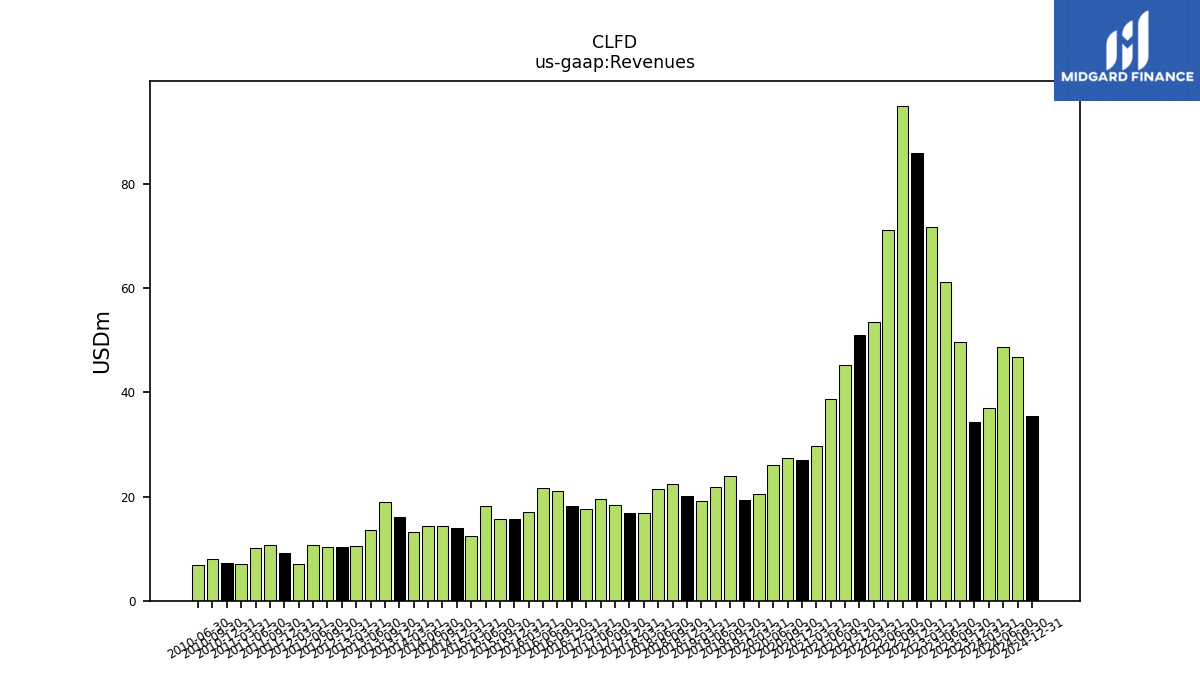
| Revenue From Contract With Customer Excluding Assessed Tax | 34.23 | 49.69 | 61.28 | 71.81 | 85.94 | 95.03 | 71.25 | 53.49 | 51.11 | 45.24 | 38.73 | 29.69 | 27.09 | 27.32 | 25.97 | 20.41 | 19.38 | 23.97 | 21.89 | 19.08 | 20.09 | 22.47 | 21.48 | 16.83 | 16.87 | 18.42 | 19.61 | 17.65 | 18.27 | 21.05 | 21.60 | 16.95 | 15.69 | 15.77 | 18.20 | 12.37 | 13.99 | 14.32 | 14.36 | 13.21 | 16.15 | 19.04 | 13.53 | 10.51 | 10.27 | 10.40 | 10.79 | 7.11 | 9.17 | 10.70 | 10.12 | 7.12 | 7.25 | 7.92 | 6.78 | |
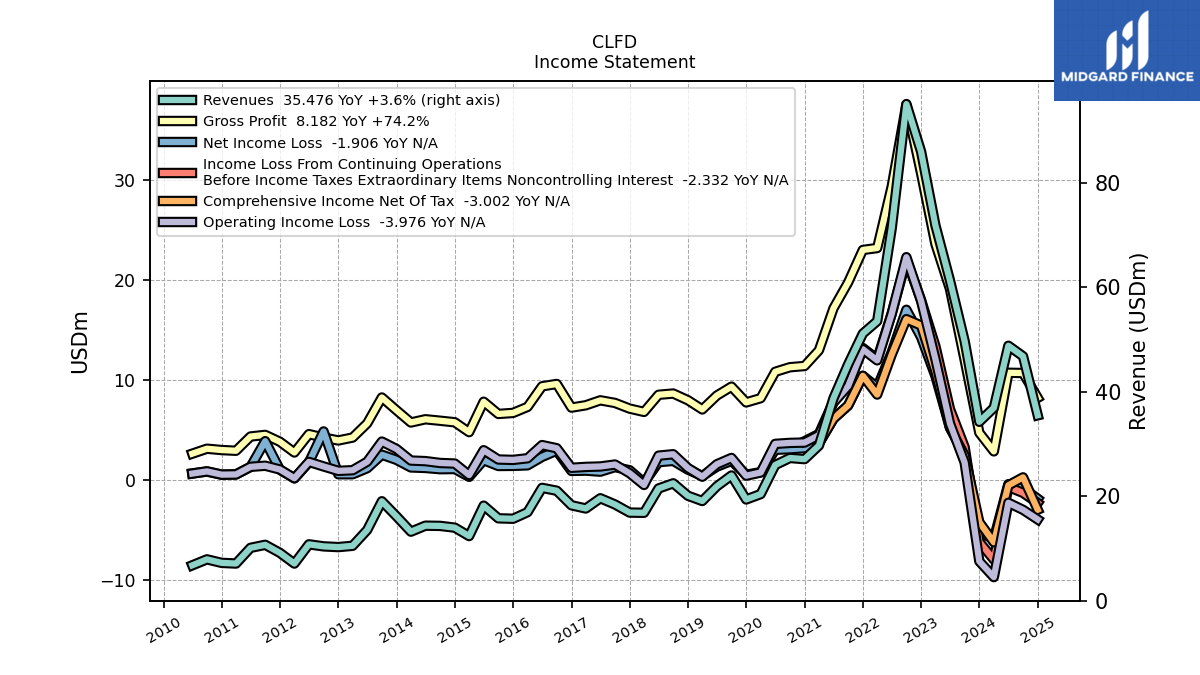
| Revenues | 34.23 | 49.69 | 61.28 | 71.81 | 85.94 | 95.03 | 71.25 | 53.49 | 51.11 | 45.24 | 38.73 | 29.69 | 27.09 | 27.32 | 25.97 | 20.41 | 19.38 | 23.97 | 21.89 | 19.08 | 20.09 | 22.47 | 21.48 | 16.83 | 16.87 | 18.42 | 19.61 | 17.65 | 18.27 | 21.05 | 21.60 | 16.95 | 15.69 | 15.77 | 18.20 | 12.37 | 13.99 | 14.32 | 14.36 | 13.21 | 16.15 | 19.04 | 13.53 | 10.51 | 10.27 | 10.40 | 10.79 | 7.11 | 9.17 | 10.70 | 10.12 | 7.12 | 7.25 | 7.92 | 6.78 | |
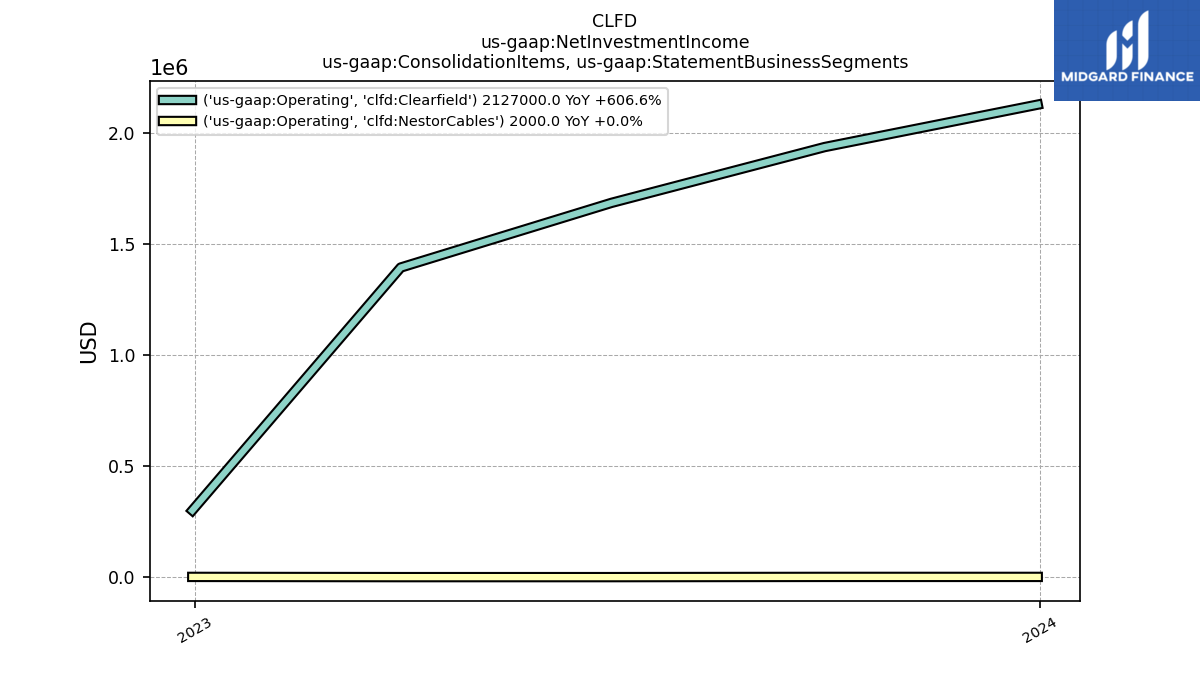
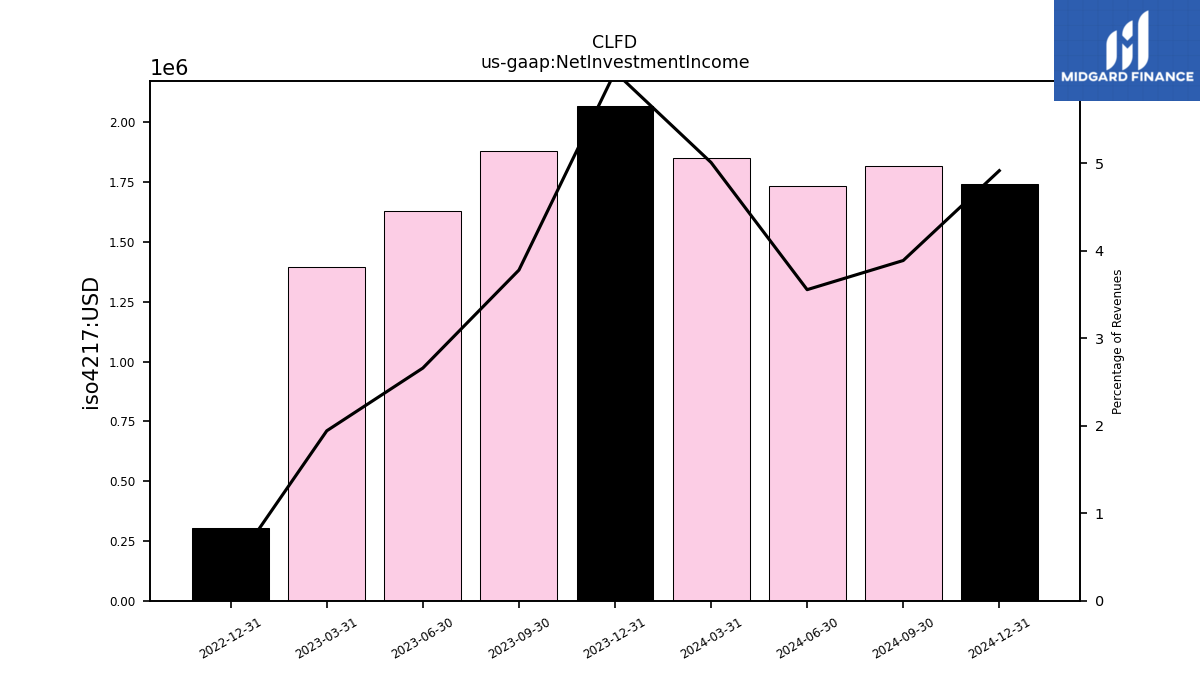
| Net Investment Income | 2.07 | 1.88 | 1.63 | 1.40 | 0.30 | NA | NA | NA | NA | NA | NA | NA | NA | NA | NA | NA | NA | NA | NA | NA | NA | NA | NA | NA | NA | NA | NA | NA | NA | NA | NA | NA | NA | NA | NA | NA | NA | NA | NA | NA | NA | NA | NA | NA | NA | NA | NA | NA | NA | NA | NA | NA | NA | NA | NA | |
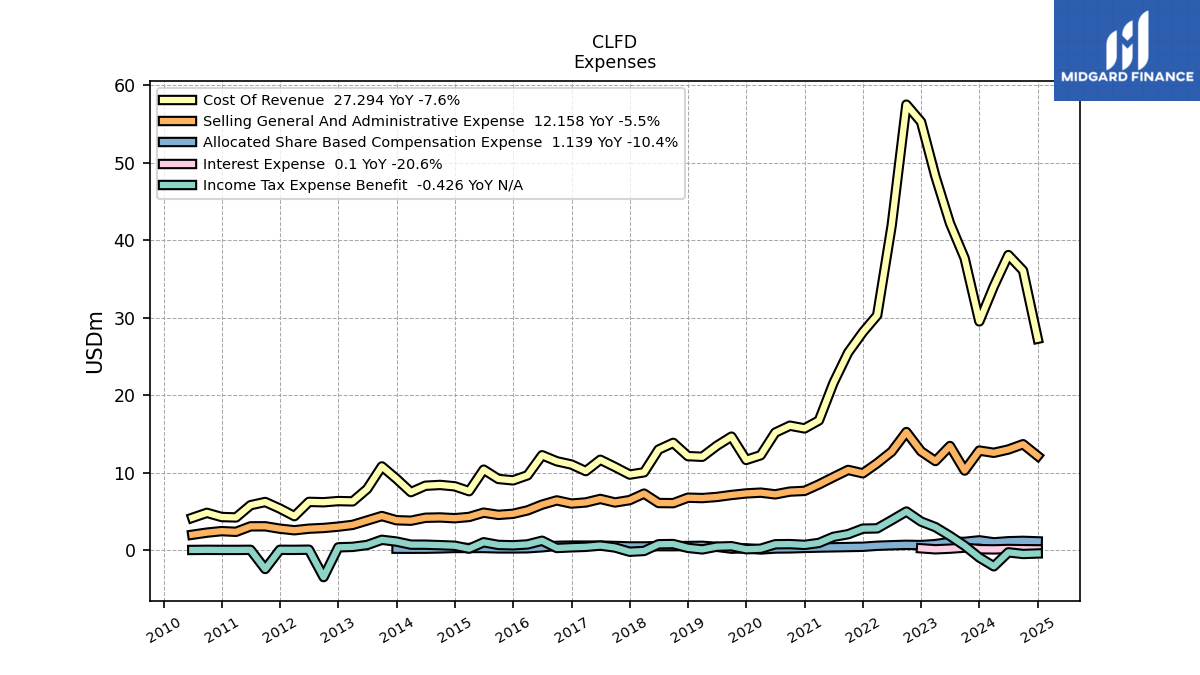
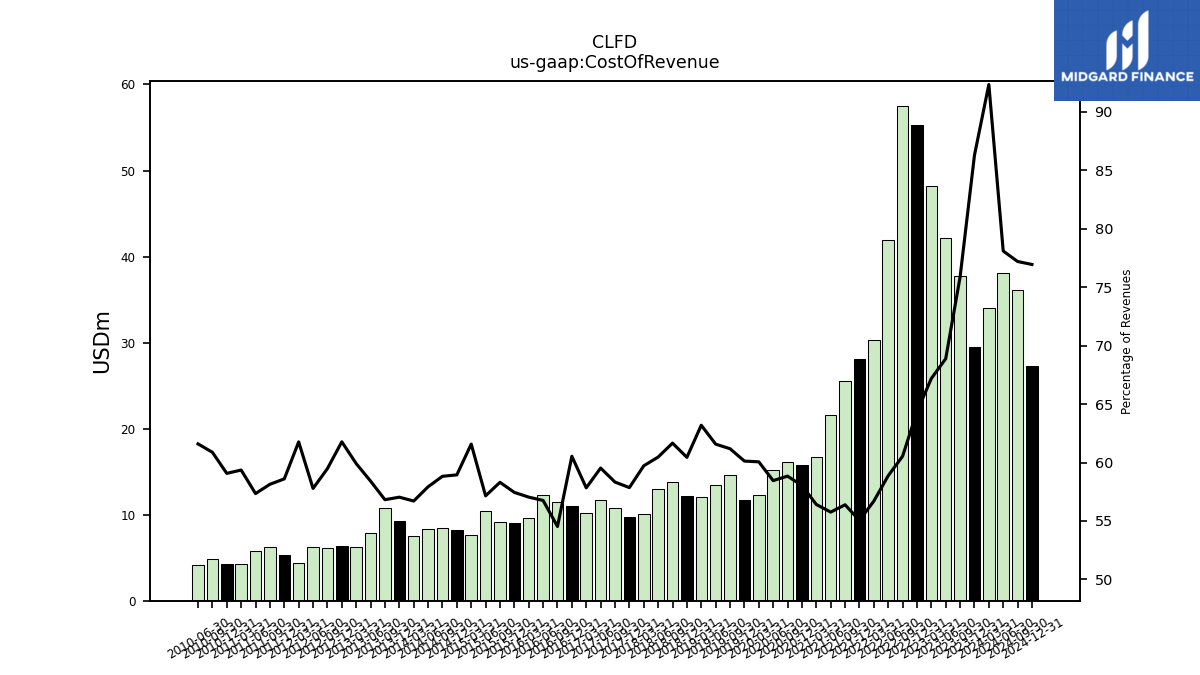
| Cost Of Revenue | 29.53 | 37.69 | 42.21 | 48.25 | 55.29 | 57.52 | 41.94 | 30.33 | 28.14 | 25.51 | 21.60 | 16.75 | 15.72 | 16.07 | 15.18 | 12.26 | 11.65 | 14.66 | 13.48 | 12.06 | 12.14 | 13.86 | 12.99 | 10.05 | 9.76 | 10.74 | 11.67 | 10.21 | 11.06 | 11.48 | 12.26 | 9.67 | 9.01 | 9.20 | 10.40 | 7.62 | 8.24 | 8.42 | 8.32 | 7.49 | 9.21 | 10.82 | 7.91 | 6.30 | 6.34 | 6.19 | 6.24 | 4.39 | 5.37 | 6.22 | 5.81 | 4.23 | 4.28 | 4.82 | 4.17 | |
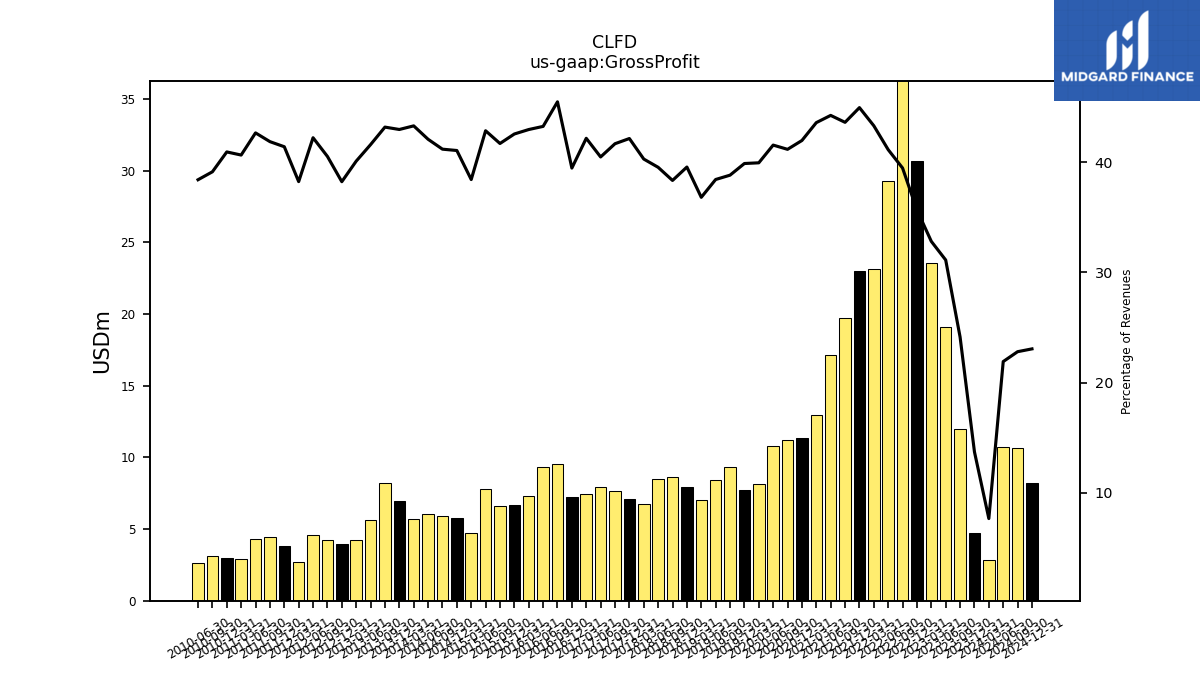
| Gross Profit | 4.70 | 11.99 | 19.07 | 23.56 | 30.65 | 37.50 | 29.31 | 23.16 | 22.97 | 19.73 | 17.14 | 12.94 | 11.37 | 11.25 | 10.79 | 8.15 | 7.73 | 9.30 | 8.41 | 7.03 | 7.95 | 8.62 | 8.49 | 6.78 | 7.11 | 7.68 | 7.94 | 7.44 | 7.21 | 9.57 | 9.34 | 7.28 | 6.68 | 6.58 | 7.80 | 4.75 | 5.74 | 5.90 | 6.04 | 5.72 | 6.94 | 8.22 | 5.63 | 4.22 | 3.92 | 4.22 | 4.56 | 2.72 | 3.79 | 4.48 | 4.32 | 2.89 | 2.97 | 3.10 | 2.60 | |
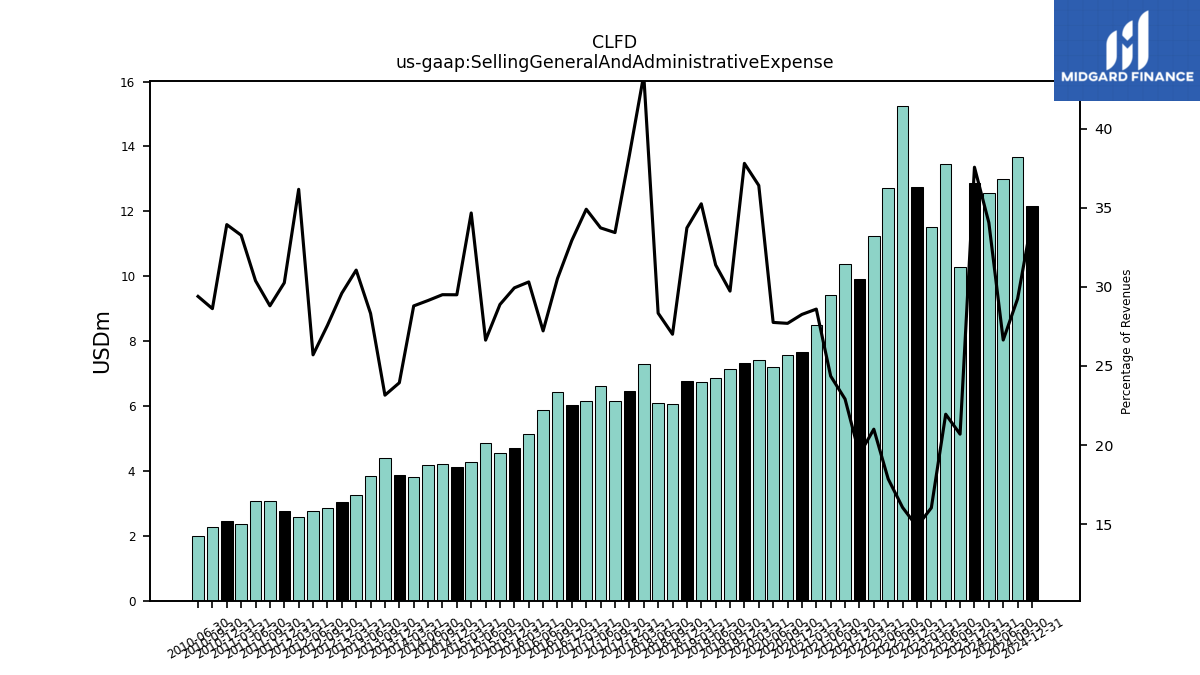
| Selling General And Administrative Expense | 12.86 | 10.28 | 13.45 | 11.51 | 12.76 | 15.25 | 12.72 | 11.23 | 9.92 | 10.36 | 9.44 | 8.49 | 7.66 | 7.57 | 7.21 | 7.43 | 7.33 | 7.13 | 6.87 | 6.73 | 6.78 | 6.07 | 6.09 | 7.31 | 6.46 | 6.16 | 6.61 | 6.16 | 6.02 | 6.43 | 5.88 | 5.14 | 4.70 | 4.56 | 4.85 | 4.29 | 4.13 | 4.23 | 4.19 | 3.81 | 3.87 | 4.41 | 3.83 | 3.27 | 3.04 | 2.87 | 2.77 | 2.57 | 2.77 | 3.08 | 3.08 | 2.37 | 2.46 | 2.27 | 1.99 | |
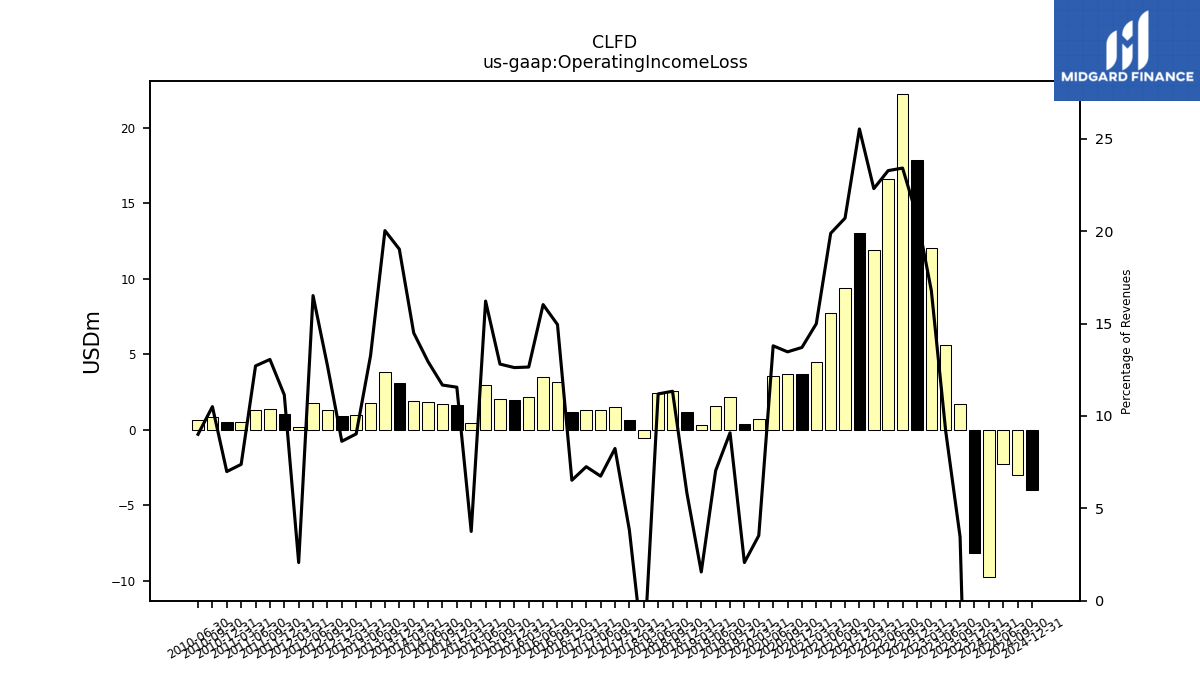
| Operating Income Loss | -8.16 | 1.72 | 5.62 | 12.05 | 17.89 | 22.25 | 16.59 | 11.93 | 13.05 | 9.37 | 7.70 | 4.45 | 3.71 | 3.68 | 3.58 | 0.72 | 0.40 | 2.18 | 1.54 | 0.30 | 1.17 | 2.55 | 2.40 | -0.53 | 0.64 | 1.52 | 1.32 | 1.28 | 1.19 | 3.15 | 3.46 | 2.14 | 1.98 | 2.02 | 2.95 | 0.46 | 1.62 | 1.67 | 1.86 | 1.92 | 3.07 | 3.81 | 1.80 | 0.95 | 0.89 | 1.32 | 1.78 | 0.15 | 1.02 | 1.40 | 1.29 | 0.53 | 0.51 | 0.83 | 0.61 | |
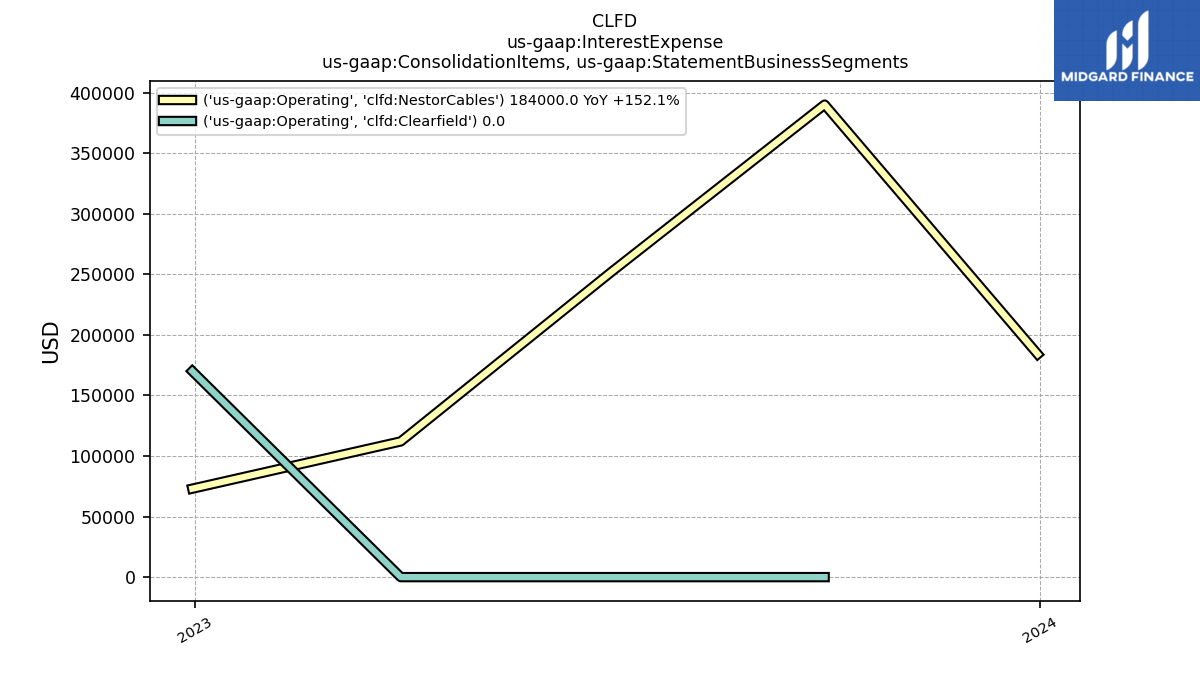
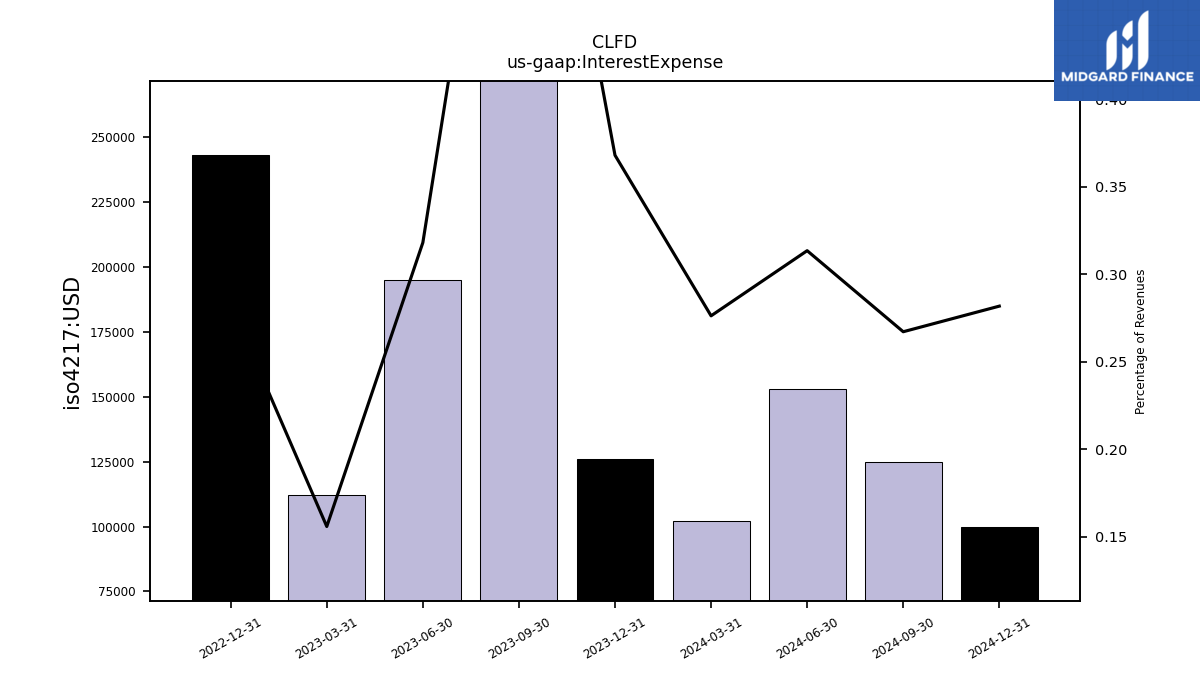
| Interest Expense | 0.13 | 0.33 | 0.20 | 0.11 | 0.24 | NA | NA | NA | NA | NA | NA | NA | NA | NA | NA | NA | NA | NA | NA | NA | NA | NA | NA | NA | NA | NA | NA | NA | NA | NA | NA | NA | NA | NA | NA | NA | NA | NA | NA | NA | NA | NA | NA | NA | NA | NA | NA | NA | NA | NA | NA | NA | NA | NA | NA | |
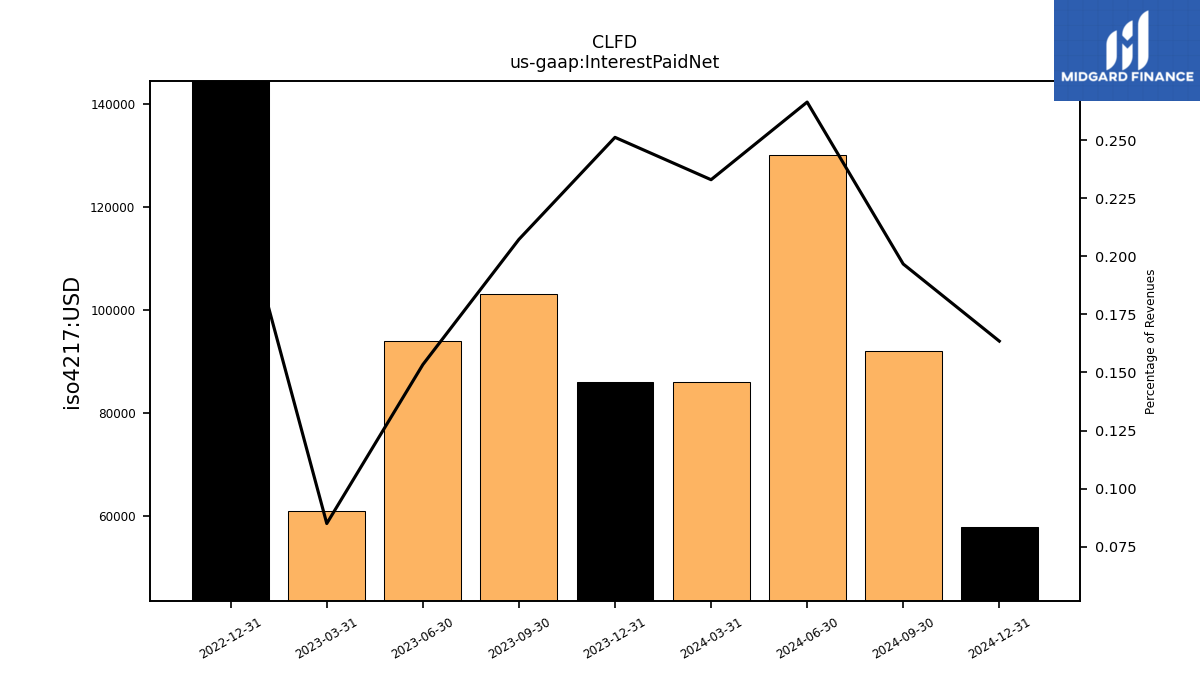
| Interest Paid Net | 0.09 | 0.10 | 0.09 | 0.06 | 0.20 | NA | NA | NA | NA | NA | NA | NA | NA | NA | NA | NA | NA | NA | NA | NA | NA | NA | NA | NA | NA | NA | NA | NA | NA | NA | NA | NA | NA | NA | NA | NA | NA | NA | NA | NA | NA | NA | NA | NA | NA | NA | NA | NA | NA | NA | NA | NA | NA | NA | NA | |
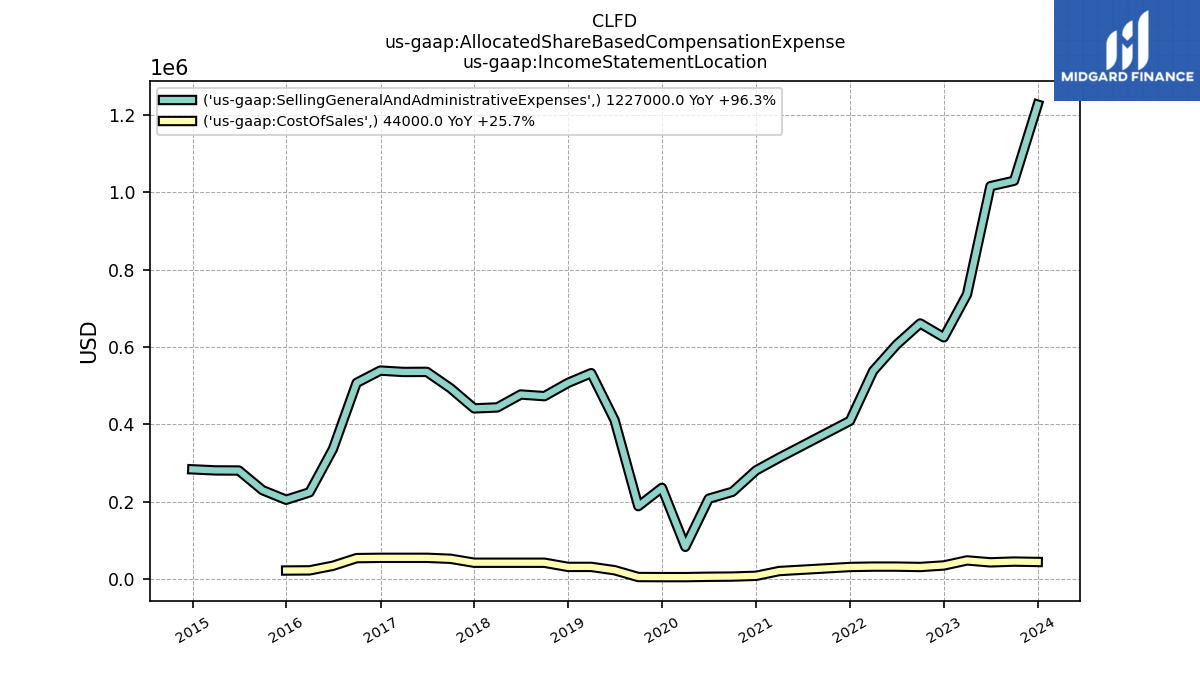
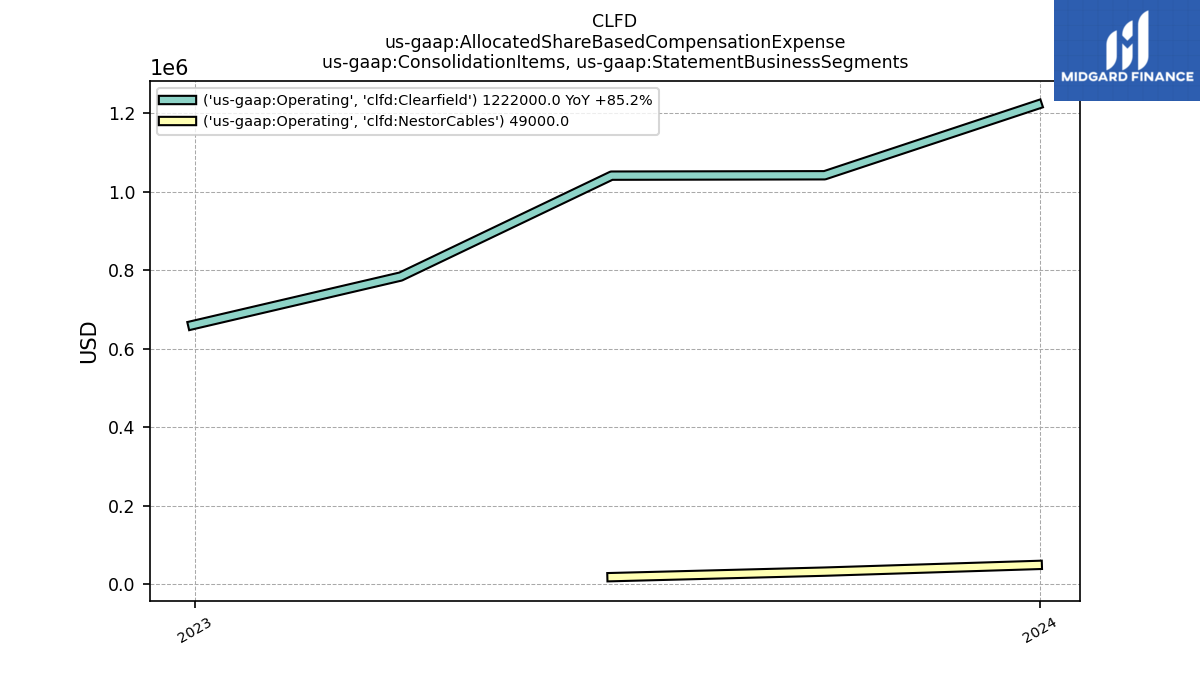
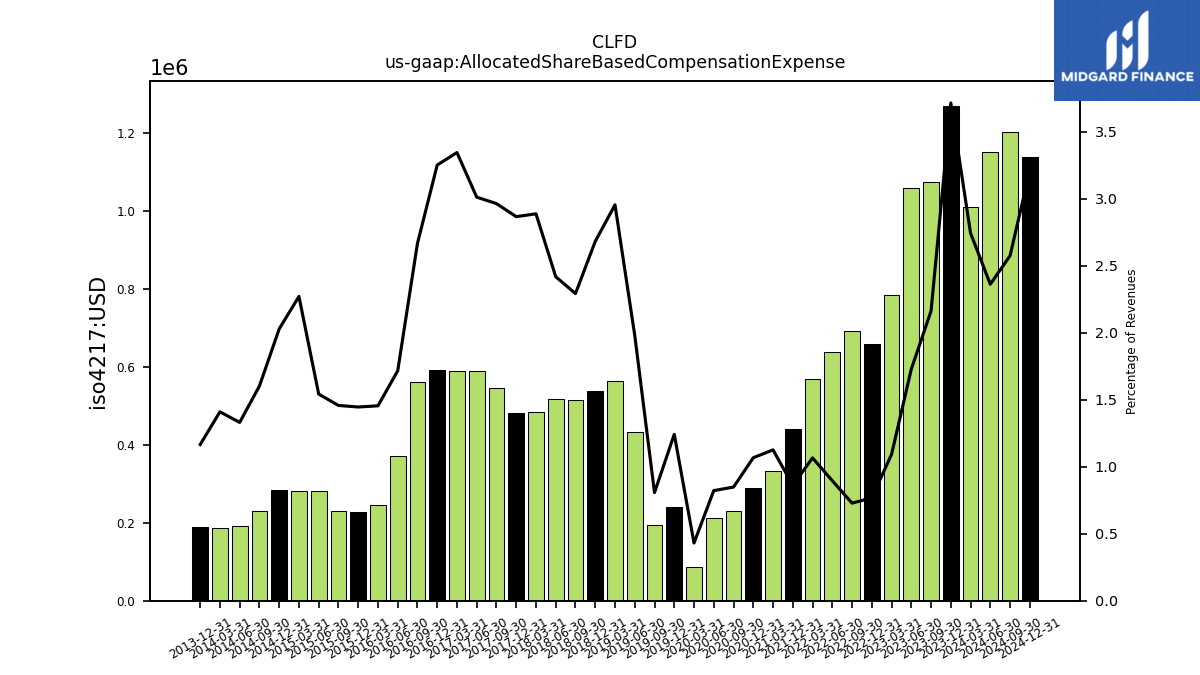
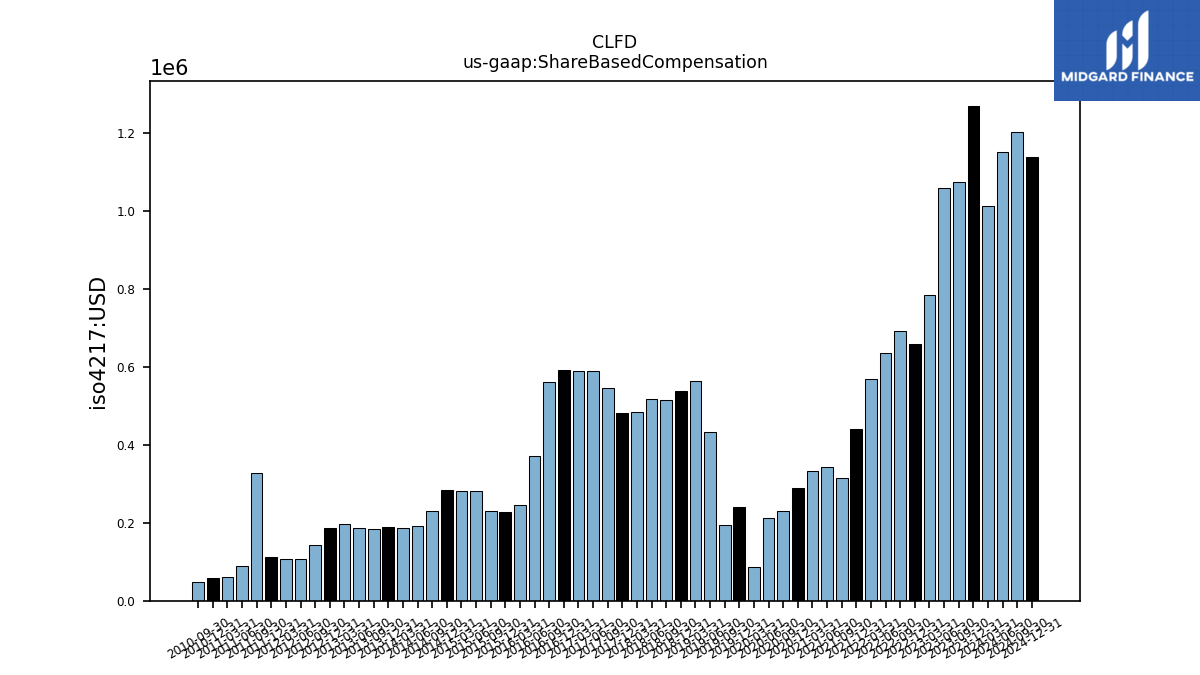
| Allocated Share Based Compensation Expense | 1.27 | 1.07 | 1.06 | 0.78 | 0.66 | 0.69 | 0.64 | 0.57 | 0.44 | NA | NA | 0.33 | 0.29 | 0.23 | 0.21 | 0.09 | 0.24 | 0.19 | 0.43 | 0.56 | 0.54 | 0.51 | 0.52 | 0.49 | 0.48 | 0.55 | 0.59 | 0.59 | 0.59 | 0.56 | 0.37 | 0.25 | 0.23 | 0.23 | 0.28 | 0.28 | 0.28 | 0.23 | 0.19 | 0.19 | 0.19 | NA | NA | NA | NA | NA | NA | NA | NA | NA | NA | NA | NA | NA | NA | |
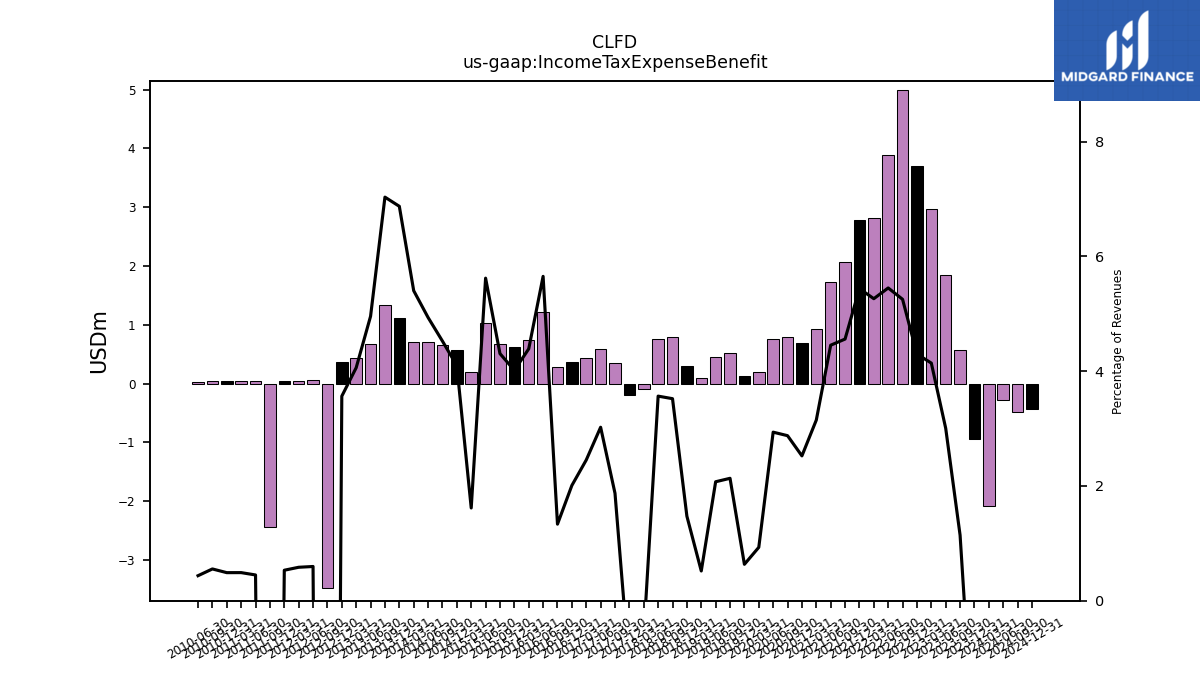
| Income Tax Expense Benefit | -0.95 | 0.57 | 1.84 | 2.97 | 3.69 | 4.99 | 3.88 | 2.82 | 2.78 | 2.06 | 1.73 | 0.94 | 0.68 | 0.79 | 0.76 | 0.19 | 0.12 | 0.51 | 0.45 | 0.10 | 0.30 | 0.79 | 0.77 | -0.10 | -0.20 | 0.34 | 0.59 | 0.43 | 0.37 | 0.28 | 1.22 | 0.74 | 0.63 | 0.68 | 1.02 | 0.20 | 0.57 | 0.65 | 0.71 | 0.71 | 1.11 | 1.34 | 0.67 | 0.43 | 0.37 | -3.48 | 0.06 | 0.04 | 0.05 | -2.43 | 0.05 | 0.03 | 0.04 | 0.04 | 0.03 | |
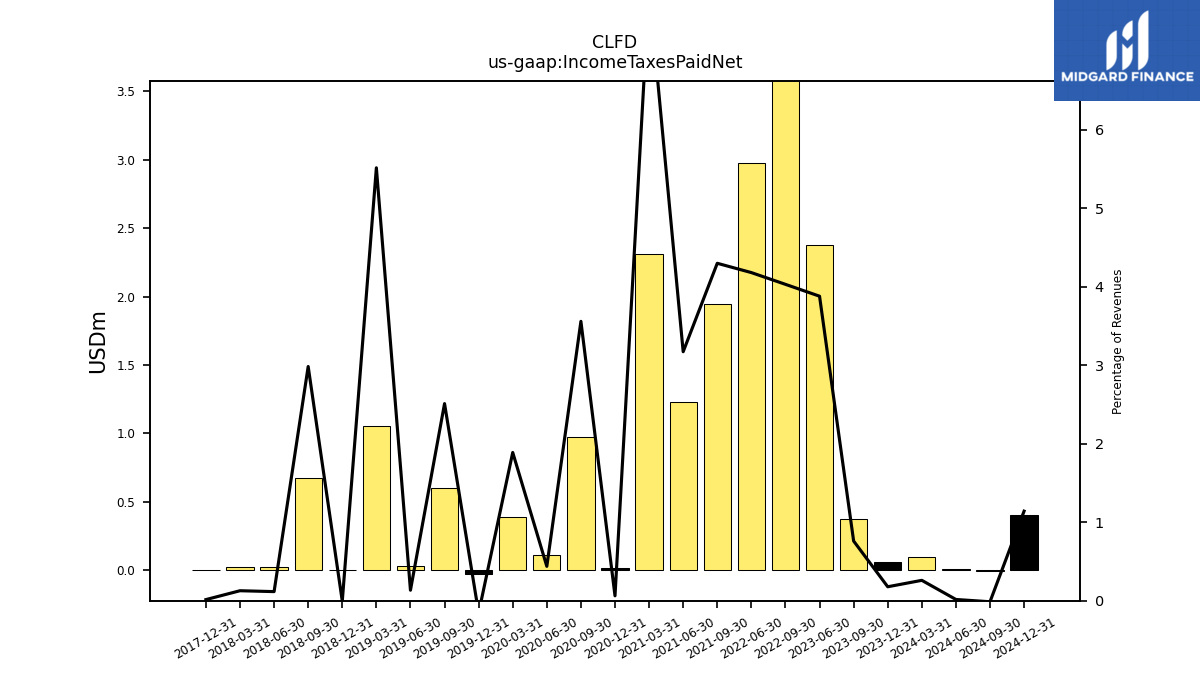
| Income Taxes Paid Net | 0.06 | 0.38 | 2.38 | NA | NA | 3.83 | 2.98 | NA | NA | 1.95 | 1.23 | 2.31 | 0.02 | 0.97 | 0.11 | 0.39 | -0.03 | 0.60 | 0.03 | 1.05 | -0.00 | 0.67 | 0.03 | 0.02 | 0.00 | NA | NA | NA | NA | NA | NA | NA | NA | NA | NA | NA | NA | NA | NA | NA | NA | NA | NA | NA | NA | NA | NA | NA | NA | NA | NA | NA | NA | NA | NA | |
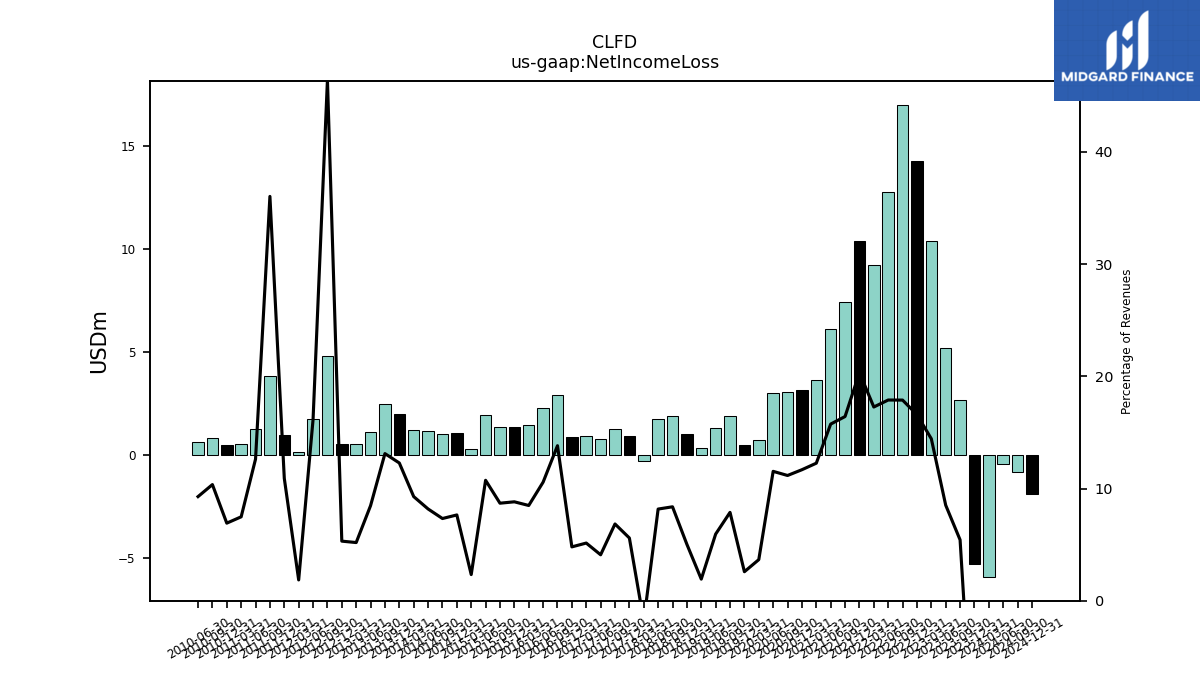
| Net Income Loss | -5.27 | 2.70 | 5.22 | 10.36 | 14.26 | 16.99 | 12.74 | 9.24 | 10.39 | 7.43 | 6.10 | 3.64 | 3.16 | 3.05 | 2.99 | 0.75 | 0.50 | 1.89 | 1.30 | 0.37 | 1.01 | 1.88 | 1.76 | -0.31 | 0.94 | 1.26 | 0.80 | 0.91 | 0.88 | 2.91 | 2.28 | 1.44 | 1.38 | 1.37 | 1.95 | 0.29 | 1.07 | 1.05 | 1.17 | 1.23 | 1.98 | 2.50 | 1.15 | 0.55 | 0.55 | 4.83 | 1.74 | 0.13 | 1.00 | 3.86 | 1.28 | 0.53 | 0.50 | 0.82 | 0.63 | |
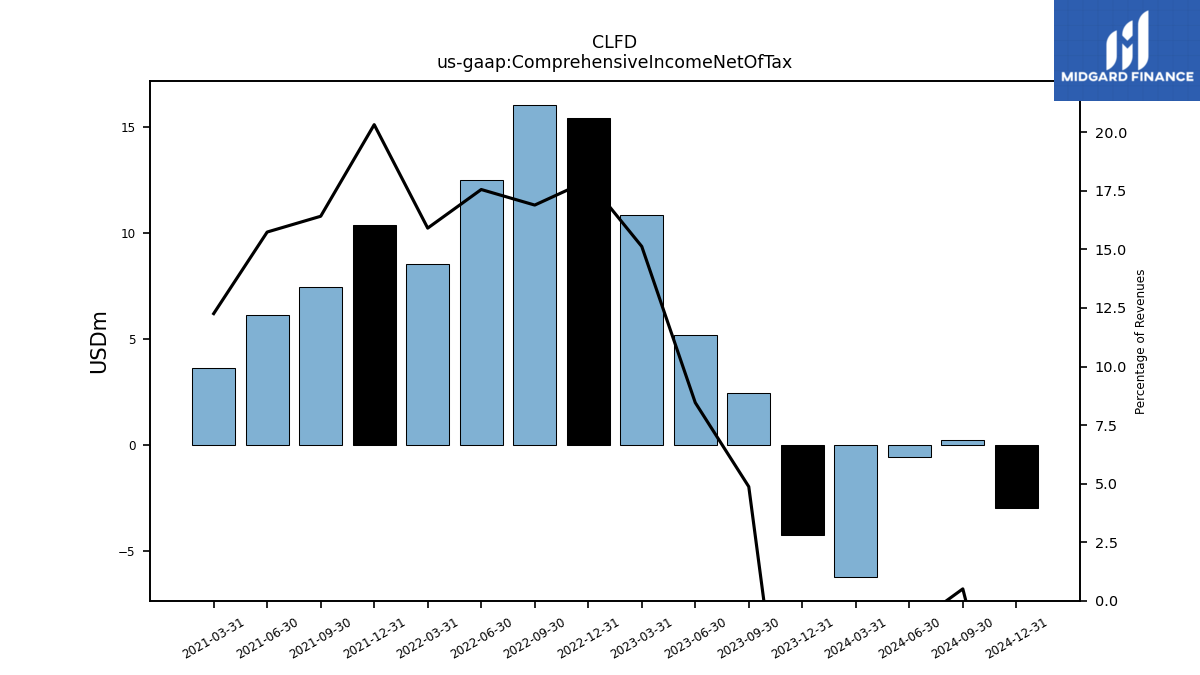
| Comprehensive Income Net Of Tax | -4.25 | 2.42 | 5.18 | 10.86 | 15.42 | 16.05 | 12.51 | 8.51 | 10.39 | 7.43 | 6.10 | 3.64 | NA | NA | NA | NA | NA | NA | NA | NA | NA | NA | NA | NA | NA | NA | NA | NA | NA | NA | NA | NA | NA | NA | NA | NA | NA | NA | NA | NA | NA | NA | NA | NA | NA | NA | NA | NA | NA | NA | NA | NA | NA | NA | NA |
| 2023-12-31 | 2023-09-30 | 2023-06-30 | 2023-03-31 | 2022-12-31 | 2022-09-30 | 2022-06-30 | 2022-03-31 | 2021-12-31 | 2021-09-30 | 2021-06-30 | 2021-03-31 | 2020-12-31 | 2020-09-30 | 2020-06-30 | 2020-03-31 | 2019-12-31 | 2019-09-30 | 2019-06-30 | 2019-03-31 | 2018-12-31 | 2018-09-30 | 2018-06-30 | 2018-03-31 | 2017-12-31 | 2017-09-30 | 2017-06-30 | 2017-03-31 | 2016-12-31 | 2016-09-30 | 2016-06-30 | 2016-03-31 | 2015-12-31 | 2015-09-30 | 2015-06-30 | 2015-03-31 | 2014-12-31 | 2014-09-30 | 2014-06-30 | 2014-03-31 | 2013-12-31 | 2013-09-30 | 2013-06-30 | 2013-03-31 | 2012-12-31 | 2012-09-30 | 2012-06-30 | 2012-03-31 | 2011-12-31 | 2011-09-30 | 2011-06-30 | 2011-03-31 | 2010-12-31 | 2010-09-30 | 2010-06-30 | ||
|---|---|---|---|---|---|---|---|---|---|---|---|---|---|---|---|---|---|---|---|---|---|---|---|---|---|---|---|---|---|---|---|---|---|---|---|---|---|---|---|---|---|---|---|---|---|---|---|---|---|---|---|---|---|---|---|---|
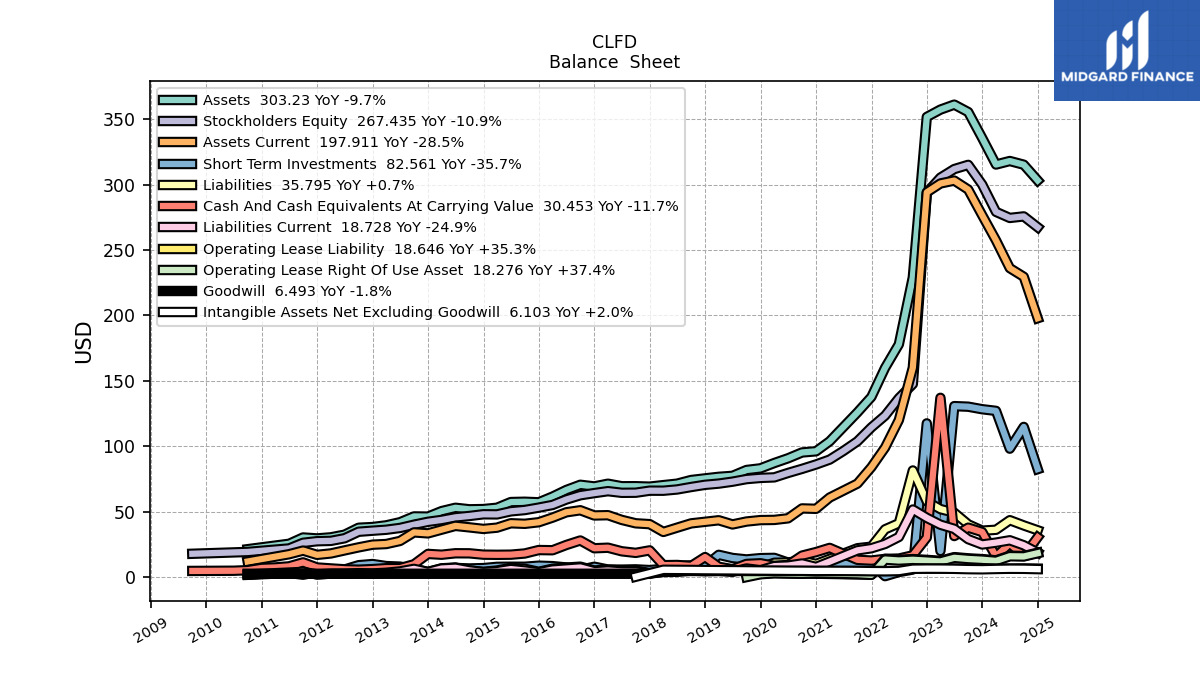
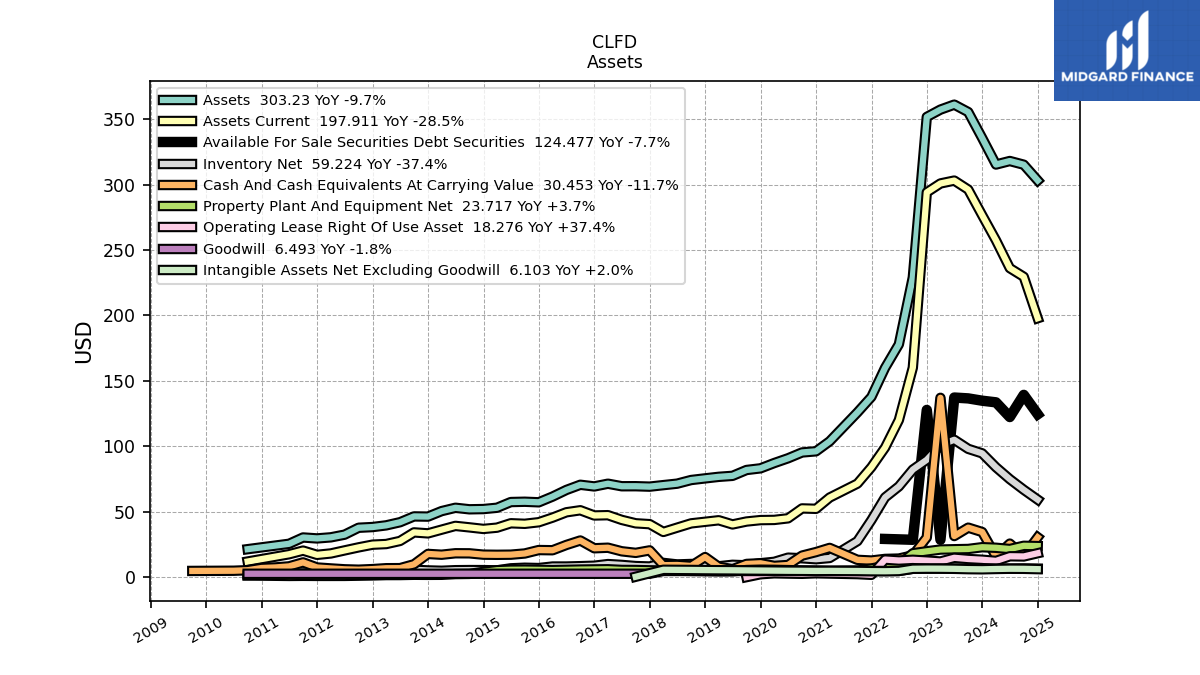
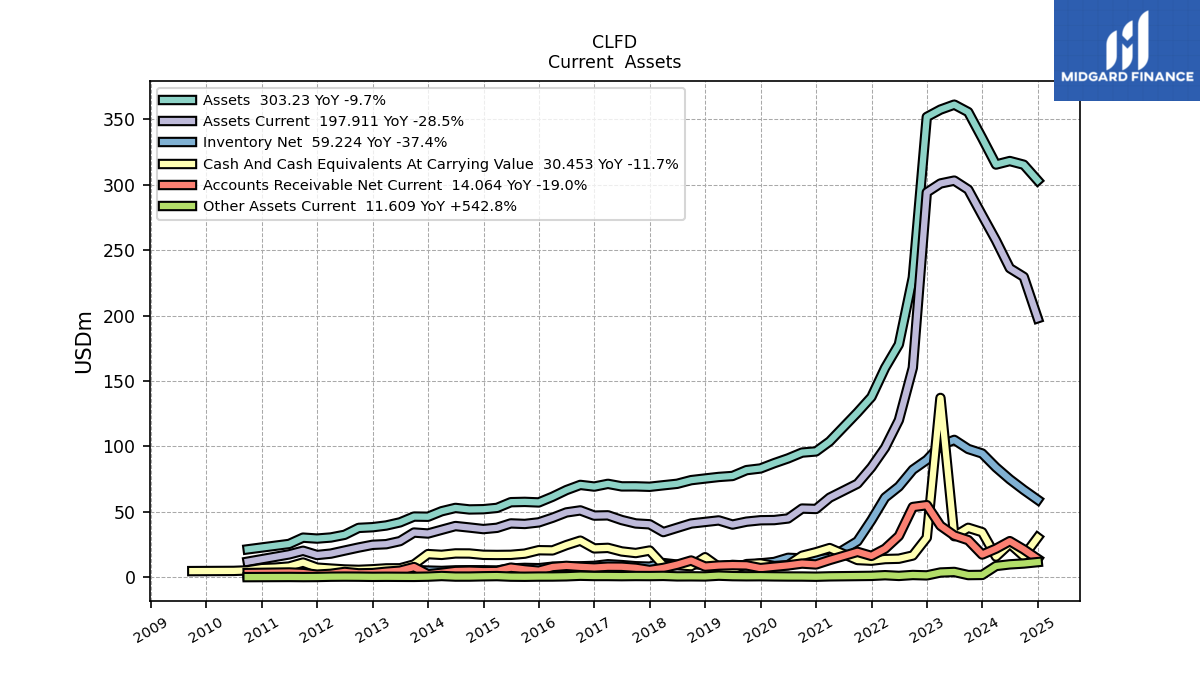
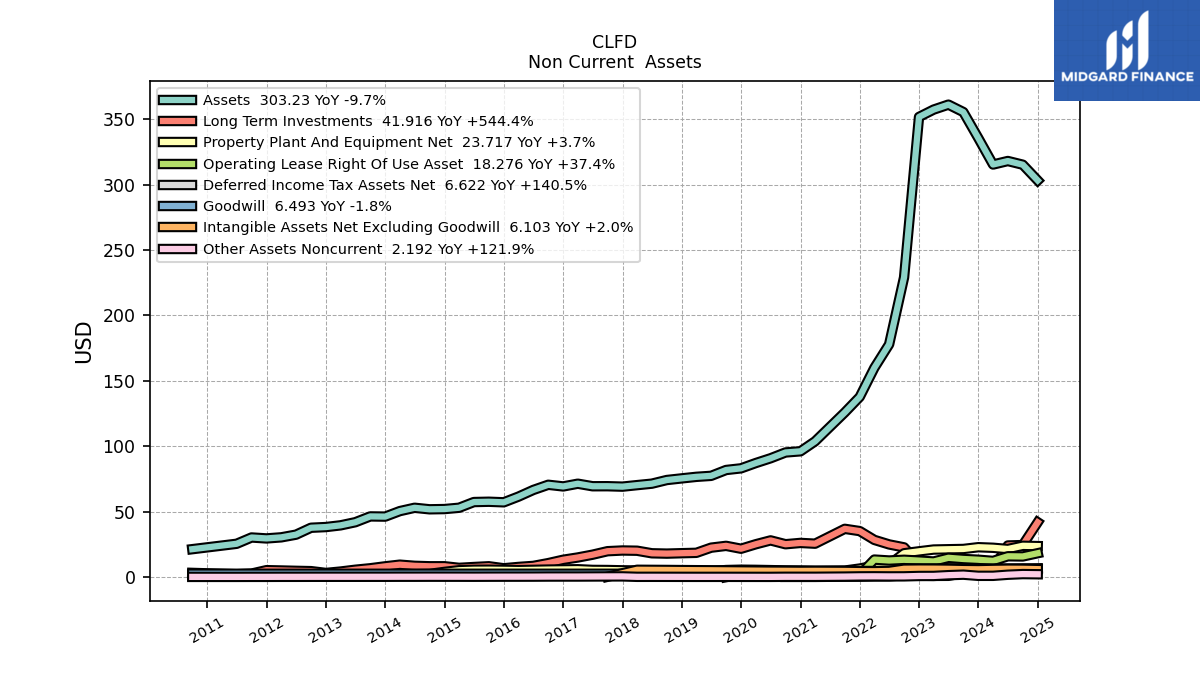
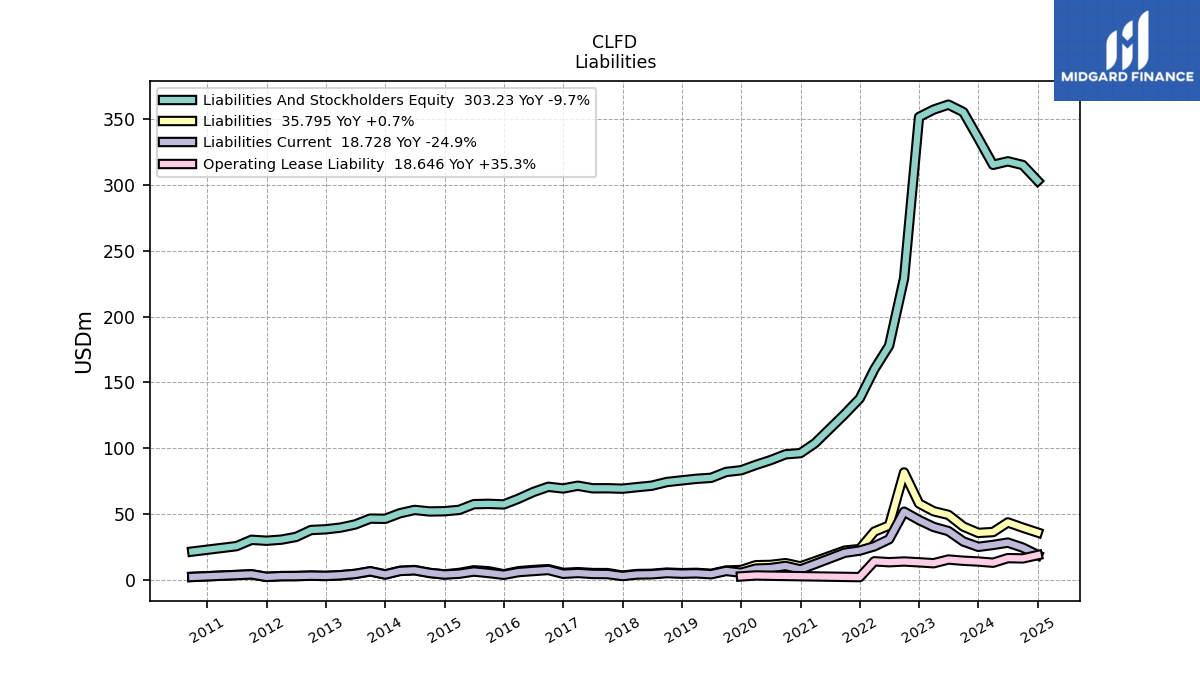
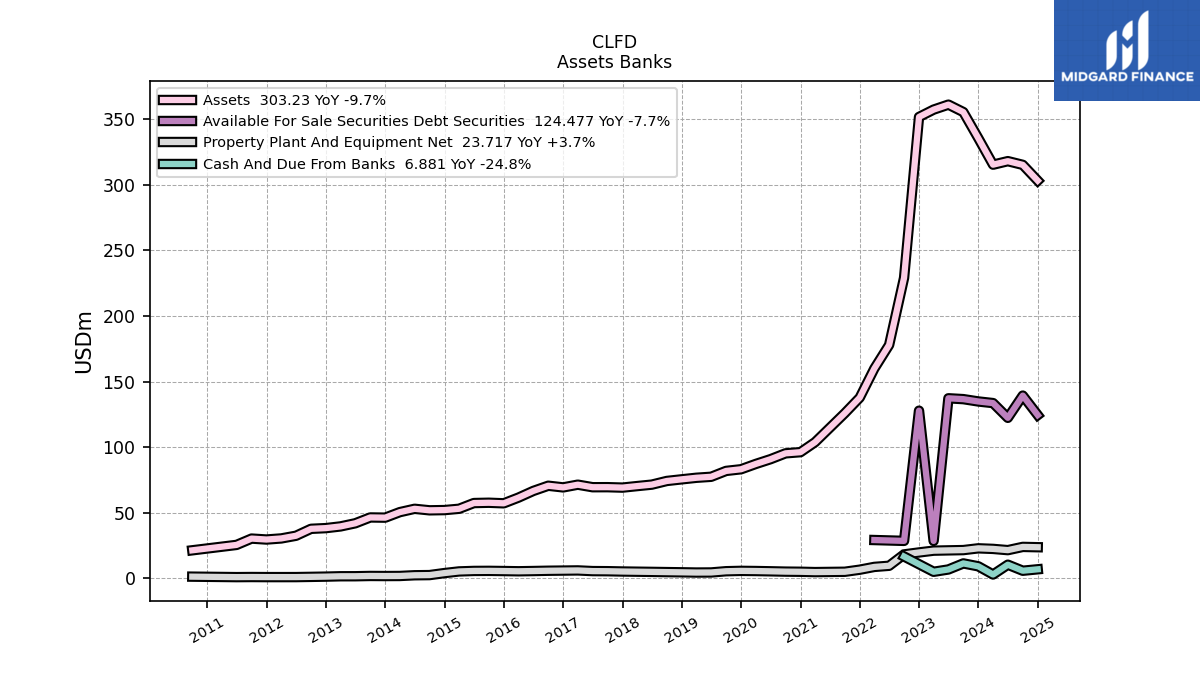
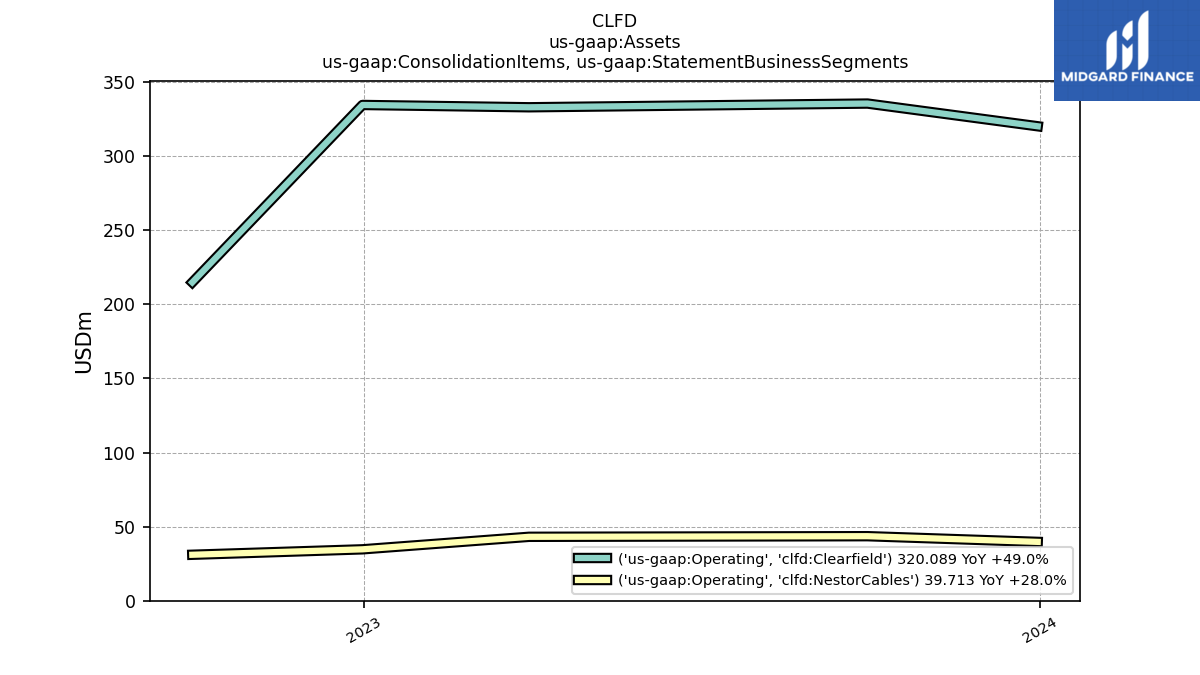
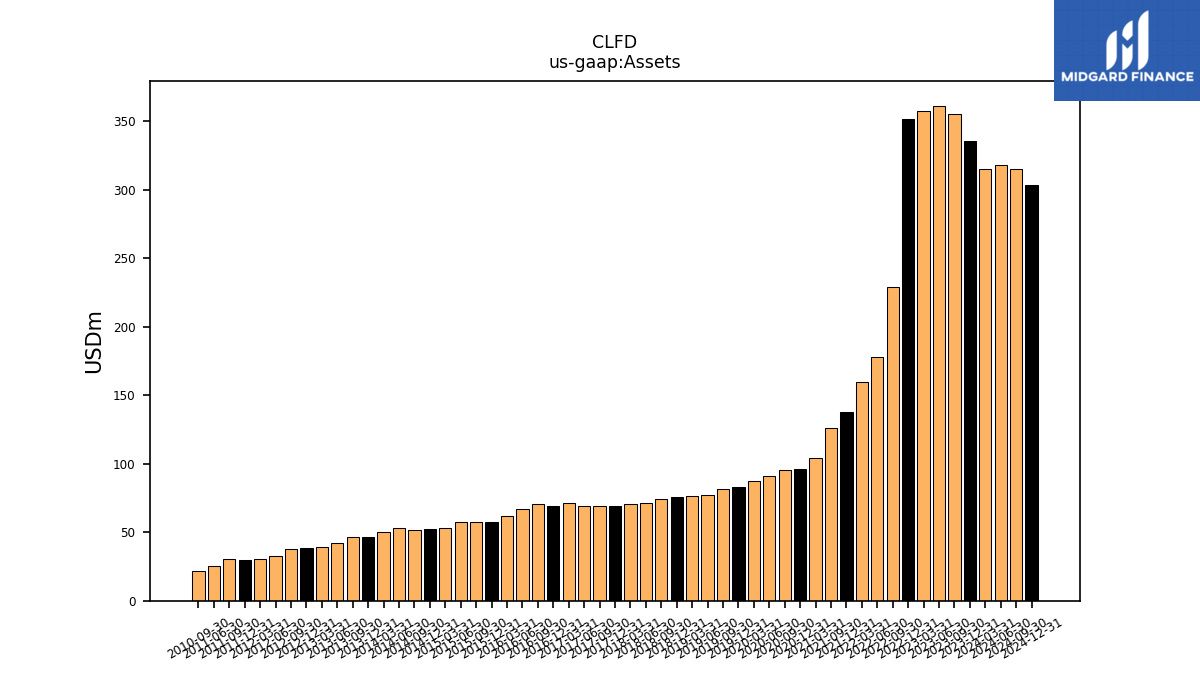
| Assets | 335.63 | 355.52 | 361.20 | 357.39 | 351.80 | 229.13 | 177.95 | 159.97 | 137.76 | 125.91 | NA | 103.82 | 96.19 | 95.30 | 90.86 | 87.21 | 83.16 | 81.89 | 77.42 | 76.67 | 75.48 | 74.23 | 71.44 | 70.32 | 69.17 | 69.49 | 69.47 | 71.41 | 69.33 | 70.60 | 66.64 | 61.57 | 57.20 | 57.63 | 57.39 | 53.03 | 52.03 | 51.85 | 53.01 | 50.47 | 46.26 | 46.41 | 41.97 | 39.58 | 38.28 | 37.74 | 32.46 | 30.41 | 29.58 | 30.30 | 25.48 | NA | NA | 21.36 | NA | |
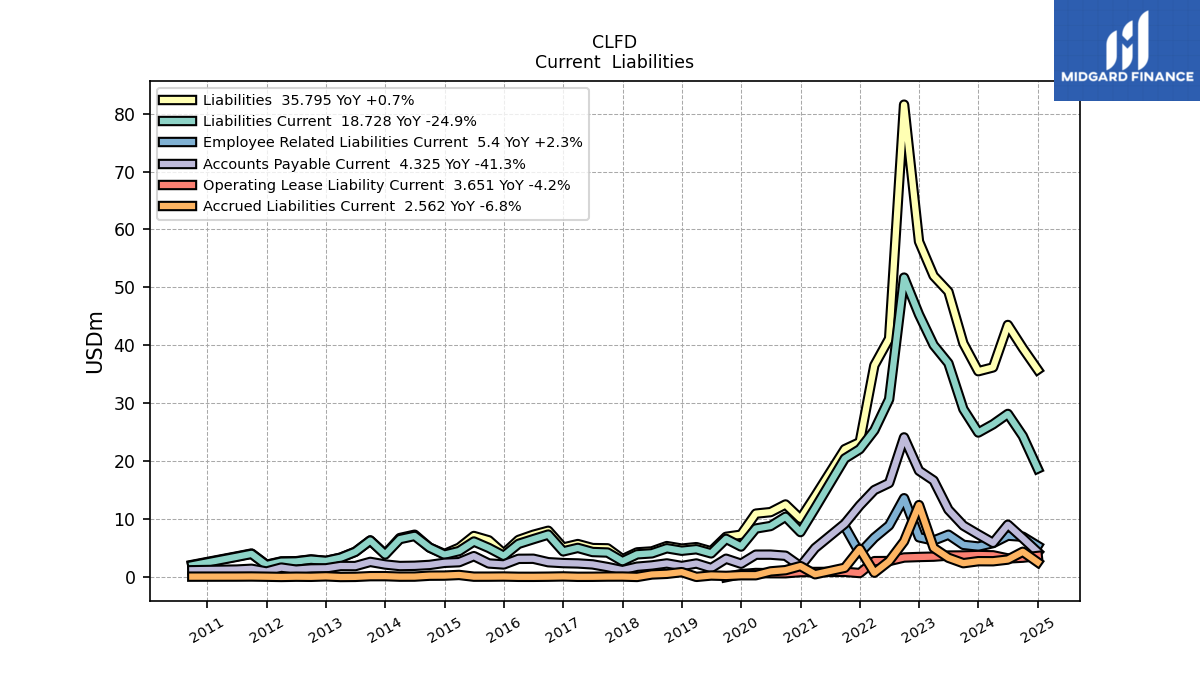
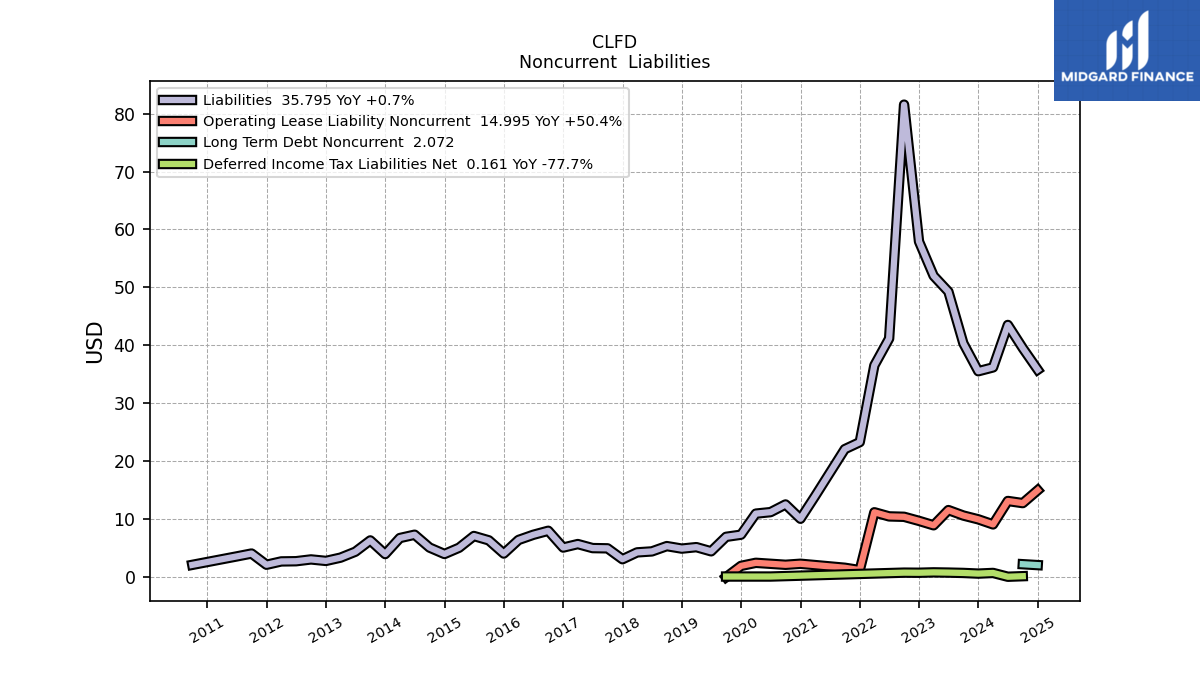
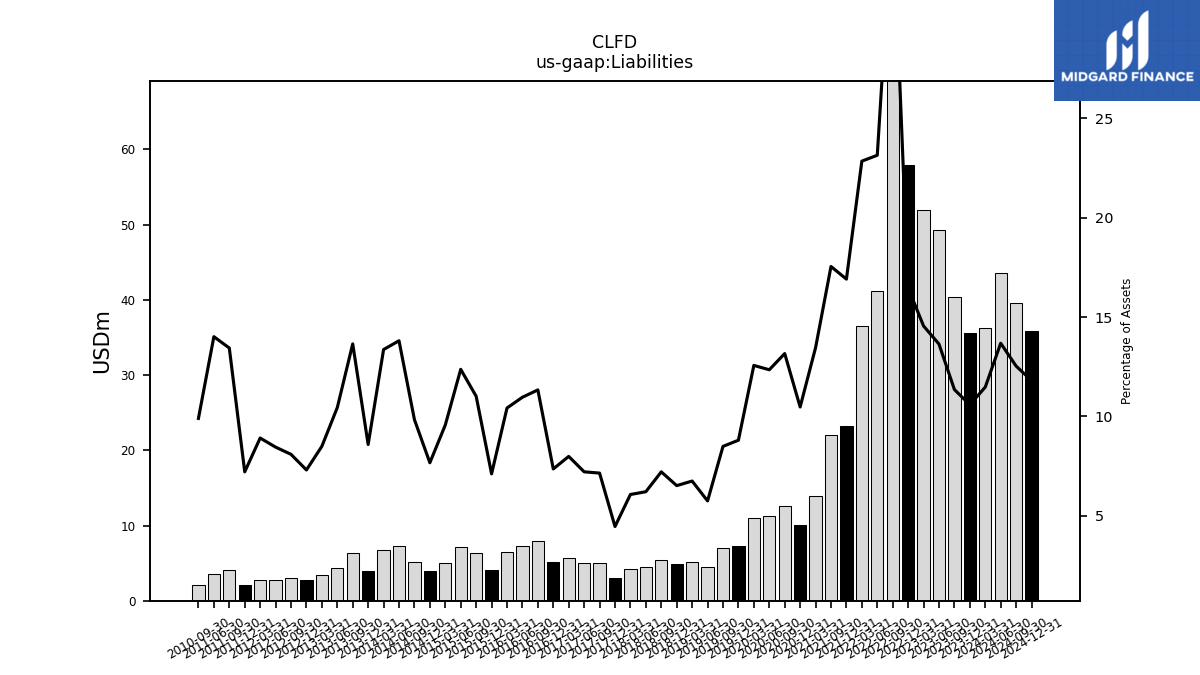
| Liabilities | 35.53 | 40.35 | 49.27 | 52.00 | 57.92 | 81.55 | 41.17 | 36.54 | 23.29 | 22.09 | NA | 13.97 | 10.08 | 12.54 | 11.22 | 10.96 | 7.32 | 6.96 | 4.45 | 5.17 | 4.92 | 5.35 | 4.44 | 4.27 | 3.09 | 4.97 | 5.01 | 5.70 | 5.10 | 8.00 | 7.31 | 6.42 | 4.07 | 6.35 | 7.10 | 5.07 | 3.99 | 5.10 | 7.32 | 6.74 | 3.97 | 6.34 | 4.38 | 3.36 | 2.80 | 3.05 | 2.75 | 2.71 | 2.13 | 4.07 | 3.57 | NA | NA | 2.11 | NA | |
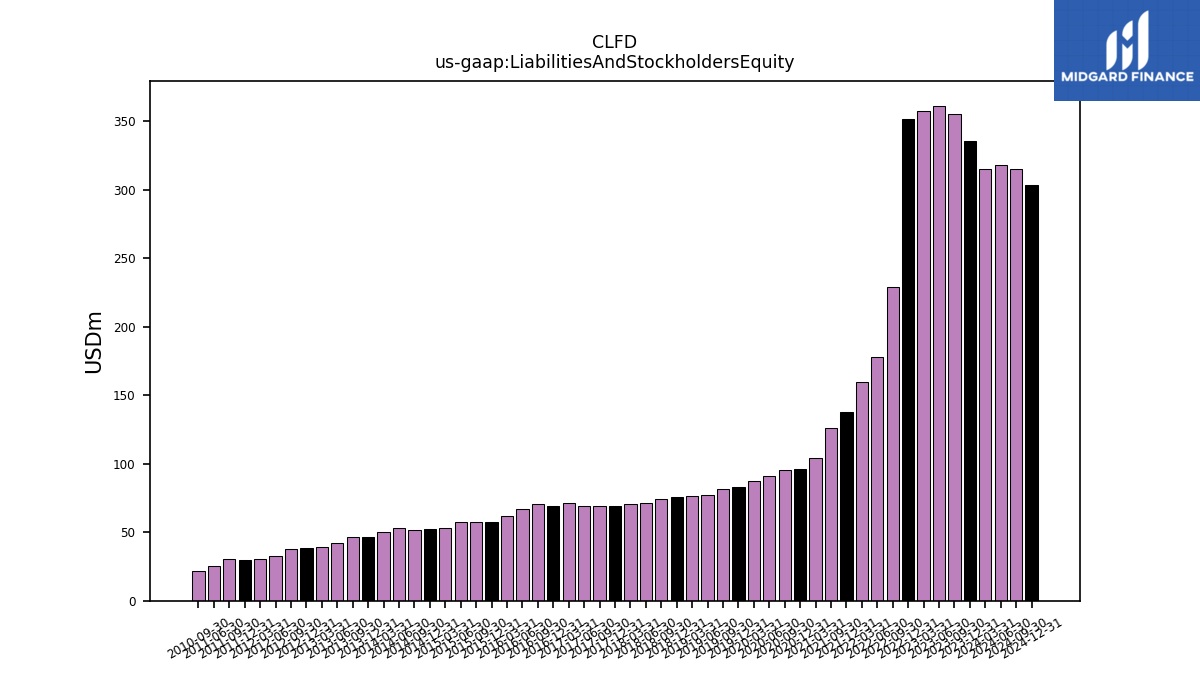
| Liabilities And Stockholders Equity | 335.63 | 355.52 | 361.20 | 357.39 | 351.80 | 229.13 | 177.95 | 159.97 | 137.76 | 125.91 | NA | 103.82 | 96.19 | 95.30 | 90.86 | 87.21 | 83.16 | 81.89 | 77.42 | 76.67 | 75.48 | 74.23 | 71.44 | 70.32 | 69.17 | 69.49 | 69.47 | 71.41 | 69.33 | 70.60 | 66.64 | 61.57 | 57.20 | 57.63 | 57.39 | 53.03 | 52.03 | 51.85 | 53.01 | 50.47 | 46.26 | 46.41 | 41.97 | 39.58 | 38.28 | 37.74 | 32.46 | 30.41 | 29.58 | 30.30 | 25.48 | NA | NA | 21.36 | NA | |
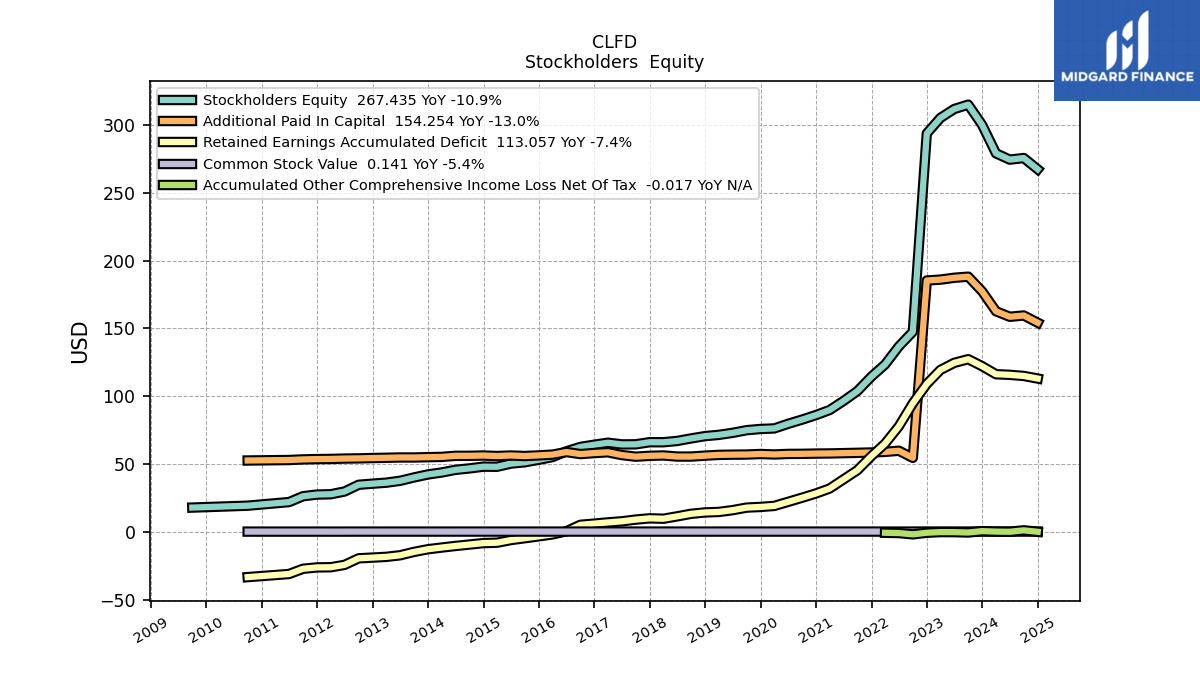
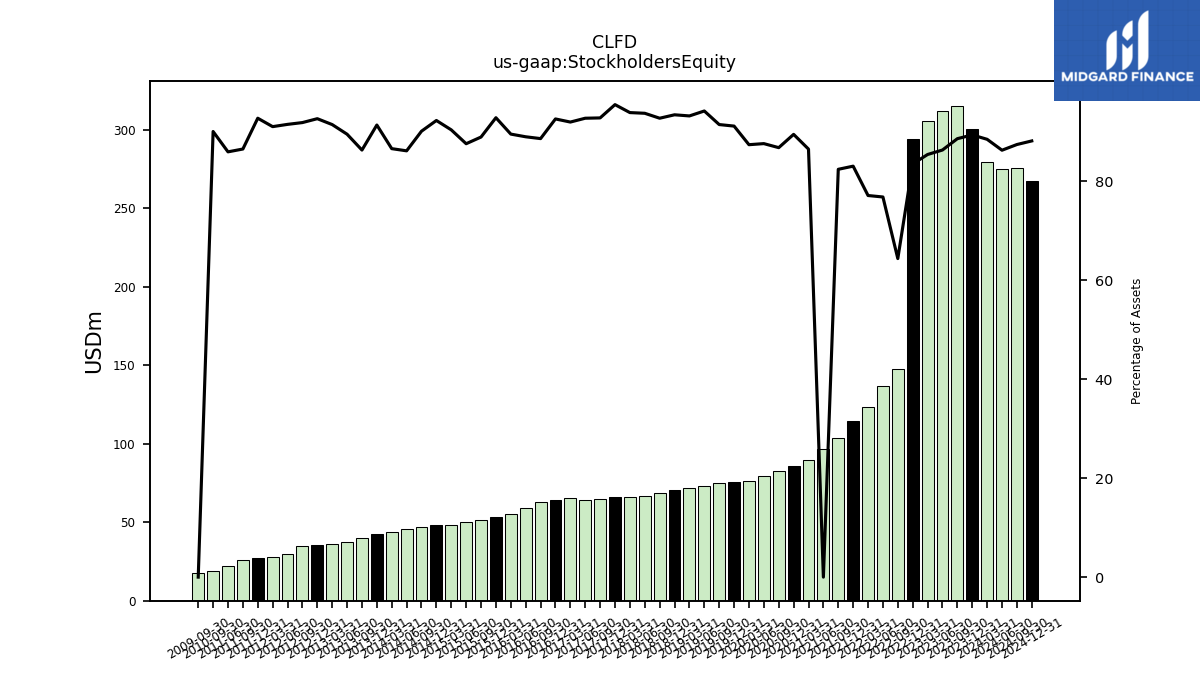
| Stockholders Equity | 300.10 | 315.16 | 311.93 | 305.40 | 293.88 | 147.58 | 136.77 | 123.43 | 114.47 | 103.82 | 96.49 | 89.85 | 86.11 | 82.75 | 79.64 | 76.25 | 75.84 | 74.93 | 72.97 | 71.49 | 70.56 | 68.87 | 67.01 | 66.05 | 66.08 | 64.53 | 64.45 | 65.70 | 64.22 | 62.59 | 59.33 | 55.15 | 53.13 | 51.28 | 50.29 | 47.95 | 48.04 | 46.75 | 45.69 | 43.72 | 42.29 | 40.08 | 37.59 | 36.22 | 35.48 | 34.69 | 29.72 | 27.70 | 27.45 | 26.23 | 21.91 | NA | NA | 19.25 | NA |
| 2023-12-31 | 2023-09-30 | 2023-06-30 | 2023-03-31 | 2022-12-31 | 2022-09-30 | 2022-06-30 | 2022-03-31 | 2021-12-31 | 2021-09-30 | 2021-06-30 | 2021-03-31 | 2020-12-31 | 2020-09-30 | 2020-06-30 | 2020-03-31 | 2019-12-31 | 2019-09-30 | 2019-06-30 | 2019-03-31 | 2018-12-31 | 2018-09-30 | 2018-06-30 | 2018-03-31 | 2017-12-31 | 2017-09-30 | 2017-06-30 | 2017-03-31 | 2016-12-31 | 2016-09-30 | 2016-06-30 | 2016-03-31 | 2015-12-31 | 2015-09-30 | 2015-06-30 | 2015-03-31 | 2014-12-31 | 2014-09-30 | 2014-06-30 | 2014-03-31 | 2013-12-31 | 2013-09-30 | 2013-06-30 | 2013-03-31 | 2012-12-31 | 2012-09-30 | 2012-06-30 | 2012-03-31 | 2011-12-31 | 2011-09-30 | 2011-06-30 | 2011-03-31 | 2010-12-31 | 2010-09-30 | 2010-06-30 | ||
|---|---|---|---|---|---|---|---|---|---|---|---|---|---|---|---|---|---|---|---|---|---|---|---|---|---|---|---|---|---|---|---|---|---|---|---|---|---|---|---|---|---|---|---|---|---|---|---|---|---|---|---|---|---|---|---|---|
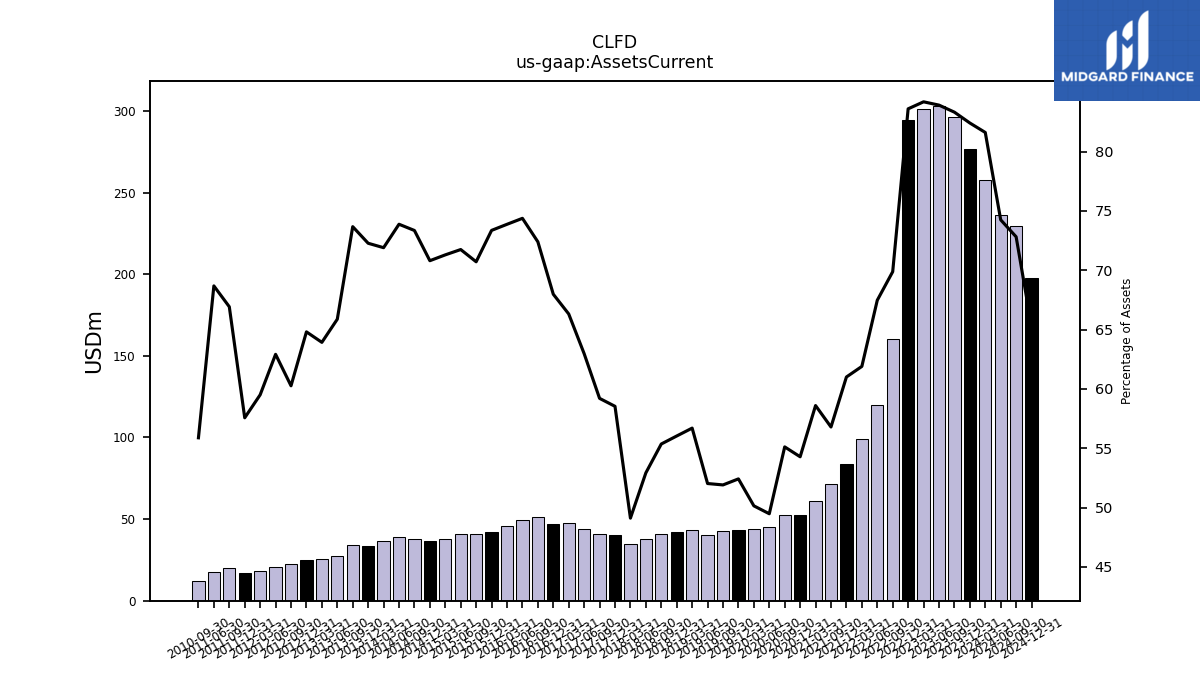
| Assets Current | 276.62 | 296.25 | 303.14 | 300.94 | 294.14 | 160.12 | 120.07 | 99.02 | 84.04 | 71.51 | NA | 60.84 | 52.21 | 52.52 | 44.96 | 43.73 | 43.59 | 42.51 | 40.28 | 43.47 | 42.30 | 41.09 | 37.81 | 34.53 | 40.49 | 41.14 | 43.75 | 47.36 | 47.13 | 51.11 | 49.57 | 45.48 | 41.96 | 40.75 | 41.18 | 37.81 | 36.84 | 38.03 | 39.16 | 36.29 | 33.44 | 34.20 | 27.65 | 25.30 | 24.81 | 22.74 | 20.43 | 18.10 | 17.03 | 20.28 | 17.50 | NA | NA | 11.94 | NA | |
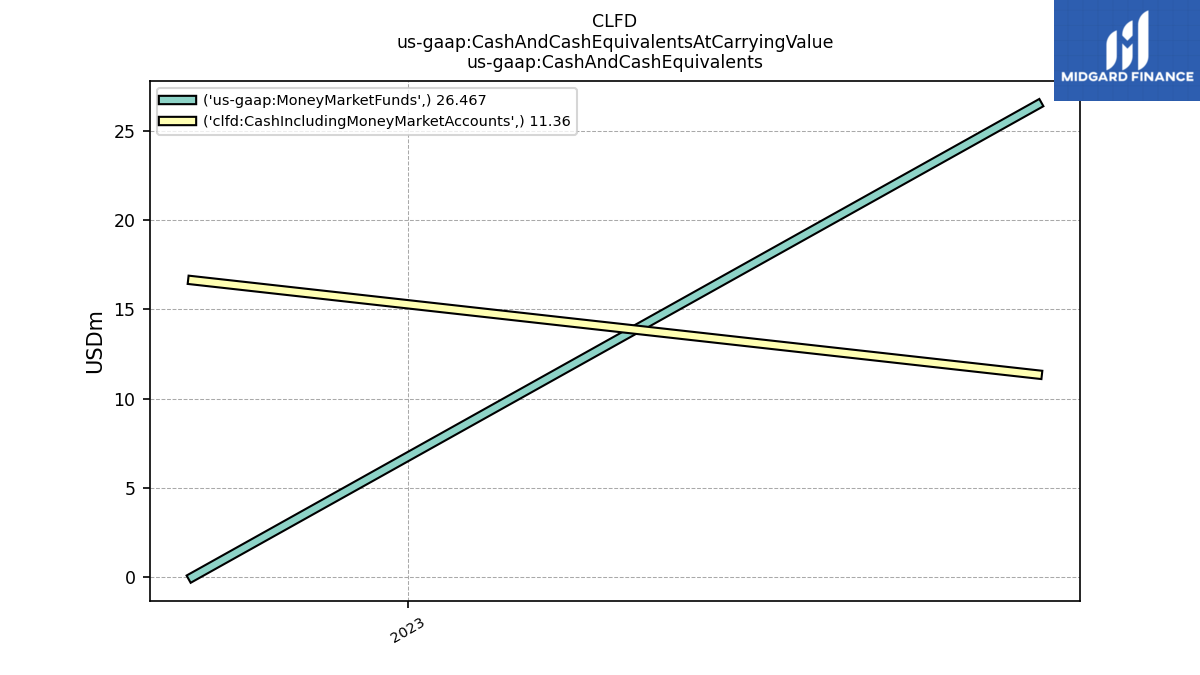
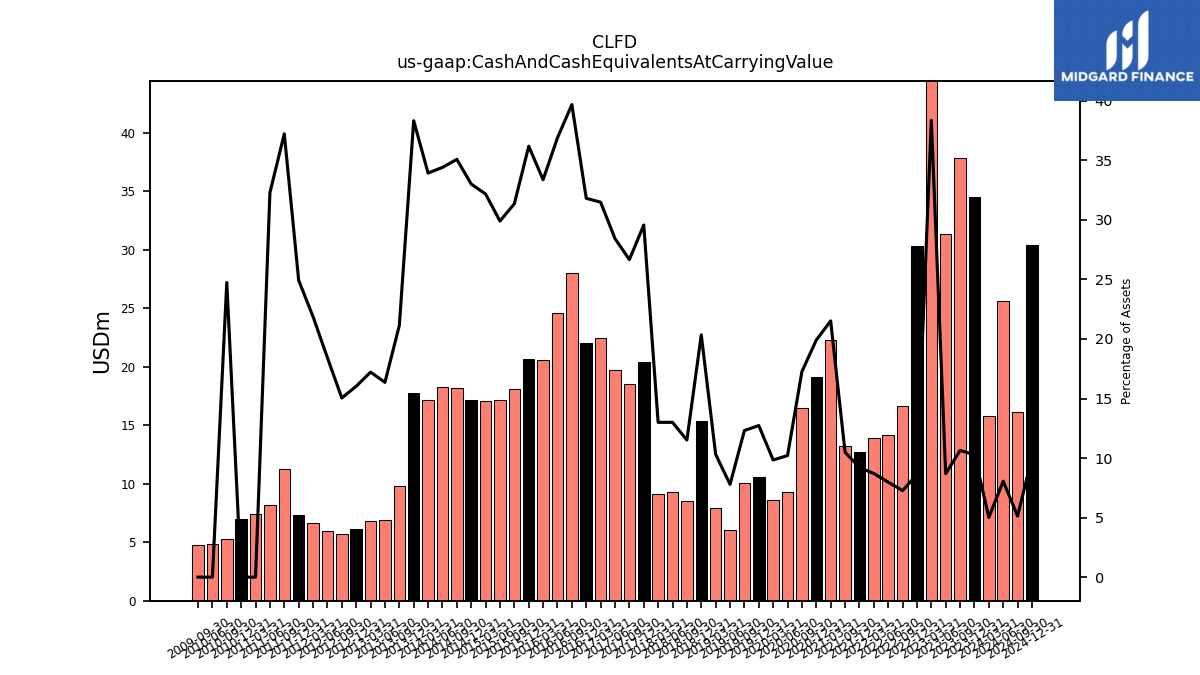
| Cash And Cash Equivalents At Carrying Value | 34.48 | 37.83 | 31.39 | 137.08 | 30.31 | 16.65 | 14.19 | 13.92 | 12.68 | 13.22 | NA | 22.34 | 19.15 | 16.45 | 9.28 | 8.58 | 10.59 | 10.08 | 6.03 | 7.91 | 15.36 | 8.55 | 9.29 | 9.14 | 20.45 | 18.54 | 19.75 | 22.48 | 22.06 | 28.01 | 24.59 | 20.55 | 20.70 | 18.07 | 17.16 | 17.06 | 17.17 | 18.19 | 18.24 | 17.13 | 17.73 | 9.81 | 6.87 | 6.81 | 6.14 | 5.68 | 5.98 | 6.65 | 7.38 | 11.28 | 8.23 | 7.40 | 6.97 | 5.29 | 4.89 | |
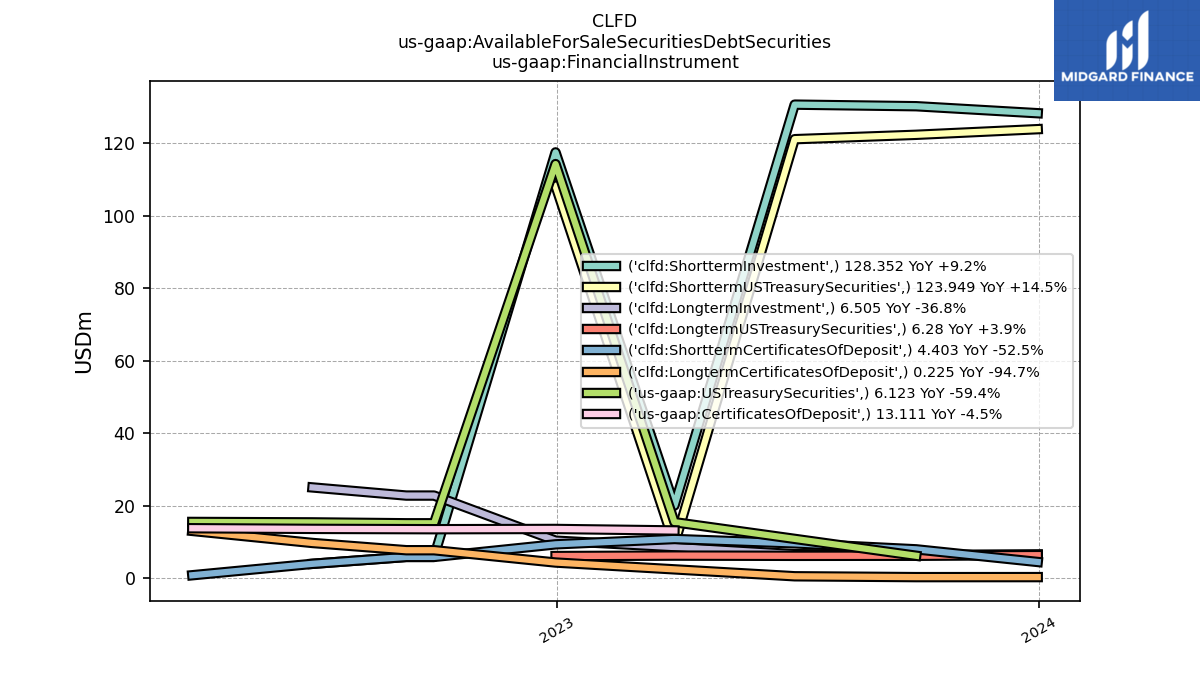
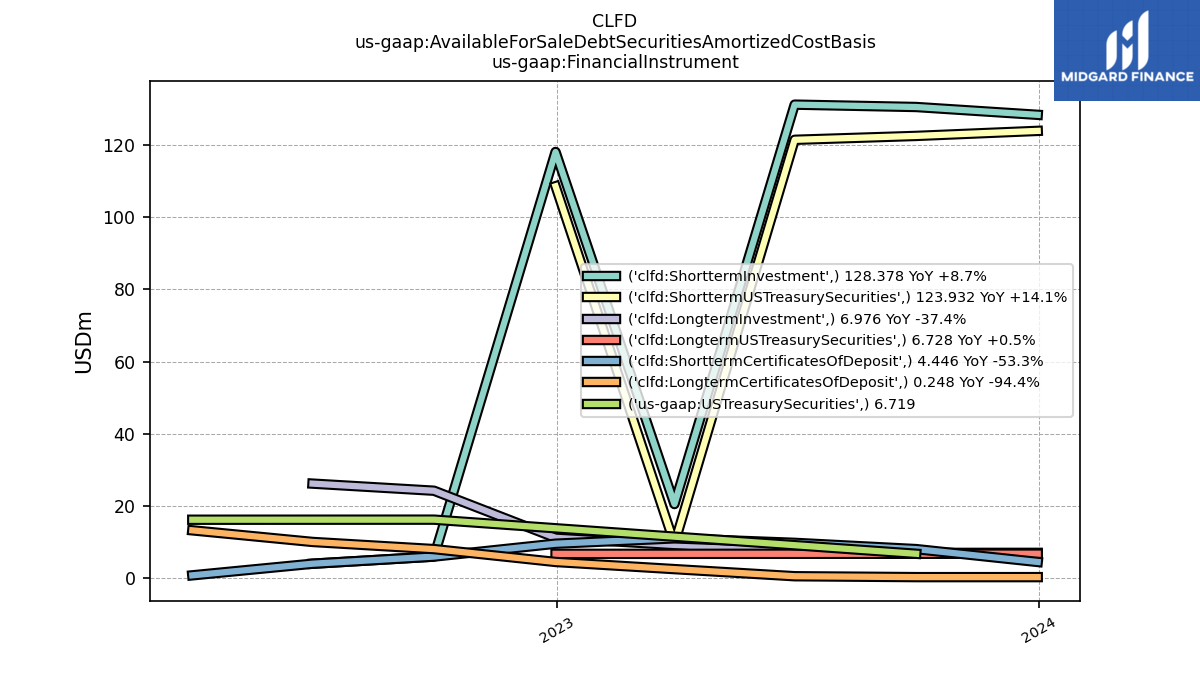
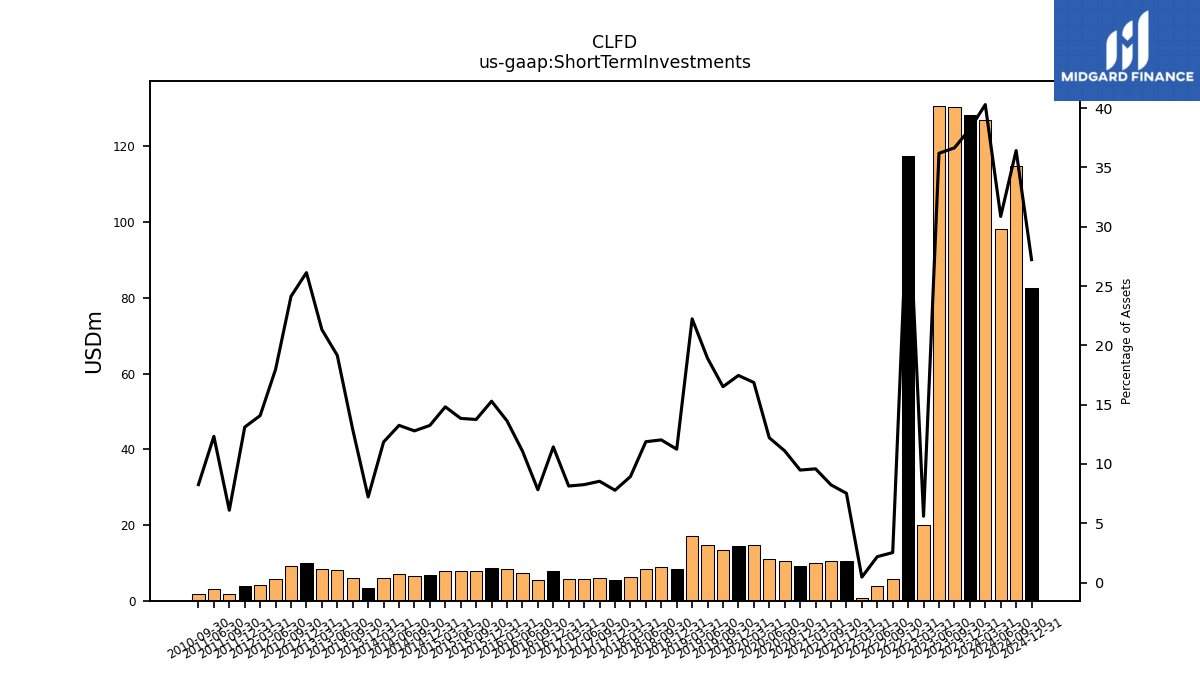
| Short Term Investments | 128.35 | 130.29 | 130.73 | 19.98 | 117.54 | 5.80 | 3.89 | 0.74 | 10.37 | 10.37 | NA | 9.96 | 9.13 | 10.58 | 11.09 | 14.71 | 14.52 | 13.52 | 14.64 | 17.05 | 8.49 | 8.93 | 8.49 | 6.29 | 5.39 | 5.94 | 5.74 | 5.81 | 7.93 | 5.53 | 7.39 | 8.39 | 8.75 | 7.92 | 7.95 | 7.86 | 6.89 | 6.63 | 7.03 | 5.98 | 3.34 | 5.99 | 8.04 | 8.44 | 10.00 | 9.11 | 5.84 | 4.28 | 3.88 | 1.85 | 3.14 | NA | NA | 1.76 | NA | |
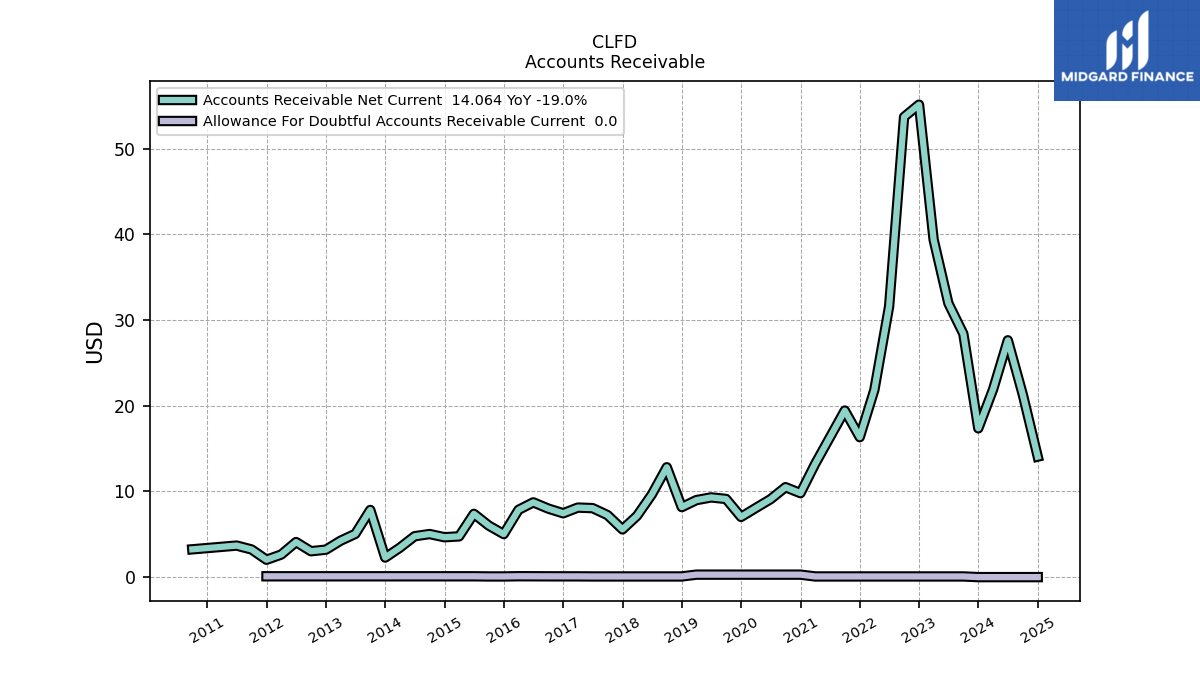
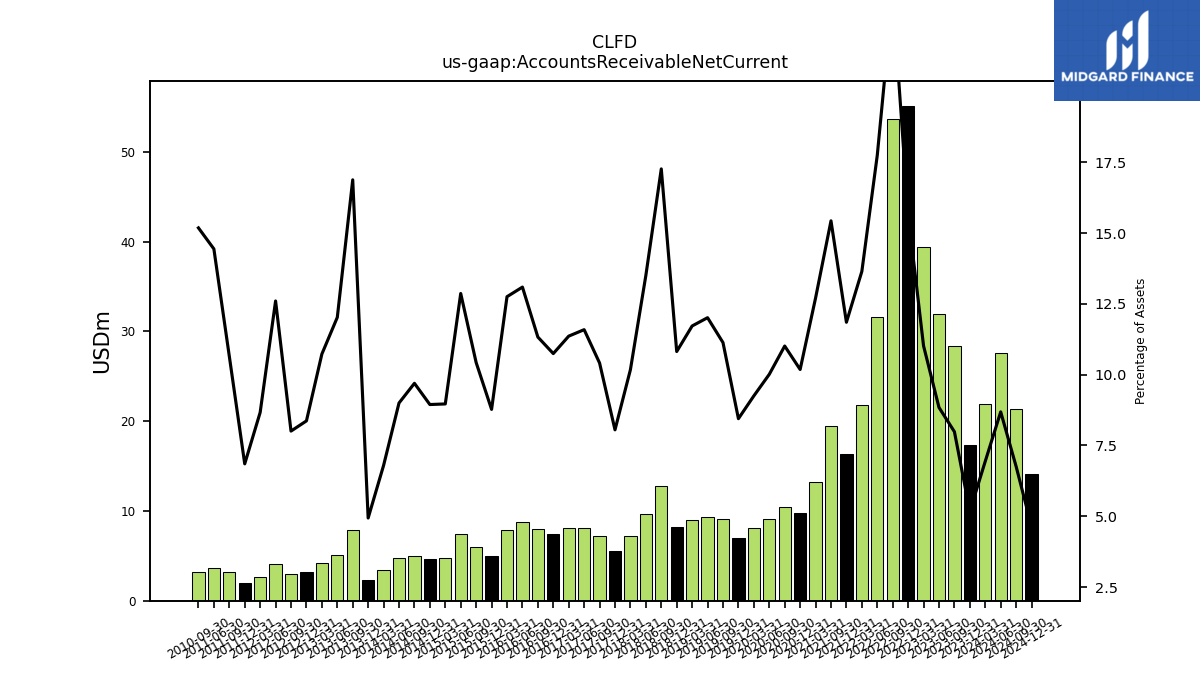
| Accounts Receivable Net Current | 17.36 | 28.39 | 31.94 | 39.38 | 55.14 | 53.70 | 31.59 | 21.84 | 16.33 | 19.44 | NA | 13.20 | 9.80 | 10.50 | 9.10 | 8.07 | 7.03 | 9.12 | 9.30 | 8.99 | 8.17 | 12.82 | 9.65 | 7.16 | 5.57 | 7.24 | 8.05 | 8.11 | 7.45 | 8.00 | 8.73 | 7.85 | 5.02 | 6.01 | 7.39 | 4.76 | 4.65 | 5.03 | 4.77 | 3.43 | 2.28 | 7.84 | 5.05 | 4.25 | 3.20 | 3.02 | 4.09 | 2.64 | 2.03 | 3.23 | 3.68 | NA | NA | 3.24 | NA | |
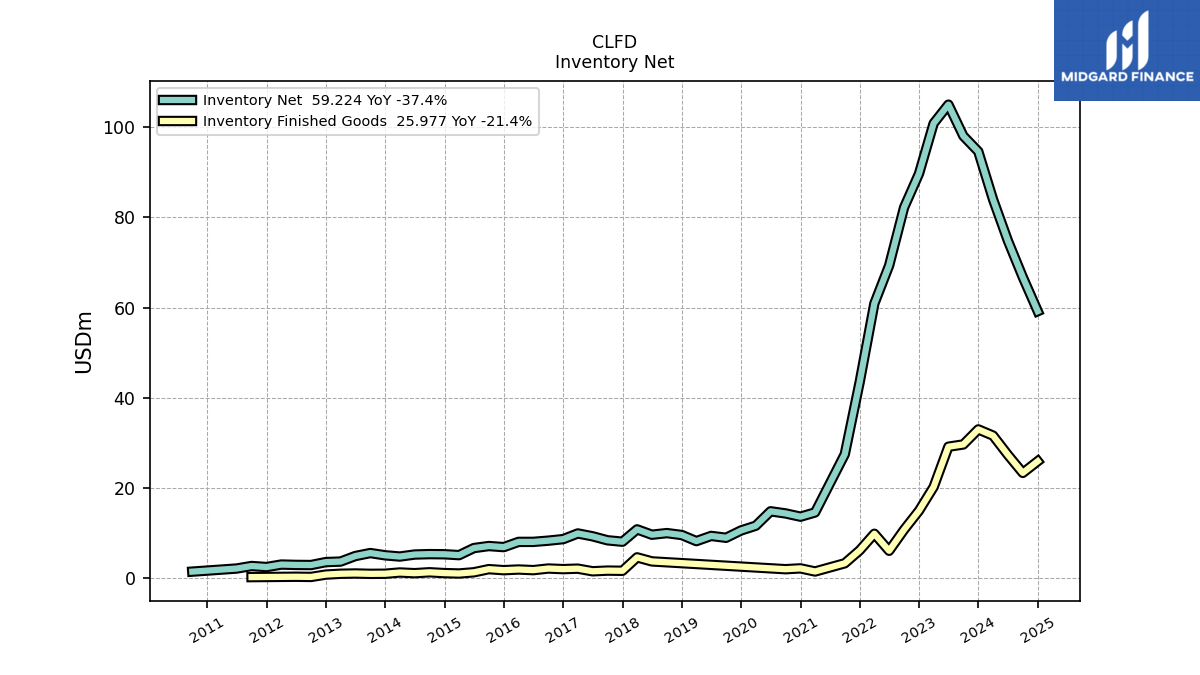
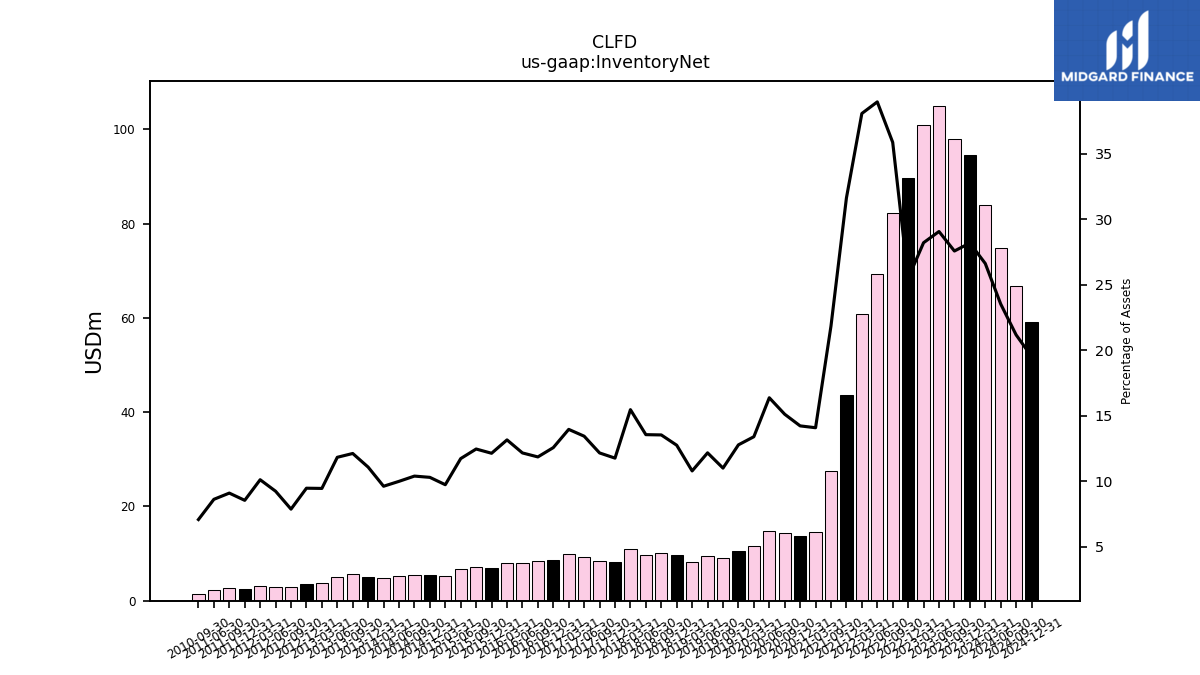
| Inventory Net | 94.61 | 98.06 | 105.00 | 100.84 | 89.70 | 82.21 | 69.34 | 60.92 | 43.57 | 27.52 | NA | 14.63 | 13.69 | 14.41 | 14.88 | 11.69 | 10.63 | 9.01 | 9.42 | 8.27 | 9.63 | 10.05 | 9.69 | 10.88 | 8.14 | 8.45 | 9.34 | 9.97 | 8.71 | 8.37 | 8.11 | 8.10 | 6.94 | 7.18 | 6.73 | 5.16 | 5.36 | 5.39 | 5.30 | 4.86 | 5.13 | 5.63 | 4.97 | 3.74 | 3.63 | 2.97 | 3.00 | 3.08 | 2.53 | 2.76 | 2.20 | NA | NA | 1.51 | NA | |
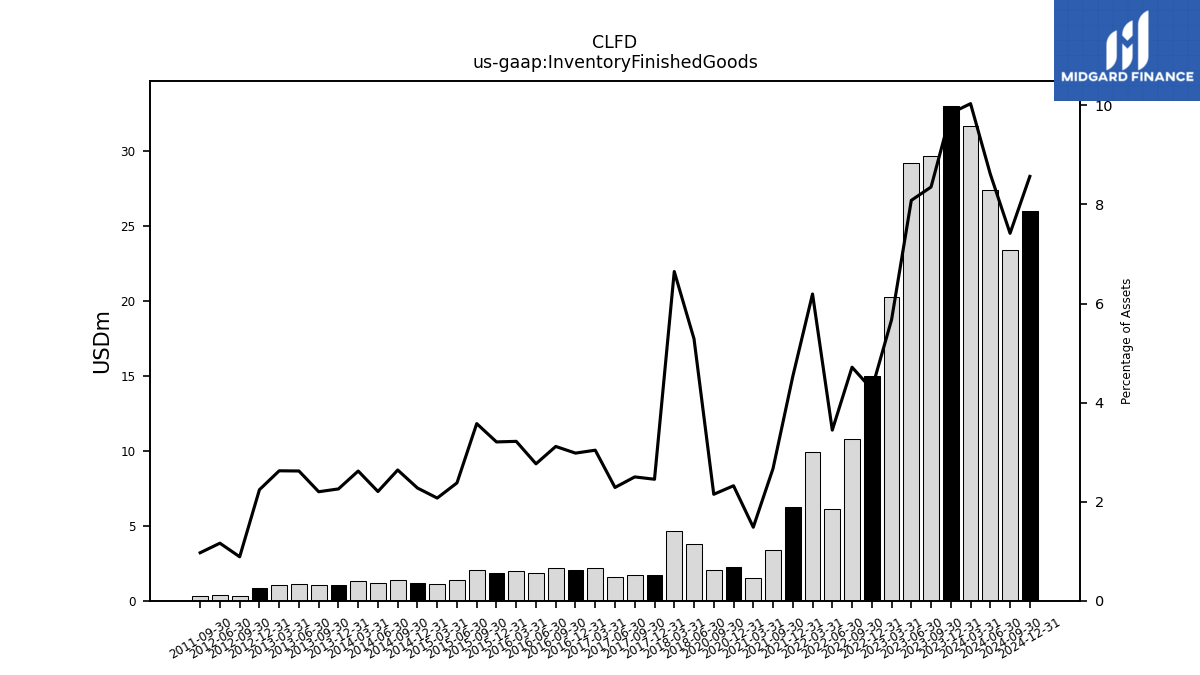
| Inventory Finished Goods | 33.03 | 29.70 | 29.20 | 20.27 | 15.03 | 10.80 | 6.13 | 9.91 | 6.24 | 3.36 | NA | 1.54 | 2.23 | 2.05 | NA | NA | NA | NA | NA | NA | NA | NA | 3.78 | 4.67 | 1.70 | 1.74 | 1.59 | 2.17 | 2.07 | 2.20 | 1.84 | 1.98 | 1.83 | 2.06 | 1.37 | 1.10 | 1.18 | 1.37 | 1.17 | 1.32 | 1.04 | 1.02 | 1.10 | 1.04 | 0.86 | 0.33 | 0.38 | NA | NA | 0.29 | NA | NA | NA | NA | NA | |
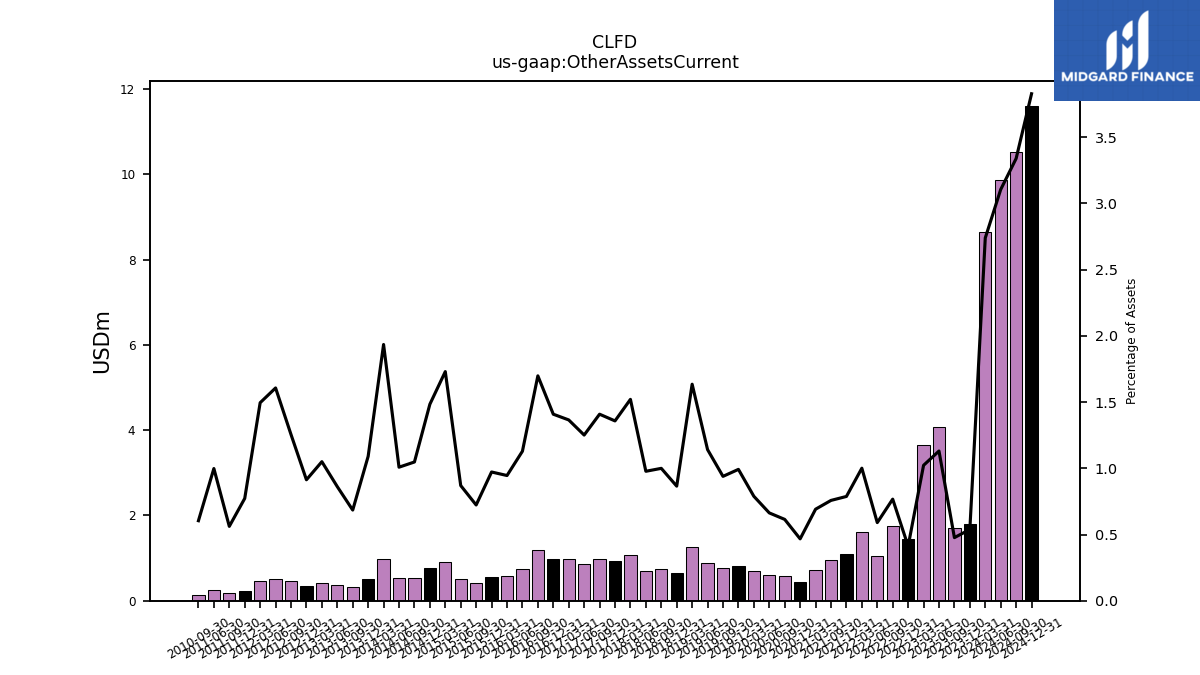
| Other Assets Current | 1.81 | 1.70 | 4.08 | 3.65 | 1.45 | 1.76 | 1.05 | 1.60 | 1.08 | 0.95 | NA | 0.72 | 0.45 | 0.59 | 0.60 | 0.69 | 0.83 | 0.77 | 0.88 | 1.25 | 0.65 | 0.74 | 0.70 | 1.07 | 0.94 | 0.98 | 0.87 | 0.97 | 0.98 | 1.20 | 0.75 | 0.58 | 0.56 | 0.42 | 0.50 | 0.92 | 0.77 | 0.54 | 0.53 | 0.98 | 0.50 | 0.32 | 0.36 | 0.42 | 0.35 | 0.47 | 0.52 | 0.45 | 0.23 | 0.17 | 0.25 | NA | NA | 0.13 | NA | |
| Available For Sale Securities Debt Securities | 134.86 | 136.63 | 137.28 | 28.51 | 127.83 | 28.55 | NA | 29.19 | NA | NA | NA | NA | NA | NA | NA | NA | NA | NA | NA | NA | NA | NA | NA | NA | NA | NA | NA | NA | NA | NA | NA | NA | NA | NA | NA | NA | NA | NA | NA | NA | NA | NA | NA | NA | NA | NA | NA | NA | NA | NA | NA | NA | NA | NA | NA |
| 2023-12-31 | 2023-09-30 | 2023-06-30 | 2023-03-31 | 2022-12-31 | 2022-09-30 | 2022-06-30 | 2022-03-31 | 2021-12-31 | 2021-09-30 | 2021-06-30 | 2021-03-31 | 2020-12-31 | 2020-09-30 | 2020-06-30 | 2020-03-31 | 2019-12-31 | 2019-09-30 | 2019-06-30 | 2019-03-31 | 2018-12-31 | 2018-09-30 | 2018-06-30 | 2018-03-31 | 2017-12-31 | 2017-09-30 | 2017-06-30 | 2017-03-31 | 2016-12-31 | 2016-09-30 | 2016-06-30 | 2016-03-31 | 2015-12-31 | 2015-09-30 | 2015-06-30 | 2015-03-31 | 2014-12-31 | 2014-09-30 | 2014-06-30 | 2014-03-31 | 2013-12-31 | 2013-09-30 | 2013-06-30 | 2013-03-31 | 2012-12-31 | 2012-09-30 | 2012-06-30 | 2012-03-31 | 2011-12-31 | 2011-09-30 | 2011-06-30 | 2011-03-31 | 2010-12-31 | 2010-09-30 | 2010-06-30 | ||
|---|---|---|---|---|---|---|---|---|---|---|---|---|---|---|---|---|---|---|---|---|---|---|---|---|---|---|---|---|---|---|---|---|---|---|---|---|---|---|---|---|---|---|---|---|---|---|---|---|---|---|---|---|---|---|---|---|
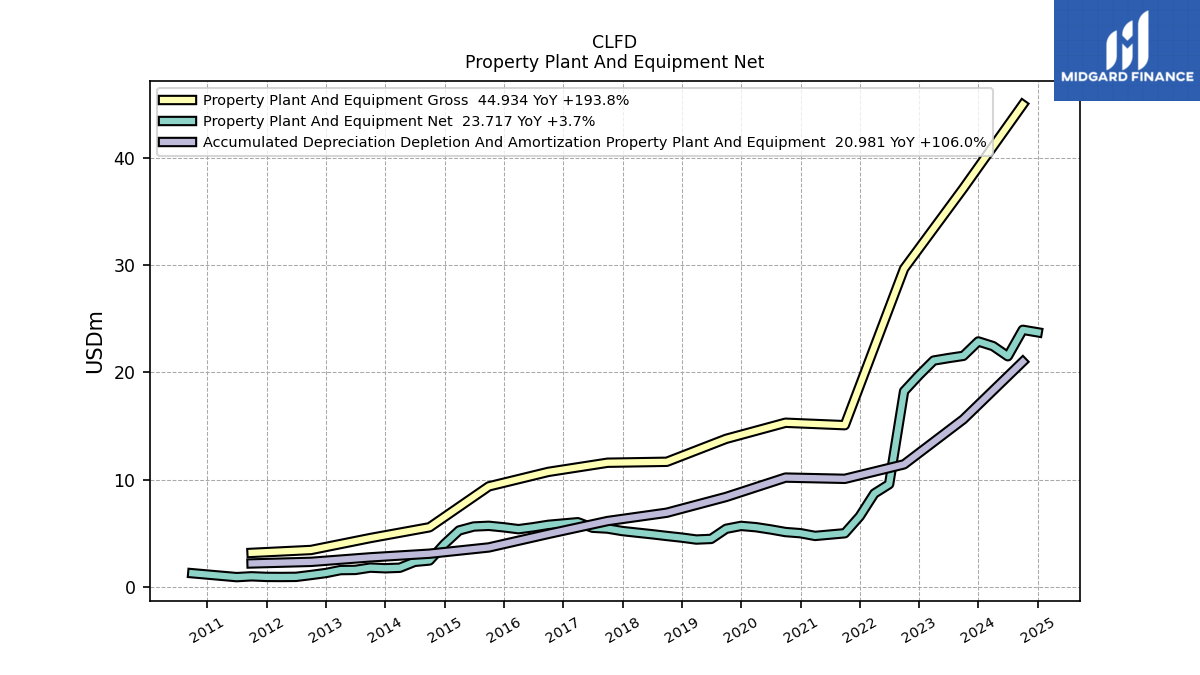
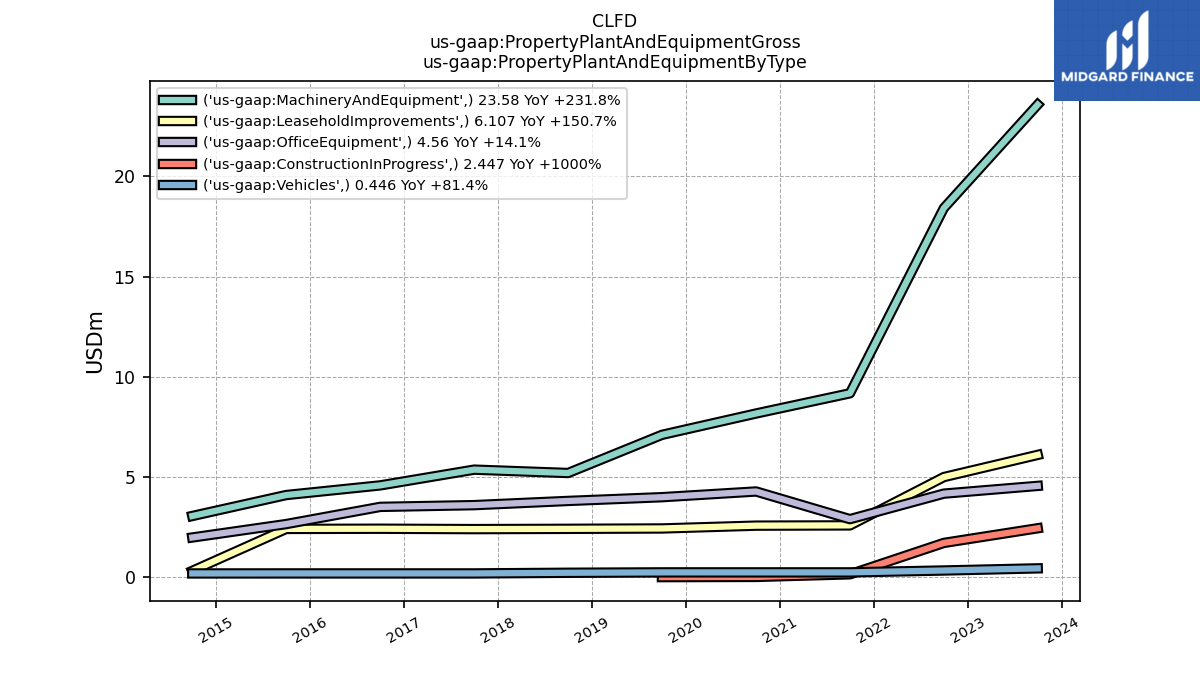
| Property Plant And Equipment Gross | NA | 37.14 | NA | NA | NA | 29.65 | NA | NA | NA | 15.07 | NA | NA | NA | 15.29 | NA | NA | NA | 13.79 | NA | NA | NA | 11.66 | NA | NA | NA | 11.57 | NA | NA | NA | 10.71 | NA | NA | NA | 9.37 | NA | NA | NA | 5.56 | NA | NA | NA | 4.55 | NA | NA | NA | 3.44 | NA | NA | NA | 3.17 | NA | NA | NA | NA | NA | |
| Accumulated Depreciation Depletion And Amortization Property Plant And Equipment | NA | 15.61 | NA | NA | NA | 11.42 | NA | NA | NA | 10.07 | NA | NA | NA | 10.18 | NA | NA | NA | 8.38 | NA | NA | NA | 6.91 | NA | NA | NA | 6.13 | NA | NA | NA | 4.93 | NA | NA | NA | 3.68 | NA | NA | NA | 3.09 | NA | NA | NA | 2.75 | NA | NA | NA | 2.33 | NA | NA | NA | 2.18 | NA | NA | NA | NA | NA | |
| Property Plant And Equipment Net | 22.87 | 21.53 | 21.32 | 21.09 | 19.73 | 18.23 | 9.57 | 8.70 | 6.57 | 5.00 | NA | 4.75 | 5.00 | 5.11 | 5.35 | 5.56 | 5.68 | 5.41 | 4.47 | 4.41 | 4.59 | 4.74 | 4.91 | 5.05 | 5.20 | 5.43 | 5.51 | 6.02 | 5.90 | 5.78 | 5.56 | 5.38 | 5.55 | 5.69 | 5.63 | 5.26 | 4.00 | 2.46 | 2.33 | 1.78 | 1.74 | 1.80 | 1.58 | 1.57 | 1.29 | 1.11 | 0.93 | 0.92 | 0.93 | 0.99 | 0.91 | NA | NA | 1.27 | NA | |
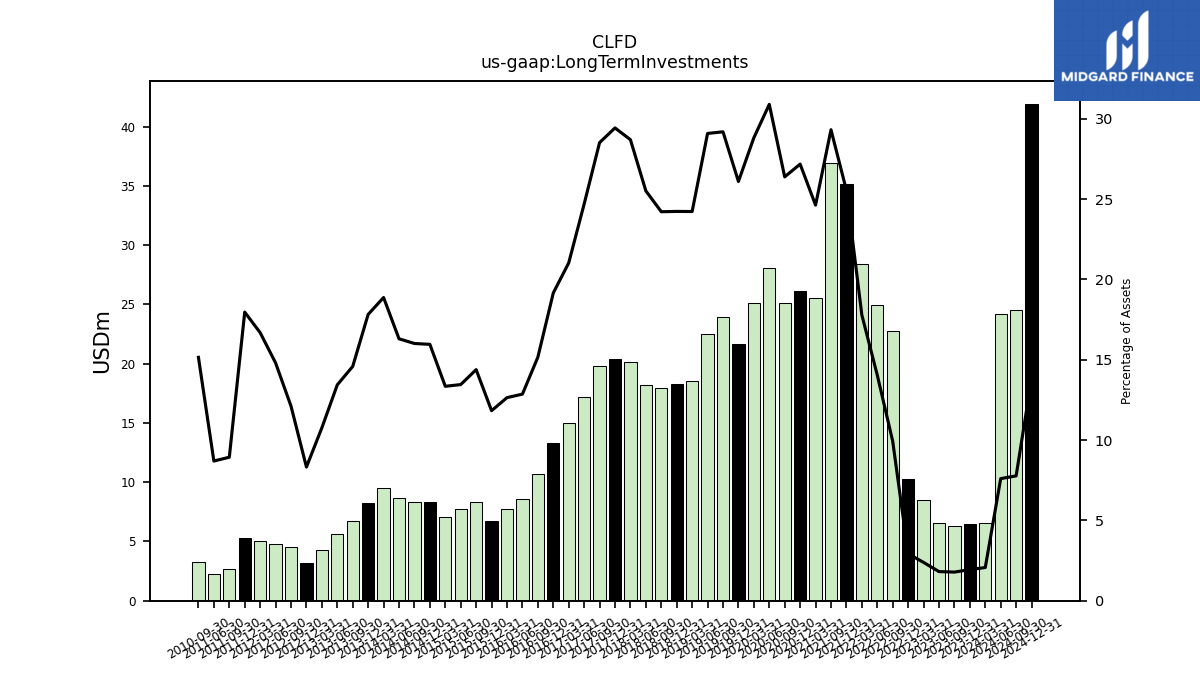
| Long Term Investments | 6.50 | 6.34 | 6.56 | 8.53 | 10.29 | 22.75 | 24.99 | 28.45 | 35.19 | 36.91 | NA | 25.57 | 26.14 | 25.14 | 28.07 | 25.13 | 21.70 | 23.90 | 22.52 | 18.57 | 18.29 | 17.97 | 18.23 | 20.18 | 20.36 | 19.82 | 17.15 | 15.02 | 13.28 | 10.70 | 8.57 | 7.78 | 6.77 | 8.29 | 7.72 | 7.08 | 8.30 | 8.30 | 8.64 | 9.53 | 8.25 | 6.77 | 5.64 | 4.26 | 3.19 | 4.57 | 4.81 | 5.08 | 5.31 | 2.71 | 2.22 | NA | NA | 3.24 | NA | |
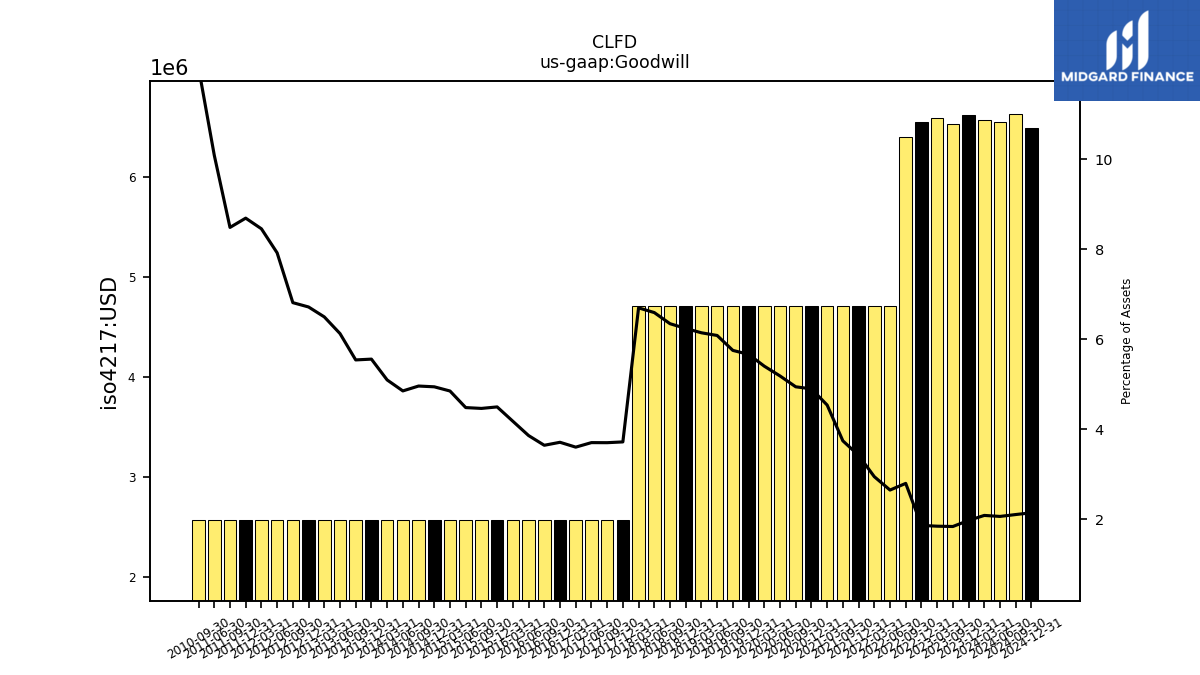
| Goodwill | 6.62 | 6.53 | NA | 6.59 | 6.54 | 6.40 | 4.71 | 4.71 | 4.71 | 4.71 | NA | 4.71 | 4.71 | 4.71 | 4.71 | 4.71 | 4.71 | 4.71 | 4.71 | 4.71 | 4.71 | 4.71 | 4.71 | 4.71 | 2.57 | 2.57 | 2.57 | 2.57 | 2.57 | 2.57 | 2.57 | 2.57 | 2.57 | 2.57 | 2.57 | 2.57 | 2.57 | 2.57 | 2.57 | 2.57 | 2.57 | 2.57 | 2.57 | 2.57 | 2.57 | 2.57 | 2.57 | 2.57 | 2.57 | 2.57 | 2.57 | NA | NA | 2.57 | NA | |
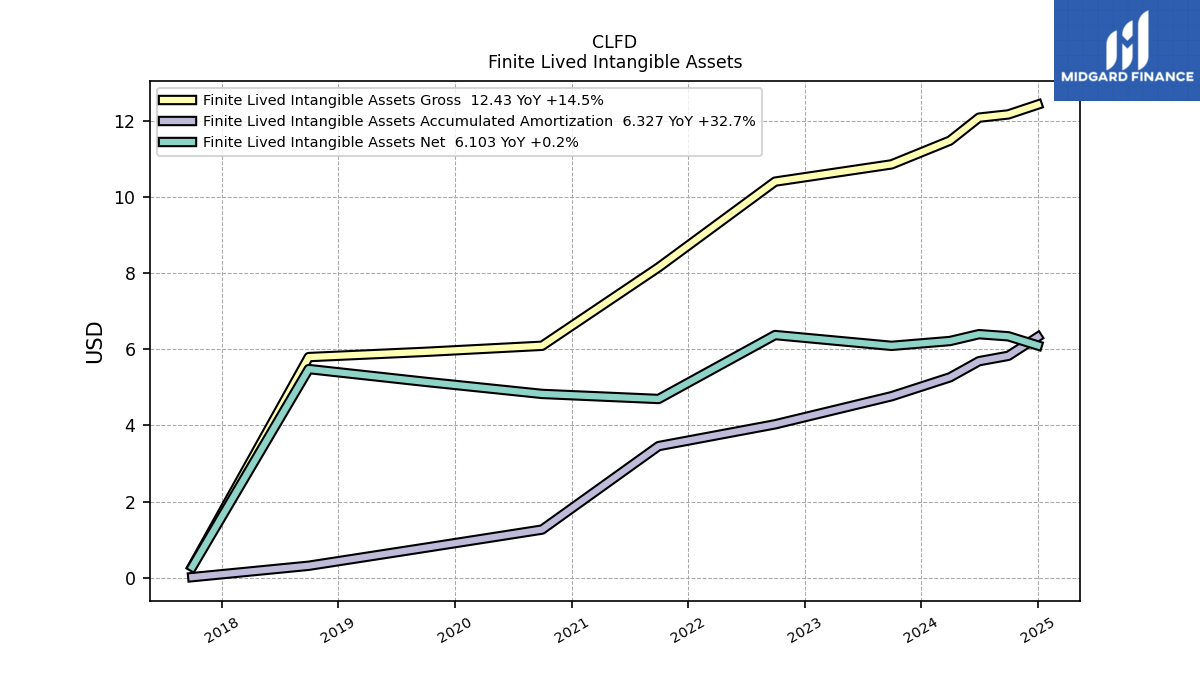
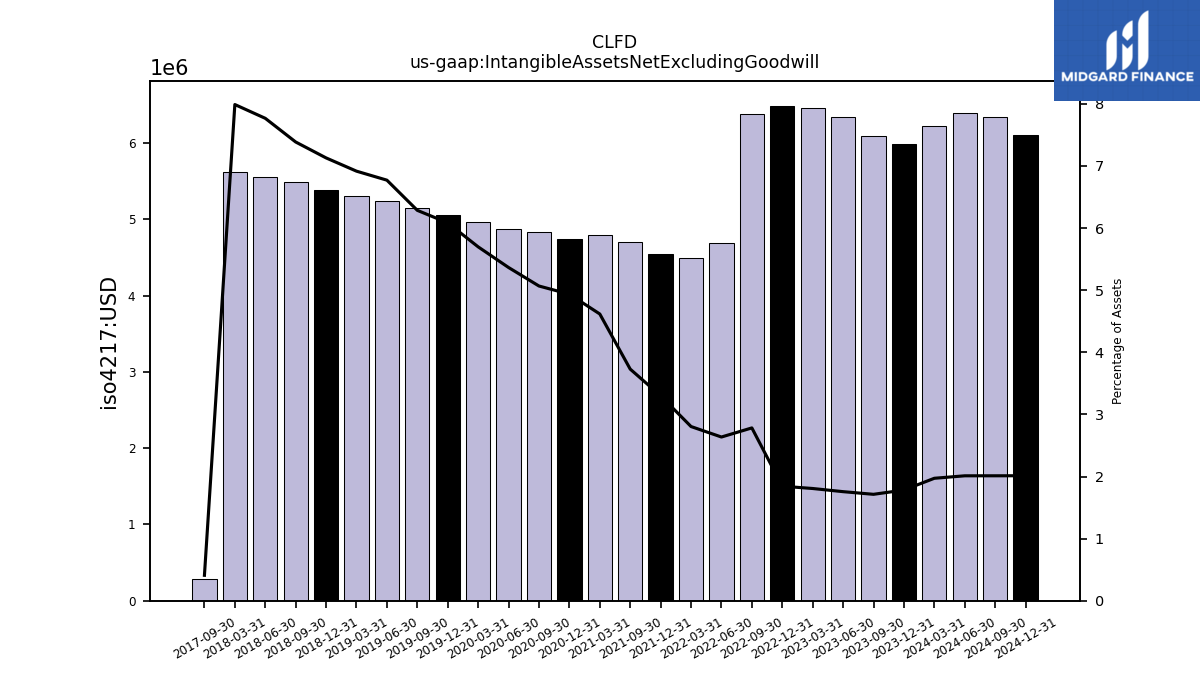
| Intangible Assets Net Excluding Goodwill | 5.98 | 6.09 | 6.34 | 6.46 | 6.49 | 6.38 | 4.69 | 4.49 | 4.55 | 4.70 | NA | 4.79 | 4.75 | 4.83 | 4.88 | 4.97 | 5.06 | 5.15 | 5.24 | 5.30 | 5.38 | 5.48 | 5.55 | 5.62 | NA | 0.28 | NA | NA | NA | NA | NA | NA | NA | NA | NA | NA | NA | NA | NA | NA | NA | NA | NA | NA | NA | NA | NA | NA | NA | NA | NA | NA | NA | NA | NA | |
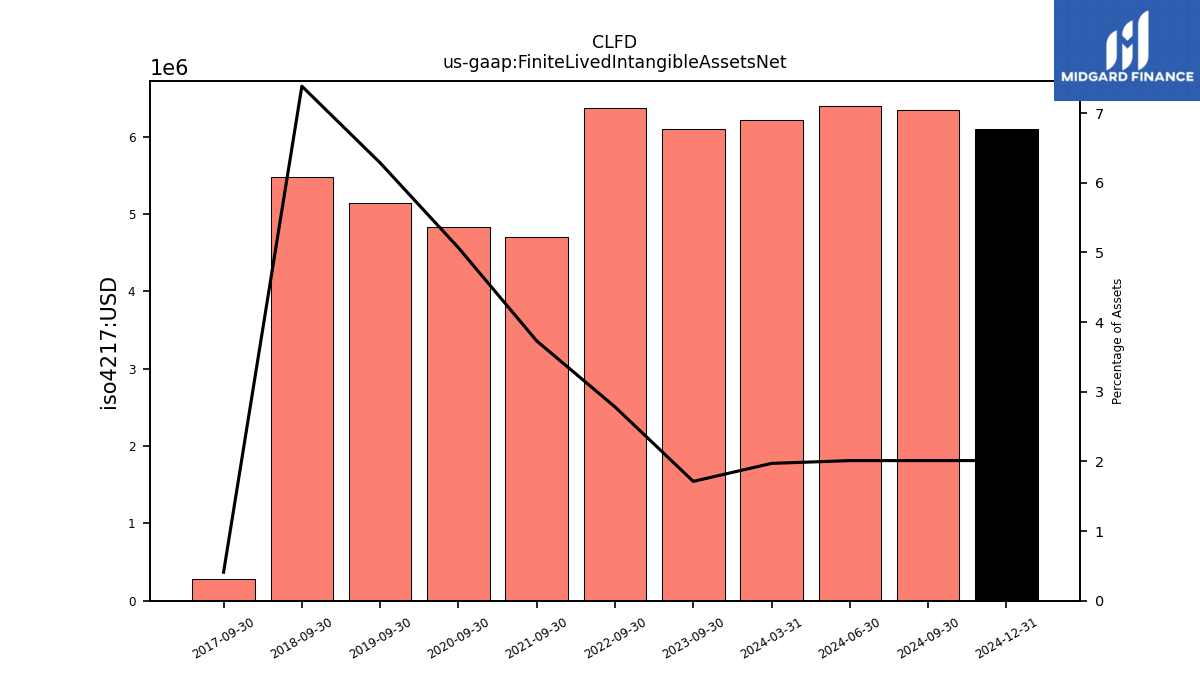
| Finite Lived Intangible Assets Net | NA | 6.09 | NA | NA | NA | 6.38 | NA | NA | NA | 4.70 | NA | NA | NA | 4.83 | NA | NA | NA | 5.15 | NA | NA | NA | 5.48 | NA | NA | NA | 0.28 | NA | NA | NA | NA | NA | NA | NA | NA | NA | NA | NA | NA | NA | NA | NA | NA | NA | NA | NA | NA | NA | NA | NA | NA | NA | NA | NA | NA | NA | |
| Other Assets Noncurrent | 0.99 | 1.87 | 1.49 | 0.90 | 0.87 | 0.58 | 0.55 | 0.62 | 0.57 | 0.42 | NA | 0.26 | 0.27 | 0.27 | 0.19 | 0.19 | 0.20 | 0.21 | 0.20 | 0.20 | 0.21 | 0.23 | 0.24 | 0.23 | 0.55 | 0.53 | 0.48 | 0.44 | 0.44 | 0.43 | 0.37 | 0.35 | 0.35 | 0.32 | 0.29 | 0.31 | 0.32 | 0.32 | 0.30 | 0.30 | 0.27 | 0.27 | 0.26 | 0.26 | 0.26 | 0.25 | 0.23 | 0.23 | 0.20 | 0.20 | 0.18 | NA | NA | 0.18 | NA |
| 2023-12-31 | 2023-09-30 | 2023-06-30 | 2023-03-31 | 2022-12-31 | 2022-09-30 | 2022-06-30 | 2022-03-31 | 2021-12-31 | 2021-09-30 | 2021-06-30 | 2021-03-31 | 2020-12-31 | 2020-09-30 | 2020-06-30 | 2020-03-31 | 2019-12-31 | 2019-09-30 | 2019-06-30 | 2019-03-31 | 2018-12-31 | 2018-09-30 | 2018-06-30 | 2018-03-31 | 2017-12-31 | 2017-09-30 | 2017-06-30 | 2017-03-31 | 2016-12-31 | 2016-09-30 | 2016-06-30 | 2016-03-31 | 2015-12-31 | 2015-09-30 | 2015-06-30 | 2015-03-31 | 2014-12-31 | 2014-09-30 | 2014-06-30 | 2014-03-31 | 2013-12-31 | 2013-09-30 | 2013-06-30 | 2013-03-31 | 2012-12-31 | 2012-09-30 | 2012-06-30 | 2012-03-31 | 2011-12-31 | 2011-09-30 | 2011-06-30 | 2011-03-31 | 2010-12-31 | 2010-09-30 | 2010-06-30 | ||
|---|---|---|---|---|---|---|---|---|---|---|---|---|---|---|---|---|---|---|---|---|---|---|---|---|---|---|---|---|---|---|---|---|---|---|---|---|---|---|---|---|---|---|---|---|---|---|---|---|---|---|---|---|---|---|---|---|
| Liabilities Current | 24.95 | 29.00 | 36.91 | 40.05 | 45.32 | 51.69 | 30.69 | 25.34 | 22.08 | 20.47 | NA | 11.89 | 7.77 | 10.41 | 8.82 | 8.39 | 5.28 | 6.61 | 4.10 | 4.81 | 4.55 | 4.98 | 4.11 | 3.93 | 2.75 | 4.24 | 4.33 | 5.04 | 4.44 | 7.35 | 6.55 | 5.74 | 3.68 | 5.04 | 6.15 | 4.50 | 3.88 | 5.10 | 7.11 | 6.56 | 3.90 | 6.31 | 4.36 | 3.34 | 2.80 | 3.02 | 2.70 | 2.66 | 2.08 | 4.01 | 3.50 | NA | NA | 2.04 | NA | |
| Debt Current | 2.21 | 2.11 | 2.17 | NA | NA | NA | NA | NA | NA | NA | NA | NA | NA | NA | NA | NA | NA | NA | NA | NA | NA | NA | NA | NA | NA | NA | NA | NA | NA | NA | NA | NA | NA | NA | NA | NA | NA | NA | NA | NA | NA | NA | NA | NA | NA | NA | NA | NA | NA | NA | NA | NA | NA | NA | NA | |
| Accounts Payable Current | 7.37 | 8.89 | 11.64 | 16.68 | 18.37 | 24.12 | 16.24 | 15.02 | 12.37 | 9.21 | NA | 5.01 | 1.87 | 3.69 | 3.88 | 3.87 | 2.32 | 3.17 | 1.57 | 2.35 | 1.92 | 2.36 | 2.02 | 1.80 | 1.21 | 1.74 | 2.20 | 2.36 | 2.42 | 2.57 | 3.17 | 3.16 | 2.18 | 2.36 | 3.63 | 2.58 | 2.47 | 2.10 | 1.96 | 1.92 | 2.18 | 2.63 | 1.91 | 1.92 | 1.52 | 1.49 | 1.29 | 1.65 | 0.97 | 1.44 | 1.30 | NA | NA | 1.19 | NA | |
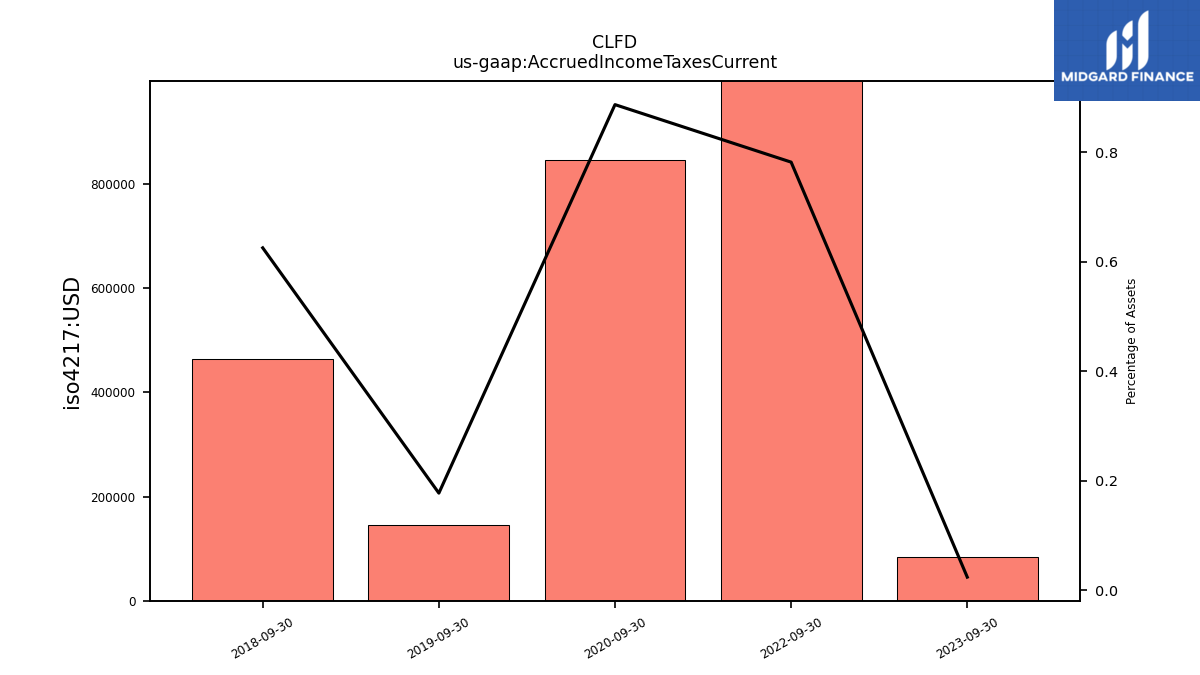
| Accrued Income Taxes Current | NA | 0.08 | NA | NA | NA | 1.79 | NA | NA | NA | NA | NA | NA | NA | 0.84 | NA | NA | NA | 0.14 | NA | NA | NA | 0.46 | NA | NA | NA | NA | NA | NA | NA | NA | NA | NA | NA | NA | NA | NA | NA | NA | NA | NA | NA | NA | NA | NA | NA | NA | NA | NA | NA | NA | NA | NA | NA | NA | NA | |
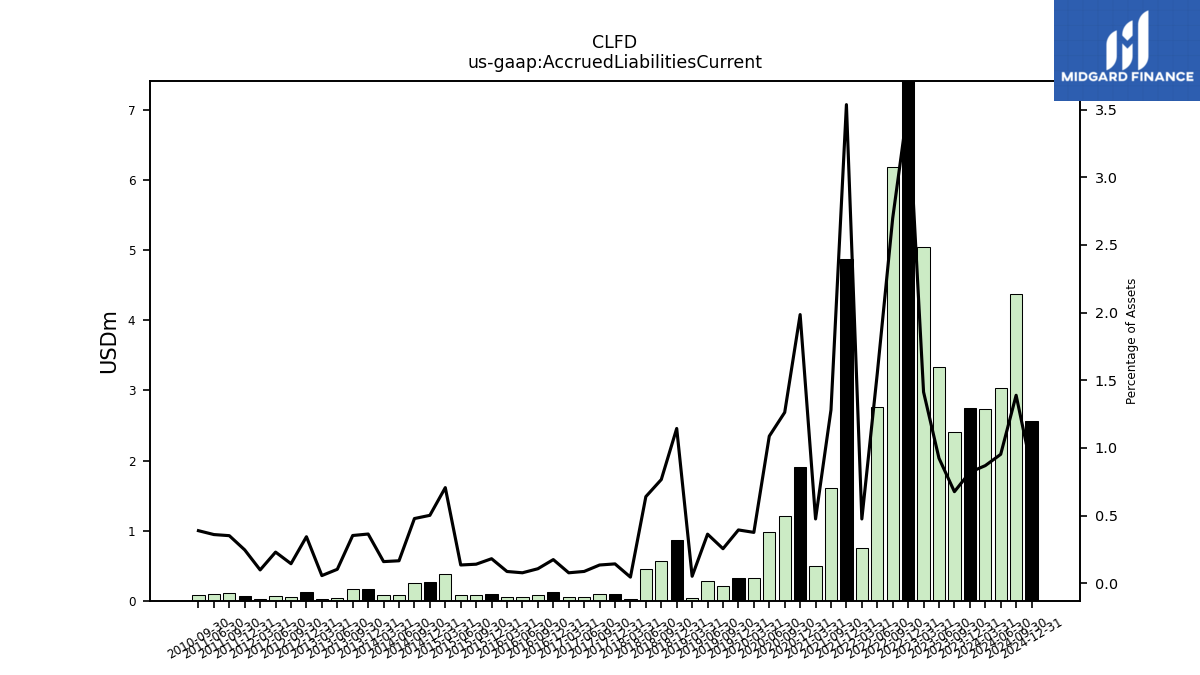
| Accrued Liabilities Current | 2.75 | 2.40 | 3.33 | 5.05 | 12.44 | 6.18 | 2.76 | 0.76 | 4.87 | 1.61 | NA | 0.49 | 1.91 | 1.20 | 0.99 | 0.33 | 0.33 | 0.21 | 0.28 | 0.04 | 0.86 | 0.57 | 0.46 | 0.03 | 0.10 | 0.09 | 0.06 | 0.05 | 0.12 | 0.08 | 0.05 | 0.05 | 0.10 | 0.08 | 0.08 | 0.37 | 0.26 | 0.25 | 0.09 | 0.08 | 0.17 | 0.16 | 0.04 | 0.02 | 0.13 | 0.05 | 0.07 | 0.03 | 0.07 | 0.11 | 0.09 | NA | NA | 0.08 | NA |
| 2023-12-31 | 2023-09-30 | 2023-06-30 | 2023-03-31 | 2022-12-31 | 2022-09-30 | 2022-06-30 | 2022-03-31 | 2021-12-31 | 2021-09-30 | 2021-06-30 | 2021-03-31 | 2020-12-31 | 2020-09-30 | 2020-06-30 | 2020-03-31 | 2019-12-31 | 2019-09-30 | 2019-06-30 | 2019-03-31 | 2018-12-31 | 2018-09-30 | 2018-06-30 | 2018-03-31 | 2017-12-31 | 2017-09-30 | 2017-06-30 | 2017-03-31 | 2016-12-31 | 2016-09-30 | 2016-06-30 | 2016-03-31 | 2015-12-31 | 2015-09-30 | 2015-06-30 | 2015-03-31 | 2014-12-31 | 2014-09-30 | 2014-06-30 | 2014-03-31 | 2013-12-31 | 2013-09-30 | 2013-06-30 | 2013-03-31 | 2012-12-31 | 2012-09-30 | 2012-06-30 | 2012-03-31 | 2011-12-31 | 2011-09-30 | 2011-06-30 | 2011-03-31 | 2010-12-31 | 2010-09-30 | 2010-06-30 | ||
|---|---|---|---|---|---|---|---|---|---|---|---|---|---|---|---|---|---|---|---|---|---|---|---|---|---|---|---|---|---|---|---|---|---|---|---|---|---|---|---|---|---|---|---|---|---|---|---|---|---|---|---|---|---|---|---|---|
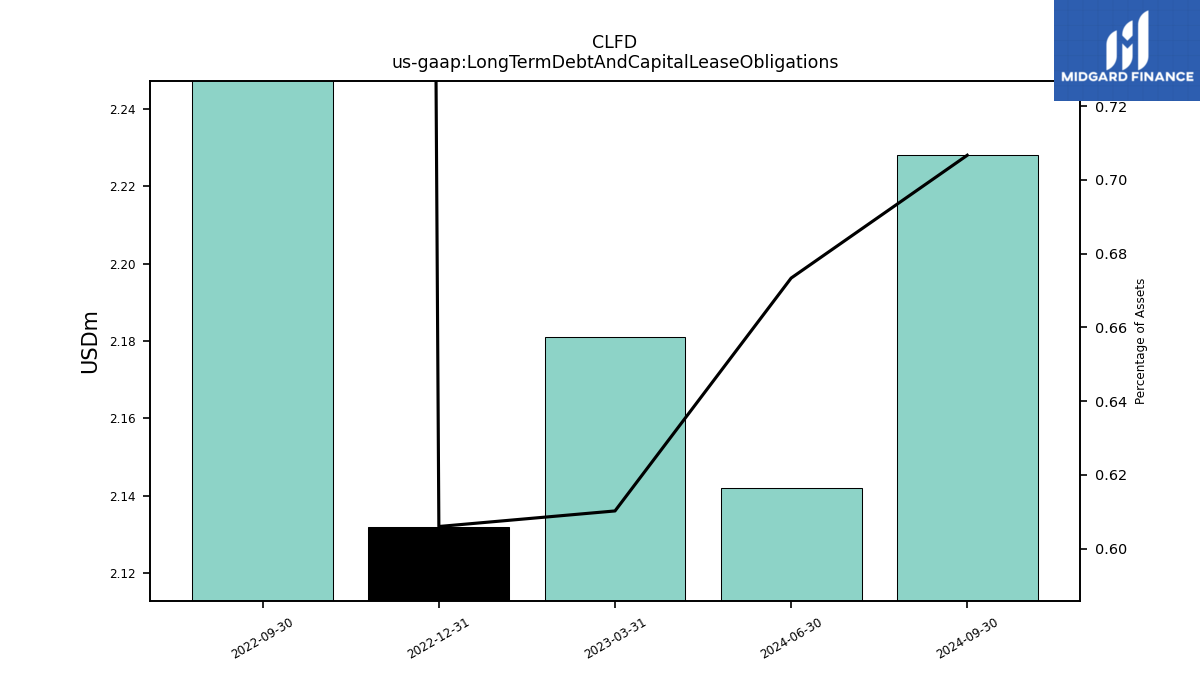
| Long Term Debt And Capital Lease Obligations | NA | NA | NA | 2.18 | 2.13 | 18.67 | NA | NA | NA | NA | NA | NA | NA | NA | NA | NA | NA | NA | NA | NA | NA | NA | NA | NA | NA | NA | NA | NA | NA | NA | NA | NA | NA | NA | NA | NA | NA | NA | NA | NA | NA | NA | NA | NA | NA | NA | NA | NA | NA | NA | NA | NA | NA | NA | NA | |
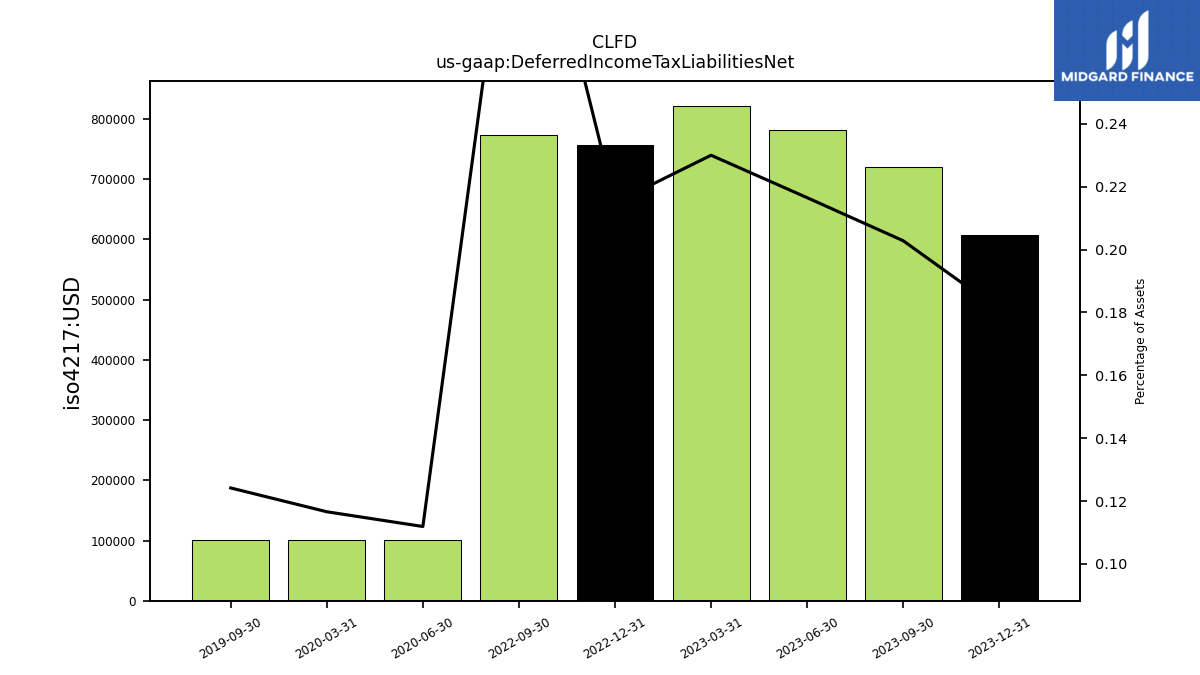
| Deferred Income Tax Liabilities Net | 0.61 | 0.72 | 0.78 | 0.82 | 0.76 | 0.77 | NA | NA | NA | NA | NA | NA | NA | NA | 0.10 | 0.10 | NA | 0.10 | NA | NA | NA | NA | NA | NA | NA | NA | NA | NA | NA | NA | NA | NA | NA | NA | NA | NA | NA | NA | NA | NA | NA | NA | NA | NA | NA | NA | NA | NA | NA | NA | NA | NA | NA | NA | NA | |
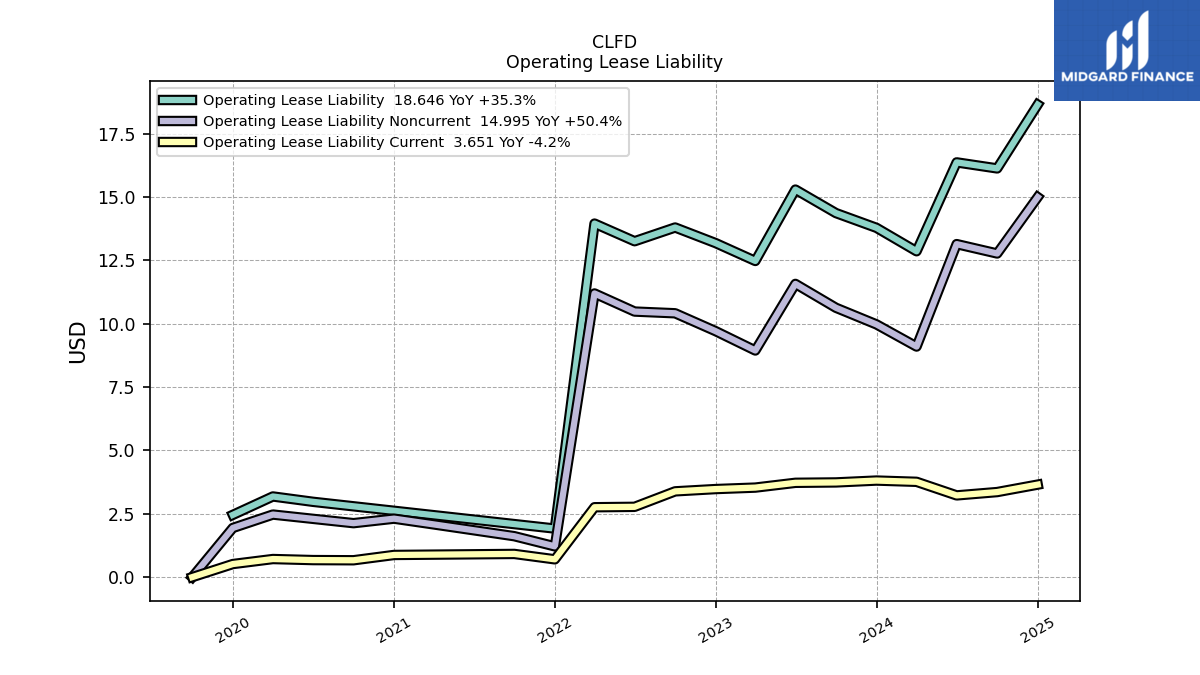
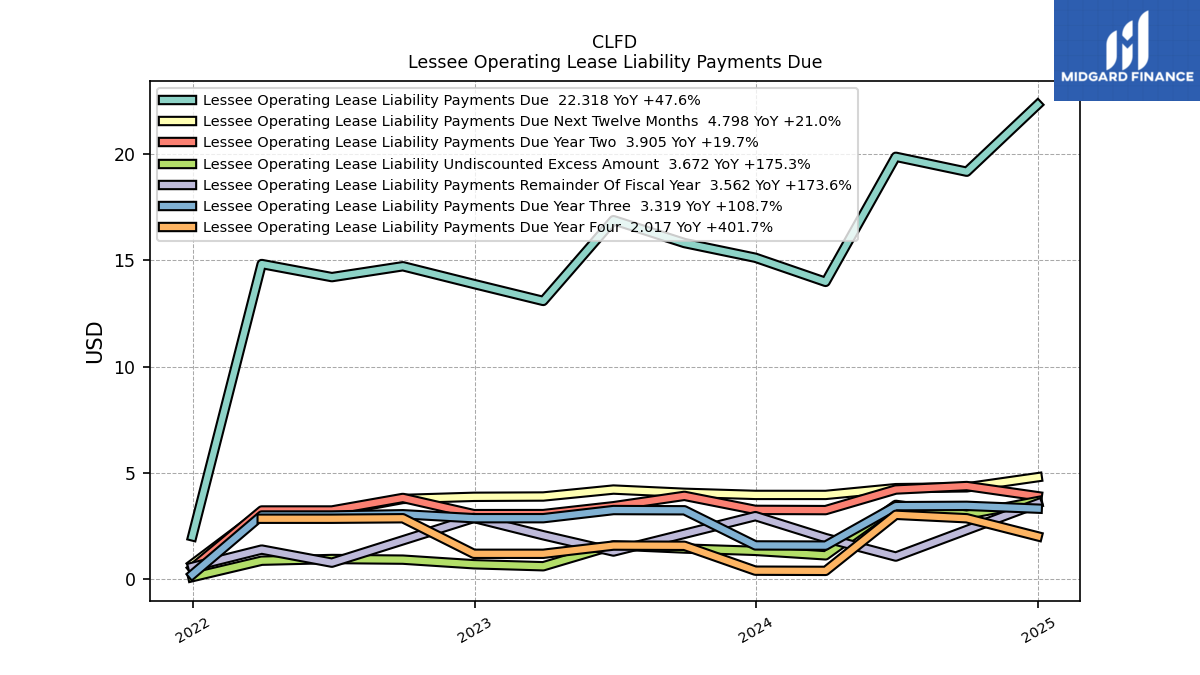
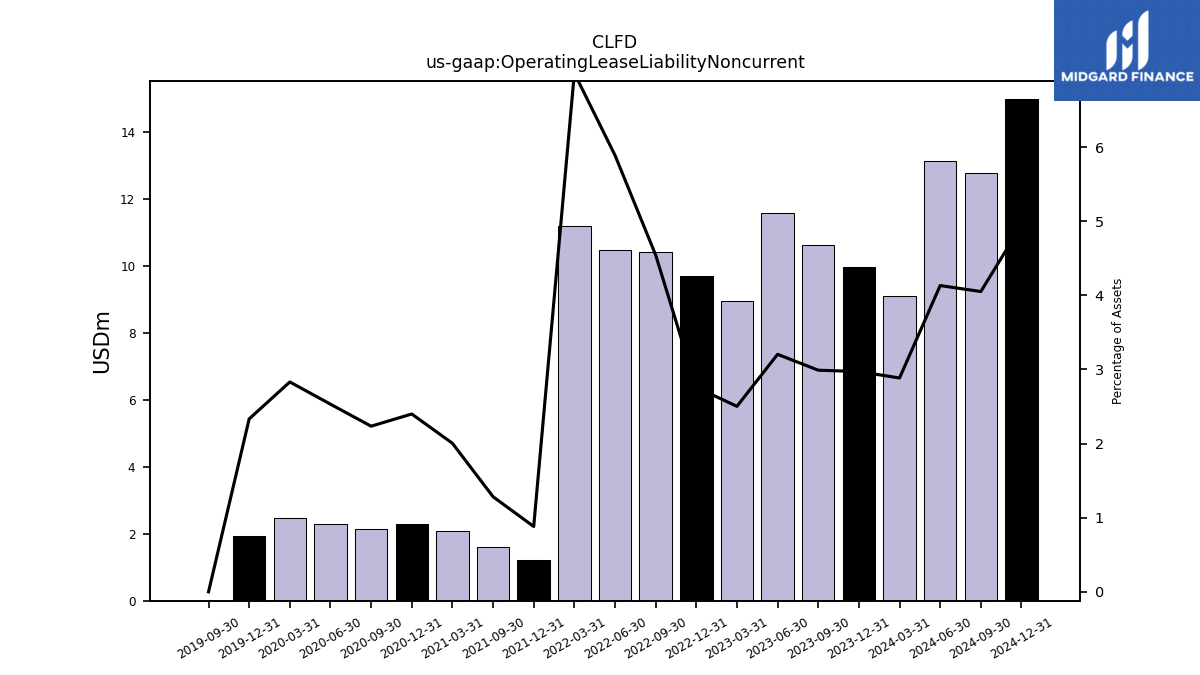
| Operating Lease Liability Noncurrent | 9.97 | 10.63 | 11.57 | 8.94 | 9.71 | 10.41 | 10.48 | 11.19 | 1.21 | 1.61 | NA | 2.08 | 2.31 | 2.13 | 2.30 | 2.47 | 1.94 | 0.00 | NA | NA | NA | NA | NA | NA | NA | NA | NA | NA | NA | NA | NA | NA | NA | NA | NA | NA | NA | NA | NA | NA | NA | NA | NA | NA | NA | NA | NA | NA | NA | NA | NA | NA | NA | NA | NA |
| 2023-12-31 | 2023-09-30 | 2023-06-30 | 2023-03-31 | 2022-12-31 | 2022-09-30 | 2022-06-30 | 2022-03-31 | 2021-12-31 | 2021-09-30 | 2021-06-30 | 2021-03-31 | 2020-12-31 | 2020-09-30 | 2020-06-30 | 2020-03-31 | 2019-12-31 | 2019-09-30 | 2019-06-30 | 2019-03-31 | 2018-12-31 | 2018-09-30 | 2018-06-30 | 2018-03-31 | 2017-12-31 | 2017-09-30 | 2017-06-30 | 2017-03-31 | 2016-12-31 | 2016-09-30 | 2016-06-30 | 2016-03-31 | 2015-12-31 | 2015-09-30 | 2015-06-30 | 2015-03-31 | 2014-12-31 | 2014-09-30 | 2014-06-30 | 2014-03-31 | 2013-12-31 | 2013-09-30 | 2013-06-30 | 2013-03-31 | 2012-12-31 | 2012-09-30 | 2012-06-30 | 2012-03-31 | 2011-12-31 | 2011-09-30 | 2011-06-30 | 2011-03-31 | 2010-12-31 | 2010-09-30 | 2010-06-30 | ||
|---|---|---|---|---|---|---|---|---|---|---|---|---|---|---|---|---|---|---|---|---|---|---|---|---|---|---|---|---|---|---|---|---|---|---|---|---|---|---|---|---|---|---|---|---|---|---|---|---|---|---|---|---|---|---|---|---|
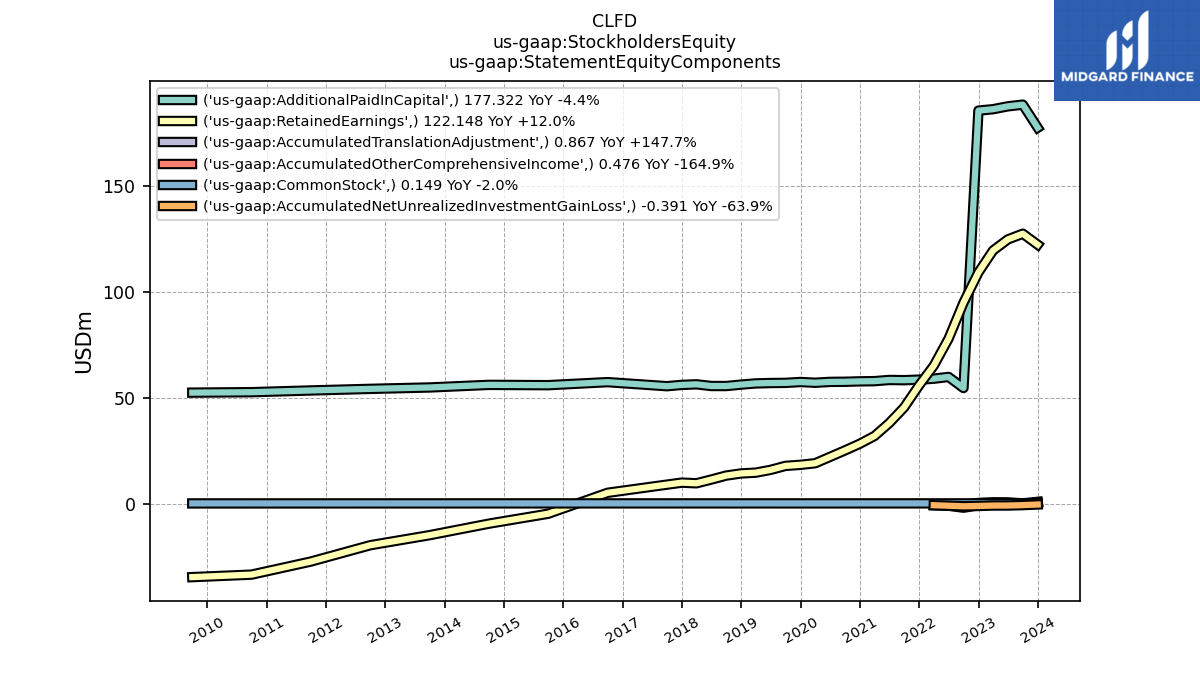
| Stockholders Equity | 300.10 | 315.16 | 311.93 | 305.40 | 293.88 | 147.58 | 136.77 | 123.43 | 114.47 | 103.82 | 96.49 | 89.85 | 86.11 | 82.75 | 79.64 | 76.25 | 75.84 | 74.93 | 72.97 | 71.49 | 70.56 | 68.87 | 67.01 | 66.05 | 66.08 | 64.53 | 64.45 | 65.70 | 64.22 | 62.59 | 59.33 | 55.15 | 53.13 | 51.28 | 50.29 | 47.95 | 48.04 | 46.75 | 45.69 | 43.72 | 42.29 | 40.08 | 37.59 | 36.22 | 35.48 | 34.69 | 29.72 | 27.70 | 27.45 | 26.23 | 21.91 | NA | NA | 19.25 | NA | |
| Common Stock Value | 0.15 | 0.15 | 0.15 | 0.15 | 0.15 | 0.14 | 0.14 | 0.14 | 0.14 | 0.14 | NA | 0.14 | 0.14 | 0.14 | 0.14 | 0.14 | 0.14 | 0.14 | 0.14 | 0.14 | 0.14 | 0.14 | 0.14 | 0.14 | 0.14 | 0.14 | 0.14 | 0.14 | 0.14 | 0.14 | 0.14 | 0.14 | 0.14 | 0.14 | 0.14 | 0.14 | 0.14 | 0.14 | 0.13 | 0.13 | 0.13 | 0.13 | 0.13 | 0.13 | 0.13 | 0.13 | 0.12 | 0.12 | 0.12 | 0.12 | 0.12 | NA | NA | 0.12 | NA | |
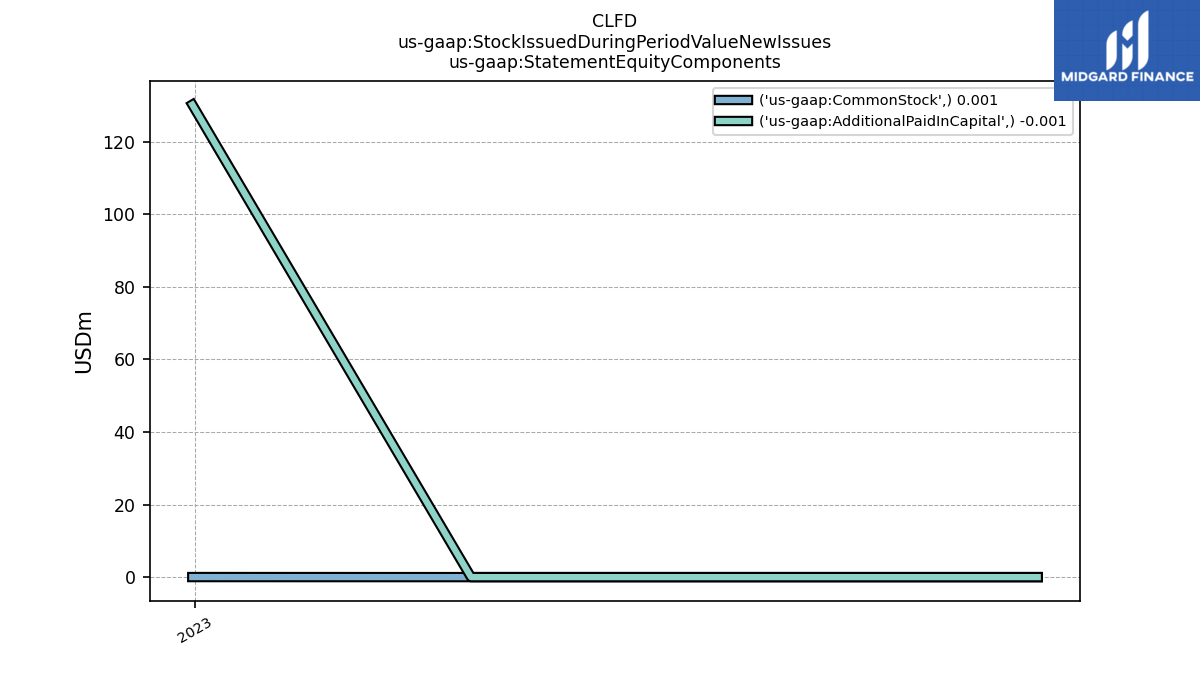
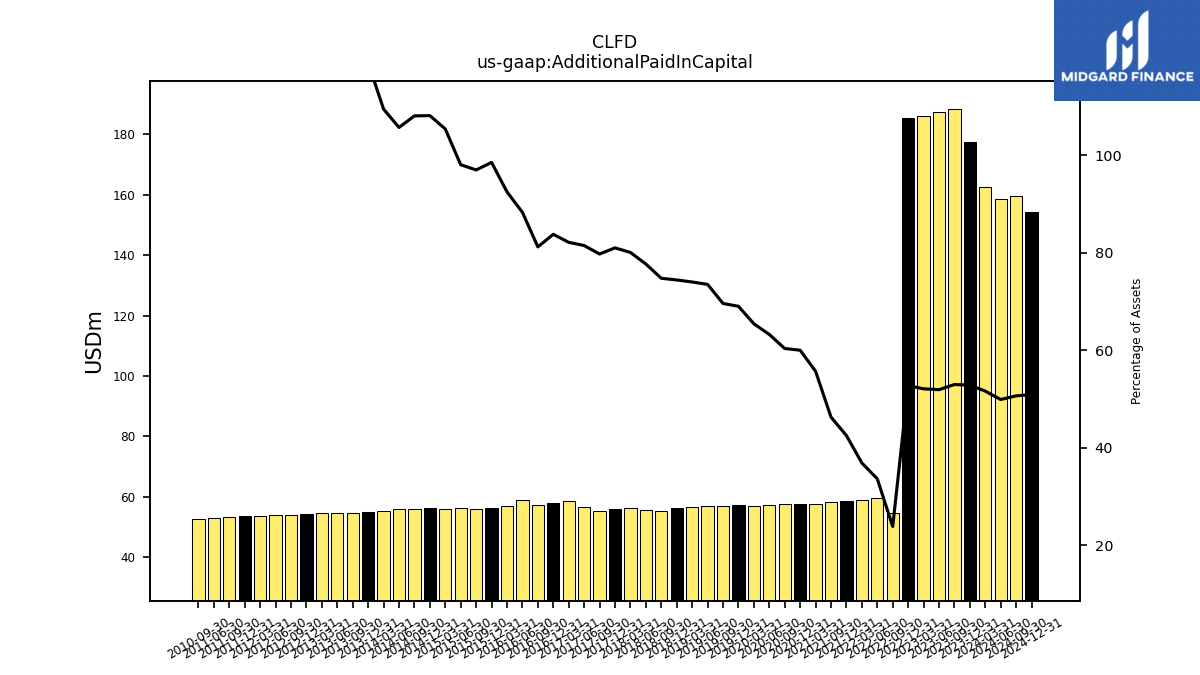
| Additional Paid In Capital | 177.32 | 188.22 | 187.41 | 186.06 | 185.40 | 54.54 | 59.78 | 58.95 | 58.51 | 58.25 | NA | 57.79 | 57.70 | 57.50 | 57.44 | 57.04 | 57.38 | 56.98 | 56.90 | 56.73 | 56.16 | 55.48 | 55.50 | 56.30 | 56.02 | 55.41 | 56.59 | 58.64 | 58.07 | 57.32 | 58.83 | 56.93 | 56.36 | 55.89 | 56.27 | 55.89 | 56.26 | 56.04 | 56.03 | 55.24 | 55.04 | 54.81 | 54.82 | 54.59 | 54.40 | 54.15 | 54.02 | 53.74 | 53.62 | 53.40 | 52.94 | NA | NA | 52.59 | NA | |
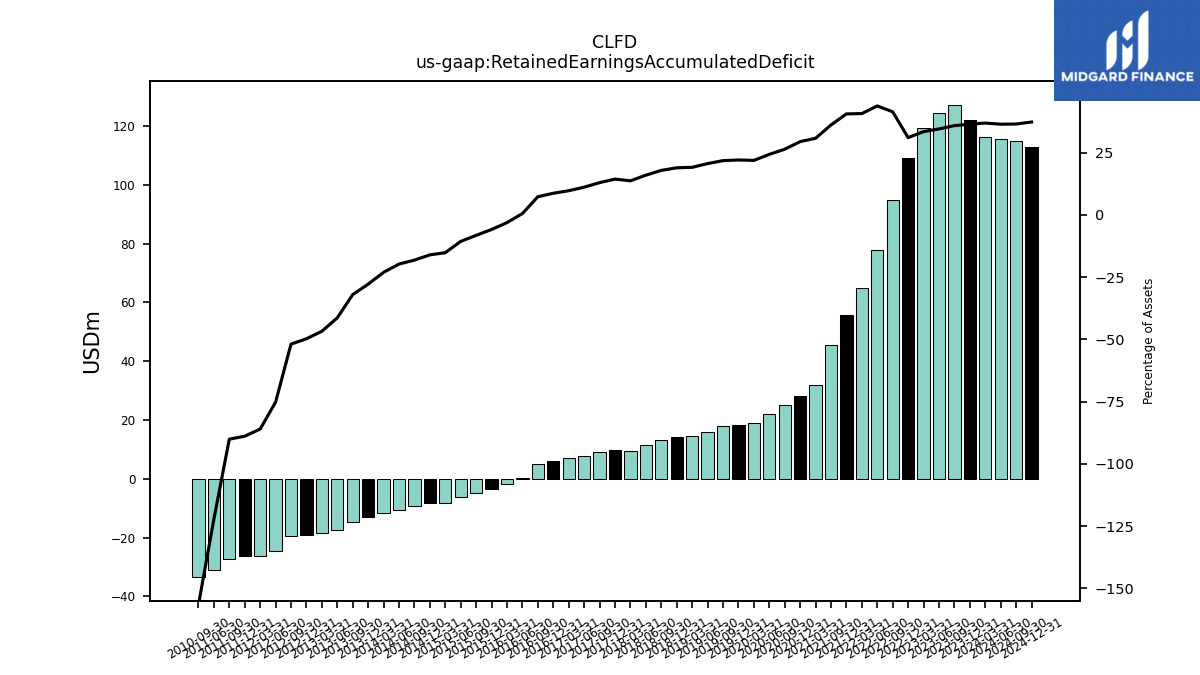
| Retained Earnings Accumulated Deficit | 122.15 | 127.34 | 124.64 | 119.42 | 109.06 | 94.80 | 77.81 | 65.07 | 55.83 | 45.44 | NA | 31.92 | 28.28 | 25.11 | 22.06 | 19.07 | 18.32 | 17.82 | 15.93 | 14.63 | 14.26 | 13.25 | 11.37 | 9.62 | 9.92 | 8.98 | 7.72 | 6.92 | 6.01 | 5.13 | 0.36 | -1.92 | -3.36 | -4.75 | -6.12 | -8.07 | -8.36 | -9.43 | -10.48 | -11.65 | -12.88 | -14.86 | -17.36 | -18.50 | -19.05 | -19.59 | -24.42 | -26.16 | -26.30 | -27.30 | -31.15 | NA | NA | -33.46 | NA | |
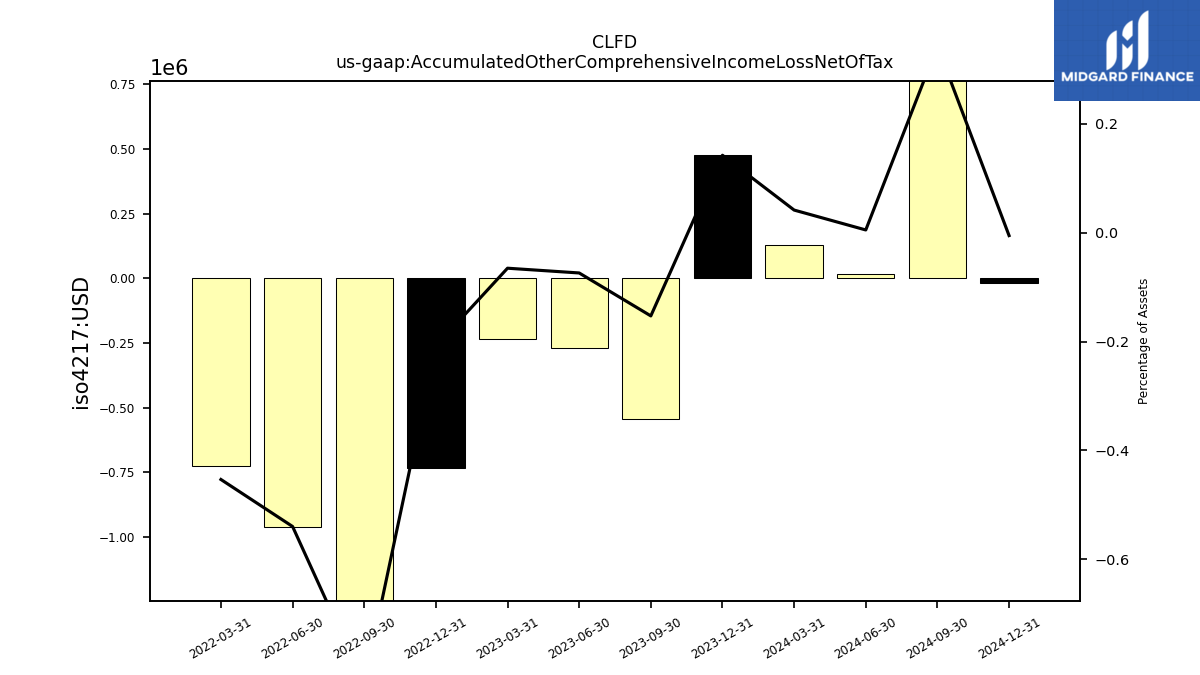
| Accumulated Other Comprehensive Income Loss Net Of Tax | 0.48 | -0.54 | -0.27 | -0.23 | -0.73 | -1.90 | -0.96 | -0.72 | NA | NA | NA | NA | NA | NA | NA | NA | NA | NA | NA | NA | NA | NA | NA | NA | NA | NA | NA | NA | NA | NA | NA | NA | NA | NA | NA | NA | NA | NA | NA | NA | NA | NA | NA | NA | NA | NA | NA | NA | NA | NA | NA | NA | NA | NA | NA | |
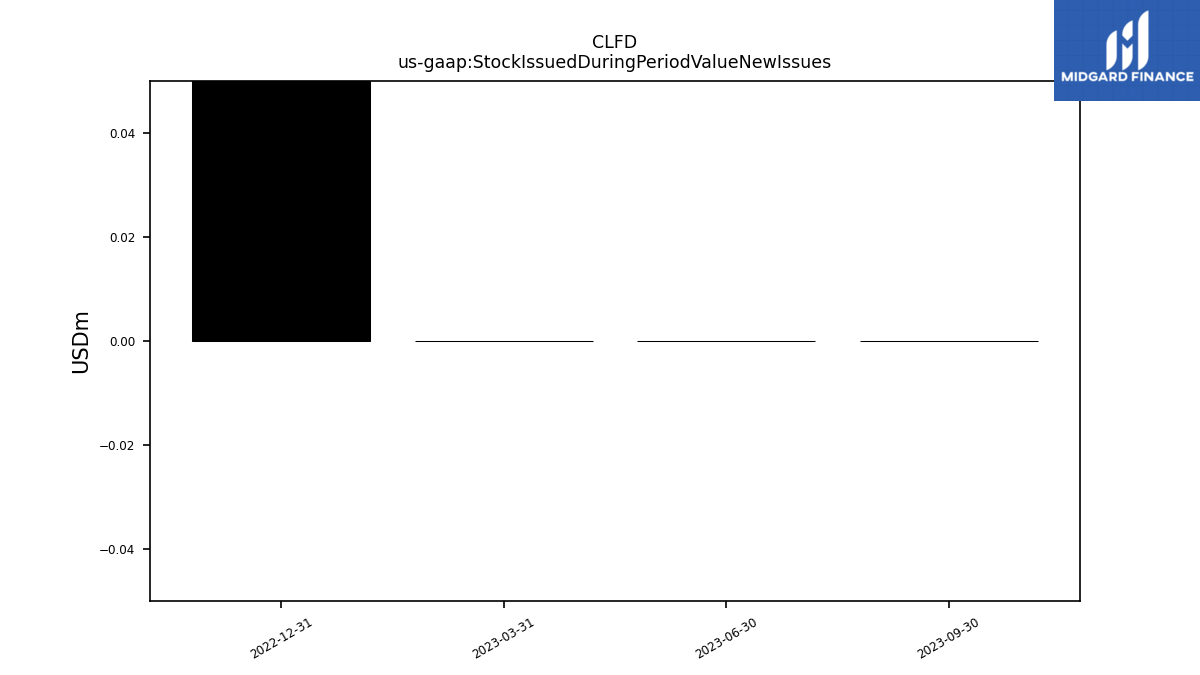
| Stock Issued During Period Value New Issues | NA | 0.00 | 0.00 | 0.00 | 130.26 | NA | NA | NA | NA | NA | NA | NA | NA | NA | NA | NA | NA | NA | NA | NA | NA | NA | NA | NA | NA | NA | NA | NA | NA | NA | NA | NA | NA | NA | NA | NA | NA | NA | NA | NA | NA | NA | NA | NA | NA | NA | NA | NA | NA | NA | NA | NA | NA | NA | NA | |
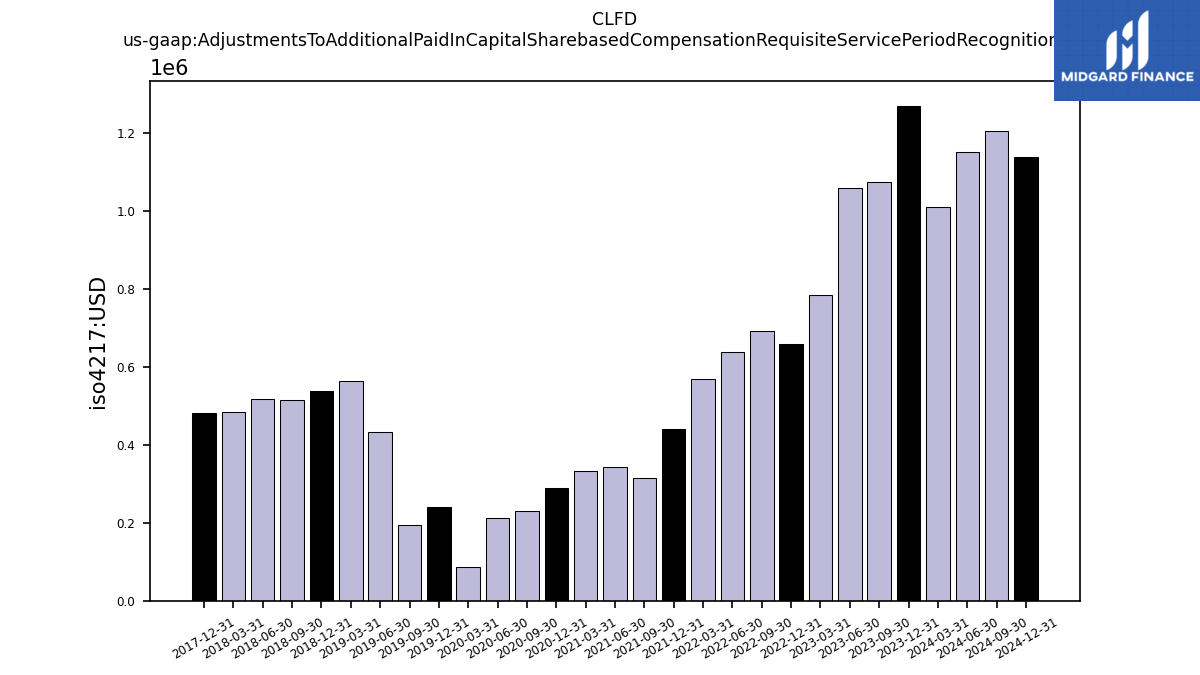
| Adjustments To Additional Paid In Capital Sharebased Compensation Requisite Service Period Recognition Value | 1.27 | 1.07 | 1.06 | 0.78 | 0.66 | 0.69 | 0.64 | 0.57 | 0.44 | 0.31 | 0.34 | 0.33 | 0.29 | 0.23 | 0.21 | 0.09 | 0.24 | 0.19 | 0.43 | 0.56 | 0.54 | 0.51 | 0.52 | 0.49 | 0.48 | NA | NA | NA | NA | NA | NA | NA | NA | NA | NA | NA | NA | NA | NA | NA | NA | NA | NA | NA | NA | NA | NA | NA | NA | NA | NA | NA | NA | NA | NA |
| 2023-12-31 | 2023-09-30 | 2023-06-30 | 2023-03-31 | 2022-12-31 | 2022-09-30 | 2022-06-30 | 2022-03-31 | 2021-12-31 | 2021-09-30 | 2021-06-30 | 2021-03-31 | 2020-12-31 | 2020-09-30 | 2020-06-30 | 2020-03-31 | 2019-12-31 | 2019-09-30 | 2019-06-30 | 2019-03-31 | 2018-12-31 | 2018-09-30 | 2018-06-30 | 2018-03-31 | 2017-12-31 | 2017-09-30 | 2017-06-30 | 2017-03-31 | 2016-12-31 | 2016-09-30 | 2016-06-30 | 2016-03-31 | 2015-12-31 | 2015-09-30 | 2015-06-30 | 2015-03-31 | 2014-12-31 | 2014-09-30 | 2014-06-30 | 2014-03-31 | 2013-12-31 | 2013-09-30 | 2013-06-30 | 2013-03-31 | 2012-12-31 | 2012-09-30 | 2012-06-30 | 2012-03-31 | 2011-12-31 | 2011-09-30 | 2011-06-30 | 2011-03-31 | 2010-12-31 | 2010-09-30 | 2010-06-30 | ||
|---|---|---|---|---|---|---|---|---|---|---|---|---|---|---|---|---|---|---|---|---|---|---|---|---|---|---|---|---|---|---|---|---|---|---|---|---|---|---|---|---|---|---|---|---|---|---|---|---|---|---|---|---|---|---|---|---|
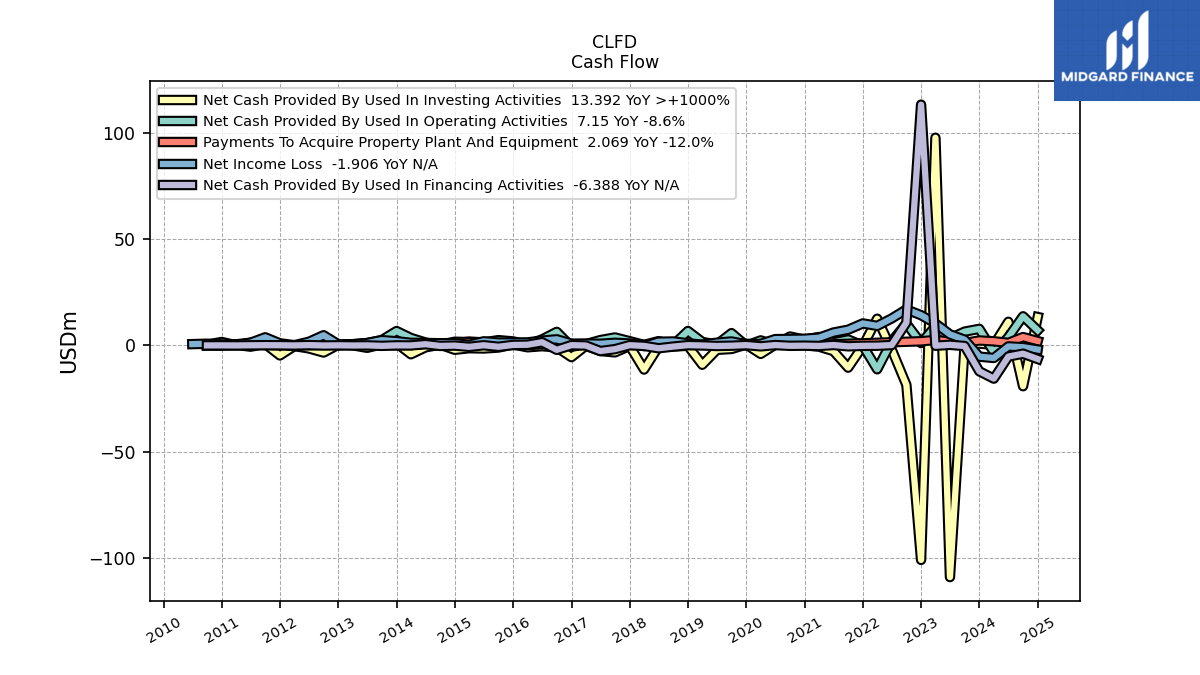
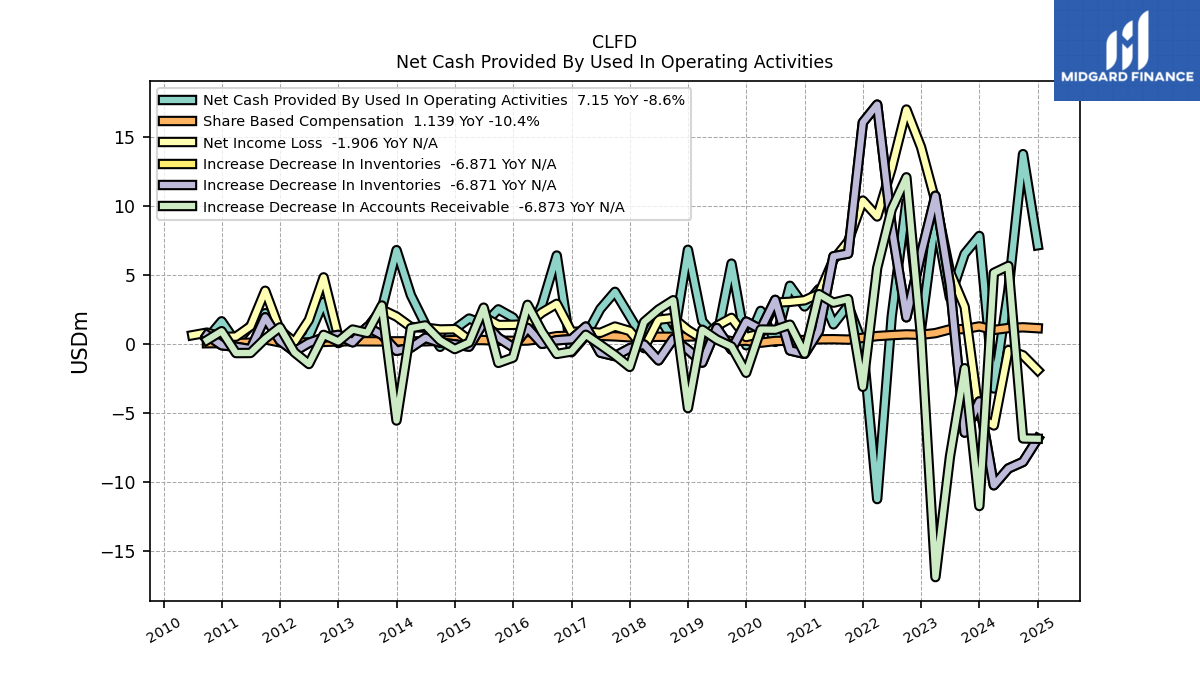
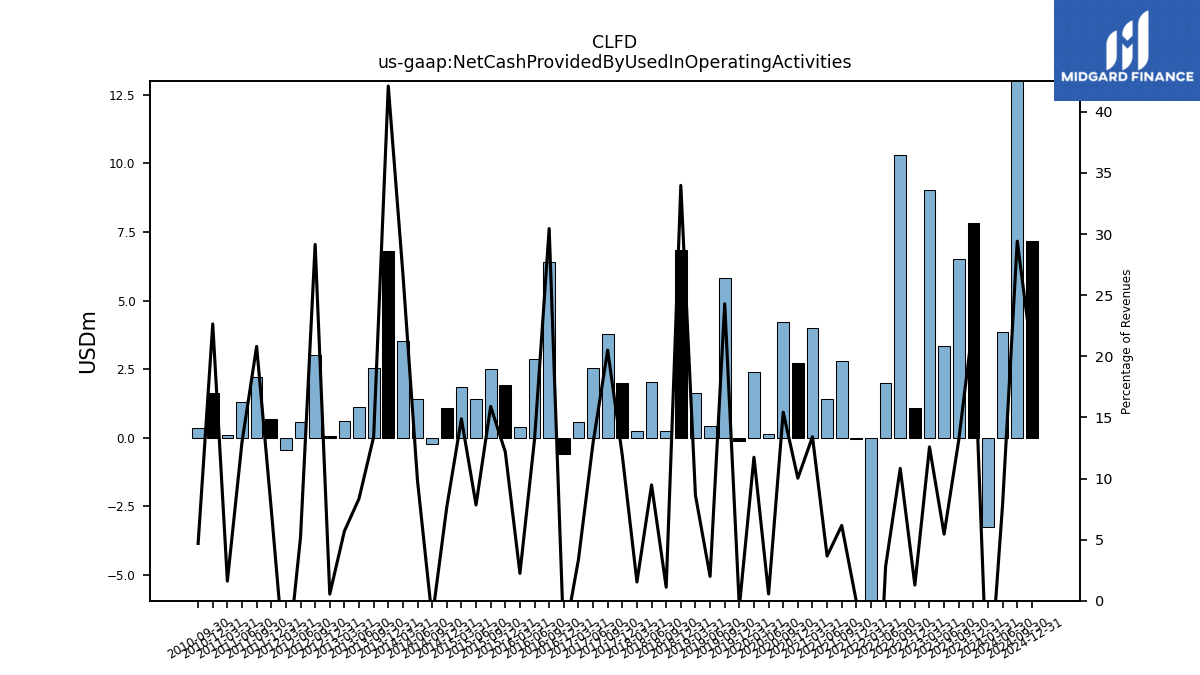
| Net Cash Provided By Used In Operating Activities | 7.83 | 6.53 | 3.34 | 9.04 | 1.10 | 10.29 | 1.99 | -11.25 | -0.03 | 2.79 | 1.42 | 3.98 | 2.72 | 4.22 | 0.14 | 2.40 | -0.10 | 5.82 | 0.44 | 1.65 | 6.83 | 0.25 | 2.04 | 0.26 | 2.00 | 3.78 | 2.53 | 0.59 | -0.61 | 6.41 | 2.85 | 0.38 | 1.91 | 2.51 | 1.43 | 1.84 | 1.07 | -0.21 | 1.41 | 3.53 | 6.80 | 2.55 | 1.13 | 0.60 | 0.06 | 3.03 | 0.56 | -0.45 | 0.69 | 2.23 | 1.31 | 0.11 | 1.64 | 0.37 | NA | |
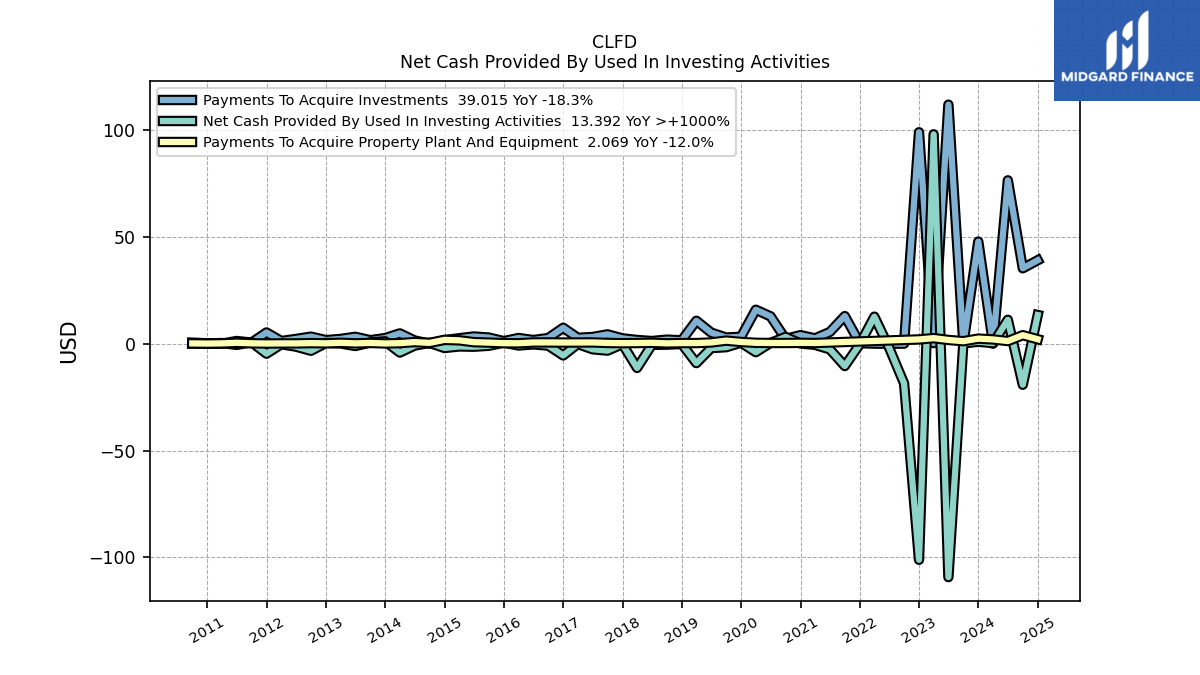
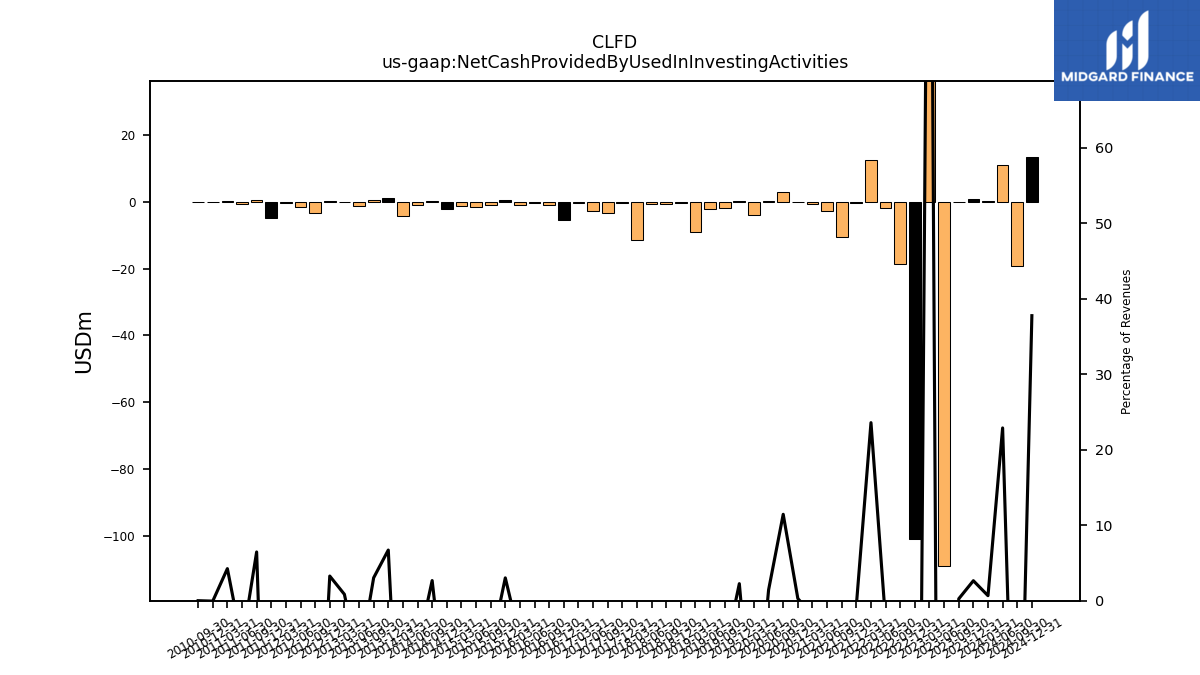
| Net Cash Provided By Used In Investing Activities | 0.91 | 0.13 | -109.19 | 97.91 | -101.09 | -18.57 | -1.92 | 12.62 | -0.32 | -10.46 | -2.66 | -0.56 | 0.08 | 3.13 | 0.37 | -3.98 | 0.44 | -1.65 | -2.05 | -9.10 | -0.15 | -0.46 | -0.57 | -11.36 | -0.22 | -3.25 | -2.63 | -0.15 | -5.51 | -0.91 | -0.35 | -0.86 | 0.48 | -0.98 | -1.43 | -1.30 | -2.03 | 0.38 | -0.89 | -4.16 | 1.08 | 0.58 | -1.12 | 0.09 | 0.34 | -3.33 | -1.40 | -0.28 | -4.70 | 0.69 | -0.57 | 0.30 | -0.00 | 0.00 | NA | |
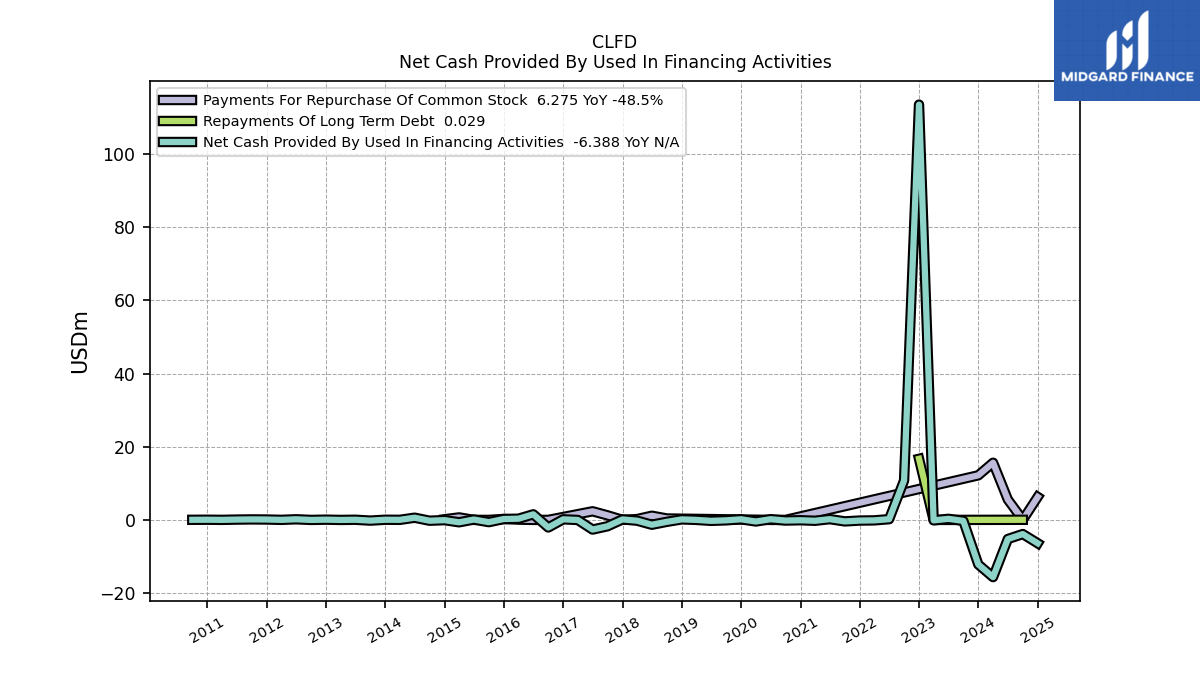
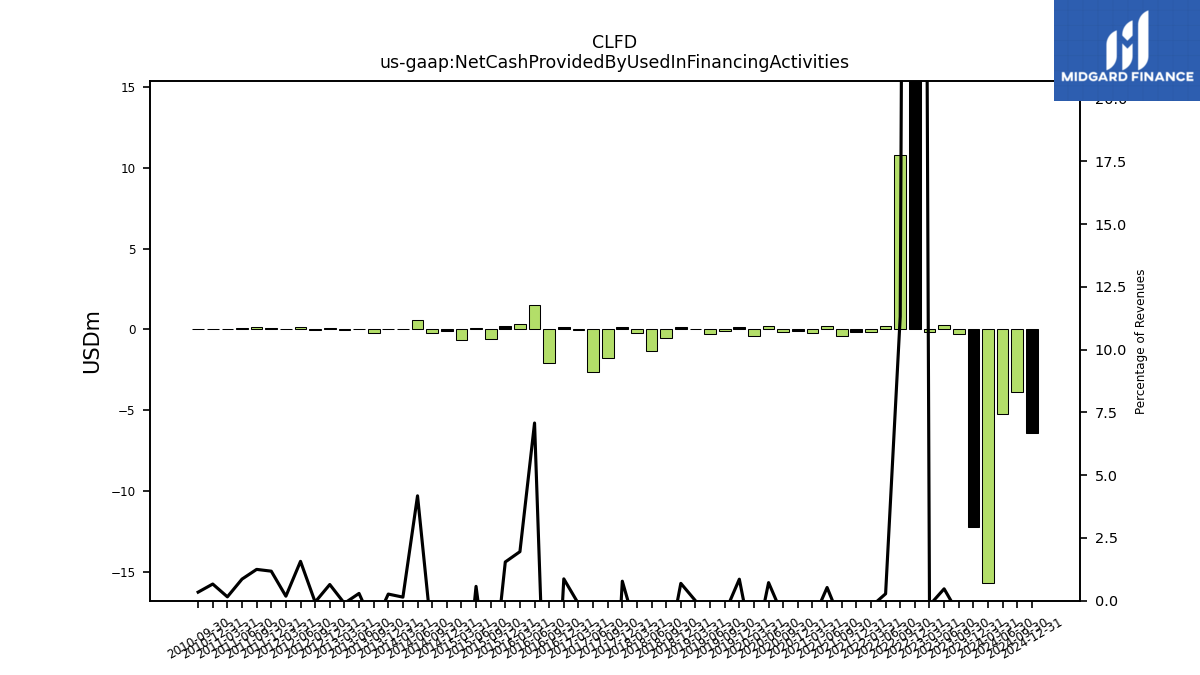
| Net Cash Provided By Used In Financing Activities | -12.17 | -0.27 | 0.29 | -0.13 | 113.52 | 10.76 | 0.20 | -0.13 | -0.18 | -0.41 | 0.20 | -0.24 | -0.09 | -0.17 | 0.19 | -0.43 | 0.17 | -0.12 | -0.26 | 0.00 | 0.14 | -0.53 | -1.32 | -0.21 | 0.13 | -1.73 | -2.64 | -0.02 | 0.16 | -2.07 | 1.53 | 0.33 | 0.24 | -0.61 | 0.10 | -0.65 | -0.06 | -0.22 | 0.60 | 0.02 | 0.04 | -0.19 | 0.04 | -0.01 | 0.07 | -0.01 | 0.17 | 0.01 | 0.11 | 0.13 | 0.09 | 0.01 | 0.05 | 0.03 | NA |
| 2023-12-31 | 2023-09-30 | 2023-06-30 | 2023-03-31 | 2022-12-31 | 2022-09-30 | 2022-06-30 | 2022-03-31 | 2021-12-31 | 2021-09-30 | 2021-06-30 | 2021-03-31 | 2020-12-31 | 2020-09-30 | 2020-06-30 | 2020-03-31 | 2019-12-31 | 2019-09-30 | 2019-06-30 | 2019-03-31 | 2018-12-31 | 2018-09-30 | 2018-06-30 | 2018-03-31 | 2017-12-31 | 2017-09-30 | 2017-06-30 | 2017-03-31 | 2016-12-31 | 2016-09-30 | 2016-06-30 | 2016-03-31 | 2015-12-31 | 2015-09-30 | 2015-06-30 | 2015-03-31 | 2014-12-31 | 2014-09-30 | 2014-06-30 | 2014-03-31 | 2013-12-31 | 2013-09-30 | 2013-06-30 | 2013-03-31 | 2012-12-31 | 2012-09-30 | 2012-06-30 | 2012-03-31 | 2011-12-31 | 2011-09-30 | 2011-06-30 | 2011-03-31 | 2010-12-31 | 2010-09-30 | 2010-06-30 | ||
|---|---|---|---|---|---|---|---|---|---|---|---|---|---|---|---|---|---|---|---|---|---|---|---|---|---|---|---|---|---|---|---|---|---|---|---|---|---|---|---|---|---|---|---|---|---|---|---|---|---|---|---|---|---|---|---|---|
| Net Cash Provided By Used In Operating Activities | 7.83 | 6.53 | 3.34 | 9.04 | 1.10 | 10.29 | 1.99 | -11.25 | -0.03 | 2.79 | 1.42 | 3.98 | 2.72 | 4.22 | 0.14 | 2.40 | -0.10 | 5.82 | 0.44 | 1.65 | 6.83 | 0.25 | 2.04 | 0.26 | 2.00 | 3.78 | 2.53 | 0.59 | -0.61 | 6.41 | 2.85 | 0.38 | 1.91 | 2.51 | 1.43 | 1.84 | 1.07 | -0.21 | 1.41 | 3.53 | 6.80 | 2.55 | 1.13 | 0.60 | 0.06 | 3.03 | 0.56 | -0.45 | 0.69 | 2.23 | 1.31 | 0.11 | 1.64 | 0.37 | NA | |
| Net Income Loss | -5.27 | 2.70 | 5.22 | 10.36 | 14.26 | 16.99 | 12.74 | 9.24 | 10.39 | 7.43 | 6.10 | 3.64 | 3.16 | 3.05 | 2.99 | 0.75 | 0.50 | 1.89 | 1.30 | 0.37 | 1.01 | 1.88 | 1.76 | -0.31 | 0.94 | 1.26 | 0.80 | 0.91 | 0.88 | 2.91 | 2.28 | 1.44 | 1.38 | 1.37 | 1.95 | 0.29 | 1.07 | 1.05 | 1.17 | 1.23 | 1.98 | 2.50 | 1.15 | 0.55 | 0.55 | 4.83 | 1.74 | 0.13 | 1.00 | 3.86 | 1.28 | 0.53 | 0.50 | 0.82 | 0.63 | |
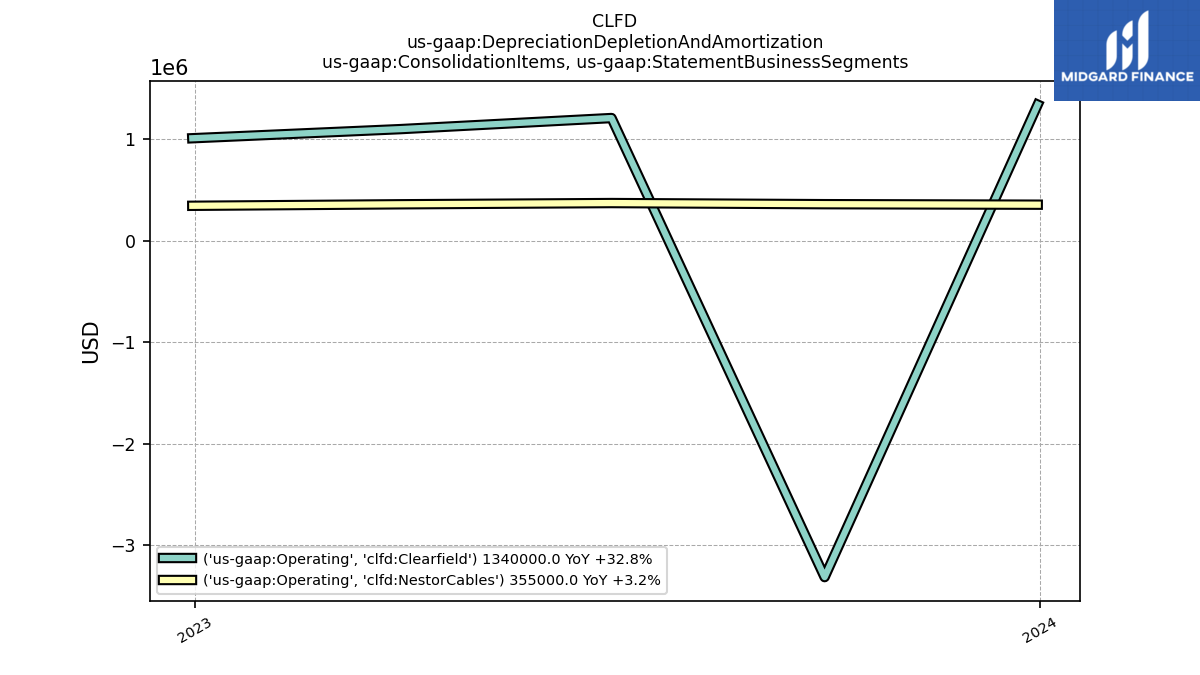
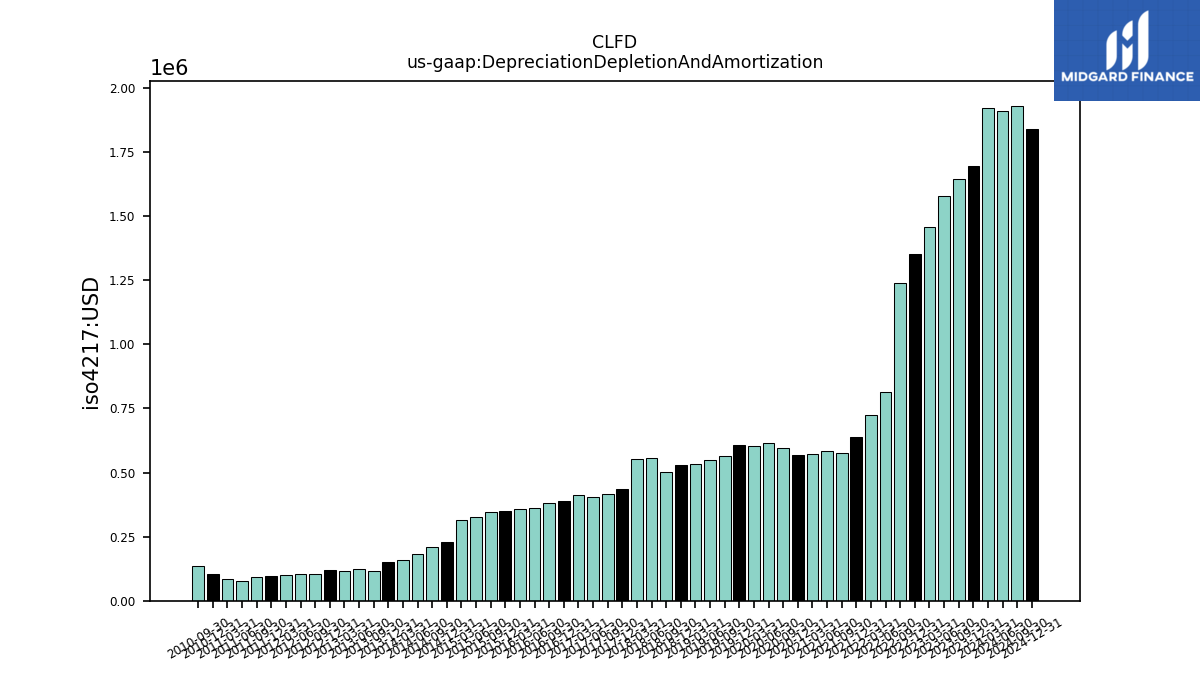
| Depreciation Depletion And Amortization | 1.70 | 1.64 | 1.58 | 1.46 | 1.35 | 1.24 | 0.81 | 0.72 | 0.64 | 0.58 | 0.59 | 0.57 | 0.57 | 0.60 | 0.61 | 0.60 | 0.61 | 0.57 | 0.55 | 0.53 | 0.53 | 0.50 | 0.56 | 0.55 | 0.44 | 0.42 | 0.41 | 0.41 | 0.39 | 0.38 | 0.36 | 0.36 | 0.35 | 0.35 | 0.32 | 0.32 | 0.23 | 0.21 | 0.18 | 0.16 | 0.15 | 0.11 | 0.12 | 0.12 | 0.12 | 0.11 | 0.10 | 0.10 | 0.10 | 0.09 | 0.08 | 0.09 | 0.11 | 0.13 | NA | |
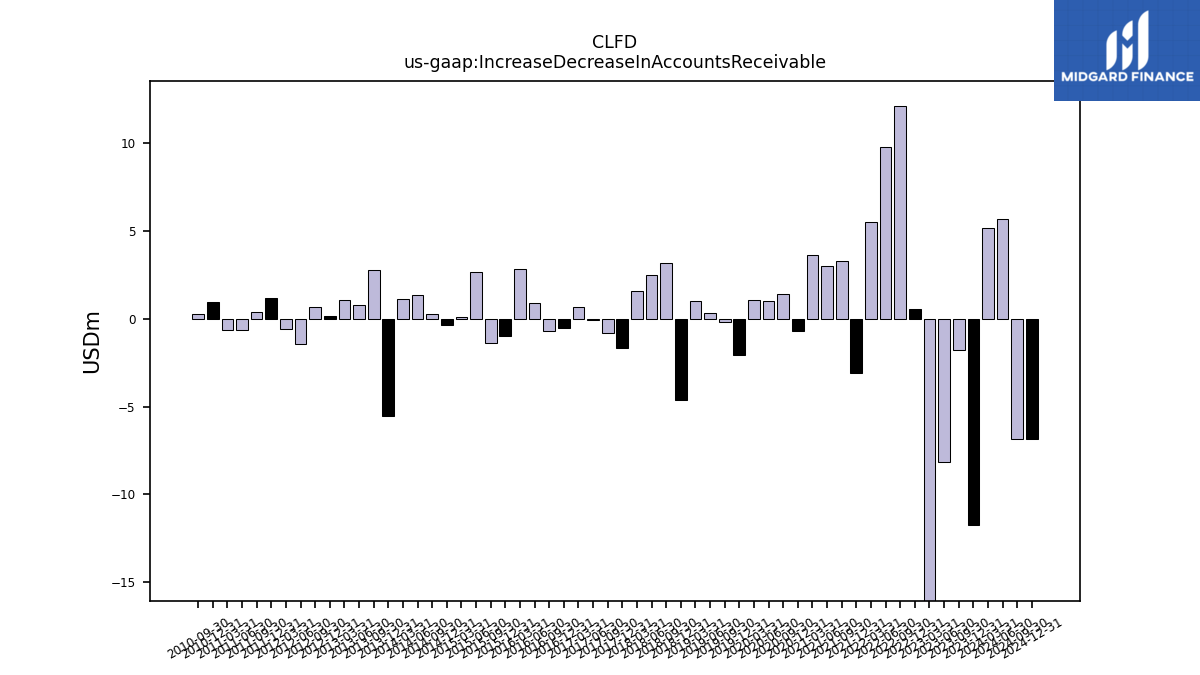
| Increase Decrease In Accounts Receivable | -11.75 | -1.76 | -8.17 | -16.90 | 0.55 | 12.08 | 9.76 | 5.51 | -3.11 | 3.25 | 2.99 | 3.61 | -0.70 | 1.40 | 1.03 | 1.04 | -2.09 | -0.18 | 0.31 | 1.03 | -4.65 | 3.17 | 2.49 | 1.59 | -1.67 | -0.82 | -0.06 | 0.66 | -0.55 | -0.73 | 0.87 | 2.83 | -0.99 | -1.38 | 2.63 | 0.10 | -0.37 | 0.26 | 1.34 | 1.15 | -5.55 | 2.79 | 0.80 | 1.04 | 0.18 | 0.66 | -1.46 | -0.61 | 1.20 | 0.38 | -0.66 | -0.66 | 0.93 | 0.27 | NA | |
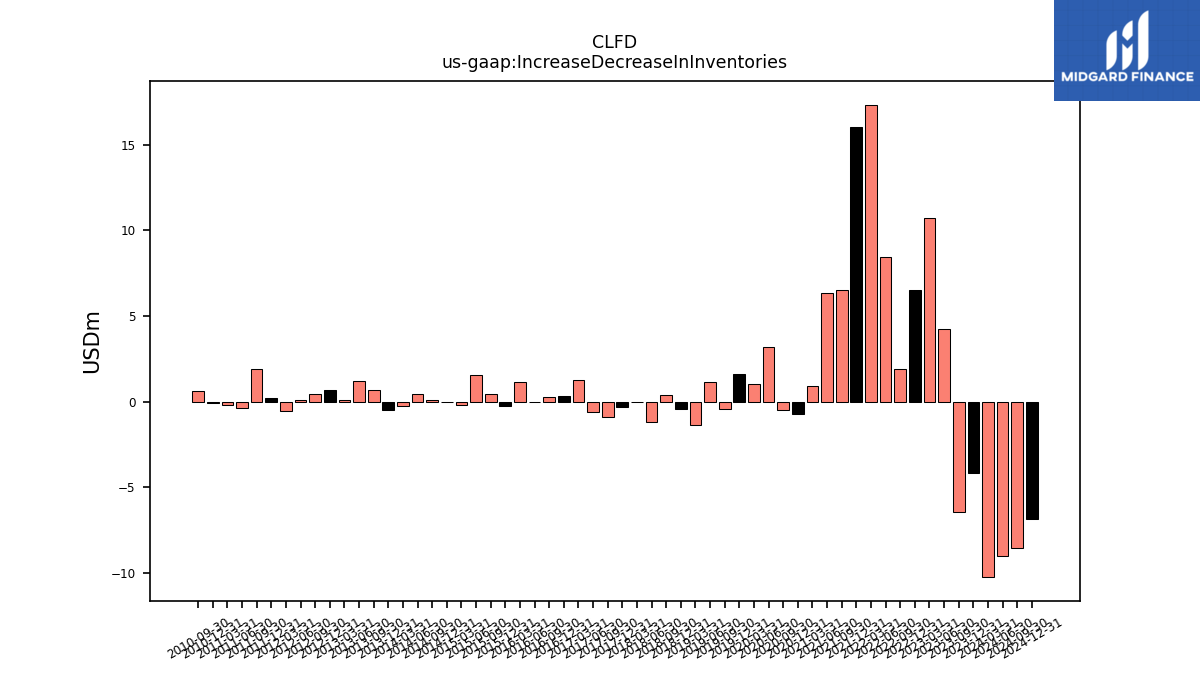
| Increase Decrease In Inventories | -4.17 | -6.43 | 4.27 | 10.74 | 6.50 | 1.93 | 8.42 | 17.34 | 16.05 | 6.54 | 6.35 | 0.94 | -0.72 | -0.47 | 3.19 | 1.06 | 1.62 | -0.41 | 1.15 | -1.35 | -0.42 | 0.36 | -1.19 | -0.04 | -0.31 | -0.89 | -0.63 | 1.26 | 0.34 | 0.27 | 0.00 | 1.16 | -0.24 | 0.45 | 1.57 | -0.19 | -0.03 | 0.09 | 0.44 | -0.27 | -0.50 | 0.66 | 1.22 | 0.12 | 0.65 | 0.45 | 0.08 | -0.55 | 0.23 | 1.93 | -0.38 | -0.21 | -0.09 | 0.64 | NA | |
| Share Based Compensation | 1.27 | 1.07 | 1.06 | 0.78 | 0.66 | 0.69 | 0.64 | 0.57 | 0.44 | 0.31 | 0.34 | 0.33 | 0.29 | 0.23 | 0.21 | 0.09 | 0.24 | 0.19 | 0.43 | 0.56 | 0.54 | 0.51 | 0.52 | 0.49 | 0.48 | 0.55 | 0.59 | 0.59 | 0.59 | 0.56 | 0.37 | 0.25 | 0.23 | 0.23 | 0.28 | 0.28 | 0.28 | 0.23 | 0.19 | 0.19 | 0.19 | 0.18 | 0.19 | 0.20 | 0.19 | 0.14 | 0.11 | 0.11 | 0.11 | 0.33 | 0.09 | 0.06 | 0.06 | 0.05 | NA |
| 2023-12-31 | 2023-09-30 | 2023-06-30 | 2023-03-31 | 2022-12-31 | 2022-09-30 | 2022-06-30 | 2022-03-31 | 2021-12-31 | 2021-09-30 | 2021-06-30 | 2021-03-31 | 2020-12-31 | 2020-09-30 | 2020-06-30 | 2020-03-31 | 2019-12-31 | 2019-09-30 | 2019-06-30 | 2019-03-31 | 2018-12-31 | 2018-09-30 | 2018-06-30 | 2018-03-31 | 2017-12-31 | 2017-09-30 | 2017-06-30 | 2017-03-31 | 2016-12-31 | 2016-09-30 | 2016-06-30 | 2016-03-31 | 2015-12-31 | 2015-09-30 | 2015-06-30 | 2015-03-31 | 2014-12-31 | 2014-09-30 | 2014-06-30 | 2014-03-31 | 2013-12-31 | 2013-09-30 | 2013-06-30 | 2013-03-31 | 2012-12-31 | 2012-09-30 | 2012-06-30 | 2012-03-31 | 2011-12-31 | 2011-09-30 | 2011-06-30 | 2011-03-31 | 2010-12-31 | 2010-09-30 | 2010-06-30 | ||
|---|---|---|---|---|---|---|---|---|---|---|---|---|---|---|---|---|---|---|---|---|---|---|---|---|---|---|---|---|---|---|---|---|---|---|---|---|---|---|---|---|---|---|---|---|---|---|---|---|---|---|---|---|---|---|---|---|
| Net Cash Provided By Used In Investing Activities | 0.91 | 0.13 | -109.19 | 97.91 | -101.09 | -18.57 | -1.92 | 12.62 | -0.32 | -10.46 | -2.66 | -0.56 | 0.08 | 3.13 | 0.37 | -3.98 | 0.44 | -1.65 | -2.05 | -9.10 | -0.15 | -0.46 | -0.57 | -11.36 | -0.22 | -3.25 | -2.63 | -0.15 | -5.51 | -0.91 | -0.35 | -0.86 | 0.48 | -0.98 | -1.43 | -1.30 | -2.03 | 0.38 | -0.89 | -4.16 | 1.08 | 0.58 | -1.12 | 0.09 | 0.34 | -3.33 | -1.40 | -0.28 | -4.70 | 0.69 | -0.57 | 0.30 | -0.00 | 0.00 | NA | |
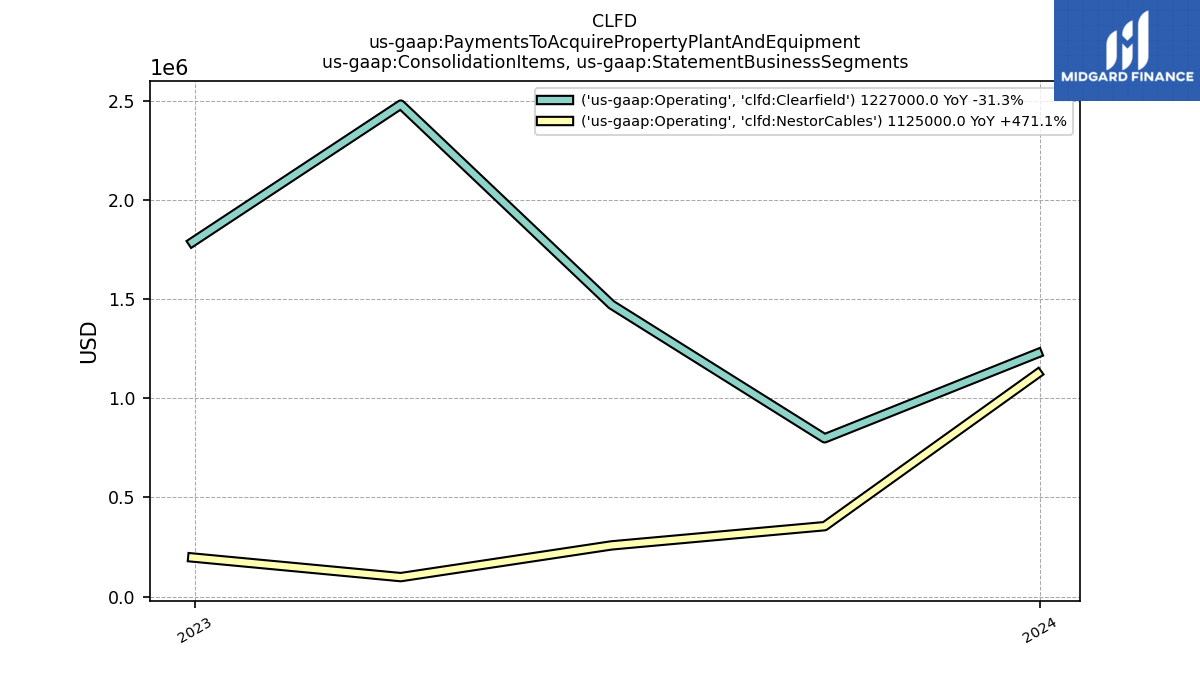
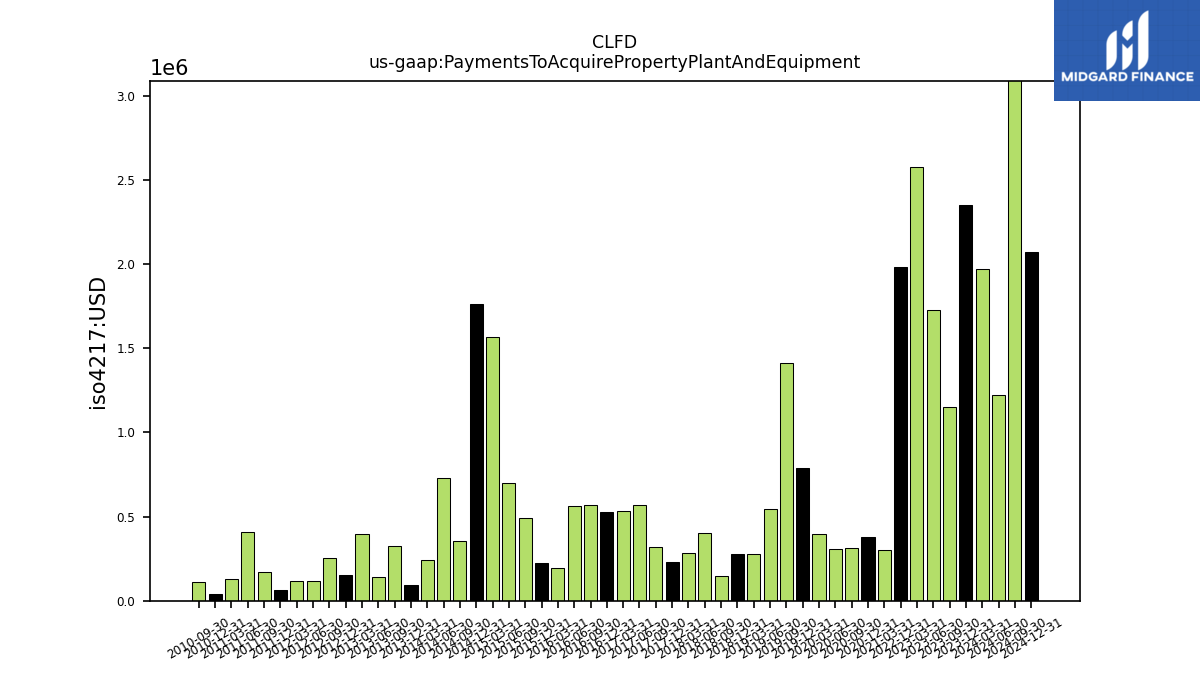
| Payments To Acquire Property Plant And Equipment | 2.35 | 1.15 | 1.73 | 2.58 | 1.98 | NA | NA | NA | NA | NA | NA | 0.30 | 0.38 | 0.31 | 0.31 | 0.39 | 0.79 | 1.41 | 0.55 | 0.28 | 0.28 | 0.15 | 0.40 | 0.29 | 0.23 | 0.32 | 0.57 | 0.54 | 0.53 | 0.57 | 0.56 | 0.19 | 0.23 | 0.49 | 0.70 | 1.56 | 1.76 | 0.36 | 0.73 | 0.24 | 0.09 | 0.33 | 0.14 | 0.40 | 0.15 | 0.25 | 0.12 | 0.12 | 0.06 | 0.17 | 0.41 | 0.13 | 0.04 | 0.11 | NA | |
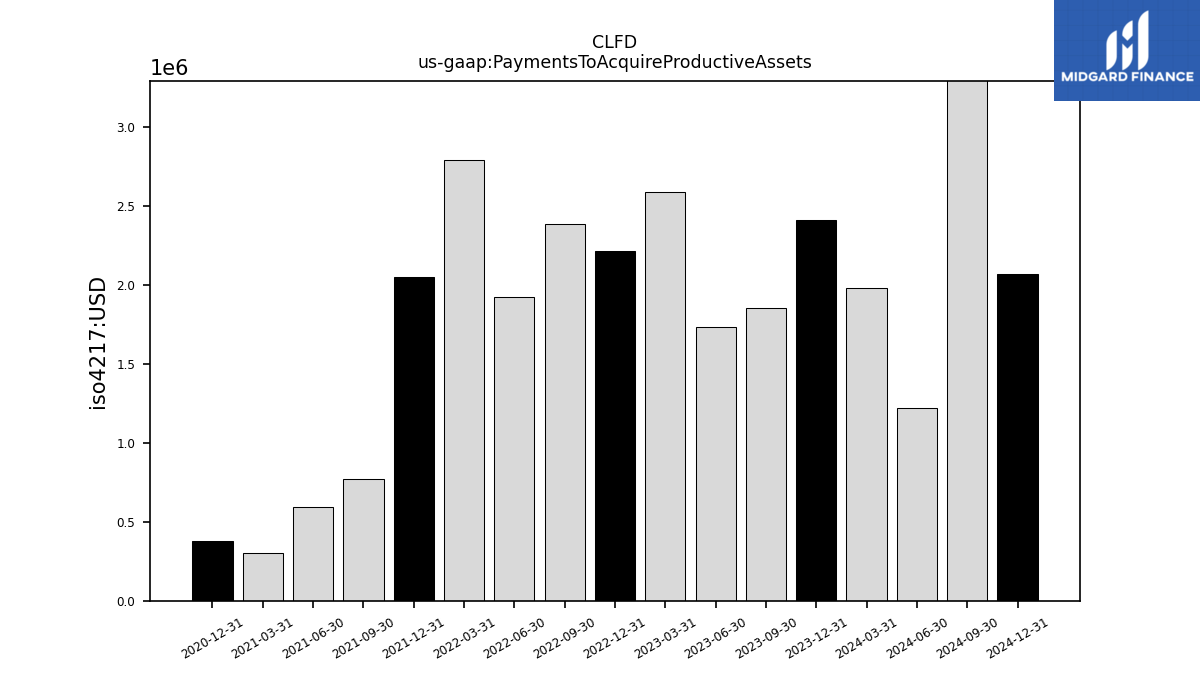
| Payments To Acquire Productive Assets | 2.41 | 1.85 | 1.73 | 2.58 | 2.21 | 2.38 | 1.92 | 2.79 | 2.05 | 0.77 | 0.59 | 0.30 | 0.38 | NA | NA | NA | NA | NA | NA | NA | NA | NA | NA | NA | NA | NA | NA | NA | NA | NA | NA | NA | NA | NA | NA | NA | NA | NA | NA | NA | NA | NA | NA | NA | NA | NA | NA | NA | NA | NA | NA | NA | NA | NA | NA | |
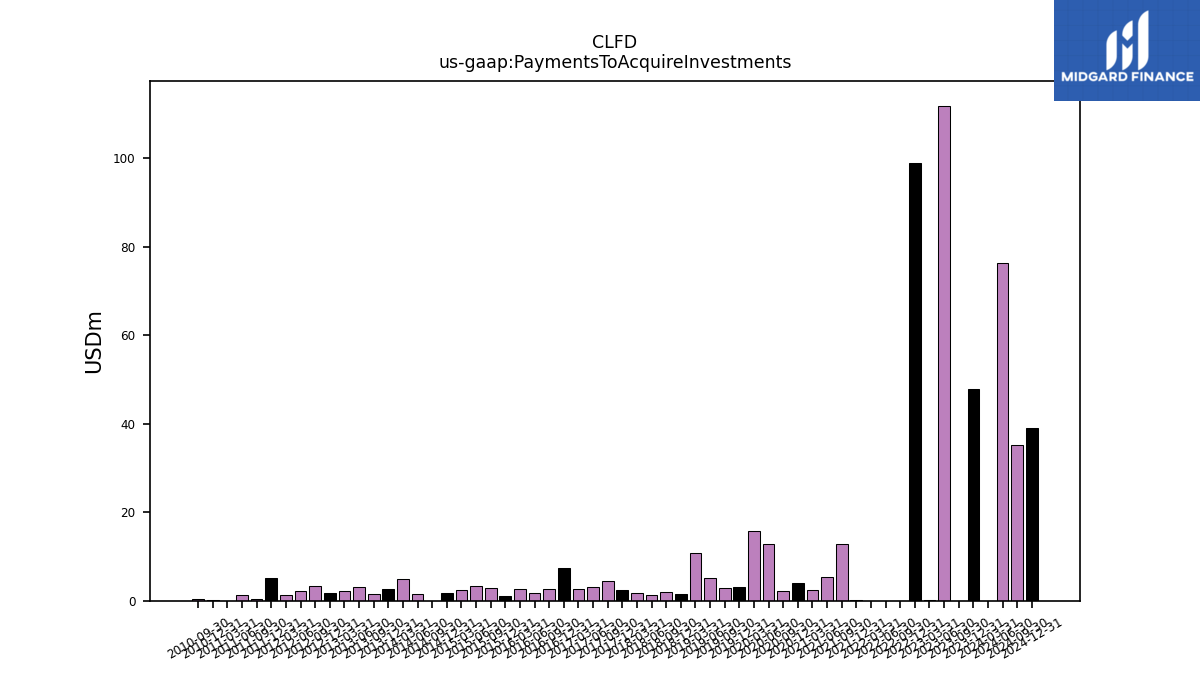
| Payments To Acquire Investments | 47.75 | 0.00 | 111.80 | 0.24 | 98.88 | 0.00 | 0.00 | 0.00 | 0.25 | 12.90 | 5.46 | 2.48 | 3.97 | 2.22 | 12.76 | 15.87 | 3.21 | 2.87 | 5.17 | 10.72 | 1.56 | 1.88 | 1.22 | 1.72 | 2.47 | 4.35 | 3.11 | 2.73 | 7.44 | 2.63 | 1.69 | 2.64 | 1.18 | 2.86 | 3.35 | 2.53 | 1.64 | 0.00 | 1.49 | 4.80 | 2.61 | 1.62 | 3.20 | 2.21 | 1.66 | 3.28 | 2.20 | 1.23 | 5.23 | 0.49 | 1.24 | 0.00 | 0.16 | 0.47 | NA |
| 2023-12-31 | 2023-09-30 | 2023-06-30 | 2023-03-31 | 2022-12-31 | 2022-09-30 | 2022-06-30 | 2022-03-31 | 2021-12-31 | 2021-09-30 | 2021-06-30 | 2021-03-31 | 2020-12-31 | 2020-09-30 | 2020-06-30 | 2020-03-31 | 2019-12-31 | 2019-09-30 | 2019-06-30 | 2019-03-31 | 2018-12-31 | 2018-09-30 | 2018-06-30 | 2018-03-31 | 2017-12-31 | 2017-09-30 | 2017-06-30 | 2017-03-31 | 2016-12-31 | 2016-09-30 | 2016-06-30 | 2016-03-31 | 2015-12-31 | 2015-09-30 | 2015-06-30 | 2015-03-31 | 2014-12-31 | 2014-09-30 | 2014-06-30 | 2014-03-31 | 2013-12-31 | 2013-09-30 | 2013-06-30 | 2013-03-31 | 2012-12-31 | 2012-09-30 | 2012-06-30 | 2012-03-31 | 2011-12-31 | 2011-09-30 | 2011-06-30 | 2011-03-31 | 2010-12-31 | 2010-09-30 | 2010-06-30 | ||
|---|---|---|---|---|---|---|---|---|---|---|---|---|---|---|---|---|---|---|---|---|---|---|---|---|---|---|---|---|---|---|---|---|---|---|---|---|---|---|---|---|---|---|---|---|---|---|---|---|---|---|---|---|---|---|---|---|
| Net Cash Provided By Used In Financing Activities | -12.17 | -0.27 | 0.29 | -0.13 | 113.52 | 10.76 | 0.20 | -0.13 | -0.18 | -0.41 | 0.20 | -0.24 | -0.09 | -0.17 | 0.19 | -0.43 | 0.17 | -0.12 | -0.26 | 0.00 | 0.14 | -0.53 | -1.32 | -0.21 | 0.13 | -1.73 | -2.64 | -0.02 | 0.16 | -2.07 | 1.53 | 0.33 | 0.24 | -0.61 | 0.10 | -0.65 | -0.06 | -0.22 | 0.60 | 0.02 | 0.04 | -0.19 | 0.04 | -0.01 | 0.07 | -0.01 | 0.17 | 0.01 | 0.11 | 0.13 | 0.09 | 0.01 | 0.05 | 0.03 | NA | |
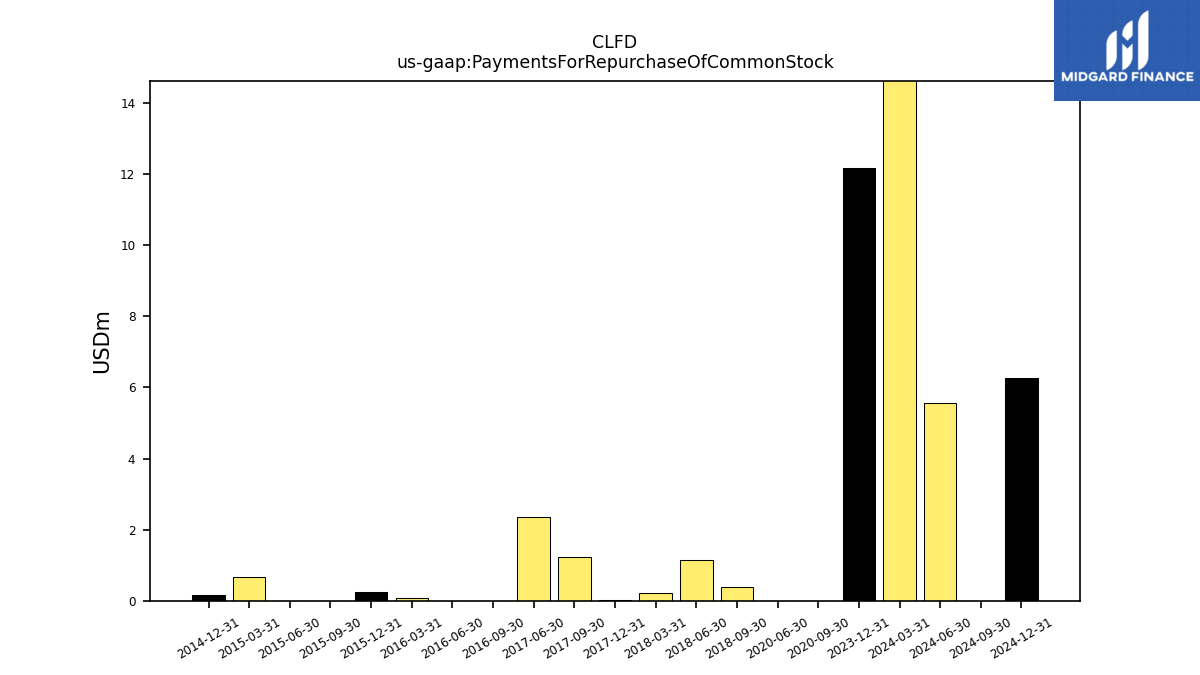
| Payments For Repurchase Of Common Stock | 12.19 | NA | NA | NA | NA | NA | NA | NA | NA | NA | NA | NA | NA | 0.00 | 0.00 | NA | NA | NA | NA | NA | NA | 0.39 | 1.14 | 0.23 | 0.01 | 1.24 | 2.35 | NA | NA | 0.00 | 0.00 | 0.08 | 0.26 | 0.00 | 0.00 | 0.68 | 0.17 | NA | NA | NA | NA | NA | NA | NA | NA | NA | NA | NA | NA | NA | NA | NA | NA | NA | NA |
| 2023-12-31 | 2023-09-30 | 2023-06-30 | 2023-03-31 | 2022-12-31 | 2022-09-30 | 2022-06-30 | 2022-03-31 | 2021-12-31 | 2021-09-30 | 2021-06-30 | 2021-03-31 | 2020-12-31 | 2020-09-30 | 2020-06-30 | 2020-03-31 | 2019-12-31 | 2019-09-30 | 2019-06-30 | 2019-03-31 | 2018-12-31 | 2018-09-30 | 2018-06-30 | 2018-03-31 | 2017-12-31 | 2017-09-30 | 2017-06-30 | 2017-03-31 | 2016-12-31 | 2016-09-30 | 2016-06-30 | 2016-03-31 | 2015-12-31 | 2015-09-30 | 2015-06-30 | 2015-03-31 | 2014-12-31 | 2014-09-30 | 2014-06-30 | 2014-03-31 | 2013-12-31 | 2013-09-30 | 2013-06-30 | 2013-03-31 | 2012-12-31 | 2012-09-30 | 2012-06-30 | 2012-03-31 | 2011-12-31 | 2011-09-30 | 2011-06-30 | 2011-03-31 | 2010-12-31 | 2010-09-30 | 2010-06-30 | ||
|---|---|---|---|---|---|---|---|---|---|---|---|---|---|---|---|---|---|---|---|---|---|---|---|---|---|---|---|---|---|---|---|---|---|---|---|---|---|---|---|---|---|---|---|---|---|---|---|---|---|---|---|---|---|---|---|---|
| Revenues | 34.23 | 49.69 | 61.28 | 71.81 | 85.94 | 95.03 | 71.25 | 53.49 | 51.11 | 45.24 | 38.73 | 29.69 | 27.09 | 27.32 | 25.97 | 20.41 | 19.38 | 23.97 | 21.89 | 19.08 | 20.09 | 22.47 | 21.48 | 16.83 | 16.87 | 18.42 | 19.61 | 17.65 | 18.27 | 21.05 | 21.60 | 16.95 | 15.69 | 15.77 | 18.20 | 12.37 | 13.99 | 14.32 | 14.36 | 13.21 | 16.15 | 19.04 | 13.53 | 10.51 | 10.27 | 10.40 | 10.79 | 7.11 | 9.17 | 10.70 | 10.12 | 7.12 | 7.25 | 7.92 | 6.78 | |
| Revenue From Contract With Customer Excluding Assessed Tax | 34.23 | 49.69 | 61.28 | 71.81 | 85.94 | 95.03 | 71.25 | 53.49 | 51.11 | 45.24 | 38.73 | 29.69 | 27.09 | 27.32 | 25.97 | 20.41 | 19.38 | 23.97 | 21.89 | 19.08 | 20.09 | 22.47 | 21.48 | 16.83 | 16.87 | 18.42 | 19.61 | 17.65 | 18.27 | 21.05 | 21.60 | 16.95 | 15.69 | 15.77 | 18.20 | 12.37 | 13.99 | 14.32 | 14.36 | 13.21 | 16.15 | 19.04 | 13.53 | 10.51 | 10.27 | 10.40 | 10.79 | 7.11 | 9.17 | 10.70 | 10.12 | 7.12 | 7.25 | 7.92 | 6.78 | |
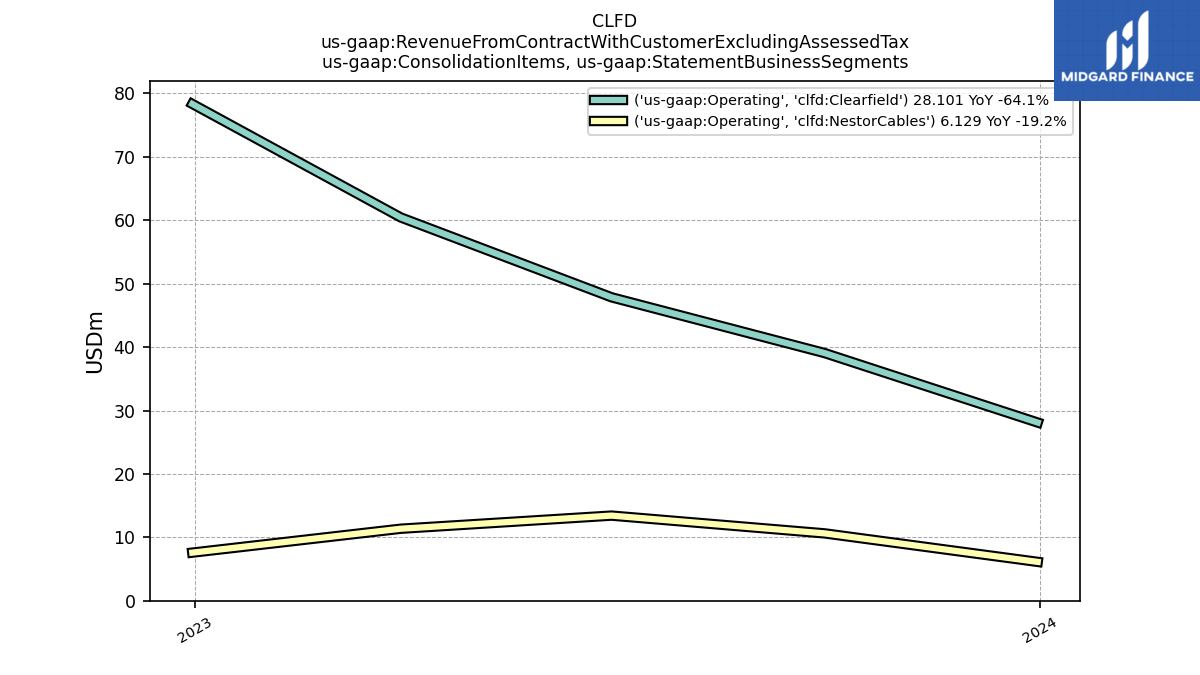
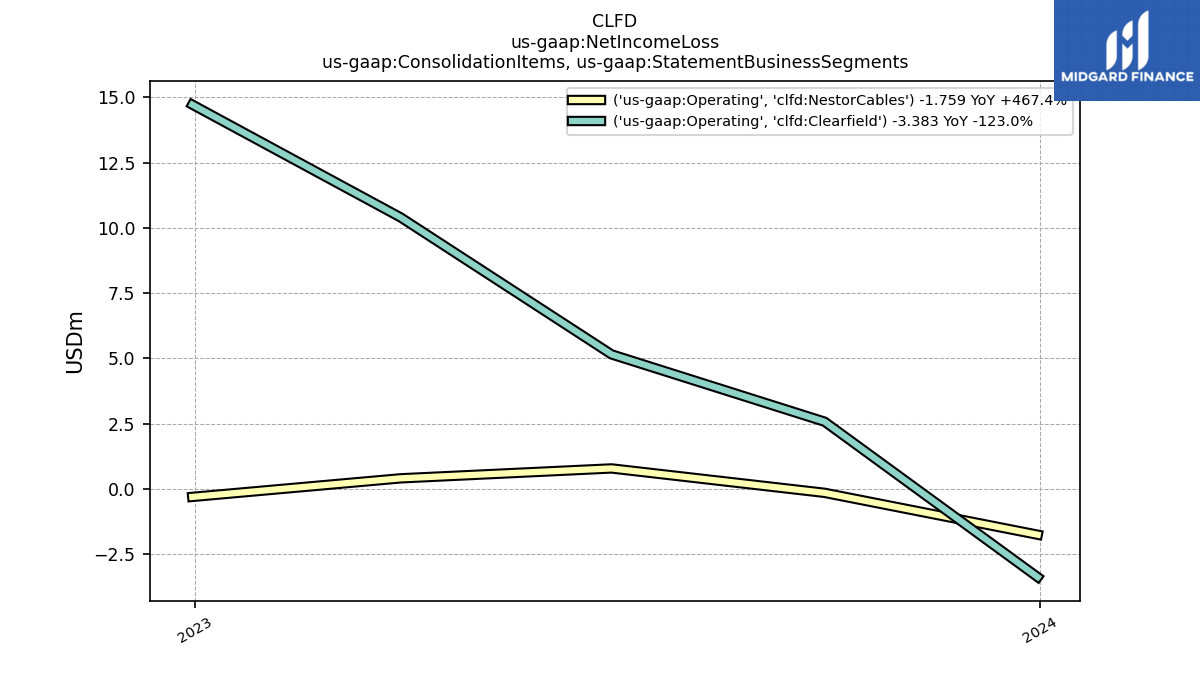
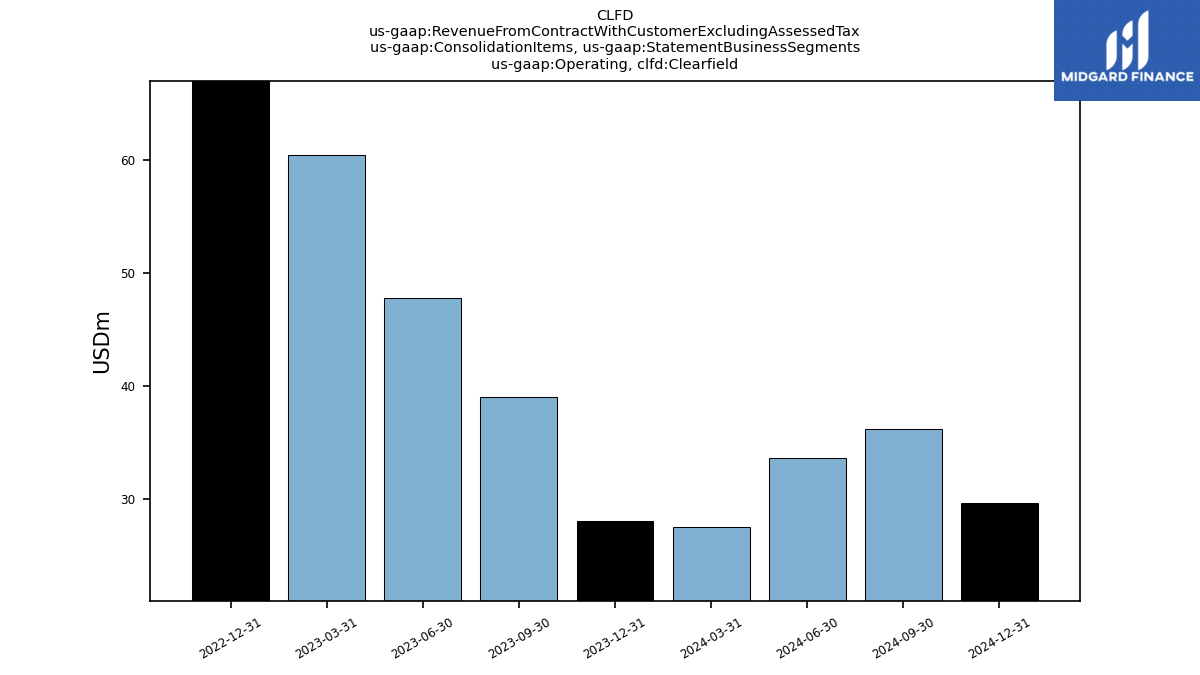
| Operating, Clearfield | 28.10 | 39.06 | 47.86 | 60.45 | 78.36 | NA | NA | NA | NA | NA | NA | NA | NA | NA | NA | NA | NA | NA | NA | NA | NA | NA | NA | NA | NA | NA | NA | NA | NA | NA | NA | NA | NA | NA | NA | NA | NA | NA | NA | NA | NA | NA | NA | NA | NA | NA | NA | NA | NA | NA | NA | NA | NA | NA | NA | |
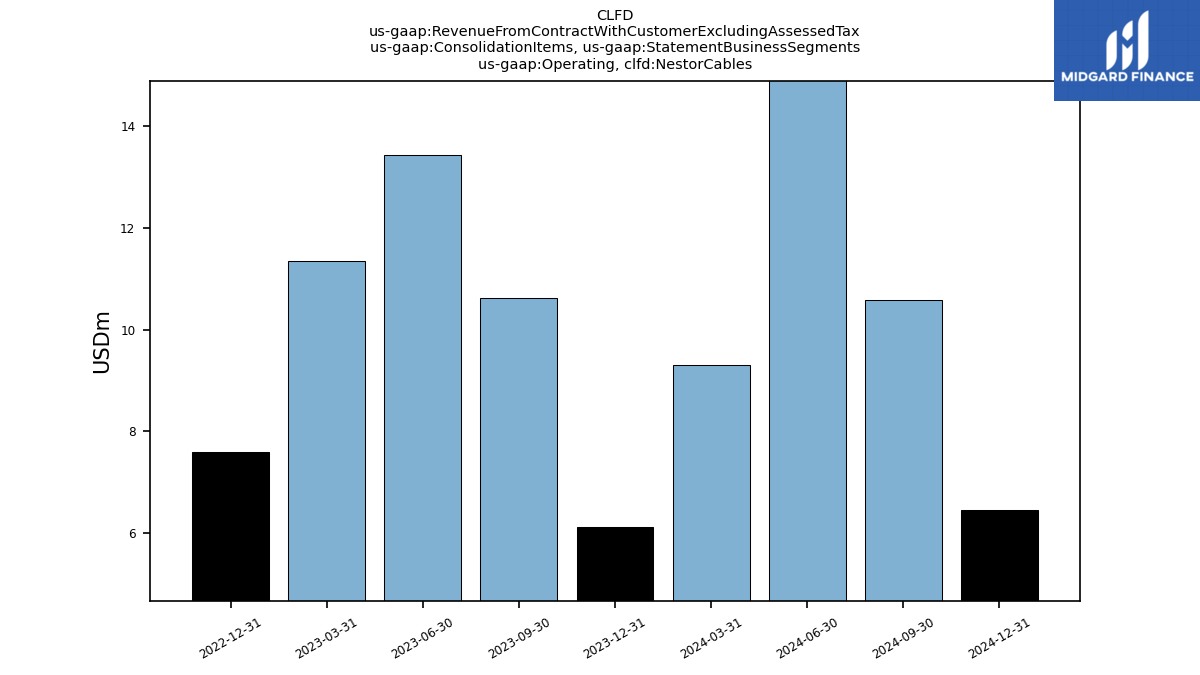
| Operating, Nestor Cables | 6.13 | 10.62 | 13.43 | 11.36 | 7.59 | NA | NA | NA | NA | NA | NA | NA | NA | NA | NA | NA | NA | NA | NA | NA | NA | NA | NA | NA | NA | NA | NA | NA | NA | NA | NA | NA | NA | NA | NA | NA | NA | NA | NA | NA | NA | NA | NA | NA | NA | NA | NA | NA | NA | NA | NA | NA | NA | NA | NA | |
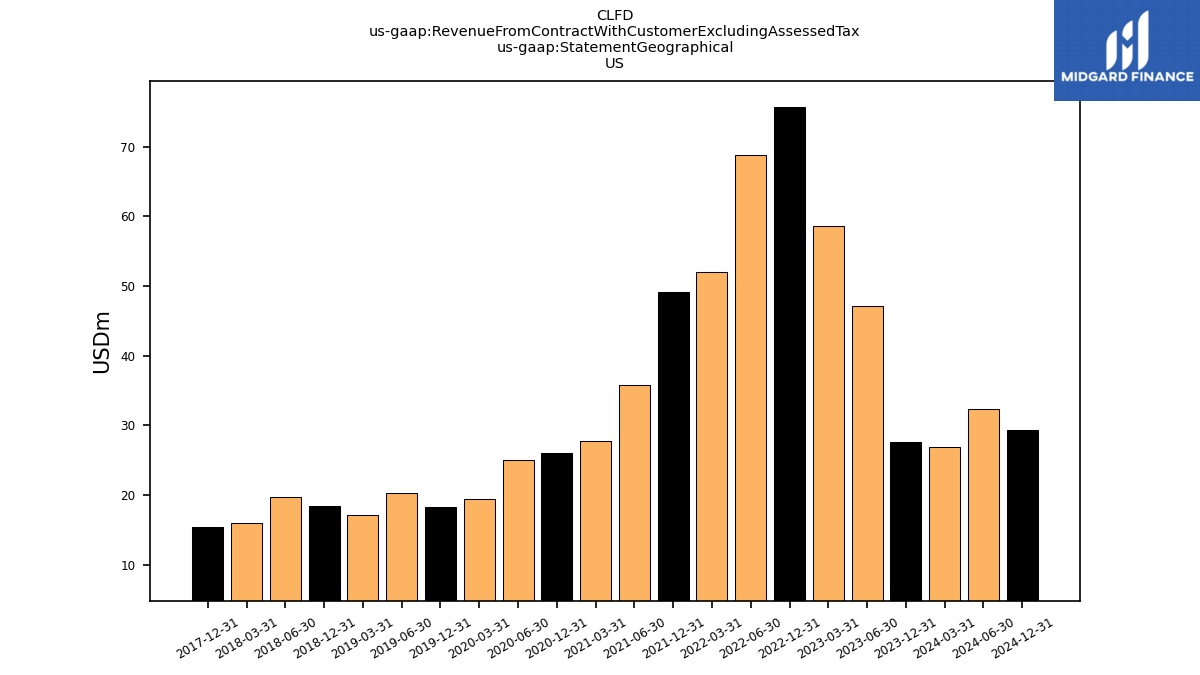
| US | 27.56 | NA | 47.10 | 58.67 | 75.74 | NA | 68.79 | 52.05 | 49.12 | NA | 35.81 | 27.74 | 26.03 | NA | 25.09 | 19.49 | 18.24 | NA | 20.24 | 17.14 | 18.50 | NA | 19.67 | 16.07 | 15.50 | NA | NA | NA | NA | NA | NA | NA | NA | NA | NA | NA | NA | NA | NA | NA | NA | NA | NA | NA | NA | NA | NA | NA | NA | NA | NA | NA | NA | NA | NA | |
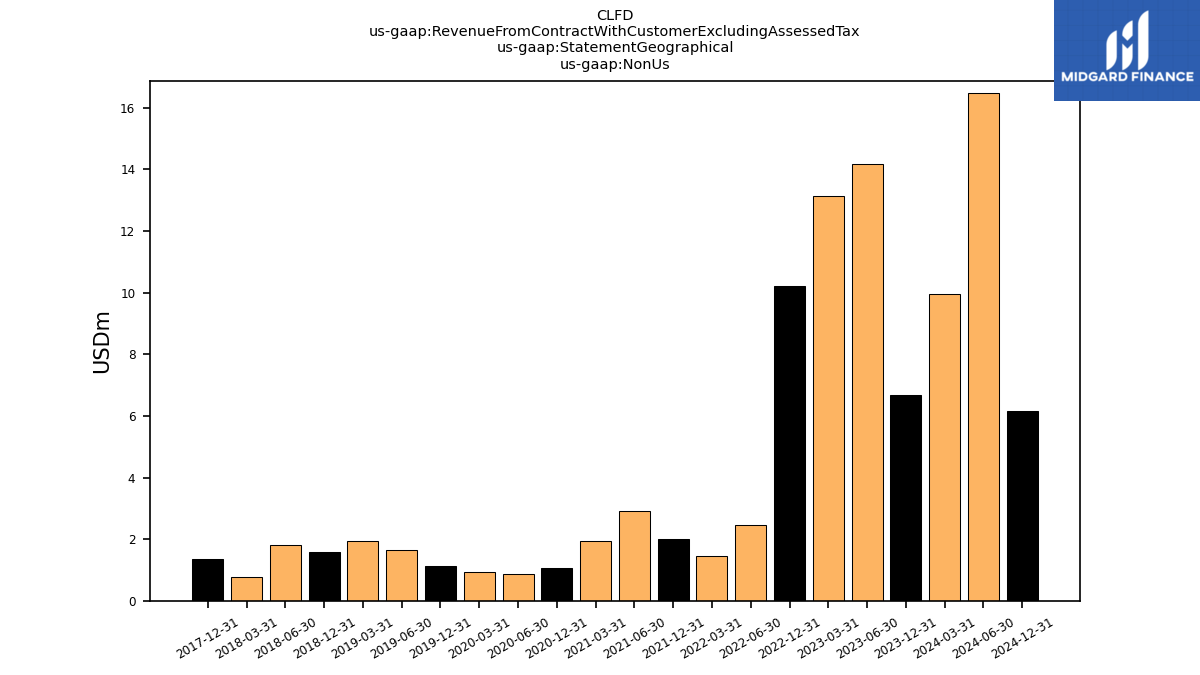
| Non Us | 6.67 | NA | 14.19 | 13.14 | 10.21 | NA | 2.46 | 1.45 | 1.99 | NA | 2.92 | 1.95 | 1.06 | NA | 0.88 | 0.92 | 1.14 | NA | 1.65 | 1.95 | 1.58 | NA | 1.81 | 0.76 | 1.37 | NA | NA | NA | NA | NA | NA | NA | NA | NA | NA | NA | NA | NA | NA | NA | NA | NA | NA | NA | NA | NA | NA | NA | NA | NA | NA | NA | NA | NA | NA |

