
| 2023-12-31 | 2023-09-30 | 2023-06-30 | 2023-03-31 | 2022-12-31 | 2022-09-30 | 2022-06-30 | 2022-03-31 | 2021-12-31 | 2021-09-30 | 2021-06-30 | 2021-03-31 | 2020-12-31 | 2020-09-30 | 2020-06-30 | 2020-03-31 | 2019-12-31 | 2019-09-30 | 2019-06-30 | 2019-03-31 | 2018-12-31 | 2018-09-30 | 2018-06-30 | 2018-03-31 | 2017-12-31 | 2017-09-30 | 2017-06-30 | 2017-03-31 | 2016-12-31 | 2016-09-30 | 2016-06-30 | 2016-03-31 | 2015-12-31 | 2015-09-30 | 2015-06-30 | 2015-03-31 | 2014-12-31 | 2014-09-30 | 2014-06-30 | 2014-03-31 | 2013-12-31 | 2013-09-30 | 2013-06-30 | 2013-03-31 | 2012-12-31 | 2012-09-30 | 2012-06-30 | 2012-03-31 | 2011-12-31 | 2011-09-30 | 2011-06-30 | 2011-03-31 | 2010-12-31 | 2010-09-30 | 2010-06-30 | 2010-03-30 | ||
|---|---|---|---|---|---|---|---|---|---|---|---|---|---|---|---|---|---|---|---|---|---|---|---|---|---|---|---|---|---|---|---|---|---|---|---|---|---|---|---|---|---|---|---|---|---|---|---|---|---|---|---|---|---|---|---|---|---|
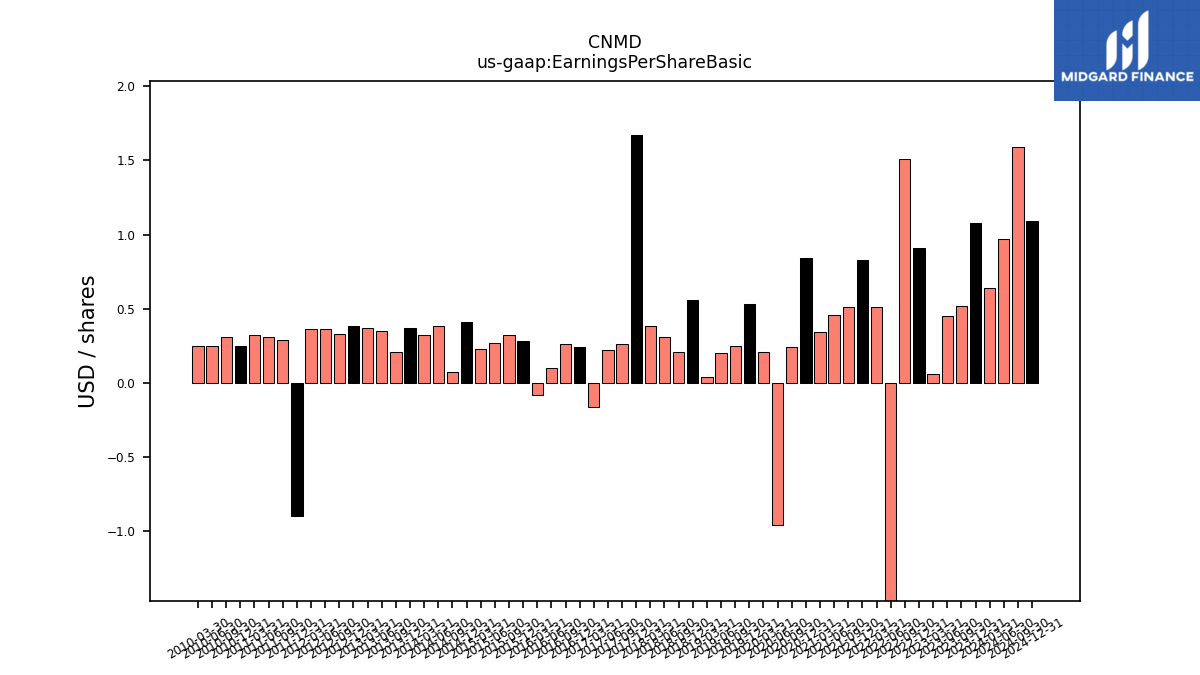
| Earnings Per Share Basic | 1.08 | 0.52 | 0.45 | 0.06 | 0.91 | 1.51 | -5.65 | 0.51 | 0.83 | 0.51 | 0.46 | 0.34 | 0.84 | 0.24 | -0.96 | 0.21 | 0.53 | 0.25 | 0.20 | 0.04 | 0.56 | 0.21 | 0.31 | 0.38 | 1.67 | 0.26 | 0.22 | -0.16 | 0.24 | 0.26 | 0.10 | -0.08 | 0.28 | 0.32 | 0.27 | 0.23 | 0.41 | 0.07 | 0.38 | 0.32 | 0.37 | 0.21 | 0.35 | 0.37 | 0.38 | 0.33 | 0.36 | 0.36 | -0.90 | 0.29 | 0.31 | 0.32 | 0.25 | 0.31 | 0.25 | 0.25 | |
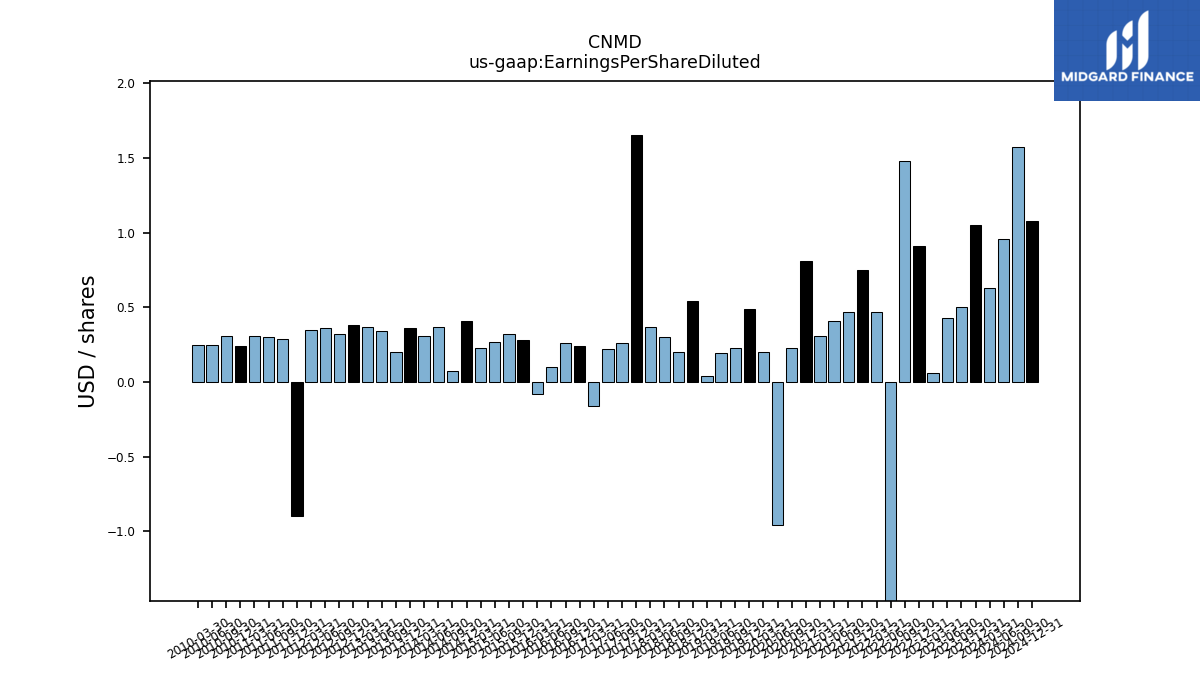
| Earnings Per Share Diluted | 1.05 | 0.50 | 0.43 | 0.06 | 0.91 | 1.48 | -5.65 | 0.47 | 0.75 | 0.47 | 0.41 | 0.31 | 0.81 | 0.23 | -0.96 | 0.20 | 0.49 | 0.23 | 0.19 | 0.04 | 0.54 | 0.20 | 0.30 | 0.37 | 1.65 | 0.26 | 0.22 | -0.16 | 0.24 | 0.26 | 0.10 | -0.08 | 0.28 | 0.32 | 0.27 | 0.23 | 0.41 | 0.07 | 0.37 | 0.31 | 0.36 | 0.20 | 0.34 | 0.37 | 0.38 | 0.32 | 0.36 | 0.35 | -0.90 | 0.29 | 0.30 | 0.31 | 0.24 | 0.31 | 0.25 | 0.25 |
| 2023-12-31 | 2023-09-30 | 2023-06-30 | 2023-03-31 | 2022-12-31 | 2022-09-30 | 2022-06-30 | 2022-03-31 | 2021-12-31 | 2021-09-30 | 2021-06-30 | 2021-03-31 | 2020-12-31 | 2020-09-30 | 2020-06-30 | 2020-03-31 | 2019-12-31 | 2019-09-30 | 2019-06-30 | 2019-03-31 | 2018-12-31 | 2018-09-30 | 2018-06-30 | 2018-03-31 | 2017-12-31 | 2017-09-30 | 2017-06-30 | 2017-03-31 | 2016-12-31 | 2016-09-30 | 2016-06-30 | 2016-03-31 | 2015-12-31 | 2015-09-30 | 2015-06-30 | 2015-03-31 | 2014-12-31 | 2014-09-30 | 2014-06-30 | 2014-03-31 | 2013-12-31 | 2013-09-30 | 2013-06-30 | 2013-03-31 | 2012-12-31 | 2012-09-30 | 2012-06-30 | 2012-03-31 | 2011-12-31 | 2011-09-30 | 2011-06-30 | 2011-03-31 | 2010-12-31 | 2010-09-30 | 2010-06-30 | 2010-03-30 | ||
|---|---|---|---|---|---|---|---|---|---|---|---|---|---|---|---|---|---|---|---|---|---|---|---|---|---|---|---|---|---|---|---|---|---|---|---|---|---|---|---|---|---|---|---|---|---|---|---|---|---|---|---|---|---|---|---|---|---|
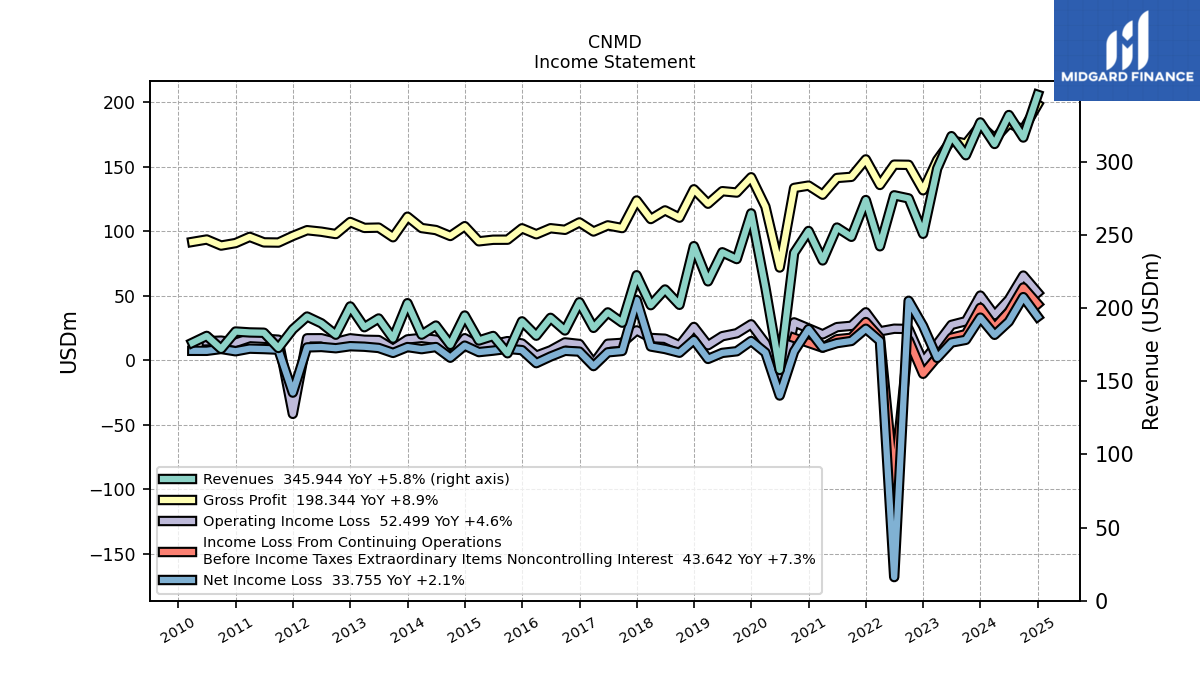
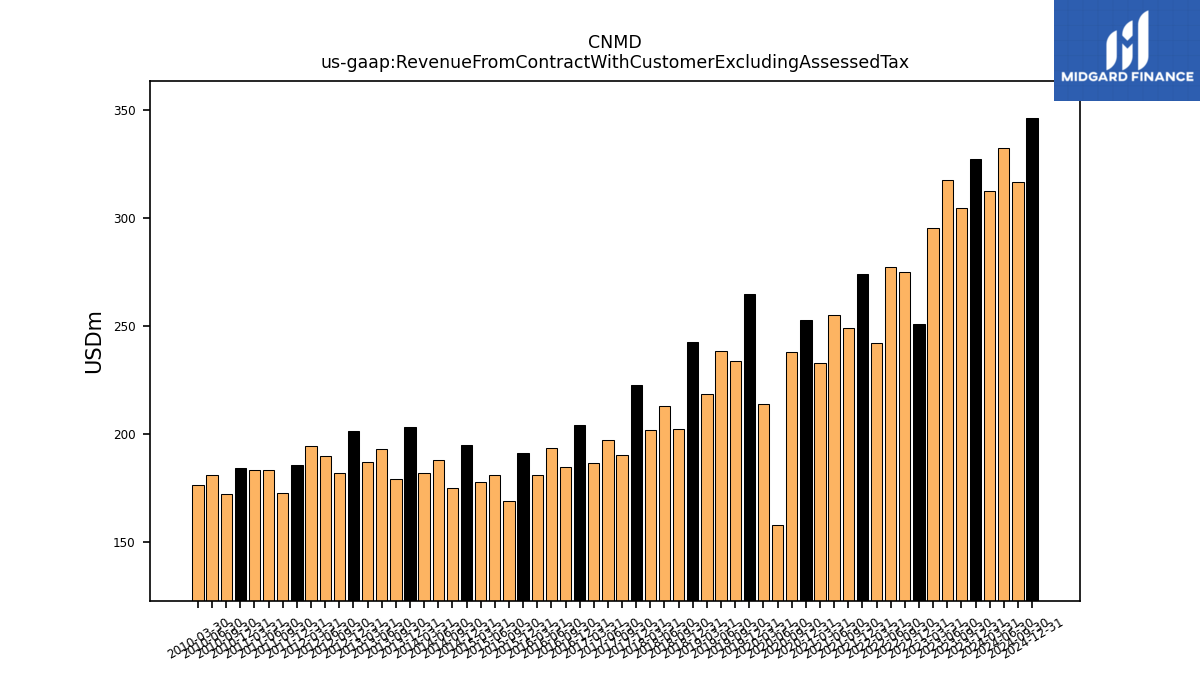
| Revenue From Contract With Customer Excluding Assessed Tax | 327.05 | 304.58 | 317.65 | 295.47 | 250.87 | 275.09 | 277.19 | 242.33 | 273.97 | 248.83 | 255.16 | 232.68 | 252.83 | 237.84 | 157.78 | 214.01 | 264.87 | 233.59 | 238.26 | 218.38 | 242.44 | 202.31 | 212.82 | 202.06 | 222.56 | 190.12 | 197.15 | 186.57 | 204.09 | 184.79 | 193.43 | 181.20 | 191.02 | 169.18 | 181.03 | 177.94 | 195.00 | 174.96 | 188.15 | 181.94 | 203.44 | 179.25 | 192.99 | 187.01 | 201.24 | 181.88 | 189.69 | 194.32 | 185.58 | 172.81 | 183.24 | 183.45 | 184.08 | 172.19 | 181.09 | 176.37 | |
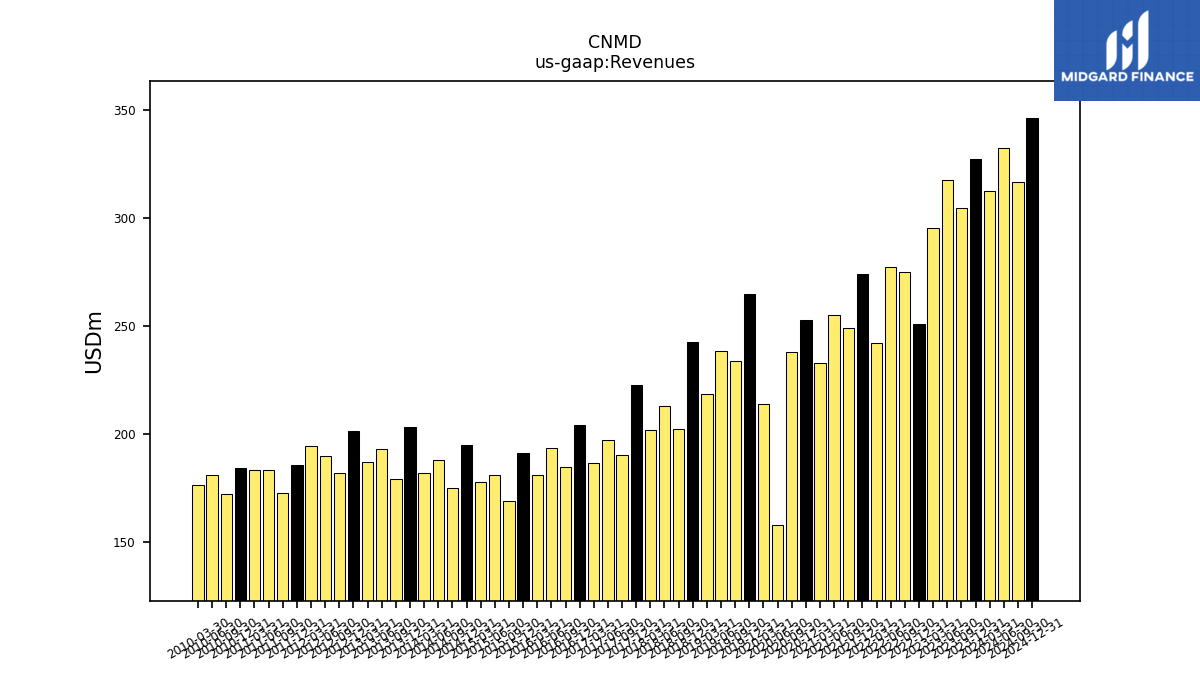
| Revenues | 327.05 | 304.58 | 317.65 | 295.47 | 250.87 | 275.09 | 277.19 | 242.33 | 273.97 | 248.83 | 255.16 | 232.68 | 252.83 | 237.84 | 157.78 | 214.01 | 264.87 | 233.59 | 238.26 | 218.38 | 242.44 | 202.31 | 212.82 | 202.06 | 222.56 | 190.12 | 197.15 | 186.57 | 204.09 | 184.79 | 193.43 | 181.20 | 191.02 | 169.18 | 181.03 | 177.94 | 195.00 | 174.96 | 188.15 | 181.94 | 203.44 | 179.25 | 192.99 | 187.01 | 201.24 | 181.88 | 189.69 | 194.32 | 185.58 | 172.81 | 183.24 | 183.45 | 184.08 | 172.19 | 181.09 | 176.37 | |
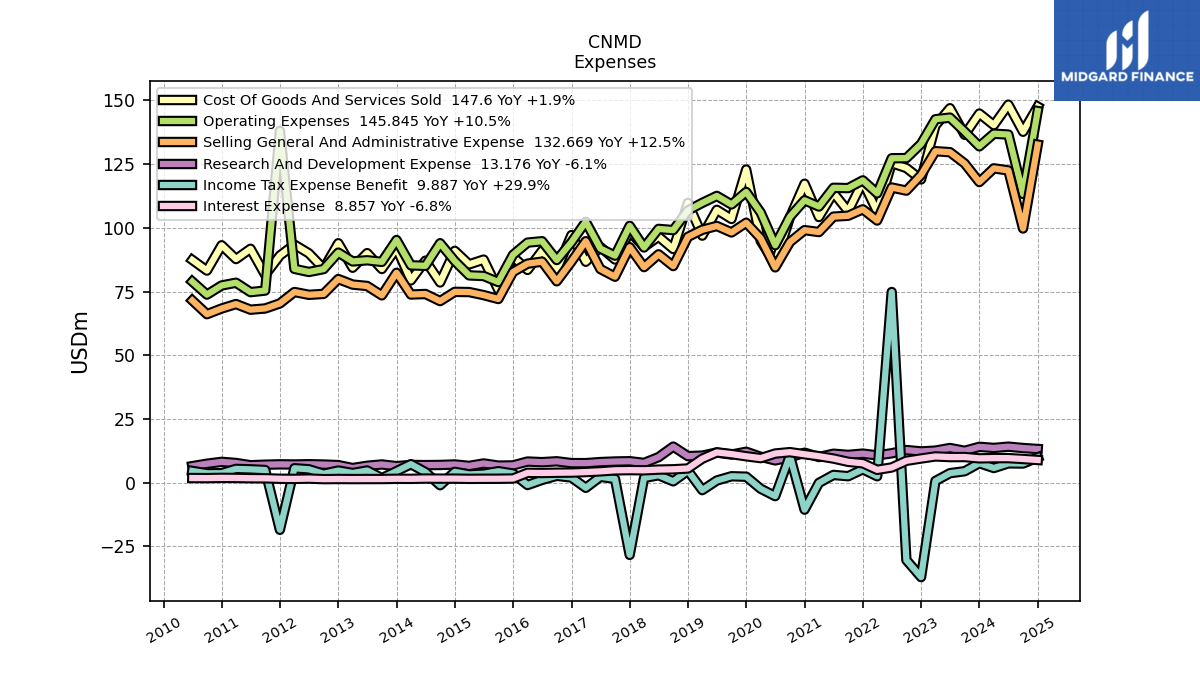
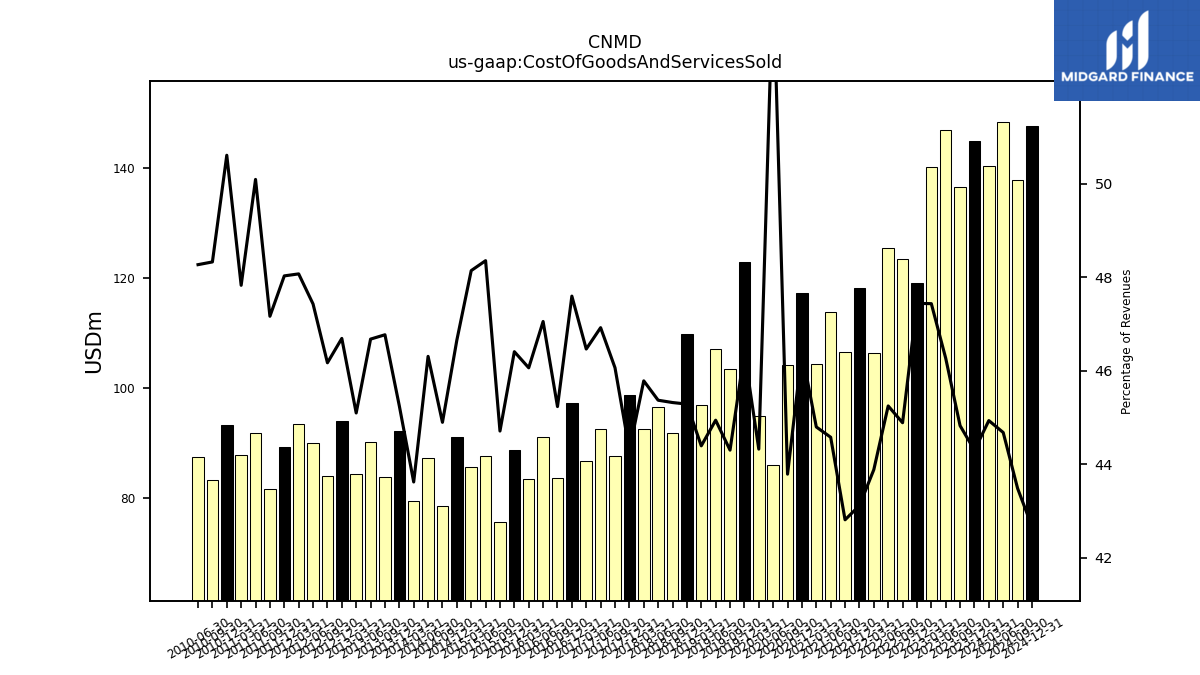
| Cost Of Goods And Services Sold | 144.87 | 136.52 | 146.96 | 140.15 | 119.00 | 123.47 | 125.41 | 106.34 | 118.11 | 106.52 | 113.74 | 104.23 | 117.31 | 104.14 | 85.86 | 94.85 | 122.89 | 103.48 | 107.07 | 96.94 | 109.79 | 91.68 | 96.55 | 92.51 | 98.60 | 87.57 | 92.50 | 86.68 | 97.14 | 83.58 | 91.01 | 83.46 | 88.64 | 75.64 | 87.53 | 85.66 | 90.97 | 78.55 | 87.12 | 79.36 | 92.05 | 83.83 | 90.08 | 84.33 | 93.96 | 83.97 | 89.96 | 93.41 | 89.12 | 81.50 | 91.78 | 87.73 | 93.15 | 83.21 | 87.40 | NA | |
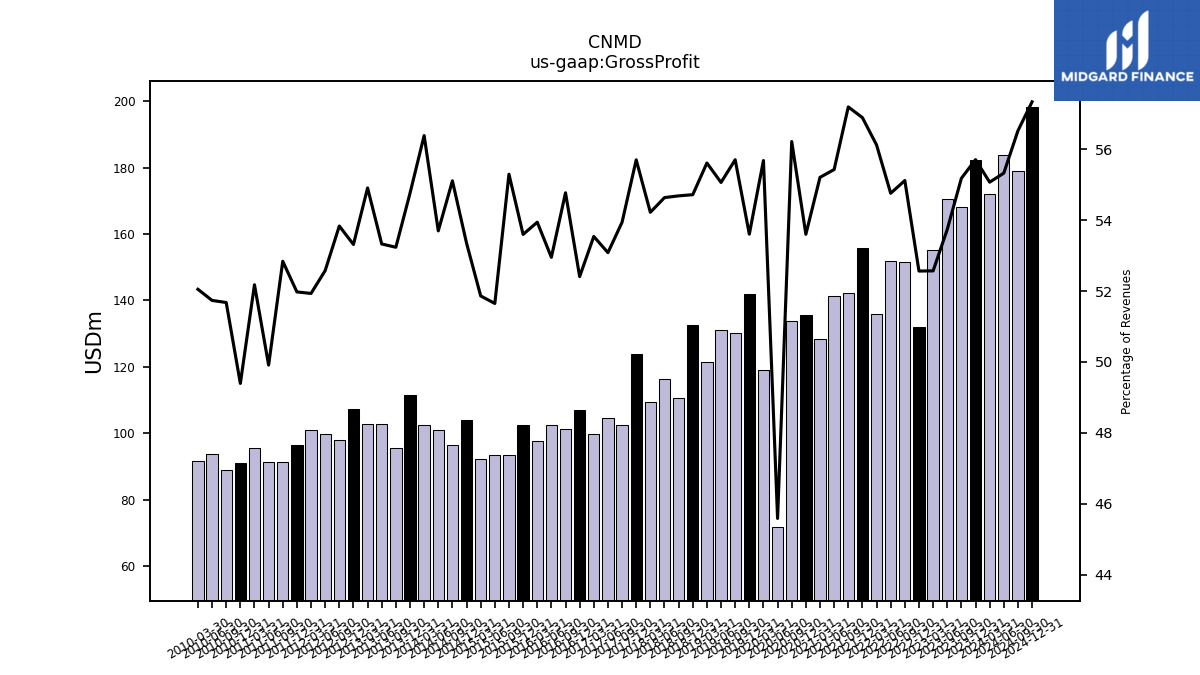
| Gross Profit | 182.18 | 168.06 | 170.69 | 155.32 | 131.86 | 151.62 | 151.78 | 135.99 | 155.86 | 142.31 | 141.42 | 128.45 | 135.51 | 133.70 | 71.93 | 119.16 | 141.97 | 130.11 | 131.19 | 121.44 | 132.66 | 110.63 | 116.27 | 109.56 | 123.96 | 102.55 | 104.65 | 99.89 | 106.96 | 101.21 | 102.42 | 97.74 | 102.38 | 93.55 | 93.50 | 92.28 | 104.03 | 96.41 | 101.03 | 102.58 | 111.39 | 95.42 | 102.92 | 102.68 | 107.29 | 97.91 | 99.73 | 100.91 | 96.45 | 91.31 | 91.45 | 95.72 | 90.92 | 88.98 | 93.68 | 91.80 | |
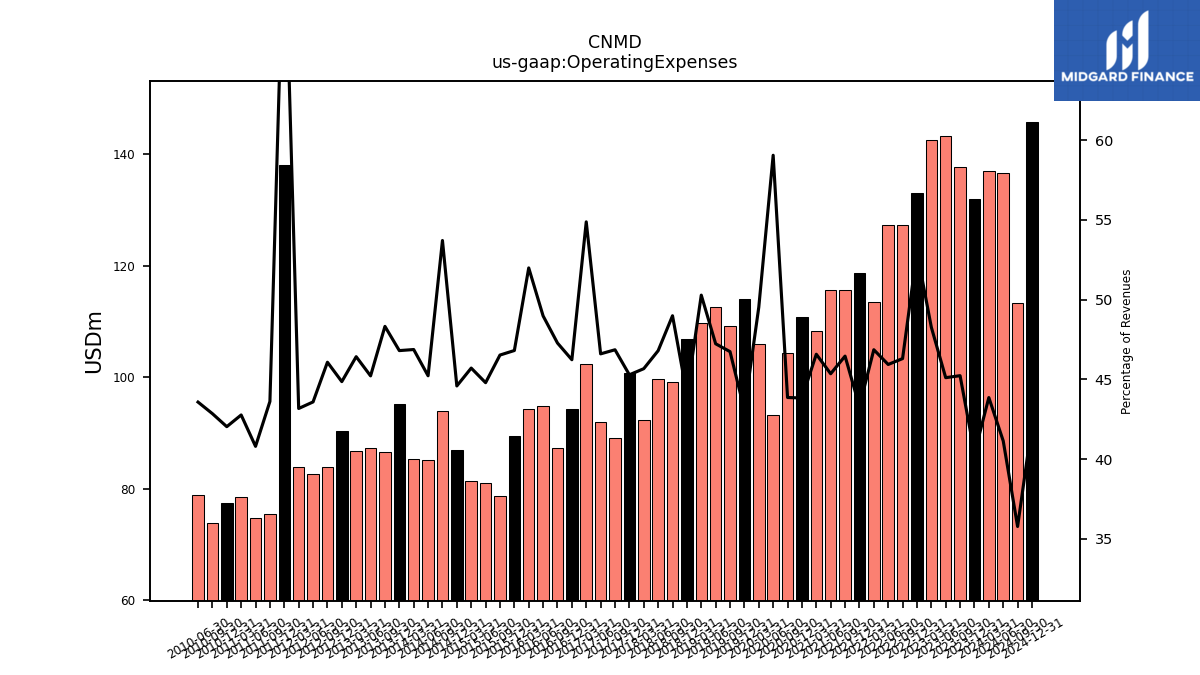
| Operating Expenses | 131.99 | 137.76 | 143.27 | 142.62 | 132.96 | 127.37 | 127.32 | 113.55 | 118.64 | 115.59 | 115.72 | 108.37 | 110.81 | 104.32 | 93.17 | 105.99 | 114.09 | 109.17 | 112.53 | 109.80 | 106.83 | 99.11 | 99.59 | 92.28 | 100.78 | 89.08 | 91.87 | 102.38 | 94.35 | 87.36 | 94.74 | 94.20 | 89.41 | 78.71 | 81.08 | 81.33 | 86.94 | 93.97 | 85.09 | 85.27 | 95.21 | 86.62 | 87.26 | 86.81 | 90.27 | 83.80 | 82.67 | 83.89 | 138.08 | 75.37 | 74.76 | 78.45 | 77.37 | 73.78 | 78.91 | NA | |
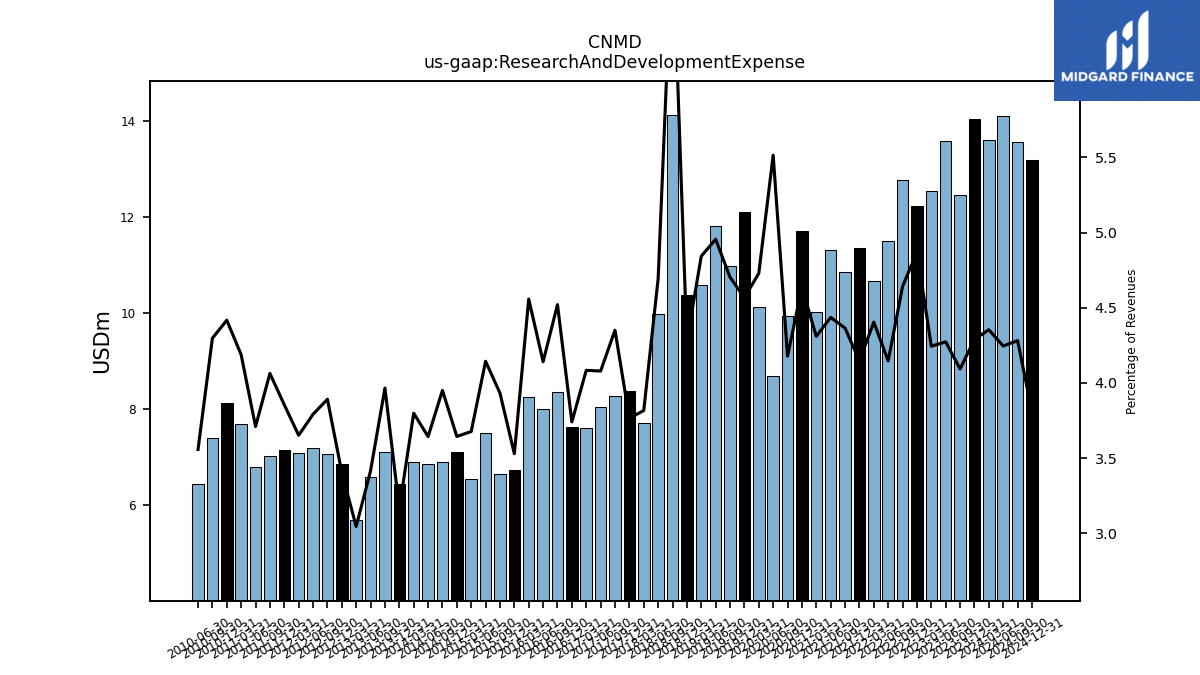
| Research And Development Expense | 14.03 | 12.46 | 13.57 | 12.54 | 12.22 | 12.77 | 11.49 | 10.67 | 11.36 | 10.86 | 11.32 | 10.03 | 11.72 | 9.94 | 8.70 | 10.12 | 12.09 | 10.98 | 11.81 | 10.57 | 10.37 | 14.12 | 9.98 | 7.71 | 8.38 | 8.27 | 8.04 | 7.62 | 7.63 | 8.35 | 8.01 | 8.26 | 6.74 | 6.65 | 7.50 | 6.54 | 7.11 | 6.91 | 6.85 | 6.91 | 6.44 | 7.11 | 6.59 | 5.69 | 6.85 | 7.08 | 7.19 | 7.09 | 7.15 | 7.02 | 6.80 | 7.68 | 8.13 | 7.40 | 6.44 | NA | |
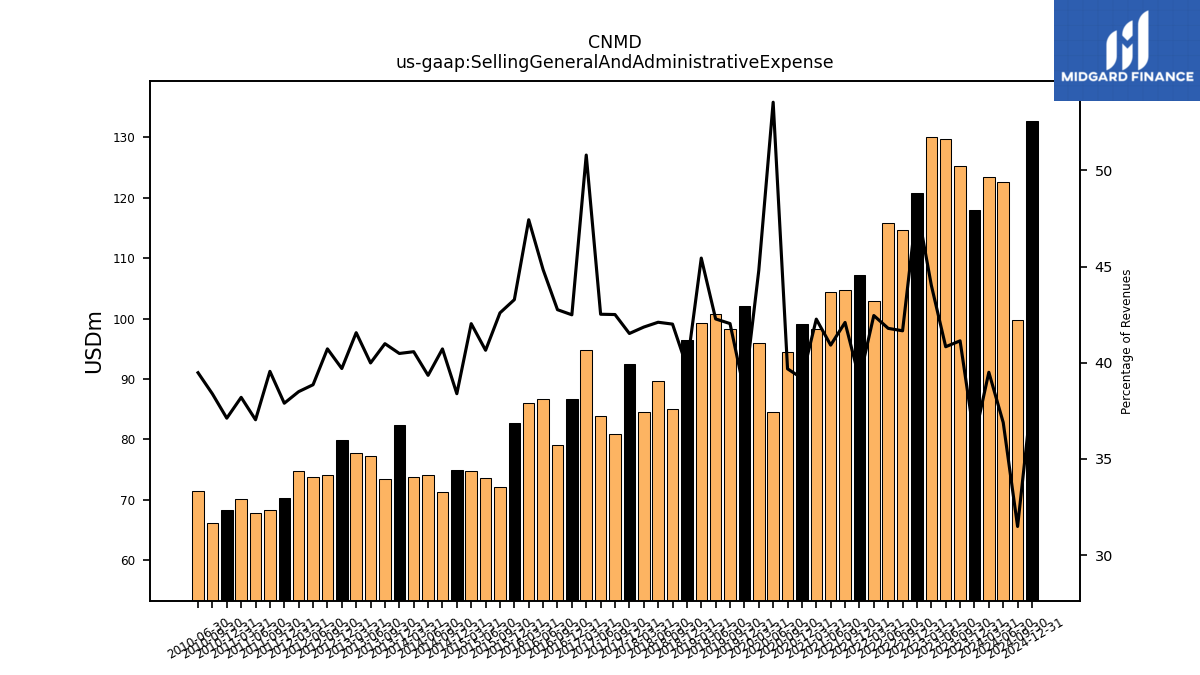
| Selling General And Administrative Expense | 117.96 | 125.30 | 129.70 | 130.08 | 120.74 | 114.60 | 115.83 | 102.88 | 107.28 | 104.74 | 104.40 | 98.34 | 99.10 | 94.38 | 84.47 | 95.87 | 102.00 | 98.19 | 100.73 | 99.23 | 96.46 | 84.98 | 89.60 | 84.57 | 92.40 | 80.81 | 83.83 | 94.76 | 86.72 | 79.01 | 86.73 | 85.94 | 82.67 | 72.06 | 73.58 | 74.79 | 74.86 | 71.24 | 74.03 | 73.82 | 82.36 | 73.48 | 77.17 | 77.72 | 79.89 | 74.06 | 73.71 | 74.81 | 70.33 | 68.35 | 67.86 | 70.08 | 68.33 | 66.09 | 71.49 | NA | |
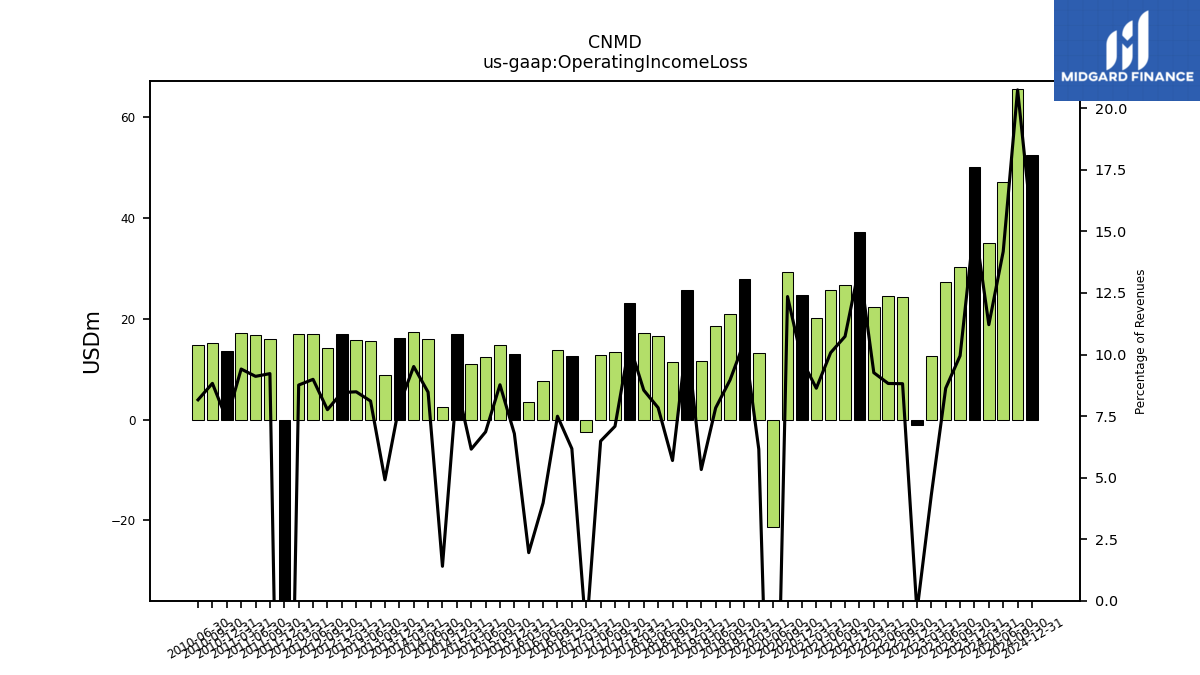
| Operating Income Loss | 50.19 | 30.30 | 27.42 | 12.70 | -1.09 | 24.25 | 24.46 | 22.44 | 37.22 | 26.71 | 25.71 | 20.08 | 24.70 | 29.38 | -21.25 | 13.17 | 27.88 | 20.94 | 18.66 | 11.64 | 25.82 | 11.52 | 16.68 | 17.28 | 23.18 | 13.47 | 12.78 | -2.49 | 12.61 | 13.85 | 7.68 | 3.54 | 12.97 | 14.84 | 12.42 | 10.95 | 17.09 | 2.45 | 15.94 | 17.31 | 16.18 | 8.80 | 15.65 | 15.87 | 17.02 | 14.11 | 17.06 | 17.02 | -41.63 | 15.94 | 16.70 | 17.26 | 13.55 | 15.20 | 14.78 | NA | |
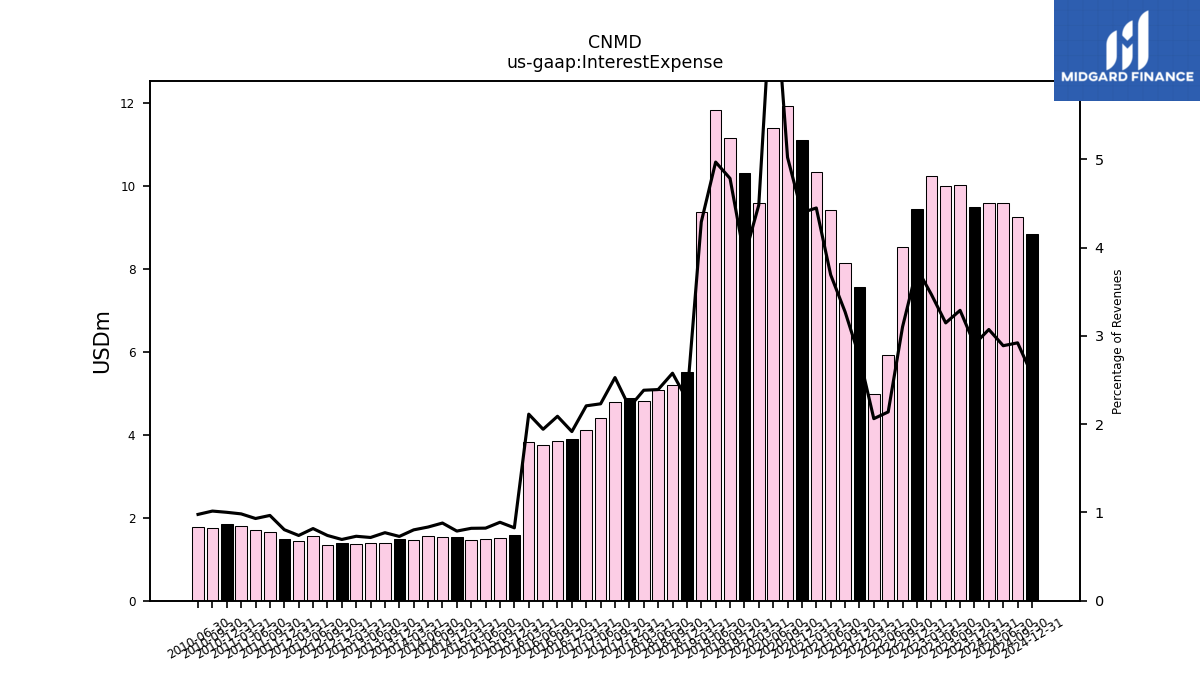
| Interest Expense | 9.50 | 10.02 | 10.00 | 10.26 | 9.44 | 8.54 | 5.93 | 5.00 | 7.57 | 8.14 | 9.42 | 10.35 | 11.11 | 11.94 | 11.40 | 9.59 | 10.32 | 11.17 | 11.84 | 9.37 | 5.53 | 5.21 | 5.09 | 4.82 | 4.88 | 4.81 | 4.40 | 4.12 | 3.91 | 3.86 | 3.76 | 3.83 | 1.58 | 1.50 | 1.49 | 1.46 | 1.54 | 1.54 | 1.57 | 1.46 | 1.48 | 1.38 | 1.38 | 1.37 | 1.40 | 1.34 | 1.55 | 1.44 | 1.49 | 1.67 | 1.71 | 1.80 | 1.84 | 1.75 | 1.77 | NA | |
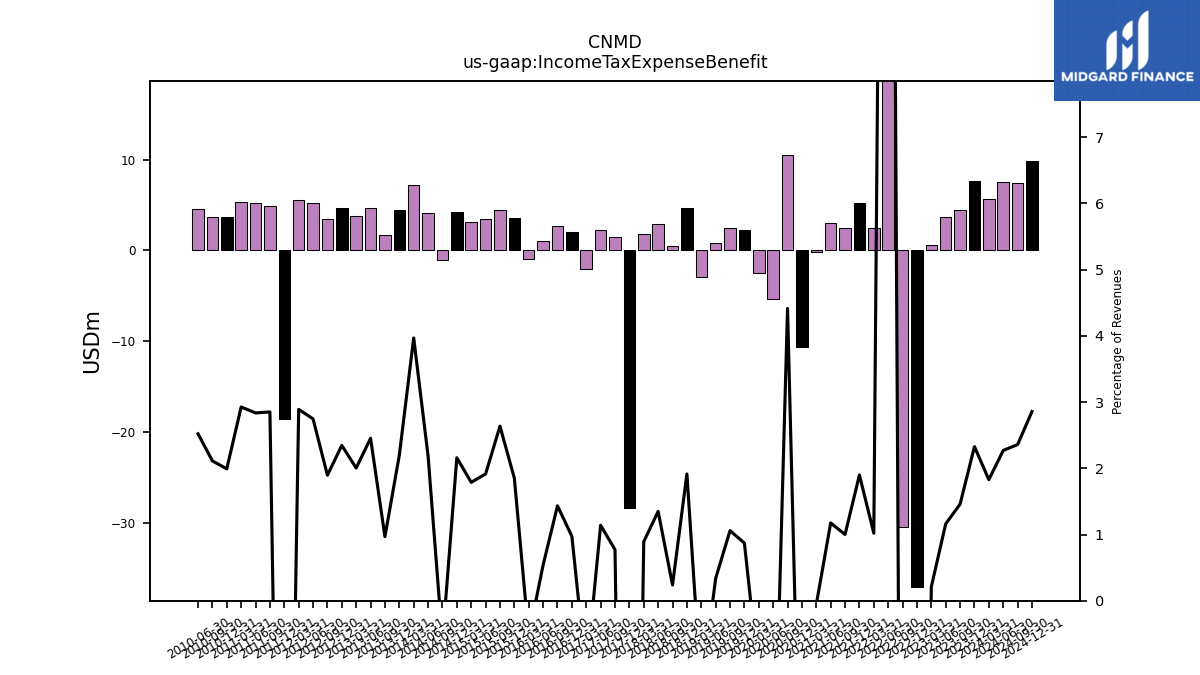
| Income Tax Expense Benefit | 7.61 | 4.44 | 3.69 | 0.62 | -37.12 | -30.44 | 74.81 | 2.47 | 5.20 | 2.49 | 3.00 | -0.13 | -10.64 | 10.50 | -5.34 | -2.44 | 2.31 | 2.47 | 0.80 | -2.98 | 4.64 | 0.48 | 2.87 | 1.80 | -28.40 | 1.47 | 2.25 | -2.07 | 1.99 | 2.65 | 1.04 | -0.97 | 3.54 | 4.46 | 3.47 | 3.18 | 4.21 | -1.06 | 4.11 | 7.22 | 4.47 | 1.74 | 4.74 | 3.75 | 4.72 | 3.45 | 5.21 | 5.62 | -18.55 | 4.93 | 5.20 | 5.37 | 3.67 | 3.64 | 4.57 | NA | |
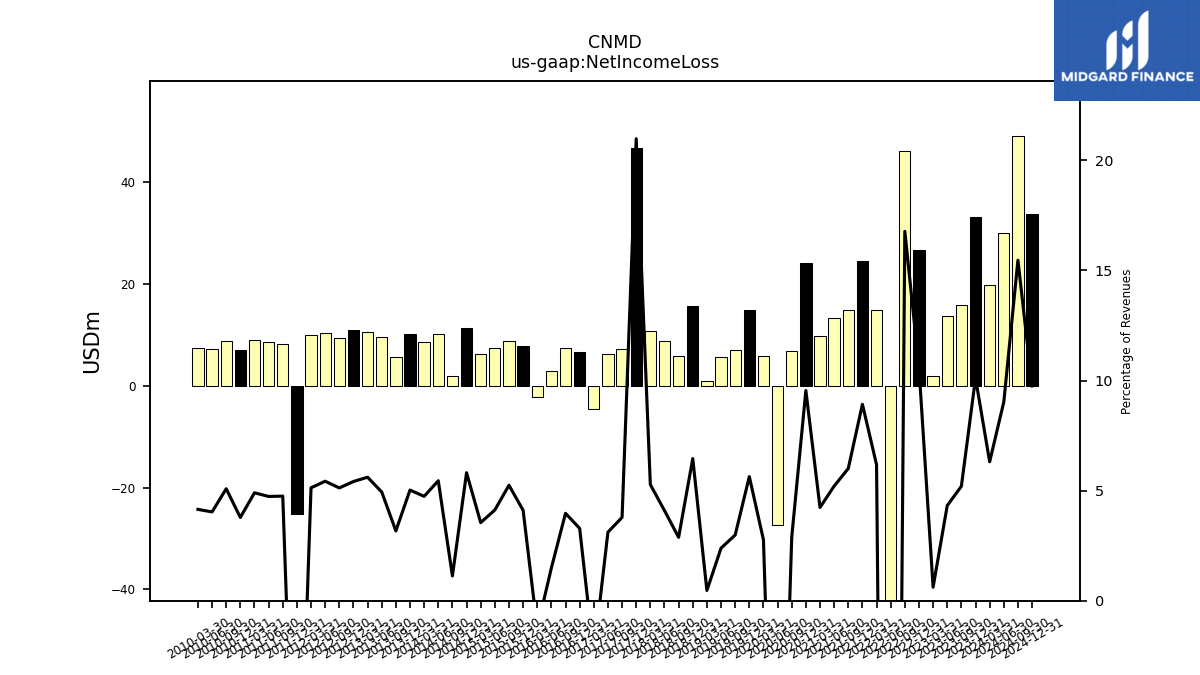
| Net Income Loss | 33.07 | 15.84 | 13.73 | 1.82 | 26.58 | 46.15 | -168.29 | 14.97 | 24.44 | 14.95 | 13.29 | 9.86 | 24.14 | 6.85 | -27.40 | 5.93 | 14.93 | 6.97 | 5.70 | 1.02 | 15.65 | 5.83 | 8.72 | 10.66 | 46.70 | 7.20 | 6.14 | -4.54 | 6.71 | 7.34 | 2.88 | -2.27 | 7.85 | 8.87 | 7.46 | 6.31 | 11.34 | 1.97 | 10.26 | 8.63 | 10.23 | 5.69 | 9.53 | 10.49 | 10.90 | 9.32 | 10.30 | 9.97 | -25.13 | 8.21 | 8.68 | 8.99 | 6.96 | 8.76 | 7.31 | 7.32 |
| 2023-12-31 | 2023-09-30 | 2023-06-30 | 2023-03-31 | 2022-12-31 | 2022-09-30 | 2022-06-30 | 2022-03-31 | 2021-12-31 | 2021-09-30 | 2021-06-30 | 2021-03-31 | 2020-12-31 | 2020-09-30 | 2020-06-30 | 2020-03-31 | 2019-12-31 | 2019-09-30 | 2019-06-30 | 2019-03-31 | 2018-12-31 | 2018-09-30 | 2018-06-30 | 2018-03-31 | 2017-12-31 | 2017-09-30 | 2017-06-30 | 2017-03-31 | 2016-12-31 | 2016-09-30 | 2016-06-30 | 2016-03-31 | 2015-12-31 | 2015-09-30 | 2015-06-30 | 2015-03-31 | 2014-12-31 | 2014-09-30 | 2014-06-30 | 2014-03-31 | 2013-12-31 | 2013-09-30 | 2013-06-30 | 2013-03-31 | 2012-12-31 | 2012-09-30 | 2012-06-30 | 2012-03-31 | 2011-12-31 | 2011-09-30 | 2011-06-30 | 2011-03-31 | 2010-12-31 | 2010-09-30 | 2010-06-30 | 2010-03-30 | ||
|---|---|---|---|---|---|---|---|---|---|---|---|---|---|---|---|---|---|---|---|---|---|---|---|---|---|---|---|---|---|---|---|---|---|---|---|---|---|---|---|---|---|---|---|---|---|---|---|---|---|---|---|---|---|---|---|---|---|
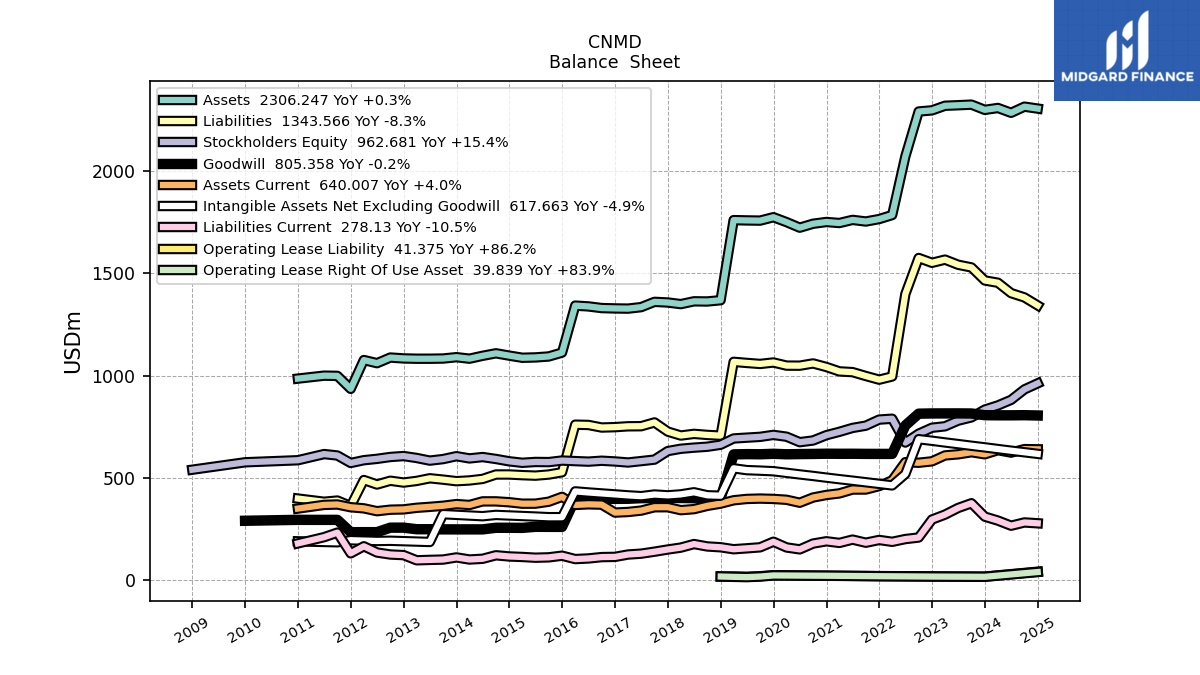
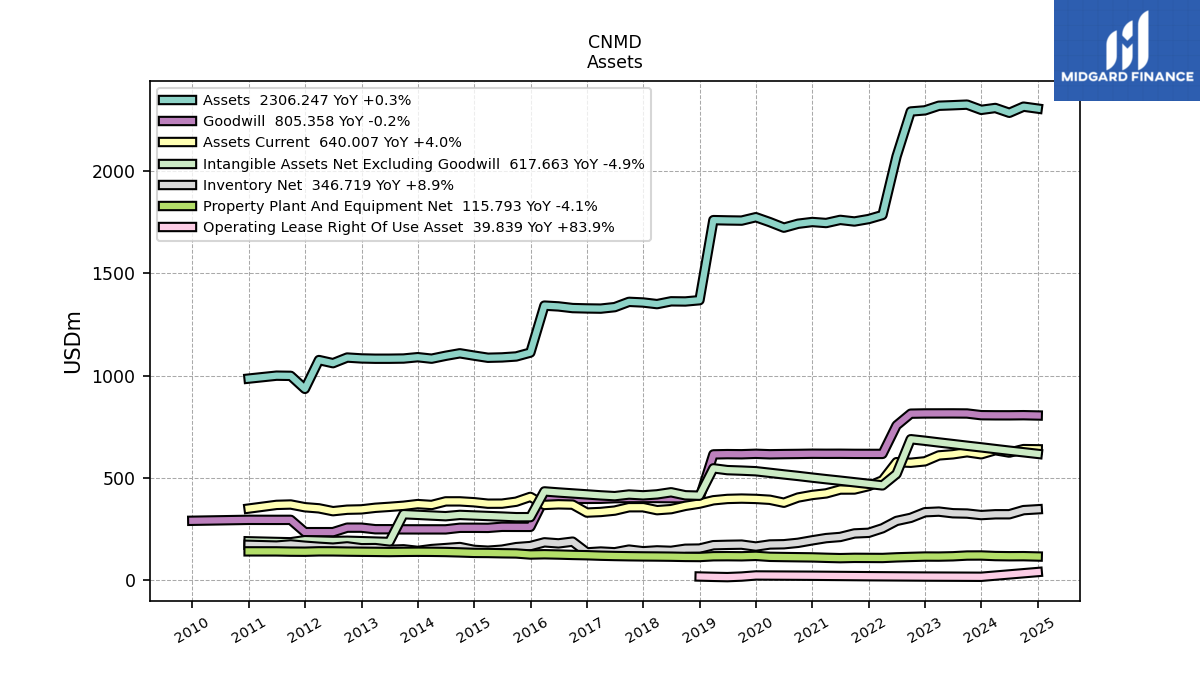
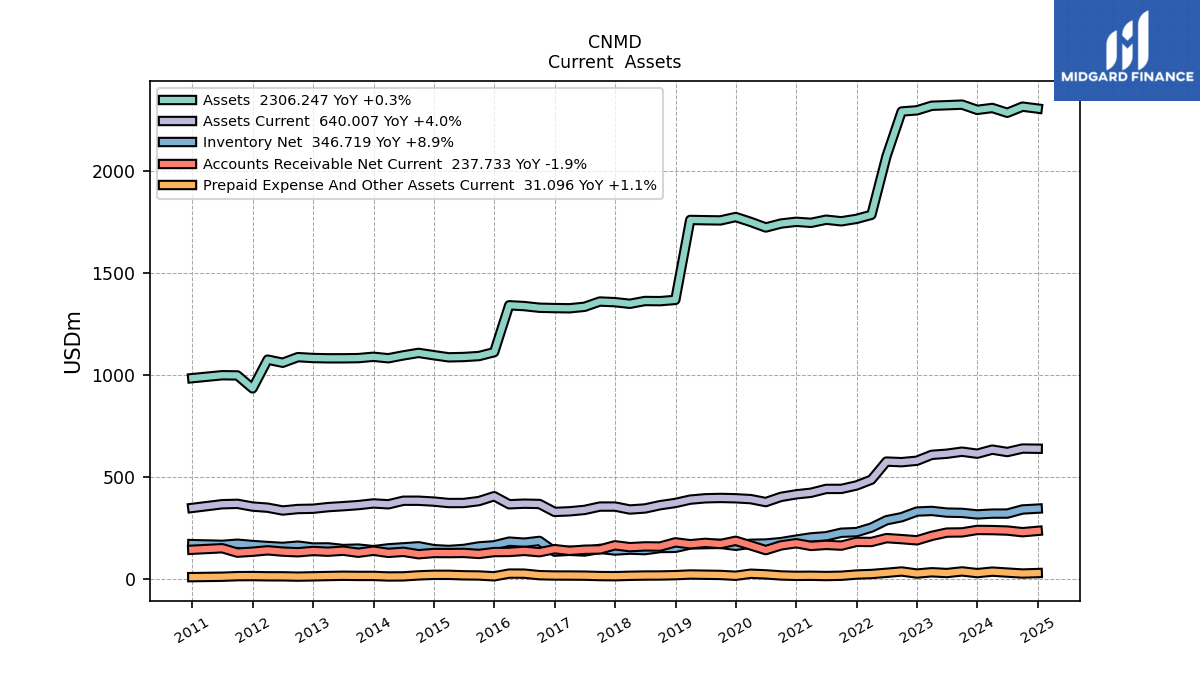
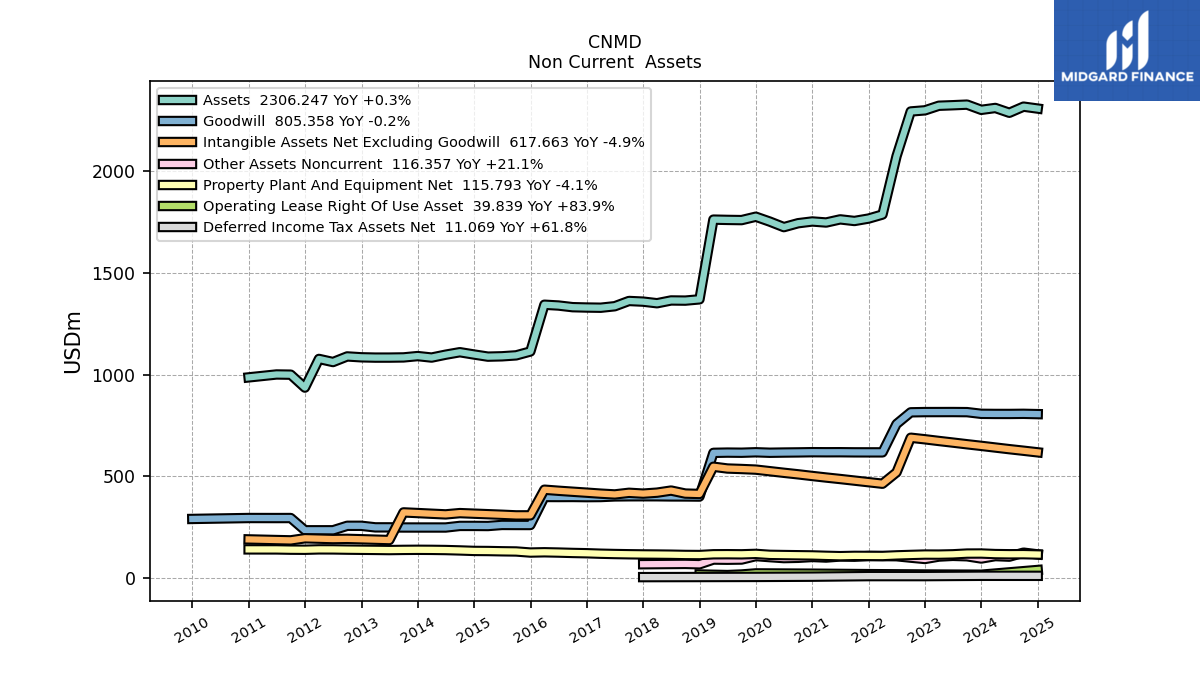
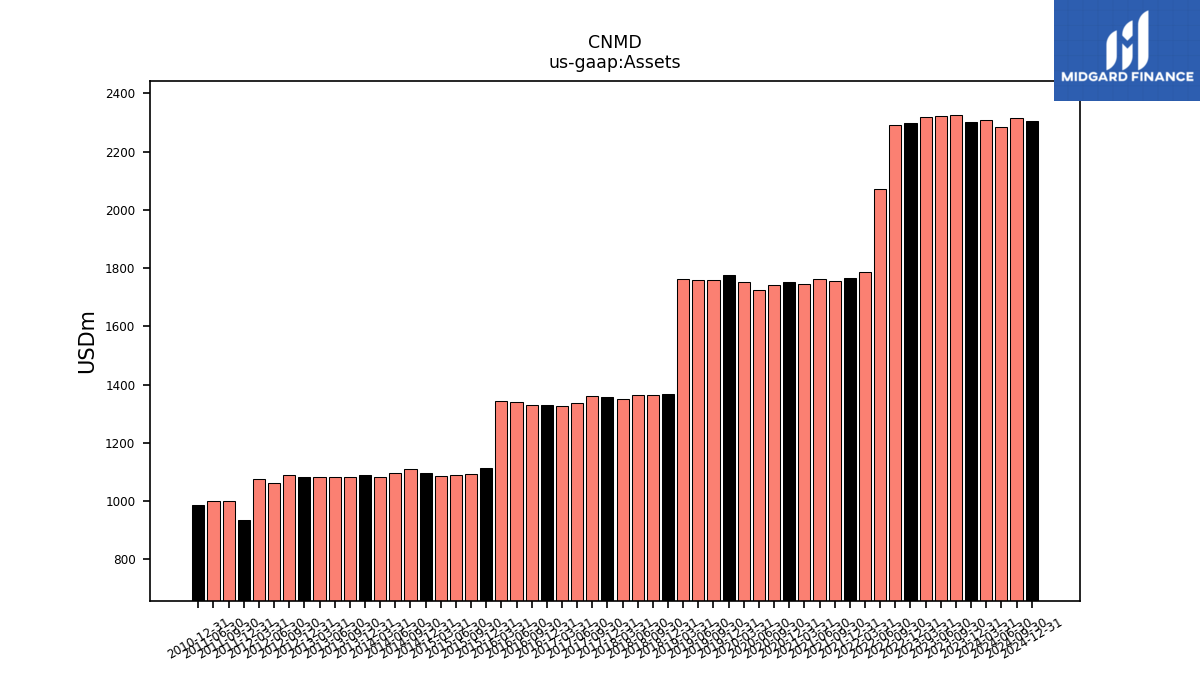
| Assets | 2300.02 | 2325.68 | 2322.72 | 2320.12 | 2297.59 | 2292.04 | 2072.26 | 1785.72 | 1766.02 | 1754.09 | 1761.97 | 1746.61 | 1751.67 | 1743.13 | 1723.91 | 1750.97 | 1775.10 | 1758.42 | 1759.40 | 1760.84 | 1369.14 | 1362.98 | 1363.73 | 1350.03 | 1357.96 | 1361.19 | 1335.34 | 1328.03 | 1328.98 | 1330.72 | 1338.83 | 1342.78 | 1112.94 | 1094.05 | 1089.39 | 1087.75 | 1098.19 | 1109.52 | 1097.32 | 1083.20 | 1090.51 | 1083.92 | 1083.02 | 1082.98 | 1084.46 | 1088.79 | 1061.23 | 1076.56 | 935.59 | 999.19 | 1000.16 | NA | 985.77 | NA | NA | NA | |
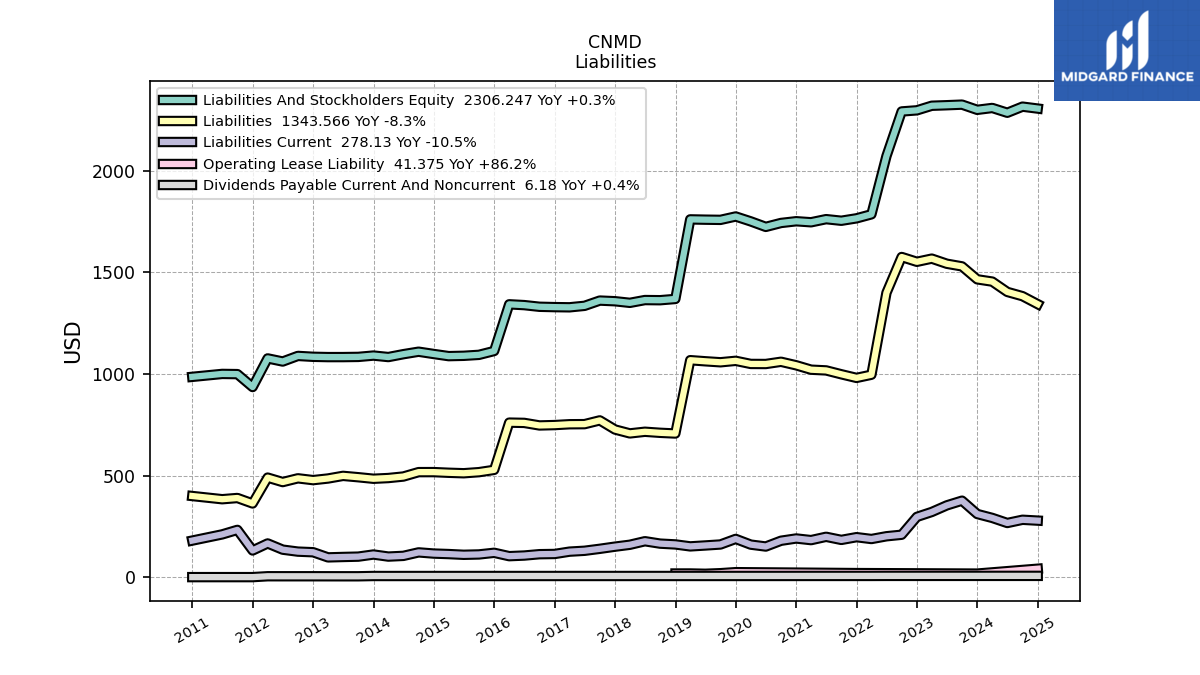
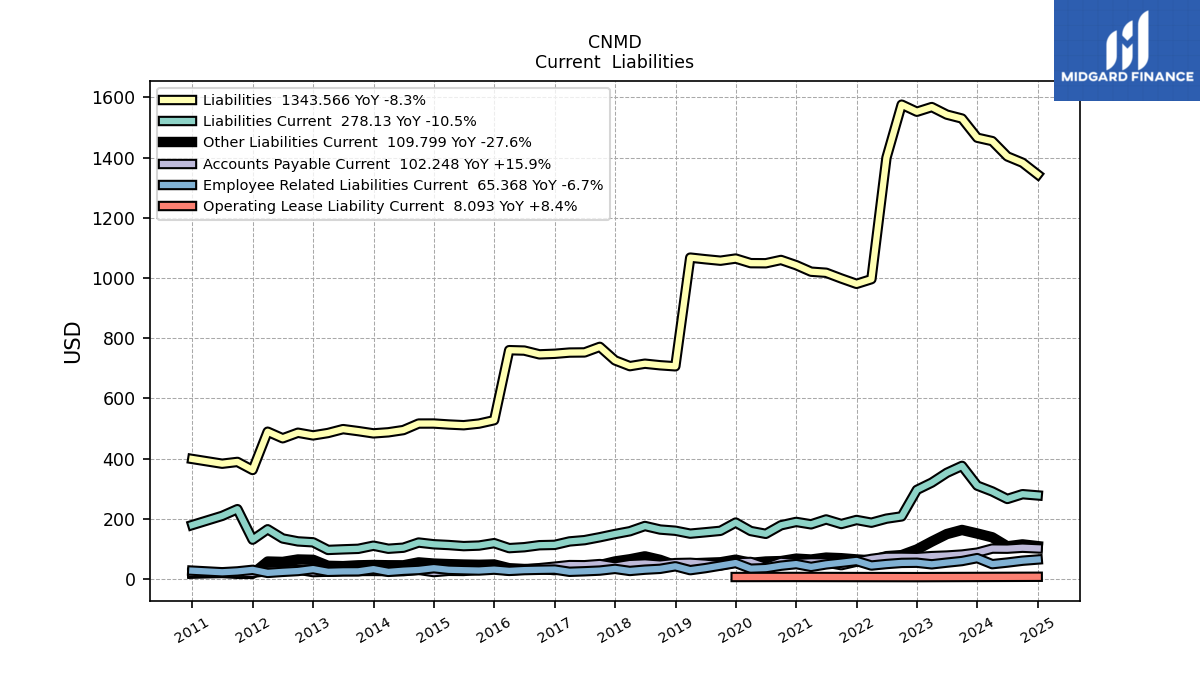
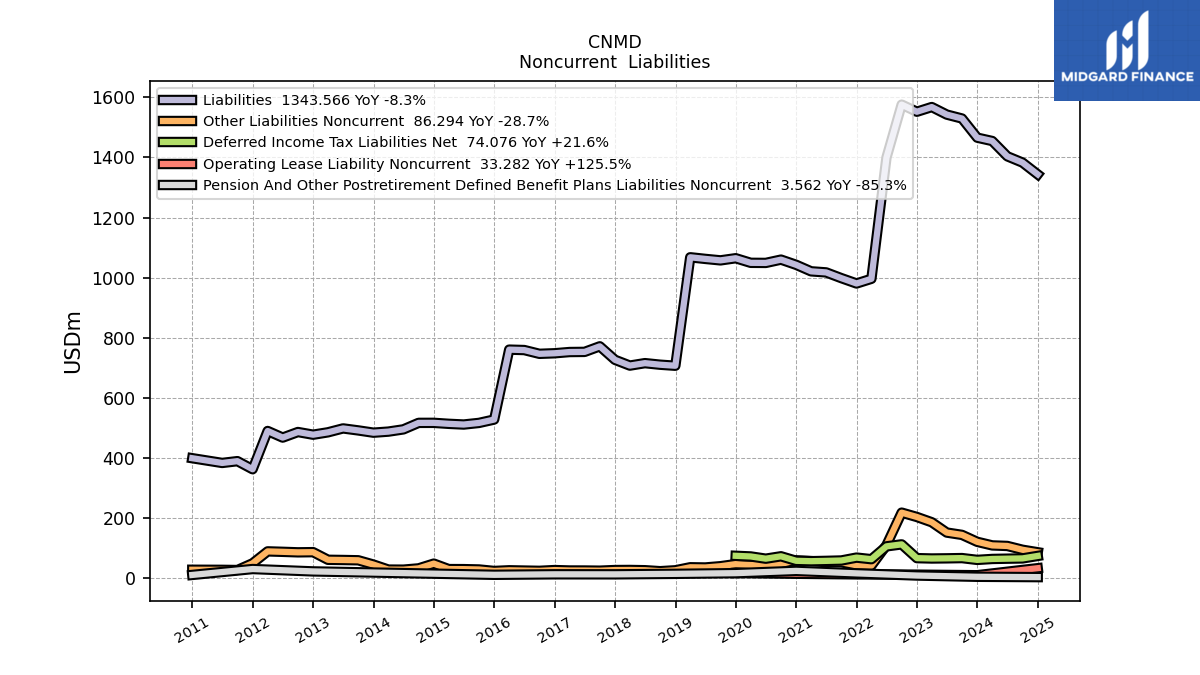
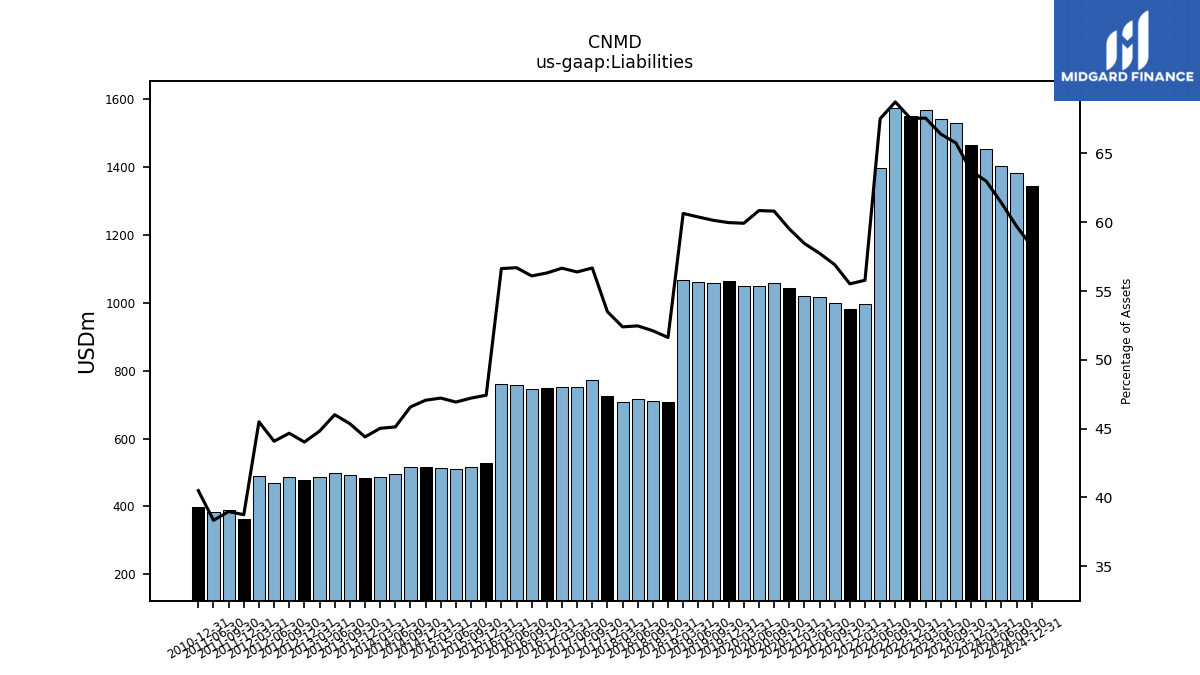
| Liabilities | 1465.80 | 1529.47 | 1542.53 | 1567.67 | 1552.05 | 1575.71 | 1399.29 | 996.18 | 980.58 | 998.41 | 1017.48 | 1021.04 | 1042.63 | 1059.99 | 1049.01 | 1049.34 | 1064.63 | 1057.50 | 1062.39 | 1067.78 | 706.87 | 710.32 | 715.54 | 707.41 | 726.53 | 771.52 | 752.98 | 752.50 | 748.41 | 746.55 | 759.10 | 760.49 | 527.87 | 516.62 | 511.29 | 513.66 | 516.90 | 516.80 | 495.17 | 487.73 | 484.19 | 491.69 | 498.35 | 485.40 | 477.46 | 486.34 | 467.85 | 489.83 | 362.52 | 389.44 | 383.46 | NA | 399.21 | NA | NA | NA | |
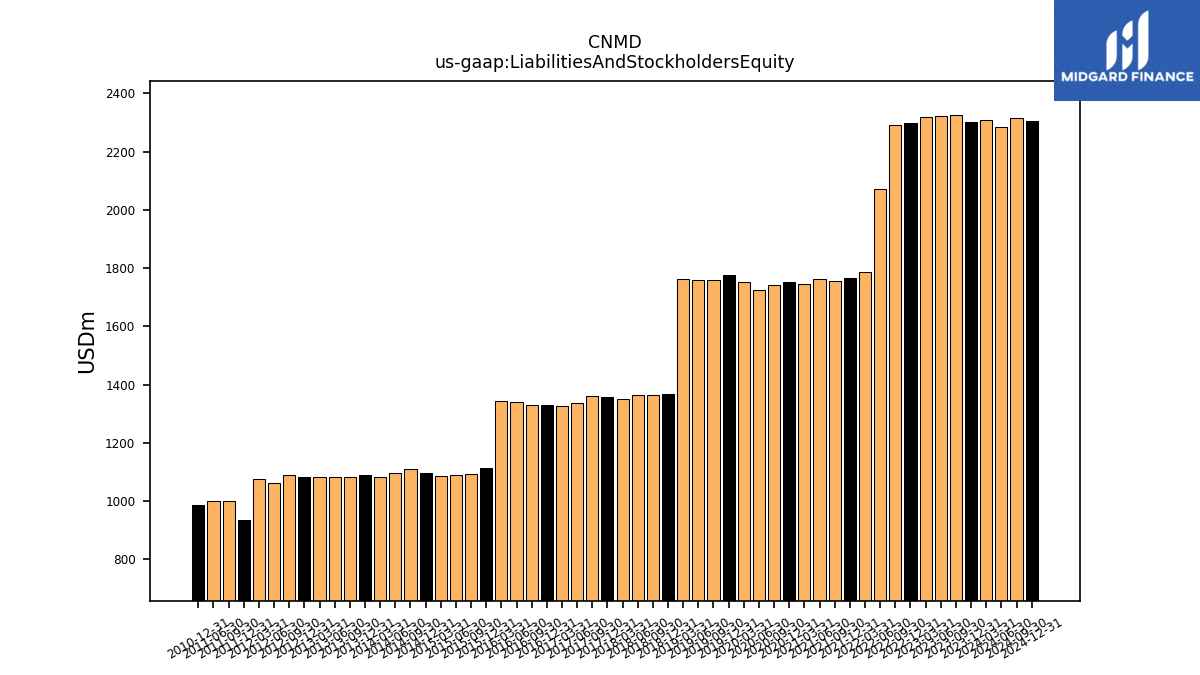
| Liabilities And Stockholders Equity | 2300.02 | 2325.68 | 2322.72 | 2320.12 | 2297.59 | 2292.04 | 2072.26 | 1785.72 | 1766.02 | 1754.09 | 1761.97 | 1746.61 | 1751.67 | 1743.13 | 1723.91 | 1750.97 | 1775.10 | 1758.42 | 1759.40 | 1760.84 | 1369.14 | 1362.98 | 1363.73 | 1350.03 | 1357.96 | 1361.19 | 1335.34 | 1328.03 | 1328.98 | 1330.72 | 1338.83 | 1342.78 | 1112.94 | 1094.05 | 1089.39 | 1087.75 | 1098.19 | 1109.52 | 1097.32 | 1083.20 | 1090.51 | 1083.92 | 1083.02 | 1082.98 | 1084.46 | 1088.79 | 1061.23 | 1076.56 | 935.59 | 999.19 | 1000.16 | NA | 985.77 | NA | NA | NA | |
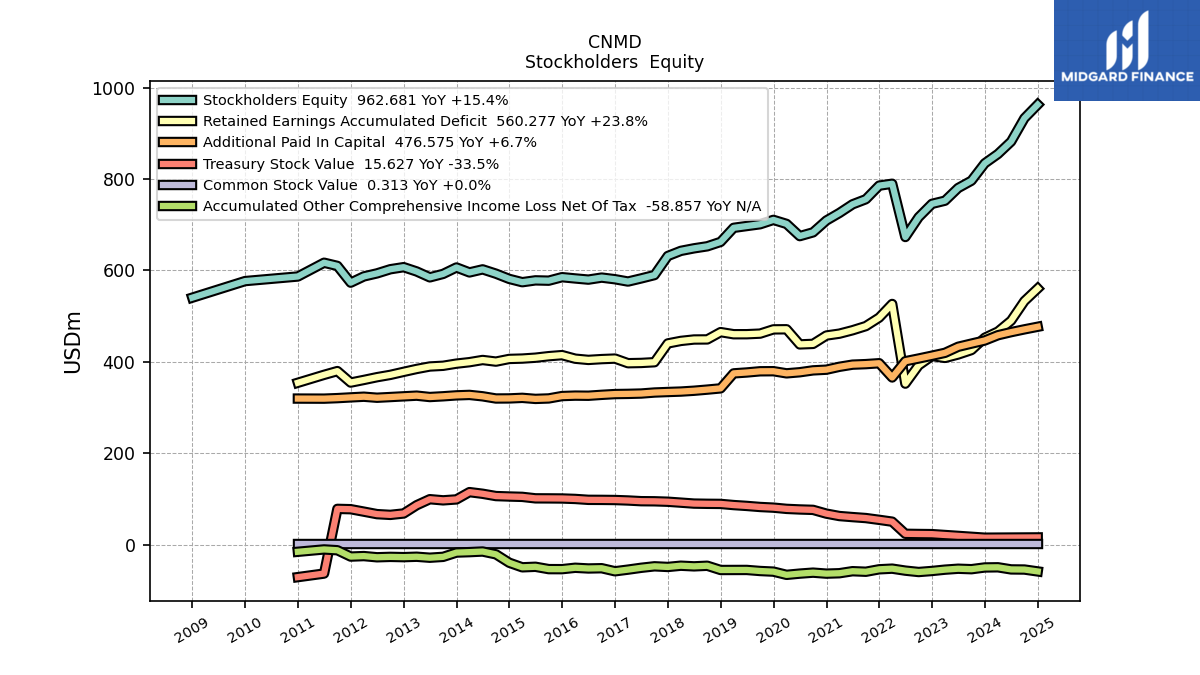
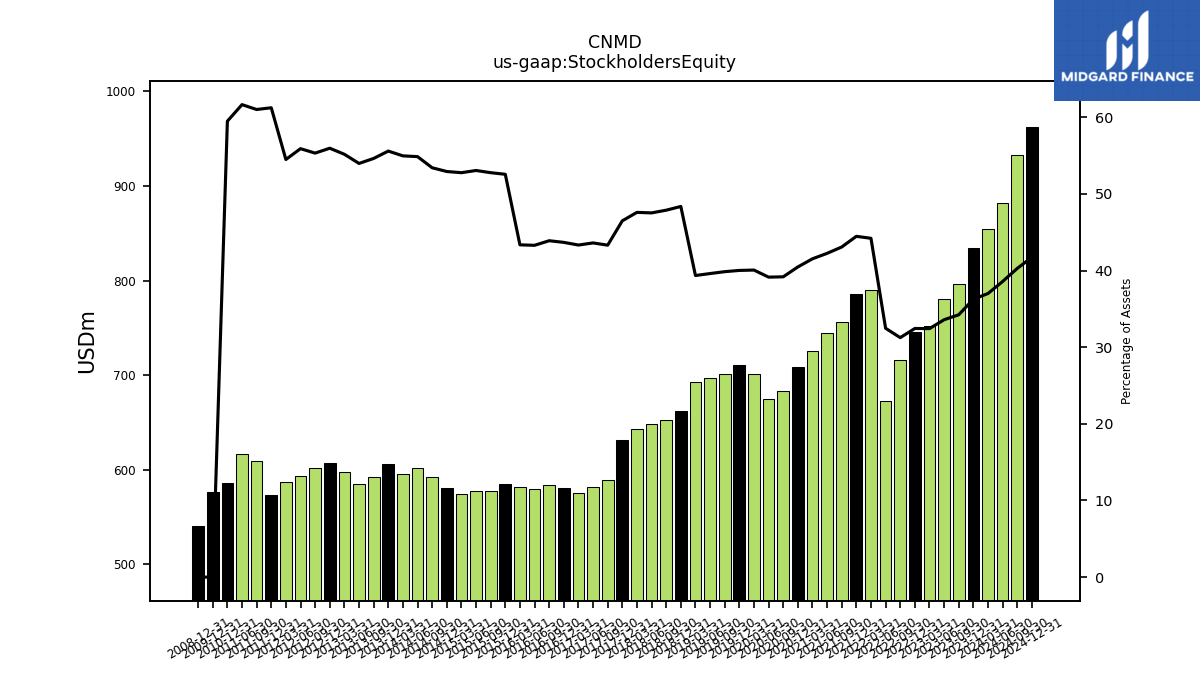
| Stockholders Equity | 834.22 | 796.21 | 780.19 | 752.45 | 745.54 | 716.34 | 672.97 | 789.55 | 785.43 | 755.68 | 744.50 | 725.57 | 709.04 | 683.14 | 674.90 | 701.63 | 710.47 | 700.92 | 697.01 | 693.06 | 662.27 | 652.66 | 648.19 | 642.63 | 631.43 | 589.67 | 582.36 | 575.52 | 580.58 | 584.17 | 579.73 | 582.29 | 585.07 | 577.42 | 578.09 | 574.09 | 581.30 | 592.72 | 602.15 | 595.47 | 606.32 | 592.23 | 584.67 | 597.58 | 607.00 | 602.45 | 593.38 | 586.73 | 573.07 | 609.75 | 616.71 | NA | 586.56 | NA | NA | NA |
| 2023-12-31 | 2023-09-30 | 2023-06-30 | 2023-03-31 | 2022-12-31 | 2022-09-30 | 2022-06-30 | 2022-03-31 | 2021-12-31 | 2021-09-30 | 2021-06-30 | 2021-03-31 | 2020-12-31 | 2020-09-30 | 2020-06-30 | 2020-03-31 | 2019-12-31 | 2019-09-30 | 2019-06-30 | 2019-03-31 | 2018-12-31 | 2018-09-30 | 2018-06-30 | 2018-03-31 | 2017-12-31 | 2017-09-30 | 2017-06-30 | 2017-03-31 | 2016-12-31 | 2016-09-30 | 2016-06-30 | 2016-03-31 | 2015-12-31 | 2015-09-30 | 2015-06-30 | 2015-03-31 | 2014-12-31 | 2014-09-30 | 2014-06-30 | 2014-03-31 | 2013-12-31 | 2013-09-30 | 2013-06-30 | 2013-03-31 | 2012-12-31 | 2012-09-30 | 2012-06-30 | 2012-03-31 | 2011-12-31 | 2011-09-30 | 2011-06-30 | 2011-03-31 | 2010-12-31 | 2010-09-30 | 2010-06-30 | 2010-03-30 | ||
|---|---|---|---|---|---|---|---|---|---|---|---|---|---|---|---|---|---|---|---|---|---|---|---|---|---|---|---|---|---|---|---|---|---|---|---|---|---|---|---|---|---|---|---|---|---|---|---|---|---|---|---|---|---|---|---|---|---|
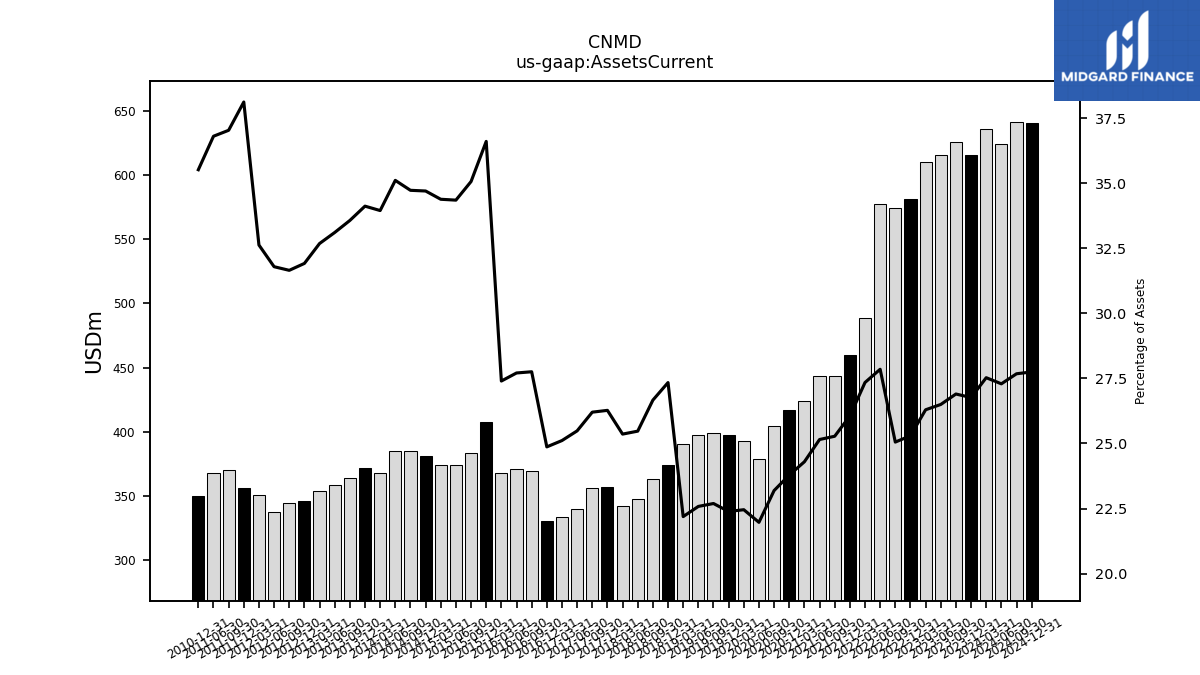
| Assets Current | 615.65 | 625.65 | 615.52 | 610.09 | 581.23 | 574.24 | 577.19 | 488.30 | 460.12 | 443.40 | 443.18 | 424.37 | 416.65 | 404.23 | 378.71 | 393.17 | 397.36 | 399.02 | 397.28 | 390.71 | 374.35 | 363.46 | 347.40 | 342.38 | 356.78 | 356.68 | 340.31 | 333.50 | 330.51 | 369.38 | 371.00 | 367.93 | 407.49 | 383.69 | 374.27 | 374.07 | 381.15 | 385.37 | 385.33 | 367.80 | 372.13 | 363.92 | 358.61 | 354.00 | 346.19 | 344.68 | 337.44 | 351.28 | 356.72 | 370.11 | 368.18 | NA | 350.19 | NA | NA | NA | |
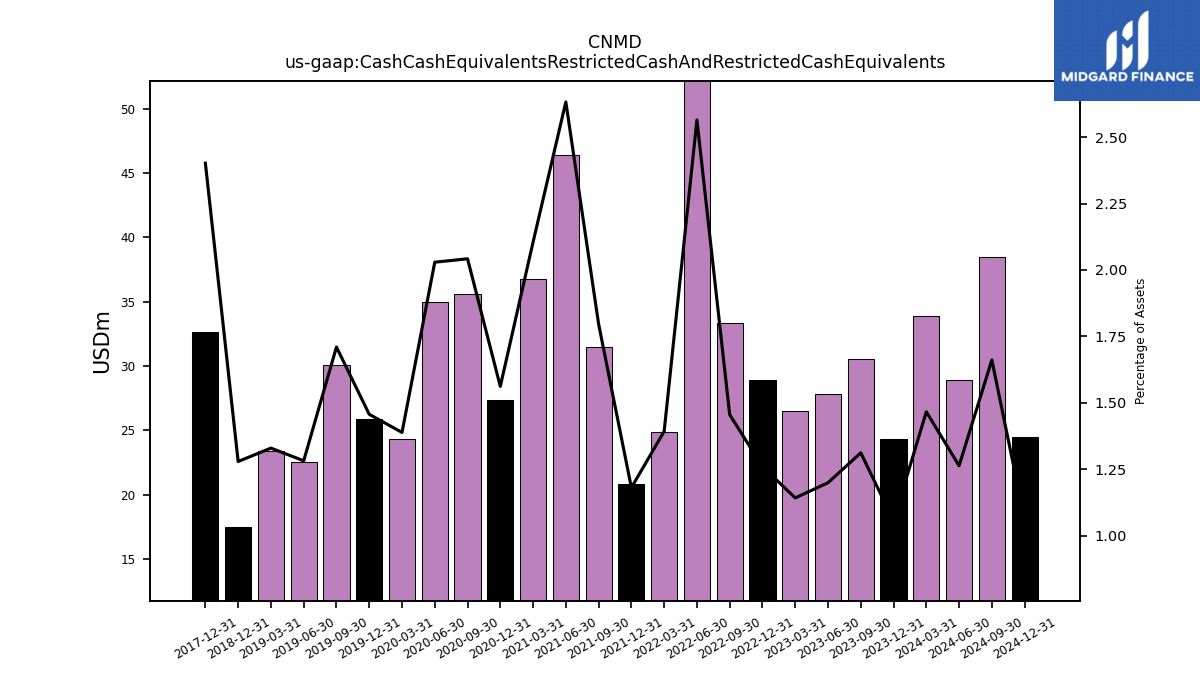
| Cash Cash Equivalents Restricted Cash And Restricted Cash Equivalents | 24.30 | 30.50 | 27.85 | 26.49 | 28.94 | 33.35 | 53.15 | 24.86 | 20.85 | 31.51 | 46.39 | 36.77 | 27.36 | 35.60 | 34.98 | 24.31 | 25.86 | 30.07 | 22.55 | 23.41 | 17.51 | NA | NA | NA | 32.62 | NA | NA | NA | NA | NA | NA | NA | NA | NA | NA | NA | NA | NA | NA | NA | NA | NA | NA | NA | NA | NA | NA | NA | NA | NA | NA | NA | NA | NA | NA | NA | |
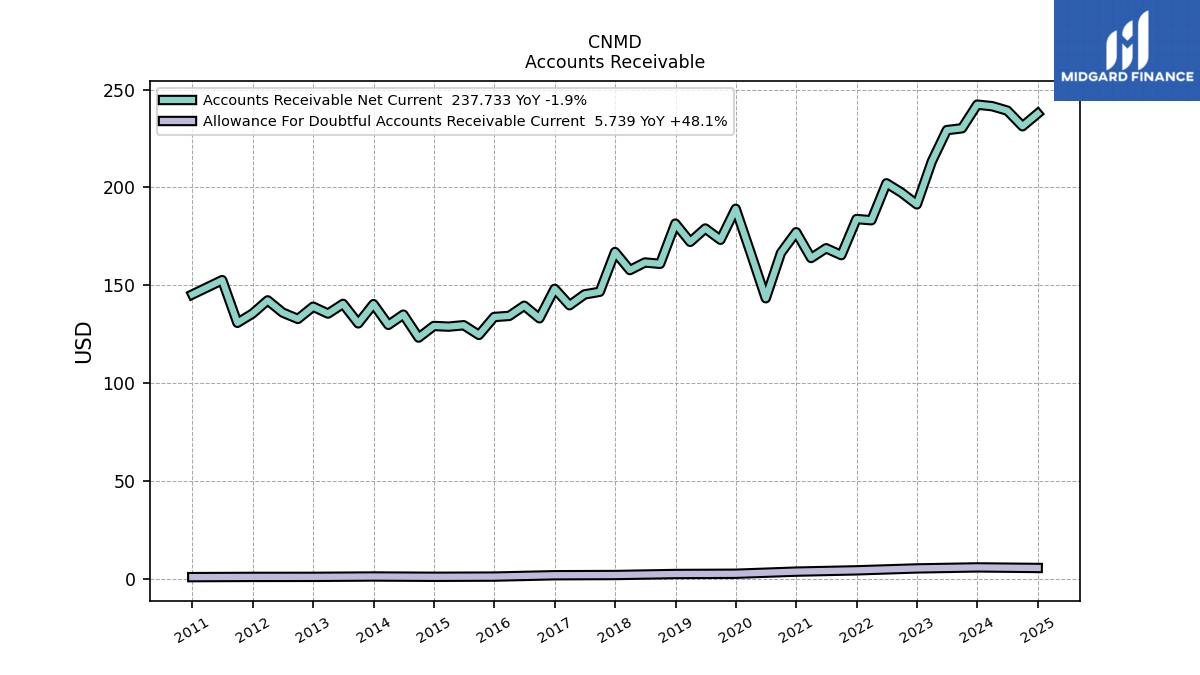
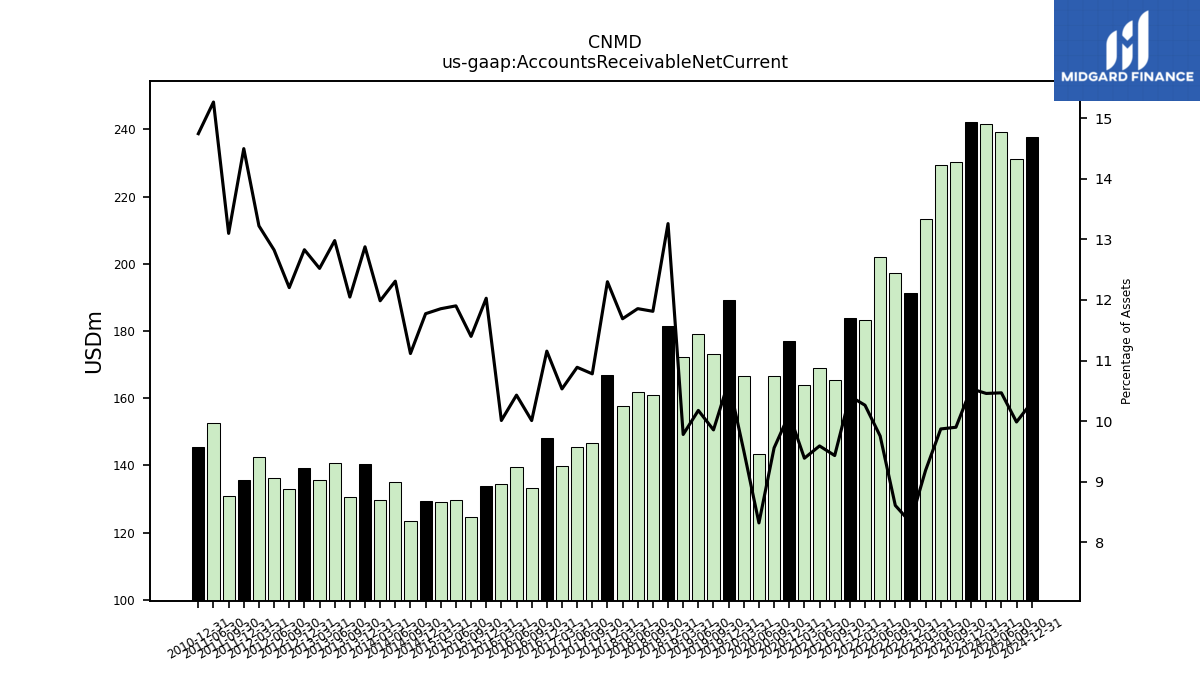
| Accounts Receivable Net Current | 242.28 | 230.20 | 229.26 | 213.18 | 191.34 | 197.29 | 202.12 | 183.25 | 183.88 | 165.43 | 168.97 | 163.95 | 177.15 | 166.59 | 143.41 | 166.50 | 189.10 | 173.28 | 179.04 | 172.19 | 181.55 | 161.00 | 161.69 | 157.81 | 167.04 | 146.74 | 145.39 | 139.85 | 148.24 | 133.19 | 139.62 | 134.41 | 133.86 | 124.70 | 129.66 | 128.95 | 129.29 | 123.33 | 135.08 | 129.83 | 140.43 | 130.59 | 140.57 | 135.60 | 139.12 | 132.87 | 136.09 | 142.35 | 135.64 | 130.88 | 152.69 | NA | 145.35 | NA | NA | NA | |
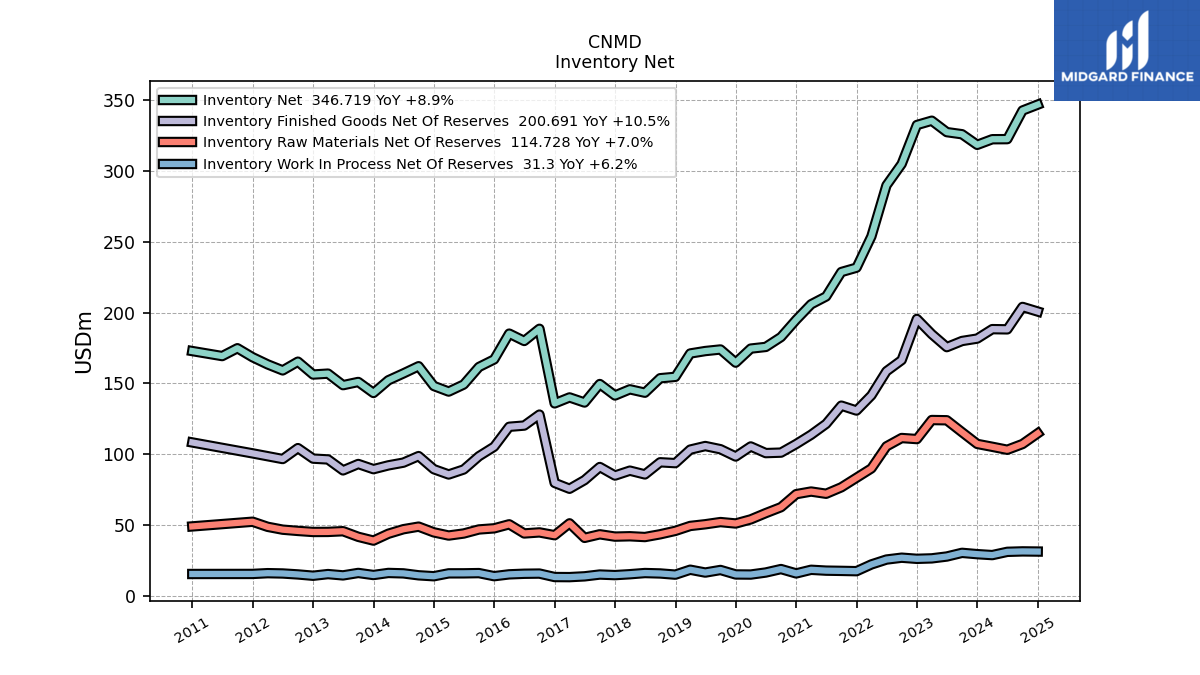
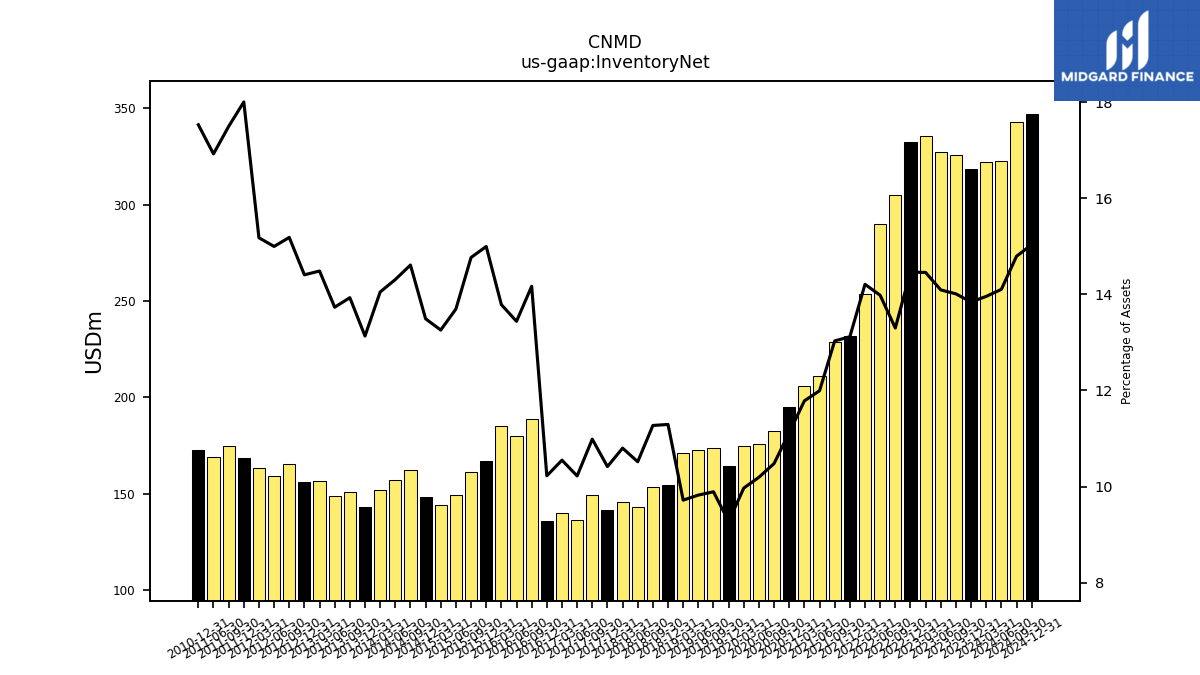
| Inventory Net | 318.32 | 325.82 | 327.31 | 335.37 | 332.32 | 304.81 | 289.71 | 253.73 | 231.64 | 228.57 | 211.32 | 205.80 | 194.87 | 182.67 | 175.72 | 174.54 | 164.62 | 173.92 | 172.80 | 171.09 | 154.60 | 153.62 | 143.41 | 145.79 | 141.44 | 149.54 | 136.47 | 140.08 | 135.87 | 188.53 | 179.91 | 185.11 | 166.89 | 161.56 | 149.18 | 144.20 | 148.15 | 162.10 | 157.01 | 152.17 | 143.21 | 151.00 | 148.72 | 156.87 | 156.23 | 165.33 | 159.15 | 163.39 | 168.44 | 174.79 | 169.25 | NA | 172.80 | NA | NA | NA | |
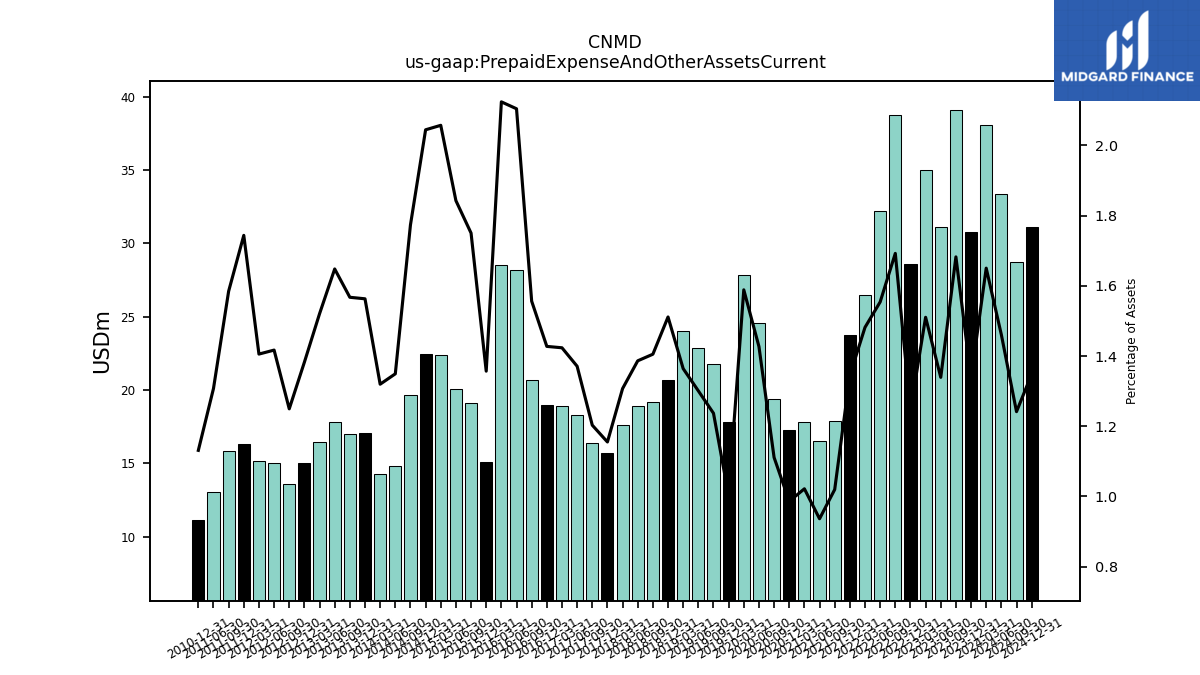
| Prepaid Expense And Other Assets Current | 30.75 | 39.13 | 31.11 | 35.04 | 28.62 | 38.79 | 32.20 | 26.46 | 23.75 | 17.89 | 16.50 | 17.85 | 17.28 | 19.37 | 24.60 | 27.82 | 17.79 | 21.75 | 22.89 | 24.02 | 20.69 | 19.15 | 18.91 | 17.65 | 15.69 | 16.38 | 18.31 | 18.91 | 18.97 | 20.71 | 28.17 | 28.52 | 15.10 | 19.15 | 20.07 | 22.38 | 22.45 | 19.68 | 14.81 | 14.30 | 17.05 | 16.99 | 17.85 | 16.47 | 14.99 | 13.61 | 15.04 | 15.13 | 16.31 | 15.83 | 13.08 | NA | 11.15 | NA | NA | NA |
| 2023-12-31 | 2023-09-30 | 2023-06-30 | 2023-03-31 | 2022-12-31 | 2022-09-30 | 2022-06-30 | 2022-03-31 | 2021-12-31 | 2021-09-30 | 2021-06-30 | 2021-03-31 | 2020-12-31 | 2020-09-30 | 2020-06-30 | 2020-03-31 | 2019-12-31 | 2019-09-30 | 2019-06-30 | 2019-03-31 | 2018-12-31 | 2018-09-30 | 2018-06-30 | 2018-03-31 | 2017-12-31 | 2017-09-30 | 2017-06-30 | 2017-03-31 | 2016-12-31 | 2016-09-30 | 2016-06-30 | 2016-03-31 | 2015-12-31 | 2015-09-30 | 2015-06-30 | 2015-03-31 | 2014-12-31 | 2014-09-30 | 2014-06-30 | 2014-03-31 | 2013-12-31 | 2013-09-30 | 2013-06-30 | 2013-03-31 | 2012-12-31 | 2012-09-30 | 2012-06-30 | 2012-03-31 | 2011-12-31 | 2011-09-30 | 2011-06-30 | 2011-03-31 | 2010-12-31 | 2010-09-30 | 2010-06-30 | 2010-03-30 | ||
|---|---|---|---|---|---|---|---|---|---|---|---|---|---|---|---|---|---|---|---|---|---|---|---|---|---|---|---|---|---|---|---|---|---|---|---|---|---|---|---|---|---|---|---|---|---|---|---|---|---|---|---|---|---|---|---|---|---|
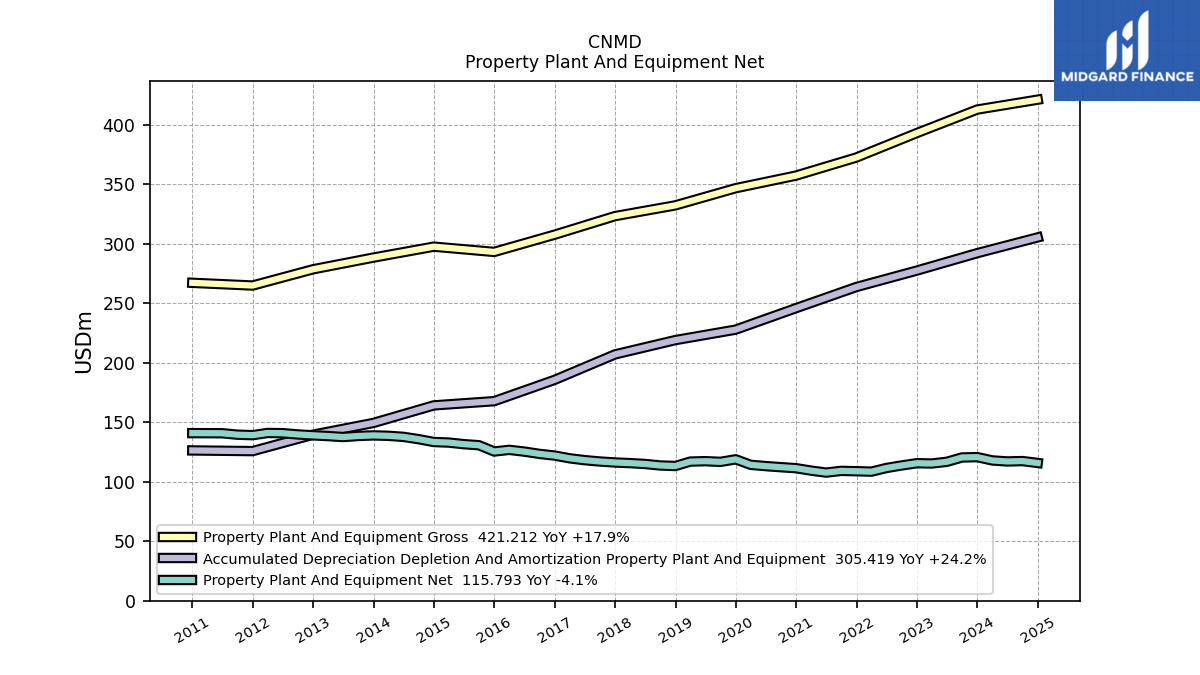
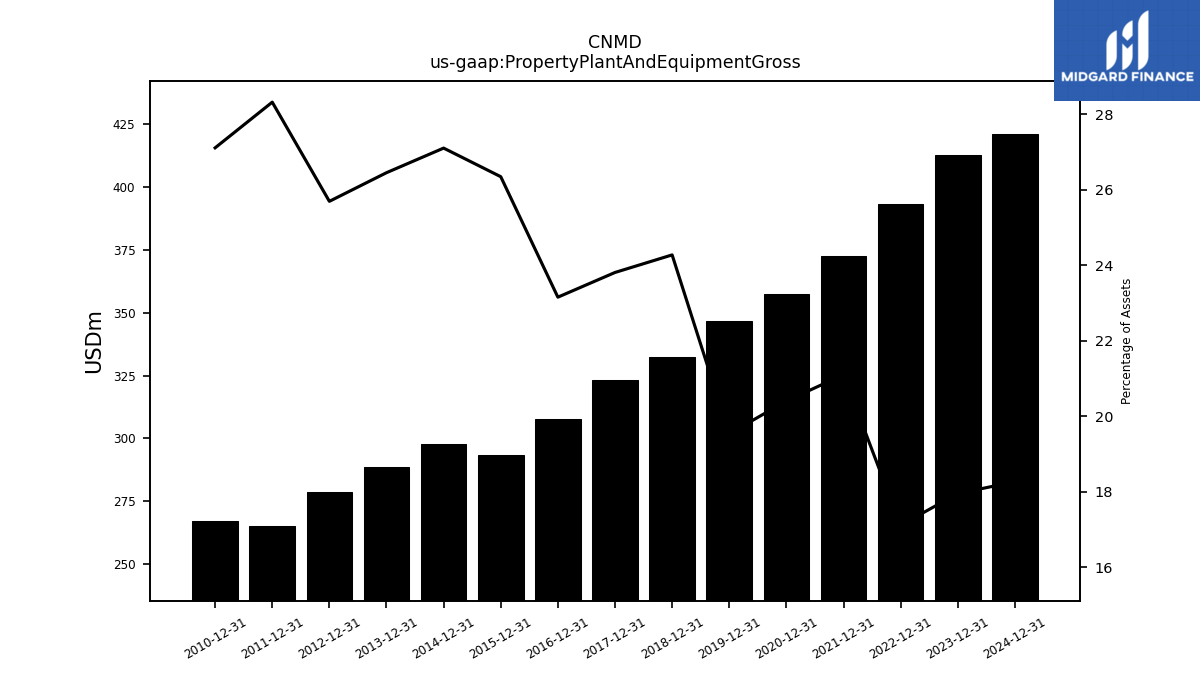
| Property Plant And Equipment Gross | 412.88 | NA | NA | NA | 393.15 | NA | NA | NA | 372.62 | NA | NA | NA | 357.40 | NA | NA | NA | 346.78 | NA | NA | NA | 332.33 | NA | NA | NA | 323.31 | NA | NA | NA | 307.71 | NA | NA | NA | 293.21 | NA | NA | NA | 297.64 | NA | NA | NA | 288.45 | NA | NA | NA | 278.63 | NA | NA | NA | 264.96 | NA | NA | NA | 267.24 | NA | NA | NA | |
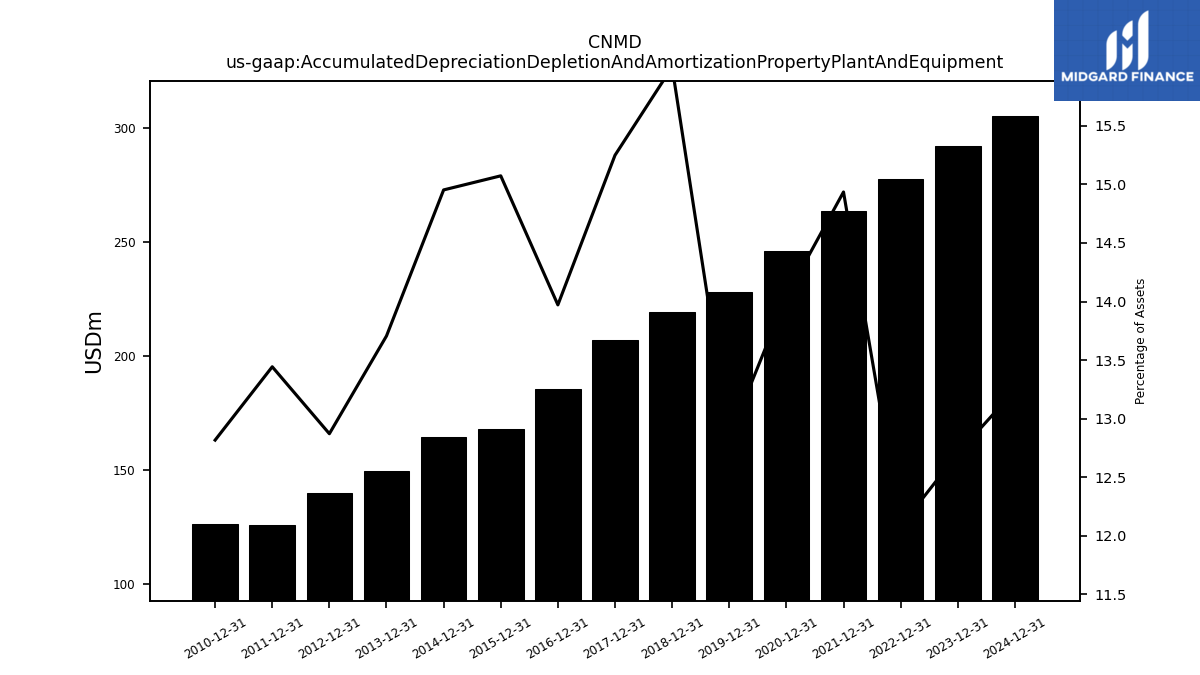
| Accumulated Depreciation Depletion And Amortization Property Plant And Equipment | 292.16 | NA | NA | NA | 277.54 | NA | NA | NA | 263.76 | NA | NA | NA | 246.00 | NA | NA | NA | 227.89 | NA | NA | NA | 219.09 | NA | NA | NA | 207.08 | NA | NA | NA | 185.68 | NA | NA | NA | 167.76 | NA | NA | NA | 164.21 | NA | NA | NA | 149.47 | NA | NA | NA | 139.59 | NA | NA | NA | 125.77 | NA | NA | NA | 126.35 | NA | NA | NA | |
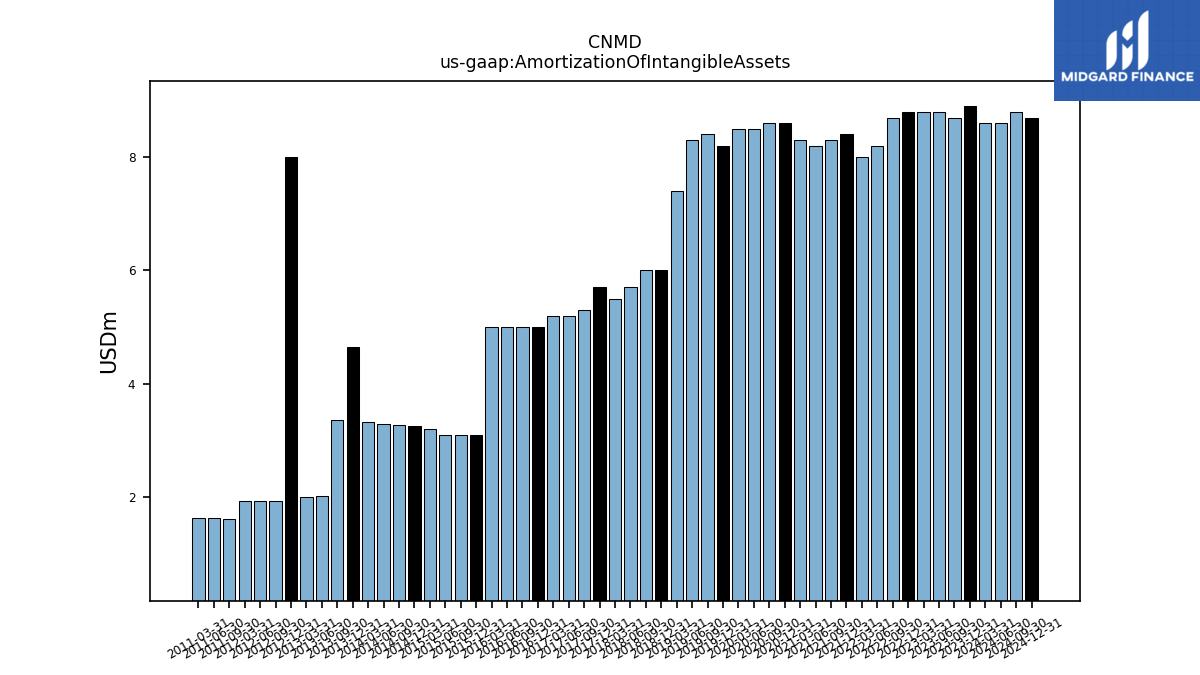
| Amortization Of Intangible Assets | 8.90 | 8.70 | 8.80 | 8.80 | 8.80 | 8.70 | 8.20 | 8.00 | 8.40 | 8.30 | 8.20 | 8.30 | 8.60 | 8.60 | 8.50 | 8.50 | 8.20 | 8.40 | 8.30 | 7.40 | 6.00 | 6.00 | 5.70 | 5.50 | 5.70 | 5.30 | 5.20 | 5.20 | 5.00 | 5.00 | 5.00 | 5.00 | 3.10 | 3.10 | 3.10 | 3.20 | 3.24 | 3.27 | 3.28 | 3.32 | 4.64 | 3.35 | 2.02 | 1.99 | 8.01 | 1.93 | 1.93 | 1.93 | NA | 1.60 | 1.63 | 1.62 | NA | NA | NA | NA | |
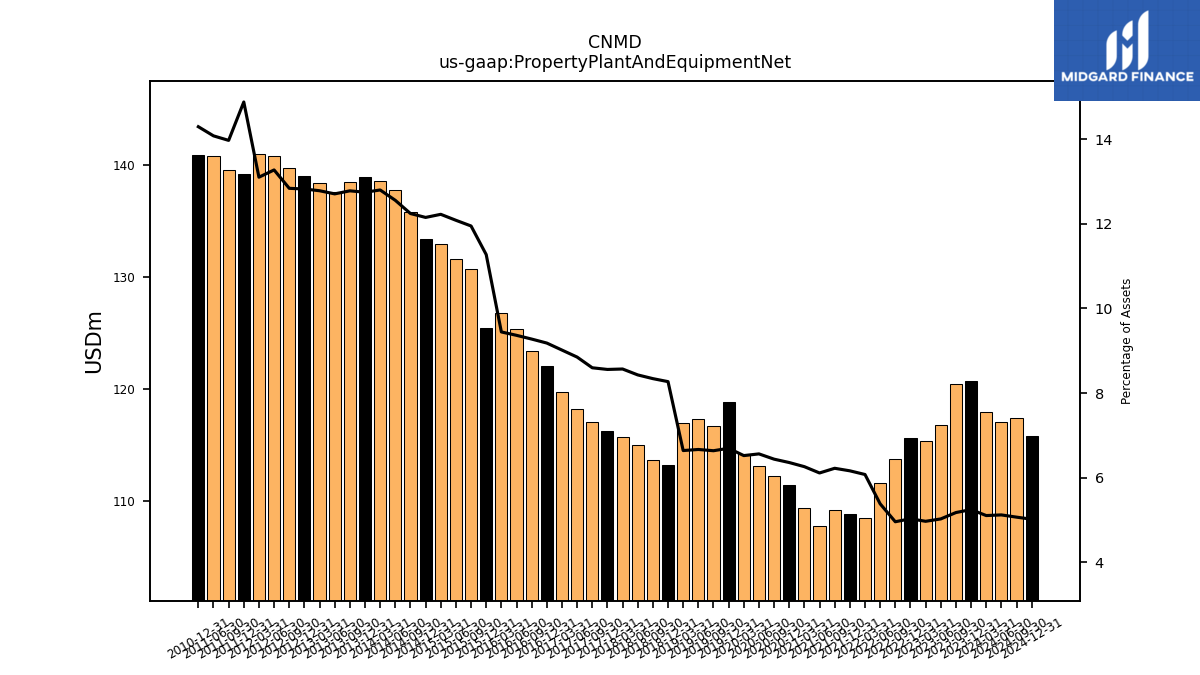
| Property Plant And Equipment Net | 120.72 | 120.44 | 116.79 | 115.36 | 115.61 | 113.72 | 111.59 | 108.53 | 108.86 | 109.18 | 107.72 | 109.38 | 111.41 | 112.25 | 113.16 | 114.23 | 118.88 | 116.74 | 117.33 | 116.98 | 113.25 | 113.70 | 114.96 | 115.69 | 116.23 | 117.04 | 118.19 | 119.74 | 122.03 | 123.45 | 125.38 | 126.83 | 125.45 | 130.72 | 131.62 | 132.96 | 133.43 | 135.82 | 137.76 | 138.63 | 138.99 | 138.50 | 137.61 | 138.41 | 139.04 | 139.78 | 140.84 | 141.03 | 139.19 | 139.59 | 140.79 | NA | 140.90 | NA | NA | NA | |
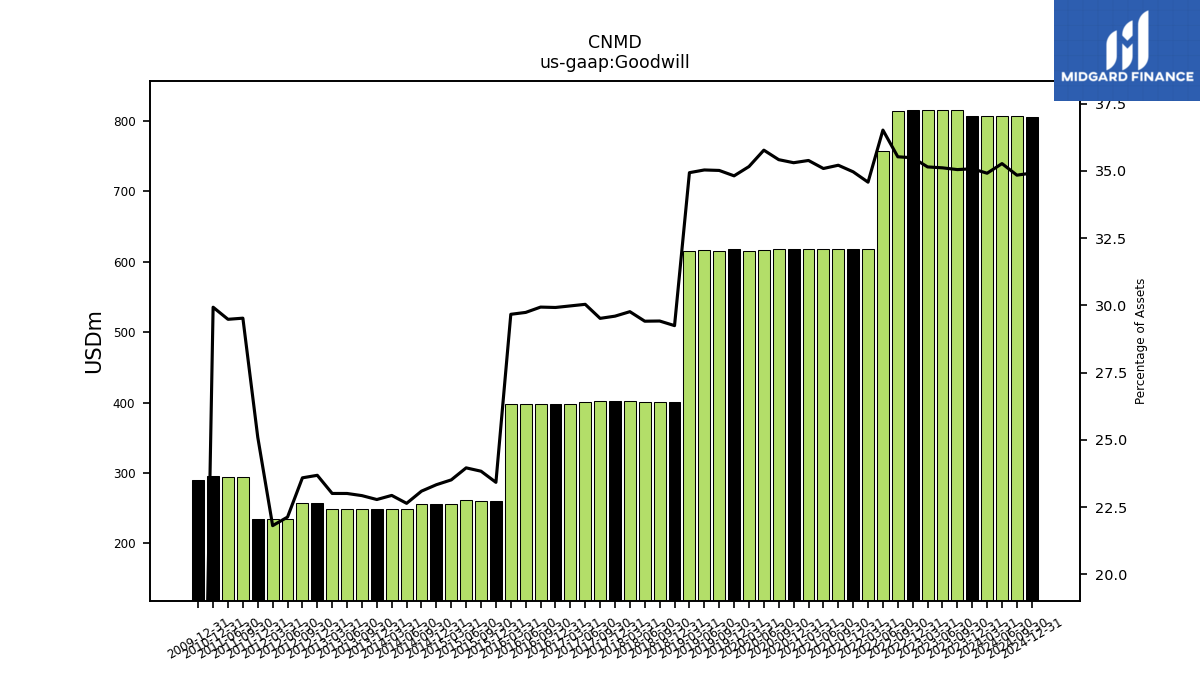
| Goodwill | 806.84 | 815.14 | 815.63 | 815.50 | 815.43 | 814.26 | 756.75 | 617.53 | 617.53 | 617.65 | 618.28 | 618.10 | 618.44 | 617.39 | 616.68 | 615.68 | 618.04 | 615.77 | 616.43 | 615.15 | 400.44 | 400.98 | 401.10 | 401.86 | 401.95 | 401.79 | 401.13 | 398.15 | 397.66 | 398.38 | 398.15 | 398.39 | 260.65 | 260.75 | 261.00 | 255.75 | 256.23 | 256.22 | 248.43 | 248.42 | 248.43 | 248.50 | 249.16 | 249.16 | 256.82 | 256.82 | 234.84 | 234.79 | 234.81 | 295.01 | 294.87 | NA | 295.07 | NA | NA | NA | |
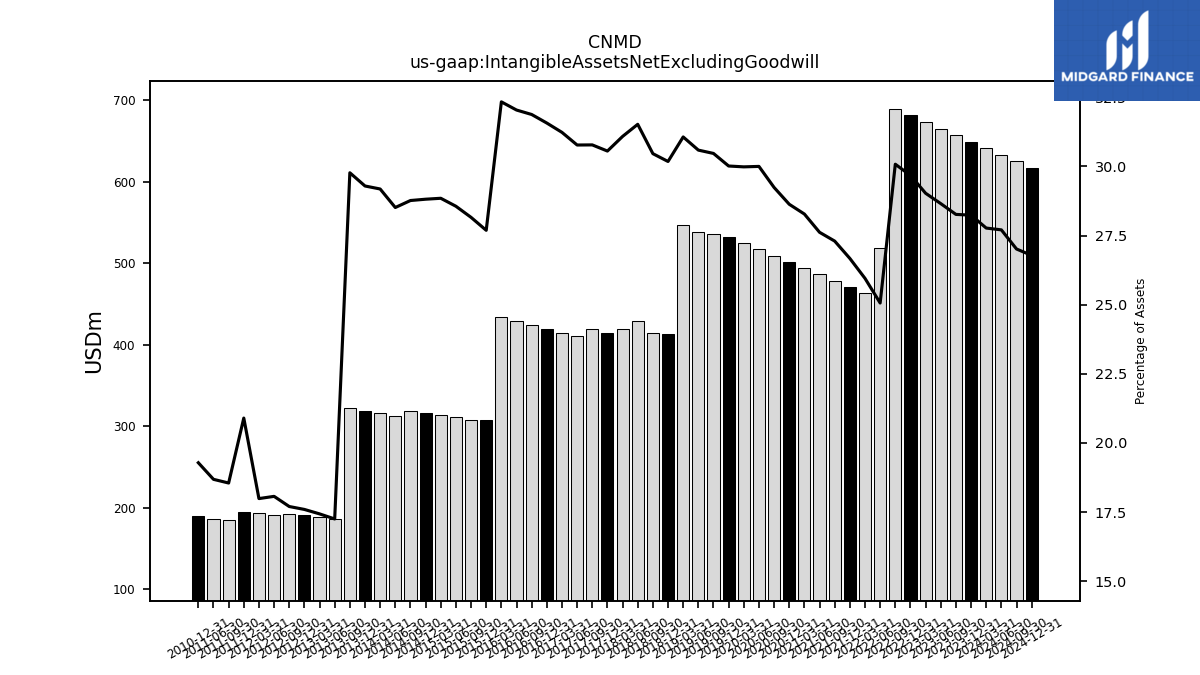
| Intangible Assets Net Excluding Goodwill | 649.48 | 657.35 | 665.58 | 673.54 | 681.80 | 689.45 | 519.32 | 463.42 | 471.05 | 478.86 | 486.62 | 493.90 | 501.54 | 509.68 | 517.19 | 525.02 | 532.80 | 535.79 | 538.21 | 547.02 | 413.19 | 415.19 | 429.90 | 419.66 | 414.94 | 418.96 | 410.94 | 414.77 | 419.55 | 424.22 | 428.96 | 434.20 | 308.17 | 308.06 | 311.13 | 313.80 | 316.44 | 319.18 | 312.89 | 316.12 | 319.44 | 322.70 | 186.82 | 188.81 | 190.81 | 192.72 | 191.74 | 193.64 | 195.53 | 185.35 | 186.87 | NA | 190.09 | NA | NA | NA | |
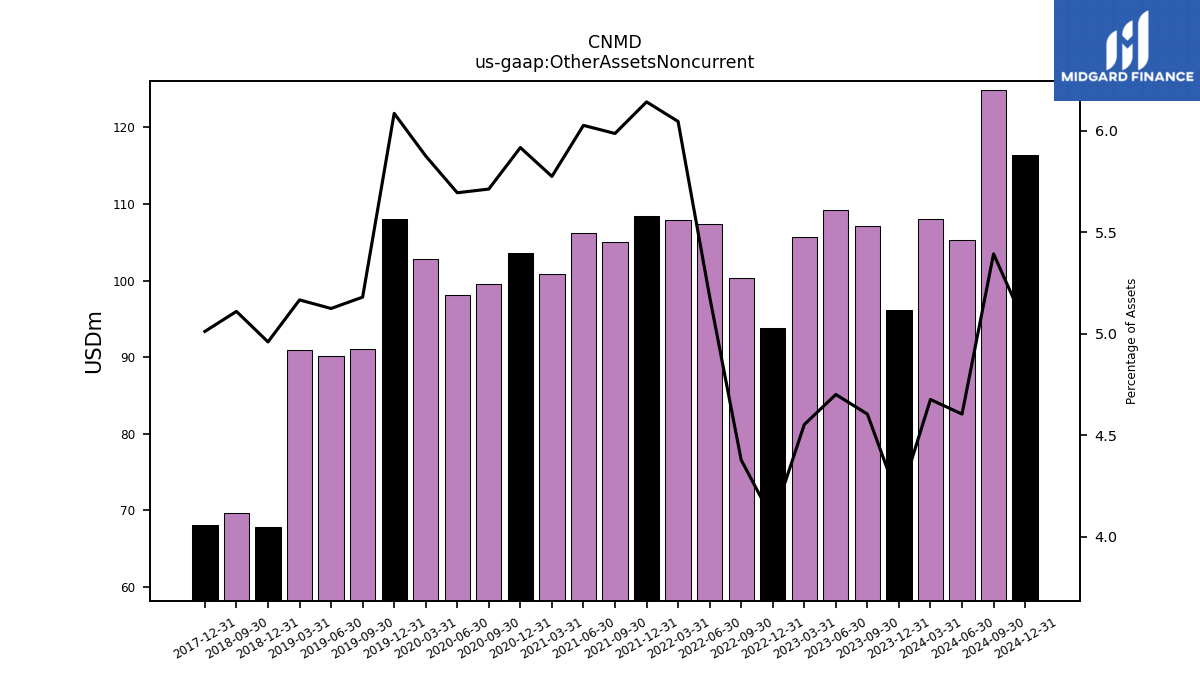
| Other Assets Noncurrent | 96.11 | 107.09 | 109.19 | 105.64 | 93.88 | 100.37 | 107.41 | 107.94 | 108.45 | 104.99 | 106.17 | 100.86 | 103.64 | 99.57 | 98.16 | 102.87 | 108.01 | 91.09 | 90.16 | 90.97 | 67.91 | 69.65 | NA | NA | 68.06 | NA | NA | NA | NA | NA | NA | NA | NA | NA | NA | NA | NA | NA | NA | NA | NA | NA | NA | NA | NA | NA | NA | NA | NA | NA | NA | NA | NA | NA | NA | NA |
| 2023-12-31 | 2023-09-30 | 2023-06-30 | 2023-03-31 | 2022-12-31 | 2022-09-30 | 2022-06-30 | 2022-03-31 | 2021-12-31 | 2021-09-30 | 2021-06-30 | 2021-03-31 | 2020-12-31 | 2020-09-30 | 2020-06-30 | 2020-03-31 | 2019-12-31 | 2019-09-30 | 2019-06-30 | 2019-03-31 | 2018-12-31 | 2018-09-30 | 2018-06-30 | 2018-03-31 | 2017-12-31 | 2017-09-30 | 2017-06-30 | 2017-03-31 | 2016-12-31 | 2016-09-30 | 2016-06-30 | 2016-03-31 | 2015-12-31 | 2015-09-30 | 2015-06-30 | 2015-03-31 | 2014-12-31 | 2014-09-30 | 2014-06-30 | 2014-03-31 | 2013-12-31 | 2013-09-30 | 2013-06-30 | 2013-03-31 | 2012-12-31 | 2012-09-30 | 2012-06-30 | 2012-03-31 | 2011-12-31 | 2011-09-30 | 2011-06-30 | 2011-03-31 | 2010-12-31 | 2010-09-30 | 2010-06-30 | 2010-03-30 | ||
|---|---|---|---|---|---|---|---|---|---|---|---|---|---|---|---|---|---|---|---|---|---|---|---|---|---|---|---|---|---|---|---|---|---|---|---|---|---|---|---|---|---|---|---|---|---|---|---|---|---|---|---|---|---|---|---|---|---|
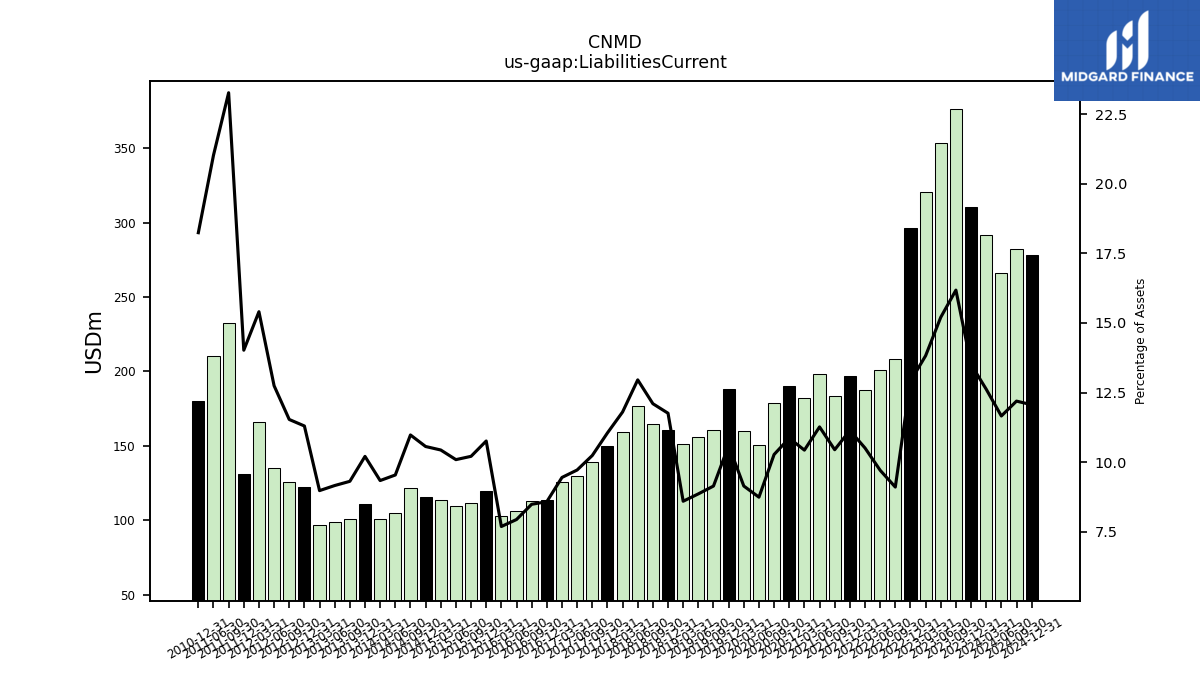
| Liabilities Current | 310.73 | 376.32 | 353.17 | 320.69 | 296.55 | 208.58 | 201.09 | 187.60 | 196.65 | 183.19 | 198.46 | 182.16 | 190.20 | 179.04 | 150.61 | 160.00 | 188.09 | 160.66 | 155.80 | 151.27 | 160.94 | 164.89 | 176.67 | 159.30 | 150.00 | 139.32 | 129.71 | 125.44 | 113.95 | 112.86 | 106.22 | 103.16 | 119.72 | 111.66 | 109.88 | 113.48 | 115.96 | 121.75 | 104.62 | 101.11 | 111.27 | 100.88 | 99.16 | 97.17 | 122.51 | 125.54 | 135.25 | 165.84 | 131.18 | 232.60 | 210.35 | NA | 179.87 | NA | NA | NA | |
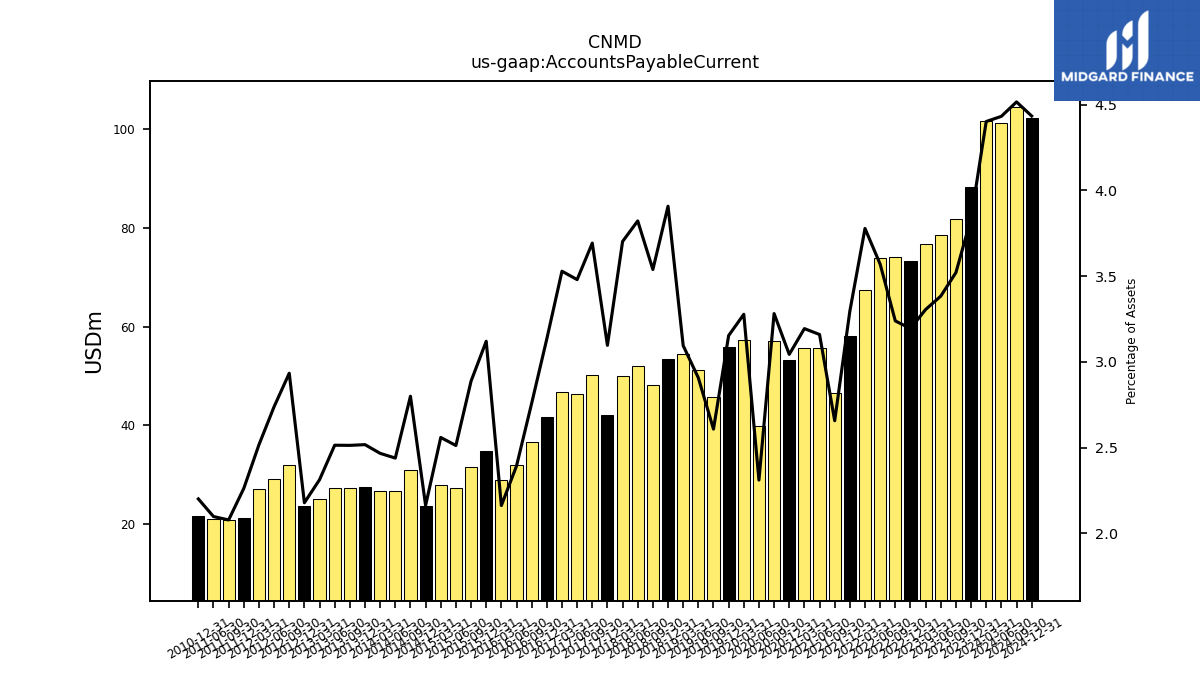
| Accounts Payable Current | 88.22 | 81.87 | 78.58 | 76.68 | 73.39 | 74.23 | 73.97 | 67.46 | 58.20 | 46.60 | 55.66 | 55.78 | 53.31 | 57.20 | 39.83 | 57.38 | 55.97 | 45.85 | 51.14 | 54.49 | 53.50 | 48.23 | 52.12 | 49.97 | 42.04 | 50.26 | 46.46 | 46.86 | 41.65 | 36.70 | 32.03 | 29.03 | 34.72 | 31.59 | 27.36 | 27.83 | 23.75 | 31.06 | 26.76 | 26.71 | 27.45 | 27.24 | 27.22 | 25.05 | 23.62 | 31.94 | 29.06 | 27.09 | 21.16 | 20.76 | 20.98 | NA | 21.69 | NA | NA | NA | |
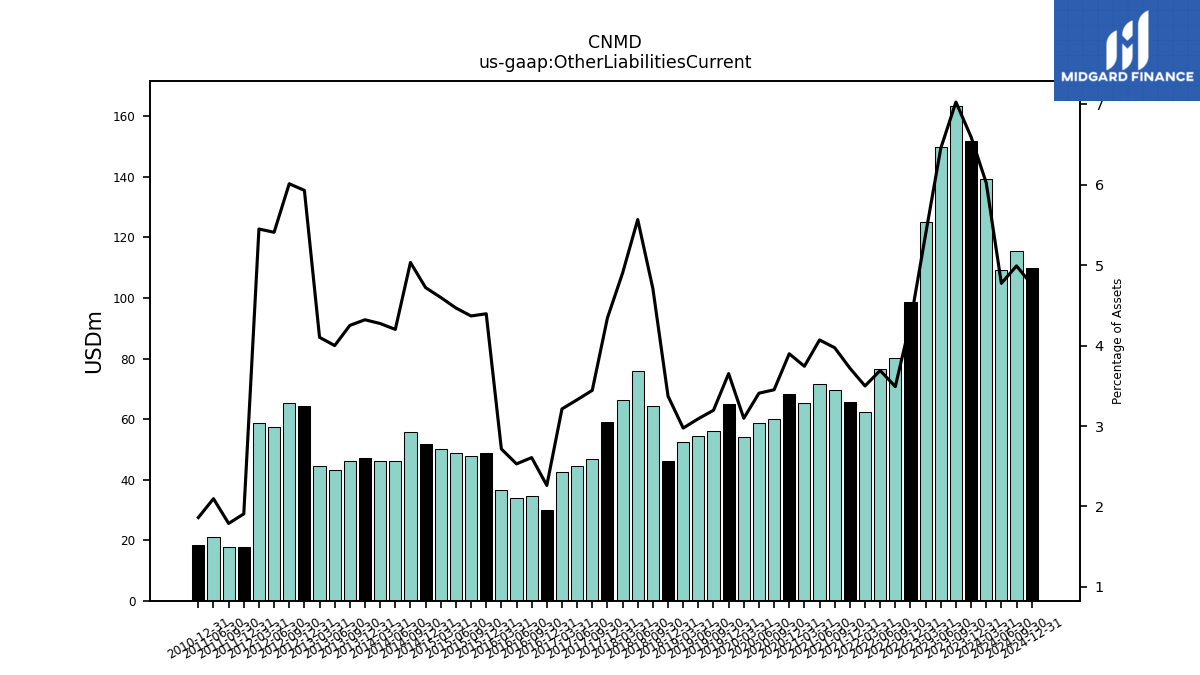
| Other Liabilities Current | 151.73 | 163.49 | 149.91 | 124.94 | 98.68 | 80.02 | 76.49 | 62.48 | 65.71 | 69.71 | 71.73 | 65.39 | 68.31 | 60.17 | 58.77 | 54.23 | 64.83 | 56.21 | 54.39 | 52.40 | 46.19 | 64.20 | 75.94 | 66.19 | 59.00 | 46.89 | 44.43 | 42.67 | 30.07 | 34.71 | 33.87 | 36.46 | 48.93 | 47.80 | 48.68 | 50.03 | 51.86 | 55.85 | 46.12 | 46.31 | 47.13 | 46.09 | 43.34 | 44.44 | 64.33 | 65.47 | 57.41 | 58.68 | 17.85 | 17.88 | 20.97 | NA | 18.36 | NA | NA | NA |
| 2023-12-31 | 2023-09-30 | 2023-06-30 | 2023-03-31 | 2022-12-31 | 2022-09-30 | 2022-06-30 | 2022-03-31 | 2021-12-31 | 2021-09-30 | 2021-06-30 | 2021-03-31 | 2020-12-31 | 2020-09-30 | 2020-06-30 | 2020-03-31 | 2019-12-31 | 2019-09-30 | 2019-06-30 | 2019-03-31 | 2018-12-31 | 2018-09-30 | 2018-06-30 | 2018-03-31 | 2017-12-31 | 2017-09-30 | 2017-06-30 | 2017-03-31 | 2016-12-31 | 2016-09-30 | 2016-06-30 | 2016-03-31 | 2015-12-31 | 2015-09-30 | 2015-06-30 | 2015-03-31 | 2014-12-31 | 2014-09-30 | 2014-06-30 | 2014-03-31 | 2013-12-31 | 2013-09-30 | 2013-06-30 | 2013-03-31 | 2012-12-31 | 2012-09-30 | 2012-06-30 | 2012-03-31 | 2011-12-31 | 2011-09-30 | 2011-06-30 | 2011-03-31 | 2010-12-31 | 2010-09-30 | 2010-06-30 | 2010-03-30 | ||
|---|---|---|---|---|---|---|---|---|---|---|---|---|---|---|---|---|---|---|---|---|---|---|---|---|---|---|---|---|---|---|---|---|---|---|---|---|---|---|---|---|---|---|---|---|---|---|---|---|---|---|---|---|---|---|---|---|---|
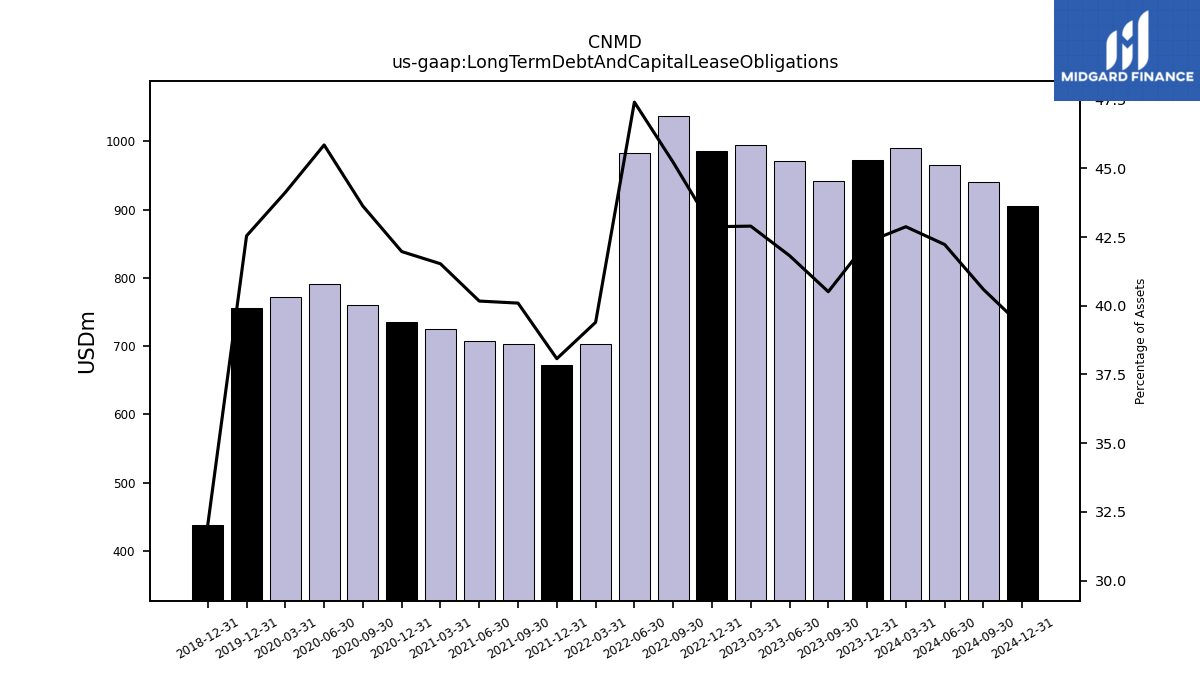
| Long Term Debt And Capital Lease Obligations | 973.14 | 942.17 | 971.48 | 995.28 | 985.08 | 1036.44 | 982.43 | 703.54 | 672.41 | 703.34 | 707.81 | 725.32 | 735.22 | 760.45 | 790.42 | 772.63 | 755.21 | NA | NA | NA | 438.56 | NA | NA | NA | NA | NA | NA | NA | NA | NA | NA | NA | NA | NA | NA | NA | NA | NA | NA | NA | NA | NA | NA | NA | NA | NA | NA | NA | NA | NA | NA | NA | NA | NA | NA | NA | |
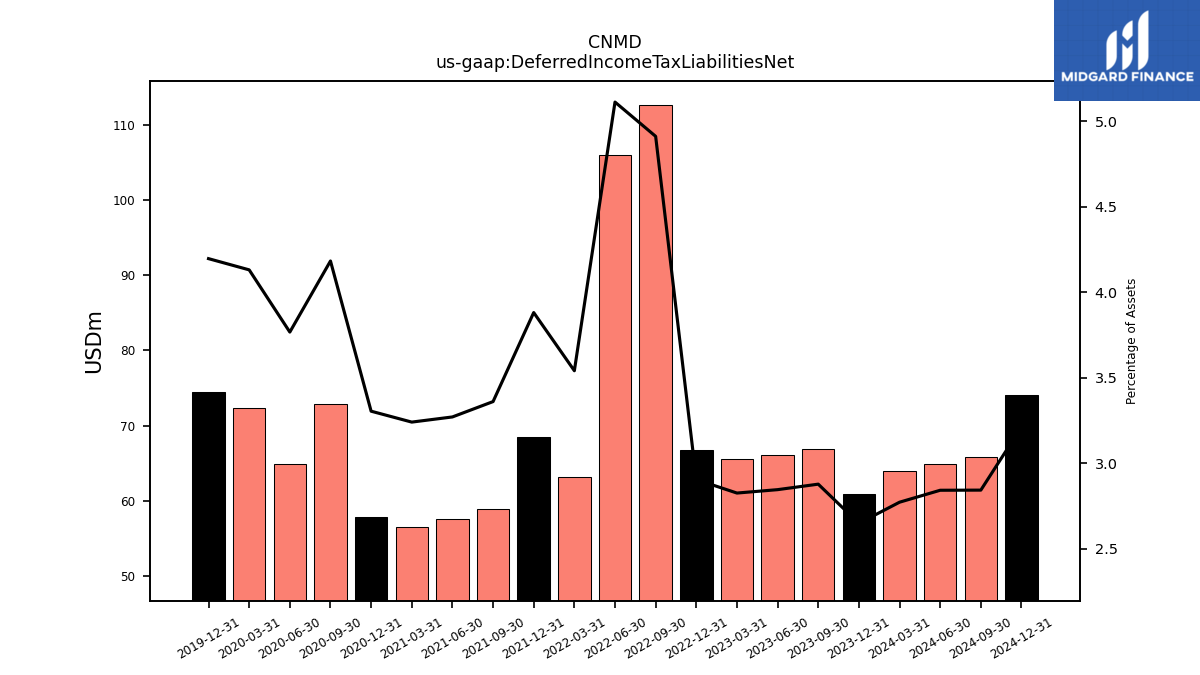
| Deferred Income Tax Liabilities Net | 60.90 | 66.91 | 66.08 | 65.55 | 66.72 | 112.58 | 105.94 | 63.23 | 68.54 | 58.94 | 57.62 | 56.59 | 57.88 | 72.91 | 64.94 | 72.33 | 74.49 | NA | NA | NA | NA | NA | NA | NA | NA | NA | NA | NA | NA | NA | NA | NA | NA | NA | NA | NA | NA | NA | NA | NA | NA | NA | NA | NA | NA | NA | NA | NA | NA | NA | NA | NA | NA | NA | NA | NA | |
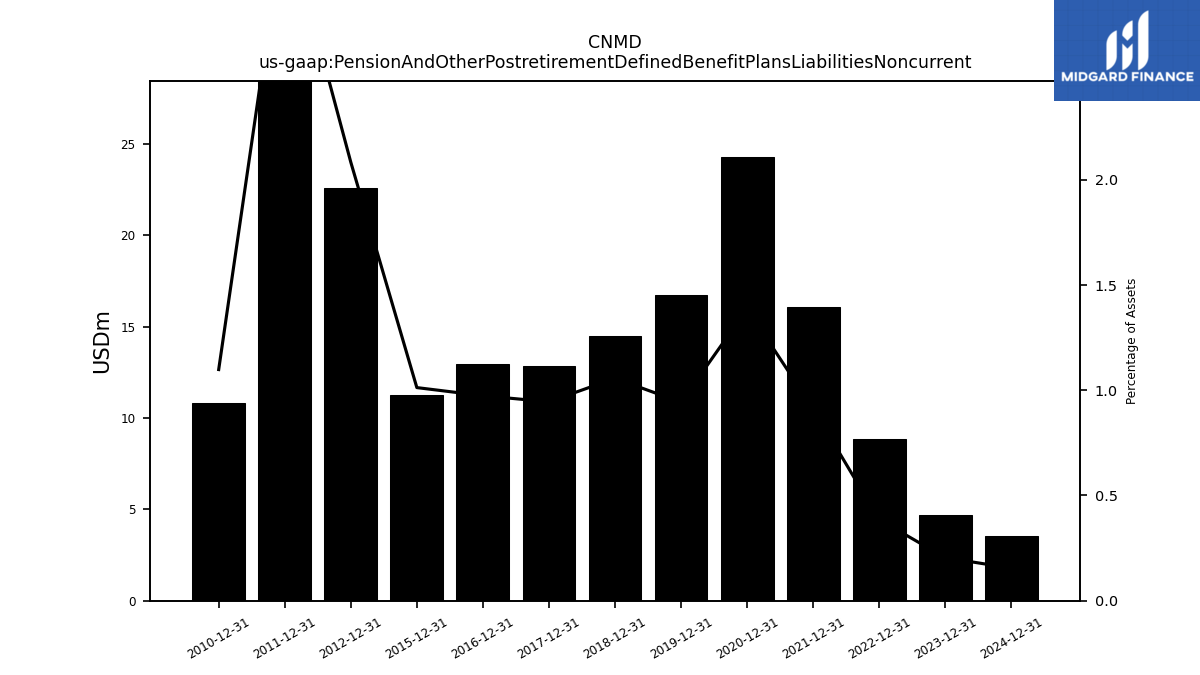
| Pension And Other Postretirement Defined Benefit Plans Liabilities Noncurrent | 4.69 | NA | NA | NA | 8.85 | NA | NA | NA | 16.10 | NA | NA | NA | 24.30 | NA | NA | NA | 16.73 | NA | NA | NA | 14.47 | NA | NA | NA | 12.83 | NA | NA | NA | 12.94 | NA | NA | NA | 11.27 | NA | NA | NA | NA | NA | NA | NA | NA | NA | NA | NA | 22.60 | NA | NA | NA | 30.47 | NA | NA | NA | 10.83 | NA | NA | NA | |
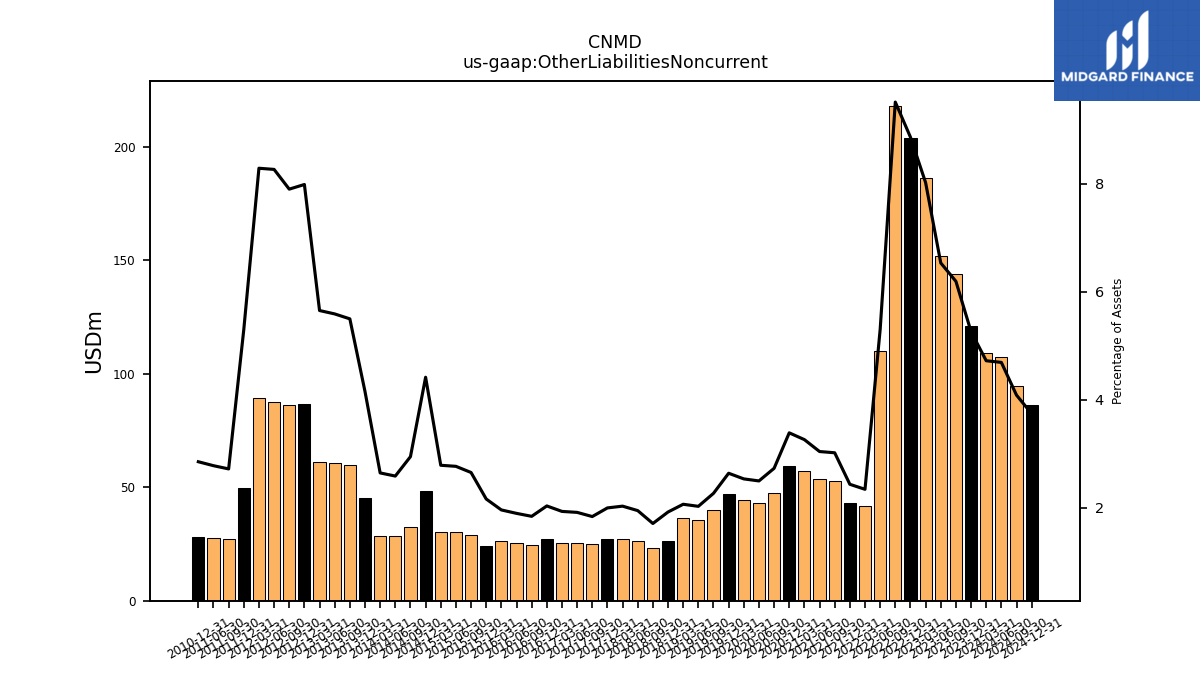
| Other Liabilities Noncurrent | 121.03 | 144.07 | 151.80 | 186.16 | 203.69 | 218.11 | 109.83 | 41.81 | 42.99 | 52.94 | 53.59 | 56.97 | 59.34 | 47.59 | 43.04 | 44.38 | 46.84 | 39.85 | 35.65 | 36.35 | 26.30 | 23.28 | 26.55 | 27.40 | 27.11 | 25.00 | 25.56 | 25.66 | 27.02 | 24.50 | 25.38 | 26.30 | 24.06 | 29.02 | 30.14 | 30.31 | 48.52 | 32.69 | 28.39 | 28.65 | 45.29 | 59.61 | 60.55 | 61.23 | 86.64 | 86.05 | 87.75 | 89.25 | 49.60 | 27.17 | 27.79 | NA | 28.12 | NA | NA | NA | |
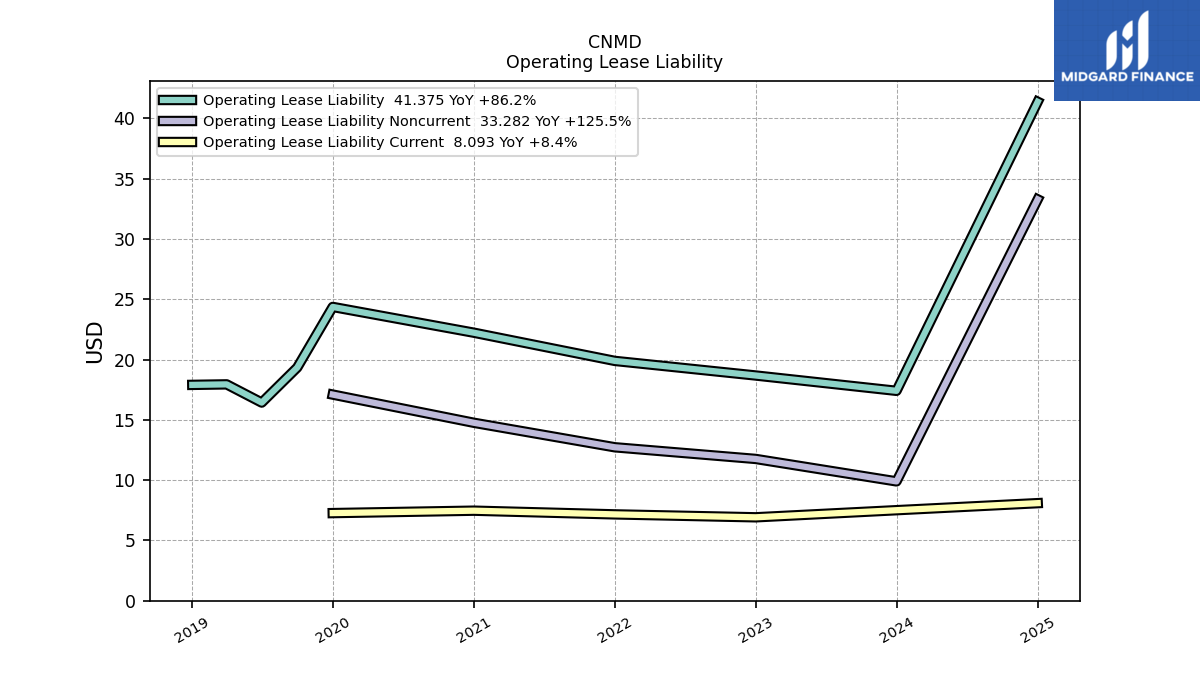
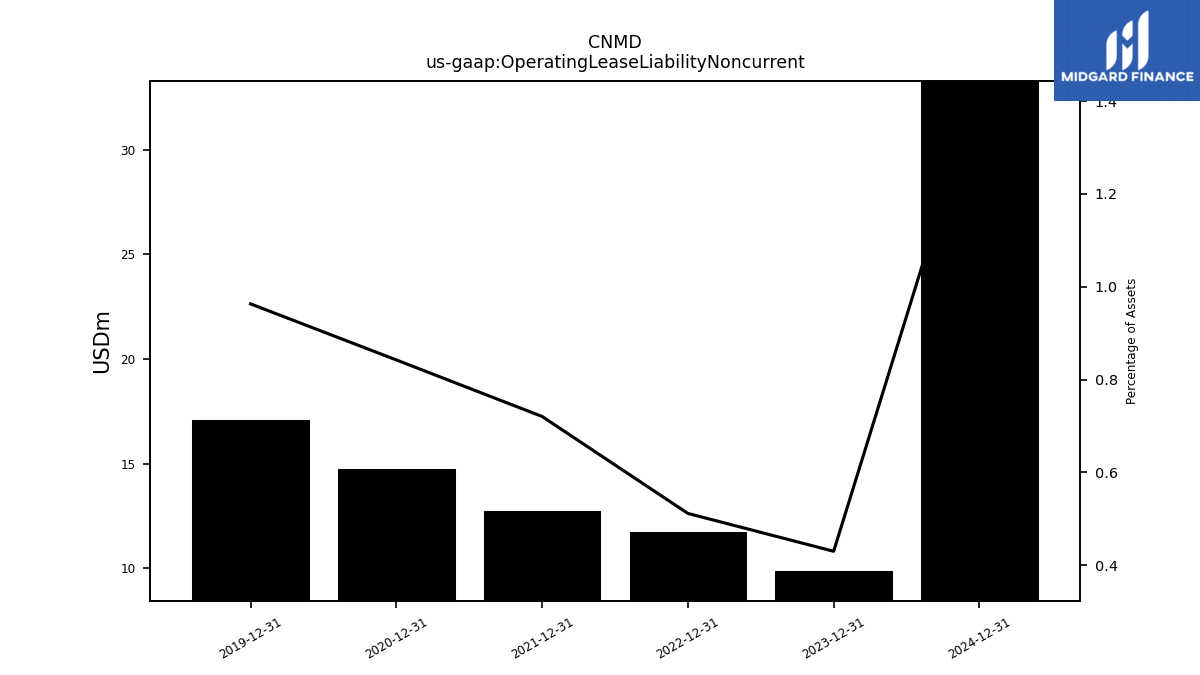
| Operating Lease Liability Noncurrent | 9.90 | NA | NA | NA | 11.76 | NA | NA | NA | 12.73 | NA | NA | NA | 14.76 | NA | NA | NA | 17.10 | NA | NA | NA | NA | NA | NA | NA | NA | NA | NA | NA | NA | NA | NA | NA | NA | NA | NA | NA | NA | NA | NA | NA | NA | NA | NA | NA | NA | NA | NA | NA | NA | NA | NA | NA | NA | NA | NA | NA |
| 2023-12-31 | 2023-09-30 | 2023-06-30 | 2023-03-31 | 2022-12-31 | 2022-09-30 | 2022-06-30 | 2022-03-31 | 2021-12-31 | 2021-09-30 | 2021-06-30 | 2021-03-31 | 2020-12-31 | 2020-09-30 | 2020-06-30 | 2020-03-31 | 2019-12-31 | 2019-09-30 | 2019-06-30 | 2019-03-31 | 2018-12-31 | 2018-09-30 | 2018-06-30 | 2018-03-31 | 2017-12-31 | 2017-09-30 | 2017-06-30 | 2017-03-31 | 2016-12-31 | 2016-09-30 | 2016-06-30 | 2016-03-31 | 2015-12-31 | 2015-09-30 | 2015-06-30 | 2015-03-31 | 2014-12-31 | 2014-09-30 | 2014-06-30 | 2014-03-31 | 2013-12-31 | 2013-09-30 | 2013-06-30 | 2013-03-31 | 2012-12-31 | 2012-09-30 | 2012-06-30 | 2012-03-31 | 2011-12-31 | 2011-09-30 | 2011-06-30 | 2011-03-31 | 2010-12-31 | 2010-09-30 | 2010-06-30 | 2010-03-30 | ||
|---|---|---|---|---|---|---|---|---|---|---|---|---|---|---|---|---|---|---|---|---|---|---|---|---|---|---|---|---|---|---|---|---|---|---|---|---|---|---|---|---|---|---|---|---|---|---|---|---|---|---|---|---|---|---|---|---|---|
| Stockholders Equity | 834.22 | 796.21 | 780.19 | 752.45 | 745.54 | 716.34 | 672.97 | 789.55 | 785.43 | 755.68 | 744.50 | 725.57 | 709.04 | 683.14 | 674.90 | 701.63 | 710.47 | 700.92 | 697.01 | 693.06 | 662.27 | 652.66 | 648.19 | 642.63 | 631.43 | 589.67 | 582.36 | 575.52 | 580.58 | 584.17 | 579.73 | 582.29 | 585.07 | 577.42 | 578.09 | 574.09 | 581.30 | 592.72 | 602.15 | 595.47 | 606.32 | 592.23 | 584.67 | 597.58 | 607.00 | 602.45 | 593.38 | 586.73 | 573.07 | 609.75 | 616.71 | NA | 586.56 | NA | NA | NA | |
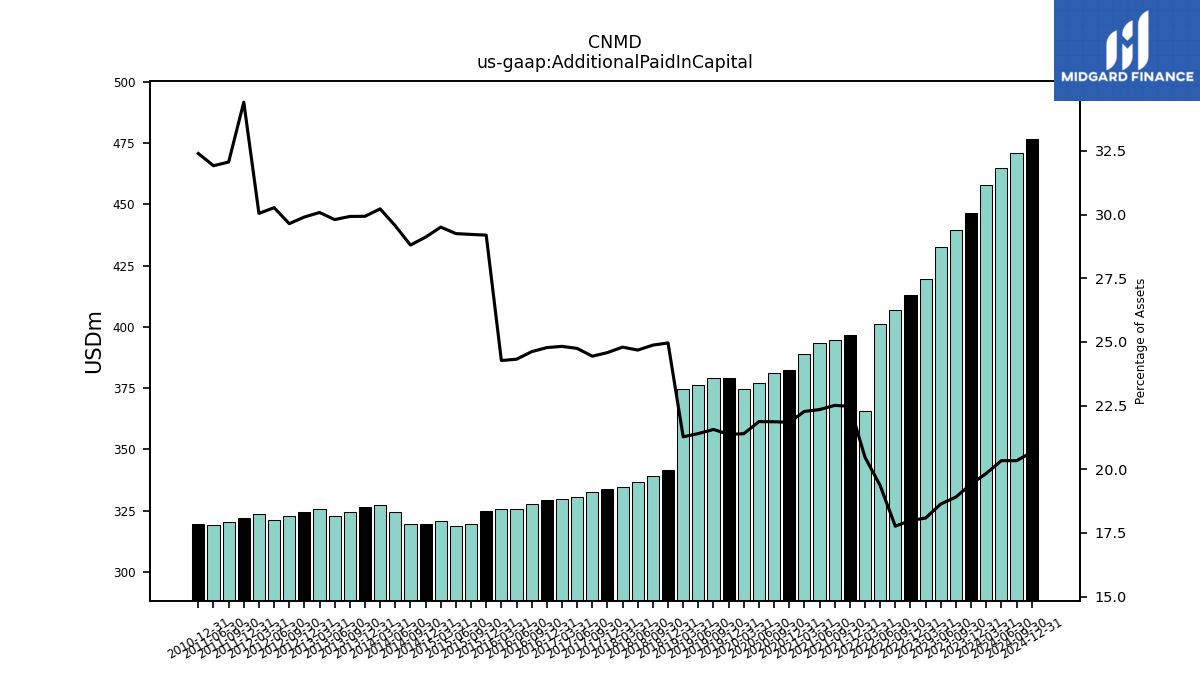
| Additional Paid In Capital | 446.54 | 439.73 | 432.78 | 419.52 | 413.24 | 407.10 | 401.18 | 365.56 | 396.77 | 394.81 | 393.66 | 388.96 | 382.63 | 381.12 | 377.02 | 374.62 | 379.32 | 379.14 | 376.52 | 374.56 | 341.74 | 339.03 | 336.56 | 334.75 | 333.80 | 332.66 | 330.43 | 329.69 | 329.28 | 327.60 | 325.61 | 325.89 | 324.92 | 319.71 | 318.69 | 320.99 | 319.75 | 319.59 | 324.37 | 327.42 | 326.44 | 324.40 | 322.79 | 325.80 | 324.32 | 322.77 | 321.26 | 323.49 | 321.99 | 320.39 | 319.26 | NA | 319.41 | NA | NA | NA | |
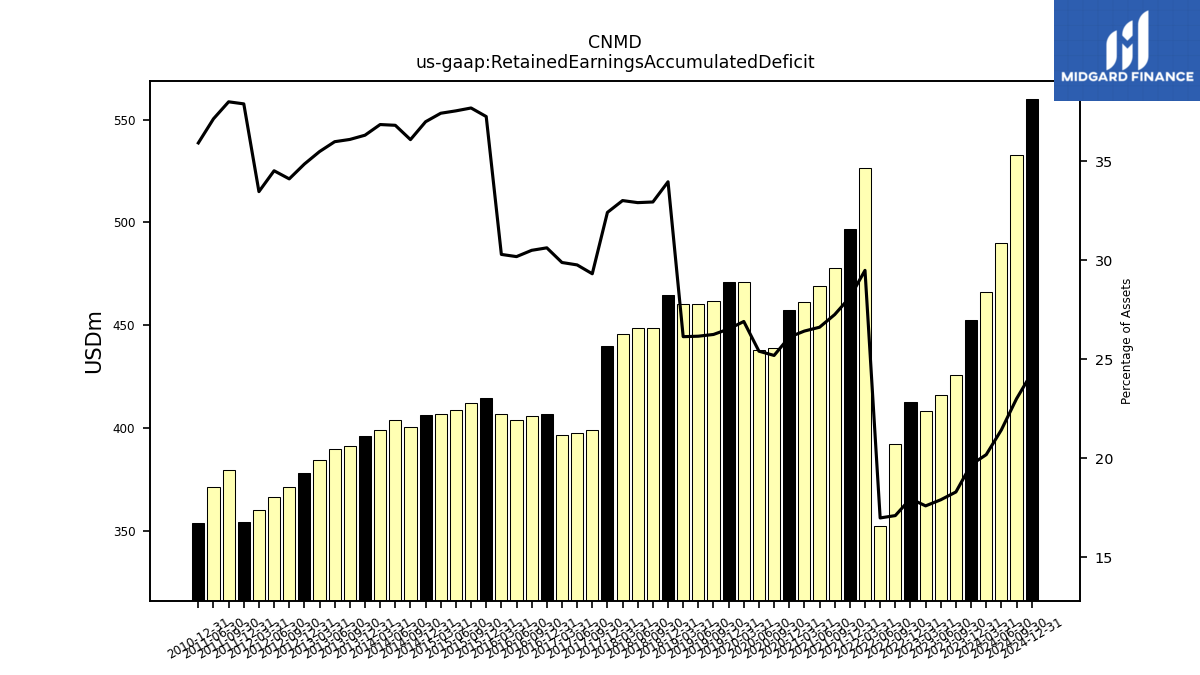
| Retained Earnings Accumulated Deficit | 452.53 | 425.61 | 415.92 | 408.34 | 412.63 | 392.14 | 352.09 | 526.47 | 496.61 | 478.04 | 468.92 | 461.46 | 457.42 | 439.09 | 437.96 | 471.07 | 470.84 | 461.56 | 460.27 | 460.23 | 464.85 | 448.88 | 448.68 | 445.58 | 440.08 | 398.98 | 397.37 | 396.81 | 406.93 | 405.79 | 404.02 | 406.69 | 414.51 | 412.20 | 408.86 | 406.94 | 406.14 | 400.32 | 403.85 | 399.06 | 395.89 | 391.18 | 389.62 | 384.21 | 377.91 | 371.27 | 366.22 | 360.19 | 354.44 | 379.57 | 371.37 | NA | 354.02 | NA | NA | NA | |
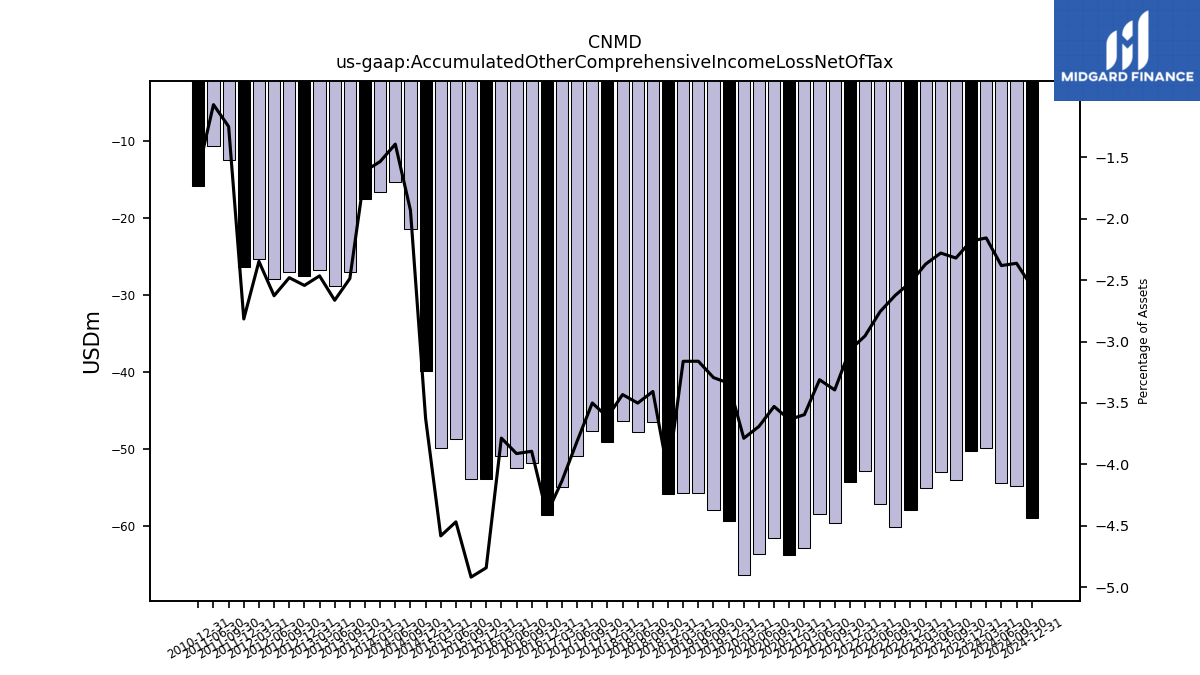
| Accumulated Other Comprehensive Income Loss Net Of Tax | -50.17 | -53.96 | -52.95 | -54.98 | -57.86 | -60.13 | -57.11 | -52.76 | -54.20 | -59.54 | -58.34 | -62.80 | -63.68 | -61.51 | -63.64 | -66.33 | -59.28 | -57.91 | -55.61 | -55.66 | -55.74 | -46.43 | -47.74 | -46.33 | -49.08 | -47.65 | -50.90 | -54.91 | -58.53 | -51.82 | -52.38 | -50.84 | -53.89 | -53.81 | -48.68 | -49.85 | -39.82 | -21.42 | -15.28 | -16.62 | -17.57 | -26.96 | -28.85 | -26.70 | -27.58 | -27.00 | -27.88 | -25.27 | -26.35 | -12.48 | -10.71 | NA | -15.86 | NA | NA | NA | |
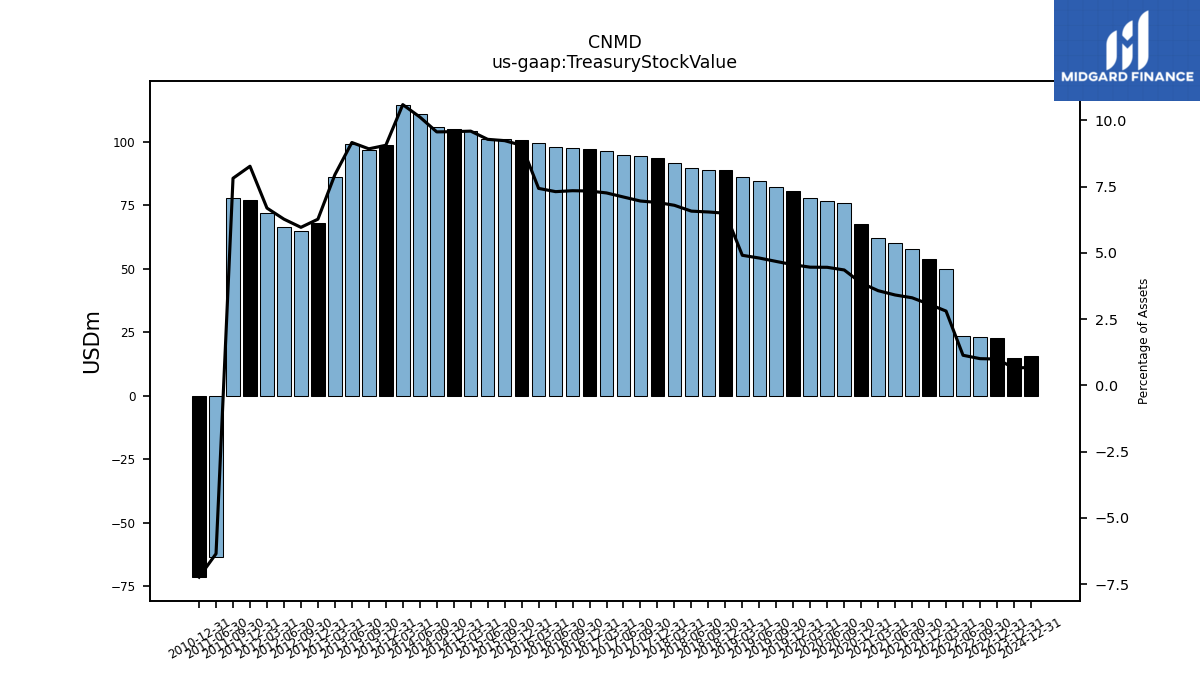
| Treasury Stock Value | 14.99 | NA | NA | NA | 22.78 | 23.08 | 23.51 | 50.03 | 54.05 | 57.94 | 60.06 | 62.37 | 67.64 | 75.86 | 76.76 | 78.04 | 80.74 | 82.18 | 84.48 | 86.38 | 88.89 | 89.13 | 89.61 | 91.68 | 93.68 | 94.63 | 94.86 | 96.39 | 97.42 | 97.71 | 97.82 | 99.76 | 100.77 | 100.98 | 101.10 | 104.31 | 105.09 | 106.08 | 111.09 | 114.70 | 98.75 | 96.71 | 99.21 | 86.05 | 67.96 | 64.90 | 66.53 | 71.99 | 77.33 | 78.05 | -63.52 | NA | -71.31 | NA | NA | NA |
| 2023-12-31 | 2023-09-30 | 2023-06-30 | 2023-03-31 | 2022-12-31 | 2022-09-30 | 2022-06-30 | 2022-03-31 | 2021-12-31 | 2021-09-30 | 2021-06-30 | 2021-03-31 | 2020-12-31 | 2020-09-30 | 2020-06-30 | 2020-03-31 | 2019-12-31 | 2019-09-30 | 2019-06-30 | 2019-03-31 | 2018-12-31 | 2018-09-30 | 2018-06-30 | 2018-03-31 | 2017-12-31 | 2017-09-30 | 2017-06-30 | 2017-03-31 | 2016-12-31 | 2016-09-30 | 2016-06-30 | 2016-03-31 | 2015-12-31 | 2015-09-30 | 2015-06-30 | 2015-03-31 | 2014-12-31 | 2014-09-30 | 2014-06-30 | 2014-03-31 | 2013-12-31 | 2013-09-30 | 2013-06-30 | 2013-03-31 | 2012-12-31 | 2012-09-30 | 2012-06-30 | 2012-03-31 | 2011-12-31 | 2011-09-30 | 2011-06-30 | 2011-03-31 | 2010-12-31 | 2010-09-30 | 2010-06-30 | 2010-03-30 | ||
|---|---|---|---|---|---|---|---|---|---|---|---|---|---|---|---|---|---|---|---|---|---|---|---|---|---|---|---|---|---|---|---|---|---|---|---|---|---|---|---|---|---|---|---|---|---|---|---|---|---|---|---|---|---|---|---|---|---|
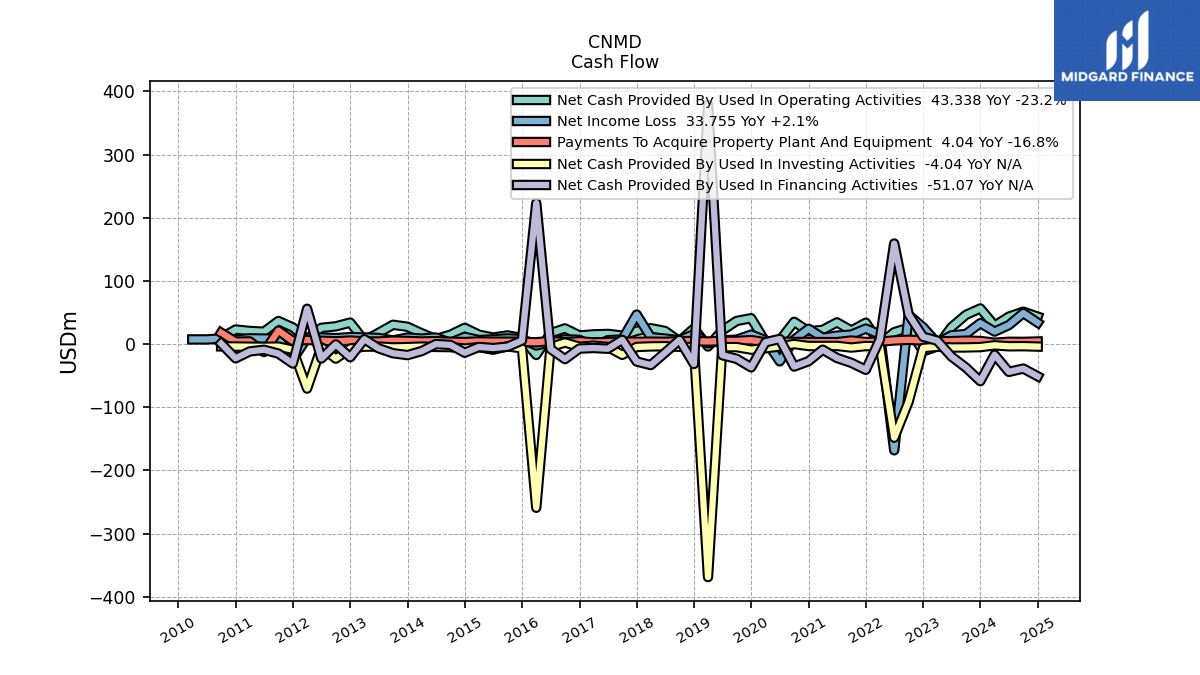
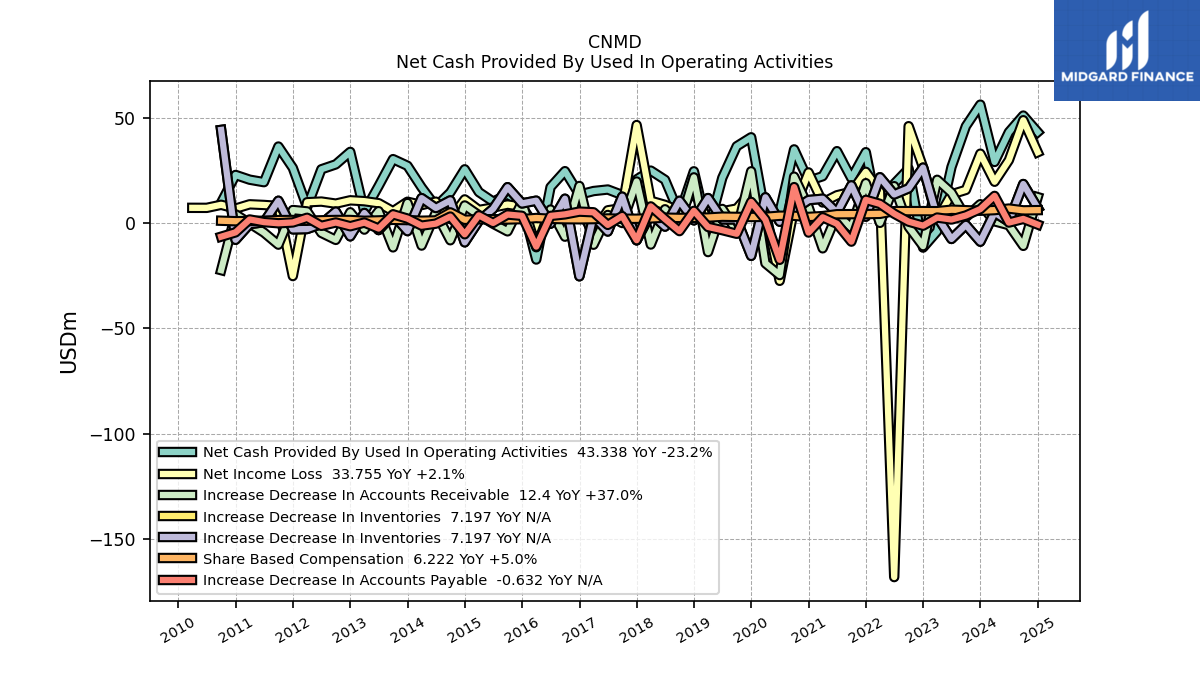
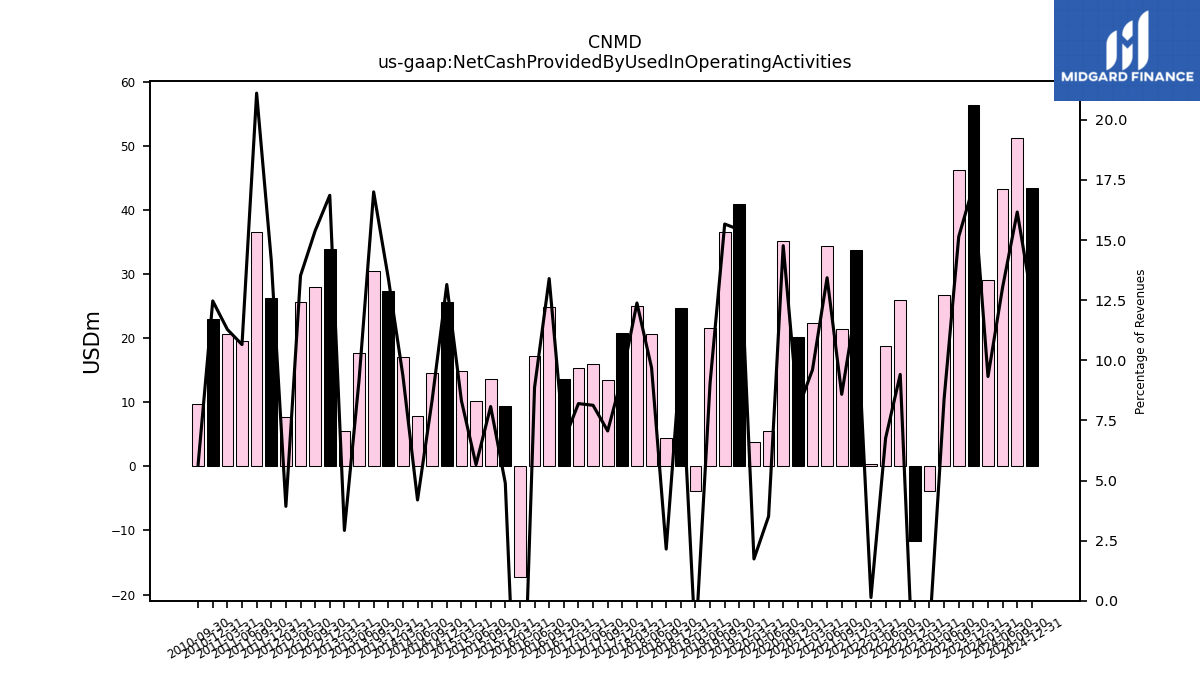
| Net Cash Provided By Used In Operating Activities | 56.40 | 46.13 | 26.67 | -3.85 | -11.60 | 25.89 | 18.74 | 0.33 | 33.78 | 21.36 | 34.28 | 22.34 | 20.14 | 35.13 | 5.54 | 3.72 | 40.88 | 36.60 | 21.58 | -3.92 | 24.70 | 4.35 | 20.62 | 25.02 | 20.81 | 13.43 | 16.03 | 15.30 | 13.58 | 24.76 | 17.16 | -17.28 | 9.35 | 13.66 | 10.25 | 14.81 | 25.65 | 14.62 | 7.89 | 17.02 | 27.31 | 30.48 | 17.68 | 5.47 | 33.94 | 27.99 | 25.65 | 7.63 | 26.28 | 36.49 | 19.52 | 20.70 | 22.95 | 9.77 | NA | NA | |
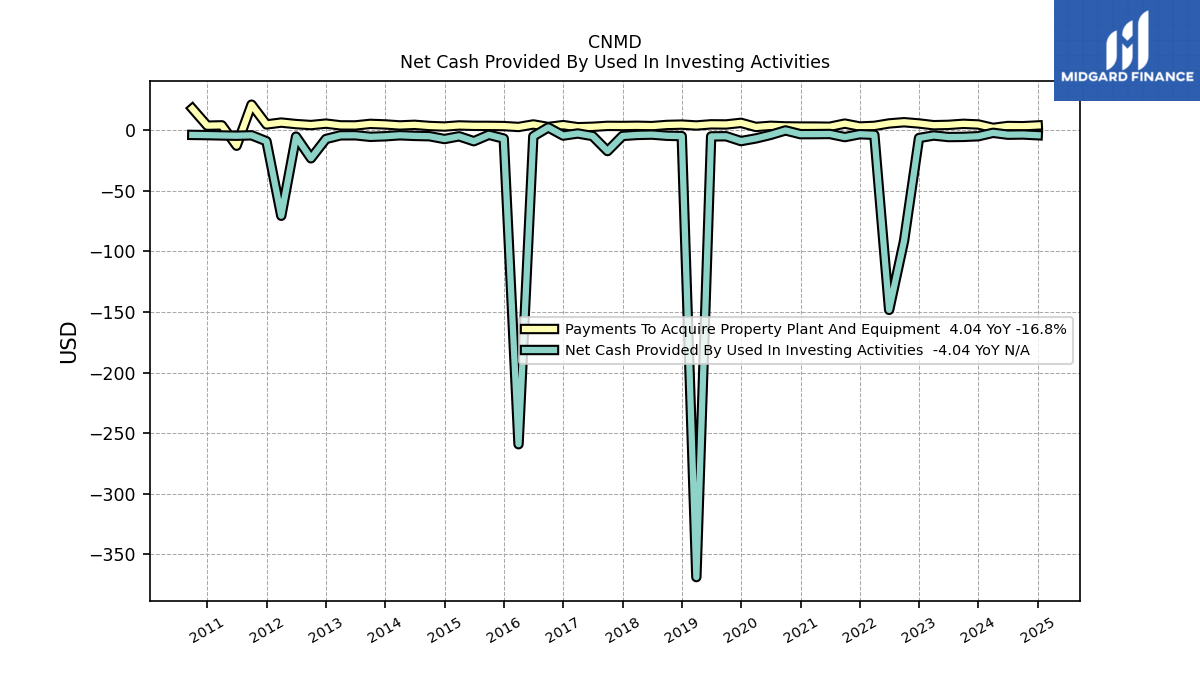
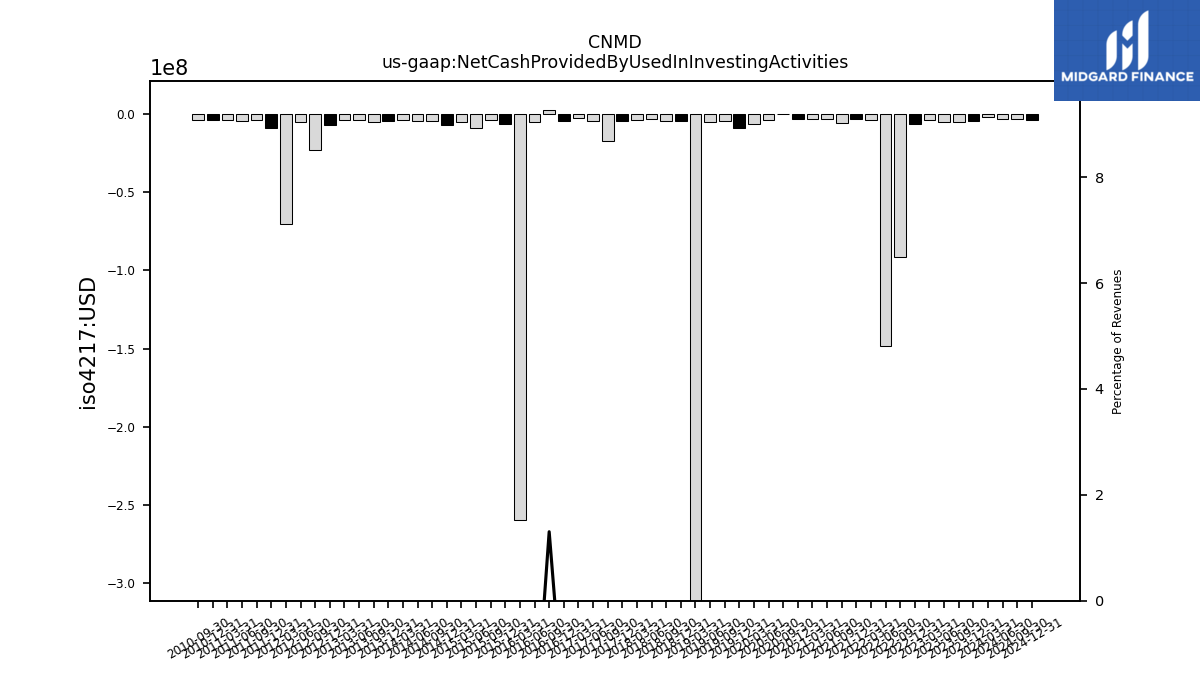
| Net Cash Provided By Used In Investing Activities | -4.86 | -5.39 | -5.53 | -4.25 | -6.32 | -91.26 | -148.27 | -3.69 | -3.19 | -5.58 | -2.99 | -3.11 | -3.15 | -0.06 | -3.75 | -6.68 | -8.86 | -4.87 | -4.98 | -368.95 | -4.76 | -4.46 | -3.51 | -3.78 | -4.63 | -17.14 | -4.71 | -2.58 | -4.32 | 2.41 | -4.90 | -259.21 | -6.78 | -3.69 | -8.97 | -4.91 | -7.18 | -4.85 | -4.58 | -4.07 | -4.89 | -5.35 | -4.07 | -4.13 | -7.14 | -23.10 | -5.17 | -70.54 | -9.00 | -4.10 | -4.43 | -4.21 | -3.94 | -3.76 | NA | NA | |
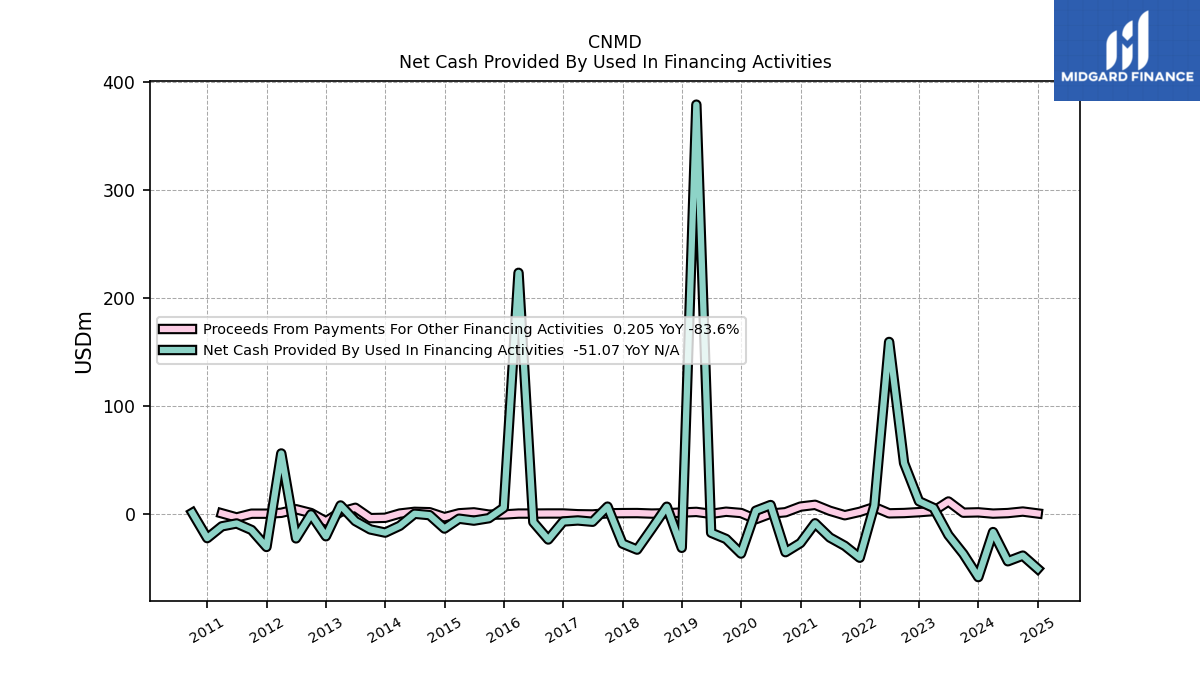
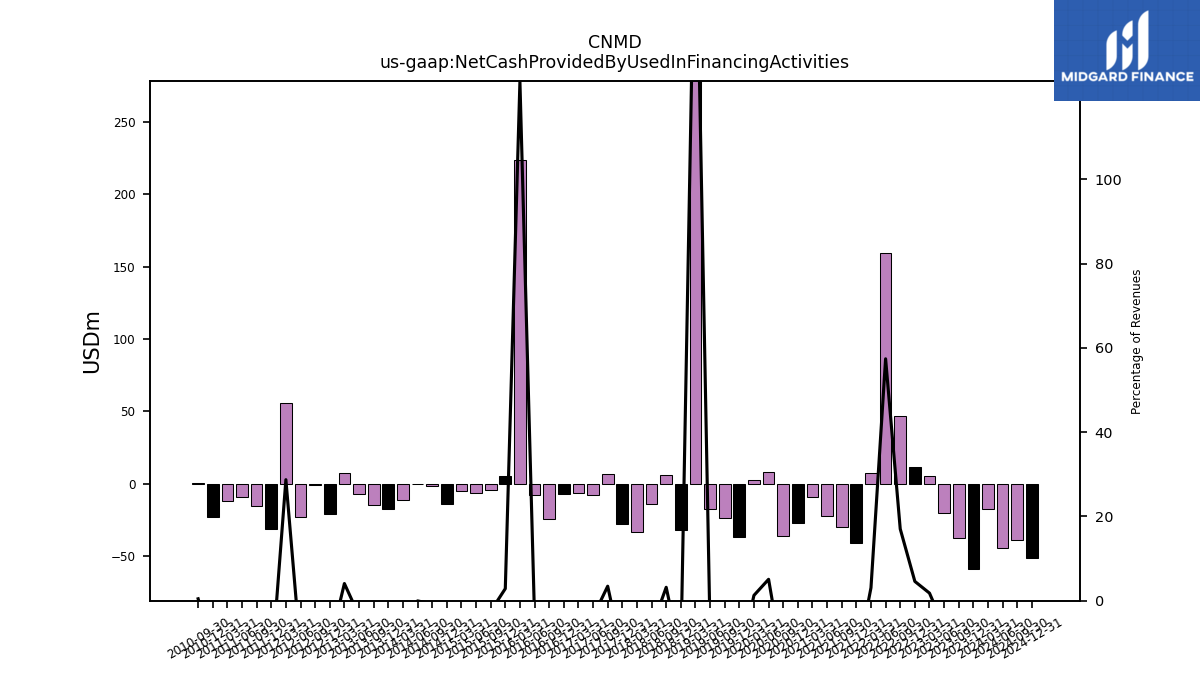
| Net Cash Provided By Used In Financing Activities | -58.77 | -37.23 | -19.79 | 5.35 | 11.52 | 46.88 | 159.12 | 7.49 | -40.79 | -29.79 | -22.09 | -8.87 | -27.16 | -35.66 | 8.03 | 2.74 | -36.97 | -23.42 | -17.68 | 378.95 | -31.64 | 6.46 | -13.78 | -33.30 | -27.71 | 6.56 | -7.46 | -6.27 | -7.22 | -23.92 | -7.83 | 223.16 | 5.48 | -4.19 | -6.43 | -4.63 | -13.78 | -1.34 | -0.06 | -11.21 | -17.53 | -14.58 | -6.82 | 7.63 | -20.94 | -0.63 | -22.89 | 55.82 | -30.84 | -15.10 | -9.05 | -11.71 | -22.65 | 0.81 | NA | NA |
| 2023-12-31 | 2023-09-30 | 2023-06-30 | 2023-03-31 | 2022-12-31 | 2022-09-30 | 2022-06-30 | 2022-03-31 | 2021-12-31 | 2021-09-30 | 2021-06-30 | 2021-03-31 | 2020-12-31 | 2020-09-30 | 2020-06-30 | 2020-03-31 | 2019-12-31 | 2019-09-30 | 2019-06-30 | 2019-03-31 | 2018-12-31 | 2018-09-30 | 2018-06-30 | 2018-03-31 | 2017-12-31 | 2017-09-30 | 2017-06-30 | 2017-03-31 | 2016-12-31 | 2016-09-30 | 2016-06-30 | 2016-03-31 | 2015-12-31 | 2015-09-30 | 2015-06-30 | 2015-03-31 | 2014-12-31 | 2014-09-30 | 2014-06-30 | 2014-03-31 | 2013-12-31 | 2013-09-30 | 2013-06-30 | 2013-03-31 | 2012-12-31 | 2012-09-30 | 2012-06-30 | 2012-03-31 | 2011-12-31 | 2011-09-30 | 2011-06-30 | 2011-03-31 | 2010-12-31 | 2010-09-30 | 2010-06-30 | 2010-03-30 | ||
|---|---|---|---|---|---|---|---|---|---|---|---|---|---|---|---|---|---|---|---|---|---|---|---|---|---|---|---|---|---|---|---|---|---|---|---|---|---|---|---|---|---|---|---|---|---|---|---|---|---|---|---|---|---|---|---|---|---|
| Net Cash Provided By Used In Operating Activities | 56.40 | 46.13 | 26.67 | -3.85 | -11.60 | 25.89 | 18.74 | 0.33 | 33.78 | 21.36 | 34.28 | 22.34 | 20.14 | 35.13 | 5.54 | 3.72 | 40.88 | 36.60 | 21.58 | -3.92 | 24.70 | 4.35 | 20.62 | 25.02 | 20.81 | 13.43 | 16.03 | 15.30 | 13.58 | 24.76 | 17.16 | -17.28 | 9.35 | 13.66 | 10.25 | 14.81 | 25.65 | 14.62 | 7.89 | 17.02 | 27.31 | 30.48 | 17.68 | 5.47 | 33.94 | 27.99 | 25.65 | 7.63 | 26.28 | 36.49 | 19.52 | 20.70 | 22.95 | 9.77 | NA | NA | |
| Net Income Loss | 33.07 | 15.84 | 13.73 | 1.82 | 26.58 | 46.15 | -168.29 | 14.97 | 24.44 | 14.95 | 13.29 | 9.86 | 24.14 | 6.85 | -27.40 | 5.93 | 14.93 | 6.97 | 5.70 | 1.02 | 15.65 | 5.83 | 8.72 | 10.66 | 46.70 | 7.20 | 6.14 | -4.54 | 6.71 | 7.34 | 2.88 | -2.27 | 7.85 | 8.87 | 7.46 | 6.31 | 11.34 | 1.97 | 10.26 | 8.63 | 10.23 | 5.69 | 9.53 | 10.49 | 10.90 | 9.32 | 10.30 | 9.97 | -25.13 | 8.21 | 8.68 | 8.99 | 6.96 | 8.76 | 7.31 | 7.32 | |
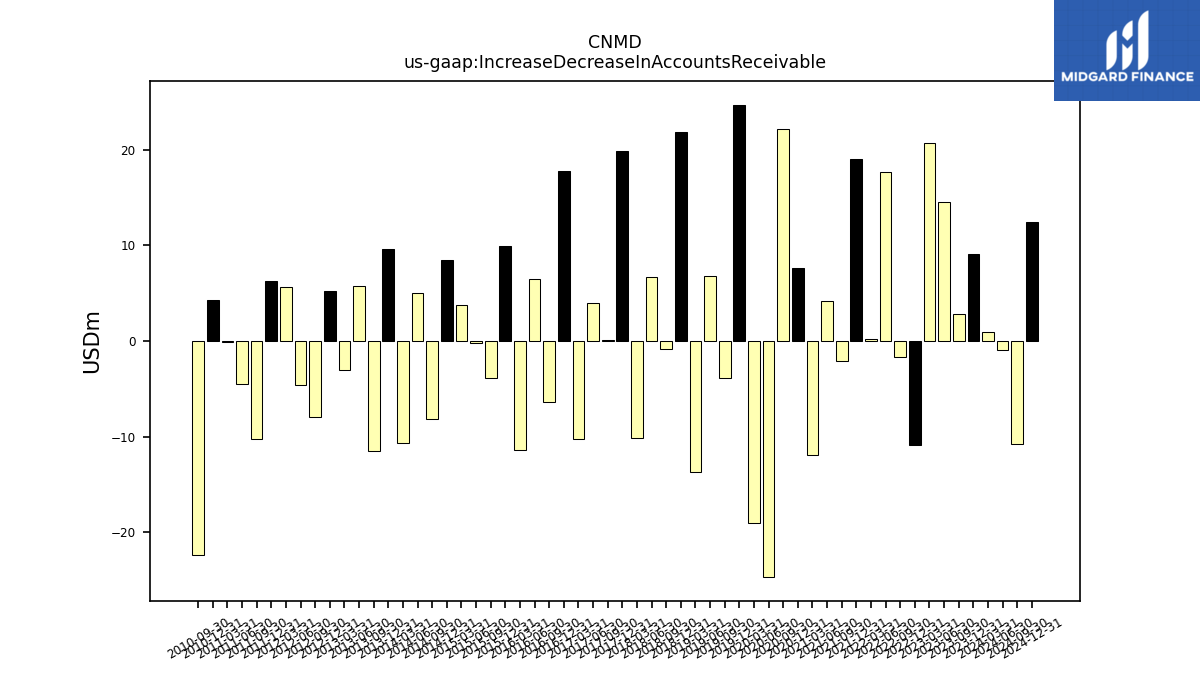
| Increase Decrease In Accounts Receivable | 9.05 | 2.83 | 14.52 | 20.67 | -10.89 | -1.69 | 17.62 | 0.16 | 19.05 | -2.11 | 4.18 | -11.96 | 7.65 | 22.16 | -24.68 | -19.06 | 24.70 | -3.82 | 6.80 | -13.73 | 21.82 | -0.85 | 6.64 | -10.14 | 19.84 | 0.09 | 3.94 | -10.24 | 17.71 | -6.41 | 6.50 | -11.43 | 9.95 | -3.88 | -0.23 | 3.81 | 8.44 | -8.12 | 5.05 | -10.64 | 9.61 | -11.50 | 5.73 | -3.04 | 5.22 | -7.94 | -4.59 | 5.62 | 6.28 | -10.20 | -4.45 | -0.09 | 4.26 | -22.32 | NA | NA | |
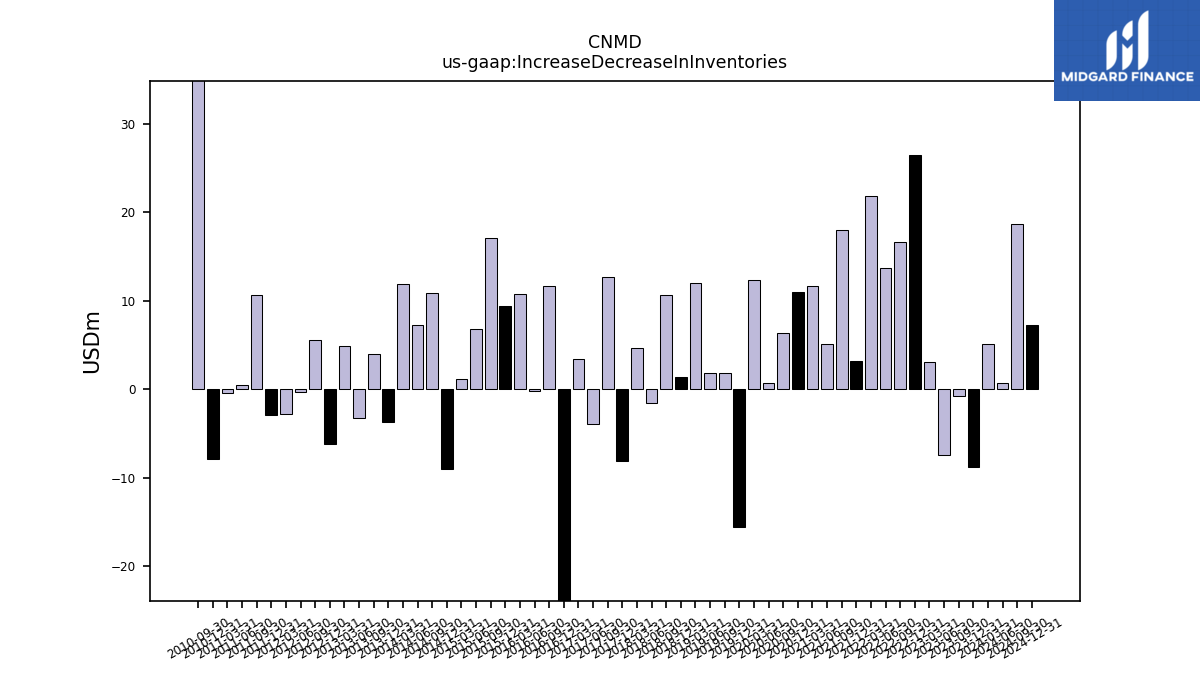
| Increase Decrease In Inventories | -8.79 | -0.82 | -7.48 | 3.02 | 26.44 | 16.58 | 13.69 | 21.86 | 3.13 | 17.99 | 5.05 | 11.64 | 11.00 | 6.37 | 0.72 | 12.31 | -15.53 | 1.84 | 1.84 | 11.97 | 1.36 | 10.66 | -1.60 | 4.62 | -8.14 | 12.63 | -3.95 | 3.37 | -25.24 | 11.65 | -0.23 | 10.72 | 9.41 | 17.13 | 6.85 | 1.16 | -9.08 | 10.86 | 7.23 | 11.94 | -3.76 | 4.00 | -3.28 | 4.86 | -6.25 | 5.51 | -0.31 | -2.76 | -2.92 | 10.69 | 0.50 | -0.42 | -7.88 | 44.37 | NA | NA | |
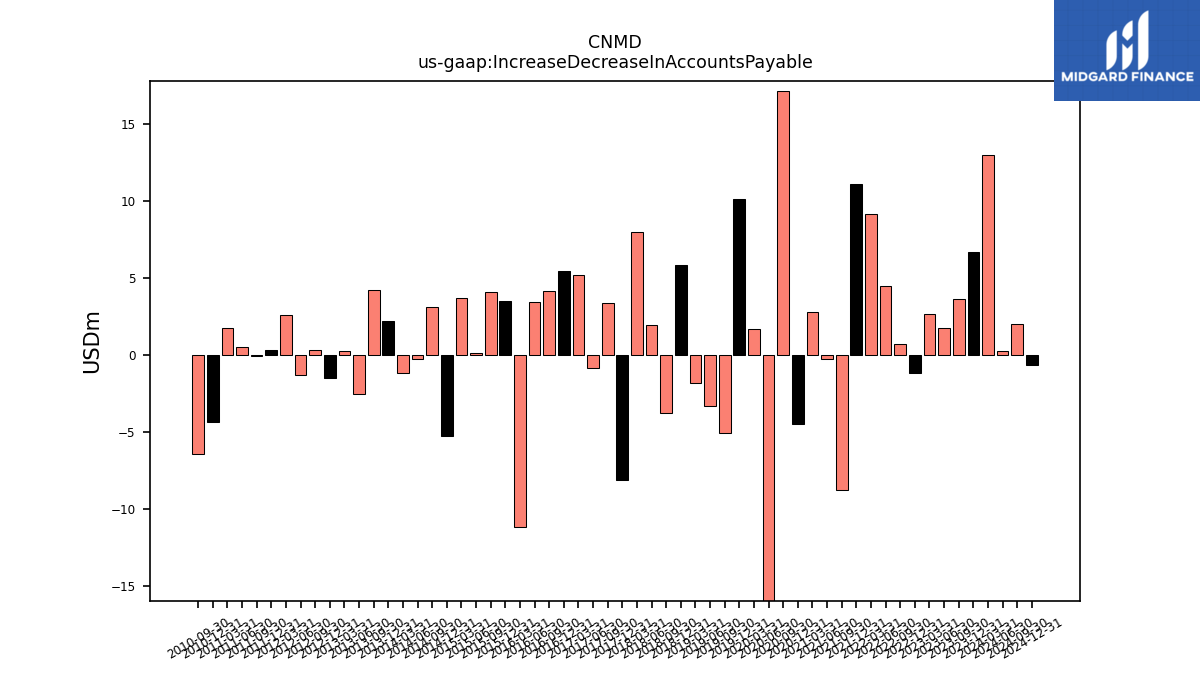
| Increase Decrease In Accounts Payable | 6.72 | 3.68 | 1.75 | 2.70 | -1.17 | 0.75 | 4.52 | 9.21 | 11.11 | -8.77 | -0.26 | 2.80 | -4.45 | 17.18 | -17.41 | 1.71 | 10.14 | -5.03 | -3.30 | -1.78 | 5.90 | -3.77 | 1.98 | 8.01 | -8.09 | 3.41 | -0.81 | 5.20 | 5.51 | 4.21 | 3.48 | -11.11 | 3.52 | 4.13 | 0.13 | 3.73 | -5.26 | 3.17 | -0.20 | -1.15 | 2.20 | 4.23 | -2.52 | 0.31 | -1.43 | 0.35 | -1.26 | 2.60 | 0.36 | -0.02 | 0.53 | 1.78 | -4.34 | -6.40 | NA | NA | |
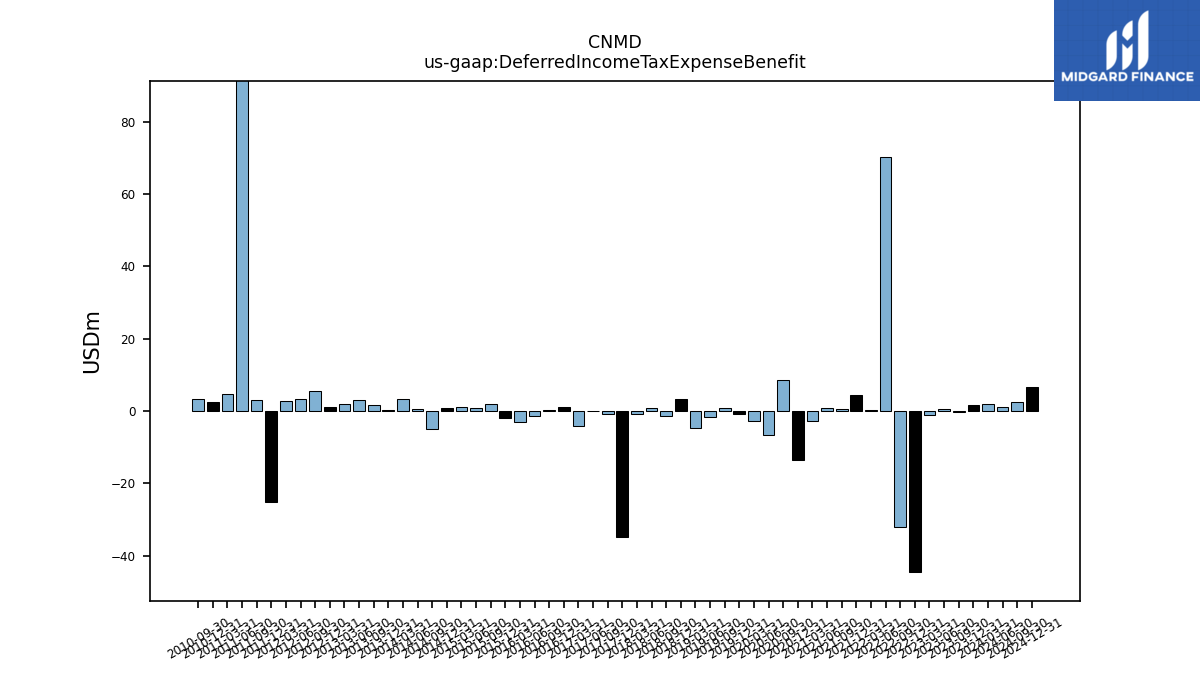
| Deferred Income Tax Expense Benefit | 1.59 | -0.28 | 0.53 | -1.14 | -44.48 | -31.96 | 70.22 | 0.18 | 4.32 | 0.47 | 0.91 | -2.69 | -13.45 | 8.70 | -6.75 | -2.74 | -0.80 | 0.75 | -1.55 | -4.70 | 3.33 | -1.39 | 0.85 | -0.74 | -34.89 | -0.85 | -0.01 | -4.27 | 1.11 | 0.36 | -1.40 | -2.94 | -1.91 | 1.98 | 0.92 | 1.25 | 0.84 | -4.96 | 0.51 | 3.33 | 0.42 | 1.76 | 3.12 | 1.91 | 1.19 | 5.66 | 3.36 | 2.73 | -25.06 | 2.98 | 114.67 | 4.62 | 2.52 | 3.40 | NA | NA | |
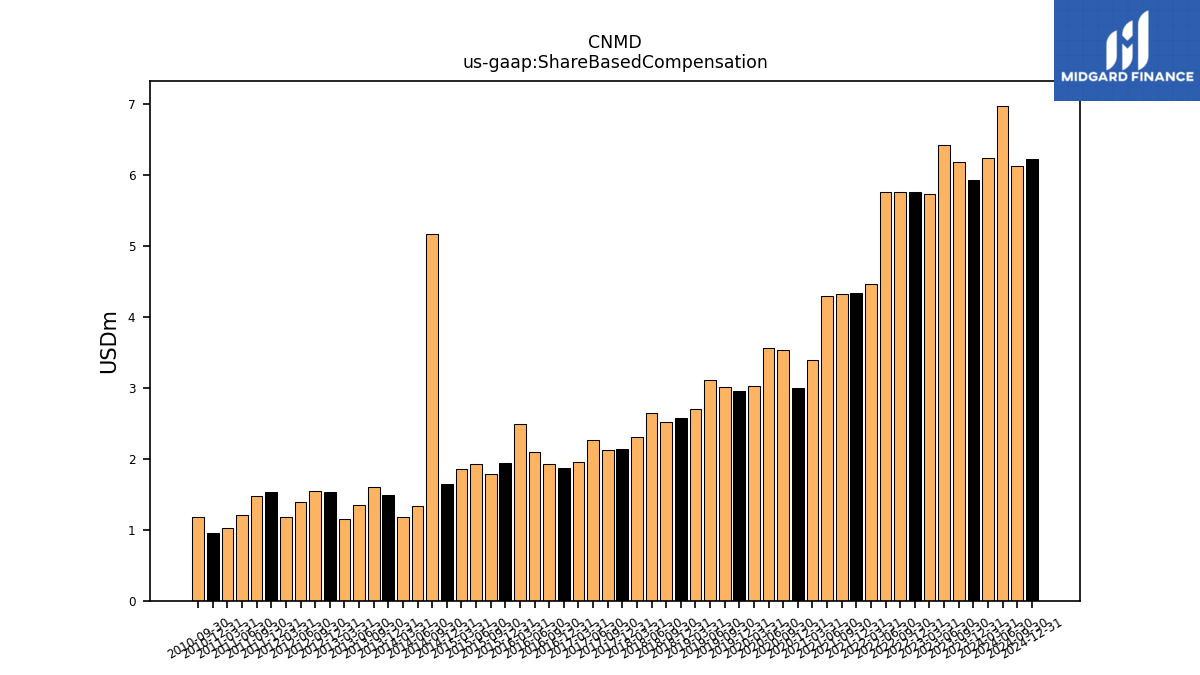
| Share Based Compensation | 5.92 | 6.19 | 6.42 | 5.73 | 5.76 | 5.75 | 5.75 | 4.46 | 4.33 | 4.33 | 4.29 | 3.39 | 2.99 | 3.53 | 3.56 | 3.03 | 2.96 | 3.01 | 3.11 | 2.70 | 2.57 | 2.51 | 2.65 | 2.30 | 2.13 | 2.12 | 2.27 | 1.96 | 1.87 | 1.92 | 2.09 | 2.49 | 1.94 | 1.78 | 1.92 | 1.86 | 1.64 | 5.17 | 1.33 | 1.19 | 1.49 | 1.61 | 1.34 | 1.15 | 1.54 | 1.54 | 1.39 | 1.18 | 1.53 | 1.48 | 1.21 | 1.03 | 0.96 | 1.18 | NA | NA | |
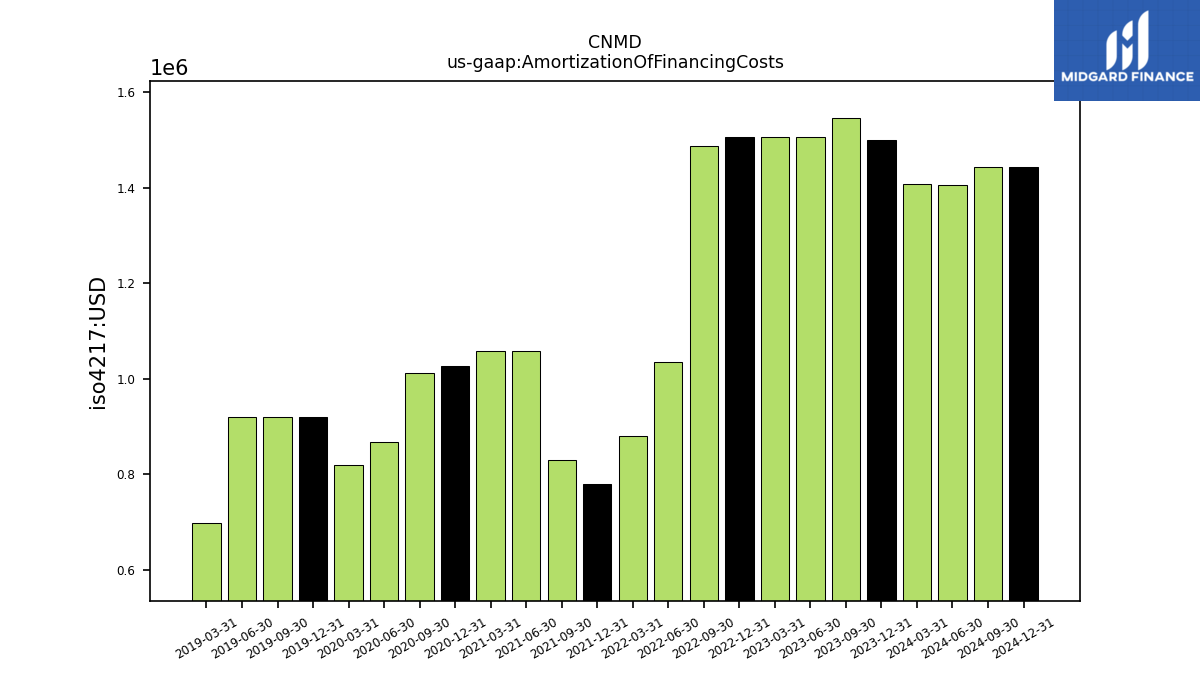
| Amortization Of Financing Costs | 1.50 | 1.55 | 1.51 | 1.51 | 1.51 | 1.49 | 1.04 | 0.88 | 0.78 | 0.83 | 1.06 | 1.06 | 1.03 | 1.01 | 0.87 | 0.82 | 0.92 | 0.92 | 0.92 | 0.70 | NA | NA | NA | NA | NA | NA | NA | NA | NA | NA | NA | NA | NA | NA | NA | NA | NA | NA | NA | NA | NA | NA | NA | NA | NA | NA | NA | NA | NA | NA | NA | NA | NA | NA | NA | NA |
| 2023-12-31 | 2023-09-30 | 2023-06-30 | 2023-03-31 | 2022-12-31 | 2022-09-30 | 2022-06-30 | 2022-03-31 | 2021-12-31 | 2021-09-30 | 2021-06-30 | 2021-03-31 | 2020-12-31 | 2020-09-30 | 2020-06-30 | 2020-03-31 | 2019-12-31 | 2019-09-30 | 2019-06-30 | 2019-03-31 | 2018-12-31 | 2018-09-30 | 2018-06-30 | 2018-03-31 | 2017-12-31 | 2017-09-30 | 2017-06-30 | 2017-03-31 | 2016-12-31 | 2016-09-30 | 2016-06-30 | 2016-03-31 | 2015-12-31 | 2015-09-30 | 2015-06-30 | 2015-03-31 | 2014-12-31 | 2014-09-30 | 2014-06-30 | 2014-03-31 | 2013-12-31 | 2013-09-30 | 2013-06-30 | 2013-03-31 | 2012-12-31 | 2012-09-30 | 2012-06-30 | 2012-03-31 | 2011-12-31 | 2011-09-30 | 2011-06-30 | 2011-03-31 | 2010-12-31 | 2010-09-30 | 2010-06-30 | 2010-03-30 | ||
|---|---|---|---|---|---|---|---|---|---|---|---|---|---|---|---|---|---|---|---|---|---|---|---|---|---|---|---|---|---|---|---|---|---|---|---|---|---|---|---|---|---|---|---|---|---|---|---|---|---|---|---|---|---|---|---|---|---|
| Net Cash Provided By Used In Investing Activities | -4.86 | -5.39 | -5.53 | -4.25 | -6.32 | -91.26 | -148.27 | -3.69 | -3.19 | -5.58 | -2.99 | -3.11 | -3.15 | -0.06 | -3.75 | -6.68 | -8.86 | -4.87 | -4.98 | -368.95 | -4.76 | -4.46 | -3.51 | -3.78 | -4.63 | -17.14 | -4.71 | -2.58 | -4.32 | 2.41 | -4.90 | -259.21 | -6.78 | -3.69 | -8.97 | -4.91 | -7.18 | -4.85 | -4.58 | -4.07 | -4.89 | -5.35 | -4.07 | -4.13 | -7.14 | -23.10 | -5.17 | -70.54 | -9.00 | -4.10 | -4.43 | -4.21 | -3.94 | -3.76 | NA | NA | |
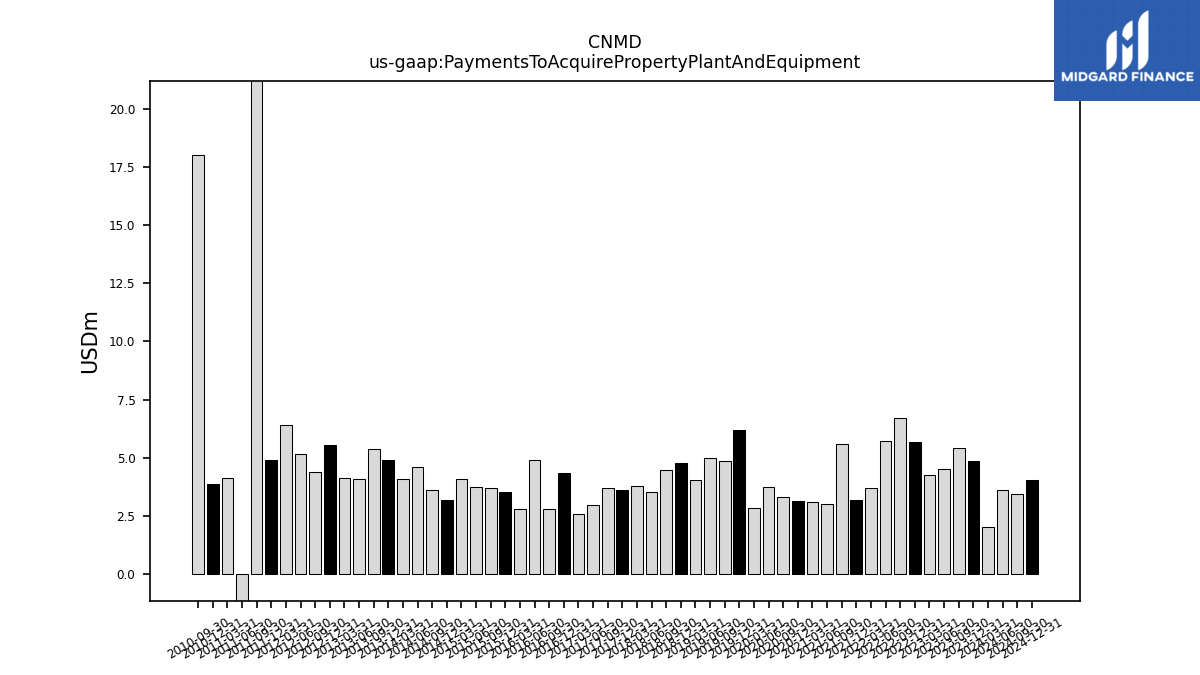
| Payments To Acquire Property Plant And Equipment | 4.86 | 5.39 | 4.53 | 4.25 | 5.68 | 6.71 | 5.71 | 3.69 | 3.19 | 5.58 | 2.99 | 3.11 | 3.15 | 3.29 | 3.75 | 2.83 | 6.19 | 4.87 | 4.98 | 4.02 | 4.76 | 4.46 | 3.51 | 3.78 | 3.61 | 3.71 | 2.94 | 2.58 | 4.32 | 2.77 | 4.88 | 2.79 | 3.53 | 3.69 | 3.72 | 4.06 | 3.16 | 3.61 | 4.58 | 4.07 | 4.89 | 5.35 | 4.07 | 4.13 | 5.56 | 4.37 | 5.17 | 6.42 | 4.88 | 21.25 | -12.72 | 4.14 | 3.88 | 18.02 | NA | NA |
| 2023-12-31 | 2023-09-30 | 2023-06-30 | 2023-03-31 | 2022-12-31 | 2022-09-30 | 2022-06-30 | 2022-03-31 | 2021-12-31 | 2021-09-30 | 2021-06-30 | 2021-03-31 | 2020-12-31 | 2020-09-30 | 2020-06-30 | 2020-03-31 | 2019-12-31 | 2019-09-30 | 2019-06-30 | 2019-03-31 | 2018-12-31 | 2018-09-30 | 2018-06-30 | 2018-03-31 | 2017-12-31 | 2017-09-30 | 2017-06-30 | 2017-03-31 | 2016-12-31 | 2016-09-30 | 2016-06-30 | 2016-03-31 | 2015-12-31 | 2015-09-30 | 2015-06-30 | 2015-03-31 | 2014-12-31 | 2014-09-30 | 2014-06-30 | 2014-03-31 | 2013-12-31 | 2013-09-30 | 2013-06-30 | 2013-03-31 | 2012-12-31 | 2012-09-30 | 2012-06-30 | 2012-03-31 | 2011-12-31 | 2011-09-30 | 2011-06-30 | 2011-03-31 | 2010-12-31 | 2010-09-30 | 2010-06-30 | 2010-03-30 | ||
|---|---|---|---|---|---|---|---|---|---|---|---|---|---|---|---|---|---|---|---|---|---|---|---|---|---|---|---|---|---|---|---|---|---|---|---|---|---|---|---|---|---|---|---|---|---|---|---|---|---|---|---|---|---|---|---|---|---|
| Net Cash Provided By Used In Financing Activities | -58.77 | -37.23 | -19.79 | 5.35 | 11.52 | 46.88 | 159.12 | 7.49 | -40.79 | -29.79 | -22.09 | -8.87 | -27.16 | -35.66 | 8.03 | 2.74 | -36.97 | -23.42 | -17.68 | 378.95 | -31.64 | 6.46 | -13.78 | -33.30 | -27.71 | 6.56 | -7.46 | -6.27 | -7.22 | -23.92 | -7.83 | 223.16 | 5.48 | -4.19 | -6.43 | -4.63 | -13.78 | -1.34 | -0.06 | -11.21 | -17.53 | -14.58 | -6.82 | 7.63 | -20.94 | -0.63 | -22.89 | 55.82 | -30.84 | -15.10 | -9.05 | -11.71 | -22.65 | 0.81 | NA | NA | |
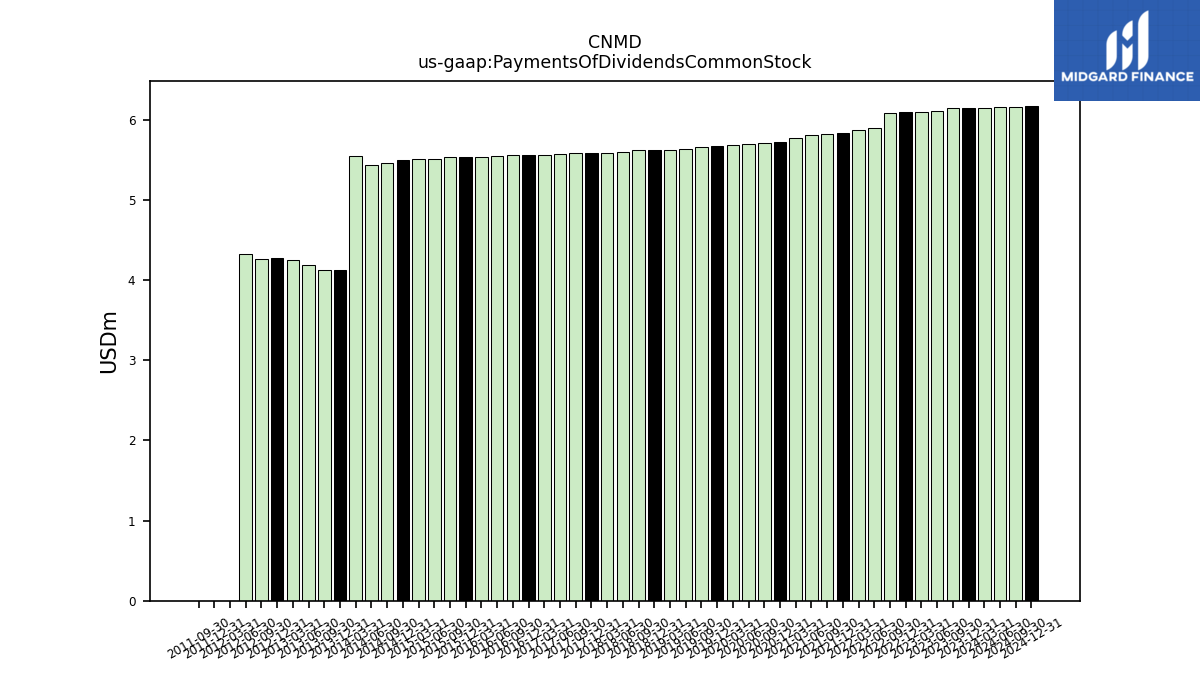
| Payments Of Dividends Common Stock | 6.15 | 6.14 | 6.11 | 6.10 | 6.09 | 6.09 | 5.90 | 5.87 | 5.84 | 5.83 | 5.81 | 5.78 | 5.72 | 5.71 | 5.70 | 5.68 | 5.67 | 5.66 | 5.64 | 5.63 | 5.62 | 5.62 | 5.61 | 5.59 | 5.58 | 5.58 | 5.57 | 5.57 | 5.56 | 5.56 | 5.55 | 5.54 | 5.54 | 5.54 | 5.52 | 5.51 | 5.50 | 5.47 | 5.44 | 5.54 | 4.13 | 4.12 | 4.19 | 4.26 | 4.27 | 4.26 | 4.33 | 0.00 | 0.00 | 0.00 | NA | NA | NA | NA | NA | NA |
| 2023-12-31 | 2023-09-30 | 2023-06-30 | 2023-03-31 | 2022-12-31 | 2022-09-30 | 2022-06-30 | 2022-03-31 | 2021-12-31 | 2021-09-30 | 2021-06-30 | 2021-03-31 | 2020-12-31 | 2020-09-30 | 2020-06-30 | 2020-03-31 | 2019-12-31 | 2019-09-30 | 2019-06-30 | 2019-03-31 | 2018-12-31 | 2018-09-30 | 2018-06-30 | 2018-03-31 | 2017-12-31 | 2017-09-30 | 2017-06-30 | 2017-03-31 | 2016-12-31 | 2016-09-30 | 2016-06-30 | 2016-03-31 | 2015-12-31 | 2015-09-30 | 2015-06-30 | 2015-03-31 | 2014-12-31 | 2014-09-30 | 2014-06-30 | 2014-03-31 | 2013-12-31 | 2013-09-30 | 2013-06-30 | 2013-03-31 | 2012-12-31 | 2012-09-30 | 2012-06-30 | 2012-03-31 | 2011-12-31 | 2011-09-30 | 2011-06-30 | 2011-03-31 | 2010-12-31 | 2010-09-30 | 2010-06-30 | 2010-03-30 | ||
|---|---|---|---|---|---|---|---|---|---|---|---|---|---|---|---|---|---|---|---|---|---|---|---|---|---|---|---|---|---|---|---|---|---|---|---|---|---|---|---|---|---|---|---|---|---|---|---|---|---|---|---|---|---|---|---|---|---|
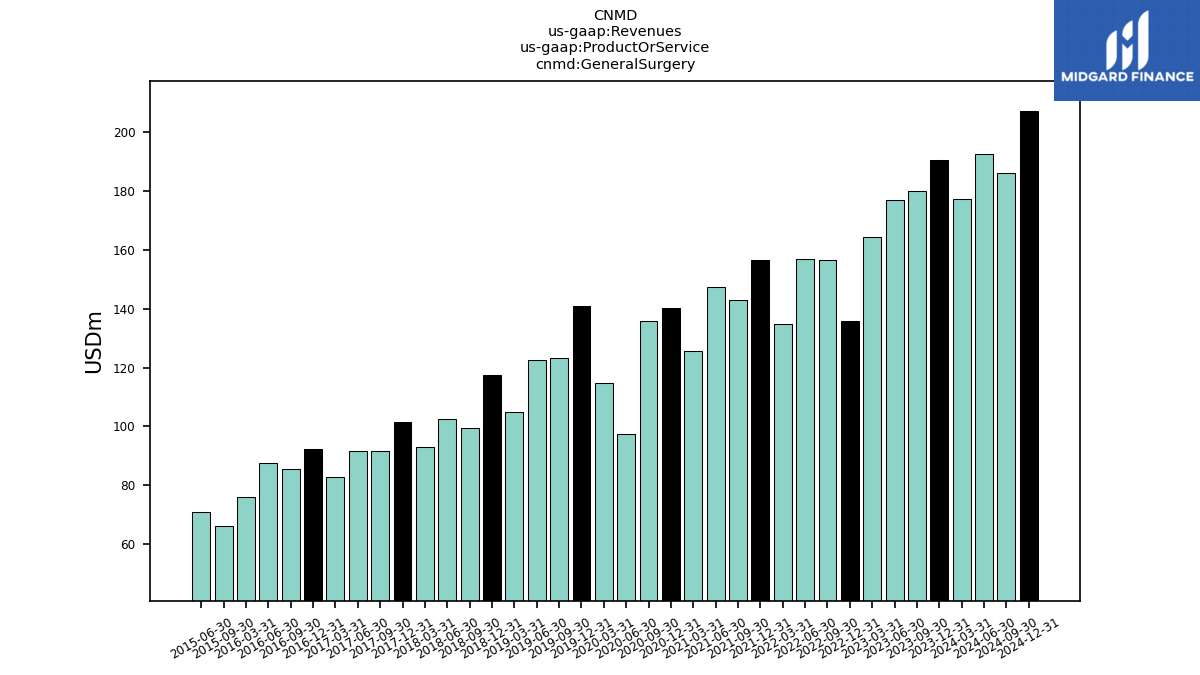
| Revenues | 327.05 | 304.58 | 317.65 | 295.47 | 250.87 | 275.09 | 277.19 | 242.33 | 273.97 | 248.83 | 255.16 | 232.68 | 252.83 | 237.84 | 157.78 | 214.01 | 264.87 | 233.59 | 238.26 | 218.38 | 242.44 | 202.31 | 212.82 | 202.06 | 222.56 | 190.12 | 197.15 | 186.57 | 204.09 | 184.79 | 193.43 | 181.20 | 191.02 | 169.18 | 181.03 | 177.94 | 195.00 | 174.96 | 188.15 | 181.94 | 203.44 | 179.25 | 192.99 | 187.01 | 201.24 | 181.88 | 189.69 | 194.32 | 185.58 | 172.81 | 183.24 | 183.45 | 184.08 | 172.19 | 181.09 | 176.37 | |
| General Surgery | 190.52 | 179.91 | 176.86 | 164.29 | 135.66 | 156.47 | 157.01 | 134.81 | 156.35 | 143.08 | 147.27 | 125.51 | 140.08 | 135.65 | 97.30 | 114.73 | 141.06 | 123.26 | 122.51 | 104.94 | 117.64 | 99.38 | 102.69 | 93.20 | 101.54 | 91.54 | 91.59 | 82.78 | 92.51 | 85.44 | 87.57 | 75.90 | NA | 66.12 | 71.11 | NA | NA | NA | NA | NA | NA | NA | NA | NA | NA | NA | NA | NA | NA | NA | NA | NA | NA | NA | NA | NA | |
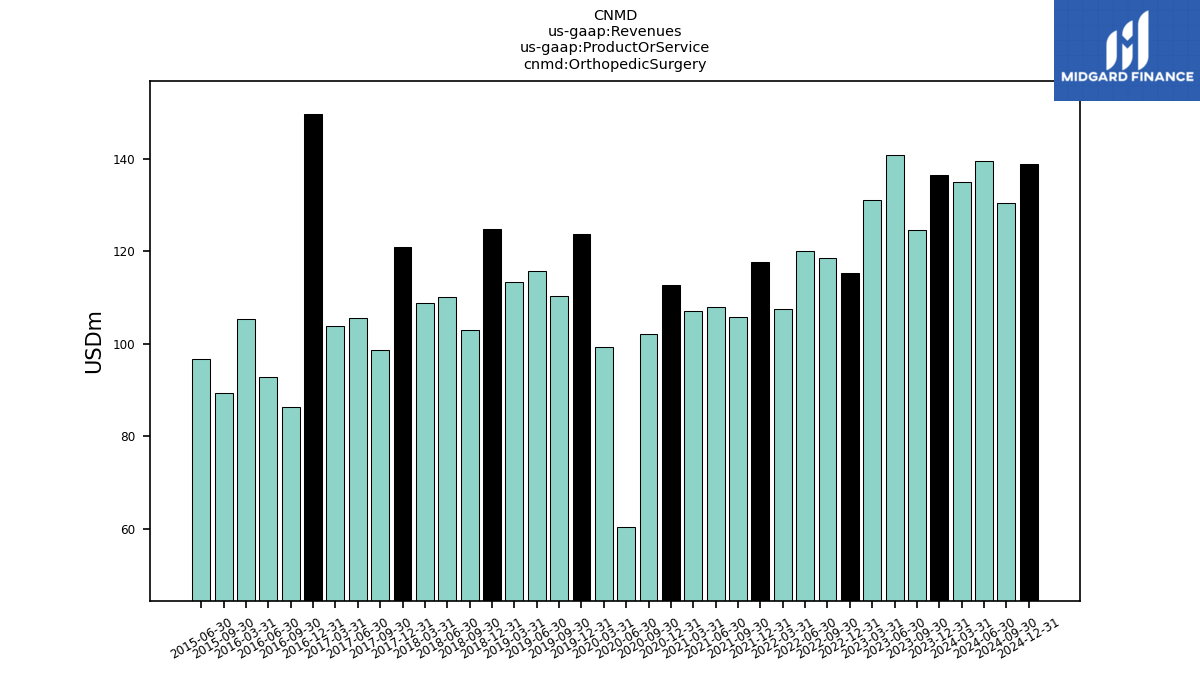
| Orthopedic Surgery | 136.53 | 124.67 | 140.79 | 131.18 | 115.21 | 118.62 | 120.18 | 107.52 | 117.61 | 105.75 | 107.89 | 107.17 | 112.75 | 102.19 | 60.48 | 99.28 | 123.80 | 110.33 | 115.76 | 113.44 | 124.81 | 102.93 | 110.13 | 108.86 | 121.01 | 98.58 | 105.56 | 103.79 | 149.66 | 86.26 | 92.74 | 105.30 | NA | 89.38 | 96.80 | NA | NA | NA | NA | NA | NA | NA | NA | NA | NA | NA | NA | NA | NA | NA | NA | NA | NA | NA | NA | NA | |
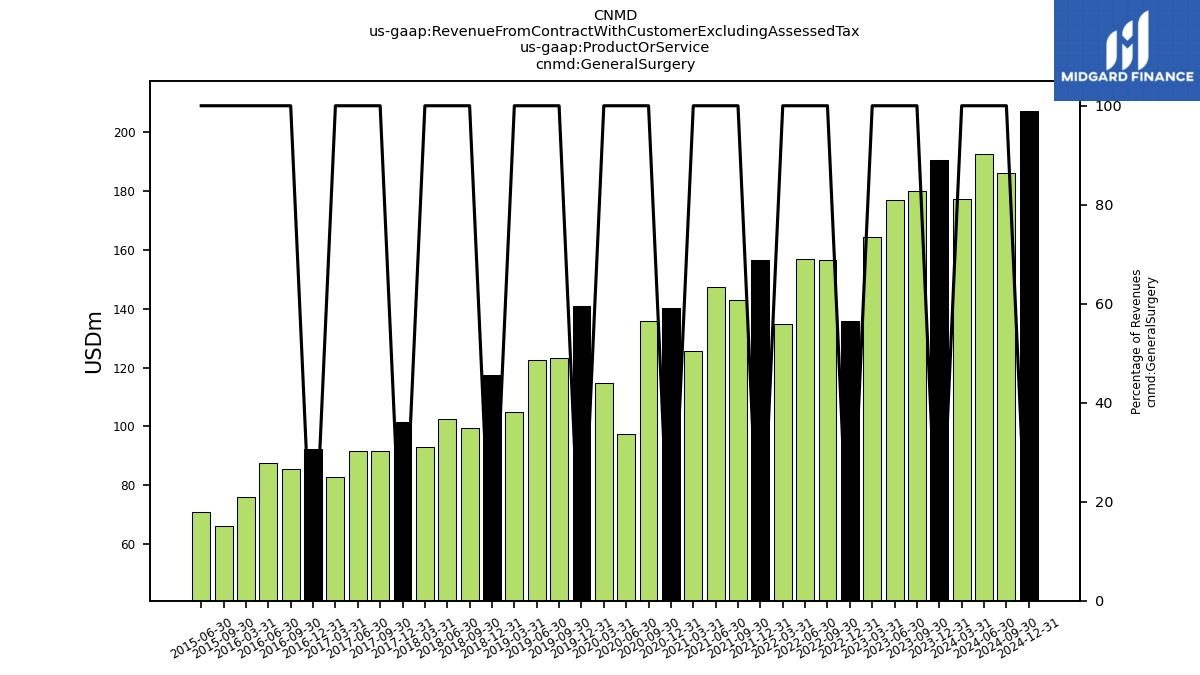
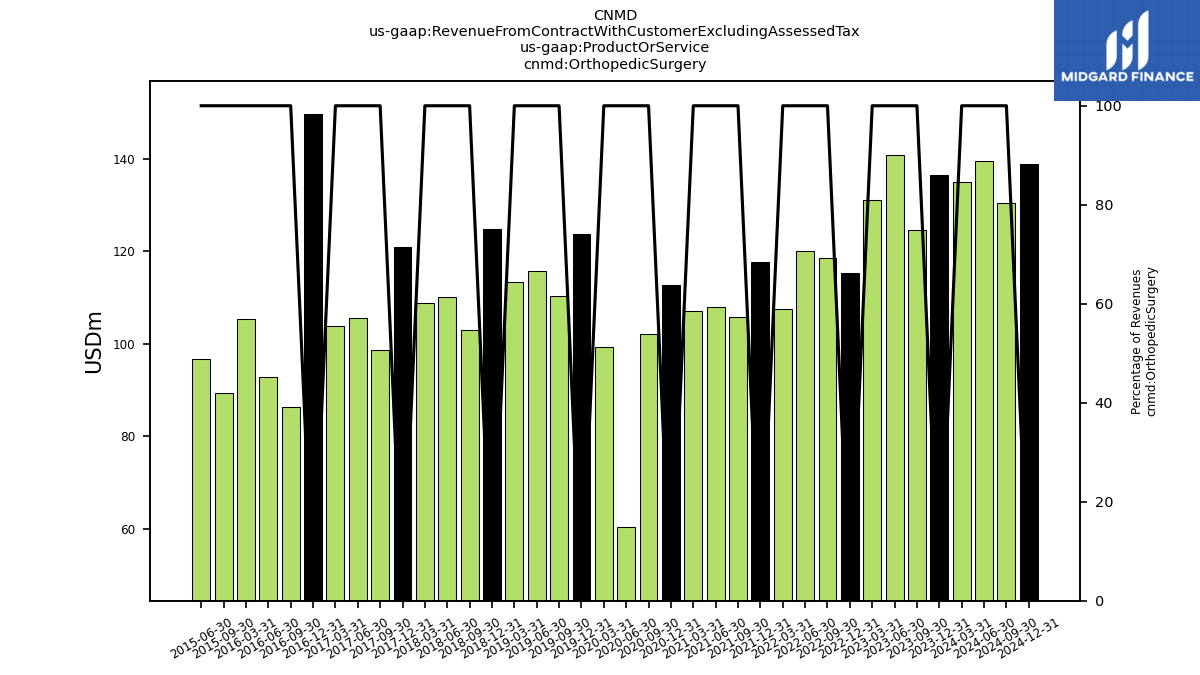
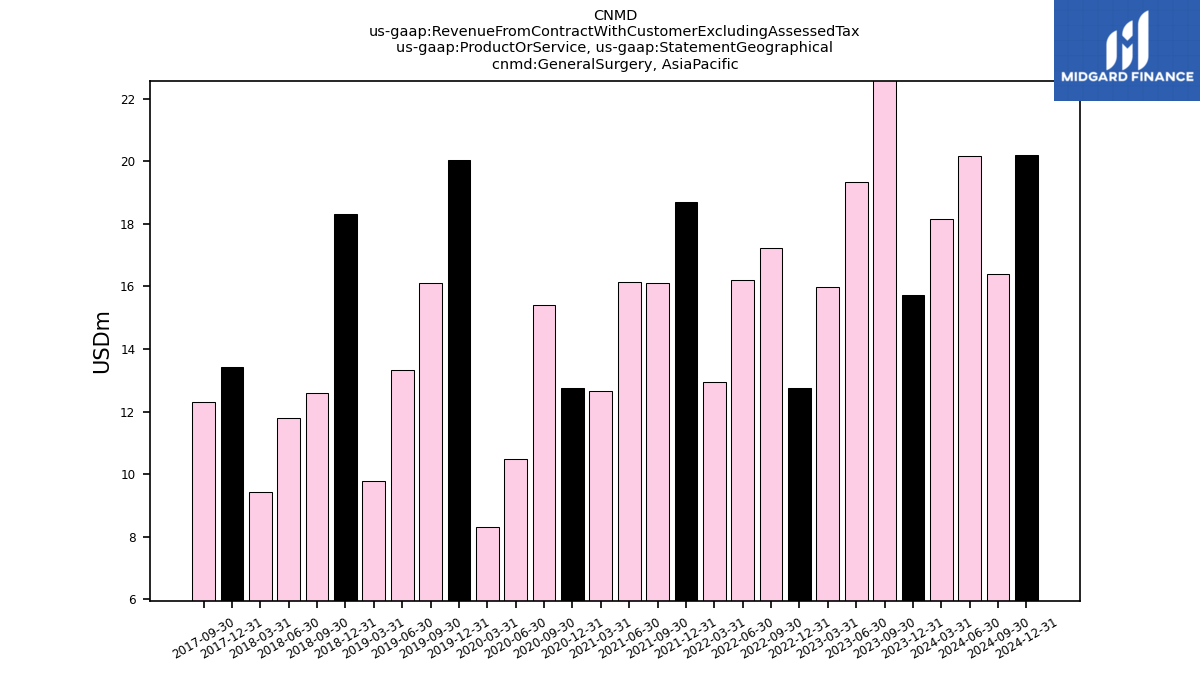
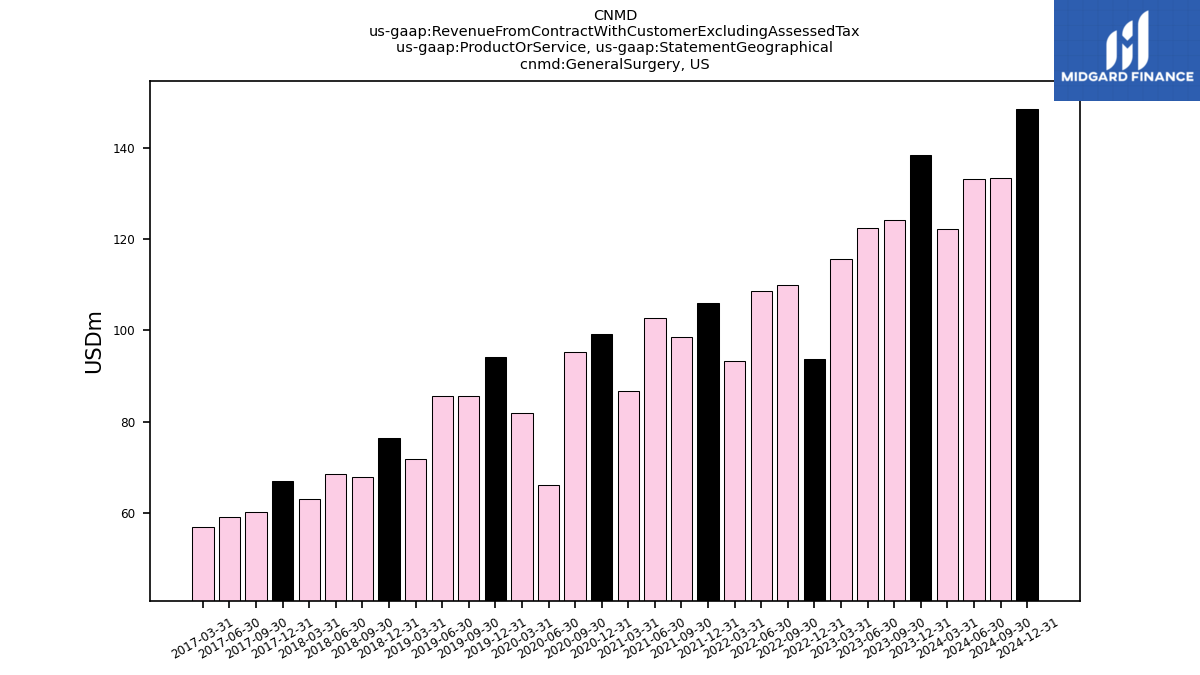
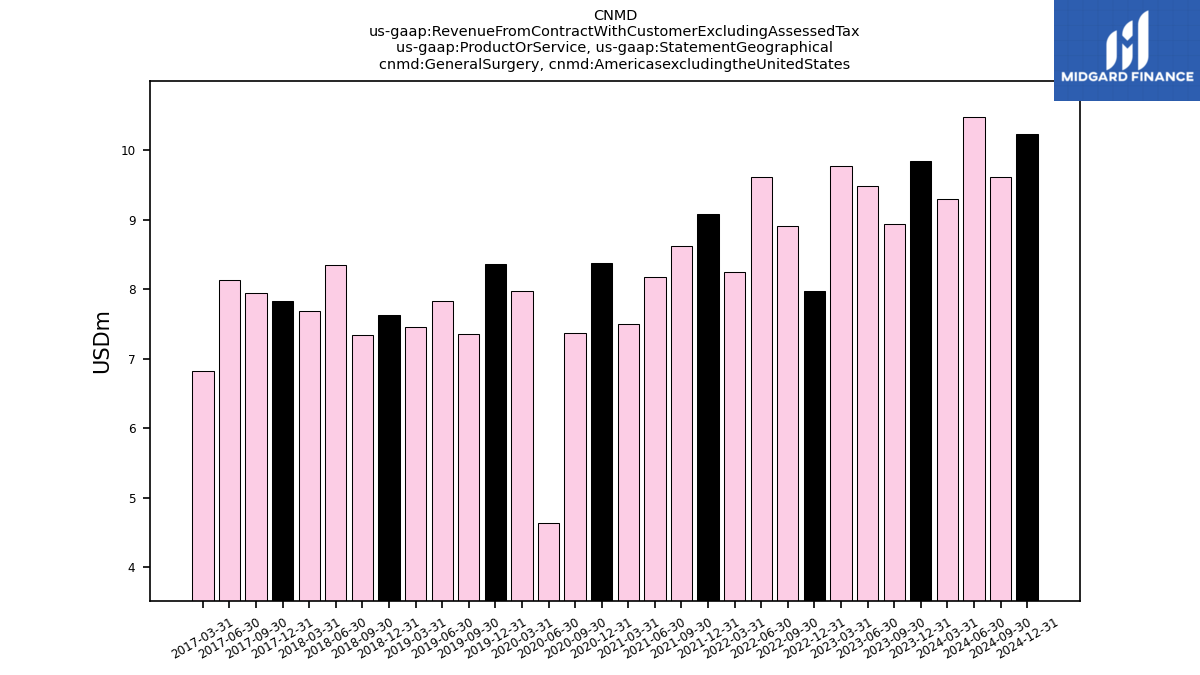
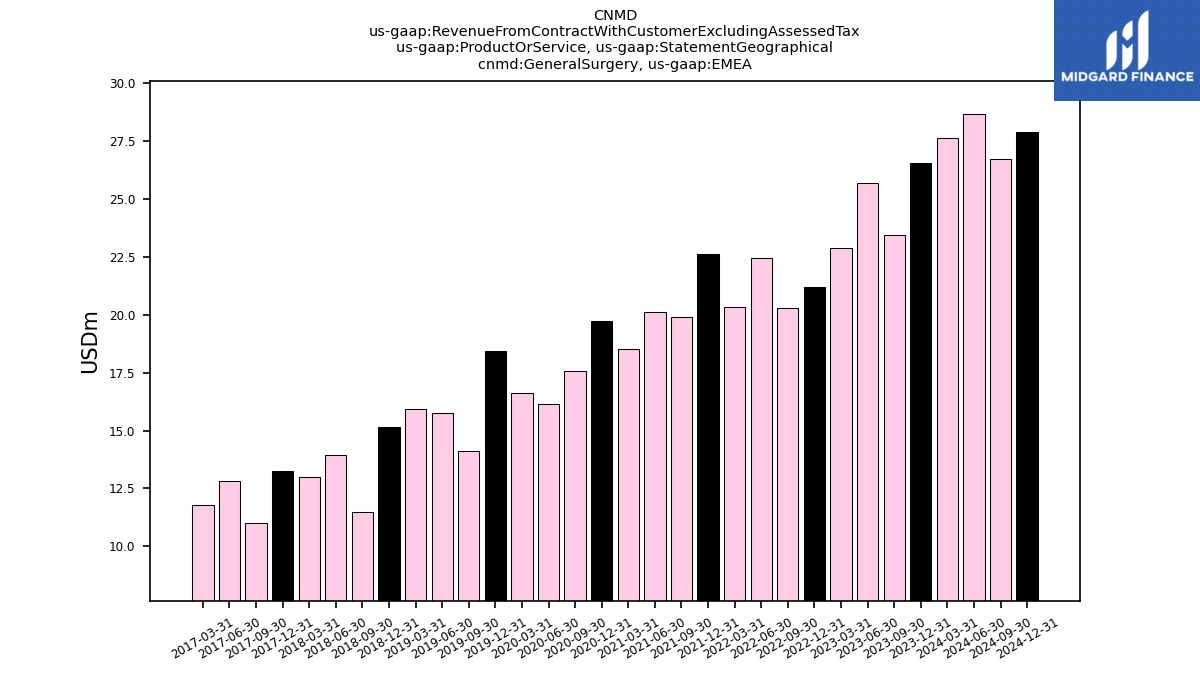
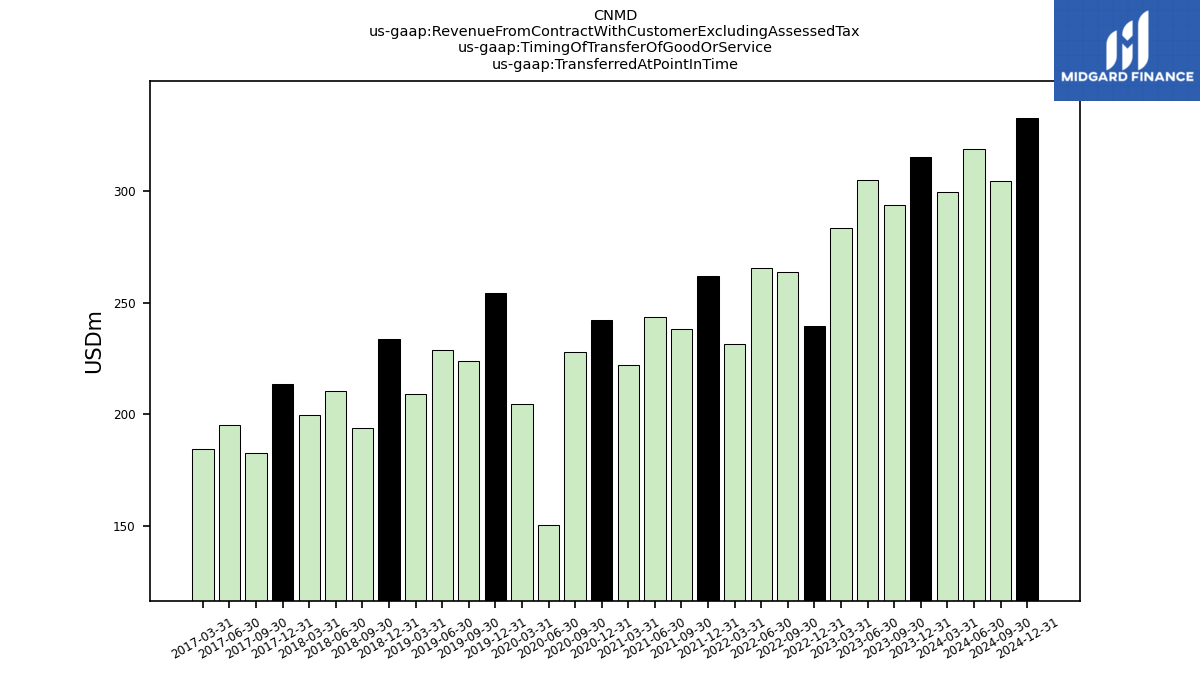
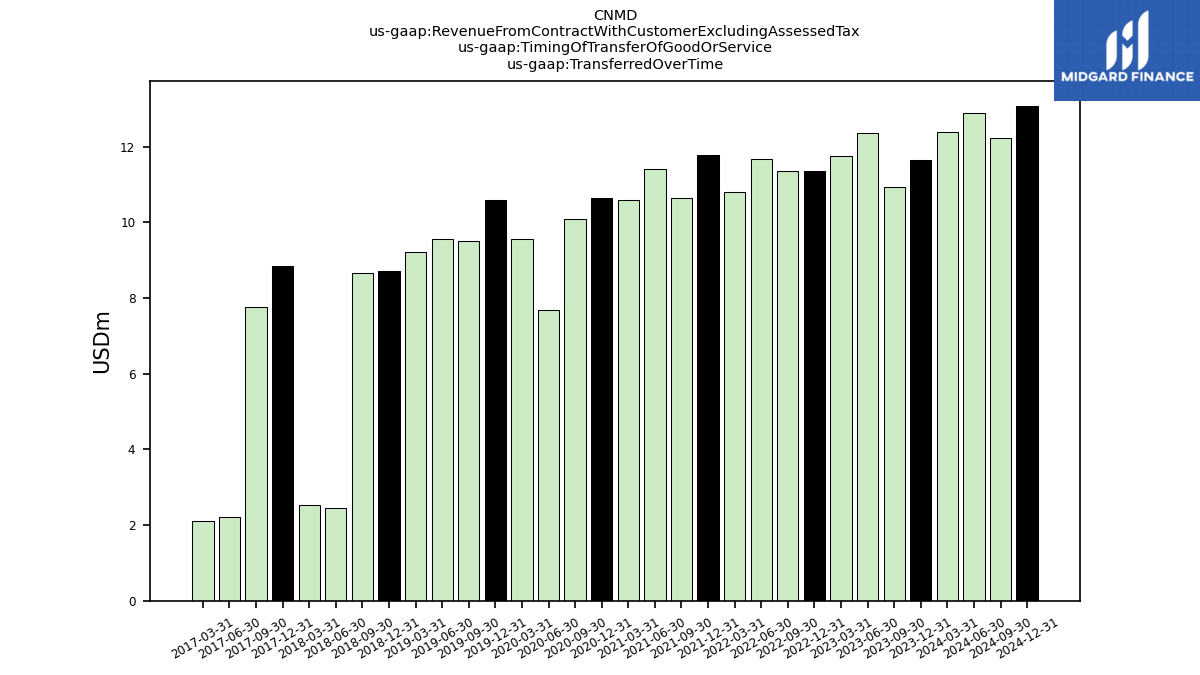
| Revenue From Contract With Customer Excluding Assessed Tax | 327.05 | 304.58 | 317.65 | 295.47 | 250.87 | 275.09 | 277.19 | 242.33 | 273.97 | 248.83 | 255.16 | 232.68 | 252.83 | 237.84 | 157.78 | 214.01 | 264.87 | 233.59 | 238.26 | 218.38 | 242.44 | 202.31 | 212.82 | 202.06 | 222.56 | 190.12 | 197.15 | 186.57 | 204.09 | 184.79 | 193.43 | 181.20 | 191.02 | 169.18 | 181.03 | 177.94 | 195.00 | 174.96 | 188.15 | 181.94 | 203.44 | 179.25 | 192.99 | 187.01 | 201.24 | 181.88 | 189.69 | 194.32 | 185.58 | 172.81 | 183.24 | 183.45 | 184.08 | 172.19 | 181.09 | 176.37 | |
| General Surgery | 190.52 | 179.91 | 176.86 | 164.29 | 135.66 | 156.47 | 157.01 | 134.81 | 156.35 | 143.08 | 147.27 | 125.51 | 140.08 | 135.65 | 97.30 | 114.73 | 141.06 | 123.26 | 122.51 | 104.94 | 117.64 | 99.38 | 102.69 | 93.20 | 101.54 | 91.54 | 91.59 | 82.78 | 92.51 | 85.44 | 87.57 | 75.90 | NA | 66.12 | 71.11 | NA | NA | NA | NA | NA | NA | NA | NA | NA | NA | NA | NA | NA | NA | NA | NA | NA | NA | NA | NA | NA | |
| Orthopedic Surgery | 136.53 | 124.67 | 140.79 | 131.18 | 115.21 | 118.62 | 120.18 | 107.52 | 117.61 | 105.75 | 107.89 | 107.17 | 112.75 | 102.19 | 60.48 | 99.28 | 123.80 | 110.33 | 115.76 | 113.44 | 124.81 | 102.93 | 110.13 | 108.86 | 121.01 | 98.58 | 105.56 | 103.79 | 149.66 | 86.26 | 92.74 | 105.30 | NA | 89.38 | 96.80 | NA | NA | NA | NA | NA | NA | NA | NA | NA | NA | NA | NA | NA | NA | NA | NA | NA | NA | NA | NA | NA | |
| General Surgery, | 15.73 | 23.29 | 19.36 | 15.99 | 12.74 | 17.22 | 16.20 | 12.95 | 18.72 | 16.11 | 16.14 | 12.66 | 12.75 | 15.40 | 10.48 | 8.32 | 20.06 | 16.11 | 13.32 | 9.78 | 18.32 | 12.58 | 11.80 | 9.44 | 13.42 | 12.30 | NA | NA | NA | NA | NA | NA | NA | NA | NA | NA | NA | NA | NA | NA | NA | NA | NA | NA | NA | NA | NA | NA | NA | NA | NA | NA | NA | NA | NA | NA | |
| General Surgery,US | 138.37 | 124.25 | 122.33 | 115.64 | 93.74 | 110.03 | 108.72 | 93.28 | 105.91 | 98.44 | 102.81 | 86.81 | 99.21 | 95.29 | 66.04 | 81.81 | 94.22 | 85.65 | 85.60 | 71.77 | 76.53 | 67.95 | 68.60 | 63.10 | 67.02 | 60.26 | 59.12 | 57.04 | NA | NA | NA | NA | NA | NA | NA | NA | NA | NA | NA | NA | NA | NA | NA | NA | NA | NA | NA | NA | NA | NA | NA | NA | NA | NA | NA | NA | |
| General Surgery, Americasexcludingthe United States | 9.84 | 8.94 | 9.48 | 9.77 | 7.97 | 8.91 | 9.62 | 8.25 | 9.08 | 8.61 | 8.18 | 7.49 | 8.37 | 7.37 | 4.64 | 7.98 | 8.36 | 7.36 | 7.82 | 7.46 | 7.63 | 7.35 | 8.35 | 7.68 | 7.83 | 7.95 | 8.14 | 6.82 | NA | NA | NA | NA | NA | NA | NA | NA | NA | NA | NA | NA | NA | NA | NA | NA | NA | NA | NA | NA | NA | NA | NA | NA | NA | NA | NA | NA | |
| General Surgery,EMEA | 26.58 | 23.44 | 25.70 | 22.90 | 21.20 | 20.30 | 22.47 | 20.33 | 22.64 | 19.91 | 20.14 | 18.54 | 19.74 | 17.58 | 16.15 | 16.61 | 18.42 | 14.14 | 15.76 | 15.93 | 15.14 | 11.49 | 13.94 | 12.98 | 13.27 | 11.03 | 12.84 | 11.79 | NA | NA | NA | NA | NA | NA | NA | NA | NA | NA | NA | NA | NA | NA | NA | NA | NA | NA | NA | NA | NA | NA | NA | NA | NA | NA | NA | NA | |
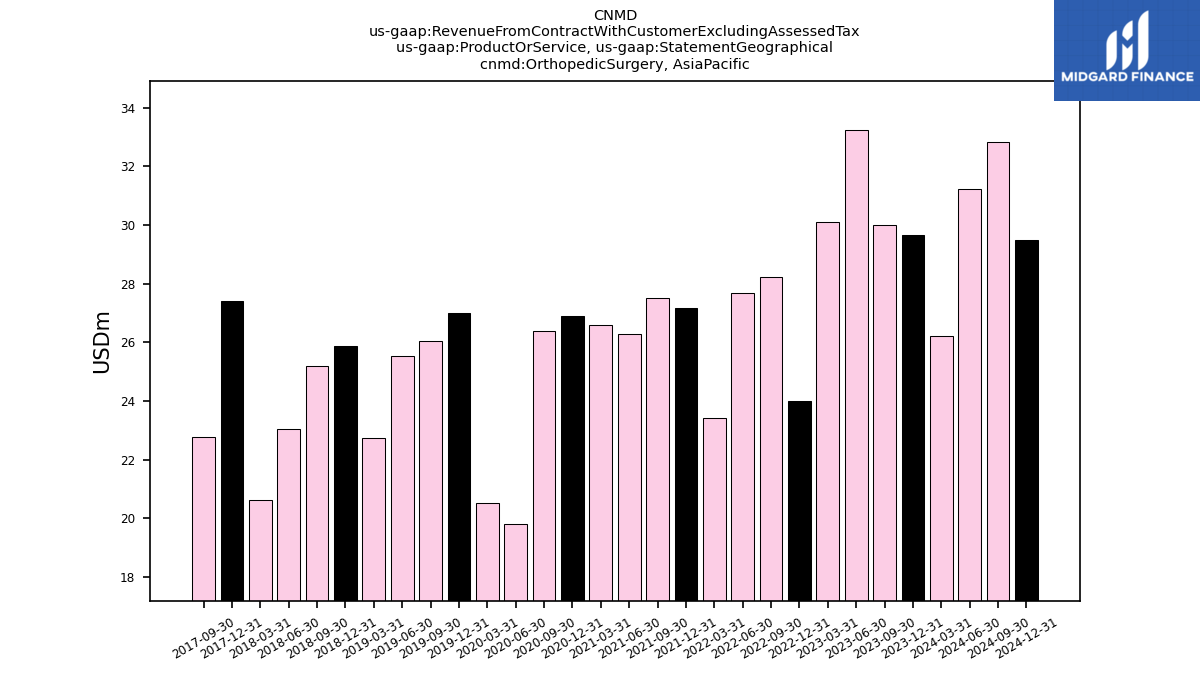
| Orthopedic Surgery, | 29.68 | 30.00 | 33.25 | 30.12 | 24.02 | 28.24 | 27.67 | 23.42 | 27.19 | 27.52 | 26.28 | 26.60 | 26.90 | 26.40 | 19.80 | 20.54 | 27.02 | 26.04 | 25.54 | 22.74 | 25.87 | 25.20 | 23.05 | 20.64 | 27.40 | 22.77 | NA | NA | NA | NA | NA | NA | NA | NA | NA | NA | NA | NA | NA | NA | NA | NA | NA | NA | NA | NA | NA | NA | NA | NA | NA | NA | NA | NA | NA | NA | |
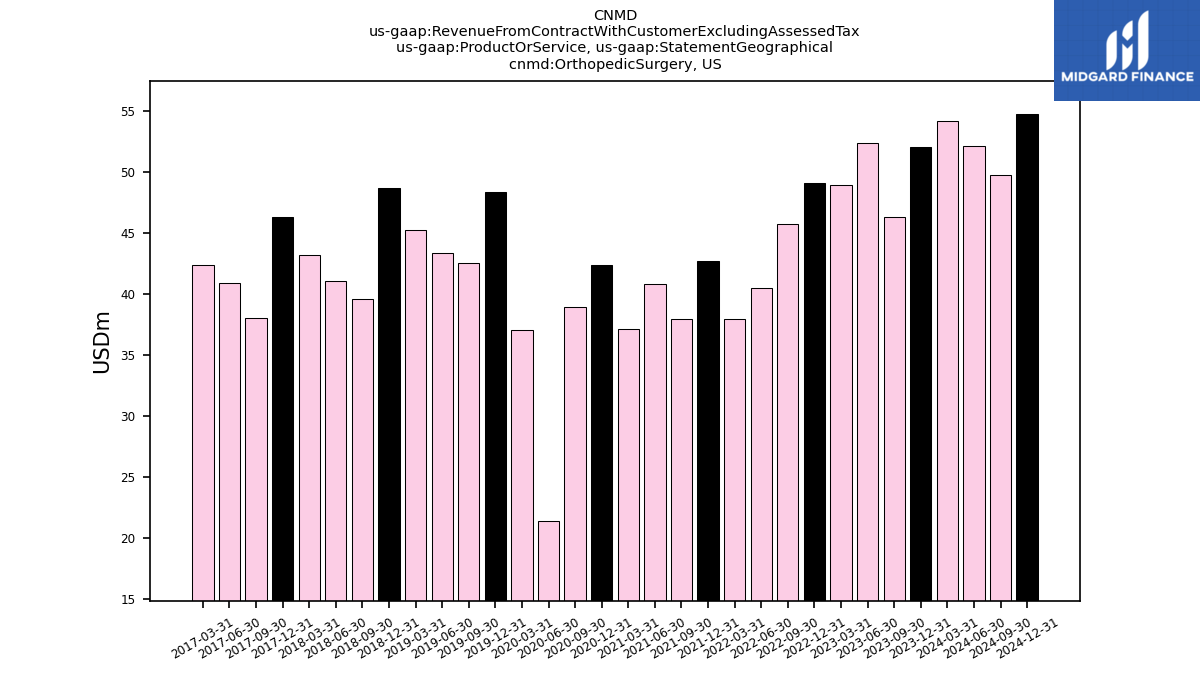
| Orthopedic Surgery,US | 52.01 | 46.27 | 52.34 | 48.94 | 49.08 | 45.69 | 40.46 | 37.95 | 42.69 | 37.96 | 40.78 | 37.13 | 42.38 | 38.91 | 21.39 | 37.04 | 48.30 | 42.53 | 43.34 | 45.26 | 48.68 | 39.57 | 41.06 | 43.15 | 46.28 | 38.04 | 40.89 | 42.39 | NA | NA | NA | NA | NA | NA | NA | NA | NA | NA | NA | NA | NA | NA | NA | NA | NA | NA | NA | NA | NA | NA | NA | NA | NA | NA | NA | NA | |
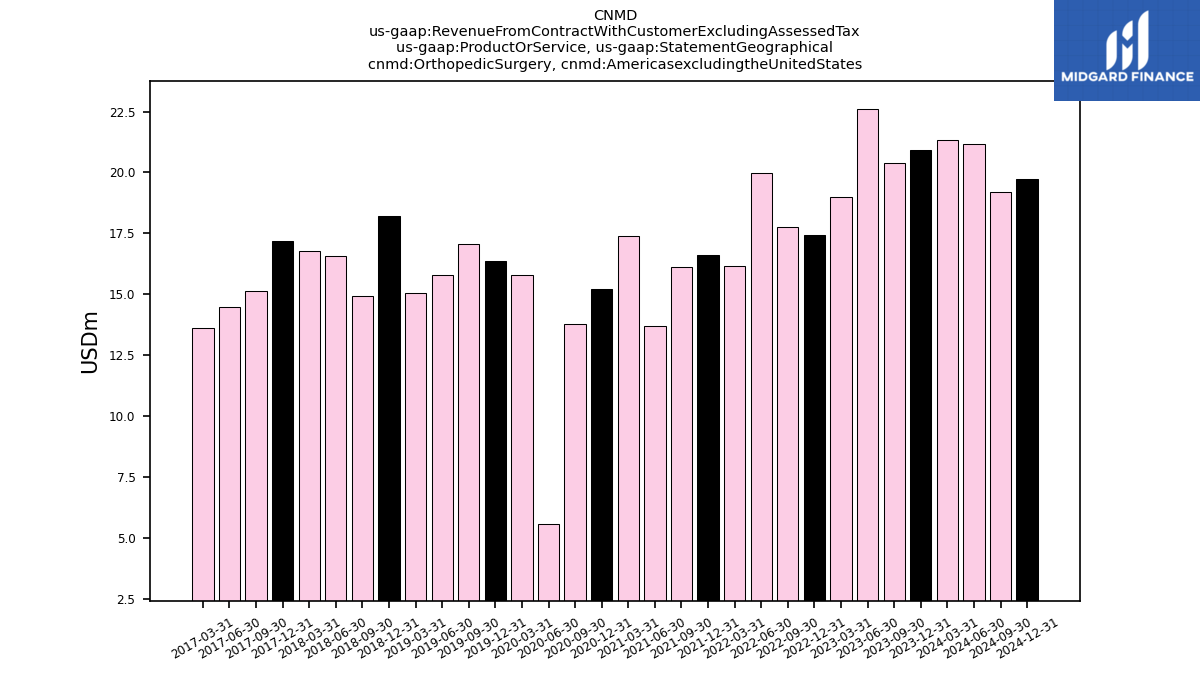
| Orthopedic Surgery, Americasexcludingthe United States | 20.90 | 20.40 | 22.62 | 18.99 | 17.42 | 17.77 | 19.99 | 16.17 | 16.61 | 16.12 | 13.71 | 17.38 | 15.20 | 13.77 | 5.58 | 15.80 | 16.38 | 17.07 | 15.78 | 15.04 | 18.21 | 14.95 | 16.59 | 16.77 | 17.18 | 15.15 | 14.49 | 13.62 | NA | NA | NA | NA | NA | NA | NA | NA | NA | NA | NA | NA | NA | NA | NA | NA | NA | NA | NA | NA | NA | NA | NA | NA | NA | NA | NA | NA | |
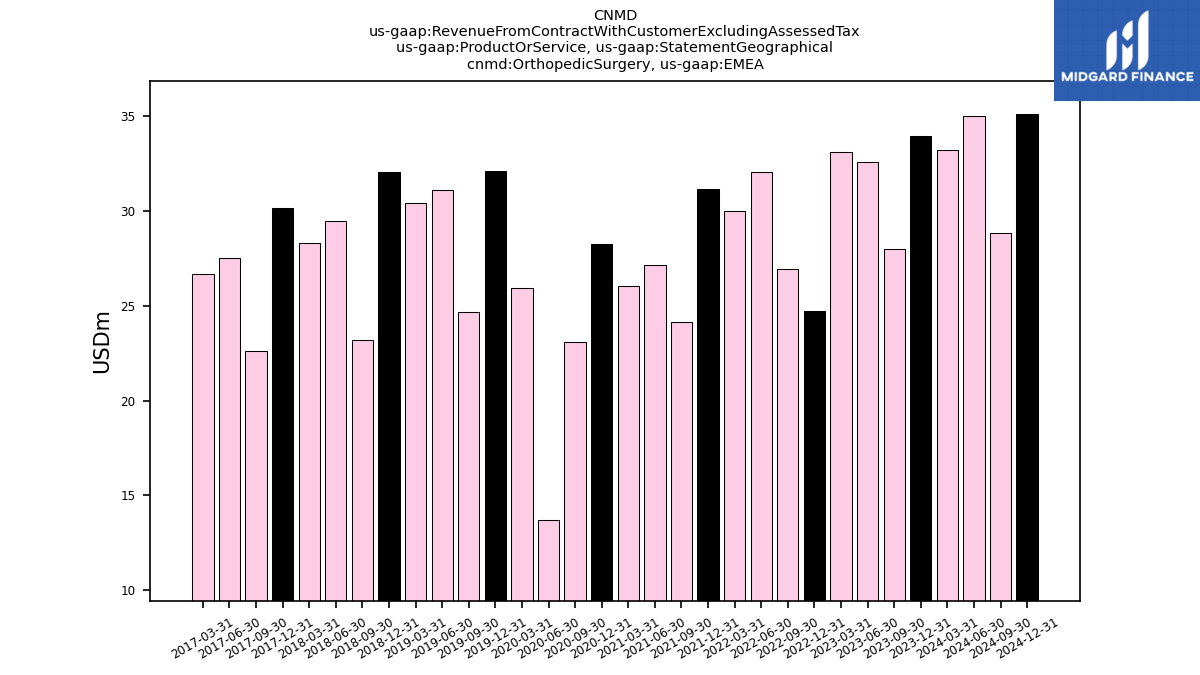
| Orthopedic Surgery,EMEA | 33.93 | 28.00 | 32.58 | 33.12 | 24.69 | 26.91 | 32.06 | 29.98 | 31.13 | 24.16 | 27.12 | 26.05 | 28.27 | 23.10 | 13.71 | 25.91 | 32.10 | 24.69 | 31.10 | 30.40 | 32.05 | 23.21 | 29.44 | 28.30 | 30.15 | 22.62 | 27.50 | 26.65 | NA | NA | NA | NA | NA | NA | NA | NA | NA | NA | NA | NA | NA | NA | NA | NA | NA | NA | NA | NA | NA | NA | NA | NA | NA | NA | NA | NA | |
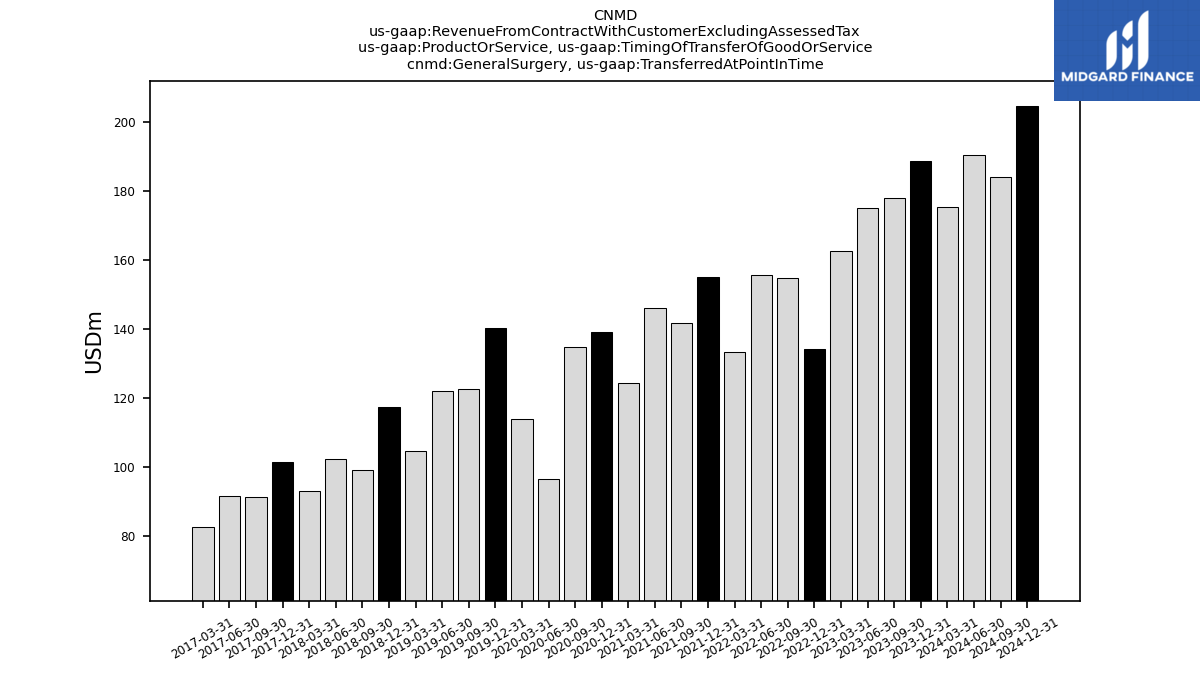
| General Surgery, Transferred At Point In Time | 188.51 | 177.91 | 175.03 | 162.59 | 134.00 | 154.86 | 155.45 | 133.32 | 154.95 | 141.80 | 146.10 | 124.39 | 139.08 | 134.75 | 96.42 | 113.90 | 140.34 | 122.62 | 121.93 | 104.42 | 117.19 | 98.99 | 102.32 | 92.88 | 101.28 | 91.31 | 91.42 | 82.66 | NA | NA | NA | NA | NA | NA | NA | NA | NA | NA | NA | NA | NA | NA | NA | NA | NA | NA | NA | NA | NA | NA | NA | NA | NA | NA | NA | NA | |
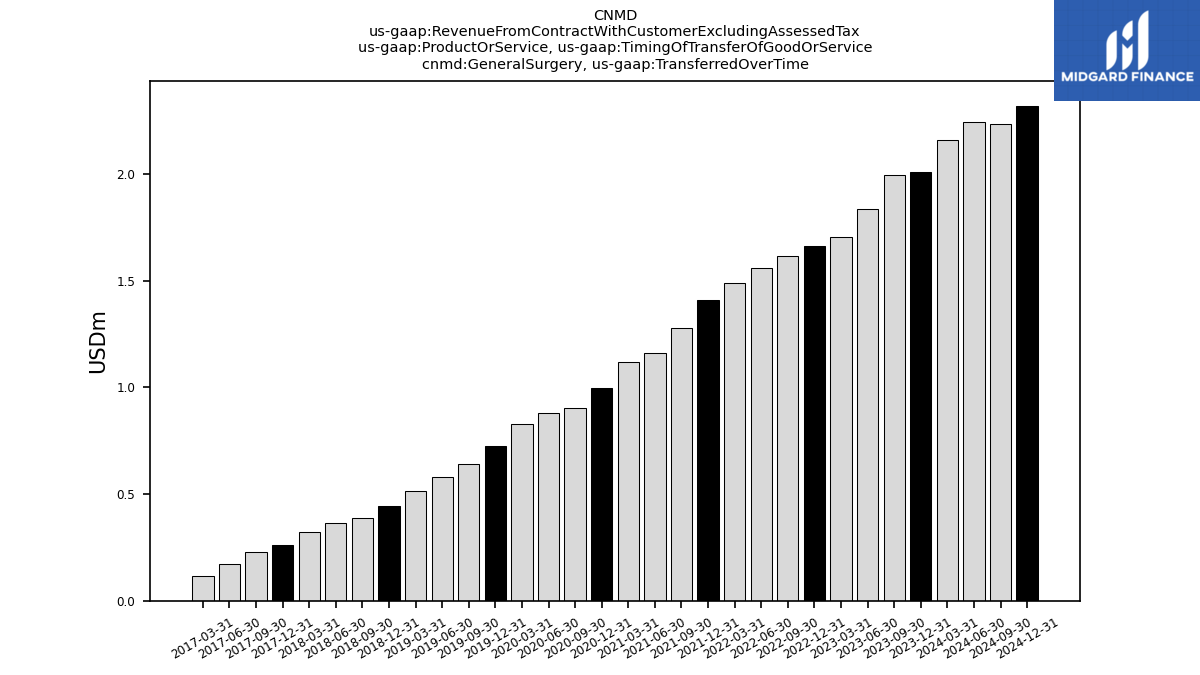
| General Surgery, Transferred Over Time | 2.01 | 2.00 | 1.84 | 1.70 | 1.66 | 1.61 | 1.56 | 1.49 | 1.41 | 1.28 | 1.16 | 1.12 | 1.00 | 0.90 | 0.88 | 0.83 | 0.72 | 0.64 | 0.58 | 0.52 | 0.44 | 0.39 | 0.37 | 0.32 | 0.26 | 0.23 | 0.17 | 0.12 | NA | NA | NA | NA | NA | NA | NA | NA | NA | NA | NA | NA | NA | NA | NA | NA | NA | NA | NA | NA | NA | NA | NA | NA | NA | NA | NA | NA | |
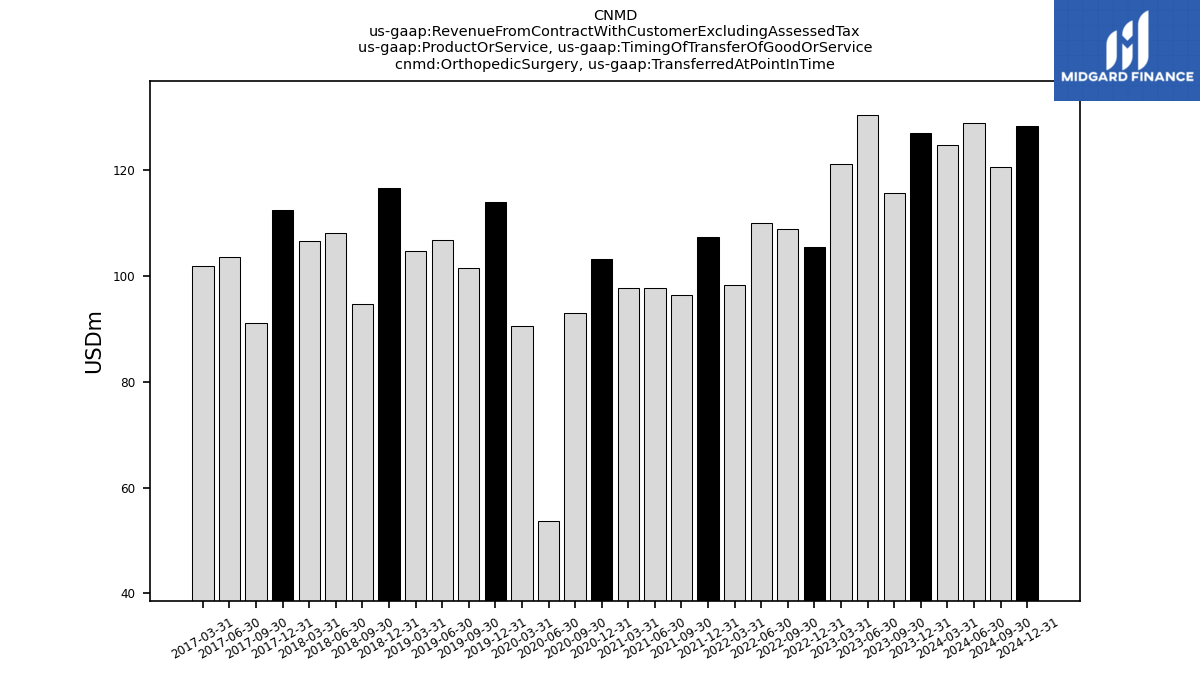
| Orthopedic Surgery, Transferred At Point In Time | 126.88 | 115.72 | 130.27 | 121.12 | 105.51 | 108.88 | 110.06 | 98.20 | 107.23 | 96.39 | 97.65 | 97.69 | 103.09 | 93.00 | 53.67 | 90.55 | 113.93 | 101.45 | 106.77 | 104.74 | 116.53 | 94.64 | 108.04 | 106.66 | 112.42 | 91.05 | 103.53 | 101.80 | NA | NA | NA | NA | NA | NA | NA | NA | NA | NA | NA | NA | NA | NA | NA | NA | NA | NA | NA | NA | NA | NA | NA | NA | NA | NA | NA | NA | |
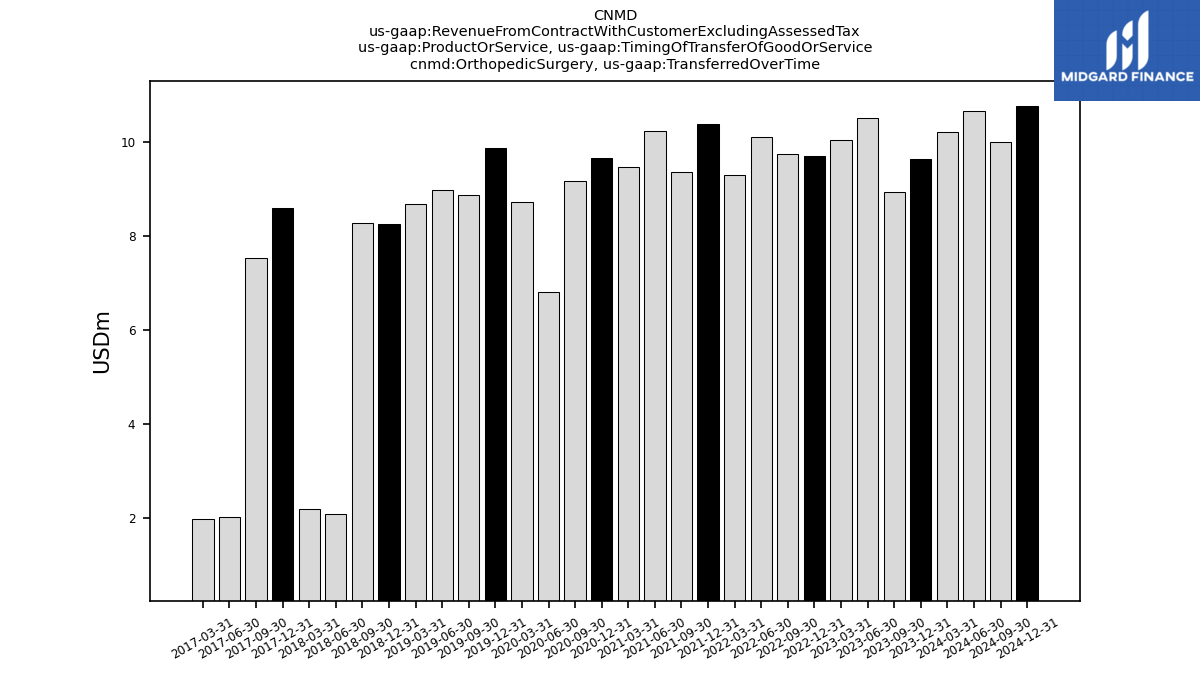
| Orthopedic Surgery, Transferred Over Time | 9.64 | 8.95 | 10.52 | 10.05 | 9.70 | 9.74 | 10.12 | 9.31 | 10.38 | 9.36 | 10.24 | 9.48 | 9.66 | 9.19 | 6.81 | 8.73 | 9.87 | 8.87 | 8.98 | 8.70 | 8.27 | 8.29 | 2.09 | 2.20 | 8.59 | 7.53 | 2.03 | 1.99 | NA | NA | NA | NA | NA | NA | NA | NA | NA | NA | NA | NA | NA | NA | NA | NA | NA | NA | NA | NA | NA | NA | NA | NA | NA | NA | NA | NA | |
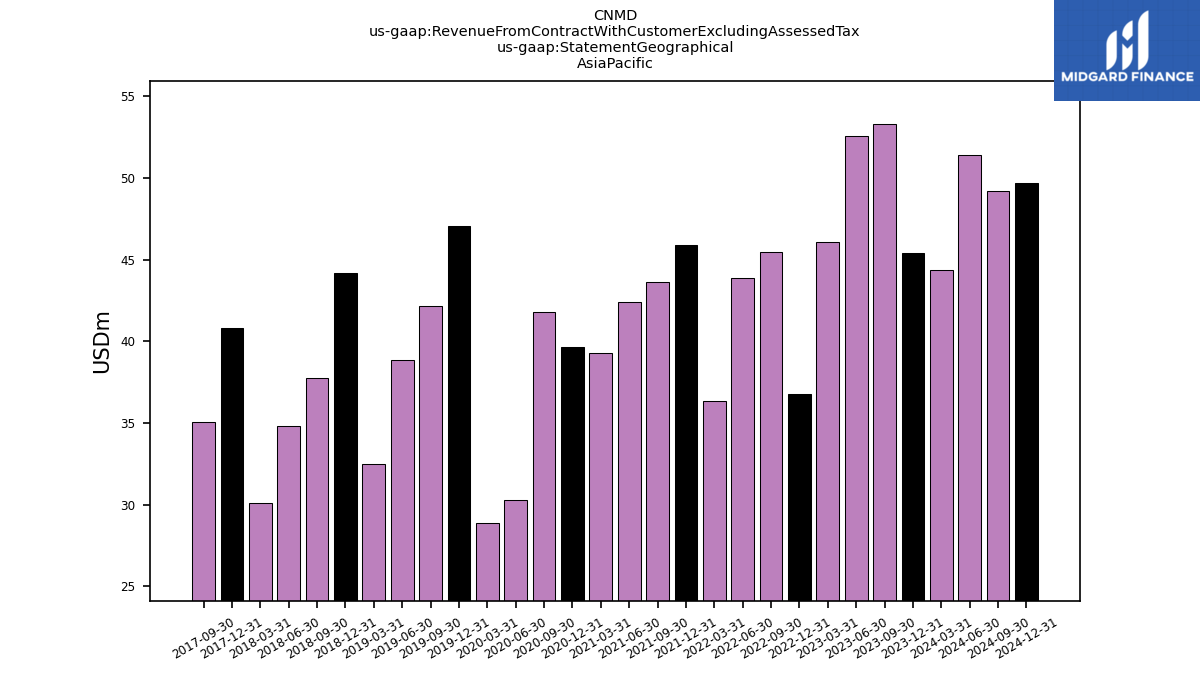
| 45.40 | 53.28 | 52.61 | 46.11 | 36.77 | 45.47 | 43.88 | 36.37 | 45.90 | 43.63 | 42.42 | 39.26 | 39.65 | 41.81 | 30.28 | 28.86 | 47.08 | 42.15 | 38.86 | 32.52 | 44.19 | 37.78 | 34.84 | 30.08 | 40.82 | 35.07 | NA | NA | NA | NA | NA | NA | NA | NA | NA | NA | NA | NA | NA | NA | NA | NA | NA | NA | NA | NA | NA | NA | NA | NA | NA | NA | NA | NA | NA | NA | ||
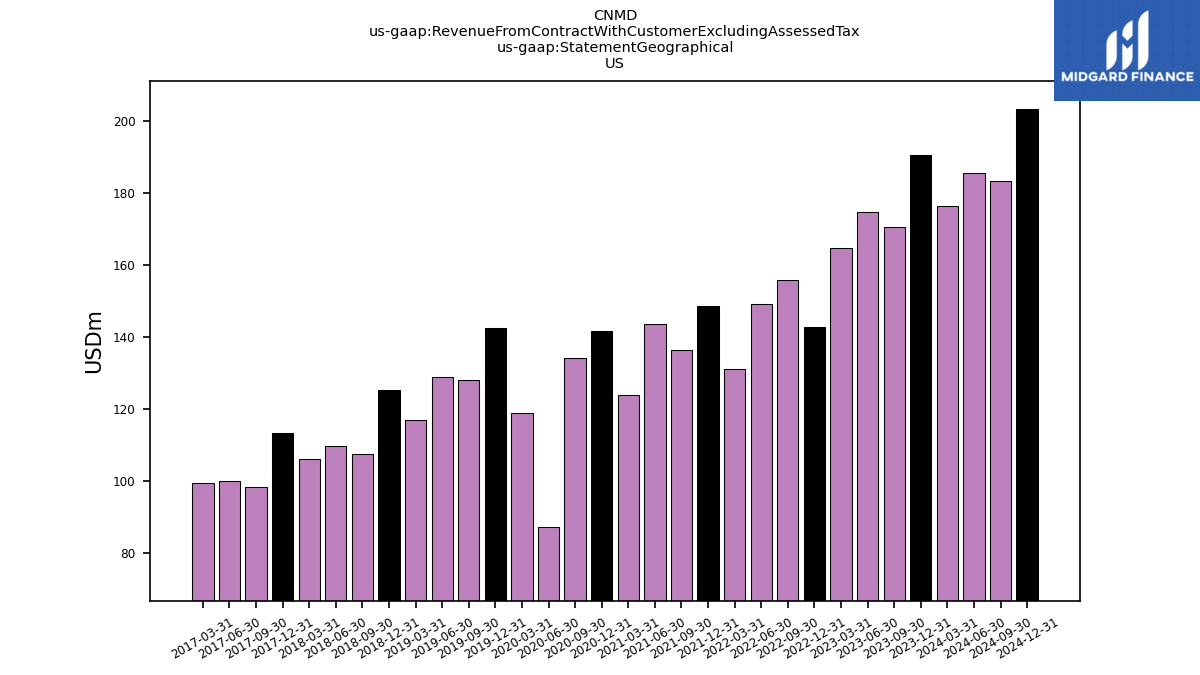
| US | 190.38 | 170.52 | 174.67 | 164.59 | 142.82 | 155.72 | 149.18 | 131.23 | 148.60 | 136.40 | 143.59 | 123.94 | 141.59 | 134.21 | 87.42 | 118.85 | 142.52 | 128.18 | 128.94 | 117.03 | 125.21 | 107.53 | 109.66 | 106.25 | 113.30 | 98.30 | 100.01 | 99.43 | NA | NA | NA | NA | NA | NA | NA | NA | NA | NA | NA | NA | NA | NA | NA | NA | NA | NA | NA | NA | NA | NA | NA | NA | NA | NA | NA | NA | |
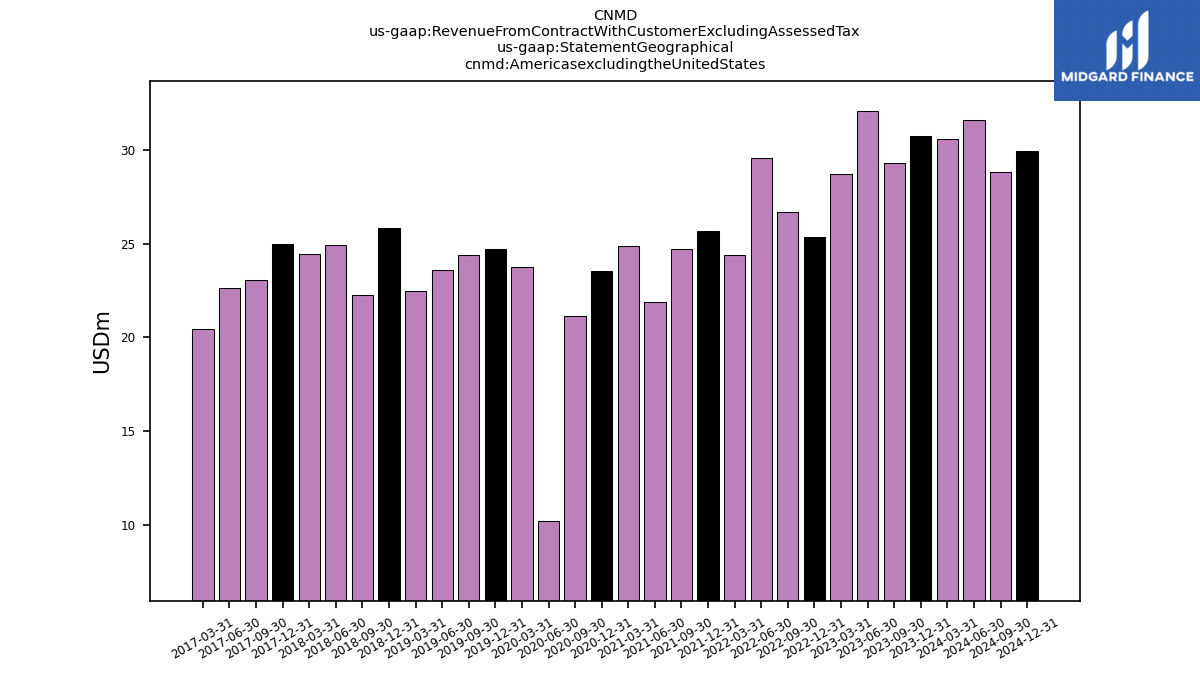
| Americasexcludingthe United States | 30.74 | 29.33 | 32.10 | 28.76 | 25.39 | 26.69 | 29.61 | 24.42 | 25.69 | 24.74 | 21.89 | 24.87 | 23.58 | 21.13 | 10.22 | 23.78 | 24.74 | 24.43 | 23.60 | 22.50 | 25.85 | 22.30 | 24.93 | 24.45 | 25.01 | 23.09 | 22.63 | 20.44 | NA | NA | NA | NA | NA | NA | NA | NA | NA | NA | NA | NA | NA | NA | NA | NA | NA | NA | NA | NA | NA | NA | NA | NA | NA | NA | NA | NA | |
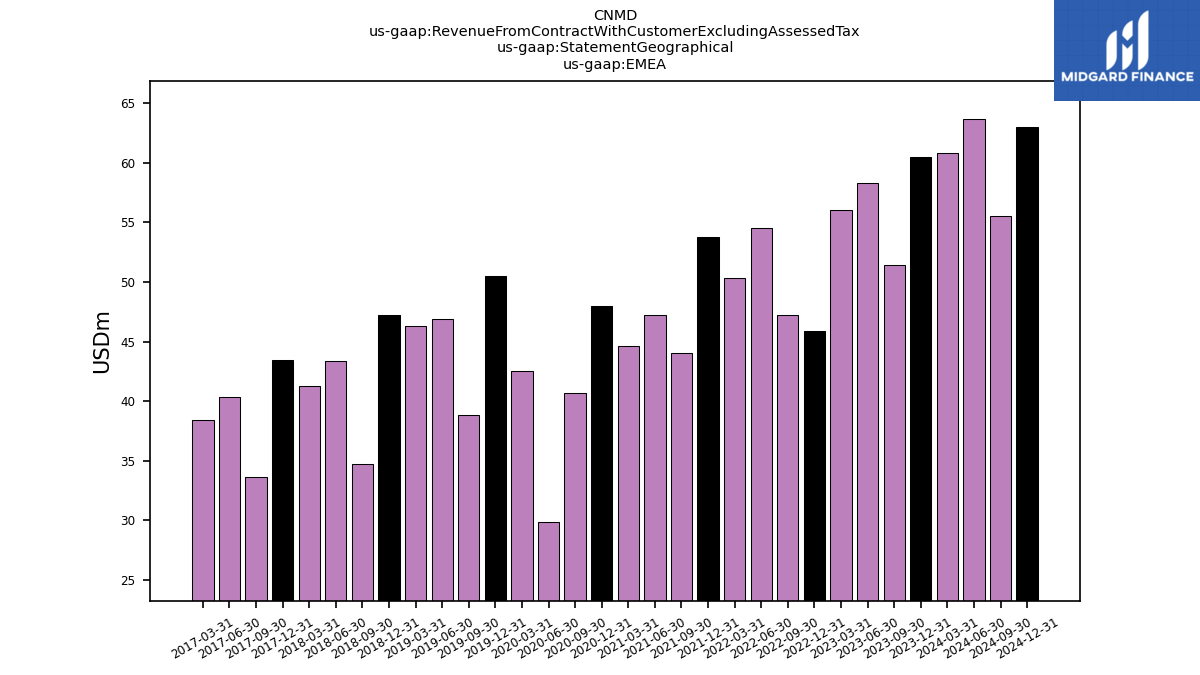
| EMEA | 60.52 | 51.44 | 58.28 | 56.02 | 45.89 | 47.21 | 54.53 | 50.31 | 53.77 | 44.06 | 47.26 | 44.60 | 48.01 | 40.69 | 29.86 | 42.52 | 50.52 | 38.83 | 46.86 | 46.33 | 47.19 | 34.70 | 43.39 | 41.29 | 43.42 | 33.65 | 40.34 | 38.44 | NA | NA | NA | NA | NA | NA | NA | NA | NA | NA | NA | NA | NA | NA | NA | NA | NA | NA | NA | NA | NA | NA | NA | NA | NA | NA | NA | NA | |
| Transferred At Point In Time | 315.40 | 293.64 | 305.30 | 283.71 | 239.50 | 263.73 | 265.51 | 231.53 | 262.18 | 238.19 | 243.75 | 222.08 | 242.17 | 227.75 | 150.09 | 204.45 | 254.27 | 224.07 | 228.70 | 209.16 | 233.73 | 193.63 | 210.36 | 199.54 | 213.70 | 182.35 | 194.95 | 184.47 | NA | NA | NA | NA | NA | NA | NA | NA | NA | NA | NA | NA | NA | NA | NA | NA | NA | NA | NA | NA | NA | NA | NA | NA | NA | NA | NA | NA | |
| Transferred Over Time | 11.65 | 10.94 | 12.35 | 11.76 | 11.36 | 11.36 | 11.68 | 10.80 | 11.79 | 10.64 | 11.41 | 10.59 | 10.65 | 10.09 | 7.69 | 9.56 | 10.60 | 9.52 | 9.56 | 9.21 | 8.71 | 8.68 | 2.46 | 2.52 | 8.86 | 7.76 | 2.20 | 2.10 | NA | NA | NA | NA | NA | NA | NA | NA | NA | NA | NA | NA | NA | NA | NA | NA | NA | NA | NA | NA | NA | NA | NA | NA | NA | NA | NA | NA |