
| 2022-12-31 | 2022-10-01 | 2022-07-24 | 2022-07-02 | 2022-04-02 | 2021-12-31 | 2021-10-02 | 2021-07-03 | 2021-04-03 | 2020-12-31 | 2020-10-03 | 2020-07-04 | 2020-04-04 | 2019-12-31 | 2019-09-28 | 2019-06-29 | 2019-03-30 | 2018-12-31 | 2018-10-28 | 2018-07-29 | 2018-04-29 | 2018-01-28 | 2017-10-29 | 2017-07-30 | 2017-04-30 | 2017-01-29 | 2016-10-30 | 2016-07-31 | 2016-05-01 | 2016-01-31 | 2015-11-01 | 2015-08-02 | 2015-05-03 | 2015-02-01 | 2014-11-02 | 2014-08-03 | 2014-05-04 | 2014-02-02 | 2013-11-03 | 2013-07-28 | 2013-04-28 | 2013-01-27 | 2012-10-28 | 2012-07-29 | 2012-07-28 | 2012-04-29 | 2012-04-28 | 2012-01-29 | 2012-01-28 | 2011-10-30 | 2011-07-31 | 2011-07-30 | 2011-05-01 | 2011-04-30 | 2011-01-31 | 2011-01-30 | 2010-10-31 | 2010-08-01 | ||
|---|---|---|---|---|---|---|---|---|---|---|---|---|---|---|---|---|---|---|---|---|---|---|---|---|---|---|---|---|---|---|---|---|---|---|---|---|---|---|---|---|---|---|---|---|---|---|---|---|---|---|---|---|---|---|---|---|---|---|---|
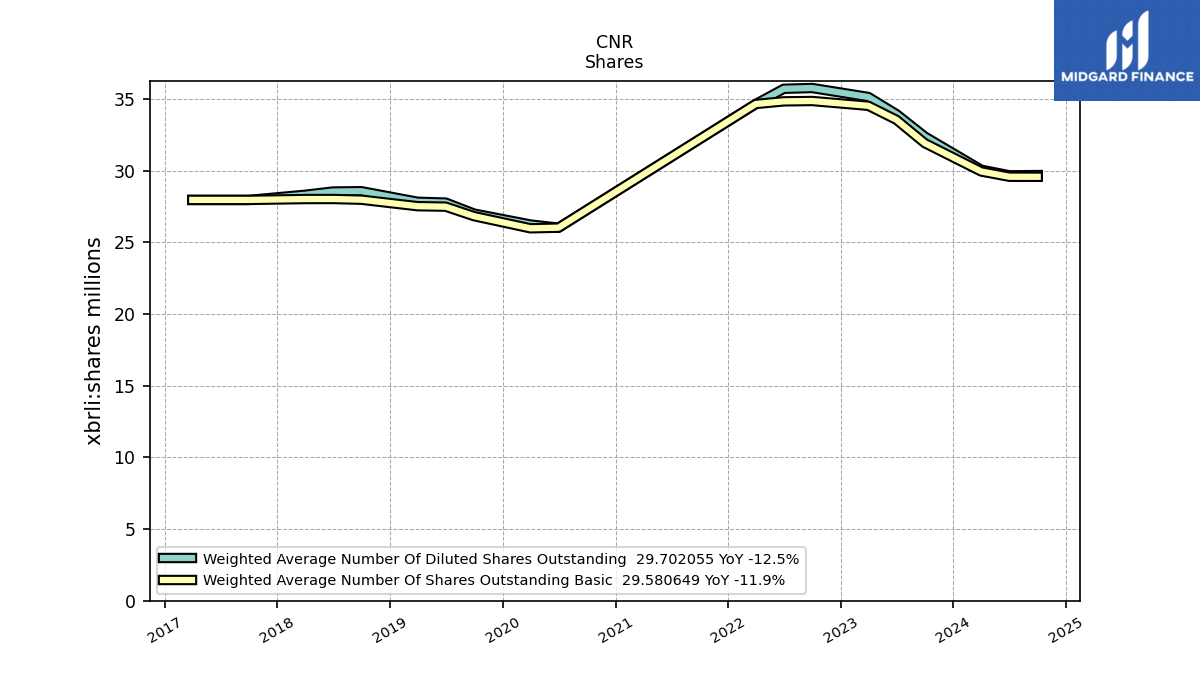
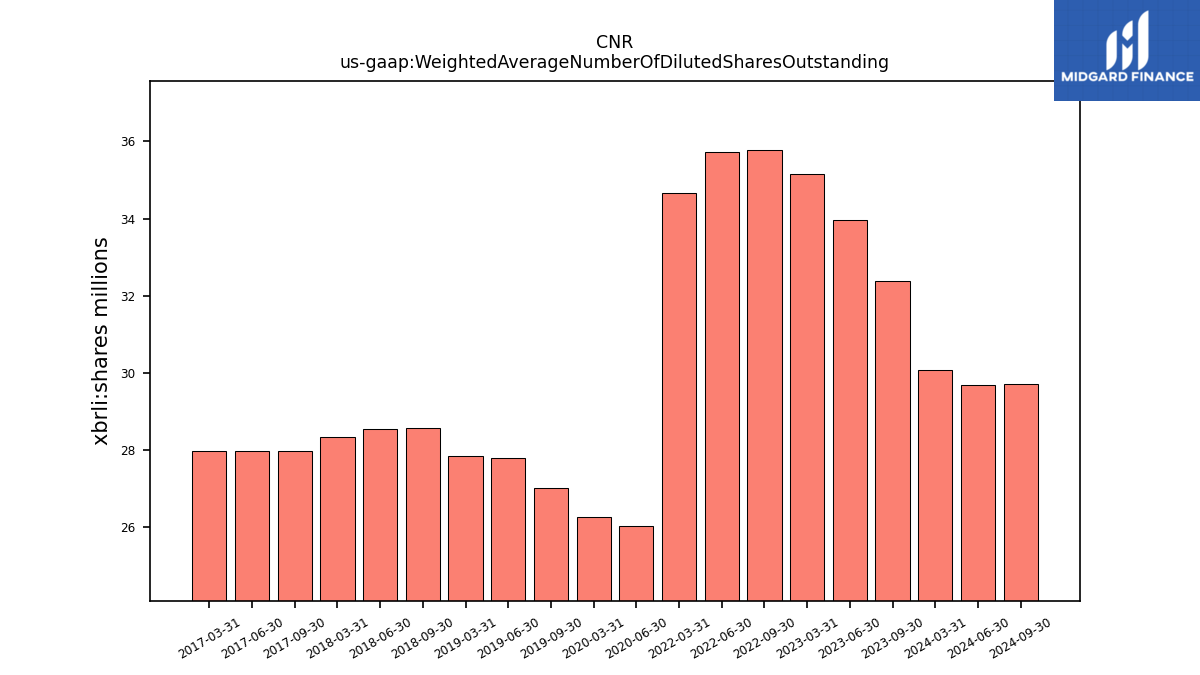
| Weighted Average Number Of Diluted Shares Outstanding | NA | NA | 129.13 | 129.05 | 128.47 | NA | 127.08 | 126.84 | 125.51 | NA | 125.29 | 125.75 | 126.09 | NA | 125.56 | 125.52 | 125.50 | 107.81 | NA | 66.44 | 66.21 | 66.55 | NA | 71.18 | 71.12 | 71.09 | NA | 73.55 | 72.89 | 73.77 | NA | 74.34 | 73.13 | 73.07 | NA | 74.39 | 72.84 | 73.52 | NA | 64.22 | 19.42 | 19.24 | NA | 19.00 | NA | 18.83 | NA | 18.69 | NA | NA | 18.47 | NA | 18.27 | NA | NA | 18.15 | NA | 18.27 | |
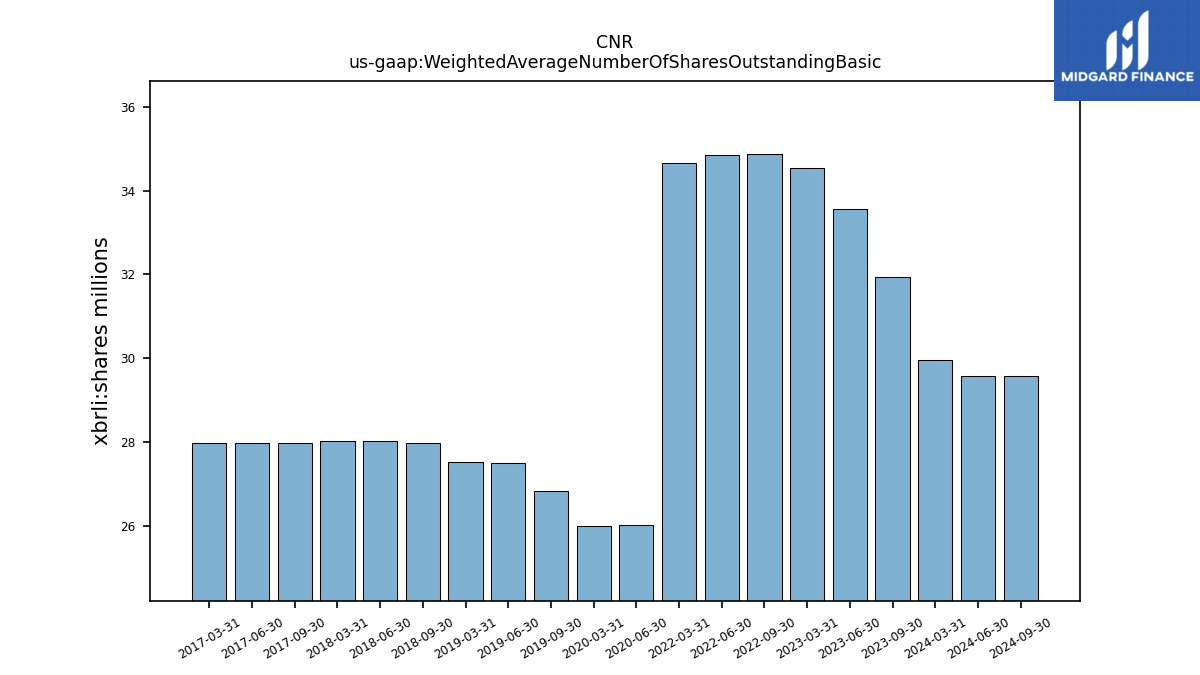
| Weighted Average Number Of Shares Outstanding Basic | NA | NA | 127.54 | 127.45 | 127.13 | NA | 126.16 | 125.86 | 125.51 | NA | 125.10 | 125.75 | 126.09 | NA | 125.56 | 125.52 | 125.50 | 107.81 | NA | 66.33 | 66.21 | 66.43 | NA | 71.05 | 70.99 | 70.88 | NA | 73.10 | 72.35 | 73.26 | NA | 73.34 | 73.13 | 73.07 | NA | 72.93 | 72.84 | 73.52 | NA | 64.22 | 19.42 | 19.24 | NA | 19.00 | NA | 18.83 | NA | 18.69 | NA | NA | 18.47 | NA | 18.27 | NA | NA | 18.15 | NA | 18.27 | |
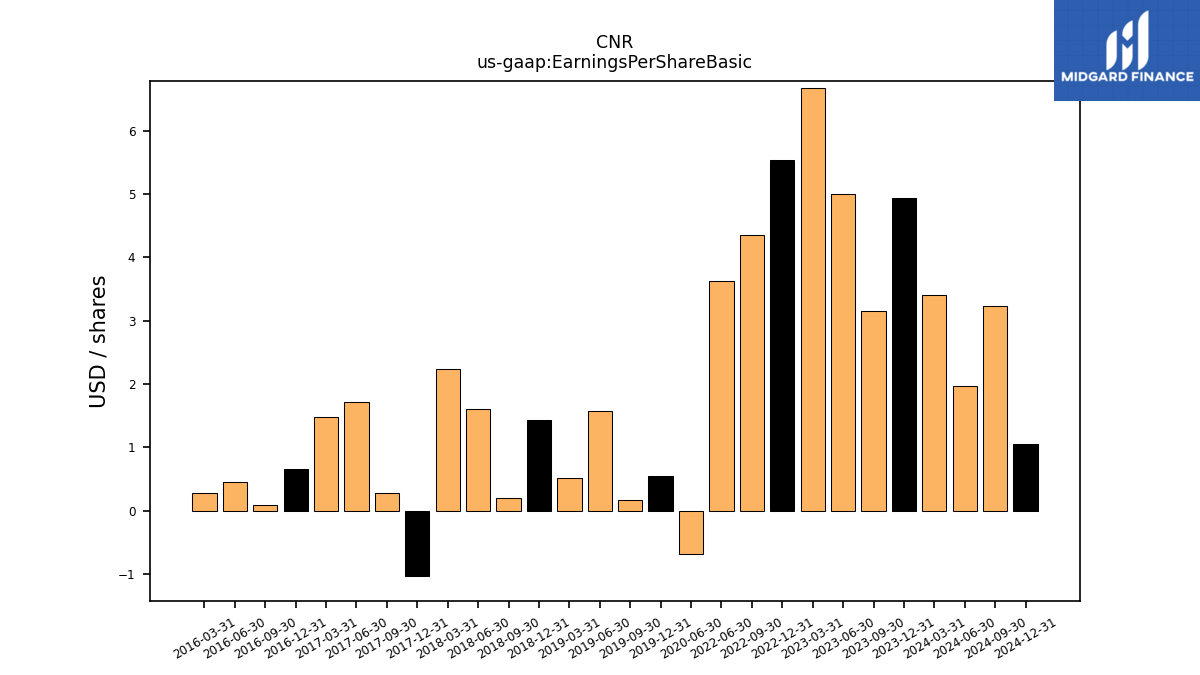
| Earnings Per Share Basic | NA | NA | 0.01 | 2.96 | 0.80 | 0.29 | 4.85 | 0.07 | -0.01 | 0.01 | 0.24 | 0.21 | -4.30 | 0.02 | 0.20 | 0.14 | -0.48 | -0.71 | 0.41 | 0.54 | -0.09 | 0.08 | 0.25 | 0.26 | 0.24 | 0.03 | 0.27 | 0.32 | 0.03 | 0.08 | 0.25 | 0.10 | -0.10 | -0.00 | 0.19 | 0.08 | -0.07 | -0.06 | 0.11 | -0.19 | -0.28 | -0.19 | 0.08 | -2.74 | -2.74 | -0.86 | -0.86 | -0.54 | -0.54 | -0.24 | -0.71 | -0.71 | -0.51 | -0.51 | -1.14 | -1.14 | -0.97 | -0.90 | |
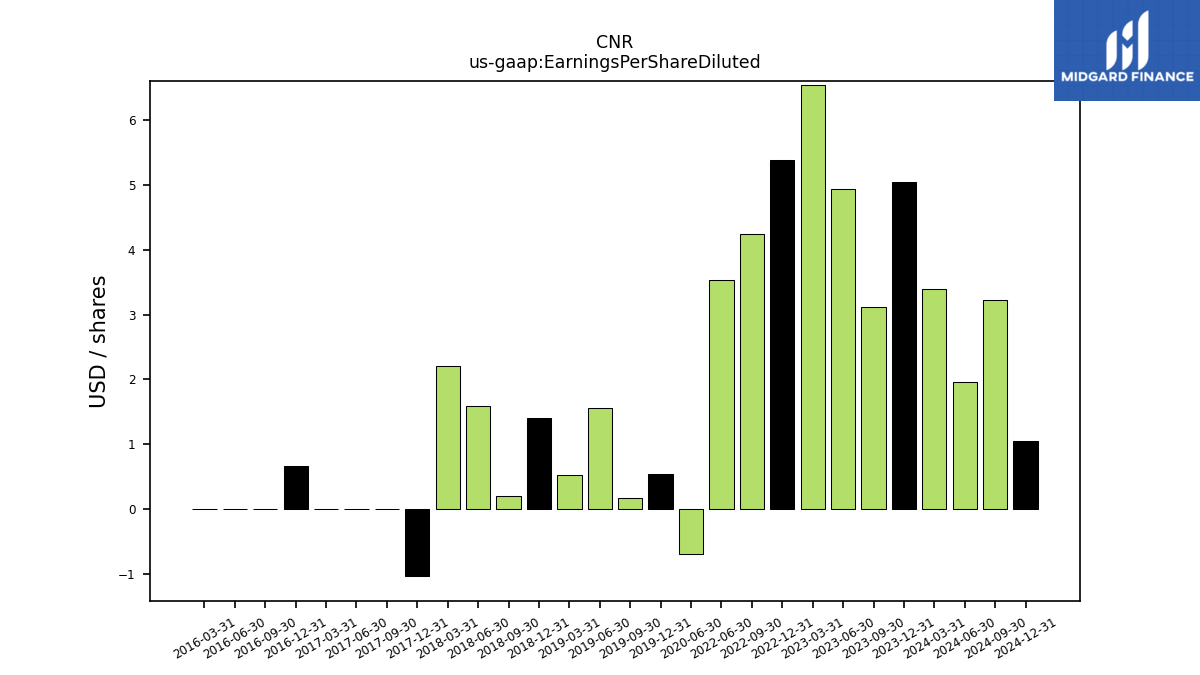
| Earnings Per Share Diluted | NA | NA | 0.01 | 2.92 | 0.79 | 0.29 | 4.82 | 0.07 | -0.01 | 0.01 | 0.24 | 0.21 | -4.30 | 0.02 | 0.20 | 0.14 | -0.48 | -0.71 | 0.41 | 0.54 | -0.09 | 0.08 | 0.25 | 0.25 | 0.24 | 0.03 | 0.27 | 0.32 | 0.03 | 0.08 | 0.25 | 0.10 | -0.10 | -0.00 | 0.19 | 0.08 | -0.07 | -0.06 | 0.11 | -0.19 | -0.28 | -0.19 | 0.08 | -2.74 | -2.74 | -0.86 | -0.86 | -0.54 | -0.54 | -0.24 | -0.71 | -0.71 | -0.51 | -0.51 | -1.14 | -1.14 | -0.97 | -0.90 |
| 2022-12-31 | 2022-10-01 | 2022-07-24 | 2022-07-02 | 2022-04-02 | 2021-12-31 | 2021-10-02 | 2021-07-03 | 2021-04-03 | 2020-12-31 | 2020-10-03 | 2020-07-04 | 2020-04-04 | 2019-12-31 | 2019-09-28 | 2019-06-29 | 2019-03-30 | 2018-12-31 | 2018-10-28 | 2018-07-29 | 2018-04-29 | 2018-01-28 | 2017-10-29 | 2017-07-30 | 2017-04-30 | 2017-01-29 | 2016-10-30 | 2016-07-31 | 2016-05-01 | 2016-01-31 | 2015-11-01 | 2015-08-02 | 2015-05-03 | 2015-02-01 | 2014-11-02 | 2014-08-03 | 2014-05-04 | 2014-02-02 | 2013-11-03 | 2013-07-28 | 2013-04-28 | 2013-01-27 | 2012-10-28 | 2012-07-29 | 2012-07-28 | 2012-04-29 | 2012-04-28 | 2012-01-29 | 2012-01-28 | 2011-10-30 | 2011-07-31 | 2011-07-30 | 2011-05-01 | 2011-04-30 | 2011-01-31 | 2011-01-30 | 2010-10-31 | 2010-08-01 | ||
|---|---|---|---|---|---|---|---|---|---|---|---|---|---|---|---|---|---|---|---|---|---|---|---|---|---|---|---|---|---|---|---|---|---|---|---|---|---|---|---|---|---|---|---|---|---|---|---|---|---|---|---|---|---|---|---|---|---|---|---|
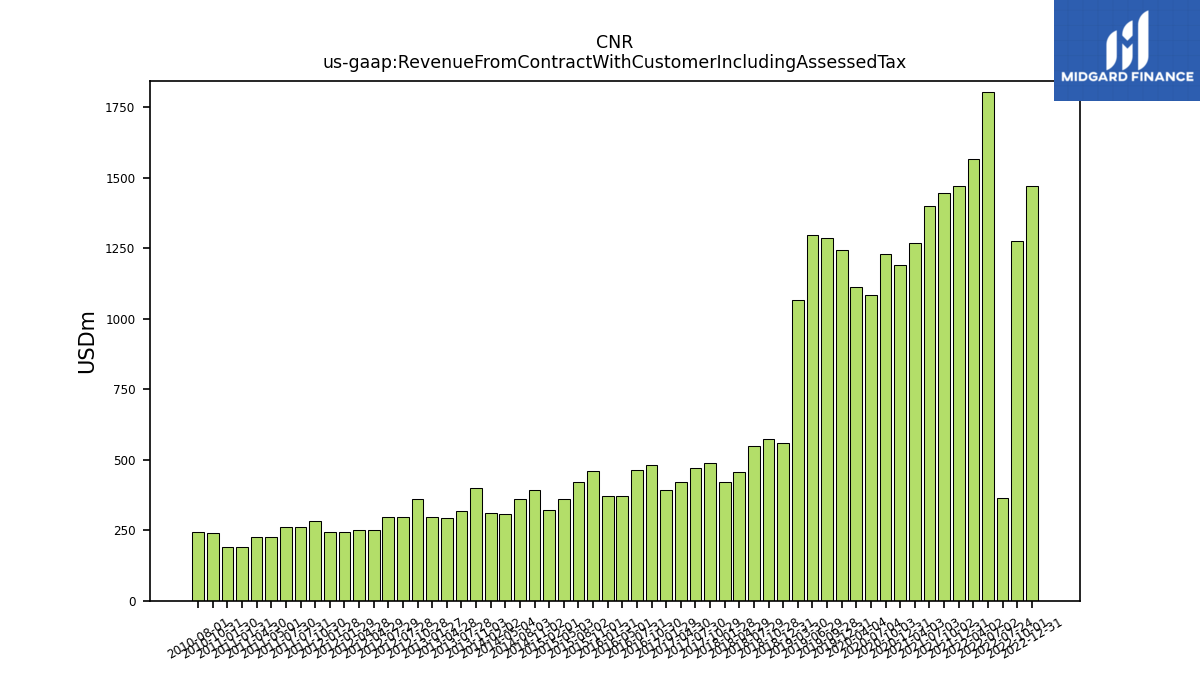
| Revenue From Contract With Customer Including Assessed Tax | 1469.27 | 1274.88 | 365.44 | 1803.80 | 1566.84 | 1471.58 | 1444.40 | 1400.12 | 1267.03 | 1191.37 | 1227.25 | 1084.94 | 1113.81 | 1244.41 | 1285.04 | 1295.46 | 1064.83 | 559.87 | 573.63 | 548.52 | 457.07 | 421.35 | 488.73 | 469.38 | 420.46 | 391.70 | 480.31 | 462.35 | 372.25 | 370.01 | 459.83 | 420.79 | 360.15 | 322.93 | 392.45 | 361.63 | 305.80 | 310.67 | 400.21 | 317.20 | 293.40 | 297.58 | 361.69 | 298.49 | 298.49 | 250.23 | 250.23 | 243.60 | 243.60 | 281.79 | 262.14 | 262.14 | 225.56 | 225.56 | 190.09 | 190.09 | 241.45 | 245.29 | |
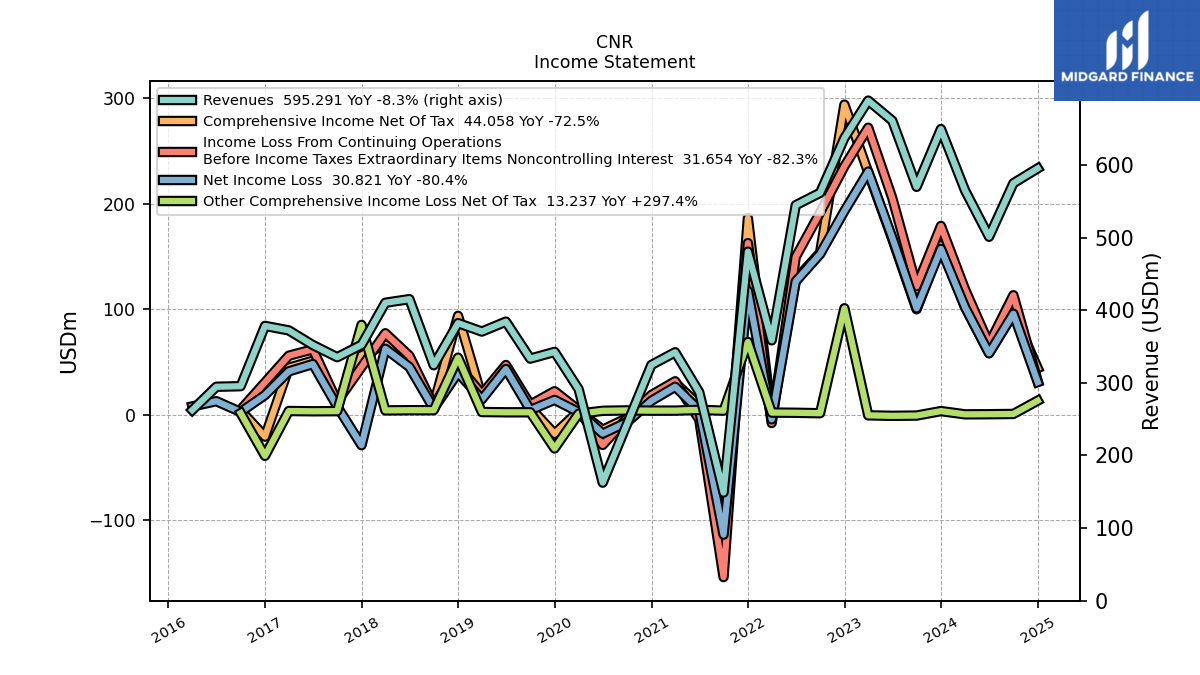
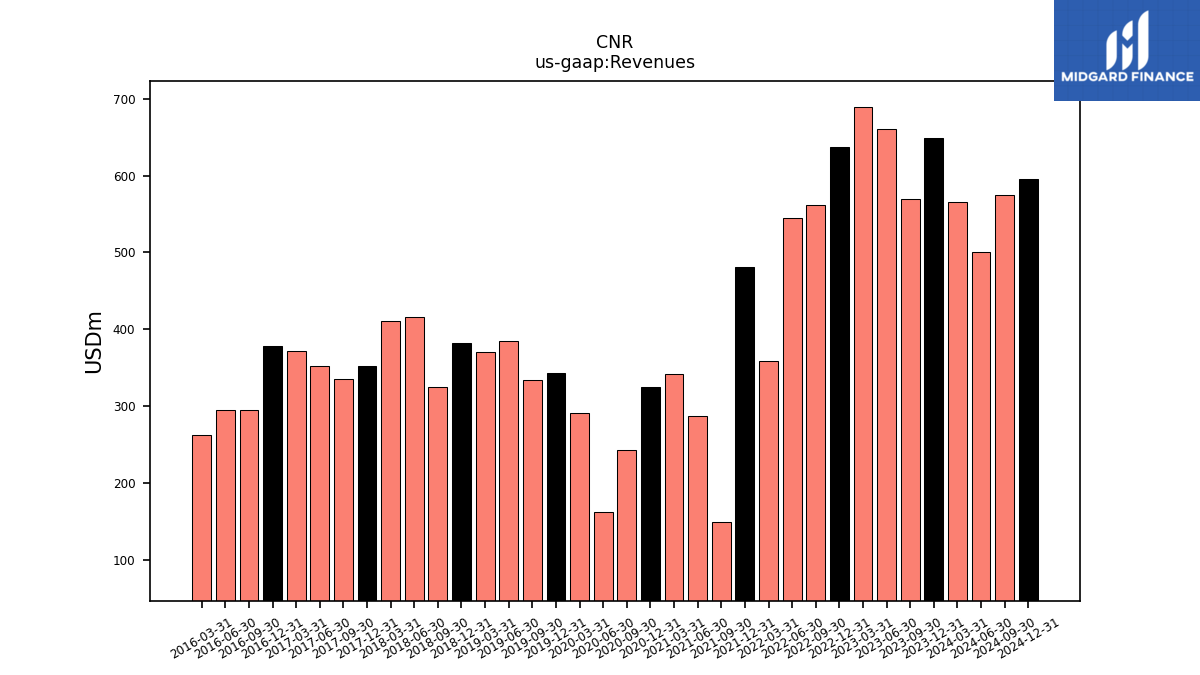
| Revenues | 1469.27 | 1274.88 | 365.44 | 1803.80 | 1566.84 | 1471.58 | 1444.40 | 1400.12 | 1267.03 | 1191.37 | 1227.25 | 1084.94 | 1113.81 | 1244.41 | 1285.04 | 1295.46 | 1064.83 | 559.87 | 573.63 | 548.52 | 457.07 | 421.35 | 488.73 | 469.38 | 420.46 | 391.70 | 480.31 | 462.35 | 372.25 | 370.01 | 459.83 | 420.79 | 360.15 | 322.93 | 392.45 | 361.63 | 305.80 | 310.67 | 400.21 | 317.20 | 293.40 | 297.58 | 361.69 | 298.49 | 298.49 | 250.23 | 250.23 | 243.60 | 243.60 | 281.79 | 262.14 | 262.14 | 225.56 | 225.56 | 190.09 | 190.09 | 241.45 | 245.29 | |
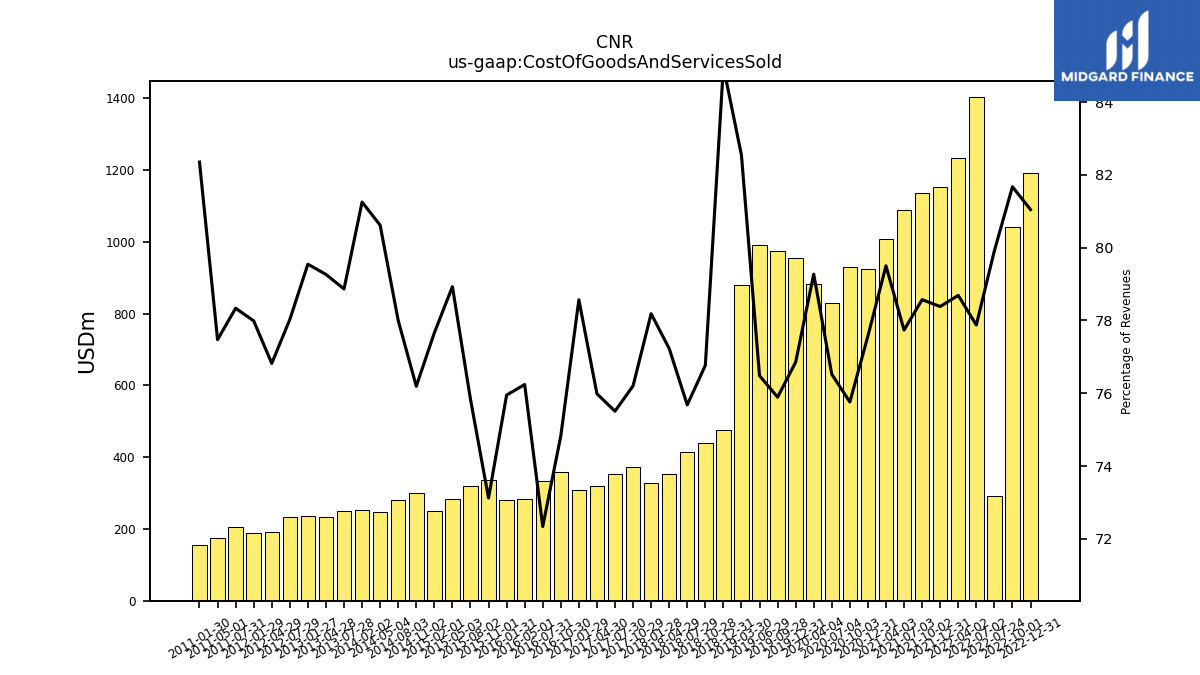
| Cost Of Goods And Services Sold | 1190.79 | 1041.26 | 292.05 | 1404.72 | 1232.93 | 1153.46 | 1134.91 | 1088.39 | 1007.30 | 924.17 | 929.75 | 830.21 | 882.92 | 956.38 | 975.24 | 990.79 | 878.91 | 475.78 | 440.35 | 415.12 | 352.99 | 329.43 | 372.42 | 354.42 | 319.49 | 307.75 | 359.40 | 334.45 | 283.80 | 281.02 | 336.23 | 319.10 | 284.26 | 250.79 | 299.01 | 282.06 | 246.53 | 252.43 | NA | 250.16 | 232.56 | 236.72 | NA | 232.90 | NA | 192.23 | NA | 189.98 | NA | NA | 205.35 | NA | 174.75 | NA | NA | 156.54 | NA | NA | |
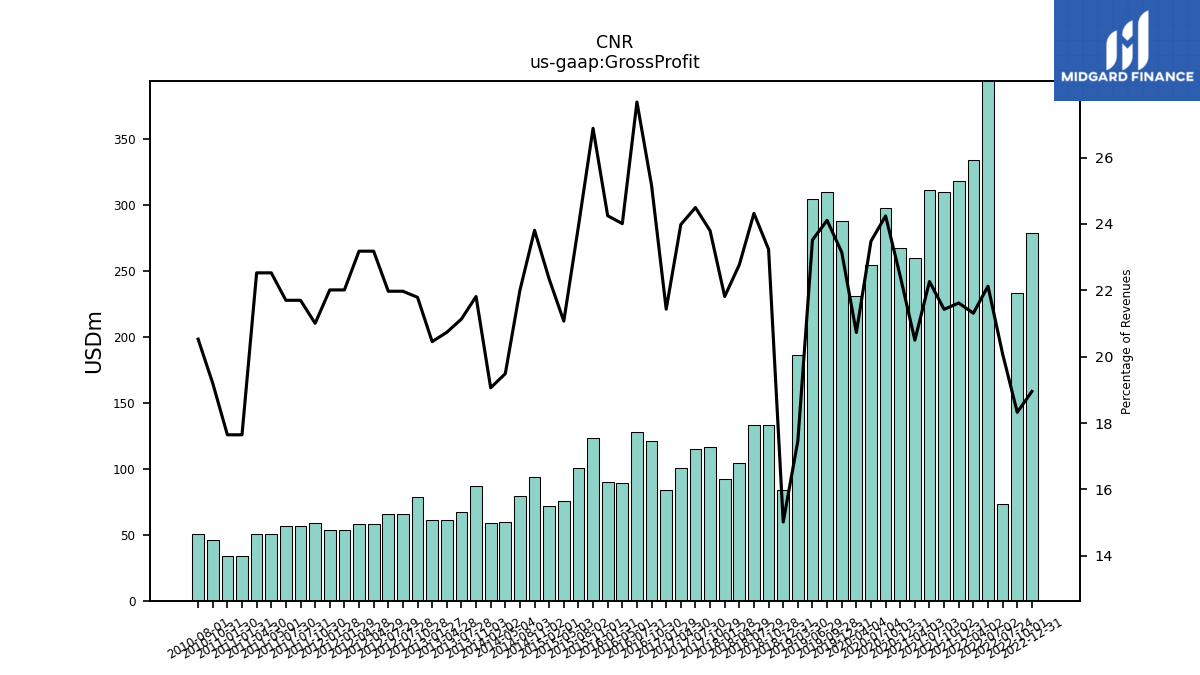
| Gross Profit | 278.48 | 233.62 | 73.40 | 399.08 | 333.91 | 318.12 | 309.50 | 311.73 | 259.73 | 267.20 | 297.50 | 254.73 | 230.89 | 288.04 | 309.80 | 304.66 | 185.92 | 84.09 | 133.28 | 133.40 | 104.08 | 91.92 | 116.31 | 114.97 | 100.84 | 83.95 | 120.85 | 127.95 | 89.38 | 89.72 | 123.60 | 100.69 | 75.89 | 72.14 | 93.44 | 79.56 | 59.60 | 59.23 | 87.30 | 67.04 | 60.84 | 60.87 | 78.81 | 65.58 | 65.58 | 58.00 | 58.00 | 53.62 | 53.62 | 59.19 | 56.88 | 56.88 | 50.81 | 50.81 | 33.55 | 33.55 | 46.36 | 50.36 | |
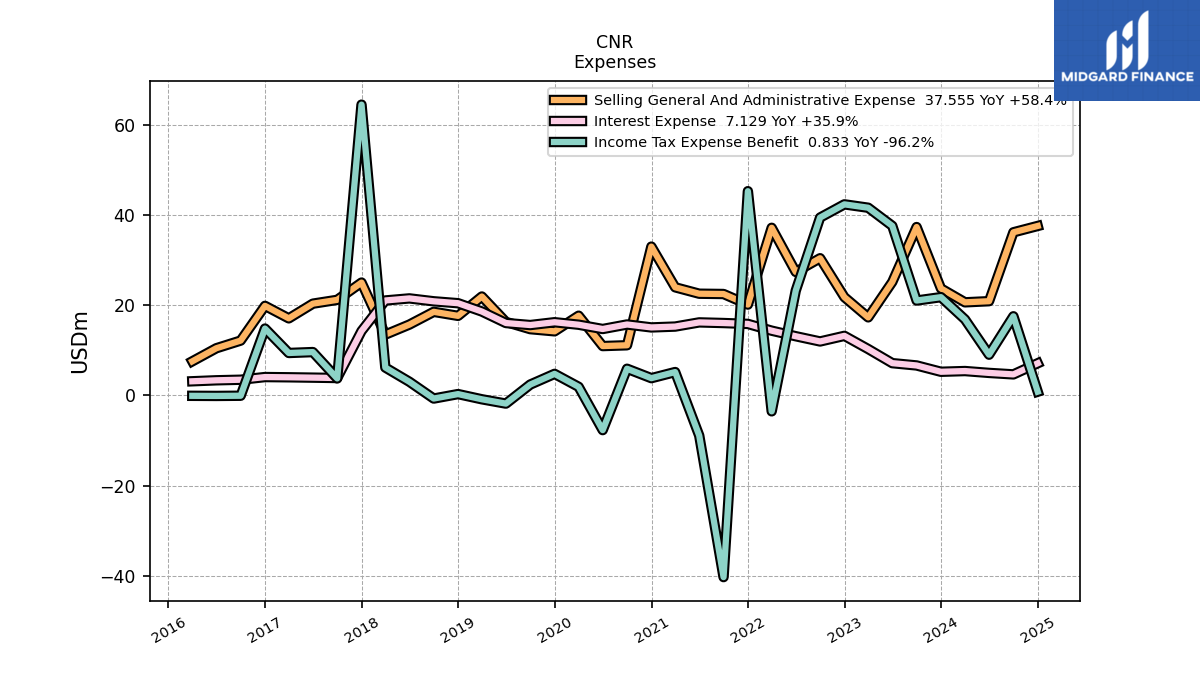
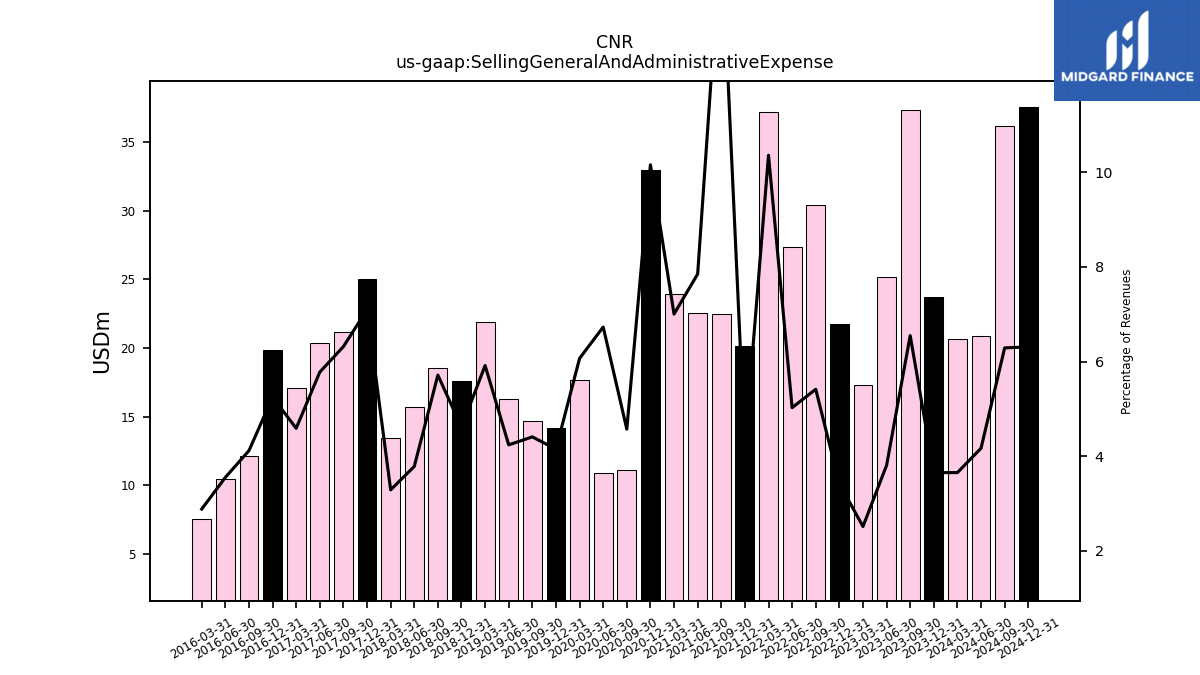
| Selling General And Administrative Expense | 249.67 | 179.69 | 56.19 | 183.40 | 176.54 | 171.65 | 161.13 | 163.52 | 153.17 | 142.62 | 137.25 | 134.37 | 164.95 | 161.49 | 154.03 | 158.03 | 154.31 | 95.78 | 78.88 | 79.04 | 74.41 | 74.79 | 72.67 | 76.31 | 75.12 | 69.04 | 77.64 | 80.41 | 74.65 | 69.85 | 76.42 | 74.52 | 73.03 | 62.87 | 68.35 | 65.88 | 65.11 | 61.38 | NA | 62.76 | 62.78 | 60.47 | NA | 55.60 | NA | 51.56 | NA | 49.34 | NA | 51.12 | 50.89 | NA | 52.66 | NA | NA | 47.68 | 48.50 | 48.73 | |
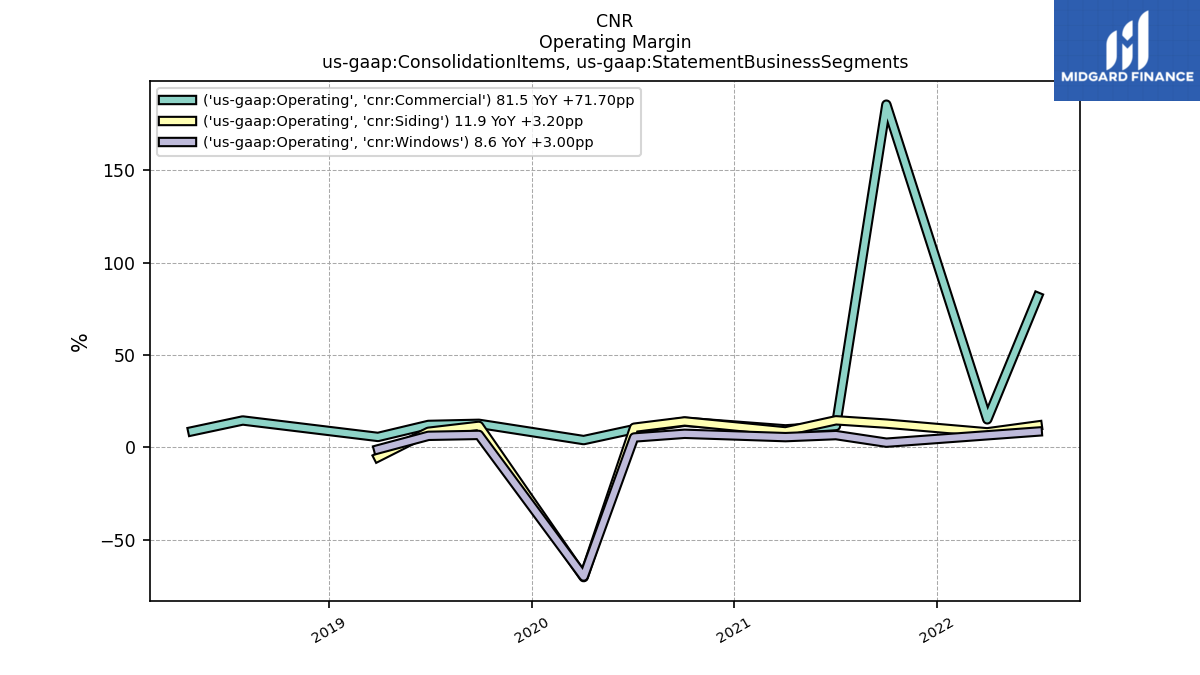
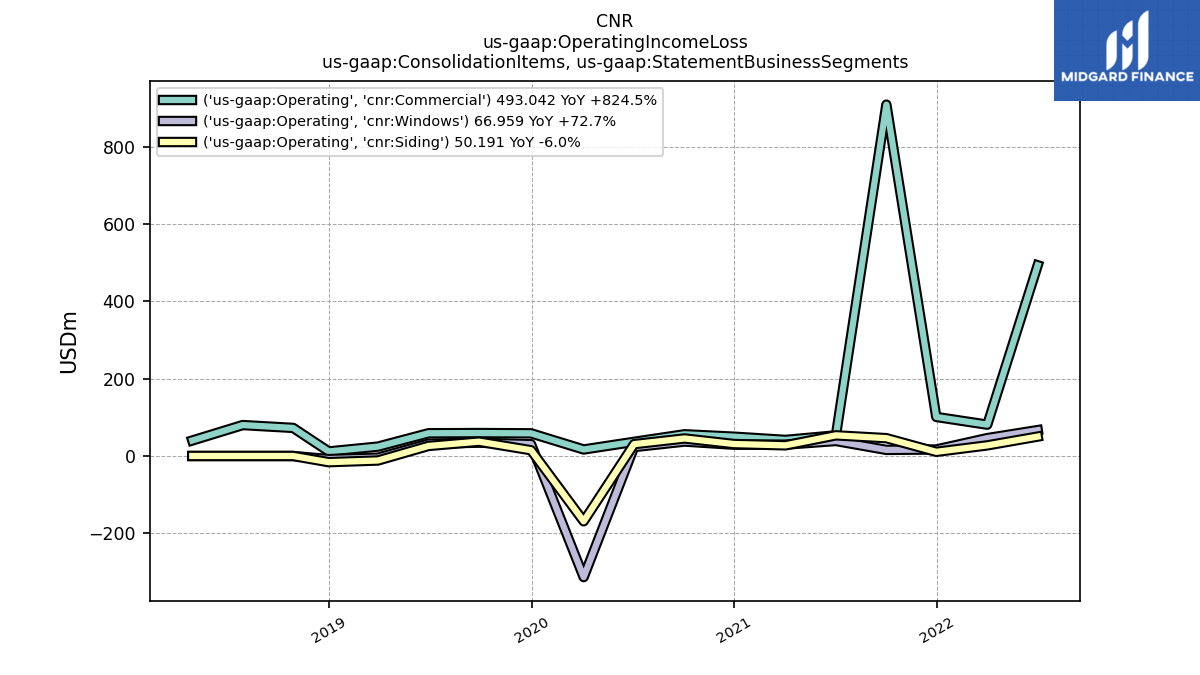
| Operating Income Loss | 34.78 | 47.03 | -12.66 | 554.89 | 179.32 | 74.50 | 910.73 | 96.81 | 55.21 | 71.38 | 103.98 | 58.92 | -500.79 | 65.61 | 95.56 | 80.93 | -27.36 | -63.42 | 39.56 | 54.50 | 18.96 | 12.90 | 33.33 | 34.10 | 32.47 | 9.89 | 39.39 | 43.53 | 10.59 | 15.26 | 36.50 | 19.38 | -3.62 | 4.57 | 21.57 | 12.20 | -5.51 | -3.17 | NA | 4.28 | -1.95 | 0.40 | NA | 7.03 | NA | 4.94 | NA | 4.29 | NA | 7.78 | 6.57 | NA | -1.84 | NA | NA | -14.14 | -3.77 | 1.08 | |
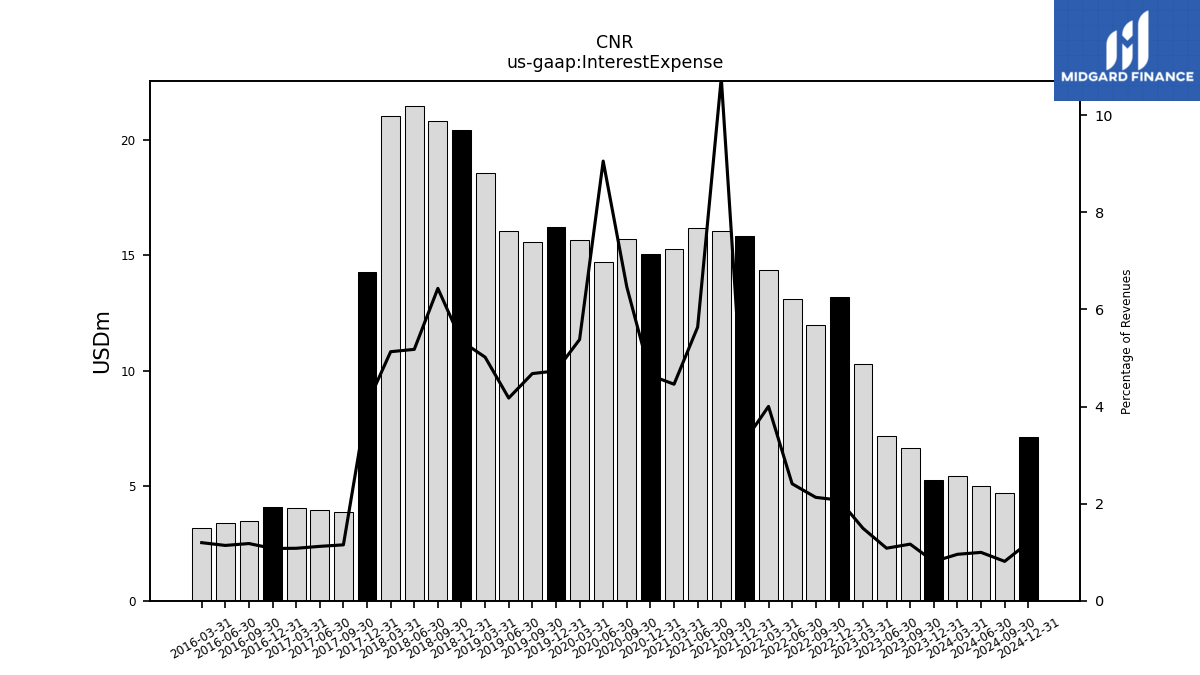
| Interest Expense | 91.38 | 65.81 | 11.40 | 45.57 | 44.11 | 43.61 | 43.73 | 47.46 | 56.50 | 54.87 | 51.52 | 52.38 | 54.84 | 56.13 | 56.55 | 58.30 | 58.29 | 28.56 | 4.89 | 4.57 | 4.85 | 7.49 | 7.16 | 7.37 | 7.48 | 6.89 | 7.56 | 7.75 | 7.84 | 7.87 | 8.01 | 8.15 | 8.31 | 3.99 | 3.07 | 3.20 | 3.06 | 3.13 | NA | 5.16 | 6.19 | 6.27 | NA | 4.20 | NA | 3.06 | NA | 3.32 | NA | 3.71 | 3.89 | NA | 3.90 | NA | NA | 4.22 | 4.28 | 4.42 | |
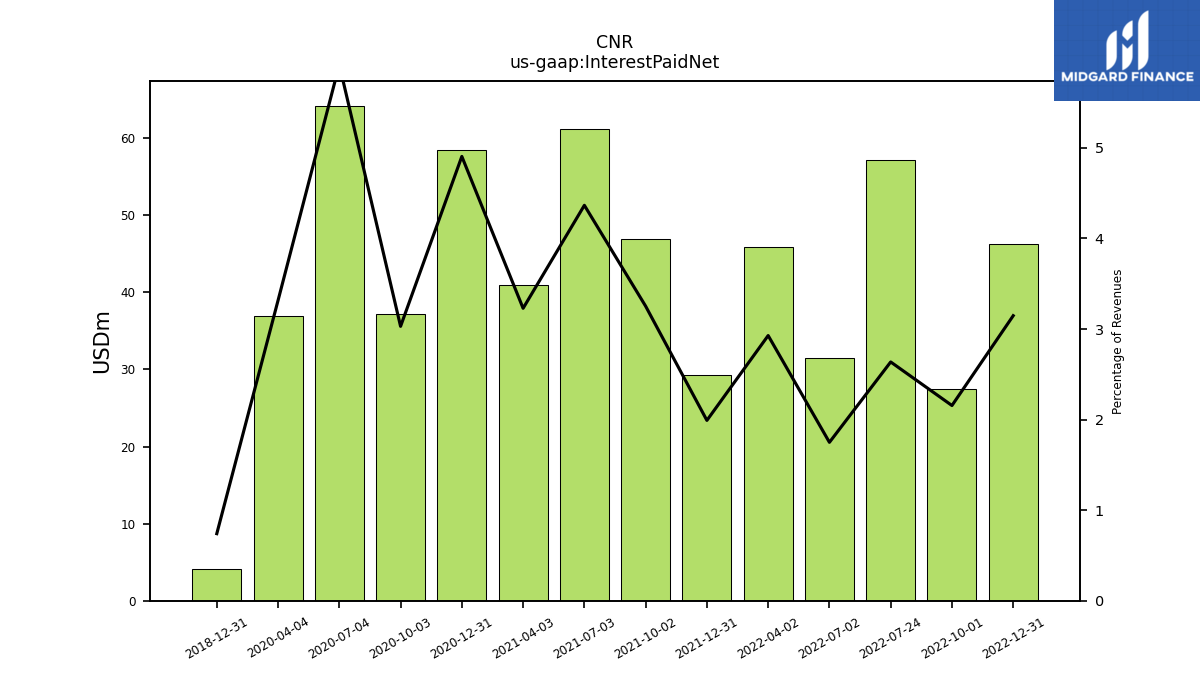
| Interest Paid Net | 46.24 | 27.48 | 57.20 | 31.55 | 45.88 | 29.30 | 46.98 | 61.13 | 40.91 | 58.45 | 37.18 | 64.21 | 36.93 | NA | NA | NA | NA | 4.15 | NA | NA | NA | NA | NA | NA | NA | NA | NA | NA | NA | NA | NA | NA | NA | NA | NA | NA | NA | NA | NA | NA | NA | NA | NA | NA | NA | NA | NA | NA | NA | NA | NA | NA | NA | NA | NA | NA | NA | NA | |
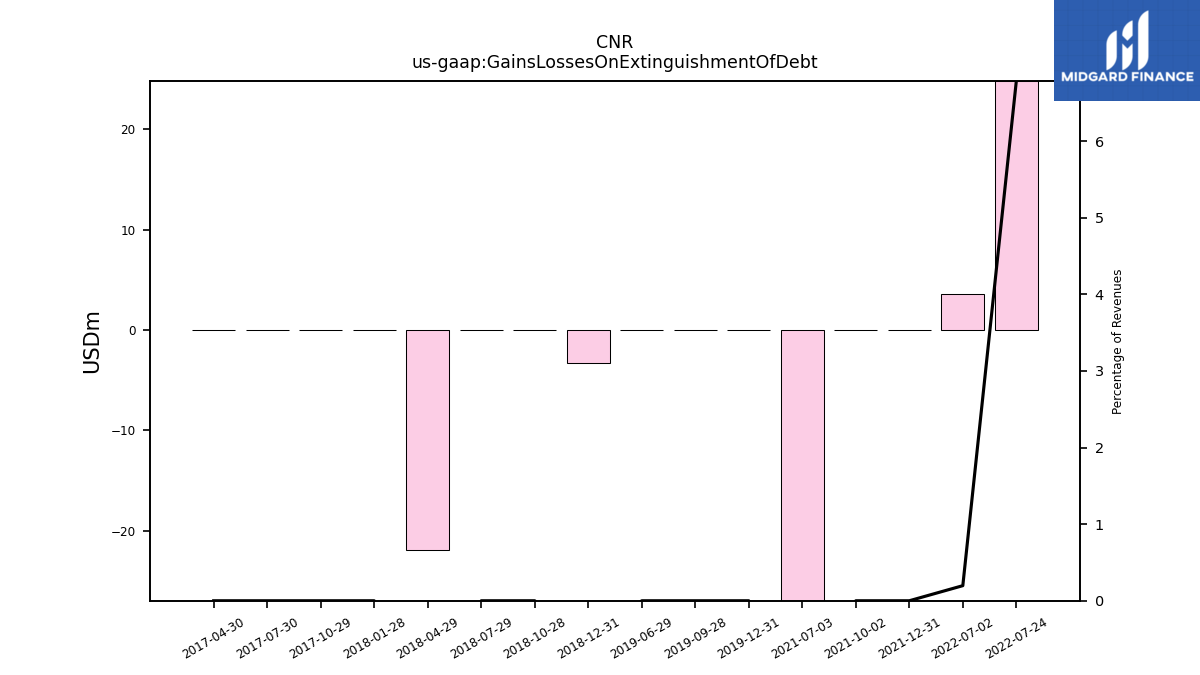
| Gains Losses On Extinguishment Of Debt | NA | NA | 24.80 | 3.55 | NA | 0.00 | 0.00 | -42.23 | NA | NA | NA | NA | NA | 0.00 | 0.00 | 0.00 | NA | -3.28 | 0.00 | 0.00 | -21.88 | 0.00 | 0.00 | 0.00 | 0.00 | NA | NA | NA | NA | NA | NA | NA | NA | NA | NA | NA | NA | NA | NA | NA | NA | NA | NA | NA | NA | NA | NA | NA | NA | NA | NA | NA | NA | NA | NA | NA | NA | NA | |
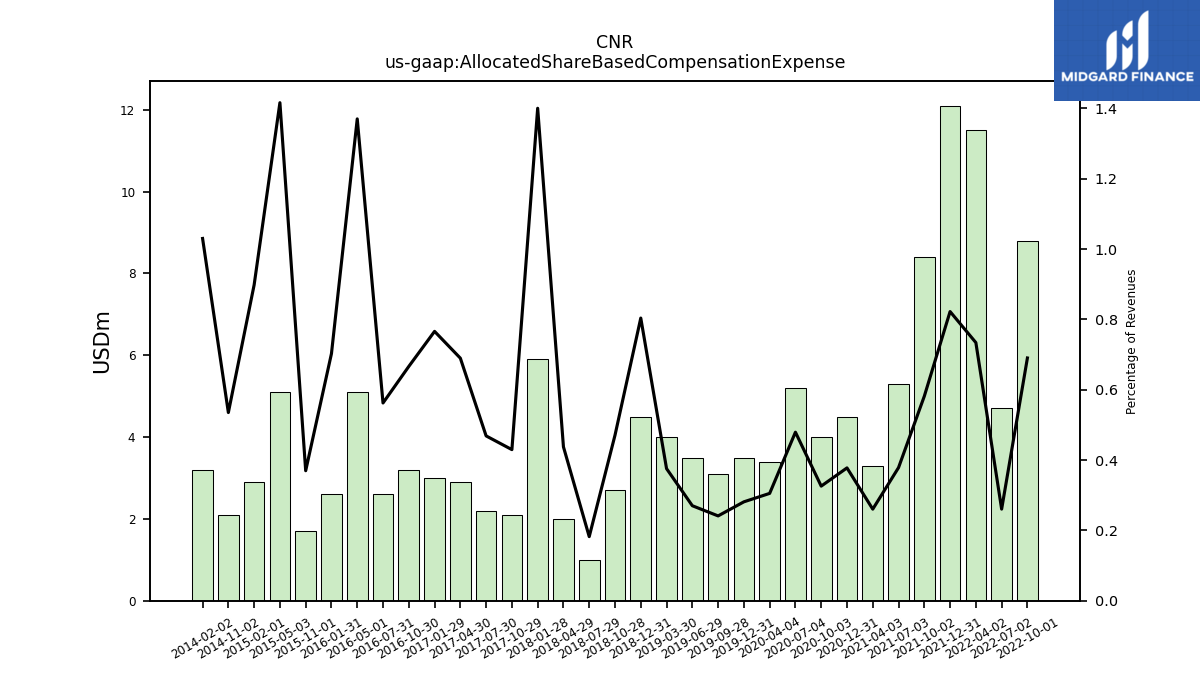
| Allocated Share Based Compensation Expense | NA | 8.80 | NA | 4.70 | 11.50 | 12.10 | 8.40 | 5.30 | 3.30 | 4.50 | 4.00 | 5.20 | 3.40 | 3.50 | 3.10 | 3.50 | 4.00 | 4.50 | 2.70 | 1.00 | 2.00 | 5.90 | 2.10 | 2.20 | 2.90 | 3.00 | 3.20 | 2.60 | 5.10 | 2.60 | 1.70 | NA | 5.10 | 2.90 | 2.10 | NA | NA | 3.20 | NA | NA | NA | NA | NA | NA | NA | NA | NA | NA | NA | NA | NA | NA | NA | NA | NA | NA | NA | NA | |
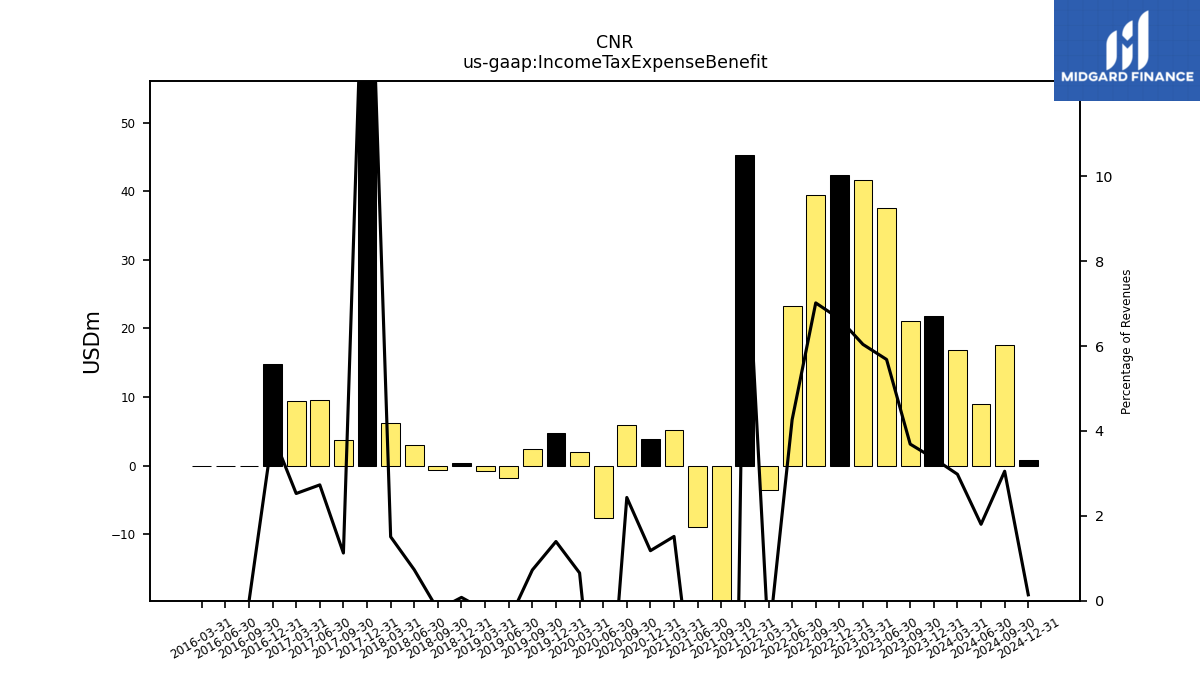
| Income Tax Expense Benefit | -13.40 | -1.67 | -1.05 | 132.50 | 34.37 | -9.36 | 245.60 | -1.06 | 0.79 | 17.85 | 23.06 | -17.33 | -18.01 | 9.22 | 14.10 | 5.35 | -23.90 | -20.67 | 6.88 | 14.08 | -2.08 | 1.12 | 8.69 | 9.85 | 8.61 | 1.27 | 12.65 | 11.63 | 1.21 | 2.45 | 10.03 | 3.52 | -4.09 | -0.49 | 4.22 | 2.84 | -3.06 | -2.51 | NA | -9.93 | -2.51 | -1.82 | NA | -0.66 | NA | 0.94 | NA | 0.43 | NA | 0.40 | 0.00 | NA | -1.79 | NA | NA | -5.01 | -1.79 | -0.22 | |
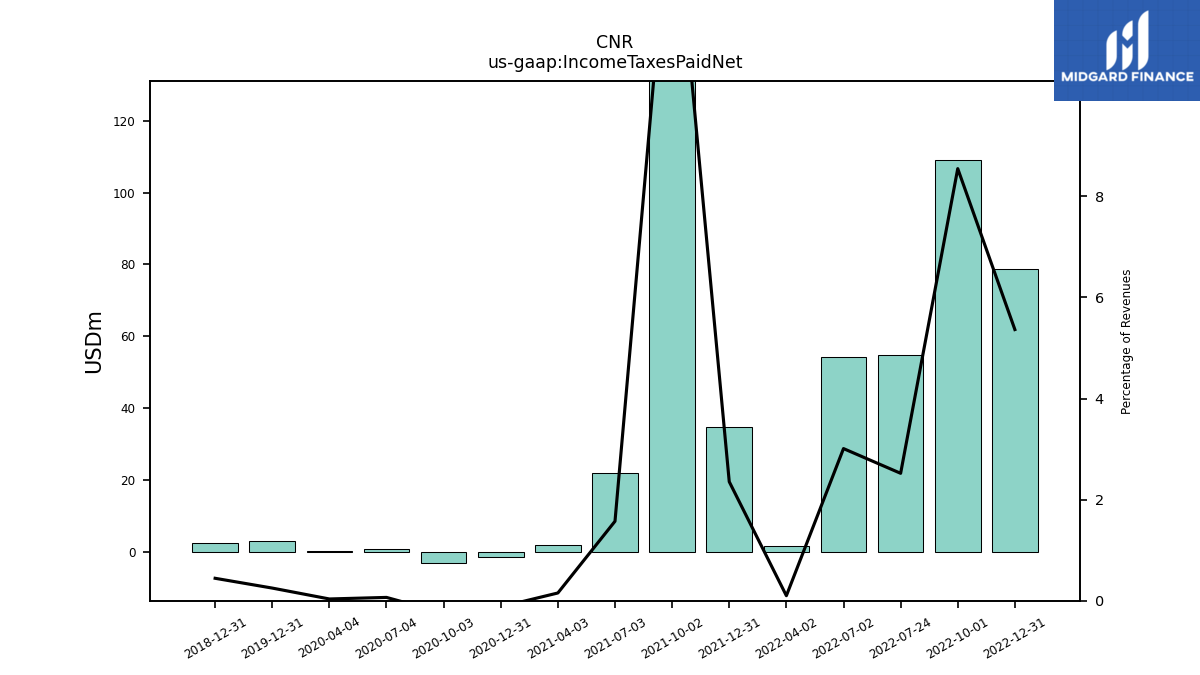
| Income Taxes Paid Net | 78.81 | 108.96 | 54.68 | 54.29 | 1.56 | 34.64 | 208.79 | 22.02 | 1.95 | -1.44 | -2.99 | 0.72 | 0.39 | 3.12 | NA | NA | NA | 2.49 | NA | NA | NA | NA | NA | NA | NA | NA | NA | NA | NA | NA | NA | NA | NA | NA | NA | NA | NA | NA | NA | NA | NA | NA | NA | NA | NA | NA | NA | NA | NA | NA | NA | NA | NA | NA | NA | NA | NA | NA | |
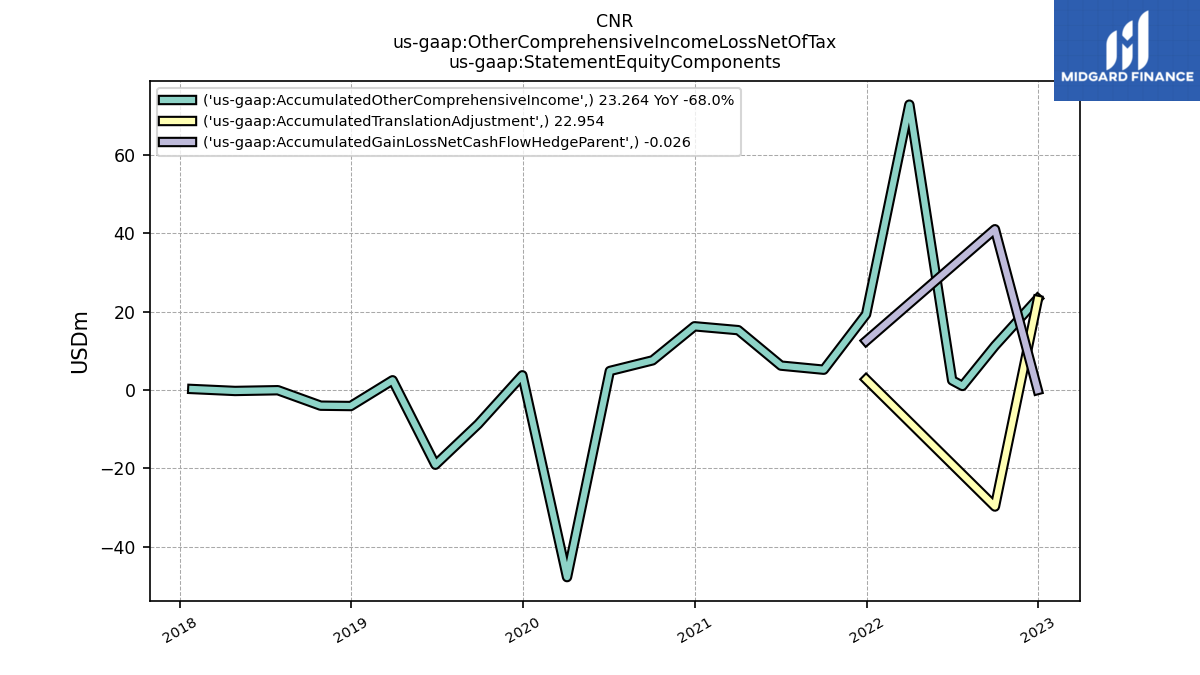
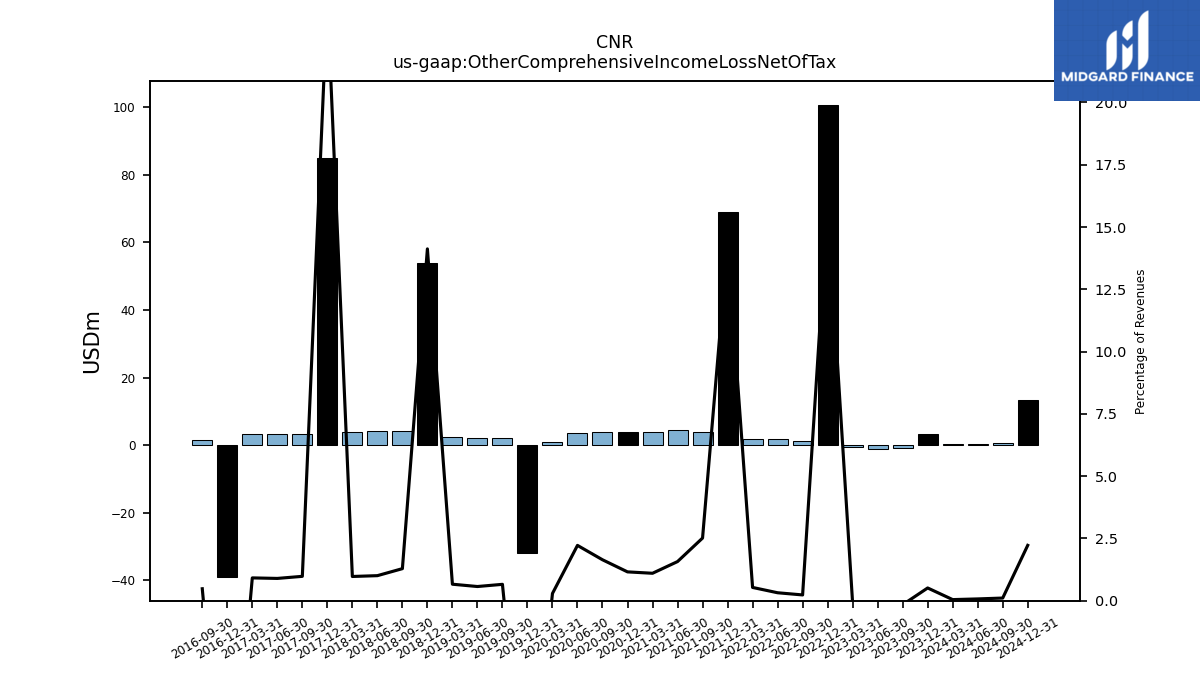
| Other Comprehensive Income Loss Net Of Tax | 23.26 | 11.24 | 1.02 | 2.44 | 72.77 | 19.29 | 5.16 | 6.20 | 15.25 | 16.23 | 7.55 | 4.84 | -47.74 | 3.74 | -8.72 | -19.08 | 2.47 | -4.11 | -3.96 | -0.07 | -0.29 | 0.21 | NA | NA | NA | NA | NA | NA | NA | NA | NA | NA | NA | NA | NA | NA | NA | NA | NA | NA | NA | NA | NA | 0.00 | NA | NA | NA | NA | NA | NA | -0.02 | NA | NA | NA | NA | NA | NA | NA | |
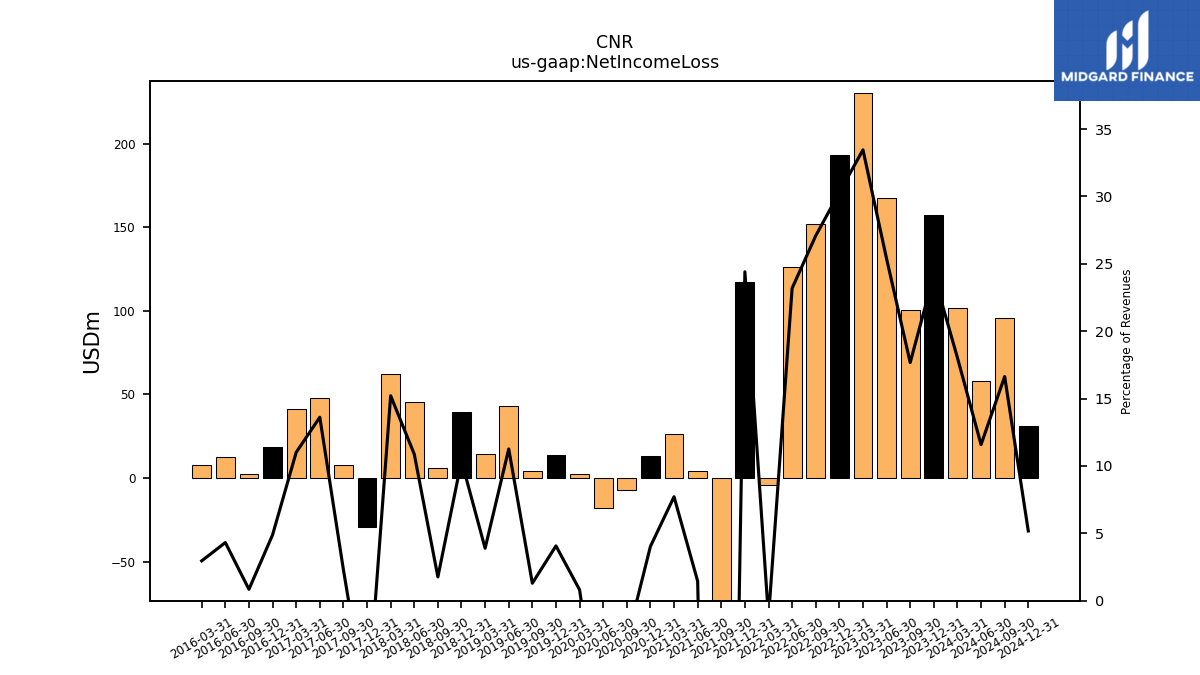
| Net Income Loss | -59.05 | -4.45 | 1.44 | 380.06 | 102.28 | 38.05 | 620.53 | 8.93 | -1.66 | 1.88 | 30.52 | 26.90 | -542.07 | 1.93 | 25.16 | 17.53 | -60.02 | -76.19 | 27.55 | 35.99 | -5.68 | 5.25 | 17.49 | 18.22 | 16.97 | 2.04 | 19.00 | 23.71 | 2.42 | 5.89 | 18.41 | 7.22 | -7.49 | -0.32 | 14.26 | 6.09 | -4.91 | -4.26 | 8.28 | -12.19 | -5.34 | -3.63 | 6.27 | -3.27 | -3.27 | 1.32 | 1.32 | 0.59 | 0.59 | 3.41 | 2.59 | 2.59 | -3.23 | -3.23 | -12.72 | -12.72 | -5.44 | -3.30 | |
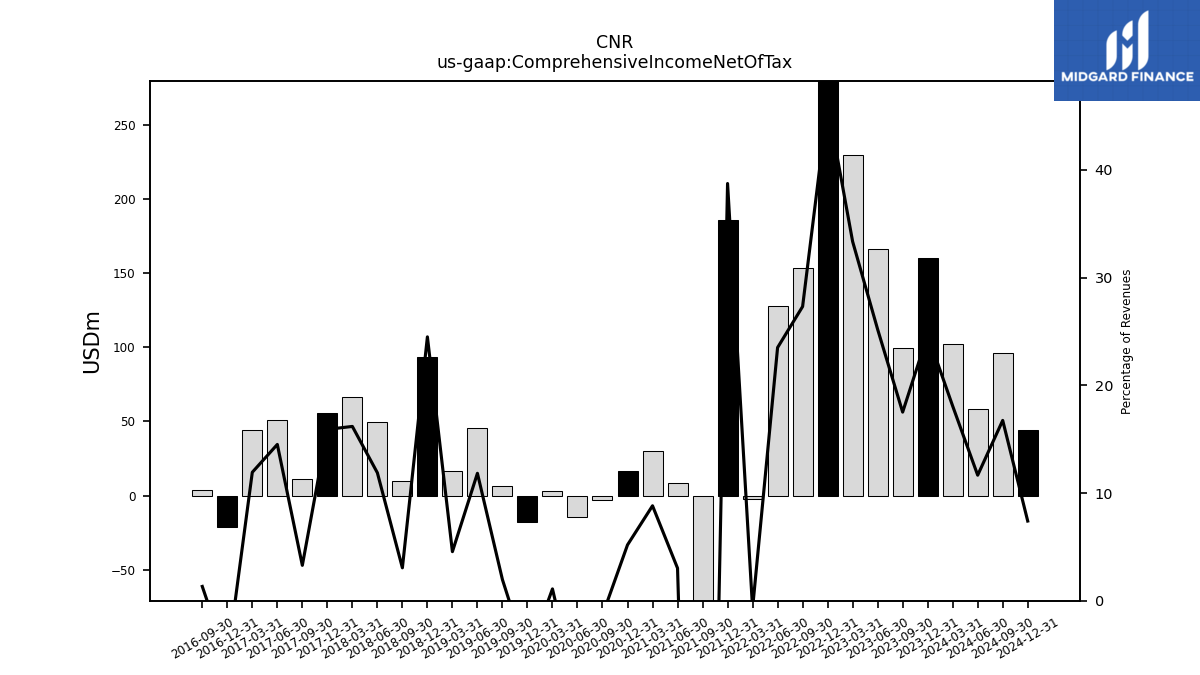
| Comprehensive Income Net Of Tax | -35.79 | 6.80 | 2.46 | 382.50 | 175.05 | 57.34 | 625.69 | 15.13 | 13.60 | 18.11 | 38.06 | 31.74 | -589.81 | 5.67 | 16.44 | -1.54 | -57.55 | -80.30 | 28.47 | 35.92 | -5.95 | 5.49 | 20.18 | 18.62 | 16.83 | 2.12 | 16.78 | 23.51 | 2.91 | 5.55 | 19.30 | 6.79 | -7.22 | -0.58 | 10.18 | 6.08 | -4.86 | -4.52 | NA | -12.22 | -5.36 | -3.65 | NA | -3.26 | NA | 1.40 | NA | 0.49 | NA | NA | 2.57 | NA | NA | NA | NA | NA | NA | NA | |
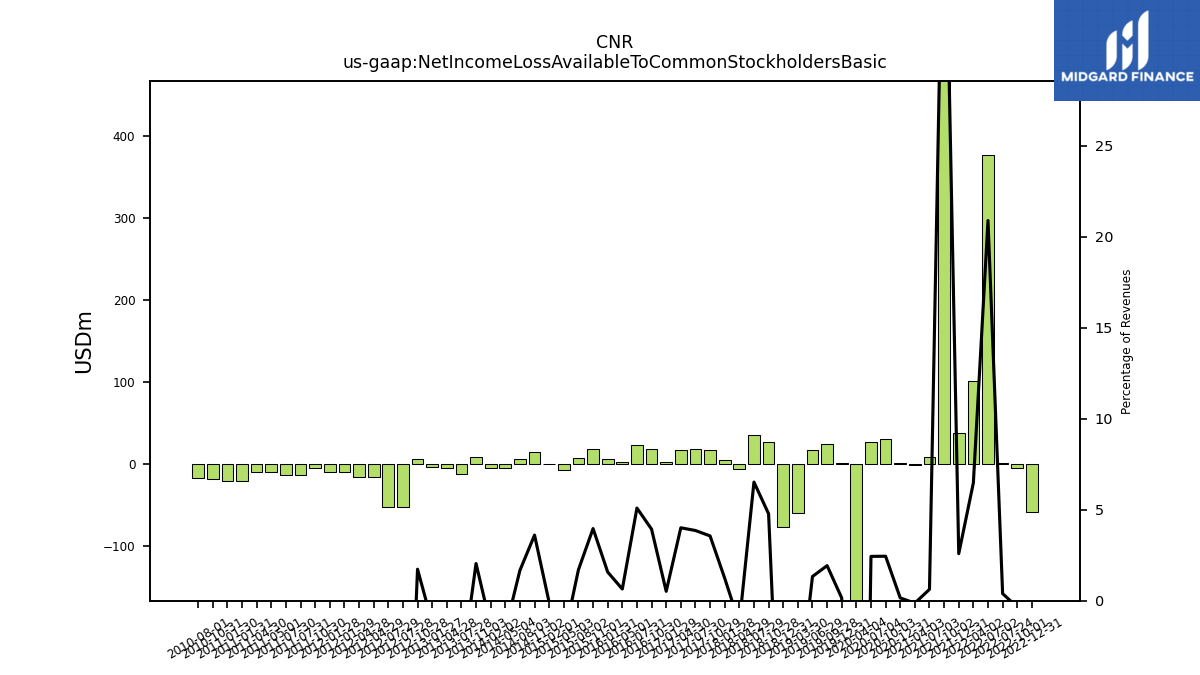
| Net Income Loss Available To Common Stockholders Basic | -59.05 | -4.45 | 1.43 | 376.93 | 101.53 | 38.07 | 612.15 | 8.80 | -1.66 | 1.85 | 30.03 | 26.46 | -542.07 | 1.90 | 24.79 | 17.26 | -60.02 | -76.19 | 27.42 | 35.77 | -5.68 | 5.21 | 17.41 | 18.12 | 16.86 | 2.03 | 18.90 | 23.55 | 2.40 | 5.83 | 18.24 | 7.16 | -7.49 | -0.32 | 14.16 | 6.04 | -4.91 | -4.26 | 8.18 | -12.19 | -5.34 | -3.63 | 6.27 | -52.07 | -52.07 | -16.28 | -16.28 | -10.04 | -10.04 | -4.40 | -13.08 | -13.08 | -9.25 | -9.25 | -20.74 | -20.74 | -18.56 | -16.52 | |
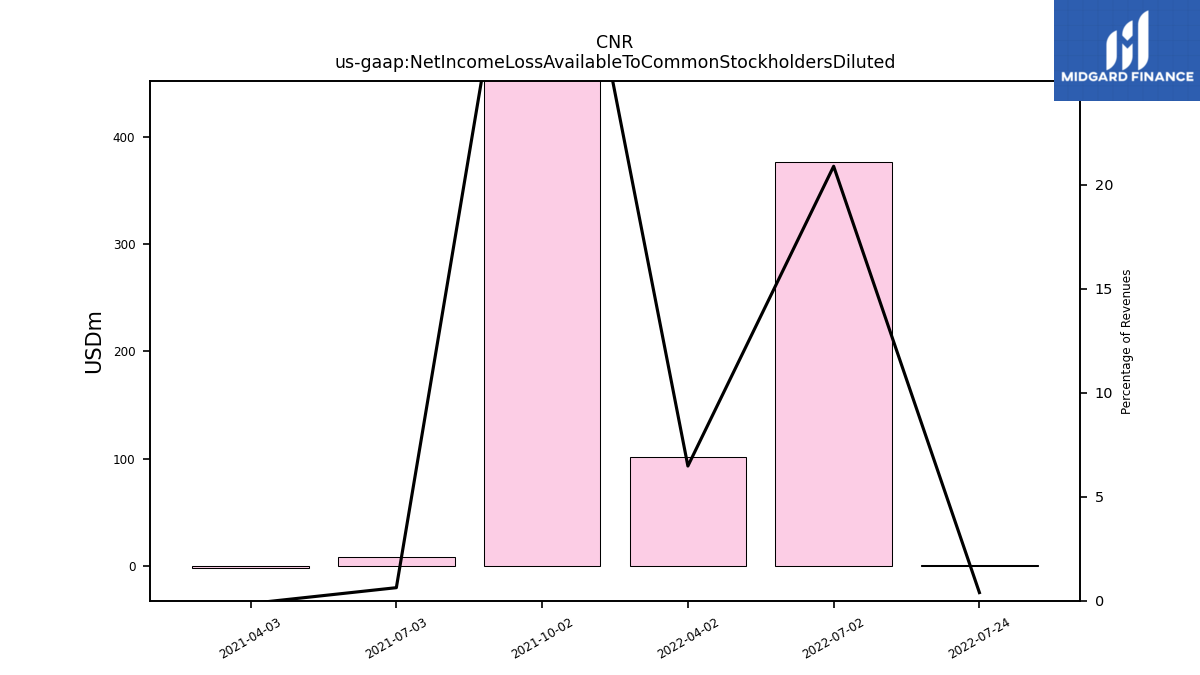
| Net Income Loss Available To Common Stockholders Diluted | NA | NA | 1.43 | 376.93 | 101.53 | NA | 612.15 | 8.80 | -1.66 | NA | NA | NA | NA | NA | NA | NA | NA | NA | NA | NA | NA | NA | NA | NA | NA | NA | NA | NA | NA | NA | NA | NA | NA | NA | NA | NA | NA | NA | NA | NA | NA | NA | NA | NA | NA | NA | NA | NA | NA | NA | NA | NA | NA | NA | NA | NA | NA | NA |
| 2022-12-31 | 2022-10-01 | 2022-07-24 | 2022-07-02 | 2022-04-02 | 2021-12-31 | 2021-10-02 | 2021-07-03 | 2021-04-03 | 2020-12-31 | 2020-10-03 | 2020-07-04 | 2020-04-04 | 2019-12-31 | 2019-09-28 | 2019-06-29 | 2019-03-30 | 2018-12-31 | 2018-10-28 | 2018-07-29 | 2018-04-29 | 2018-01-28 | 2017-10-29 | 2017-07-30 | 2017-04-30 | 2017-01-29 | 2016-10-30 | 2016-07-31 | 2016-05-01 | 2016-01-31 | 2015-11-01 | 2015-08-02 | 2015-05-03 | 2015-02-01 | 2014-11-02 | 2014-08-03 | 2014-05-04 | 2014-02-02 | 2013-11-03 | 2013-07-28 | 2013-04-28 | 2013-01-27 | 2012-10-28 | 2012-07-29 | 2012-07-28 | 2012-04-29 | 2012-04-28 | 2012-01-29 | 2012-01-28 | 2011-10-30 | 2011-07-31 | 2011-07-30 | 2011-05-01 | 2011-04-30 | 2011-01-31 | 2011-01-30 | 2010-10-31 | 2010-08-01 | ||
|---|---|---|---|---|---|---|---|---|---|---|---|---|---|---|---|---|---|---|---|---|---|---|---|---|---|---|---|---|---|---|---|---|---|---|---|---|---|---|---|---|---|---|---|---|---|---|---|---|---|---|---|---|---|---|---|---|---|---|---|
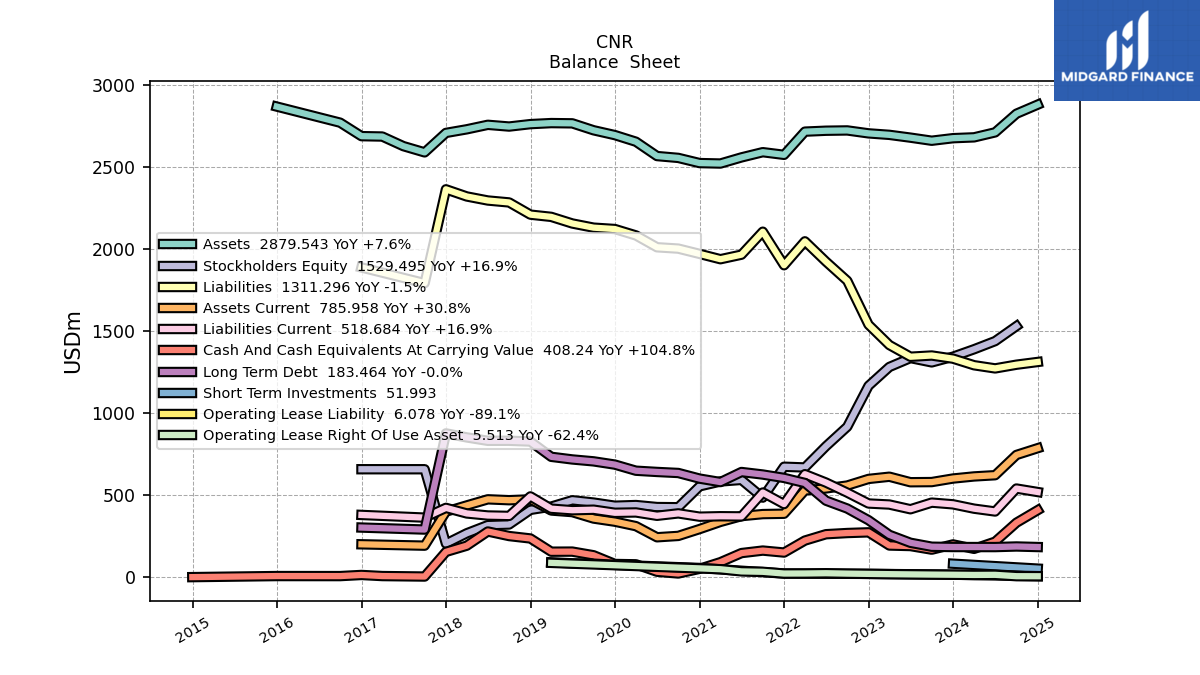
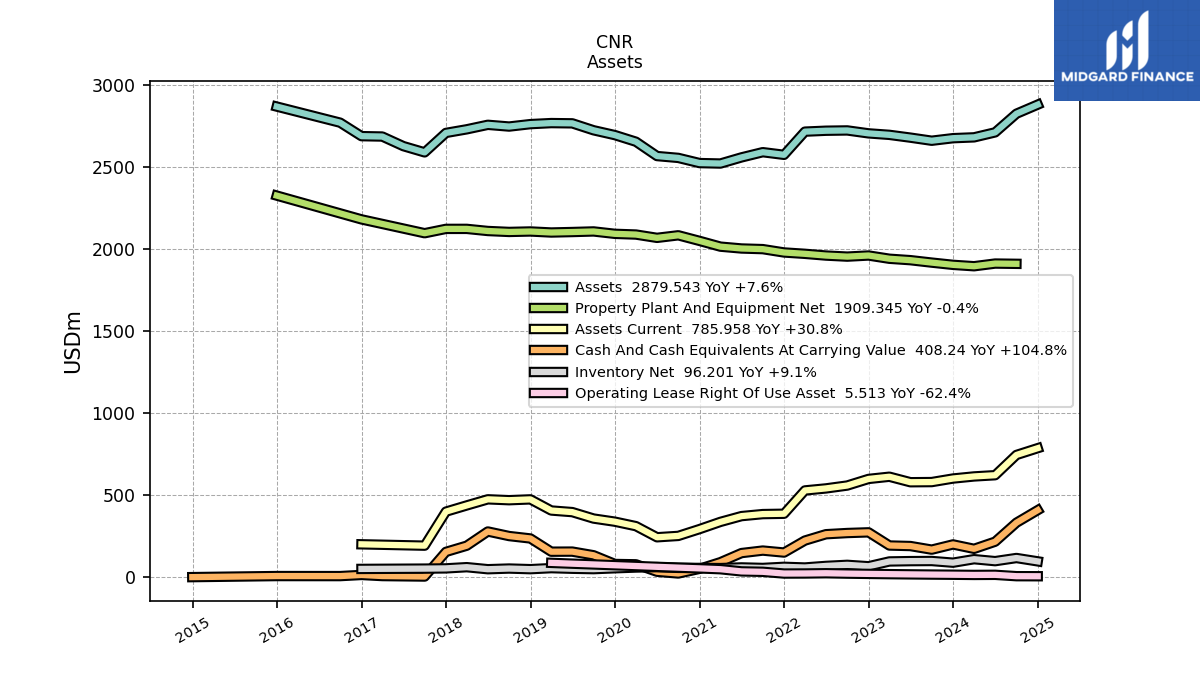
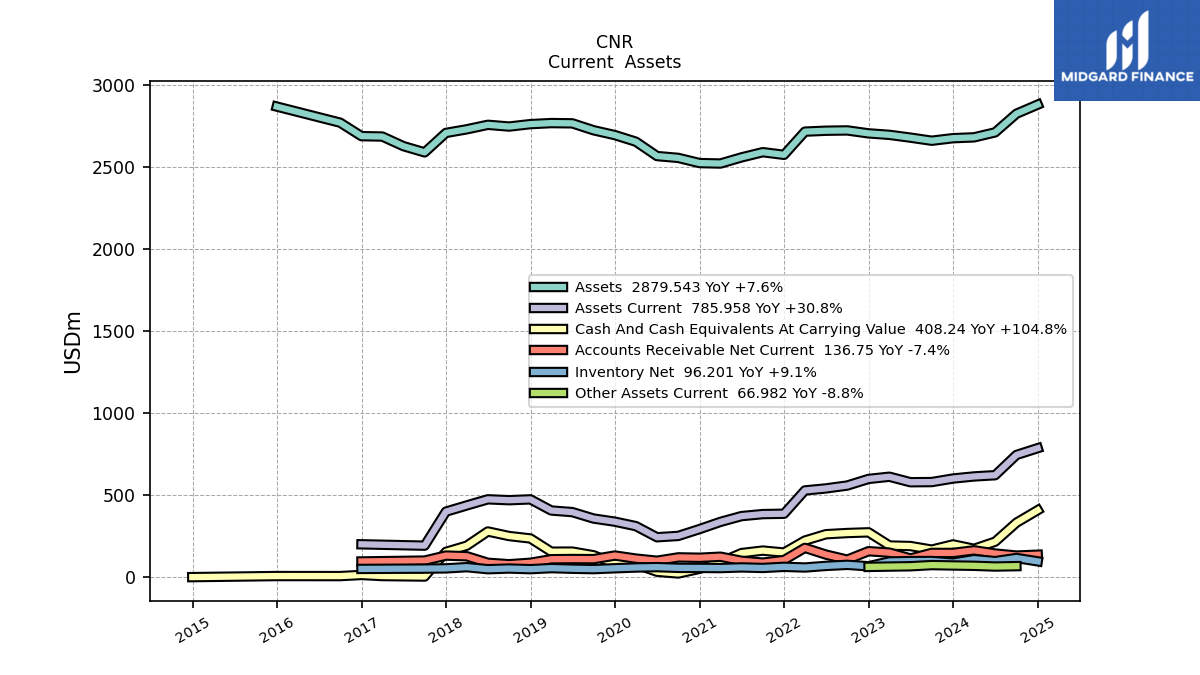
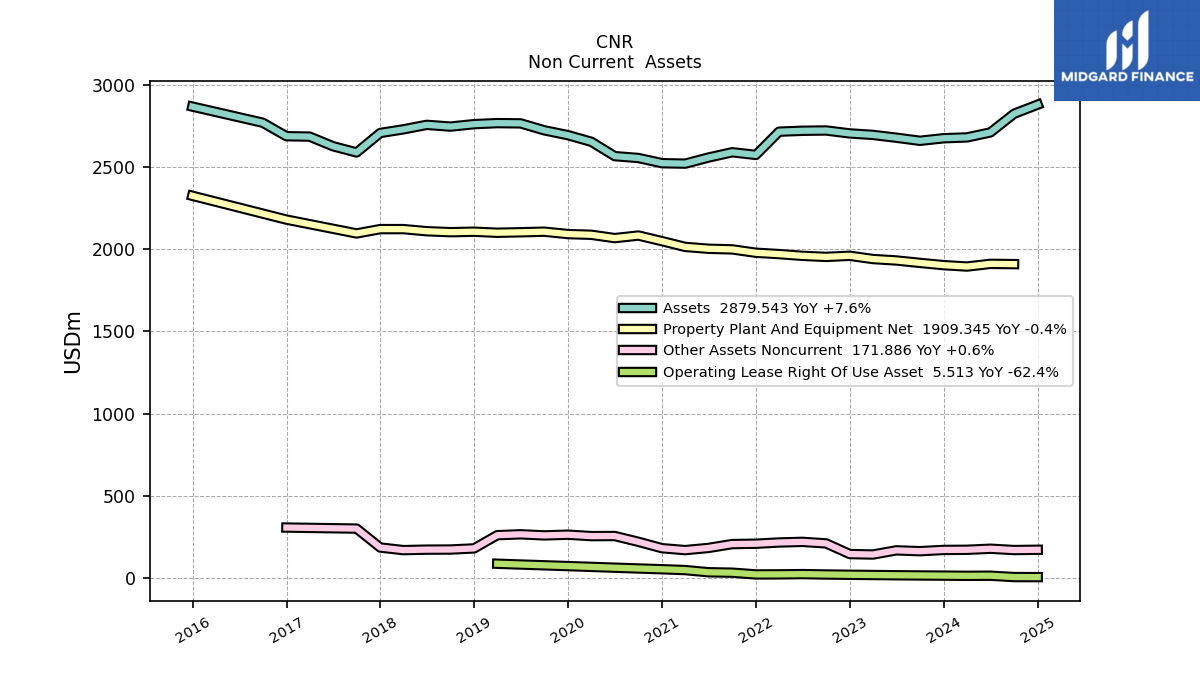
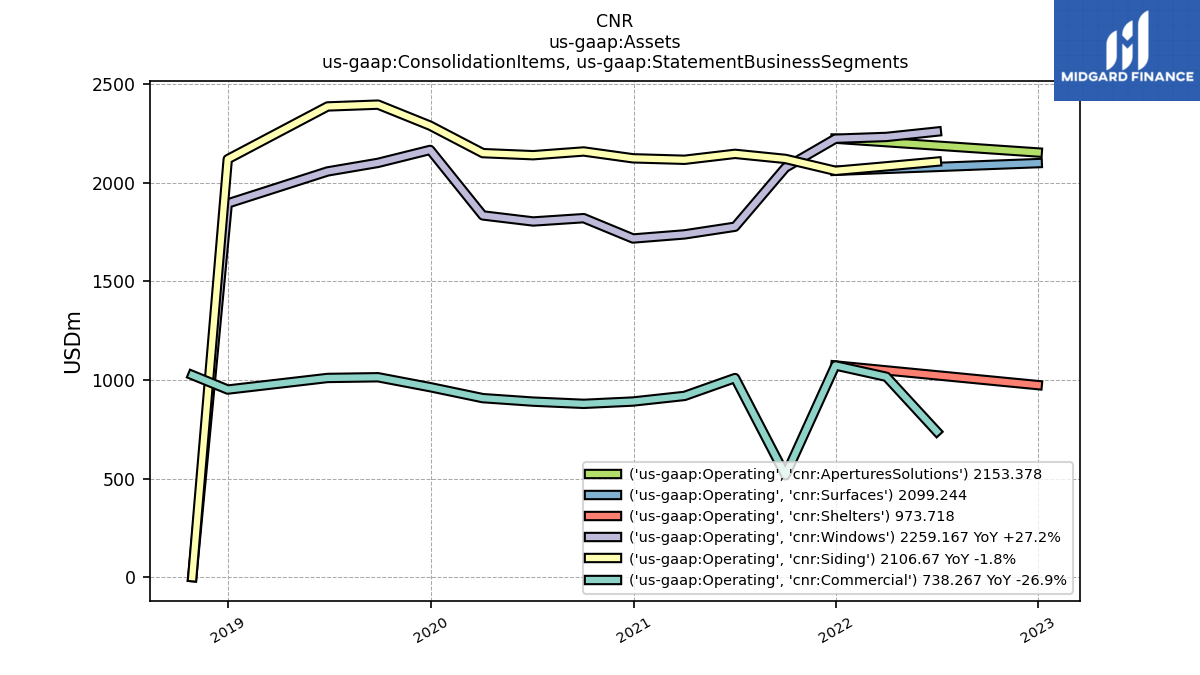
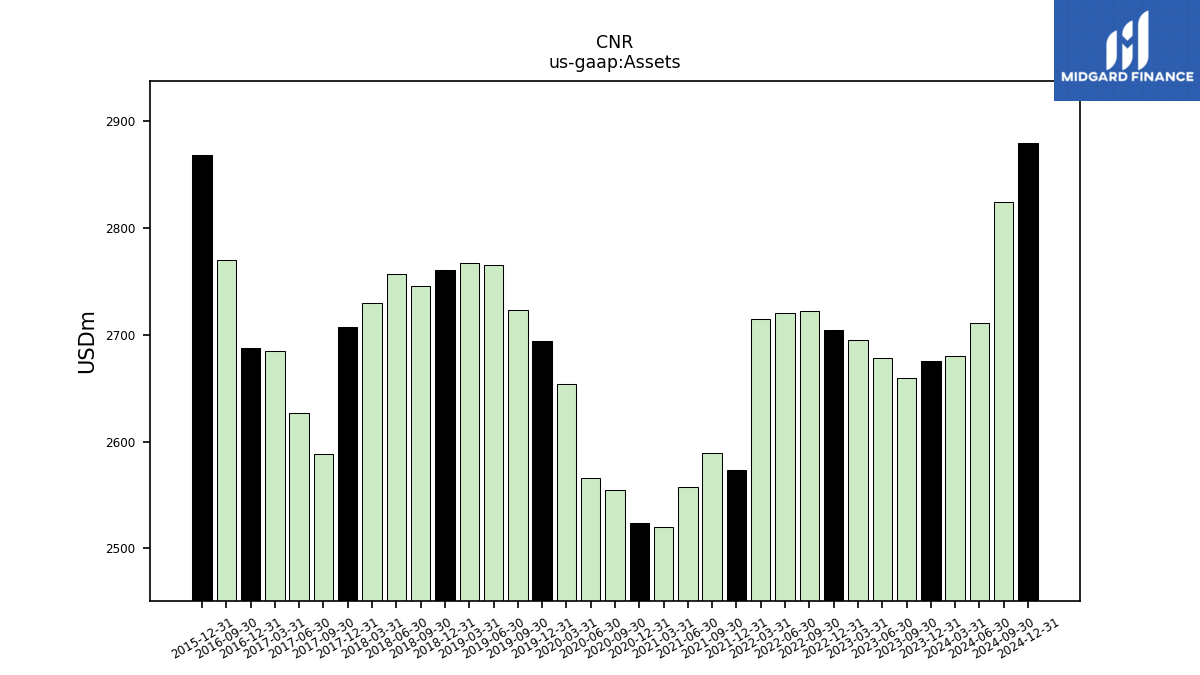
| Assets | 7193.65 | 7142.24 | NA | 6438.45 | 6031.66 | 5827.46 | 5731.10 | 5254.06 | 5528.31 | 5478.49 | 5474.98 | 5337.85 | 5392.43 | 5564.35 | 5708.46 | 5653.74 | 5589.85 | 5141.19 | 1110.38 | 1081.69 | 1006.61 | 945.99 | 1051.17 | 1044.86 | 1023.81 | 979.41 | 1058.30 | 1051.82 | 1016.74 | 1016.84 | 1079.73 | 1045.19 | 1013.72 | 1046.26 | 758.68 | 737.53 | 703.68 | 709.65 | 780.26 | 730.32 | 724.57 | 706.72 | 751.48 | 720.93 | NA | 562.66 | NA | 544.62 | NA | 561.15 | 559.95 | NA | NA | NA | NA | NA | 560.52 | NA | |
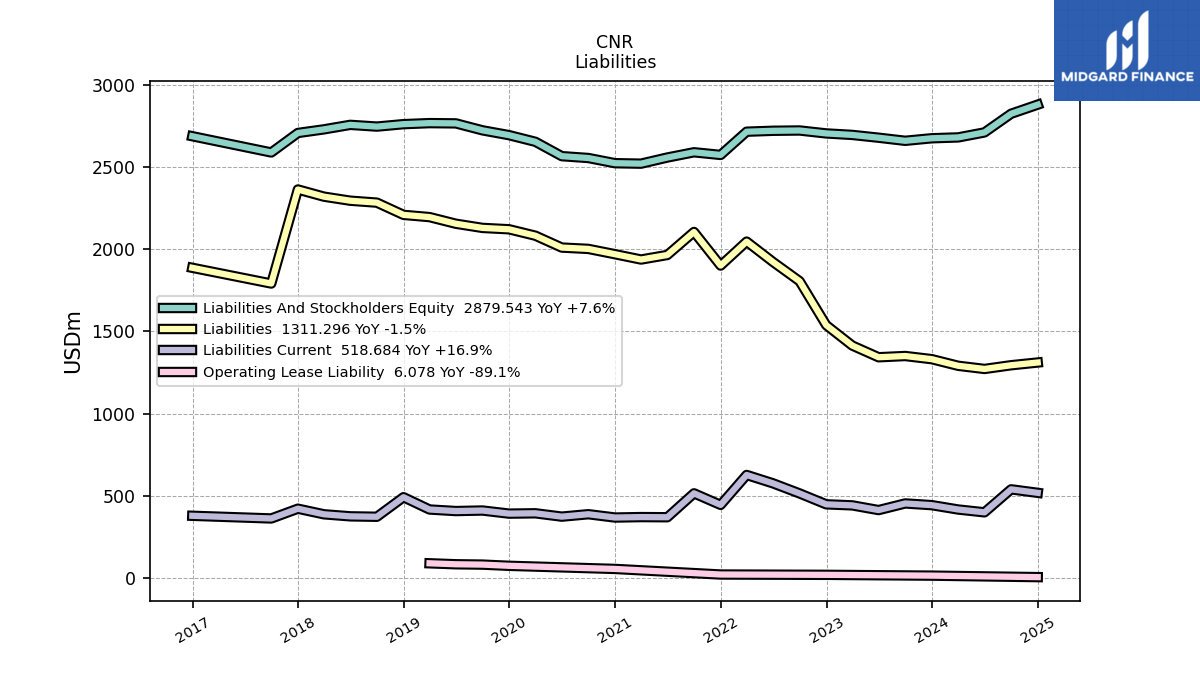
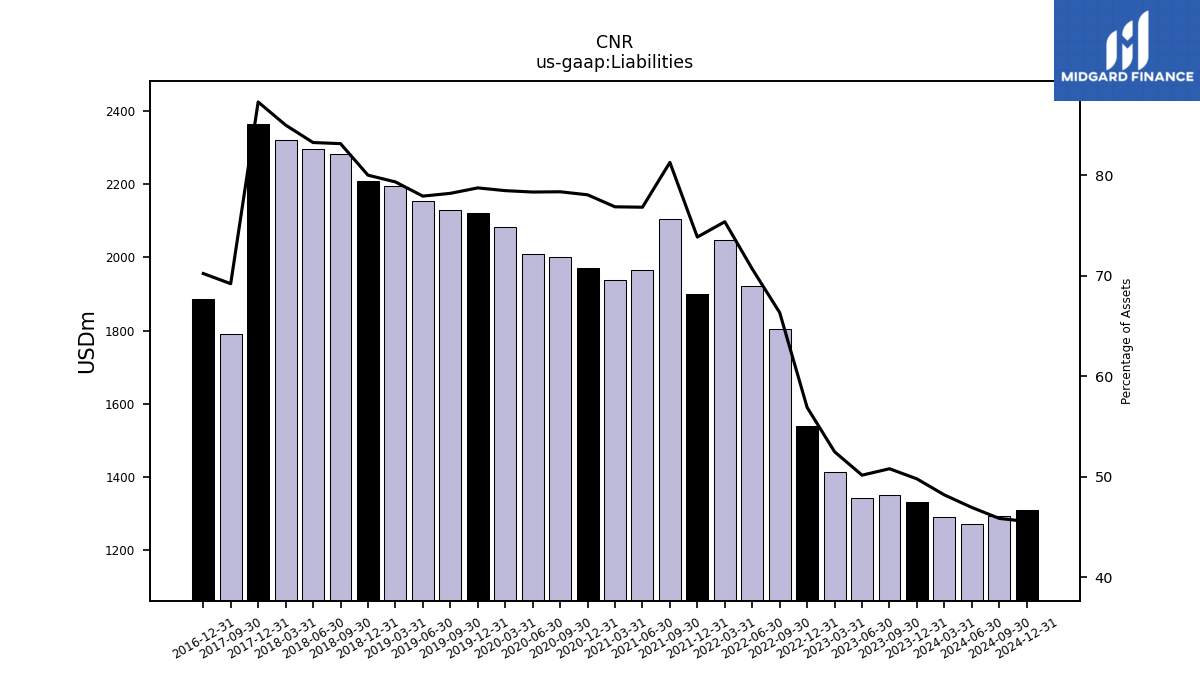
| Liabilities | 5464.70 | 5380.00 | NA | NA | NA | 4651.12 | NA | NA | NA | NA | NA | NA | NA | NA | NA | NA | NA | NA | NA | NA | NA | NA | NA | NA | NA | NA | NA | NA | NA | NA | NA | NA | NA | NA | NA | NA | NA | NA | NA | NA | NA | NA | NA | NA | NA | NA | NA | NA | NA | NA | NA | NA | NA | NA | NA | NA | NA | NA | |
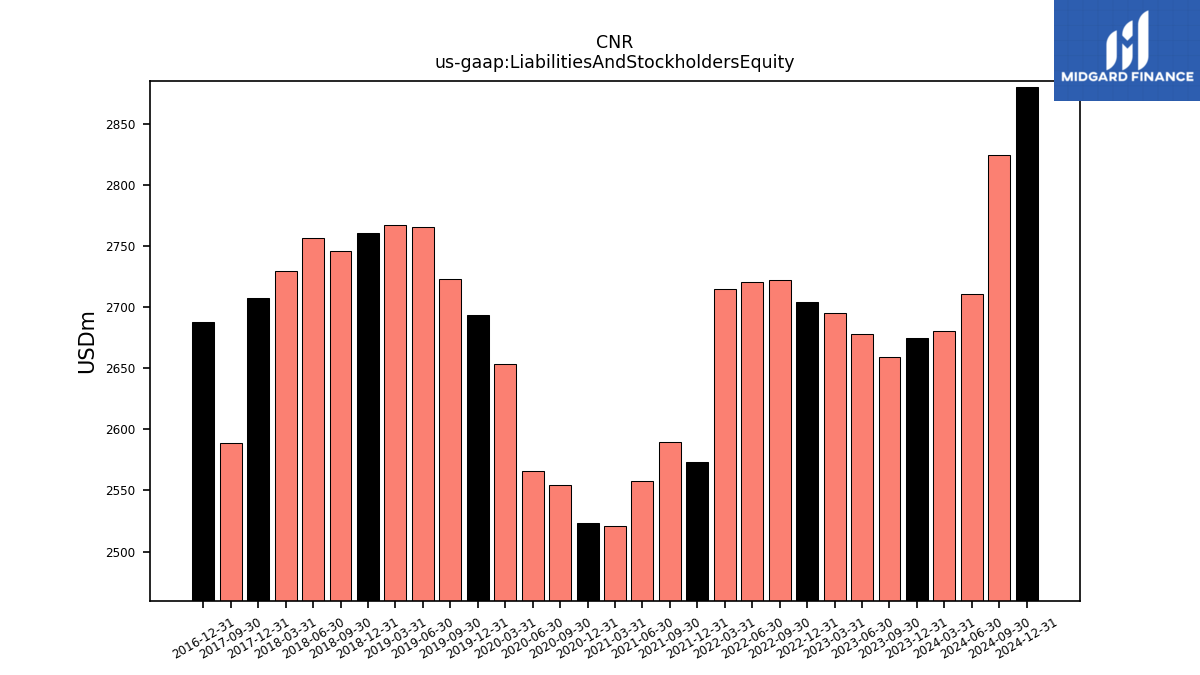
| Liabilities And Stockholders Equity | 7193.65 | 7142.24 | NA | 6438.45 | 6031.66 | 5827.46 | 5731.10 | 5254.06 | 5528.31 | 5478.49 | 5474.98 | 5337.85 | 5392.43 | 5564.35 | 5708.46 | 5653.74 | 5589.85 | 5141.19 | 1110.38 | 1081.69 | 1006.61 | 945.99 | 1051.17 | 1044.86 | 1023.81 | 979.41 | 1058.30 | 1051.82 | 1016.74 | 1016.84 | 1079.73 | 1045.19 | 1013.72 | 1046.26 | 758.68 | 737.53 | 703.68 | 709.65 | 780.26 | 730.32 | 724.57 | 706.72 | 751.48 | 720.93 | NA | 562.66 | NA | 544.62 | NA | 561.15 | 559.95 | NA | NA | NA | NA | NA | 560.52 | NA | |
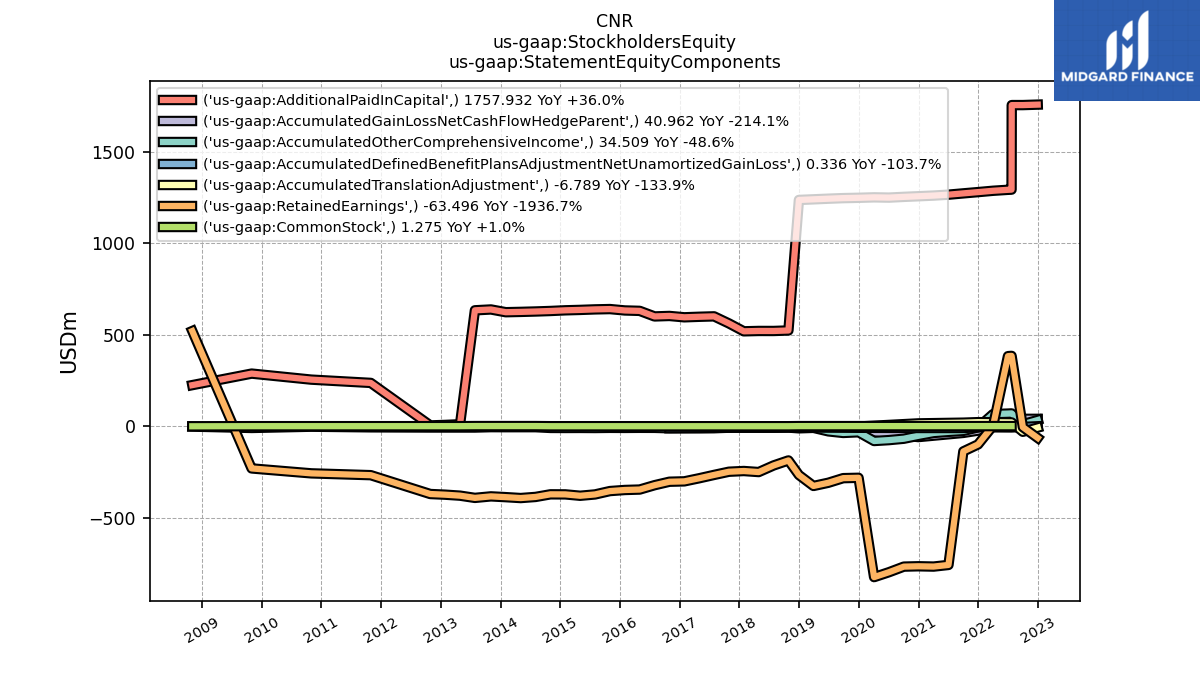
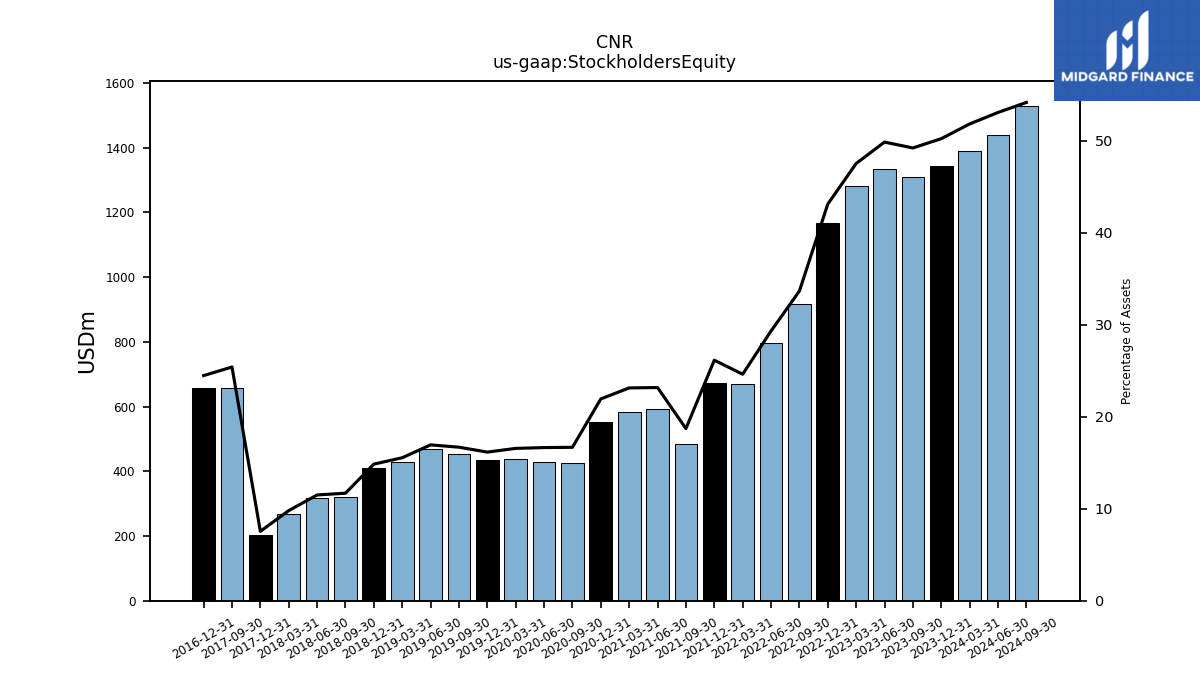
| Stockholders Equity | 1728.94 | 1762.24 | 1750.25 | 1746.85 | 1359.12 | 1176.34 | 1112.06 | 479.25 | 457.65 | 441.81 | 420.29 | 378.21 | 347.89 | 935.32 | 927.88 | 908.20 | 906.29 | 959.98 | 330.26 | 299.09 | 262.32 | 266.31 | 305.25 | 323.77 | 302.87 | 283.10 | 281.32 | 268.57 | 275.51 | 275.22 | 271.98 | 251.01 | 243.07 | 248.12 | 246.54 | 234.36 | 226.13 | 229.67 | 252.76 | 237.73 | -373.40 | -371.47 | -370.53 | -378.84 | NA | -46.80 | NA | -40.79 | NA | -35.69 | -31.21 | NA | NA | NA | NA | NA | -2.71 | NA |
| 2022-12-31 | 2022-10-01 | 2022-07-24 | 2022-07-02 | 2022-04-02 | 2021-12-31 | 2021-10-02 | 2021-07-03 | 2021-04-03 | 2020-12-31 | 2020-10-03 | 2020-07-04 | 2020-04-04 | 2019-12-31 | 2019-09-28 | 2019-06-29 | 2019-03-30 | 2018-12-31 | 2018-10-28 | 2018-07-29 | 2018-04-29 | 2018-01-28 | 2017-10-29 | 2017-07-30 | 2017-04-30 | 2017-01-29 | 2016-10-30 | 2016-07-31 | 2016-05-01 | 2016-01-31 | 2015-11-01 | 2015-08-02 | 2015-05-03 | 2015-02-01 | 2014-11-02 | 2014-08-03 | 2014-05-04 | 2014-02-02 | 2013-11-03 | 2013-07-28 | 2013-04-28 | 2013-01-27 | 2012-10-28 | 2012-07-29 | 2012-07-28 | 2012-04-29 | 2012-04-28 | 2012-01-29 | 2012-01-28 | 2011-10-30 | 2011-07-31 | 2011-07-30 | 2011-05-01 | 2011-04-30 | 2011-01-31 | 2011-01-30 | 2010-10-31 | 2010-08-01 | ||
|---|---|---|---|---|---|---|---|---|---|---|---|---|---|---|---|---|---|---|---|---|---|---|---|---|---|---|---|---|---|---|---|---|---|---|---|---|---|---|---|---|---|---|---|---|---|---|---|---|---|---|---|---|---|---|---|---|---|---|---|
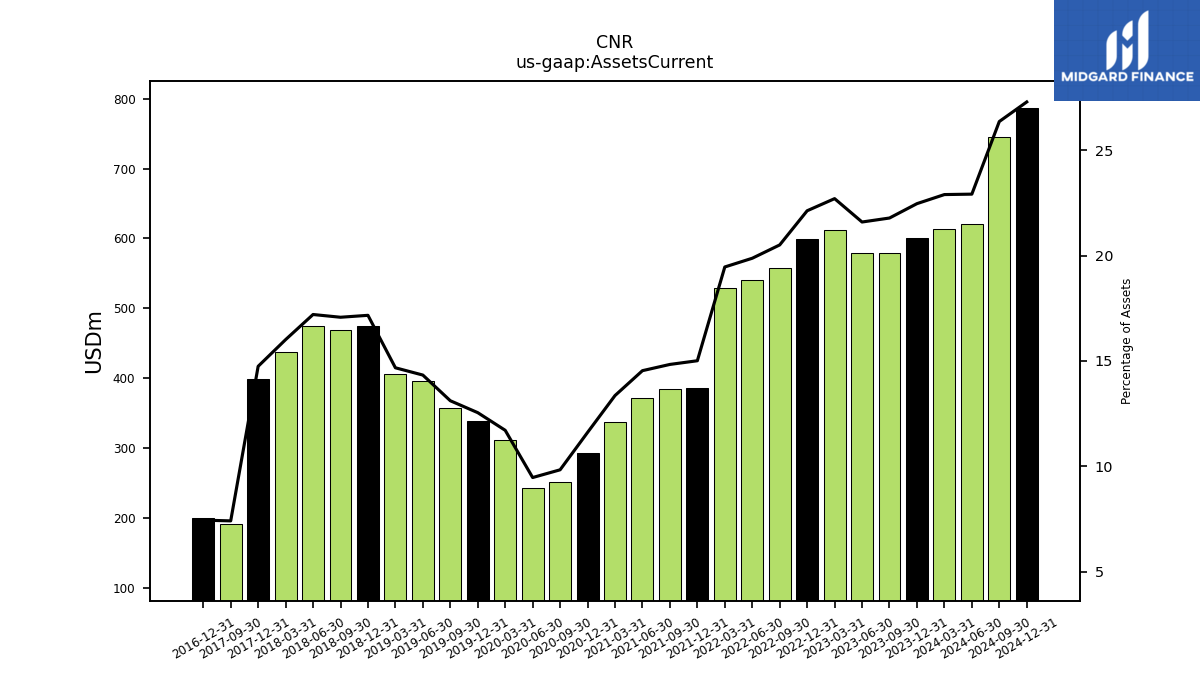
| Assets Current | 1896.62 | 1992.64 | NA | 2717.06 | 2179.28 | 1987.08 | 2076.59 | 1786.15 | 1890.47 | 1791.17 | 1735.82 | 1526.18 | 1538.14 | 1165.75 | 1282.82 | 1282.23 | 1223.54 | 1203.79 | 590.74 | 565.57 | 496.70 | 434.60 | 533.63 | 519.06 | 490.91 | 440.15 | 504.86 | 490.05 | 440.45 | 433.46 | 496.35 | 447.02 | 402.36 | 427.93 | 390.53 | 363.32 | 324.74 | 324.52 | 390.83 | 338.44 | 321.04 | 300.54 | 341.83 | 309.65 | NA | 312.90 | NA | 296.63 | NA | 311.61 | 308.51 | NA | NA | NA | NA | NA | 298.33 | NA | |
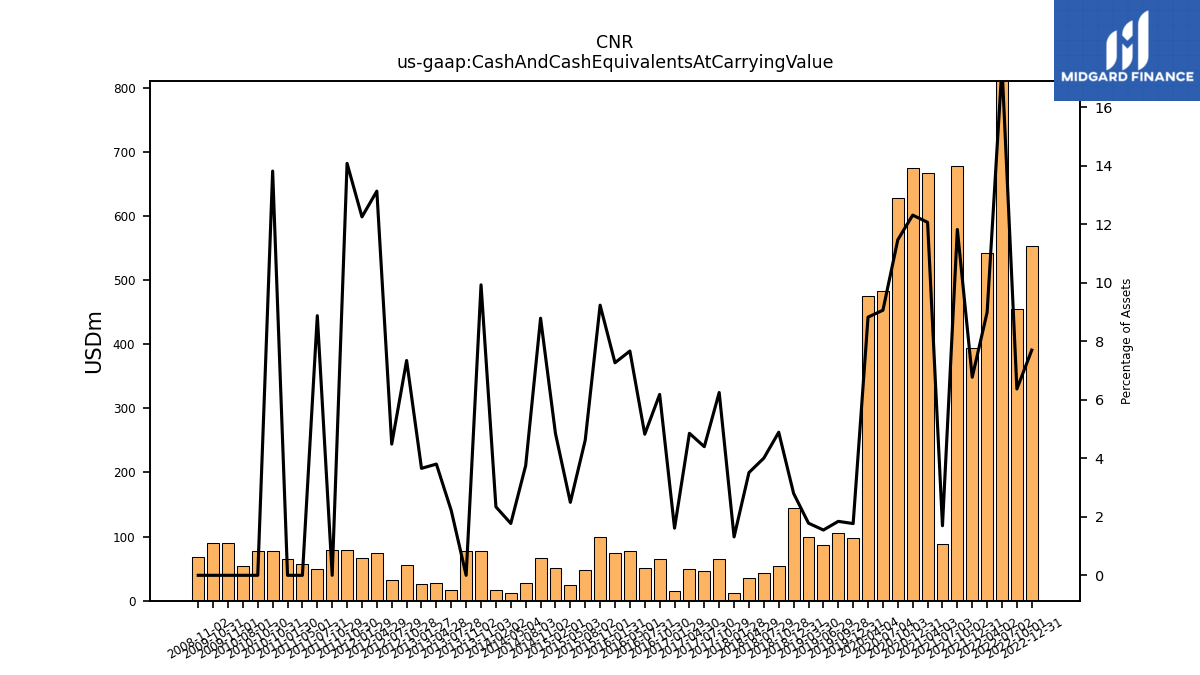
| Cash And Cash Equivalents At Carrying Value | 553.55 | 454.75 | NA | 1119.24 | 542.03 | 394.45 | 677.19 | 88.98 | 666.72 | 674.25 | 627.60 | 483.50 | 475.70 | 98.39 | 105.24 | 87.50 | 99.59 | 143.85 | 54.27 | 43.32 | 35.34 | 12.42 | 65.66 | 45.92 | 49.68 | 15.79 | 65.40 | 50.71 | 77.92 | 73.85 | 99.66 | 48.28 | 25.28 | 50.72 | 66.65 | 27.66 | 12.47 | 16.60 | 77.44 | 16.15 | 27.54 | 25.83 | 55.16 | 32.32 | NA | 73.86 | NA | 66.71 | NA | 78.98 | 49.67 | NA | 57.41 | NA | NA | 65.22 | 77.42 | 53.64 | |
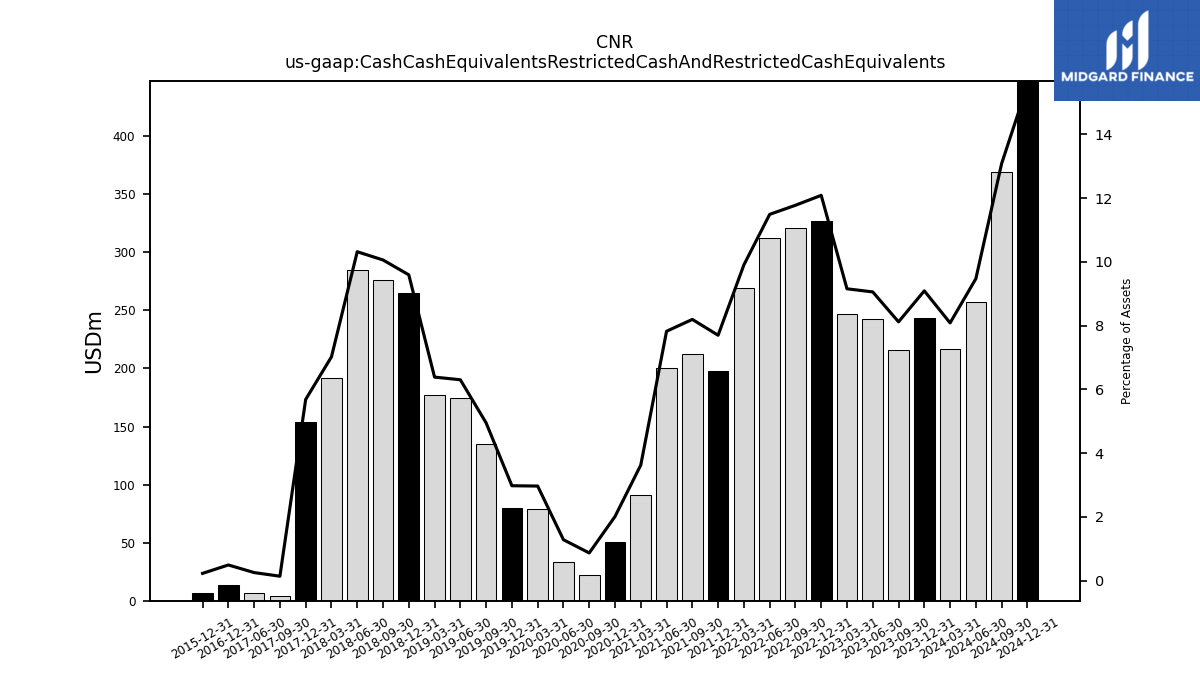
| Cash Cash Equivalents Restricted Cash And Restricted Cash Equivalents | 554.01 | 455.21 | 1109.59 | 1121.45 | 544.25 | 396.66 | 679.40 | 95.20 | 672.94 | 680.48 | 633.83 | 489.72 | 483.62 | 102.31 | 109.12 | 91.48 | 103.63 | 147.61 | 54.52 | 43.50 | 35.51 | 12.60 | 65.79 | NA | NA | NA | 65.71 | NA | NA | NA | NA | NA | NA | NA | NA | NA | NA | NA | NA | NA | NA | NA | NA | NA | NA | NA | NA | NA | NA | NA | NA | NA | NA | NA | NA | NA | NA | NA | |
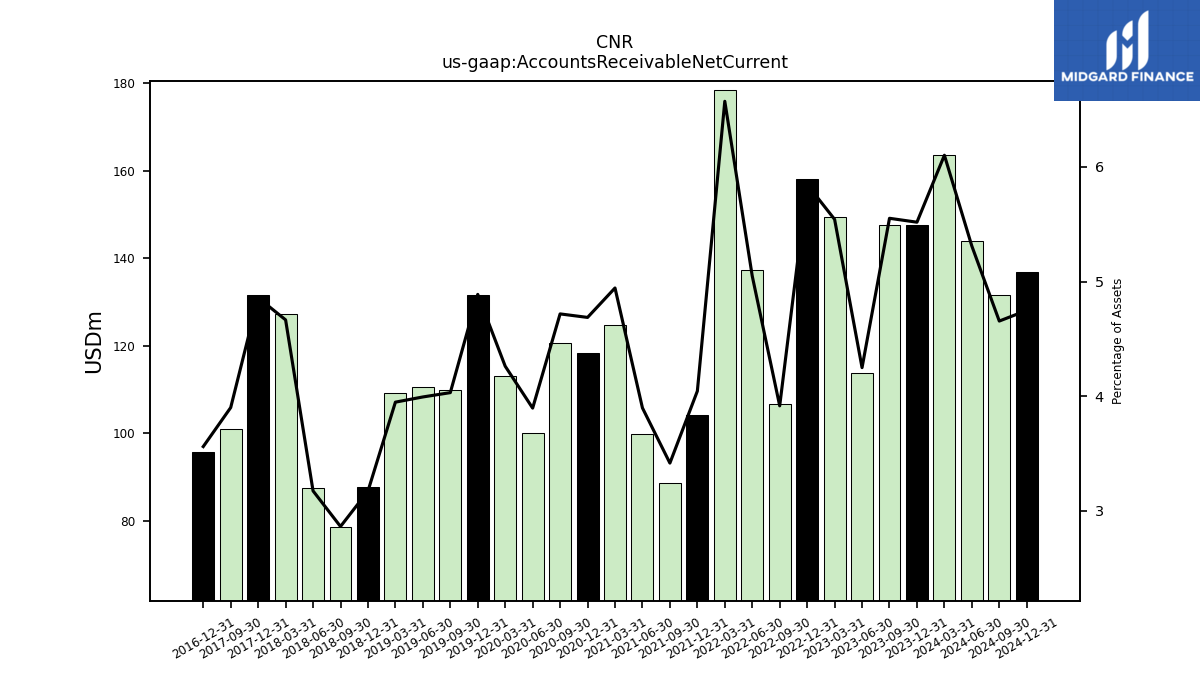
| Accounts Receivable Net Current | 665.94 | 790.35 | NA | 790.09 | 708.34 | 685.32 | 645.30 | 613.19 | 601.48 | 554.65 | 578.68 | 522.61 | 476.78 | 491.74 | 594.68 | 589.61 | 499.44 | 438.50 | 233.30 | 211.10 | 180.39 | 169.06 | 199.90 | 189.68 | 168.62 | 161.49 | 182.26 | 175.39 | 139.60 | 141.66 | 166.80 | 161.55 | 141.90 | 146.16 | 136.92 | 133.53 | 109.65 | 111.65 | 135.37 | 118.91 | 112.56 | 108.95 | 133.47 | 111.91 | NA | 83.05 | NA | 79.72 | NA | 95.38 | 91.88 | NA | NA | NA | NA | NA | 81.90 | NA | |
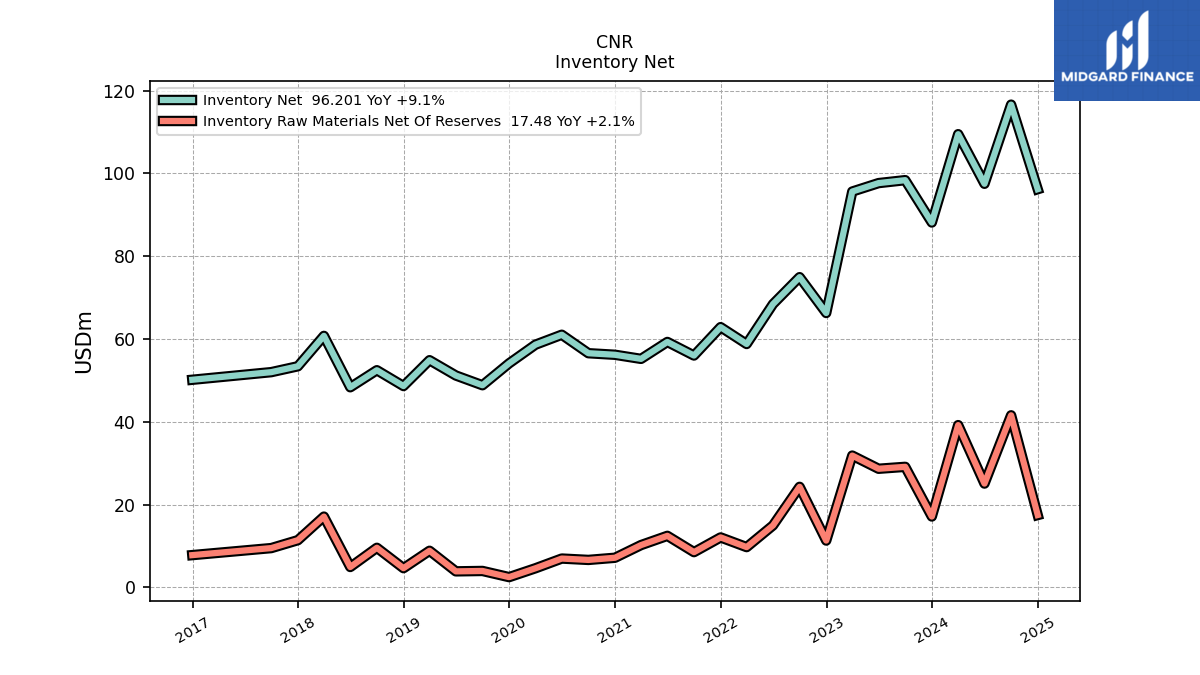
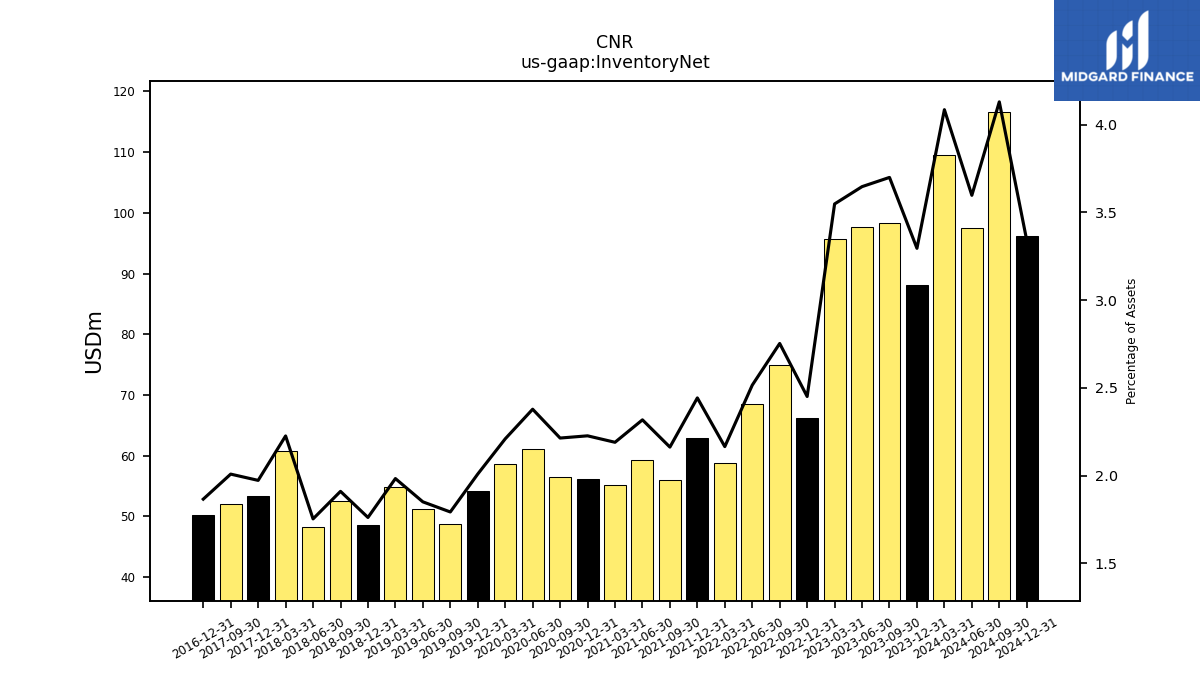
| Inventory Net | 551.83 | 651.24 | NA | 707.66 | 817.72 | 748.73 | 614.57 | 549.74 | 494.09 | 431.94 | 408.90 | 402.99 | 460.40 | 439.19 | 467.92 | 502.12 | 516.96 | 536.67 | 254.53 | 260.88 | 221.37 | 200.53 | 198.30 | 212.73 | 195.44 | 191.76 | 186.82 | 183.34 | 151.48 | 150.56 | 157.83 | 164.25 | 159.68 | 165.63 | 131.50 | 136.58 | 136.25 | 137.63 | 122.11 | 135.20 | 125.78 | 113.77 | 106.02 | 113.24 | NA | 106.90 | NA | 102.06 | NA | 88.53 | 116.32 | NA | NA | NA | NA | NA | 81.39 | NA | |
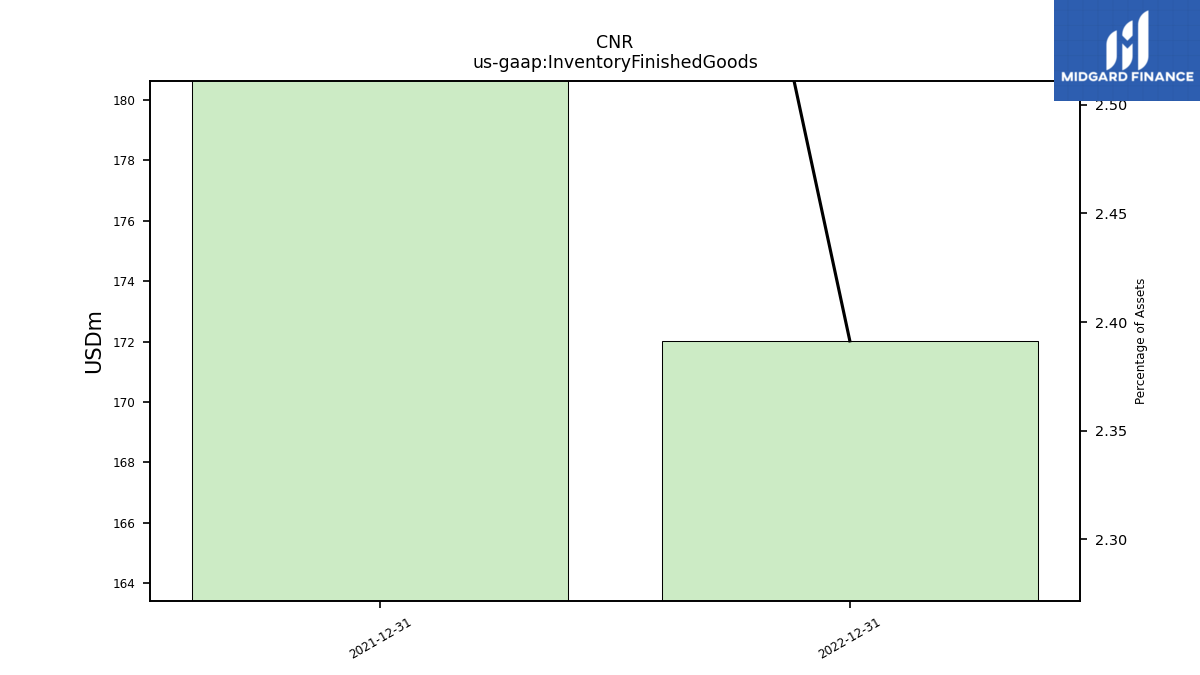
| Inventory Finished Goods | 172.02 | NA | NA | NA | NA | 198.02 | NA | NA | NA | NA | NA | NA | NA | NA | NA | NA | NA | NA | NA | NA | NA | NA | NA | NA | NA | NA | NA | NA | NA | NA | NA | NA | NA | NA | NA | NA | NA | NA | NA | NA | NA | NA | NA | NA | NA | NA | NA | NA | NA | NA | NA | NA | NA | NA | NA | NA | NA | NA | |
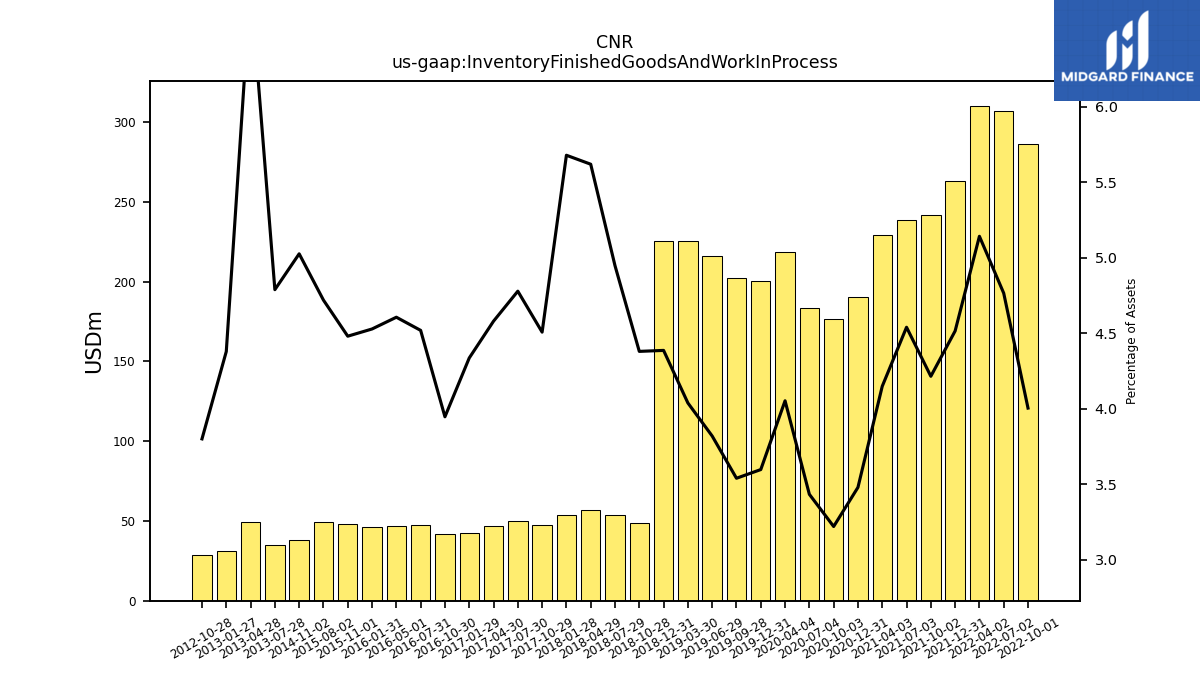
| Inventory Finished Goods And Work In Process | NA | 285.97 | NA | 306.79 | 310.14 | 263.09 | 241.54 | 238.50 | 229.33 | 190.58 | 176.27 | 183.24 | 218.51 | 200.13 | 202.03 | 215.91 | 225.71 | 225.49 | 48.63 | 53.52 | 56.56 | 53.72 | 47.38 | 49.93 | 46.89 | 42.46 | 41.76 | 47.53 | 46.83 | 46.04 | 48.37 | 49.32 | NA | NA | 38.13 | NA | NA | NA | NA | 34.97 | 49.33 | 30.95 | 28.56 | NA | NA | NA | NA | NA | NA | NA | NA | NA | NA | NA | NA | NA | NA | NA | |
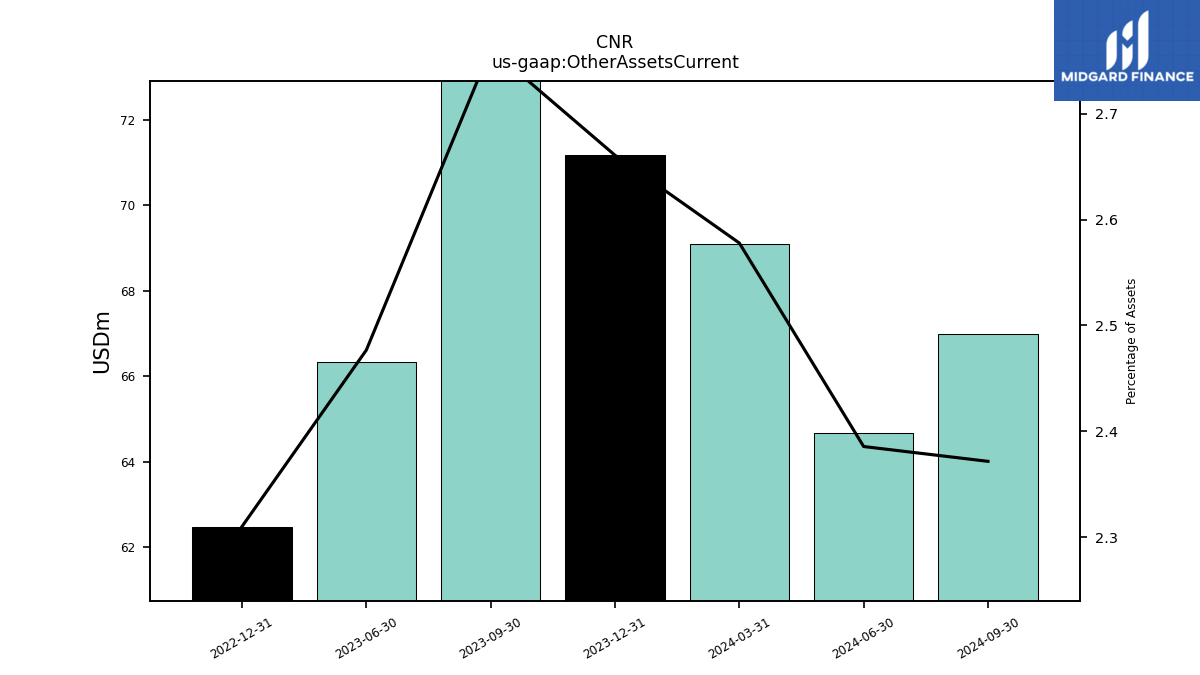
| Other Assets Current | 125.31 | 96.31 | NA | NA | NA | 86.53 | NA | NA | NA | NA | NA | NA | NA | NA | NA | NA | NA | NA | NA | NA | NA | NA | NA | NA | NA | NA | NA | NA | NA | NA | NA | NA | NA | NA | NA | NA | NA | NA | NA | NA | NA | NA | NA | NA | NA | NA | NA | NA | NA | NA | NA | NA | NA | NA | NA | NA | NA | NA | |
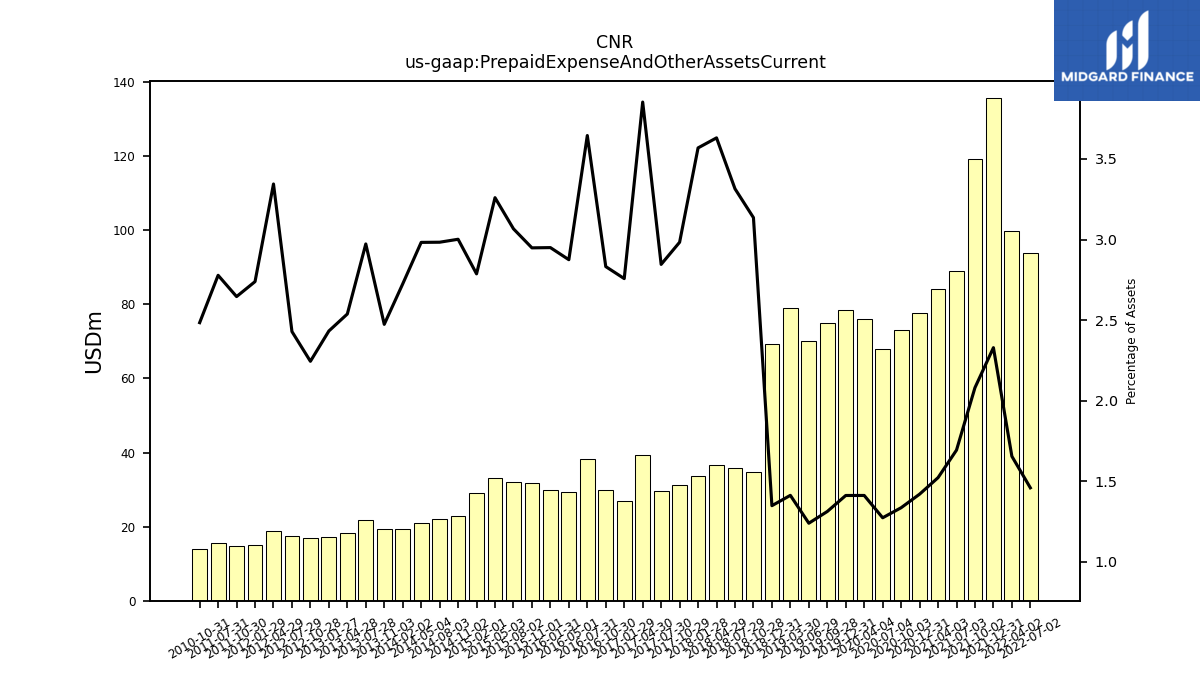
| Prepaid Expense And Other Assets Current | NA | NA | NA | 93.92 | 99.78 | 135.70 | 119.23 | 88.94 | 84.13 | 77.75 | 73.10 | 67.93 | 76.10 | 78.52 | 74.88 | 70.05 | 78.93 | 69.29 | 34.82 | 35.86 | 36.55 | 33.76 | 31.36 | 29.73 | 39.45 | 27.01 | 29.97 | 38.35 | 29.23 | 30.00 | 31.83 | 32.05 | 33.05 | 29.16 | 22.77 | 22.00 | 20.99 | 19.33 | 19.30 | 21.71 | 18.39 | 17.19 | 16.86 | 17.51 | NA | 18.82 | NA | 14.92 | NA | 14.85 | 15.55 | NA | NA | NA | NA | NA | 13.92 | NA |
| 2022-12-31 | 2022-10-01 | 2022-07-24 | 2022-07-02 | 2022-04-02 | 2021-12-31 | 2021-10-02 | 2021-07-03 | 2021-04-03 | 2020-12-31 | 2020-10-03 | 2020-07-04 | 2020-04-04 | 2019-12-31 | 2019-09-28 | 2019-06-29 | 2019-03-30 | 2018-12-31 | 2018-10-28 | 2018-07-29 | 2018-04-29 | 2018-01-28 | 2017-10-29 | 2017-07-30 | 2017-04-30 | 2017-01-29 | 2016-10-30 | 2016-07-31 | 2016-05-01 | 2016-01-31 | 2015-11-01 | 2015-08-02 | 2015-05-03 | 2015-02-01 | 2014-11-02 | 2014-08-03 | 2014-05-04 | 2014-02-02 | 2013-11-03 | 2013-07-28 | 2013-04-28 | 2013-01-27 | 2012-10-28 | 2012-07-29 | 2012-07-28 | 2012-04-29 | 2012-04-28 | 2012-01-29 | 2012-01-28 | 2011-10-30 | 2011-07-31 | 2011-07-30 | 2011-05-01 | 2011-04-30 | 2011-01-31 | 2011-01-30 | 2010-10-31 | 2010-08-01 | ||
|---|---|---|---|---|---|---|---|---|---|---|---|---|---|---|---|---|---|---|---|---|---|---|---|---|---|---|---|---|---|---|---|---|---|---|---|---|---|---|---|---|---|---|---|---|---|---|---|---|---|---|---|---|---|---|---|---|---|---|---|
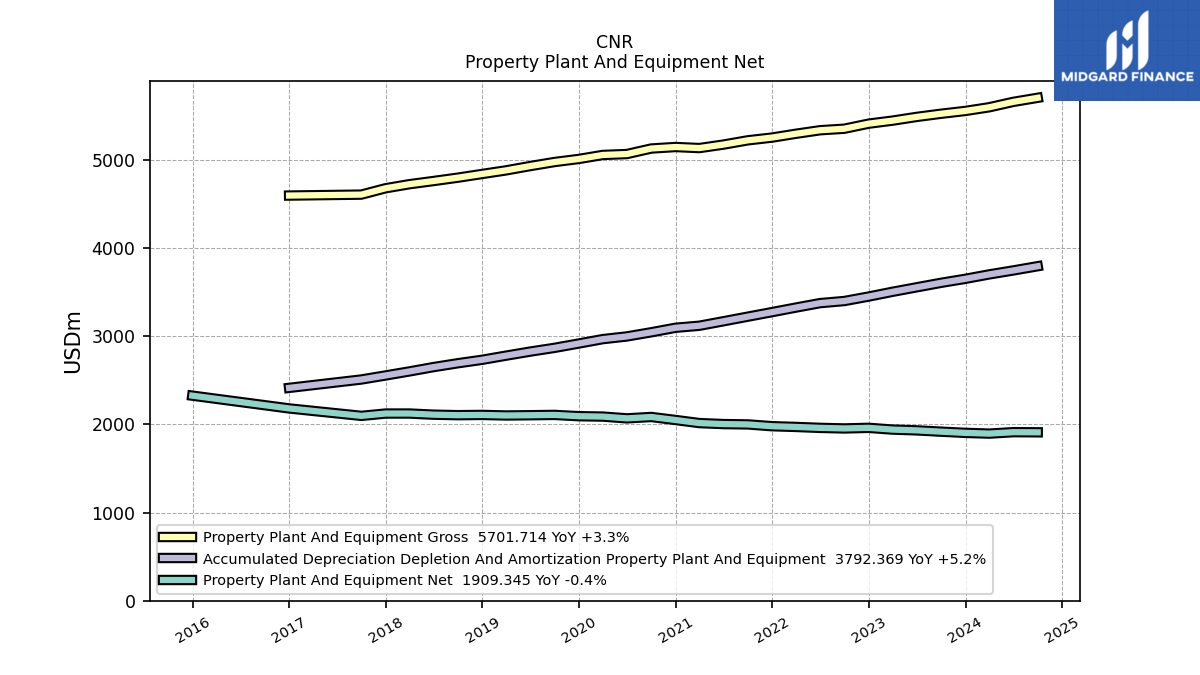
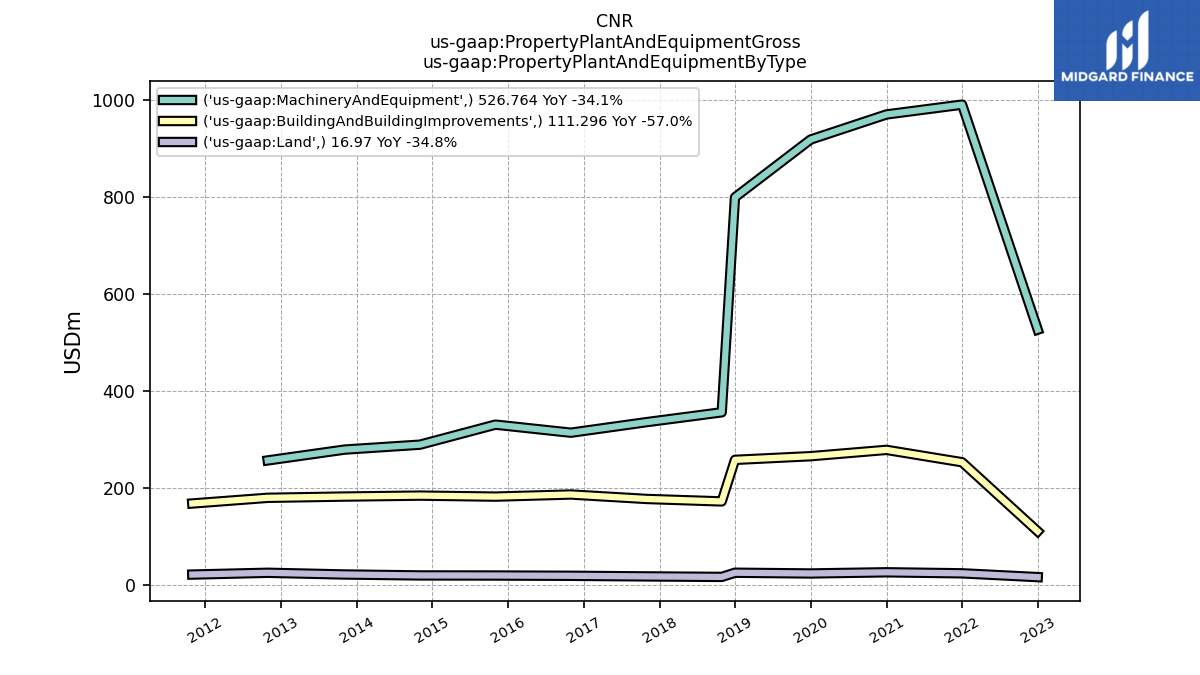
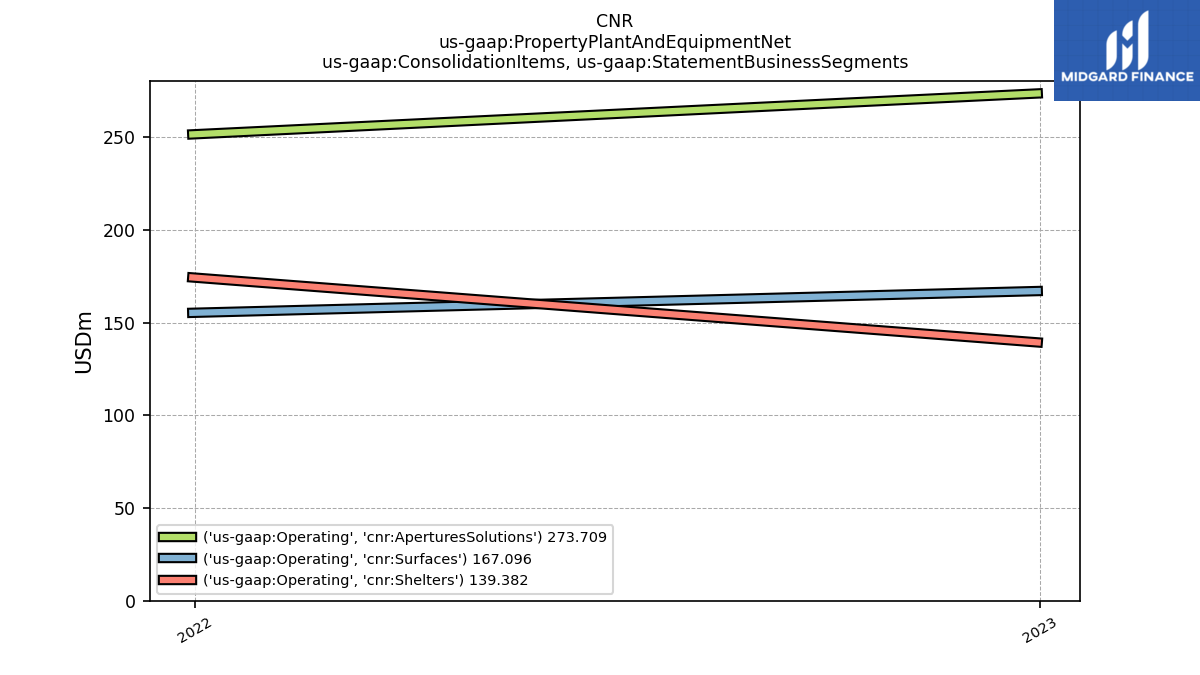
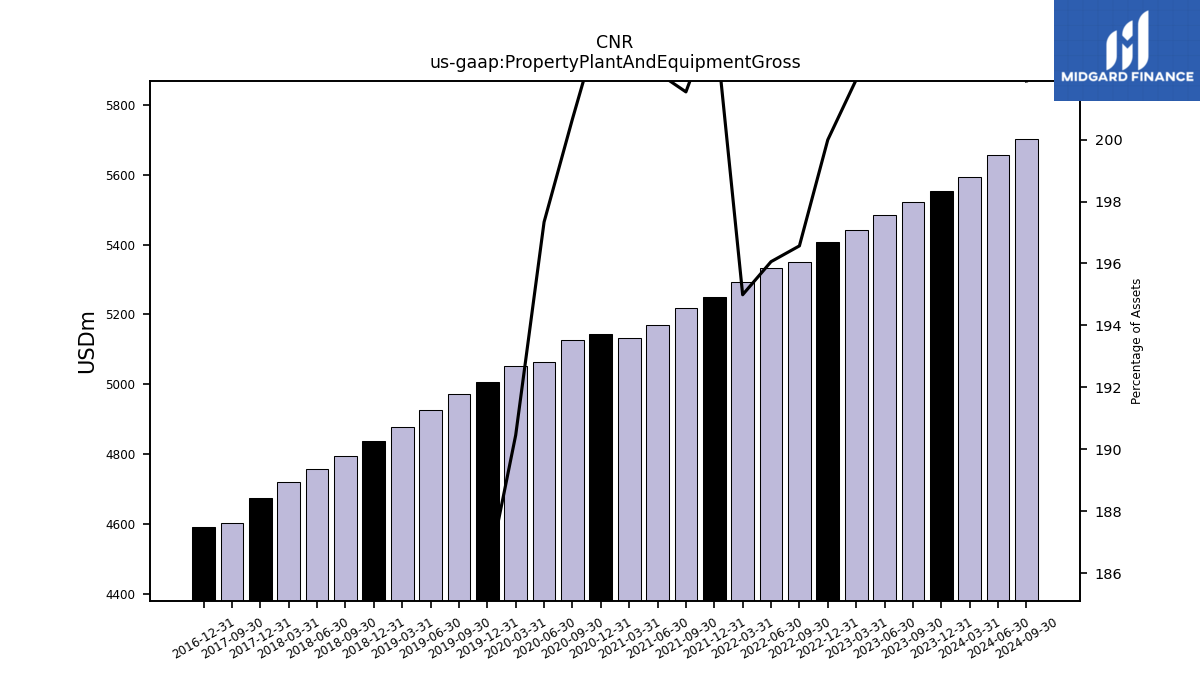
| Property Plant And Equipment Gross | 655.03 | NA | NA | NA | NA | 1268.79 | NA | NA | NA | 1276.13 | NA | NA | NA | 1208.98 | NA | NA | NA | 1083.92 | 696.17 | NA | NA | NA | 669.86 | NA | NA | NA | 661.86 | NA | NA | NA | 668.68 | NA | NA | NA | 619.45 | NA | NA | NA | 612.90 | NA | NA | NA | 589.58 | NA | NA | NA | NA | NA | NA | 505.81 | NA | NA | NA | NA | NA | NA | NA | NA | |
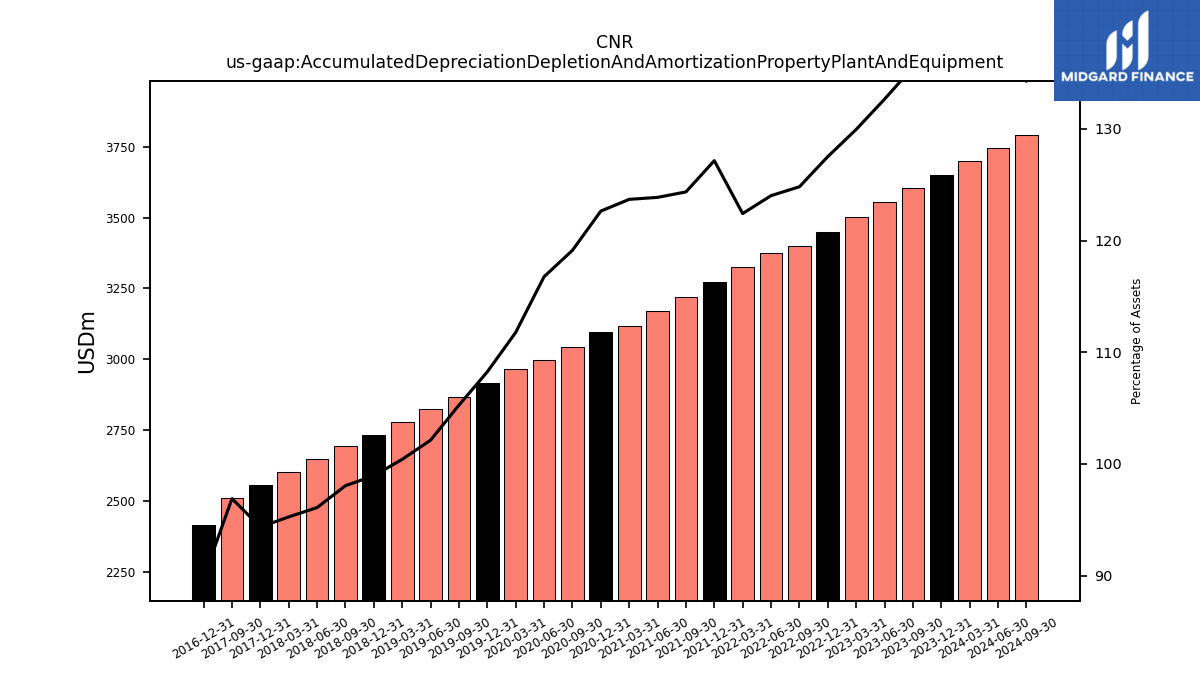
| Accumulated Depreciation Depletion And Amortization Property Plant And Equipment | 36.97 | NA | NA | 575.94 | 674.32 | 656.49 | 613.46 | 593.55 | 670.07 | 644.31 | 619.65 | 602.65 | 580.84 | 556.14 | 530.49 | 508.10 | 487.25 | 469.91 | 459.93 | NA | NA | NA | 442.87 | NA | NA | NA | 419.64 | NA | NA | NA | 410.78 | NA | NA | NA | 374.73 | NA | NA | NA | 351.98 | NA | NA | NA | -320.71 | NA | NA | NA | NA | NA | NA | -297.29 | NA | NA | NA | NA | NA | NA | NA | NA | |
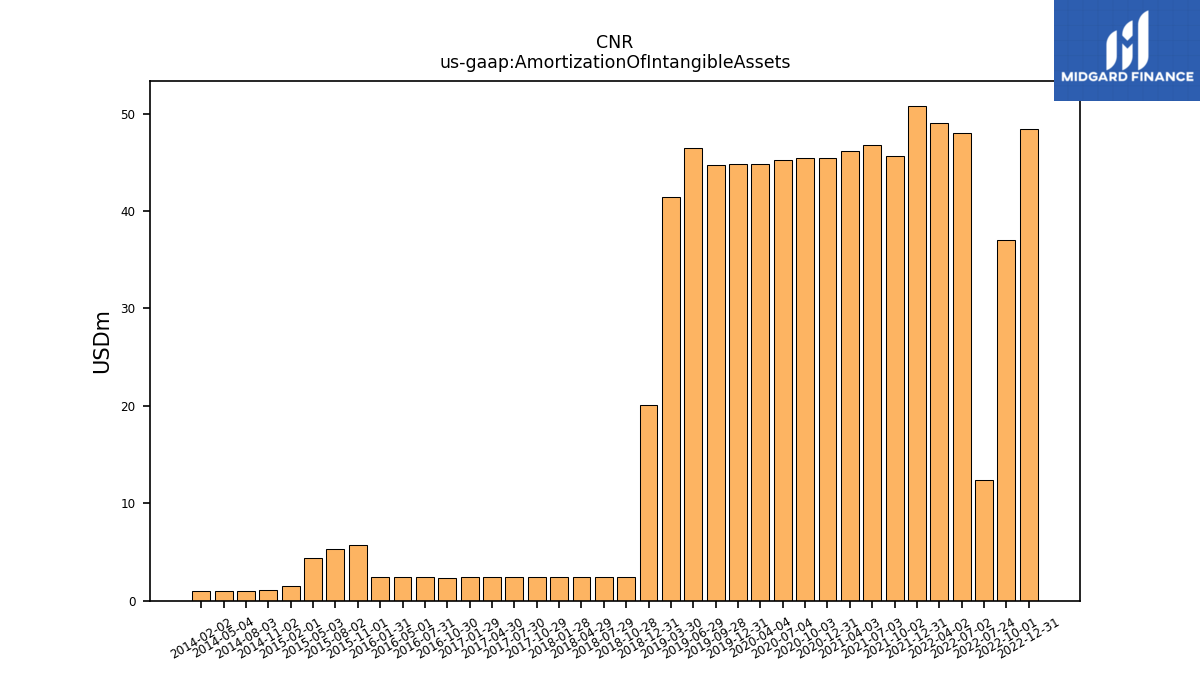
| Amortization Of Intangible Assets | 48.40 | 37.00 | 12.40 | 48.05 | 49.01 | 50.81 | 45.67 | 46.81 | 46.20 | 45.45 | 45.45 | 45.24 | 44.86 | 44.88 | 44.73 | 46.51 | 41.46 | 20.13 | 2.41 | 2.41 | 2.41 | 2.41 | 2.40 | 2.40 | 2.40 | 2.40 | 2.37 | 2.40 | 2.40 | 2.42 | 5.69 | 5.34 | 4.38 | 1.49 | 1.06 | 1.01 | 1.01 | 1.01 | NA | NA | NA | NA | NA | NA | NA | NA | NA | NA | NA | NA | NA | NA | NA | NA | NA | NA | NA | NA | |
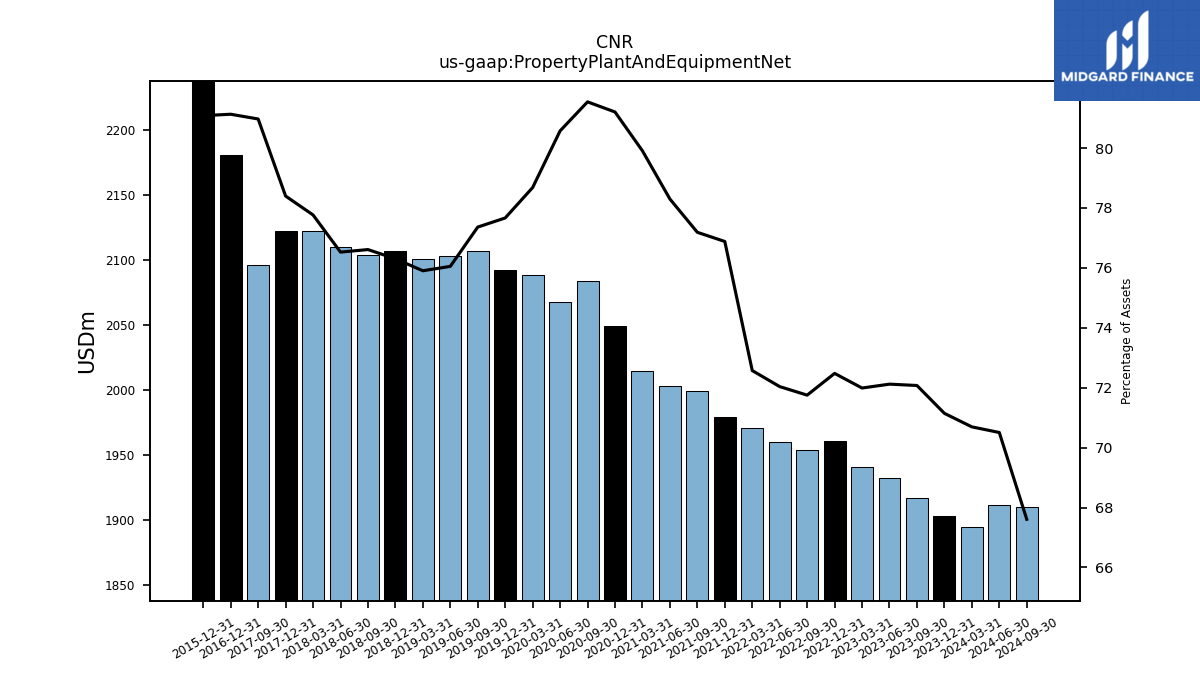
| Property Plant And Equipment Net | 618.06 | 576.62 | NA | 572.82 | 625.11 | 612.29 | 583.37 | 568.90 | 628.20 | 631.82 | 635.90 | 644.28 | 651.80 | 652.84 | 643.84 | 634.60 | 638.17 | 614.01 | 236.24 | 230.85 | 221.40 | 220.47 | 227.00 | 230.04 | 234.83 | 238.58 | 242.21 | 244.35 | 255.97 | 260.20 | 257.89 | 266.24 | 270.00 | 275.39 | 244.71 | 249.49 | 252.97 | 257.89 | 260.92 | 262.12 | 265.70 | 266.81 | 268.88 | 271.54 | NA | 211.35 | NA | 208.66 | NA | 208.51 | 208.78 | NA | NA | NA | NA | NA | 214.45 | NA | |
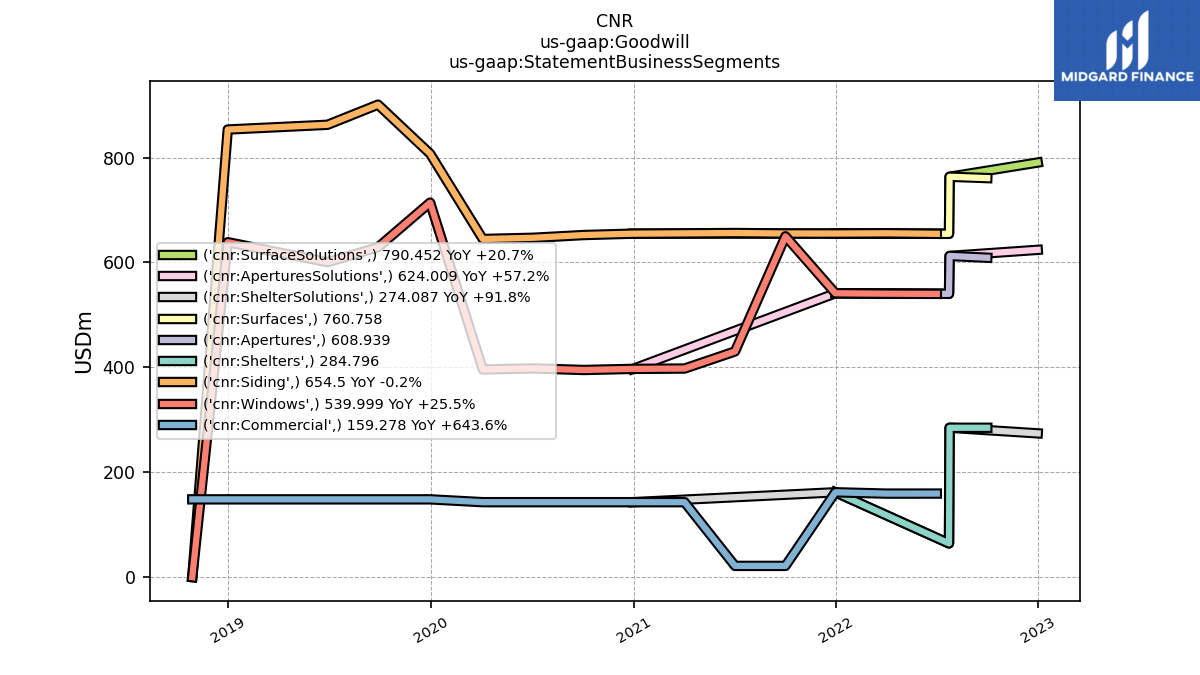
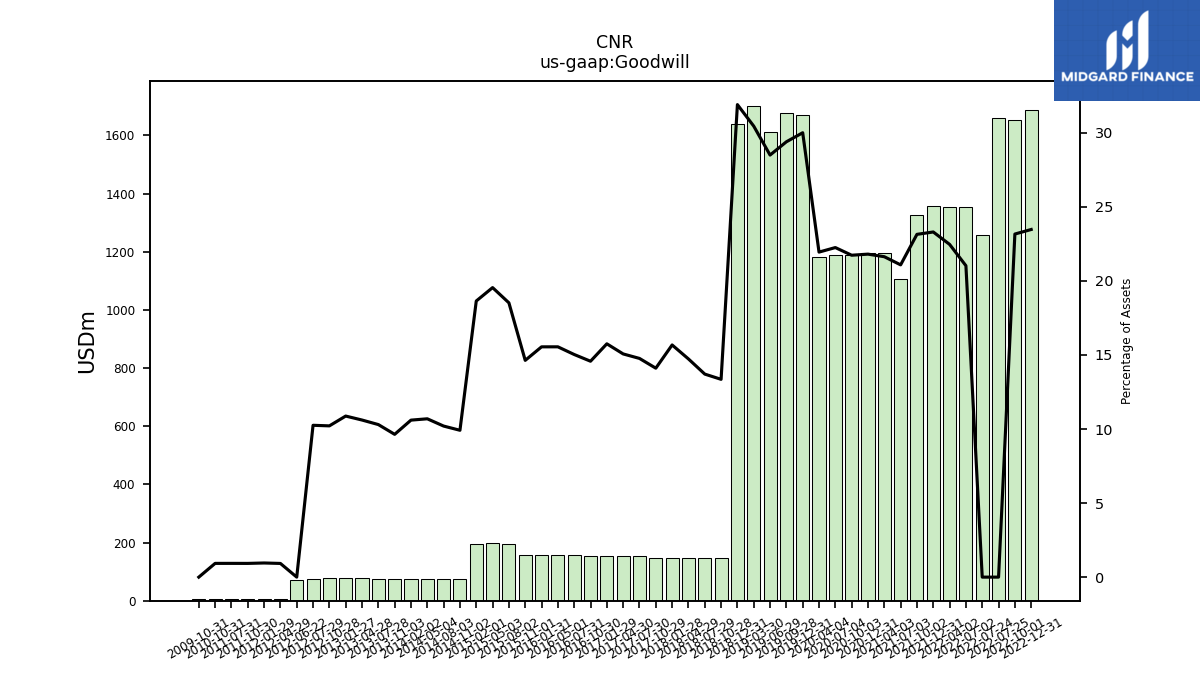
| Goodwill | 1688.55 | 1654.49 | 1258.89 | 1353.78 | 1355.16 | 1358.06 | 1326.41 | 1107.76 | 1195.98 | 1194.73 | 1189.99 | 1187.79 | 1183.43 | 1669.59 | 1677.93 | 1611.21 | 1702.18 | 1640.21 | 148.29 | 148.29 | 148.29 | 148.29 | 148.29 | 154.29 | 154.29 | 154.29 | 154.27 | 158.11 | 158.11 | 158.11 | 158.03 | 193.57 | 198.17 | 195.07 | 75.23 | 75.23 | 75.23 | 75.23 | 75.23 | 75.23 | 76.86 | 76.86 | 76.75 | 73.91 | NA | 5.20 | NA | 5.20 | NA | 5.20 | 5.20 | NA | NA | NA | NA | NA | 5.20 | NA | |
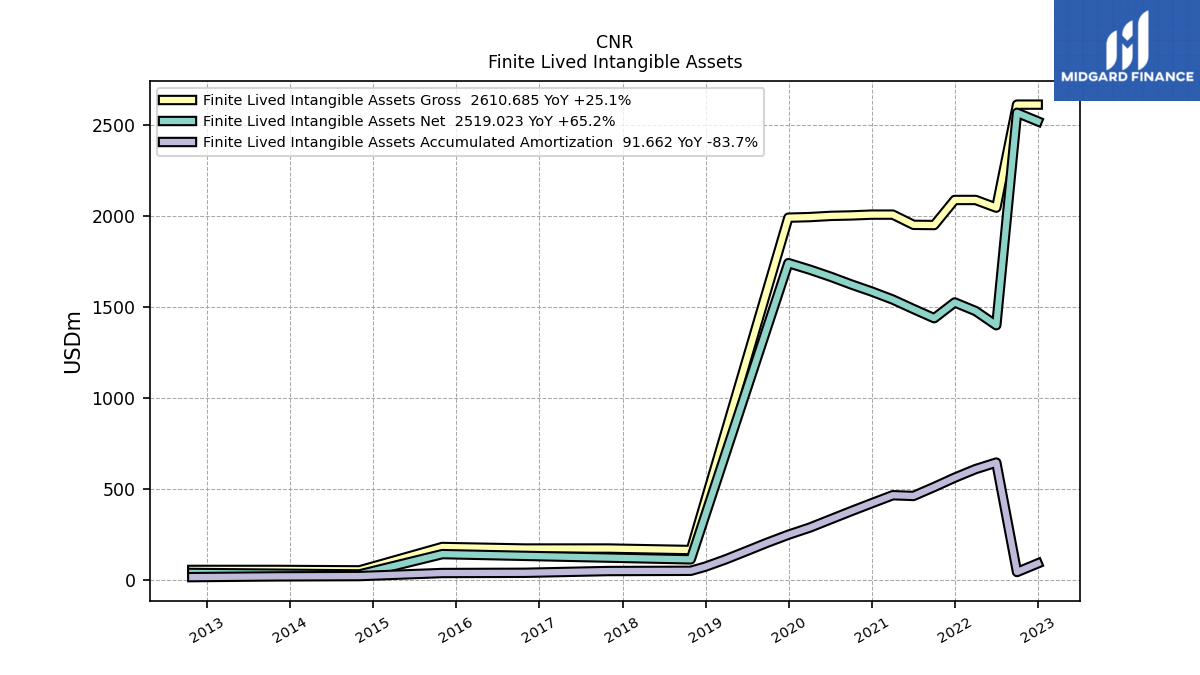
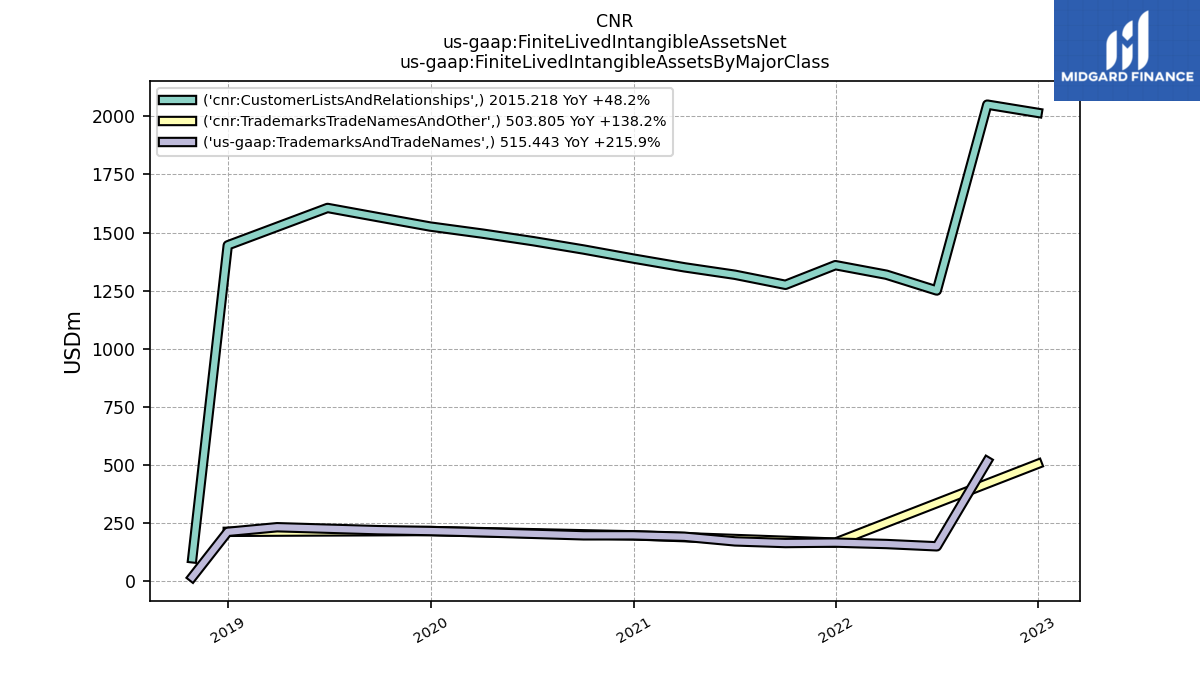
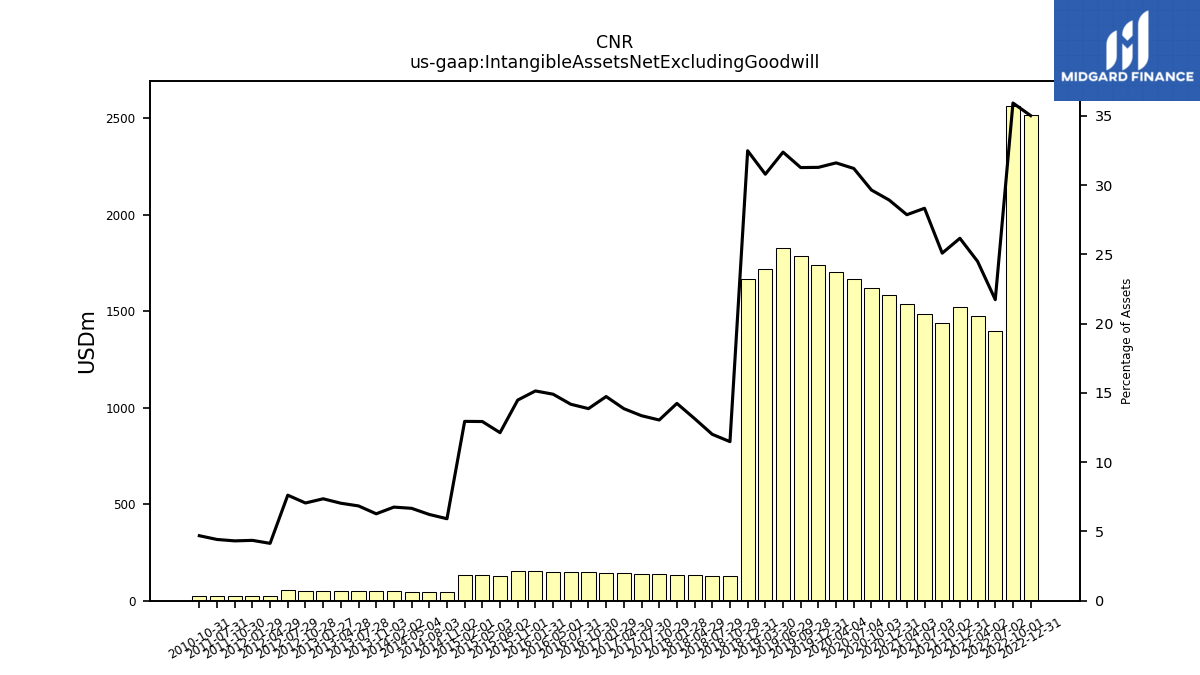
| Intangible Assets Net Excluding Goodwill | 2519.02 | 2566.03 | NA | 1399.36 | 1477.43 | 1524.63 | 1438.04 | 1488.43 | 1540.47 | 1584.60 | 1623.13 | 1665.59 | 1704.37 | 1740.70 | 1784.94 | 1830.82 | 1721.05 | 1669.90 | 127.53 | 129.93 | 132.34 | 134.74 | 137.15 | 139.55 | 141.96 | 144.36 | 146.77 | 149.18 | 151.59 | 153.99 | 156.40 | 126.82 | 131.14 | 135.46 | 44.92 | 45.94 | 46.95 | 47.96 | 48.98 | 49.99 | 51.00 | 52.02 | 53.03 | 54.94 | NA | 23.31 | NA | 23.74 | NA | 24.25 | 24.77 | NA | NA | NA | NA | NA | 26.31 | NA | |
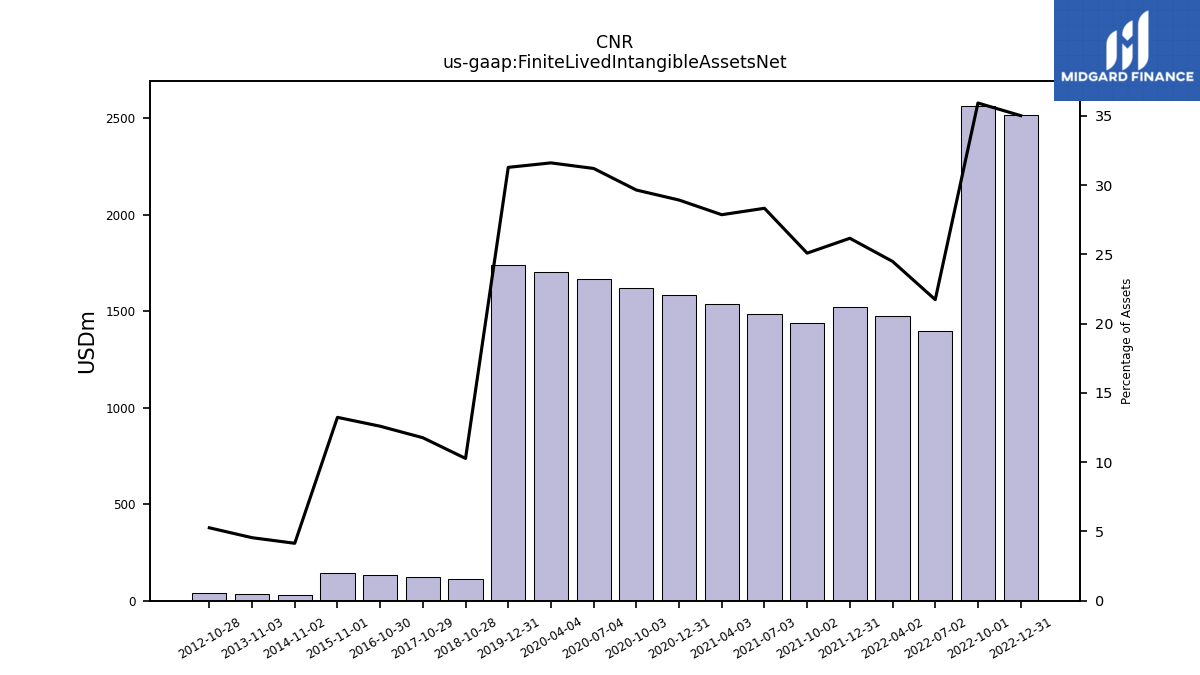
| Finite Lived Intangible Assets Net | 2519.02 | 2566.03 | NA | 1399.36 | 1477.43 | 1524.63 | 1438.04 | 1488.43 | 1540.47 | 1584.60 | 1623.13 | 1665.59 | 1704.37 | 1740.70 | NA | NA | NA | NA | 114.07 | NA | NA | NA | 123.69 | NA | NA | NA | 133.31 | NA | NA | NA | 142.94 | NA | NA | NA | 31.47 | NA | NA | NA | 35.52 | NA | NA | NA | 39.57 | NA | NA | NA | NA | NA | NA | NA | NA | NA | NA | NA | NA | NA | NA | NA | |
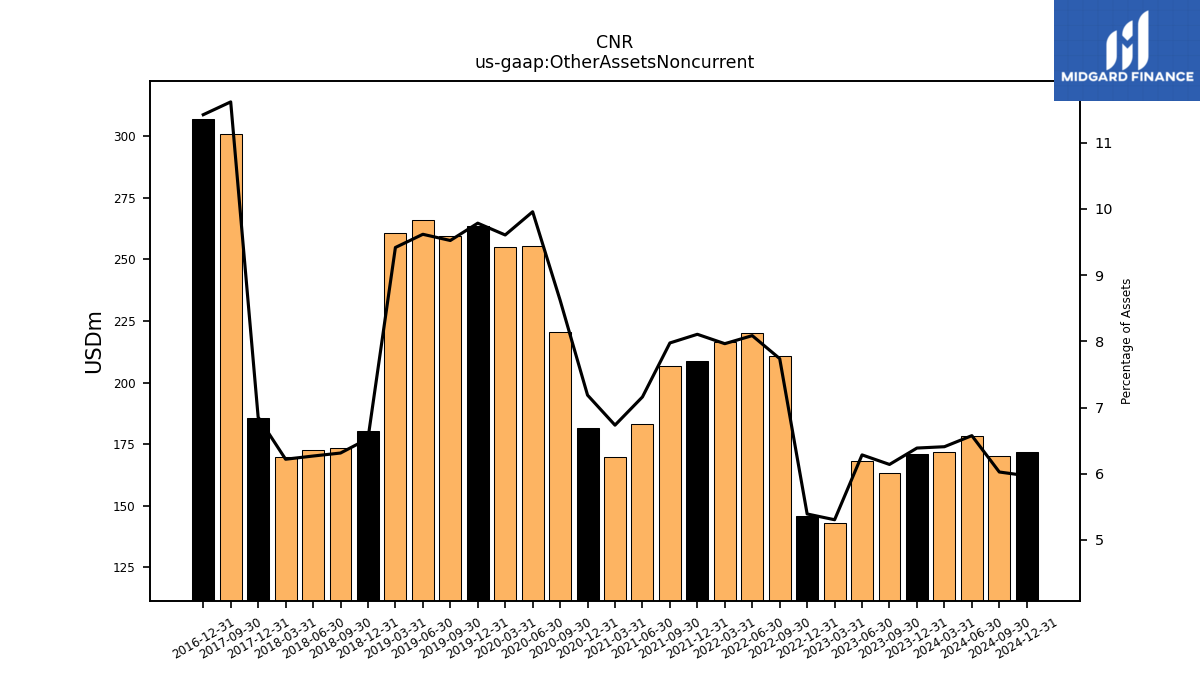
| Other Assets Noncurrent | 105.84 | 109.75 | NA | 102.99 | 96.93 | 20.95 | 26.26 | 28.28 | 10.35 | 10.19 | 11.96 | 11.88 | 12.07 | 11.80 | 10.67 | 12.09 | 11.98 | 12.08 | 6.60 | 5.35 | 5.37 | 5.22 | 5.11 | 1.92 | 1.82 | 2.02 | 2.09 | 10.13 | 10.62 | 11.08 | 11.07 | NA | NA | NA | NA | NA | NA | NA | NA | NA | 9.97 | 10.51 | 11.00 | 10.90 | NA | 9.90 | NA | 10.39 | NA | 11.57 | 12.69 | NA | NA | NA | NA | NA | 16.22 | NA |
| 2022-12-31 | 2022-10-01 | 2022-07-24 | 2022-07-02 | 2022-04-02 | 2021-12-31 | 2021-10-02 | 2021-07-03 | 2021-04-03 | 2020-12-31 | 2020-10-03 | 2020-07-04 | 2020-04-04 | 2019-12-31 | 2019-09-28 | 2019-06-29 | 2019-03-30 | 2018-12-31 | 2018-10-28 | 2018-07-29 | 2018-04-29 | 2018-01-28 | 2017-10-29 | 2017-07-30 | 2017-04-30 | 2017-01-29 | 2016-10-30 | 2016-07-31 | 2016-05-01 | 2016-01-31 | 2015-11-01 | 2015-08-02 | 2015-05-03 | 2015-02-01 | 2014-11-02 | 2014-08-03 | 2014-05-04 | 2014-02-02 | 2013-11-03 | 2013-07-28 | 2013-04-28 | 2013-01-27 | 2012-10-28 | 2012-07-29 | 2012-07-28 | 2012-04-29 | 2012-04-28 | 2012-01-29 | 2012-01-28 | 2011-10-30 | 2011-07-31 | 2011-07-30 | 2011-05-01 | 2011-04-30 | 2011-01-31 | 2011-01-30 | 2010-10-31 | 2010-08-01 | ||
|---|---|---|---|---|---|---|---|---|---|---|---|---|---|---|---|---|---|---|---|---|---|---|---|---|---|---|---|---|---|---|---|---|---|---|---|---|---|---|---|---|---|---|---|---|---|---|---|---|---|---|---|---|---|---|---|---|---|---|---|
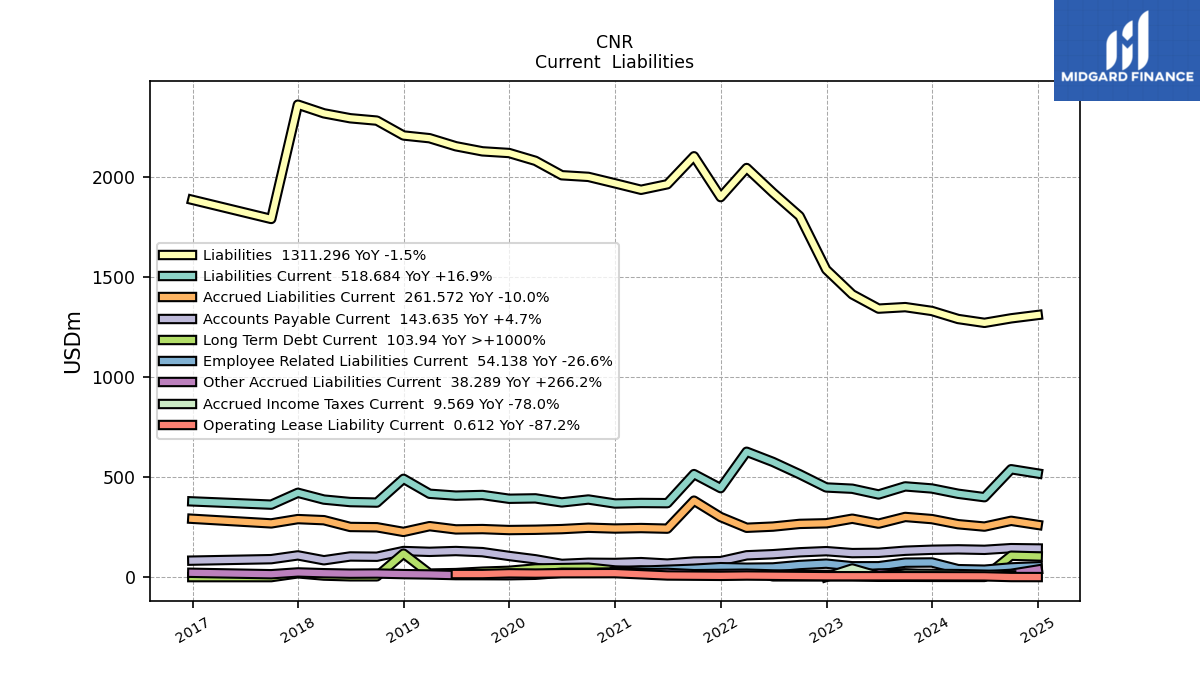
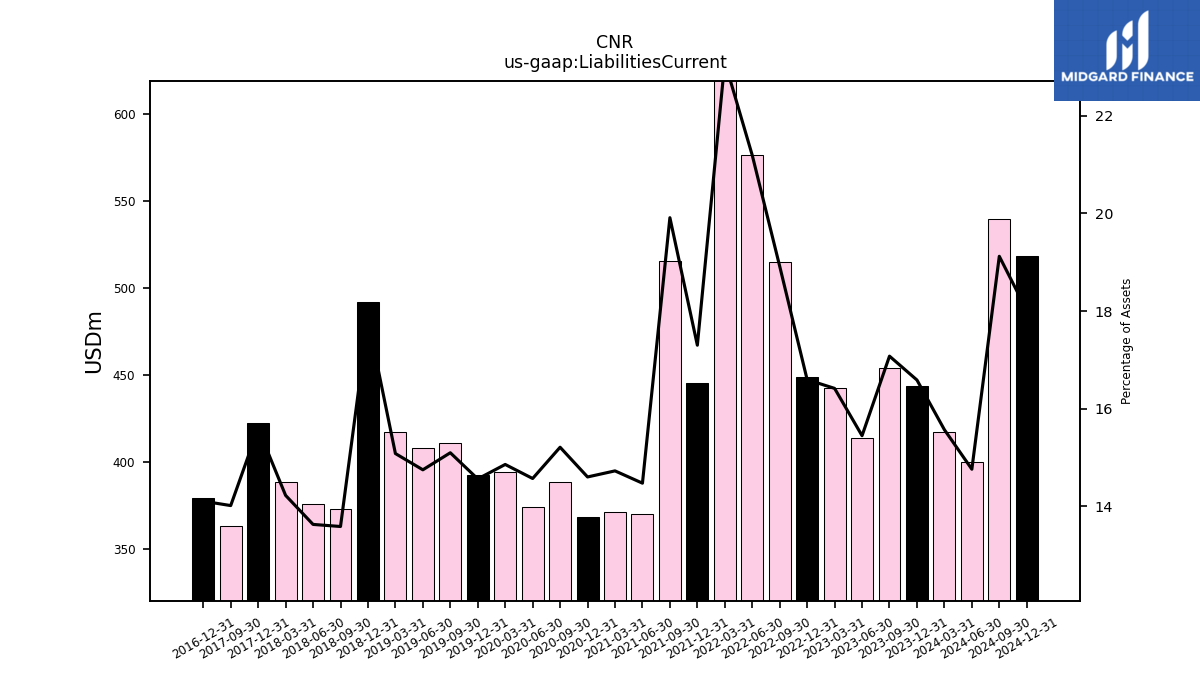
| Liabilities Current | 893.24 | 967.50 | NA | 931.55 | 895.33 | 855.43 | 817.94 | 820.36 | 728.99 | 667.15 | 696.25 | 593.47 | 629.53 | 648.54 | 744.52 | 756.13 | 712.04 | 650.17 | 335.70 | 358.92 | 315.26 | 271.30 | 316.05 | 289.75 | 288.17 | 261.44 | 326.53 | 323.71 | 272.57 | 262.86 | 321.62 | 293.92 | 264.21 | 270.31 | 245.71 | 229.72 | 203.66 | 206.29 | 251.61 | 204.14 | 204.40 | 183.43 | 220.06 | 199.32 | NA | 173.21 | NA | 157.02 | NA | 174.04 | 176.46 | NA | NA | NA | NA | NA | 150.88 | NA | |
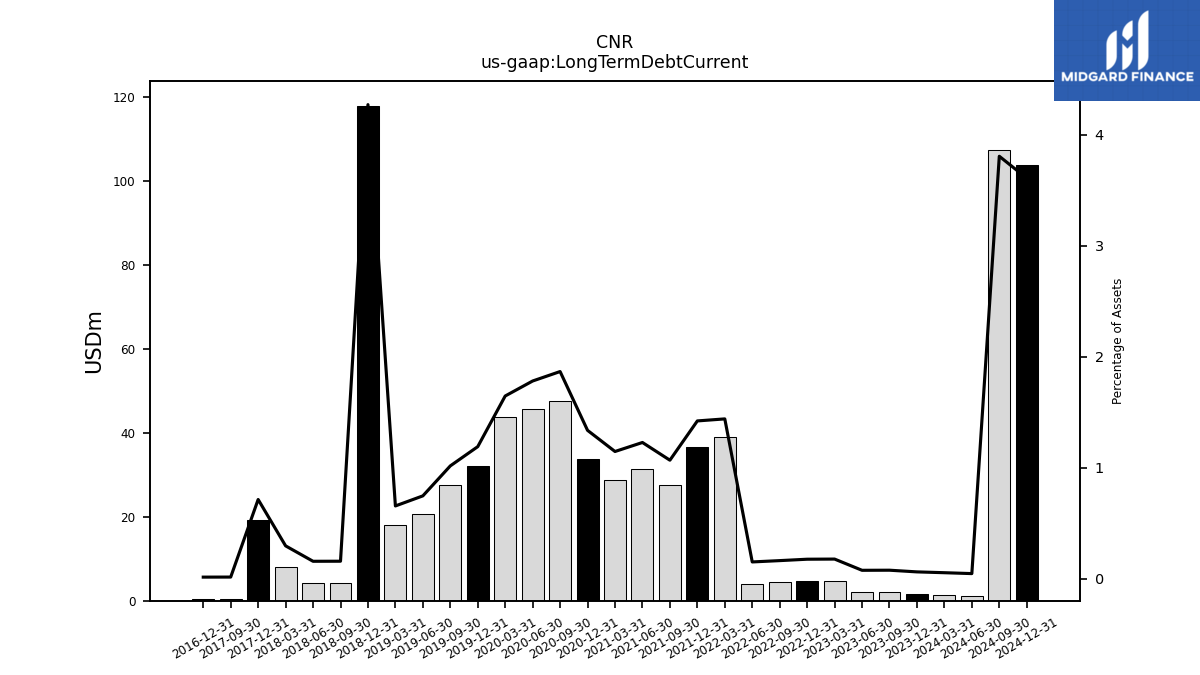
| Long Term Debt Current | 29.00 | 28.25 | NA | 26.00 | 26.00 | 26.00 | 26.00 | 26.00 | 25.60 | 25.60 | 25.60 | 25.60 | 25.60 | 25.60 | 25.60 | 25.60 | 25.60 | 25.60 | 4.15 | 4.15 | NA | 10.00 | 387.29 | 7.18 | 7.34 | 7.72 | 404.15 | 0.00 | 0.00 | 0.00 | 0.00 | 0.00 | 2.38 | 2.38 | 2.38 | 2.38 | 2.38 | 2.38 | 2.38 | 2.38 | 2.50 | 2.50 | -2.50 | -2.50 | NA | NA | NA | NA | NA | 0.00 | NA | NA | NA | NA | NA | NA | NA | NA | |
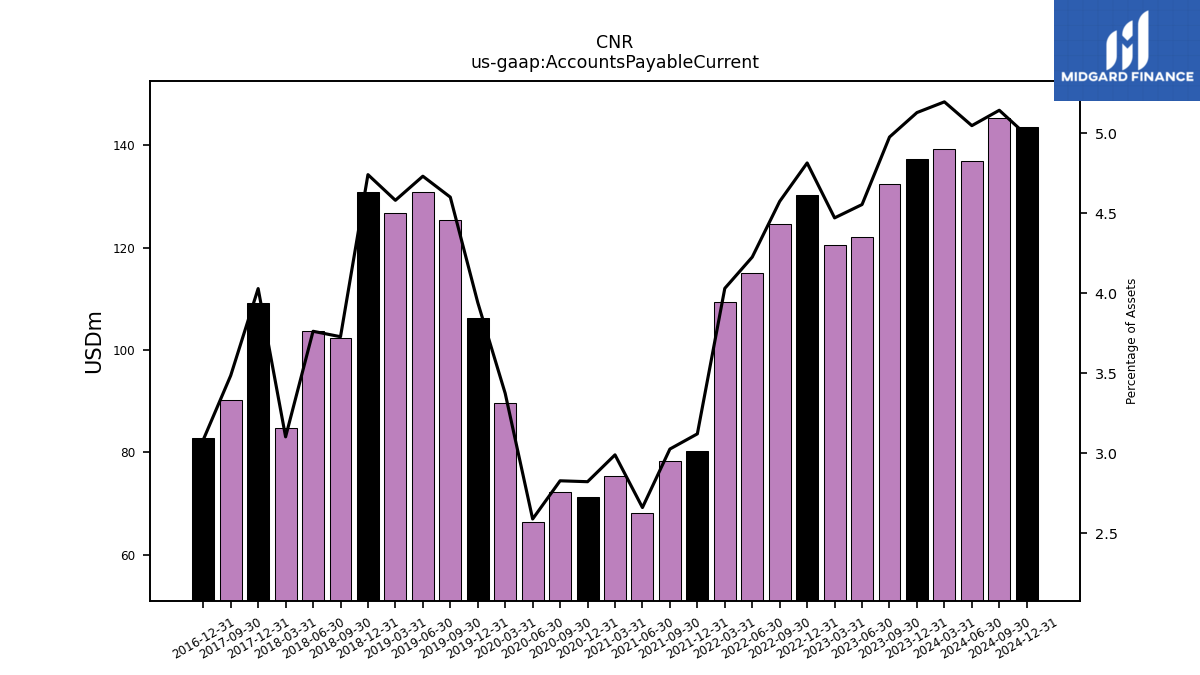
| Accounts Payable Current | 288.94 | 365.55 | NA | 308.45 | 396.41 | 311.74 | 307.15 | 266.07 | 260.93 | 211.44 | 229.35 | 198.94 | 219.30 | 205.63 | 235.25 | 241.81 | 216.31 | 220.86 | 170.66 | 179.70 | 157.82 | 116.57 | 147.77 | 120.70 | 121.18 | 112.71 | 142.91 | 146.42 | 121.28 | 110.30 | 145.92 | 146.56 | 120.91 | 128.12 | 118.16 | 115.19 | 100.95 | 105.21 | 144.55 | 103.71 | 97.75 | 84.21 | 113.18 | 98.06 | NA | 85.26 | NA | 79.32 | NA | 88.16 | 91.84 | NA | NA | NA | NA | NA | 70.59 | NA | |
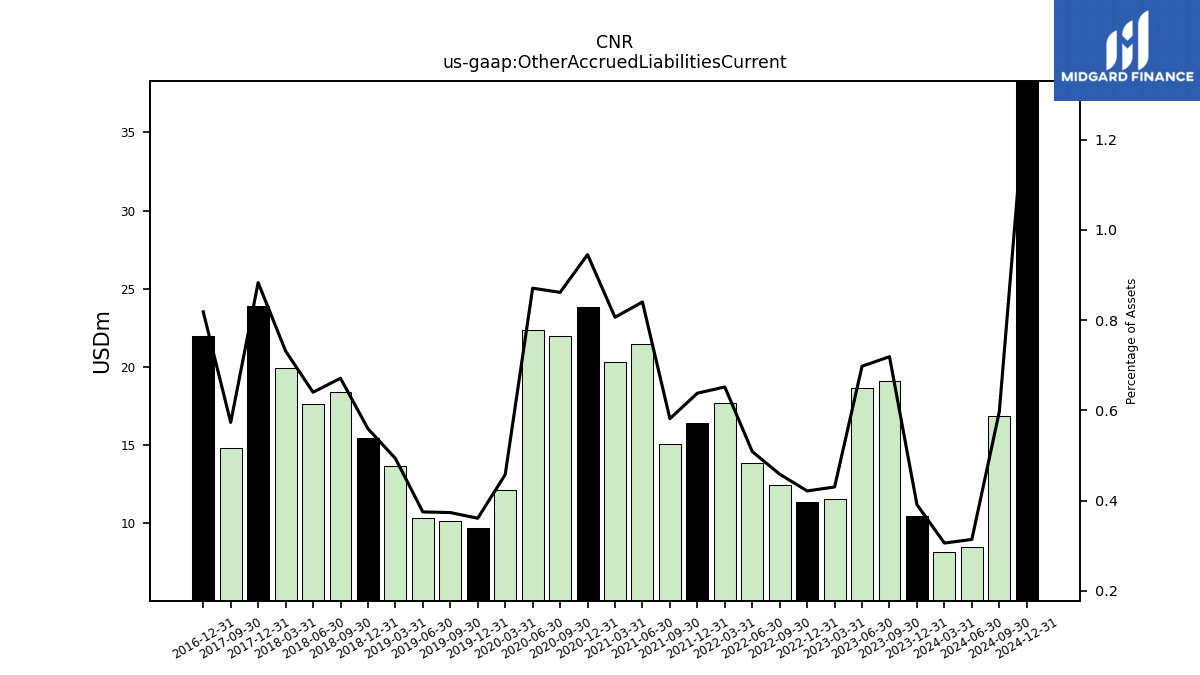
| Other Accrued Liabilities Current | NA | NA | NA | 313.98 | 281.38 | 320.39 | 294.07 | 280.24 | 255.29 | 247.89 | 258.89 | 222.43 | 213.04 | 233.69 | 254.83 | 252.37 | 236.07 | 265.14 | 81.88 | 106.20 | 104.47 | 95.74 | 102.23 | 104.28 | 102.58 | 93.39 | 103.38 | 103.59 | 89.80 | 94.97 | 97.31 | 85.65 | 79.73 | 75.33 | 72.26 | 62.84 | 56.01 | 56.55 | 61.27 | 56.32 | 57.13 | 55.62 | 60.45 | 56.84 | NA | 50.58 | NA | 47.03 | NA | 49.67 | 49.96 | NA | NA | NA | NA | NA | 46.72 | NA | |
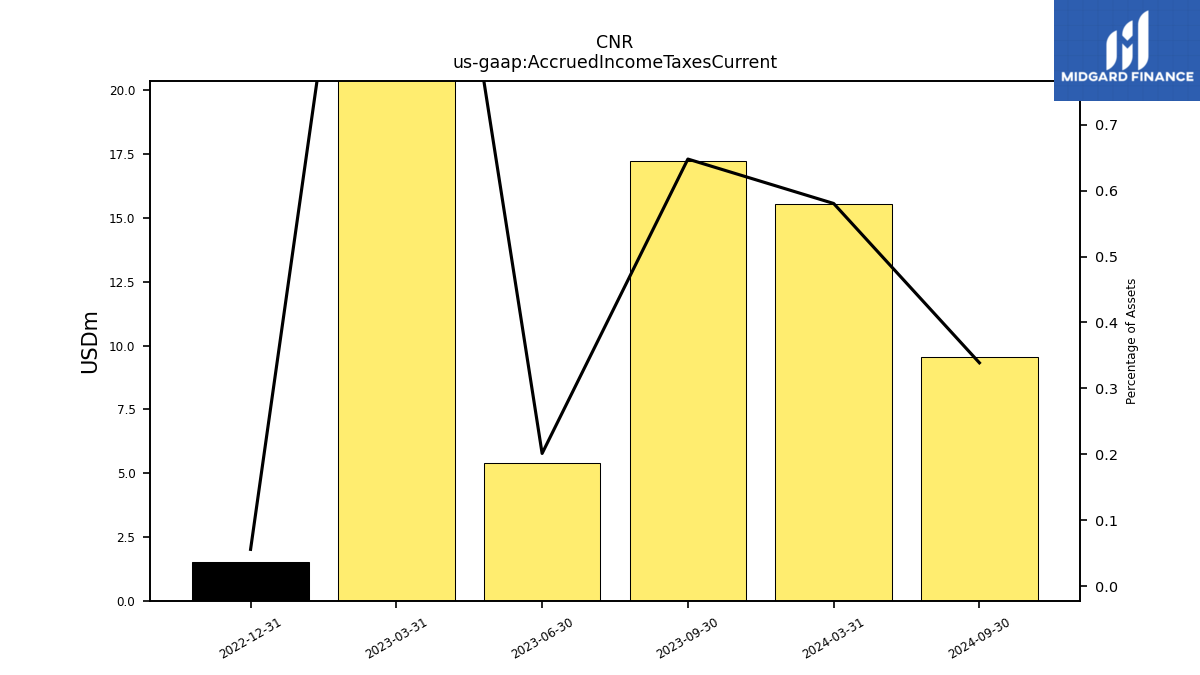
| Accrued Income Taxes Current | 21.87 | 25.86 | NA | 114.53 | 39.09 | 3.22 | 8.22 | 6.56 | 5.65 | 5.06 | 2.73 | 0.50 | 5.52 | 0.00 | 18.14 | 11.72 | 5.82 | 0.00 | 11.69 | 7.92 | NA | NA | 0.00 | NA | 1.12 | NA | 0.00 | 5.37 | 0.00 | 0.23 | 9.30 | NA | NA | NA | 3.49 | NA | NA | NA | NA | NA | NA | NA | NA | NA | NA | NA | NA | NA | NA | NA | NA | NA | NA | NA | NA | NA | NA | NA | |
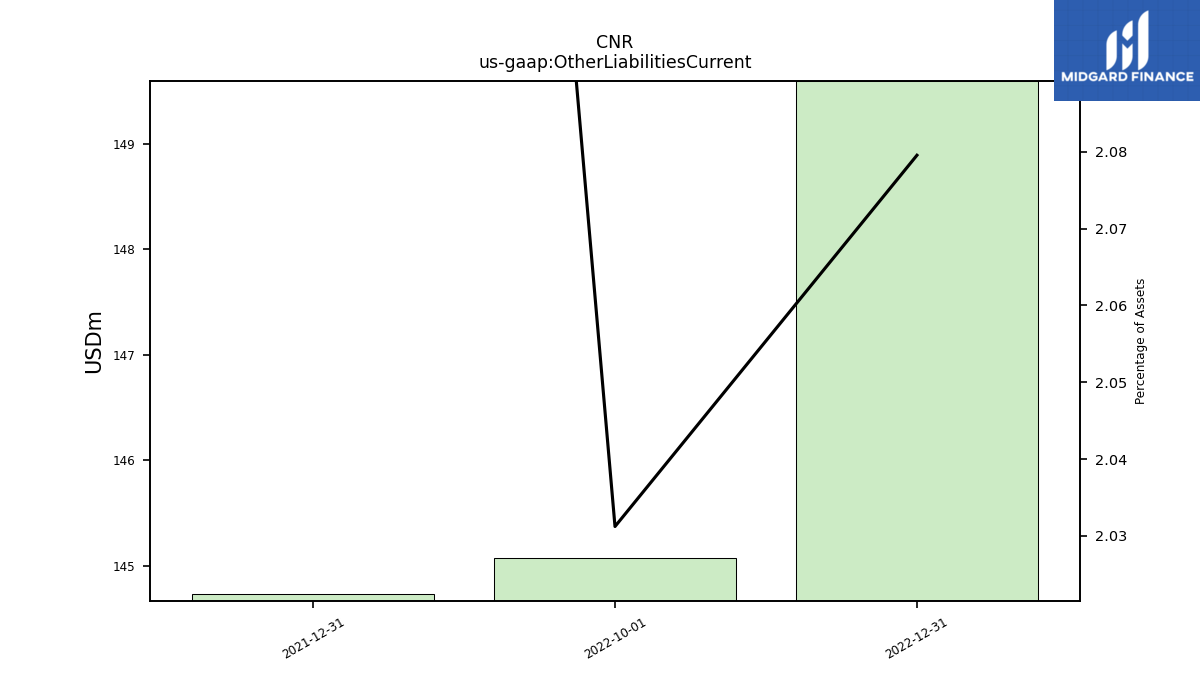
| Other Liabilities Current | 149.60 | 145.07 | NA | NA | NA | 144.74 | NA | NA | NA | NA | NA | NA | NA | NA | NA | NA | NA | NA | NA | NA | NA | NA | NA | NA | NA | NA | NA | NA | NA | NA | NA | NA | NA | NA | NA | NA | NA | NA | NA | NA | NA | NA | NA | NA | NA | NA | NA | NA | NA | NA | NA | NA | NA | NA | NA | NA | NA | NA |
| 2022-12-31 | 2022-10-01 | 2022-07-24 | 2022-07-02 | 2022-04-02 | 2021-12-31 | 2021-10-02 | 2021-07-03 | 2021-04-03 | 2020-12-31 | 2020-10-03 | 2020-07-04 | 2020-04-04 | 2019-12-31 | 2019-09-28 | 2019-06-29 | 2019-03-30 | 2018-12-31 | 2018-10-28 | 2018-07-29 | 2018-04-29 | 2018-01-28 | 2017-10-29 | 2017-07-30 | 2017-04-30 | 2017-01-29 | 2016-10-30 | 2016-07-31 | 2016-05-01 | 2016-01-31 | 2015-11-01 | 2015-08-02 | 2015-05-03 | 2015-02-01 | 2014-11-02 | 2014-08-03 | 2014-05-04 | 2014-02-02 | 2013-11-03 | 2013-07-28 | 2013-04-28 | 2013-01-27 | 2012-10-28 | 2012-07-29 | 2012-07-28 | 2012-04-29 | 2012-04-28 | 2012-01-29 | 2012-01-28 | 2011-10-30 | 2011-07-31 | 2011-07-30 | 2011-05-01 | 2011-04-30 | 2011-01-31 | 2011-01-30 | 2010-10-31 | 2010-08-01 | ||
|---|---|---|---|---|---|---|---|---|---|---|---|---|---|---|---|---|---|---|---|---|---|---|---|---|---|---|---|---|---|---|---|---|---|---|---|---|---|---|---|---|---|---|---|---|---|---|---|---|---|---|---|---|---|---|---|---|---|---|---|
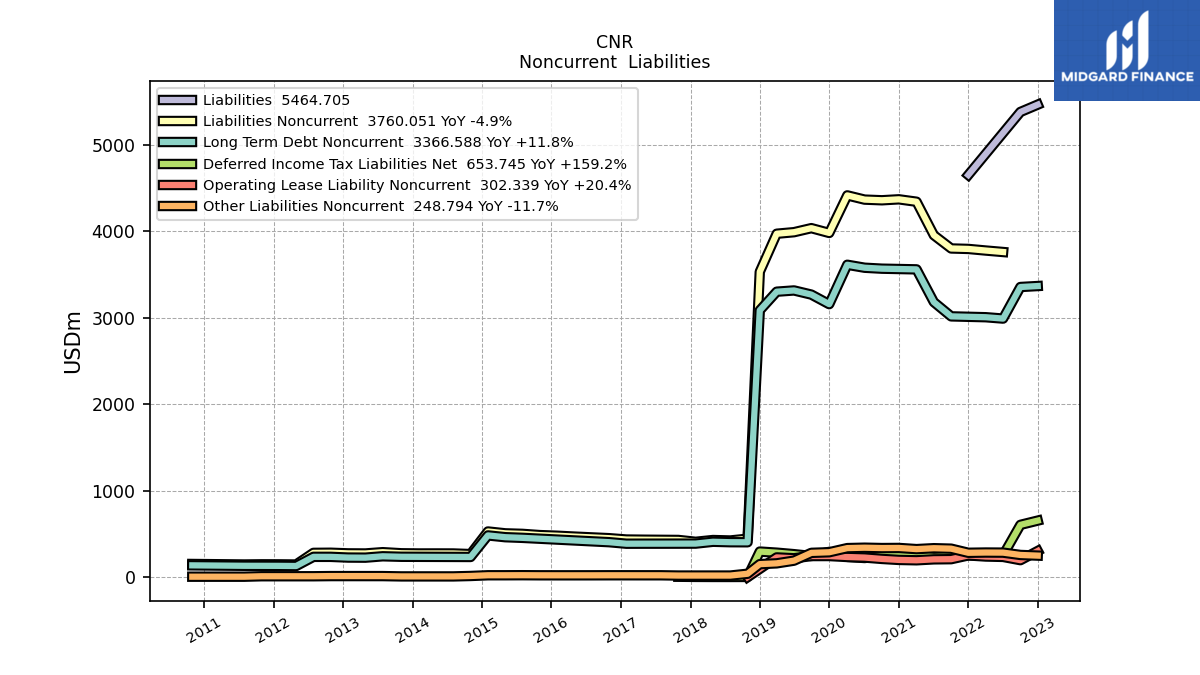
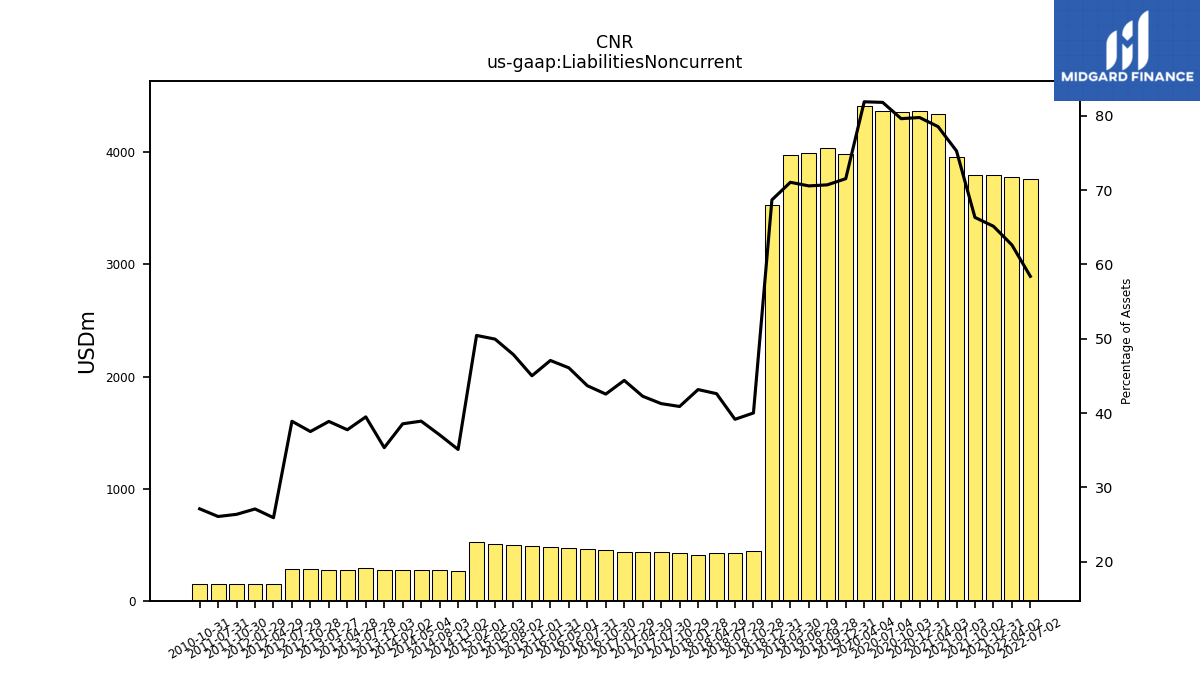
| Liabilities Noncurrent | NA | NA | NA | 3760.05 | 3777.20 | 3795.69 | 3801.10 | 3954.46 | 4341.67 | 4369.53 | 4358.44 | 4366.16 | 4415.01 | 3980.48 | 4036.05 | 3989.40 | 3971.52 | 3531.03 | 444.41 | 423.69 | 429.02 | 408.39 | 429.88 | 431.34 | 432.77 | 434.88 | 450.44 | 459.54 | 468.67 | 478.76 | 486.13 | 500.26 | 506.44 | 527.82 | 266.43 | 273.46 | 273.89 | 273.69 | 275.89 | 288.45 | 273.62 | 274.81 | 282.00 | 280.50 | NA | 145.95 | NA | 147.65 | NA | 148.09 | 146.13 | NA | NA | NA | NA | NA | 152.07 | NA | |
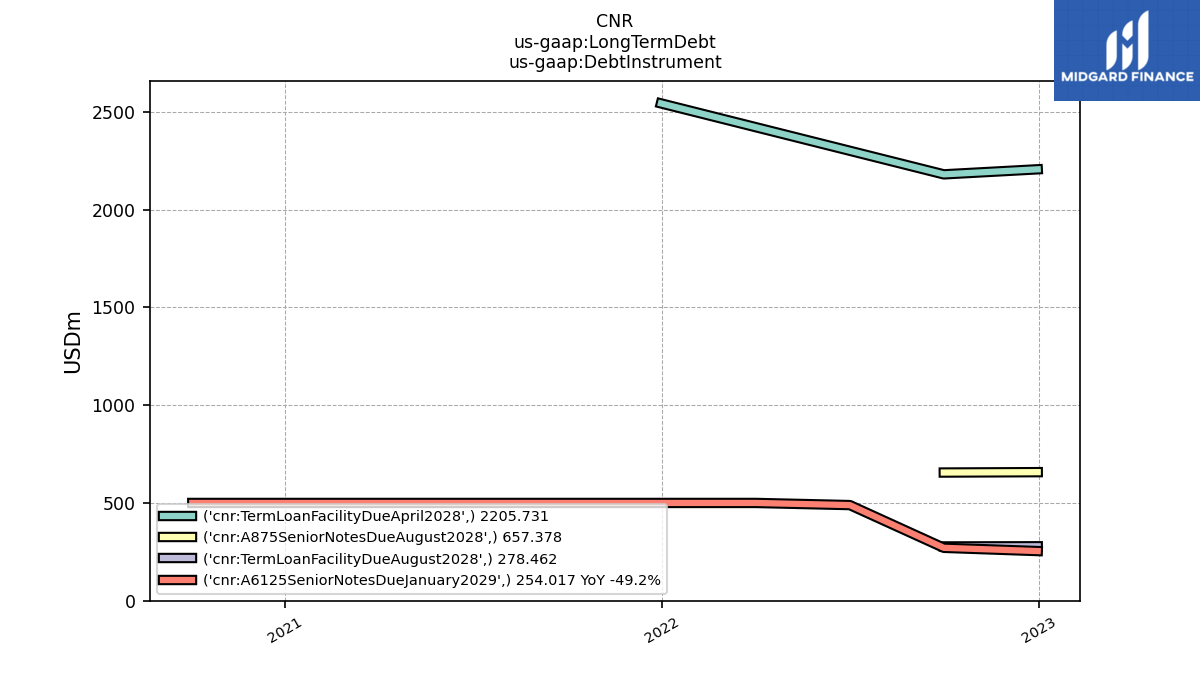
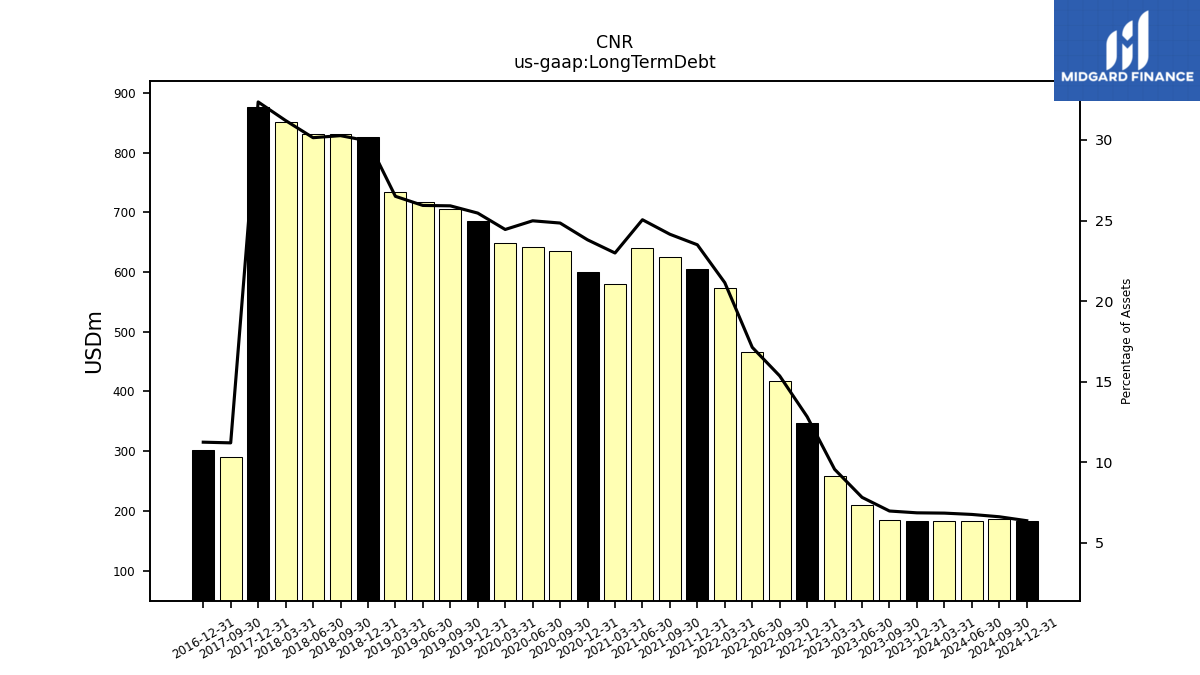
| Long Term Debt | 3395.59 | 3383.58 | NA | 3016.09 | 3031.87 | 3036.84 | 3041.80 | 3206.76 | 3584.94 | 3589.03 | 3592.90 | 3603.94 | 3638.21 | 3182.52 | 3293.25 | 3341.15 | 3326.85 | 3110.76 | 407.23 | 407.99 | 408.96 | 397.62 | 394.15 | NA | NA | NA | 404.15 | NA | NA | NA | 444.15 | NA | NA | NA | 235.39 | NA | NA | NA | 237.78 | NA | NA | NA | 248.75 | 249.37 | NA | NA | NA | NA | NA | 130.70 | NA | NA | NA | NA | NA | NA | NA | NA | |
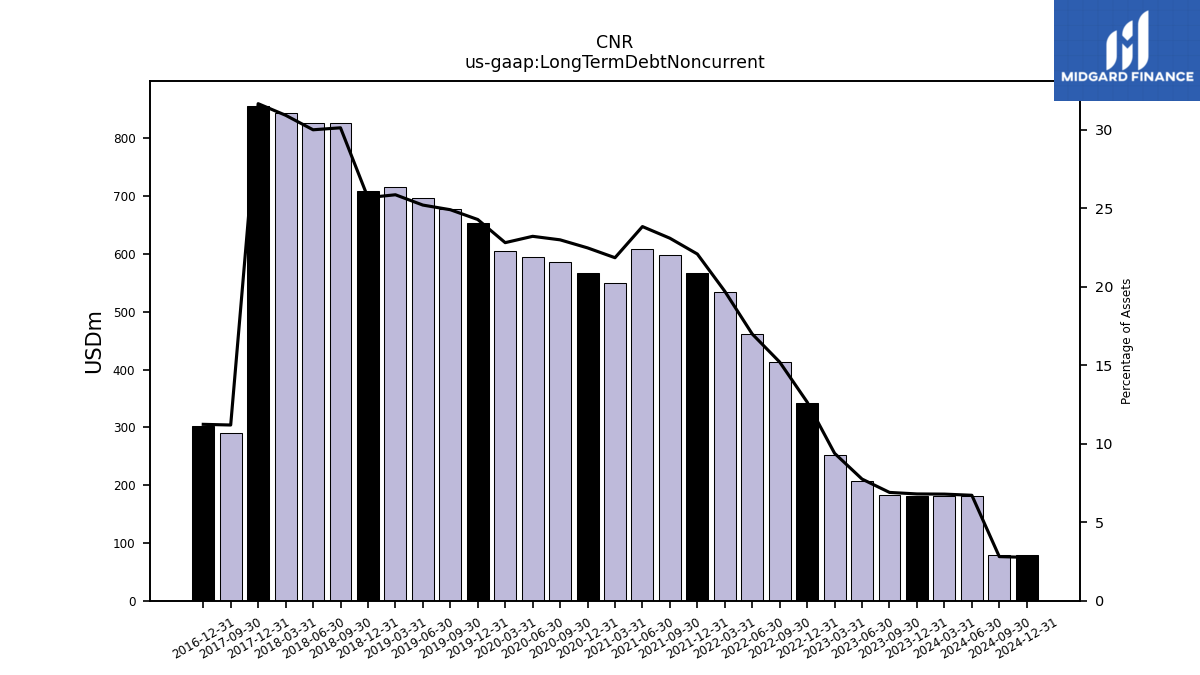
| Long Term Debt Noncurrent | 3366.59 | 3355.33 | NA | 2990.09 | 3005.87 | 3010.84 | 3015.80 | 3180.76 | 3559.34 | 3563.43 | 3567.30 | 3578.34 | 3612.61 | 3156.92 | 3267.65 | 3315.55 | 3301.25 | 3085.16 | 403.08 | 403.84 | 408.96 | 387.62 | 387.29 | 386.97 | 386.81 | 386.43 | 404.15 | 414.15 | 424.15 | 434.15 | 444.15 | 454.15 | 461.76 | 482.41 | 233.00 | 233.60 | 234.19 | 234.79 | 235.39 | 240.99 | 225.11 | 226.22 | 234.44 | 234.55 | NA | 128.50 | NA | 130.20 | NA | 130.70 | 131.06 | NA | NA | NA | NA | NA | 136.31 | NA | |
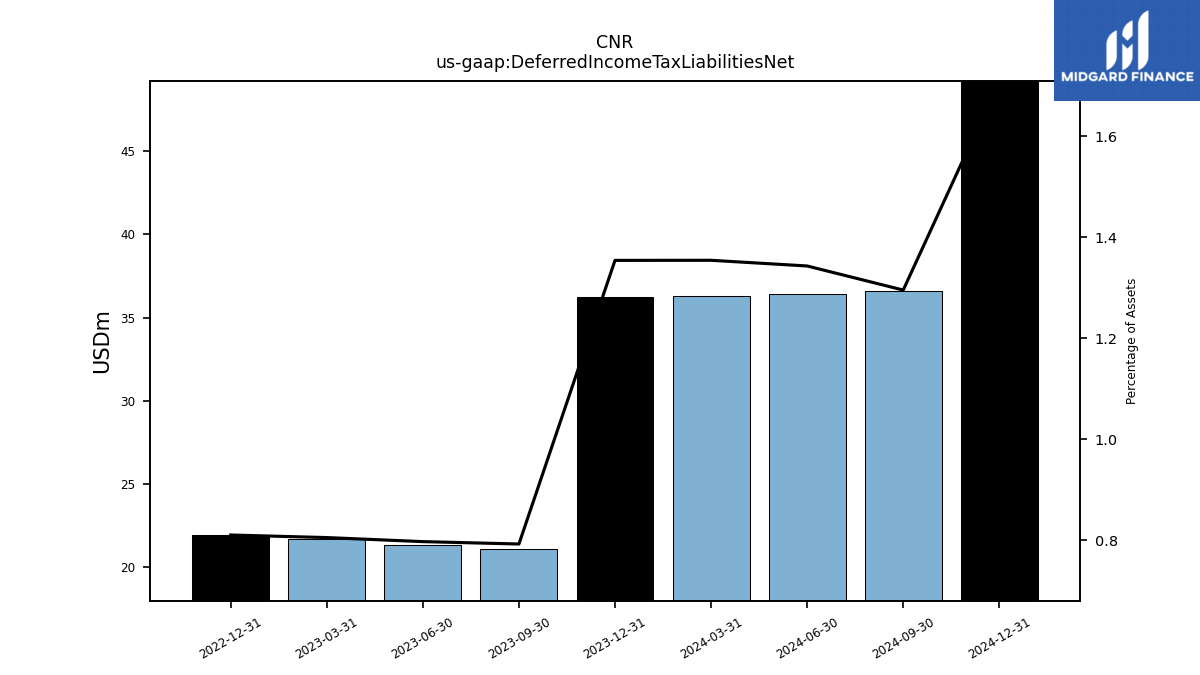
| Deferred Income Tax Liabilities Net | 653.75 | 604.61 | NA | 252.77 | 248.73 | 252.17 | 248.54 | 233.60 | 263.64 | 269.79 | 244.47 | 221.08 | 234.11 | 291.99 | 244.06 | 265.46 | 282.89 | 295.68 | 2.25 | 1.74 | 1.93 | 2.62 | 4.30 | NA | NA | NA | NA | NA | NA | NA | NA | NA | NA | NA | NA | NA | NA | NA | NA | NA | NA | NA | NA | NA | NA | NA | NA | NA | NA | NA | NA | NA | NA | NA | NA | NA | NA | NA | |
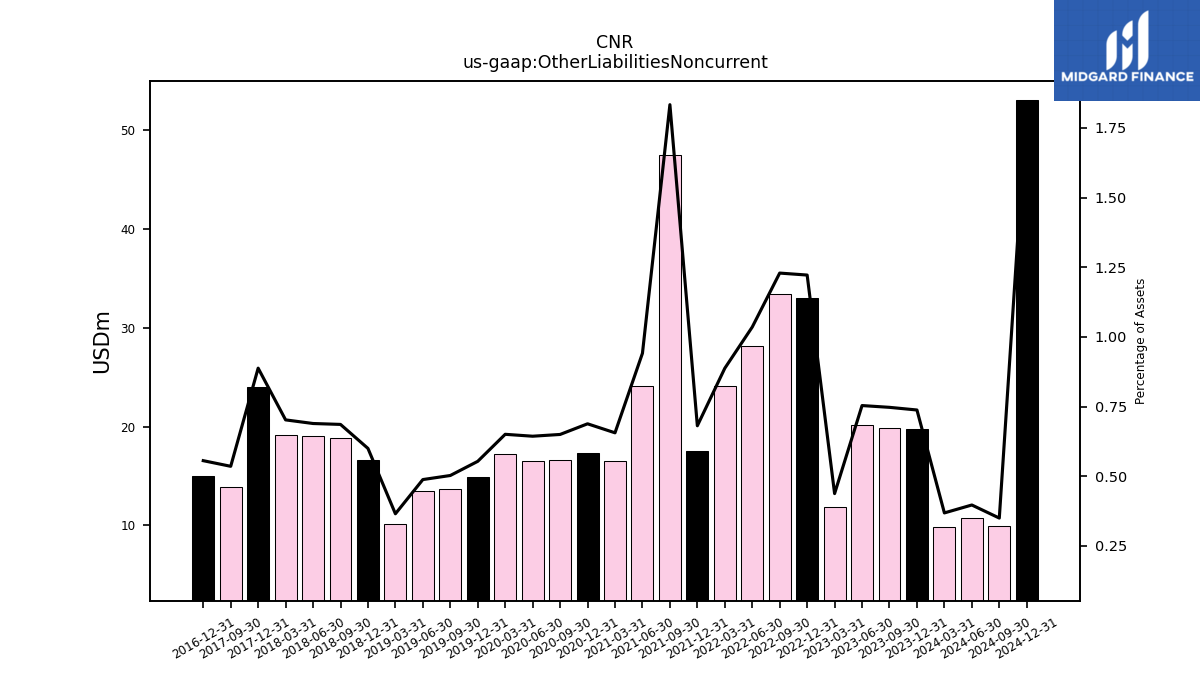
| Other Liabilities Noncurrent | 248.79 | 256.41 | NA | 283.39 | 284.47 | 281.61 | 329.19 | 334.56 | 324.02 | 337.44 | 336.22 | 340.37 | 335.63 | 287.79 | 280.72 | 190.42 | 159.38 | 150.20 | 39.09 | 18.11 | 18.13 | 18.14 | 18.23 | 21.25 | 21.27 | 21.48 | 21.49 | 21.06 | 20.95 | 20.97 | 21.18 | 22.26 | 21.55 | 21.49 | 13.21 | 8.24 | 8.27 | 8.29 | 8.31 | 11.87 | 11.94 | 12.01 | 11.99 | 10.06 | NA | 10.07 | NA | 10.08 | NA | 10.08 | 4.80 | NA | NA | NA | NA | NA | 4.82 | NA | |
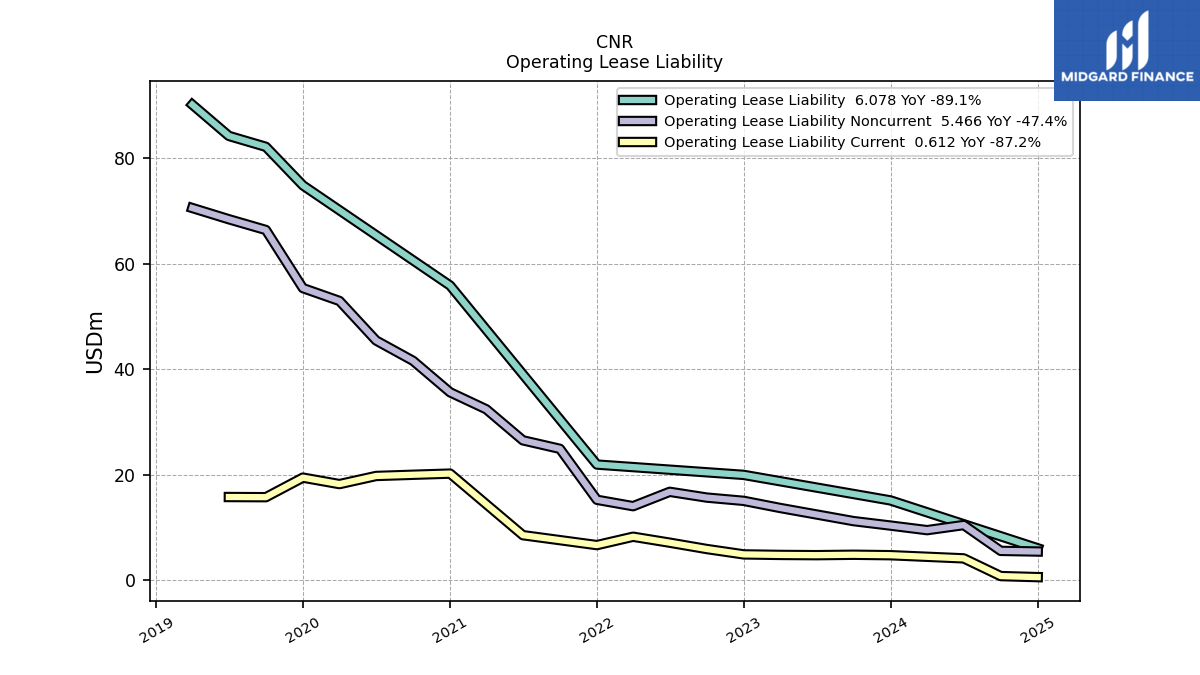
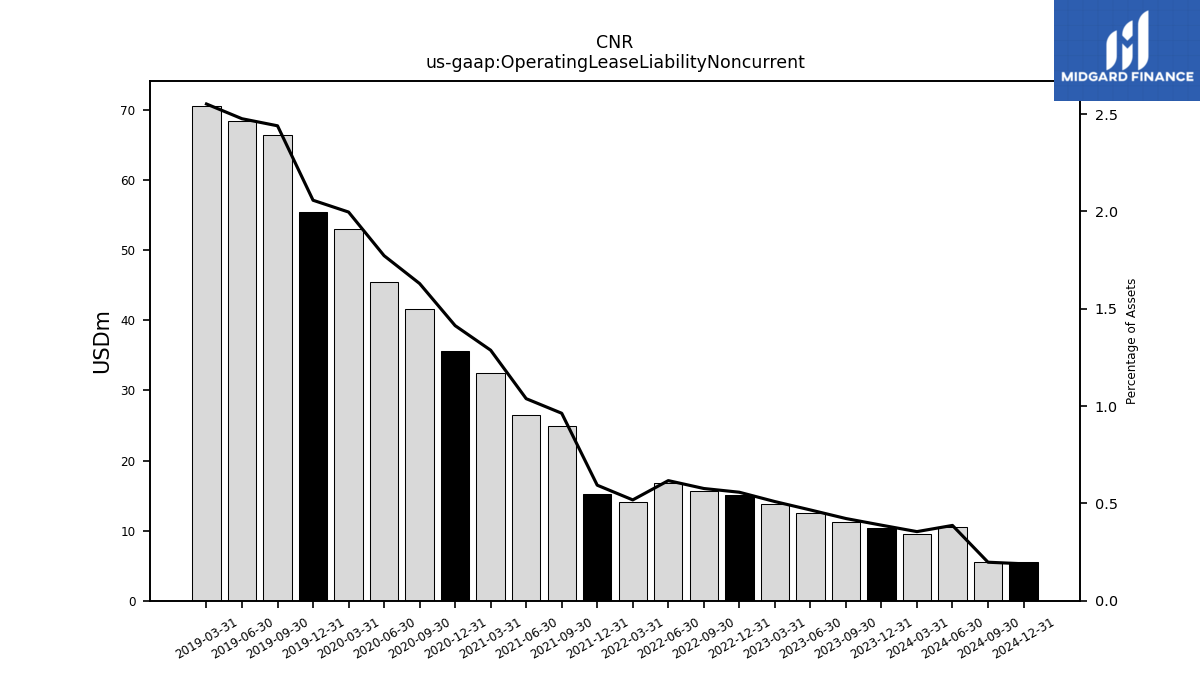
| Operating Lease Liability Noncurrent | 302.34 | 196.14 | NA | 233.80 | 238.13 | 251.06 | 207.57 | 205.53 | 194.67 | 198.88 | 210.45 | 226.37 | 232.66 | 243.78 | 243.62 | 217.97 | 228.01 | NA | 0.00 | NA | NA | NA | NA | NA | NA | NA | NA | NA | NA | NA | NA | NA | NA | NA | NA | NA | NA | NA | NA | NA | NA | NA | NA | NA | NA | NA | NA | NA | NA | NA | NA | NA | NA | NA | NA | NA | NA | NA |
| 2022-12-31 | 2022-10-01 | 2022-07-24 | 2022-07-02 | 2022-04-02 | 2021-12-31 | 2021-10-02 | 2021-07-03 | 2021-04-03 | 2020-12-31 | 2020-10-03 | 2020-07-04 | 2020-04-04 | 2019-12-31 | 2019-09-28 | 2019-06-29 | 2019-03-30 | 2018-12-31 | 2018-10-28 | 2018-07-29 | 2018-04-29 | 2018-01-28 | 2017-10-29 | 2017-07-30 | 2017-04-30 | 2017-01-29 | 2016-10-30 | 2016-07-31 | 2016-05-01 | 2016-01-31 | 2015-11-01 | 2015-08-02 | 2015-05-03 | 2015-02-01 | 2014-11-02 | 2014-08-03 | 2014-05-04 | 2014-02-02 | 2013-11-03 | 2013-07-28 | 2013-04-28 | 2013-01-27 | 2012-10-28 | 2012-07-29 | 2012-07-28 | 2012-04-29 | 2012-04-28 | 2012-01-29 | 2012-01-28 | 2011-10-30 | 2011-07-31 | 2011-07-30 | 2011-05-01 | 2011-04-30 | 2011-01-31 | 2011-01-30 | 2010-10-31 | 2010-08-01 | ||
|---|---|---|---|---|---|---|---|---|---|---|---|---|---|---|---|---|---|---|---|---|---|---|---|---|---|---|---|---|---|---|---|---|---|---|---|---|---|---|---|---|---|---|---|---|---|---|---|---|---|---|---|---|---|---|---|---|---|---|---|
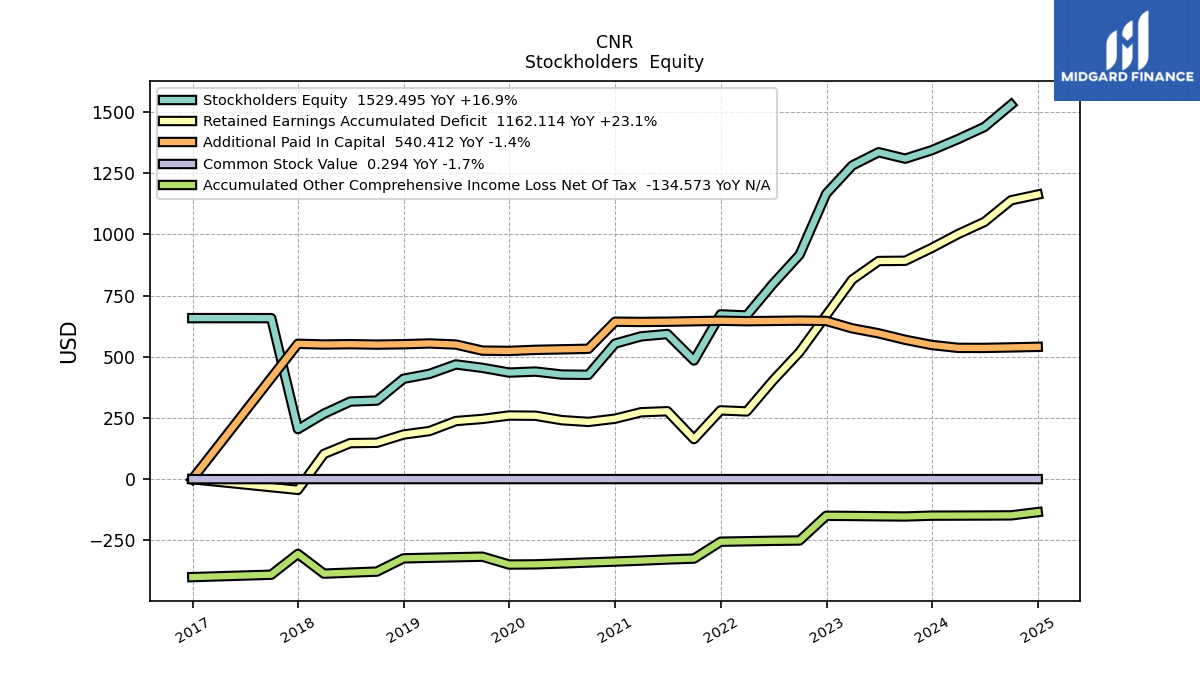
| Stockholders Equity | 1728.94 | 1762.24 | 1750.25 | 1746.85 | 1359.12 | 1176.34 | 1112.06 | 479.25 | 457.65 | 441.81 | 420.29 | 378.21 | 347.89 | 935.32 | 927.88 | 908.20 | 906.29 | 959.98 | 330.26 | 299.09 | 262.32 | 266.31 | 305.25 | 323.77 | 302.87 | 283.10 | 281.32 | 268.57 | 275.51 | 275.22 | 271.98 | 251.01 | 243.07 | 248.12 | 246.54 | 234.36 | 226.13 | 229.67 | 252.76 | 237.73 | -373.40 | -371.47 | -370.53 | -378.84 | NA | -46.80 | NA | -40.79 | NA | -35.69 | -31.21 | NA | NA | NA | NA | NA | -2.71 | NA | |
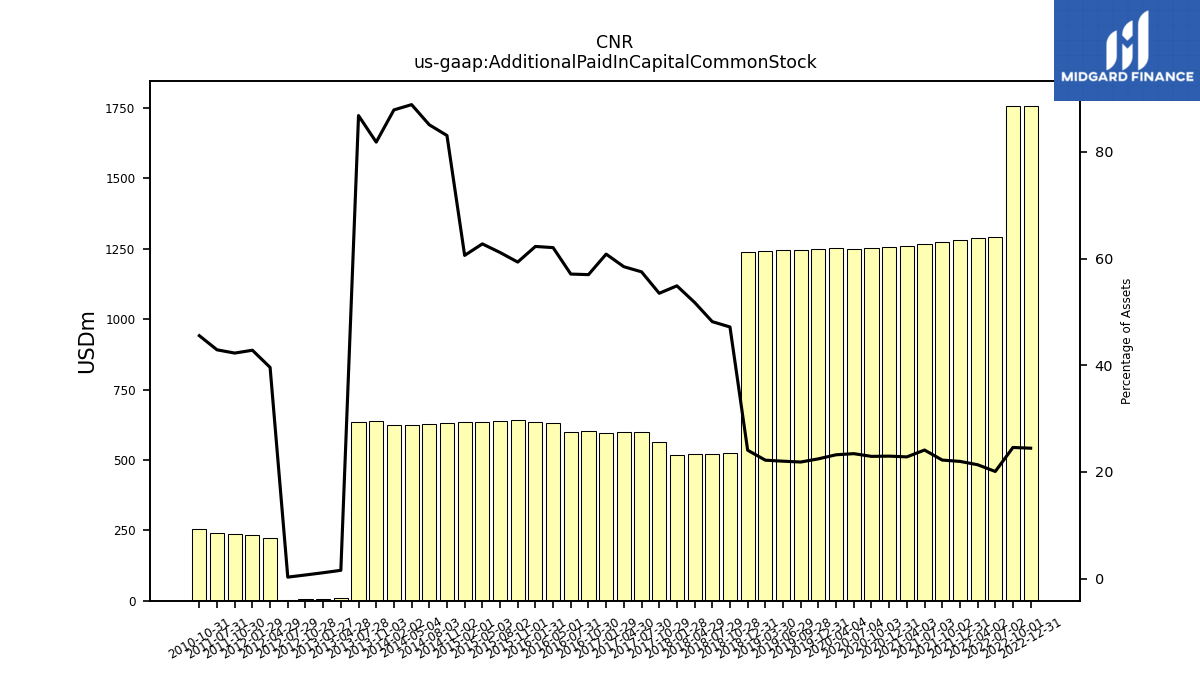
| Additional Paid In Capital Common Stock | 1757.93 | 1755.44 | NA | 1292.46 | 1287.24 | 1279.93 | 1273.00 | 1265.89 | 1260.95 | 1257.26 | 1253.88 | 1249.85 | 1251.25 | 1248.79 | 1247.03 | 1243.90 | 1240.42 | 1237.06 | 523.79 | 521.06 | 521.19 | 519.22 | 562.28 | 600.95 | 598.67 | 595.79 | 603.12 | 600.54 | 630.95 | 633.22 | 640.77 | 639.05 | 636.16 | 633.98 | 630.30 | 627.56 | 625.37 | 623.63 | 638.57 | 634.01 | 11.13 | 7.68 | 4.99 | 1.88 | NA | 222.77 | NA | 233.15 | NA | 237.24 | 240.14 | NA | NA | NA | NA | NA | 255.25 | NA | |
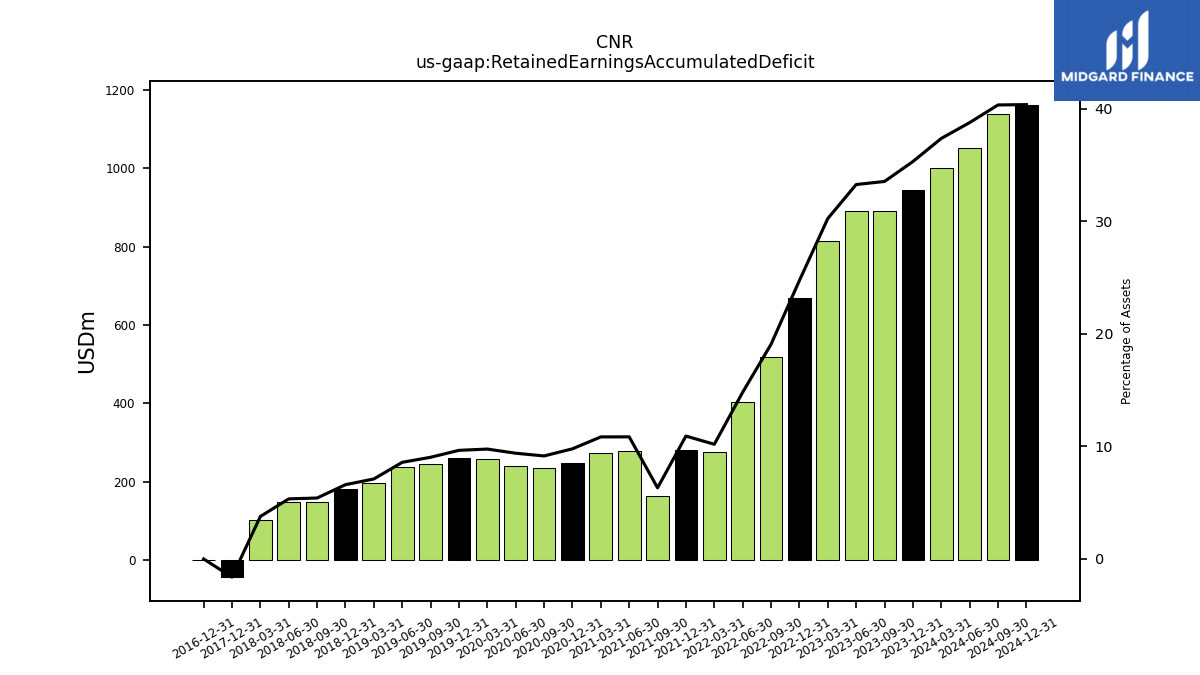
| Retained Earnings Accumulated Deficit | -63.50 | -4.45 | NA | 383.52 | 3.46 | -98.83 | -136.88 | -757.41 | -766.34 | -764.68 | -766.57 | -797.08 | -823.98 | -281.23 | -283.16 | -308.32 | -325.86 | -265.84 | -186.29 | -213.85 | -249.83 | -244.15 | -248.05 | -265.54 | -283.76 | -300.67 | -302.71 | -321.71 | -345.42 | -347.84 | -353.73 | -372.14 | -379.36 | -371.87 | -371.55 | -385.81 | -391.90 | -386.99 | -382.74 | -391.01 | -378.82 | -373.48 | -369.85 | -376.12 | NA | -264.99 | NA | -266.31 | NA | -266.90 | -270.31 | NA | NA | NA | NA | NA | -256.95 | NA | |
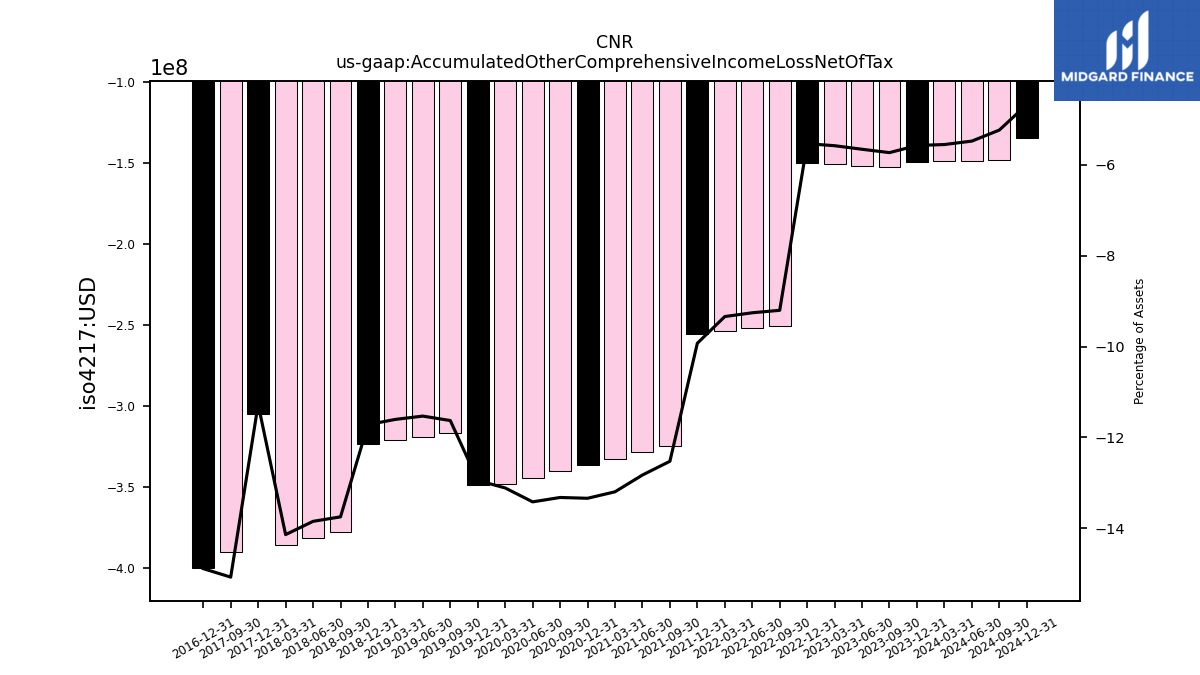
| Accumulated Other Comprehensive Income Loss Net Of Tax | 34.51 | 11.24 | NA | 69.60 | 67.16 | -5.61 | -24.91 | -30.06 | -36.27 | -51.52 | -67.75 | -75.30 | -80.14 | -32.40 | -36.14 | -27.42 | -8.34 | -10.81 | -6.71 | -7.62 | -7.55 | -7.29 | -7.53 | -10.22 | -10.61 | -10.47 | -10.55 | -8.33 | -8.13 | -8.62 | -8.28 | -9.17 | -8.74 | -9.00 | -8.74 | -4.66 | -4.66 | -4.70 | -4.44 | -6.64 | -6.61 | -6.59 | -6.57 | -5.50 | NA | -5.50 | NA | -5.58 | NA | -5.49 | -1.97 | NA | NA | NA | NA | NA | -1.94 | NA | |
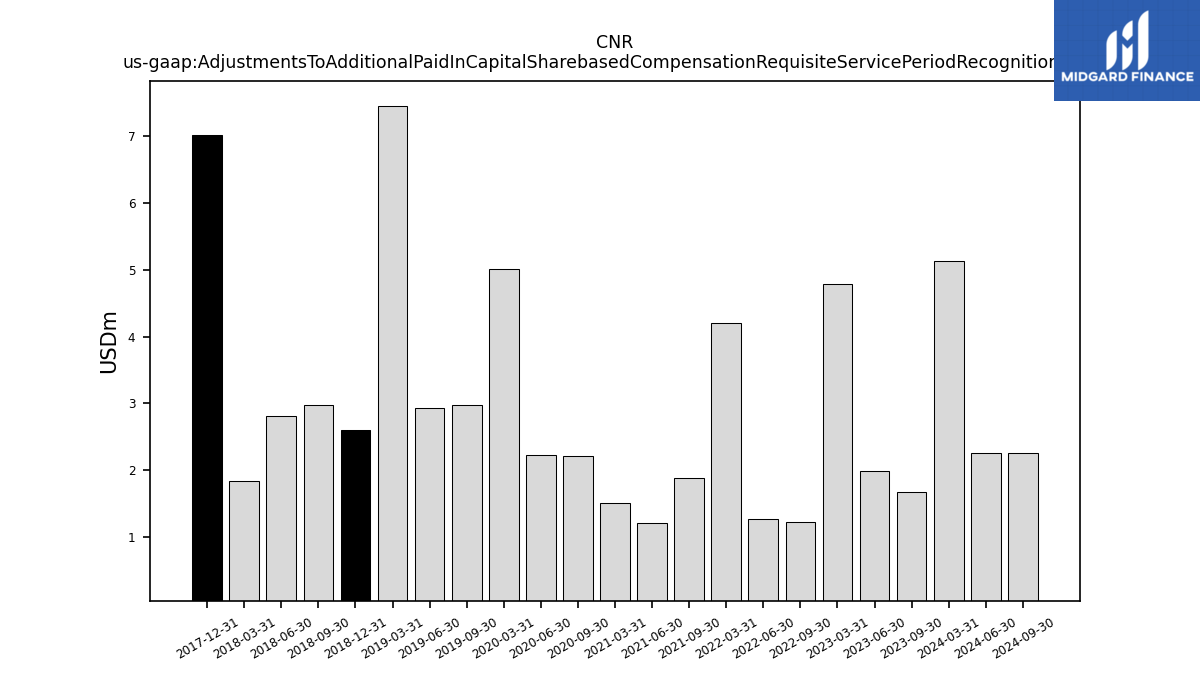
| Adjustments To Additional Paid In Capital Sharebased Compensation Requisite Service Period Recognition Value | NA | NA | 0.94 | 4.71 | 11.45 | 12.06 | 8.35 | 5.29 | 3.30 | 4.49 | 4.03 | 5.16 | 3.39 | 3.46 | 3.13 | 3.47 | 4.00 | 4.46 | 2.73 | 1.04 | 2.00 | 5.87 | 2.08 | 2.28 | 2.82 | 3.04 | 3.18 | 2.66 | 2.47 | 2.58 | 1.68 | NA | NA | 2.93 | 2.02 | 2.40 | 2.56 | 3.18 | NA | 3.45 | 3.44 | 3.44 | NA | NA | NA | NA | NA | NA | NA | NA | NA | NA | NA | NA | NA | NA | NA | NA |
| 2022-12-31 | 2022-10-01 | 2022-07-24 | 2022-07-02 | 2022-04-02 | 2021-12-31 | 2021-10-02 | 2021-07-03 | 2021-04-03 | 2020-12-31 | 2020-10-03 | 2020-07-04 | 2020-04-04 | 2019-12-31 | 2019-09-28 | 2019-06-29 | 2019-03-30 | 2018-12-31 | 2018-10-28 | 2018-07-29 | 2018-04-29 | 2018-01-28 | 2017-10-29 | 2017-07-30 | 2017-04-30 | 2017-01-29 | 2016-10-30 | 2016-07-31 | 2016-05-01 | 2016-01-31 | 2015-11-01 | 2015-08-02 | 2015-05-03 | 2015-02-01 | 2014-11-02 | 2014-08-03 | 2014-05-04 | 2014-02-02 | 2013-11-03 | 2013-07-28 | 2013-04-28 | 2013-01-27 | 2012-10-28 | 2012-07-29 | 2012-07-28 | 2012-04-29 | 2012-04-28 | 2012-01-29 | 2012-01-28 | 2011-10-30 | 2011-07-31 | 2011-07-30 | 2011-05-01 | 2011-04-30 | 2011-01-31 | 2011-01-30 | 2010-10-31 | 2010-08-01 | ||
|---|---|---|---|---|---|---|---|---|---|---|---|---|---|---|---|---|---|---|---|---|---|---|---|---|---|---|---|---|---|---|---|---|---|---|---|---|---|---|---|---|---|---|---|---|---|---|---|---|---|---|---|---|---|---|---|---|---|---|---|
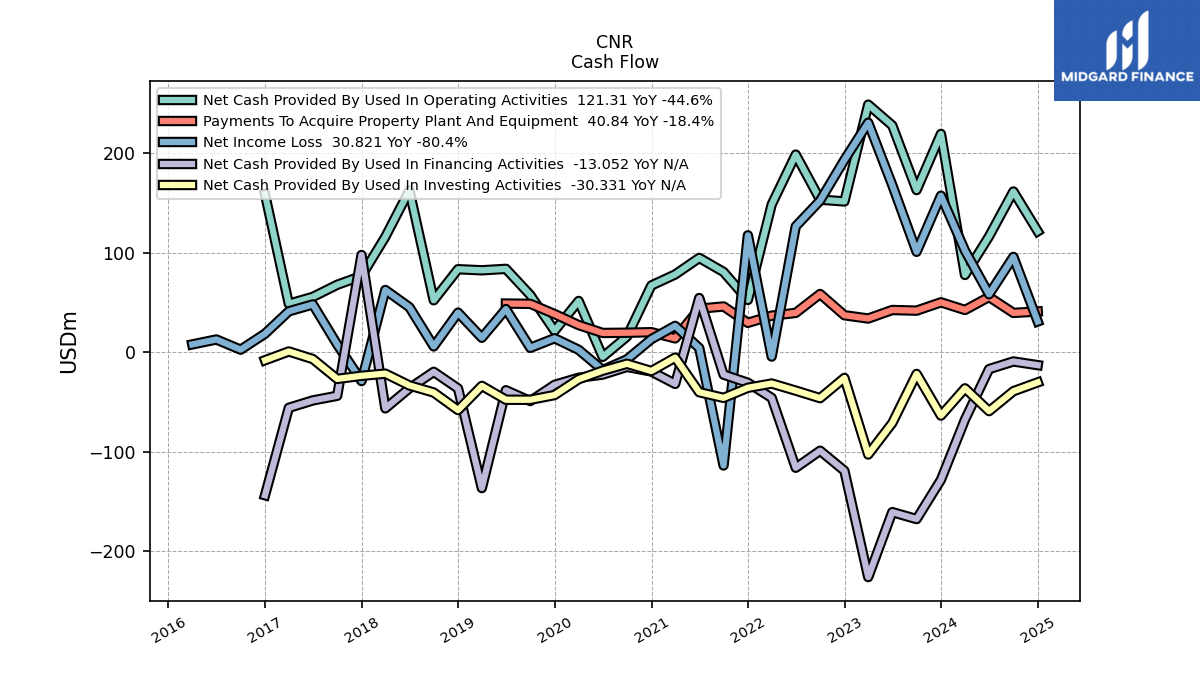
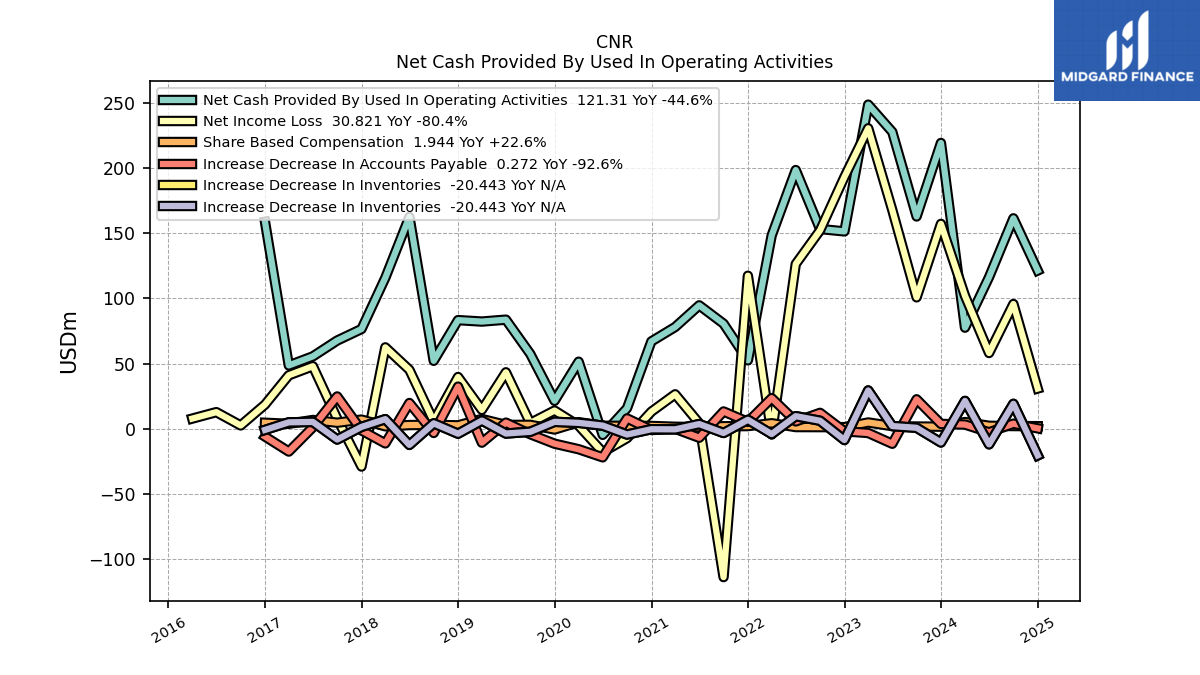
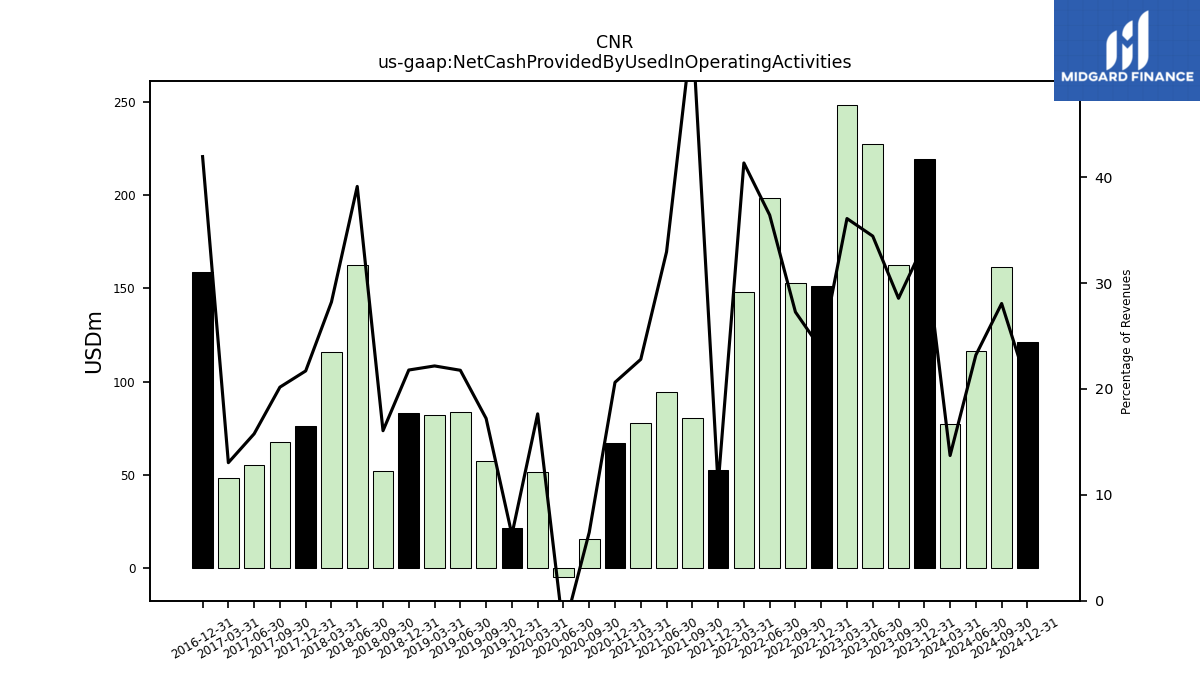
| Net Cash Provided By Used In Operating Activities | 209.09 | -31.79 | 160.56 | 103.66 | 190.11 | -32.25 | -171.92 | -31.75 | 20.03 | 71.54 | 169.91 | 69.19 | -2.22 | 161.79 | 97.73 | 18.81 | -48.72 | 11.10 | 25.55 | NA | NA | NA | NA | NA | NA | NA | NA | NA | NA | NA | NA | NA | NA | NA | NA | NA | NA | NA | NA | -4.72 | 8.75 | -13.17 | NA | 10.26 | NA | 14.19 | NA | -4.21 | NA | 35.99 | NA | NA | NA | NA | NA | -0.33 | 27.05 | NA | |
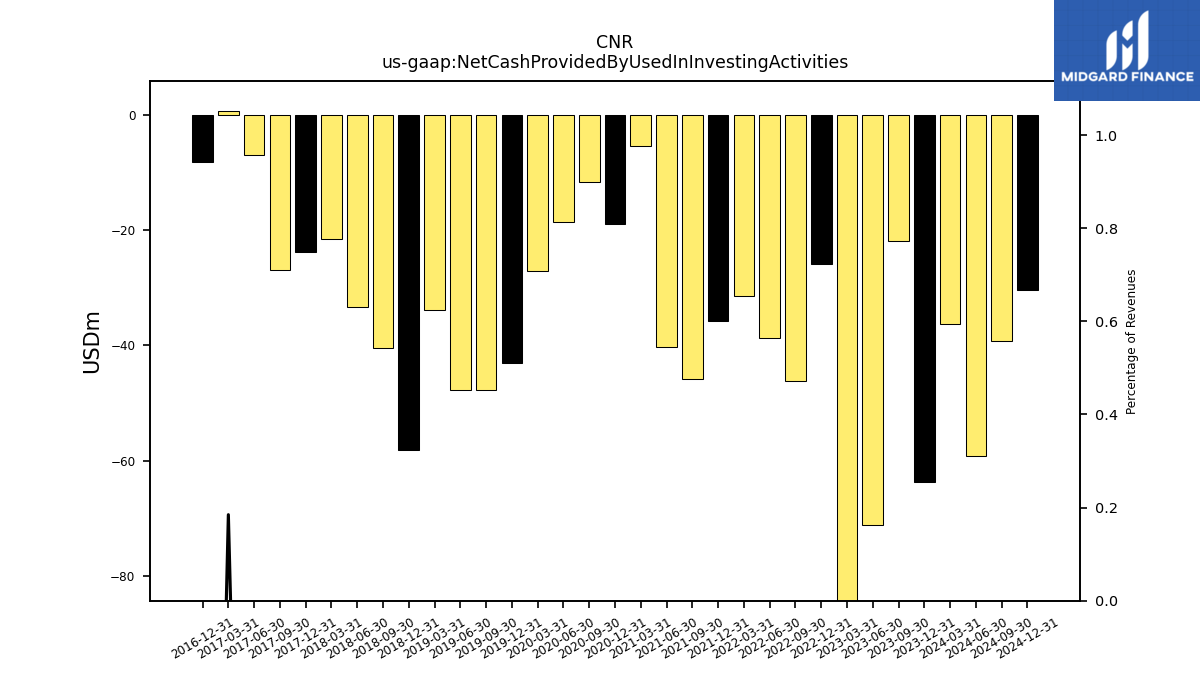
| Net Cash Provided By Used In Investing Activities | -61.24 | -24.40 | 485.27 | 490.05 | -28.91 | -236.26 | 927.04 | -120.62 | -20.70 | -17.29 | -13.50 | -21.91 | -67.42 | -30.08 | -29.14 | -25.92 | -209.61 | 73.49 | -12.96 | NA | NA | NA | NA | NA | NA | NA | NA | NA | NA | NA | NA | NA | NA | NA | NA | NA | NA | NA | NA | -4.83 | -6.64 | -6.07 | NA | -149.36 | NA | -8.12 | NA | -5.75 | NA | -6.30 | NA | NA | NA | NA | NA | -2.21 | -2.77 | NA | |
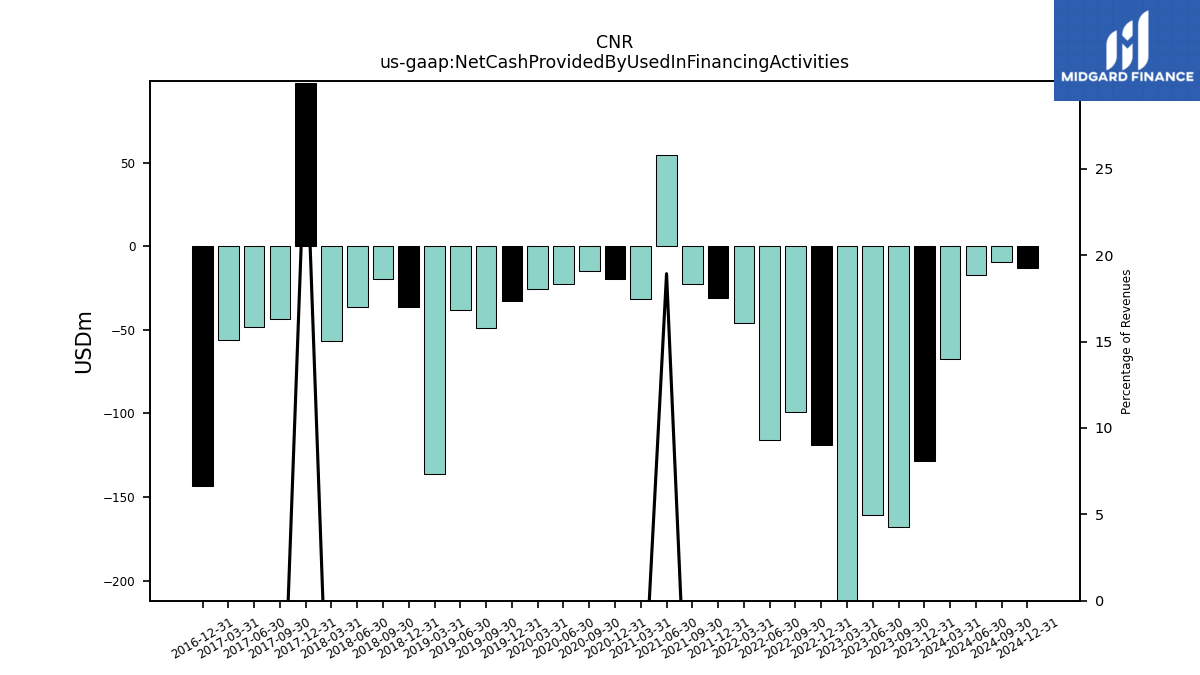
| Net Cash Provided By Used In Financing Activities | -29.52 | -598.43 | -80.59 | -16.55 | -13.50 | -14.86 | -171.02 | -423.90 | -7.46 | -7.32 | -13.32 | -42.97 | 453.27 | -139.42 | -50.06 | -6.42 | 213.44 | 9.16 | -1.64 | -2.29 | -10.62 | -41.03 | -37.62 | -0.96 | 0.27 | -13.70 | -17.25 | -43.55 | -16.45 | -15.49 | NA | NA | NA | NA | NA | NA | NA | NA | NA | -1.81 | -0.37 | -10.06 | NA | 97.57 | NA | 0.99 | NA | -2.32 | NA | -0.42 | NA | NA | NA | NA | NA | -9.65 | -0.51 | NA |
| 2022-12-31 | 2022-10-01 | 2022-07-24 | 2022-07-02 | 2022-04-02 | 2021-12-31 | 2021-10-02 | 2021-07-03 | 2021-04-03 | 2020-12-31 | 2020-10-03 | 2020-07-04 | 2020-04-04 | 2019-12-31 | 2019-09-28 | 2019-06-29 | 2019-03-30 | 2018-12-31 | 2018-10-28 | 2018-07-29 | 2018-04-29 | 2018-01-28 | 2017-10-29 | 2017-07-30 | 2017-04-30 | 2017-01-29 | 2016-10-30 | 2016-07-31 | 2016-05-01 | 2016-01-31 | 2015-11-01 | 2015-08-02 | 2015-05-03 | 2015-02-01 | 2014-11-02 | 2014-08-03 | 2014-05-04 | 2014-02-02 | 2013-11-03 | 2013-07-28 | 2013-04-28 | 2013-01-27 | 2012-10-28 | 2012-07-29 | 2012-07-28 | 2012-04-29 | 2012-04-28 | 2012-01-29 | 2012-01-28 | 2011-10-30 | 2011-07-31 | 2011-07-30 | 2011-05-01 | 2011-04-30 | 2011-01-31 | 2011-01-30 | 2010-10-31 | 2010-08-01 | ||
|---|---|---|---|---|---|---|---|---|---|---|---|---|---|---|---|---|---|---|---|---|---|---|---|---|---|---|---|---|---|---|---|---|---|---|---|---|---|---|---|---|---|---|---|---|---|---|---|---|---|---|---|---|---|---|---|---|---|---|---|
| Net Cash Provided By Used In Operating Activities | 209.09 | -31.79 | 160.56 | 103.66 | 190.11 | -32.25 | -171.92 | -31.75 | 20.03 | 71.54 | 169.91 | 69.19 | -2.22 | 161.79 | 97.73 | 18.81 | -48.72 | 11.10 | 25.55 | NA | NA | NA | NA | NA | NA | NA | NA | NA | NA | NA | NA | NA | NA | NA | NA | NA | NA | NA | NA | -4.72 | 8.75 | -13.17 | NA | 10.26 | NA | 14.19 | NA | -4.21 | NA | 35.99 | NA | NA | NA | NA | NA | -0.33 | 27.05 | NA | |
| Net Income Loss | -59.05 | -4.45 | 1.44 | 380.06 | 102.28 | 38.05 | 620.53 | 8.93 | -1.66 | 1.88 | 30.52 | 26.90 | -542.07 | 1.93 | 25.16 | 17.53 | -60.02 | -76.19 | 27.55 | 35.99 | -5.68 | 5.25 | 17.49 | 18.22 | 16.97 | 2.04 | 19.00 | 23.71 | 2.42 | 5.89 | 18.41 | 7.22 | -7.49 | -0.32 | 14.26 | 6.09 | -4.91 | -4.26 | 8.28 | -12.19 | -5.34 | -3.63 | 6.27 | -3.27 | -3.27 | 1.32 | 1.32 | 0.59 | 0.59 | 3.41 | 2.59 | 2.59 | -3.23 | -3.23 | -12.72 | -12.72 | -5.44 | -3.30 | |
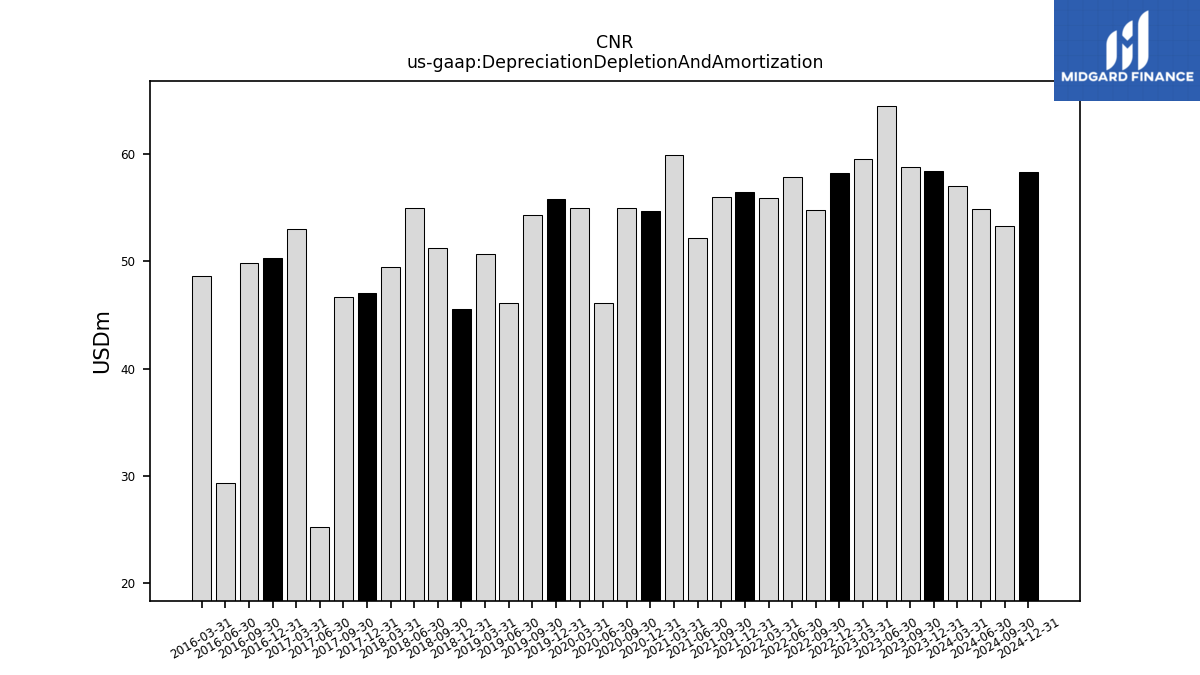
| Depreciation Depletion And Amortization | 73.89 | 56.26 | 18.29 | 73.96 | 73.93 | 75.94 | 71.06 | 73.29 | 72.61 | 72.19 | 71.93 | 70.71 | 69.77 | 72.28 | 64.01 | 67.53 | 59.95 | 30.94 | 11.35 | 10.17 | 10.44 | 10.36 | 10.66 | 10.28 | 10.06 | 10.31 | 9.82 | 10.60 | 10.77 | 10.75 | 13.35 | 14.54 | 13.77 | 9.73 | 9.17 | 8.99 | 8.94 | 8.77 | NA | 9.89 | 9.90 | 10.21 | NA | 7.57 | NA | 7.06 | NA | 7.37 | NA | 7.96 | NA | NA | NA | NA | NA | 8.45 | 8.49 | NA | |
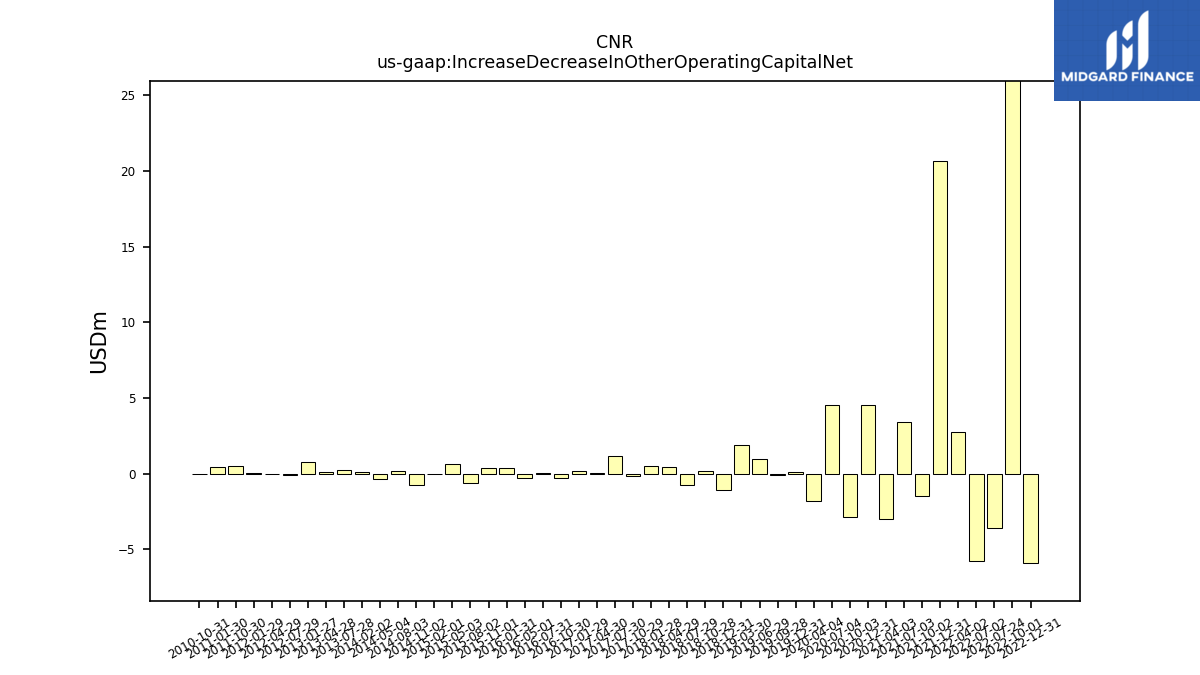
| Increase Decrease In Other Operating Capital Net | -5.92 | 43.48 | -3.59 | -5.76 | 2.74 | 20.65 | -1.44 | 3.41 | -2.96 | 4.53 | -2.89 | 4.56 | -1.80 | 0.12 | -0.08 | 1.00 | 1.87 | -1.08 | 0.21 | -0.75 | 0.42 | 0.52 | -0.12 | 1.16 | 0.03 | 0.16 | -0.28 | 0.06 | -0.29 | 0.35 | 0.37 | -0.64 | 0.64 | -0.01 | -0.75 | 0.18 | -0.34 | 0.13 | NA | 0.26 | 0.12 | 0.79 | NA | -0.08 | NA | 0.00 | NA | 0.05 | NA | 0.51 | NA | NA | NA | NA | NA | 0.45 | -0.04 | NA | |
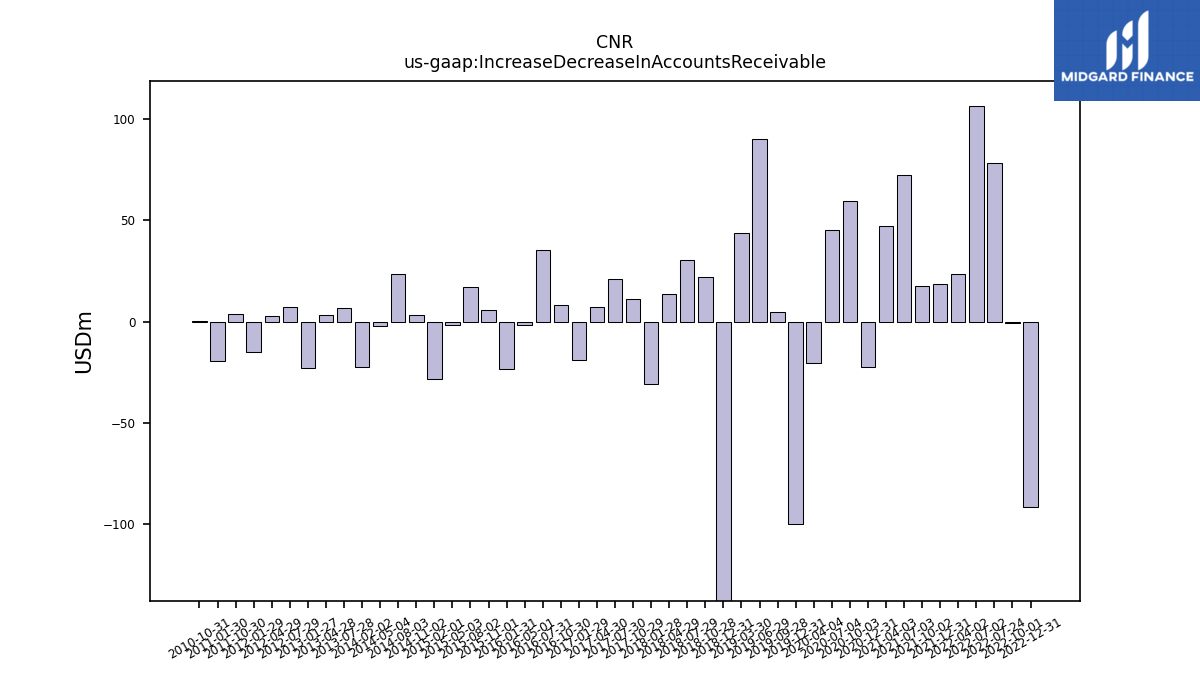
| Increase Decrease In Accounts Receivable | -91.67 | -0.92 | 78.31 | 106.57 | 23.63 | 18.64 | 17.61 | 72.66 | 47.16 | -22.33 | 59.47 | 45.38 | -20.53 | -100.09 | 4.51 | 90.19 | 43.63 | -141.67 | 21.89 | 30.57 | 13.80 | -30.86 | 11.02 | 20.79 | 6.95 | -19.18 | 8.04 | 35.40 | -1.63 | -23.67 | 5.64 | 17.01 | -1.87 | -28.39 | 3.31 | 23.63 | -2.42 | -22.71 | NA | 6.67 | 3.40 | -23.22 | NA | 7.42 | NA | 2.64 | NA | -15.20 | NA | 3.89 | NA | NA | NA | NA | NA | -19.52 | 0.01 | NA | |
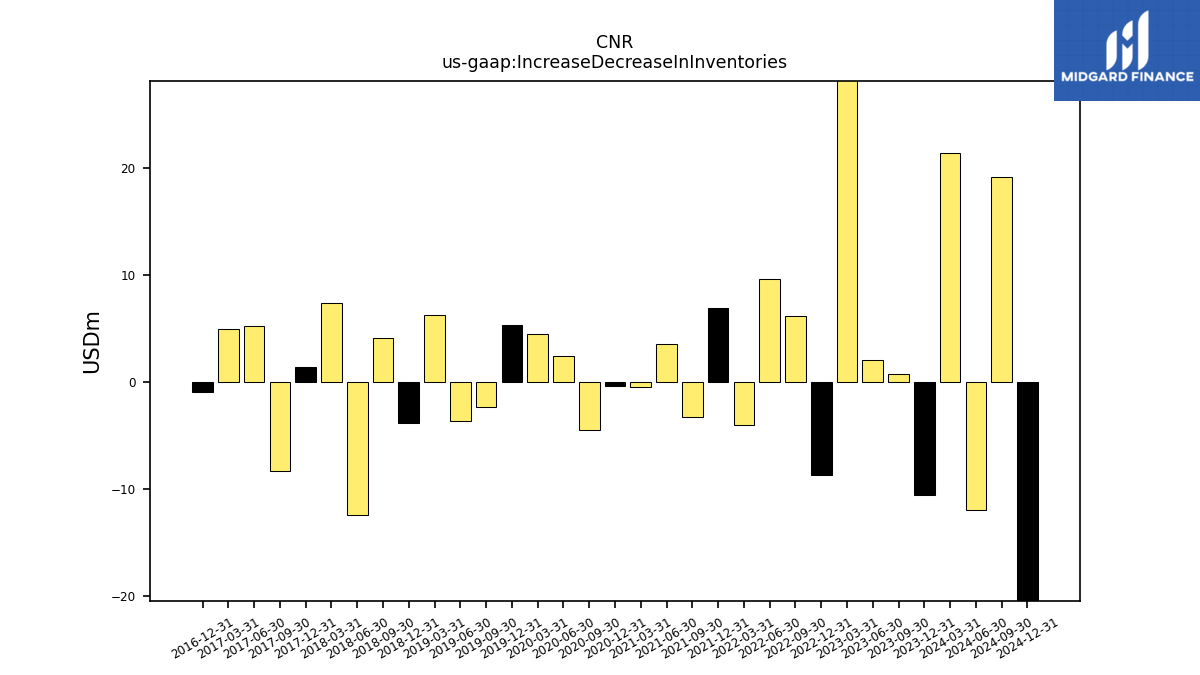
| Increase Decrease In Inventories | -94.29 | -55.46 | -55.90 | -63.54 | 68.86 | 70.17 | 64.99 | 114.05 | 62.03 | 23.05 | 5.89 | -57.60 | 20.72 | -28.50 | -33.90 | -12.73 | -16.70 | -0.10 | -6.35 | 39.96 | 22.68 | 2.24 | -14.44 | 17.29 | 3.69 | 4.93 | 3.75 | 31.86 | 0.91 | -7.47 | -6.51 | 3.57 | -7.68 | 6.02 | -5.08 | 0.33 | -1.38 | 15.52 | NA | 9.42 | 12.01 | 7.75 | NA | -2.04 | NA | 4.85 | NA | 13.52 | NA | -27.79 | NA | NA | NA | NA | NA | 2.06 | -23.93 | NA | |
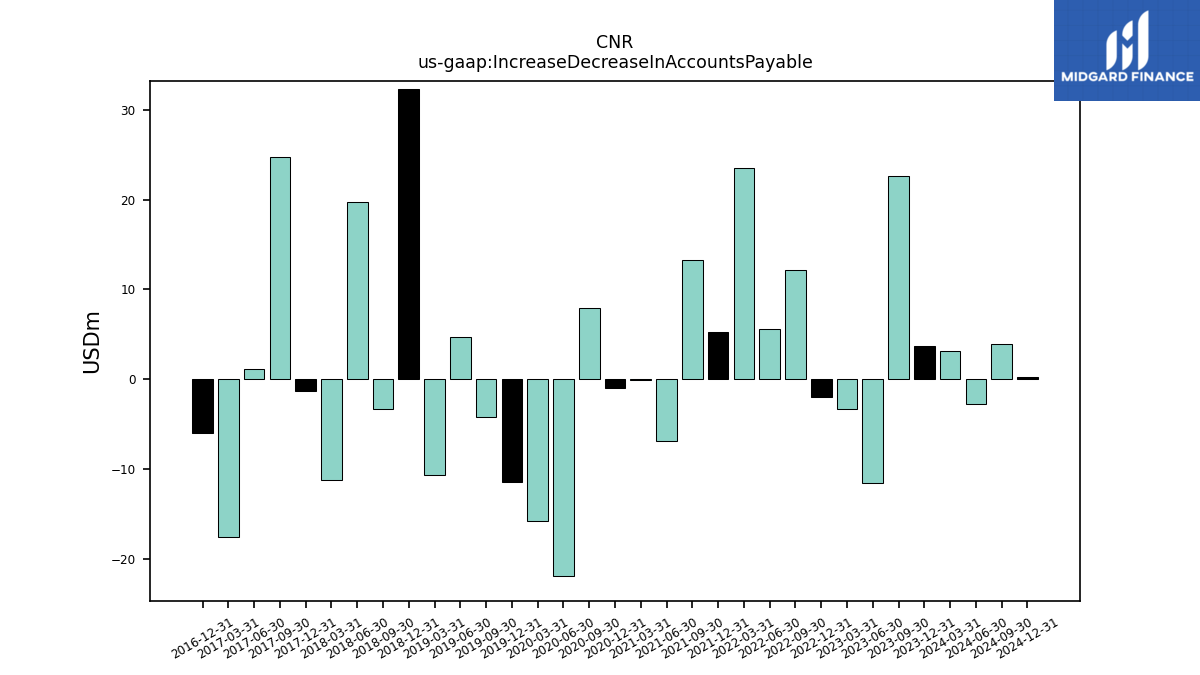
| Increase Decrease In Accounts Payable | -52.74 | 12.64 | -20.68 | -62.26 | 84.73 | -28.14 | 26.77 | 24.20 | 49.42 | -18.01 | 30.49 | -20.28 | 12.46 | -29.63 | -6.59 | 22.30 | -7.22 | -88.49 | -10.10 | 21.88 | 43.89 | -31.20 | 27.07 | -0.47 | 8.46 | -30.20 | -2.10 | 25.13 | 10.99 | -35.62 | 10.98 | 25.54 | -7.09 | -17.95 | 2.97 | 14.24 | -4.26 | -39.34 | NA | 9.86 | 13.54 | -28.97 | NA | -0.17 | NA | 5.94 | NA | -8.84 | NA | -3.68 | NA | NA | NA | NA | NA | -6.99 | -0.50 | NA | |
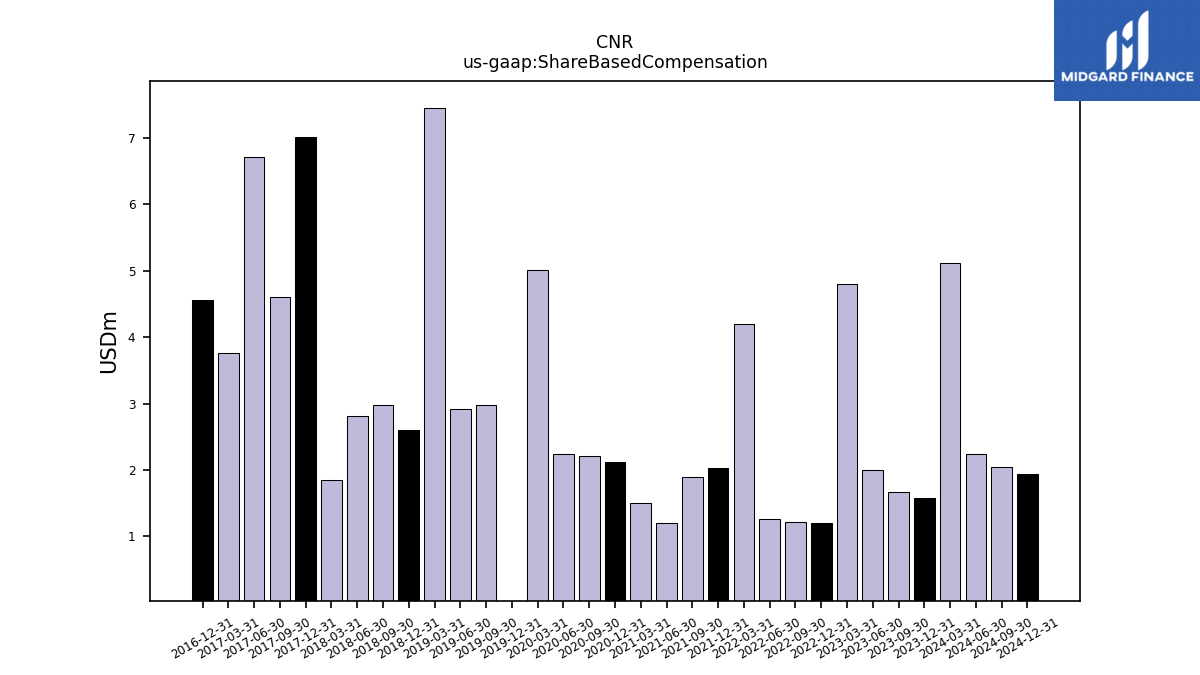
| Share Based Compensation | -6.51 | 8.84 | 5.65 | 4.71 | 11.45 | 12.06 | 8.35 | 5.29 | 3.30 | 4.49 | 4.03 | 5.16 | 3.39 | 3.46 | 3.13 | 3.47 | 4.00 | 4.46 | 2.73 | 1.04 | 2.00 | 5.87 | 2.08 | 2.28 | 2.82 | 3.04 | 3.18 | 2.66 | 2.47 | 2.58 | 1.68 | 2.57 | 2.20 | 2.93 | 2.02 | 2.40 | 2.56 | 3.18 | NA | 3.45 | 3.44 | 3.44 | NA | 2.09 | NA | 2.12 | NA | 1.97 | NA | 1.78 | NA | NA | NA | NA | NA | 1.69 | 1.38 | NA |
| 2022-12-31 | 2022-10-01 | 2022-07-24 | 2022-07-02 | 2022-04-02 | 2021-12-31 | 2021-10-02 | 2021-07-03 | 2021-04-03 | 2020-12-31 | 2020-10-03 | 2020-07-04 | 2020-04-04 | 2019-12-31 | 2019-09-28 | 2019-06-29 | 2019-03-30 | 2018-12-31 | 2018-10-28 | 2018-07-29 | 2018-04-29 | 2018-01-28 | 2017-10-29 | 2017-07-30 | 2017-04-30 | 2017-01-29 | 2016-10-30 | 2016-07-31 | 2016-05-01 | 2016-01-31 | 2015-11-01 | 2015-08-02 | 2015-05-03 | 2015-02-01 | 2014-11-02 | 2014-08-03 | 2014-05-04 | 2014-02-02 | 2013-11-03 | 2013-07-28 | 2013-04-28 | 2013-01-27 | 2012-10-28 | 2012-07-29 | 2012-07-28 | 2012-04-29 | 2012-04-28 | 2012-01-29 | 2012-01-28 | 2011-10-30 | 2011-07-31 | 2011-07-30 | 2011-05-01 | 2011-04-30 | 2011-01-31 | 2011-01-30 | 2010-10-31 | 2010-08-01 | ||
|---|---|---|---|---|---|---|---|---|---|---|---|---|---|---|---|---|---|---|---|---|---|---|---|---|---|---|---|---|---|---|---|---|---|---|---|---|---|---|---|---|---|---|---|---|---|---|---|---|---|---|---|---|---|---|---|---|---|---|---|
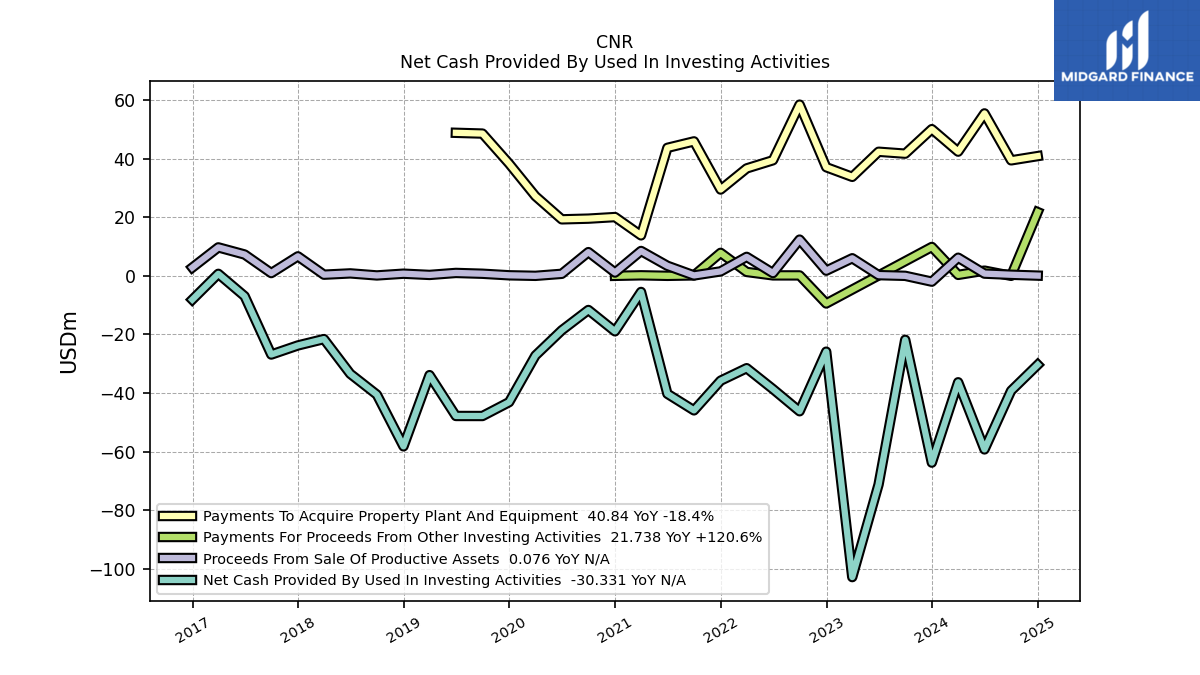
| Net Cash Provided By Used In Investing Activities | -61.24 | -24.40 | 485.27 | 490.05 | -28.91 | -236.26 | 927.04 | -120.62 | -20.70 | -17.29 | -13.50 | -21.91 | -67.42 | -30.08 | -29.14 | -25.92 | -209.61 | 73.49 | -12.96 | NA | NA | NA | NA | NA | NA | NA | NA | NA | NA | NA | NA | NA | NA | NA | NA | NA | NA | NA | NA | -4.83 | -6.64 | -6.07 | NA | -149.36 | NA | -8.12 | NA | -5.75 | NA | -6.30 | NA | NA | NA | NA | NA | -2.21 | -2.77 | NA | |
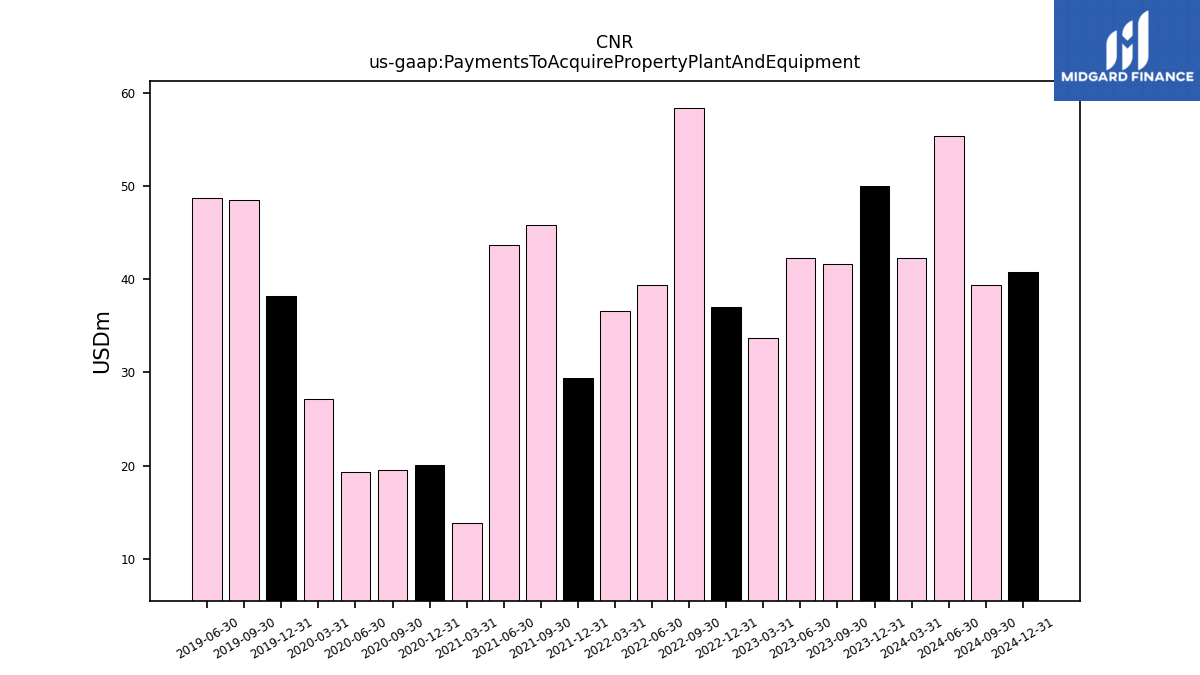
| Payments To Acquire Property Plant And Equipment | 73.61 | 24.40 | 31.54 | 26.90 | 33.31 | 39.53 | 27.54 | 26.41 | 21.23 | 19.32 | 14.93 | 20.04 | 27.57 | 34.72 | 29.14 | 30.03 | 27.19 | 13.59 | 12.96 | 17.97 | 8.79 | 8.11 | 6.45 | 4.07 | 7.44 | 4.12 | 5.88 | 4.86 | 4.51 | 5.77 | 5.35 | 6.02 | 4.30 | 5.00 | 3.49 | 4.53 | 5.27 | 4.74 | NA | 4.83 | 6.64 | 6.07 | NA | 8.39 | NA | 8.13 | NA | 5.77 | NA | 6.30 | NA | NA | NA | NA | NA | 2.25 | 2.77 | NA |
| 2022-12-31 | 2022-10-01 | 2022-07-24 | 2022-07-02 | 2022-04-02 | 2021-12-31 | 2021-10-02 | 2021-07-03 | 2021-04-03 | 2020-12-31 | 2020-10-03 | 2020-07-04 | 2020-04-04 | 2019-12-31 | 2019-09-28 | 2019-06-29 | 2019-03-30 | 2018-12-31 | 2018-10-28 | 2018-07-29 | 2018-04-29 | 2018-01-28 | 2017-10-29 | 2017-07-30 | 2017-04-30 | 2017-01-29 | 2016-10-30 | 2016-07-31 | 2016-05-01 | 2016-01-31 | 2015-11-01 | 2015-08-02 | 2015-05-03 | 2015-02-01 | 2014-11-02 | 2014-08-03 | 2014-05-04 | 2014-02-02 | 2013-11-03 | 2013-07-28 | 2013-04-28 | 2013-01-27 | 2012-10-28 | 2012-07-29 | 2012-07-28 | 2012-04-29 | 2012-04-28 | 2012-01-29 | 2012-01-28 | 2011-10-30 | 2011-07-31 | 2011-07-30 | 2011-05-01 | 2011-04-30 | 2011-01-31 | 2011-01-30 | 2010-10-31 | 2010-08-01 | ||
|---|---|---|---|---|---|---|---|---|---|---|---|---|---|---|---|---|---|---|---|---|---|---|---|---|---|---|---|---|---|---|---|---|---|---|---|---|---|---|---|---|---|---|---|---|---|---|---|---|---|---|---|---|---|---|---|---|---|---|---|
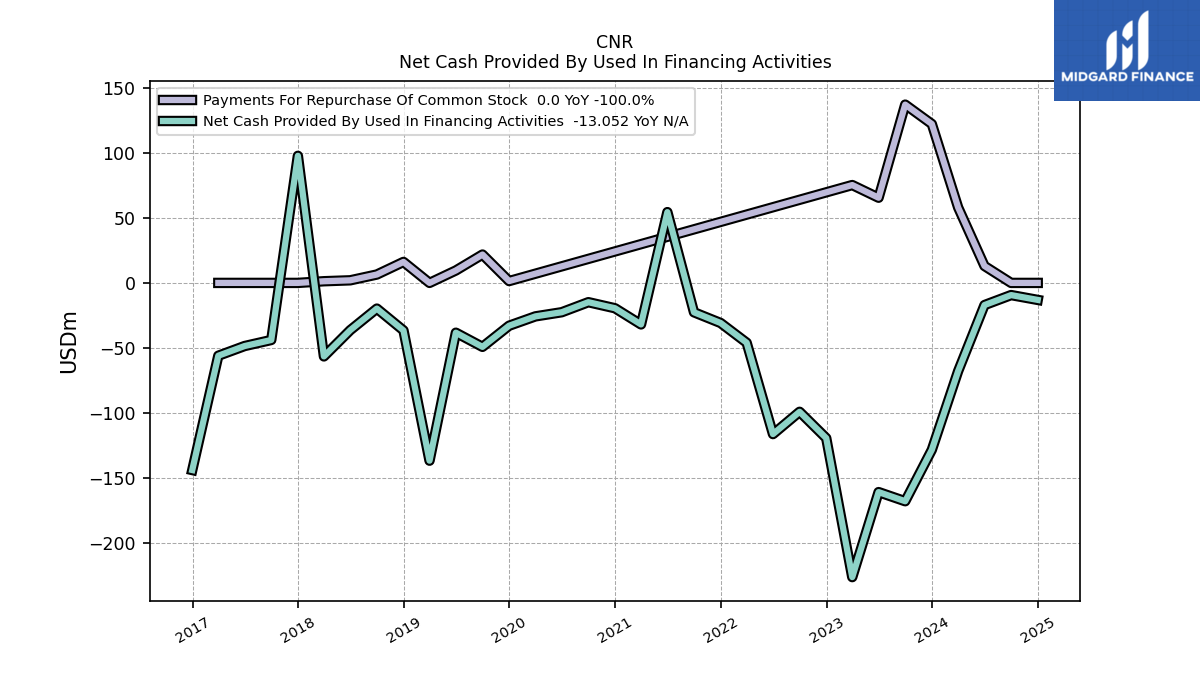
| Net Cash Provided By Used In Financing Activities | -29.52 | -598.43 | -80.59 | -16.55 | -13.50 | -14.86 | -171.02 | -423.90 | -7.46 | -7.32 | -13.32 | -42.97 | 453.27 | -139.42 | -50.06 | -6.42 | 213.44 | 9.16 | -1.64 | -2.29 | -10.62 | -41.03 | -37.62 | -0.96 | 0.27 | -13.70 | -17.25 | -43.55 | -16.45 | -15.49 | NA | NA | NA | NA | NA | NA | NA | NA | NA | -1.81 | -0.37 | -10.06 | NA | 97.57 | NA | 0.99 | NA | -2.32 | NA | -0.42 | NA | NA | NA | NA | NA | -9.65 | -0.51 | NA |
| 2022-12-31 | 2022-10-01 | 2022-07-24 | 2022-07-02 | 2022-04-02 | 2021-12-31 | 2021-10-02 | 2021-07-03 | 2021-04-03 | 2020-12-31 | 2020-10-03 | 2020-07-04 | 2020-04-04 | 2019-12-31 | 2019-09-28 | 2019-06-29 | 2019-03-30 | 2018-12-31 | 2018-10-28 | 2018-07-29 | 2018-04-29 | 2018-01-28 | 2017-10-29 | 2017-07-30 | 2017-04-30 | 2017-01-29 | 2016-10-30 | 2016-07-31 | 2016-05-01 | 2016-01-31 | 2015-11-01 | 2015-08-02 | 2015-05-03 | 2015-02-01 | 2014-11-02 | 2014-08-03 | 2014-05-04 | 2014-02-02 | 2013-11-03 | 2013-07-28 | 2013-04-28 | 2013-01-27 | 2012-10-28 | 2012-07-29 | 2012-07-28 | 2012-04-29 | 2012-04-28 | 2012-01-29 | 2012-01-28 | 2011-10-30 | 2011-07-31 | 2011-07-30 | 2011-05-01 | 2011-04-30 | 2011-01-31 | 2011-01-30 | 2010-10-31 | 2010-08-01 | ||
|---|---|---|---|---|---|---|---|---|---|---|---|---|---|---|---|---|---|---|---|---|---|---|---|---|---|---|---|---|---|---|---|---|---|---|---|---|---|---|---|---|---|---|---|---|---|---|---|---|---|---|---|---|---|---|---|---|---|---|---|
| Revenues | 1469.27 | 1274.88 | 365.44 | 1803.80 | 1566.84 | 1471.58 | 1444.40 | 1400.12 | 1267.03 | 1191.37 | 1227.25 | 1084.94 | 1113.81 | 1244.41 | 1285.04 | 1295.46 | 1064.83 | 559.87 | 573.63 | 548.52 | 457.07 | 421.35 | 488.73 | 469.38 | 420.46 | 391.70 | 480.31 | 462.35 | 372.25 | 370.01 | 459.83 | 420.79 | 360.15 | 322.93 | 392.45 | 361.63 | 305.80 | 310.67 | 400.21 | 317.20 | 293.40 | 297.58 | 361.69 | 298.49 | 298.49 | 250.23 | 250.23 | 243.60 | 243.60 | 281.79 | 262.14 | 262.14 | 225.56 | 225.56 | 190.09 | 190.09 | 241.45 | 245.29 | |
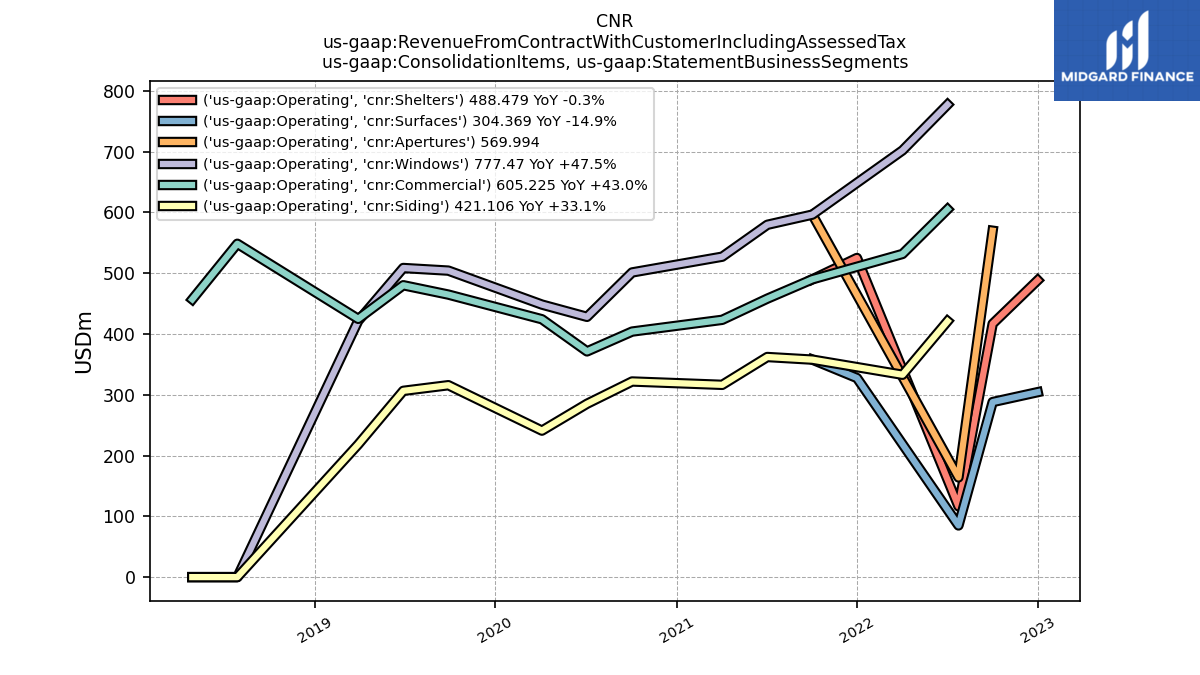
| Revenue From Contract With Customer Including Assessed Tax | 1469.27 | 1274.88 | 365.44 | 1803.80 | 1566.84 | 1471.58 | 1444.40 | 1400.12 | 1267.03 | 1191.37 | 1227.25 | 1084.94 | 1113.81 | 1244.41 | 1285.04 | 1295.46 | 1064.83 | 559.87 | 573.63 | 548.52 | 457.07 | 421.35 | 488.73 | 469.38 | 420.46 | 391.70 | 480.31 | 462.35 | 372.25 | 370.01 | 459.83 | 420.79 | 360.15 | 322.93 | 392.45 | 361.63 | 305.80 | 310.67 | 400.21 | 317.20 | 293.40 | 297.58 | 361.69 | 298.49 | 298.49 | 250.23 | 250.23 | 243.60 | 243.60 | 281.79 | 262.14 | 262.14 | 225.56 | 225.56 | 190.09 | 190.09 | 241.45 | 245.29 | |
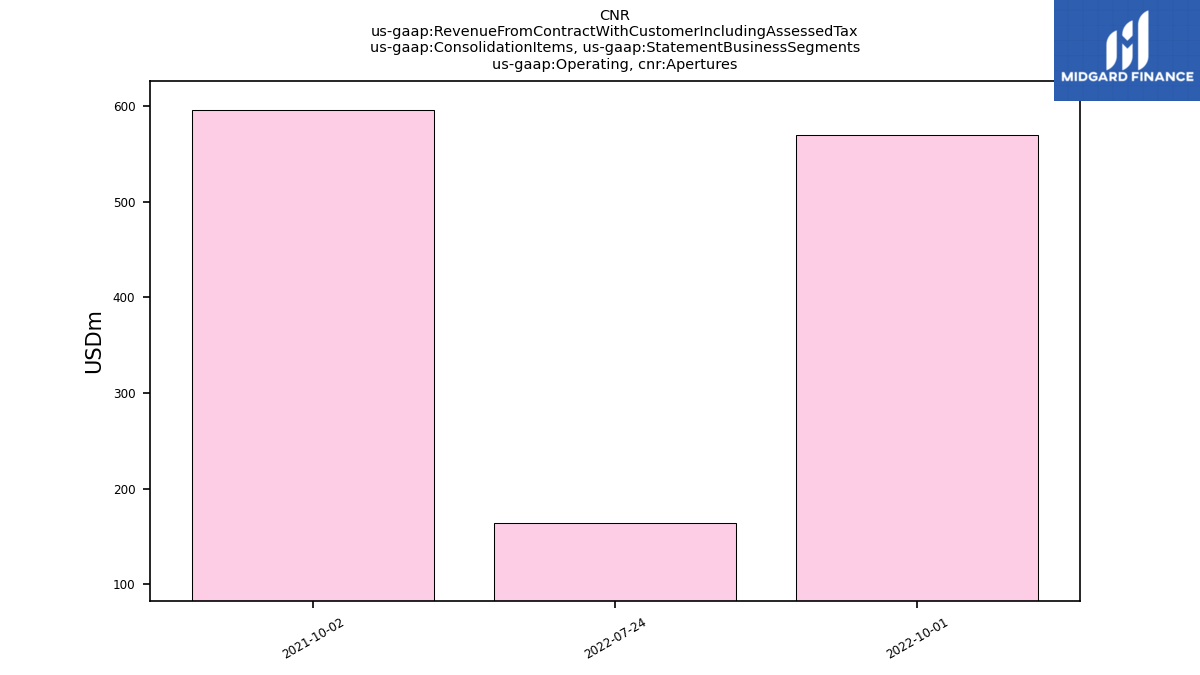
| Operating, Apertures | NA | 569.99 | 164.04 | NA | NA | NA | 596.49 | NA | NA | NA | NA | NA | NA | NA | NA | NA | NA | NA | NA | NA | NA | NA | NA | NA | NA | NA | NA | NA | NA | NA | NA | NA | NA | NA | NA | NA | NA | NA | NA | NA | NA | NA | NA | NA | NA | NA | NA | NA | NA | NA | NA | NA | NA | NA | NA | NA | NA | NA | |
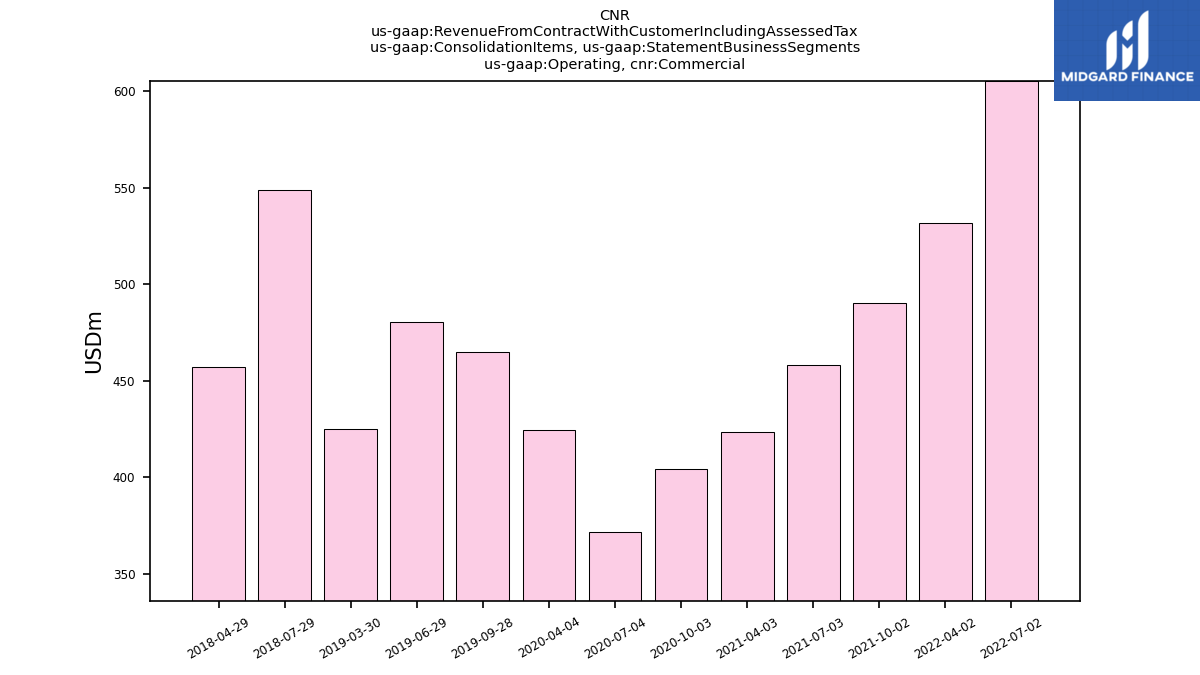
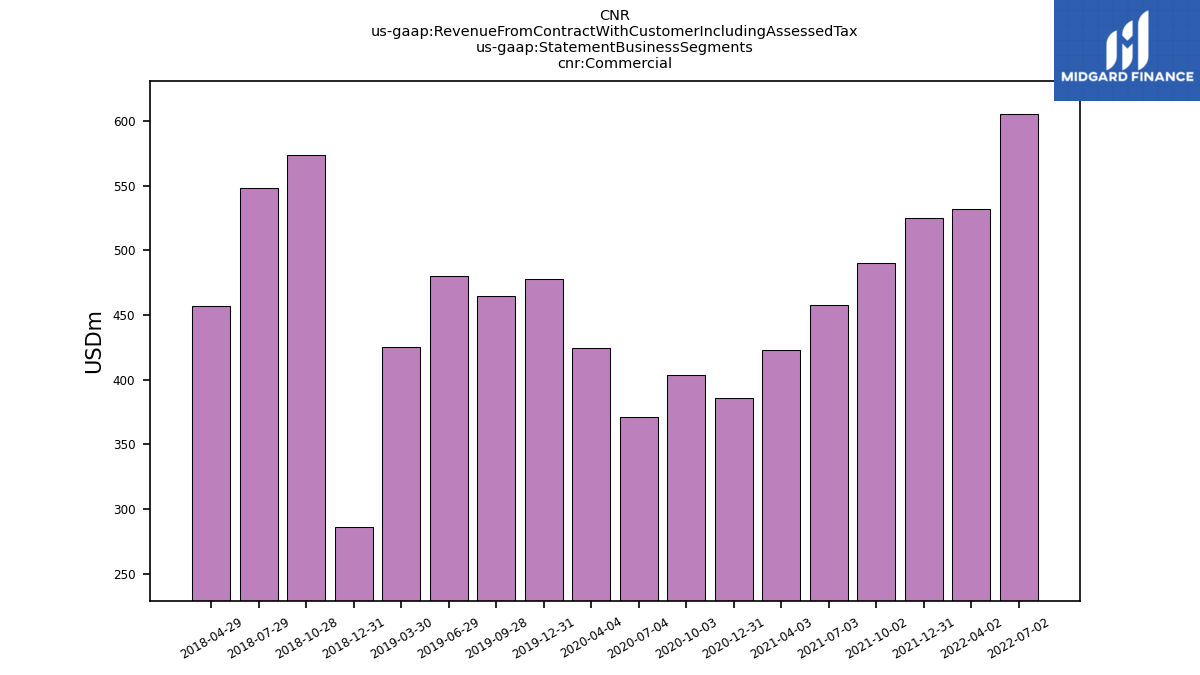
| Operating, Commercial | NA | NA | NA | 605.23 | 531.74 | NA | 490.05 | 458.19 | 423.38 | NA | 404.04 | 371.41 | 424.32 | NA | 464.91 | 480.29 | 424.96 | NA | NA | 548.52 | 457.07 | NA | NA | NA | NA | NA | NA | NA | NA | NA | NA | NA | NA | NA | NA | NA | NA | NA | NA | NA | NA | NA | NA | NA | NA | NA | NA | NA | NA | NA | NA | NA | NA | NA | NA | NA | NA | NA | |
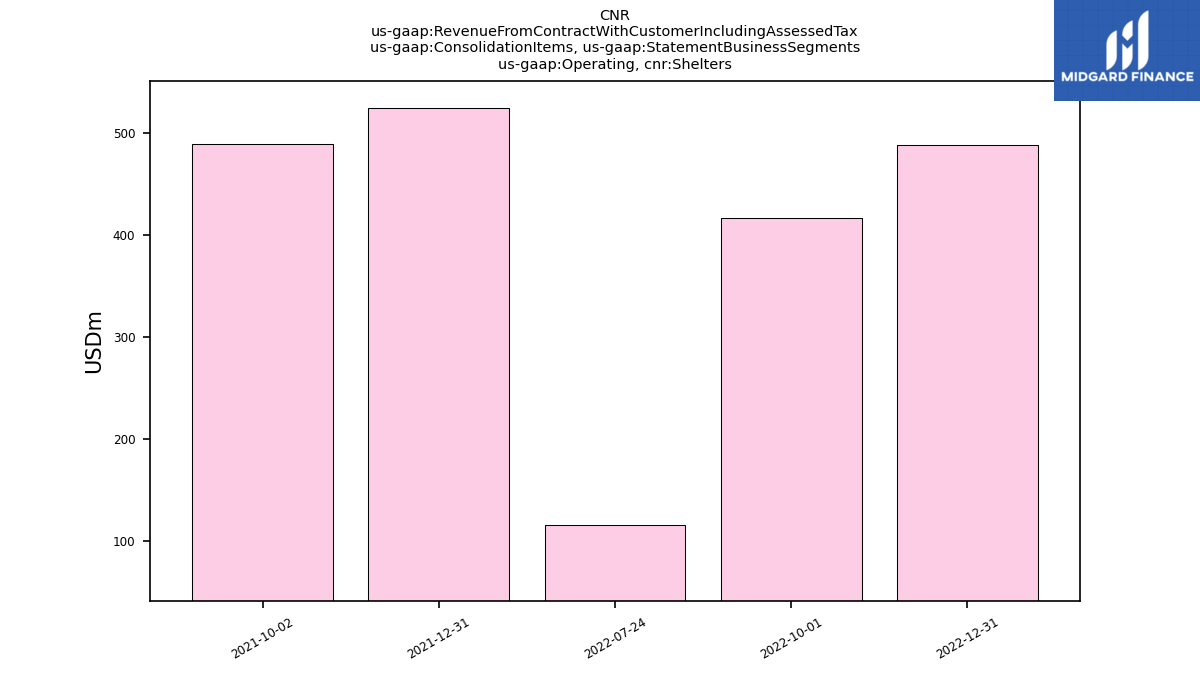
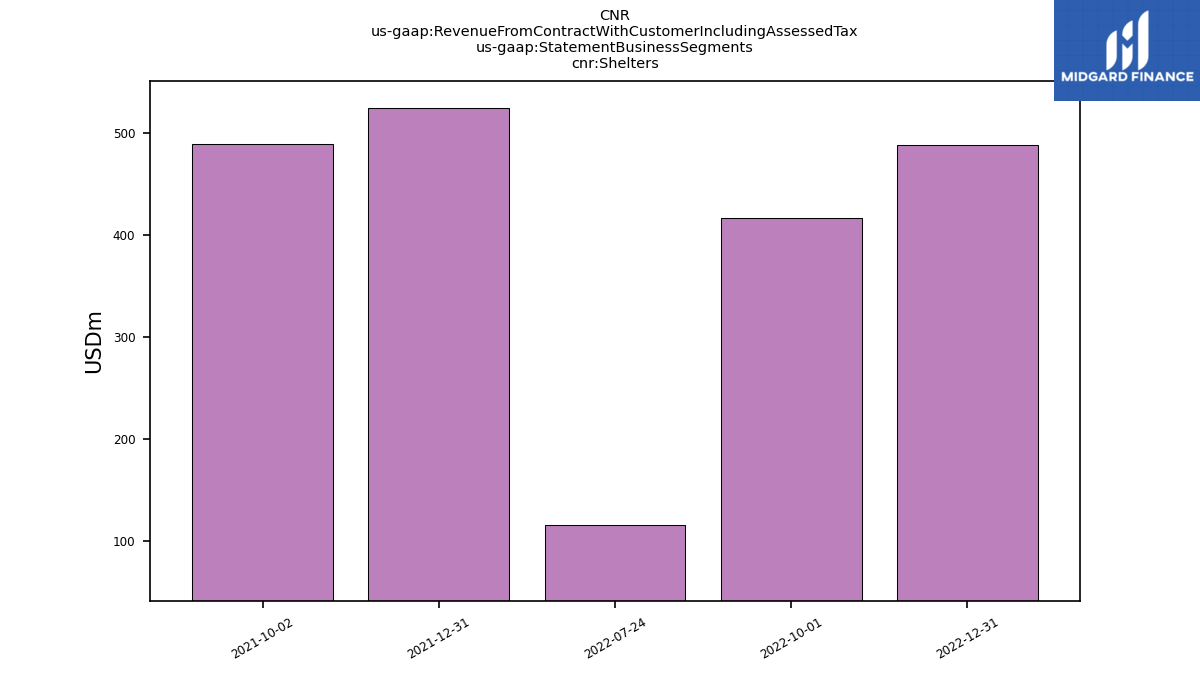
| Operating, Shelters | 488.48 | 416.81 | 116.37 | NA | NA | 525.16 | 490.05 | NA | NA | NA | NA | NA | NA | NA | NA | NA | NA | NA | NA | NA | NA | NA | NA | NA | NA | NA | NA | NA | NA | NA | NA | NA | NA | NA | NA | NA | NA | NA | NA | NA | NA | NA | NA | NA | NA | NA | NA | NA | NA | NA | NA | NA | NA | NA | NA | NA | NA | NA | |
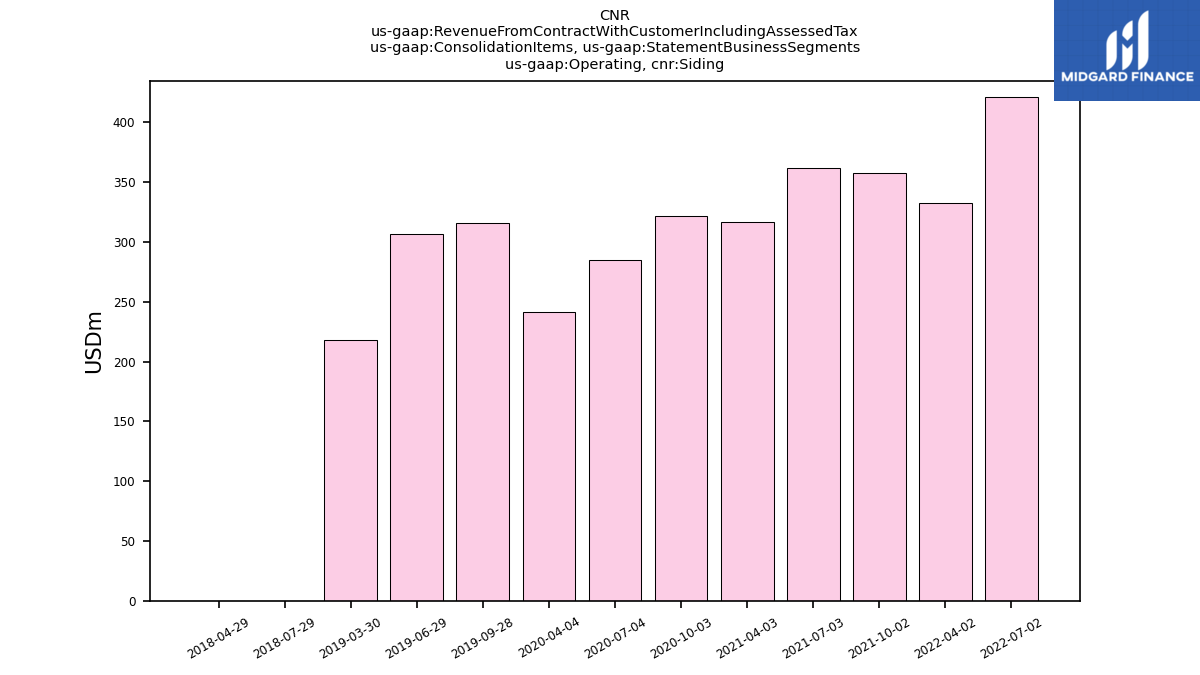
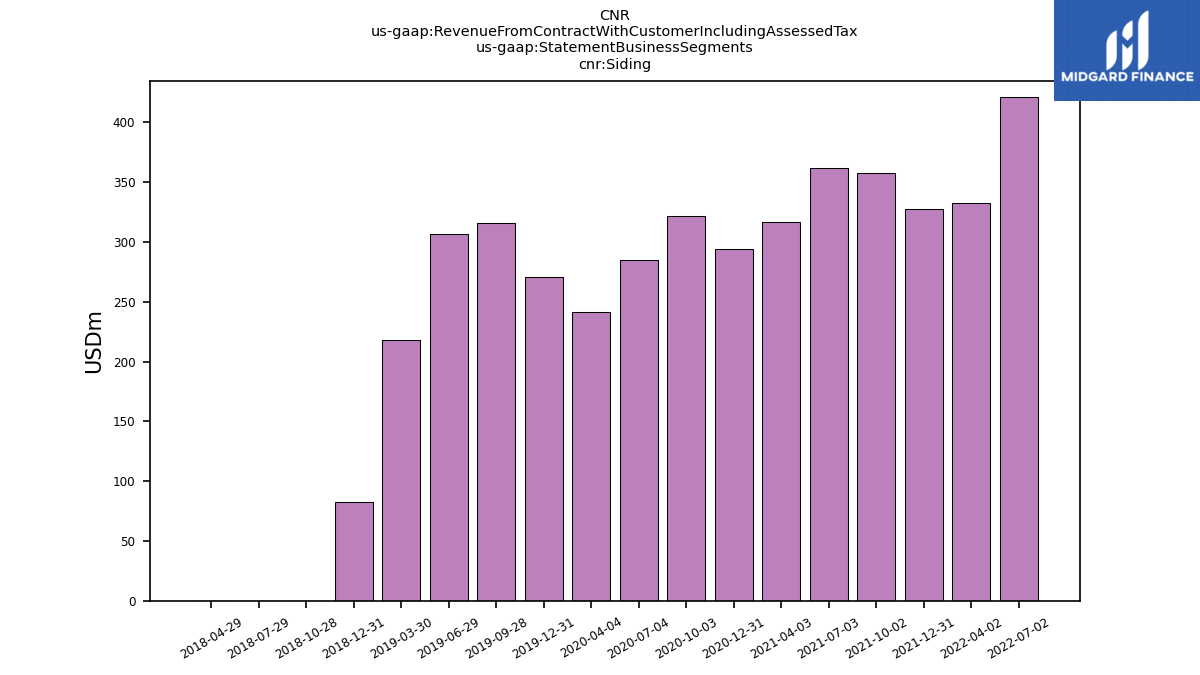
| Operating, Siding | NA | NA | NA | 421.11 | 332.99 | NA | 357.87 | 362.19 | 316.39 | NA | 321.90 | 285.25 | 241.04 | NA | 315.80 | 306.52 | 218.28 | NA | NA | 0.00 | 0.00 | NA | NA | NA | NA | NA | NA | NA | NA | NA | NA | NA | NA | NA | NA | NA | NA | NA | NA | NA | NA | NA | NA | NA | NA | NA | NA | NA | NA | NA | NA | NA | NA | NA | NA | NA | NA | NA | |
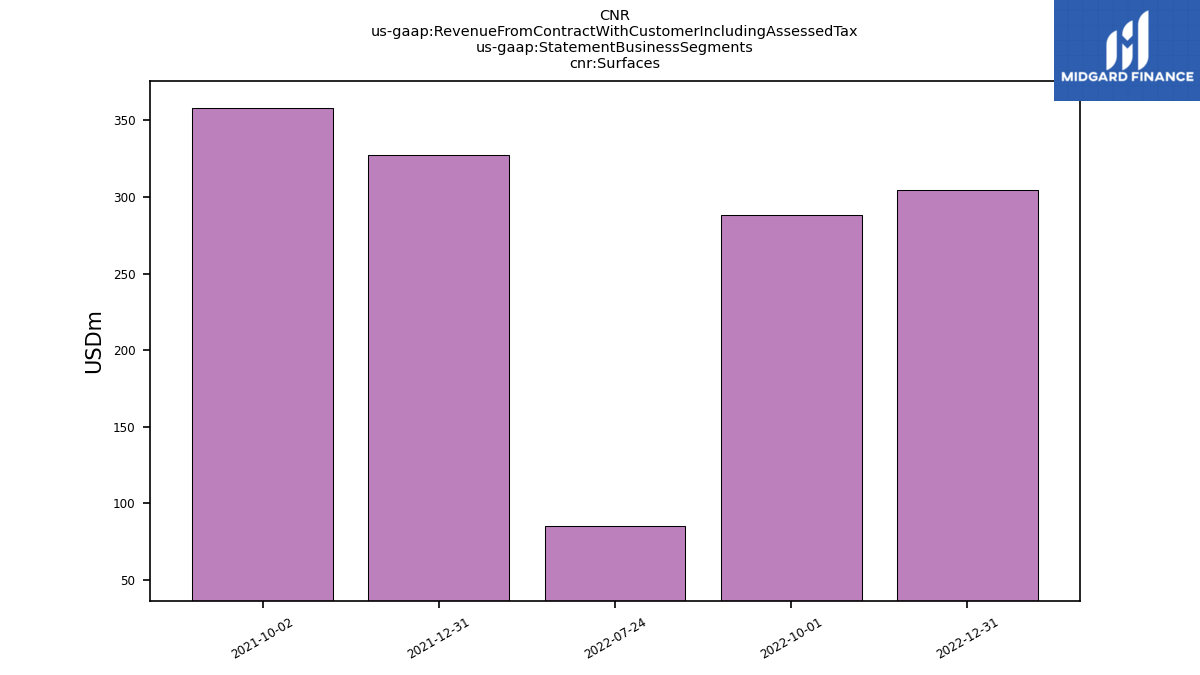
| Operating, Surfaces | 304.37 | 288.08 | 85.03 | NA | NA | 327.63 | 357.87 | NA | NA | NA | NA | NA | NA | NA | NA | NA | NA | NA | NA | NA | NA | NA | NA | NA | NA | NA | NA | NA | NA | NA | NA | NA | NA | NA | NA | NA | NA | NA | NA | NA | NA | NA | NA | NA | NA | NA | NA | NA | NA | NA | NA | NA | NA | NA | NA | NA | NA | NA | |
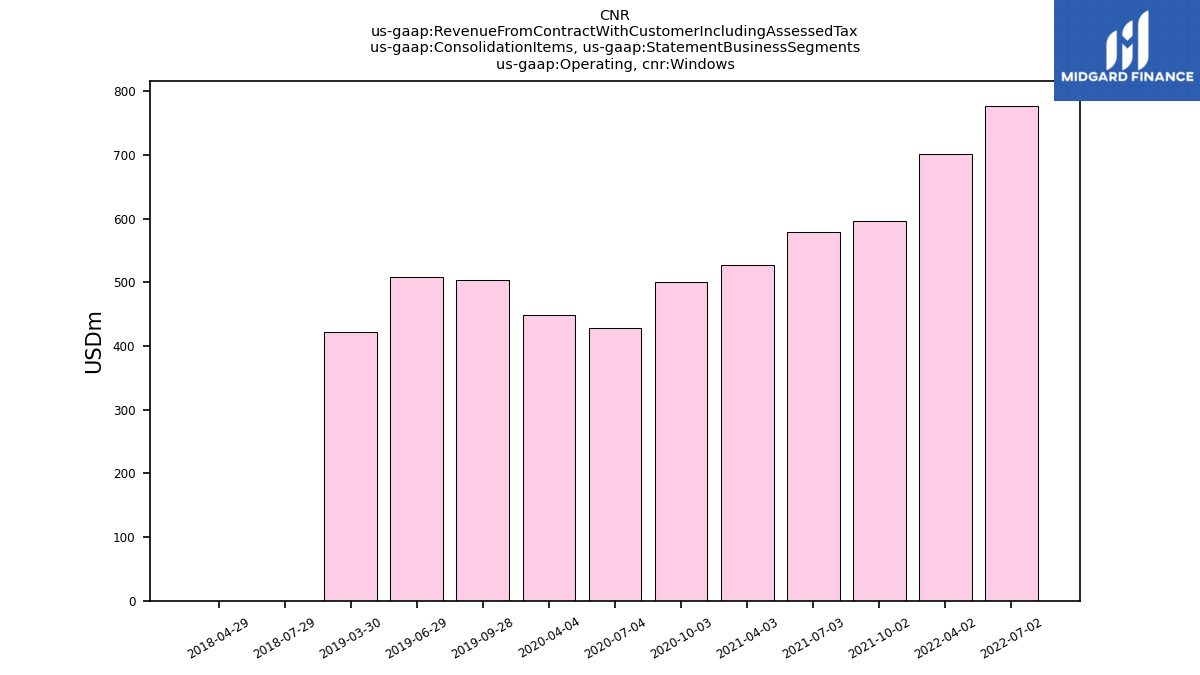
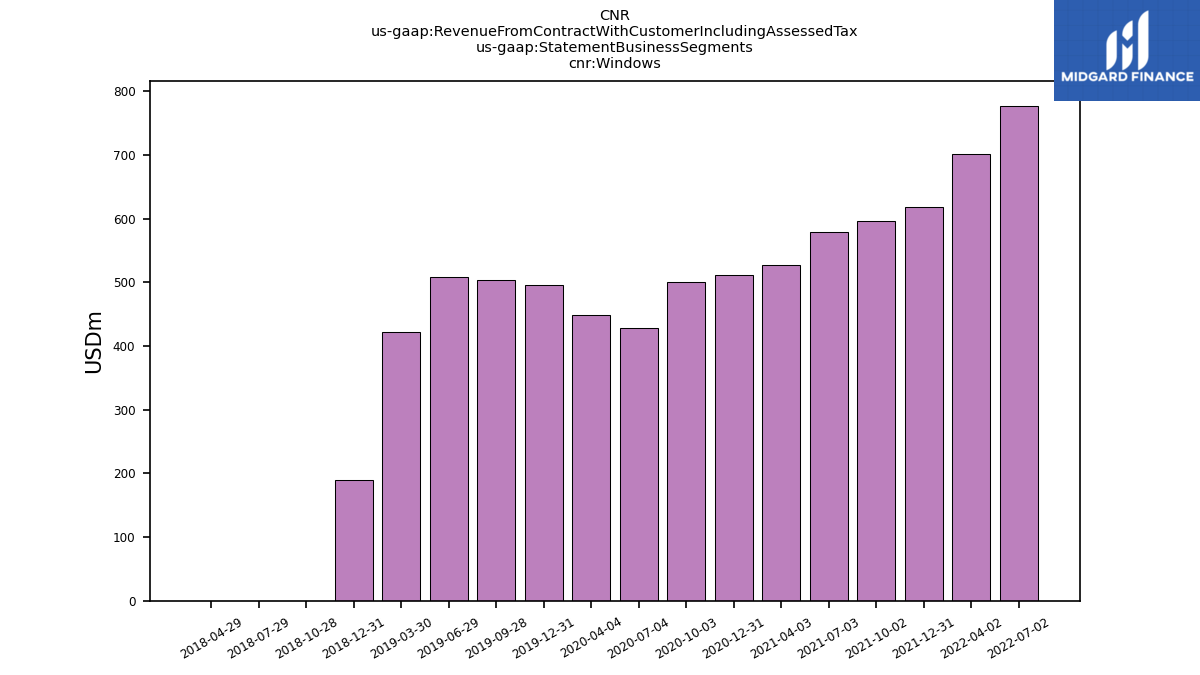
| Operating, Windows | NA | NA | NA | 777.47 | 702.11 | NA | 596.49 | 579.74 | 527.26 | NA | 501.31 | 428.27 | 448.45 | NA | 504.34 | 508.65 | 421.59 | NA | NA | 0.00 | 0.00 | NA | NA | NA | NA | NA | NA | NA | NA | NA | NA | NA | NA | NA | NA | NA | NA | NA | NA | NA | NA | NA | NA | NA | NA | NA | NA | NA | NA | NA | NA | NA | NA | NA | NA | NA | NA | NA | |
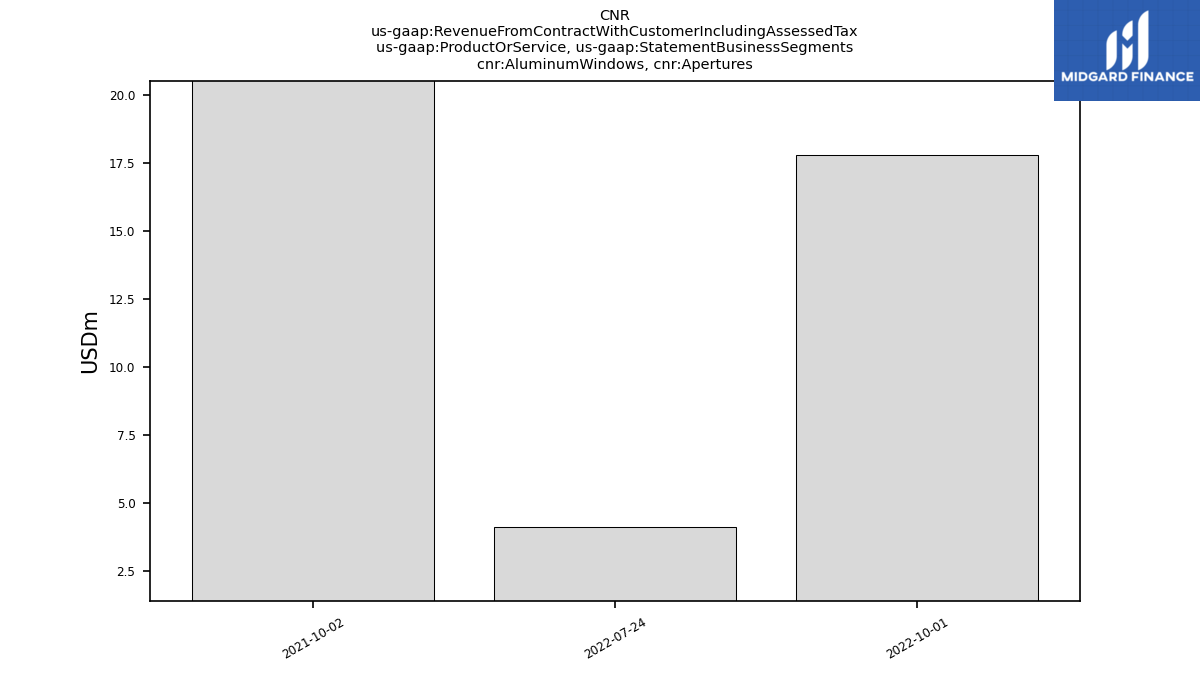
| Aluminum Windows, Apertures | NA | 17.77 | 4.13 | NA | NA | NA | 22.42 | NA | NA | NA | NA | NA | NA | NA | NA | NA | NA | NA | NA | NA | NA | NA | NA | NA | NA | NA | NA | NA | NA | NA | NA | NA | NA | NA | NA | NA | NA | NA | NA | NA | NA | NA | NA | NA | NA | NA | NA | NA | NA | NA | NA | NA | NA | NA | NA | NA | NA | NA | |
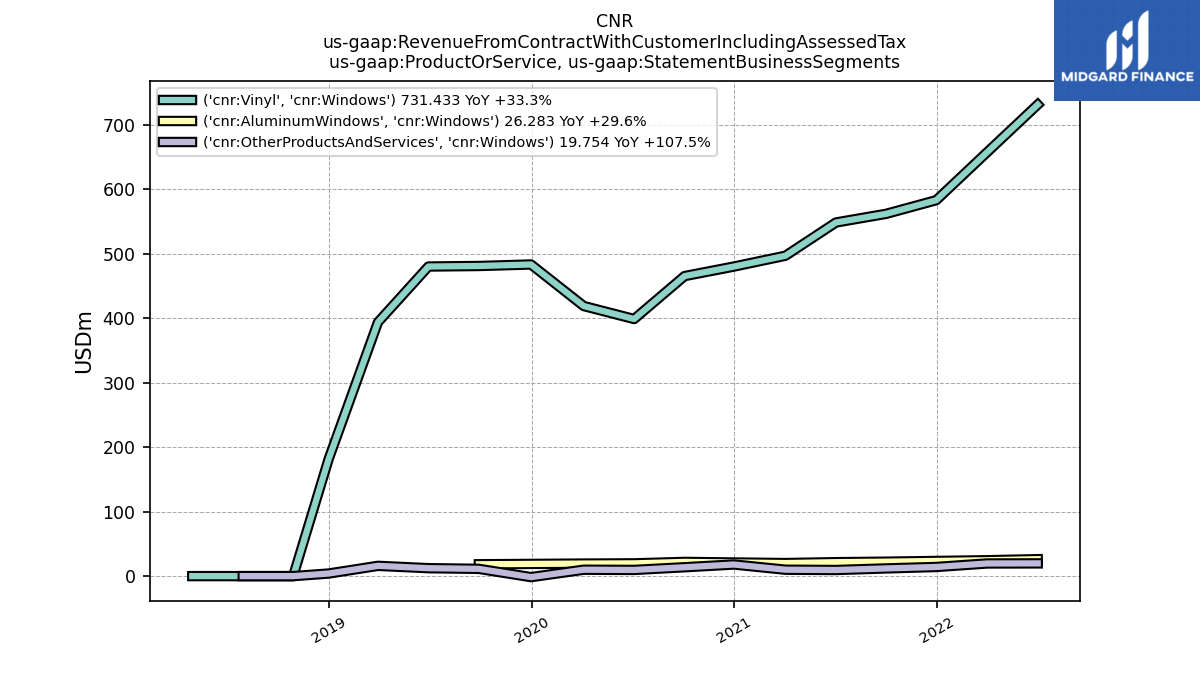
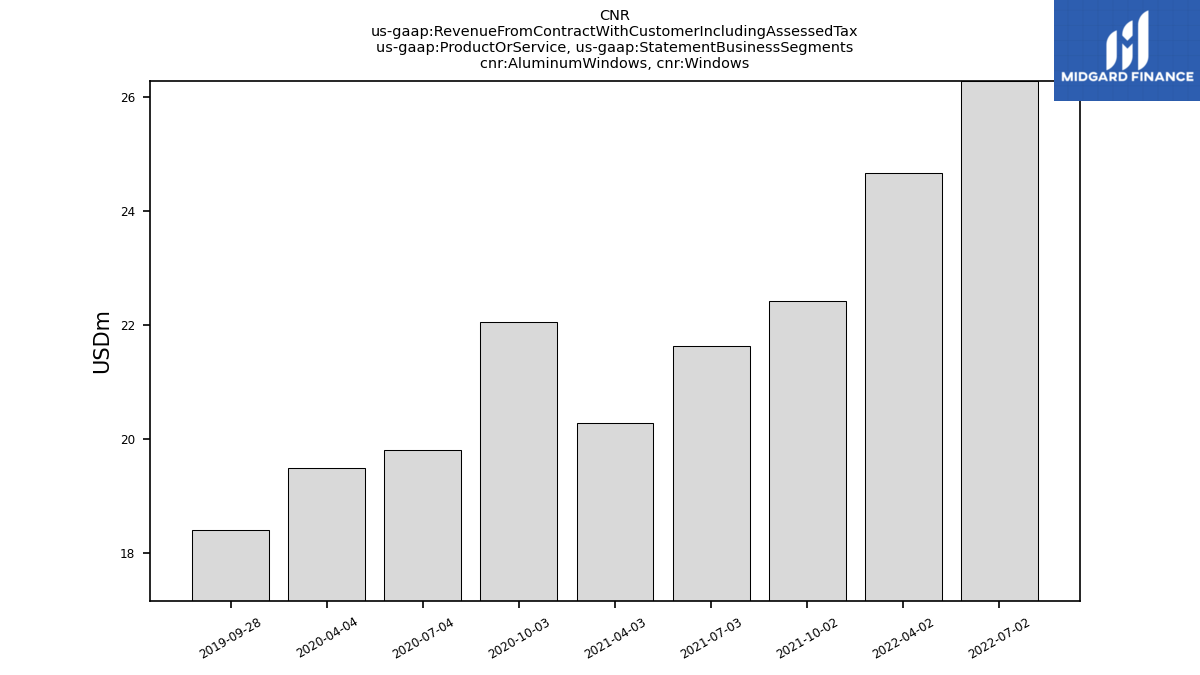
| Aluminum Windows, Windows | NA | NA | NA | 26.28 | 24.66 | NA | 22.42 | 21.64 | 20.28 | NA | 22.06 | 19.81 | 19.48 | NA | 18.40 | NA | NA | NA | NA | NA | NA | NA | NA | NA | NA | NA | NA | NA | NA | NA | NA | NA | NA | NA | NA | NA | NA | NA | NA | NA | NA | NA | NA | NA | NA | NA | NA | NA | NA | NA | NA | NA | NA | NA | NA | NA | NA | NA | |
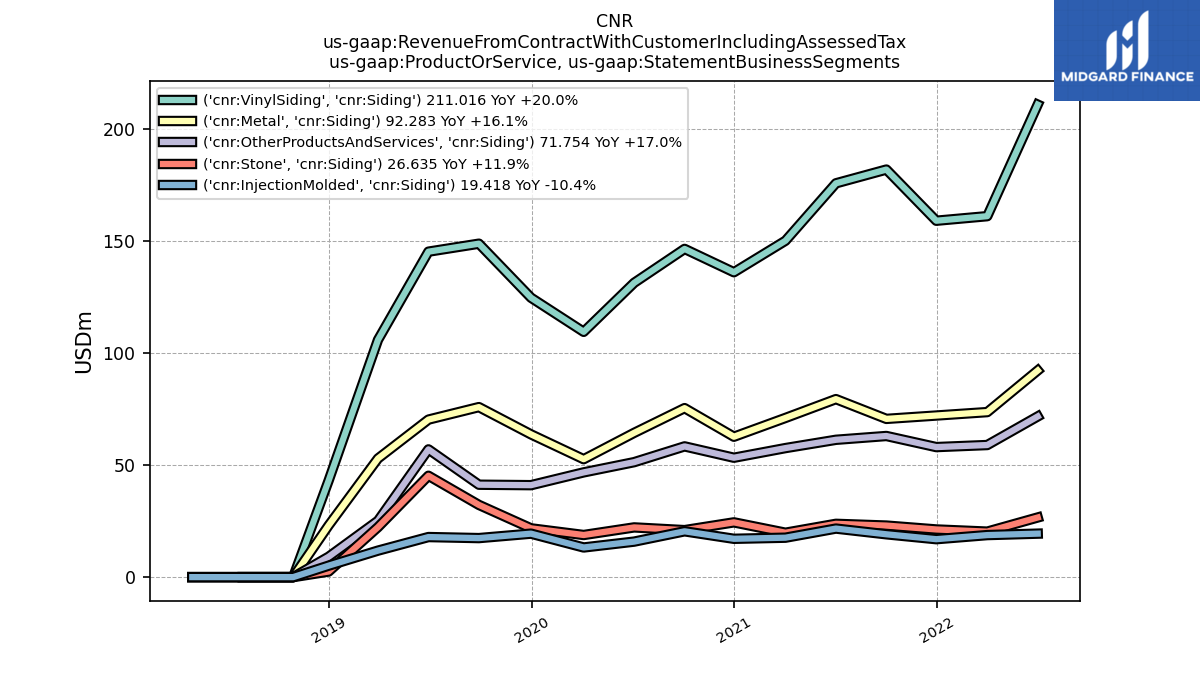
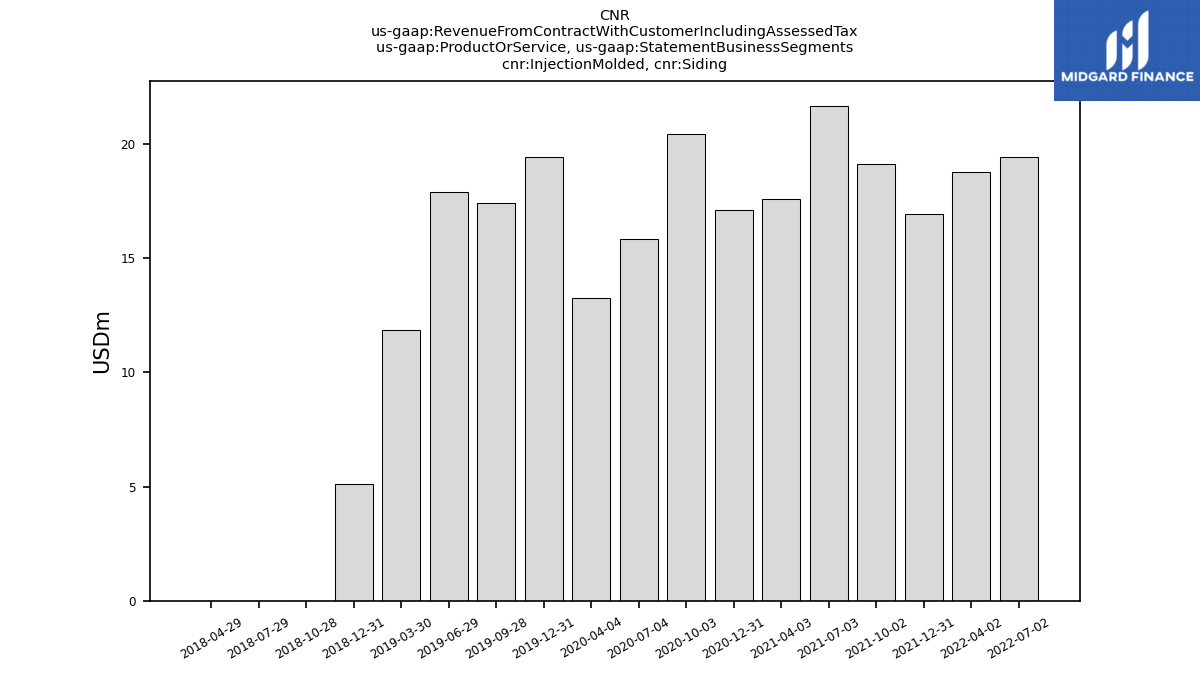
| Injection Molded, Siding | NA | NA | NA | 19.42 | 18.77 | 16.94 | 19.13 | 21.68 | 17.61 | 17.12 | 20.46 | 15.86 | 13.24 | 19.41 | 17.43 | 17.90 | 11.84 | 5.12 | 0.00 | 0.00 | 0.00 | NA | NA | NA | NA | NA | NA | NA | NA | NA | NA | NA | NA | NA | NA | NA | NA | NA | NA | NA | NA | NA | NA | NA | NA | NA | NA | NA | NA | NA | NA | NA | NA | NA | NA | NA | NA | NA | |
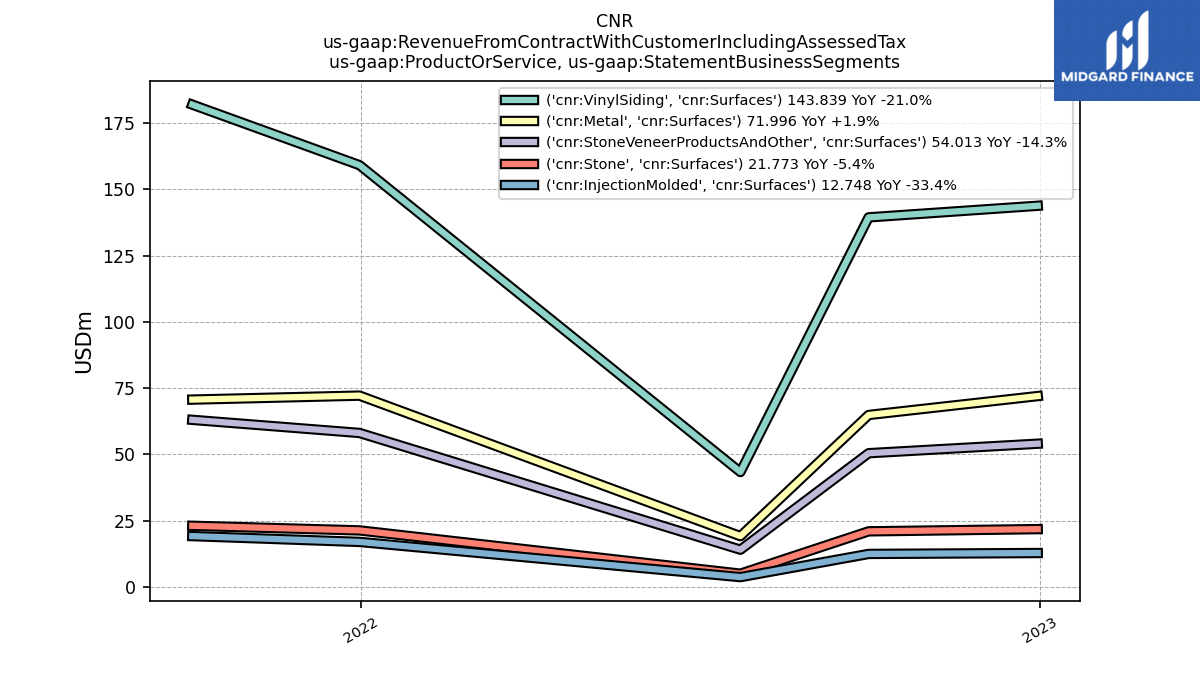
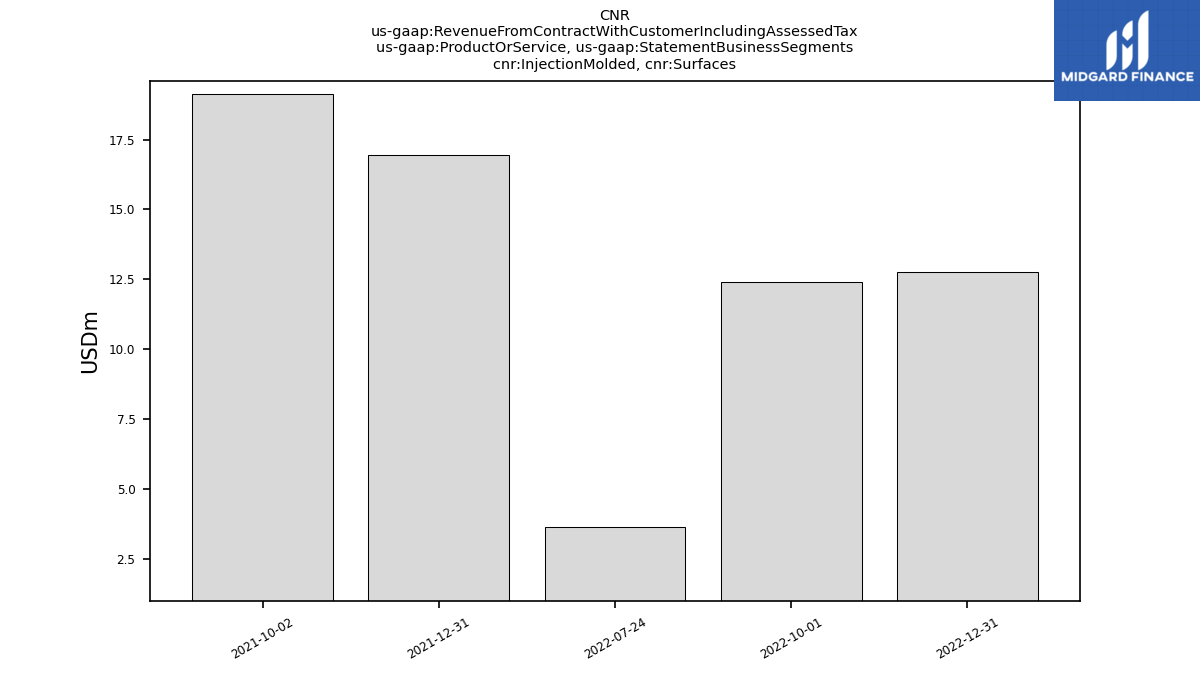
| Injection Molded, Surfaces | 12.75 | 12.40 | 3.65 | NA | NA | 16.94 | 19.13 | NA | NA | NA | NA | NA | NA | NA | NA | NA | NA | NA | NA | NA | NA | NA | NA | NA | NA | NA | NA | NA | NA | NA | NA | NA | NA | NA | NA | NA | NA | NA | NA | NA | NA | NA | NA | NA | NA | NA | NA | NA | NA | NA | NA | NA | NA | NA | NA | NA | NA | NA | |
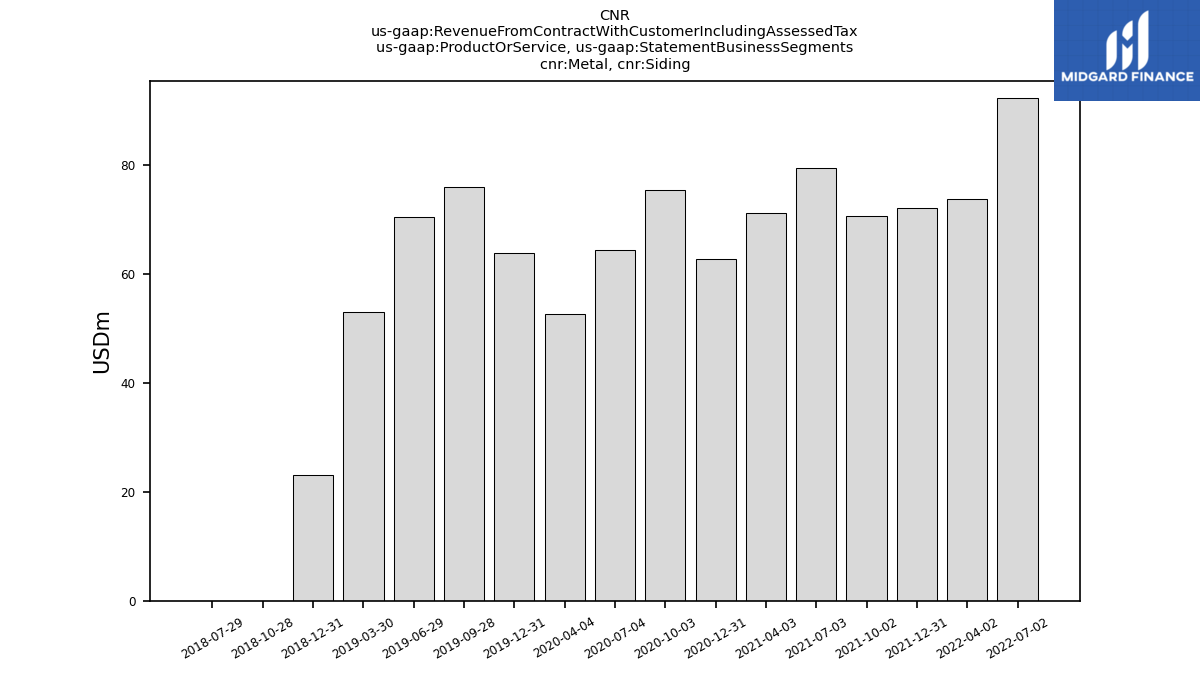
| Metal, Siding | NA | NA | NA | 92.28 | 73.70 | 72.17 | 70.67 | 79.50 | 71.09 | 62.70 | 75.48 | 64.42 | 52.67 | 63.75 | 75.93 | 70.35 | 52.98 | 23.10 | 0.00 | 0.00 | NA | NA | NA | NA | NA | NA | NA | NA | NA | NA | NA | NA | NA | NA | NA | NA | NA | NA | NA | NA | NA | NA | NA | NA | NA | NA | NA | NA | NA | NA | NA | NA | NA | NA | NA | NA | NA | NA | |
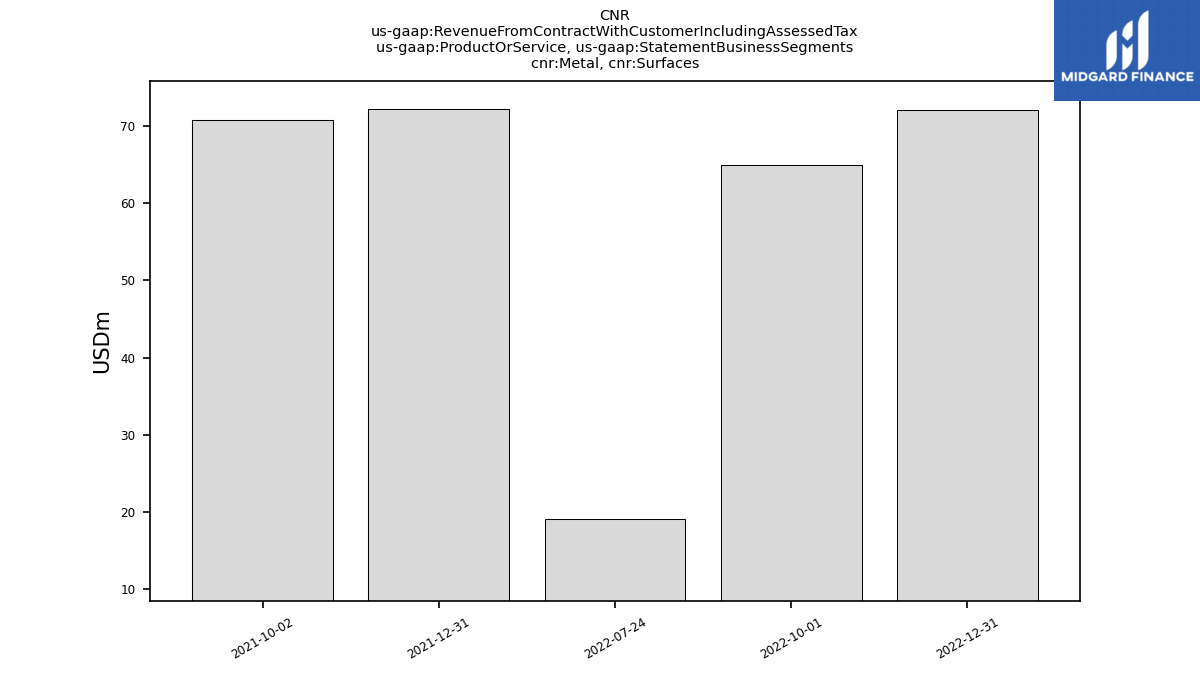
| Metal, Surfaces | 72.00 | 64.86 | 19.11 | NA | NA | 72.17 | 70.67 | NA | NA | NA | NA | NA | NA | NA | NA | NA | NA | NA | NA | NA | NA | NA | NA | NA | NA | NA | NA | NA | NA | NA | NA | NA | NA | NA | NA | NA | NA | NA | NA | NA | NA | NA | NA | NA | NA | NA | NA | NA | NA | NA | NA | NA | NA | NA | NA | NA | NA | NA | |
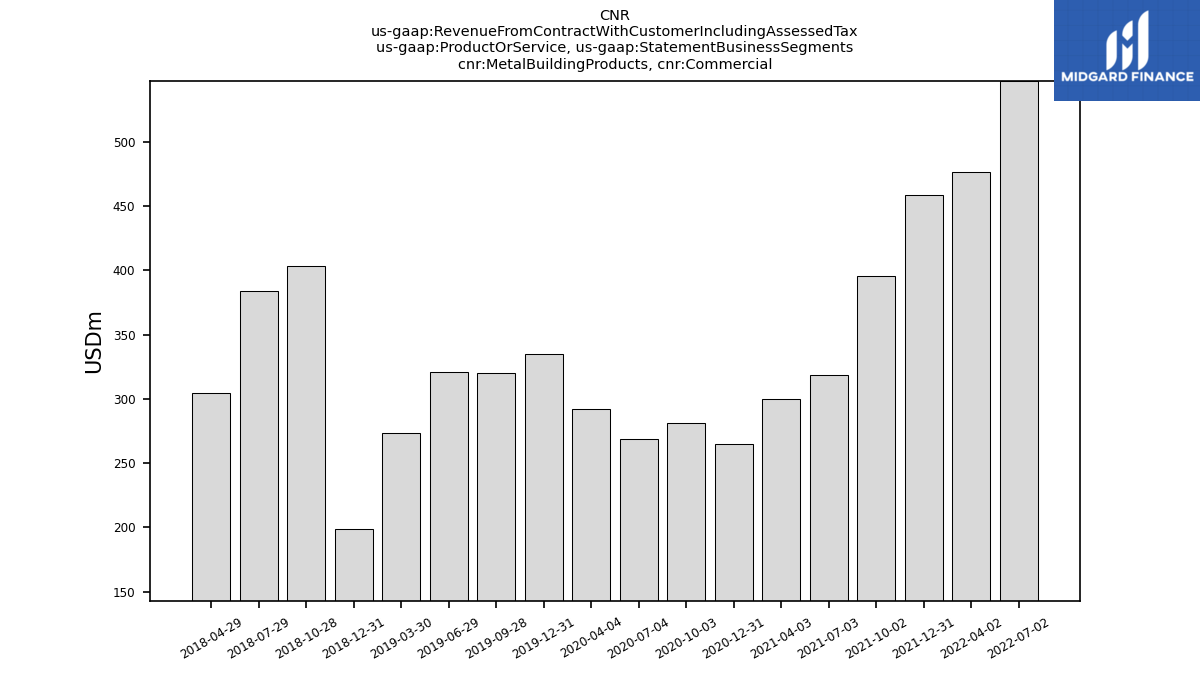
| Metal Building Products, Commercial | NA | NA | NA | 547.43 | 476.46 | 459.00 | 395.87 | 318.86 | 299.94 | 264.87 | 281.34 | 269.09 | 292.44 | 335.13 | 320.03 | 321.17 | 273.43 | 198.48 | 403.07 | 384.31 | 304.80 | NA | NA | NA | NA | NA | NA | NA | NA | NA | NA | NA | NA | NA | NA | NA | NA | NA | NA | NA | NA | NA | NA | NA | NA | NA | NA | NA | NA | NA | NA | NA | NA | NA | NA | NA | NA | NA | |
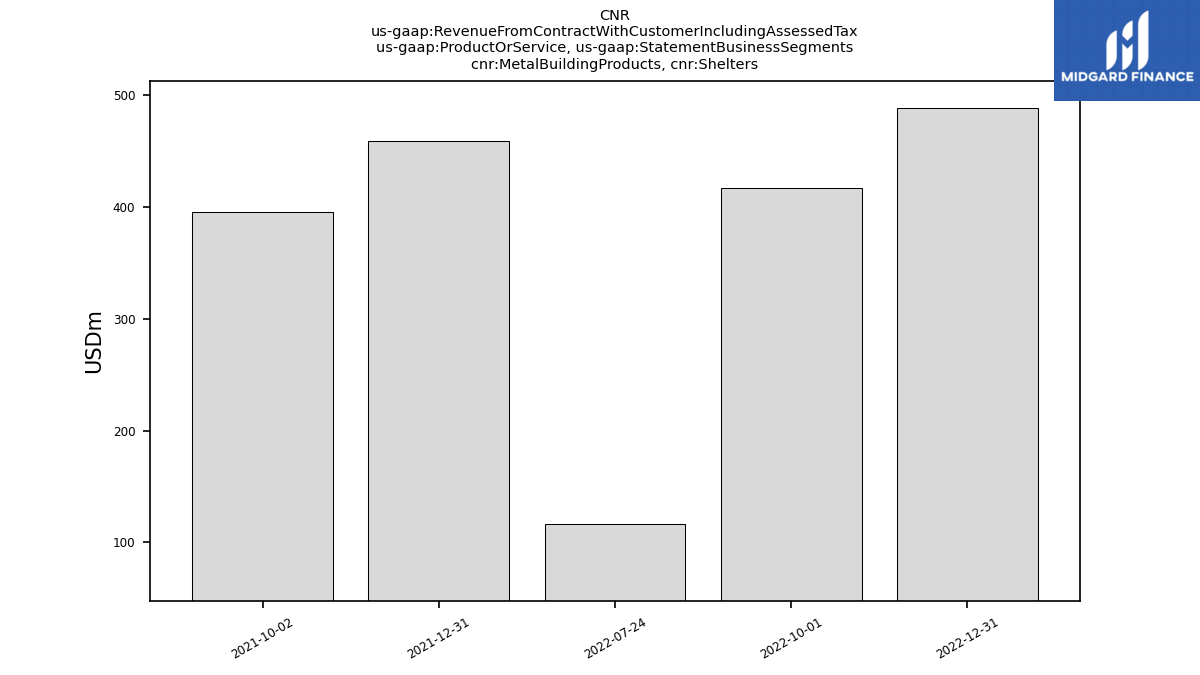
| Metal Building Products, Shelters | 488.48 | 416.81 | 116.37 | NA | NA | 459.00 | 395.87 | NA | NA | NA | NA | NA | NA | NA | NA | NA | NA | NA | NA | NA | NA | NA | NA | NA | NA | NA | NA | NA | NA | NA | NA | NA | NA | NA | NA | NA | NA | NA | NA | NA | NA | NA | NA | NA | NA | NA | NA | NA | NA | NA | NA | NA | NA | NA | NA | NA | NA | NA | |
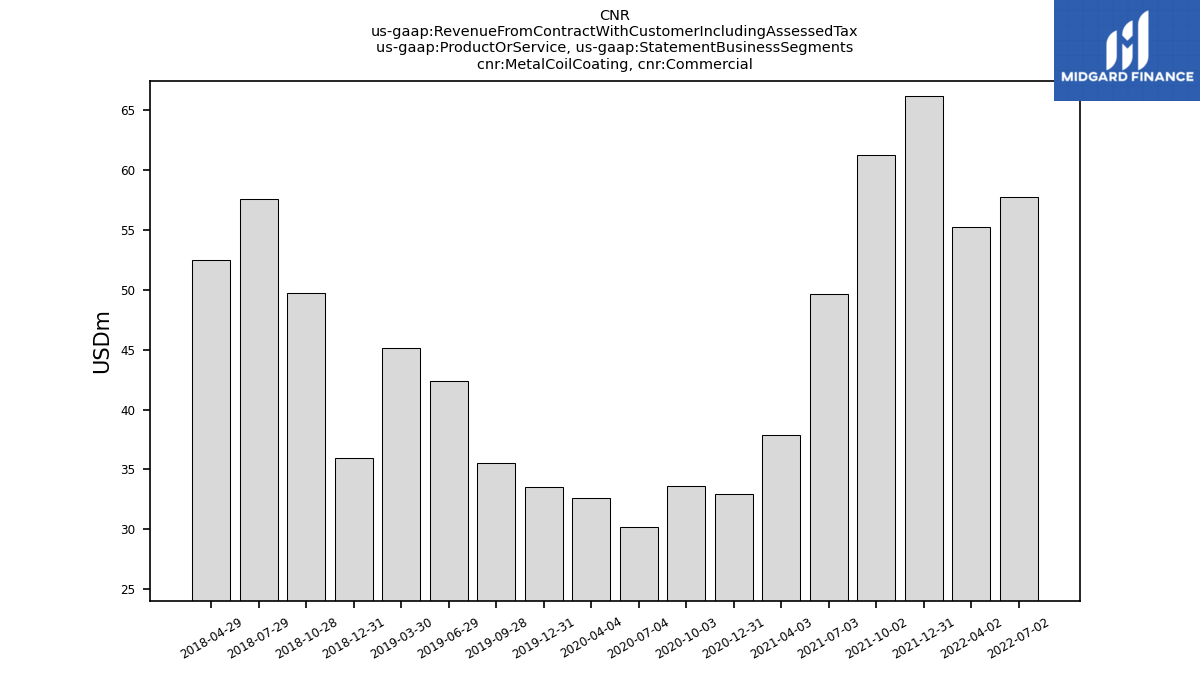
| Metal Coil Coating, Commercial | NA | NA | NA | 57.80 | 55.28 | 66.16 | 61.25 | 49.65 | 37.84 | 32.93 | 33.61 | 30.23 | 32.65 | 33.57 | 35.56 | 42.41 | 45.16 | 35.99 | 49.71 | 57.61 | 52.48 | NA | NA | NA | NA | NA | NA | NA | NA | NA | NA | NA | NA | NA | NA | NA | NA | NA | NA | NA | NA | NA | NA | NA | NA | NA | NA | NA | NA | NA | NA | NA | NA | NA | NA | NA | NA | NA | |
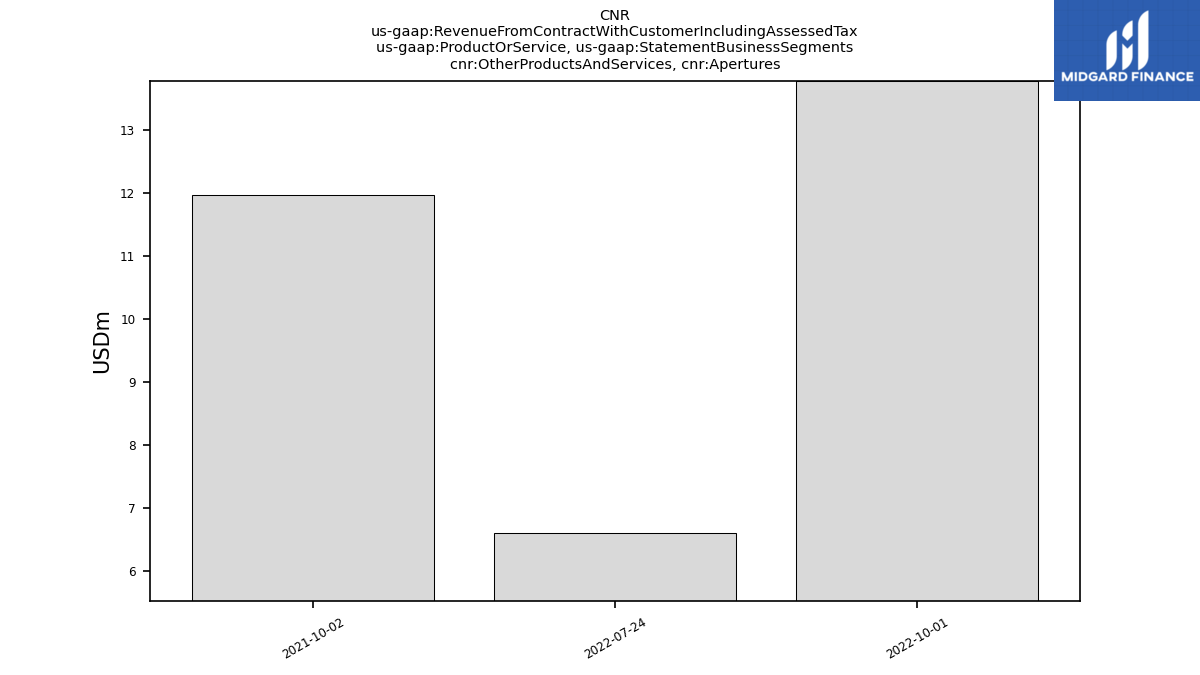
| Other Products And Services, Apertures | NA | 13.78 | 6.61 | NA | NA | NA | 11.97 | NA | NA | NA | NA | NA | NA | NA | NA | NA | NA | NA | NA | NA | NA | NA | NA | NA | NA | NA | NA | NA | NA | NA | NA | NA | NA | NA | NA | NA | NA | NA | NA | NA | NA | NA | NA | NA | NA | NA | NA | NA | NA | NA | NA | NA | NA | NA | NA | NA | NA | NA | |
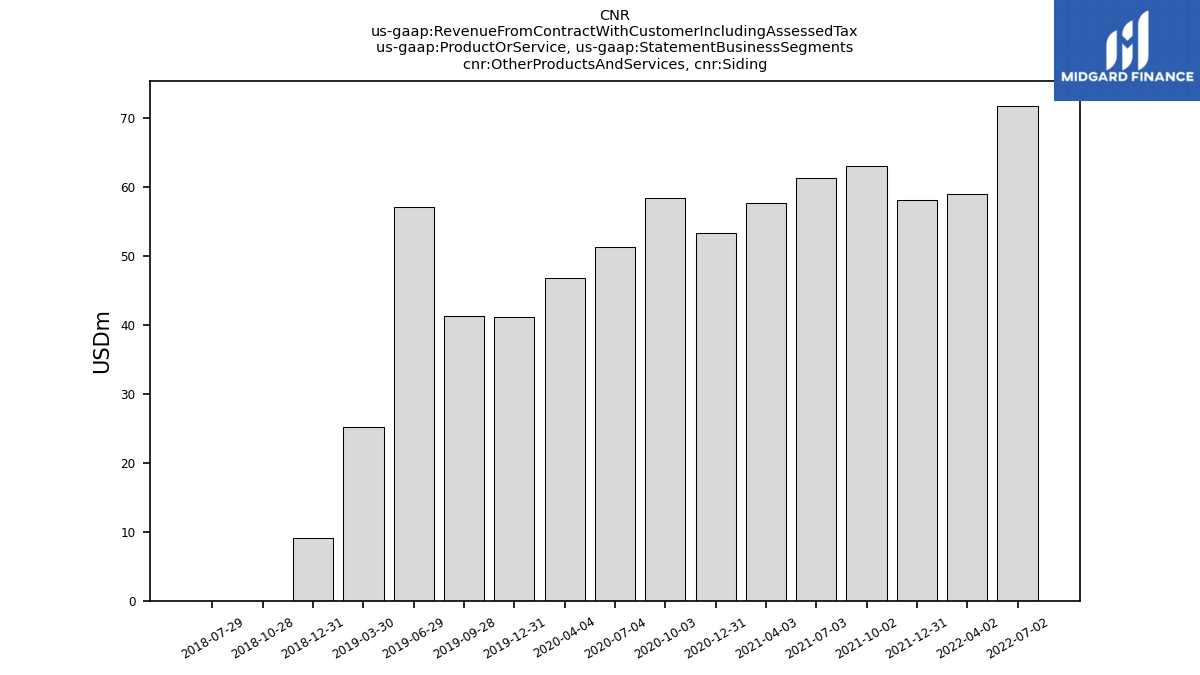
| Other Products And Services, Siding | NA | NA | NA | 71.75 | 58.99 | 58.07 | 63.03 | 61.33 | 57.63 | 53.32 | 58.39 | 51.34 | 46.78 | 41.07 | 41.27 | 57.05 | 25.19 | 9.11 | 0.00 | 0.00 | NA | NA | NA | NA | NA | NA | NA | NA | NA | NA | NA | NA | NA | NA | NA | NA | NA | NA | NA | NA | NA | NA | NA | NA | NA | NA | NA | NA | NA | NA | NA | NA | NA | NA | NA | NA | NA | NA | |
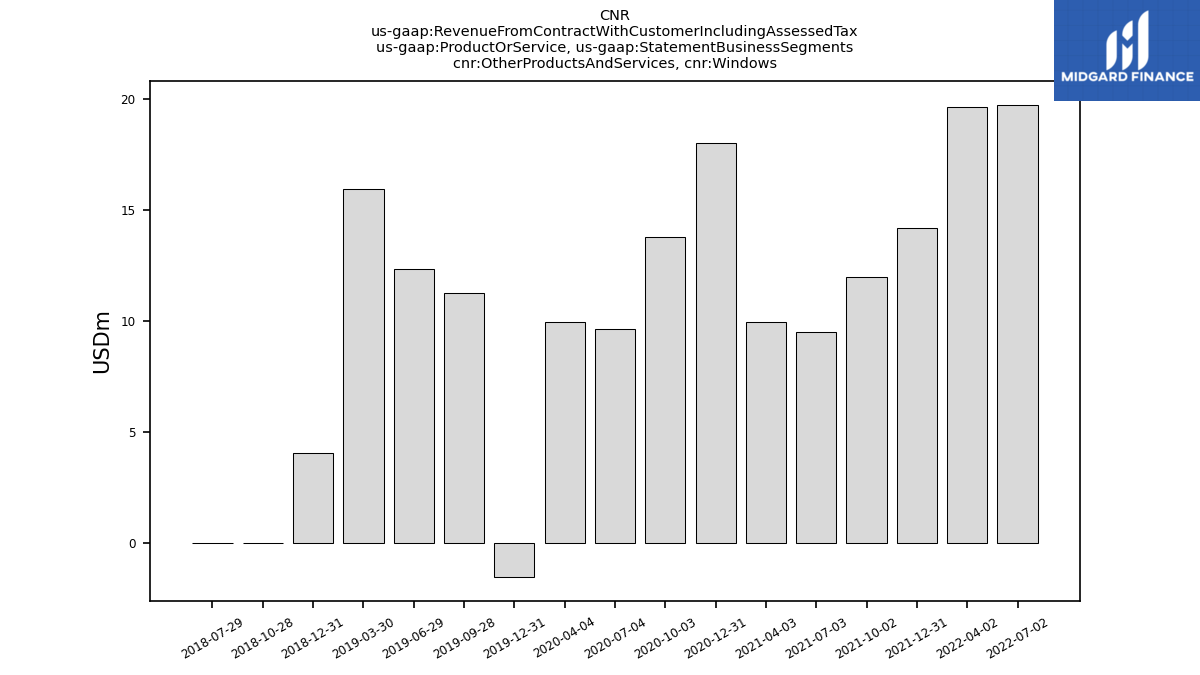
| Other Products And Services, Windows | NA | NA | NA | 19.75 | 19.65 | 14.20 | 11.97 | 9.52 | 9.97 | 18.02 | 13.79 | 9.63 | 9.95 | -1.54 | 11.28 | 12.33 | 15.96 | 4.05 | 0.00 | 0.00 | NA | NA | NA | NA | NA | NA | NA | NA | NA | NA | NA | NA | NA | NA | NA | NA | NA | NA | NA | NA | NA | NA | NA | NA | NA | NA | NA | NA | NA | NA | NA | NA | NA | NA | NA | NA | NA | NA | |
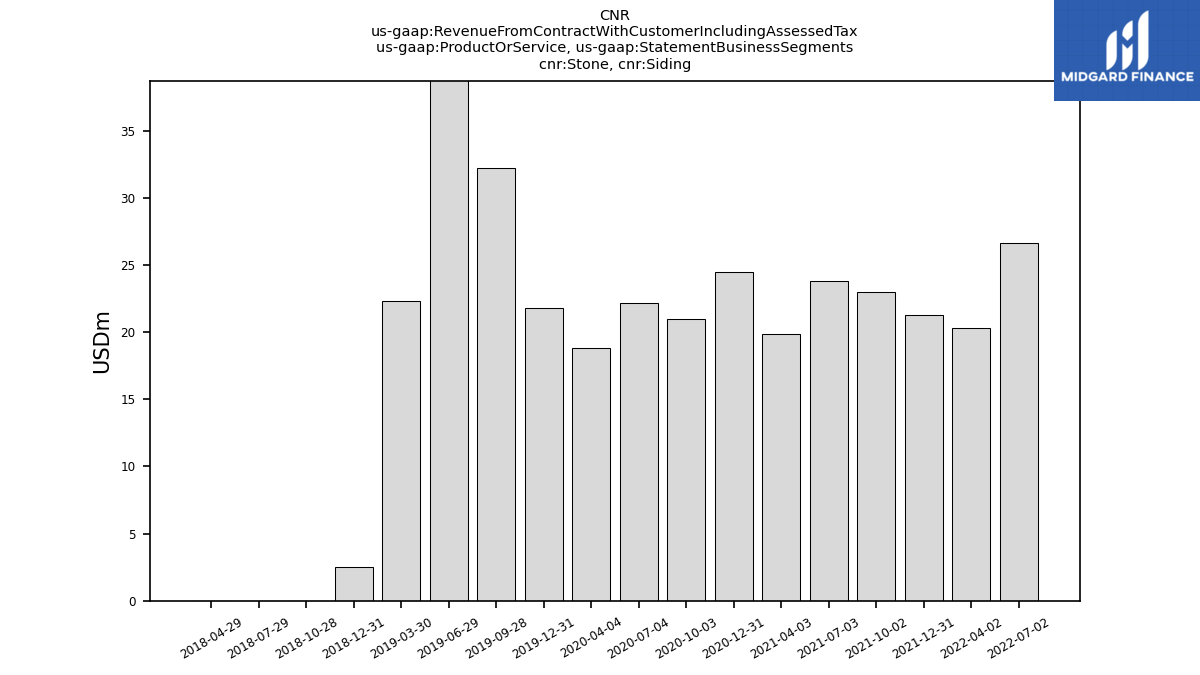
| Stone, Siding | NA | NA | NA | 26.64 | 20.32 | 21.29 | 23.02 | 23.80 | 19.83 | 24.46 | 20.99 | 22.20 | 18.81 | 21.79 | 32.25 | 45.27 | 22.31 | 2.50 | 0.00 | 0.00 | 0.00 | NA | NA | NA | NA | NA | NA | NA | NA | NA | NA | NA | NA | NA | NA | NA | NA | NA | NA | NA | NA | NA | NA | NA | NA | NA | NA | NA | NA | NA | NA | NA | NA | NA | NA | NA | NA | NA | |
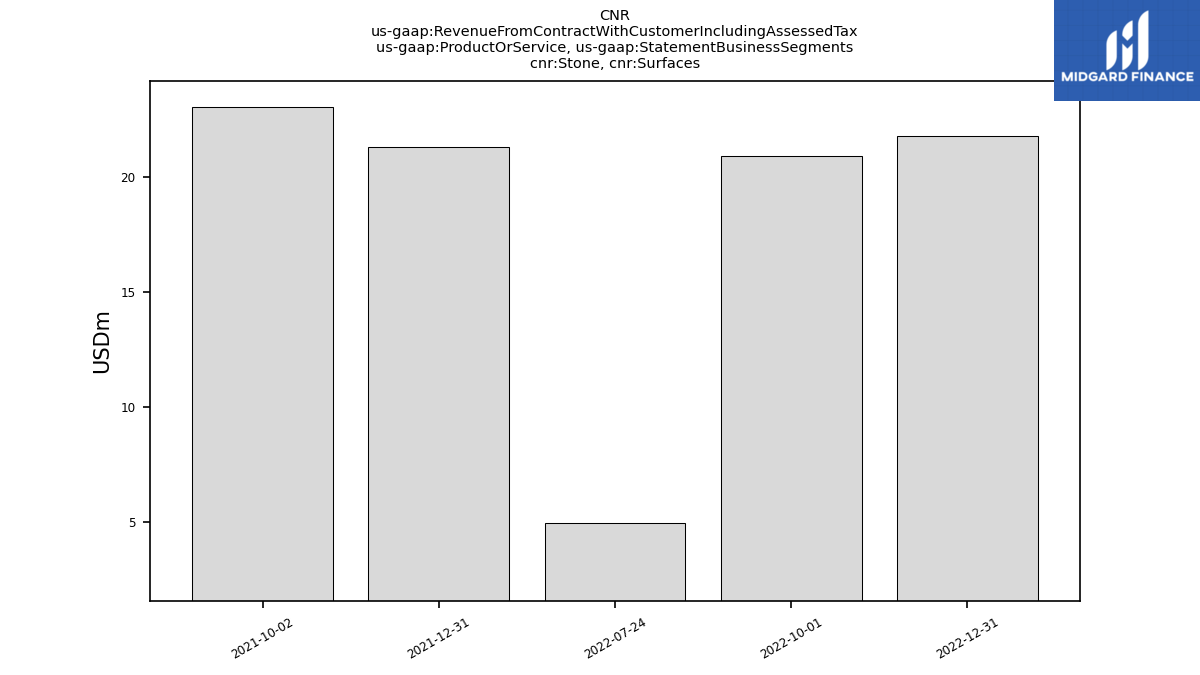
| Stone, Surfaces | 21.77 | 20.93 | 4.95 | NA | NA | 21.29 | 23.02 | NA | NA | NA | NA | NA | NA | NA | NA | NA | NA | NA | NA | NA | NA | NA | NA | NA | NA | NA | NA | NA | NA | NA | NA | NA | NA | NA | NA | NA | NA | NA | NA | NA | NA | NA | NA | NA | NA | NA | NA | NA | NA | NA | NA | NA | NA | NA | NA | NA | NA | NA | |
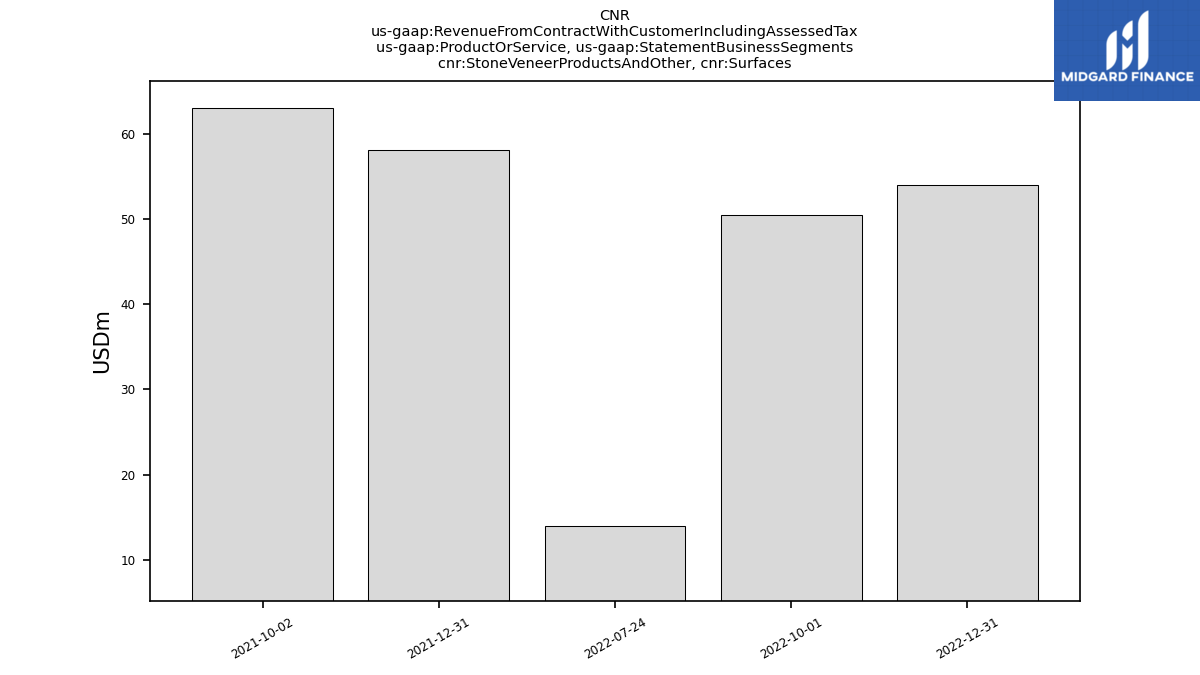
| Stone Veneer Products And Other, Surfaces | 54.01 | 50.43 | 14.01 | NA | NA | 58.07 | 63.03 | NA | NA | NA | NA | NA | NA | NA | NA | NA | NA | NA | NA | NA | NA | NA | NA | NA | NA | NA | NA | NA | NA | NA | NA | NA | NA | NA | NA | NA | NA | NA | NA | NA | NA | NA | NA | NA | NA | NA | NA | NA | NA | NA | NA | NA | NA | NA | NA | NA | NA | NA | |
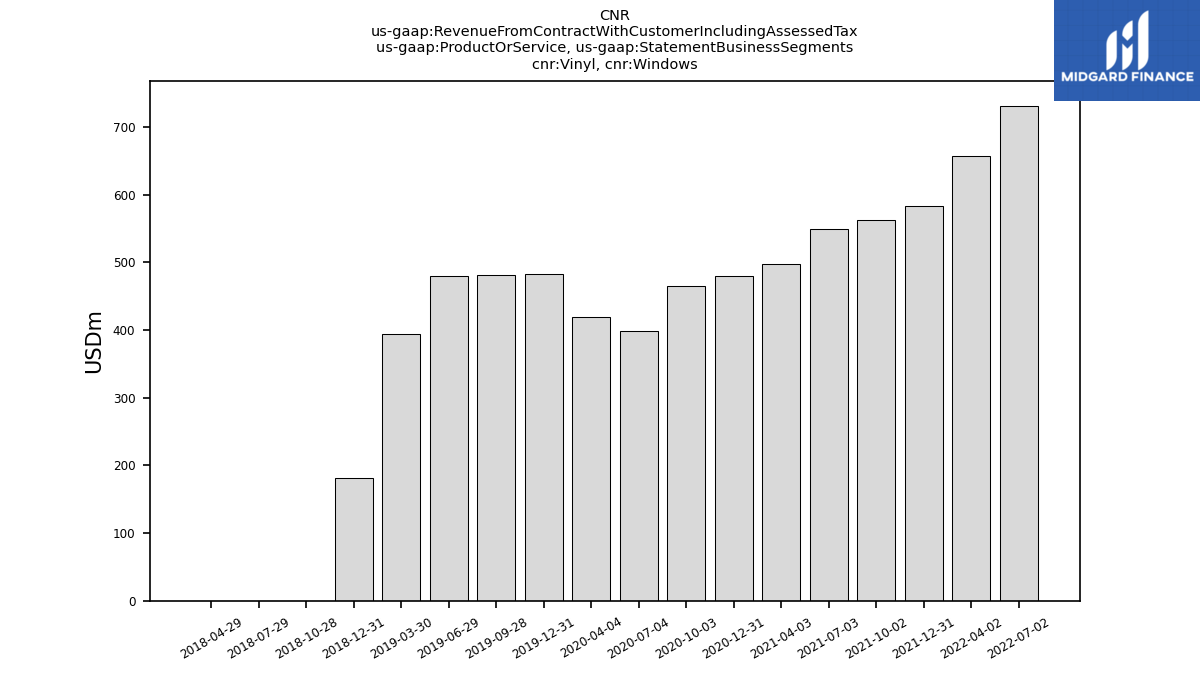
| Vinyl, Windows | NA | NA | NA | 731.43 | 657.80 | 583.18 | 562.10 | 548.59 | 497.02 | 480.23 | 465.47 | 398.84 | 419.02 | 483.46 | 481.10 | 480.30 | 393.93 | 181.62 | 0.00 | 0.00 | 0.00 | NA | NA | NA | NA | NA | NA | NA | NA | NA | NA | NA | NA | NA | NA | NA | NA | NA | NA | NA | NA | NA | NA | NA | NA | NA | NA | NA | NA | NA | NA | NA | NA | NA | NA | NA | NA | NA | |
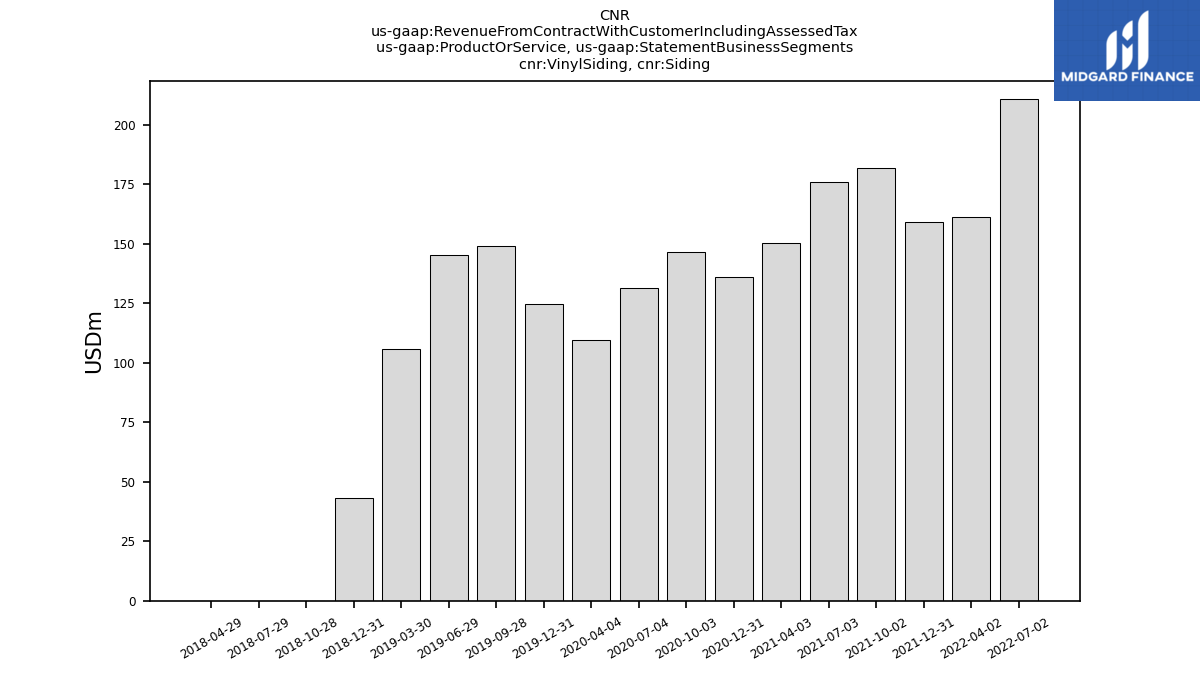
| Vinyl Siding, Siding | NA | NA | NA | 211.02 | 161.20 | 159.16 | 182.02 | 175.87 | 150.23 | 136.16 | 146.59 | 131.43 | 109.55 | 124.78 | 148.91 | 145.35 | 105.96 | 43.14 | 0.00 | 0.00 | 0.00 | NA | NA | NA | NA | NA | NA | NA | NA | NA | NA | NA | NA | NA | NA | NA | NA | NA | NA | NA | NA | NA | NA | NA | NA | NA | NA | NA | NA | NA | NA | NA | NA | NA | NA | NA | NA | NA | |
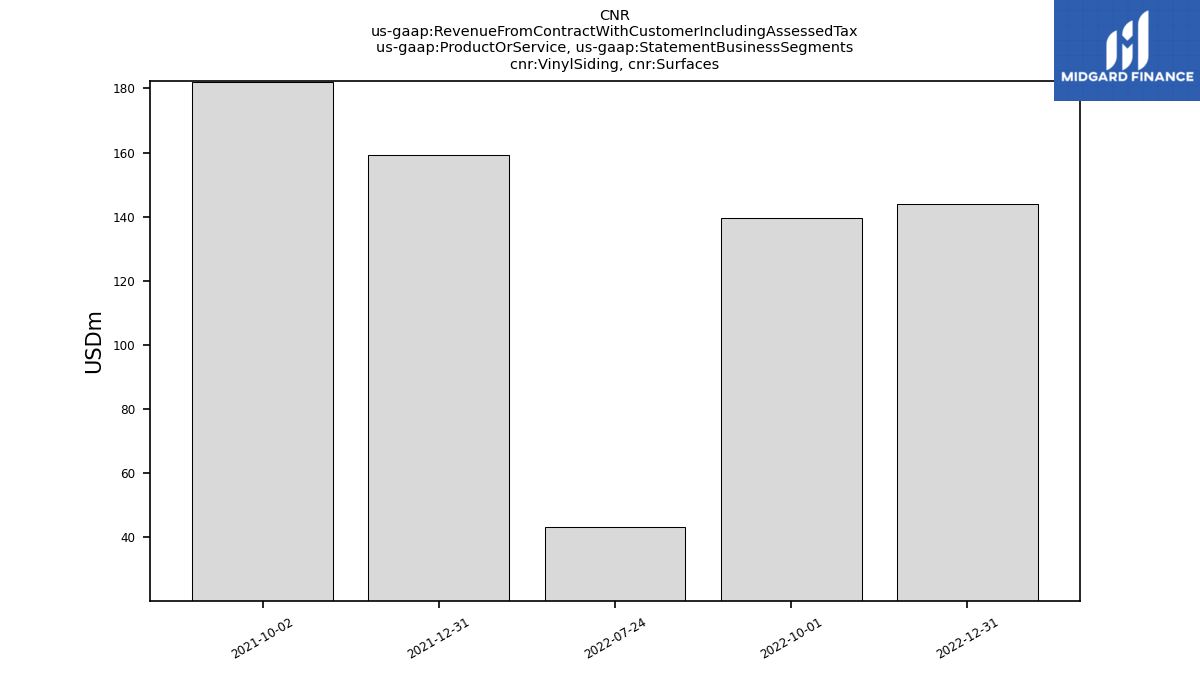
| Vinyl Siding, Surfaces | 143.84 | 139.46 | 43.32 | NA | NA | 159.16 | 182.02 | NA | NA | NA | NA | NA | NA | NA | NA | NA | NA | NA | NA | NA | NA | NA | NA | NA | NA | NA | NA | NA | NA | NA | NA | NA | NA | NA | NA | NA | NA | NA | NA | NA | NA | NA | NA | NA | NA | NA | NA | NA | NA | NA | NA | NA | NA | NA | NA | NA | NA | NA | |
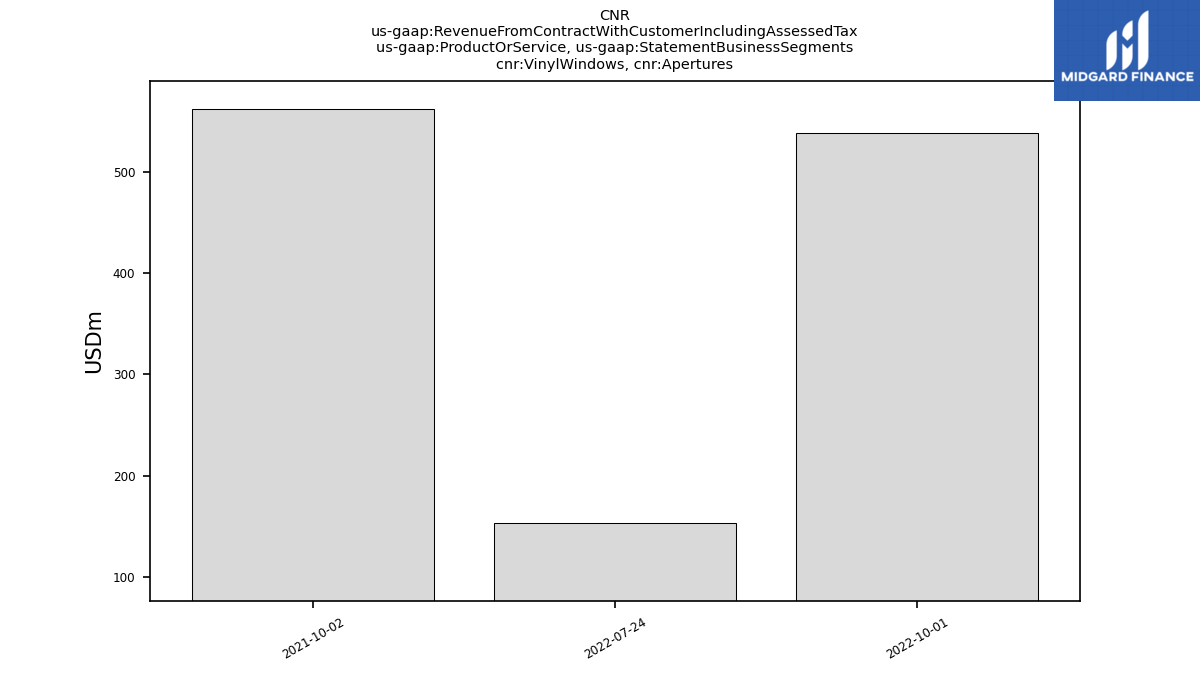
| Vinyl Windows, Apertures | NA | 538.45 | 153.30 | NA | NA | NA | 562.10 | NA | NA | NA | NA | NA | NA | NA | NA | NA | NA | NA | NA | NA | NA | NA | NA | NA | NA | NA | NA | NA | NA | NA | NA | NA | NA | NA | NA | NA | NA | NA | NA | NA | NA | NA | NA | NA | NA | NA | NA | NA | NA | NA | NA | NA | NA | NA | NA | NA | NA | NA | |
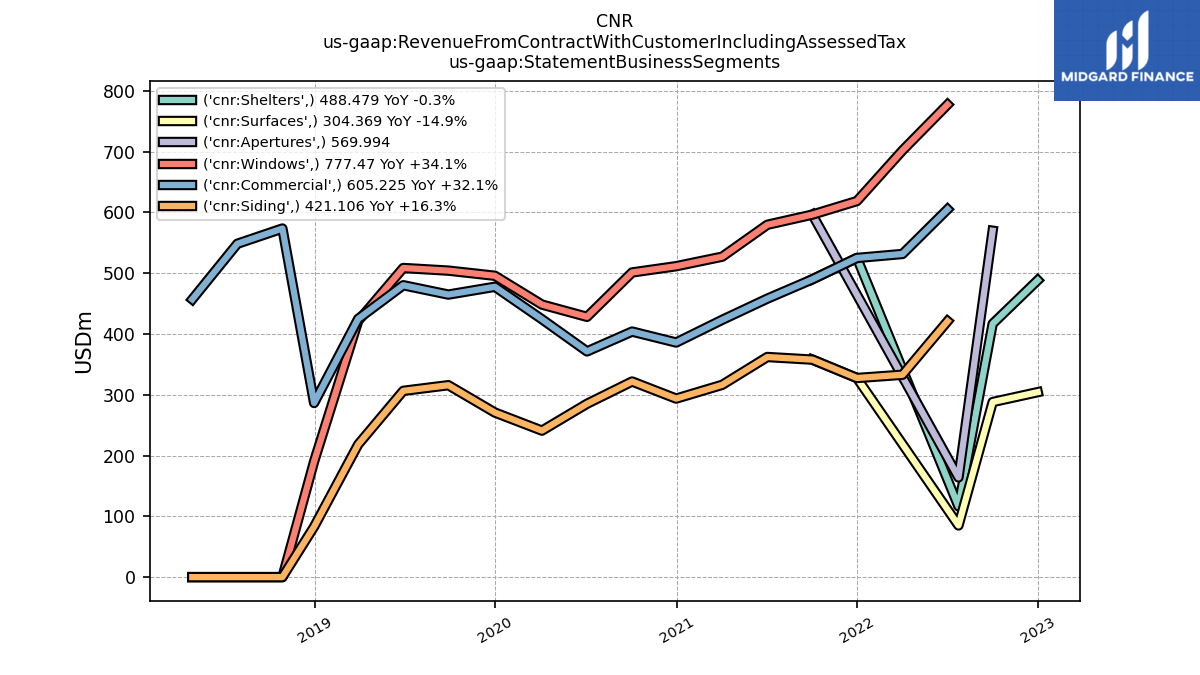
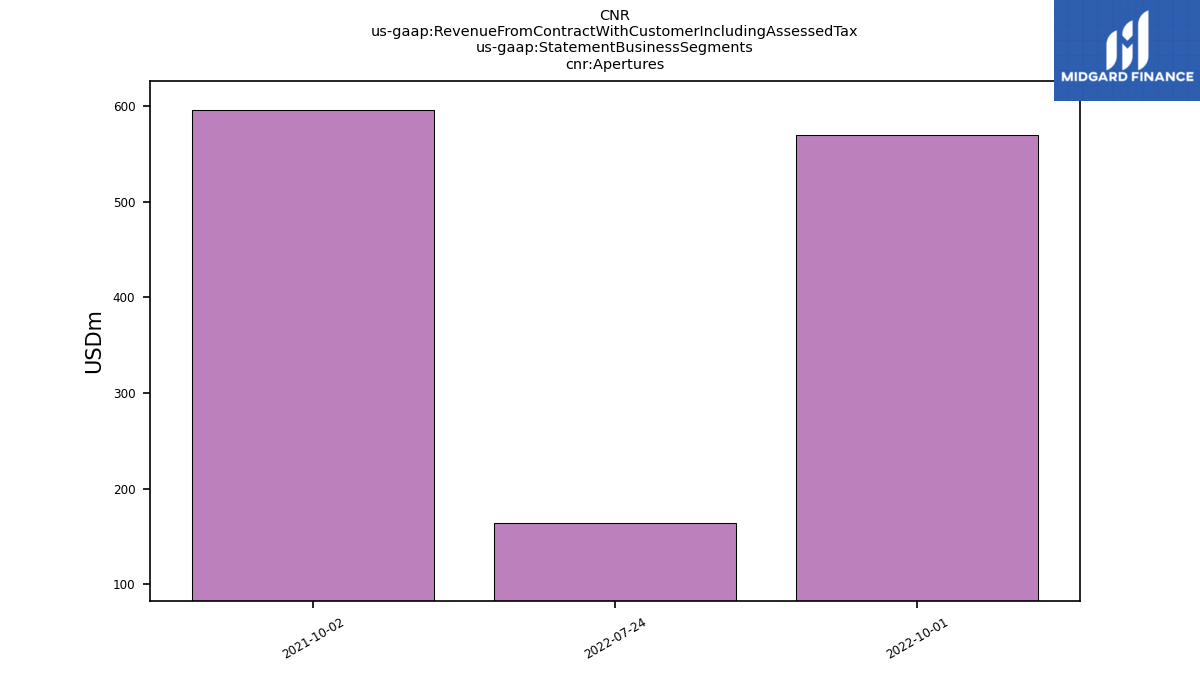
| Apertures | NA | 569.99 | 164.04 | NA | NA | NA | 596.49 | NA | NA | NA | NA | NA | NA | NA | NA | NA | NA | NA | NA | NA | NA | NA | NA | NA | NA | NA | NA | NA | NA | NA | NA | NA | NA | NA | NA | NA | NA | NA | NA | NA | NA | NA | NA | NA | NA | NA | NA | NA | NA | NA | NA | NA | NA | NA | NA | NA | NA | NA | |
| Commercial | NA | NA | NA | 605.23 | 531.74 | 525.16 | 490.05 | 458.19 | 423.38 | 386.03 | 404.04 | 371.41 | 424.32 | 477.74 | 464.91 | 480.29 | 424.96 | 286.52 | 573.63 | 548.52 | 457.07 | NA | NA | NA | NA | NA | NA | NA | NA | NA | NA | NA | NA | NA | NA | NA | NA | NA | NA | NA | NA | NA | NA | NA | NA | NA | NA | NA | NA | NA | NA | NA | NA | NA | NA | NA | NA | NA | |
| Shelters | 488.48 | 416.81 | 116.37 | NA | NA | 525.16 | 490.05 | NA | NA | NA | NA | NA | NA | NA | NA | NA | NA | NA | NA | NA | NA | NA | NA | NA | NA | NA | NA | NA | NA | NA | NA | NA | NA | NA | NA | NA | NA | NA | NA | NA | NA | NA | NA | NA | NA | NA | NA | NA | NA | NA | NA | NA | NA | NA | NA | NA | NA | NA | |
| Siding | NA | NA | NA | 421.11 | 332.99 | 327.63 | 357.87 | 362.19 | 316.39 | 293.76 | 321.90 | 285.25 | 241.04 | 270.81 | 315.80 | 306.52 | 218.28 | 82.97 | 0.00 | 0.00 | 0.00 | NA | NA | NA | NA | NA | NA | NA | NA | NA | NA | NA | NA | NA | NA | NA | NA | NA | NA | NA | NA | NA | NA | NA | NA | NA | NA | NA | NA | NA | NA | NA | NA | NA | NA | NA | NA | NA | |
| Surfaces | 304.37 | 288.08 | 85.03 | NA | NA | 327.63 | 357.87 | NA | NA | NA | NA | NA | NA | NA | NA | NA | NA | NA | NA | NA | NA | NA | NA | NA | NA | NA | NA | NA | NA | NA | NA | NA | NA | NA | NA | NA | NA | NA | NA | NA | NA | NA | NA | NA | NA | NA | NA | NA | NA | NA | NA | NA | NA | NA | NA | NA | NA | NA | |
| Windows | NA | NA | NA | 777.47 | 702.11 | 618.78 | 596.49 | 579.74 | 527.26 | 511.59 | 501.31 | 428.27 | 448.45 | 495.87 | 504.34 | 508.65 | 421.59 | 190.37 | 0.00 | 0.00 | 0.00 | NA | NA | NA | NA | NA | NA | NA | NA | NA | NA | NA | NA | NA | NA | NA | NA | NA | NA | NA | NA | NA | NA | NA | NA | NA | NA | NA | NA | NA | NA | NA | NA | NA | NA | NA | NA | NA |