

| 2023-09-30 | 2023-06-30 | 2023-03-31 | 2022-12-31 | 2022-09-30 | 2022-06-30 | 2022-03-31 | 2021-12-31 | 2021-09-30 | 2021-06-30 | 2021-03-31 | 2020-12-31 | 2020-09-30 | 2020-06-30 | 2020-03-31 | ||
|---|---|---|---|---|---|---|---|---|---|---|---|---|---|---|---|---|
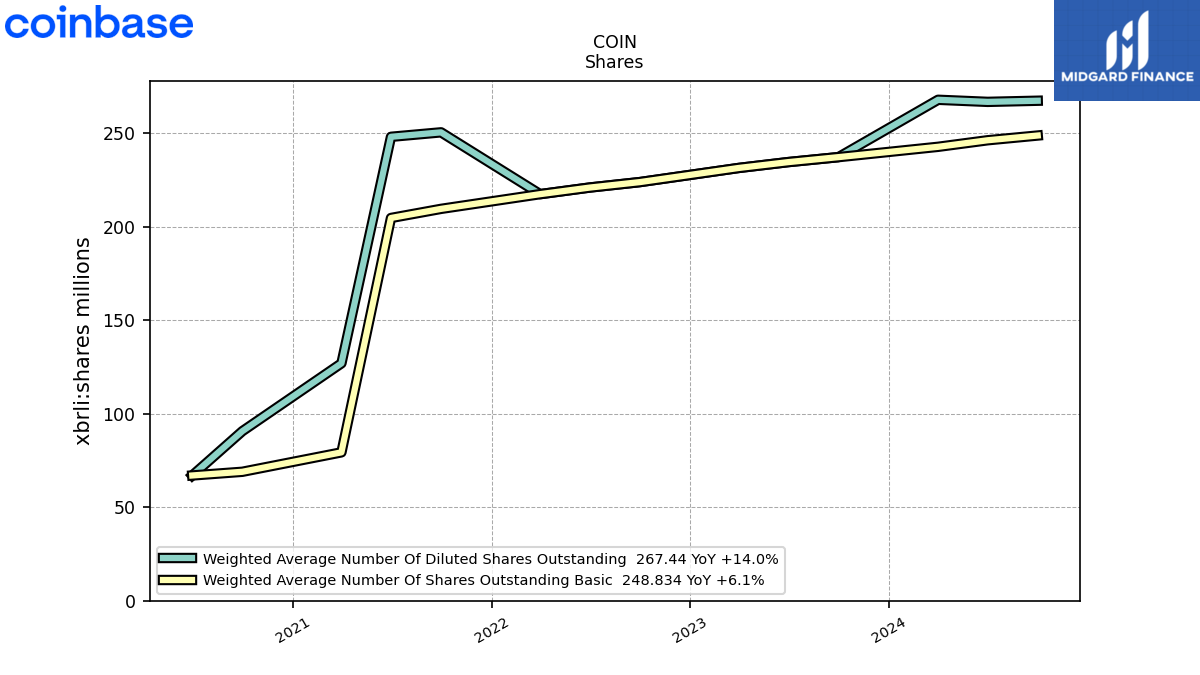
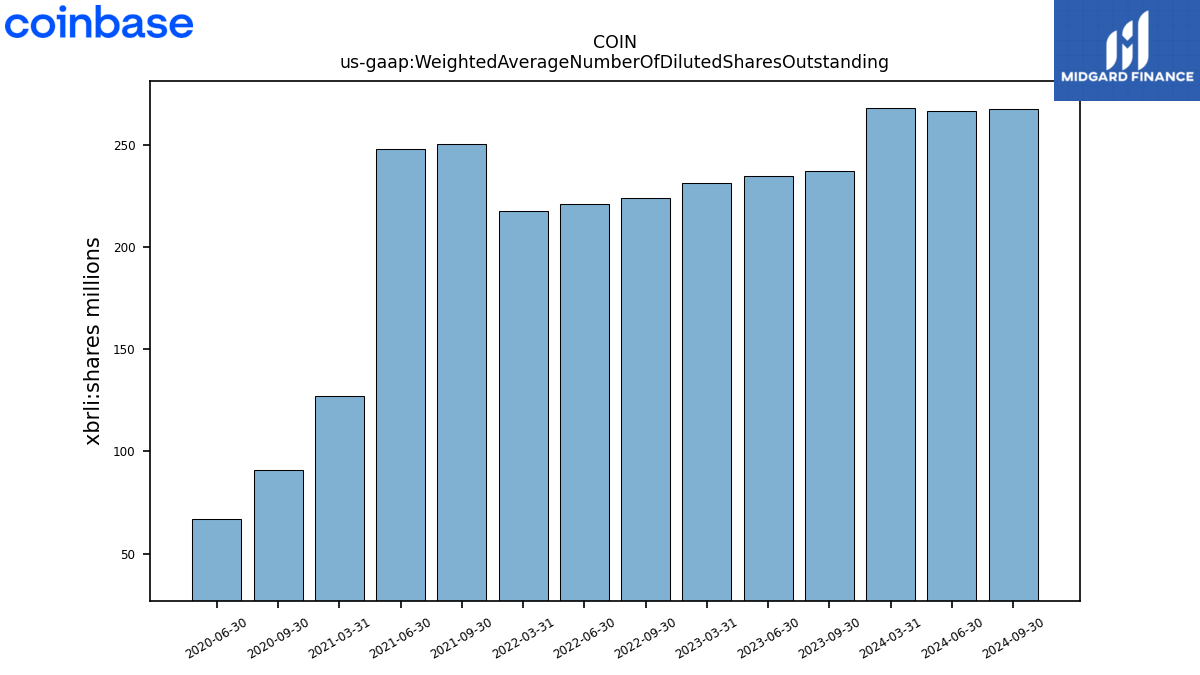
| Weighted Average Number Of Diluted Shares Outstanding | 237.27 | 234.64 | 231.49 | NA | 223.92 | 221.03 | 217.47 | NA | 250.54 | 248.15 | 127.00 | NA | 90.71 | 67.01 | NA | |
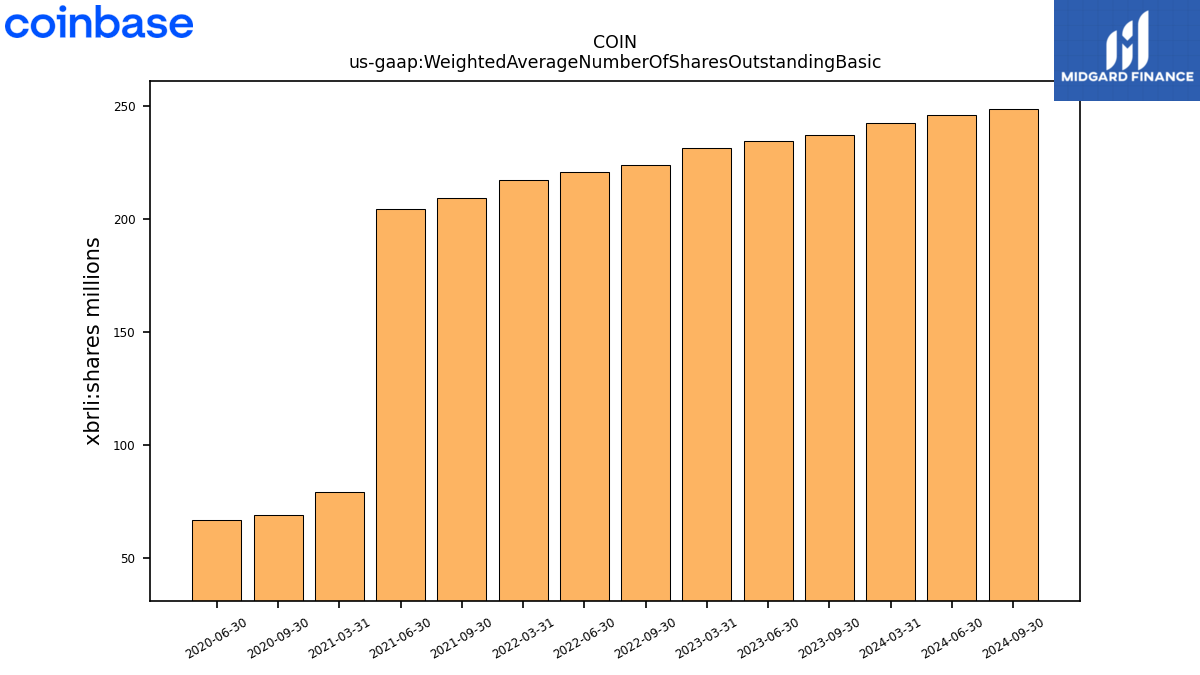
| Weighted Average Number Of Shares Outstanding Basic | 237.27 | 234.61 | 231.49 | NA | 223.92 | 220.99 | 217.47 | NA | 209.60 | 204.73 | 79.37 | NA | 68.98 | 67.01 | NA | |
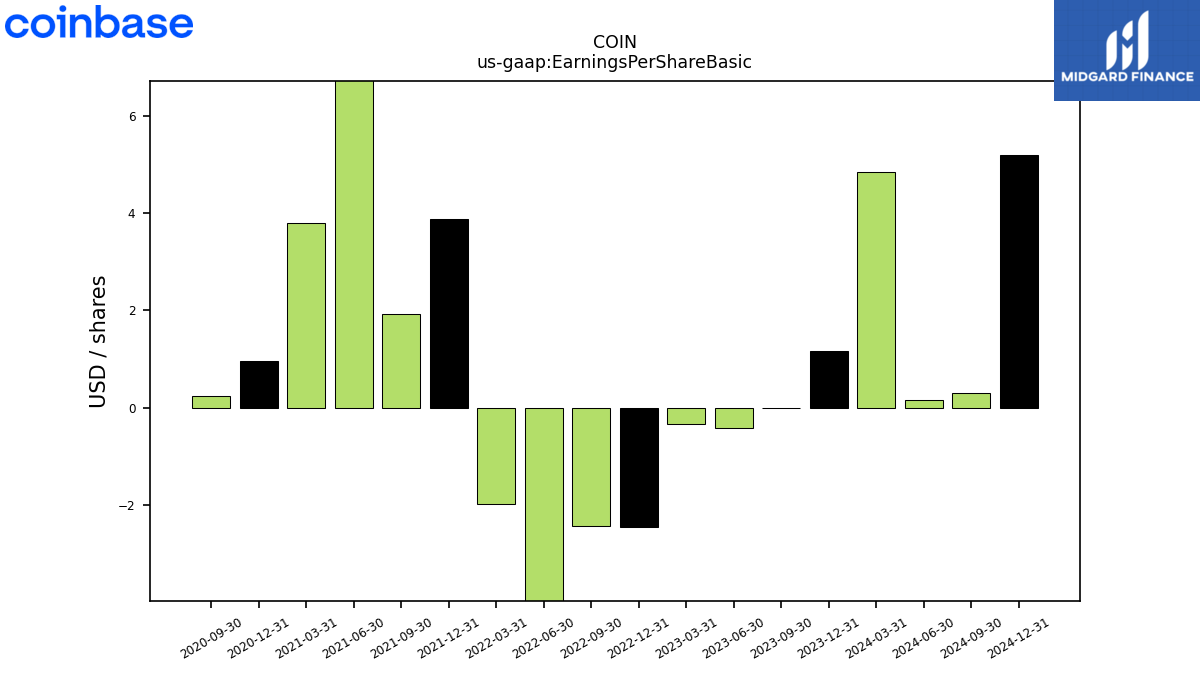
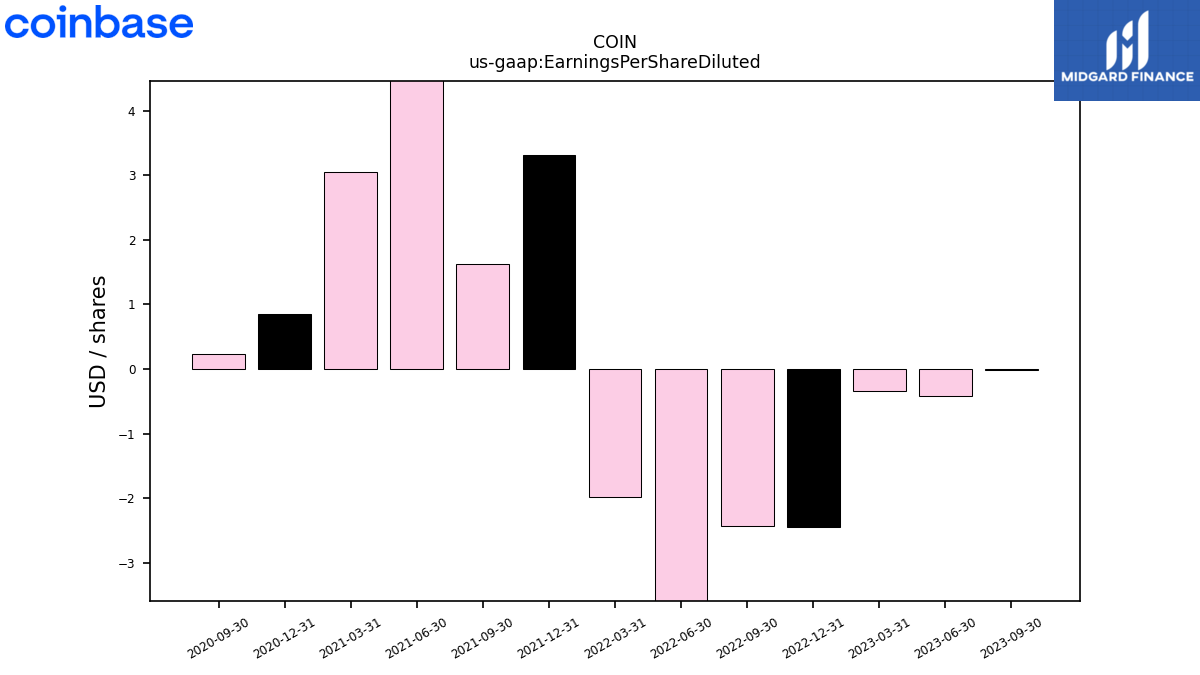
| Earnings Per Share Basic | -0.01 | -0.42 | -0.34 | -2.44 | -2.43 | -4.95 | -1.98 | 3.89 | 1.92 | 7.77 | 3.80 | 0.97 | 0.25 | NA | NA | |
| Earnings Per Share Diluted | -0.01 | -0.42 | -0.34 | -2.44 | -2.43 | -4.98 | -1.98 | 3.31 | 1.62 | 6.42 | 3.05 | 0.85 | 0.23 | NA | NA |
| 2023-09-30 | 2023-06-30 | 2023-03-31 | 2022-12-31 | 2022-09-30 | 2022-06-30 | 2022-03-31 | 2021-12-31 | 2021-09-30 | 2021-06-30 | 2021-03-31 | 2020-12-31 | 2020-09-30 | 2020-06-30 | 2020-03-31 | ||
|---|---|---|---|---|---|---|---|---|---|---|---|---|---|---|---|---|
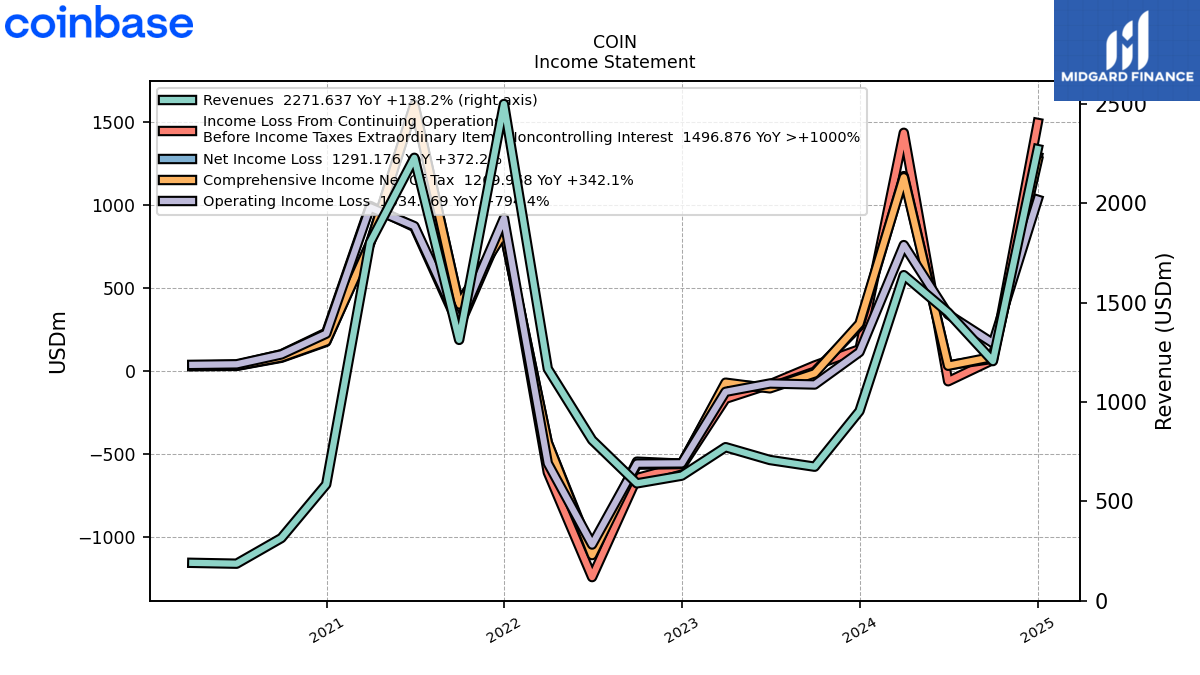
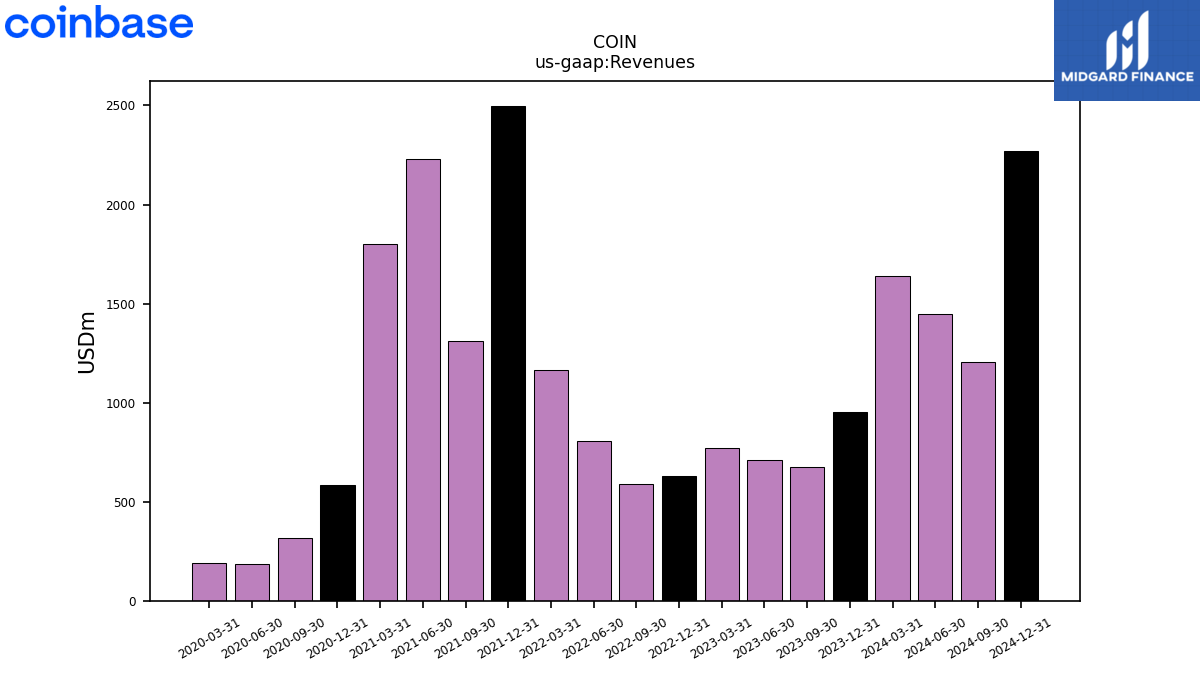
| Revenues | 674.15 | 707.91 | 772.53 | 629.11 | 590.34 | 808.33 | 1166.44 | 2498.46 | 1311.91 | 2227.96 | 1801.11 | 585.11 | 315.36 | 186.38 | 190.63 | |
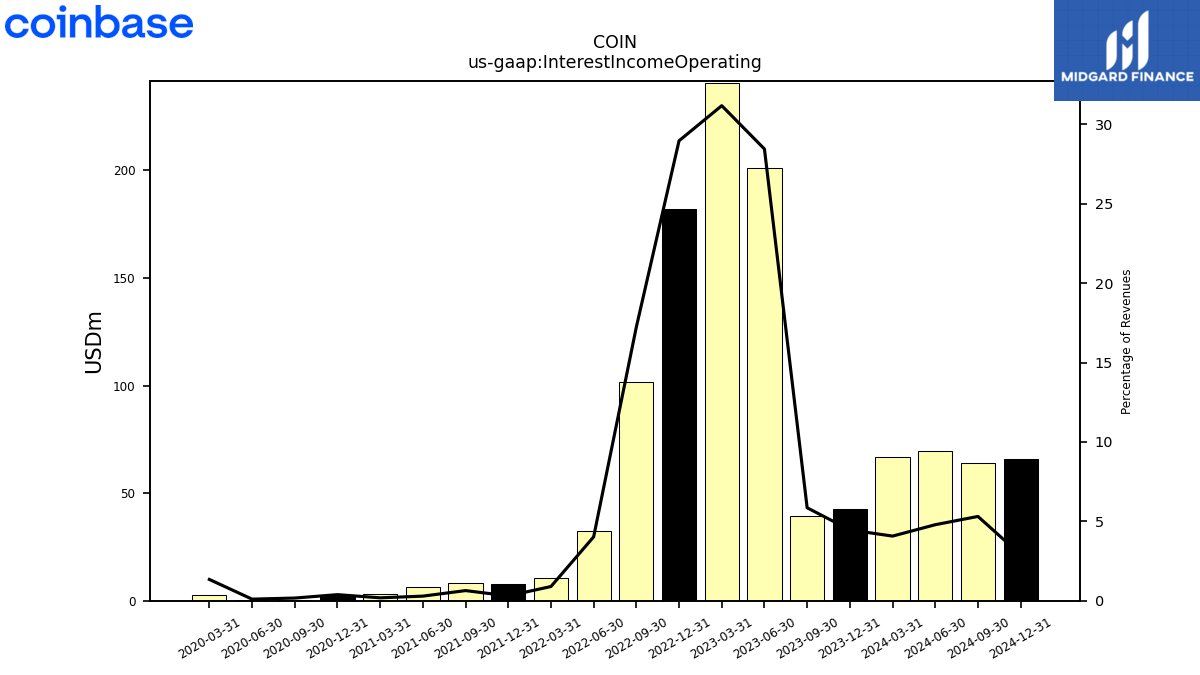
| Interest Income Operating | 39.47 | 201.36 | 240.82 | 182.21 | 101.78 | 32.51 | 10.45 | 7.64 | 8.39 | 6.48 | 3.32 | 2.25 | 0.54 | 0.19 | 2.56 | |
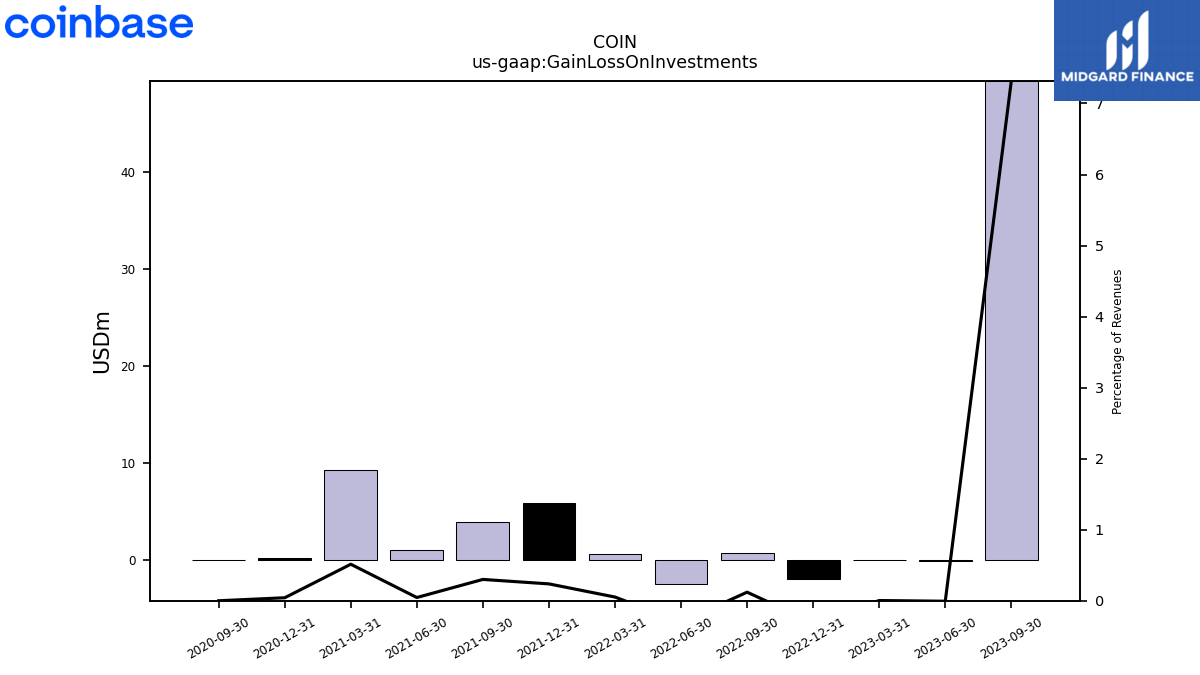
| Gain Loss On Investments | 49.32 | -0.05 | 0.03 | -1.94 | 0.71 | -2.44 | 0.61 | 5.93 | 3.94 | 1.01 | 9.26 | 0.25 | 0.00 | NA | NA | |
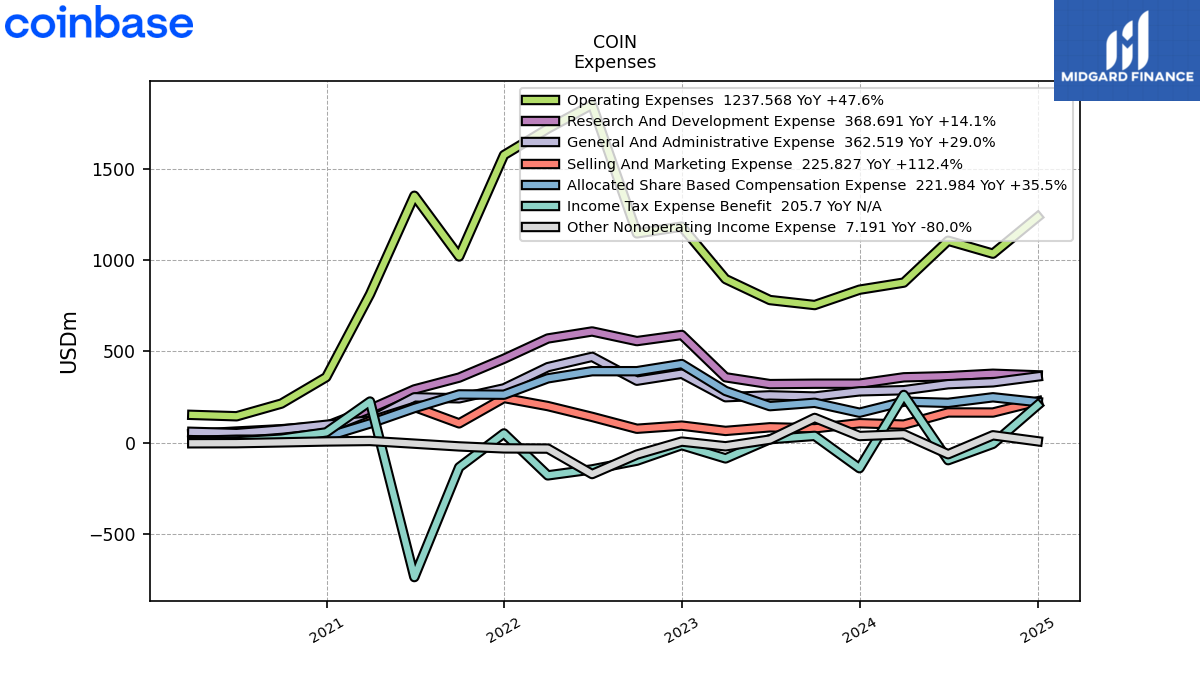
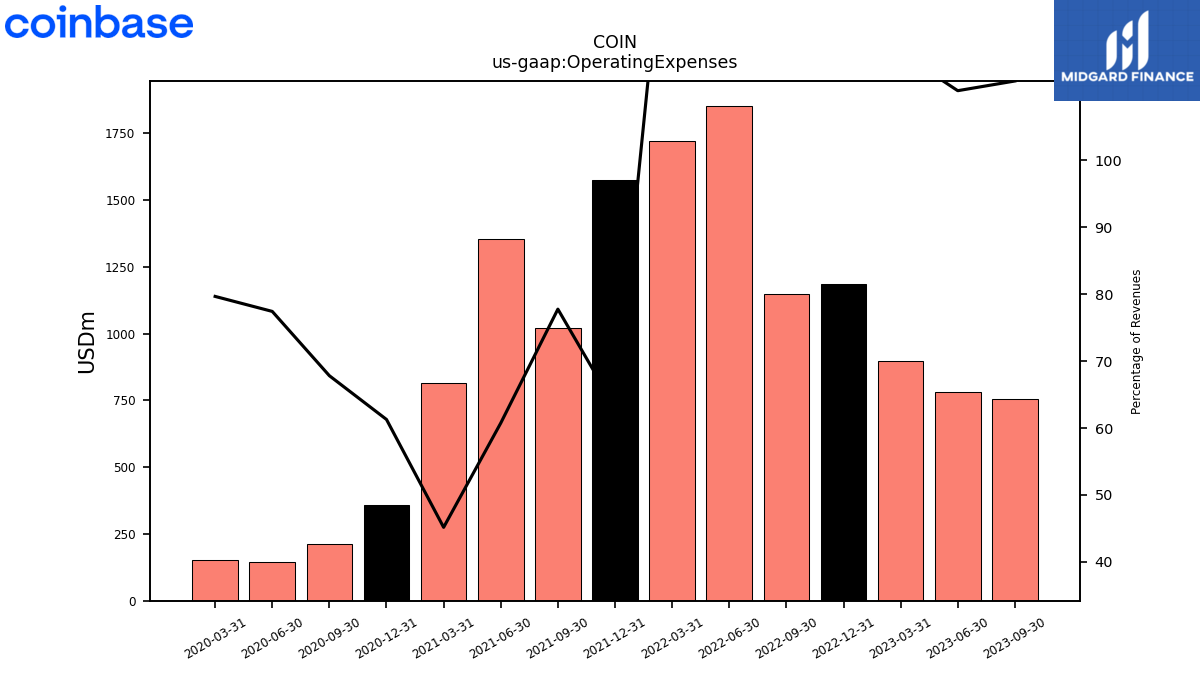
| Operating Expenses | 753.97 | 781.49 | 896.40 | 1183.98 | 1146.82 | 1852.71 | 1720.90 | 1576.14 | 1020.10 | 1353.24 | 813.40 | 358.53 | 213.85 | 144.30 | 151.85 | |
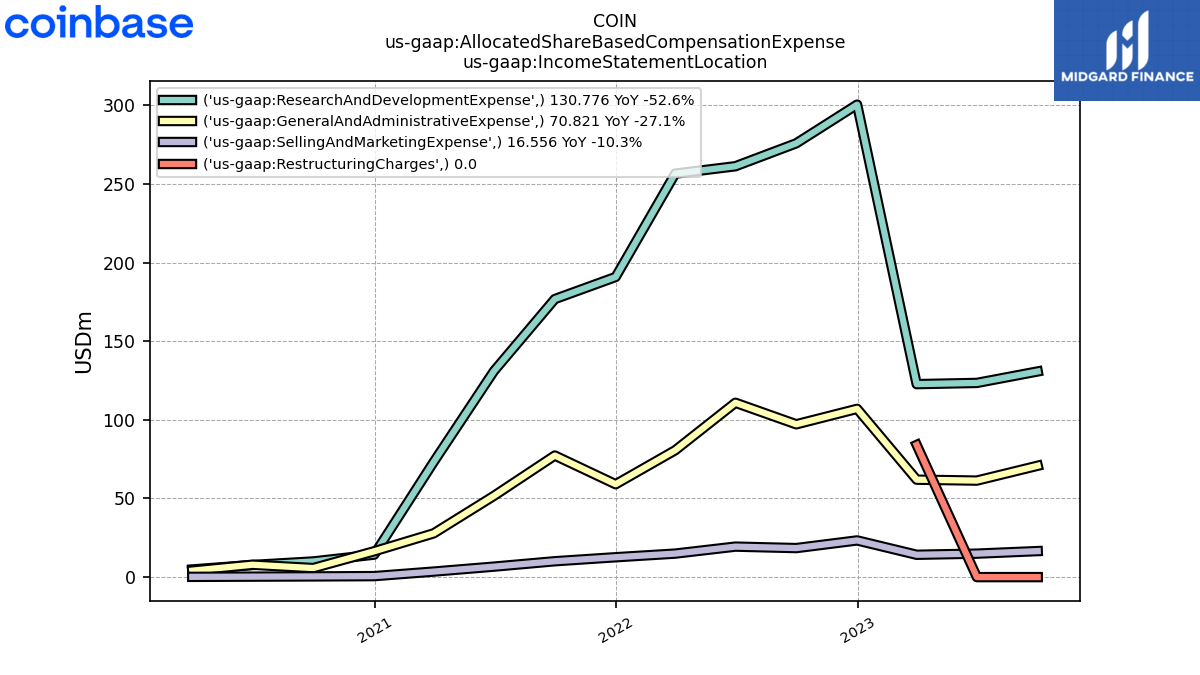
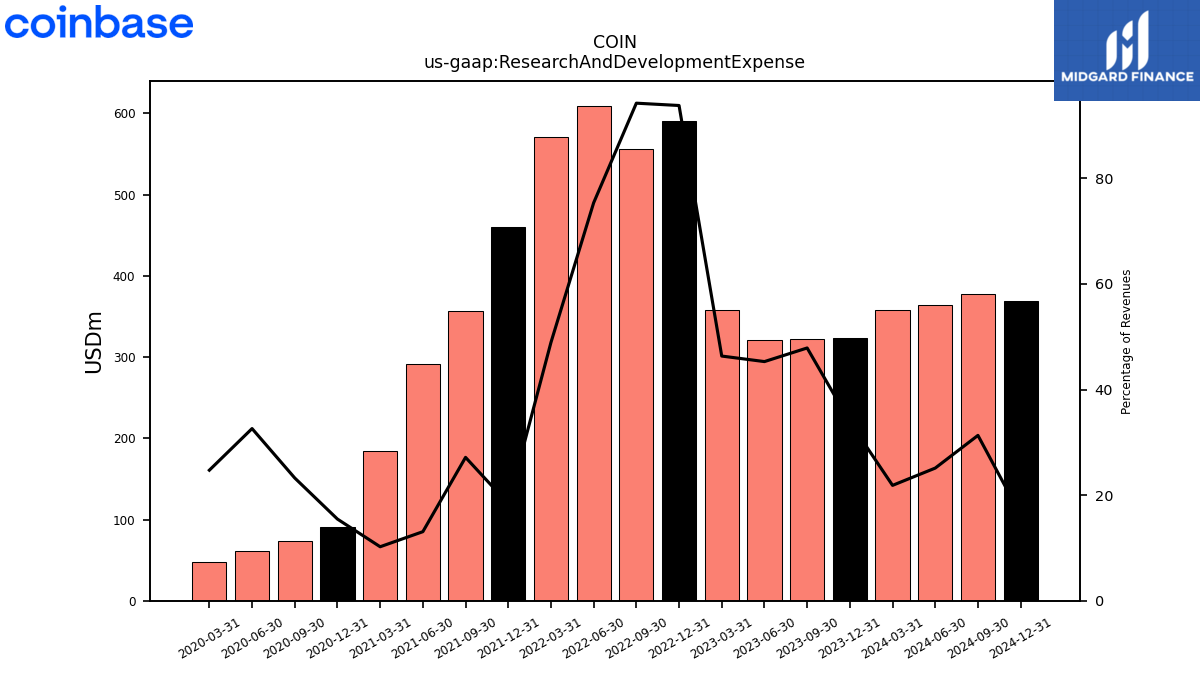
| Research And Development Expense | 322.76 | 320.67 | 358.03 | 590.10 | 556.34 | 609.25 | 570.66 | 459.61 | 356.26 | 291.46 | 184.22 | 90.50 | 73.32 | 60.78 | 47.14 | |
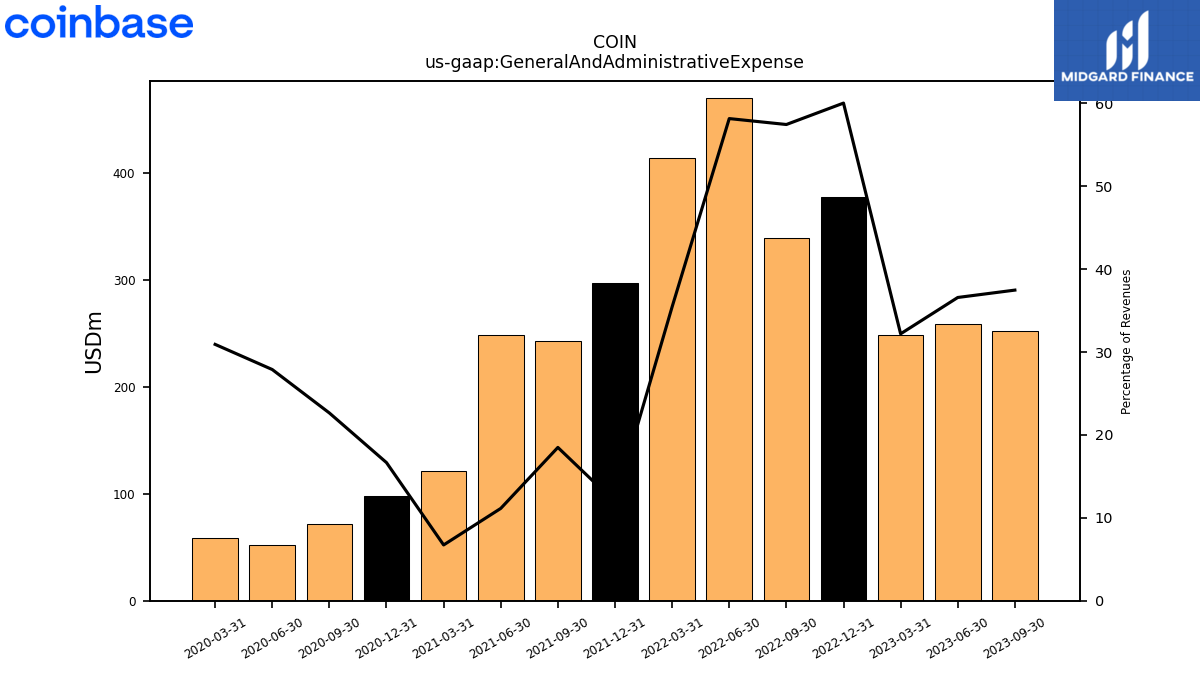
| General And Administrative Expense | 252.63 | 258.99 | 248.76 | 377.68 | 339.16 | 470.17 | 413.58 | 297.32 | 242.64 | 248.19 | 121.23 | 97.50 | 71.43 | 51.99 | 58.96 | |
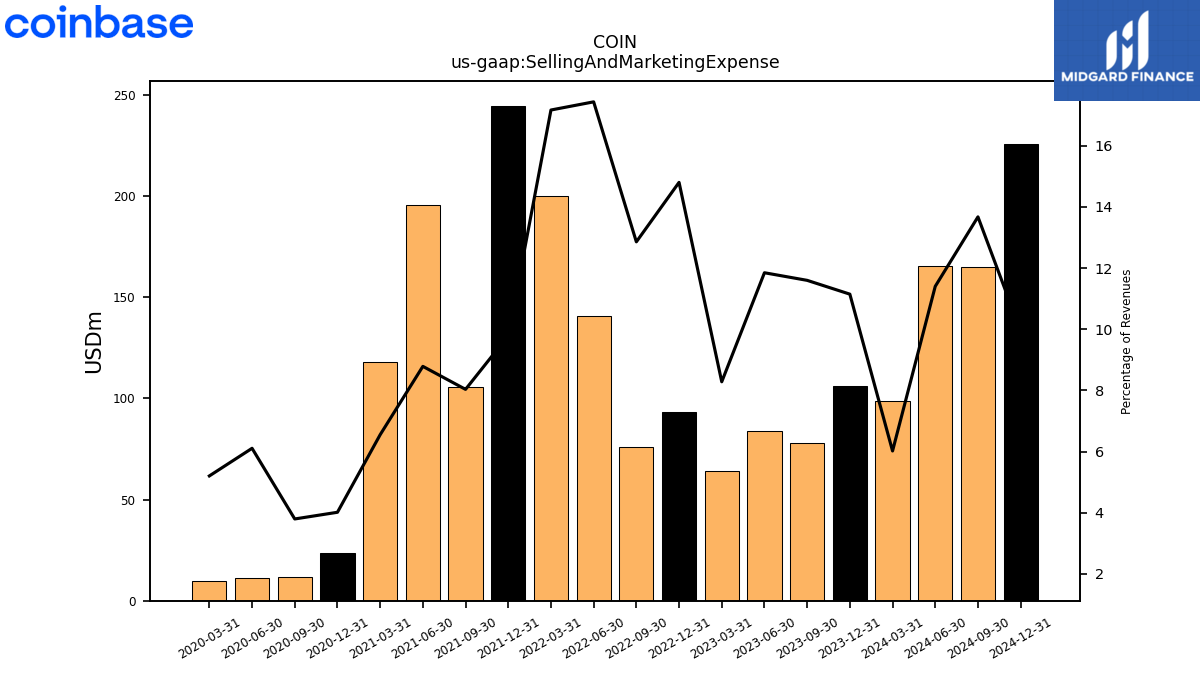
| Selling And Marketing Expense | 78.18 | 83.85 | 63.98 | 93.10 | 75.89 | 140.89 | 200.20 | 244.57 | 105.39 | 195.73 | 117.99 | 23.50 | 11.98 | 11.38 | 9.92 | |
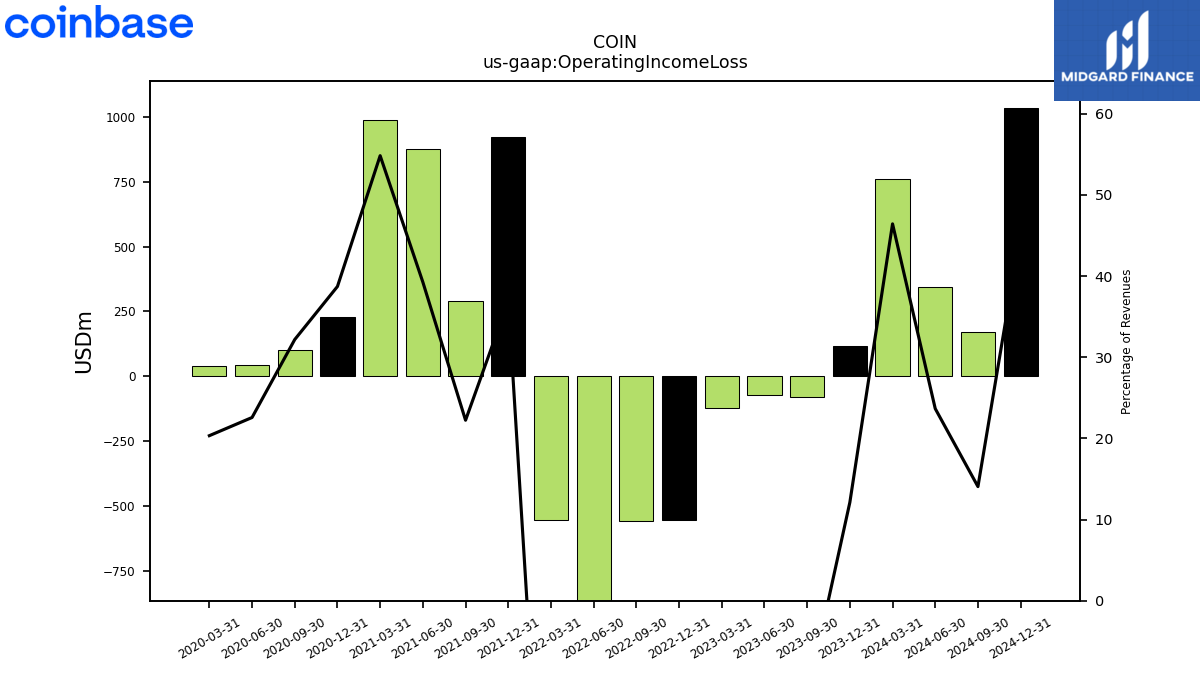
| Operating Income Loss | -79.83 | -73.58 | -123.88 | -554.87 | -556.48 | -1044.39 | -554.46 | 922.32 | 291.81 | 874.73 | 987.71 | 226.59 | 101.50 | 42.09 | 38.77 | |
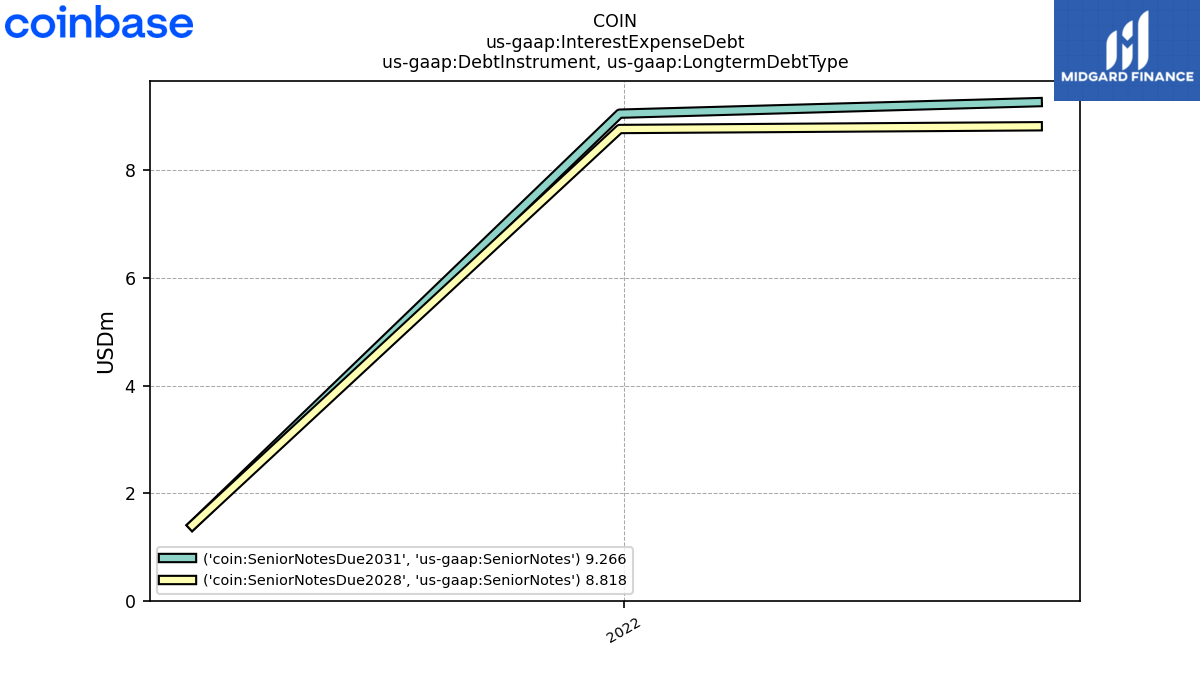
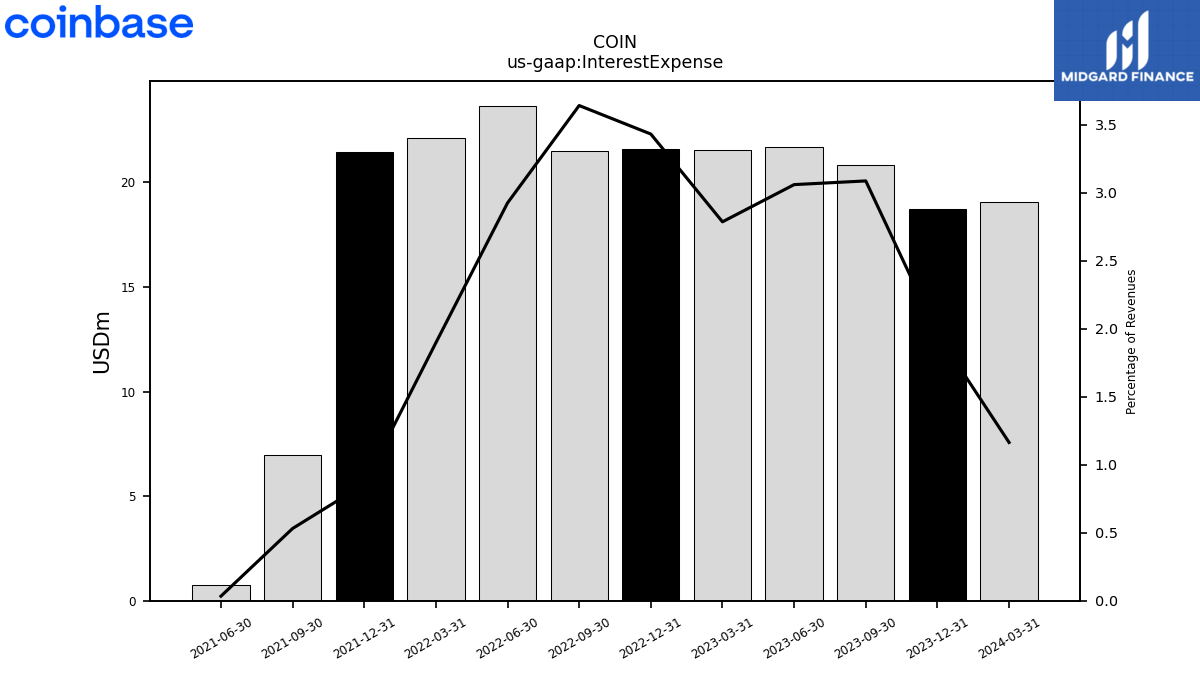
| Interest Expense | 20.82 | 21.67 | 21.54 | 21.60 | 21.51 | 23.66 | 22.14 | 21.44 | 6.97 | 0.75 | NA | NA | NA | NA | NA | |
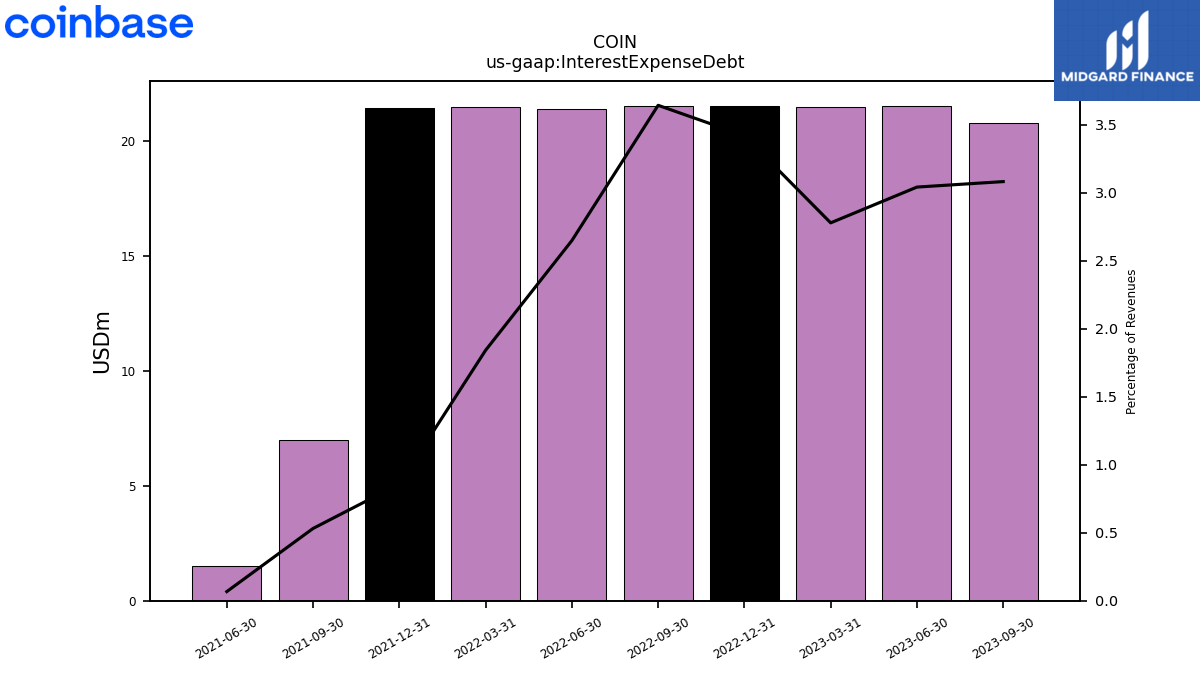
| Interest Expense Debt | 20.77 | 21.53 | 21.46 | 21.51 | 21.50 | 21.40 | 21.48 | 21.44 | 6.97 | 1.50 | NA | NA | NA | NA | NA | |
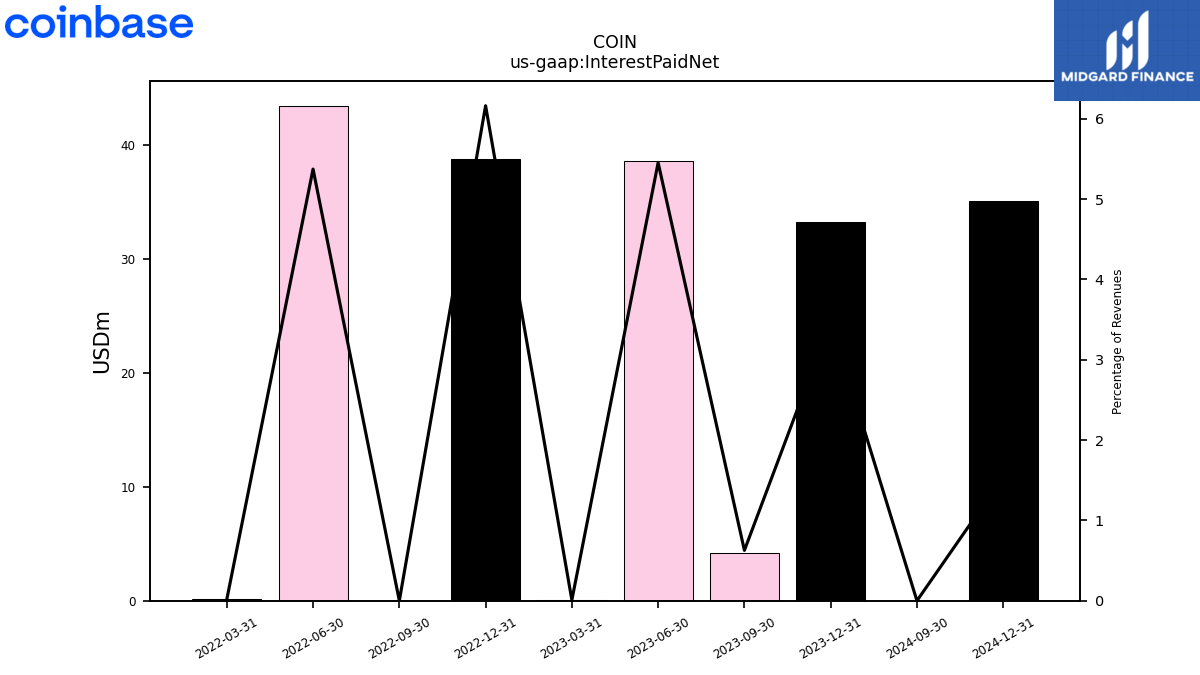
| Interest Paid Net | 4.23 | 38.61 | 0.07 | 38.77 | 0.00 | 43.44 | 0.19 | NA | NA | NA | NA | NA | NA | NA | NA | |
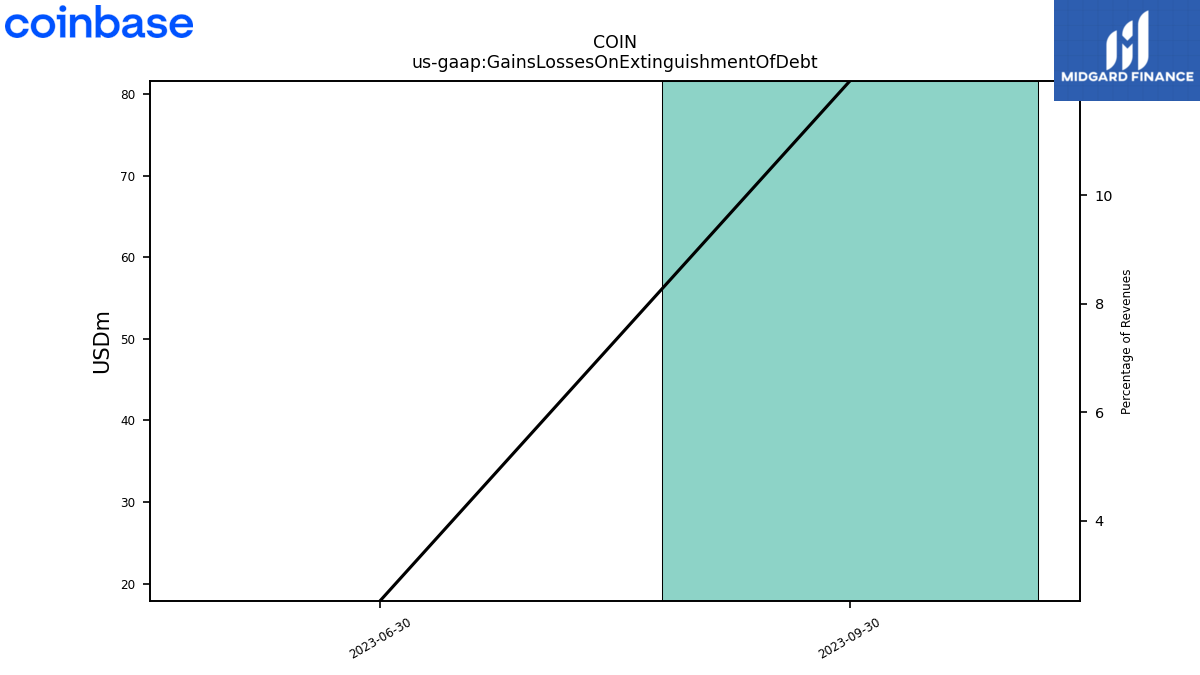
| Gains Losses On Extinguishment Of Debt | 81.59 | 17.90 | NA | NA | NA | NA | NA | NA | NA | NA | NA | NA | NA | NA | NA | |
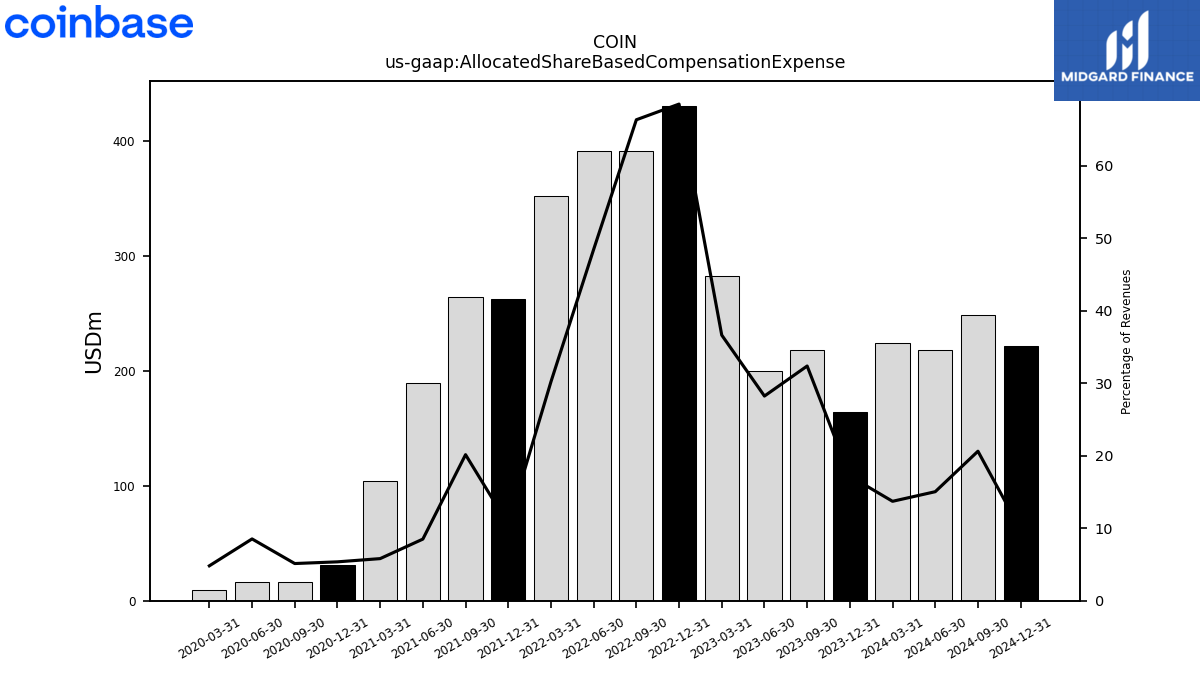
| Allocated Share Based Compensation Expense | 218.15 | 199.77 | 282.90 | 430.75 | 391.44 | 391.50 | 352.14 | 262.53 | 264.19 | 189.34 | 104.63 | 31.38 | 16.18 | 15.88 | 9.18 | |
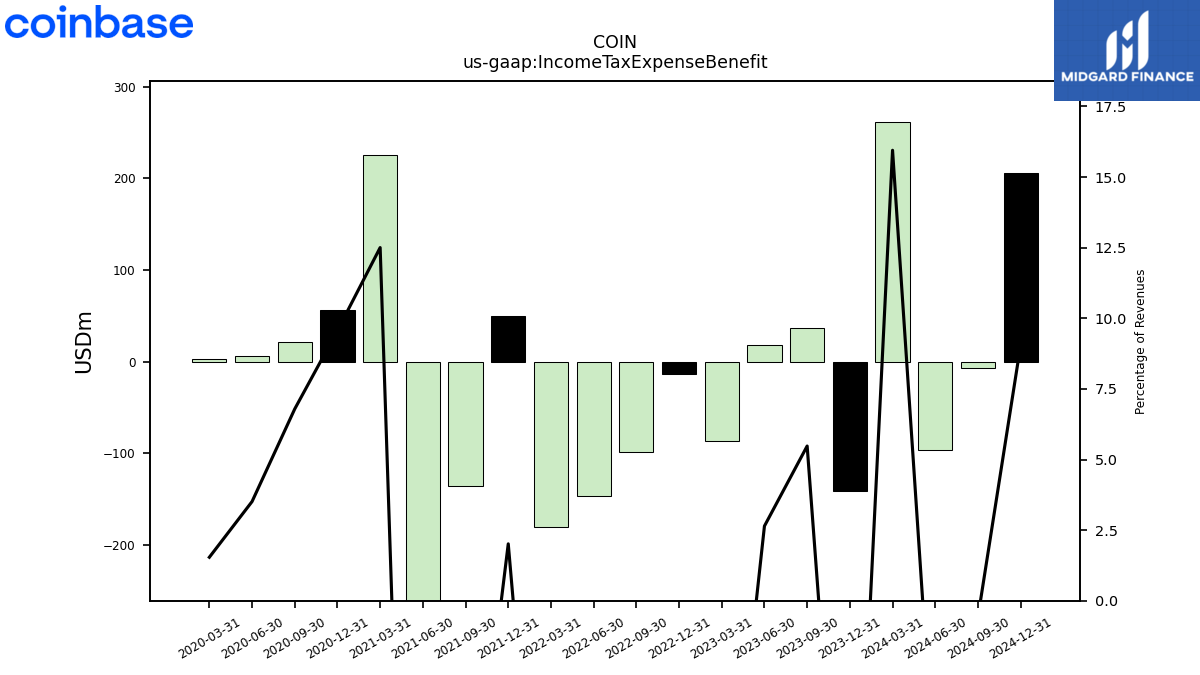
| Income Tax Expense Benefit | 36.93 | 18.72 | -86.78 | -13.88 | -99.06 | -146.91 | -179.79 | 50.33 | -135.24 | -737.47 | 225.20 | 55.98 | 21.42 | 6.55 | 2.94 | |
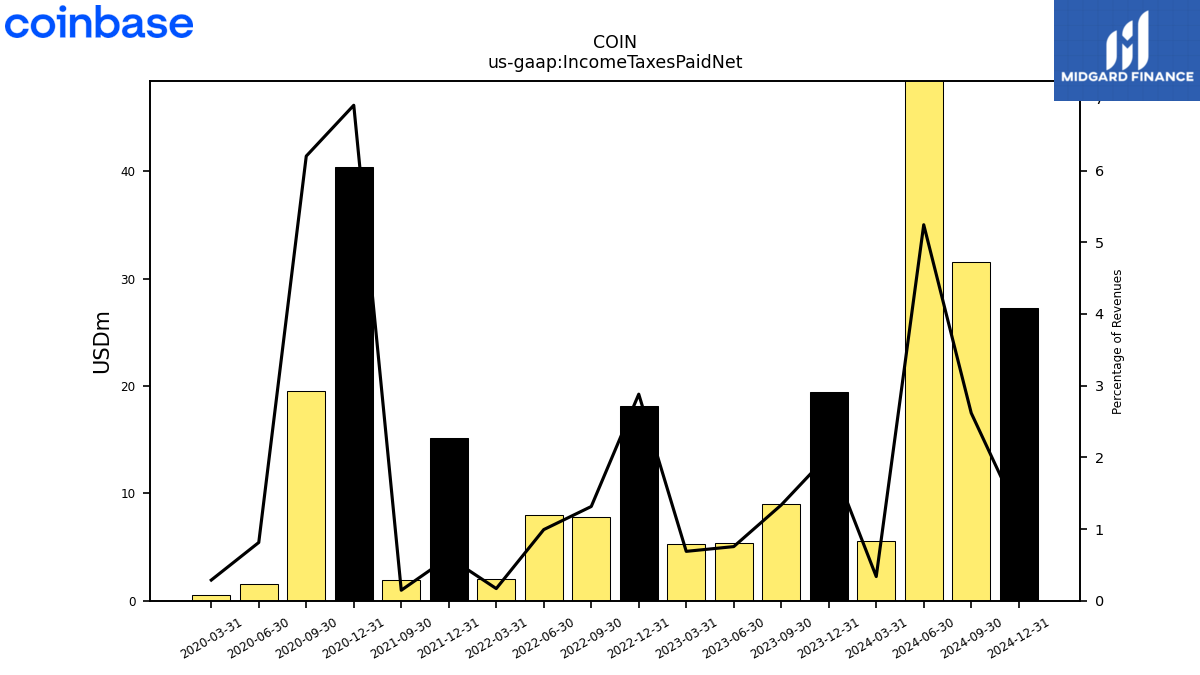
| Income Taxes Paid Net | 9.01 | 5.35 | 5.32 | 18.13 | 7.76 | 8.02 | 1.98 | 15.19 | 1.92 | NA | NA | 40.44 | 19.56 | 1.51 | 0.55 | |
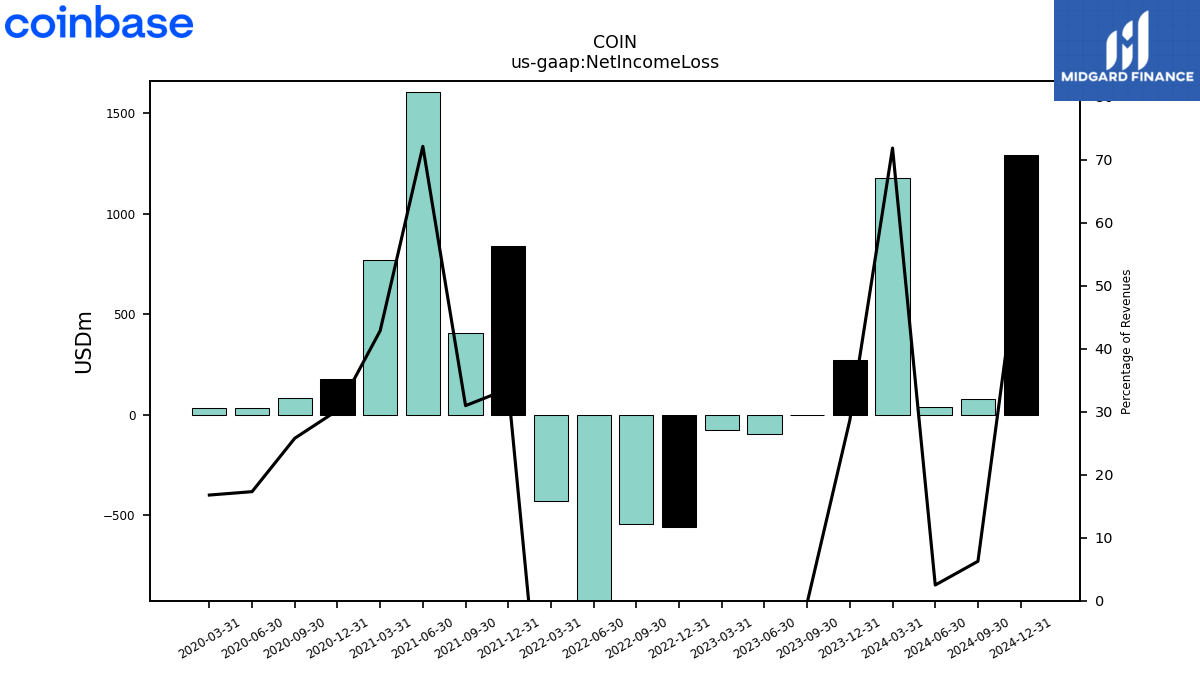
| Net Income Loss | -2.27 | -97.41 | -78.90 | -557.00 | -544.63 | -1093.65 | -429.66 | 840.21 | 406.10 | 1606.35 | 771.46 | 176.78 | 81.30 | 32.26 | 31.97 | |
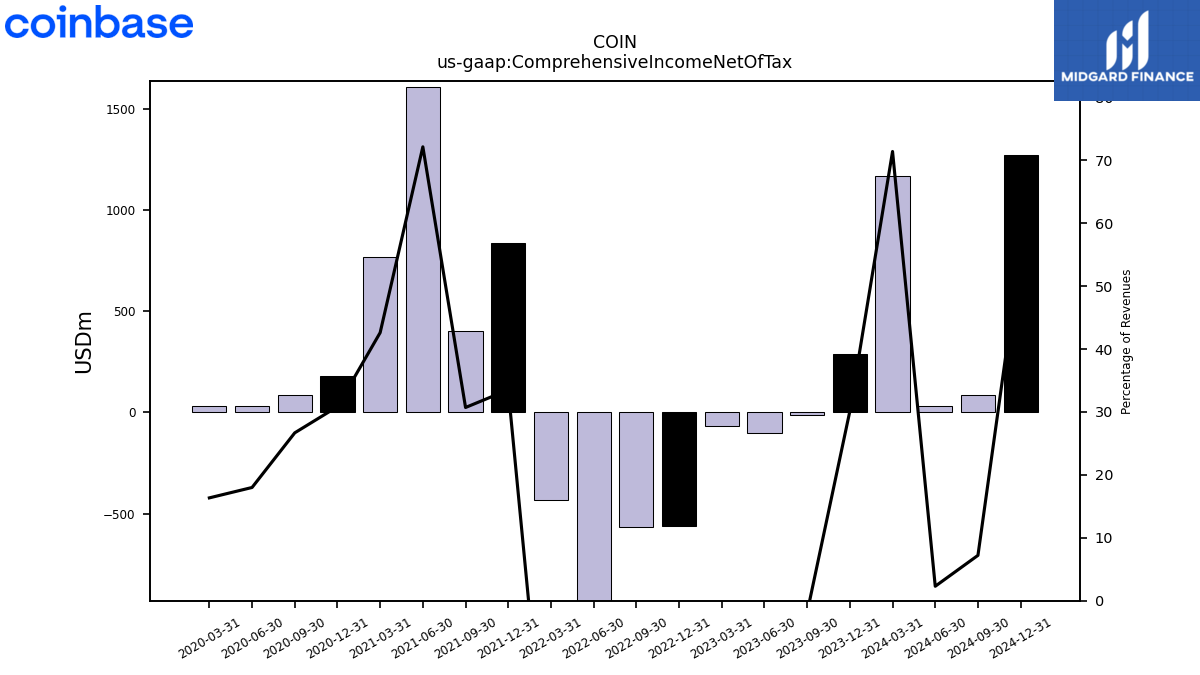
| Comprehensive Income Net Of Tax | -12.59 | -102.79 | -68.70 | -559.11 | -562.95 | -1107.95 | -430.15 | 837.25 | 402.89 | 1607.01 | 767.33 | 180.44 | 84.14 | 33.55 | 31.16 | |
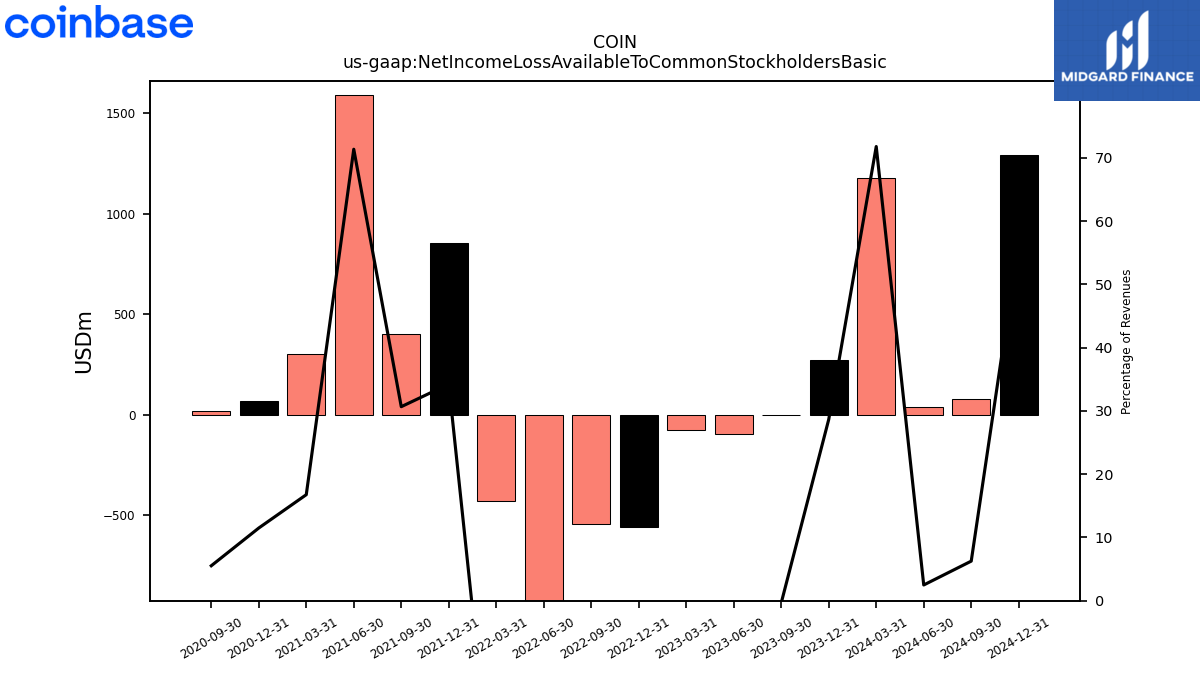
| Net Income Loss Available To Common Stockholders Basic | -2.27 | -97.41 | -78.90 | -557.00 | -544.63 | -1093.65 | -429.66 | 855.17 | 402.34 | 1589.71 | 301.90 | 67.24 | 17.44 | NA | NA | |
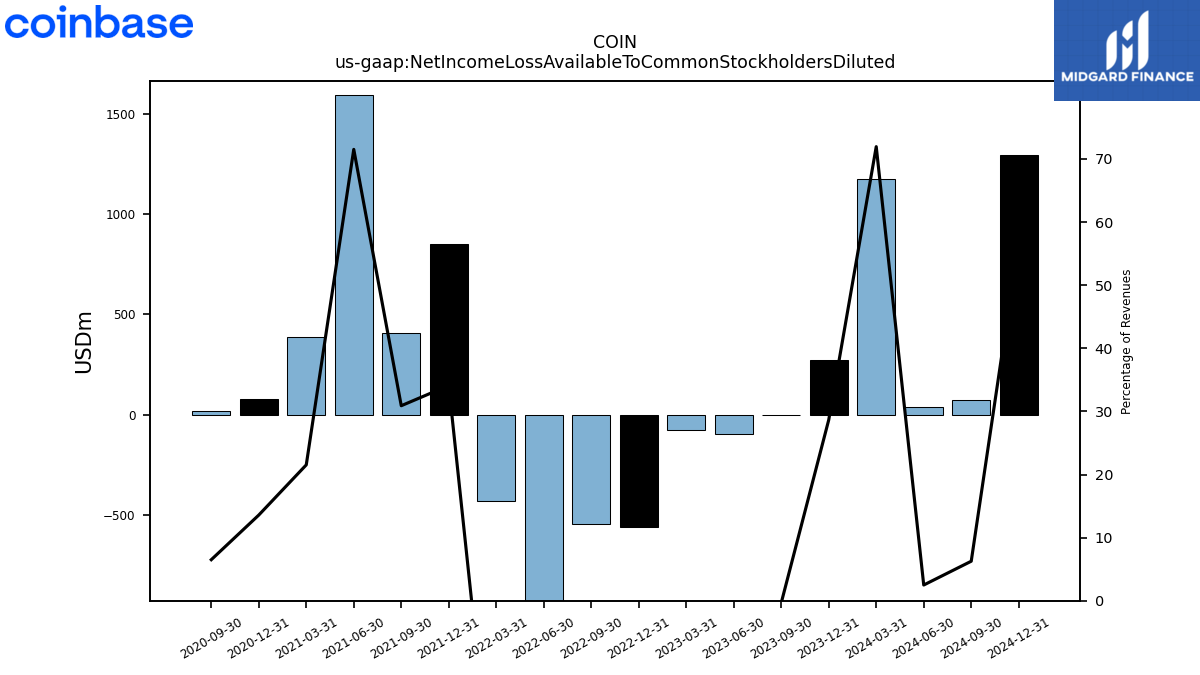
| Net Income Loss Available To Common Stockholders Diluted | -2.27 | -97.60 | -78.90 | -557.84 | -544.63 | -1099.84 | -429.66 | 852.00 | 405.34 | 1593.15 | 387.72 | 79.42 | 20.50 | NA | NA |
| 2023-09-30 | 2023-06-30 | 2023-03-31 | 2022-12-31 | 2022-09-30 | 2022-06-30 | 2022-03-31 | 2021-12-31 | 2021-09-30 | 2021-06-30 | 2021-03-31 | 2020-12-31 | 2020-09-30 | 2020-06-30 | 2020-03-31 | ||
|---|---|---|---|---|---|---|---|---|---|---|---|---|---|---|---|---|
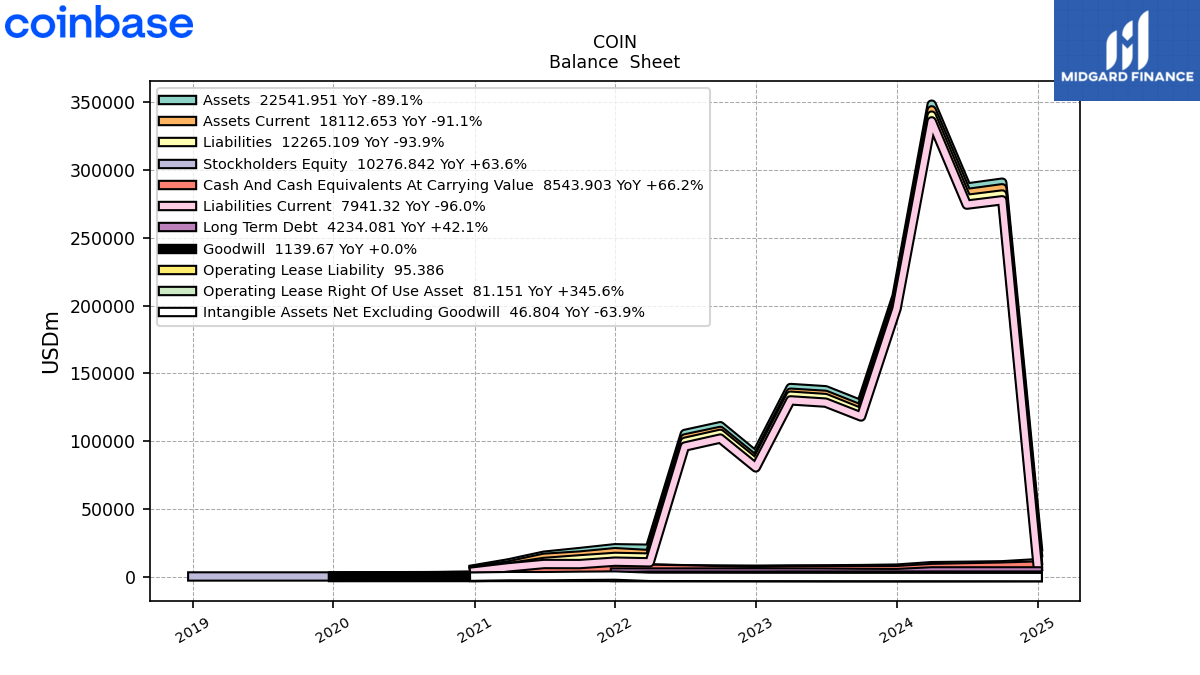
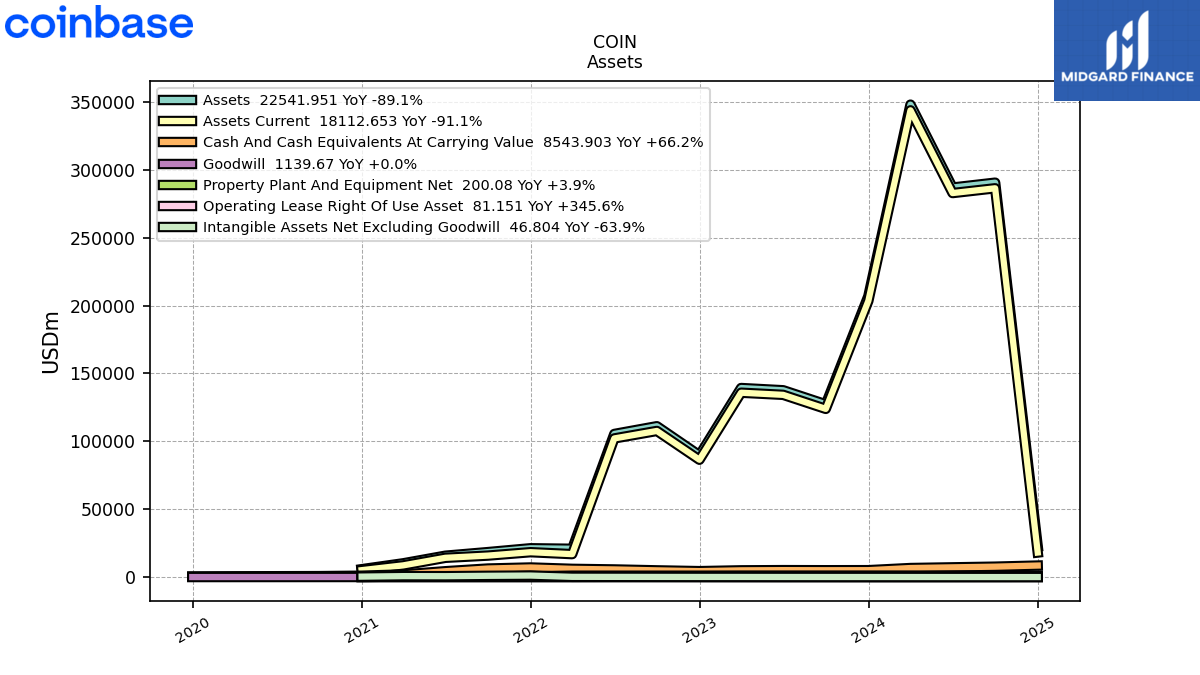
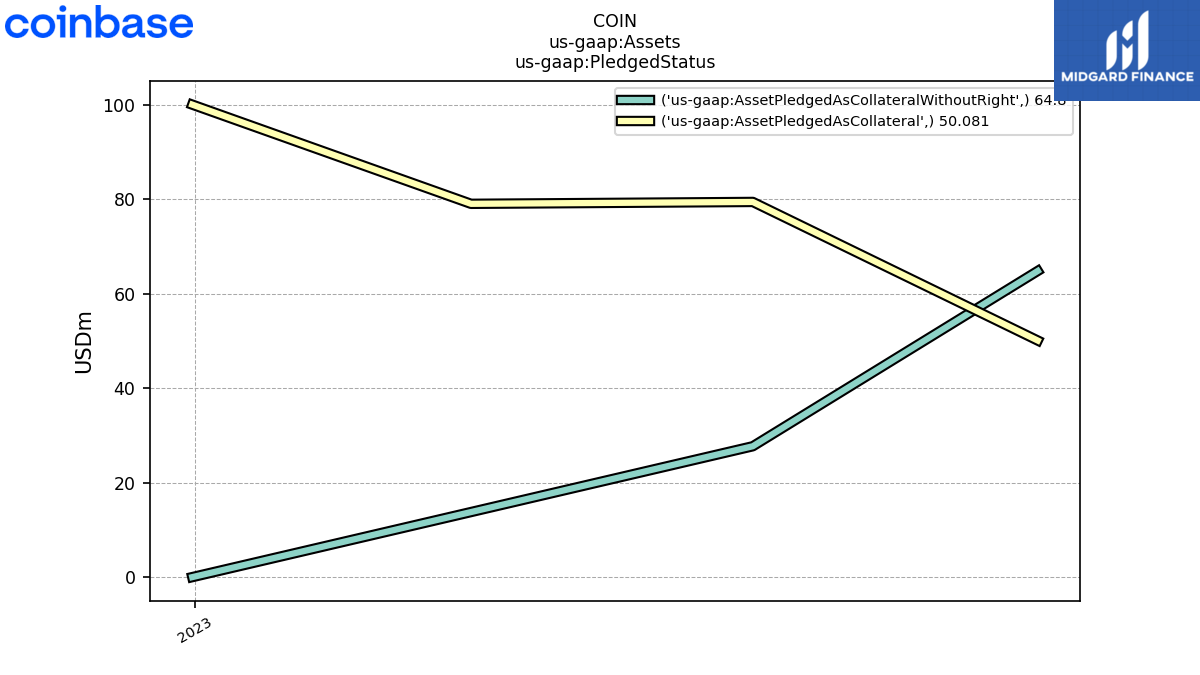
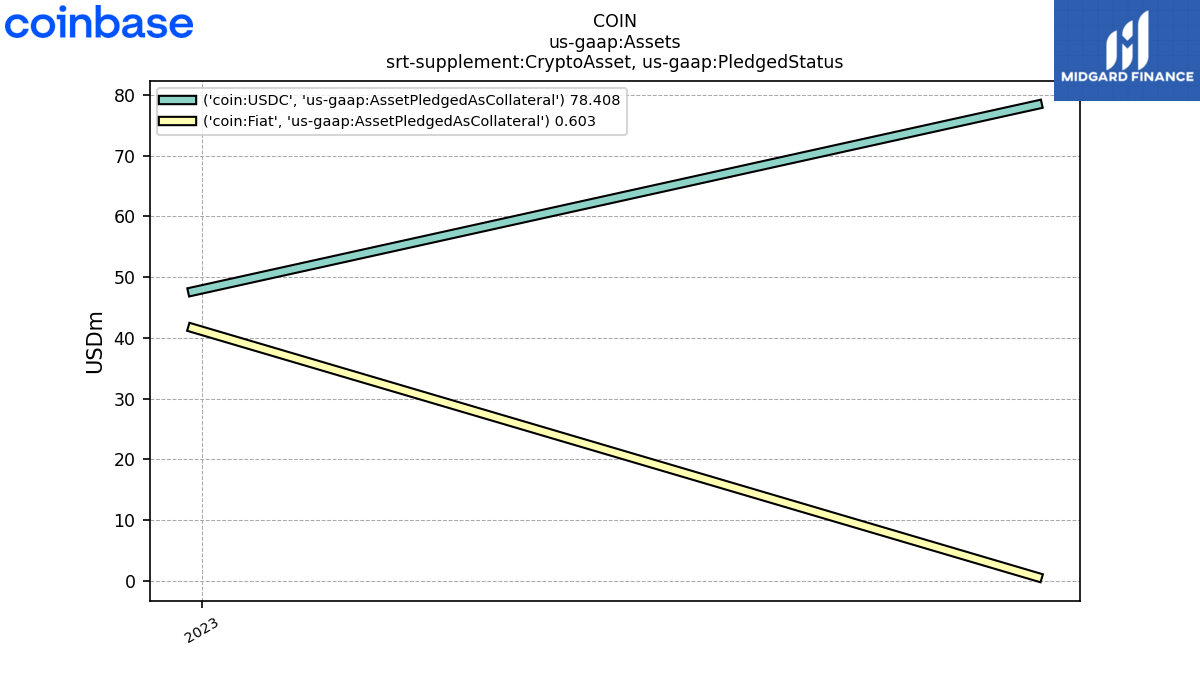
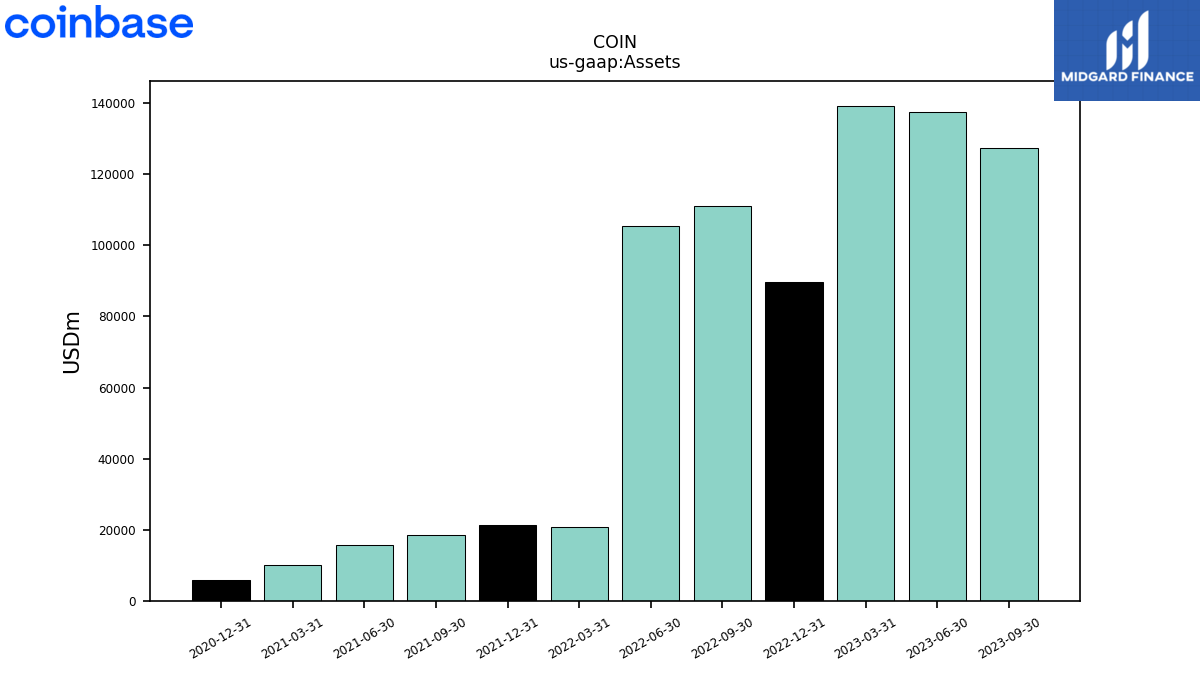
| Assets | 127305.60 | 137650.58 | 139301.86 | 89724.87 | 111168.36 | 105468.24 | 20895.19 | 21274.42 | 18454.27 | 15790.21 | 10201.11 | 5855.41 | NA | NA | NA | |
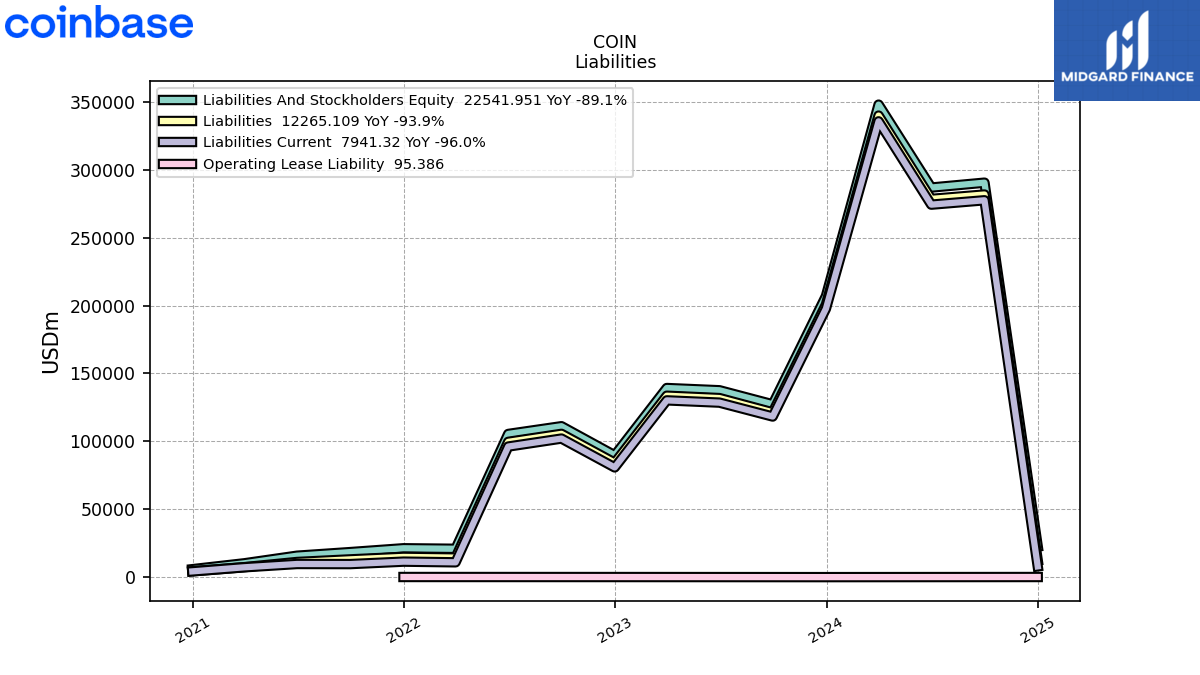
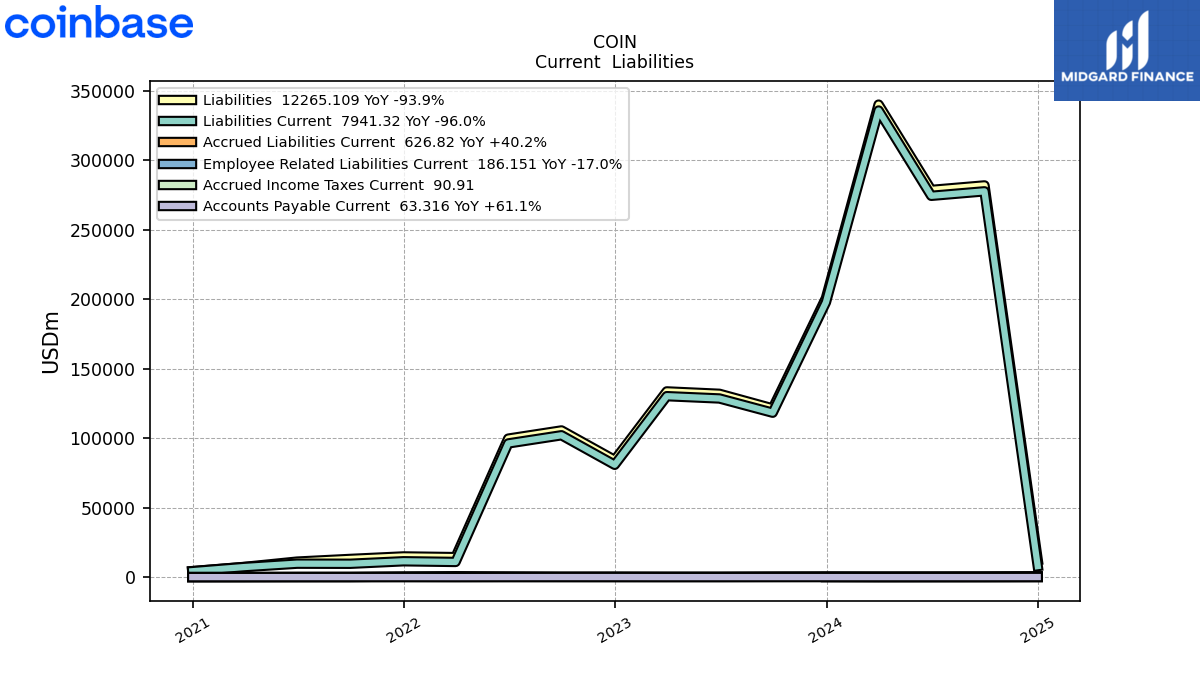
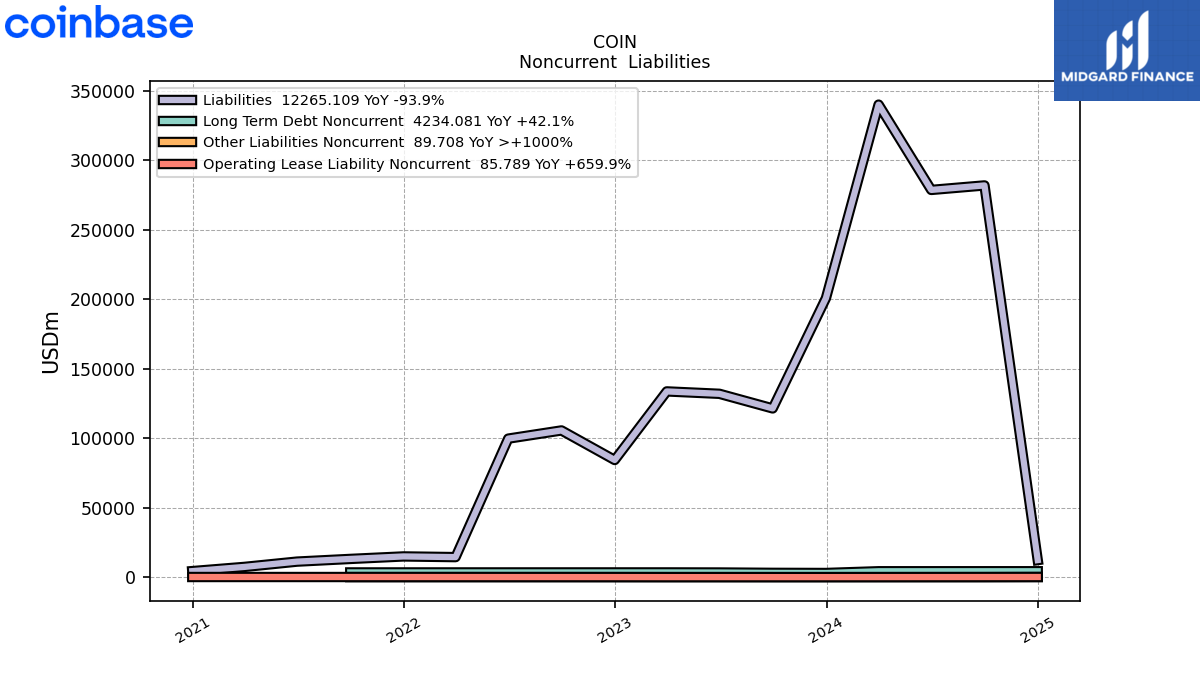
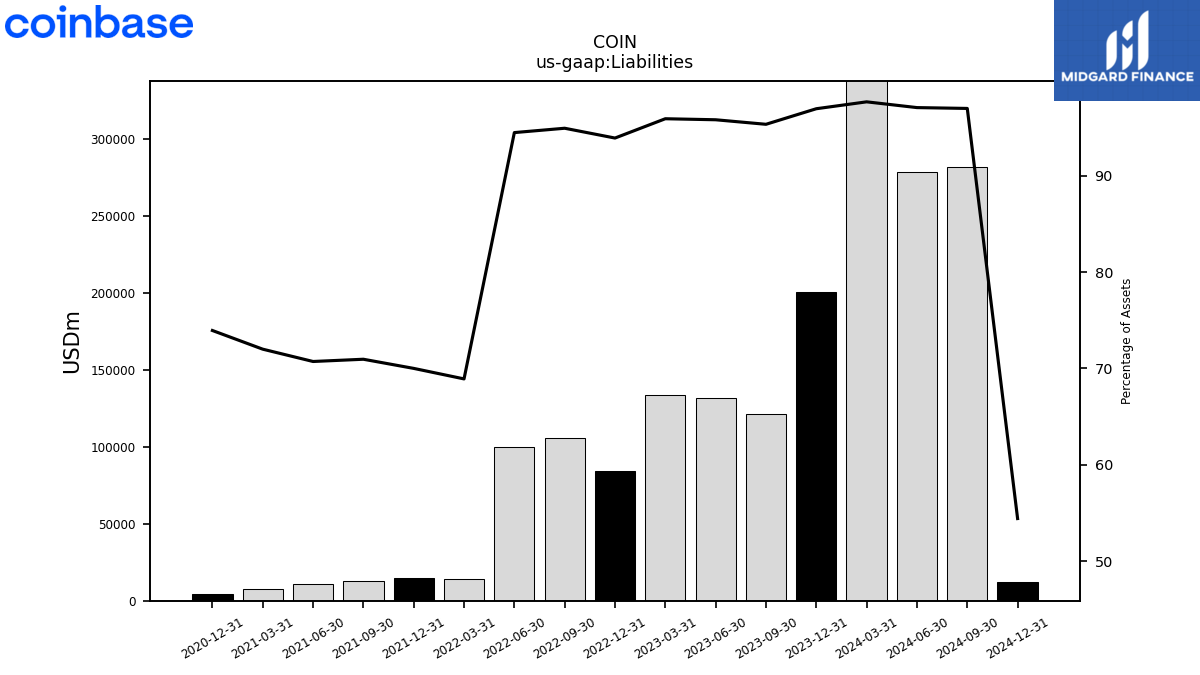
| Liabilities | 121384.47 | 131895.87 | 133626.91 | 84270.32 | 105542.05 | 99654.85 | 14399.10 | 14892.74 | 13093.77 | 11166.78 | 7344.67 | 4329.36 | NA | NA | NA | |
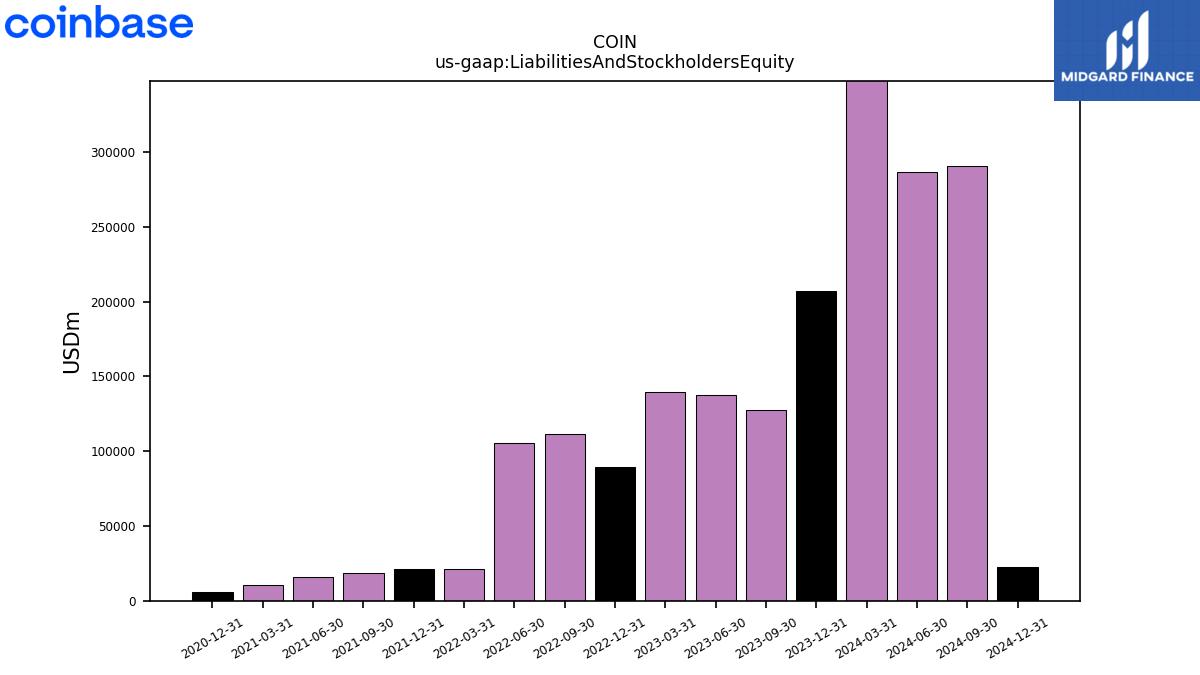
| Liabilities And Stockholders Equity | 127305.60 | 137650.58 | 139301.86 | 89724.87 | 111168.36 | 105468.24 | 20895.19 | 21274.42 | 18454.27 | 15790.21 | 10201.11 | 5855.41 | NA | NA | NA | |
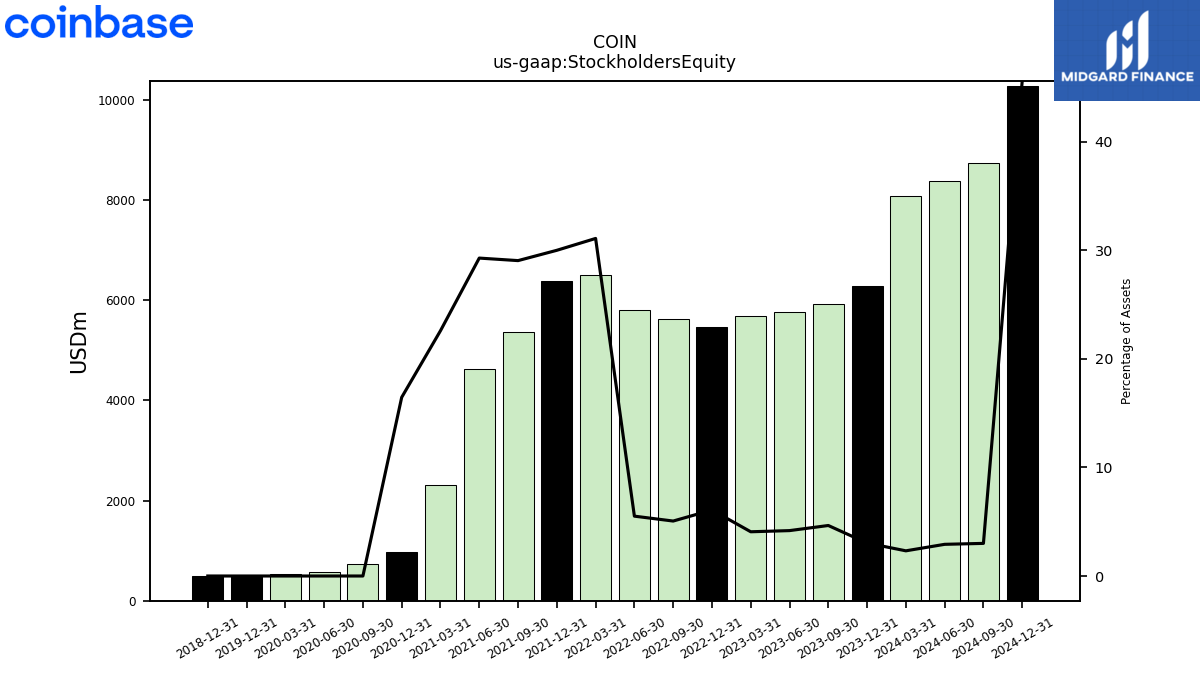
| Stockholders Equity | 5921.12 | 5754.70 | 5674.95 | 5454.56 | 5626.31 | 5813.39 | 6496.09 | 6381.69 | 5360.50 | 4623.43 | 2304.41 | 963.58 | 735.61 | 583.12 | 537.91 |
| 2023-09-30 | 2023-06-30 | 2023-03-31 | 2022-12-31 | 2022-09-30 | 2022-06-30 | 2022-03-31 | 2021-12-31 | 2021-09-30 | 2021-06-30 | 2021-03-31 | 2020-12-31 | 2020-09-30 | 2020-06-30 | 2020-03-31 | ||
|---|---|---|---|---|---|---|---|---|---|---|---|---|---|---|---|---|
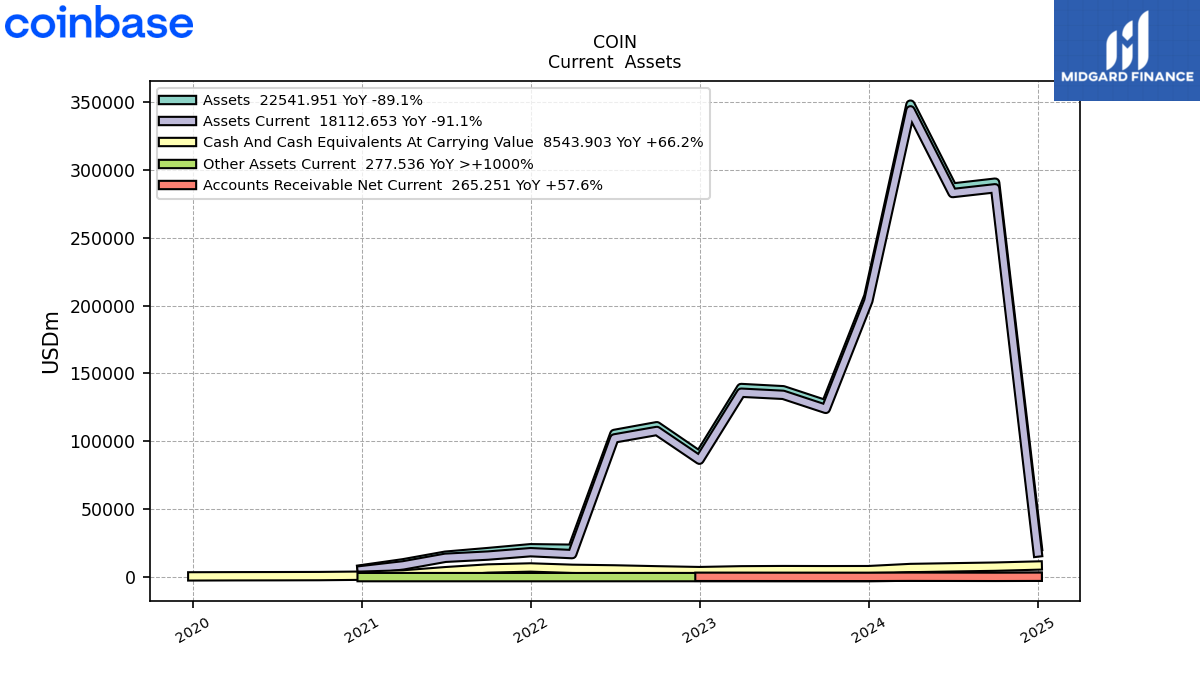
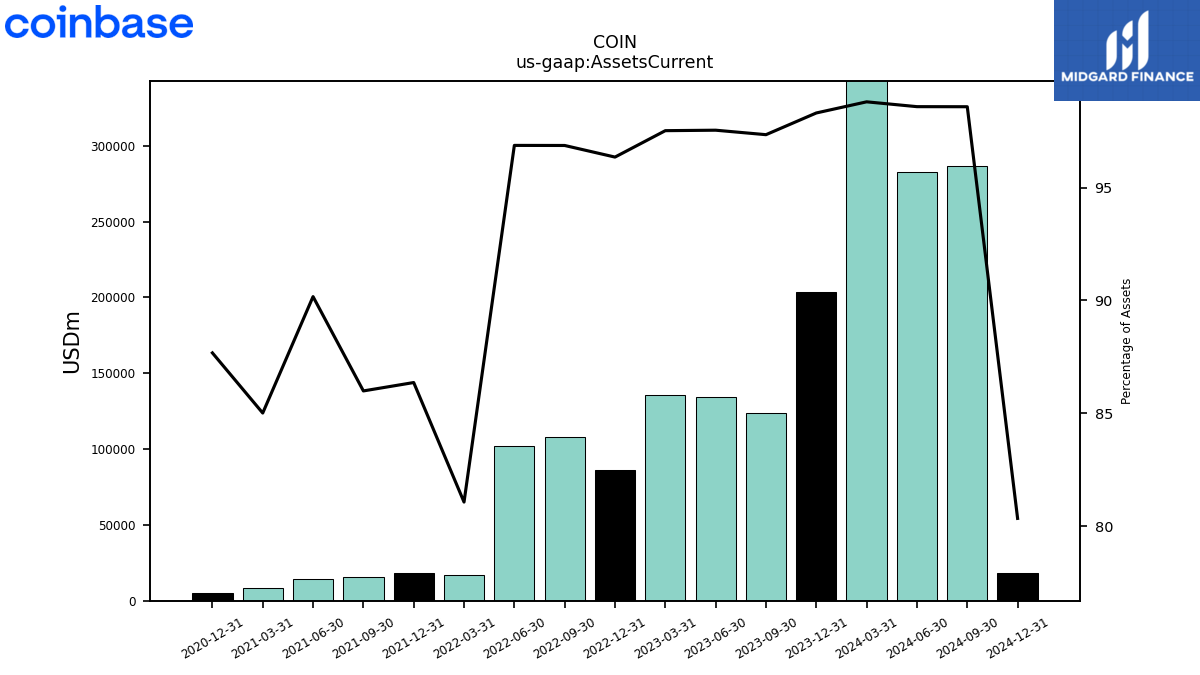
| Assets Current | 123919.22 | 134261.97 | 135843.95 | 86448.21 | 107679.97 | 102162.25 | 16940.65 | 18373.86 | 15869.72 | 14238.06 | 8672.54 | 5133.95 | NA | NA | NA | |
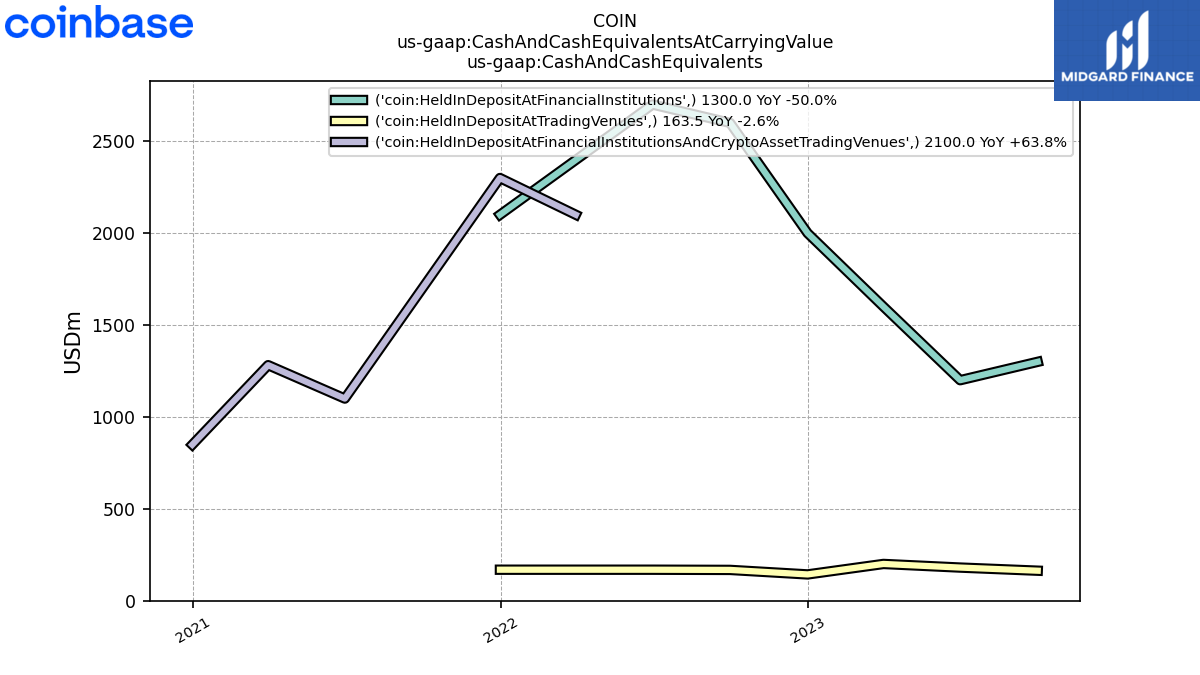
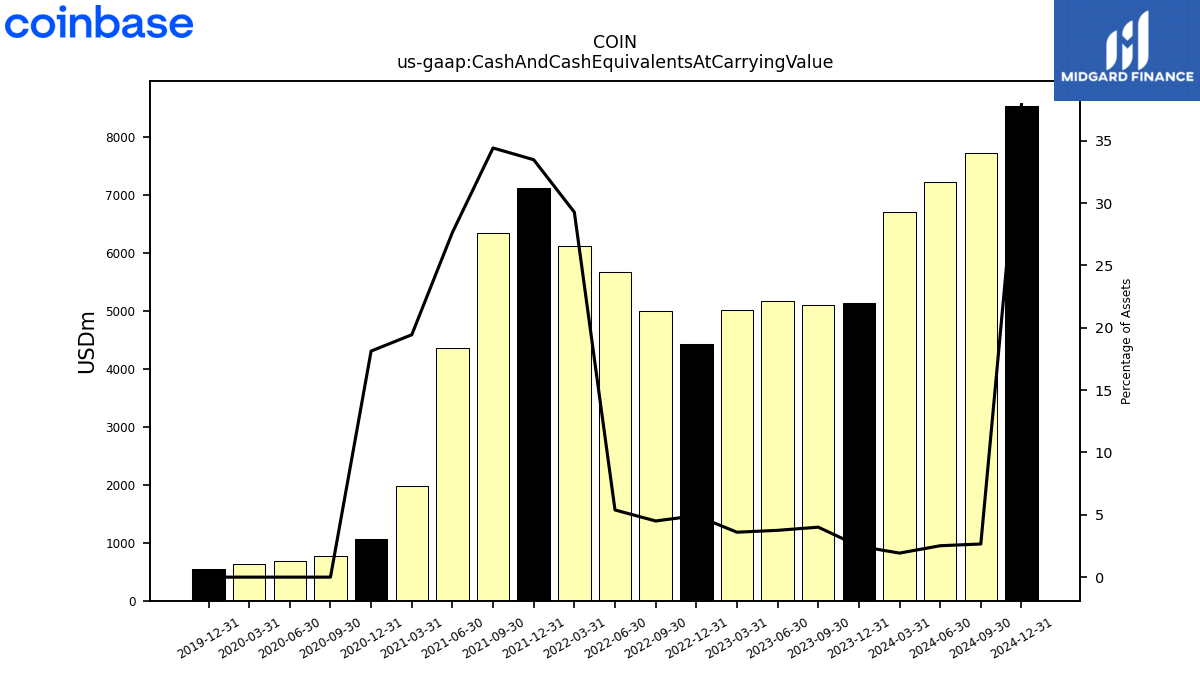
| Cash And Cash Equivalents At Carrying Value | 5100.80 | 5166.73 | 5018.41 | 4425.02 | 5006.58 | 5682.07 | 6116.39 | 7123.48 | 6352.77 | 4365.98 | 1983.32 | 1061.85 | 766.26 | 687.41 | 636.32 | |
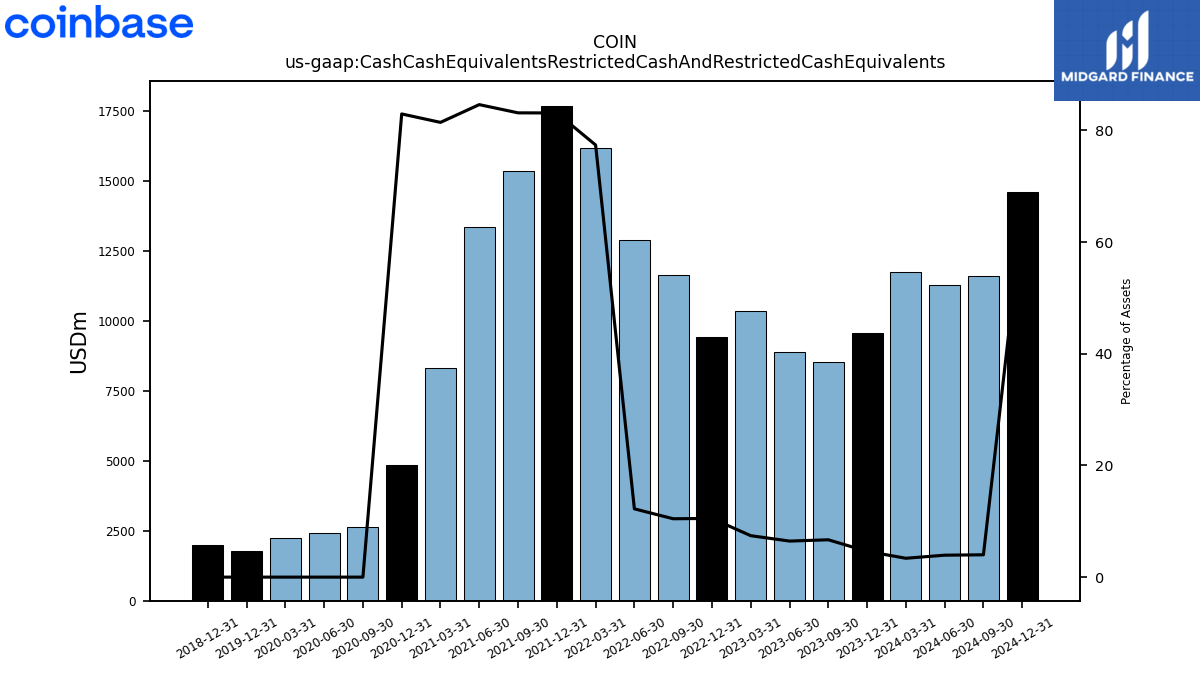
| Cash Cash Equivalents Restricted Cash And Restricted Cash Equivalents | 8511.18 | 8884.46 | 10338.15 | 9429.65 | 11620.80 | 12892.18 | 16166.88 | 17680.66 | 15340.62 | 13358.64 | 8305.93 | 4856.03 | 2643.96 | 2417.44 | 2238.73 | |
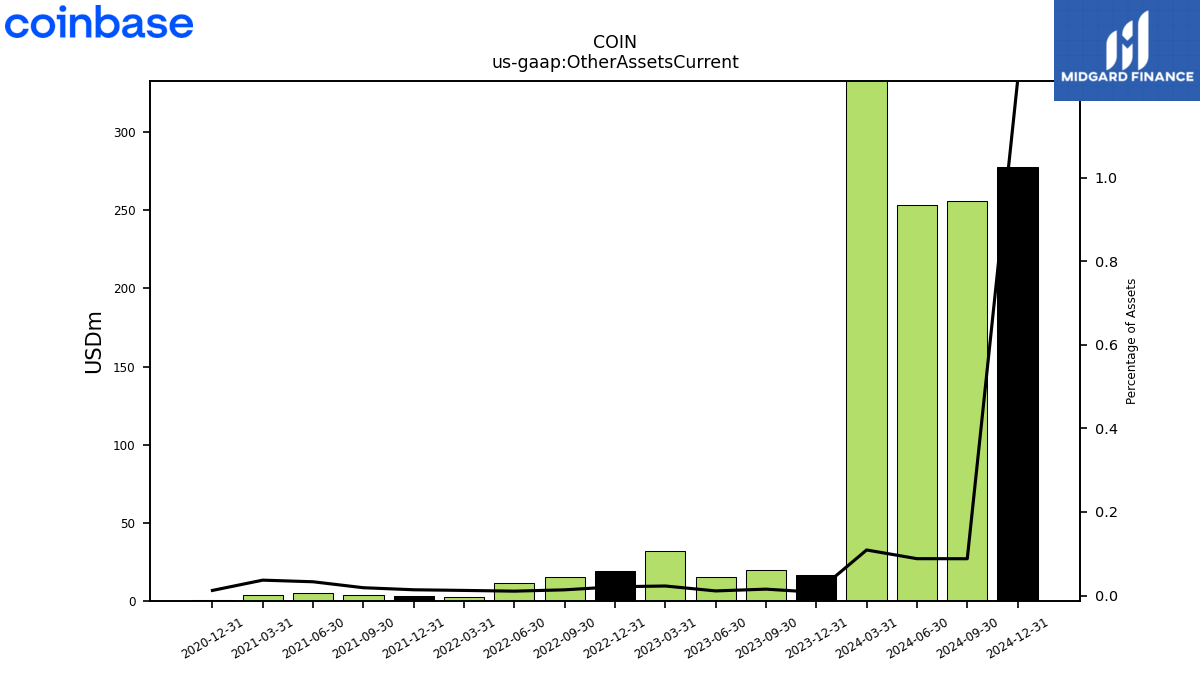
| Other Assets Current | 19.53 | 15.27 | 31.88 | 18.84 | 15.22 | 11.13 | 2.56 | 2.94 | 3.46 | 5.21 | 3.76 | 0.72 | NA | NA | NA | |
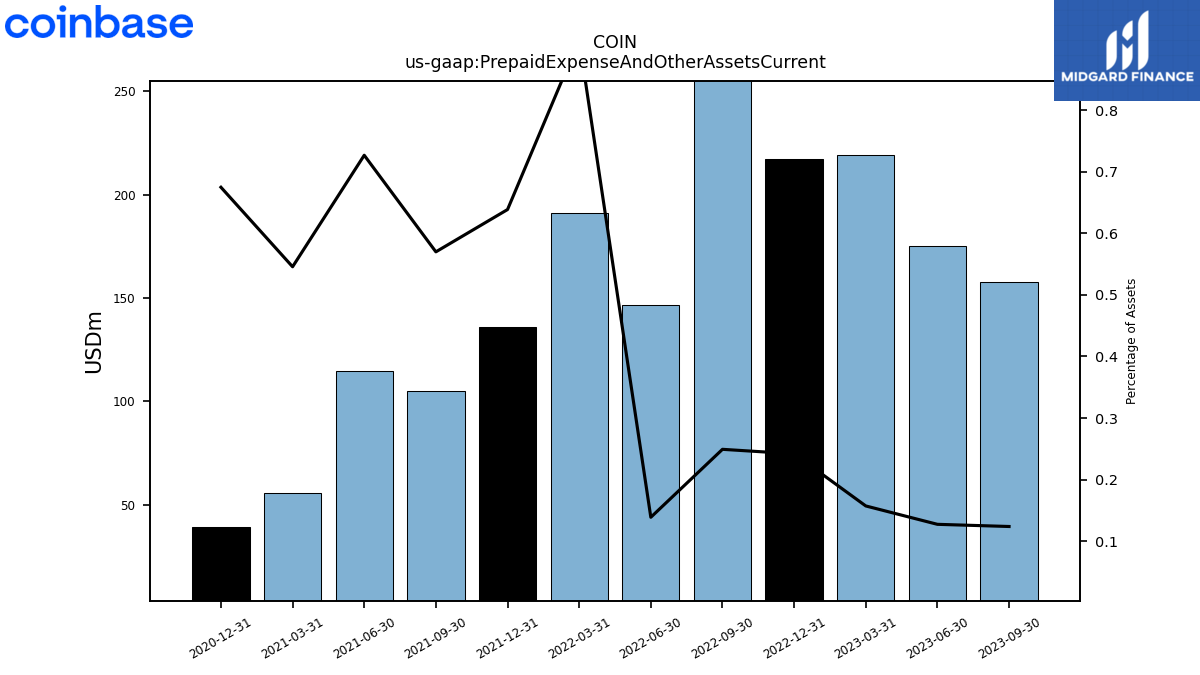
| Prepaid Expense And Other Assets Current | 157.71 | 175.40 | 219.07 | 217.05 | 277.04 | 146.46 | 191.07 | 135.85 | 105.17 | 114.75 | 55.66 | 39.51 | NA | NA | NA | |
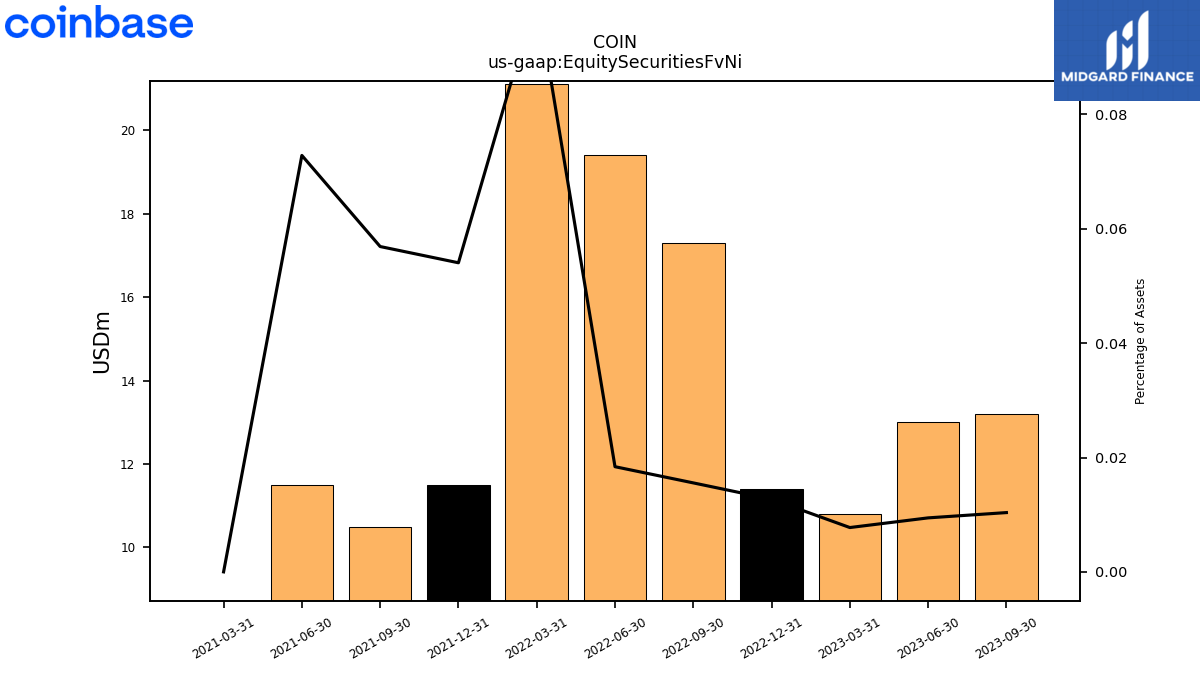
| Equity Securities Fv Ni | 13.20 | 13.00 | 10.80 | 11.40 | 17.30 | 19.40 | 21.10 | 11.50 | 10.50 | 11.50 | 0.00 | NA | NA | NA | NA |
| 2023-09-30 | 2023-06-30 | 2023-03-31 | 2022-12-31 | 2022-09-30 | 2022-06-30 | 2022-03-31 | 2021-12-31 | 2021-09-30 | 2021-06-30 | 2021-03-31 | 2020-12-31 | 2020-09-30 | 2020-06-30 | 2020-03-31 | ||
|---|---|---|---|---|---|---|---|---|---|---|---|---|---|---|---|---|
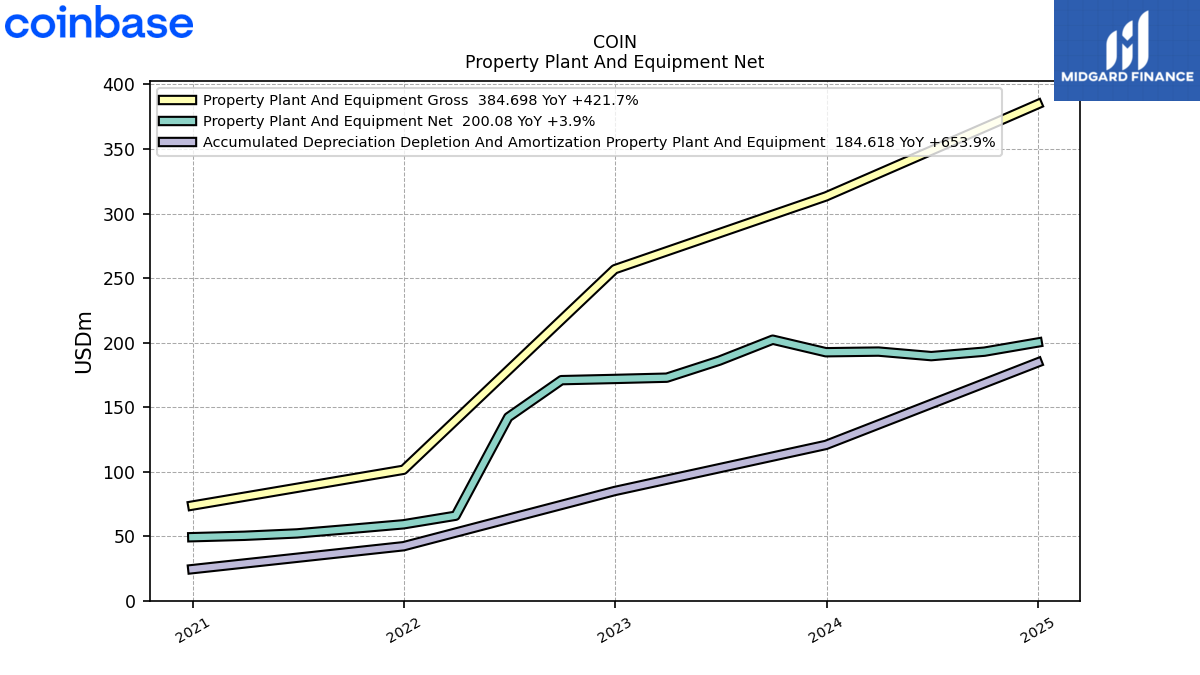
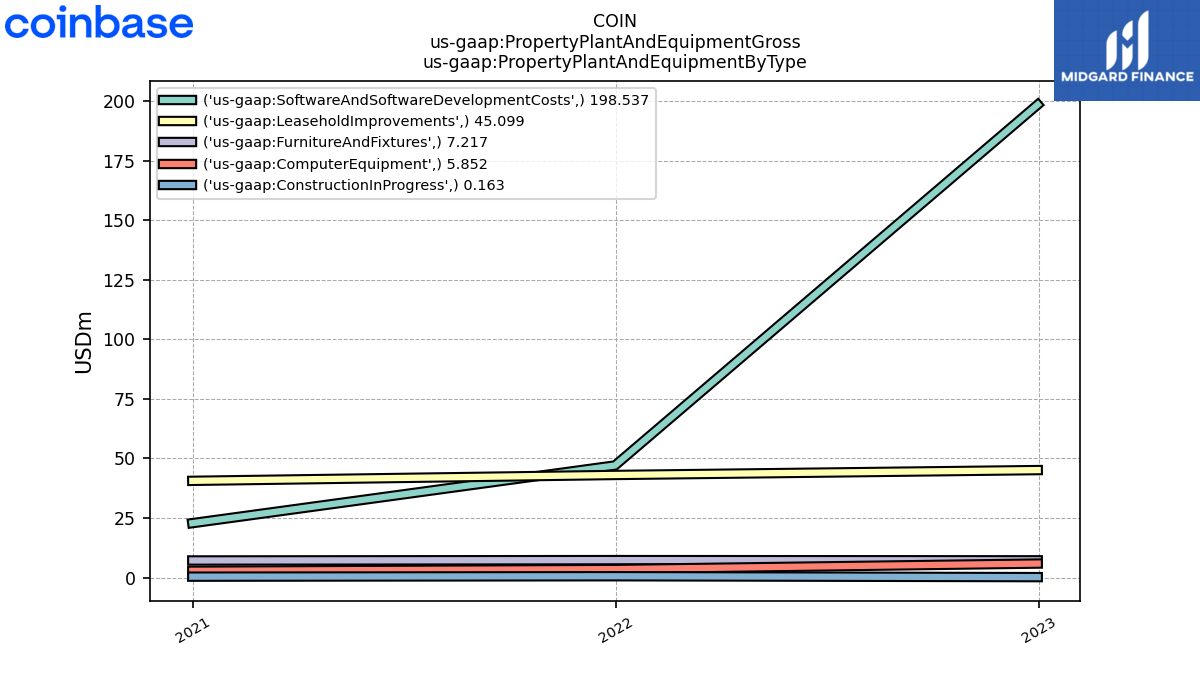
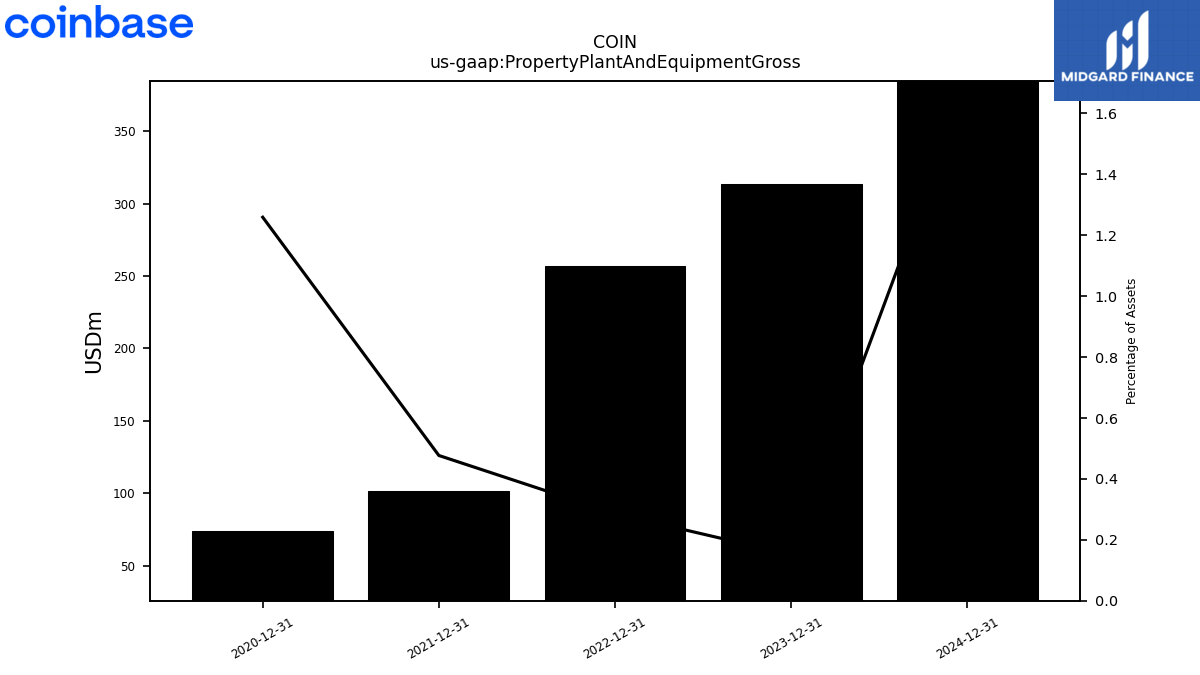
| Property Plant And Equipment Gross | NA | NA | NA | 256.87 | NA | NA | NA | 101.48 | NA | NA | NA | 73.74 | NA | NA | NA | |
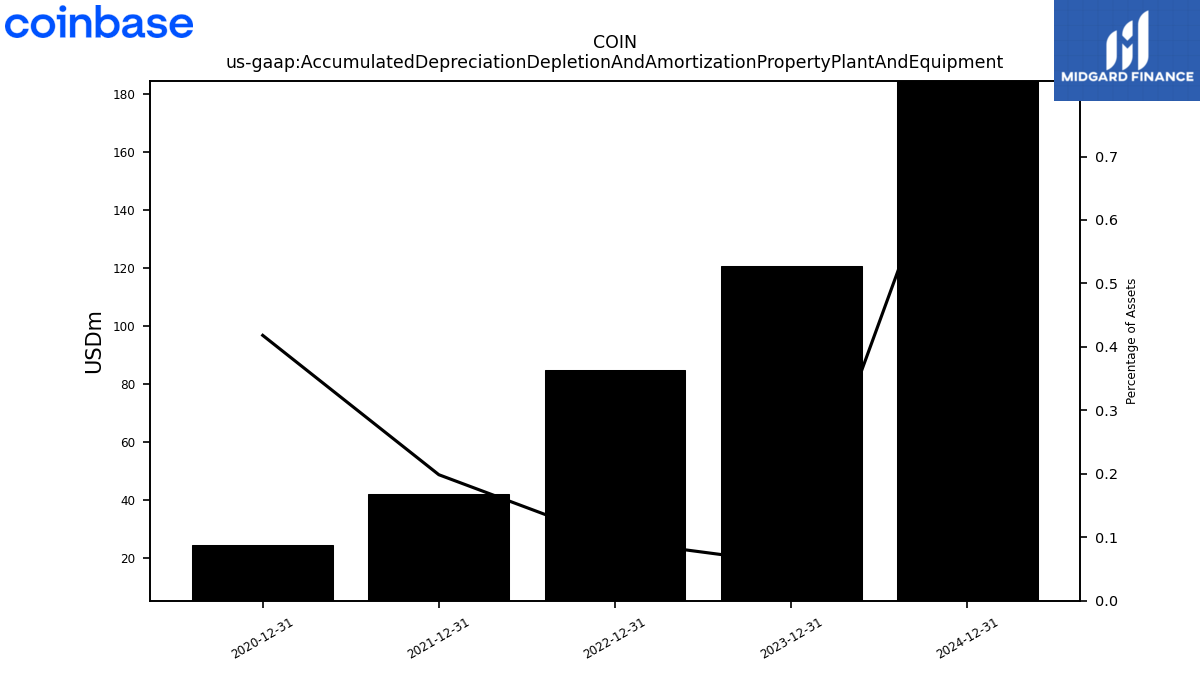
| Accumulated Depreciation Depletion And Amortization Property Plant And Equipment | NA | NA | NA | 85.02 | NA | NA | NA | 42.25 | NA | NA | NA | 24.49 | NA | NA | NA | |
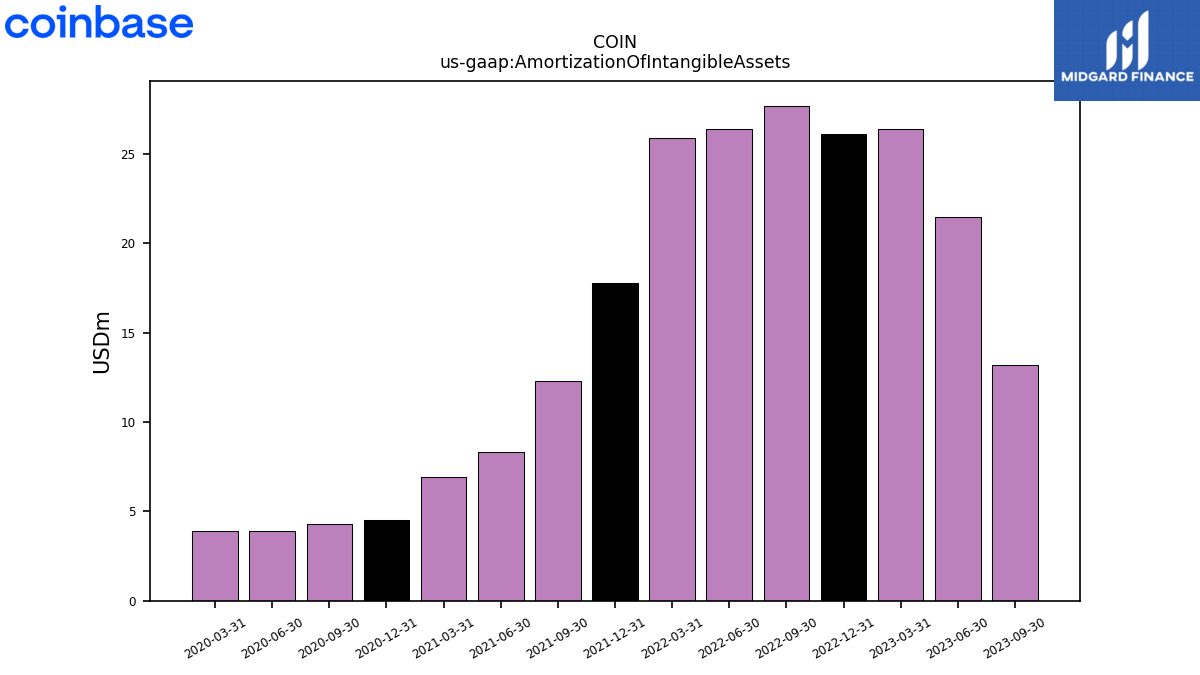
| Amortization Of Intangible Assets | 13.20 | 21.50 | 26.40 | 26.10 | 27.70 | 26.40 | 25.90 | 17.80 | 12.30 | 8.30 | 6.90 | 4.50 | 4.30 | 3.90 | 3.90 | |
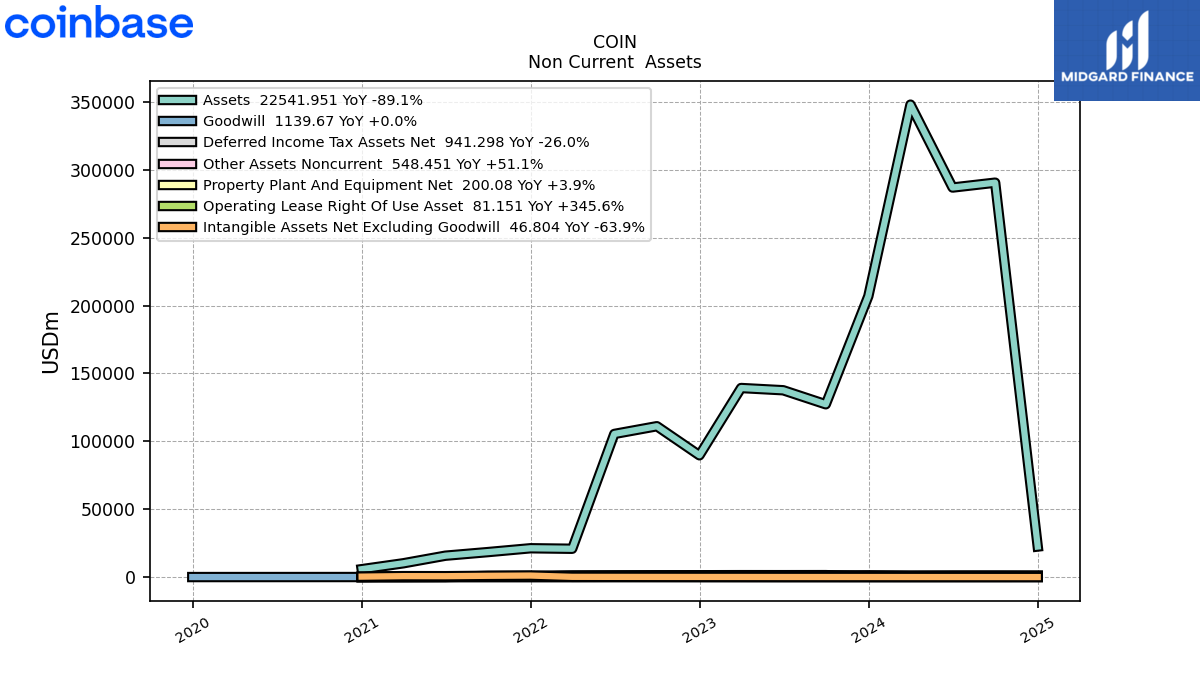
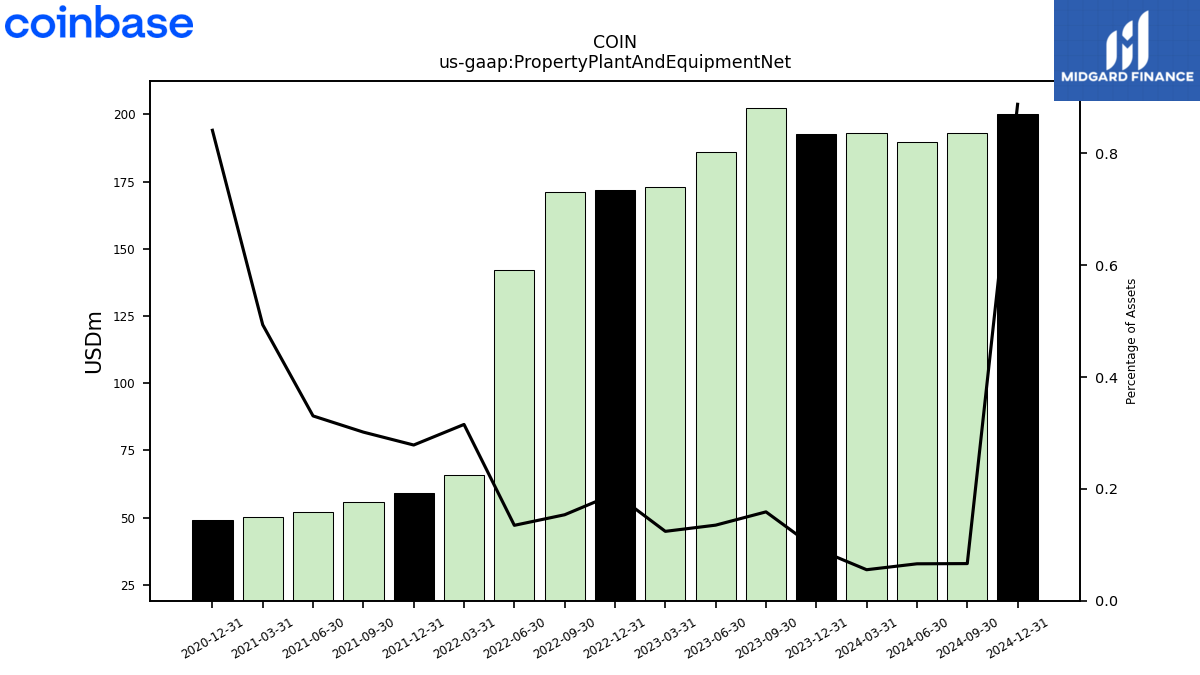
| Property Plant And Equipment Net | 202.27 | 186.05 | 172.84 | 171.85 | 170.92 | 142.21 | 65.86 | 59.23 | 55.63 | 52.17 | 50.33 | 49.25 | NA | NA | NA | |
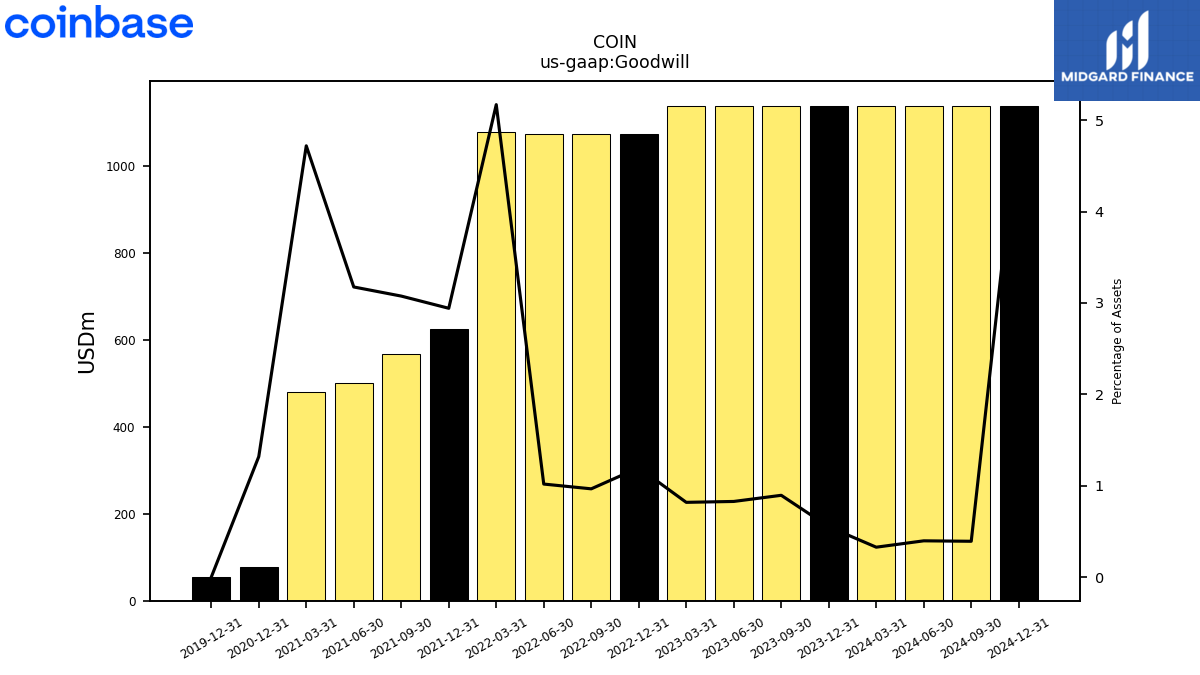
| Goodwill | 1139.67 | 1139.67 | 1139.67 | 1073.91 | 1073.91 | 1073.91 | 1080.18 | 625.76 | 567.42 | 501.26 | 481.38 | 77.21 | NA | NA | NA | |
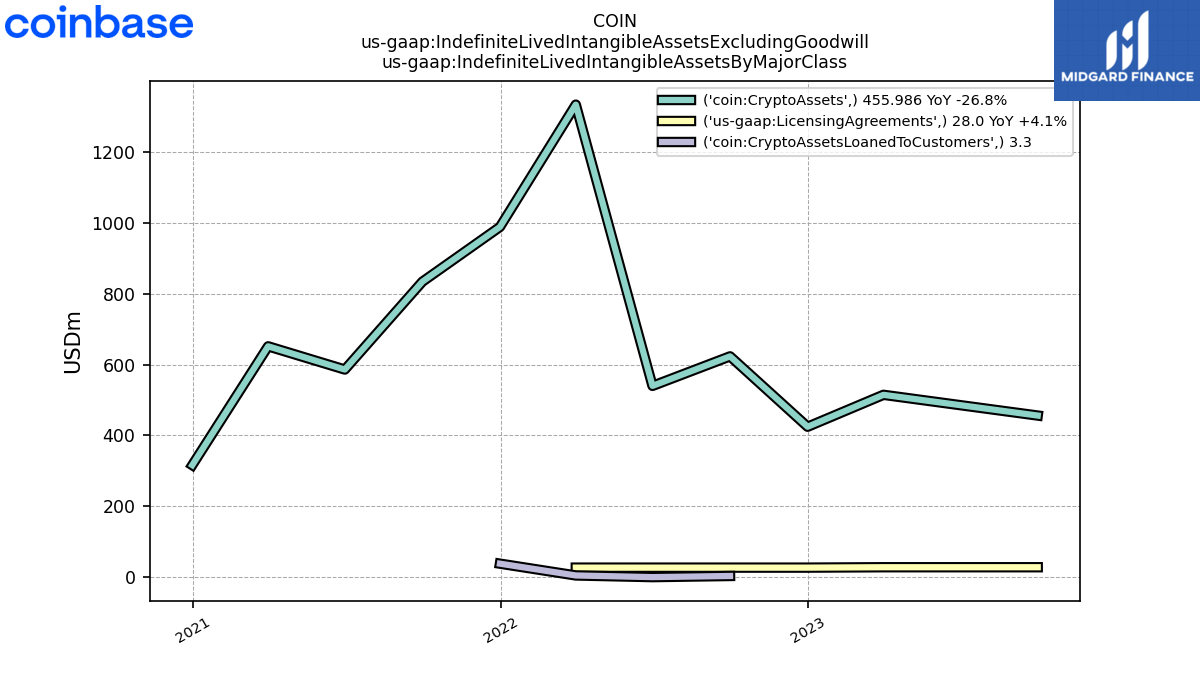
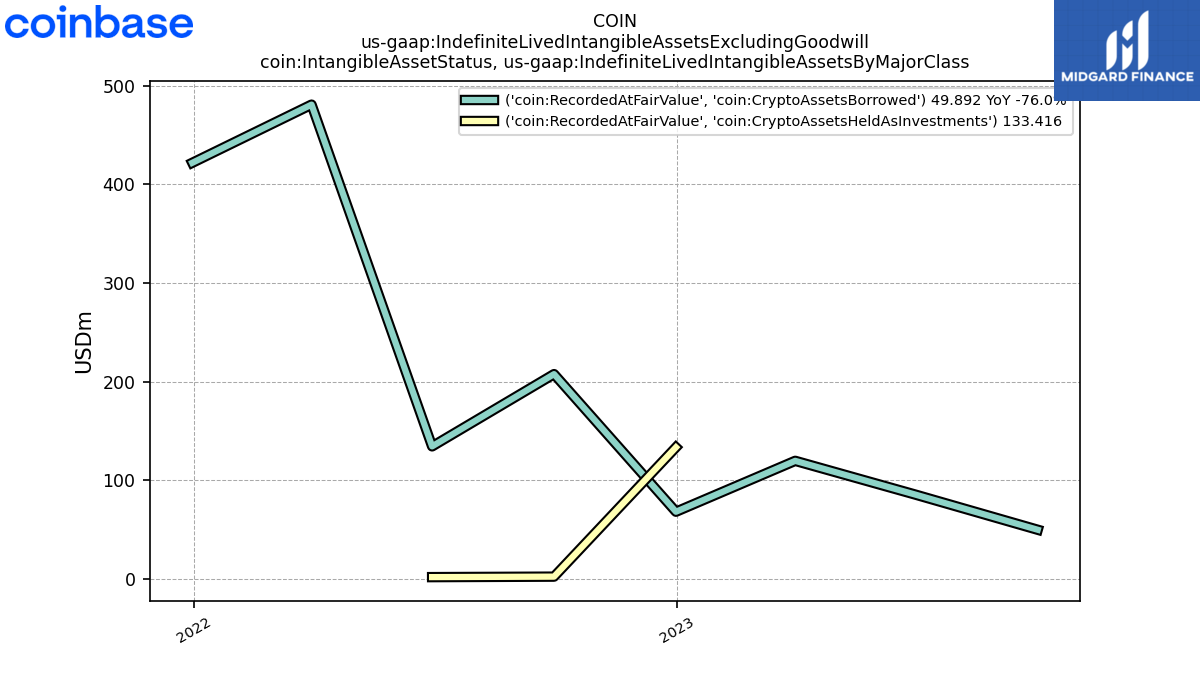
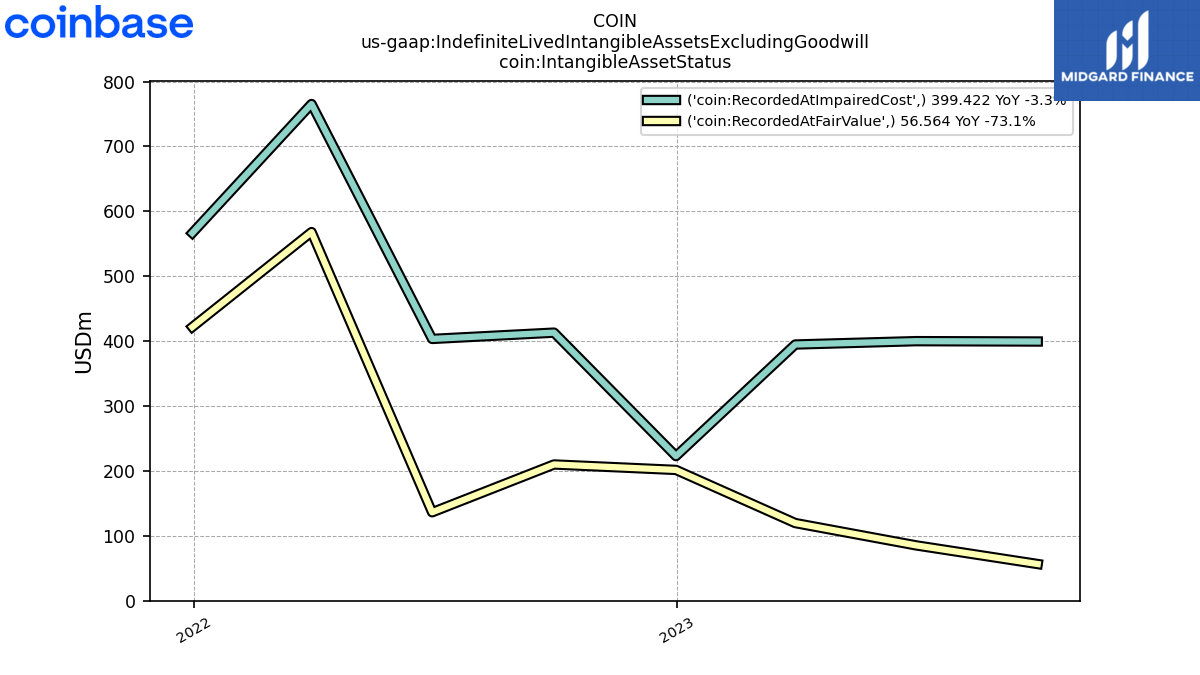
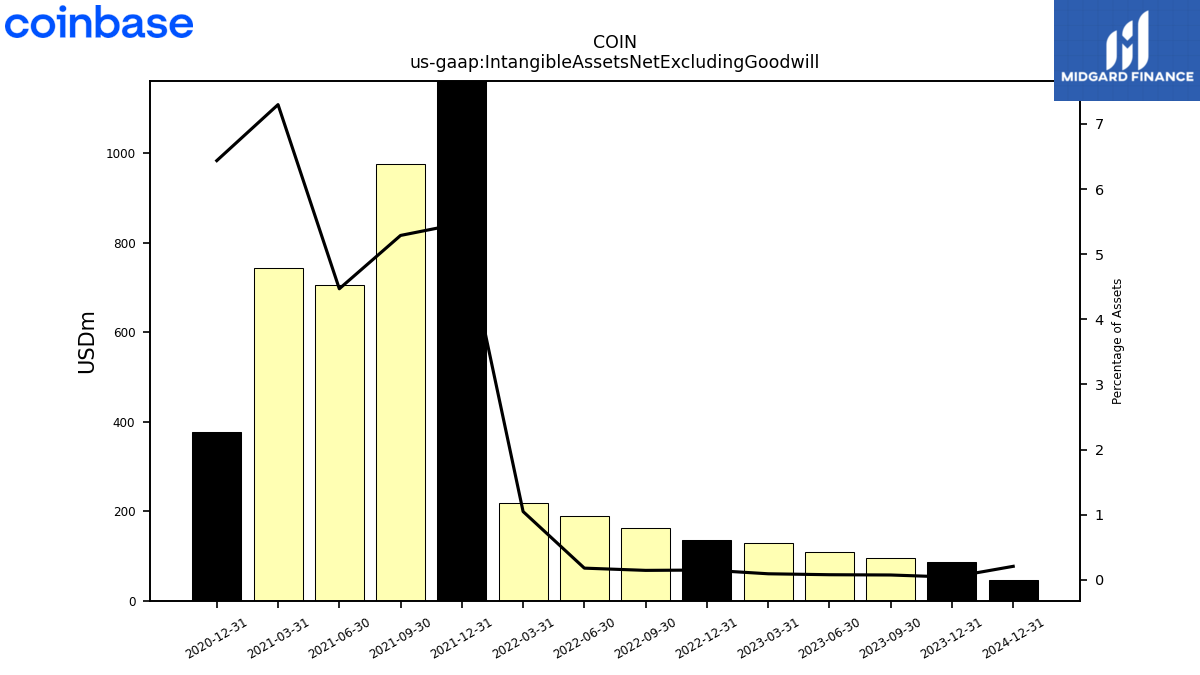
| Intangible Assets Net Excluding Goodwill | 94.94 | 108.13 | 129.69 | 135.43 | 161.67 | 189.51 | 219.13 | 1164.88 | 975.95 | 705.74 | 744.39 | 376.92 | NA | NA | NA | |
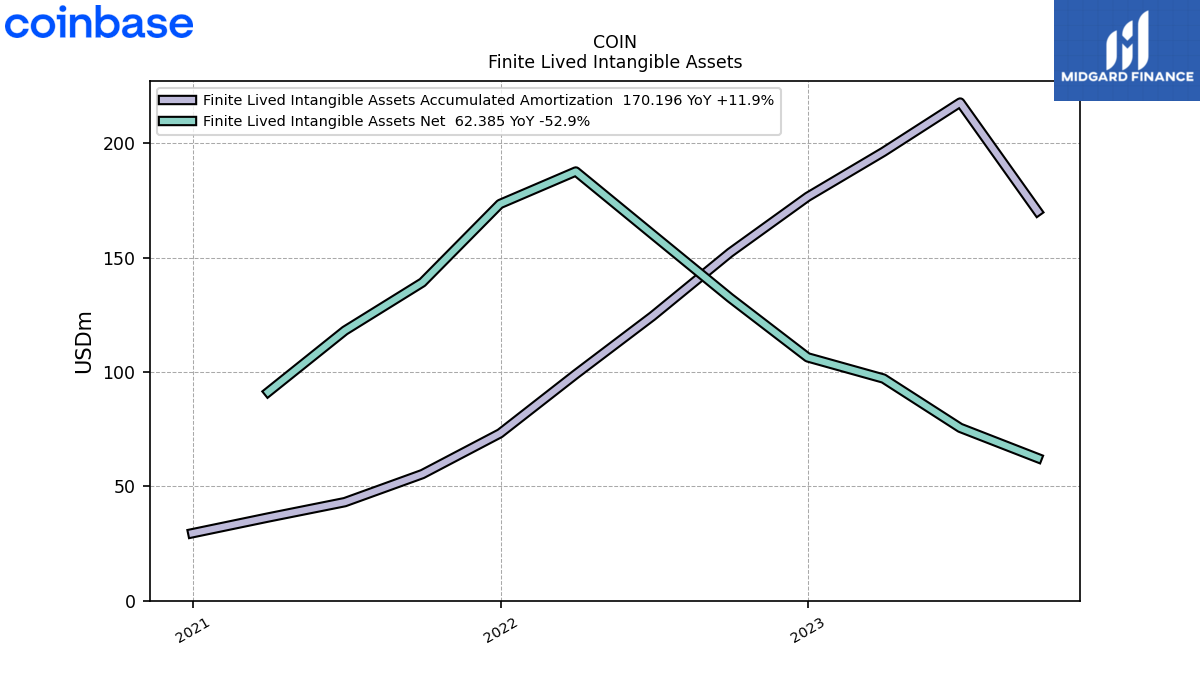
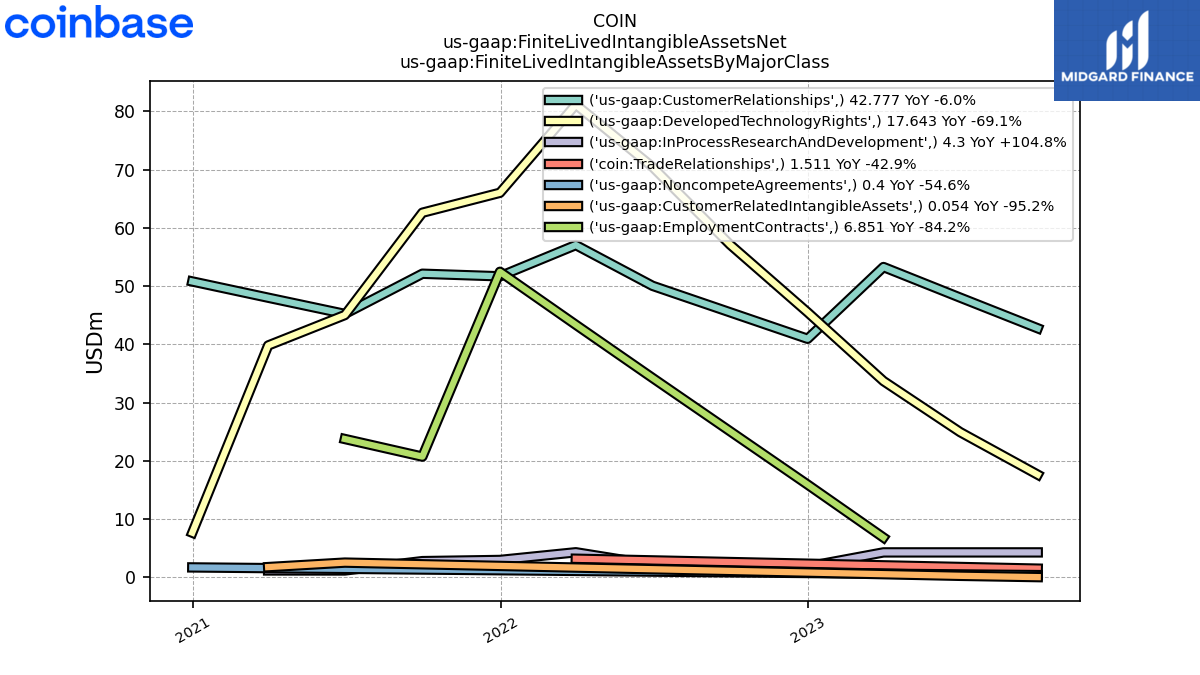
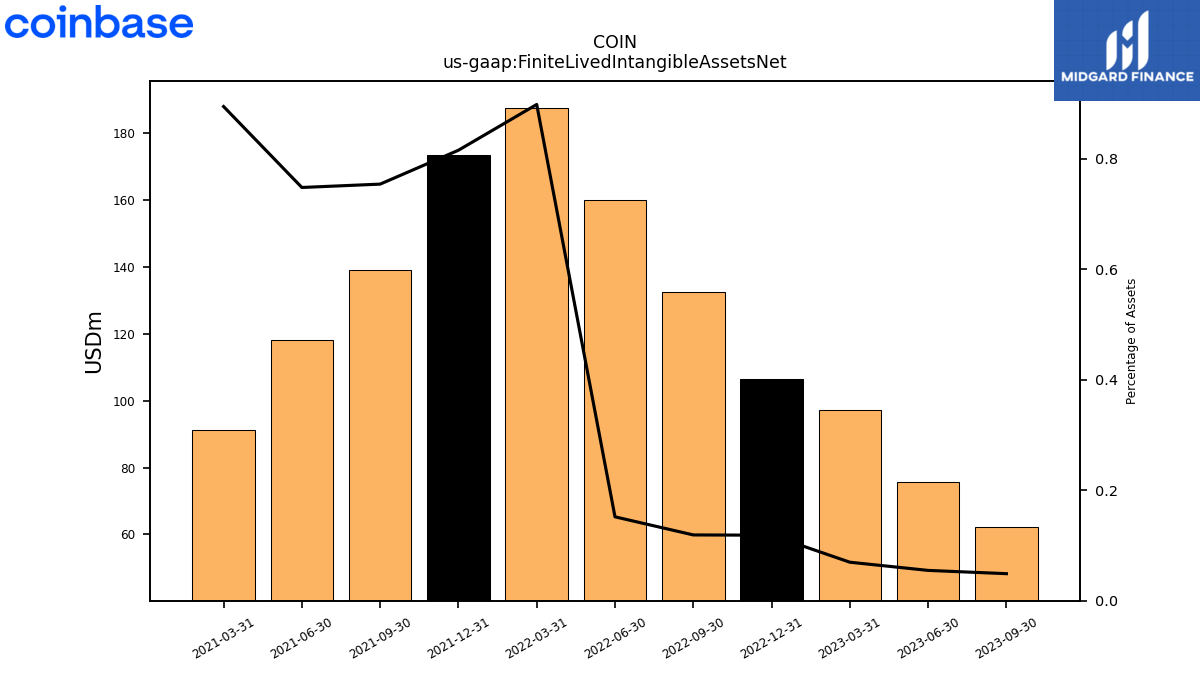
| Finite Lived Intangible Assets Net | 62.38 | 75.58 | 97.14 | 106.40 | 132.42 | 160.16 | 187.66 | 173.44 | 139.13 | 118.09 | 91.23 | NA | NA | NA | NA | |
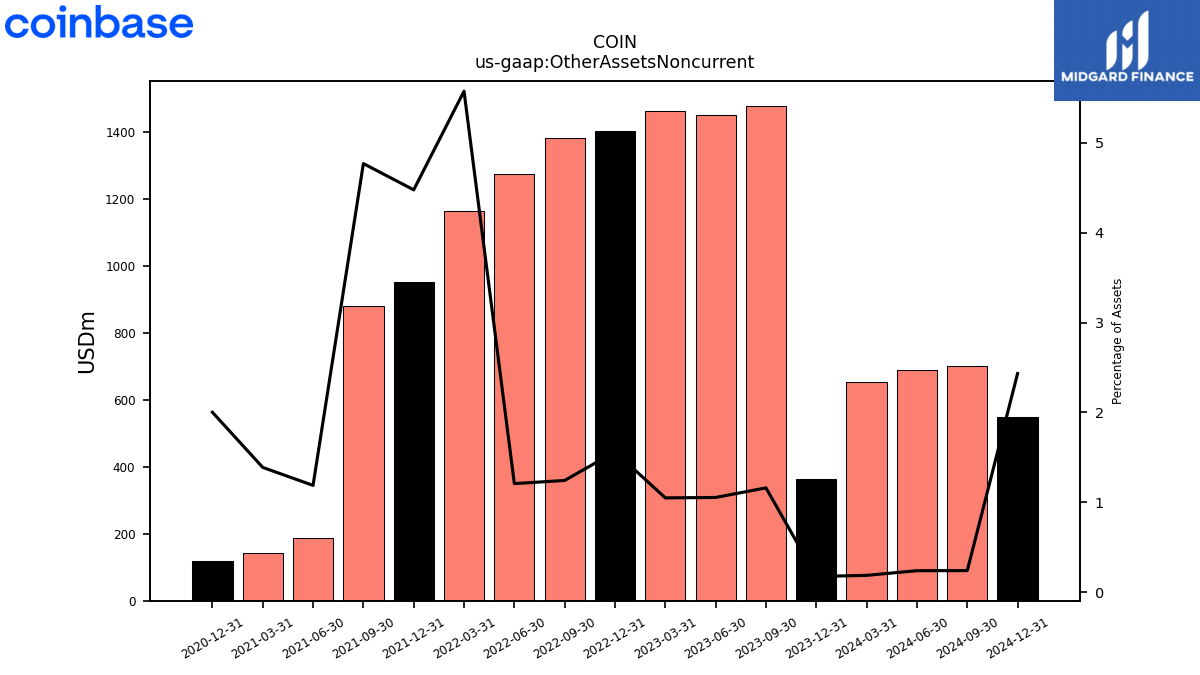
| Other Assets Noncurrent | 1478.10 | 1451.20 | 1462.34 | 1401.72 | 1382.36 | 1274.71 | 1164.61 | 952.31 | 879.97 | 187.69 | 141.68 | 117.24 | NA | NA | NA | |
| Equity Securities Fv Ni | 13.20 | 13.00 | 10.80 | 11.40 | 17.30 | 19.40 | 21.10 | 11.50 | 10.50 | 11.50 | 0.00 | NA | NA | NA | NA |
| 2023-09-30 | 2023-06-30 | 2023-03-31 | 2022-12-31 | 2022-09-30 | 2022-06-30 | 2022-03-31 | 2021-12-31 | 2021-09-30 | 2021-06-30 | 2021-03-31 | 2020-12-31 | 2020-09-30 | 2020-06-30 | 2020-03-31 | ||
|---|---|---|---|---|---|---|---|---|---|---|---|---|---|---|---|---|
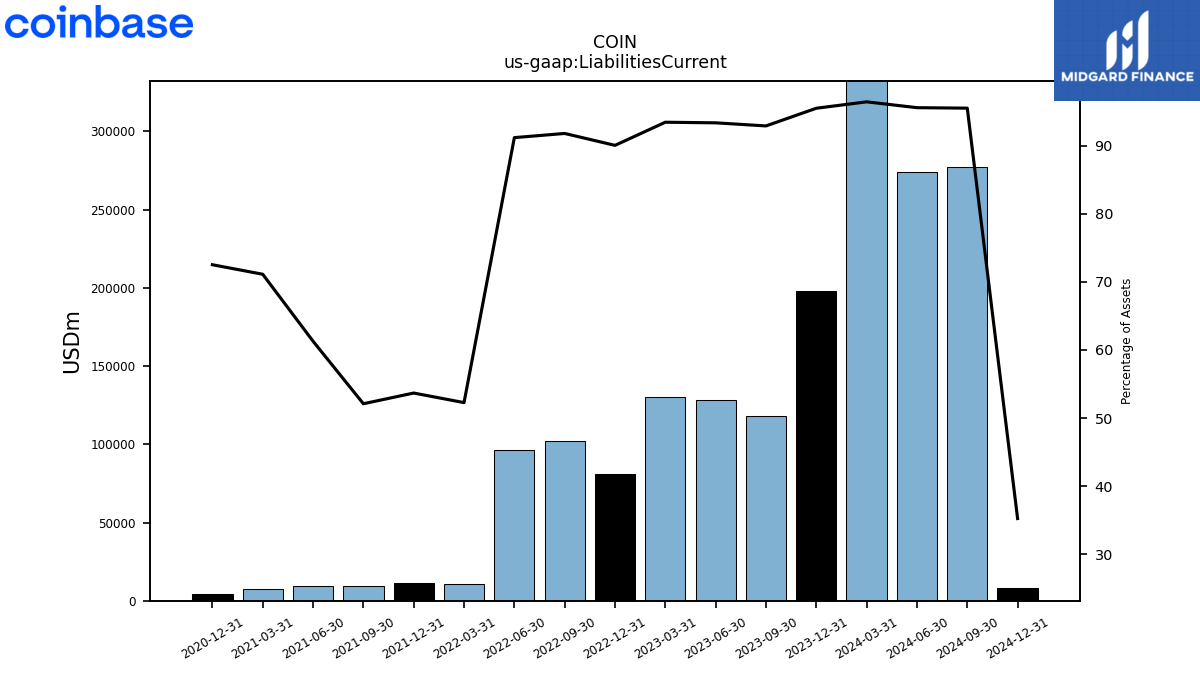
| Liabilities Current | 118298.79 | 128538.75 | 130202.82 | 80815.29 | 102073.10 | 96194.30 | 10921.82 | 11419.03 | 9615.16 | 9677.56 | 7256.15 | 4246.85 | NA | NA | NA | |
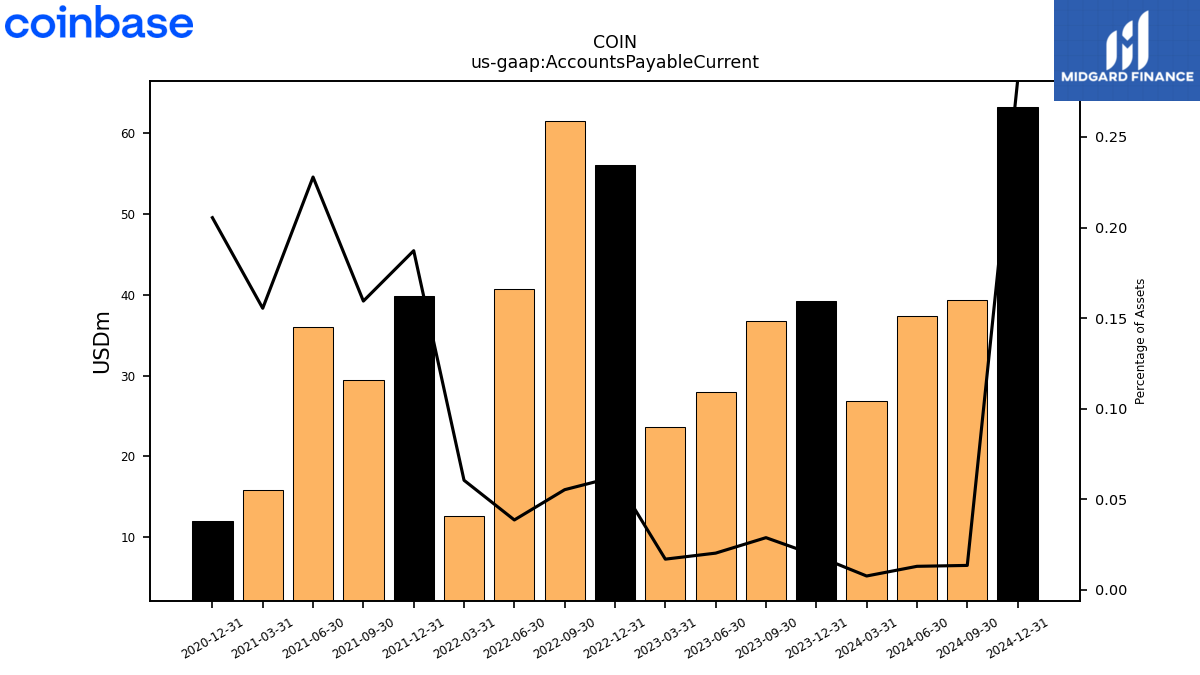
| Accounts Payable Current | 36.74 | 27.98 | 23.69 | 56.04 | 61.51 | 40.74 | 12.65 | 39.83 | 29.42 | 35.98 | 15.86 | 12.03 | NA | NA | NA | |
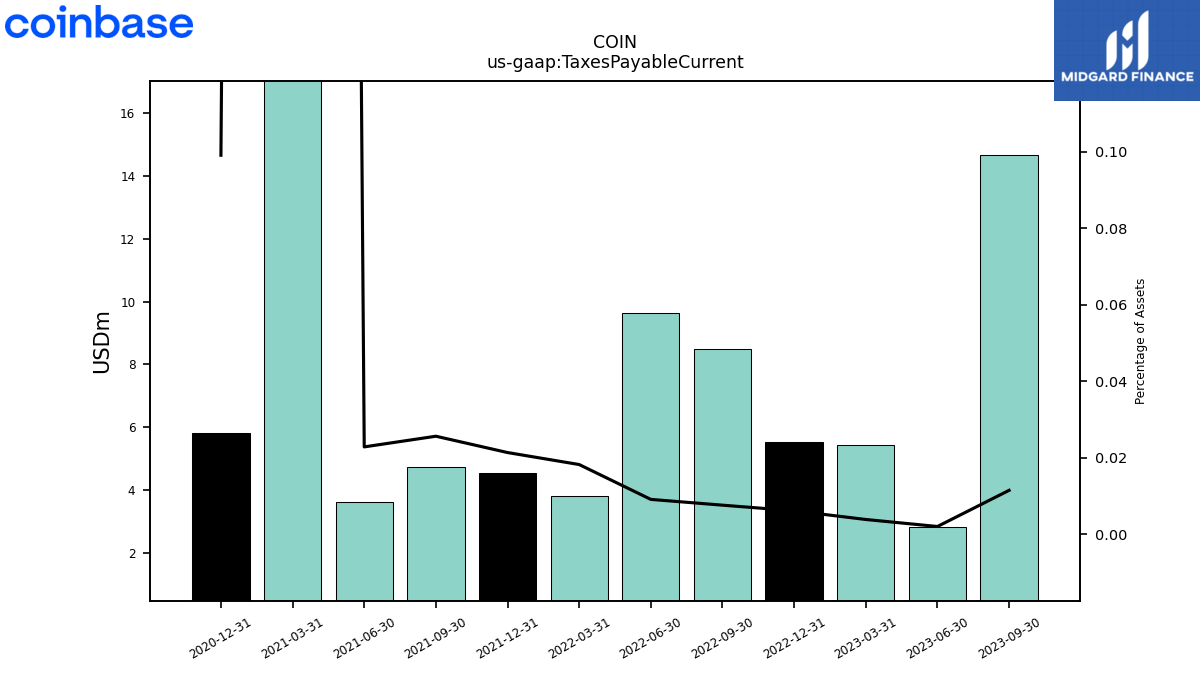
| Taxes Payable Current | 14.66 | 2.84 | 5.43 | 5.53 | 8.49 | 9.65 | 3.82 | 4.55 | 4.74 | 3.61 | 244.29 | 5.80 | NA | NA | NA | |
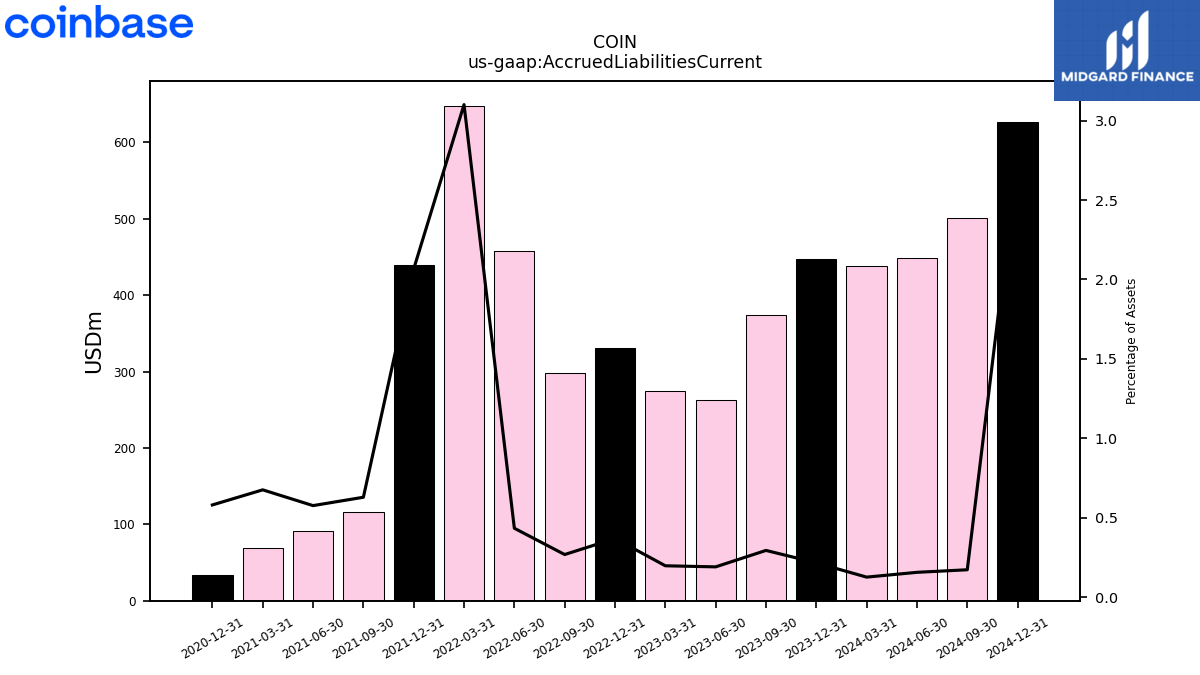
| Accrued Liabilities Current | 374.37 | 262.25 | 274.98 | 331.24 | 298.10 | 457.40 | 647.96 | 439.56 | 116.05 | 90.99 | 68.91 | 33.99 | NA | NA | NA |
| 2023-09-30 | 2023-06-30 | 2023-03-31 | 2022-12-31 | 2022-09-30 | 2022-06-30 | 2022-03-31 | 2021-12-31 | 2021-09-30 | 2021-06-30 | 2021-03-31 | 2020-12-31 | 2020-09-30 | 2020-06-30 | 2020-03-31 | ||
|---|---|---|---|---|---|---|---|---|---|---|---|---|---|---|---|---|
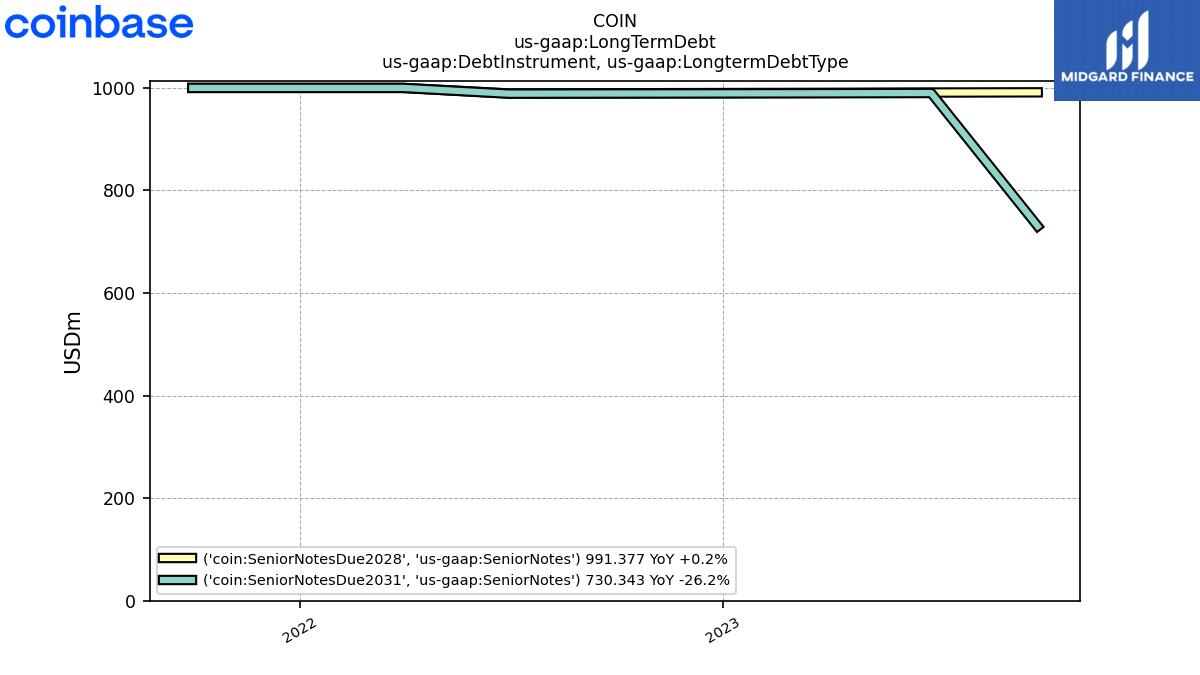
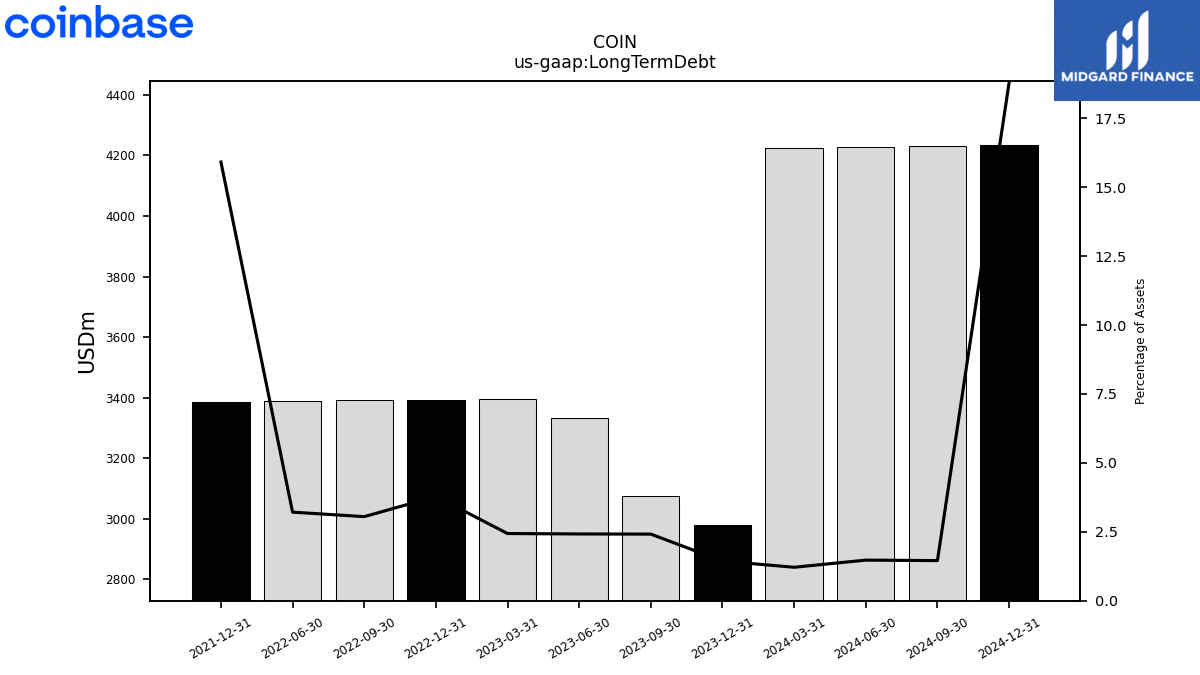
| Long Term Debt | 3076.60 | 3334.26 | 3395.61 | 3393.45 | 3391.24 | 3389.03 | NA | 3384.80 | NA | NA | NA | NA | NA | NA | NA | |
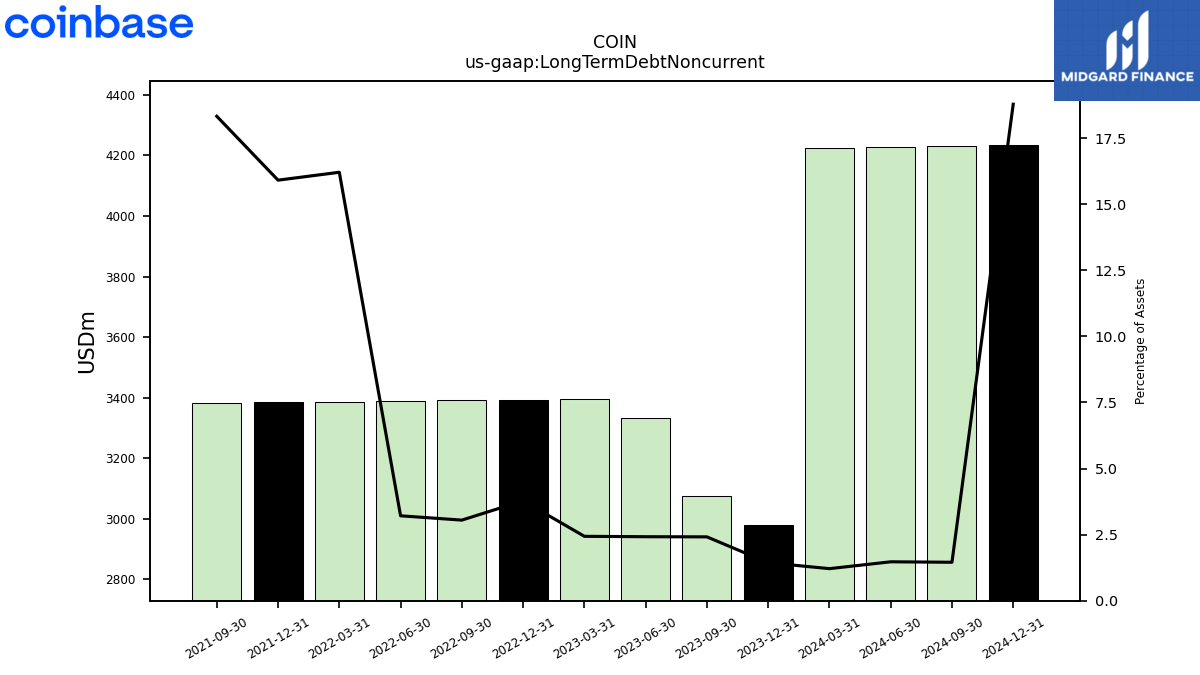
| Long Term Debt Noncurrent | 3076.60 | 3334.26 | 3395.61 | 3393.45 | 3391.24 | 3389.03 | 3386.86 | 3384.80 | 3382.18 | NA | NA | NA | NA | NA | NA | |
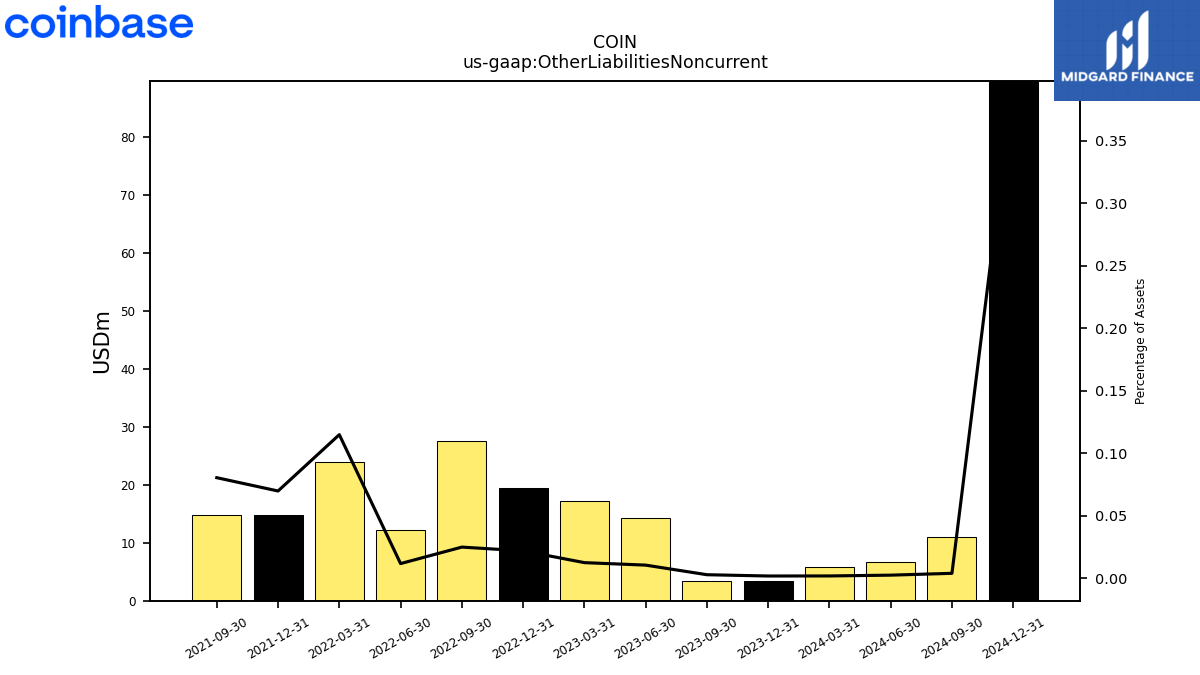
| Other Liabilities Noncurrent | 3.40 | 14.25 | 17.19 | 19.53 | 27.55 | 12.21 | 23.99 | 14.83 | 14.83 | NA | NA | NA | NA | NA | NA | |
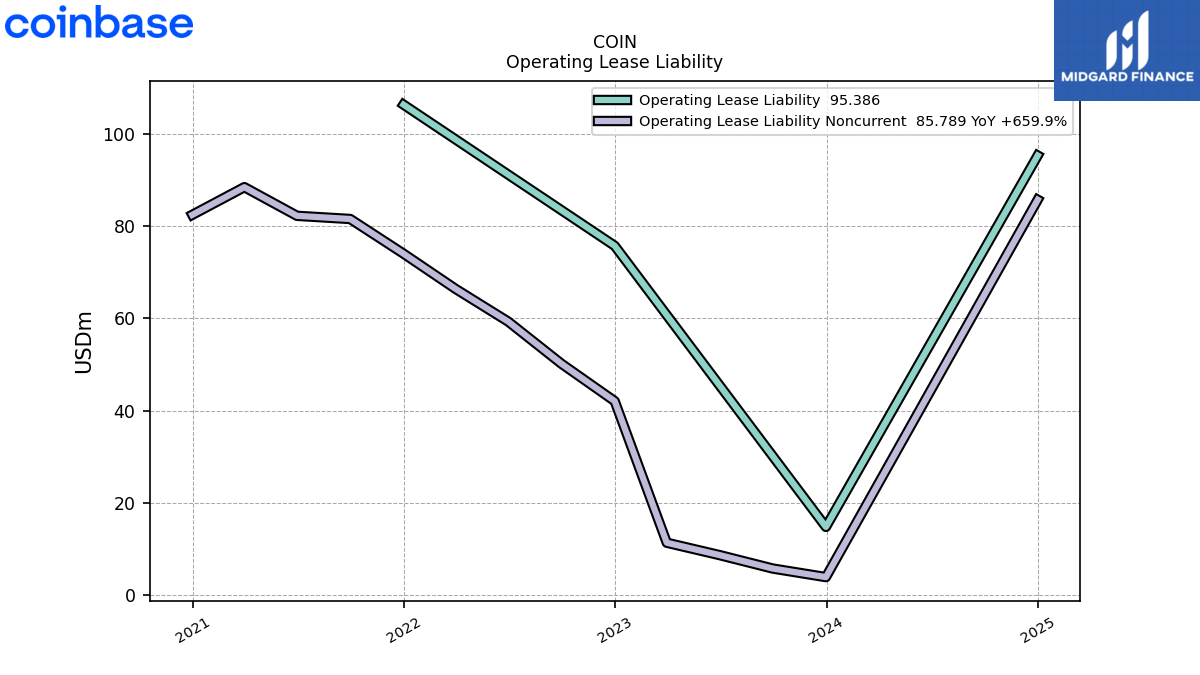
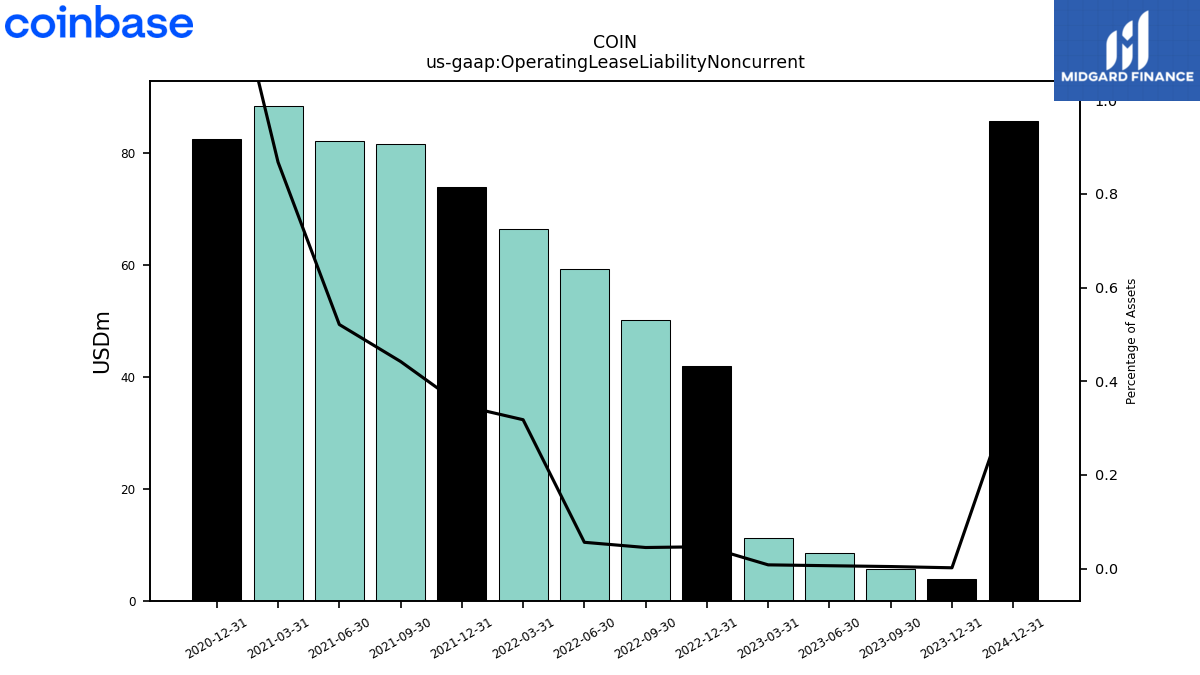
| Operating Lease Liability Noncurrent | 5.69 | 8.61 | 11.29 | 42.04 | 50.17 | 59.32 | 66.42 | 74.08 | 81.60 | 82.29 | 88.52 | 82.51 | NA | NA | NA |
| 2023-09-30 | 2023-06-30 | 2023-03-31 | 2022-12-31 | 2022-09-30 | 2022-06-30 | 2022-03-31 | 2021-12-31 | 2021-09-30 | 2021-06-30 | 2021-03-31 | 2020-12-31 | 2020-09-30 | 2020-06-30 | 2020-03-31 | ||
|---|---|---|---|---|---|---|---|---|---|---|---|---|---|---|---|---|
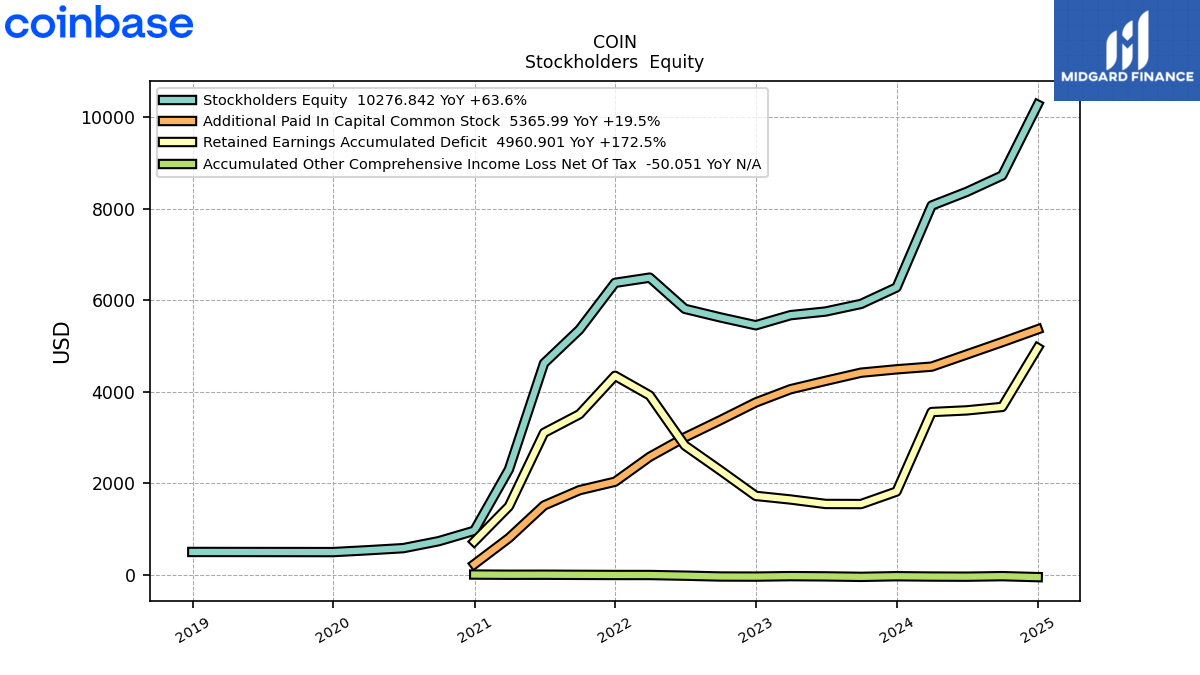
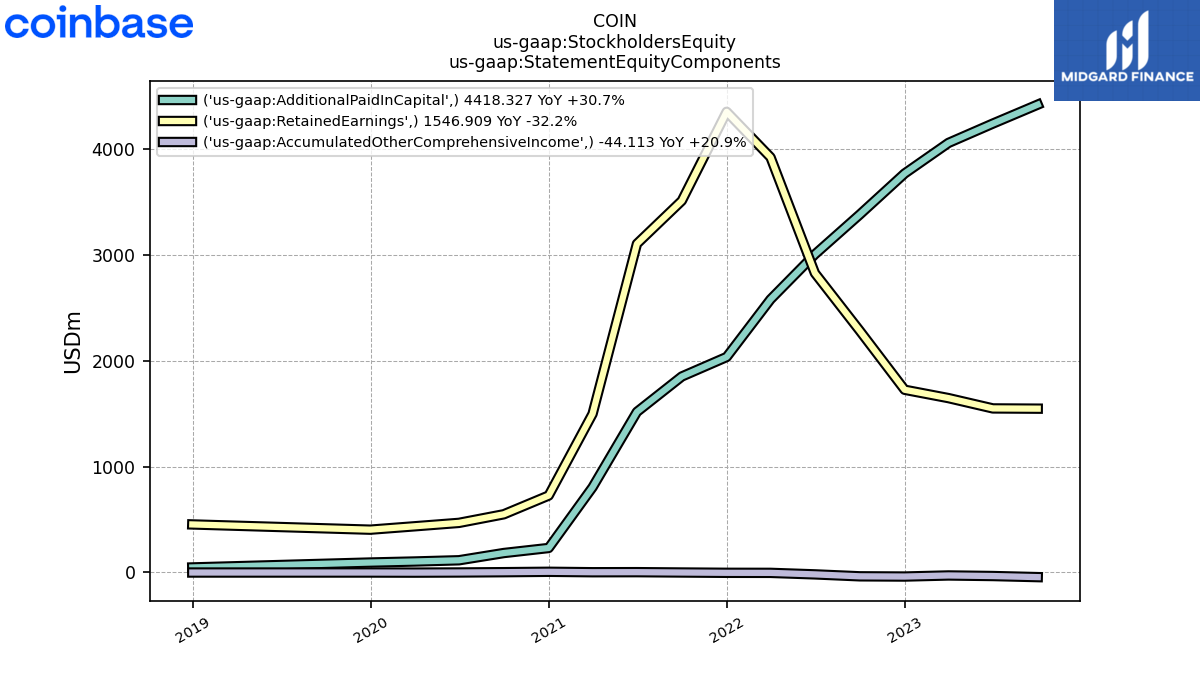
| Stockholders Equity | 5921.12 | 5754.70 | 5674.95 | 5454.56 | 5626.31 | 5813.39 | 6496.09 | 6381.69 | 5360.50 | 4623.43 | 2304.41 | 963.58 | 735.61 | 583.12 | 537.91 | |
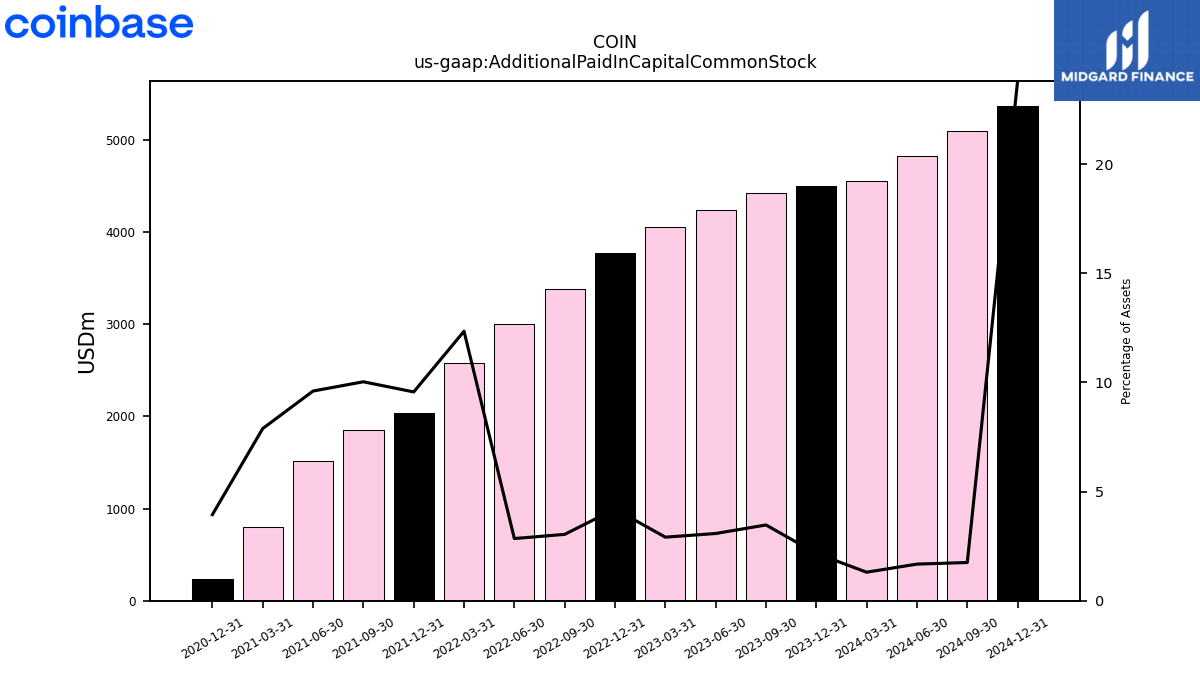
| Additional Paid In Capital Common Stock | 4418.33 | 4239.32 | 4056.77 | 3767.69 | 3380.33 | 3004.46 | 2579.22 | 2034.66 | 1850.71 | 1516.53 | 804.52 | 231.02 | NA | NA | NA | |
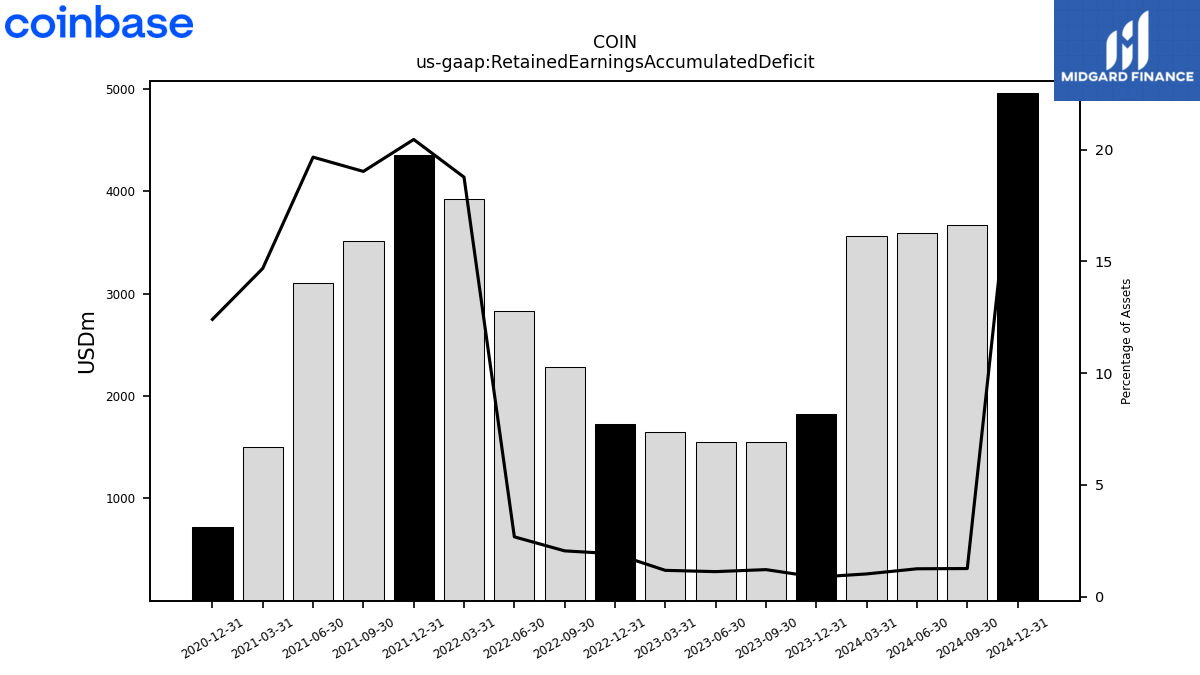
| Retained Earnings Accumulated Deficit | 1546.91 | 1549.17 | 1646.58 | 1725.47 | 2282.48 | 2827.11 | 3920.76 | 4350.42 | 3510.22 | 3104.12 | 1497.77 | 726.30 | NA | NA | NA | |
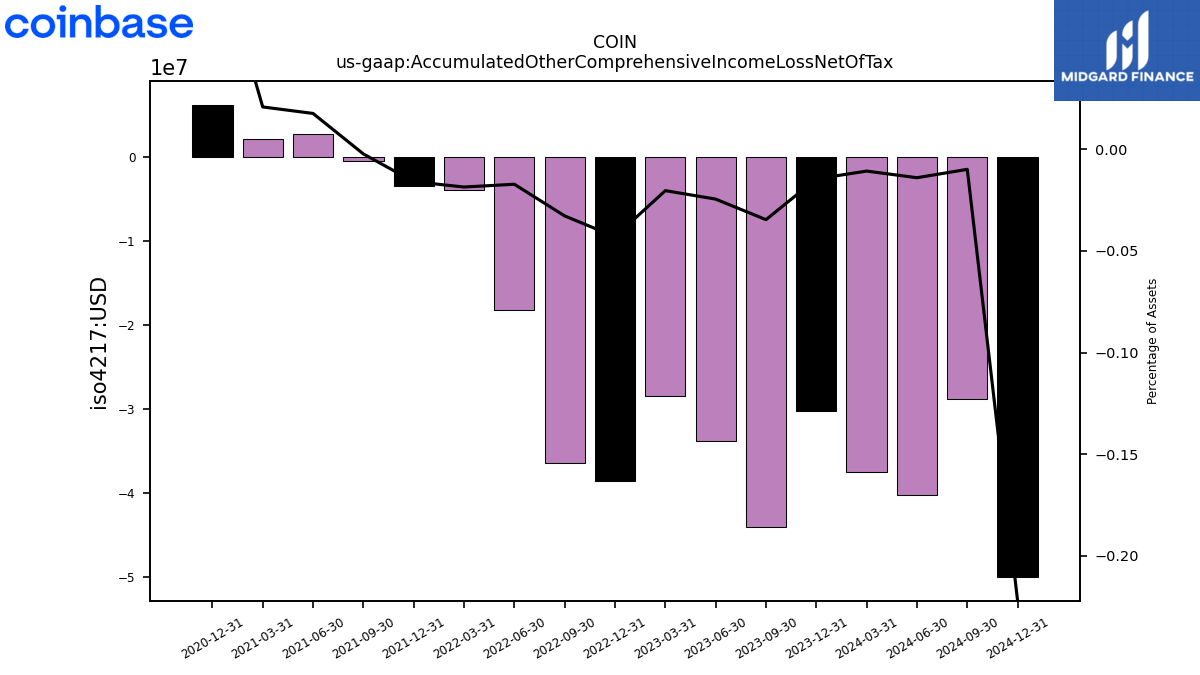
| Accumulated Other Comprehensive Income Loss Net Of Tax | -44.11 | -33.79 | -28.41 | -38.61 | -36.49 | -18.18 | -3.89 | -3.40 | -0.43 | 2.77 | 2.12 | 6.26 | NA | NA | NA | |
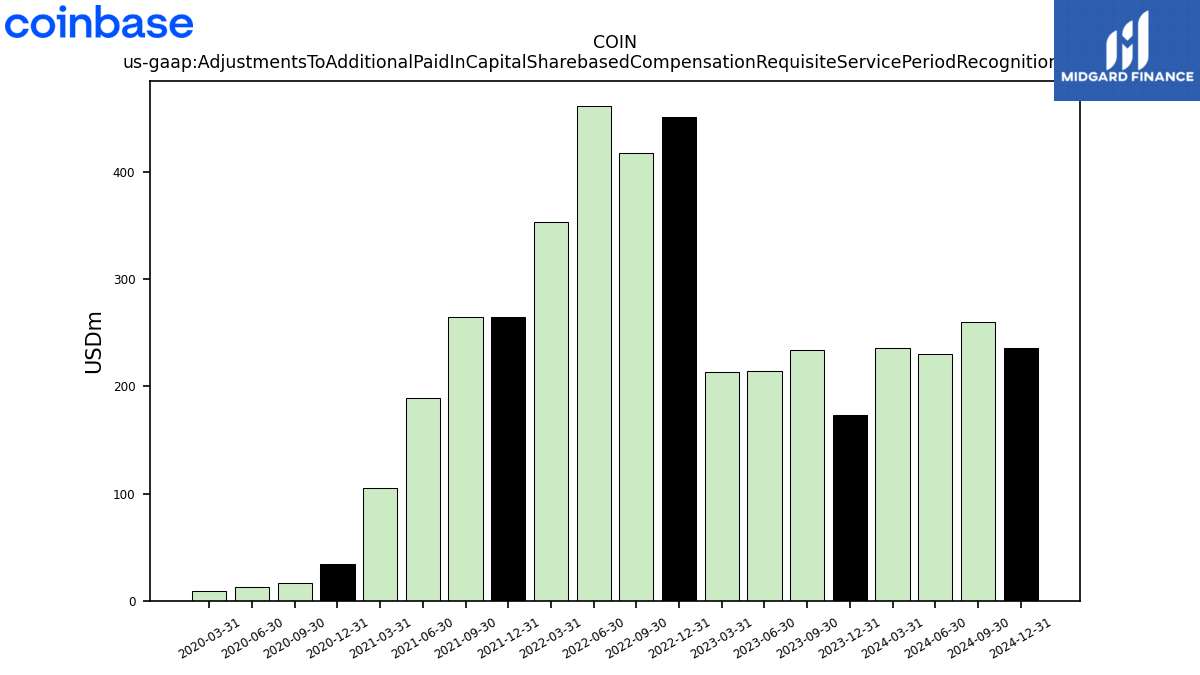
| Adjustments To Additional Paid In Capital Sharebased Compensation Requisite Service Period Recognition Value | 233.90 | 214.62 | 212.98 | 451.02 | 417.72 | 461.56 | 353.54 | 264.50 | 264.94 | 189.34 | 105.38 | 34.08 | 16.18 | 13.21 | 9.18 |
| 2023-09-30 | 2023-06-30 | 2023-03-31 | 2022-12-31 | 2022-09-30 | 2022-06-30 | 2022-03-31 | 2021-12-31 | 2021-09-30 | 2021-06-30 | 2021-03-31 | 2020-12-31 | 2020-09-30 | 2020-06-30 | 2020-03-31 | ||
|---|---|---|---|---|---|---|---|---|---|---|---|---|---|---|---|---|
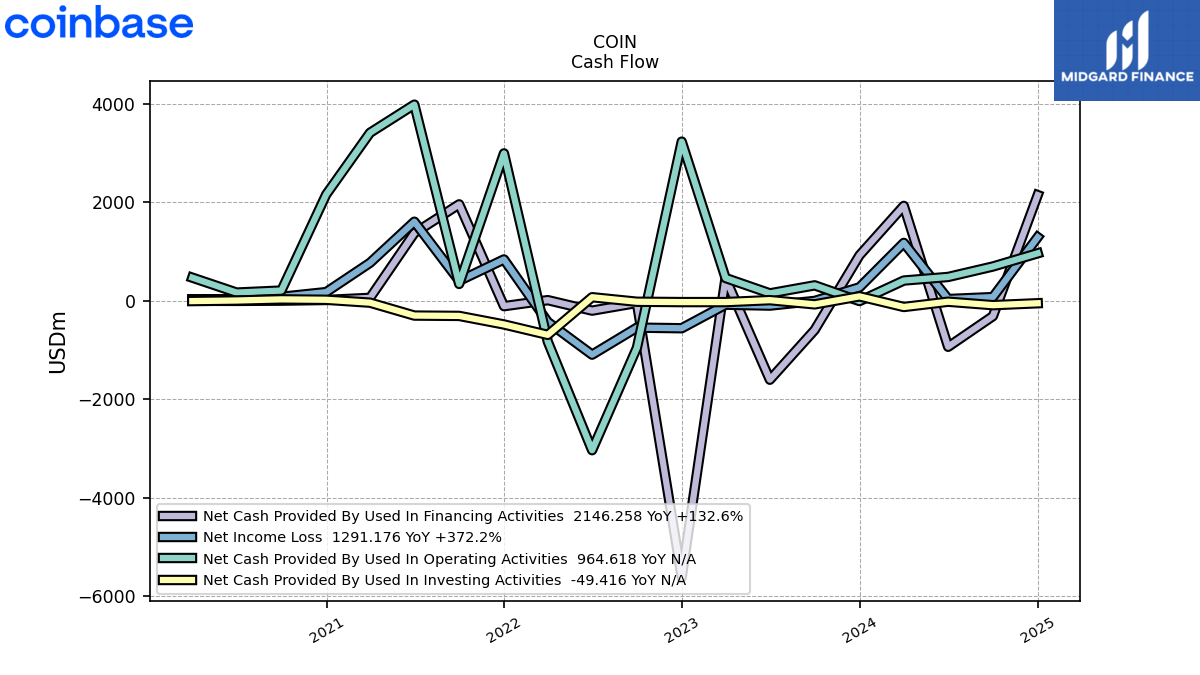
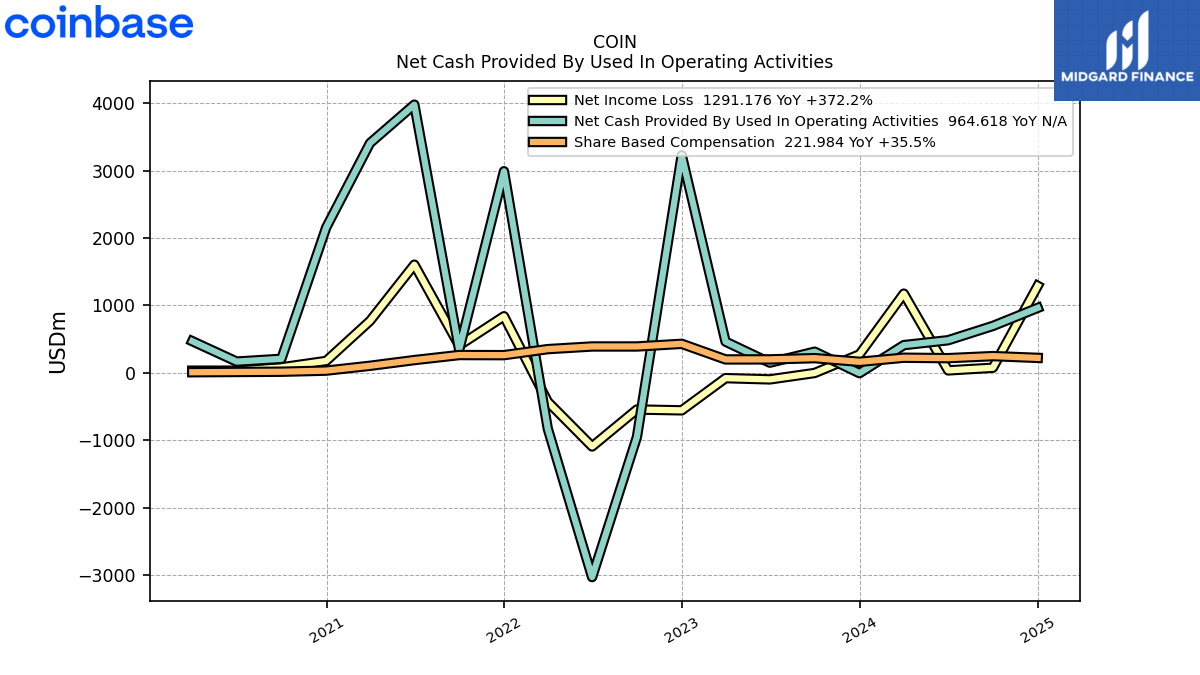
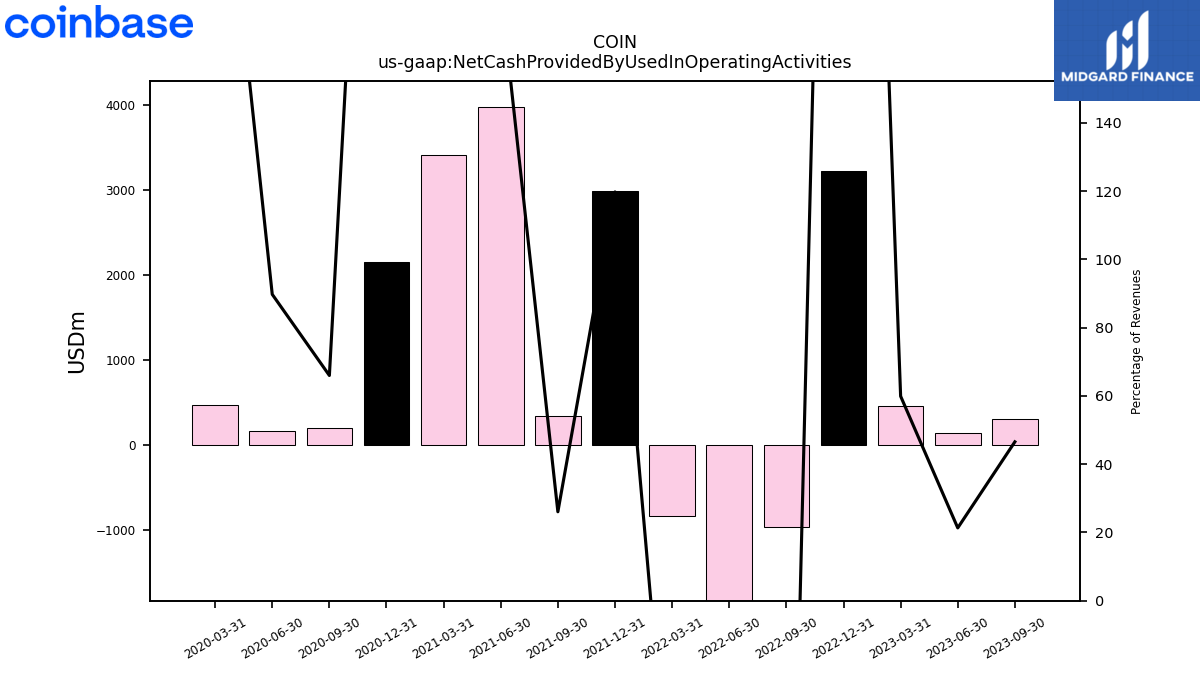
| Net Cash Provided By Used In Operating Activities | 313.94 | 151.12 | 463.08 | 3231.86 | -953.50 | -3033.66 | -830.11 | 2993.32 | 342.05 | 3982.90 | 3411.76 | 2158.24 | 208.19 | 167.34 | 470.30 | |
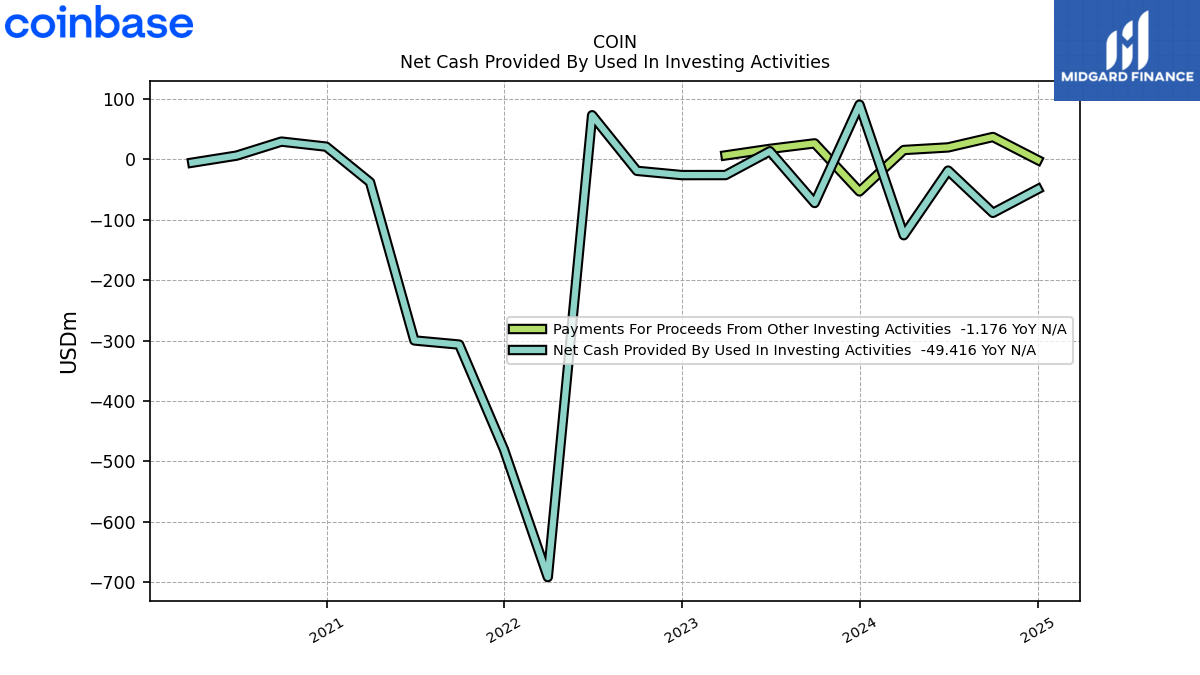
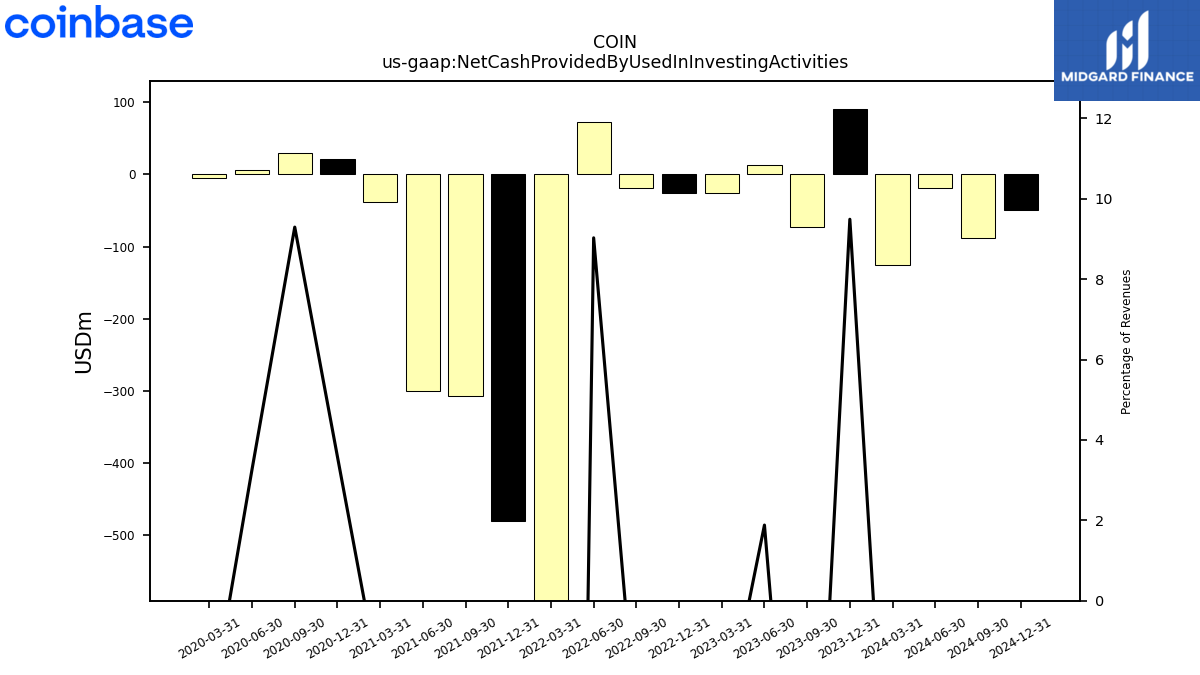
| Net Cash Provided By Used In Investing Activities | -72.36 | 13.33 | -26.08 | -26.12 | -19.08 | 72.97 | -691.59 | -480.32 | -306.67 | -299.84 | -37.91 | 20.96 | 29.31 | 6.09 | -5.54 | |
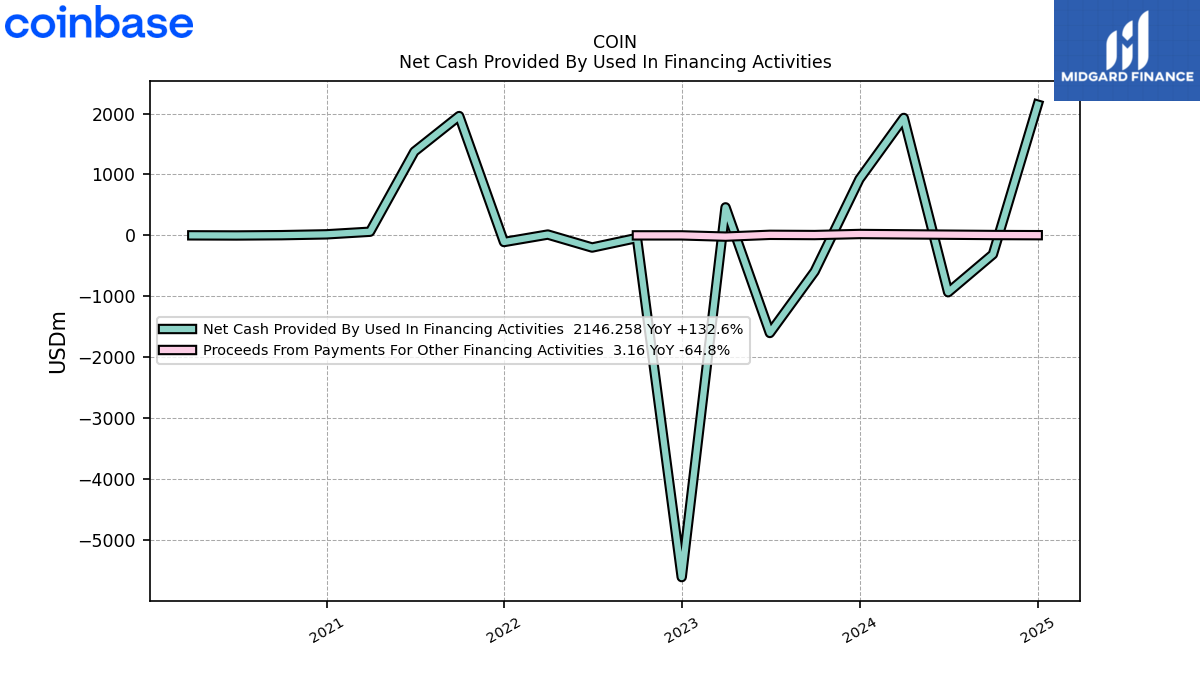
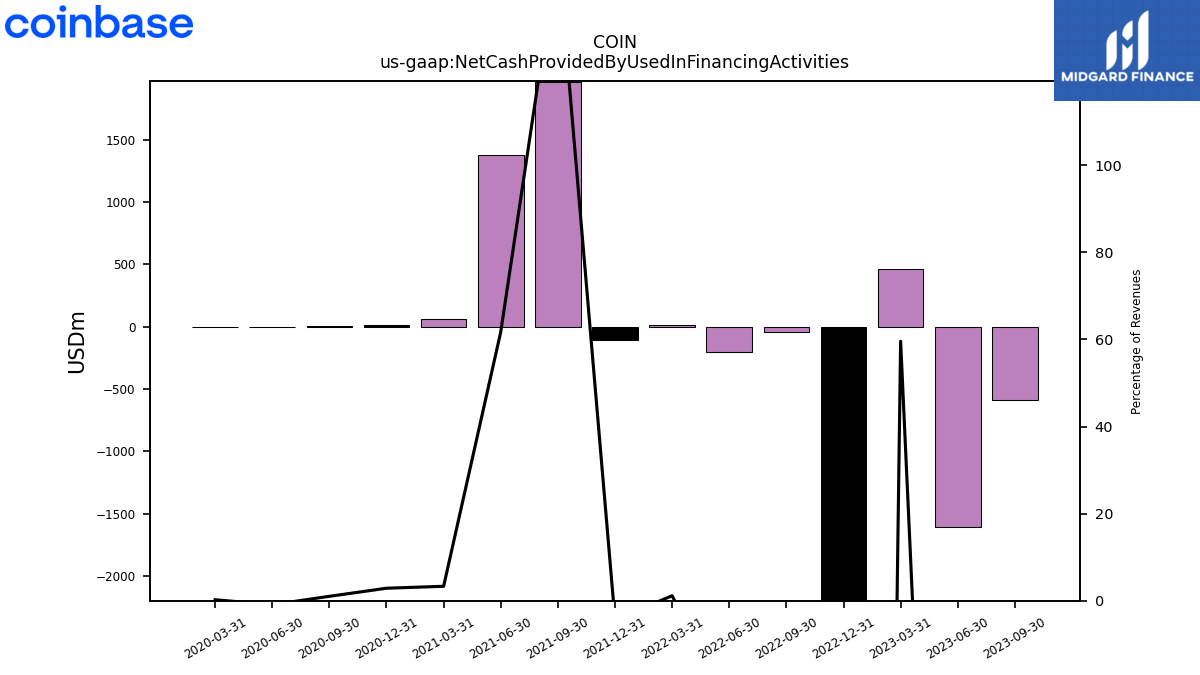
| Net Cash Provided By Used In Financing Activities | -591.87 | -1602.39 | 460.13 | -5609.89 | -42.47 | -199.59 | 13.43 | -109.19 | 1958.73 | 1374.86 | 59.82 | 16.83 | 3.21 | -1.67 | 0.43 |
| 2023-09-30 | 2023-06-30 | 2023-03-31 | 2022-12-31 | 2022-09-30 | 2022-06-30 | 2022-03-31 | 2021-12-31 | 2021-09-30 | 2021-06-30 | 2021-03-31 | 2020-12-31 | 2020-09-30 | 2020-06-30 | 2020-03-31 | ||
|---|---|---|---|---|---|---|---|---|---|---|---|---|---|---|---|---|
| Net Cash Provided By Used In Operating Activities | 313.94 | 151.12 | 463.08 | 3231.86 | -953.50 | -3033.66 | -830.11 | 2993.32 | 342.05 | 3982.90 | 3411.76 | 2158.24 | 208.19 | 167.34 | 470.30 | |
| Net Income Loss | -2.27 | -97.41 | -78.90 | -557.00 | -544.63 | -1093.65 | -429.66 | 840.21 | 406.10 | 1606.35 | 771.46 | 176.78 | 81.30 | 32.26 | 31.97 | |
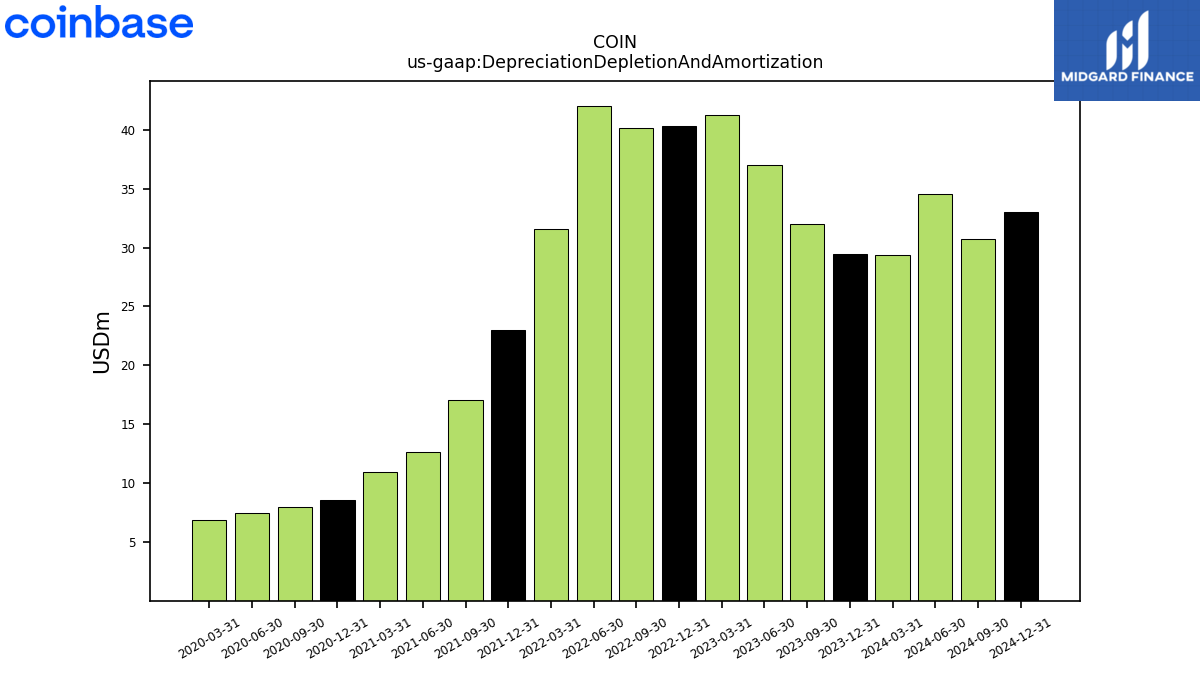
| Depreciation Depletion And Amortization | 31.97 | 36.98 | 41.21 | 40.35 | 40.11 | 42.03 | 31.58 | 23.02 | 17.10 | 12.61 | 10.92 | 8.58 | 8.01 | 7.48 | 6.89 | |
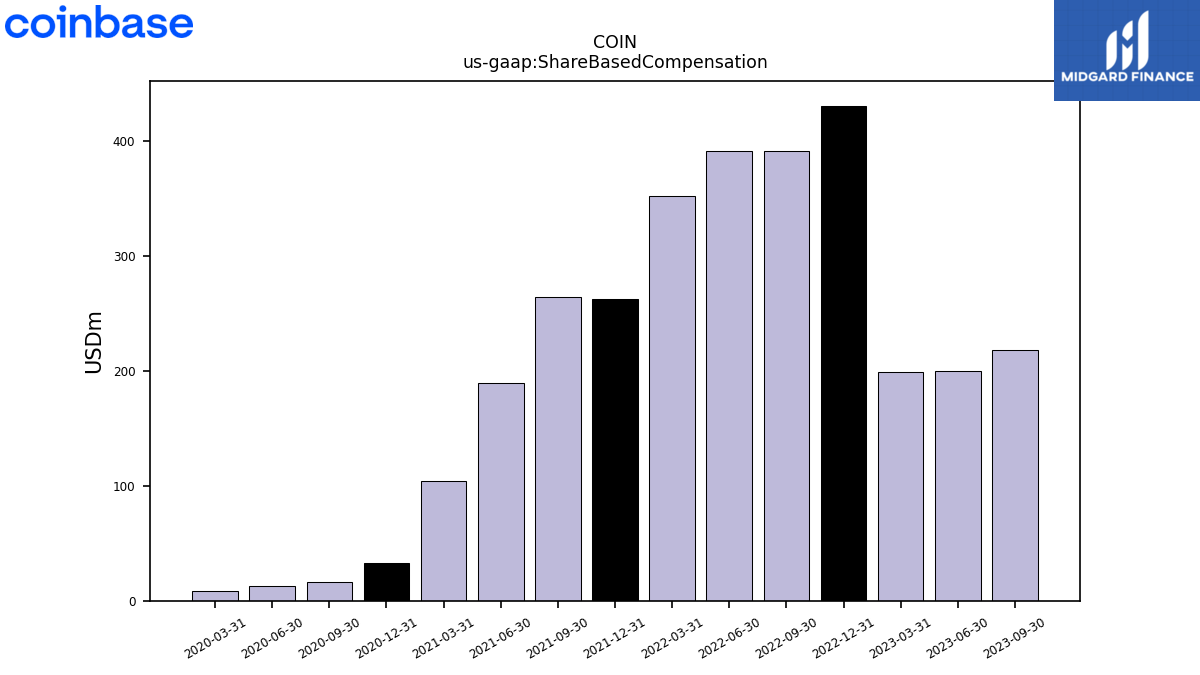
| Share Based Compensation | 218.15 | 199.77 | 198.86 | 430.75 | 391.44 | 391.50 | 352.14 | 262.53 | 264.19 | 189.34 | 104.63 | 32.75 | 16.38 | 12.65 | 8.77 |
| 2023-09-30 | 2023-06-30 | 2023-03-31 | 2022-12-31 | 2022-09-30 | 2022-06-30 | 2022-03-31 | 2021-12-31 | 2021-09-30 | 2021-06-30 | 2021-03-31 | 2020-12-31 | 2020-09-30 | 2020-06-30 | 2020-03-31 | ||
|---|---|---|---|---|---|---|---|---|---|---|---|---|---|---|---|---|
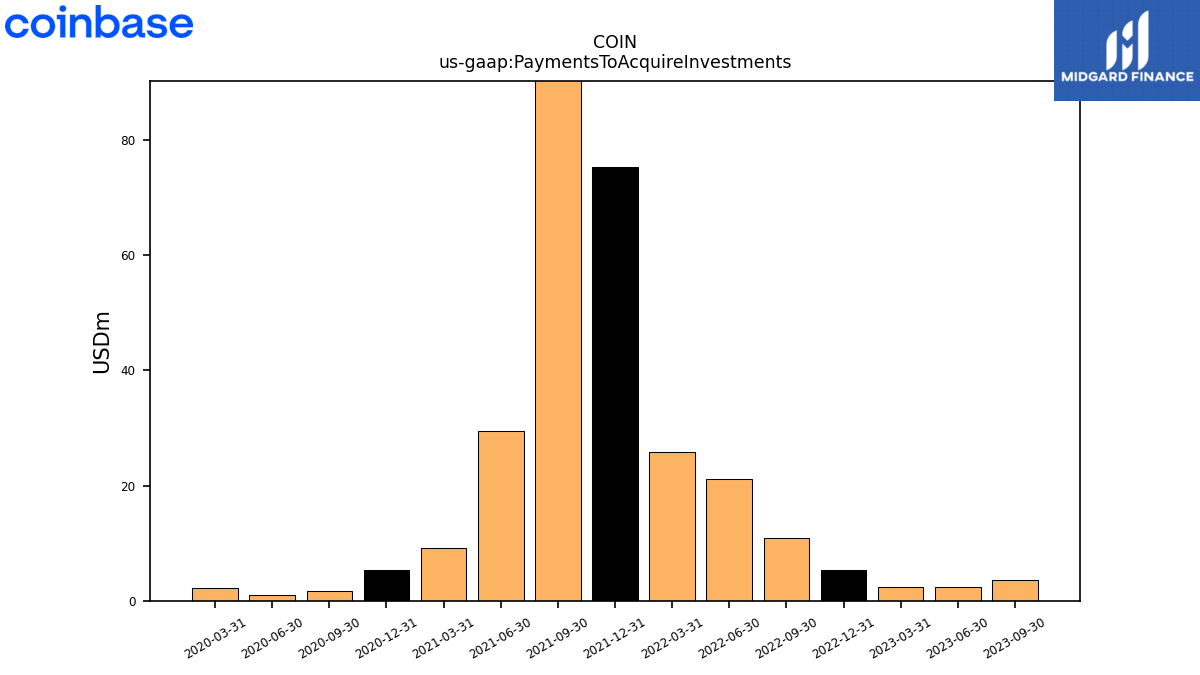
| Net Cash Provided By Used In Investing Activities | -72.36 | 13.33 | -26.08 | -26.12 | -19.08 | 72.97 | -691.59 | -480.32 | -306.67 | -299.84 | -37.91 | 20.96 | 29.31 | 6.09 | -5.54 | |
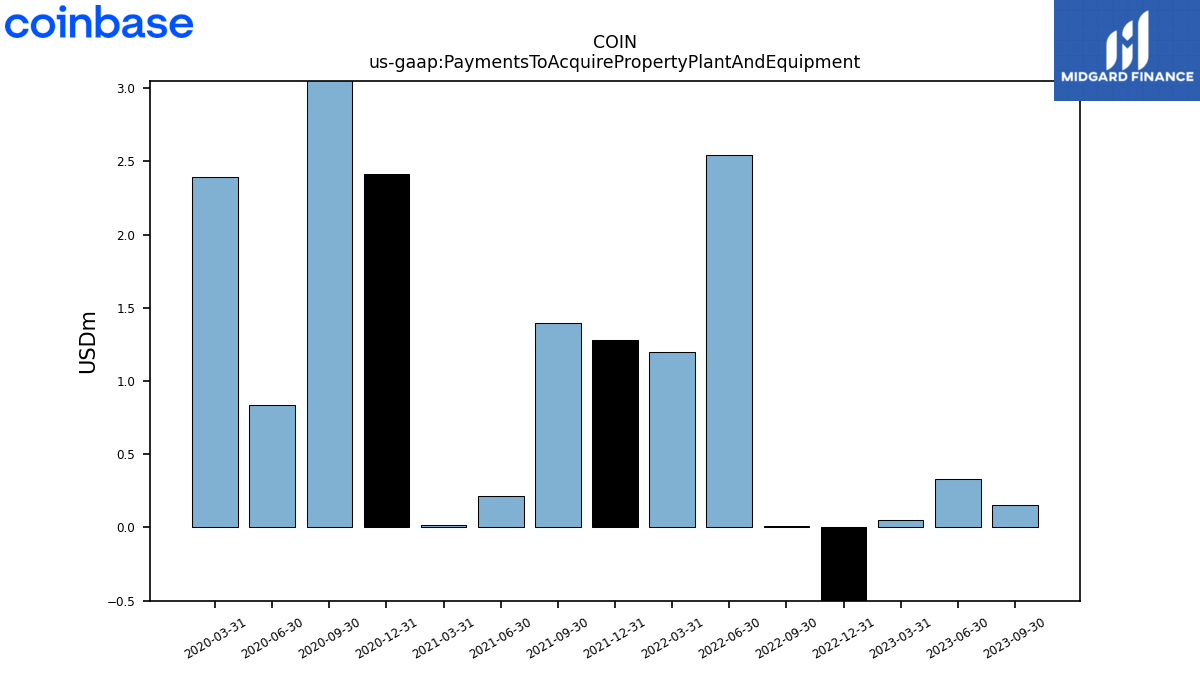
| Payments To Acquire Property Plant And Equipment | 0.15 | 0.33 | 0.05 | -0.81 | 0.01 | 2.54 | 1.20 | 1.28 | 1.39 | 0.22 | 0.02 | 2.41 | 4.27 | 0.84 | 2.39 | |
| Payments To Acquire Investments | 3.65 | 2.35 | 2.46 | 5.33 | 10.81 | 21.13 | 25.77 | 75.39 | 212.49 | 29.43 | 9.20 | 5.38 | 1.70 | 1.00 | 2.25 |
| 2023-09-30 | 2023-06-30 | 2023-03-31 | 2022-12-31 | 2022-09-30 | 2022-06-30 | 2022-03-31 | 2021-12-31 | 2021-09-30 | 2021-06-30 | 2021-03-31 | 2020-12-31 | 2020-09-30 | 2020-06-30 | 2020-03-31 | ||
|---|---|---|---|---|---|---|---|---|---|---|---|---|---|---|---|---|
| Net Cash Provided By Used In Financing Activities | -591.87 | -1602.39 | 460.13 | -5609.89 | -42.47 | -199.59 | 13.43 | -109.19 | 1958.73 | 1374.86 | 59.82 | 16.83 | 3.21 | -1.67 | 0.43 |
| 2023-09-30 | 2023-06-30 | 2023-03-31 | 2022-12-31 | 2022-09-30 | 2022-06-30 | 2022-03-31 | 2021-12-31 | 2021-09-30 | 2021-06-30 | 2021-03-31 | 2020-12-31 | 2020-09-30 | 2020-06-30 | 2020-03-31 | ||
|---|---|---|---|---|---|---|---|---|---|---|---|---|---|---|---|---|
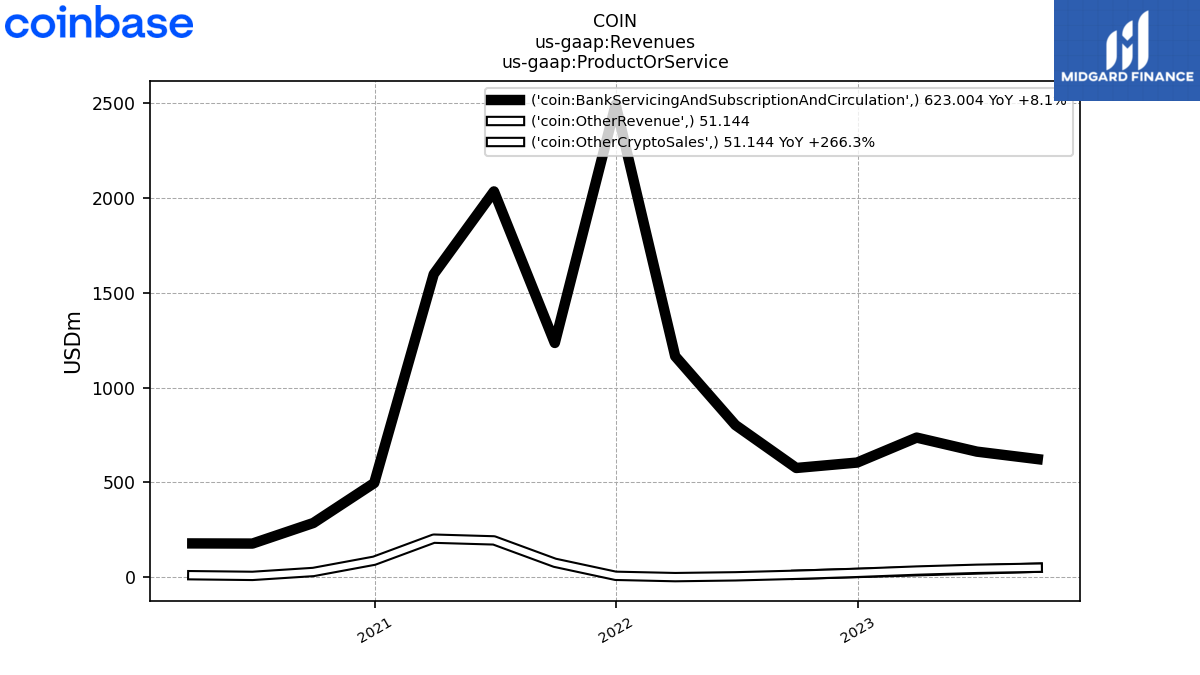
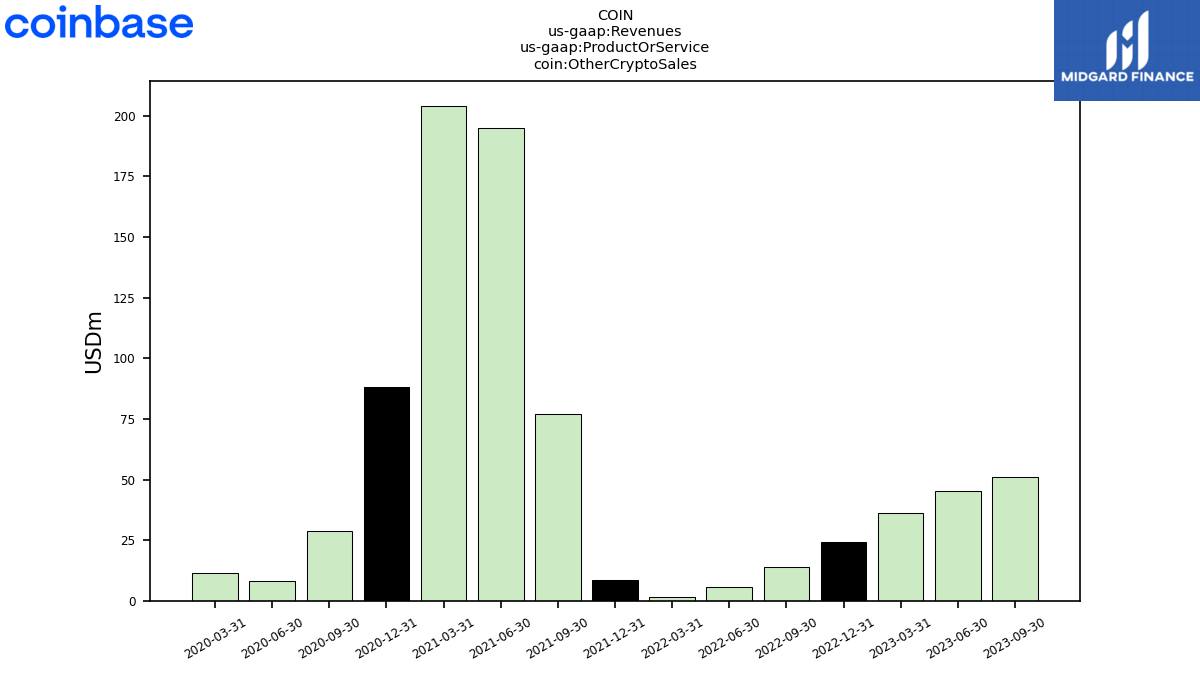
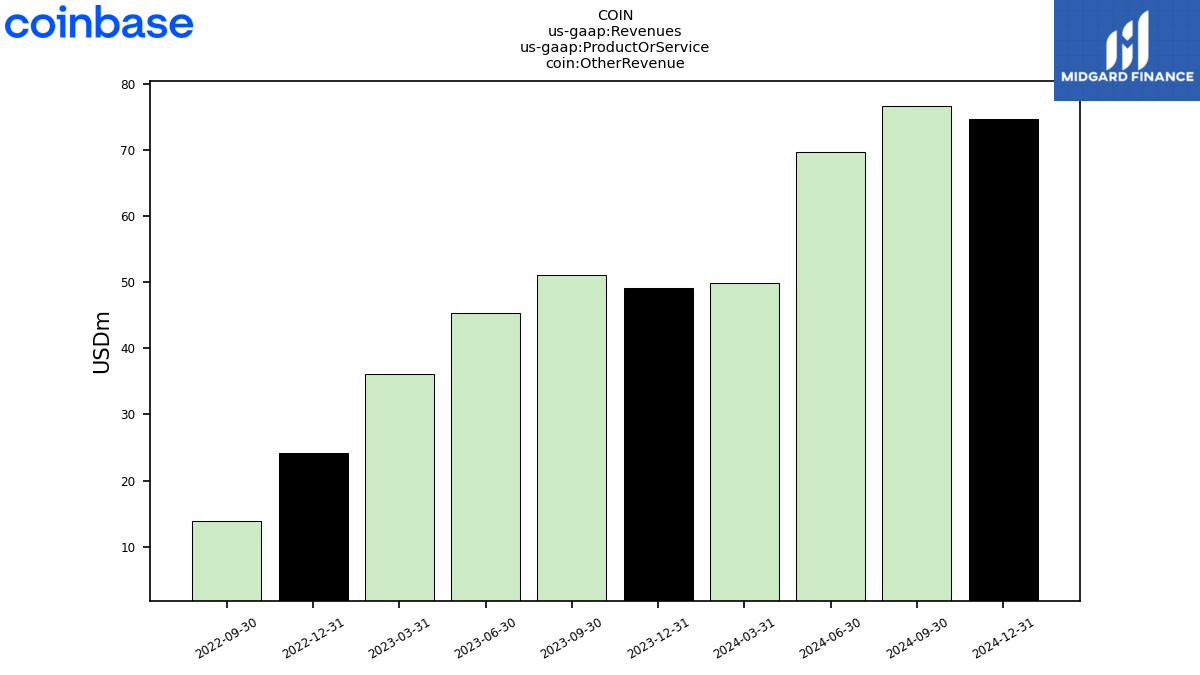
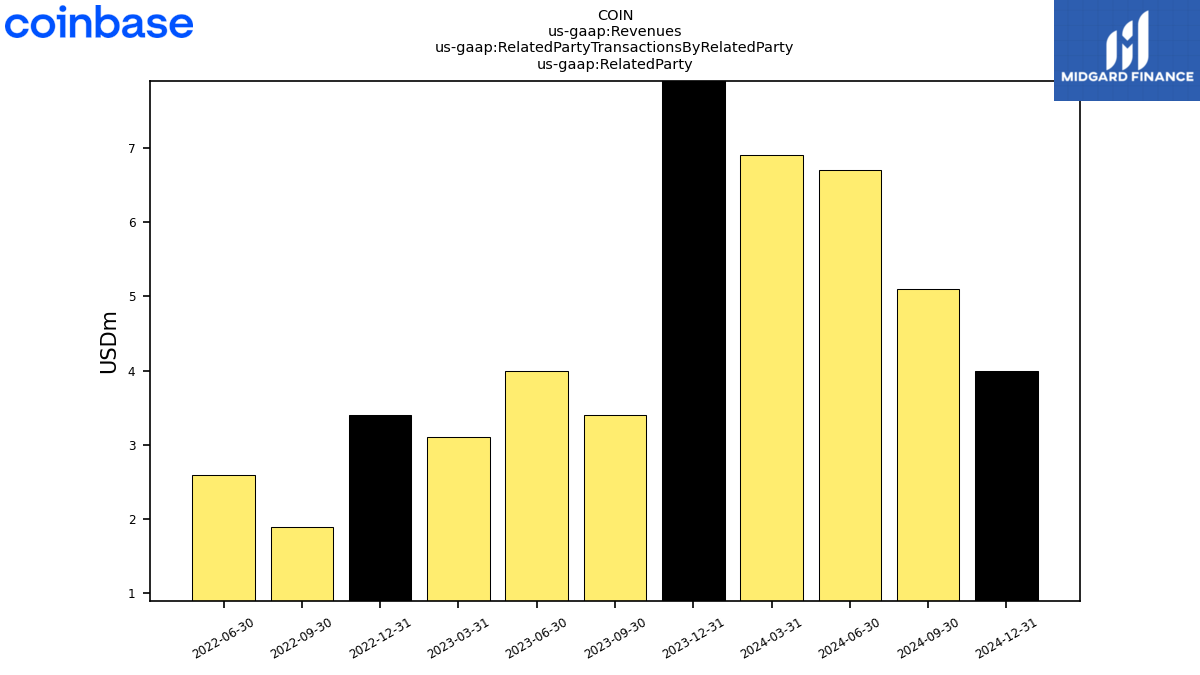
| Revenues | 674.15 | 707.91 | 772.53 | 629.11 | 590.34 | 808.33 | 1166.44 | 2498.46 | 1311.91 | 2227.96 | 1801.11 | 585.11 | 315.36 | 186.38 | 190.63 | |
| Bank Servicing And Subscription And Circulation | 623.00 | 662.50 | 736.40 | 604.95 | 576.38 | 802.60 | 1164.89 | 2490.03 | 1234.74 | 2033.01 | 1596.98 | 497.09 | 286.66 | 178.33 | 179.08 | |
| Other Crypto Sales | 51.14 | 45.41 | 36.13 | 24.16 | 13.96 | 5.72 | 1.54 | 8.44 | 77.17 | 194.95 | 204.13 | 88.02 | 28.69 | 8.05 | 11.55 | |
| Other Revenue | 51.14 | NA | NA | NA | 13.96 | NA | NA | NA | NA | NA | NA | NA | NA | NA | NA | |
| Related Party | 3.40 | 4.00 | NA | NA | 1.90 | 2.60 | NA | NA | NA | NA | NA | NA | NA | NA | NA | |
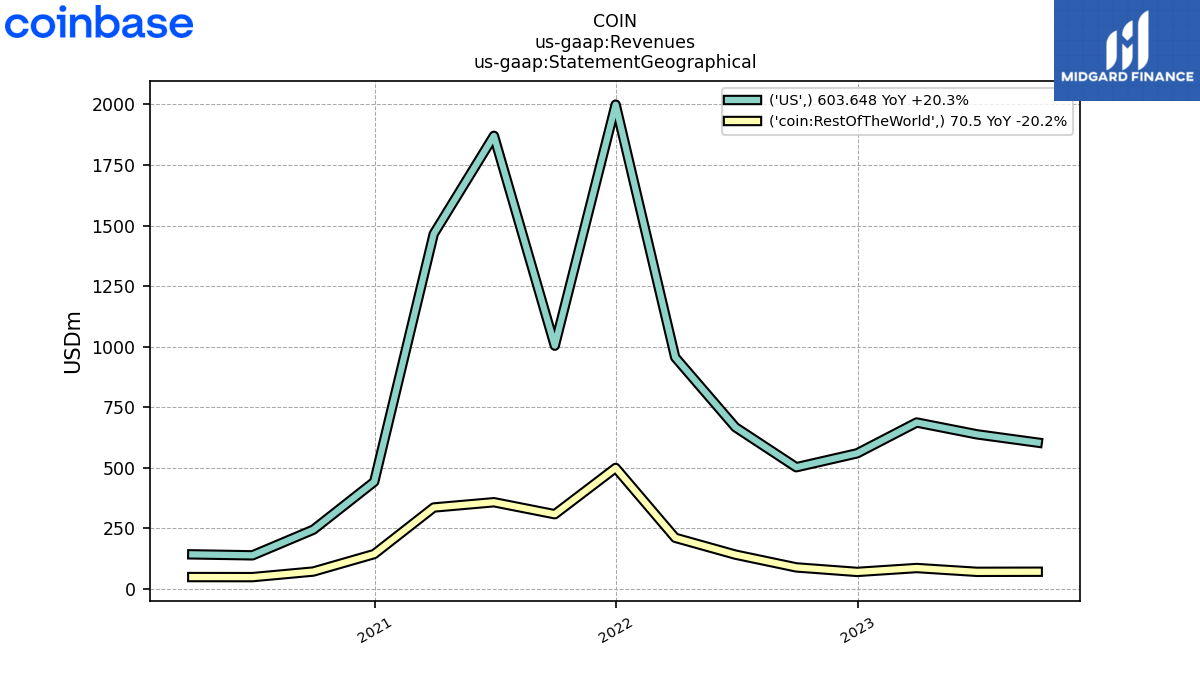
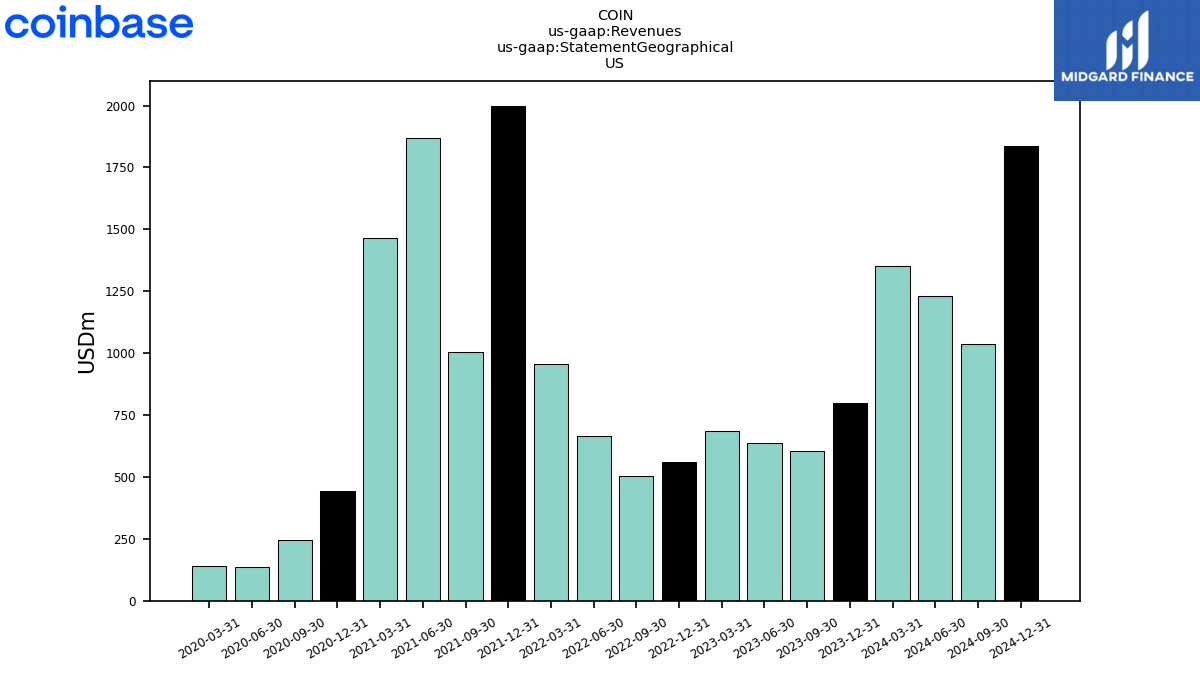
| US | 603.65 | 637.86 | 686.77 | 559.41 | 501.96 | 667.21 | 955.83 | 1999.37 | 1004.00 | 1870.46 | 1465.44 | 441.73 | 244.06 | 138.18 | 142.19 | |
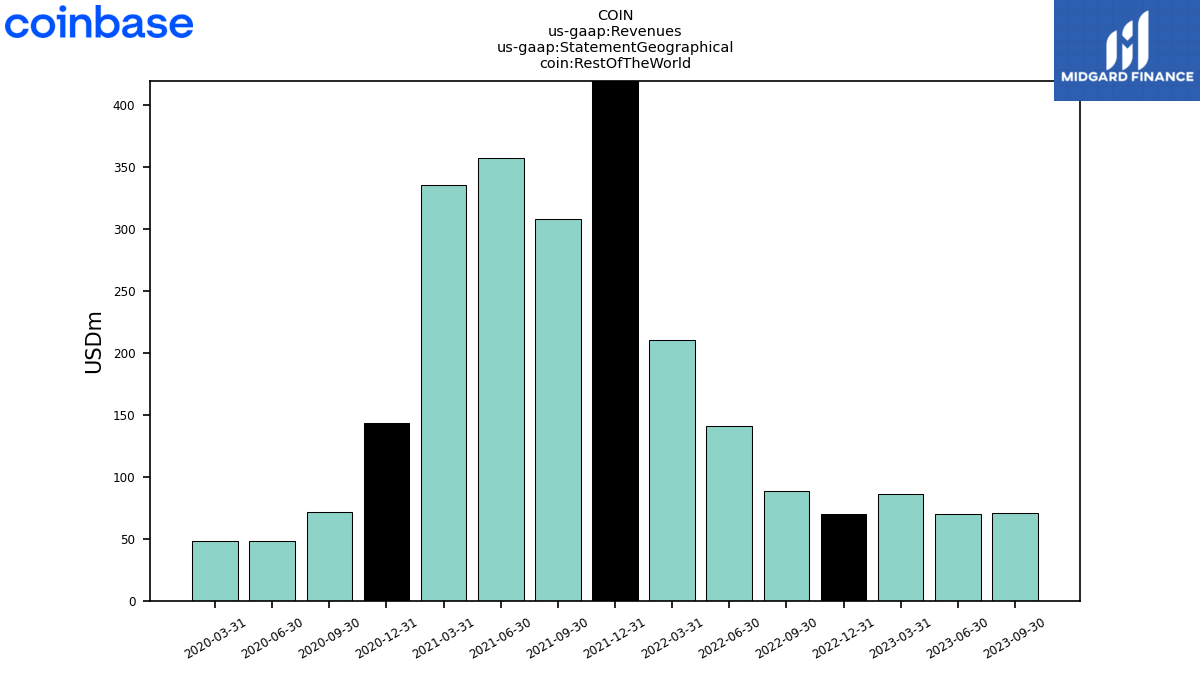
| Rest Of The World | 70.50 | 70.05 | 85.76 | 69.69 | 88.38 | 141.11 | 210.60 | 499.09 | 307.91 | 357.50 | 335.68 | 143.38 | 71.30 | 48.20 | 48.44 | |
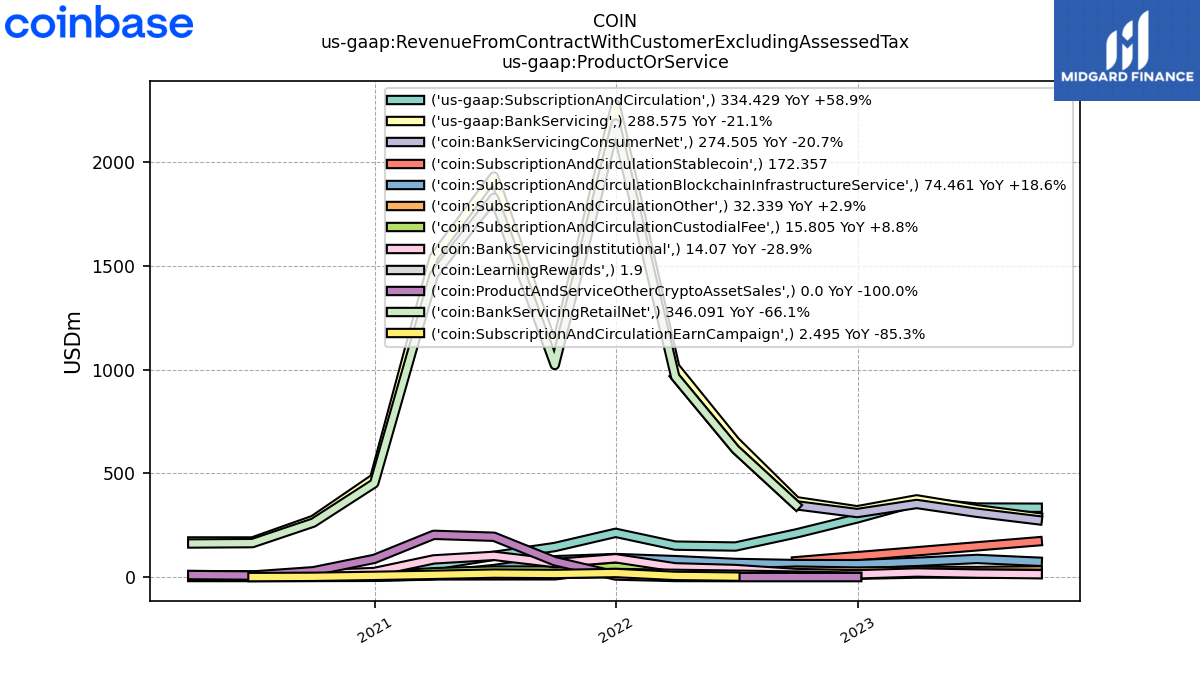
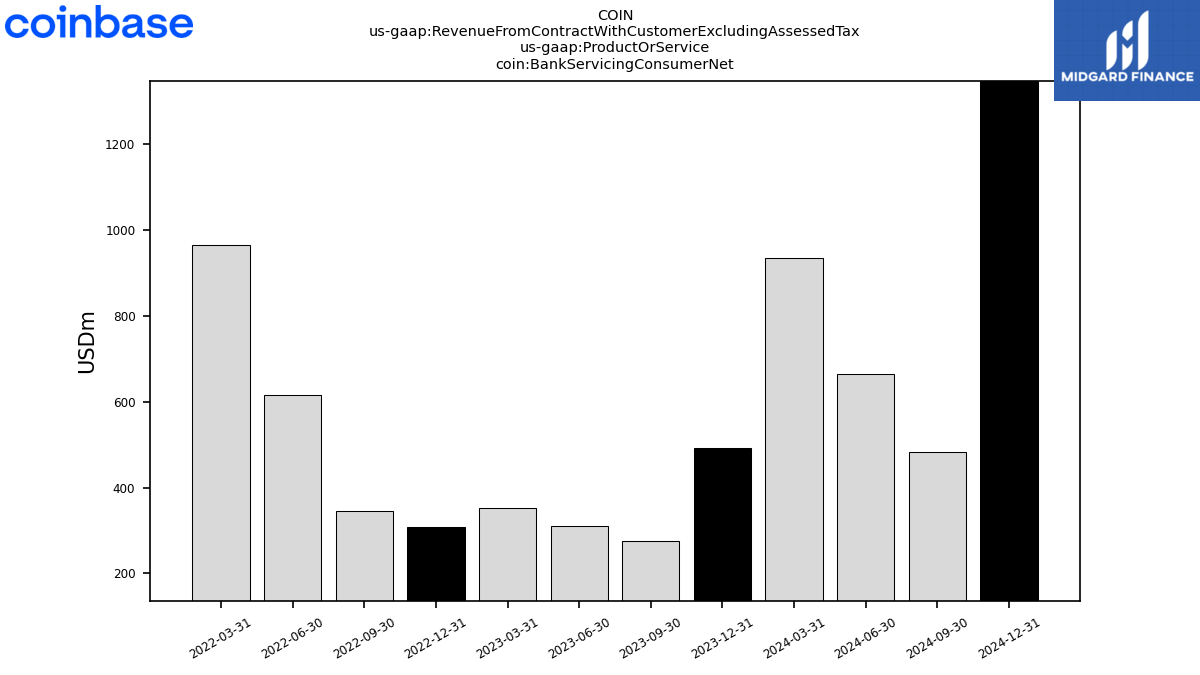
| Bank Servicing Consumer Net | 274.50 | 310.04 | 352.40 | 308.75 | 346.09 | 616.21 | 965.84 | NA | NA | NA | NA | NA | NA | NA | NA | |
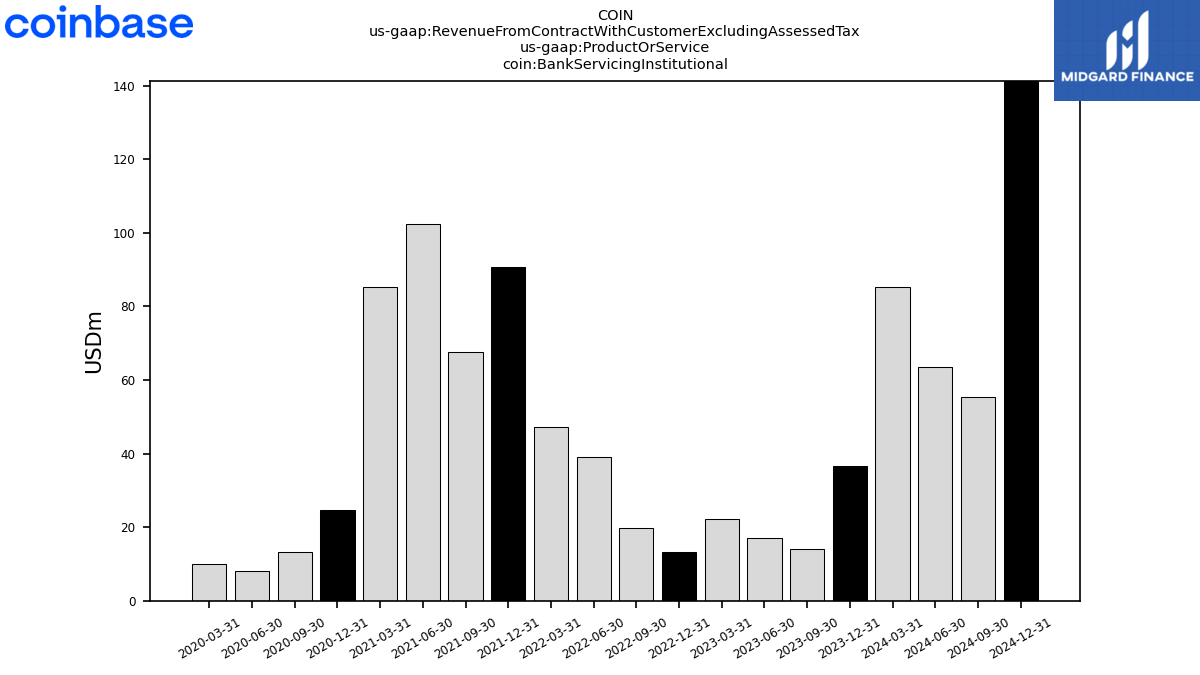
| Bank Servicing Institutional | 14.07 | 17.06 | 22.31 | 13.37 | 19.78 | 39.00 | 47.20 | 90.75 | 67.69 | 102.43 | 85.41 | 24.62 | 13.28 | 8.04 | 9.99 | |
| Bank Servicing Retail Net | NA | NA | NA | NA | 346.09 | 616.21 | 965.84 | 2185.90 | 1021.97 | 1827.95 | 1455.17 | 451.80 | 262.62 | 163.82 | 162.00 | |
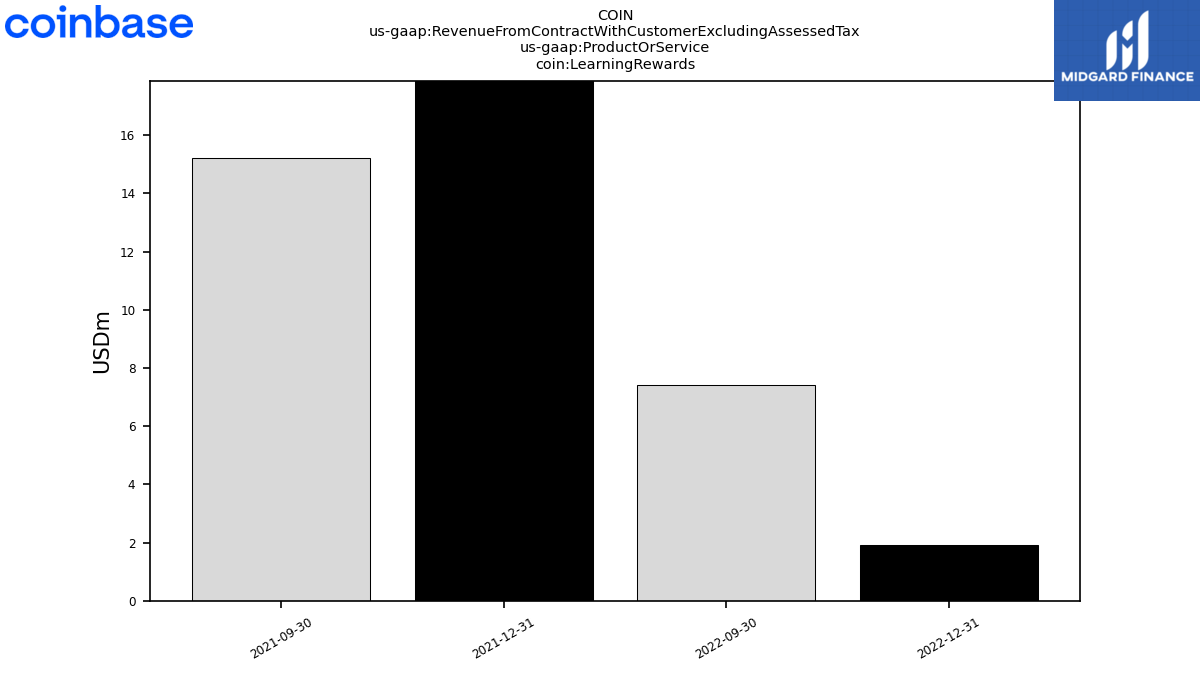
| Learning Rewards | NA | NA | NA | 1.90 | 7.40 | NA | NA | 19.90 | 15.20 | NA | NA | NA | NA | NA | NA | |
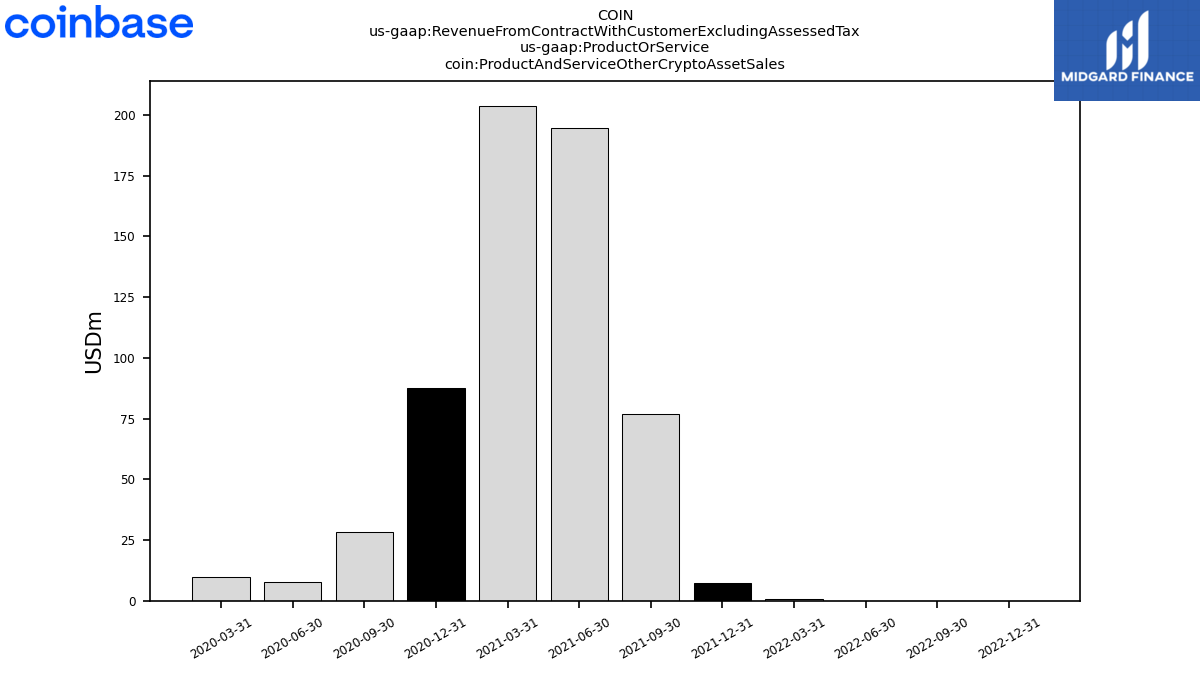
| Product And Service Other Crypto Asset Sales | NA | NA | NA | 0.00 | 0.01 | 0.05 | 0.57 | 7.49 | 76.74 | 194.52 | 203.80 | 87.73 | 28.40 | 7.70 | 9.86 | |
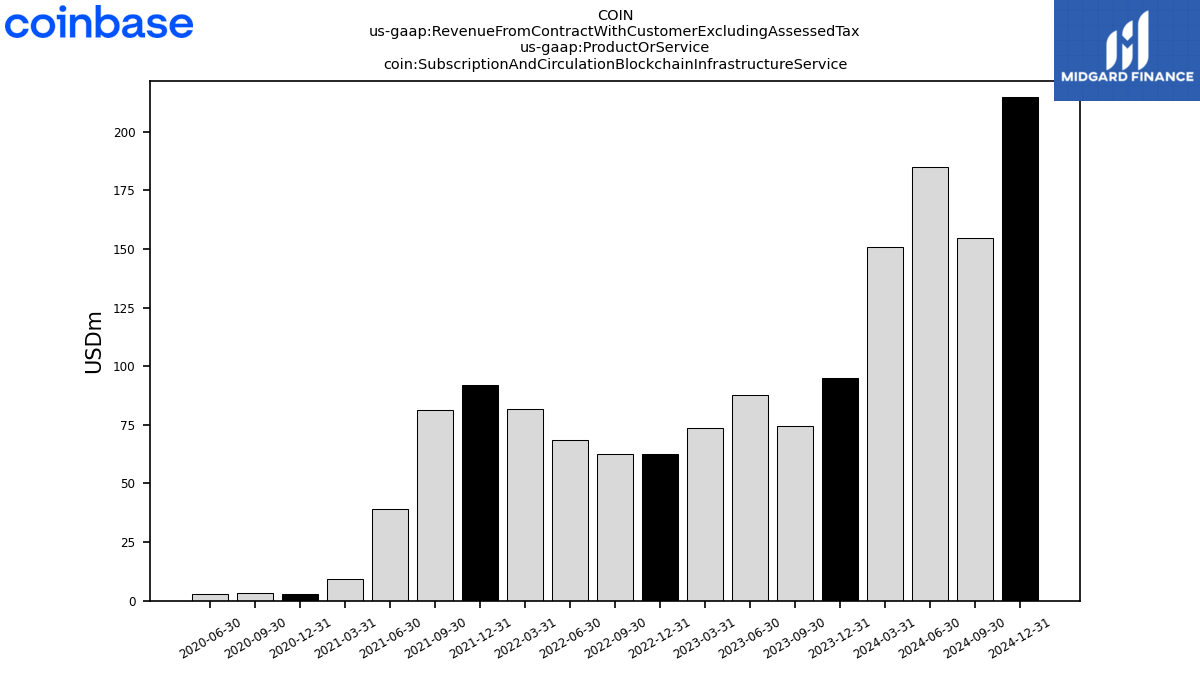
| Subscription And Circulation Blockchain Infrastructure Service | 74.46 | 87.61 | 73.75 | 62.44 | 62.76 | 68.41 | 81.89 | 92.00 | 81.49 | 39.02 | 9.25 | 3.00 | 3.25 | 2.71 | NA | |
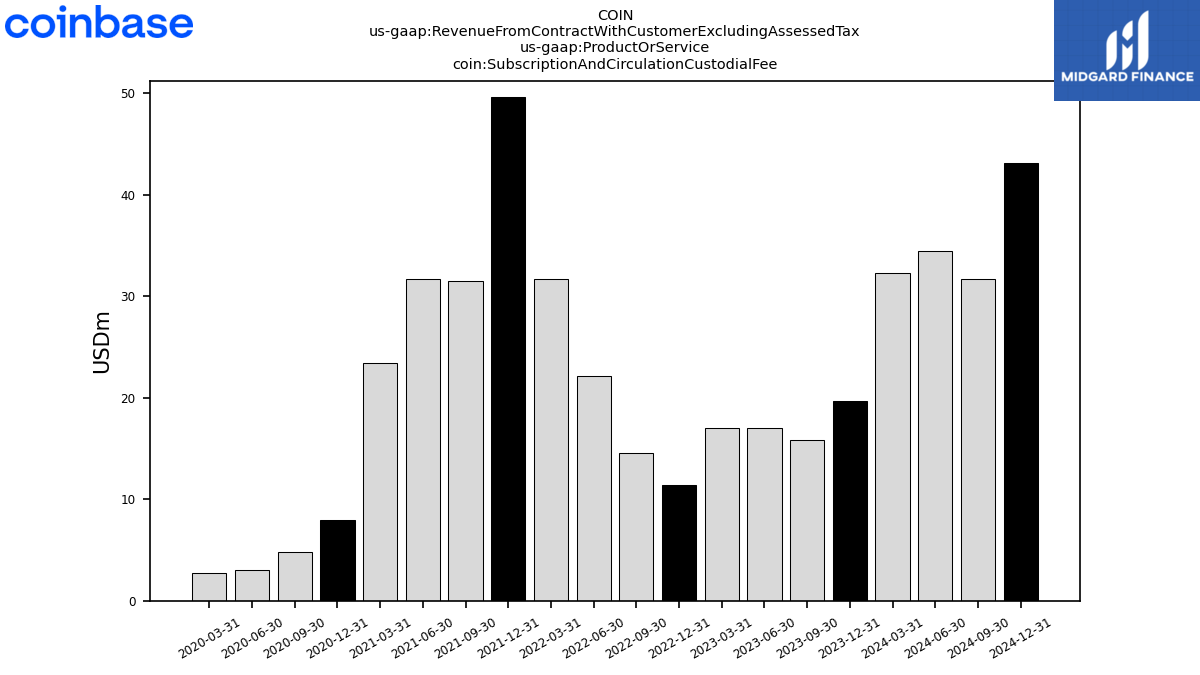
| Subscription And Circulation Custodial Fee | 15.80 | 16.99 | 17.04 | 11.44 | 14.53 | 22.18 | 31.69 | 49.68 | 31.47 | 31.70 | 23.45 | 7.97 | 4.80 | 3.08 | 2.71 | |
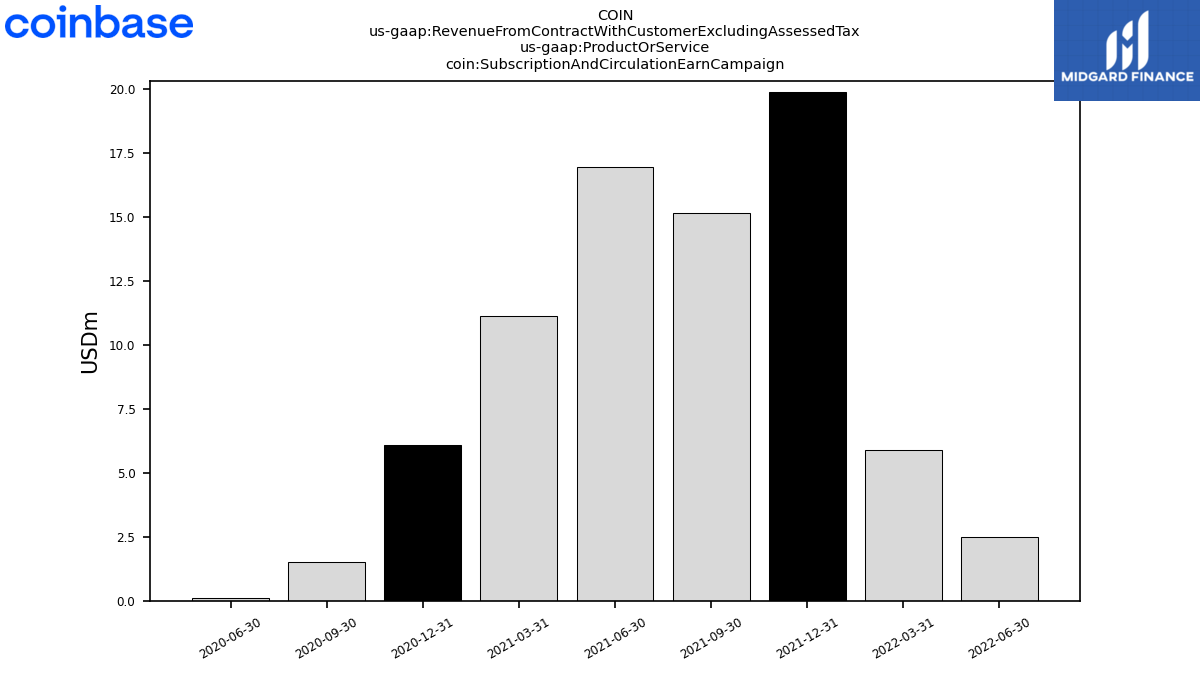
| Subscription And Circulation Earn Campaign | NA | NA | NA | NA | NA | 2.50 | 5.91 | 19.89 | 15.17 | 16.95 | 11.11 | 6.08 | 1.53 | 0.11 | NA | |
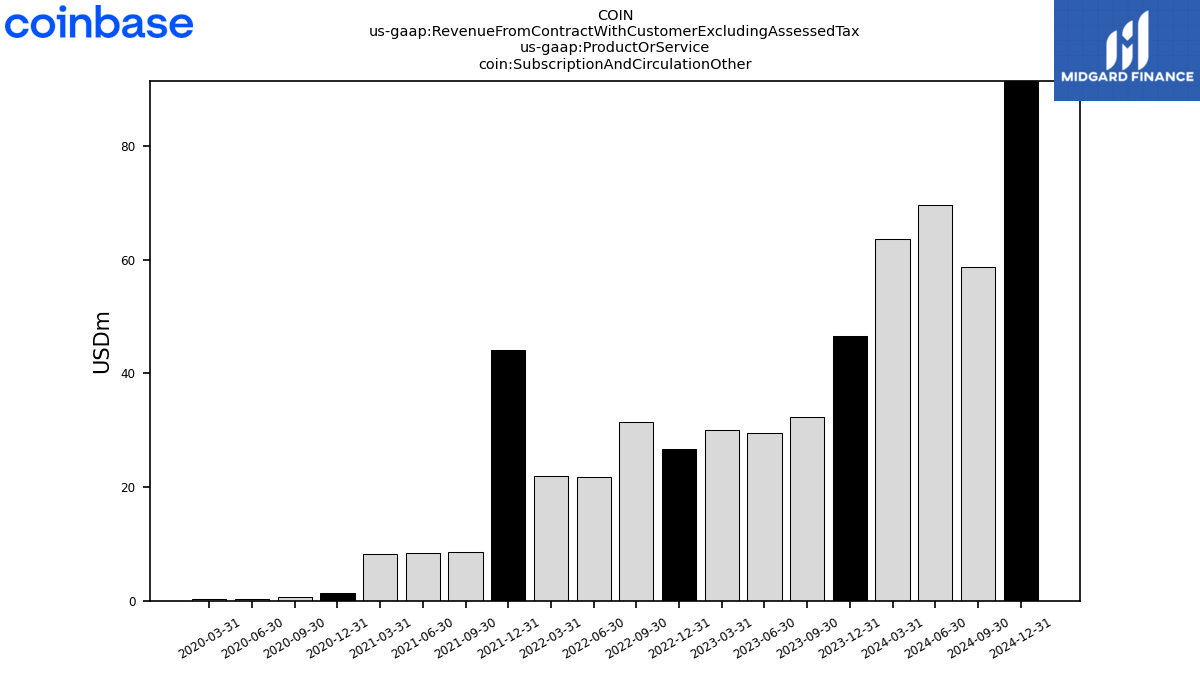
| Subscription And Circulation Other | 32.34 | 29.43 | 30.07 | 26.72 | 31.44 | 21.79 | 21.91 | 44.16 | 8.56 | 8.48 | 8.22 | 1.37 | 0.64 | 0.38 | 0.37 | |
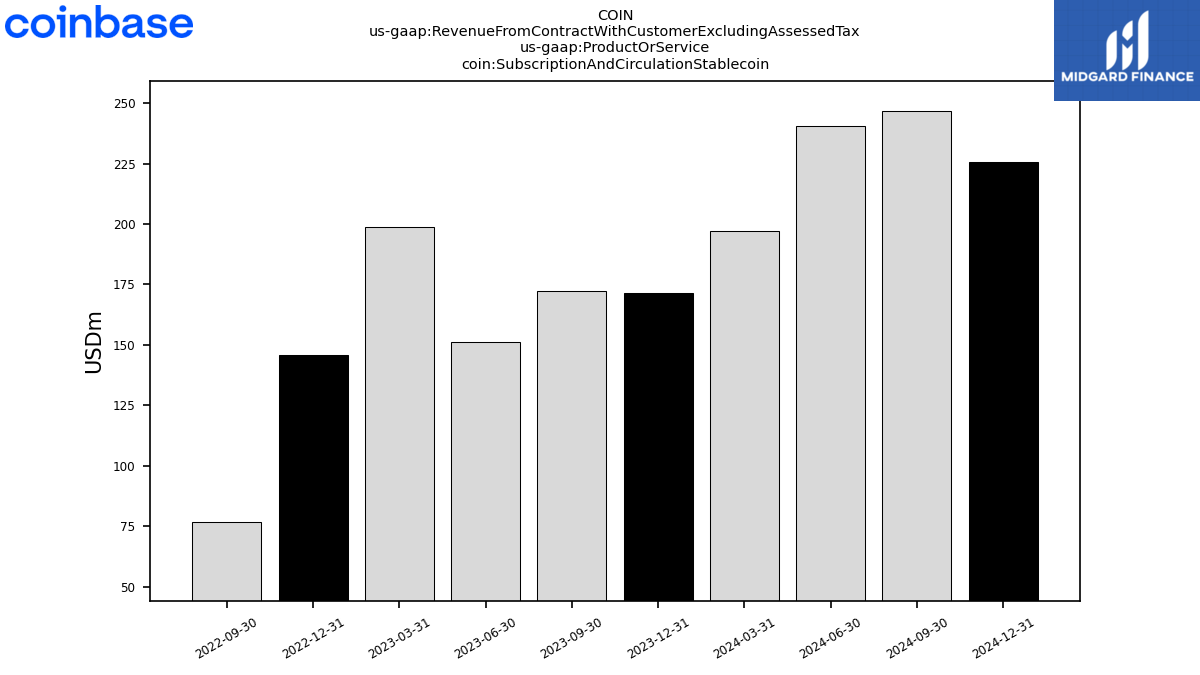
| Subscription And Circulation Stablecoin | 172.36 | NA | NA | NA | 76.86 | NA | NA | NA | NA | NA | NA | NA | NA | NA | NA | |
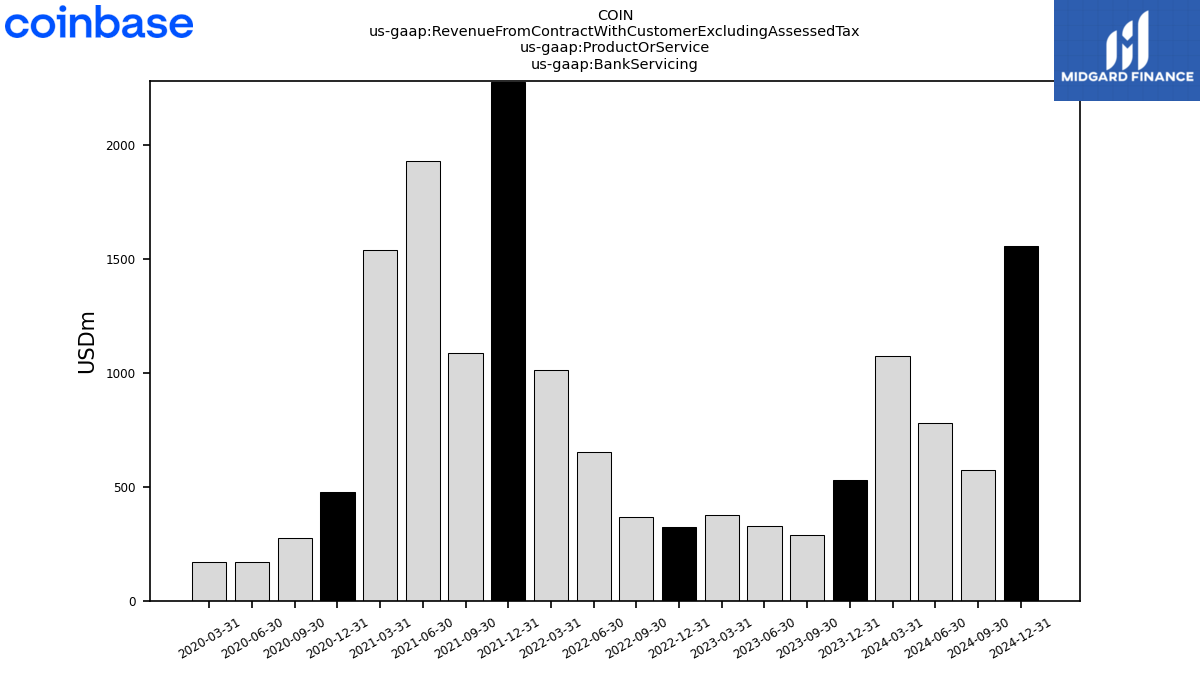
| Bank Servicing | 288.57 | 327.10 | 374.71 | 322.13 | 365.87 | 655.21 | 1013.04 | 2276.65 | 1089.66 | 1930.38 | 1540.58 | 476.42 | 275.90 | 171.86 | 171.99 | |
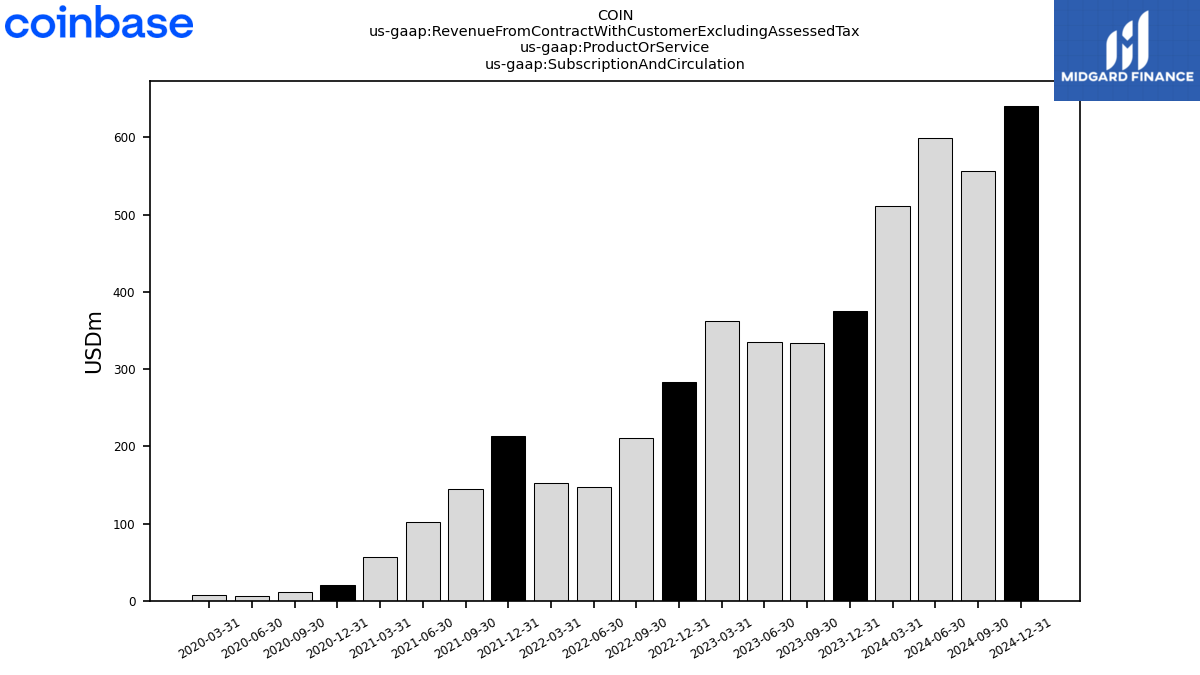
| Subscription And Circulation | 334.43 | 335.40 | 361.69 | 282.82 | 210.51 | 147.39 | 151.85 | 213.38 | 145.08 | 102.63 | 56.40 | 20.68 | 10.76 | 6.47 | 7.09 | |
| Interest Income Operating | 39.47 | 201.36 | 240.82 | 182.21 | 101.78 | 32.51 | 10.45 | 7.64 | 8.39 | 6.48 | 3.32 | 2.25 | 0.54 | 0.19 | 2.56 |