
| 2023-12-31 | 2023-09-30 | 2023-06-30 | 2023-03-31 | 2022-12-31 | 2022-09-30 | 2022-06-30 | 2022-03-31 | 2021-12-31 | 2021-09-30 | 2021-06-30 | 2021-03-31 | 2020-12-31 | 2020-09-30 | 2020-06-30 | 2020-03-31 | 2019-12-31 | 2019-09-30 | 2019-06-30 | 2019-03-31 | 2018-12-31 | 2018-09-30 | 2018-06-30 | 2018-03-31 | 2017-12-31 | 2017-09-30 | 2017-06-30 | 2017-03-31 | ||
|---|---|---|---|---|---|---|---|---|---|---|---|---|---|---|---|---|---|---|---|---|---|---|---|---|---|---|---|---|---|
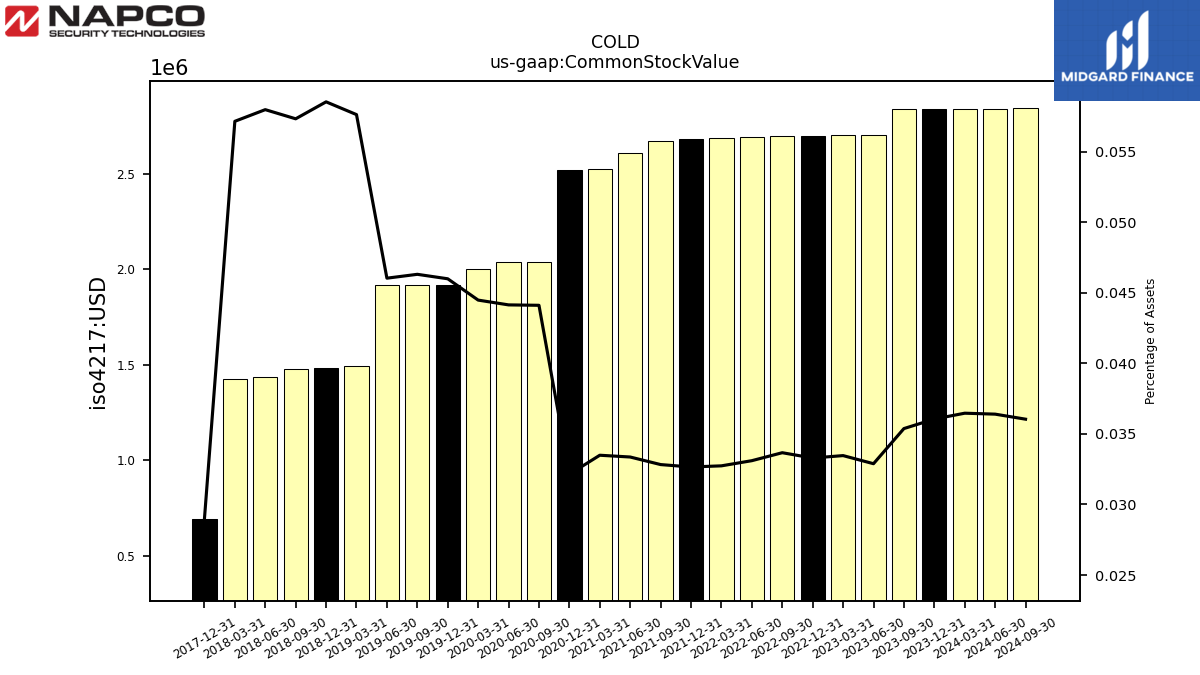
| Common Stock Value | 2.84 | 2.83 | 2.70 | 2.70 | 2.70 | 2.69 | 2.69 | 2.69 | 2.68 | 2.67 | 2.61 | 2.52 | 2.52 | 2.04 | 2.04 | 2.00 | 1.92 | 1.92 | 1.92 | 1.49 | 1.48 | 1.48 | 1.44 | 1.43 | 0.69 | NA | NA | NA | |
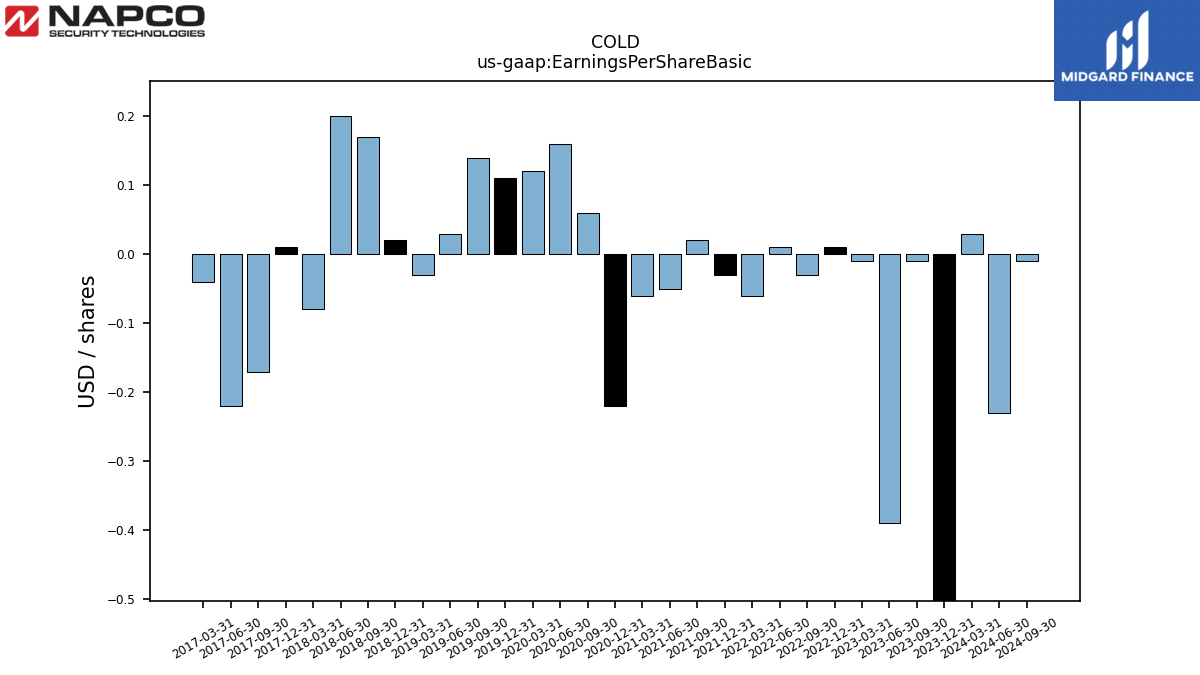
| Earnings Per Share Basic | -0.82 | -0.01 | -0.39 | -0.01 | 0.01 | -0.03 | 0.01 | -0.06 | -0.03 | 0.02 | -0.05 | -0.06 | -0.22 | 0.06 | 0.16 | 0.12 | 0.11 | 0.14 | 0.03 | -0.03 | 0.02 | 0.17 | 0.20 | -0.08 | 0.01 | -0.17 | -0.22 | -0.04 | |
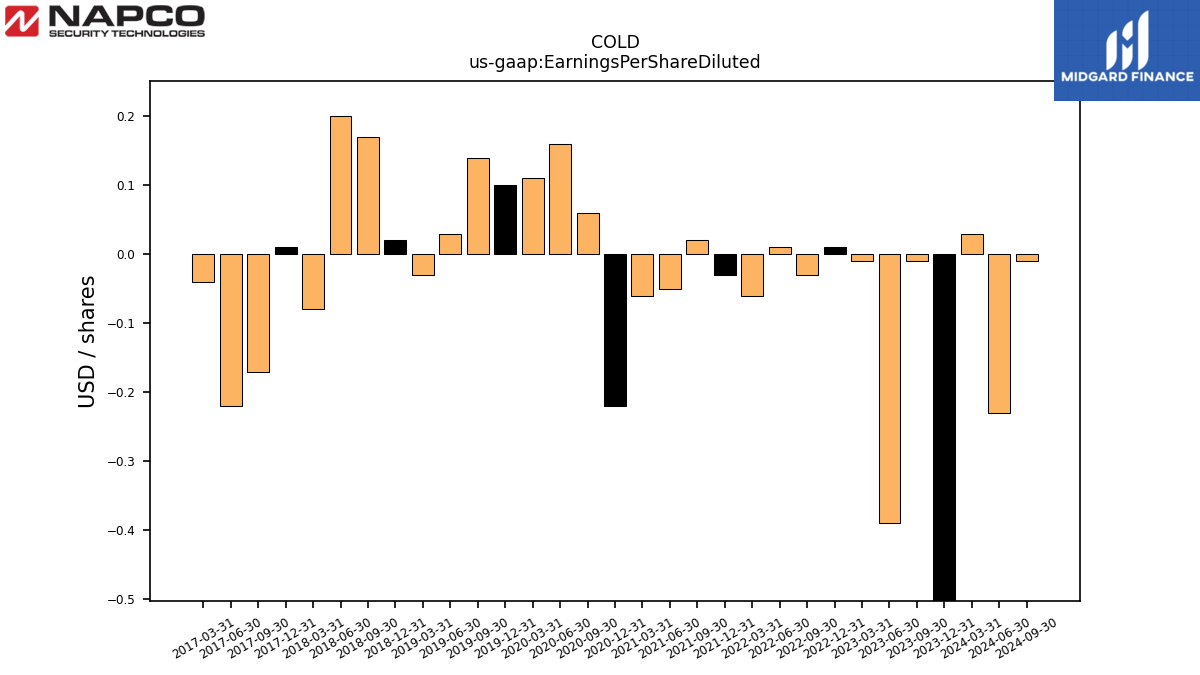
| Earnings Per Share Diluted | -0.82 | -0.01 | -0.39 | -0.01 | 0.01 | -0.03 | 0.01 | -0.06 | -0.03 | 0.02 | -0.05 | -0.06 | -0.22 | 0.06 | 0.16 | 0.11 | 0.10 | 0.14 | 0.03 | -0.03 | 0.02 | 0.17 | 0.20 | -0.08 | 0.01 | -0.17 | -0.22 | -0.04 | |
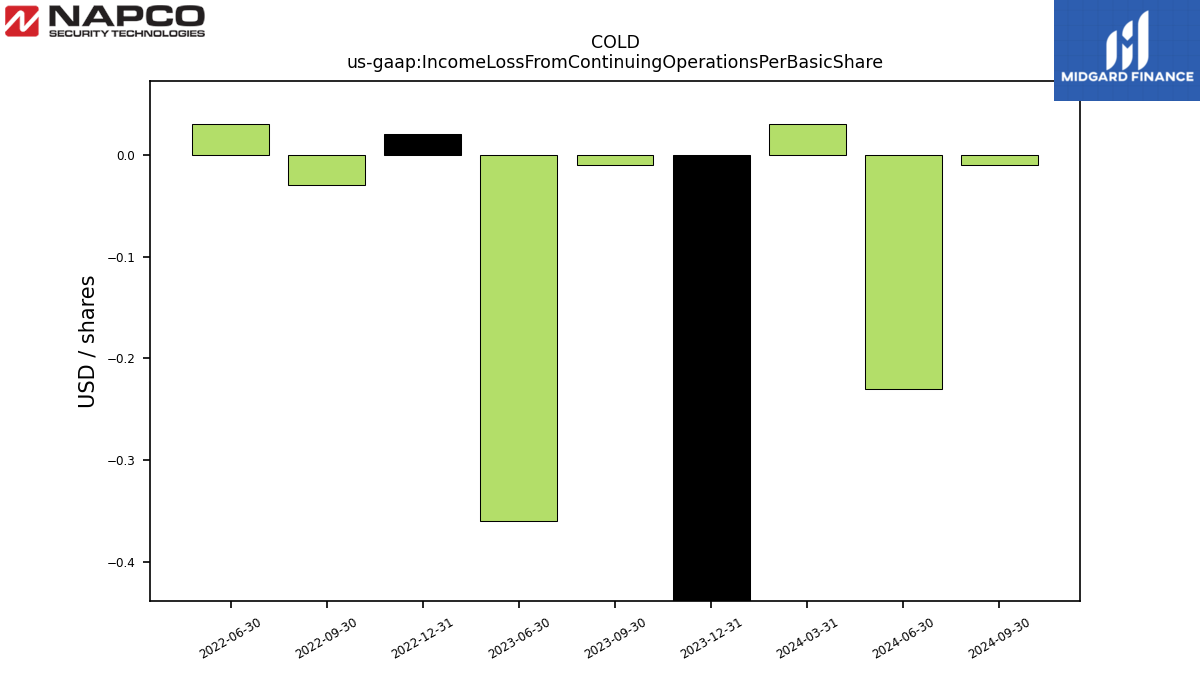
| Income Loss From Continuing Operations Per Basic Share | -0.00 | -0.00 | -0.00 | NA | 0.00 | -0.00 | 0.00 | NA | NA | NA | NA | NA | NA | NA | NA | NA | NA | NA | NA | NA | NA | NA | NA | NA | NA | NA | NA | NA | |
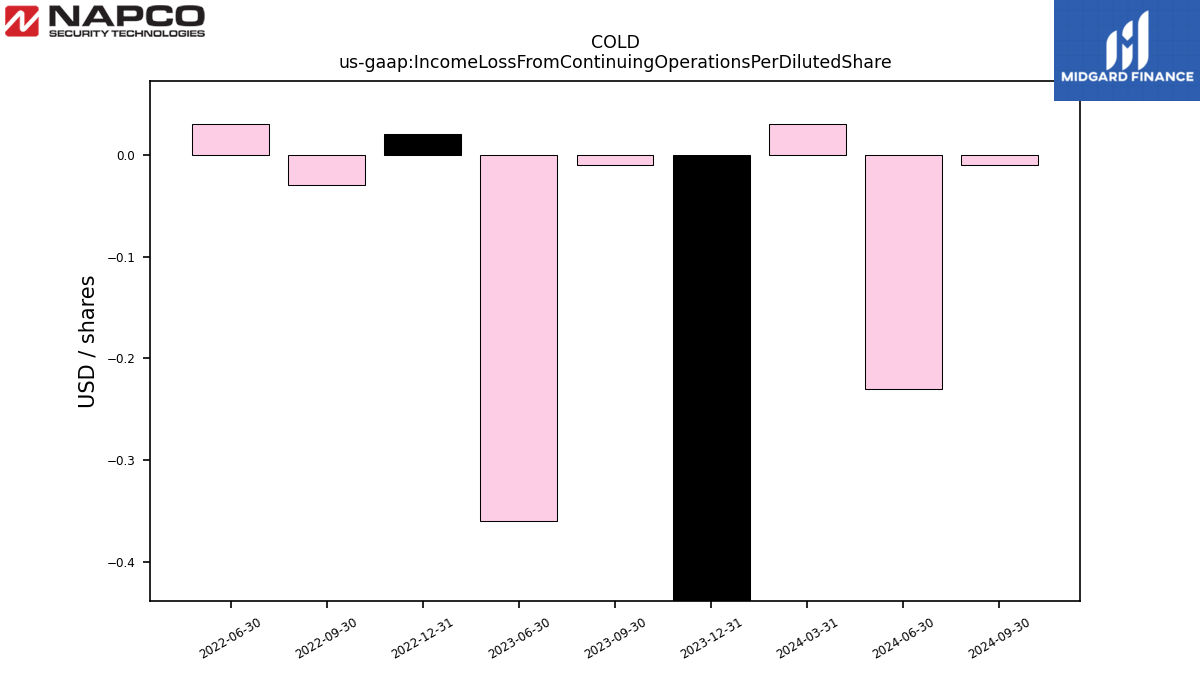
| Income Loss From Continuing Operations Per Diluted Share | -0.00 | -0.00 | -0.00 | NA | 0.00 | -0.00 | 0.00 | NA | NA | NA | NA | NA | NA | NA | NA | NA | NA | NA | NA | NA | NA | NA | NA | NA | NA | NA | NA | NA |
| 2023-12-31 | 2023-09-30 | 2023-06-30 | 2023-03-31 | 2022-12-31 | 2022-09-30 | 2022-06-30 | 2022-03-31 | 2021-12-31 | 2021-09-30 | 2021-06-30 | 2021-03-31 | 2020-12-31 | 2020-09-30 | 2020-06-30 | 2020-03-31 | 2019-12-31 | 2019-09-30 | 2019-06-30 | 2019-03-31 | 2018-12-31 | 2018-09-30 | 2018-06-30 | 2018-03-31 | 2017-12-31 | 2017-09-30 | 2017-06-30 | 2017-03-31 | ||
|---|---|---|---|---|---|---|---|---|---|---|---|---|---|---|---|---|---|---|---|---|---|---|---|---|---|---|---|---|---|
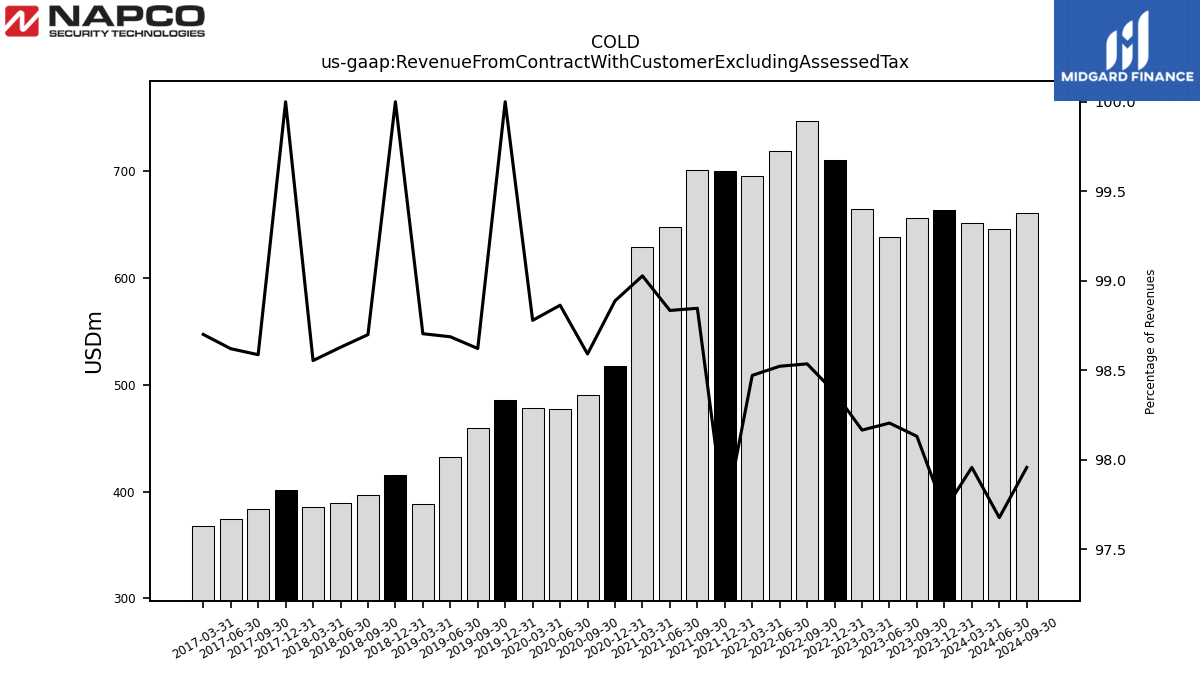
| Revenue From Contract With Customer Excluding Assessed Tax | 663.78 | 655.45 | 637.94 | 664.08 | 709.79 | 746.68 | 718.97 | 694.90 | 699.87 | 700.63 | 647.07 | 628.62 | 517.85 | 490.45 | 477.04 | 478.15 | 485.98 | 459.75 | 432.70 | 387.98 | 415.82 | 396.78 | 389.25 | 385.48 | 401.72 | 384.00 | 374.21 | 368.06 | |
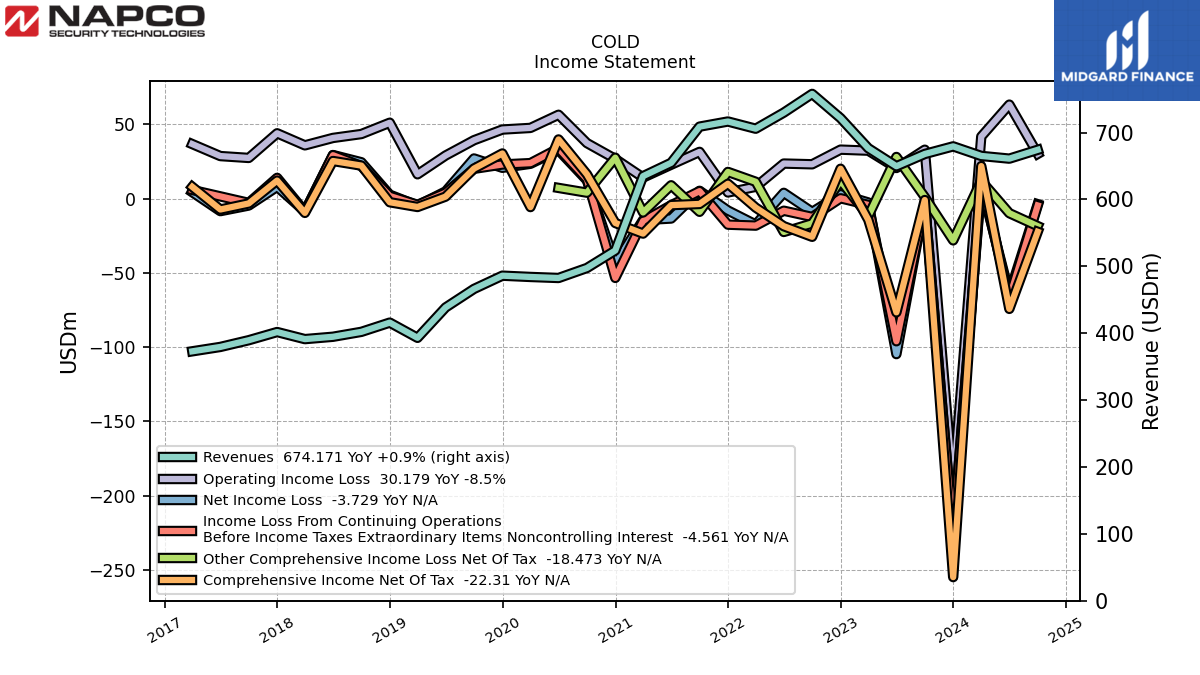
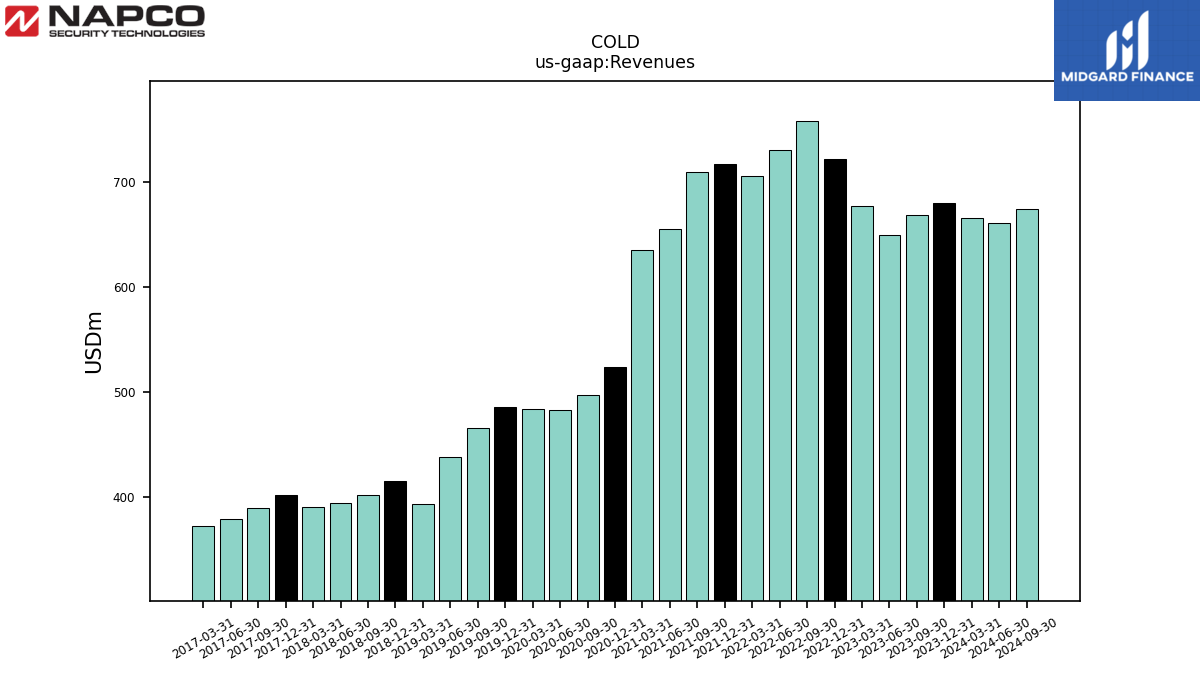
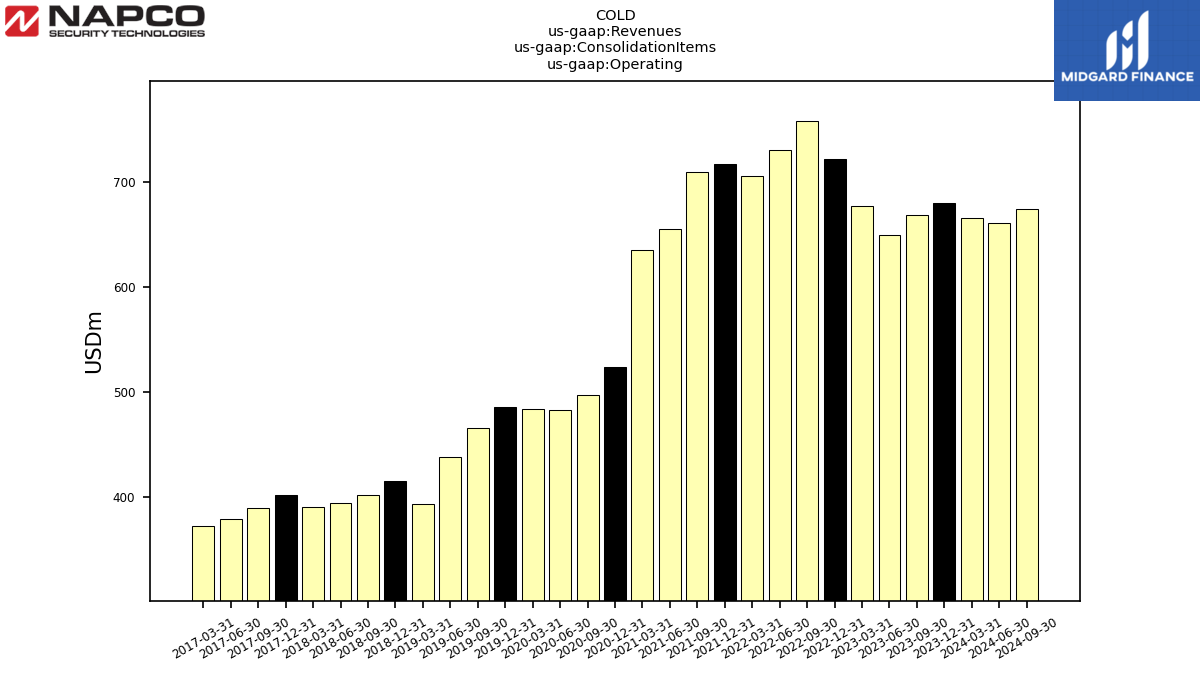
| Revenues | 679.29 | 667.94 | 649.61 | 676.49 | 721.50 | 757.78 | 729.76 | 705.70 | 716.48 | 708.81 | 654.71 | 634.79 | 523.68 | 497.46 | 482.52 | 484.07 | 485.98 | 466.18 | 438.46 | 393.08 | 415.82 | 402.01 | 394.67 | 391.14 | 401.72 | 389.50 | 379.45 | 372.91 | |
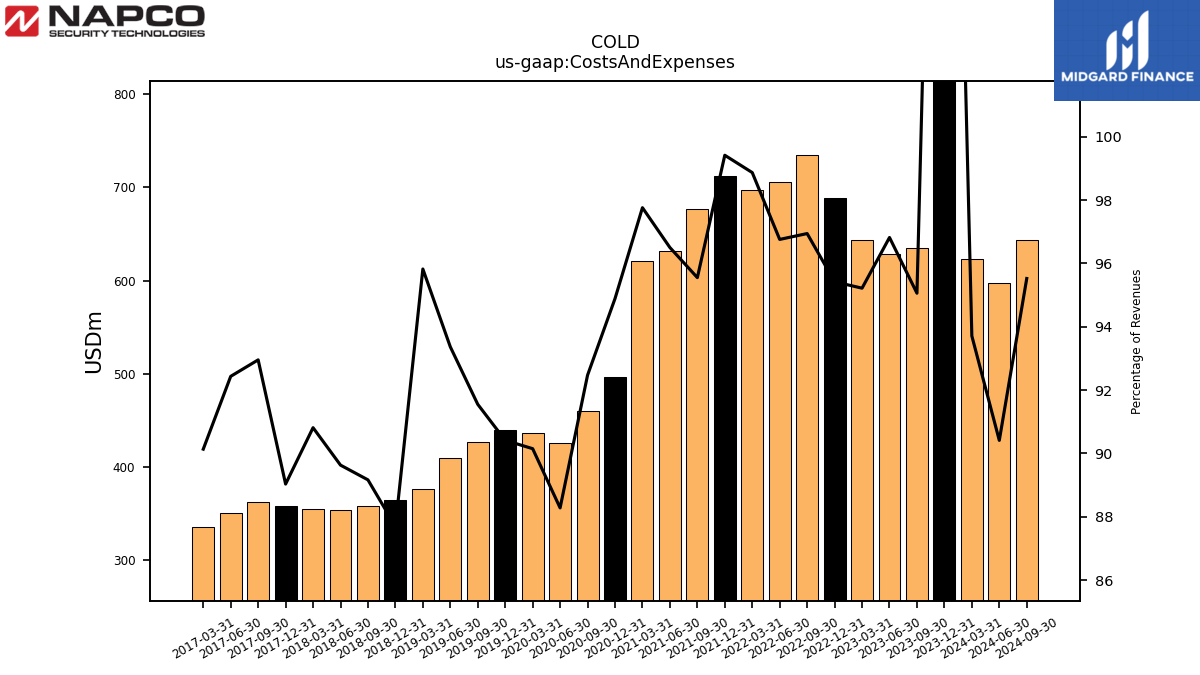
| Costs And Expenses | 873.61 | 634.94 | 628.94 | 644.14 | 688.46 | 734.61 | 706.09 | 697.70 | 712.28 | 677.27 | 631.80 | 620.57 | 496.91 | 460.00 | 425.98 | 436.39 | 439.40 | 426.80 | 409.38 | 376.66 | 364.65 | 358.46 | 353.75 | 355.21 | 357.67 | 362.06 | 350.74 | 336.13 | |
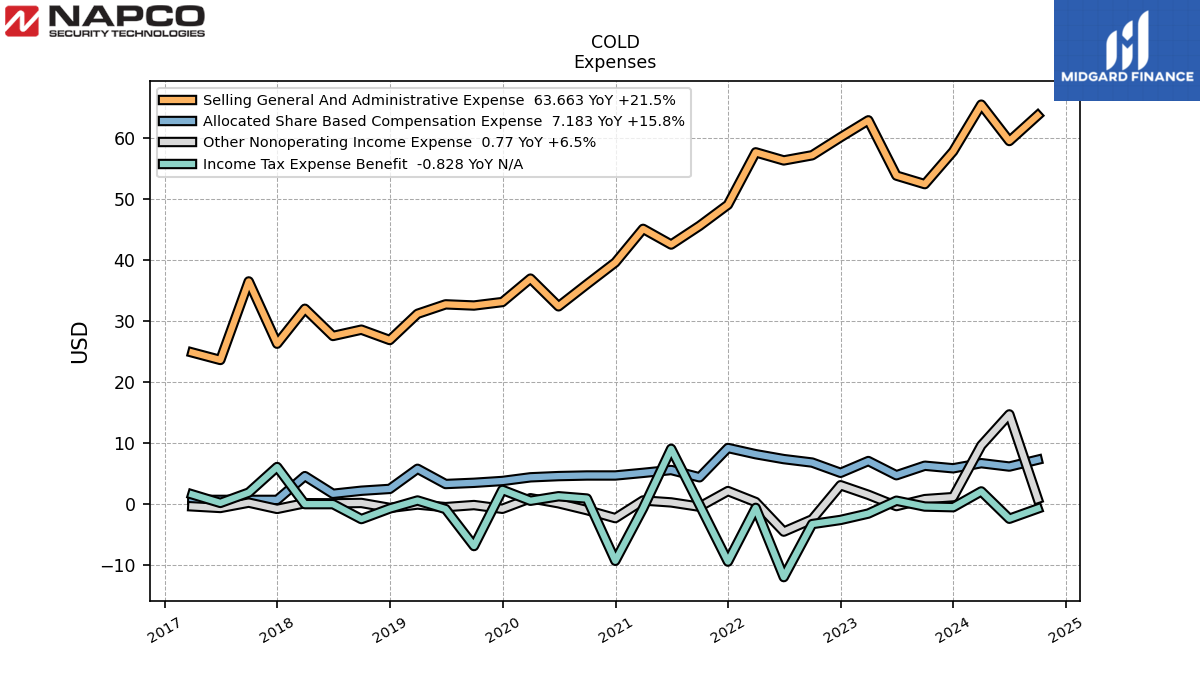
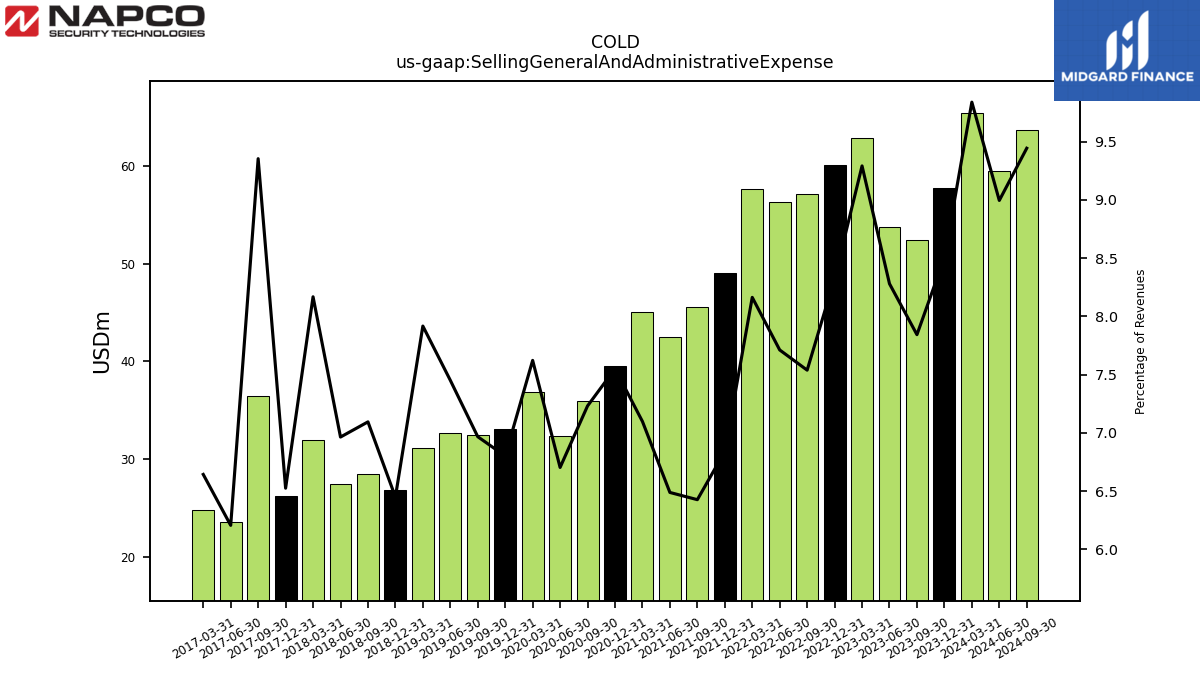
| Selling General And Administrative Expense | 57.76 | 52.38 | 53.78 | 62.85 | 60.07 | 57.12 | 56.27 | 57.60 | 49.00 | 45.55 | 42.48 | 45.05 | 39.54 | 35.97 | 32.34 | 36.89 | 33.05 | 32.48 | 32.67 | 31.12 | 26.81 | 28.52 | 27.48 | 31.95 | 26.21 | 36.43 | 23.55 | 24.77 | |
| Litigation Settlement Expense | 0.16 | -0.10 | 0.50 | NA | 0.00 | -2.20 | 1.18 | 1.20 | 1.27 | 0.82 | 0.12 | NA | 0.05 | 0.26 | 0.00 | 0.00 | 2.98 | 0.20 | 0.47 | 0.91 | 0.00 | 0.00 | 0.00 | 0.00 | NA | NA | NA | NA | |
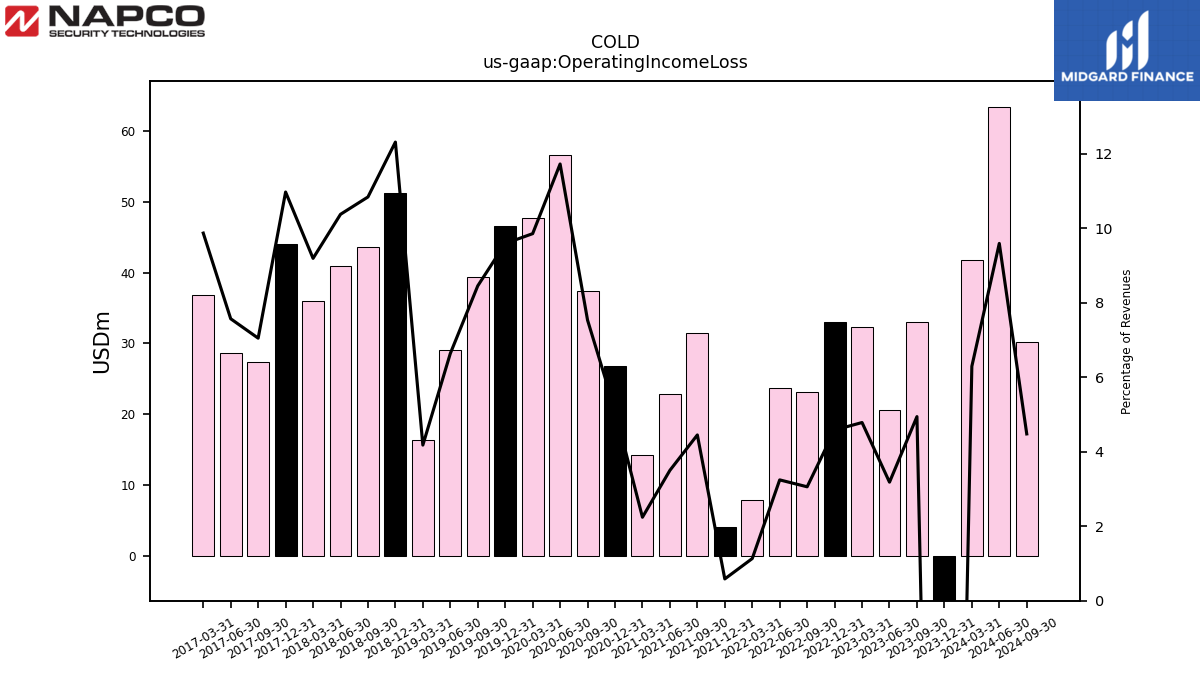
| Operating Income Loss | -194.32 | 33.00 | 20.67 | 32.35 | 33.04 | 23.17 | 23.66 | 7.99 | 4.20 | 31.54 | 22.91 | 14.23 | 26.77 | 37.46 | 56.55 | 47.68 | 46.58 | 39.38 | 29.09 | 16.42 | 51.17 | 43.55 | 40.92 | 35.93 | 44.05 | 27.44 | 28.71 | 36.79 | |
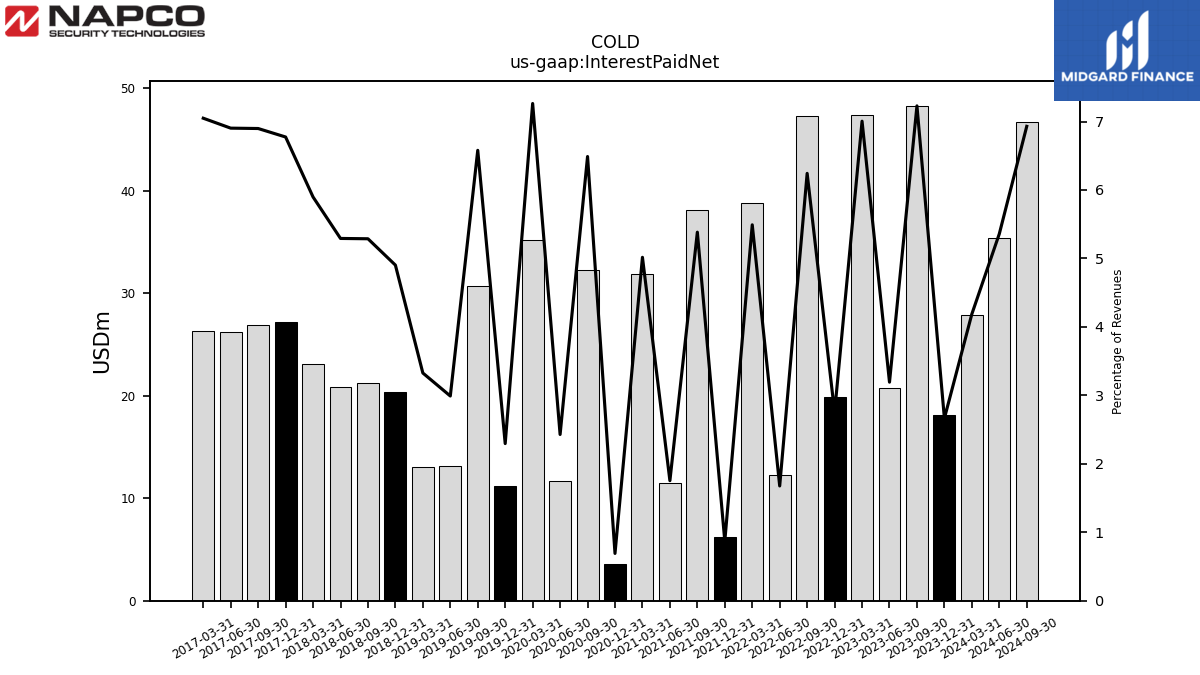
| Interest Paid Net | 18.10 | 48.28 | 20.74 | 47.39 | 19.87 | 47.30 | 12.24 | 38.75 | 6.23 | 38.16 | 11.48 | 31.84 | 3.62 | 32.28 | 11.72 | 35.16 | 11.16 | 30.67 | 13.11 | 13.08 | 20.39 | 21.26 | 20.89 | 23.07 | 27.21 | 26.87 | 26.19 | 26.28 | |
| Disposal Group Not Discontinued Operation Gain Loss On Disposal | 0.00 | -0.62 | NA | NA | NA | NA | NA | NA | NA | NA | NA | NA | NA | NA | NA | NA | NA | NA | NA | NA | NA | NA | NA | NA | NA | NA | NA | NA | |
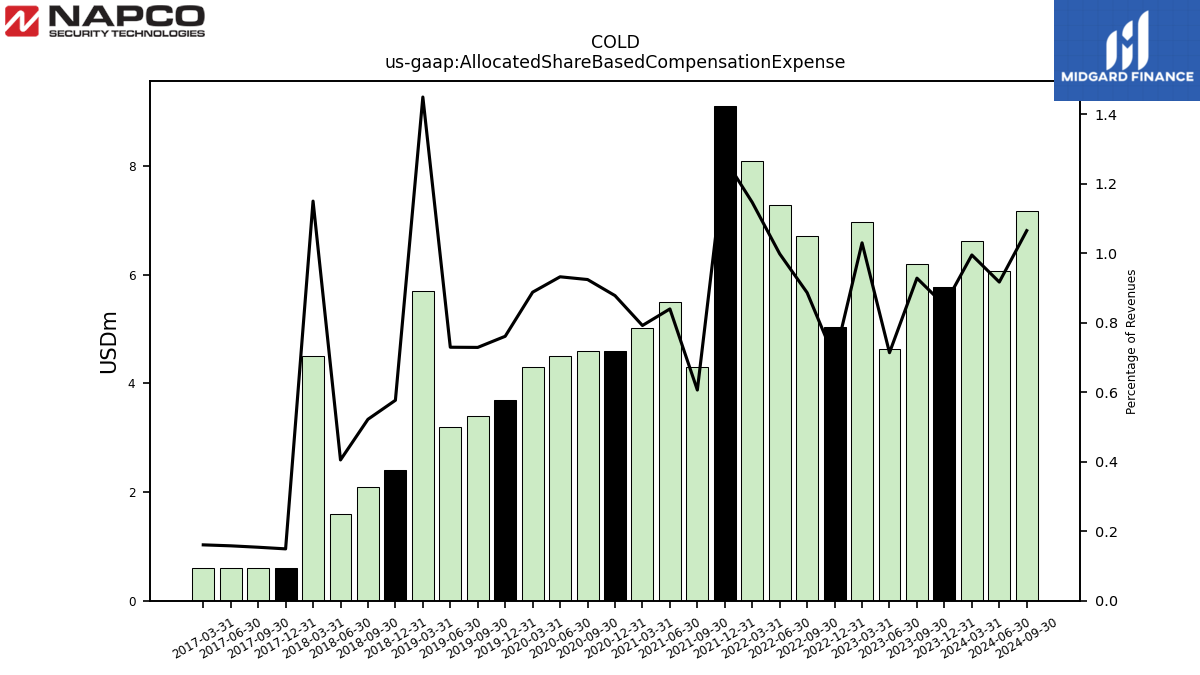
| Allocated Share Based Compensation Expense | 5.78 | 6.20 | 4.64 | 6.97 | 5.04 | 6.72 | 7.29 | 8.09 | 9.11 | 4.30 | 5.50 | 5.03 | 4.60 | 4.60 | 4.50 | 4.30 | 3.70 | 3.40 | 3.20 | 5.70 | 2.40 | 2.10 | 1.60 | 4.50 | 0.60 | 0.60 | 0.60 | 0.60 | |
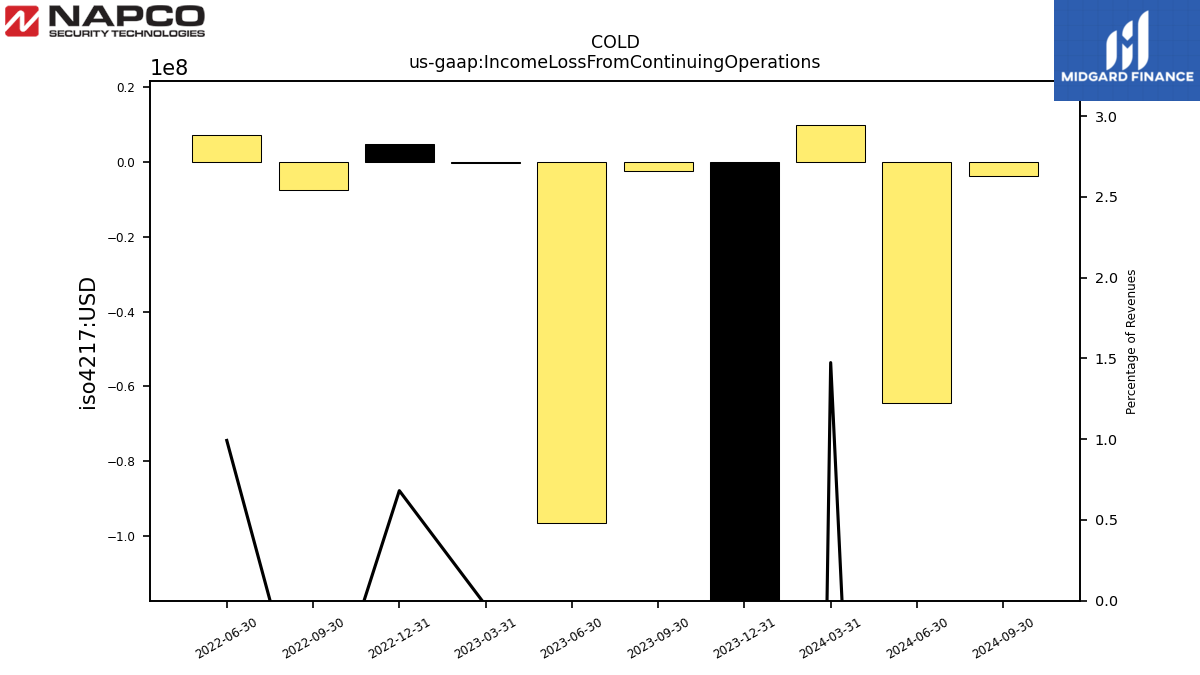
| Income Loss From Continuing Operations | -226.80 | -2.30 | -96.53 | NA | 4.92 | -7.45 | 7.24 | NA | NA | NA | NA | NA | NA | NA | NA | NA | NA | NA | NA | NA | NA | NA | NA | NA | NA | NA | NA | NA | |
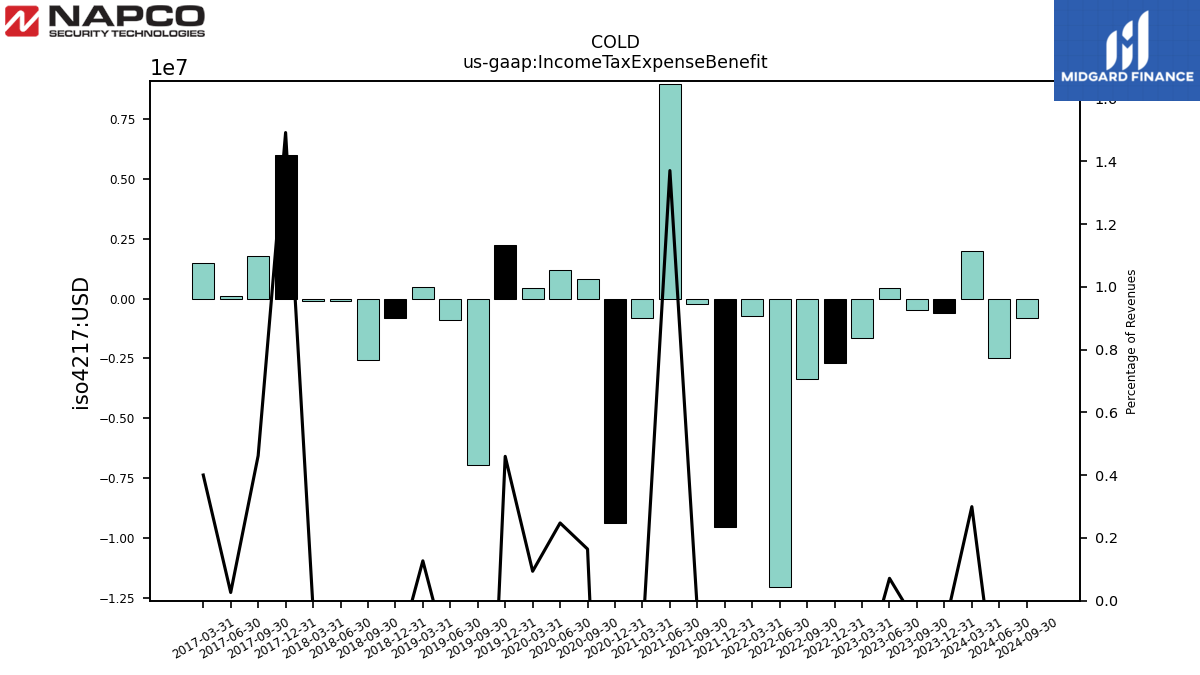
| Income Tax Expense Benefit | -0.60 | -0.49 | 0.46 | -1.64 | -2.69 | -3.37 | -12.07 | -0.71 | -9.53 | -0.23 | 8.97 | -0.79 | -9.40 | 0.82 | 1.20 | 0.46 | 2.24 | -6.97 | -0.91 | 0.50 | -0.82 | -2.55 | -0.10 | -0.10 | 5.99 | 1.80 | 0.10 | 1.49 | |
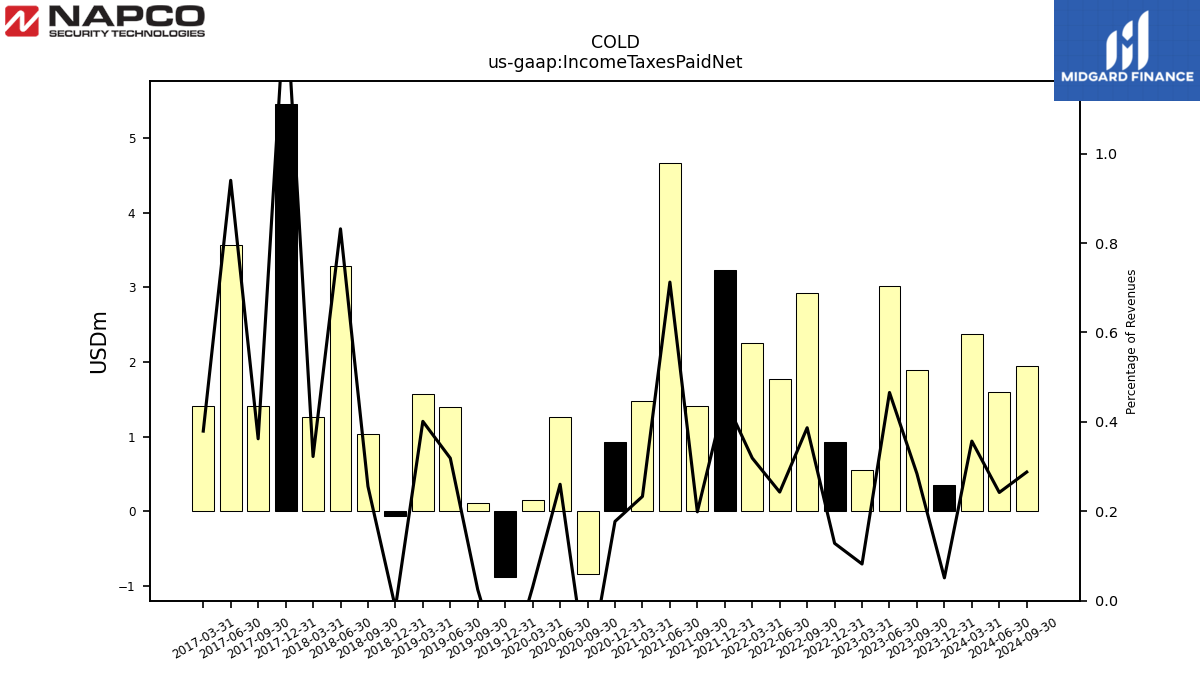
| Income Taxes Paid Net | 0.35 | 1.90 | 3.03 | 0.56 | 0.93 | 2.93 | 1.77 | 2.25 | 3.23 | 1.41 | 4.67 | 1.48 | 0.93 | -0.85 | 1.26 | 0.15 | -0.88 | 0.12 | 1.40 | 1.58 | -0.07 | 1.03 | 3.28 | 1.26 | 5.46 | 1.41 | 3.57 | 1.42 | |
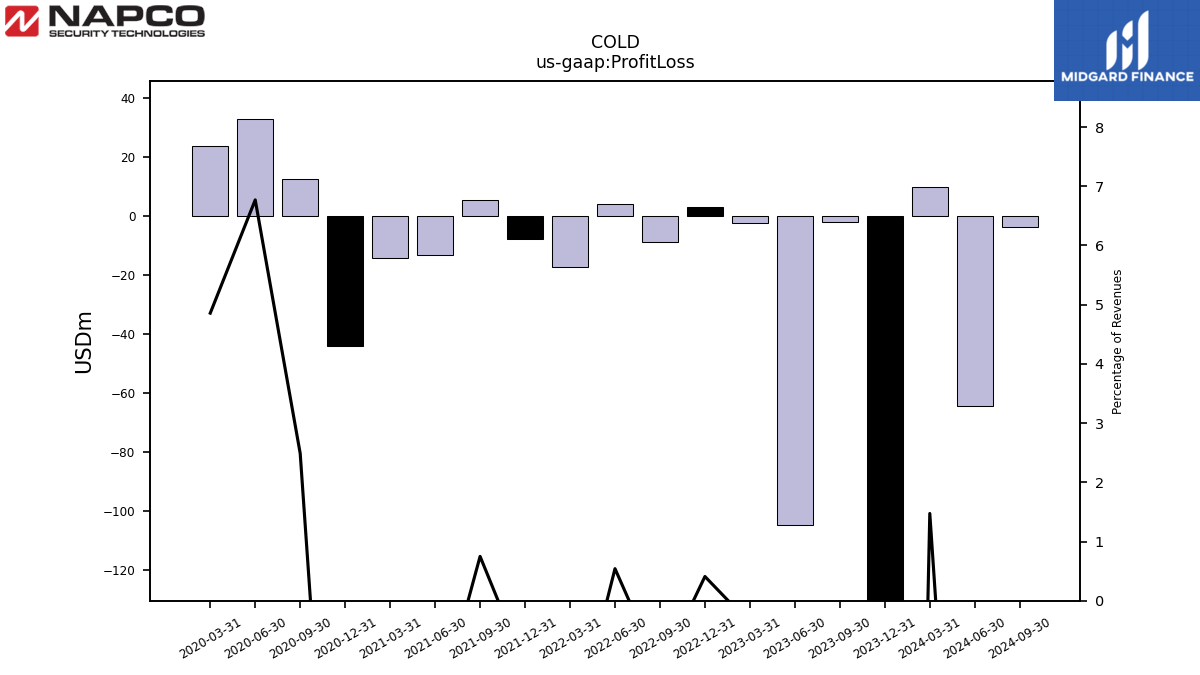
| Profit Loss | -226.80 | -2.10 | -104.80 | -2.57 | 2.96 | -8.94 | 3.95 | -17.45 | -7.98 | 5.31 | -13.40 | -14.24 | -43.99 | 12.37 | 32.66 | 23.51 | NA | NA | NA | NA | NA | NA | NA | NA | NA | NA | NA | NA | |
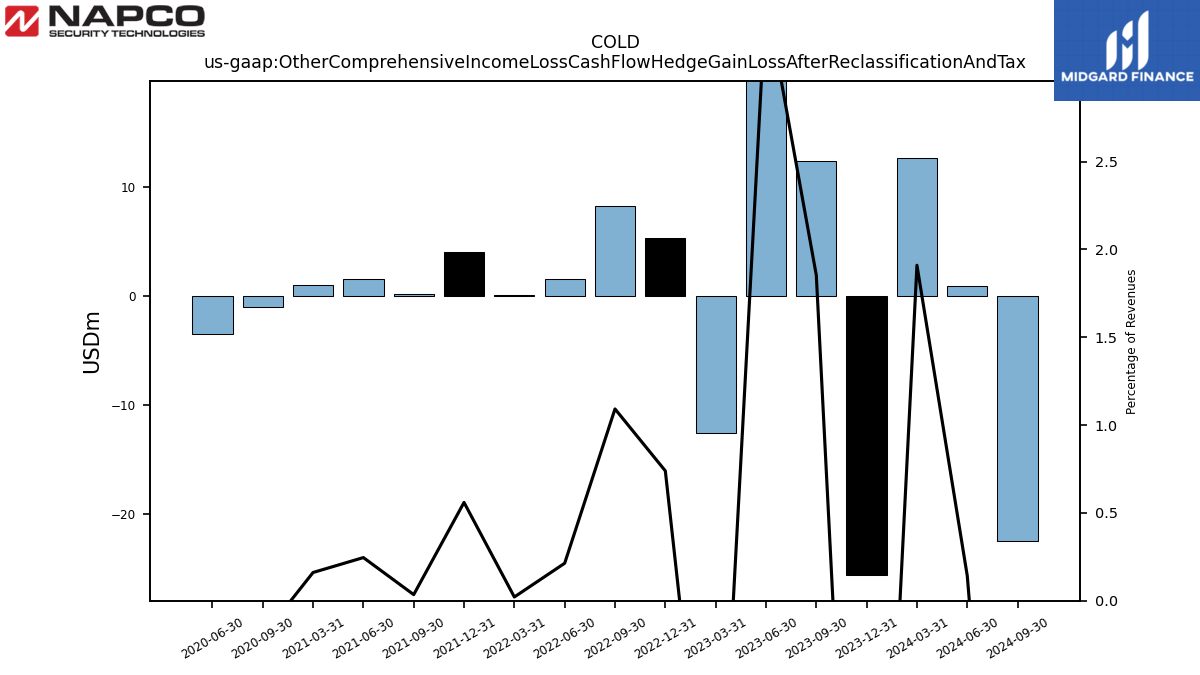
| Other Comprehensive Income Loss Cash Flow Hedge Gain Loss After Reclassification And Tax | -25.53 | 12.38 | NA | NA | 5.33 | 8.27 | 1.56 | 0.15 | 4.01 | 0.25 | 1.61 | 1.02 | NA | -1.00 | -3.49 | NA | NA | NA | NA | NA | NA | NA | NA | NA | NA | NA | NA | NA | |
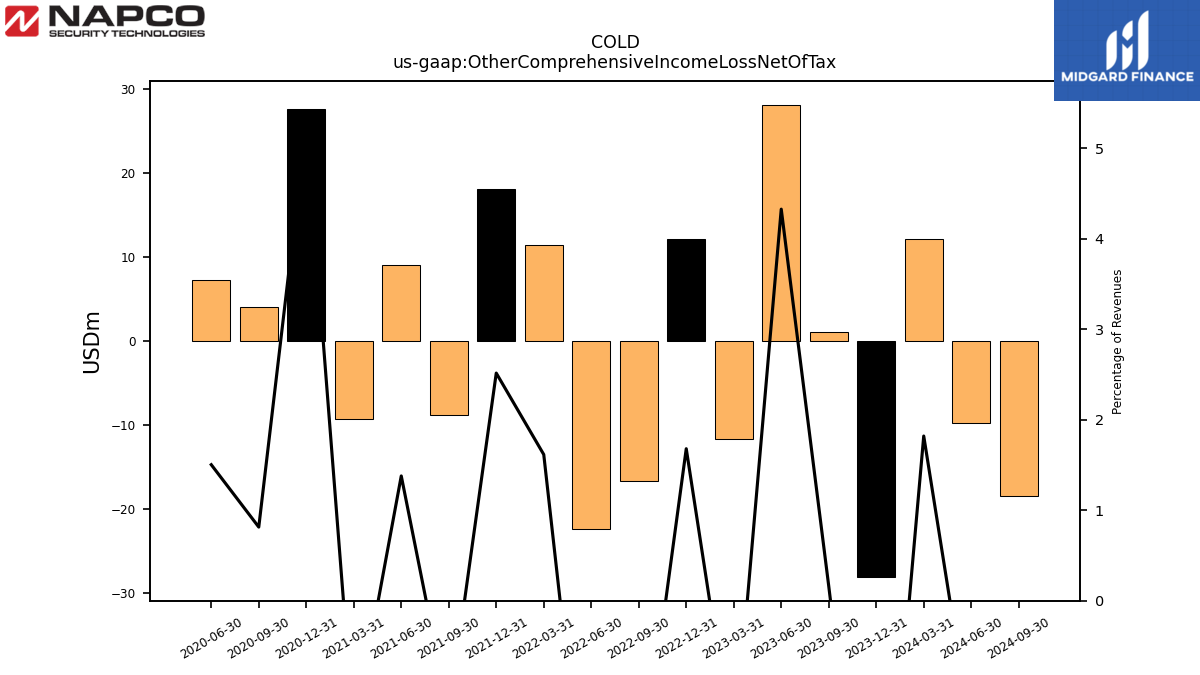
| Other Comprehensive Income Loss Net Of Tax | -28.10 | 1.08 | NA | NA | 12.12 | -16.70 | -22.42 | 11.40 | 18.03 | -8.85 | 9.03 | -9.28 | 27.62 | 4.05 | 7.25 | NA | NA | NA | NA | NA | NA | NA | NA | NA | NA | NA | NA | NA | |
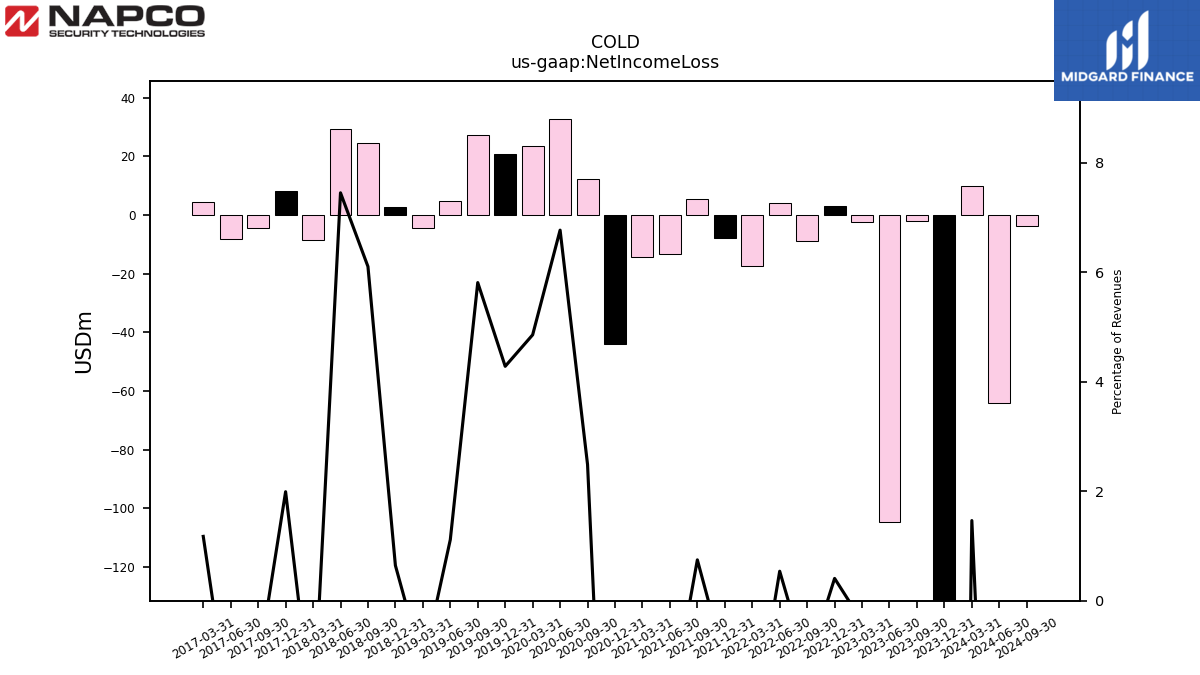
| Net Income Loss | -226.84 | -2.09 | -104.72 | -2.56 | 2.94 | -8.91 | 3.94 | -17.41 | -7.96 | 5.29 | -13.37 | -14.41 | -44.01 | 12.37 | 32.66 | 23.51 | 20.81 | 27.09 | 4.89 | -4.63 | 2.68 | 24.54 | 29.41 | -8.64 | 8.00 | -4.61 | -8.38 | 4.38 | |
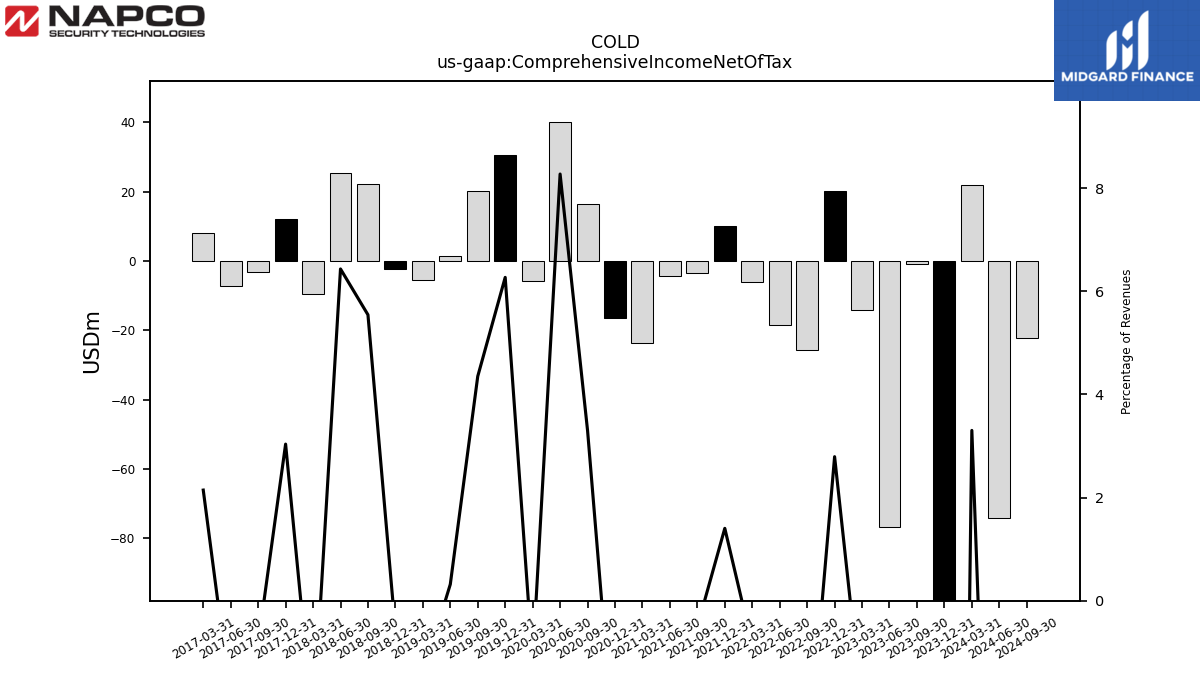
| Comprehensive Income Net Of Tax | -254.97 | -0.91 | -76.58 | -14.29 | 20.15 | -25.69 | -18.54 | -6.02 | 10.06 | -3.56 | -4.35 | -23.53 | -16.38 | 16.43 | 39.92 | -5.66 | 30.47 | 20.29 | 1.40 | -5.60 | -2.39 | 22.29 | 25.39 | -9.58 | 12.20 | -3.21 | -7.29 | 8.00 |
| 2023-12-31 | 2023-09-30 | 2023-06-30 | 2023-03-31 | 2022-12-31 | 2022-09-30 | 2022-06-30 | 2022-03-31 | 2021-12-31 | 2021-09-30 | 2021-06-30 | 2021-03-31 | 2020-12-31 | 2020-09-30 | 2020-06-30 | 2020-03-31 | 2019-12-31 | 2019-09-30 | 2019-06-30 | 2019-03-31 | 2018-12-31 | 2018-09-30 | 2018-06-30 | 2018-03-31 | 2017-12-31 | 2017-09-30 | 2017-06-30 | 2017-03-31 | ||
|---|---|---|---|---|---|---|---|---|---|---|---|---|---|---|---|---|---|---|---|---|---|---|---|---|---|---|---|---|---|
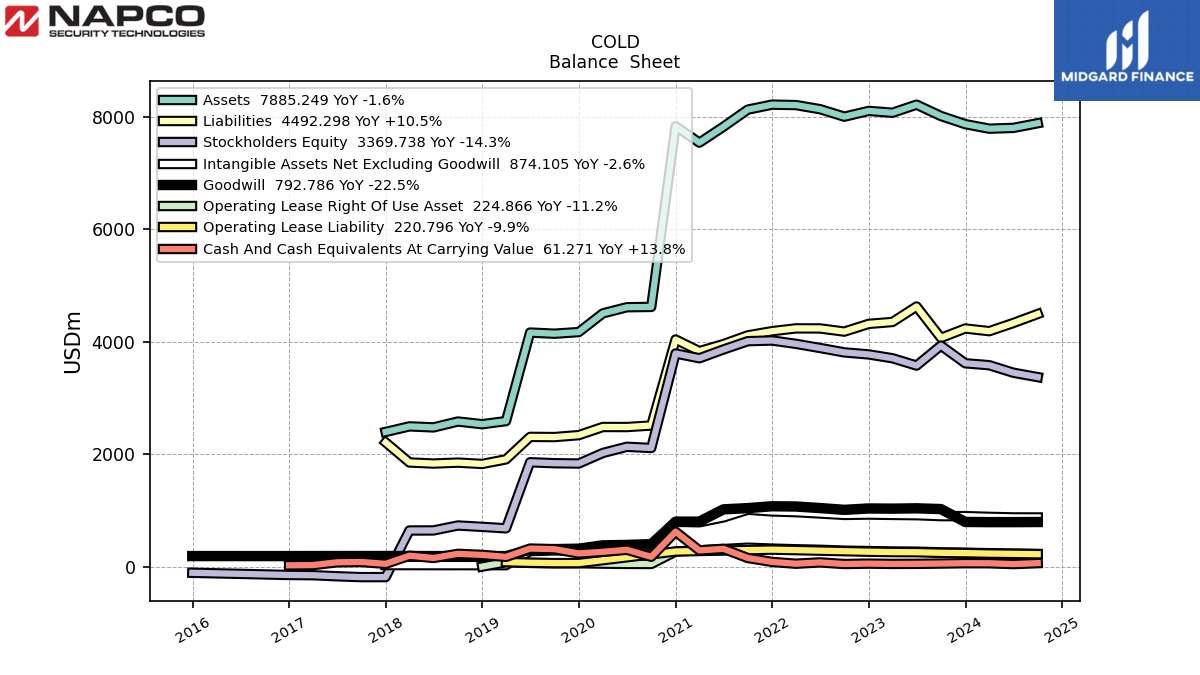
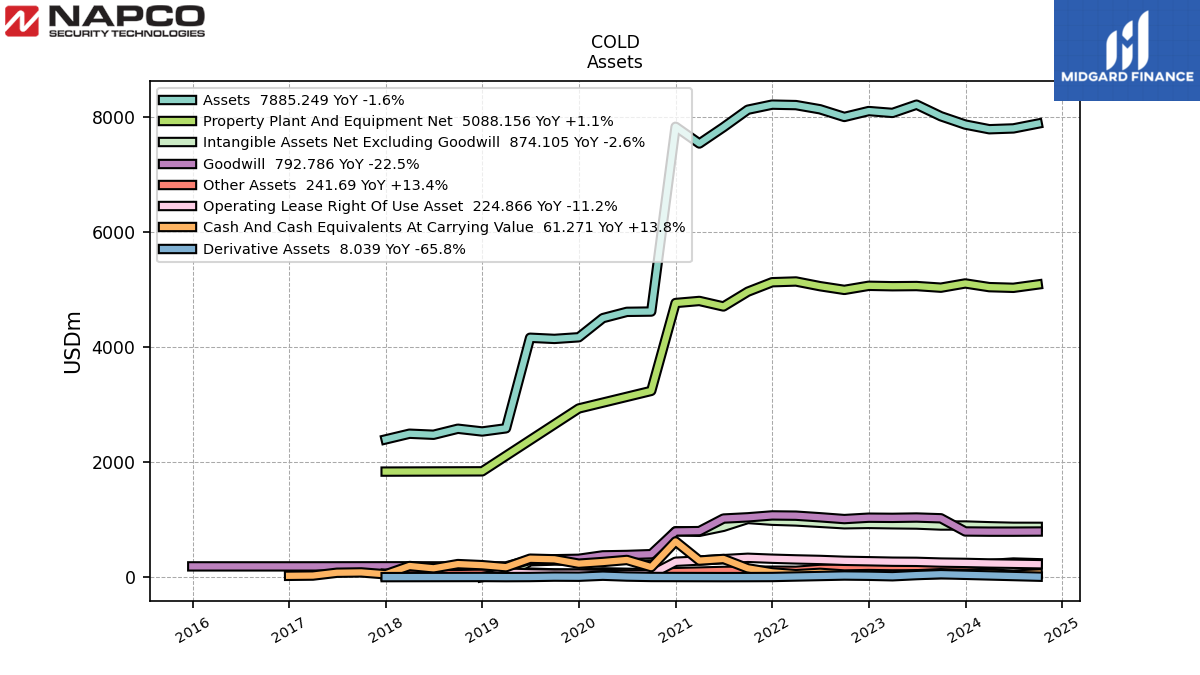
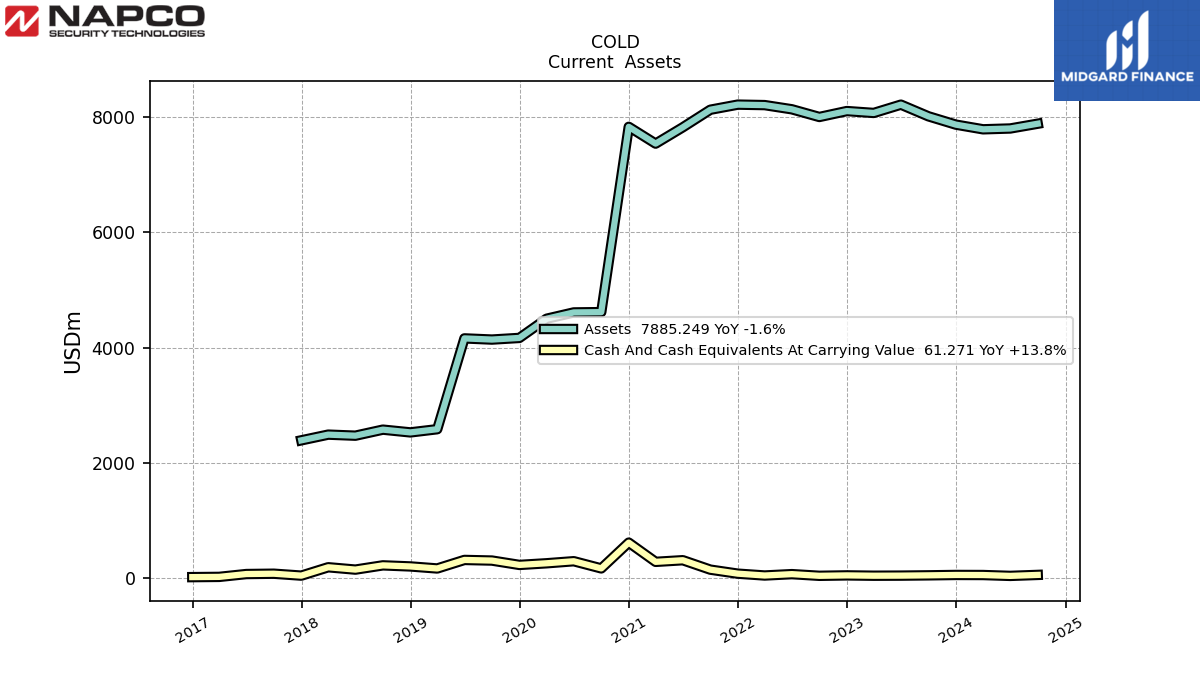
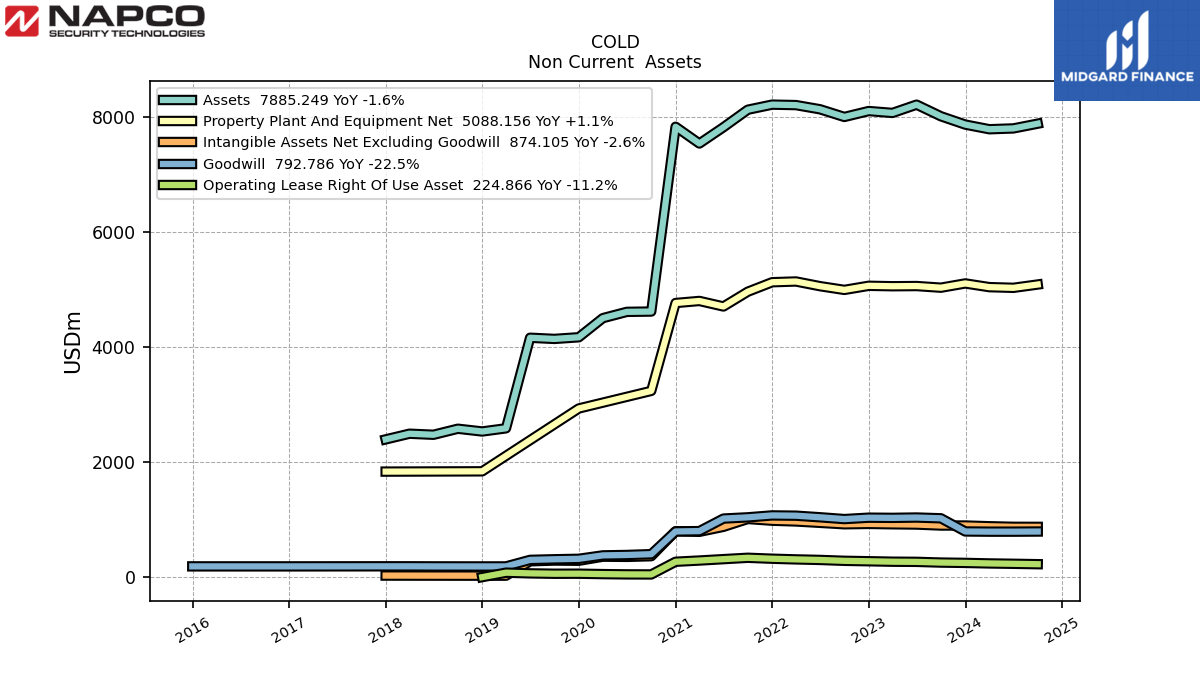
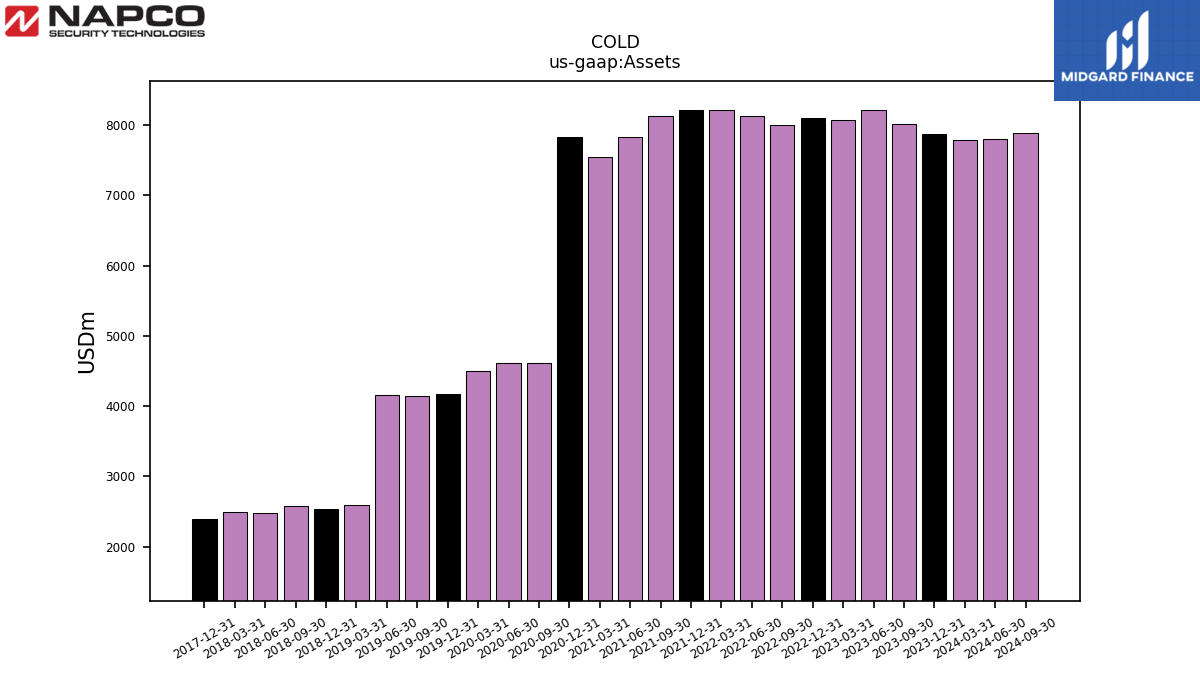
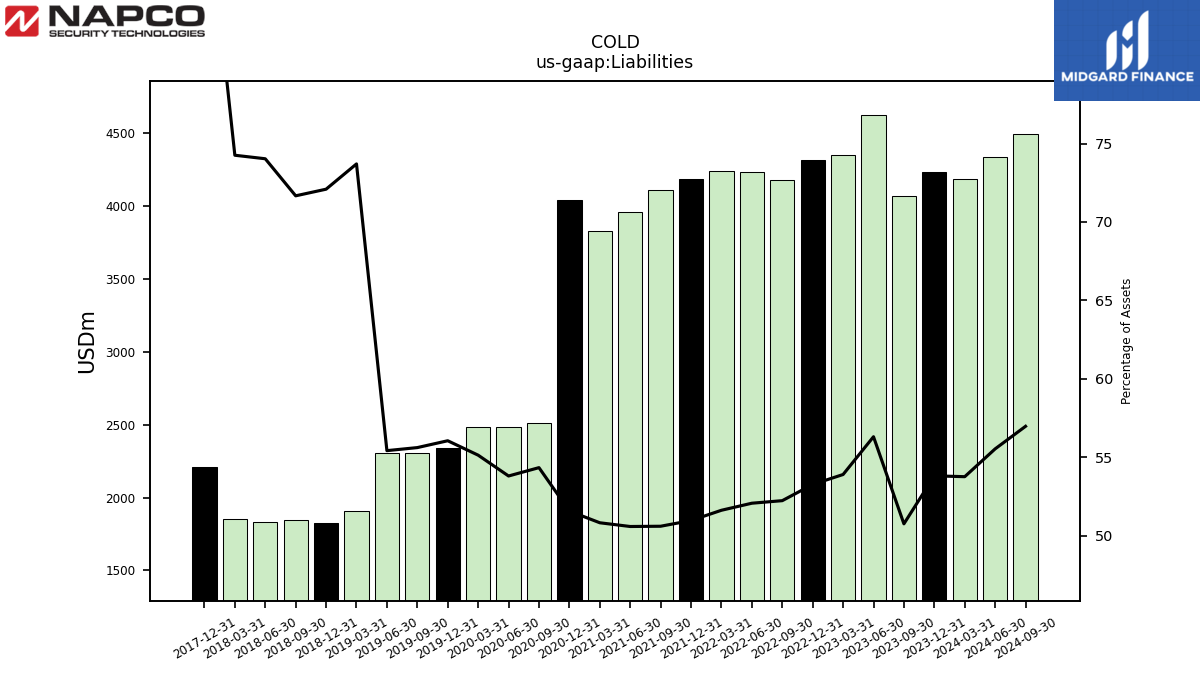
| Assets | 7869.25 | 8013.72 | 8215.76 | 8071.72 | 8104.56 | 8001.90 | 8135.33 | 8207.87 | 8216.20 | 8127.55 | 7823.32 | 7540.01 | 7831.15 | 4618.11 | 4612.78 | 4503.39 | 4170.68 | 4142.19 | 4162.46 | 2587.73 | 2532.43 | 2580.23 | 2475.47 | 2493.76 | 2394.90 | NA | NA | NA | |
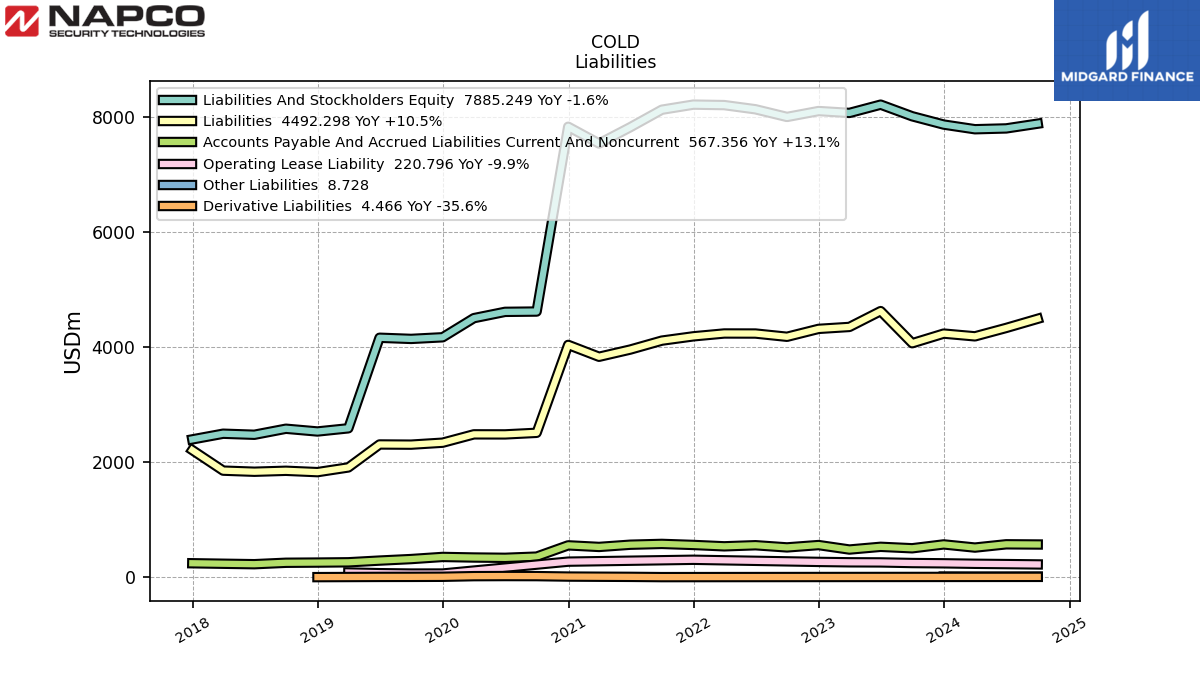
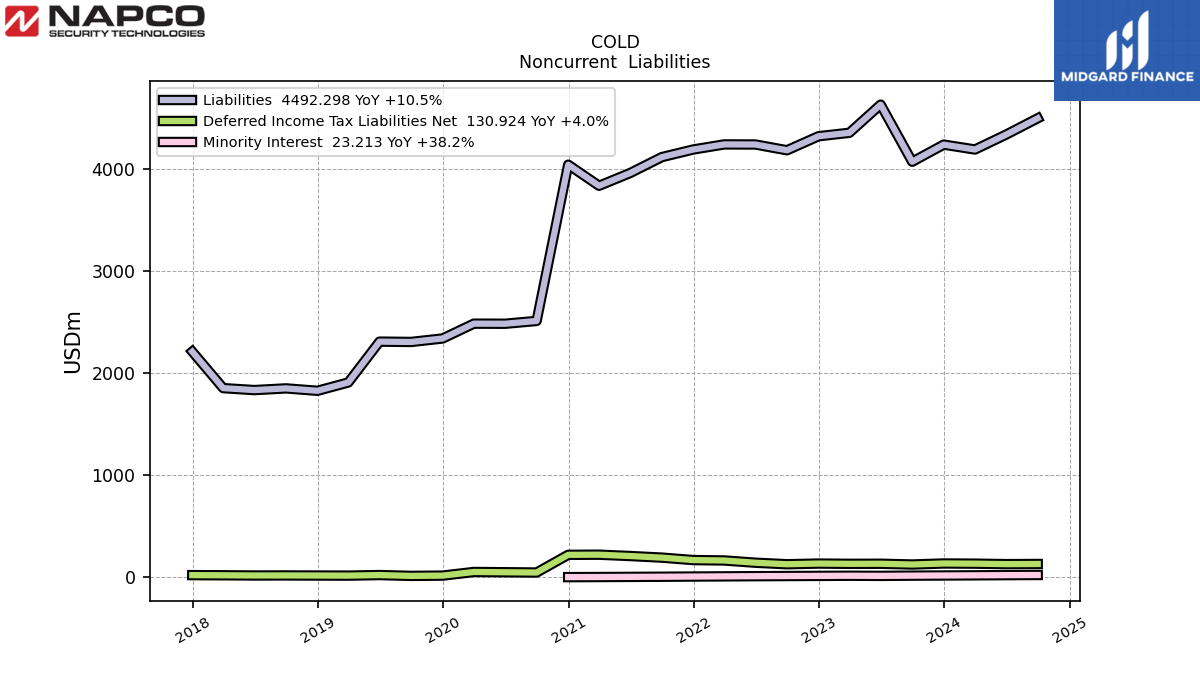
| Liabilities | 4234.66 | 4067.07 | 4626.00 | 4350.44 | 4316.68 | 4179.31 | 4235.75 | 4236.63 | 4187.12 | 4112.37 | 3957.14 | 3831.80 | 4038.33 | 2509.23 | 2481.77 | 2482.72 | 2337.66 | 2303.61 | 2306.80 | 1907.25 | 1825.67 | 1849.23 | 1832.66 | 1851.77 | 2209.03 | NA | NA | NA | |
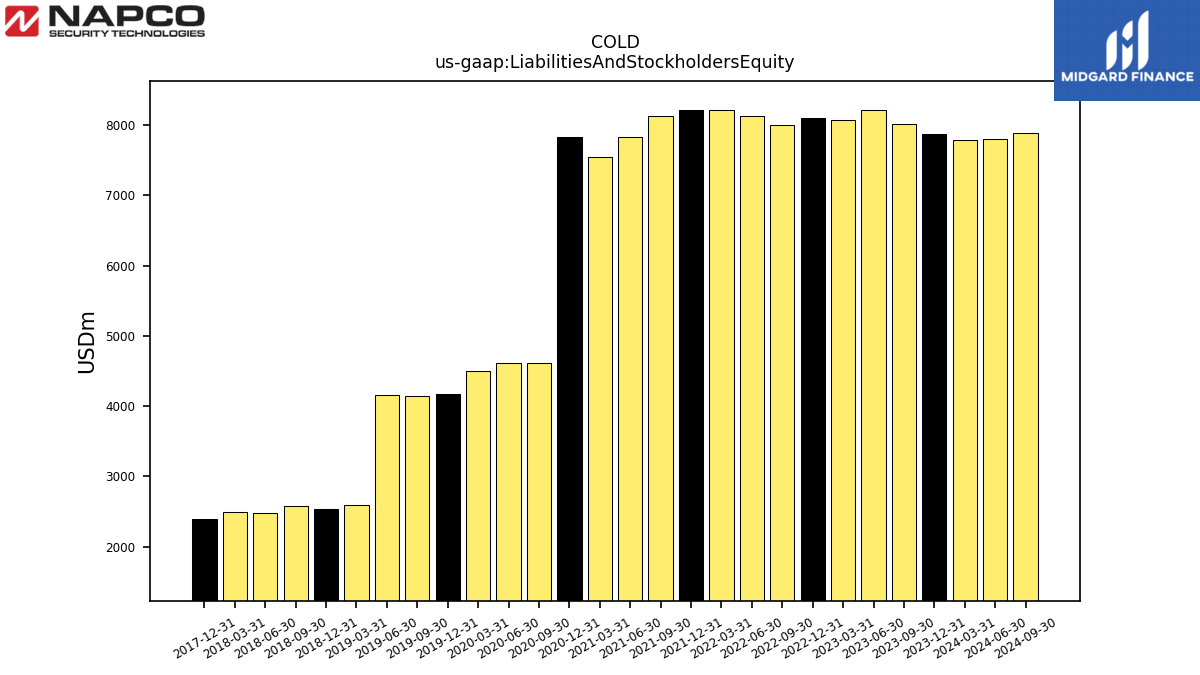
| Liabilities And Stockholders Equity | 7869.25 | 8013.72 | 8215.76 | 8071.72 | 8104.56 | 8001.90 | 8135.33 | 8207.87 | 8216.20 | 8127.55 | 7823.32 | 7540.01 | 7831.15 | 4618.11 | 4612.78 | 4503.39 | 4170.68 | 4142.19 | 4162.46 | 2587.73 | 2532.43 | 2580.23 | 2475.47 | 2493.76 | 2394.90 | NA | NA | NA | |
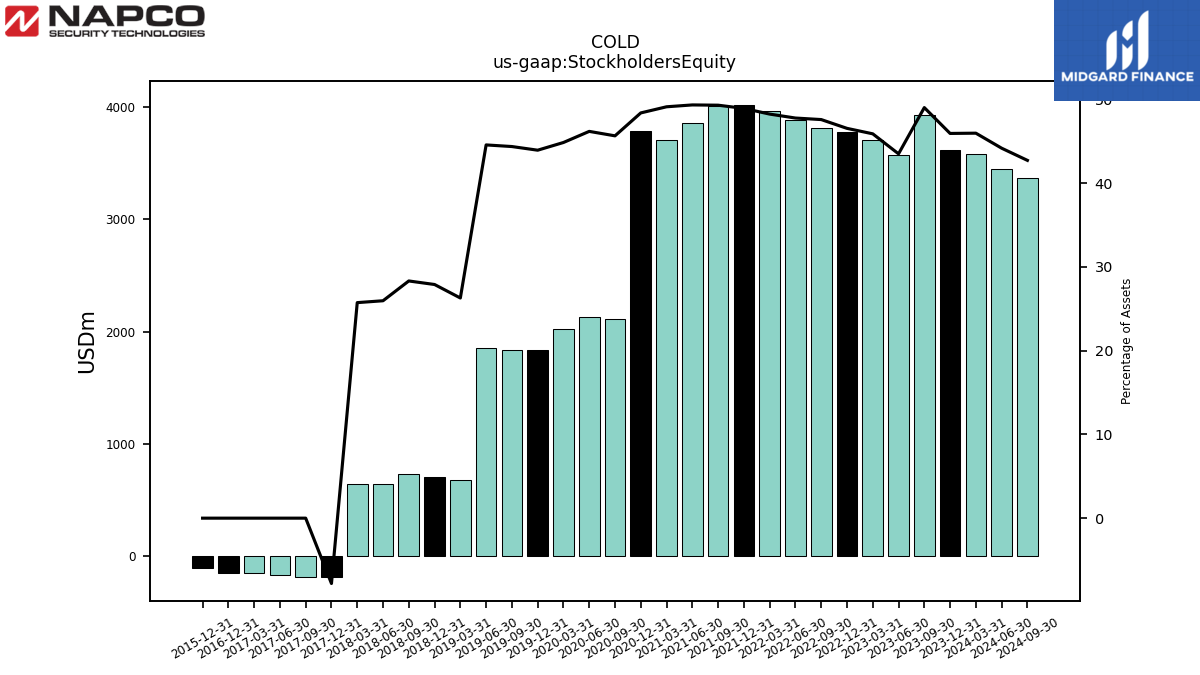
| Stockholders Equity | 3616.13 | 3929.86 | 3575.10 | 3705.41 | 3773.42 | 3809.61 | 3887.99 | 3961.38 | 4021.01 | 4009.03 | 3861.39 | 3704.83 | 3790.44 | 2108.87 | 2131.01 | 2020.68 | 1833.02 | 1838.58 | 1855.66 | 680.48 | 706.75 | 731.00 | 642.82 | 641.99 | -186.92 | -187.34 | -172.34 | -153.25 |
| 2023-12-31 | 2023-09-30 | 2023-06-30 | 2023-03-31 | 2022-12-31 | 2022-09-30 | 2022-06-30 | 2022-03-31 | 2021-12-31 | 2021-09-30 | 2021-06-30 | 2021-03-31 | 2020-12-31 | 2020-09-30 | 2020-06-30 | 2020-03-31 | 2019-12-31 | 2019-09-30 | 2019-06-30 | 2019-03-31 | 2018-12-31 | 2018-09-30 | 2018-06-30 | 2018-03-31 | 2017-12-31 | 2017-09-30 | 2017-06-30 | 2017-03-31 | ||
|---|---|---|---|---|---|---|---|---|---|---|---|---|---|---|---|---|---|---|---|---|---|---|---|---|---|---|---|---|---|
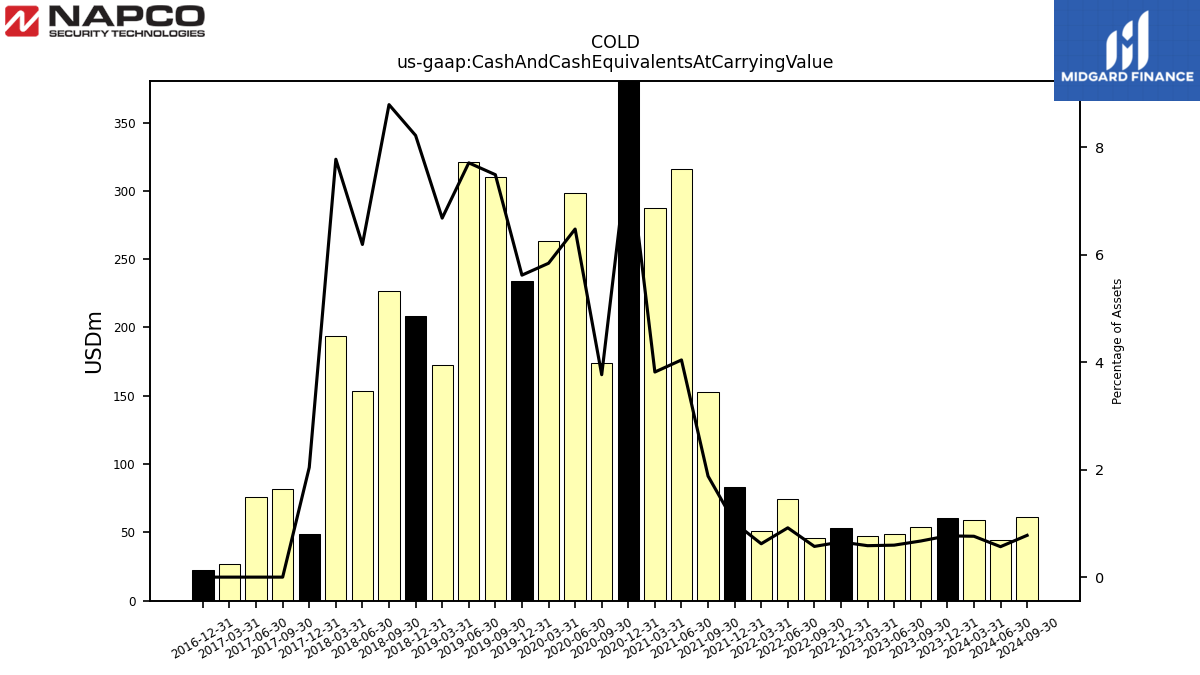
| Cash And Cash Equivalents At Carrying Value | 60.39 | 53.83 | 48.87 | 47.22 | 53.06 | 45.69 | 74.62 | 50.97 | 82.96 | 152.77 | 316.08 | 287.69 | 621.05 | 173.91 | 298.71 | 262.95 | 234.30 | 310.12 | 320.81 | 172.84 | 208.08 | 226.81 | 153.20 | 193.87 | 48.87 | 82.04 | 76.29 | 26.95 | |
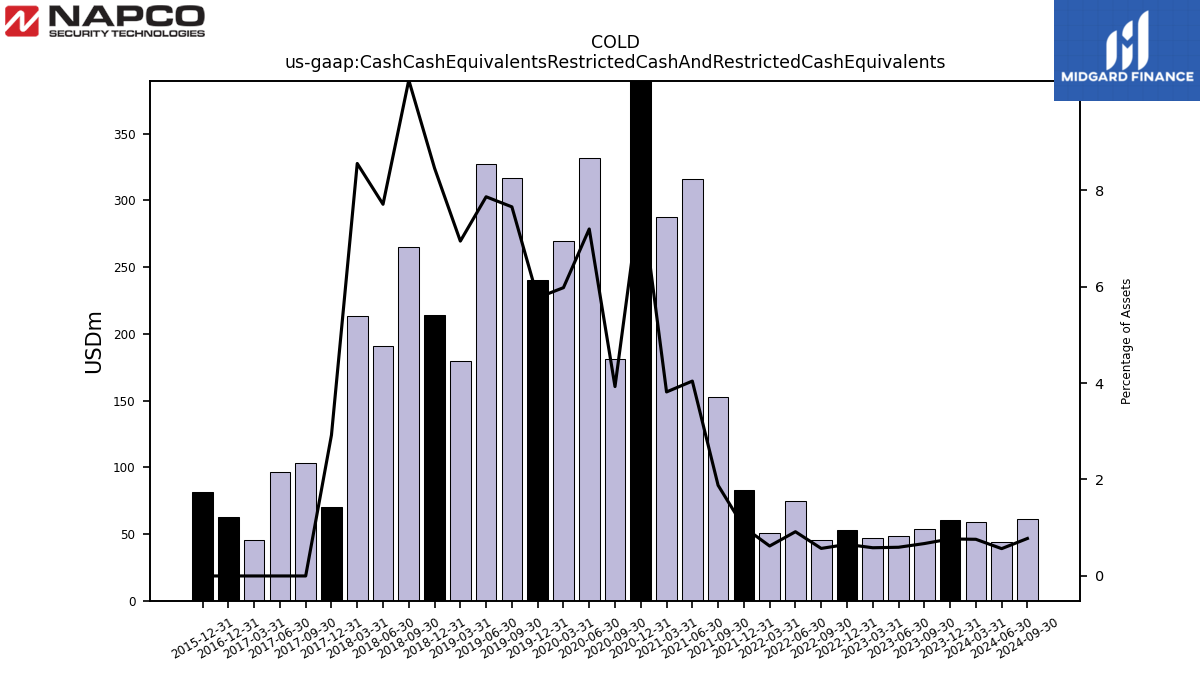
| Cash Cash Equivalents Restricted Cash And Restricted Cash Equivalents | 60.39 | 53.83 | 48.87 | 47.22 | 53.06 | 45.69 | 74.62 | 50.97 | 82.96 | 152.77 | 316.08 | 287.69 | 621.05 | 181.35 | 331.84 | 269.18 | 240.61 | 316.99 | 327.25 | 179.65 | 214.10 | 265.25 | 190.78 | 213.26 | 69.96 | 103.53 | 96.76 | 45.78 | |
| Inventory Net | 30.72 | NA | NA | NA | 29.30 | NA | NA | NA | 27.04 | NA | NA | NA | 21.51 | NA | NA | NA | 9.37 | NA | NA | NA | 7.88 | NA | NA | NA | 10.40 | NA | NA | NA |
| 2023-12-31 | 2023-09-30 | 2023-06-30 | 2023-03-31 | 2022-12-31 | 2022-09-30 | 2022-06-30 | 2022-03-31 | 2021-12-31 | 2021-09-30 | 2021-06-30 | 2021-03-31 | 2020-12-31 | 2020-09-30 | 2020-06-30 | 2020-03-31 | 2019-12-31 | 2019-09-30 | 2019-06-30 | 2019-03-31 | 2018-12-31 | 2018-09-30 | 2018-06-30 | 2018-03-31 | 2017-12-31 | 2017-09-30 | 2017-06-30 | 2017-03-31 | ||
|---|---|---|---|---|---|---|---|---|---|---|---|---|---|---|---|---|---|---|---|---|---|---|---|---|---|---|---|---|---|
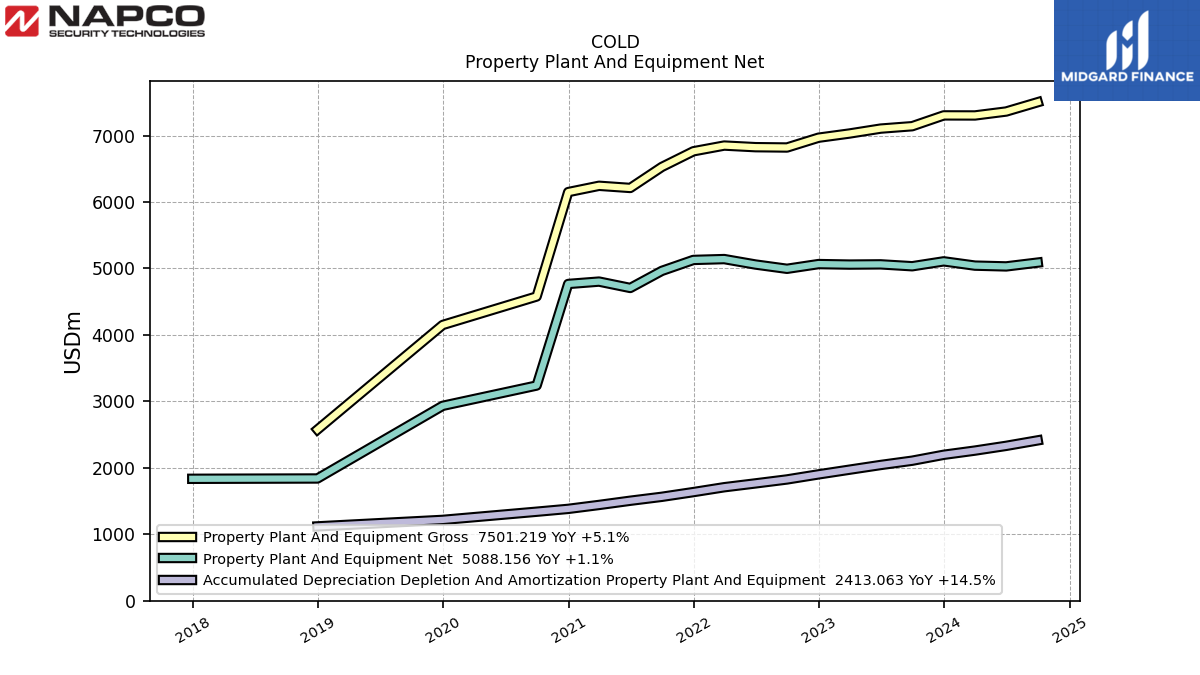
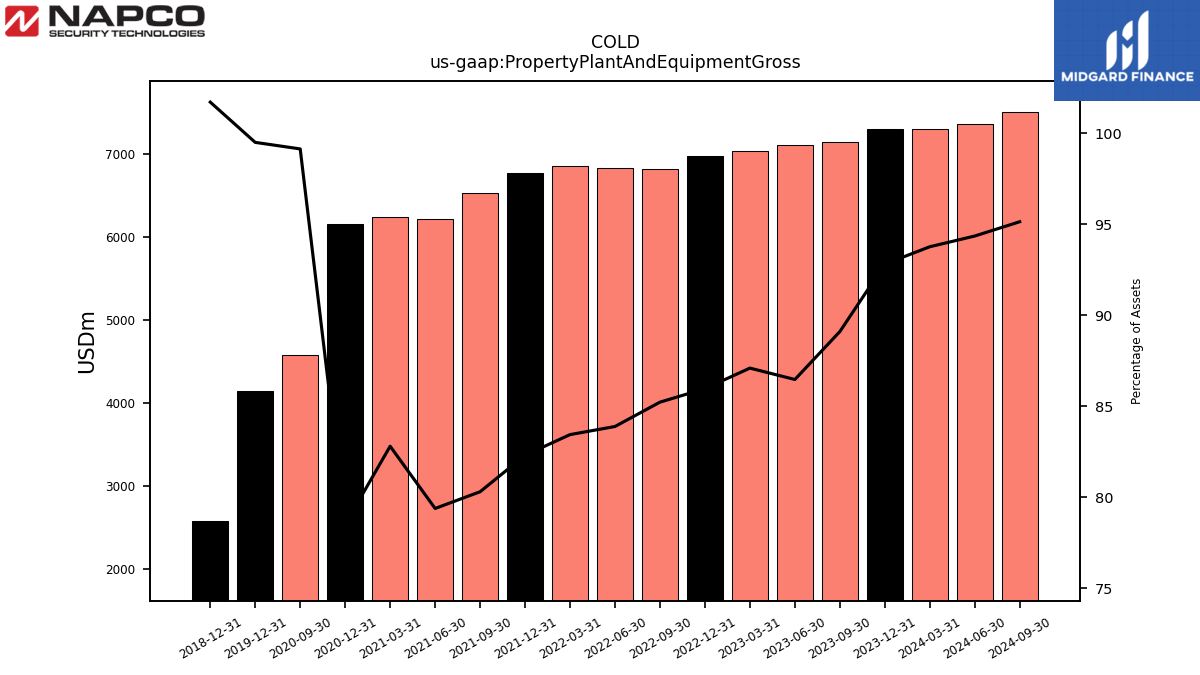
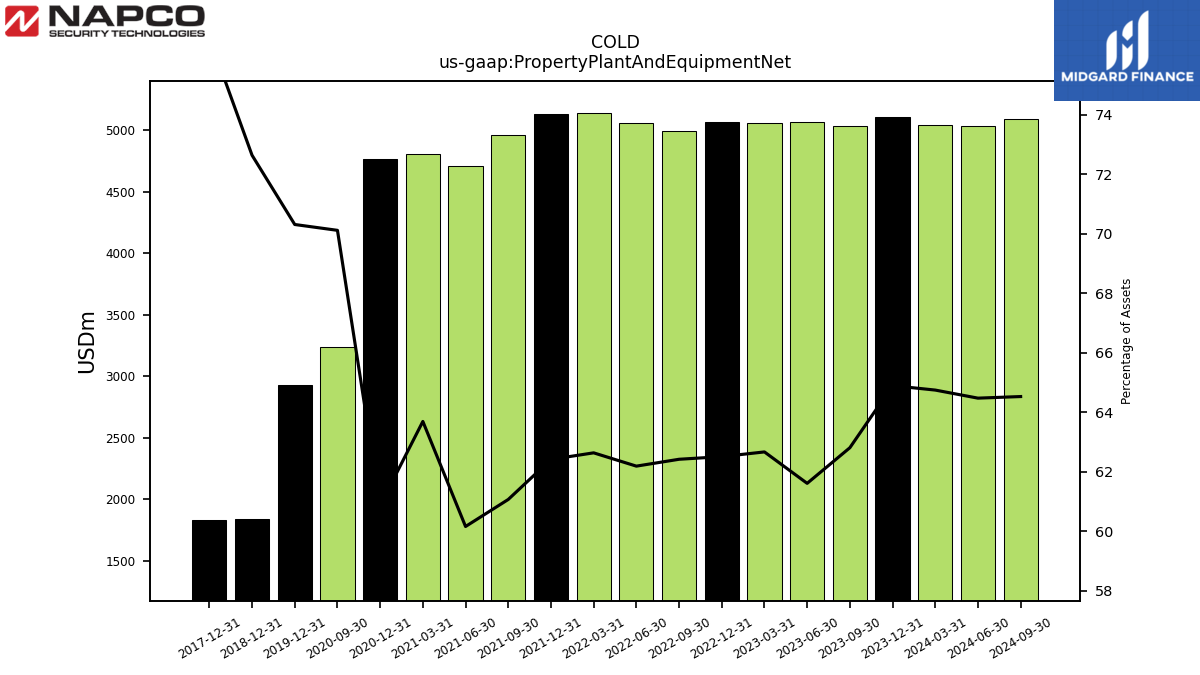
| Property Plant And Equipment Gross | 7302.93 | 7140.17 | 7104.08 | 7030.00 | 6967.27 | 6819.68 | 6824.68 | 6848.93 | 6762.81 | 6526.98 | 6210.91 | 6243.57 | 6148.81 | 4577.76 | NA | NA | 4149.21 | NA | NA | NA | 2575.37 | NA | NA | NA | NA | NA | NA | NA | |
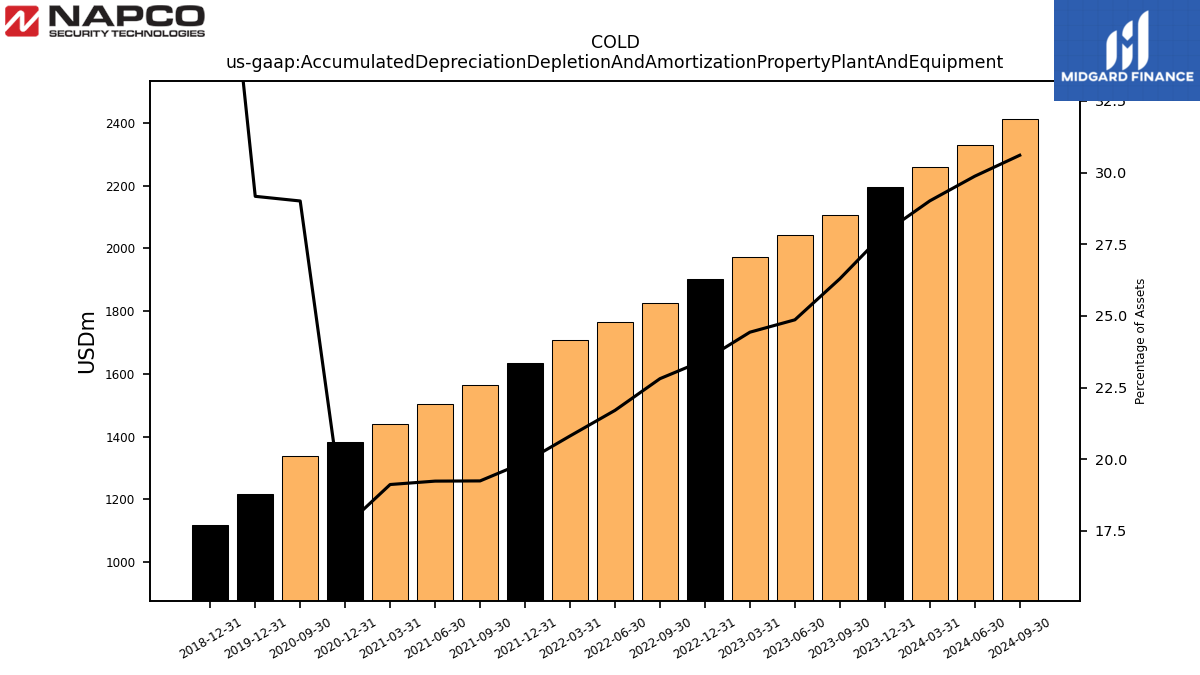
| Accumulated Depreciation Depletion And Amortization Property Plant And Equipment | 2196.20 | 2107.13 | 2042.57 | 1971.90 | 1901.45 | 1825.11 | 1765.61 | 1708.03 | 1634.91 | 1563.87 | 1504.76 | 1441.34 | 1382.30 | 1339.56 | NA | NA | 1216.55 | NA | NA | NA | 1118.94 | NA | NA | NA | NA | NA | NA | NA | |
| Property Plant And Equipment Net | 5106.74 | 5033.04 | 5061.51 | 5058.10 | 5065.82 | 4994.57 | 5059.07 | 5140.90 | 5127.90 | 4963.11 | 4706.15 | 4802.24 | 4766.51 | 3238.20 | NA | NA | 2932.66 | NA | NA | NA | 1839.70 | NA | NA | NA | 1834.88 | NA | NA | NA | |
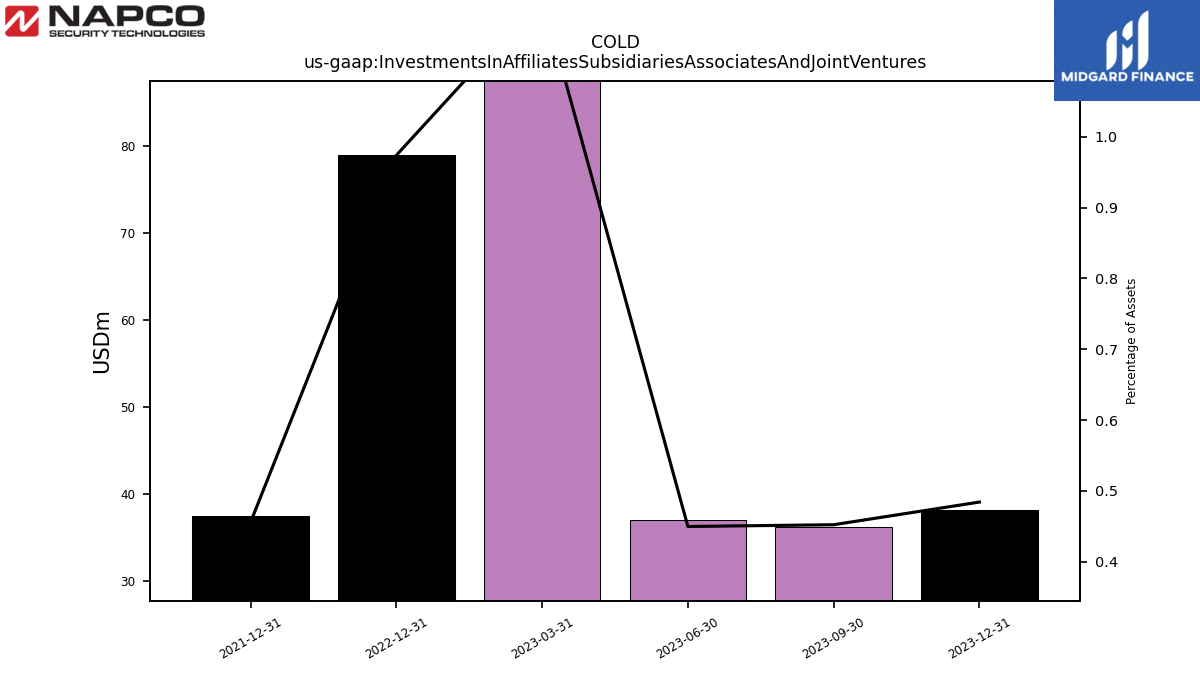
| Investments In Affiliates Subsidiaries Associates And Joint Ventures | 38.11 | 36.25 | 36.96 | 96.72 | 78.93 | NA | NA | NA | 37.46 | NA | NA | NA | NA | NA | NA | NA | NA | NA | NA | NA | NA | NA | NA | NA | NA | NA | NA | NA | |
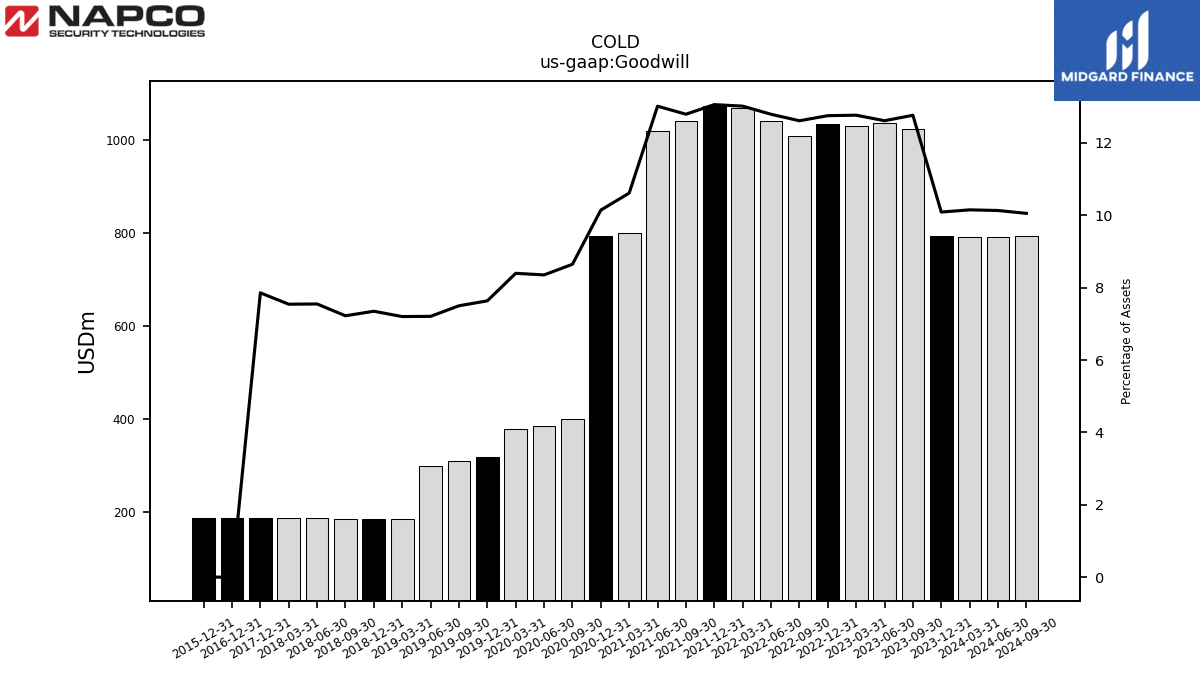
| Goodwill | 794.00 | 1022.99 | 1036.33 | 1030.56 | 1033.64 | 1009.33 | 1040.75 | 1068.48 | 1072.98 | 1039.85 | 1018.29 | 800.36 | 794.34 | 399.30 | 385.29 | 378.15 | 318.48 | 310.64 | 300.01 | 186.36 | 186.09 | 186.38 | 186.89 | 188.10 | 188.17 | NA | NA | NA | |
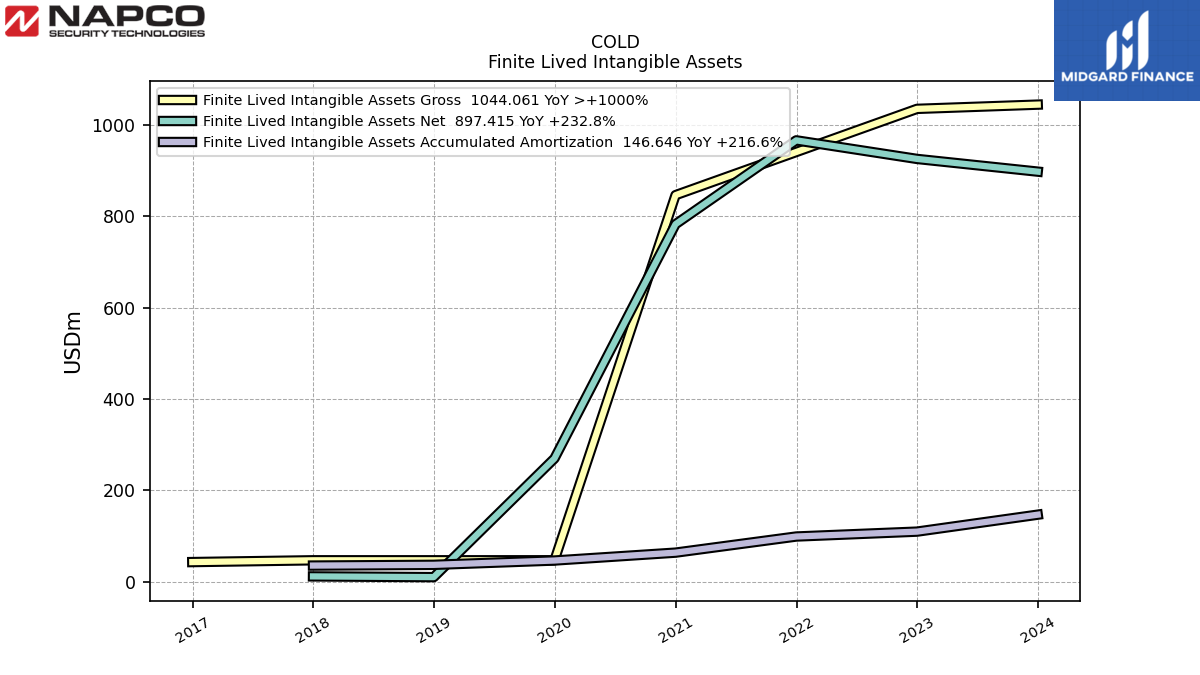
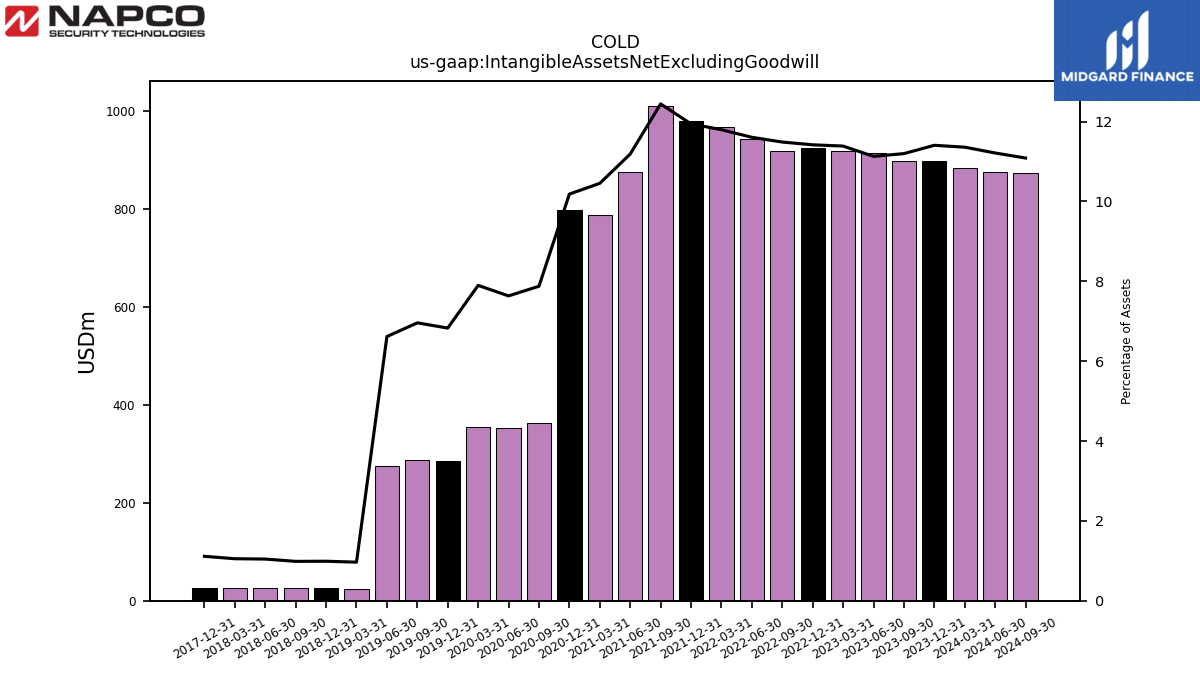
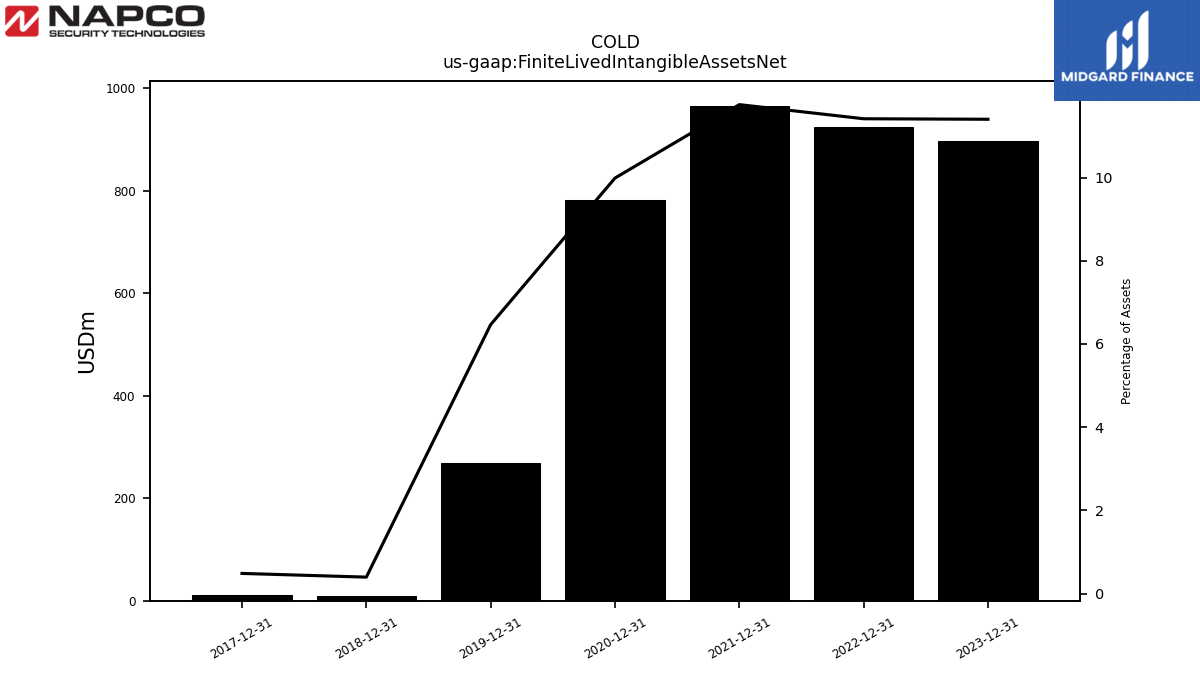
| Intangible Assets Net Excluding Goodwill | 897.41 | 897.24 | 914.17 | 918.95 | 925.22 | 919.05 | 944.06 | 968.10 | 980.97 | 1011.10 | 875.04 | 788.04 | 797.42 | 363.70 | 352.10 | 355.61 | 284.76 | 288.23 | 275.36 | 25.00 | 25.06 | 25.44 | 25.84 | 26.24 | 26.64 | NA | NA | NA | |
| Finite Lived Intangible Assets Net | 897.41 | NA | NA | NA | 925.22 | NA | NA | NA | 965.89 | NA | NA | NA | 782.35 | NA | NA | NA | 269.68 | NA | NA | NA | 9.98 | NA | NA | NA | 11.57 | NA | NA | NA |
| 2023-12-31 | 2023-09-30 | 2023-06-30 | 2023-03-31 | 2022-12-31 | 2022-09-30 | 2022-06-30 | 2022-03-31 | 2021-12-31 | 2021-09-30 | 2021-06-30 | 2021-03-31 | 2020-12-31 | 2020-09-30 | 2020-06-30 | 2020-03-31 | 2019-12-31 | 2019-09-30 | 2019-06-30 | 2019-03-31 | 2018-12-31 | 2018-09-30 | 2018-06-30 | 2018-03-31 | 2017-12-31 | 2017-09-30 | 2017-06-30 | 2017-03-31 | ||
|---|---|---|---|---|---|---|---|---|---|---|---|---|---|---|---|---|---|---|---|---|---|---|---|---|---|---|---|---|---|
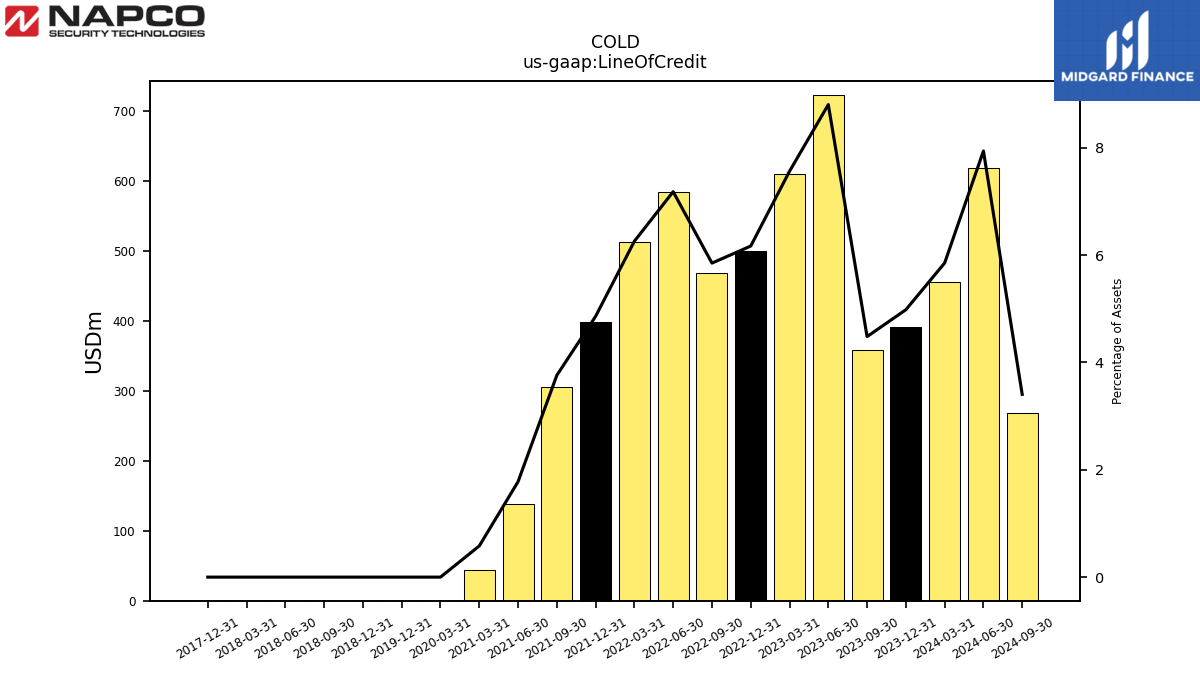
| Line Of Credit | 392.16 | 359.20 | 723.44 | 610.50 | 500.05 | 468.29 | 584.33 | 513.82 | 399.31 | 305.66 | 139.10 | 43.79 | NA | NA | NA | 0.00 | 0.00 | NA | NA | NA | 0.00 | 0.00 | 0.00 | 0.00 | 0.00 | NA | NA | NA |
| 2023-12-31 | 2023-09-30 | 2023-06-30 | 2023-03-31 | 2022-12-31 | 2022-09-30 | 2022-06-30 | 2022-03-31 | 2021-12-31 | 2021-09-30 | 2021-06-30 | 2021-03-31 | 2020-12-31 | 2020-09-30 | 2020-06-30 | 2020-03-31 | 2019-12-31 | 2019-09-30 | 2019-06-30 | 2019-03-31 | 2018-12-31 | 2018-09-30 | 2018-06-30 | 2018-03-31 | 2017-12-31 | 2017-09-30 | 2017-06-30 | 2017-03-31 | ||
|---|---|---|---|---|---|---|---|---|---|---|---|---|---|---|---|---|---|---|---|---|---|---|---|---|---|---|---|---|---|
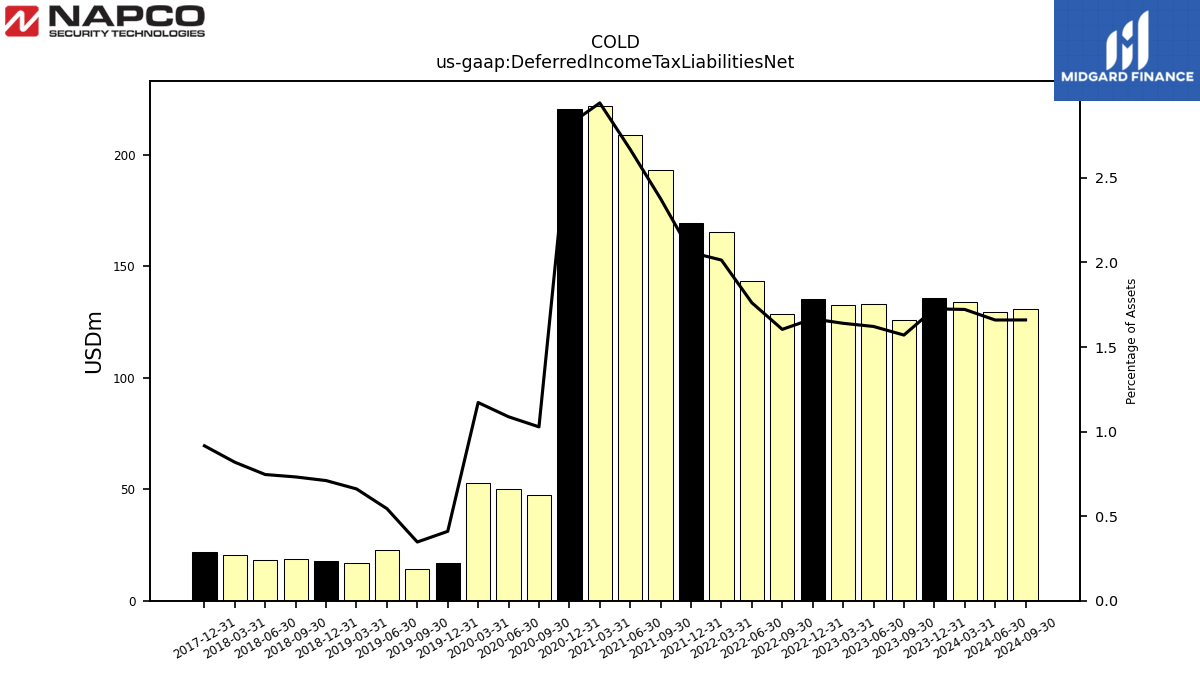
| Deferred Income Tax Liabilities Net | 135.80 | 125.89 | 133.24 | 132.41 | 135.10 | 128.40 | 143.34 | 165.33 | 169.21 | 193.19 | 208.80 | 221.92 | 220.50 | 47.48 | 50.18 | 52.78 | 17.12 | 14.38 | 22.67 | 17.11 | 17.99 | 18.89 | 18.47 | 20.42 | 21.94 | NA | NA | NA | |
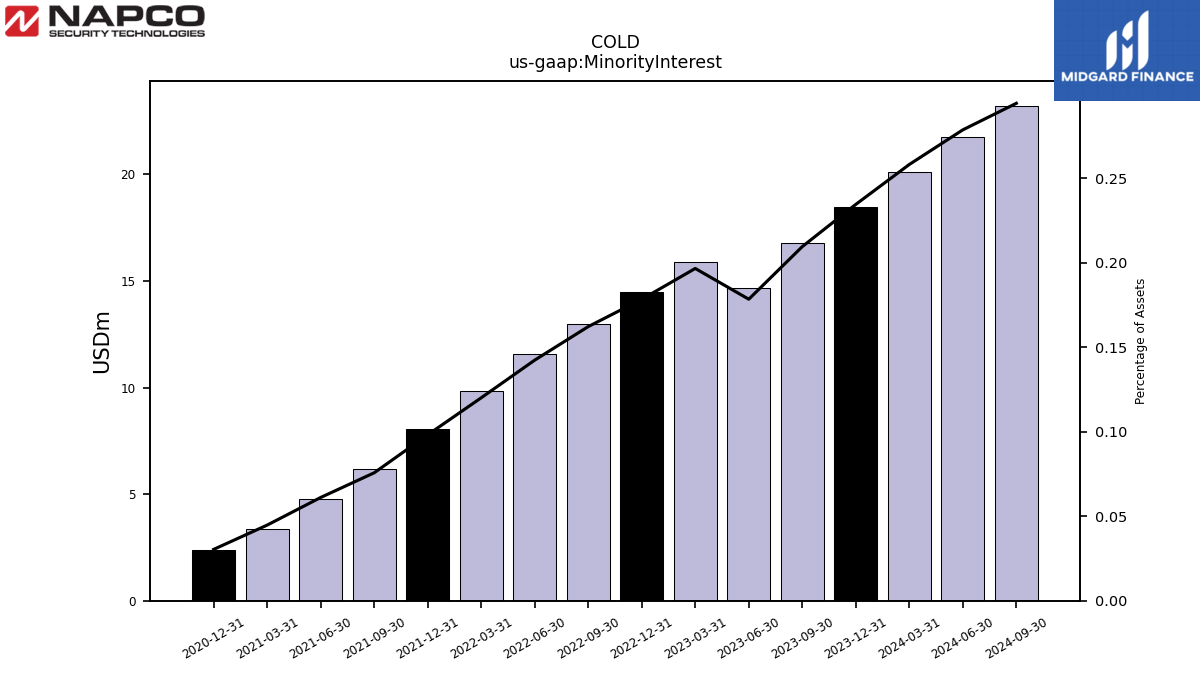
| Minority Interest | 18.46 | 16.80 | 14.66 | 15.87 | 14.46 | 12.98 | 11.59 | 9.86 | 8.07 | 6.16 | 4.78 | 3.38 | 2.38 | NA | NA | NA | NA | NA | NA | NA | NA | NA | NA | NA | NA | NA | NA | NA |
| 2023-12-31 | 2023-09-30 | 2023-06-30 | 2023-03-31 | 2022-12-31 | 2022-09-30 | 2022-06-30 | 2022-03-31 | 2021-12-31 | 2021-09-30 | 2021-06-30 | 2021-03-31 | 2020-12-31 | 2020-09-30 | 2020-06-30 | 2020-03-31 | 2019-12-31 | 2019-09-30 | 2019-06-30 | 2019-03-31 | 2018-12-31 | 2018-09-30 | 2018-06-30 | 2018-03-31 | 2017-12-31 | 2017-09-30 | 2017-06-30 | 2017-03-31 | ||
|---|---|---|---|---|---|---|---|---|---|---|---|---|---|---|---|---|---|---|---|---|---|---|---|---|---|---|---|---|---|
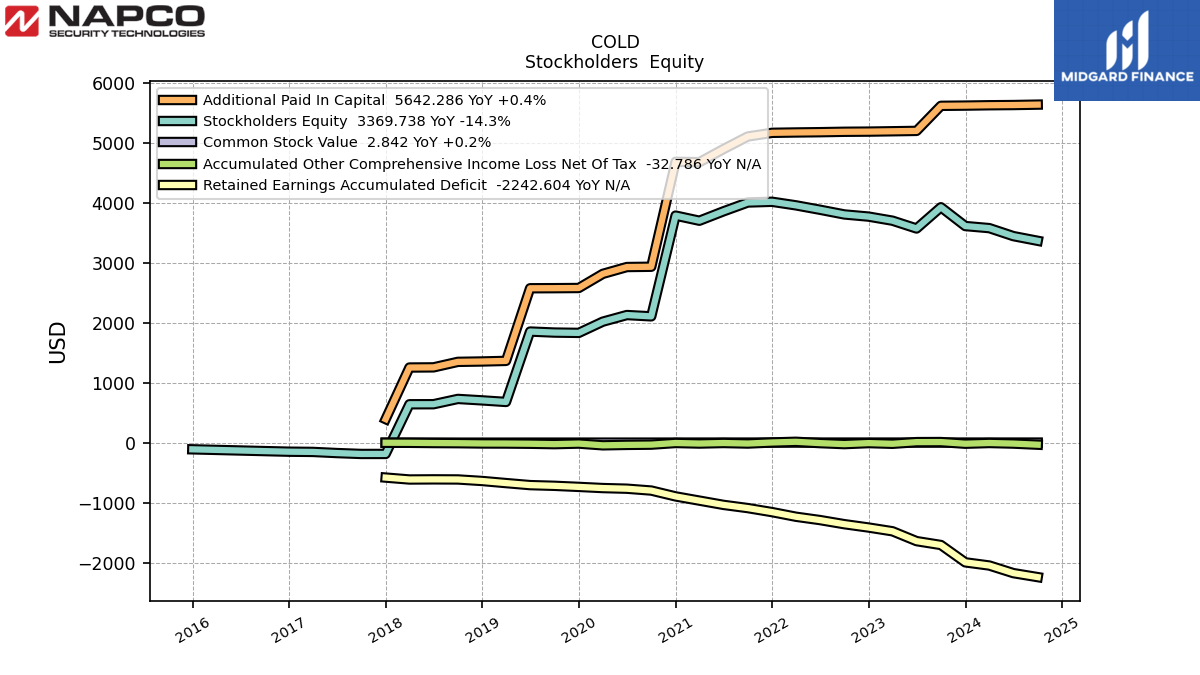
| Stockholders Equity | 3616.13 | 3929.86 | 3575.10 | 3705.41 | 3773.42 | 3809.61 | 3887.99 | 3961.38 | 4021.01 | 4009.03 | 3861.39 | 3704.83 | 3790.44 | 2108.87 | 2131.01 | 2020.68 | 1833.02 | 1838.58 | 1855.66 | 680.48 | 706.75 | 731.00 | 642.82 | 641.99 | -186.92 | -187.34 | -172.34 | -153.25 | |
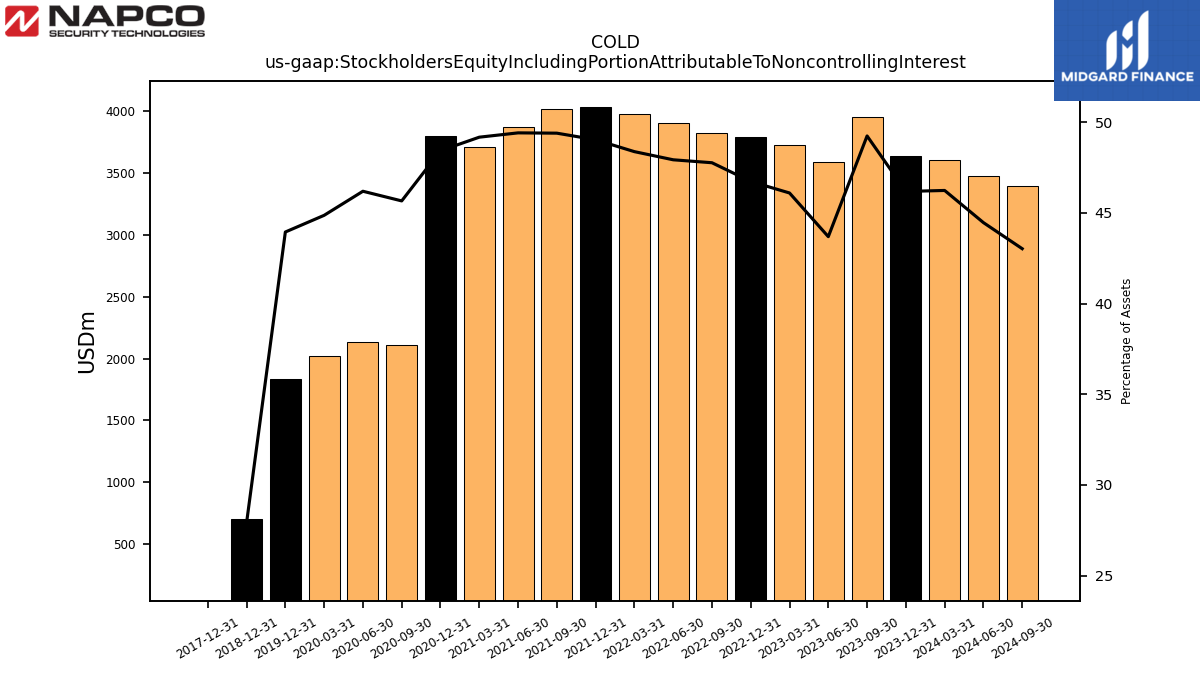
| Stockholders Equity Including Portion Attributable To Noncontrolling Interest | 3634.59 | 3946.65 | 3589.76 | 3721.28 | 3787.88 | 3822.59 | 3899.58 | 3971.24 | 4029.08 | 4015.18 | 3866.18 | 3708.21 | 3792.82 | 2108.87 | 2131.01 | 2020.68 | 1833.02 | NA | NA | NA | 706.75 | NA | NA | NA | -186.92 | NA | NA | NA | |
| Common Stock Value | 2.84 | 2.83 | 2.70 | 2.70 | 2.70 | 2.69 | 2.69 | 2.69 | 2.68 | 2.67 | 2.61 | 2.52 | 2.52 | 2.04 | 2.04 | 2.00 | 1.92 | 1.92 | 1.92 | 1.49 | 1.48 | 1.48 | 1.44 | 1.43 | 0.69 | NA | NA | NA | |
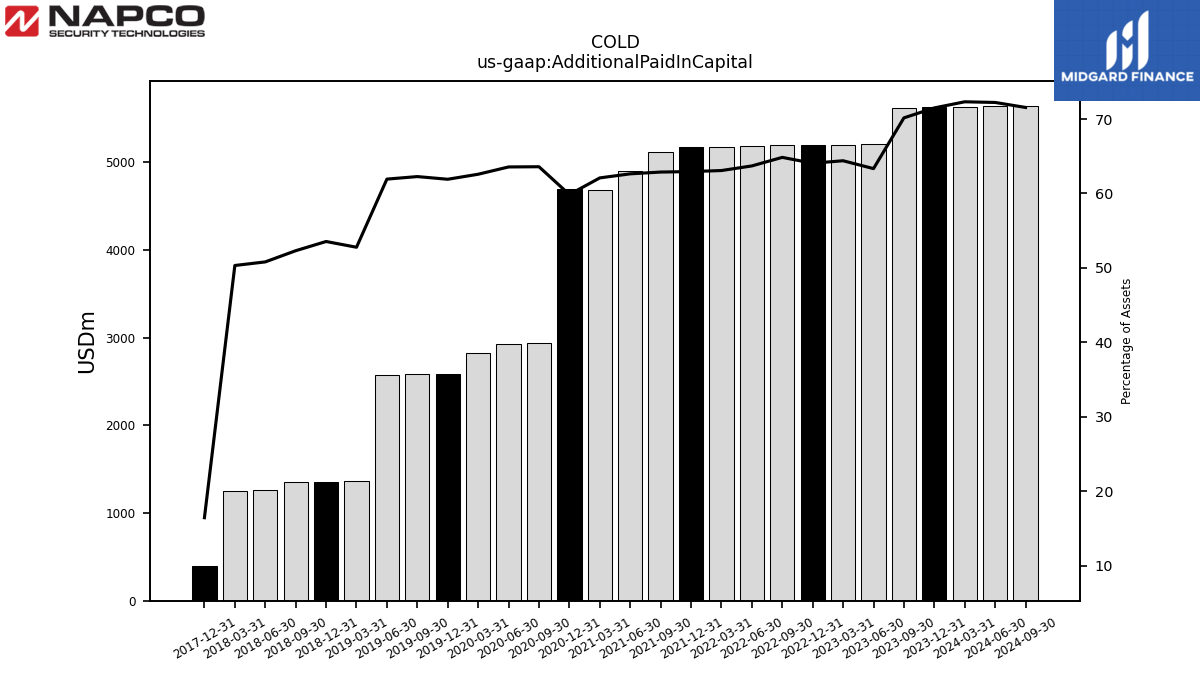
| Additional Paid In Capital | 5625.91 | 5622.15 | 5203.89 | 5197.89 | 5191.97 | 5189.22 | 5182.31 | 5177.64 | 5171.69 | 5110.43 | 4900.40 | 4681.81 | 4687.82 | 2936.76 | 2932.04 | 2818.39 | 2582.09 | 2579.32 | 2577.89 | 1365.77 | 1356.13 | 1349.76 | 1257.78 | 1255.09 | 394.08 | NA | NA | NA | |
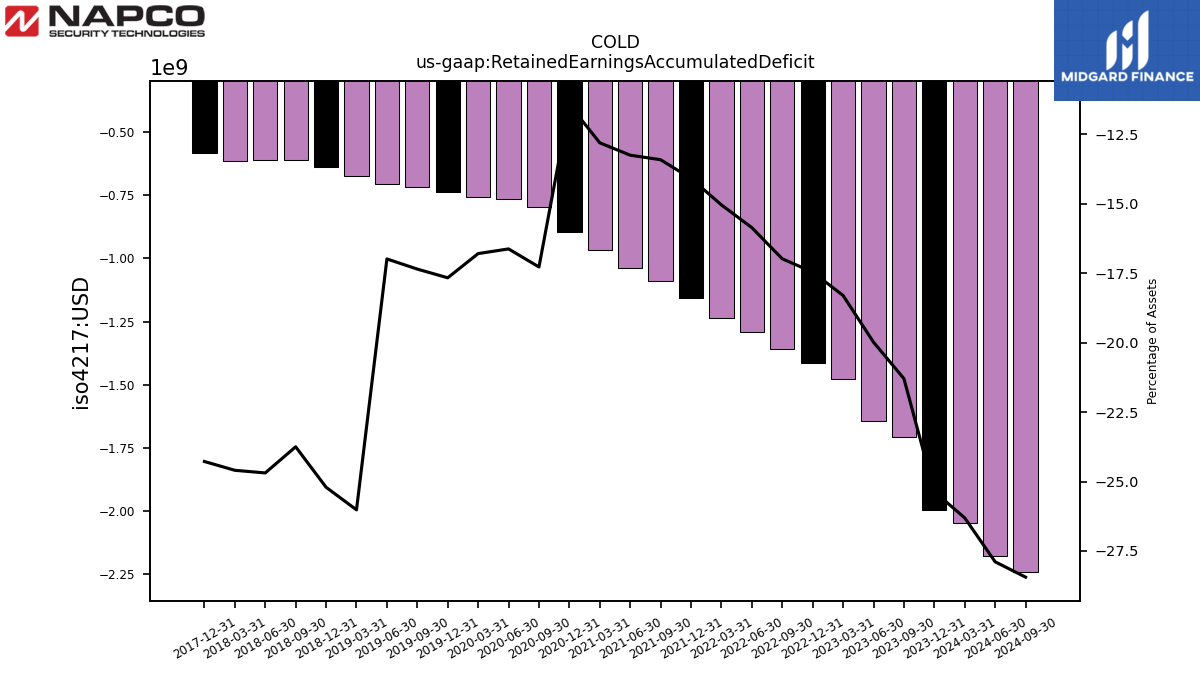
| Retained Earnings Accumulated Deficit | -1995.97 | -1706.59 | -1641.87 | -1477.45 | -1415.20 | -1359.11 | -1290.51 | -1234.88 | -1157.89 | -1090.60 | -1036.99 | -965.84 | -895.52 | -797.93 | -767.03 | -756.42 | -736.86 | -718.87 | -707.17 | -673.30 | -638.35 | -612.79 | -611.21 | -613.36 | -581.47 | NA | NA | NA | |
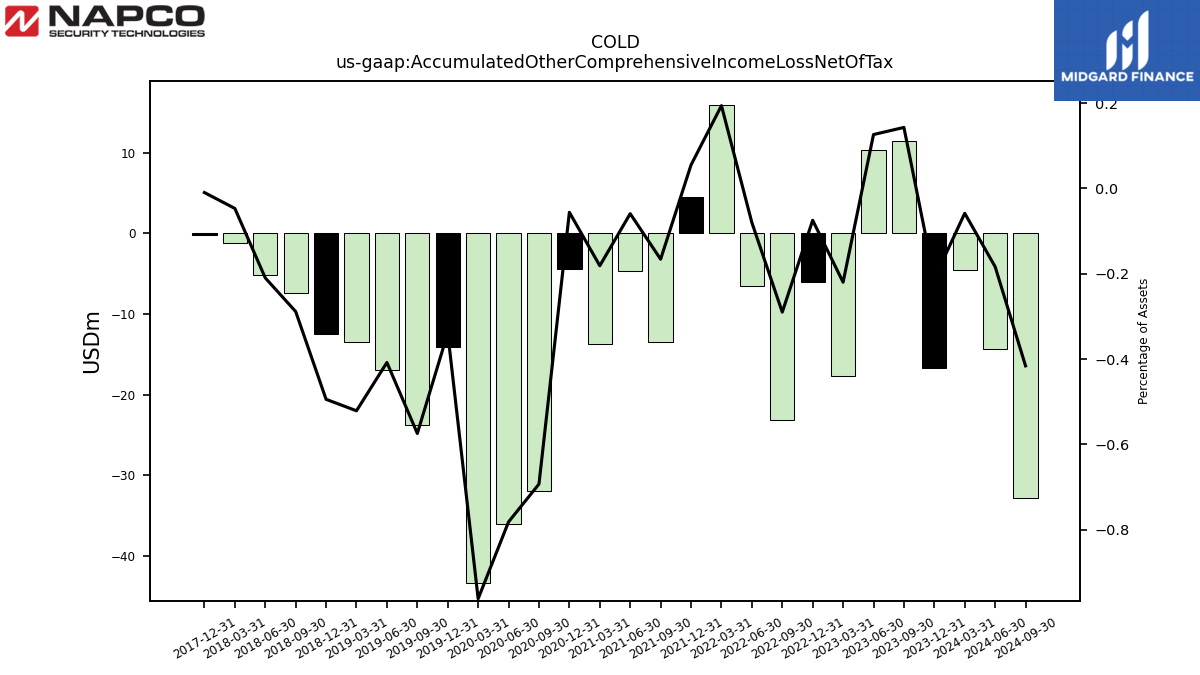
| Accumulated Other Comprehensive Income Loss Net Of Tax | -16.64 | 11.46 | 10.38 | -17.74 | -6.05 | -23.19 | -6.50 | 15.93 | 4.52 | -13.48 | -4.63 | -13.66 | -4.38 | -31.99 | -36.04 | -43.30 | -14.13 | -23.78 | -16.98 | -13.48 | -12.52 | -7.44 | -5.19 | -1.17 | -0.23 | NA | NA | NA | |
| Minority Interest | 18.46 | 16.80 | 14.66 | 15.87 | 14.46 | 12.98 | 11.59 | 9.86 | 8.07 | 6.16 | 4.78 | 3.38 | 2.38 | NA | NA | NA | NA | NA | NA | NA | NA | NA | NA | NA | NA | NA | NA | NA |
| 2023-12-31 | 2023-09-30 | 2023-06-30 | 2023-03-31 | 2022-12-31 | 2022-09-30 | 2022-06-30 | 2022-03-31 | 2021-12-31 | 2021-09-30 | 2021-06-30 | 2021-03-31 | 2020-12-31 | 2020-09-30 | 2020-06-30 | 2020-03-31 | 2019-12-31 | 2019-09-30 | 2019-06-30 | 2019-03-31 | 2018-12-31 | 2018-09-30 | 2018-06-30 | 2018-03-31 | 2017-12-31 | 2017-09-30 | 2017-06-30 | 2017-03-31 | ||
|---|---|---|---|---|---|---|---|---|---|---|---|---|---|---|---|---|---|---|---|---|---|---|---|---|---|---|---|---|---|
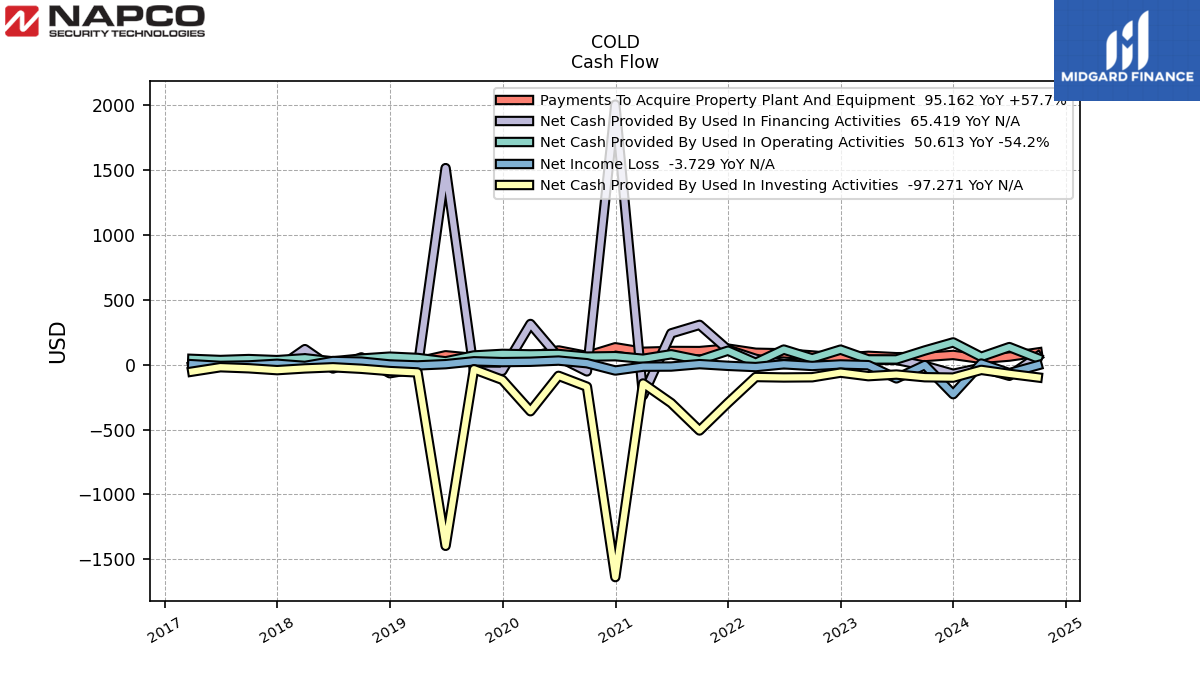
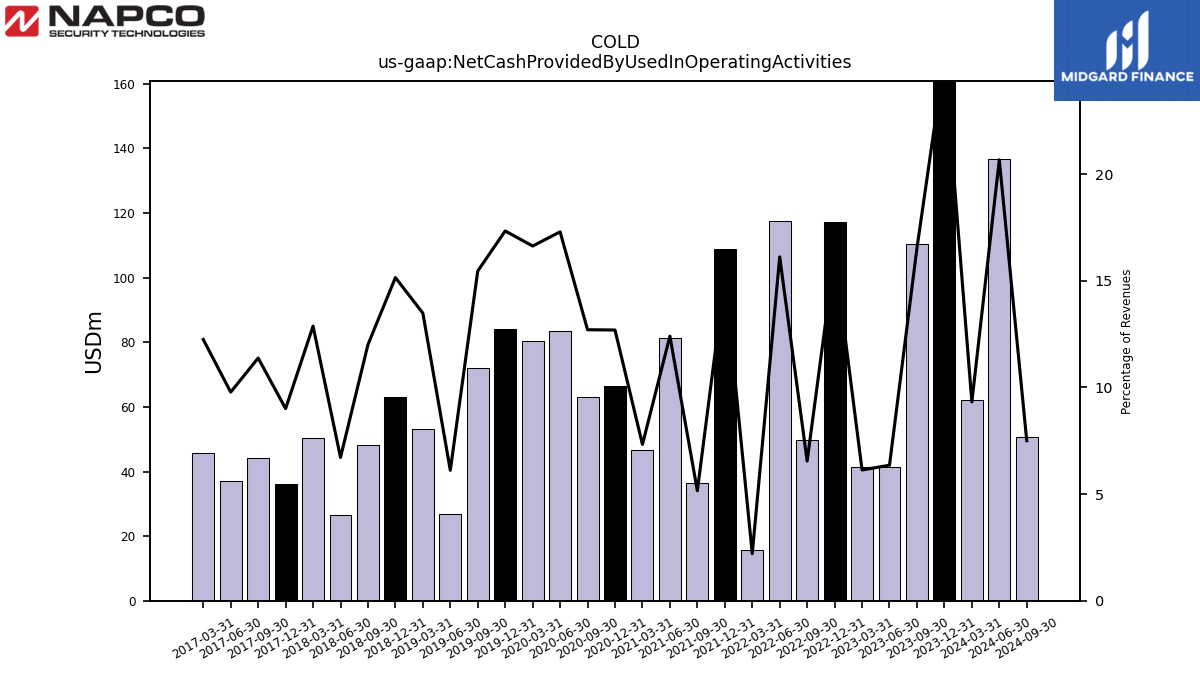
| Net Cash Provided By Used In Operating Activities | 172.94 | 110.44 | 41.29 | 41.48 | 117.11 | 49.64 | 117.66 | 15.59 | 108.74 | 36.57 | 81.22 | 46.53 | 66.48 | 63.22 | 83.46 | 80.52 | 84.27 | 72.09 | 26.82 | 53.01 | 63.01 | 48.27 | 26.53 | 50.36 | 36.20 | 44.33 | 37.12 | 45.68 | |
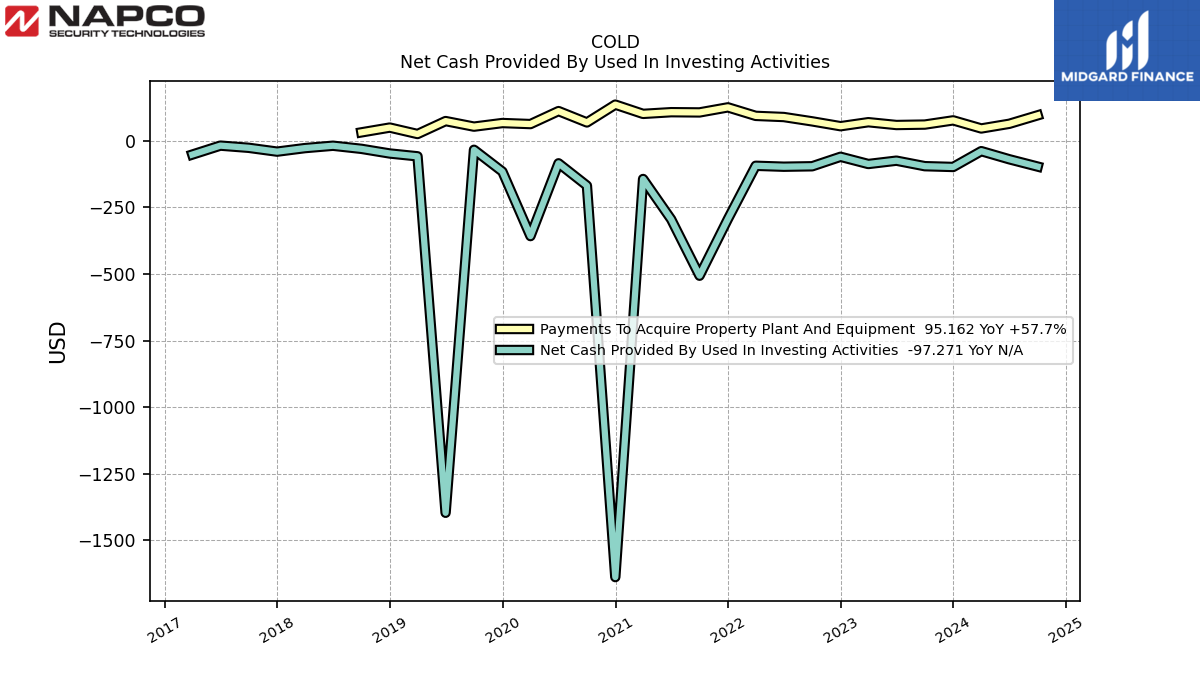
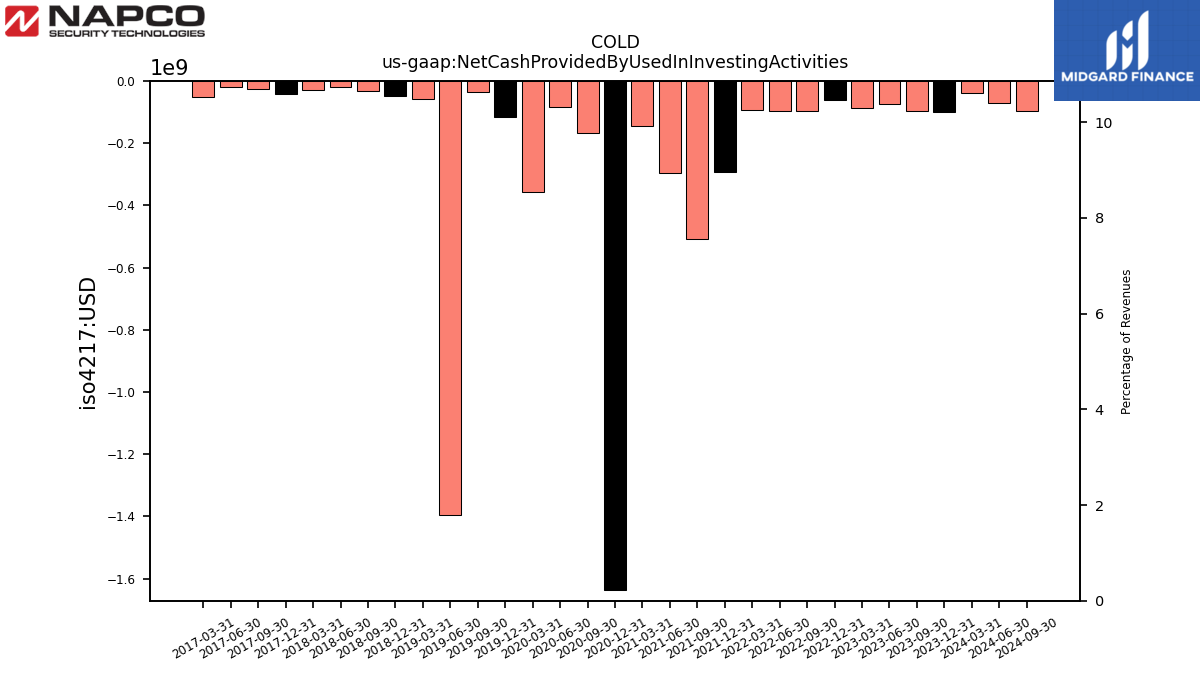
| Net Cash Provided By Used In Investing Activities | -98.69 | -95.70 | -75.08 | -87.59 | -60.48 | -96.05 | -97.72 | -94.24 | -293.71 | -506.67 | -295.08 | -143.74 | -1637.41 | -168.69 | -84.95 | -358.07 | -116.00 | -34.14 | -1396.09 | -58.70 | -48.11 | -30.66 | -19.02 | -27.92 | -41.16 | -26.82 | -18.61 | -52.24 | |
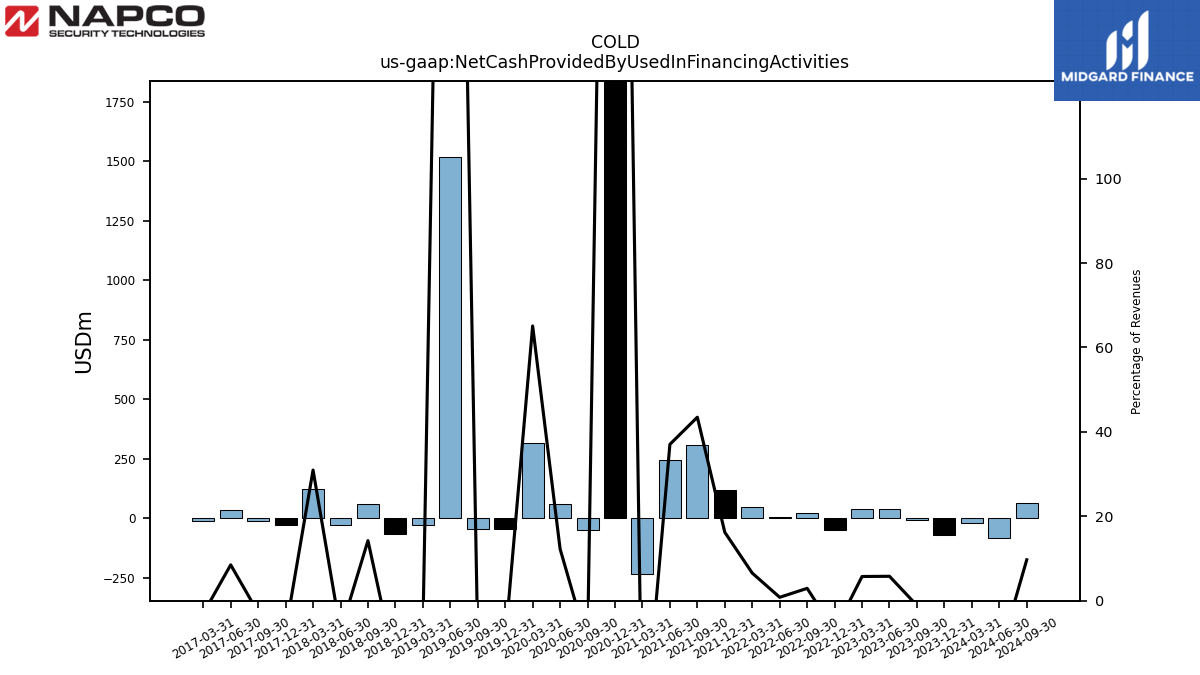
| Net Cash Provided By Used In Financing Activities | -69.34 | -7.45 | 37.65 | 38.87 | -51.15 | 22.25 | 5.96 | 46.26 | 116.22 | 308.19 | 242.61 | -235.53 | 2006.58 | -50.99 | 59.21 | 315.10 | -46.07 | -46.58 | 1517.13 | -29.11 | -64.96 | 57.28 | -28.46 | 121.09 | -28.55 | -11.01 | 32.25 | -11.30 |
| 2023-12-31 | 2023-09-30 | 2023-06-30 | 2023-03-31 | 2022-12-31 | 2022-09-30 | 2022-06-30 | 2022-03-31 | 2021-12-31 | 2021-09-30 | 2021-06-30 | 2021-03-31 | 2020-12-31 | 2020-09-30 | 2020-06-30 | 2020-03-31 | 2019-12-31 | 2019-09-30 | 2019-06-30 | 2019-03-31 | 2018-12-31 | 2018-09-30 | 2018-06-30 | 2018-03-31 | 2017-12-31 | 2017-09-30 | 2017-06-30 | 2017-03-31 | ||
|---|---|---|---|---|---|---|---|---|---|---|---|---|---|---|---|---|---|---|---|---|---|---|---|---|---|---|---|---|---|
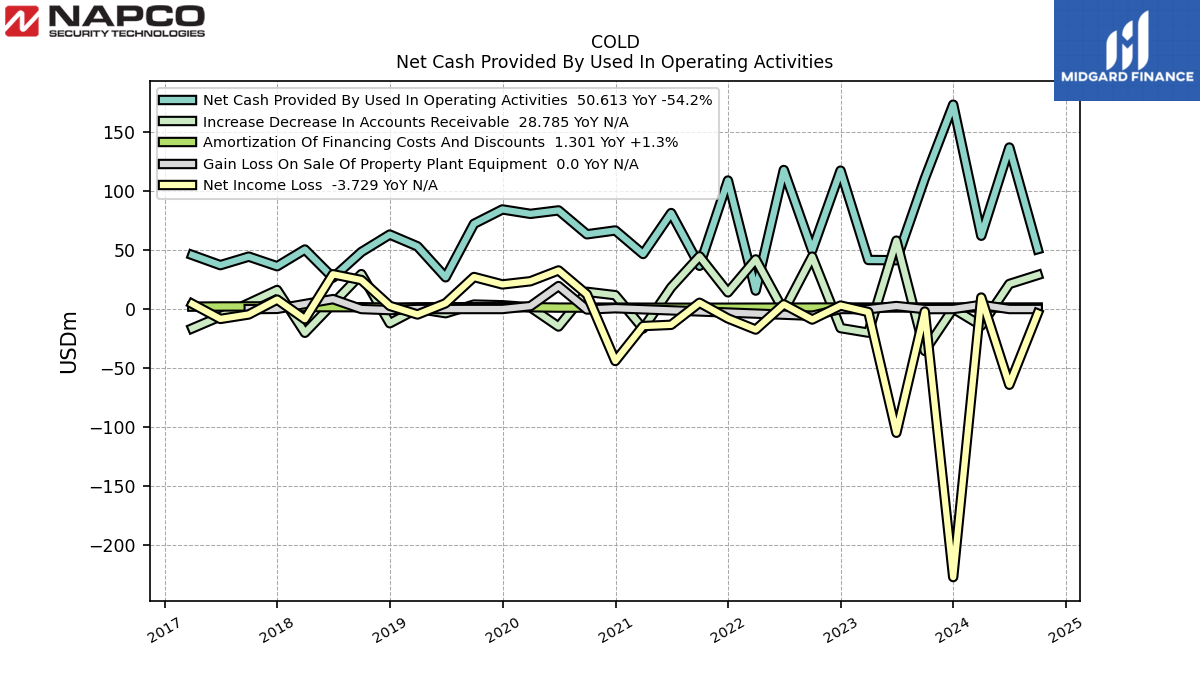
| Net Cash Provided By Used In Operating Activities | 172.94 | 110.44 | 41.29 | 41.48 | 117.11 | 49.64 | 117.66 | 15.59 | 108.74 | 36.57 | 81.22 | 46.53 | 66.48 | 63.22 | 83.46 | 80.52 | 84.27 | 72.09 | 26.82 | 53.01 | 63.01 | 48.27 | 26.53 | 50.36 | 36.20 | 44.33 | 37.12 | 45.68 | |
| Net Income Loss | -226.84 | -2.09 | -104.72 | -2.56 | 2.94 | -8.91 | 3.94 | -17.41 | -7.96 | 5.29 | -13.37 | -14.41 | -44.01 | 12.37 | 32.66 | 23.51 | 20.81 | 27.09 | 4.89 | -4.63 | 2.68 | 24.54 | 29.41 | -8.64 | 8.00 | -4.61 | -8.38 | 4.38 | |
| Profit Loss | -226.80 | -2.10 | -104.80 | -2.57 | 2.96 | -8.94 | 3.95 | -17.45 | -7.98 | 5.31 | -13.40 | -14.24 | -43.99 | 12.37 | 32.66 | 23.51 | NA | NA | NA | NA | NA | NA | NA | NA | NA | NA | NA | NA | |
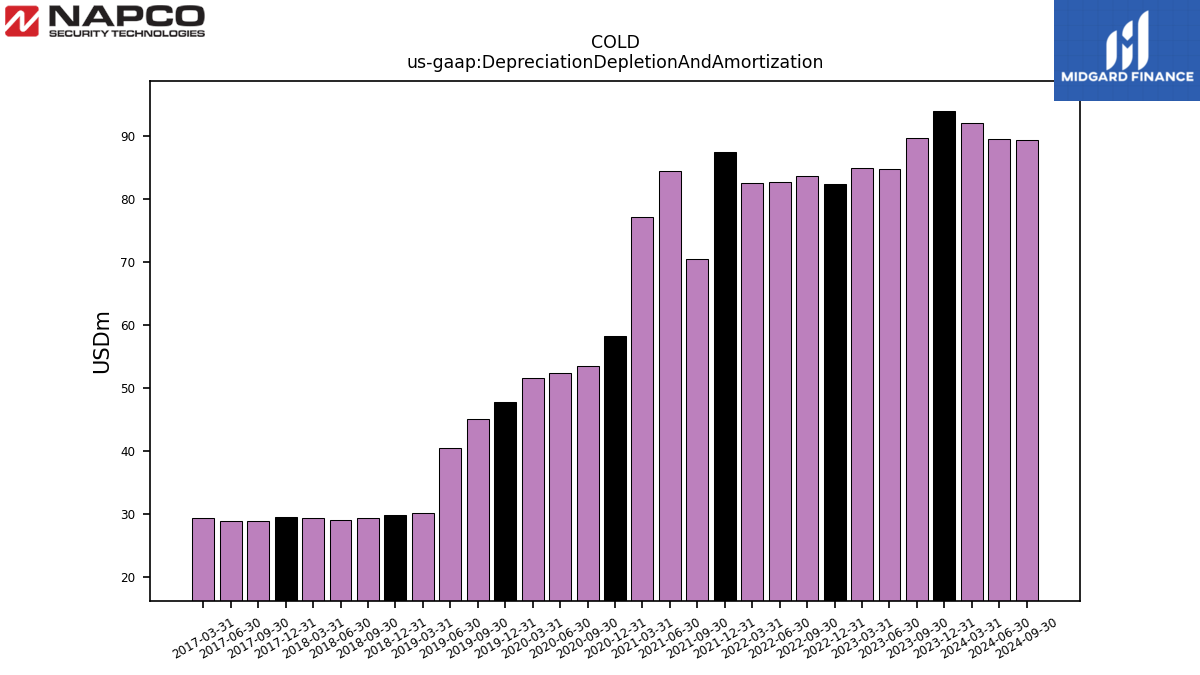
| Depreciation Depletion And Amortization | 94.10 | 89.73 | 84.89 | 85.02 | 82.47 | 83.67 | 82.69 | 82.62 | 87.60 | 70.57 | 84.46 | 77.21 | 58.32 | 53.57 | 52.40 | 51.60 | 47.75 | 45.06 | 40.44 | 30.10 | 29.79 | 29.40 | 29.05 | 29.41 | 29.55 | 28.88 | 28.91 | 29.41 | |
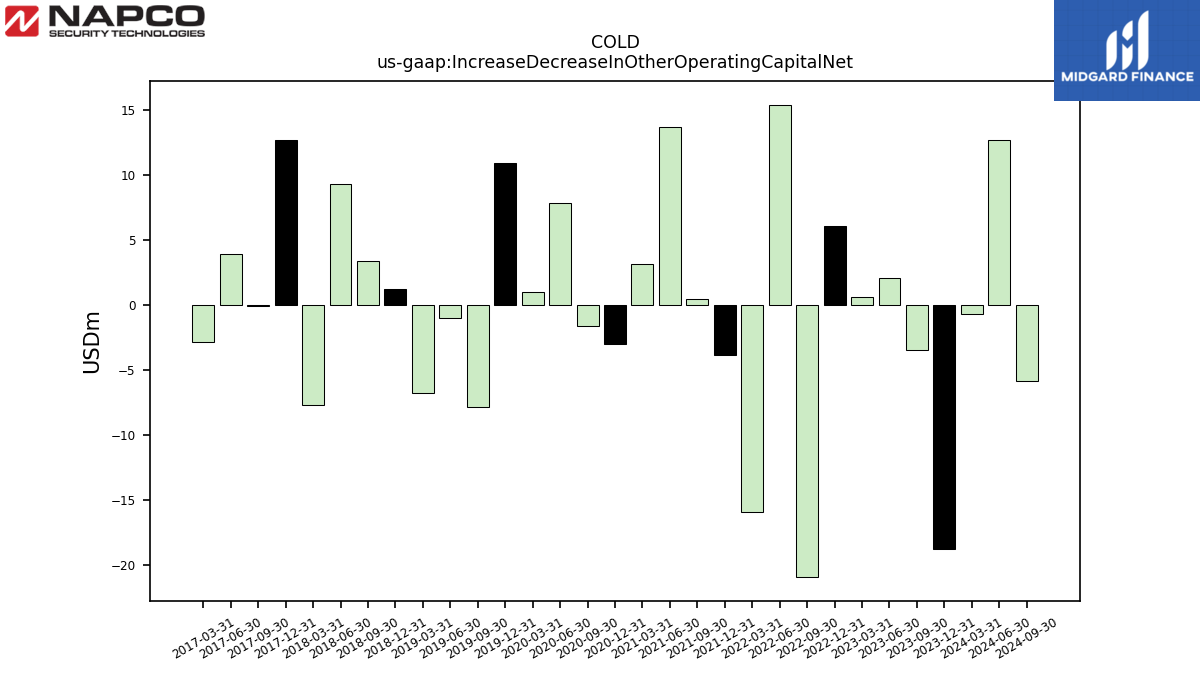
| Increase Decrease In Other Operating Capital Net | -18.81 | -3.49 | 2.08 | 0.59 | 6.10 | -20.94 | 15.43 | -15.91 | -3.83 | 0.49 | 13.69 | 3.18 | -2.99 | -1.59 | 7.84 | 1.03 | 10.90 | -7.83 | -1.03 | -6.81 | 1.26 | 3.36 | 9.31 | -7.68 | 12.70 | -0.04 | 3.93 | -2.88 | |
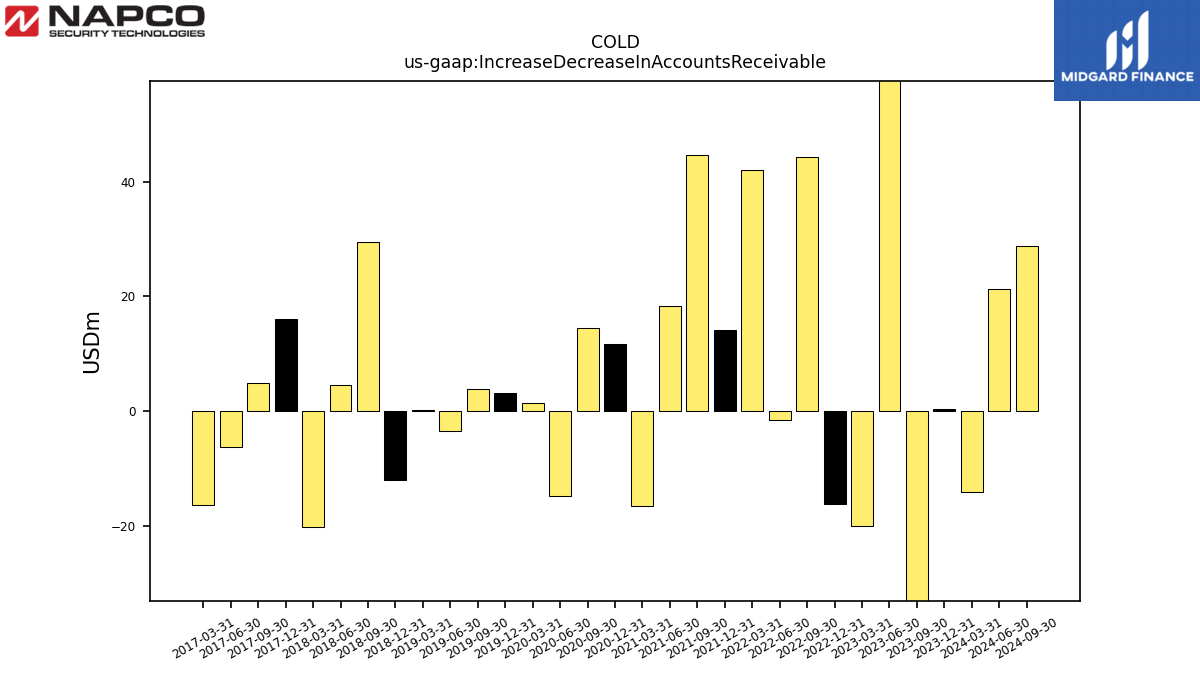
| Increase Decrease In Accounts Receivable | 0.31 | -35.44 | 57.89 | -20.01 | -16.13 | 44.35 | -1.58 | 41.99 | 14.10 | 44.60 | 18.29 | -16.52 | 11.70 | 14.56 | -14.81 | 1.44 | 3.19 | 3.78 | -3.54 | 0.26 | -12.06 | 29.55 | 4.57 | -20.11 | 16.10 | 4.90 | -6.24 | -16.36 | |
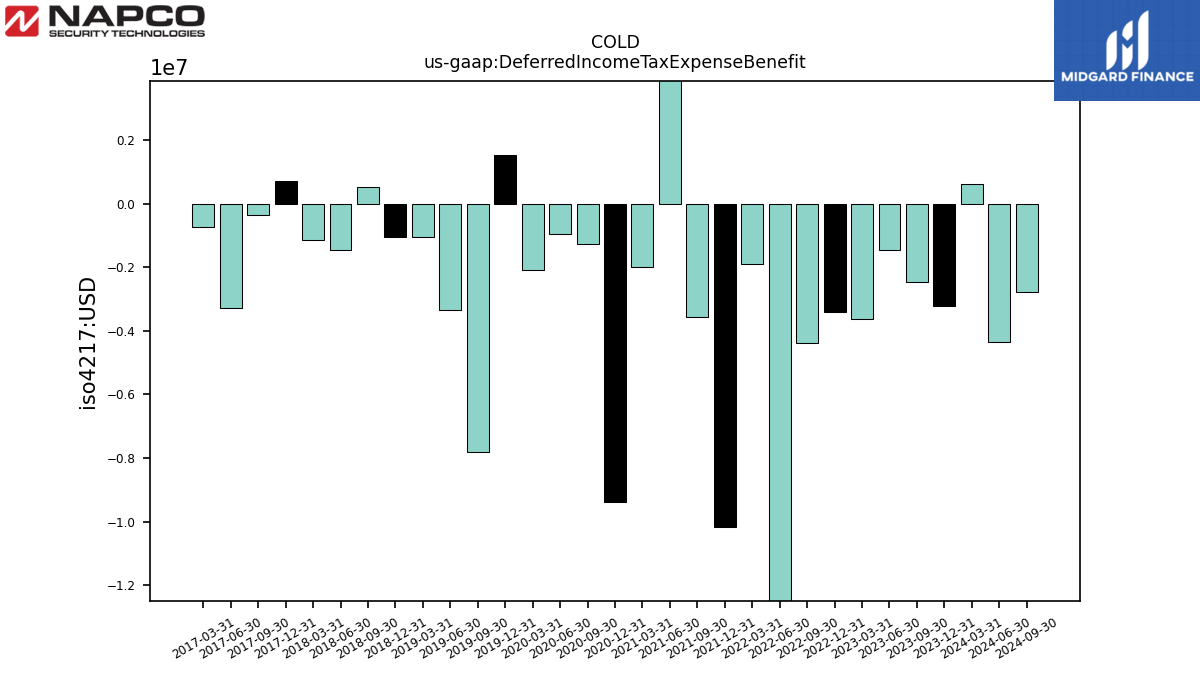
| Deferred Income Tax Expense Benefit | -3.23 | -2.47 | -1.46 | -3.62 | -3.41 | -4.37 | -12.89 | -1.89 | -10.15 | -3.56 | 6.57 | -2.00 | -9.38 | -1.28 | -0.97 | -2.10 | 1.52 | -7.81 | -3.35 | -1.06 | -1.06 | 0.51 | -1.45 | -1.16 | 0.72 | -0.35 | -3.28 | -0.75 |
| 2023-12-31 | 2023-09-30 | 2023-06-30 | 2023-03-31 | 2022-12-31 | 2022-09-30 | 2022-06-30 | 2022-03-31 | 2021-12-31 | 2021-09-30 | 2021-06-30 | 2021-03-31 | 2020-12-31 | 2020-09-30 | 2020-06-30 | 2020-03-31 | 2019-12-31 | 2019-09-30 | 2019-06-30 | 2019-03-31 | 2018-12-31 | 2018-09-30 | 2018-06-30 | 2018-03-31 | 2017-12-31 | 2017-09-30 | 2017-06-30 | 2017-03-31 | ||
|---|---|---|---|---|---|---|---|---|---|---|---|---|---|---|---|---|---|---|---|---|---|---|---|---|---|---|---|---|---|
| Net Cash Provided By Used In Investing Activities | -98.69 | -95.70 | -75.08 | -87.59 | -60.48 | -96.05 | -97.72 | -94.24 | -293.71 | -506.67 | -295.08 | -143.74 | -1637.41 | -168.69 | -84.95 | -358.07 | -116.00 | -34.14 | -1396.09 | -58.70 | -48.11 | -30.66 | -19.02 | -27.92 | -41.16 | -26.82 | -18.61 | -52.24 | |
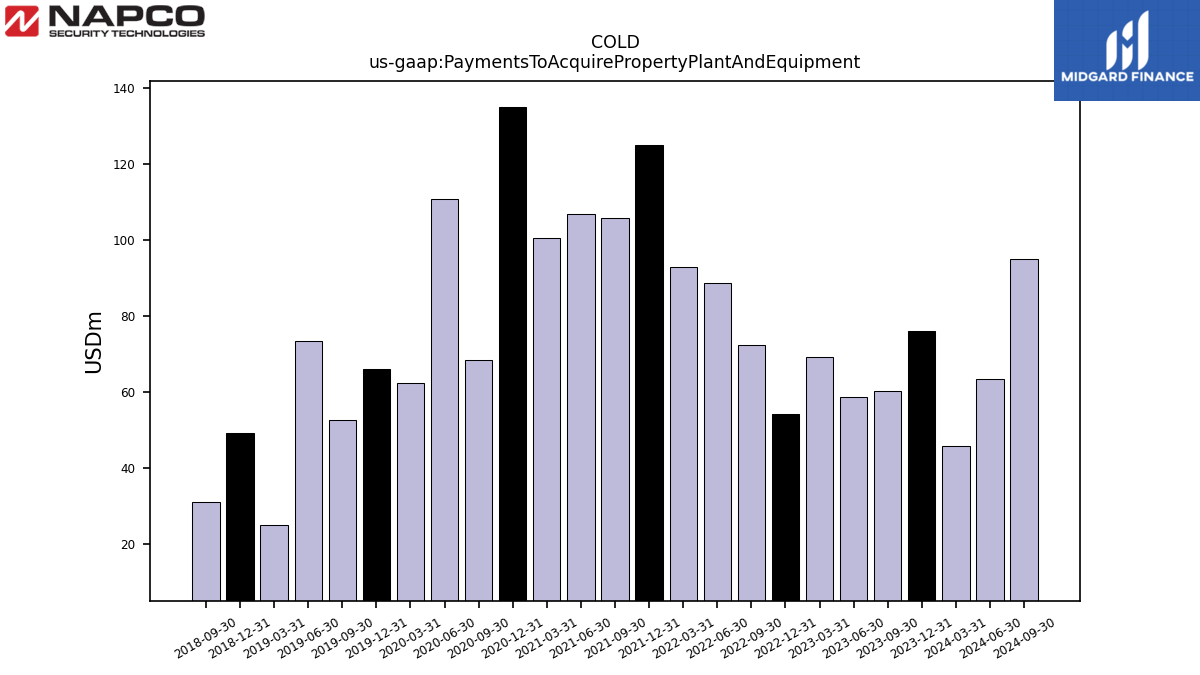
| Payments To Acquire Property Plant And Equipment | 76.15 | 60.34 | 58.71 | 69.26 | 54.25 | 72.40 | 88.69 | 93.02 | 124.96 | 105.94 | 106.83 | 100.47 | 135.20 | 68.37 | 110.98 | 62.26 | 66.15 | 52.64 | 73.49 | 24.93 | 49.11 | 31.07 | NA | NA | NA | NA | NA | NA |
| 2023-12-31 | 2023-09-30 | 2023-06-30 | 2023-03-31 | 2022-12-31 | 2022-09-30 | 2022-06-30 | 2022-03-31 | 2021-12-31 | 2021-09-30 | 2021-06-30 | 2021-03-31 | 2020-12-31 | 2020-09-30 | 2020-06-30 | 2020-03-31 | 2019-12-31 | 2019-09-30 | 2019-06-30 | 2019-03-31 | 2018-12-31 | 2018-09-30 | 2018-06-30 | 2018-03-31 | 2017-12-31 | 2017-09-30 | 2017-06-30 | 2017-03-31 | ||
|---|---|---|---|---|---|---|---|---|---|---|---|---|---|---|---|---|---|---|---|---|---|---|---|---|---|---|---|---|---|
| Net Cash Provided By Used In Financing Activities | -69.34 | -7.45 | 37.65 | 38.87 | -51.15 | 22.25 | 5.96 | 46.26 | 116.22 | 308.19 | 242.61 | -235.53 | 2006.58 | -50.99 | 59.21 | 315.10 | -46.07 | -46.58 | 1517.13 | -29.11 | -64.96 | 57.28 | -28.46 | 121.09 | -28.55 | -11.01 | 32.25 | -11.30 | |
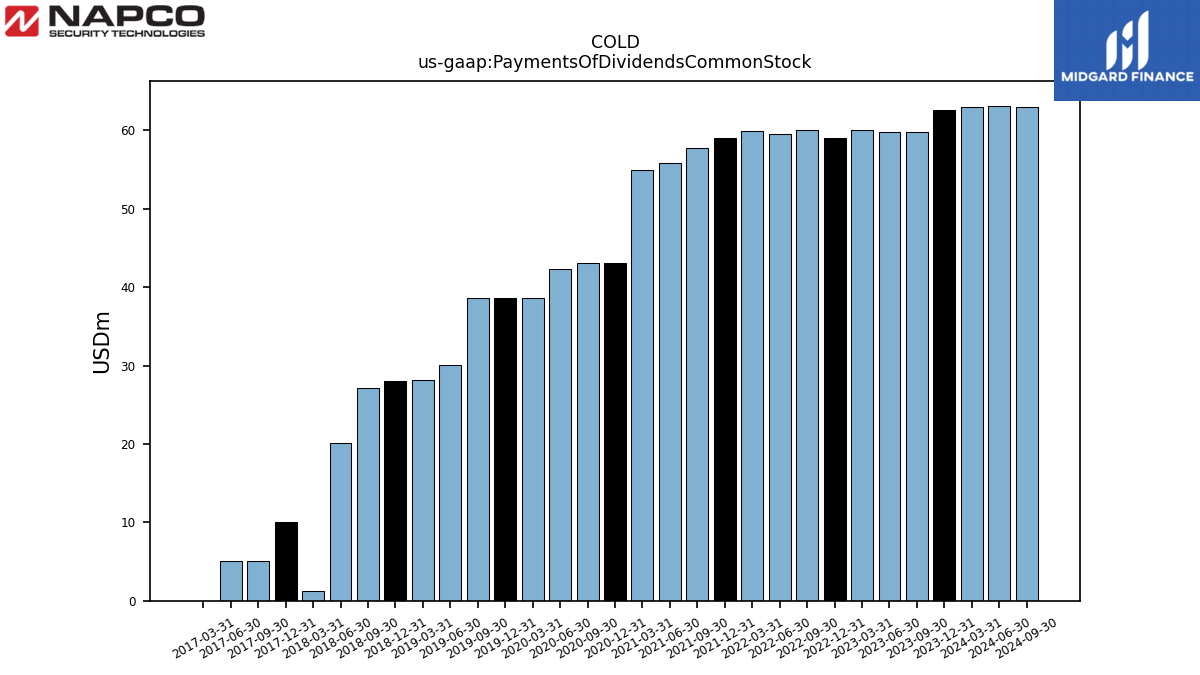
| Payments Of Dividends Common Stock | 62.66 | 59.76 | 59.74 | 60.06 | 59.09 | 60.10 | 59.59 | 59.94 | 58.98 | 57.73 | 55.86 | 54.96 | 43.06 | 43.05 | 42.34 | 38.63 | 38.63 | 38.60 | 30.11 | 28.10 | 27.99 | 27.16 | 20.09 | 1.29 | 10.11 | 5.05 | 5.05 | 0.00 |
| 2023-12-31 | 2023-09-30 | 2023-06-30 | 2023-03-31 | 2022-12-31 | 2022-09-30 | 2022-06-30 | 2022-03-31 | 2021-12-31 | 2021-09-30 | 2021-06-30 | 2021-03-31 | 2020-12-31 | 2020-09-30 | 2020-06-30 | 2020-03-31 | 2019-12-31 | 2019-09-30 | 2019-06-30 | 2019-03-31 | 2018-12-31 | 2018-09-30 | 2018-06-30 | 2018-03-31 | 2017-12-31 | 2017-09-30 | 2017-06-30 | 2017-03-31 | ||
|---|---|---|---|---|---|---|---|---|---|---|---|---|---|---|---|---|---|---|---|---|---|---|---|---|---|---|---|---|---|
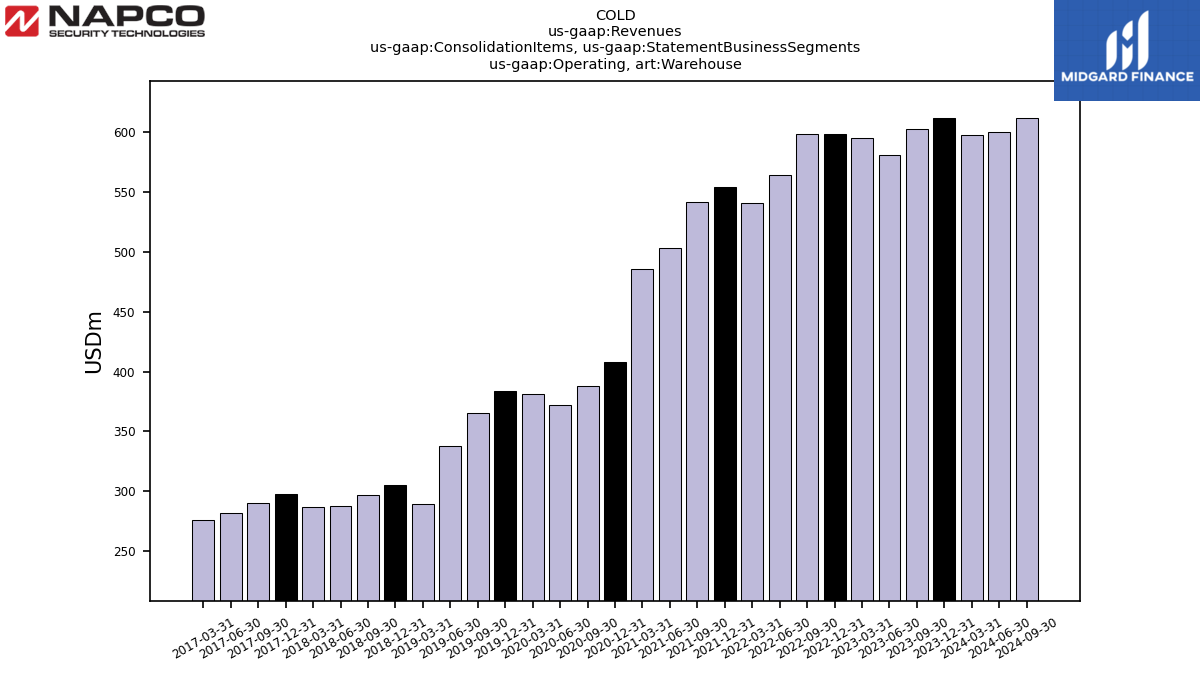
| Revenues | 679.29 | 667.94 | 649.61 | 676.49 | 721.50 | 757.78 | 729.76 | 705.70 | 716.48 | 708.81 | 654.71 | 634.79 | 523.68 | 497.46 | 482.52 | 484.07 | 485.98 | 466.18 | 438.46 | 393.08 | 415.82 | 402.01 | 394.67 | 391.14 | 401.72 | 389.50 | 379.45 | 372.91 | |
| Operating | 679.29 | 667.94 | 649.61 | 676.49 | 721.50 | 757.78 | 729.76 | 705.70 | 716.48 | 708.81 | 654.71 | 634.79 | 523.68 | 497.46 | 482.52 | 484.07 | 485.98 | 466.18 | 438.46 | 393.08 | 415.82 | 402.01 | 394.67 | 391.14 | 401.72 | 389.50 | 379.45 | 372.91 | |
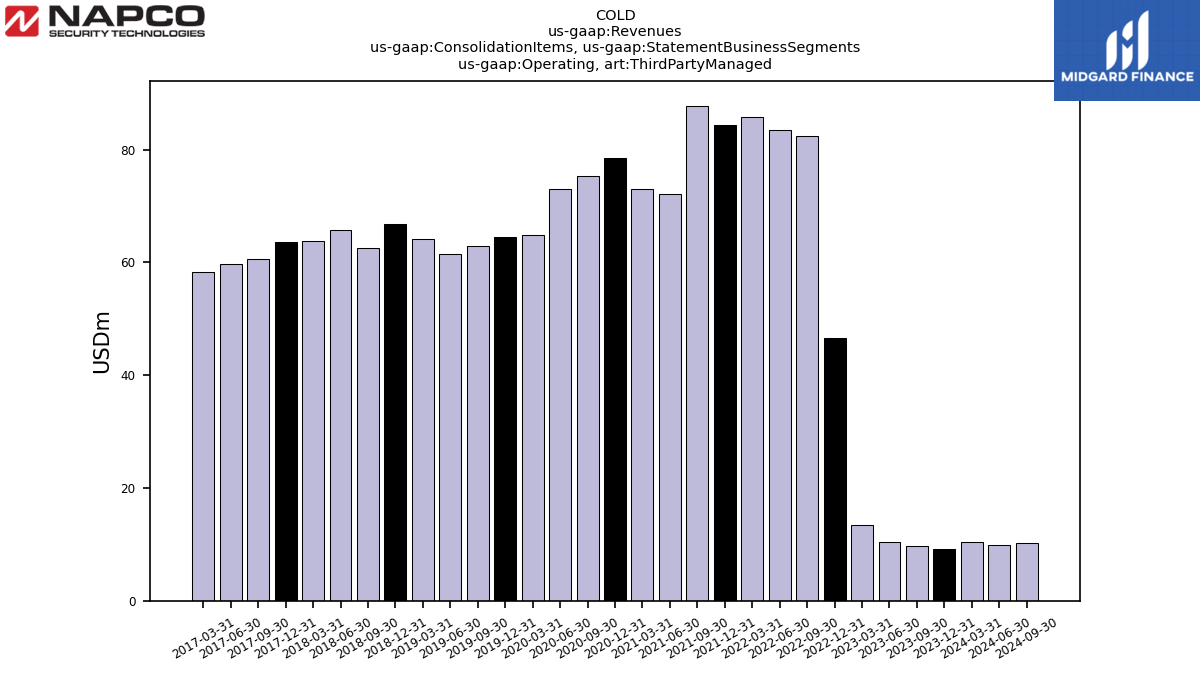
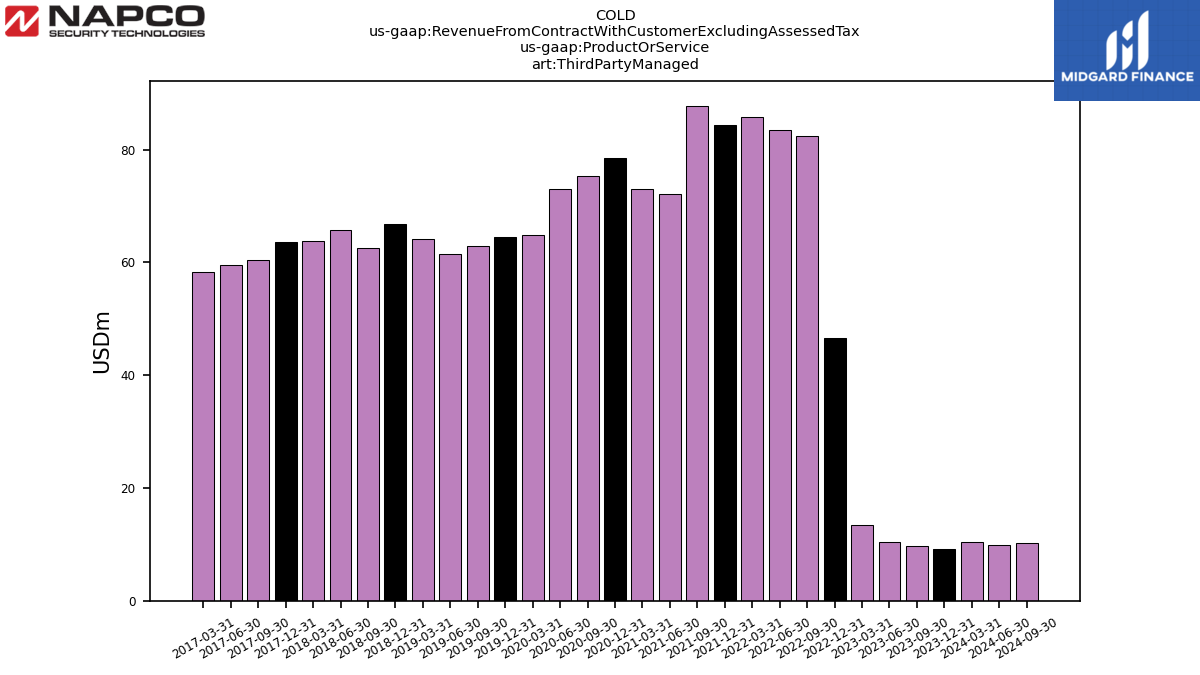
| Operating, Third Party Managed | 9.15 | 9.69 | 10.37 | 13.36 | 46.62 | 82.44 | 83.49 | 85.86 | 84.28 | 87.78 | 72.17 | 73.07 | 78.54 | 75.34 | 72.95 | 64.92 | 64.44 | 62.85 | 61.52 | 64.14 | 66.85 | 62.55 | 65.75 | 63.88 | 63.63 | 60.56 | 59.64 | 58.37 | |
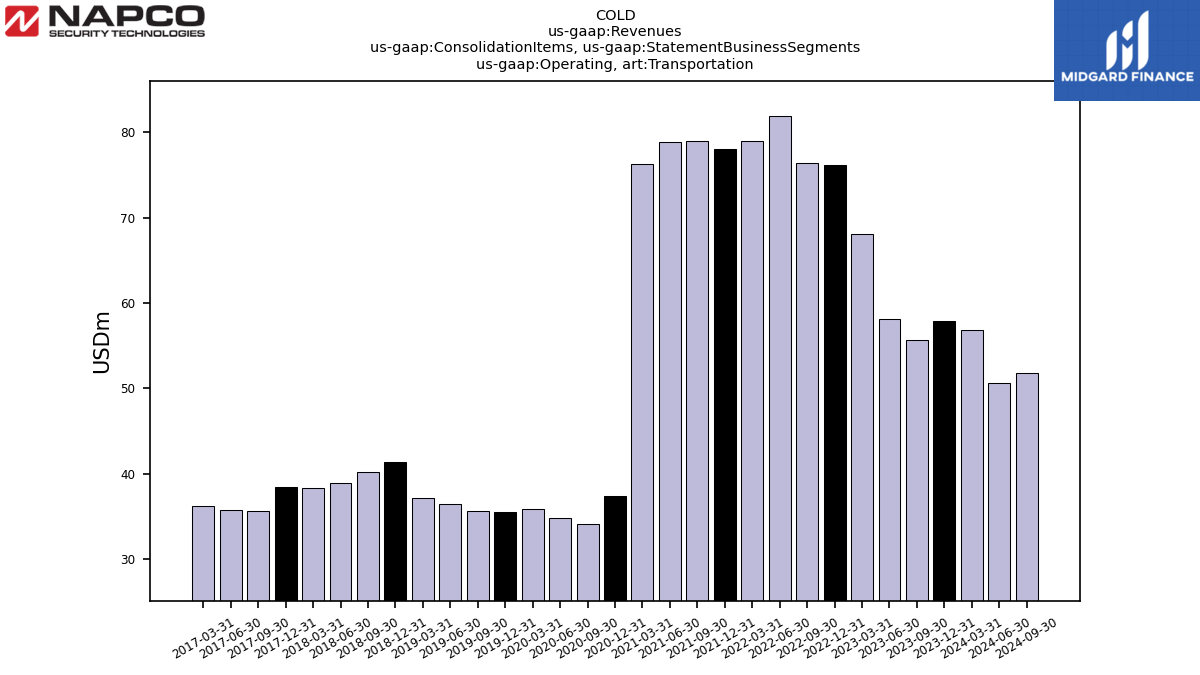
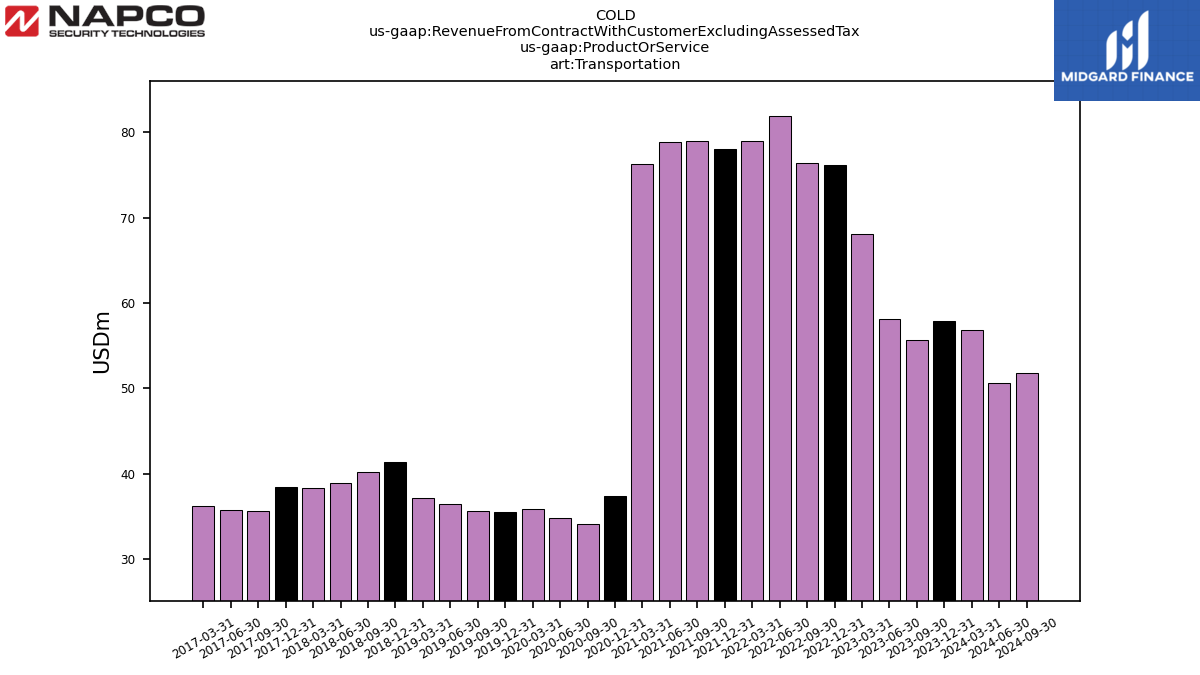
| Operating, Transportation | 57.88 | 55.64 | 58.07 | 68.08 | 76.19 | 76.37 | 81.89 | 78.91 | 78.04 | 78.98 | 78.80 | 76.27 | 37.33 | 34.10 | 34.86 | 35.92 | 35.57 | 35.69 | 36.49 | 37.10 | 41.36 | 40.19 | 38.89 | 38.34 | 38.41 | 35.69 | 35.80 | 36.18 | |
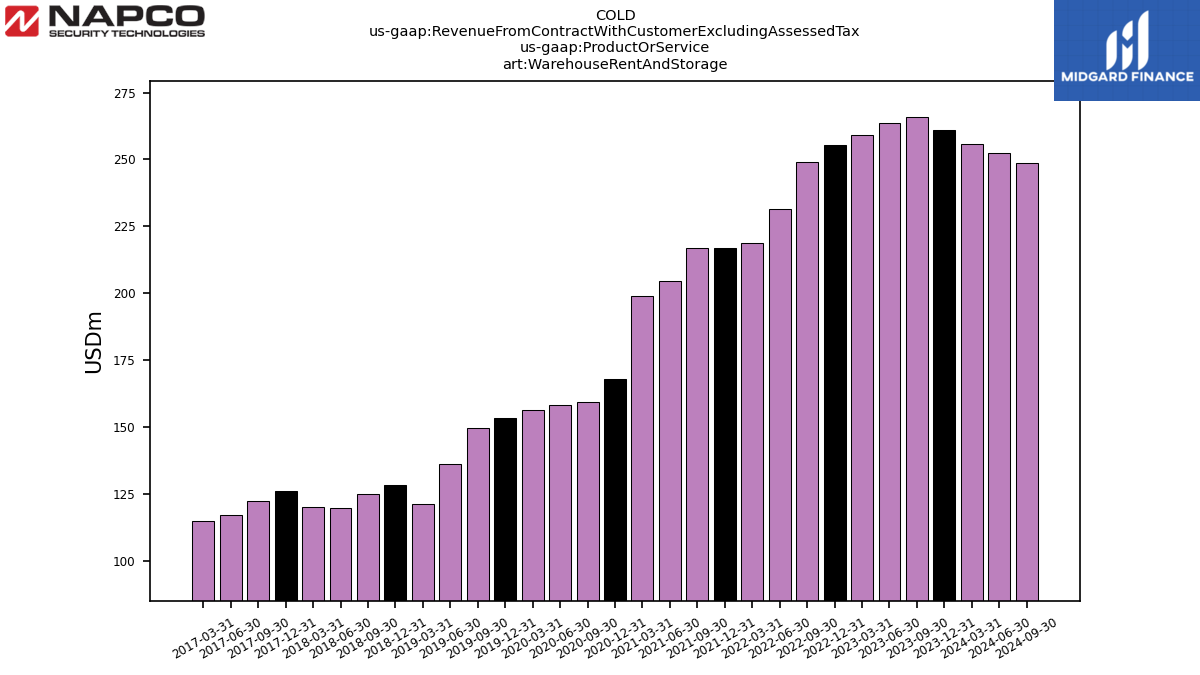
| Operating, Warehouse | 612.26 | 602.61 | 581.17 | 595.05 | 598.69 | 598.98 | 564.38 | 540.92 | 554.15 | 542.05 | 503.73 | 485.45 | 407.81 | 388.02 | 372.41 | 381.07 | 383.78 | 365.59 | 338.23 | 289.62 | 305.46 | 297.23 | 287.71 | 286.52 | 297.60 | 290.59 | 281.66 | 275.81 | |
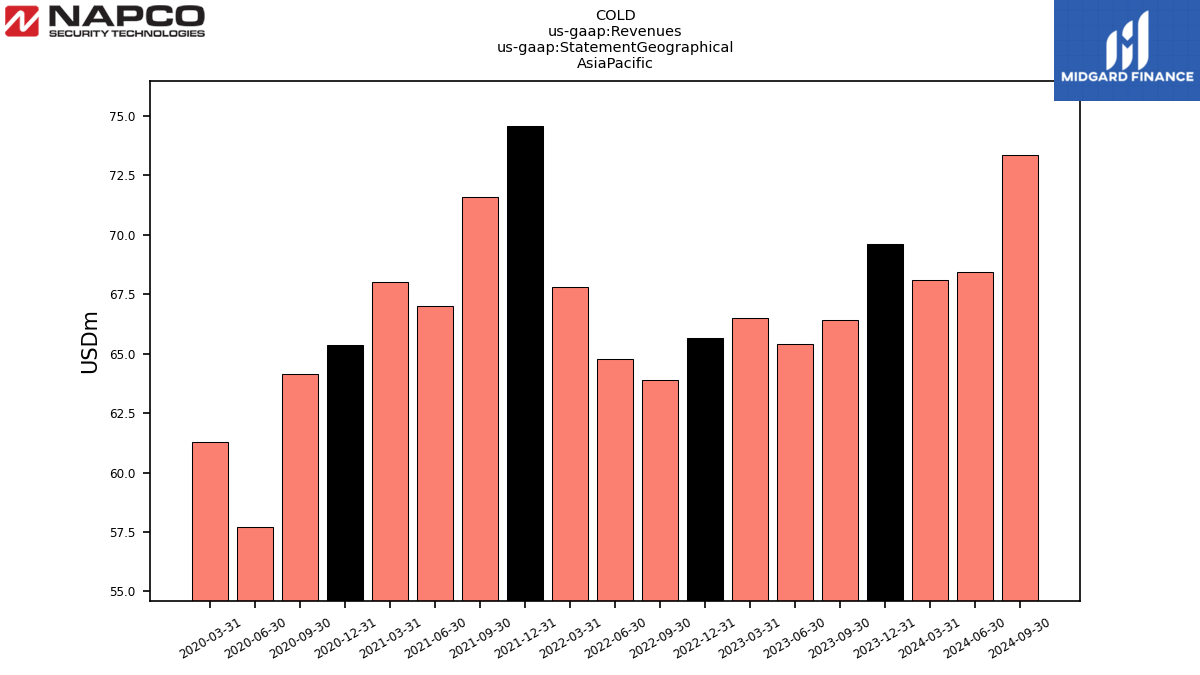
| 69.63 | 66.40 | 65.42 | 66.50 | 65.65 | 63.87 | 64.78 | 67.82 | 74.56 | 71.61 | 67.00 | 67.99 | 65.34 | 64.15 | 57.73 | 61.27 | NA | NA | NA | NA | NA | NA | NA | NA | NA | NA | NA | NA | ||
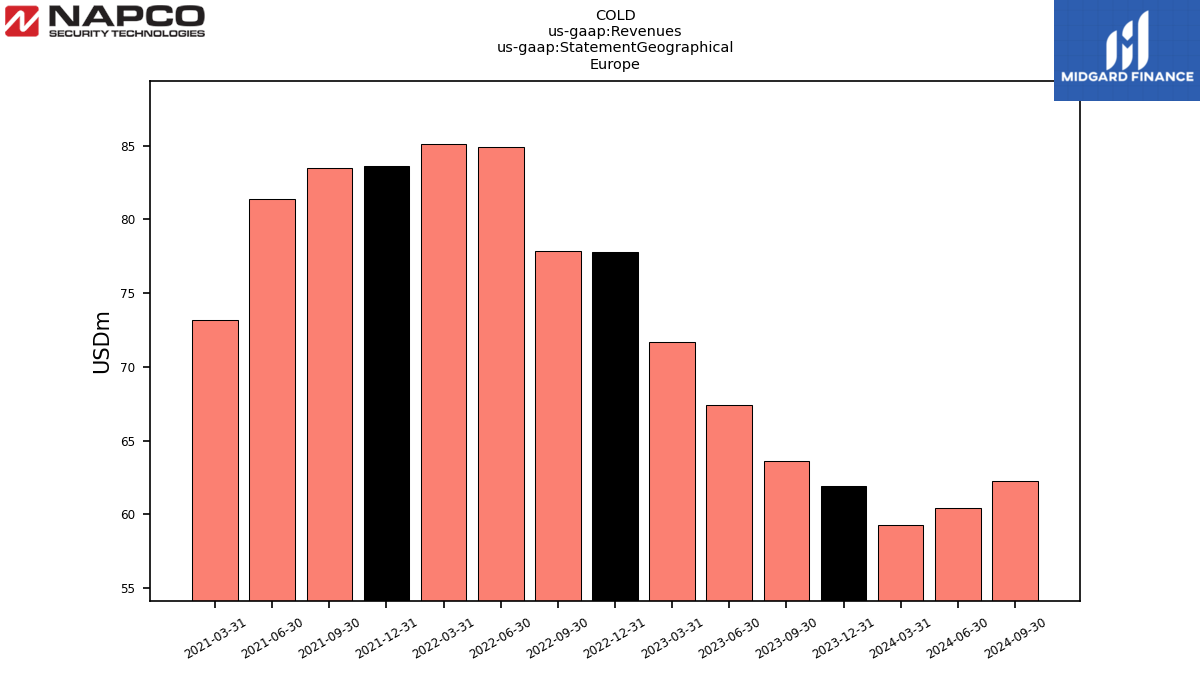
| 61.94 | 63.63 | 67.38 | 71.67 | 77.79 | 77.86 | 84.93 | 85.14 | 83.64 | 83.48 | 81.39 | 73.20 | NA | NA | NA | NA | NA | NA | NA | NA | NA | NA | NA | NA | NA | NA | NA | NA | ||
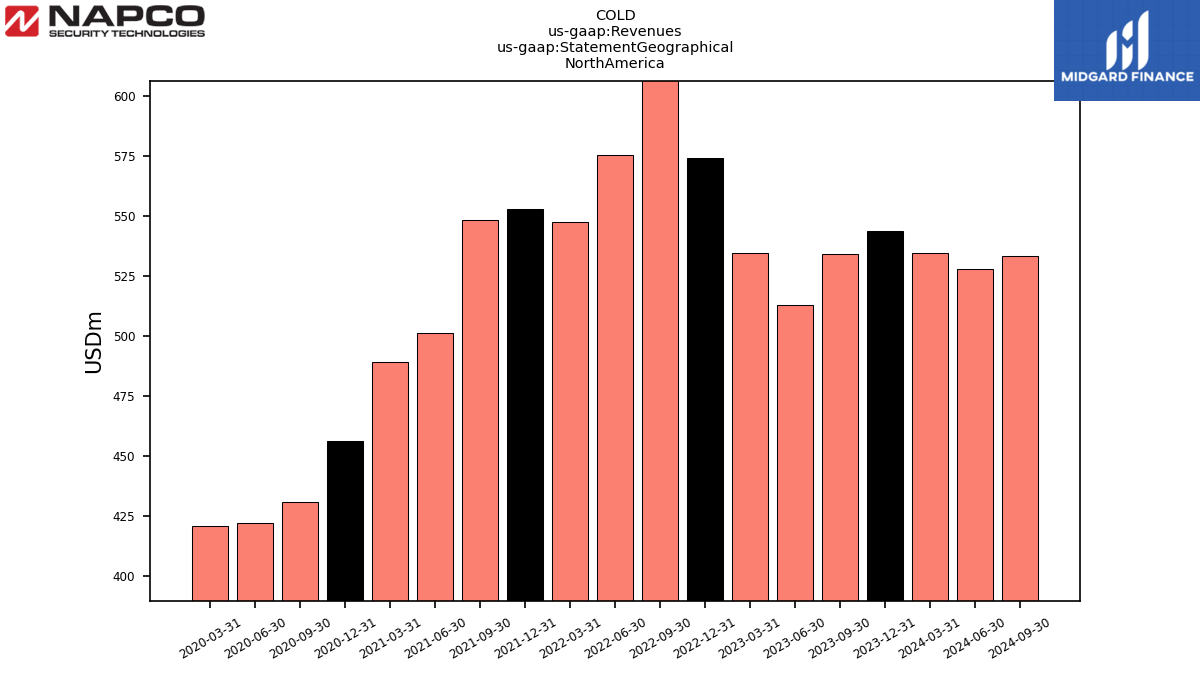
| 543.75 | 534.02 | 512.98 | 534.71 | 574.11 | 612.31 | 575.34 | 547.73 | 552.93 | 548.50 | 501.34 | 489.28 | 456.07 | 430.72 | 422.22 | 420.64 | NA | NA | NA | NA | NA | NA | NA | NA | NA | NA | NA | NA | ||
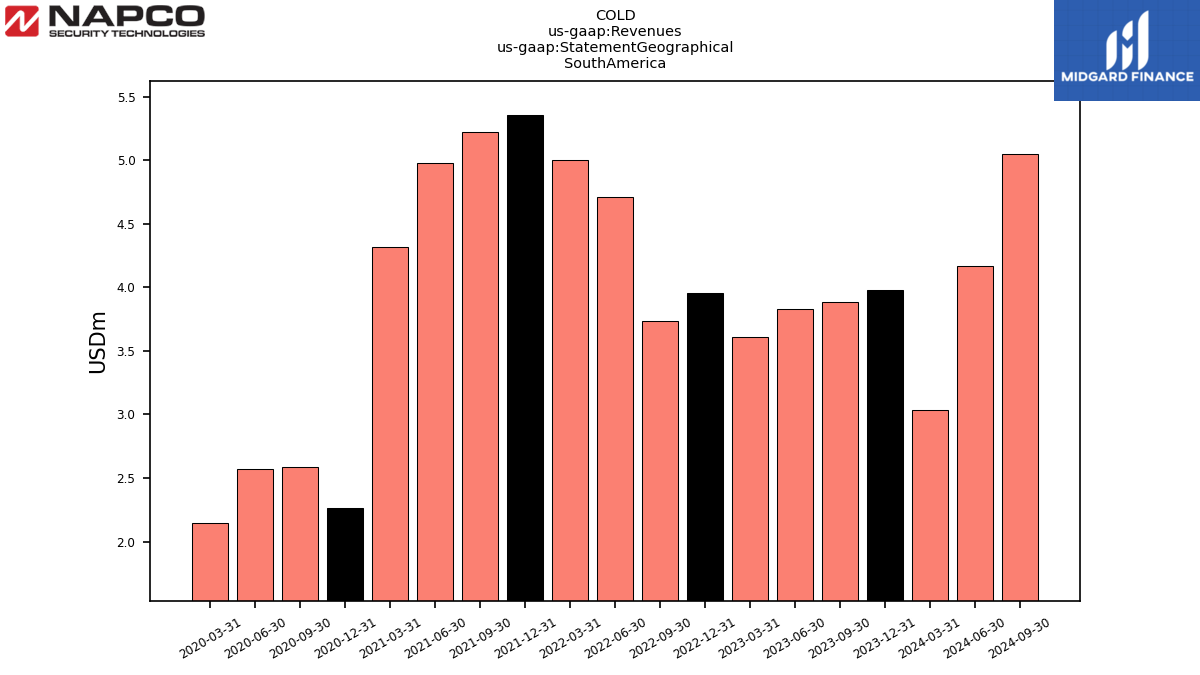
| 3.98 | 3.88 | 3.83 | 3.61 | 3.96 | 3.73 | 4.71 | 5.00 | 5.36 | 5.22 | 4.98 | 4.32 | 2.26 | 2.59 | 2.57 | 2.15 | NA | NA | NA | NA | NA | NA | NA | NA | NA | NA | NA | NA | ||
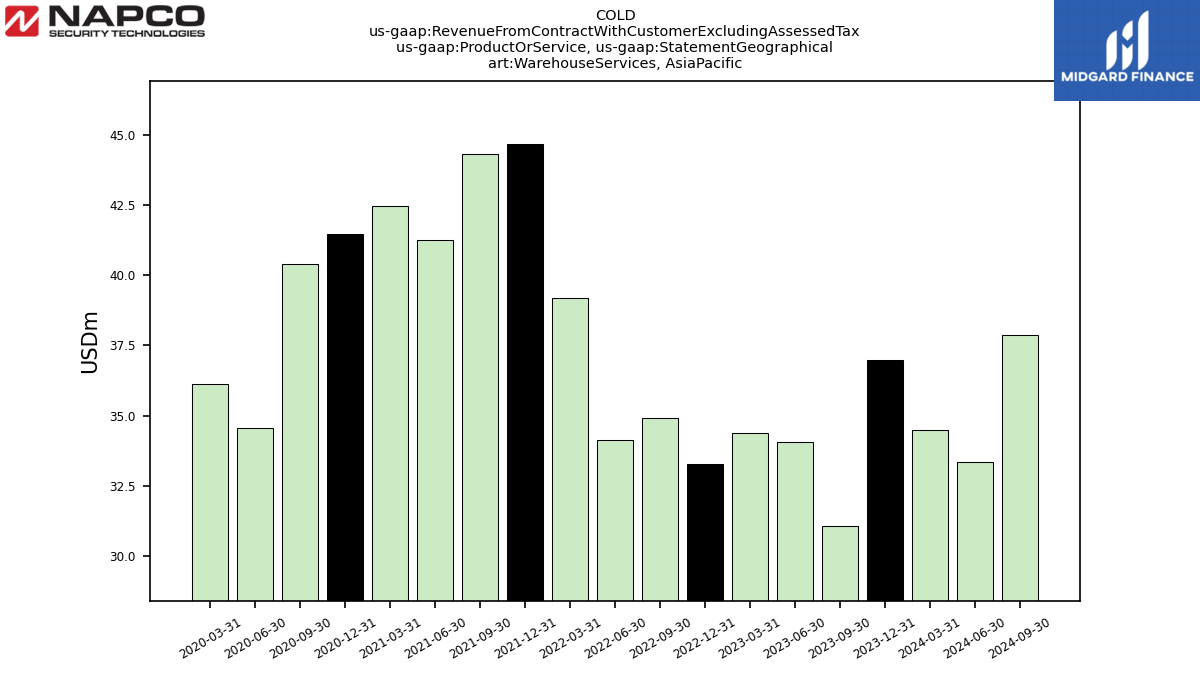
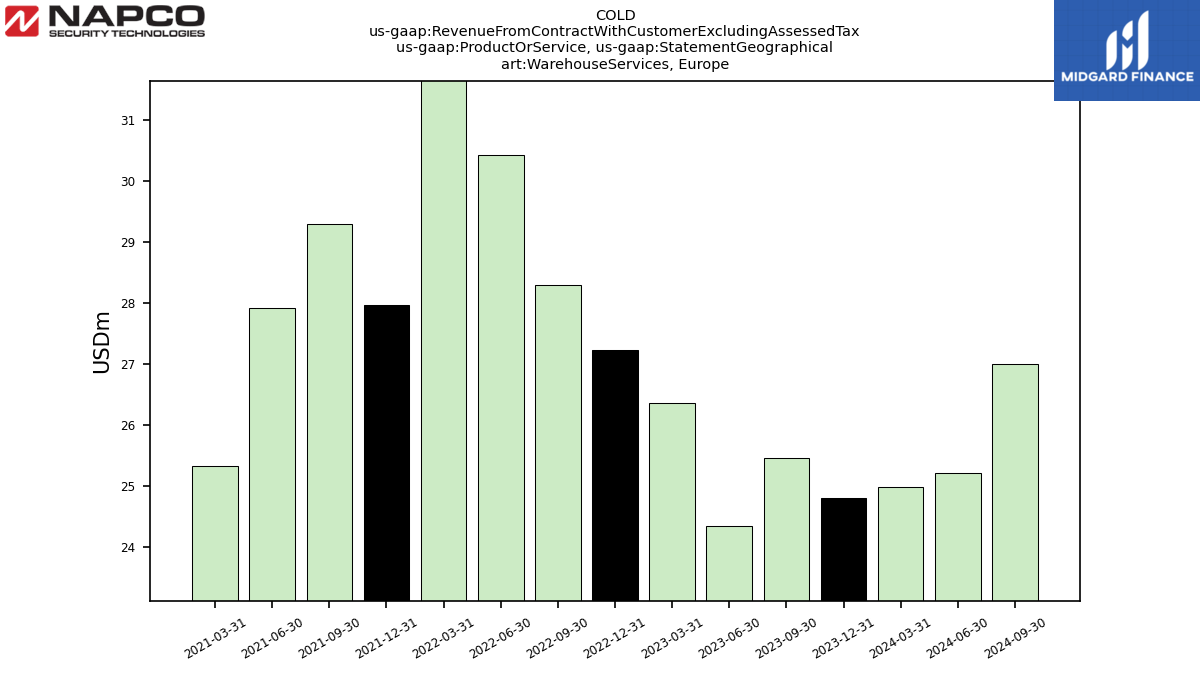
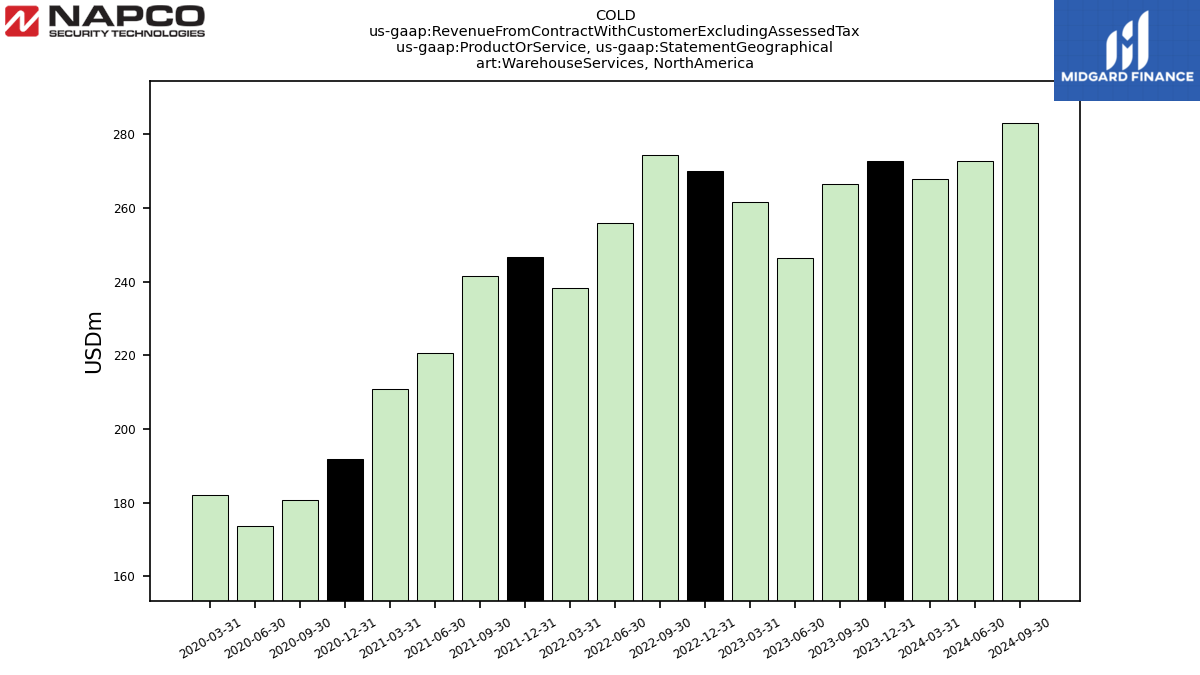
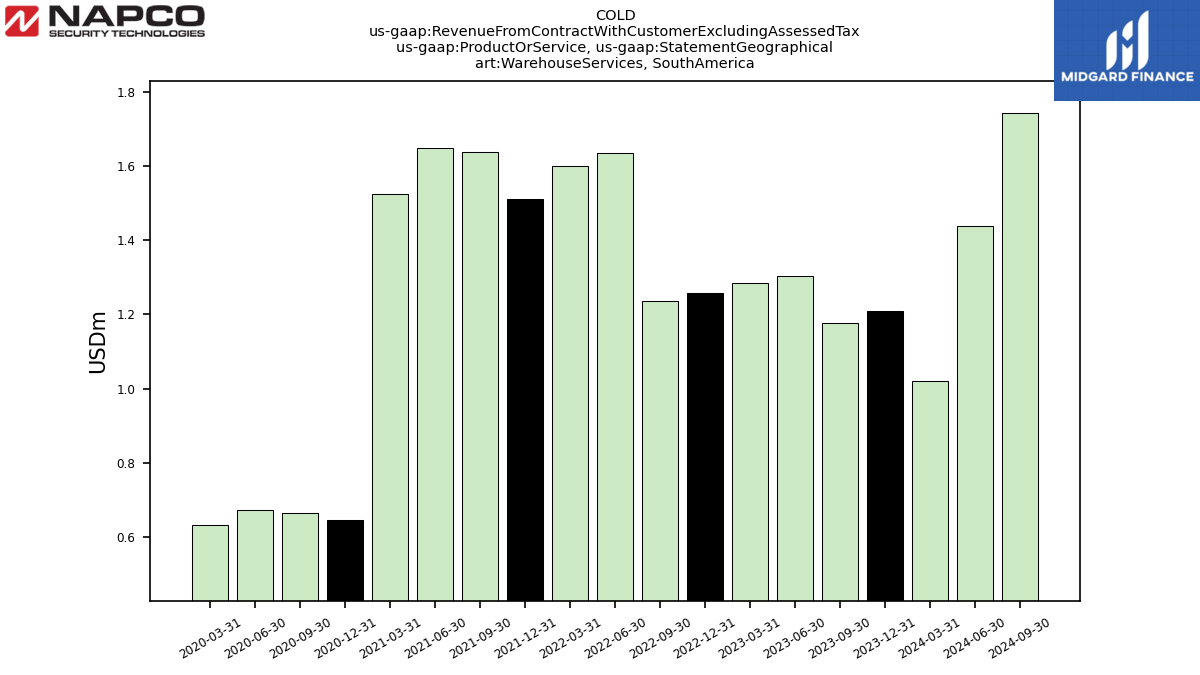
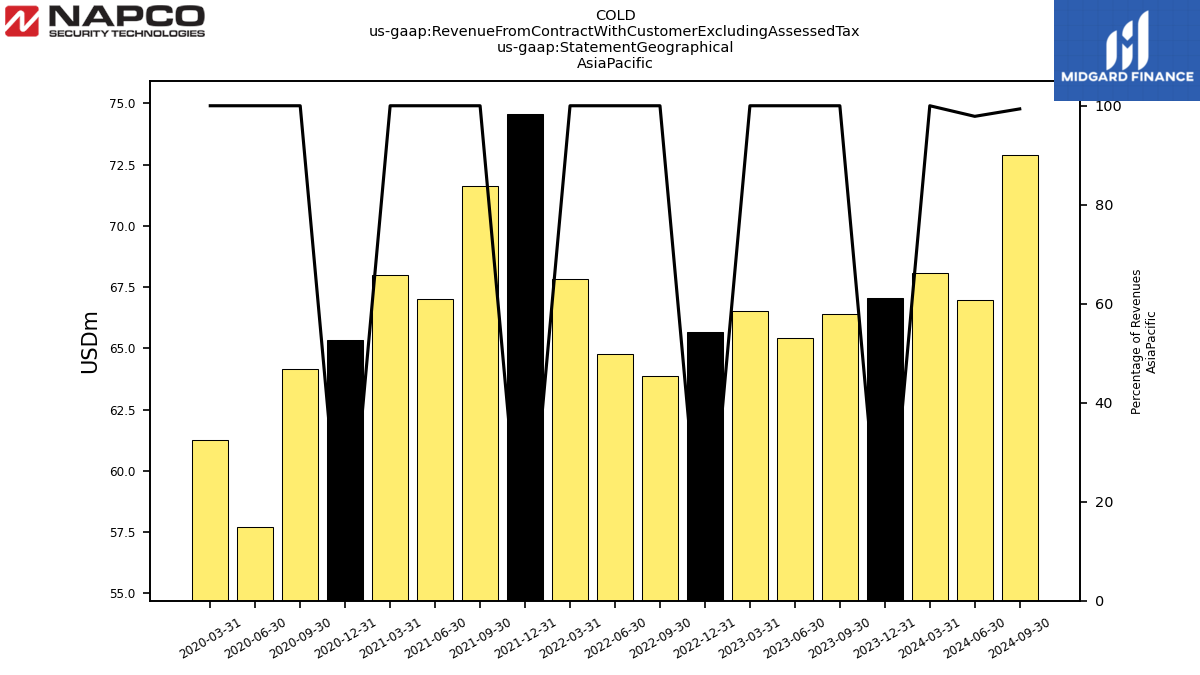
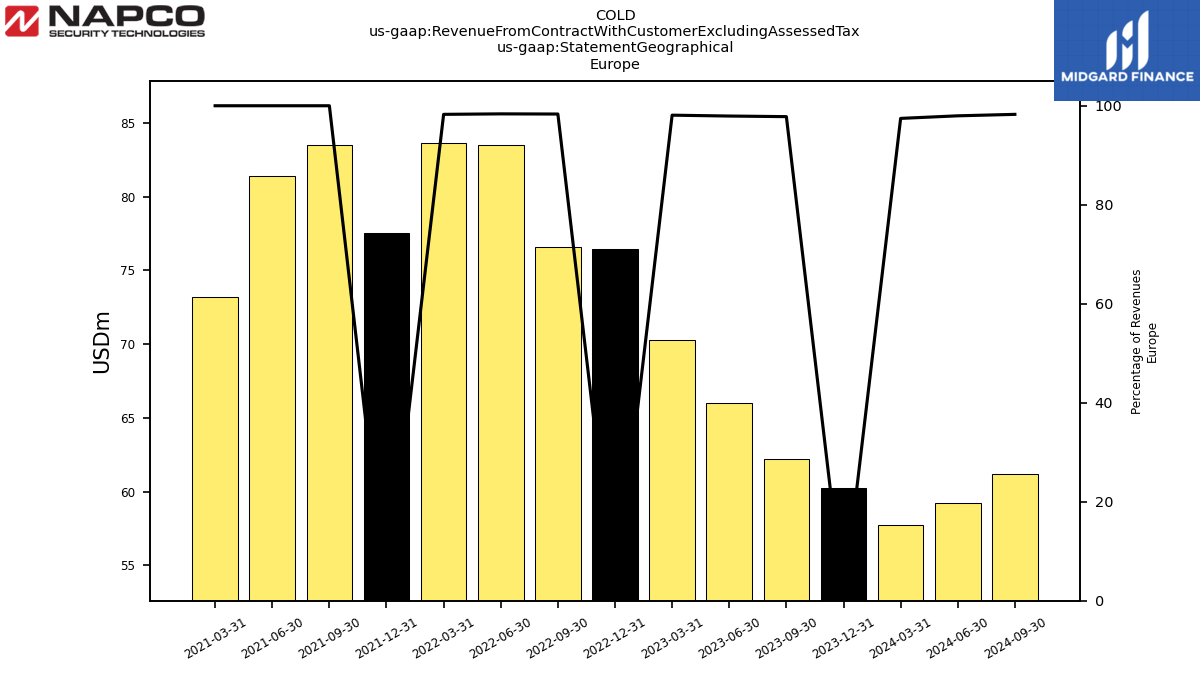
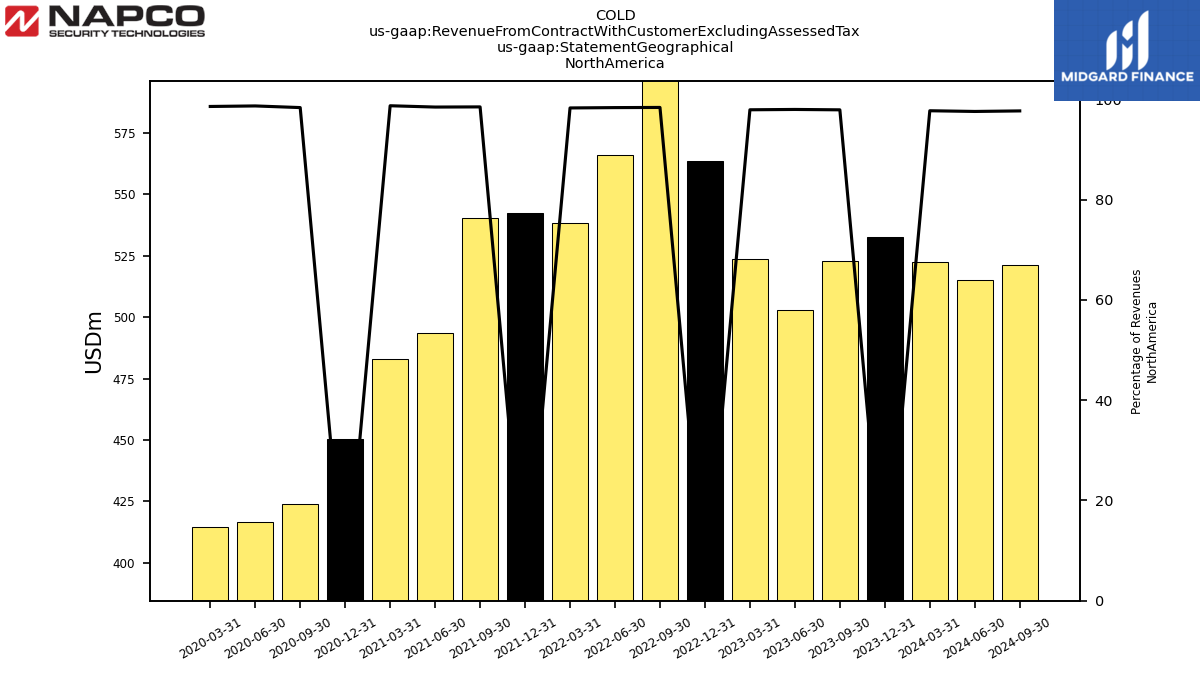
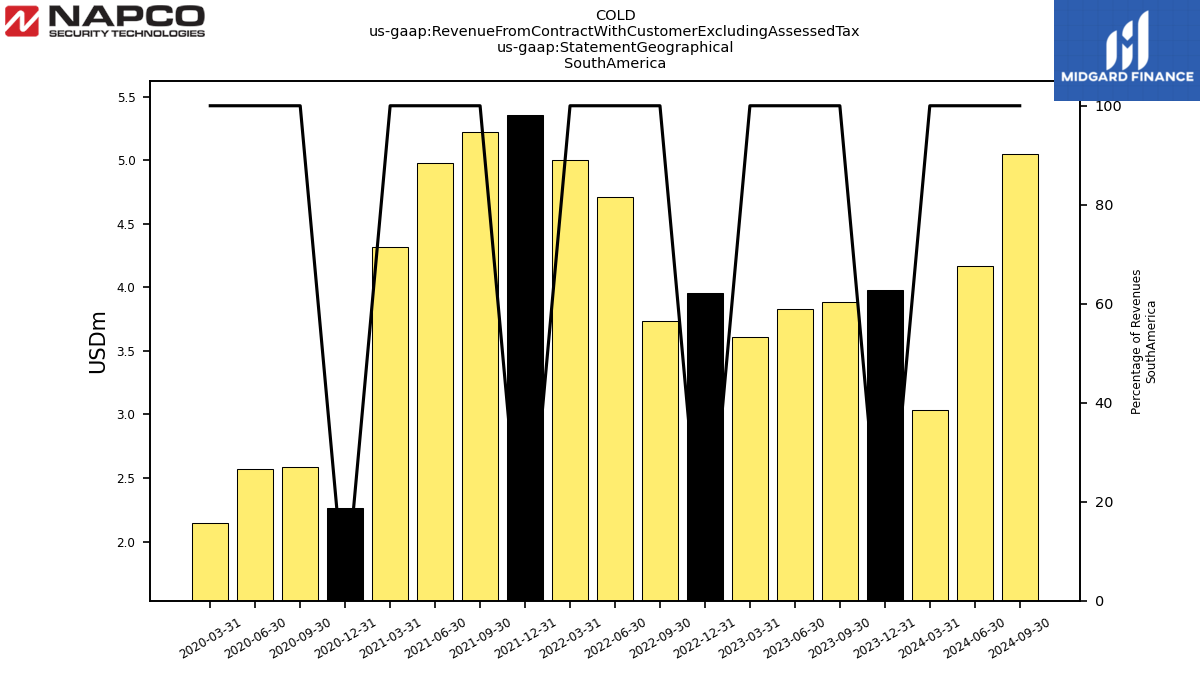
| Revenue From Contract With Customer Excluding Assessed Tax | 663.78 | 655.45 | 637.94 | 664.08 | 709.79 | 746.68 | 718.97 | 694.90 | 699.87 | 700.63 | 647.07 | 628.62 | 517.85 | 490.45 | 477.04 | 478.15 | 485.98 | 459.75 | 432.70 | 387.98 | 415.82 | 396.78 | 389.25 | 385.48 | 401.72 | 384.00 | 374.21 | 368.06 | |
| Third Party Managed | 9.15 | 9.69 | 10.37 | 13.36 | 46.62 | 82.44 | 83.49 | 85.86 | 84.28 | 87.78 | 72.17 | 73.07 | 78.54 | 75.34 | 72.95 | 64.92 | 64.44 | 62.85 | 61.52 | 64.12 | 66.80 | 62.50 | 65.70 | 63.83 | 63.58 | 60.51 | 59.59 | 58.32 | |
| Transportation | 57.88 | 55.64 | 58.07 | 68.08 | 76.19 | 76.37 | 81.89 | 78.91 | 78.04 | 78.98 | 78.80 | 76.27 | 37.33 | 34.10 | 34.86 | 35.92 | 35.57 | 35.69 | 36.49 | 37.10 | 41.36 | 40.19 | 38.89 | 38.34 | 38.41 | 35.69 | 35.80 | 36.18 | |
| Warehouse Rent And Storage | 261.13 | 266.02 | 263.52 | 258.99 | 255.31 | 249.15 | 231.56 | 218.97 | 216.76 | 217.05 | 204.64 | 199.10 | 167.99 | 159.34 | 158.18 | 156.40 | 153.30 | 149.57 | 136.27 | 121.31 | 128.45 | 124.87 | 119.97 | 120.12 | 126.08 | 122.37 | 117.24 | 114.87 | |
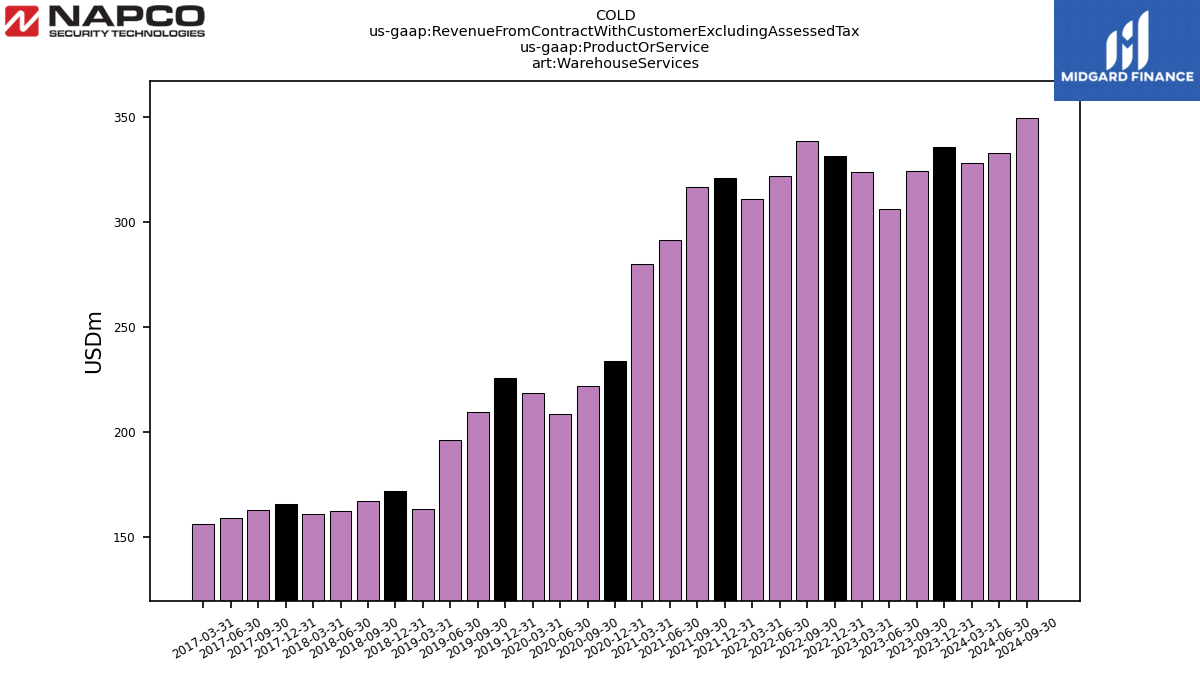
| Warehouse Services | 335.62 | 324.10 | 305.99 | 323.64 | 331.66 | 338.73 | 322.03 | 311.17 | 320.79 | 316.81 | 291.46 | 280.18 | 233.99 | 221.67 | 208.75 | 218.76 | 225.67 | 209.59 | 196.22 | 163.24 | 171.81 | 167.18 | 162.38 | 160.79 | 165.90 | 162.77 | 159.24 | 156.14 | |
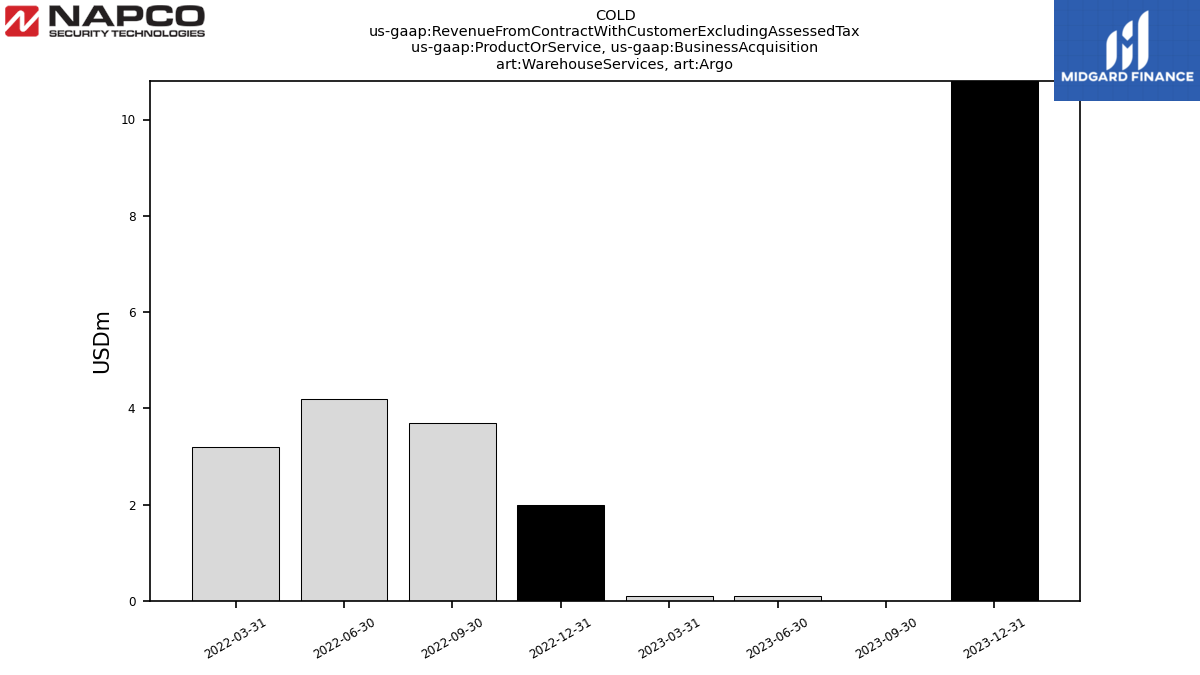
| Warehouse Services, Argo | 10.80 | 0.00 | 0.10 | 0.10 | 2.00 | 3.70 | 4.20 | 3.20 | NA | NA | NA | NA | NA | NA | NA | NA | NA | NA | NA | NA | NA | NA | NA | NA | NA | NA | NA | NA | |
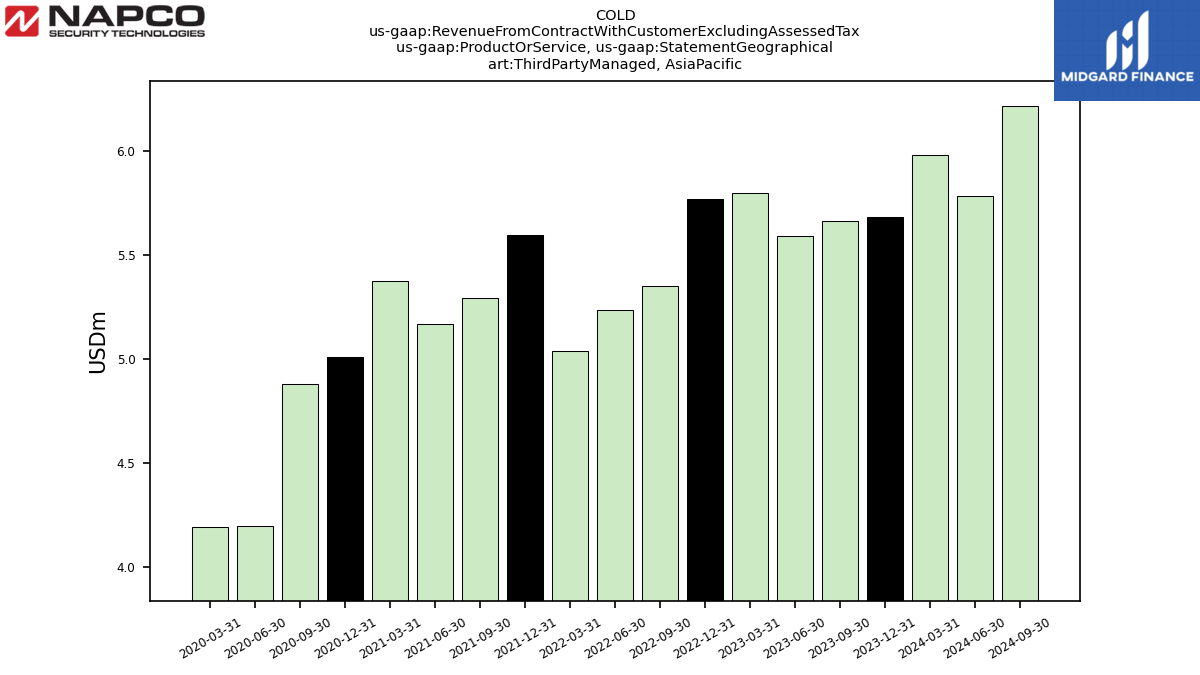
| Third Party Managed, | 5.68 | 5.66 | 5.59 | 5.80 | 5.77 | 5.35 | 5.24 | 5.04 | 5.60 | 5.29 | 5.17 | 5.38 | 5.01 | 4.88 | 4.20 | 4.20 | NA | NA | NA | NA | NA | NA | NA | NA | NA | NA | NA | NA | |
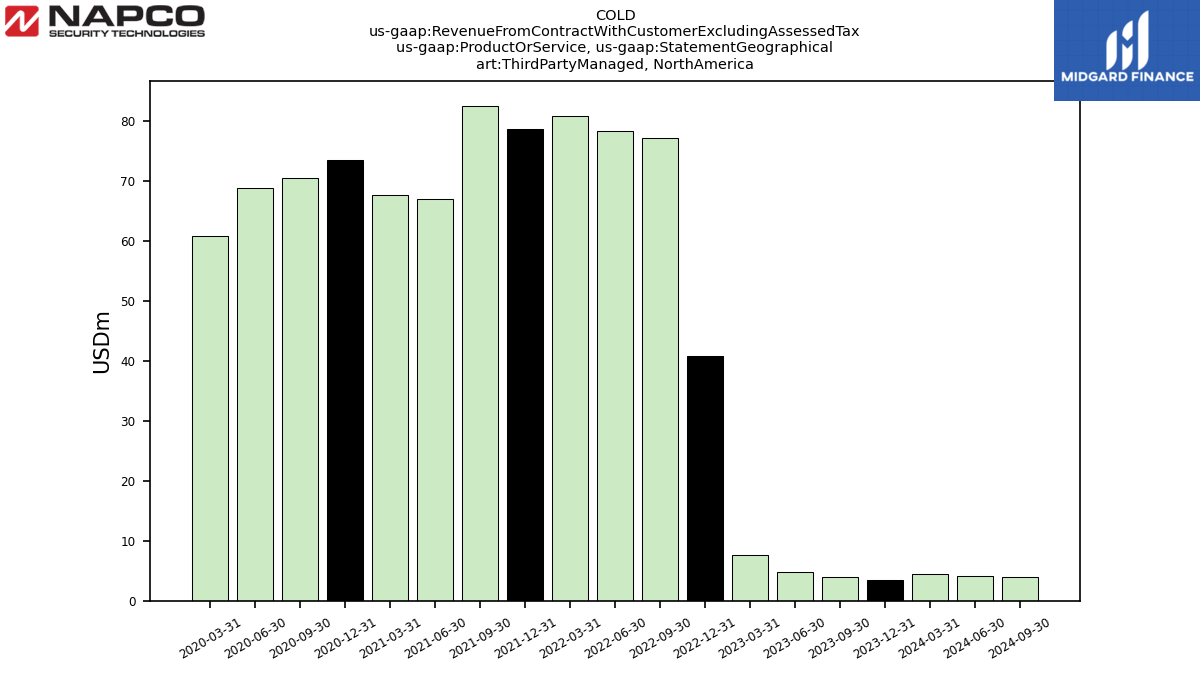
| Third Party Managed, | 3.47 | 4.03 | 4.78 | 7.56 | 40.86 | 77.08 | 78.25 | 80.82 | 78.69 | 82.49 | 67.01 | 67.70 | 73.53 | 70.46 | 68.76 | 60.73 | NA | NA | NA | NA | NA | NA | NA | NA | NA | NA | NA | NA | |
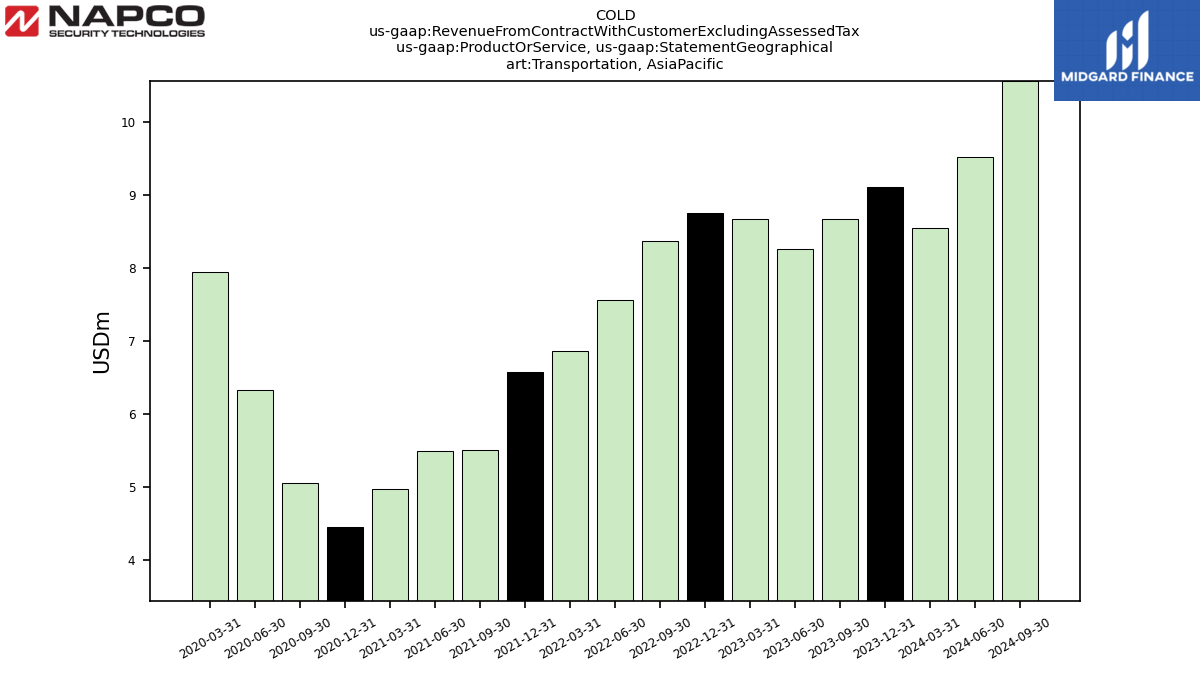
| Transportation, | 9.12 | 8.67 | 8.26 | 8.67 | 8.75 | 8.38 | 7.56 | 6.86 | 6.58 | 5.51 | 5.50 | 4.97 | 4.46 | 5.05 | 6.33 | 7.95 | NA | NA | NA | NA | NA | NA | NA | NA | NA | NA | NA | NA | |
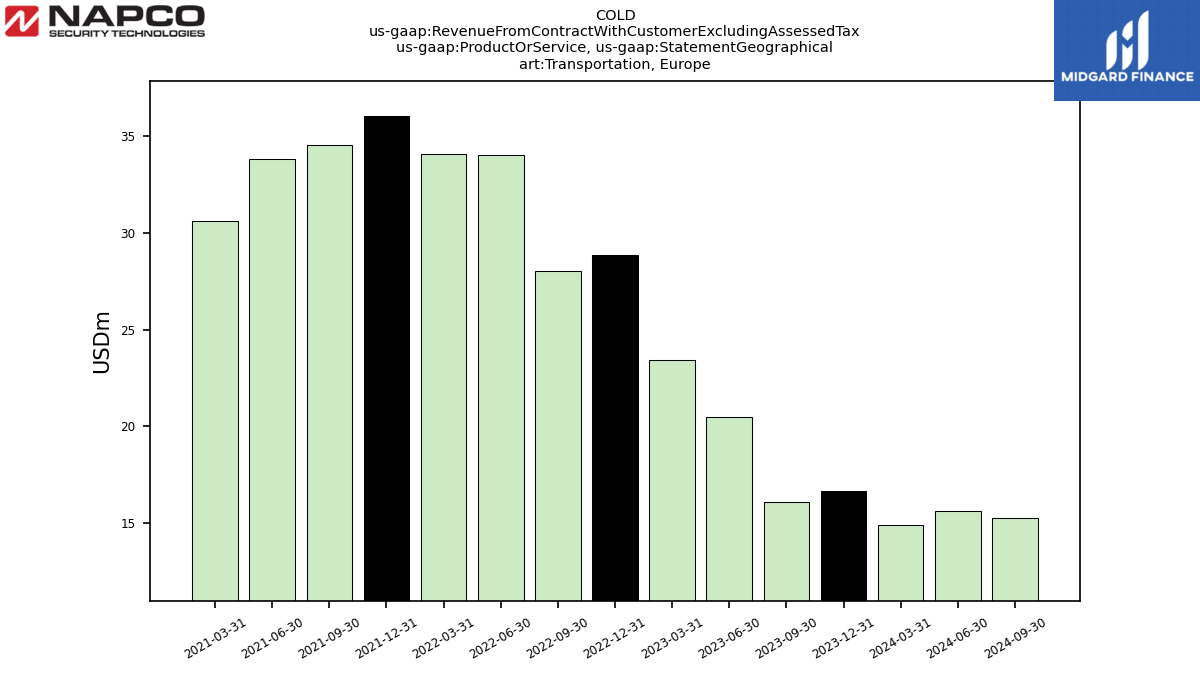
| Transportation, | 16.67 | 16.08 | 20.48 | 23.41 | 28.89 | 28.02 | 34.04 | 34.11 | 36.07 | 34.55 | 33.84 | 30.61 | NA | NA | NA | NA | NA | NA | NA | NA | NA | NA | NA | NA | NA | NA | NA | NA | |
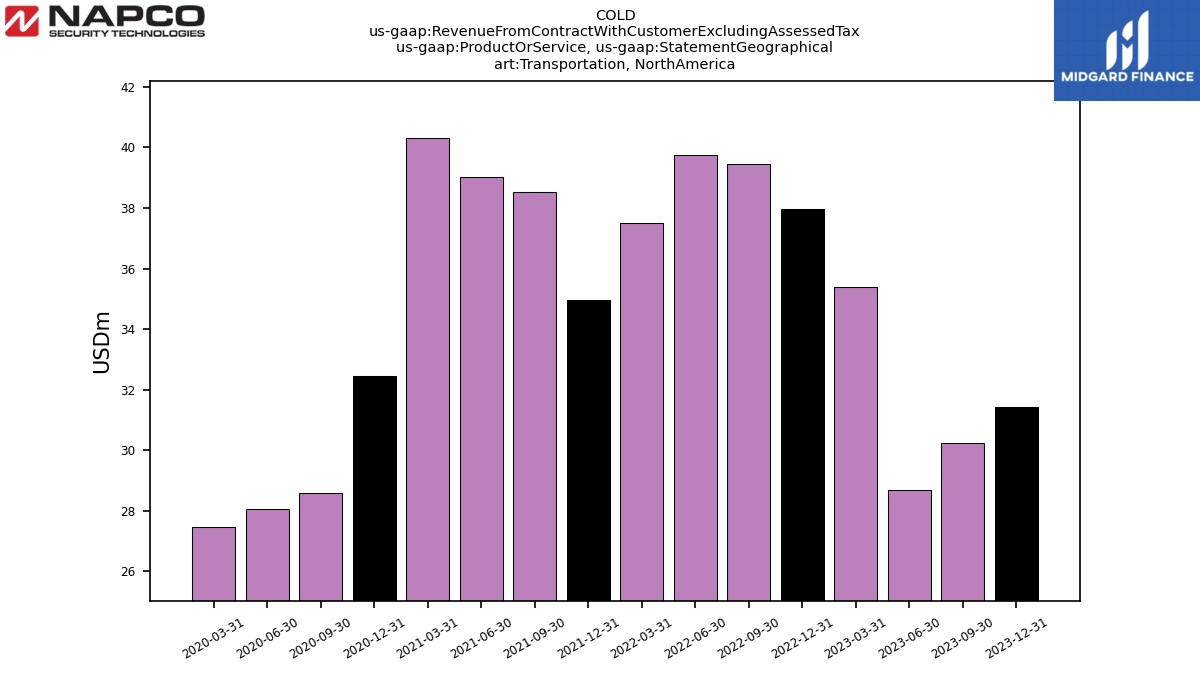
| Transportation, | 31.45 | 30.25 | 28.68 | 35.38 | 37.98 | 39.46 | 39.74 | 37.49 | 34.96 | 38.51 | 39.04 | 40.31 | 32.44 | 28.58 | 28.07 | 27.48 | NA | NA | NA | NA | NA | NA | NA | NA | NA | NA | NA | NA | |
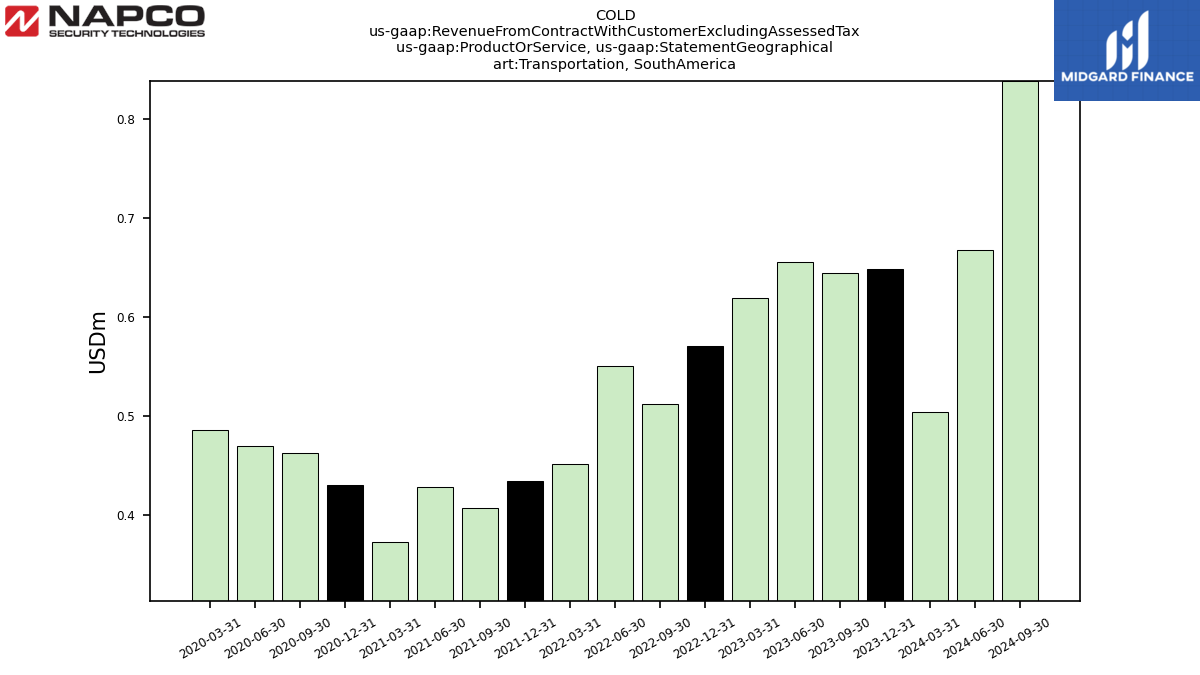
| Transportation, | 0.65 | 0.64 | 0.66 | 0.62 | 0.57 | 0.51 | 0.55 | 0.45 | 0.43 | 0.41 | 0.43 | 0.37 | 0.43 | 0.46 | 0.47 | 0.48 | NA | NA | NA | NA | NA | NA | NA | NA | NA | NA | NA | NA | |
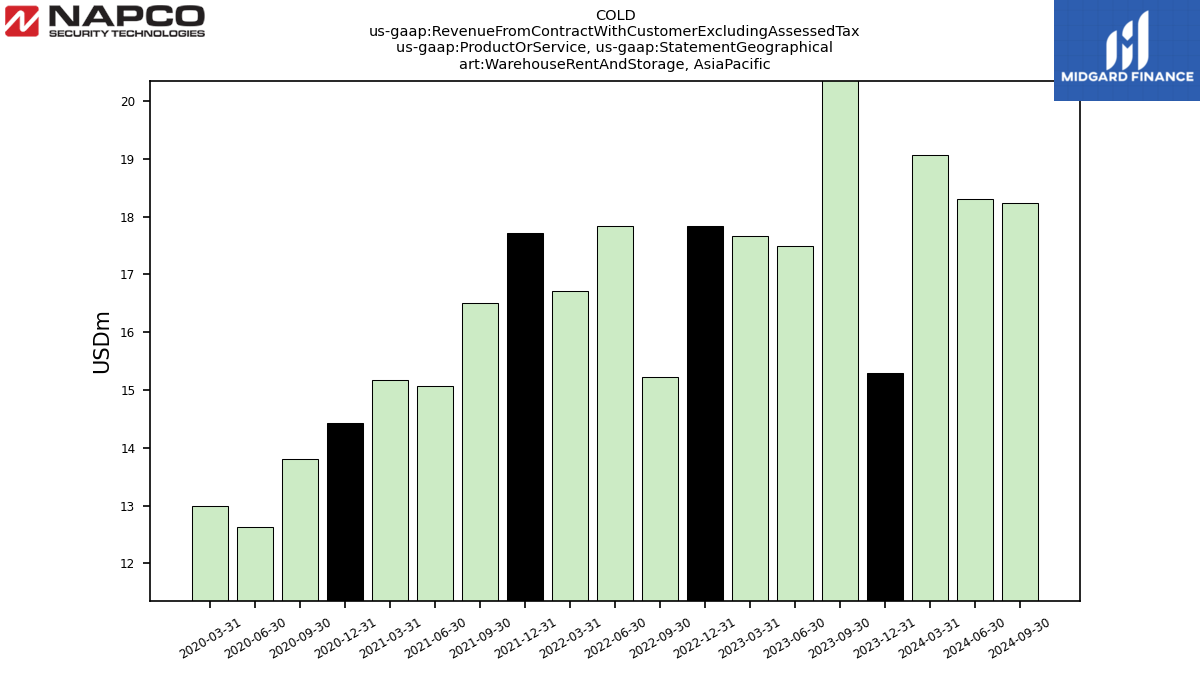
| Warehouse Rent And Storage, | 15.29 | 20.99 | 17.49 | 17.66 | 17.84 | 15.22 | 17.84 | 16.72 | 17.71 | 16.50 | 15.08 | 15.18 | 14.42 | 13.80 | 12.64 | 13.00 | NA | NA | NA | NA | NA | NA | NA | NA | NA | NA | NA | NA | |
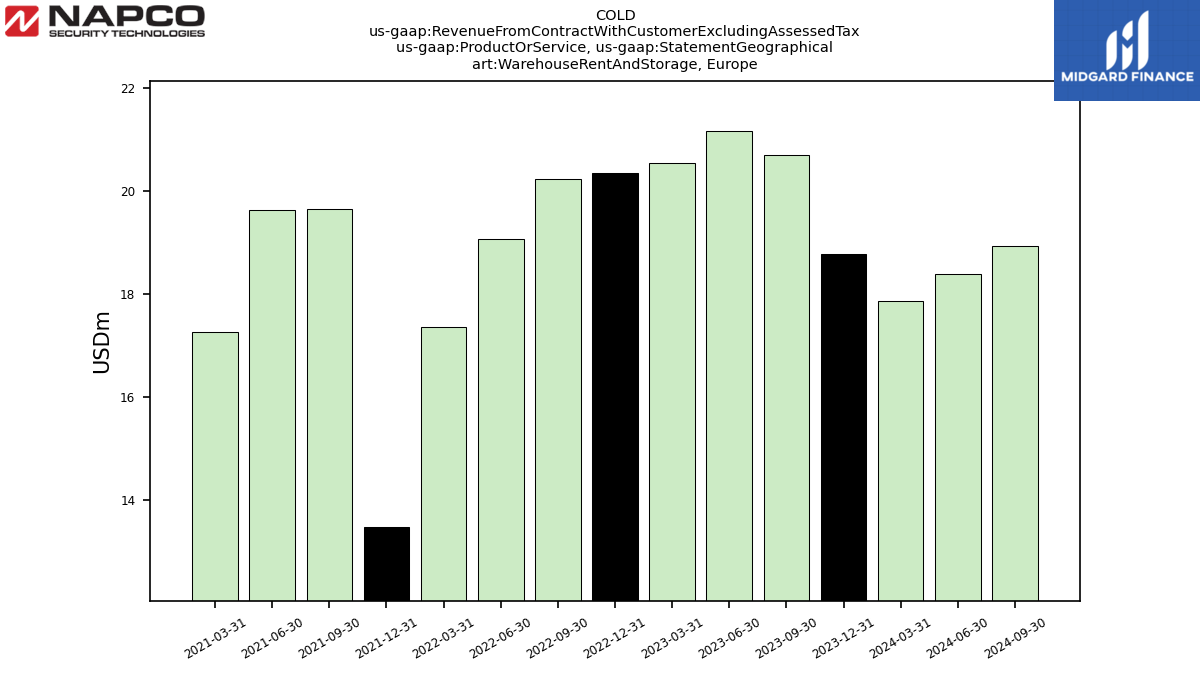
| Warehouse Rent And Storage, | 18.77 | 20.69 | 21.16 | 20.55 | 20.36 | 20.24 | 19.07 | 17.36 | 13.48 | 19.64 | 19.62 | 17.25 | NA | NA | NA | NA | NA | NA | NA | NA | NA | NA | NA | NA | NA | NA | NA | NA | |
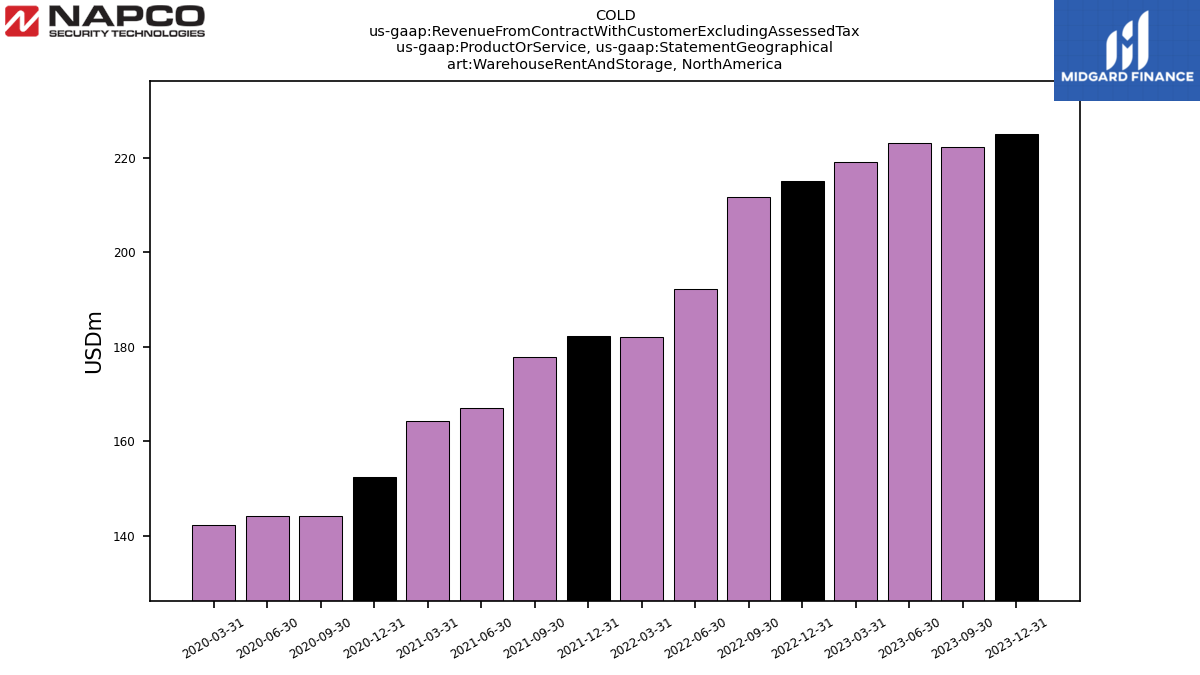
| Warehouse Rent And Storage, | 224.94 | 222.27 | 222.99 | 219.08 | 214.99 | 211.71 | 192.13 | 181.94 | 182.16 | 177.73 | 167.04 | 164.25 | 152.38 | 144.08 | 144.10 | 142.36 | NA | NA | NA | NA | NA | NA | NA | NA | NA | NA | NA | NA | |
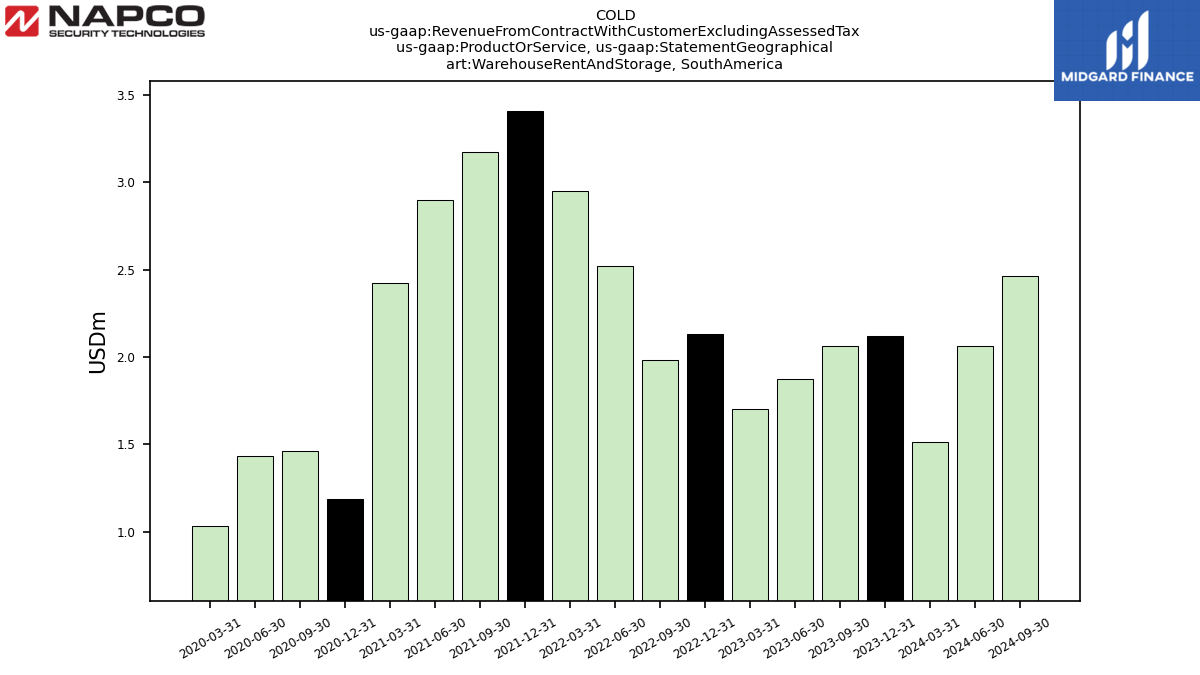
| Warehouse Rent And Storage, | 2.12 | 2.06 | 1.87 | 1.70 | 2.13 | 1.98 | 2.52 | 2.95 | 3.41 | 3.17 | 2.90 | 2.42 | 1.19 | 1.47 | 1.43 | 1.03 | NA | NA | NA | NA | NA | NA | NA | NA | NA | NA | NA | NA | |
| Warehouse Services, | 36.97 | 31.07 | 34.08 | 34.37 | 33.29 | 34.92 | 34.14 | 39.20 | 44.67 | 44.30 | 41.26 | 42.47 | 41.45 | 40.41 | 34.57 | 36.13 | NA | NA | NA | NA | NA | NA | NA | NA | NA | NA | NA | NA | |
| Warehouse Services, | 24.81 | 25.46 | 24.34 | 26.36 | 27.23 | 28.30 | 30.43 | 32.20 | 27.96 | 29.29 | 27.93 | 25.34 | NA | NA | NA | NA | NA | NA | NA | NA | NA | NA | NA | NA | NA | NA | NA | NA | |
| Warehouse Services, | 272.62 | 266.39 | 246.27 | 261.63 | 269.88 | 274.27 | 255.83 | 238.17 | 246.64 | 241.58 | 220.62 | 210.85 | 191.89 | 180.59 | 173.51 | 182.00 | NA | NA | NA | NA | NA | NA | NA | NA | NA | NA | NA | NA | |
| Warehouse Services, | 1.21 | 1.18 | 1.30 | 1.28 | 1.26 | 1.24 | 1.64 | 1.60 | 1.51 | 1.64 | 1.65 | 1.52 | 0.64 | 0.66 | 0.67 | 0.63 | NA | NA | NA | NA | NA | NA | NA | NA | NA | NA | NA | NA | |
| 67.06 | 66.40 | 65.42 | 66.50 | 65.65 | 63.87 | 64.78 | 67.82 | 74.56 | 71.61 | 67.00 | 67.99 | 65.34 | 64.15 | 57.73 | 61.27 | NA | NA | NA | NA | NA | NA | NA | NA | NA | NA | NA | NA | ||
| 60.26 | 62.23 | 65.98 | 70.31 | 76.47 | 76.56 | 83.53 | 83.66 | 77.51 | 83.48 | 81.39 | 73.20 | NA | NA | NA | NA | NA | NA | NA | NA | NA | NA | NA | NA | NA | NA | NA | NA | ||
| 532.48 | 522.93 | 502.72 | 523.66 | 563.71 | 602.51 | 565.95 | 538.42 | 542.45 | 540.32 | 493.70 | 483.10 | 450.24 | 423.71 | 416.73 | 414.73 | NA | NA | NA | NA | NA | NA | NA | NA | NA | NA | NA | NA | ||
| 3.98 | 3.88 | 3.83 | 3.61 | 3.96 | 3.73 | 4.71 | 5.00 | 5.36 | 5.22 | 4.98 | 4.32 | 2.26 | 2.59 | 2.57 | 2.15 | NA | NA | NA | NA | NA | NA | NA | NA | NA | NA | NA | NA |