

| 2024-01-31 | 2023-10-31 | 2023-07-31 | 2023-04-30 | 2023-01-31 | 2022-10-31 | 2022-07-31 | 2022-04-30 | 2022-01-31 | 2021-10-31 | 2021-07-31 | 2021-04-30 | 2021-01-31 | 2020-10-31 | 2020-07-31 | 2020-04-30 | 2020-01-31 | 2019-10-31 | 2019-07-31 | 2019-04-30 | 2019-01-31 | 2018-10-31 | 2018-07-31 | 2018-04-30 | 2018-01-31 | 2017-10-31 | 2017-07-31 | 2017-04-30 | 2017-01-31 | 2016-10-31 | 2016-07-31 | 2016-04-30 | 2016-01-31 | 2015-10-31 | 2015-07-31 | 2015-04-30 | 2015-01-31 | 2014-10-31 | 2014-07-31 | 2014-04-30 | 2014-01-31 | 2013-10-31 | 2013-07-31 | 2013-04-30 | 2013-01-31 | 2012-10-31 | 2012-07-31 | 2012-04-30 | 2012-01-31 | 2011-10-31 | 2011-07-31 | 2011-04-30 | 2011-01-31 | 2010-10-31 | 2010-07-31 | 2010-04-30 | 2010-01-31 | ||
|---|---|---|---|---|---|---|---|---|---|---|---|---|---|---|---|---|---|---|---|---|---|---|---|---|---|---|---|---|---|---|---|---|---|---|---|---|---|---|---|---|---|---|---|---|---|---|---|---|---|---|---|---|---|---|---|---|---|---|
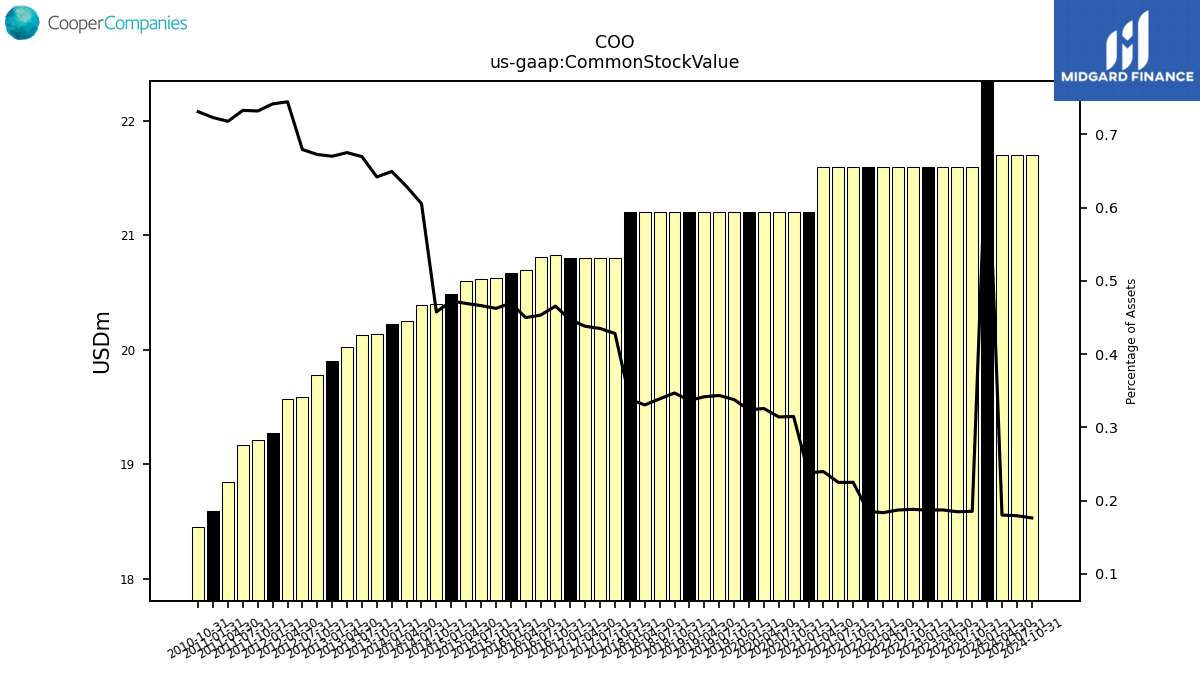
| Common Stock Value | 21.60 | 5.40 | 5.40 | 5.40 | 5.40 | 5.40 | 5.40 | 5.40 | 5.40 | 5.40 | 5.40 | 5.40 | 5.30 | 5.30 | 5.30 | 5.30 | 5.30 | 5.30 | 5.30 | 5.30 | 5.30 | 5.30 | 5.30 | 5.30 | 5.30 | 5.20 | 5.20 | 5.20 | 5.20 | 5.21 | 5.20 | 5.17 | 5.17 | 5.16 | 5.15 | 5.15 | 5.12 | 5.10 | 5.10 | 5.06 | 5.06 | 5.03 | 5.03 | 5.01 | 4.97 | 4.95 | 4.90 | 4.89 | 4.82 | 4.80 | 4.79 | 4.71 | 4.65 | 4.61 | NA | NA | NA | |
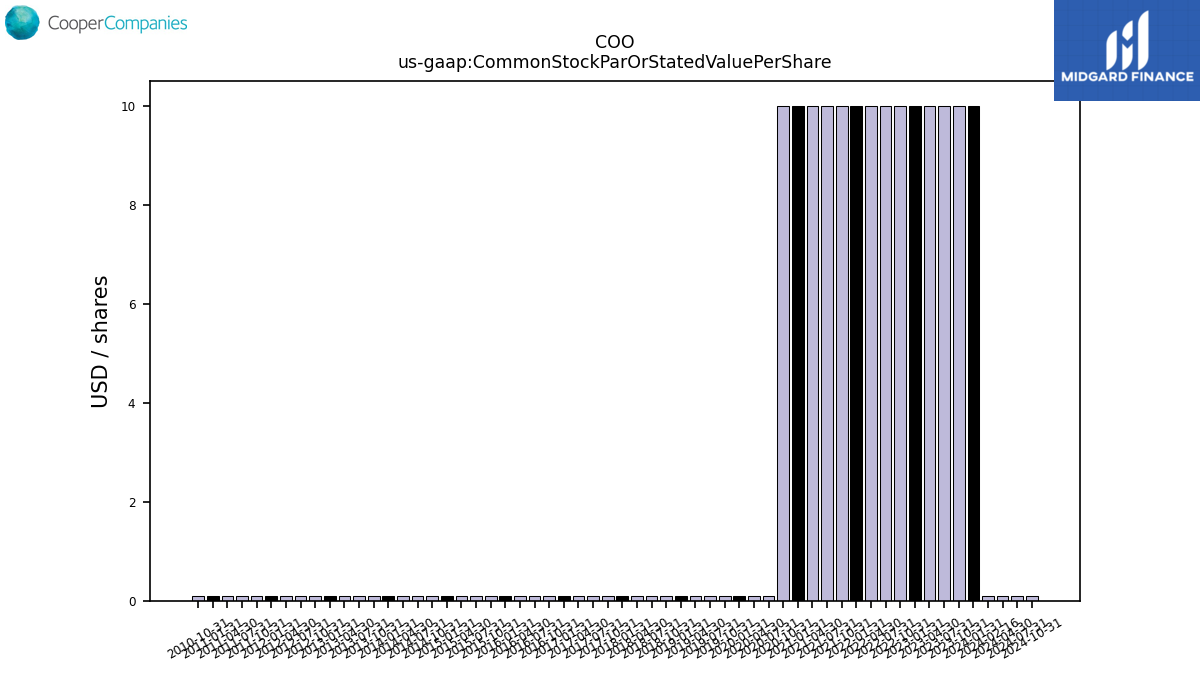
| Common Stock Par Or Stated Value Per Share | 0.00 | 0.00 | 0.00 | 0.00 | 0.00 | 0.00 | 0.00 | 0.00 | 0.00 | 0.00 | 0.00 | 0.00 | 0.00 | 0.00 | 0.00 | 0.00 | 0.00 | 0.00 | 0.00 | 0.00 | 0.00 | 0.00 | 0.00 | 0.00 | 0.00 | 0.00 | 0.00 | 0.00 | 0.00 | 0.00 | 0.00 | 0.00 | 0.00 | 0.00 | 0.00 | 0.00 | 0.00 | 0.00 | 0.00 | 0.00 | 0.00 | 0.00 | 0.00 | 0.00 | 0.00 | 0.00 | 0.00 | 0.00 | 0.00 | 0.00 | 0.00 | 0.00 | 0.00 | 0.00 | NA | NA | NA | |
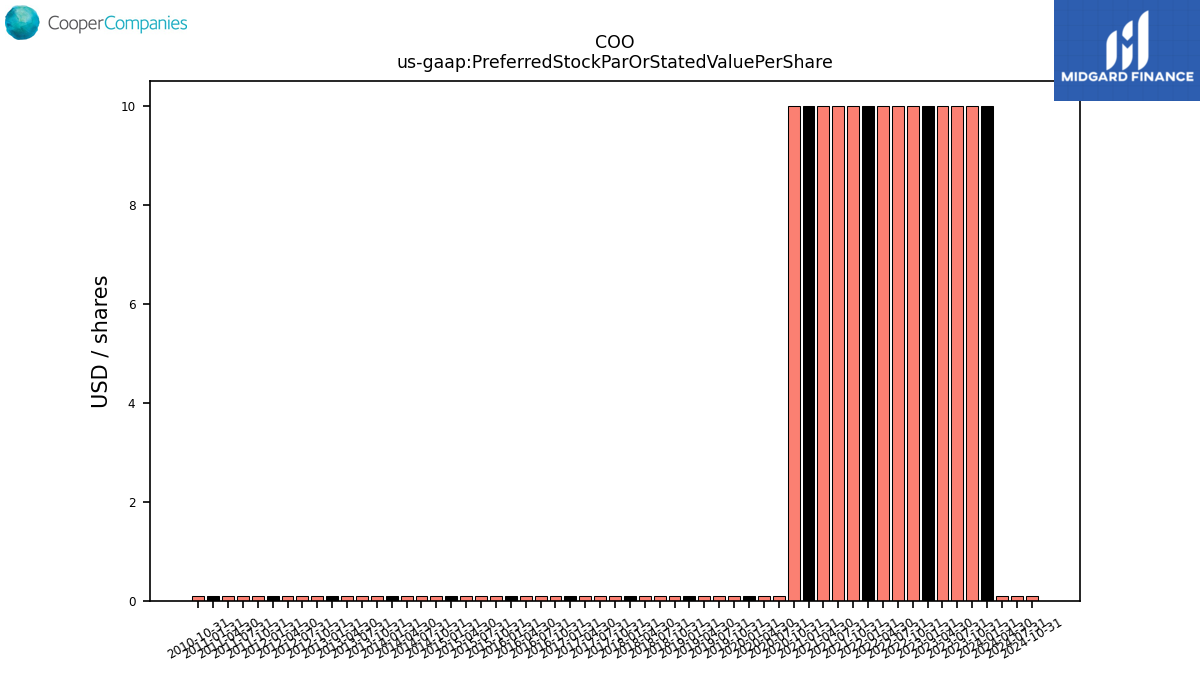
| Preferred Stock Par Or Stated Value Per Share | 0.00 | 0.00 | 0.00 | 0.00 | 0.00 | 0.00 | 0.00 | 0.00 | 0.00 | 0.00 | 0.00 | 0.00 | 0.00 | 0.00 | 0.00 | 0.00 | 0.00 | 0.00 | 0.00 | 0.00 | 0.00 | 0.00 | 0.00 | 0.00 | 0.00 | 0.00 | 0.00 | 0.00 | 0.00 | 0.00 | 0.00 | 0.00 | 0.00 | 0.00 | 0.00 | 0.00 | 0.00 | 0.00 | 0.00 | 0.00 | 0.00 | 0.00 | 0.00 | 0.00 | 0.00 | 0.00 | 0.00 | 0.00 | 0.00 | 0.00 | 0.00 | 0.00 | 0.00 | 0.00 | NA | NA | NA | |
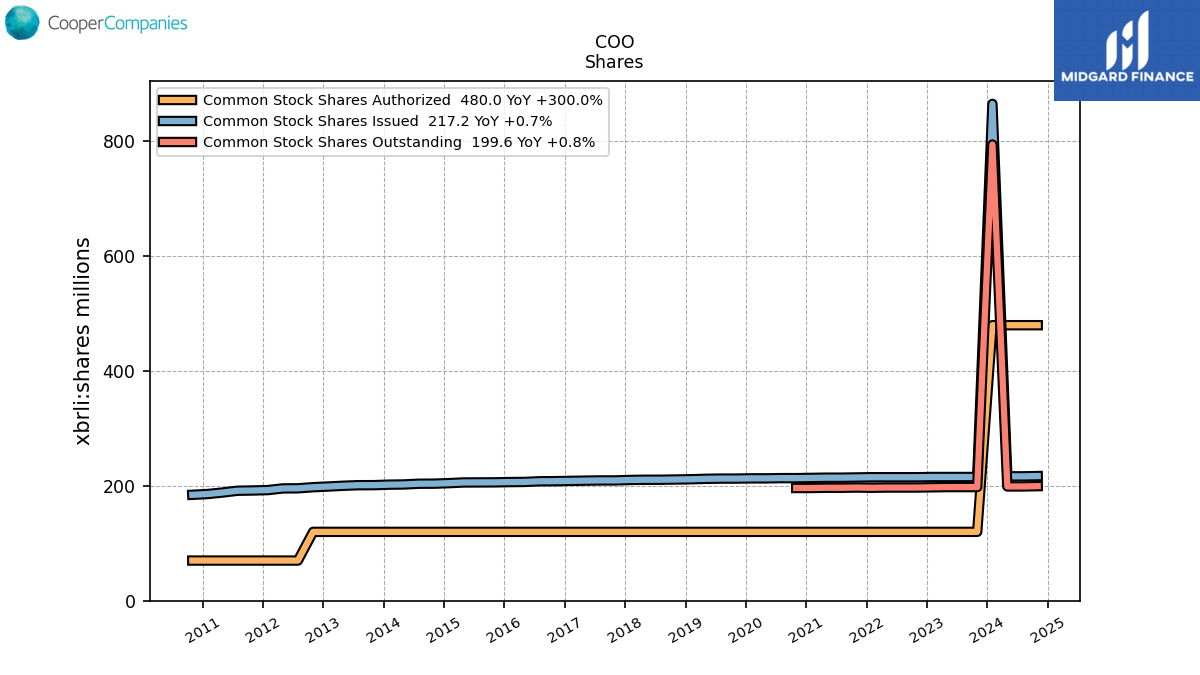
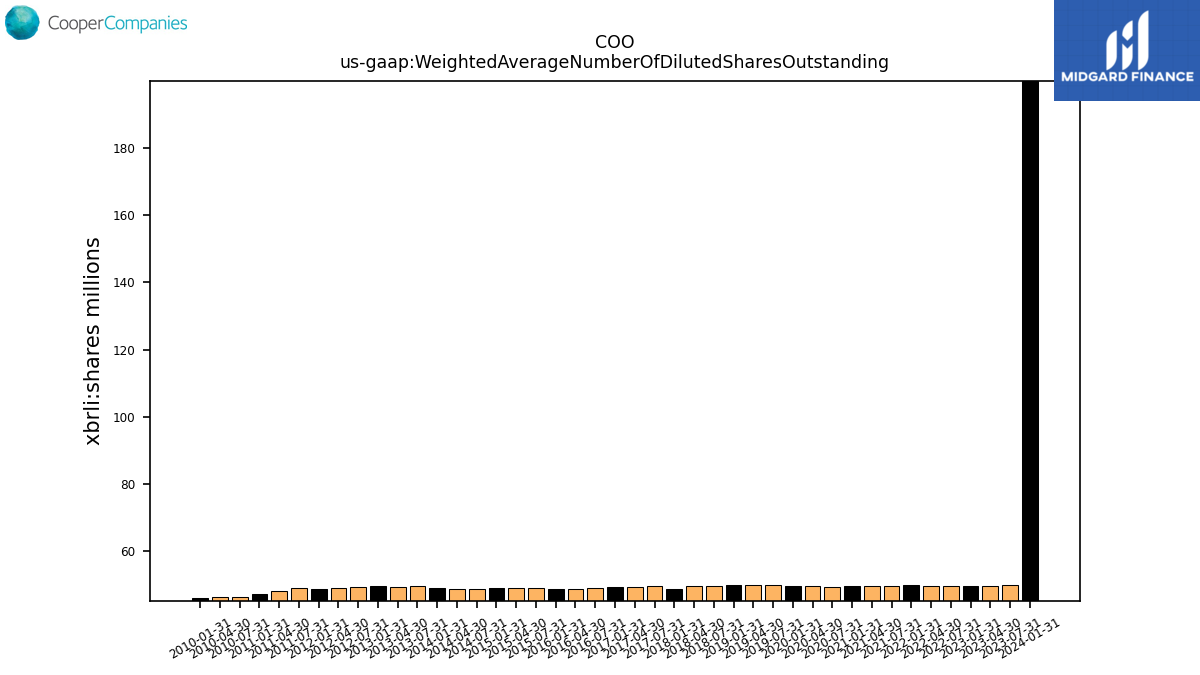
| Weighted Average Number Of Diluted Shares Outstanding | 199.90 | NA | 49.90 | 49.80 | 49.70 | NA | 49.60 | 49.70 | 49.90 | NA | 49.80 | 49.70 | 49.70 | NA | 49.50 | 49.60 | 49.70 | NA | 50.10 | 50.00 | 49.90 | NA | 49.70 | 49.60 | 48.90 | NA | 49.60 | 49.50 | 49.40 | NA | 49.05 | 48.85 | 48.84 | NA | 49.24 | 49.16 | 49.08 | NA | 48.92 | 48.75 | 49.01 | NA | 49.75 | 49.48 | 49.63 | NA | 49.30 | 49.01 | 48.79 | NA | 49.01 | 48.24 | 47.39 | NA | 46.40 | 46.37 | 46.12 | |
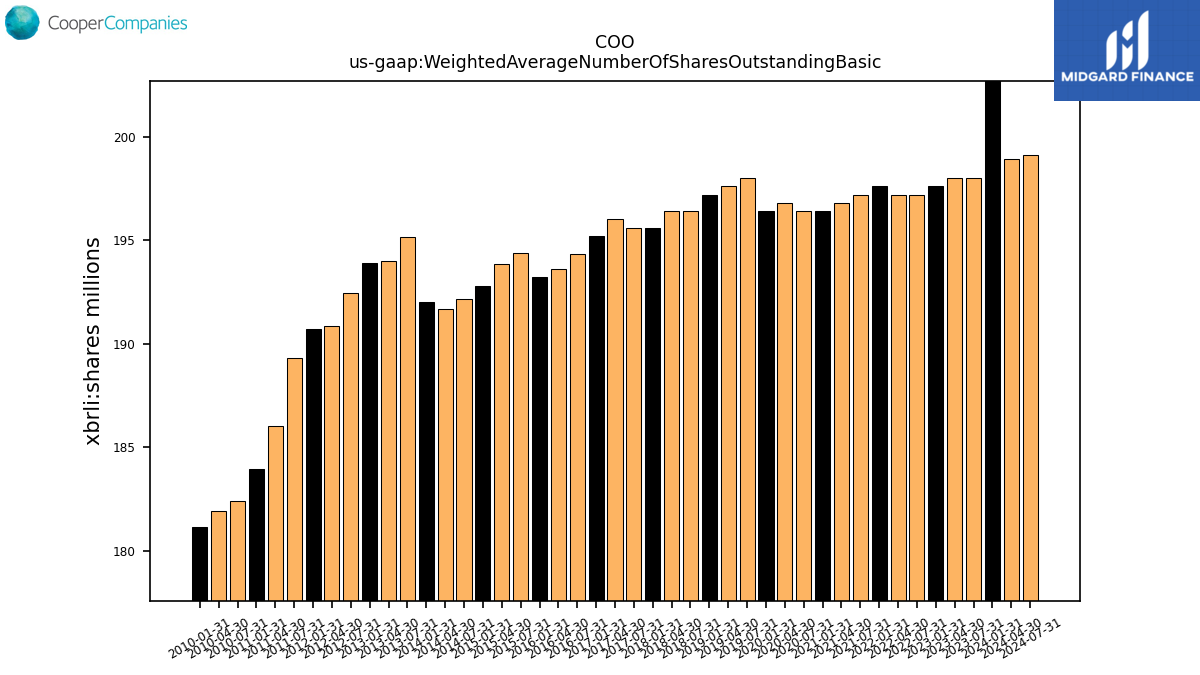
| Weighted Average Number Of Shares Outstanding Basic | 198.40 | NA | 49.50 | 49.50 | 49.40 | NA | 49.30 | 49.30 | 49.40 | NA | 49.30 | 49.20 | 49.10 | NA | 49.10 | 49.20 | 49.10 | NA | 49.50 | 49.40 | 49.30 | NA | 49.10 | 49.10 | 48.90 | NA | 48.90 | 49.00 | 48.80 | NA | 48.58 | 48.40 | 48.30 | NA | 48.60 | 48.46 | 48.20 | NA | 48.04 | 47.92 | 48.01 | NA | 48.79 | 48.49 | 48.48 | NA | 48.11 | 47.71 | 47.67 | NA | 47.32 | 46.51 | 45.99 | NA | 45.60 | 45.48 | 45.29 | |
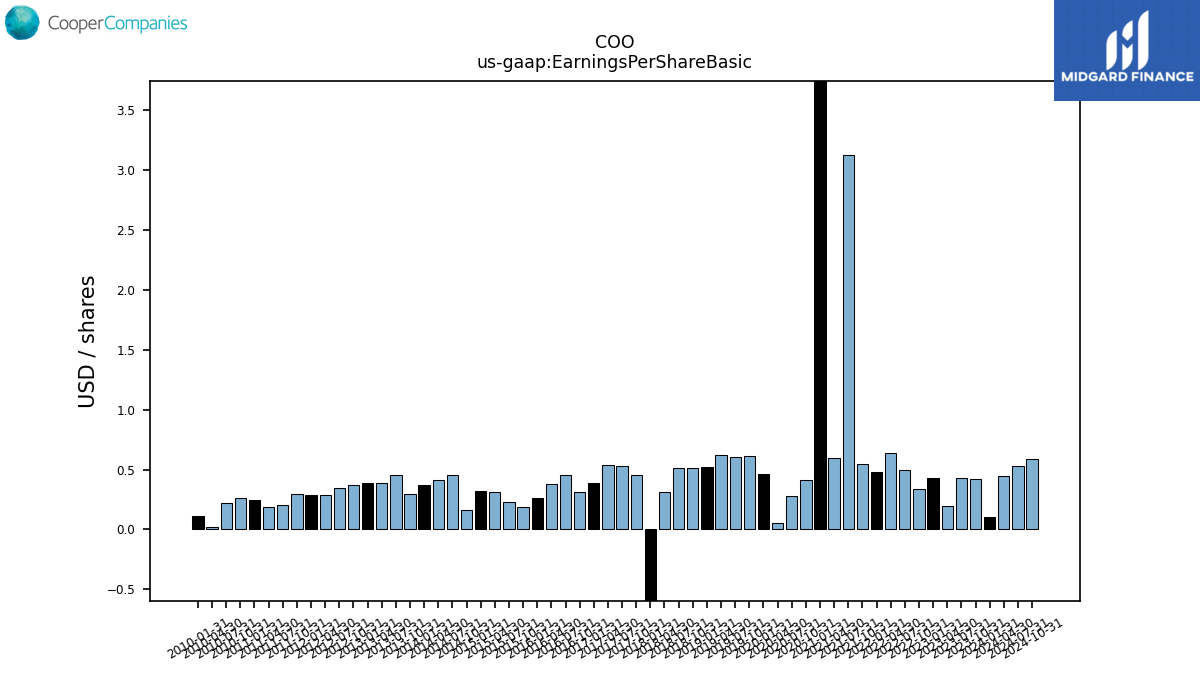
| Earnings Per Share Basic | 0.41 | 1.70 | 1.72 | 0.80 | 1.71 | 1.34 | 1.99 | 2.57 | 1.93 | 2.19 | 12.50 | 2.39 | 42.77 | 1.65 | 1.13 | 0.23 | 1.84 | 2.44 | 2.43 | 2.48 | 2.09 | 2.05 | 2.05 | 1.24 | -2.50 | 1.82 | 2.12 | 2.14 | 1.55 | 1.25 | 1.81 | 1.53 | 1.06 | 0.76 | 0.92 | 1.25 | 1.27 | 0.64 | 1.83 | 1.65 | 1.50 | 1.18 | 1.82 | 1.55 | 1.54 | 1.49 | 1.39 | 1.15 | 1.15 | 1.19 | 0.81 | 0.76 | 0.99 | 1.06 | 0.87 | 0.10 | 0.45 | |
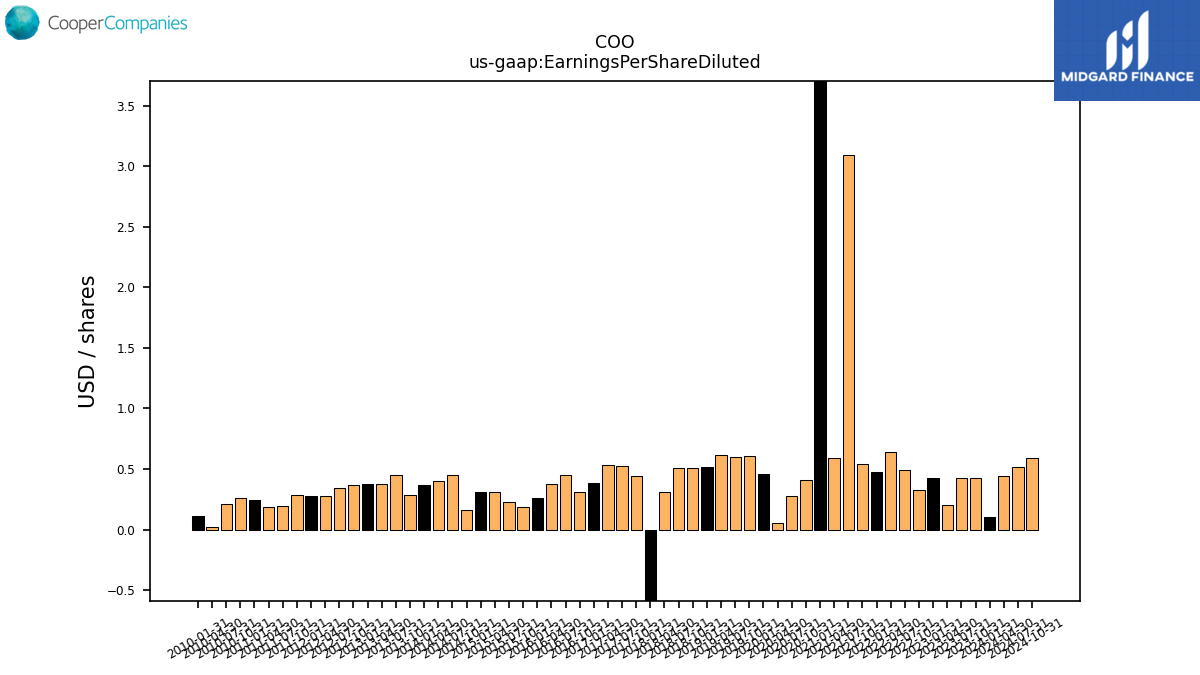
| Earnings Per Share Diluted | 0.41 | 1.70 | 1.71 | 0.80 | 1.70 | 1.32 | 1.98 | 2.55 | 1.91 | 2.15 | 12.37 | 2.36 | 42.31 | 1.64 | 1.12 | 0.23 | 1.82 | 2.42 | 2.40 | 2.45 | 2.07 | 2.02 | 2.03 | 1.23 | -2.50 | 1.78 | 2.09 | 2.12 | 1.53 | 1.23 | 1.79 | 1.52 | 1.05 | 0.75 | 0.91 | 1.23 | 1.25 | 0.63 | 1.80 | 1.62 | 1.47 | 1.15 | 1.79 | 1.52 | 1.50 | 1.46 | 1.36 | 1.12 | 1.12 | 1.15 | 0.78 | 0.73 | 0.96 | 1.03 | 0.86 | 0.10 | 0.44 |
| 2024-01-31 | 2023-10-31 | 2023-07-31 | 2023-04-30 | 2023-01-31 | 2022-10-31 | 2022-07-31 | 2022-04-30 | 2022-01-31 | 2021-10-31 | 2021-07-31 | 2021-04-30 | 2021-01-31 | 2020-10-31 | 2020-07-31 | 2020-04-30 | 2020-01-31 | 2019-10-31 | 2019-07-31 | 2019-04-30 | 2019-01-31 | 2018-10-31 | 2018-07-31 | 2018-04-30 | 2018-01-31 | 2017-10-31 | 2017-07-31 | 2017-04-30 | 2017-01-31 | 2016-10-31 | 2016-07-31 | 2016-04-30 | 2016-01-31 | 2015-10-31 | 2015-07-31 | 2015-04-30 | 2015-01-31 | 2014-10-31 | 2014-07-31 | 2014-04-30 | 2014-01-31 | 2013-10-31 | 2013-07-31 | 2013-04-30 | 2013-01-31 | 2012-10-31 | 2012-07-31 | 2012-04-30 | 2012-01-31 | 2011-10-31 | 2011-07-31 | 2011-04-30 | 2011-01-31 | 2010-10-31 | 2010-07-31 | 2010-04-30 | 2010-01-31 | ||
|---|---|---|---|---|---|---|---|---|---|---|---|---|---|---|---|---|---|---|---|---|---|---|---|---|---|---|---|---|---|---|---|---|---|---|---|---|---|---|---|---|---|---|---|---|---|---|---|---|---|---|---|---|---|---|---|---|---|---|
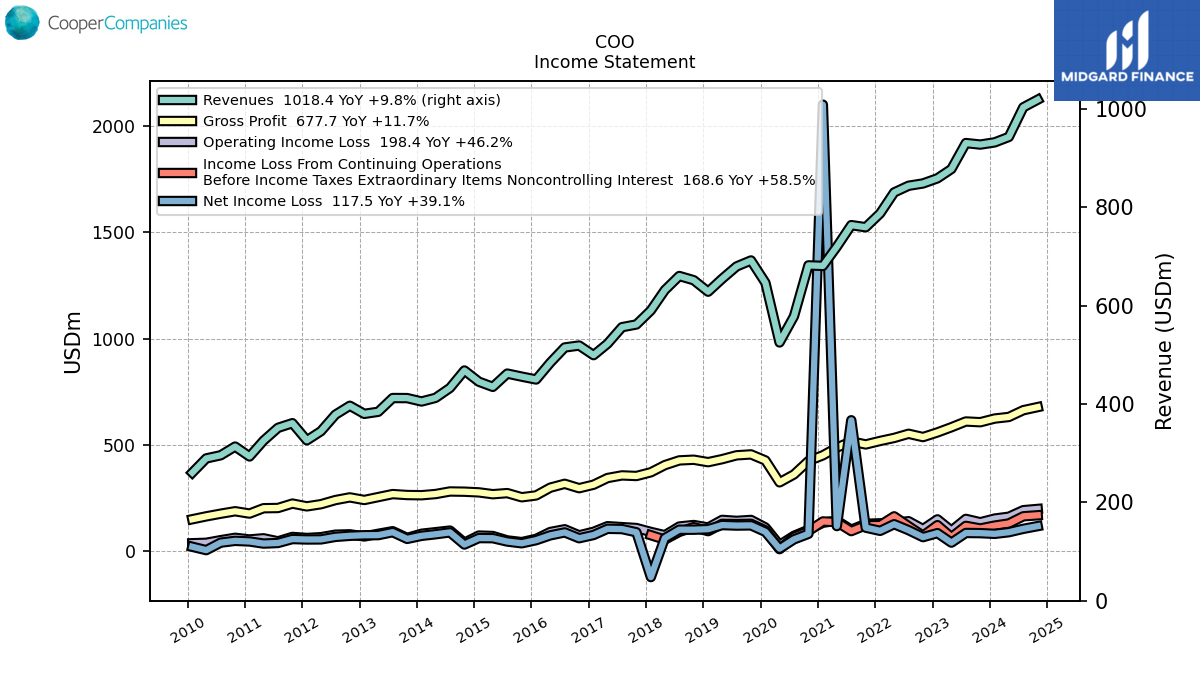
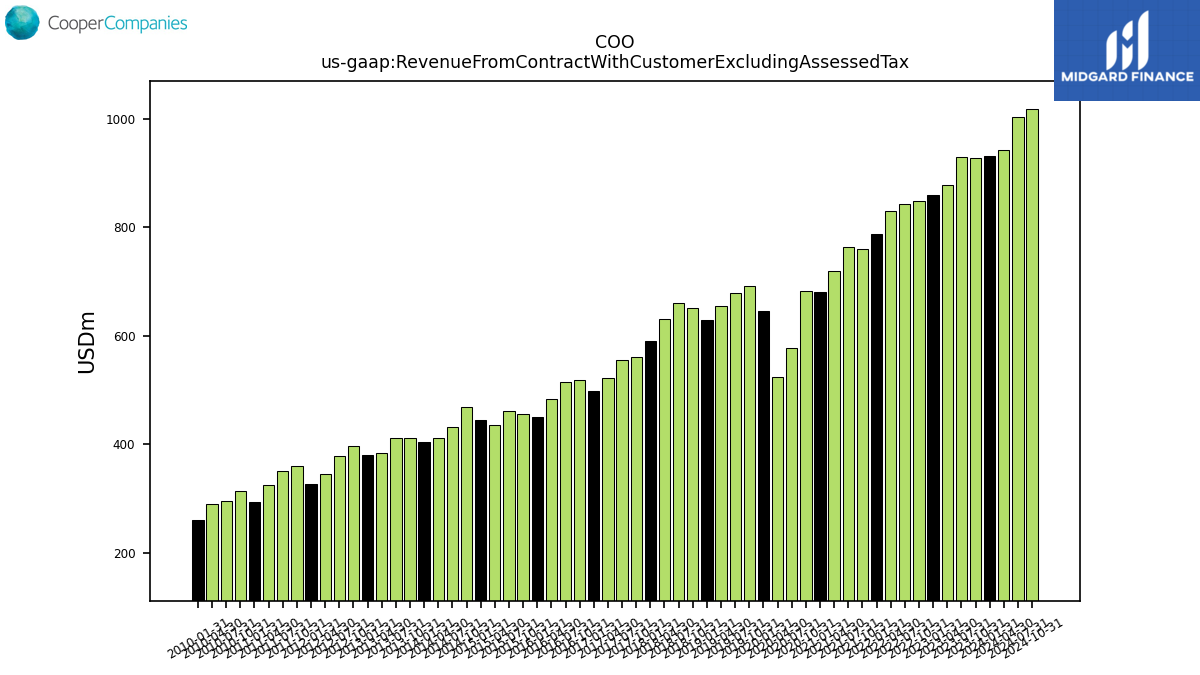
| Revenue From Contract With Customer Excluding Assessed Tax | 931.60 | 927.10 | 930.20 | 877.40 | 858.50 | 848.10 | 843.40 | 829.80 | 787.20 | 759.10 | 763.40 | 719.50 | 680.50 | 681.60 | 578.20 | 524.90 | 646.20 | 691.60 | 679.40 | 654.30 | 628.10 | 651.50 | 660.00 | 631.30 | 590.00 | 561.50 | 556.00 | 522.40 | 499.10 | 518.70 | 514.73 | 483.80 | 449.64 | 455.50 | 461.68 | 434.68 | 445.17 | 468.00 | 432.48 | 412.32 | 404.98 | 411.85 | 411.99 | 384.04 | 379.84 | 396.30 | 378.19 | 344.59 | 326.06 | 360.91 | 351.40 | 325.30 | 293.23 | 313.35 | 295.63 | 289.27 | 260.26 | |
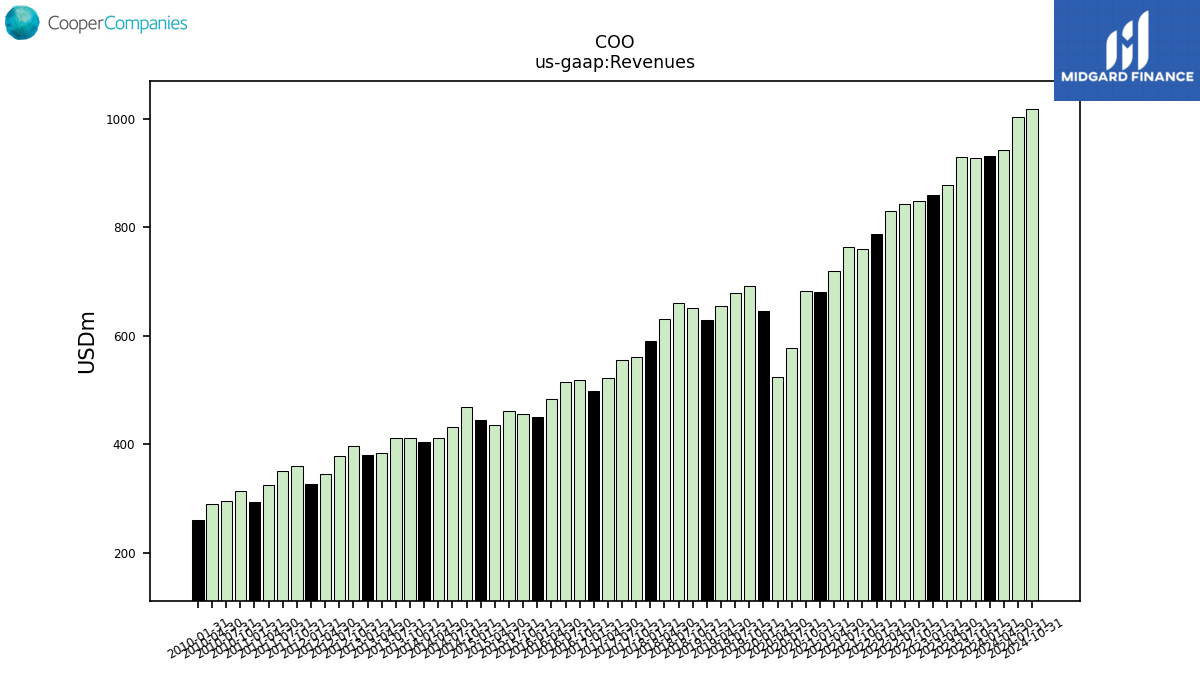
| Revenues | 931.60 | 927.10 | 930.20 | 877.40 | 858.50 | 848.10 | 843.40 | 829.80 | 787.20 | 759.10 | 763.40 | 719.50 | 680.50 | 681.60 | 578.20 | 524.90 | 646.20 | 691.60 | 679.40 | 654.30 | 628.10 | 651.50 | 660.00 | 631.30 | 590.00 | 561.50 | 556.00 | 522.40 | 499.10 | 518.70 | 514.73 | 483.80 | 449.64 | 455.50 | 461.68 | 434.68 | 445.17 | 468.00 | 432.48 | 412.32 | 404.98 | 411.85 | 411.99 | 384.04 | 379.84 | 396.30 | 378.19 | 344.59 | 326.06 | 360.91 | 351.40 | 325.30 | 293.23 | 313.35 | 295.63 | 289.27 | 260.26 | |
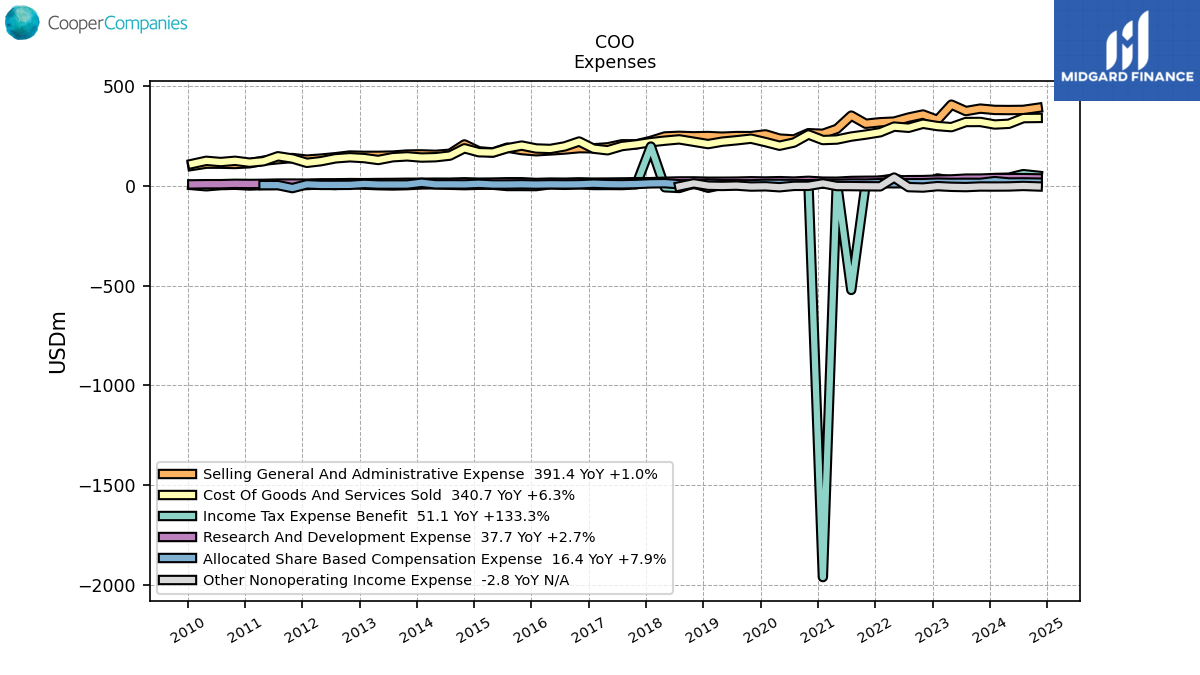
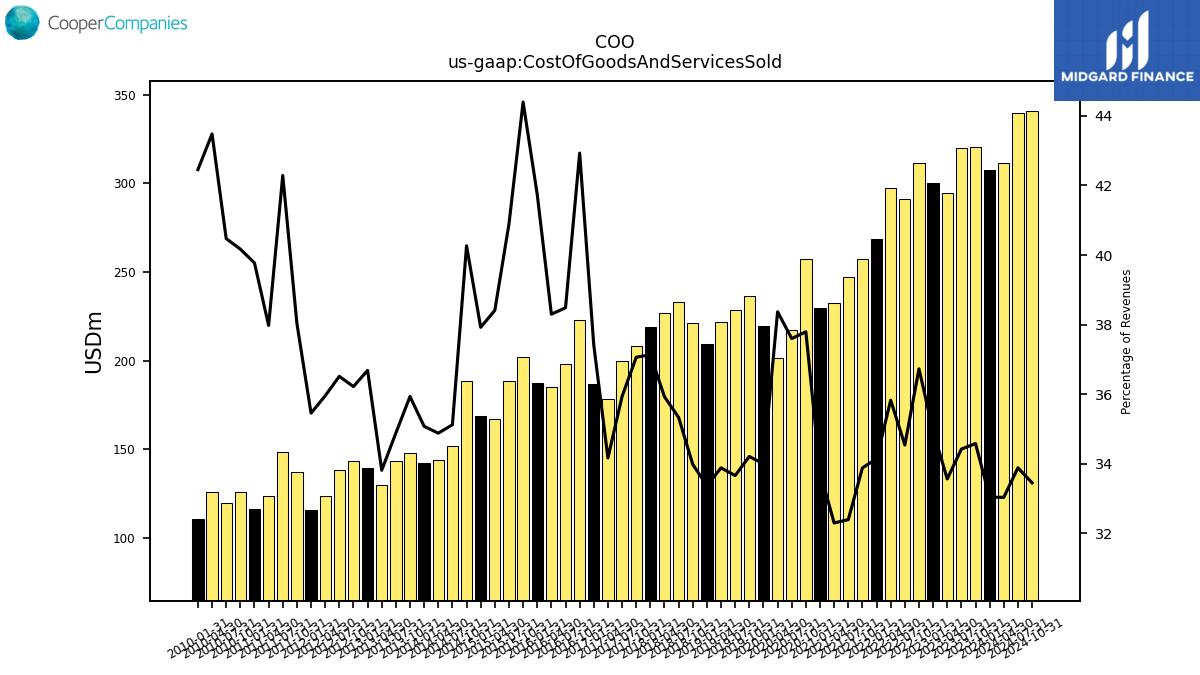
| Cost Of Goods And Services Sold | 307.80 | 320.60 | 320.20 | 294.50 | 300.00 | 311.50 | 291.30 | 297.30 | 268.80 | 257.20 | 247.30 | 232.40 | 229.80 | 257.60 | 217.40 | 201.40 | 219.70 | 236.60 | 228.70 | 221.70 | 209.60 | 221.40 | 233.20 | 226.80 | 219.10 | 208.10 | 199.80 | 178.50 | 186.70 | 222.68 | 198.09 | 185.29 | 187.68 | 202.23 | 188.79 | 166.96 | 168.82 | 188.44 | 151.89 | 143.82 | 142.05 | 147.99 | 143.72 | 129.86 | 139.34 | 143.54 | 138.09 | 123.89 | 115.61 | 137.28 | 148.59 | 123.54 | 116.62 | 125.87 | 119.65 | 125.78 | 110.50 | |
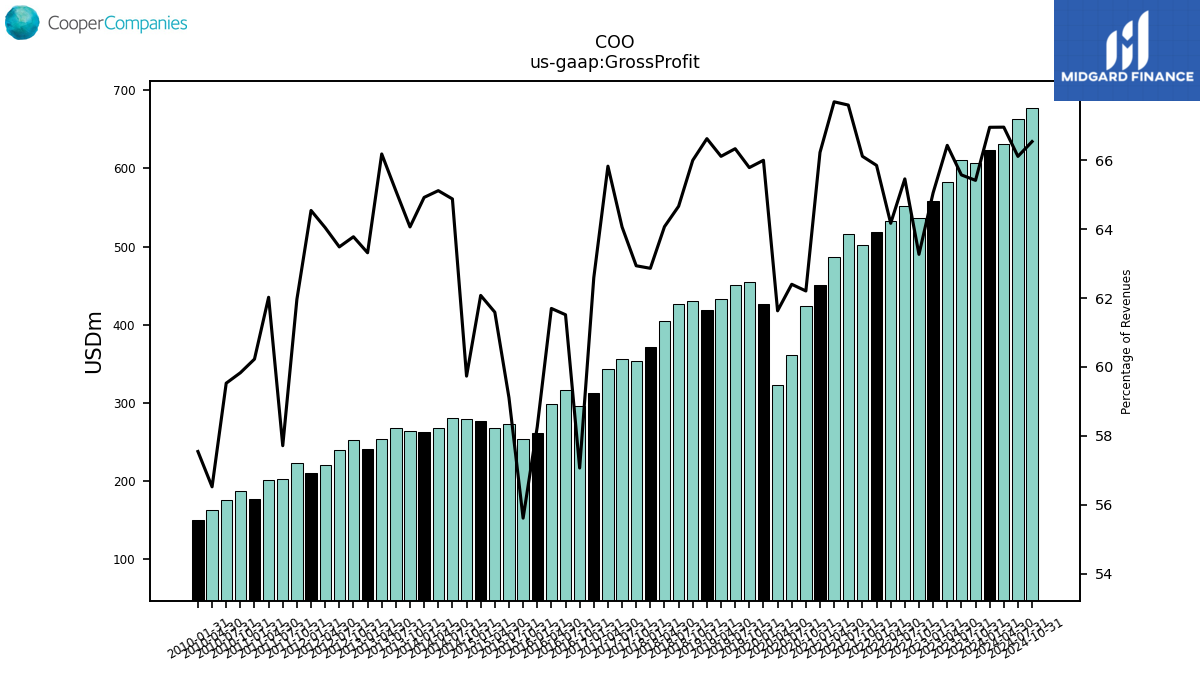
| Gross Profit | 623.80 | 606.50 | 610.00 | 582.90 | 558.50 | 536.60 | 552.10 | 532.50 | 518.40 | 501.90 | 516.10 | 487.10 | 450.70 | 424.00 | 360.80 | 323.50 | 426.50 | 455.00 | 450.70 | 432.60 | 418.50 | 430.00 | 426.80 | 404.50 | 370.90 | 353.40 | 356.20 | 343.90 | 312.40 | 296.00 | 316.64 | 298.50 | 261.96 | 253.30 | 272.89 | 267.72 | 276.35 | 279.55 | 280.59 | 268.50 | 262.93 | 263.86 | 268.27 | 254.18 | 240.50 | 252.76 | 240.10 | 220.70 | 210.45 | 223.63 | 202.80 | 201.76 | 176.61 | 187.48 | 175.99 | 163.49 | 149.76 | |
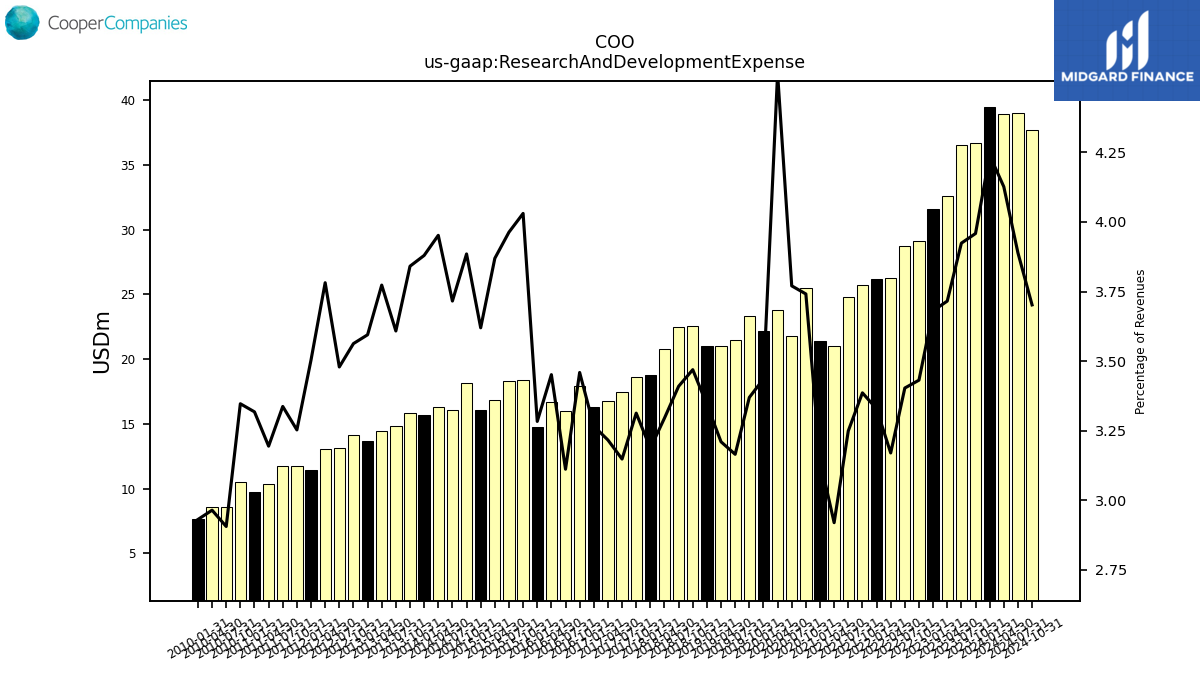
| Research And Development Expense | 39.50 | 36.70 | 36.50 | 32.60 | 31.60 | 29.10 | 28.70 | 26.30 | 26.20 | 25.70 | 24.80 | 21.00 | 21.40 | 25.50 | 21.80 | 23.80 | 22.20 | 23.30 | 21.50 | 21.00 | 21.00 | 22.60 | 22.50 | 20.80 | 18.80 | 18.60 | 17.50 | 16.80 | 16.30 | 17.94 | 16.01 | 16.70 | 14.76 | 18.36 | 18.30 | 16.82 | 16.11 | 18.18 | 16.07 | 16.30 | 15.71 | 15.82 | 14.87 | 14.49 | 13.65 | 14.12 | 13.16 | 13.03 | 11.43 | 11.74 | 11.72 | 10.39 | 9.73 | 10.49 | 8.59 | 8.57 | 7.63 | |
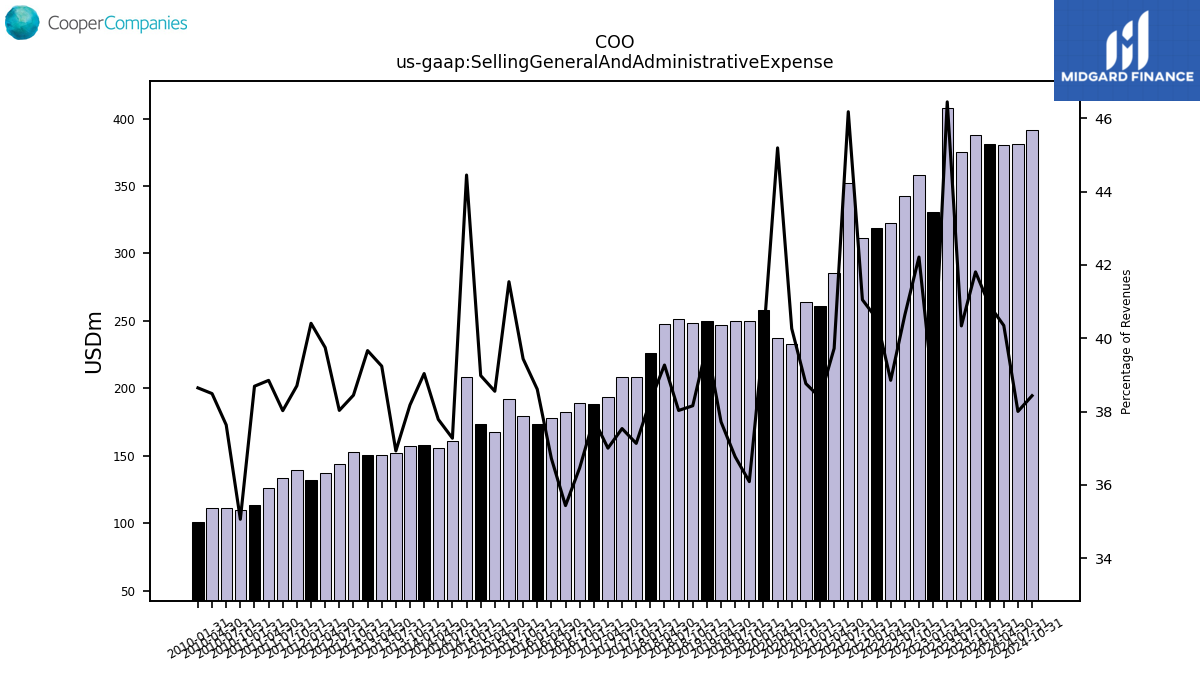
| Selling General And Administrative Expense | 380.90 | 387.60 | 375.20 | 407.50 | 330.90 | 358.00 | 342.70 | 322.40 | 319.10 | 311.60 | 352.50 | 285.80 | 261.20 | 264.20 | 232.80 | 237.20 | 258.30 | 249.60 | 249.80 | 246.80 | 250.00 | 248.60 | 251.00 | 247.90 | 225.90 | 208.50 | 208.70 | 193.30 | 188.60 | 189.13 | 182.40 | 177.66 | 173.60 | 179.64 | 191.78 | 167.58 | 173.53 | 208.02 | 161.20 | 155.80 | 158.09 | 157.25 | 152.14 | 150.69 | 150.65 | 152.36 | 143.83 | 136.96 | 131.75 | 139.69 | 133.62 | 126.38 | 113.45 | 109.87 | 111.27 | 111.34 | 100.58 | |
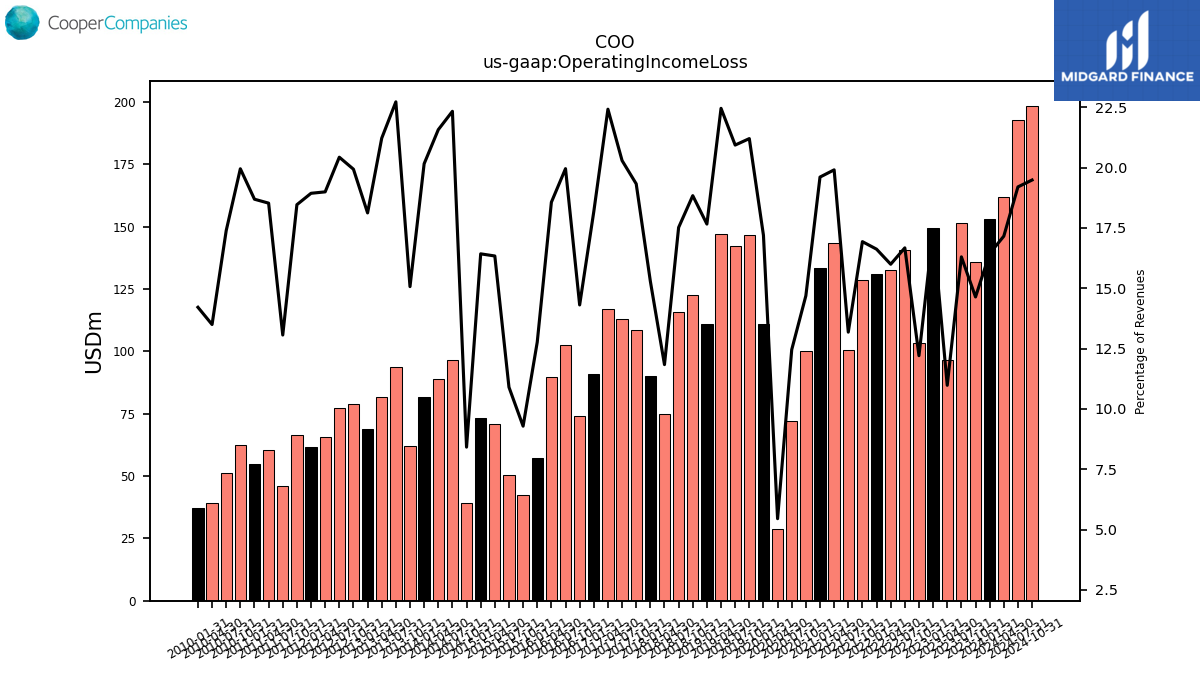
| Operating Income Loss | 153.10 | 135.70 | 151.60 | 96.30 | 149.50 | 103.50 | 140.60 | 132.70 | 130.80 | 128.50 | 100.60 | 143.20 | 133.40 | 100.10 | 72.00 | 28.60 | 111.10 | 146.60 | 142.20 | 146.90 | 110.90 | 122.70 | 115.60 | 74.70 | 90.20 | 108.50 | 112.80 | 117.10 | 90.70 | 74.20 | 102.70 | 89.80 | 57.40 | 42.28 | 50.31 | 71.00 | 73.11 | 39.38 | 96.56 | 88.92 | 81.62 | 62.04 | 93.61 | 81.47 | 68.82 | 78.98 | 77.25 | 65.44 | 61.73 | 66.62 | 45.89 | 60.26 | 54.79 | 62.50 | 51.40 | 39.03 | 36.98 | |
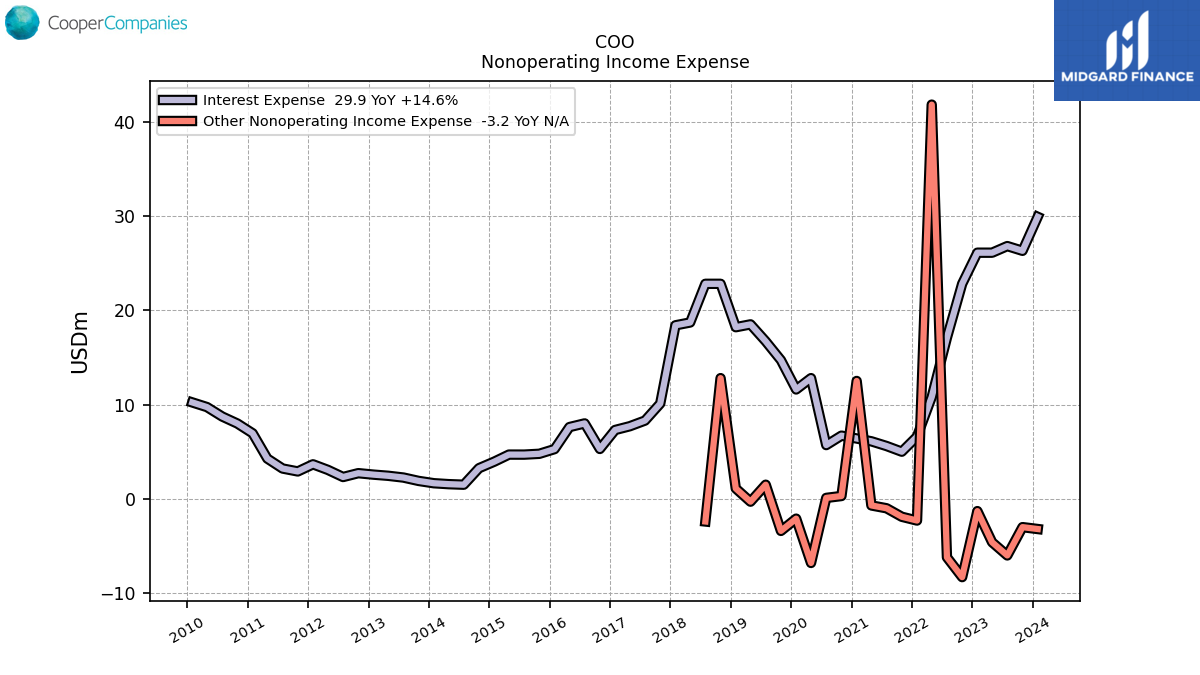
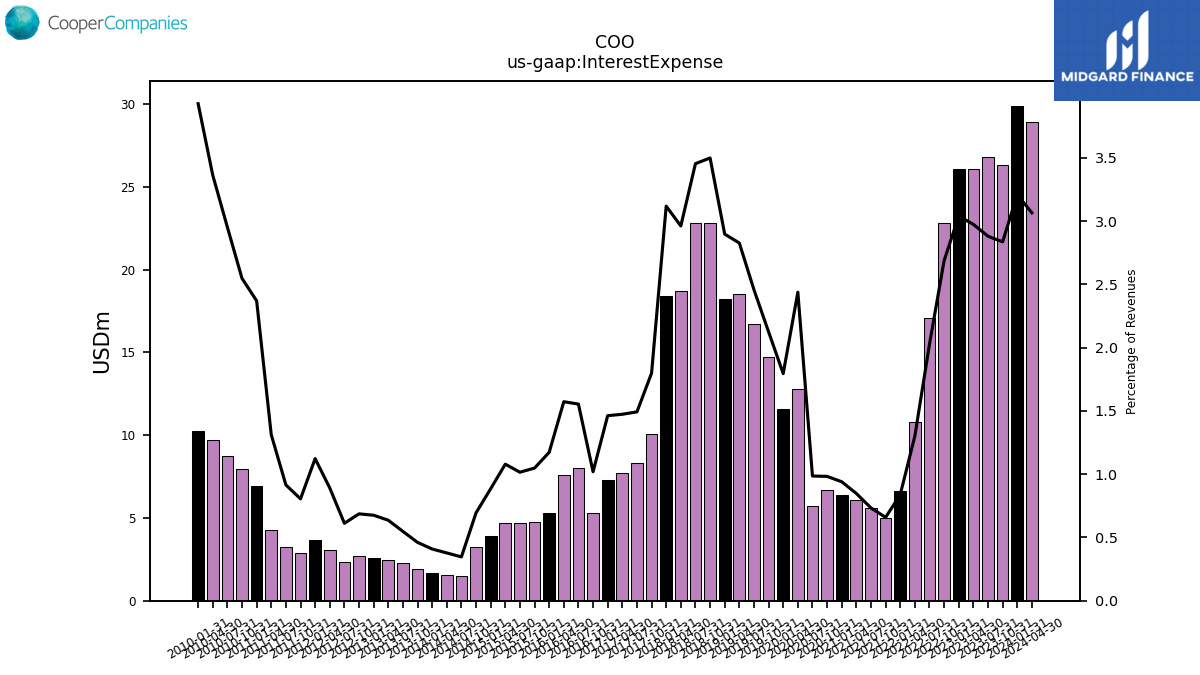
| Interest Expense | 29.90 | 26.30 | 26.80 | 26.10 | 26.10 | 22.80 | 17.10 | 10.80 | 6.60 | 5.00 | 5.60 | 6.10 | 6.40 | 6.70 | 5.70 | 12.80 | 11.60 | 14.70 | 16.70 | 18.50 | 18.20 | 22.80 | 22.80 | 18.70 | 18.40 | 10.10 | 8.30 | 7.70 | 7.30 | 5.29 | 8.00 | 7.61 | 5.27 | 4.78 | 4.69 | 4.69 | 3.94 | 3.25 | 1.50 | 1.56 | 1.66 | 1.90 | 2.26 | 2.44 | 2.57 | 2.72 | 2.31 | 3.07 | 3.66 | 2.91 | 3.22 | 4.27 | 6.95 | 7.98 | 8.73 | 9.73 | 10.22 | |
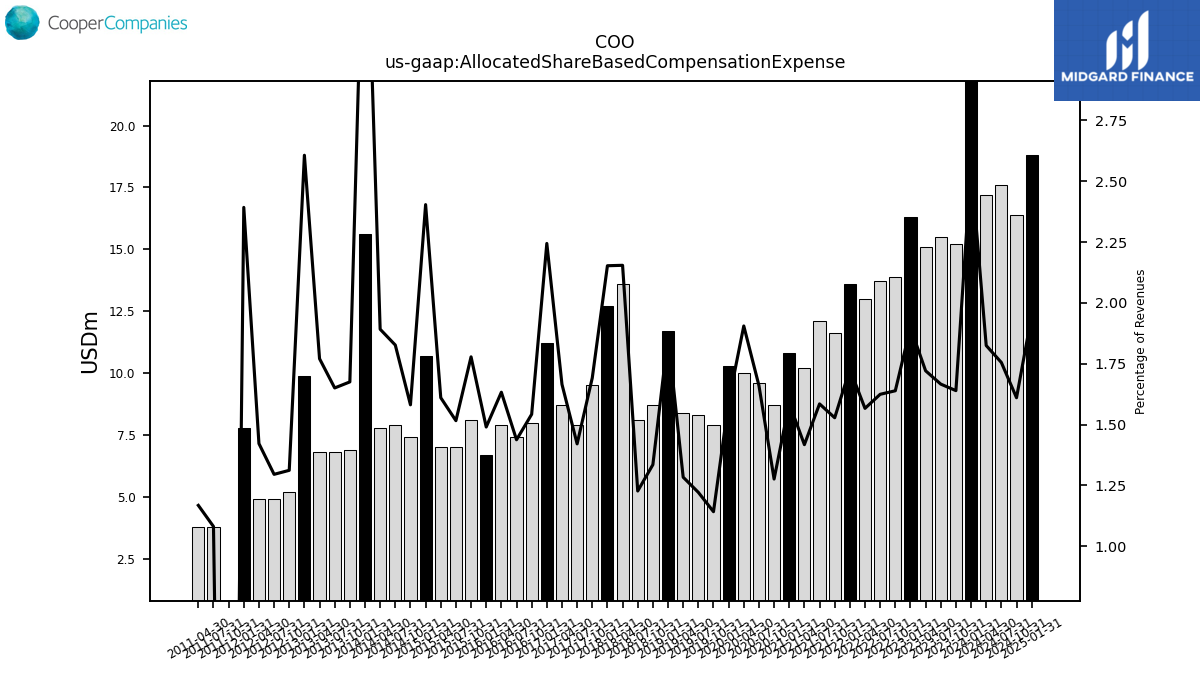
| Allocated Share Based Compensation Expense | 23.90 | 15.20 | 15.50 | 15.10 | 16.30 | 13.90 | 13.70 | 13.00 | 13.60 | 11.60 | 12.10 | 10.20 | 10.80 | 8.70 | 9.60 | 10.00 | 10.30 | 7.90 | 8.30 | 8.40 | 11.70 | 8.70 | 8.10 | 13.60 | 12.70 | 9.50 | 7.90 | 8.70 | 11.20 | 8.00 | 7.40 | 7.90 | 6.70 | 8.10 | 7.00 | 7.00 | 10.70 | 7.40 | 7.90 | 7.80 | 15.60 | 6.90 | 6.80 | 6.80 | 9.90 | 5.20 | 4.90 | 4.90 | 7.80 | -11.10 | 3.80 | 3.80 | NA | NA | NA | NA | NA | |
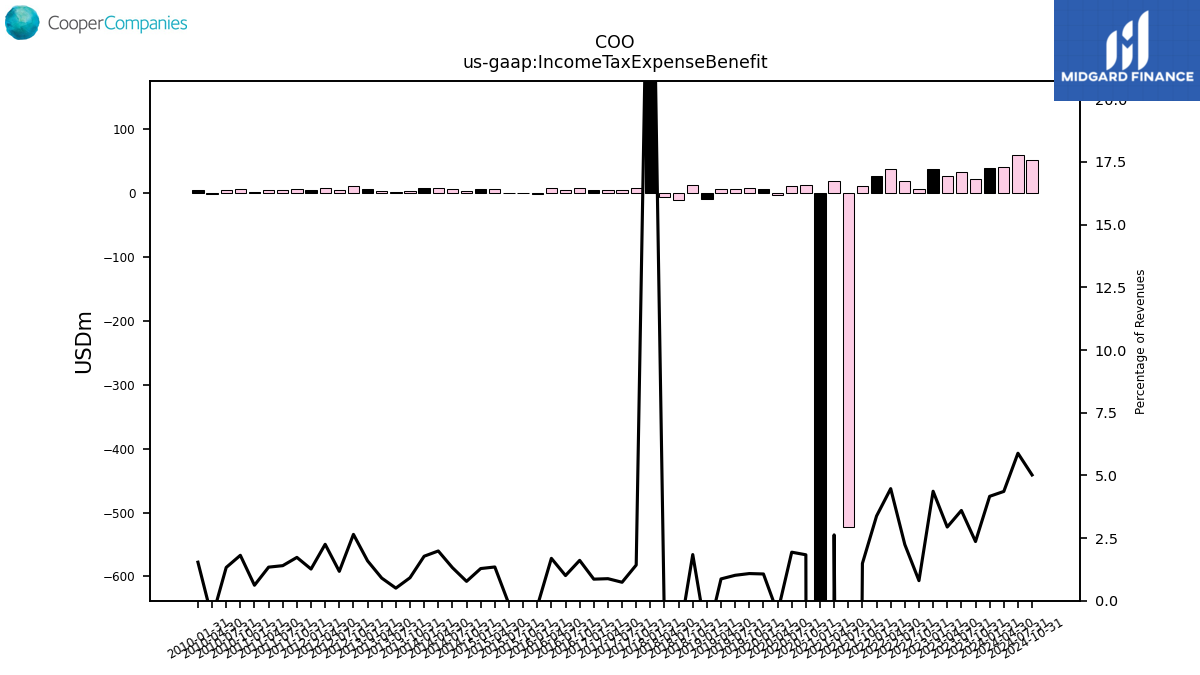
| Income Tax Expense Benefit | 38.80 | 21.90 | 33.50 | 25.80 | 37.50 | 6.80 | 18.90 | 37.10 | 26.60 | 11.30 | -521.80 | 18.90 | -1961.60 | 12.50 | 11.20 | -2.50 | 6.90 | 7.50 | 6.90 | 5.70 | -9.40 | 12.00 | -10.40 | -6.90 | 197.30 | 8.00 | 4.10 | 4.60 | 4.30 | 8.36 | 5.17 | 8.18 | -1.01 | -0.59 | -0.64 | 5.86 | 5.72 | 3.62 | 5.71 | 8.19 | 7.19 | 3.78 | 2.07 | 3.47 | 6.04 | 10.49 | 4.43 | 7.76 | 4.12 | 6.24 | 4.92 | 4.36 | 1.81 | 5.68 | 3.92 | -1.98 | 4.00 | |
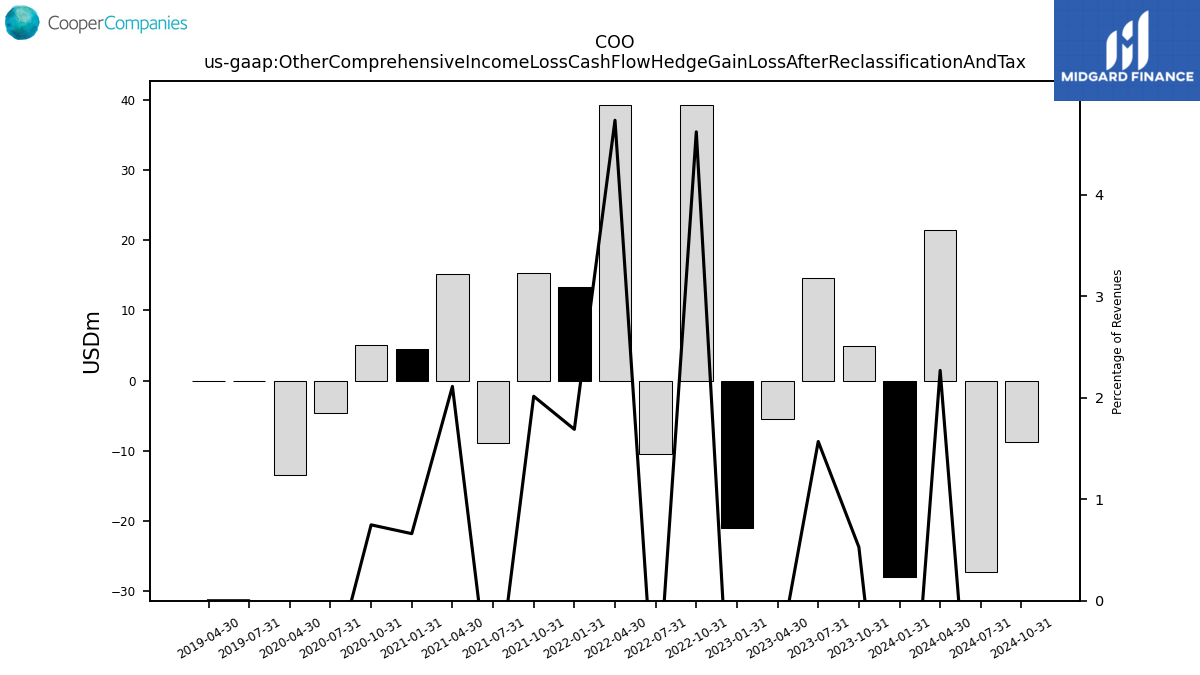
| Other Comprehensive Income Loss Cash Flow Hedge Gain Loss After Reclassification And Tax | -28.00 | 4.90 | 14.60 | -5.50 | -21.00 | 39.20 | -10.50 | 39.30 | 13.30 | 15.30 | -8.90 | 15.20 | 4.50 | 5.10 | -4.60 | -13.50 | NA | NA | 0.00 | 0.00 | NA | NA | NA | NA | NA | NA | NA | NA | NA | NA | NA | NA | NA | NA | NA | NA | NA | NA | NA | NA | NA | NA | NA | NA | NA | NA | NA | NA | NA | NA | NA | NA | NA | NA | NA | NA | NA | |
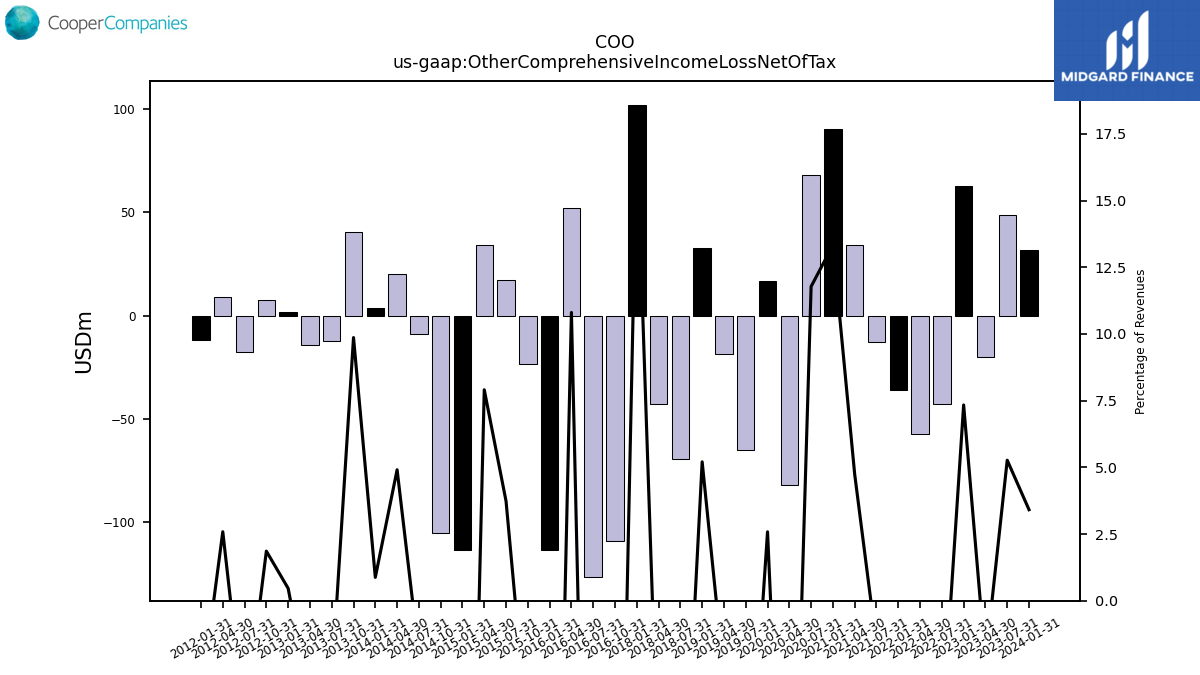
| Other Comprehensive Income Loss Net Of Tax | 31.80 | NA | 49.00 | -20.00 | 63.00 | NA | -42.80 | -57.30 | -35.90 | NA | -12.60 | 34.10 | 90.70 | NA | 68.10 | -82.40 | 16.70 | NA | -65.20 | -18.60 | 32.70 | NA | -69.60 | -43.00 | 102.30 | NA | NA | NA | NA | -109.57 | -126.88 | 52.28 | -113.79 | -23.50 | 17.23 | 34.37 | -113.56 | -105.46 | -8.76 | 20.24 | 3.55 | 40.63 | -12.38 | -14.51 | 1.76 | 7.37 | -17.56 | 8.91 | -11.87 | NA | NA | NA | NA | NA | NA | NA | NA | |
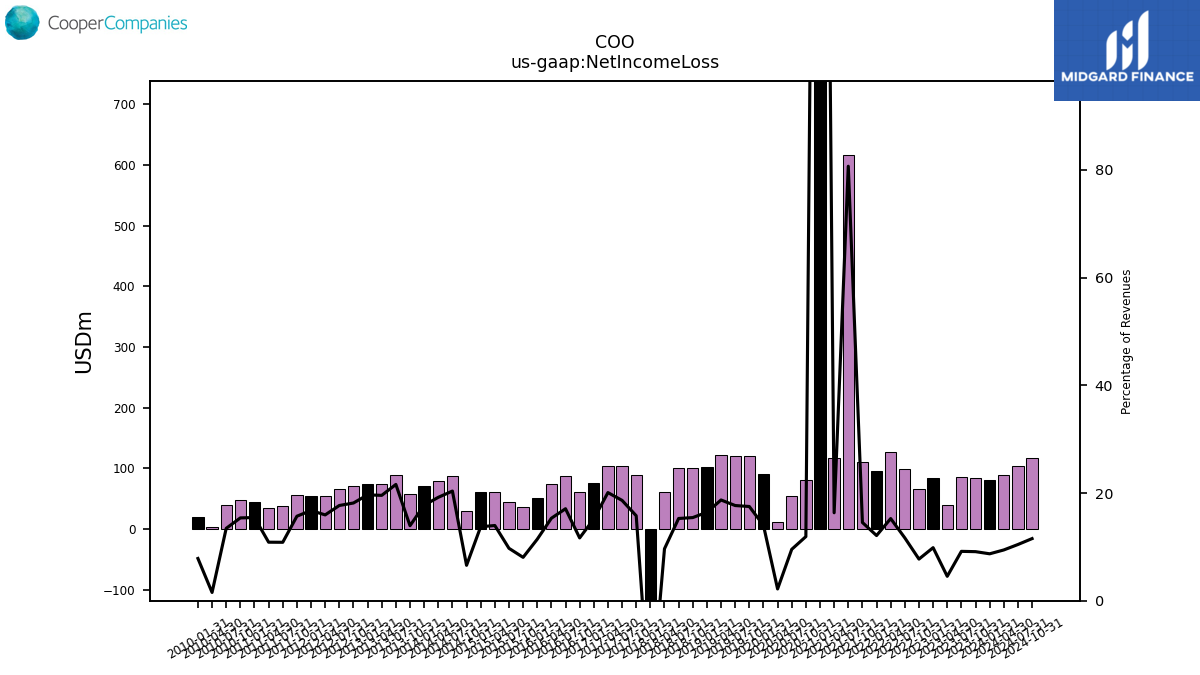
| Net Income Loss | 81.20 | 84.50 | 85.30 | 39.80 | 84.60 | 65.60 | 98.40 | 126.60 | 95.30 | 110.30 | 615.80 | 117.50 | 2101.10 | 81.20 | 55.20 | 11.50 | 90.50 | 121.00 | 120.10 | 122.40 | 103.20 | 100.60 | 100.80 | 60.90 | -122.50 | 88.60 | 103.60 | 104.90 | 75.80 | 60.50 | 87.93 | 74.10 | 51.36 | 36.70 | 44.95 | 60.71 | 61.18 | 30.79 | 88.07 | 79.16 | 71.84 | 57.40 | 88.95 | 75.14 | 74.67 | 71.92 | 66.88 | 54.92 | 54.62 | 56.64 | 38.14 | 35.36 | 45.30 | 48.20 | 39.73 | 4.46 | 20.42 |
| 2024-01-31 | 2023-10-31 | 2023-07-31 | 2023-04-30 | 2023-01-31 | 2022-10-31 | 2022-07-31 | 2022-04-30 | 2022-01-31 | 2021-10-31 | 2021-07-31 | 2021-04-30 | 2021-01-31 | 2020-10-31 | 2020-07-31 | 2020-04-30 | 2020-01-31 | 2019-10-31 | 2019-07-31 | 2019-04-30 | 2019-01-31 | 2018-10-31 | 2018-07-31 | 2018-04-30 | 2018-01-31 | 2017-10-31 | 2017-07-31 | 2017-04-30 | 2017-01-31 | 2016-10-31 | 2016-07-31 | 2016-04-30 | 2016-01-31 | 2015-10-31 | 2015-07-31 | 2015-04-30 | 2015-01-31 | 2014-10-31 | 2014-07-31 | 2014-04-30 | 2014-01-31 | 2013-10-31 | 2013-07-31 | 2013-04-30 | 2013-01-31 | 2012-10-31 | 2012-07-31 | 2012-04-30 | 2012-01-31 | 2011-10-31 | 2011-07-31 | 2011-04-30 | 2011-01-31 | 2010-10-31 | 2010-07-31 | 2010-04-30 | 2010-01-31 | ||
|---|---|---|---|---|---|---|---|---|---|---|---|---|---|---|---|---|---|---|---|---|---|---|---|---|---|---|---|---|---|---|---|---|---|---|---|---|---|---|---|---|---|---|---|---|---|---|---|---|---|---|---|---|---|---|---|---|---|---|
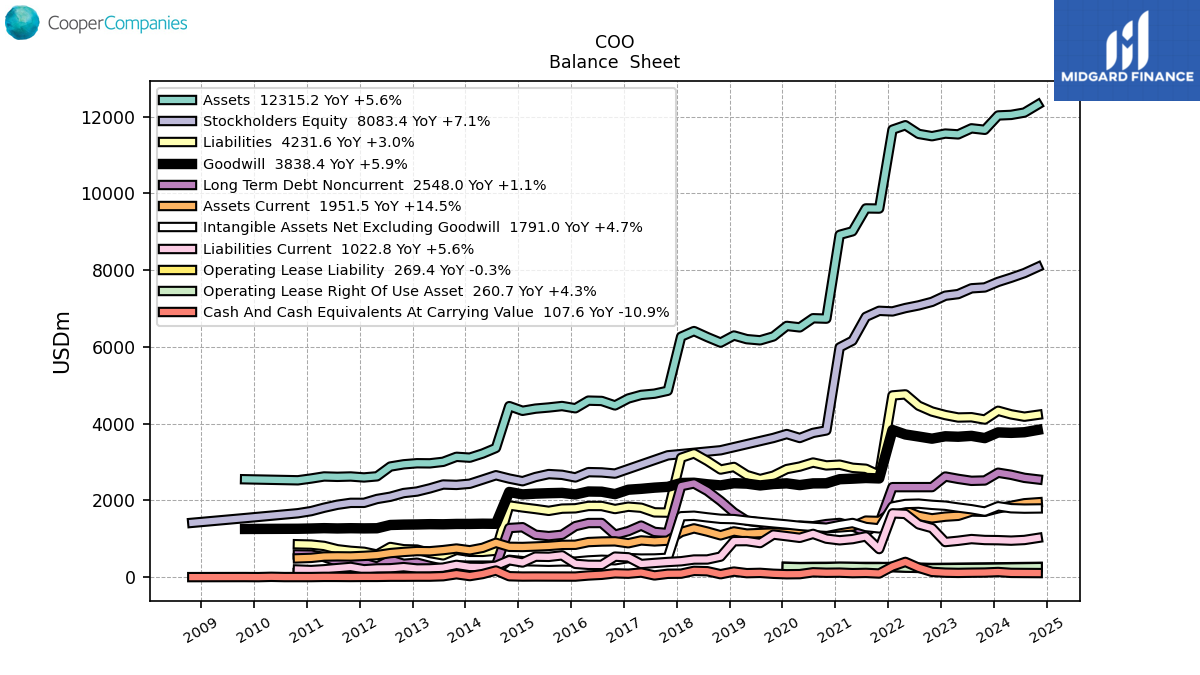
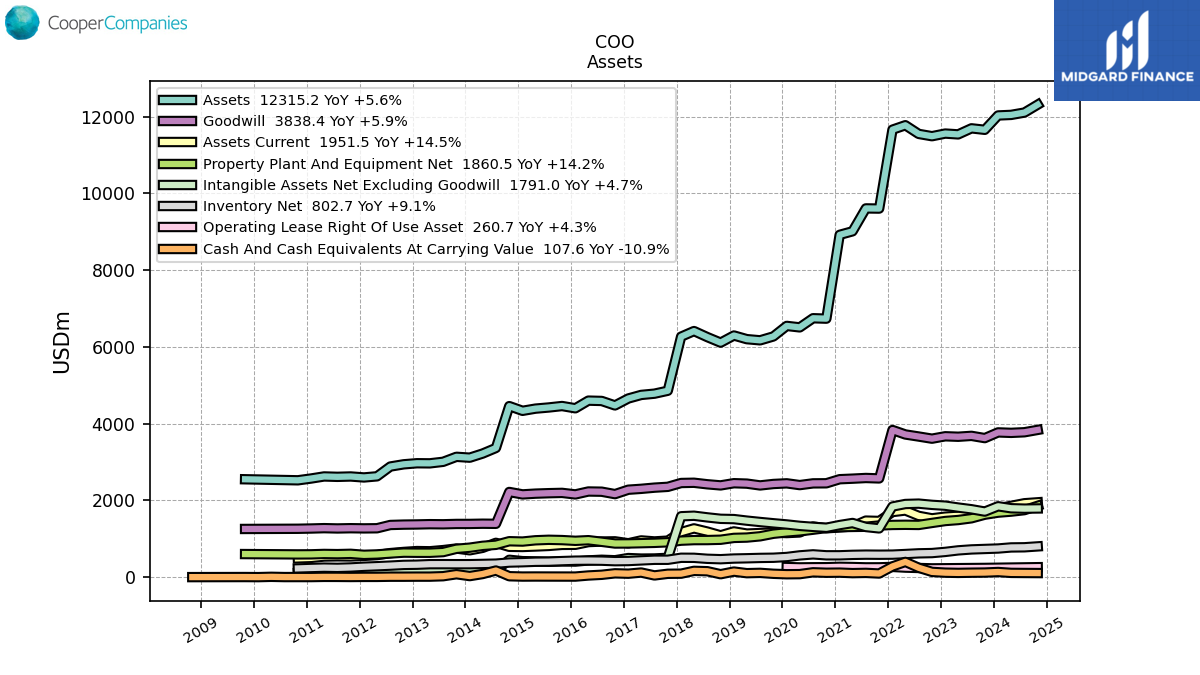
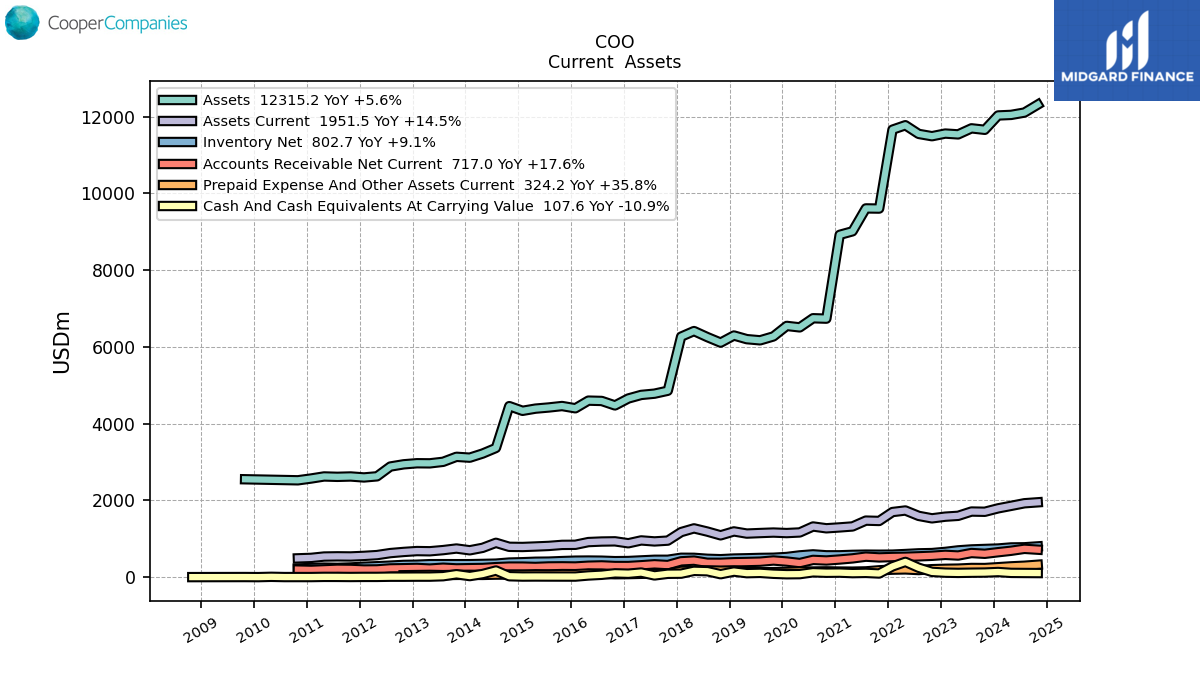
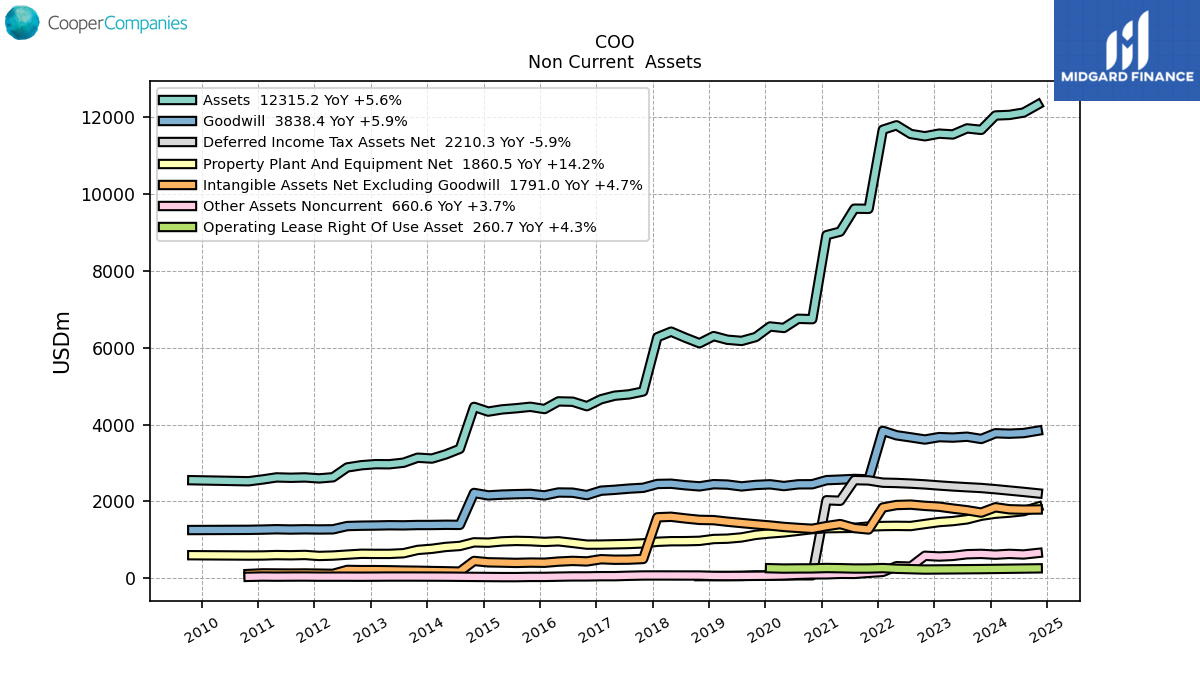
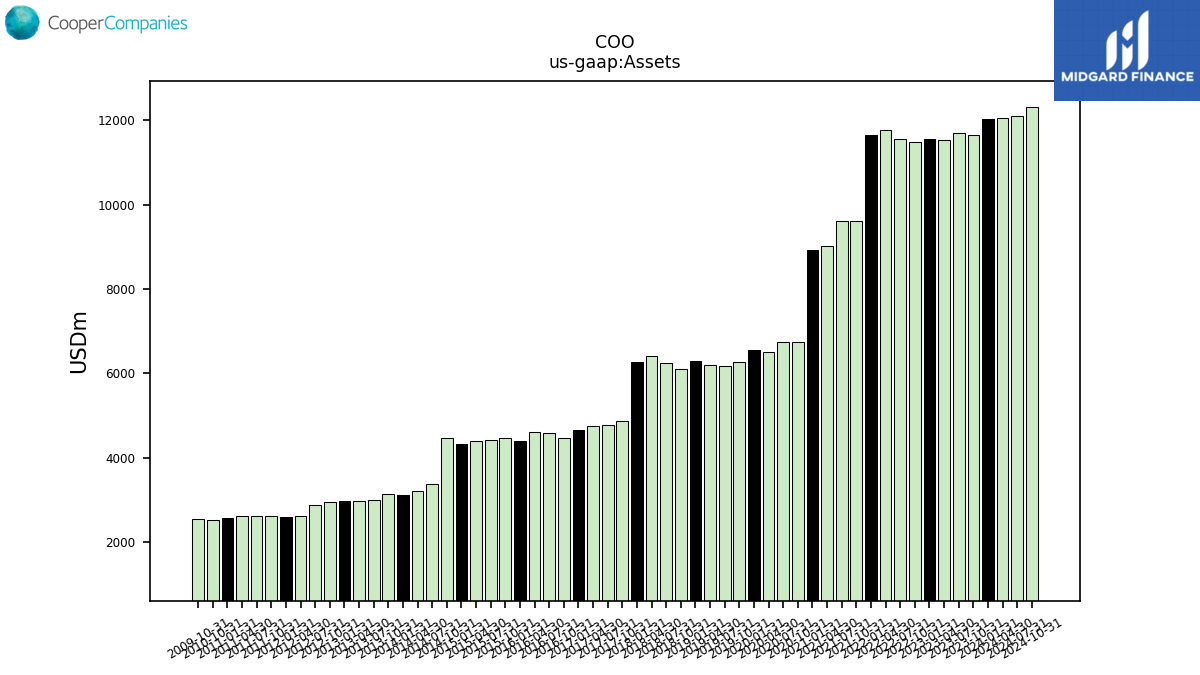
| Assets | 12032.60 | 11658.90 | 11697.30 | 11539.50 | 11561.10 | 11492.30 | 11552.10 | 11778.00 | 11662.50 | 9606.20 | 9610.60 | 9013.80 | 8921.90 | 6737.50 | 6748.40 | 6510.00 | 6548.50 | 6274.50 | 6172.80 | 6203.40 | 6298.60 | 6112.80 | 6256.90 | 6414.40 | 6268.60 | 4858.70 | 4782.80 | 4749.80 | 4656.70 | 4475.90 | 4592.70 | 4601.30 | 4401.80 | 4460.61 | 4422.68 | 4392.66 | 4335.74 | 4458.34 | 3367.37 | 3221.98 | 3114.76 | 3137.26 | 3006.91 | 2966.73 | 2969.54 | 2941.38 | 2883.92 | 2628.56 | 2599.27 | 2624.52 | 2615.33 | 2625.19 | 2571.94 | 2525.02 | NA | NA | NA | |
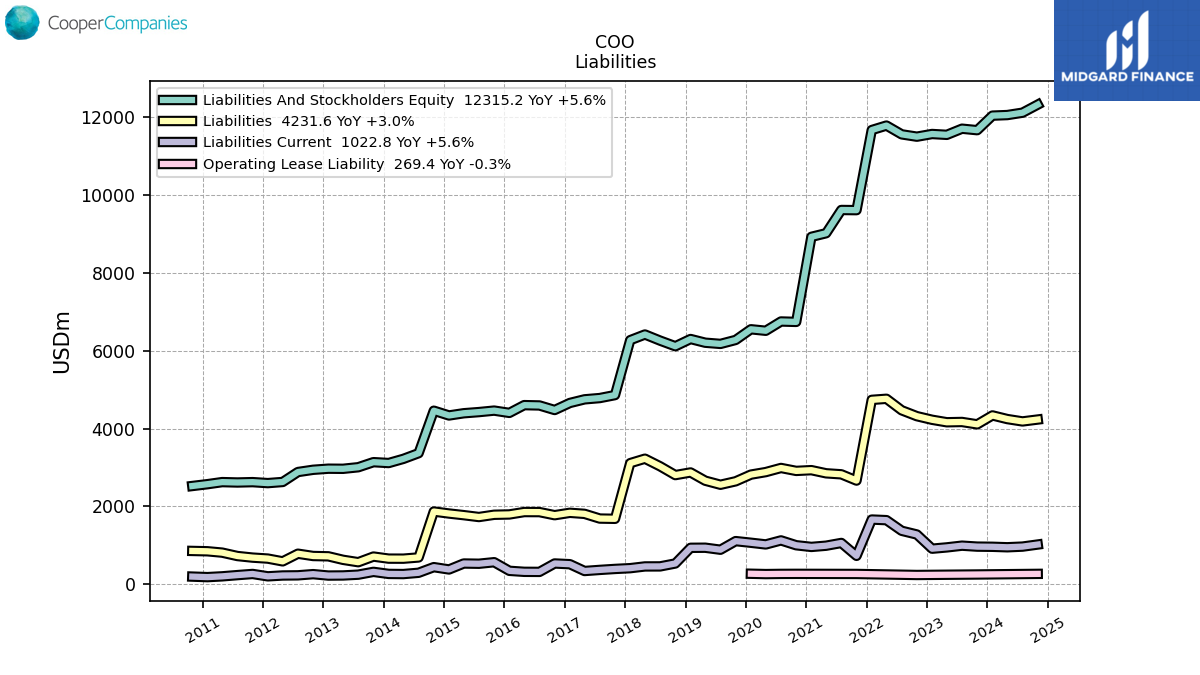
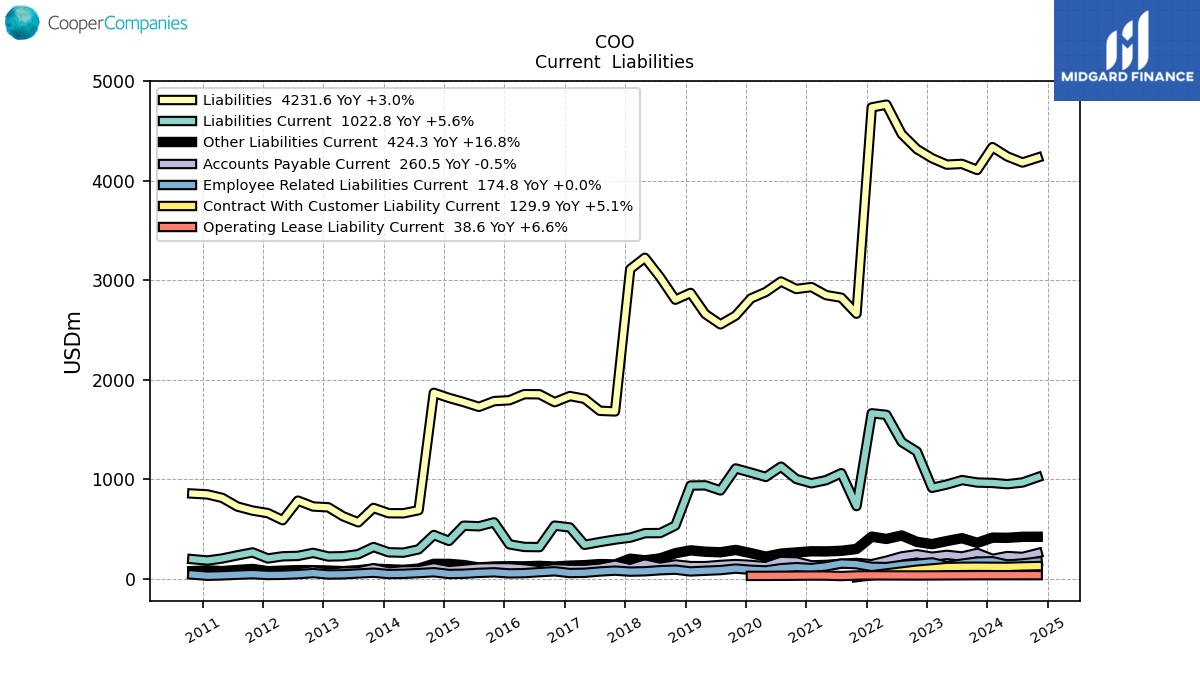
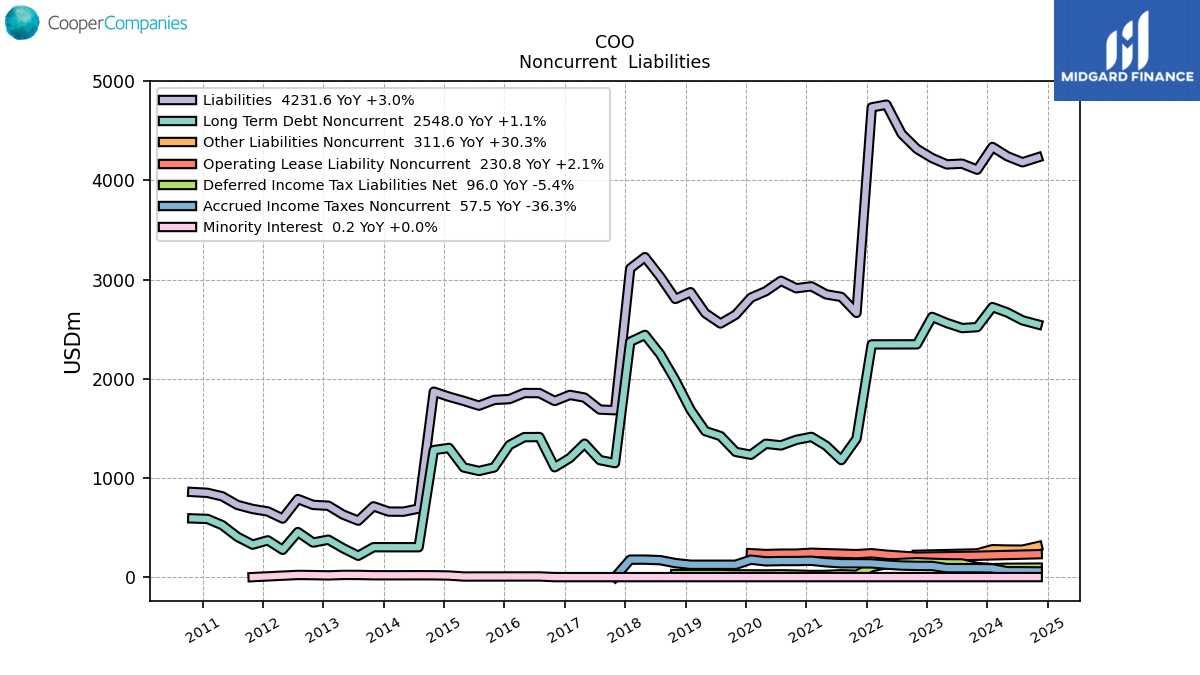
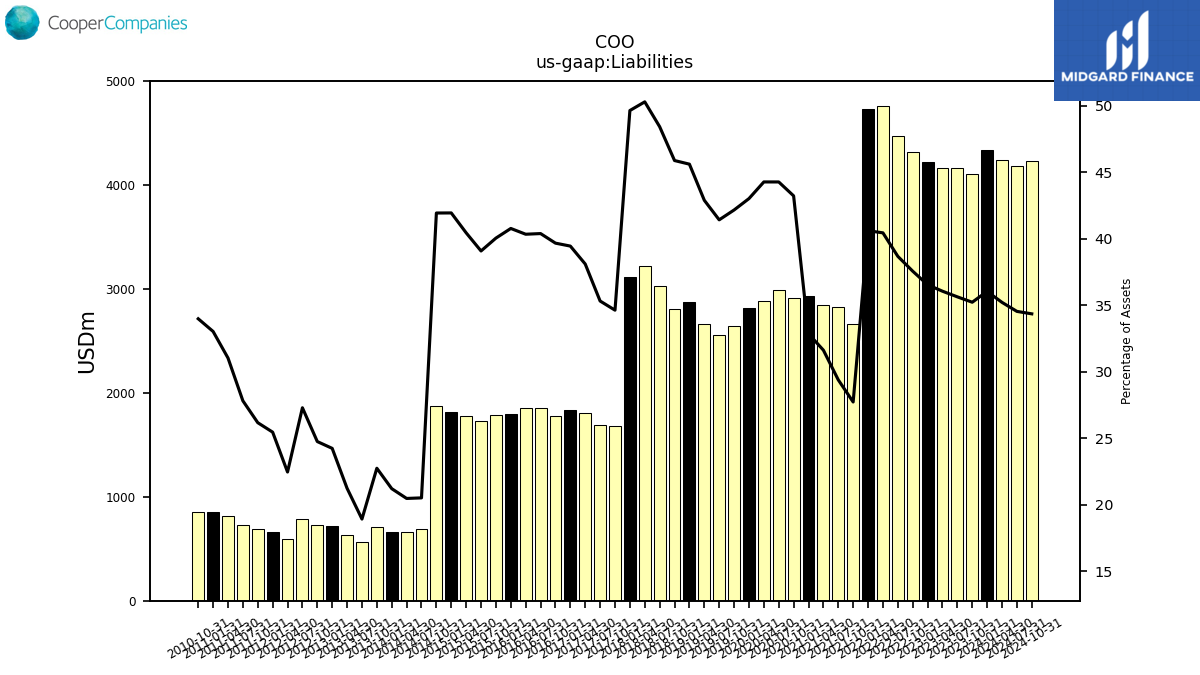
| Liabilities | 4337.30 | 4107.90 | 4168.80 | 4161.50 | 4225.40 | 4317.60 | 4469.00 | 4764.20 | 4736.40 | 2664.20 | 2825.20 | 2851.00 | 2932.00 | 2912.70 | 2988.00 | 2882.50 | 2817.60 | 2645.90 | 2557.30 | 2661.20 | 2873.10 | 2805.00 | 3030.30 | 3226.40 | 3112.20 | 1682.90 | 1689.50 | 1810.00 | 1837.30 | 1775.88 | 1855.27 | 1856.47 | 1795.08 | 1786.71 | 1728.75 | 1776.92 | 1818.76 | 1869.90 | 691.10 | 659.90 | 660.85 | 713.77 | 569.27 | 630.24 | 720.00 | 728.23 | 787.27 | 590.61 | 661.91 | 687.03 | 727.66 | 814.87 | 849.64 | 858.24 | NA | NA | NA | |
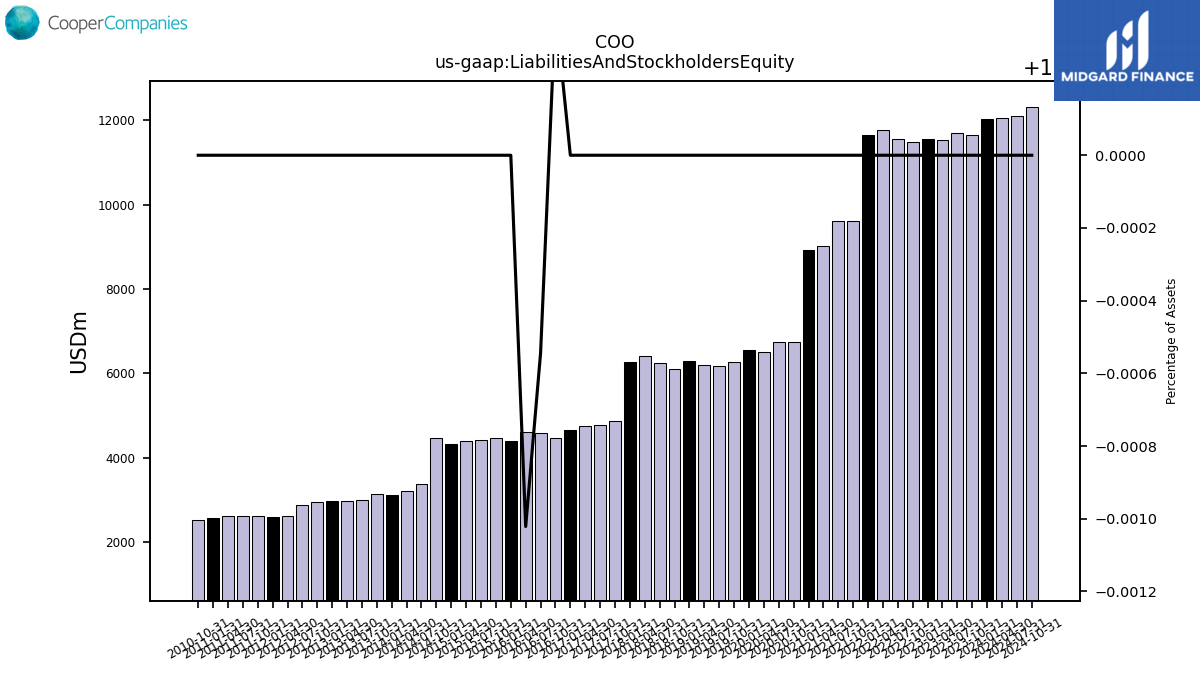
| Liabilities And Stockholders Equity | 12032.60 | 11658.90 | 11697.30 | 11539.50 | 11561.10 | 11492.30 | 11552.10 | 11778.00 | 11662.50 | 9606.20 | 9610.60 | 9013.80 | 8921.90 | 6737.50 | 6748.40 | 6510.00 | 6548.50 | 6274.50 | 6172.80 | 6203.40 | 6298.60 | 6112.80 | 6256.90 | 6414.40 | 6268.60 | 4858.70 | 4782.80 | 4749.80 | 4656.70 | 4475.92 | 4592.68 | 4601.25 | 4401.80 | 4460.61 | 4422.68 | 4392.66 | 4335.74 | 4458.34 | 3367.37 | 3221.98 | 3114.76 | 3137.26 | 3006.91 | 2966.73 | 2969.54 | 2941.38 | 2883.92 | 2628.56 | 2599.27 | 2624.52 | 2615.33 | 2625.19 | 2571.94 | 2525.02 | NA | NA | NA | |
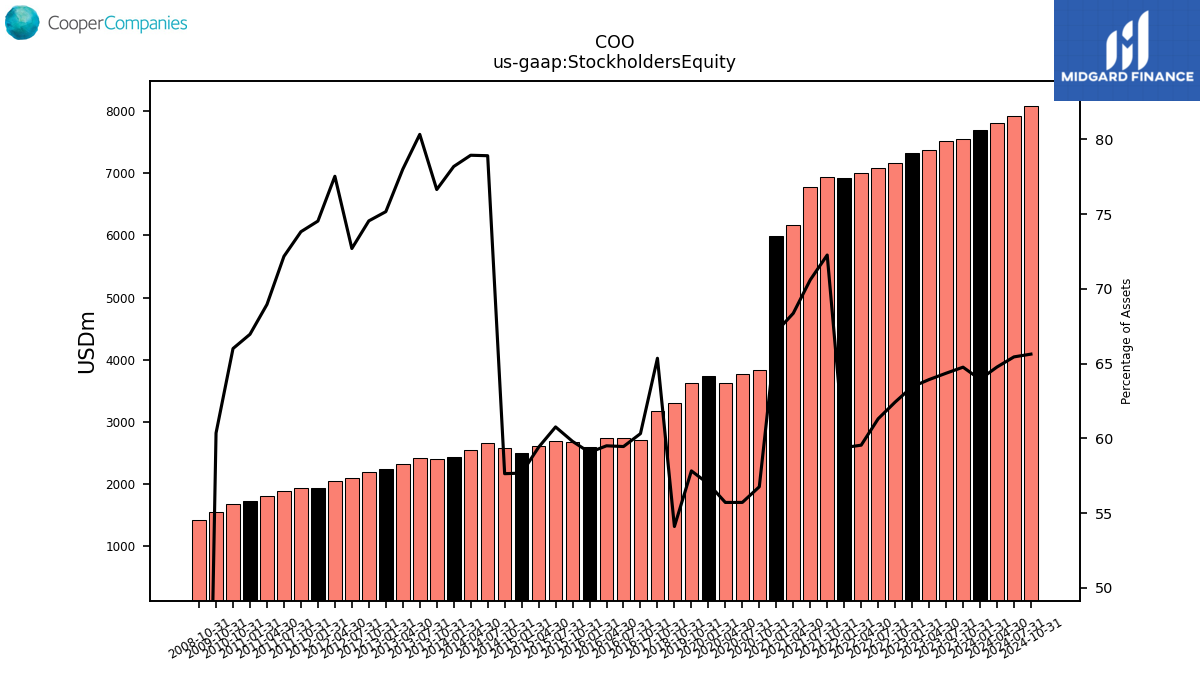
| Stockholders Equity | 7695.10 | 7550.80 | 7528.30 | 7377.80 | 7335.50 | 7174.50 | 7082.90 | 7013.60 | 6925.90 | 6941.80 | 6785.20 | 6162.60 | 5989.70 | 3824.60 | 3760.20 | 3627.30 | 3730.70 | 3628.40 | NA | NA | NA | 3307.60 | NA | NA | NA | 3175.70 | NA | NA | NA | 2699.87 | 2730.69 | 2738.08 | 2599.96 | 2667.51 | 2687.57 | 2609.67 | 2500.87 | 2569.88 | 2657.07 | 2543.35 | 2435.28 | 2404.53 | 2415.52 | 2314.20 | 2232.06 | 2192.75 | 2096.65 | 2037.96 | 1937.36 | 1937.49 | 1887.68 | 1810.33 | 1722.30 | 1666.78 | NA | NA | NA |
| 2024-01-31 | 2023-10-31 | 2023-07-31 | 2023-04-30 | 2023-01-31 | 2022-10-31 | 2022-07-31 | 2022-04-30 | 2022-01-31 | 2021-10-31 | 2021-07-31 | 2021-04-30 | 2021-01-31 | 2020-10-31 | 2020-07-31 | 2020-04-30 | 2020-01-31 | 2019-10-31 | 2019-07-31 | 2019-04-30 | 2019-01-31 | 2018-10-31 | 2018-07-31 | 2018-04-30 | 2018-01-31 | 2017-10-31 | 2017-07-31 | 2017-04-30 | 2017-01-31 | 2016-10-31 | 2016-07-31 | 2016-04-30 | 2016-01-31 | 2015-10-31 | 2015-07-31 | 2015-04-30 | 2015-01-31 | 2014-10-31 | 2014-07-31 | 2014-04-30 | 2014-01-31 | 2013-10-31 | 2013-07-31 | 2013-04-30 | 2013-01-31 | 2012-10-31 | 2012-07-31 | 2012-04-30 | 2012-01-31 | 2011-10-31 | 2011-07-31 | 2011-04-30 | 2011-01-31 | 2010-10-31 | 2010-07-31 | 2010-04-30 | 2010-01-31 | ||
|---|---|---|---|---|---|---|---|---|---|---|---|---|---|---|---|---|---|---|---|---|---|---|---|---|---|---|---|---|---|---|---|---|---|---|---|---|---|---|---|---|---|---|---|---|---|---|---|---|---|---|---|---|---|---|---|---|---|---|
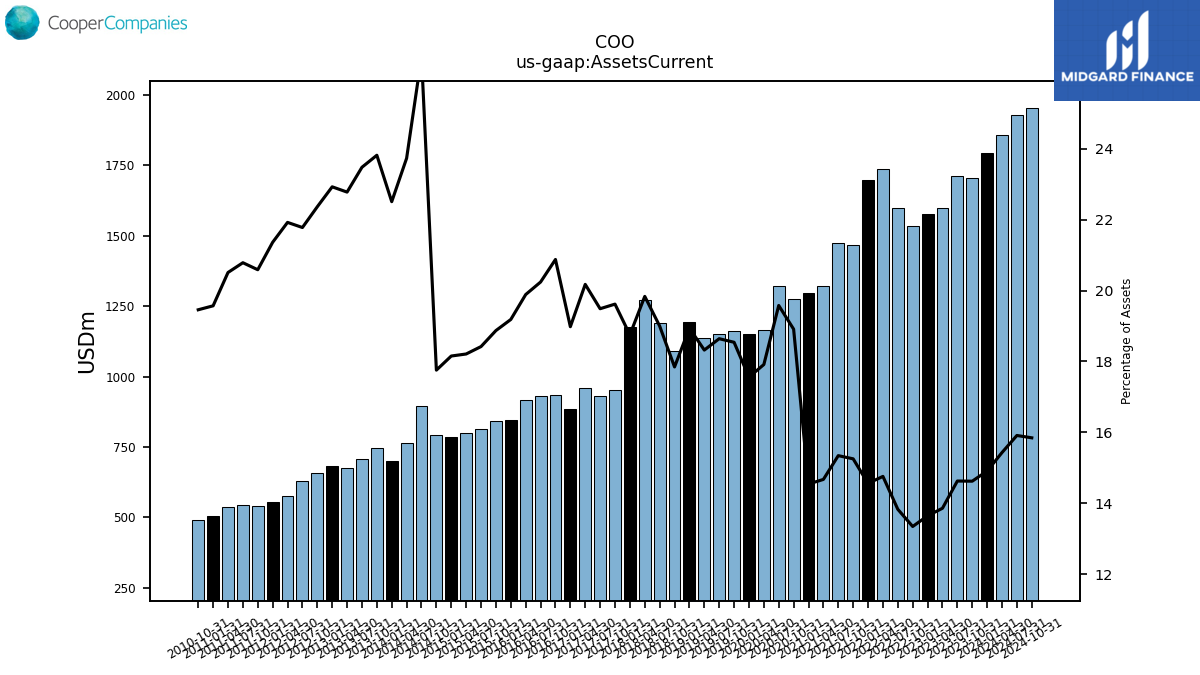
| Assets Current | 1793.90 | 1704.90 | 1711.00 | 1599.30 | 1577.50 | 1533.60 | 1597.70 | 1738.20 | 1698.10 | 1465.30 | 1474.60 | 1322.60 | 1297.40 | 1274.20 | 1321.30 | 1166.20 | 1149.90 | 1163.40 | 1150.80 | 1136.60 | 1193.00 | 1090.90 | 1188.80 | 1272.40 | 1175.50 | 953.20 | 932.10 | 958.30 | 883.90 | 934.46 | 929.64 | 915.12 | 844.50 | 841.82 | 814.69 | 799.97 | 787.11 | 791.62 | 895.81 | 764.68 | 701.09 | 747.24 | 706.01 | 675.79 | 680.85 | 657.86 | 628.11 | 576.28 | 555.26 | 540.35 | 543.64 | 538.43 | 503.34 | 491.34 | NA | NA | NA | |
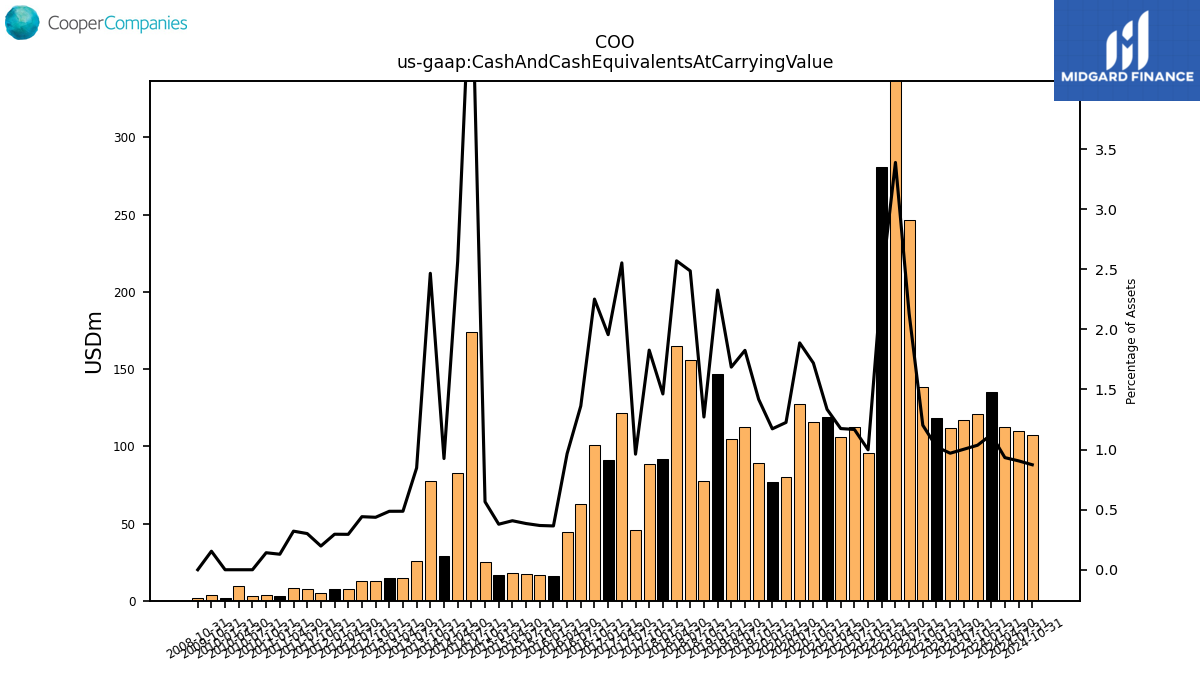
| Cash And Cash Equivalents At Carrying Value | 135.20 | 120.80 | 117.30 | 111.90 | 118.20 | 138.20 | 246.30 | 399.20 | 280.70 | 95.90 | 112.20 | 105.90 | 119.10 | 115.90 | 127.40 | 79.80 | 76.80 | 89.00 | 112.70 | 104.60 | 146.60 | 77.70 | 155.60 | 164.90 | 91.70 | 88.80 | 46.00 | 121.30 | 91.10 | 100.82 | 62.61 | 44.46 | 16.05 | 16.43 | 17.00 | 17.91 | 16.43 | 25.22 | 173.79 | 82.66 | 28.83 | 77.39 | 25.48 | 14.44 | 14.45 | 12.84 | 12.73 | 7.75 | 7.68 | 5.17 | 7.87 | 8.43 | 3.32 | 3.57 | 3.24 | 9.83 | 1.82 | |
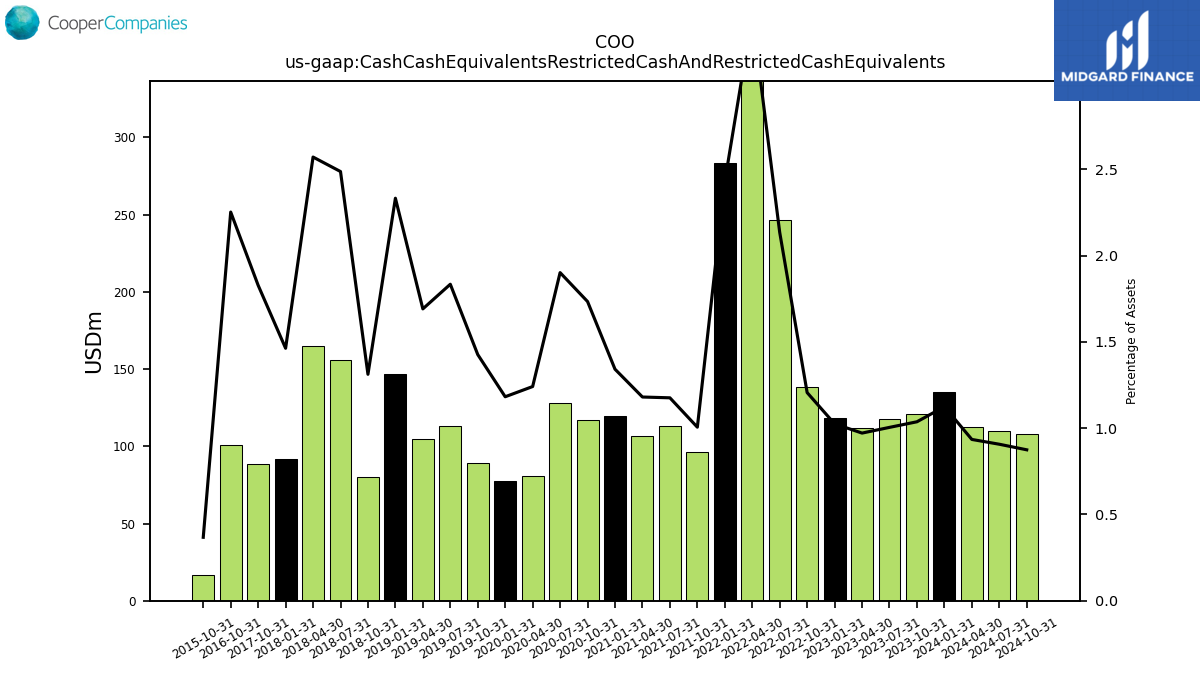
| Cash Cash Equivalents Restricted Cash And Restricted Cash Equivalents | 135.30 | 120.90 | 117.50 | 112.10 | 118.50 | 138.60 | 246.60 | 399.60 | 283.20 | 96.60 | 113.00 | 106.40 | 119.70 | 116.80 | 128.30 | 80.80 | 77.40 | 89.50 | 113.20 | 104.90 | 146.90 | 80.20 | 155.60 | 164.90 | 91.70 | 88.80 | NA | NA | NA | 100.80 | NA | NA | NA | 16.40 | NA | NA | NA | NA | NA | NA | NA | NA | NA | NA | NA | NA | NA | NA | NA | NA | NA | NA | NA | NA | NA | NA | NA | |
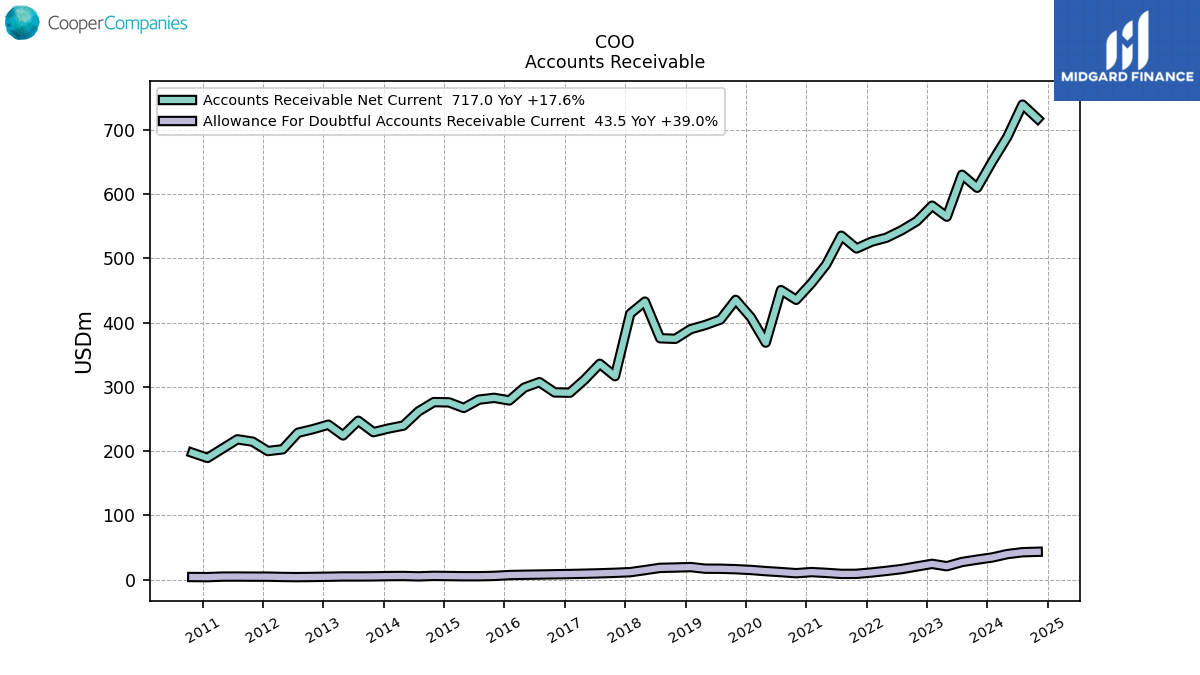
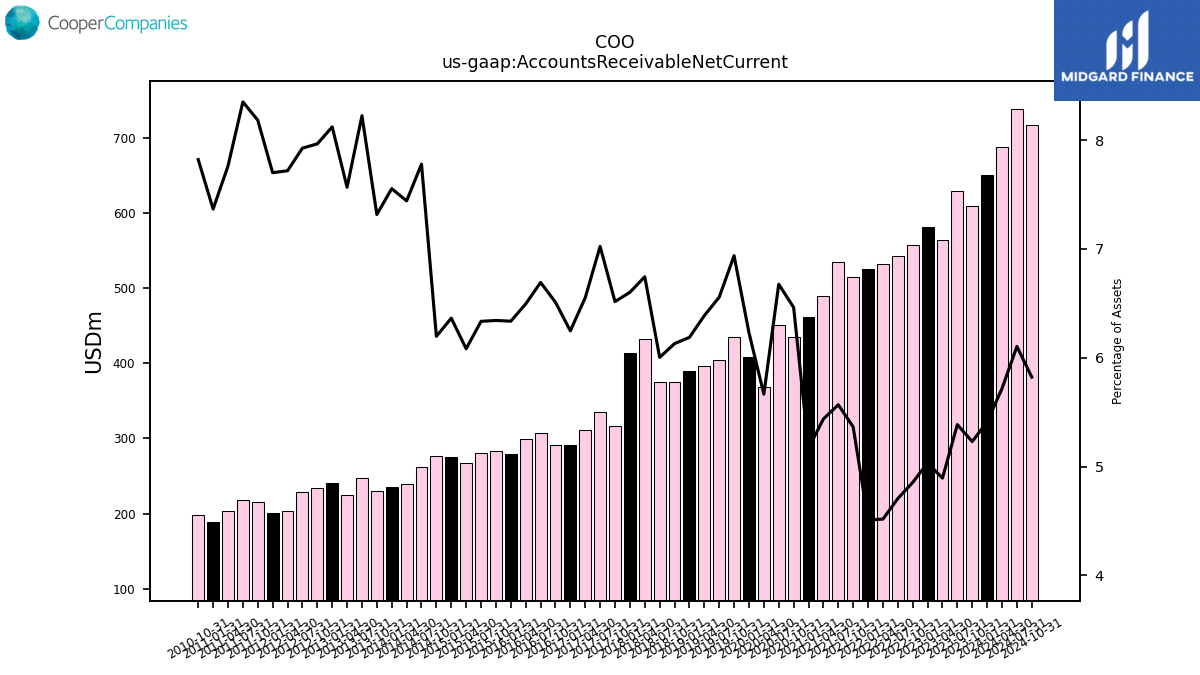
| Accounts Receivable Net Current | 651.00 | 609.70 | 629.90 | 564.70 | 581.80 | 557.80 | 543.60 | 532.00 | 525.90 | 515.30 | 535.10 | 490.10 | 461.20 | 435.40 | 450.50 | 368.80 | 408.00 | 435.30 | 404.70 | 396.20 | 389.70 | 374.70 | 375.60 | 432.60 | 413.80 | 316.60 | 335.90 | 311.20 | 290.90 | 291.37 | 307.34 | 298.82 | 278.89 | 282.92 | 280.16 | 267.18 | 275.90 | 276.28 | 261.96 | 239.77 | 235.29 | 229.54 | 247.30 | 224.49 | 241.17 | 234.30 | 228.59 | 202.88 | 200.16 | 214.78 | 218.42 | 203.76 | 189.46 | 197.49 | NA | NA | NA | |
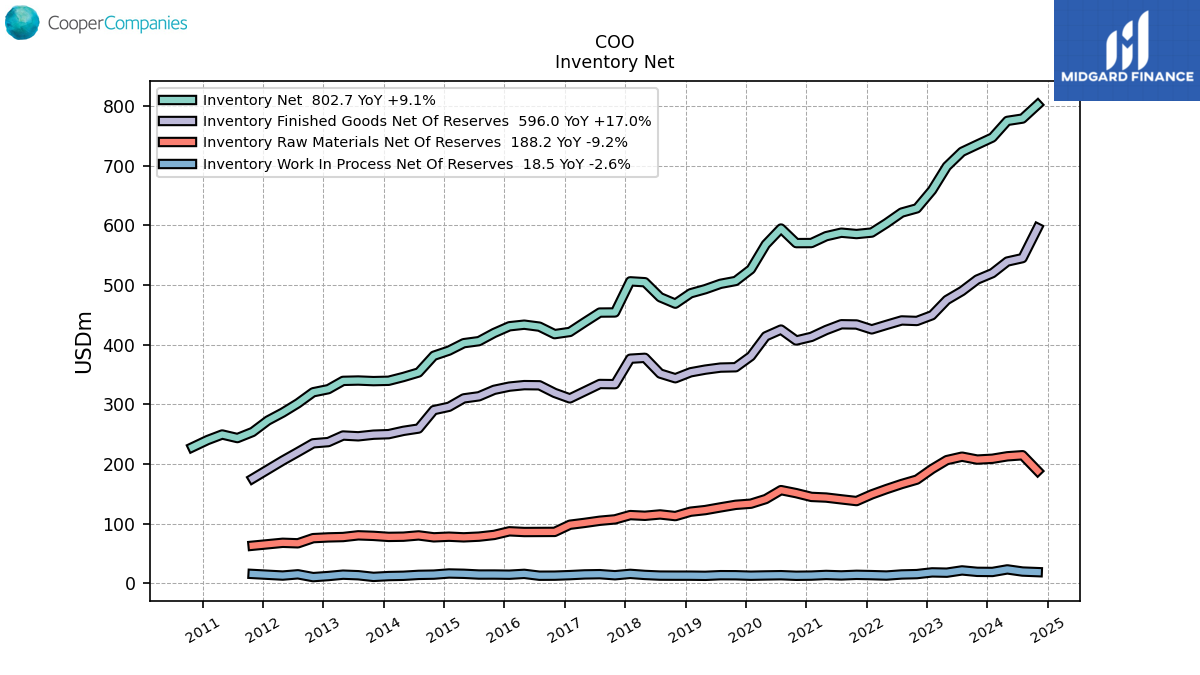
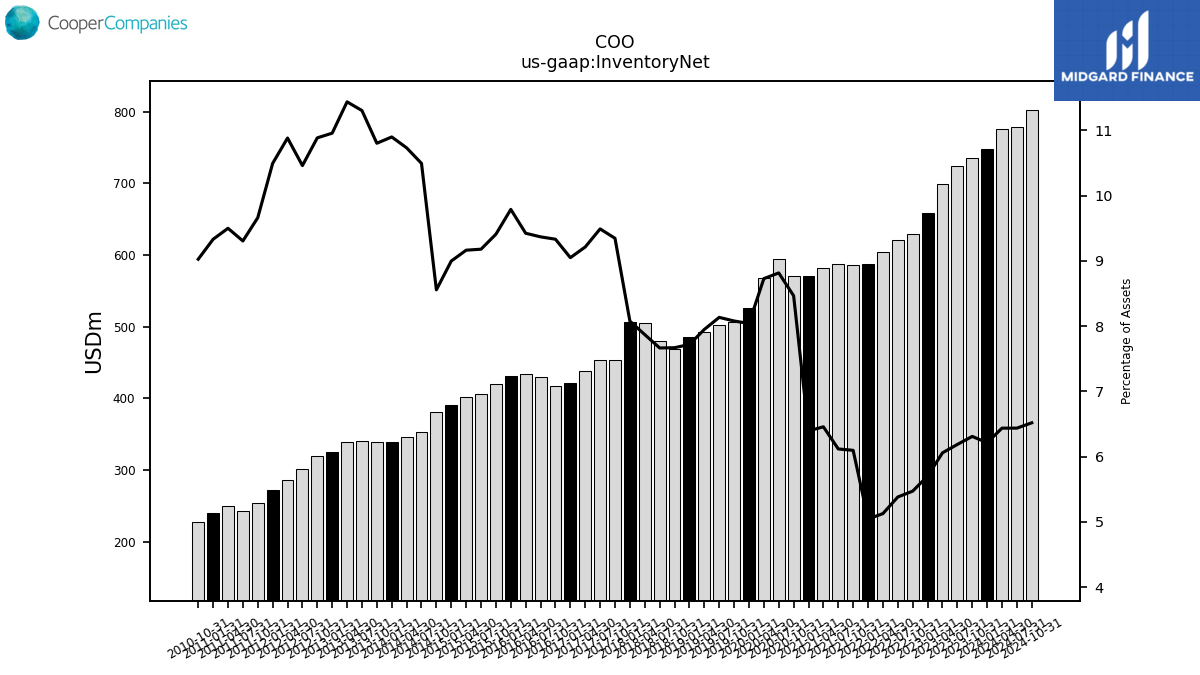
| Inventory Net | 747.50 | 735.60 | 723.60 | 699.00 | 659.10 | 628.70 | 621.60 | 603.80 | 588.10 | 585.60 | 587.90 | 582.00 | 570.50 | 570.40 | 594.90 | 568.20 | 526.50 | 506.90 | 502.10 | 493.10 | 486.20 | 468.80 | 479.60 | 504.80 | 506.30 | 454.10 | 453.90 | 437.60 | 421.40 | 417.70 | 430.26 | 433.60 | 430.90 | 419.69 | 405.97 | 402.54 | 390.10 | 381.47 | 353.38 | 345.82 | 339.50 | 338.92 | 339.91 | 339.32 | 325.39 | 320.20 | 301.69 | 286.07 | 272.77 | 253.58 | 243.37 | 249.38 | 240.00 | 227.90 | NA | NA | NA | |
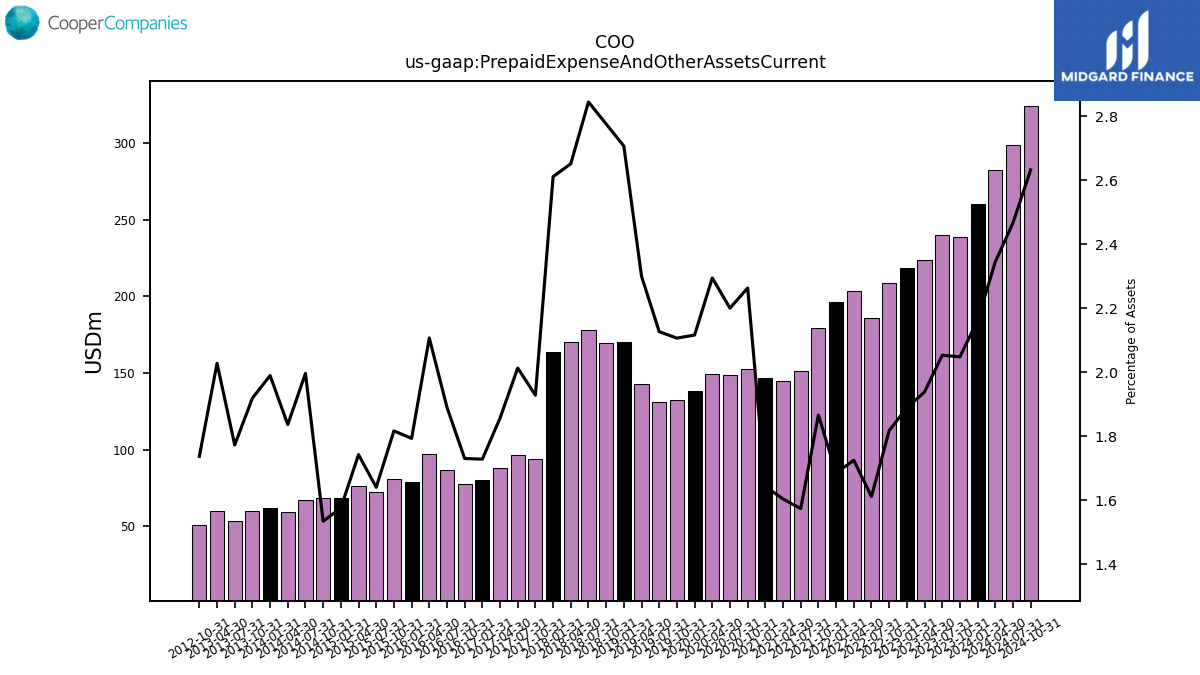
| Prepaid Expense And Other Assets Current | 260.20 | 238.80 | 240.20 | 223.70 | 218.40 | 208.90 | 186.20 | 203.20 | 196.60 | 179.30 | 151.30 | 144.60 | 146.60 | 152.50 | 148.50 | 149.40 | 138.60 | 132.20 | 131.30 | 142.70 | 170.50 | 169.70 | 178.00 | 170.10 | 163.70 | 93.70 | 96.30 | 88.20 | 80.50 | 77.47 | 86.84 | 96.97 | 78.95 | 81.05 | 72.57 | 76.56 | 68.35 | 68.42 | 67.23 | 59.18 | 61.98 | 60.22 | 53.31 | 60.17 | NA | 51.11 | NA | NA | NA | NA | NA | NA | NA | NA | NA | NA | NA |
| 2024-01-31 | 2023-10-31 | 2023-07-31 | 2023-04-30 | 2023-01-31 | 2022-10-31 | 2022-07-31 | 2022-04-30 | 2022-01-31 | 2021-10-31 | 2021-07-31 | 2021-04-30 | 2021-01-31 | 2020-10-31 | 2020-07-31 | 2020-04-30 | 2020-01-31 | 2019-10-31 | 2019-07-31 | 2019-04-30 | 2019-01-31 | 2018-10-31 | 2018-07-31 | 2018-04-30 | 2018-01-31 | 2017-10-31 | 2017-07-31 | 2017-04-30 | 2017-01-31 | 2016-10-31 | 2016-07-31 | 2016-04-30 | 2016-01-31 | 2015-10-31 | 2015-07-31 | 2015-04-30 | 2015-01-31 | 2014-10-31 | 2014-07-31 | 2014-04-30 | 2014-01-31 | 2013-10-31 | 2013-07-31 | 2013-04-30 | 2013-01-31 | 2012-10-31 | 2012-07-31 | 2012-04-30 | 2012-01-31 | 2011-10-31 | 2011-07-31 | 2011-04-30 | 2011-01-31 | 2010-10-31 | 2010-07-31 | 2010-04-30 | 2010-01-31 | ||
|---|---|---|---|---|---|---|---|---|---|---|---|---|---|---|---|---|---|---|---|---|---|---|---|---|---|---|---|---|---|---|---|---|---|---|---|---|---|---|---|---|---|---|---|---|---|---|---|---|---|---|---|---|---|---|---|---|---|---|
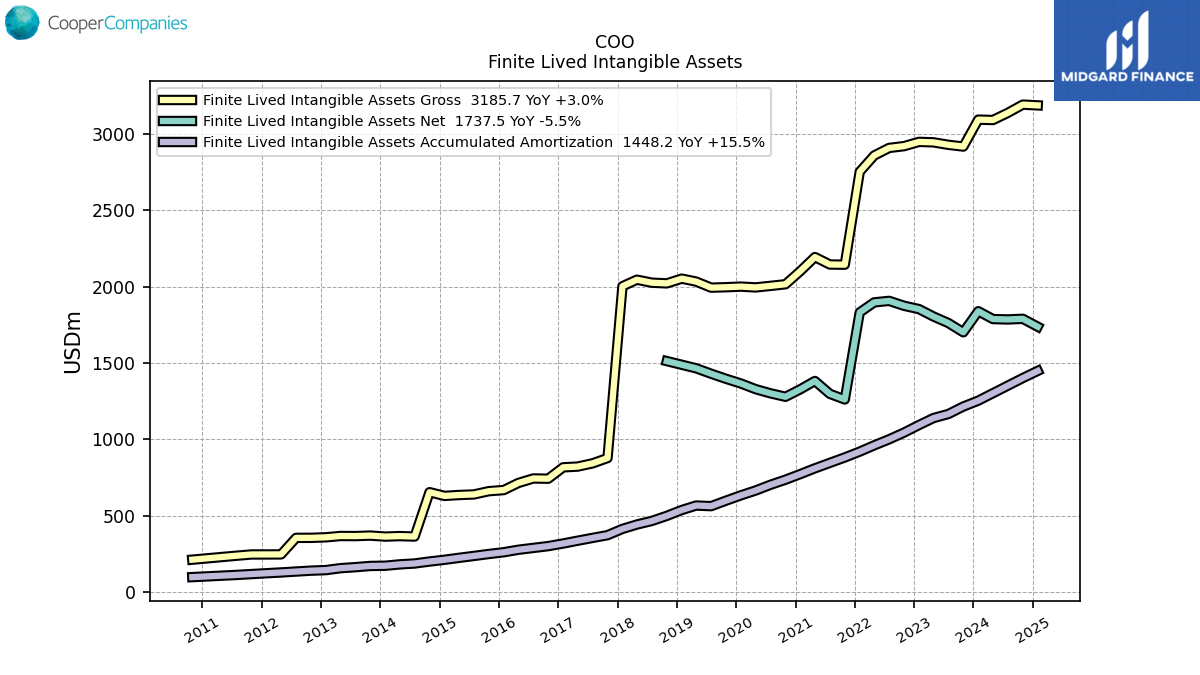
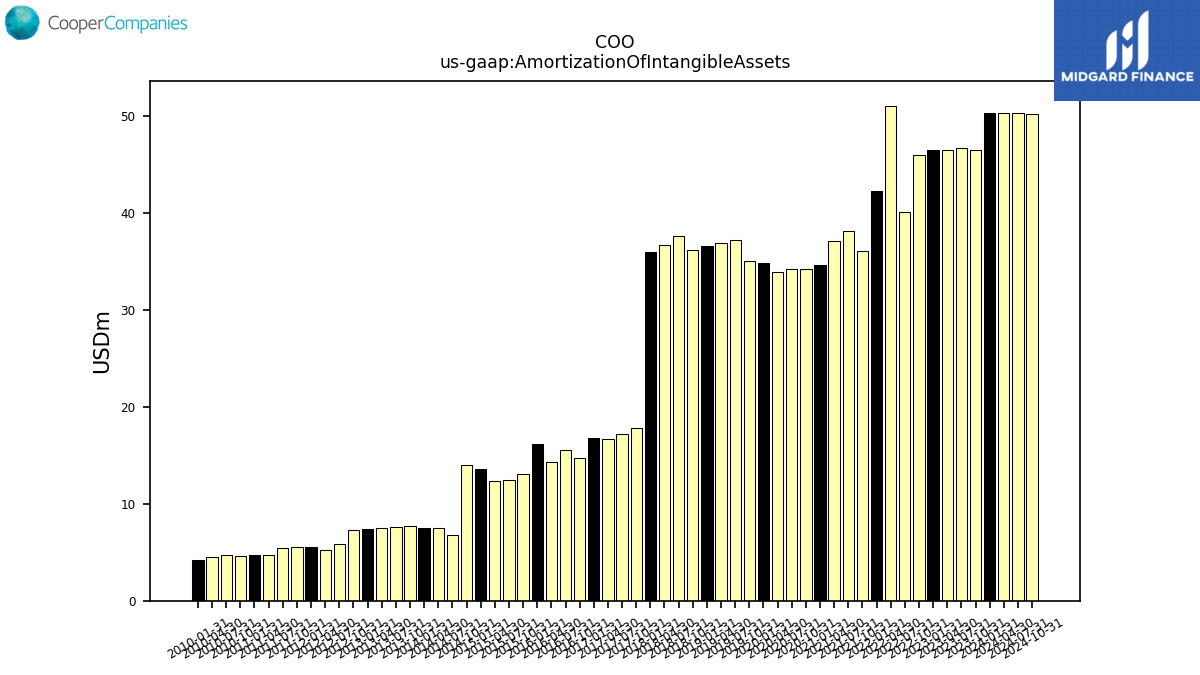
| Amortization Of Intangible Assets | 50.30 | 46.50 | 46.70 | 46.50 | 46.50 | 46.00 | 40.10 | 51.10 | 42.30 | 36.10 | 38.20 | 37.10 | 34.70 | 34.20 | 34.20 | 33.90 | 34.90 | 35.10 | 37.20 | 36.90 | 36.60 | 36.20 | 37.70 | 36.70 | 36.00 | 17.80 | 17.20 | 16.70 | 16.80 | 14.72 | 15.55 | 14.31 | 16.20 | 13.05 | 12.49 | 12.32 | 13.60 | 13.97 | 6.75 | 7.48 | 7.51 | 7.69 | 7.66 | 7.52 | 7.37 | 7.30 | 5.86 | 5.26 | 5.55 | 5.59 | 5.49 | 4.73 | 4.71 | 4.62 | 4.72 | 4.50 | 4.22 | |
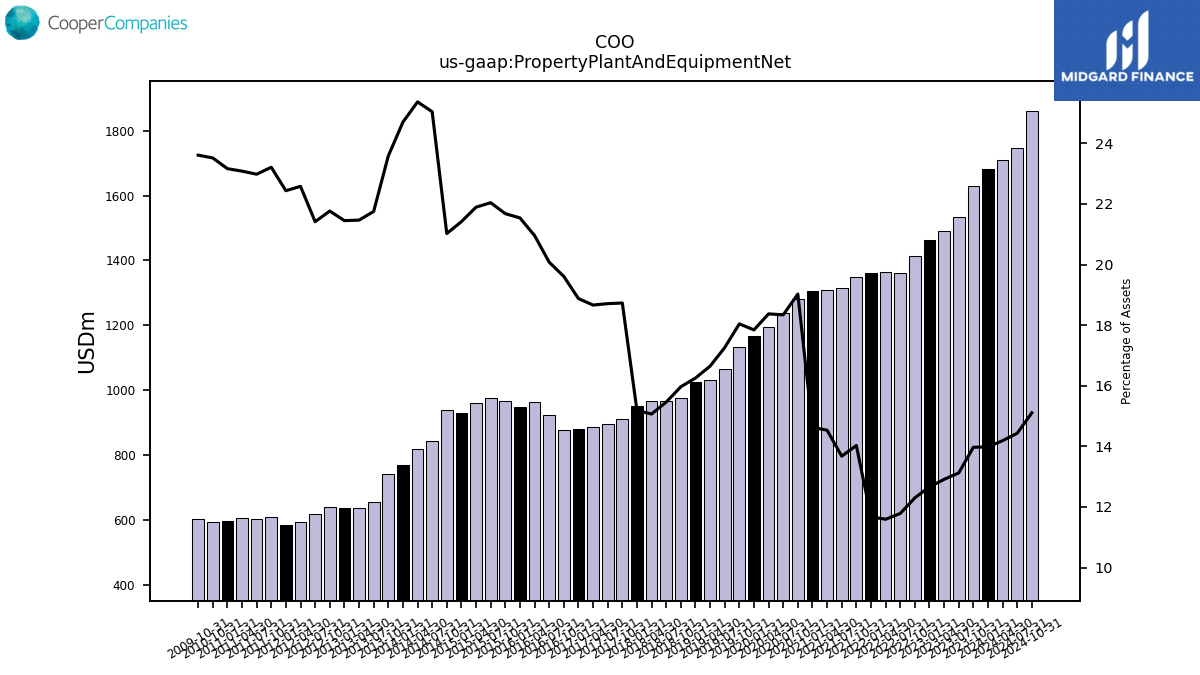
| Property Plant And Equipment Net | 1682.20 | 1628.80 | 1535.00 | 1489.80 | 1464.00 | 1413.70 | 1361.30 | 1365.60 | 1361.50 | 1347.60 | 1314.30 | 1310.00 | 1305.10 | 1281.90 | 1237.70 | 1196.10 | 1168.50 | 1132.10 | 1065.40 | 1032.70 | 1023.80 | 976.00 | 967.40 | 966.50 | 952.00 | 910.10 | 894.90 | 886.50 | 879.10 | 877.67 | 922.21 | 964.36 | 948.17 | 967.10 | 974.88 | 961.76 | 928.63 | 937.33 | 843.41 | 817.44 | 769.40 | 739.87 | 654.10 | 636.88 | 637.00 | 640.25 | 617.62 | 593.60 | 583.24 | 609.21 | 601.09 | 606.00 | 595.83 | 593.89 | NA | NA | NA | |
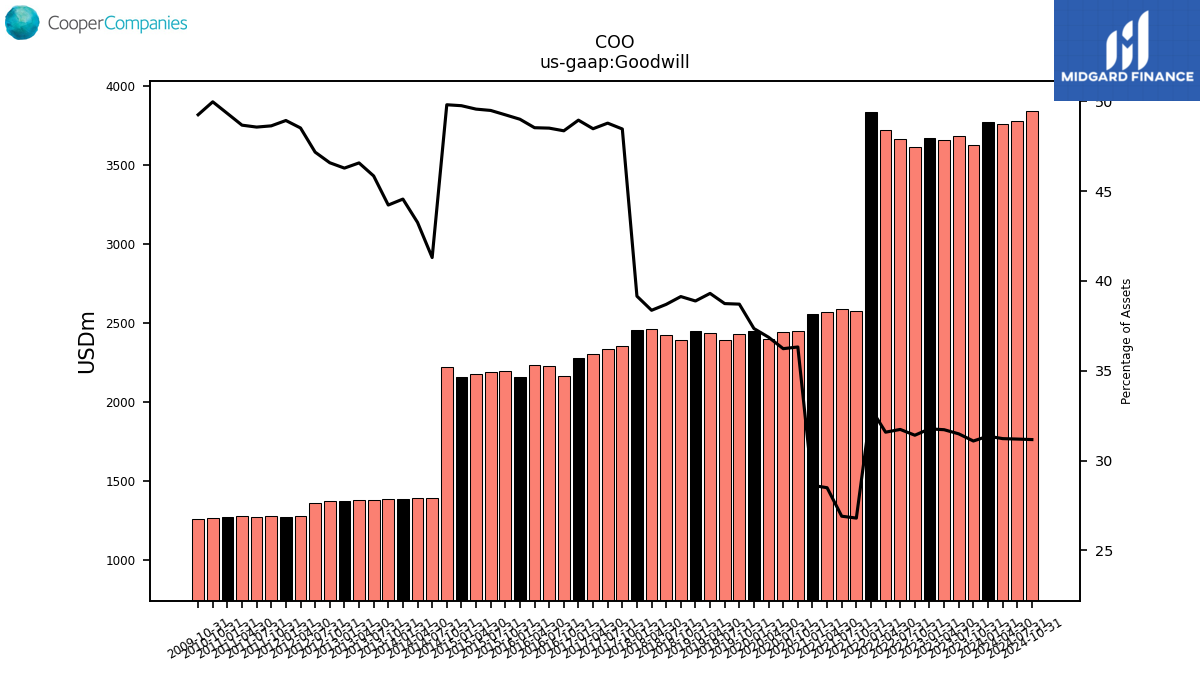
| Goodwill | 3773.20 | 3624.50 | 3683.10 | 3660.00 | 3672.30 | 3609.70 | 3665.80 | 3719.40 | 3835.70 | 2574.00 | 2585.20 | 2567.70 | 2553.30 | 2447.30 | 2445.00 | 2400.00 | 2445.90 | 2428.90 | 2391.40 | 2438.50 | 2449.30 | 2392.10 | 2421.30 | 2461.10 | 2454.40 | 2354.80 | 2333.60 | 2302.70 | 2279.80 | 2164.75 | 2228.06 | 2233.30 | 2157.26 | 2197.08 | 2189.15 | 2177.55 | 2157.58 | 2220.92 | 1390.91 | 1393.91 | 1387.98 | 1387.61 | 1378.68 | 1381.78 | 1374.50 | 1370.25 | 1360.50 | 1275.44 | 1272.03 | 1276.57 | 1270.30 | 1277.90 | 1268.73 | 1261.98 | NA | NA | NA | |
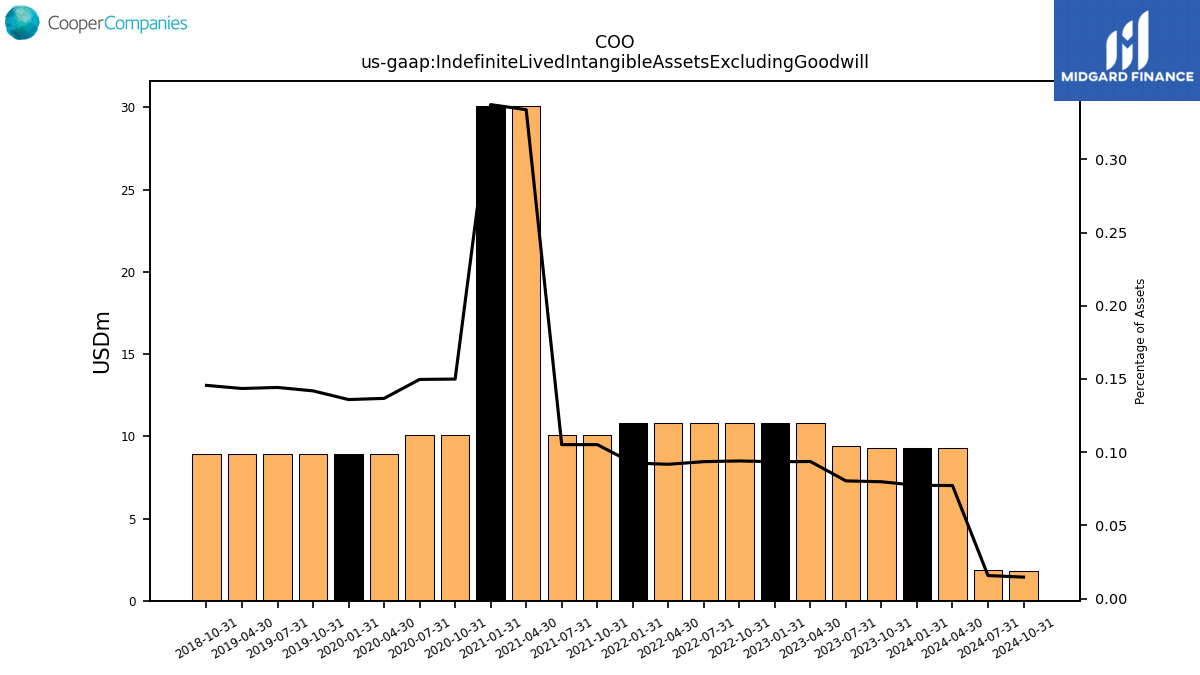
| Indefinite Lived Intangible Assets Excluding Goodwill | 9.30 | 9.30 | 9.40 | 10.80 | 10.80 | 10.80 | 10.80 | 10.80 | 10.80 | 10.10 | 10.10 | 30.10 | 30.10 | 10.10 | 10.10 | 8.90 | 8.90 | 8.90 | 8.90 | 8.90 | NA | 8.90 | NA | NA | NA | NA | NA | NA | NA | NA | NA | NA | NA | NA | NA | NA | NA | NA | NA | NA | NA | NA | NA | NA | NA | NA | NA | NA | NA | NA | NA | NA | NA | NA | NA | NA | NA | |
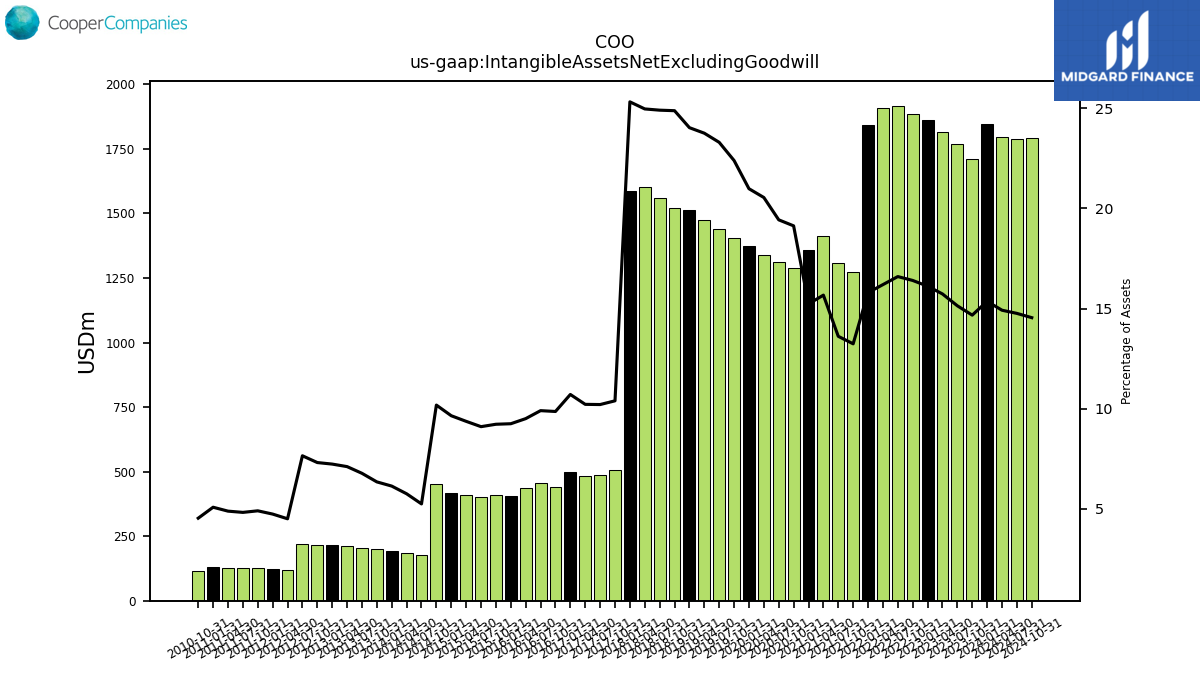
| Intangible Assets Net Excluding Goodwill | 1848.10 | 1710.30 | 1770.60 | 1815.00 | 1863.40 | 1885.10 | 1917.30 | 1907.40 | 1842.00 | 1271.50 | 1308.10 | 1412.40 | 1358.60 | 1289.00 | 1311.40 | 1337.70 | 1374.40 | 1405.30 | 1438.60 | 1474.10 | 1514.10 | 1521.30 | 1558.80 | 1602.00 | 1587.80 | 504.70 | 487.90 | 485.00 | 498.50 | 441.09 | 454.50 | 437.00 | 406.83 | 411.10 | 402.29 | 411.23 | 418.04 | 453.61 | 176.29 | 185.00 | 190.81 | 198.77 | 203.40 | 210.62 | 214.56 | 214.78 | 220.35 | 118.08 | 122.87 | 128.34 | 125.84 | 127.95 | 130.38 | 114.18 | NA | NA | NA | |
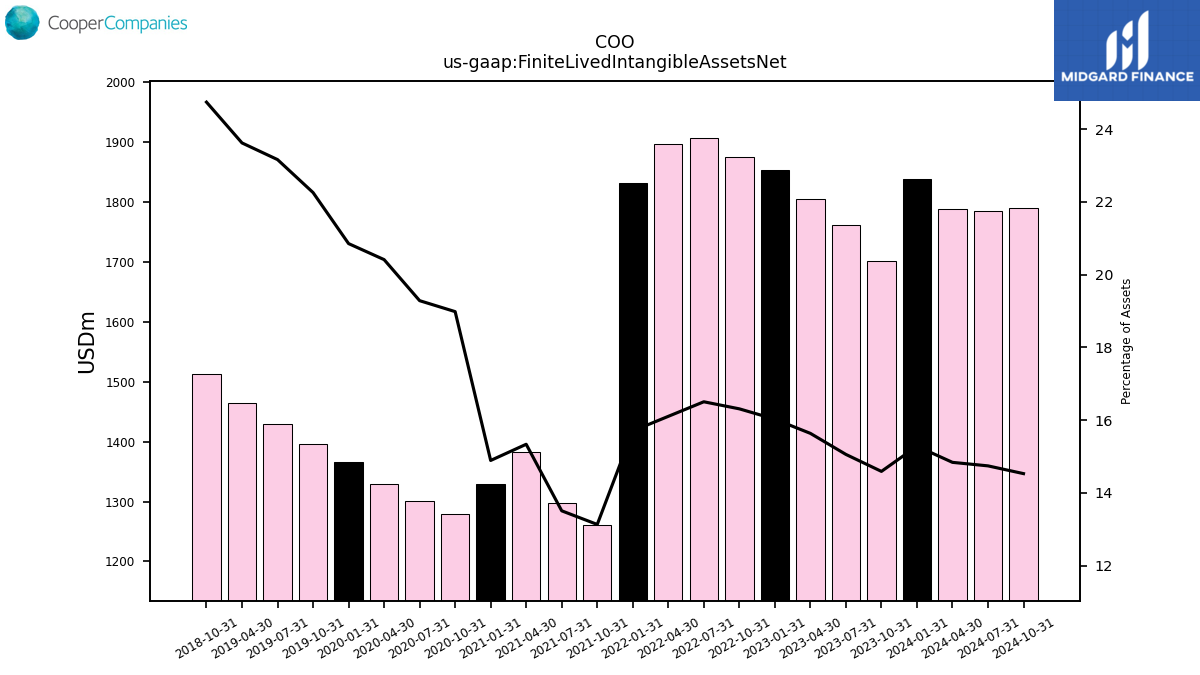
| Finite Lived Intangible Assets Net | 1838.80 | 1701.00 | 1761.20 | 1804.20 | 1852.60 | 1874.30 | 1906.50 | 1896.60 | 1831.20 | 1261.40 | 1298.00 | 1382.30 | 1328.50 | 1278.90 | 1301.30 | 1328.80 | 1365.50 | 1396.40 | 1429.70 | 1465.20 | NA | 1512.40 | NA | NA | NA | NA | NA | NA | NA | NA | NA | NA | NA | NA | NA | NA | NA | NA | NA | NA | NA | NA | NA | NA | NA | NA | NA | NA | NA | NA | NA | NA | NA | NA | NA | NA | NA | |
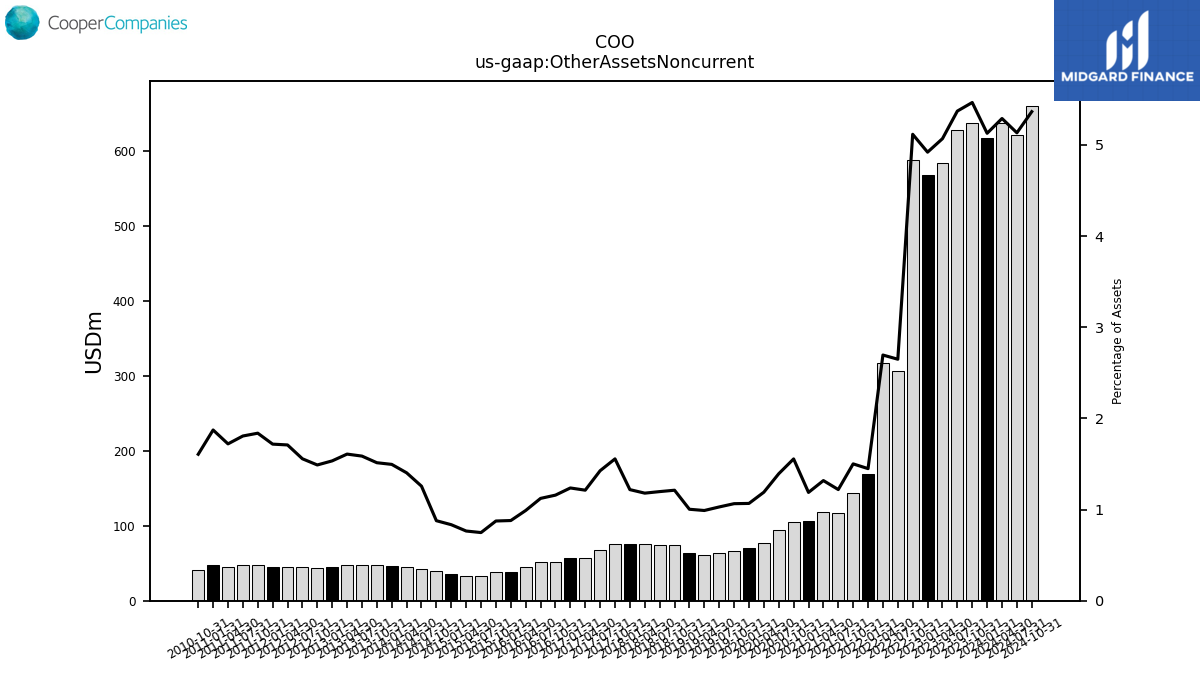
| Other Assets Noncurrent | 616.90 | 637.10 | 628.20 | 584.80 | 568.80 | 587.90 | 306.00 | 317.40 | 169.00 | 144.20 | 117.20 | 118.80 | 106.00 | 104.80 | 94.00 | 77.50 | 69.90 | 66.80 | 63.50 | 61.40 | 63.20 | 74.10 | 74.90 | 75.70 | 76.40 | 75.60 | 68.20 | 57.60 | 57.60 | 51.85 | 51.56 | 45.55 | 38.73 | 39.02 | 33.07 | 33.59 | 36.16 | 39.14 | 42.31 | 45.21 | 46.58 | 47.49 | 47.70 | 47.72 | 45.55 | 43.80 | 44.90 | 44.92 | 44.65 | 48.23 | 47.26 | 45.17 | 48.17 | 40.57 | NA | NA | NA |
| 2024-01-31 | 2023-10-31 | 2023-07-31 | 2023-04-30 | 2023-01-31 | 2022-10-31 | 2022-07-31 | 2022-04-30 | 2022-01-31 | 2021-10-31 | 2021-07-31 | 2021-04-30 | 2021-01-31 | 2020-10-31 | 2020-07-31 | 2020-04-30 | 2020-01-31 | 2019-10-31 | 2019-07-31 | 2019-04-30 | 2019-01-31 | 2018-10-31 | 2018-07-31 | 2018-04-30 | 2018-01-31 | 2017-10-31 | 2017-07-31 | 2017-04-30 | 2017-01-31 | 2016-10-31 | 2016-07-31 | 2016-04-30 | 2016-01-31 | 2015-10-31 | 2015-07-31 | 2015-04-30 | 2015-01-31 | 2014-10-31 | 2014-07-31 | 2014-04-30 | 2014-01-31 | 2013-10-31 | 2013-07-31 | 2013-04-30 | 2013-01-31 | 2012-10-31 | 2012-07-31 | 2012-04-30 | 2012-01-31 | 2011-10-31 | 2011-07-31 | 2011-04-30 | 2011-01-31 | 2010-10-31 | 2010-07-31 | 2010-04-30 | 2010-01-31 | ||
|---|---|---|---|---|---|---|---|---|---|---|---|---|---|---|---|---|---|---|---|---|---|---|---|---|---|---|---|---|---|---|---|---|---|---|---|---|---|---|---|---|---|---|---|---|---|---|---|---|---|---|---|---|---|---|---|---|---|---|
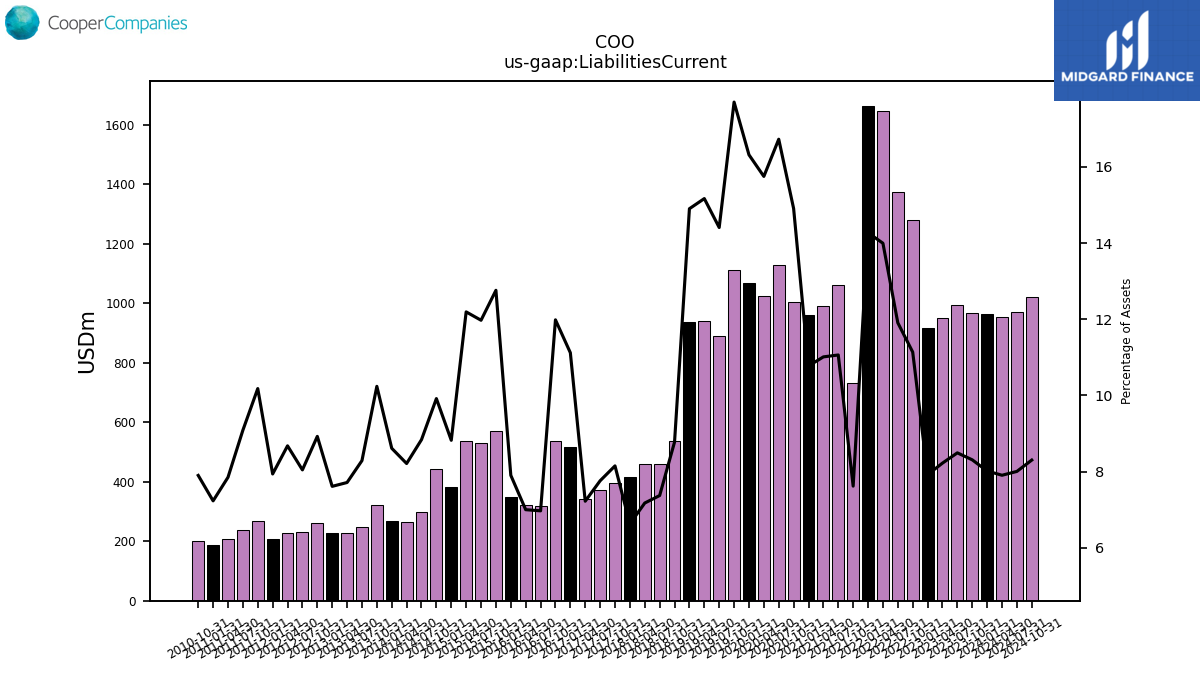
| Liabilities Current | 964.90 | 969.00 | 993.60 | 949.10 | 915.80 | 1280.20 | 1375.70 | 1648.40 | 1664.40 | 732.10 | 1063.20 | 992.70 | 961.30 | 1004.40 | 1128.70 | 1025.30 | 1068.50 | 1110.60 | 889.40 | 940.90 | 938.60 | 536.50 | 461.40 | 460.40 | 415.70 | 396.10 | 371.20 | 343.20 | 517.90 | 536.46 | 320.24 | 322.22 | 347.97 | 569.17 | 529.59 | 535.64 | 382.58 | 442.18 | 297.69 | 264.67 | 268.31 | 321.25 | 249.29 | 228.92 | 226.13 | 262.55 | 232.07 | 228.12 | 206.39 | 267.21 | 237.69 | 206.15 | 186.07 | 199.52 | NA | NA | NA | |
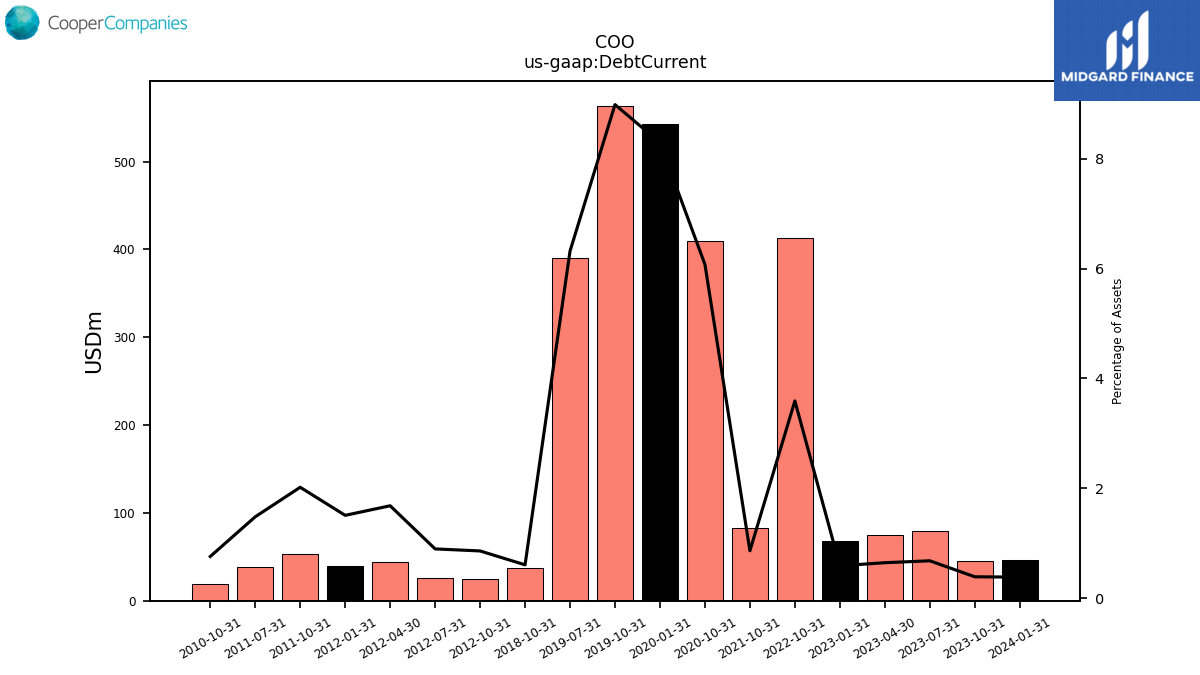
| Debt Current | 46.10 | 45.40 | 79.60 | 74.50 | 68.10 | 412.60 | NA | NA | NA | 82.90 | NA | NA | NA | 409.30 | NA | NA | 543.00 | 563.70 | 390.00 | NA | NA | 37.10 | NA | NA | NA | NA | NA | NA | NA | NA | NA | NA | NA | NA | NA | NA | NA | NA | NA | NA | NA | NA | NA | NA | NA | 25.28 | 25.86 | 44.22 | 39.19 | 52.98 | 38.73 | NA | NA | 19.16 | NA | NA | NA | |
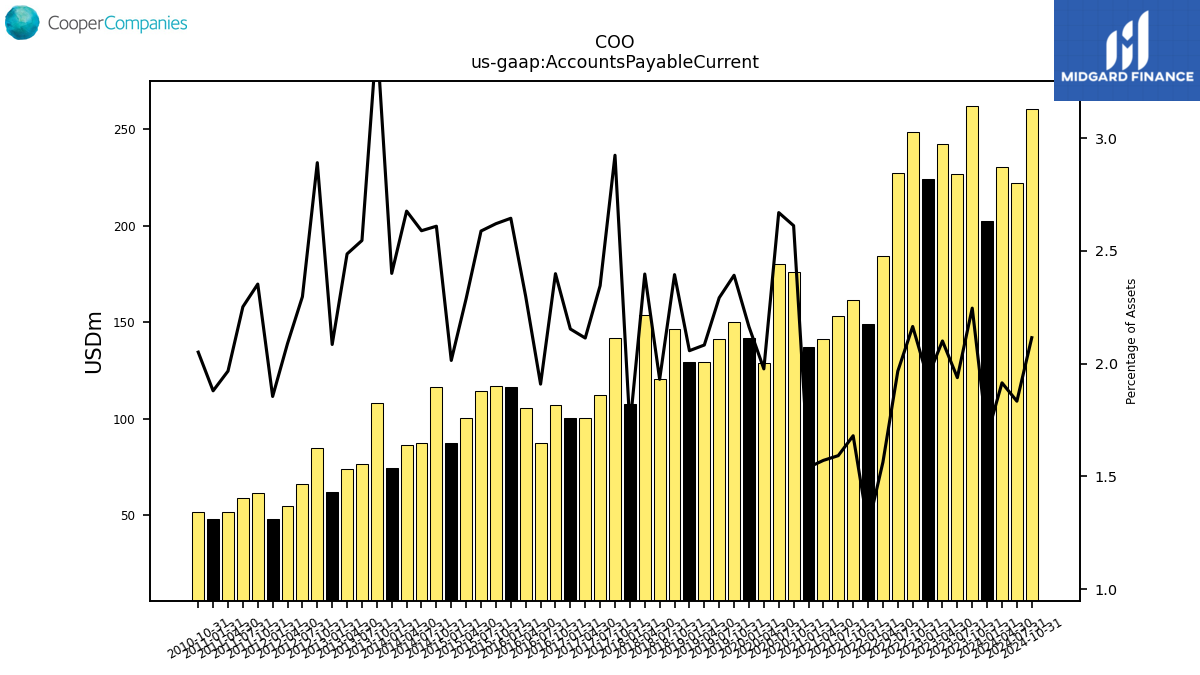
| Accounts Payable Current | 202.30 | 261.90 | 226.70 | 242.40 | 224.10 | 248.80 | 227.20 | 184.10 | 149.00 | 161.40 | 153.00 | 141.60 | 137.40 | 176.00 | 180.20 | 128.70 | 141.70 | 150.10 | 141.50 | 129.20 | 129.60 | 146.40 | 120.80 | 153.80 | 107.90 | 142.10 | 112.20 | 100.40 | 100.30 | 107.39 | 87.69 | 105.76 | 116.43 | 116.91 | 114.48 | 100.55 | 87.34 | 116.35 | 87.21 | 86.25 | 74.77 | 108.17 | 76.57 | 73.78 | 61.92 | 85.06 | 66.25 | 54.93 | 48.20 | 61.76 | 58.91 | 51.64 | 48.34 | 51.79 | NA | NA | NA | |
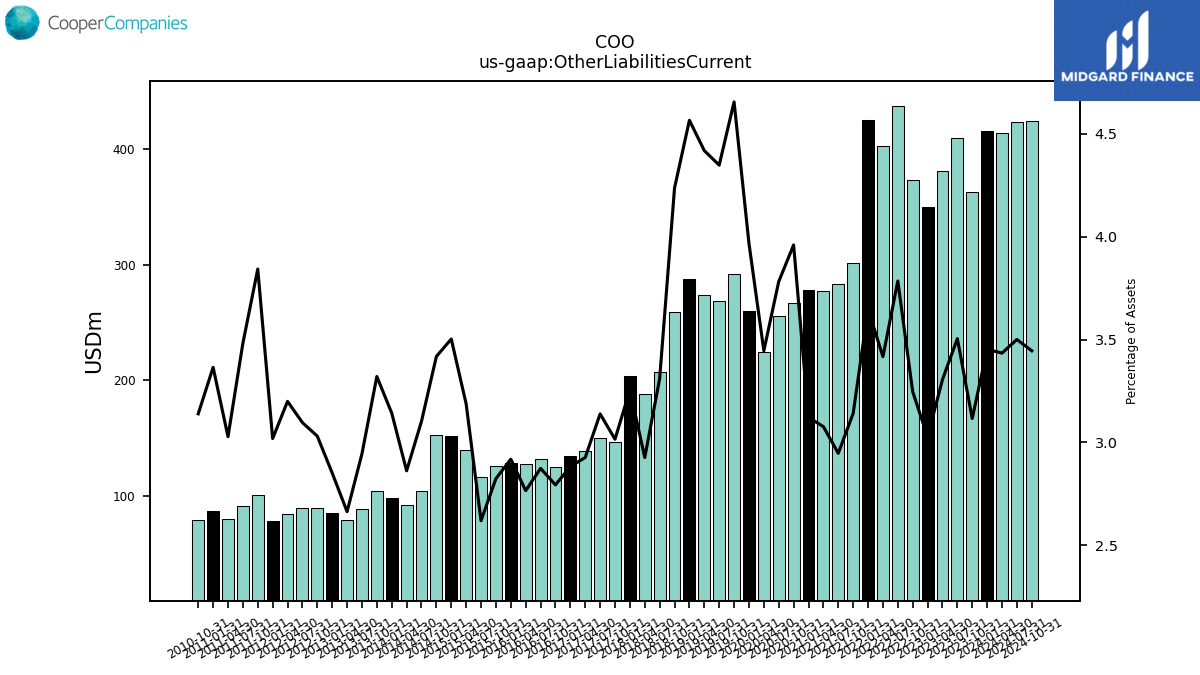
| Other Liabilities Current | 415.40 | 363.30 | 409.90 | 381.40 | 350.00 | 373.10 | 437.20 | 402.40 | 425.50 | 301.70 | 283.20 | 277.30 | 278.50 | 266.80 | 255.20 | 224.30 | 259.80 | 292.10 | 268.40 | 274.10 | 287.60 | 259.00 | 207.10 | 187.70 | 204.00 | 146.50 | 150.10 | 139.00 | 134.20 | 125.03 | 131.97 | 127.23 | 128.44 | 125.95 | 115.84 | 139.99 | 151.86 | 152.37 | 104.47 | 92.21 | 97.88 | 104.16 | 88.54 | 79.01 | 84.66 | 89.13 | 89.29 | 84.10 | 78.46 | 100.85 | 91.06 | 79.48 | 86.54 | 79.25 | NA | NA | NA | |
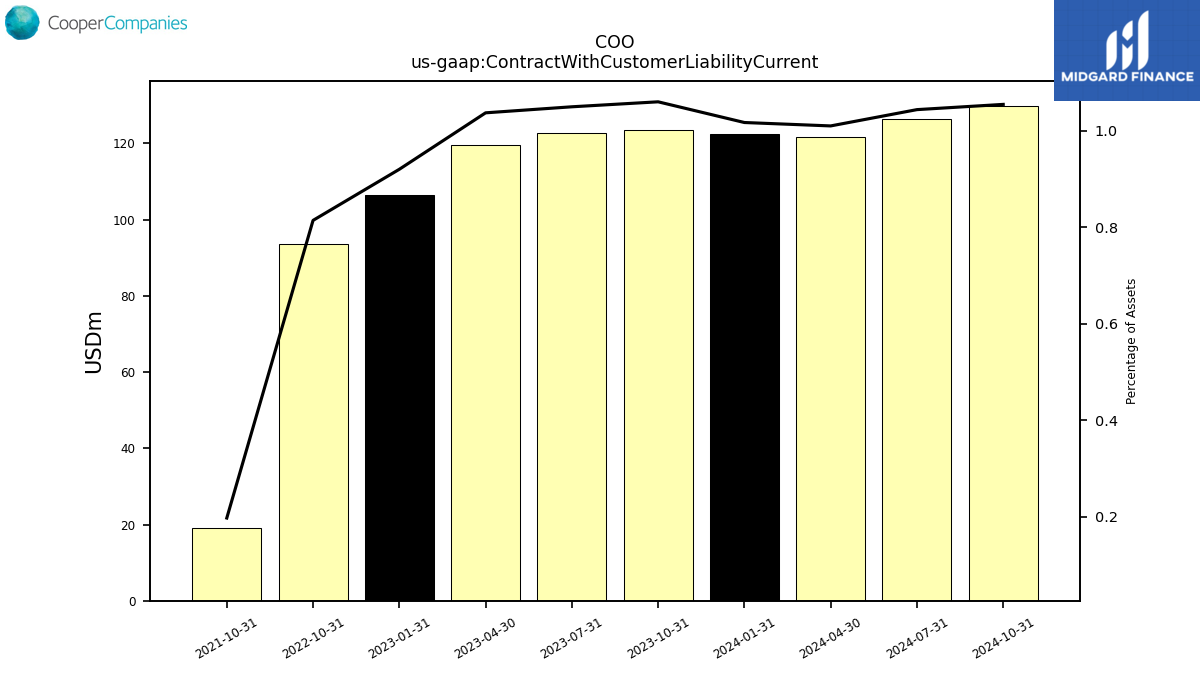
| Contract With Customer Liability Current | 122.40 | 123.60 | 122.80 | 119.70 | 106.40 | 93.60 | NA | NA | NA | 19.00 | NA | NA | NA | NA | NA | NA | NA | NA | NA | NA | NA | NA | NA | NA | NA | NA | NA | NA | NA | NA | NA | NA | NA | NA | NA | NA | NA | NA | NA | NA | NA | NA | NA | NA | NA | NA | NA | NA | NA | NA | NA | NA | NA | NA | NA | NA | NA |
| 2024-01-31 | 2023-10-31 | 2023-07-31 | 2023-04-30 | 2023-01-31 | 2022-10-31 | 2022-07-31 | 2022-04-30 | 2022-01-31 | 2021-10-31 | 2021-07-31 | 2021-04-30 | 2021-01-31 | 2020-10-31 | 2020-07-31 | 2020-04-30 | 2020-01-31 | 2019-10-31 | 2019-07-31 | 2019-04-30 | 2019-01-31 | 2018-10-31 | 2018-07-31 | 2018-04-30 | 2018-01-31 | 2017-10-31 | 2017-07-31 | 2017-04-30 | 2017-01-31 | 2016-10-31 | 2016-07-31 | 2016-04-30 | 2016-01-31 | 2015-10-31 | 2015-07-31 | 2015-04-30 | 2015-01-31 | 2014-10-31 | 2014-07-31 | 2014-04-30 | 2014-01-31 | 2013-10-31 | 2013-07-31 | 2013-04-30 | 2013-01-31 | 2012-10-31 | 2012-07-31 | 2012-04-30 | 2012-01-31 | 2011-10-31 | 2011-07-31 | 2011-04-30 | 2011-01-31 | 2010-10-31 | 2010-07-31 | 2010-04-30 | 2010-01-31 | ||
|---|---|---|---|---|---|---|---|---|---|---|---|---|---|---|---|---|---|---|---|---|---|---|---|---|---|---|---|---|---|---|---|---|---|---|---|---|---|---|---|---|---|---|---|---|---|---|---|---|---|---|---|---|---|---|---|---|---|---|
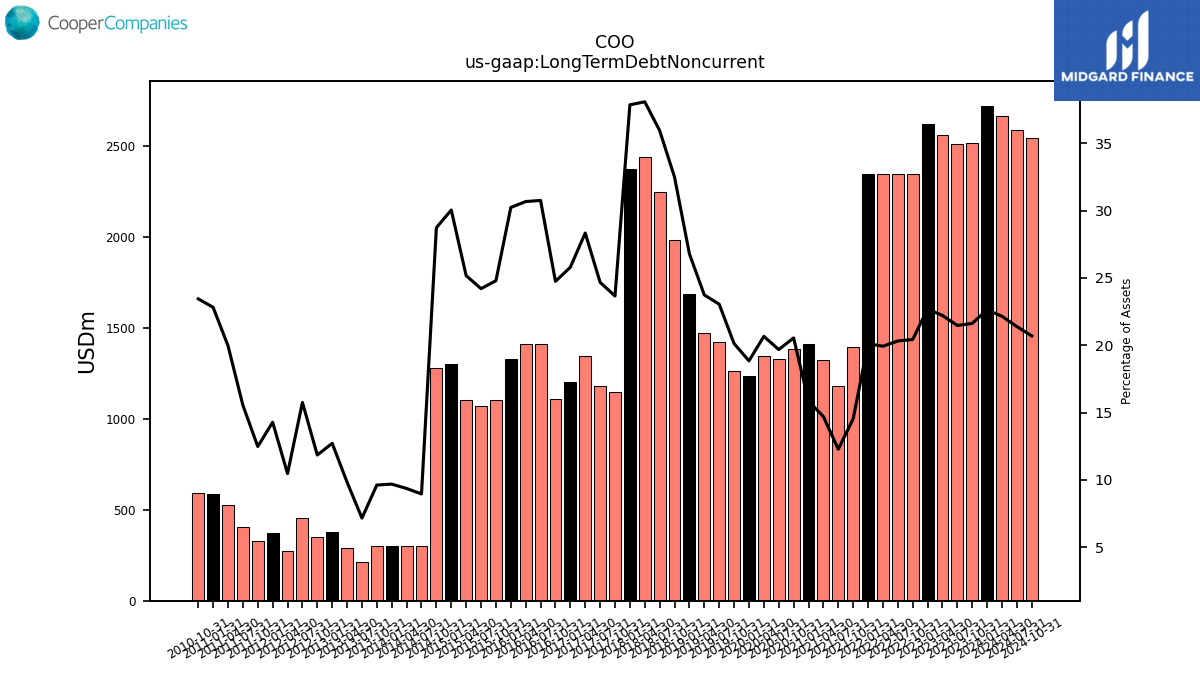
| Long Term Debt Noncurrent | 2722.90 | 2520.40 | 2511.10 | 2562.40 | 2623.70 | 2347.10 | 2346.90 | 2346.70 | 2346.50 | 1396.10 | 1179.90 | 1324.90 | 1413.90 | 1383.90 | 1327.80 | 1344.80 | 1233.70 | 1262.60 | 1422.60 | 1472.30 | 1686.90 | 1985.70 | 2248.90 | 2442.40 | 2372.90 | 1149.30 | 1180.00 | 1345.60 | 1201.00 | 1107.45 | 1412.37 | 1411.18 | 1330.63 | 1105.76 | 1070.30 | 1105.54 | 1302.54 | 1280.83 | 301.45 | 301.51 | 301.59 | 301.67 | 215.29 | 291.55 | 377.51 | 348.42 | 454.23 | 275.09 | 371.11 | 327.45 | 406.49 | 524.12 | 586.72 | 591.98 | NA | NA | NA | |
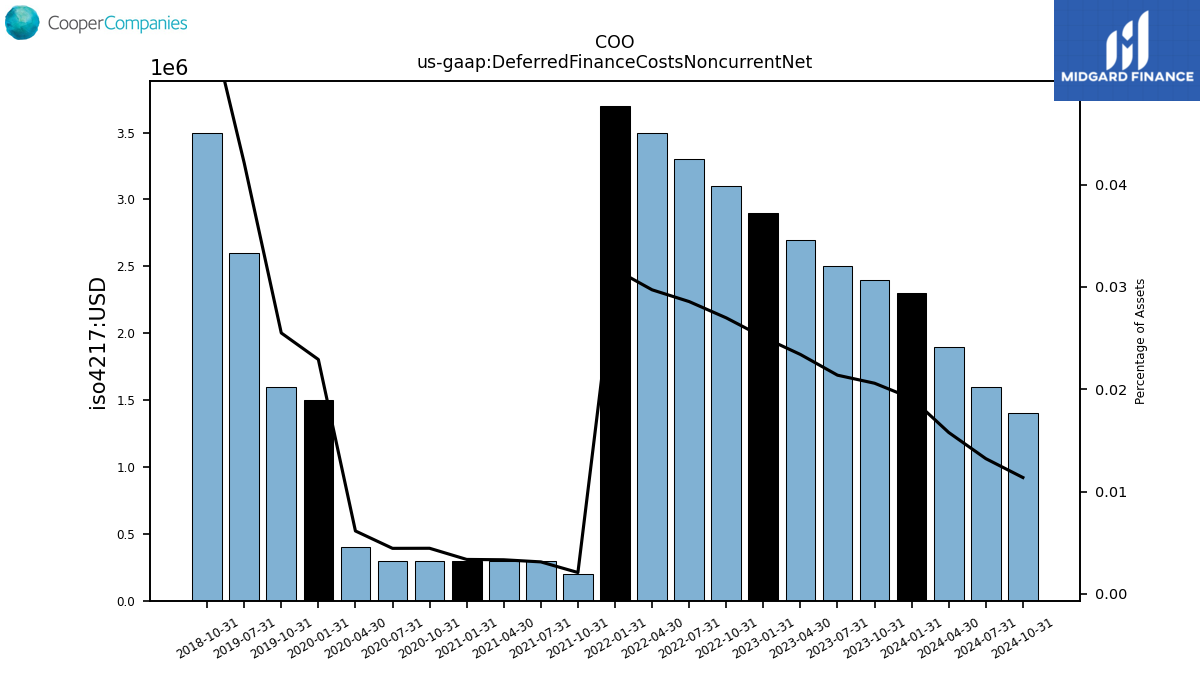
| Deferred Finance Costs Noncurrent Net | 2.30 | 2.40 | 2.50 | 2.70 | 2.90 | 3.10 | 3.30 | 3.50 | 3.70 | 0.20 | 0.30 | 0.30 | 0.30 | 0.30 | 0.30 | 0.40 | 1.50 | 1.60 | 2.60 | NA | NA | 3.50 | NA | NA | NA | NA | NA | NA | NA | NA | NA | NA | NA | NA | NA | NA | NA | NA | NA | NA | NA | NA | NA | NA | NA | NA | NA | NA | NA | NA | NA | NA | NA | NA | NA | NA | NA | |
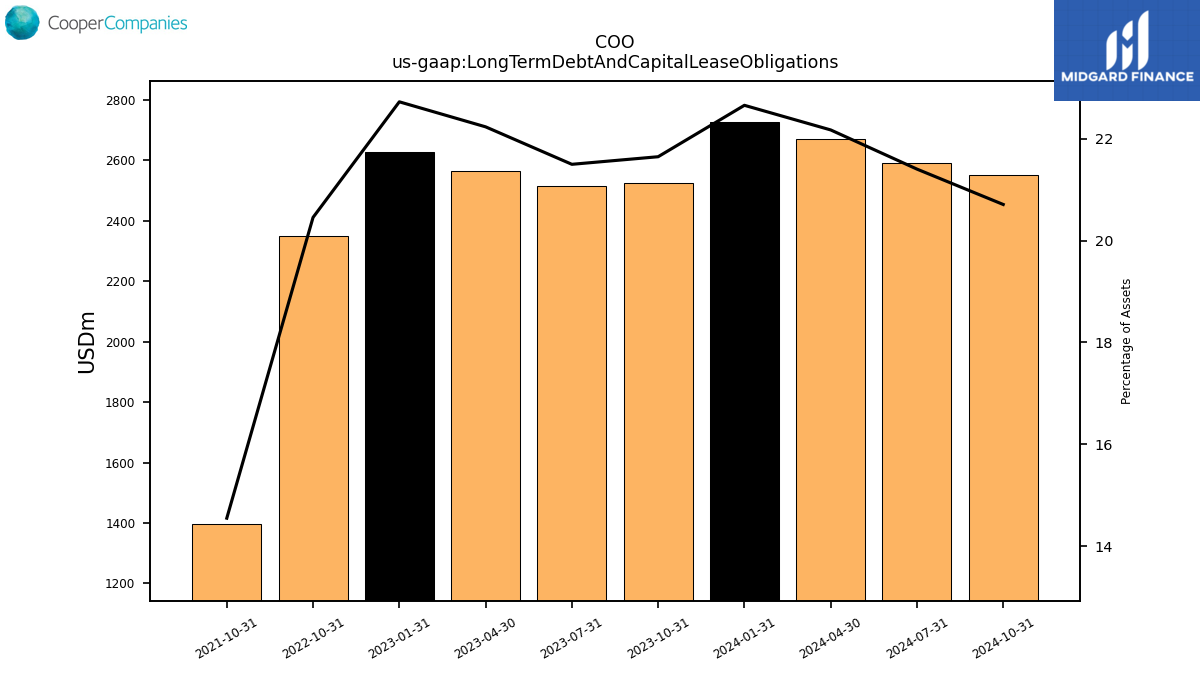
| Long Term Debt And Capital Lease Obligations | 2726.20 | 2523.80 | 2514.70 | 2565.70 | 2627.30 | 2350.80 | NA | NA | NA | 1397.60 | NA | NA | NA | NA | NA | NA | NA | NA | NA | NA | NA | NA | NA | NA | NA | NA | NA | NA | NA | NA | NA | NA | NA | NA | NA | NA | NA | NA | NA | NA | NA | NA | NA | NA | NA | NA | NA | NA | NA | NA | NA | NA | NA | NA | NA | NA | NA | |
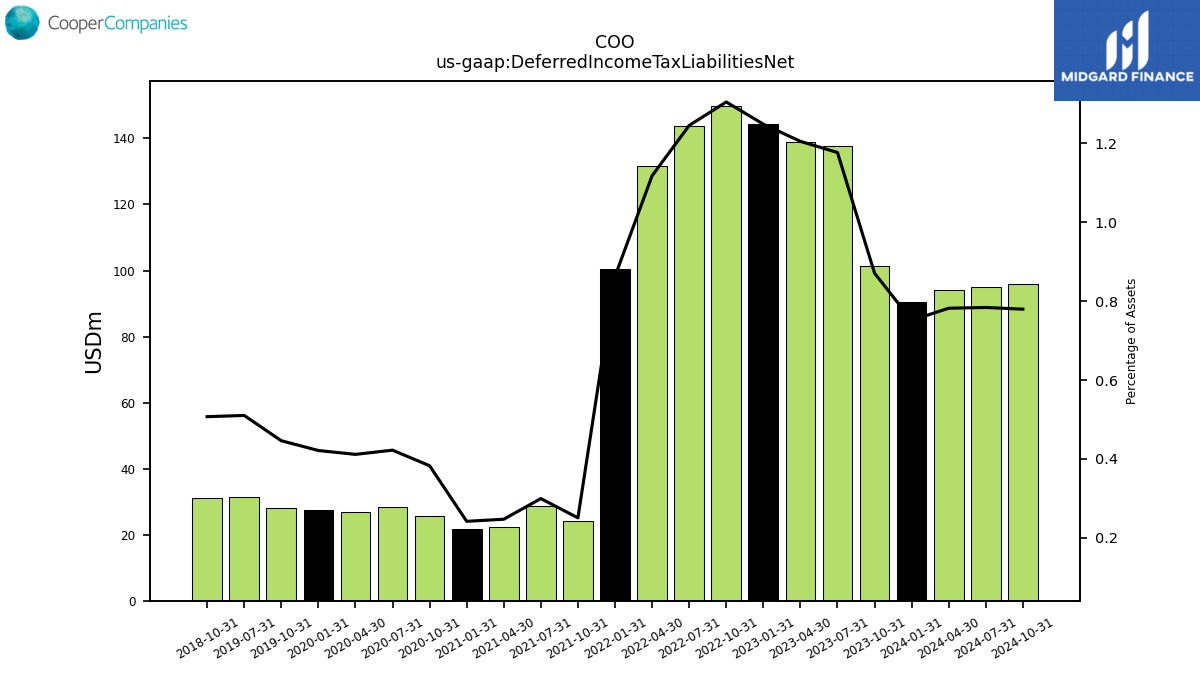
| Deferred Income Tax Liabilities Net | 90.40 | 101.50 | 137.60 | 139.00 | 144.30 | 149.90 | 143.80 | 131.60 | 100.60 | 24.10 | 28.80 | 22.30 | 21.60 | 25.80 | 28.50 | 26.80 | 27.60 | 28.00 | 31.50 | NA | NA | 31.00 | NA | NA | NA | NA | NA | NA | NA | NA | NA | NA | NA | NA | NA | NA | NA | NA | NA | NA | NA | NA | NA | NA | NA | NA | NA | NA | NA | NA | NA | NA | NA | NA | NA | NA | NA | |
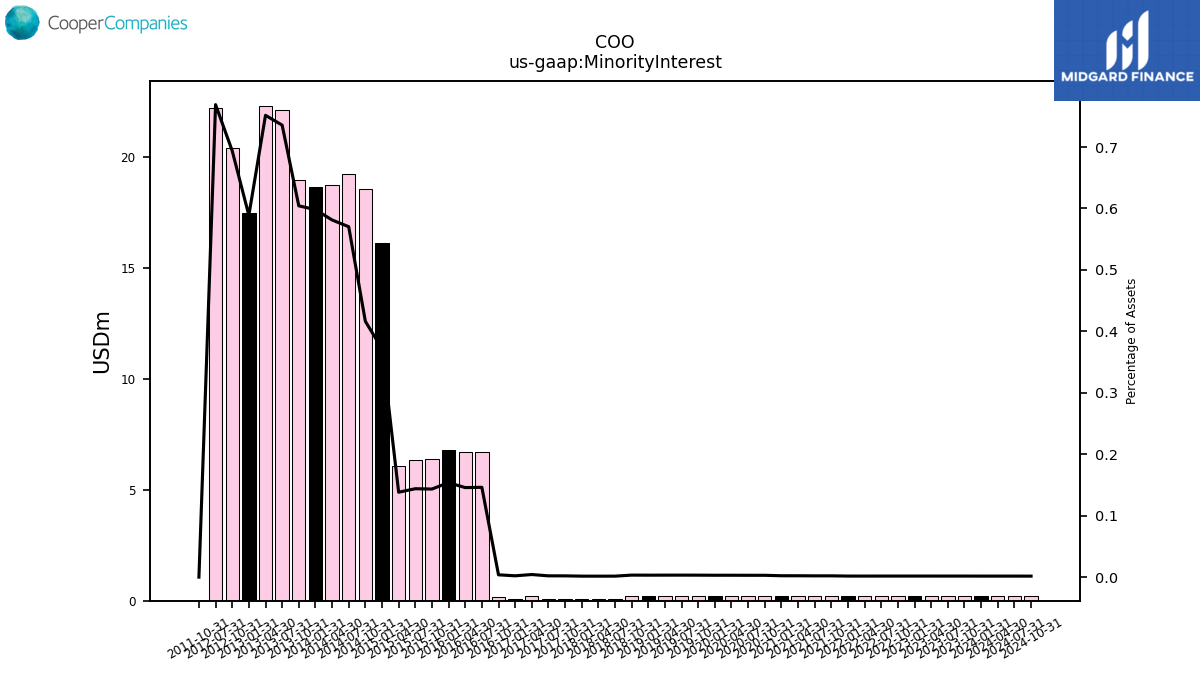
| Minority Interest | 0.20 | 0.20 | 0.20 | 0.20 | 0.20 | 0.20 | 0.20 | 0.20 | 0.20 | 0.20 | 0.20 | 0.20 | 0.20 | 0.20 | 0.20 | 0.20 | 0.20 | 0.20 | 0.20 | 0.20 | 0.20 | 0.20 | 0.10 | 0.10 | 0.10 | 0.10 | 0.10 | 0.20 | 0.10 | 0.17 | 6.71 | 6.71 | 6.77 | 6.39 | 6.36 | 6.07 | 16.11 | 18.56 | 19.20 | 18.73 | 18.63 | 18.96 | 22.12 | 22.30 | 17.49 | 20.41 | 22.18 | NA | NA | 0.00 | NA | NA | NA | NA | NA | NA | NA | |
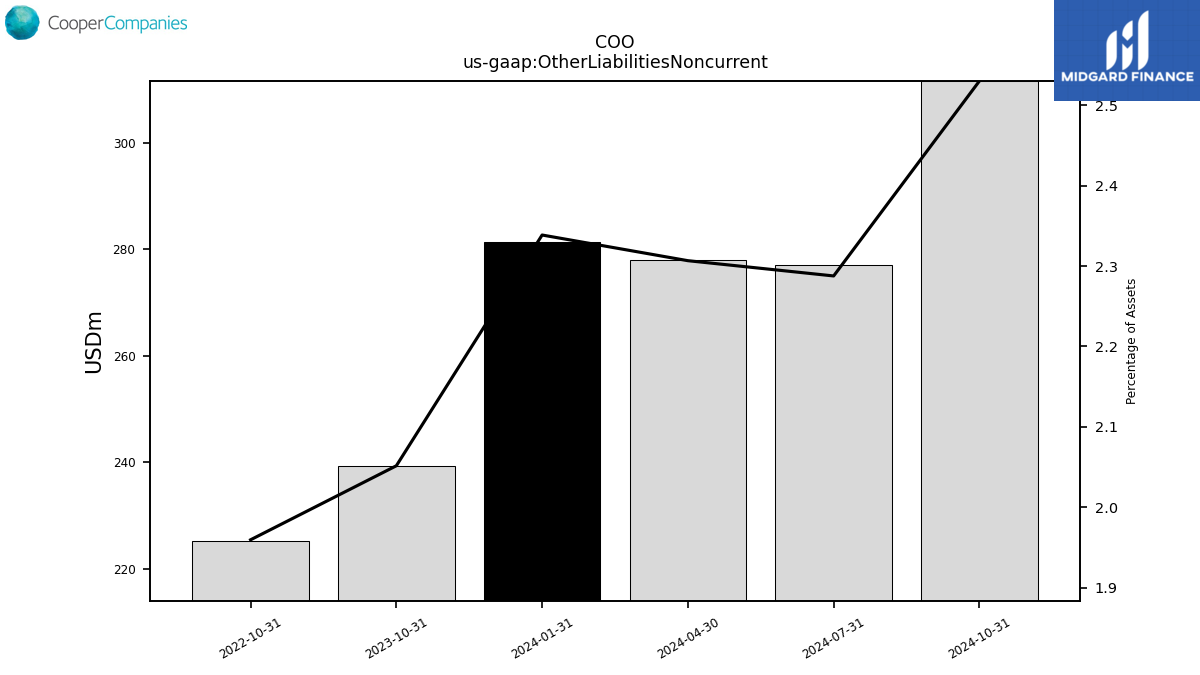
| Other Liabilities Noncurrent | 281.40 | 239.20 | NA | NA | NA | 225.20 | NA | NA | NA | NA | NA | NA | NA | NA | NA | NA | NA | NA | NA | NA | NA | NA | NA | NA | NA | NA | NA | NA | NA | NA | NA | NA | NA | NA | NA | NA | NA | NA | NA | NA | NA | NA | NA | NA | NA | NA | NA | NA | NA | NA | NA | NA | NA | NA | NA | NA | NA |
| 2024-01-31 | 2023-10-31 | 2023-07-31 | 2023-04-30 | 2023-01-31 | 2022-10-31 | 2022-07-31 | 2022-04-30 | 2022-01-31 | 2021-10-31 | 2021-07-31 | 2021-04-30 | 2021-01-31 | 2020-10-31 | 2020-07-31 | 2020-04-30 | 2020-01-31 | 2019-10-31 | 2019-07-31 | 2019-04-30 | 2019-01-31 | 2018-10-31 | 2018-07-31 | 2018-04-30 | 2018-01-31 | 2017-10-31 | 2017-07-31 | 2017-04-30 | 2017-01-31 | 2016-10-31 | 2016-07-31 | 2016-04-30 | 2016-01-31 | 2015-10-31 | 2015-07-31 | 2015-04-30 | 2015-01-31 | 2014-10-31 | 2014-07-31 | 2014-04-30 | 2014-01-31 | 2013-10-31 | 2013-07-31 | 2013-04-30 | 2013-01-31 | 2012-10-31 | 2012-07-31 | 2012-04-30 | 2012-01-31 | 2011-10-31 | 2011-07-31 | 2011-04-30 | 2011-01-31 | 2010-10-31 | 2010-07-31 | 2010-04-30 | 2010-01-31 | ||
|---|---|---|---|---|---|---|---|---|---|---|---|---|---|---|---|---|---|---|---|---|---|---|---|---|---|---|---|---|---|---|---|---|---|---|---|---|---|---|---|---|---|---|---|---|---|---|---|---|---|---|---|---|---|---|---|---|---|---|
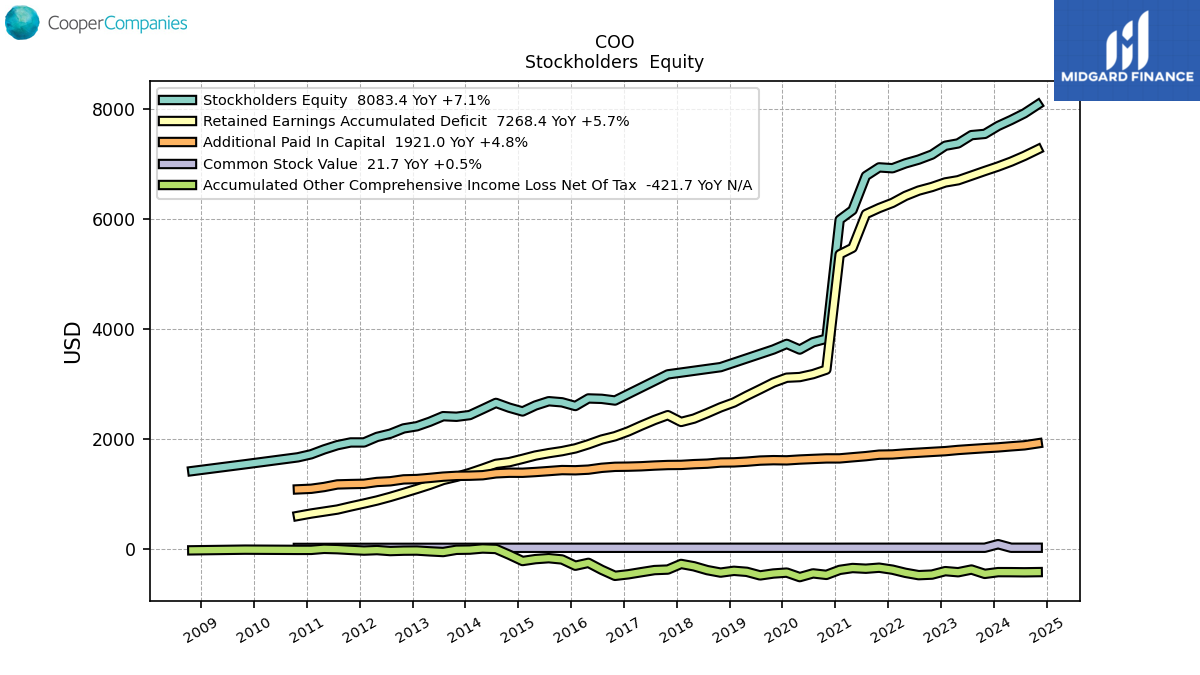
| Stockholders Equity | 7695.10 | 7550.80 | 7528.30 | 7377.80 | 7335.50 | 7174.50 | 7082.90 | 7013.60 | 6925.90 | 6941.80 | 6785.20 | 6162.60 | 5989.70 | 3824.60 | 3760.20 | 3627.30 | 3730.70 | 3628.40 | NA | NA | NA | 3307.60 | NA | NA | NA | 3175.70 | NA | NA | NA | 2699.87 | 2730.69 | 2738.08 | 2599.96 | 2667.51 | 2687.57 | 2609.67 | 2500.87 | 2569.88 | 2657.07 | 2543.35 | 2435.28 | 2404.53 | 2415.52 | 2314.20 | 2232.06 | 2192.75 | 2096.65 | 2037.96 | 1937.36 | 1937.49 | 1887.68 | 1810.33 | 1722.30 | 1666.78 | NA | NA | NA | |
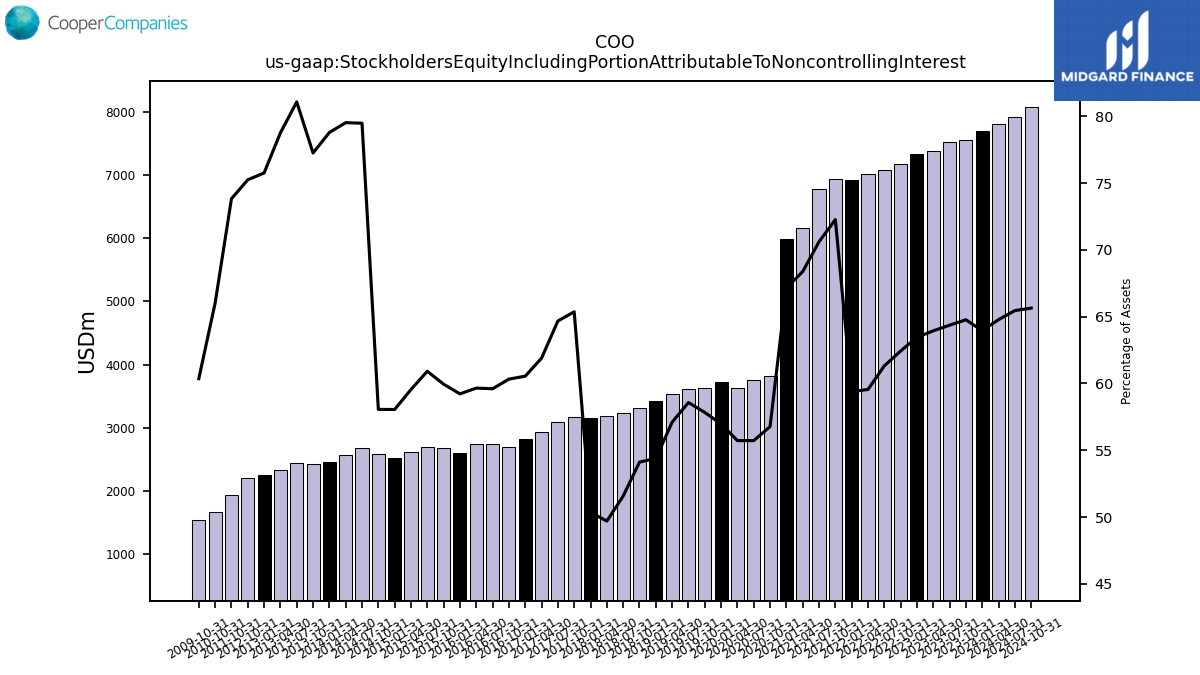
| Stockholders Equity Including Portion Attributable To Noncontrolling Interest | 7695.30 | 7551.00 | 7528.50 | 7378.00 | 7335.70 | 7174.70 | 7083.10 | 7013.80 | 6926.10 | 6942.00 | 6785.40 | 6162.80 | 5989.90 | 3824.80 | 3760.40 | 3627.50 | 3730.90 | 3628.60 | 3615.50 | 3542.20 | 3425.50 | 3307.80 | 3226.60 | 3188.00 | 3156.40 | 3175.80 | 3093.30 | 2939.80 | 2819.40 | 2700.03 | 2737.40 | 2744.78 | 2606.73 | 2673.90 | 2693.93 | 2615.74 | 2516.99 | 2588.44 | 2676.28 | 2562.08 | 2453.91 | 2423.49 | 2437.64 | 2336.50 | 2249.55 | 2213.16 | NA | NA | NA | 1937.49 | NA | NA | NA | 1666.78 | NA | NA | NA | |
| Common Stock Value | 21.60 | 5.40 | 5.40 | 5.40 | 5.40 | 5.40 | 5.40 | 5.40 | 5.40 | 5.40 | 5.40 | 5.40 | 5.30 | 5.30 | 5.30 | 5.30 | 5.30 | 5.30 | 5.30 | 5.30 | 5.30 | 5.30 | 5.30 | 5.30 | 5.30 | 5.20 | 5.20 | 5.20 | 5.20 | 5.21 | 5.20 | 5.17 | 5.17 | 5.16 | 5.15 | 5.15 | 5.12 | 5.10 | 5.10 | 5.06 | 5.06 | 5.03 | 5.03 | 5.01 | 4.97 | 4.95 | 4.90 | 4.89 | 4.82 | 4.80 | 4.79 | 4.71 | 4.65 | 4.61 | NA | NA | NA | |
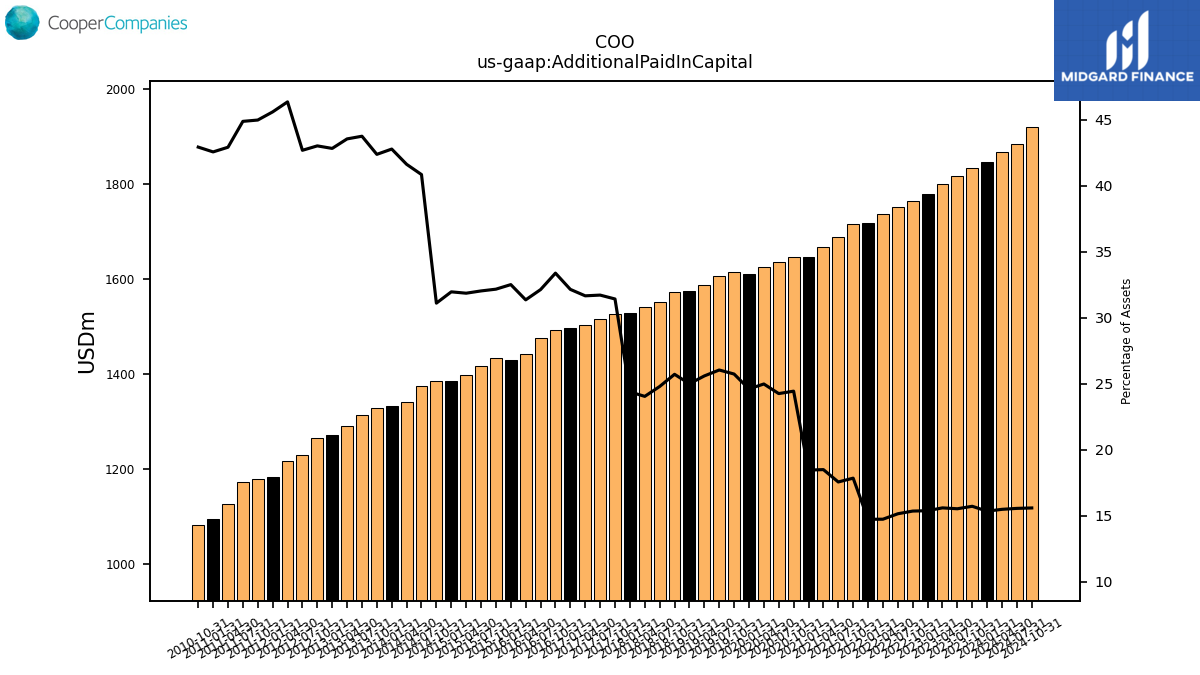
| Additional Paid In Capital | 1847.40 | 1833.40 | 1817.40 | 1800.70 | 1779.20 | 1765.50 | 1751.00 | 1736.80 | 1719.20 | 1715.20 | 1688.10 | 1667.80 | 1647.20 | 1646.80 | 1637.00 | 1626.50 | 1611.60 | 1615.00 | 1607.60 | 1587.70 | 1574.80 | 1572.10 | 1551.40 | 1542.50 | 1528.80 | 1526.70 | 1516.90 | 1503.80 | 1497.00 | 1493.96 | 1475.76 | 1442.73 | 1431.03 | 1434.70 | 1416.64 | 1399.46 | 1385.79 | 1386.80 | 1375.31 | 1340.94 | 1332.28 | 1329.33 | 1315.37 | 1291.78 | 1271.61 | 1265.20 | 1230.85 | 1218.24 | 1184.91 | 1180.25 | 1173.52 | 1126.49 | 1094.55 | 1083.78 | NA | NA | NA | |
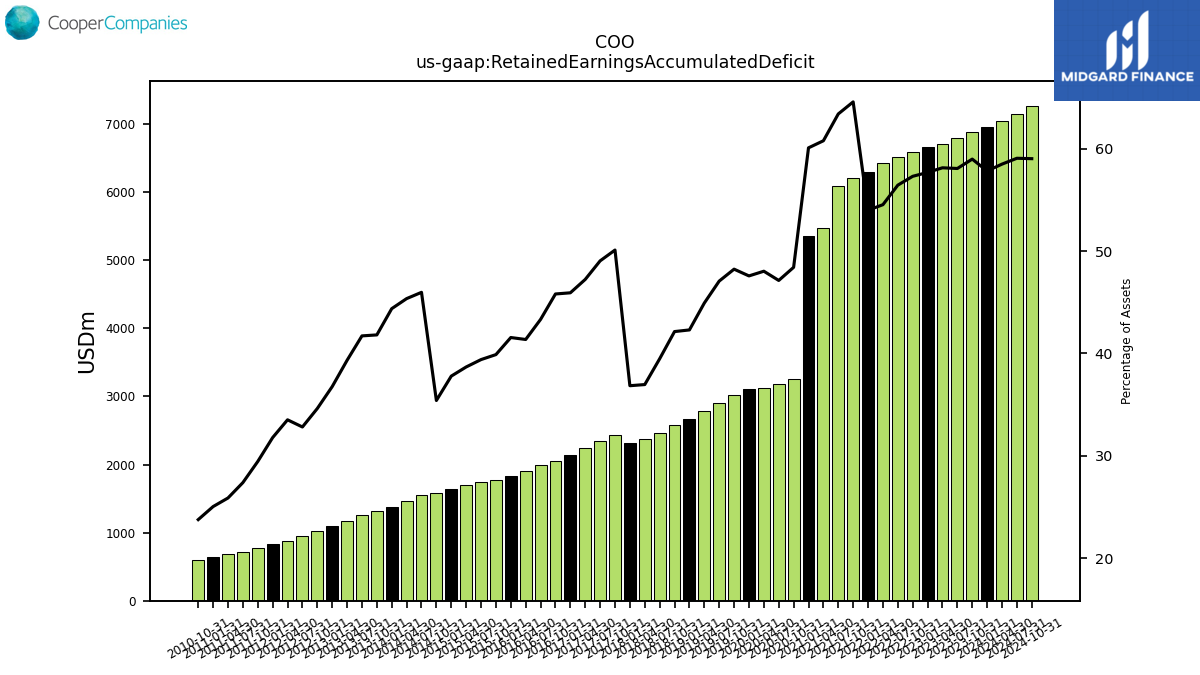
| Retained Earnings Accumulated Deficit | 6957.30 | 6876.10 | 6791.60 | 6707.80 | 6668.00 | 6584.90 | 6519.40 | 6422.50 | 6295.90 | 6202.10 | 6091.80 | 5477.50 | 5360.00 | 3261.80 | 3180.60 | 3126.90 | 3115.40 | 3026.40 | 2905.40 | 2786.80 | 2664.40 | 2576.00 | 2470.50 | 2371.20 | 2310.30 | 2434.20 | 2345.60 | 2243.40 | 2138.60 | 2050.44 | 1989.91 | 1903.47 | 1829.34 | 1779.44 | 1742.76 | 1699.27 | 1638.56 | 1578.82 | 1548.04 | 1461.42 | 1382.26 | 1311.85 | 1254.45 | 1166.97 | 1091.84 | 1018.62 | 946.70 | 881.26 | 826.34 | 773.14 | 716.50 | 679.79 | 644.43 | 600.52 | NA | NA | NA | |
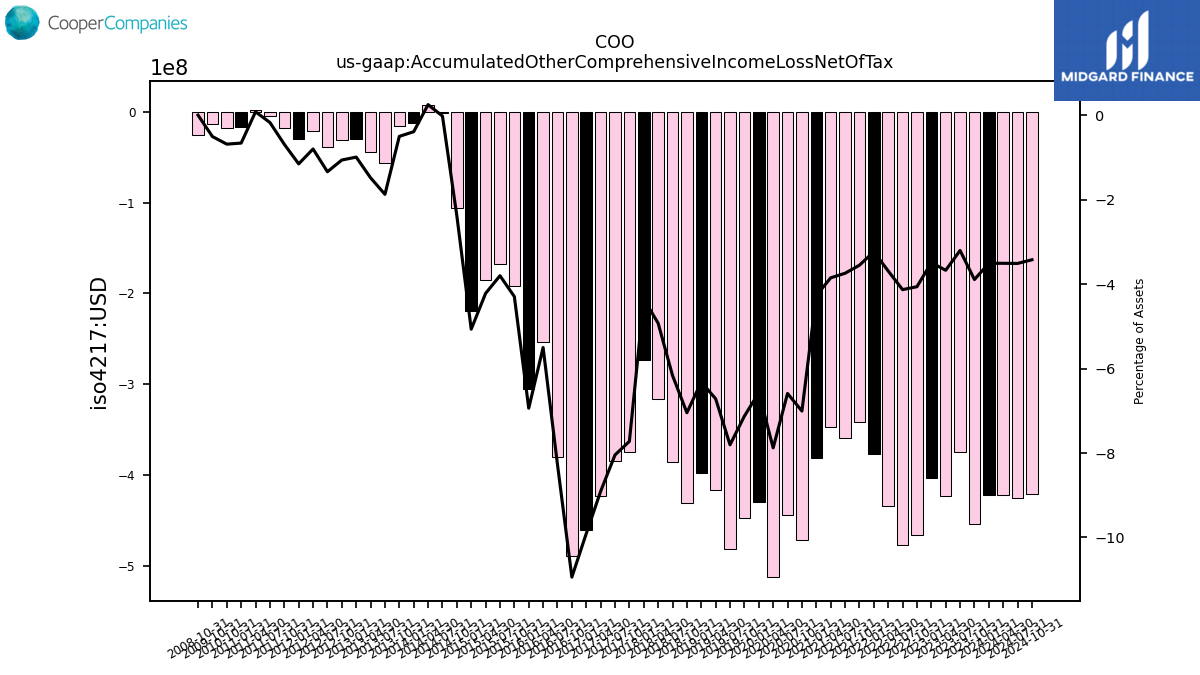
| Accumulated Other Comprehensive Income Loss Net Of Tax | -422.00 | -453.80 | -374.80 | -423.80 | -403.80 | -466.80 | -477.30 | -434.50 | -377.20 | -341.30 | -359.80 | -347.20 | -381.30 | -472.00 | -444.70 | -512.80 | -430.40 | -447.10 | -481.80 | -416.60 | -398.00 | -430.70 | -385.60 | -316.00 | -273.00 | -375.30 | -384.80 | -423.10 | -461.40 | -489.60 | -380.03 | -253.15 | -305.43 | -191.60 | -168.14 | -185.37 | -219.75 | -106.18 | -0.73 | 8.03 | -12.21 | -15.76 | -56.39 | -44.00 | -29.50 | -31.26 | -38.63 | -21.07 | -29.98 | -18.11 | -4.54 | 2.08 | -17.01 | -17.33 | NA | NA | NA | |
| Minority Interest | 0.20 | 0.20 | 0.20 | 0.20 | 0.20 | 0.20 | 0.20 | 0.20 | 0.20 | 0.20 | 0.20 | 0.20 | 0.20 | 0.20 | 0.20 | 0.20 | 0.20 | 0.20 | 0.20 | 0.20 | 0.20 | 0.20 | 0.10 | 0.10 | 0.10 | 0.10 | 0.10 | 0.20 | 0.10 | 0.17 | 6.71 | 6.71 | 6.77 | 6.39 | 6.36 | 6.07 | 16.11 | 18.56 | 19.20 | 18.73 | 18.63 | 18.96 | 22.12 | 22.30 | 17.49 | 20.41 | 22.18 | NA | NA | 0.00 | NA | NA | NA | NA | NA | NA | NA | |
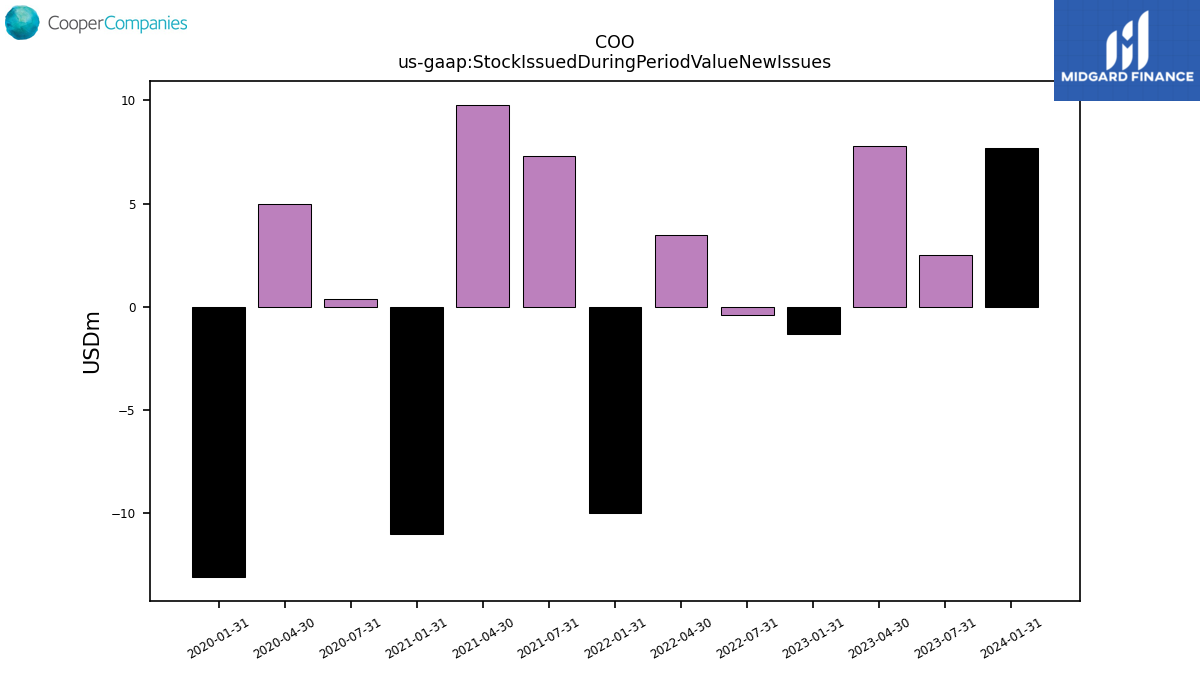
| Stock Issued During Period Value New Issues | 7.70 | NA | 2.50 | 7.80 | -1.30 | NA | -0.40 | 3.50 | -10.00 | NA | 7.30 | 9.80 | -11.00 | NA | 0.40 | 5.00 | -13.10 | NA | NA | NA | NA | NA | NA | NA | NA | NA | NA | NA | NA | NA | NA | NA | NA | NA | NA | NA | NA | NA | NA | NA | NA | NA | NA | NA | NA | NA | NA | NA | NA | NA | NA | NA | NA | NA | NA | NA | NA | |
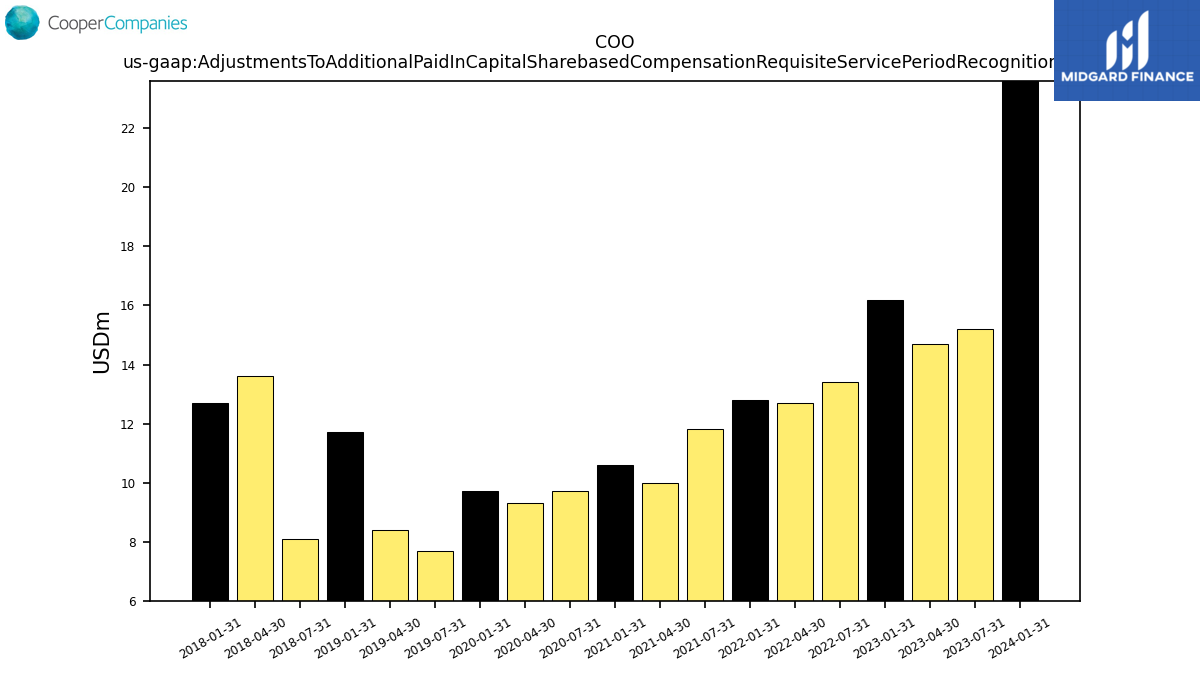
| Adjustments To Additional Paid In Capital Sharebased Compensation Requisite Service Period Recognition Value | 23.60 | NA | 15.20 | 14.70 | 16.20 | NA | 13.40 | 12.70 | 12.80 | NA | 11.80 | 10.00 | 10.60 | NA | 9.70 | 9.30 | 9.70 | NA | 7.70 | 8.40 | 11.70 | NA | 8.10 | 13.60 | 12.70 | NA | NA | NA | NA | NA | NA | NA | NA | NA | NA | NA | NA | NA | NA | NA | NA | NA | NA | NA | NA | NA | NA | NA | NA | NA | NA | NA | NA | NA | NA | NA | NA |
| 2024-01-31 | 2023-10-31 | 2023-07-31 | 2023-04-30 | 2023-01-31 | 2022-10-31 | 2022-07-31 | 2022-04-30 | 2022-01-31 | 2021-10-31 | 2021-07-31 | 2021-04-30 | 2021-01-31 | 2020-10-31 | 2020-07-31 | 2020-04-30 | 2020-01-31 | 2019-10-31 | 2019-07-31 | 2019-04-30 | 2019-01-31 | 2018-10-31 | 2018-07-31 | 2018-04-30 | 2018-01-31 | 2017-10-31 | 2017-07-31 | 2017-04-30 | 2017-01-31 | 2016-10-31 | 2016-07-31 | 2016-04-30 | 2016-01-31 | 2015-10-31 | 2015-07-31 | 2015-04-30 | 2015-01-31 | 2014-10-31 | 2014-07-31 | 2014-04-30 | 2014-01-31 | 2013-10-31 | 2013-07-31 | 2013-04-30 | 2013-01-31 | 2012-10-31 | 2012-07-31 | 2012-04-30 | 2012-01-31 | 2011-10-31 | 2011-07-31 | 2011-04-30 | 2011-01-31 | 2010-10-31 | 2010-07-31 | 2010-04-30 | 2010-01-31 | ||
|---|---|---|---|---|---|---|---|---|---|---|---|---|---|---|---|---|---|---|---|---|---|---|---|---|---|---|---|---|---|---|---|---|---|---|---|---|---|---|---|---|---|---|---|---|---|---|---|---|---|---|---|---|---|---|---|---|---|---|
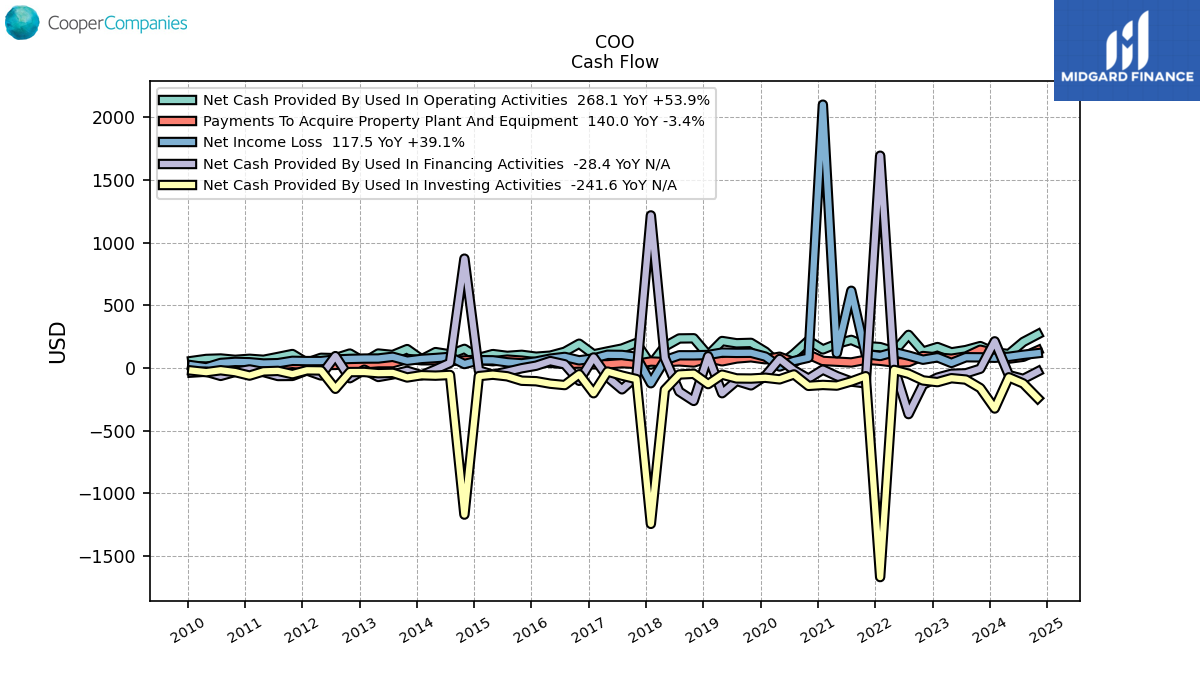
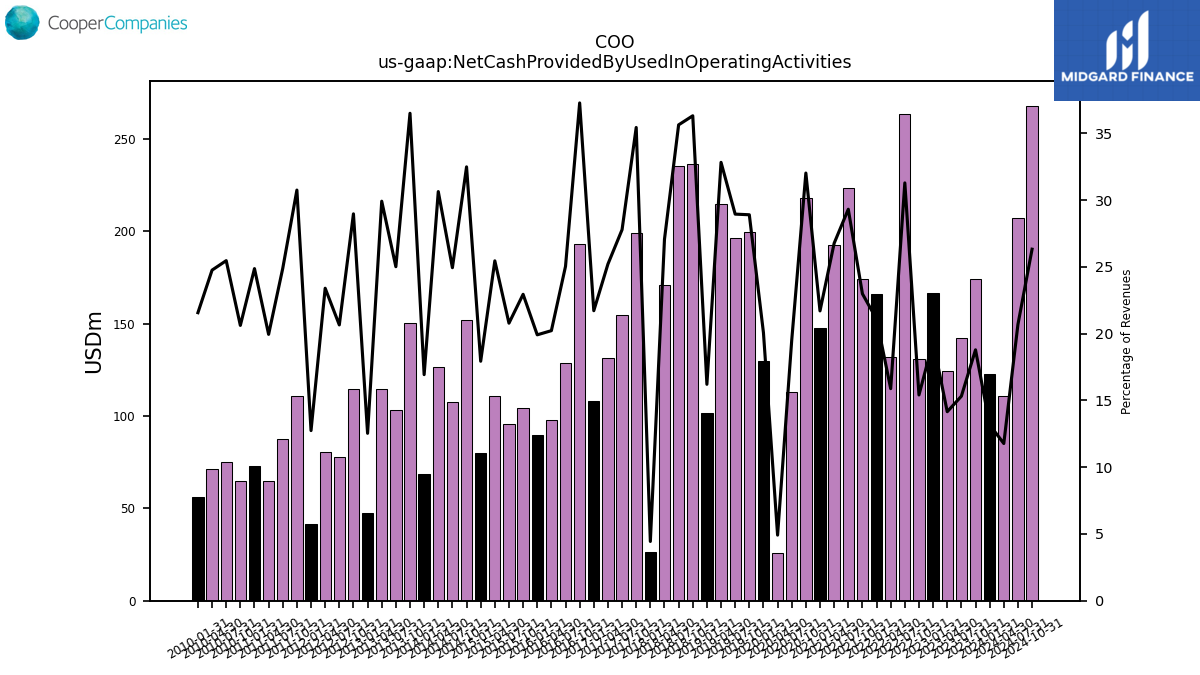
| Net Cash Provided By Used In Operating Activities | 122.70 | 174.20 | 142.50 | 124.20 | 166.60 | 130.70 | 263.90 | 131.80 | 166.00 | 174.50 | 223.80 | 192.60 | 147.70 | 218.30 | 112.80 | 25.80 | 129.70 | 199.90 | 196.70 | 214.80 | 101.80 | 236.60 | 235.20 | 170.90 | 26.20 | 199.00 | 154.50 | 131.70 | 108.40 | 193.36 | 128.89 | 97.85 | 89.54 | 104.52 | 95.97 | 110.64 | 79.84 | 152.06 | 107.86 | 126.33 | 68.57 | 150.34 | 103.06 | 114.90 | 47.62 | 114.82 | 78.11 | 80.64 | 41.55 | 110.99 | 87.47 | 64.89 | 72.93 | 64.61 | 75.29 | 71.62 | 56.14 | |
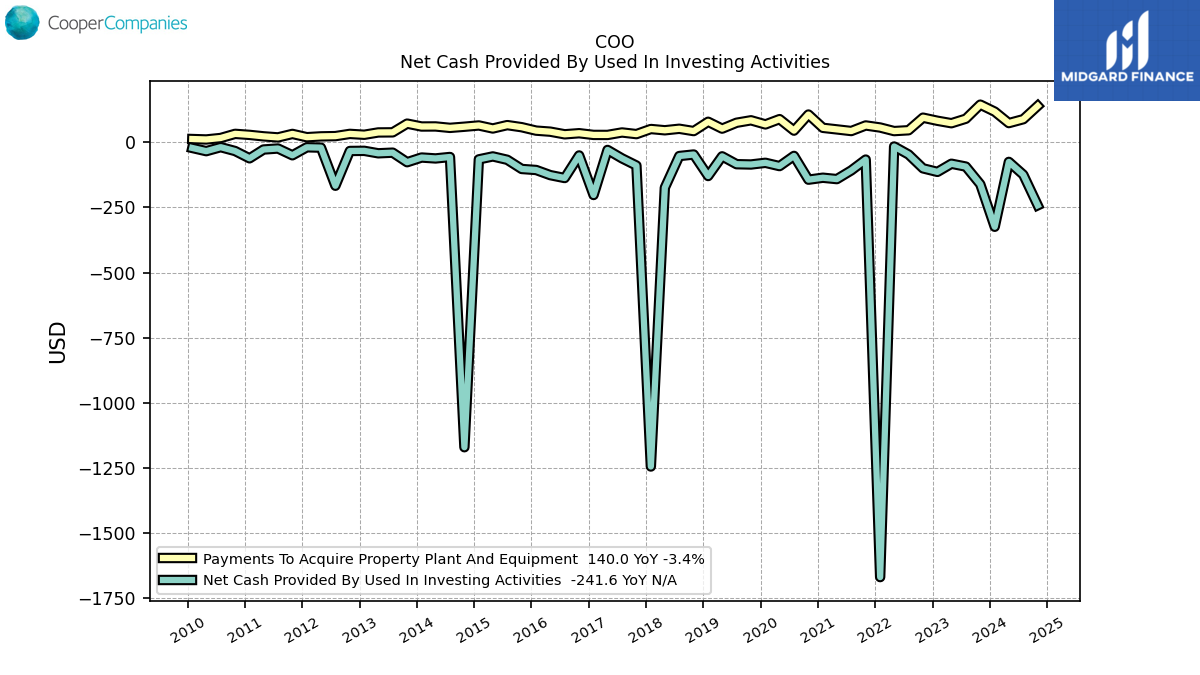
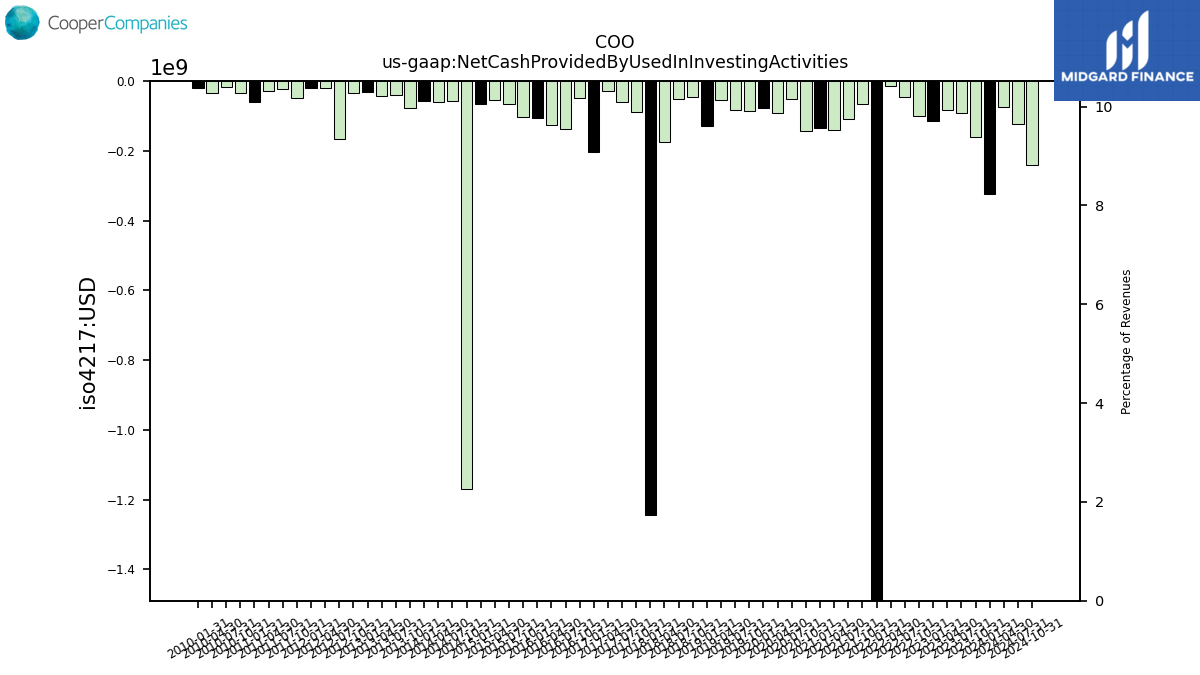
| Net Cash Provided By Used In Investing Activities | -324.10 | -160.80 | -92.90 | -82.00 | -113.30 | -99.70 | -46.50 | -15.70 | -1669.30 | -66.00 | -107.60 | -141.00 | -135.70 | -143.20 | -51.80 | -91.10 | -78.40 | -84.90 | -83.70 | -53.50 | -129.20 | -46.50 | -52.40 | -174.00 | -1244.60 | -88.90 | -61.30 | -29.00 | -202.10 | -50.13 | -136.90 | -125.73 | -106.03 | -102.06 | -66.77 | -53.92 | -65.20 | -1170.59 | -56.07 | -61.63 | -58.13 | -76.11 | -39.44 | -41.92 | -32.45 | -32.99 | -166.52 | -20.18 | -18.79 | -49.55 | -23.51 | -27.38 | -61.23 | -33.17 | -18.34 | -33.67 | -21.42 | |
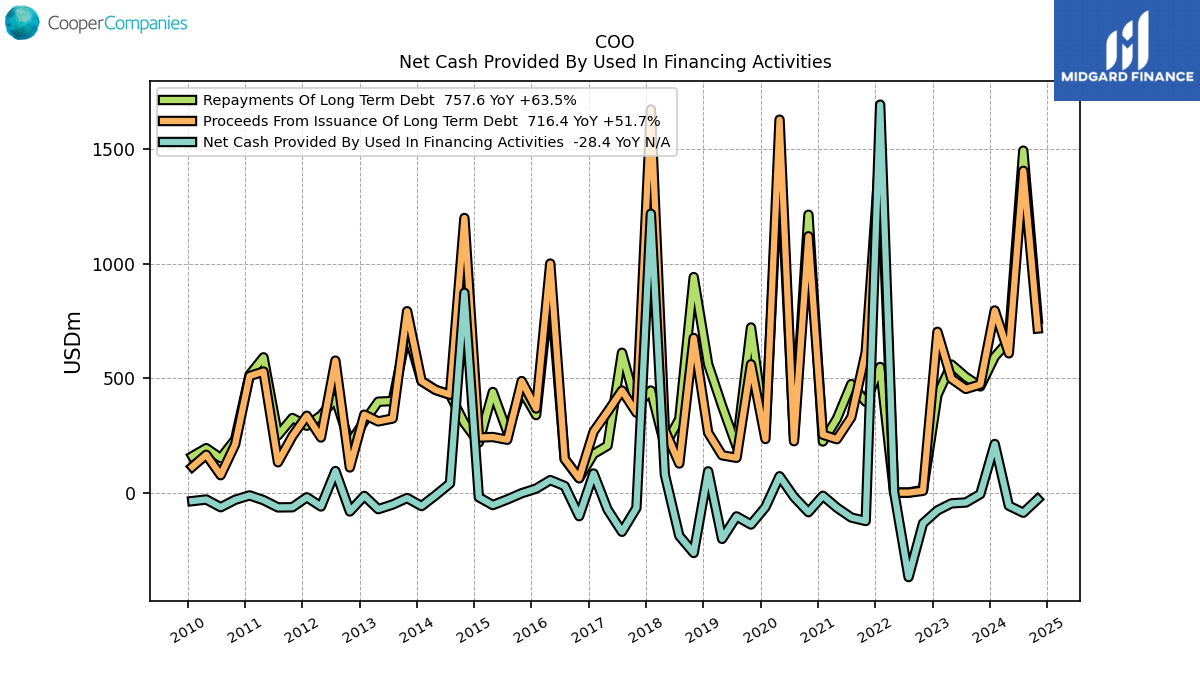
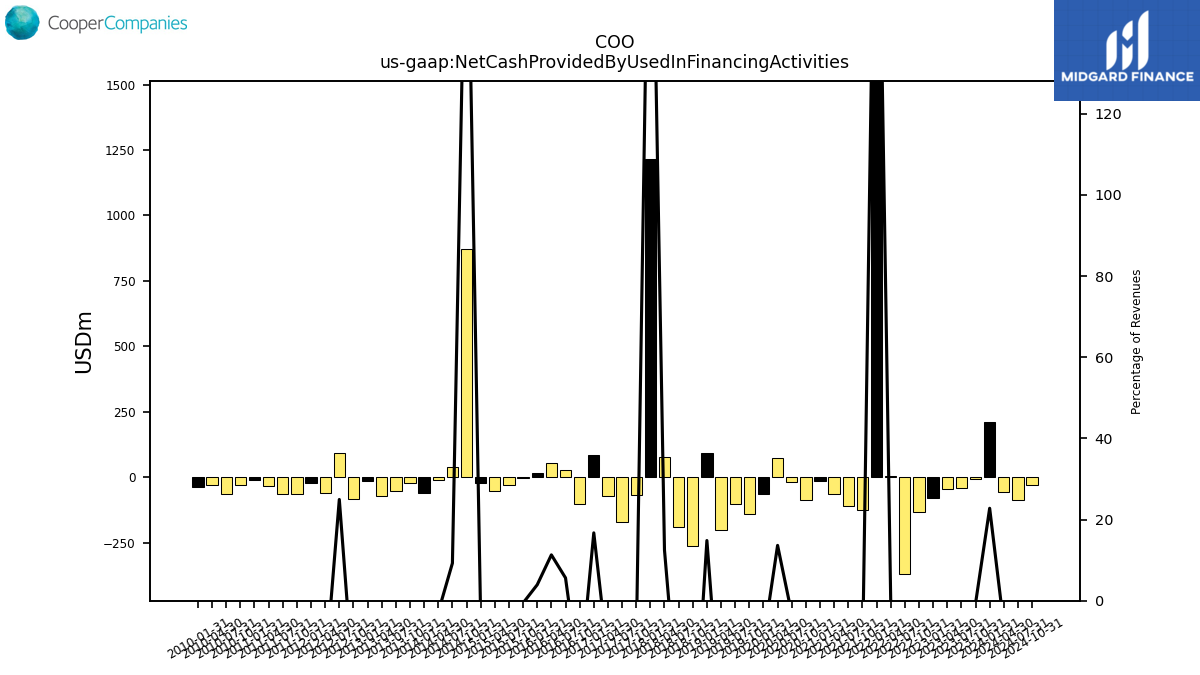
| Net Cash Provided By Used In Financing Activities | 212.30 | -6.50 | -43.00 | -46.80 | -77.60 | -134.10 | -368.70 | 2.90 | 1693.60 | -123.80 | -108.60 | -65.40 | -13.60 | -85.30 | -18.60 | 71.60 | -63.20 | -139.10 | -103.60 | -201.90 | 93.20 | -263.30 | -188.60 | 78.90 | 1217.40 | -67.00 | -170.90 | -73.50 | 83.50 | -102.83 | 28.99 | 54.70 | 17.76 | -2.50 | -29.68 | -54.24 | -20.25 | 872.25 | 40.04 | -11.54 | -58.58 | -23.46 | -51.81 | -72.20 | -14.12 | -82.25 | 94.38 | -60.37 | -20.20 | -63.68 | -64.45 | -32.80 | -11.95 | -31.25 | -63.55 | -29.94 | -36.83 |
| 2024-01-31 | 2023-10-31 | 2023-07-31 | 2023-04-30 | 2023-01-31 | 2022-10-31 | 2022-07-31 | 2022-04-30 | 2022-01-31 | 2021-10-31 | 2021-07-31 | 2021-04-30 | 2021-01-31 | 2020-10-31 | 2020-07-31 | 2020-04-30 | 2020-01-31 | 2019-10-31 | 2019-07-31 | 2019-04-30 | 2019-01-31 | 2018-10-31 | 2018-07-31 | 2018-04-30 | 2018-01-31 | 2017-10-31 | 2017-07-31 | 2017-04-30 | 2017-01-31 | 2016-10-31 | 2016-07-31 | 2016-04-30 | 2016-01-31 | 2015-10-31 | 2015-07-31 | 2015-04-30 | 2015-01-31 | 2014-10-31 | 2014-07-31 | 2014-04-30 | 2014-01-31 | 2013-10-31 | 2013-07-31 | 2013-04-30 | 2013-01-31 | 2012-10-31 | 2012-07-31 | 2012-04-30 | 2012-01-31 | 2011-10-31 | 2011-07-31 | 2011-04-30 | 2011-01-31 | 2010-10-31 | 2010-07-31 | 2010-04-30 | 2010-01-31 | ||
|---|---|---|---|---|---|---|---|---|---|---|---|---|---|---|---|---|---|---|---|---|---|---|---|---|---|---|---|---|---|---|---|---|---|---|---|---|---|---|---|---|---|---|---|---|---|---|---|---|---|---|---|---|---|---|---|---|---|---|
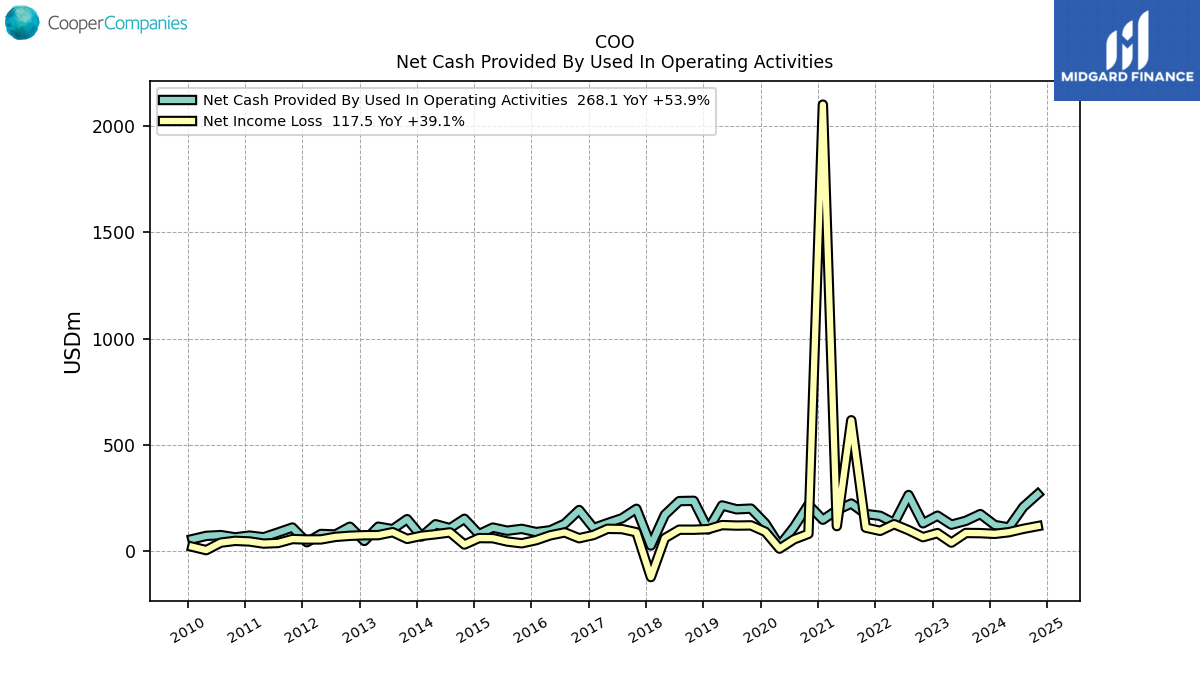
| Net Cash Provided By Used In Operating Activities | 122.70 | 174.20 | 142.50 | 124.20 | 166.60 | 130.70 | 263.90 | 131.80 | 166.00 | 174.50 | 223.80 | 192.60 | 147.70 | 218.30 | 112.80 | 25.80 | 129.70 | 199.90 | 196.70 | 214.80 | 101.80 | 236.60 | 235.20 | 170.90 | 26.20 | 199.00 | 154.50 | 131.70 | 108.40 | 193.36 | 128.89 | 97.85 | 89.54 | 104.52 | 95.97 | 110.64 | 79.84 | 152.06 | 107.86 | 126.33 | 68.57 | 150.34 | 103.06 | 114.90 | 47.62 | 114.82 | 78.11 | 80.64 | 41.55 | 110.99 | 87.47 | 64.89 | 72.93 | 64.61 | 75.29 | 71.62 | 56.14 | |
| Net Income Loss | 81.20 | 84.50 | 85.30 | 39.80 | 84.60 | 65.60 | 98.40 | 126.60 | 95.30 | 110.30 | 615.80 | 117.50 | 2101.10 | 81.20 | 55.20 | 11.50 | 90.50 | 121.00 | 120.10 | 122.40 | 103.20 | 100.60 | 100.80 | 60.90 | -122.50 | 88.60 | 103.60 | 104.90 | 75.80 | 60.50 | 87.93 | 74.10 | 51.36 | 36.70 | 44.95 | 60.71 | 61.18 | 30.79 | 88.07 | 79.16 | 71.84 | 57.40 | 88.95 | 75.14 | 74.67 | 71.92 | 66.88 | 54.92 | 54.62 | 56.64 | 38.14 | 35.36 | 45.30 | 48.20 | 39.73 | 4.46 | 20.42 | |
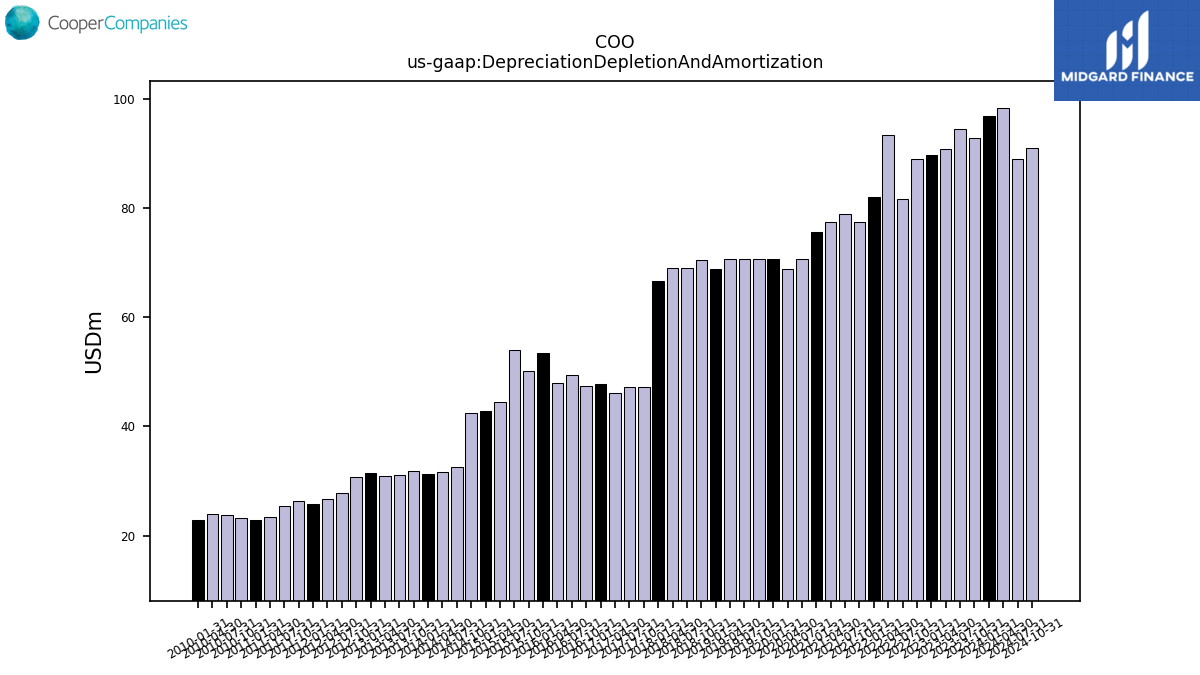
| Depreciation Depletion And Amortization | 96.80 | 92.70 | 94.50 | 90.80 | 89.70 | 89.00 | 81.70 | 93.40 | 82.00 | 77.40 | 78.90 | 77.50 | 75.50 | NA | 70.60 | 68.80 | 70.60 | 70.60 | 70.70 | 70.70 | 68.80 | 70.50 | 69.00 | 69.00 | 66.60 | 47.20 | 47.20 | 46.20 | 47.80 | 47.34 | 49.50 | 47.98 | 53.45 | 50.10 | 53.91 | 44.51 | 42.88 | 42.55 | 32.50 | 31.75 | 31.39 | 31.76 | 31.12 | 30.94 | 31.52 | 30.82 | 27.82 | 26.75 | 25.82 | 26.34 | 25.41 | 23.51 | 22.89 | 23.22 | 23.89 | 23.99 | 22.91 |
| 2024-01-31 | 2023-10-31 | 2023-07-31 | 2023-04-30 | 2023-01-31 | 2022-10-31 | 2022-07-31 | 2022-04-30 | 2022-01-31 | 2021-10-31 | 2021-07-31 | 2021-04-30 | 2021-01-31 | 2020-10-31 | 2020-07-31 | 2020-04-30 | 2020-01-31 | 2019-10-31 | 2019-07-31 | 2019-04-30 | 2019-01-31 | 2018-10-31 | 2018-07-31 | 2018-04-30 | 2018-01-31 | 2017-10-31 | 2017-07-31 | 2017-04-30 | 2017-01-31 | 2016-10-31 | 2016-07-31 | 2016-04-30 | 2016-01-31 | 2015-10-31 | 2015-07-31 | 2015-04-30 | 2015-01-31 | 2014-10-31 | 2014-07-31 | 2014-04-30 | 2014-01-31 | 2013-10-31 | 2013-07-31 | 2013-04-30 | 2013-01-31 | 2012-10-31 | 2012-07-31 | 2012-04-30 | 2012-01-31 | 2011-10-31 | 2011-07-31 | 2011-04-30 | 2011-01-31 | 2010-10-31 | 2010-07-31 | 2010-04-30 | 2010-01-31 | ||
|---|---|---|---|---|---|---|---|---|---|---|---|---|---|---|---|---|---|---|---|---|---|---|---|---|---|---|---|---|---|---|---|---|---|---|---|---|---|---|---|---|---|---|---|---|---|---|---|---|---|---|---|---|---|---|---|---|---|---|
| Net Cash Provided By Used In Investing Activities | -324.10 | -160.80 | -92.90 | -82.00 | -113.30 | -99.70 | -46.50 | -15.70 | -1669.30 | -66.00 | -107.60 | -141.00 | -135.70 | -143.20 | -51.80 | -91.10 | -78.40 | -84.90 | -83.70 | -53.50 | -129.20 | -46.50 | -52.40 | -174.00 | -1244.60 | -88.90 | -61.30 | -29.00 | -202.10 | -50.13 | -136.90 | -125.73 | -106.03 | -102.06 | -66.77 | -53.92 | -65.20 | -1170.59 | -56.07 | -61.63 | -58.13 | -76.11 | -39.44 | -41.92 | -32.45 | -32.99 | -166.52 | -20.18 | -18.79 | -49.55 | -23.51 | -27.38 | -61.23 | -33.17 | -18.34 | -33.67 | -21.42 | |
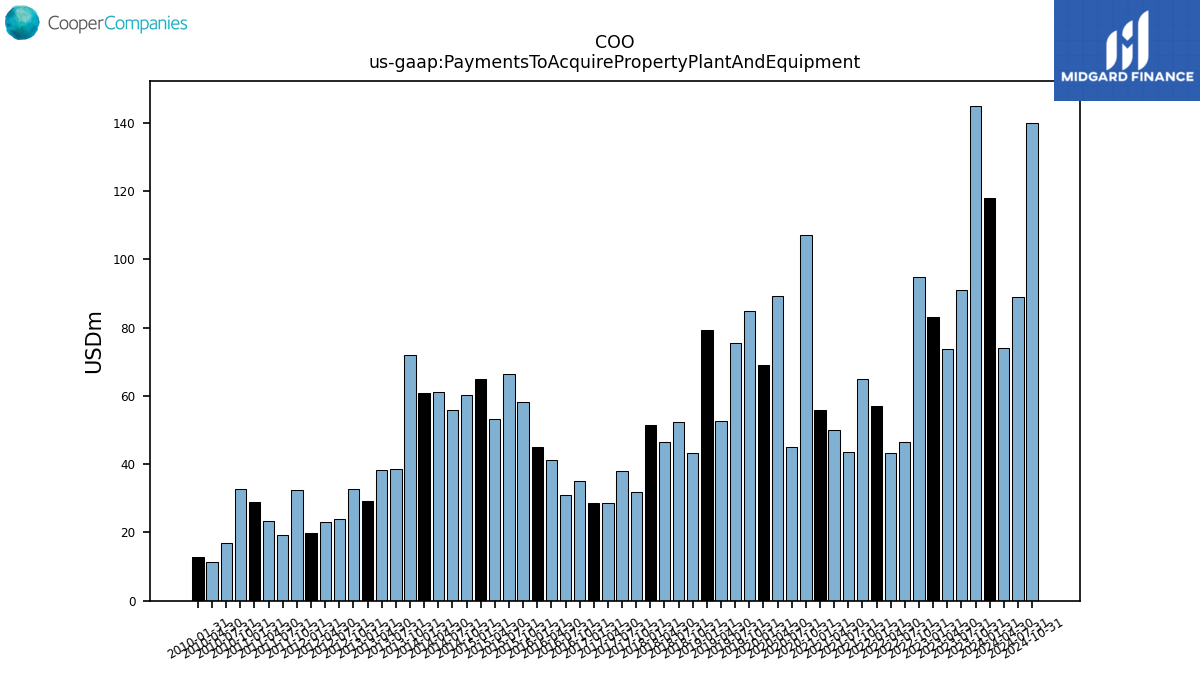
| Payments To Acquire Property Plant And Equipment | 118.10 | 145.00 | 90.90 | 73.60 | 83.00 | 94.90 | 46.60 | 43.40 | 57.10 | 65.00 | 43.60 | 49.90 | 55.90 | 107.00 | 45.10 | 89.30 | 69.00 | 84.80 | 75.40 | 52.70 | 79.20 | 43.40 | 52.30 | 46.50 | 51.40 | 31.80 | 38.10 | 28.60 | 28.70 | 35.22 | 31.05 | 41.18 | 45.16 | 58.31 | 66.35 | 53.37 | 65.00 | 60.13 | 55.76 | 61.20 | 60.98 | 72.06 | 38.57 | 38.17 | 29.32 | 32.64 | 24.08 | 23.10 | 19.95 | 32.51 | 19.14 | 23.23 | 28.79 | 32.77 | 16.87 | 11.21 | 12.91 |
| 2024-01-31 | 2023-10-31 | 2023-07-31 | 2023-04-30 | 2023-01-31 | 2022-10-31 | 2022-07-31 | 2022-04-30 | 2022-01-31 | 2021-10-31 | 2021-07-31 | 2021-04-30 | 2021-01-31 | 2020-10-31 | 2020-07-31 | 2020-04-30 | 2020-01-31 | 2019-10-31 | 2019-07-31 | 2019-04-30 | 2019-01-31 | 2018-10-31 | 2018-07-31 | 2018-04-30 | 2018-01-31 | 2017-10-31 | 2017-07-31 | 2017-04-30 | 2017-01-31 | 2016-10-31 | 2016-07-31 | 2016-04-30 | 2016-01-31 | 2015-10-31 | 2015-07-31 | 2015-04-30 | 2015-01-31 | 2014-10-31 | 2014-07-31 | 2014-04-30 | 2014-01-31 | 2013-10-31 | 2013-07-31 | 2013-04-30 | 2013-01-31 | 2012-10-31 | 2012-07-31 | 2012-04-30 | 2012-01-31 | 2011-10-31 | 2011-07-31 | 2011-04-30 | 2011-01-31 | 2010-10-31 | 2010-07-31 | 2010-04-30 | 2010-01-31 | ||
|---|---|---|---|---|---|---|---|---|---|---|---|---|---|---|---|---|---|---|---|---|---|---|---|---|---|---|---|---|---|---|---|---|---|---|---|---|---|---|---|---|---|---|---|---|---|---|---|---|---|---|---|---|---|---|---|---|---|---|
| Net Cash Provided By Used In Financing Activities | 212.30 | -6.50 | -43.00 | -46.80 | -77.60 | -134.10 | -368.70 | 2.90 | 1693.60 | -123.80 | -108.60 | -65.40 | -13.60 | -85.30 | -18.60 | 71.60 | -63.20 | -139.10 | -103.60 | -201.90 | 93.20 | -263.30 | -188.60 | 78.90 | 1217.40 | -67.00 | -170.90 | -73.50 | 83.50 | -102.83 | 28.99 | 54.70 | 17.76 | -2.50 | -29.68 | -54.24 | -20.25 | 872.25 | 40.04 | -11.54 | -58.58 | -23.46 | -51.81 | -72.20 | -14.12 | -82.25 | 94.38 | -60.37 | -20.20 | -63.68 | -64.45 | -32.80 | -11.95 | -31.25 | -63.55 | -29.94 | -36.83 |
| 2024-01-31 | 2023-10-31 | 2023-07-31 | 2023-04-30 | 2023-01-31 | 2022-10-31 | 2022-07-31 | 2022-04-30 | 2022-01-31 | 2021-10-31 | 2021-07-31 | 2021-04-30 | 2021-01-31 | 2020-10-31 | 2020-07-31 | 2020-04-30 | 2020-01-31 | 2019-10-31 | 2019-07-31 | 2019-04-30 | 2019-01-31 | 2018-10-31 | 2018-07-31 | 2018-04-30 | 2018-01-31 | 2017-10-31 | 2017-07-31 | 2017-04-30 | 2017-01-31 | 2016-10-31 | 2016-07-31 | 2016-04-30 | 2016-01-31 | 2015-10-31 | 2015-07-31 | 2015-04-30 | 2015-01-31 | 2014-10-31 | 2014-07-31 | 2014-04-30 | 2014-01-31 | 2013-10-31 | 2013-07-31 | 2013-04-30 | 2013-01-31 | 2012-10-31 | 2012-07-31 | 2012-04-30 | 2012-01-31 | 2011-10-31 | 2011-07-31 | 2011-04-30 | 2011-01-31 | 2010-10-31 | 2010-07-31 | 2010-04-30 | 2010-01-31 | ||
|---|---|---|---|---|---|---|---|---|---|---|---|---|---|---|---|---|---|---|---|---|---|---|---|---|---|---|---|---|---|---|---|---|---|---|---|---|---|---|---|---|---|---|---|---|---|---|---|---|---|---|---|---|---|---|---|---|---|---|
| Revenues | 931.60 | 927.10 | 930.20 | 877.40 | 858.50 | 848.10 | 843.40 | 829.80 | 787.20 | 759.10 | 763.40 | 719.50 | 680.50 | 681.60 | 578.20 | 524.90 | 646.20 | 691.60 | 679.40 | 654.30 | 628.10 | 651.50 | 660.00 | 631.30 | 590.00 | 561.50 | 556.00 | 522.40 | 499.10 | 518.70 | 514.73 | 483.80 | 449.64 | 455.50 | 461.68 | 434.68 | 445.17 | 468.00 | 432.48 | 412.32 | 404.98 | 411.85 | 411.99 | 384.04 | 379.84 | 396.30 | 378.19 | 344.59 | 326.06 | 360.91 | 351.40 | 325.30 | 293.23 | 313.35 | 295.63 | 289.27 | 260.26 | |
| Revenue From Contract With Customer Excluding Assessed Tax | 931.60 | 927.10 | 930.20 | 877.40 | 858.50 | 848.10 | 843.40 | 829.80 | 787.20 | 759.10 | 763.40 | 719.50 | 680.50 | 681.60 | 578.20 | 524.90 | 646.20 | 691.60 | 679.40 | 654.30 | 628.10 | 651.50 | 660.00 | 631.30 | 590.00 | 561.50 | 556.00 | 522.40 | 499.10 | 518.70 | 514.73 | 483.80 | 449.64 | 455.50 | 461.68 | 434.68 | 445.17 | 468.00 | 432.48 | 412.32 | 404.98 | 411.85 | 411.99 | 384.04 | 379.84 | 396.30 | 378.19 | 344.59 | 326.06 | 360.91 | 351.40 | 325.30 | 293.23 | 313.35 | 295.63 | 289.27 | 260.26 | |
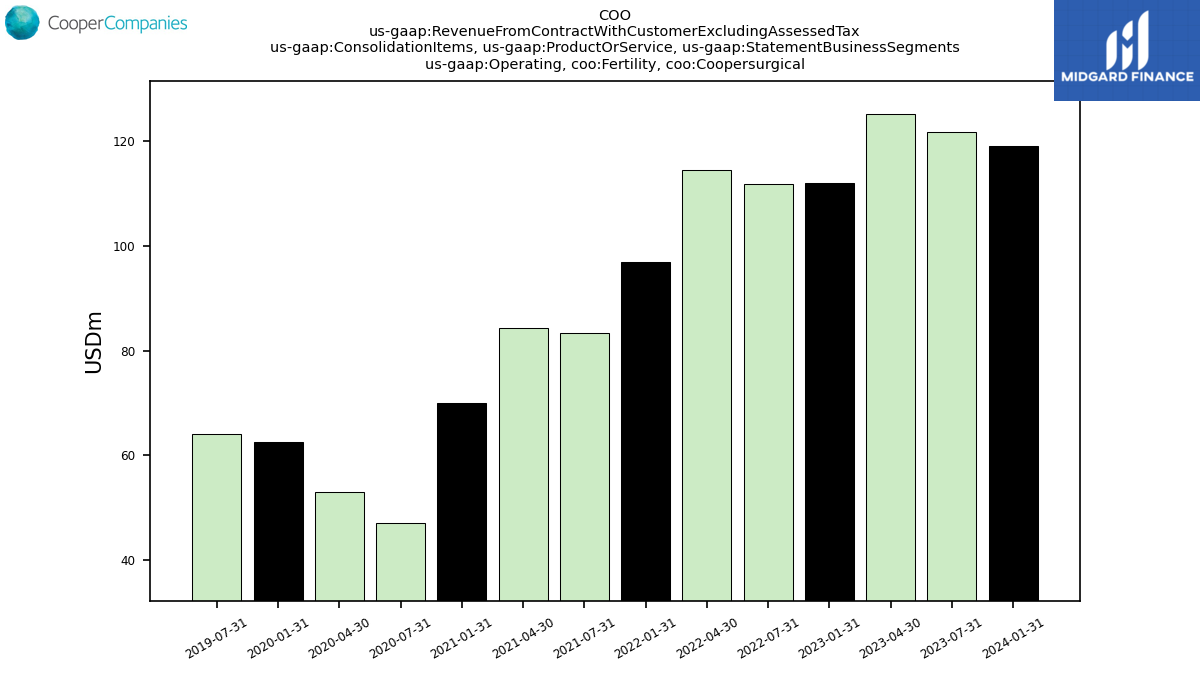
| Operating, Fertility, Coopersurgical | 119.00 | NA | 121.60 | 125.10 | 112.00 | NA | 111.70 | 114.40 | 96.80 | NA | 83.40 | 84.30 | 70.00 | NA | 47.20 | 53.10 | 62.50 | NA | 64.00 | NA | NA | NA | NA | NA | NA | NA | NA | NA | NA | NA | NA | NA | NA | NA | NA | NA | NA | NA | NA | NA | NA | NA | NA | NA | NA | NA | NA | NA | NA | NA | NA | NA | NA | NA | NA | NA | NA | |
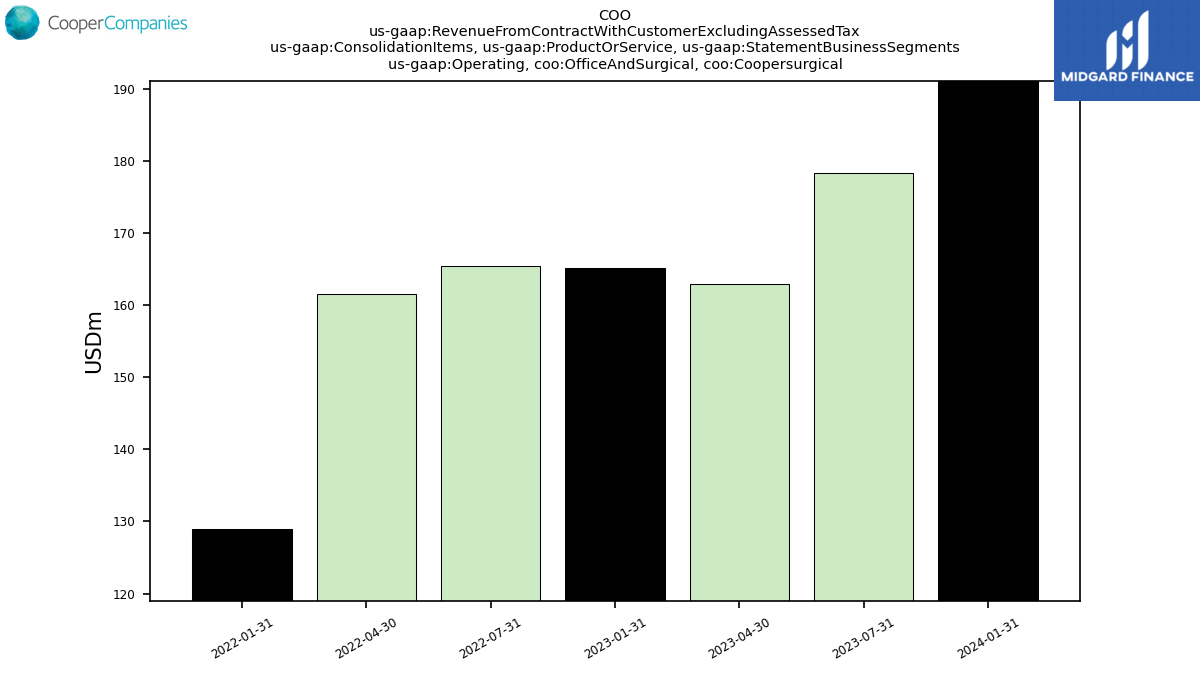
| Operating, Office And Surgical, Coopersurgical | 191.10 | NA | 178.40 | 163.00 | 165.20 | NA | 165.40 | 161.60 | 128.90 | NA | NA | NA | NA | NA | NA | NA | NA | NA | NA | NA | NA | NA | NA | NA | NA | NA | NA | NA | NA | NA | NA | NA | NA | NA | NA | NA | NA | NA | NA | NA | NA | NA | NA | NA | NA | NA | NA | NA | NA | NA | NA | NA | NA | NA | NA | NA | NA | |
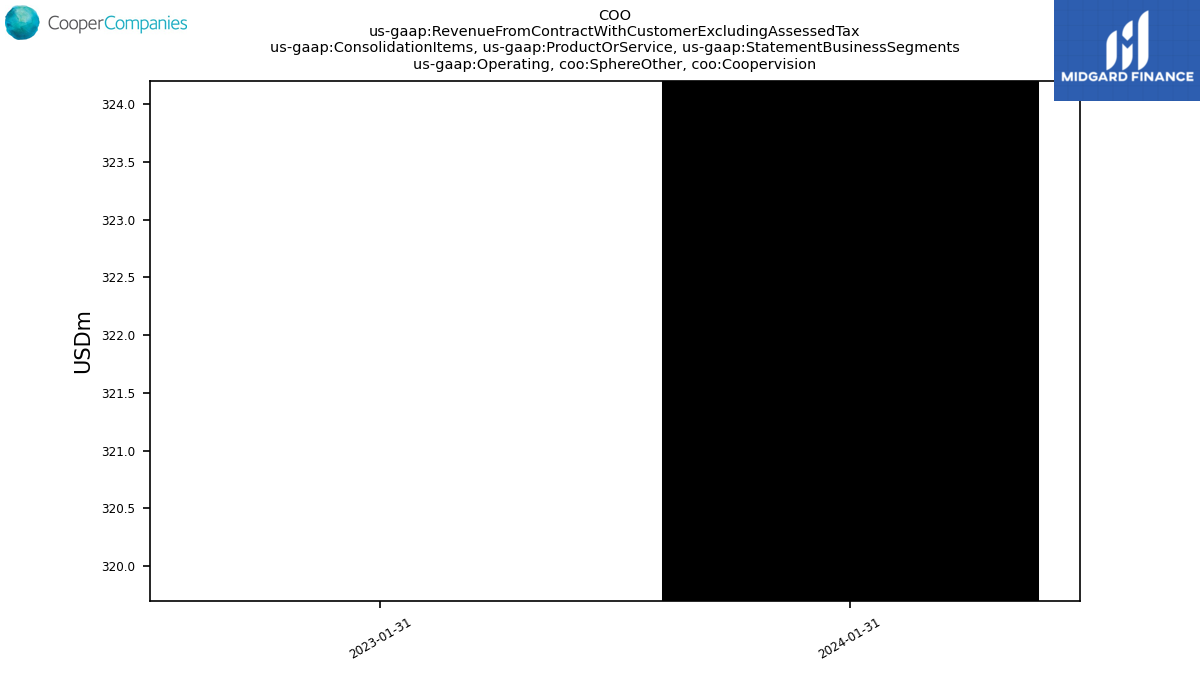
| Operating, Sphere Other, Coopervision | 324.20 | NA | NA | NA | 319.70 | NA | NA | NA | NA | NA | NA | NA | NA | NA | NA | NA | NA | NA | NA | NA | NA | NA | NA | NA | NA | NA | NA | NA | NA | NA | NA | NA | NA | NA | NA | NA | NA | NA | NA | NA | NA | NA | NA | NA | NA | NA | NA | NA | NA | NA | NA | NA | NA | NA | NA | NA | NA | |
| Operating, Toric And Multifocal, Coopervision | 297.30 | NA | NA | NA | 261.60 | NA | NA | NA | NA | NA | NA | NA | NA | NA | NA | NA | NA | NA | NA | NA | NA | NA | NA | NA | NA | NA | NA | NA | NA | NA | NA | NA | NA | NA | NA | NA | NA | NA | NA | NA | NA | NA | NA | NA | NA | NA | NA | NA | NA | NA | NA | NA | NA | NA | NA | NA | NA | |
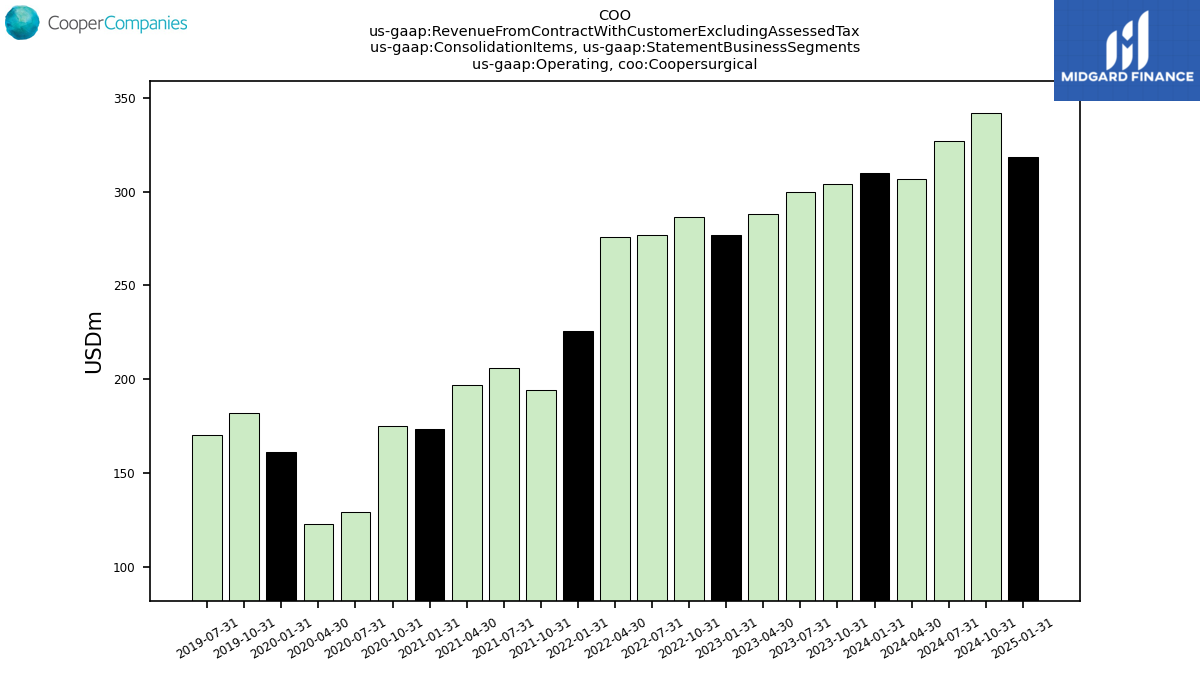
| Operating, Coopersurgical | 310.10 | NA | 300.00 | 288.10 | 277.20 | 286.30 | 277.10 | 276.00 | 225.70 | 194.20 | 205.90 | 196.90 | 173.50 | 175.30 | 128.90 | 122.70 | 161.00 | 182.00 | 170.30 | NA | NA | NA | NA | NA | NA | NA | NA | NA | NA | NA | NA | NA | NA | NA | NA | NA | NA | NA | NA | NA | NA | NA | NA | NA | NA | NA | NA | NA | NA | NA | NA | NA | NA | NA | NA | NA | NA | |
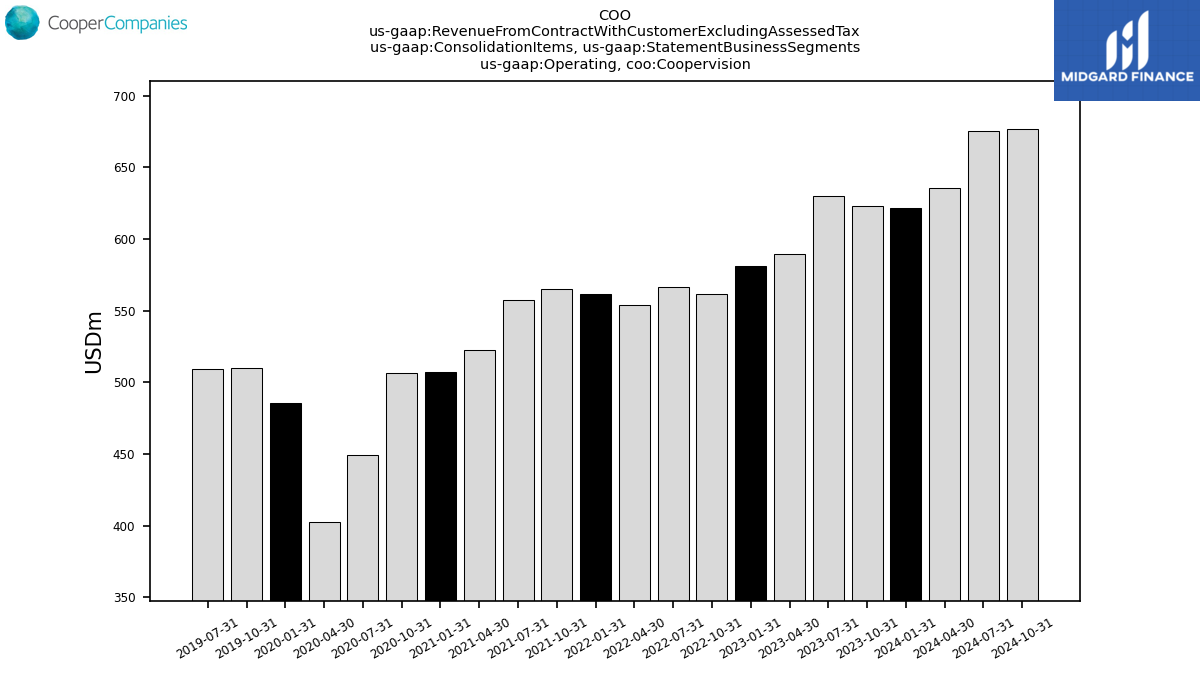
| Operating, Coopervision | 621.50 | NA | 630.20 | 589.30 | 581.30 | 561.80 | 566.30 | 553.80 | 561.50 | 564.90 | 557.50 | 522.60 | 507.00 | 506.30 | 449.30 | 402.20 | 485.20 | 509.60 | 509.10 | NA | NA | NA | NA | NA | NA | NA | NA | NA | NA | NA | NA | NA | NA | NA | NA | NA | NA | NA | NA | NA | NA | NA | NA | NA | NA | NA | NA | NA | NA | NA | NA | NA | NA | NA | NA | NA | NA | |
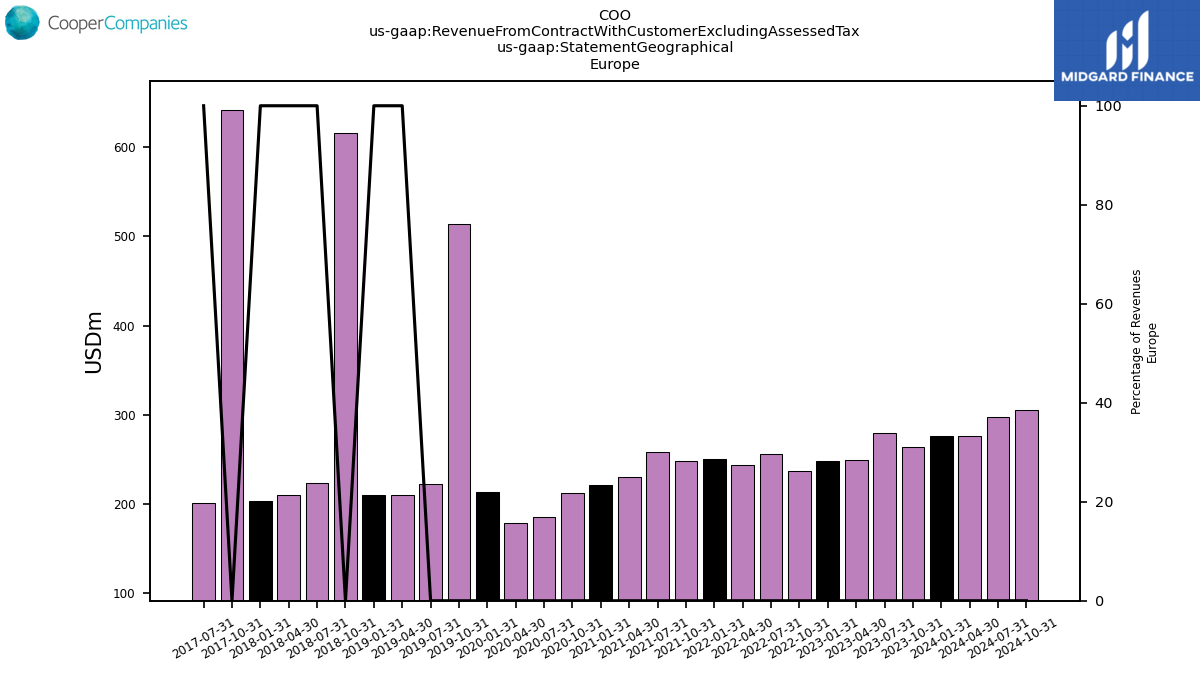
| 276.60 | 263.80 | 279.70 | 249.50 | 248.20 | 237.30 | 256.30 | 243.20 | 250.40 | 248.40 | 258.70 | 230.00 | 220.80 | 212.50 | 185.20 | 178.80 | 213.40 | 513.60 | 222.70 | 209.50 | 209.70 | 615.80 | 224.00 | 210.40 | 203.80 | 642.20 | 200.60 | NA | NA | NA | NA | NA | NA | NA | NA | NA | NA | NA | NA | NA | NA | NA | NA | NA | NA | NA | NA | NA | NA | NA | NA | NA | NA | NA | NA | NA | NA | ||
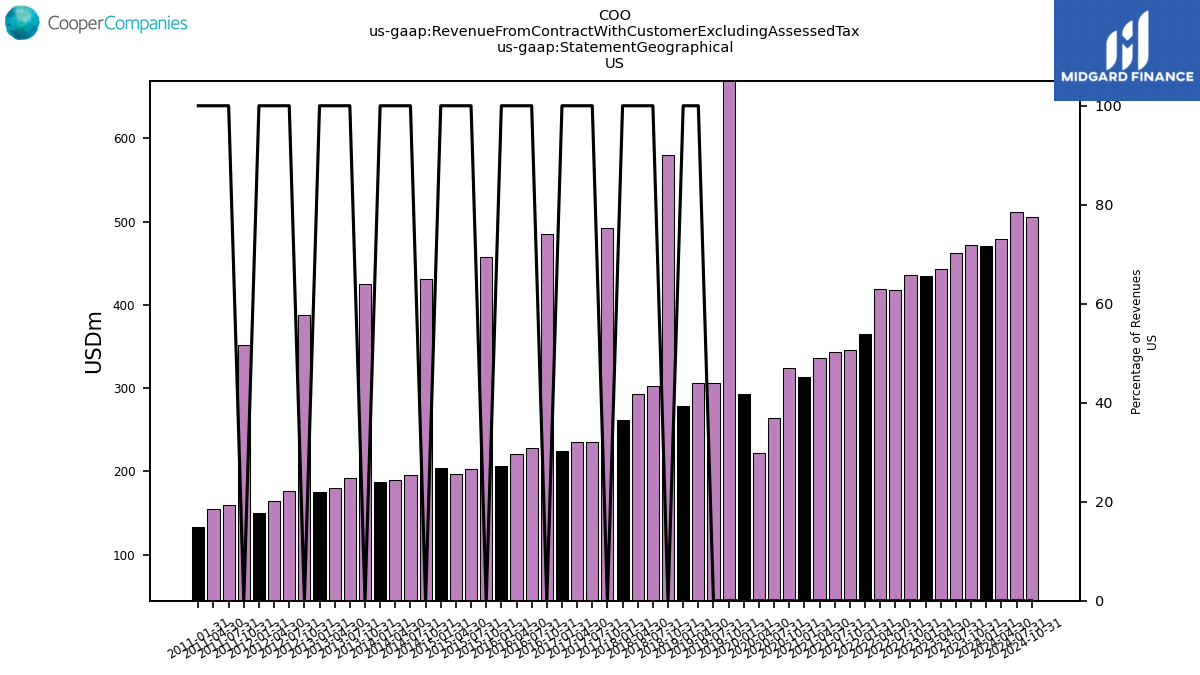
| US | 470.40 | 471.80 | 462.50 | 443.10 | 434.80 | 436.40 | 418.00 | 418.90 | 365.30 | 346.30 | 343.70 | 336.10 | 313.10 | 324.00 | 263.70 | 222.50 | 293.50 | 971.40 | 306.20 | 305.90 | 278.90 | 579.70 | 302.10 | 293.20 | 261.50 | 492.00 | 235.30 | 235.30 | 224.30 | 485.20 | 227.80 | 221.40 | 206.80 | 457.62 | 203.02 | 197.39 | 203.88 | 431.11 | 196.03 | 189.56 | 187.69 | 424.49 | 192.03 | 180.31 | 175.76 | 387.77 | 176.78 | 164.67 | 150.13 | 352.35 | 159.51 | 154.47 | 133.74 | NA | NA | NA | NA | |
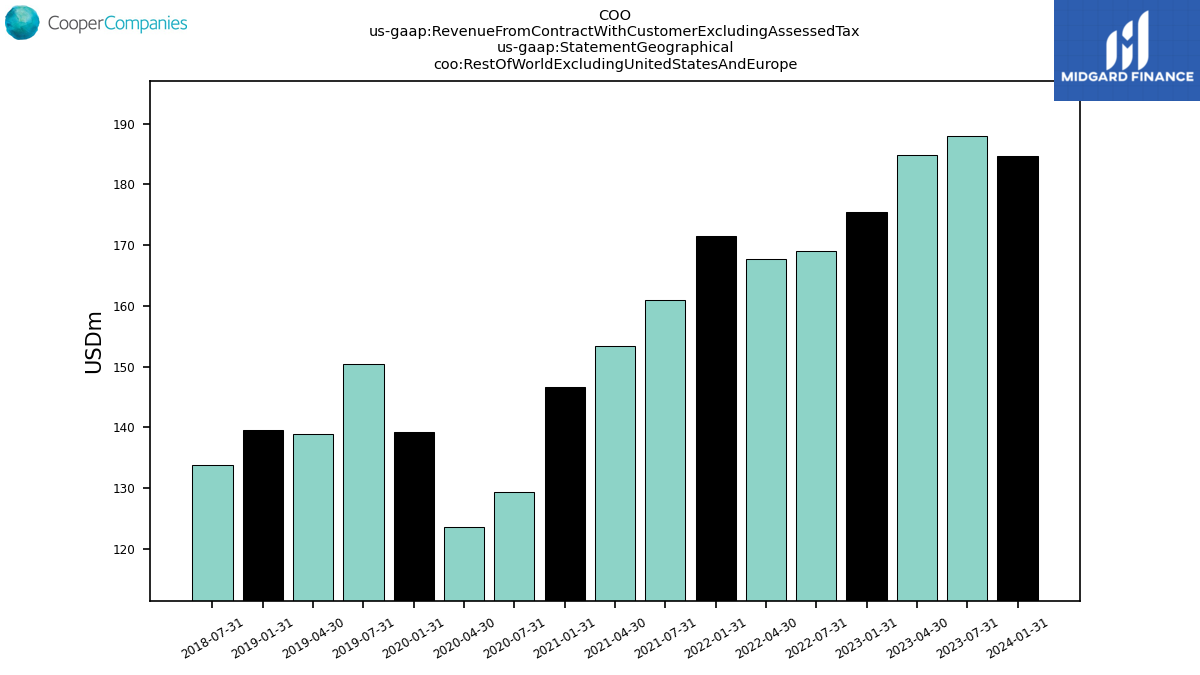
| Rest Of World Excluding United States And Europe | 184.60 | NA | 188.00 | 184.80 | 175.50 | NA | 169.10 | 167.70 | 171.50 | NA | 161.00 | 153.40 | 146.60 | NA | 129.30 | 123.70 | 139.30 | NA | 150.50 | 138.90 | 139.50 | NA | 133.90 | NA | NA | NA | NA | NA | NA | NA | NA | NA | NA | NA | NA | NA | NA | NA | NA | NA | NA | NA | NA | NA | NA | NA | NA | NA | NA | NA | NA | NA | NA | NA | NA | NA | NA |