
| 2023-12-31 | 2023-09-30 | 2023-06-30 | 2023-03-31 | 2022-12-31 | 2022-09-30 | 2022-06-30 | 2022-03-31 | 2021-12-31 | 2021-09-30 | 2021-06-30 | 2021-03-31 | 2020-12-31 | 2020-09-30 | 2020-06-30 | 2020-03-31 | 2019-12-31 | 2019-09-30 | 2019-06-30 | 2019-03-31 | 2018-12-31 | 2018-09-30 | 2018-06-30 | 2018-03-31 | 2017-12-31 | 2017-09-30 | 2017-06-30 | 2017-03-31 | ||
|---|---|---|---|---|---|---|---|---|---|---|---|---|---|---|---|---|---|---|---|---|---|---|---|---|---|---|---|---|---|
| dei: Entity Common Stock Shares Outstanding | NA | NA | NA | NA | NA | NA | NA | NA | NA | NA | NA | NA | NA | NA | NA | NA | NA | NA | NA | NA | NA | NA | NA | NA | NA | NA | NA | NA | |
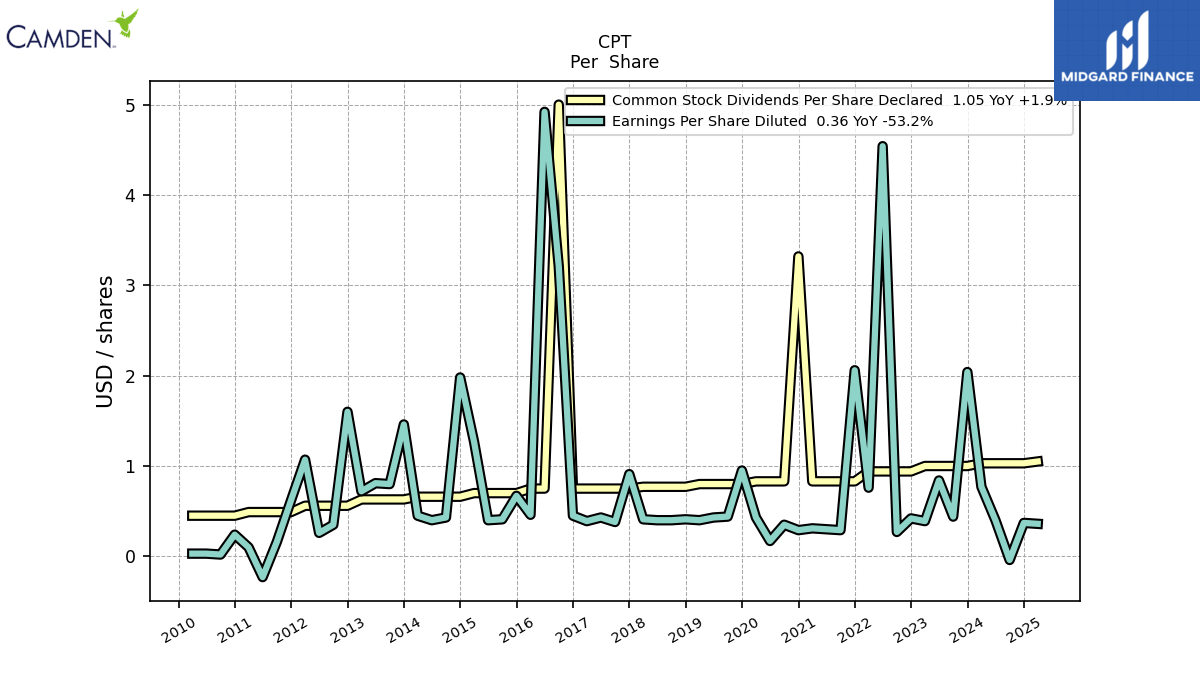
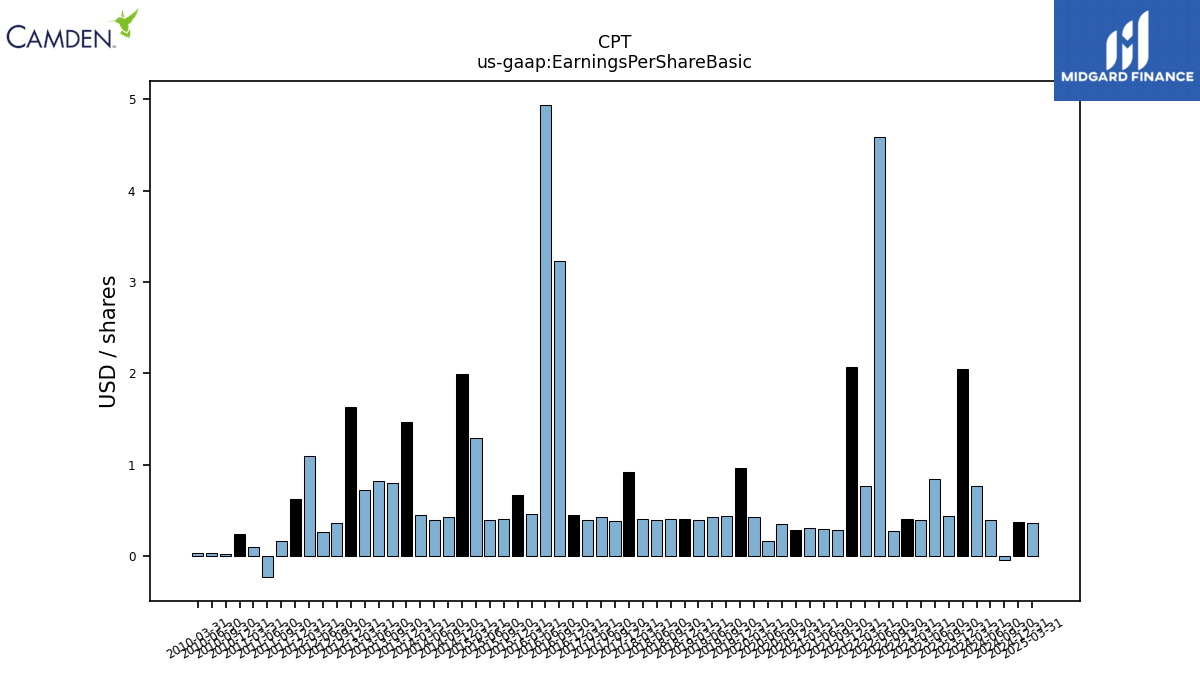
| Earnings Per Share Basic | 2.05 | 0.44 | 0.84 | 0.39 | 0.41 | 0.27 | 4.59 | 0.77 | 2.07 | 0.29 | 0.30 | 0.31 | 0.29 | 0.35 | 0.17 | 0.43 | 0.96 | 0.44 | 0.43 | 0.40 | 0.41 | 0.41 | 0.40 | 0.41 | 0.92 | 0.38 | 0.43 | 0.39 | |
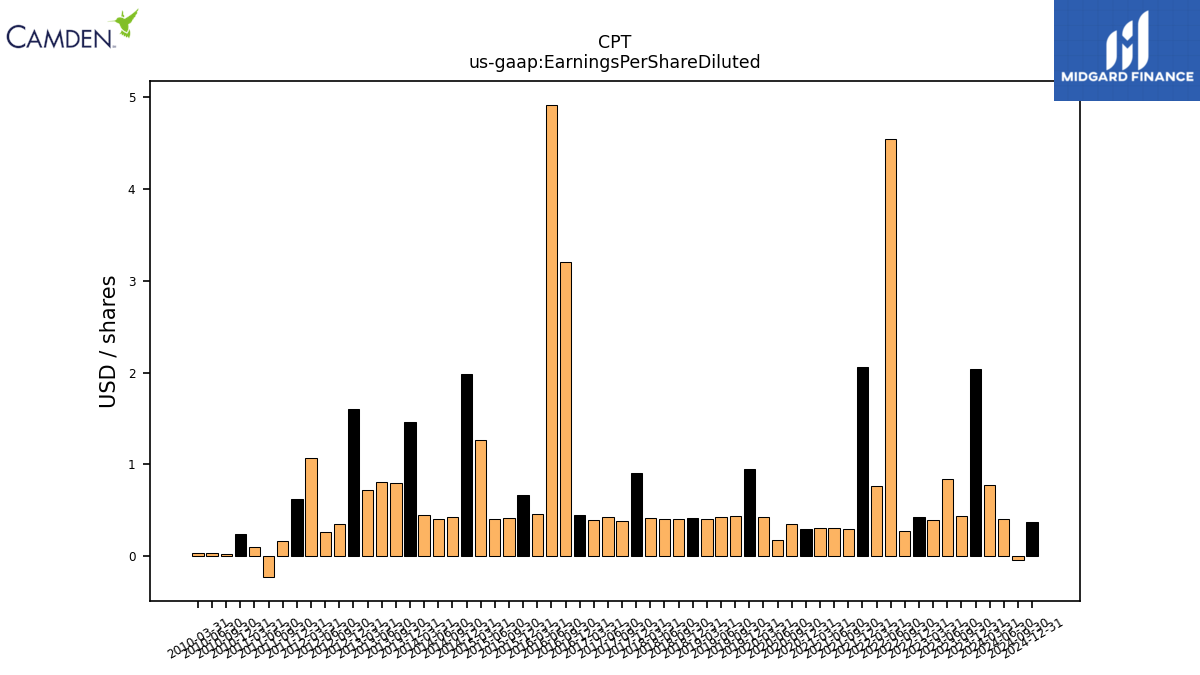
| Earnings Per Share Diluted | 2.04 | 0.44 | 0.84 | 0.39 | 0.42 | 0.27 | 4.54 | 0.76 | 2.06 | 0.29 | 0.30 | 0.31 | 0.29 | 0.35 | 0.17 | 0.43 | 0.95 | 0.44 | 0.43 | 0.40 | 0.41 | 0.40 | 0.40 | 0.41 | 0.91 | 0.38 | 0.43 | 0.39 |
| 2023-12-31 | 2023-09-30 | 2023-06-30 | 2023-03-31 | 2022-12-31 | 2022-09-30 | 2022-06-30 | 2022-03-31 | 2021-12-31 | 2021-09-30 | 2021-06-30 | 2021-03-31 | 2020-12-31 | 2020-09-30 | 2020-06-30 | 2020-03-31 | 2019-12-31 | 2019-09-30 | 2019-06-30 | 2019-03-31 | 2018-12-31 | 2018-09-30 | 2018-06-30 | 2018-03-31 | 2017-12-31 | 2017-09-30 | 2017-06-30 | 2017-03-31 | ||
|---|---|---|---|---|---|---|---|---|---|---|---|---|---|---|---|---|---|---|---|---|---|---|---|---|---|---|---|---|---|
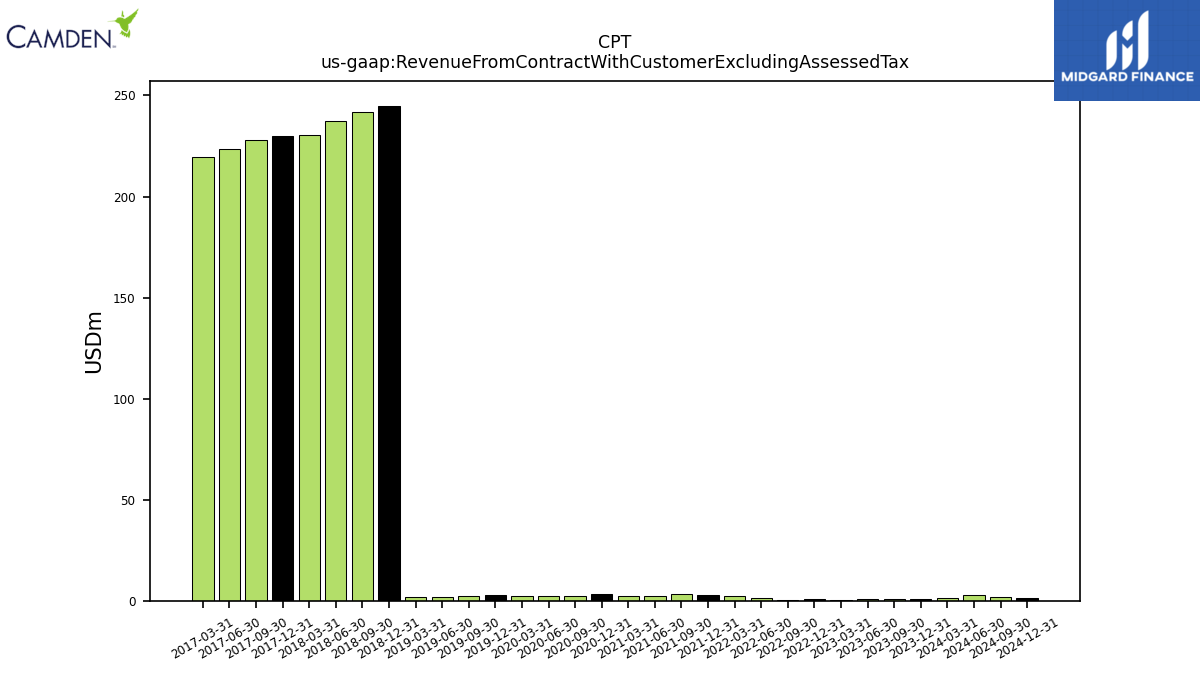
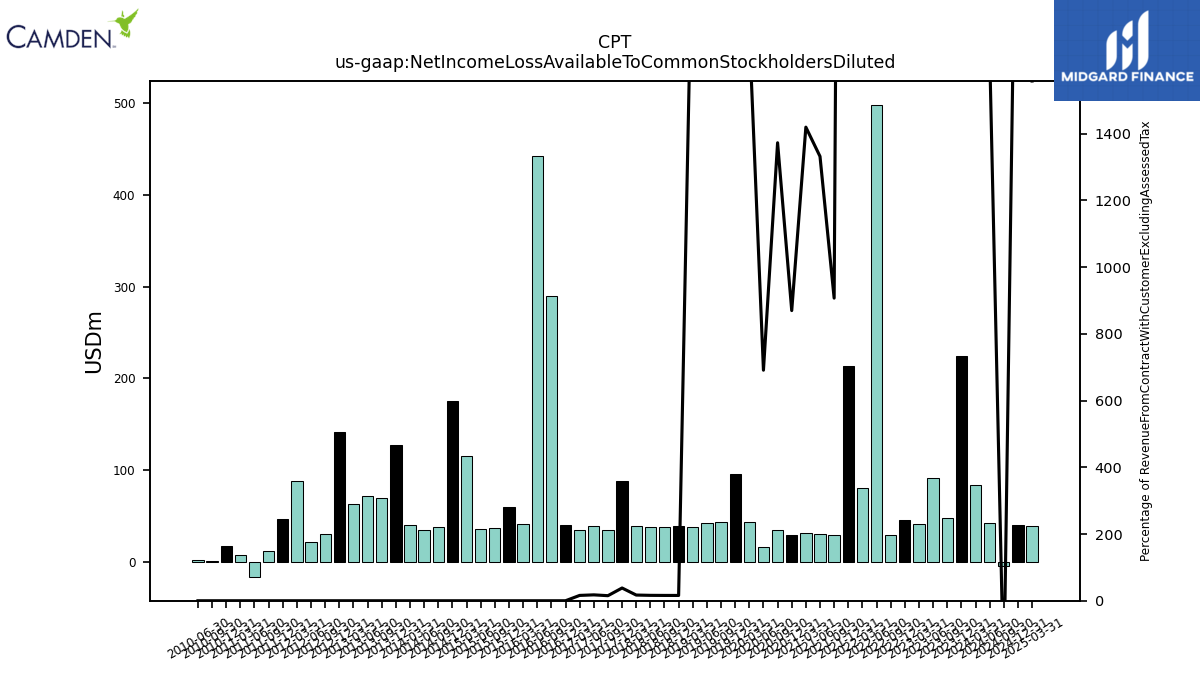
| Revenue From Contract With Customer Excluding Assessed Tax | 1.08 | 1.08 | 0.72 | 0.58 | 0.93 | 0.62 | 1.19 | 2.45 | 2.81 | 3.25 | 2.26 | 2.21 | 3.35 | 2.54 | 2.38 | 2.53 | 2.85 | 2.14 | 1.87 | 1.84 | 244.92 | 241.77 | 237.13 | 230.68 | 229.83 | 228.18 | 223.37 | 219.52 | |
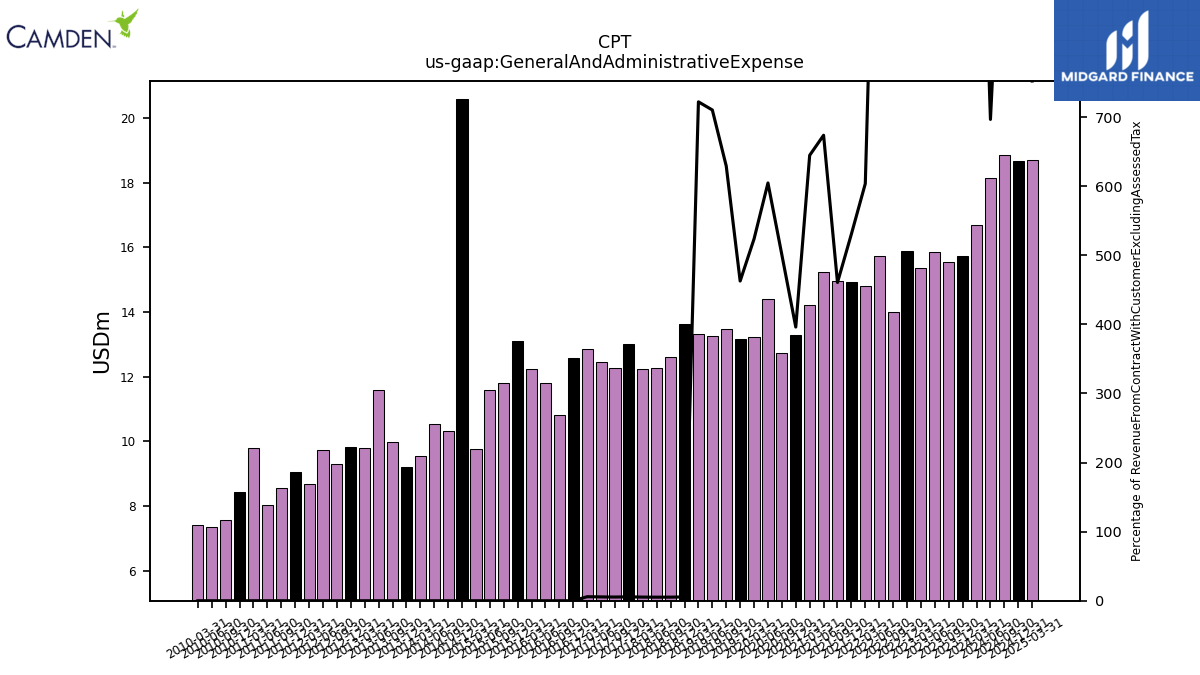
| General And Administrative Expense | 15.74 | 15.54 | 15.86 | 15.36 | 15.89 | 14.00 | 15.73 | 14.79 | 14.94 | 14.96 | 15.25 | 14.22 | 13.27 | 12.73 | 14.39 | 13.23 | 13.17 | 13.46 | 13.26 | 13.31 | 13.62 | 12.62 | 12.27 | 12.22 | 13.00 | 12.27 | 12.45 | 12.87 | |
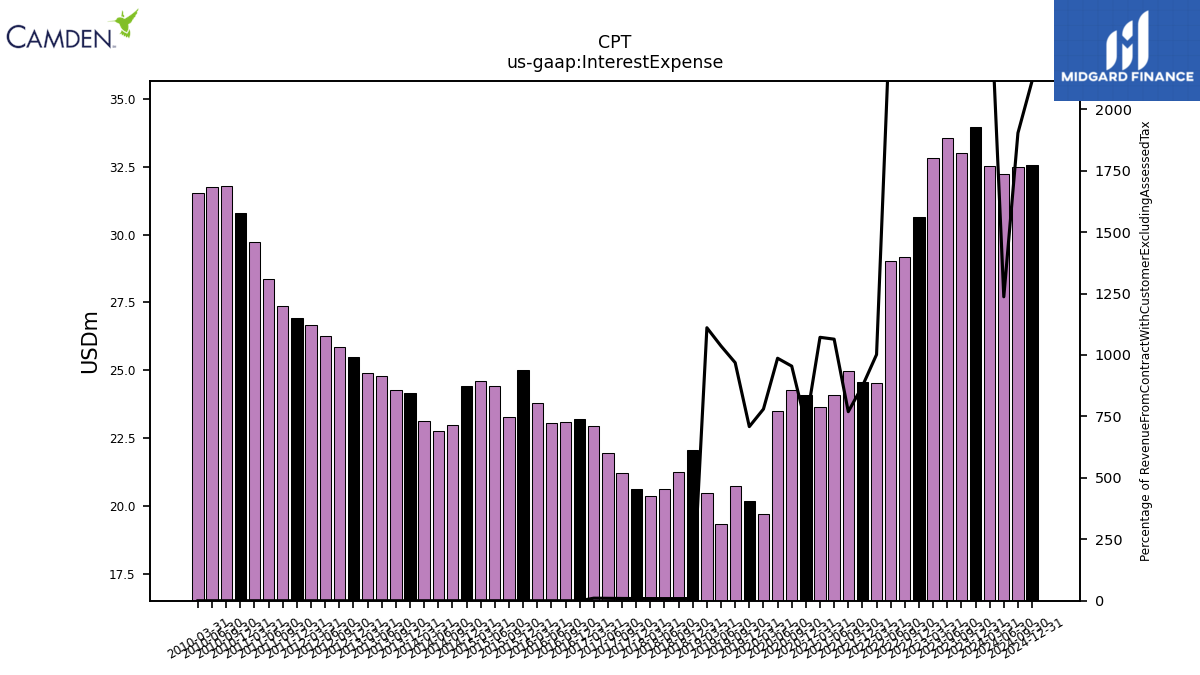
| Interest Expense | 33.97 | 33.01 | 33.58 | 32.84 | 30.67 | 29.19 | 29.02 | 24.54 | 24.58 | 24.99 | 24.08 | 23.64 | 24.07 | 24.27 | 23.48 | 19.71 | 20.17 | 20.72 | 19.35 | 20.47 | 22.05 | 21.23 | 20.61 | 20.37 | 20.62 | 21.21 | 21.97 | 22.96 | |
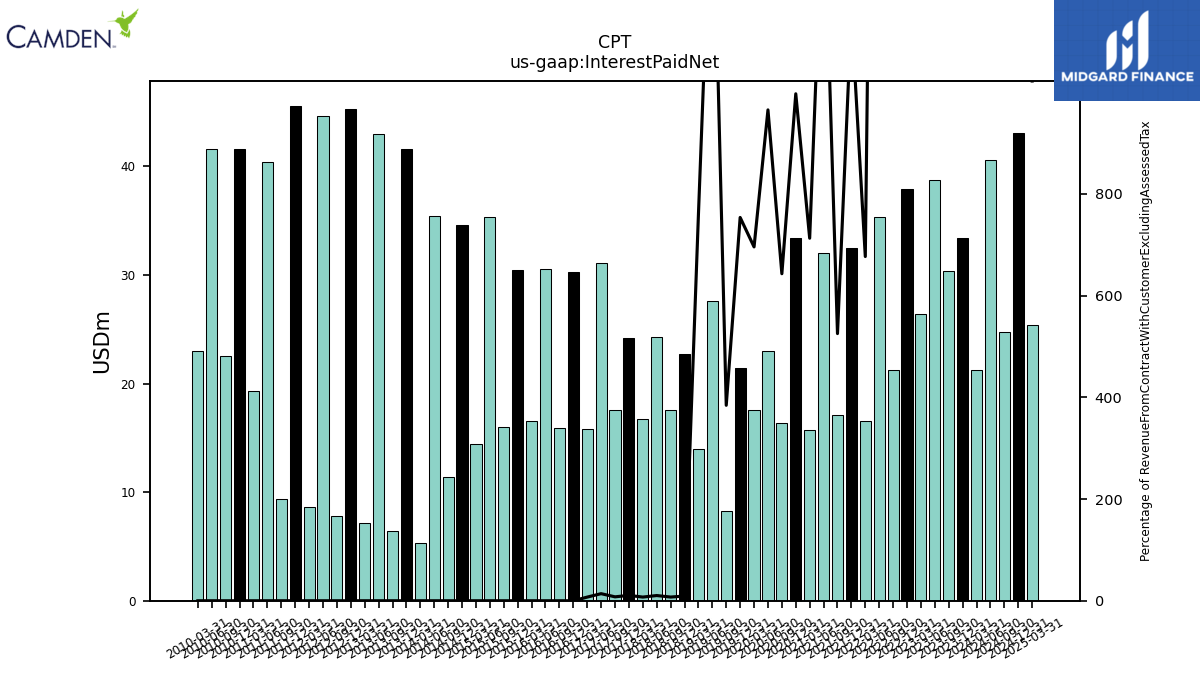
| Interest Paid Net | 33.39 | 30.38 | 38.73 | 26.38 | 37.91 | 21.22 | 35.36 | 16.58 | 32.51 | 17.06 | 32.01 | 15.72 | 33.40 | 16.34 | 22.97 | 17.58 | 21.45 | 8.22 | 27.58 | 14.00 | 22.70 | 17.59 | 24.31 | 16.70 | 24.20 | 17.58 | 31.11 | 15.77 | |
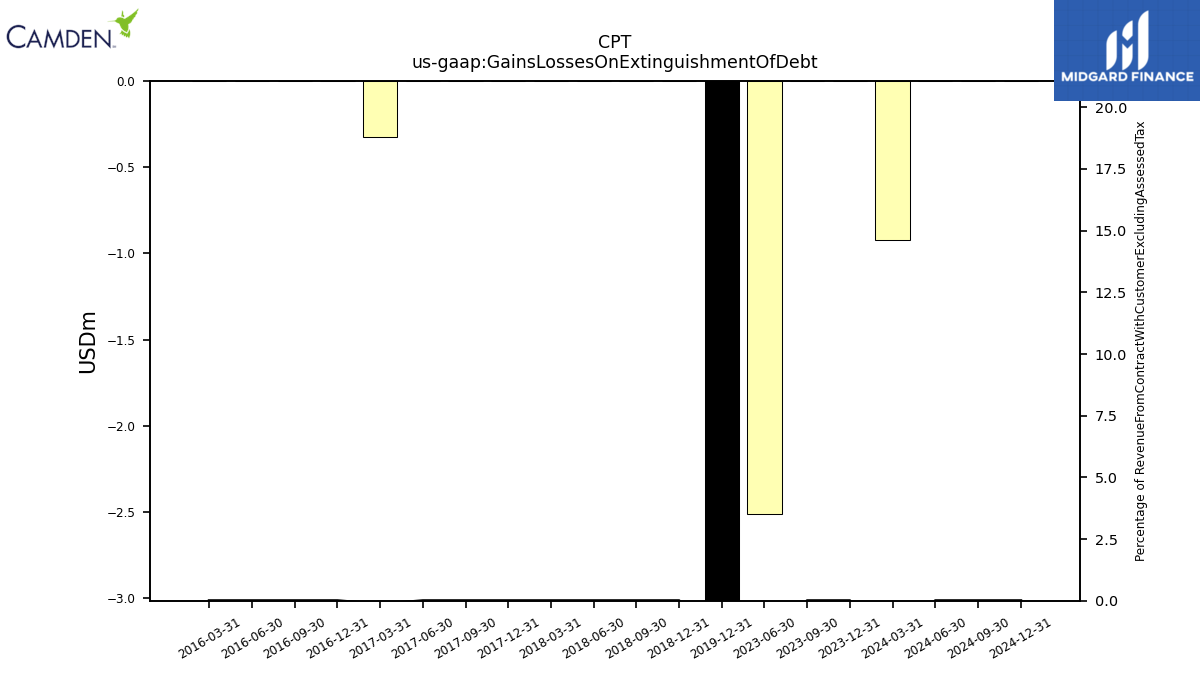
| Gains Losses On Extinguishment Of Debt | 0.00 | 0.00 | -2.51 | NA | NA | NA | NA | NA | NA | NA | NA | NA | NA | NA | NA | NA | -11.99 | NA | NA | NA | 0.00 | 0.00 | 0.00 | 0.00 | 0.00 | 0.00 | 0.00 | -0.32 | |
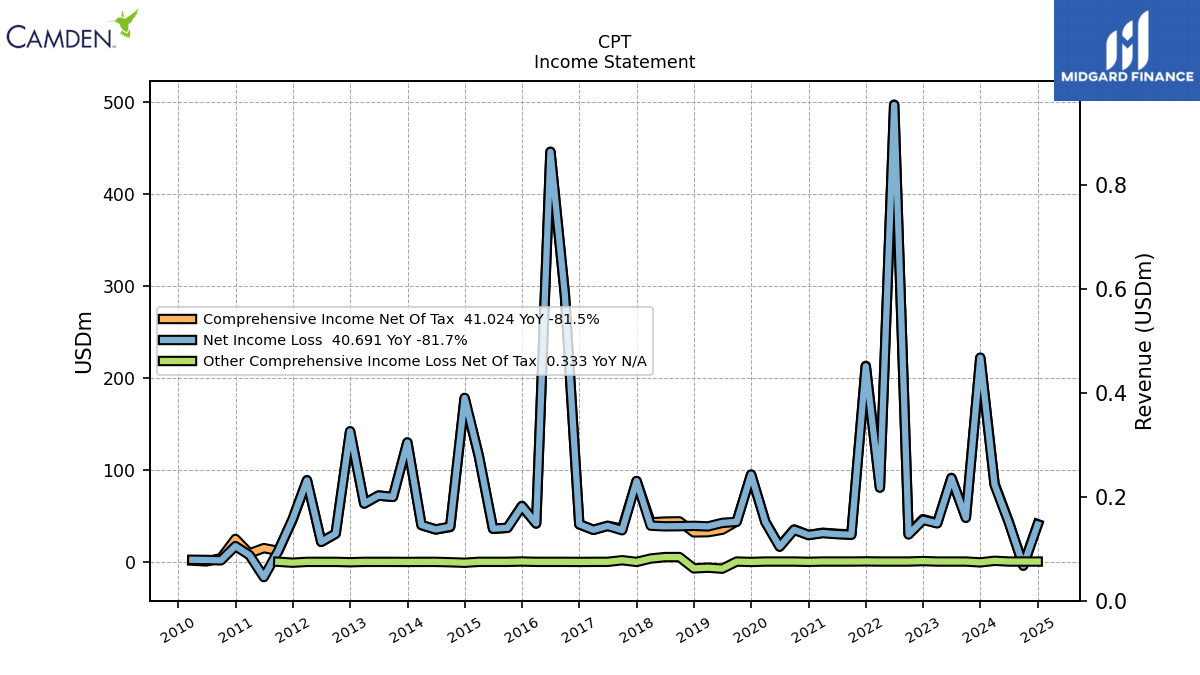
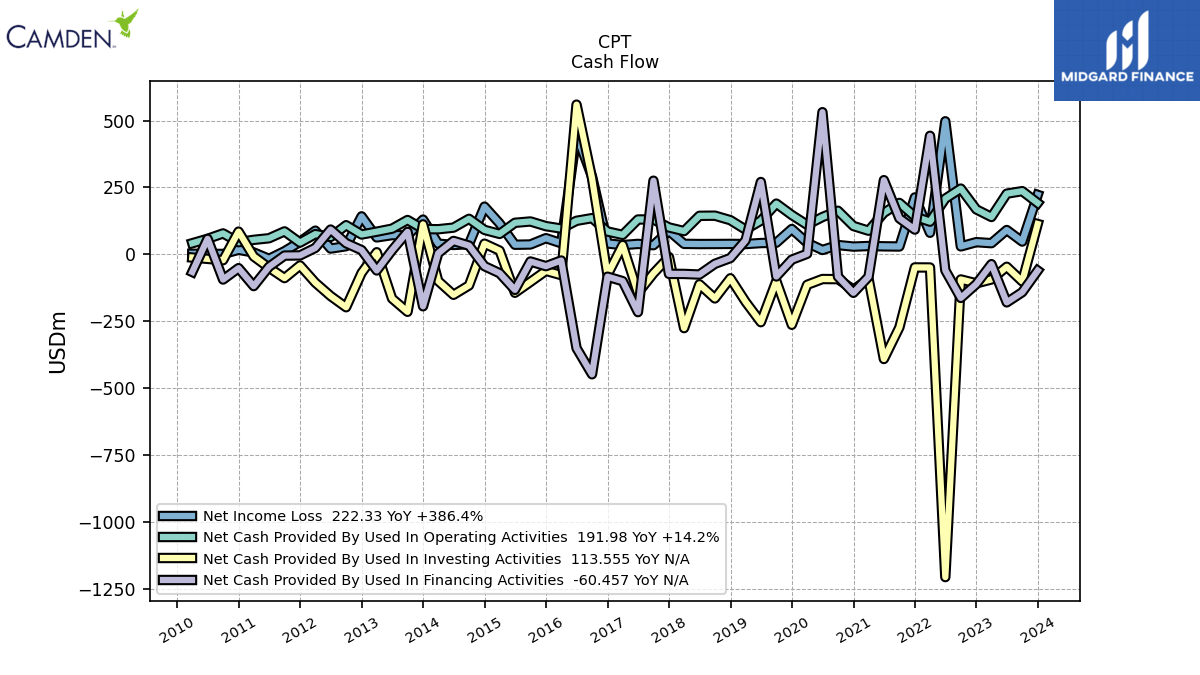
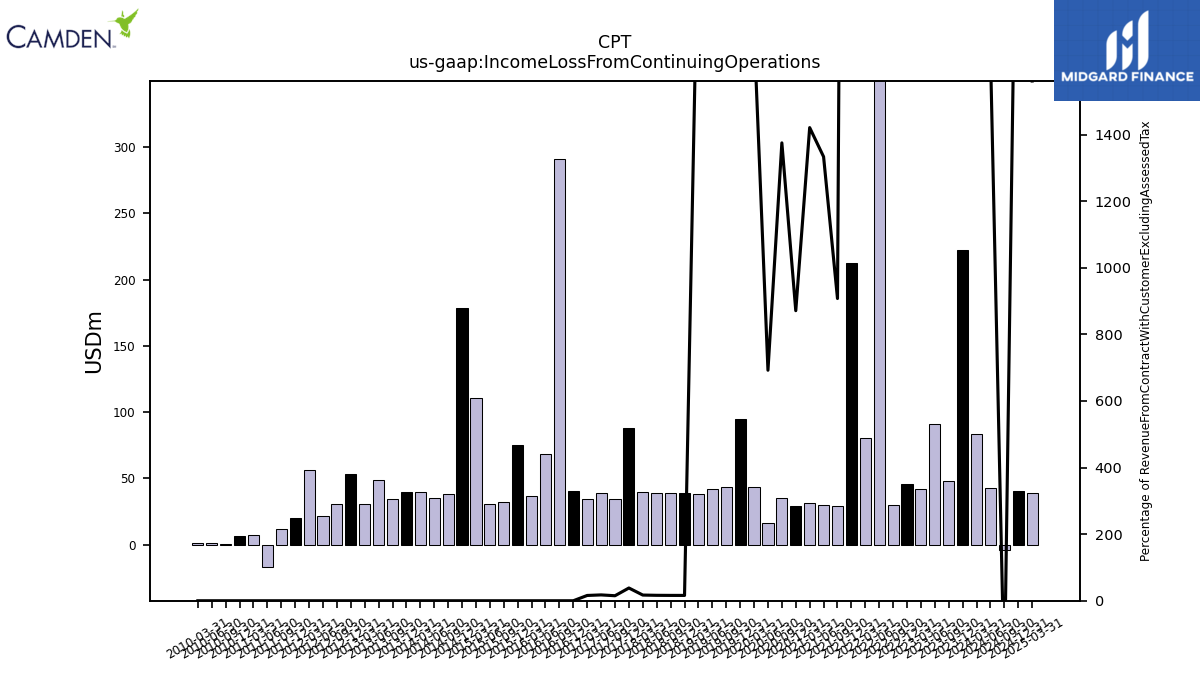
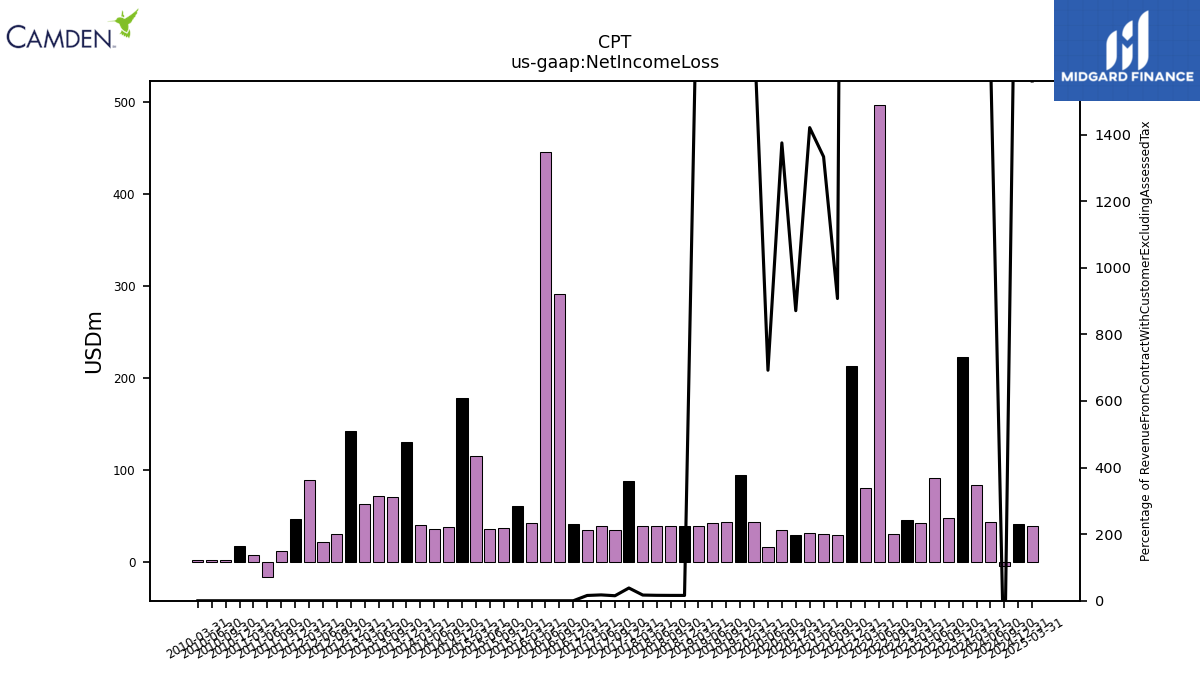
| Income Loss From Continuing Operations | 222.33 | 47.96 | 91.10 | 41.92 | 45.71 | 29.84 | 497.31 | 80.75 | 212.90 | 29.48 | 30.18 | 31.35 | 29.19 | 34.96 | 16.48 | 43.28 | 95.01 | 43.60 | 42.40 | 38.61 | 39.20 | 38.87 | 38.67 | 39.40 | 87.99 | 34.38 | 39.19 | 34.86 | |
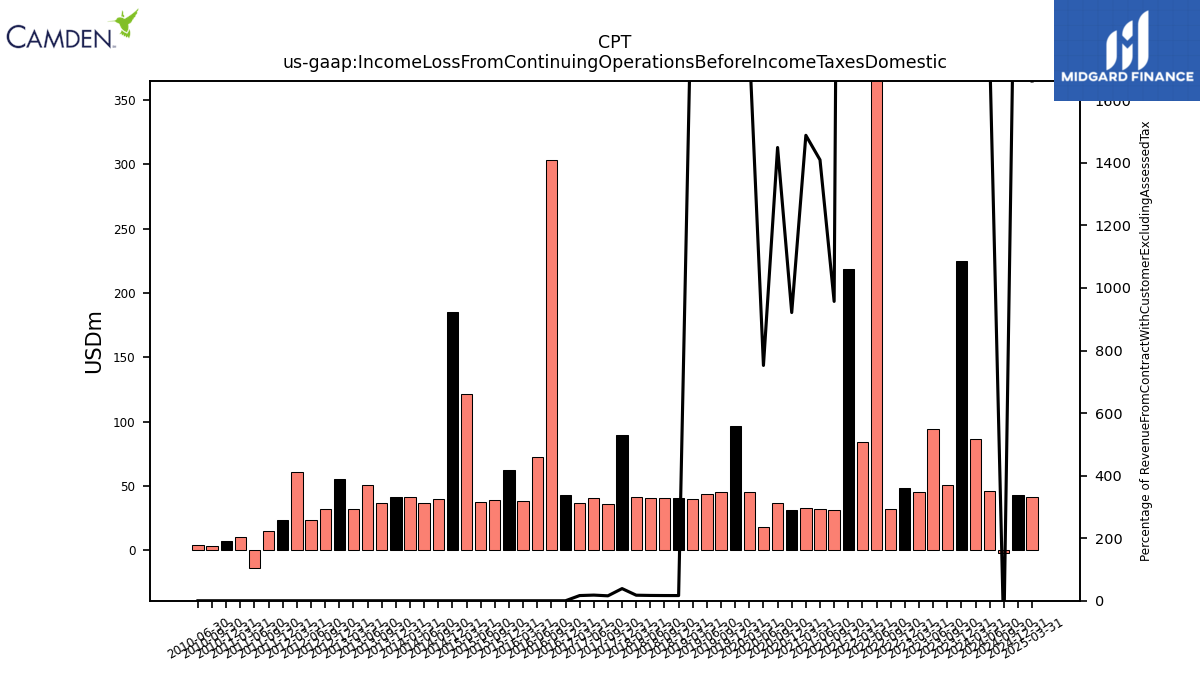
| Income Loss From Continuing Operations Before Income Taxes Domestic | 225.07 | 50.57 | 93.79 | 44.77 | 48.22 | 32.29 | 499.77 | 84.19 | 218.46 | 31.09 | 31.90 | 32.83 | 30.88 | 36.84 | 17.91 | 44.93 | 96.61 | 45.09 | 43.77 | 39.89 | 40.63 | 40.32 | 40.25 | 40.91 | 89.30 | 35.99 | 40.34 | 36.46 | |
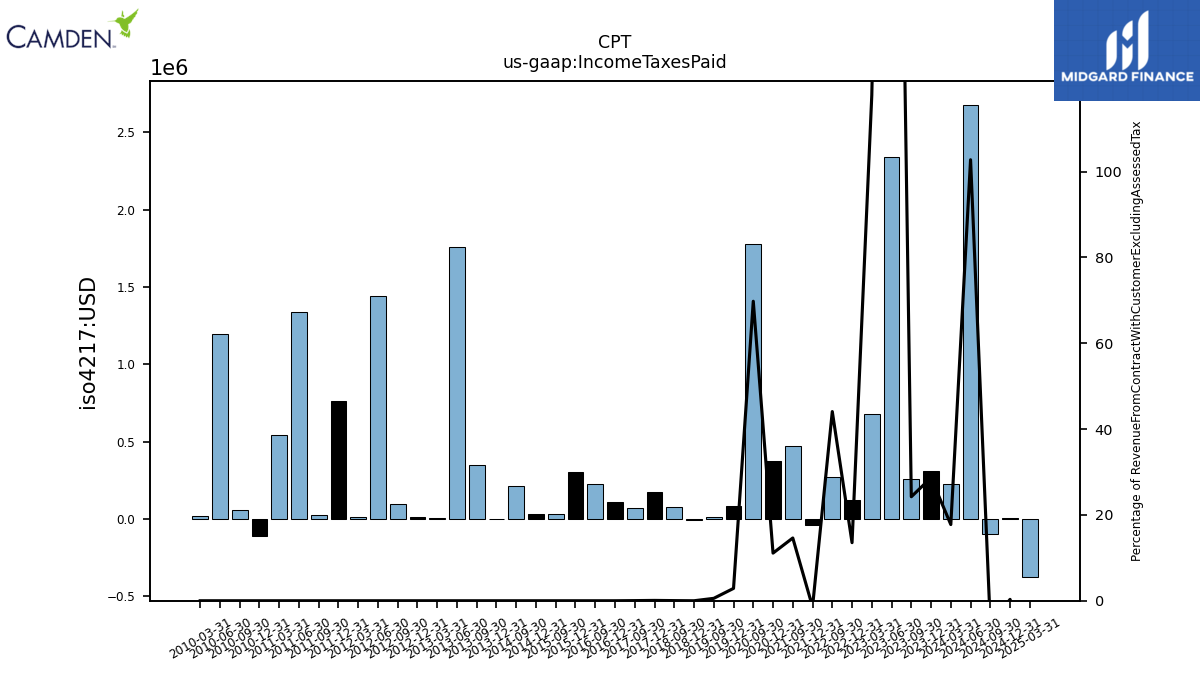
| Income Taxes Paid | 0.31 | 0.26 | NA | NA | 0.13 | 0.27 | NA | NA | -0.04 | 0.47 | NA | NA | 0.37 | 1.77 | NA | NA | 0.08 | 0.01 | NA | NA | -0.00 | 0.08 | NA | NA | 0.18 | 0.07 | NA | NA | |
| Profit Loss | 224.18 | 49.82 | 92.94 | 43.62 | 47.47 | 31.55 | 498.89 | 83.60 | 217.86 | 30.61 | 31.44 | 32.47 | 30.38 | 36.22 | 17.51 | 44.47 | 96.22 | 44.78 | 43.54 | 39.72 | 40.31 | 39.99 | 39.87 | 40.52 | 89.08 | 35.48 | 40.31 | 35.99 | |
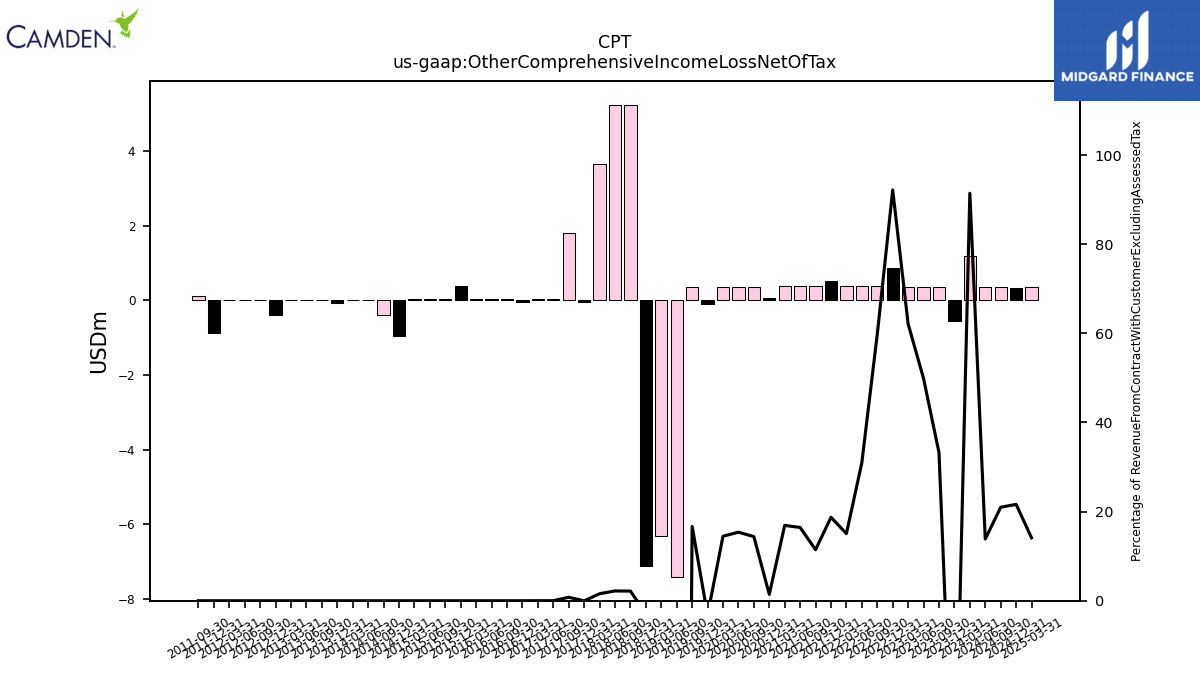
| Other Comprehensive Income Loss Net Of Tax | -0.55 | 0.36 | 0.36 | 0.36 | 0.86 | 0.37 | 0.37 | 0.37 | 0.53 | 0.37 | 0.37 | 0.37 | 0.05 | 0.37 | 0.37 | 0.37 | -0.09 | 0.36 | -7.41 | -6.31 | -7.10 | 5.24 | 5.21 | 3.64 | -0.05 | 1.79 | 0.03 | 0.03 | |
| Net Income Loss | 222.33 | 47.96 | 91.10 | 41.92 | 45.71 | 29.84 | 497.31 | 80.75 | 212.90 | 29.48 | 30.18 | 31.35 | 29.19 | 34.96 | 16.48 | 43.28 | 95.01 | 43.60 | 42.40 | 38.61 | 39.20 | 38.87 | 38.67 | 39.40 | 87.99 | 34.38 | 39.19 | 34.86 | |
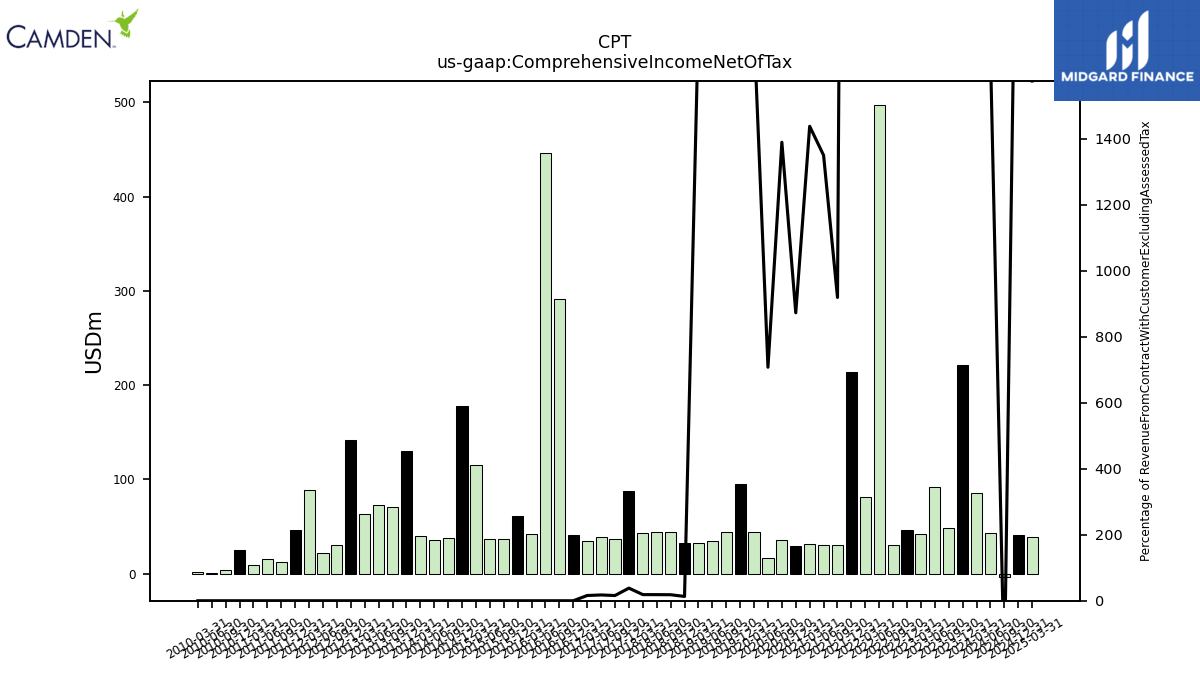
| Comprehensive Income Net Of Tax | 221.78 | 48.32 | 91.46 | 42.28 | 46.57 | 30.21 | 497.68 | 81.11 | 213.43 | 29.86 | 30.55 | 31.72 | 29.24 | 35.32 | 16.84 | 43.65 | 94.92 | 43.95 | 34.99 | 32.30 | 32.09 | 44.10 | 43.89 | 43.03 | 87.94 | 36.17 | 39.22 | 34.90 | |
| Net Income Loss Available To Common Stockholders Basic | 222.00 | 47.90 | 90.95 | 41.84 | 45.65 | 29.80 | 496.57 | 80.62 | 212.47 | 29.45 | 30.13 | 31.30 | 29.14 | 34.88 | 16.44 | 43.19 | 94.76 | 43.51 | 42.28 | 38.53 | 38.92 | 38.58 | 38.39 | 39.13 | 87.46 | 34.36 | 39.11 | 34.82 | |
| Net Income Loss Available To Common Stockholders Diluted | 224.09 | 47.90 | 91.52 | 41.84 | 46.05 | 29.80 | 498.15 | 80.92 | 213.66 | 29.45 | 30.13 | 31.30 | 29.14 | 34.88 | 16.44 | 43.19 | 96.35 | 43.51 | 42.28 | 38.53 | 38.92 | 38.58 | 38.39 | 39.43 | 87.77 | 34.66 | 39.42 | 35.10 |
| 2023-12-31 | 2023-09-30 | 2023-06-30 | 2023-03-31 | 2022-12-31 | 2022-09-30 | 2022-06-30 | 2022-03-31 | 2021-12-31 | 2021-09-30 | 2021-06-30 | 2021-03-31 | 2020-12-31 | 2020-09-30 | 2020-06-30 | 2020-03-31 | 2019-12-31 | 2019-09-30 | 2019-06-30 | 2019-03-31 | 2018-12-31 | 2018-09-30 | 2018-06-30 | 2018-03-31 | 2017-12-31 | 2017-09-30 | 2017-06-30 | 2017-03-31 | ||
|---|---|---|---|---|---|---|---|---|---|---|---|---|---|---|---|---|---|---|---|---|---|---|---|---|---|---|---|---|---|
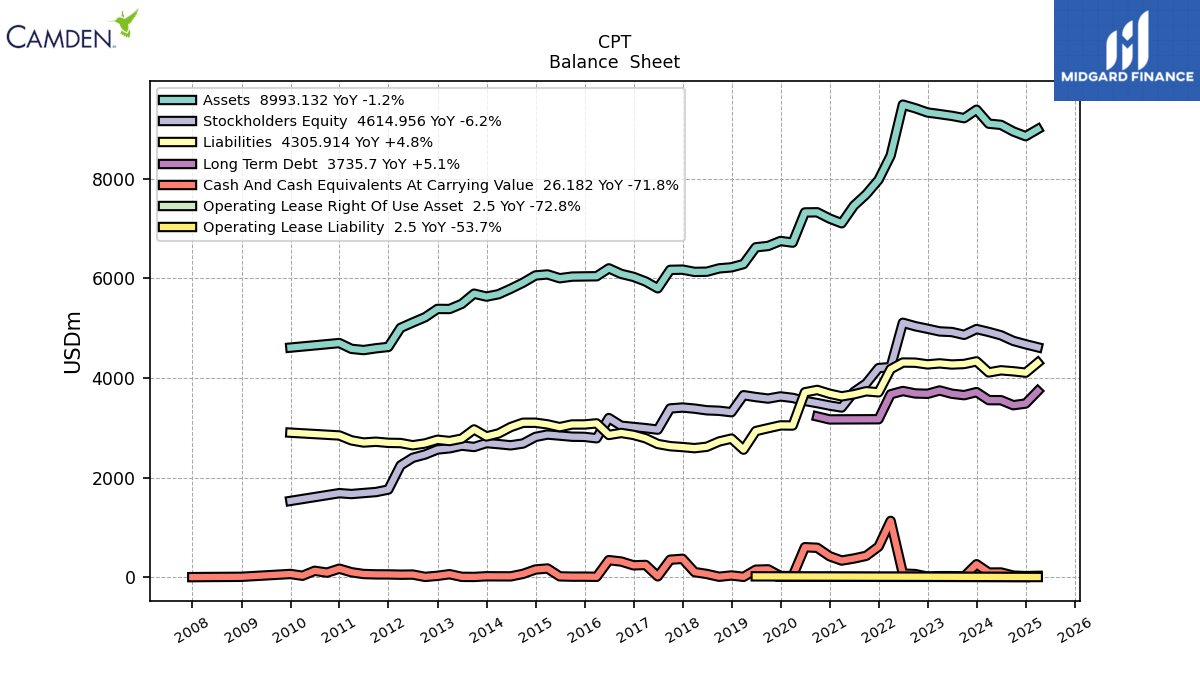
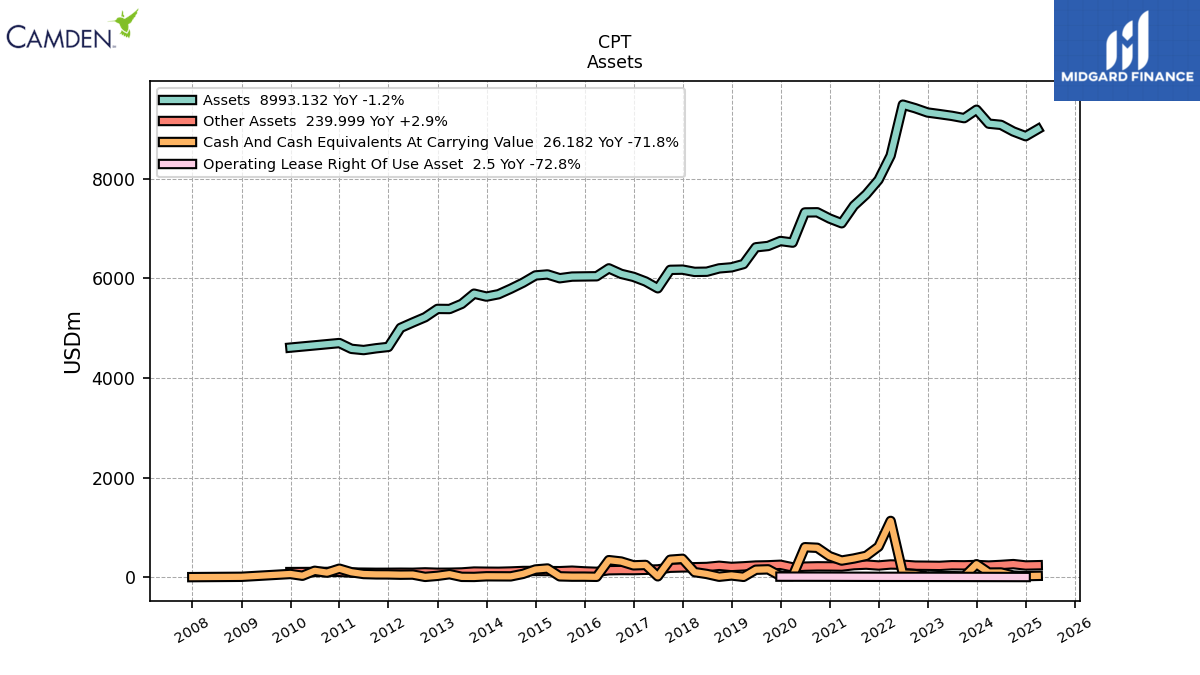
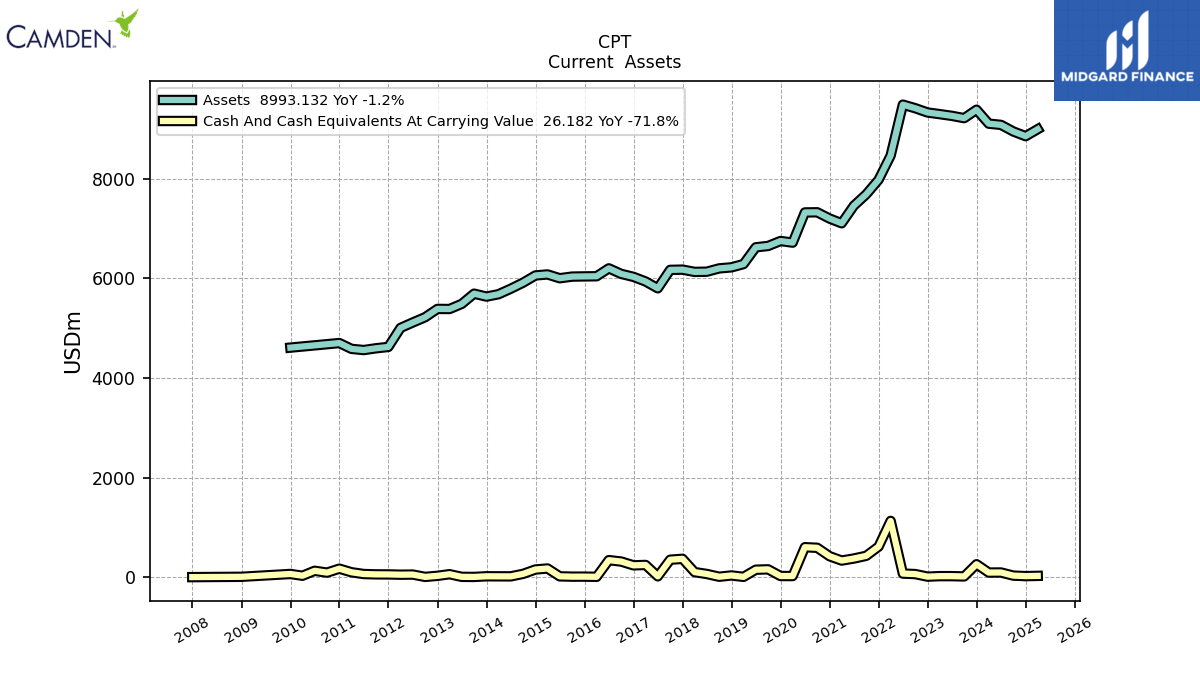
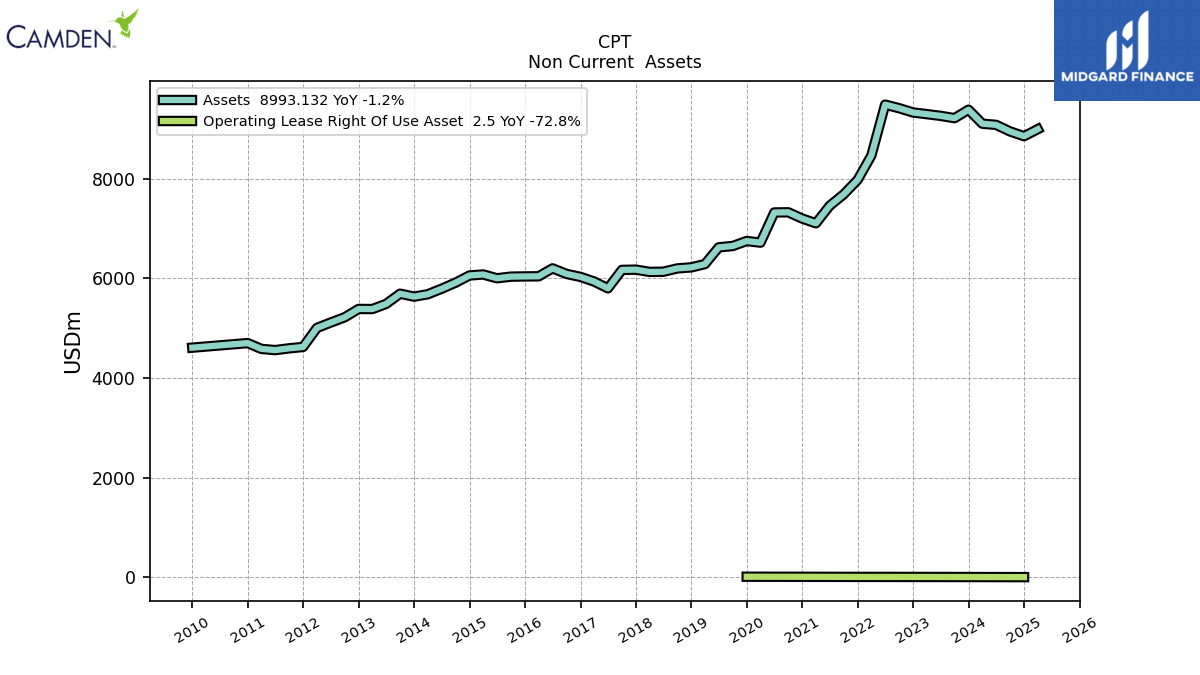
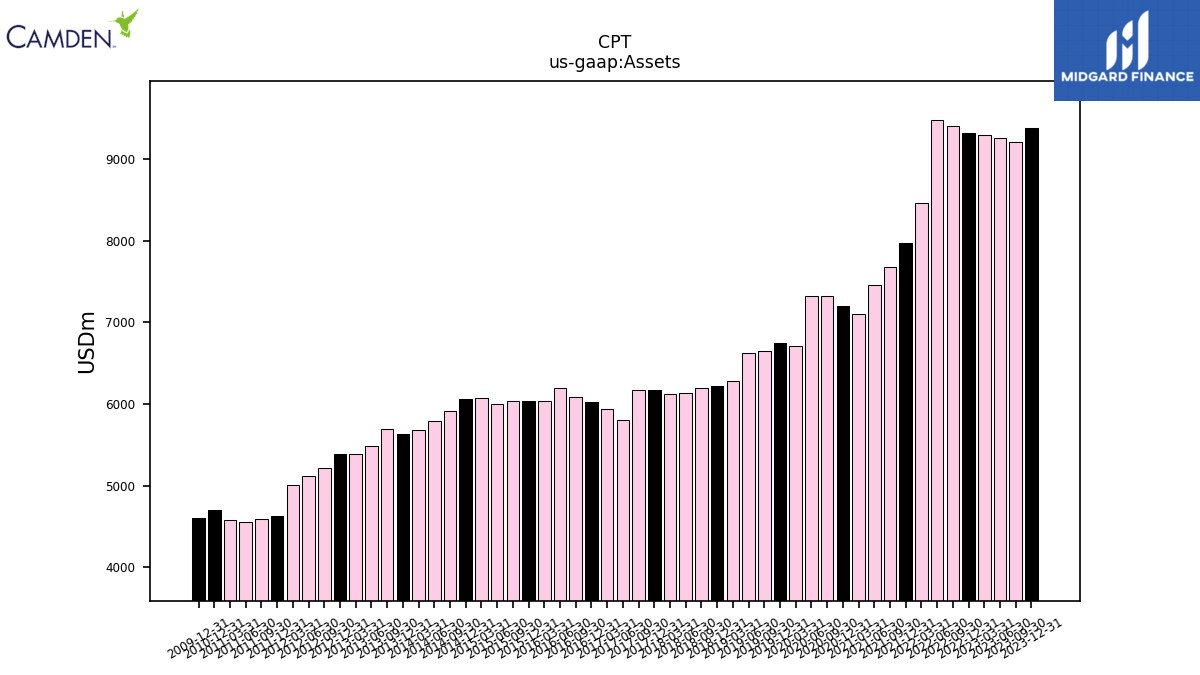
| Assets | 9383.74 | 9214.46 | 9260.40 | 9295.17 | 9327.93 | 9414.12 | 9486.02 | 8462.71 | 7976.78 | 7685.57 | 7457.12 | 7104.03 | 7198.95 | 7324.72 | 7321.70 | 6715.57 | 6748.50 | 6648.65 | 6621.60 | 6285.39 | 6219.59 | 6198.50 | 6131.91 | 6128.38 | 6173.75 | 6168.90 | 5798.60 | 5935.35 | |
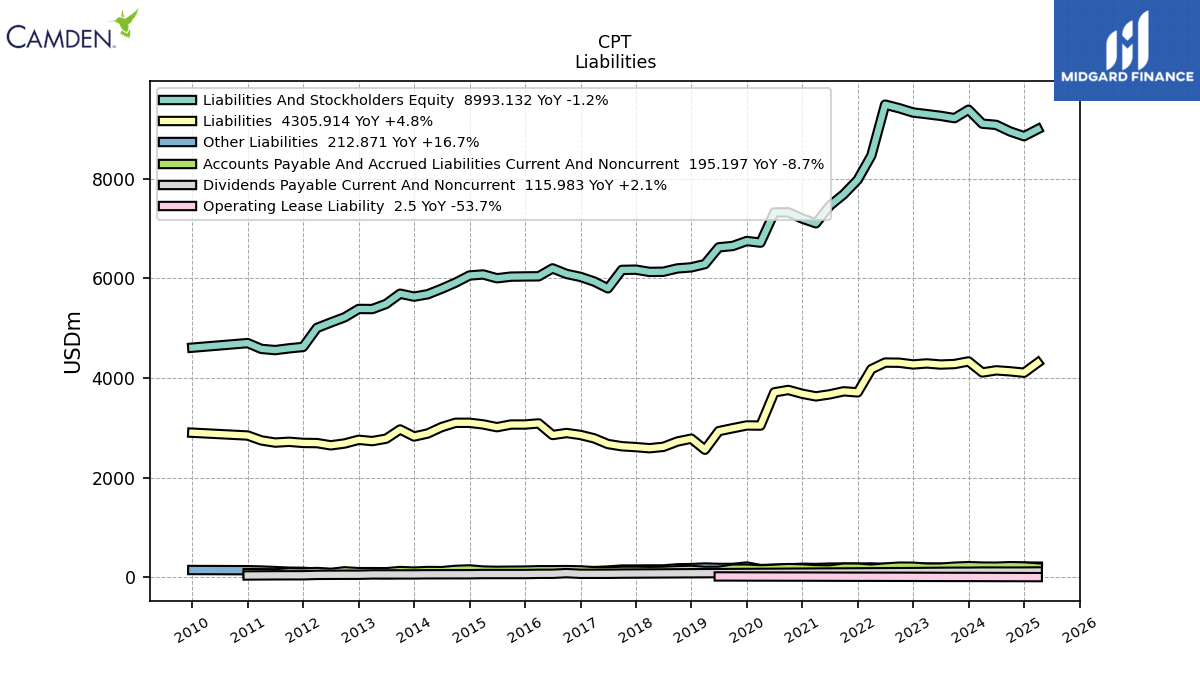
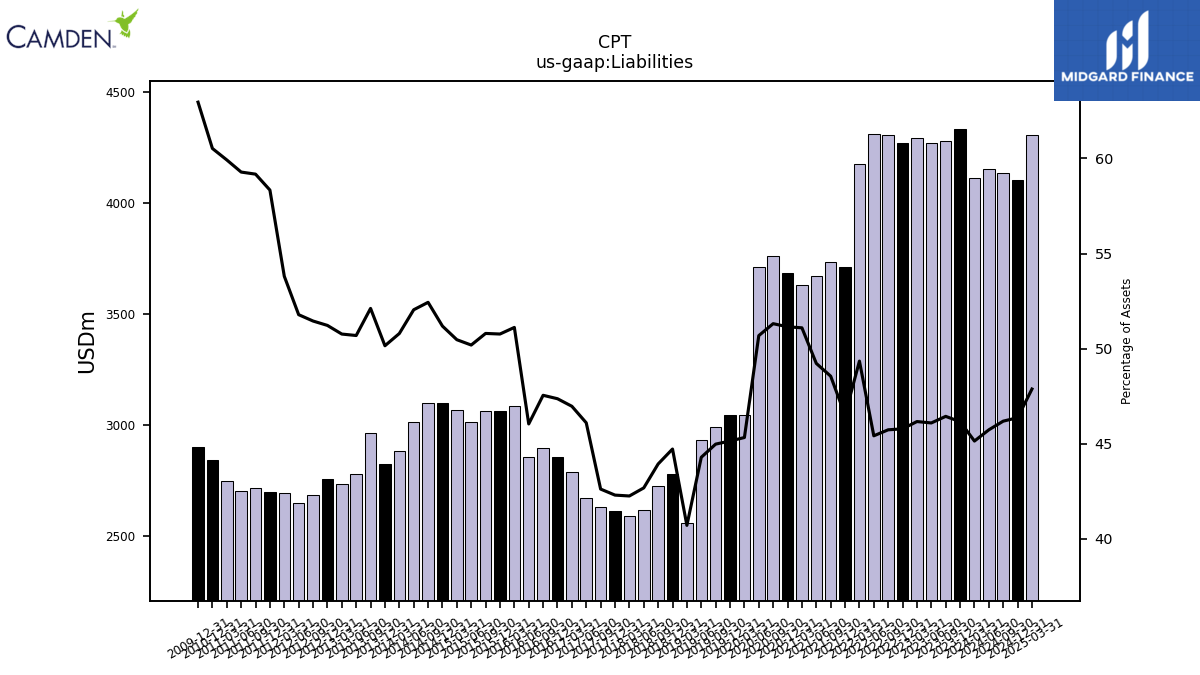
| Liabilities | 4331.97 | 4279.48 | 4268.86 | 4291.62 | 4271.01 | 4305.76 | 4308.74 | 4176.17 | 3710.53 | 3731.74 | 3670.91 | 3629.96 | 3682.36 | 3758.72 | 3711.13 | 3044.25 | 3046.78 | 2990.86 | 2932.83 | 2559.07 | 2781.81 | 2723.70 | 2617.36 | 2589.79 | 2611.80 | 2629.30 | 2673.41 | 2788.04 | |
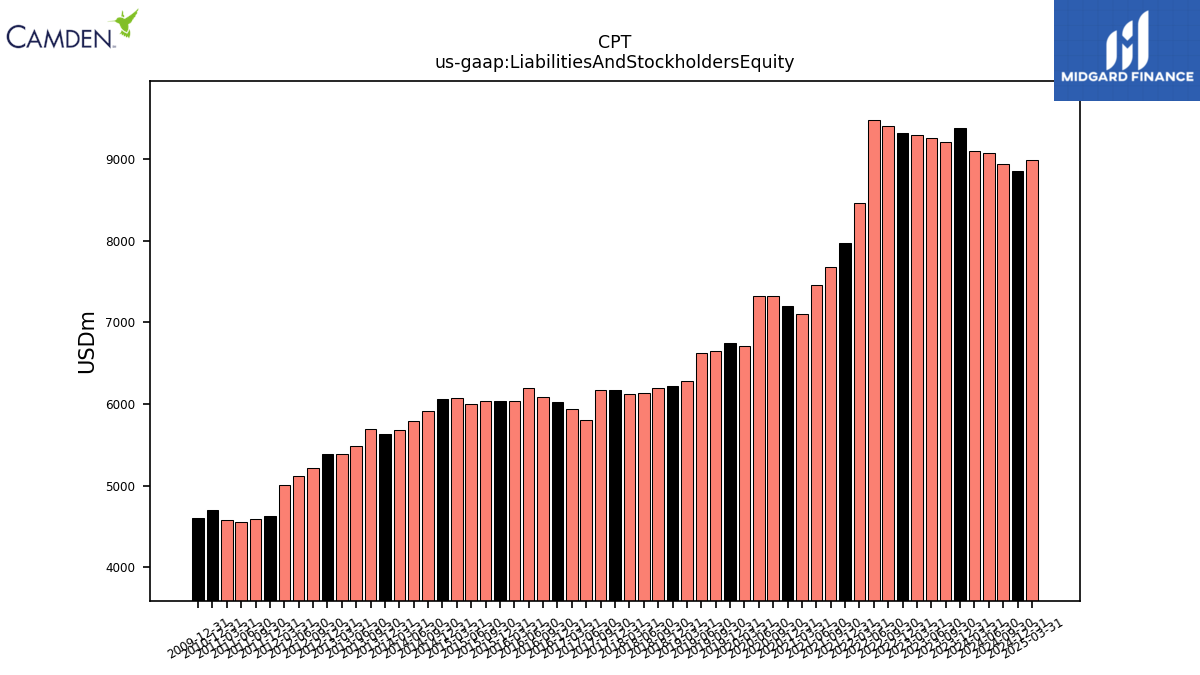
| Liabilities And Stockholders Equity | 9383.74 | 9214.46 | 9260.40 | 9295.17 | 9327.93 | 9414.12 | 9486.02 | 8462.71 | 7976.78 | 7685.57 | 7457.12 | 7104.03 | 7198.95 | 7324.72 | 7321.70 | 6715.57 | 6748.50 | 6648.65 | 6621.60 | 6285.39 | 6219.59 | 6198.50 | 6131.91 | 6128.38 | 6173.75 | 6168.90 | 5798.60 | 5935.35 | |
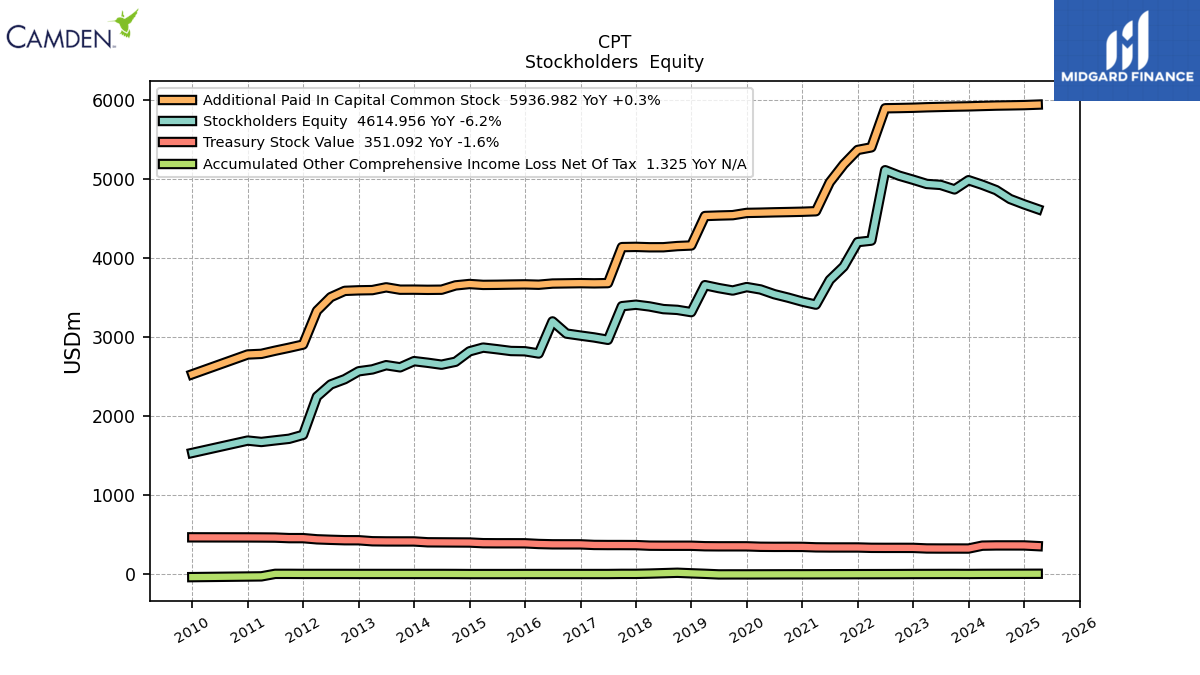
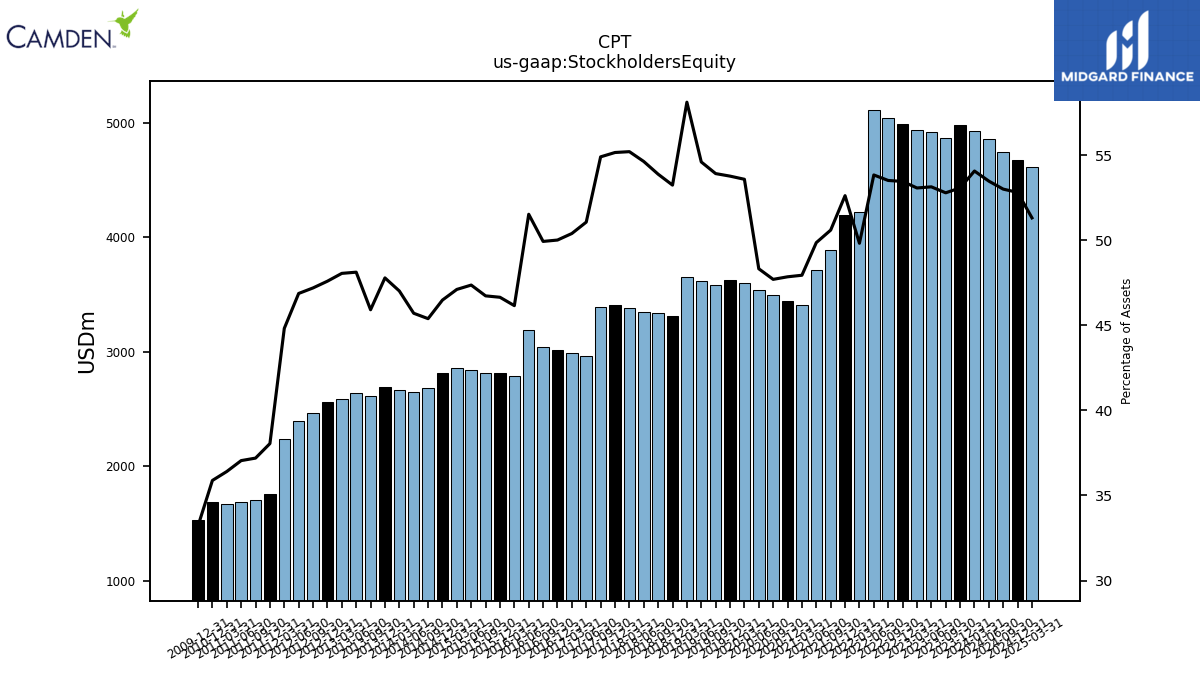
| Stockholders Equity | 4980.76 | 4864.27 | 4921.03 | 4933.29 | 4986.62 | 5037.99 | 5107.11 | 4216.43 | 4197.49 | 3888.68 | 3718.24 | 3405.98 | 3444.91 | 3494.06 | 3538.21 | 3598.55 | 3628.68 | 3584.88 | 3615.62 | 3652.83 | 3311.42 | 3340.00 | 3349.90 | 3383.38 | 3405.36 | 3386.91 | 2961.15 | 2991.32 |
| 2023-12-31 | 2023-09-30 | 2023-06-30 | 2023-03-31 | 2022-12-31 | 2022-09-30 | 2022-06-30 | 2022-03-31 | 2021-12-31 | 2021-09-30 | 2021-06-30 | 2021-03-31 | 2020-12-31 | 2020-09-30 | 2020-06-30 | 2020-03-31 | 2019-12-31 | 2019-09-30 | 2019-06-30 | 2019-03-31 | 2018-12-31 | 2018-09-30 | 2018-06-30 | 2018-03-31 | 2017-12-31 | 2017-09-30 | 2017-06-30 | 2017-03-31 | ||
|---|---|---|---|---|---|---|---|---|---|---|---|---|---|---|---|---|---|---|---|---|---|---|---|---|---|---|---|---|---|
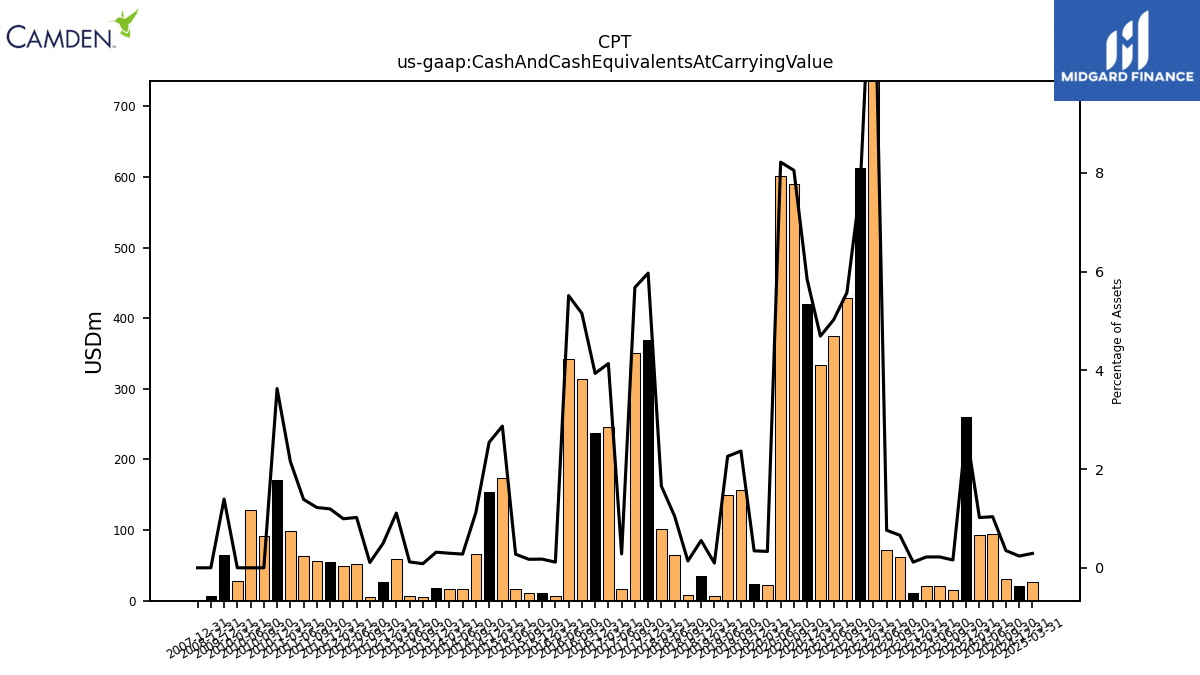
| Cash And Cash Equivalents At Carrying Value | 259.69 | 14.60 | 20.33 | 20.42 | 10.69 | 62.03 | 72.09 | 1129.72 | 613.39 | 428.23 | 374.56 | 333.40 | 420.44 | 589.61 | 601.58 | 22.28 | 23.18 | 157.24 | 149.55 | 6.09 | 34.38 | 8.53 | 64.07 | 101.40 | 368.49 | 350.27 | 16.32 | 245.53 | |
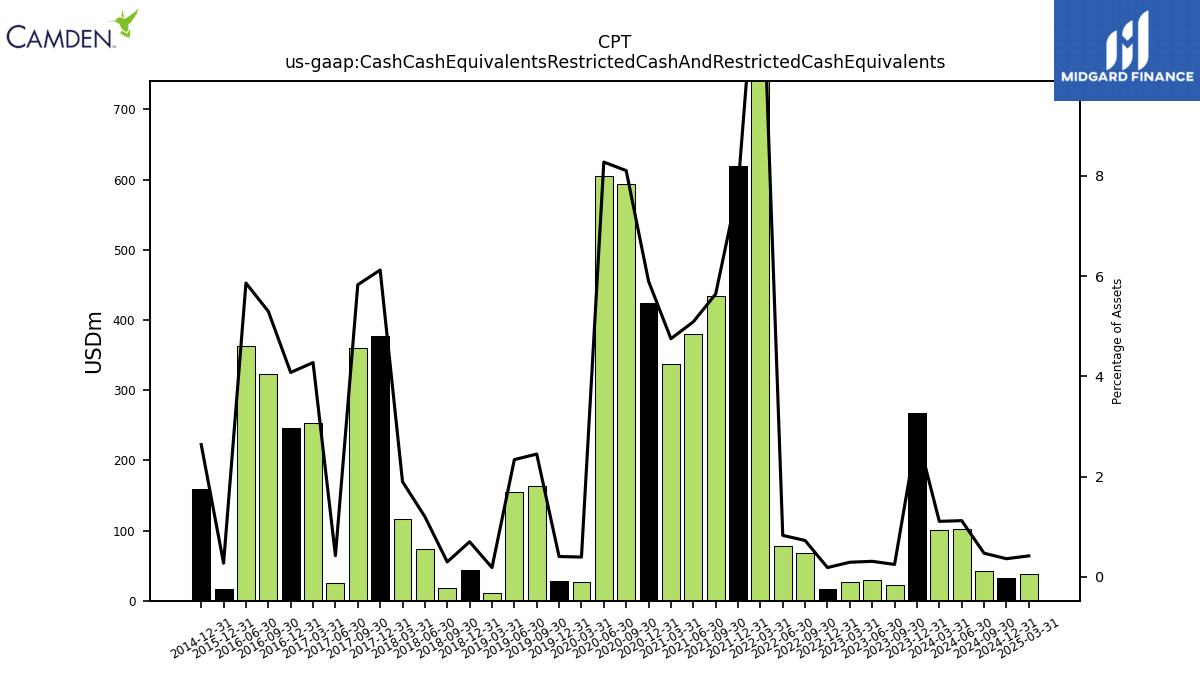
| Cash Cash Equivalents Restricted Cash And Restricted Cash Equivalents | 268.05 | 22.97 | 28.86 | 27.28 | 17.44 | 68.42 | 78.66 | 1135.49 | 618.98 | 433.55 | 379.32 | 337.51 | 424.53 | 593.53 | 605.68 | 26.64 | 27.50 | 162.93 | 154.94 | 11.75 | 43.60 | 18.59 | 73.65 | 116.44 | 377.81 | 359.45 | 24.63 | 253.70 | |
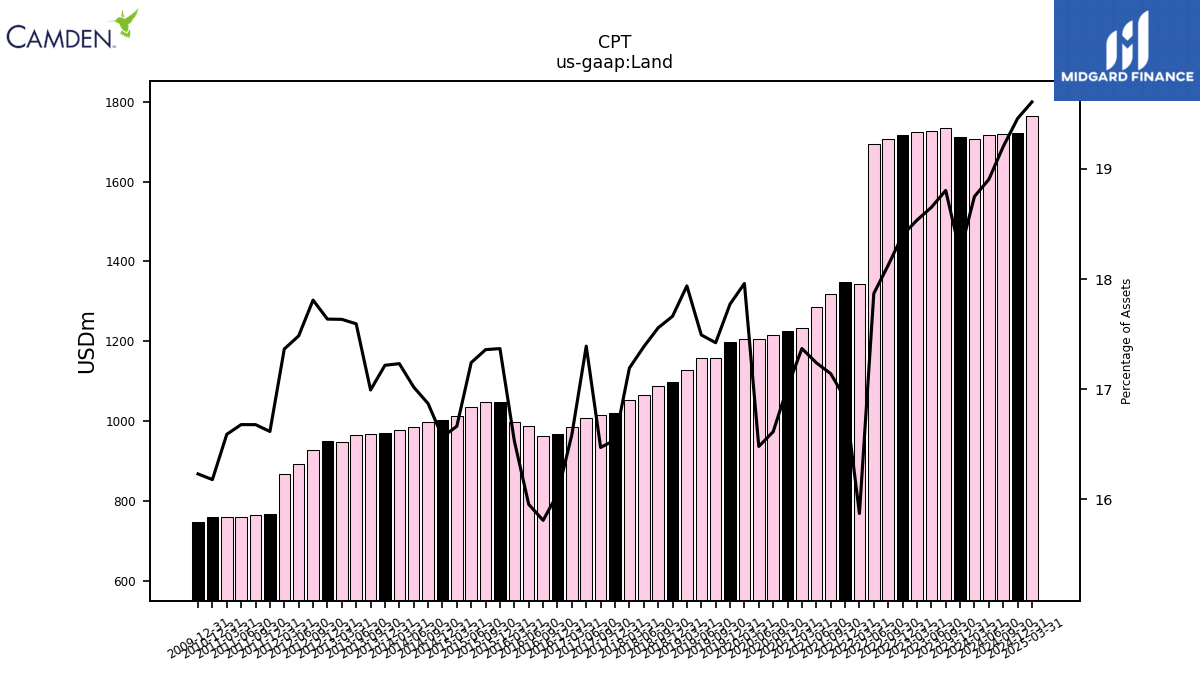
| Land | 1711.87 | 1732.80 | 1727.18 | 1722.88 | 1716.27 | 1706.40 | 1695.12 | 1343.21 | 1349.59 | 1317.43 | 1285.63 | 1233.94 | 1225.21 | 1216.94 | 1206.66 | 1206.13 | 1199.38 | 1158.34 | 1158.34 | 1127.48 | 1098.53 | 1088.29 | 1066.08 | 1053.58 | 1021.03 | 1016.10 | 1008.46 | 984.52 |
| 2023-12-31 | 2023-09-30 | 2023-06-30 | 2023-03-31 | 2022-12-31 | 2022-09-30 | 2022-06-30 | 2022-03-31 | 2021-12-31 | 2021-09-30 | 2021-06-30 | 2021-03-31 | 2020-12-31 | 2020-09-30 | 2020-06-30 | 2020-03-31 | 2019-12-31 | 2019-09-30 | 2019-06-30 | 2019-03-31 | 2018-12-31 | 2018-09-30 | 2018-06-30 | 2018-03-31 | 2017-12-31 | 2017-09-30 | 2017-06-30 | 2017-03-31 | ||
|---|---|---|---|---|---|---|---|---|---|---|---|---|---|---|---|---|---|---|---|---|---|---|---|---|---|---|---|---|---|
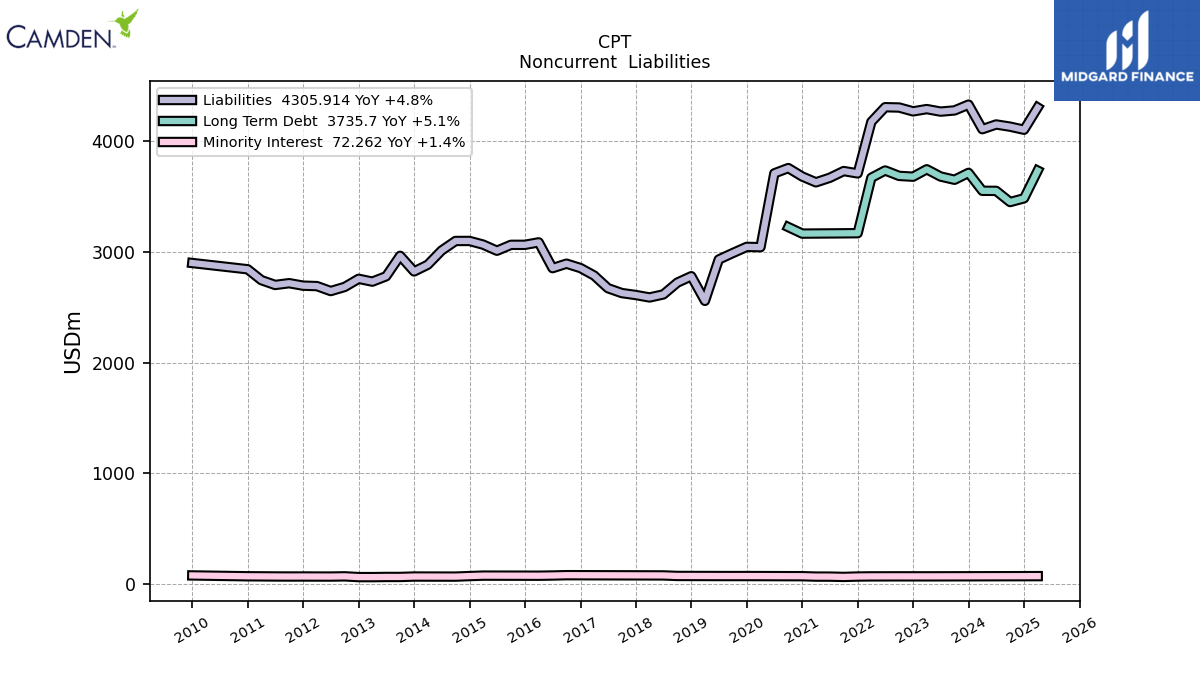
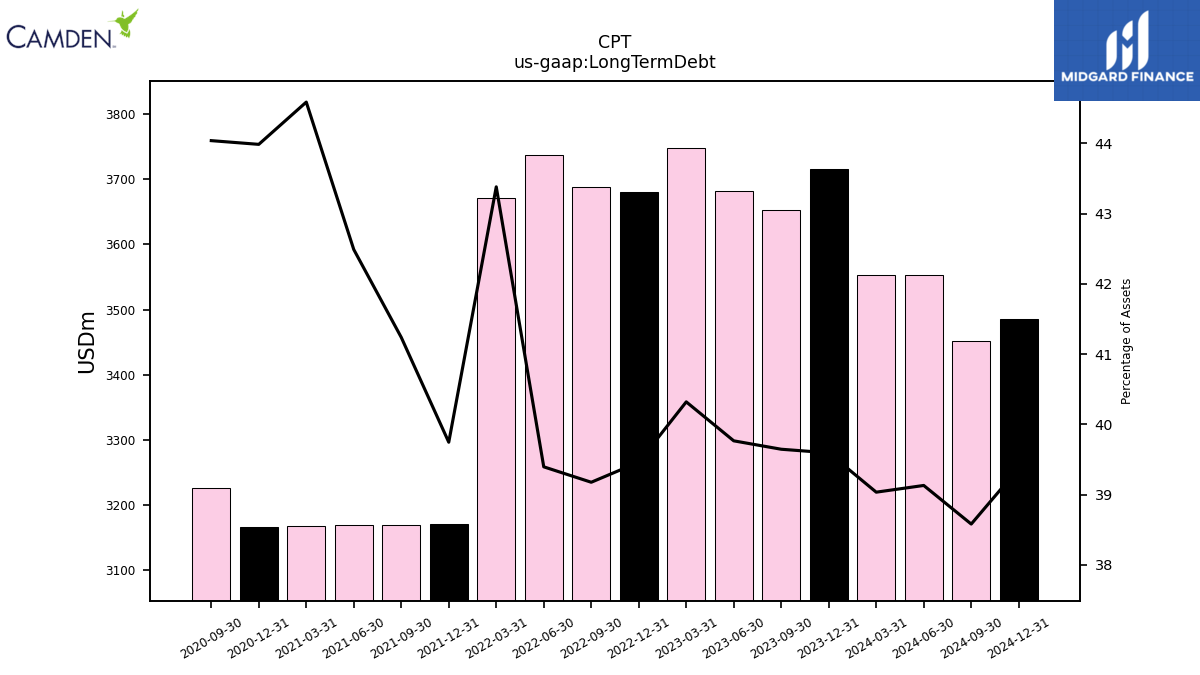
| Long Term Debt | 3715.40 | 3653.10 | 3682.40 | 3747.80 | 3680.90 | 3688.00 | 3737.00 | 3671.30 | 3170.40 | 3169.40 | 3168.50 | 3167.60 | 3166.60 | 3225.80 | NA | NA | NA | NA | NA | NA | NA | NA | NA | NA | NA | NA | NA | NA | |
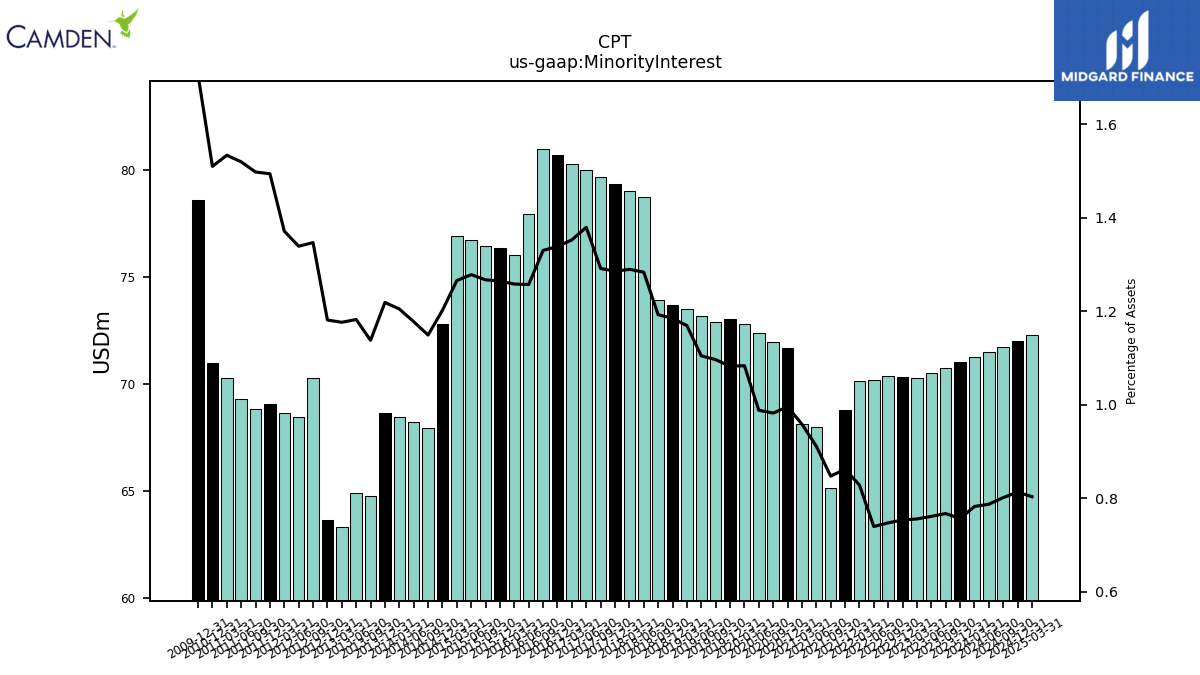
| Minority Interest | 71.01 | 70.71 | 70.51 | 70.26 | 70.30 | 70.37 | 70.17 | 70.11 | 68.77 | 65.14 | 67.97 | 68.10 | 71.68 | 71.94 | 72.36 | 72.77 | 73.04 | 72.90 | 73.14 | 73.49 | 73.68 | 73.92 | 78.71 | 79.03 | 79.35 | 79.67 | 79.99 | 80.28 |
| 2023-12-31 | 2023-09-30 | 2023-06-30 | 2023-03-31 | 2022-12-31 | 2022-09-30 | 2022-06-30 | 2022-03-31 | 2021-12-31 | 2021-09-30 | 2021-06-30 | 2021-03-31 | 2020-12-31 | 2020-09-30 | 2020-06-30 | 2020-03-31 | 2019-12-31 | 2019-09-30 | 2019-06-30 | 2019-03-31 | 2018-12-31 | 2018-09-30 | 2018-06-30 | 2018-03-31 | 2017-12-31 | 2017-09-30 | 2017-06-30 | 2017-03-31 | ||
|---|---|---|---|---|---|---|---|---|---|---|---|---|---|---|---|---|---|---|---|---|---|---|---|---|---|---|---|---|---|
| Stockholders Equity | 4980.76 | 4864.27 | 4921.03 | 4933.29 | 4986.62 | 5037.99 | 5107.11 | 4216.43 | 4197.49 | 3888.68 | 3718.24 | 3405.98 | 3444.91 | 3494.06 | 3538.21 | 3598.55 | 3628.68 | 3584.88 | 3615.62 | 3652.83 | 3311.42 | 3340.00 | 3349.90 | 3383.38 | 3405.36 | 3386.91 | 2961.15 | 2991.32 | |
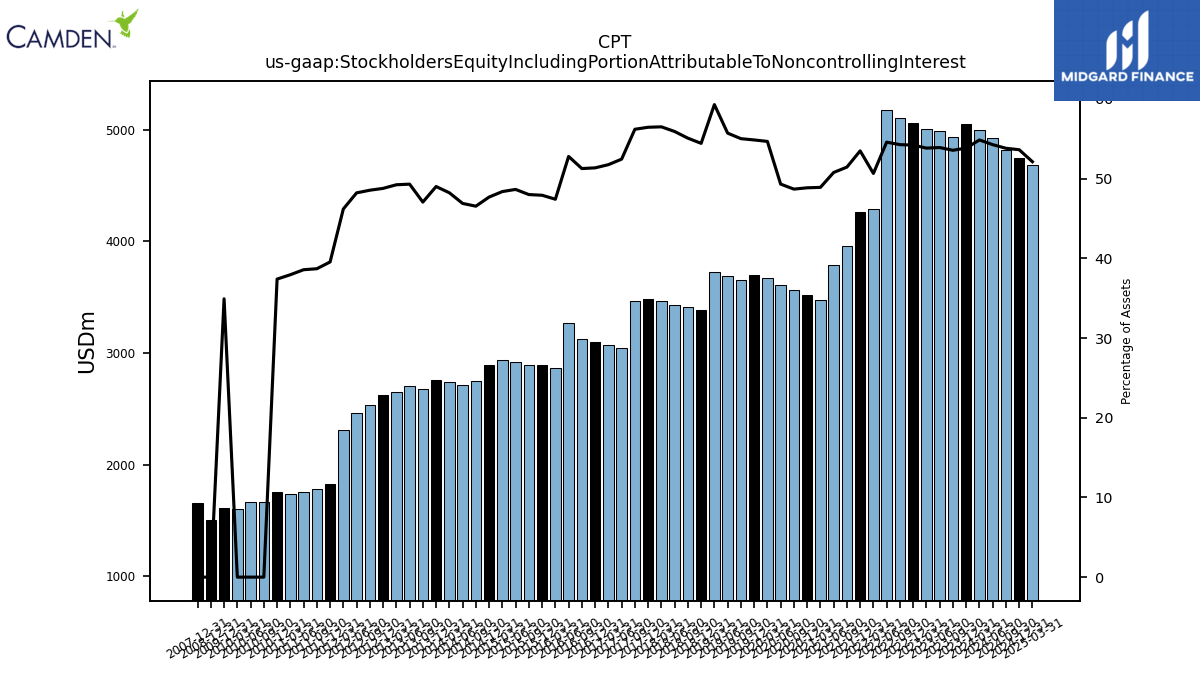
| Stockholders Equity Including Portion Attributable To Noncontrolling Interest | 5051.77 | 4934.98 | 4991.54 | 5003.55 | 5056.92 | 5108.36 | 5177.28 | 4286.54 | 4266.26 | 3953.82 | 3786.21 | 3474.08 | 3516.59 | 3566.01 | 3610.57 | 3671.32 | 3701.72 | 3657.78 | 3688.77 | 3726.32 | 3385.10 | 3413.92 | 3428.60 | 3462.41 | 3484.71 | 3466.58 | 3041.14 | 3071.60 | |
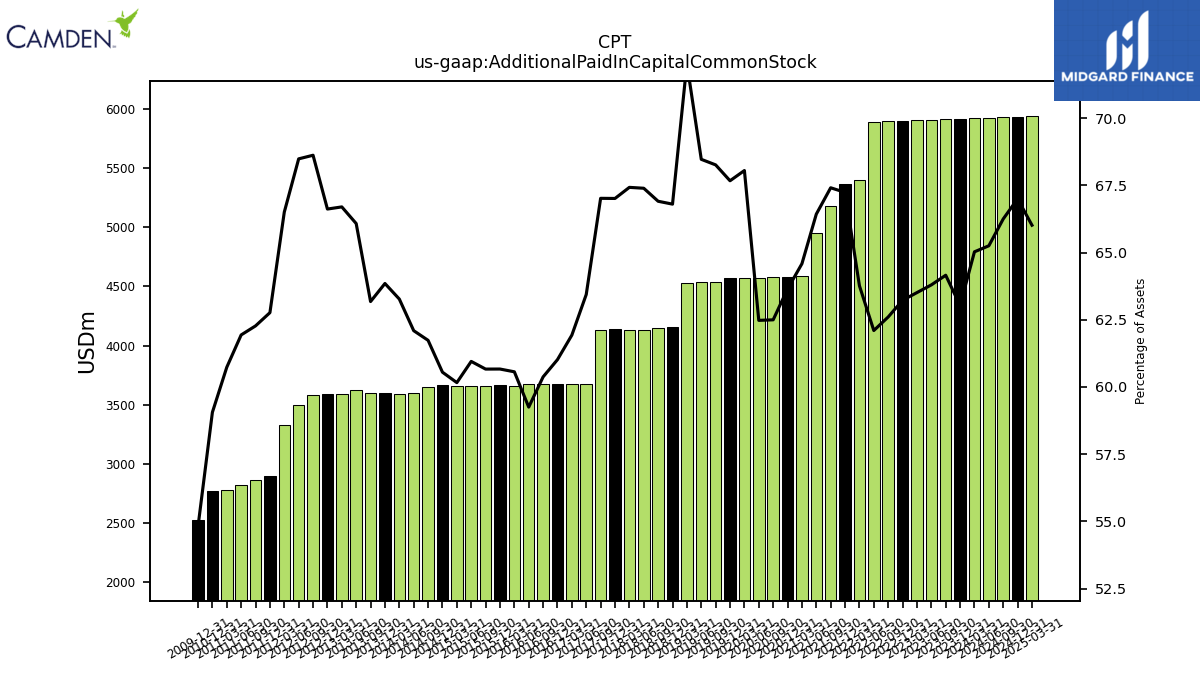
| Additional Paid In Capital Common Stock | 5914.87 | 5911.63 | 5907.83 | 5903.44 | 5897.45 | 5893.62 | 5890.79 | 5396.27 | 5363.53 | 5180.78 | 4953.70 | 4588.06 | 4581.71 | 4577.81 | 4574.39 | 4569.99 | 4566.73 | 4538.42 | 4533.67 | 4527.66 | 4154.76 | 4147.28 | 4132.40 | 4132.06 | 4137.16 | 4134.21 | 3678.66 | 3675.74 | |
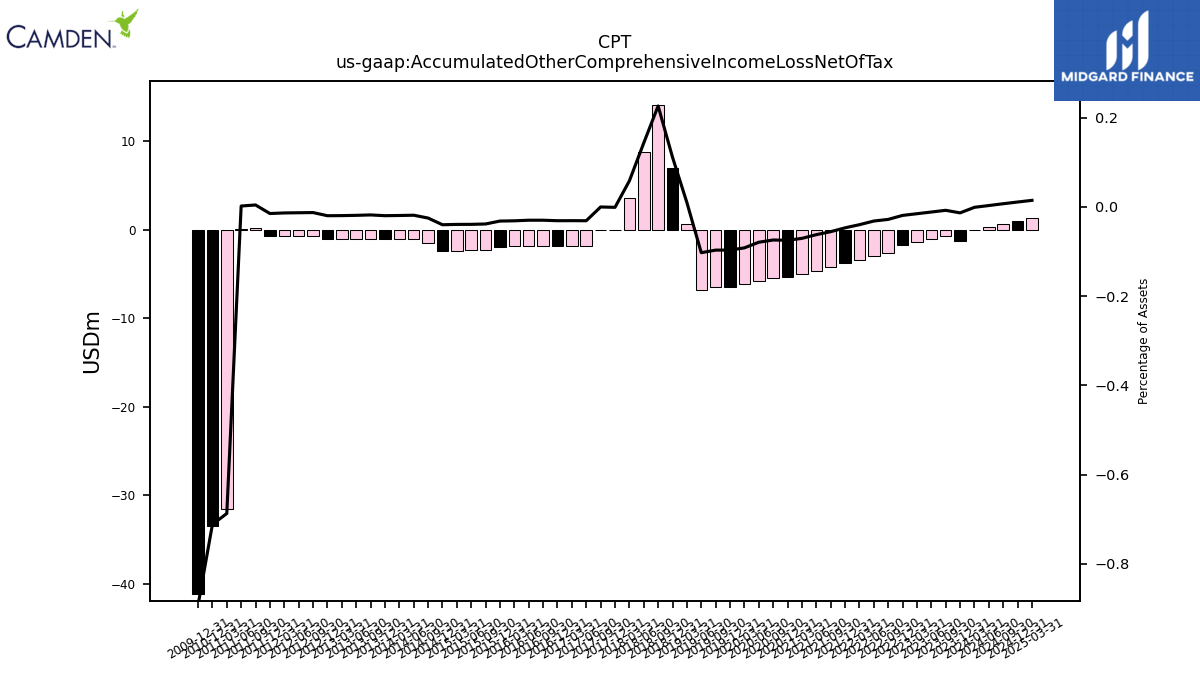
| Accumulated Other Comprehensive Income Loss Net Of Tax | -1.25 | -0.70 | -1.06 | -1.42 | -1.77 | -2.63 | -3.00 | -3.37 | -3.74 | -4.27 | -4.64 | -5.01 | -5.38 | -5.43 | -5.80 | -6.16 | -6.53 | -6.44 | -6.79 | 0.62 | 6.93 | 14.03 | 8.79 | 3.58 | -0.06 | -0.01 | -1.79 | -1.83 | |
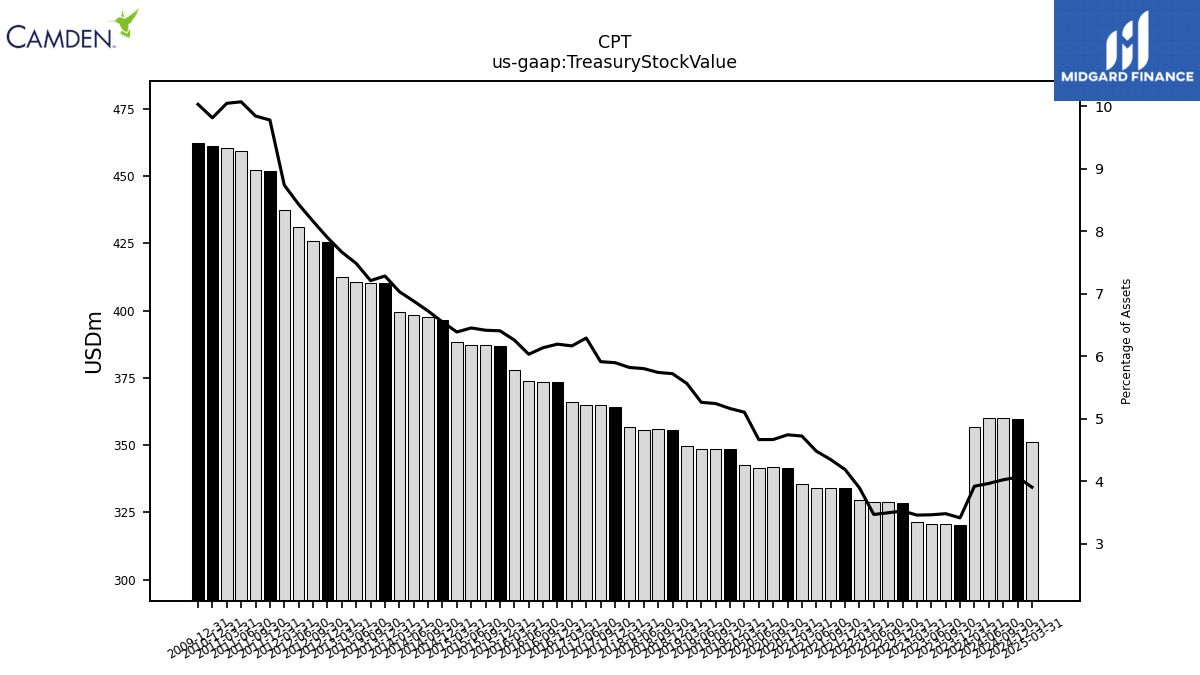
| Treasury Stock Value | 320.36 | 320.70 | 320.68 | 321.43 | 328.68 | 329.03 | 328.98 | 329.52 | 333.97 | 334.07 | 334.16 | 335.51 | 341.41 | 341.83 | 341.64 | 342.78 | 348.42 | 348.56 | 348.48 | 349.65 | 355.80 | 355.82 | 355.75 | 356.69 | 364.07 | 364.74 | 364.79 | 365.92 | |
| Minority Interest | 71.01 | 70.71 | 70.51 | 70.26 | 70.30 | 70.37 | 70.17 | 70.11 | 68.77 | 65.14 | 67.97 | 68.10 | 71.68 | 71.94 | 72.36 | 72.77 | 73.04 | 72.90 | 73.14 | 73.49 | 73.68 | 73.92 | 78.71 | 79.03 | 79.35 | 79.67 | 79.99 | 80.28 |
| 2023-12-31 | 2023-09-30 | 2023-06-30 | 2023-03-31 | 2022-12-31 | 2022-09-30 | 2022-06-30 | 2022-03-31 | 2021-12-31 | 2021-09-30 | 2021-06-30 | 2021-03-31 | 2020-12-31 | 2020-09-30 | 2020-06-30 | 2020-03-31 | 2019-12-31 | 2019-09-30 | 2019-06-30 | 2019-03-31 | 2018-12-31 | 2018-09-30 | 2018-06-30 | 2018-03-31 | 2017-12-31 | 2017-09-30 | 2017-06-30 | 2017-03-31 | ||
|---|---|---|---|---|---|---|---|---|---|---|---|---|---|---|---|---|---|---|---|---|---|---|---|---|---|---|---|---|---|
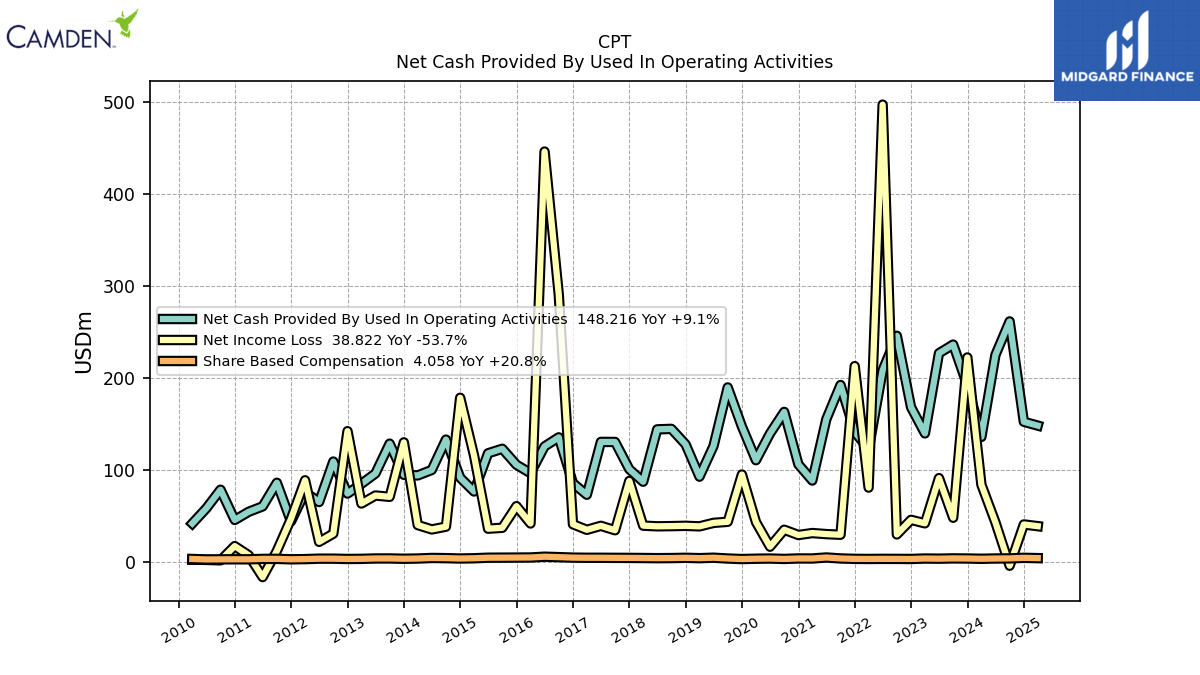
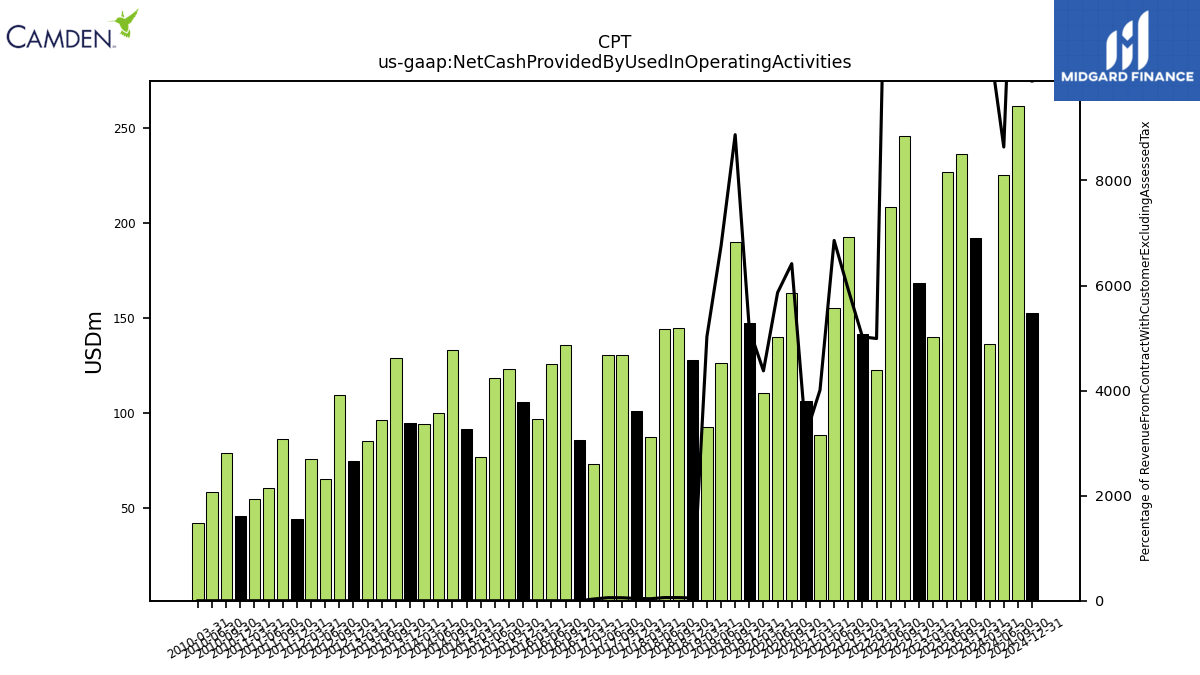
| Net Cash Provided By Used In Operating Activities | 191.98 | 236.33 | 226.93 | 139.71 | 168.18 | 245.90 | 208.35 | 122.29 | 141.44 | 192.35 | 155.21 | 88.46 | 106.03 | 163.11 | 139.59 | 110.58 | 147.16 | 189.76 | 126.02 | 92.65 | 127.80 | 144.67 | 144.13 | 87.15 | 100.78 | 130.42 | 130.46 | 72.98 | |
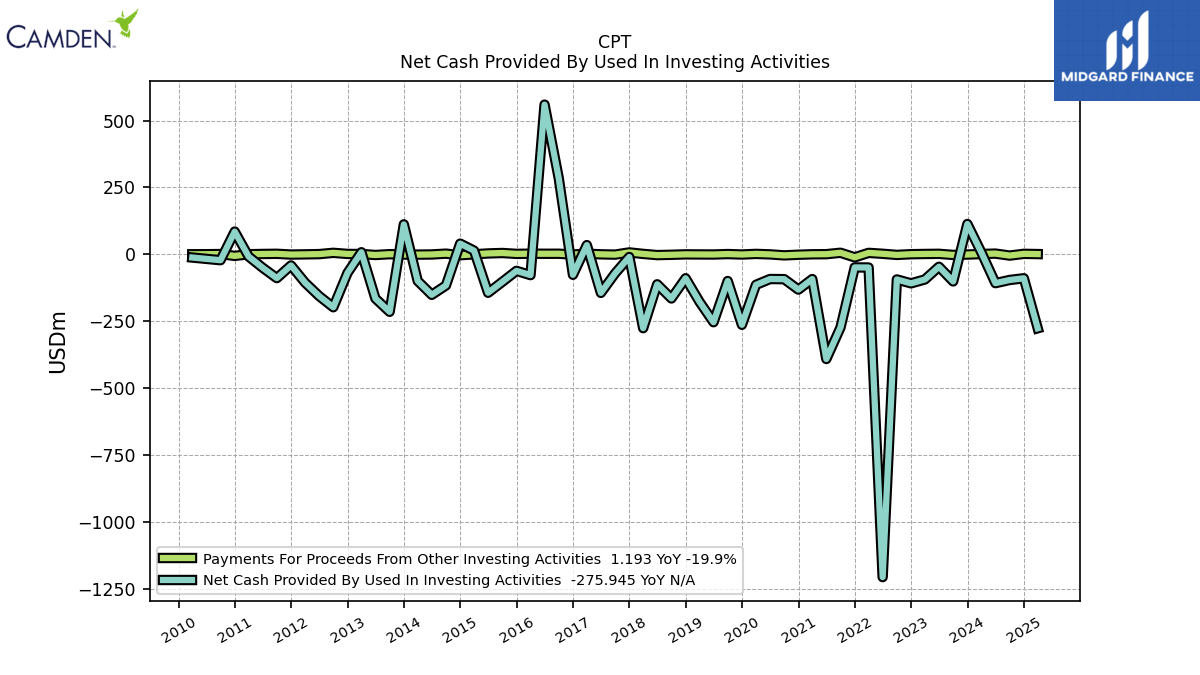
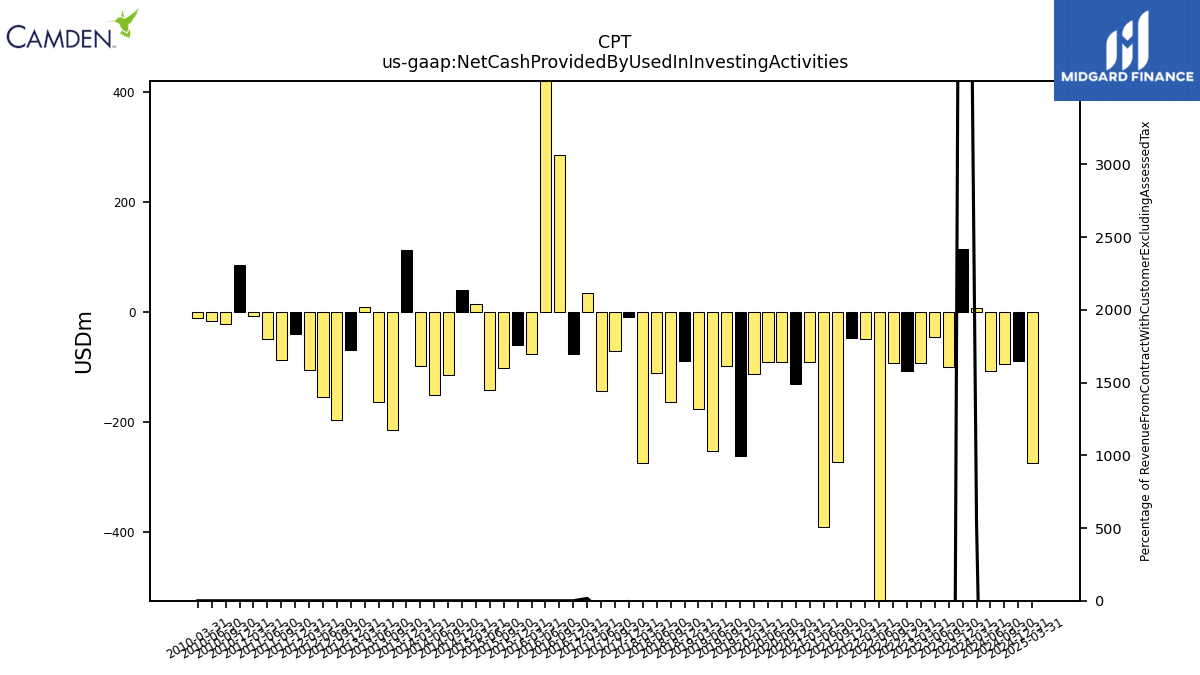
| Net Cash Provided By Used In Investing Activities | 113.56 | -100.99 | -46.16 | -93.53 | -108.11 | -93.57 | -1205.59 | -48.91 | -48.64 | -272.85 | -390.84 | -92.07 | -131.51 | -92.45 | -91.96 | -113.68 | -262.96 | -99.38 | -253.35 | -176.76 | -89.13 | -164.55 | -111.68 | -275.56 | -9.72 | -70.98 | -143.82 | 34.77 | |
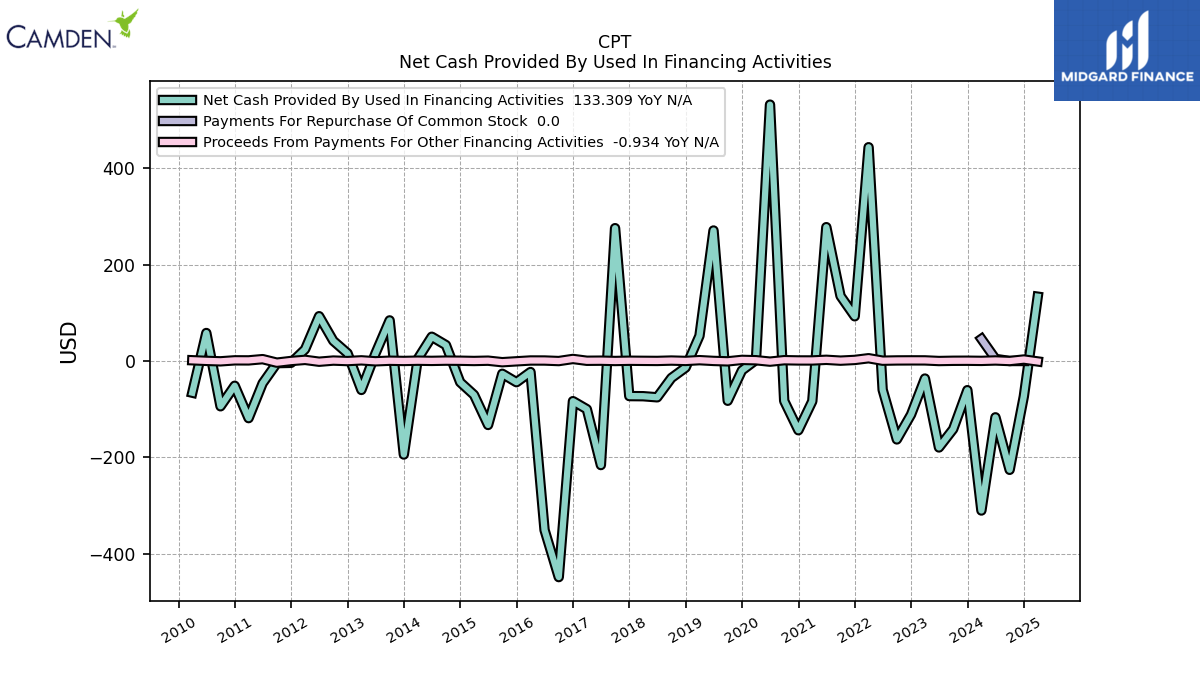
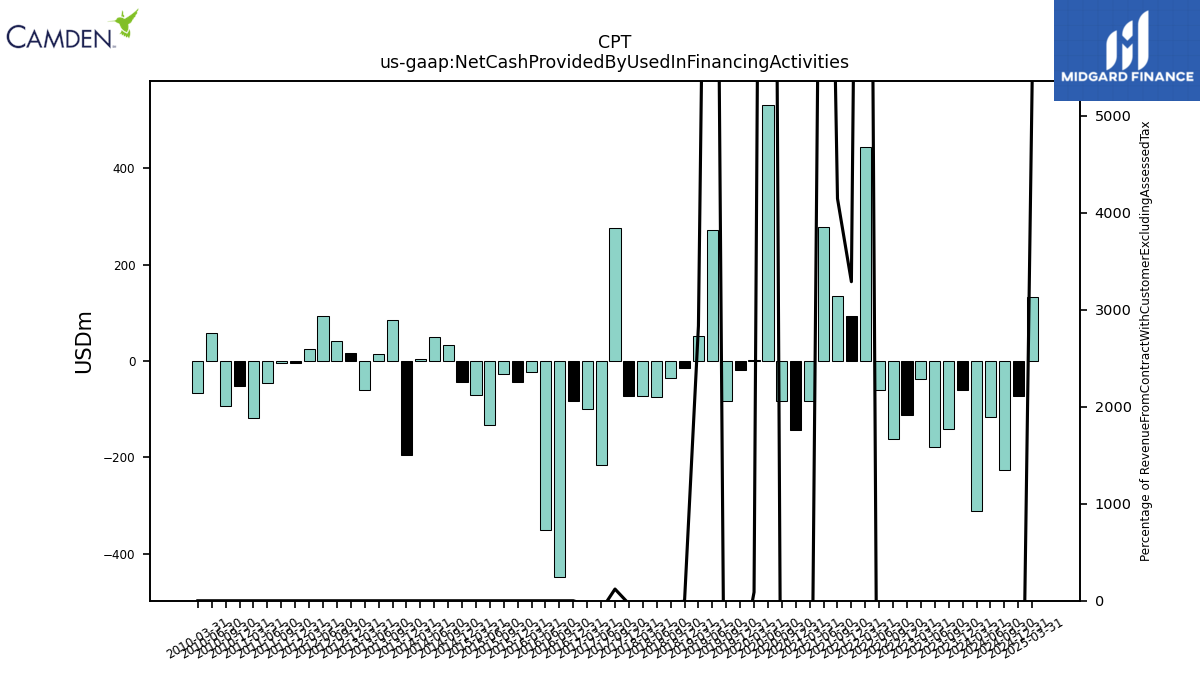
| Net Cash Provided By Used In Financing Activities | -60.46 | -141.23 | -179.19 | -36.33 | -111.06 | -162.56 | -59.59 | 443.14 | 92.62 | 134.72 | 277.44 | -83.42 | -143.52 | -82.80 | 531.40 | 2.24 | -19.63 | -82.41 | 270.53 | 52.25 | -13.65 | -35.18 | -75.23 | -72.97 | -72.71 | 275.38 | -215.71 | -99.88 |
| 2023-12-31 | 2023-09-30 | 2023-06-30 | 2023-03-31 | 2022-12-31 | 2022-09-30 | 2022-06-30 | 2022-03-31 | 2021-12-31 | 2021-09-30 | 2021-06-30 | 2021-03-31 | 2020-12-31 | 2020-09-30 | 2020-06-30 | 2020-03-31 | 2019-12-31 | 2019-09-30 | 2019-06-30 | 2019-03-31 | 2018-12-31 | 2018-09-30 | 2018-06-30 | 2018-03-31 | 2017-12-31 | 2017-09-30 | 2017-06-30 | 2017-03-31 | ||
|---|---|---|---|---|---|---|---|---|---|---|---|---|---|---|---|---|---|---|---|---|---|---|---|---|---|---|---|---|---|
| Net Cash Provided By Used In Operating Activities | 191.98 | 236.33 | 226.93 | 139.71 | 168.18 | 245.90 | 208.35 | 122.29 | 141.44 | 192.35 | 155.21 | 88.46 | 106.03 | 163.11 | 139.59 | 110.58 | 147.16 | 189.76 | 126.02 | 92.65 | 127.80 | 144.67 | 144.13 | 87.15 | 100.78 | 130.42 | 130.46 | 72.98 | |
| Net Income Loss | 222.33 | 47.96 | 91.10 | 41.92 | 45.71 | 29.84 | 497.31 | 80.75 | 212.90 | 29.48 | 30.18 | 31.35 | 29.19 | 34.96 | 16.48 | 43.28 | 95.01 | 43.60 | 42.40 | 38.61 | 39.20 | 38.87 | 38.67 | 39.40 | 87.99 | 34.38 | 39.19 | 34.86 | |
| Profit Loss | 224.18 | 49.82 | 92.94 | 43.62 | 47.47 | 31.55 | 498.89 | 83.60 | 217.86 | 30.61 | 31.44 | 32.47 | 30.38 | 36.22 | 17.51 | 44.47 | 96.22 | 44.78 | 43.54 | 39.72 | 40.31 | 39.99 | 39.87 | 40.52 | 89.08 | 35.48 | 40.31 | 35.99 | |
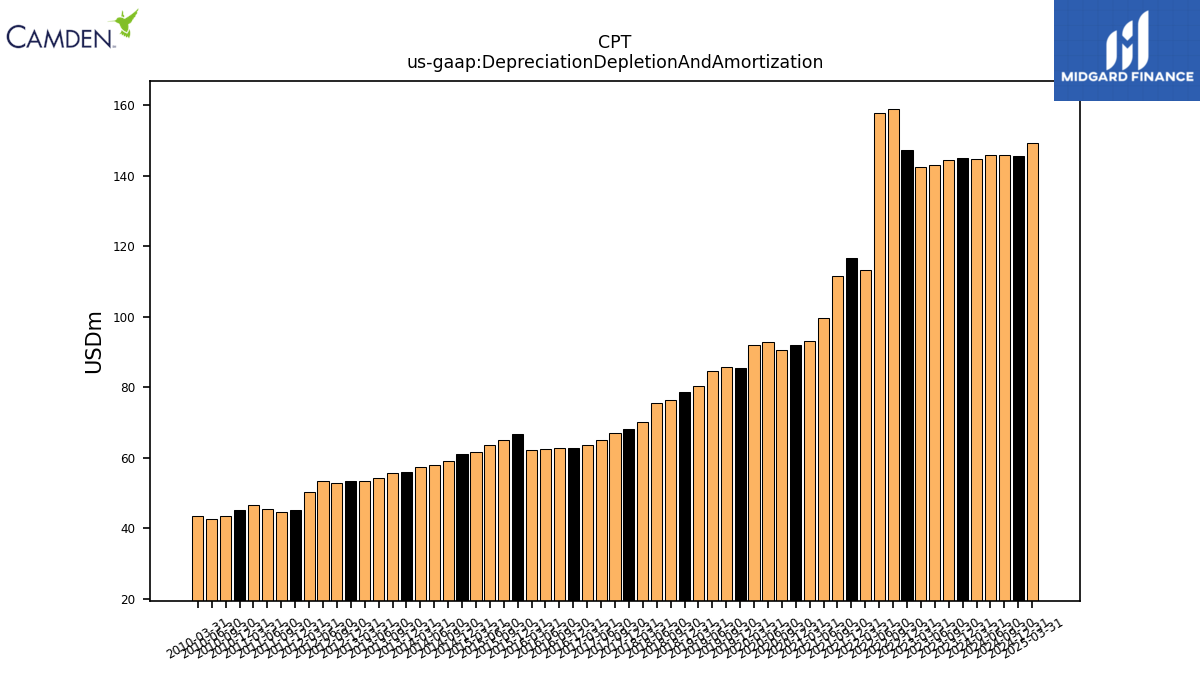
| Depreciation Depletion And Amortization | 144.96 | 144.36 | 143.05 | 142.44 | 147.27 | 158.88 | 157.73 | 113.14 | 116.50 | 111.46 | 99.59 | 93.14 | 91.92 | 90.58 | 92.80 | 91.86 | 85.54 | 85.81 | 84.65 | 80.27 | 78.68 | 76.48 | 75.57 | 70.22 | 68.19 | 67.01 | 65.03 | 63.73 | |
| Share Based Compensation | 3.65 | 3.77 | 3.47 | 3.63 | 3.15 | 3.23 | 3.27 | 3.17 | 3.25 | 3.72 | 4.75 | 3.68 | 3.71 | 3.19 | 3.61 | 3.43 | 3.05 | 3.65 | 4.50 | 4.03 | 4.41 | 4.13 | 4.02 | 4.18 | 4.30 | 4.35 | 4.45 | 4.45 |
| 2023-12-31 | 2023-09-30 | 2023-06-30 | 2023-03-31 | 2022-12-31 | 2022-09-30 | 2022-06-30 | 2022-03-31 | 2021-12-31 | 2021-09-30 | 2021-06-30 | 2021-03-31 | 2020-12-31 | 2020-09-30 | 2020-06-30 | 2020-03-31 | 2019-12-31 | 2019-09-30 | 2019-06-30 | 2019-03-31 | 2018-12-31 | 2018-09-30 | 2018-06-30 | 2018-03-31 | 2017-12-31 | 2017-09-30 | 2017-06-30 | 2017-03-31 | ||
|---|---|---|---|---|---|---|---|---|---|---|---|---|---|---|---|---|---|---|---|---|---|---|---|---|---|---|---|---|---|
| Net Cash Provided By Used In Investing Activities | 113.56 | -100.99 | -46.16 | -93.53 | -108.11 | -93.57 | -1205.59 | -48.91 | -48.64 | -272.85 | -390.84 | -92.07 | -131.51 | -92.45 | -91.96 | -113.68 | -262.96 | -99.38 | -253.35 | -176.76 | -89.13 | -164.55 | -111.68 | -275.56 | -9.72 | -70.98 | -143.82 | 34.77 |
| 2023-12-31 | 2023-09-30 | 2023-06-30 | 2023-03-31 | 2022-12-31 | 2022-09-30 | 2022-06-30 | 2022-03-31 | 2021-12-31 | 2021-09-30 | 2021-06-30 | 2021-03-31 | 2020-12-31 | 2020-09-30 | 2020-06-30 | 2020-03-31 | 2019-12-31 | 2019-09-30 | 2019-06-30 | 2019-03-31 | 2018-12-31 | 2018-09-30 | 2018-06-30 | 2018-03-31 | 2017-12-31 | 2017-09-30 | 2017-06-30 | 2017-03-31 | ||
|---|---|---|---|---|---|---|---|---|---|---|---|---|---|---|---|---|---|---|---|---|---|---|---|---|---|---|---|---|---|
| Net Cash Provided By Used In Financing Activities | -60.46 | -141.23 | -179.19 | -36.33 | -111.06 | -162.56 | -59.59 | 443.14 | 92.62 | 134.72 | 277.44 | -83.42 | -143.52 | -82.80 | 531.40 | 2.24 | -19.63 | -82.41 | 270.53 | 52.25 | -13.65 | -35.18 | -75.23 | -72.97 | -72.71 | 275.38 | -215.71 | -99.88 | |
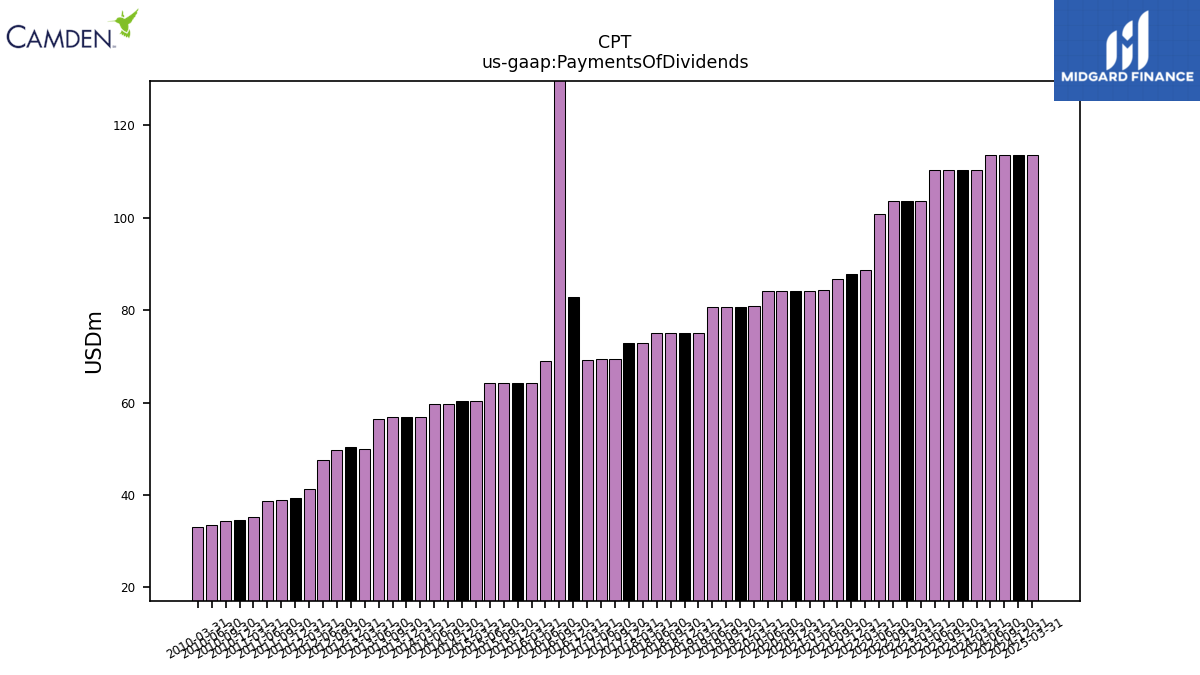
| Payments Of Dividends | 110.43 | 110.44 | 110.41 | 103.60 | 103.59 | 103.59 | 100.85 | 88.79 | 87.92 | 86.69 | 84.28 | 84.15 | 84.14 | 84.14 | 84.11 | 80.97 | 80.76 | 80.77 | 80.74 | 74.98 | 74.98 | 75.07 | 75.02 | 72.94 | 72.93 | 69.34 | 69.33 | 69.16 | |
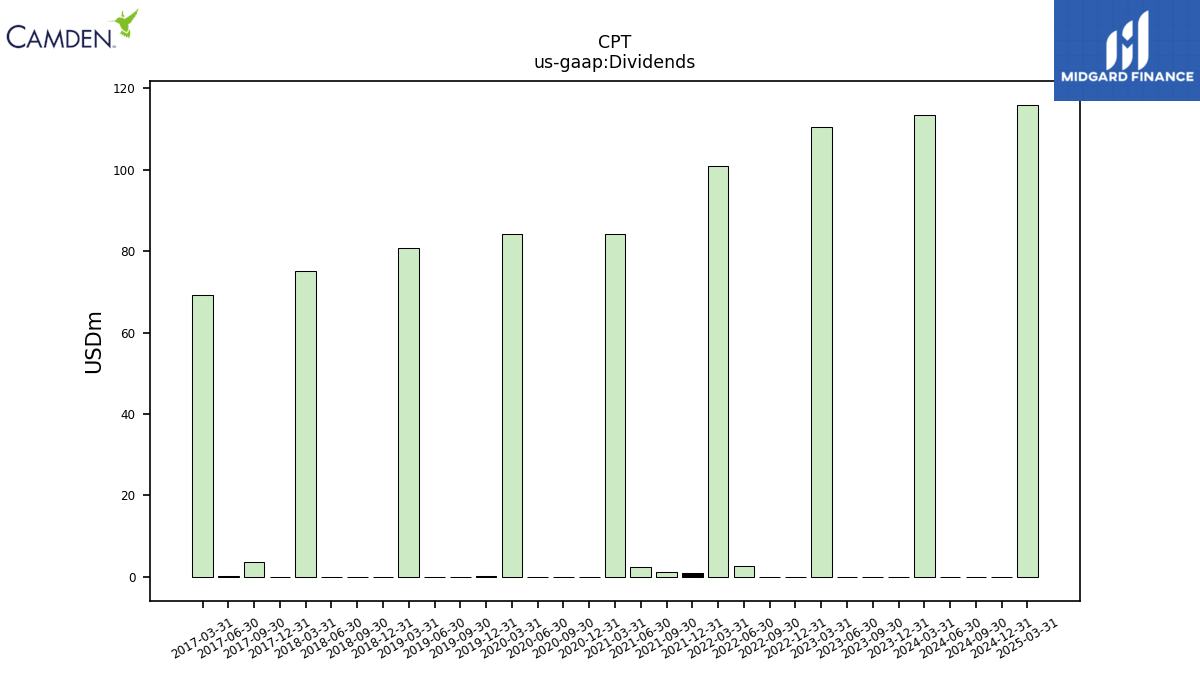
| Dividends | -0.04 | -0.00 | 0.02 | 110.44 | 0.01 | -0.00 | 2.74 | 100.88 | 0.87 | 1.23 | 2.41 | 84.28 | 0.01 | -0.00 | 0.03 | 84.11 | 0.21 | -0.00 | -0.00 | 80.77 | 0.01 | -0.10 | -0.01 | 75.08 | -0.02 | 3.62 | 0.11 | 69.24 |
| 2023-12-31 | 2023-09-30 | 2023-06-30 | 2023-03-31 | 2022-12-31 | 2022-09-30 | 2022-06-30 | 2022-03-31 | 2021-12-31 | 2021-09-30 | 2021-06-30 | 2021-03-31 | 2020-12-31 | 2020-09-30 | 2020-06-30 | 2020-03-31 | 2019-12-31 | 2019-09-30 | 2019-06-30 | 2019-03-31 | 2018-12-31 | 2018-09-30 | 2018-06-30 | 2018-03-31 | 2017-12-31 | 2017-09-30 | 2017-06-30 | 2017-03-31 | ||
|---|---|---|---|---|---|---|---|---|---|---|---|---|---|---|---|---|---|---|---|---|---|---|---|---|---|---|---|---|---|
| Revenue From Contract With Customer Excluding Assessed Tax | 1.08 | 1.08 | 0.72 | 0.58 | 0.93 | 0.62 | 1.19 | 2.45 | 2.81 | 3.25 | 2.26 | 2.21 | 3.35 | 2.54 | 2.38 | 2.53 | 2.85 | 2.14 | 1.87 | 1.84 | 244.92 | 241.77 | 237.13 | 230.68 | 229.83 | 228.18 | 223.37 | 219.52 |