
| 2022-12-31 | 2022-09-30 | 2022-06-30 | 2022-03-31 | 2021-12-31 | 2021-09-30 | 2021-06-30 | 2021-03-31 | 2020-12-31 | 2020-09-30 | 2020-06-30 | 2020-03-31 | ||
|---|---|---|---|---|---|---|---|---|---|---|---|---|---|
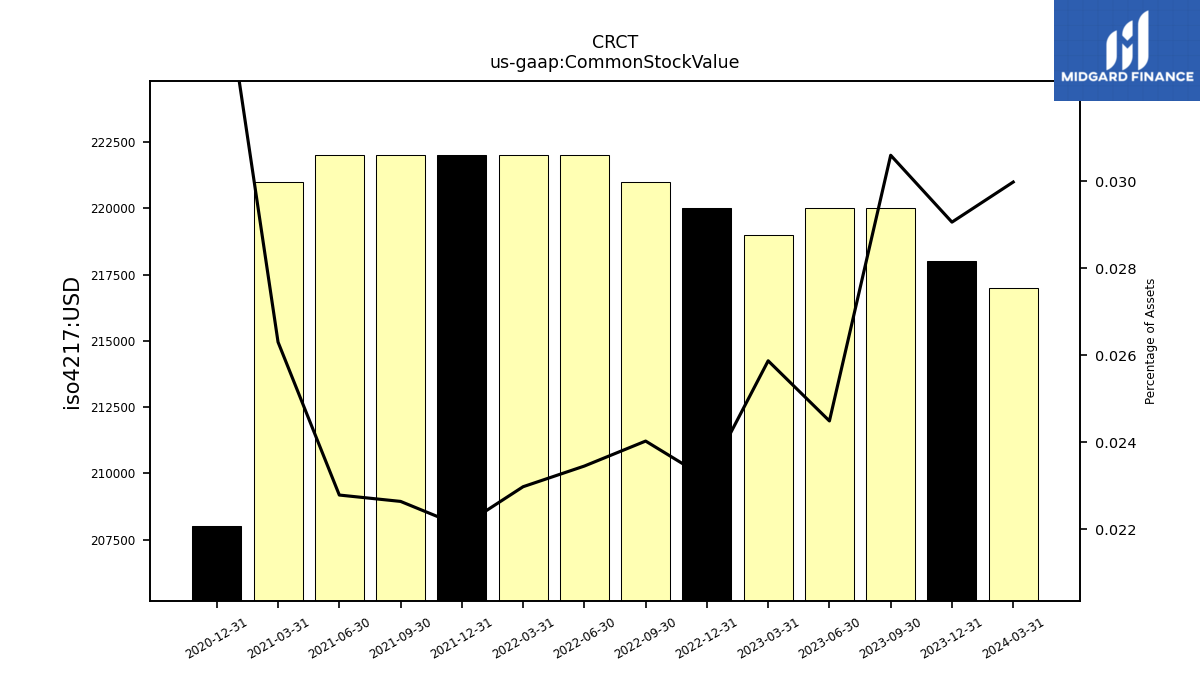
| Common Stock Value | 0.22 | 0.22 | 0.22 | 0.22 | 0.22 | 0.22 | 0.22 | 0.22 | 0.21 | NA | NA | NA | |
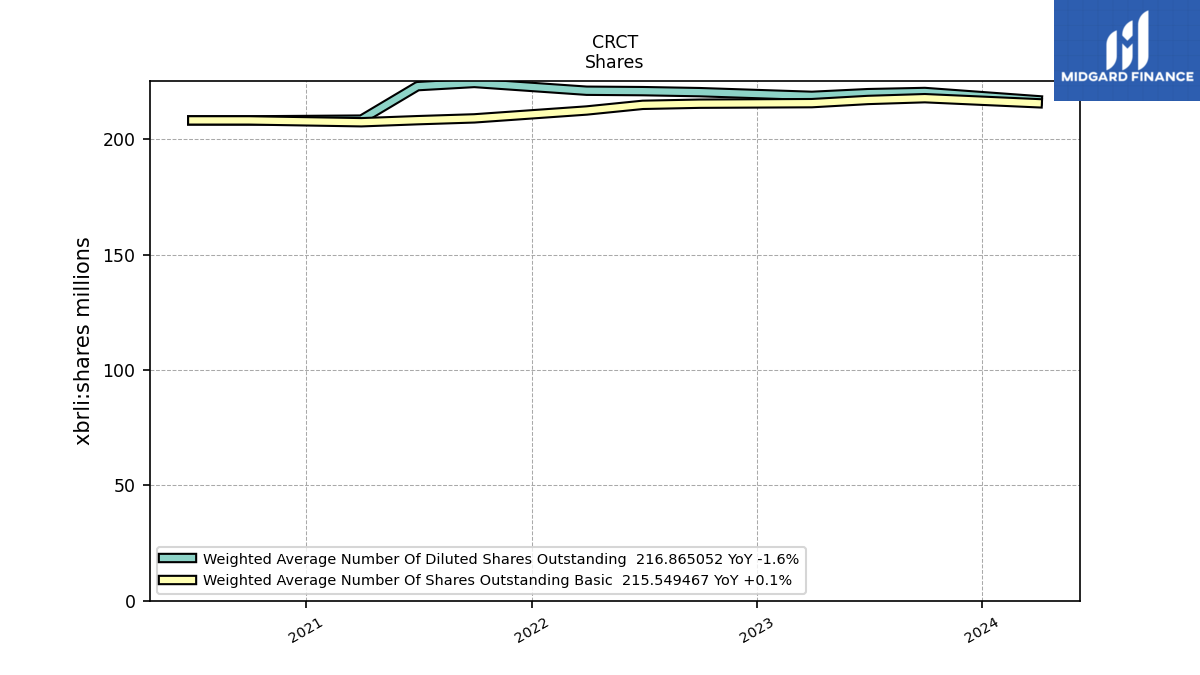
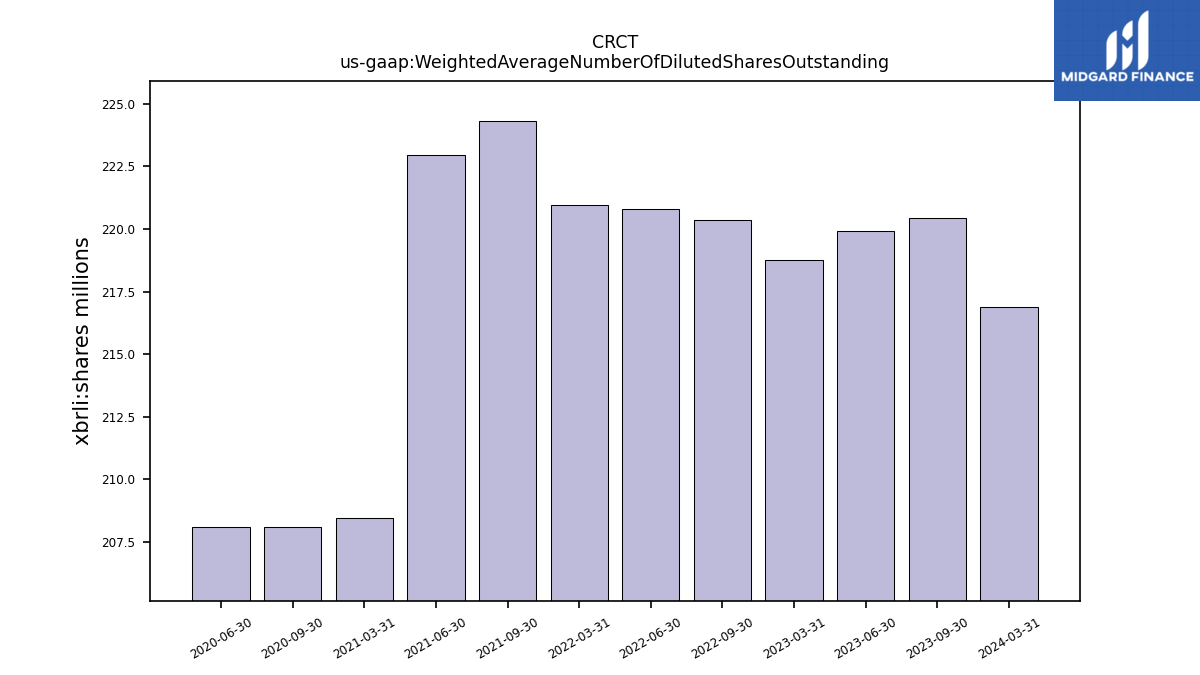
| Weighted Average Number Of Diluted Shares Outstanding | NA | 220.35 | 220.79 | 220.97 | NA | 224.33 | 222.95 | 208.46 | NA | 208.12 | 208.12 | NA | |
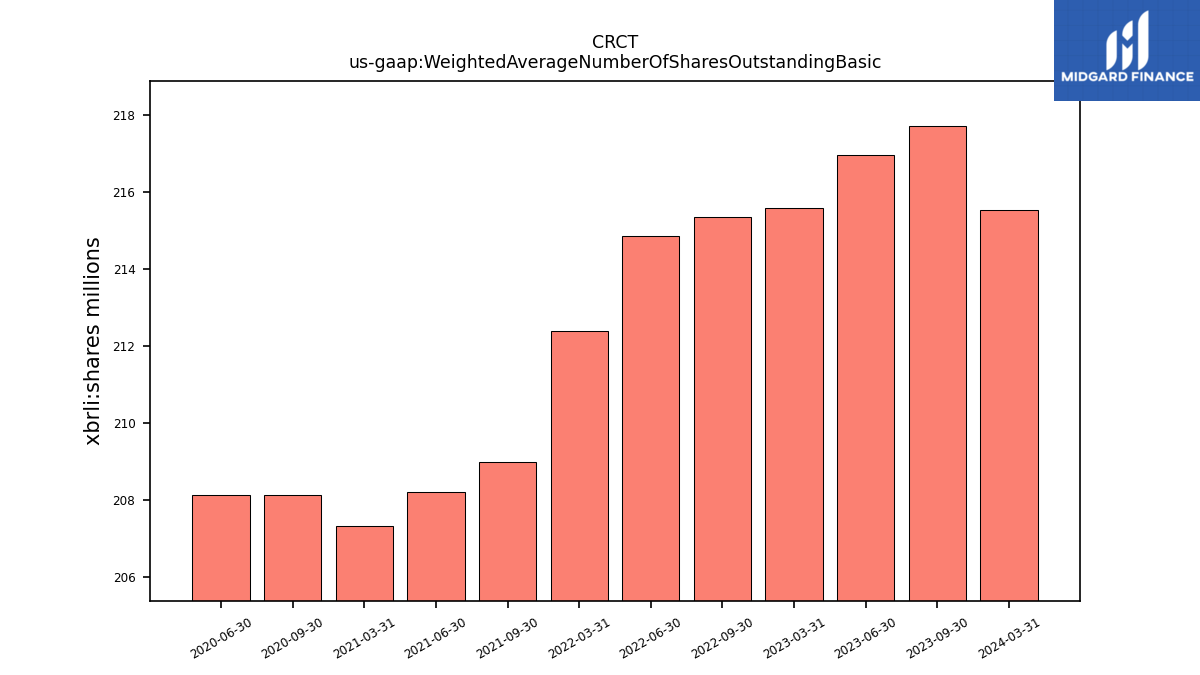
| Weighted Average Number Of Shares Outstanding Basic | NA | 215.35 | 214.85 | 212.40 | NA | 208.99 | 208.21 | 207.31 | NA | 208.12 | 208.12 | NA | |
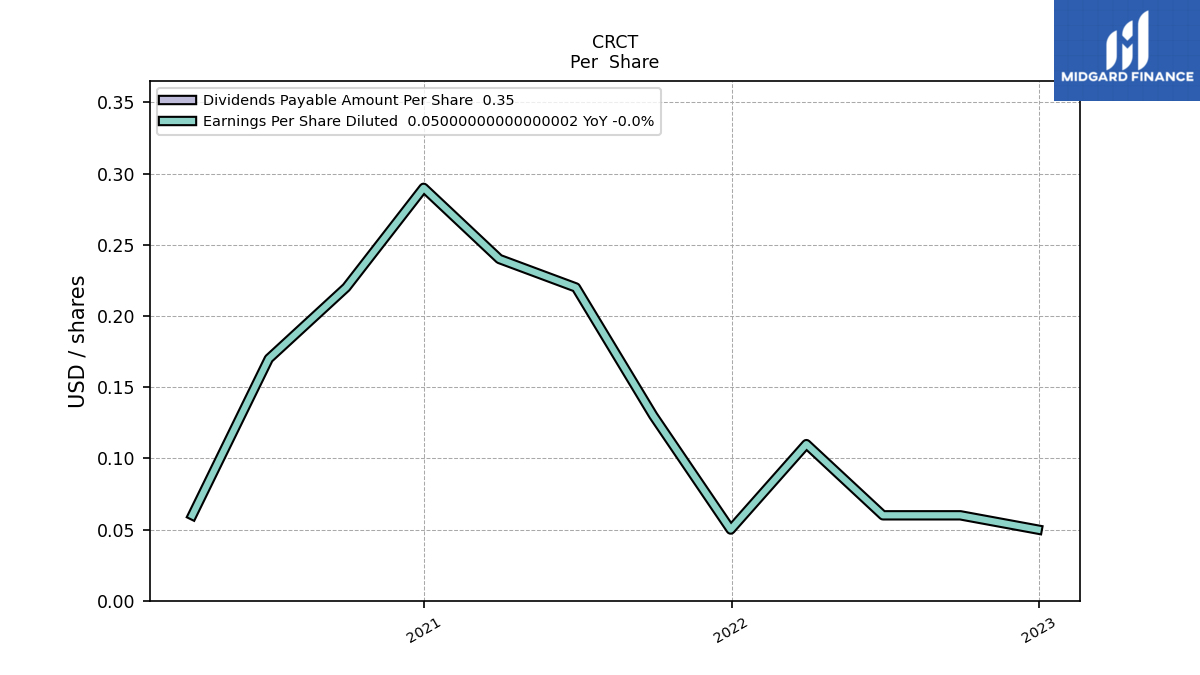
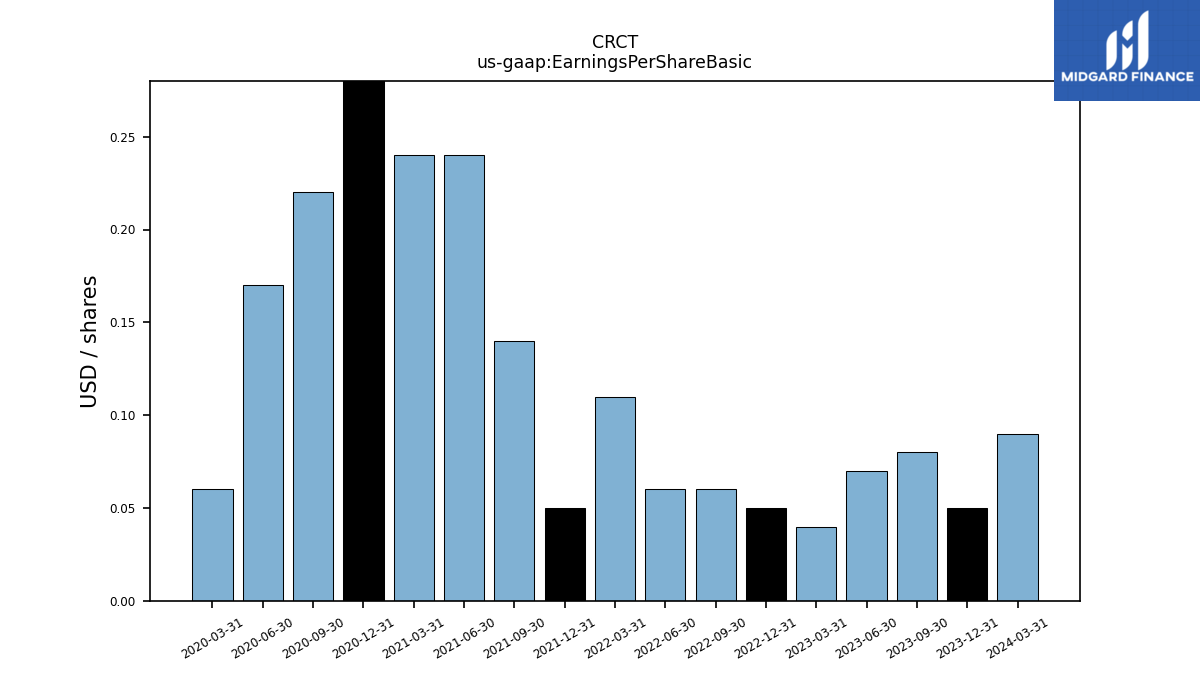
| Earnings Per Share Basic | 0.05 | 0.06 | 0.06 | 0.11 | 0.05 | 0.14 | 0.24 | 0.24 | 0.29 | 0.22 | 0.17 | 0.06 | |
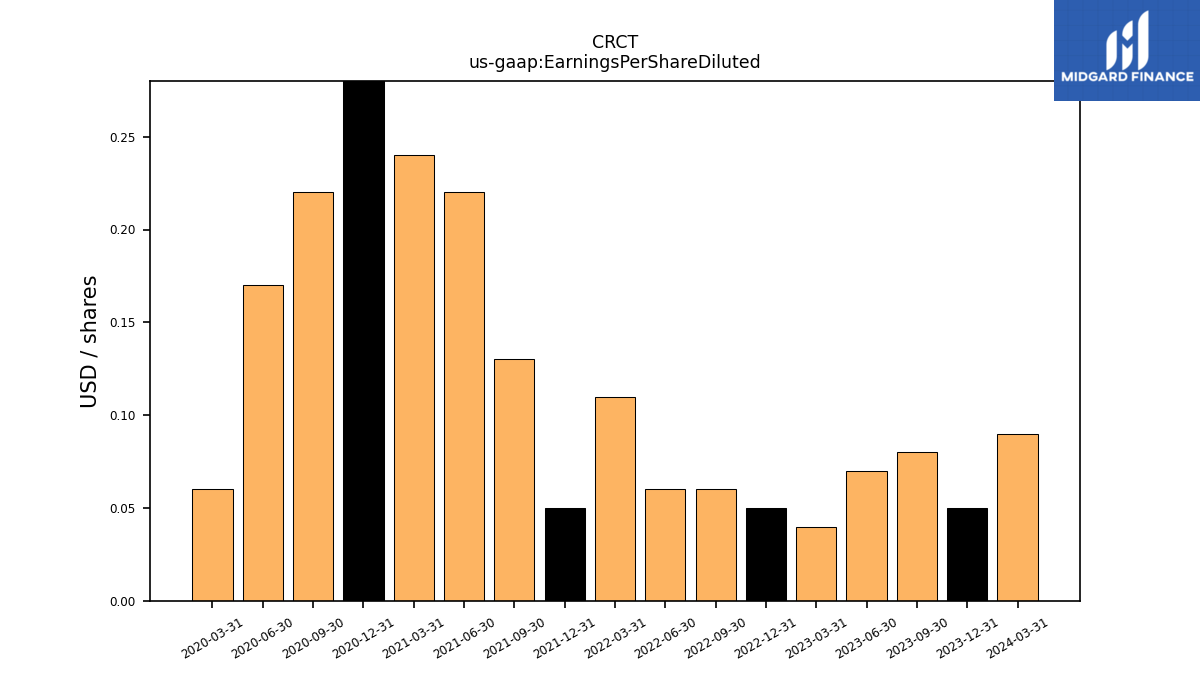
| Earnings Per Share Diluted | 0.05 | 0.06 | 0.06 | 0.11 | 0.05 | 0.13 | 0.22 | 0.24 | 0.29 | 0.22 | 0.17 | 0.06 |
| 2022-12-31 | 2022-09-30 | 2022-06-30 | 2022-03-31 | 2021-12-31 | 2021-09-30 | 2021-06-30 | 2021-03-31 | 2020-12-31 | 2020-09-30 | 2020-06-30 | 2020-03-31 | ||
|---|---|---|---|---|---|---|---|---|---|---|---|---|---|
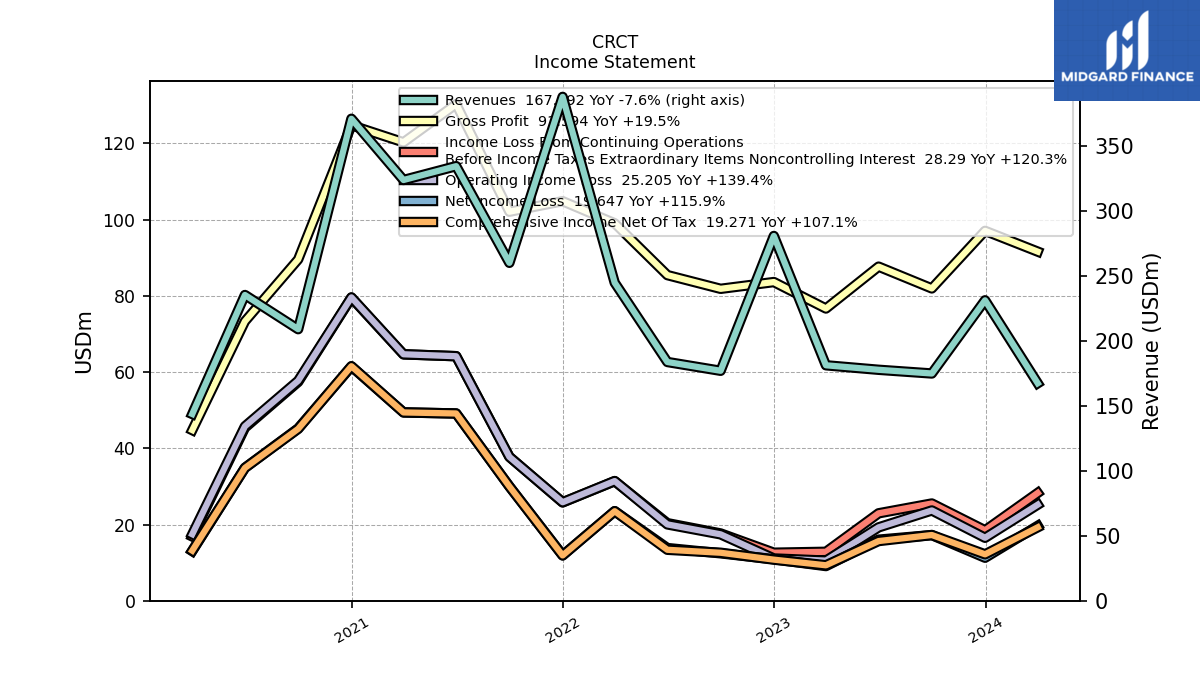
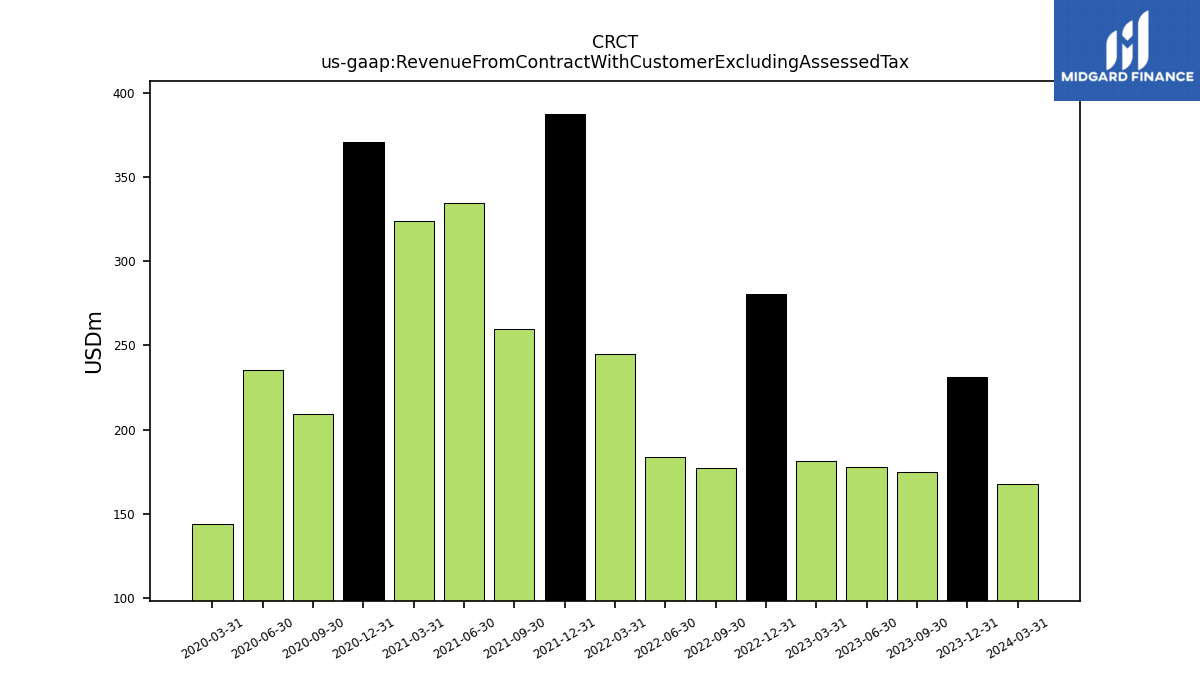
| Revenue From Contract With Customer Excluding Assessed Tax | 280.76 | 177.00 | 183.76 | 244.78 | 387.83 | 260.09 | 334.49 | 323.82 | 370.97 | 209.00 | 235.34 | 143.72 | |
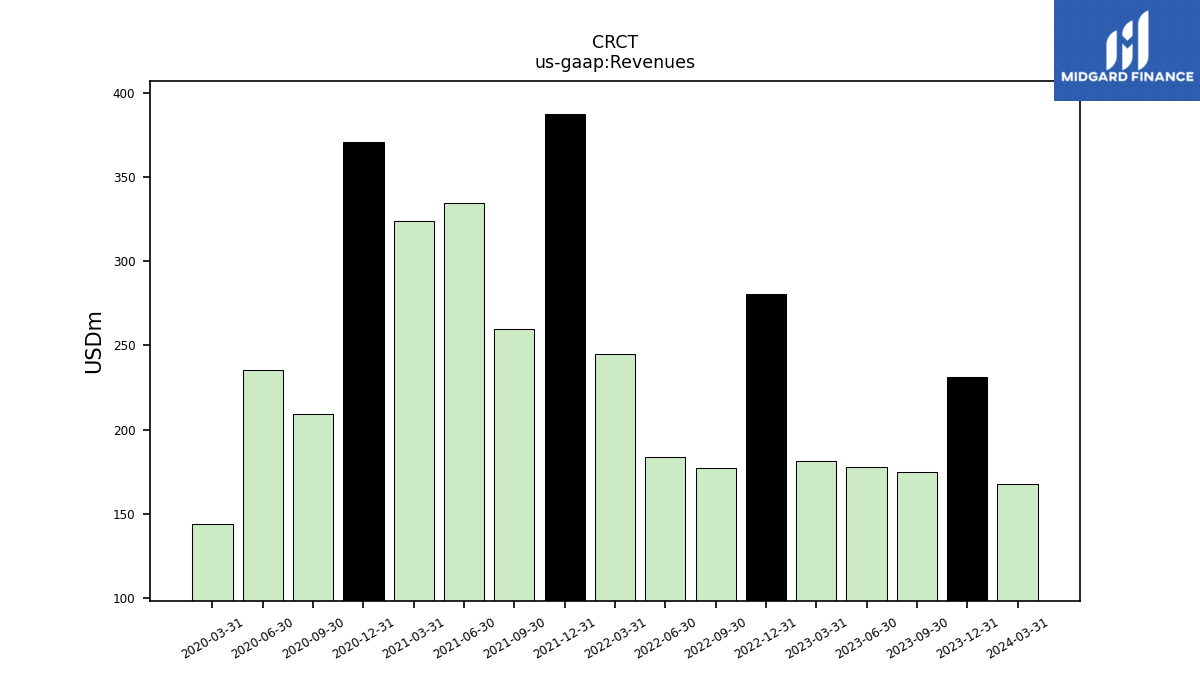
| Revenues | 280.76 | 177.00 | 183.76 | 244.78 | 387.83 | 260.09 | 334.49 | 323.82 | 370.97 | 209.00 | 235.34 | 143.72 | |
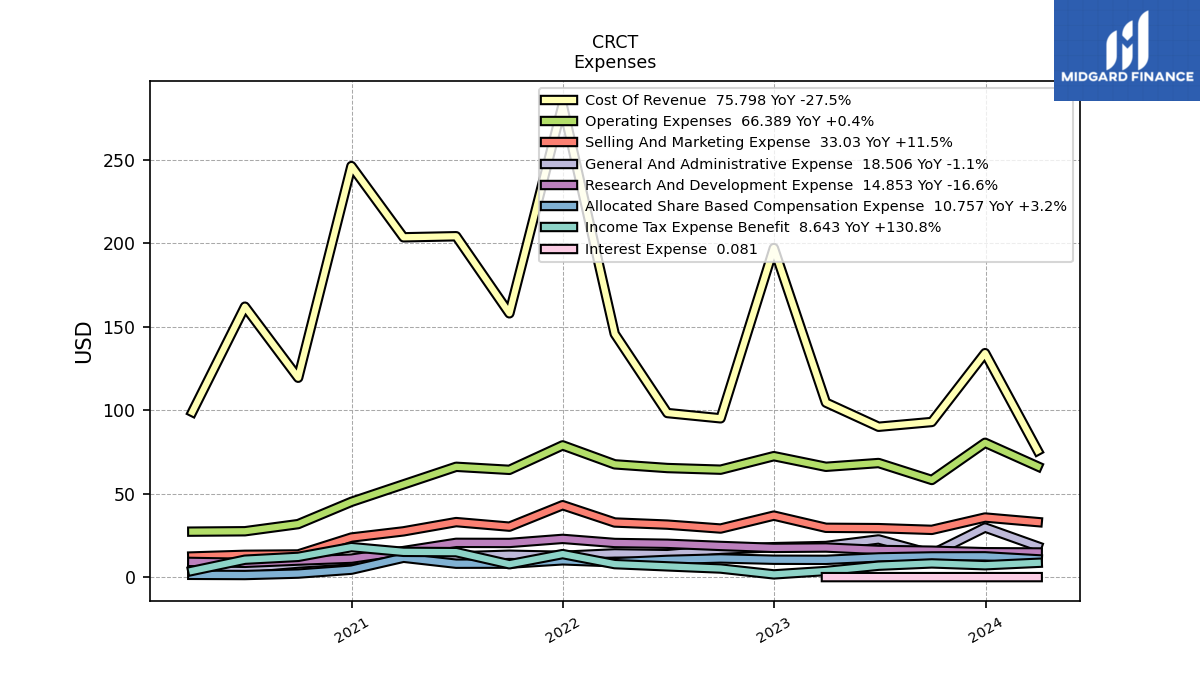
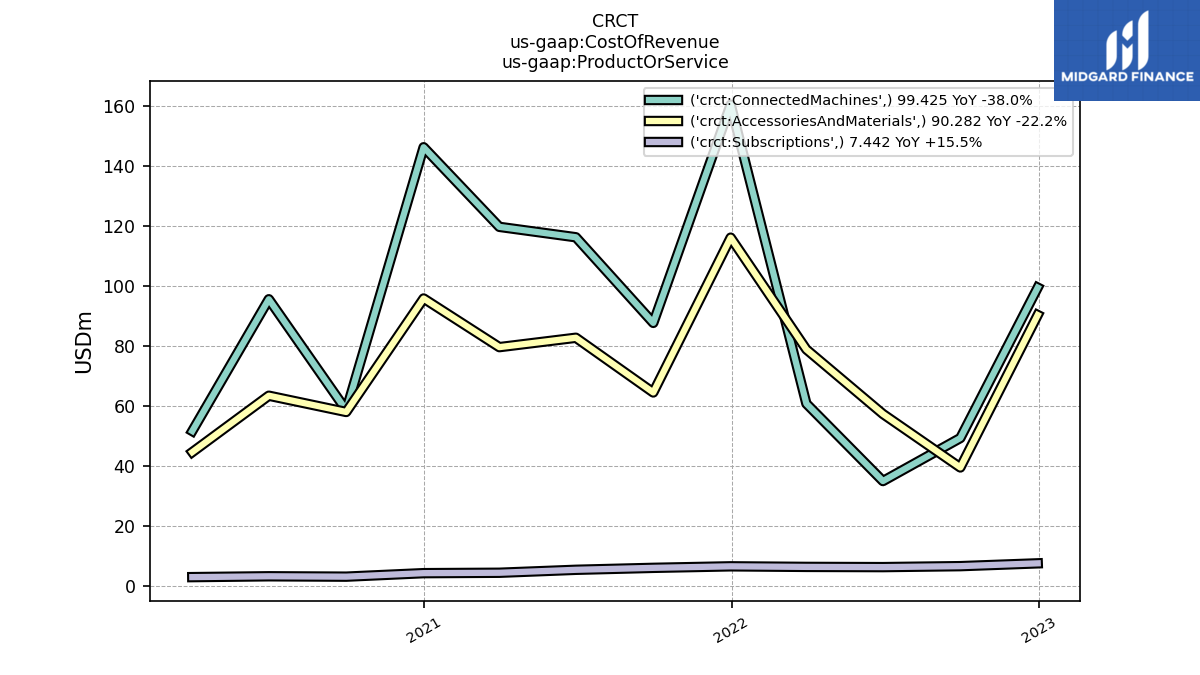
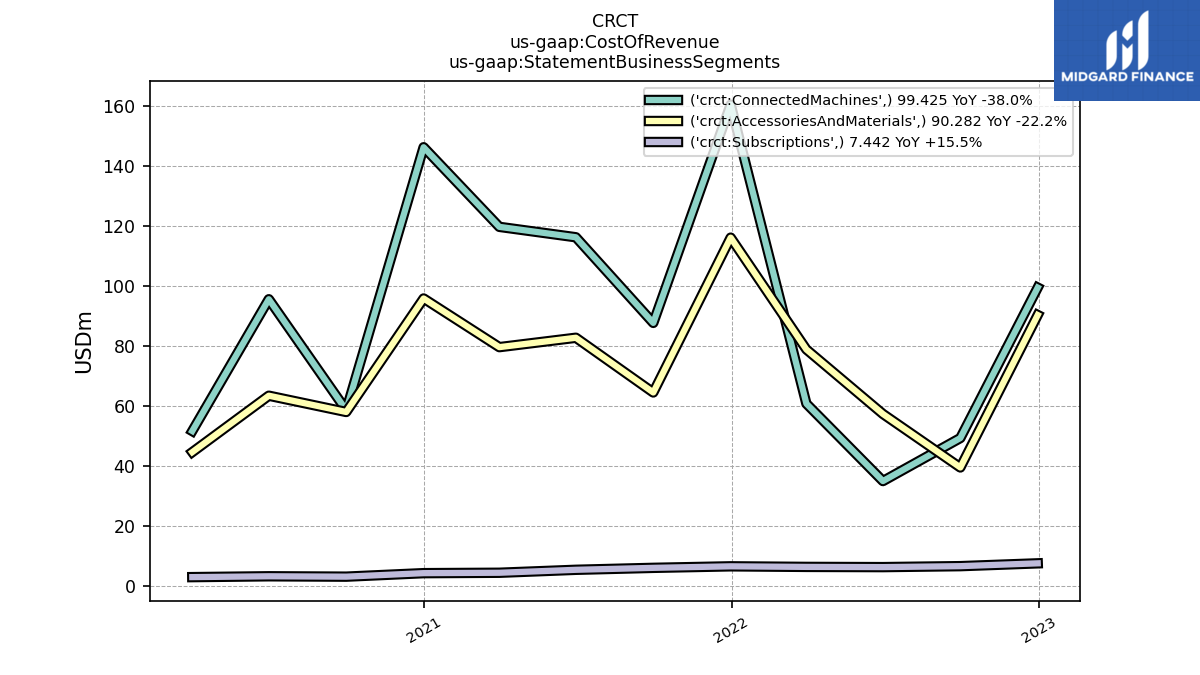
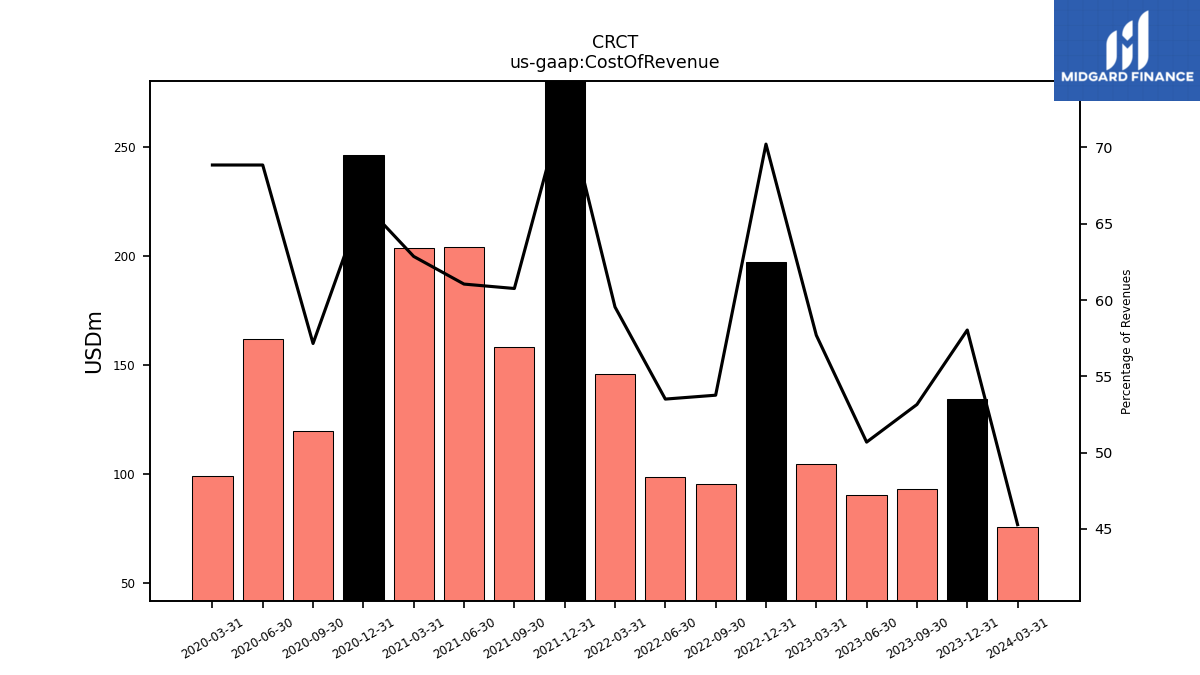
| Cost Of Revenue | 197.15 | 95.16 | 98.33 | 145.76 | 283.00 | 158.02 | 204.20 | 203.55 | 246.22 | 119.45 | 162.03 | 98.95 | |
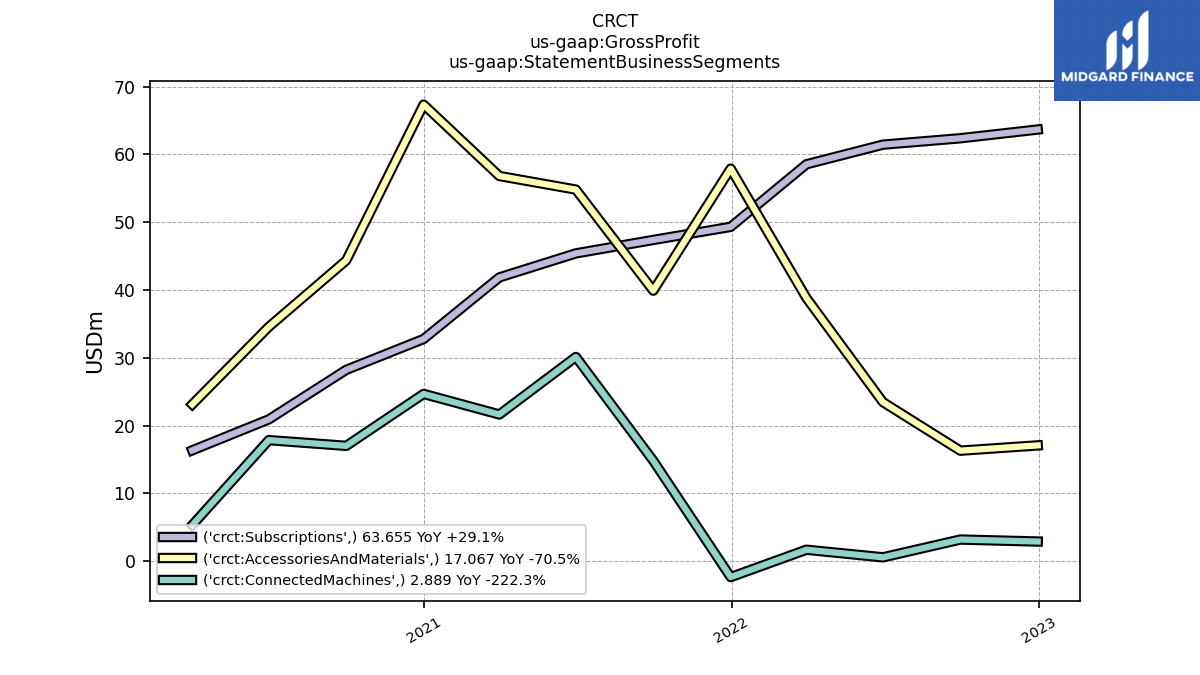
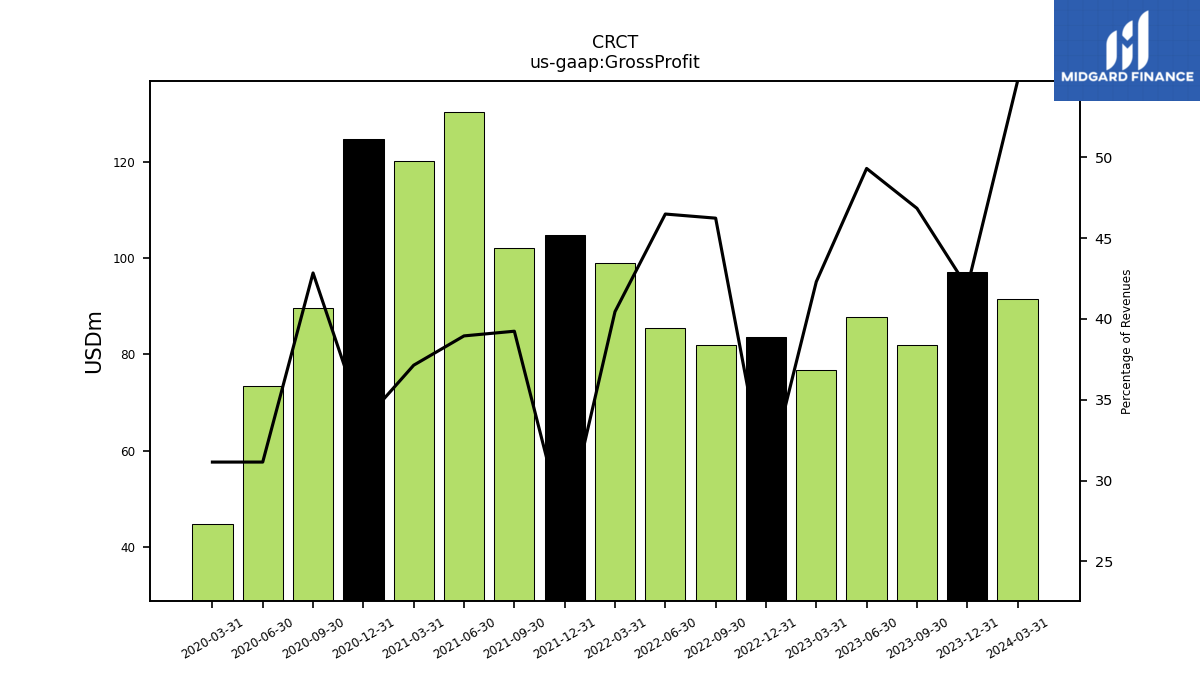
| Gross Profit | 83.61 | 81.83 | 85.43 | 99.02 | 104.82 | 102.06 | 130.29 | 120.27 | 124.75 | 89.55 | 73.31 | 44.77 | |
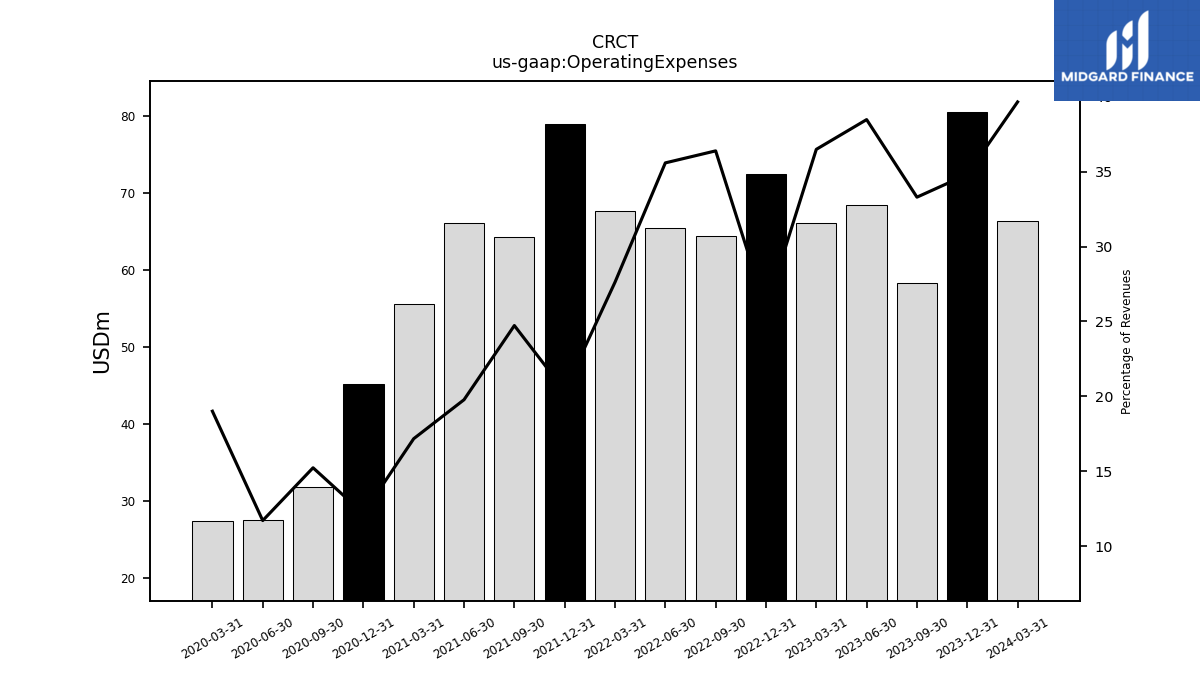
| Operating Expenses | 72.52 | 64.41 | 65.40 | 67.61 | 78.98 | 64.31 | 66.14 | 55.61 | 45.16 | 31.83 | 27.55 | 27.32 | |
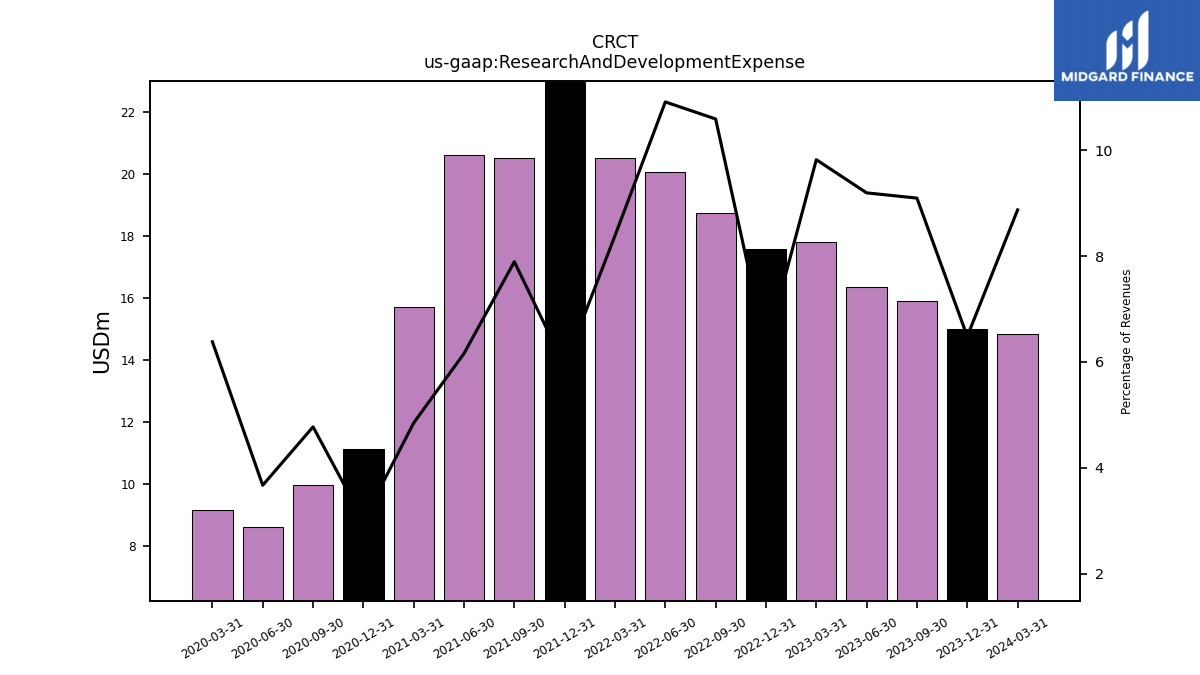
| Research And Development Expense | 17.58 | 18.75 | 20.05 | 20.53 | 22.98 | 20.53 | 20.61 | 15.70 | 11.15 | 9.98 | 8.64 | 9.17 | |
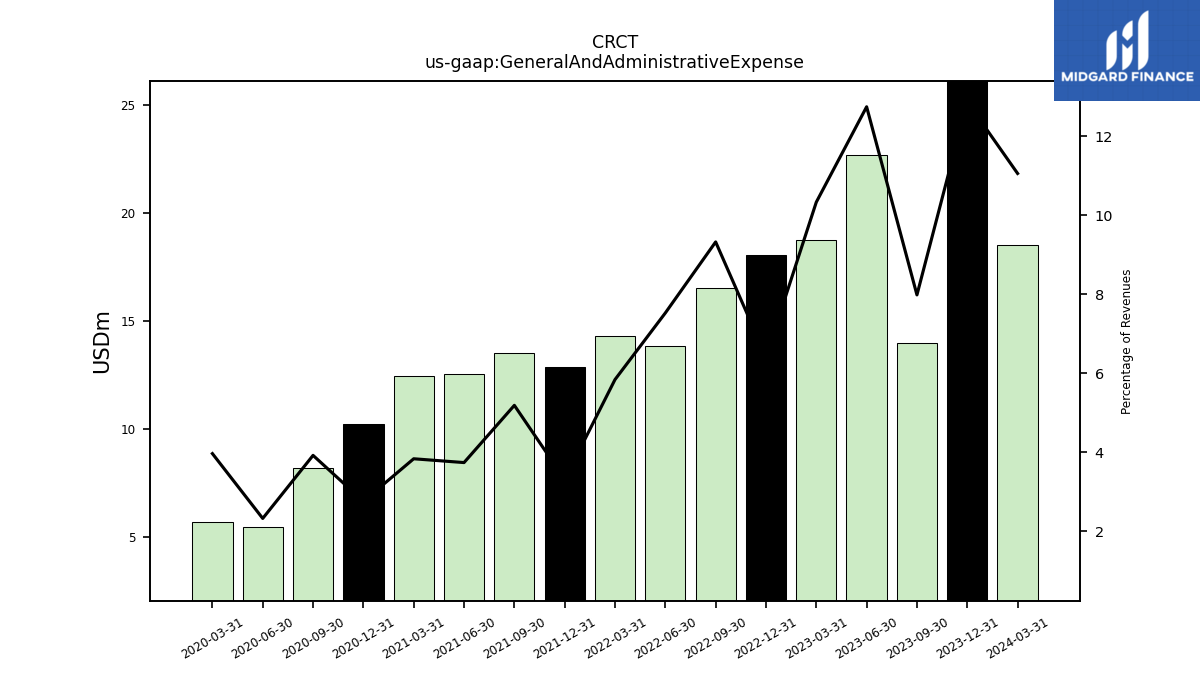
| General And Administrative Expense | 18.02 | 16.50 | 13.83 | 14.29 | 12.85 | 13.49 | 12.51 | 12.42 | 10.23 | 8.20 | 5.47 | 5.70 | |
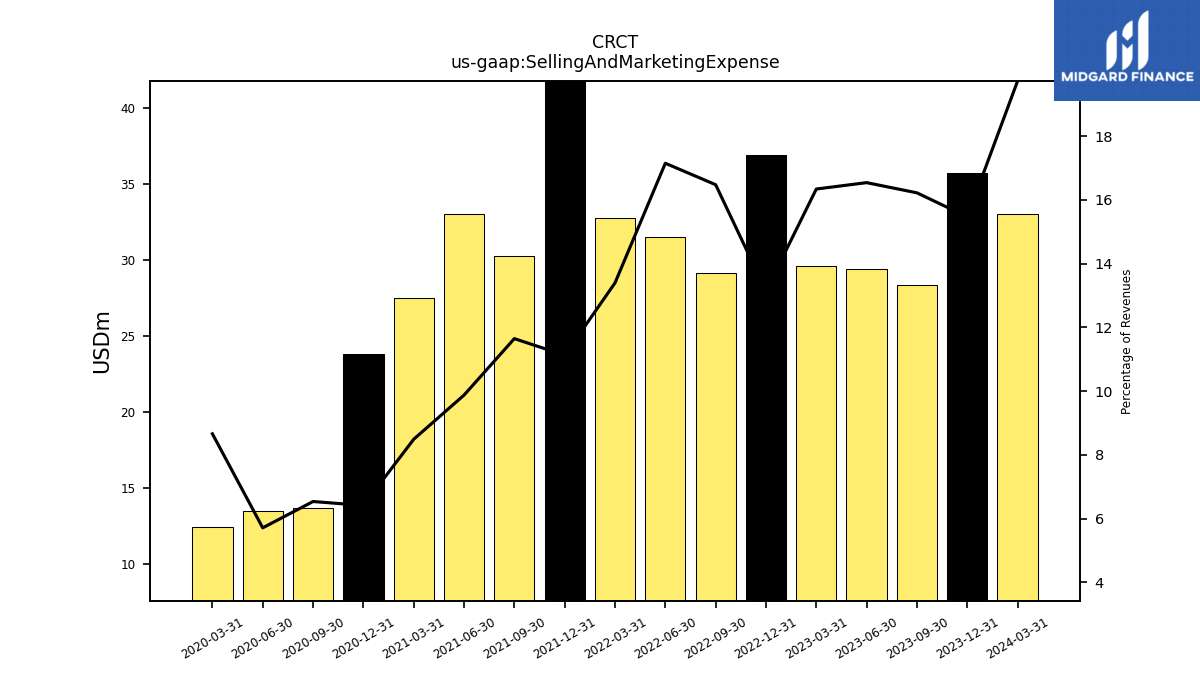
| Selling And Marketing Expense | 36.91 | 29.16 | 31.52 | 32.79 | 43.15 | 30.29 | 33.03 | 27.49 | 23.79 | 13.66 | 13.44 | 12.45 | |
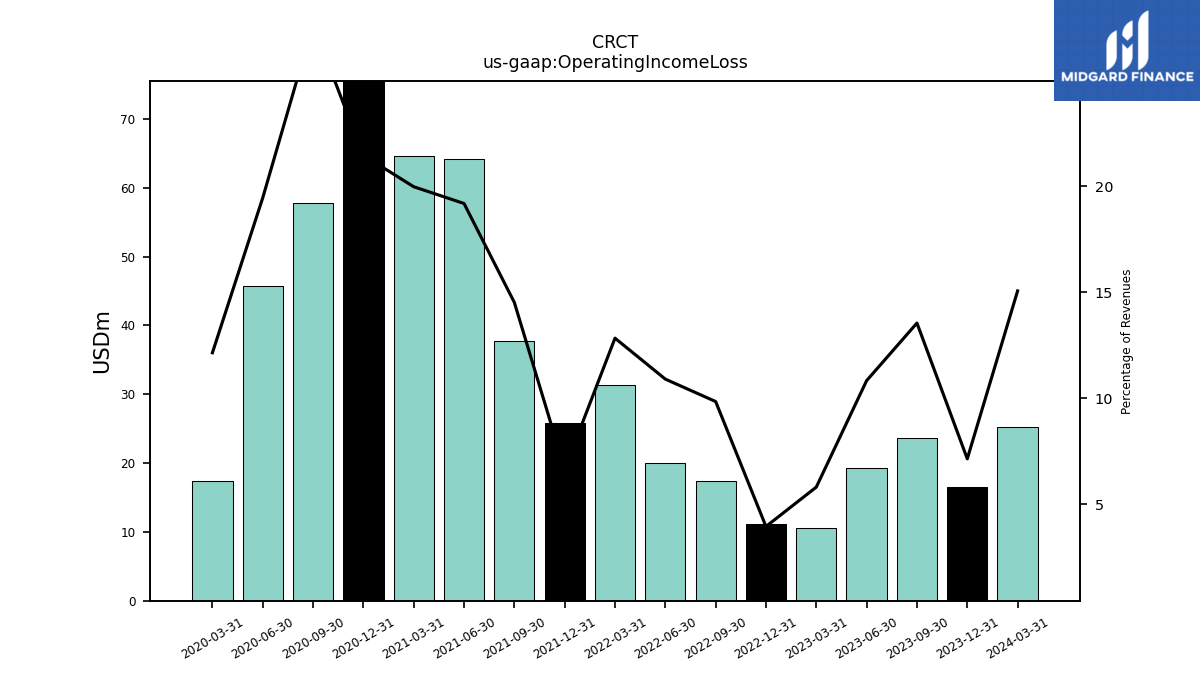
| Operating Income Loss | 11.10 | 17.42 | 20.03 | 31.41 | 25.84 | 37.75 | 64.15 | 64.66 | 79.58 | 57.72 | 45.76 | 17.45 | |
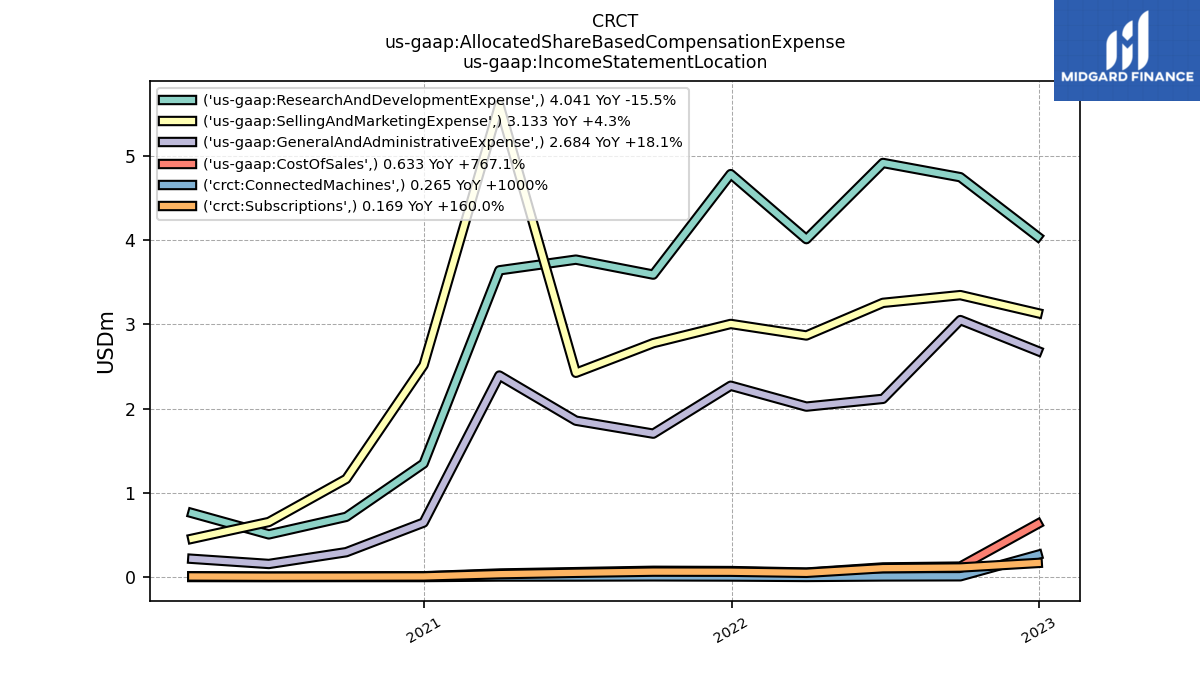
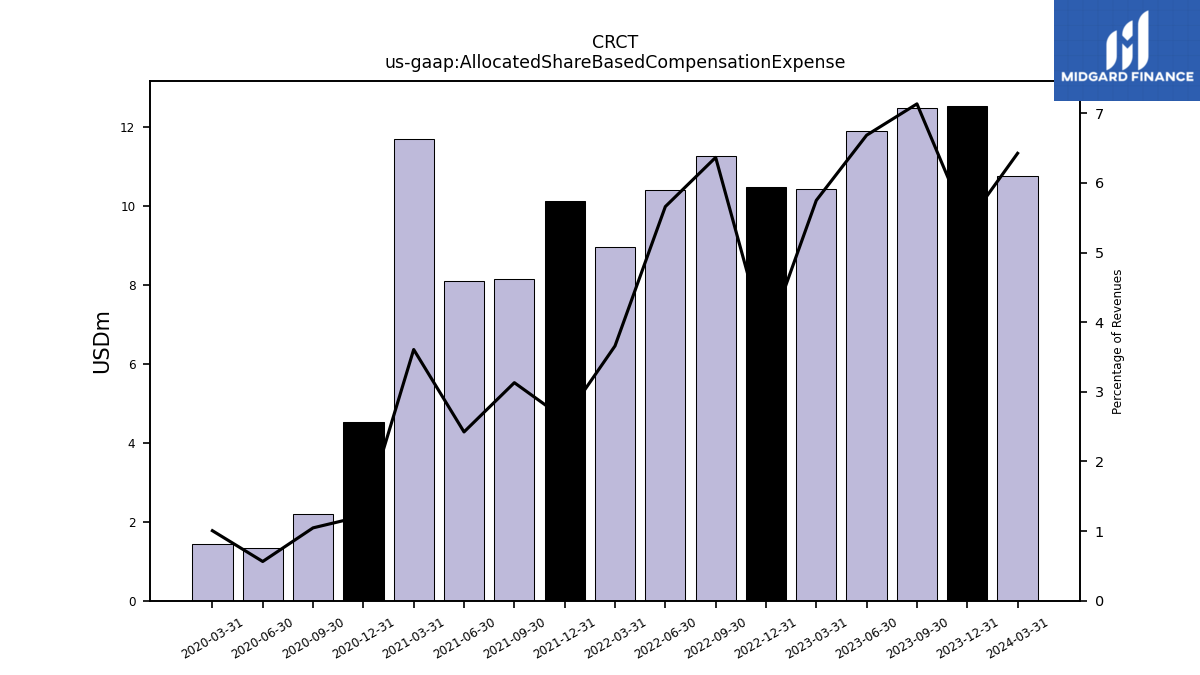
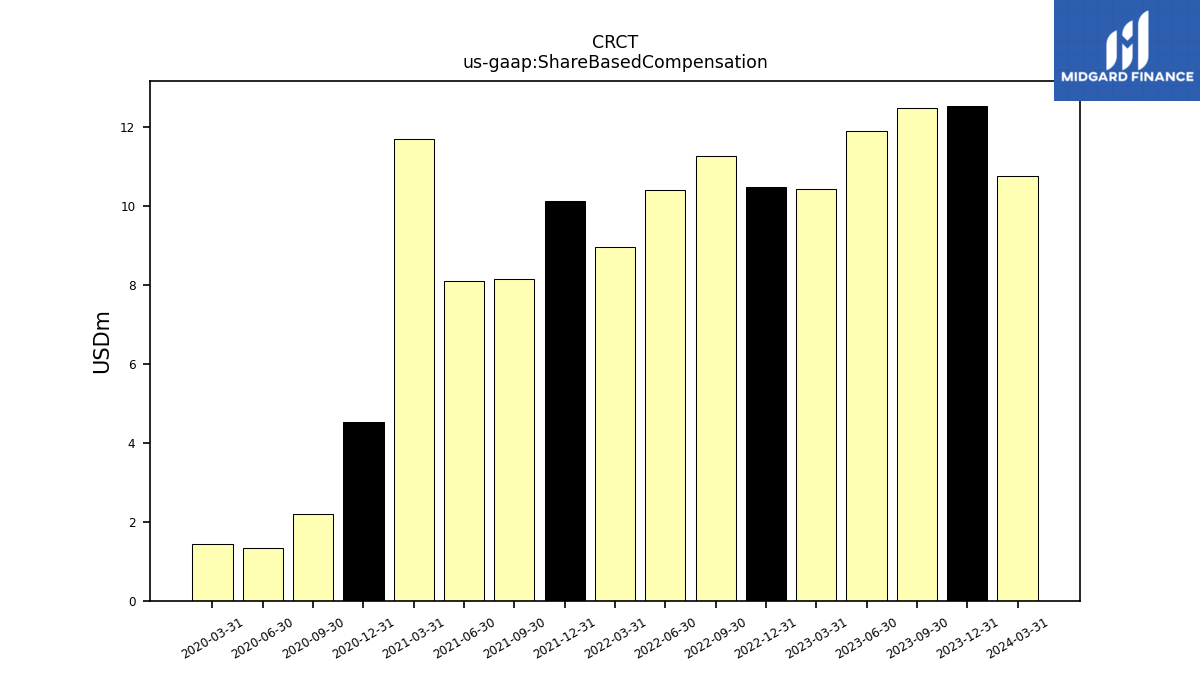
| Allocated Share Based Compensation Expense | 10.49 | 11.27 | 10.40 | 8.96 | 10.13 | 8.15 | 8.11 | 11.69 | 4.52 | 2.19 | 1.33 | 1.45 | |
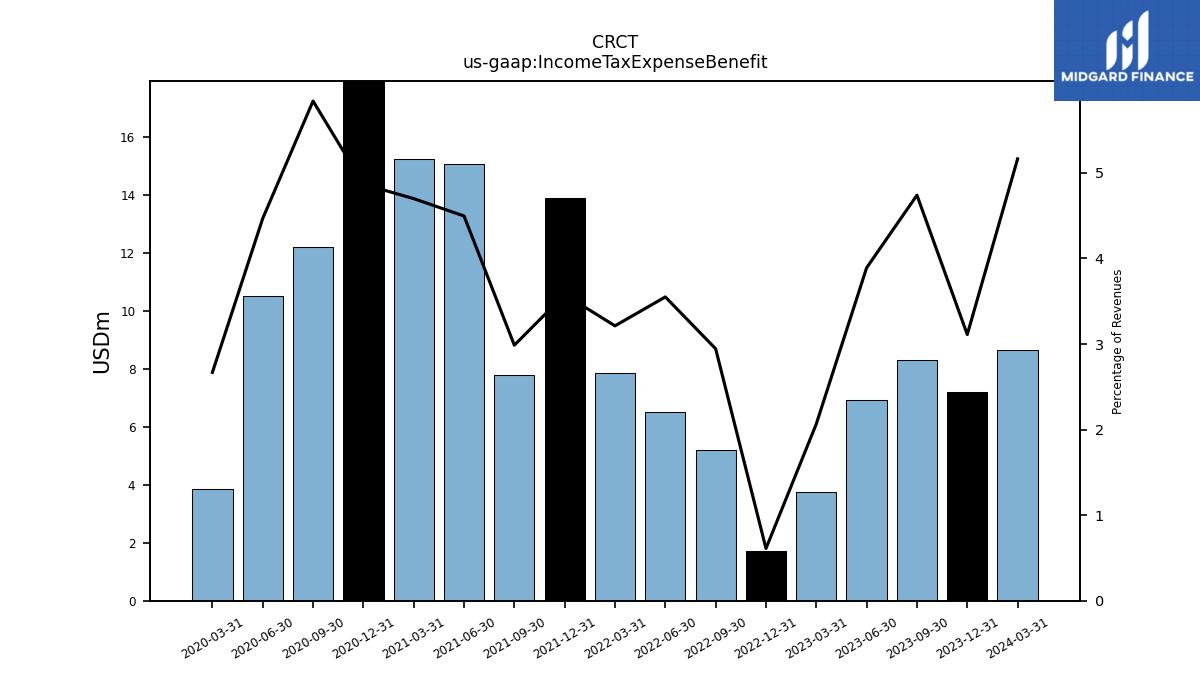
| Income Tax Expense Benefit | 1.72 | 5.21 | 6.52 | 7.86 | 13.88 | 7.77 | 15.04 | 15.22 | 18.06 | 12.21 | 10.51 | 3.84 | |
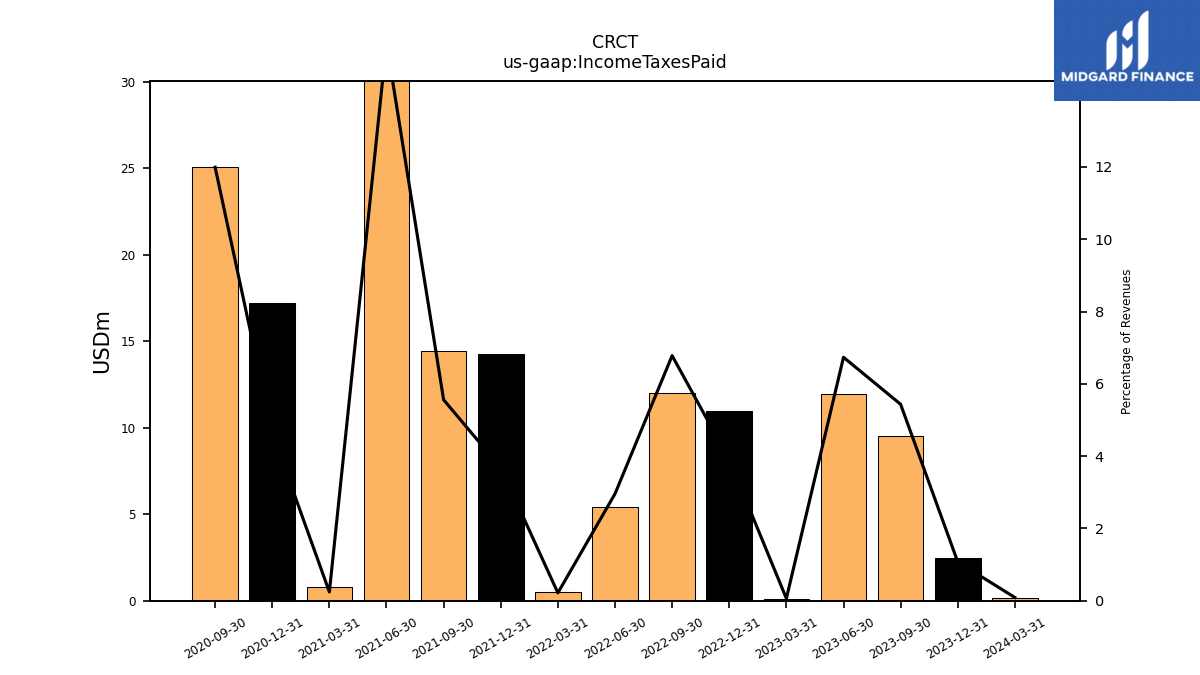
| Income Taxes Paid | 10.95 | 12.00 | 5.43 | 0.53 | 14.26 | 14.46 | 51.62 | 0.79 | 17.22 | 25.06 | NA | NA | |
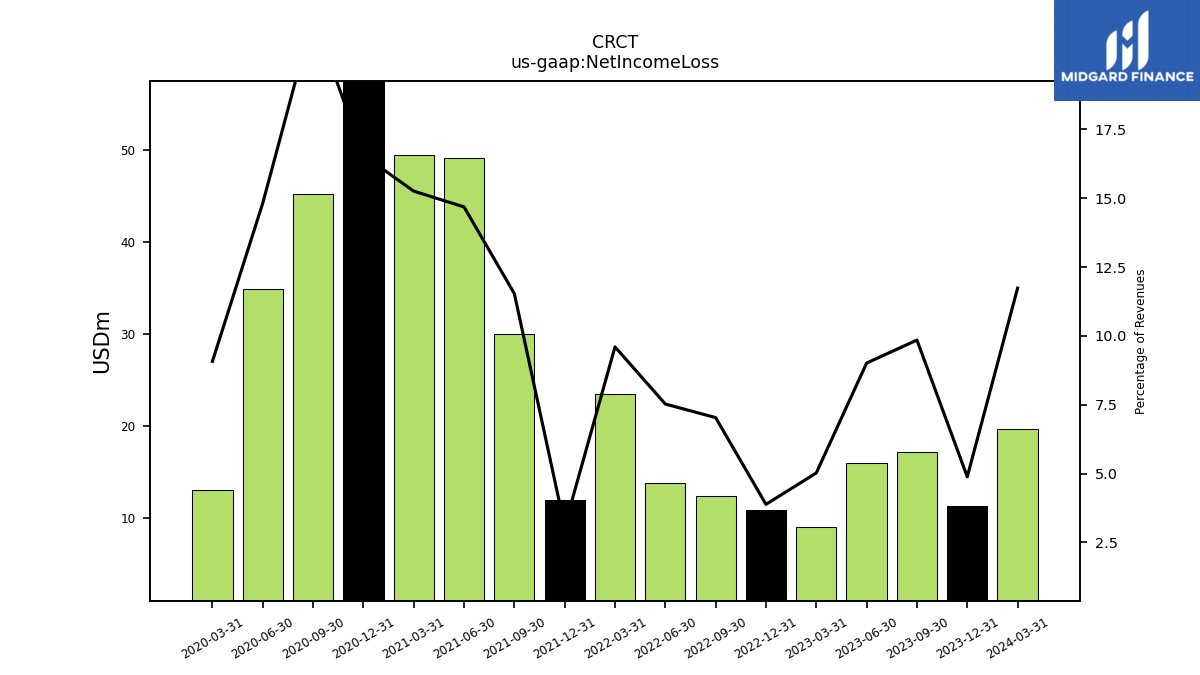
| Net Income Loss | 10.89 | 12.44 | 13.83 | 23.50 | 11.92 | 30.00 | 49.13 | 49.42 | 61.45 | 45.21 | 34.88 | 13.04 | |
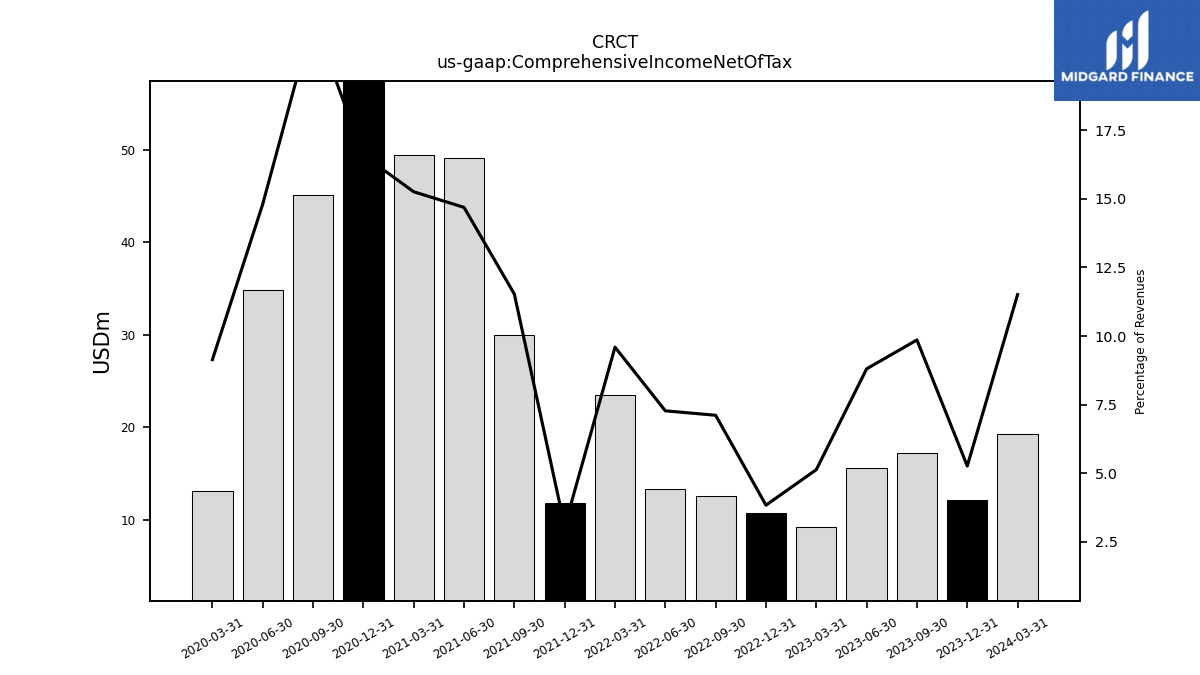
| Comprehensive Income Net Of Tax | 10.79 | 12.60 | 13.37 | 23.49 | 11.88 | 29.99 | 49.13 | 49.41 | 61.53 | 45.10 | 34.85 | 13.14 |
| 2022-12-31 | 2022-09-30 | 2022-06-30 | 2022-03-31 | 2021-12-31 | 2021-09-30 | 2021-06-30 | 2021-03-31 | 2020-12-31 | 2020-09-30 | 2020-06-30 | 2020-03-31 | ||
|---|---|---|---|---|---|---|---|---|---|---|---|---|---|
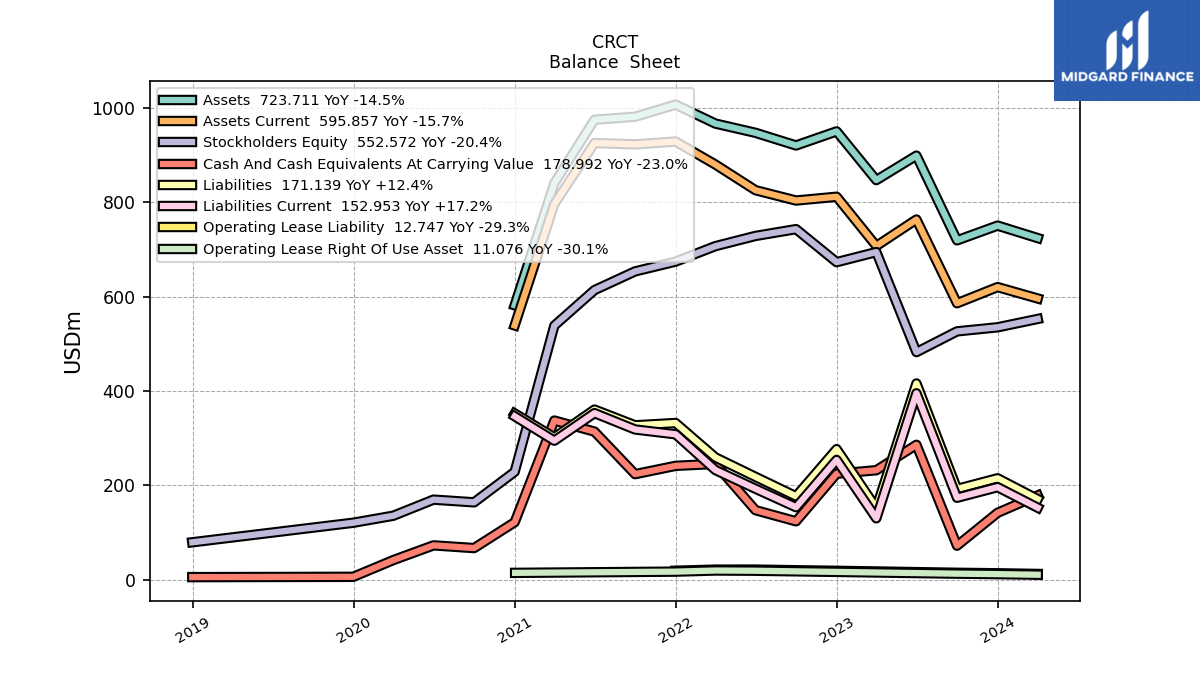
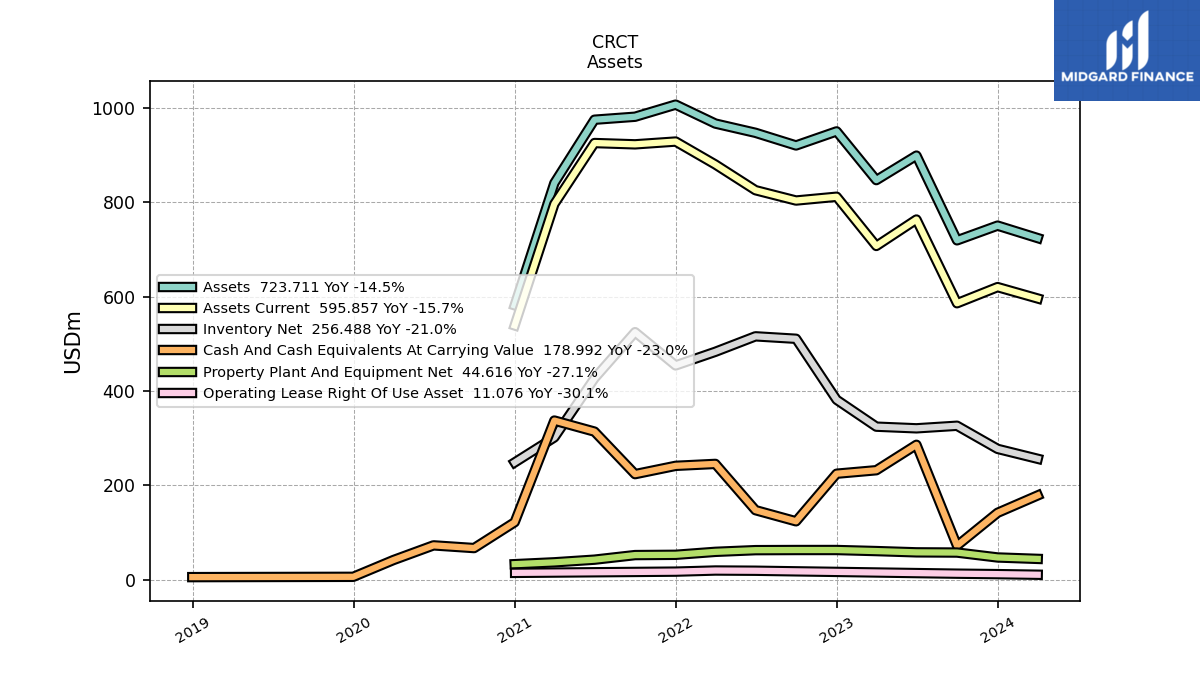
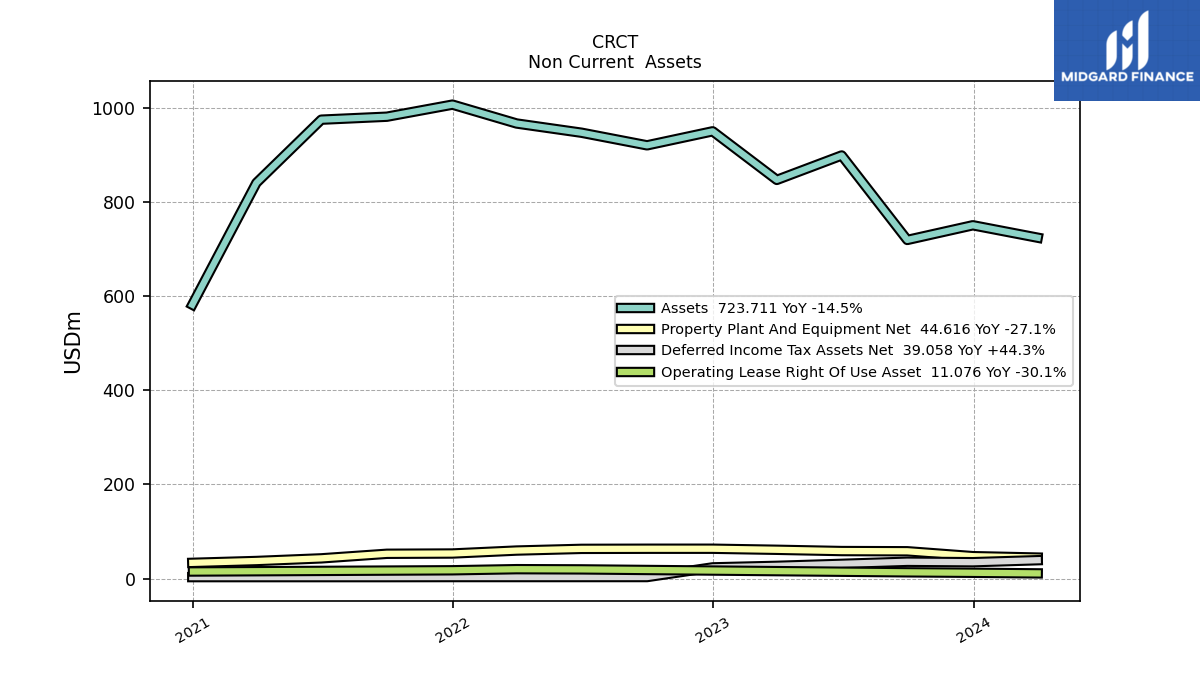
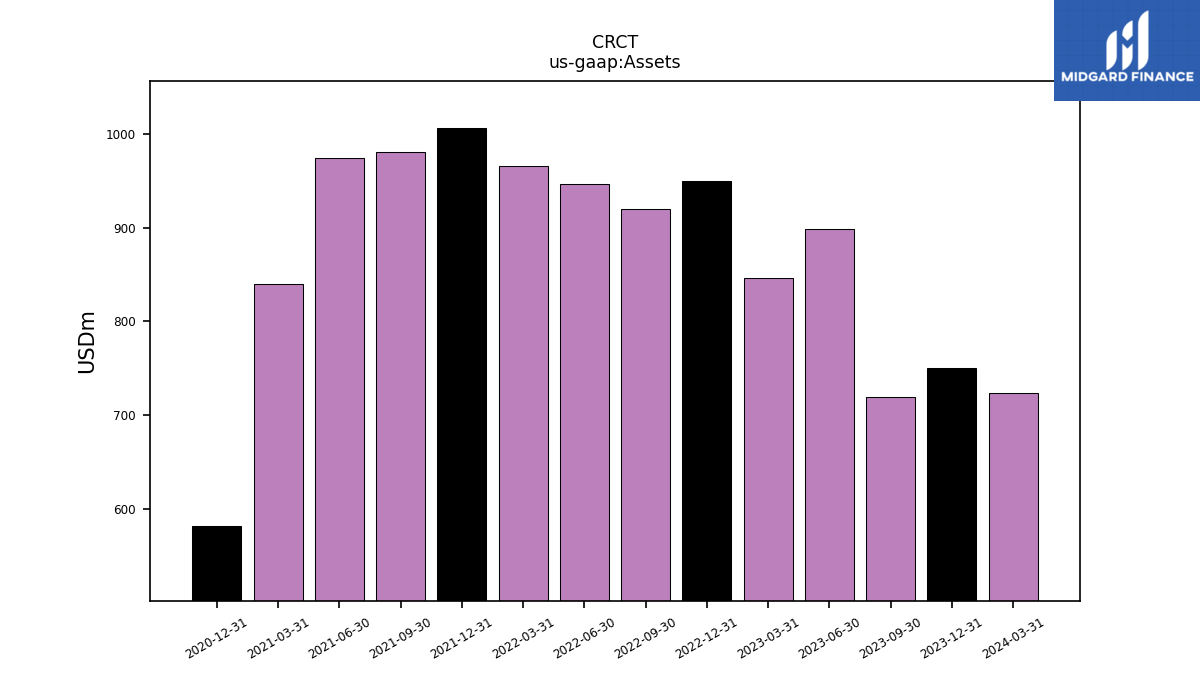
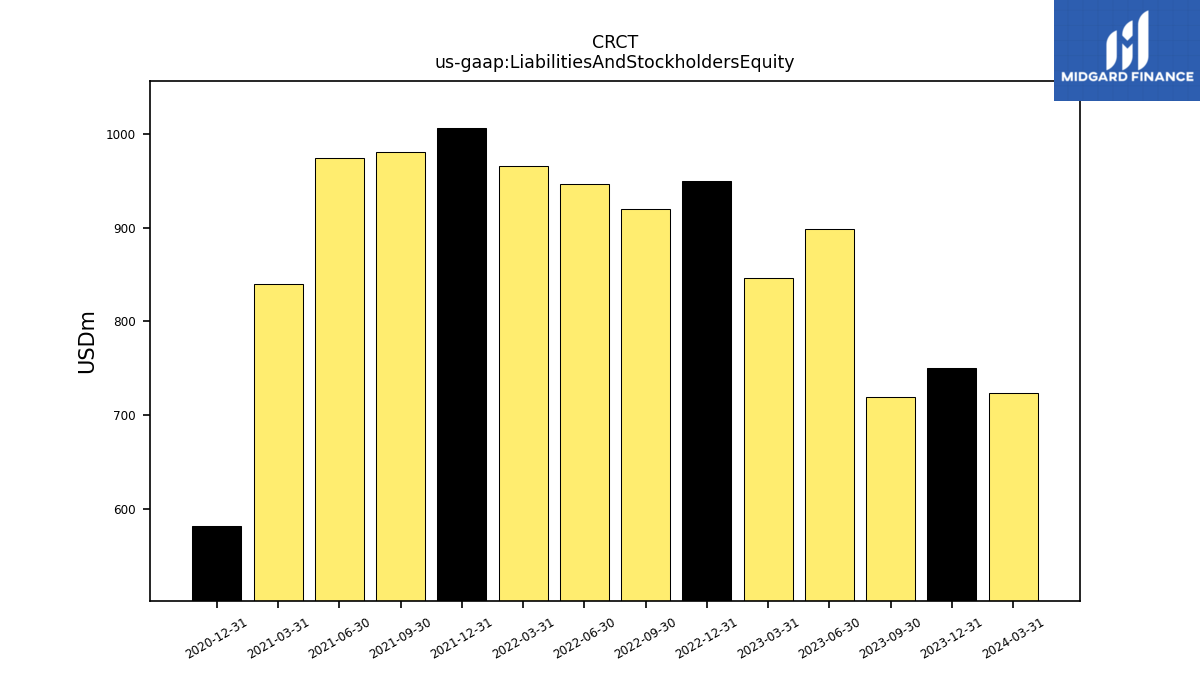
| Assets | 949.63 | 919.80 | 946.60 | 966.18 | 1006.25 | 980.60 | 974.30 | 840.19 | 581.40 | NA | NA | NA | |
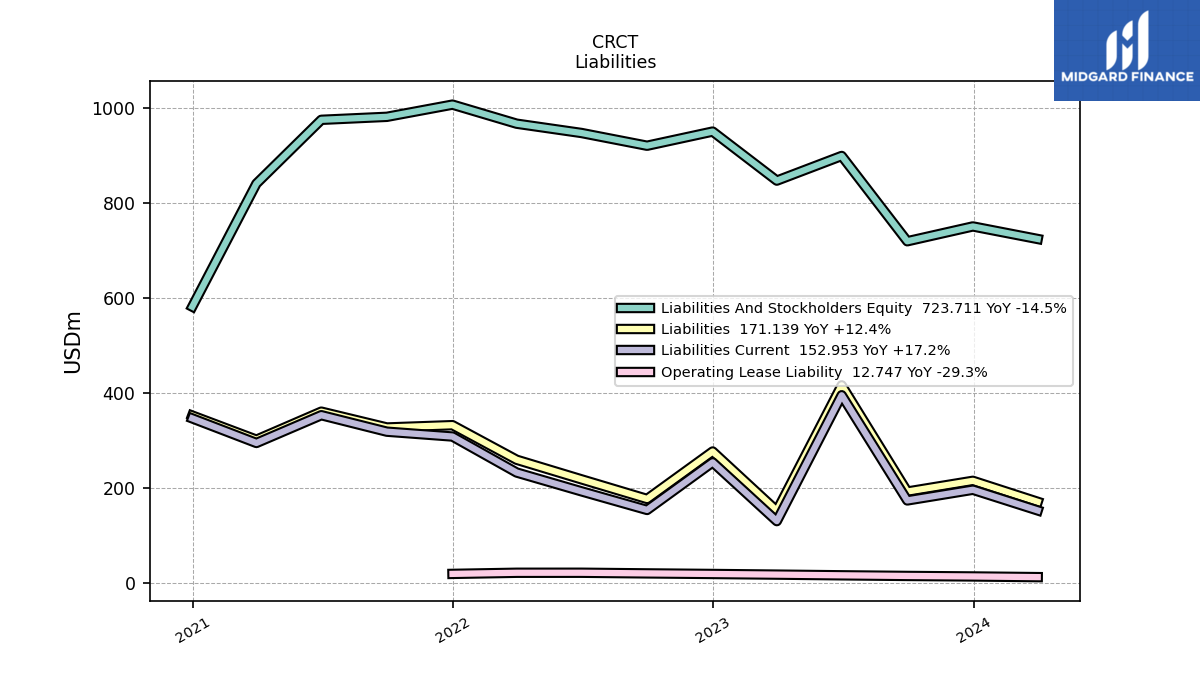
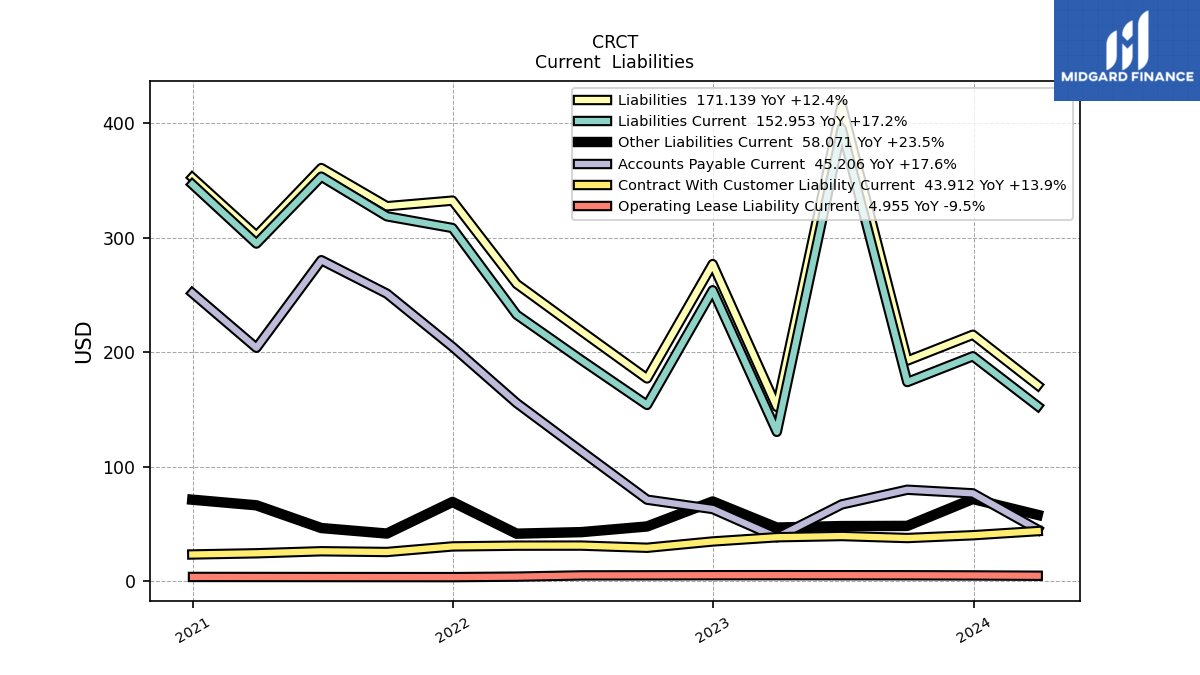
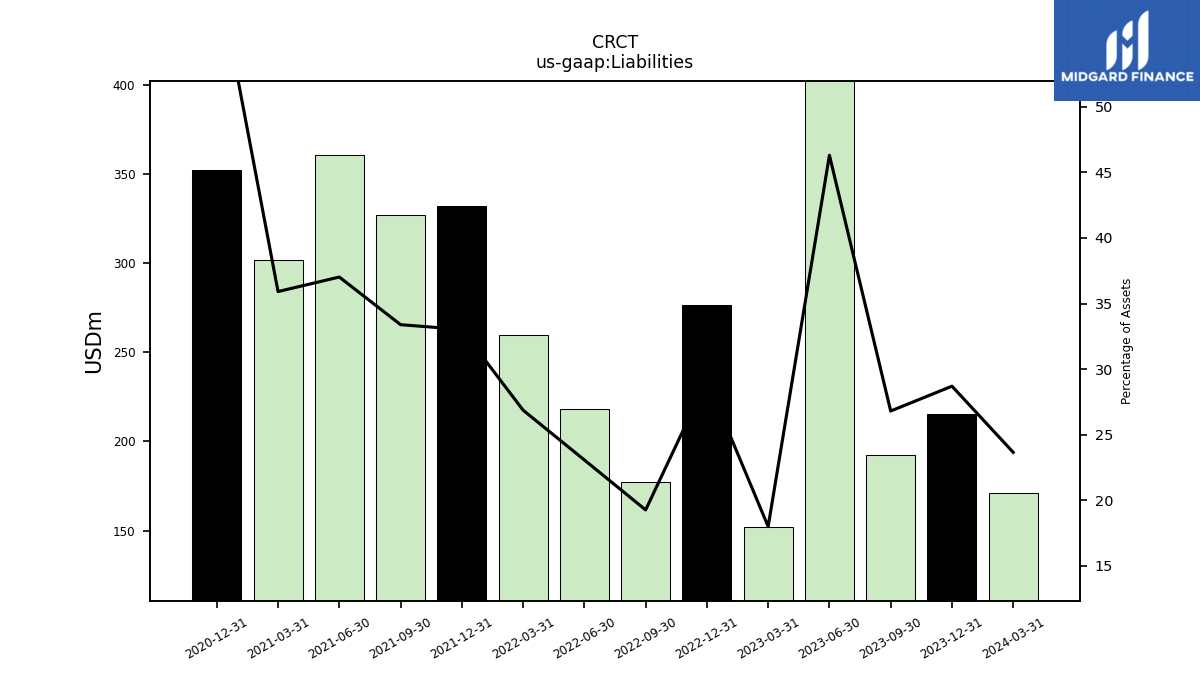
| Liabilities | 276.89 | 177.11 | 218.34 | 259.56 | 332.27 | 327.39 | 360.69 | 301.74 | 352.48 | NA | NA | NA | |
| Liabilities And Stockholders Equity | 949.63 | 919.80 | 946.60 | 966.18 | 1006.25 | 980.60 | 974.30 | 840.19 | 581.40 | NA | NA | NA | |
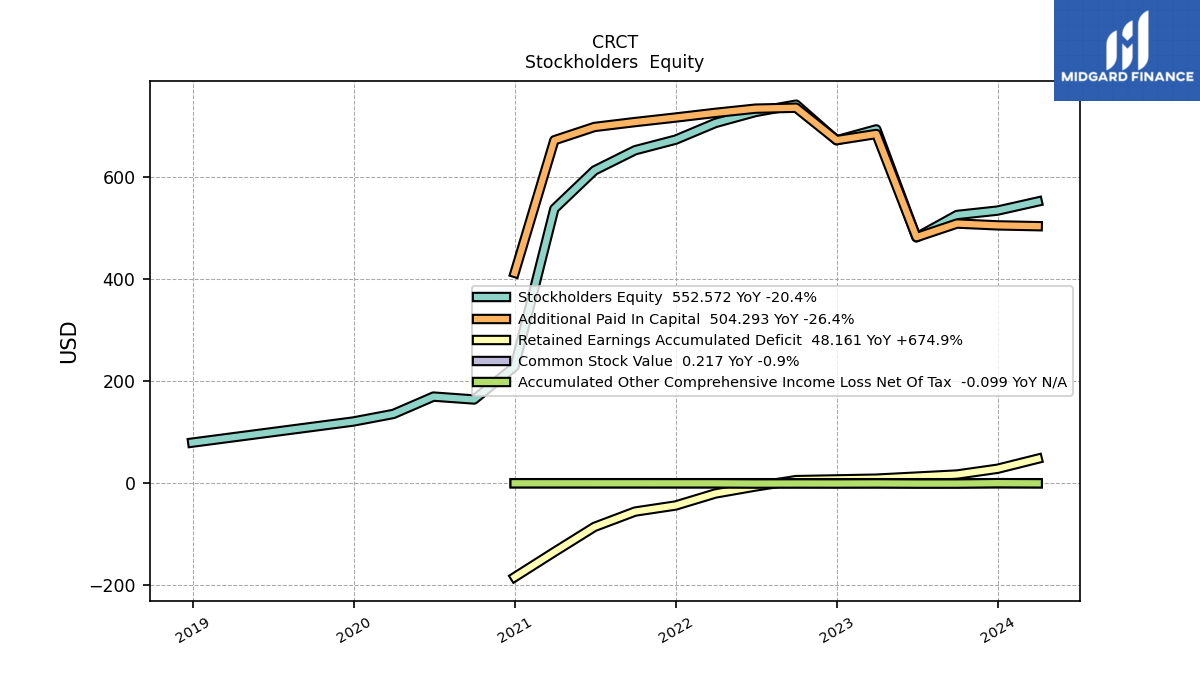
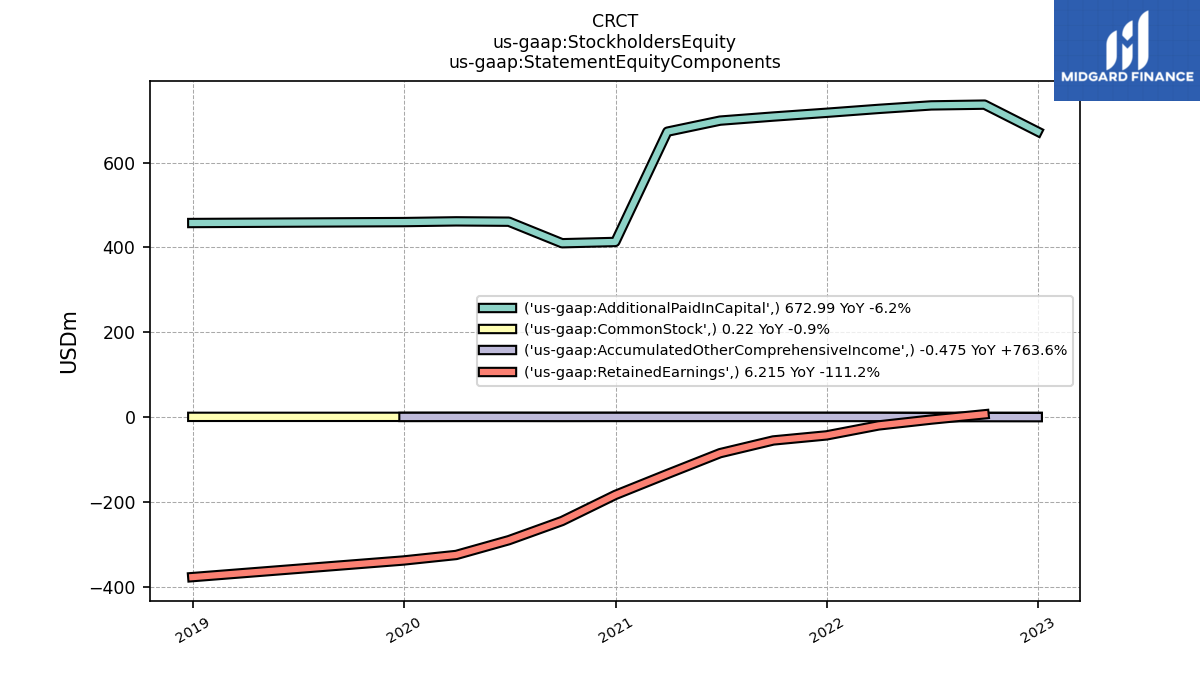
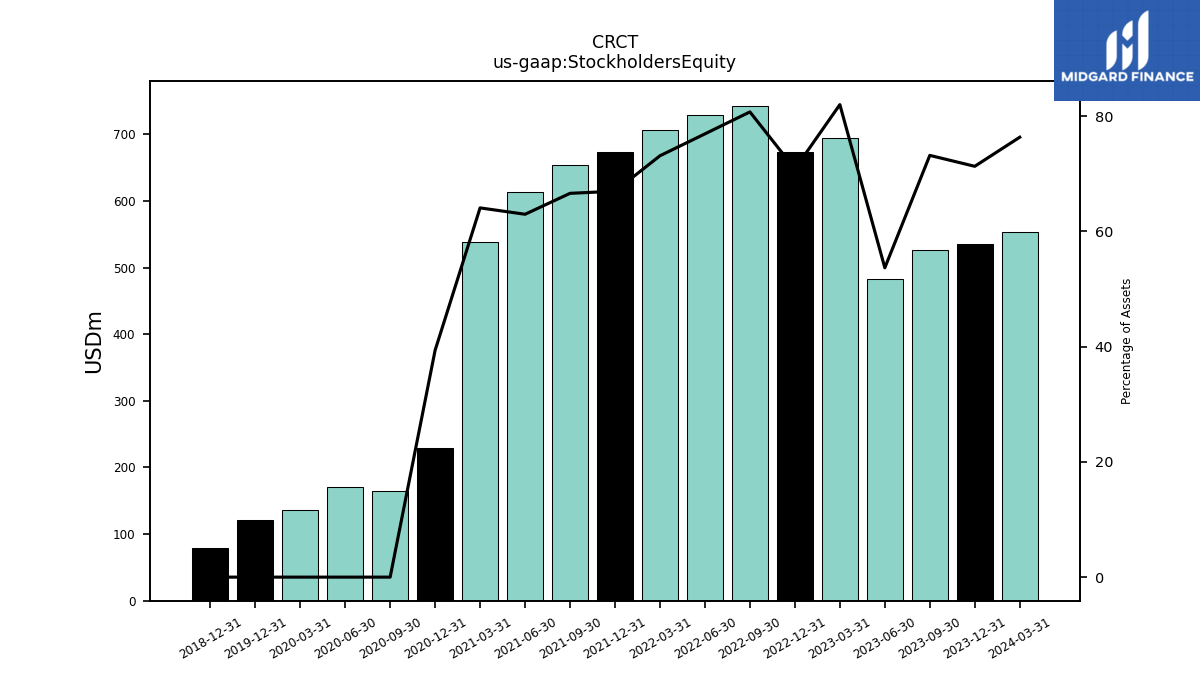
| Stockholders Equity | 672.74 | 742.70 | 728.26 | 706.63 | 673.98 | 653.22 | 613.61 | 538.45 | 228.93 | 164.33 | 170.06 | 136.01 |
| 2022-12-31 | 2022-09-30 | 2022-06-30 | 2022-03-31 | 2021-12-31 | 2021-09-30 | 2021-06-30 | 2021-03-31 | 2020-12-31 | 2020-09-30 | 2020-06-30 | 2020-03-31 | ||
|---|---|---|---|---|---|---|---|---|---|---|---|---|---|
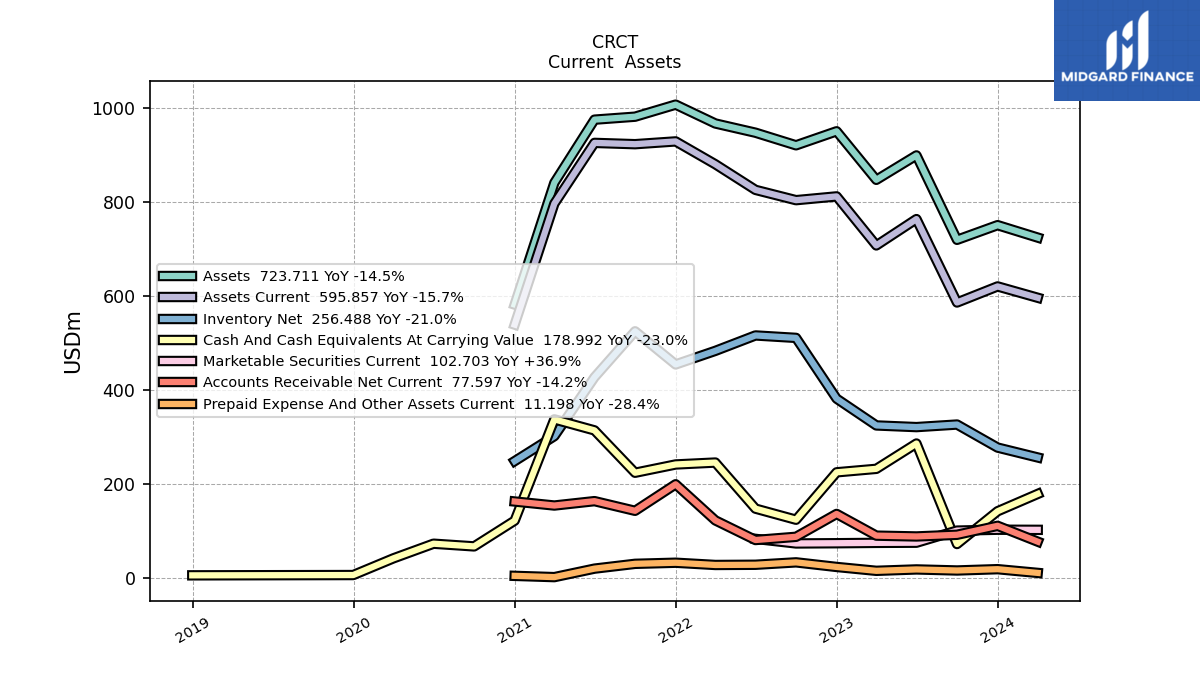
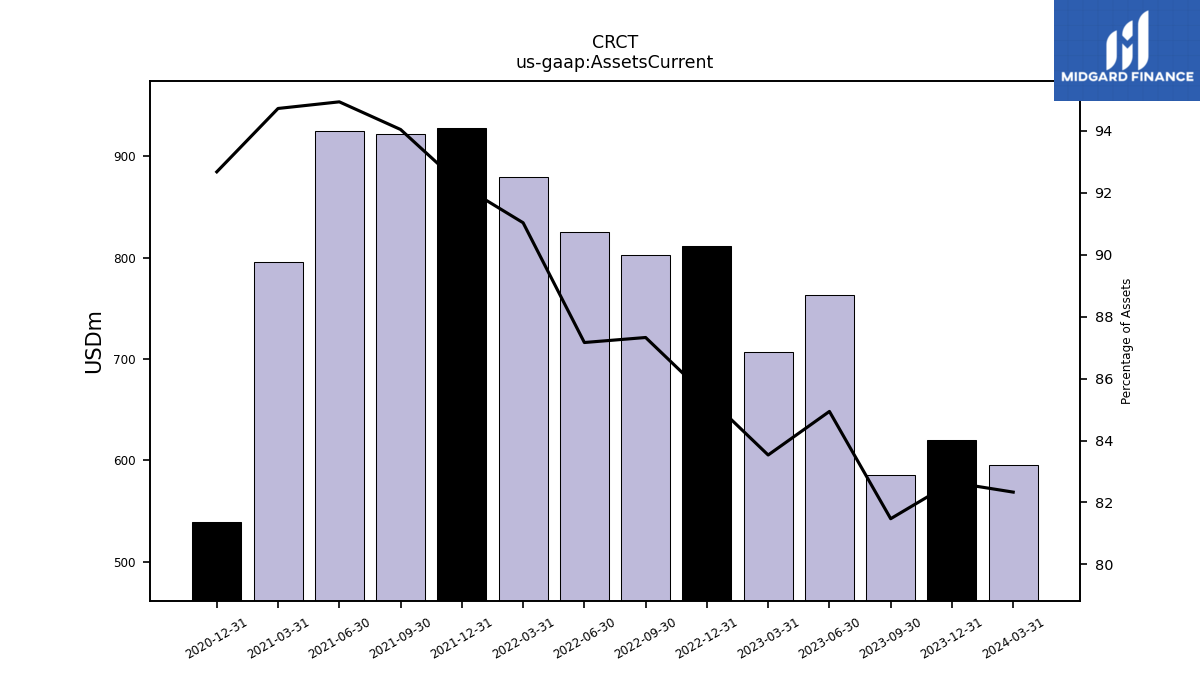
| Assets Current | 811.26 | 803.23 | 825.09 | 879.53 | 928.10 | 922.18 | 924.95 | 795.83 | 538.81 | NA | NA | NA | |
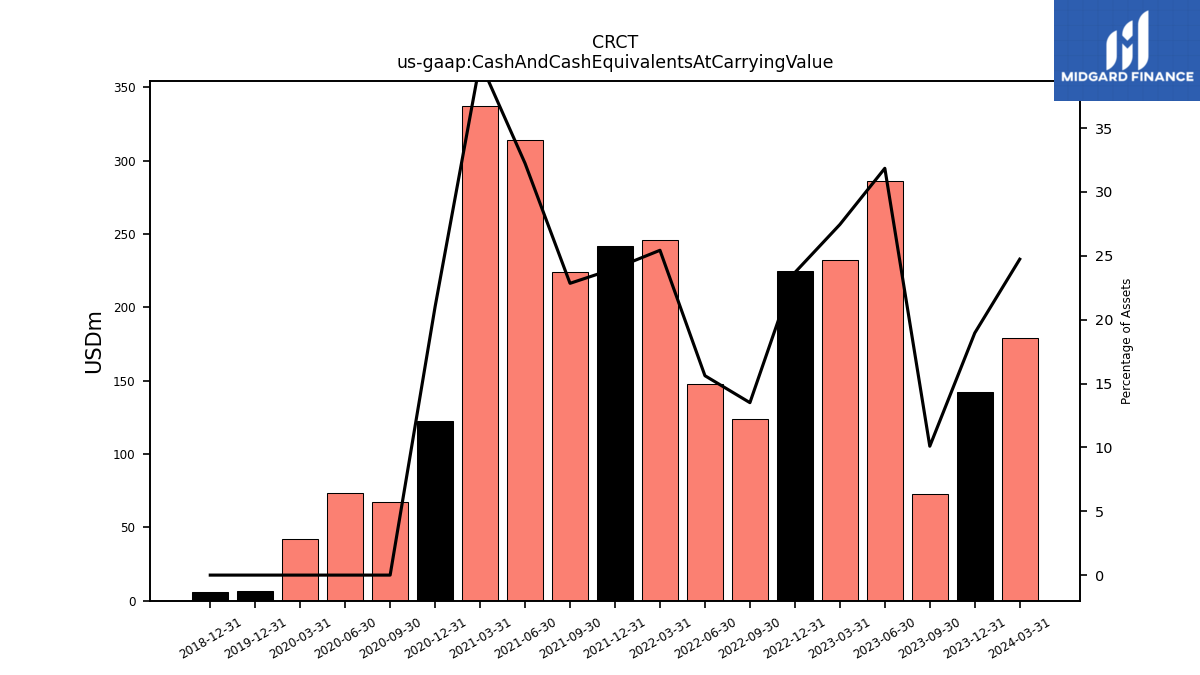
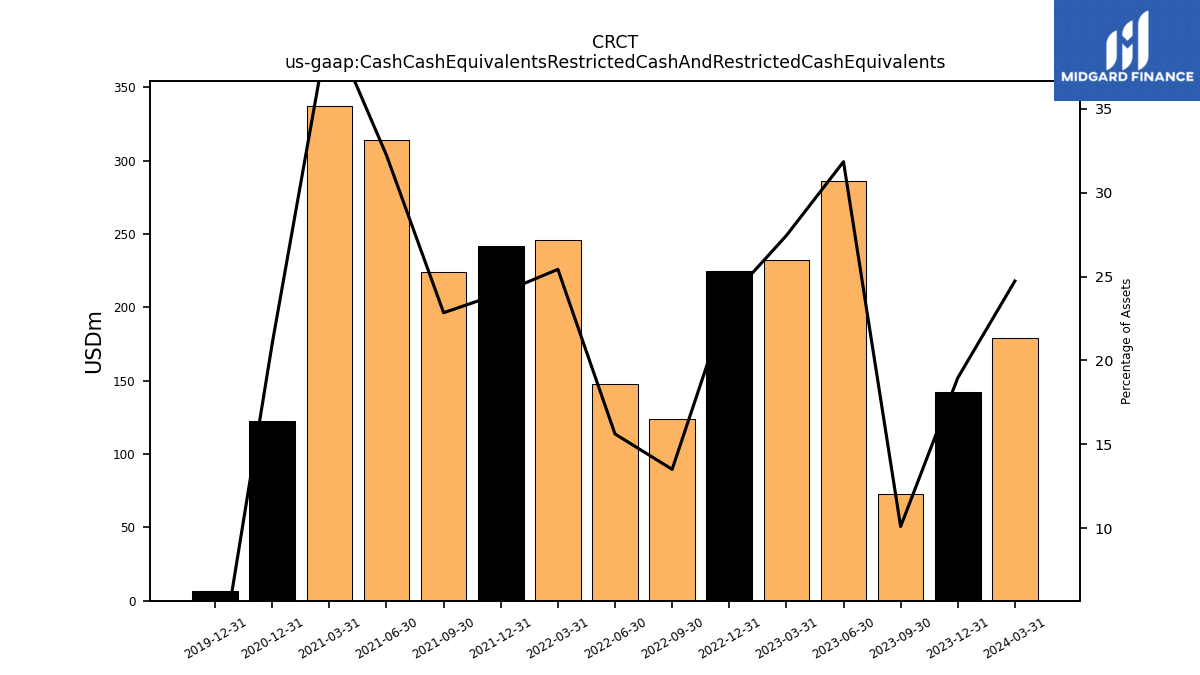
| Cash And Cash Equivalents At Carrying Value | 224.94 | 124.18 | 147.77 | 245.70 | 241.60 | 224.00 | 314.08 | 337.47 | 122.22 | 67.51 | 73.24 | 42.13 | |
| Cash Cash Equivalents Restricted Cash And Restricted Cash Equivalents | 224.94 | 124.18 | 147.77 | 245.70 | 241.60 | 224.00 | 314.08 | 337.47 | 122.22 | NA | NA | NA | |
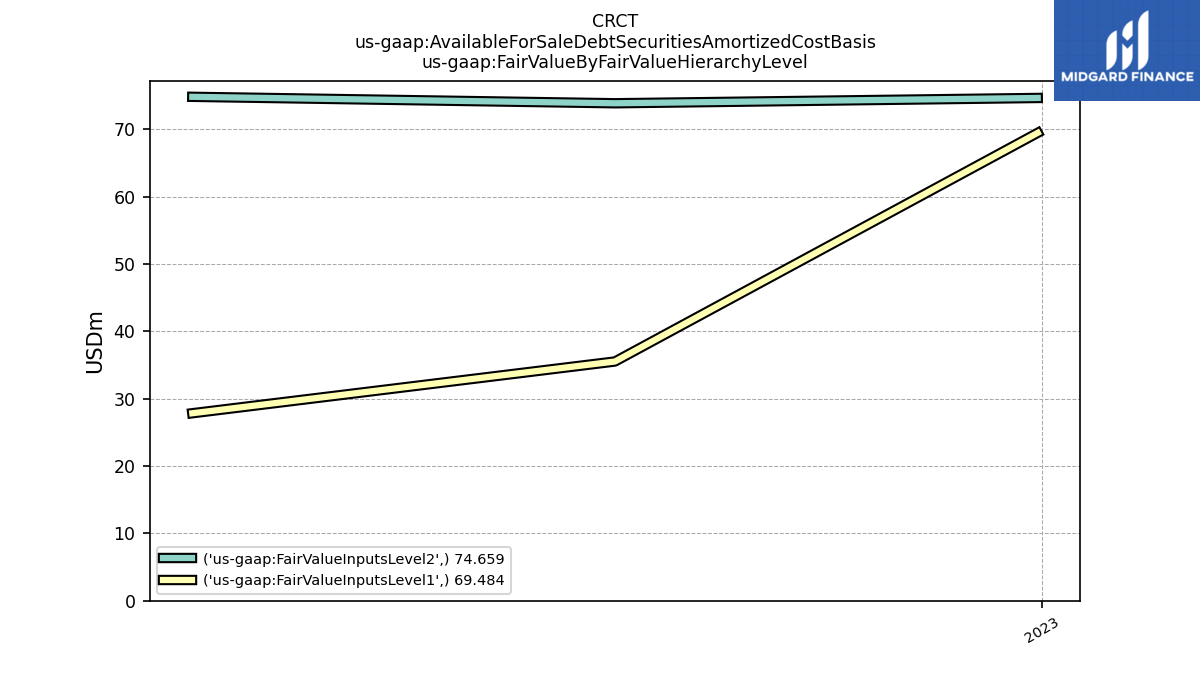
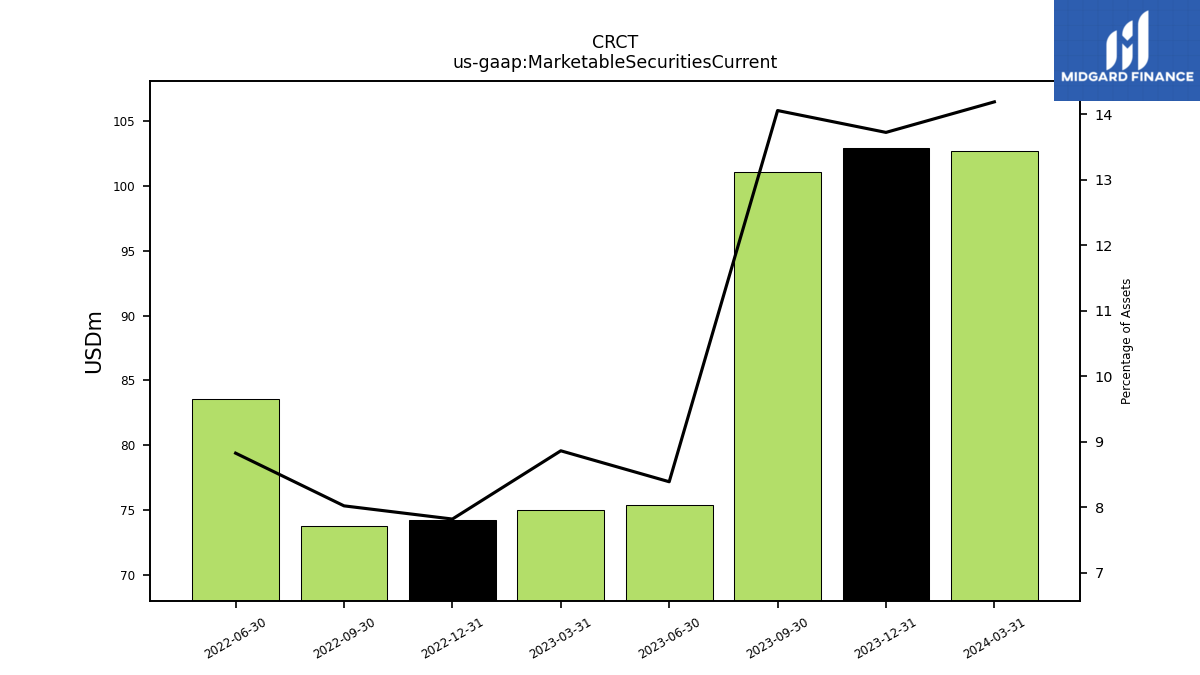
| Marketable Securities Current | 74.26 | 73.78 | 83.55 | NA | NA | NA | NA | NA | NA | NA | NA | NA | |
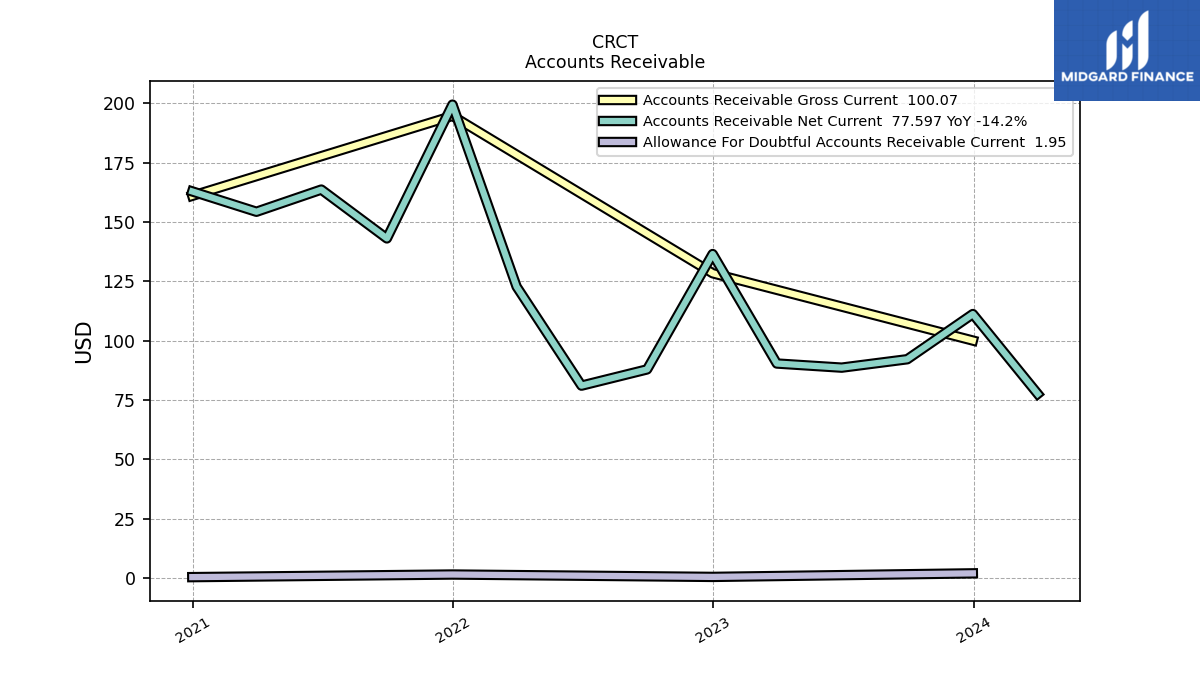
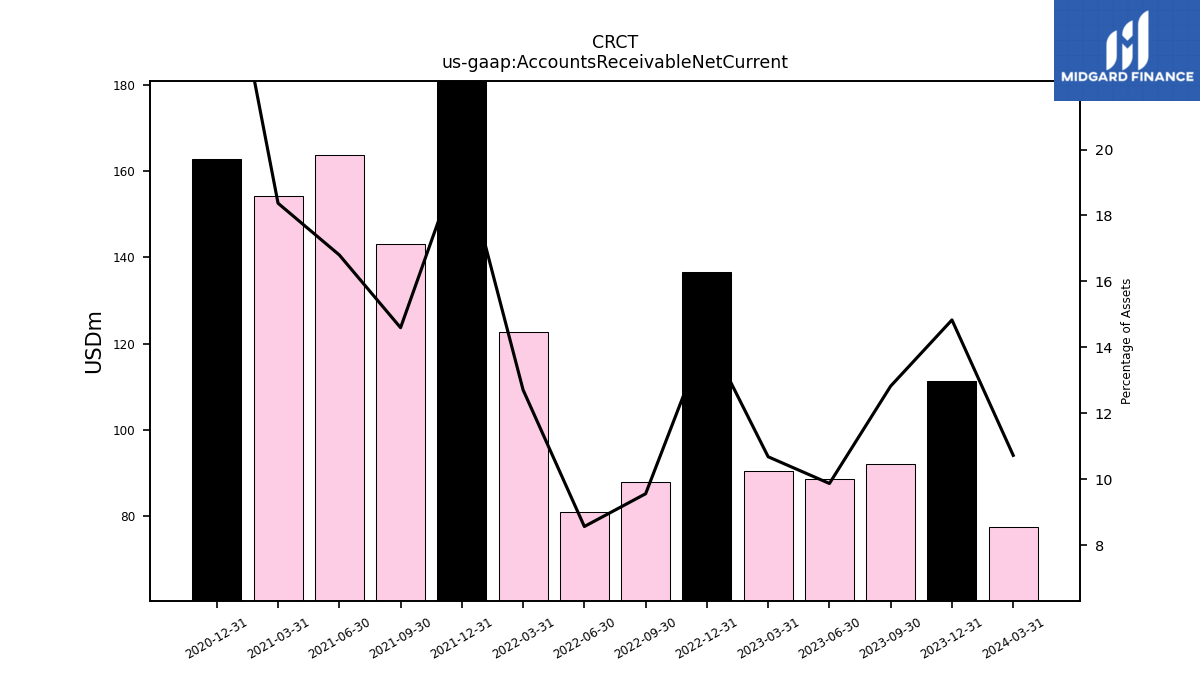
| Accounts Receivable Net Current | 136.54 | 87.91 | 81.06 | 122.78 | 199.51 | 143.12 | 163.70 | 154.36 | 162.93 | NA | NA | NA | |
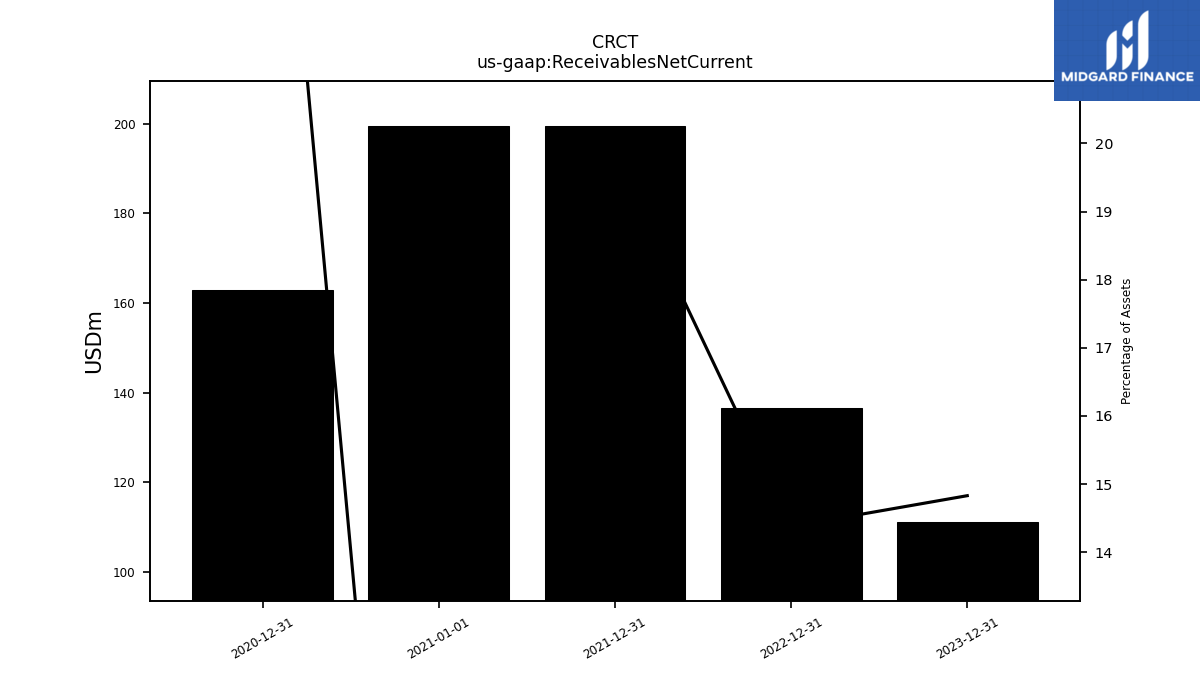
| Receivables Net Current | 136.54 | NA | NA | NA | 199.51 | NA | NA | NA | 162.93 | NA | NA | NA | |
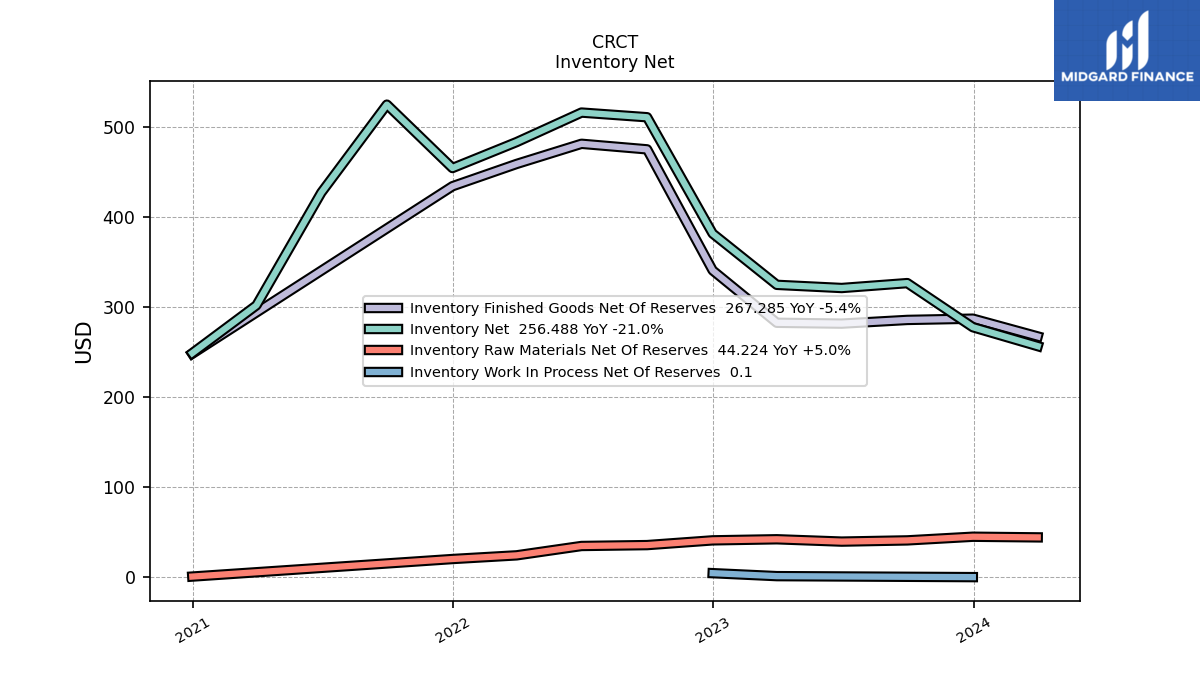
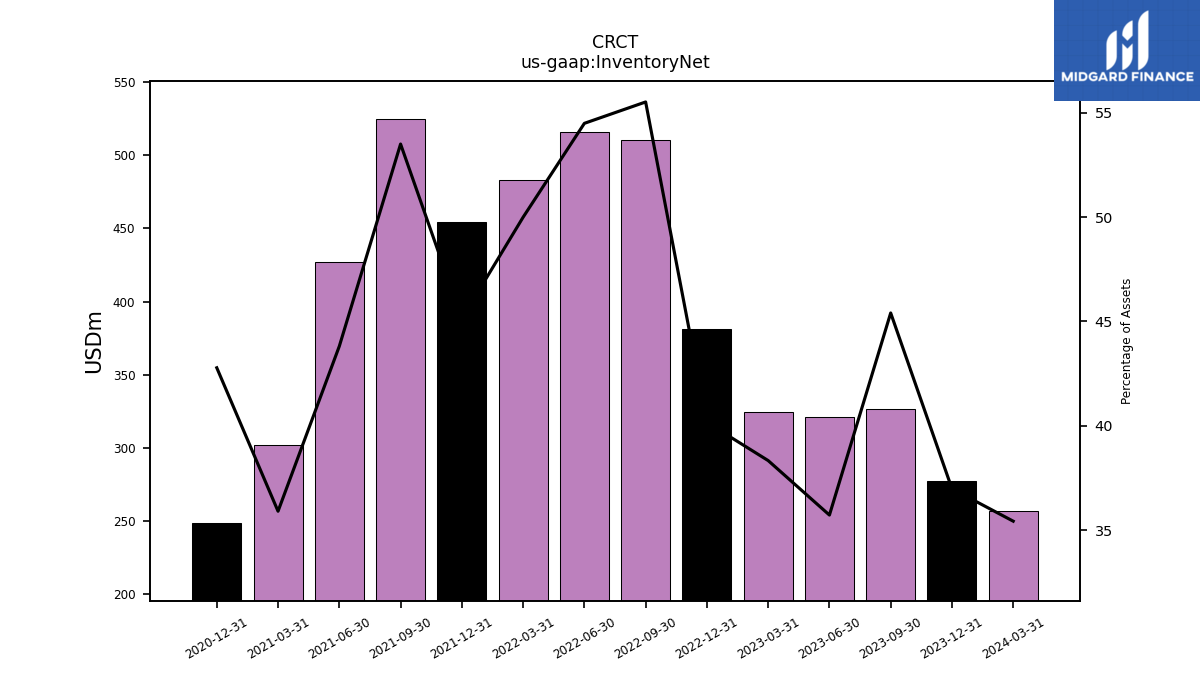
| Inventory Net | 381.47 | 510.58 | 515.76 | 483.01 | 454.17 | 524.58 | 426.90 | 301.78 | 248.75 | NA | NA | NA | |
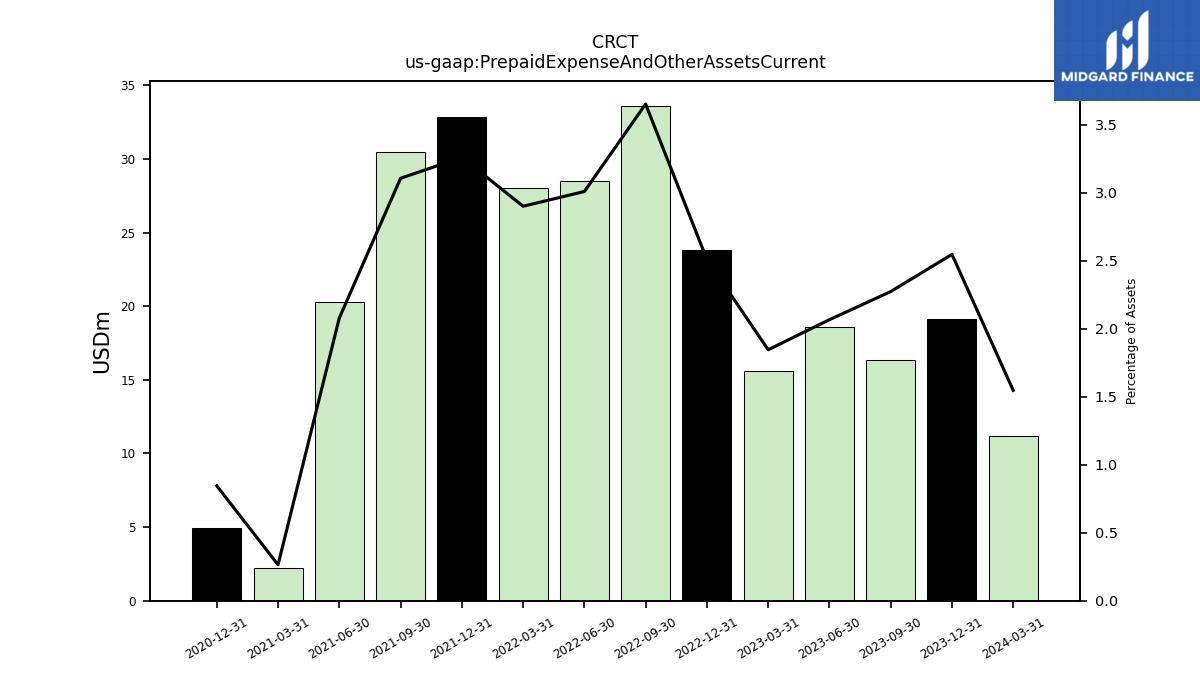
| Prepaid Expense And Other Assets Current | 23.84 | 33.61 | 28.50 | 28.04 | 32.82 | 30.48 | 20.27 | 2.23 | 4.92 | NA | NA | NA |
| 2022-12-31 | 2022-09-30 | 2022-06-30 | 2022-03-31 | 2021-12-31 | 2021-09-30 | 2021-06-30 | 2021-03-31 | 2020-12-31 | 2020-09-30 | 2020-06-30 | 2020-03-31 | ||
|---|---|---|---|---|---|---|---|---|---|---|---|---|---|
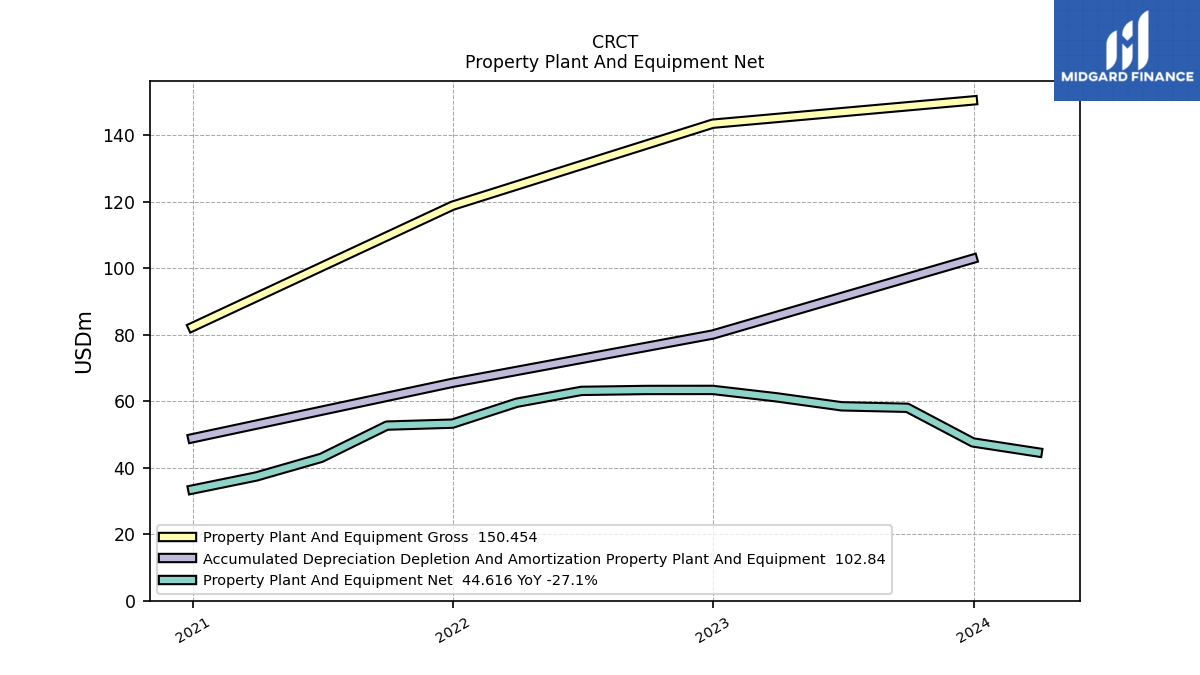
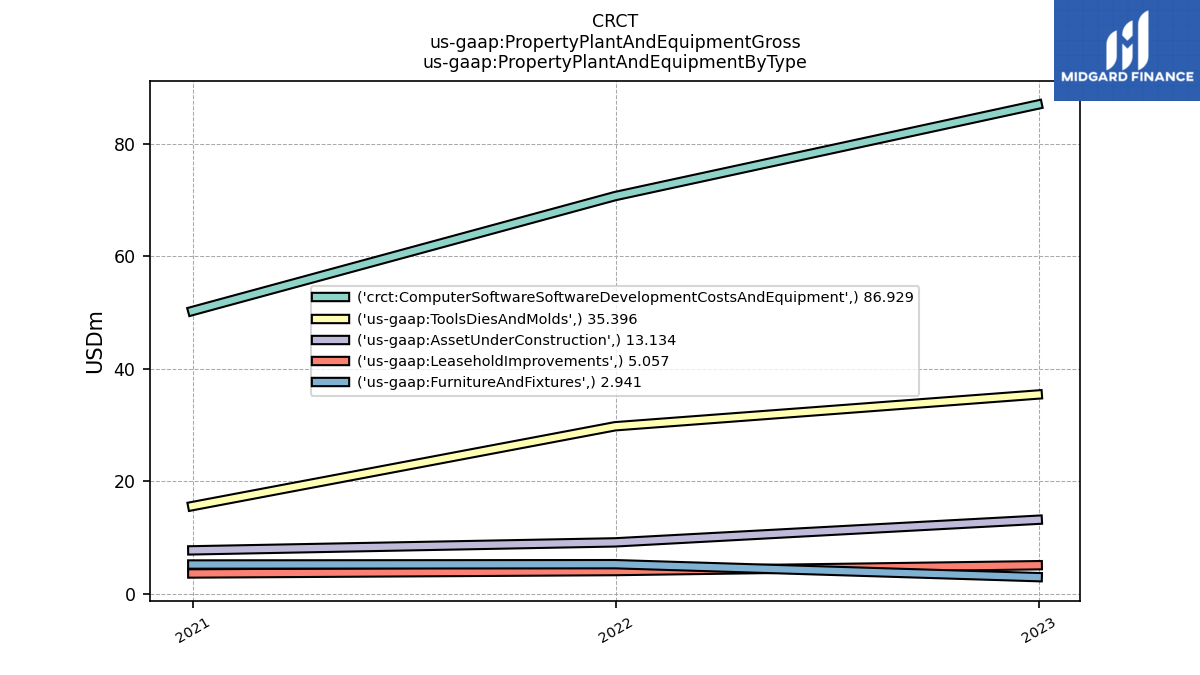
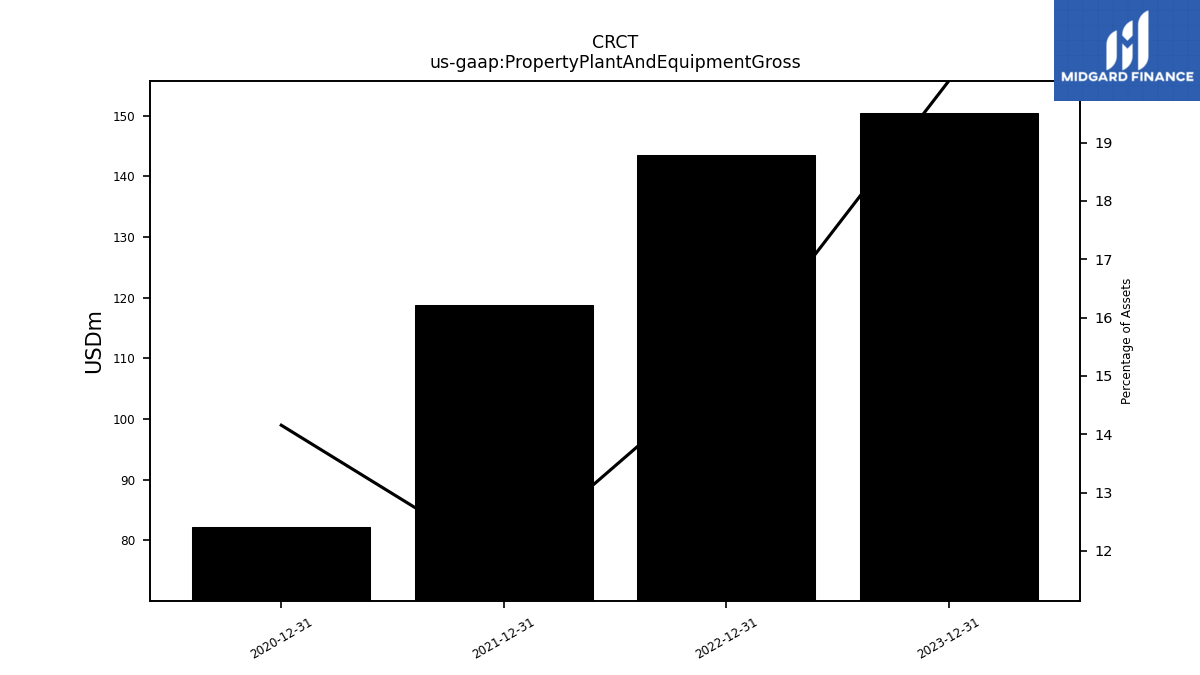
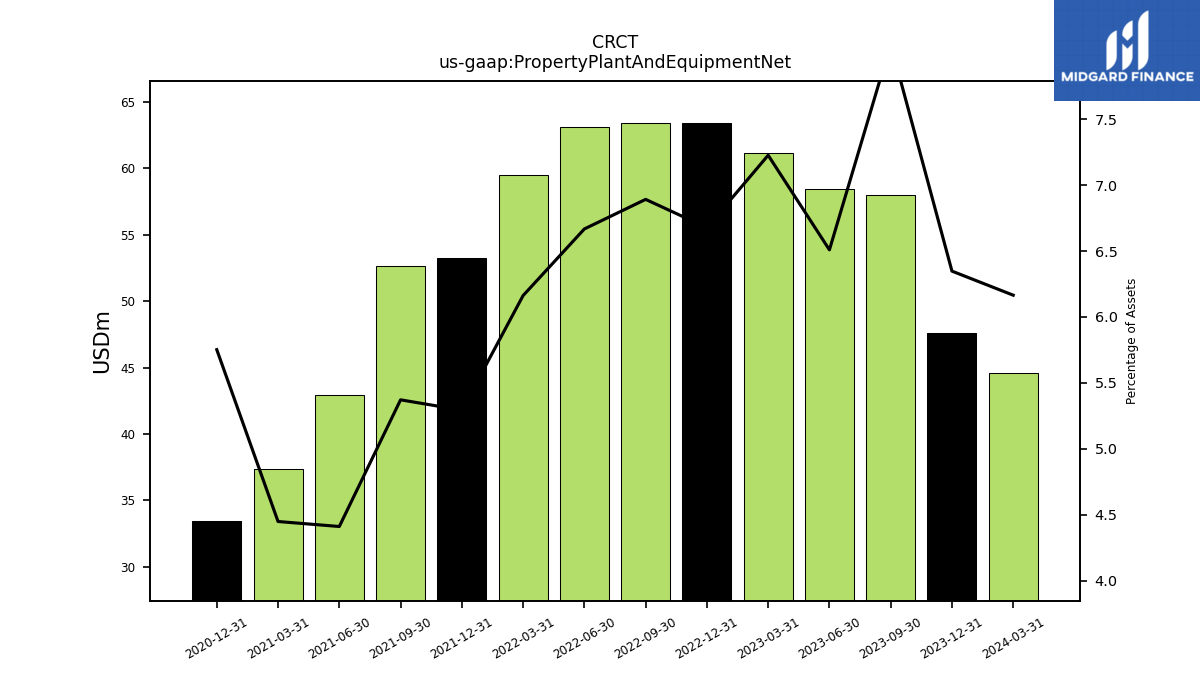
| Property Plant And Equipment Gross | 143.46 | NA | NA | NA | 118.80 | NA | NA | NA | 82.30 | NA | NA | NA | |
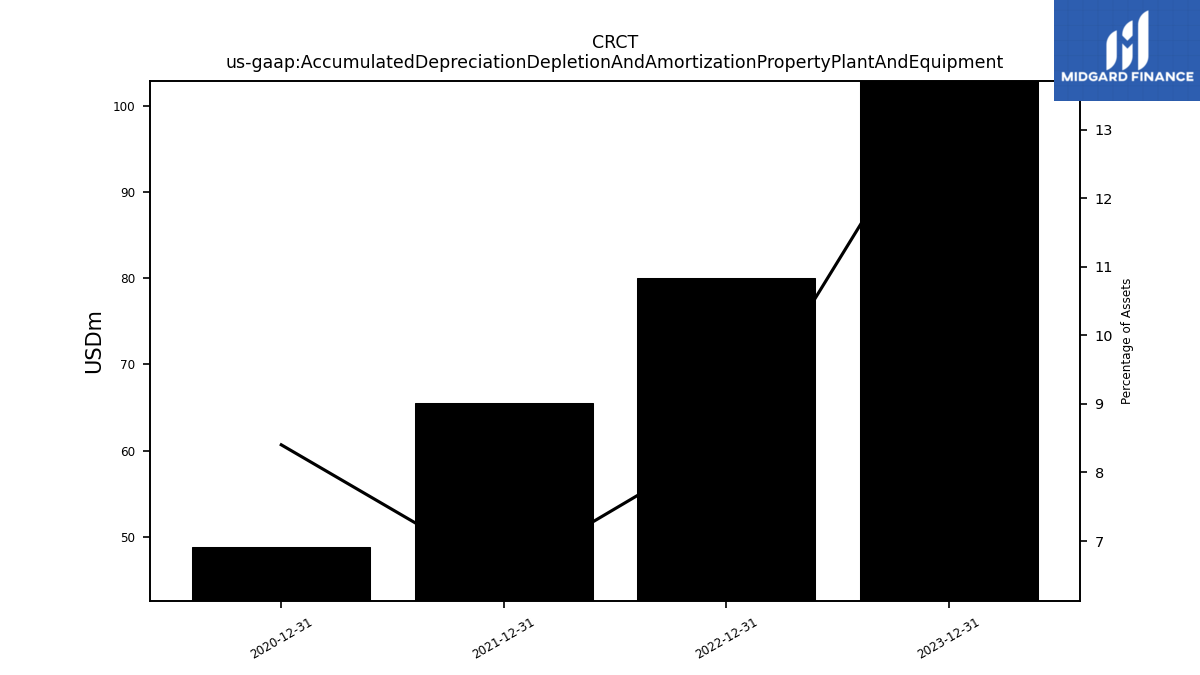
| Accumulated Depreciation Depletion And Amortization Property Plant And Equipment | 80.05 | NA | NA | NA | 65.53 | NA | NA | NA | 48.86 | NA | NA | NA | |
| Property Plant And Equipment Net | 63.41 | 63.39 | 63.11 | 59.54 | 53.26 | 52.67 | 42.97 | 37.38 | 33.44 | NA | NA | NA | |
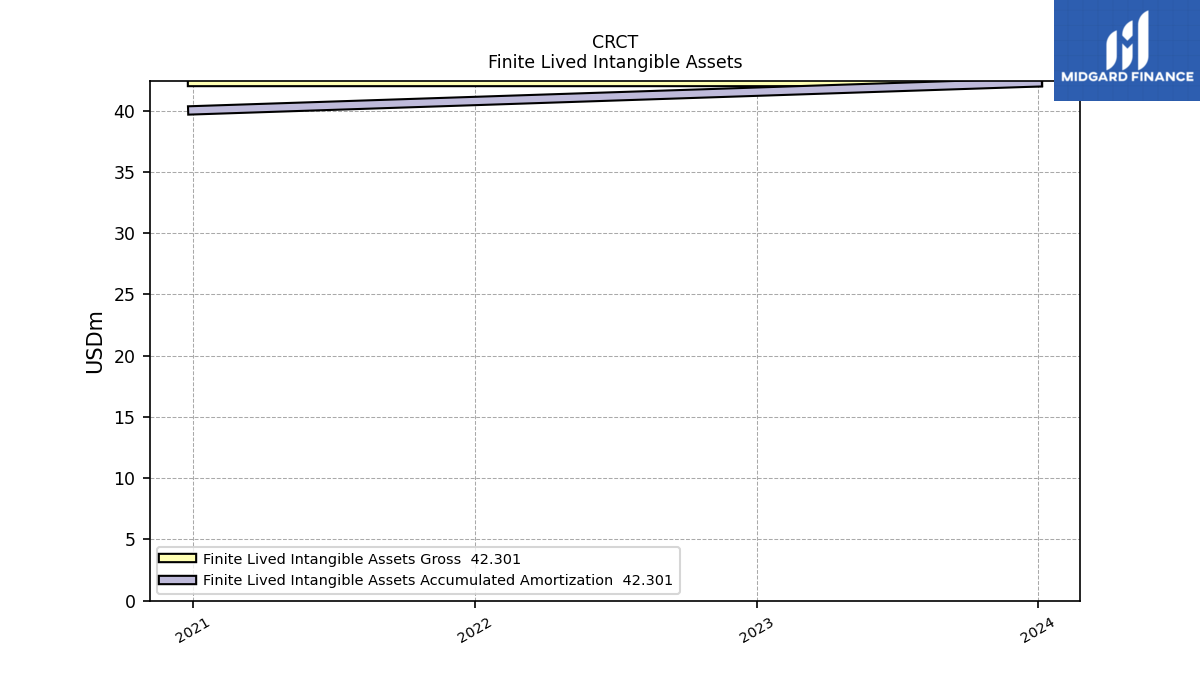
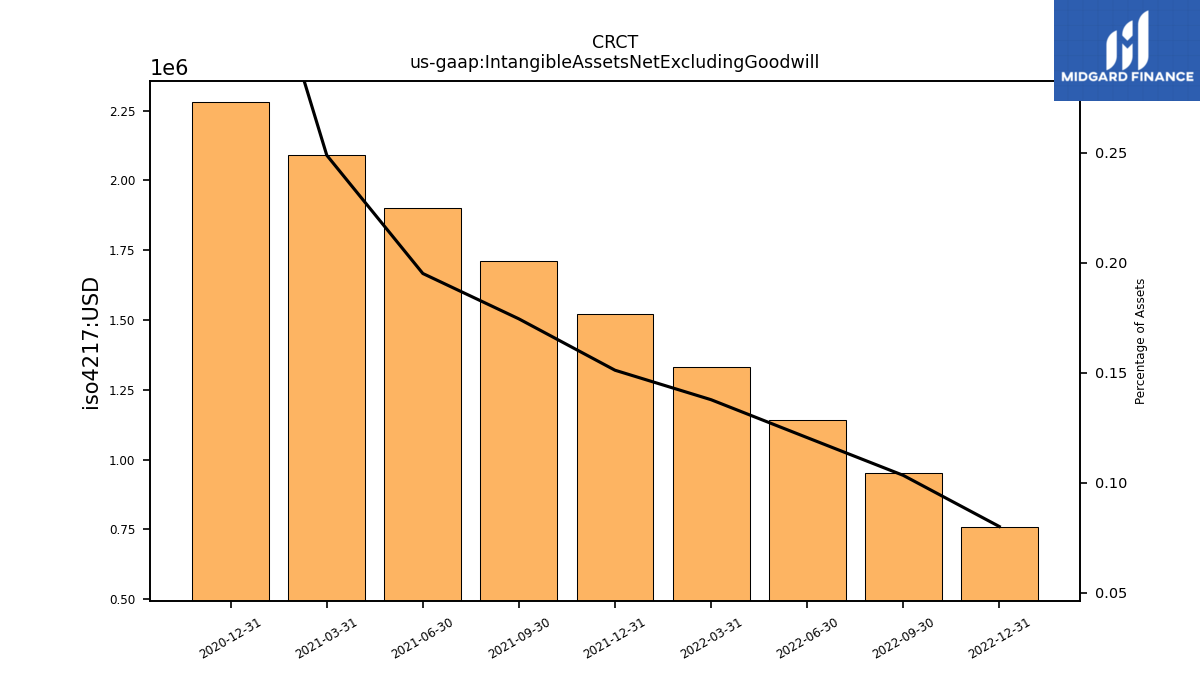
| Intangible Assets Net Excluding Goodwill | 0.76 | 0.95 | 1.14 | 1.33 | 1.52 | 1.71 | 1.90 | 2.09 | 2.28 | NA | NA | NA | |
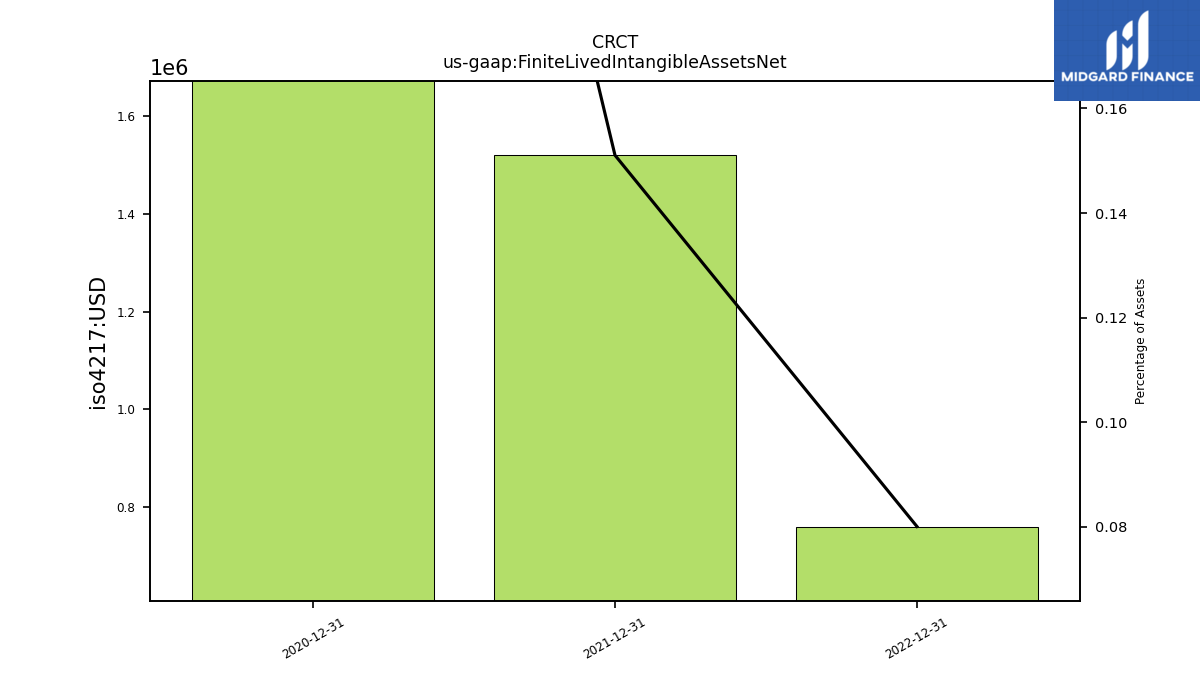
| Finite Lived Intangible Assets Net | 0.76 | NA | NA | NA | 1.52 | NA | NA | NA | 2.28 | NA | NA | NA |
| 2022-12-31 | 2022-09-30 | 2022-06-30 | 2022-03-31 | 2021-12-31 | 2021-09-30 | 2021-06-30 | 2021-03-31 | 2020-12-31 | 2020-09-30 | 2020-06-30 | 2020-03-31 | ||
|---|---|---|---|---|---|---|---|---|---|---|---|---|---|
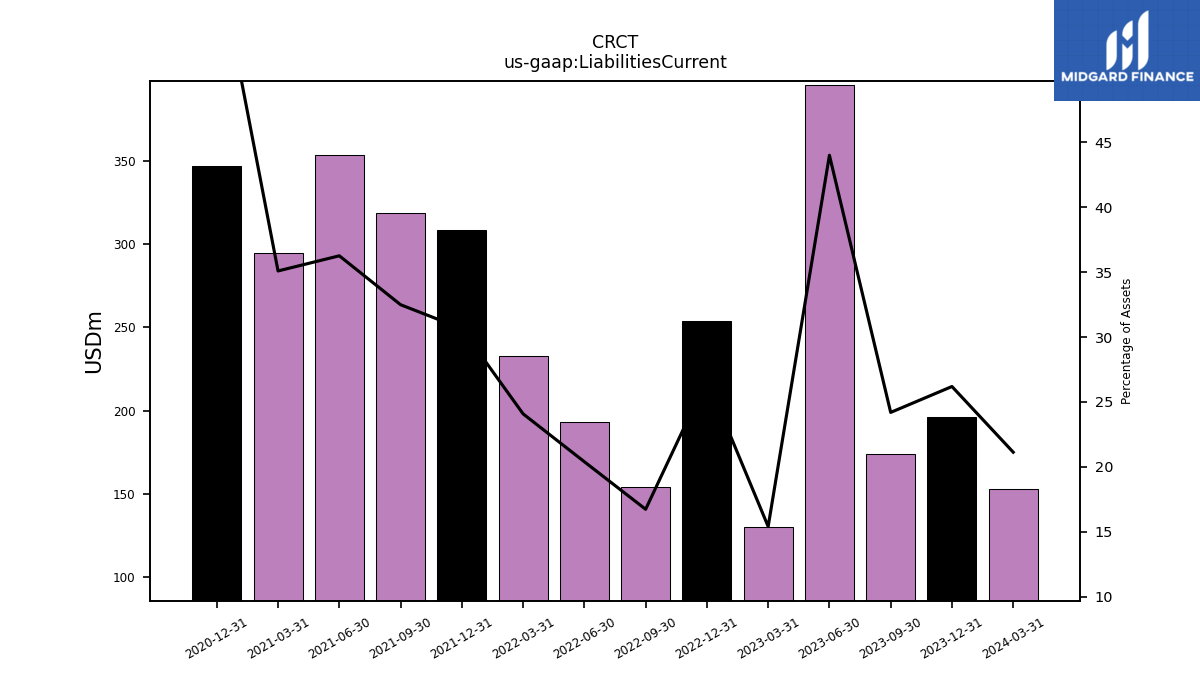
| Liabilities Current | 254.06 | 154.00 | 193.10 | 232.72 | 308.37 | 318.58 | 353.21 | 294.79 | 346.50 | NA | NA | NA | |
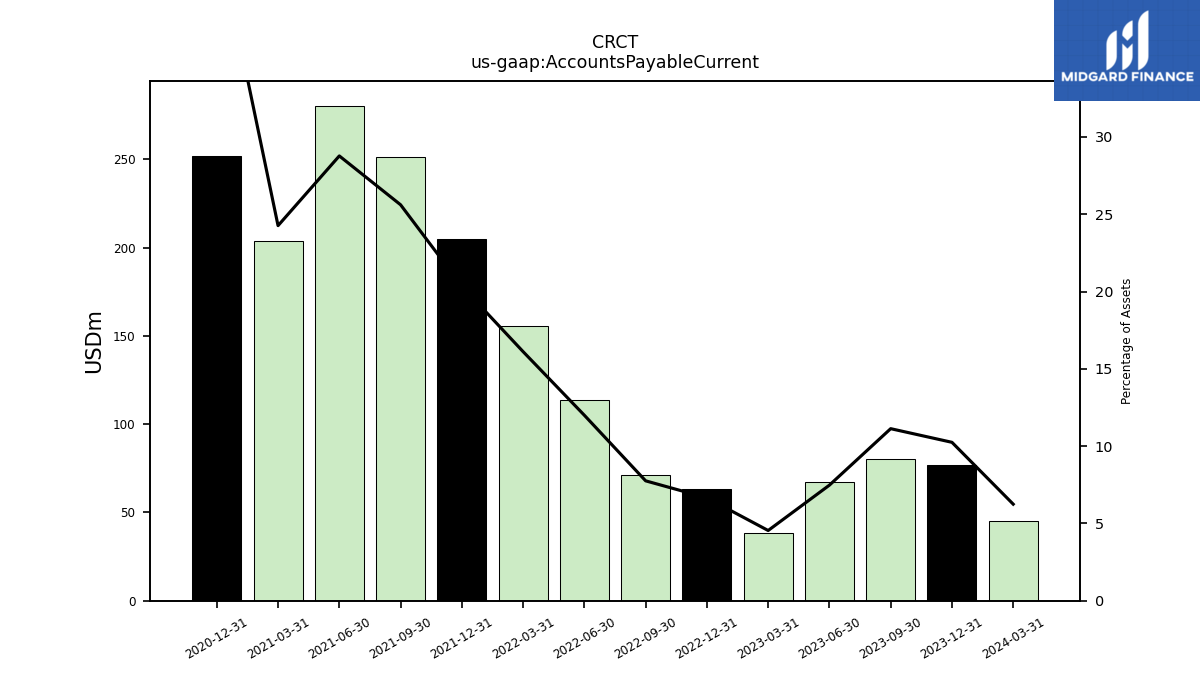
| Accounts Payable Current | 63.20 | 71.33 | 113.55 | 155.66 | 204.71 | 251.12 | 280.30 | 203.83 | 251.66 | NA | NA | NA | |
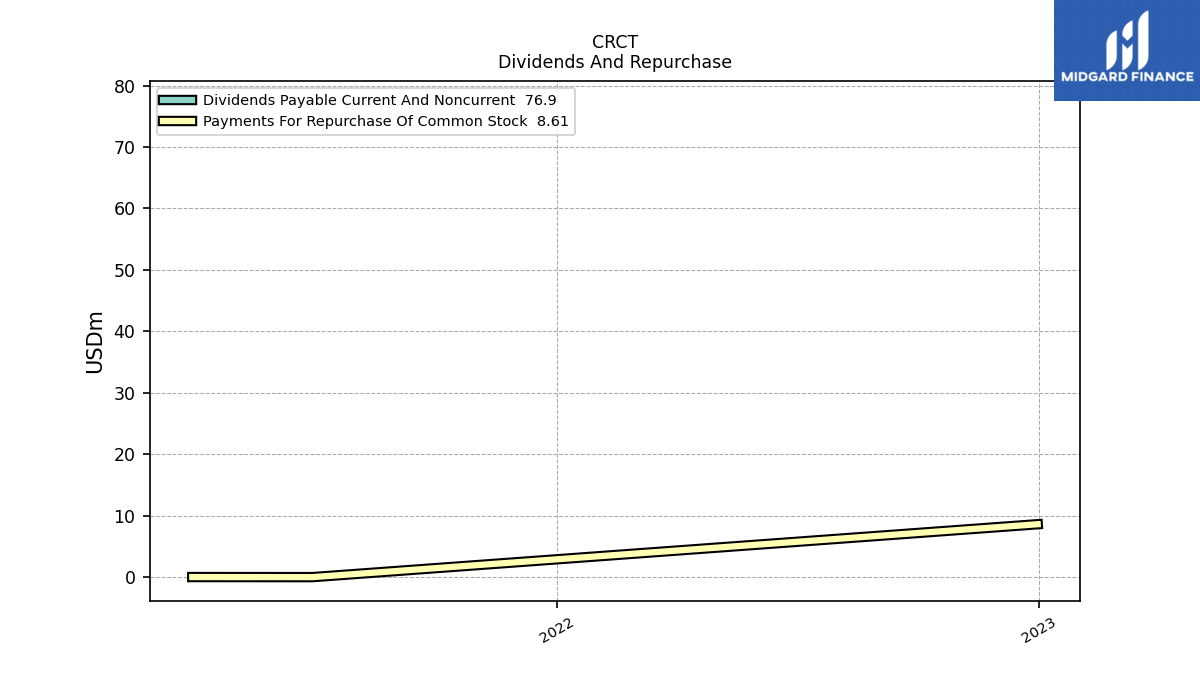
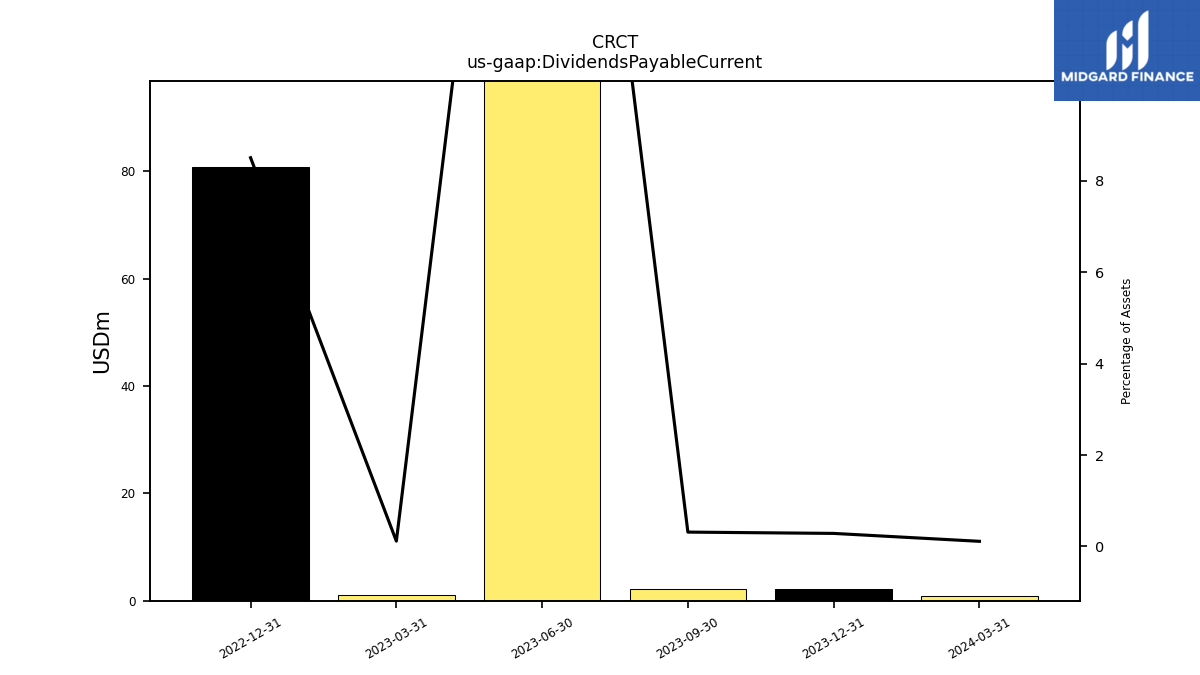
| Dividends Payable Current | 80.78 | NA | NA | NA | NA | NA | NA | NA | NA | NA | NA | NA | |
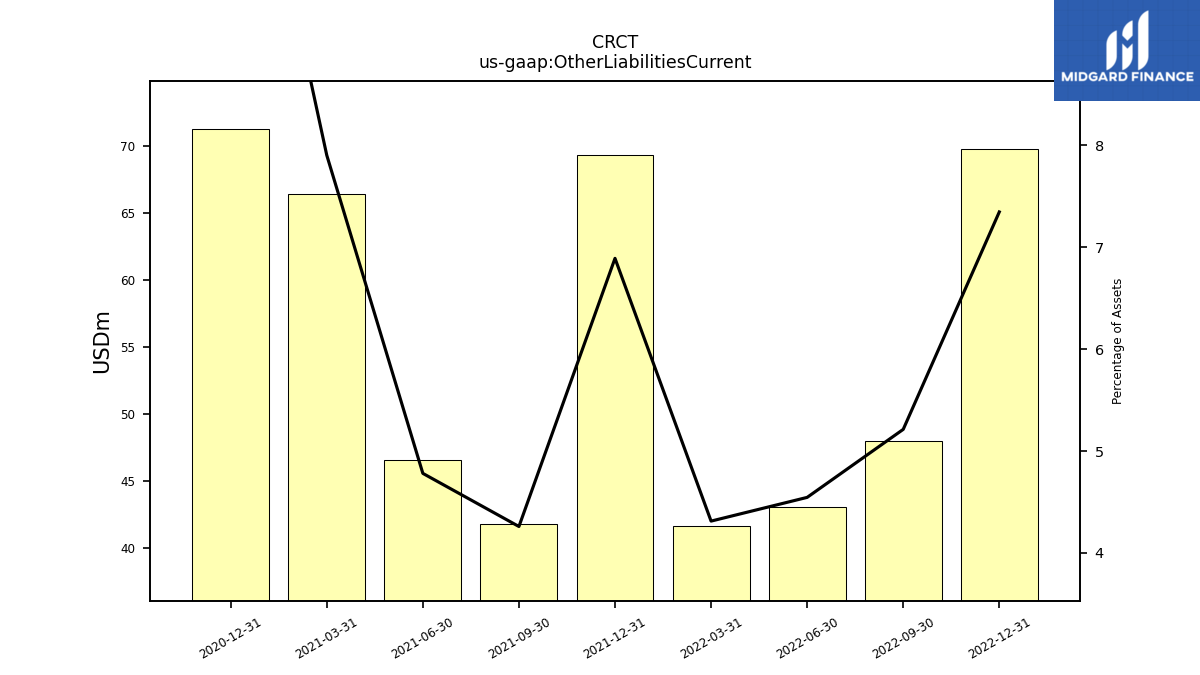
| Other Liabilities Current | 69.78 | 47.95 | 43.03 | 41.67 | 69.35 | 41.77 | 46.58 | 66.41 | 71.32 | NA | NA | NA | |
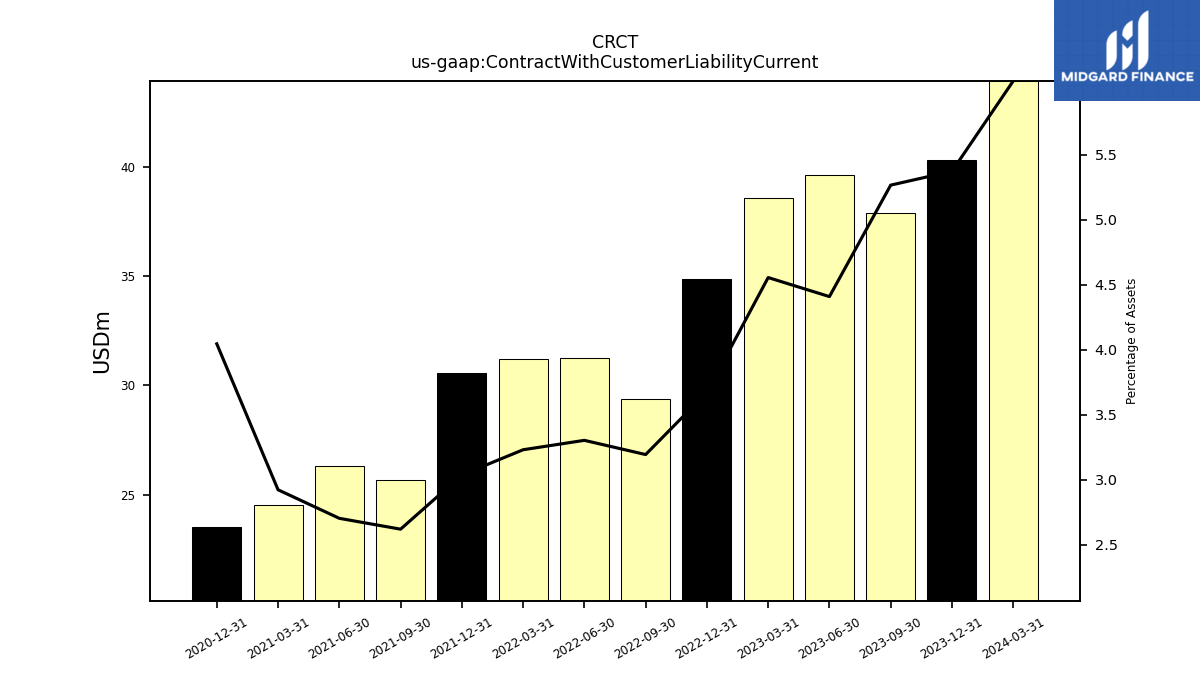
| Contract With Customer Liability Current | 34.87 | 29.37 | 31.26 | 31.21 | 30.55 | 25.68 | 26.33 | 24.55 | 23.52 | NA | NA | NA |
| 2022-12-31 | 2022-09-30 | 2022-06-30 | 2022-03-31 | 2021-12-31 | 2021-09-30 | 2021-06-30 | 2021-03-31 | 2020-12-31 | 2020-09-30 | 2020-06-30 | 2020-03-31 | ||
|---|---|---|---|---|---|---|---|---|---|---|---|---|---|
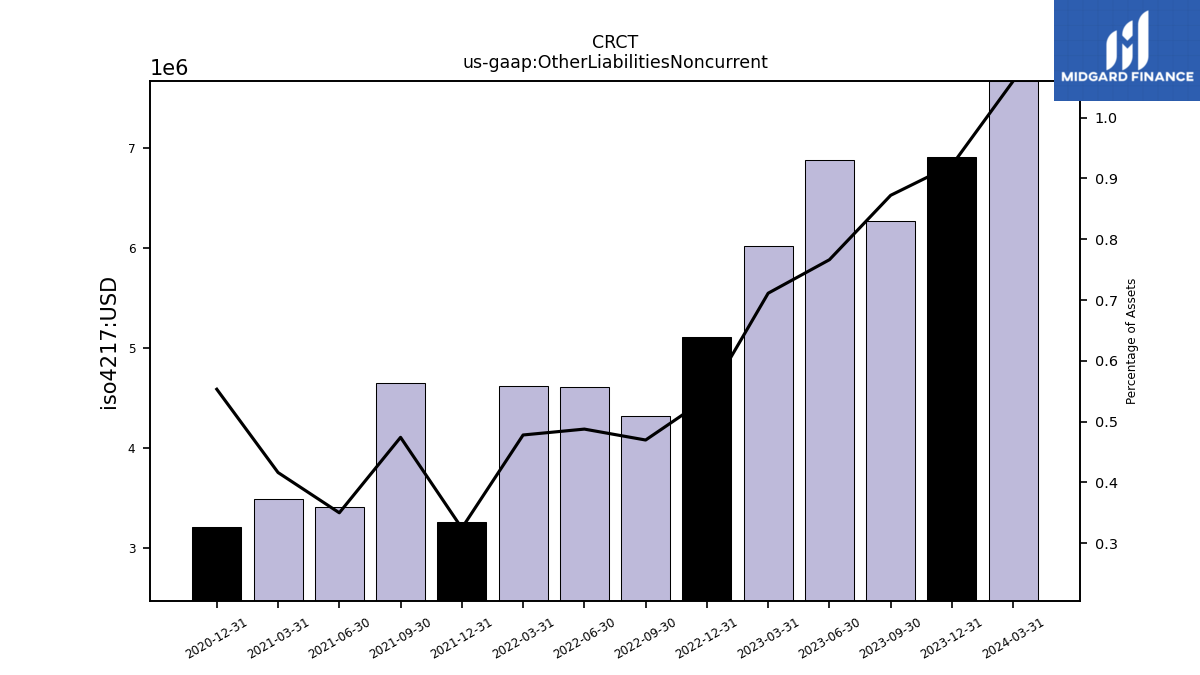
| Other Liabilities Noncurrent | 5.11 | 4.32 | 4.62 | 4.62 | 3.27 | 4.65 | 3.41 | 3.50 | 3.22 | NA | NA | NA | |
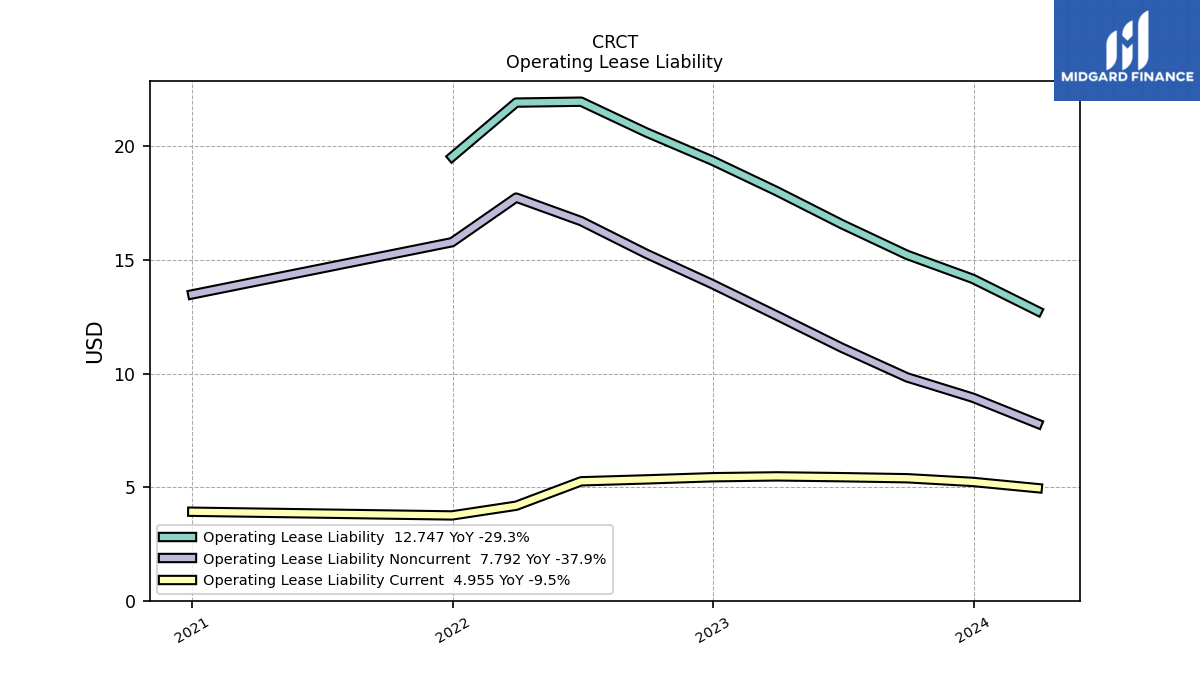
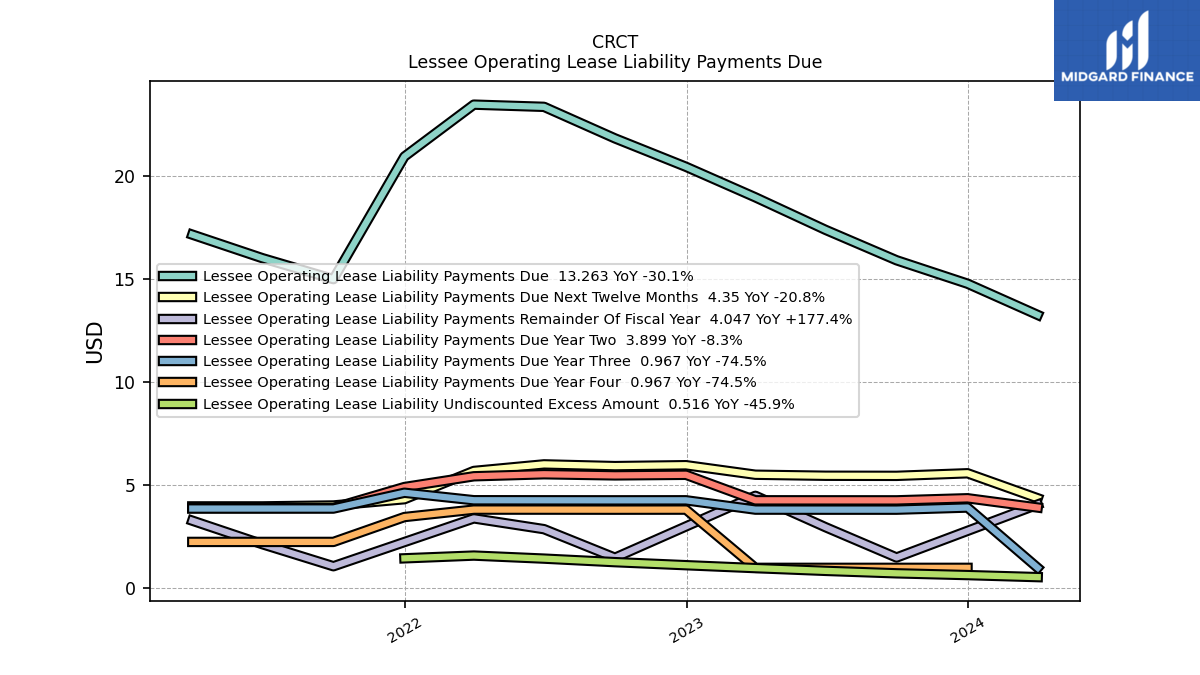
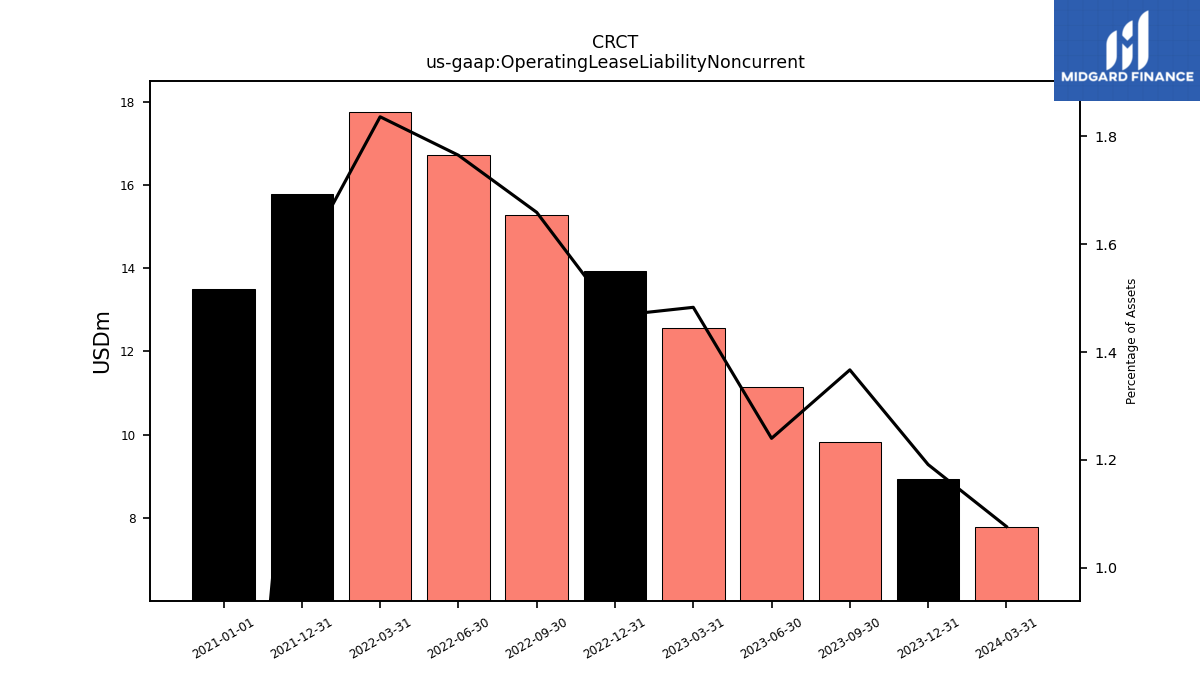
| Operating Lease Liability Noncurrent | 13.94 | 15.26 | 16.71 | 17.74 | 15.78 | NA | NA | NA | NA | NA | NA | NA |
| 2022-12-31 | 2022-09-30 | 2022-06-30 | 2022-03-31 | 2021-12-31 | 2021-09-30 | 2021-06-30 | 2021-03-31 | 2020-12-31 | 2020-09-30 | 2020-06-30 | 2020-03-31 | ||
|---|---|---|---|---|---|---|---|---|---|---|---|---|---|
| Stockholders Equity | 672.74 | 742.70 | 728.26 | 706.63 | 673.98 | 653.22 | 613.61 | 538.45 | 228.93 | 164.33 | 170.06 | 136.01 | |
| Common Stock Value | 0.22 | 0.22 | 0.22 | 0.22 | 0.22 | 0.22 | 0.22 | 0.22 | 0.21 | NA | NA | NA | |
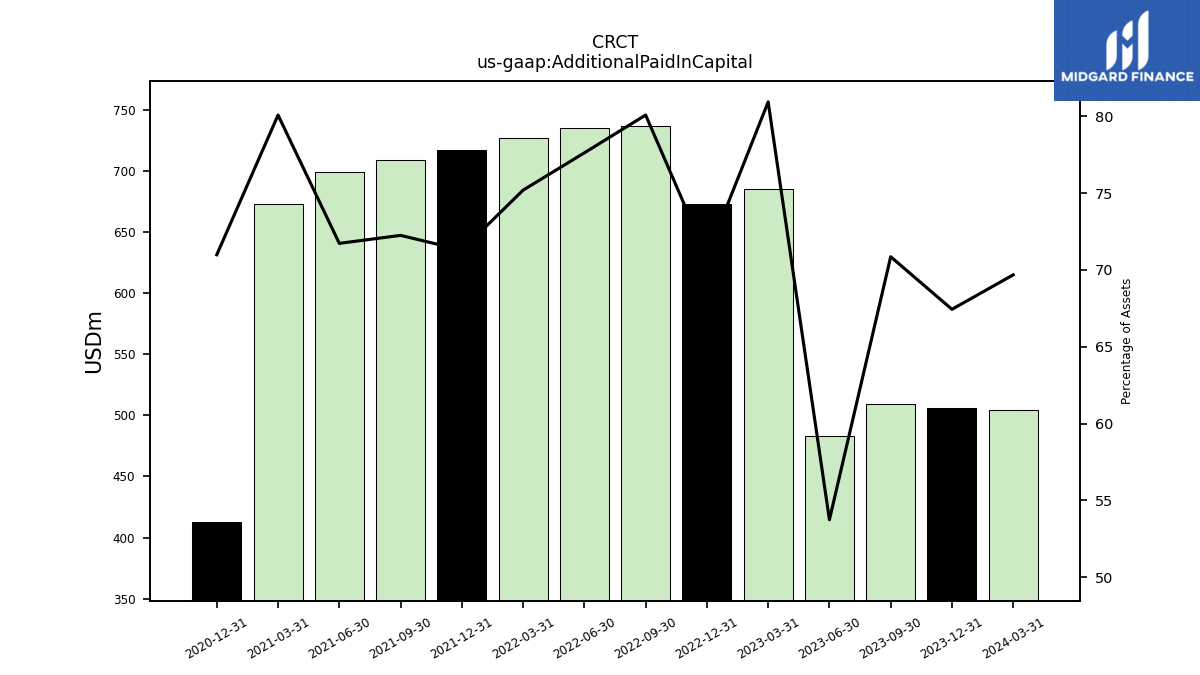
| Additional Paid In Capital | 672.99 | 736.63 | 734.79 | 726.53 | 717.37 | 708.50 | 698.88 | 672.85 | 412.74 | NA | NA | NA | |
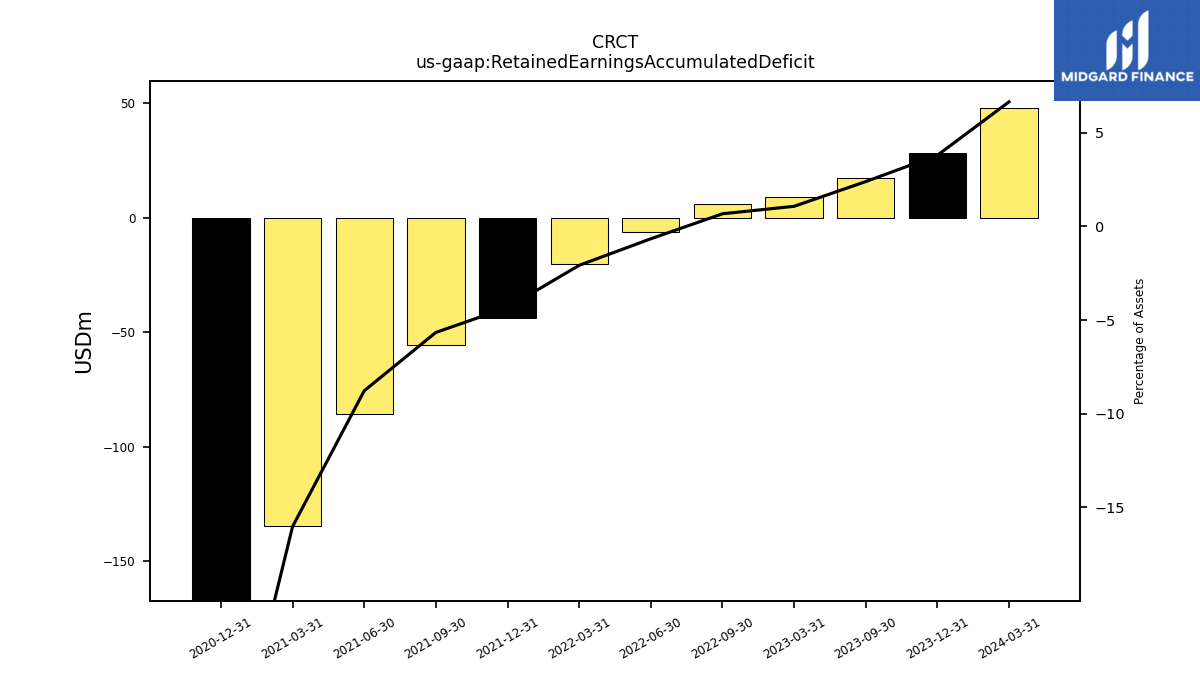
| Retained Earnings Accumulated Deficit | NA | 6.21 | -6.23 | -20.06 | -43.56 | -55.48 | -85.49 | -134.62 | -184.03 | NA | NA | NA | |
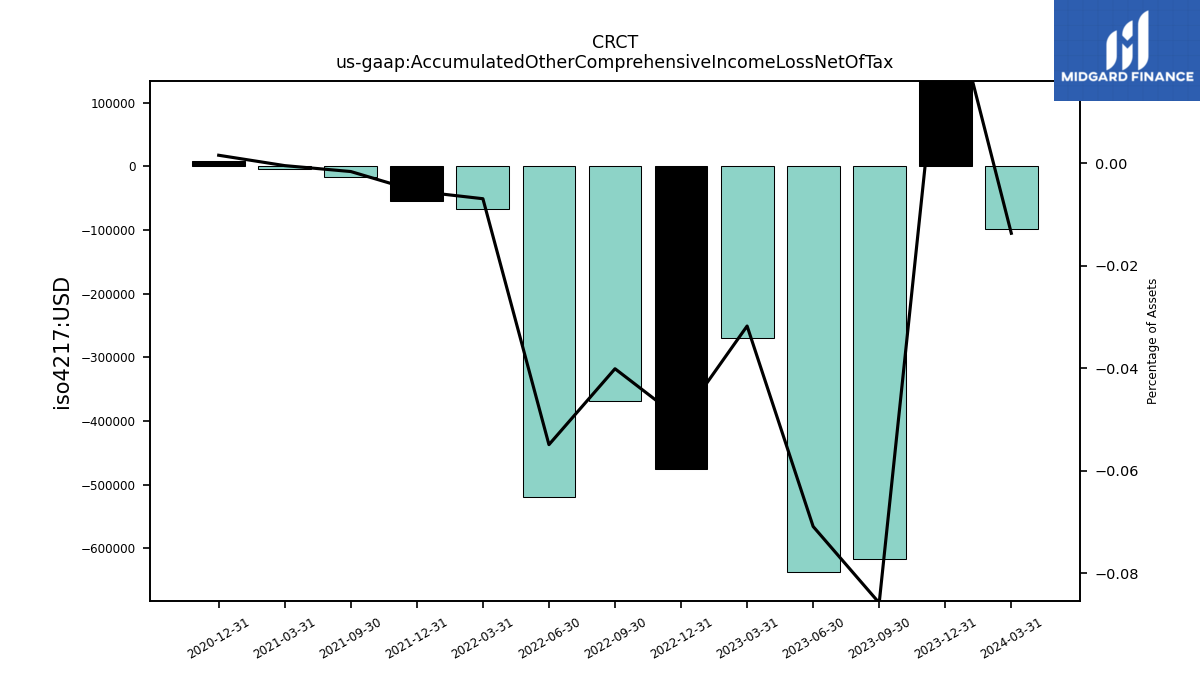
| Accumulated Other Comprehensive Income Loss Net Of Tax | -0.47 | -0.37 | -0.52 | -0.07 | -0.06 | -0.02 | NA | -0.00 | 0.01 | NA | NA | NA | |
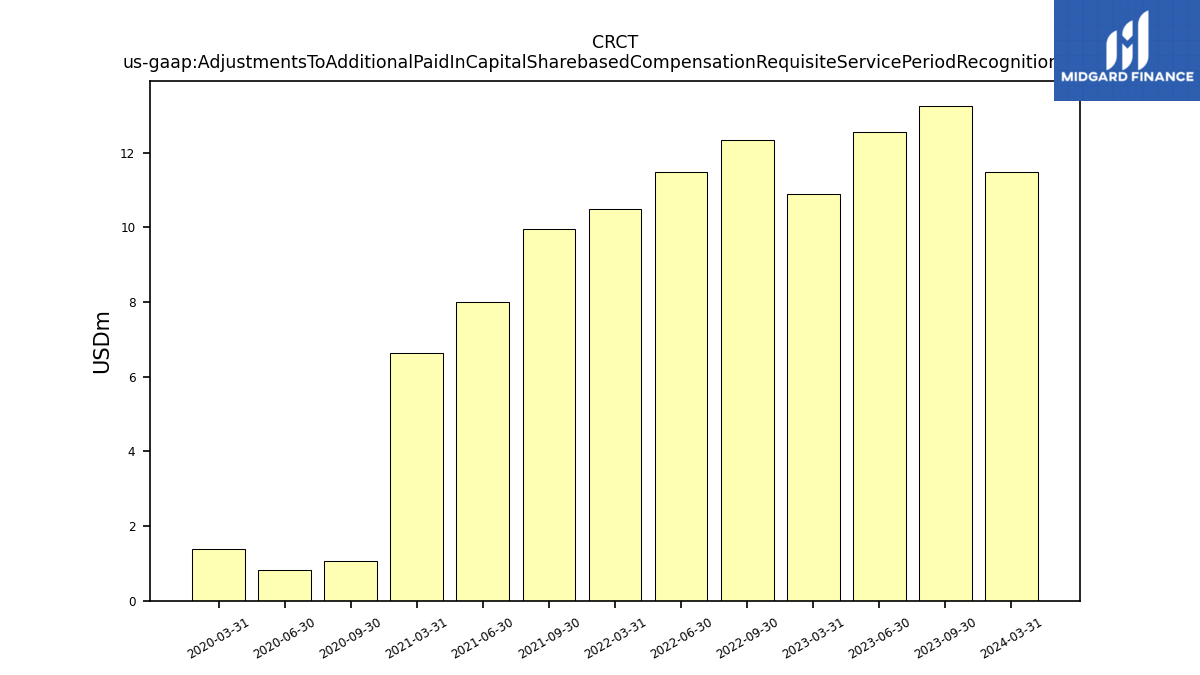
| Adjustments To Additional Paid In Capital Sharebased Compensation Requisite Service Period Recognition Value | NA | 12.35 | 11.48 | 10.50 | NA | 9.97 | 8.02 | 6.63 | NA | 1.05 | 0.83 | 1.38 |
| 2022-12-31 | 2022-09-30 | 2022-06-30 | 2022-03-31 | 2021-12-31 | 2021-09-30 | 2021-06-30 | 2021-03-31 | 2020-12-31 | 2020-09-30 | 2020-06-30 | 2020-03-31 | ||
|---|---|---|---|---|---|---|---|---|---|---|---|---|---|
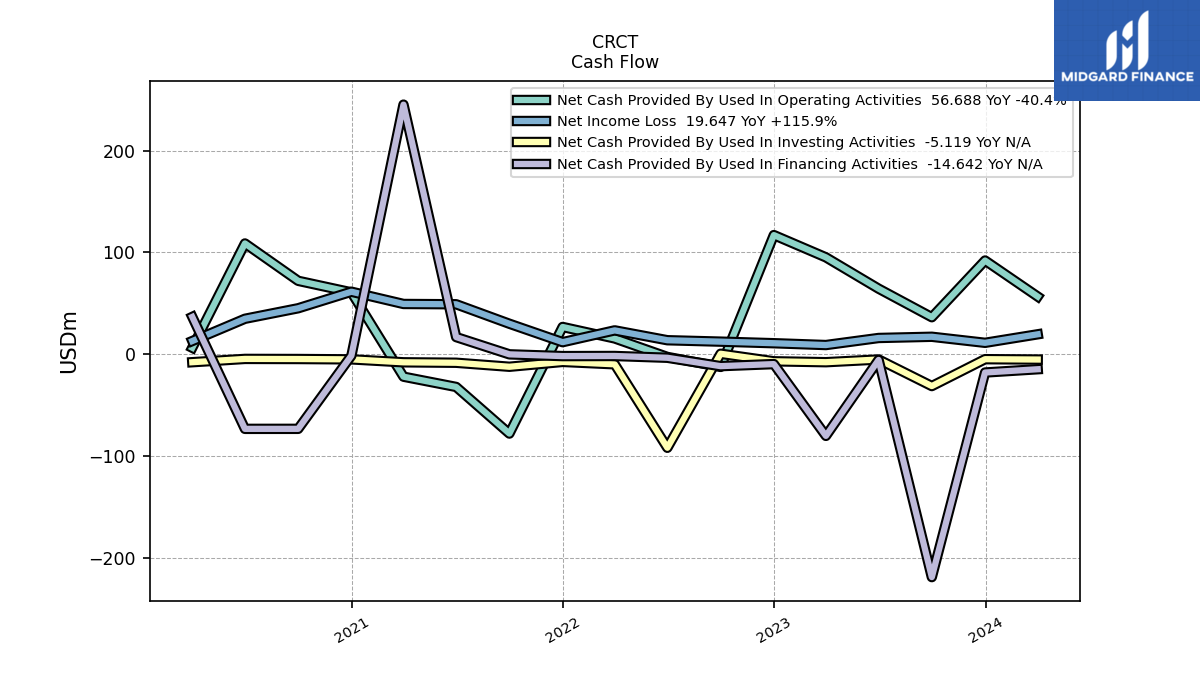
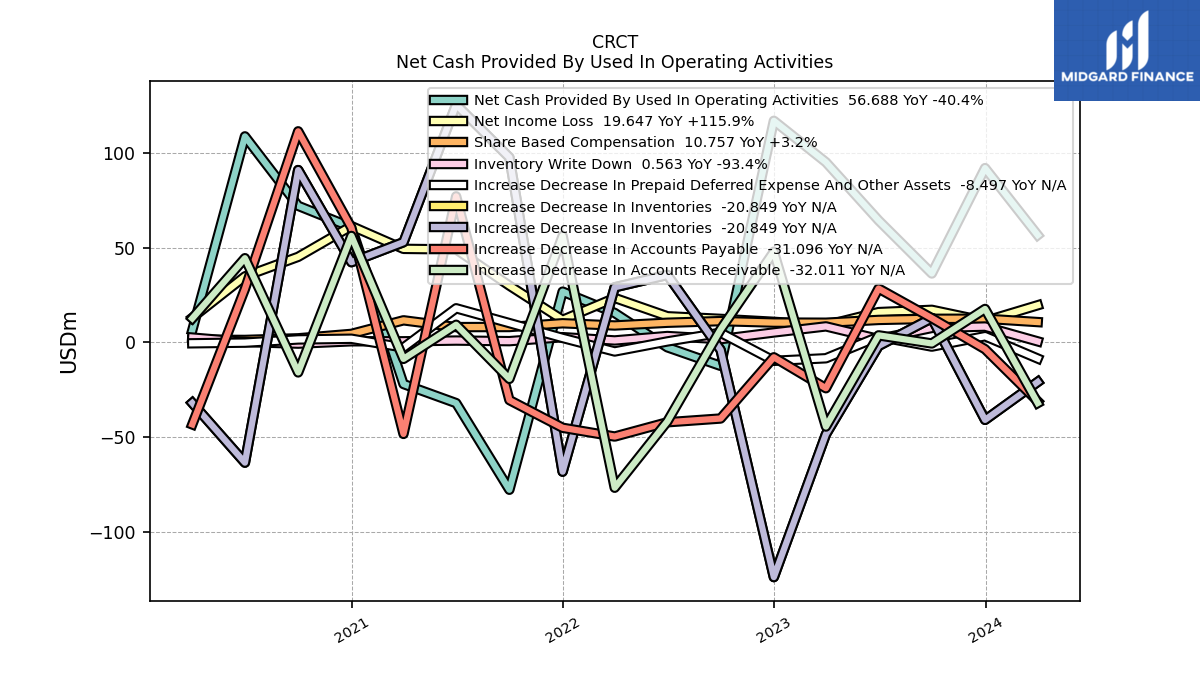
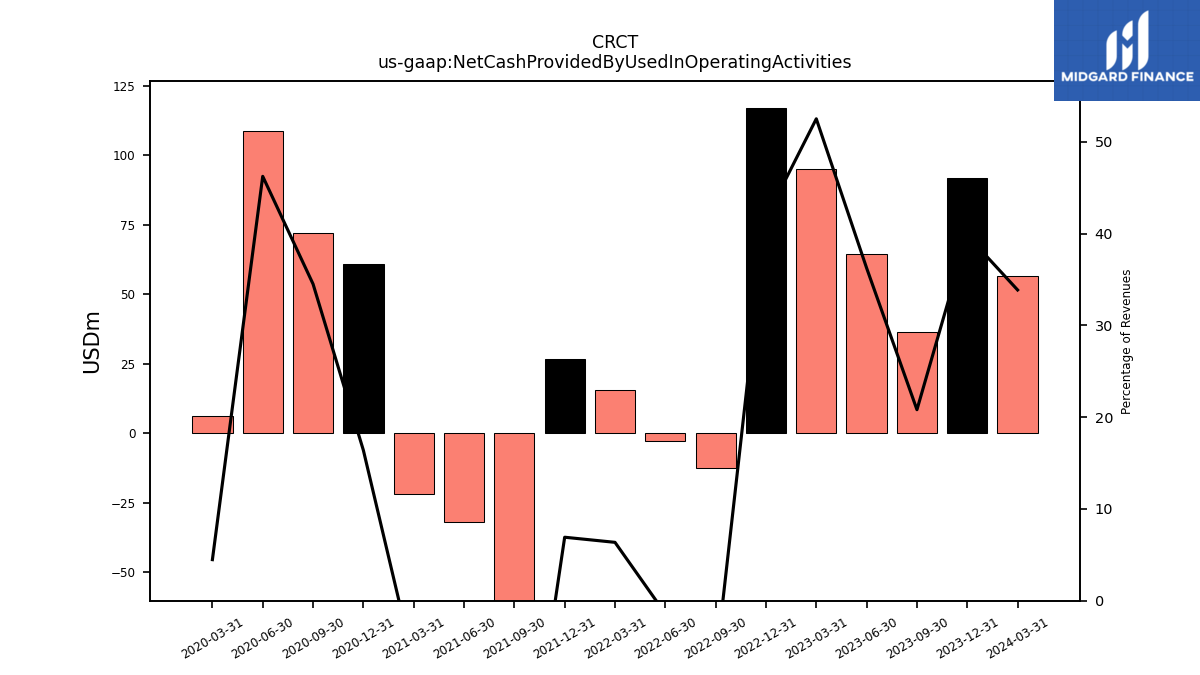
| Net Cash Provided By Used In Operating Activities | 117.05 | -12.38 | -2.57 | 15.58 | 26.84 | -77.80 | -32.03 | -21.96 | 60.82 | 72.14 | 108.83 | 6.44 | |
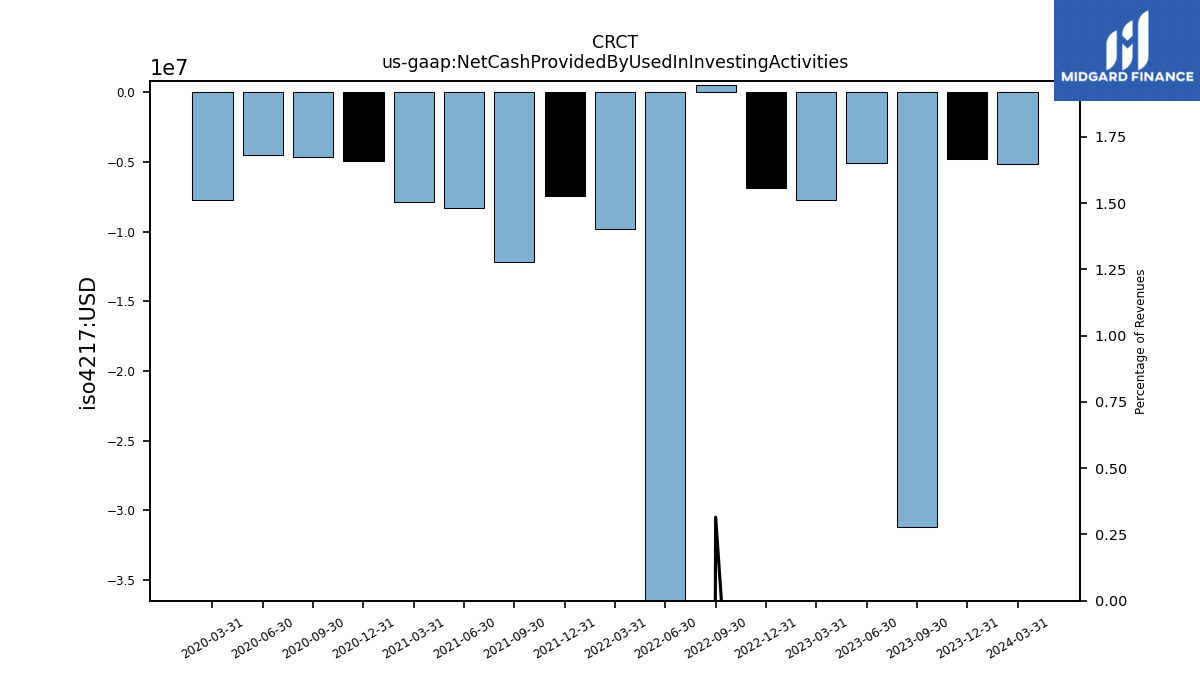
| Net Cash Provided By Used In Investing Activities | -6.86 | 0.56 | -91.76 | -9.81 | -7.45 | -12.21 | -8.29 | -7.84 | -4.96 | -4.61 | -4.52 | -7.75 | |
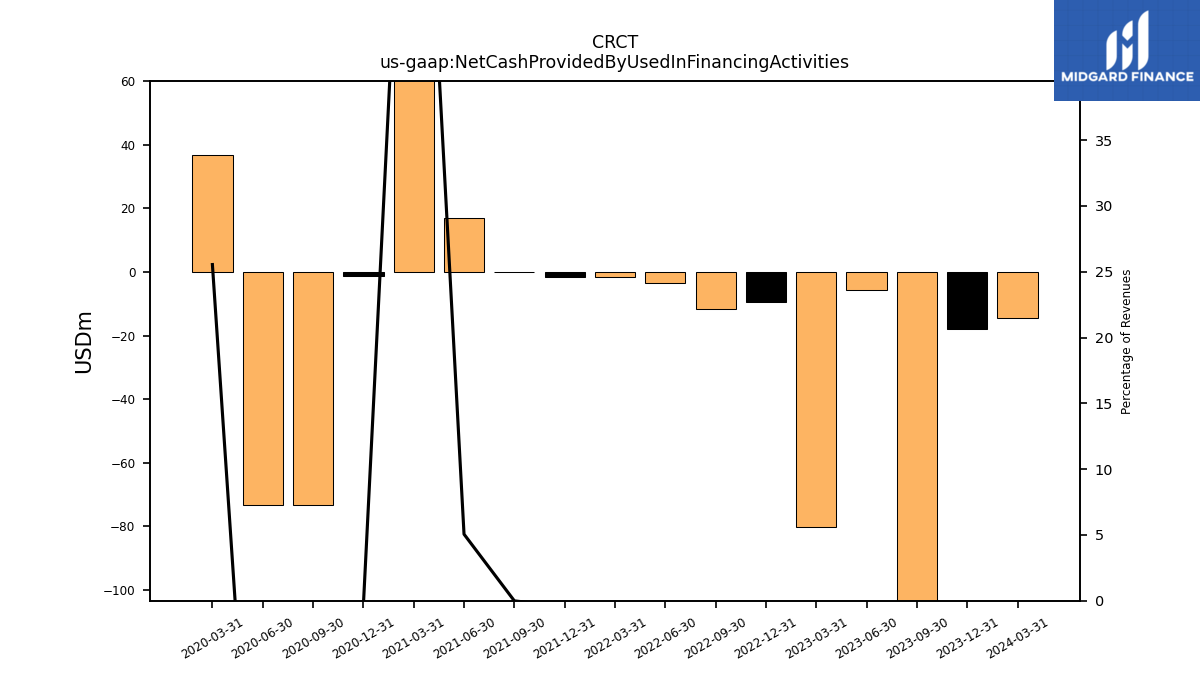
| Net Cash Provided By Used In Financing Activities | -9.59 | -11.62 | -3.39 | -1.64 | -1.75 | -0.02 | 16.91 | 245.10 | -1.29 | -73.16 | -73.18 | 36.71 |
| 2022-12-31 | 2022-09-30 | 2022-06-30 | 2022-03-31 | 2021-12-31 | 2021-09-30 | 2021-06-30 | 2021-03-31 | 2020-12-31 | 2020-09-30 | 2020-06-30 | 2020-03-31 | ||
|---|---|---|---|---|---|---|---|---|---|---|---|---|---|
| Net Cash Provided By Used In Operating Activities | 117.05 | -12.38 | -2.57 | 15.58 | 26.84 | -77.80 | -32.03 | -21.96 | 60.82 | 72.14 | 108.83 | 6.44 | |
| Net Income Loss | 10.89 | 12.44 | 13.83 | 23.50 | 11.92 | 30.00 | 49.13 | 49.42 | 61.45 | 45.21 | 34.88 | 13.04 | |
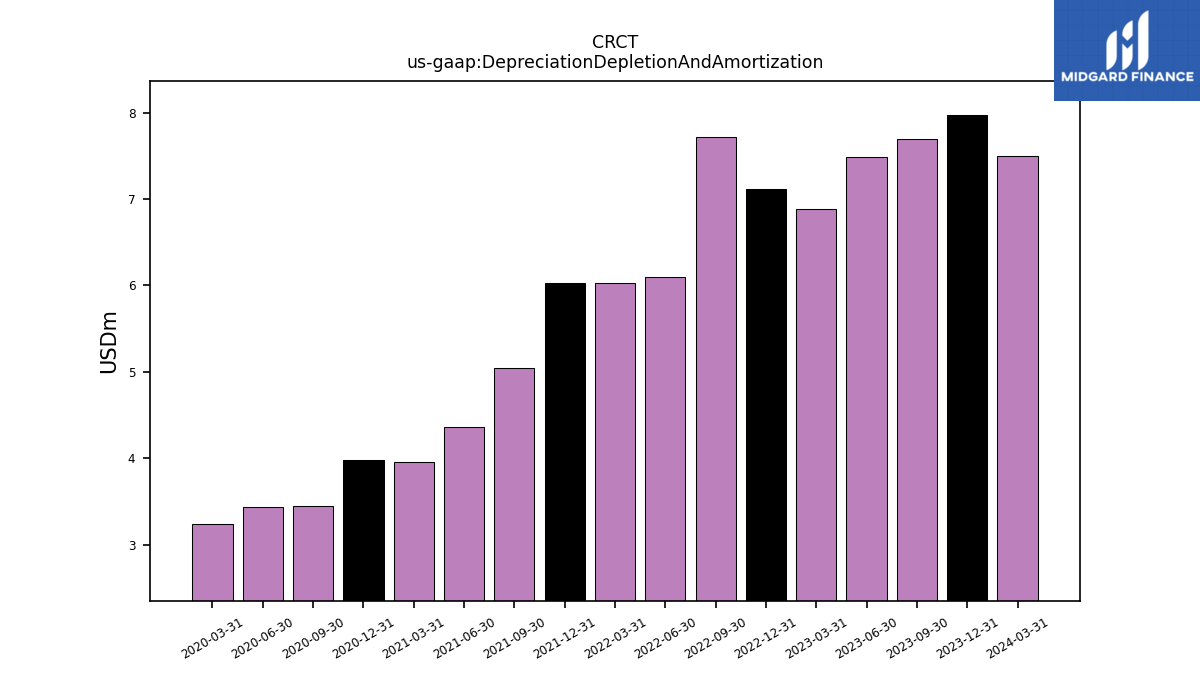
| Depreciation Depletion And Amortization | 7.12 | 7.71 | 6.10 | 6.03 | 6.02 | 5.05 | 4.36 | 3.96 | 3.98 | 3.45 | 3.44 | 3.25 | |
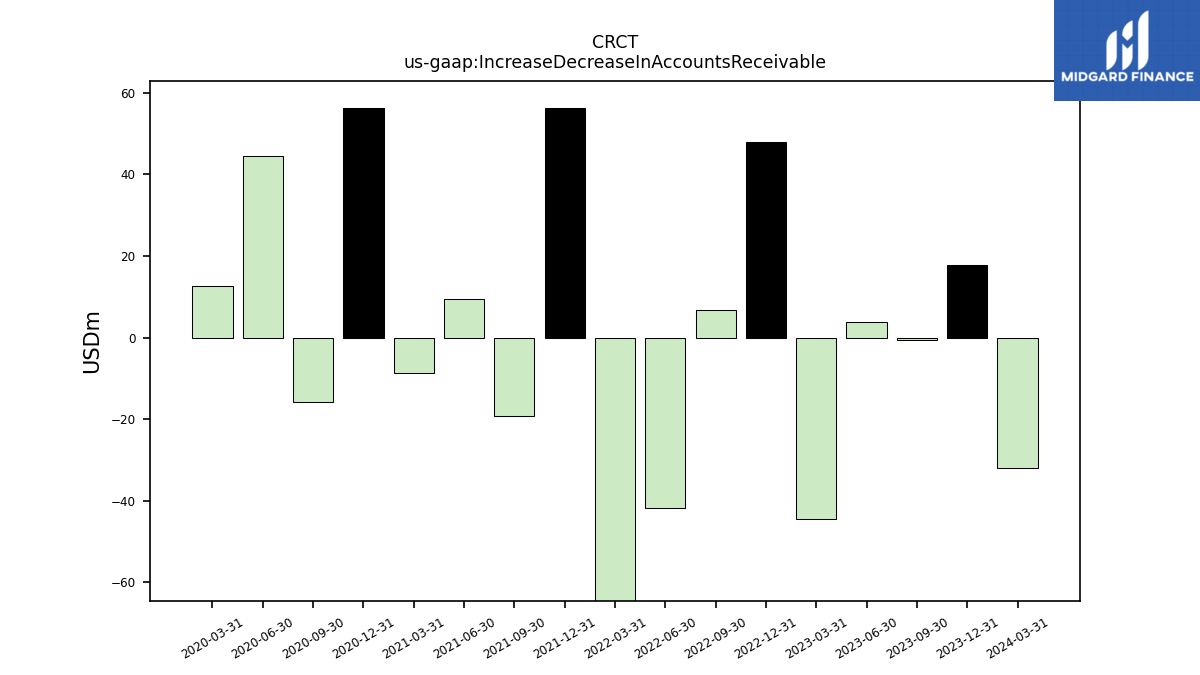
| Increase Decrease In Accounts Receivable | 47.90 | 6.85 | -41.72 | -76.73 | 56.25 | -19.24 | 9.34 | -8.68 | 56.25 | -15.83 | 44.50 | 12.71 | |
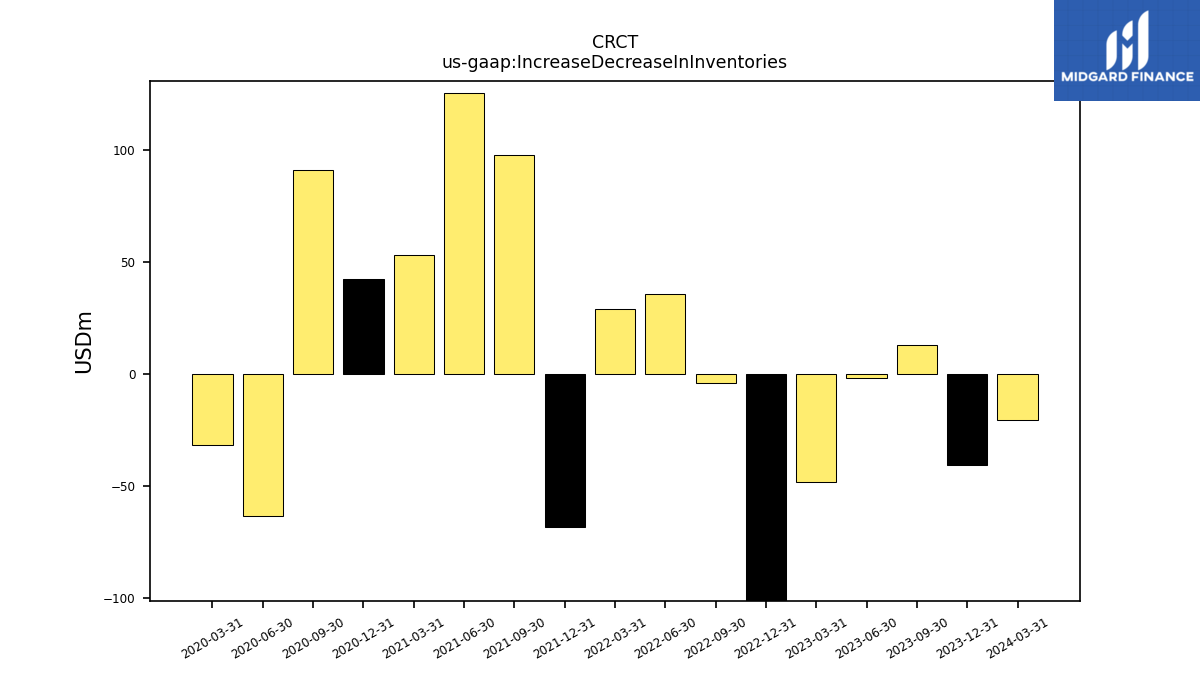
| Increase Decrease In Inventories | -123.93 | -3.94 | 35.66 | 29.13 | -68.25 | 97.70 | 125.59 | 52.94 | 42.38 | 91.03 | -63.47 | -31.97 | |
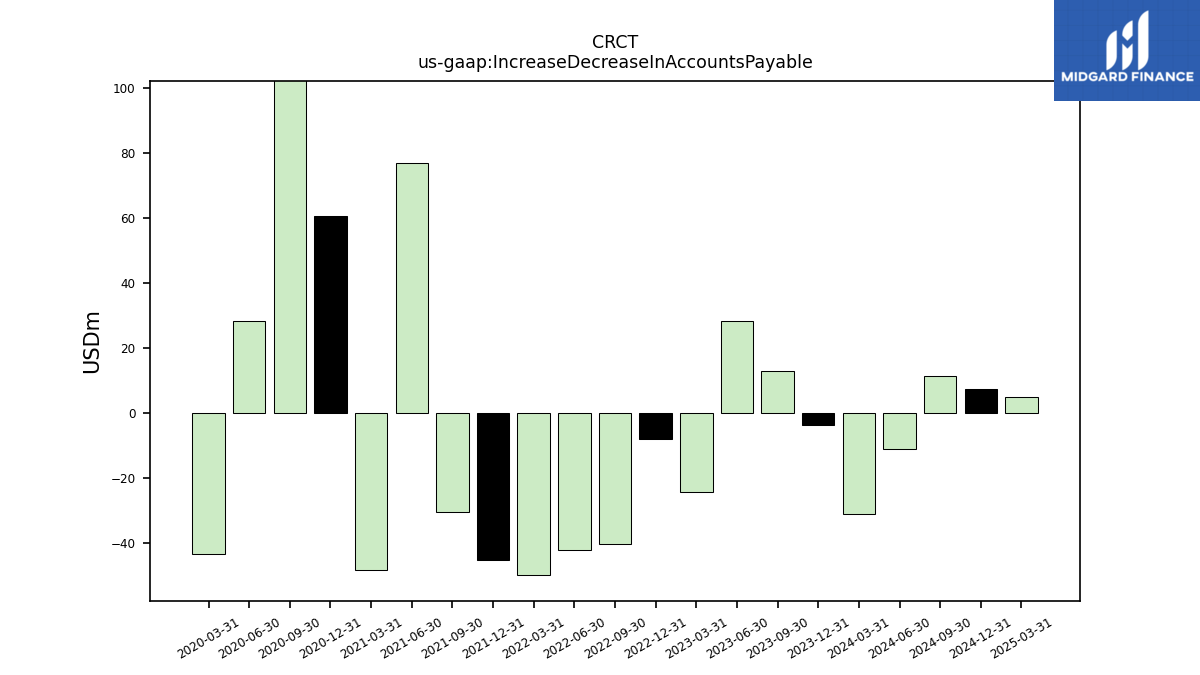
| Increase Decrease In Accounts Payable | -7.83 | -40.17 | -42.15 | -49.69 | -45.06 | -30.44 | 77.15 | -48.32 | 60.59 | 111.50 | 28.23 | -43.29 | |
| Share Based Compensation | 10.49 | 11.27 | 10.40 | 8.96 | 10.13 | 8.15 | 8.11 | 11.69 | 4.52 | 2.19 | 1.33 | 1.45 |
| 2022-12-31 | 2022-09-30 | 2022-06-30 | 2022-03-31 | 2021-12-31 | 2021-09-30 | 2021-06-30 | 2021-03-31 | 2020-12-31 | 2020-09-30 | 2020-06-30 | 2020-03-31 | ||
|---|---|---|---|---|---|---|---|---|---|---|---|---|---|
| Net Cash Provided By Used In Investing Activities | -6.86 | 0.56 | -91.76 | -9.81 | -7.45 | -12.21 | -8.29 | -7.84 | -4.96 | -4.61 | -4.52 | -7.75 |
| 2022-12-31 | 2022-09-30 | 2022-06-30 | 2022-03-31 | 2021-12-31 | 2021-09-30 | 2021-06-30 | 2021-03-31 | 2020-12-31 | 2020-09-30 | 2020-06-30 | 2020-03-31 | ||
|---|---|---|---|---|---|---|---|---|---|---|---|---|---|
| Net Cash Provided By Used In Financing Activities | -9.59 | -11.62 | -3.39 | -1.64 | -1.75 | -0.02 | 16.91 | 245.10 | -1.29 | -73.16 | -73.18 | 36.71 | |
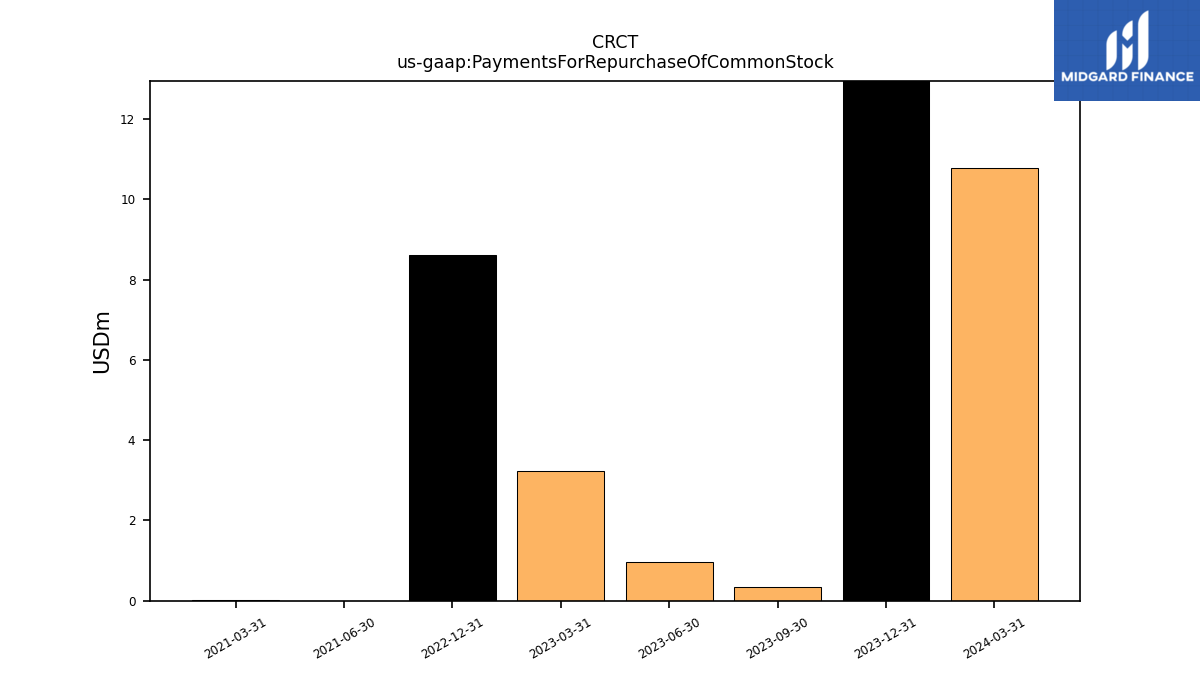
| Payments For Repurchase Of Common Stock | 8.61 | NA | NA | NA | NA | NA | 0.00 | 0.01 | NA | NA | NA | NA |
| 2022-12-31 | 2022-09-30 | 2022-06-30 | 2022-03-31 | 2021-12-31 | 2021-09-30 | 2021-06-30 | 2021-03-31 | 2020-12-31 | 2020-09-30 | 2020-06-30 | 2020-03-31 | ||
|---|---|---|---|---|---|---|---|---|---|---|---|---|---|
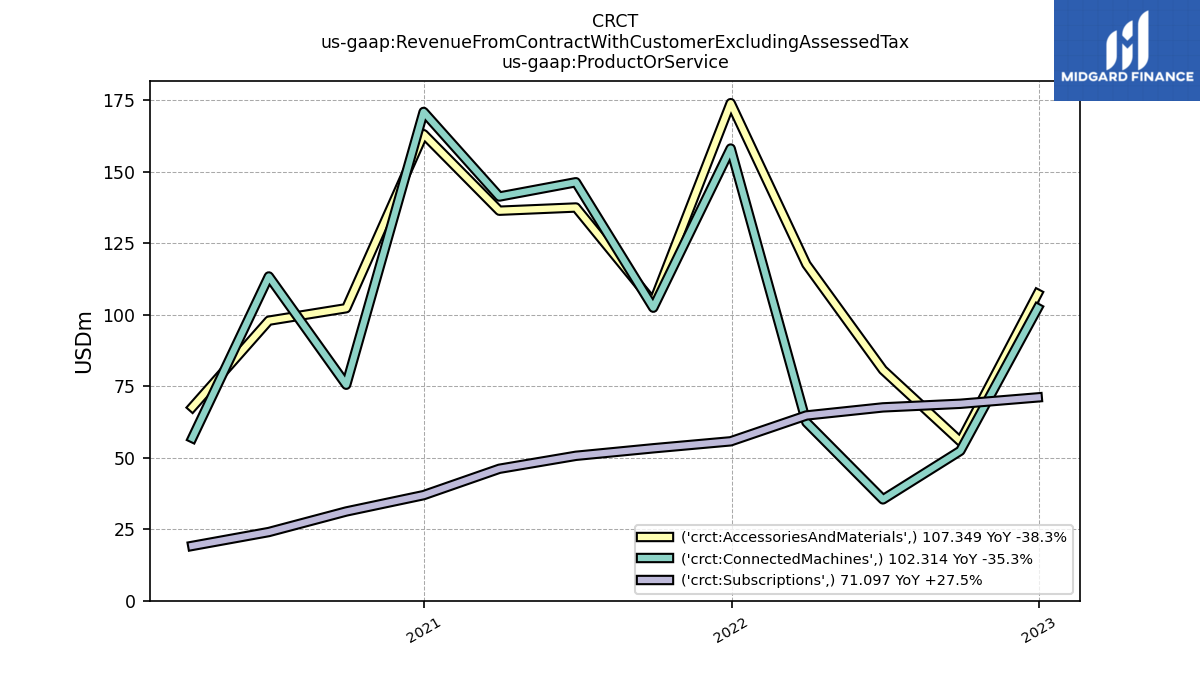
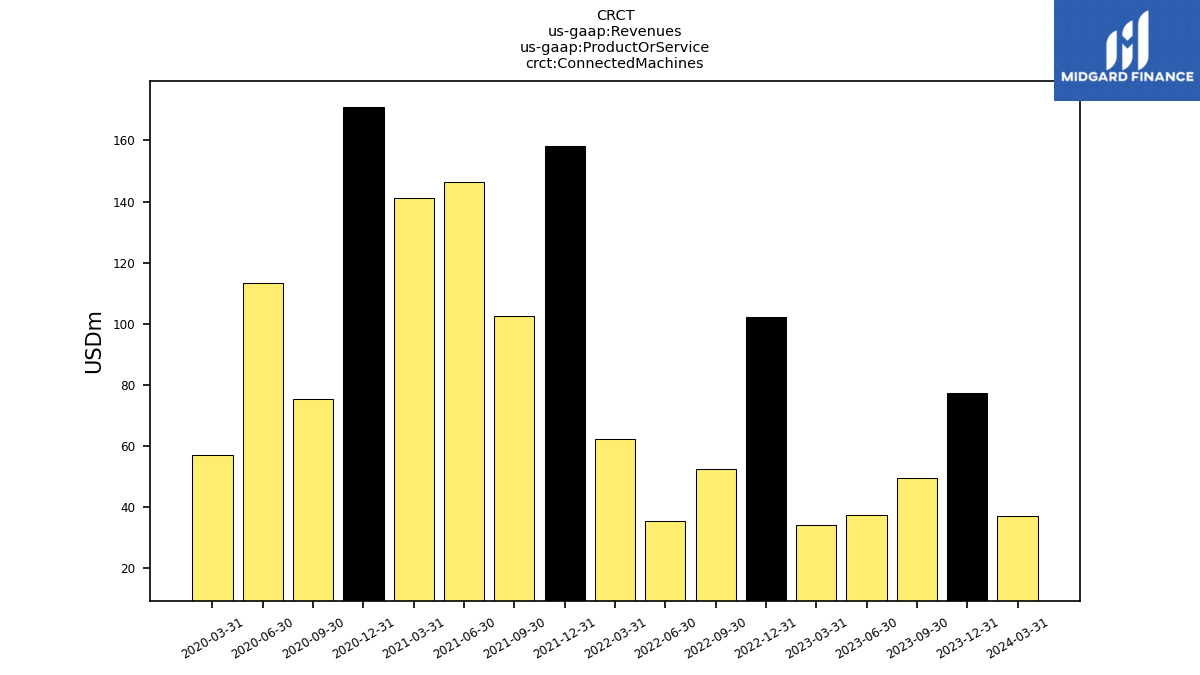
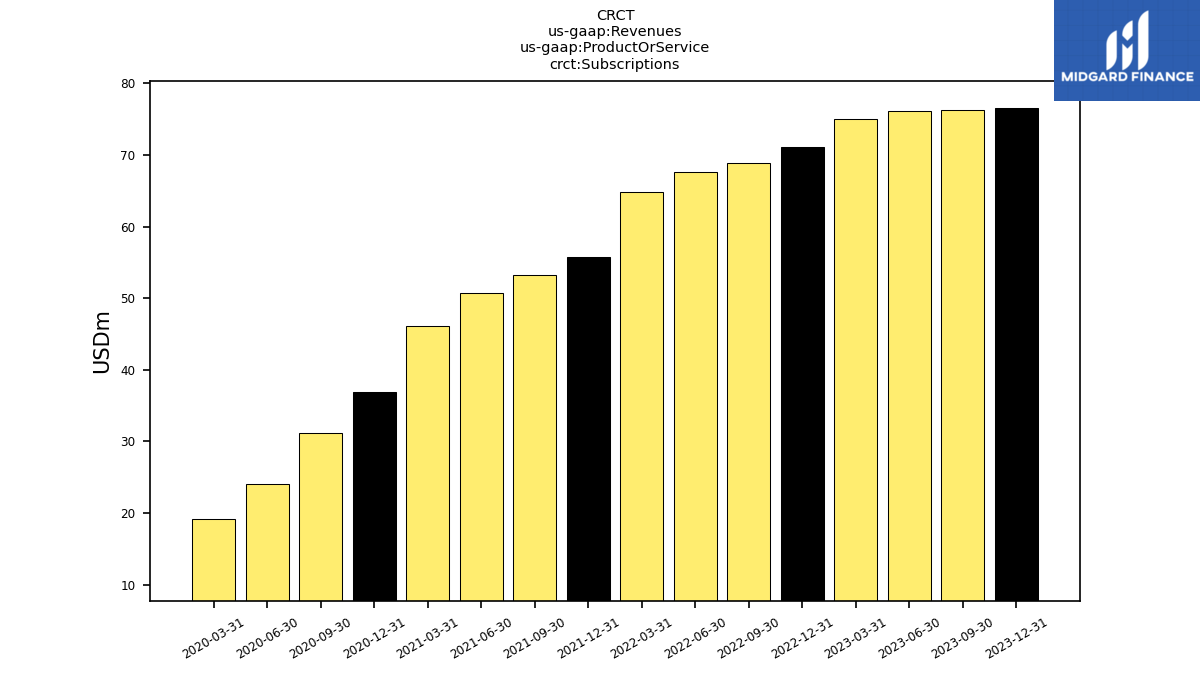
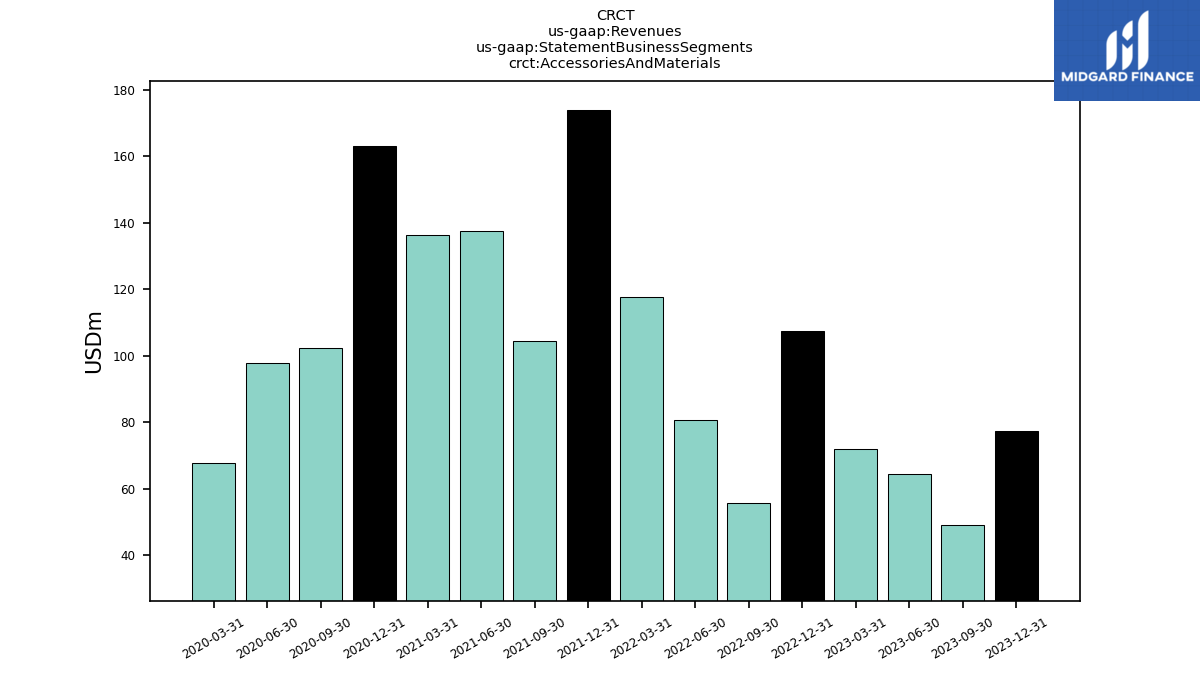
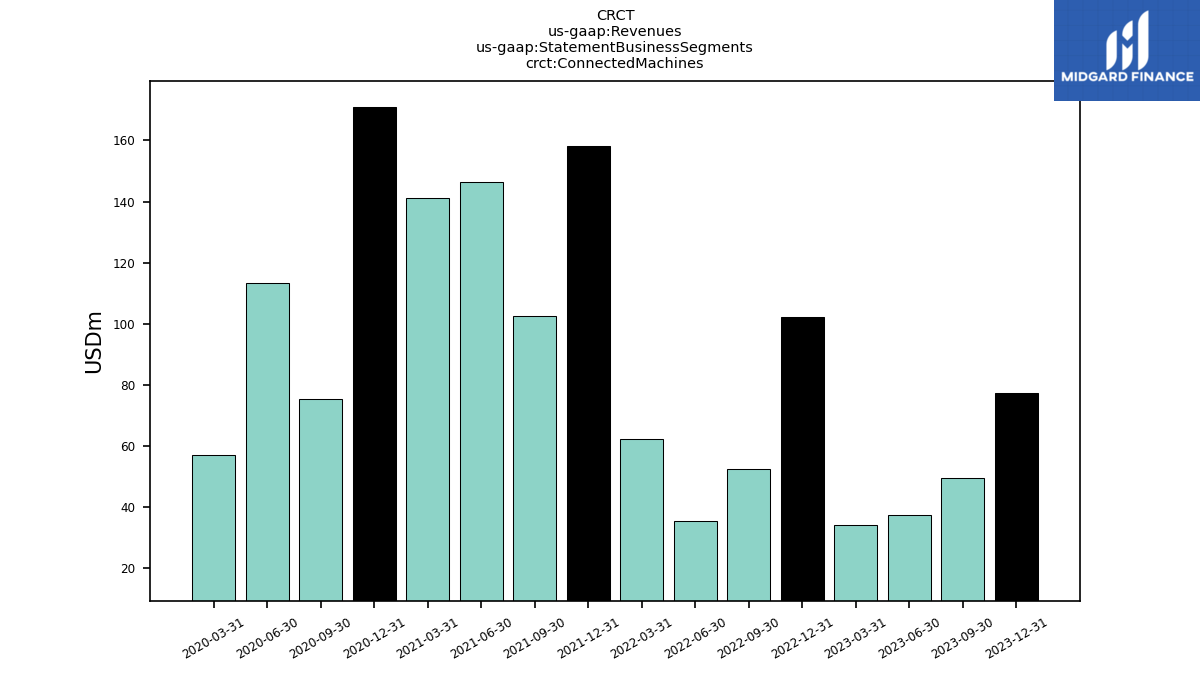
| Revenues | 280.76 | 177.00 | 183.76 | 244.78 | 387.83 | 260.09 | 334.49 | 323.82 | 370.97 | 209.00 | 235.34 | 143.72 | |
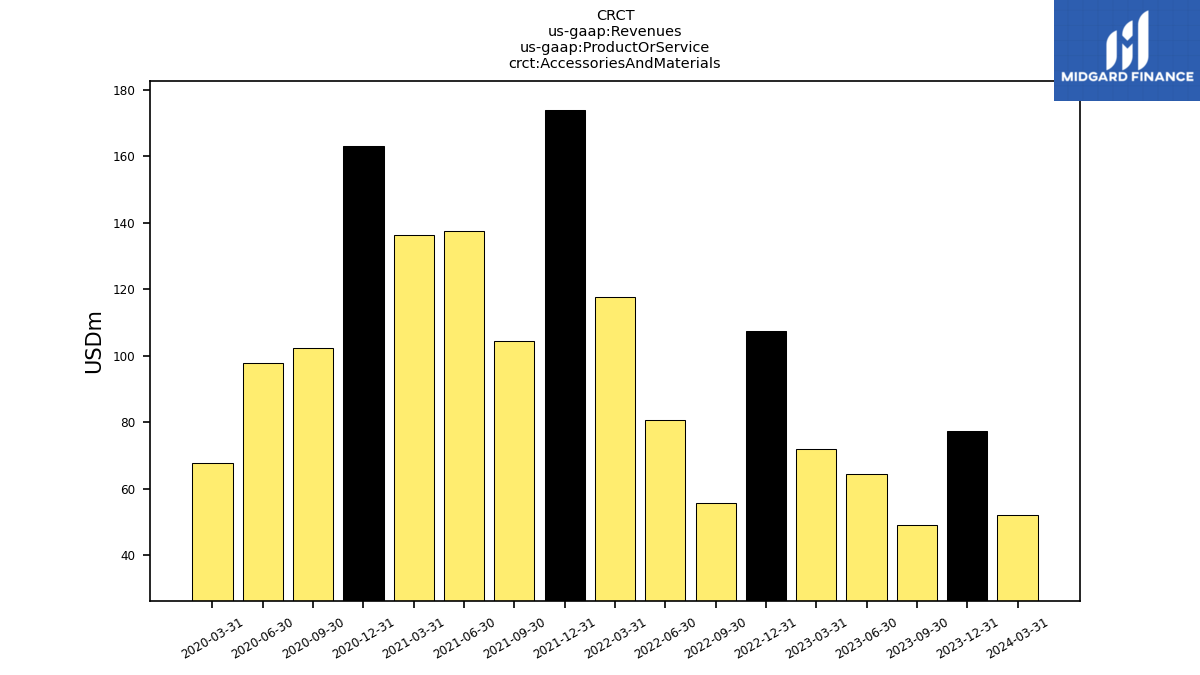
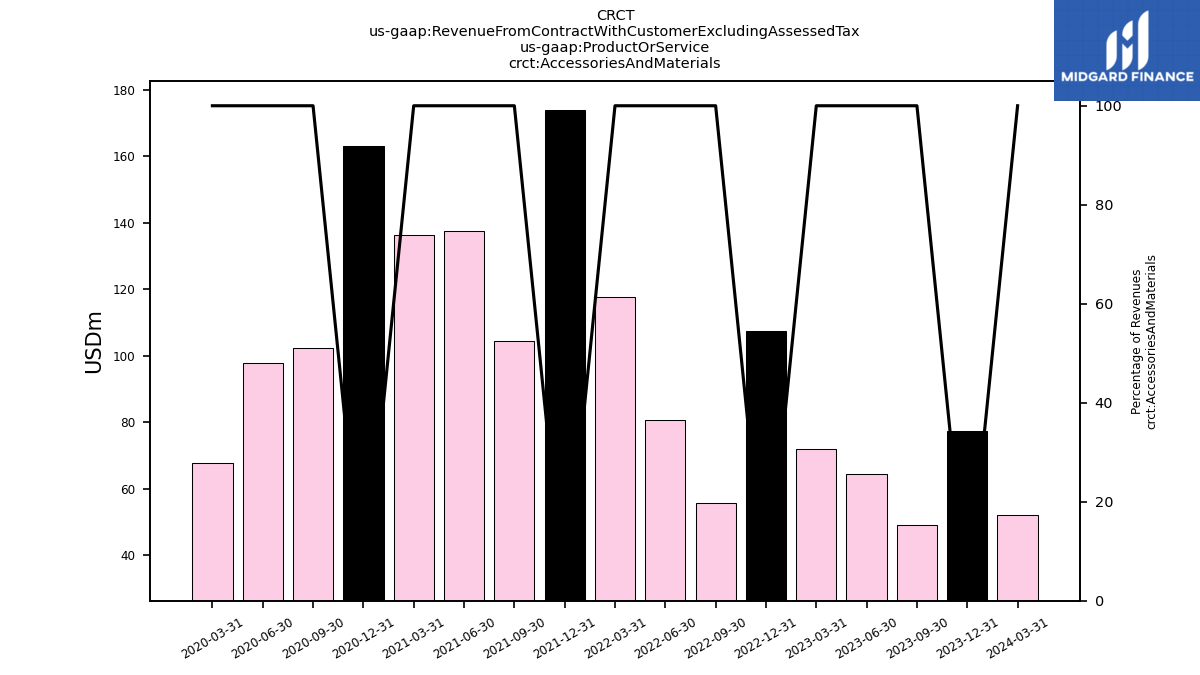
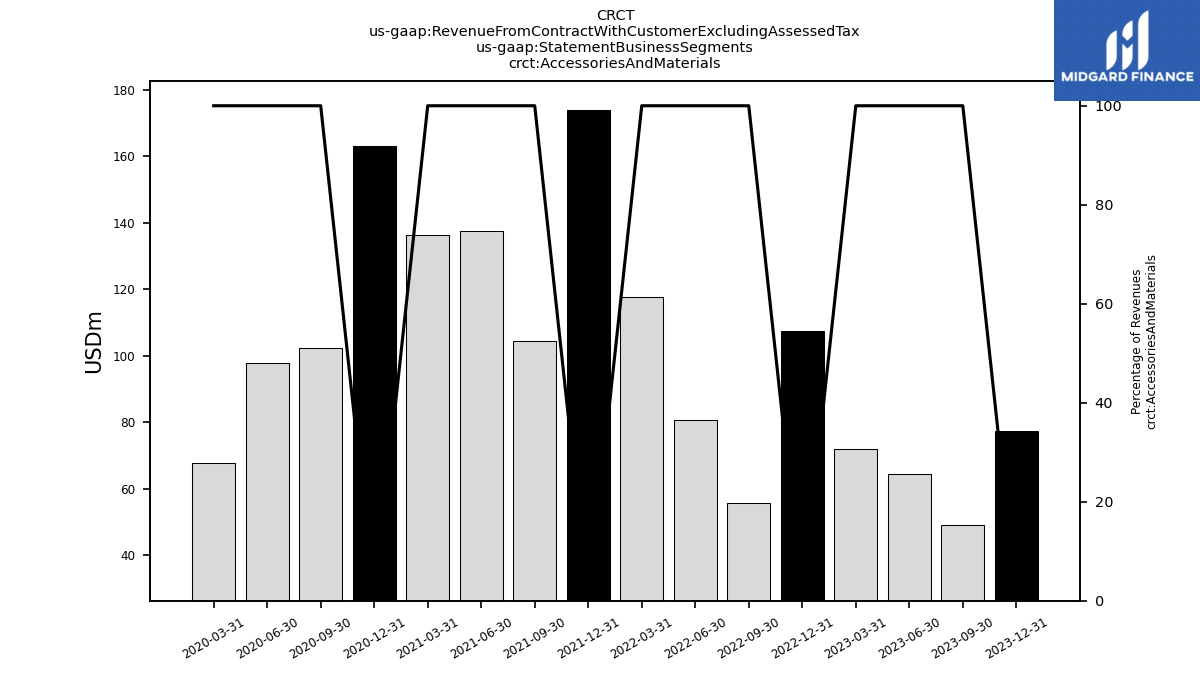
| Accessories And Materials | 107.35 | 55.71 | 80.72 | 117.61 | 173.98 | 104.33 | 137.49 | 136.36 | 163.13 | 102.28 | 97.92 | 67.66 | |
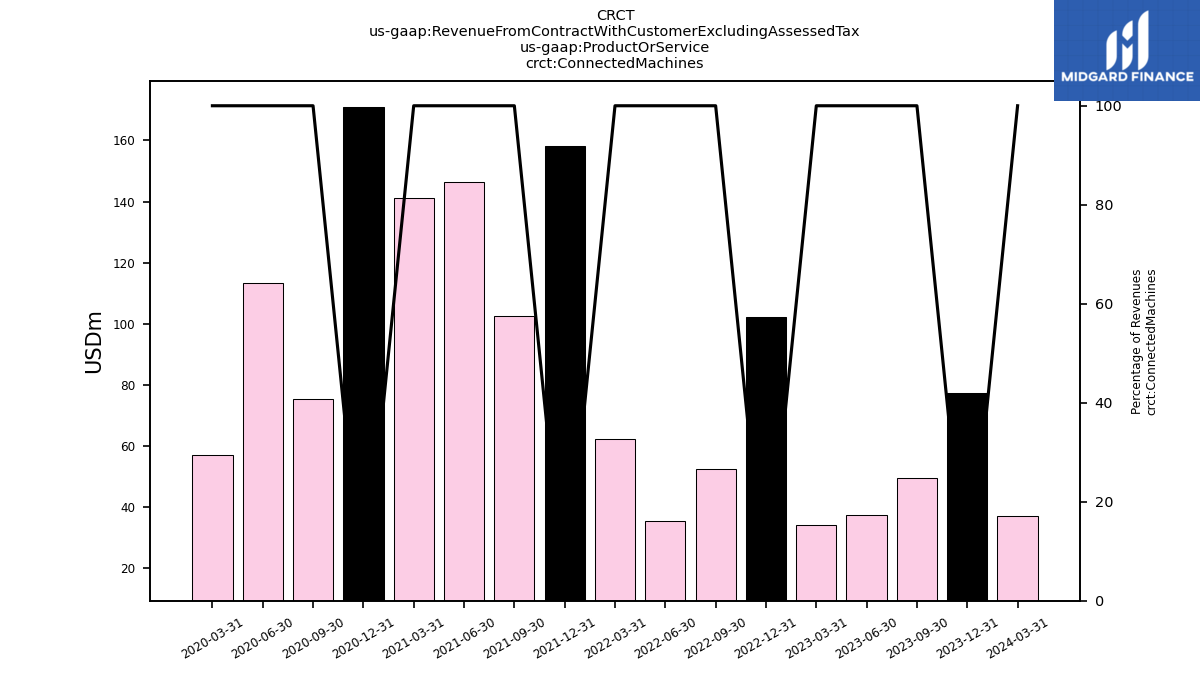
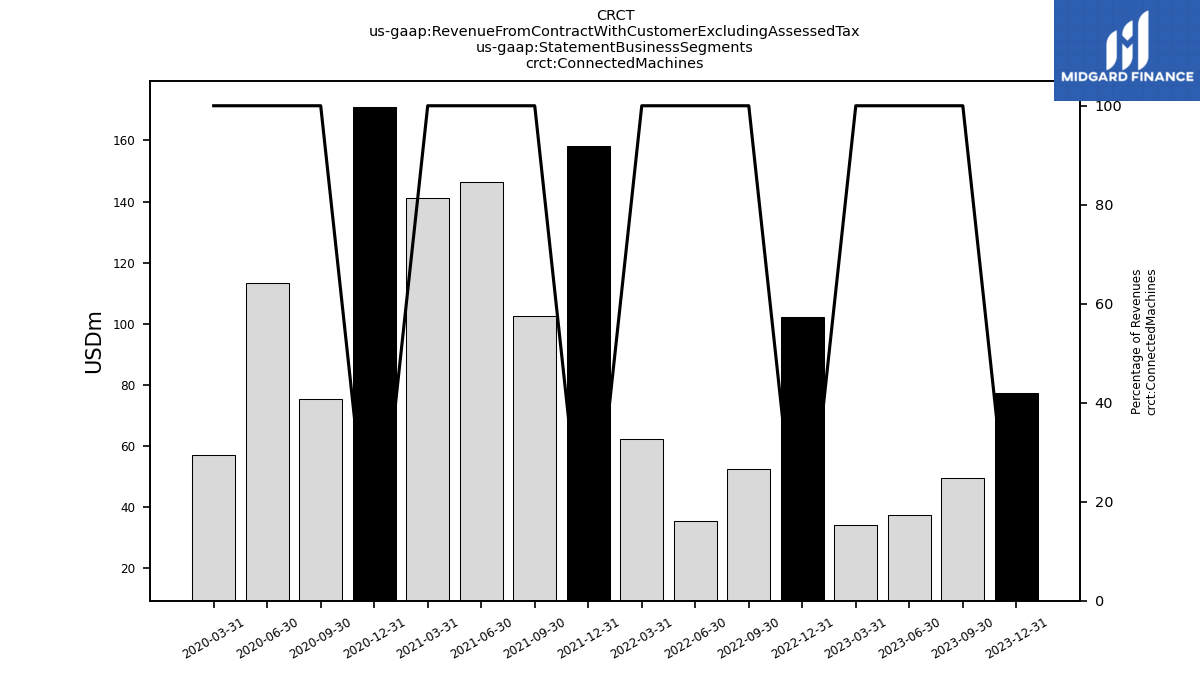
| Connected Machines | 102.31 | 52.42 | 35.44 | 62.39 | 158.10 | 102.45 | 146.33 | 141.32 | 170.91 | 75.52 | 113.39 | 56.89 | |
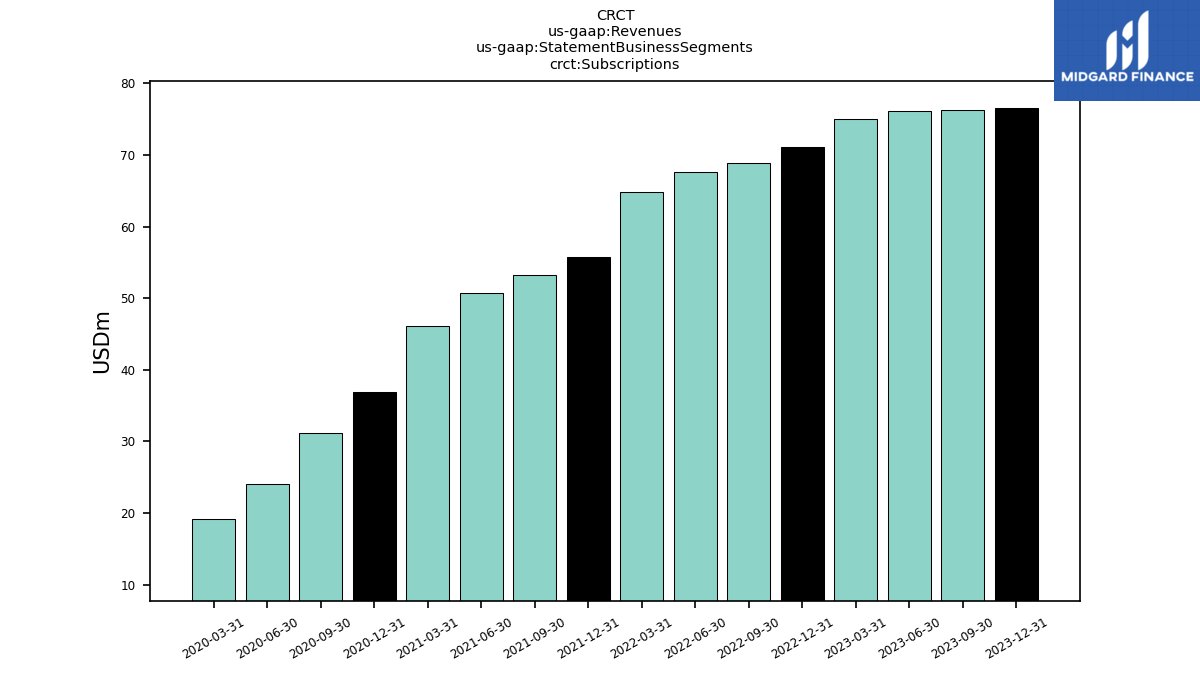
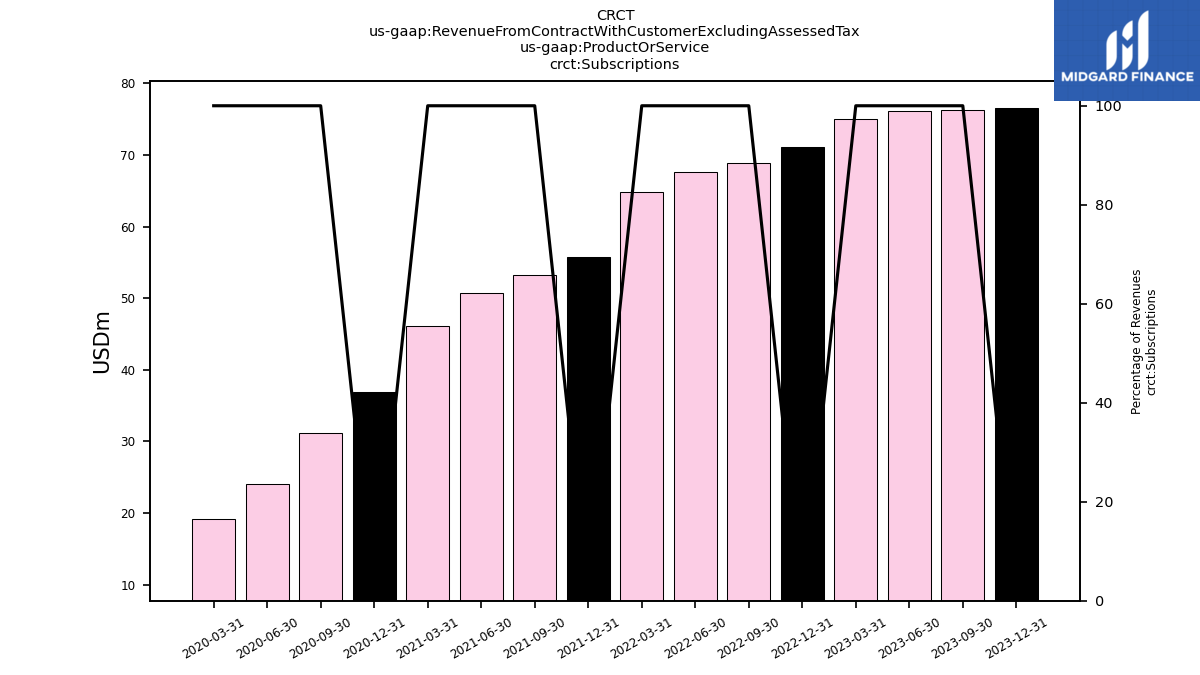
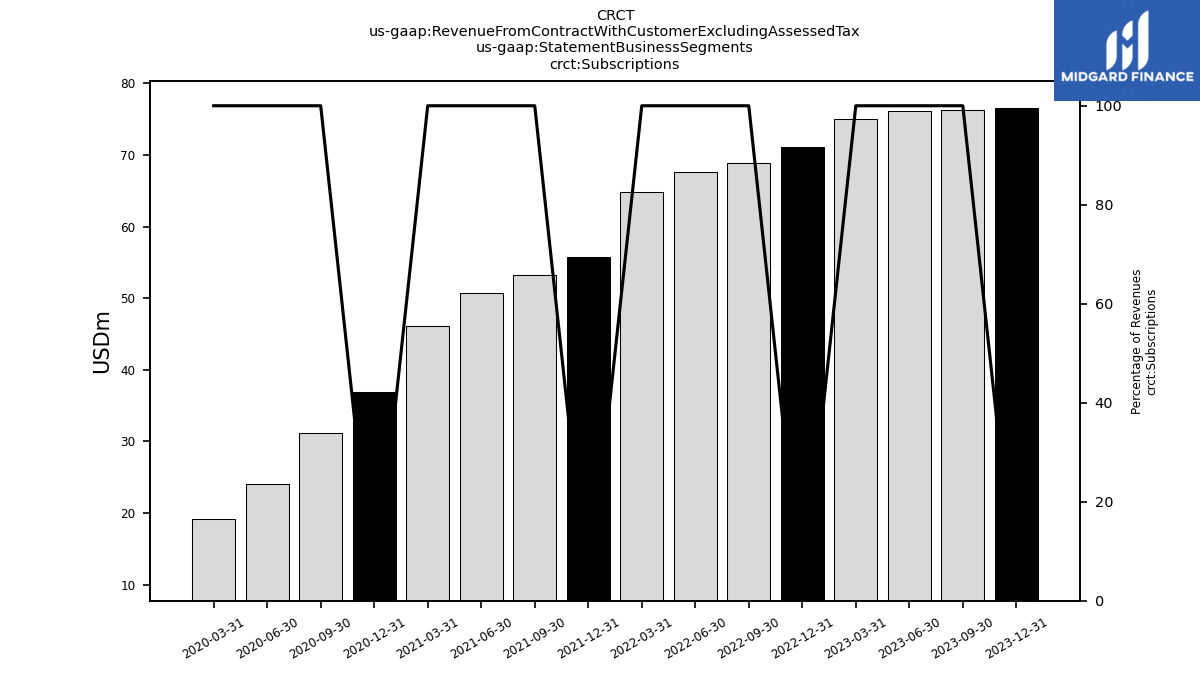
| Subscriptions | 71.10 | 68.86 | 67.60 | 64.78 | 55.74 | 53.30 | 50.67 | 46.14 | 36.92 | 31.21 | 24.03 | 19.18 | |
| Accessories And Materials | 107.35 | 55.71 | 80.72 | 117.61 | 173.98 | 104.33 | 137.49 | 136.36 | 163.13 | 102.28 | 97.92 | 67.66 | |
| Connected Machines | 102.31 | 52.42 | 35.44 | 62.39 | 158.10 | 102.45 | 146.33 | 141.32 | 170.91 | 75.52 | 113.39 | 56.89 | |
| Subscriptions | 71.10 | 68.86 | 67.60 | 64.78 | 55.74 | 53.30 | 50.67 | 46.14 | 36.92 | 31.21 | 24.03 | 19.18 | |
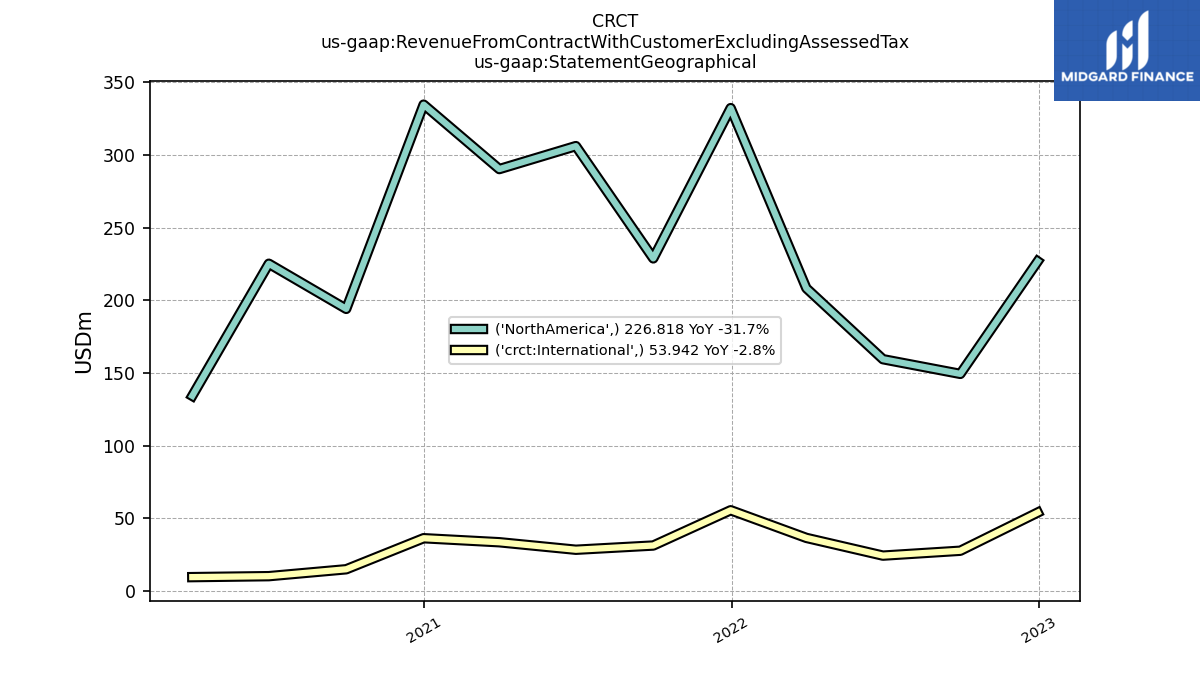
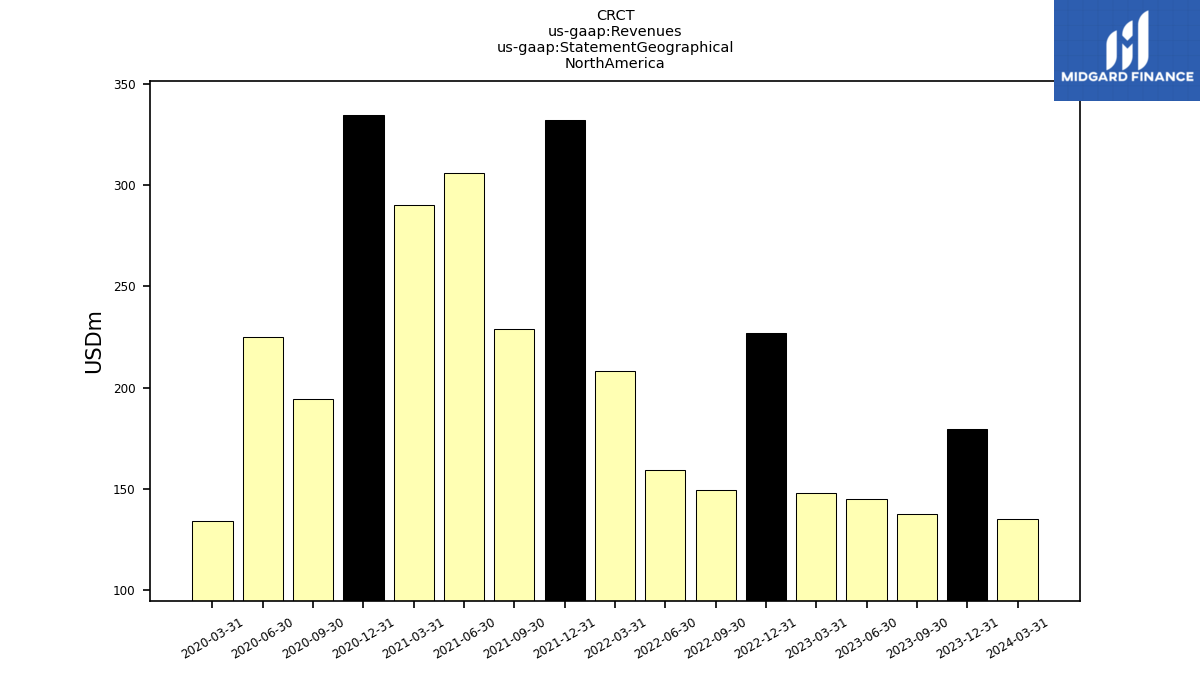
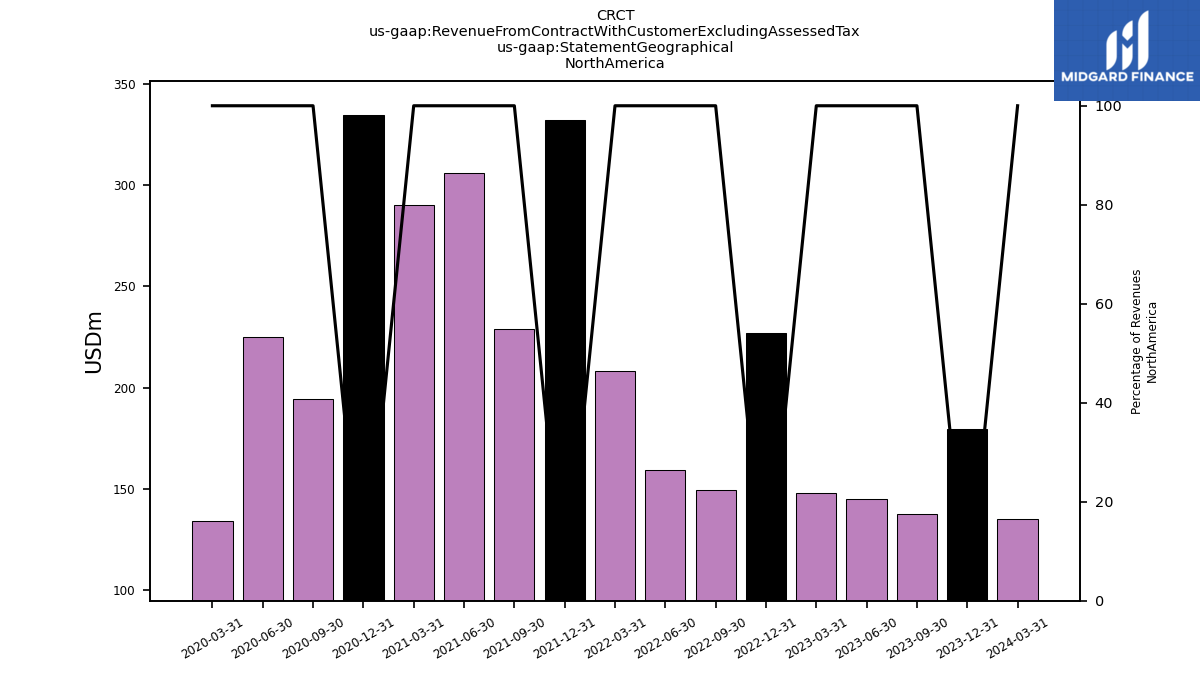
| 226.82 | 149.36 | 159.48 | 208.31 | 332.31 | 228.86 | 306.17 | 290.34 | 334.71 | 194.12 | 225.20 | 134.25 | ||
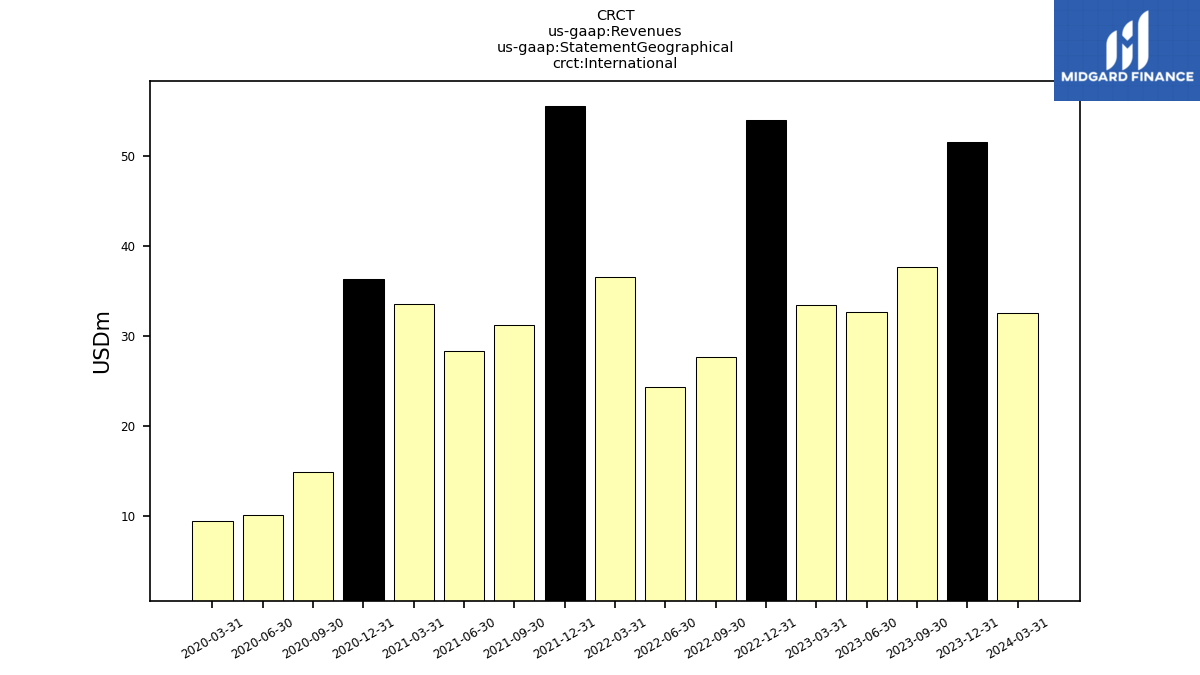
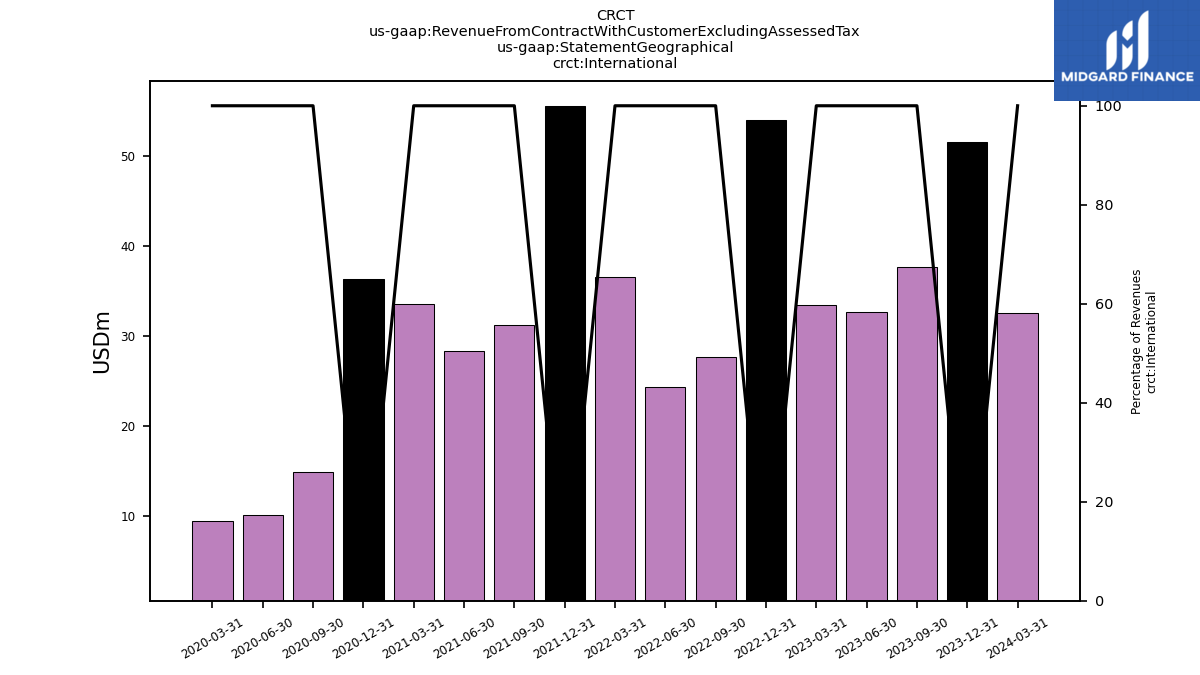
| International | 53.94 | 27.64 | 24.28 | 36.48 | 55.52 | 31.23 | 28.32 | 33.48 | 36.26 | 14.89 | 10.13 | 9.47 | |
| Revenue From Contract With Customer Excluding Assessed Tax | 280.76 | 177.00 | 183.76 | 244.78 | 387.83 | 260.09 | 334.49 | 323.82 | 370.97 | 209.00 | 235.34 | 143.72 | |
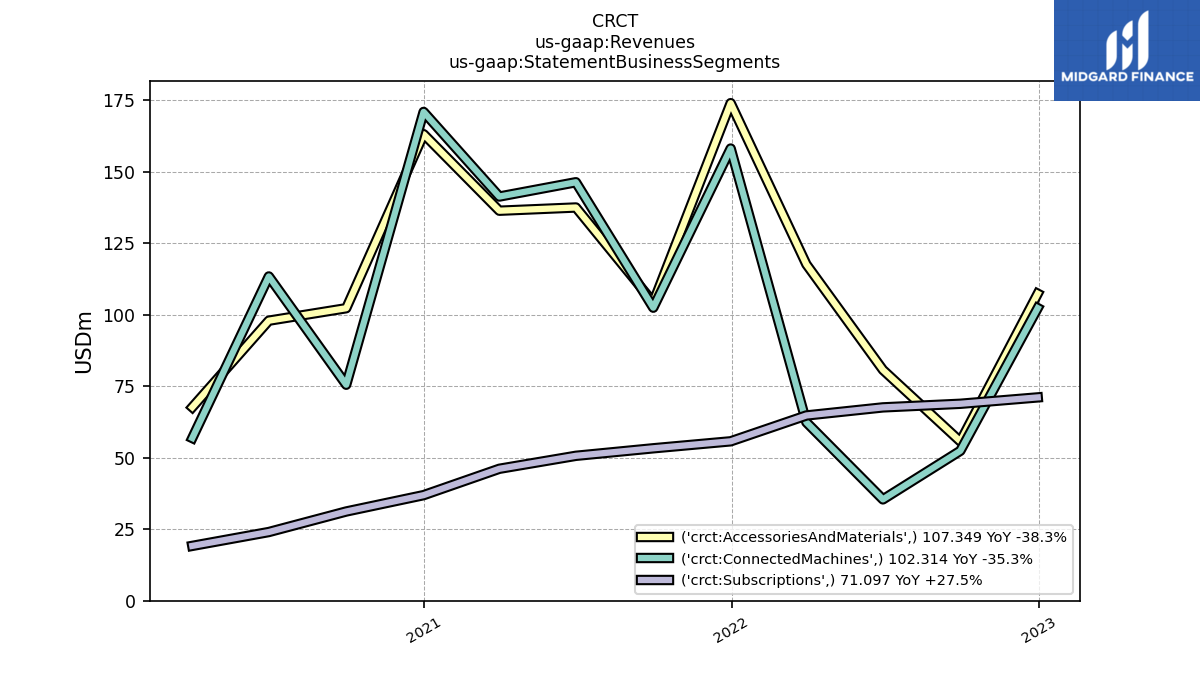
| Accessories And Materials | 107.35 | 55.71 | 80.72 | 117.61 | 173.98 | 104.33 | 137.49 | 136.36 | 163.13 | 102.28 | 97.92 | 67.66 | |
| Connected Machines | 102.31 | 52.42 | 35.44 | 62.39 | 158.10 | 102.45 | 146.33 | 141.32 | 170.91 | 75.52 | 113.39 | 56.89 | |
| Subscriptions | 71.10 | 68.86 | 67.60 | 64.78 | 55.74 | 53.30 | 50.67 | 46.14 | 36.92 | 31.21 | 24.03 | 19.18 | |
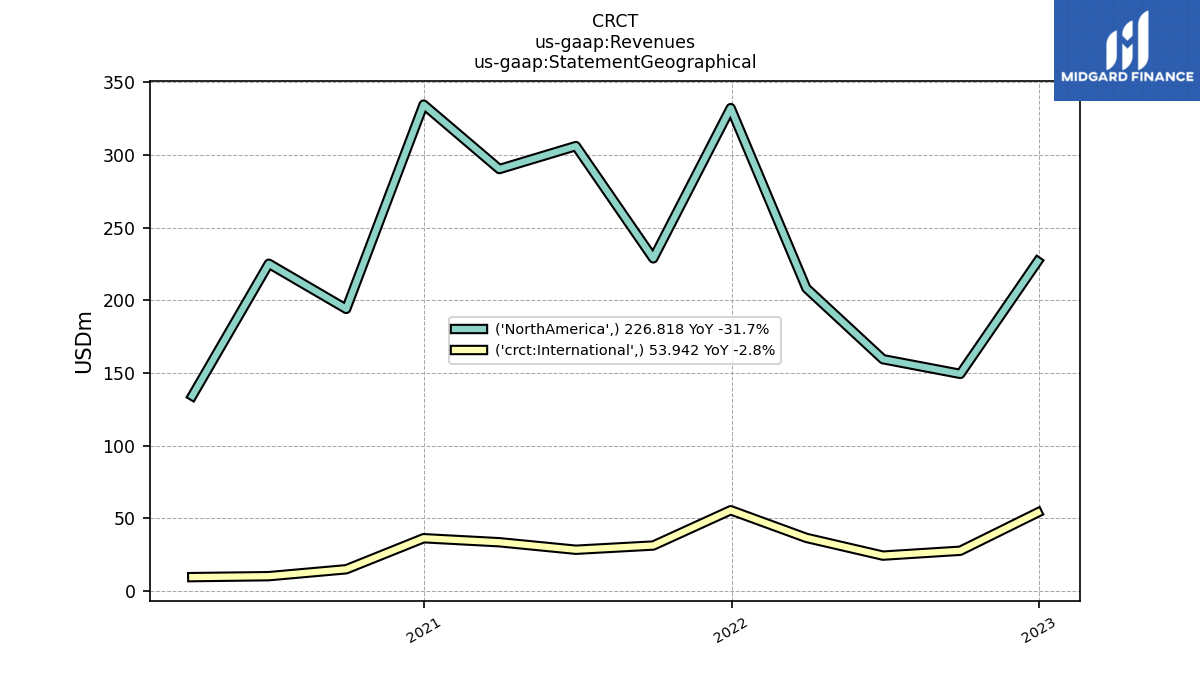
| 226.82 | 149.36 | 159.48 | 208.31 | 332.31 | 228.86 | 306.17 | 290.34 | 334.71 | 194.12 | 225.20 | 134.25 | ||
| International | 53.94 | 27.64 | 24.28 | 36.48 | 55.52 | 31.23 | 28.32 | 33.48 | 36.26 | 14.89 | 10.13 | 9.47 |


