
| 2023-12-30 | 2023-09-30 | 2023-07-01 | 2023-04-01 | 2022-12-31 | 2022-09-24 | 2022-06-25 | 2022-03-26 | 2021-12-25 | 2021-09-25 | 2021-06-26 | 2021-03-27 | 2020-12-26 | 2020-09-26 | 2020-06-27 | 2020-03-28 | 2019-12-28 | 2019-09-28 | 2019-06-29 | 2019-03-30 | 2018-12-29 | 2018-09-29 | 2018-06-30 | 2018-03-31 | 2017-12-30 | 2017-09-30 | 2017-07-01 | 2017-04-01 | 2016-12-31 | 2016-09-24 | 2016-06-25 | 2016-03-26 | 2015-12-26 | 2015-09-26 | 2015-06-27 | 2015-03-28 | 2014-12-27 | 2014-09-27 | 2014-06-28 | 2014-03-29 | 2013-12-28 | 2013-09-28 | 2013-06-29 | 2013-03-30 | 2012-12-29 | 2012-09-29 | 2012-06-30 | 2012-03-31 | 2011-12-31 | 2011-09-24 | 2011-06-25 | 2011-03-26 | 2010-12-25 | 2010-09-25 | 2010-06-26 | 2010-03-27 | ||
|---|---|---|---|---|---|---|---|---|---|---|---|---|---|---|---|---|---|---|---|---|---|---|---|---|---|---|---|---|---|---|---|---|---|---|---|---|---|---|---|---|---|---|---|---|---|---|---|---|---|---|---|---|---|---|---|---|---|
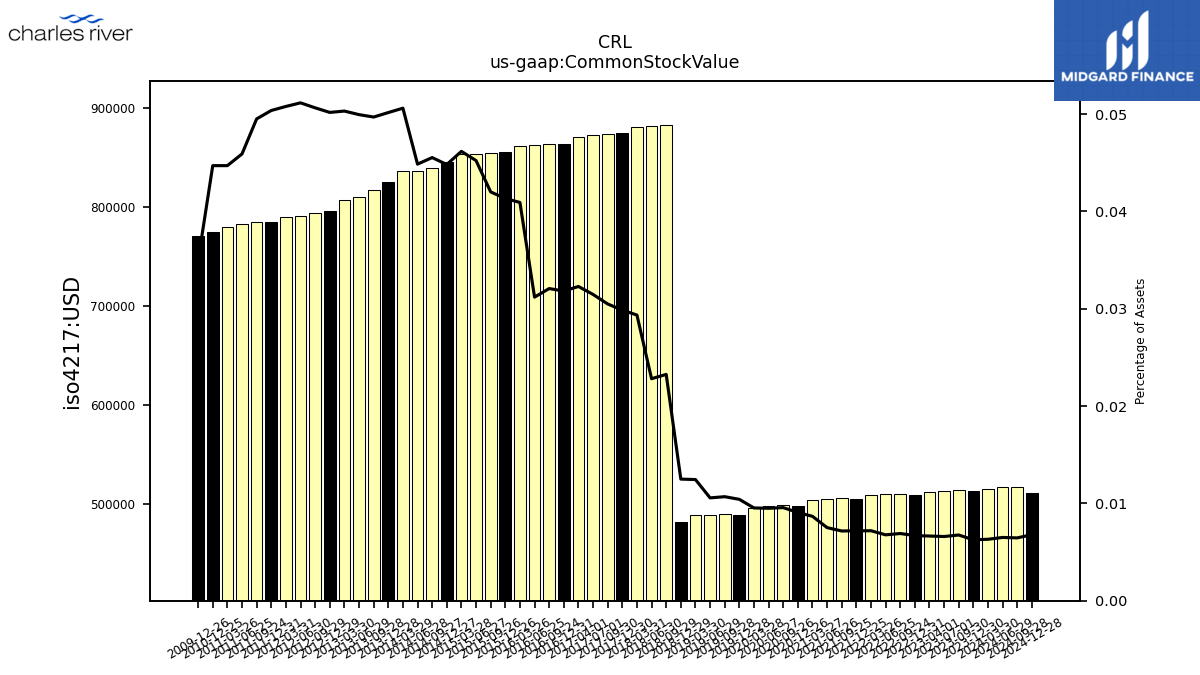
| Common Stock Value | 0.51 | 0.51 | 0.51 | 0.51 | 0.51 | 0.51 | 0.51 | 0.51 | 0.51 | 0.51 | 0.51 | 0.50 | 0.50 | 0.50 | 0.50 | 0.50 | 0.49 | 0.49 | 0.49 | 0.49 | 0.48 | 0.88 | 0.88 | 0.88 | 0.88 | 0.87 | 0.87 | 0.87 | 0.86 | 0.86 | 0.86 | 0.86 | 0.85 | 0.85 | 0.85 | 0.85 | 0.84 | 0.84 | 0.84 | 0.84 | 0.82 | 0.82 | 0.81 | 0.81 | 0.80 | 0.79 | 0.79 | 0.79 | 0.79 | 0.79 | 0.78 | 0.78 | 0.78 | NA | NA | NA | |
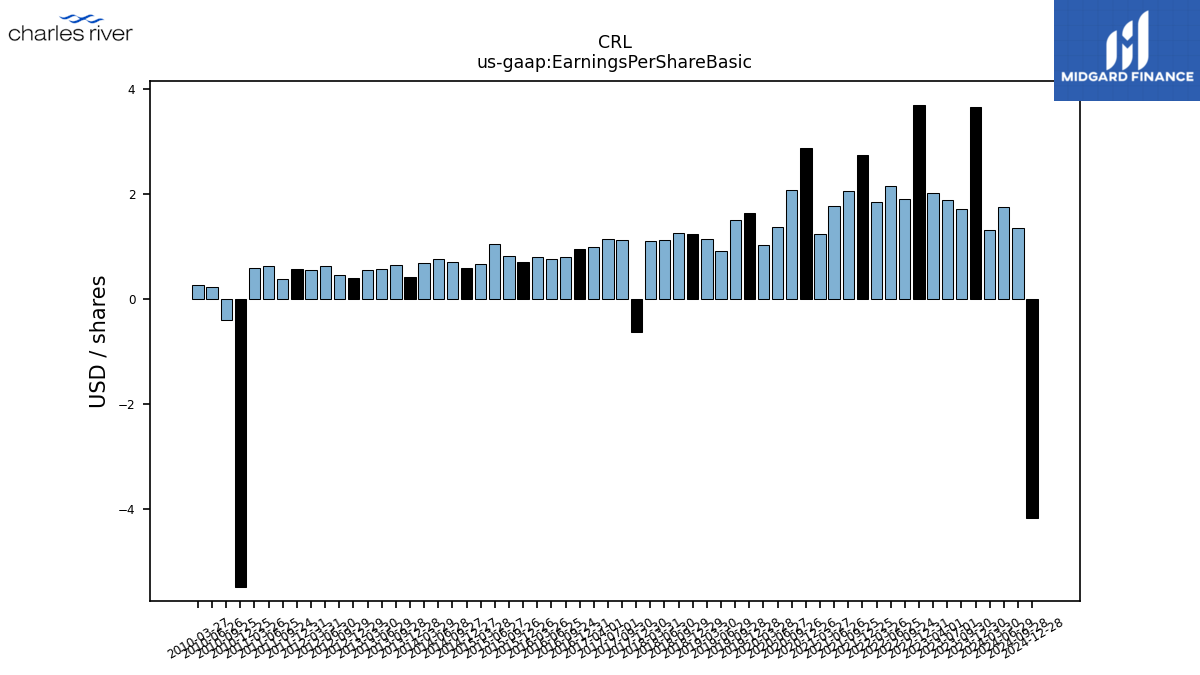
| Earnings Per Share Basic | 3.65 | 1.70 | 1.89 | 2.02 | 3.69 | 1.90 | 2.15 | 1.84 | 2.73 | 2.05 | 1.76 | 1.23 | 2.88 | 2.07 | 1.36 | 1.03 | 1.64 | 1.49 | 0.90 | 1.14 | 1.24 | 1.25 | 1.11 | 1.10 | -0.63 | 1.11 | 1.13 | 0.98 | 0.95 | 0.80 | 0.75 | 0.80 | 0.69 | 0.81 | 1.04 | 0.67 | 0.58 | 0.70 | 0.75 | 0.68 | 0.41 | 0.64 | 0.57 | 0.54 | 0.39 | 0.46 | 0.63 | 0.55 | 0.56 | 0.38 | 0.63 | 0.58 | -5.49 | -0.40 | 0.22 | 0.27 | |
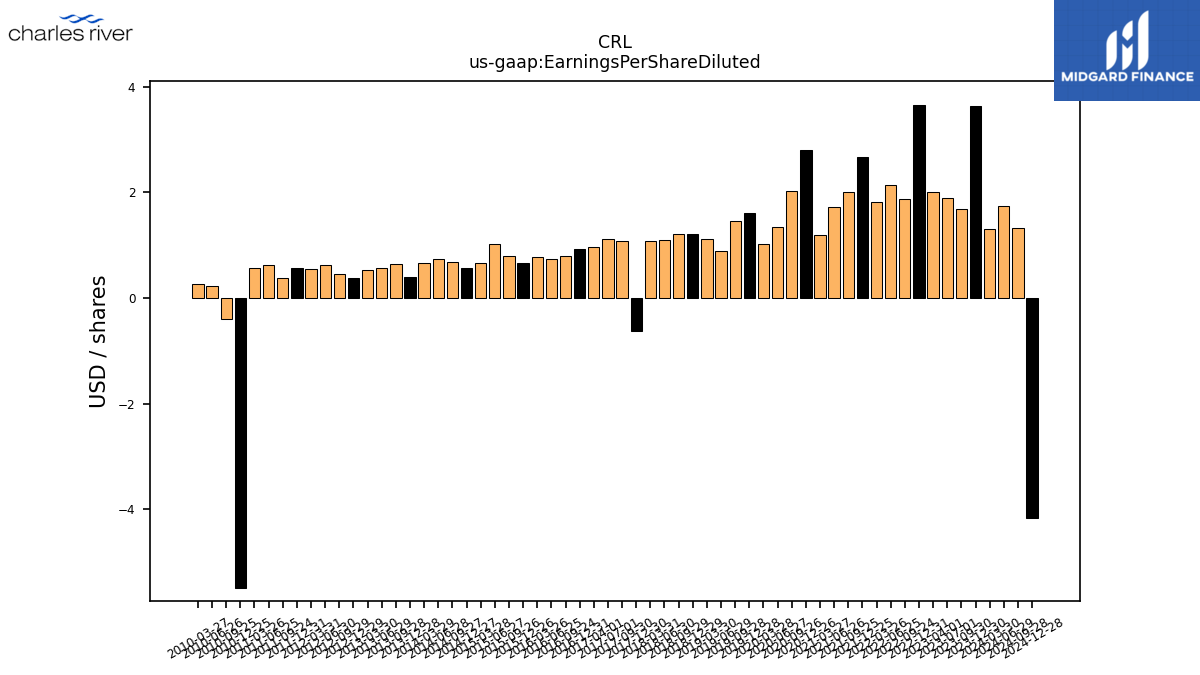
| Earnings Per Share Diluted | 3.64 | 1.69 | 1.89 | 2.01 | 3.65 | 1.88 | 2.13 | 1.81 | 2.67 | 2.01 | 1.72 | 1.20 | 2.81 | 2.03 | 1.34 | 1.02 | 1.61 | 1.46 | 0.88 | 1.11 | 1.21 | 1.22 | 1.10 | 1.08 | -0.63 | 1.08 | 1.12 | 0.97 | 0.93 | 0.79 | 0.73 | 0.78 | 0.67 | 0.79 | 1.02 | 0.66 | 0.57 | 0.68 | 0.74 | 0.67 | 0.40 | 0.64 | 0.56 | 0.53 | 0.38 | 0.46 | 0.63 | 0.54 | 0.56 | 0.37 | 0.63 | 0.57 | -5.49 | -0.40 | 0.22 | 0.26 |
| 2023-12-30 | 2023-09-30 | 2023-07-01 | 2023-04-01 | 2022-12-31 | 2022-09-24 | 2022-06-25 | 2022-03-26 | 2021-12-25 | 2021-09-25 | 2021-06-26 | 2021-03-27 | 2020-12-26 | 2020-09-26 | 2020-06-27 | 2020-03-28 | 2019-12-28 | 2019-09-28 | 2019-06-29 | 2019-03-30 | 2018-12-29 | 2018-09-29 | 2018-06-30 | 2018-03-31 | 2017-12-30 | 2017-09-30 | 2017-07-01 | 2017-04-01 | 2016-12-31 | 2016-09-24 | 2016-06-25 | 2016-03-26 | 2015-12-26 | 2015-09-26 | 2015-06-27 | 2015-03-28 | 2014-12-27 | 2014-09-27 | 2014-06-28 | 2014-03-29 | 2013-12-28 | 2013-09-28 | 2013-06-29 | 2013-03-30 | 2012-12-29 | 2012-09-29 | 2012-06-30 | 2012-03-31 | 2011-12-31 | 2011-09-24 | 2011-06-25 | 2011-03-26 | 2010-12-25 | 2010-09-25 | 2010-06-26 | 2010-03-27 | ||
|---|---|---|---|---|---|---|---|---|---|---|---|---|---|---|---|---|---|---|---|---|---|---|---|---|---|---|---|---|---|---|---|---|---|---|---|---|---|---|---|---|---|---|---|---|---|---|---|---|---|---|---|---|---|---|---|---|---|
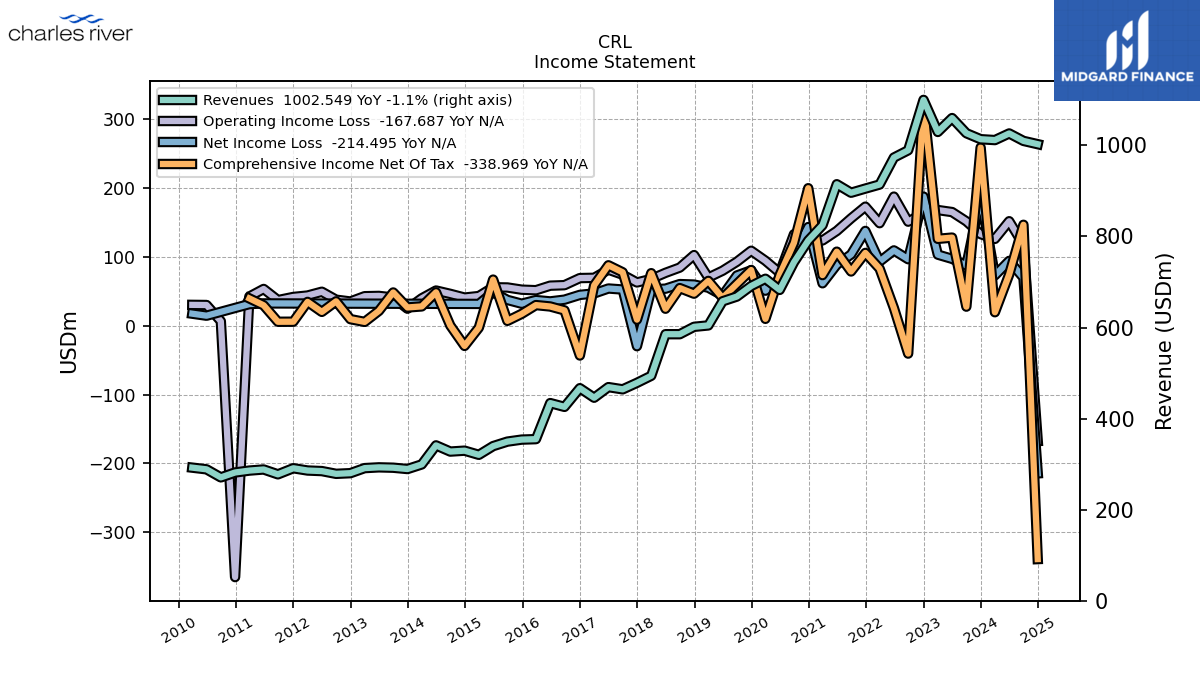
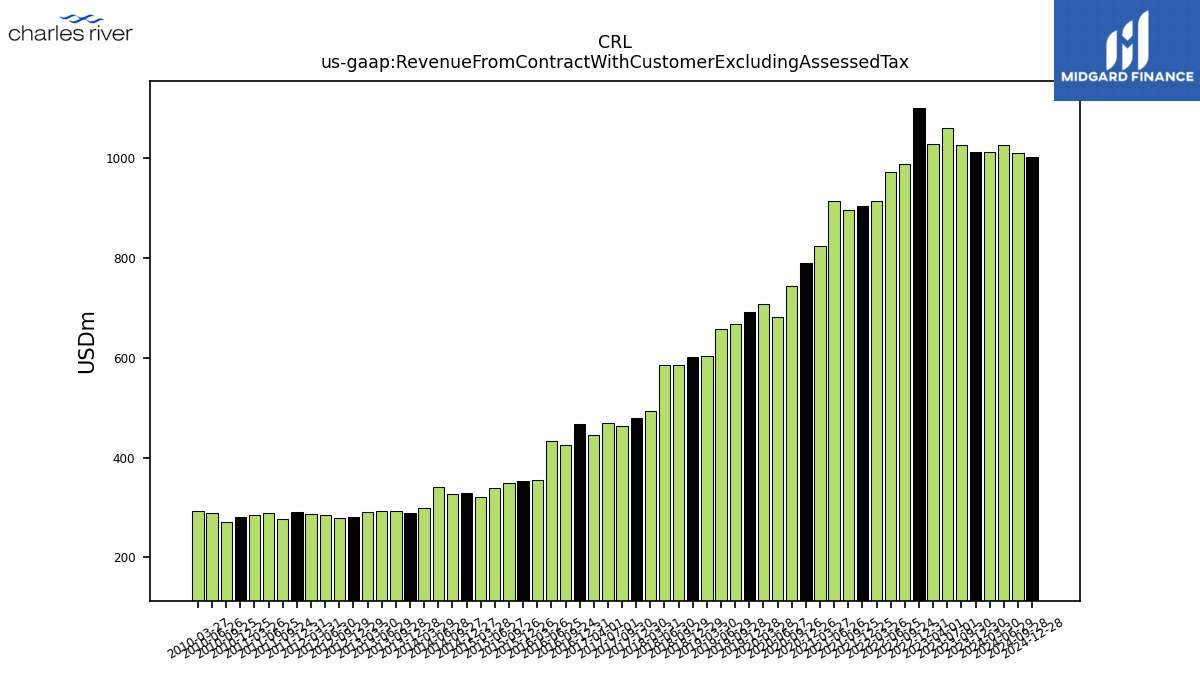
| Revenue From Contract With Customer Excluding Assessed Tax | 1013.48 | 1026.62 | 1059.94 | 1029.37 | 1099.84 | 989.16 | 973.13 | 913.93 | 905.05 | 895.94 | 914.61 | 824.57 | 790.99 | 743.30 | 682.58 | 707.06 | 691.14 | 667.95 | 657.57 | 604.57 | 601.53 | 585.29 | 585.30 | 493.97 | 478.48 | 464.23 | 469.13 | 445.76 | 466.79 | 425.72 | 434.06 | 354.87 | 353.85 | 349.46 | 339.57 | 320.41 | 329.55 | 327.57 | 341.18 | 299.37 | 289.23 | 292.13 | 292.93 | 291.24 | 280.14 | 278.69 | 284.72 | 285.98 | 290.96 | 277.58 | 288.26 | 285.84 | 281.65 | 270.88 | 288.59 | 292.29 | |
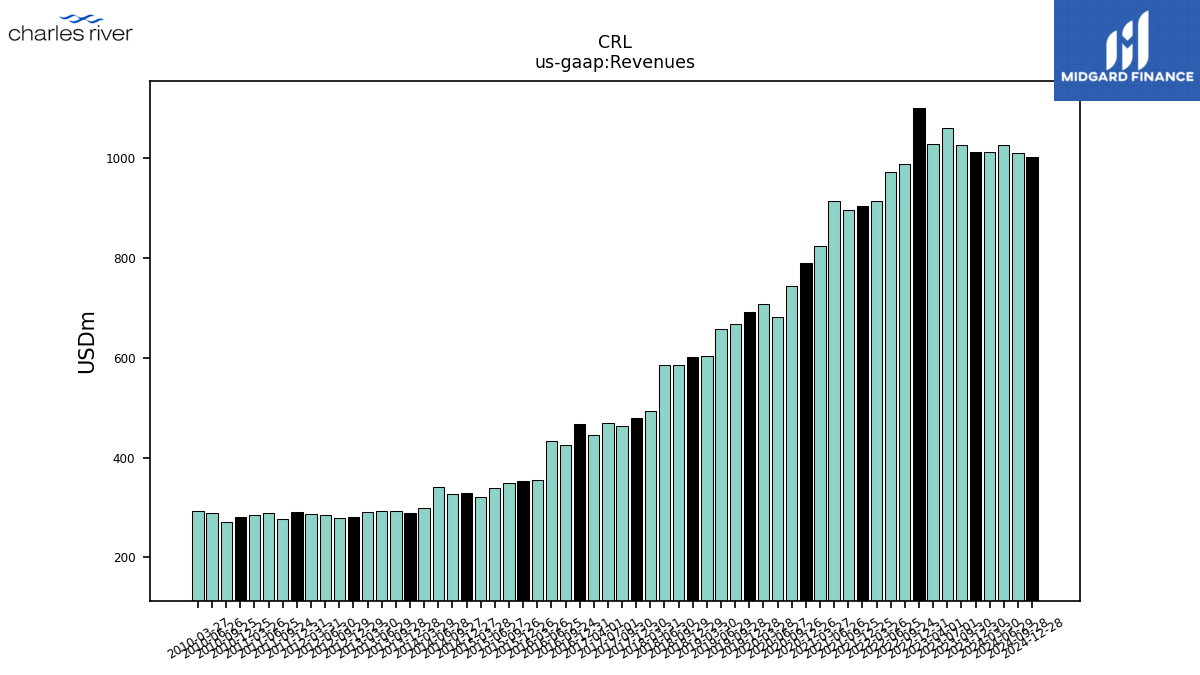
| Revenues | 1013.48 | 1026.62 | 1059.94 | 1029.37 | 1099.84 | 989.16 | 973.13 | 913.93 | 905.05 | 895.94 | 914.61 | 824.57 | 790.99 | 743.30 | 682.58 | 707.06 | 691.14 | 667.95 | 657.57 | 604.57 | 601.53 | 585.29 | 585.30 | 493.97 | 478.48 | 464.23 | 469.13 | 445.76 | 466.79 | 425.72 | 434.06 | 354.87 | 353.85 | 349.46 | 339.57 | 320.41 | 329.55 | 327.57 | 341.18 | 299.37 | 289.23 | 292.13 | 292.93 | 291.24 | 280.14 | 278.69 | 284.72 | 285.98 | 290.96 | 277.58 | 288.26 | 285.84 | 281.65 | 270.88 | 288.59 | 292.29 | |
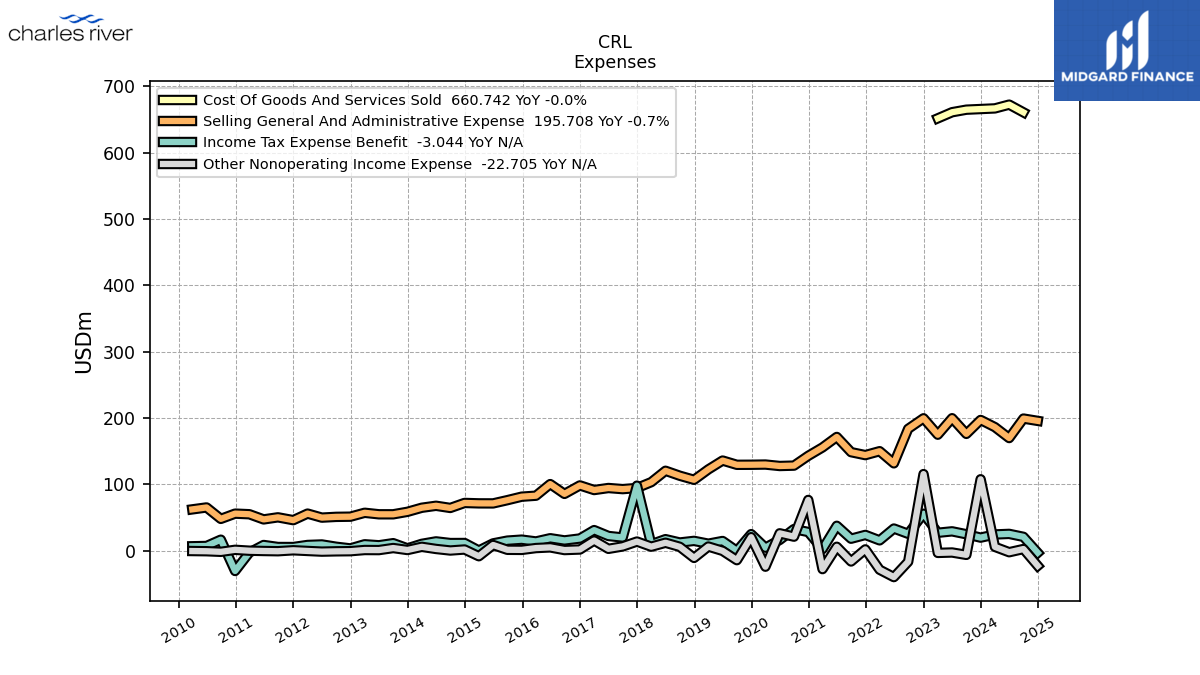
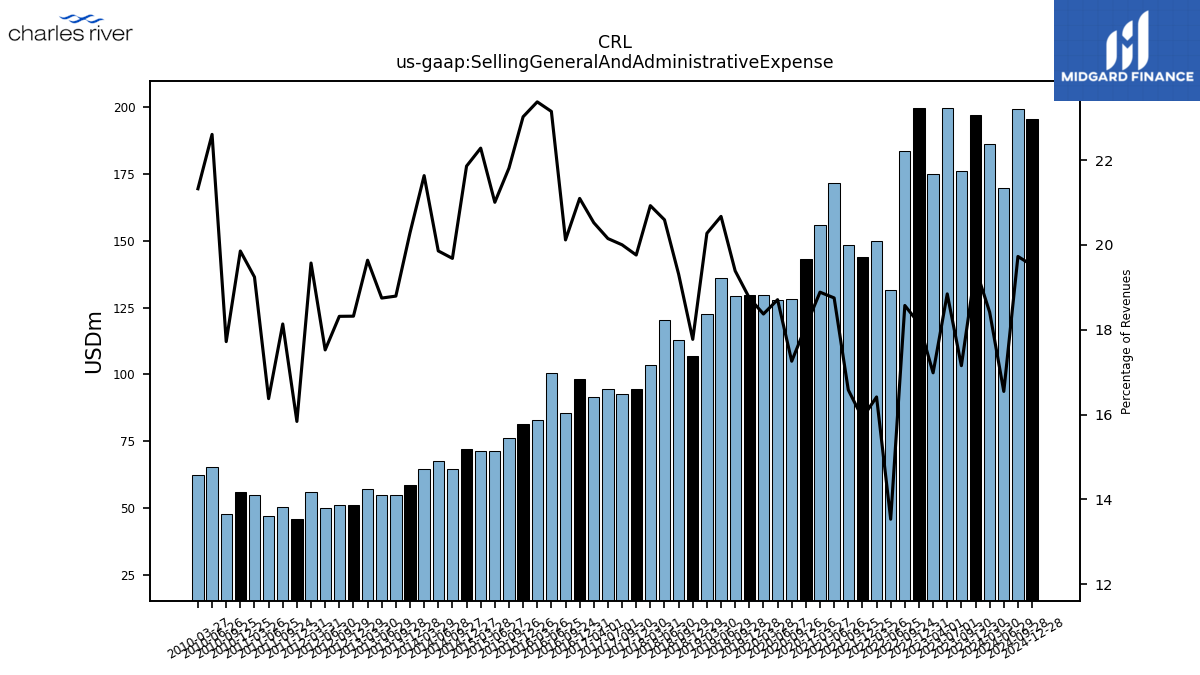
| Selling General And Administrative Expense | 197.14 | 176.11 | 199.76 | 174.85 | 199.64 | 183.71 | 131.71 | 150.03 | 144.11 | 148.57 | 171.50 | 155.73 | 143.03 | 128.29 | 127.71 | 129.90 | 129.60 | 129.51 | 135.94 | 122.57 | 106.92 | 113.03 | 120.53 | 103.37 | 94.56 | 92.86 | 94.53 | 91.49 | 98.48 | 85.65 | 100.47 | 82.94 | 81.46 | 76.22 | 71.33 | 71.40 | 72.03 | 64.48 | 67.76 | 64.77 | 58.67 | 54.90 | 54.92 | 57.20 | 51.32 | 51.05 | 49.90 | 55.98 | 46.09 | 50.34 | 47.21 | 55.01 | 55.93 | 48.01 | 65.24 | 62.33 | |
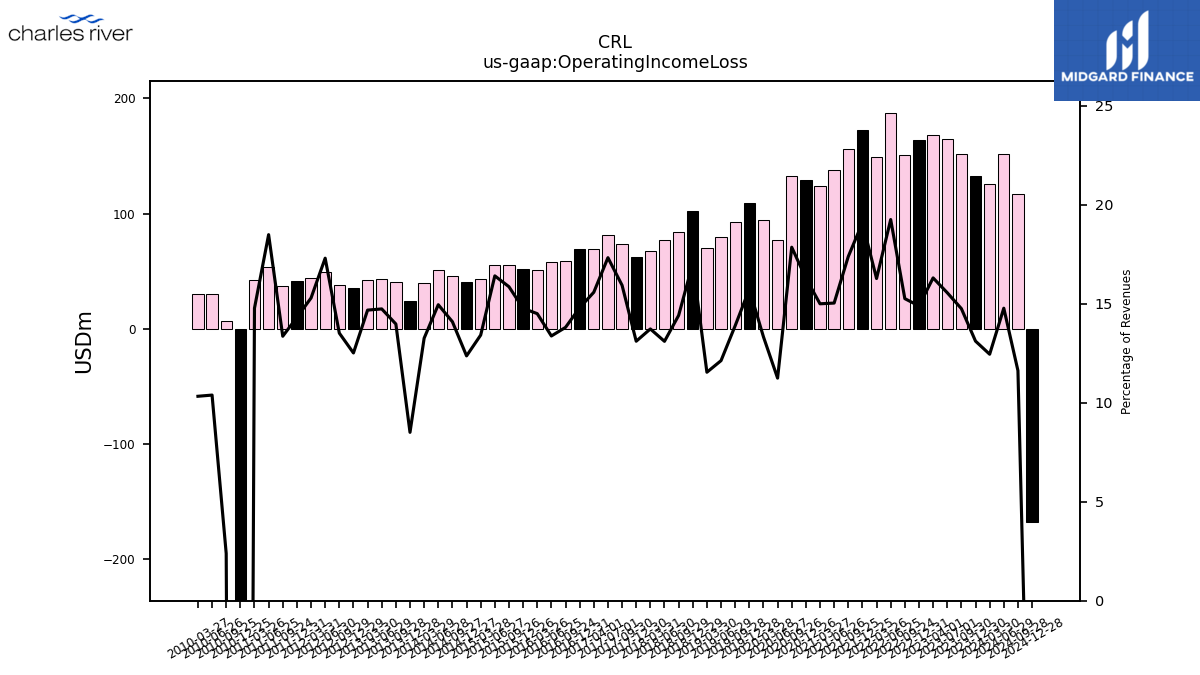
| Operating Income Loss | 132.92 | 151.50 | 164.94 | 167.89 | 163.81 | 150.98 | 187.41 | 148.78 | 172.81 | 155.80 | 137.55 | 123.70 | 128.93 | 132.75 | 76.77 | 94.28 | 108.79 | 92.80 | 79.77 | 69.79 | 102.48 | 84.36 | 76.71 | 67.83 | 62.73 | 73.98 | 81.31 | 69.47 | 69.09 | 58.80 | 58.06 | 51.47 | 52.27 | 55.44 | 55.73 | 43.01 | 40.77 | 46.17 | 51.02 | 39.71 | 24.61 | 40.84 | 43.19 | 42.76 | 35.07 | 37.68 | 49.27 | 43.74 | 41.65 | 37.09 | 53.31 | 42.25 | -365.16 | 6.47 | 29.98 | 30.19 | |
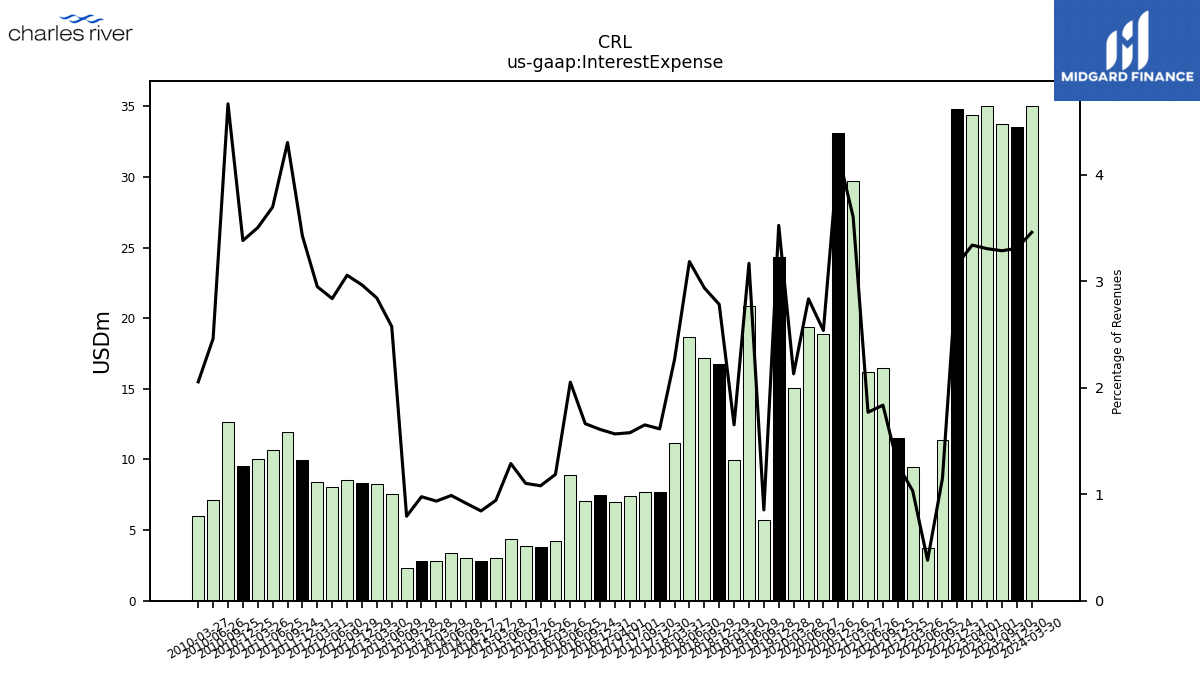
| Interest Expense | 33.54 | 33.74 | 35.04 | 34.38 | 34.78 | 11.38 | 3.70 | 9.43 | 11.55 | 16.45 | 16.19 | 29.72 | 33.15 | 18.87 | 19.35 | 15.07 | 24.36 | 5.70 | 20.84 | 9.99 | 16.74 | 17.20 | 18.64 | 11.19 | 7.72 | 7.67 | 7.40 | 6.98 | 7.51 | 7.08 | 8.91 | 4.21 | 3.82 | 3.85 | 4.38 | 3.02 | 2.78 | 3.00 | 3.37 | 2.80 | 2.83 | 2.32 | 7.54 | 8.28 | 8.31 | 8.52 | 8.08 | 8.44 | 9.97 | 11.94 | 10.66 | 10.02 | 9.53 | 12.64 | 7.10 | 6.01 | |
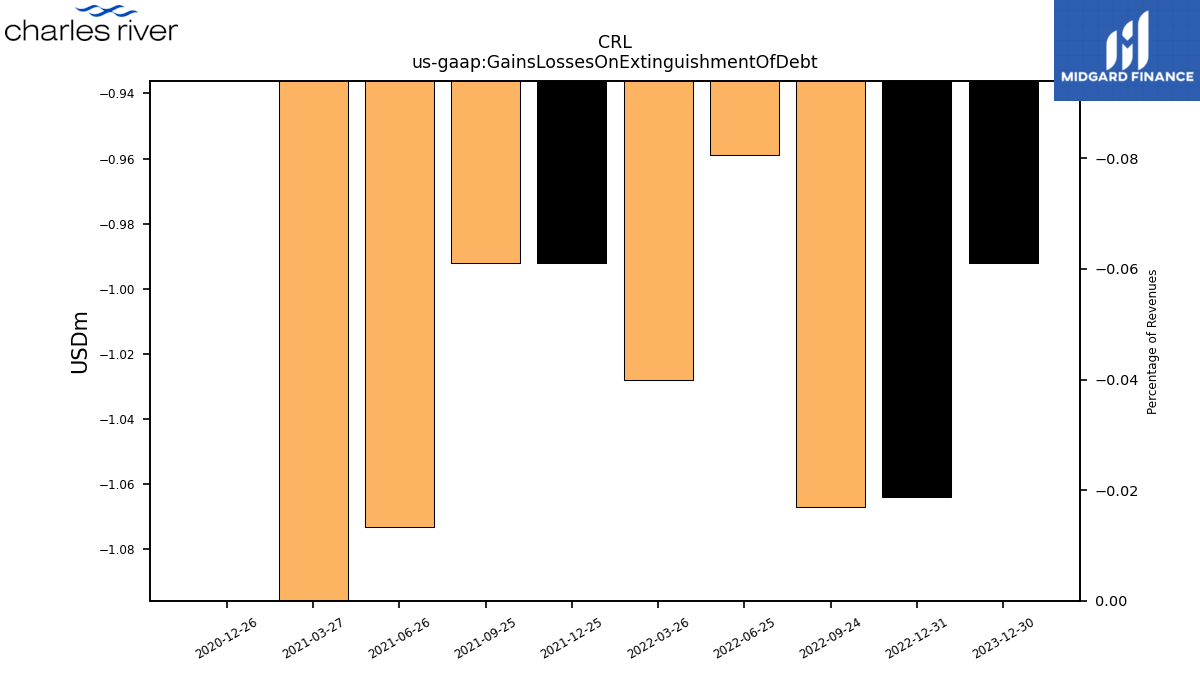
| Gains Losses On Extinguishment Of Debt | -0.99 | NA | NA | NA | -1.06 | -1.07 | -0.96 | -1.03 | -0.99 | -0.99 | -1.07 | -26.91 | -0.90 | NA | NA | NA | NA | NA | NA | NA | NA | NA | NA | NA | NA | NA | NA | NA | NA | NA | NA | NA | NA | NA | NA | NA | NA | NA | NA | NA | NA | NA | NA | NA | NA | NA | NA | NA | NA | NA | NA | NA | NA | NA | NA | NA | |
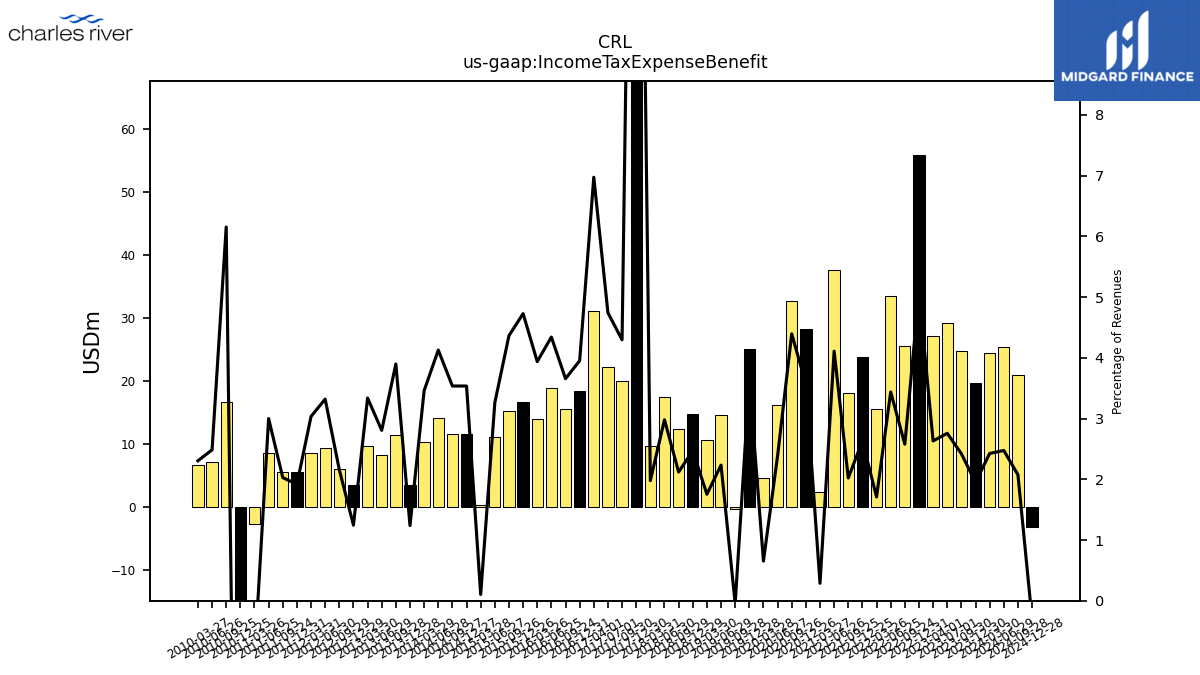
| Income Tax Expense Benefit | 19.75 | 24.85 | 29.22 | 27.09 | 55.81 | 25.50 | 33.45 | 15.62 | 23.82 | 18.11 | 37.58 | 2.37 | 28.24 | 32.66 | 16.28 | 4.62 | 25.05 | -0.32 | 14.69 | 10.60 | 14.85 | 12.40 | 17.44 | 9.77 | 98.10 | 19.95 | 22.24 | 31.08 | 18.45 | 15.56 | 18.84 | 13.97 | 16.73 | 15.26 | 11.08 | 0.33 | 11.65 | 11.58 | 14.08 | 10.36 | 3.58 | 11.39 | 8.22 | 9.72 | 3.49 | 6.01 | 9.45 | 8.68 | 5.58 | 5.63 | 8.65 | -2.71 | -30.55 | 16.67 | 7.17 | 6.74 | |
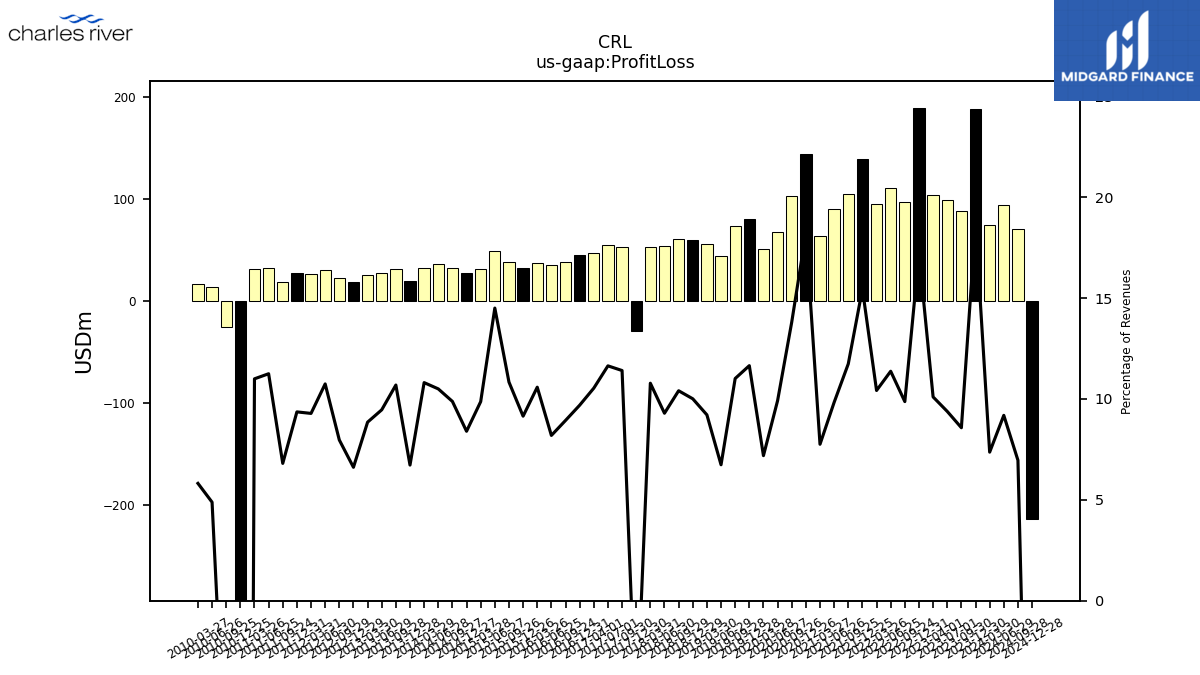
| Profit Loss | 188.95 | 88.02 | 99.44 | 103.95 | 189.11 | 97.61 | 110.66 | 95.23 | 139.83 | 105.16 | 89.92 | 63.94 | 144.19 | 102.61 | 67.67 | 50.84 | 80.51 | 73.55 | 44.31 | 55.69 | 60.20 | 60.90 | 54.38 | 53.24 | -29.07 | 52.95 | 54.60 | 46.96 | 45.23 | 38.03 | 35.56 | 37.55 | 32.36 | 37.87 | 49.24 | 31.61 | 27.67 | 32.35 | 35.82 | 32.36 | 19.44 | 31.22 | 27.71 | 25.77 | 18.53 | 22.20 | 30.59 | 26.55 | 27.23 | 18.89 | 32.42 | 31.43 | -347.98 | -25.23 | 14.10 | 17.00 | |
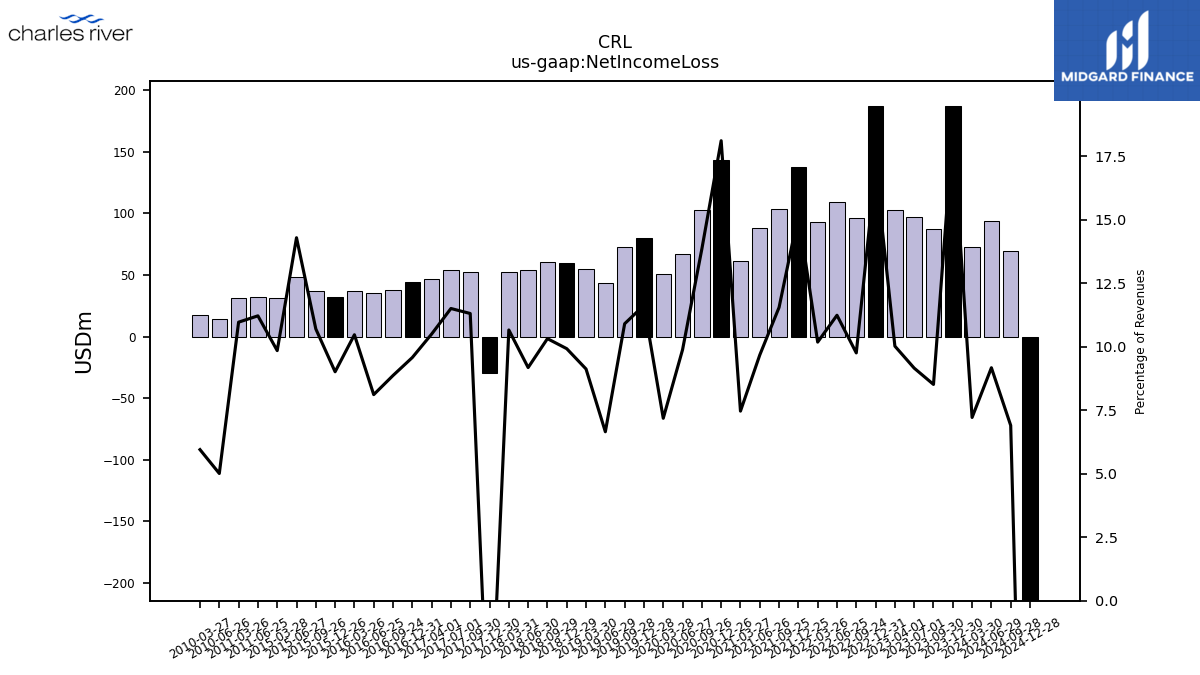
| Net Income Loss | 187.08 | 87.39 | 97.02 | 103.13 | 187.41 | 96.47 | 109.32 | 93.02 | 137.58 | 103.43 | 88.45 | 61.53 | 143.19 | 102.91 | 67.44 | 50.77 | 80.35 | 72.81 | 43.73 | 55.13 | 59.66 | 60.37 | 53.71 | 52.63 | -29.85 | 52.47 | 53.95 | 46.78 | 44.68 | 37.73 | 35.21 | 37.14 | 31.88 | 37.38 | 48.51 | 31.54 | NA | NA | NA | NA | NA | NA | NA | NA | NA | NA | NA | NA | NA | NA | 32.32 | 31.34 | NA | NA | 14.45 | 17.38 | |
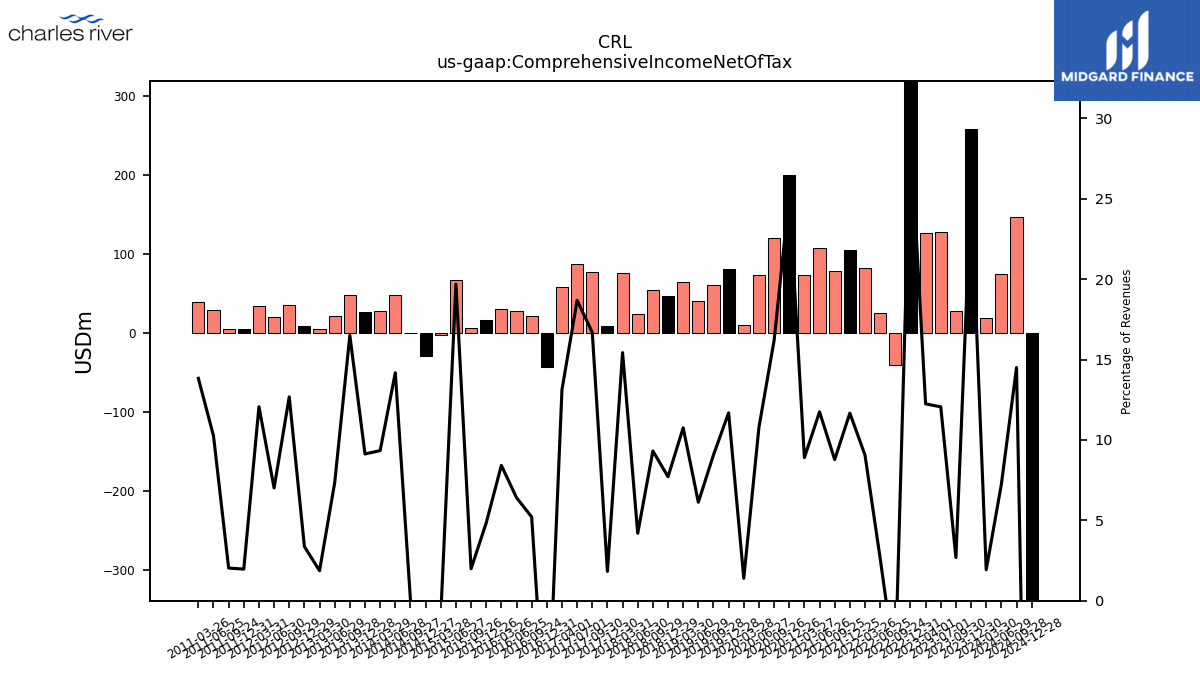
| Comprehensive Income Net Of Tax | 258.72 | 27.59 | 127.88 | 126.06 | 320.96 | -40.58 | 25.70 | 82.83 | 105.62 | 78.67 | 107.44 | 73.39 | 199.60 | 120.34 | 73.64 | 9.87 | 80.80 | 60.58 | 40.29 | 65.04 | 46.41 | 54.53 | 24.56 | 76.23 | 8.73 | 77.49 | 87.66 | 58.51 | -43.34 | 22.18 | 27.83 | 29.87 | 17.14 | 6.94 | 66.89 | -2.96 | -29.43 | 0.17 | 48.39 | 27.96 | 26.41 | 48.22 | 21.51 | 5.44 | 9.46 | 35.34 | 19.98 | 34.52 | 5.73 | 5.65 | 29.59 | 39.55 | NA | NA | NA | NA |
| 2023-12-30 | 2023-09-30 | 2023-07-01 | 2023-04-01 | 2022-12-31 | 2022-09-24 | 2022-06-25 | 2022-03-26 | 2021-12-25 | 2021-09-25 | 2021-06-26 | 2021-03-27 | 2020-12-26 | 2020-09-26 | 2020-06-27 | 2020-03-28 | 2019-12-28 | 2019-09-28 | 2019-06-29 | 2019-03-30 | 2018-12-29 | 2018-09-29 | 2018-06-30 | 2018-03-31 | 2017-12-30 | 2017-09-30 | 2017-07-01 | 2017-04-01 | 2016-12-31 | 2016-09-24 | 2016-06-25 | 2016-03-26 | 2015-12-26 | 2015-09-26 | 2015-06-27 | 2015-03-28 | 2014-12-27 | 2014-09-27 | 2014-06-28 | 2014-03-29 | 2013-12-28 | 2013-09-28 | 2013-06-29 | 2013-03-30 | 2012-12-29 | 2012-09-29 | 2012-06-30 | 2012-03-31 | 2011-12-31 | 2011-09-24 | 2011-06-25 | 2011-03-26 | 2010-12-25 | 2010-09-25 | 2010-06-26 | 2010-03-27 | ||
|---|---|---|---|---|---|---|---|---|---|---|---|---|---|---|---|---|---|---|---|---|---|---|---|---|---|---|---|---|---|---|---|---|---|---|---|---|---|---|---|---|---|---|---|---|---|---|---|---|---|---|---|---|---|---|---|---|---|
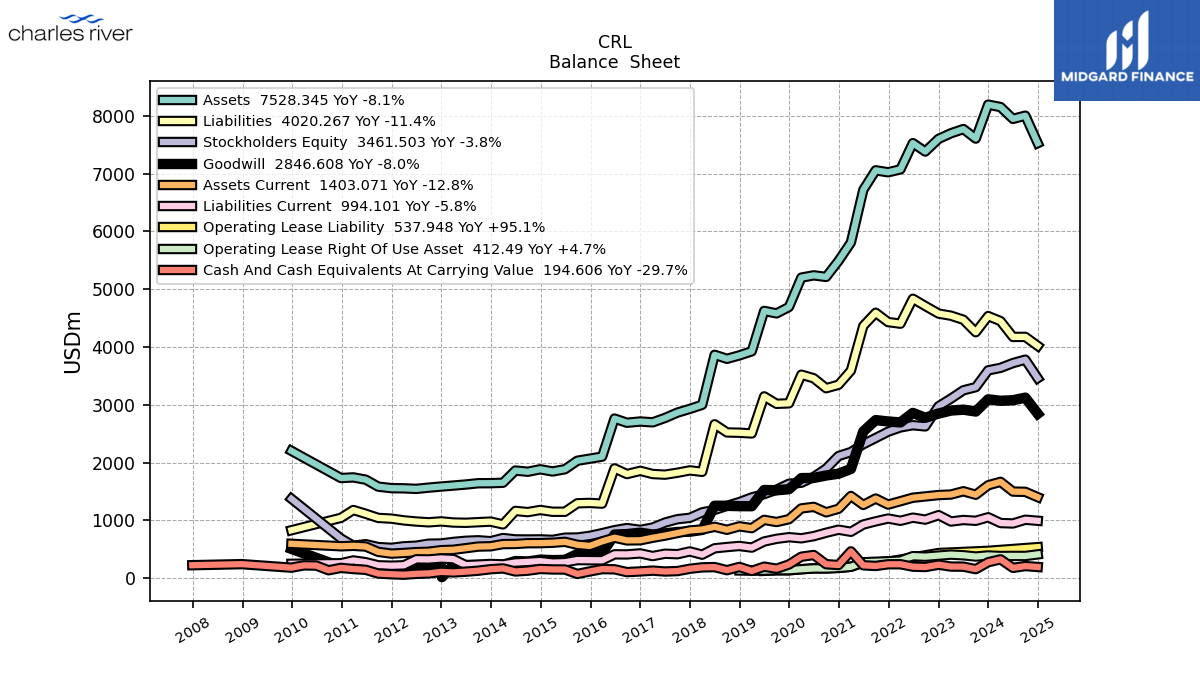
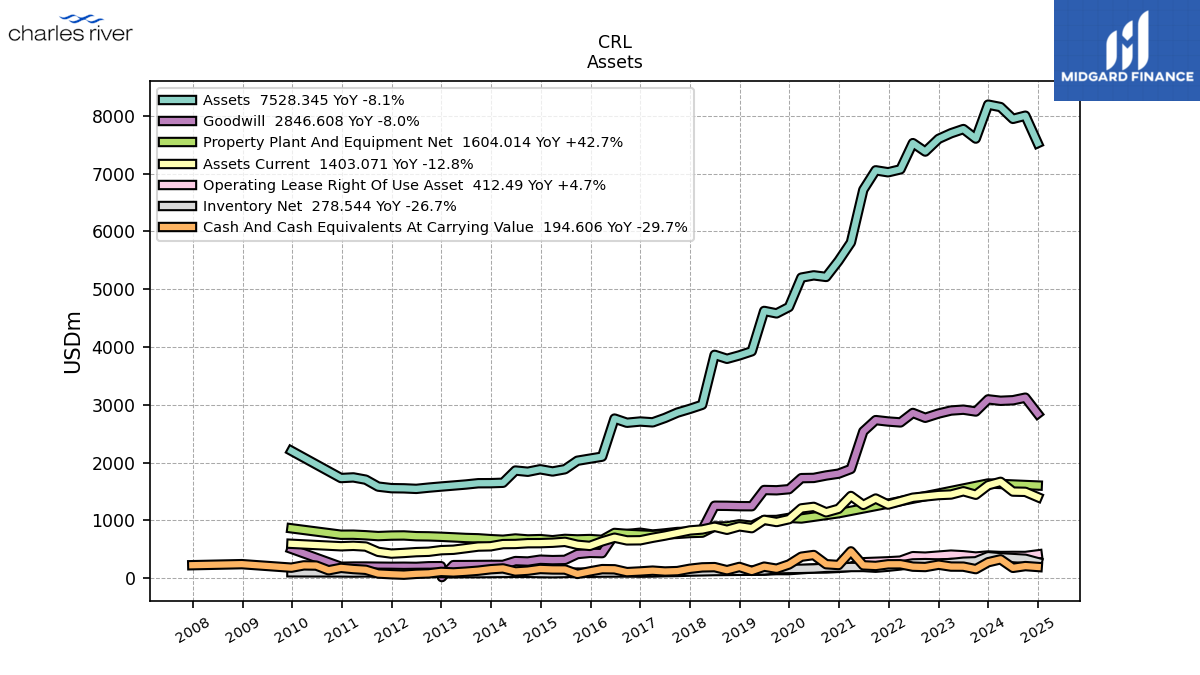
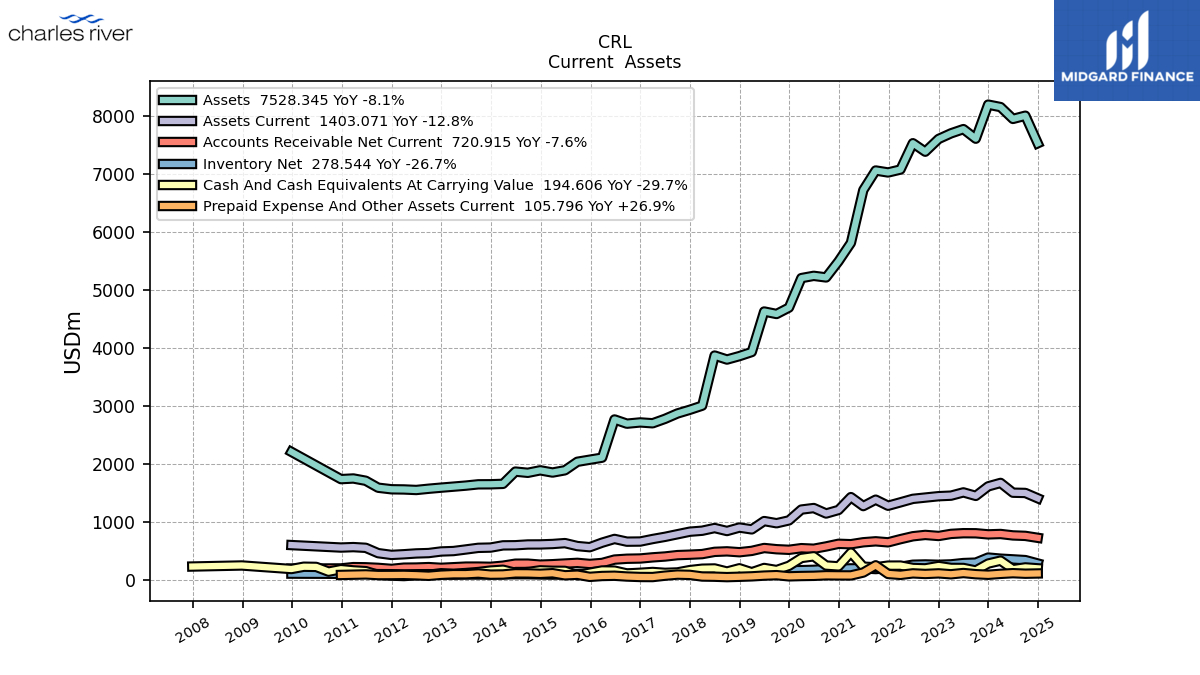
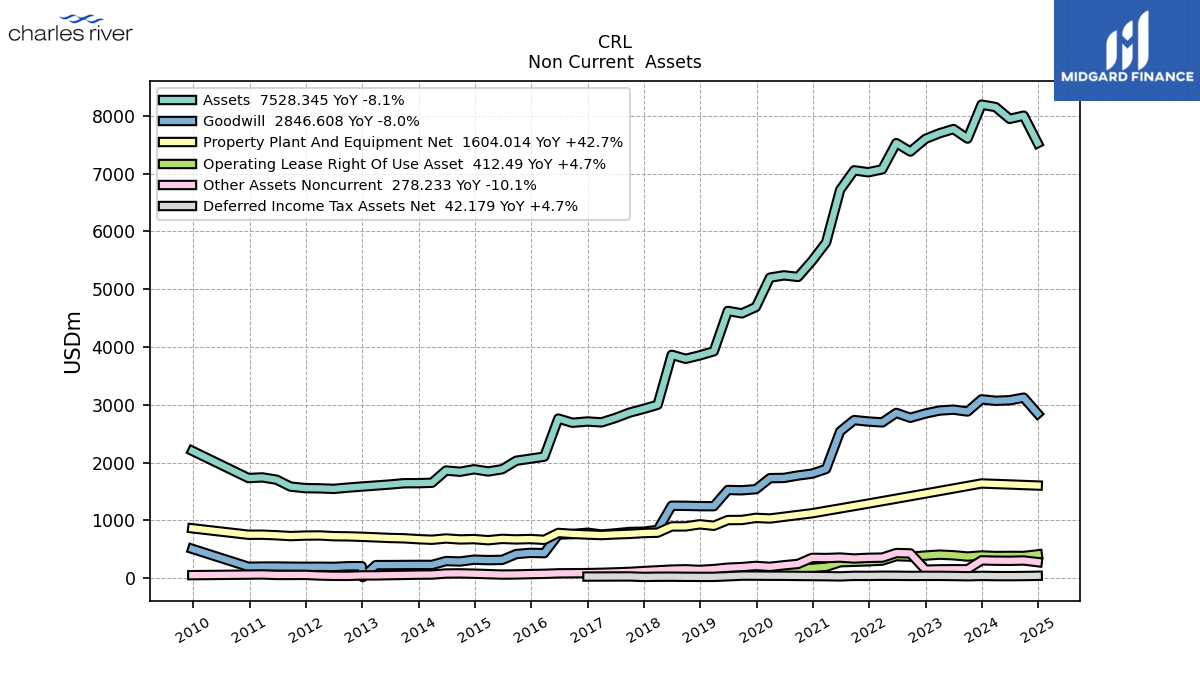
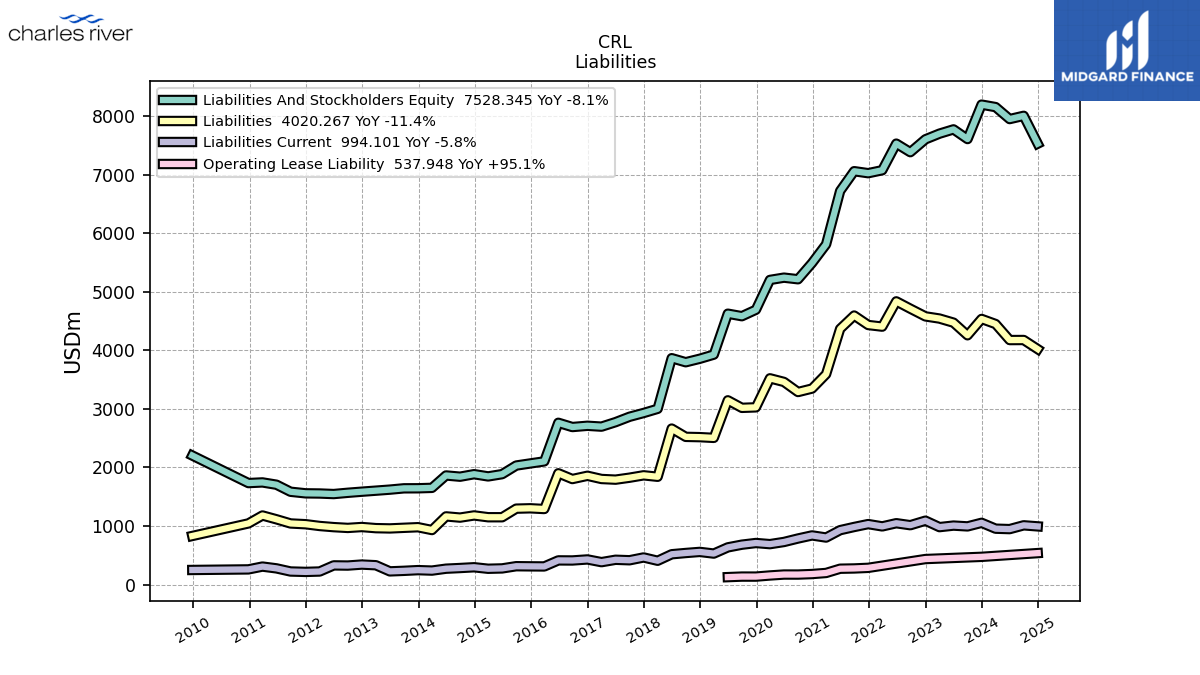
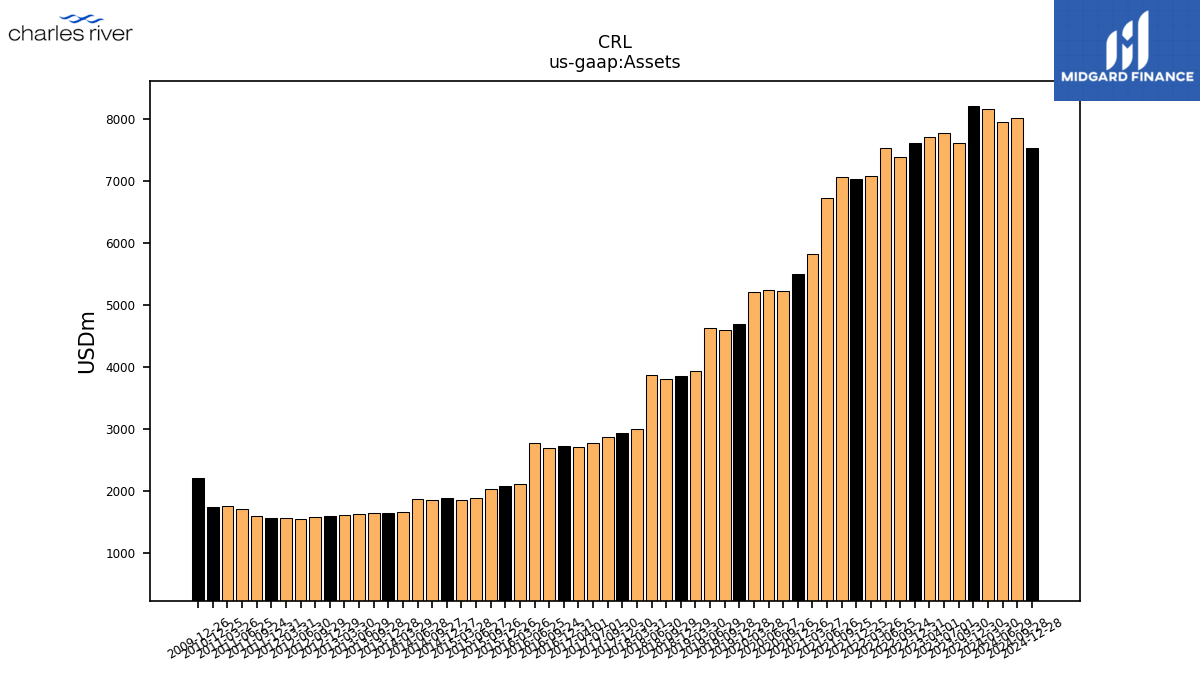
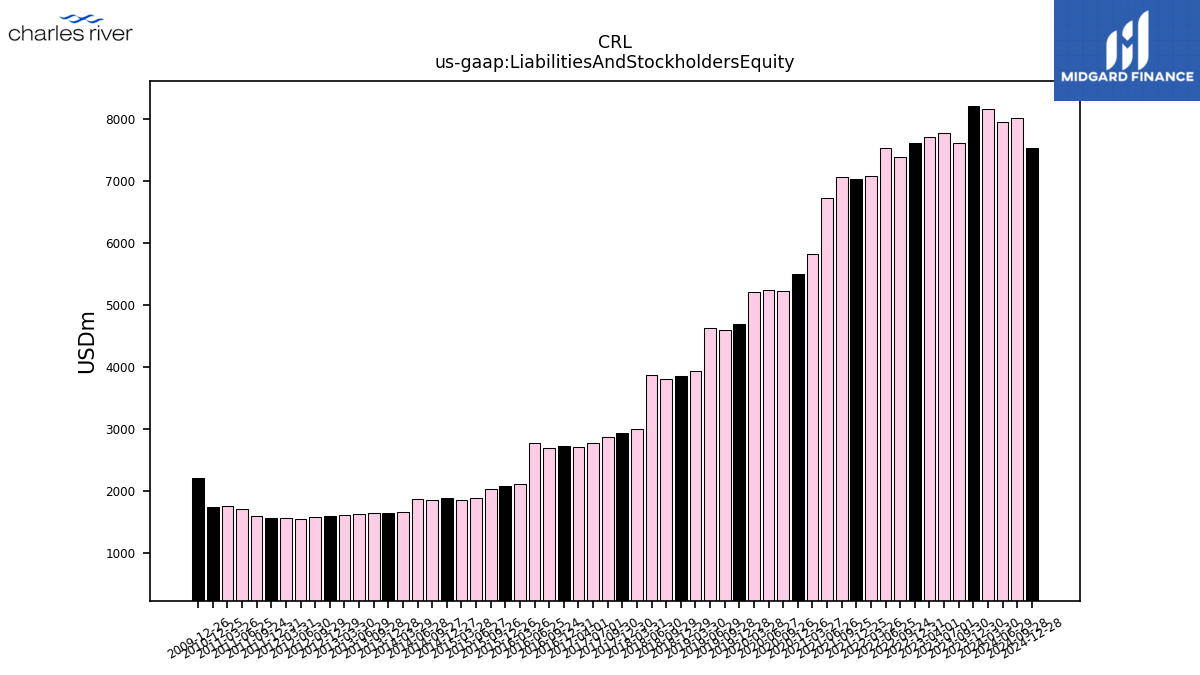
| Assets | 8195.00 | 7607.01 | 7772.38 | 7699.44 | 7602.77 | 7382.77 | 7529.36 | 7075.05 | 7024.29 | 7058.44 | 6720.35 | 5808.96 | 5490.83 | 5213.34 | 5240.88 | 5201.79 | 4692.79 | 4582.56 | 4625.48 | 3926.64 | 3855.88 | 3796.66 | 3865.88 | 3001.00 | 2929.92 | 2865.92 | 2773.66 | 2697.07 | 2711.80 | 2690.19 | 2762.99 | 2103.72 | 2068.50 | 2032.84 | 1885.92 | 1847.23 | 1885.19 | 1842.36 | 1863.46 | 1651.76 | 1644.62 | 1643.77 | 1621.60 | 1603.81 | 1586.34 | 1567.62 | 1546.07 | 1555.36 | 1558.32 | 1585.37 | 1705.42 | 1744.62 | 1733.37 | NA | NA | NA | |
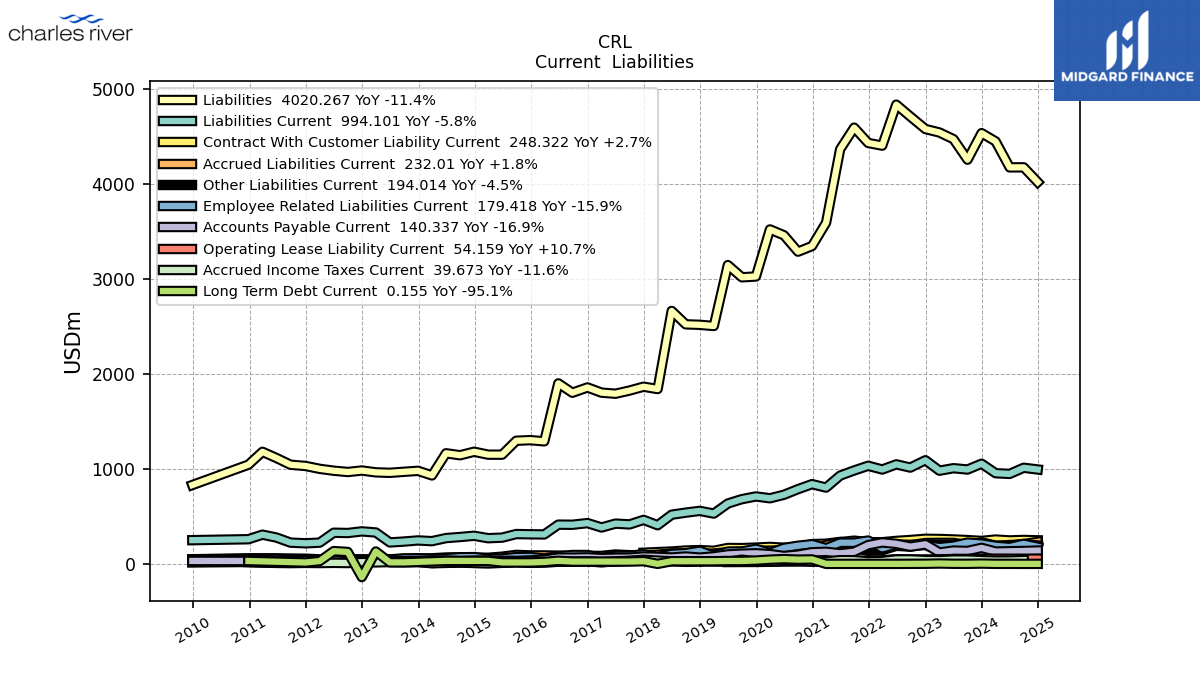
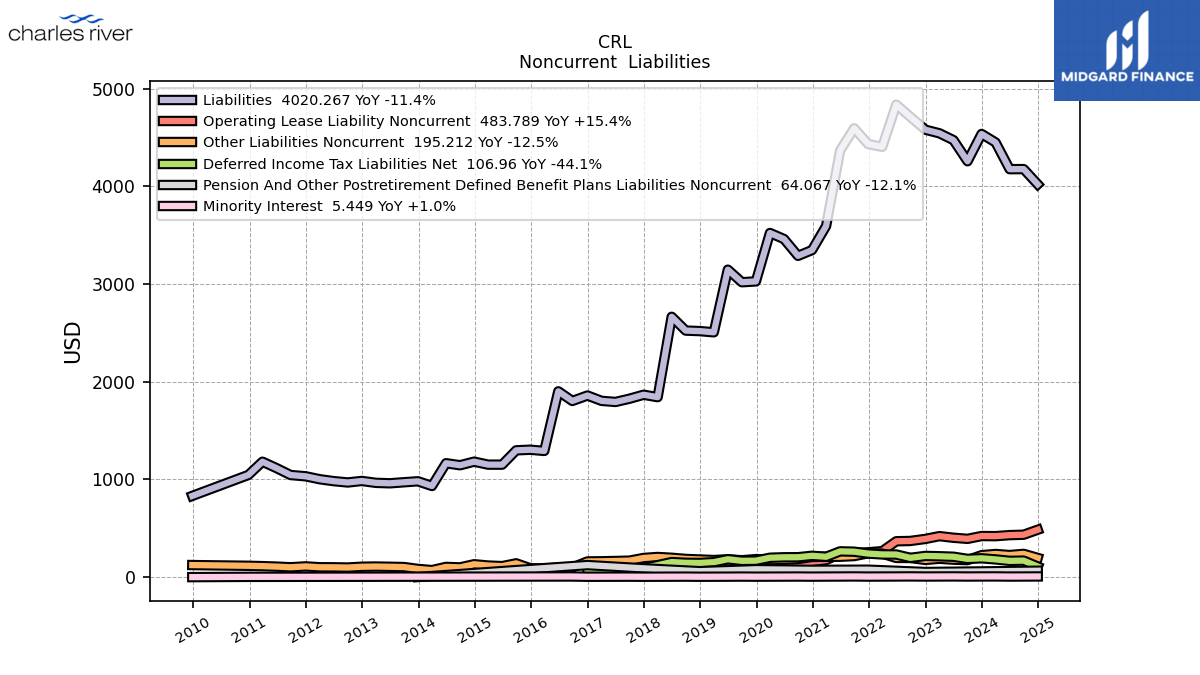
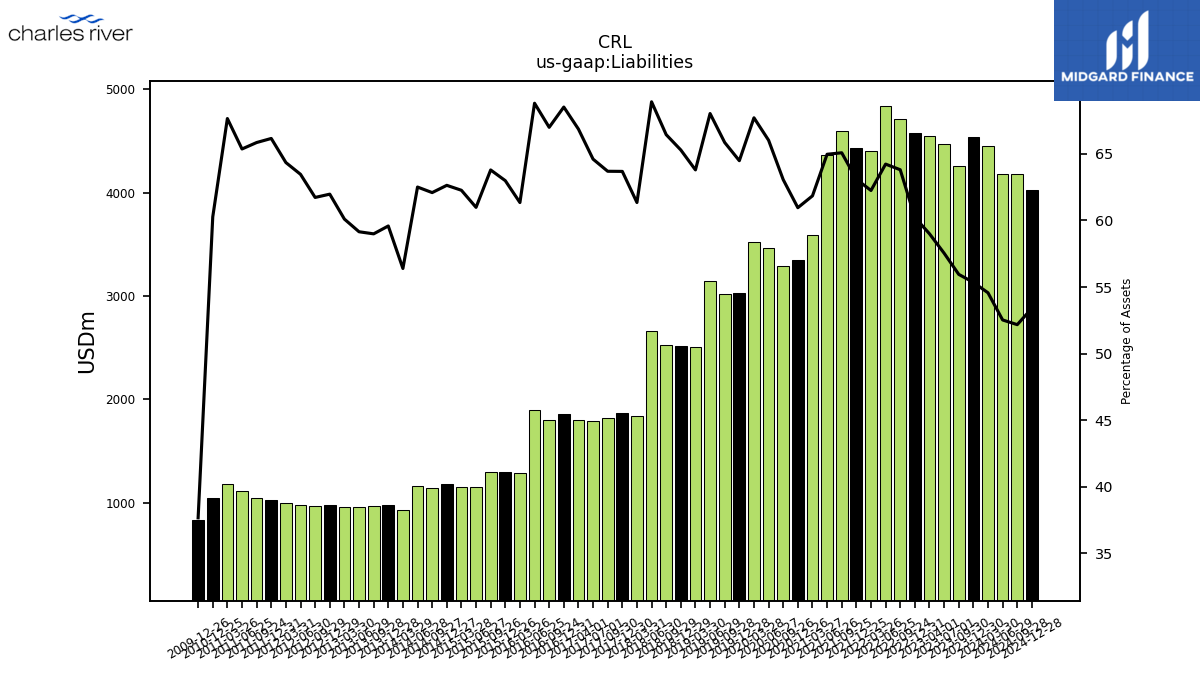
| Liabilities | 4536.00 | 4256.30 | 4472.38 | 4542.62 | 4579.27 | 4710.82 | 4836.26 | 4404.32 | 4432.30 | 4593.82 | 4366.27 | 3592.74 | 3347.16 | 3287.84 | 3460.28 | 3522.12 | 3026.32 | 3017.83 | 3146.64 | 2505.09 | 2517.58 | 2522.62 | 2664.02 | 1841.06 | 1865.91 | 1825.42 | 1791.95 | 1803.33 | 1858.02 | 1802.29 | 1901.00 | 1290.55 | 1302.93 | 1296.80 | 1150.11 | 1150.21 | 1180.85 | 1143.98 | 1164.84 | 931.50 | 979.96 | 969.74 | 959.21 | 963.94 | 983.14 | 967.67 | 981.22 | 1000.85 | 1030.96 | 1044.00 | 1114.80 | 1180.29 | 1044.65 | NA | NA | NA | |
| Liabilities And Stockholders Equity | 8195.00 | 7607.01 | 7772.38 | 7699.44 | 7602.77 | 7382.77 | 7529.36 | 7075.05 | 7024.29 | 7058.44 | 6720.35 | 5808.96 | 5490.83 | 5213.34 | 5240.88 | 5201.79 | 4692.79 | 4582.56 | 4625.48 | 3926.64 | 3855.88 | 3796.66 | 3865.88 | 3001.00 | 2929.92 | 2865.92 | 2773.66 | 2697.07 | 2711.80 | 2690.19 | 2762.99 | 2103.72 | 2068.50 | 2032.84 | 1885.92 | 1847.23 | 1885.19 | 1842.36 | 1863.46 | 1651.76 | 1644.62 | 1643.77 | 1621.60 | 1603.81 | 1586.34 | 1567.62 | 1546.07 | 1555.36 | 1558.32 | 1585.37 | 1705.42 | 1744.62 | 1733.37 | NA | NA | NA | |
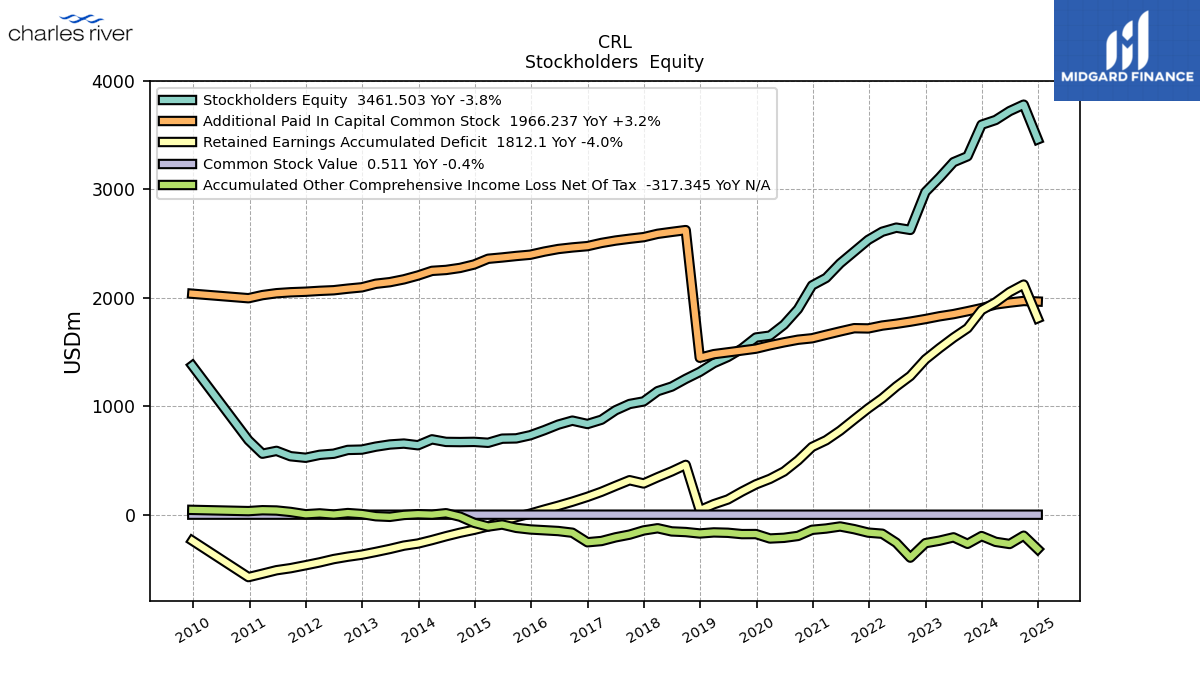
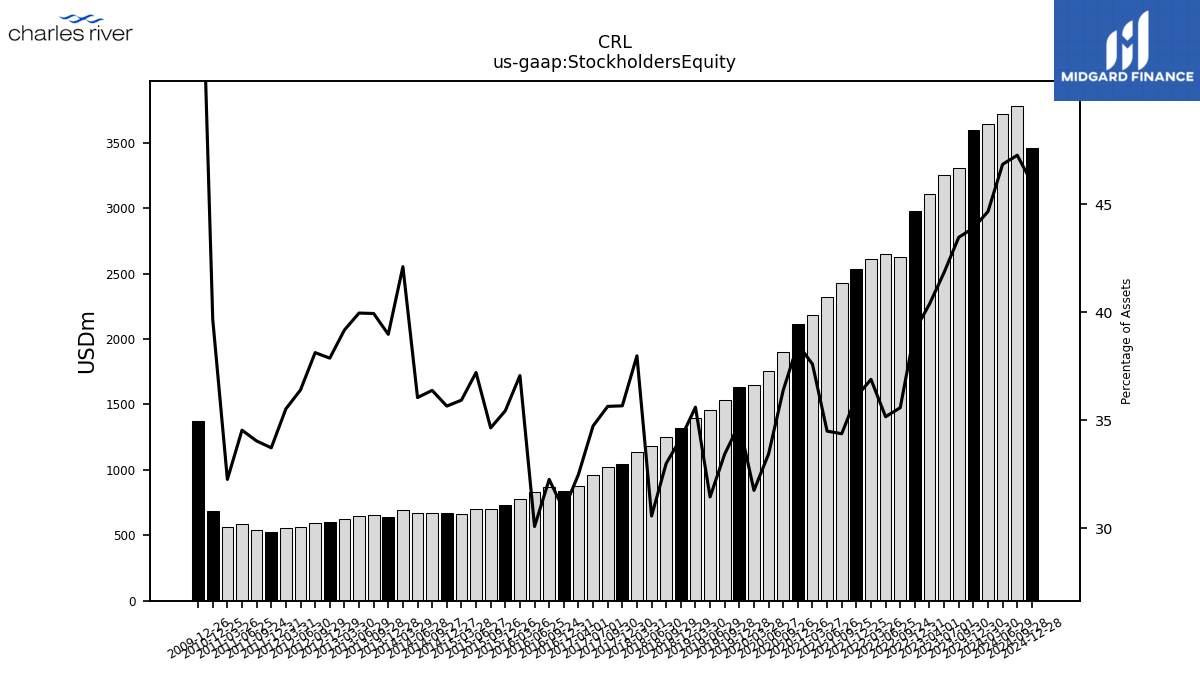
| Stockholders Equity | 3596.88 | 3305.99 | 3251.70 | 3108.60 | 2976.29 | 2626.85 | 2647.71 | 2610.18 | 2534.82 | 2426.57 | 2318.44 | 2183.93 | 2114.60 | 1896.94 | 1752.64 | 1651.98 | 1634.58 | 1532.31 | 1455.07 | 1398.11 | 1317.33 | 1253.11 | 1181.97 | 1139.83 | 1045.08 | 1021.51 | 963.50 | 876.43 | 836.77 | 867.97 | 831.35 | 779.82 | 733.07 | 704.36 | 701.70 | 663.71 | 672.20 | 670.30 | 671.82 | 695.46 | 640.98 | 656.51 | 647.95 | 628.28 | 600.80 | 597.71 | 562.84 | 552.60 | 525.58 | 539.71 | 589.09 | 562.92 | 687.42 | NA | NA | NA |
| 2023-12-30 | 2023-09-30 | 2023-07-01 | 2023-04-01 | 2022-12-31 | 2022-09-24 | 2022-06-25 | 2022-03-26 | 2021-12-25 | 2021-09-25 | 2021-06-26 | 2021-03-27 | 2020-12-26 | 2020-09-26 | 2020-06-27 | 2020-03-28 | 2019-12-28 | 2019-09-28 | 2019-06-29 | 2019-03-30 | 2018-12-29 | 2018-09-29 | 2018-06-30 | 2018-03-31 | 2017-12-30 | 2017-09-30 | 2017-07-01 | 2017-04-01 | 2016-12-31 | 2016-09-24 | 2016-06-25 | 2016-03-26 | 2015-12-26 | 2015-09-26 | 2015-06-27 | 2015-03-28 | 2014-12-27 | 2014-09-27 | 2014-06-28 | 2014-03-29 | 2013-12-28 | 2013-09-28 | 2013-06-29 | 2013-03-30 | 2012-12-29 | 2012-09-29 | 2012-06-30 | 2012-03-31 | 2011-12-31 | 2011-09-24 | 2011-06-25 | 2011-03-26 | 2010-12-25 | 2010-09-25 | 2010-06-26 | 2010-03-27 | ||
|---|---|---|---|---|---|---|---|---|---|---|---|---|---|---|---|---|---|---|---|---|---|---|---|---|---|---|---|---|---|---|---|---|---|---|---|---|---|---|---|---|---|---|---|---|---|---|---|---|---|---|---|---|---|---|---|---|---|
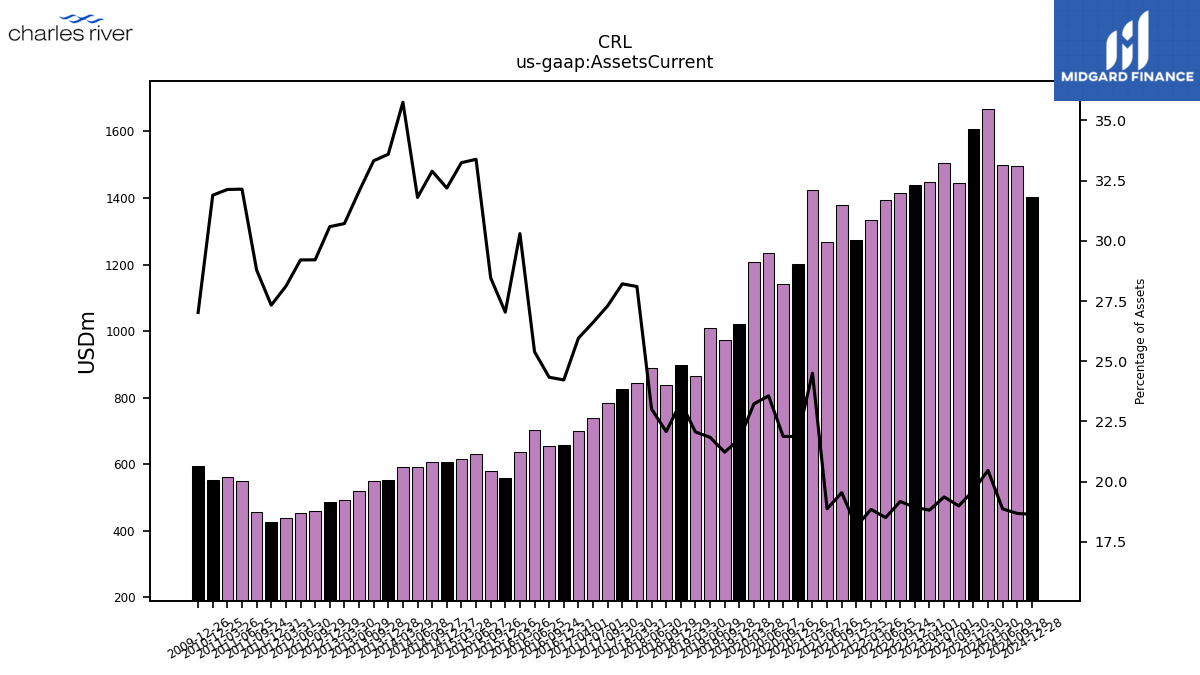
| Assets Current | 1608.66 | 1444.33 | 1504.78 | 1448.36 | 1439.03 | 1415.35 | 1393.09 | 1333.09 | 1274.10 | 1379.04 | 1267.91 | 1423.21 | 1201.13 | 1140.27 | 1234.72 | 1208.28 | 1021.33 | 972.41 | 1010.06 | 866.18 | 897.84 | 838.17 | 889.53 | 843.35 | 826.62 | 782.38 | 738.07 | 700.12 | 656.83 | 654.58 | 701.55 | 637.39 | 559.23 | 578.66 | 629.65 | 614.14 | 606.90 | 606.02 | 592.70 | 590.66 | 552.55 | 547.78 | 519.76 | 492.62 | 485.25 | 457.92 | 451.56 | 437.27 | 425.84 | 456.33 | 548.25 | 560.58 | 552.89 | NA | NA | NA | |
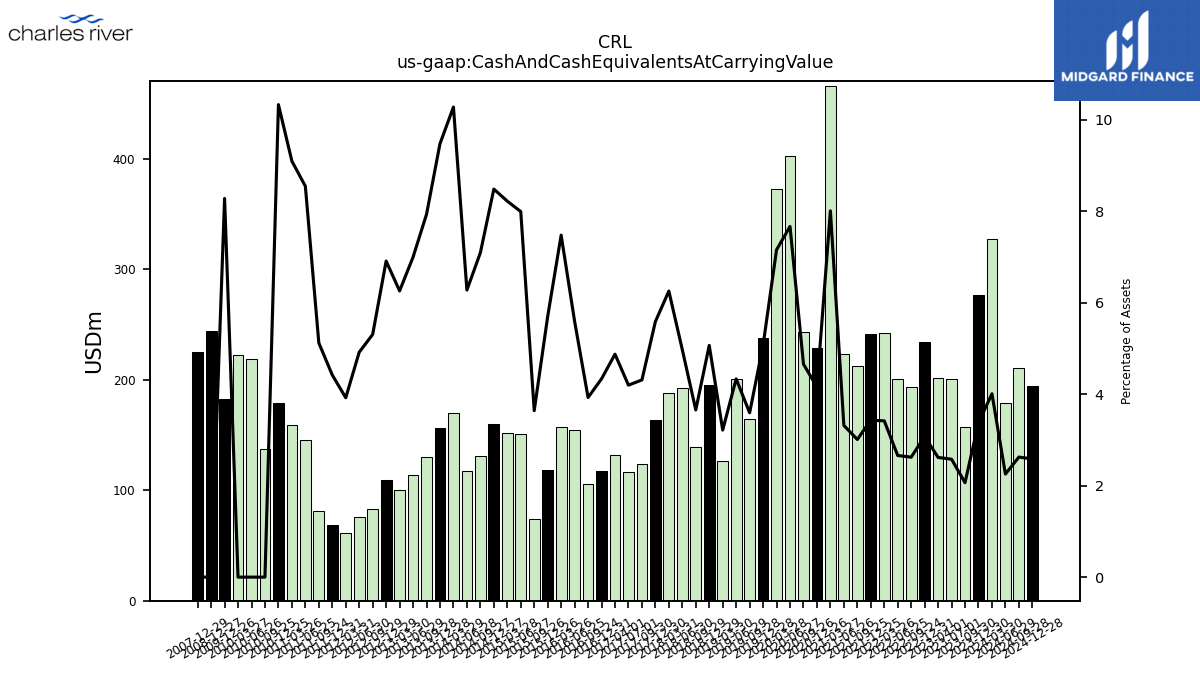
| Cash And Cash Equivalents At Carrying Value | 276.77 | 157.17 | 200.44 | 201.59 | 233.91 | 193.70 | 200.32 | 241.87 | 241.21 | 212.54 | 222.97 | 465.41 | 228.42 | 242.88 | 402.02 | 372.43 | 238.01 | 164.76 | 200.59 | 126.32 | 195.44 | 138.87 | 192.30 | 187.77 | 163.79 | 123.62 | 116.47 | 131.52 | 117.63 | 105.72 | 154.59 | 157.38 | 117.95 | 74.03 | 150.81 | 151.92 | 160.02 | 130.75 | 117.01 | 169.85 | 155.93 | 130.45 | 113.52 | 100.42 | 109.69 | 83.22 | 76.08 | 61.03 | 68.91 | 81.22 | 145.83 | 158.75 | 179.16 | 137.43 | 219.08 | 222.20 | |
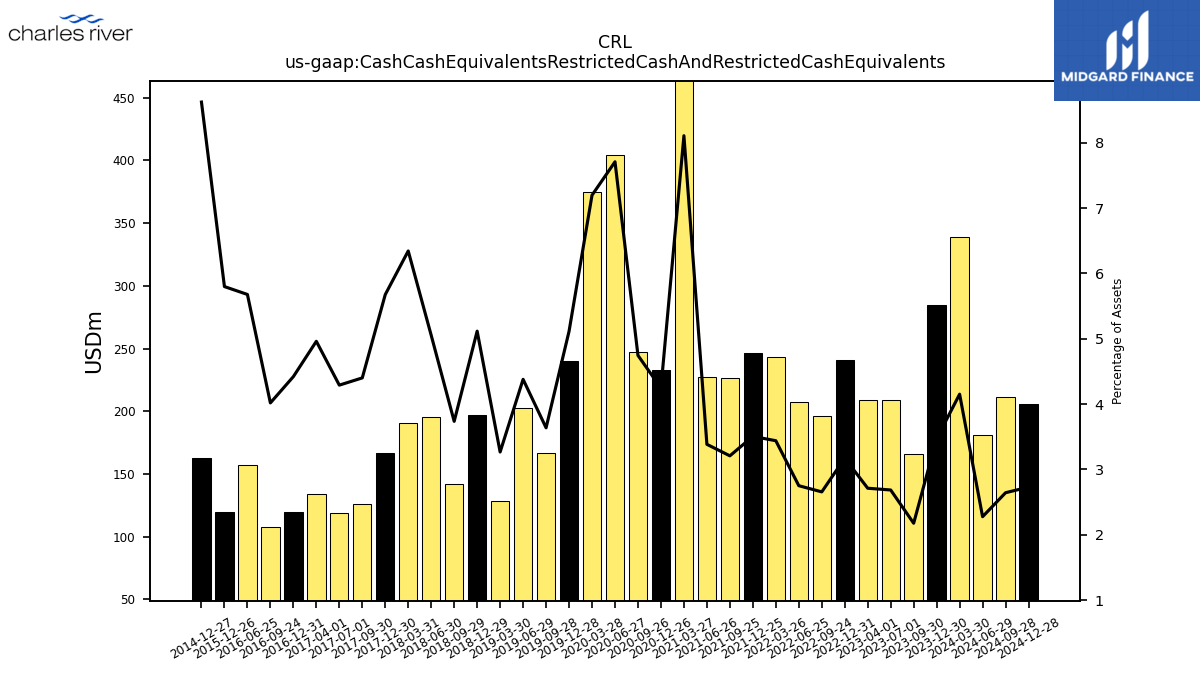
| Cash Cash Equivalents Restricted Cash And Restricted Cash Equivalents | 284.48 | 165.62 | 208.78 | 208.89 | 241.21 | 196.18 | 207.21 | 243.40 | 246.31 | 226.50 | 227.49 | 471.02 | 233.12 | 247.42 | 404.04 | 374.45 | 240.05 | 166.72 | 202.59 | 128.31 | 197.32 | 141.88 | 195.37 | 190.40 | 166.33 | 126.15 | 119.02 | 133.83 | 119.89 | 108.12 | 156.91 | NA | 119.96 | NA | NA | NA | 162.57 | NA | NA | NA | NA | NA | NA | NA | NA | NA | NA | NA | NA | NA | NA | NA | NA | NA | NA | NA | |
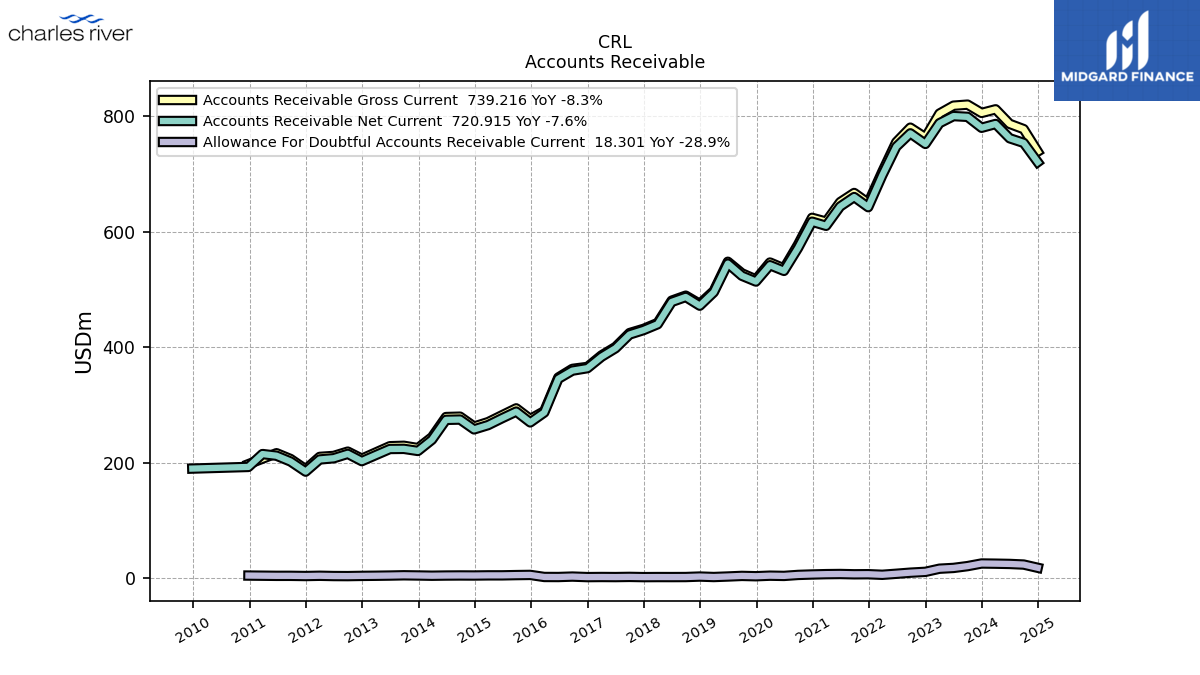
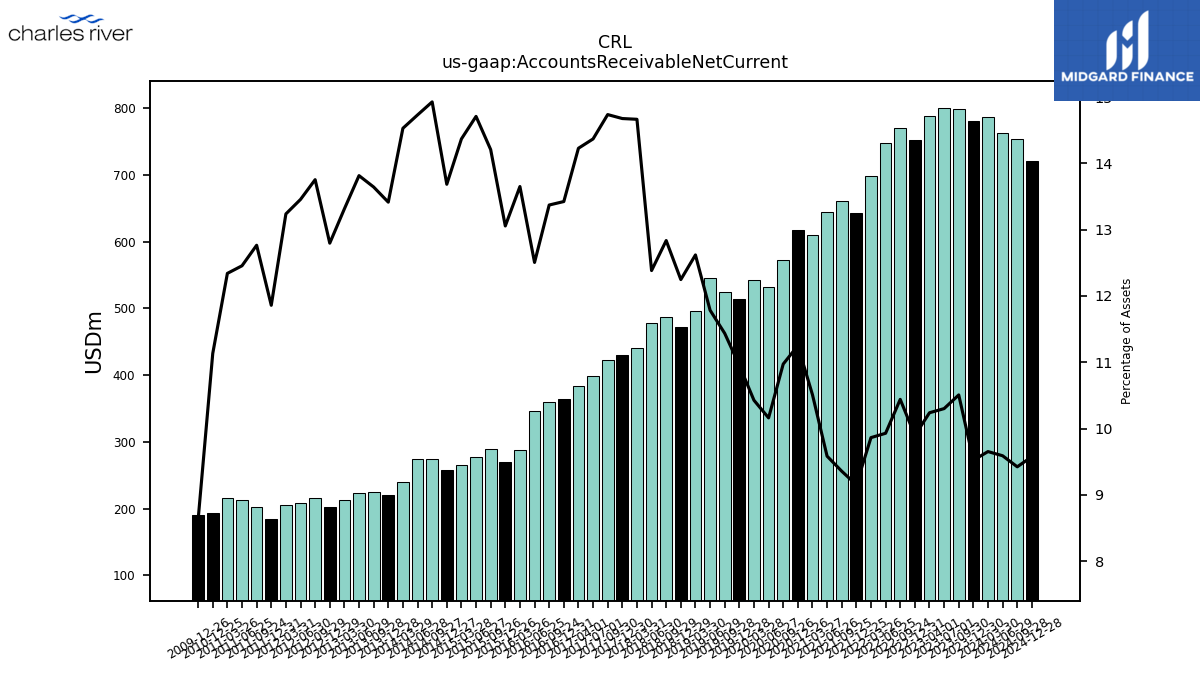
| Accounts Receivable Net Current | 780.38 | 799.31 | 800.65 | 788.31 | 752.39 | 770.78 | 747.61 | 697.84 | 642.88 | 660.45 | 644.03 | 610.57 | 617.74 | 572.06 | 532.53 | 542.39 | 514.03 | 524.07 | 545.15 | 495.50 | 472.25 | 487.34 | 478.74 | 440.11 | 430.02 | 422.33 | 398.55 | 383.75 | 364.05 | 359.73 | 345.54 | 287.18 | 270.07 | 288.84 | 277.40 | 265.43 | 257.99 | 275.02 | 274.50 | 240.00 | 220.63 | 224.27 | 224.03 | 213.54 | 203.00 | 215.62 | 208.05 | 205.89 | 184.81 | 202.38 | 212.42 | 215.30 | 192.97 | NA | NA | NA | |
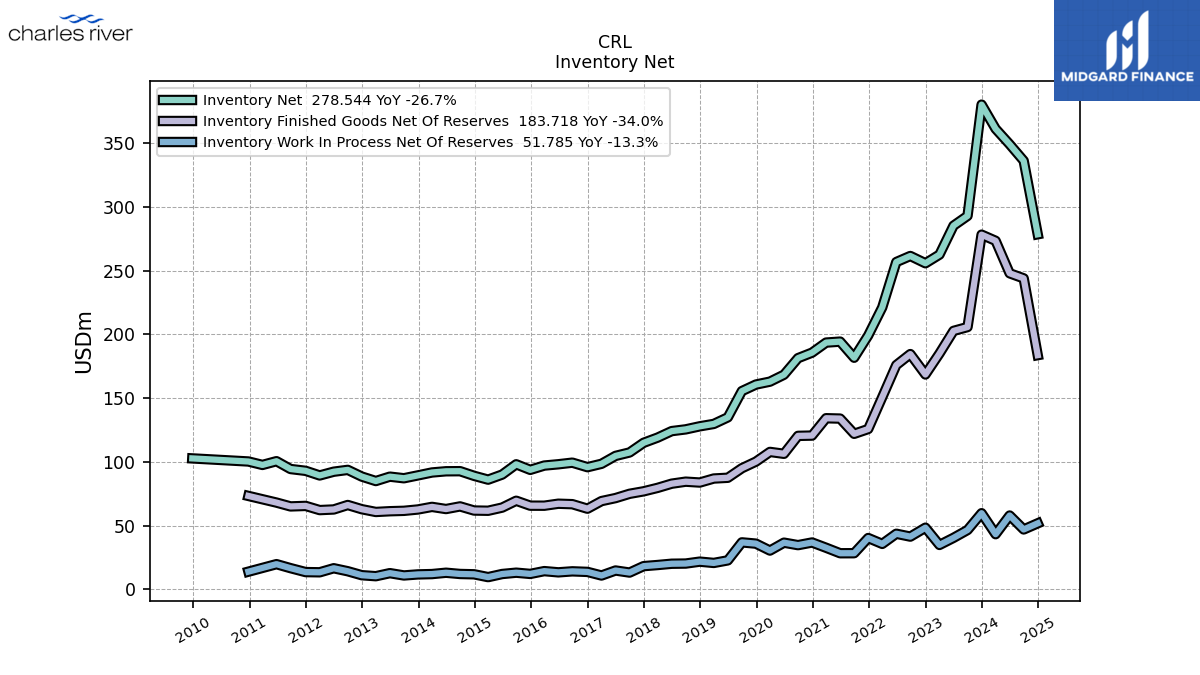
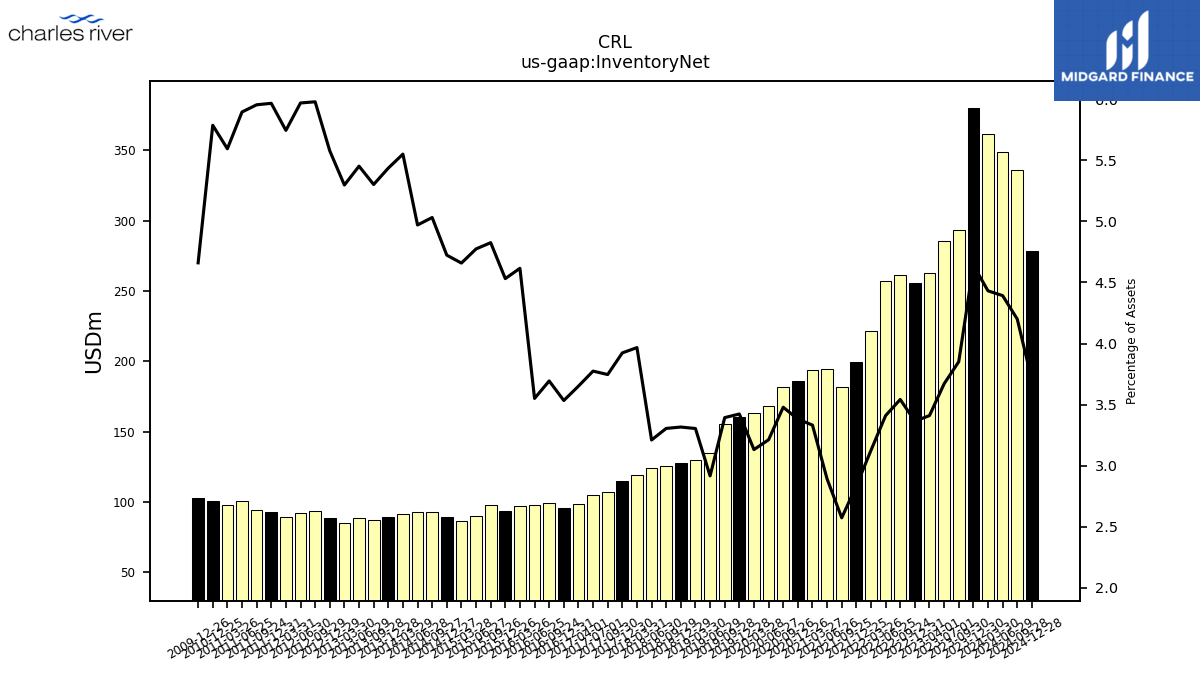
| Inventory Net | 380.26 | 292.97 | 285.28 | 262.58 | 255.81 | 261.52 | 256.76 | 221.18 | 199.15 | 181.69 | 194.34 | 193.58 | 185.69 | 181.37 | 168.37 | 162.94 | 160.66 | 155.53 | 134.93 | 129.76 | 127.89 | 125.50 | 124.13 | 119.05 | 114.96 | 107.37 | 104.69 | 98.48 | 95.83 | 99.37 | 98.12 | 97.10 | 93.73 | 98.10 | 90.04 | 86.06 | 89.04 | 92.69 | 92.62 | 91.67 | 89.40 | 87.15 | 88.41 | 84.96 | 88.47 | 93.72 | 92.28 | 89.35 | 92.97 | 94.39 | 100.53 | 97.59 | 100.30 | NA | NA | NA | |
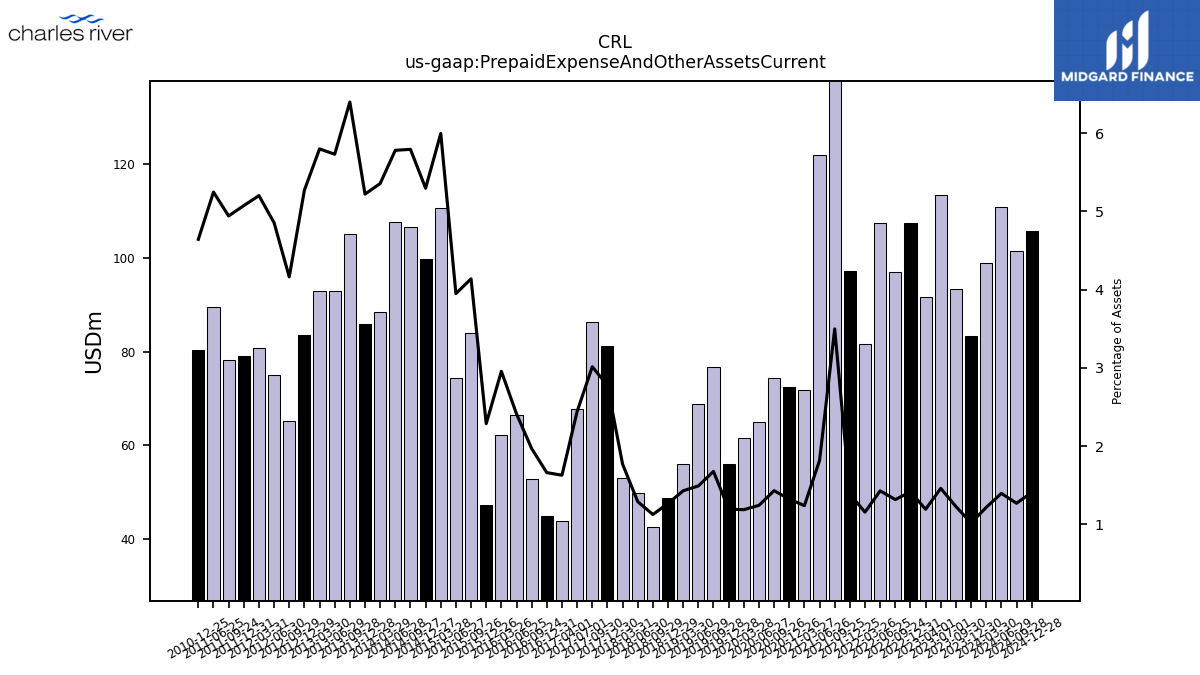
| Prepaid Expense And Other Assets Current | 83.38 | 93.31 | 113.39 | 91.71 | 107.58 | 97.09 | 107.46 | 81.70 | 97.31 | 246.83 | 121.97 | 71.92 | 72.56 | 74.49 | 65.06 | 61.69 | 56.03 | 76.77 | 68.91 | 56.05 | 48.81 | 42.70 | 49.83 | 53.08 | 81.31 | 86.36 | 67.69 | 43.87 | 45.01 | 52.92 | 66.61 | 62.16 | 47.29 | 84.10 | 74.45 | 110.74 | 99.84 | 106.72 | 107.71 | 88.46 | 85.85 | 105.15 | 92.92 | 92.99 | 83.60 | 65.24 | 75.05 | 80.89 | 79.05 | 78.34 | 89.47 | NA | 80.47 | NA | NA | NA |
| 2023-12-30 | 2023-09-30 | 2023-07-01 | 2023-04-01 | 2022-12-31 | 2022-09-24 | 2022-06-25 | 2022-03-26 | 2021-12-25 | 2021-09-25 | 2021-06-26 | 2021-03-27 | 2020-12-26 | 2020-09-26 | 2020-06-27 | 2020-03-28 | 2019-12-28 | 2019-09-28 | 2019-06-29 | 2019-03-30 | 2018-12-29 | 2018-09-29 | 2018-06-30 | 2018-03-31 | 2017-12-30 | 2017-09-30 | 2017-07-01 | 2017-04-01 | 2016-12-31 | 2016-09-24 | 2016-06-25 | 2016-03-26 | 2015-12-26 | 2015-09-26 | 2015-06-27 | 2015-03-28 | 2014-12-27 | 2014-09-27 | 2014-06-28 | 2014-03-29 | 2013-12-28 | 2013-09-28 | 2013-06-29 | 2013-03-30 | 2012-12-29 | 2012-09-29 | 2012-06-30 | 2012-03-31 | 2011-12-31 | 2011-09-24 | 2011-06-25 | 2011-03-26 | 2010-12-25 | 2010-09-25 | 2010-06-26 | 2010-03-27 | ||
|---|---|---|---|---|---|---|---|---|---|---|---|---|---|---|---|---|---|---|---|---|---|---|---|---|---|---|---|---|---|---|---|---|---|---|---|---|---|---|---|---|---|---|---|---|---|---|---|---|---|---|---|---|---|---|---|---|---|
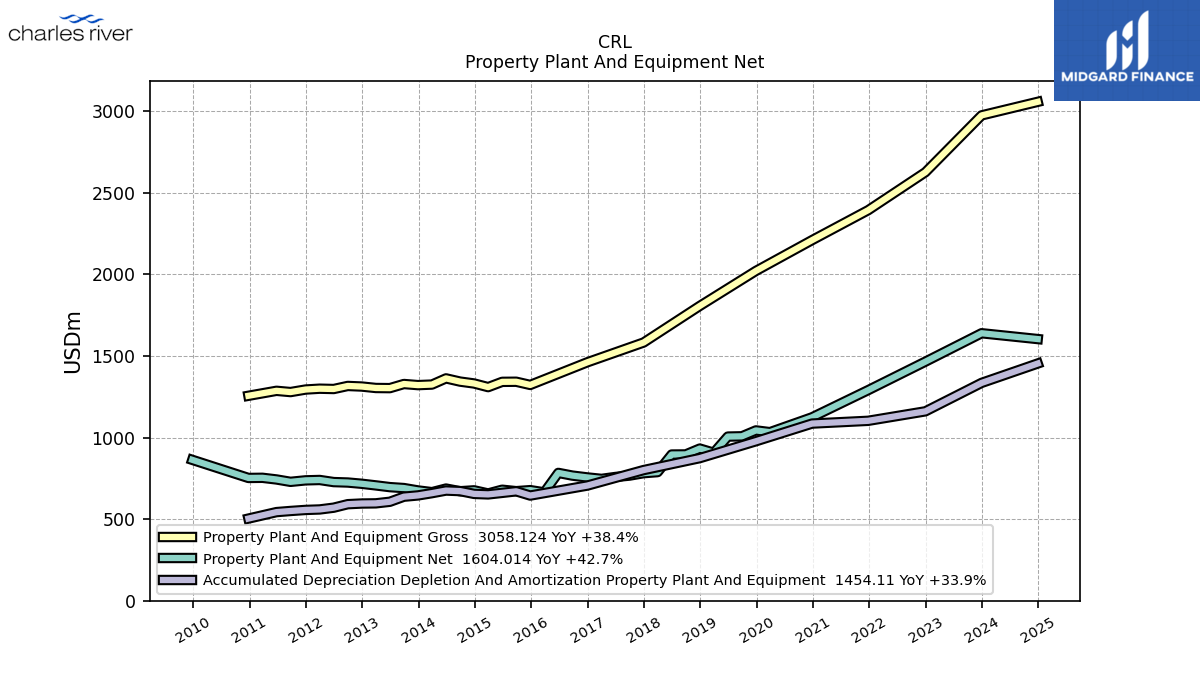
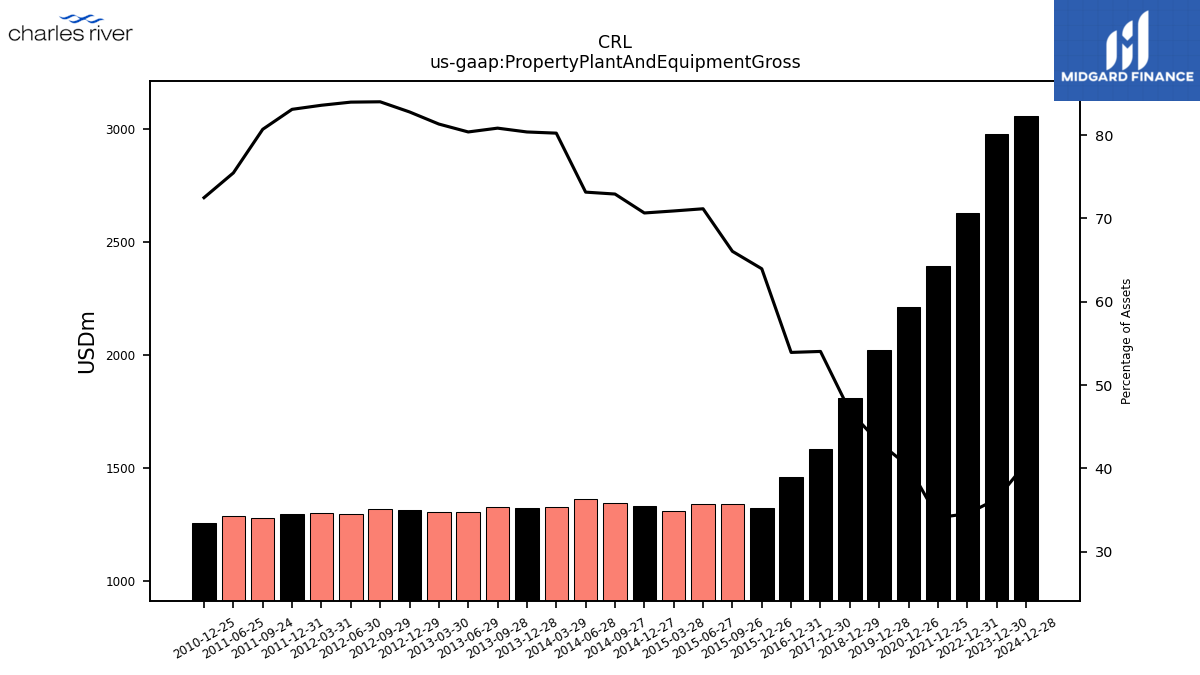
| Property Plant And Equipment Gross | 2975.05 | NA | NA | NA | 2626.78 | NA | NA | NA | 2394.05 | NA | NA | NA | 2210.35 | NA | NA | NA | 2021.70 | NA | NA | NA | 1807.01 | NA | NA | NA | 1582.95 | NA | NA | NA | 1461.97 | NA | NA | NA | 1322.77 | 1342.51 | 1341.80 | 1309.43 | 1331.78 | 1343.37 | 1363.04 | 1325.11 | 1321.71 | 1328.55 | 1303.24 | 1304.13 | 1313.01 | 1316.58 | 1297.86 | 1299.82 | 1294.67 | 1279.15 | 1286.82 | NA | 1256.34 | NA | NA | NA | |
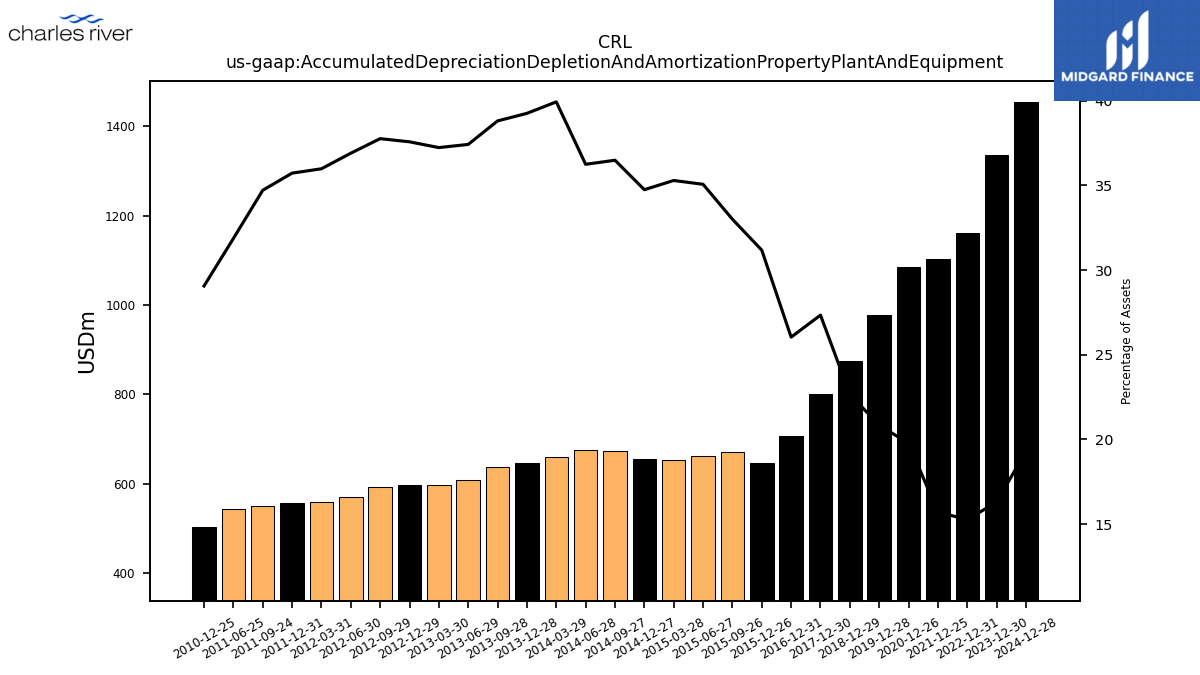
| Accumulated Depreciation Depletion And Amortization Property Plant And Equipment | 1335.31 | NA | NA | NA | 1161.13 | NA | NA | NA | 1102.98 | NA | NA | NA | 1085.99 | NA | NA | NA | 977.57 | NA | NA | NA | 874.13 | NA | NA | NA | 800.98 | NA | NA | NA | 706.14 | NA | NA | NA | 644.81 | 670.84 | 661.23 | 651.83 | 654.98 | 672.12 | 675.37 | 659.50 | 645.53 | 637.83 | 606.74 | 597.08 | 595.99 | 591.88 | 570.46 | 559.60 | 556.64 | 550.26 | 543.37 | NA | 503.69 | NA | NA | NA | |
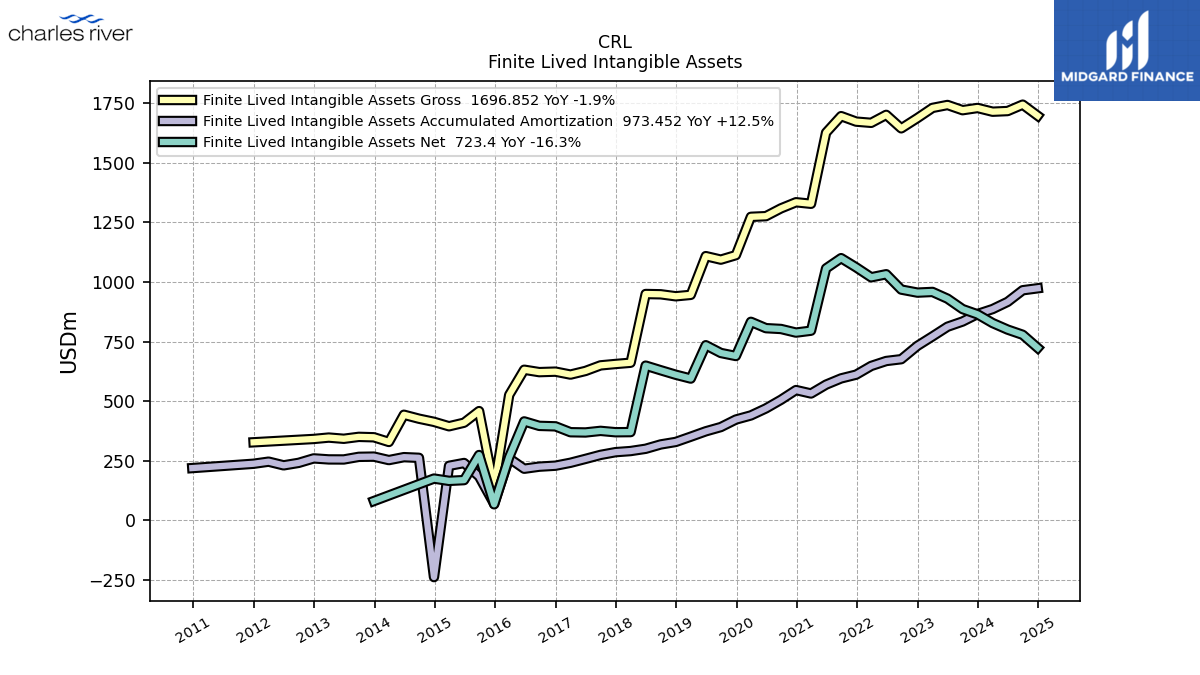
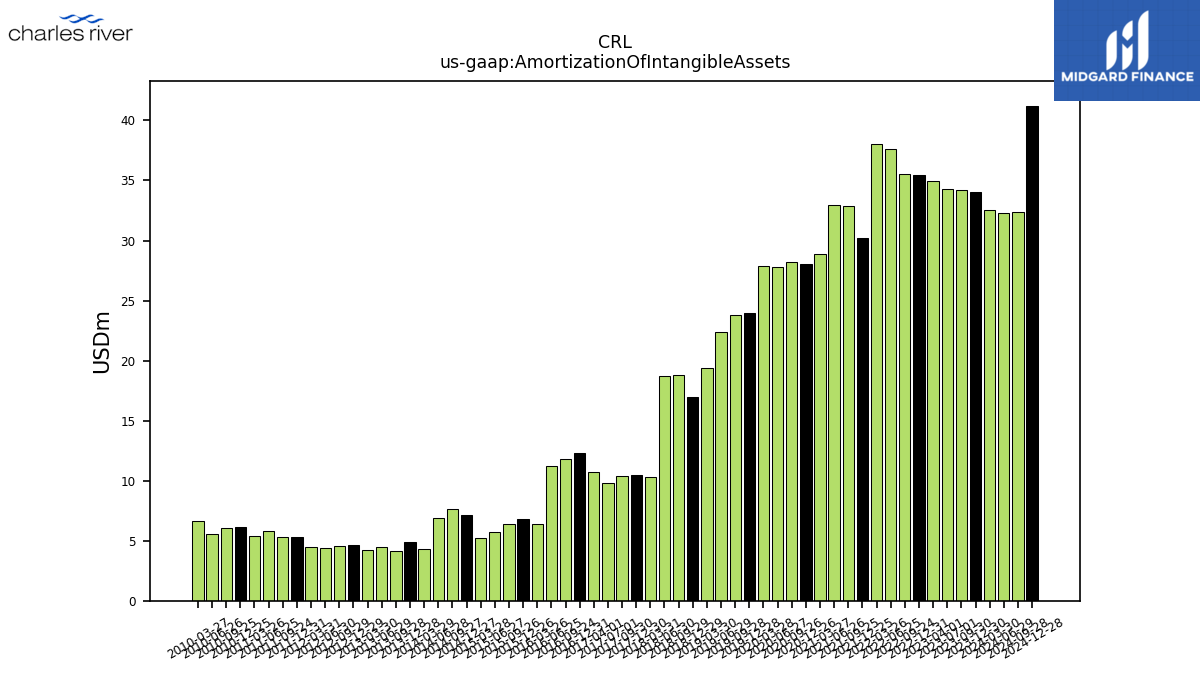
| Amortization Of Intangible Assets | 34.02 | 34.23 | 34.27 | 34.92 | 35.43 | 35.53 | 37.60 | 38.01 | 30.19 | 32.85 | 32.97 | 28.84 | 28.01 | 28.23 | 27.76 | 27.88 | 23.93 | 23.80 | 22.39 | 19.41 | 16.99 | 18.80 | 18.74 | 10.27 | 10.46 | 10.36 | 9.82 | 10.74 | 12.31 | 11.82 | 11.21 | 6.35 | 6.84 | 6.41 | 5.72 | 5.26 | 7.14 | 7.62 | 6.85 | 4.34 | 4.91 | 4.18 | 4.46 | 4.25 | 4.63 | 4.53 | 4.41 | 4.50 | 5.34 | 5.28 | 5.80 | 5.38 | 6.16 | 6.03 | 5.54 | 6.68 | |
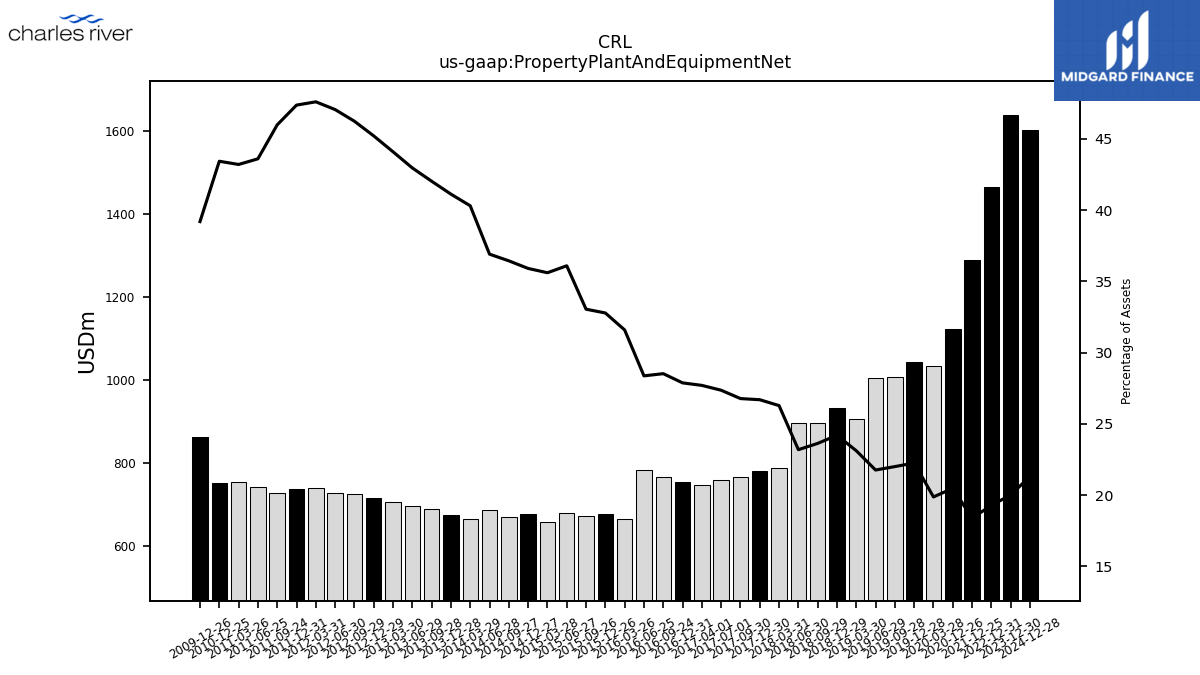
| Property Plant And Equipment Net | 1639.74 | NA | NA | NA | 1465.65 | NA | NA | NA | 1291.07 | NA | NA | NA | 1124.36 | NA | NA | 1033.41 | 1044.13 | 1008.05 | 1006.33 | 907.37 | 932.88 | 896.90 | 896.27 | 788.55 | 781.97 | 767.19 | 758.72 | 746.95 | 755.83 | 767.18 | 783.68 | 664.44 | 677.96 | 671.67 | 680.57 | 657.60 | 676.80 | 671.24 | 687.66 | 665.61 | 676.18 | 690.73 | 696.50 | 707.05 | 717.02 | 724.70 | 727.40 | 740.23 | 738.03 | 728.89 | 743.45 | 753.61 | 752.66 | NA | NA | NA | |
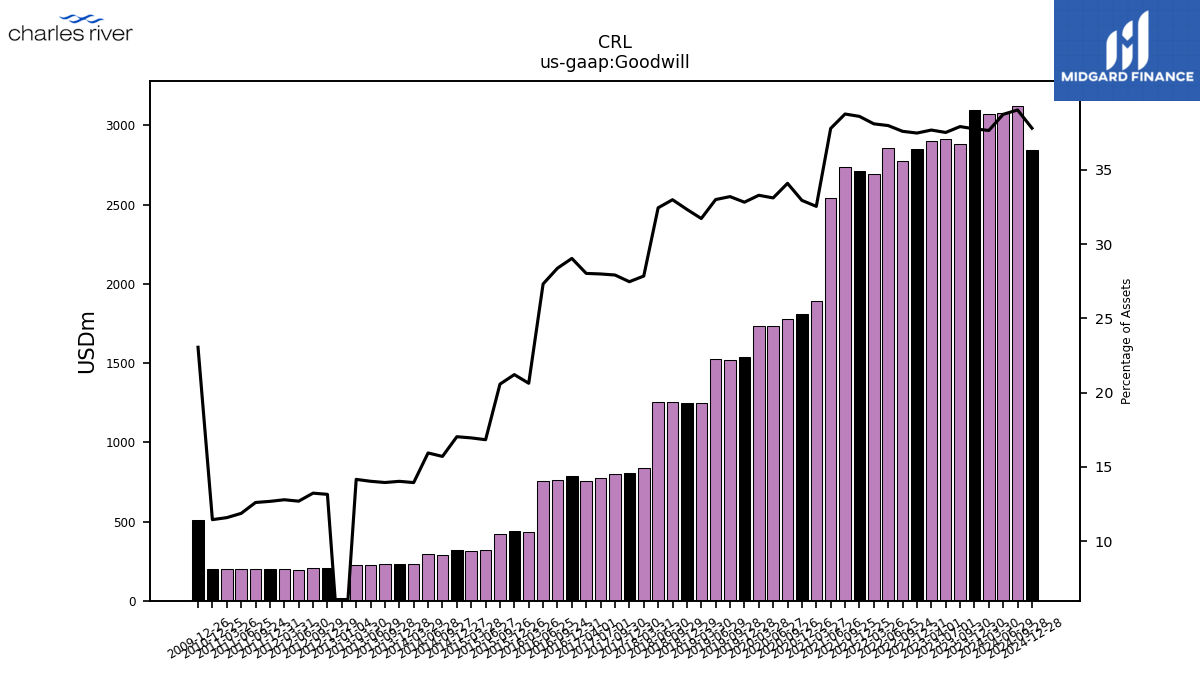
| Goodwill | 3095.05 | 2884.60 | 2916.59 | 2901.63 | 2849.90 | 2776.01 | 2860.26 | 2695.99 | 2711.88 | 2736.32 | 2540.07 | 1890.63 | 1809.17 | 1777.64 | 1735.64 | 1731.84 | 1540.57 | 1521.62 | 1526.68 | 1245.85 | 1247.13 | 1252.70 | 1254.44 | 835.94 | 804.91 | 800.25 | 776.45 | 756.02 | 787.52 | 763.58 | 754.92 | 434.06 | 438.83 | 418.25 | 317.41 | 313.16 | 321.08 | 289.36 | 297.00 | 230.32 | 230.70 | 229.27 | 227.52 | 227.08 | 208.61 | 207.42 | 196.22 | 198.88 | 197.56 | 199.80 | 202.43 | 202.06 | 198.44 | NA | NA | NA | |
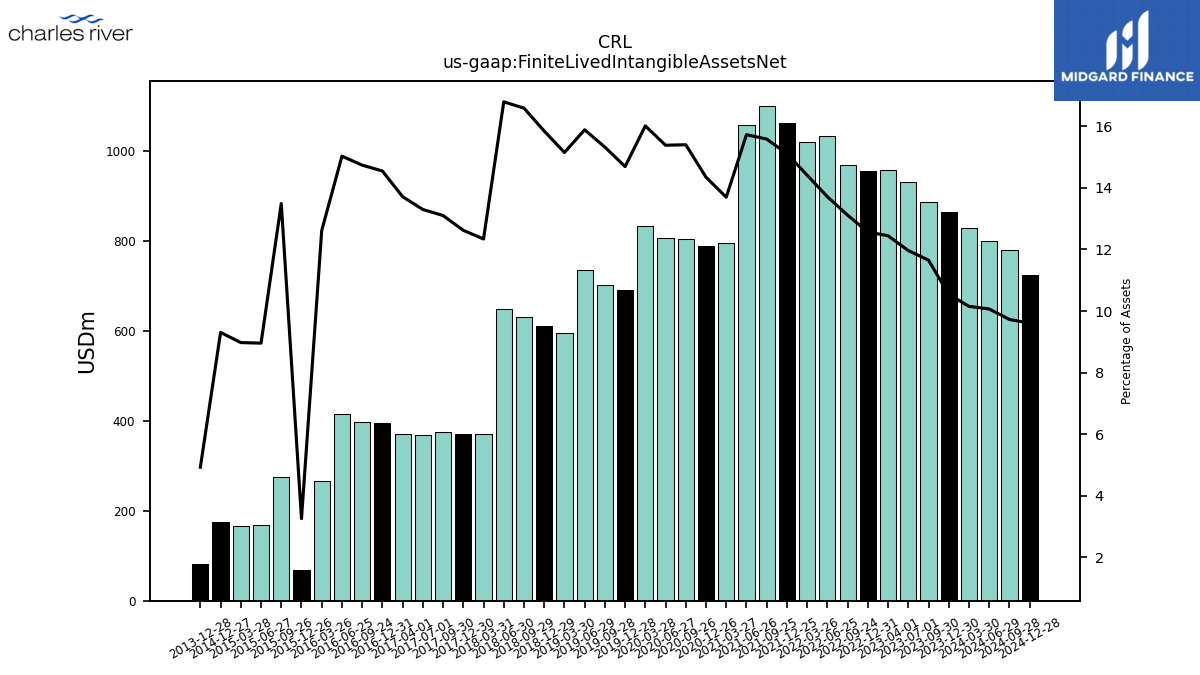
| Finite Lived Intangible Assets Net | 864.05 | 886.29 | 929.89 | 958.12 | 955.27 | 968.02 | 1032.37 | 1019.54 | 1061.19 | 1099.88 | 1056.78 | 795.57 | 787.60 | 802.78 | 806.19 | 832.86 | 689.41 | 702.12 | 734.70 | 594.76 | 610.89 | 629.73 | 649.14 | 370.30 | 369.76 | 375.45 | 368.79 | 369.81 | 394.45 | 396.45 | 415.20 | 265.38 | 67.43 | 274.25 | 168.94 | 165.80 | 175.44 | NA | NA | NA | 81.10 | NA | NA | NA | NA | NA | NA | NA | NA | NA | NA | NA | NA | NA | NA | NA | |
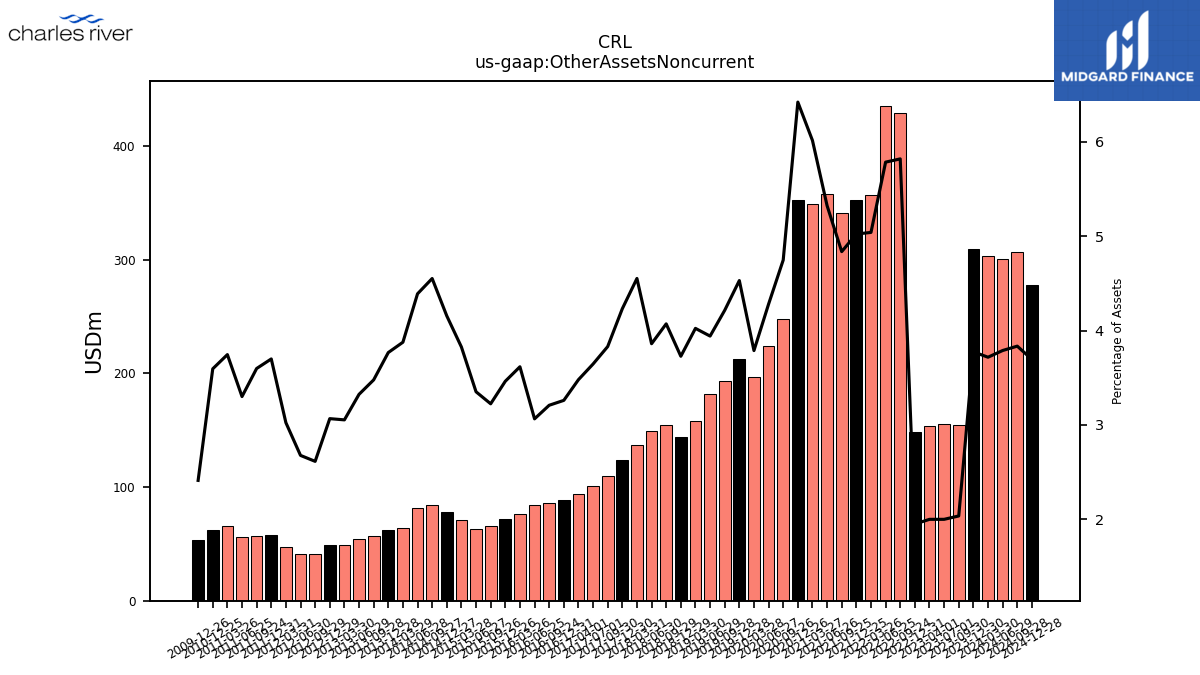
| Other Assets Noncurrent | 309.38 | 154.88 | 155.47 | 153.99 | 148.28 | 429.69 | 435.63 | 356.65 | 352.89 | 341.44 | 357.79 | 349.43 | 352.63 | 247.54 | 224.37 | 197.08 | 212.62 | 193.17 | 182.35 | 158.00 | 143.76 | 154.59 | 149.27 | 136.63 | 124.00 | 109.80 | 101.13 | 93.86 | 88.43 | 86.33 | 84.69 | 76.09 | 71.64 | 65.55 | 63.22 | 70.69 | 78.35 | 83.87 | 81.81 | 64.04 | 61.96 | 57.17 | 53.91 | 48.98 | 48.66 | 40.99 | 41.40 | 47.05 | 57.66 | 57.05 | 56.30 | 65.35 | 62.32 | NA | NA | NA |
| 2023-12-30 | 2023-09-30 | 2023-07-01 | 2023-04-01 | 2022-12-31 | 2022-09-24 | 2022-06-25 | 2022-03-26 | 2021-12-25 | 2021-09-25 | 2021-06-26 | 2021-03-27 | 2020-12-26 | 2020-09-26 | 2020-06-27 | 2020-03-28 | 2019-12-28 | 2019-09-28 | 2019-06-29 | 2019-03-30 | 2018-12-29 | 2018-09-29 | 2018-06-30 | 2018-03-31 | 2017-12-30 | 2017-09-30 | 2017-07-01 | 2017-04-01 | 2016-12-31 | 2016-09-24 | 2016-06-25 | 2016-03-26 | 2015-12-26 | 2015-09-26 | 2015-06-27 | 2015-03-28 | 2014-12-27 | 2014-09-27 | 2014-06-28 | 2014-03-29 | 2013-12-28 | 2013-09-28 | 2013-06-29 | 2013-03-30 | 2012-12-29 | 2012-09-29 | 2012-06-30 | 2012-03-31 | 2011-12-31 | 2011-09-24 | 2011-06-25 | 2011-03-26 | 2010-12-25 | 2010-09-25 | 2010-06-26 | 2010-03-27 | ||
|---|---|---|---|---|---|---|---|---|---|---|---|---|---|---|---|---|---|---|---|---|---|---|---|---|---|---|---|---|---|---|---|---|---|---|---|---|---|---|---|---|---|---|---|---|---|---|---|---|---|---|---|---|---|---|---|---|---|
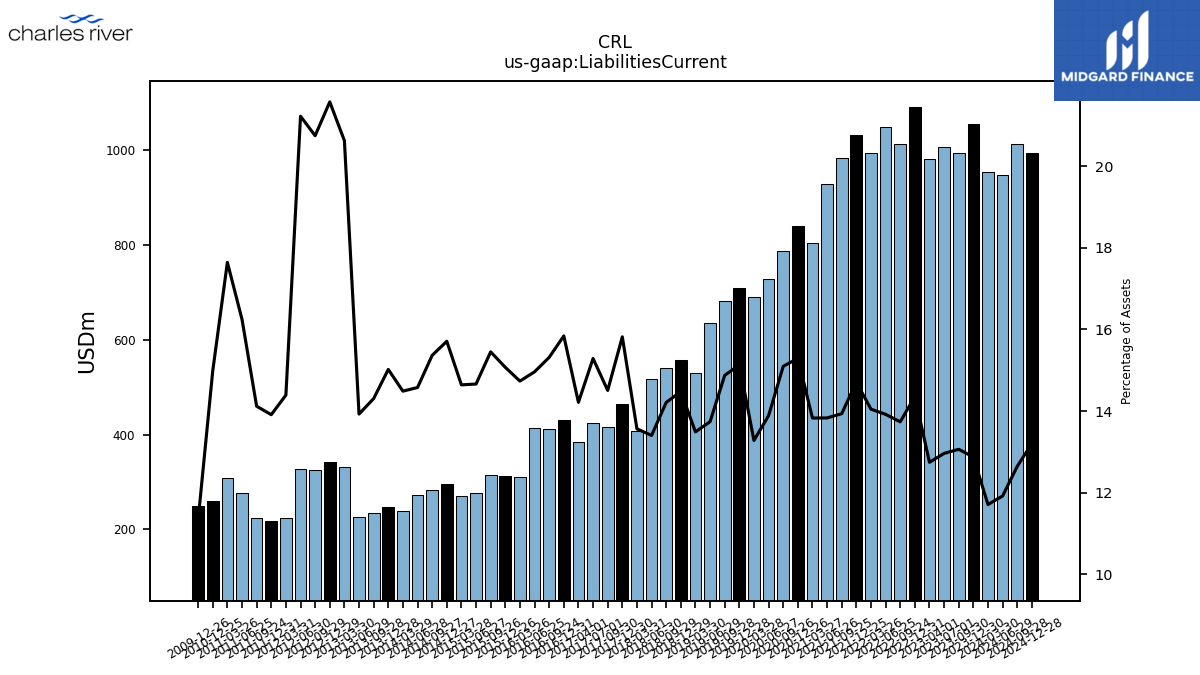
| Liabilities Current | 1055.08 | 993.82 | 1007.62 | 981.39 | 1091.59 | 1014.19 | 1048.13 | 993.84 | 1033.18 | 983.75 | 929.61 | 803.38 | 839.75 | 787.01 | 727.94 | 690.90 | 710.18 | 681.65 | 635.60 | 529.76 | 558.22 | 539.60 | 518.14 | 407.10 | 463.50 | 415.75 | 424.07 | 383.37 | 429.59 | 412.05 | 413.39 | 309.99 | 311.76 | 314.10 | 276.53 | 270.49 | 296.17 | 283.08 | 271.65 | 239.32 | 247.03 | 235.17 | 225.85 | 330.81 | 342.25 | 325.24 | 328.13 | 223.84 | 216.80 | 223.84 | 277.10 | 307.81 | 259.78 | NA | NA | NA | |
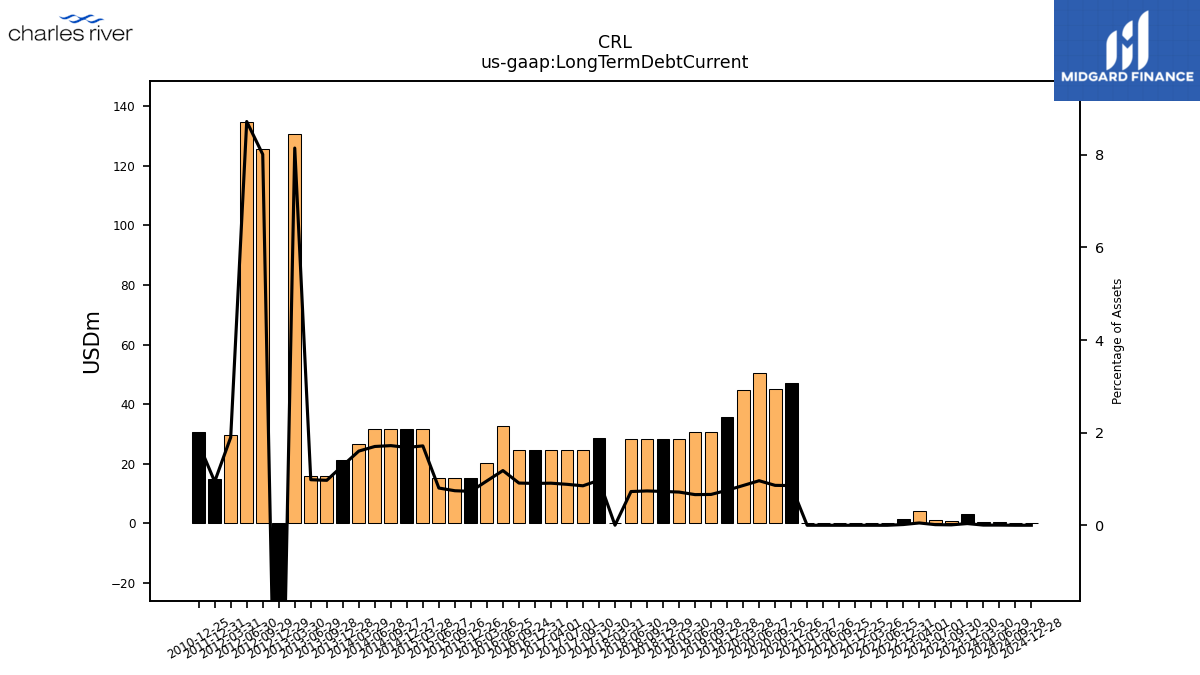
| Long Term Debt Current | 3.17 | 0.80 | 1.19 | 4.00 | 1.35 | NA | 0.10 | 0.10 | 0.10 | 0.10 | 0.11 | 0.11 | 47.20 | 45.02 | 50.51 | 44.74 | 35.55 | 30.61 | 30.71 | 28.23 | 28.23 | 28.23 | 28.23 | 0.11 | 28.55 | 24.48 | 24.58 | 24.56 | 24.56 | 24.57 | 32.70 | 20.20 | 15.19 | 15.20 | 15.20 | 31.70 | 31.71 | 31.72 | 31.74 | 26.49 | 21.24 | 15.99 | 15.98 | 130.66 | -139.37 | 125.59 | 134.81 | 29.55 | 14.73 | NA | NA | NA | 30.54 | NA | NA | NA | |
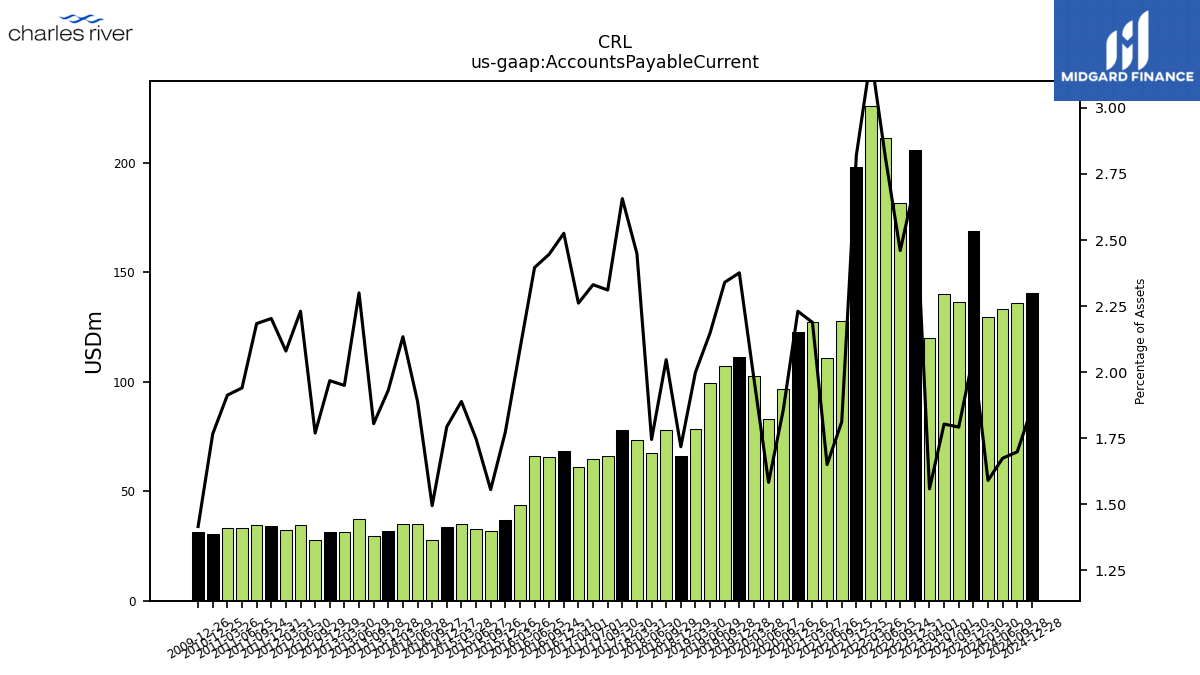
| Accounts Payable Current | 168.94 | 136.34 | 140.20 | 120.00 | 205.91 | 181.63 | 211.38 | 225.98 | 198.13 | 127.91 | 110.93 | 127.13 | 122.47 | 96.76 | 82.98 | 102.70 | 111.50 | 107.23 | 99.38 | 78.52 | 66.25 | 77.74 | 67.48 | 73.48 | 77.84 | 66.23 | 64.65 | 60.99 | 68.48 | 65.81 | 66.20 | 43.90 | 36.67 | 31.63 | 32.97 | 34.90 | 33.81 | 27.55 | 35.22 | 35.25 | 31.77 | 29.68 | 37.30 | 31.28 | 31.22 | 27.74 | 34.49 | 32.35 | 34.33 | 34.62 | 33.09 | 33.38 | 30.63 | NA | NA | NA | |
| Accrued Liabilities Current | 227.82 | 198.06 | 220.70 | 221.37 | 219.76 | 196.75 | 199.23 | 227.20 | 228.80 | 244.79 | 228.97 | 198.19 | 149.82 | 151.06 | 144.24 | 139.16 | 139.12 | 130.01 | 122.89 | 109.05 | 106.92 | 109.81 | 110.77 | 96.63 | 89.78 | 91.78 | 99.13 | 84.09 | 84.47 | 80.52 | 86.84 | 89.43 | 89.49 | 94.69 | 76.03 | 64.58 | 67.38 | 69.52 | 67.46 | 58.92 | 56.71 | 54.00 | 48.86 | 48.08 | 45.21 | 49.66 | 45.03 | 47.89 | 54.38 | 56.56 | 58.57 | 59.37 | 59.37 | NA | NA | NA | |
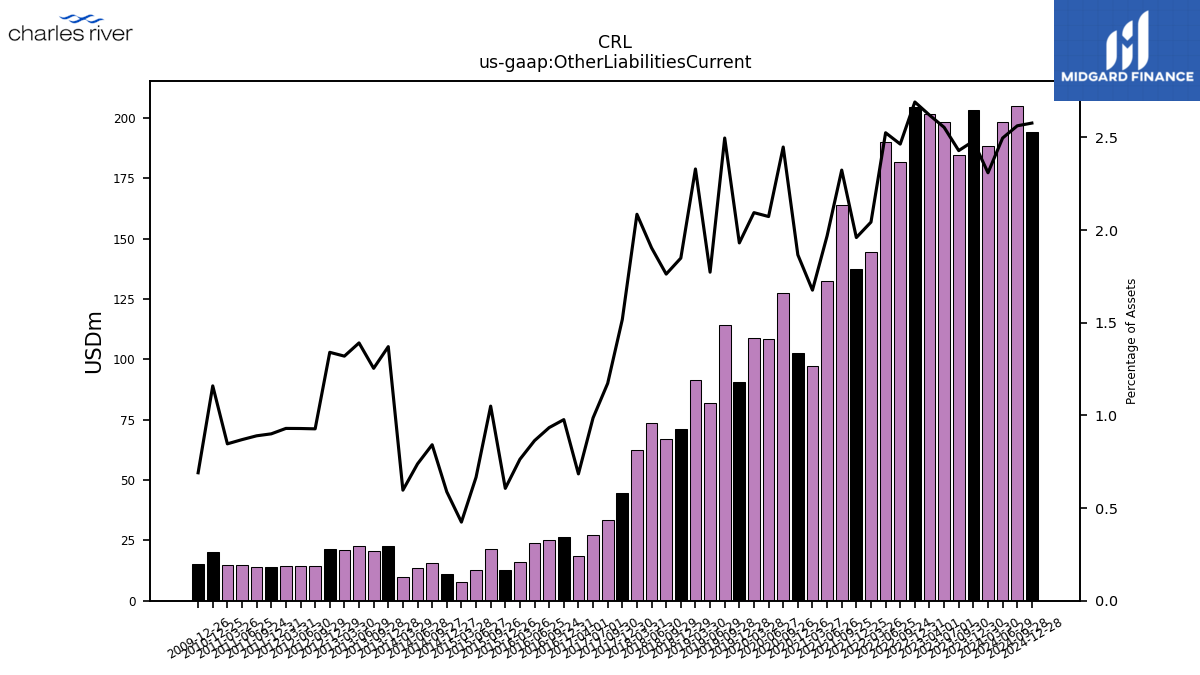
| Other Liabilities Current | 203.21 | 184.75 | 198.52 | 201.74 | 204.57 | 181.89 | 190.11 | 144.53 | 137.64 | 164.00 | 132.30 | 97.35 | 102.48 | 127.62 | 108.64 | 108.92 | 90.60 | 114.40 | 82.00 | 91.47 | 71.28 | 66.91 | 73.60 | 62.57 | 44.46 | 33.61 | 27.36 | 18.46 | 26.50 | 25.13 | 23.87 | 16.06 | 12.54 | 21.35 | 12.56 | 7.84 | 11.08 | 15.51 | 13.76 | 9.86 | 22.55 | 20.61 | 22.56 | 21.17 | 21.26 | 14.54 | 14.37 | 14.46 | 14.03 | 14.11 | 14.82 | 14.77 | 20.09 | NA | NA | NA | |
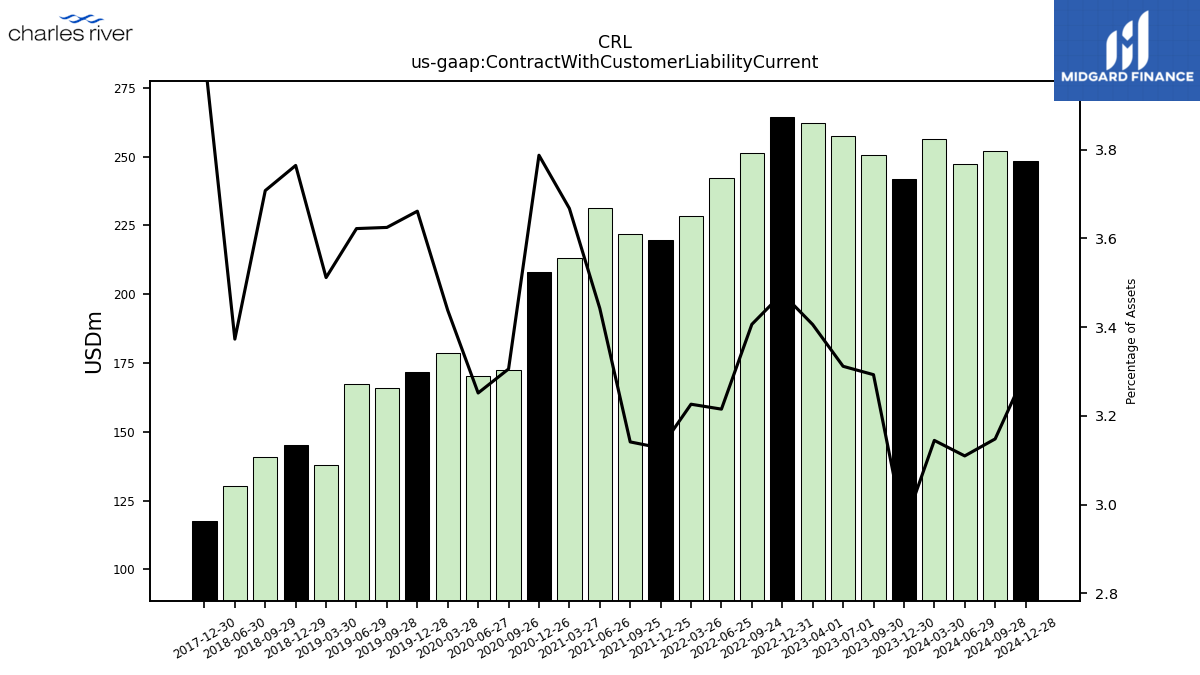
| Contract With Customer Liability Current | 241.82 | 250.49 | 257.40 | 262.23 | 264.26 | 251.47 | 242.08 | 228.26 | 219.70 | 221.73 | 231.33 | 213.03 | 207.94 | 172.34 | 170.41 | 178.83 | 171.81 | 166.09 | 167.53 | 137.89 | 145.14 | 140.76 | 130.39 | NA | 117.57 | NA | NA | NA | NA | NA | NA | NA | NA | NA | NA | NA | NA | NA | NA | NA | NA | NA | NA | NA | NA | NA | NA | NA | NA | NA | NA | NA | NA | NA | NA | NA |
| 2023-12-30 | 2023-09-30 | 2023-07-01 | 2023-04-01 | 2022-12-31 | 2022-09-24 | 2022-06-25 | 2022-03-26 | 2021-12-25 | 2021-09-25 | 2021-06-26 | 2021-03-27 | 2020-12-26 | 2020-09-26 | 2020-06-27 | 2020-03-28 | 2019-12-28 | 2019-09-28 | 2019-06-29 | 2019-03-30 | 2018-12-29 | 2018-09-29 | 2018-06-30 | 2018-03-31 | 2017-12-30 | 2017-09-30 | 2017-07-01 | 2017-04-01 | 2016-12-31 | 2016-09-24 | 2016-06-25 | 2016-03-26 | 2015-12-26 | 2015-09-26 | 2015-06-27 | 2015-03-28 | 2014-12-27 | 2014-09-27 | 2014-06-28 | 2014-03-29 | 2013-12-28 | 2013-09-28 | 2013-06-29 | 2013-03-30 | 2012-12-29 | 2012-09-29 | 2012-06-30 | 2012-03-31 | 2011-12-31 | 2011-09-24 | 2011-06-25 | 2011-03-26 | 2010-12-25 | 2010-09-25 | 2010-06-26 | 2010-03-27 | ||
|---|---|---|---|---|---|---|---|---|---|---|---|---|---|---|---|---|---|---|---|---|---|---|---|---|---|---|---|---|---|---|---|---|---|---|---|---|---|---|---|---|---|---|---|---|---|---|---|---|---|---|---|---|---|---|---|---|---|
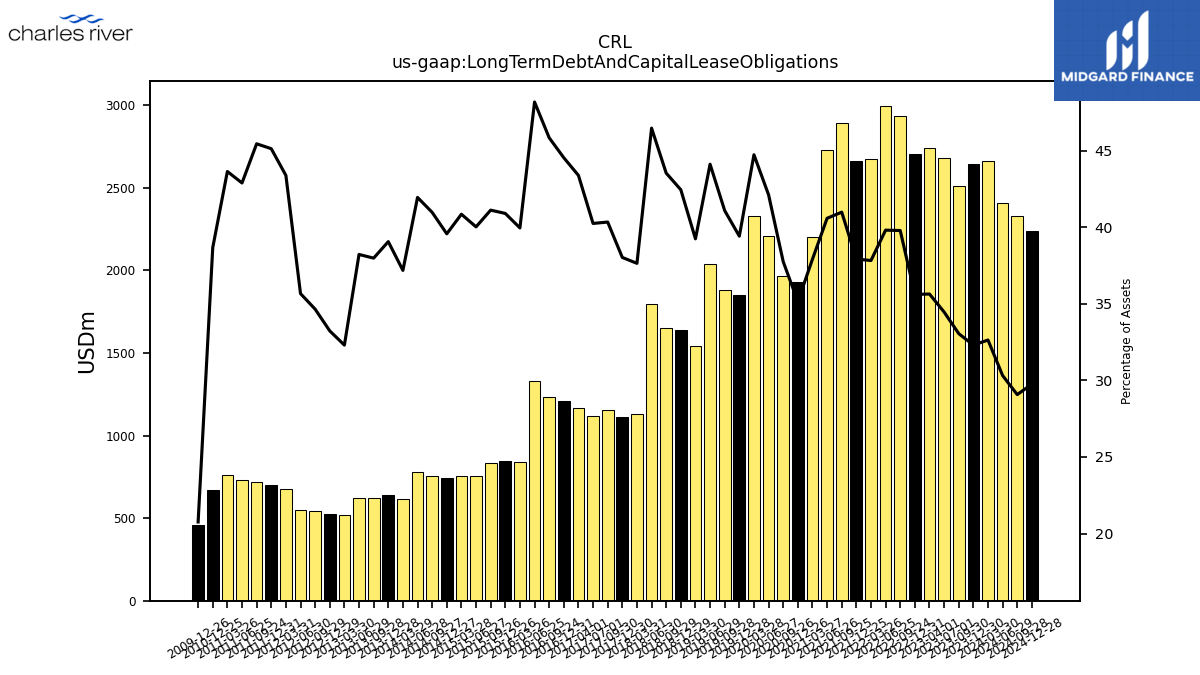
| Long Term Debt And Capital Lease Obligations | 2647.15 | 2514.22 | 2678.47 | 2743.77 | 2707.53 | 2937.06 | 2997.22 | 2676.16 | 2663.56 | 2892.68 | 2727.24 | 2202.33 | 1929.57 | 1968.16 | 2207.16 | 2326.77 | 1849.67 | 1882.59 | 2040.39 | 1540.83 | 1636.60 | 1652.73 | 1796.45 | 1129.58 | 1114.11 | 1156.00 | 1116.28 | 1170.06 | 1207.70 | 1233.19 | 1331.05 | 840.48 | 846.00 | 835.80 | 754.78 | 754.53 | 745.96 | 754.80 | 781.62 | 614.13 | 642.35 | 624.31 | 619.77 | 518.03 | 527.14 | 543.14 | 551.40 | 674.74 | 703.19 | 720.48 | 731.42 | 761.29 | 670.27 | NA | NA | NA | |
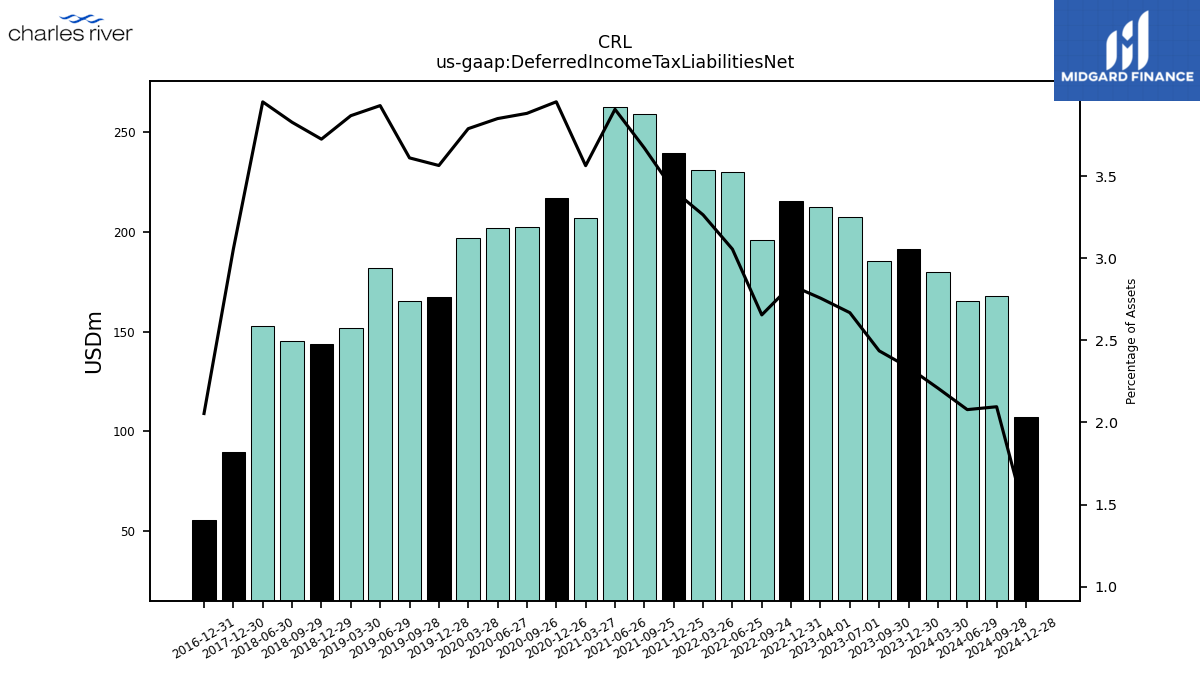
| Deferred Income Tax Liabilities Net | 191.35 | 185.31 | 207.40 | 212.28 | 215.58 | 196.01 | 230.05 | 230.95 | 239.72 | 259.12 | 262.56 | 207.01 | 217.03 | 202.39 | 201.79 | 197.09 | 167.28 | 165.48 | 181.75 | 151.88 | 143.63 | 145.33 | 152.78 | NA | 89.54 | NA | NA | NA | 55.72 | NA | NA | NA | NA | NA | NA | NA | NA | NA | NA | NA | NA | NA | NA | NA | NA | NA | NA | NA | NA | NA | NA | NA | NA | NA | NA | NA | |
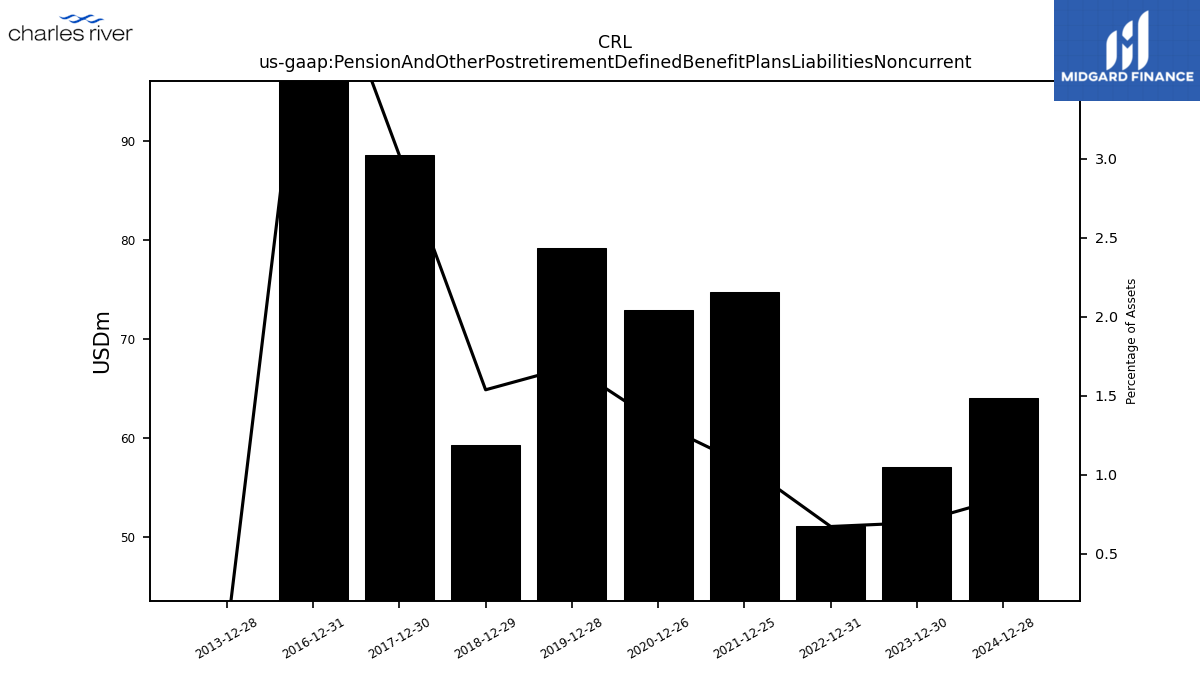
| Pension And Other Postretirement Defined Benefit Plans Liabilities Noncurrent | 57.01 | NA | NA | NA | 51.05 | NA | NA | NA | 74.71 | NA | NA | NA | 72.92 | NA | NA | NA | 79.18 | NA | NA | NA | 59.28 | NA | NA | NA | 88.58 | NA | NA | NA | 121.92 | NA | NA | NA | NA | NA | NA | NA | NA | NA | NA | NA | -0.30 | NA | NA | NA | NA | NA | NA | NA | NA | NA | NA | NA | NA | NA | NA | NA | |
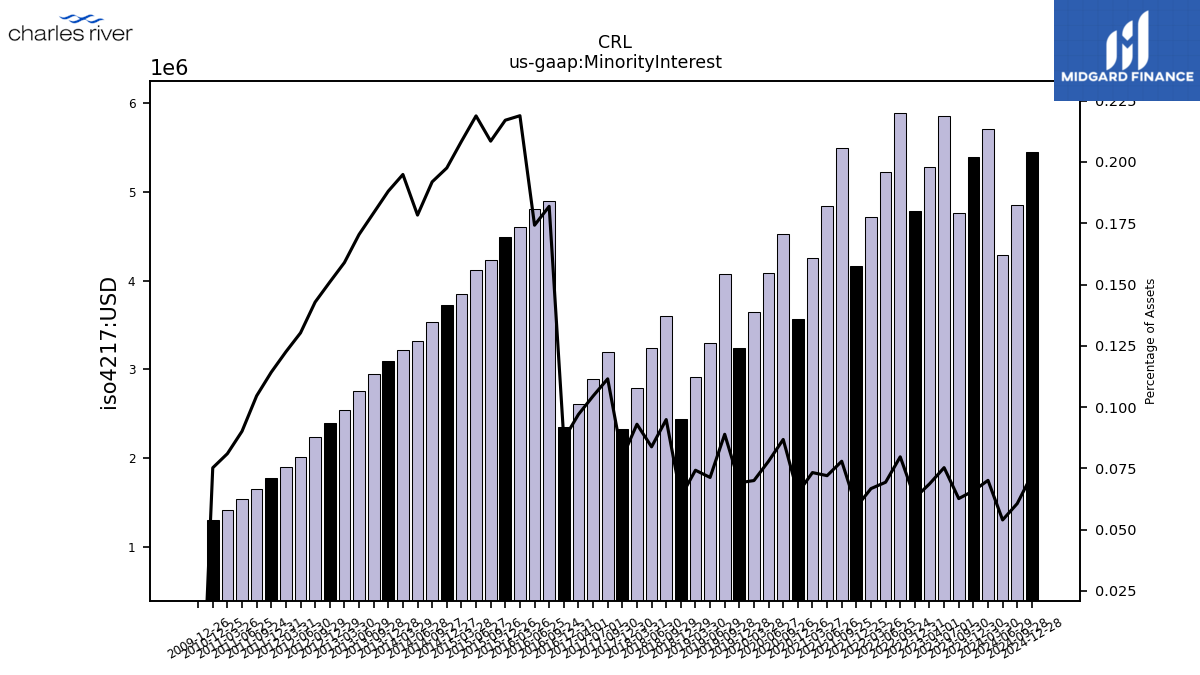
| Minority Interest | 5.39 | 4.77 | 5.85 | 5.29 | 4.79 | 5.88 | 5.22 | 4.72 | 4.16 | 5.50 | 4.84 | 4.26 | 3.57 | 4.53 | 4.08 | 3.64 | 3.24 | 4.07 | 3.30 | 2.92 | 2.45 | 3.60 | 3.24 | 2.79 | 2.33 | 3.20 | 2.90 | 2.62 | 2.36 | 4.89 | 4.81 | 4.60 | 4.49 | 4.24 | 4.13 | 3.85 | 3.72 | 3.54 | 3.32 | 3.22 | 3.09 | 2.95 | 2.76 | 2.55 | 2.40 | 2.24 | 2.01 | 1.91 | 1.78 | 1.66 | 1.54 | 1.41 | 1.30 | NA | NA | NA | |
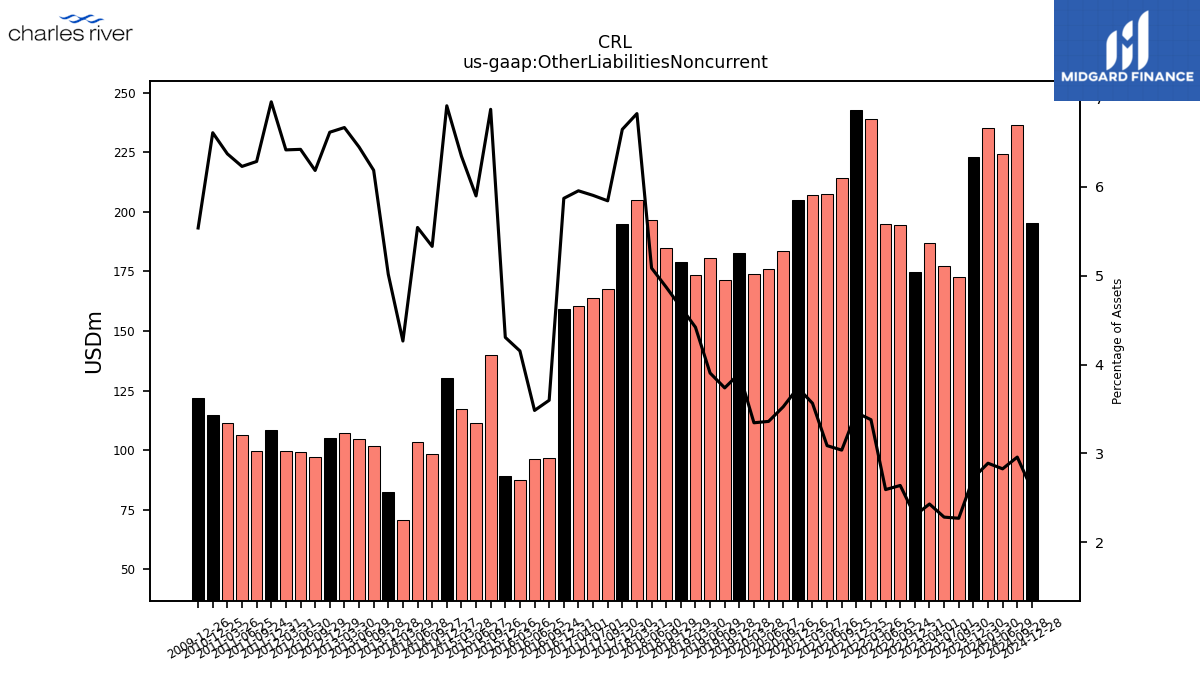
| Other Liabilities Noncurrent | 223.19 | 172.52 | 177.25 | 186.97 | 174.82 | 194.71 | 195.07 | 239.01 | 242.86 | 214.26 | 207.38 | 207.01 | 205.22 | 183.69 | 176.04 | 173.92 | 182.93 | 171.24 | 180.59 | 173.56 | 179.12 | 184.95 | 196.64 | 204.87 | 194.81 | 167.49 | 163.80 | 160.66 | 159.24 | 96.77 | 96.22 | 87.36 | 89.06 | 139.76 | 111.26 | 117.25 | 130.36 | 98.22 | 103.31 | 70.44 | 82.50 | 101.72 | 104.60 | 106.97 | 104.97 | 96.97 | 99.32 | 99.82 | 108.45 | 99.68 | 106.28 | 111.19 | 114.60 | NA | NA | NA | |
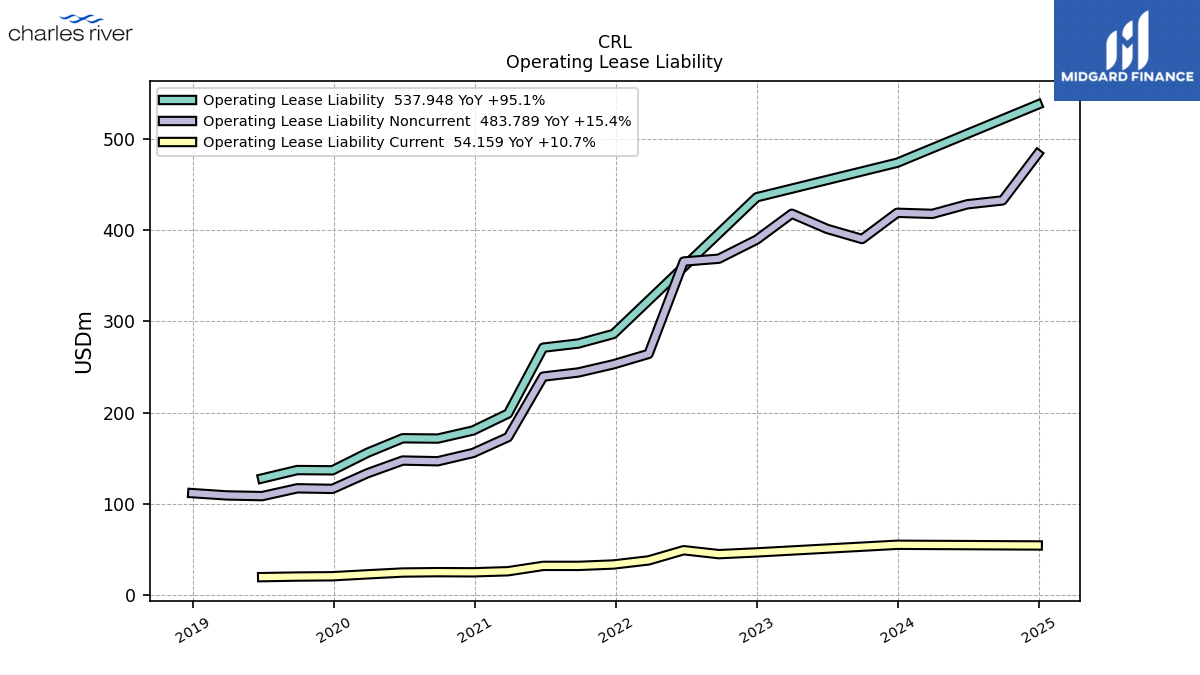
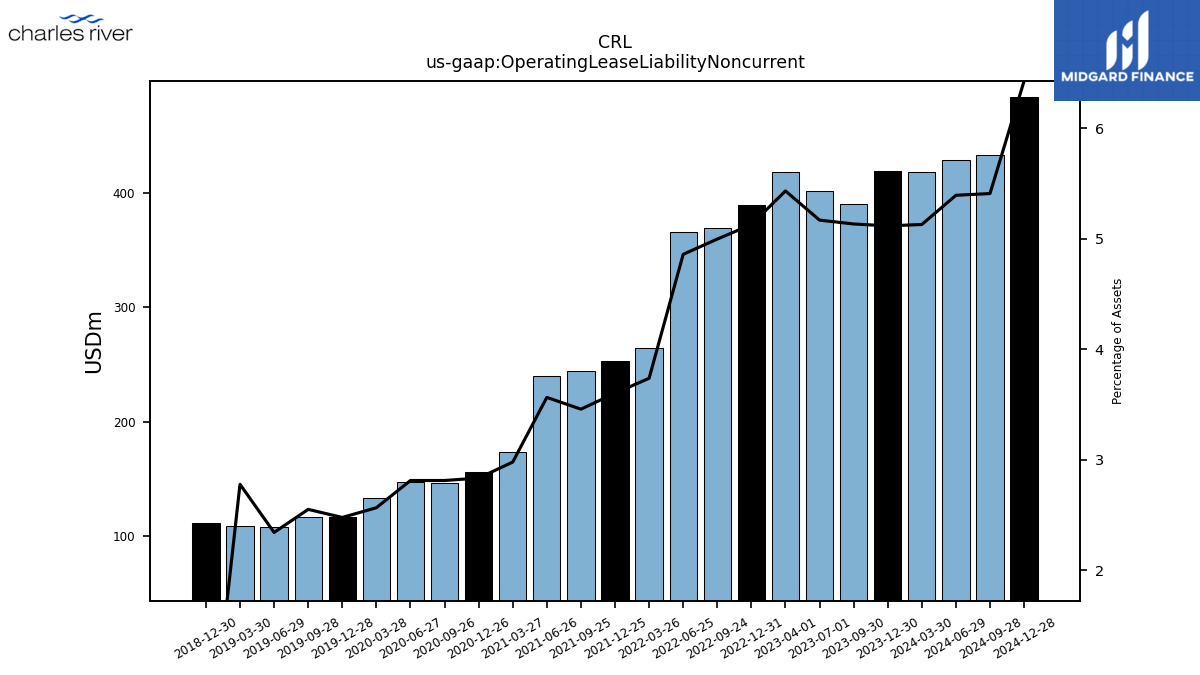
| Operating Lease Liability Noncurrent | 419.23 | 390.44 | 401.63 | 418.20 | 389.75 | 368.85 | 365.77 | 264.36 | 252.97 | 244.01 | 239.48 | 173.01 | 155.59 | 146.58 | 147.35 | 133.44 | 116.25 | 116.87 | 108.31 | 109.05 | NA | NA | NA | NA | NA | NA | NA | NA | NA | NA | NA | NA | NA | NA | NA | NA | NA | NA | NA | NA | NA | NA | NA | NA | NA | NA | NA | NA | NA | NA | NA | NA | NA | NA | NA | NA |
| 2023-12-30 | 2023-09-30 | 2023-07-01 | 2023-04-01 | 2022-12-31 | 2022-09-24 | 2022-06-25 | 2022-03-26 | 2021-12-25 | 2021-09-25 | 2021-06-26 | 2021-03-27 | 2020-12-26 | 2020-09-26 | 2020-06-27 | 2020-03-28 | 2019-12-28 | 2019-09-28 | 2019-06-29 | 2019-03-30 | 2018-12-29 | 2018-09-29 | 2018-06-30 | 2018-03-31 | 2017-12-30 | 2017-09-30 | 2017-07-01 | 2017-04-01 | 2016-12-31 | 2016-09-24 | 2016-06-25 | 2016-03-26 | 2015-12-26 | 2015-09-26 | 2015-06-27 | 2015-03-28 | 2014-12-27 | 2014-09-27 | 2014-06-28 | 2014-03-29 | 2013-12-28 | 2013-09-28 | 2013-06-29 | 2013-03-30 | 2012-12-29 | 2012-09-29 | 2012-06-30 | 2012-03-31 | 2011-12-31 | 2011-09-24 | 2011-06-25 | 2011-03-26 | 2010-12-25 | 2010-09-25 | 2010-06-26 | 2010-03-27 | ||
|---|---|---|---|---|---|---|---|---|---|---|---|---|---|---|---|---|---|---|---|---|---|---|---|---|---|---|---|---|---|---|---|---|---|---|---|---|---|---|---|---|---|---|---|---|---|---|---|---|---|---|---|---|---|---|---|---|---|
| Stockholders Equity | 3596.88 | 3305.99 | 3251.70 | 3108.60 | 2976.29 | 2626.85 | 2647.71 | 2610.18 | 2534.82 | 2426.57 | 2318.44 | 2183.93 | 2114.60 | 1896.94 | 1752.64 | 1651.98 | 1634.58 | 1532.31 | 1455.07 | 1398.11 | 1317.33 | 1253.11 | 1181.97 | 1139.83 | 1045.08 | 1021.51 | 963.50 | 876.43 | 836.77 | 867.97 | 831.35 | 779.82 | 733.07 | 704.36 | 701.70 | 663.71 | 672.20 | 670.30 | 671.82 | 695.46 | 640.98 | 656.51 | 647.95 | 628.28 | 600.80 | 597.71 | 562.84 | 552.60 | 525.58 | 539.71 | 589.09 | 562.92 | 687.42 | NA | NA | NA | |
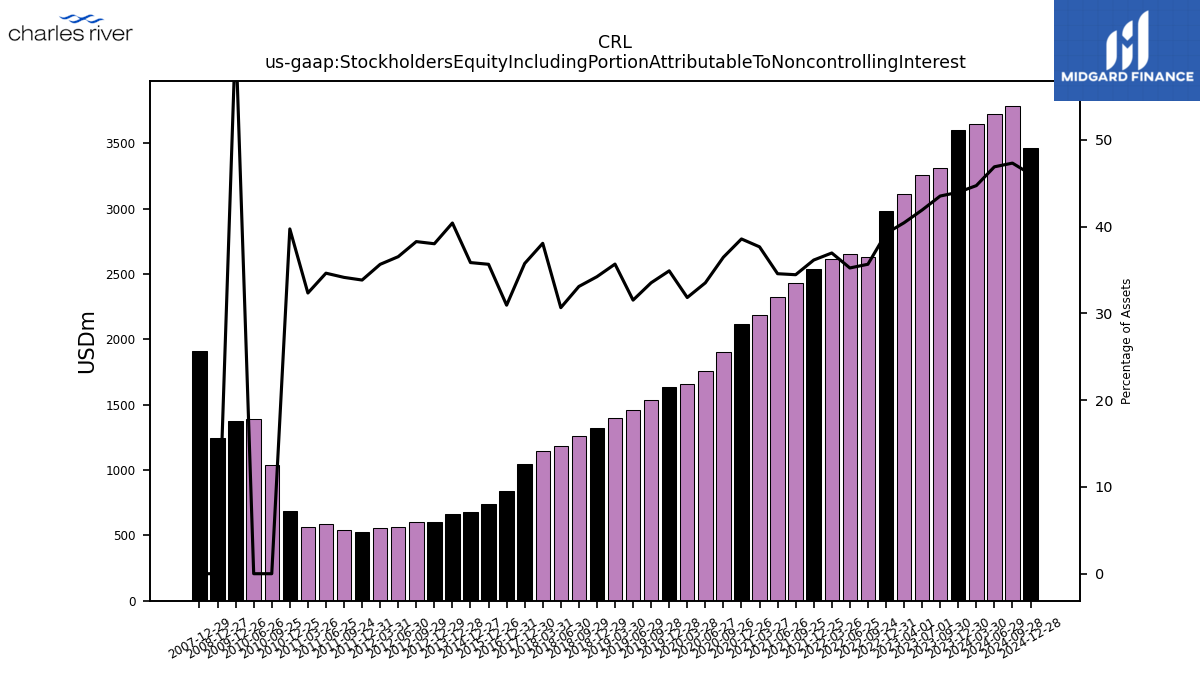
| Stockholders Equity Including Portion Attributable To Noncontrolling Interest | 3602.28 | 3310.76 | 3257.55 | 3113.88 | 2981.08 | 2632.74 | 2652.93 | 2614.91 | 2538.98 | 2432.07 | 2323.28 | 2188.18 | 2118.17 | 1901.46 | 1756.72 | 1655.63 | 1637.83 | 1536.39 | 1458.36 | 1401.03 | 1319.78 | 1256.71 | 1185.20 | 1142.62 | 1047.41 | NA | NA | NA | 839.12 | NA | NA | NA | 737.56 | NA | NA | NA | 675.93 | NA | NA | NA | 664.66 | NA | NA | NA | 603.20 | 599.95 | 564.85 | 554.50 | 527.36 | 541.37 | 590.63 | 564.33 | 688.73 | 1038.17 | 1394.02 | NA | |
| Common Stock Value | 0.51 | 0.51 | 0.51 | 0.51 | 0.51 | 0.51 | 0.51 | 0.51 | 0.51 | 0.51 | 0.51 | 0.50 | 0.50 | 0.50 | 0.50 | 0.50 | 0.49 | 0.49 | 0.49 | 0.49 | 0.48 | 0.88 | 0.88 | 0.88 | 0.88 | 0.87 | 0.87 | 0.87 | 0.86 | 0.86 | 0.86 | 0.86 | 0.85 | 0.85 | 0.85 | 0.85 | 0.84 | 0.84 | 0.84 | 0.84 | 0.82 | 0.82 | 0.81 | 0.81 | 0.80 | 0.79 | 0.79 | 0.79 | 0.79 | 0.79 | 0.78 | 0.78 | 0.78 | NA | NA | NA | |
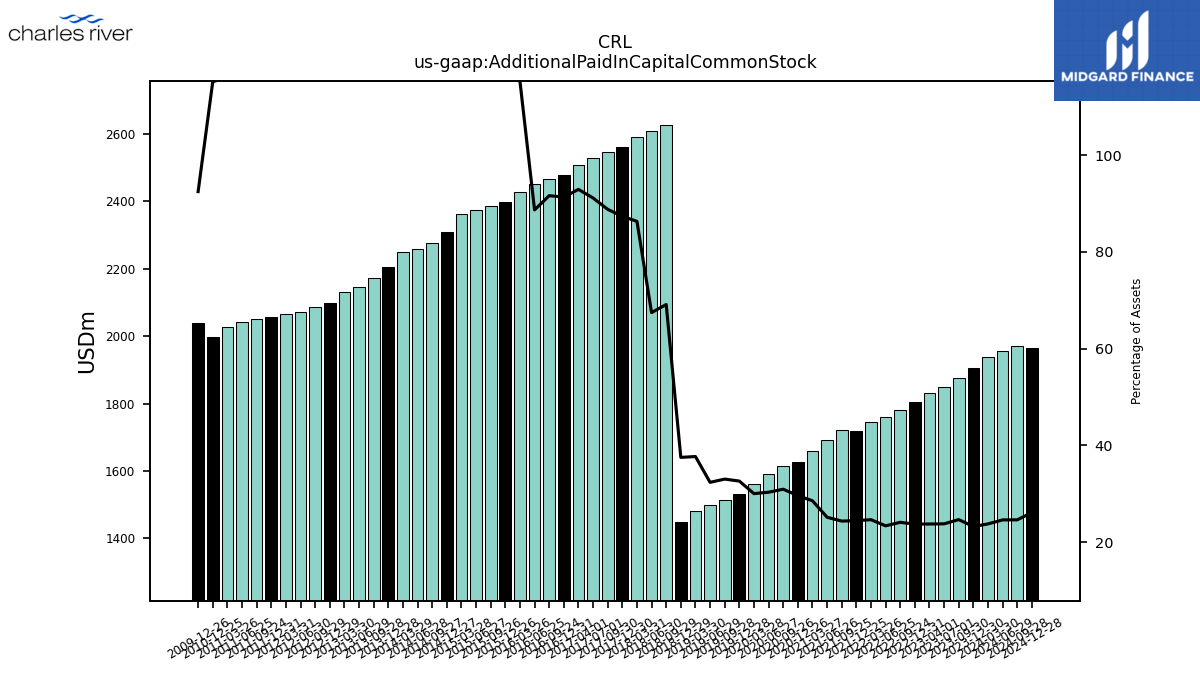
| Additional Paid In Capital Common Stock | 1905.58 | 1877.12 | 1850.38 | 1830.19 | 1804.94 | 1780.88 | 1761.12 | 1744.83 | 1718.30 | 1720.46 | 1690.86 | 1659.52 | 1627.56 | 1614.18 | 1590.12 | 1562.98 | 1531.79 | 1514.62 | 1497.79 | 1481.01 | 1447.51 | 2625.26 | 2608.52 | 2590.82 | 2560.19 | 2545.35 | 2528.74 | 2506.70 | 2477.37 | 2465.19 | 2450.73 | 2426.98 | 2397.96 | 2386.34 | 2372.68 | 2360.73 | 2307.64 | 2276.28 | 2257.60 | 2249.14 | 2206.16 | 2170.90 | 2145.05 | 2130.27 | 2097.32 | 2085.03 | 2070.47 | 2064.89 | 2056.92 | 2051.78 | 2043.01 | 2025.64 | 1996.87 | NA | NA | NA | |
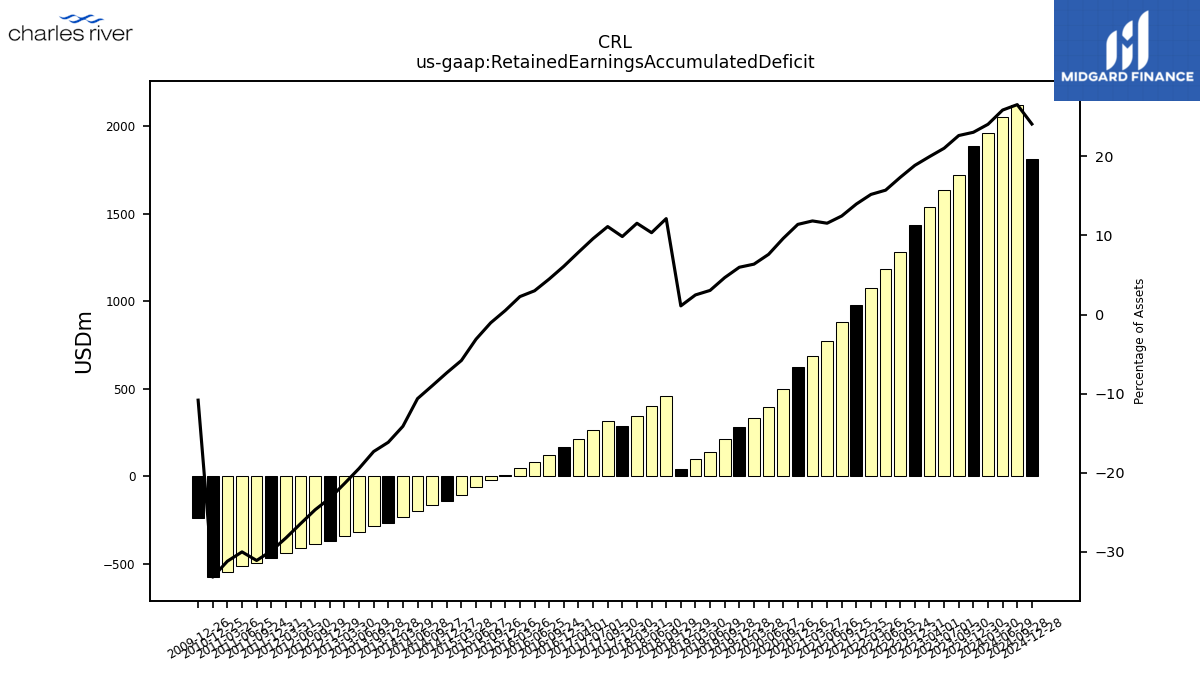
| Retained Earnings Accumulated Deficit | 1887.22 | 1720.44 | 1633.05 | 1536.03 | 1432.90 | 1279.57 | 1183.09 | 1073.77 | 980.75 | 878.82 | 775.39 | 686.94 | 625.41 | 501.44 | 398.53 | 331.10 | 280.33 | 213.77 | 140.96 | 97.23 | 42.10 | 460.12 | 399.75 | 346.04 | 288.66 | 318.51 | 266.03 | 212.08 | 165.30 | 120.62 | 82.89 | 47.68 | 10.54 | -21.35 | -58.73 | -107.23 | -138.78 | -165.94 | -197.98 | -233.24 | -265.47 | -284.57 | -315.44 | -342.72 | -368.30 | -386.72 | -408.69 | -439.16 | -465.60 | -492.71 | -511.51 | -543.83 | -575.16 | NA | NA | NA | |
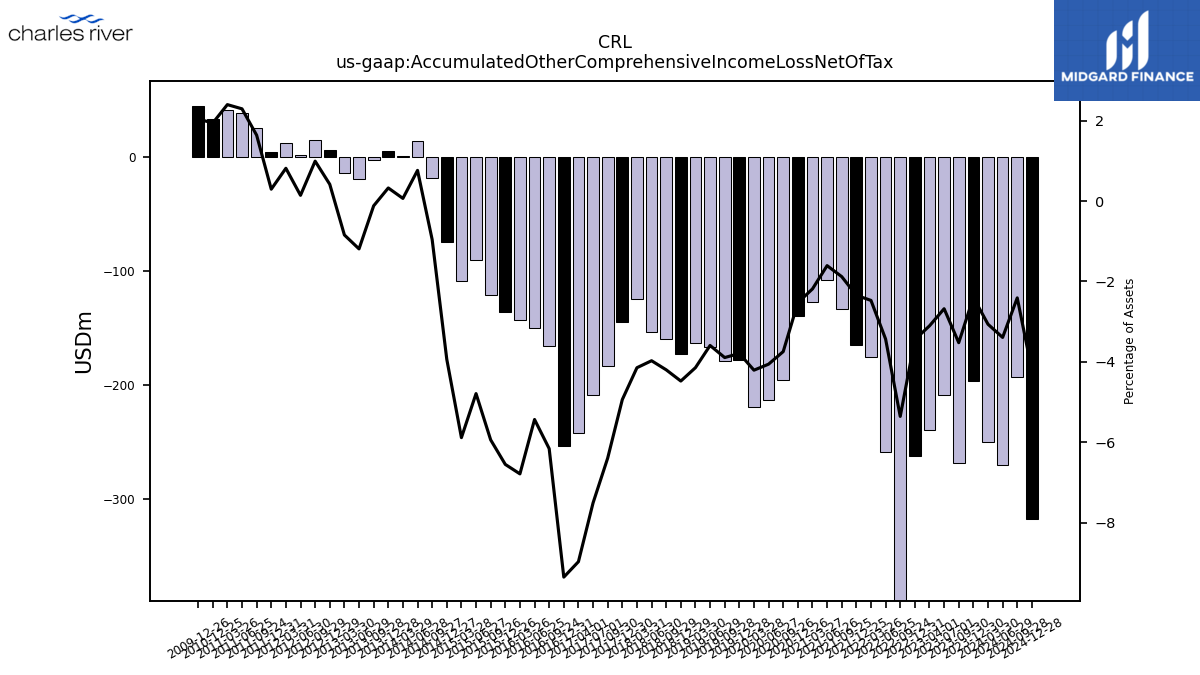
| Accumulated Other Comprehensive Income Loss Net Of Tax | -196.43 | -268.07 | -208.27 | -239.12 | -262.06 | -395.61 | -258.56 | -174.93 | -164.74 | -132.78 | -108.02 | -127.02 | -138.87 | -195.28 | -212.71 | -218.92 | -178.02 | -178.47 | -166.24 | -162.80 | -172.70 | -159.45 | -153.61 | -124.46 | -144.73 | -183.31 | -208.33 | -242.03 | -253.76 | -165.75 | -150.19 | -142.82 | -135.55 | -120.80 | -90.36 | -108.75 | -74.25 | -17.65 | 14.21 | 1.08 | 5.36 | -1.96 | -19.31 | -13.53 | 6.60 | 15.56 | 2.19 | 12.68 | 4.59 | 25.98 | 39.13 | 41.85 | 33.63 | NA | NA | NA | |
| Minority Interest | 5.39 | 4.77 | 5.85 | 5.29 | 4.79 | 5.88 | 5.22 | 4.72 | 4.16 | 5.50 | 4.84 | 4.26 | 3.57 | 4.53 | 4.08 | 3.64 | 3.24 | 4.07 | 3.30 | 2.92 | 2.45 | 3.60 | 3.24 | 2.79 | 2.33 | 3.20 | 2.90 | 2.62 | 2.36 | 4.89 | 4.81 | 4.60 | 4.49 | 4.24 | 4.13 | 3.85 | 3.72 | 3.54 | 3.32 | 3.22 | 3.09 | 2.95 | 2.76 | 2.55 | 2.40 | 2.24 | 2.01 | 1.91 | 1.78 | 1.66 | 1.54 | 1.41 | 1.30 | NA | NA | NA |
| 2023-12-30 | 2023-09-30 | 2023-07-01 | 2023-04-01 | 2022-12-31 | 2022-09-24 | 2022-06-25 | 2022-03-26 | 2021-12-25 | 2021-09-25 | 2021-06-26 | 2021-03-27 | 2020-12-26 | 2020-09-26 | 2020-06-27 | 2020-03-28 | 2019-12-28 | 2019-09-28 | 2019-06-29 | 2019-03-30 | 2018-12-29 | 2018-09-29 | 2018-06-30 | 2018-03-31 | 2017-12-30 | 2017-09-30 | 2017-07-01 | 2017-04-01 | 2016-12-31 | 2016-09-24 | 2016-06-25 | 2016-03-26 | 2015-12-26 | 2015-09-26 | 2015-06-27 | 2015-03-28 | 2014-12-27 | 2014-09-27 | 2014-06-28 | 2014-03-29 | 2013-12-28 | 2013-09-28 | 2013-06-29 | 2013-03-30 | 2012-12-29 | 2012-09-29 | 2012-06-30 | 2012-03-31 | 2011-12-31 | 2011-09-24 | 2011-06-25 | 2011-03-26 | 2010-12-25 | 2010-09-25 | 2010-06-26 | 2010-03-27 | ||
|---|---|---|---|---|---|---|---|---|---|---|---|---|---|---|---|---|---|---|---|---|---|---|---|---|---|---|---|---|---|---|---|---|---|---|---|---|---|---|---|---|---|---|---|---|---|---|---|---|---|---|---|---|---|---|---|---|---|
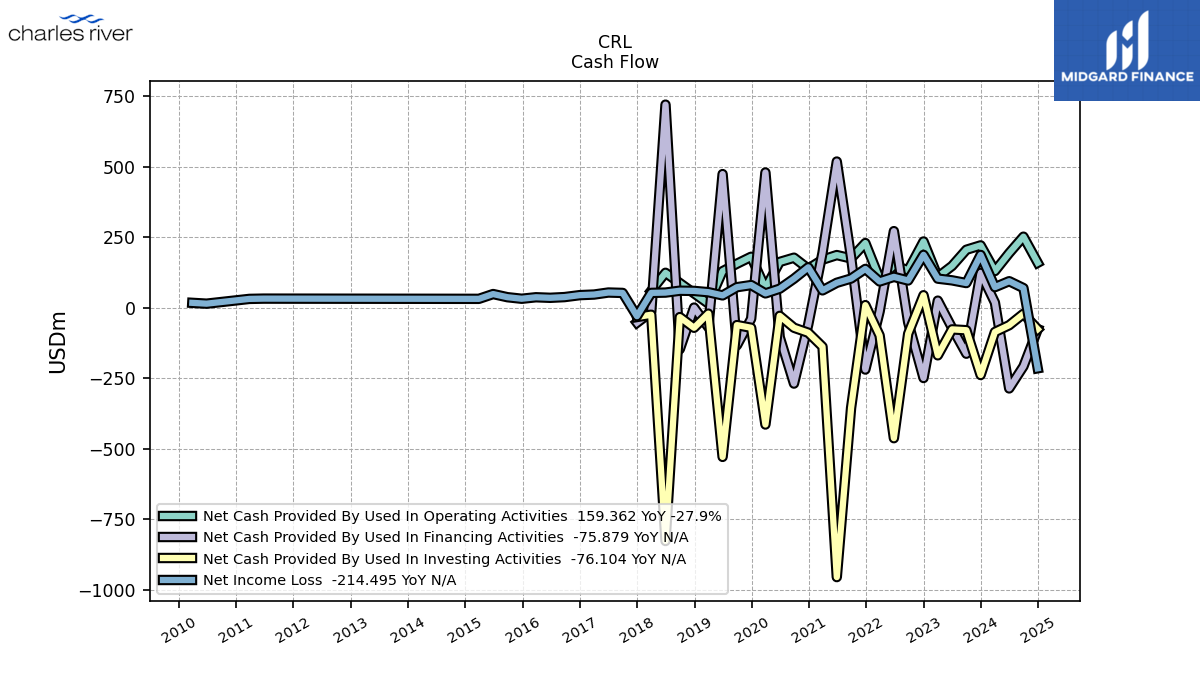
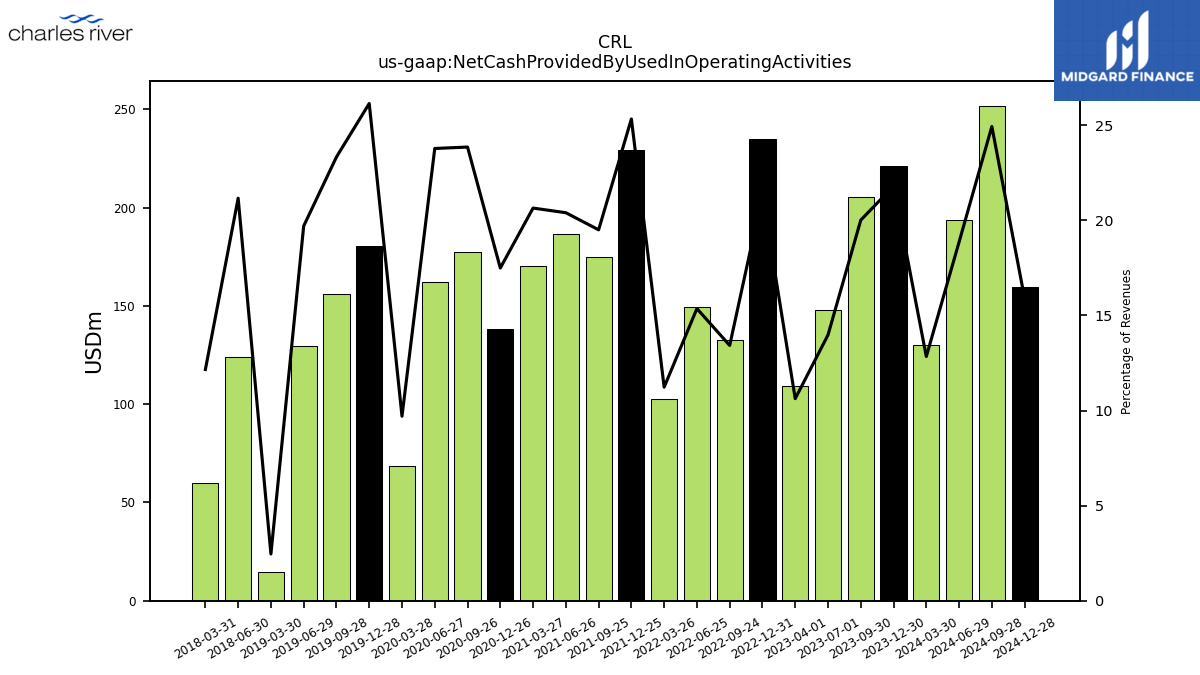
| Net Cash Provided By Used In Operating Activities | 220.94 | 205.45 | 148.12 | 109.38 | 234.76 | 132.78 | 149.47 | 102.63 | 229.26 | 174.72 | 186.59 | 170.23 | 138.38 | 177.30 | 162.31 | 68.59 | 180.68 | 155.85 | 129.55 | 14.86 | NA | NA | 123.87 | 60.05 | NA | NA | NA | NA | NA | NA | NA | NA | NA | NA | NA | NA | NA | NA | NA | NA | NA | NA | NA | NA | NA | NA | NA | NA | NA | NA | NA | NA | NA | NA | NA | NA | |
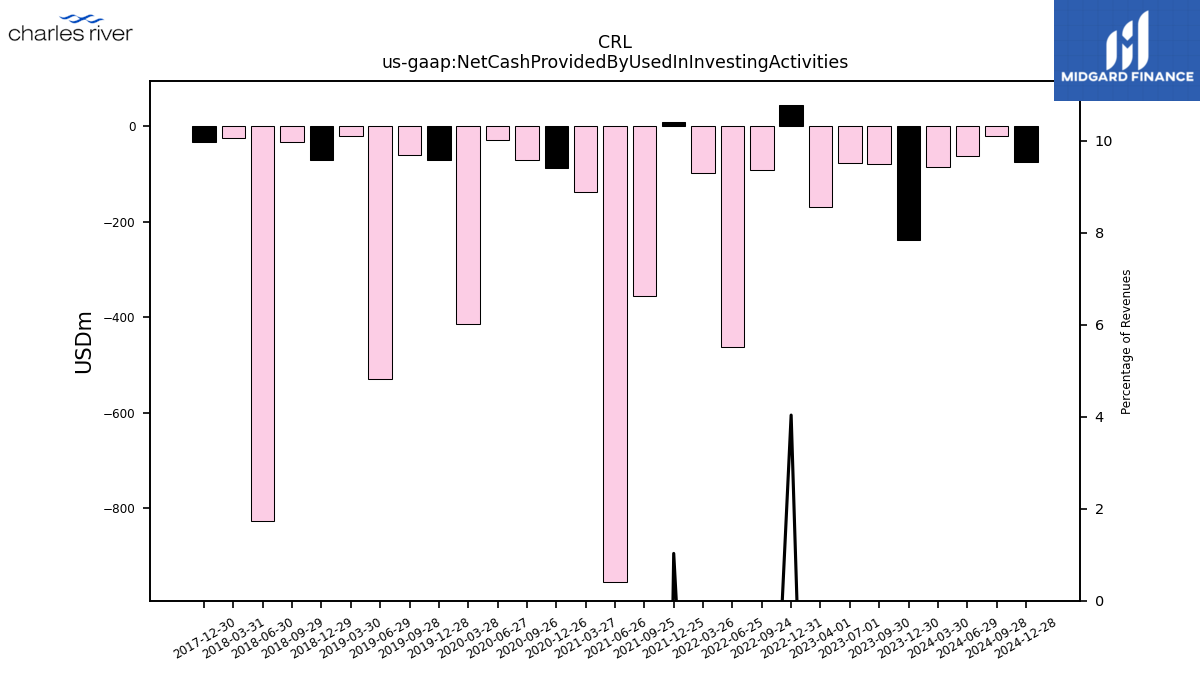
| Net Cash Provided By Used In Investing Activities | -238.37 | -79.56 | -76.61 | -168.62 | 44.38 | -92.19 | -462.11 | -98.00 | 9.31 | -355.05 | -954.19 | -138.00 | -88.42 | -70.81 | -28.63 | -413.69 | -70.87 | -61.39 | -528.42 | -20.81 | -70.96 | -33.01 | -826.37 | -24.66 | -32.83 | NA | NA | NA | NA | NA | NA | NA | NA | NA | NA | NA | NA | NA | NA | NA | NA | NA | NA | NA | NA | NA | NA | NA | NA | NA | NA | NA | NA | NA | NA | NA | |
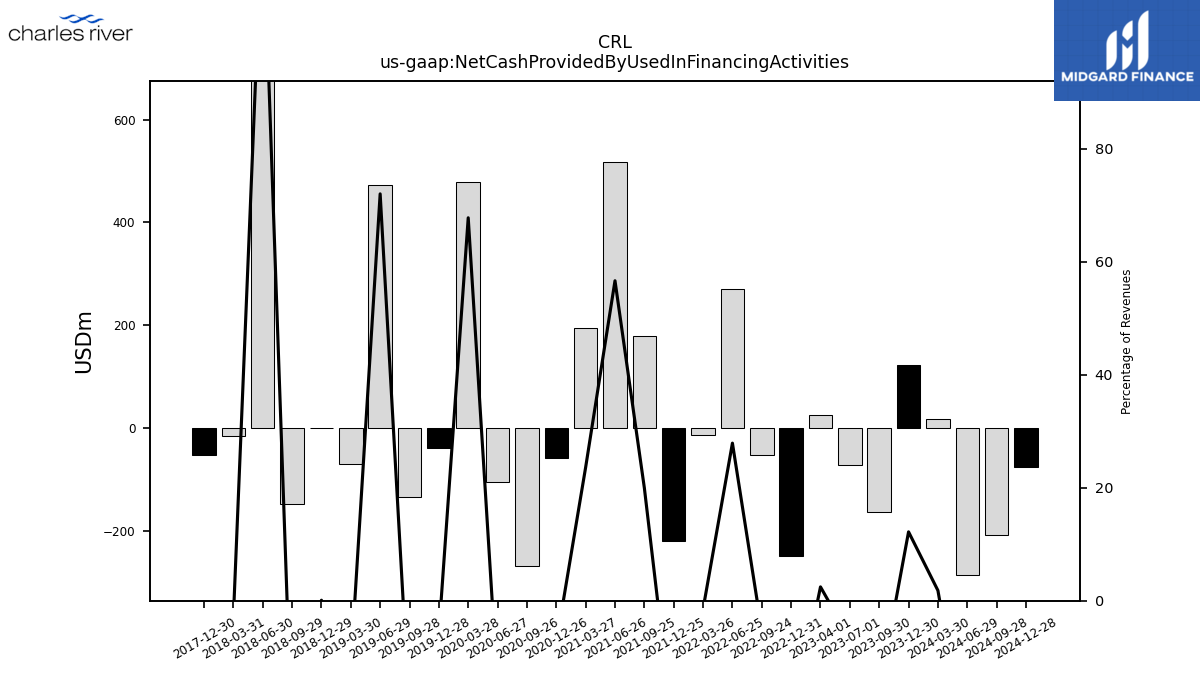
| Net Cash Provided By Used In Financing Activities | 123.57 | -162.87 | -71.46 | 25.24 | -248.96 | -51.59 | 271.44 | -13.28 | -218.97 | 178.90 | 517.96 | 194.72 | -59.23 | -268.64 | -104.10 | 479.21 | -39.04 | -133.44 | 473.51 | -69.08 | 0.56 | -147.08 | 719.51 | -14.94 | -53.01 | NA | NA | NA | NA | NA | NA | NA | NA | NA | NA | NA | NA | NA | NA | NA | NA | NA | NA | NA | NA | NA | NA | NA | NA | NA | NA | NA | NA | NA | NA | NA |
| 2023-12-30 | 2023-09-30 | 2023-07-01 | 2023-04-01 | 2022-12-31 | 2022-09-24 | 2022-06-25 | 2022-03-26 | 2021-12-25 | 2021-09-25 | 2021-06-26 | 2021-03-27 | 2020-12-26 | 2020-09-26 | 2020-06-27 | 2020-03-28 | 2019-12-28 | 2019-09-28 | 2019-06-29 | 2019-03-30 | 2018-12-29 | 2018-09-29 | 2018-06-30 | 2018-03-31 | 2017-12-30 | 2017-09-30 | 2017-07-01 | 2017-04-01 | 2016-12-31 | 2016-09-24 | 2016-06-25 | 2016-03-26 | 2015-12-26 | 2015-09-26 | 2015-06-27 | 2015-03-28 | 2014-12-27 | 2014-09-27 | 2014-06-28 | 2014-03-29 | 2013-12-28 | 2013-09-28 | 2013-06-29 | 2013-03-30 | 2012-12-29 | 2012-09-29 | 2012-06-30 | 2012-03-31 | 2011-12-31 | 2011-09-24 | 2011-06-25 | 2011-03-26 | 2010-12-25 | 2010-09-25 | 2010-06-26 | 2010-03-27 | ||
|---|---|---|---|---|---|---|---|---|---|---|---|---|---|---|---|---|---|---|---|---|---|---|---|---|---|---|---|---|---|---|---|---|---|---|---|---|---|---|---|---|---|---|---|---|---|---|---|---|---|---|---|---|---|---|---|---|---|
| Net Cash Provided By Used In Operating Activities | 220.94 | 205.45 | 148.12 | 109.38 | 234.76 | 132.78 | 149.47 | 102.63 | 229.26 | 174.72 | 186.59 | 170.23 | 138.38 | 177.30 | 162.31 | 68.59 | 180.68 | 155.85 | 129.55 | 14.86 | NA | NA | 123.87 | 60.05 | NA | NA | NA | NA | NA | NA | NA | NA | NA | NA | NA | NA | NA | NA | NA | NA | NA | NA | NA | NA | NA | NA | NA | NA | NA | NA | NA | NA | NA | NA | NA | NA | |
| Net Income Loss | 187.08 | 87.39 | 97.02 | 103.13 | 187.41 | 96.47 | 109.32 | 93.02 | 137.58 | 103.43 | 88.45 | 61.53 | 143.19 | 102.91 | 67.44 | 50.77 | 80.35 | 72.81 | 43.73 | 55.13 | 59.66 | 60.37 | 53.71 | 52.63 | -29.85 | 52.47 | 53.95 | 46.78 | 44.68 | 37.73 | 35.21 | 37.14 | 31.88 | 37.38 | 48.51 | 31.54 | NA | NA | NA | NA | NA | NA | NA | NA | NA | NA | NA | NA | NA | NA | 32.32 | 31.34 | NA | NA | 14.45 | 17.38 | |
| Profit Loss | 188.95 | 88.02 | 99.44 | 103.95 | 189.11 | 97.61 | 110.66 | 95.23 | 139.83 | 105.16 | 89.92 | 63.94 | 144.19 | 102.61 | 67.67 | 50.84 | 80.51 | 73.55 | 44.31 | 55.69 | 60.20 | 60.90 | 54.38 | 53.24 | -29.07 | 52.95 | 54.60 | 46.96 | 45.23 | 38.03 | 35.56 | 37.55 | 32.36 | 37.87 | 49.24 | 31.61 | 27.67 | 32.35 | 35.82 | 32.36 | 19.44 | 31.22 | 27.71 | 25.77 | 18.53 | 22.20 | 30.59 | 26.55 | 27.23 | 18.89 | 32.42 | 31.43 | -347.98 | -25.23 | 14.10 | 17.00 | |
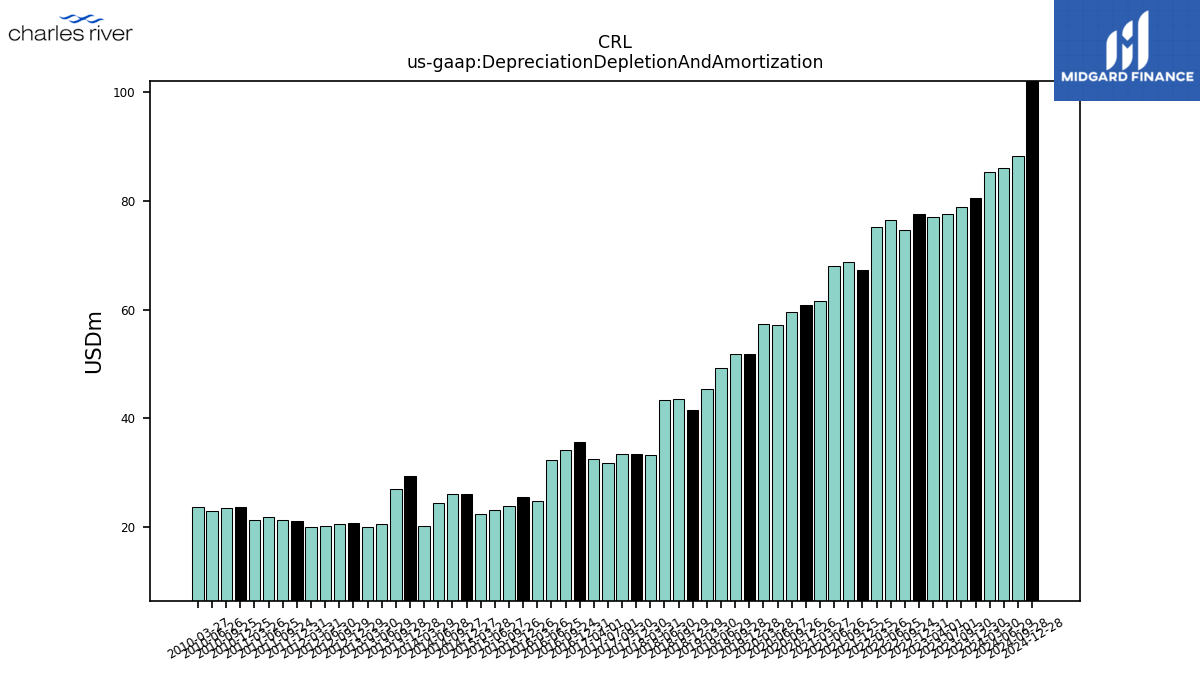
| Depreciation Depletion And Amortization | 80.51 | 78.87 | 77.67 | 77.07 | 77.55 | 74.61 | 76.42 | 75.30 | 67.24 | 68.69 | 68.11 | 61.51 | 60.88 | 59.58 | 57.21 | 57.26 | 51.83 | 51.76 | 49.15 | 45.36 | 41.58 | 43.59 | 43.40 | 33.21 | 33.48 | 33.47 | 31.80 | 32.41 | 35.54 | 34.11 | 32.35 | 24.66 | 25.55 | 23.81 | 23.15 | 22.37 | 26.01 | 26.07 | 24.30 | 20.05 | 29.30 | 26.92 | 20.41 | 20.01 | 20.66 | 20.55 | 20.07 | 20.00 | 20.98 | 21.17 | 21.82 | 21.27 | 23.66 | 23.48 | 22.93 | 23.58 | |
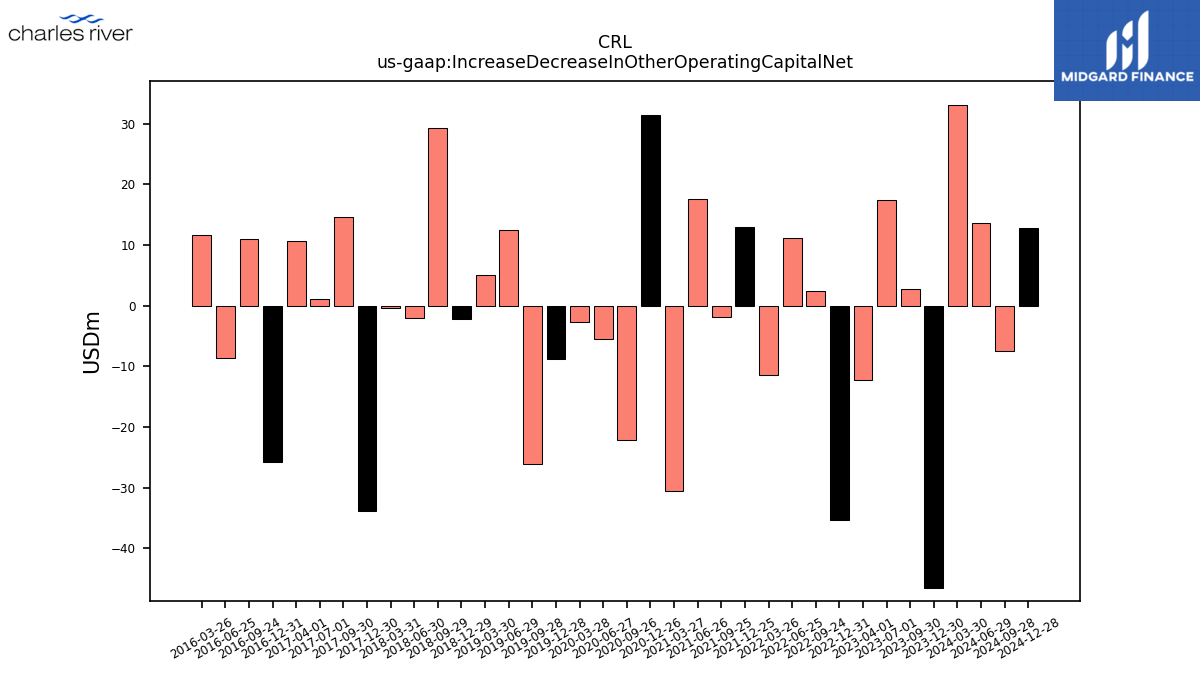
| Increase Decrease In Other Operating Capital Net | -46.58 | 2.73 | 17.44 | -12.23 | -35.28 | 2.40 | 11.14 | -11.50 | 13.01 | -1.92 | 17.49 | -30.58 | 31.43 | -22.11 | -5.46 | -2.77 | -8.83 | -26.07 | 12.52 | 5.12 | -2.15 | 29.28 | -1.97 | -0.41 | -33.79 | 14.67 | 1.13 | 10.68 | -25.81 | 10.98 | -8.66 | 11.56 | NA | NA | NA | NA | NA | NA | NA | NA | NA | NA | NA | NA | NA | NA | NA | NA | NA | NA | NA | NA | NA | NA | NA | NA | |
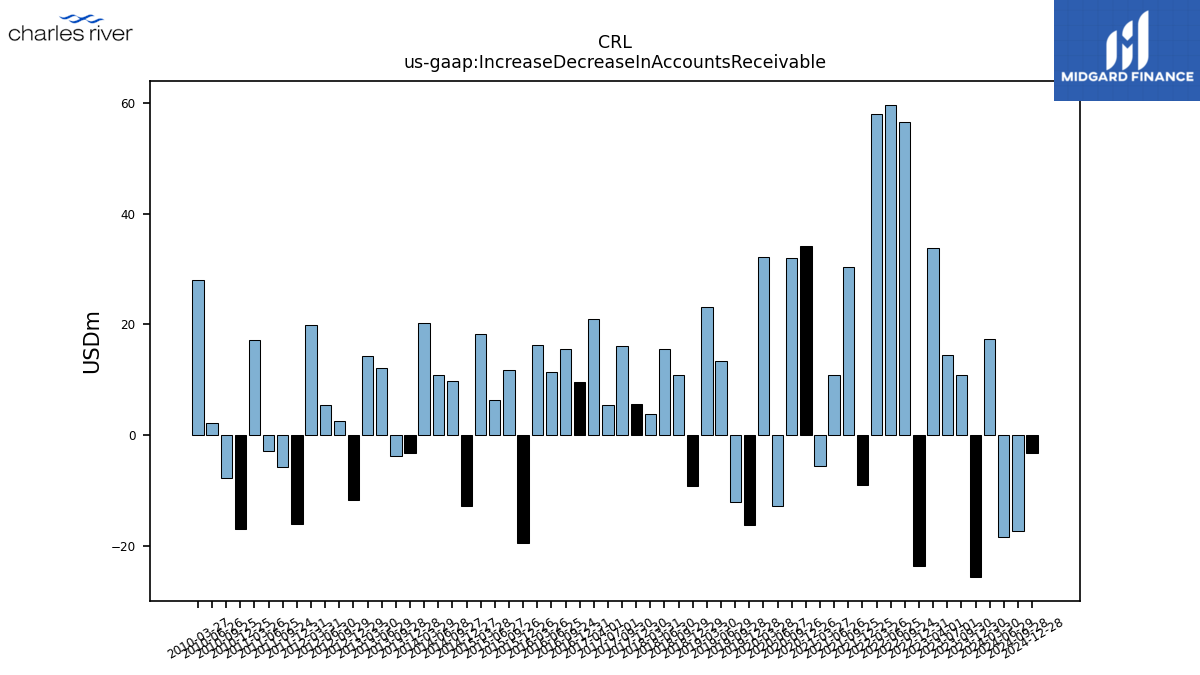
| Increase Decrease In Accounts Receivable | -25.65 | 10.83 | 14.42 | 33.83 | -23.60 | 56.53 | 59.70 | 57.94 | -8.96 | 30.37 | 10.82 | -5.60 | 34.17 | 32.09 | -12.77 | 32.14 | -16.17 | -12.05 | 13.41 | 23.13 | -9.12 | 10.94 | 15.60 | 3.78 | 5.57 | 16.12 | 5.53 | 21.06 | 9.52 | 15.62 | 11.36 | 16.28 | -19.47 | 11.86 | 6.27 | 18.30 | -12.87 | 9.80 | 10.94 | 20.22 | -3.17 | -3.79 | 12.22 | 14.23 | -11.66 | 2.54 | 5.51 | 19.88 | -16.14 | -5.75 | -2.95 | 17.17 | -16.96 | -7.73 | 2.23 | 28.11 | |
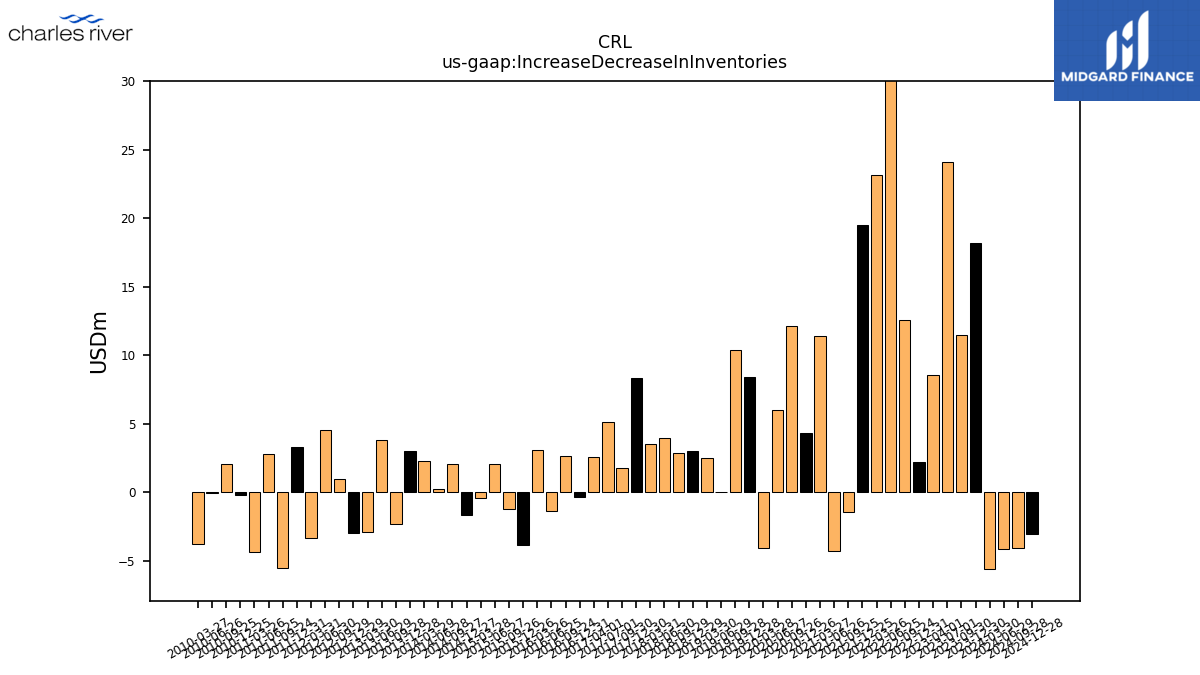
| Increase Decrease In Inventories | 18.18 | 11.46 | 24.08 | 8.59 | 2.24 | 12.56 | 40.56 | 23.16 | 19.52 | -1.47 | -4.30 | 11.40 | 4.32 | 12.15 | 5.98 | -4.08 | 8.42 | 10.42 | 0.04 | 2.52 | 3.00 | 2.90 | 3.94 | 3.50 | 8.34 | 1.75 | 5.15 | 2.59 | -0.33 | 2.67 | -1.40 | 3.08 | -3.83 | -1.19 | 2.09 | -0.43 | -1.62 | 2.07 | 0.21 | 2.29 | 3.02 | -2.33 | 3.80 | -2.92 | -2.97 | 0.98 | 4.52 | -3.31 | 3.32 | -5.53 | 2.77 | -4.34 | -0.18 | 2.04 | -0.08 | -3.77 | |
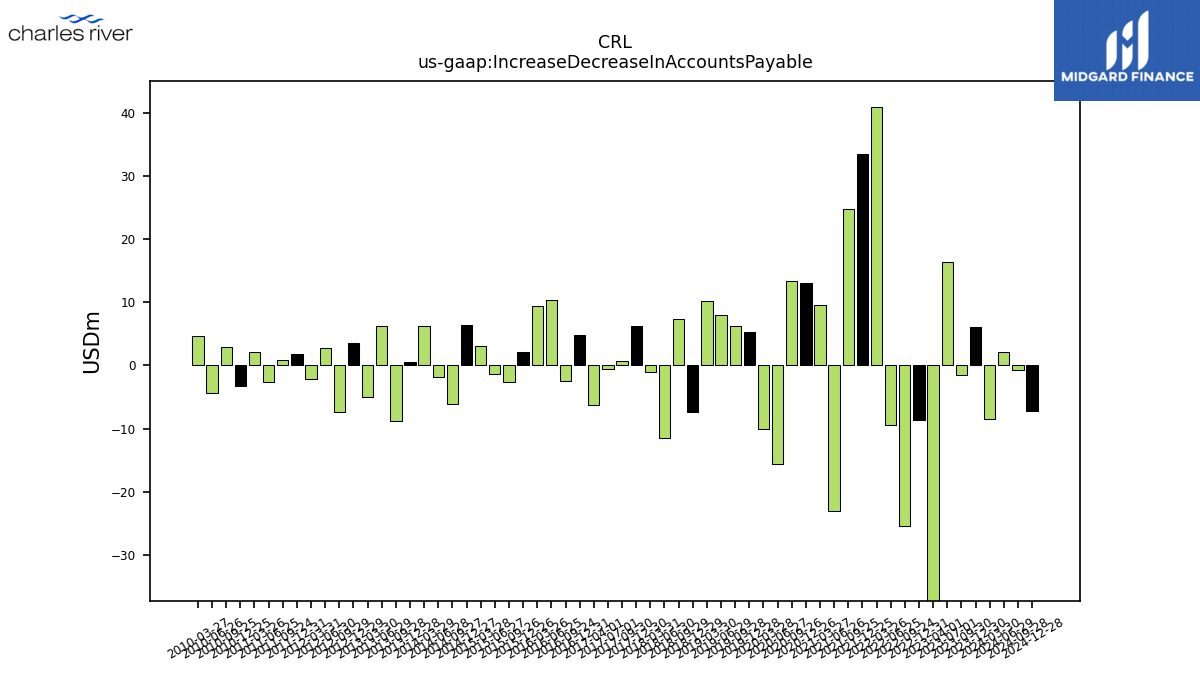
| Increase Decrease In Accounts Payable | 6.10 | -1.55 | 16.33 | -41.31 | -8.63 | -25.49 | -9.47 | 40.93 | 33.47 | 24.81 | -23.00 | 9.62 | 13.07 | 13.29 | -15.62 | -10.00 | 5.29 | 6.29 | 7.95 | 10.24 | -7.41 | 7.29 | -11.53 | -1.08 | 6.19 | 0.67 | -0.57 | -6.26 | 4.89 | -2.54 | 10.37 | 9.35 | 2.07 | -2.65 | -1.29 | 3.04 | 6.38 | -6.18 | -1.91 | 6.31 | 0.61 | -8.83 | 6.18 | -5.04 | 3.49 | -7.36 | 2.80 | -2.19 | 1.75 | 0.86 | -2.57 | 2.17 | -3.26 | 2.93 | -4.30 | 4.70 | |
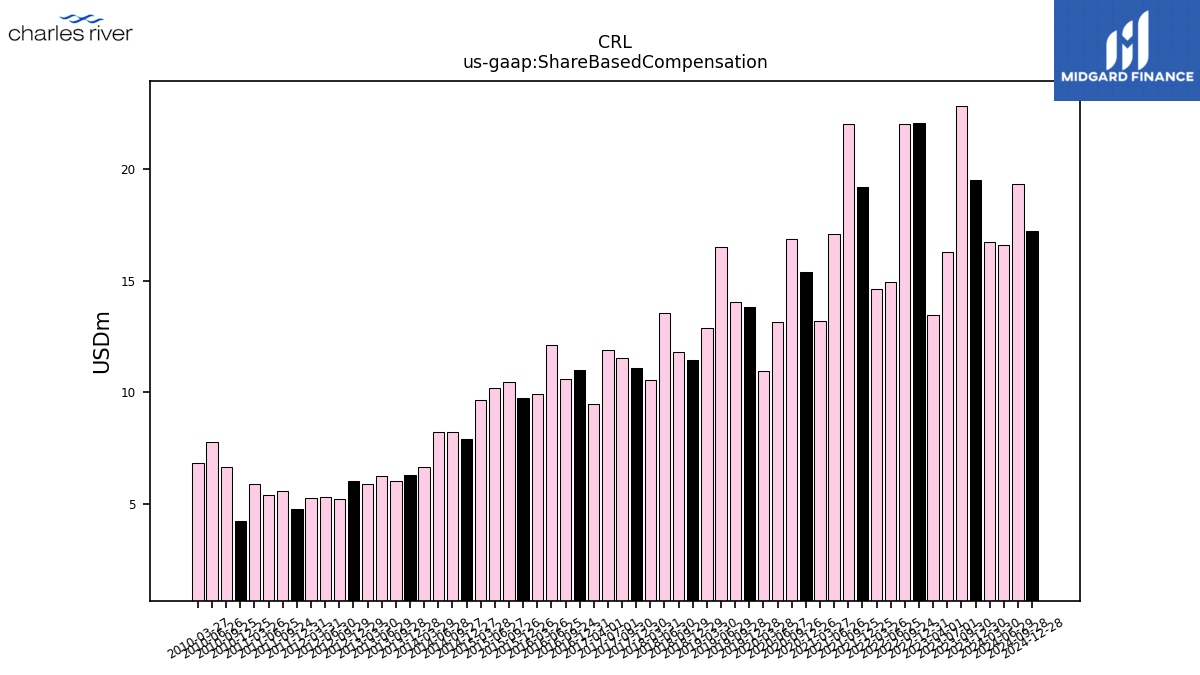
| Share Based Compensation | 19.52 | 22.80 | 16.27 | 13.46 | 22.07 | 22.00 | 14.93 | 14.62 | 19.18 | 22.02 | 17.08 | 13.19 | 15.37 | 16.87 | 13.14 | 10.96 | 13.84 | 14.03 | 16.50 | 12.90 | 11.44 | 11.82 | 13.55 | 10.54 | 11.10 | 11.53 | 11.89 | 9.49 | 10.99 | 10.60 | 12.11 | 9.94 | 9.77 | 10.48 | 10.20 | 9.67 | 7.90 | 8.25 | 8.22 | 6.66 | 6.31 | 6.05 | 6.28 | 5.90 | 6.03 | 5.24 | 5.32 | 5.27 | 4.79 | 5.57 | 5.43 | 5.92 | 4.24 | 6.67 | 7.76 | 6.86 |
| 2023-12-30 | 2023-09-30 | 2023-07-01 | 2023-04-01 | 2022-12-31 | 2022-09-24 | 2022-06-25 | 2022-03-26 | 2021-12-25 | 2021-09-25 | 2021-06-26 | 2021-03-27 | 2020-12-26 | 2020-09-26 | 2020-06-27 | 2020-03-28 | 2019-12-28 | 2019-09-28 | 2019-06-29 | 2019-03-30 | 2018-12-29 | 2018-09-29 | 2018-06-30 | 2018-03-31 | 2017-12-30 | 2017-09-30 | 2017-07-01 | 2017-04-01 | 2016-12-31 | 2016-09-24 | 2016-06-25 | 2016-03-26 | 2015-12-26 | 2015-09-26 | 2015-06-27 | 2015-03-28 | 2014-12-27 | 2014-09-27 | 2014-06-28 | 2014-03-29 | 2013-12-28 | 2013-09-28 | 2013-06-29 | 2013-03-30 | 2012-12-29 | 2012-09-29 | 2012-06-30 | 2012-03-31 | 2011-12-31 | 2011-09-24 | 2011-06-25 | 2011-03-26 | 2010-12-25 | 2010-09-25 | 2010-06-26 | 2010-03-27 | ||
|---|---|---|---|---|---|---|---|---|---|---|---|---|---|---|---|---|---|---|---|---|---|---|---|---|---|---|---|---|---|---|---|---|---|---|---|---|---|---|---|---|---|---|---|---|---|---|---|---|---|---|---|---|---|---|---|---|---|
| Net Cash Provided By Used In Investing Activities | -238.37 | -79.56 | -76.61 | -168.62 | 44.38 | -92.19 | -462.11 | -98.00 | 9.31 | -355.05 | -954.19 | -138.00 | -88.42 | -70.81 | -28.63 | -413.69 | -70.87 | -61.39 | -528.42 | -20.81 | -70.96 | -33.01 | -826.37 | -24.66 | -32.83 | NA | NA | NA | NA | NA | NA | NA | NA | NA | NA | NA | NA | NA | NA | NA | NA | NA | NA | NA | NA | NA | NA | NA | NA | NA | NA | NA | NA | NA | NA | NA | |
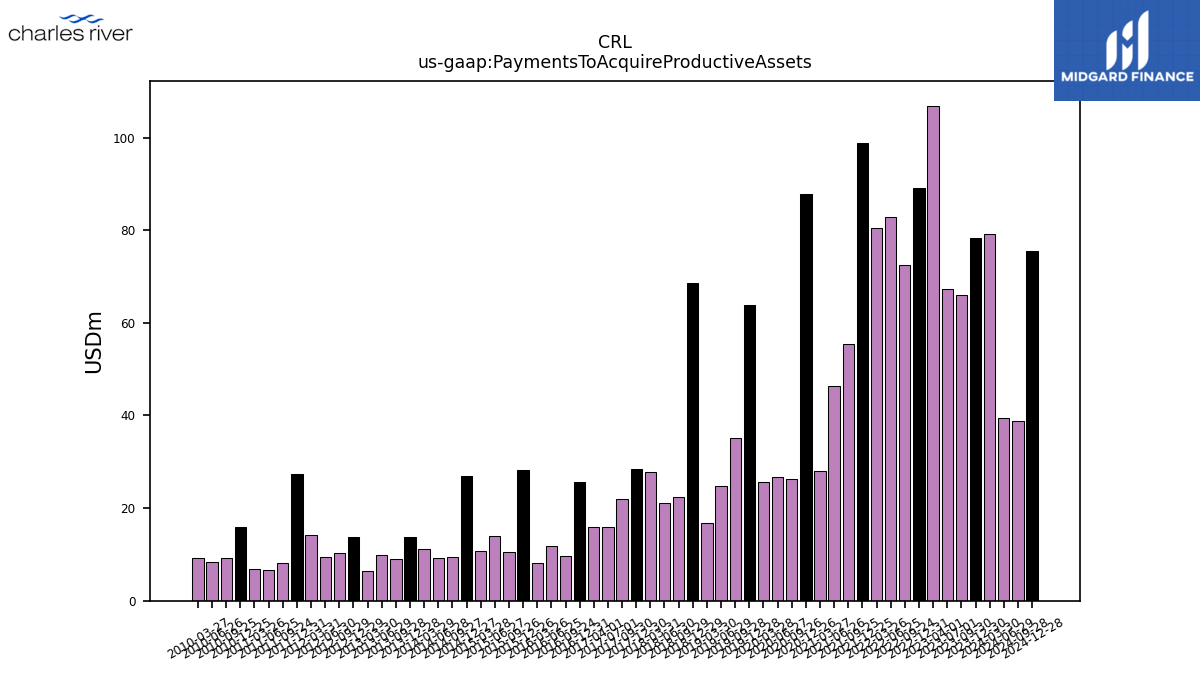
| Payments To Acquire Productive Assets | 78.32 | 65.95 | 67.38 | 106.88 | 89.02 | 72.39 | 82.85 | 80.46 | 98.78 | 55.54 | 46.43 | 28.03 | 87.85 | 26.18 | 26.80 | 25.72 | 63.84 | 35.16 | 24.78 | 16.73 | 68.68 | 22.44 | 21.21 | 27.73 | 28.50 | 22.01 | 16.00 | 15.92 | 25.68 | 9.57 | 11.79 | 8.25 | 28.24 | 10.45 | 13.91 | 10.65 | 27.02 | 9.40 | 9.31 | 11.19 | 13.84 | 9.10 | 9.79 | 6.43 | 13.74 | 10.24 | 9.44 | 14.11 | 27.47 | 8.22 | 6.66 | 6.79 | 16.01 | 9.13 | 8.43 | 9.29 | |
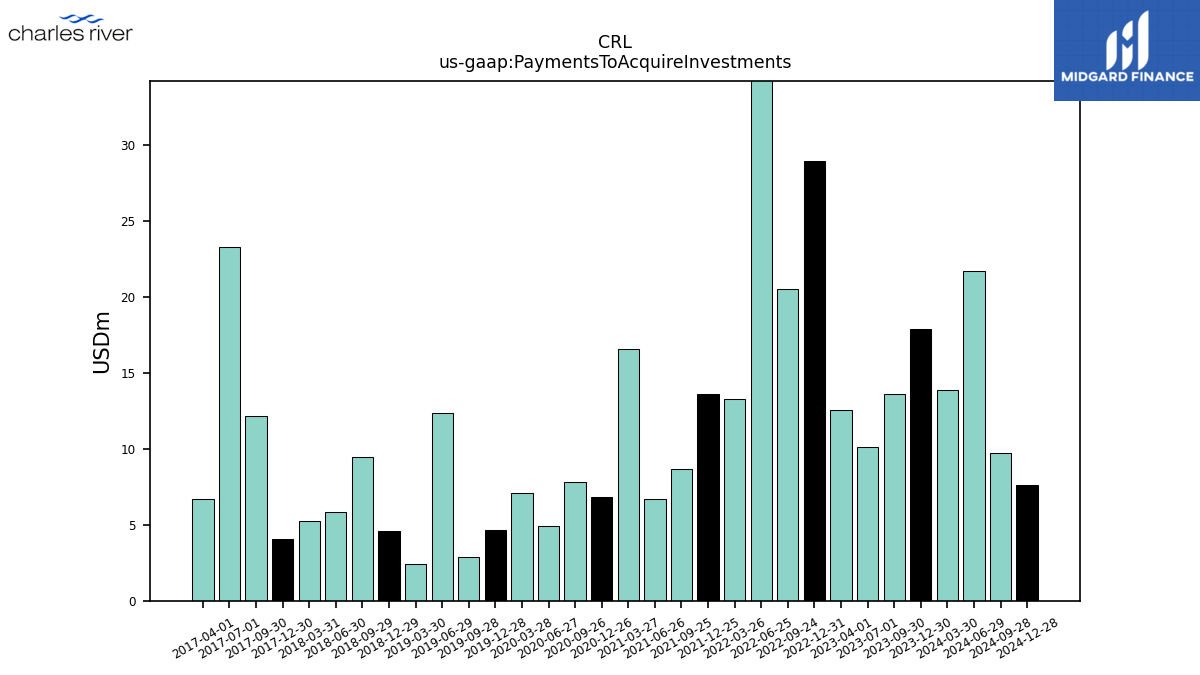
| Payments To Acquire Investments | 17.89 | 13.63 | 10.12 | 12.57 | 28.91 | 20.52 | 95.55 | 13.30 | 13.59 | 8.70 | 6.72 | 16.55 | 6.80 | 7.82 | 4.94 | 7.12 | 4.68 | 2.91 | 12.33 | 2.42 | 4.59 | 9.44 | 5.83 | 5.27 | 4.08 | 12.16 | 23.28 | 6.70 | NA | NA | NA | NA | NA | NA | NA | NA | NA | NA | NA | NA | NA | NA | NA | NA | NA | NA | NA | NA | NA | NA | NA | NA | NA | NA | NA | NA |
| 2023-12-30 | 2023-09-30 | 2023-07-01 | 2023-04-01 | 2022-12-31 | 2022-09-24 | 2022-06-25 | 2022-03-26 | 2021-12-25 | 2021-09-25 | 2021-06-26 | 2021-03-27 | 2020-12-26 | 2020-09-26 | 2020-06-27 | 2020-03-28 | 2019-12-28 | 2019-09-28 | 2019-06-29 | 2019-03-30 | 2018-12-29 | 2018-09-29 | 2018-06-30 | 2018-03-31 | 2017-12-30 | 2017-09-30 | 2017-07-01 | 2017-04-01 | 2016-12-31 | 2016-09-24 | 2016-06-25 | 2016-03-26 | 2015-12-26 | 2015-09-26 | 2015-06-27 | 2015-03-28 | 2014-12-27 | 2014-09-27 | 2014-06-28 | 2014-03-29 | 2013-12-28 | 2013-09-28 | 2013-06-29 | 2013-03-30 | 2012-12-29 | 2012-09-29 | 2012-06-30 | 2012-03-31 | 2011-12-31 | 2011-09-24 | 2011-06-25 | 2011-03-26 | 2010-12-25 | 2010-09-25 | 2010-06-26 | 2010-03-27 | ||
|---|---|---|---|---|---|---|---|---|---|---|---|---|---|---|---|---|---|---|---|---|---|---|---|---|---|---|---|---|---|---|---|---|---|---|---|---|---|---|---|---|---|---|---|---|---|---|---|---|---|---|---|---|---|---|---|---|---|
| Net Cash Provided By Used In Financing Activities | 123.57 | -162.87 | -71.46 | 25.24 | -248.96 | -51.59 | 271.44 | -13.28 | -218.97 | 178.90 | 517.96 | 194.72 | -59.23 | -268.64 | -104.10 | 479.21 | -39.04 | -133.44 | 473.51 | -69.08 | 0.56 | -147.08 | 719.51 | -14.94 | -53.01 | NA | NA | NA | NA | NA | NA | NA | NA | NA | NA | NA | NA | NA | NA | NA | NA | NA | NA | NA | NA | NA | NA | NA | NA | NA | NA | NA | NA | NA | NA | NA | |
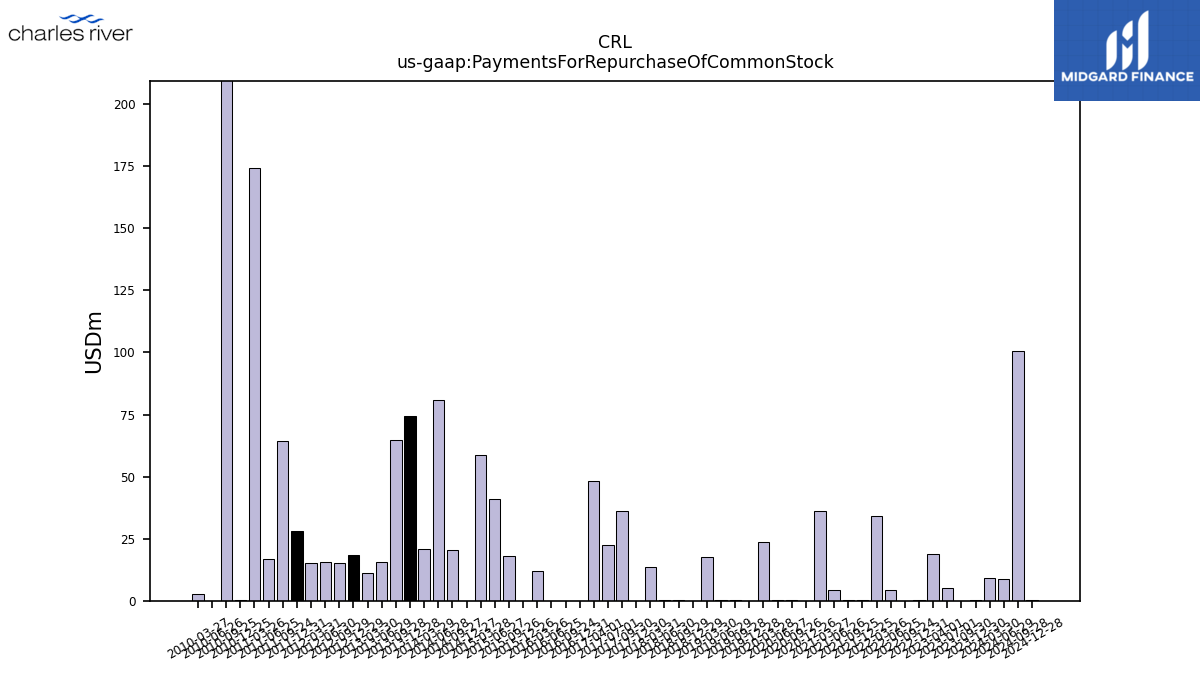
| Payments For Repurchase Of Common Stock | 0.14 | 0.04 | 4.97 | 19.01 | 0.16 | 0.02 | 4.47 | 33.99 | 0.27 | 0.14 | 4.27 | 36.03 | 0.07 | 0.11 | 0.12 | 23.68 | 0.05 | 0.16 | 0.12 | 17.76 | 0.06 | 0.12 | 0.12 | 13.55 | 0.01 | 36.08 | 22.64 | 48.18 | 0.04 | 0.03 | 0.05 | 12.15 | 0.05 | 17.95 | 40.85 | 58.63 | 0.03 | 20.38 | 80.80 | 20.81 | 74.23 | 64.80 | 15.67 | 11.23 | 18.35 | 15.03 | 15.57 | 15.25 | 28.18 | 64.50 | 16.64 | 174.47 | 0.11 | 353.46 | 0.07 | 2.90 |
| 2023-12-30 | 2023-09-30 | 2023-07-01 | 2023-04-01 | 2022-12-31 | 2022-09-24 | 2022-06-25 | 2022-03-26 | 2021-12-25 | 2021-09-25 | 2021-06-26 | 2021-03-27 | 2020-12-26 | 2020-09-26 | 2020-06-27 | 2020-03-28 | 2019-12-28 | 2019-09-28 | 2019-06-29 | 2019-03-30 | 2018-12-29 | 2018-09-29 | 2018-06-30 | 2018-03-31 | 2017-12-30 | 2017-09-30 | 2017-07-01 | 2017-04-01 | 2016-12-31 | 2016-09-24 | 2016-06-25 | 2016-03-26 | 2015-12-26 | 2015-09-26 | 2015-06-27 | 2015-03-28 | 2014-12-27 | 2014-09-27 | 2014-06-28 | 2014-03-29 | 2013-12-28 | 2013-09-28 | 2013-06-29 | 2013-03-30 | 2012-12-29 | 2012-09-29 | 2012-06-30 | 2012-03-31 | 2011-12-31 | 2011-09-24 | 2011-06-25 | 2011-03-26 | 2010-12-25 | 2010-09-25 | 2010-06-26 | 2010-03-27 | ||
|---|---|---|---|---|---|---|---|---|---|---|---|---|---|---|---|---|---|---|---|---|---|---|---|---|---|---|---|---|---|---|---|---|---|---|---|---|---|---|---|---|---|---|---|---|---|---|---|---|---|---|---|---|---|---|---|---|---|
| Revenues | 1013.48 | 1026.62 | 1059.94 | 1029.37 | 1099.84 | 989.16 | 973.13 | 913.93 | 905.05 | 895.94 | 914.61 | 824.57 | 790.99 | 743.30 | 682.58 | 707.06 | 691.14 | 667.95 | 657.57 | 604.57 | 601.53 | 585.29 | 585.30 | 493.97 | 478.48 | 464.23 | 469.13 | 445.76 | 466.79 | 425.72 | 434.06 | 354.87 | 353.85 | 349.46 | 339.57 | 320.41 | 329.55 | 327.57 | 341.18 | 299.37 | 289.23 | 292.13 | 292.93 | 291.24 | 280.14 | 278.69 | 284.72 | 285.98 | 290.96 | 277.58 | 288.26 | 285.84 | 281.65 | 270.88 | 288.59 | 292.29 | |
| Revenue From Contract With Customer Excluding Assessed Tax | 1013.48 | 1026.62 | 1059.94 | 1029.37 | 1099.84 | 989.16 | 973.13 | 913.93 | 905.05 | 895.94 | 914.61 | 824.57 | 790.99 | 743.30 | 682.58 | 707.06 | 691.14 | 667.95 | 657.57 | 604.57 | 601.53 | 585.29 | 585.30 | 493.97 | 478.48 | 464.23 | 469.13 | 445.76 | 466.79 | 425.72 | 434.06 | 354.87 | 353.85 | 349.46 | 339.57 | 320.41 | 329.55 | 327.57 | 341.18 | 299.37 | 289.23 | 292.13 | 292.93 | 291.24 | 280.14 | 278.69 | 284.72 | 285.98 | 290.96 | 277.58 | 288.26 | 285.84 | 281.65 | 270.88 | 288.59 | 292.29 | |
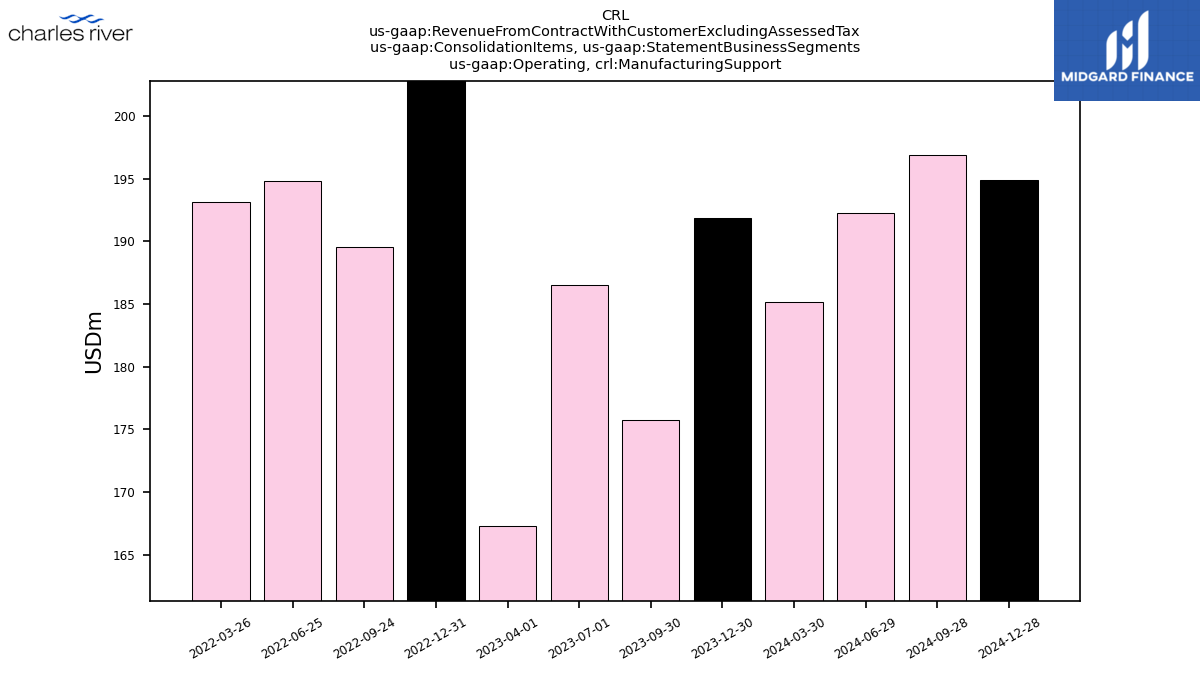
| Operating, Manufacturing Support | 191.91 | 175.75 | 186.53 | 167.25 | 212.06 | 189.58 | 194.80 | 193.13 | NA | NA | NA | NA | NA | NA | NA | NA | NA | NA | NA | NA | NA | NA | NA | NA | NA | NA | NA | NA | NA | NA | NA | NA | NA | NA | NA | NA | NA | NA | NA | NA | NA | NA | NA | NA | NA | NA | NA | NA | NA | NA | NA | NA | NA | NA | NA | NA | |
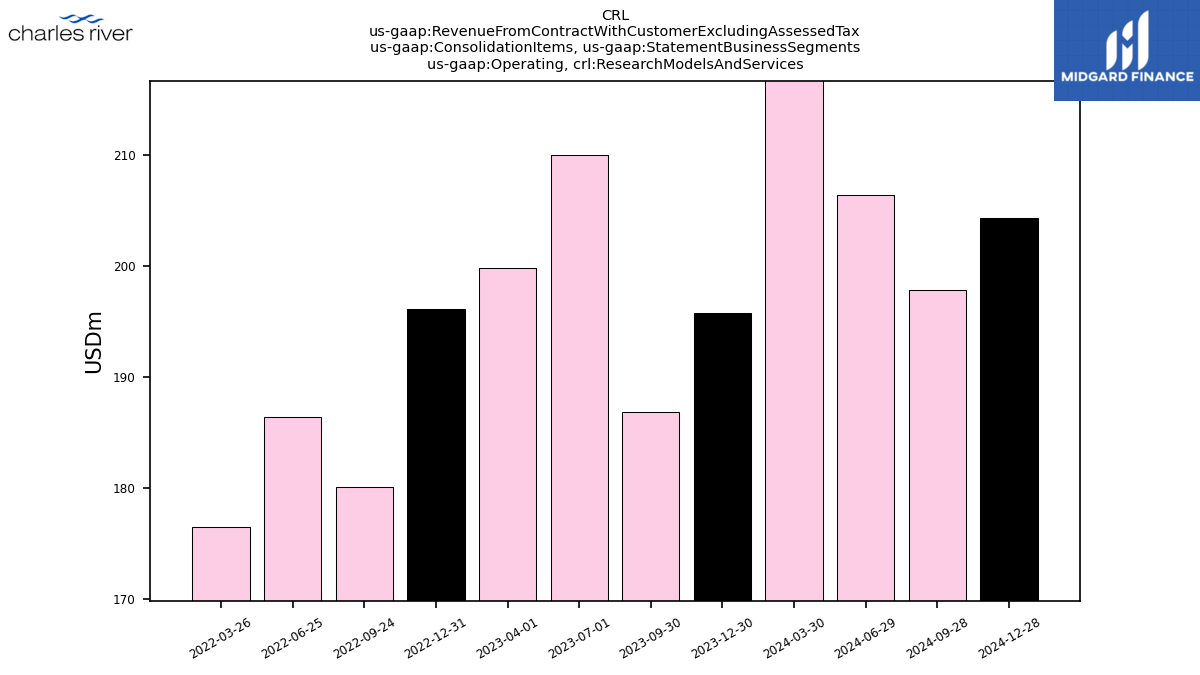
| Operating, Research Models And Services | 195.78 | 186.85 | 209.95 | 199.77 | 196.11 | 180.11 | 186.41 | 176.54 | NA | NA | NA | NA | NA | NA | NA | NA | NA | NA | NA | NA | NA | NA | NA | NA | NA | NA | NA | NA | NA | NA | NA | NA | NA | NA | NA | NA | NA | NA | NA | NA | NA | NA | NA | NA | NA | NA | NA | NA | NA | NA | NA | NA | NA | NA | NA | NA | |
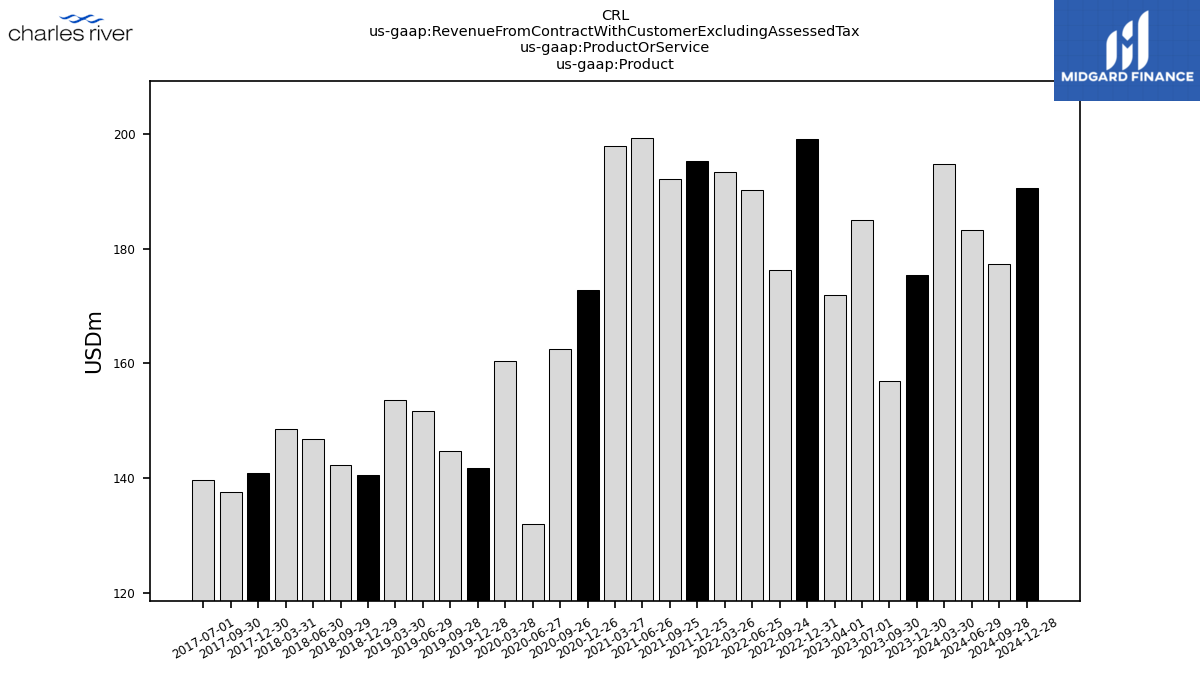
| Product | 175.47 | 156.86 | 185.05 | 172.01 | 199.15 | 176.26 | 190.30 | 193.44 | 195.23 | 192.08 | 199.29 | 197.99 | 172.76 | 162.53 | 132.02 | 160.47 | 141.76 | 144.78 | 151.69 | 153.63 | 140.54 | 142.26 | 146.84 | 148.52 | 140.82 | 137.52 | 139.73 | NA | NA | NA | NA | NA | NA | NA | NA | NA | NA | NA | NA | NA | NA | NA | NA | NA | NA | NA | NA | NA | NA | NA | NA | NA | NA | NA | NA | NA | |
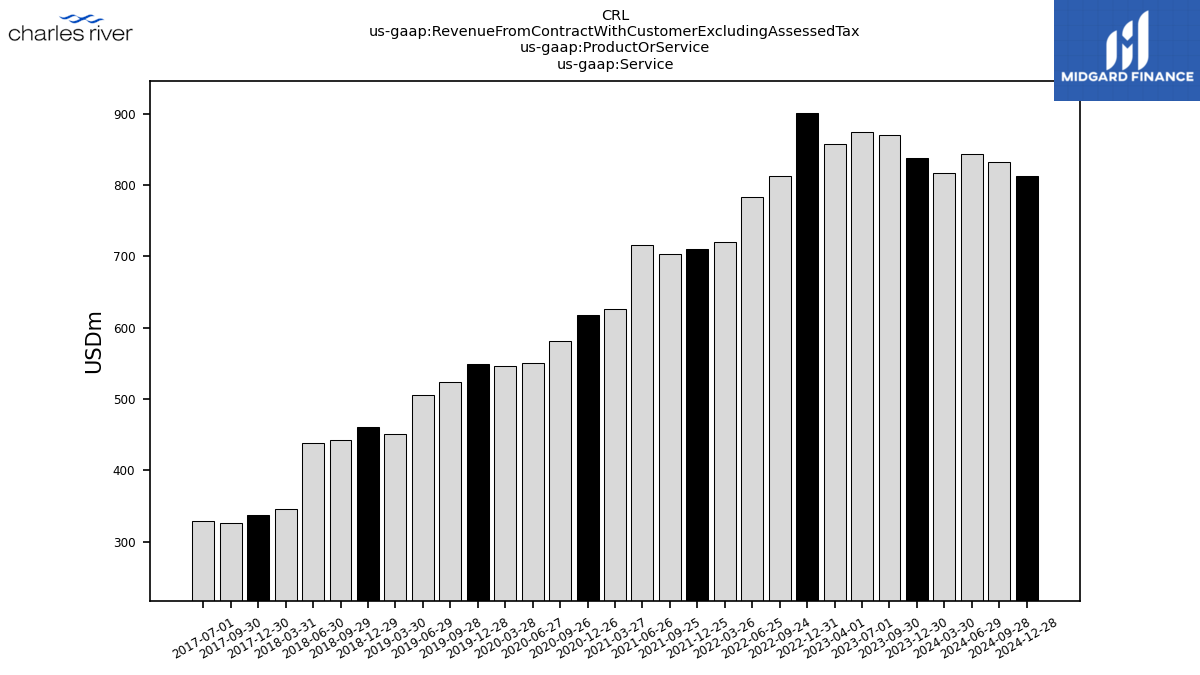
| Service | 838.00 | 869.76 | 874.89 | 857.37 | 900.70 | 812.89 | 782.83 | 720.49 | 709.82 | 703.86 | 715.32 | 626.58 | 618.23 | 580.77 | 550.56 | 546.59 | 549.38 | 523.17 | 505.88 | 450.94 | 460.99 | 443.04 | 438.46 | 345.45 | 337.66 | 326.71 | 329.40 | NA | NA | NA | NA | NA | NA | NA | NA | NA | NA | NA | NA | NA | NA | NA | NA | NA | NA | NA | NA | NA | NA | NA | NA | NA | NA | NA | NA | NA | |
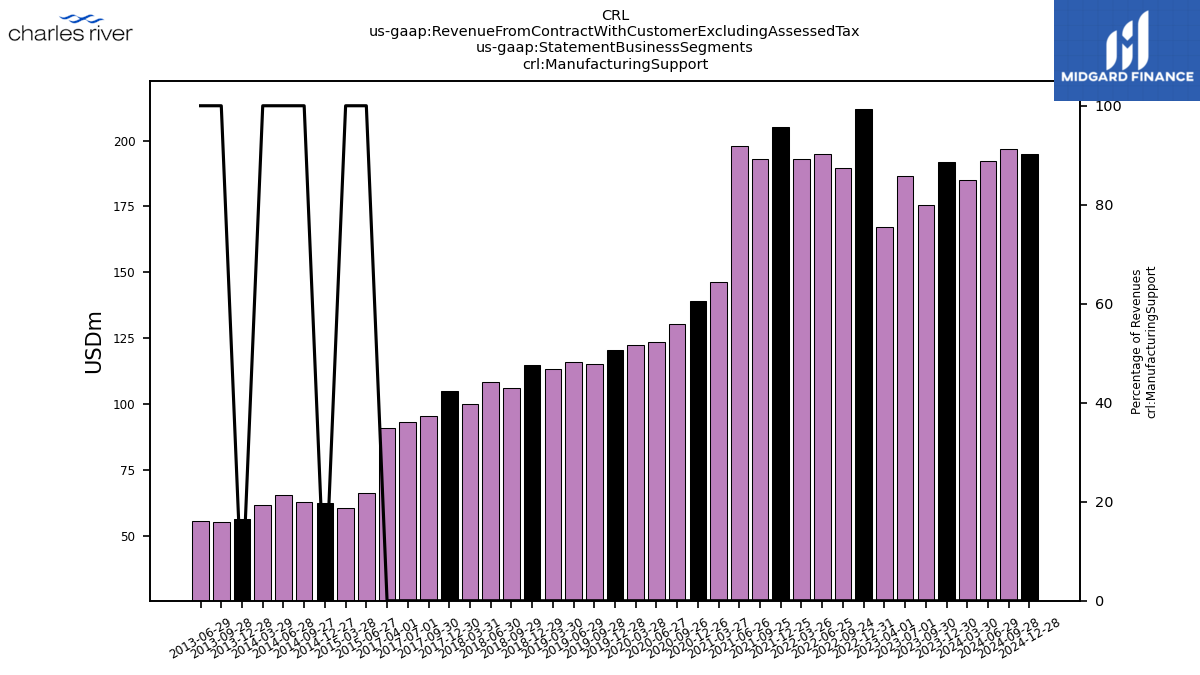
| Manufacturing Support | 191.91 | 175.75 | 186.53 | 167.25 | 212.06 | 189.58 | 194.80 | 193.13 | 205.34 | 192.86 | 197.82 | 146.48 | 139.29 | 130.21 | 123.47 | 122.38 | 120.62 | 115.33 | 116.00 | 113.20 | 114.85 | 106.23 | 108.46 | 100.02 | 104.82 | 95.27 | 93.03 | 90.84 | NA | NA | NA | NA | NA | NA | 66.15 | 60.39 | 62.25 | 62.68 | 65.44 | 61.73 | 56.28 | 55.27 | 55.68 | NA | NA | NA | NA | NA | NA | NA | NA | NA | NA | NA | NA | NA | |
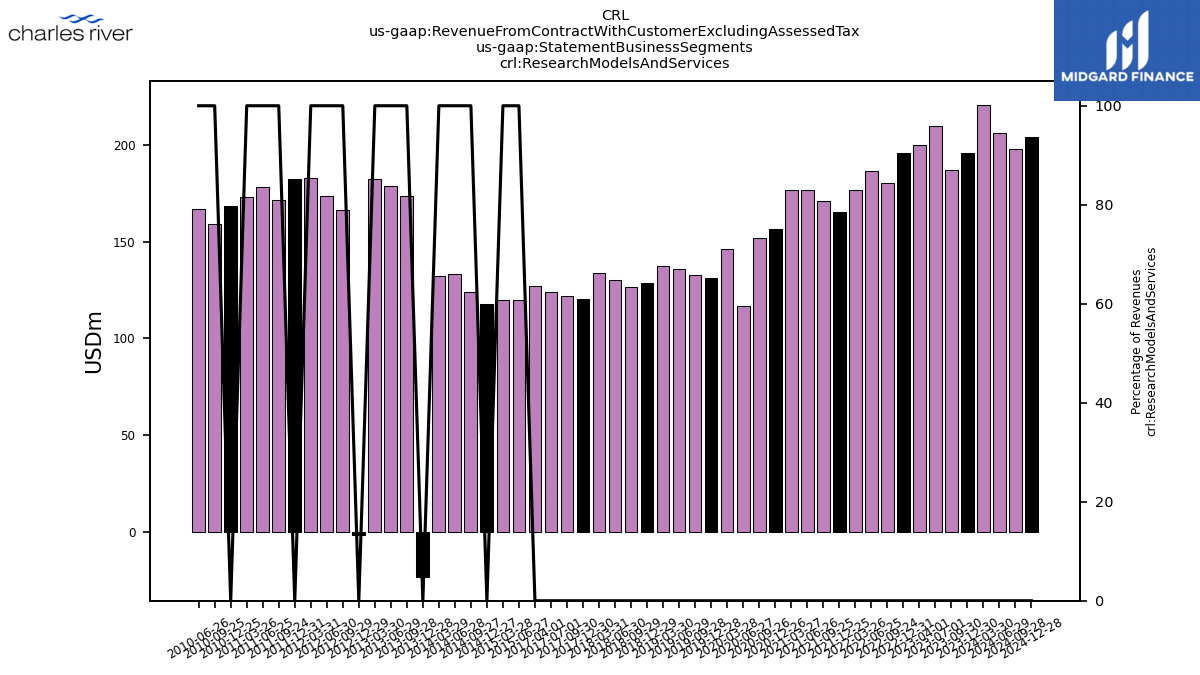
| Research Models And Services | 195.78 | 186.85 | 209.95 | 199.77 | 196.11 | 180.11 | 186.41 | 176.54 | 165.57 | 171.26 | 176.69 | 176.91 | 156.70 | 151.91 | 116.55 | 146.00 | 131.32 | 132.55 | 136.05 | 137.17 | 128.49 | 126.81 | 130.43 | 133.96 | 120.43 | 122.02 | 124.00 | 127.16 | NA | NA | NA | NA | NA | NA | 120.04 | 120.01 | 117.69 | 124.02 | 133.12 | 132.50 | -23.52 | 173.41 | 178.97 | 182.49 | -1.61 | 166.48 | 173.61 | 183.15 | 182.41 | 171.47 | 178.16 | 173.37 | 168.38 | 159.26 | 167.14 | NA | |
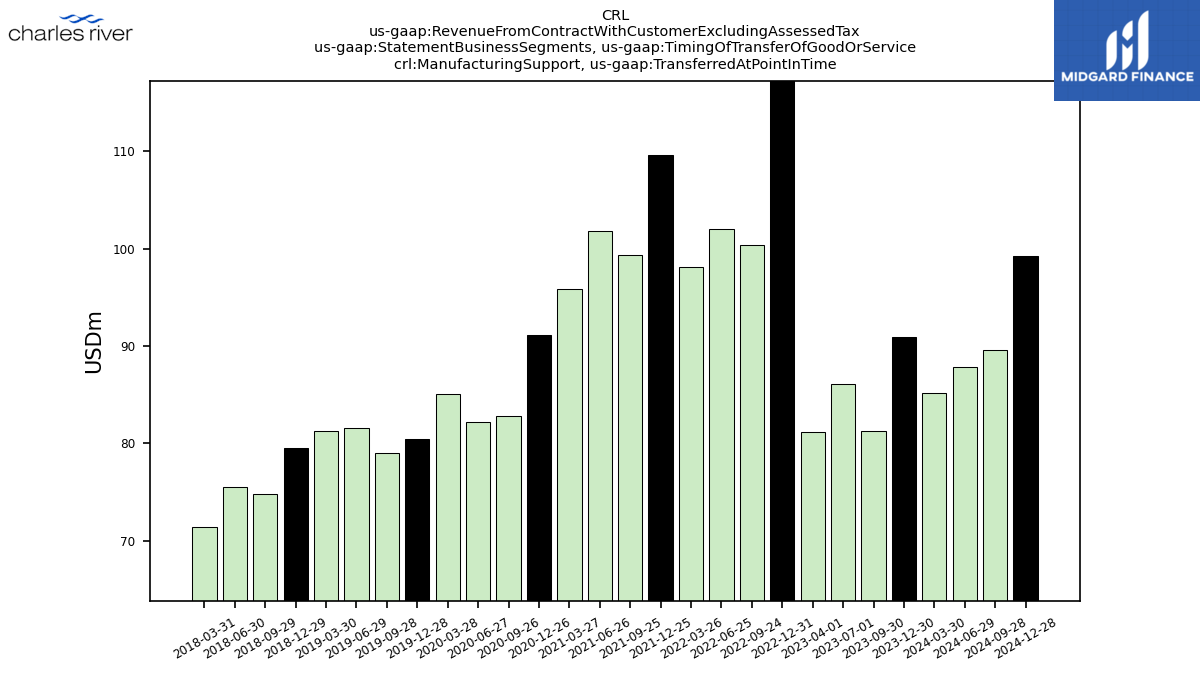
| Manufacturing Support, Transferred At Point In Time | 90.96 | 81.30 | 86.07 | 81.17 | 117.55 | 100.41 | 101.99 | 98.12 | 109.61 | 99.38 | 101.84 | 95.91 | 91.12 | 82.76 | 82.15 | 85.07 | 80.40 | 79.02 | 81.53 | 81.30 | 79.55 | 74.81 | 75.47 | 71.45 | NA | NA | NA | NA | NA | NA | NA | NA | NA | NA | NA | NA | NA | NA | NA | NA | NA | NA | NA | NA | NA | NA | NA | NA | NA | NA | NA | NA | NA | NA | NA | NA | |
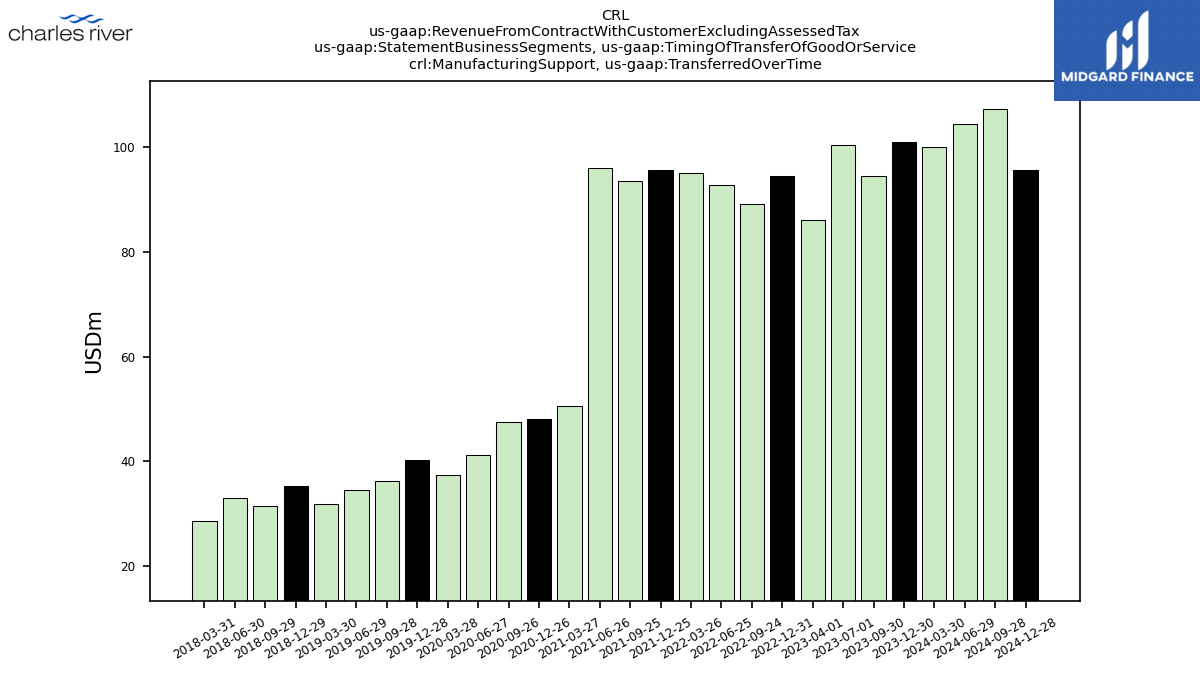
| Manufacturing Support, Transferred Over Time | 100.95 | 94.45 | 100.46 | 86.09 | 94.51 | 89.17 | 92.81 | 95.01 | 95.73 | 93.47 | 95.97 | 50.57 | 48.17 | 47.46 | 41.32 | 37.31 | 40.22 | 36.31 | 34.47 | 31.90 | 35.31 | 31.42 | 32.99 | 28.57 | NA | NA | NA | NA | NA | NA | NA | NA | NA | NA | NA | NA | NA | NA | NA | NA | NA | NA | NA | NA | NA | NA | NA | NA | NA | NA | NA | NA | NA | NA | NA | NA | |
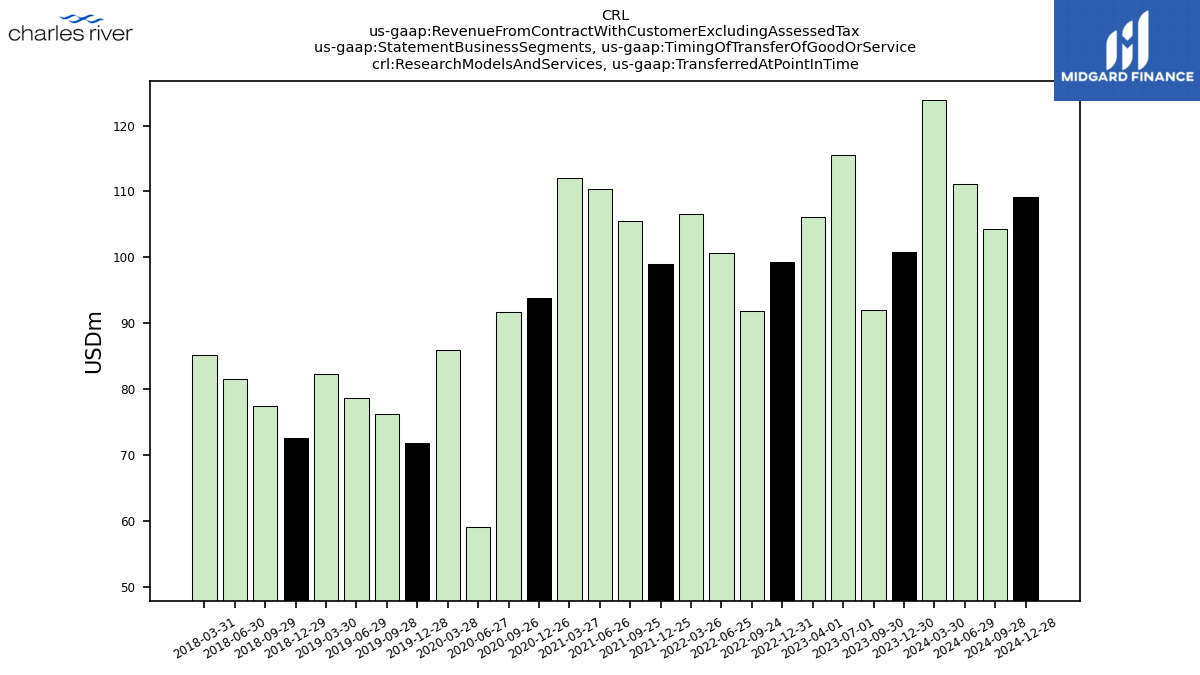
| Research Models And Services, Transferred At Point In Time | 100.81 | 91.97 | 115.49 | 106.13 | 99.30 | 91.94 | 100.61 | 106.62 | 98.95 | 105.45 | 110.36 | 112.01 | 93.84 | 91.69 | 59.19 | 85.95 | 71.82 | 76.30 | 78.73 | 82.36 | 72.56 | 77.39 | 81.62 | 85.23 | NA | NA | NA | NA | NA | NA | NA | NA | NA | NA | NA | NA | NA | NA | NA | NA | NA | NA | NA | NA | NA | NA | NA | NA | NA | NA | NA | NA | NA | NA | NA | NA | |
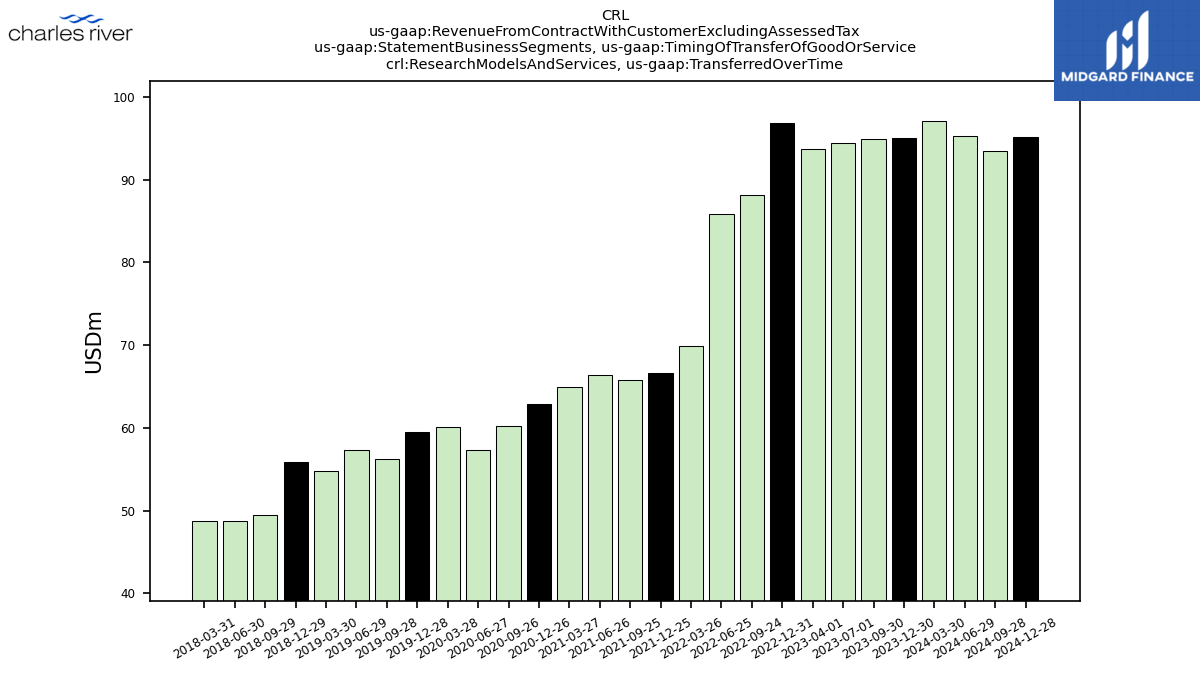
| Research Models And Services, Transferred Over Time | 94.97 | 94.88 | 94.46 | 93.64 | 96.81 | 88.17 | 85.80 | 69.92 | 66.62 | 65.81 | 66.33 | 64.90 | 62.86 | 60.23 | 57.36 | 60.04 | 59.49 | 56.24 | 57.32 | 54.81 | 55.92 | 49.42 | 48.80 | 48.73 | NA | NA | NA | NA | NA | NA | NA | NA | NA | NA | NA | NA | NA | NA | NA | NA | NA | NA | NA | NA | NA | NA | NA | NA | NA | NA | NA | NA | NA | NA | NA | NA | |
| 57.92 | 40.23 | 59.86 | 42.81 | 53.85 | 43.80 | 46.24 | 48.95 | 51.72 | 56.61 | 55.13 | 59.45 | 45.74 | 41.55 | 35.97 | 31.83 | 40.13 | 36.70 | 36.21 | 33.18 | NA | 34.06 | 36.23 | 34.52 | NA | 31.95 | 31.05 | NA | NA | NA | NA | NA | NA | NA | NA | NA | NA | NA | NA | NA | NA | NA | NA | NA | NA | NA | NA | NA | NA | NA | NA | NA | NA | NA | NA | NA | ||
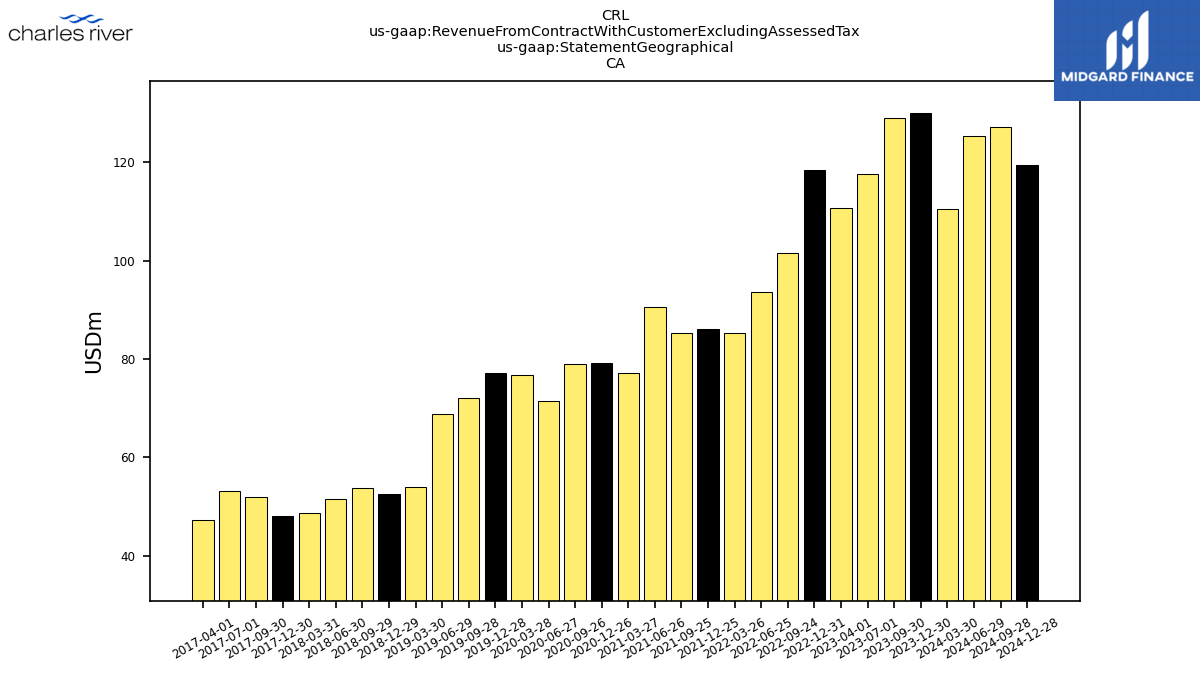
| 130.03 | 129.02 | 117.65 | 110.61 | 118.44 | 101.60 | 93.69 | 85.25 | 86.17 | 85.25 | 90.56 | 77.11 | 79.09 | 79.00 | 71.54 | 76.63 | 77.12 | 71.98 | 68.90 | 53.98 | 52.58 | 53.66 | 51.56 | 48.58 | 48.05 | 51.86 | 53.24 | 47.19 | NA | NA | NA | NA | NA | NA | NA | NA | NA | NA | NA | NA | NA | NA | NA | NA | NA | NA | NA | NA | NA | NA | NA | NA | NA | NA | NA | NA | ||
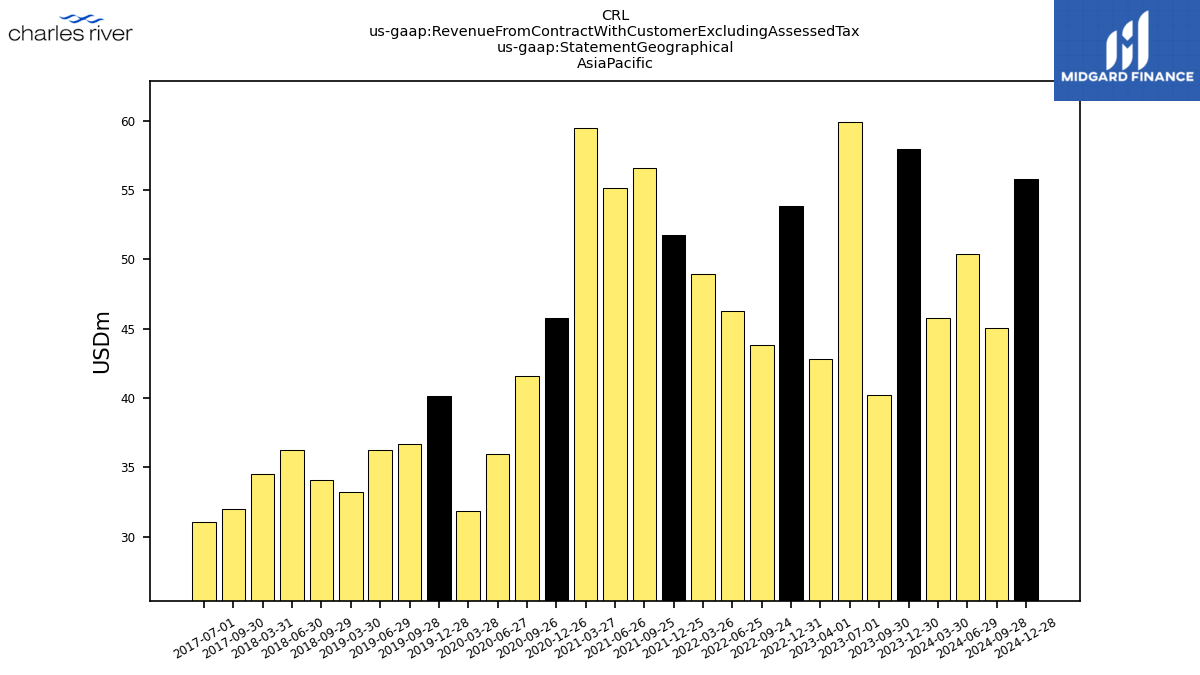
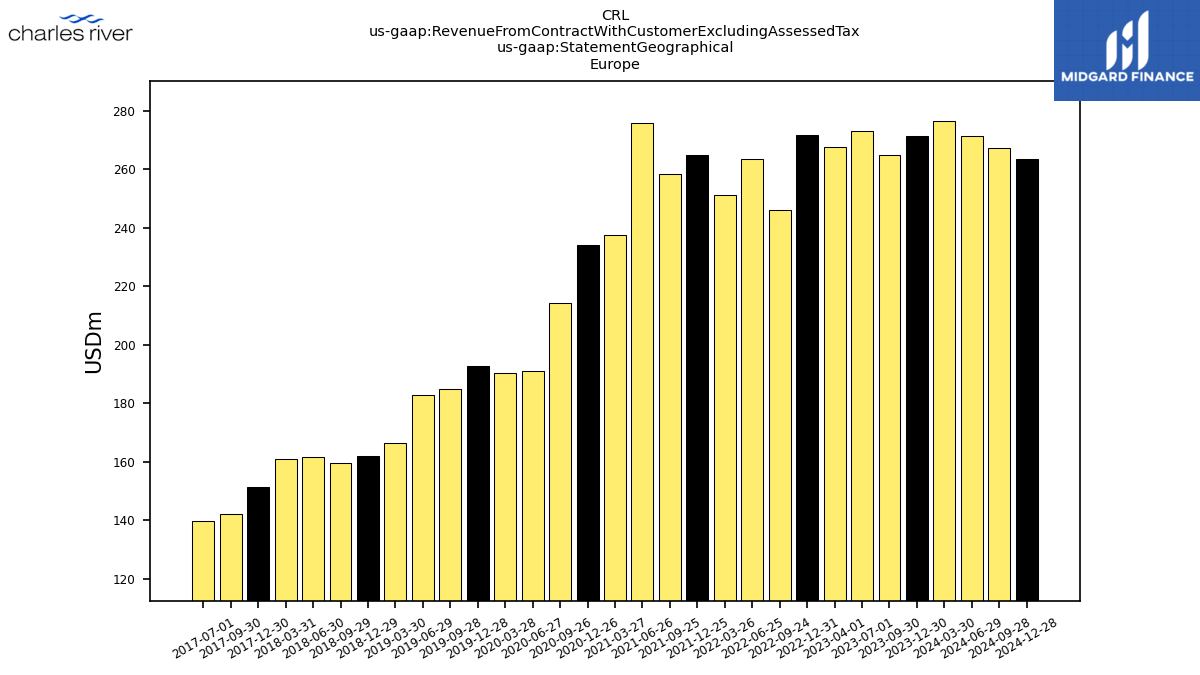
| 271.47 | 264.79 | 272.98 | 267.70 | 271.53 | 245.93 | 263.58 | 251.09 | 264.87 | 258.35 | 275.71 | 237.53 | 233.92 | 214.19 | 190.94 | 190.26 | 192.60 | 184.69 | 182.77 | 166.37 | 162.00 | 159.47 | 161.66 | 160.83 | 151.34 | 141.97 | 139.62 | NA | NA | NA | NA | NA | NA | NA | NA | NA | NA | NA | NA | NA | NA | NA | NA | NA | NA | NA | NA | NA | NA | NA | NA | NA | NA | NA | NA | NA | ||
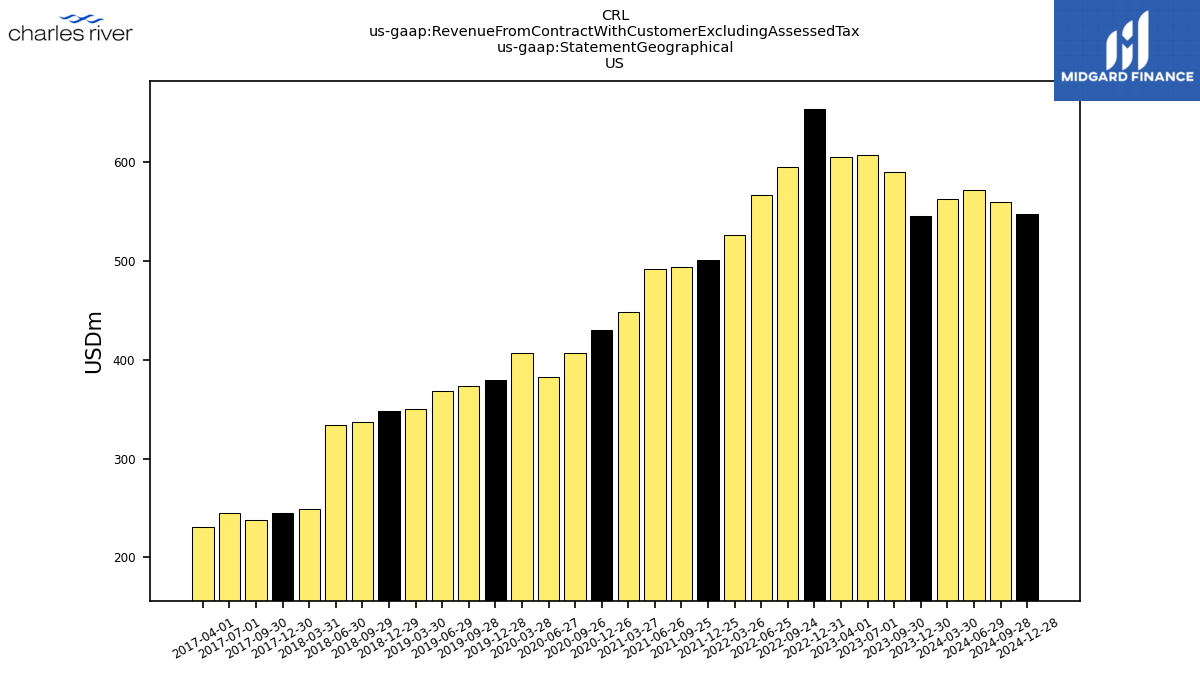
| US | 544.95 | 590.32 | 606.77 | 605.44 | 653.43 | 595.26 | 566.92 | 526.55 | 500.74 | 493.56 | 491.62 | 448.48 | 430.54 | 406.98 | 382.92 | 406.71 | 379.90 | 373.09 | 367.92 | 350.18 | 347.81 | 336.81 | 334.02 | 248.98 | 244.80 | 238.23 | 244.92 | 231.31 | NA | NA | NA | NA | NA | NA | NA | NA | NA | NA | NA | NA | NA | NA | NA | NA | NA | NA | NA | NA | NA | NA | NA | NA | NA | NA | NA | NA | |
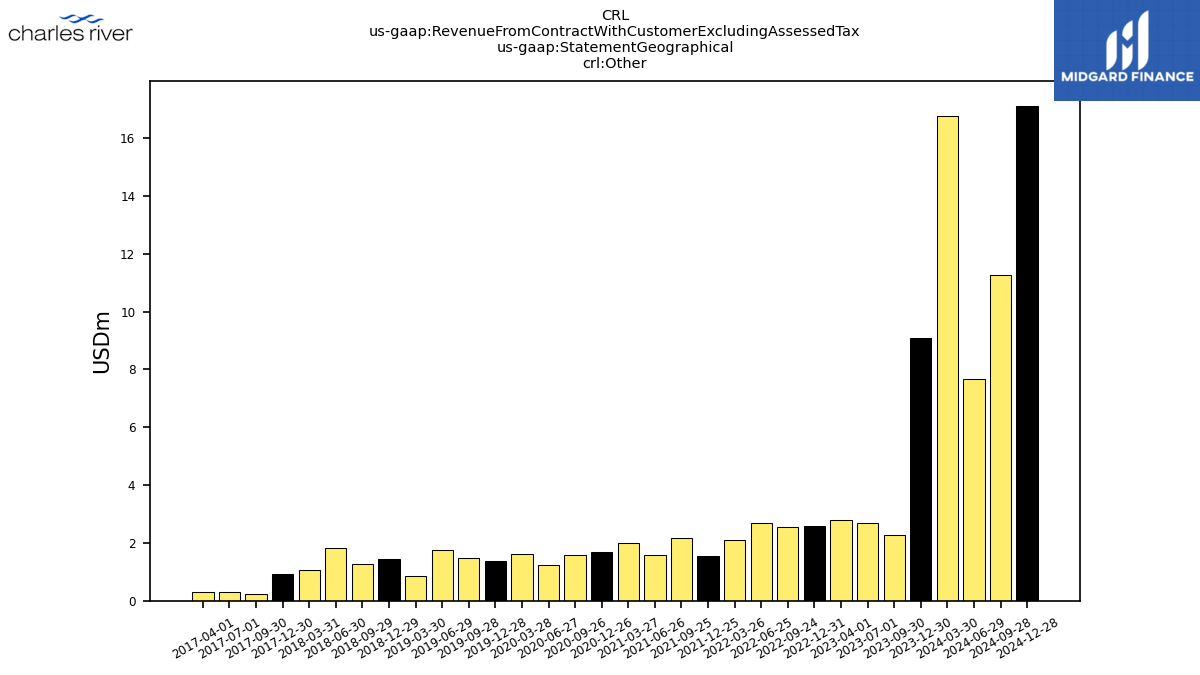
| Other | 9.10 | 2.26 | 2.67 | 2.81 | 2.60 | 2.56 | 2.70 | 2.10 | 1.55 | 2.16 | 1.58 | 2.00 | 1.70 | 1.58 | 1.22 | 1.62 | 1.38 | 1.49 | 1.76 | 0.87 | 1.46 | 1.28 | 1.83 | 1.07 | 0.91 | 0.22 | 0.30 | 0.29 | NA | NA | NA | NA | NA | NA | NA | NA | NA | NA | NA | NA | NA | NA | NA | NA | NA | NA | NA | NA | NA | NA | NA | NA | NA | NA | NA | NA |