
| 2022-12-31 | 2022-09-30 | 2022-06-30 | 2022-03-31 | 2021-12-31 | 2021-09-30 | 2021-06-30 | 2021-03-31 | 2020-12-31 | 2020-09-30 | 2020-06-30 | 2020-03-31 | 2019-12-31 | 2019-09-30 | 2019-06-30 | 2019-03-31 | 2018-12-31 | 2018-09-30 | 2018-06-30 | 2018-03-31 | 2017-12-31 | 2017-09-30 | 2017-06-30 | 2017-03-31 | 2016-12-31 | 2016-09-30 | 2016-06-30 | 2016-03-31 | 2015-12-31 | 2015-09-30 | 2015-06-30 | 2015-03-31 | ||
|---|---|---|---|---|---|---|---|---|---|---|---|---|---|---|---|---|---|---|---|---|---|---|---|---|---|---|---|---|---|---|---|---|---|
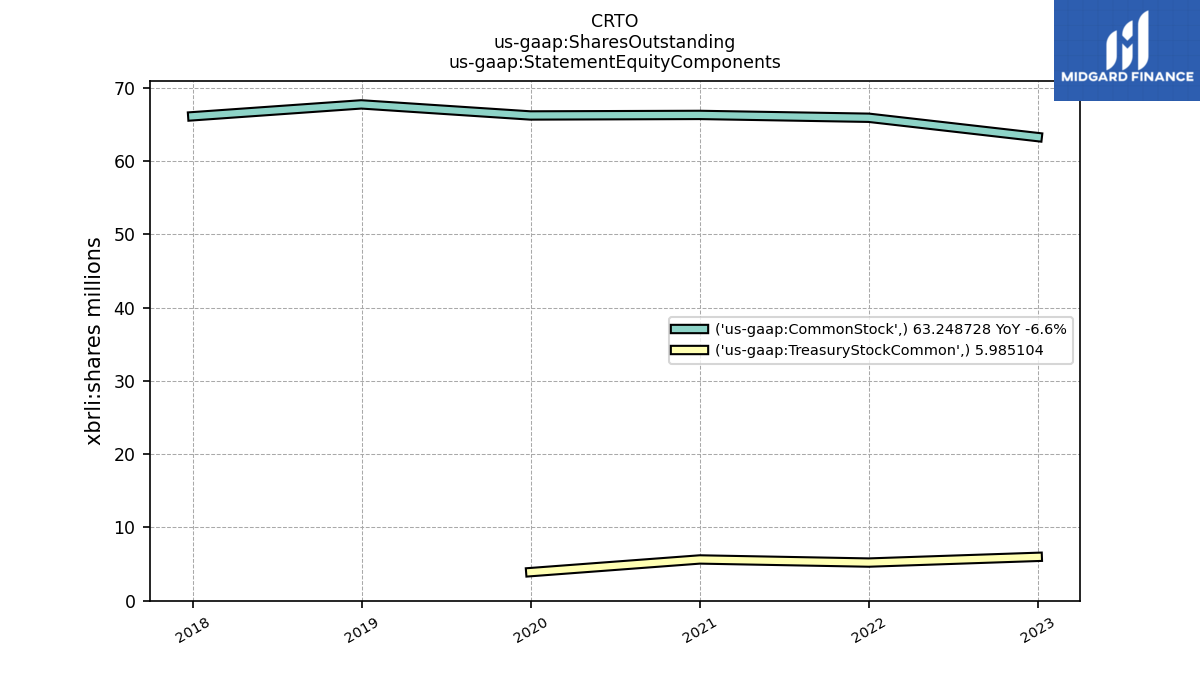
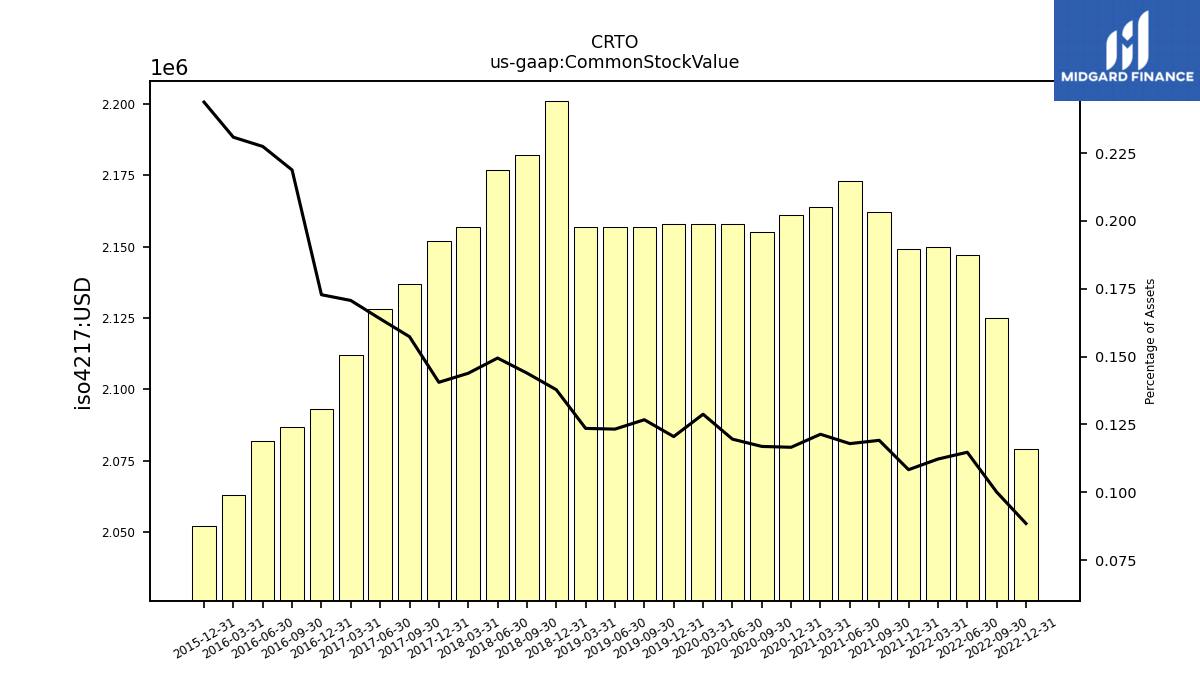
| Common Stock Value | 2.08 | 2.12 | 2.15 | 2.15 | 2.15 | 2.16 | 2.17 | 2.16 | 2.16 | 2.15 | 2.16 | 2.16 | 2.16 | 2.16 | 2.16 | 2.16 | 2.20 | 2.18 | 2.18 | 2.16 | 2.15 | 2.14 | 2.13 | 2.11 | 2.09 | 2.09 | 2.08 | 2.06 | 2.05 | NA | NA | NA | |
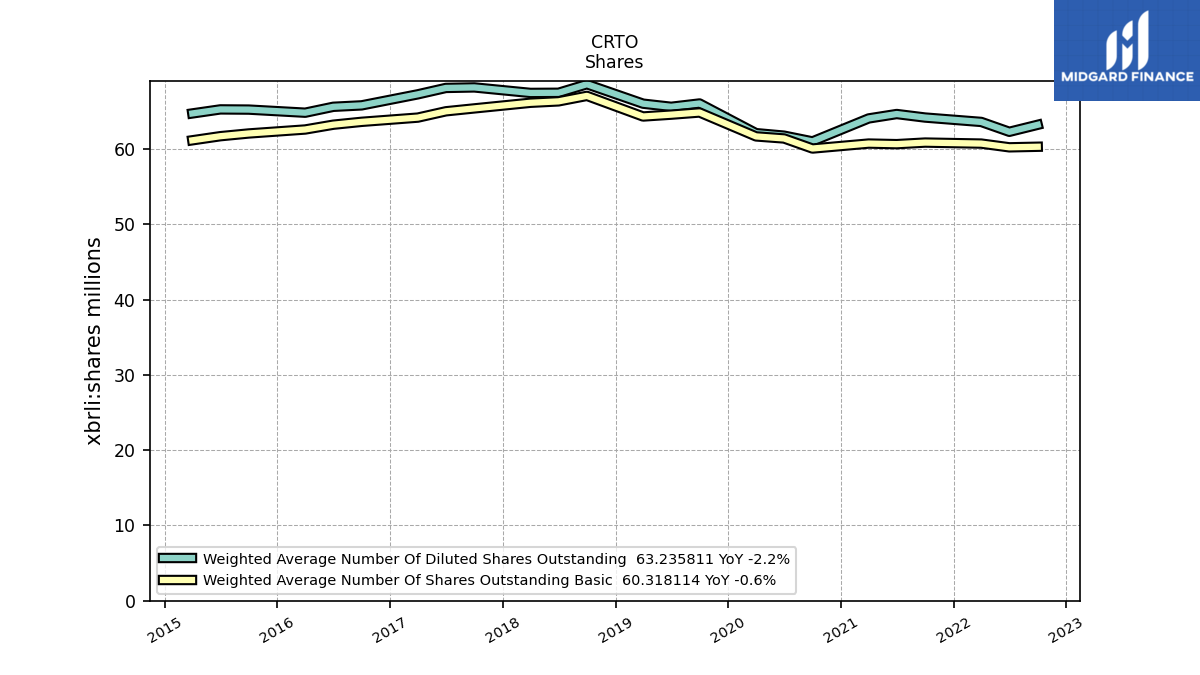
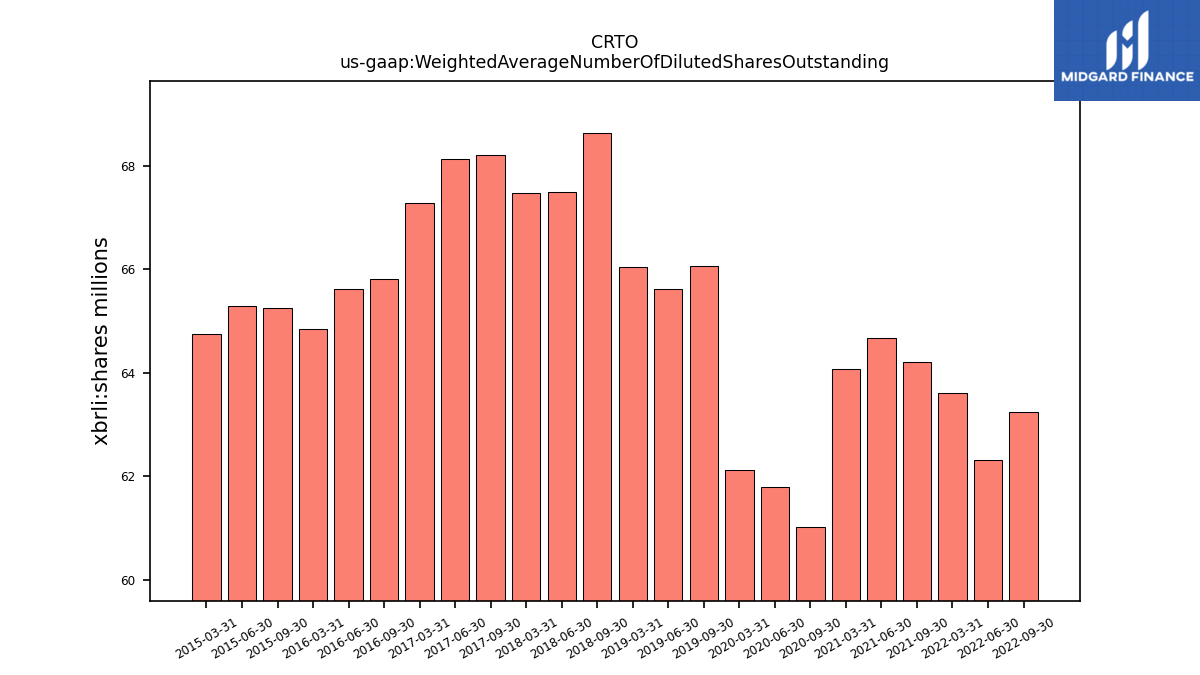
| Weighted Average Number Of Diluted Shares Outstanding | NA | 63.24 | 62.30 | 63.61 | NA | 64.20 | 64.67 | 64.08 | NA | 61.03 | 61.79 | 62.13 | NA | 66.07 | 65.62 | 66.04 | NA | 68.63 | 67.49 | 67.47 | NA | 68.20 | 68.13 | 67.28 | NA | 65.82 | 65.63 | 64.84 | NA | 65.25 | 65.28 | 64.74 | |
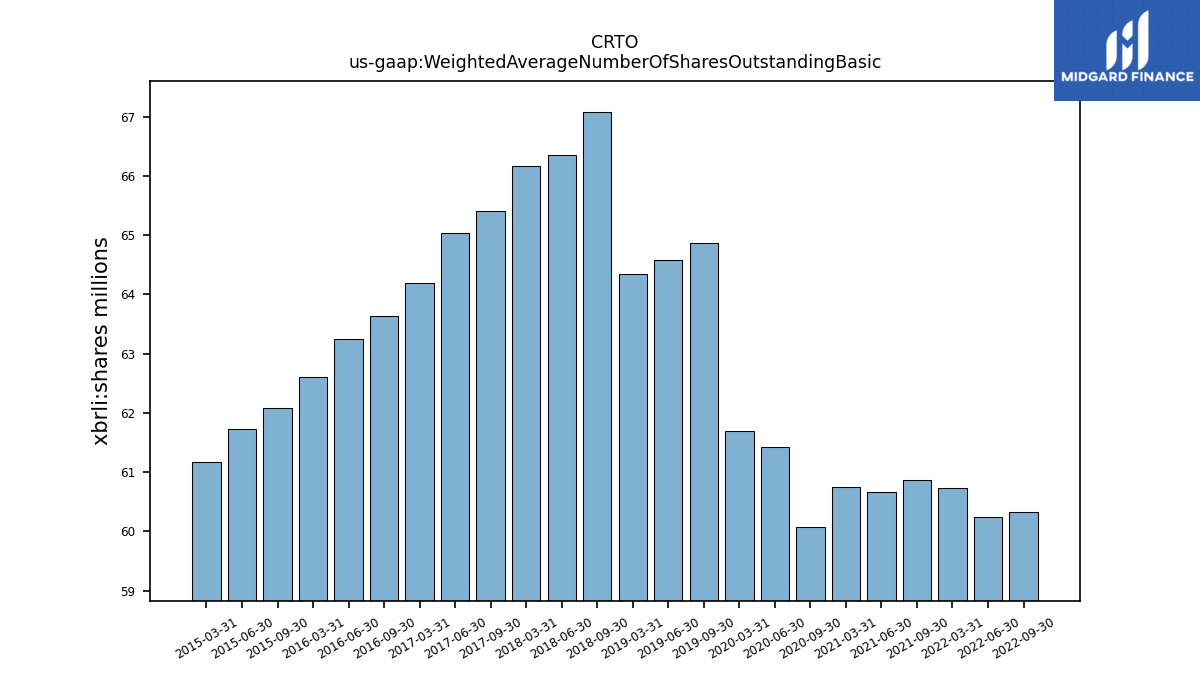
| Weighted Average Number Of Shares Outstanding Basic | NA | 60.32 | 60.24 | 60.74 | NA | 60.87 | 60.66 | 60.74 | NA | 60.08 | 61.42 | 61.69 | NA | 64.87 | 64.58 | 64.34 | NA | 67.08 | 66.35 | 66.16 | NA | 65.41 | 65.03 | 64.19 | NA | 63.63 | 63.25 | 62.61 | NA | 62.08 | 61.72 | 61.17 | |
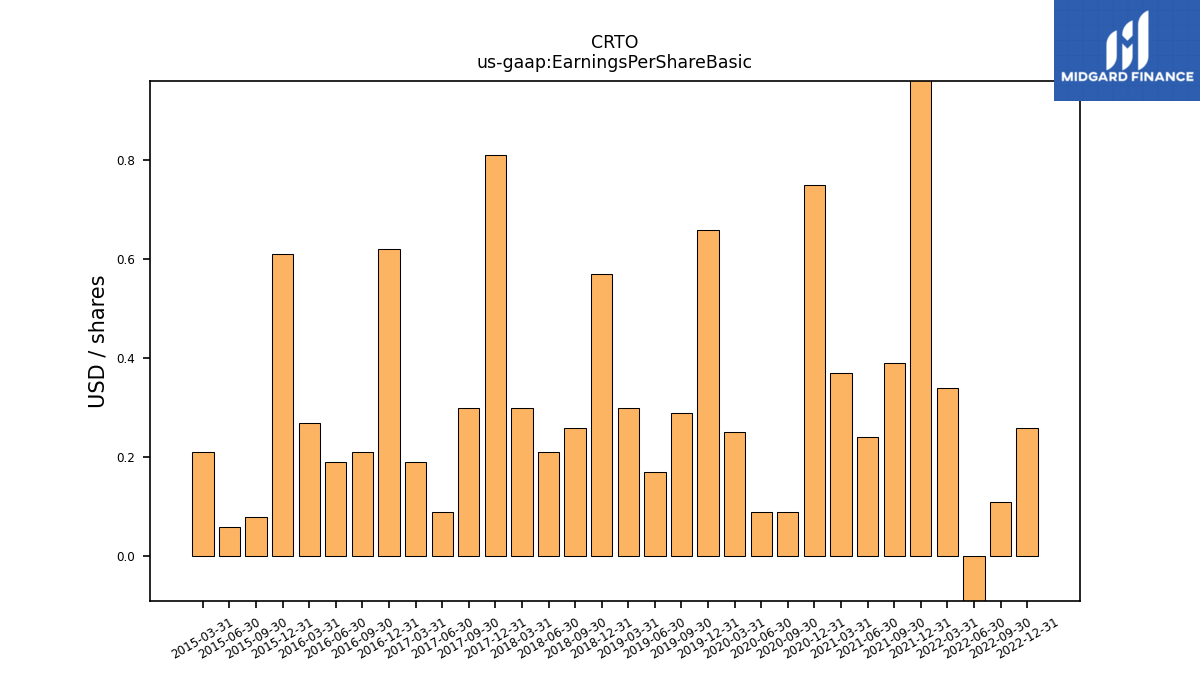
| Earnings Per Share Basic | 0.26 | 0.11 | -0.56 | 0.34 | 1.21 | 0.39 | 0.24 | 0.37 | 0.75 | 0.09 | 0.09 | 0.25 | 0.66 | 0.29 | 0.17 | 0.30 | 0.57 | 0.26 | 0.21 | 0.30 | 0.81 | 0.30 | 0.09 | 0.19 | 0.62 | 0.21 | 0.19 | 0.27 | 0.61 | 0.08 | 0.06 | 0.21 | |
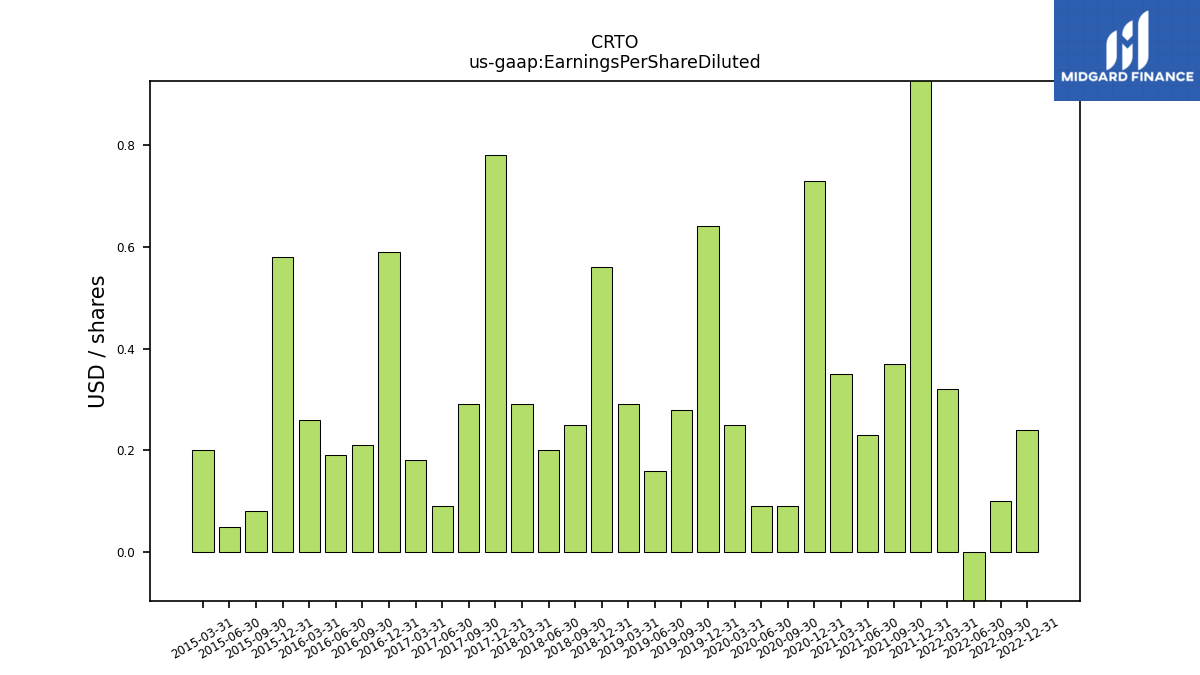
| Earnings Per Share Diluted | 0.24 | 0.10 | -0.54 | 0.32 | 1.15 | 0.37 | 0.23 | 0.35 | 0.73 | 0.09 | 0.09 | 0.25 | 0.64 | 0.28 | 0.16 | 0.29 | 0.56 | 0.25 | 0.20 | 0.29 | 0.78 | 0.29 | 0.09 | 0.18 | 0.59 | 0.21 | 0.19 | 0.26 | 0.58 | 0.08 | 0.05 | 0.20 |
| 2022-12-31 | 2022-09-30 | 2022-06-30 | 2022-03-31 | 2021-12-31 | 2021-09-30 | 2021-06-30 | 2021-03-31 | 2020-12-31 | 2020-09-30 | 2020-06-30 | 2020-03-31 | 2019-12-31 | 2019-09-30 | 2019-06-30 | 2019-03-31 | 2018-12-31 | 2018-09-30 | 2018-06-30 | 2018-03-31 | 2017-12-31 | 2017-09-30 | 2017-06-30 | 2017-03-31 | 2016-12-31 | 2016-09-30 | 2016-06-30 | 2016-03-31 | 2015-12-31 | 2015-09-30 | 2015-06-30 | 2015-03-31 | ||
|---|---|---|---|---|---|---|---|---|---|---|---|---|---|---|---|---|---|---|---|---|---|---|---|---|---|---|---|---|---|---|---|---|---|
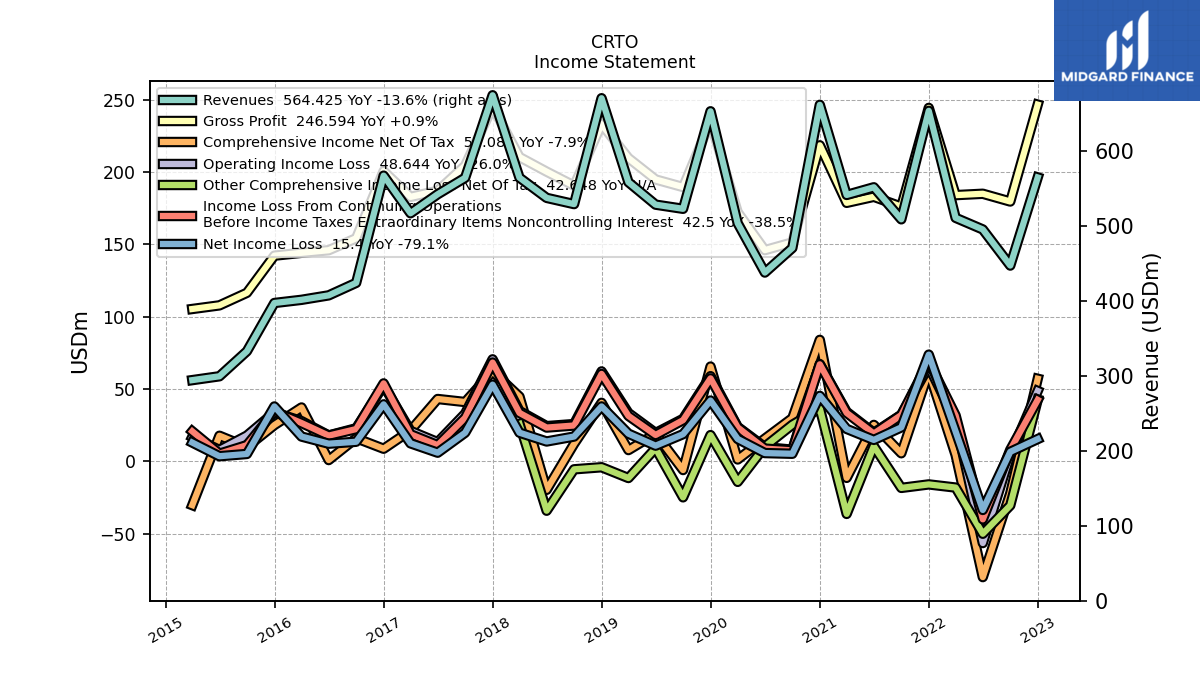
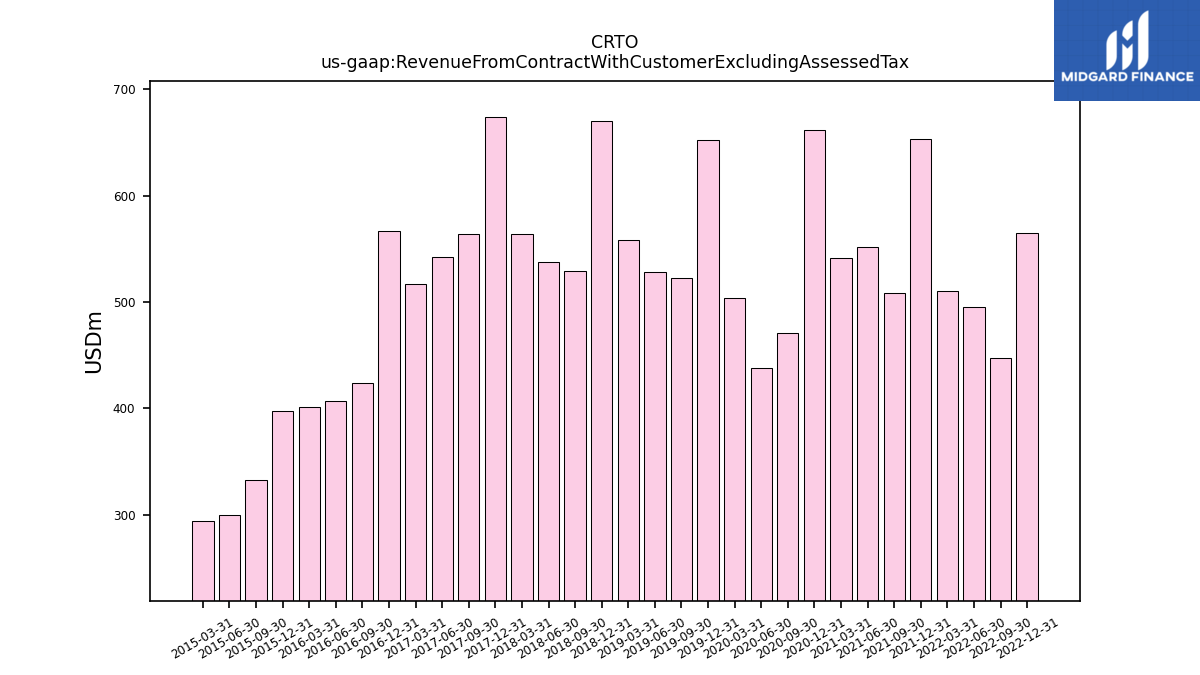
| Revenue From Contract With Customer Excluding Assessed Tax | 564.42 | 446.92 | 495.09 | 510.57 | 653.27 | 508.58 | 551.31 | 541.08 | 661.28 | 470.35 | 437.61 | 503.38 | 652.64 | 522.61 | 528.15 | 558.12 | 670.10 | 528.87 | 537.18 | 564.16 | 674.03 | 563.97 | 542.02 | 516.67 | 566.83 | 423.87 | 407.20 | 401.25 | 397.02 | 332.67 | 299.31 | 294.17 | |
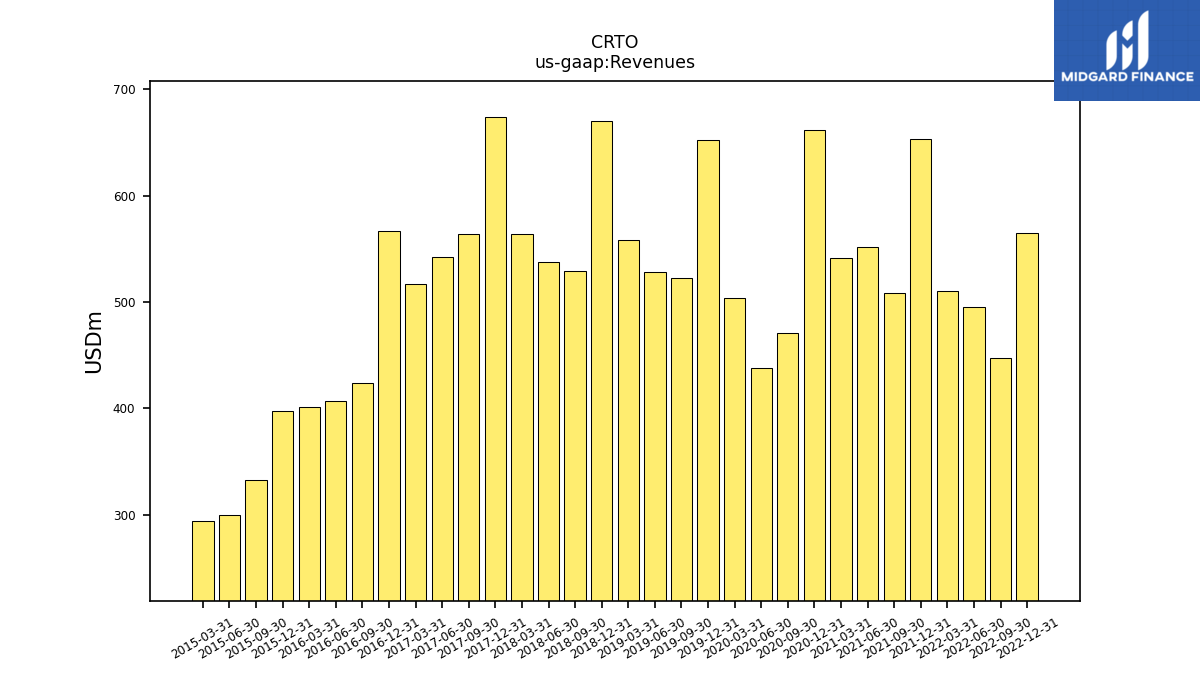
| Revenues | 564.42 | 446.92 | 495.09 | 510.57 | 653.27 | 508.58 | 551.31 | 541.08 | 661.28 | 470.35 | 437.61 | 503.38 | 652.64 | 522.61 | 528.15 | 558.12 | 670.10 | 528.87 | 537.18 | 564.16 | 674.03 | 563.97 | 542.02 | 516.67 | 566.83 | 423.87 | 407.20 | 401.25 | 397.02 | 332.67 | 299.31 | 294.17 | |
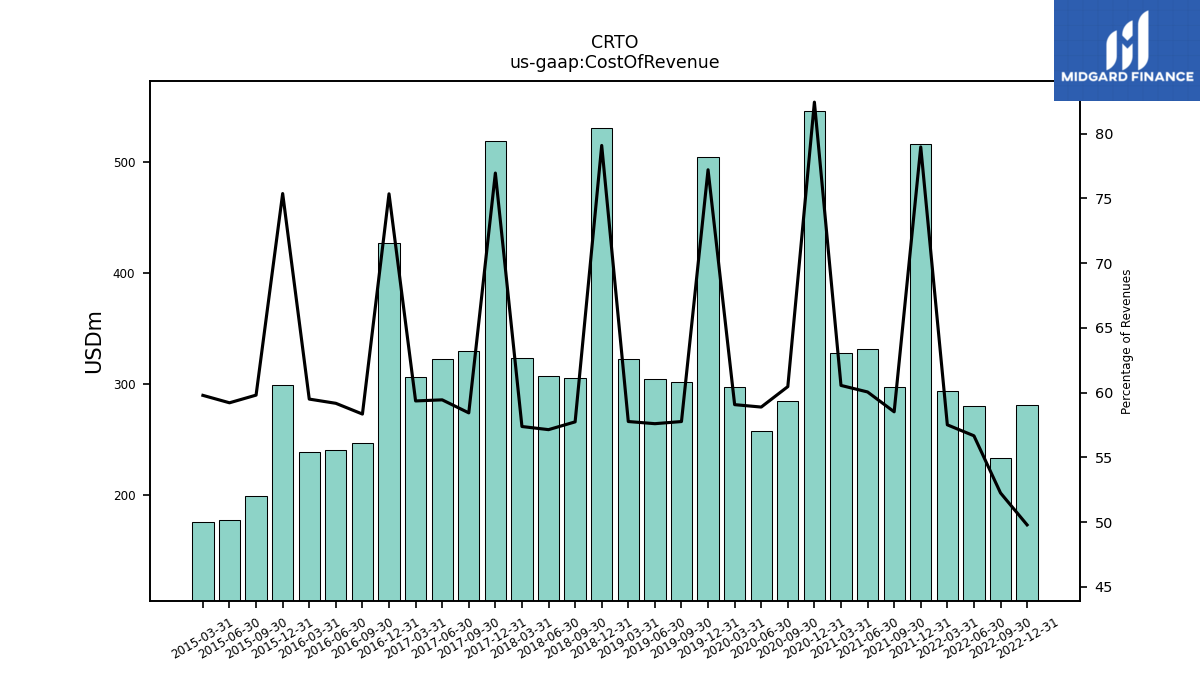
| Cost Of Revenue | 281.02 | 233.54 | 280.56 | 293.65 | 515.93 | 297.62 | 331.08 | 327.67 | 545.14 | 284.40 | 257.70 | 297.36 | 503.92 | 301.90 | 304.23 | 322.43 | 529.98 | 305.39 | 306.96 | 323.75 | 518.73 | 329.58 | 322.20 | 306.69 | 427.14 | 247.31 | 240.97 | 238.75 | 299.26 | 198.97 | 177.24 | 175.89 | |
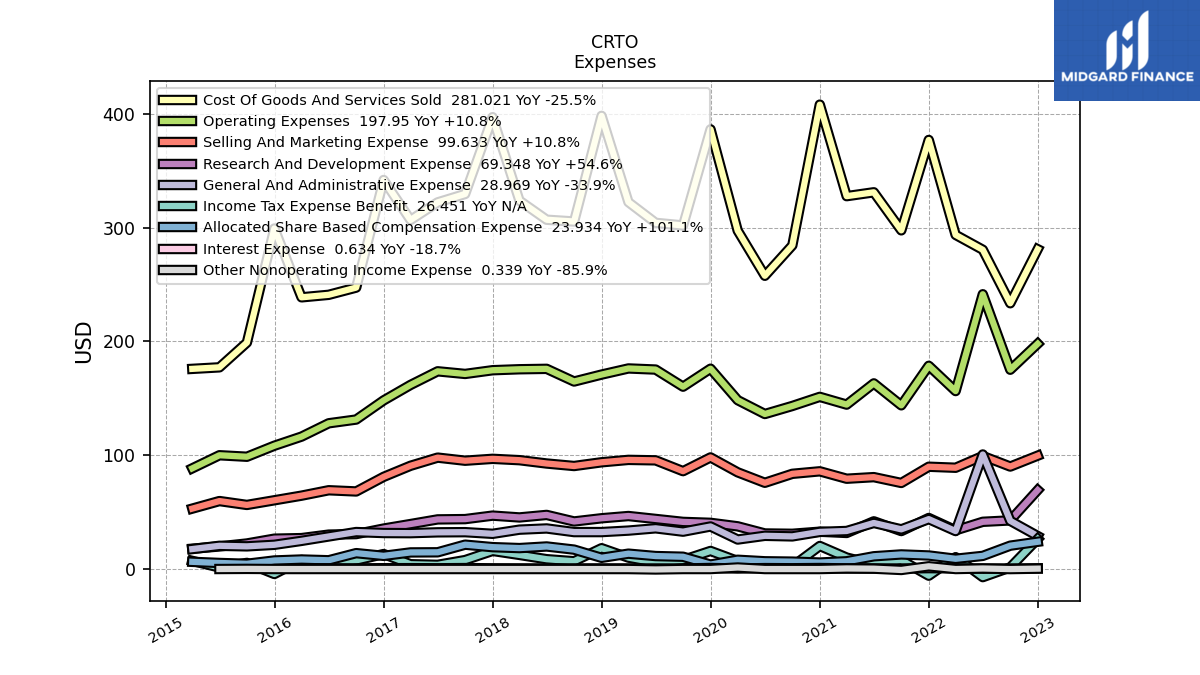
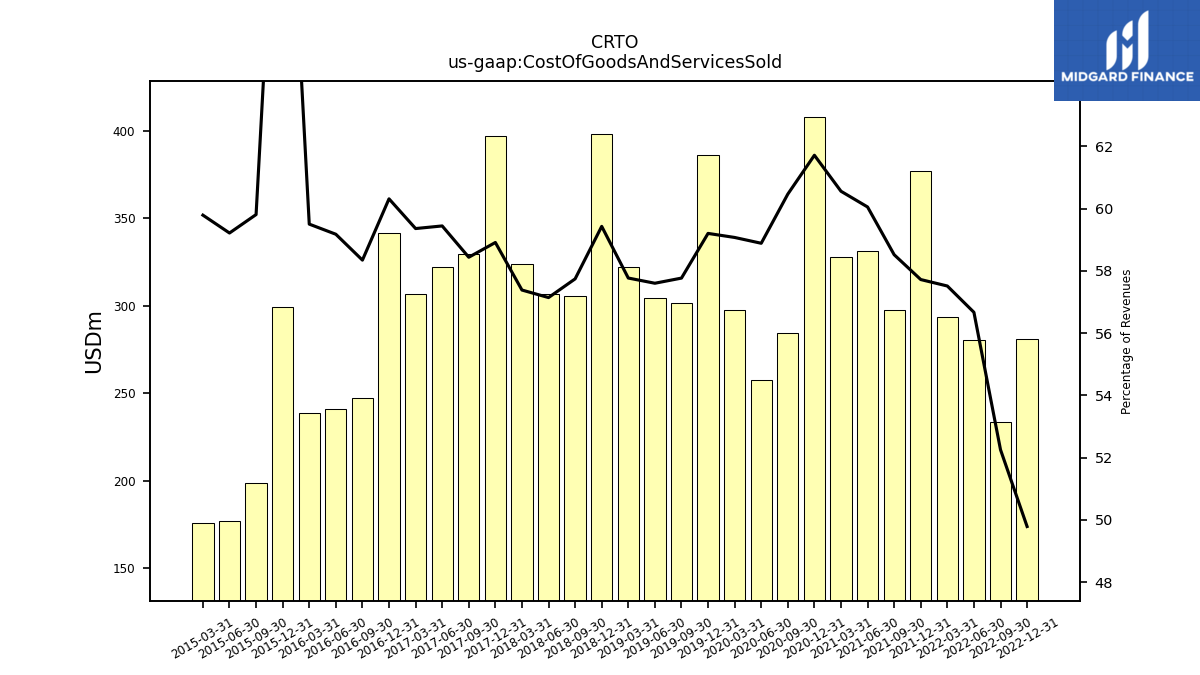
| Cost Of Goods And Services Sold | 281.02 | 233.54 | 280.56 | 293.65 | 377.08 | 297.62 | 331.08 | 327.67 | 408.11 | 284.40 | 257.70 | 297.36 | 386.39 | 301.90 | 304.23 | 322.43 | 398.24 | 305.39 | 306.96 | 323.75 | 397.09 | 329.58 | 322.20 | 306.69 | 341.88 | 247.31 | 240.97 | 238.75 | 299.26 | 198.97 | 177.24 | 175.89 | |
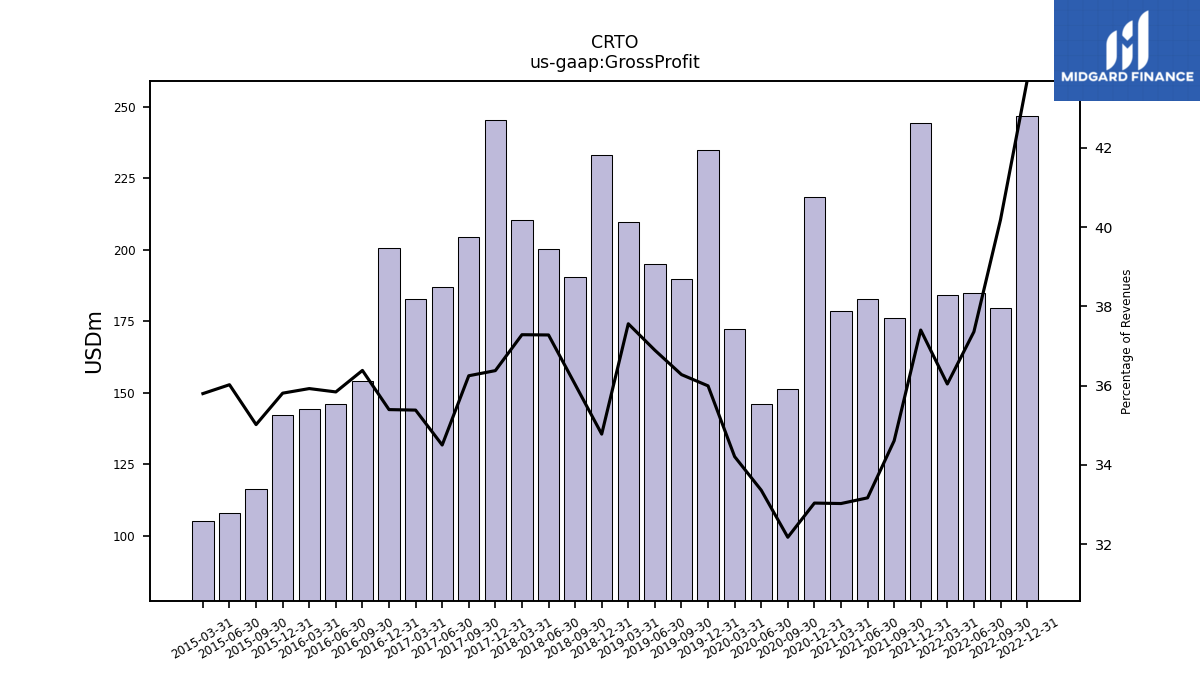
| Gross Profit | 246.59 | 179.61 | 184.97 | 184.02 | 244.35 | 176.03 | 182.87 | 178.70 | 218.47 | 151.34 | 146.00 | 172.21 | 234.92 | 189.60 | 194.86 | 209.65 | 233.05 | 190.56 | 200.26 | 210.36 | 245.22 | 204.45 | 187.01 | 182.82 | 200.64 | 154.22 | 145.95 | 144.16 | 142.18 | 116.50 | 107.82 | 105.31 | |
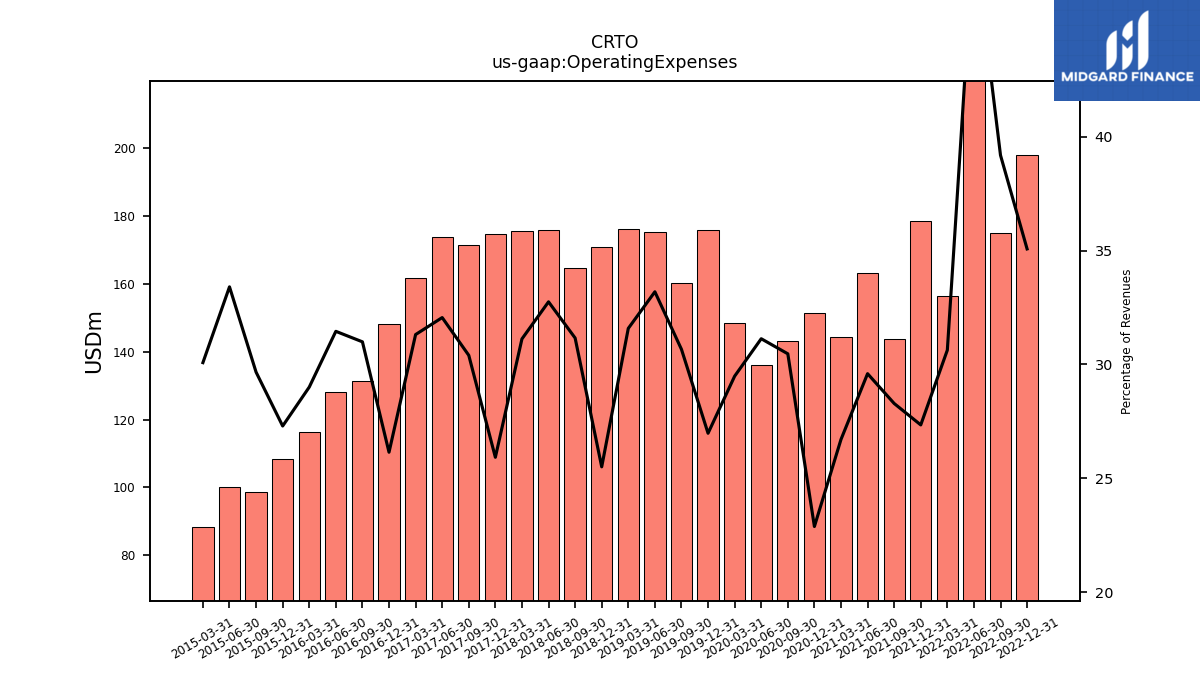
| Operating Expenses | 197.95 | 175.13 | 241.48 | 156.36 | 178.61 | 143.84 | 163.14 | 144.48 | 151.29 | 143.28 | 136.21 | 148.40 | 176.05 | 160.23 | 175.28 | 176.26 | 170.87 | 164.78 | 175.91 | 175.56 | 174.70 | 171.43 | 173.75 | 161.77 | 148.17 | 131.36 | 128.07 | 116.37 | 108.36 | 98.67 | 99.98 | 88.47 | |
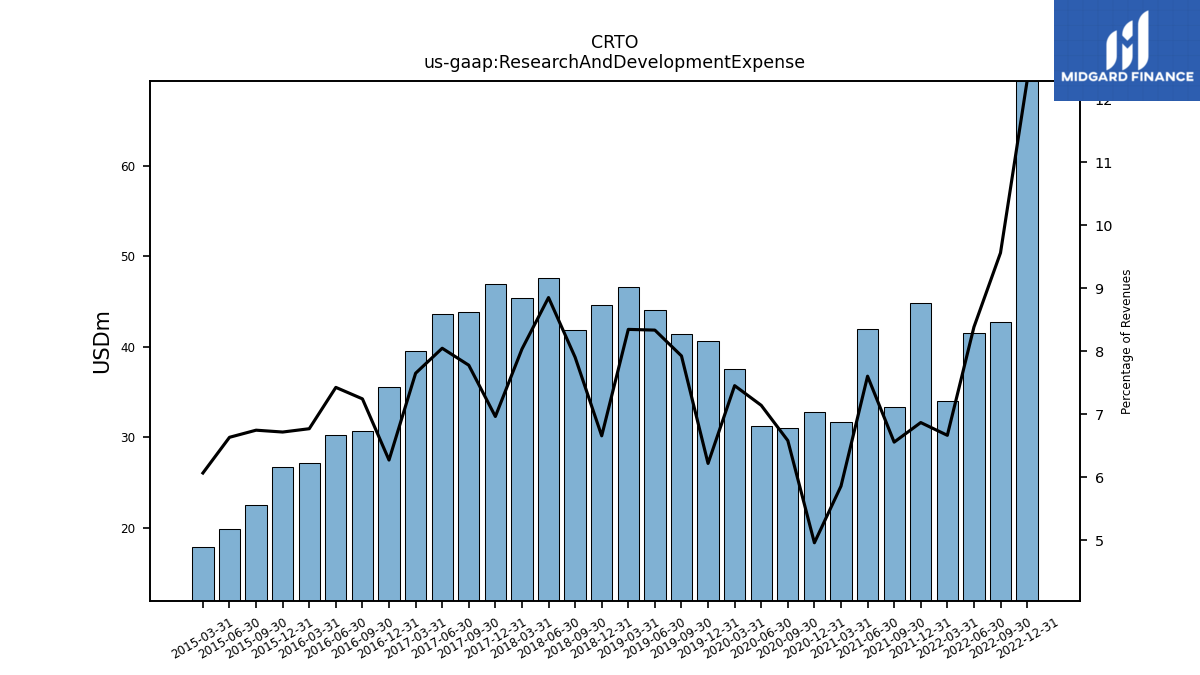
| Research And Development Expense | 69.35 | 42.73 | 41.50 | 34.03 | 44.86 | 33.34 | 41.91 | 31.70 | 32.80 | 30.95 | 31.25 | 37.52 | 40.59 | 41.41 | 44.02 | 46.58 | 44.60 | 41.80 | 47.54 | 45.32 | 46.93 | 43.86 | 43.61 | 39.52 | 35.55 | 30.70 | 30.23 | 27.16 | 26.67 | 22.44 | 19.85 | 17.85 | |
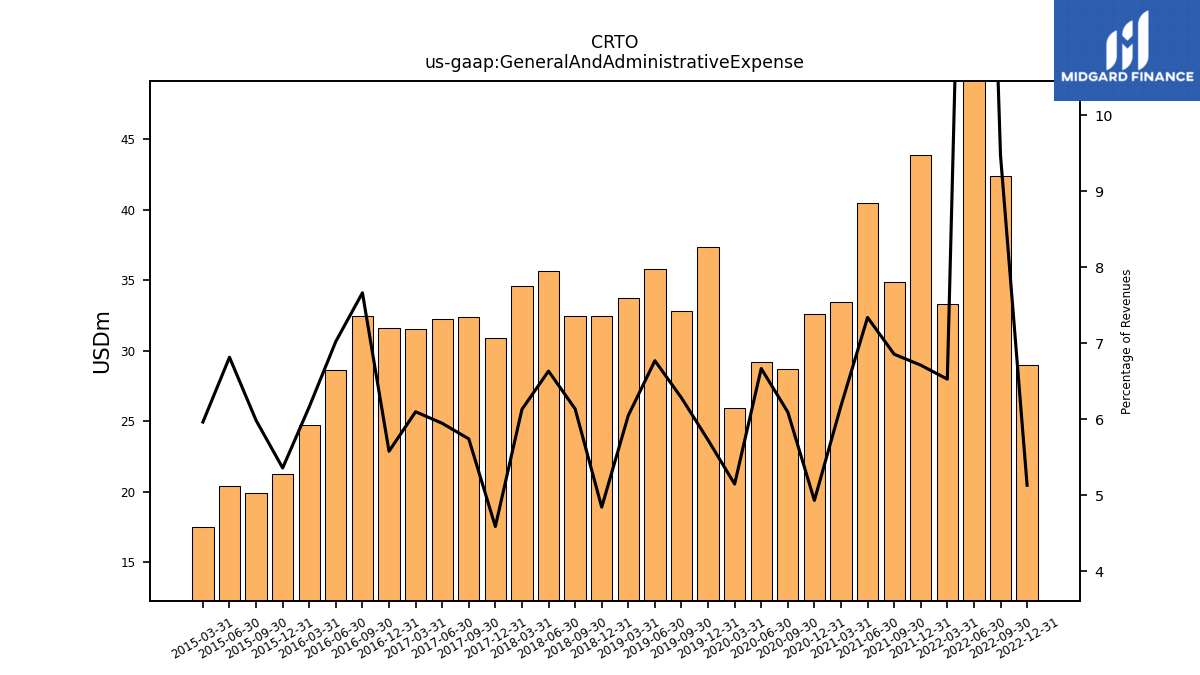
| General And Administrative Expense | 28.97 | 42.35 | 100.67 | 33.34 | 43.85 | 34.88 | 40.47 | 33.43 | 32.62 | 28.67 | 29.18 | 25.91 | 37.38 | 32.84 | 35.77 | 33.77 | 32.46 | 32.46 | 35.64 | 34.59 | 30.93 | 32.39 | 32.24 | 31.52 | 31.63 | 32.49 | 28.61 | 24.74 | 21.28 | 19.91 | 20.40 | 17.55 | |
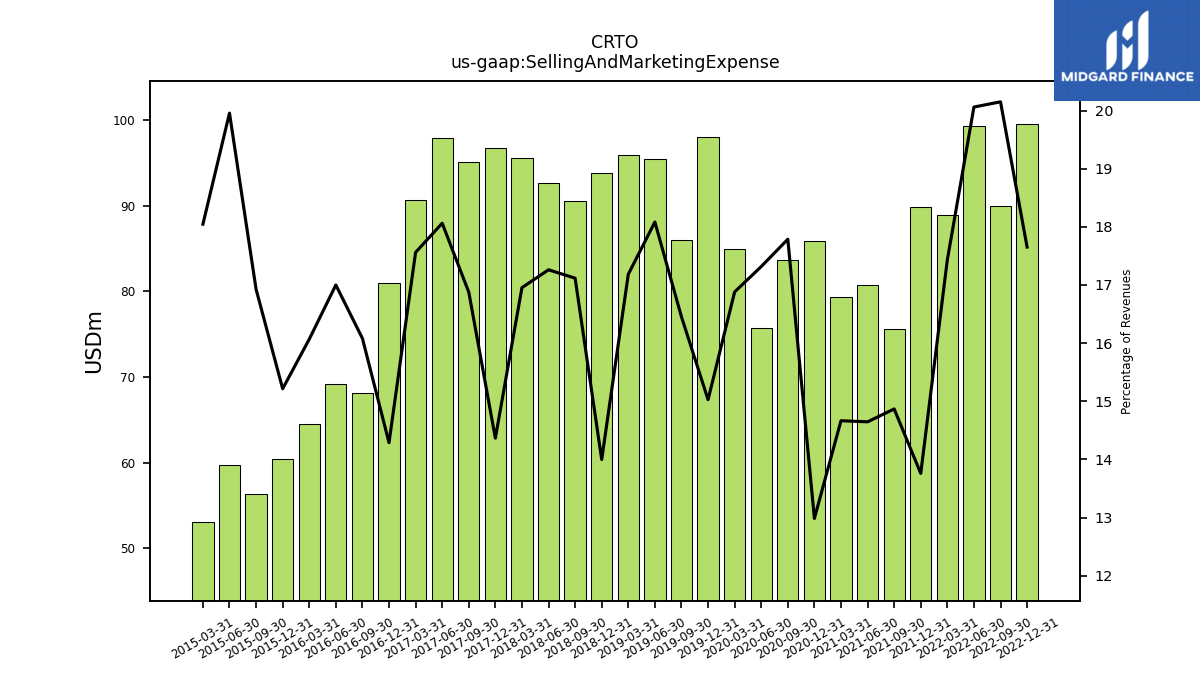
| Selling And Marketing Expense | 99.63 | 90.05 | 99.31 | 89.00 | 89.89 | 75.62 | 80.75 | 79.35 | 85.87 | 83.66 | 75.78 | 84.97 | 98.08 | 85.98 | 95.50 | 95.91 | 93.81 | 90.53 | 92.73 | 95.65 | 96.83 | 95.18 | 97.90 | 90.73 | 80.99 | 68.16 | 69.22 | 64.47 | 60.41 | 56.31 | 59.73 | 53.08 | |
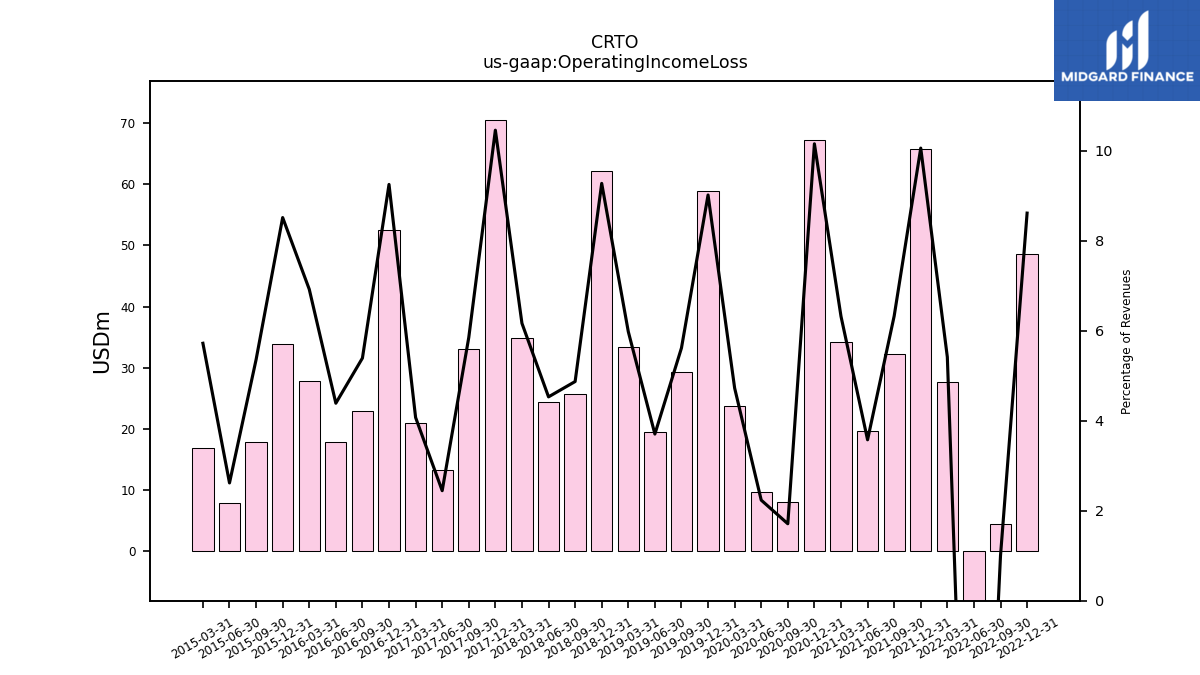
| Operating Income Loss | 48.64 | 4.48 | -56.51 | 27.66 | 65.74 | 32.19 | 19.73 | 34.22 | 67.18 | 8.05 | 9.79 | 23.80 | 58.88 | 29.37 | 19.57 | 33.39 | 62.18 | 25.78 | 24.35 | 34.80 | 70.52 | 33.01 | 13.26 | 21.05 | 52.47 | 22.87 | 17.88 | 27.79 | 33.82 | 17.83 | 7.84 | 16.84 | |
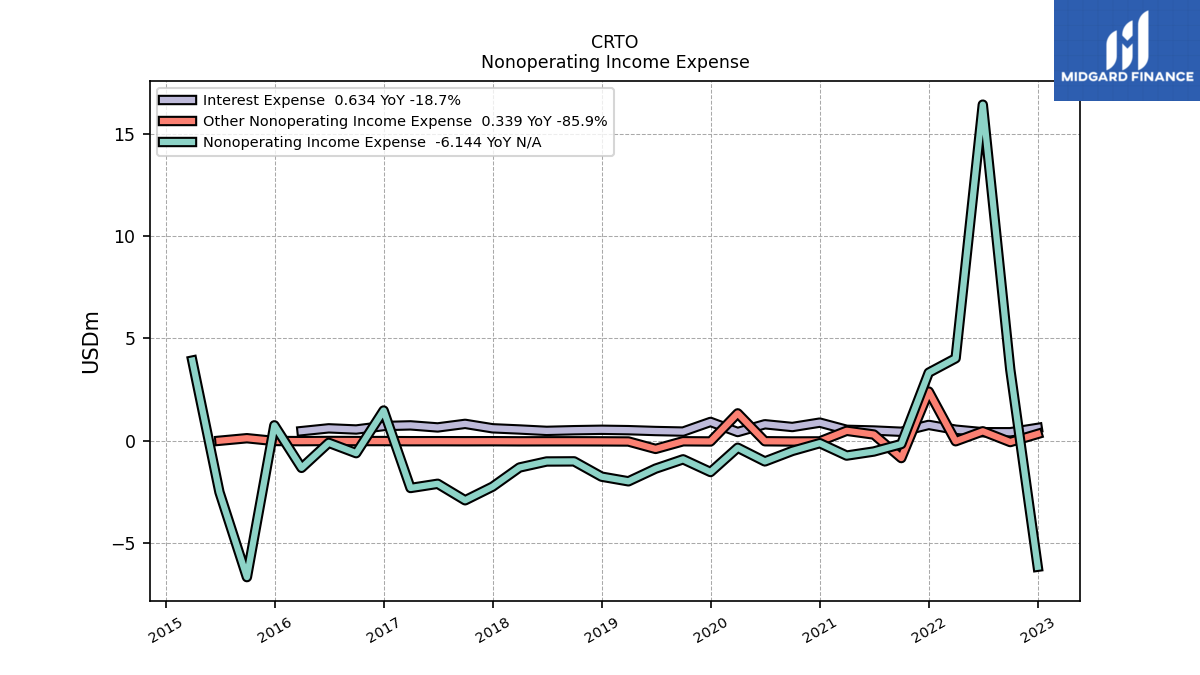
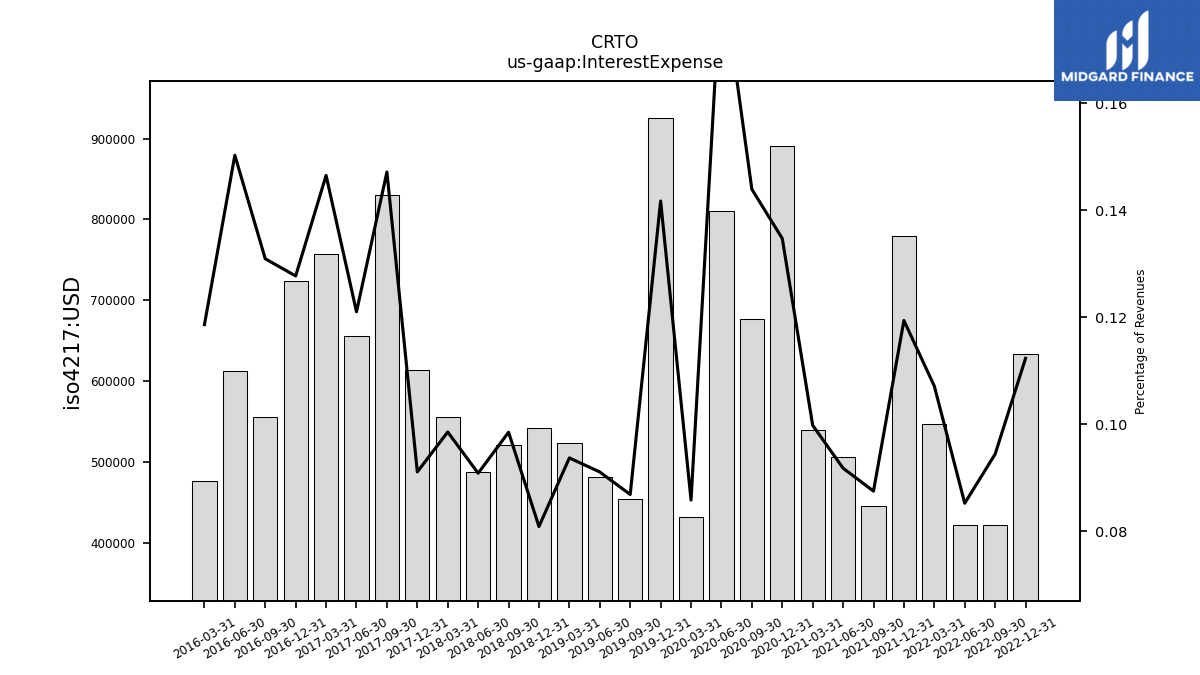
| Interest Expense | 0.63 | 0.42 | 0.42 | 0.55 | 0.78 | 0.45 | 0.51 | 0.54 | 0.89 | 0.68 | 0.81 | 0.43 | 0.93 | 0.45 | 0.48 | 0.52 | 0.54 | 0.52 | 0.49 | 0.56 | 0.61 | 0.83 | 0.66 | 0.76 | 0.72 | 0.56 | 0.61 | 0.48 | NA | NA | NA | NA | |
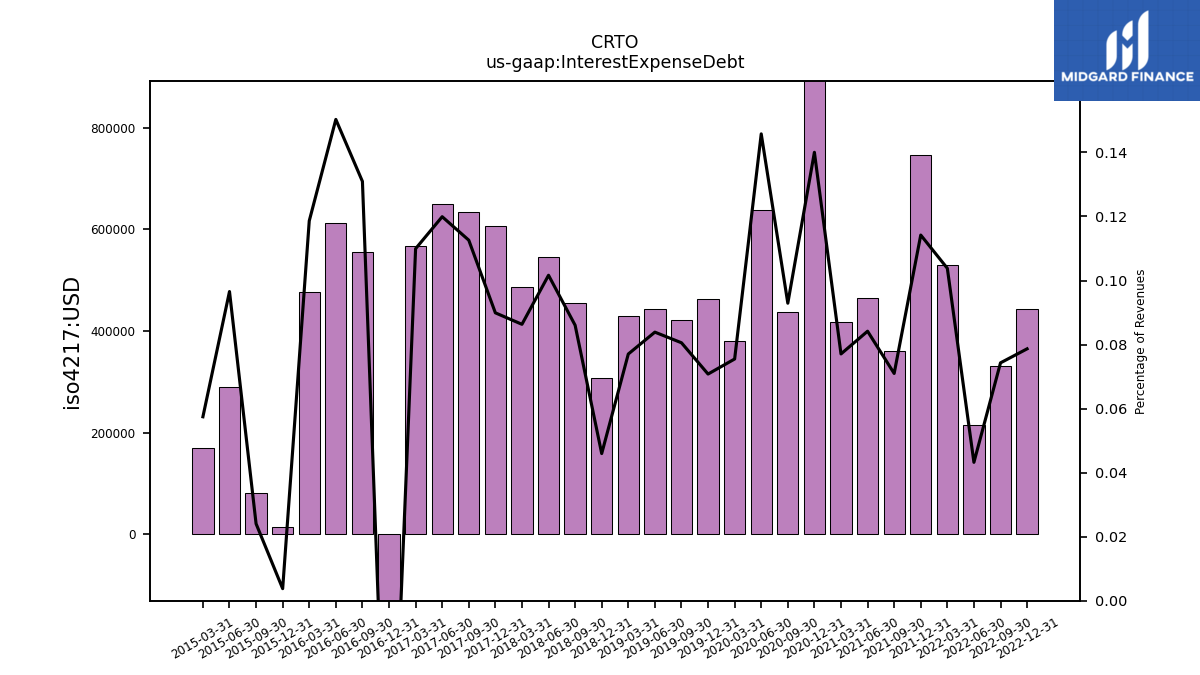
| Interest Expense Debt | 0.44 | 0.33 | 0.21 | 0.53 | 0.75 | 0.36 | 0.46 | 0.42 | 0.93 | 0.44 | 0.64 | 0.38 | 0.46 | 0.42 | 0.44 | 0.43 | 0.31 | 0.46 | 0.55 | 0.49 | 0.61 | 0.64 | 0.65 | 0.57 | -0.51 | 0.56 | 0.61 | 0.48 | 0.01 | 0.08 | 0.29 | 0.17 | |
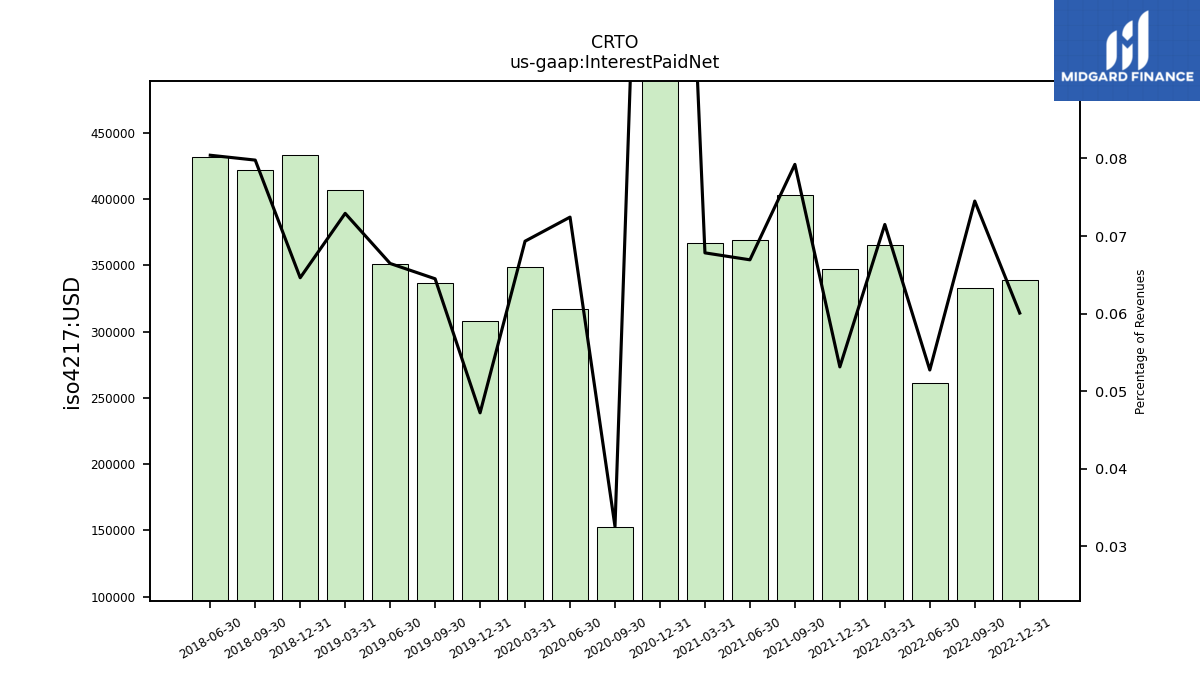
| Interest Paid Net | 0.34 | 0.33 | 0.26 | 0.36 | 0.35 | 0.40 | 0.37 | 0.37 | 1.34 | 0.15 | 0.32 | 0.35 | 0.31 | 0.34 | 0.35 | 0.41 | 0.43 | 0.42 | 0.43 | NA | NA | NA | NA | NA | NA | NA | NA | NA | NA | NA | NA | NA | |
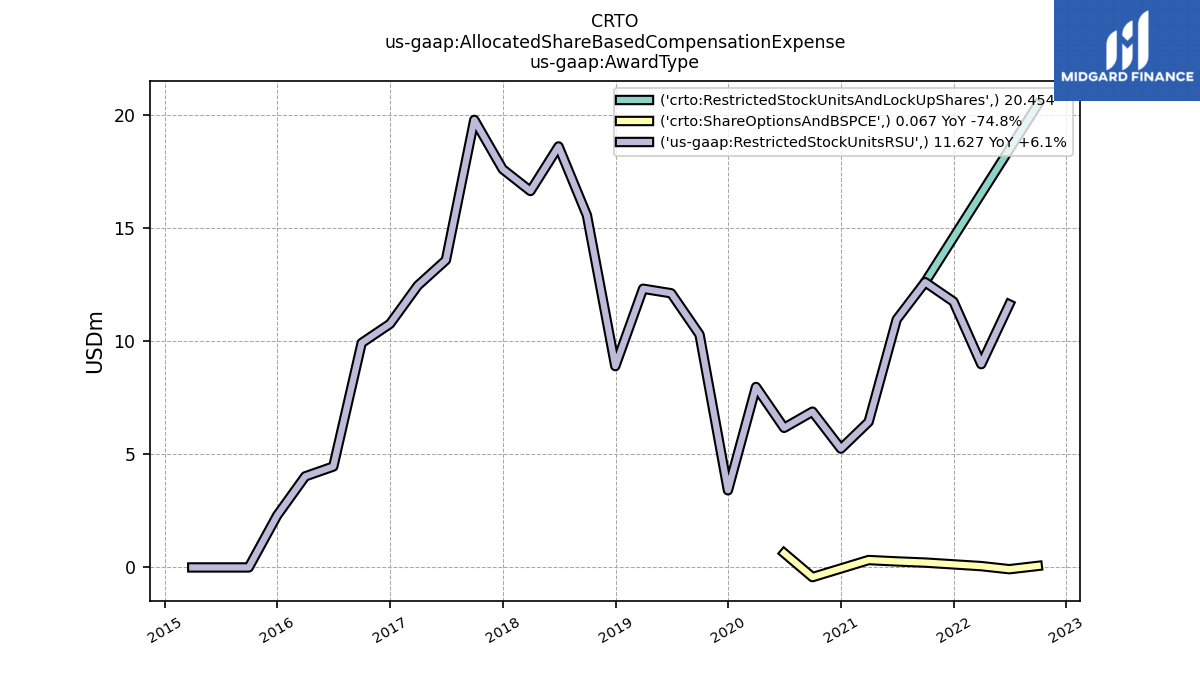
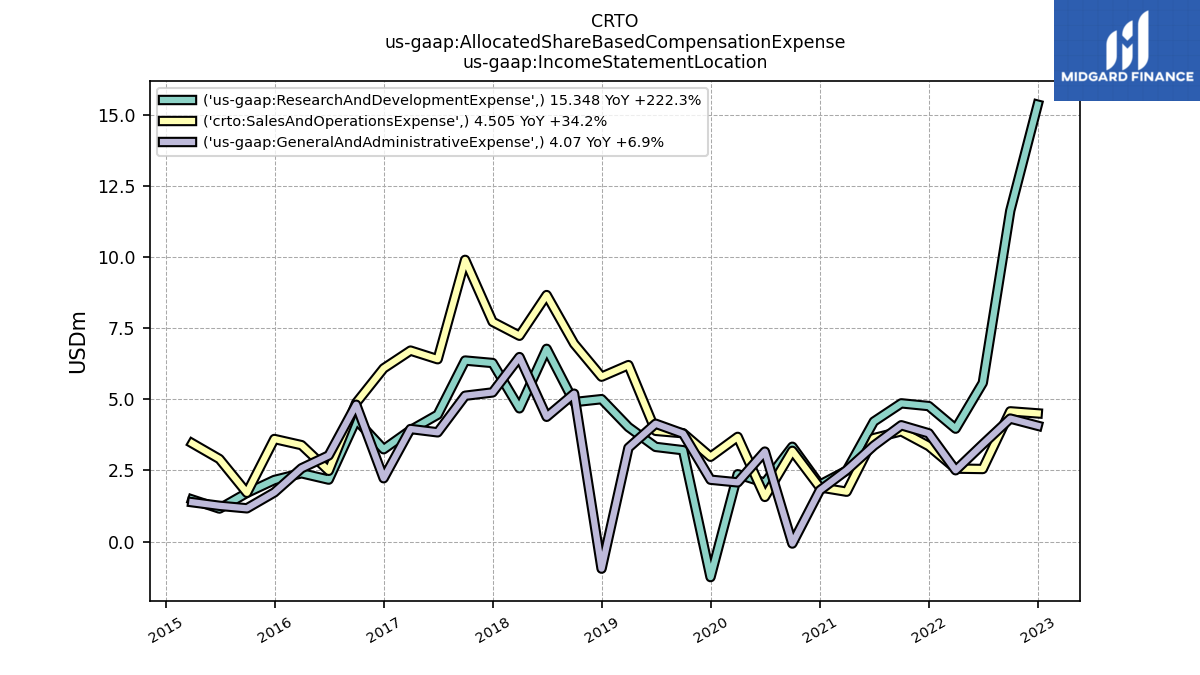
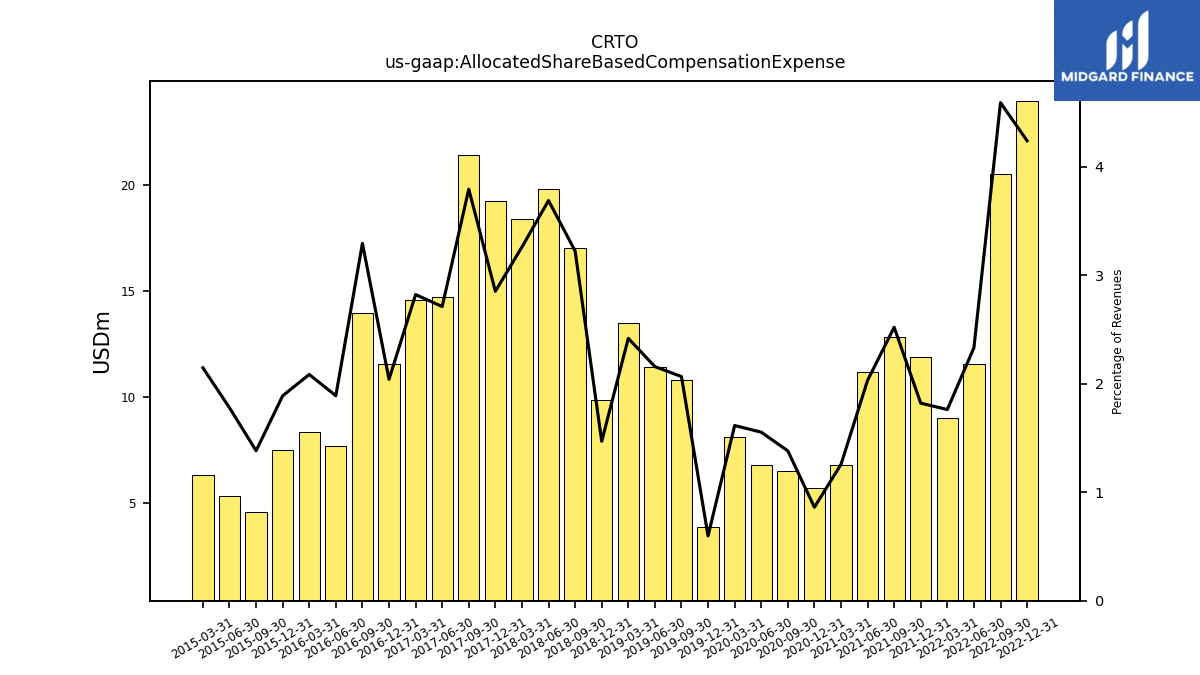
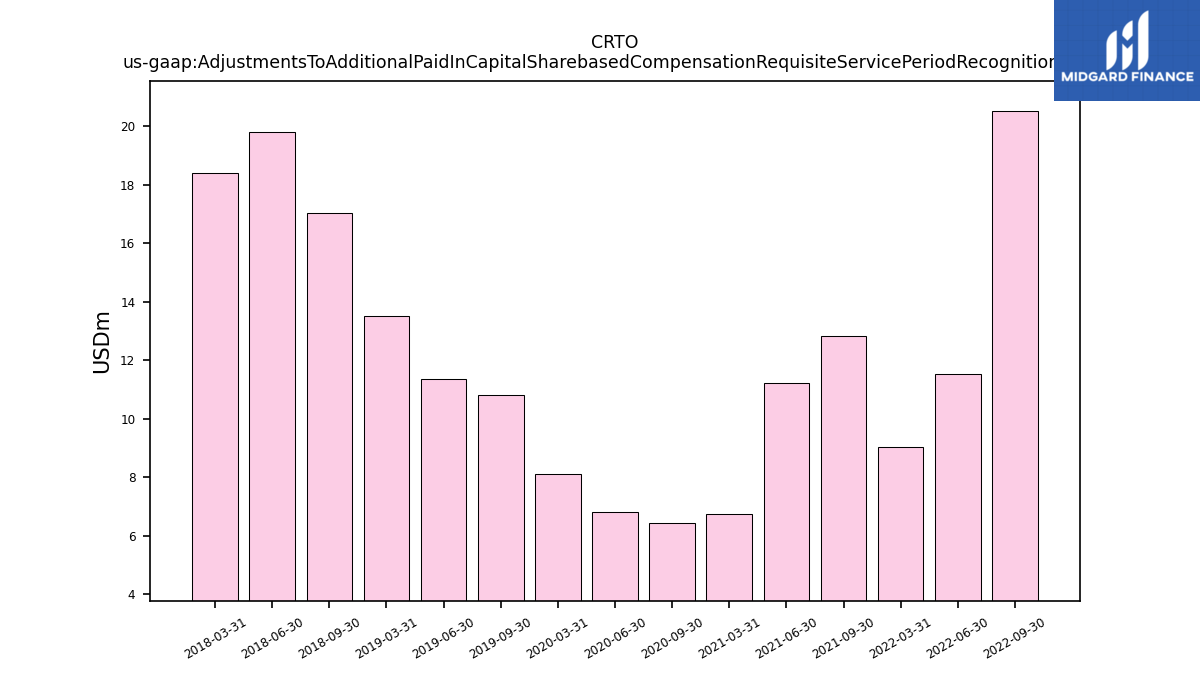
| Allocated Share Based Compensation Expense | 23.93 | 20.52 | 11.55 | 9.00 | 11.90 | 12.82 | 11.20 | 6.80 | 5.70 | 6.50 | 6.80 | 8.13 | 3.90 | 10.80 | 11.40 | 13.50 | 9.85 | 17.05 | 19.82 | 18.40 | 19.23 | 21.40 | 14.70 | 14.58 | 11.57 | 13.96 | 7.70 | 8.37 | 7.50 | 4.60 | 5.33 | 6.32 | |
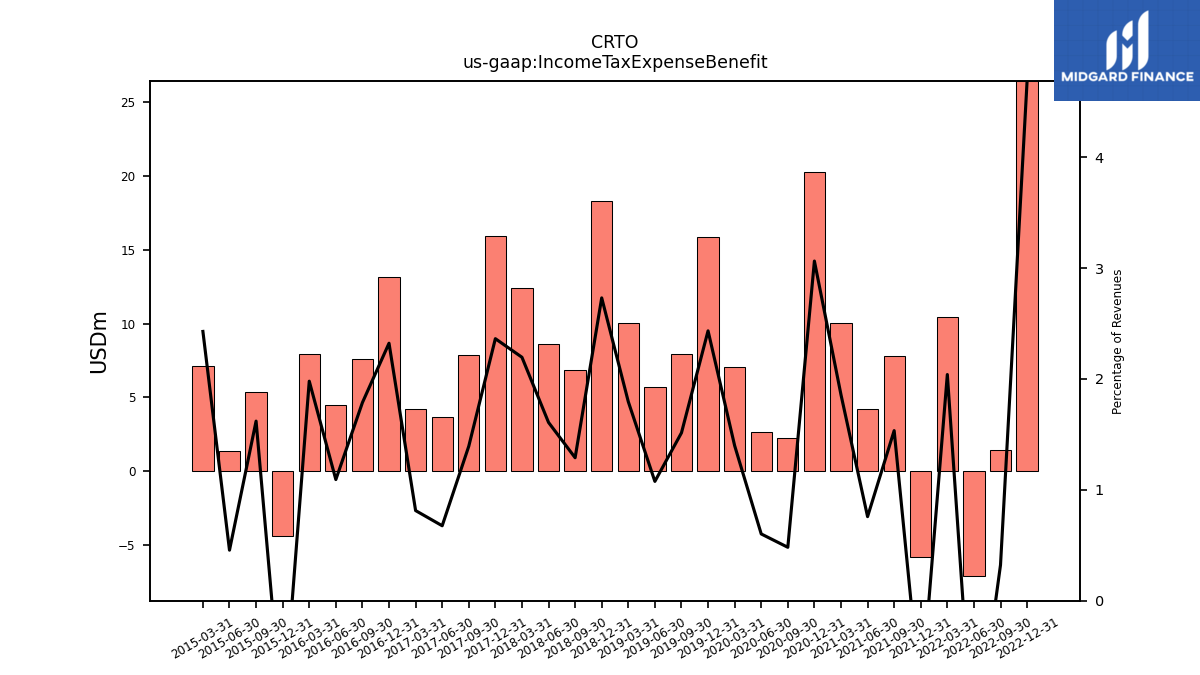
| Income Tax Expense Benefit | 26.45 | 1.44 | -7.12 | 10.41 | -5.86 | 7.80 | 4.18 | 10.05 | 20.25 | 2.27 | 2.64 | 7.04 | 15.88 | 7.91 | 5.68 | 10.02 | 18.30 | 6.82 | 8.64 | 12.39 | 15.93 | 7.86 | 3.67 | 4.20 | 13.16 | 7.57 | 4.45 | 7.94 | -4.38 | 5.39 | 1.36 | 7.14 | |
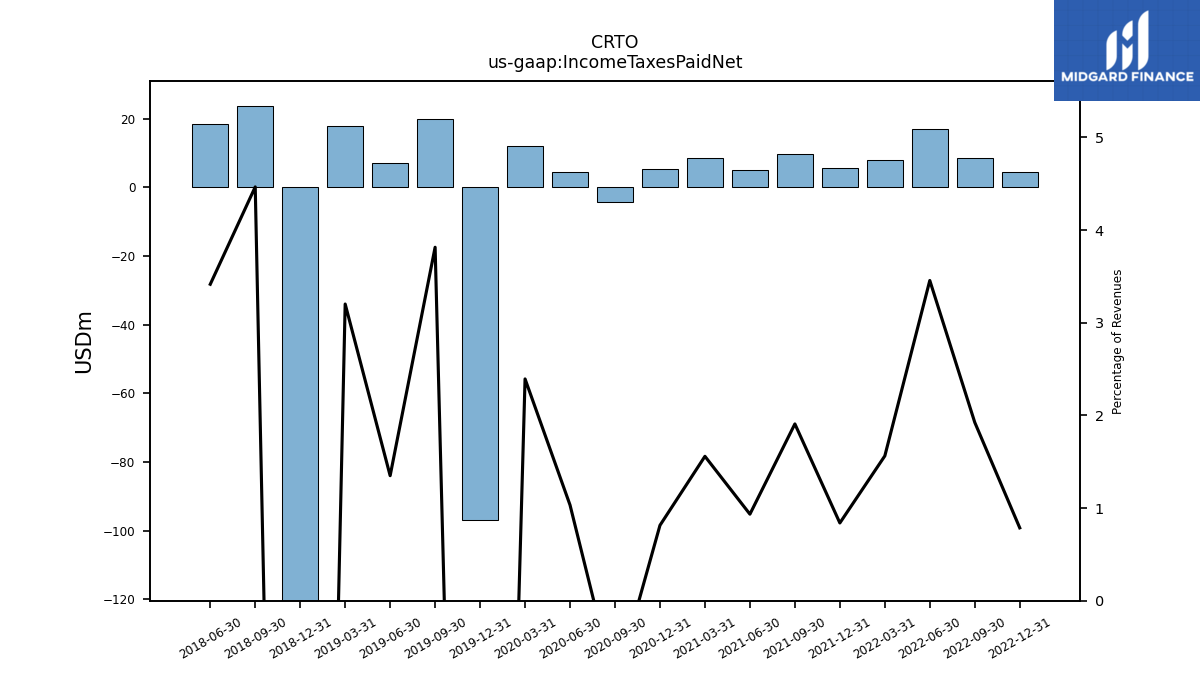
| Income Taxes Paid Net | 4.44 | 8.60 | 17.11 | 7.98 | 5.48 | 9.70 | 5.15 | 8.43 | 5.38 | -4.34 | 4.52 | 12.05 | -97.02 | 19.93 | 7.13 | 17.87 | -123.22 | 23.61 | 18.34 | NA | NA | NA | NA | NA | NA | NA | NA | NA | NA | NA | NA | NA | |
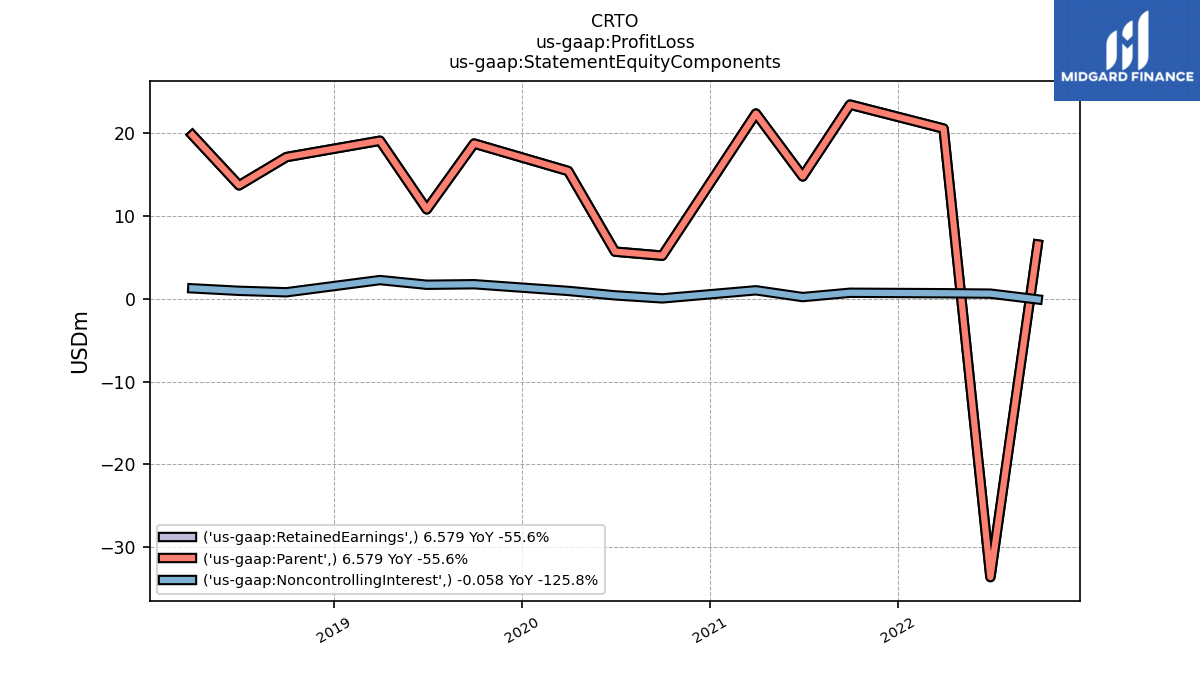
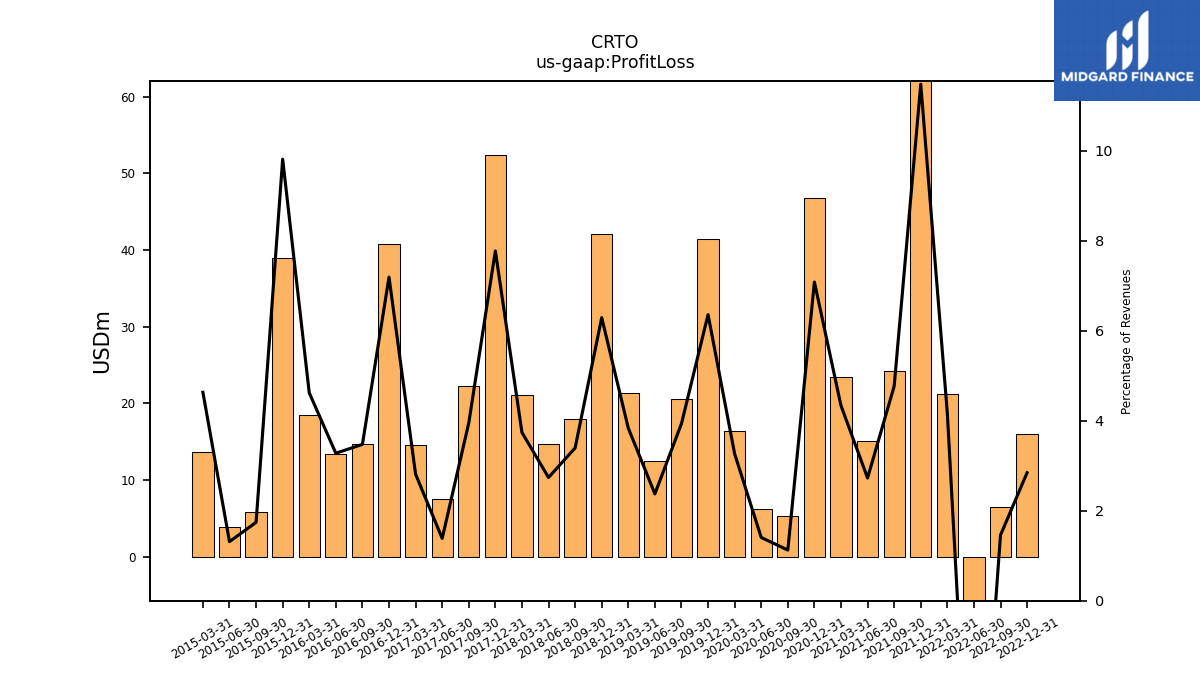
| Profit Loss | 16.05 | 6.52 | -32.97 | 21.28 | 74.94 | 24.23 | 15.03 | 23.45 | 46.82 | 5.29 | 6.15 | 16.43 | 41.47 | 20.56 | 12.54 | 21.40 | 42.13 | 17.95 | 14.71 | 21.09 | 52.37 | 22.27 | 7.50 | 14.52 | 40.74 | 14.72 | 13.34 | 18.53 | 38.94 | 5.79 | 3.93 | 13.62 | |
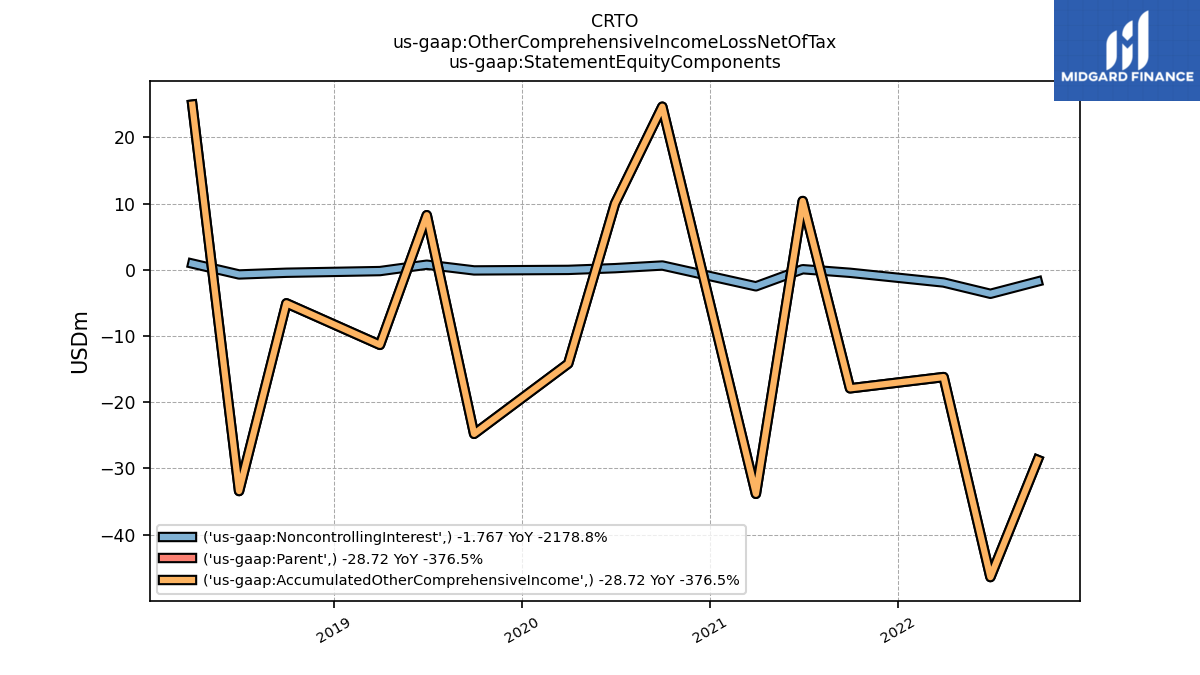
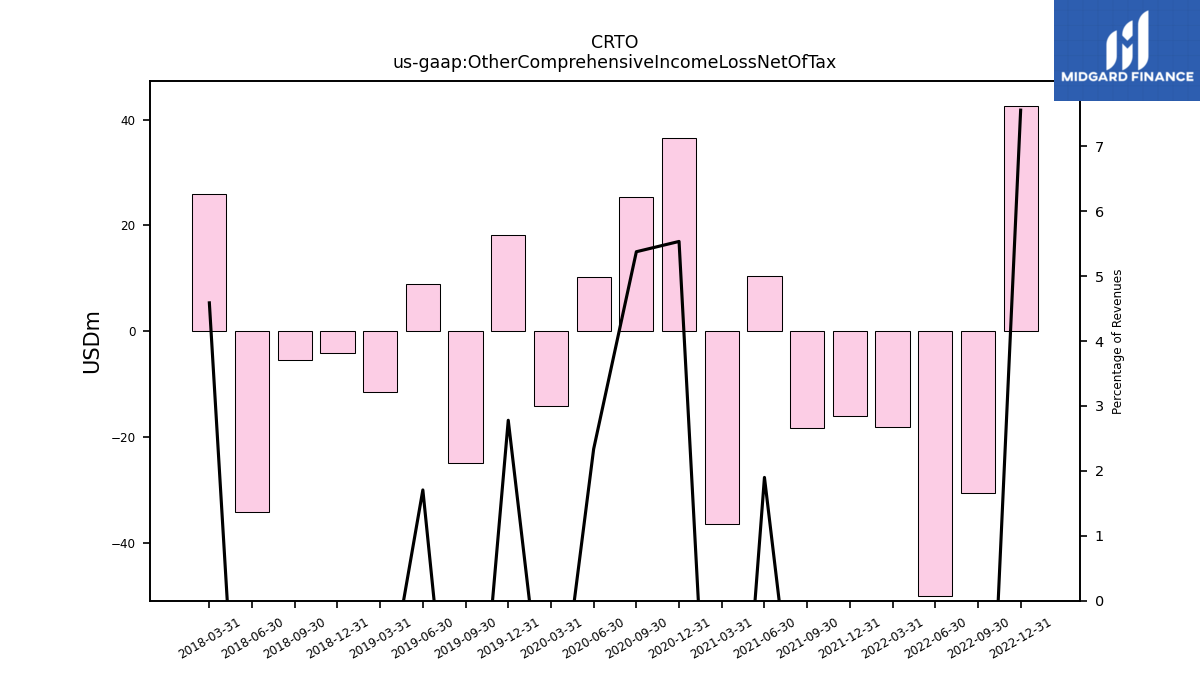
| Other Comprehensive Income Loss Net Of Tax | 42.65 | -30.49 | -50.06 | -18.13 | -15.95 | -18.37 | 10.47 | -36.35 | 36.59 | 25.28 | 10.23 | -14.20 | 18.14 | -24.89 | 9.01 | -11.54 | -4.09 | -5.52 | -34.14 | 25.88 | NA | NA | NA | NA | NA | NA | NA | NA | NA | NA | NA | NA | |
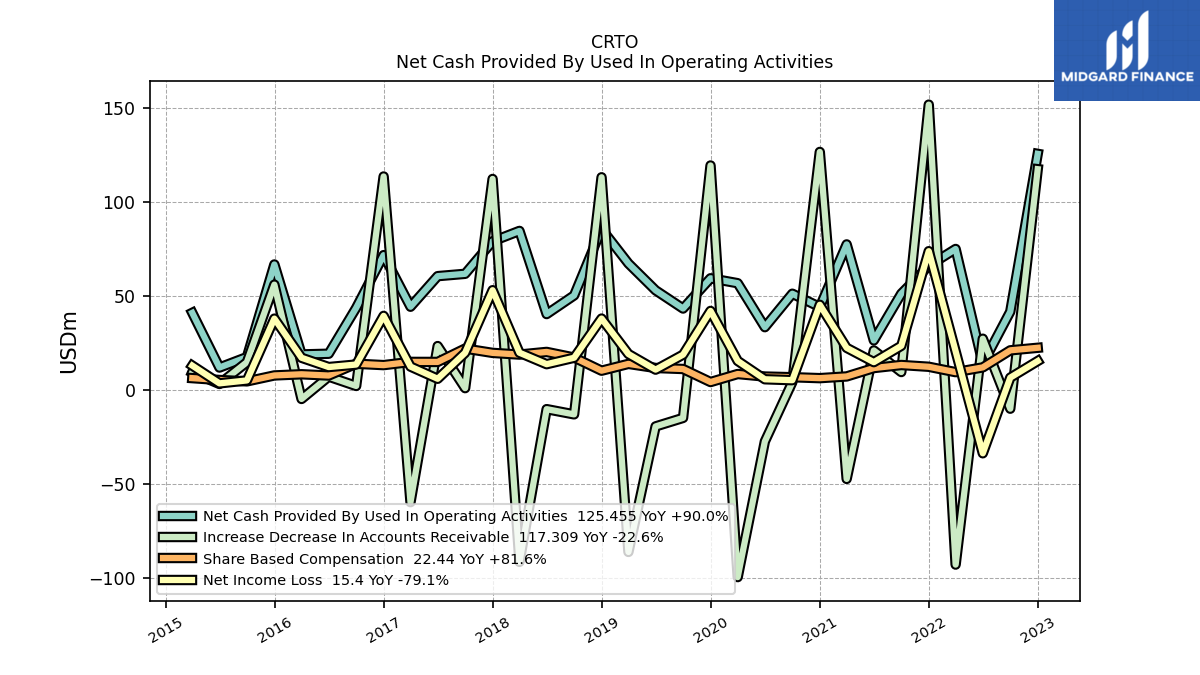
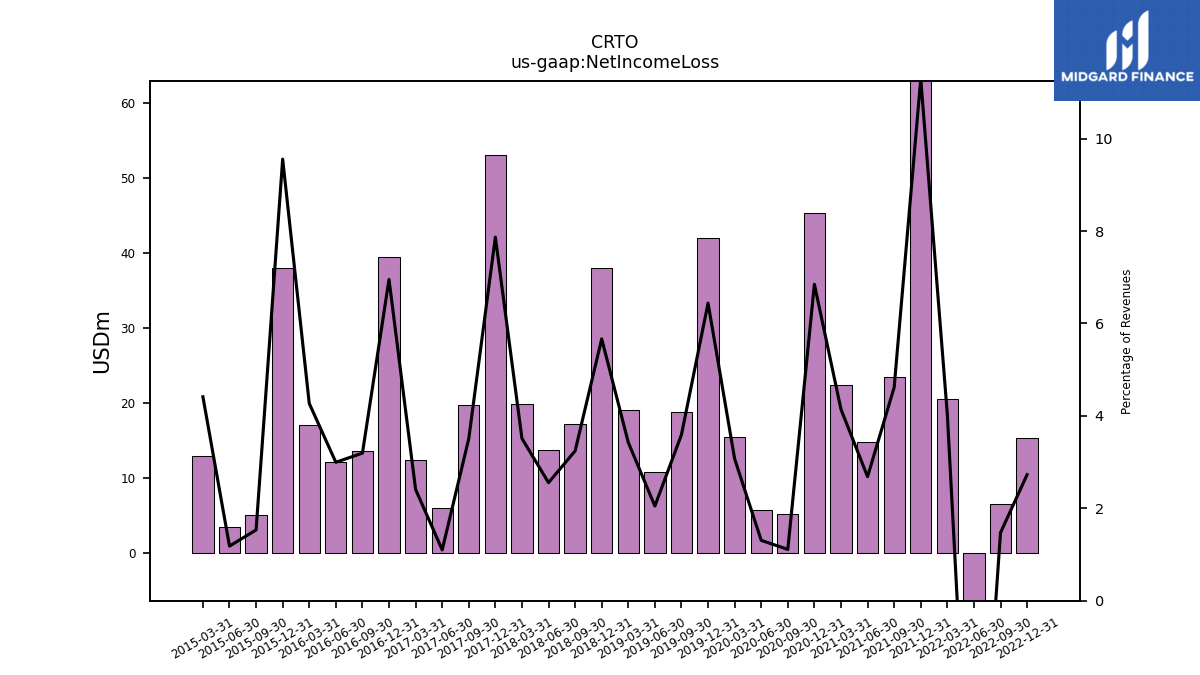
| Net Income Loss | 15.40 | 6.58 | -33.61 | 20.59 | 73.77 | 23.48 | 14.80 | 22.41 | 45.28 | 5.23 | 5.72 | 15.46 | 42.02 | 18.78 | 10.82 | 19.12 | 37.97 | 17.14 | 13.73 | 19.81 | 53.03 | 19.77 | 5.97 | 12.44 | 39.40 | 13.54 | 12.20 | 17.13 | 37.94 | 5.10 | 3.54 | 12.98 | |
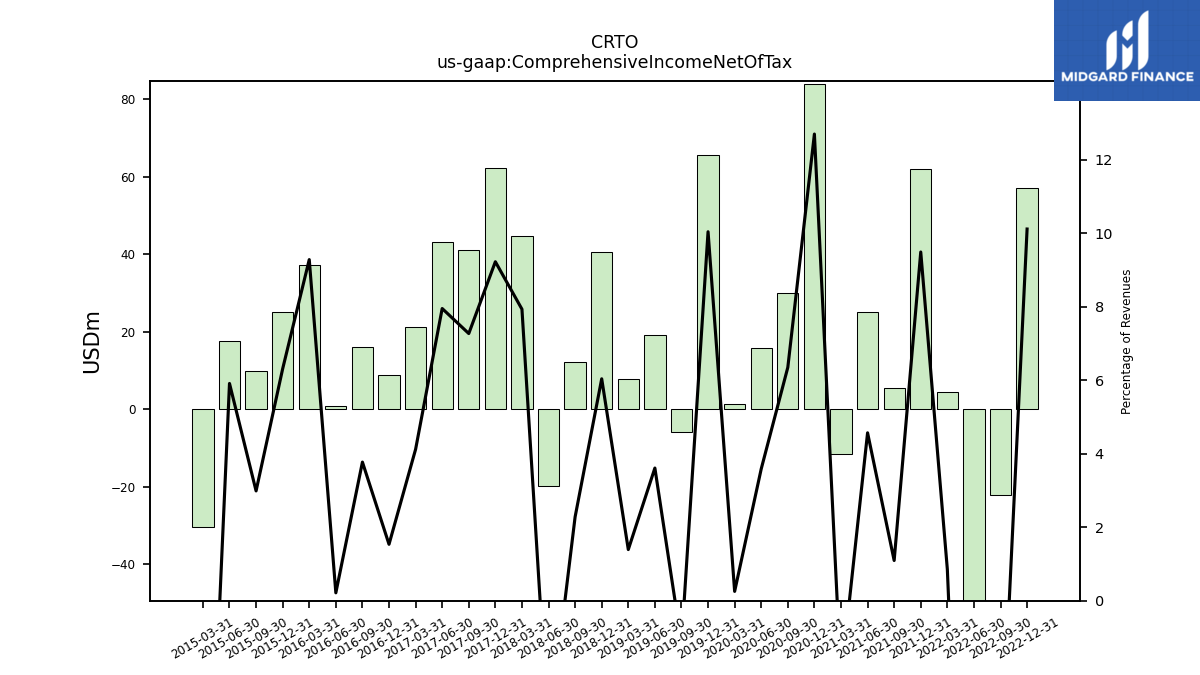
| Comprehensive Income Net Of Tax | 57.09 | -22.14 | -80.04 | 4.38 | 61.99 | 5.57 | 25.19 | -11.45 | 83.97 | 29.87 | 15.70 | 1.28 | 65.53 | -6.01 | 19.07 | 7.77 | 40.47 | 12.08 | -19.70 | 44.76 | 62.17 | 41.00 | 43.10 | 21.29 | 8.71 | 15.99 | 0.88 | 37.24 | 25.06 | 9.94 | 17.70 | -30.28 |
| 2022-12-31 | 2022-09-30 | 2022-06-30 | 2022-03-31 | 2021-12-31 | 2021-09-30 | 2021-06-30 | 2021-03-31 | 2020-12-31 | 2020-09-30 | 2020-06-30 | 2020-03-31 | 2019-12-31 | 2019-09-30 | 2019-06-30 | 2019-03-31 | 2018-12-31 | 2018-09-30 | 2018-06-30 | 2018-03-31 | 2017-12-31 | 2017-09-30 | 2017-06-30 | 2017-03-31 | 2016-12-31 | 2016-09-30 | 2016-06-30 | 2016-03-31 | 2015-12-31 | 2015-09-30 | 2015-06-30 | 2015-03-31 | ||
|---|---|---|---|---|---|---|---|---|---|---|---|---|---|---|---|---|---|---|---|---|---|---|---|---|---|---|---|---|---|---|---|---|---|
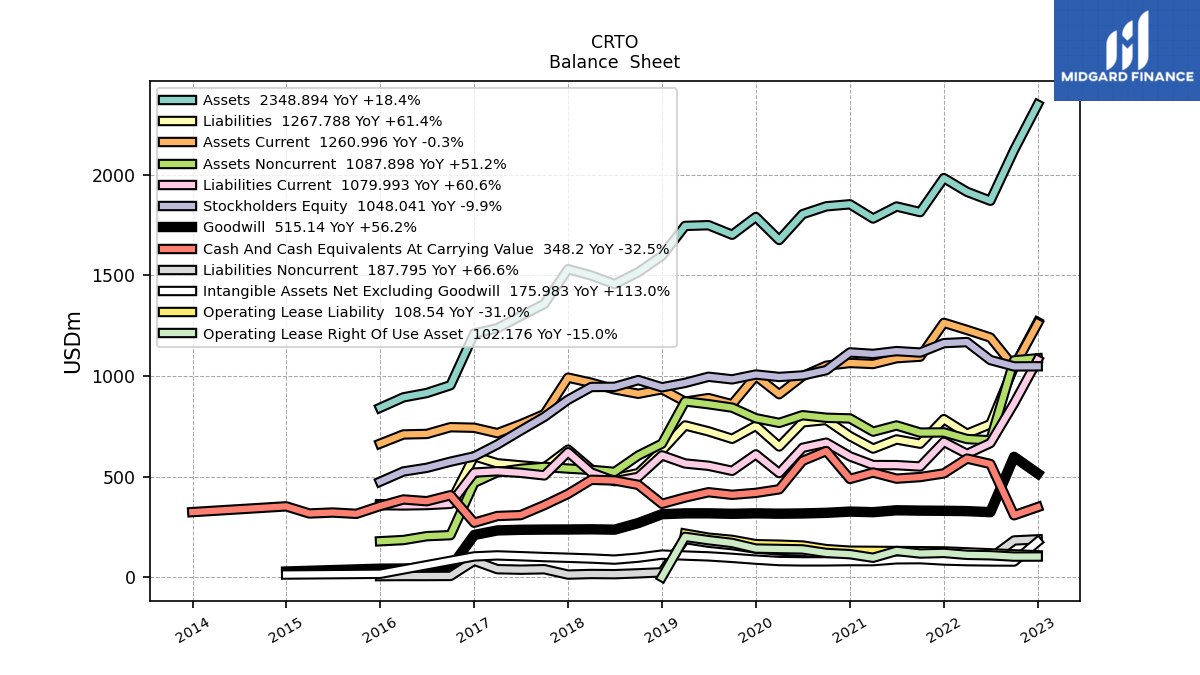
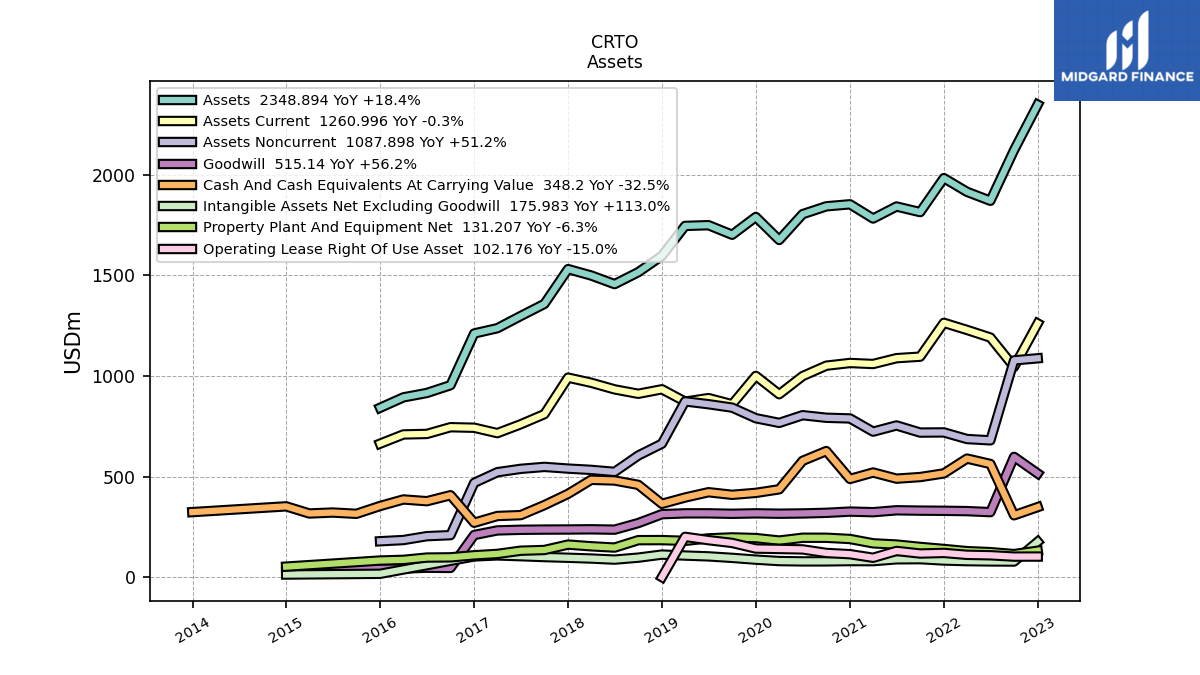
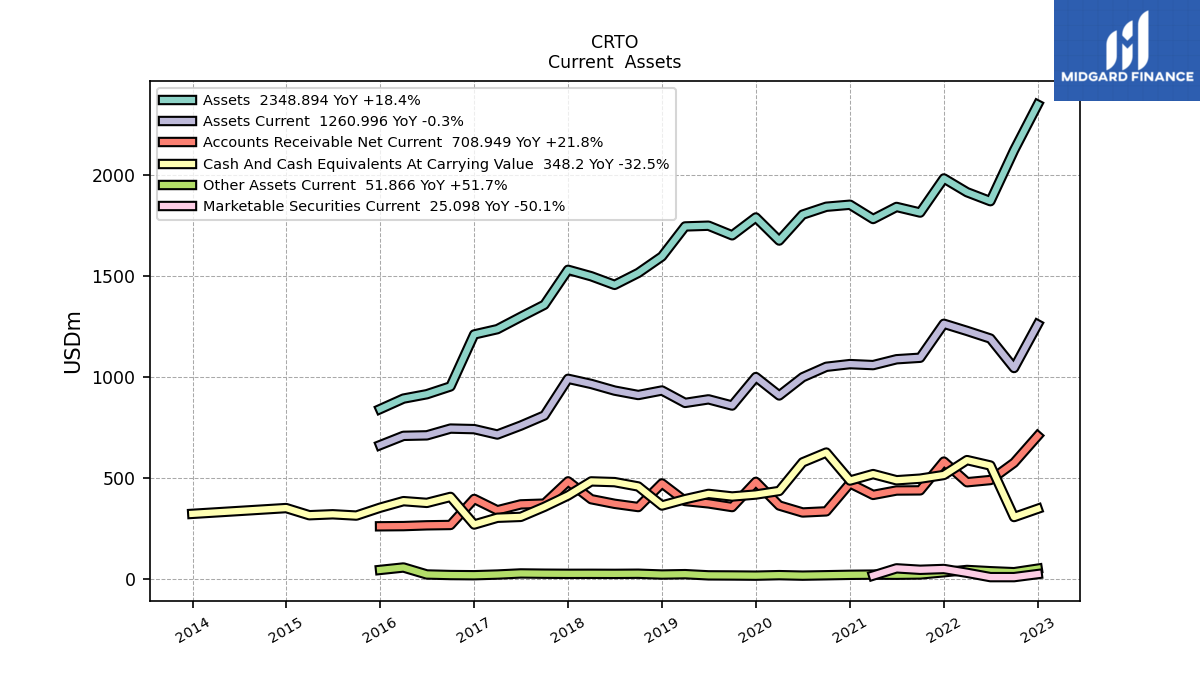
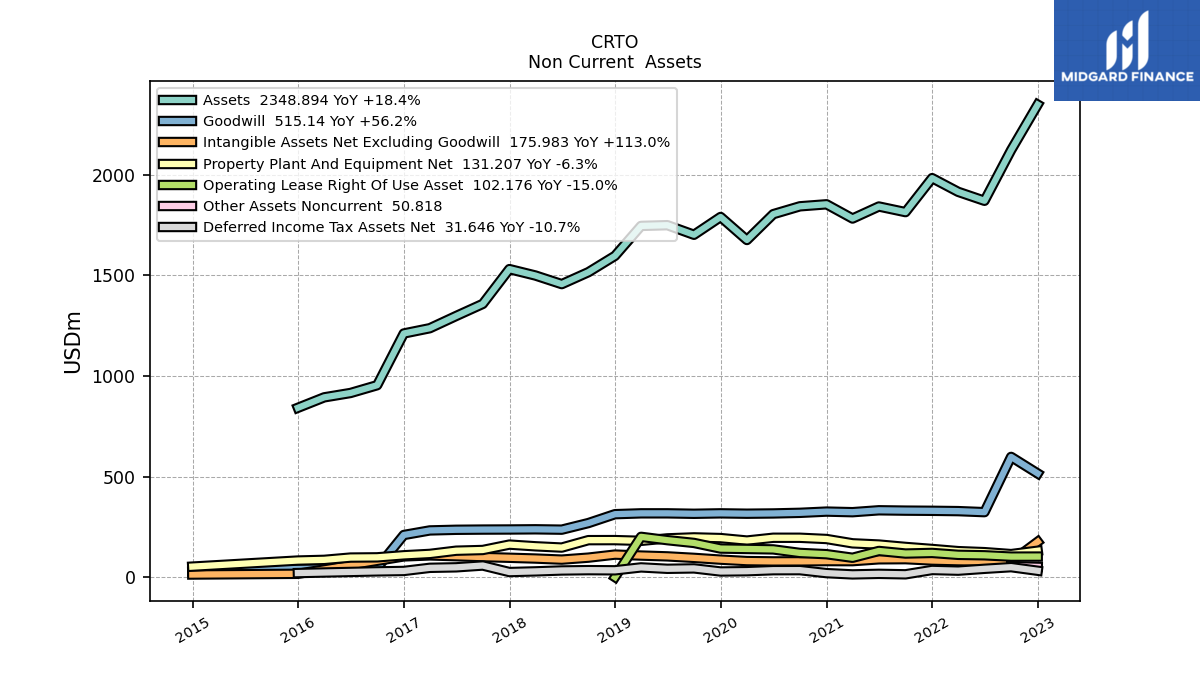
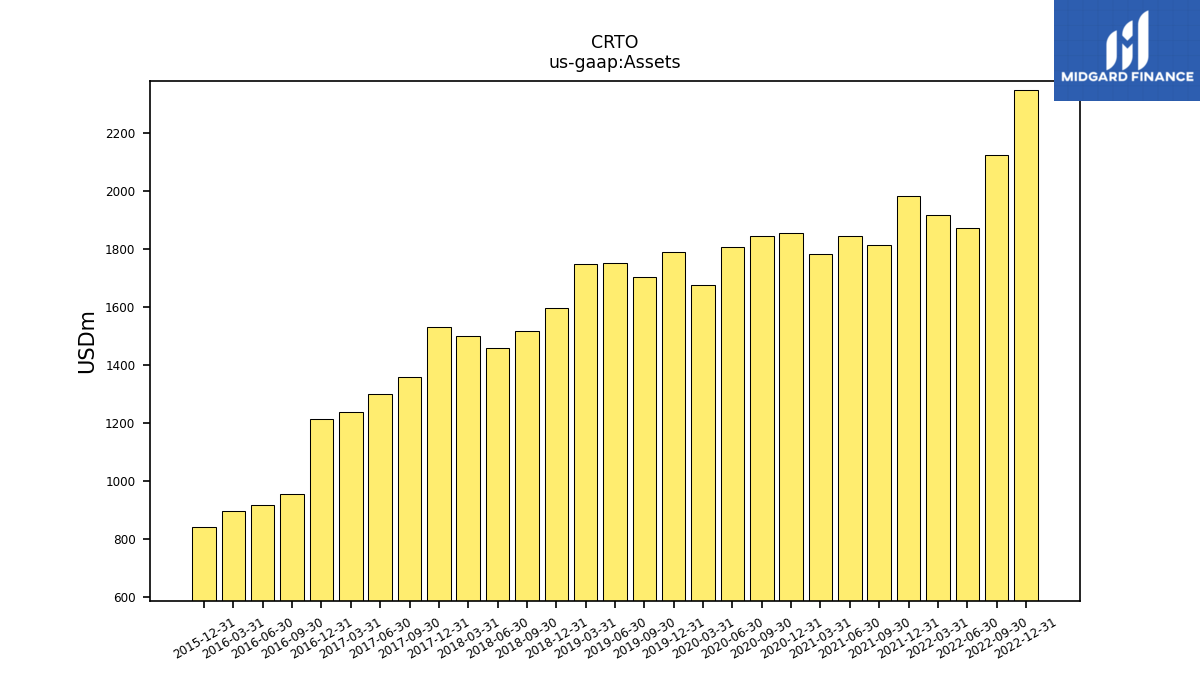
| Assets | 2348.89 | 2122.57 | 1870.84 | 1915.34 | 1983.59 | 1814.49 | 1842.44 | 1782.63 | 1853.41 | 1843.37 | 1804.40 | 1675.89 | 1790.38 | 1701.89 | 1749.57 | 1745.92 | 1597.13 | 1515.94 | 1456.54 | 1499.36 | 1531.30 | 1358.19 | 1298.14 | 1237.39 | 1211.19 | 953.97 | 915.42 | 893.71 | 841.72 | NA | NA | NA | |
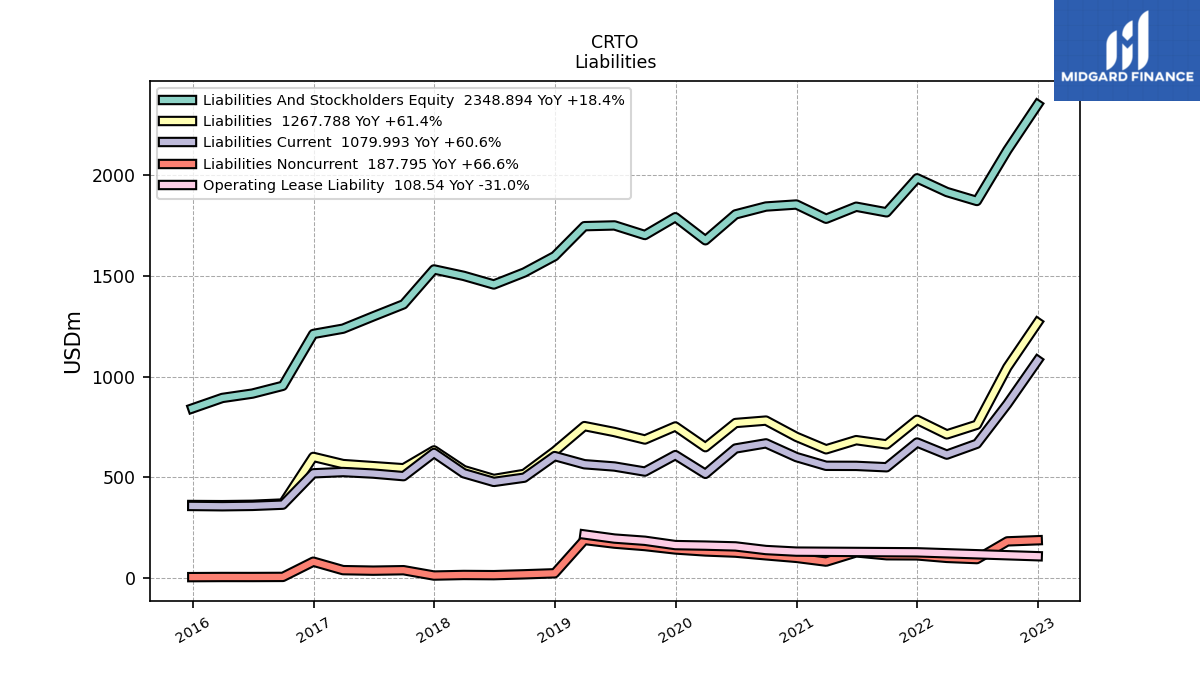
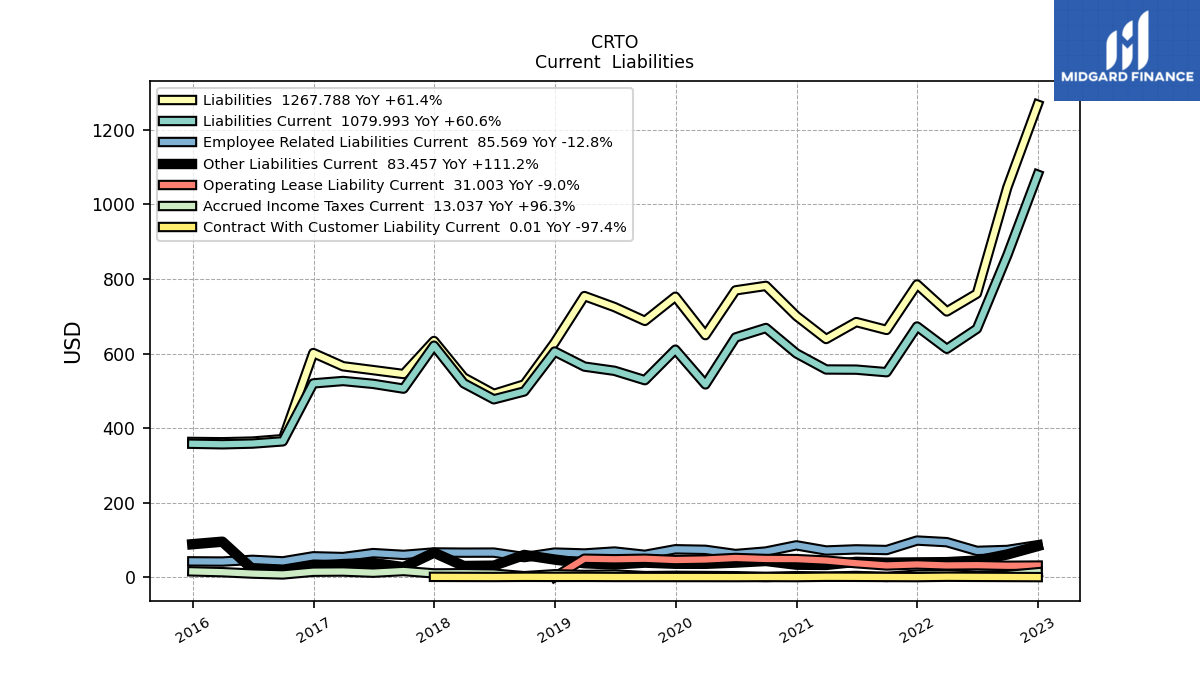
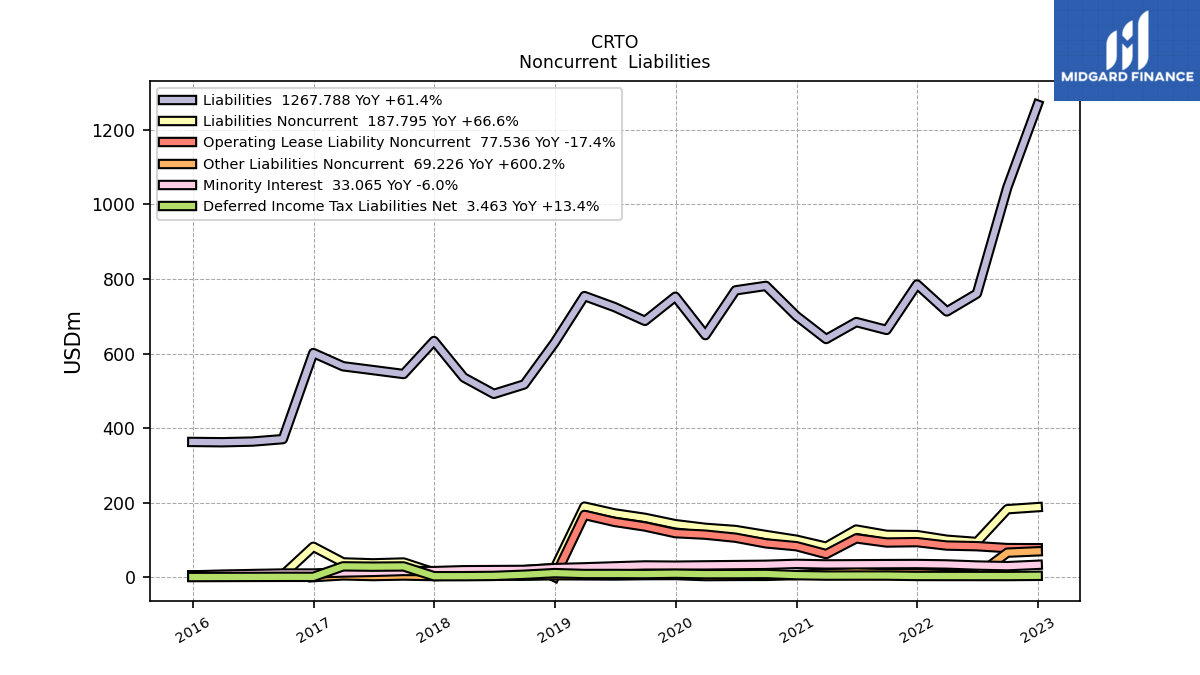
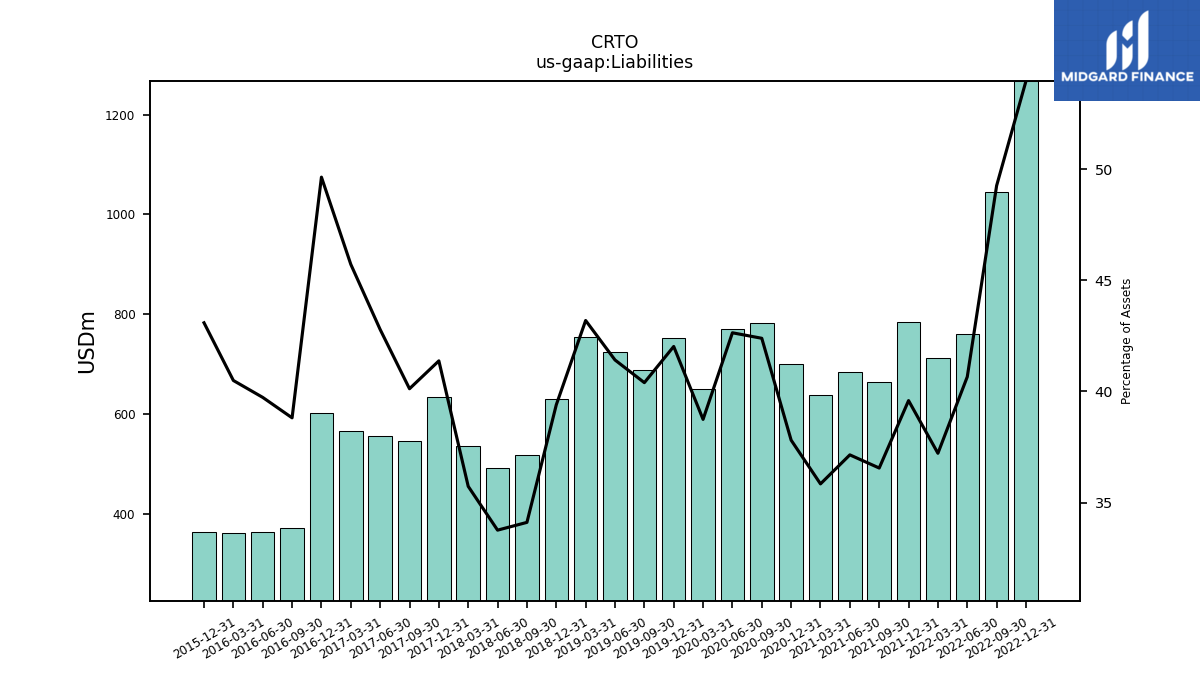
| Liabilities | 1267.79 | 1045.67 | 760.66 | 712.82 | 785.27 | 663.24 | 684.37 | 638.87 | 700.72 | 781.46 | 769.40 | 649.28 | 752.40 | 687.48 | 724.61 | 754.12 | 629.24 | 517.03 | 491.67 | 535.69 | 633.60 | 544.93 | 555.47 | 565.75 | 601.31 | 370.25 | 363.71 | 361.89 | 362.70 | NA | NA | NA | |
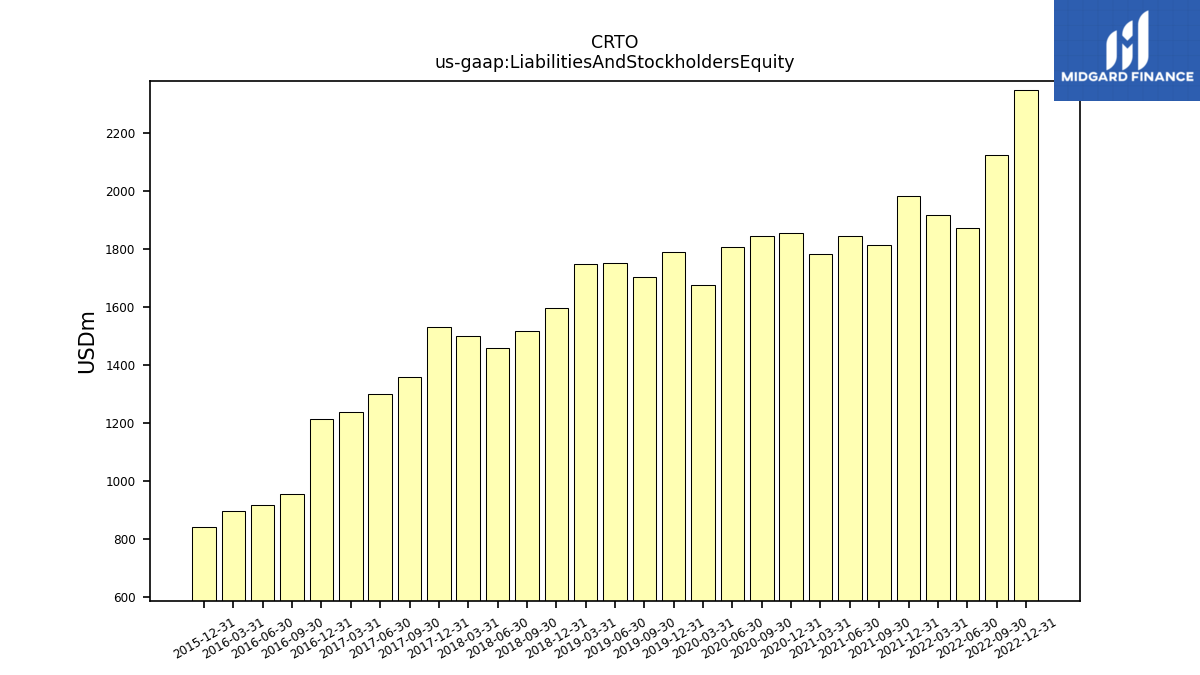
| Liabilities And Stockholders Equity | 2348.89 | 2122.57 | 1870.84 | 1915.34 | 1983.59 | 1814.49 | 1842.44 | 1782.63 | 1853.41 | 1843.37 | 1804.40 | 1675.89 | 1790.38 | 1701.89 | 1749.57 | 1745.92 | 1597.13 | 1515.94 | 1456.54 | 1499.36 | 1531.30 | 1358.19 | 1298.14 | 1237.39 | 1211.19 | 953.97 | 915.42 | 893.71 | 841.72 | NA | NA | NA | |
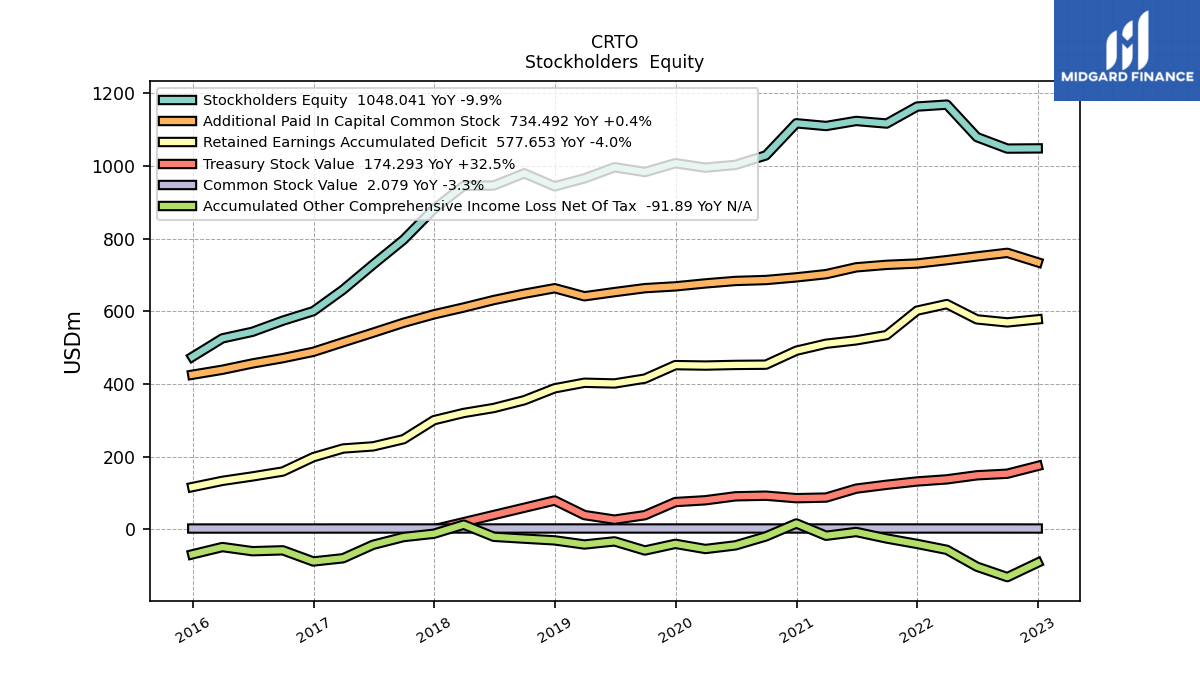
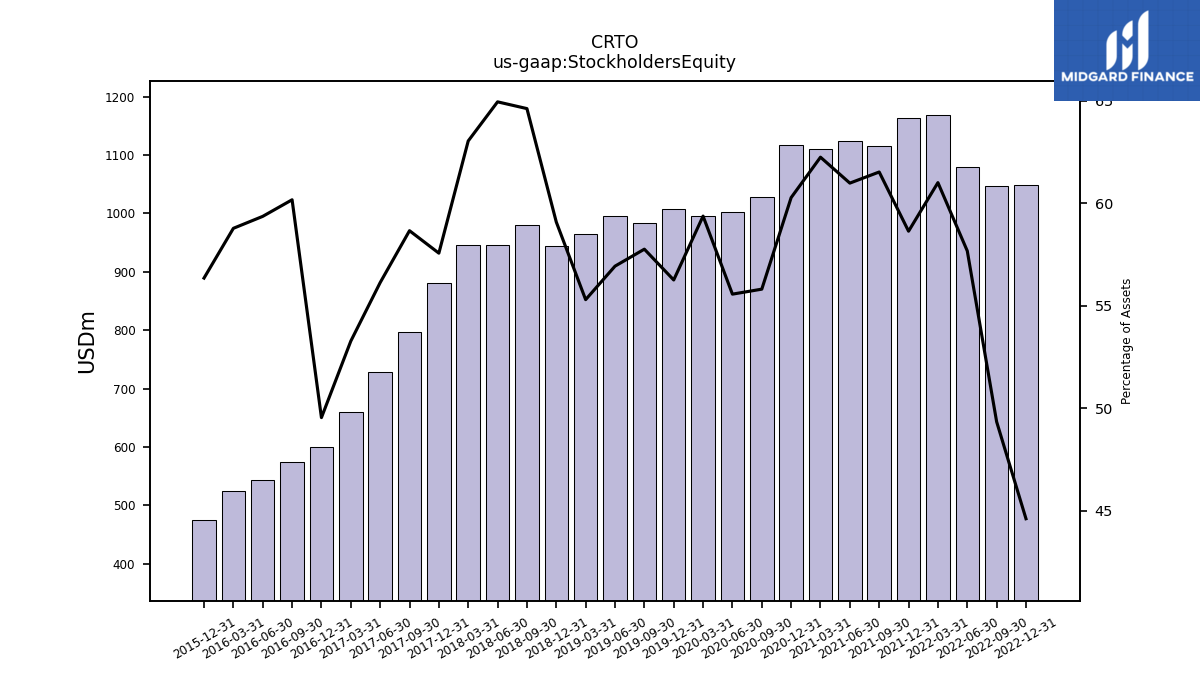
| Stockholders Equity | 1048.04 | 1047.47 | 1079.03 | 1168.47 | 1163.13 | 1116.36 | 1123.57 | 1109.63 | 1117.14 | 1028.82 | 1002.68 | 995.03 | 1007.27 | 983.03 | 996.08 | 965.50 | 943.67 | 979.54 | 945.95 | 945.17 | 881.52 | 796.74 | 728.65 | 659.26 | 600.13 | 574.00 | 543.40 | 525.31 | 474.32 | NA | NA | NA |
| 2022-12-31 | 2022-09-30 | 2022-06-30 | 2022-03-31 | 2021-12-31 | 2021-09-30 | 2021-06-30 | 2021-03-31 | 2020-12-31 | 2020-09-30 | 2020-06-30 | 2020-03-31 | 2019-12-31 | 2019-09-30 | 2019-06-30 | 2019-03-31 | 2018-12-31 | 2018-09-30 | 2018-06-30 | 2018-03-31 | 2017-12-31 | 2017-09-30 | 2017-06-30 | 2017-03-31 | 2016-12-31 | 2016-09-30 | 2016-06-30 | 2016-03-31 | 2015-12-31 | 2015-09-30 | 2015-06-30 | 2015-03-31 | ||
|---|---|---|---|---|---|---|---|---|---|---|---|---|---|---|---|---|---|---|---|---|---|---|---|---|---|---|---|---|---|---|---|---|---|
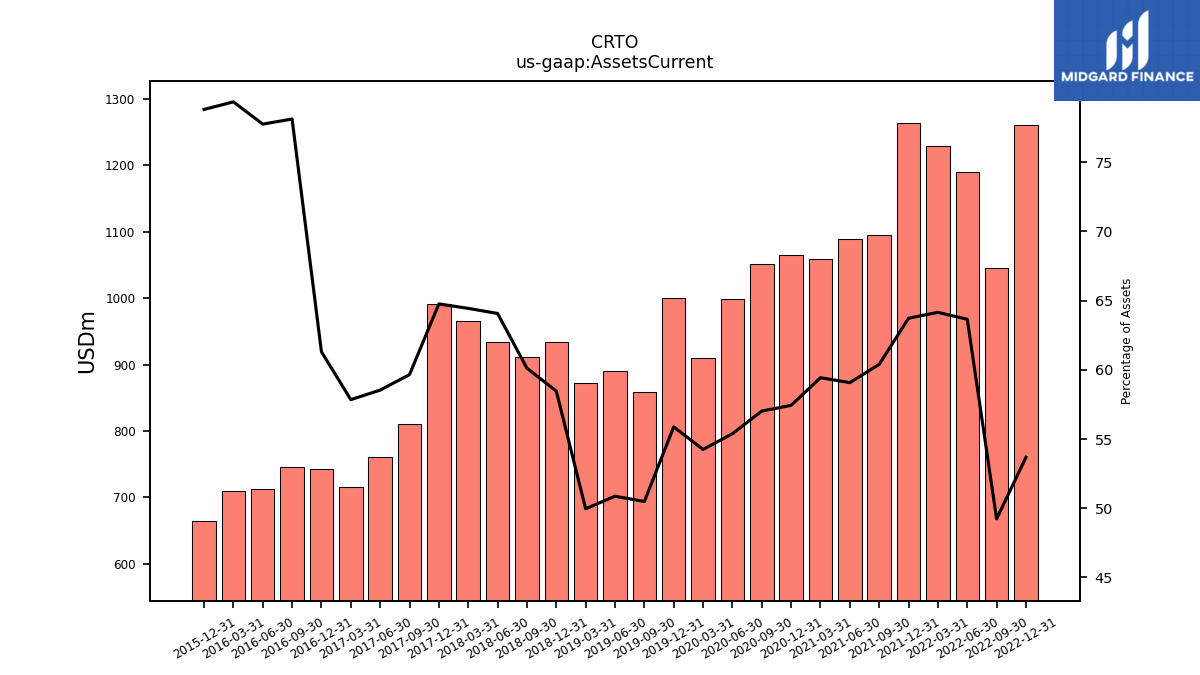
| Assets Current | 1261.00 | 1045.02 | 1190.92 | 1228.83 | 1264.17 | 1095.94 | 1088.46 | 1059.49 | 1064.55 | 1051.15 | 999.41 | 909.17 | 1000.46 | 859.26 | 890.03 | 872.31 | 933.85 | 911.38 | 933.30 | 966.25 | 991.77 | 810.24 | 759.89 | 715.82 | 742.58 | 745.29 | 711.81 | 709.32 | 663.41 | NA | NA | NA | |
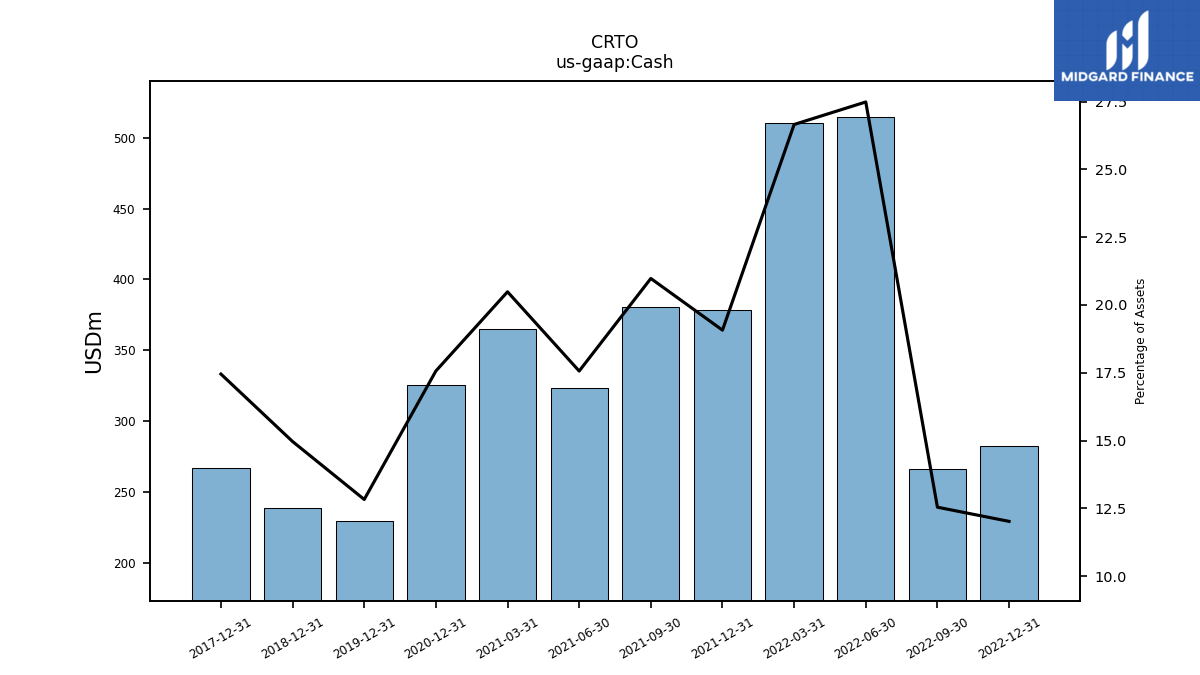
| Cash | 282.29 | 266.18 | 514.23 | 510.56 | 378.30 | 380.62 | 323.58 | 365.18 | 325.55 | NA | NA | NA | 229.64 | NA | NA | NA | 238.98 | NA | NA | NA | 267.24 | NA | NA | NA | NA | NA | NA | NA | NA | NA | NA | NA | |
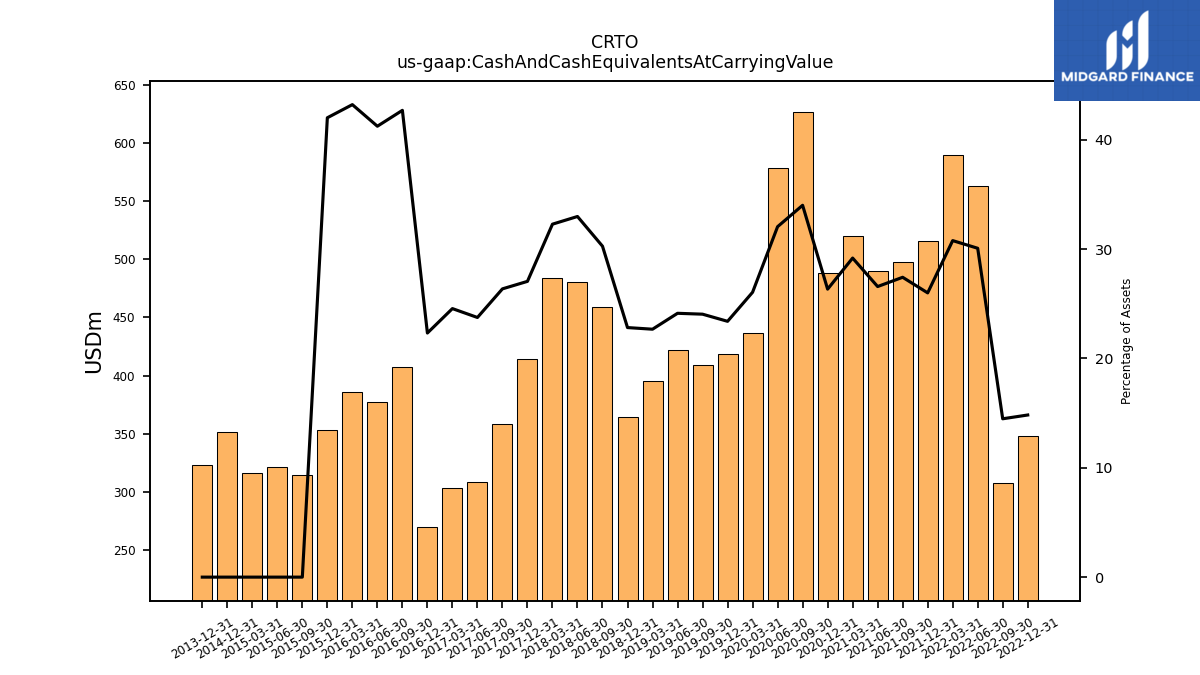
| Cash And Cash Equivalents At Carrying Value | 348.20 | 307.32 | 562.55 | 589.34 | 515.53 | 497.46 | 489.52 | 520.06 | 488.01 | 626.74 | 578.18 | 436.51 | 418.76 | 409.18 | 422.05 | 395.77 | 364.43 | 458.69 | 480.29 | 483.87 | 414.11 | 357.98 | 308.19 | 303.81 | 270.32 | 407.16 | 377.41 | 386.11 | 353.54 | 314.64 | 321.11 | 316.38 | |
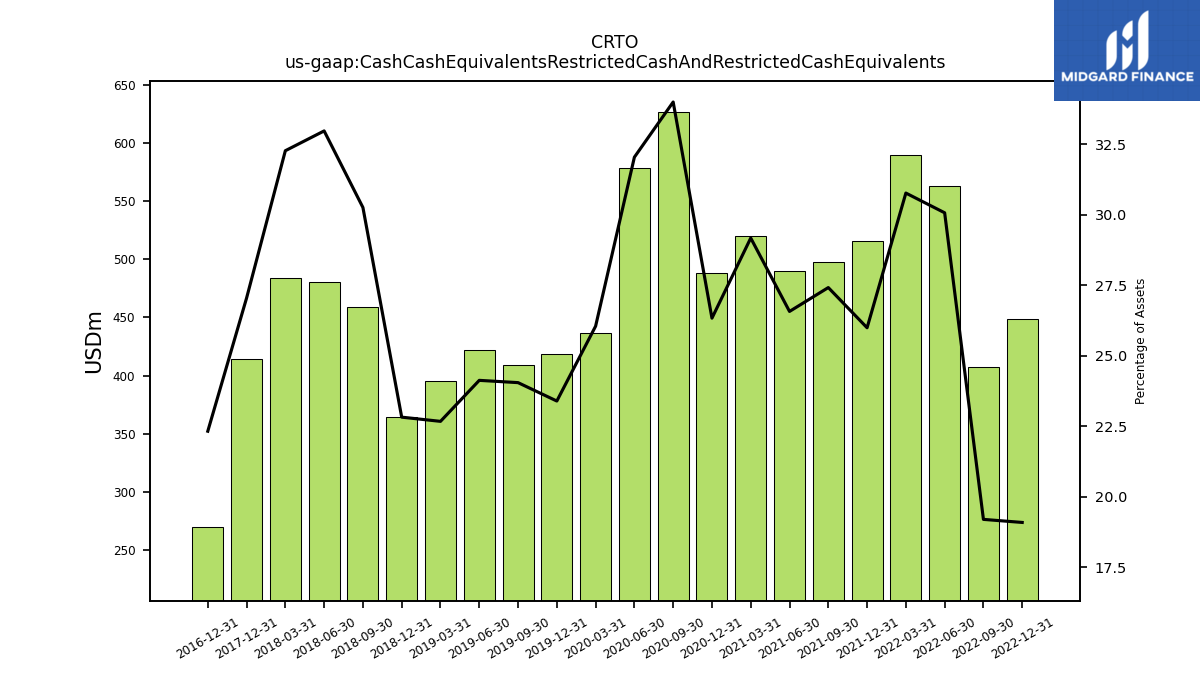
| Cash Cash Equivalents Restricted Cash And Restricted Cash Equivalents | 448.20 | 407.32 | 562.55 | 589.34 | 515.53 | 497.46 | 489.52 | 520.06 | 488.01 | 626.74 | 578.18 | 436.51 | 418.76 | 409.18 | 422.05 | 395.77 | 364.43 | 458.69 | 480.29 | 483.87 | 414.11 | NA | NA | NA | 270.32 | NA | NA | NA | NA | NA | NA | NA | |
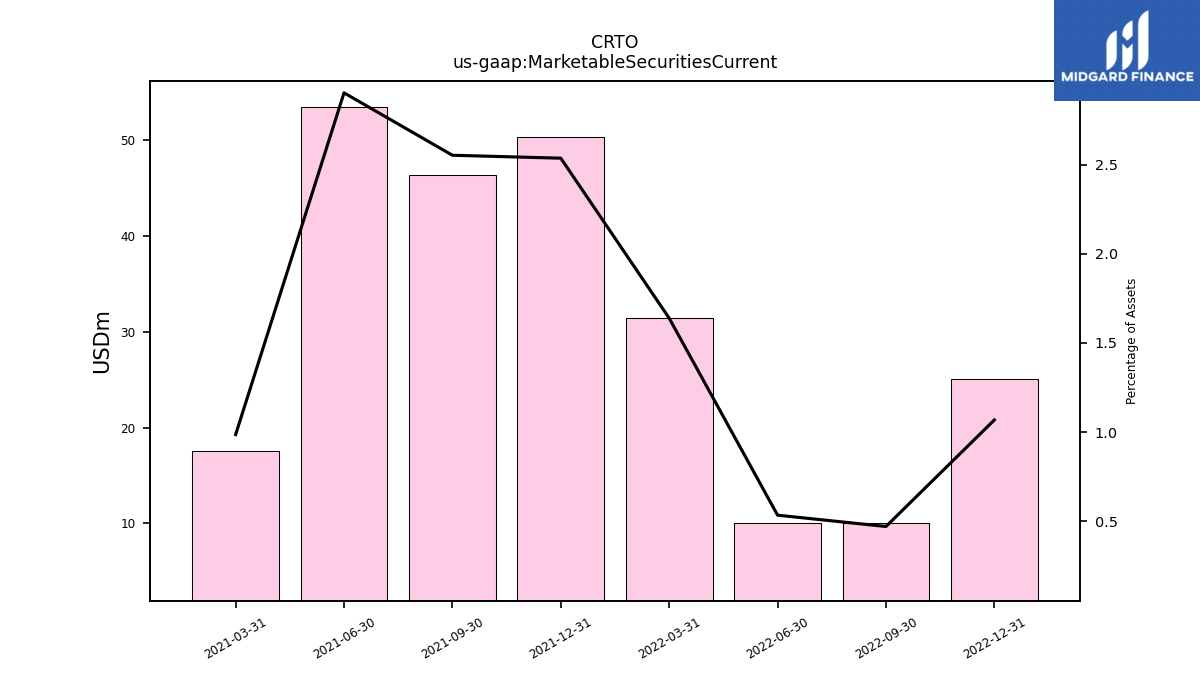
| Marketable Securities Current | 25.10 | 10.00 | 10.00 | 31.39 | 50.30 | 46.31 | 53.47 | 17.59 | NA | NA | NA | NA | NA | NA | NA | NA | NA | NA | NA | NA | NA | NA | NA | NA | NA | NA | NA | NA | NA | NA | NA | NA | |
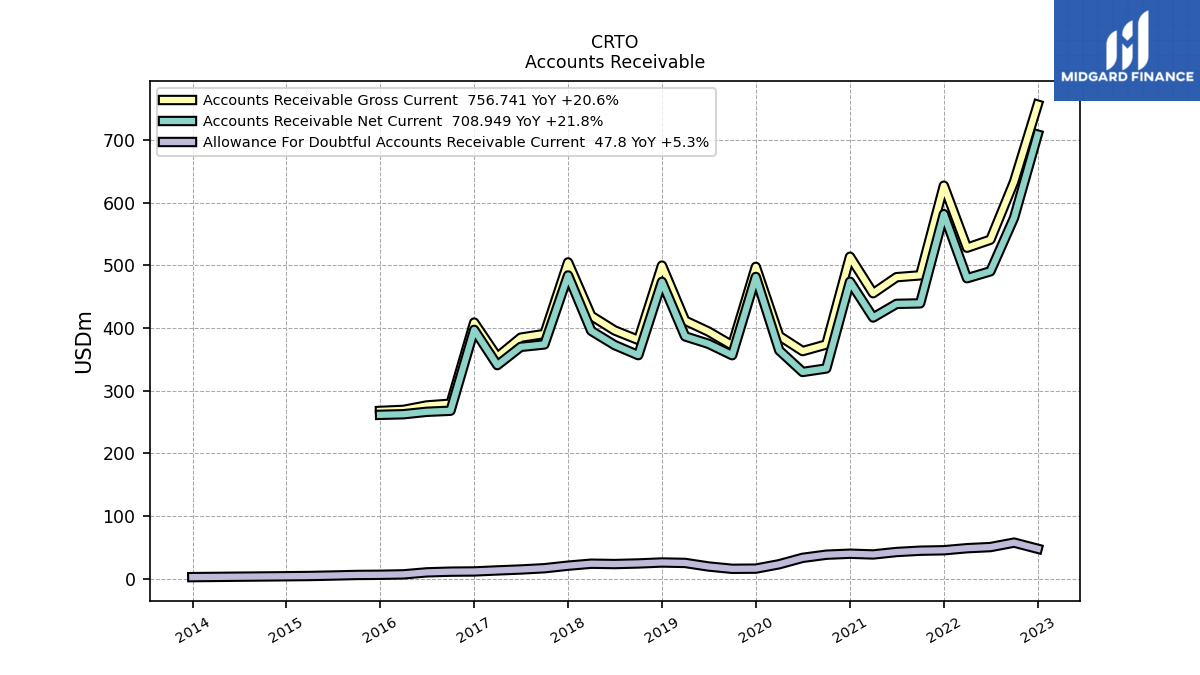
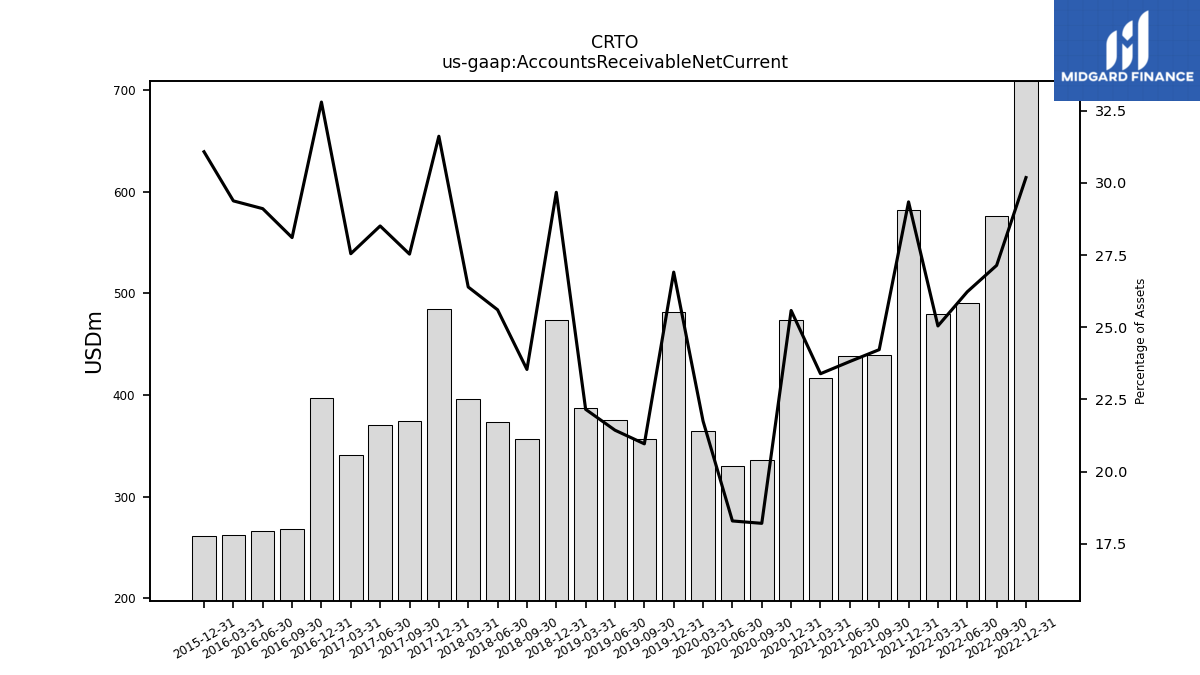
| Accounts Receivable Net Current | 708.95 | 576.08 | 490.64 | 479.64 | 581.99 | 439.49 | 438.70 | 416.91 | 474.06 | 335.58 | 329.98 | 364.44 | 481.73 | 356.70 | 374.95 | 386.79 | 473.90 | 356.79 | 372.91 | 395.71 | 484.10 | 373.92 | 370.05 | 340.84 | 397.24 | 268.10 | 266.44 | 262.52 | 261.58 | NA | NA | NA | |
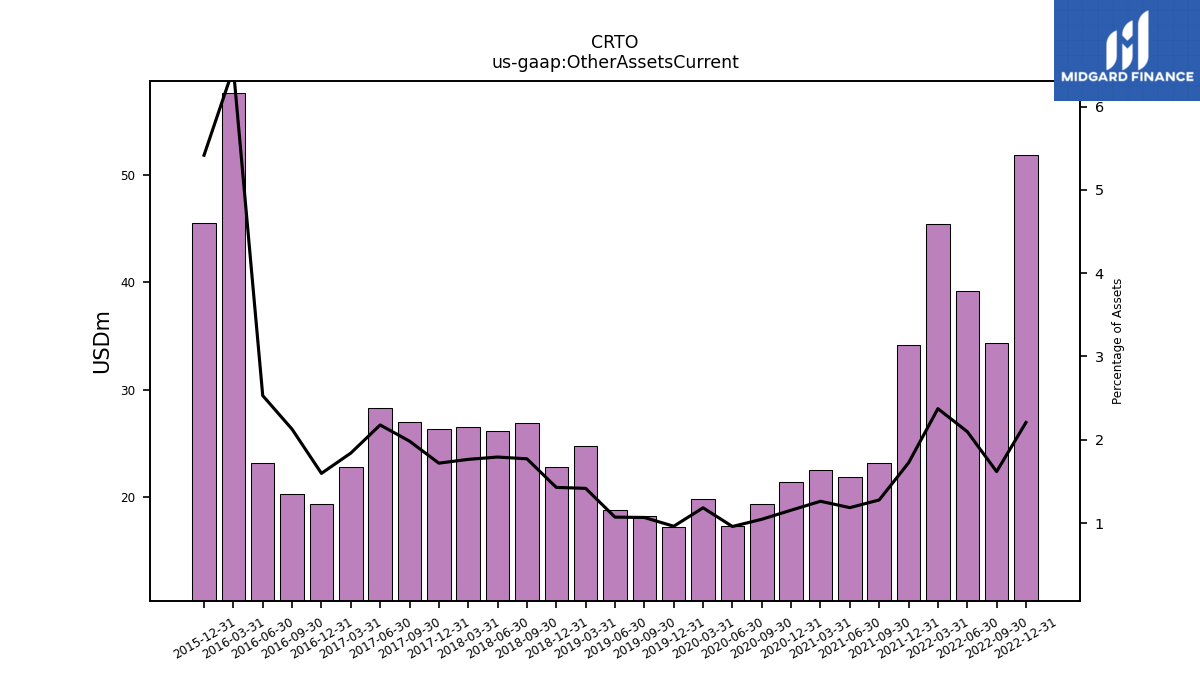
| Other Assets Current | 51.87 | 34.35 | 39.24 | 45.46 | 34.18 | 23.18 | 21.84 | 22.49 | 21.41 | 19.28 | 17.31 | 19.83 | 17.23 | 18.16 | 18.75 | 24.74 | 22.82 | 26.86 | 26.11 | 26.46 | 26.33 | 26.95 | 28.27 | 22.77 | 19.34 | 20.29 | 23.16 | 57.71 | 45.58 | NA | NA | NA |
| 2022-12-31 | 2022-09-30 | 2022-06-30 | 2022-03-31 | 2021-12-31 | 2021-09-30 | 2021-06-30 | 2021-03-31 | 2020-12-31 | 2020-09-30 | 2020-06-30 | 2020-03-31 | 2019-12-31 | 2019-09-30 | 2019-06-30 | 2019-03-31 | 2018-12-31 | 2018-09-30 | 2018-06-30 | 2018-03-31 | 2017-12-31 | 2017-09-30 | 2017-06-30 | 2017-03-31 | 2016-12-31 | 2016-09-30 | 2016-06-30 | 2016-03-31 | 2015-12-31 | 2015-09-30 | 2015-06-30 | 2015-03-31 | ||
|---|---|---|---|---|---|---|---|---|---|---|---|---|---|---|---|---|---|---|---|---|---|---|---|---|---|---|---|---|---|---|---|---|---|
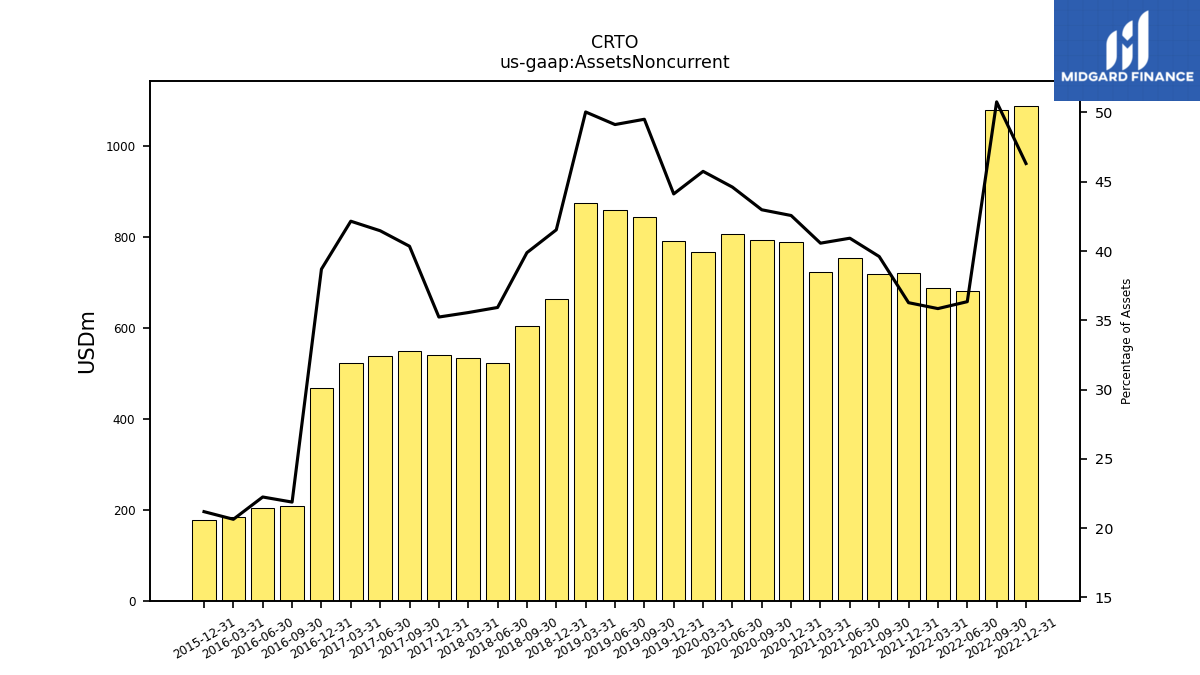
| Assets Noncurrent | 1087.90 | 1077.55 | 679.92 | 686.51 | 719.42 | 718.56 | 753.99 | 723.14 | 788.86 | 792.22 | 805.00 | 766.72 | 789.92 | 842.62 | 859.54 | 873.61 | 663.28 | 604.57 | 523.24 | 533.11 | 539.53 | 547.95 | 538.25 | 521.57 | 468.60 | 208.68 | 203.60 | 184.40 | 178.31 | NA | NA | NA | |
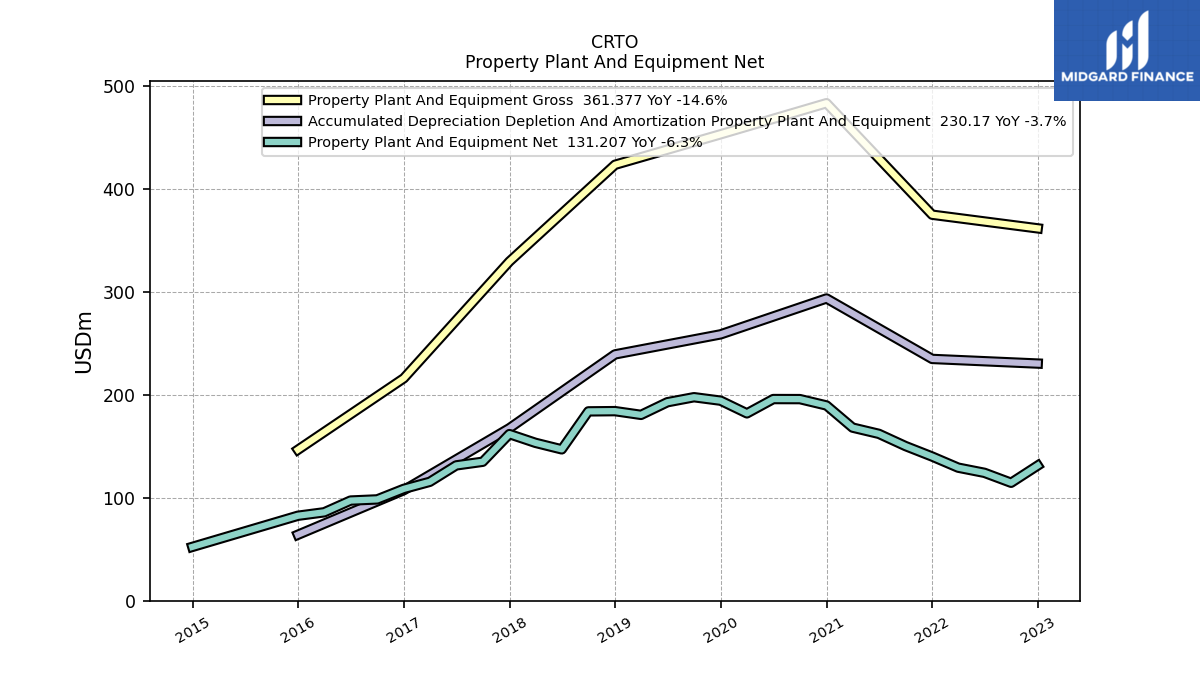
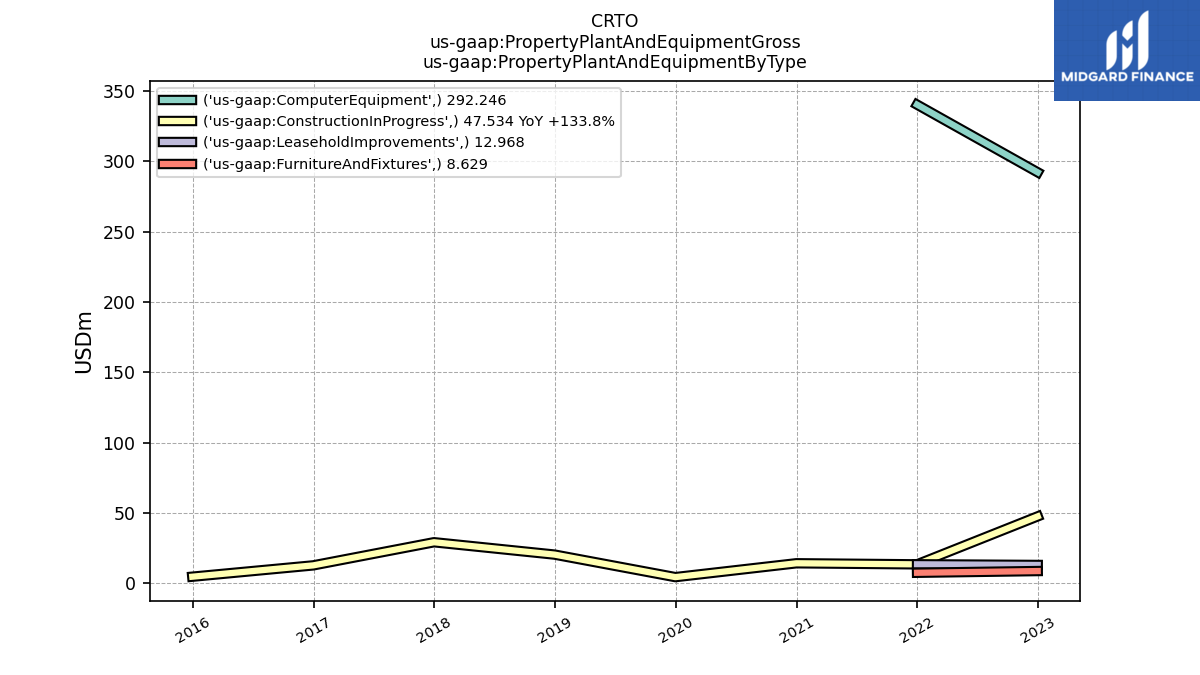
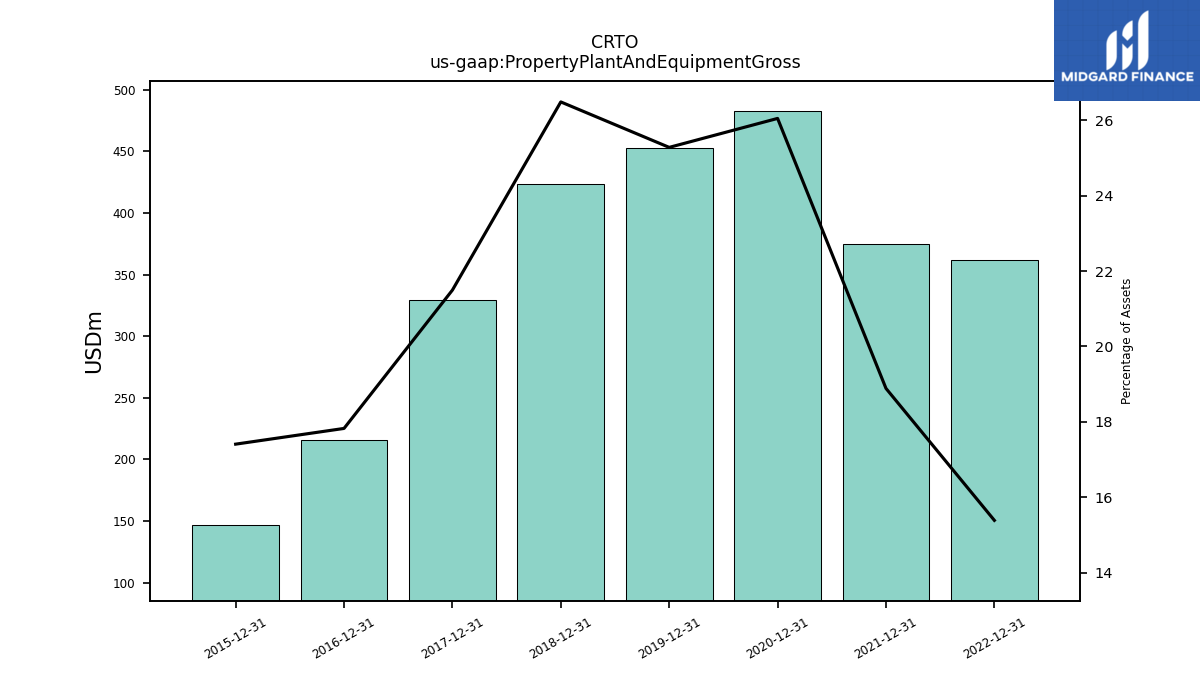
| Property Plant And Equipment Gross | 361.38 | NA | NA | NA | 374.64 | NA | NA | NA | 482.86 | NA | NA | NA | 452.68 | NA | NA | NA | 423.08 | NA | NA | NA | 329.18 | NA | NA | NA | 215.89 | NA | NA | NA | 146.52 | NA | NA | NA | |
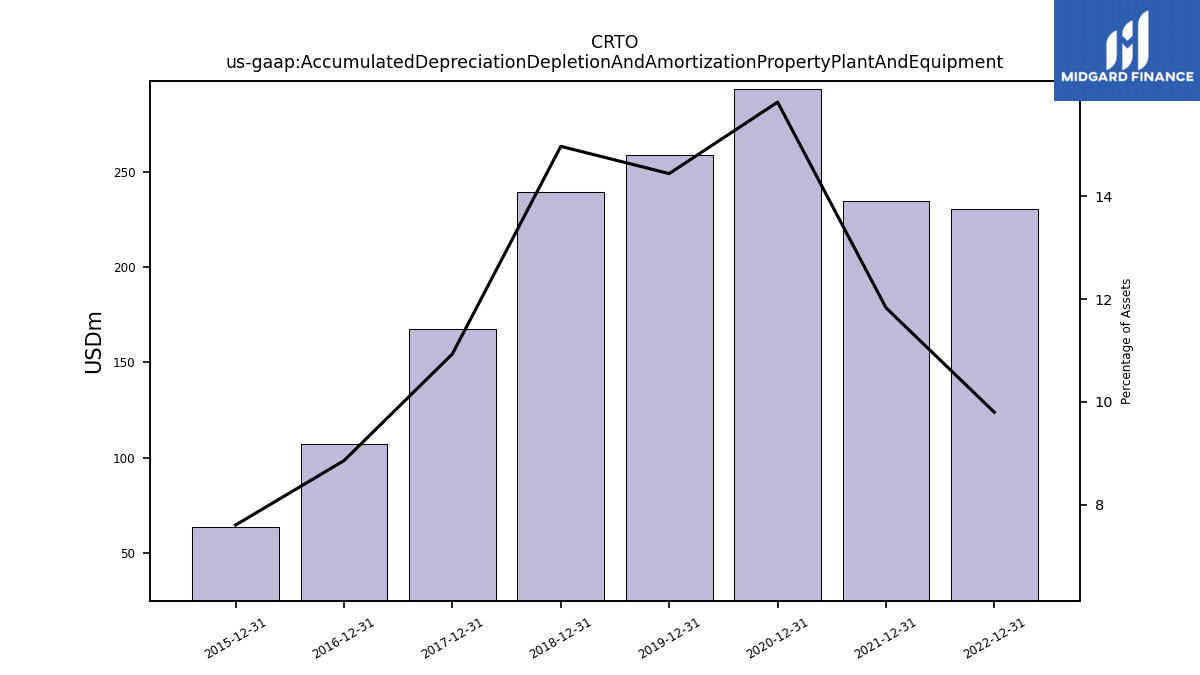
| Accumulated Depreciation Depletion And Amortization Property Plant And Equipment | 230.17 | NA | NA | NA | 234.68 | NA | NA | NA | 293.35 | NA | NA | NA | 258.52 | NA | NA | NA | 239.07 | NA | NA | NA | 167.44 | NA | NA | NA | 107.31 | NA | NA | NA | 64.04 | NA | NA | NA | |
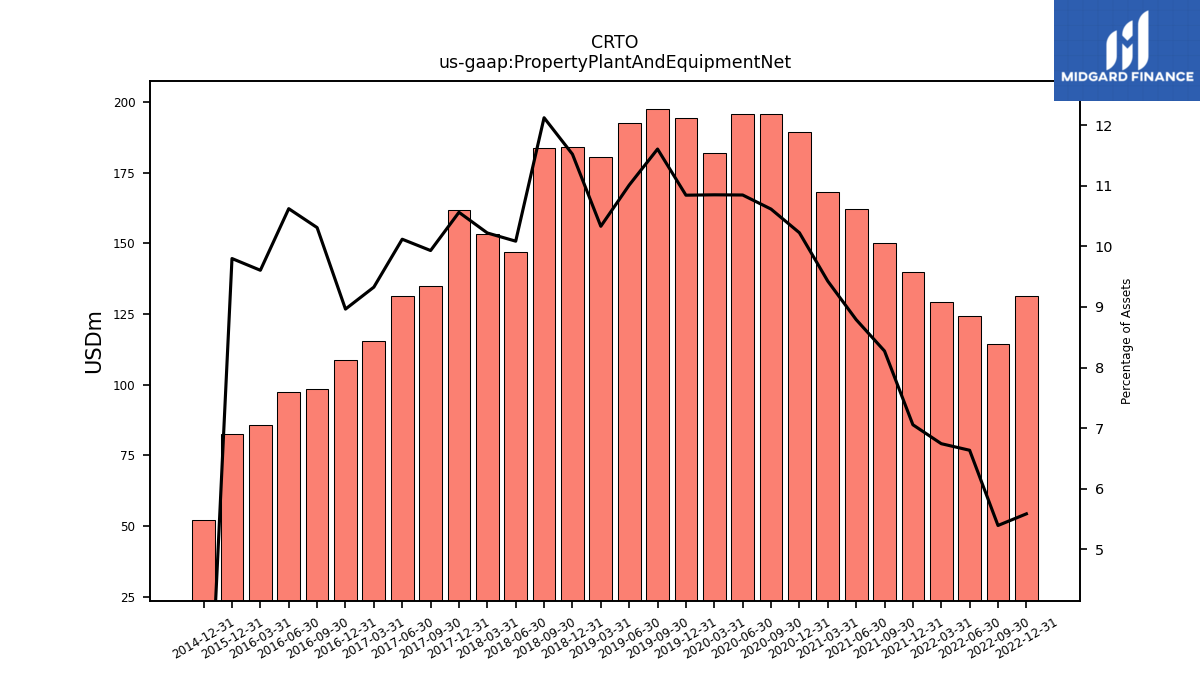
| Property Plant And Equipment Net | 131.21 | 114.49 | 124.13 | 129.16 | 139.96 | 150.11 | 161.97 | 168.04 | 189.50 | 195.68 | 195.74 | 181.85 | 194.16 | 197.52 | 192.65 | 180.38 | 184.01 | 183.78 | 146.90 | 153.25 | 161.74 | 134.88 | 131.35 | 115.42 | 108.58 | 98.35 | 97.24 | 85.84 | 82.48 | NA | NA | NA | |
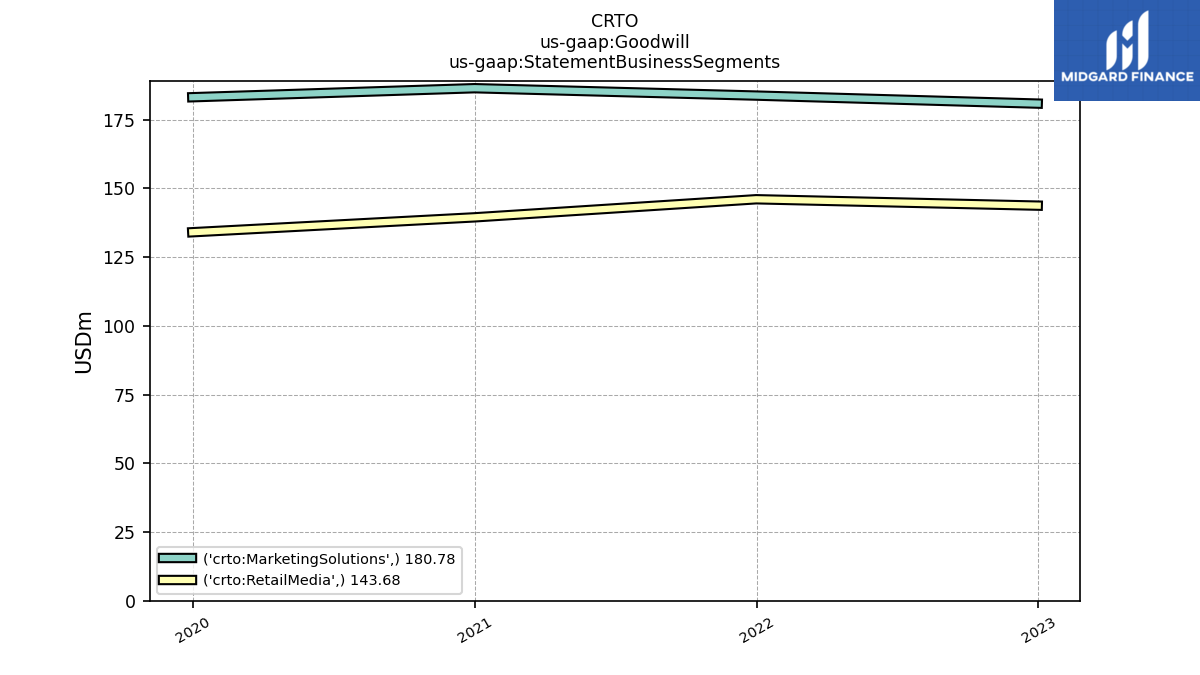
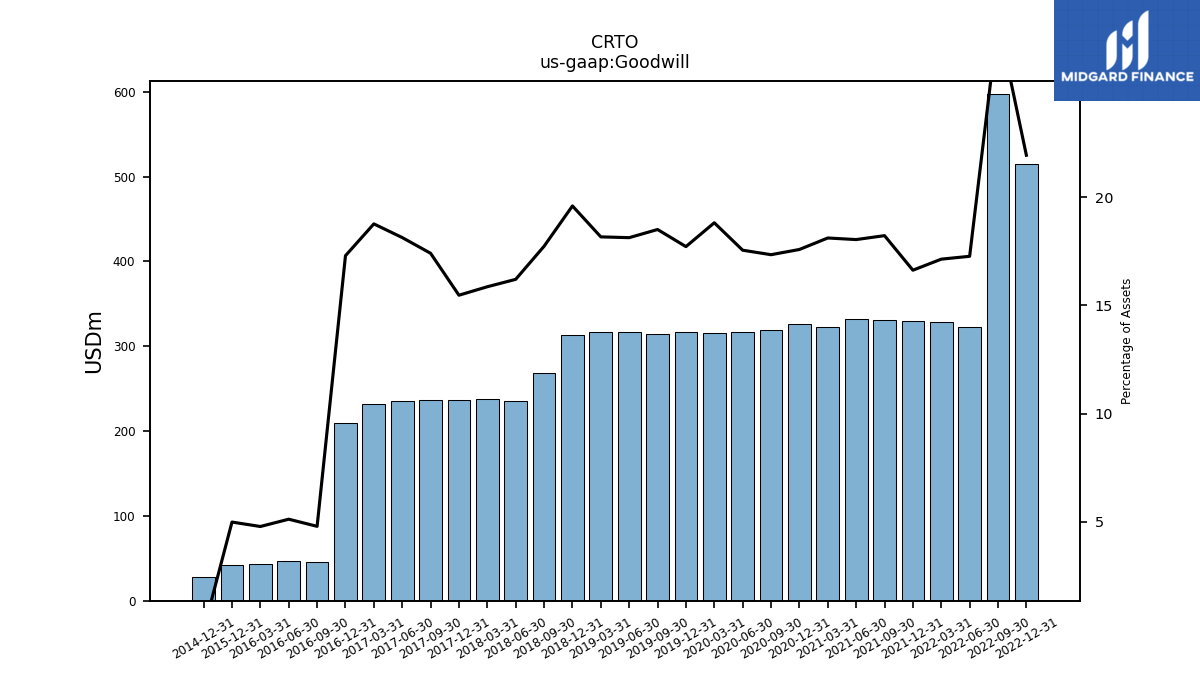
| Goodwill | 515.14 | 597.78 | 322.97 | 328.12 | 329.70 | 330.56 | 332.30 | 322.82 | 325.81 | 319.60 | 316.57 | 315.27 | 317.10 | 314.87 | 317.09 | 317.08 | 312.88 | 268.73 | 235.95 | 237.76 | 236.83 | 236.36 | 235.34 | 232.14 | 209.42 | 45.69 | 46.86 | 42.74 | 41.97 | NA | NA | NA | |
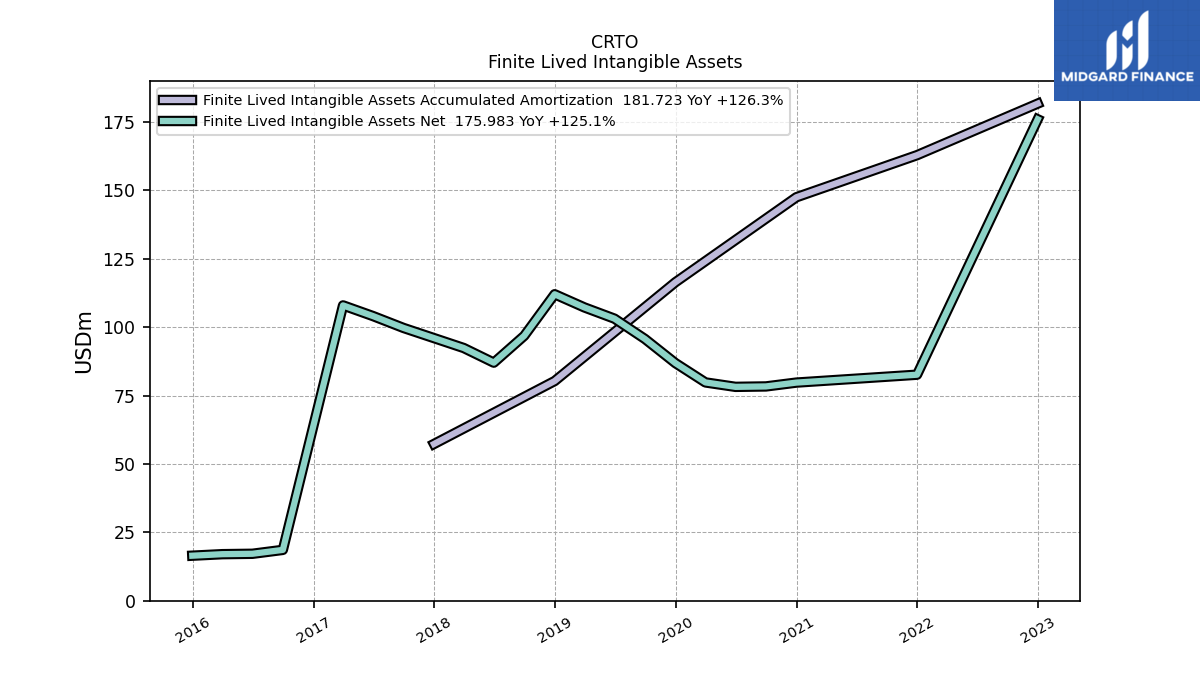
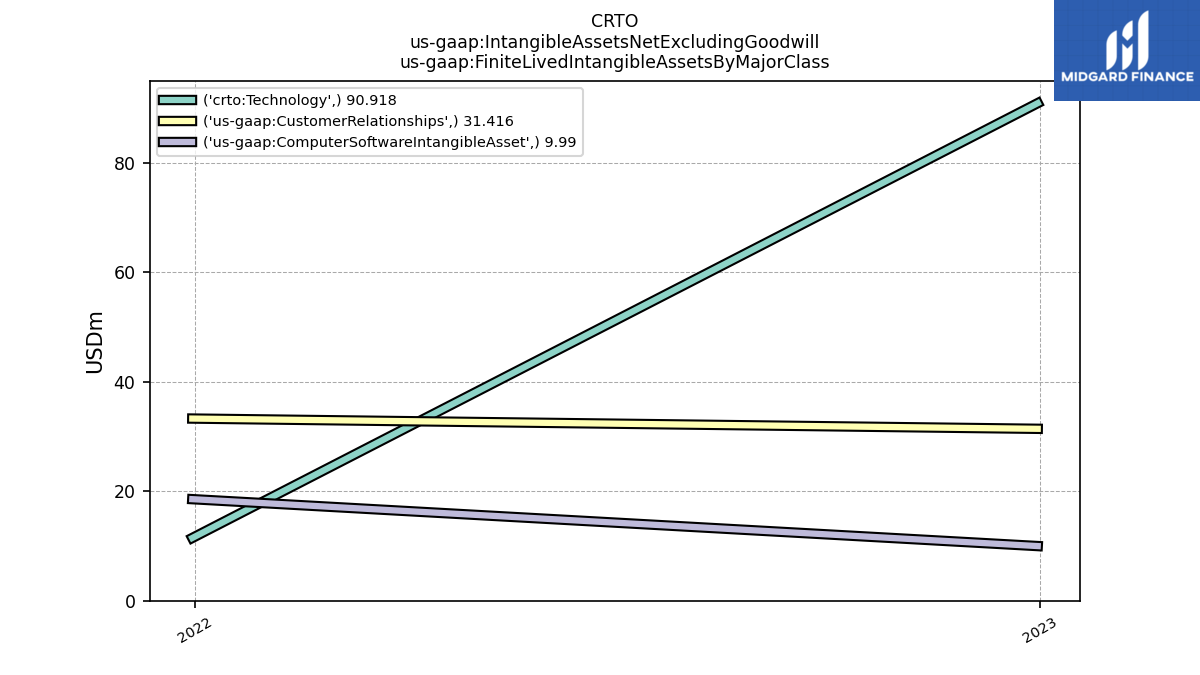
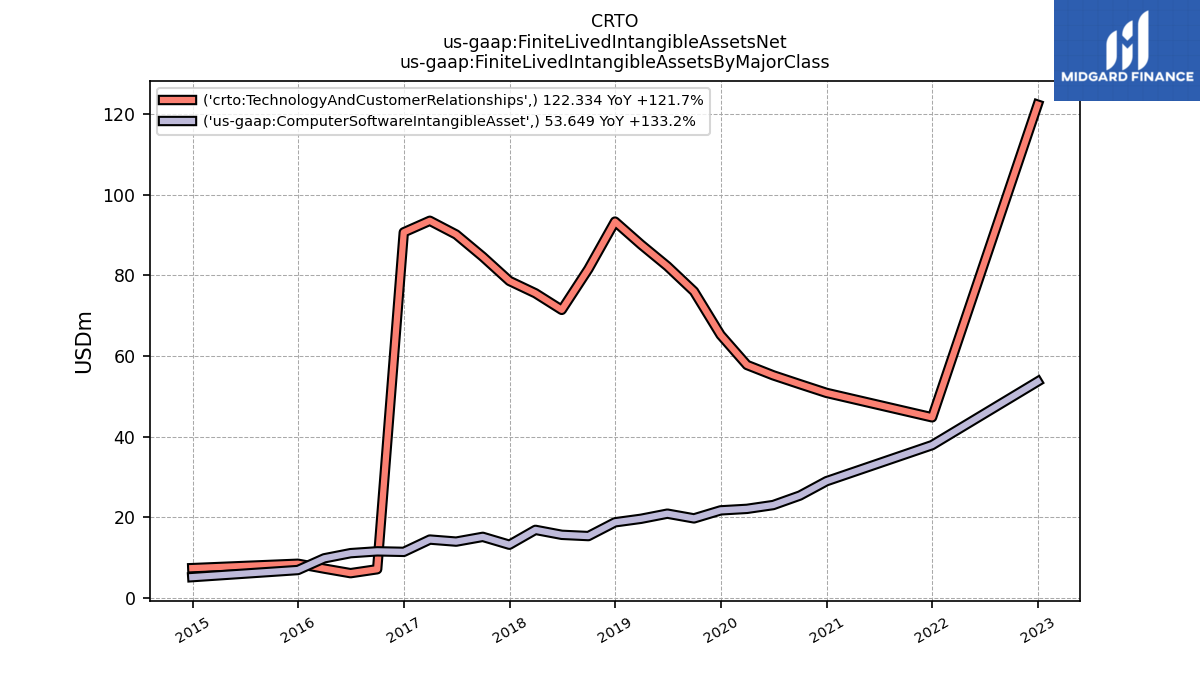
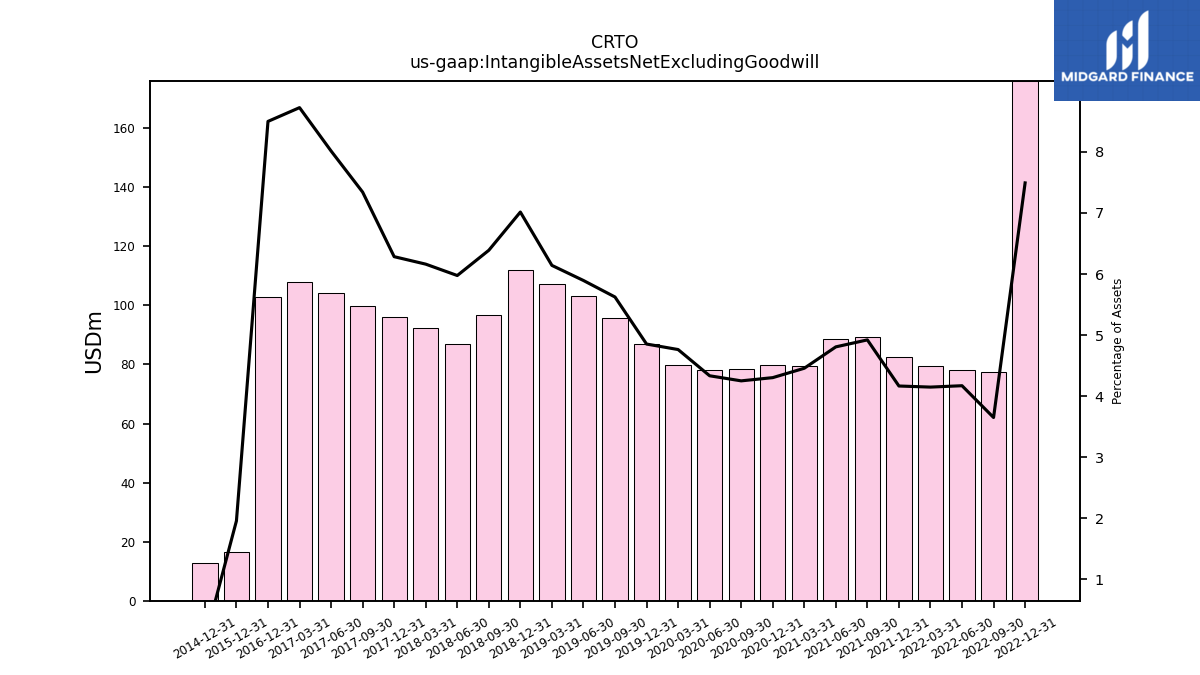
| Intangible Assets Net Excluding Goodwill | 175.98 | 77.46 | 78.02 | 79.44 | 82.63 | 89.29 | 88.56 | 79.44 | 79.74 | 78.34 | 78.19 | 79.82 | 86.89 | 95.70 | 103.11 | 107.22 | 112.04 | 96.85 | 87.03 | 92.38 | 96.22 | 99.71 | 104.05 | 107.96 | 102.94 | NA | NA | NA | 16.47 | NA | NA | NA | |
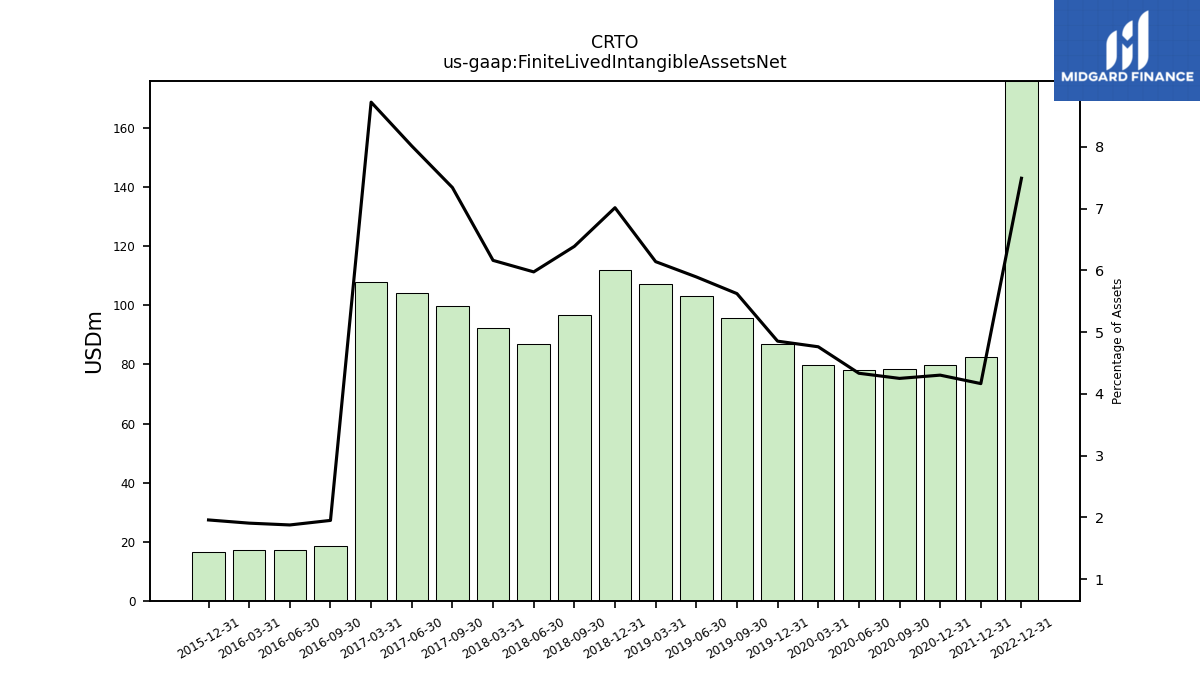
| Finite Lived Intangible Assets Net | 175.98 | NA | NA | NA | 82.63 | NA | NA | NA | 79.74 | 78.34 | 78.19 | 79.81 | 86.89 | 95.70 | 103.11 | 107.22 | 112.04 | 96.85 | 87.03 | 92.38 | NA | 99.71 | 104.05 | 107.96 | NA | 18.59 | 17.17 | 17.02 | 16.47 | NA | NA | NA | |
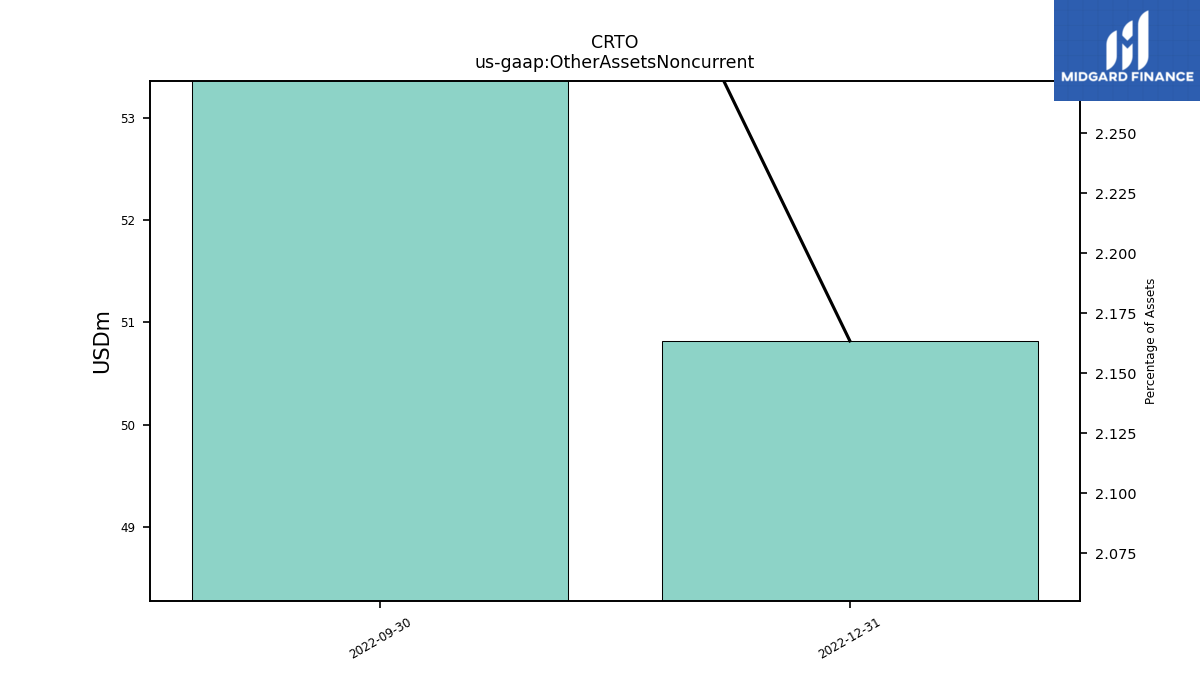
| Other Assets Noncurrent | 50.82 | 54.48 | NA | NA | NA | NA | NA | NA | NA | NA | NA | NA | NA | NA | NA | NA | NA | NA | NA | NA | NA | NA | NA | NA | NA | NA | NA | NA | NA | NA | NA | NA |
| 2022-12-31 | 2022-09-30 | 2022-06-30 | 2022-03-31 | 2021-12-31 | 2021-09-30 | 2021-06-30 | 2021-03-31 | 2020-12-31 | 2020-09-30 | 2020-06-30 | 2020-03-31 | 2019-12-31 | 2019-09-30 | 2019-06-30 | 2019-03-31 | 2018-12-31 | 2018-09-30 | 2018-06-30 | 2018-03-31 | 2017-12-31 | 2017-09-30 | 2017-06-30 | 2017-03-31 | 2016-12-31 | 2016-09-30 | 2016-06-30 | 2016-03-31 | 2015-12-31 | 2015-09-30 | 2015-06-30 | 2015-03-31 | ||
|---|---|---|---|---|---|---|---|---|---|---|---|---|---|---|---|---|---|---|---|---|---|---|---|---|---|---|---|---|---|---|---|---|---|
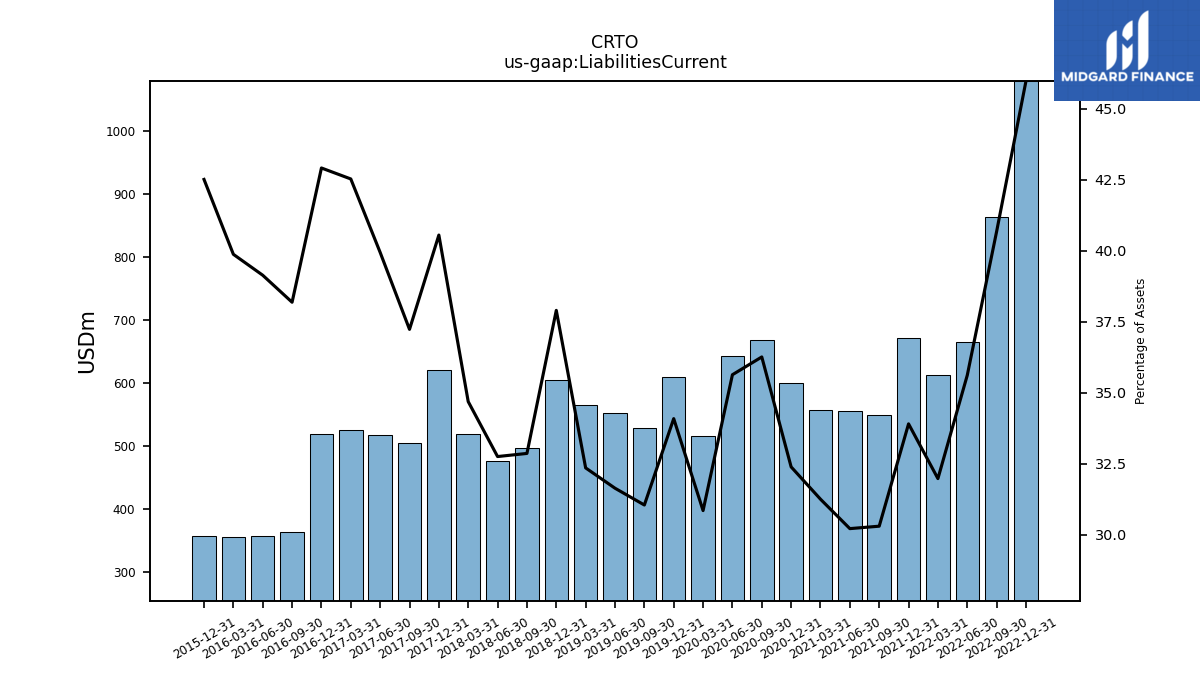
| Liabilities Current | 1079.99 | 863.47 | 666.36 | 612.51 | 672.55 | 549.85 | 556.74 | 557.13 | 600.33 | 668.45 | 643.02 | 517.06 | 610.34 | 528.42 | 553.57 | 564.90 | 605.34 | 498.21 | 477.09 | 520.12 | 621.00 | 505.70 | 518.53 | 526.26 | 519.79 | 364.30 | 358.29 | 356.38 | 357.84 | NA | NA | NA | |
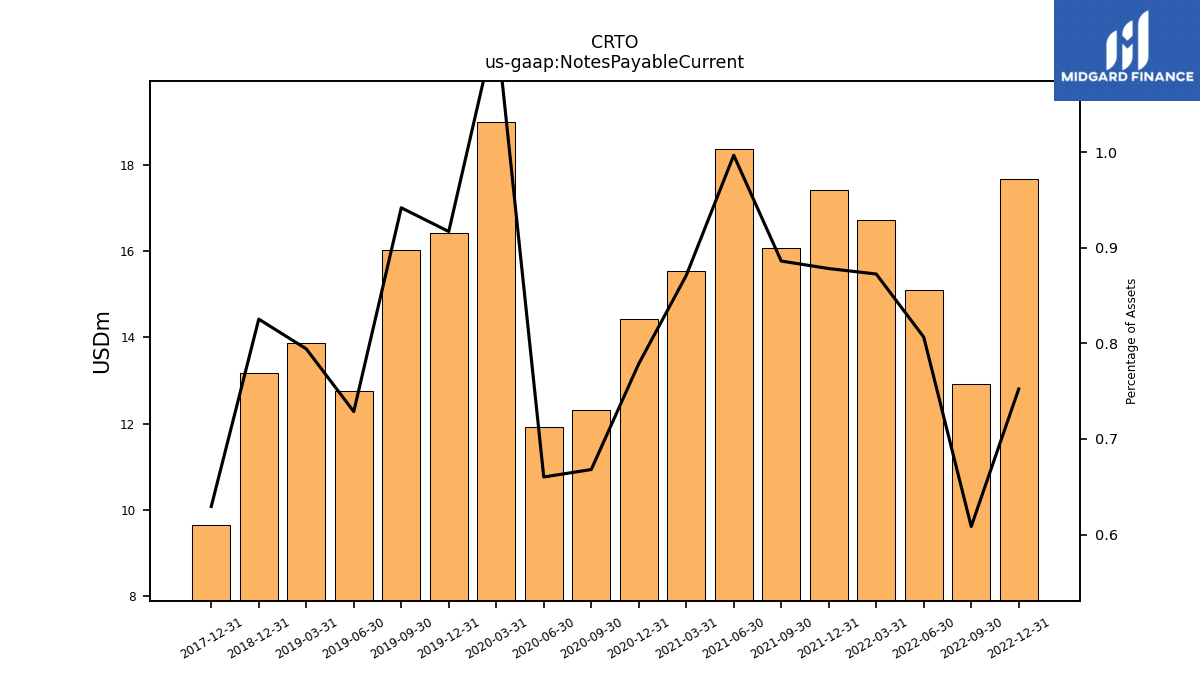
| Notes Payable Current | 17.67 | 12.91 | 15.09 | 16.71 | 17.42 | 16.08 | 18.37 | 15.53 | 14.43 | 12.31 | 11.91 | 18.99 | 16.42 | 16.03 | 12.75 | 13.87 | 13.18 | NA | NA | NA | 9.64 | NA | NA | NA | NA | NA | NA | NA | NA | NA | NA | NA | |
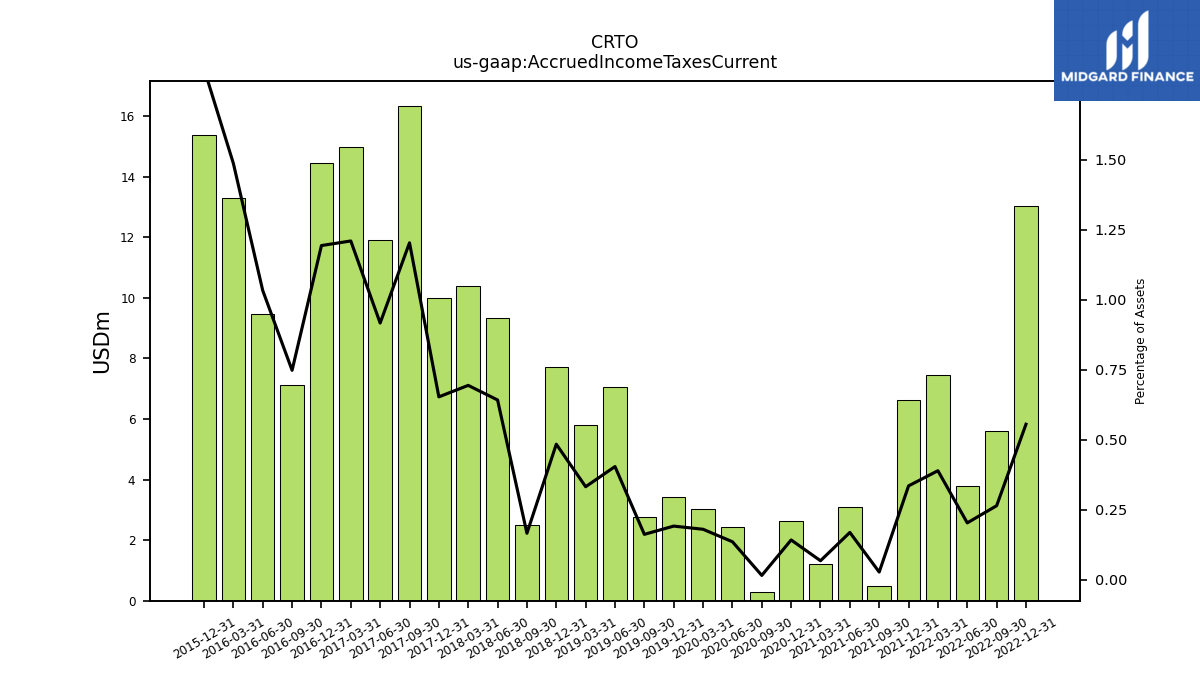
| Accrued Income Taxes Current | 13.04 | 5.60 | 3.79 | 7.45 | 6.64 | 0.49 | 3.10 | 1.20 | 2.63 | 0.28 | 2.44 | 3.01 | 3.42 | 2.75 | 7.07 | 5.79 | 7.72 | 2.51 | 9.35 | 10.40 | 10.00 | 16.34 | 11.90 | 14.97 | 14.45 | 7.13 | 9.46 | 13.29 | 15.37 | NA | NA | NA | |
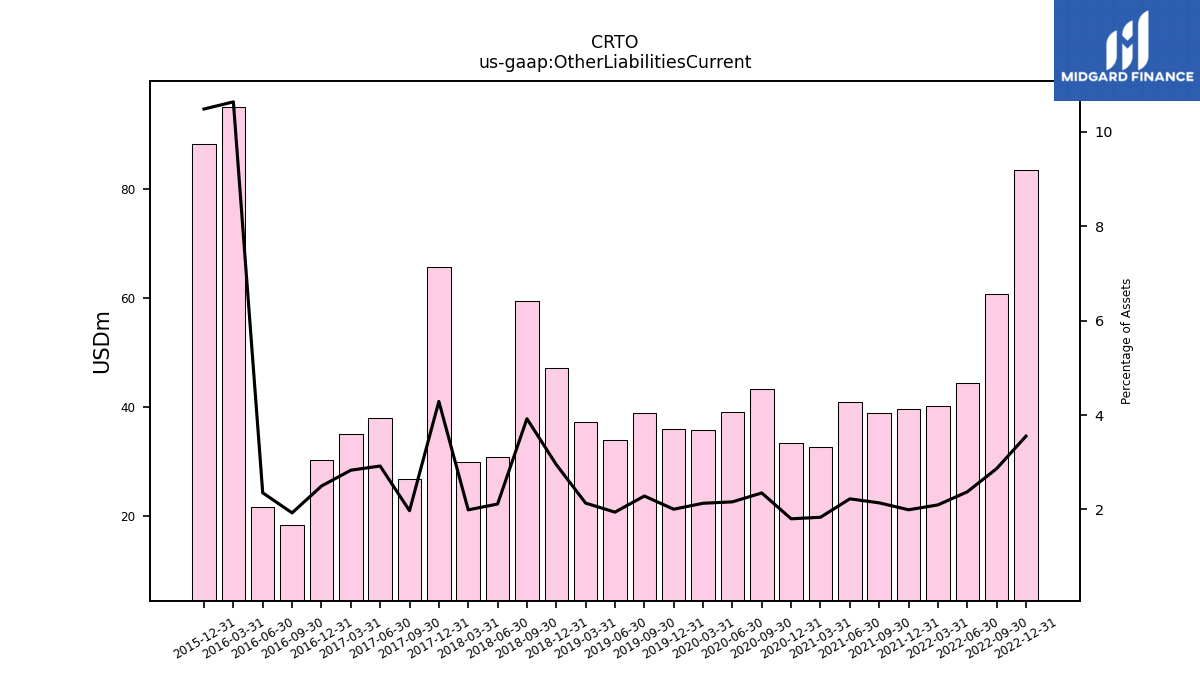
| Other Liabilities Current | 83.46 | 60.81 | 44.39 | 40.15 | 39.52 | 38.82 | 40.99 | 32.69 | 33.39 | 43.30 | 38.98 | 35.71 | 35.89 | 38.87 | 33.99 | 37.26 | 47.12 | 59.46 | 30.80 | 29.85 | 65.68 | 26.80 | 37.91 | 35.03 | 30.22 | 18.38 | 21.53 | 95.08 | 88.27 | NA | NA | NA | |
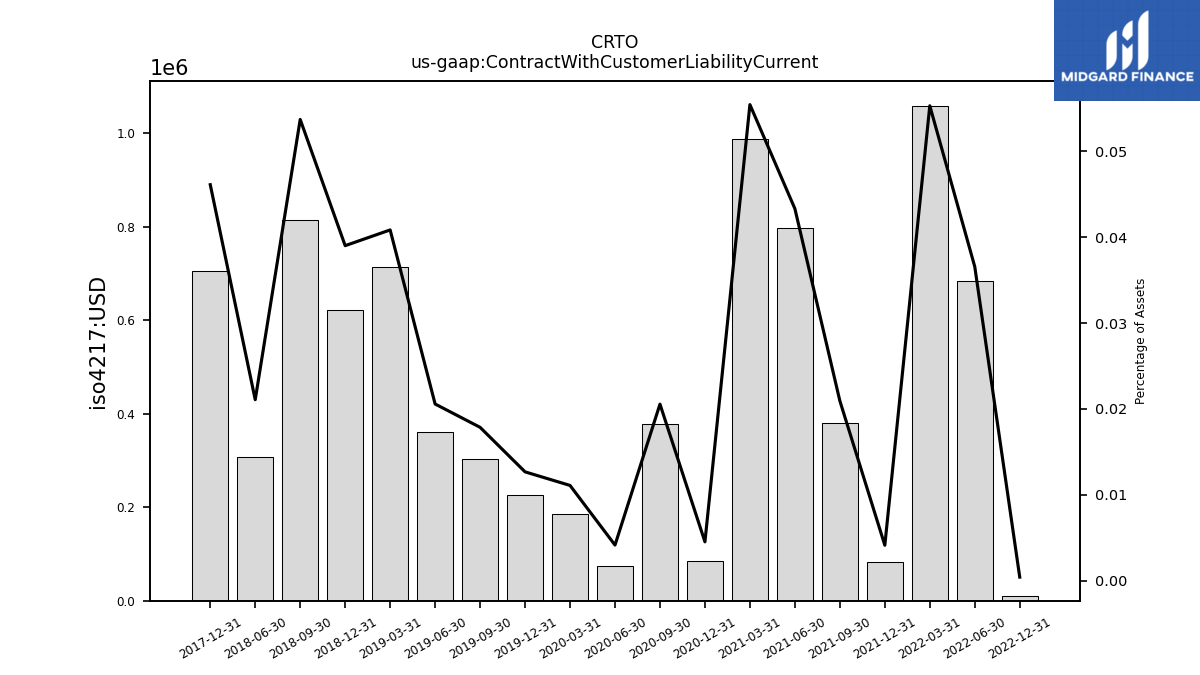
| Contract With Customer Liability Current | 0.01 | NA | 0.68 | 1.06 | 0.08 | 0.38 | 0.80 | 0.99 | 0.08 | 0.38 | 0.07 | 0.19 | 0.23 | 0.30 | 0.36 | 0.71 | 0.62 | 0.81 | 0.31 | NA | 0.71 | NA | NA | NA | NA | NA | NA | NA | NA | NA | NA | NA |
| 2022-12-31 | 2022-09-30 | 2022-06-30 | 2022-03-31 | 2021-12-31 | 2021-09-30 | 2021-06-30 | 2021-03-31 | 2020-12-31 | 2020-09-30 | 2020-06-30 | 2020-03-31 | 2019-12-31 | 2019-09-30 | 2019-06-30 | 2019-03-31 | 2018-12-31 | 2018-09-30 | 2018-06-30 | 2018-03-31 | 2017-12-31 | 2017-09-30 | 2017-06-30 | 2017-03-31 | 2016-12-31 | 2016-09-30 | 2016-06-30 | 2016-03-31 | 2015-12-31 | 2015-09-30 | 2015-06-30 | 2015-03-31 | ||
|---|---|---|---|---|---|---|---|---|---|---|---|---|---|---|---|---|---|---|---|---|---|---|---|---|---|---|---|---|---|---|---|---|---|
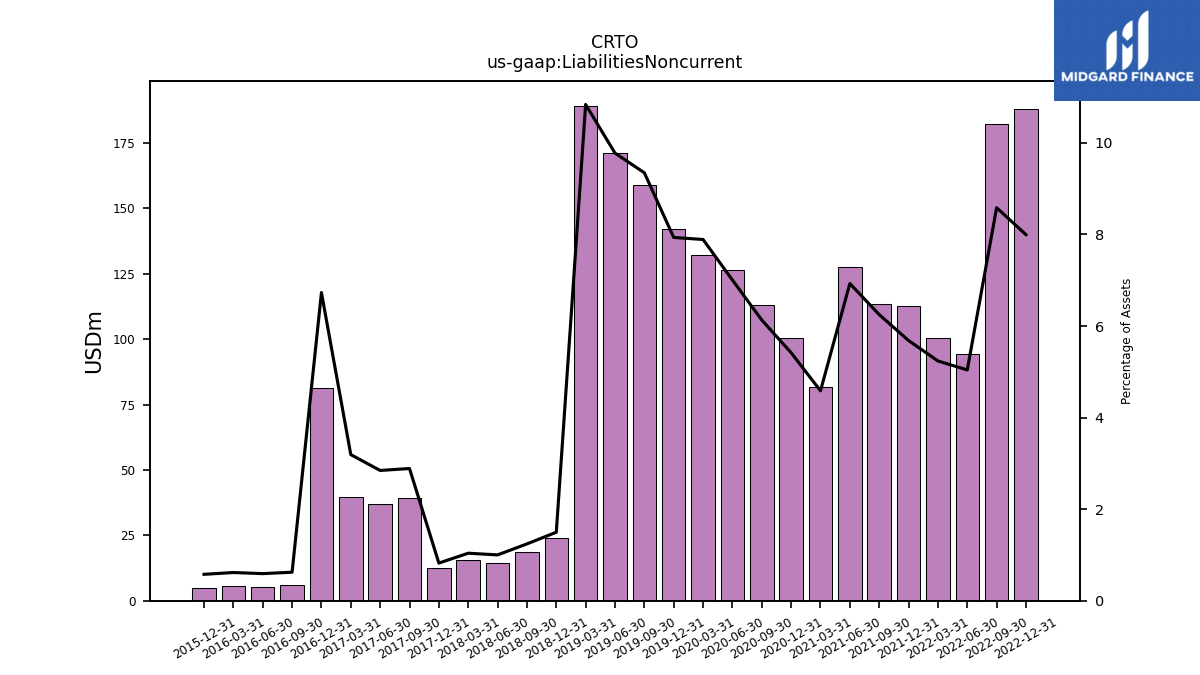
| Liabilities Noncurrent | 187.79 | 182.20 | 94.30 | 100.30 | 112.72 | 113.39 | 127.64 | 81.74 | 100.39 | 113.01 | 126.39 | 132.22 | 142.06 | 159.07 | 171.04 | 189.22 | 23.90 | 18.82 | 14.59 | 15.57 | 12.60 | 39.22 | 36.94 | 39.49 | 81.52 | 5.95 | 5.42 | 5.51 | 4.86 | NA | NA | NA | |
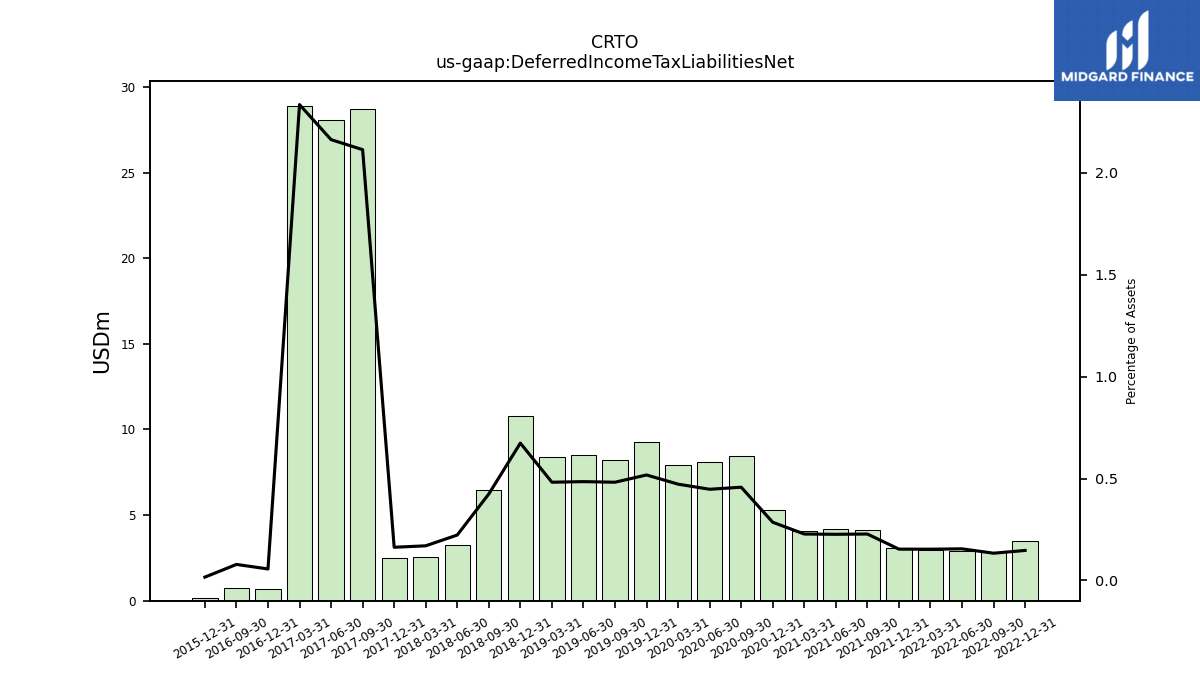
| Deferred Income Tax Liabilities Net | 3.46 | 2.84 | 2.91 | 2.94 | 3.05 | 4.14 | 4.18 | 4.07 | 5.30 | 8.44 | 8.08 | 7.92 | 9.27 | 8.21 | 8.49 | 8.42 | 10.77 | 6.44 | 3.25 | 2.55 | 2.50 | 28.72 | 28.09 | 28.90 | 0.69 | 0.75 | NA | NA | 0.14 | NA | NA | NA | |
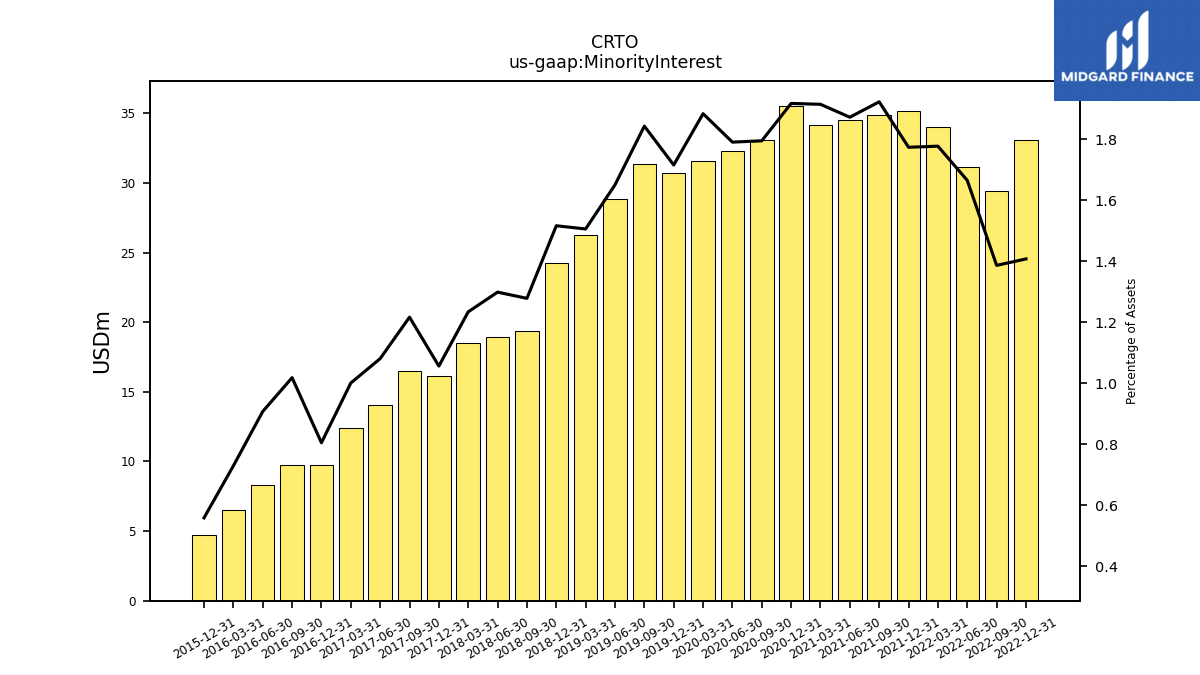
| Minority Interest | 33.06 | 29.43 | 31.16 | 34.05 | 35.19 | 34.90 | 34.50 | 34.14 | 35.55 | 33.09 | 32.31 | 31.58 | 30.72 | 31.37 | 28.88 | 26.29 | 24.22 | 19.38 | 18.92 | 18.50 | 16.17 | 16.52 | 14.03 | 12.38 | 9.74 | 9.71 | 8.30 | 6.51 | 4.70 | NA | NA | NA | |
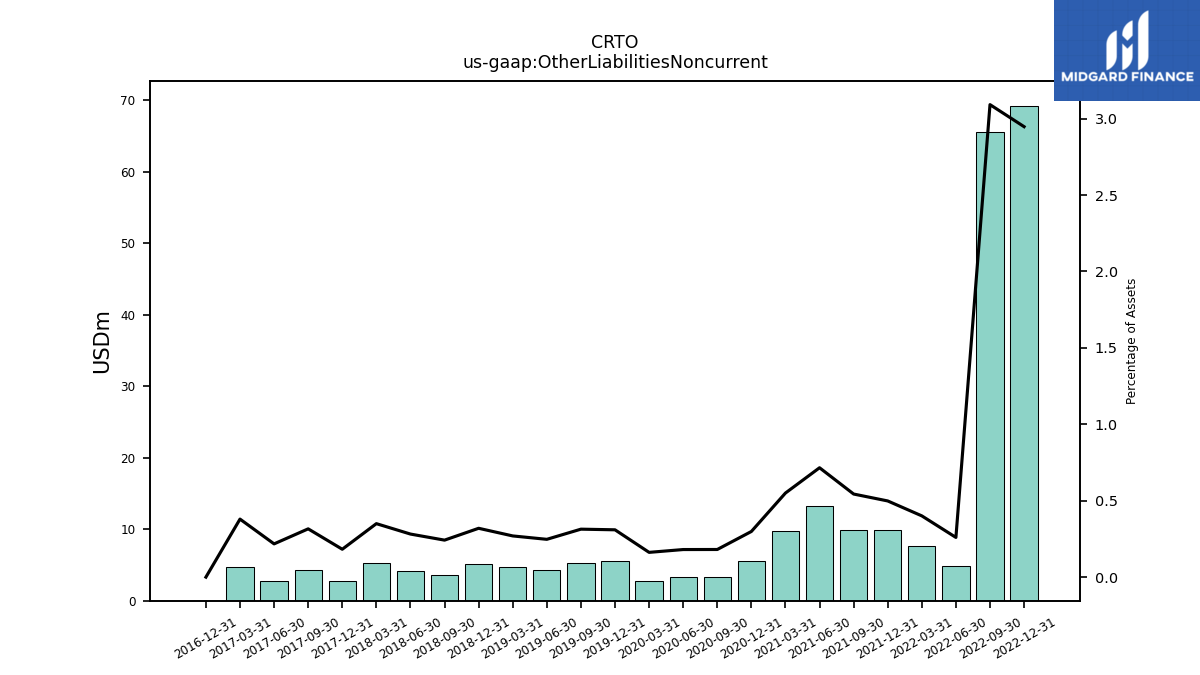
| Other Liabilities Noncurrent | 69.23 | 65.62 | 4.86 | 7.68 | 9.89 | 9.86 | 13.19 | 9.81 | 5.54 | 3.33 | 3.26 | 2.71 | 5.54 | 5.34 | 4.33 | 4.71 | 5.10 | 3.67 | 4.10 | 5.25 | 2.79 | 4.29 | 2.82 | 4.70 | 0.00 | NA | NA | NA | NA | NA | NA | NA | |
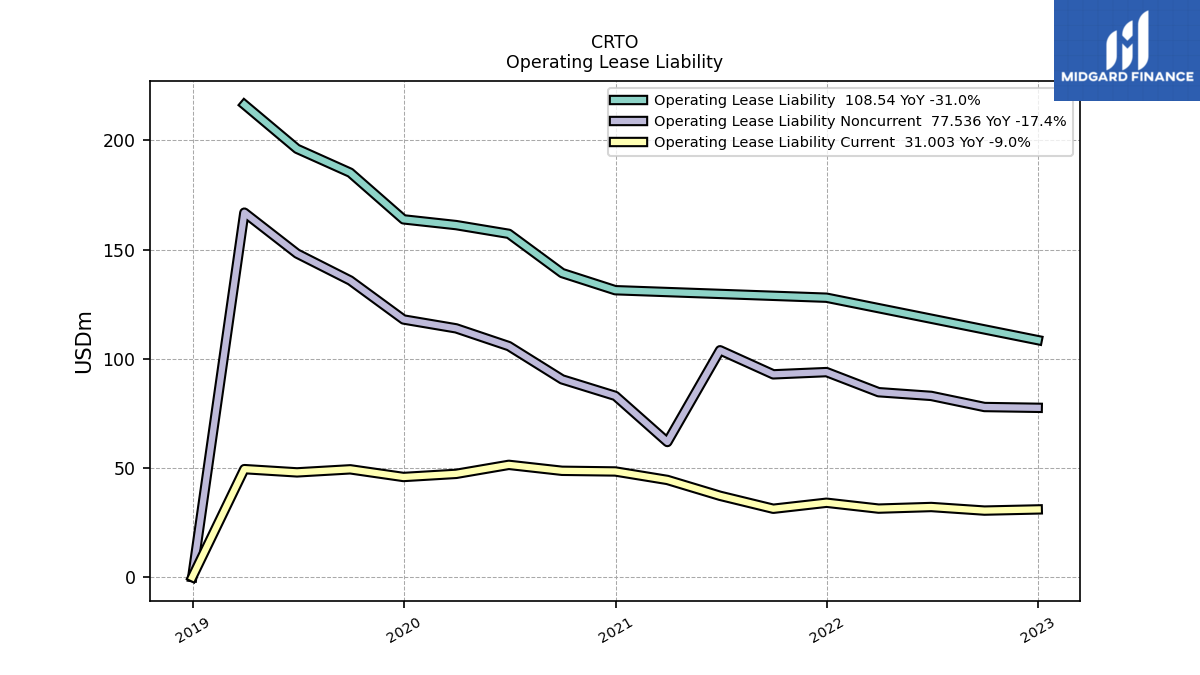
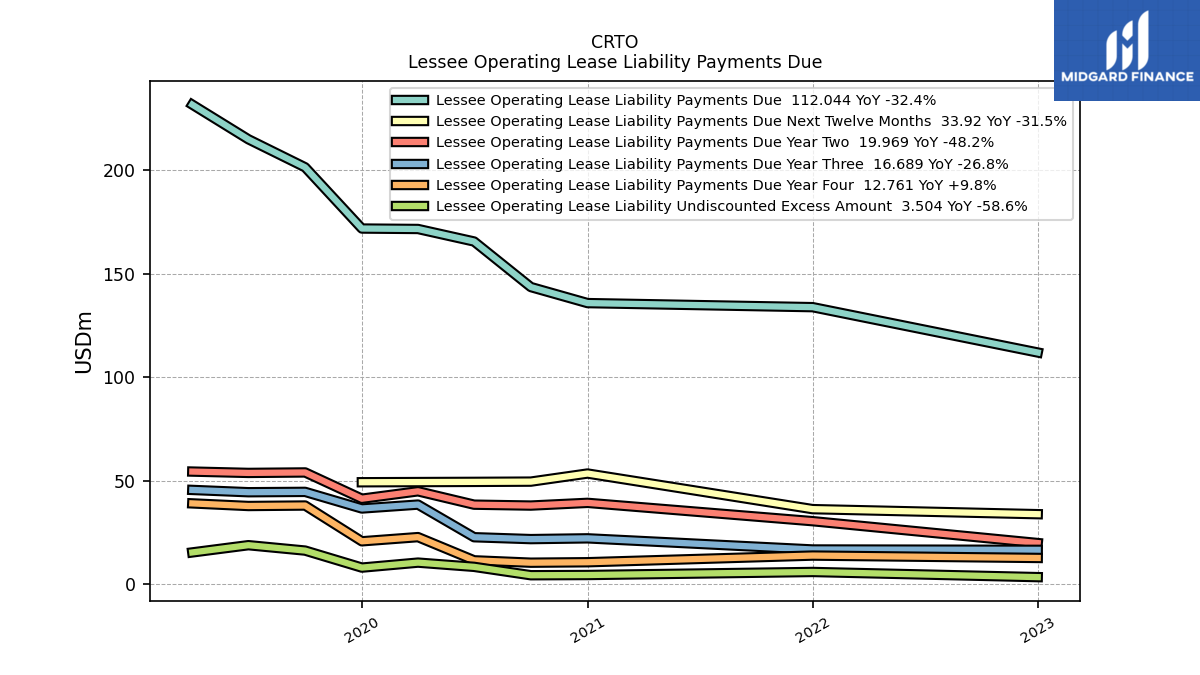
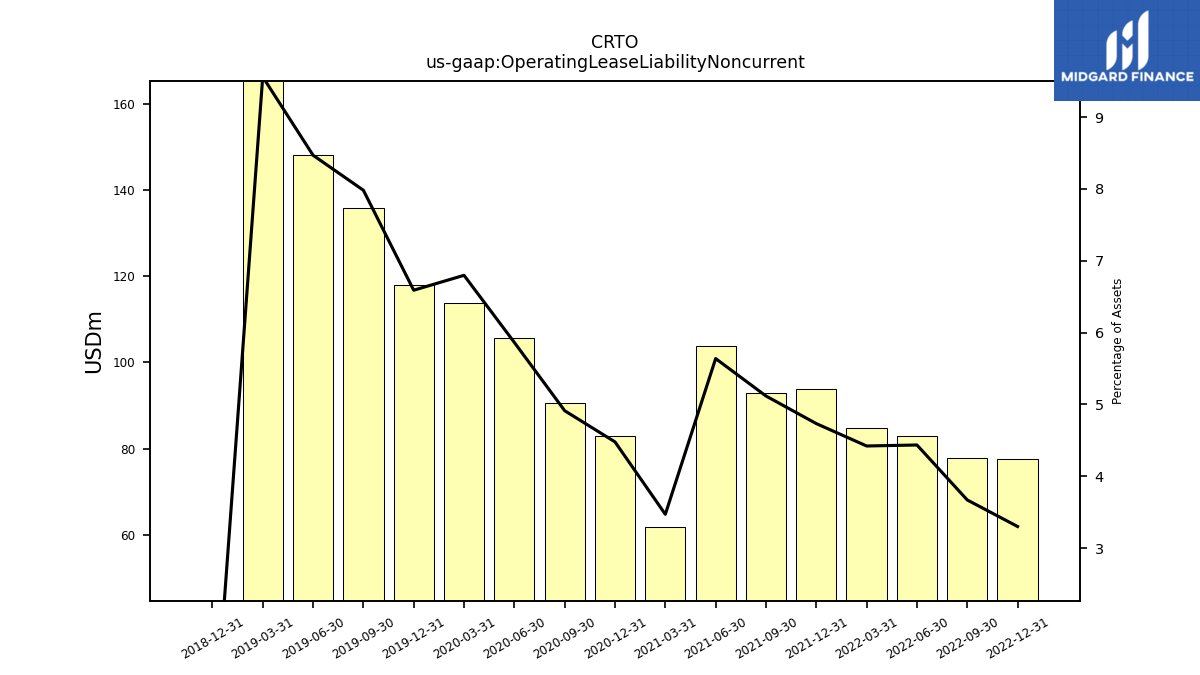
| Operating Lease Liability Noncurrent | 77.54 | 77.90 | 82.98 | 84.69 | 93.89 | 92.86 | 103.89 | 61.87 | 83.01 | 90.56 | 105.79 | 113.92 | 117.99 | 135.84 | 148.17 | 166.92 | 0.00 | NA | NA | NA | NA | NA | NA | NA | NA | NA | NA | NA | NA | NA | NA | NA |
| 2022-12-31 | 2022-09-30 | 2022-06-30 | 2022-03-31 | 2021-12-31 | 2021-09-30 | 2021-06-30 | 2021-03-31 | 2020-12-31 | 2020-09-30 | 2020-06-30 | 2020-03-31 | 2019-12-31 | 2019-09-30 | 2019-06-30 | 2019-03-31 | 2018-12-31 | 2018-09-30 | 2018-06-30 | 2018-03-31 | 2017-12-31 | 2017-09-30 | 2017-06-30 | 2017-03-31 | 2016-12-31 | 2016-09-30 | 2016-06-30 | 2016-03-31 | 2015-12-31 | 2015-09-30 | 2015-06-30 | 2015-03-31 | ||
|---|---|---|---|---|---|---|---|---|---|---|---|---|---|---|---|---|---|---|---|---|---|---|---|---|---|---|---|---|---|---|---|---|---|
| Stockholders Equity | 1048.04 | 1047.47 | 1079.03 | 1168.47 | 1163.13 | 1116.36 | 1123.57 | 1109.63 | 1117.14 | 1028.82 | 1002.68 | 995.03 | 1007.27 | 983.03 | 996.08 | 965.50 | 943.67 | 979.54 | 945.95 | 945.17 | 881.52 | 796.74 | 728.65 | 659.26 | 600.13 | 574.00 | 543.40 | 525.31 | 474.32 | NA | NA | NA | |
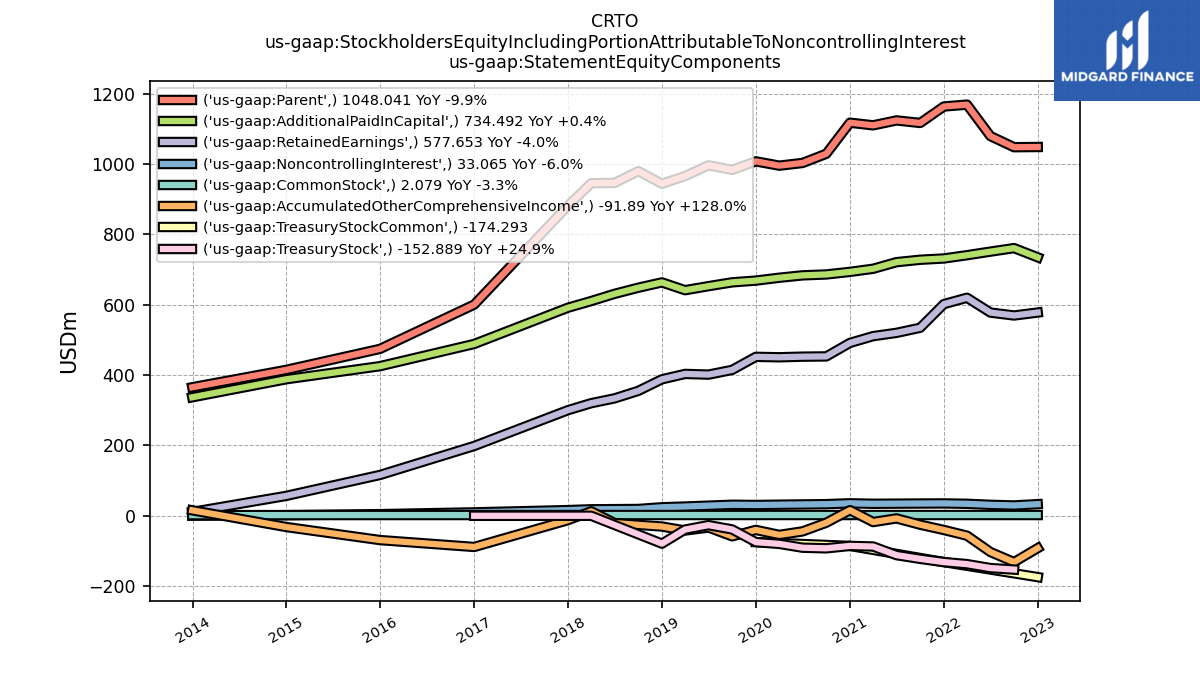
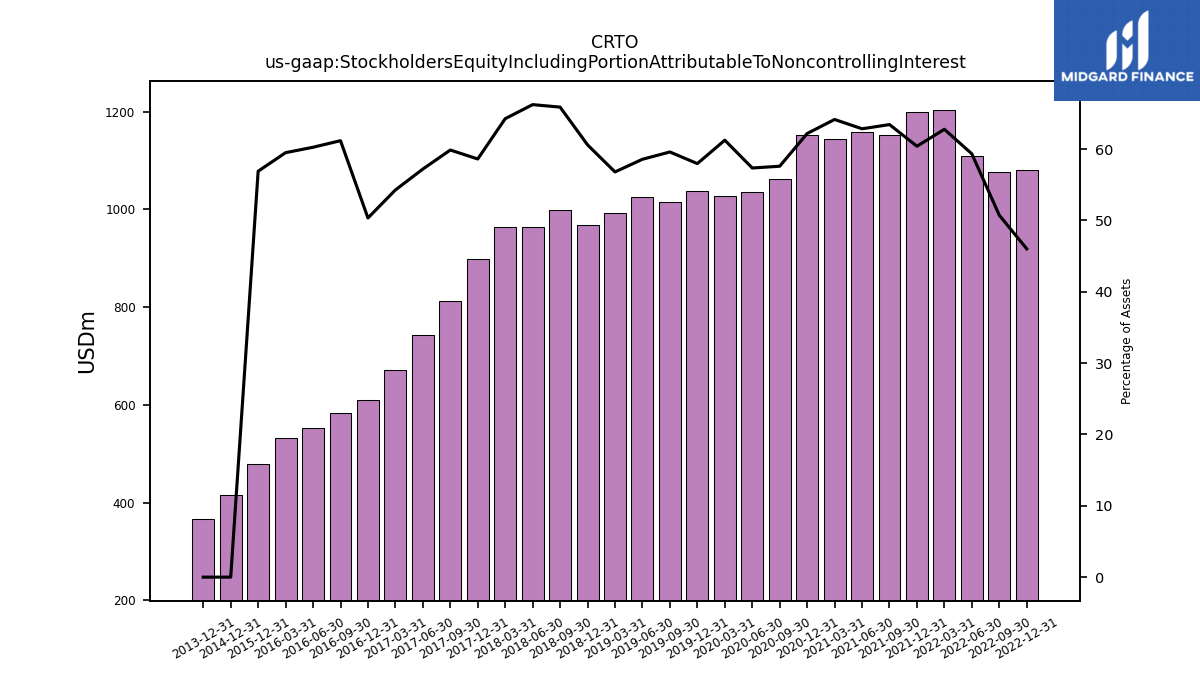
| Stockholders Equity Including Portion Attributable To Noncontrolling Interest | 1081.11 | 1076.90 | 1110.19 | 1202.52 | 1198.32 | 1151.25 | 1158.07 | 1143.76 | 1152.69 | 1061.91 | 1035.00 | 1026.61 | 1037.99 | 1014.40 | 1024.96 | 991.80 | 967.89 | 998.92 | 964.87 | 963.67 | 897.70 | 813.27 | 742.68 | 671.64 | 609.88 | 583.71 | 551.71 | 531.82 | 479.02 | NA | NA | NA | |
| Common Stock Value | 2.08 | 2.12 | 2.15 | 2.15 | 2.15 | 2.16 | 2.17 | 2.16 | 2.16 | 2.15 | 2.16 | 2.16 | 2.16 | 2.16 | 2.16 | 2.16 | 2.20 | 2.18 | 2.18 | 2.16 | 2.15 | 2.14 | 2.13 | 2.11 | 2.09 | 2.09 | 2.08 | 2.06 | 2.05 | NA | NA | NA | |
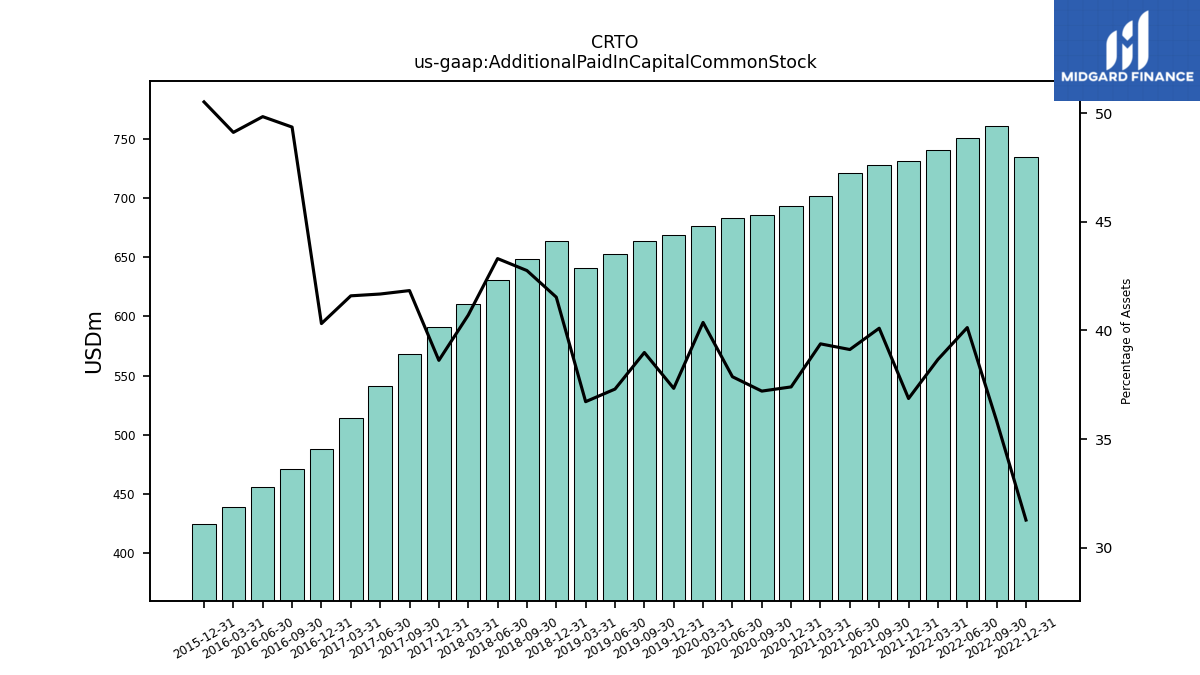
| Additional Paid In Capital Common Stock | 734.49 | 760.67 | 750.77 | 740.51 | 731.25 | 727.61 | 720.76 | 702.02 | 693.16 | 685.84 | 683.29 | 676.51 | 668.39 | 663.44 | 652.57 | 641.09 | 663.28 | 648.14 | 630.77 | 610.28 | 591.40 | 568.17 | 541.00 | 514.65 | 488.28 | 470.87 | 456.24 | 438.94 | 425.22 | NA | NA | NA | |
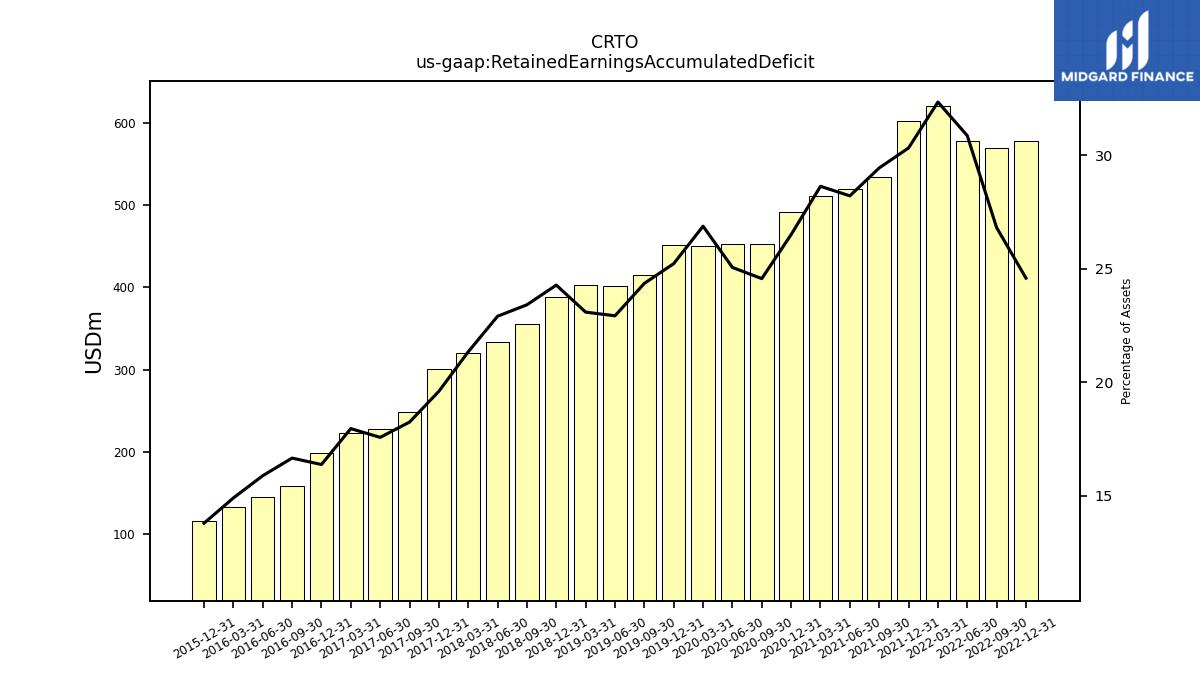
| Retained Earnings Accumulated Deficit | 577.65 | 569.22 | 577.55 | 619.64 | 601.59 | 534.32 | 519.89 | 510.53 | 491.36 | 452.93 | 452.25 | 450.48 | 451.73 | 414.59 | 401.21 | 403.20 | 387.87 | 355.00 | 333.73 | 320.02 | 300.21 | 247.82 | 228.14 | 222.24 | 198.35 | 158.94 | 145.41 | 133.21 | 116.08 | NA | NA | NA | |
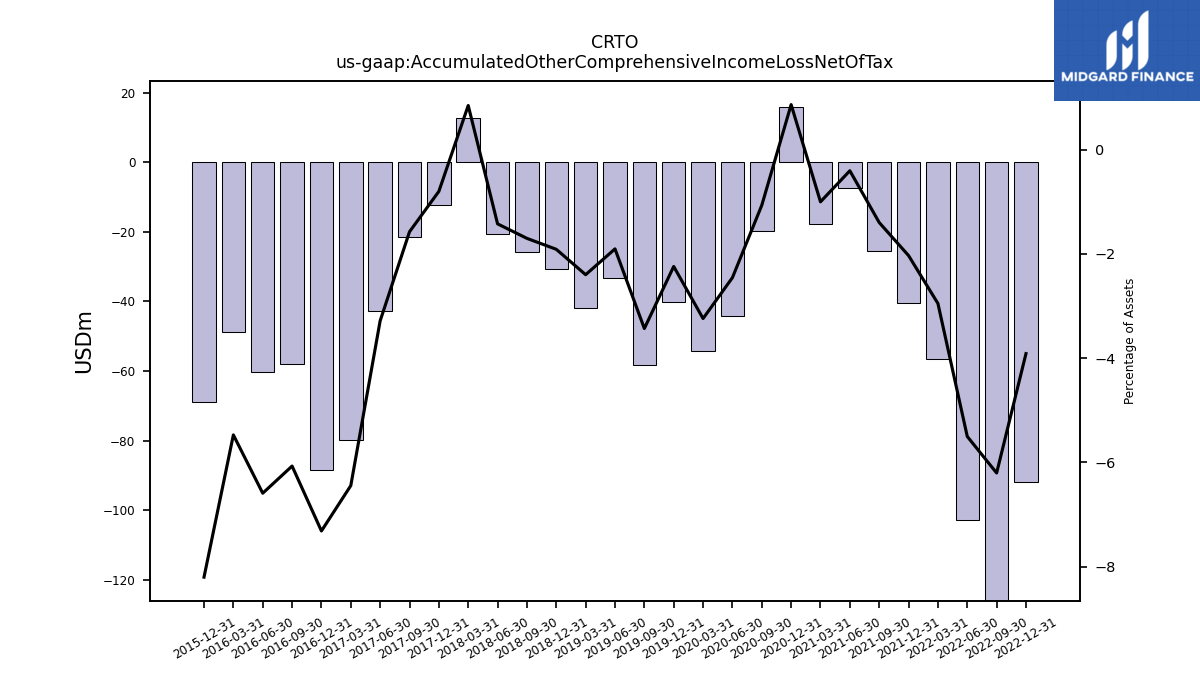
| Accumulated Other Comprehensive Income Loss Net Of Tax | -91.89 | -131.65 | -102.93 | -56.50 | -40.29 | -25.35 | -7.44 | -17.82 | 16.03 | -19.66 | -44.30 | -54.28 | -40.10 | -58.38 | -33.29 | -41.87 | -30.52 | -25.79 | -20.72 | 12.71 | -12.24 | -21.39 | -42.62 | -79.74 | -88.59 | -57.90 | -60.33 | -48.90 | -69.02 | NA | NA | NA | |
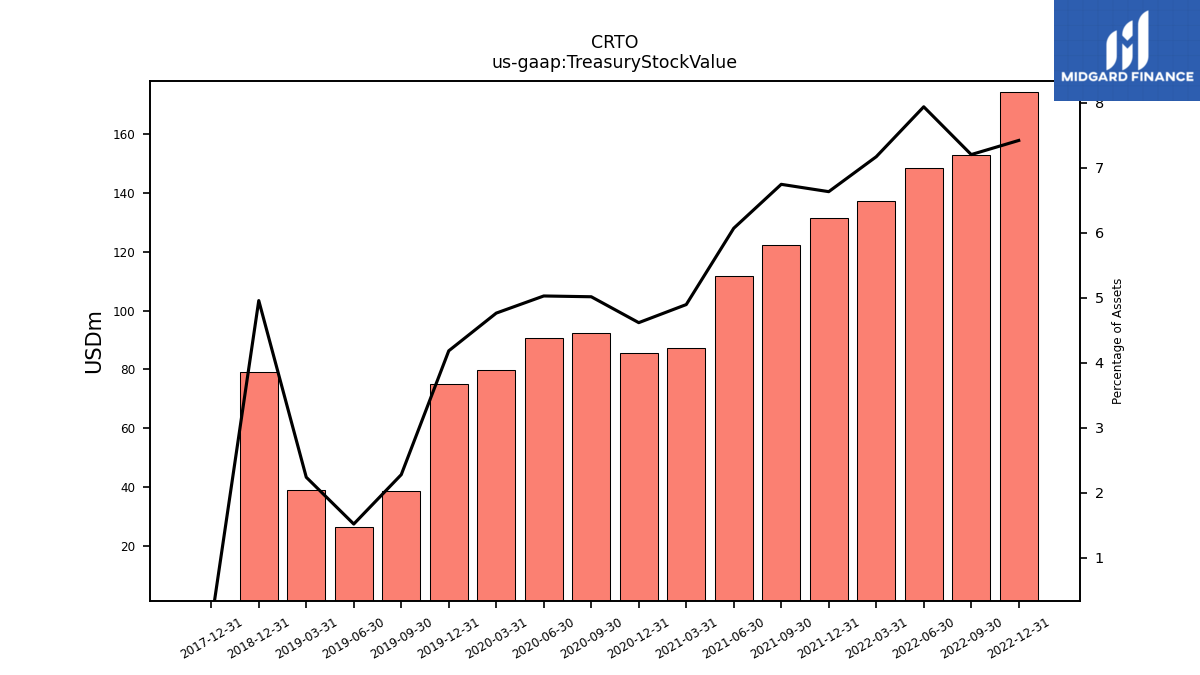
| Treasury Stock Value | 174.29 | 152.89 | 148.51 | 137.33 | 131.56 | 122.39 | 111.82 | 87.26 | 85.57 | 92.45 | 90.71 | 79.83 | 74.90 | 38.77 | 26.56 | 39.08 | 79.16 | NA | NA | NA | 0.00 | NA | NA | NA | NA | NA | NA | NA | NA | NA | NA | NA | |
| Minority Interest | 33.06 | 29.43 | 31.16 | 34.05 | 35.19 | 34.90 | 34.50 | 34.14 | 35.55 | 33.09 | 32.31 | 31.58 | 30.72 | 31.37 | 28.88 | 26.29 | 24.22 | 19.38 | 18.92 | 18.50 | 16.17 | 16.52 | 14.03 | 12.38 | 9.74 | 9.71 | 8.30 | 6.51 | 4.70 | NA | NA | NA | |
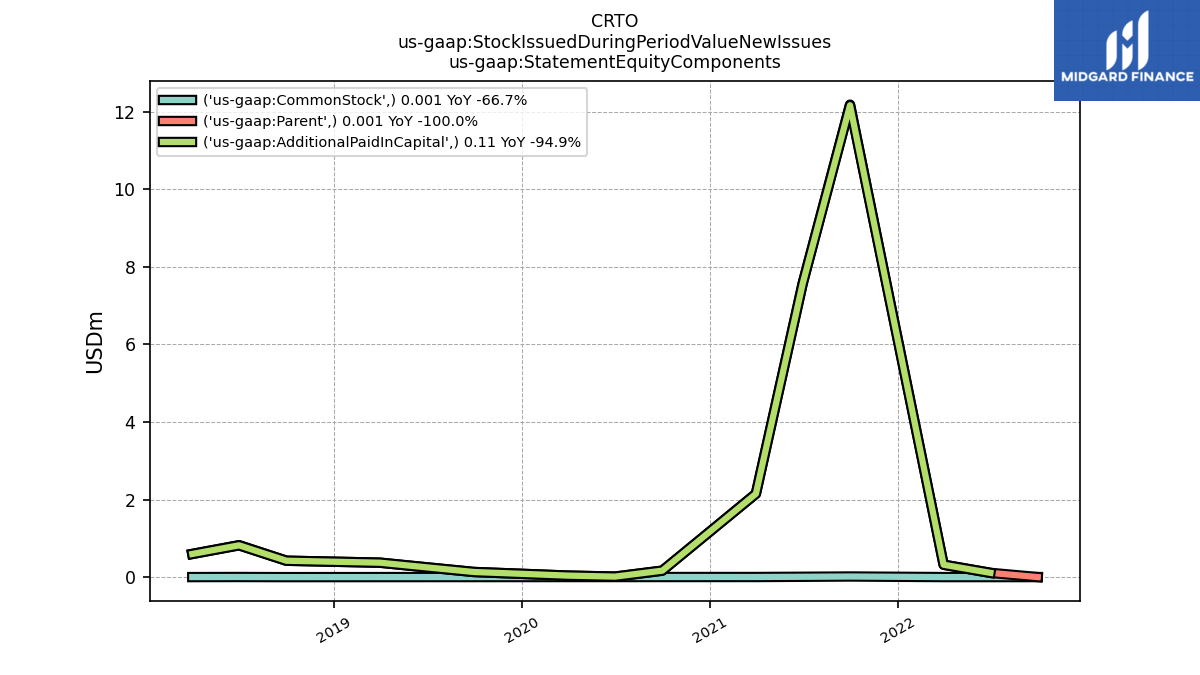
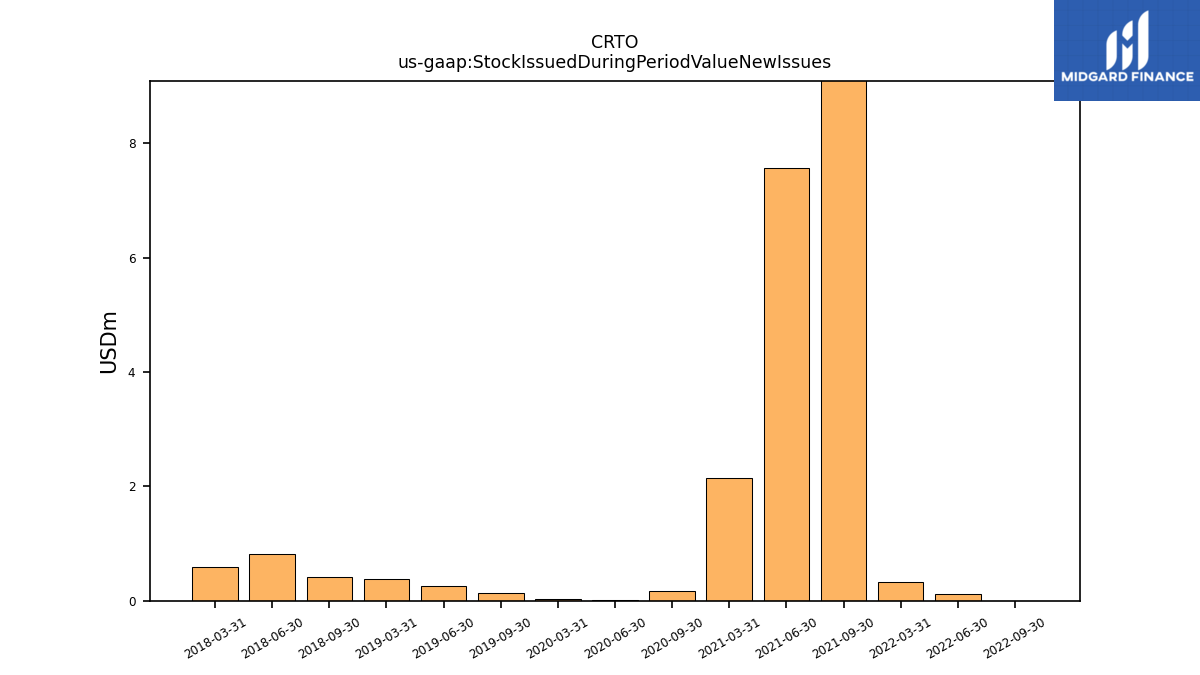
| Stock Issued During Period Value New Issues | NA | 0.00 | 0.11 | 0.32 | NA | 12.18 | 7.58 | 2.15 | NA | 0.17 | 0.01 | 0.04 | NA | 0.13 | 0.25 | 0.37 | NA | 0.42 | 0.82 | 0.60 | NA | NA | NA | NA | NA | NA | NA | NA | NA | NA | NA | NA | |
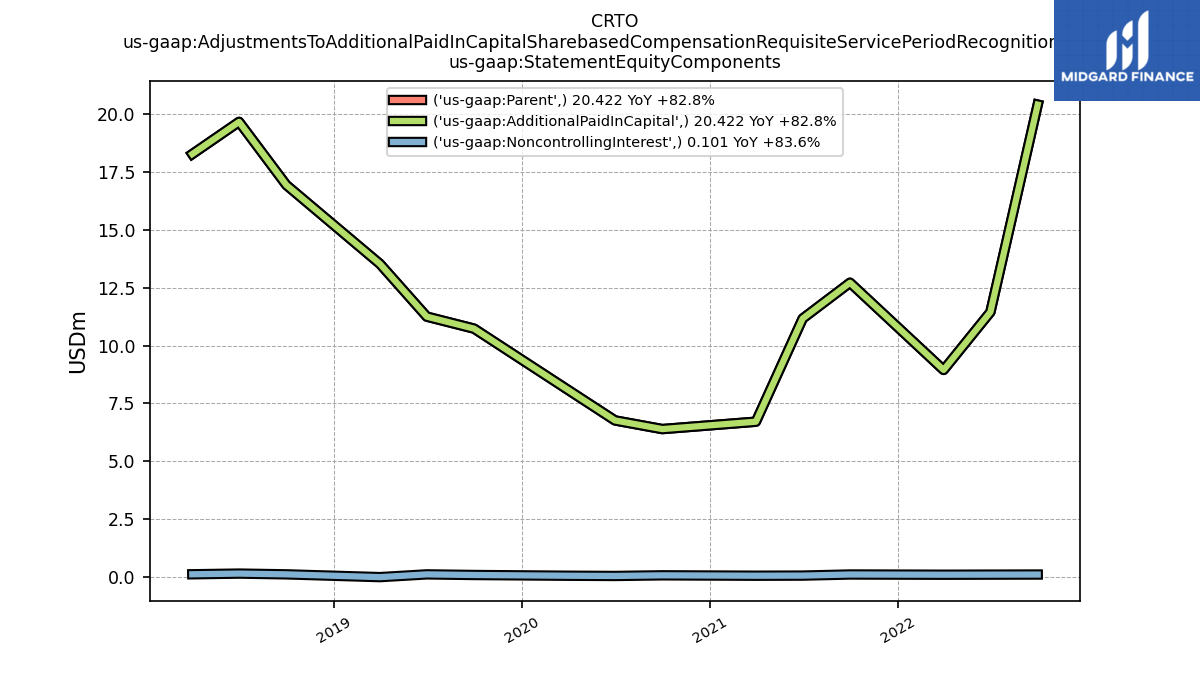
| Adjustments To Additional Paid In Capital Sharebased Compensation Requisite Service Period Recognition Value | NA | 20.52 | 11.55 | 9.04 | NA | 12.82 | 11.23 | 6.76 | NA | 6.46 | 6.80 | 8.13 | NA | 10.82 | 11.36 | 13.52 | NA | 17.05 | 19.82 | 18.40 | NA | NA | NA | NA | NA | NA | NA | NA | NA | NA | NA | NA |
| 2022-12-31 | 2022-09-30 | 2022-06-30 | 2022-03-31 | 2021-12-31 | 2021-09-30 | 2021-06-30 | 2021-03-31 | 2020-12-31 | 2020-09-30 | 2020-06-30 | 2020-03-31 | 2019-12-31 | 2019-09-30 | 2019-06-30 | 2019-03-31 | 2018-12-31 | 2018-09-30 | 2018-06-30 | 2018-03-31 | 2017-12-31 | 2017-09-30 | 2017-06-30 | 2017-03-31 | 2016-12-31 | 2016-09-30 | 2016-06-30 | 2016-03-31 | 2015-12-31 | 2015-09-30 | 2015-06-30 | 2015-03-31 | ||
|---|---|---|---|---|---|---|---|---|---|---|---|---|---|---|---|---|---|---|---|---|---|---|---|---|---|---|---|---|---|---|---|---|---|
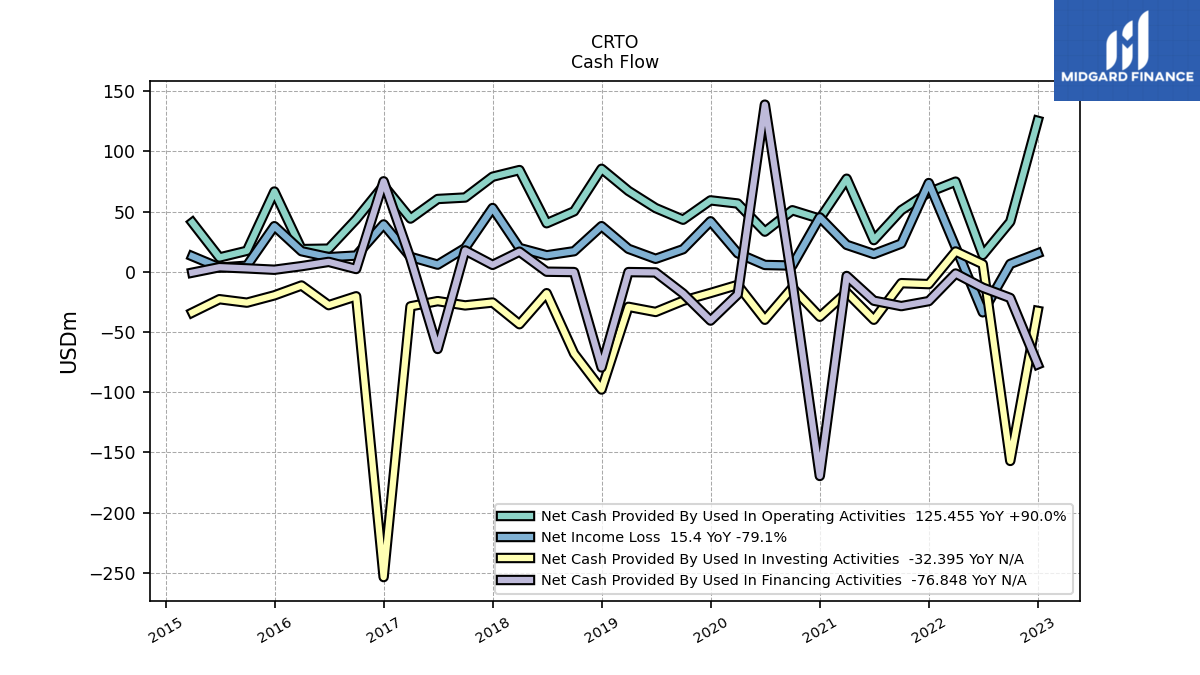
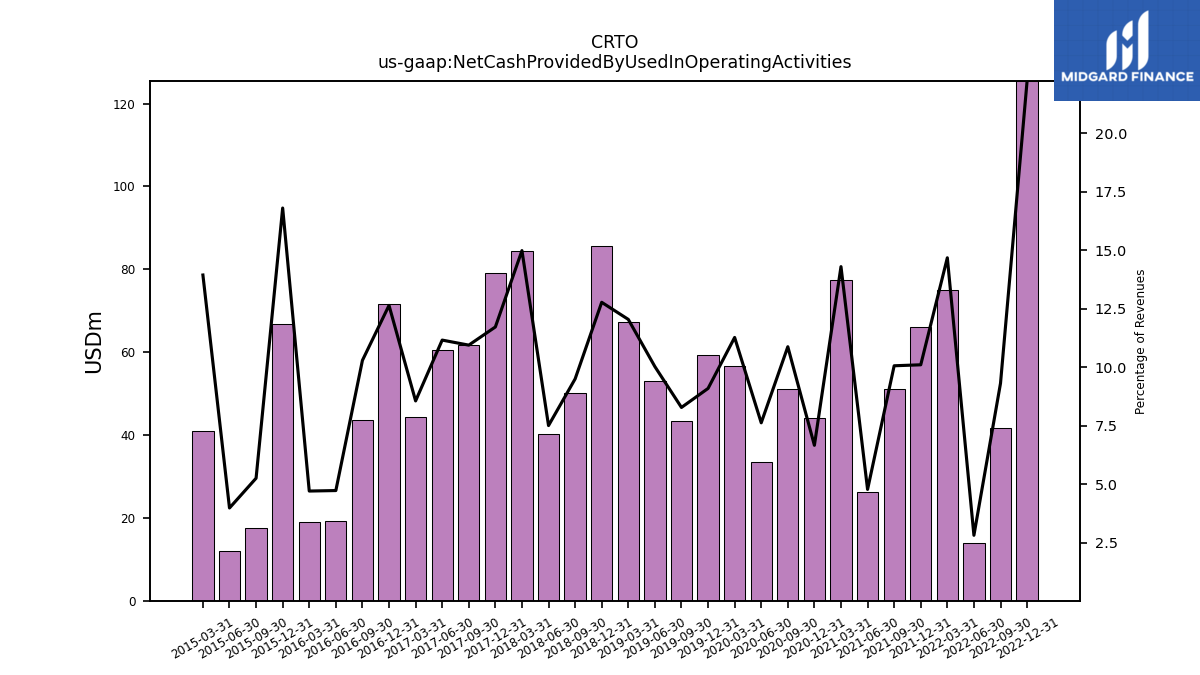
| Net Cash Provided By Used In Operating Activities | 125.45 | 41.63 | 13.97 | 74.93 | 66.01 | 51.18 | 26.36 | 77.36 | 44.08 | 51.16 | 33.38 | 56.74 | 59.36 | 43.29 | 52.96 | 67.22 | 85.60 | 50.26 | 40.34 | 84.53 | 79.00 | 61.73 | 60.49 | 44.24 | 71.66 | 43.63 | 19.27 | 18.91 | 66.70 | 17.50 | 11.94 | 41.01 | |
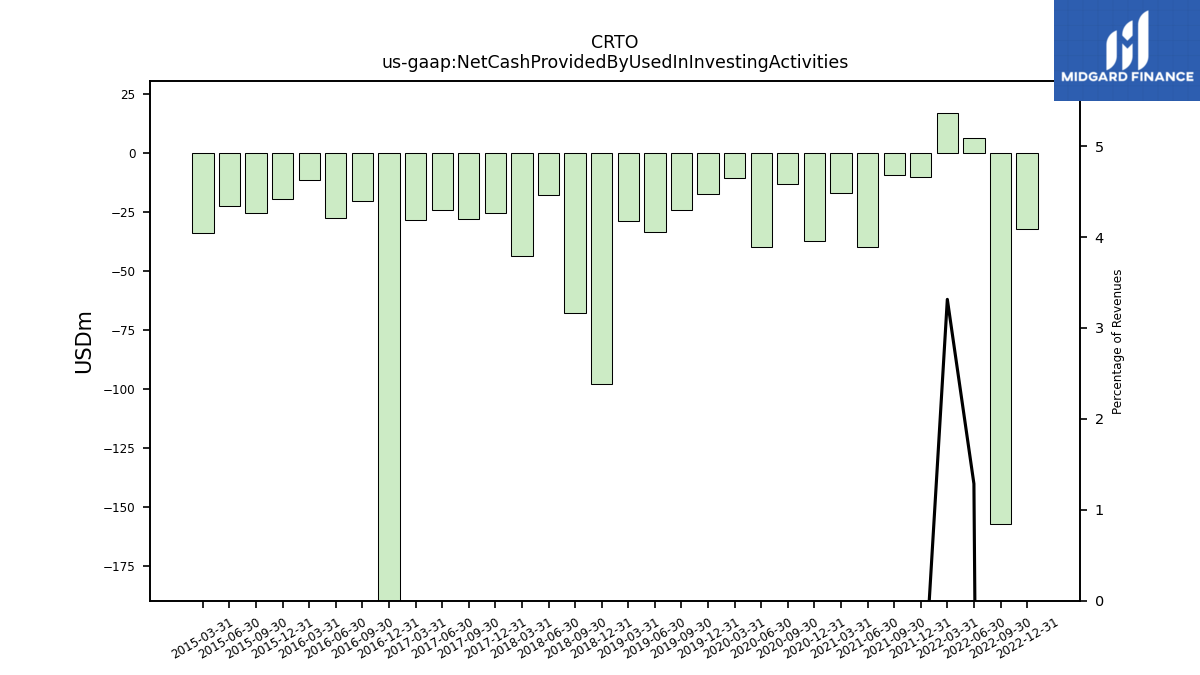
| Net Cash Provided By Used In Investing Activities | -32.40 | -157.02 | 6.37 | 16.93 | -10.17 | -9.38 | -39.78 | -17.03 | -37.29 | -13.18 | -39.77 | -10.85 | -17.54 | -24.00 | -33.31 | -29.04 | -97.73 | -67.80 | -17.69 | -43.49 | -25.46 | -27.86 | -24.30 | -28.64 | -253.49 | -20.28 | -27.67 | -11.33 | -19.52 | -25.59 | -22.71 | -33.82 | |
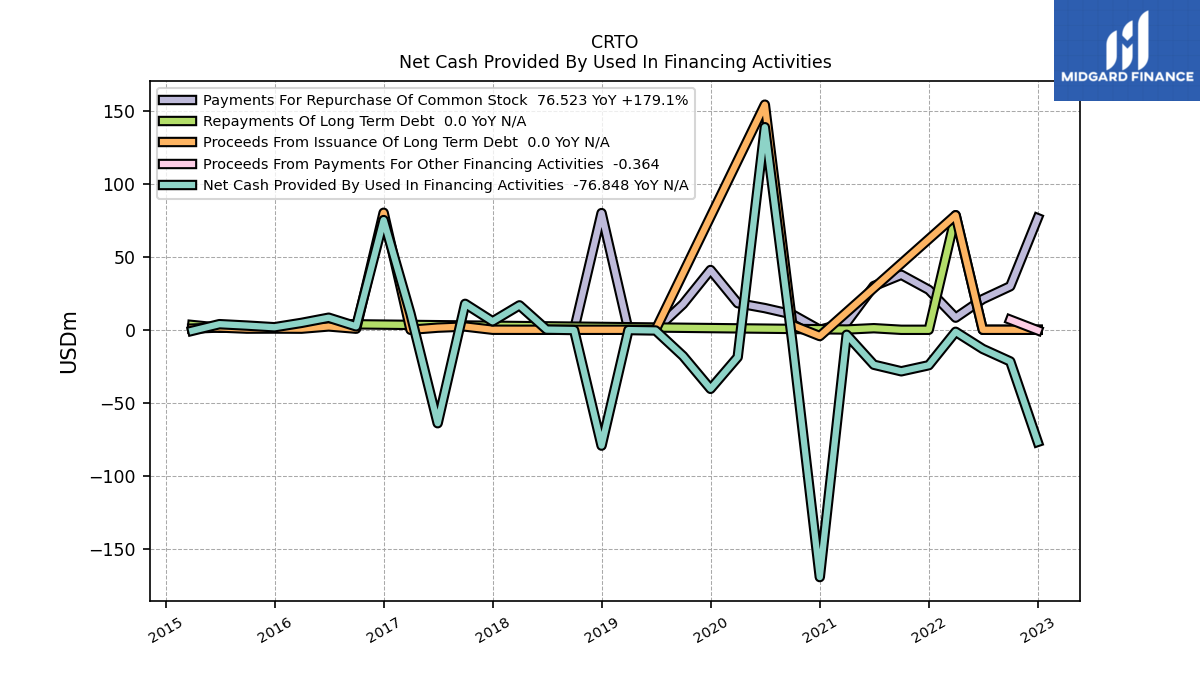
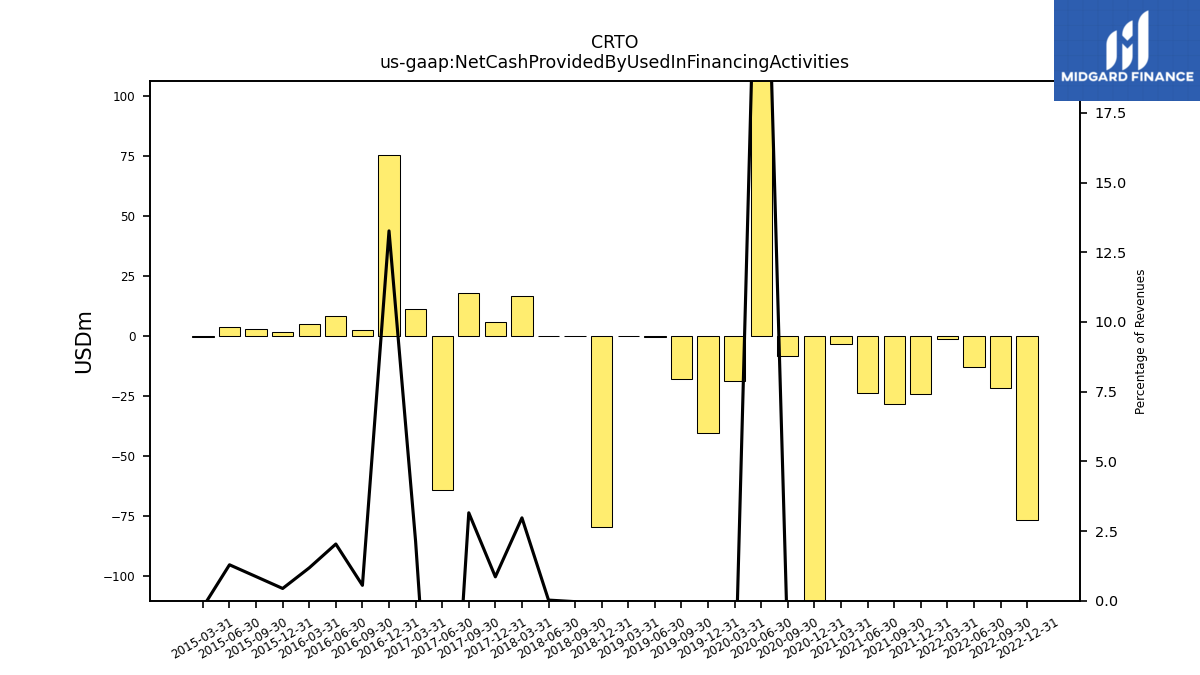
| Net Cash Provided By Used In Financing Activities | -76.85 | -21.69 | -13.14 | -1.37 | -24.30 | -28.45 | -23.96 | -3.42 | -169.50 | -8.34 | 138.86 | -18.76 | -40.47 | -17.97 | -0.47 | -0.19 | -79.40 | -0.17 | 0.13 | 16.77 | 5.79 | 17.79 | -64.05 | 11.00 | 75.20 | 2.35 | 8.29 | 4.74 | 1.75 | 2.88 | 3.86 | -0.68 |
| 2022-12-31 | 2022-09-30 | 2022-06-30 | 2022-03-31 | 2021-12-31 | 2021-09-30 | 2021-06-30 | 2021-03-31 | 2020-12-31 | 2020-09-30 | 2020-06-30 | 2020-03-31 | 2019-12-31 | 2019-09-30 | 2019-06-30 | 2019-03-31 | 2018-12-31 | 2018-09-30 | 2018-06-30 | 2018-03-31 | 2017-12-31 | 2017-09-30 | 2017-06-30 | 2017-03-31 | 2016-12-31 | 2016-09-30 | 2016-06-30 | 2016-03-31 | 2015-12-31 | 2015-09-30 | 2015-06-30 | 2015-03-31 | ||
|---|---|---|---|---|---|---|---|---|---|---|---|---|---|---|---|---|---|---|---|---|---|---|---|---|---|---|---|---|---|---|---|---|---|
| Net Cash Provided By Used In Operating Activities | 125.45 | 41.63 | 13.97 | 74.93 | 66.01 | 51.18 | 26.36 | 77.36 | 44.08 | 51.16 | 33.38 | 56.74 | 59.36 | 43.29 | 52.96 | 67.22 | 85.60 | 50.26 | 40.34 | 84.53 | 79.00 | 61.73 | 60.49 | 44.24 | 71.66 | 43.63 | 19.27 | 18.91 | 66.70 | 17.50 | 11.94 | 41.01 | |
| Net Income Loss | 15.40 | 6.58 | -33.61 | 20.59 | 73.77 | 23.48 | 14.80 | 22.41 | 45.28 | 5.23 | 5.72 | 15.46 | 42.02 | 18.78 | 10.82 | 19.12 | 37.97 | 17.14 | 13.73 | 19.81 | 53.03 | 19.77 | 5.97 | 12.44 | 39.40 | 13.54 | 12.20 | 17.13 | 37.94 | 5.10 | 3.54 | 12.98 | |
| Profit Loss | 16.05 | 6.52 | -32.97 | 21.28 | 74.94 | 24.23 | 15.03 | 23.45 | 46.82 | 5.29 | 6.15 | 16.43 | 41.47 | 20.56 | 12.54 | 21.40 | 42.13 | 17.95 | 14.71 | 21.09 | 52.37 | 22.27 | 7.50 | 14.52 | 40.74 | 14.72 | 13.34 | 18.53 | 38.94 | 5.79 | 3.93 | 13.62 | |
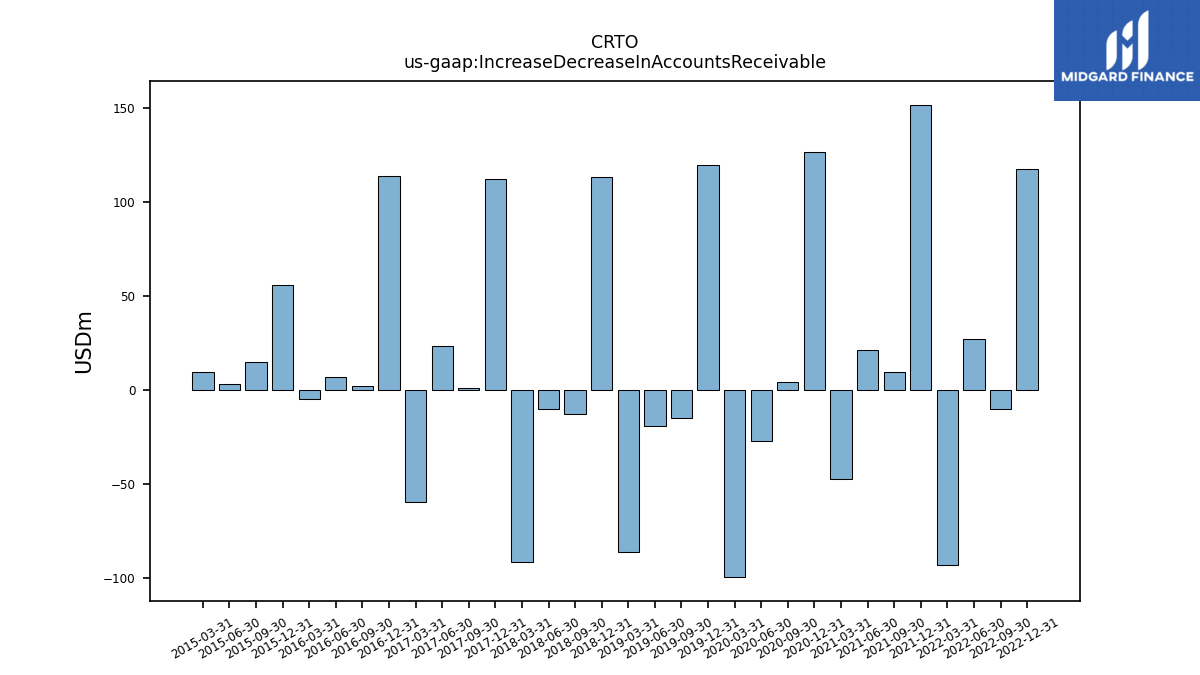
| Increase Decrease In Accounts Receivable | 117.31 | -9.92 | 27.26 | -92.74 | 151.60 | 9.54 | 21.03 | -47.23 | 126.49 | 4.18 | -27.32 | -99.39 | 119.29 | -14.82 | -19.32 | -86.02 | 113.02 | -12.93 | -10.15 | -91.29 | 112.13 | 0.99 | 23.36 | -59.57 | 113.44 | 2.16 | 7.13 | -4.76 | 55.99 | 14.79 | 3.22 | 9.42 | |
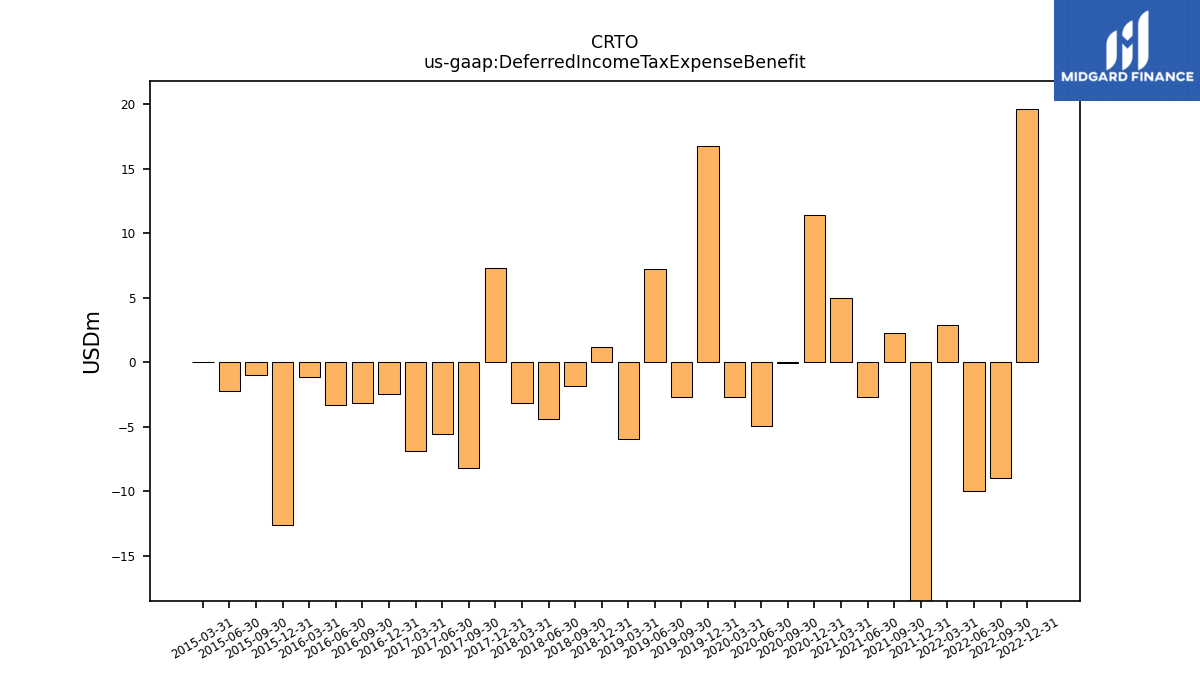
| Deferred Income Tax Expense Benefit | 19.65 | -8.94 | -9.98 | 2.87 | -23.21 | 2.26 | -2.69 | 5.00 | 11.42 | -0.08 | -4.94 | -2.68 | 16.79 | -2.71 | 7.25 | -5.92 | 1.18 | -1.81 | -4.39 | -3.15 | 7.30 | -8.16 | -5.54 | -6.87 | -2.48 | -3.12 | -3.29 | -1.14 | -12.60 | -0.98 | -2.20 | 0.03 | |
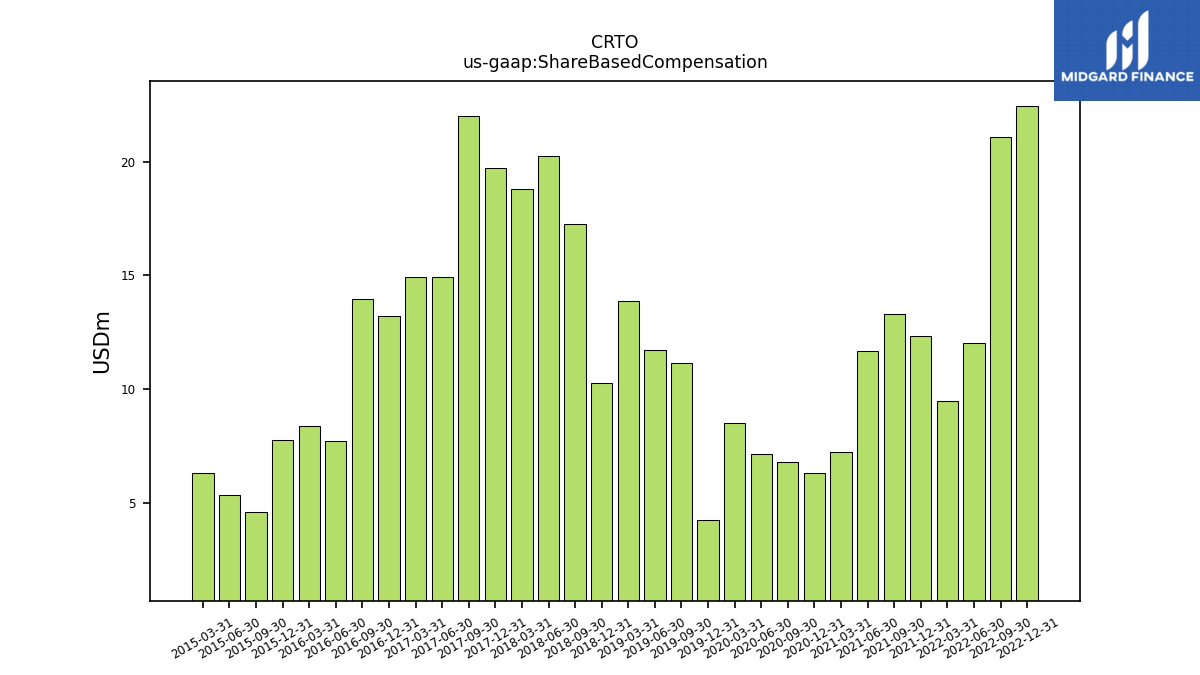
| Share Based Compensation | 22.44 | 21.08 | 12.02 | 9.49 | 12.35 | 13.29 | 11.67 | 7.21 | 6.30 | 6.80 | 7.16 | 8.50 | 4.24 | 11.16 | 11.71 | 13.88 | 10.27 | 17.26 | 20.24 | 18.83 | 19.73 | 22.03 | 14.92 | 14.94 | 13.23 | 13.96 | 7.70 | 8.37 | 7.75 | 4.60 | 5.33 | 6.32 |
| 2022-12-31 | 2022-09-30 | 2022-06-30 | 2022-03-31 | 2021-12-31 | 2021-09-30 | 2021-06-30 | 2021-03-31 | 2020-12-31 | 2020-09-30 | 2020-06-30 | 2020-03-31 | 2019-12-31 | 2019-09-30 | 2019-06-30 | 2019-03-31 | 2018-12-31 | 2018-09-30 | 2018-06-30 | 2018-03-31 | 2017-12-31 | 2017-09-30 | 2017-06-30 | 2017-03-31 | 2016-12-31 | 2016-09-30 | 2016-06-30 | 2016-03-31 | 2015-12-31 | 2015-09-30 | 2015-06-30 | 2015-03-31 | ||
|---|---|---|---|---|---|---|---|---|---|---|---|---|---|---|---|---|---|---|---|---|---|---|---|---|---|---|---|---|---|---|---|---|---|
| Net Cash Provided By Used In Investing Activities | -32.40 | -157.02 | 6.37 | 16.93 | -10.17 | -9.38 | -39.78 | -17.03 | -37.29 | -13.18 | -39.77 | -10.85 | -17.54 | -24.00 | -33.31 | -29.04 | -97.73 | -67.80 | -17.69 | -43.49 | -25.46 | -27.86 | -24.30 | -28.64 | -253.49 | -20.28 | -27.67 | -11.33 | -19.52 | -25.59 | -22.71 | -33.82 |
| 2022-12-31 | 2022-09-30 | 2022-06-30 | 2022-03-31 | 2021-12-31 | 2021-09-30 | 2021-06-30 | 2021-03-31 | 2020-12-31 | 2020-09-30 | 2020-06-30 | 2020-03-31 | 2019-12-31 | 2019-09-30 | 2019-06-30 | 2019-03-31 | 2018-12-31 | 2018-09-30 | 2018-06-30 | 2018-03-31 | 2017-12-31 | 2017-09-30 | 2017-06-30 | 2017-03-31 | 2016-12-31 | 2016-09-30 | 2016-06-30 | 2016-03-31 | 2015-12-31 | 2015-09-30 | 2015-06-30 | 2015-03-31 | ||
|---|---|---|---|---|---|---|---|---|---|---|---|---|---|---|---|---|---|---|---|---|---|---|---|---|---|---|---|---|---|---|---|---|---|
| Net Cash Provided By Used In Financing Activities | -76.85 | -21.69 | -13.14 | -1.37 | -24.30 | -28.45 | -23.96 | -3.42 | -169.50 | -8.34 | 138.86 | -18.76 | -40.47 | -17.97 | -0.47 | -0.19 | -79.40 | -0.17 | 0.13 | 16.77 | 5.79 | 17.79 | -64.05 | 11.00 | 75.20 | 2.35 | 8.29 | 4.74 | 1.75 | 2.88 | 3.86 | -0.68 | |
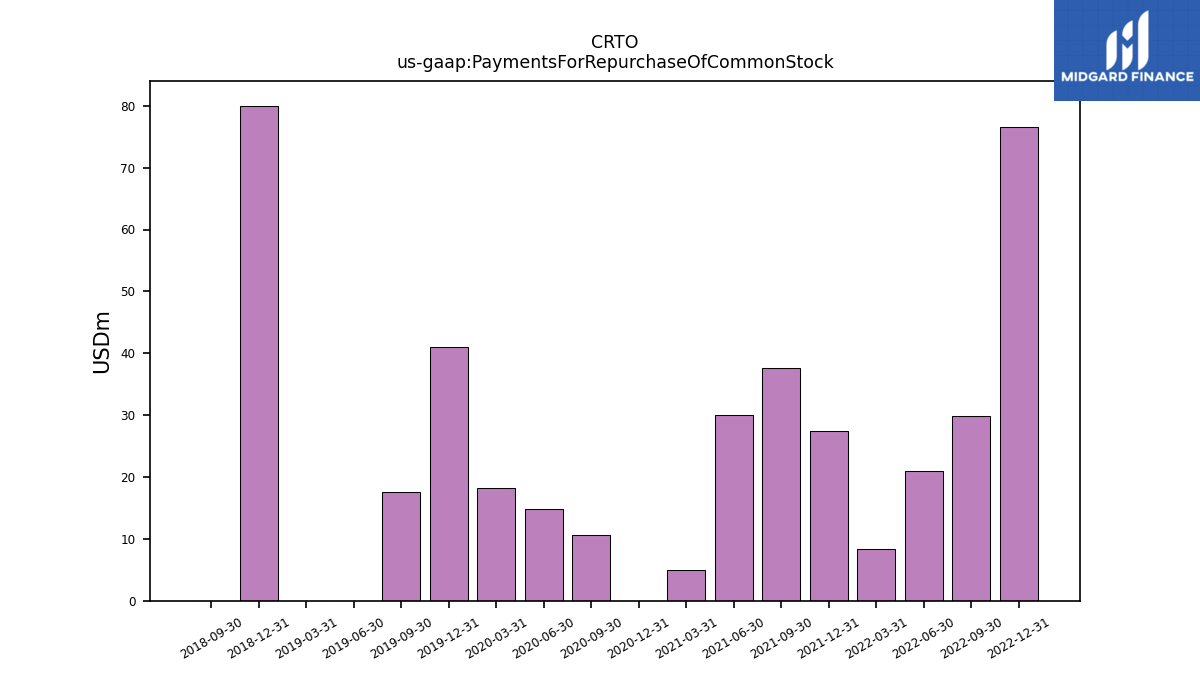
| Payments For Repurchase Of Common Stock | 76.52 | 29.83 | 21.03 | 8.30 | 27.42 | 37.68 | 30.00 | 4.93 | 0.00 | 10.55 | 14.86 | 18.24 | 40.98 | 17.60 | 0.00 | 0.00 | 80.00 | 0.00 | NA | NA | NA | NA | NA | NA | NA | NA | NA | NA | NA | NA | NA | NA |
| 2022-12-31 | 2022-09-30 | 2022-06-30 | 2022-03-31 | 2021-12-31 | 2021-09-30 | 2021-06-30 | 2021-03-31 | 2020-12-31 | 2020-09-30 | 2020-06-30 | 2020-03-31 | 2019-12-31 | 2019-09-30 | 2019-06-30 | 2019-03-31 | 2018-12-31 | 2018-09-30 | 2018-06-30 | 2018-03-31 | 2017-12-31 | 2017-09-30 | 2017-06-30 | 2017-03-31 | 2016-12-31 | 2016-09-30 | 2016-06-30 | 2016-03-31 | 2015-12-31 | 2015-09-30 | 2015-06-30 | 2015-03-31 | ||
|---|---|---|---|---|---|---|---|---|---|---|---|---|---|---|---|---|---|---|---|---|---|---|---|---|---|---|---|---|---|---|---|---|---|
| Revenues | 564.42 | 446.92 | 495.09 | 510.57 | 653.27 | 508.58 | 551.31 | 541.08 | 661.28 | 470.35 | 437.61 | 503.38 | 652.64 | 522.61 | 528.15 | 558.12 | 670.10 | 528.87 | 537.18 | 564.16 | 674.03 | 563.97 | 542.02 | 516.67 | 566.83 | 423.87 | 407.20 | 401.25 | 397.02 | 332.67 | 299.31 | 294.17 | |
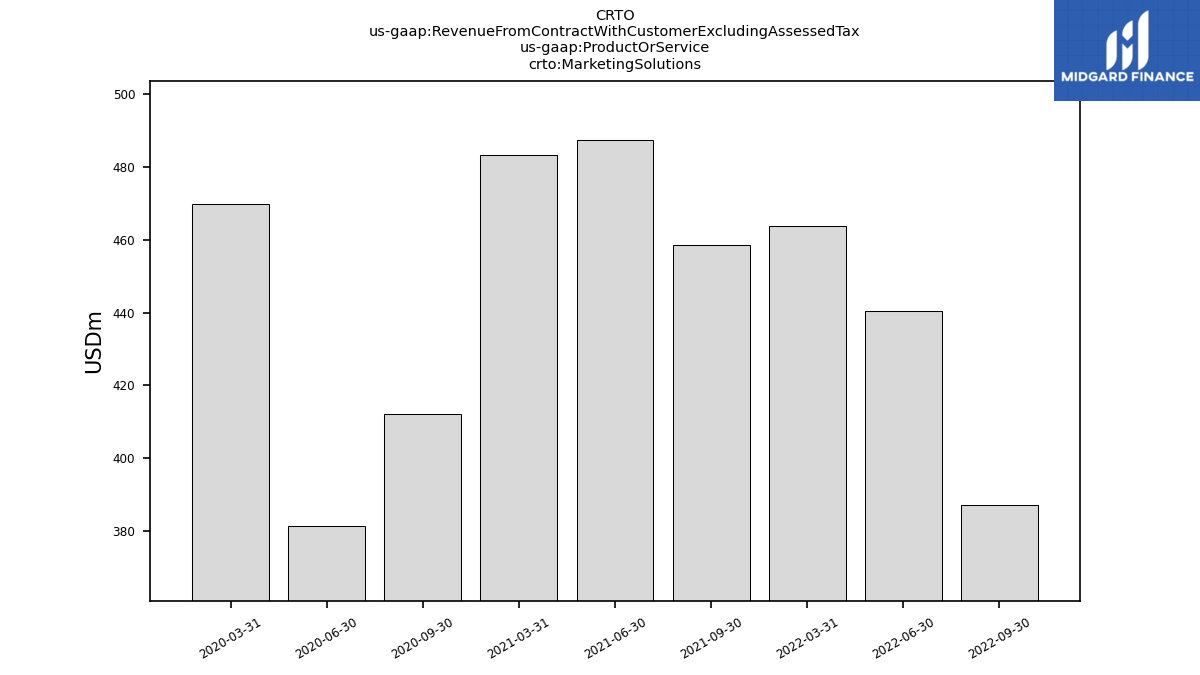
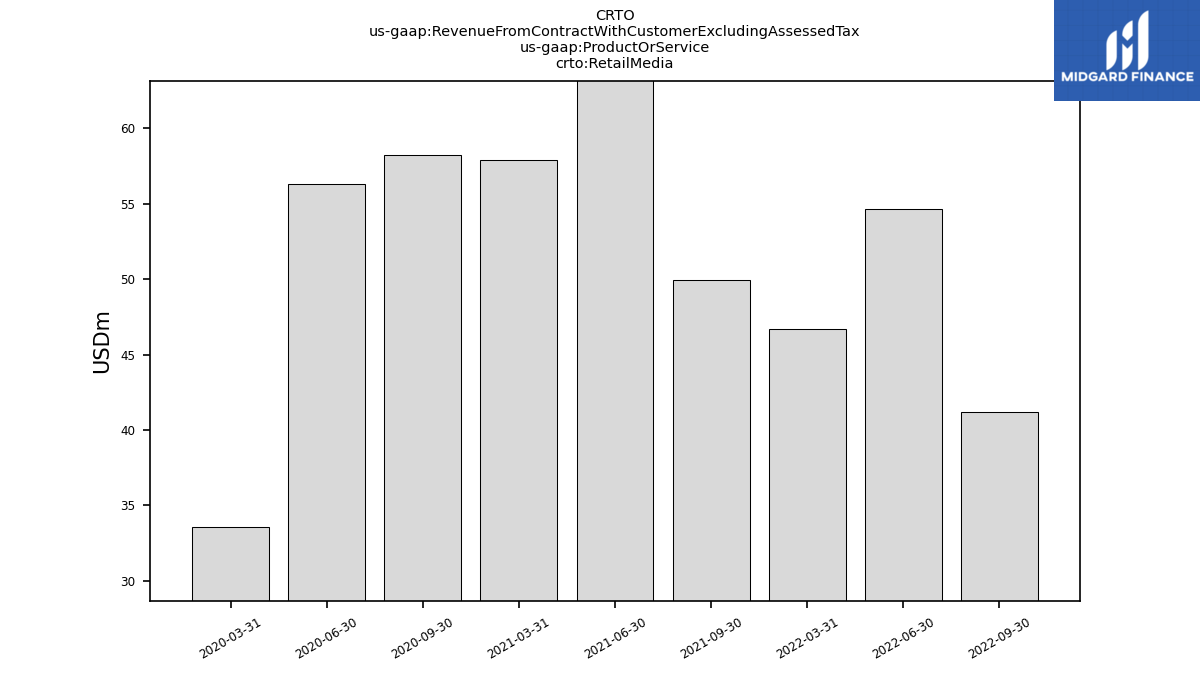
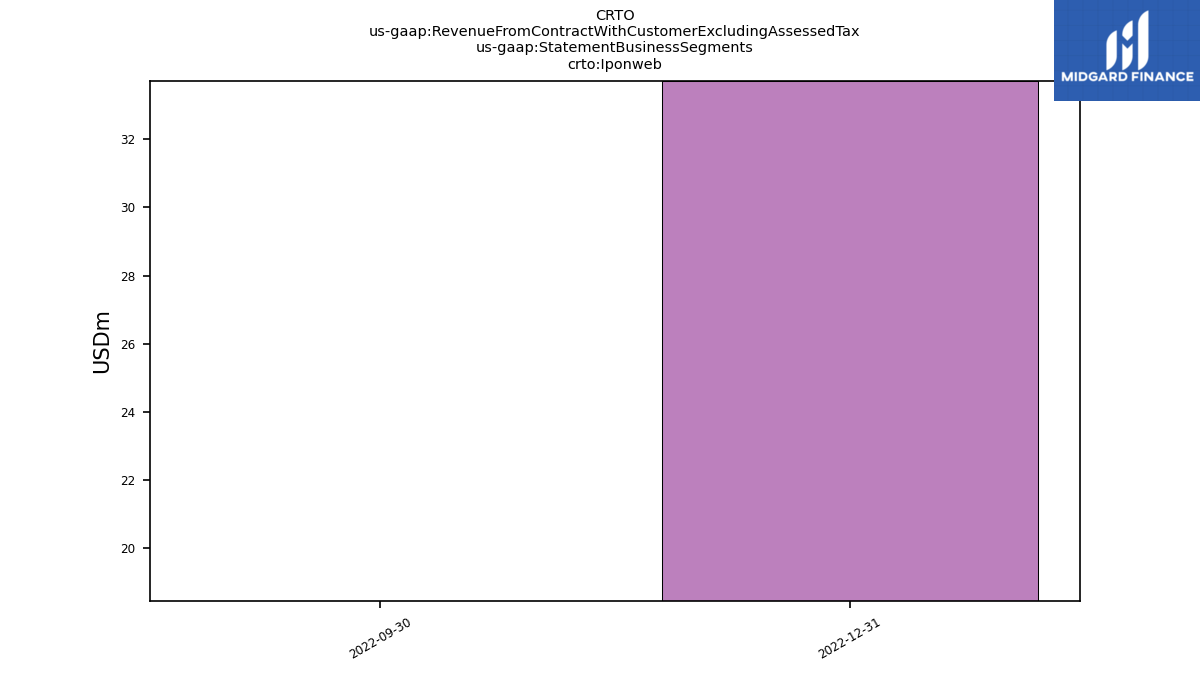
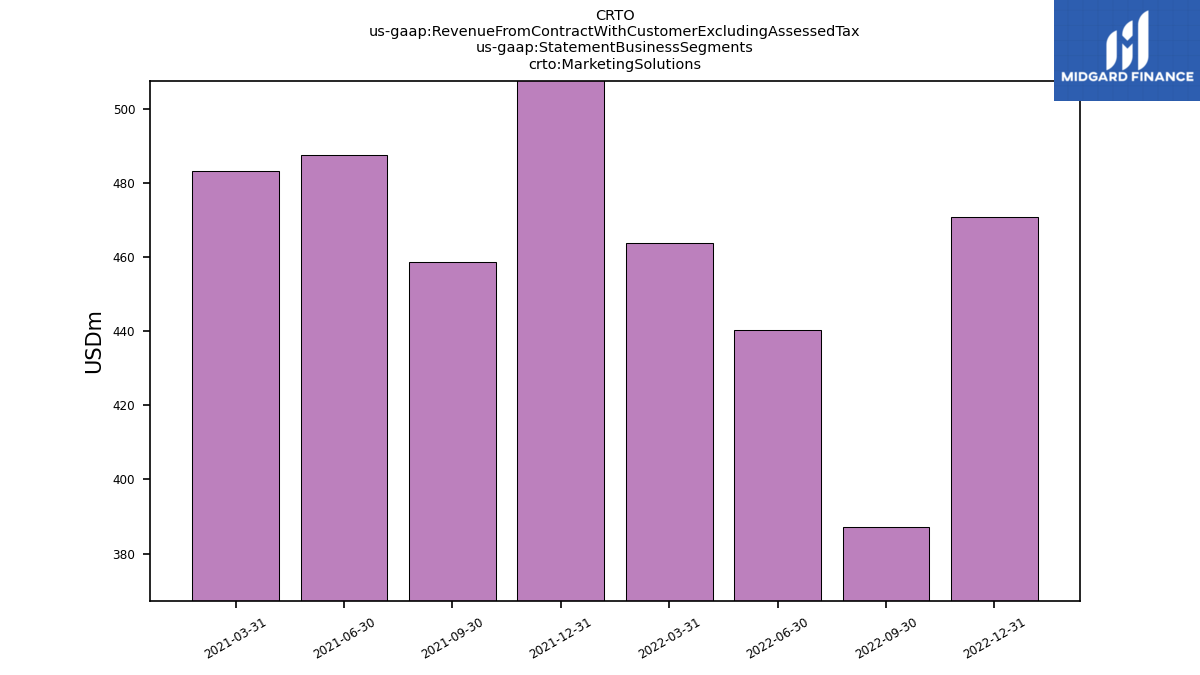
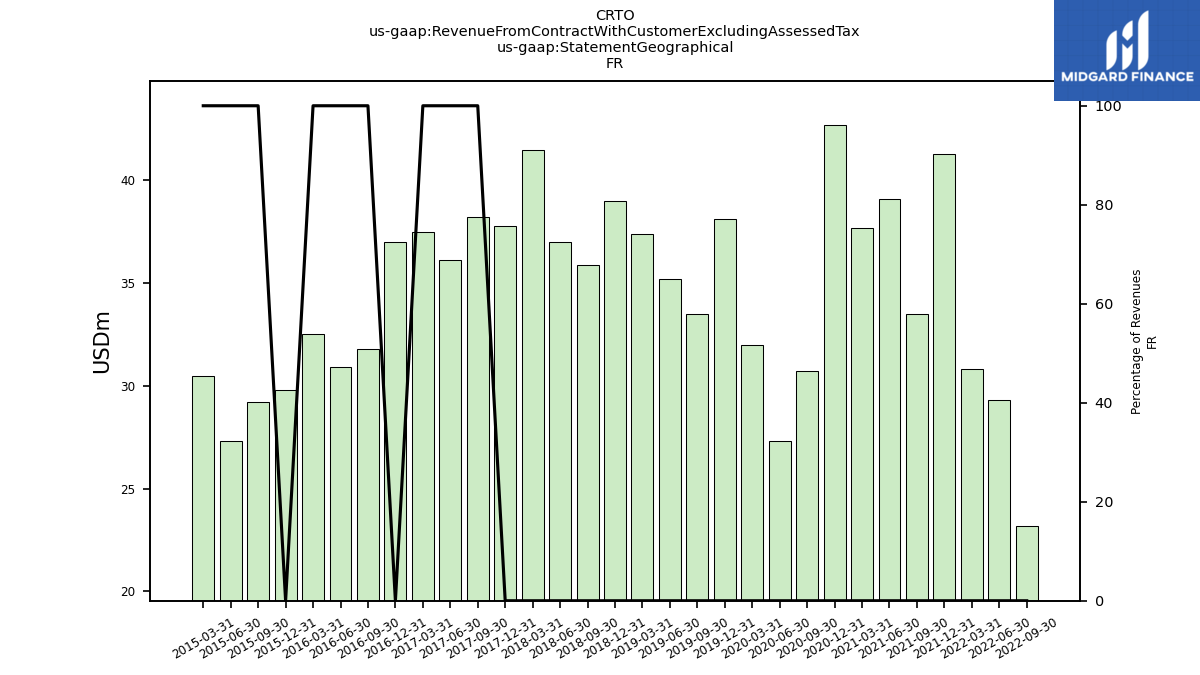
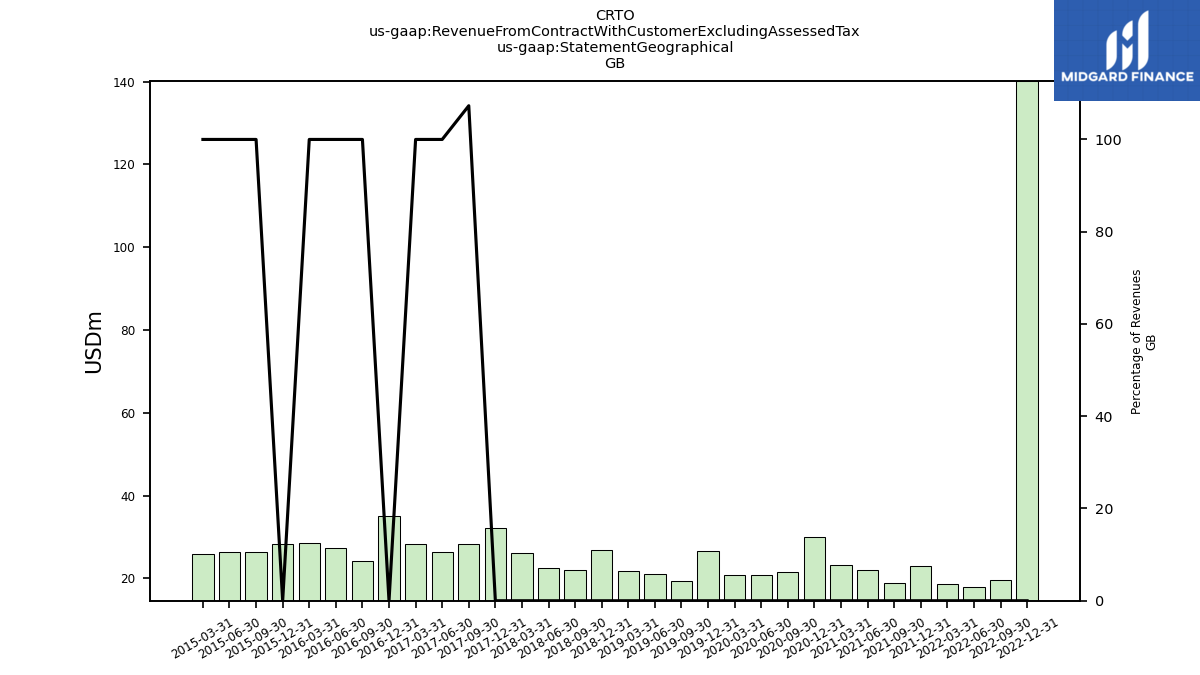
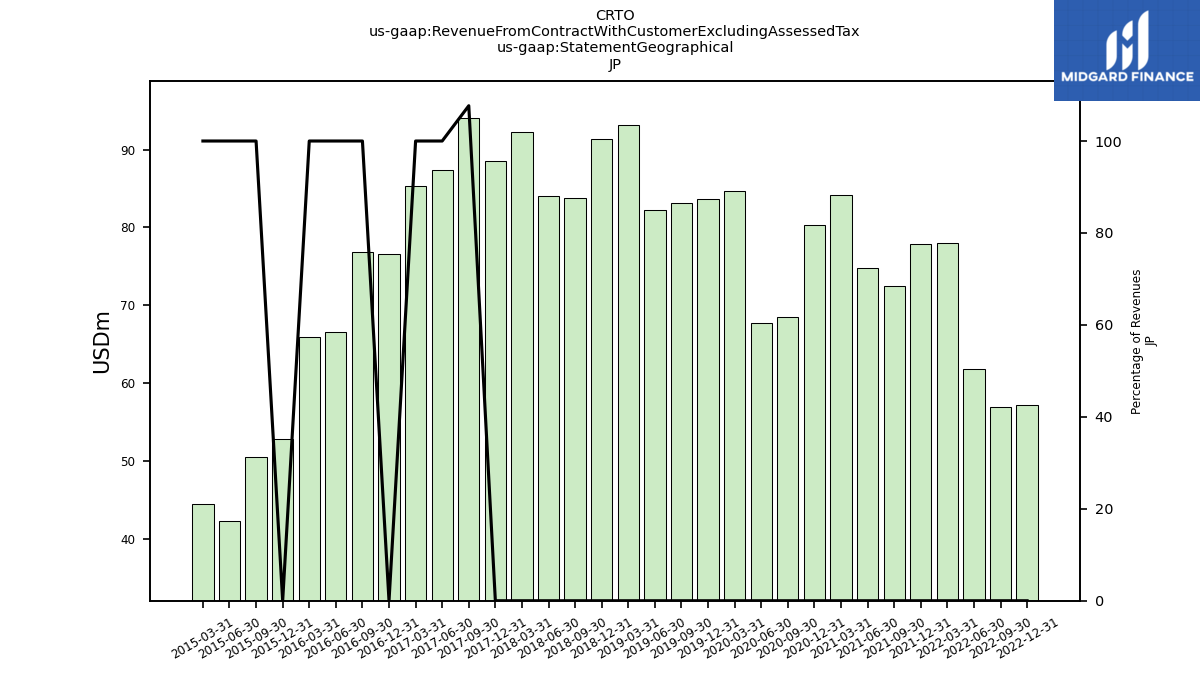
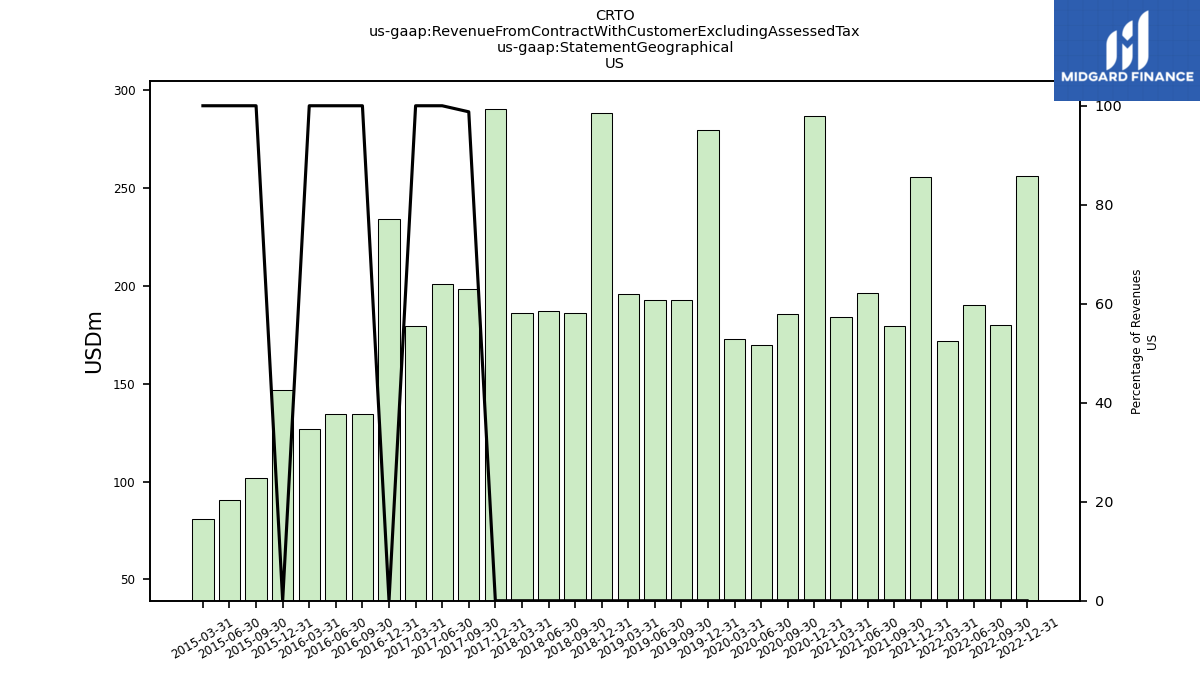
| Revenue From Contract With Customer Excluding Assessed Tax | 564.42 | 446.92 | 495.09 | 510.57 | 653.27 | 508.58 | 551.31 | 541.08 | 661.28 | 470.35 | 437.61 | 503.38 | 652.64 | 522.61 | 528.15 | 558.12 | 670.10 | 528.87 | 537.18 | 564.16 | 674.03 | 563.97 | 542.02 | 516.67 | 566.83 | 423.87 | 407.20 | 401.25 | 397.02 | 332.67 | 299.31 | 294.17 | |
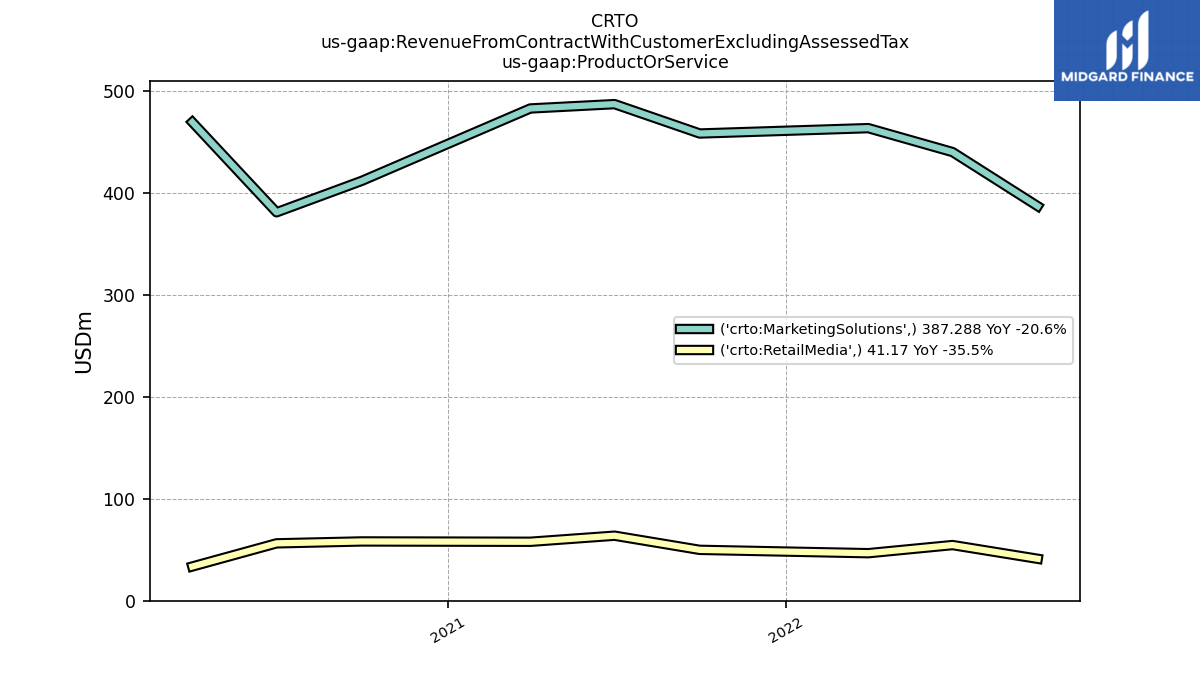
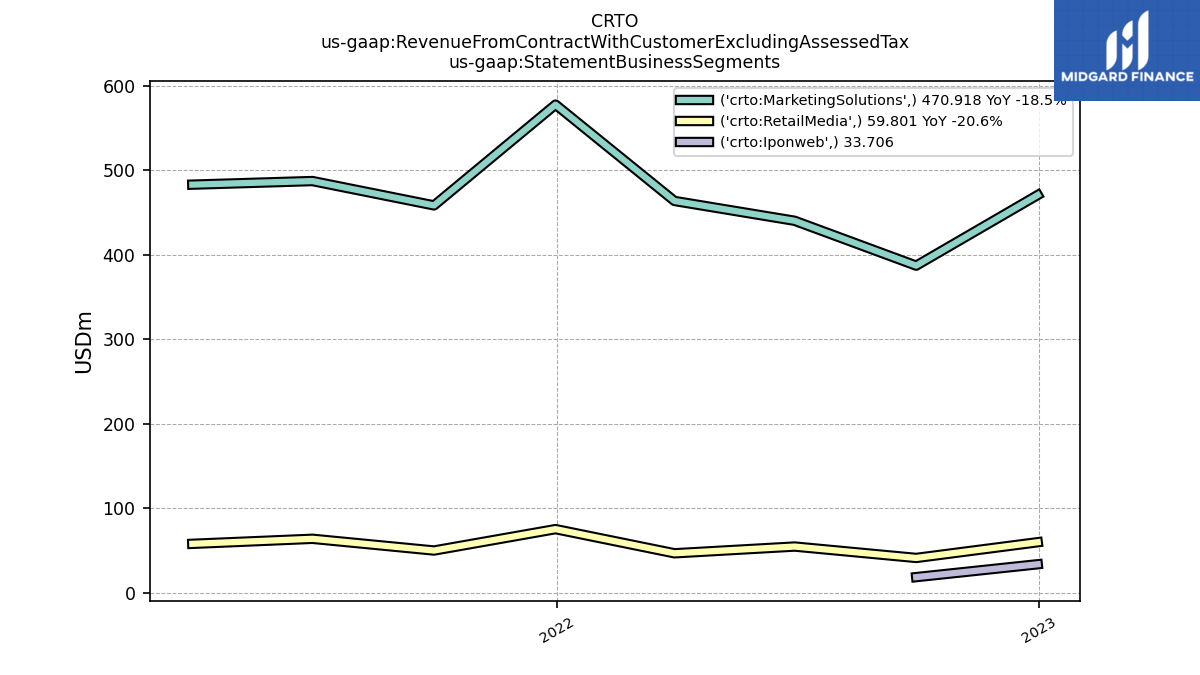
| Marketing Solutions | NA | 387.29 | 440.42 | 463.89 | NA | 458.62 | 487.46 | 483.19 | NA | 412.13 | 381.27 | 469.77 | NA | NA | NA | NA | NA | NA | NA | NA | NA | NA | NA | NA | NA | NA | NA | NA | NA | NA | NA | NA | |
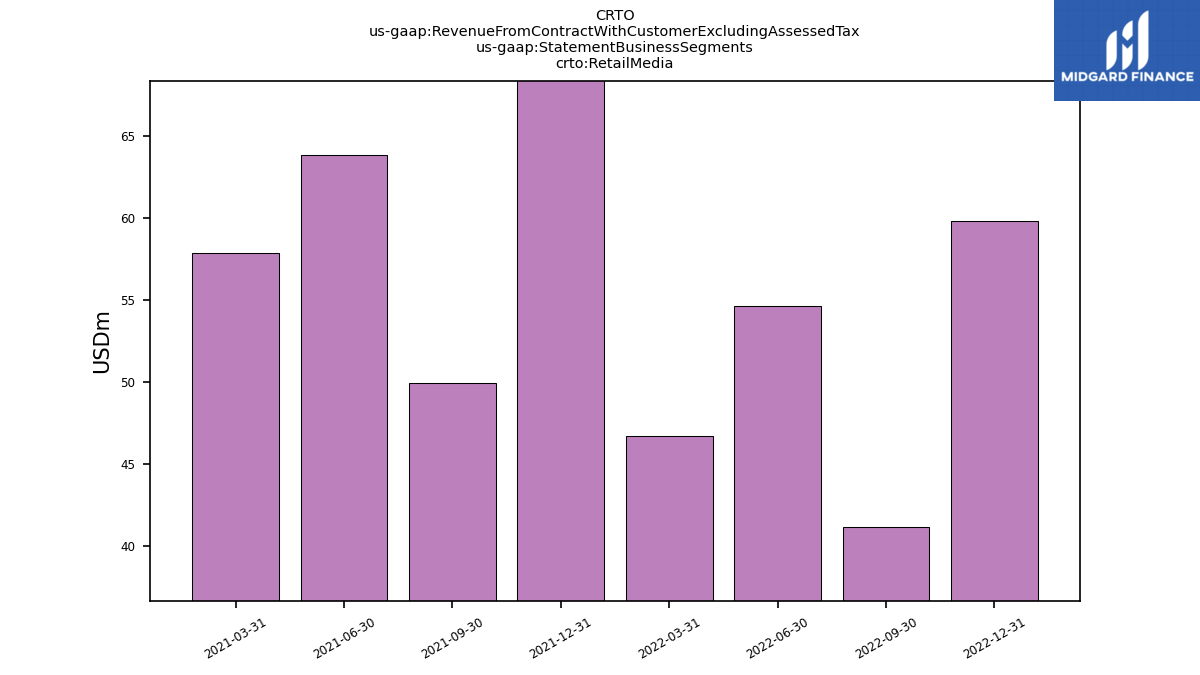
| Retail Media | NA | 41.17 | 54.67 | 46.68 | NA | 49.96 | 63.85 | 57.89 | NA | 58.22 | 56.34 | 33.60 | NA | NA | NA | NA | NA | NA | NA | NA | NA | NA | NA | NA | NA | NA | NA | NA | NA | NA | NA | NA | |
| Iponweb | 33.71 | 18.46 | NA | NA | NA | NA | NA | NA | NA | NA | NA | NA | NA | NA | NA | NA | NA | NA | NA | NA | NA | NA | NA | NA | NA | NA | NA | NA | NA | NA | NA | NA | |
| Marketing Solutions | 470.92 | 387.29 | 440.42 | 463.89 | 577.96 | 458.62 | 487.46 | 483.19 | NA | NA | NA | NA | NA | NA | NA | NA | NA | NA | NA | NA | NA | NA | NA | NA | NA | NA | NA | NA | NA | NA | NA | NA | |
| Retail Media | 59.80 | 41.17 | 54.67 | 46.68 | 75.31 | 49.96 | 63.85 | 57.89 | NA | NA | NA | NA | NA | NA | NA | NA | NA | NA | NA | NA | NA | NA | NA | NA | NA | NA | NA | NA | NA | NA | NA | NA | |
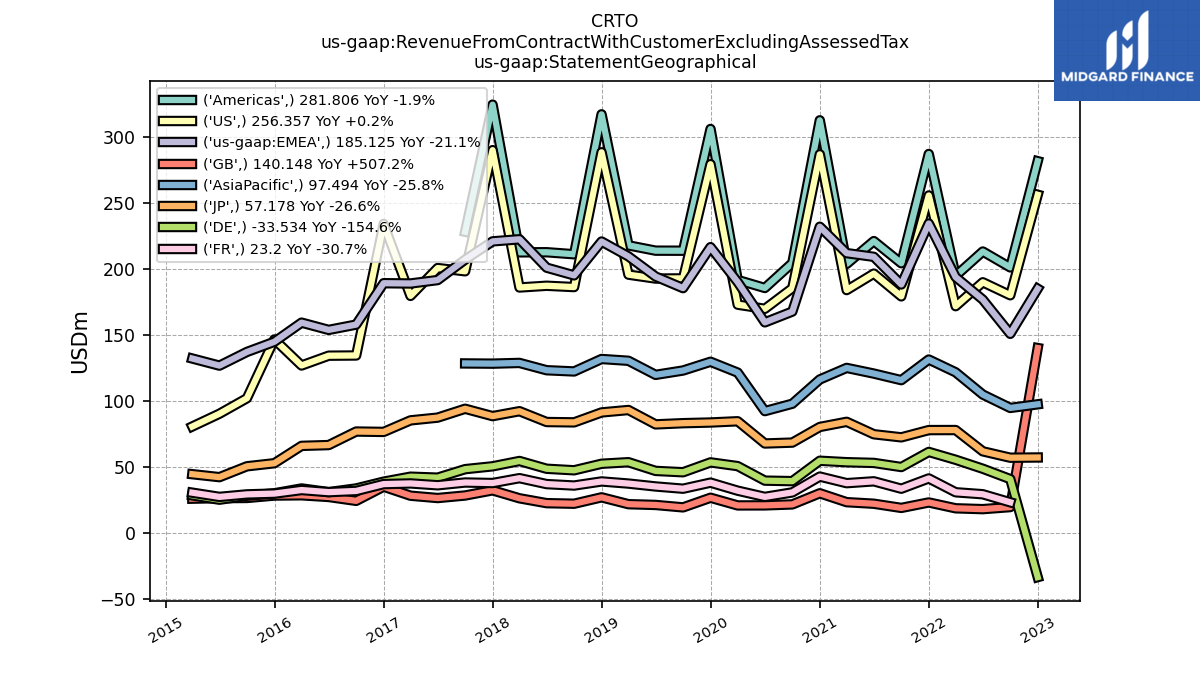
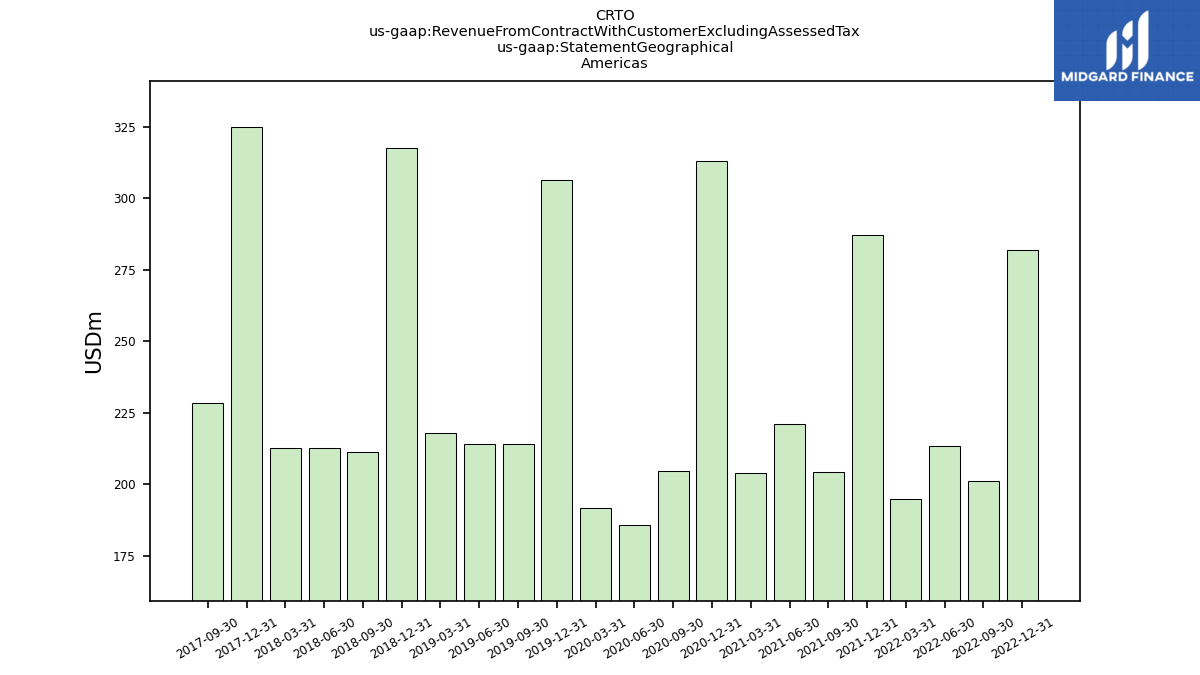
| 281.81 | 201.27 | 213.34 | 194.85 | 287.27 | 204.43 | 221.23 | 203.90 | 312.82 | 204.62 | 185.67 | 191.75 | 306.25 | 213.94 | 213.97 | 217.99 | 317.35 | 211.25 | 212.78 | 212.69 | 324.69 | 228.33 | NA | NA | NA | NA | NA | NA | NA | NA | NA | NA | ||
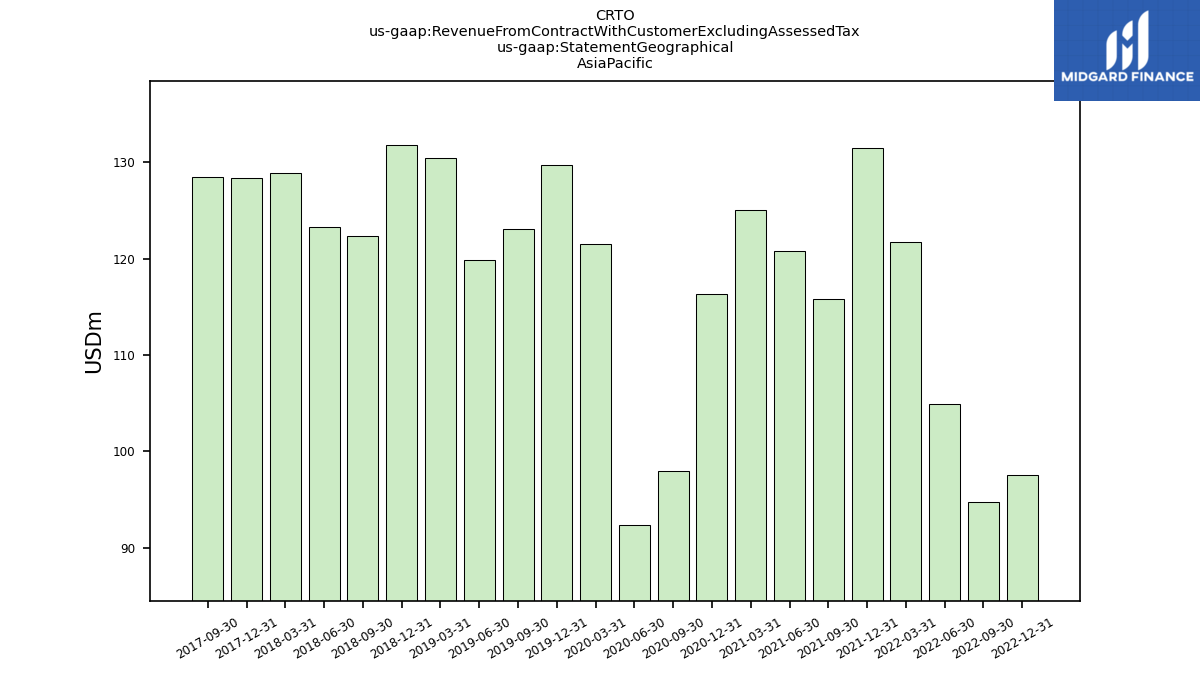
| 97.49 | 94.73 | 104.88 | 121.77 | 131.44 | 115.80 | 120.78 | 125.08 | 116.33 | 97.93 | 92.32 | 121.52 | 129.75 | 123.11 | 119.81 | 130.49 | 131.84 | 122.39 | 123.32 | 128.86 | 128.32 | 128.48 | NA | NA | NA | NA | NA | NA | NA | NA | NA | NA | ||
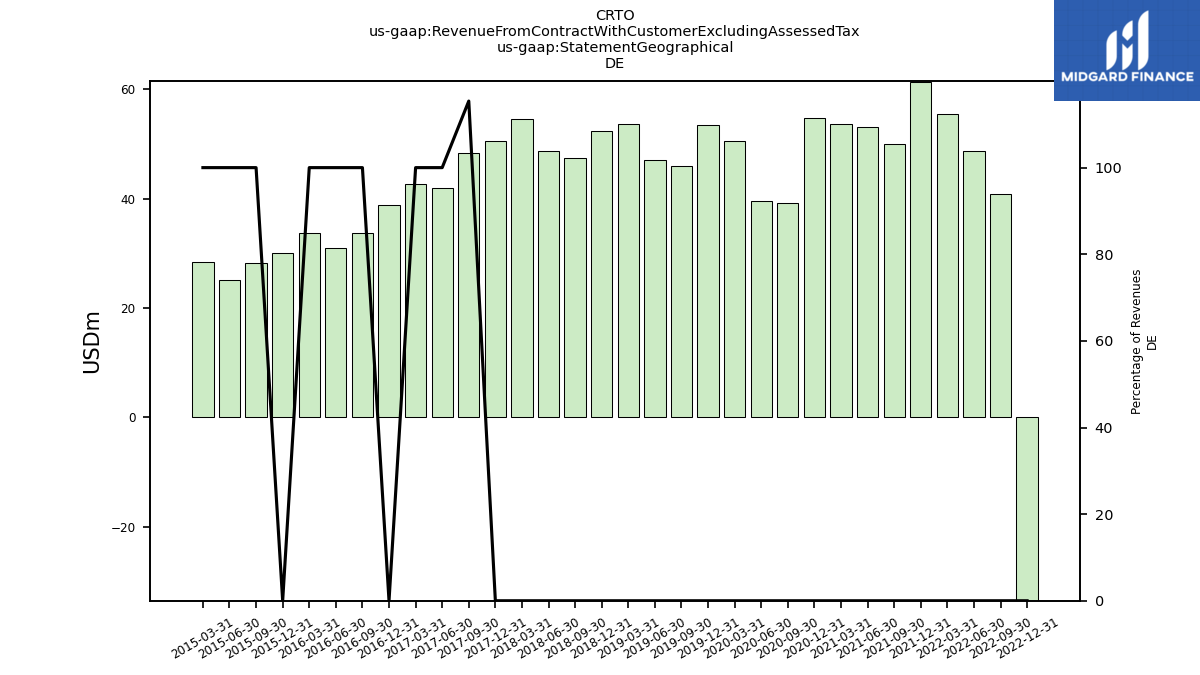
| -33.53 | 40.81 | 48.64 | 55.45 | 61.39 | 49.93 | 53.05 | 53.60 | 54.70 | 39.25 | 39.62 | 50.62 | 53.46 | 45.97 | 47.00 | 53.59 | 52.41 | 47.46 | 48.63 | 54.52 | 50.48 | 48.32 | 41.88 | 42.61 | 38.84 | 33.69 | 30.89 | 33.70 | 30.00 | 28.19 | 25.16 | 28.45 | ||
| NA | 23.20 | 29.30 | 30.80 | 41.30 | 33.50 | 39.10 | 37.70 | 42.70 | 30.70 | 27.30 | 32.00 | 38.10 | 33.50 | 35.20 | 37.40 | 39.00 | 35.90 | 37.00 | 41.50 | 37.80 | 38.20 | 36.10 | 37.50 | 37.00 | 31.80 | 30.90 | 32.50 | 29.80 | 29.20 | 27.30 | 30.50 | ||
| 140.15 | 19.57 | 18.01 | 18.65 | 23.08 | 18.94 | 22.11 | 23.29 | 30.05 | 21.60 | 20.86 | 20.82 | 26.64 | 19.34 | 21.18 | 21.77 | 26.96 | 22.11 | 22.54 | 26.23 | 32.26 | 28.35 | 26.42 | 28.20 | 35.03 | 24.29 | 27.23 | 28.51 | 28.31 | 26.48 | 26.33 | 25.94 | ||
| 57.18 | 57.00 | 61.84 | 77.97 | 77.94 | 72.44 | 74.79 | 84.21 | 80.31 | 68.46 | 67.78 | 84.64 | 83.69 | 83.17 | 82.26 | 93.17 | 91.33 | 83.79 | 84.06 | 92.26 | 88.53 | 94.10 | 87.40 | 85.31 | 76.56 | 76.84 | 66.59 | 65.97 | 52.82 | 50.48 | 42.26 | 44.51 | ||
| US | 256.36 | 180.15 | 190.02 | 171.86 | 255.83 | 179.30 | 196.58 | 184.08 | 287.02 | 185.55 | 169.88 | 173.03 | 279.54 | 192.95 | 192.81 | 195.79 | 288.59 | 186.37 | 187.37 | 186.05 | 290.20 | 198.34 | 200.80 | 179.66 | 234.28 | 134.50 | 134.35 | 126.91 | 146.67 | 102.06 | 90.35 | 80.66 | |
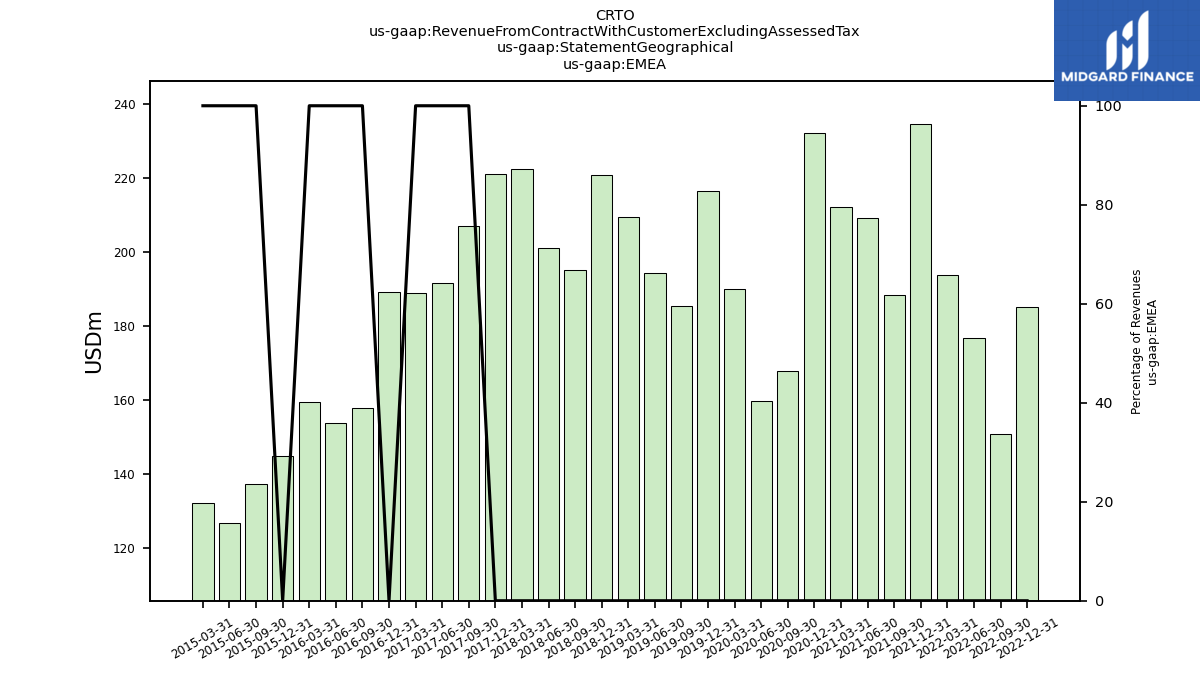
| EMEA | 185.12 | 150.91 | 176.87 | 193.95 | 234.56 | 188.35 | 209.30 | 212.10 | 232.14 | 167.80 | 159.62 | 190.11 | 216.64 | 185.56 | 194.36 | 209.64 | 220.90 | 195.23 | 201.08 | 222.61 | 221.02 | 207.17 | 191.68 | 189.09 | 189.30 | 157.92 | 153.90 | 159.41 | 144.91 | 137.19 | 126.81 | 132.21 |