
| 2023-12-31 | 2023-09-30 | 2023-06-30 | 2023-03-31 | 2022-12-31 | 2022-09-30 | 2022-06-30 | 2022-03-31 | 2021-12-31 | 2021-09-30 | 2021-06-30 | 2021-03-31 | 2020-12-31 | 2020-09-30 | 2020-06-30 | 2020-03-31 | 2019-12-31 | 2019-09-30 | 2019-06-30 | 2019-03-31 | 2018-12-31 | 2018-09-30 | 2018-06-30 | 2018-03-31 | 2017-12-31 | 2017-09-30 | 2017-06-30 | 2017-03-31 | 2016-12-31 | 2016-09-30 | 2016-06-30 | 2016-03-31 | 2015-12-31 | 2015-09-30 | 2015-06-30 | 2015-03-31 | 2014-12-31 | 2014-09-30 | 2014-06-30 | ||
|---|---|---|---|---|---|---|---|---|---|---|---|---|---|---|---|---|---|---|---|---|---|---|---|---|---|---|---|---|---|---|---|---|---|---|---|---|---|---|---|---|
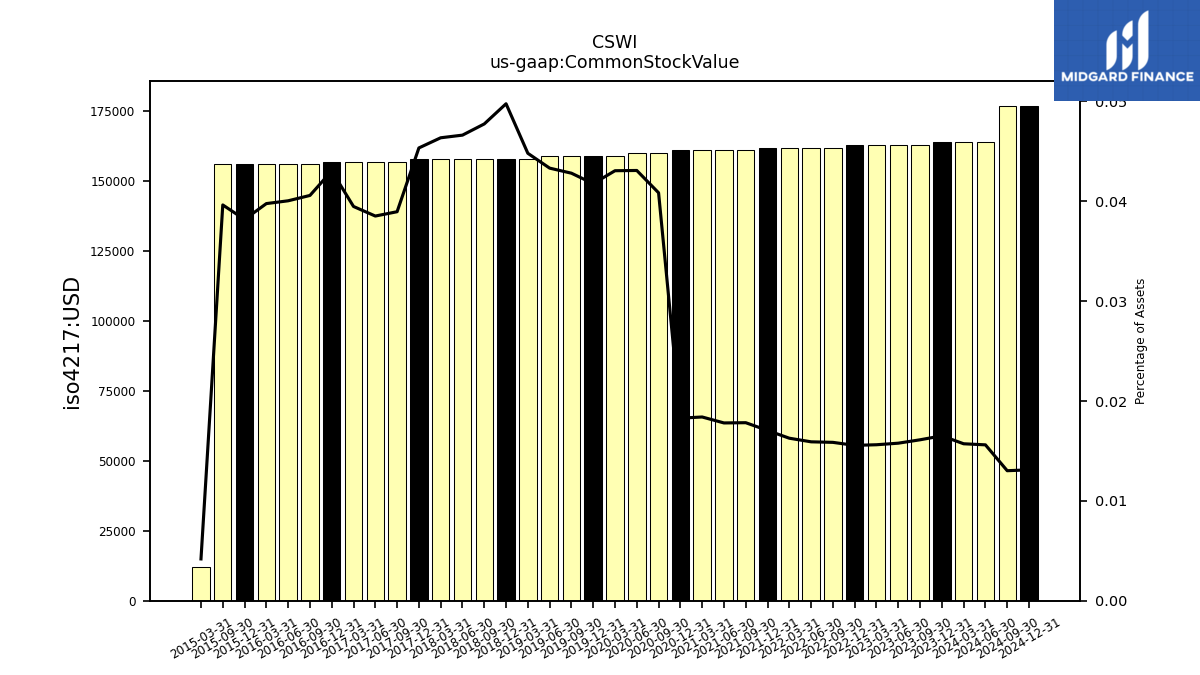
| Common Stock Value | 0.16 | 0.16 | 0.16 | 0.16 | 0.16 | 0.16 | 0.16 | 0.16 | 0.16 | 0.16 | 0.16 | 0.16 | 0.16 | 0.16 | 0.16 | 0.16 | 0.16 | 0.16 | 0.16 | 0.16 | 0.16 | 0.16 | 0.16 | 0.16 | 0.16 | 0.16 | 0.16 | 0.16 | 0.16 | 0.16 | 0.16 | 0.16 | 0.16 | 0.16 | NA | 0.01 | NA | NA | NA | |
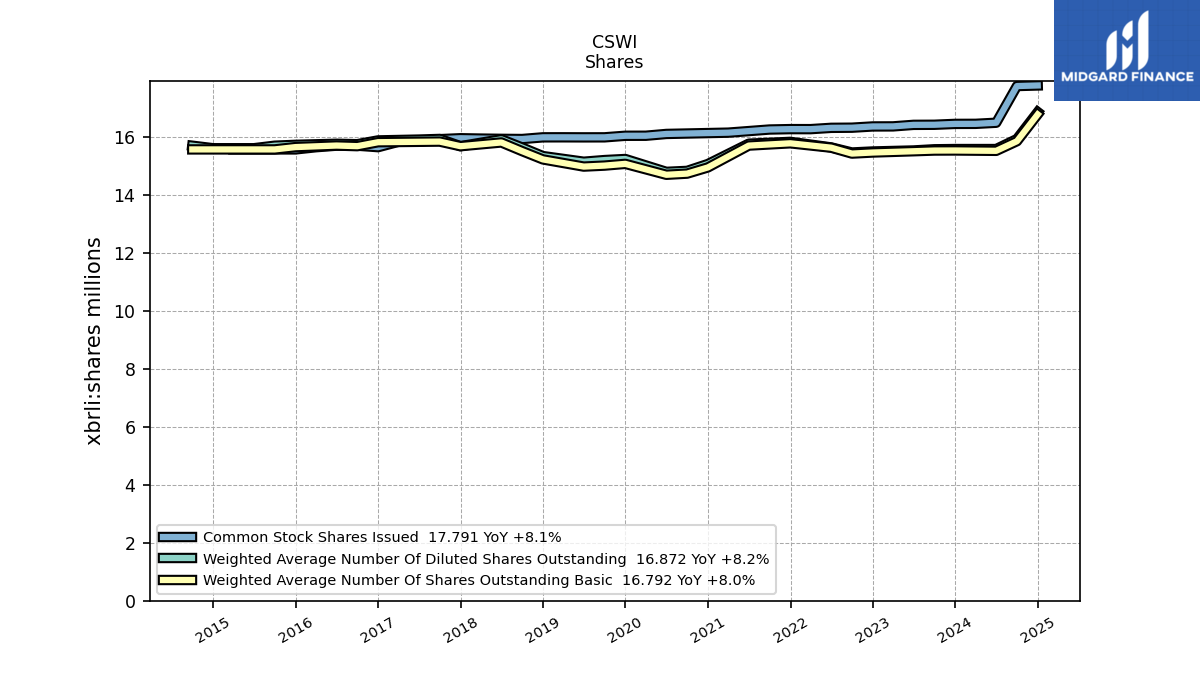
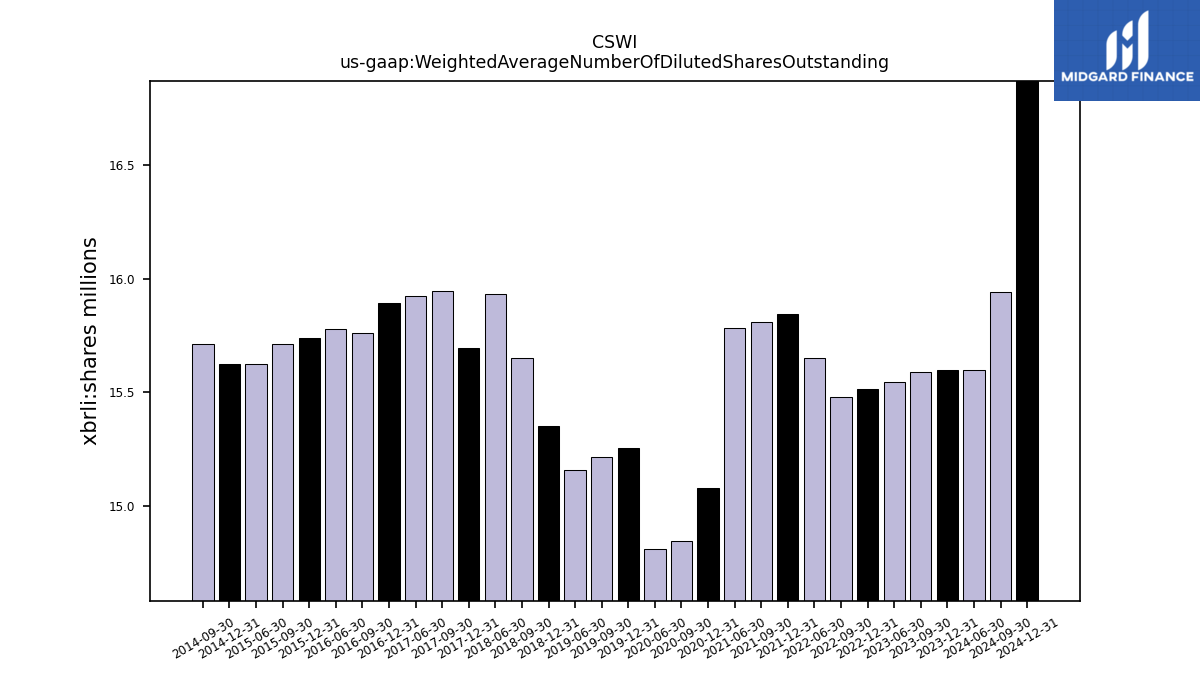
| Weighted Average Number Of Diluted Shares Outstanding | 15.60 | 15.59 | 15.55 | NA | 15.51 | 15.48 | 15.65 | NA | 15.84 | 15.81 | 15.78 | NA | 15.08 | 14.84 | 14.81 | NA | 15.25 | 15.21 | 15.16 | NA | 15.35 | 15.65 | 15.93 | NA | 15.69 | 15.95 | 15.92 | NA | 15.89 | 15.76 | 15.78 | NA | 15.74 | 15.71 | 15.62 | NA | 15.62 | 15.71 | NA | |
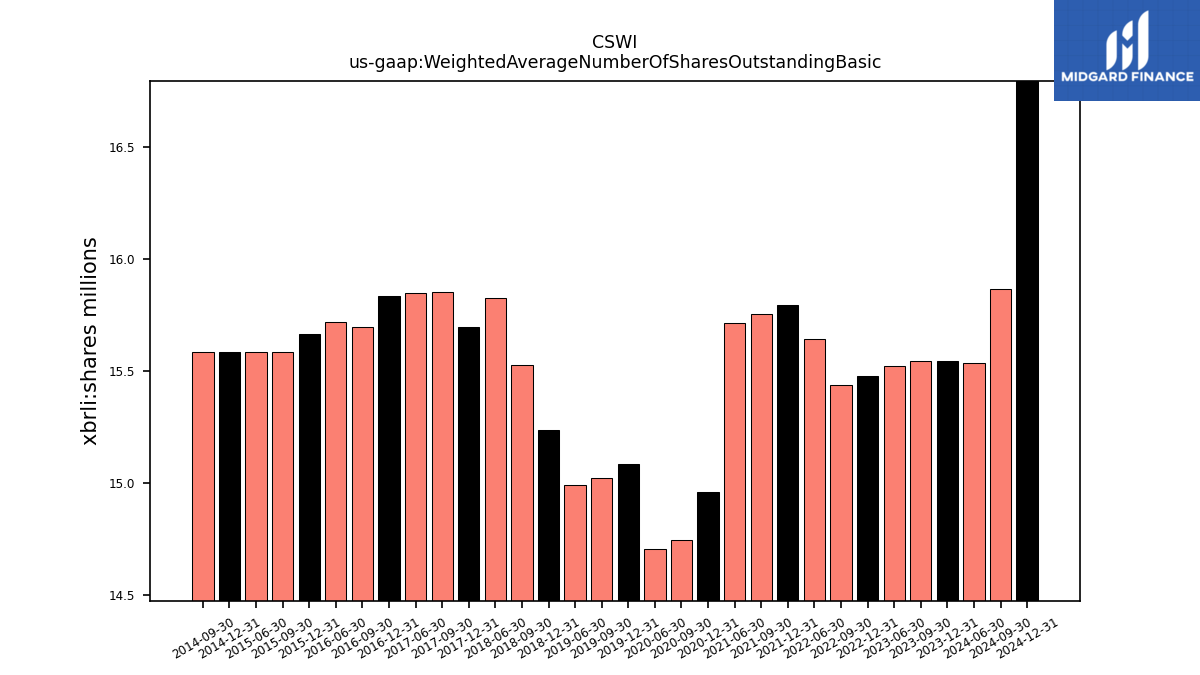
| Weighted Average Number Of Shares Outstanding Basic | 15.55 | 15.54 | 15.52 | NA | 15.48 | 15.44 | 15.64 | NA | 15.79 | 15.76 | 15.71 | NA | 14.96 | 14.75 | 14.71 | NA | 15.08 | 15.02 | 14.99 | NA | 15.24 | 15.52 | 15.82 | NA | 15.69 | 15.85 | 15.85 | NA | 15.83 | 15.70 | 15.72 | NA | 15.66 | 15.58 | 15.58 | NA | 15.58 | 15.58 | NA | |
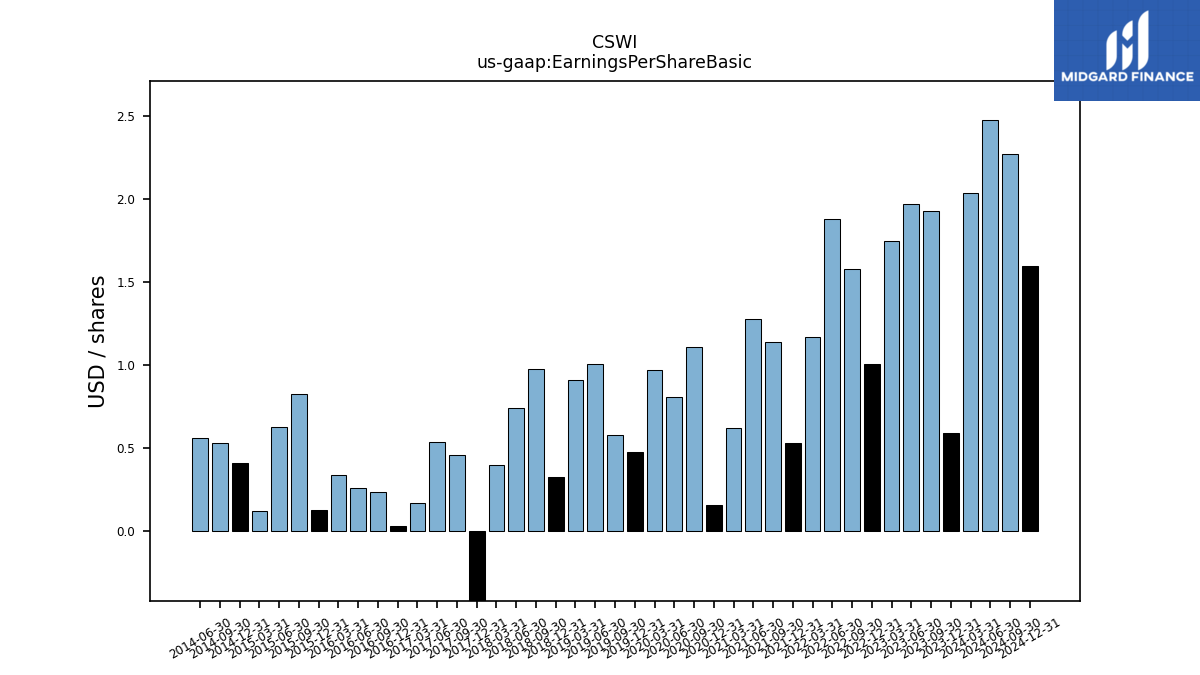
| Earnings Per Share Basic | 0.59 | 1.93 | 1.97 | 1.75 | 1.01 | 1.58 | 1.88 | 1.17 | 0.53 | 1.14 | 1.28 | 0.62 | 0.16 | 1.11 | 0.81 | 0.97 | 0.48 | 0.58 | 1.01 | 0.91 | 0.33 | 0.98 | 0.74 | 0.40 | -2.17 | 0.46 | 0.54 | 0.17 | 0.03 | 0.24 | 0.26 | 0.34 | 0.13 | 0.83 | 0.63 | 0.12 | 0.41 | 0.53 | 0.56 | |
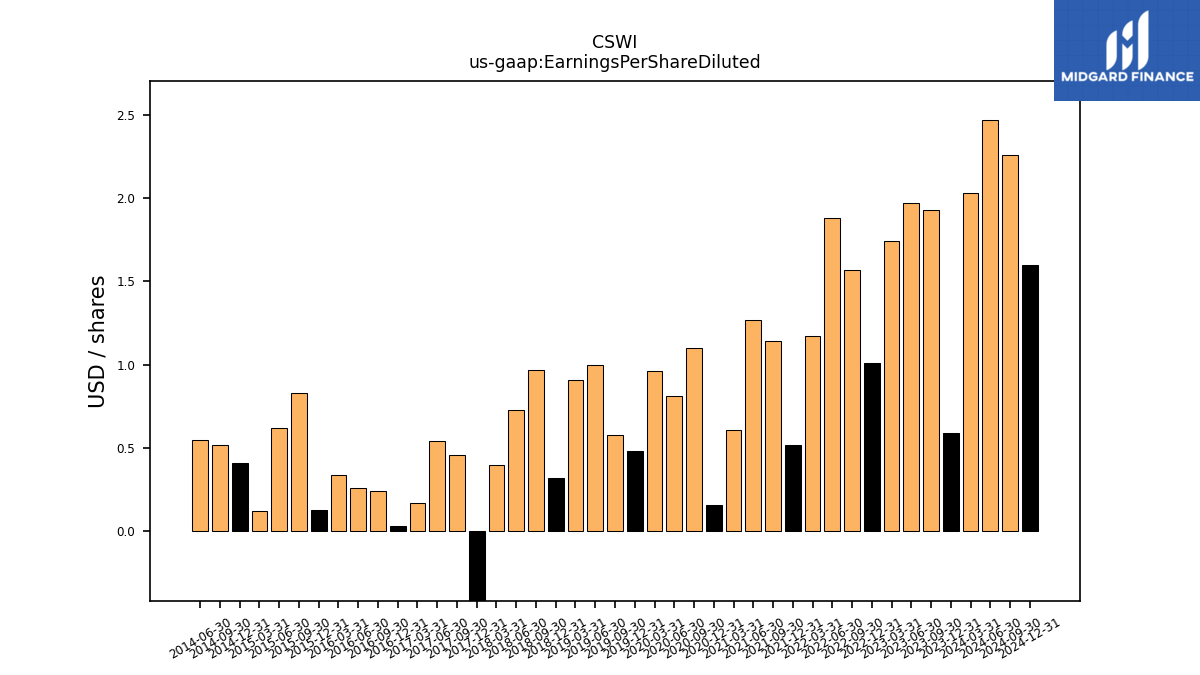
| Earnings Per Share Diluted | 0.59 | 1.93 | 1.97 | 1.74 | 1.01 | 1.57 | 1.88 | 1.17 | 0.52 | 1.14 | 1.27 | 0.61 | 0.16 | 1.10 | 0.81 | 0.96 | 0.48 | 0.58 | 1.00 | 0.91 | 0.32 | 0.97 | 0.73 | 0.40 | -2.17 | 0.46 | 0.54 | 0.17 | 0.03 | 0.24 | 0.26 | 0.34 | 0.13 | 0.83 | 0.62 | 0.12 | 0.41 | 0.52 | 0.55 |
| 2023-12-31 | 2023-09-30 | 2023-06-30 | 2023-03-31 | 2022-12-31 | 2022-09-30 | 2022-06-30 | 2022-03-31 | 2021-12-31 | 2021-09-30 | 2021-06-30 | 2021-03-31 | 2020-12-31 | 2020-09-30 | 2020-06-30 | 2020-03-31 | 2019-12-31 | 2019-09-30 | 2019-06-30 | 2019-03-31 | 2018-12-31 | 2018-09-30 | 2018-06-30 | 2018-03-31 | 2017-12-31 | 2017-09-30 | 2017-06-30 | 2017-03-31 | 2016-12-31 | 2016-09-30 | 2016-06-30 | 2016-03-31 | 2015-12-31 | 2015-09-30 | 2015-06-30 | 2015-03-31 | 2014-12-31 | 2014-09-30 | 2014-06-30 | ||
|---|---|---|---|---|---|---|---|---|---|---|---|---|---|---|---|---|---|---|---|---|---|---|---|---|---|---|---|---|---|---|---|---|---|---|---|---|---|---|---|---|
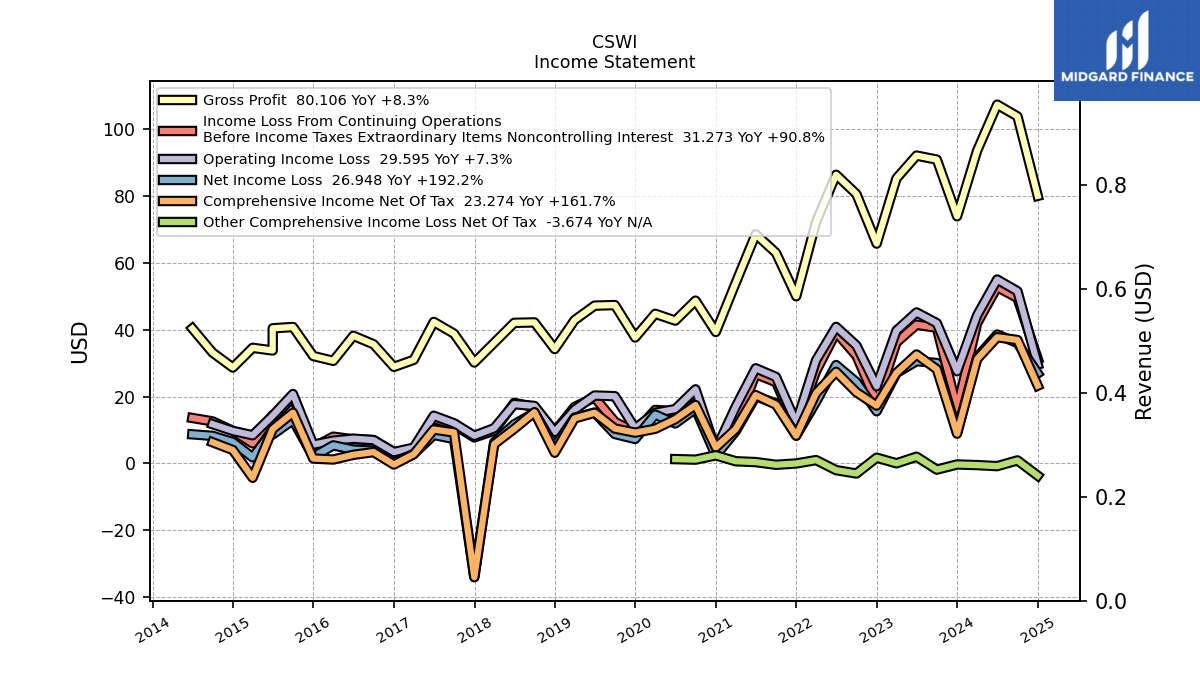
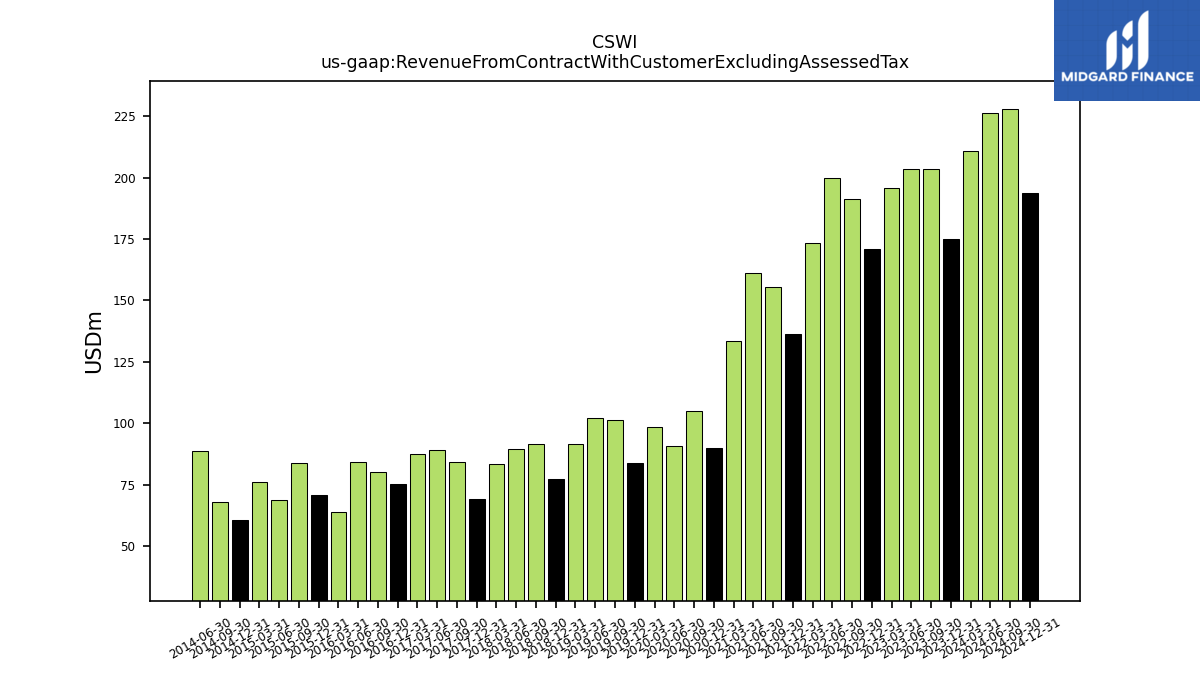
| Revenue From Contract With Customer Excluding Assessed Tax | 174.97 | 203.65 | 203.36 | 195.69 | 171.09 | 191.19 | 199.93 | 173.30 | 136.29 | 155.59 | 161.27 | 133.40 | 89.93 | 104.94 | 90.96 | 98.60 | 83.72 | 101.32 | 102.33 | 91.50 | 77.49 | 91.61 | 89.60 | 83.50 | 69.04 | 84.42 | 89.30 | 87.40 | 75.50 | 80.13 | 84.11 | 64.00 | 70.92 | 83.74 | 68.80 | 76.30 | 60.87 | 68.09 | 88.90 | |
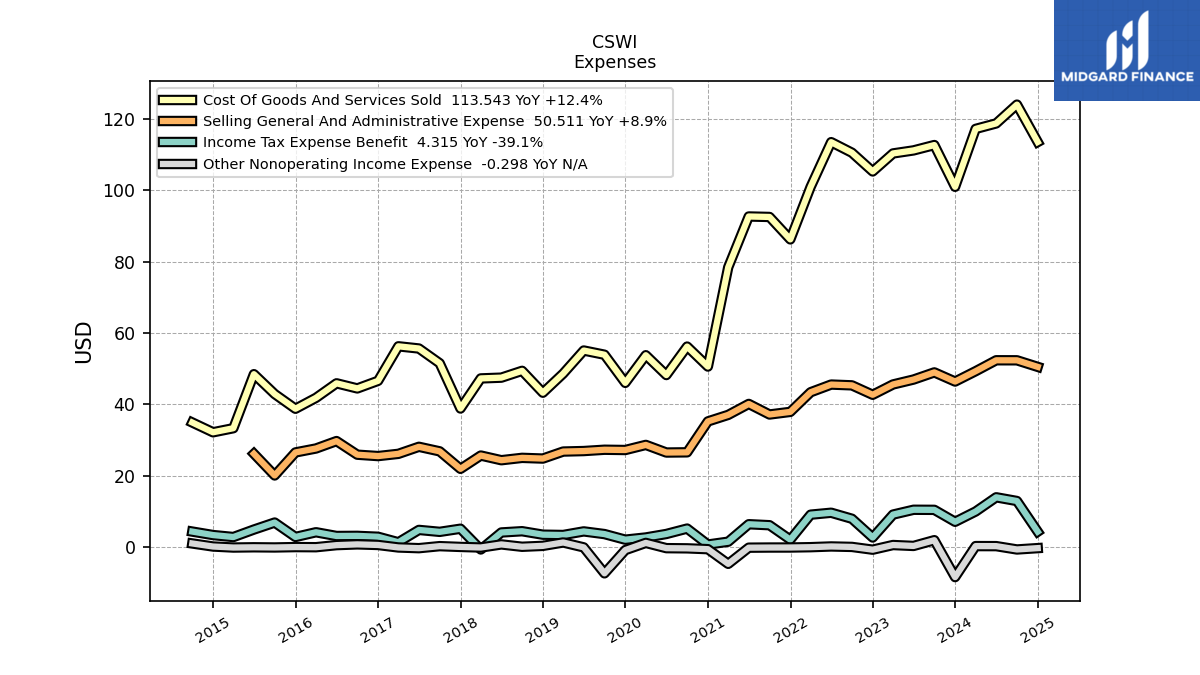
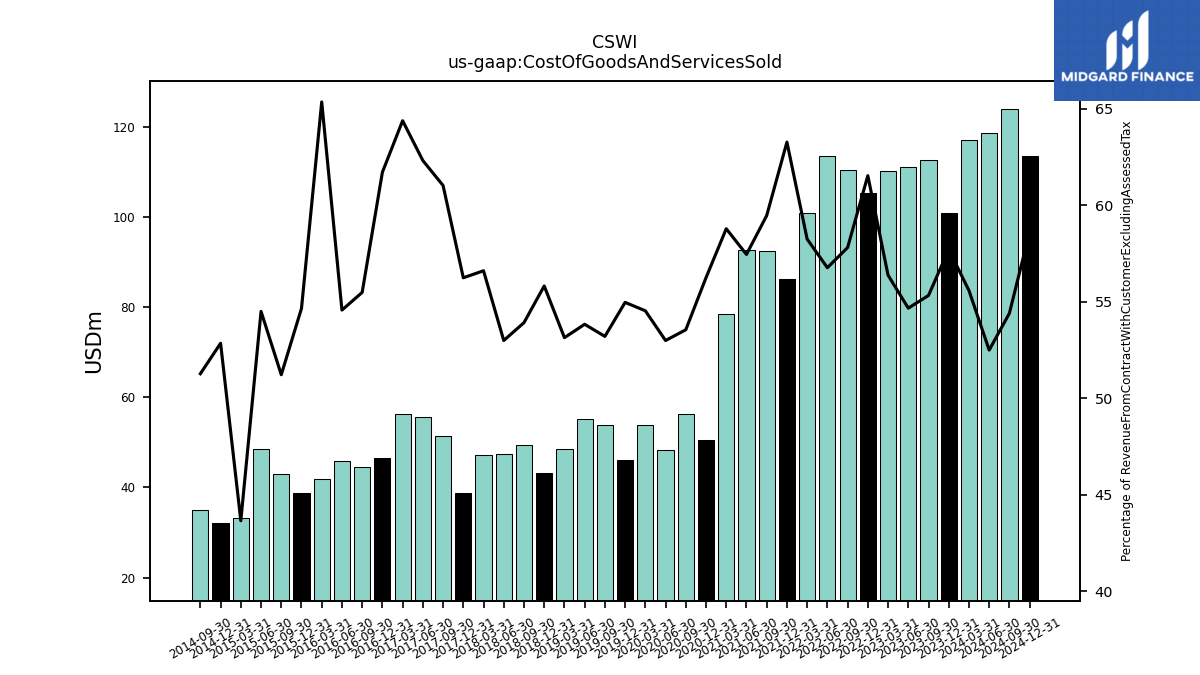
| Cost Of Goods And Services Sold | 100.99 | 112.69 | 111.19 | 110.34 | 105.30 | 110.55 | 113.51 | 100.96 | 86.24 | 92.53 | 92.67 | 78.43 | 50.59 | 56.20 | 48.21 | 53.78 | 46.02 | 53.92 | 55.10 | 48.63 | 43.26 | 49.40 | 47.49 | 47.27 | 38.83 | 51.52 | 55.66 | 56.28 | 46.60 | 44.47 | 45.90 | 41.83 | 38.77 | 42.90 | 48.47 | 33.31 | 32.17 | 34.92 | NA | |
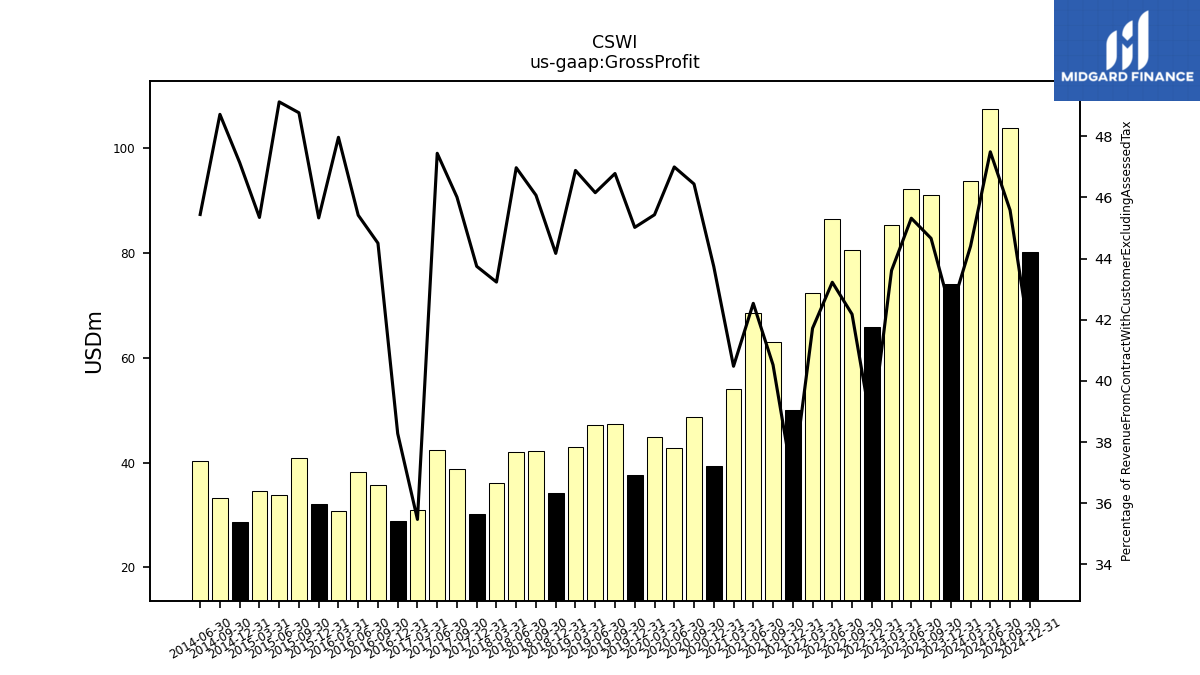
| Gross Profit | 73.98 | 90.96 | 92.17 | 85.34 | 65.80 | 80.65 | 86.42 | 72.30 | 50.04 | 63.05 | 68.60 | 54.00 | 39.34 | 48.74 | 42.75 | 44.80 | 37.69 | 47.40 | 47.23 | 42.90 | 34.23 | 42.21 | 42.09 | 36.10 | 30.20 | 38.84 | 42.37 | 31.00 | 28.90 | 35.66 | 38.20 | 30.70 | 32.15 | 40.84 | 33.80 | 34.60 | 28.70 | 33.17 | 40.40 | |
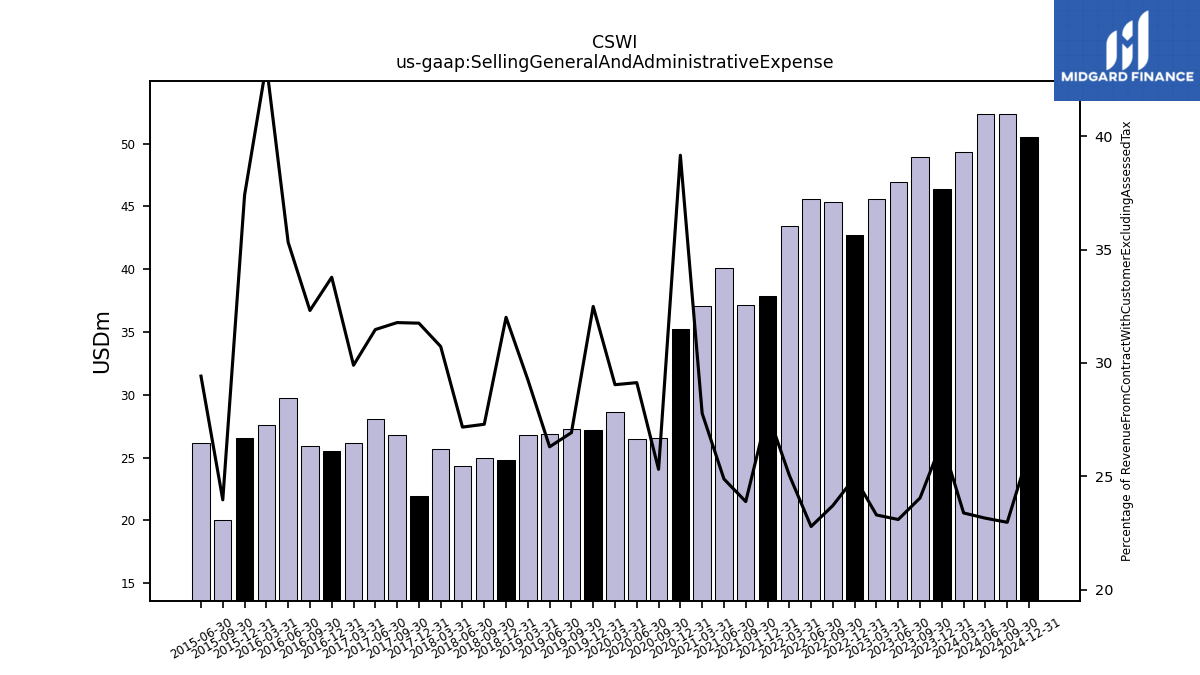
| Selling General And Administrative Expense | 46.40 | 48.97 | 46.96 | 45.58 | 42.69 | 45.33 | 45.55 | 43.41 | 37.89 | 37.16 | 40.12 | 37.05 | 35.22 | 26.56 | 26.50 | 28.63 | 27.20 | 27.28 | 26.91 | 26.77 | 24.81 | 25.00 | 24.34 | 25.66 | 21.92 | 26.83 | 28.11 | 26.13 | 25.50 | 25.89 | 29.71 | 27.63 | 26.53 | 20.07 | 26.16 | NA | NA | NA | NA | |
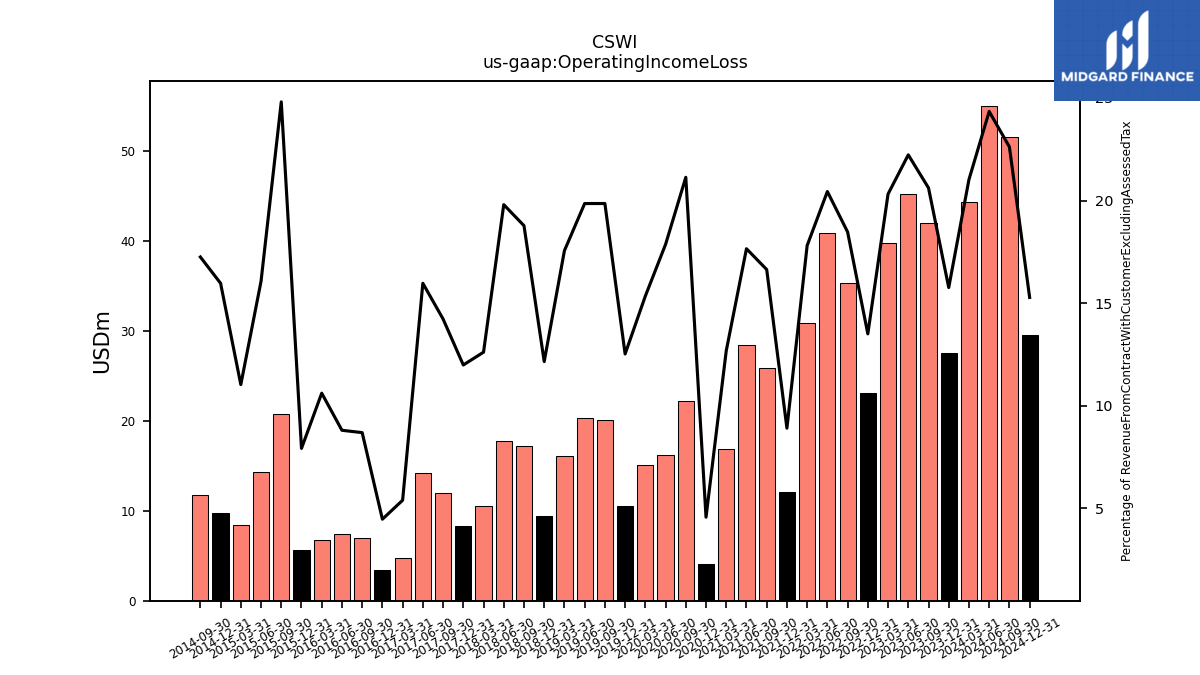
| Operating Income Loss | 27.58 | 41.99 | 45.21 | 39.76 | 23.11 | 35.32 | 40.87 | 30.87 | 12.15 | 25.89 | 28.47 | 16.92 | 4.12 | 22.18 | 16.25 | 15.13 | 10.49 | 20.12 | 20.32 | 16.07 | 9.42 | 17.20 | 17.74 | 10.53 | 8.28 | 12.02 | 14.26 | 4.72 | 3.38 | 6.97 | 7.41 | 6.80 | 5.62 | 20.78 | 14.29 | 8.42 | 9.72 | 11.75 | NA | |
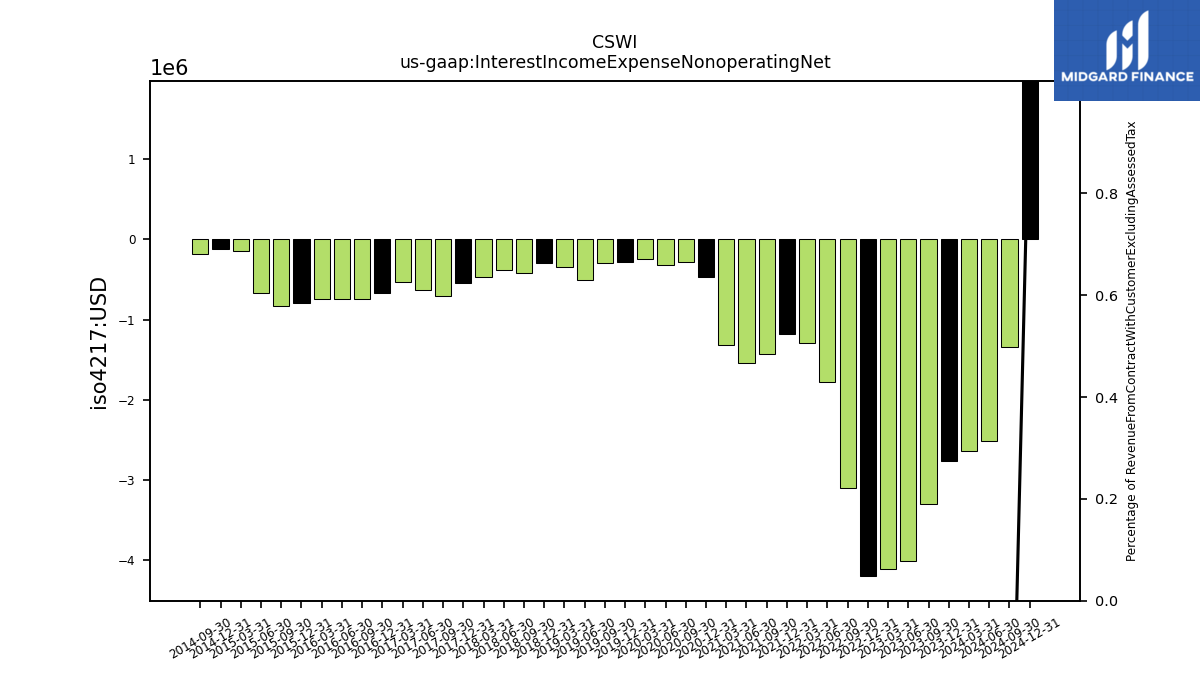
| Interest Income Expense Nonoperating Net | -2.77 | -3.31 | -4.01 | -4.11 | -4.20 | -3.11 | -1.78 | -1.30 | -1.18 | -1.43 | -1.54 | -1.31 | -0.47 | -0.28 | -0.32 | -0.24 | -0.29 | -0.30 | -0.50 | -0.35 | -0.29 | -0.42 | -0.38 | -0.47 | -0.54 | -0.71 | -0.63 | -0.53 | -0.67 | -0.74 | -0.75 | -0.74 | -0.79 | -0.83 | -0.67 | -0.14 | -0.12 | -0.18 | NA | |
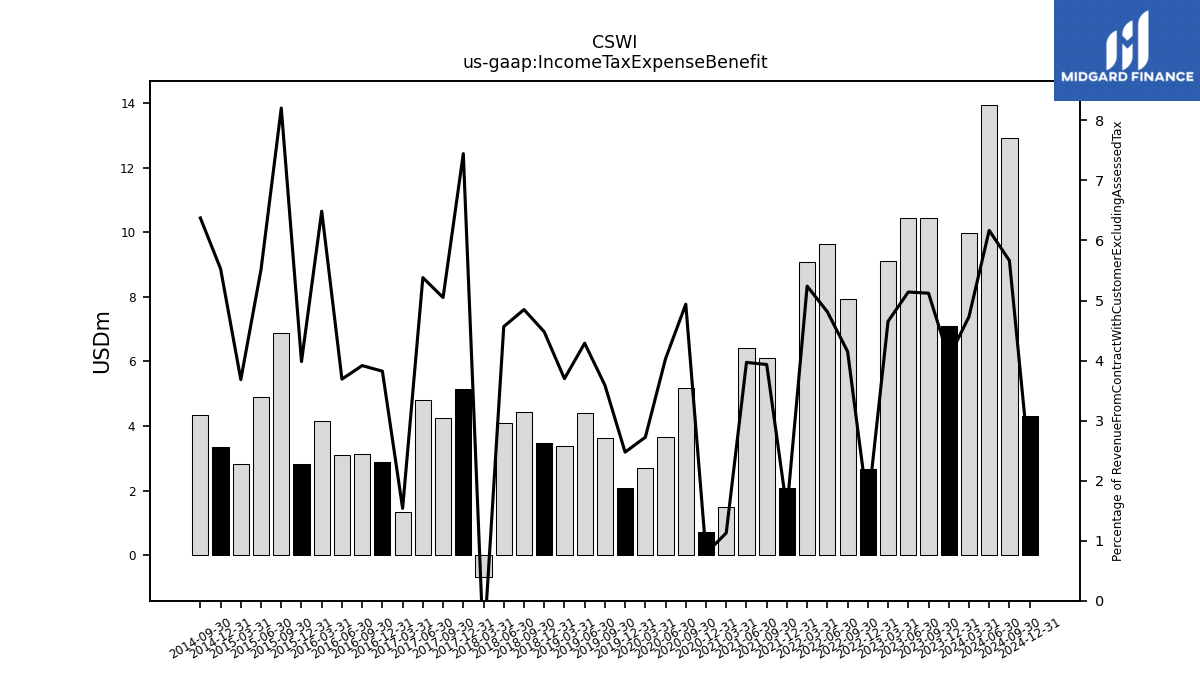
| Income Tax Expense Benefit | 7.08 | 10.43 | 10.46 | 9.11 | 2.68 | 7.94 | 9.62 | 9.08 | 2.07 | 6.12 | 6.40 | 1.51 | 0.71 | 5.18 | 3.67 | 2.69 | 2.07 | 3.64 | 4.39 | 3.38 | 3.47 | 4.44 | 4.09 | -0.68 | 5.14 | 4.26 | 4.80 | 1.34 | 2.89 | 3.14 | 3.10 | 4.15 | 2.83 | 6.87 | 4.91 | 2.81 | 3.37 | 4.34 | NA | |
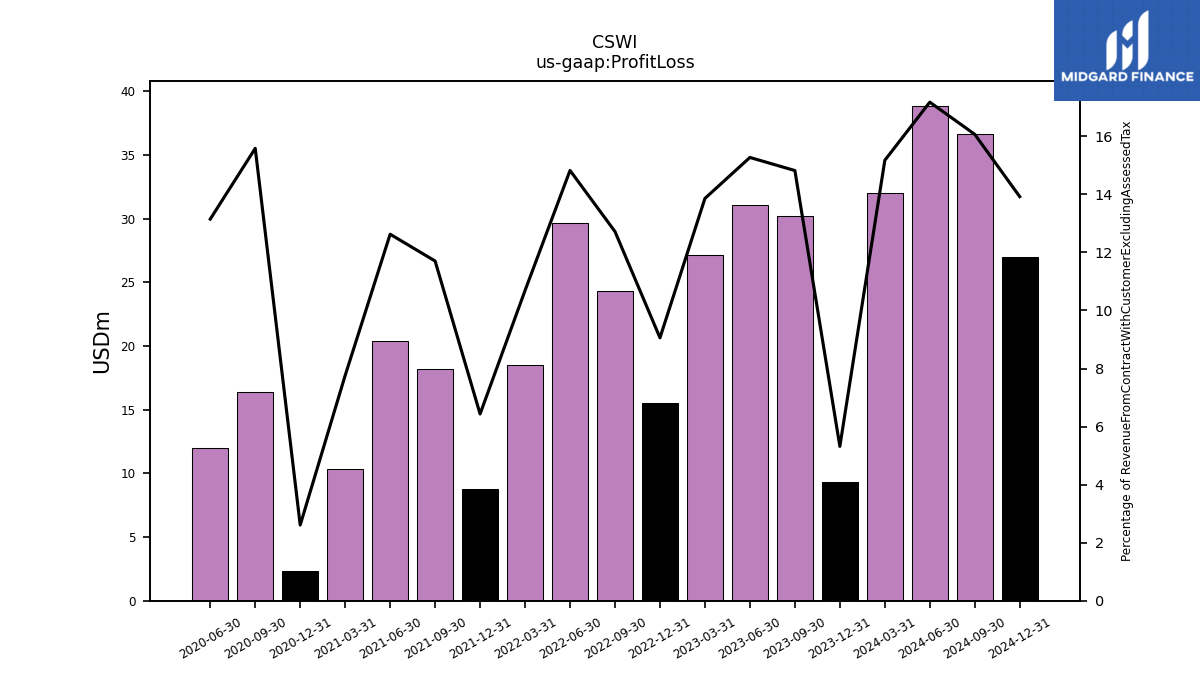
| Profit Loss | 9.30 | 30.18 | 31.06 | 27.12 | 15.50 | 24.32 | 29.64 | 18.52 | 8.77 | 18.21 | 20.36 | 10.36 | 2.35 | 16.35 | 11.96 | NA | NA | NA | NA | NA | NA | NA | NA | NA | NA | NA | NA | NA | NA | NA | NA | NA | NA | NA | NA | NA | NA | NA | NA | |
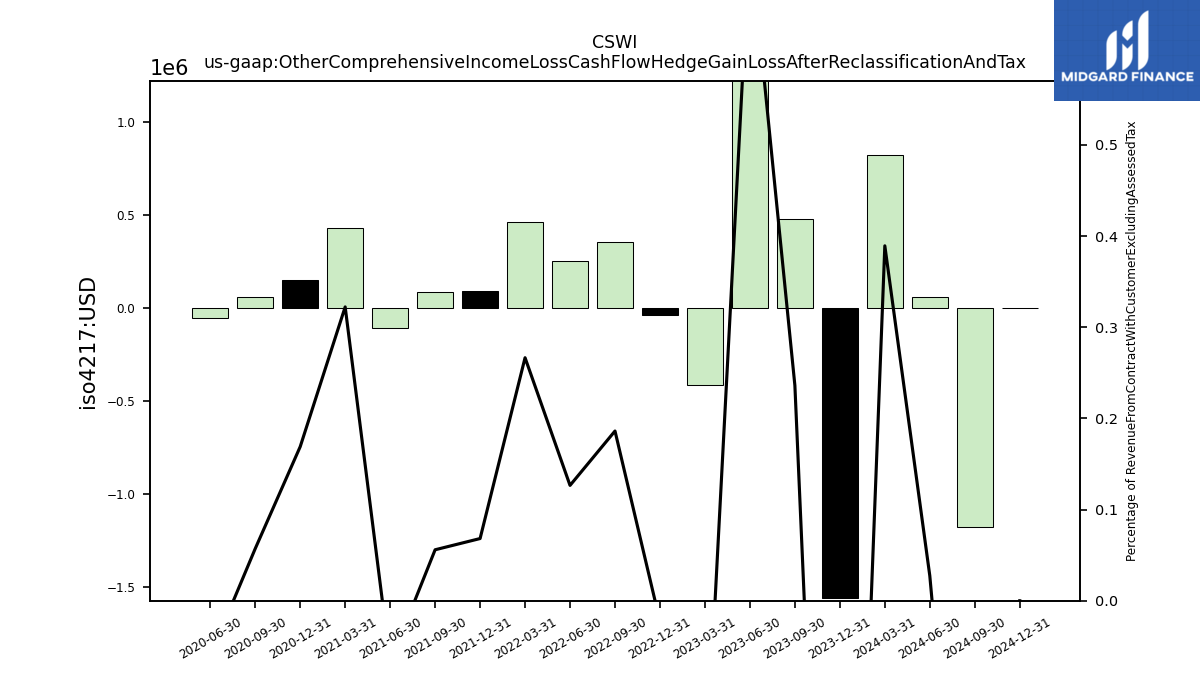
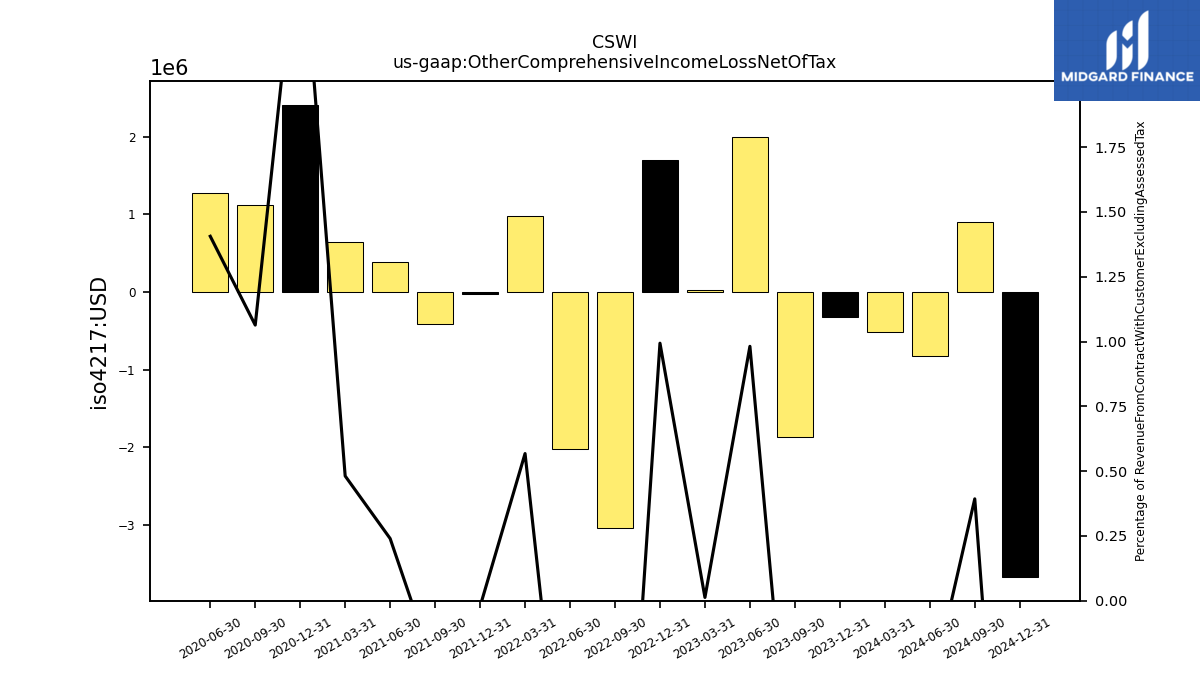
| Other Comprehensive Income Loss Cash Flow Hedge Gain Loss After Reclassification And Tax | -1.56 | 0.48 | 1.48 | -0.41 | -0.04 | 0.36 | 0.25 | 0.46 | 0.09 | 0.09 | -0.11 | 0.43 | 0.15 | 0.06 | -0.06 | NA | NA | NA | NA | NA | NA | NA | NA | NA | NA | NA | NA | NA | NA | NA | NA | NA | NA | NA | NA | NA | NA | NA | NA | |
| Other Comprehensive Income Loss Net Of Tax | -0.33 | -1.87 | 2.00 | 0.03 | 1.70 | -3.04 | -2.02 | 0.98 | -0.03 | -0.42 | 0.39 | 0.64 | 2.41 | 1.12 | 1.28 | NA | NA | NA | NA | NA | NA | NA | NA | NA | NA | NA | NA | NA | NA | NA | NA | NA | NA | NA | NA | NA | NA | NA | NA | |
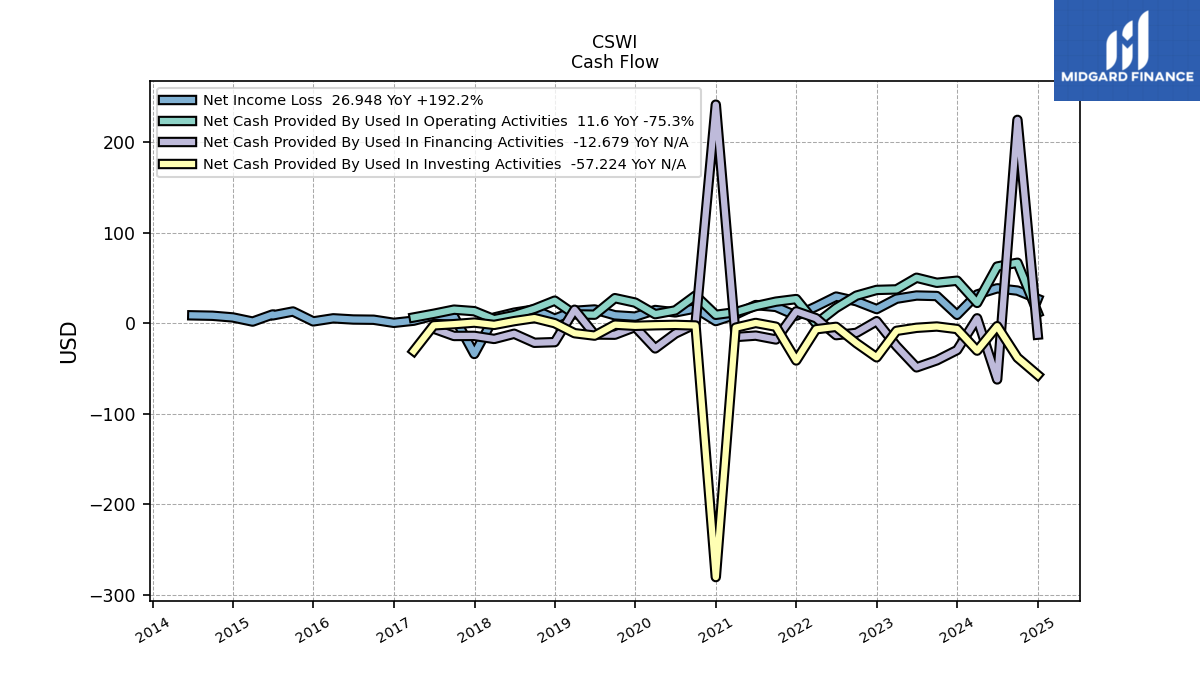
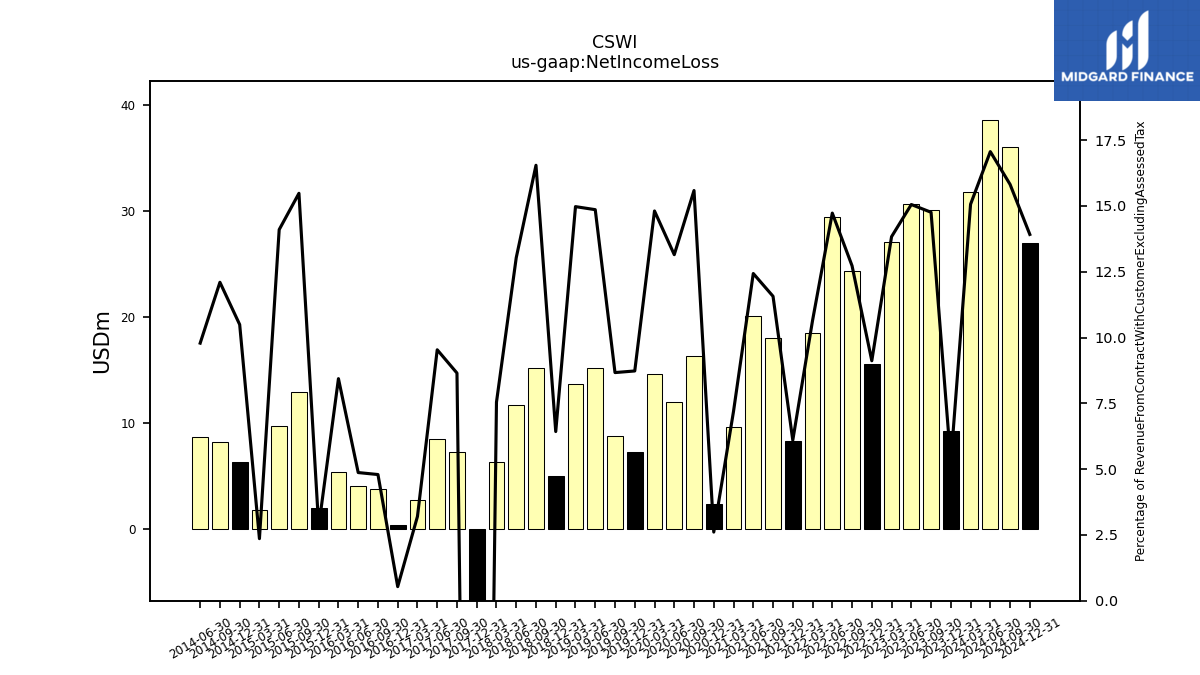
| Net Income Loss | 9.22 | 30.05 | 30.61 | 27.06 | 15.60 | 24.33 | 29.44 | 18.45 | 8.31 | 18.00 | 20.05 | 9.60 | 2.35 | 16.35 | 11.96 | 14.60 | 7.31 | 8.78 | 15.20 | 13.70 | 4.98 | 15.16 | 11.68 | 6.30 | -34.04 | 7.30 | 8.51 | 2.80 | 0.41 | 3.84 | 4.10 | 5.40 | 2.00 | 12.96 | 9.70 | 1.80 | 6.39 | 8.24 | 8.70 | |
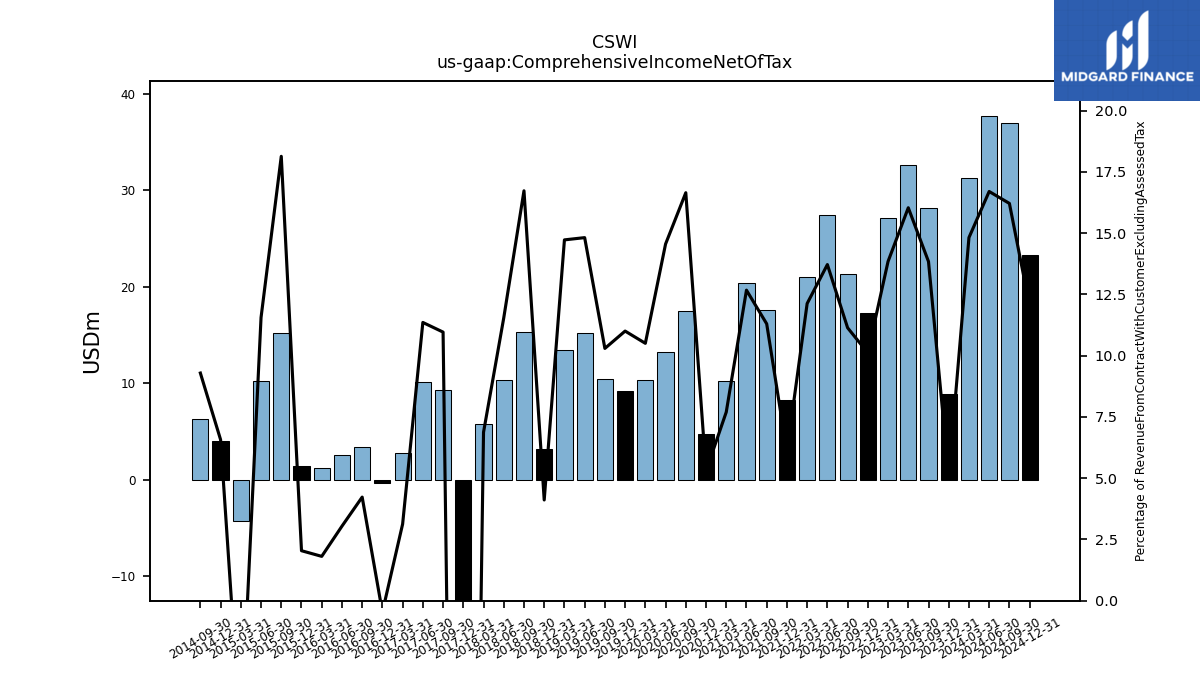
| Comprehensive Income Net Of Tax | 8.89 | 28.18 | 32.61 | 27.09 | 17.30 | 21.29 | 27.42 | 21.02 | 8.28 | 17.58 | 20.43 | 10.27 | 4.76 | 17.47 | 13.24 | 10.36 | 9.21 | 10.43 | 15.16 | 13.47 | 3.19 | 15.32 | 10.34 | 5.74 | -34.06 | 9.25 | 10.14 | 2.73 | -0.35 | 3.39 | 2.56 | 1.16 | 1.45 | 15.19 | 10.27 | -4.33 | 4.00 | 6.33 | NA |
| 2023-12-31 | 2023-09-30 | 2023-06-30 | 2023-03-31 | 2022-12-31 | 2022-09-30 | 2022-06-30 | 2022-03-31 | 2021-12-31 | 2021-09-30 | 2021-06-30 | 2021-03-31 | 2020-12-31 | 2020-09-30 | 2020-06-30 | 2020-03-31 | 2019-12-31 | 2019-09-30 | 2019-06-30 | 2019-03-31 | 2018-12-31 | 2018-09-30 | 2018-06-30 | 2018-03-31 | 2017-12-31 | 2017-09-30 | 2017-06-30 | 2017-03-31 | 2016-12-31 | 2016-09-30 | 2016-06-30 | 2016-03-31 | 2015-12-31 | 2015-09-30 | 2015-06-30 | 2015-03-31 | 2014-12-31 | 2014-09-30 | 2014-06-30 | ||
|---|---|---|---|---|---|---|---|---|---|---|---|---|---|---|---|---|---|---|---|---|---|---|---|---|---|---|---|---|---|---|---|---|---|---|---|---|---|---|---|---|
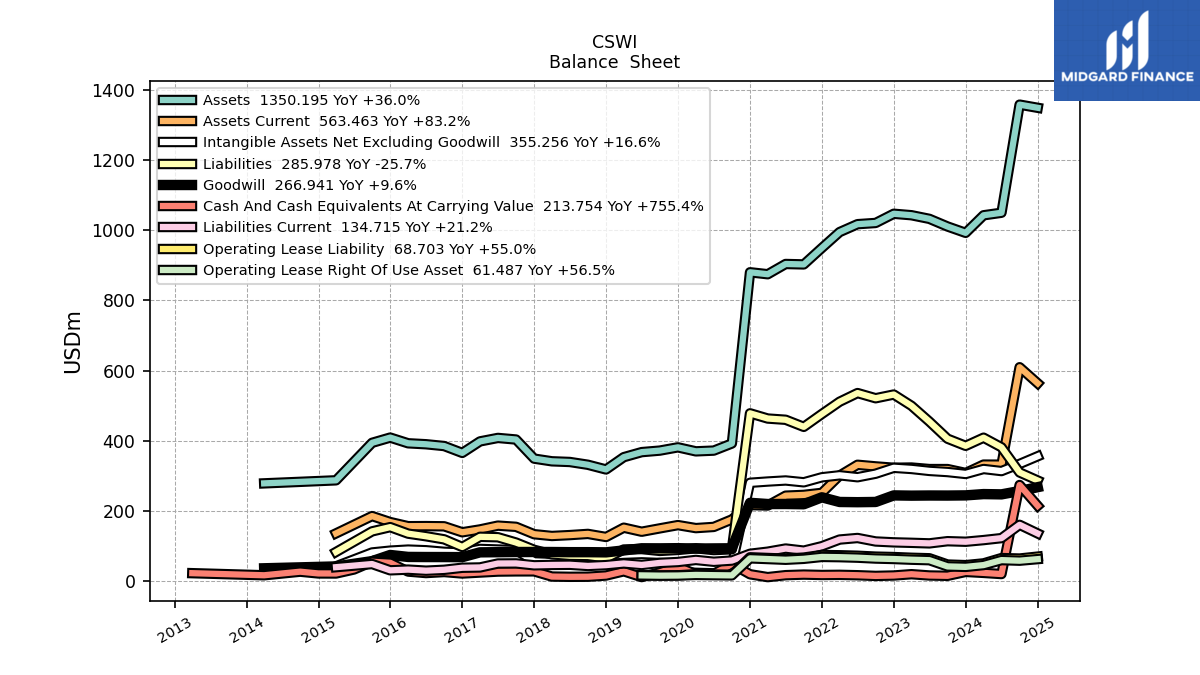
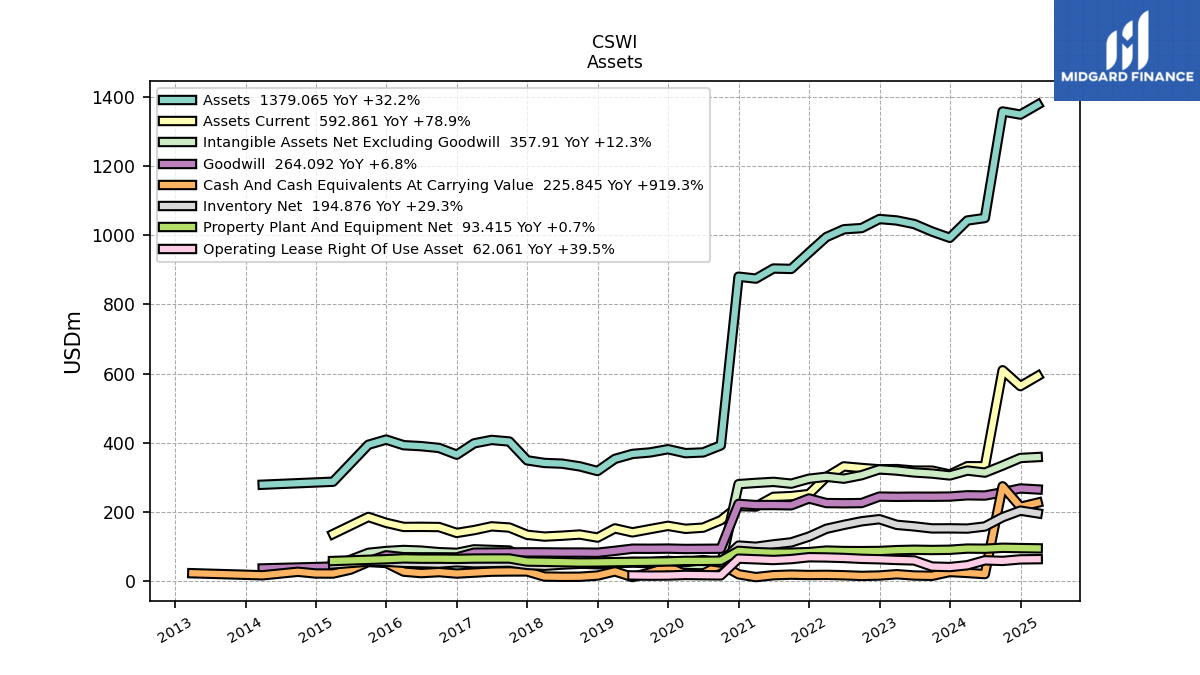
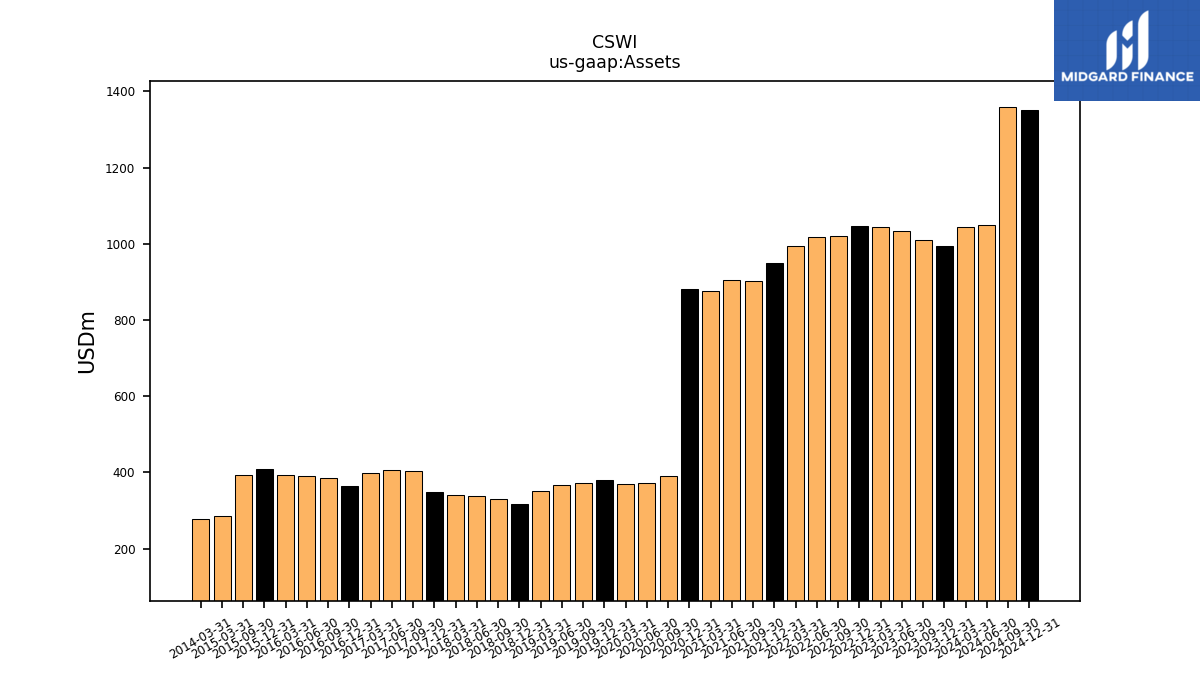
| Assets | 993.13 | 1011.31 | 1033.10 | 1043.45 | 1047.67 | 1021.39 | 1017.92 | 995.36 | 950.04 | 903.02 | 904.24 | 874.96 | 880.58 | 391.67 | 371.36 | 369.25 | 380.69 | 371.38 | 367.03 | 352.63 | 317.48 | 330.92 | 338.88 | 340.82 | 348.46 | 403.02 | 407.55 | 397.66 | 364.78 | 384.38 | 389.51 | 392.26 | 408.57 | 393.60 | NA | 286.52 | NA | NA | NA | |
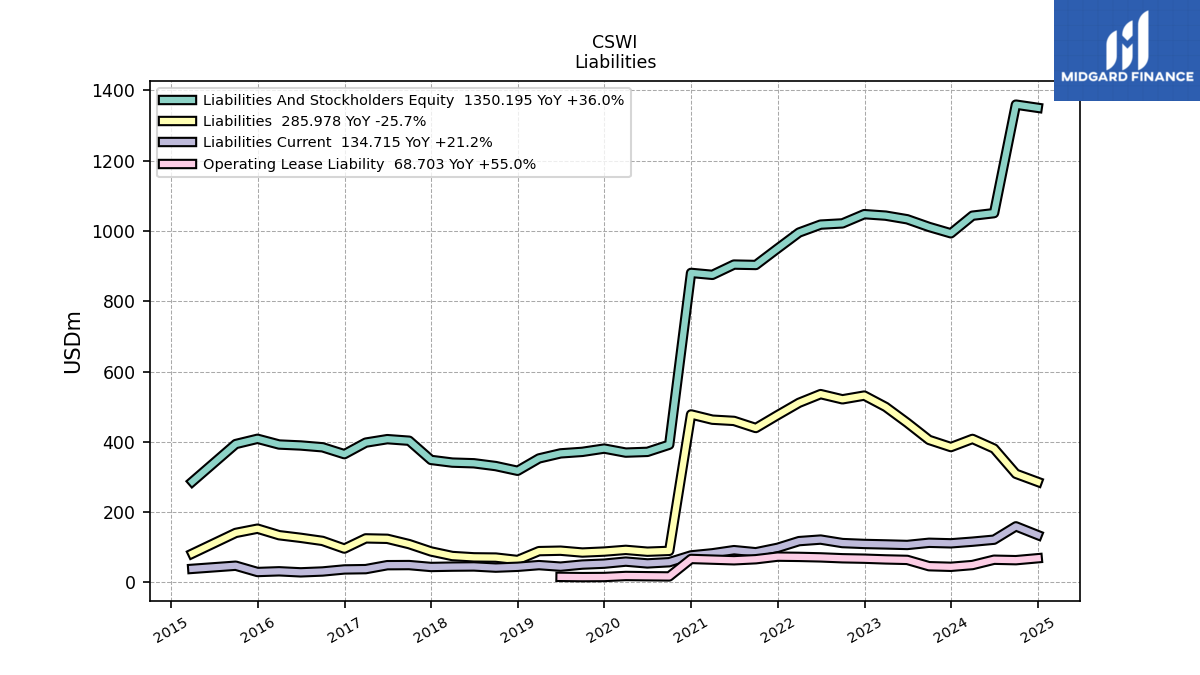
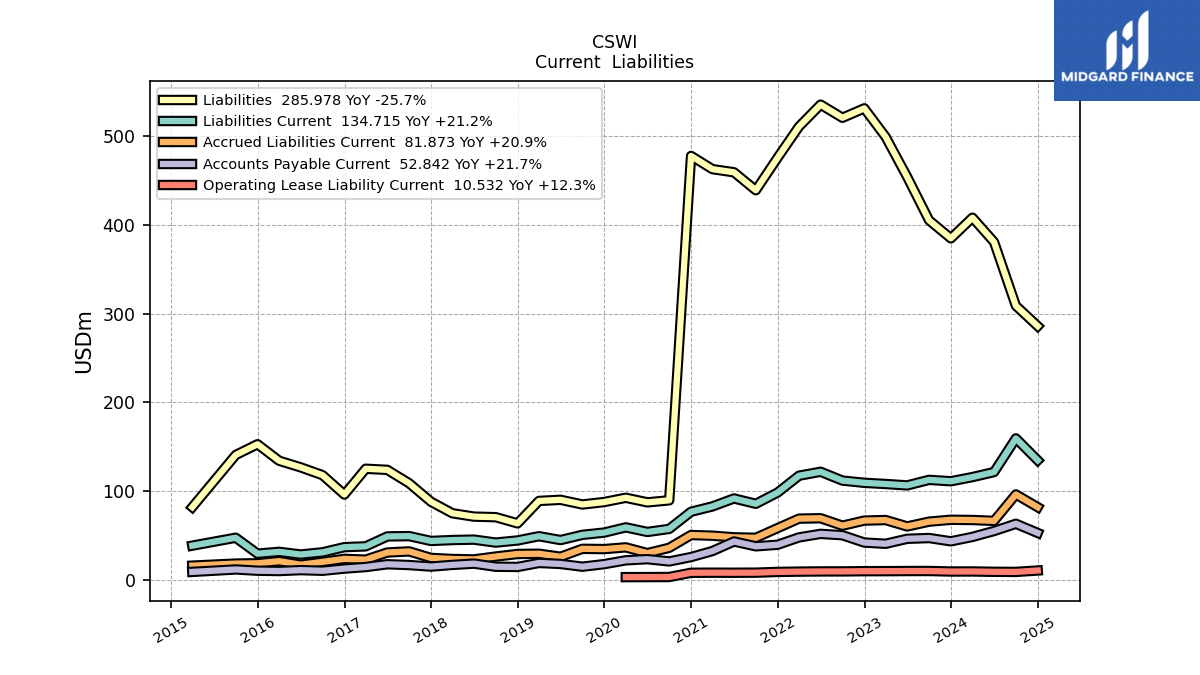
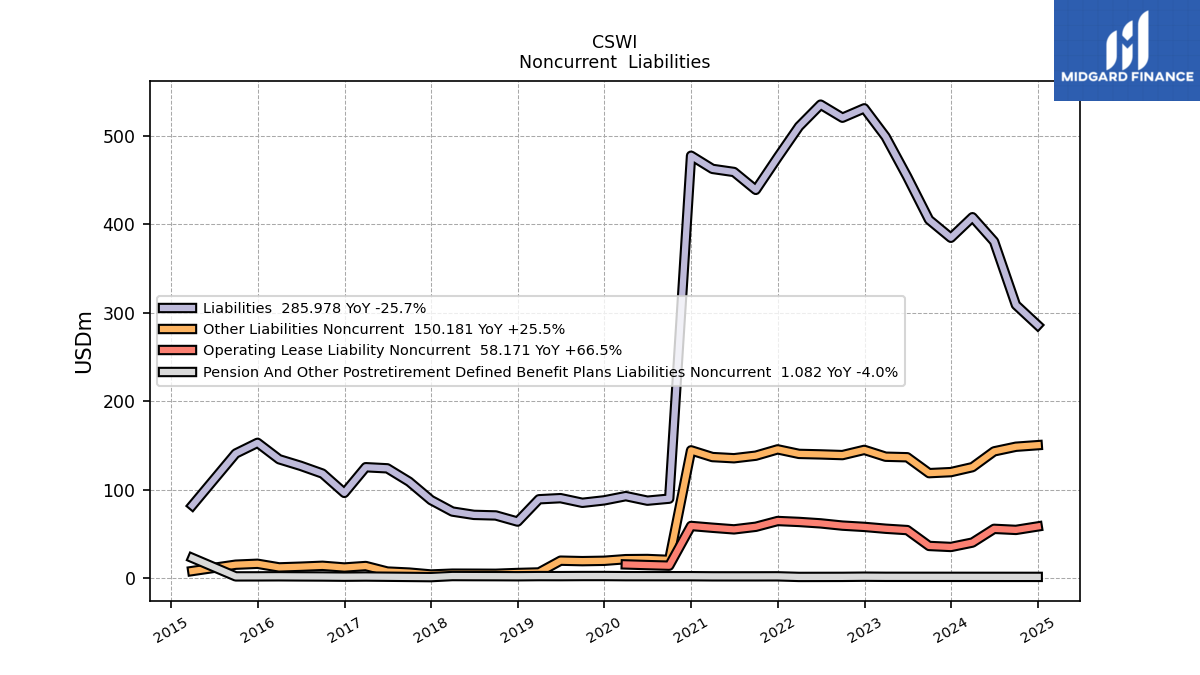
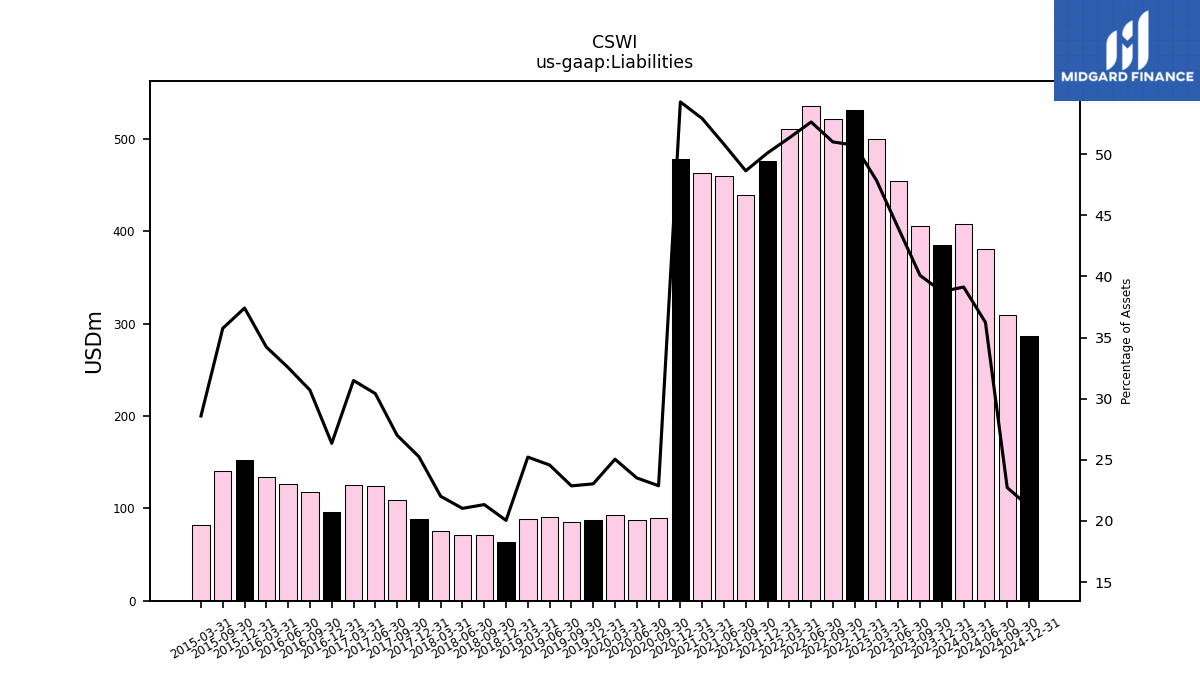
| Liabilities | 384.94 | 405.34 | 454.10 | 499.31 | 531.50 | 520.86 | 535.68 | 510.95 | 475.93 | 439.16 | 459.42 | 462.94 | 477.86 | 89.63 | 87.35 | 92.50 | 87.70 | 84.94 | 90.20 | 88.95 | 63.66 | 70.62 | 71.27 | 75.05 | 88.03 | 108.85 | 123.97 | 125.23 | 96.13 | 118.00 | 126.77 | 134.25 | 152.86 | 140.73 | NA | 81.92 | NA | NA | NA | |
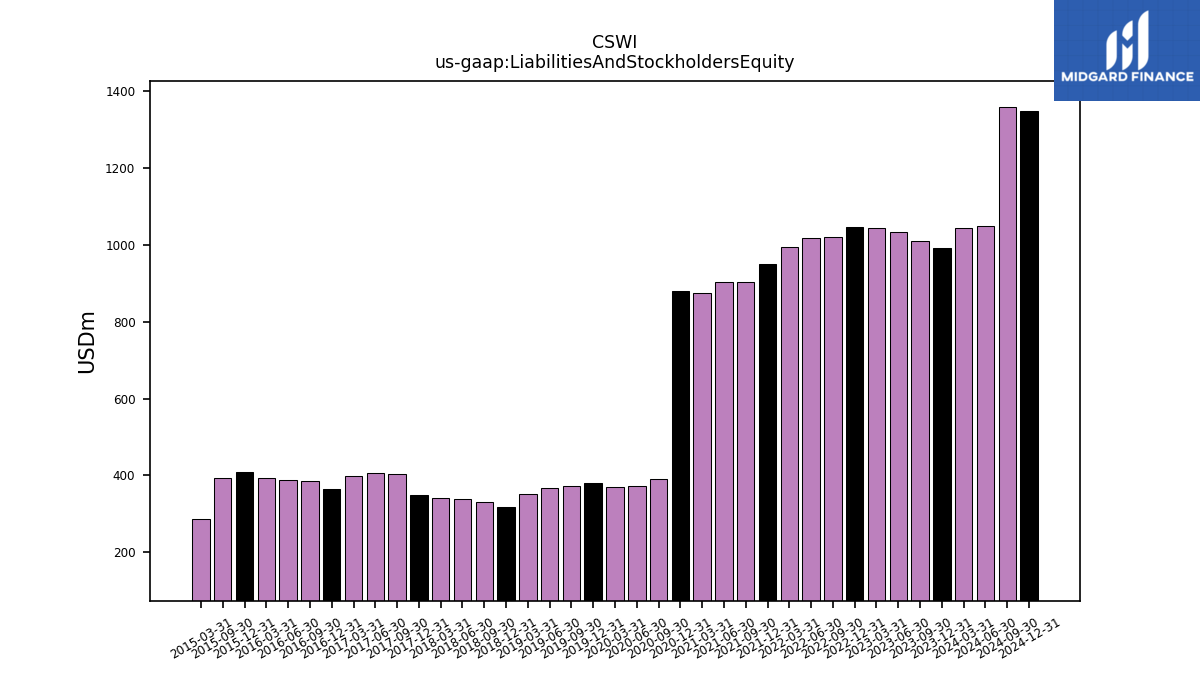
| Liabilities And Stockholders Equity | 993.13 | 1011.31 | 1033.10 | 1043.45 | 1047.67 | 1021.39 | 1017.92 | 995.36 | 950.04 | 903.02 | 904.24 | 874.96 | 880.58 | 391.67 | 371.36 | 369.25 | 380.69 | 371.38 | 367.03 | 352.63 | 317.48 | 330.92 | 338.88 | 340.82 | 348.46 | 403.02 | 407.55 | 397.66 | 364.78 | 384.38 | 389.51 | 392.26 | 408.57 | 393.60 | NA | 286.52 | NA | NA | NA |
| 2023-12-31 | 2023-09-30 | 2023-06-30 | 2023-03-31 | 2022-12-31 | 2022-09-30 | 2022-06-30 | 2022-03-31 | 2021-12-31 | 2021-09-30 | 2021-06-30 | 2021-03-31 | 2020-12-31 | 2020-09-30 | 2020-06-30 | 2020-03-31 | 2019-12-31 | 2019-09-30 | 2019-06-30 | 2019-03-31 | 2018-12-31 | 2018-09-30 | 2018-06-30 | 2018-03-31 | 2017-12-31 | 2017-09-30 | 2017-06-30 | 2017-03-31 | 2016-12-31 | 2016-09-30 | 2016-06-30 | 2016-03-31 | 2015-12-31 | 2015-09-30 | 2015-06-30 | 2015-03-31 | 2014-12-31 | 2014-09-30 | 2014-06-30 | ||
|---|---|---|---|---|---|---|---|---|---|---|---|---|---|---|---|---|---|---|---|---|---|---|---|---|---|---|---|---|---|---|---|---|---|---|---|---|---|---|---|---|
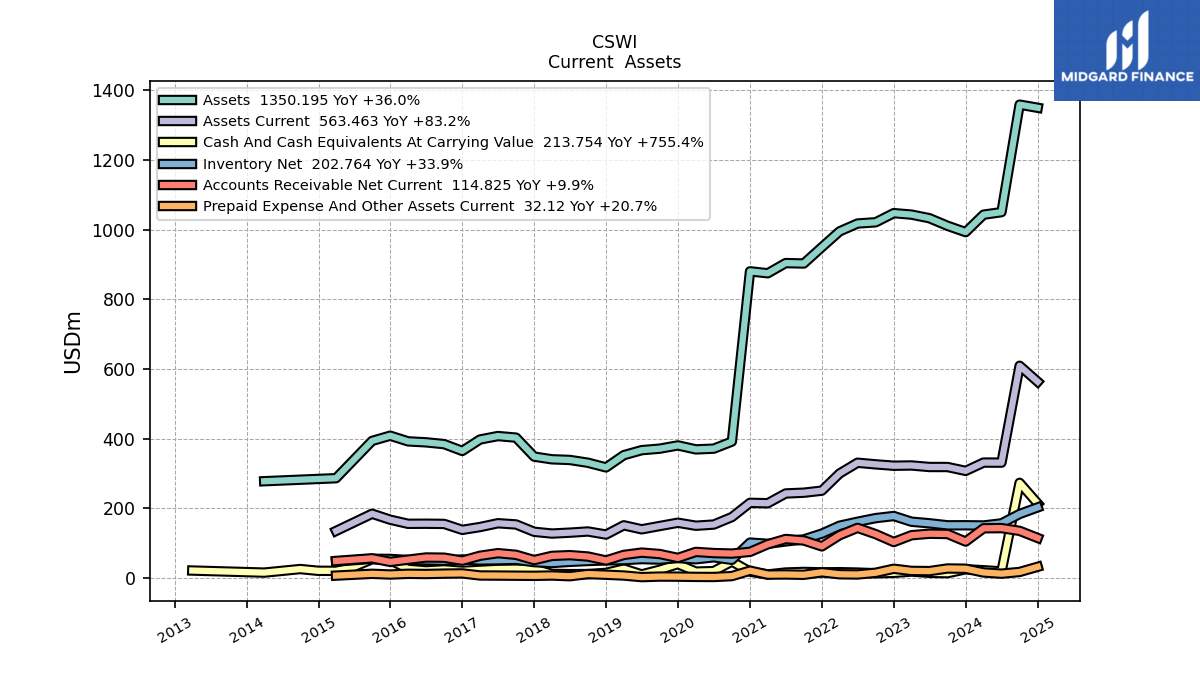
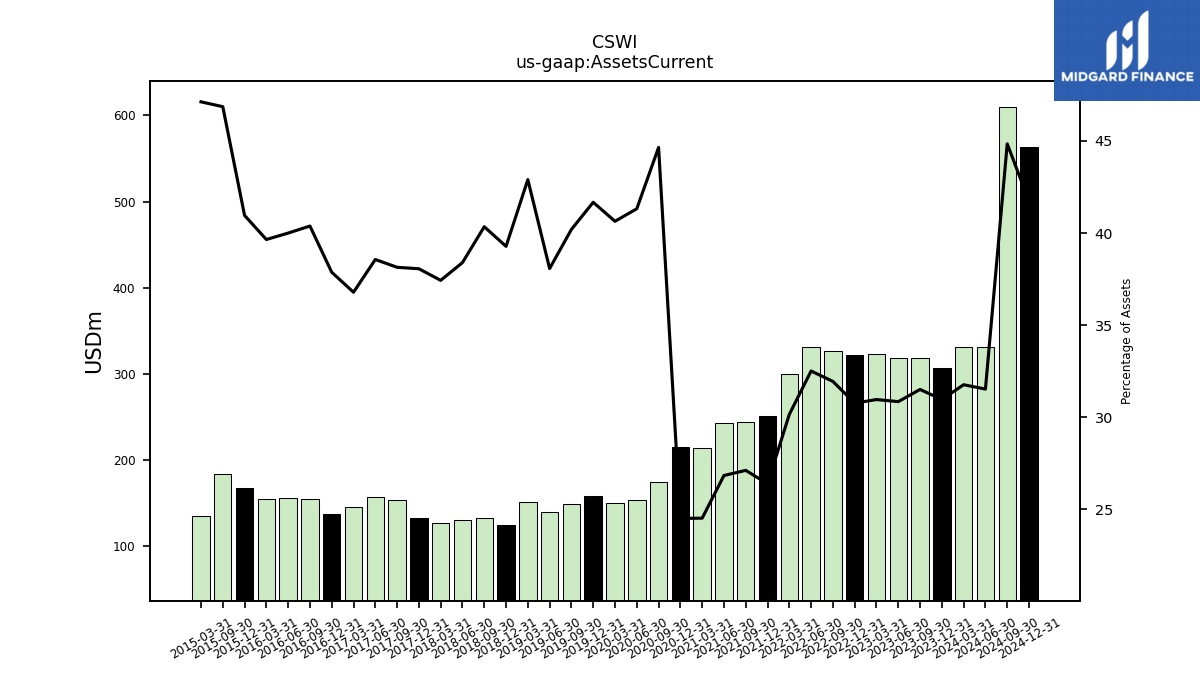
| Assets Current | 307.51 | 318.65 | 318.68 | 323.06 | 322.34 | 326.29 | 330.93 | 300.15 | 250.72 | 244.87 | 242.67 | 214.55 | 215.82 | 174.86 | 153.43 | 150.04 | 158.62 | 149.28 | 139.74 | 151.27 | 124.69 | 133.50 | 130.11 | 127.57 | 132.62 | 153.71 | 157.16 | 146.28 | 138.14 | 155.20 | 155.79 | 155.52 | 167.33 | 184.43 | NA | 135.01 | NA | NA | NA | |
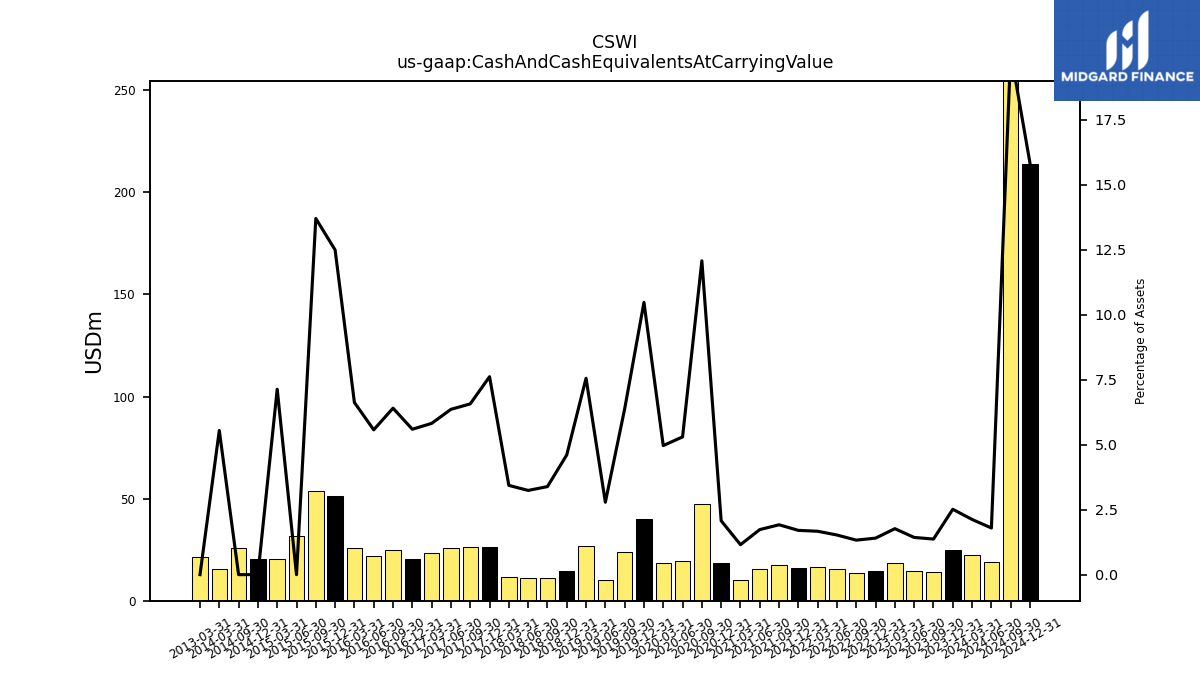
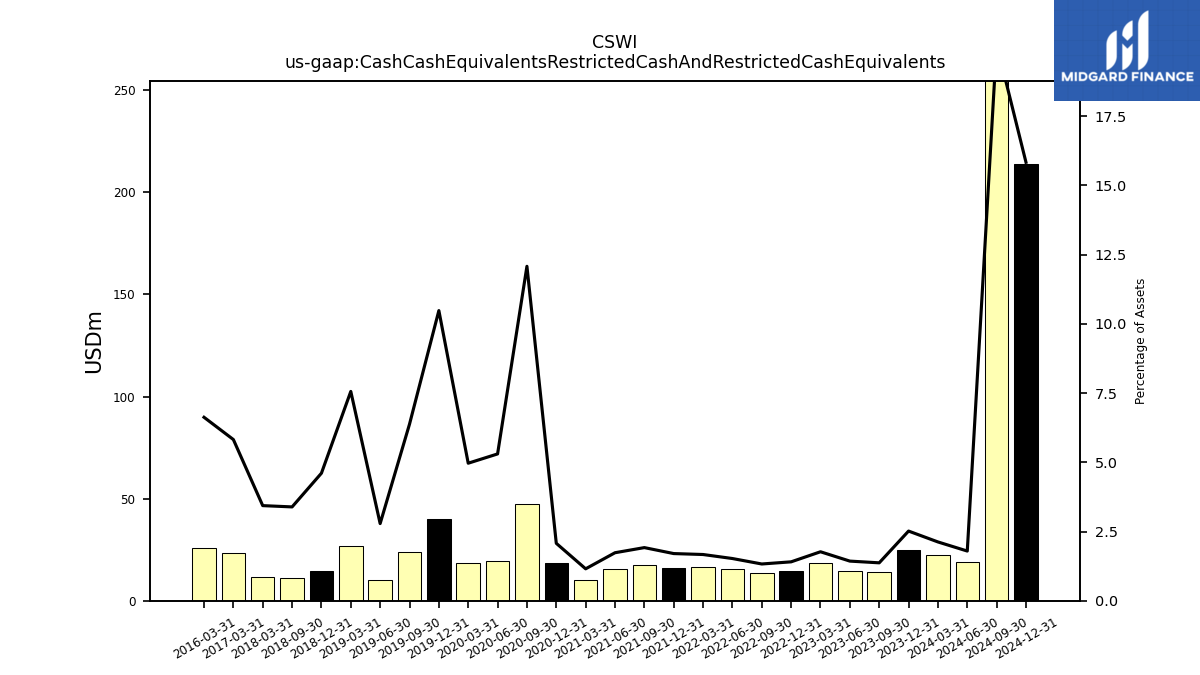
| Cash And Cash Equivalents At Carrying Value | 24.99 | 13.85 | 14.79 | 18.45 | 14.72 | 13.56 | 15.52 | 16.62 | 16.18 | 17.33 | 15.68 | 10.09 | 18.26 | 47.30 | 19.69 | 18.34 | 39.88 | 23.68 | 10.23 | 26.65 | 14.62 | 11.21 | 10.98 | 11.71 | 26.54 | 26.48 | 25.93 | 23.15 | 20.41 | 24.62 | 21.71 | 25.99 | 51.05 | 53.95 | 31.89 | 20.45 | 20.59 | 25.62 | NA | |
| Cash Cash Equivalents Restricted Cash And Restricted Cash Equivalents | 24.99 | 13.85 | 14.79 | 18.45 | 14.72 | 13.56 | 15.52 | 16.62 | 16.18 | 17.33 | 15.68 | 10.09 | 18.26 | 47.30 | 19.69 | 18.34 | 39.88 | 23.68 | 10.23 | 26.65 | 14.62 | 11.21 | NA | 11.71 | NA | NA | NA | 23.15 | NA | NA | NA | 25.99 | NA | NA | NA | NA | NA | NA | NA | |
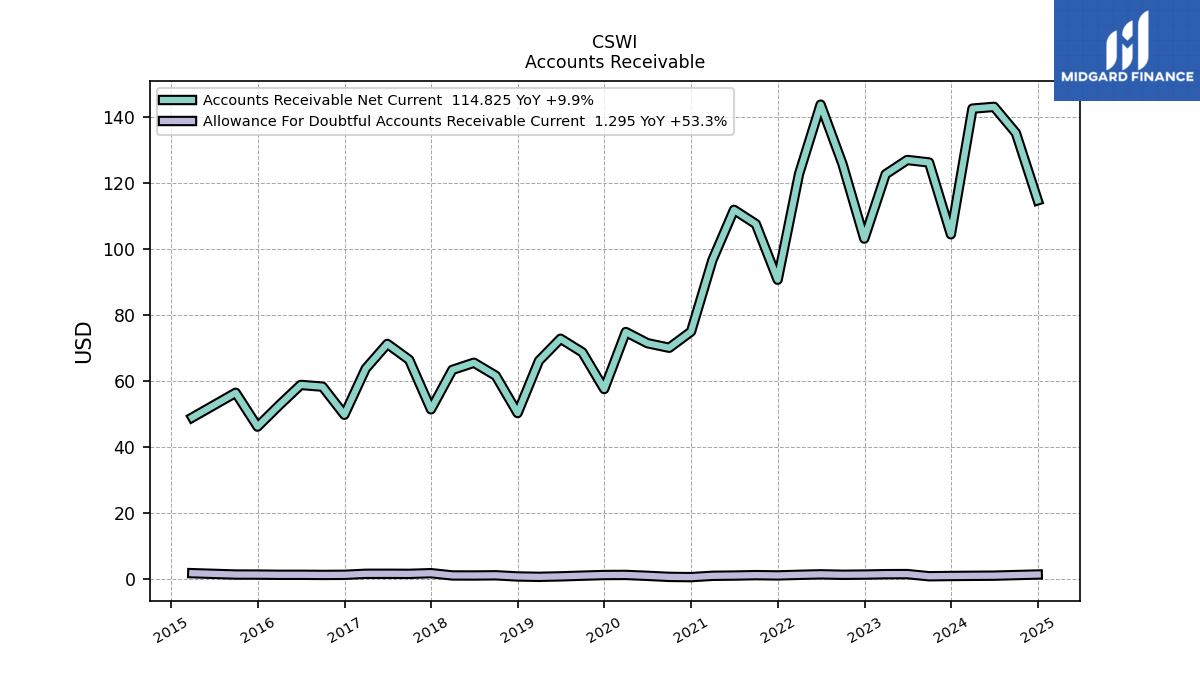
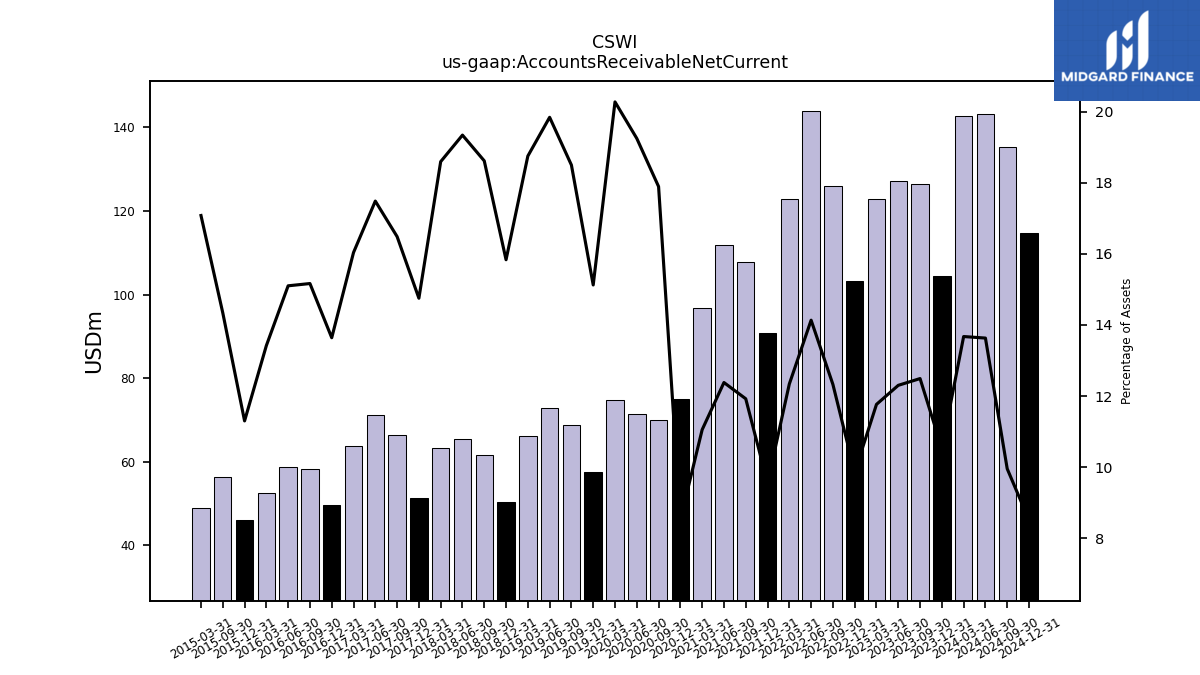
| Accounts Receivable Net Current | 104.52 | 126.32 | 127.08 | 122.75 | 103.21 | 125.90 | 143.87 | 122.80 | 90.74 | 107.66 | 111.94 | 96.69 | 75.00 | 70.09 | 71.49 | 74.88 | 57.58 | 68.71 | 72.84 | 66.14 | 50.28 | 61.62 | 65.56 | 63.38 | 51.41 | 66.45 | 71.27 | 63.78 | 49.76 | 58.30 | 58.83 | 52.64 | 46.16 | 56.45 | NA | 48.94 | NA | NA | NA | |
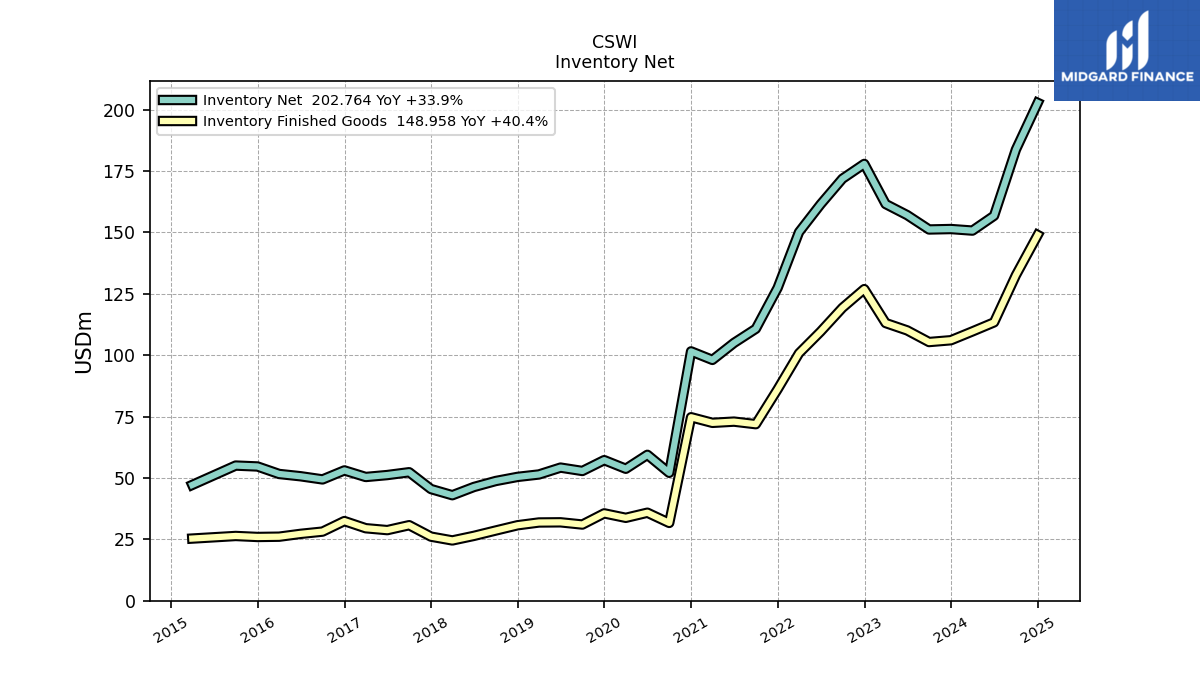
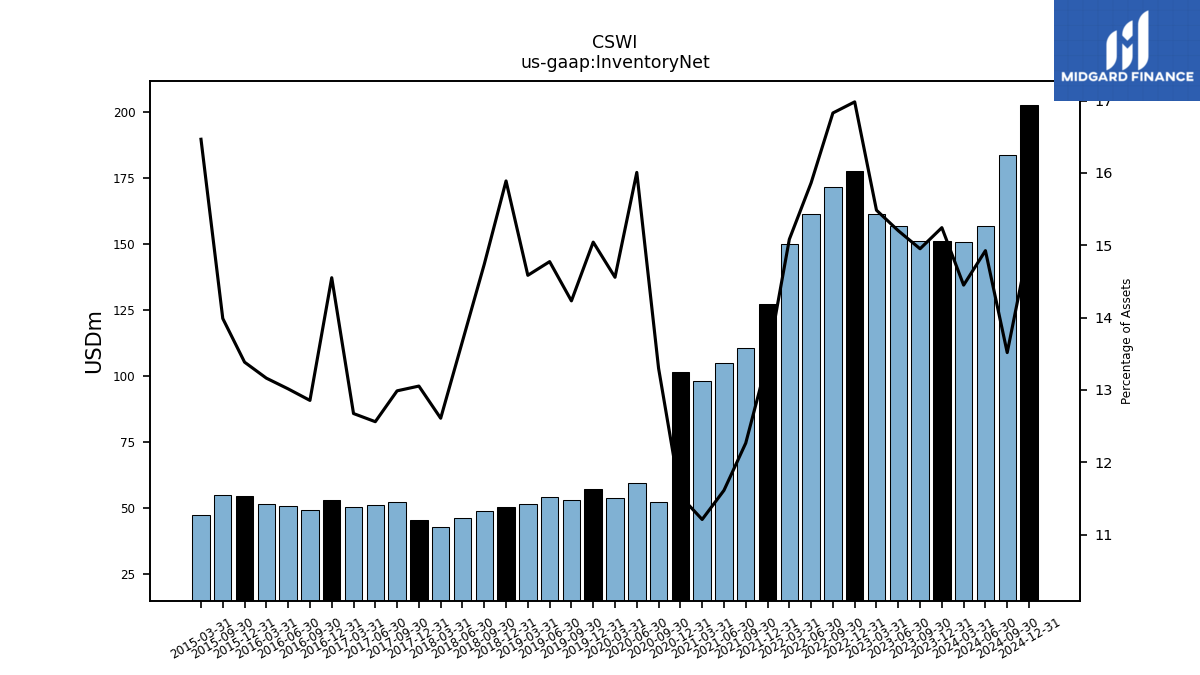
| Inventory Net | 151.39 | 151.20 | 157.04 | 161.57 | 177.91 | 171.88 | 161.46 | 150.11 | 127.44 | 110.76 | 105.00 | 98.09 | 101.56 | 52.09 | 59.44 | 53.75 | 57.27 | 52.85 | 54.22 | 51.43 | 50.44 | 48.77 | 46.34 | 42.97 | 45.49 | 52.34 | 51.19 | 50.40 | 53.08 | 49.41 | 50.70 | 51.63 | 54.68 | 55.05 | NA | 47.17 | NA | NA | NA | |
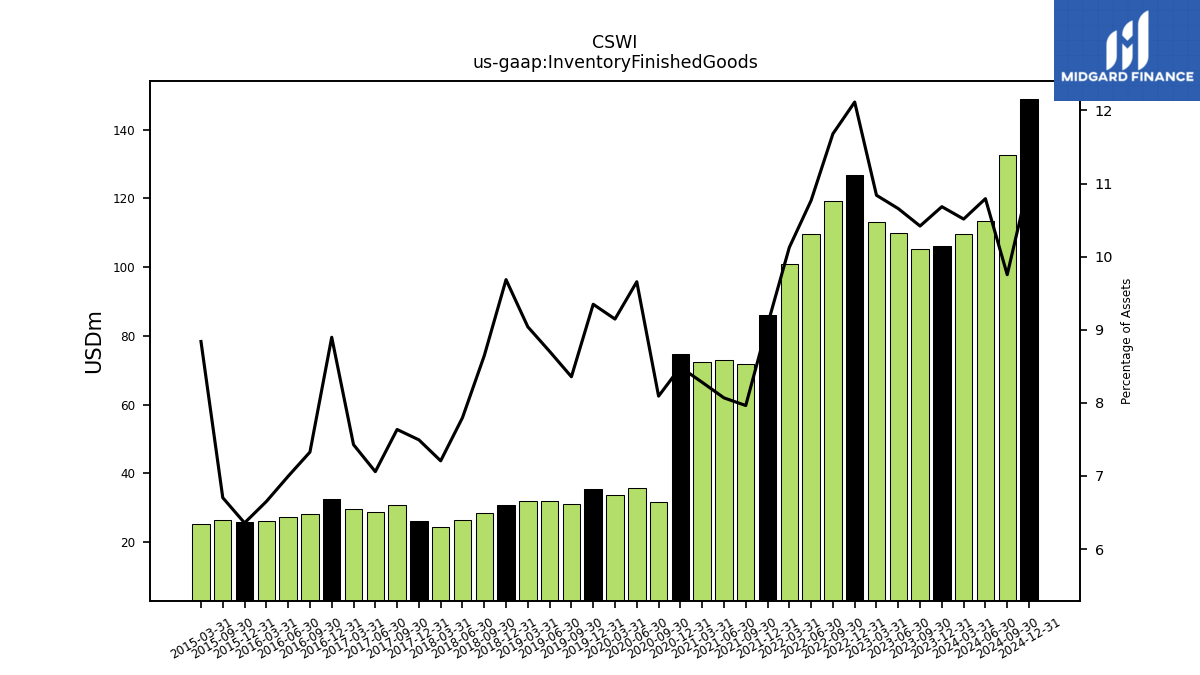
| Inventory Finished Goods | 106.10 | 105.36 | 110.10 | 113.10 | 126.92 | 119.30 | 109.61 | 100.79 | 86.15 | 71.91 | 72.95 | 72.45 | 74.74 | 31.69 | 35.86 | 33.77 | 35.59 | 31.04 | 31.94 | 31.88 | 30.75 | 28.61 | 26.42 | 24.56 | 26.11 | 30.77 | 28.77 | 29.54 | 32.45 | 28.16 | 27.25 | 26.09 | 25.97 | 26.38 | NA | 25.32 | NA | NA | NA | |
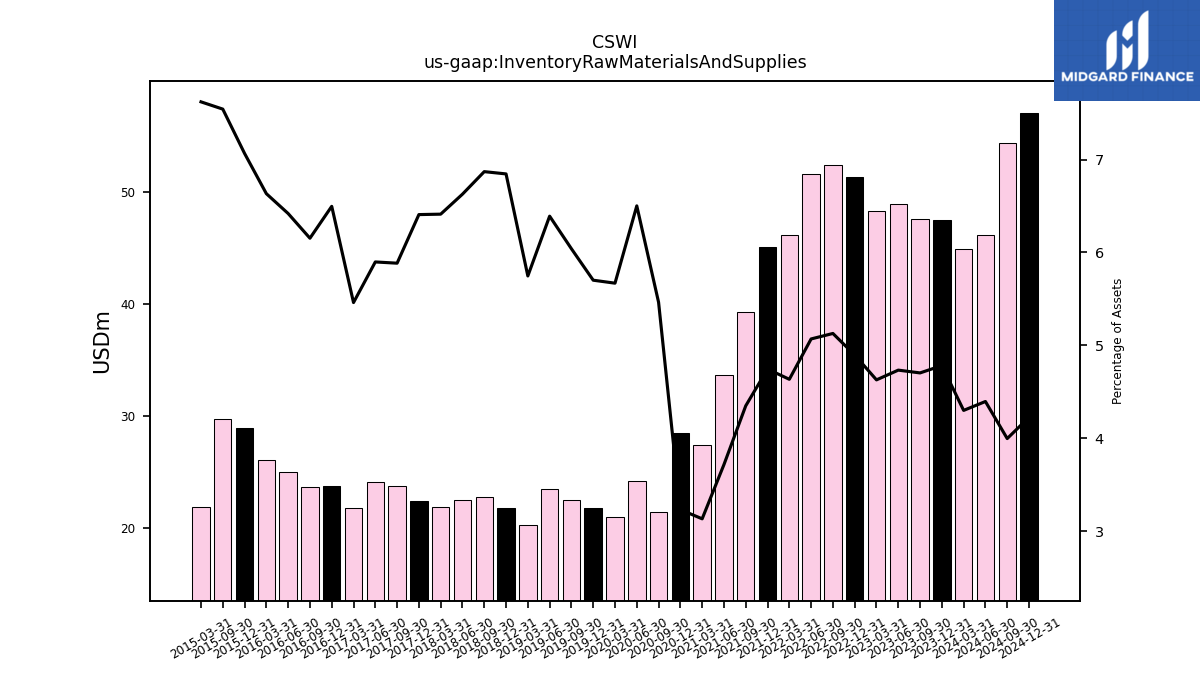
| Inventory Raw Materials And Supplies | 47.50 | 47.57 | 48.90 | 48.30 | 51.30 | 52.38 | 51.60 | 46.14 | 45.08 | 39.28 | 33.61 | 27.42 | 28.46 | 21.40 | 24.14 | 20.93 | 21.71 | 22.43 | 23.46 | 20.27 | 21.73 | 22.73 | 22.46 | 21.86 | 22.33 | 23.72 | 24.04 | 21.72 | 23.70 | 23.65 | 25.00 | 26.02 | 28.87 | 29.69 | NA | 21.84 | NA | NA | NA | |
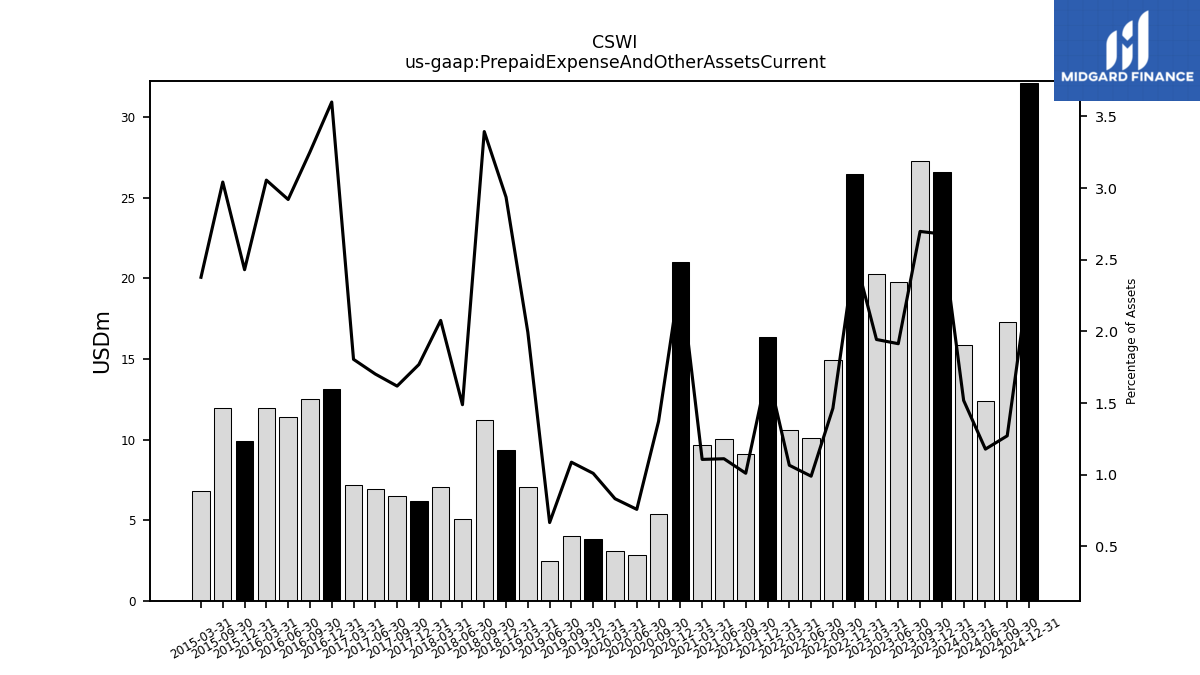
| Prepaid Expense And Other Assets Current | 26.61 | 27.28 | 19.77 | 20.28 | 26.49 | 14.95 | 10.07 | 10.61 | 16.36 | 9.12 | 10.05 | 9.68 | 21.00 | 5.38 | 2.82 | 3.07 | 3.84 | 4.04 | 2.44 | 7.03 | 9.32 | 11.23 | 5.04 | 7.08 | 6.16 | 6.52 | 6.94 | 7.18 | 13.13 | 12.50 | 11.38 | 11.98 | 9.93 | 11.97 | NA | 6.81 | NA | NA | NA |
| 2023-12-31 | 2023-09-30 | 2023-06-30 | 2023-03-31 | 2022-12-31 | 2022-09-30 | 2022-06-30 | 2022-03-31 | 2021-12-31 | 2021-09-30 | 2021-06-30 | 2021-03-31 | 2020-12-31 | 2020-09-30 | 2020-06-30 | 2020-03-31 | 2019-12-31 | 2019-09-30 | 2019-06-30 | 2019-03-31 | 2018-12-31 | 2018-09-30 | 2018-06-30 | 2018-03-31 | 2017-12-31 | 2017-09-30 | 2017-06-30 | 2017-03-31 | 2016-12-31 | 2016-09-30 | 2016-06-30 | 2016-03-31 | 2015-12-31 | 2015-09-30 | 2015-06-30 | 2015-03-31 | 2014-12-31 | 2014-09-30 | 2014-06-30 | ||
|---|---|---|---|---|---|---|---|---|---|---|---|---|---|---|---|---|---|---|---|---|---|---|---|---|---|---|---|---|---|---|---|---|---|---|---|---|---|---|---|---|
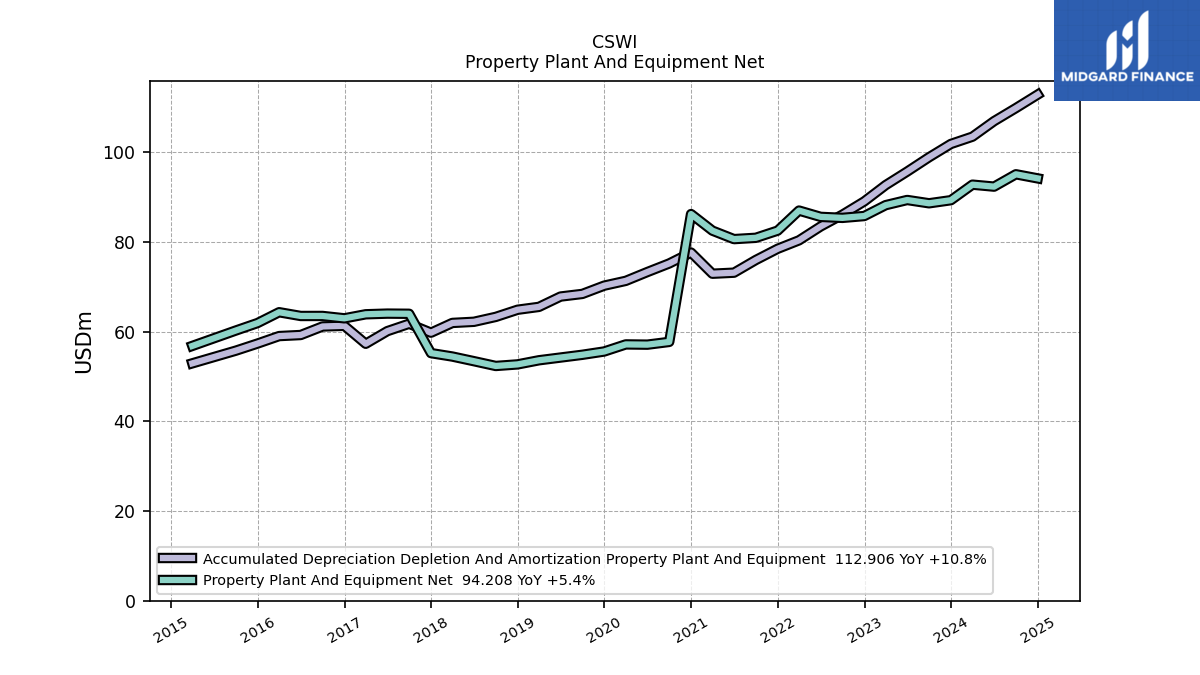
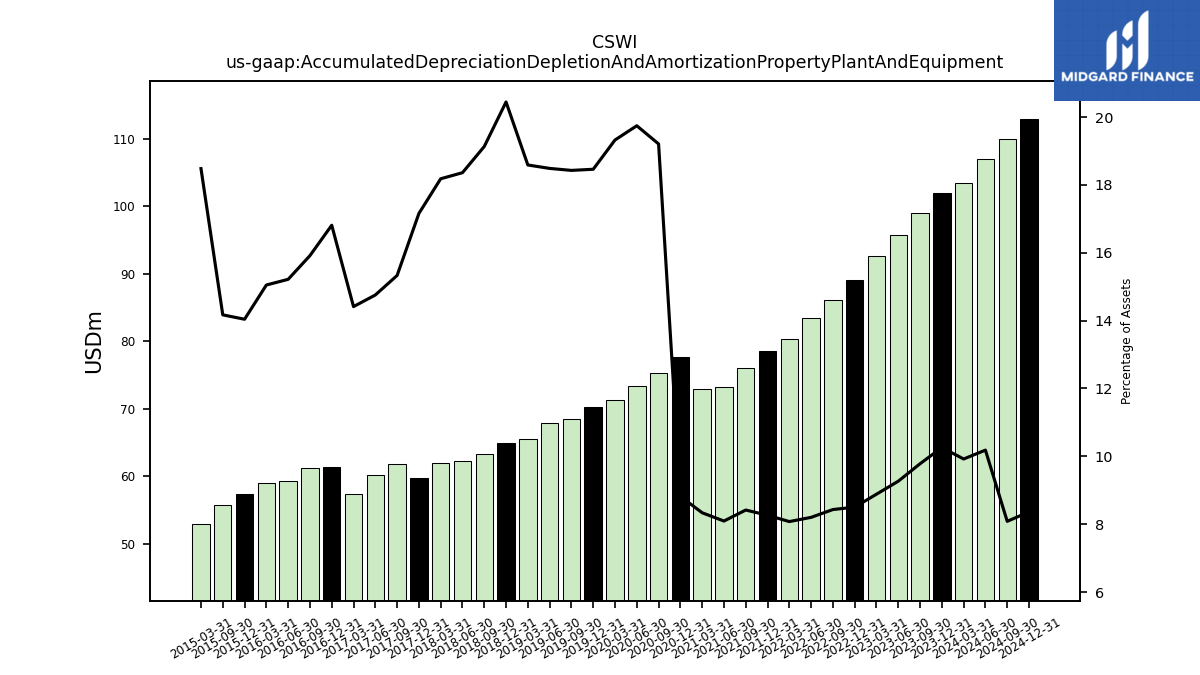
| Accumulated Depreciation Depletion And Amortization Property Plant And Equipment | 101.89 | 98.93 | 95.74 | 92.70 | 89.08 | 86.12 | 83.48 | 80.39 | 78.51 | 76.01 | 73.18 | 72.94 | 77.67 | 75.23 | 73.33 | 71.36 | 70.28 | 68.44 | 67.85 | 65.55 | 64.91 | 63.31 | 62.22 | 61.97 | 59.79 | 61.79 | 60.14 | 57.32 | 61.33 | 61.18 | 59.27 | 59.03 | 57.37 | 55.77 | NA | 52.95 | NA | NA | NA | |
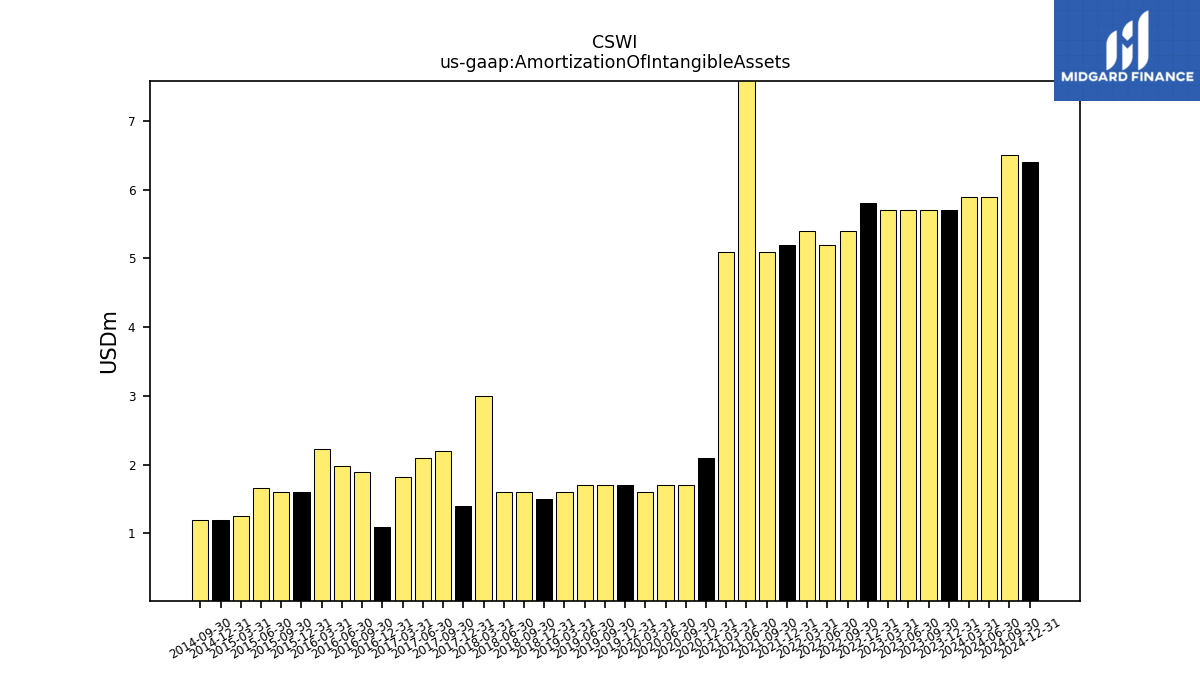
| Amortization Of Intangible Assets | 5.70 | 5.70 | 5.70 | 5.70 | 5.80 | 5.40 | 5.20 | 5.40 | 5.20 | 5.10 | 9.10 | 5.10 | 2.10 | 1.70 | 1.70 | 1.60 | 1.70 | 1.70 | 1.70 | 1.60 | 1.50 | 1.60 | 1.60 | 3.00 | 1.40 | 2.20 | 2.10 | 1.82 | 1.10 | 1.90 | 1.99 | 2.23 | 1.60 | 1.60 | 1.66 | 1.25 | 1.20 | 1.20 | NA | |
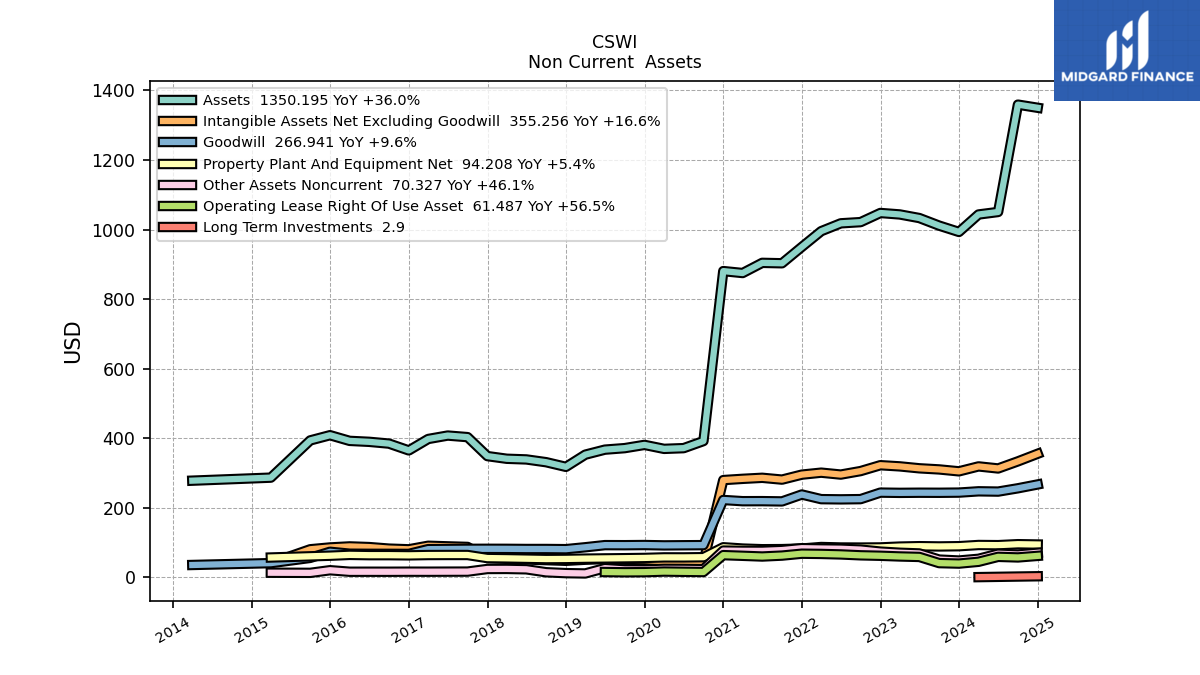
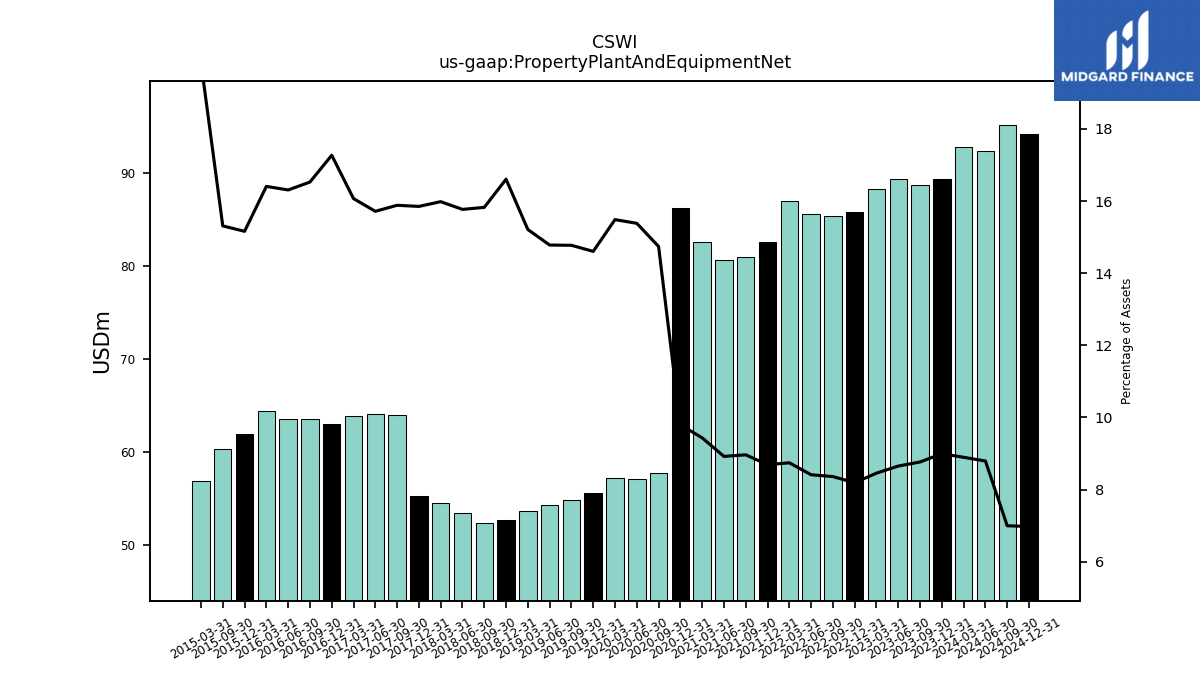
| Property Plant And Equipment Net | 89.34 | 88.66 | 89.39 | 88.23 | 85.81 | 85.40 | 85.63 | 87.03 | 82.56 | 80.96 | 80.66 | 82.55 | 86.25 | 57.73 | 57.12 | 57.18 | 55.60 | 54.86 | 54.25 | 53.64 | 52.72 | 52.37 | 53.44 | 54.47 | 55.23 | 64.01 | 64.05 | 63.90 | 63.00 | 63.52 | 63.52 | 64.36 | 61.94 | 60.27 | NA | 56.84 | NA | NA | NA | |
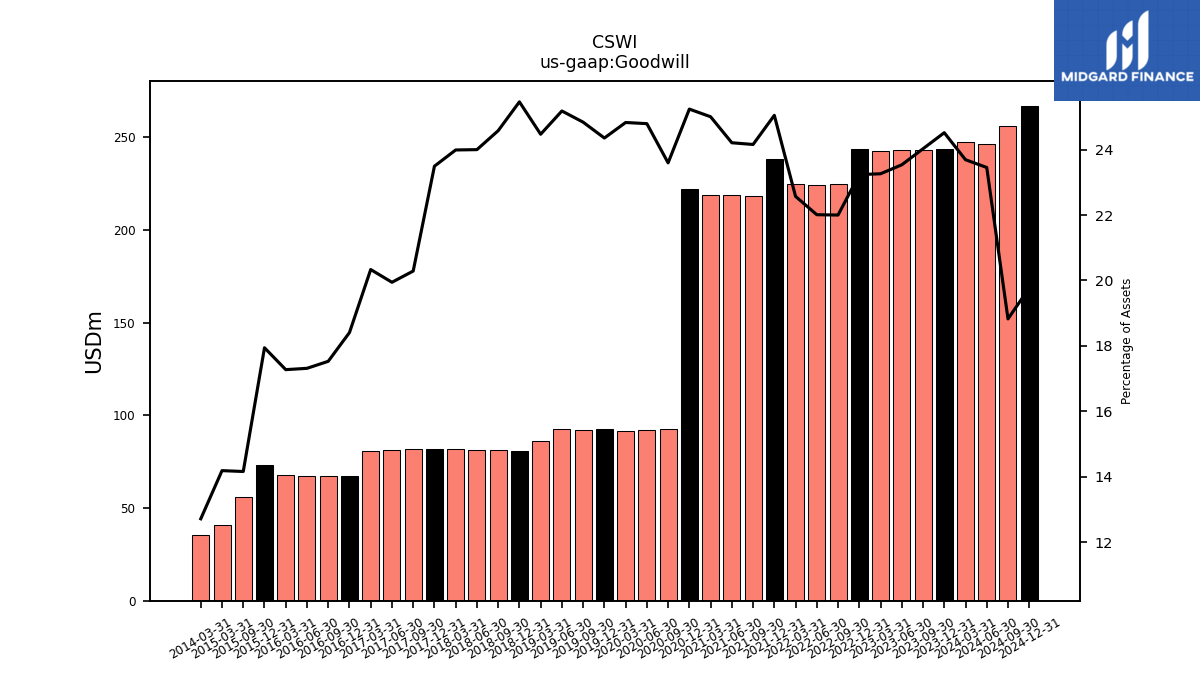
| Goodwill | 243.50 | 242.99 | 243.16 | 242.74 | 243.45 | 224.72 | 224.06 | 224.66 | 237.99 | 218.16 | 218.93 | 218.79 | 222.26 | 92.42 | 92.08 | 91.69 | 92.72 | 92.25 | 92.43 | 86.30 | 80.84 | 81.34 | 81.33 | 81.76 | 81.87 | 81.77 | 81.29 | 80.86 | 67.15 | 67.38 | 67.44 | 67.76 | 73.31 | 55.73 | NA | 40.65 | NA | NA | NA | |
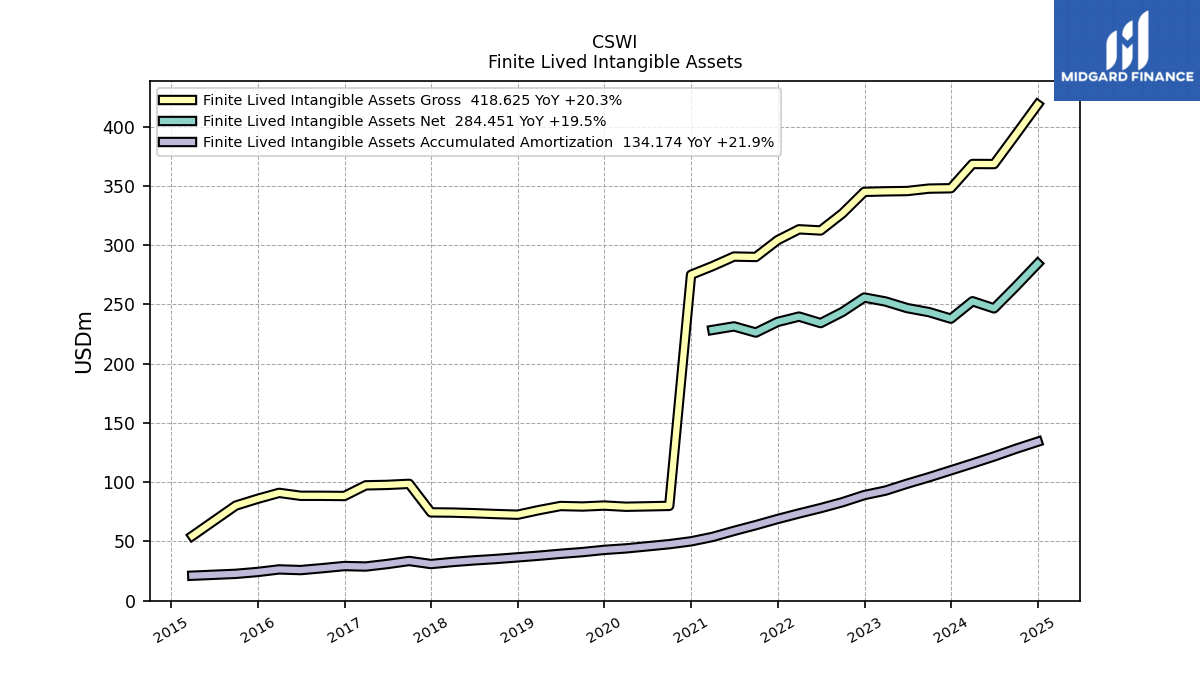
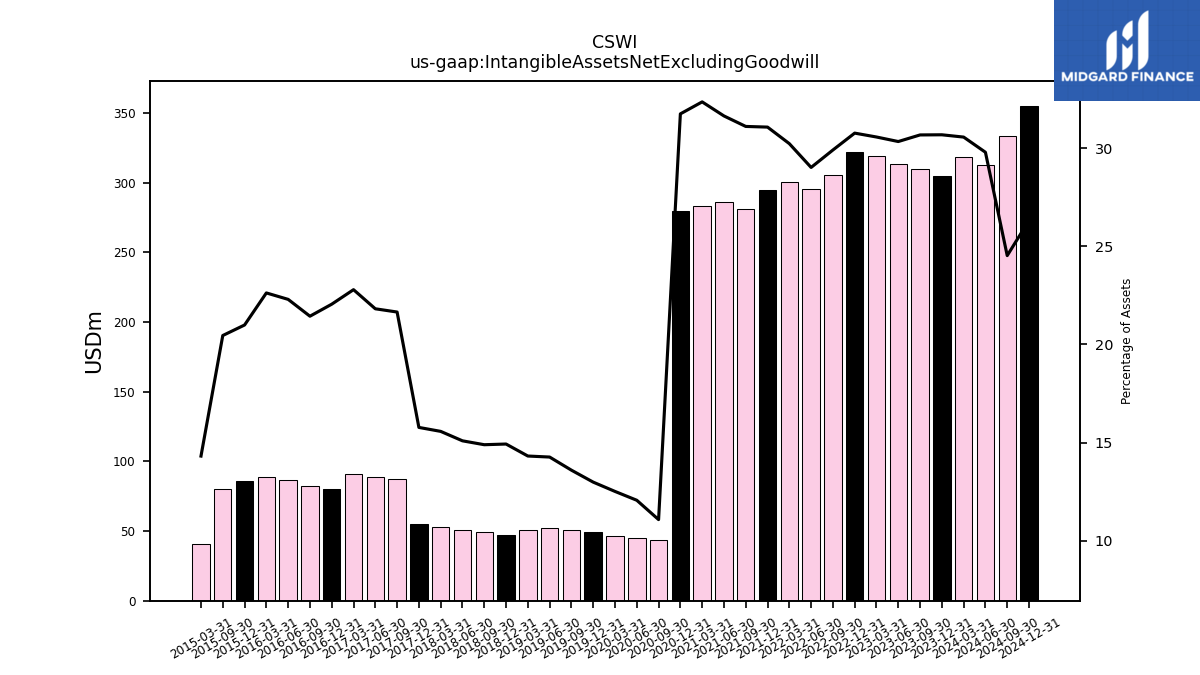
| Intangible Assets Net Excluding Goodwill | 304.65 | 310.14 | 313.36 | 318.90 | 322.27 | 305.39 | 295.32 | 300.84 | 295.15 | 280.85 | 286.06 | 283.06 | 279.50 | 43.37 | 44.78 | 46.19 | 49.42 | 50.47 | 52.34 | 50.47 | 47.38 | 49.27 | 51.12 | 53.05 | 54.95 | 87.24 | 88.89 | 90.61 | 80.42 | 82.39 | 86.83 | 88.73 | 85.74 | 80.49 | NA | 41.00 | NA | NA | NA | |
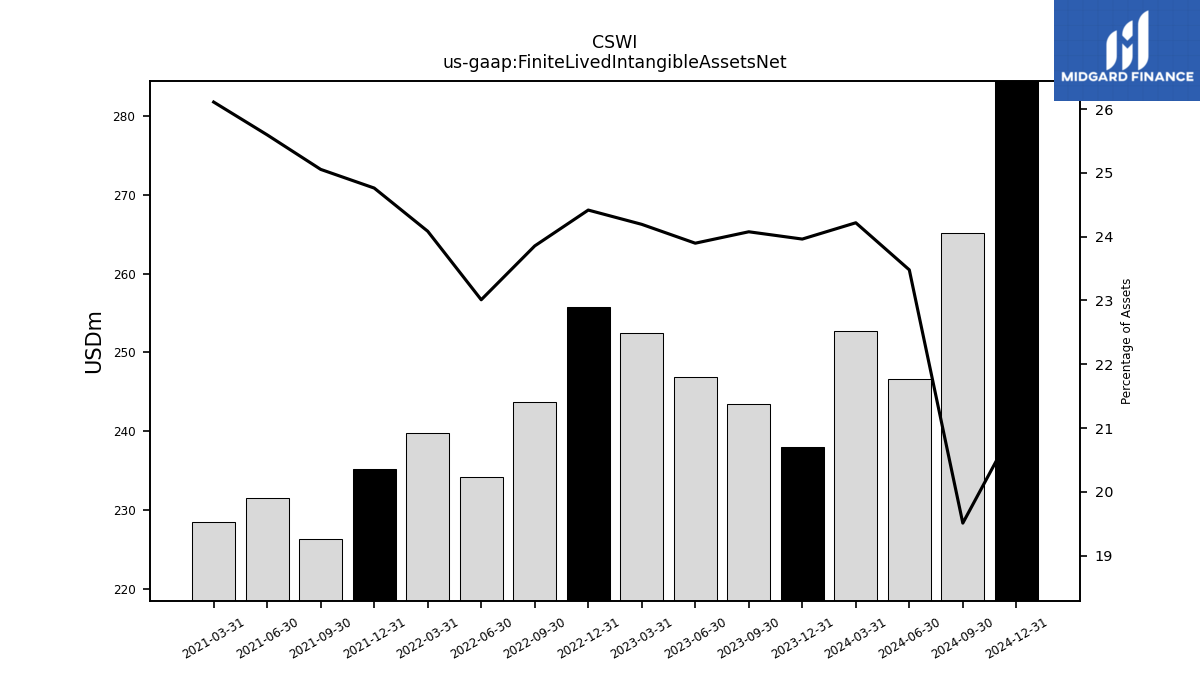
| Finite Lived Intangible Assets Net | 237.99 | 243.50 | 246.89 | 252.45 | 255.82 | 243.66 | 234.24 | 239.74 | 235.26 | 226.26 | 231.46 | 228.47 | NA | NA | NA | NA | NA | NA | NA | NA | NA | NA | NA | NA | NA | NA | NA | NA | NA | NA | NA | NA | NA | NA | NA | NA | NA | NA | NA | |
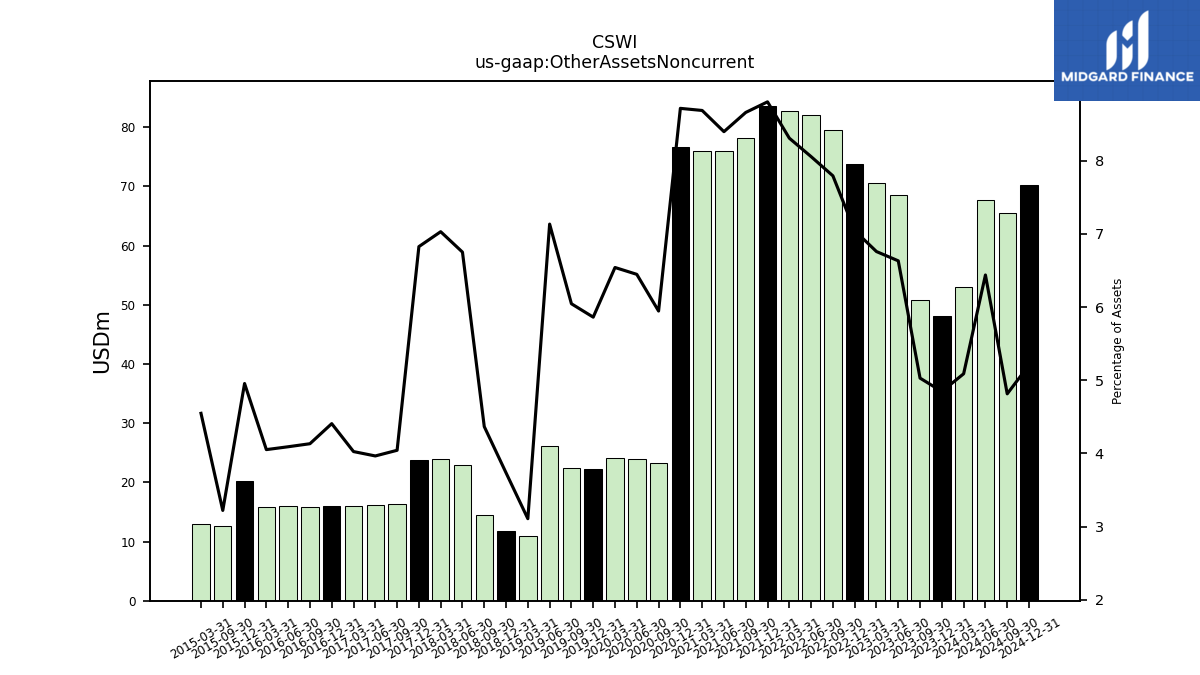
| Other Assets Noncurrent | 48.13 | 50.87 | 68.51 | 70.52 | 73.80 | 79.59 | 81.99 | 82.69 | 83.64 | 78.19 | 75.92 | 76.00 | 76.74 | 23.29 | 23.94 | 24.15 | 22.32 | 22.45 | 26.18 | 10.96 | 11.86 | 14.45 | 22.88 | 23.96 | 23.79 | 16.30 | 16.16 | 16.01 | 16.08 | 15.89 | 15.94 | 15.90 | 20.25 | 12.68 | NA | 13.03 | NA | NA | NA |
| 2023-12-31 | 2023-09-30 | 2023-06-30 | 2023-03-31 | 2022-12-31 | 2022-09-30 | 2022-06-30 | 2022-03-31 | 2021-12-31 | 2021-09-30 | 2021-06-30 | 2021-03-31 | 2020-12-31 | 2020-09-30 | 2020-06-30 | 2020-03-31 | 2019-12-31 | 2019-09-30 | 2019-06-30 | 2019-03-31 | 2018-12-31 | 2018-09-30 | 2018-06-30 | 2018-03-31 | 2017-12-31 | 2017-09-30 | 2017-06-30 | 2017-03-31 | 2016-12-31 | 2016-09-30 | 2016-06-30 | 2016-03-31 | 2015-12-31 | 2015-09-30 | 2015-06-30 | 2015-03-31 | 2014-12-31 | 2014-09-30 | 2014-06-30 | ||
|---|---|---|---|---|---|---|---|---|---|---|---|---|---|---|---|---|---|---|---|---|---|---|---|---|---|---|---|---|---|---|---|---|---|---|---|---|---|---|---|---|
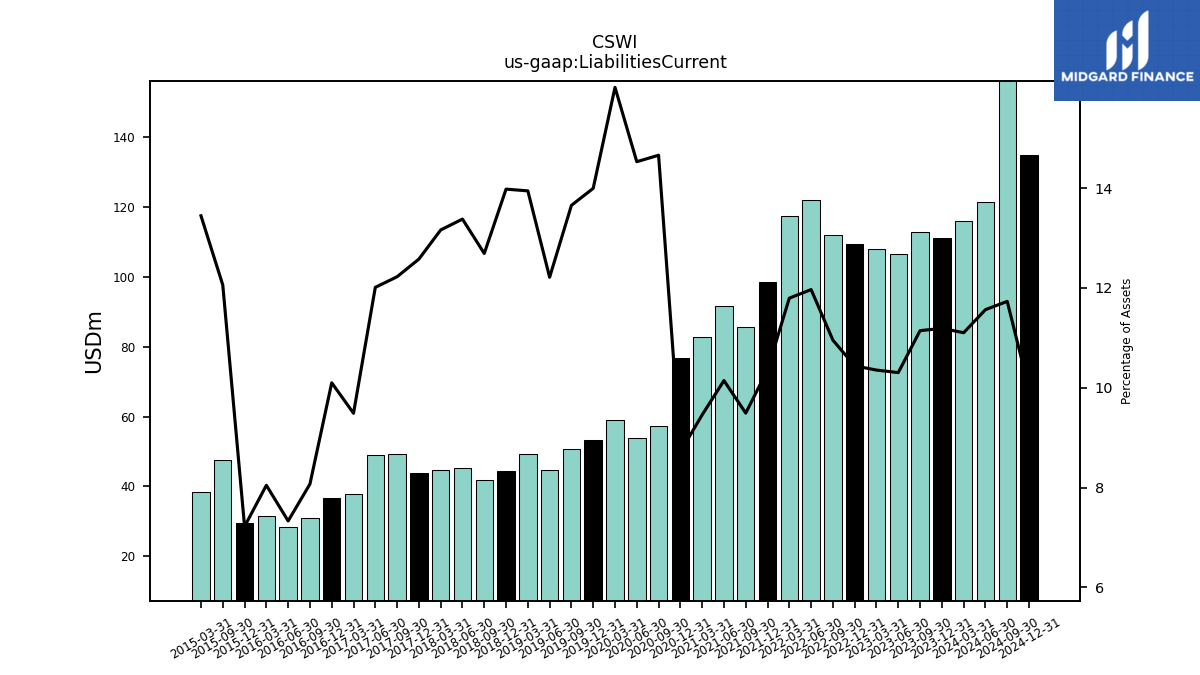
| Liabilities Current | 111.13 | 112.70 | 106.44 | 108.04 | 109.38 | 111.88 | 121.81 | 117.40 | 98.43 | 85.71 | 91.73 | 82.75 | 76.76 | 57.41 | 53.95 | 59.15 | 53.28 | 50.71 | 44.83 | 49.17 | 44.38 | 42.00 | 45.34 | 44.85 | 43.83 | 49.27 | 48.95 | 37.74 | 36.84 | 31.02 | 28.56 | 31.56 | 29.50 | 47.46 | NA | 38.52 | NA | NA | NA | |
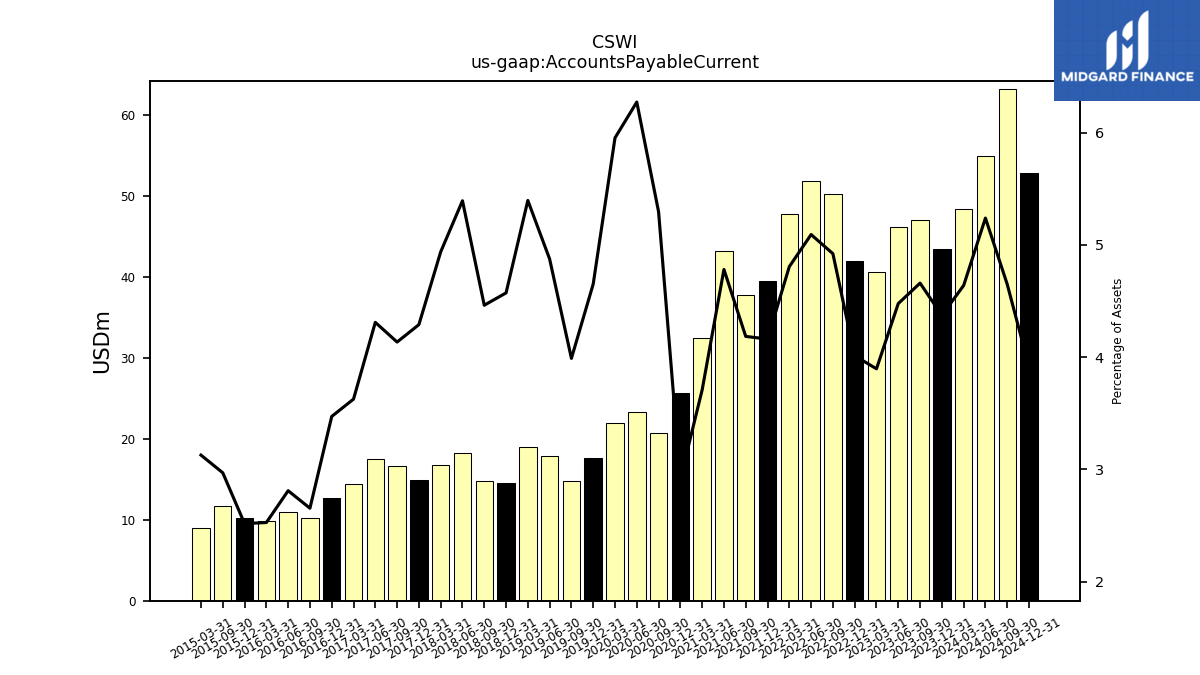
| Accounts Payable Current | 43.42 | 47.11 | 46.25 | 40.65 | 42.03 | 50.26 | 51.83 | 47.84 | 39.53 | 37.78 | 43.23 | 32.44 | 25.67 | 20.74 | 23.29 | 21.98 | 17.70 | 14.81 | 17.89 | 19.02 | 14.51 | 14.77 | 18.27 | 16.83 | 14.95 | 16.66 | 17.56 | 14.42 | 12.66 | 10.20 | 10.95 | 9.91 | 10.29 | 11.69 | NA | 8.96 | NA | NA | NA | |
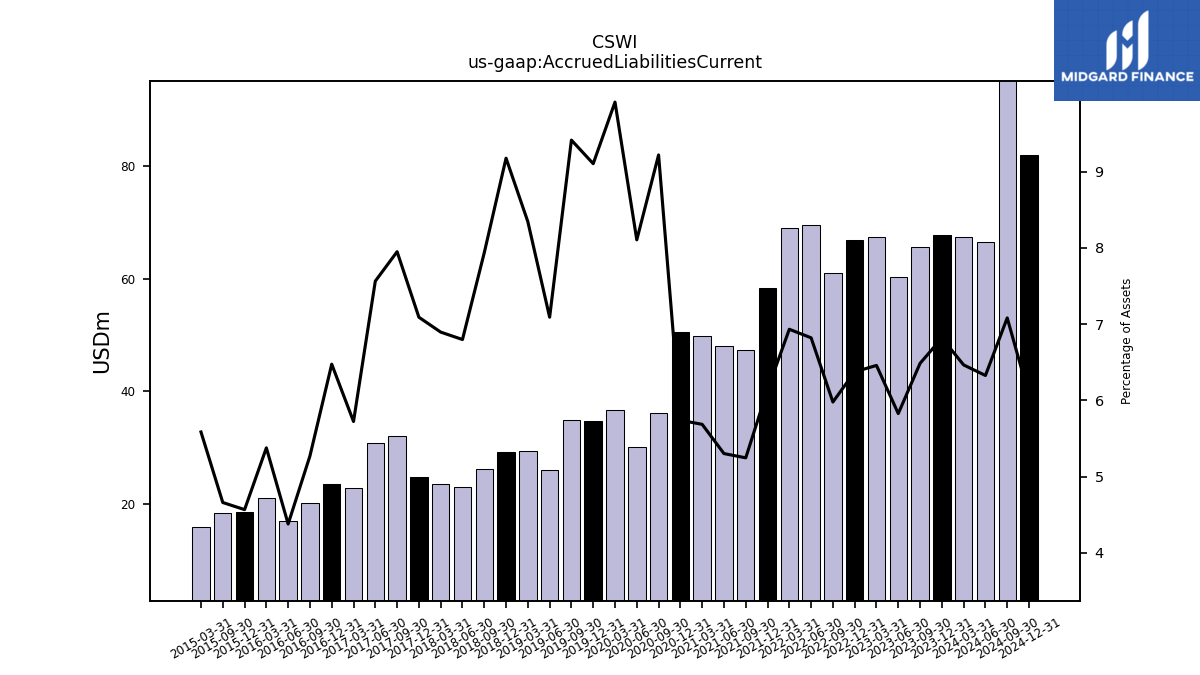
| Accrued Liabilities Current | 67.71 | 65.59 | 60.19 | 67.39 | 66.78 | 61.06 | 69.43 | 69.00 | 58.34 | 47.37 | 47.94 | 49.74 | 50.53 | 36.11 | 30.10 | 36.61 | 34.67 | 34.97 | 26.03 | 29.43 | 29.14 | 26.27 | 23.04 | 23.50 | 24.71 | 32.04 | 30.83 | 22.76 | 23.62 | 20.26 | 17.05 | 21.09 | 18.66 | 18.34 | NA | 16.00 | NA | NA | NA |
| 2023-12-31 | 2023-09-30 | 2023-06-30 | 2023-03-31 | 2022-12-31 | 2022-09-30 | 2022-06-30 | 2022-03-31 | 2021-12-31 | 2021-09-30 | 2021-06-30 | 2021-03-31 | 2020-12-31 | 2020-09-30 | 2020-06-30 | 2020-03-31 | 2019-12-31 | 2019-09-30 | 2019-06-30 | 2019-03-31 | 2018-12-31 | 2018-09-30 | 2018-06-30 | 2018-03-31 | 2017-12-31 | 2017-09-30 | 2017-06-30 | 2017-03-31 | 2016-12-31 | 2016-09-30 | 2016-06-30 | 2016-03-31 | 2015-12-31 | 2015-09-30 | 2015-06-30 | 2015-03-31 | 2014-12-31 | 2014-09-30 | 2014-06-30 | ||
|---|---|---|---|---|---|---|---|---|---|---|---|---|---|---|---|---|---|---|---|---|---|---|---|---|---|---|---|---|---|---|---|---|---|---|---|---|---|---|---|---|
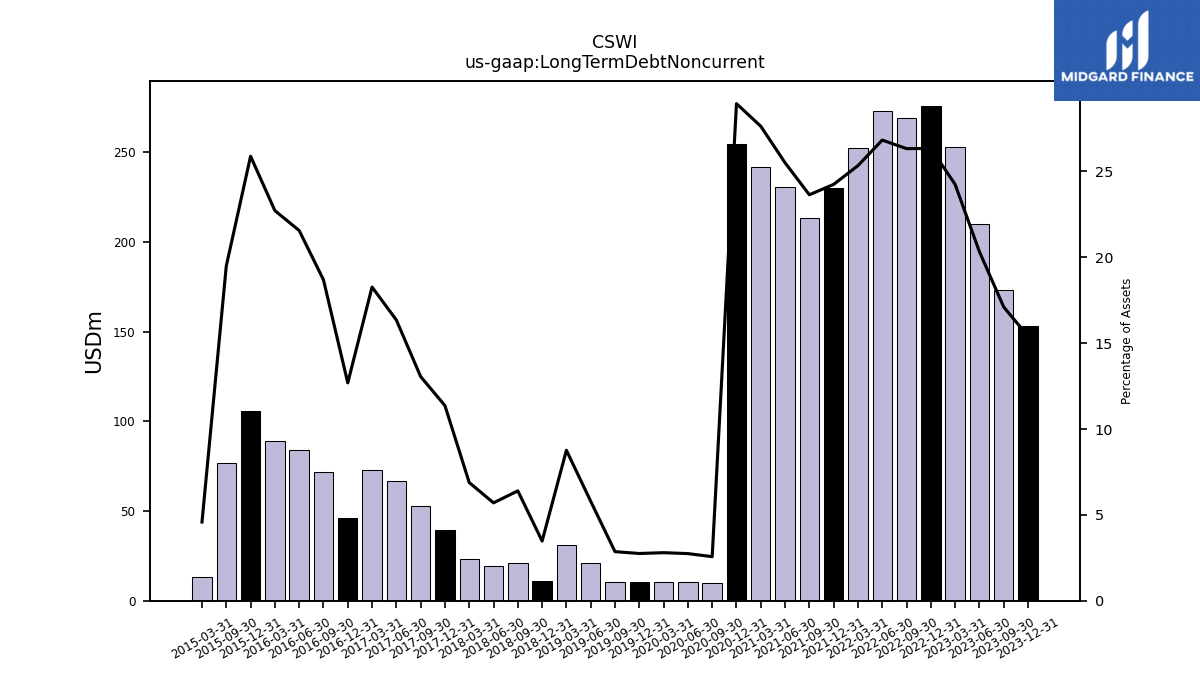
| Long Term Debt Noncurrent | 153.00 | 173.00 | 210.00 | 253.00 | 275.97 | 268.93 | 273.07 | 252.21 | 230.35 | 213.50 | 230.63 | 241.78 | 254.92 | 10.06 | 10.20 | 10.34 | 10.48 | 10.62 | 21.26 | 30.90 | 11.04 | 21.18 | 19.32 | 23.46 | 39.60 | 52.62 | 66.63 | 72.65 | 46.29 | 71.84 | 83.98 | 89.12 | 105.76 | 76.74 | NA | 13.14 | NA | NA | NA | |
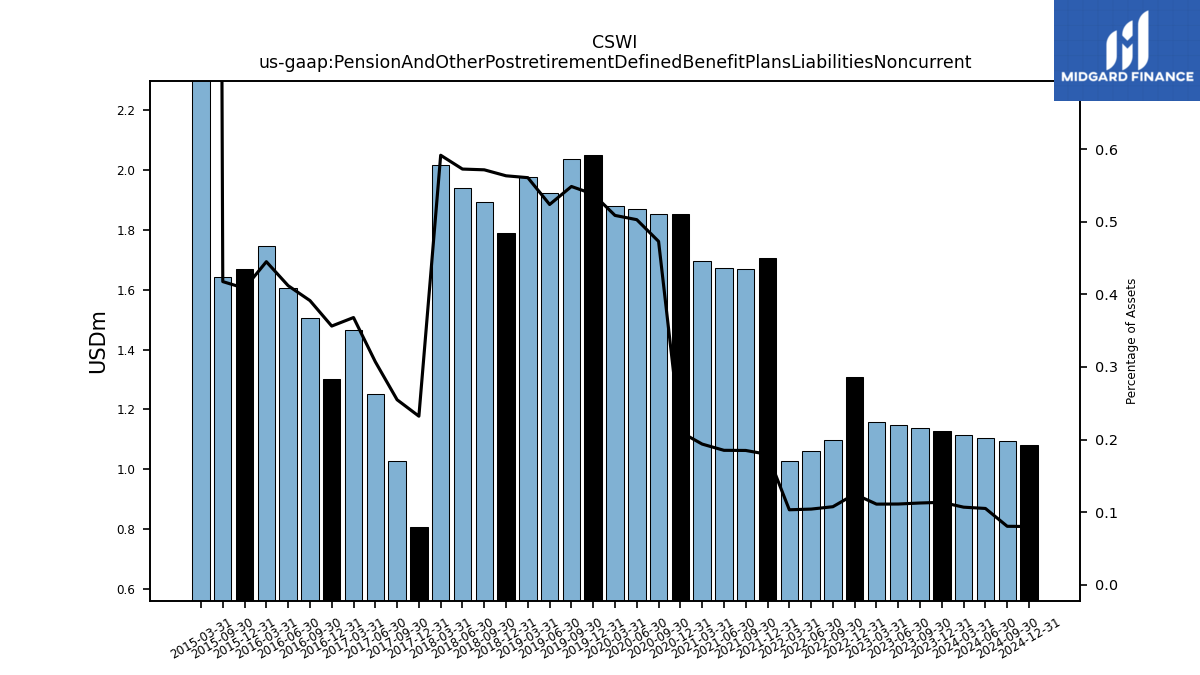
| Pension And Other Postretirement Defined Benefit Plans Liabilities Noncurrent | 1.13 | 1.14 | 1.15 | 1.16 | 1.31 | 1.10 | 1.06 | 1.03 | 1.71 | 1.67 | 1.67 | 1.70 | 1.85 | 1.85 | 1.87 | 1.88 | 2.05 | 2.04 | 1.92 | 1.98 | 1.79 | 1.89 | 1.94 | 2.02 | 0.81 | 1.03 | 1.25 | 1.46 | 1.30 | 1.50 | 1.60 | 1.75 | 1.67 | 1.64 | NA | 22.55 | NA | NA | NA | |
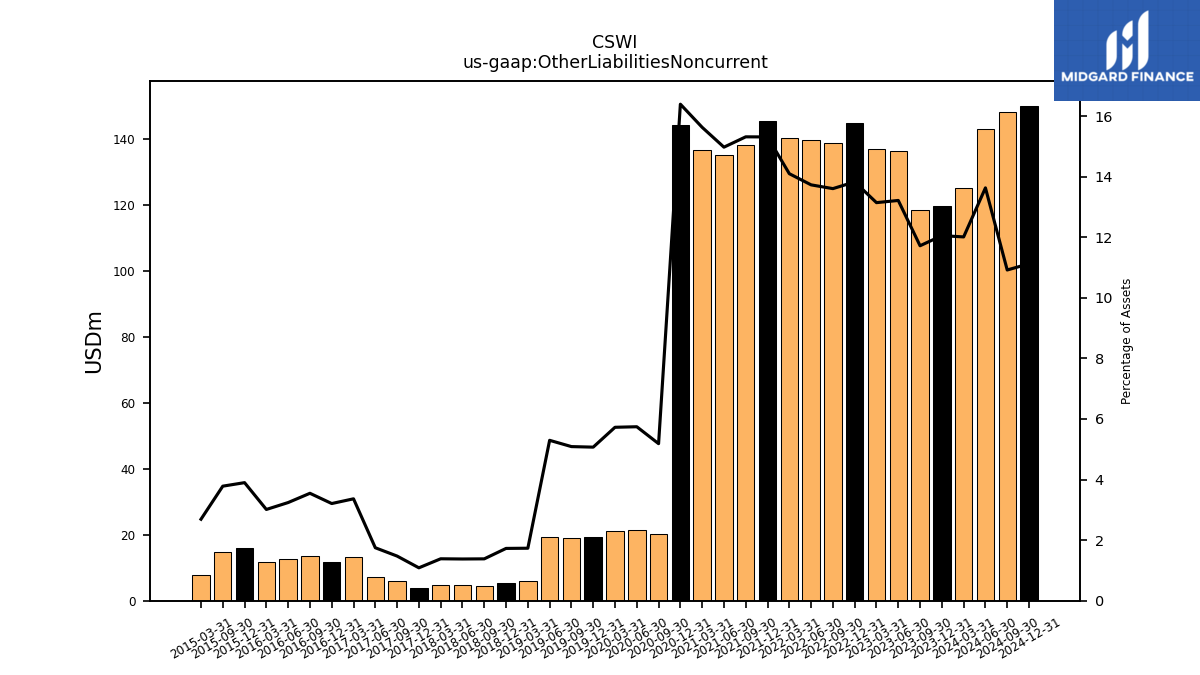
| Other Liabilities Noncurrent | 119.69 | 118.50 | 136.50 | 137.12 | 144.84 | 138.94 | 139.74 | 140.31 | 145.44 | 138.28 | 135.38 | 136.72 | 144.33 | 20.31 | 21.33 | 21.14 | 19.30 | 18.90 | 19.43 | 6.11 | 5.48 | 4.58 | 4.67 | 4.72 | 3.79 | 5.94 | 7.13 | 13.38 | 11.71 | 13.63 | 12.63 | 11.82 | 15.93 | 14.89 | NA | 7.71 | NA | NA | NA | |
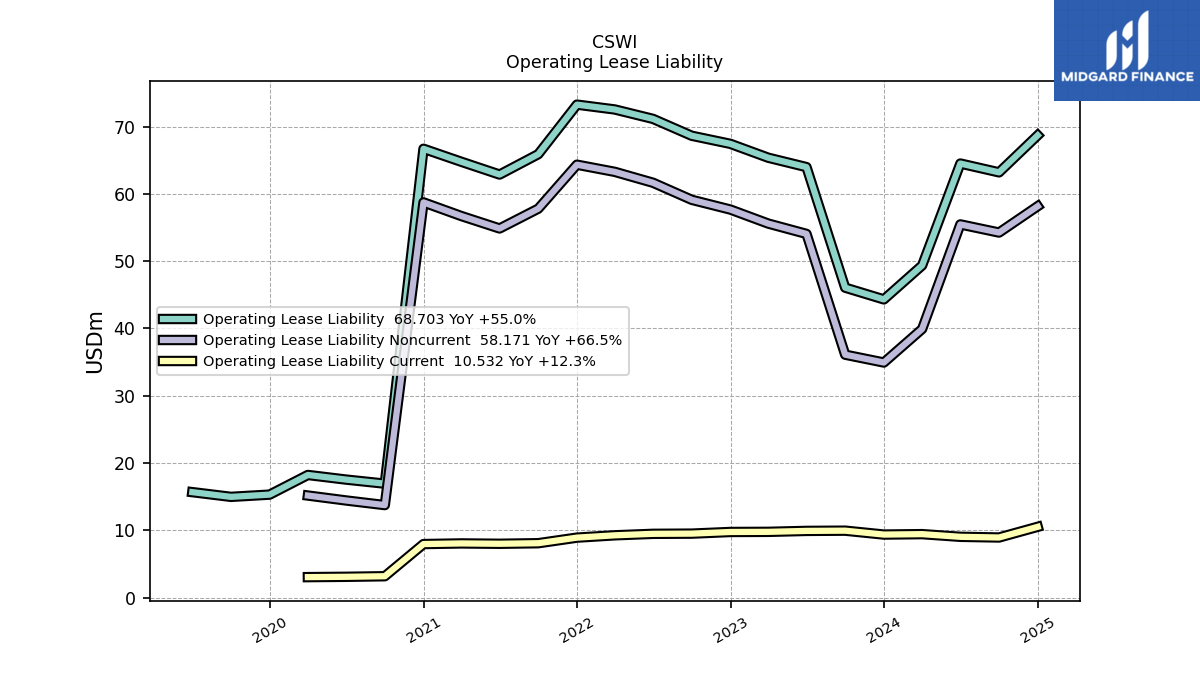
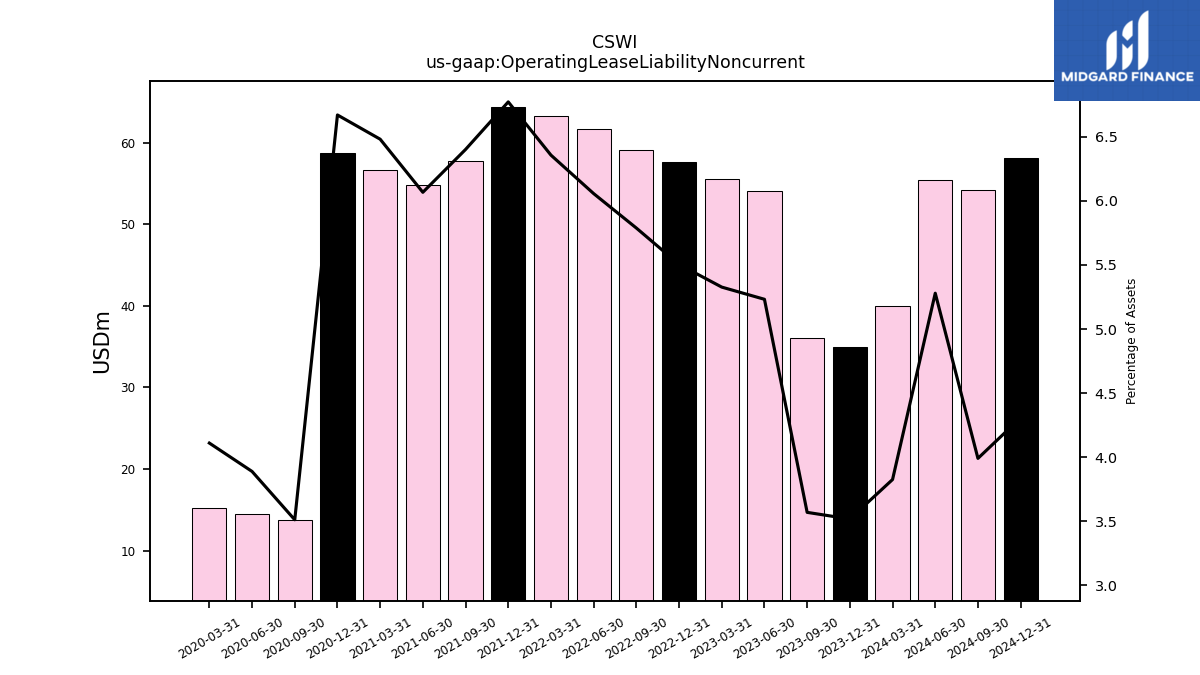
| Operating Lease Liability Noncurrent | 34.94 | 36.11 | 54.06 | 55.59 | 57.67 | 59.12 | 61.66 | 63.27 | 64.34 | 57.80 | 54.86 | 56.71 | 58.74 | 13.76 | 14.44 | 15.18 | NA | NA | NA | NA | NA | NA | NA | NA | NA | NA | NA | NA | NA | NA | NA | NA | NA | NA | NA | NA | NA | NA | NA |
| 2023-12-31 | 2023-09-30 | 2023-06-30 | 2023-03-31 | 2022-12-31 | 2022-09-30 | 2022-06-30 | 2022-03-31 | 2021-12-31 | 2021-09-30 | 2021-06-30 | 2021-03-31 | 2020-12-31 | 2020-09-30 | 2020-06-30 | 2020-03-31 | 2019-12-31 | 2019-09-30 | 2019-06-30 | 2019-03-31 | 2018-12-31 | 2018-09-30 | 2018-06-30 | 2018-03-31 | 2017-12-31 | 2017-09-30 | 2017-06-30 | 2017-03-31 | 2016-12-31 | 2016-09-30 | 2016-06-30 | 2016-03-31 | 2015-12-31 | 2015-09-30 | 2015-06-30 | 2015-03-31 | 2014-12-31 | 2014-09-30 | 2014-06-30 | ||
|---|---|---|---|---|---|---|---|---|---|---|---|---|---|---|---|---|---|---|---|---|---|---|---|---|---|---|---|---|---|---|---|---|---|---|---|---|---|---|---|---|
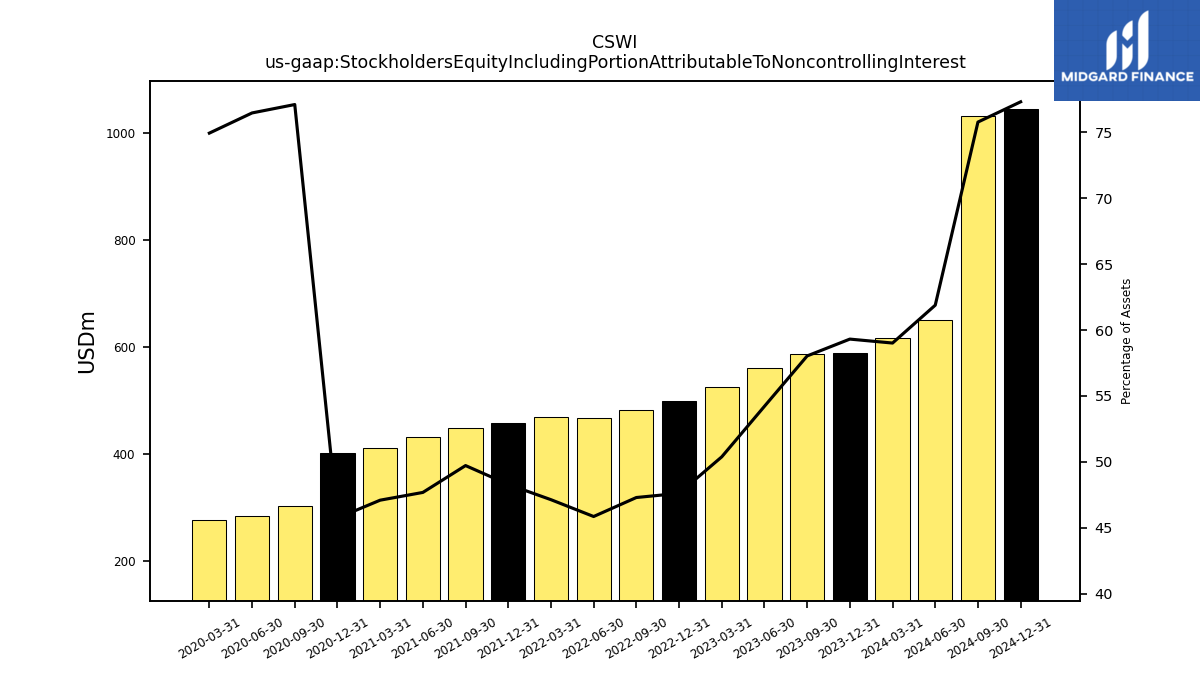
| Stockholders Equity Including Portion Attributable To Noncontrolling Interest | 589.07 | 586.93 | 560.09 | 525.67 | 498.77 | 483.03 | 466.72 | 469.09 | 458.74 | 448.95 | 431.12 | 412.01 | 402.72 | 302.04 | 284.01 | 276.74 | NA | NA | NA | NA | NA | NA | NA | NA | NA | NA | NA | NA | NA | NA | NA | NA | NA | NA | NA | NA | NA | NA | NA | |
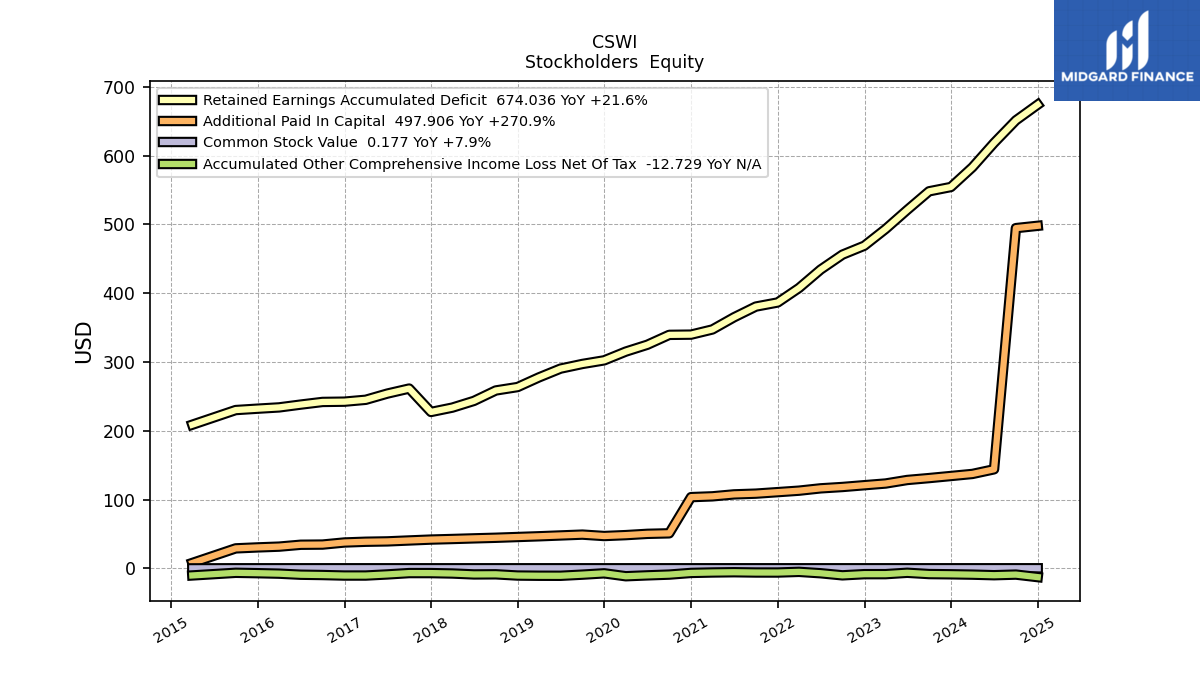
| Common Stock Value | 0.16 | 0.16 | 0.16 | 0.16 | 0.16 | 0.16 | 0.16 | 0.16 | 0.16 | 0.16 | 0.16 | 0.16 | 0.16 | 0.16 | 0.16 | 0.16 | 0.16 | 0.16 | 0.16 | 0.16 | 0.16 | 0.16 | 0.16 | 0.16 | 0.16 | 0.16 | 0.16 | 0.16 | 0.16 | 0.16 | 0.16 | 0.16 | 0.16 | 0.16 | NA | 0.01 | NA | NA | NA | |
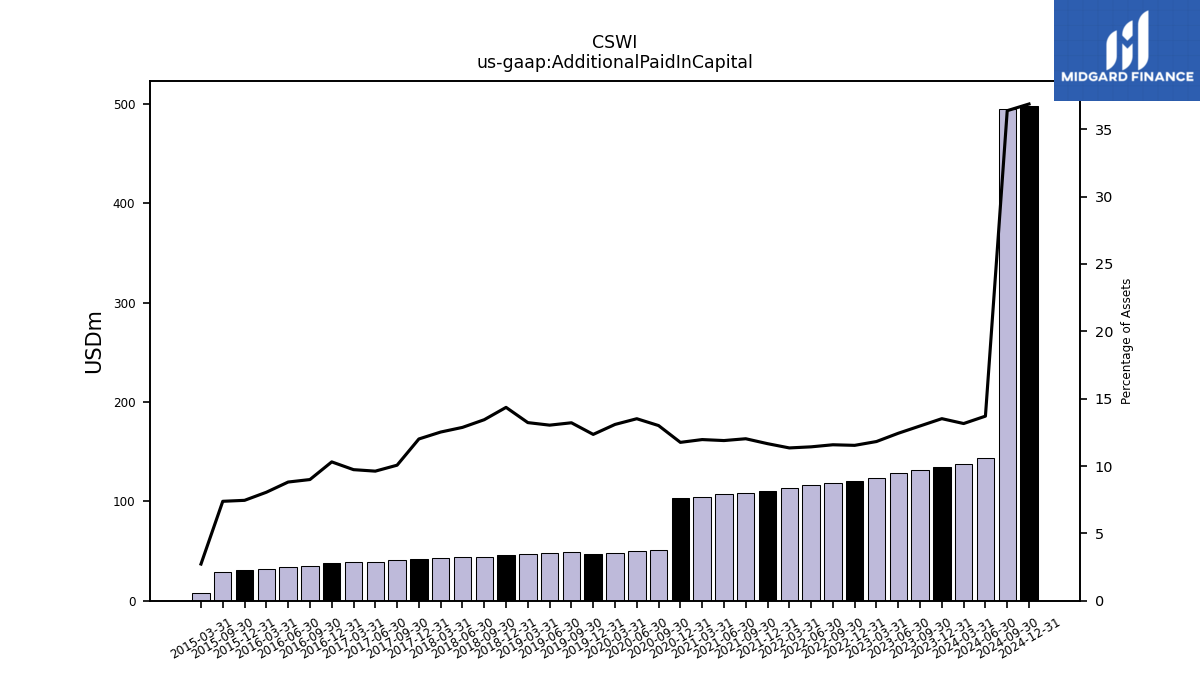
| Additional Paid In Capital | 134.25 | 131.22 | 128.45 | 123.34 | 120.86 | 118.27 | 116.31 | 112.92 | 110.79 | 108.60 | 107.53 | 104.69 | 103.54 | 50.94 | 50.18 | 48.33 | 47.01 | 49.07 | 47.85 | 46.63 | 45.58 | 44.48 | 43.61 | 42.68 | 41.85 | 40.56 | 39.21 | 38.70 | 37.60 | 34.59 | 34.33 | 31.60 | 30.46 | 29.06 | NA | 7.81 | NA | NA | NA | |
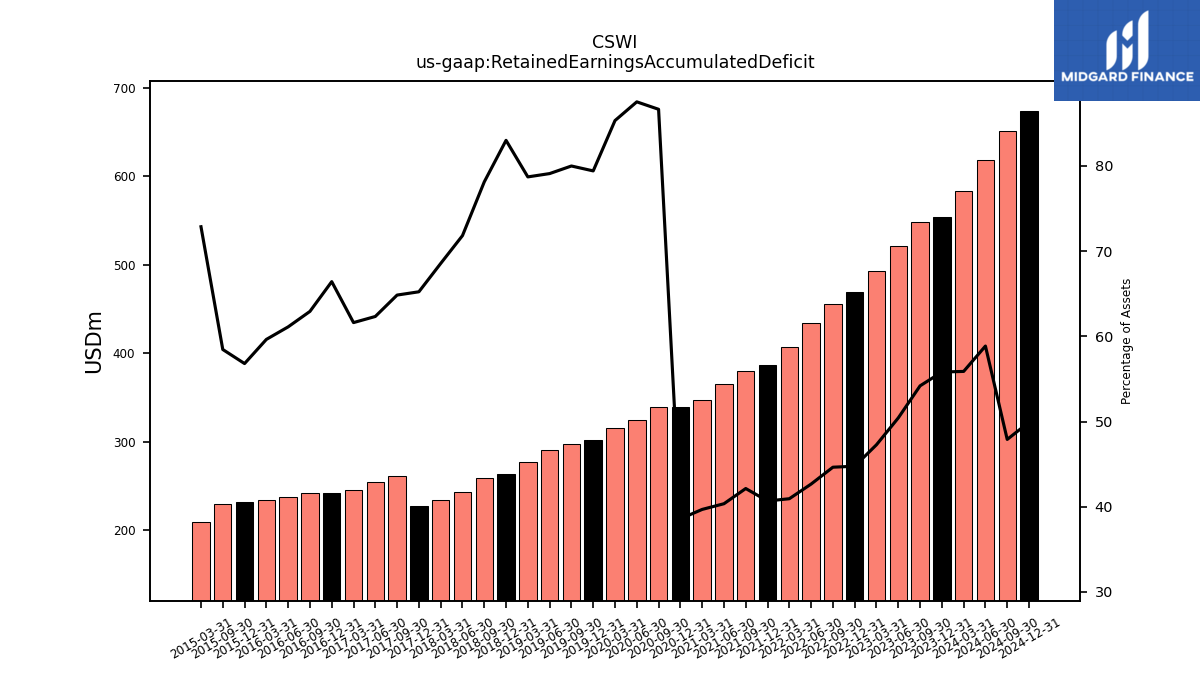
| Retained Earnings Accumulated Deficit | 554.29 | 548.04 | 520.97 | 493.32 | 468.91 | 455.96 | 434.27 | 407.52 | 386.45 | 380.52 | 364.90 | 347.23 | 339.73 | 339.40 | 325.04 | 315.08 | 302.36 | 297.09 | 290.35 | 277.59 | 263.54 | 258.56 | 243.40 | 233.65 | 227.31 | 261.35 | 254.05 | 245.03 | 242.30 | 241.89 | 238.05 | 233.96 | 232.09 | 230.10 | NA | 208.78 | NA | NA | NA | |
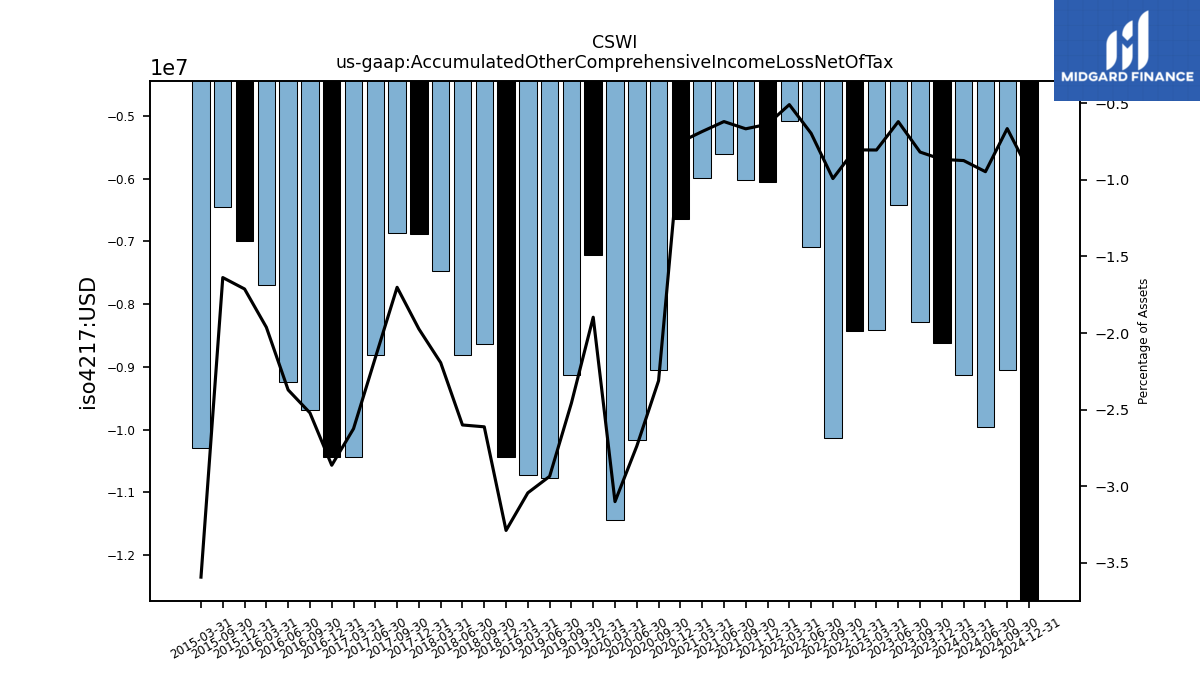
| Accumulated Other Comprehensive Income Loss Net Of Tax | -8.61 | -8.29 | -6.41 | -8.41 | -8.43 | -10.13 | -7.10 | -5.07 | -6.06 | -6.03 | -5.61 | -6.00 | -6.64 | -9.05 | -10.17 | -11.45 | -7.22 | -9.12 | -10.77 | -10.73 | -10.44 | -8.64 | -8.81 | -7.47 | -6.88 | -6.86 | -8.81 | -10.44 | -10.44 | -9.69 | -9.23 | -7.70 | -7.00 | -6.45 | NA | -10.29 | NA | NA | NA | |
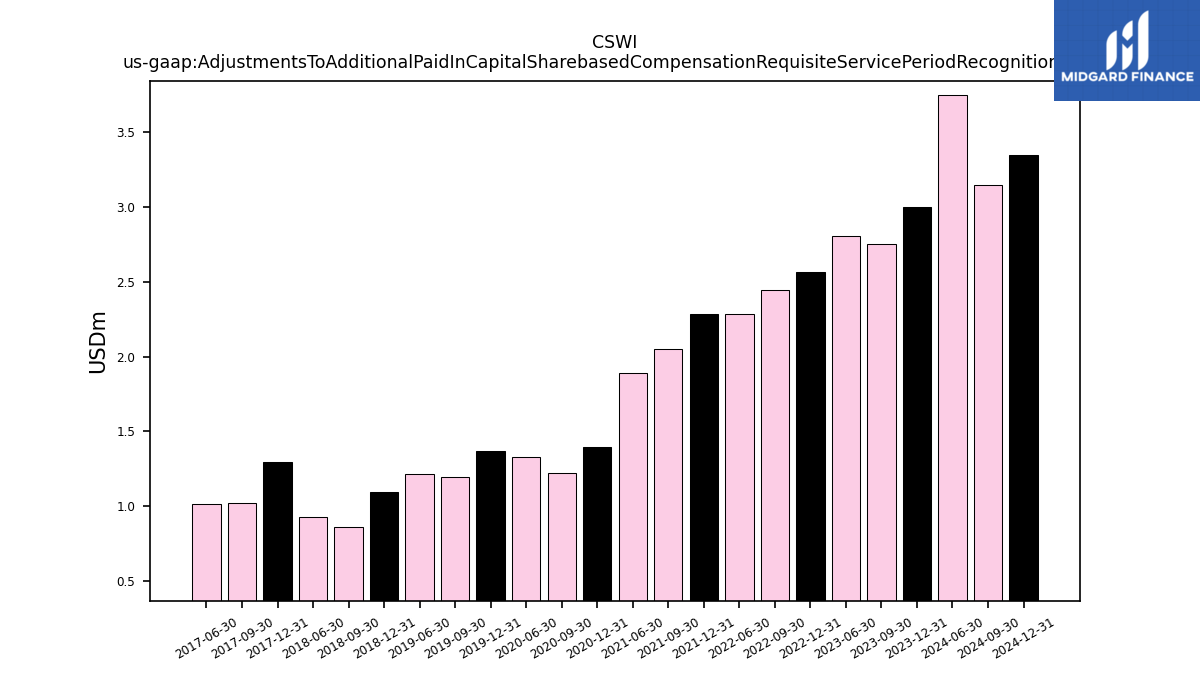
| Adjustments To Additional Paid In Capital Sharebased Compensation Requisite Service Period Recognition Value | 3.00 | 2.75 | 2.81 | NA | 2.57 | 2.45 | 2.28 | NA | 2.29 | 2.05 | 1.89 | NA | 1.40 | 1.22 | 1.33 | NA | 1.37 | 1.20 | 1.21 | NA | 1.10 | 0.86 | 0.93 | NA | 1.29 | 1.02 | 1.02 | NA | NA | NA | NA | NA | NA | NA | NA | NA | NA | NA | NA |
| 2023-12-31 | 2023-09-30 | 2023-06-30 | 2023-03-31 | 2022-12-31 | 2022-09-30 | 2022-06-30 | 2022-03-31 | 2021-12-31 | 2021-09-30 | 2021-06-30 | 2021-03-31 | 2020-12-31 | 2020-09-30 | 2020-06-30 | 2020-03-31 | 2019-12-31 | 2019-09-30 | 2019-06-30 | 2019-03-31 | 2018-12-31 | 2018-09-30 | 2018-06-30 | 2018-03-31 | 2017-12-31 | 2017-09-30 | 2017-06-30 | 2017-03-31 | 2016-12-31 | 2016-09-30 | 2016-06-30 | 2016-03-31 | 2015-12-31 | 2015-09-30 | 2015-06-30 | 2015-03-31 | 2014-12-31 | 2014-09-30 | 2014-06-30 | ||
|---|---|---|---|---|---|---|---|---|---|---|---|---|---|---|---|---|---|---|---|---|---|---|---|---|---|---|---|---|---|---|---|---|---|---|---|---|---|---|---|---|
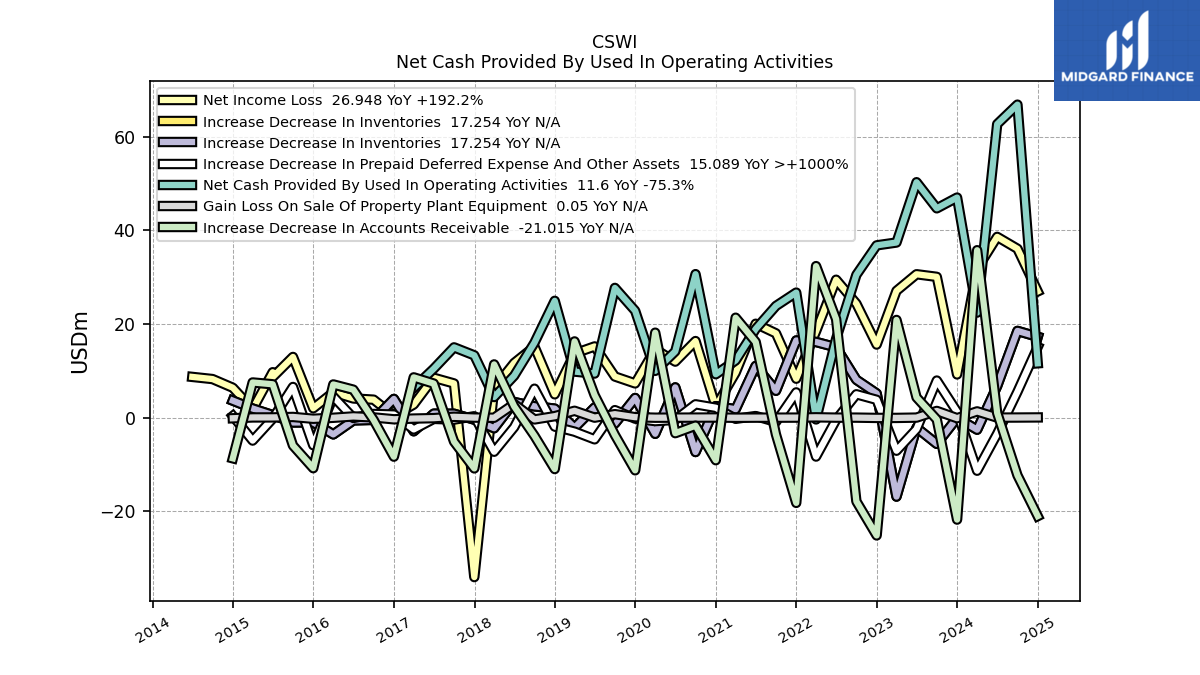
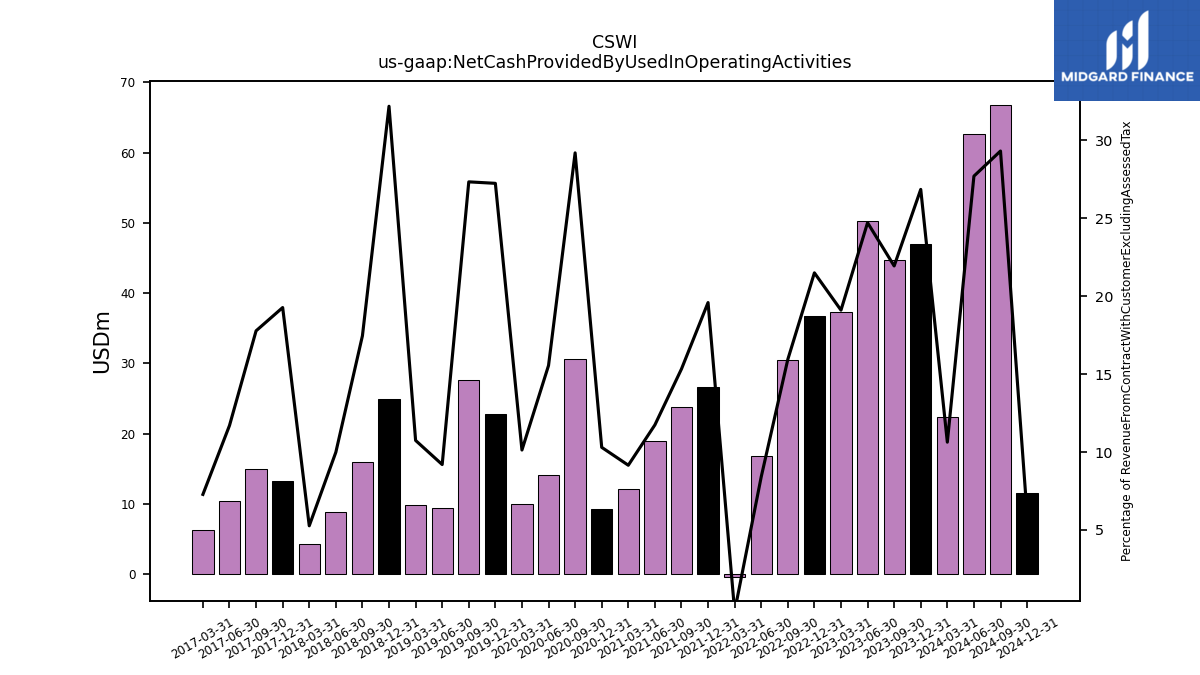
| Net Cash Provided By Used In Operating Activities | 46.98 | 44.68 | 50.26 | 37.38 | 36.78 | 30.48 | 16.81 | -0.38 | 26.70 | 23.85 | 18.93 | 12.21 | 9.26 | 30.64 | 14.15 | 9.99 | 22.80 | 27.70 | 9.41 | 9.83 | 24.94 | 15.99 | 8.95 | 4.40 | 13.30 | 15.01 | 10.45 | 6.36 | NA | NA | NA | NA | NA | NA | NA | NA | NA | NA | NA | |
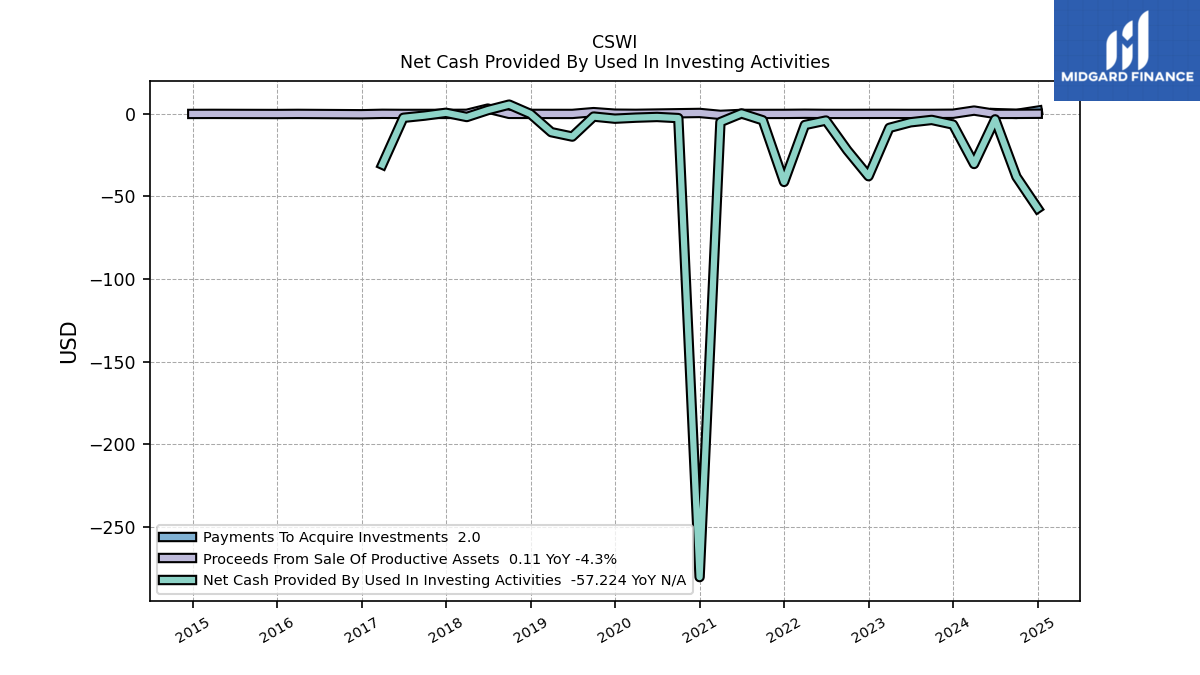
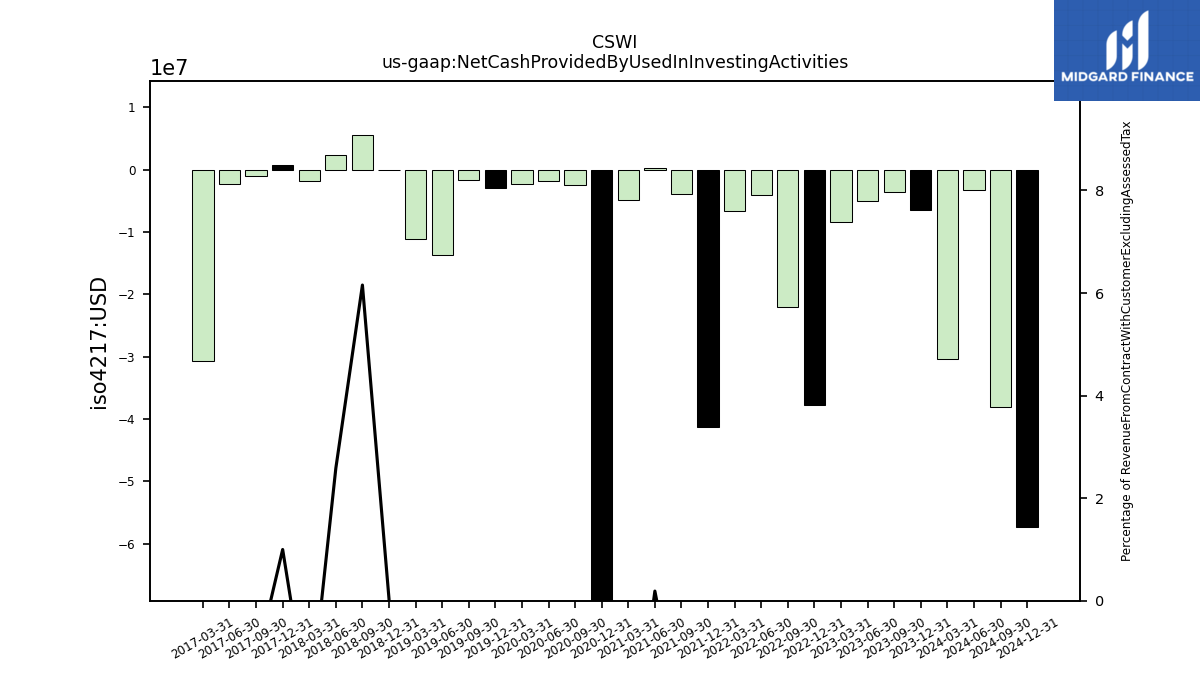
| Net Cash Provided By Used In Investing Activities | -6.43 | -3.63 | -5.07 | -8.44 | -37.73 | -21.99 | -4.00 | -6.69 | -41.21 | -3.86 | 0.30 | -4.93 | -280.61 | -2.51 | -1.84 | -2.25 | -2.87 | -1.59 | -13.73 | -11.04 | 0.03 | 5.64 | 2.32 | -1.86 | 0.69 | -1.02 | -2.35 | -30.74 | NA | NA | NA | NA | NA | NA | NA | NA | NA | NA | NA | |
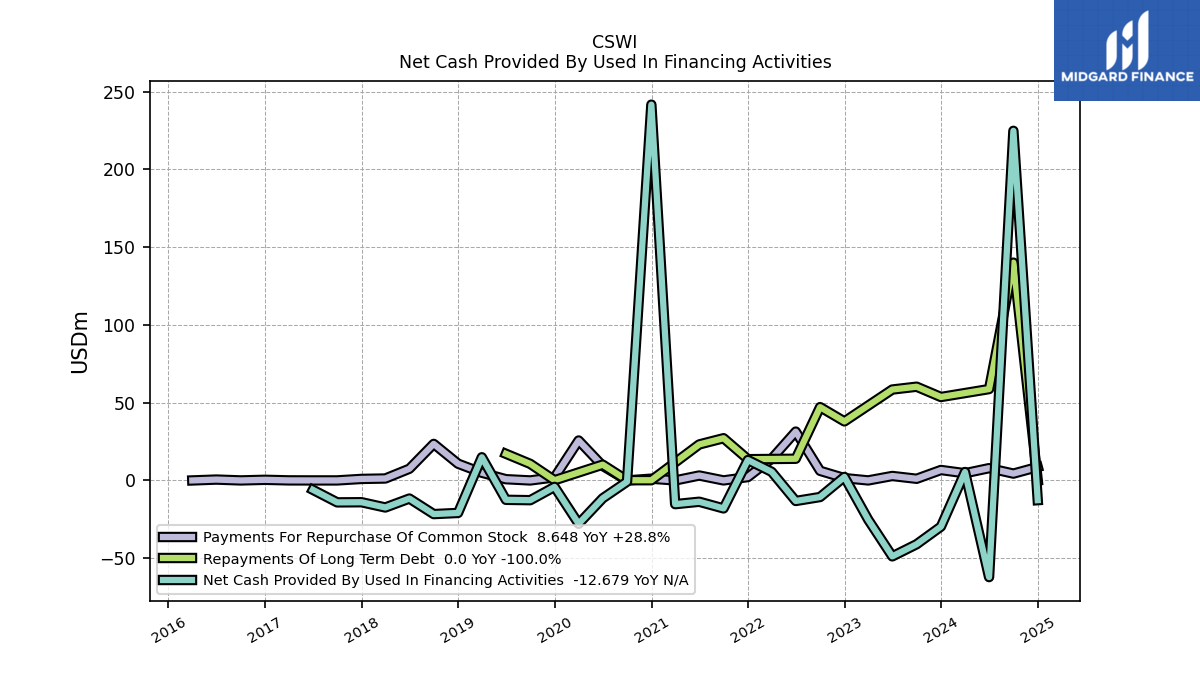
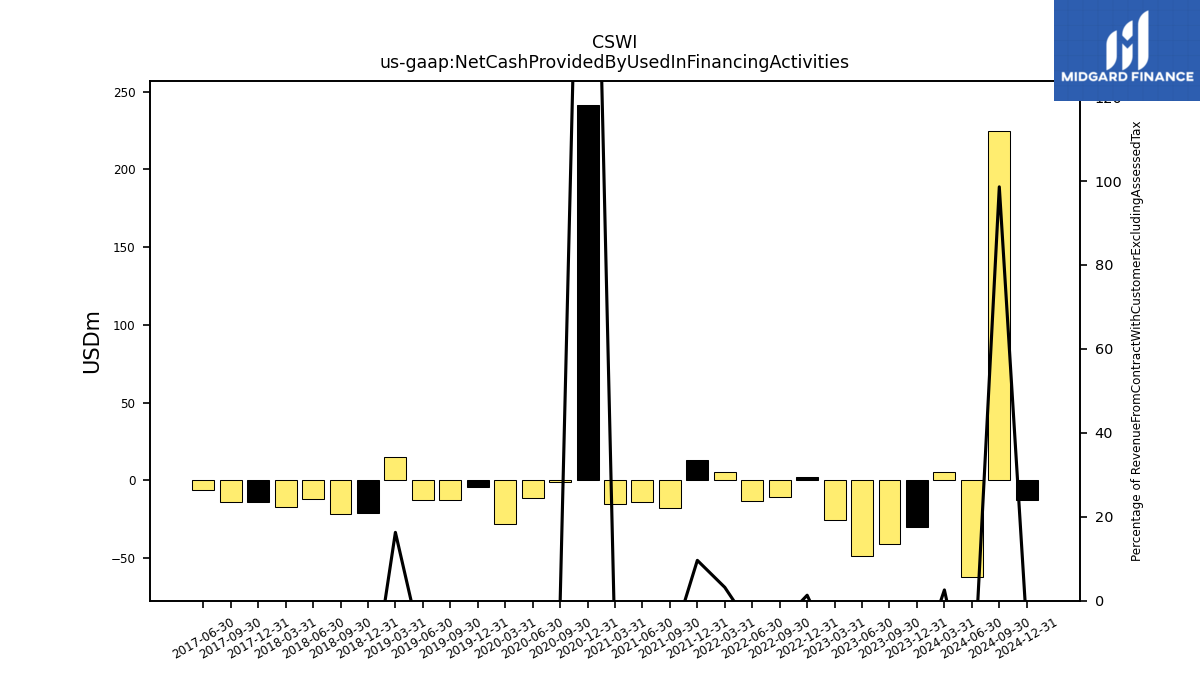
| Net Cash Provided By Used In Financing Activities | -29.67 | -41.02 | -48.81 | -25.22 | 2.25 | -10.66 | -13.21 | 5.53 | 13.12 | -17.98 | -13.70 | -15.25 | 241.58 | -0.80 | -11.47 | -27.86 | -4.14 | -12.69 | -12.46 | 14.90 | -20.90 | -21.64 | -11.64 | -17.38 | -14.01 | -14.10 | -6.03 | NA | NA | NA | NA | NA | NA | NA | NA | NA | NA | NA | NA |
| 2023-12-31 | 2023-09-30 | 2023-06-30 | 2023-03-31 | 2022-12-31 | 2022-09-30 | 2022-06-30 | 2022-03-31 | 2021-12-31 | 2021-09-30 | 2021-06-30 | 2021-03-31 | 2020-12-31 | 2020-09-30 | 2020-06-30 | 2020-03-31 | 2019-12-31 | 2019-09-30 | 2019-06-30 | 2019-03-31 | 2018-12-31 | 2018-09-30 | 2018-06-30 | 2018-03-31 | 2017-12-31 | 2017-09-30 | 2017-06-30 | 2017-03-31 | 2016-12-31 | 2016-09-30 | 2016-06-30 | 2016-03-31 | 2015-12-31 | 2015-09-30 | 2015-06-30 | 2015-03-31 | 2014-12-31 | 2014-09-30 | 2014-06-30 | ||
|---|---|---|---|---|---|---|---|---|---|---|---|---|---|---|---|---|---|---|---|---|---|---|---|---|---|---|---|---|---|---|---|---|---|---|---|---|---|---|---|---|
| Net Cash Provided By Used In Operating Activities | 46.98 | 44.68 | 50.26 | 37.38 | 36.78 | 30.48 | 16.81 | -0.38 | 26.70 | 23.85 | 18.93 | 12.21 | 9.26 | 30.64 | 14.15 | 9.99 | 22.80 | 27.70 | 9.41 | 9.83 | 24.94 | 15.99 | 8.95 | 4.40 | 13.30 | 15.01 | 10.45 | 6.36 | NA | NA | NA | NA | NA | NA | NA | NA | NA | NA | NA | |
| Net Income Loss | 9.22 | 30.05 | 30.61 | 27.06 | 15.60 | 24.33 | 29.44 | 18.45 | 8.31 | 18.00 | 20.05 | 9.60 | 2.35 | 16.35 | 11.96 | 14.60 | 7.31 | 8.78 | 15.20 | 13.70 | 4.98 | 15.16 | 11.68 | 6.30 | -34.04 | 7.30 | 8.51 | 2.80 | 0.41 | 3.84 | 4.10 | 5.40 | 2.00 | 12.96 | 9.70 | 1.80 | 6.39 | 8.24 | 8.70 | |
| Profit Loss | 9.30 | 30.18 | 31.06 | 27.12 | 15.50 | 24.32 | 29.64 | 18.52 | 8.77 | 18.21 | 20.36 | 10.36 | 2.35 | 16.35 | 11.96 | NA | NA | NA | NA | NA | NA | NA | NA | NA | NA | NA | NA | NA | NA | NA | NA | NA | NA | NA | NA | NA | NA | NA | NA | |
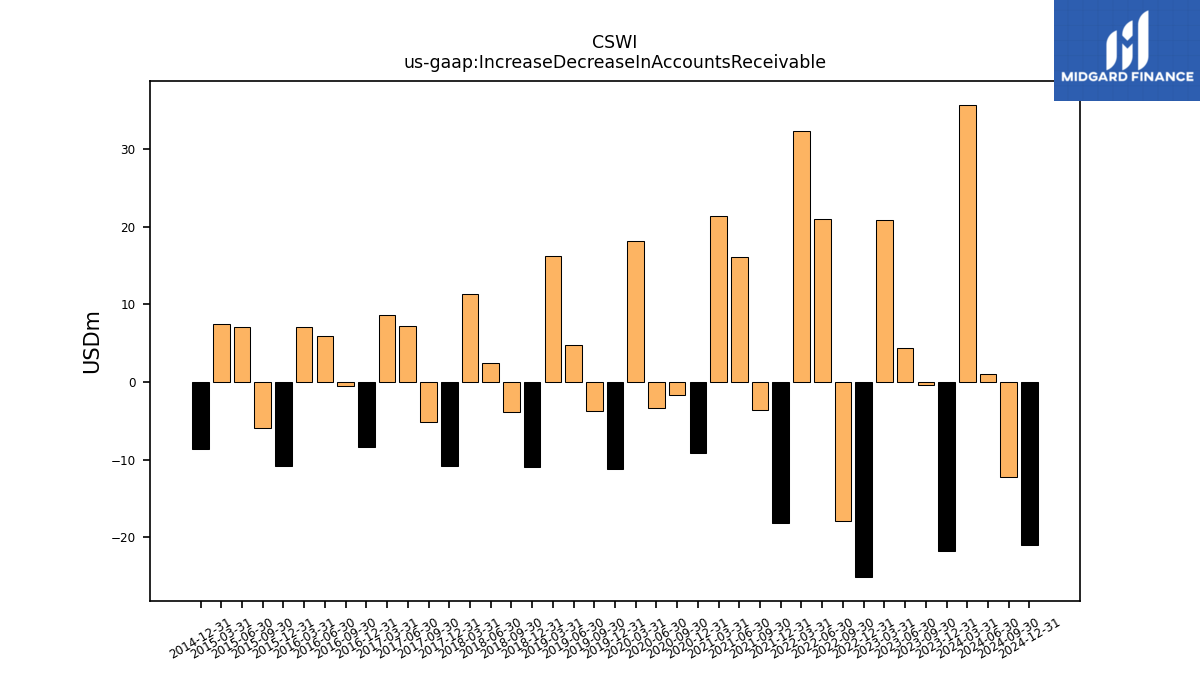
| Increase Decrease In Accounts Receivable | -21.76 | -0.40 | 4.32 | 20.86 | -25.14 | -17.86 | 21.04 | 32.35 | -18.20 | -3.59 | 16.16 | 21.33 | -9.09 | -1.71 | -3.31 | 18.14 | -11.24 | -3.70 | 4.80 | 16.27 | -10.98 | -3.88 | 2.40 | 11.37 | -10.84 | -5.12 | 7.28 | 8.60 | -8.33 | -0.49 | 5.98 | 7.09 | -10.79 | -5.95 | 7.12 | 7.51 | -8.68 | NA | NA | |
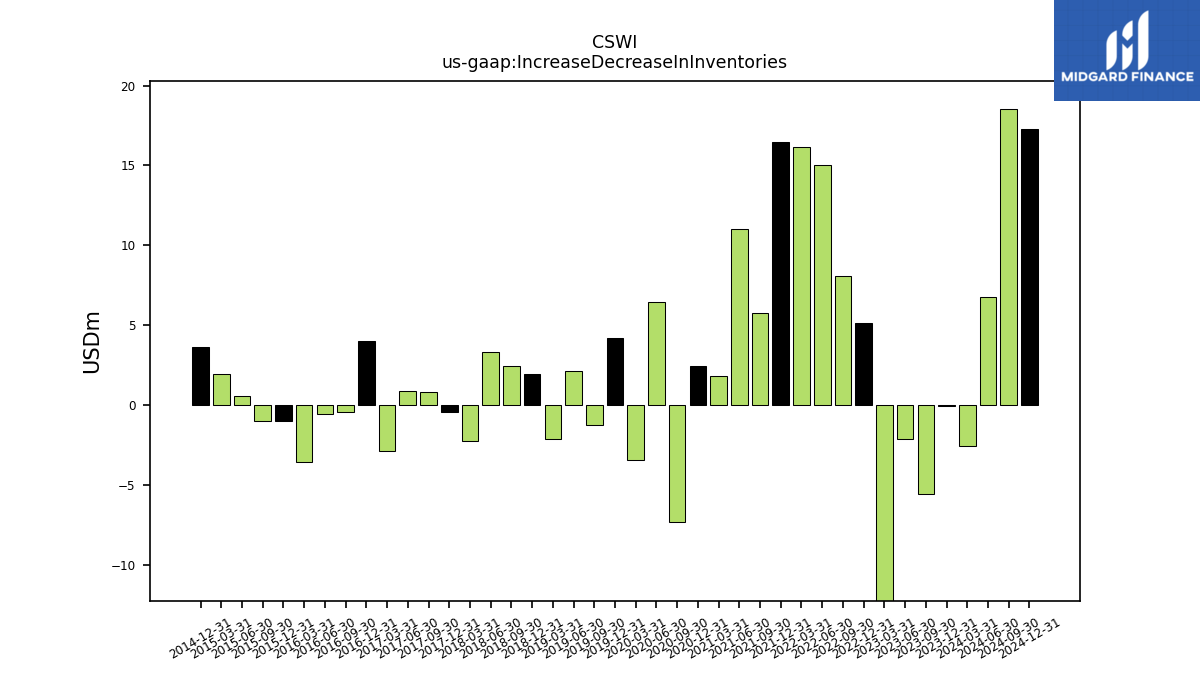
| Increase Decrease In Inventories | -0.06 | -5.60 | -2.14 | -16.85 | 5.16 | 8.09 | 15.02 | 16.15 | 16.47 | 5.74 | 11.04 | 1.80 | 2.46 | -7.34 | 6.46 | -3.45 | 4.20 | -1.26 | 2.16 | -2.14 | 1.93 | 2.42 | 3.33 | -2.25 | -0.42 | 0.83 | 0.85 | -2.90 | 4.00 | -0.47 | -0.59 | -3.57 | -1.01 | -1.03 | 0.55 | 1.95 | 3.63 | NA | NA |
| 2023-12-31 | 2023-09-30 | 2023-06-30 | 2023-03-31 | 2022-12-31 | 2022-09-30 | 2022-06-30 | 2022-03-31 | 2021-12-31 | 2021-09-30 | 2021-06-30 | 2021-03-31 | 2020-12-31 | 2020-09-30 | 2020-06-30 | 2020-03-31 | 2019-12-31 | 2019-09-30 | 2019-06-30 | 2019-03-31 | 2018-12-31 | 2018-09-30 | 2018-06-30 | 2018-03-31 | 2017-12-31 | 2017-09-30 | 2017-06-30 | 2017-03-31 | 2016-12-31 | 2016-09-30 | 2016-06-30 | 2016-03-31 | 2015-12-31 | 2015-09-30 | 2015-06-30 | 2015-03-31 | 2014-12-31 | 2014-09-30 | 2014-06-30 | ||
|---|---|---|---|---|---|---|---|---|---|---|---|---|---|---|---|---|---|---|---|---|---|---|---|---|---|---|---|---|---|---|---|---|---|---|---|---|---|---|---|---|
| Net Cash Provided By Used In Investing Activities | -6.43 | -3.63 | -5.07 | -8.44 | -37.73 | -21.99 | -4.00 | -6.69 | -41.21 | -3.86 | 0.30 | -4.93 | -280.61 | -2.51 | -1.84 | -2.25 | -2.87 | -1.59 | -13.73 | -11.04 | 0.03 | 5.64 | 2.32 | -1.86 | 0.69 | -1.02 | -2.35 | -30.74 | NA | NA | NA | NA | NA | NA | NA | NA | NA | NA | NA | |
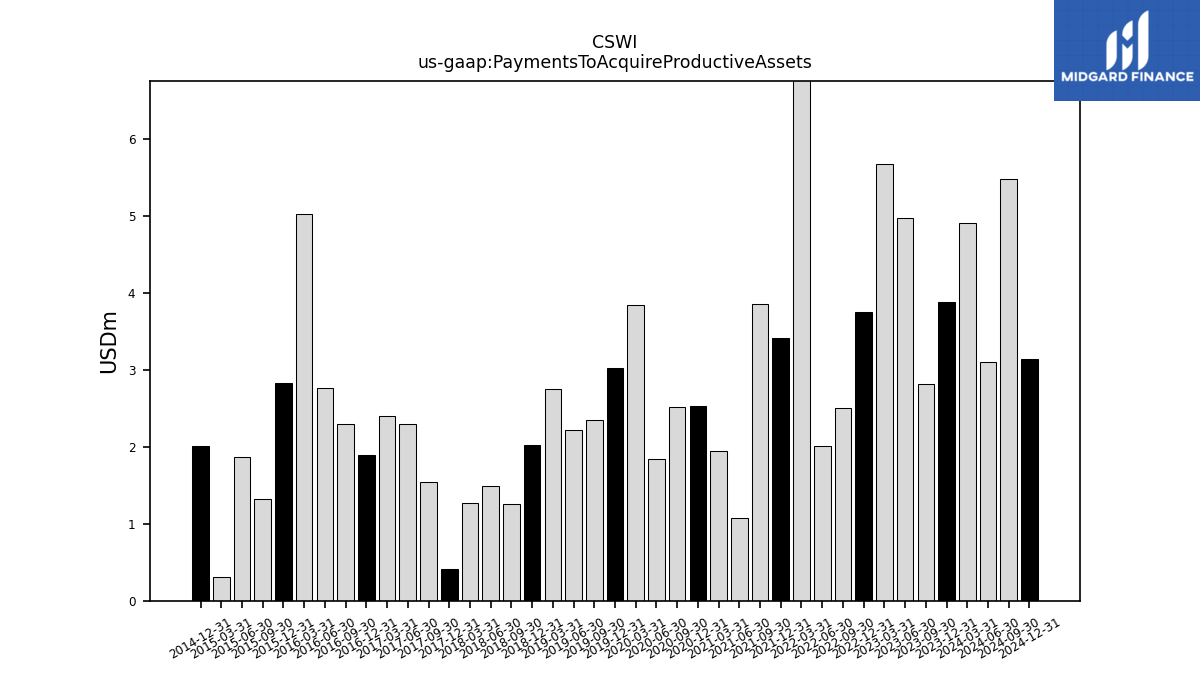
| Payments To Acquire Productive Assets | 3.88 | 2.81 | 4.97 | 5.68 | 3.75 | 2.50 | 2.02 | 7.30 | 3.42 | 3.86 | 1.08 | 1.95 | 2.53 | 2.52 | 1.84 | 3.84 | 3.02 | 2.35 | 2.23 | 2.75 | 2.02 | 1.25 | 1.49 | 1.27 | 0.42 | 1.55 | 2.30 | 2.40 | 1.89 | 2.30 | 2.77 | 5.03 | 2.83 | 1.32 | 1.87 | 0.31 | 2.01 | NA | NA |
| 2023-12-31 | 2023-09-30 | 2023-06-30 | 2023-03-31 | 2022-12-31 | 2022-09-30 | 2022-06-30 | 2022-03-31 | 2021-12-31 | 2021-09-30 | 2021-06-30 | 2021-03-31 | 2020-12-31 | 2020-09-30 | 2020-06-30 | 2020-03-31 | 2019-12-31 | 2019-09-30 | 2019-06-30 | 2019-03-31 | 2018-12-31 | 2018-09-30 | 2018-06-30 | 2018-03-31 | 2017-12-31 | 2017-09-30 | 2017-06-30 | 2017-03-31 | 2016-12-31 | 2016-09-30 | 2016-06-30 | 2016-03-31 | 2015-12-31 | 2015-09-30 | 2015-06-30 | 2015-03-31 | 2014-12-31 | 2014-09-30 | 2014-06-30 | ||
|---|---|---|---|---|---|---|---|---|---|---|---|---|---|---|---|---|---|---|---|---|---|---|---|---|---|---|---|---|---|---|---|---|---|---|---|---|---|---|---|---|
| Net Cash Provided By Used In Financing Activities | -29.67 | -41.02 | -48.81 | -25.22 | 2.25 | -10.66 | -13.21 | 5.53 | 13.12 | -17.98 | -13.70 | -15.25 | 241.58 | -0.80 | -11.47 | -27.86 | -4.14 | -12.69 | -12.46 | 14.90 | -20.90 | -21.64 | -11.64 | -17.38 | -14.01 | -14.10 | -6.03 | NA | NA | NA | NA | NA | NA | NA | NA | NA | NA | NA | NA | |
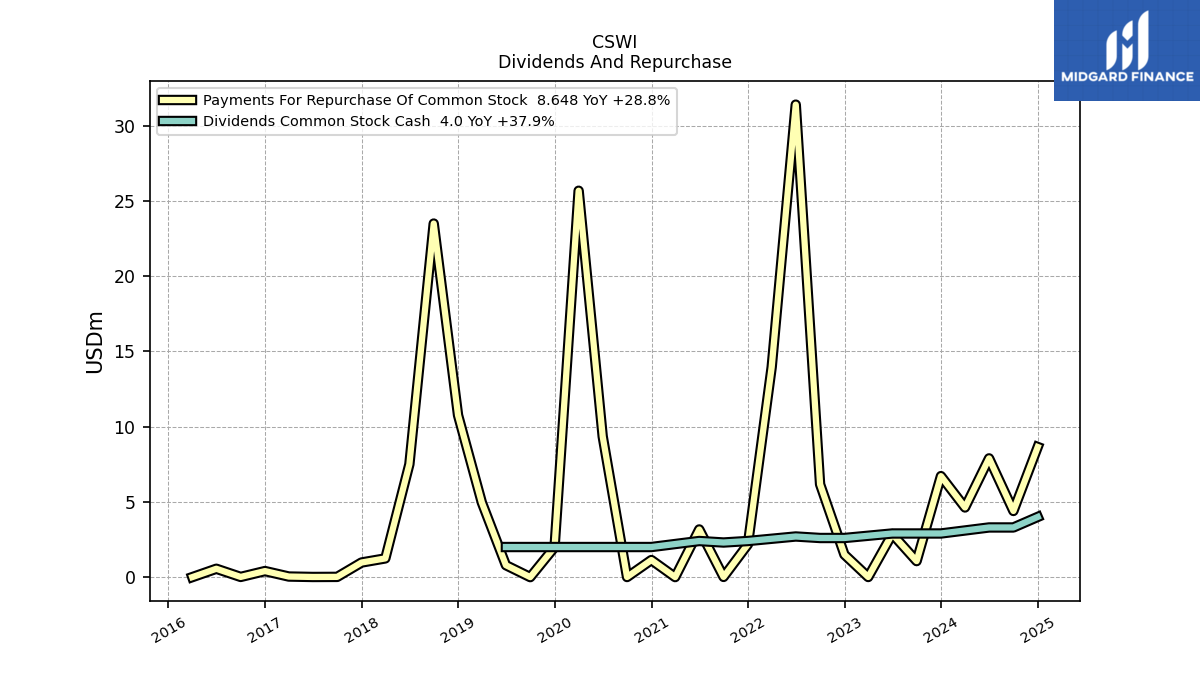
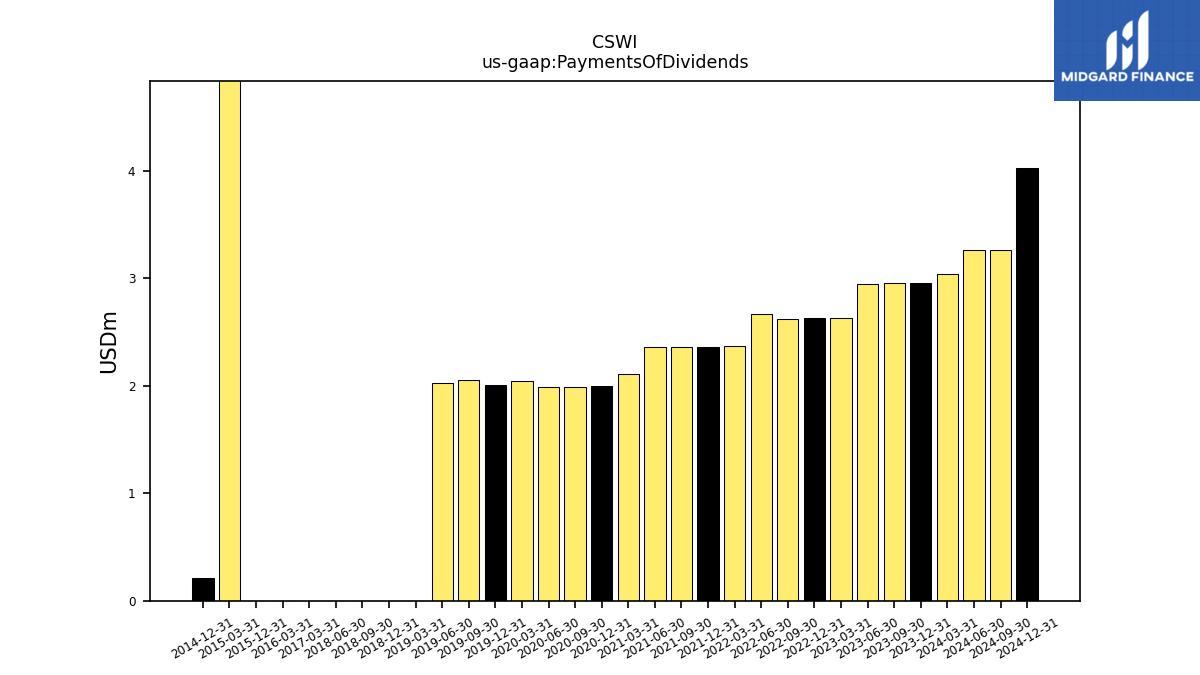
| Payments Of Dividends | 2.96 | 2.95 | 2.95 | 2.63 | 2.63 | 2.62 | 2.67 | 2.38 | 2.37 | 2.36 | 2.36 | 2.11 | 2.00 | 1.99 | 1.99 | 2.04 | 2.01 | 2.05 | 2.03 | 0.00 | 0.00 | 0.00 | 0.00 | NA | NA | NA | NA | 0.00 | NA | NA | NA | 0.00 | 0.00 | NA | NA | 7.63 | 0.21 | NA | NA | |
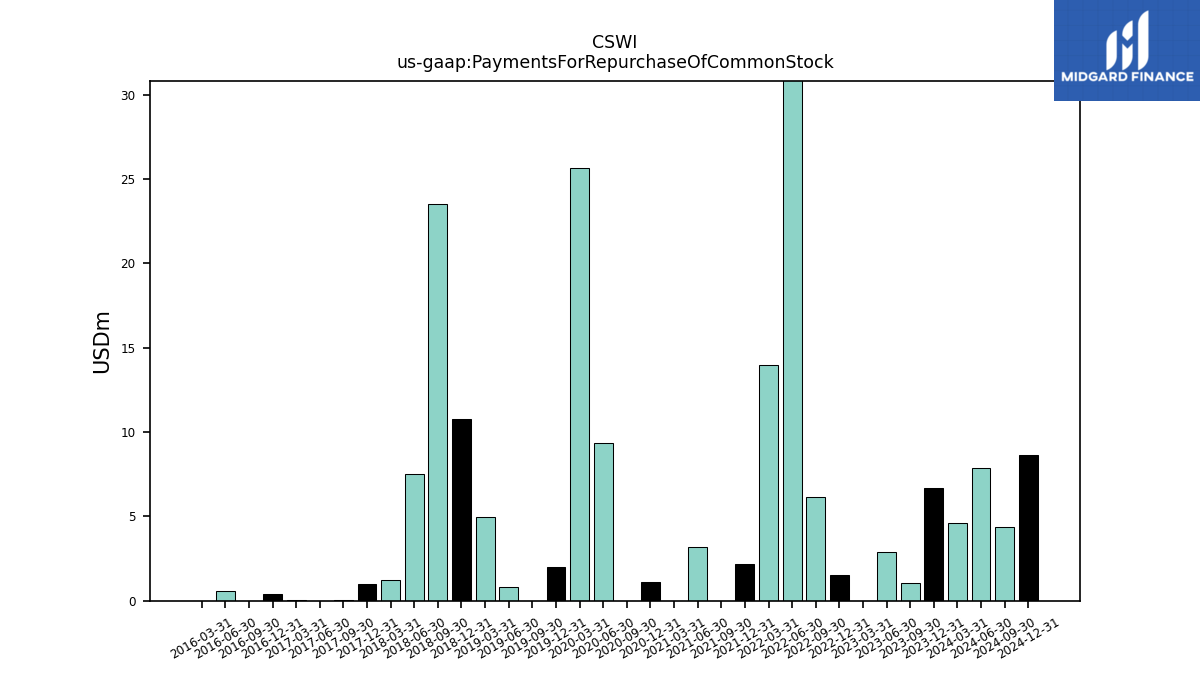
| Payments For Repurchase Of Common Stock | 6.71 | 1.06 | 2.86 | 0.01 | 1.50 | 6.17 | 31.40 | 13.96 | 2.17 | 0.01 | 3.17 | 0.00 | 1.14 | 0.01 | 9.35 | 25.68 | 1.99 | 0.00 | 0.79 | 4.96 | 10.76 | 23.50 | 7.50 | 1.24 | 0.97 | 0.02 | 0.01 | 0.04 | 0.40 | 0.01 | 0.56 | 0.00 | NA | NA | NA | NA | NA | NA | NA |
| 2023-12-31 | 2023-09-30 | 2023-06-30 | 2023-03-31 | 2022-12-31 | 2022-09-30 | 2022-06-30 | 2022-03-31 | 2021-12-31 | 2021-09-30 | 2021-06-30 | 2021-03-31 | 2020-12-31 | 2020-09-30 | 2020-06-30 | 2020-03-31 | 2019-12-31 | 2019-09-30 | 2019-06-30 | 2019-03-31 | 2018-12-31 | 2018-09-30 | 2018-06-30 | 2018-03-31 | 2017-12-31 | 2017-09-30 | 2017-06-30 | 2017-03-31 | 2016-12-31 | 2016-09-30 | 2016-06-30 | 2016-03-31 | 2015-12-31 | 2015-09-30 | 2015-06-30 | 2015-03-31 | 2014-12-31 | 2014-09-30 | 2014-06-30 | ||
|---|---|---|---|---|---|---|---|---|---|---|---|---|---|---|---|---|---|---|---|---|---|---|---|---|---|---|---|---|---|---|---|---|---|---|---|---|---|---|---|---|
| Revenue From Contract With Customer Excluding Assessed Tax | 174.97 | 203.65 | 203.36 | 195.69 | 171.09 | 191.19 | 199.93 | 173.30 | 136.29 | 155.59 | 161.27 | 133.40 | 89.93 | 104.94 | 90.96 | 98.60 | 83.72 | 101.32 | 102.33 | 91.50 | 77.49 | 91.61 | 89.60 | 83.50 | 69.04 | 84.42 | 89.30 | 87.40 | 75.50 | 80.13 | 84.11 | 64.00 | 70.92 | 83.74 | 68.80 | 76.30 | 60.87 | 68.09 | 88.90 | |
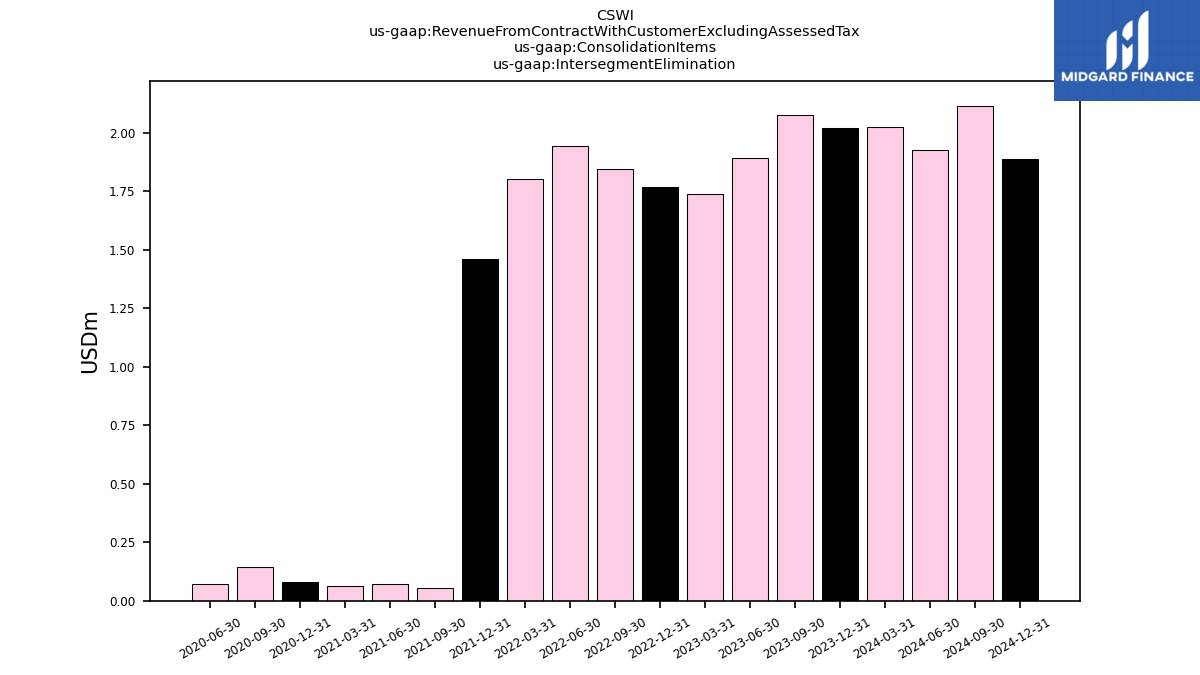
| Eliminations And Reconciling Items | -2.02 | -2.07 | -1.89 | -1.74 | -1.77 | -1.84 | -1.94 | -1.80 | -1.46 | -0.05 | -0.07 | -0.06 | -0.08 | -0.14 | 0.00 | 0.00 | 0.00 | 0.00 | 0.00 | -0.00 | 0.00 | 0.00 | 0.00 | 0.00 | 0.00 | -0.00 | 0.00 | 0.00 | 0.04 | 0.02 | 0.02 | 0.09 | 0.04 | NA | NA | NA | NA | NA | NA | |
| Intersegment Elimination | 2.02 | 2.07 | 1.89 | 1.74 | 1.77 | 1.84 | 1.94 | 1.80 | 1.46 | 0.05 | 0.07 | 0.06 | 0.08 | 0.14 | 0.07 | NA | NA | NA | NA | NA | NA | NA | NA | NA | NA | NA | NA | NA | NA | NA | NA | NA | NA | NA | NA | NA | NA | NA | NA | |
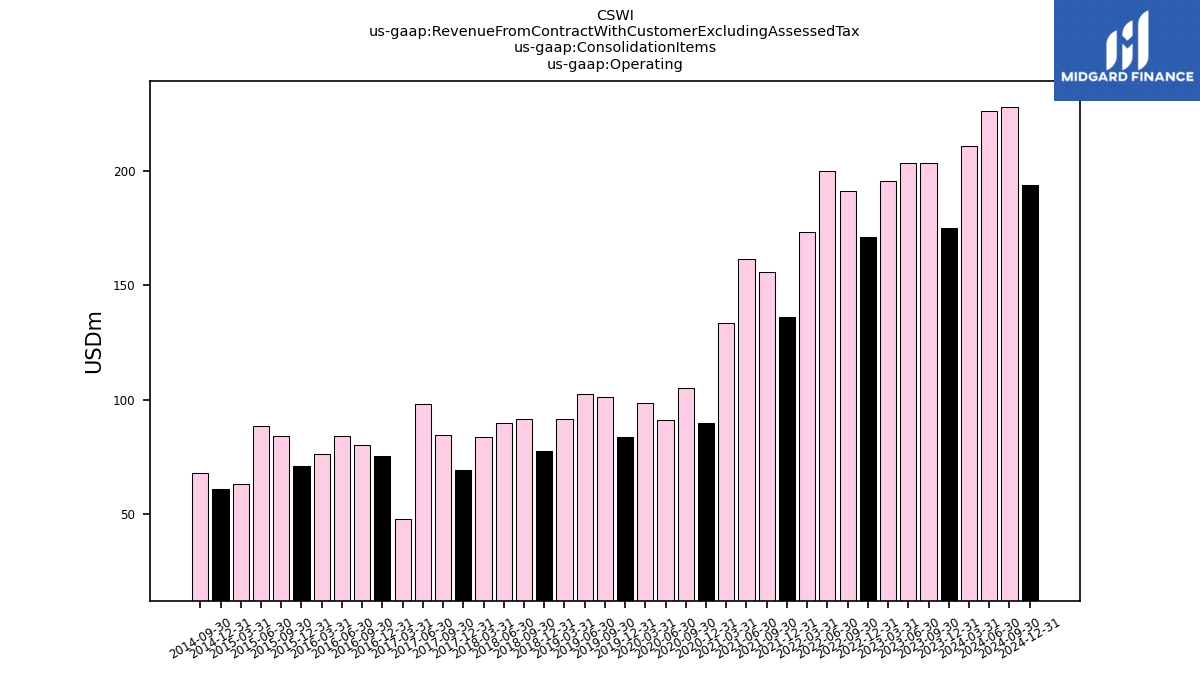
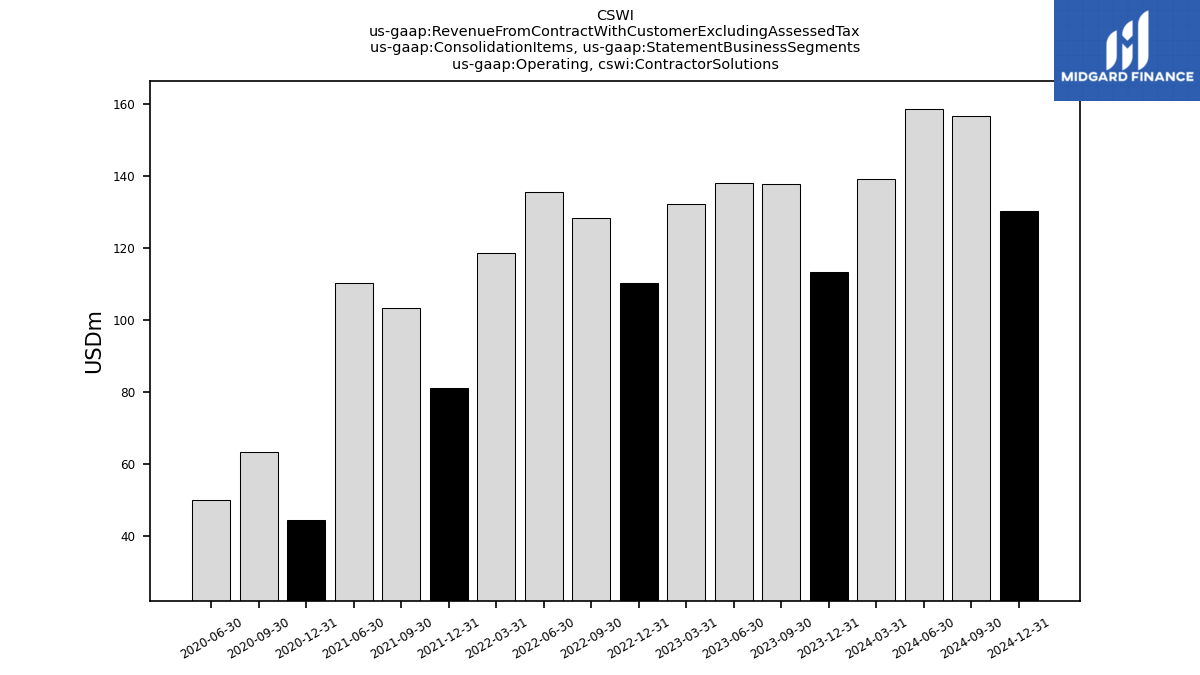
| Operating | 174.97 | 203.65 | 203.36 | 195.69 | 171.09 | 191.19 | 199.93 | 173.30 | 136.29 | 155.58 | 161.27 | 133.37 | 89.93 | 104.94 | 90.96 | 98.50 | 83.72 | 101.32 | 102.33 | 91.48 | 77.49 | 91.61 | 89.58 | 83.46 | 69.03 | 84.42 | 98.03 | 47.72 | 75.45 | 80.11 | 84.09 | 76.17 | 70.87 | 83.93 | 88.59 | 63.22 | 60.77 | 67.76 | NA | |
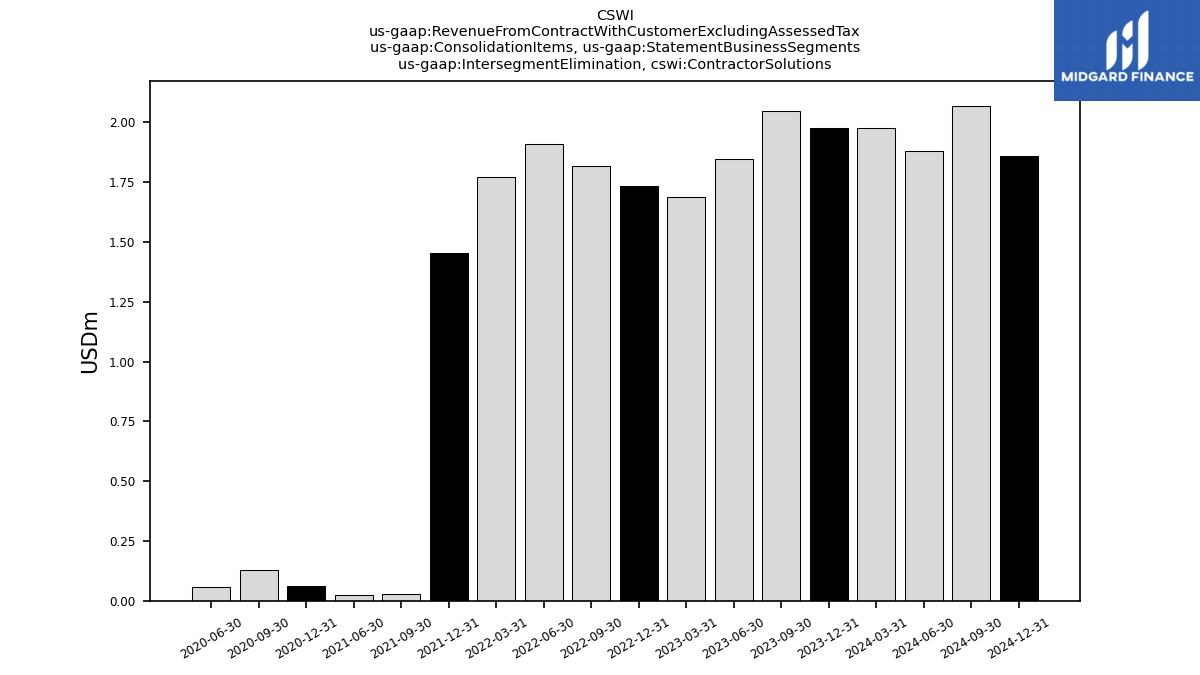
| Intersegment Elimination, Contractor Solutions | 1.98 | 2.05 | 1.85 | NA | 1.74 | 1.82 | 1.91 | NA | 1.45 | 0.03 | 0.03 | NA | 0.06 | 0.13 | 0.06 | NA | NA | NA | NA | NA | NA | NA | NA | NA | NA | NA | NA | NA | NA | NA | NA | NA | NA | NA | NA | NA | NA | NA | NA | |
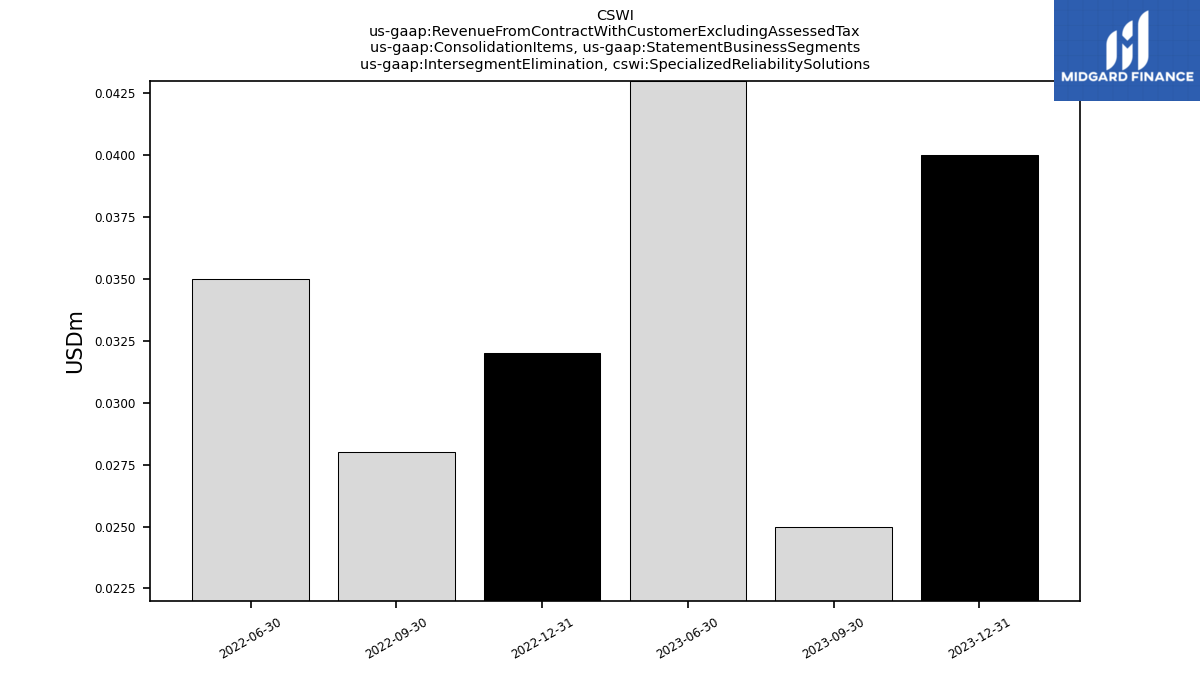
| Intersegment Elimination, Specialized Reliability Solutions | 0.04 | 0.03 | 0.04 | NA | 0.03 | 0.03 | 0.04 | NA | NA | NA | NA | NA | NA | NA | NA | NA | NA | NA | NA | NA | NA | NA | NA | NA | NA | NA | NA | NA | NA | NA | NA | NA | NA | NA | NA | NA | NA | NA | NA | |
| Operating, Contractor Solutions | 113.43 | 137.85 | 138.10 | NA | 110.17 | 128.49 | 135.72 | NA | 81.00 | 103.32 | 110.22 | NA | 44.38 | 63.24 | 49.83 | NA | NA | NA | NA | NA | NA | NA | NA | NA | NA | NA | NA | NA | NA | NA | NA | NA | NA | NA | NA | NA | NA | NA | NA | |
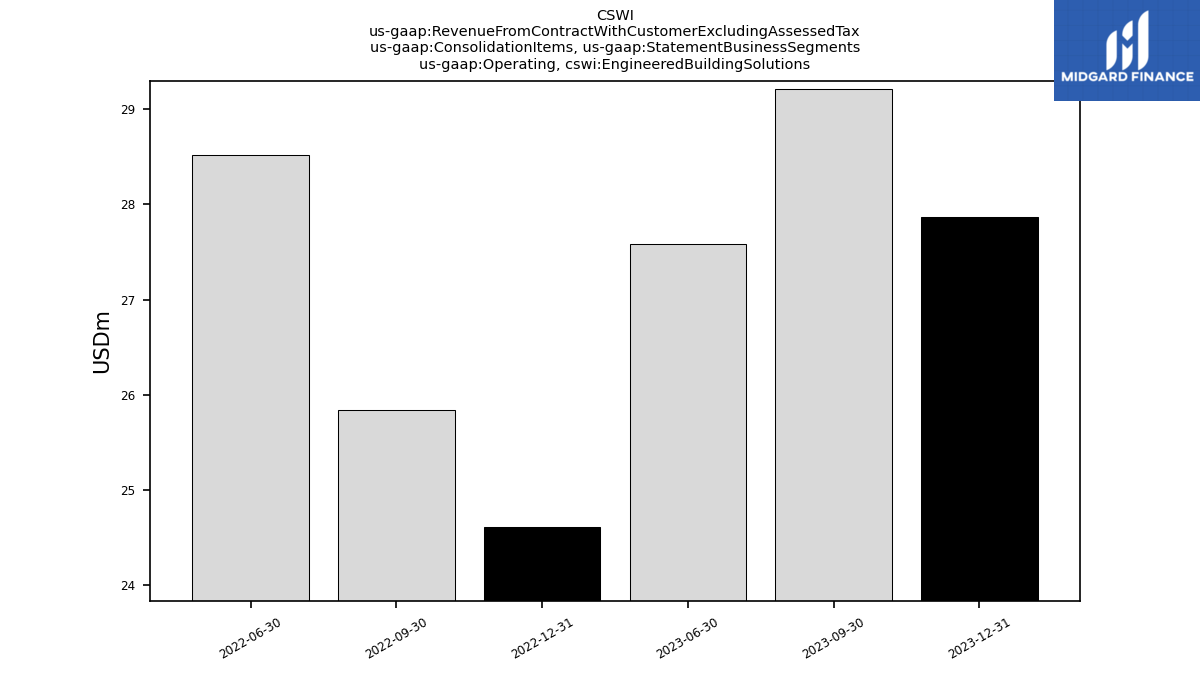
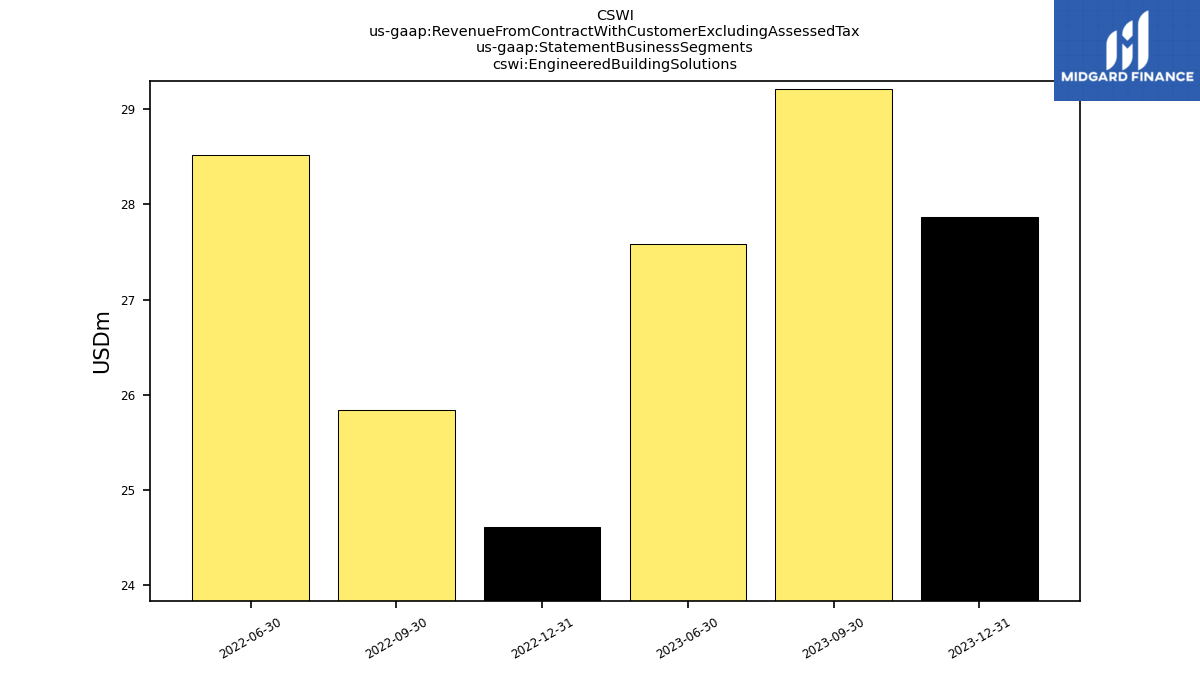
| Operating, Engineered Building Solutions | 27.86 | 29.21 | 27.59 | NA | 24.62 | 25.84 | 28.51 | NA | NA | NA | NA | NA | NA | NA | NA | NA | NA | NA | NA | NA | NA | NA | NA | NA | NA | NA | NA | NA | NA | NA | NA | NA | NA | NA | NA | NA | NA | NA | NA | |
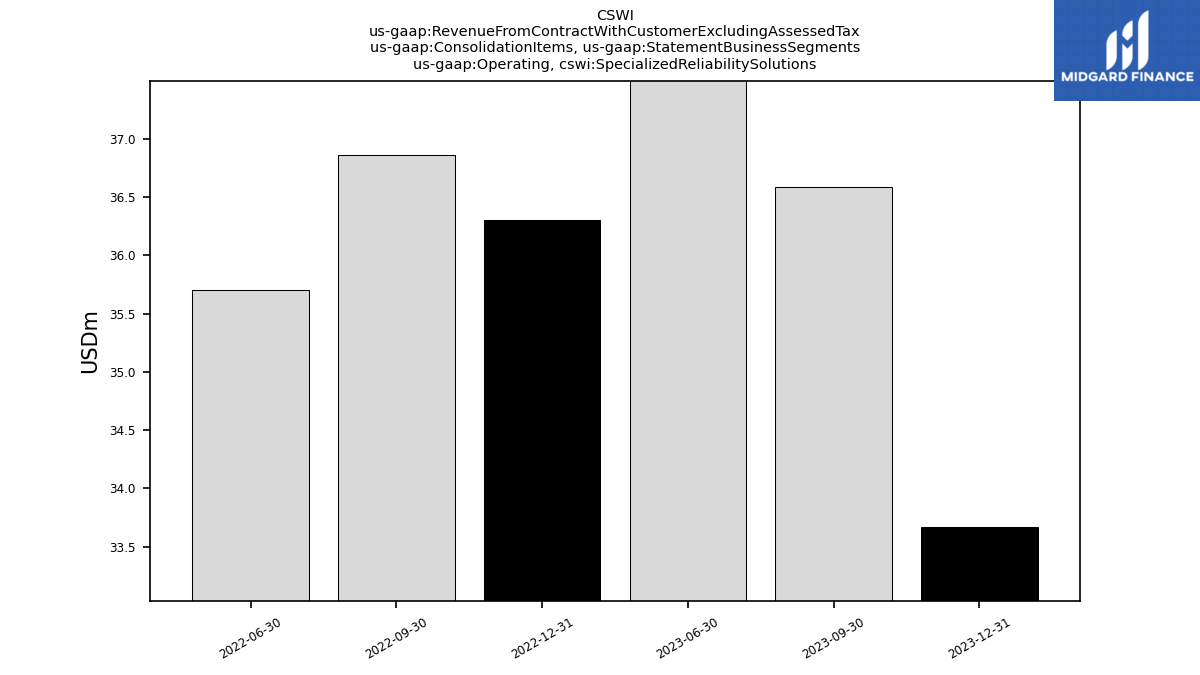
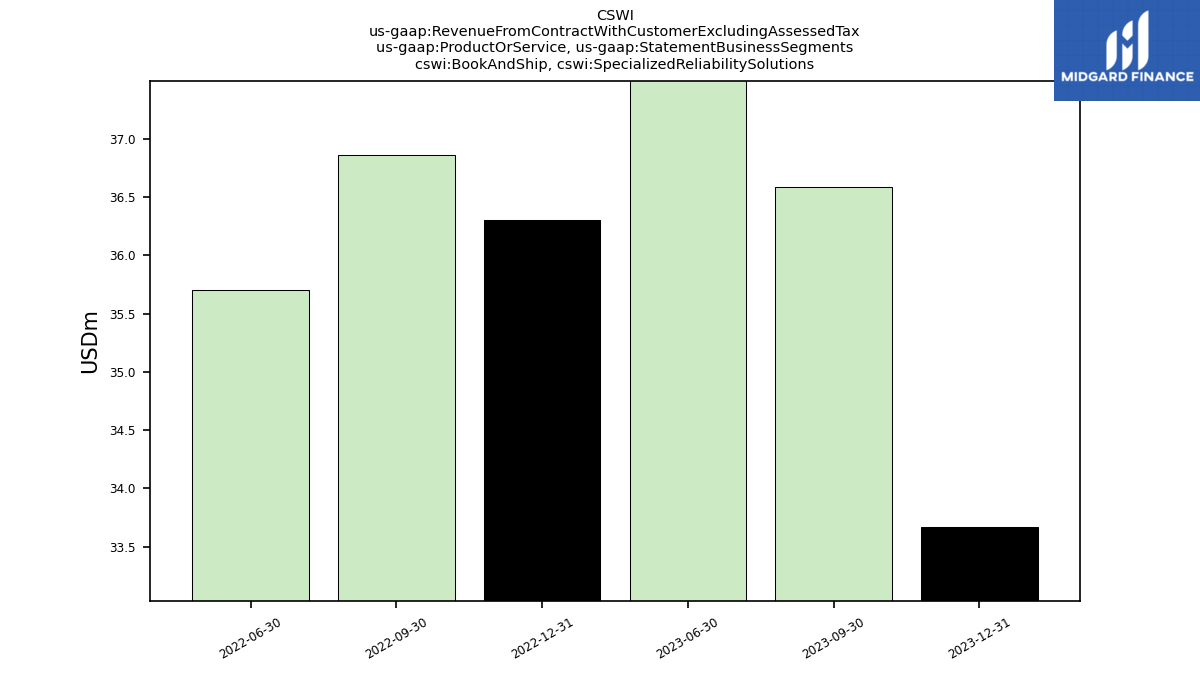
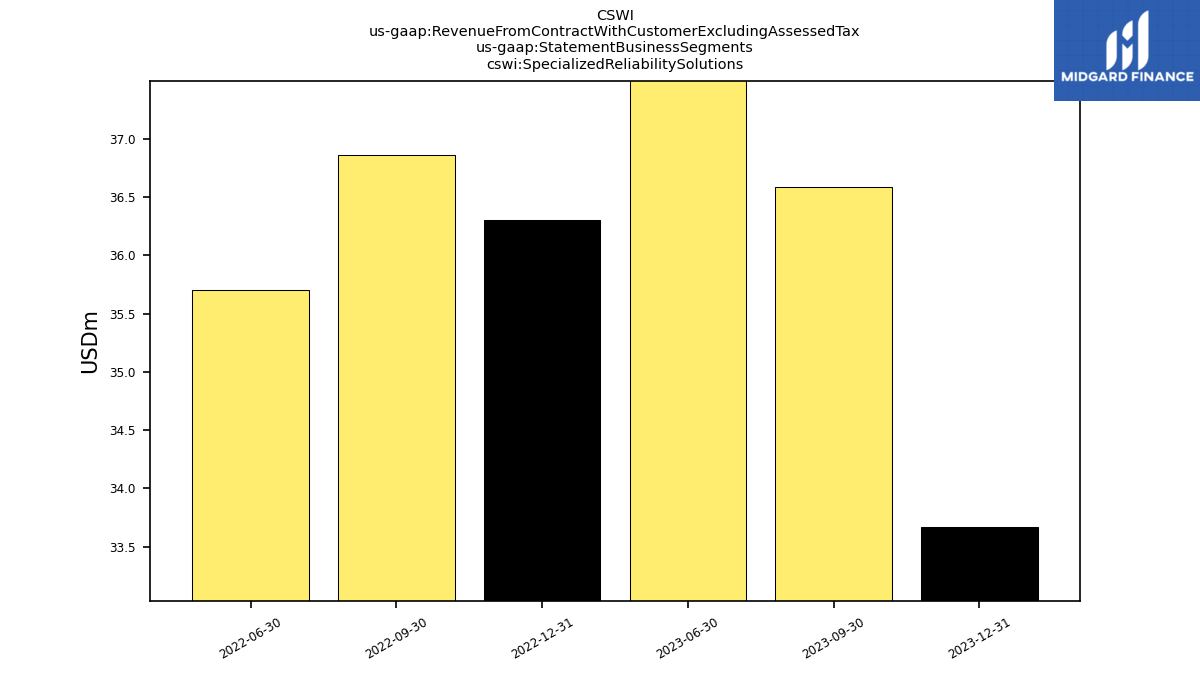
| Operating, Specialized Reliability Solutions | 33.67 | 36.59 | 37.67 | NA | 36.30 | 36.86 | 35.70 | NA | NA | NA | NA | NA | NA | NA | NA | NA | NA | NA | NA | NA | NA | NA | NA | NA | NA | NA | NA | NA | NA | NA | NA | NA | NA | NA | NA | NA | NA | NA | NA | |
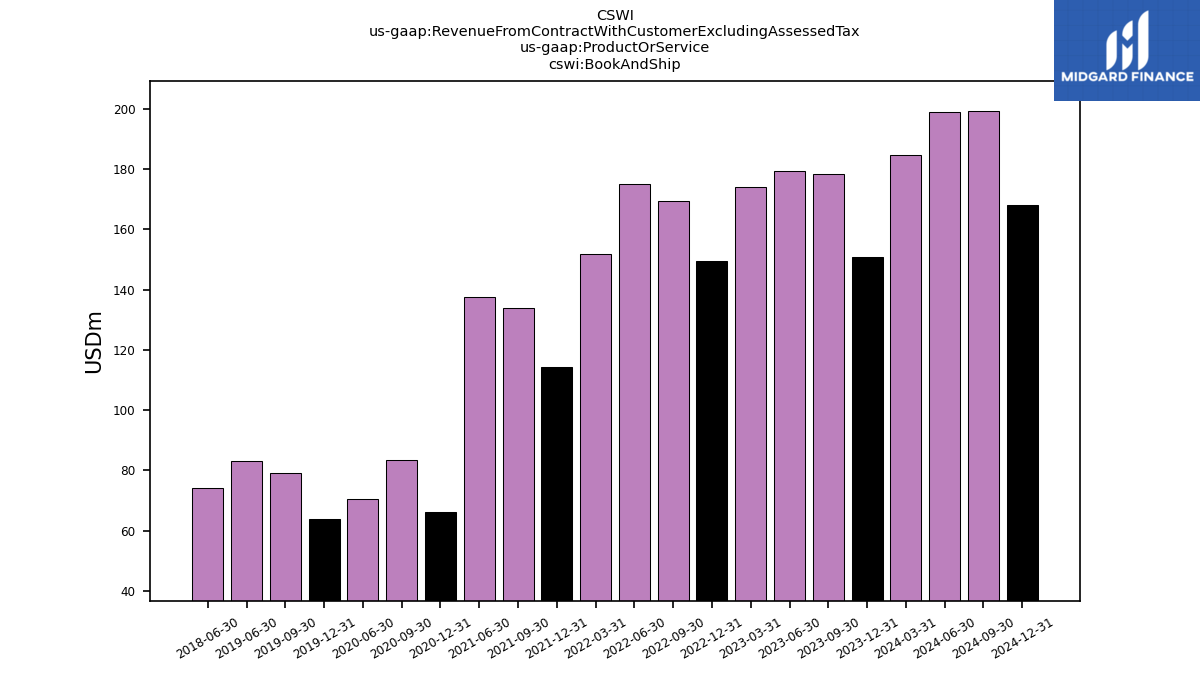
| Book And Ship | 150.80 | 178.29 | 179.42 | NA | 149.58 | 169.36 | 174.91 | NA | 114.40 | 133.82 | 137.62 | NA | 66.27 | 83.46 | 70.42 | NA | 63.76 | 79.28 | 83.13 | NA | NA | NA | 74.07 | NA | NA | NA | NA | NA | NA | NA | NA | NA | NA | NA | NA | NA | NA | NA | NA | |
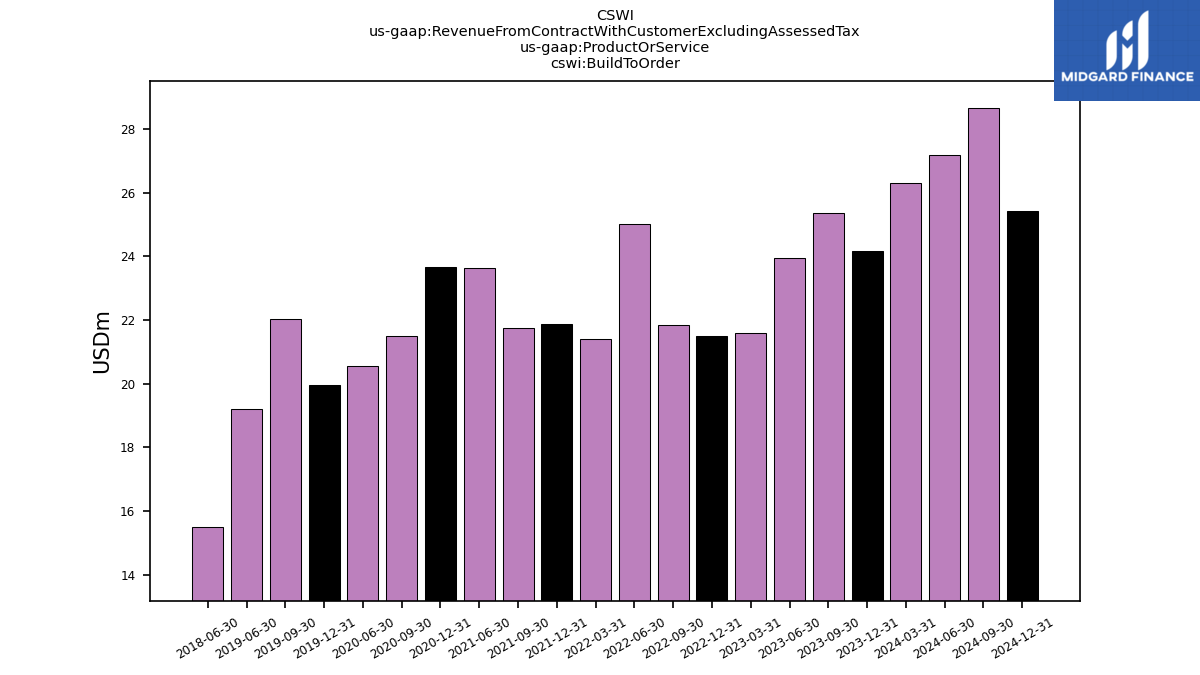
| Build To Order | 24.17 | 25.36 | 23.94 | NA | 21.51 | 21.84 | 25.02 | NA | 21.89 | 21.76 | 23.65 | NA | 23.66 | 21.48 | 20.54 | NA | 19.95 | 22.04 | 19.20 | NA | NA | NA | 15.51 | NA | NA | NA | NA | NA | NA | NA | NA | NA | NA | NA | NA | NA | NA | NA | NA | |
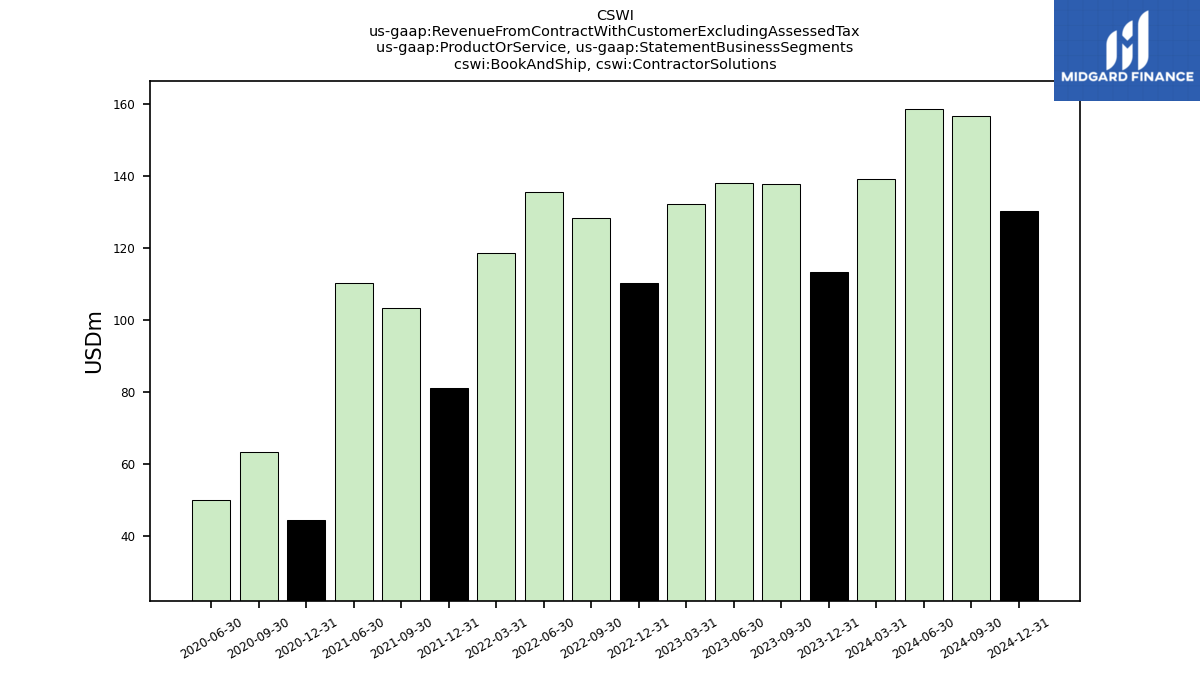
| Book And Ship, Contractor Solutions | 113.43 | 137.85 | 138.10 | NA | 110.17 | 128.49 | 135.72 | NA | 81.00 | 103.32 | 110.22 | NA | 44.38 | 63.24 | 49.83 | NA | NA | NA | NA | NA | NA | NA | NA | NA | NA | NA | NA | NA | NA | NA | NA | NA | NA | NA | NA | NA | NA | NA | NA | |
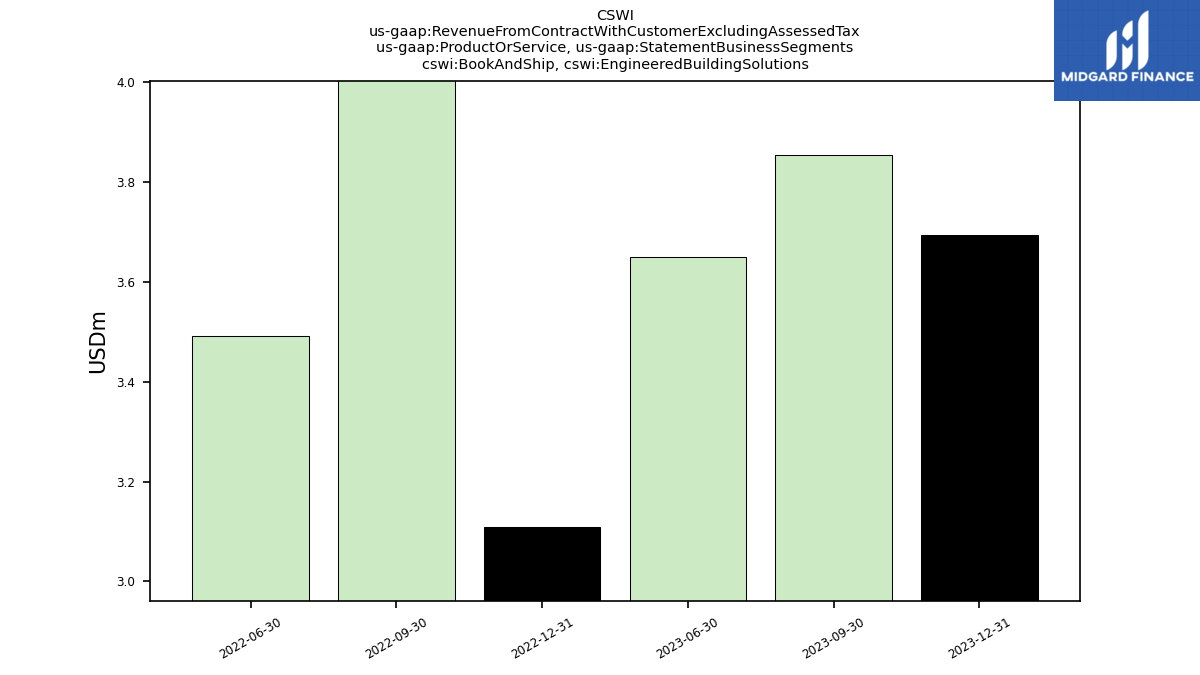
| Book And Ship, Engineered Building Solutions | 3.69 | 3.85 | 3.65 | NA | 3.11 | 4.01 | 3.49 | NA | NA | NA | NA | NA | NA | NA | NA | NA | NA | NA | NA | NA | NA | NA | NA | NA | NA | NA | NA | NA | NA | NA | NA | NA | NA | NA | NA | NA | NA | NA | NA | |
| Book And Ship, Specialized Reliability Solutions | 33.67 | 36.59 | 37.67 | NA | 36.30 | 36.86 | 35.70 | NA | NA | NA | NA | NA | NA | NA | NA | NA | NA | NA | NA | NA | NA | NA | NA | NA | NA | NA | NA | NA | NA | NA | NA | NA | NA | NA | NA | NA | NA | NA | NA | |
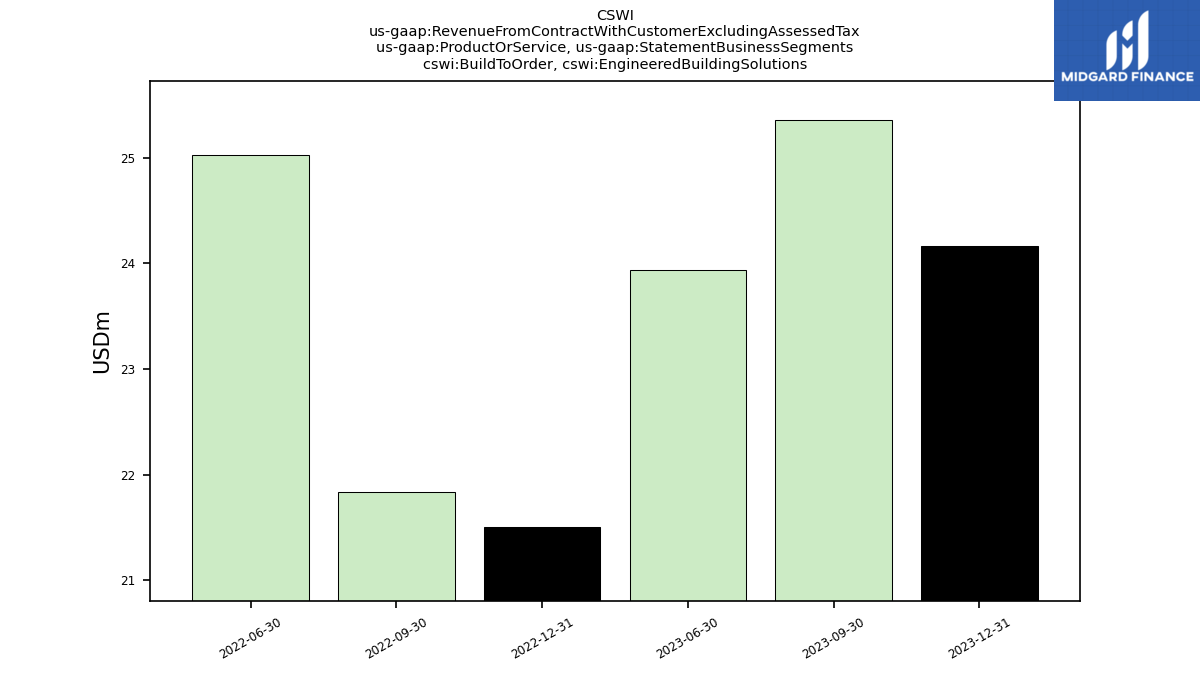
| Build To Order, Engineered Building Solutions | 24.17 | 25.36 | 23.94 | NA | 21.51 | 21.84 | 25.02 | NA | NA | NA | NA | NA | NA | NA | NA | NA | NA | NA | NA | NA | NA | NA | NA | NA | NA | NA | NA | NA | NA | NA | NA | NA | NA | NA | NA | NA | NA | NA | NA | |
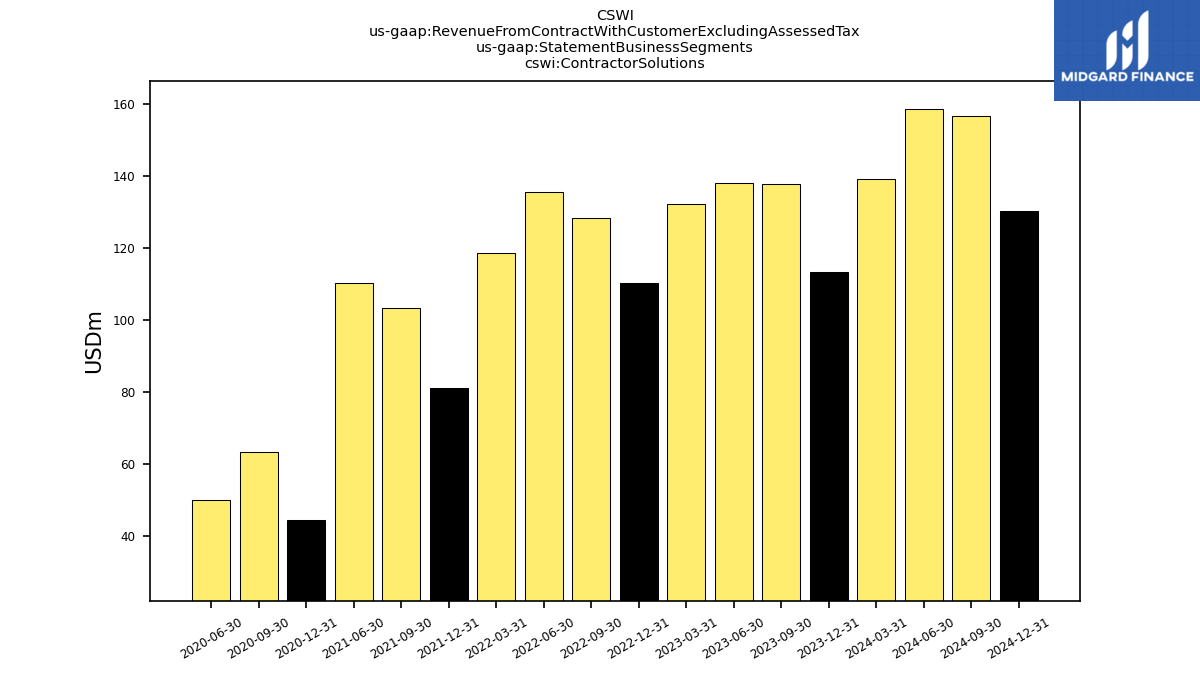
| Contractor Solutions | 113.43 | 137.85 | 138.10 | NA | 110.17 | 128.49 | 135.72 | NA | 81.00 | 103.32 | 110.22 | NA | 44.38 | 63.24 | 49.83 | NA | NA | NA | NA | NA | NA | NA | NA | NA | NA | NA | NA | NA | NA | NA | NA | NA | NA | NA | NA | NA | NA | NA | NA | |
| Engineered Building Solutions | 27.86 | 29.21 | 27.59 | NA | 24.62 | 25.84 | 28.51 | NA | NA | NA | NA | NA | NA | NA | NA | NA | NA | NA | NA | NA | NA | NA | NA | NA | NA | NA | NA | NA | NA | NA | NA | NA | NA | NA | NA | NA | NA | NA | NA | |
| Specialized Reliability Solutions | 33.67 | 36.59 | 37.67 | NA | 36.30 | 36.86 | 35.70 | NA | NA | NA | NA | NA | NA | NA | NA | NA | NA | NA | NA | NA | NA | NA | NA | NA | NA | NA | NA | NA | NA | NA | NA | NA | NA | NA | NA | NA | NA | NA | NA |