
| 2023-09-30 | 2023-06-30 | 2023-03-31 | 2022-12-31 | 2022-09-30 | 2022-06-30 | 2022-03-31 | 2021-12-31 | 2021-09-30 | 2021-06-30 | 2021-03-31 | 2020-12-31 | 2020-09-30 | 2020-06-30 | ||
|---|---|---|---|---|---|---|---|---|---|---|---|---|---|---|---|
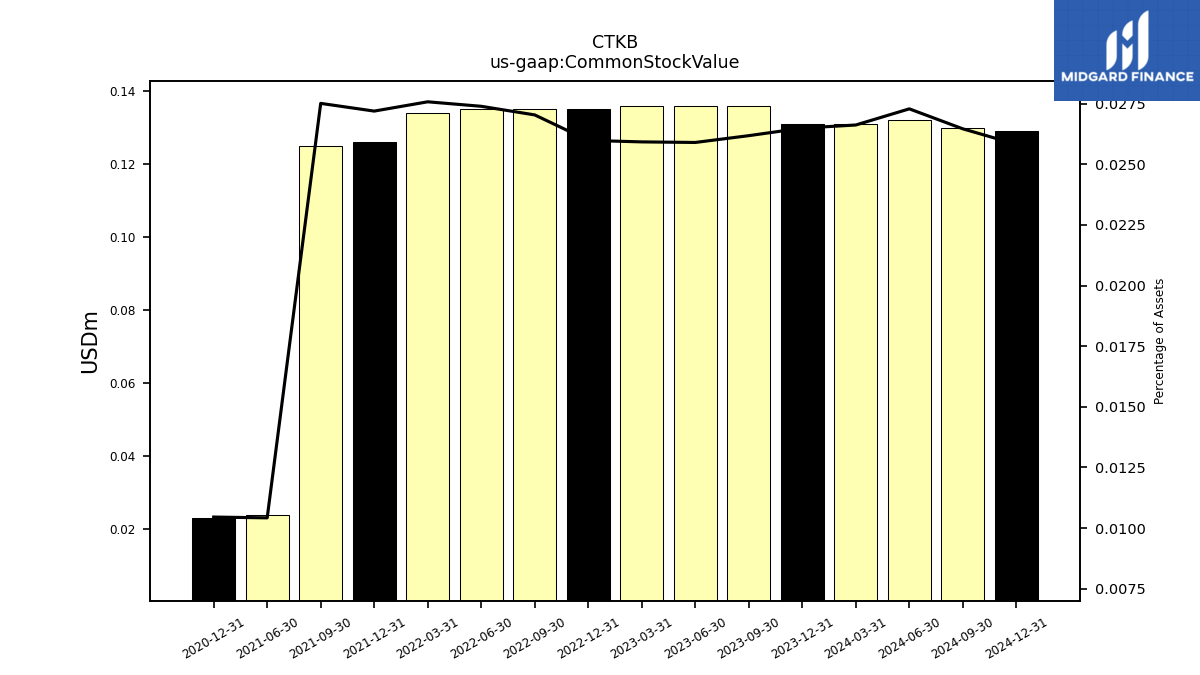
| Common Stock Value | 0.14 | 0.14 | 0.14 | 0.14 | 0.14 | 0.14 | 0.13 | 0.13 | 0.12 | 0.02 | NA | 0.02 | NA | NA | |
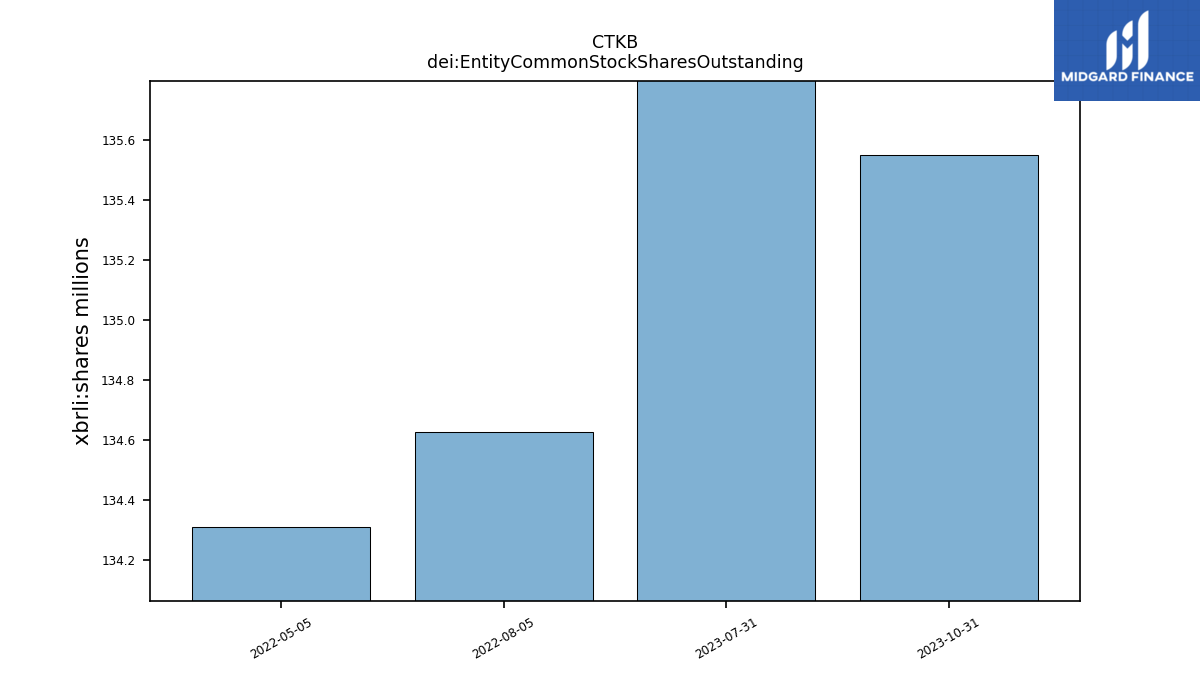
| dei: Entity Common Stock Shares Outstanding | NA | NA | NA | NA | NA | NA | NA | NA | NA | NA | NA | NA | NA | NA | |
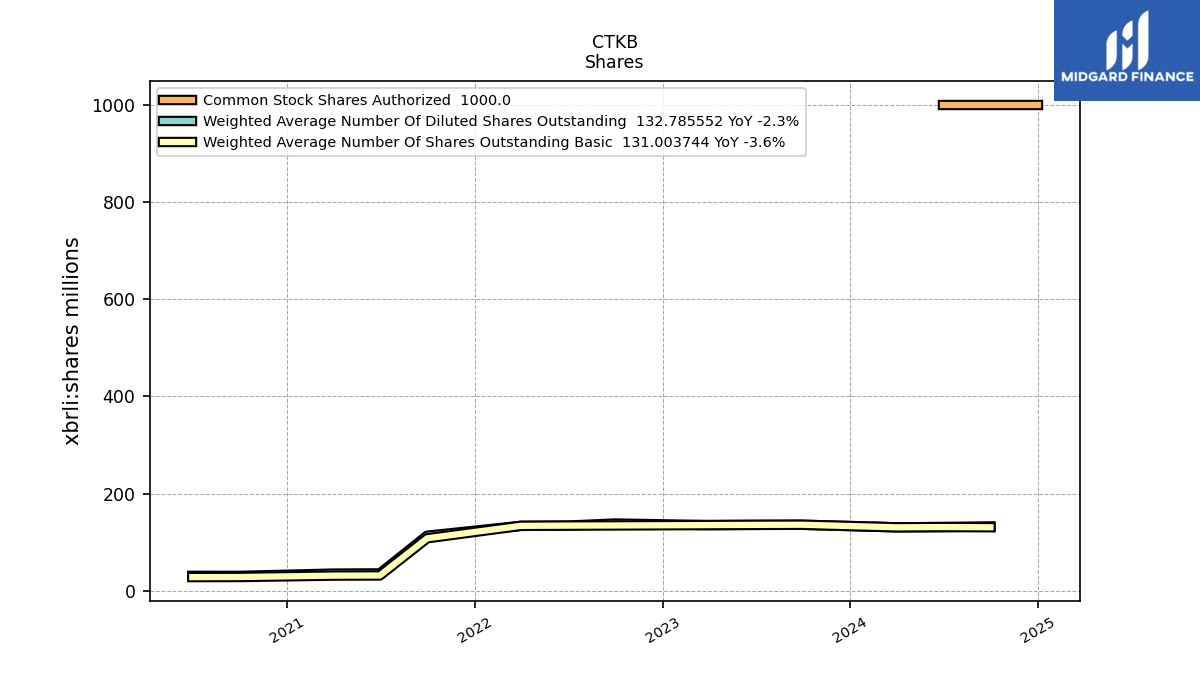
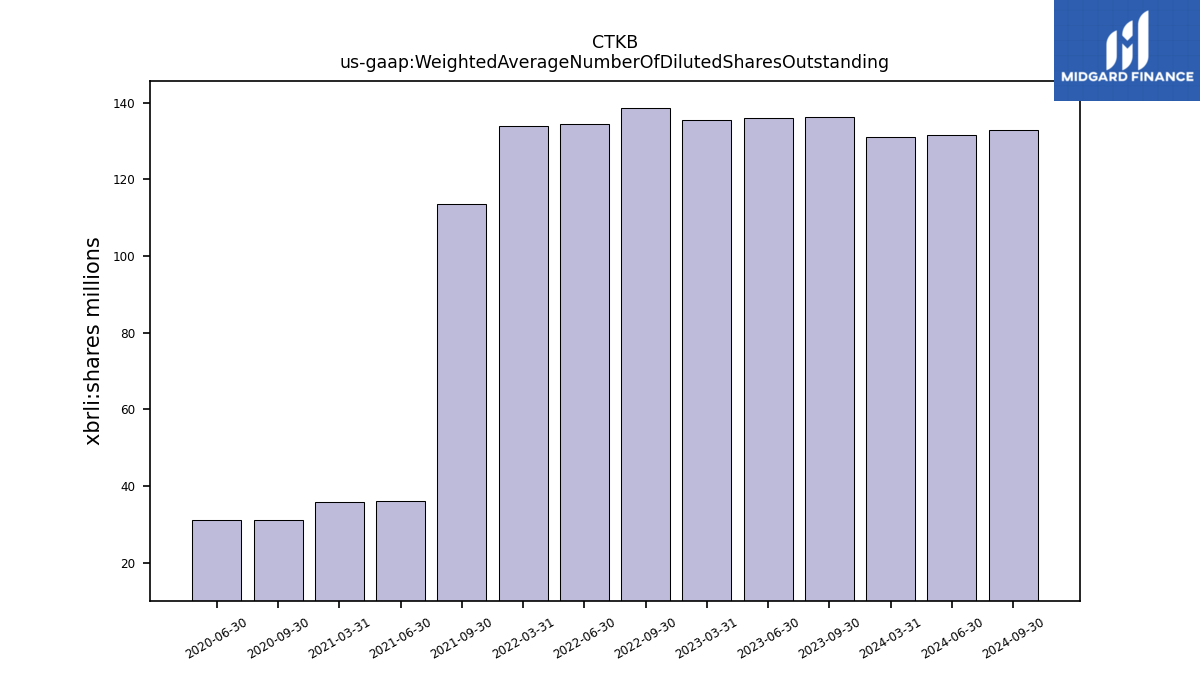
| Weighted Average Number Of Diluted Shares Outstanding | 136.17 | 135.92 | 135.49 | NA | 138.71 | 134.40 | 133.90 | NA | 113.64 | 36.17 | 35.76 | NA | 31.06 | 31.13 | |
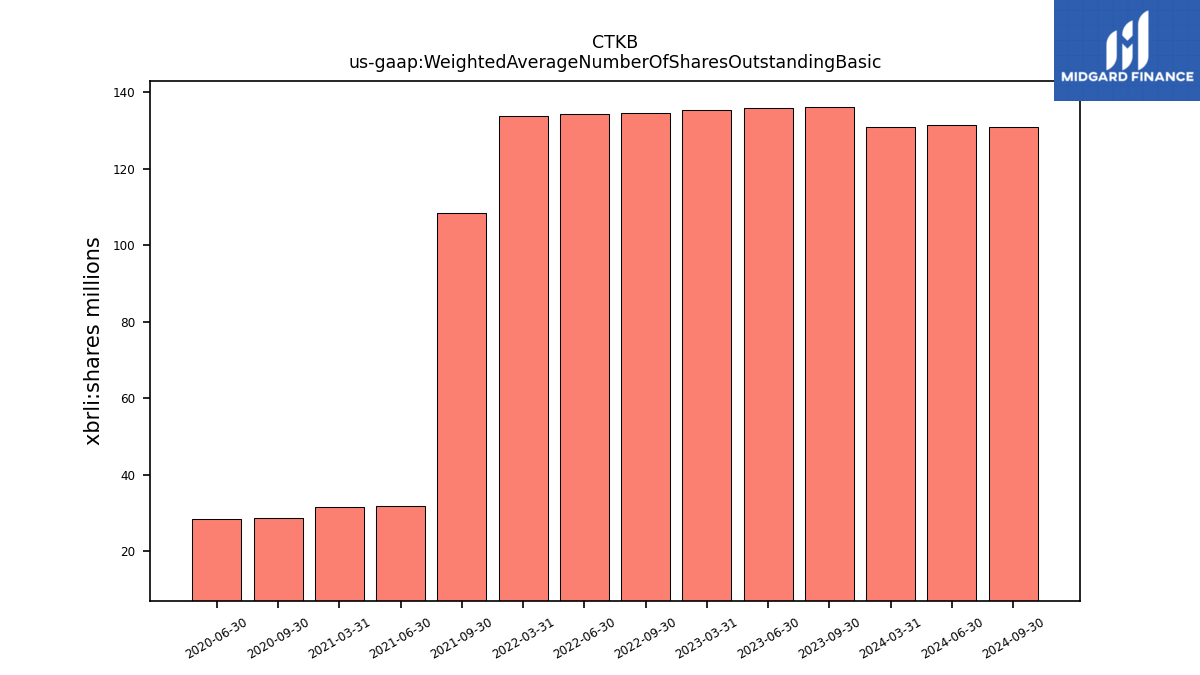
| Weighted Average Number Of Shares Outstanding Basic | 136.17 | 135.92 | 135.49 | NA | 134.71 | 134.40 | 133.90 | NA | 108.32 | 31.88 | 31.56 | NA | 28.70 | 28.50 | |
| Earnings Per Share Basic | NA | NA | NA | 0.03 | -0.01 | -0.00 | 0.02 | NA | 0.00 | NA | NA | 0.02 | 0.05 | 0.07 | |
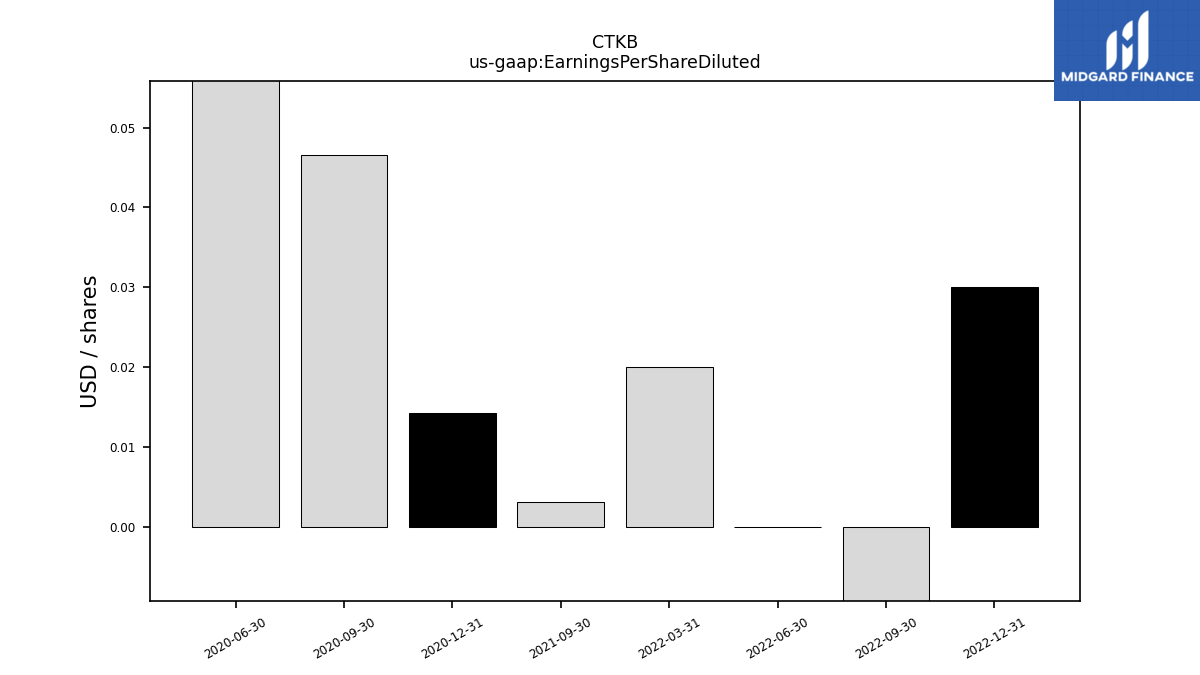
| Earnings Per Share Diluted | NA | NA | NA | 0.03 | -0.01 | -0.00 | 0.02 | NA | 0.00 | NA | NA | 0.01 | 0.05 | 0.06 | |
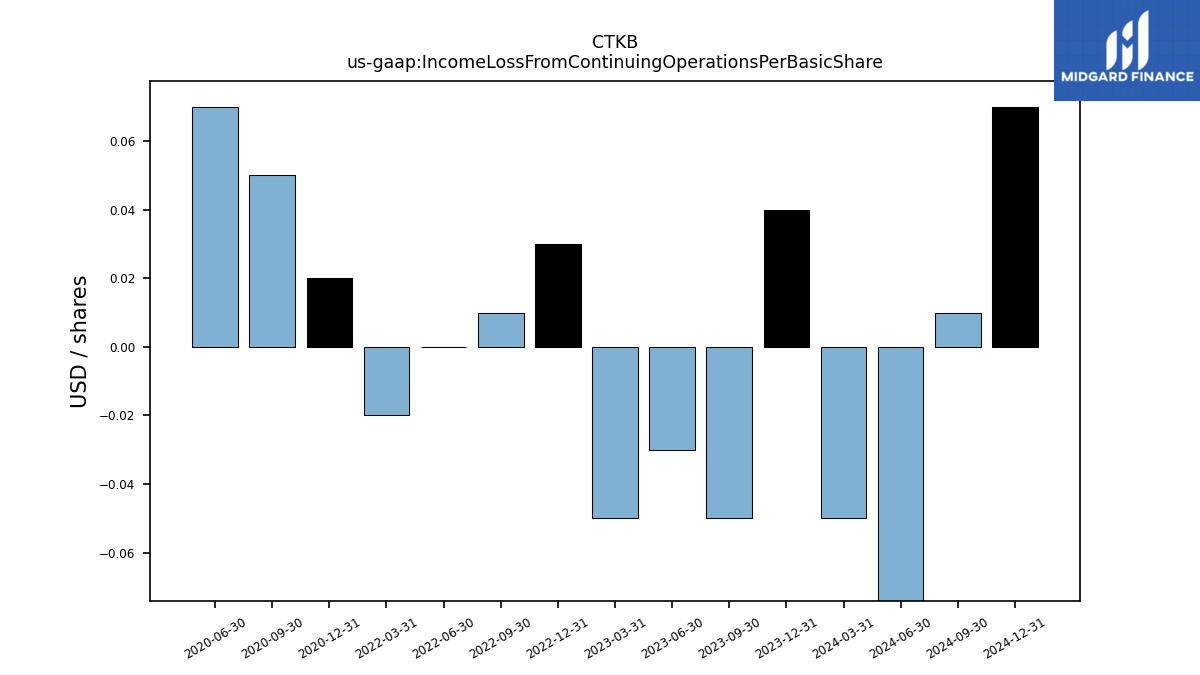
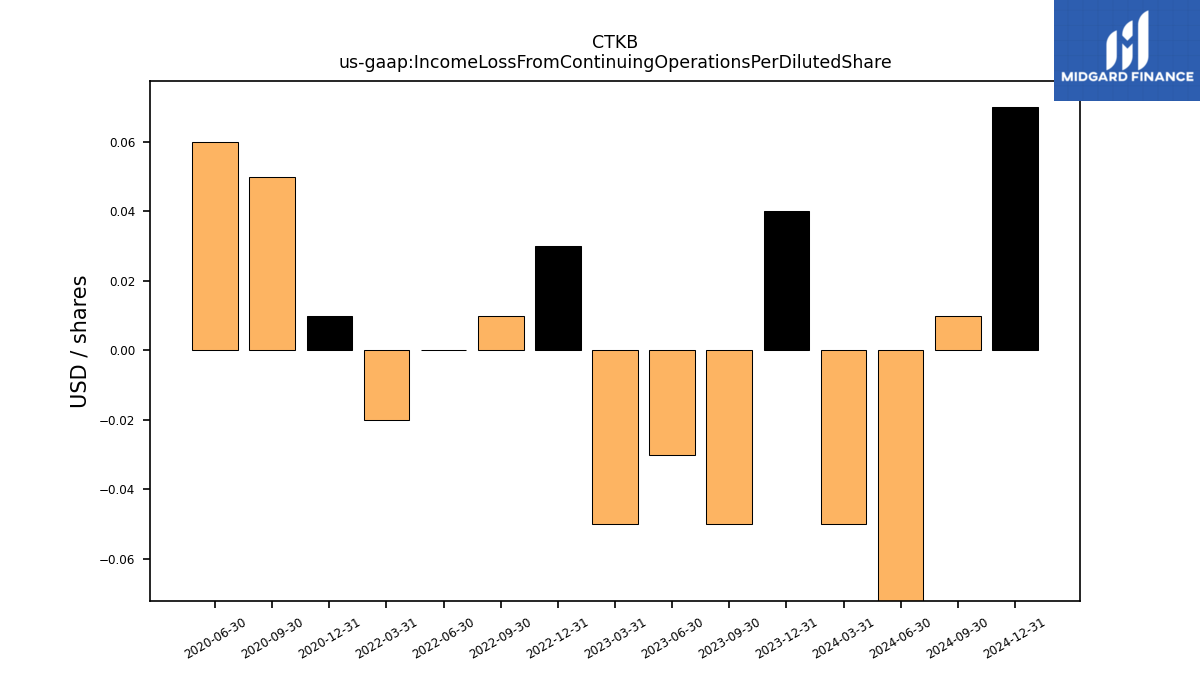
| Income Loss From Continuing Operations Per Basic Share | -0.00 | -0.00 | -0.00 | 0.00 | 0.00 | -0.00 | -0.00 | NA | NA | NA | NA | 0.00 | 0.00 | 0.00 | |
| Income Loss From Continuing Operations Per Diluted Share | -0.00 | -0.00 | -0.00 | 0.00 | 0.00 | -0.00 | -0.00 | NA | NA | NA | NA | 0.00 | 0.00 | 0.00 |
| 2023-09-30 | 2023-06-30 | 2023-03-31 | 2022-12-31 | 2022-09-30 | 2022-06-30 | 2022-03-31 | 2021-12-31 | 2021-09-30 | 2021-06-30 | 2021-03-31 | 2020-12-31 | 2020-09-30 | 2020-06-30 | ||
|---|---|---|---|---|---|---|---|---|---|---|---|---|---|---|---|
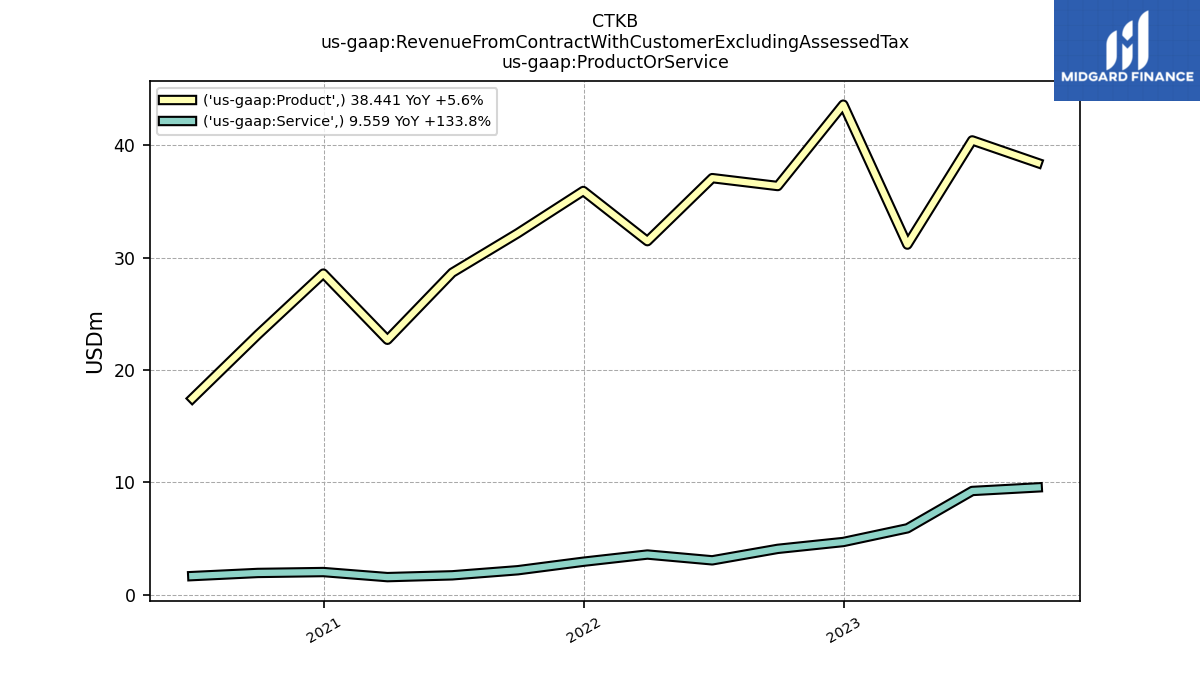
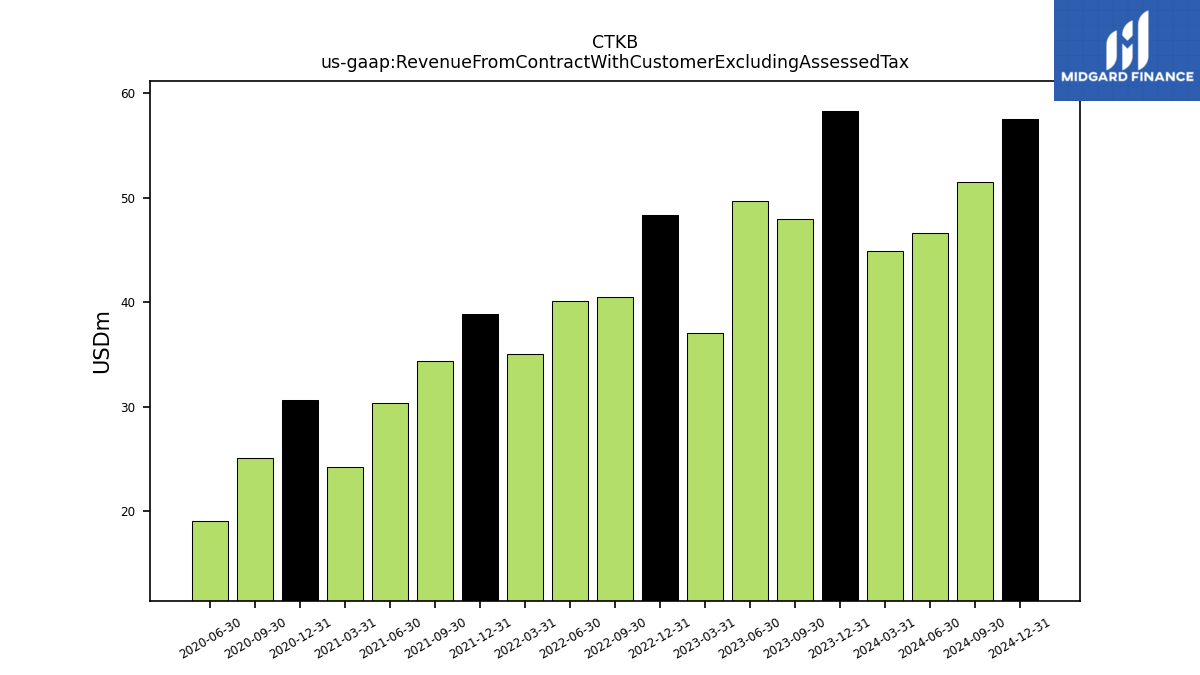
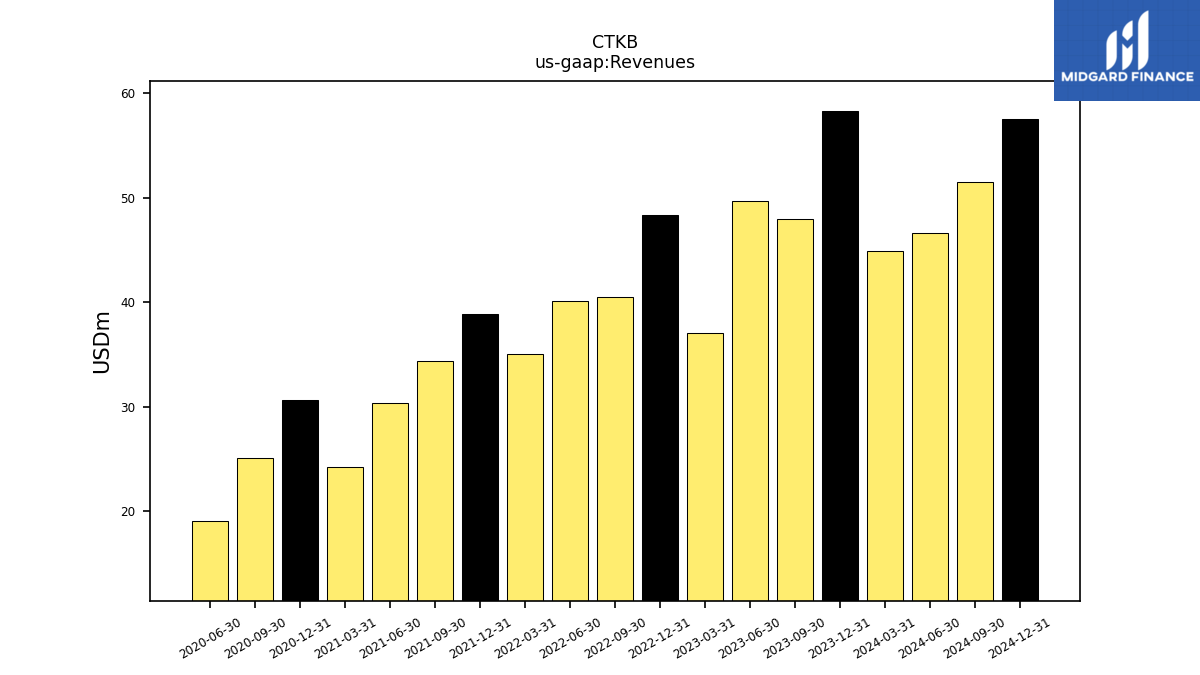
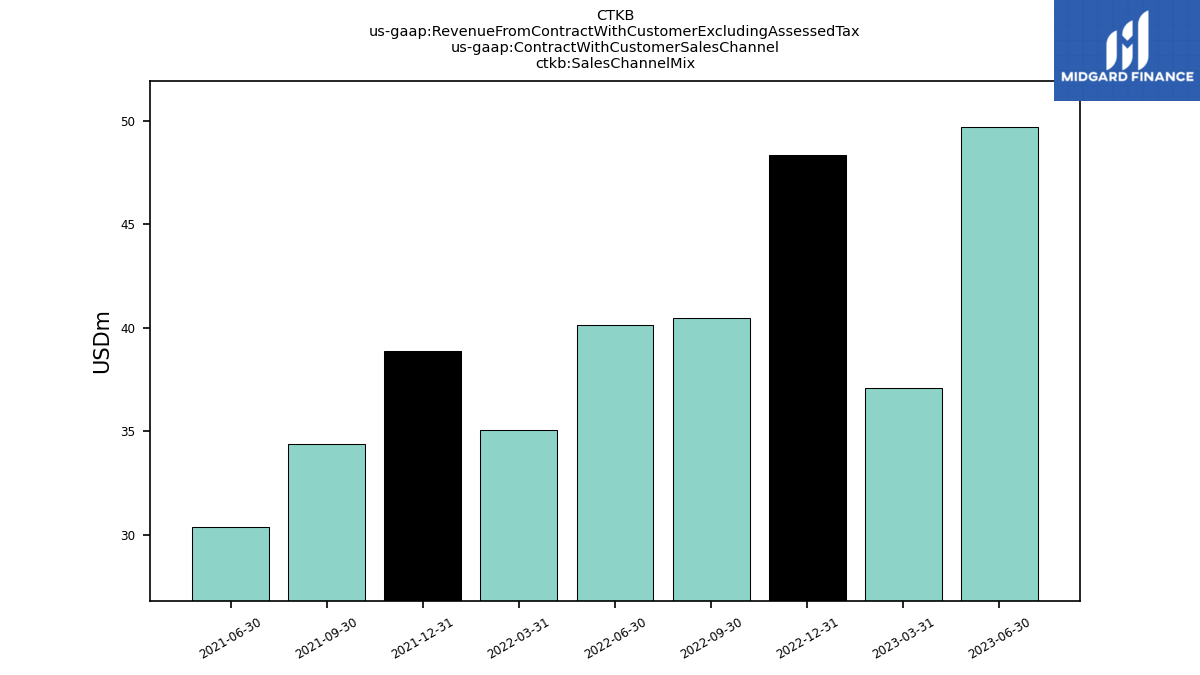
| Revenue From Contract With Customer Excluding Assessed Tax | 48.00 | 49.69 | 37.09 | 48.34 | 40.48 | 40.16 | 35.06 | 38.89 | 34.38 | 30.41 | 24.27 | 30.62 | 25.10 | 19.14 | |
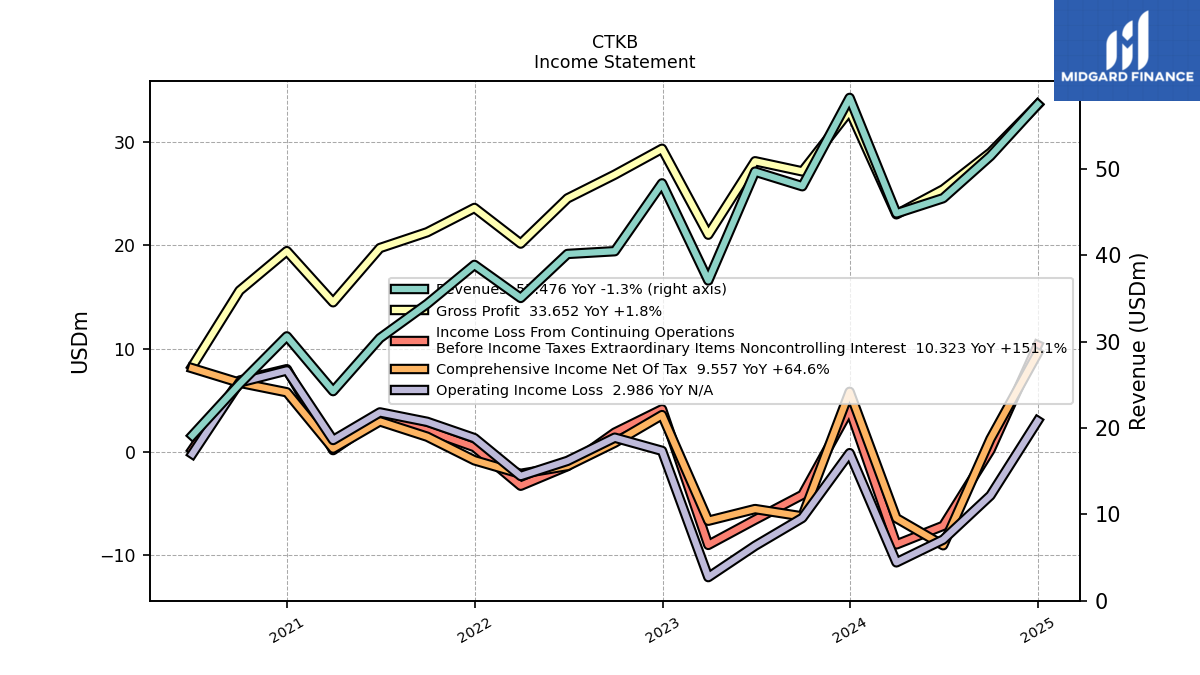
| Revenues | 48.00 | 49.69 | 37.09 | 48.34 | 40.48 | 40.16 | 35.06 | 38.89 | 34.38 | 30.41 | 24.27 | 30.62 | 25.10 | 19.14 | |
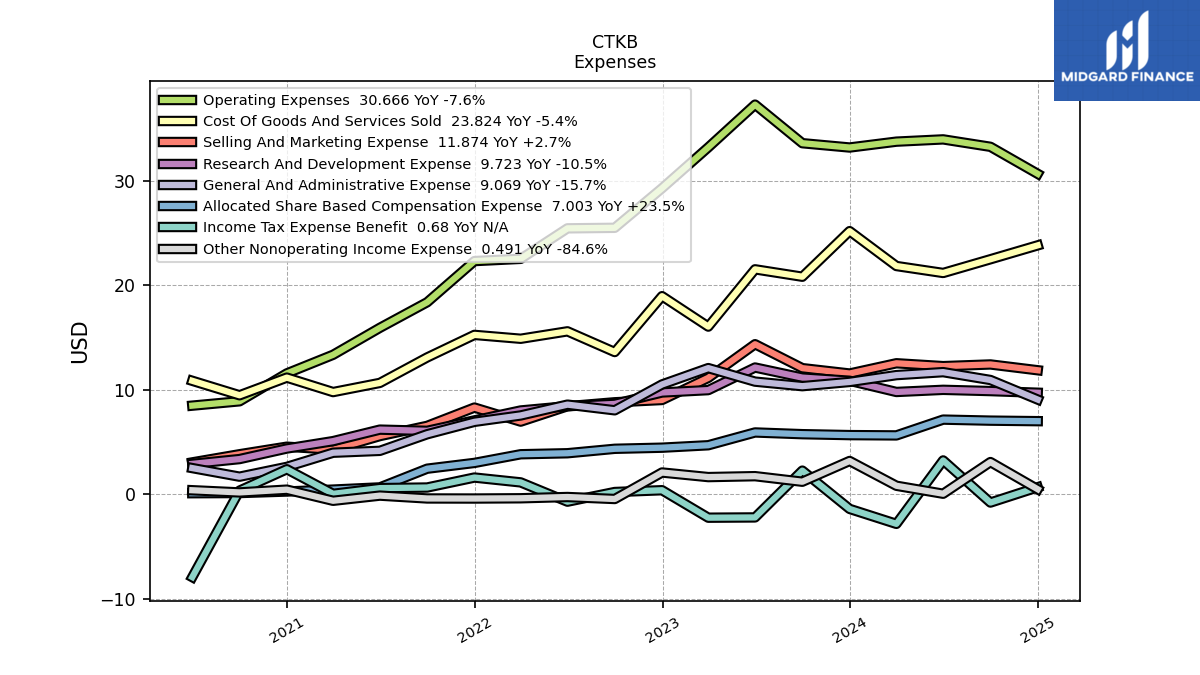
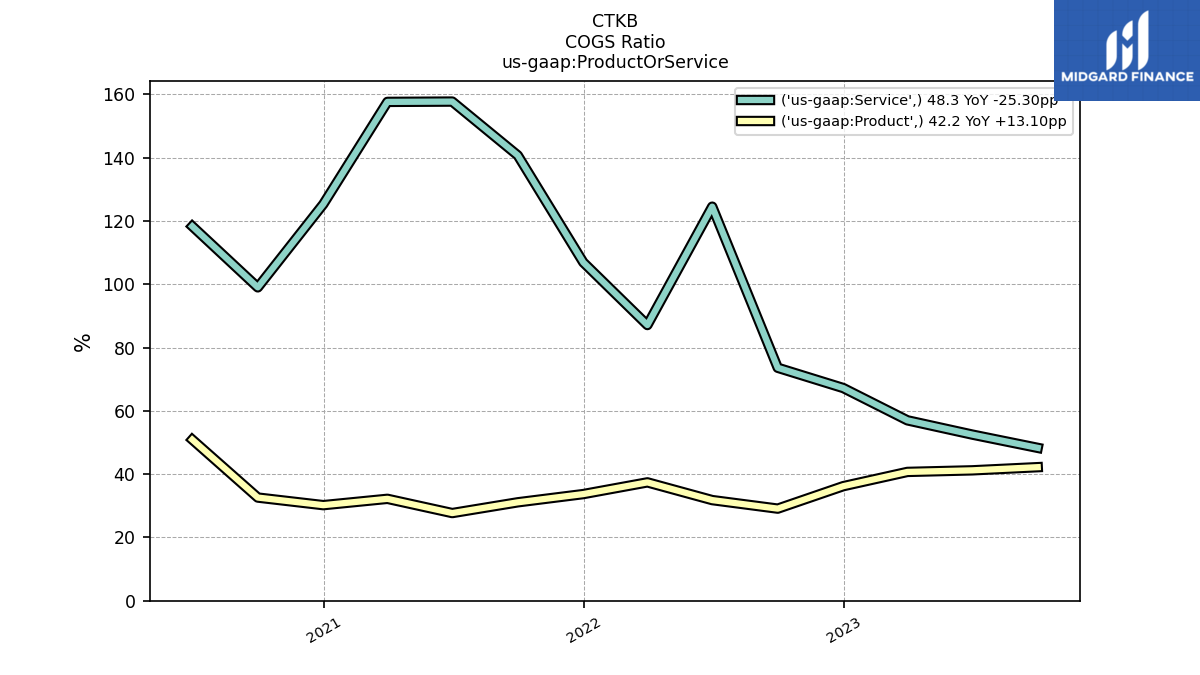
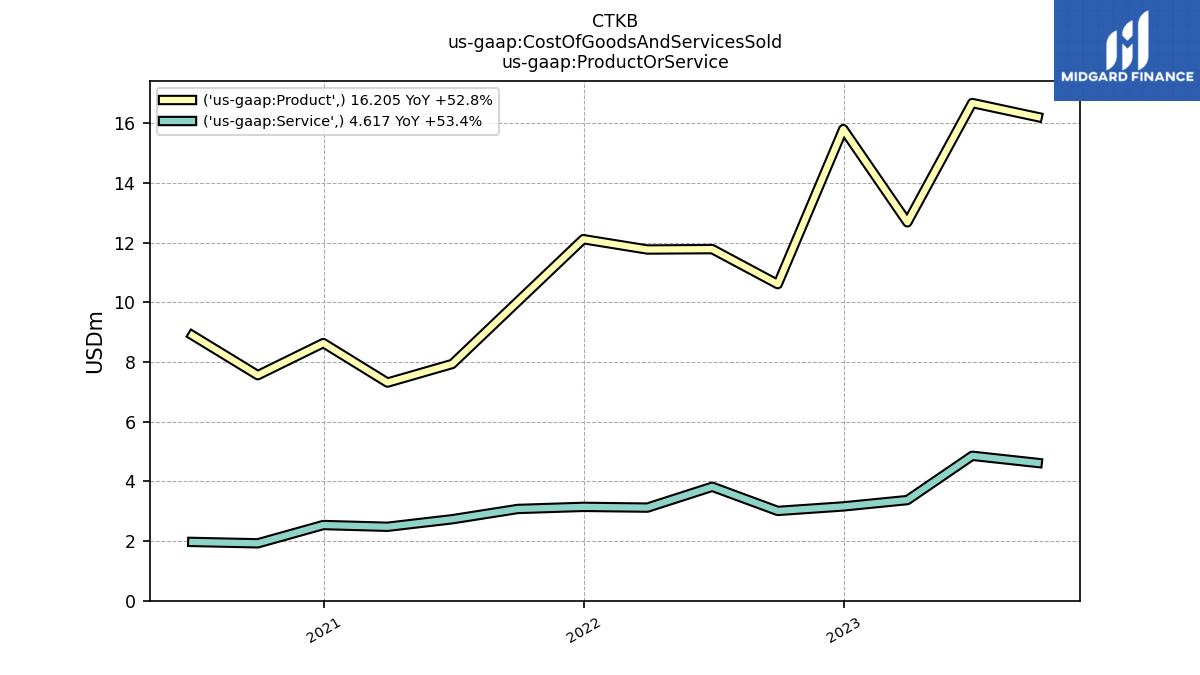
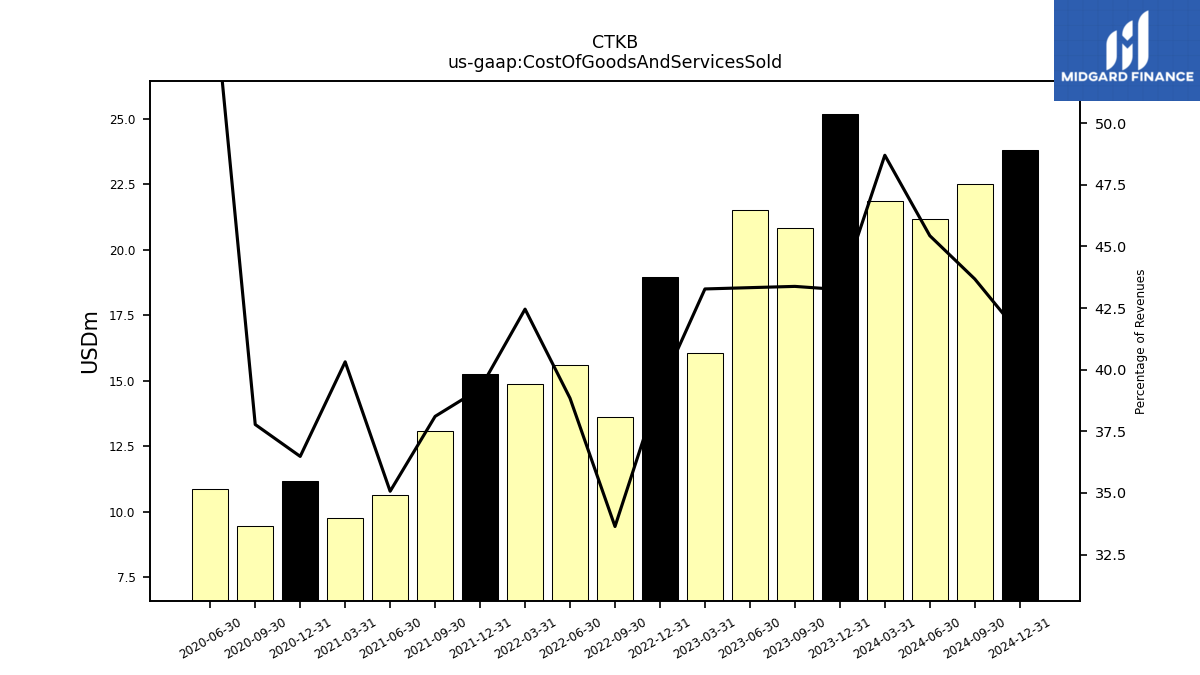
| Cost Of Goods And Services Sold | 20.82 | 21.53 | 16.05 | 18.96 | 13.62 | 15.60 | 14.89 | 15.26 | 13.10 | 10.66 | 9.79 | 11.17 | 9.48 | 10.87 | |
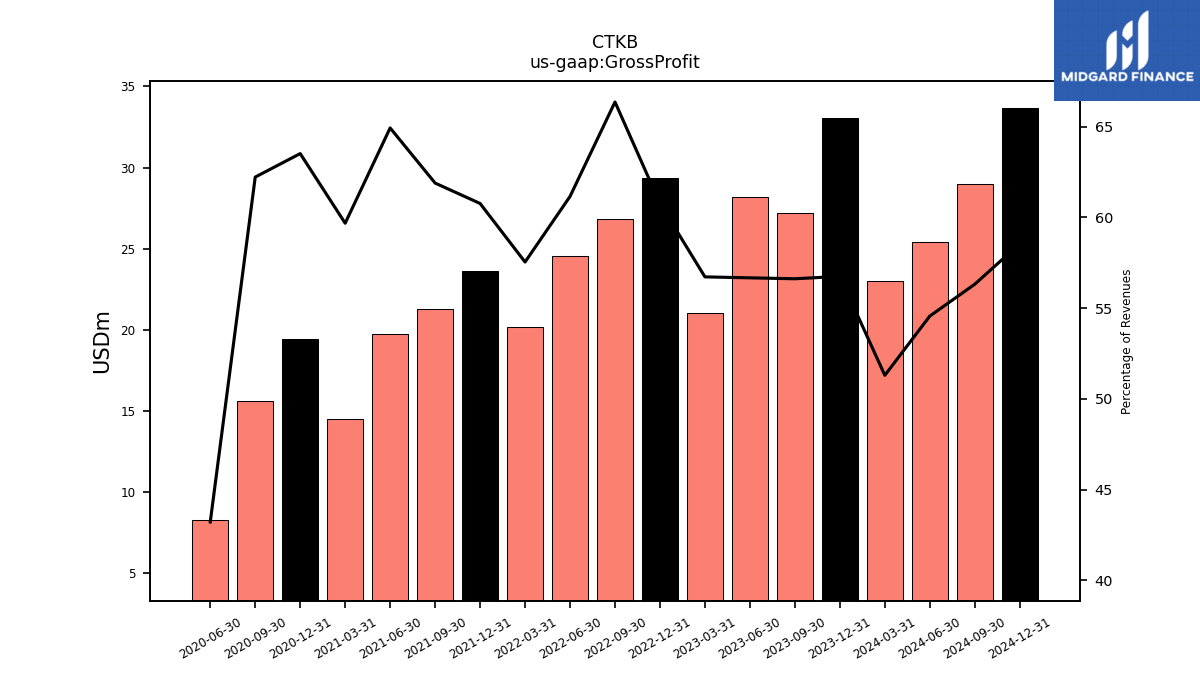
| Gross Profit | 27.18 | 28.16 | 21.04 | 29.37 | 26.86 | 24.56 | 20.18 | 23.64 | 21.28 | 19.75 | 14.49 | 19.45 | 15.62 | 8.27 | |
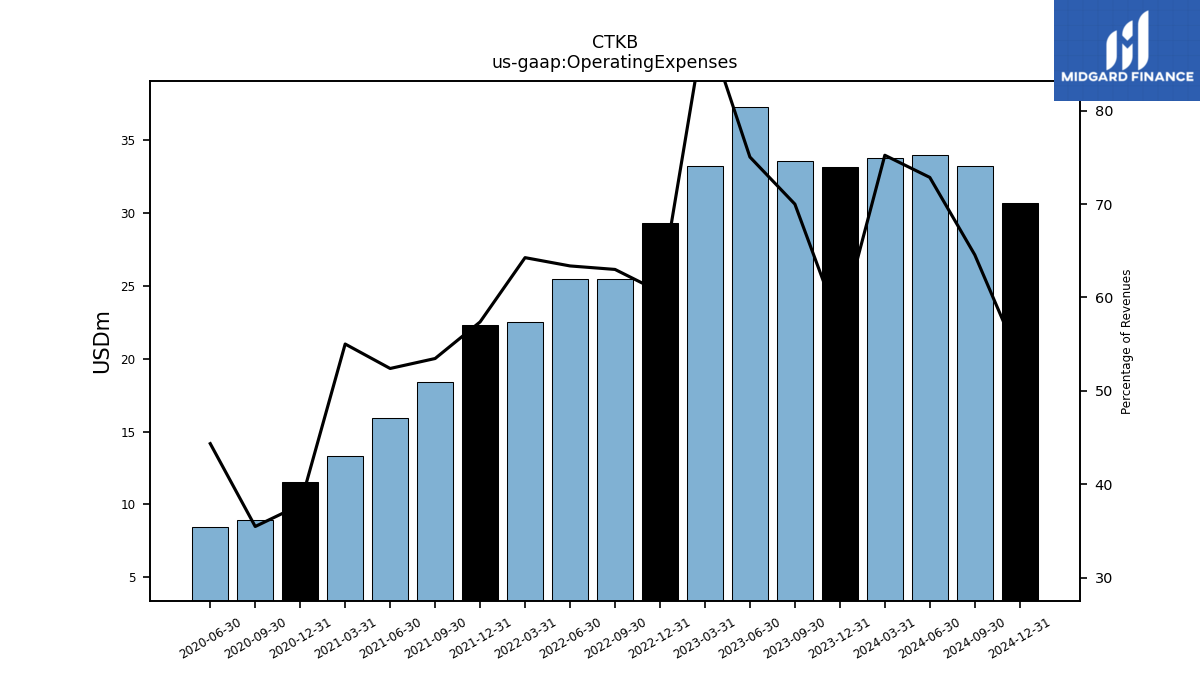
| Operating Expenses | 33.60 | 37.29 | 33.20 | 29.29 | 25.50 | 25.45 | 22.53 | 22.32 | 18.38 | 15.93 | 13.35 | 11.57 | 8.90 | 8.49 | |
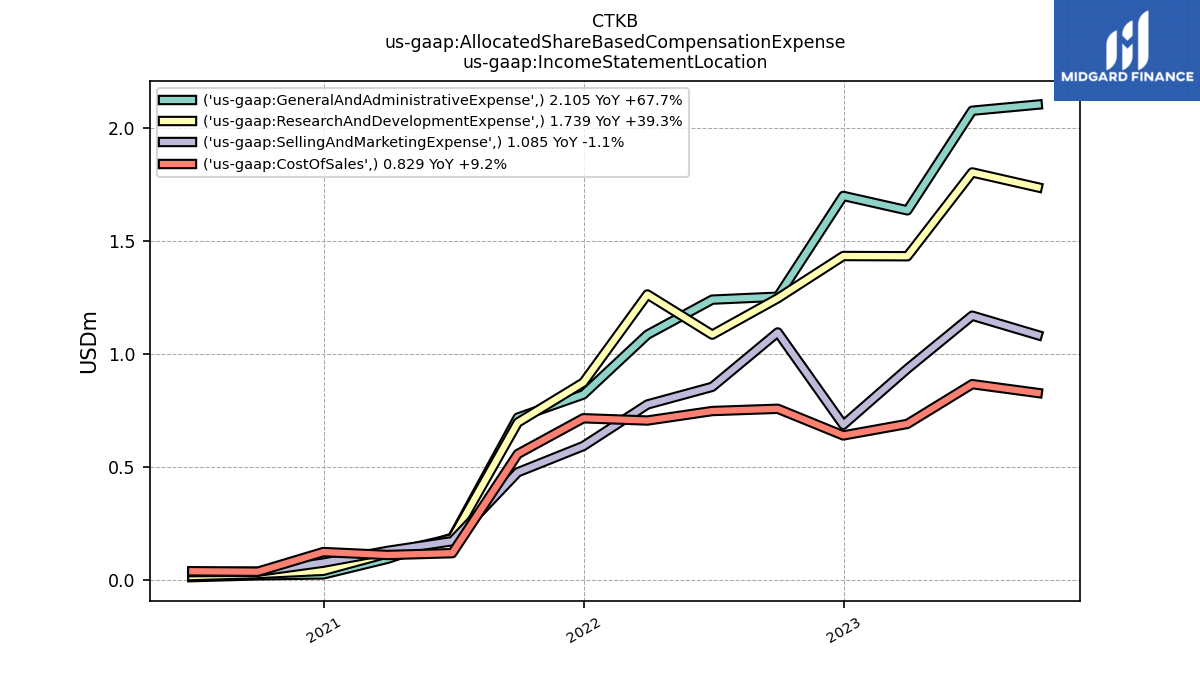
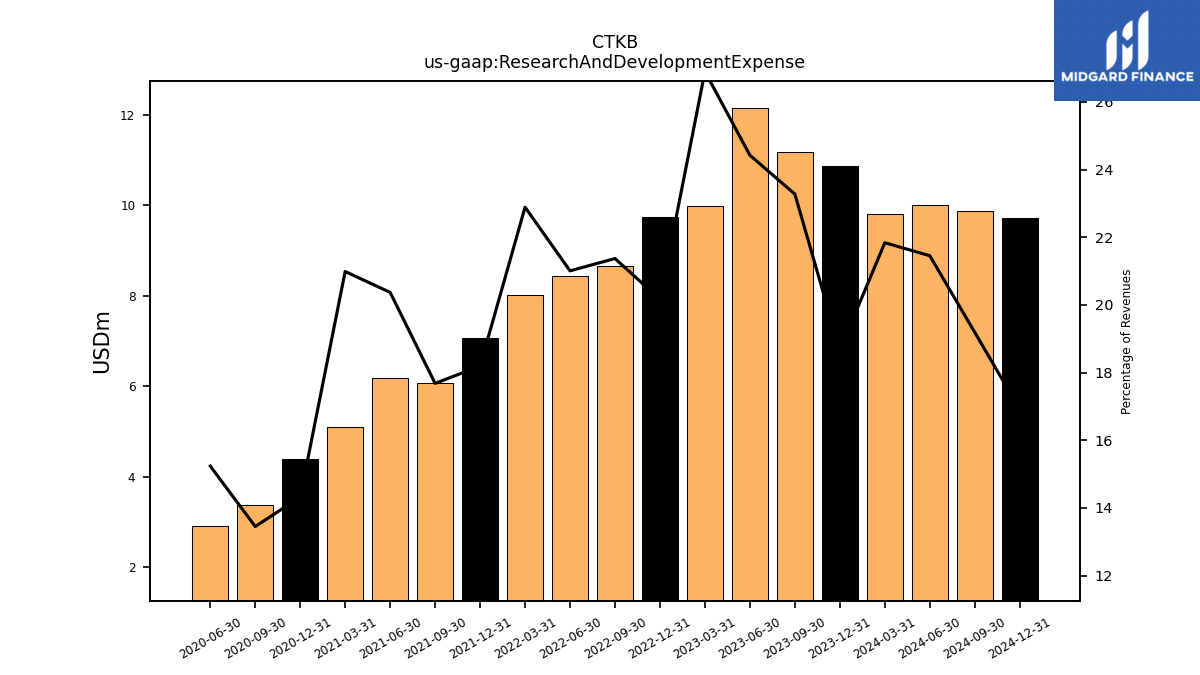
| Research And Development Expense | 11.17 | 12.14 | 9.97 | 9.75 | 8.65 | 8.44 | 8.03 | 7.08 | 6.08 | 6.19 | 5.09 | 4.38 | 3.38 | 2.92 | |
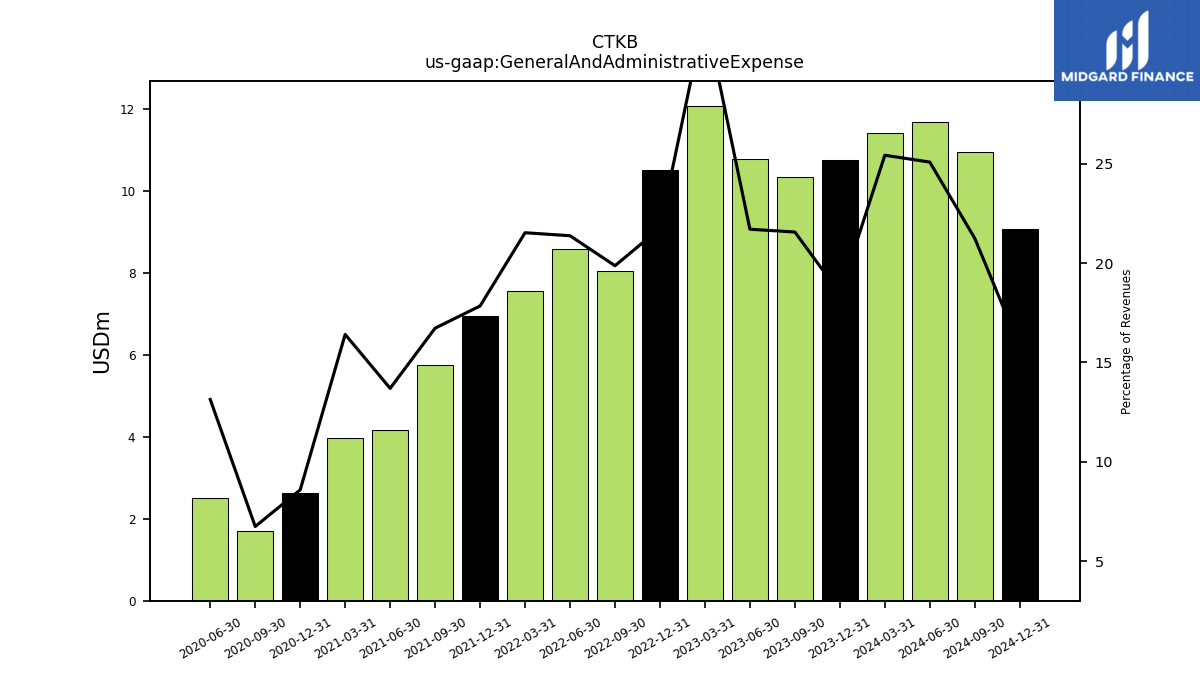
| General And Administrative Expense | 10.35 | 10.79 | 12.08 | 10.51 | 8.04 | 8.59 | 7.55 | 6.94 | 5.75 | 4.16 | 3.98 | 2.63 | 1.69 | 2.51 | |
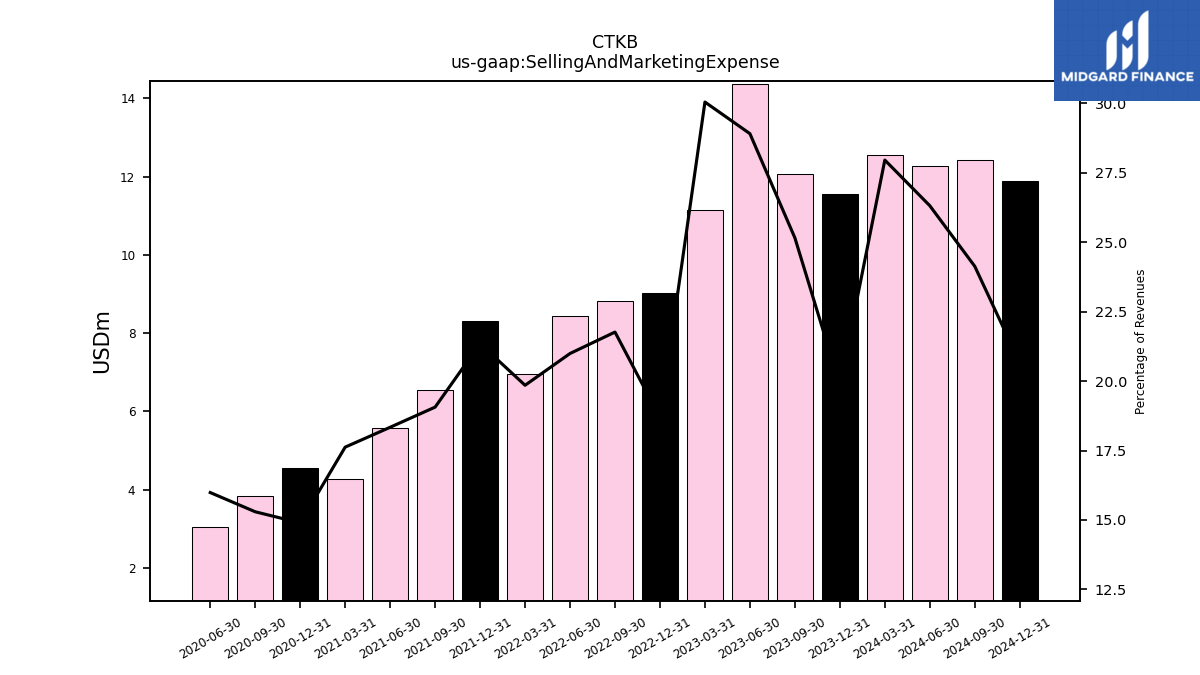
| Selling And Marketing Expense | 12.08 | 14.37 | 11.14 | 9.03 | 8.81 | 8.43 | 6.96 | 8.30 | 6.55 | 5.58 | 4.28 | 4.56 | 3.84 | 3.06 | |
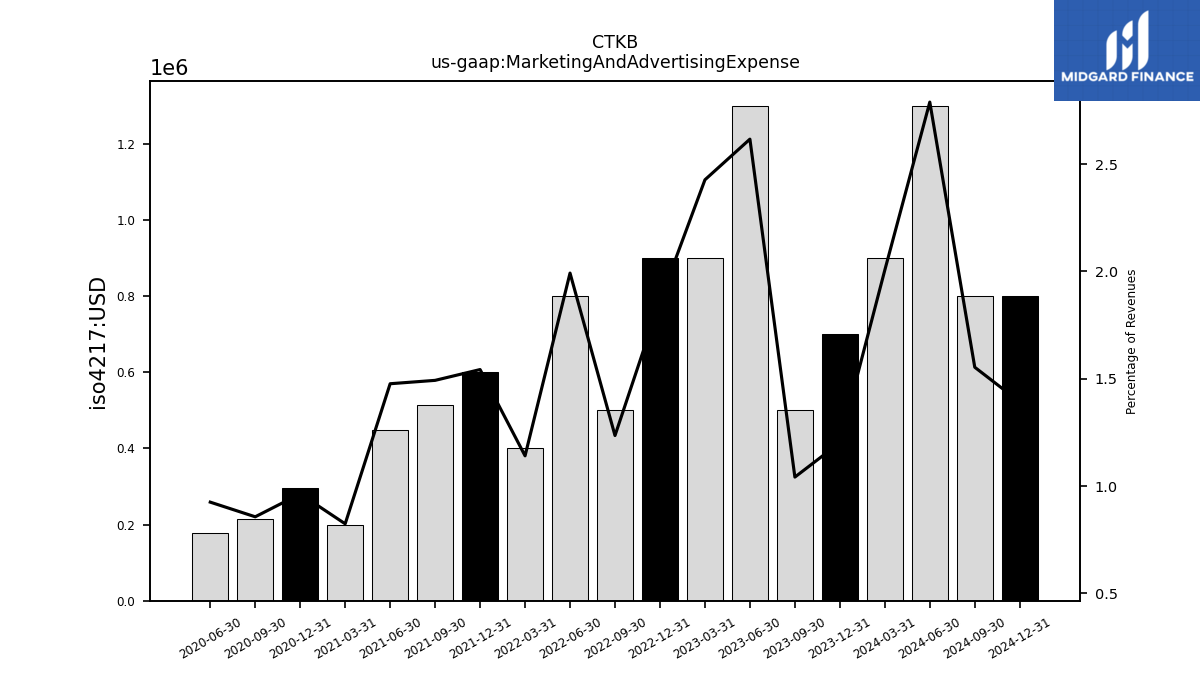
| Marketing And Advertising Expense | 0.50 | 1.30 | 0.90 | 0.90 | 0.50 | 0.80 | 0.40 | 0.60 | 0.51 | 0.45 | 0.20 | 0.29 | 0.21 | 0.18 | |
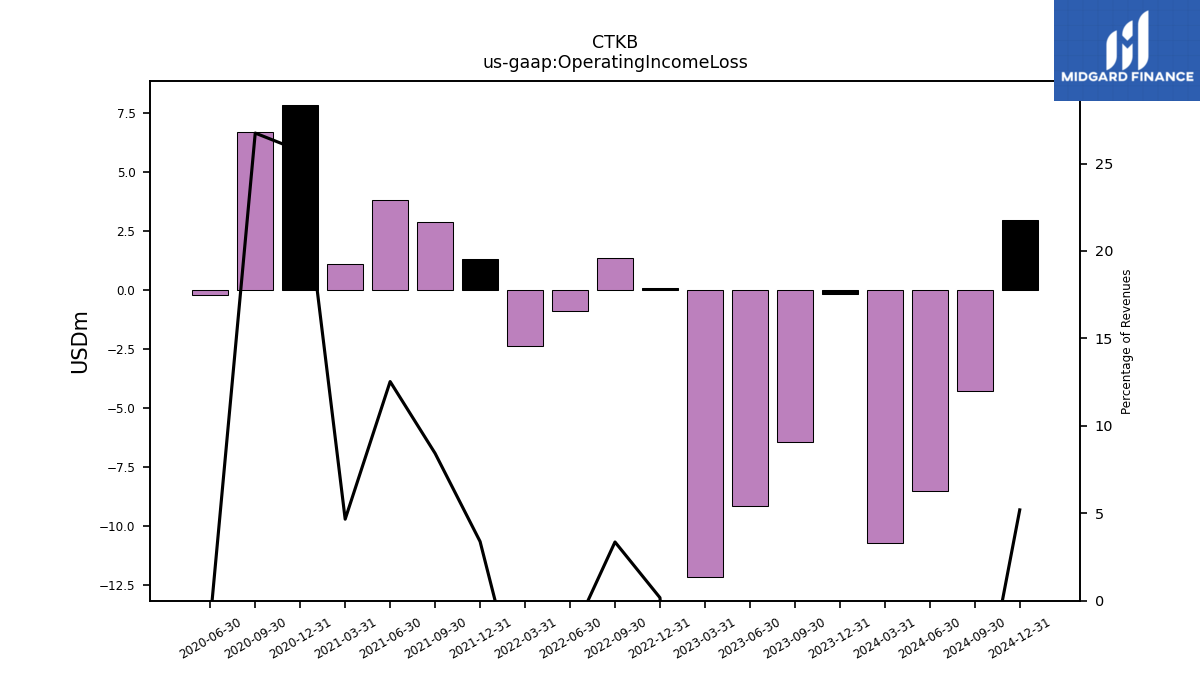
| Operating Income Loss | -6.42 | -9.13 | -12.16 | 0.08 | 1.36 | -0.89 | -2.36 | 1.32 | 2.90 | 3.81 | 1.13 | 7.88 | 6.71 | -0.22 | |
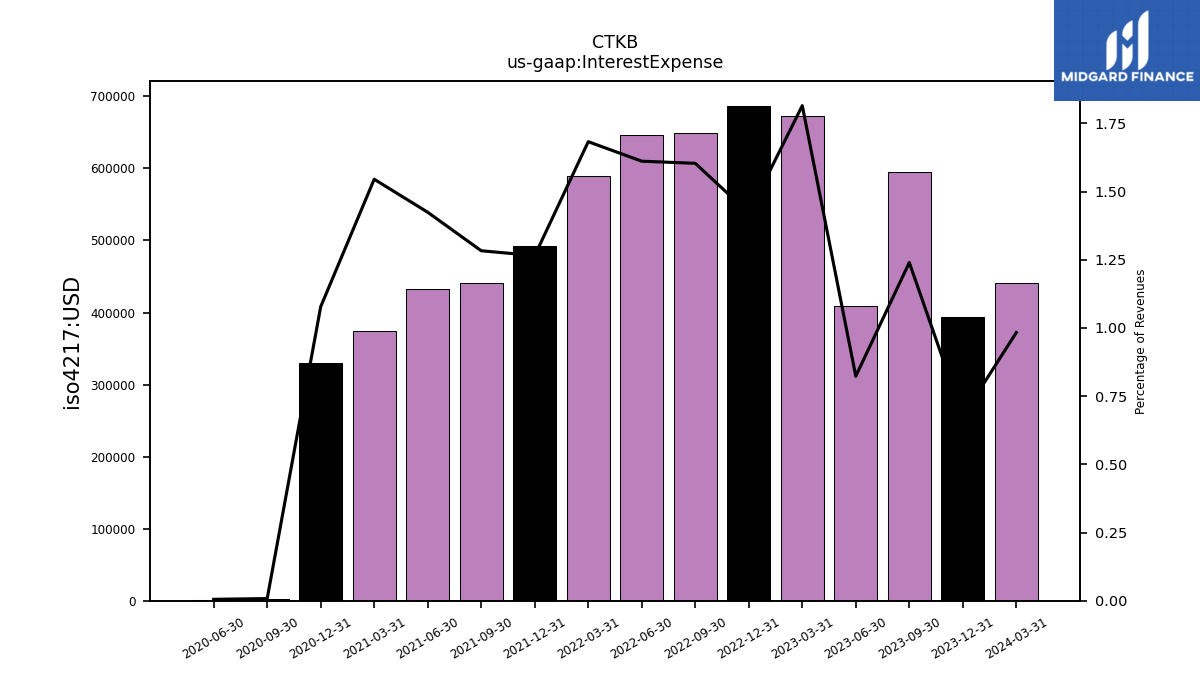
| Interest Expense | 0.59 | 0.41 | 0.67 | 0.69 | 0.65 | 0.65 | 0.59 | 0.49 | 0.44 | 0.43 | 0.38 | 0.33 | 0.00 | 0.00 | |
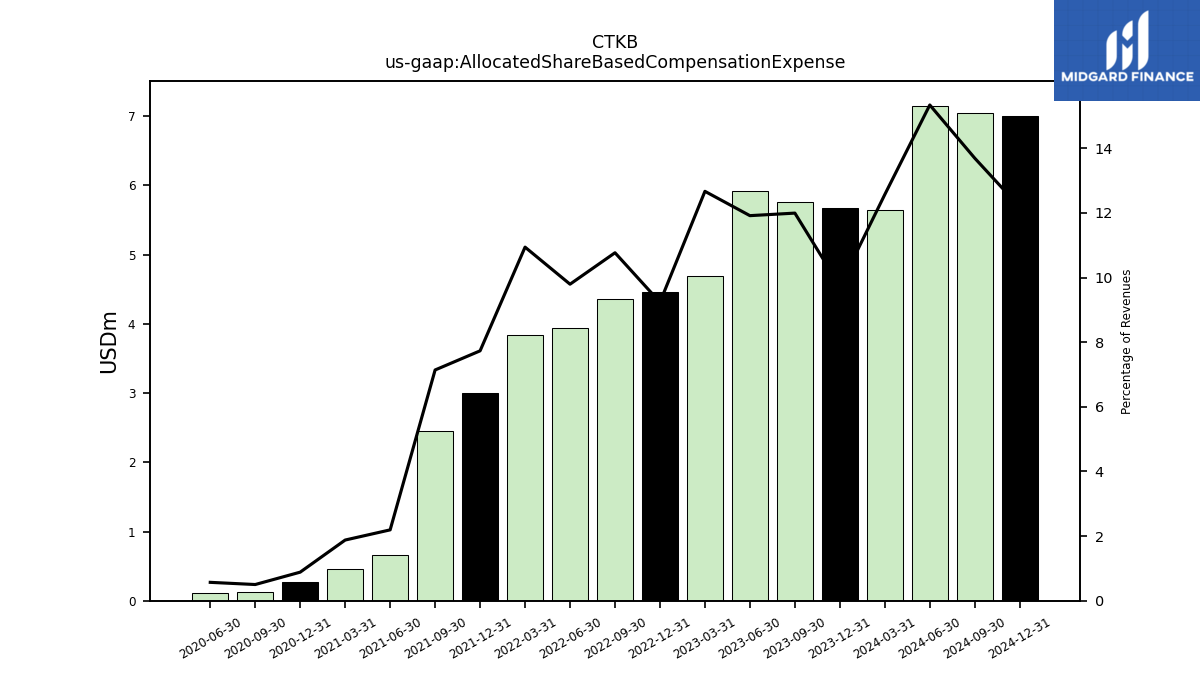
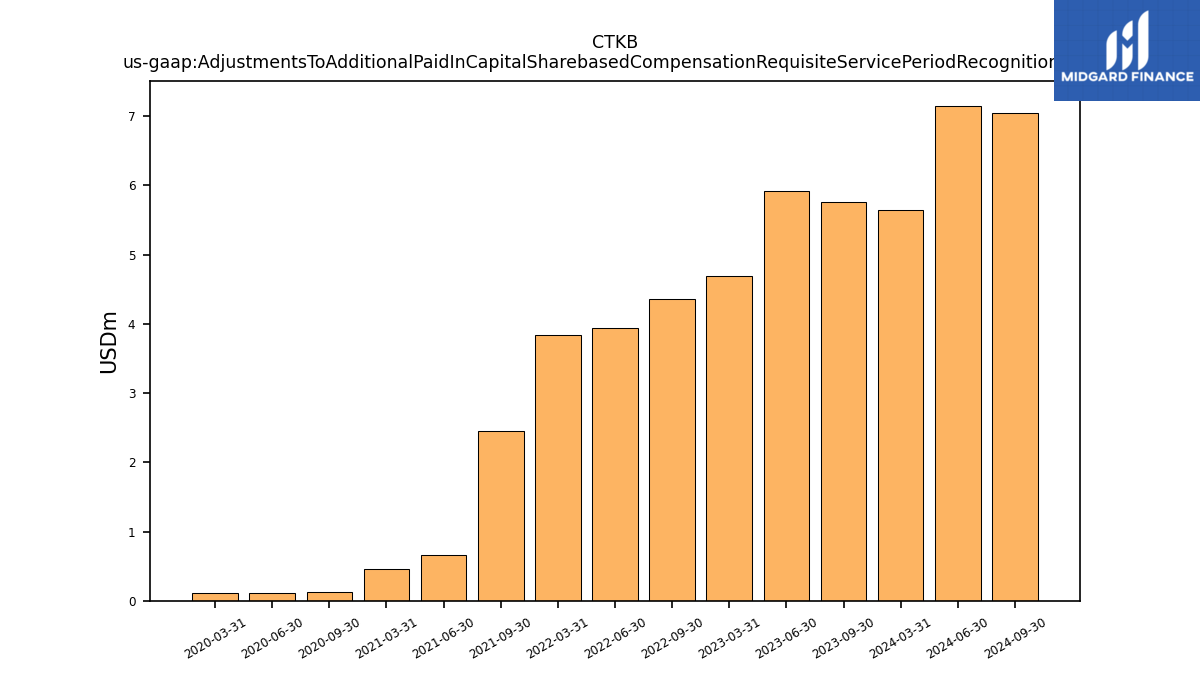
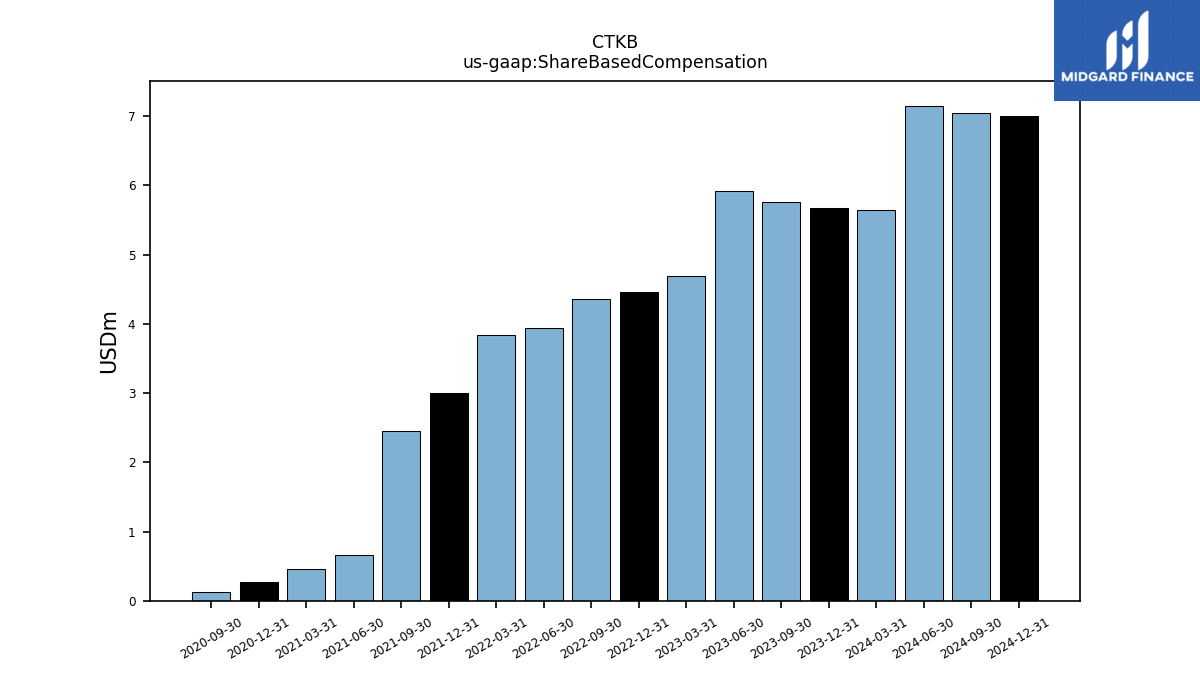
| Allocated Share Based Compensation Expense | 5.76 | 5.92 | 4.70 | 4.46 | 4.36 | 3.93 | 3.84 | 3.01 | 2.46 | 0.67 | 0.46 | 0.27 | 0.13 | 0.11 | |
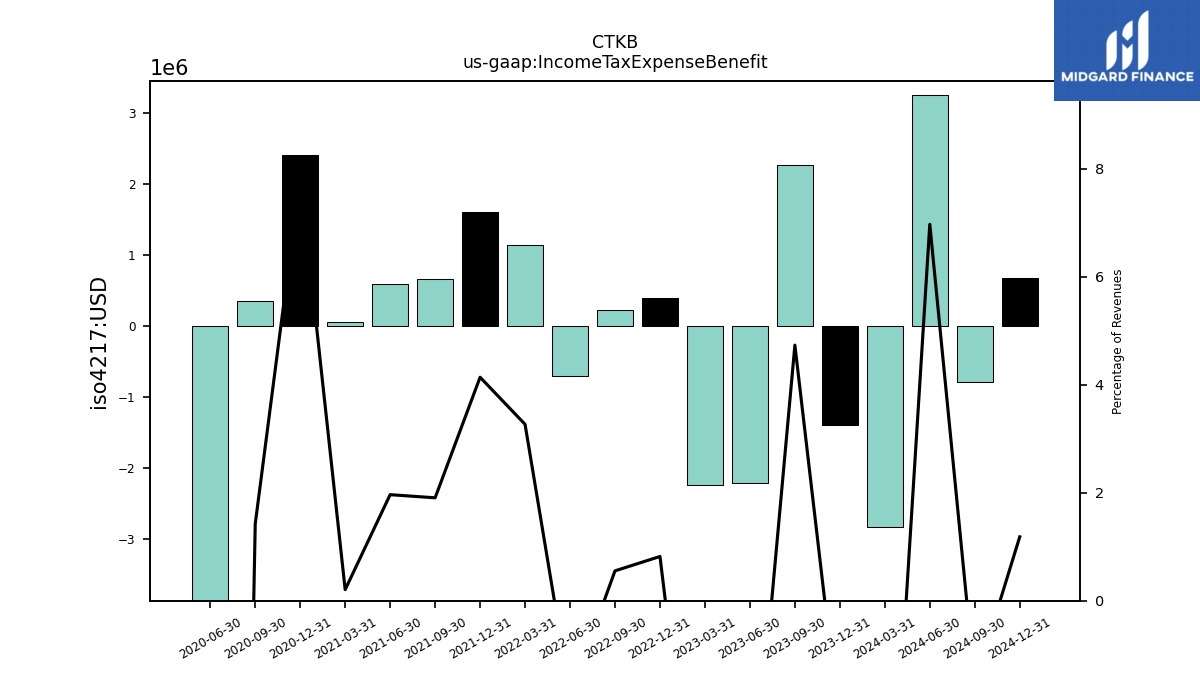
| Income Tax Expense Benefit | 2.27 | -2.21 | -2.23 | 0.40 | 0.22 | -0.70 | 1.15 | 1.61 | 0.66 | 0.60 | 0.05 | 2.40 | 0.36 | -7.92 | |
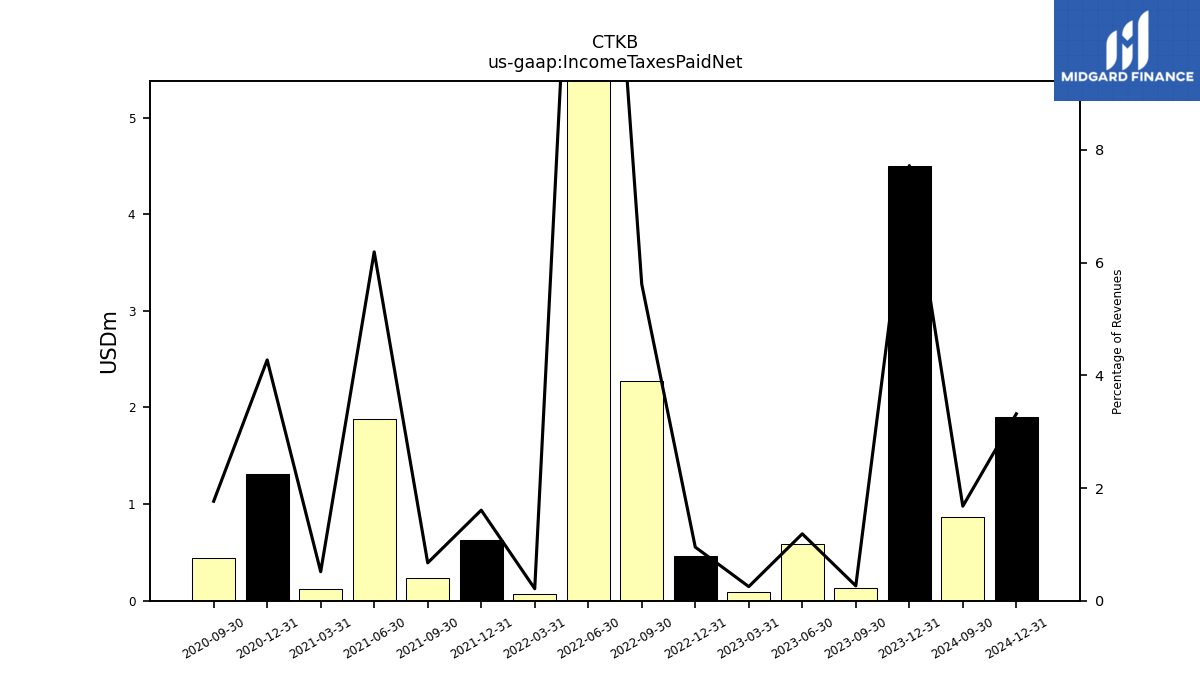
| Income Taxes Paid Net | 0.13 | 0.59 | 0.09 | 0.46 | 2.27 | 7.58 | 0.07 | 0.62 | 0.23 | 1.88 | 0.12 | 1.31 | 0.44 | NA | |
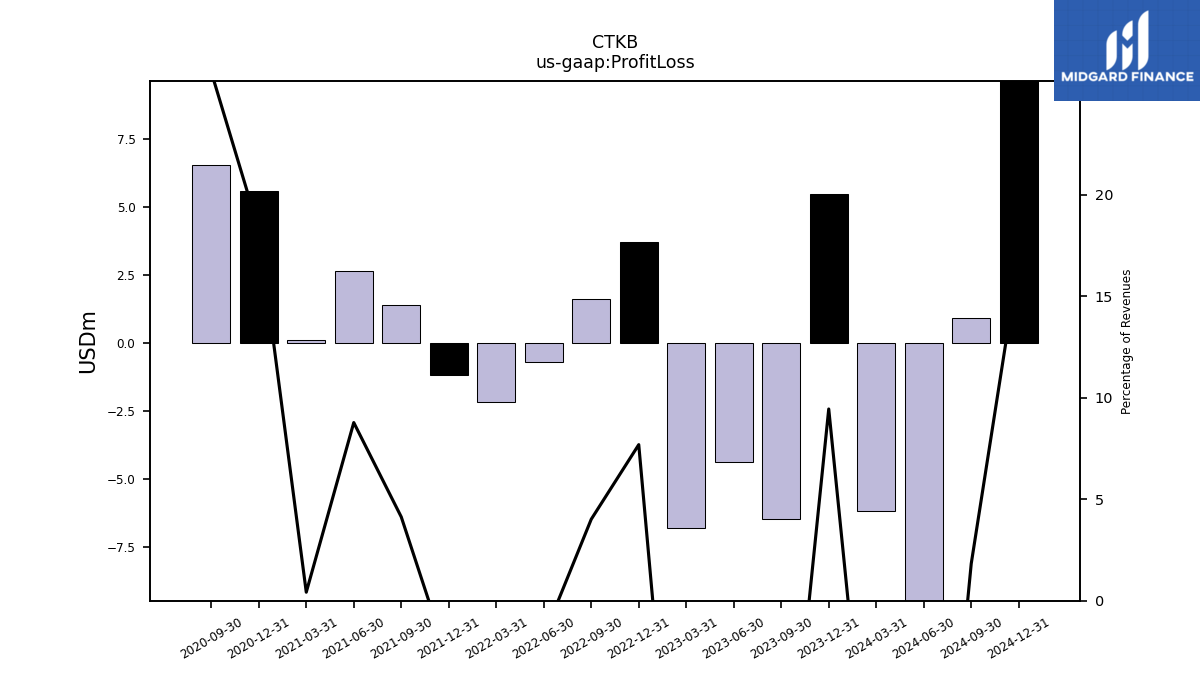
| Profit Loss | -6.46 | -4.39 | -6.81 | 3.72 | 1.63 | -0.70 | -2.16 | -1.17 | 1.42 | 2.67 | 0.10 | 5.60 | 6.54 | NA | |
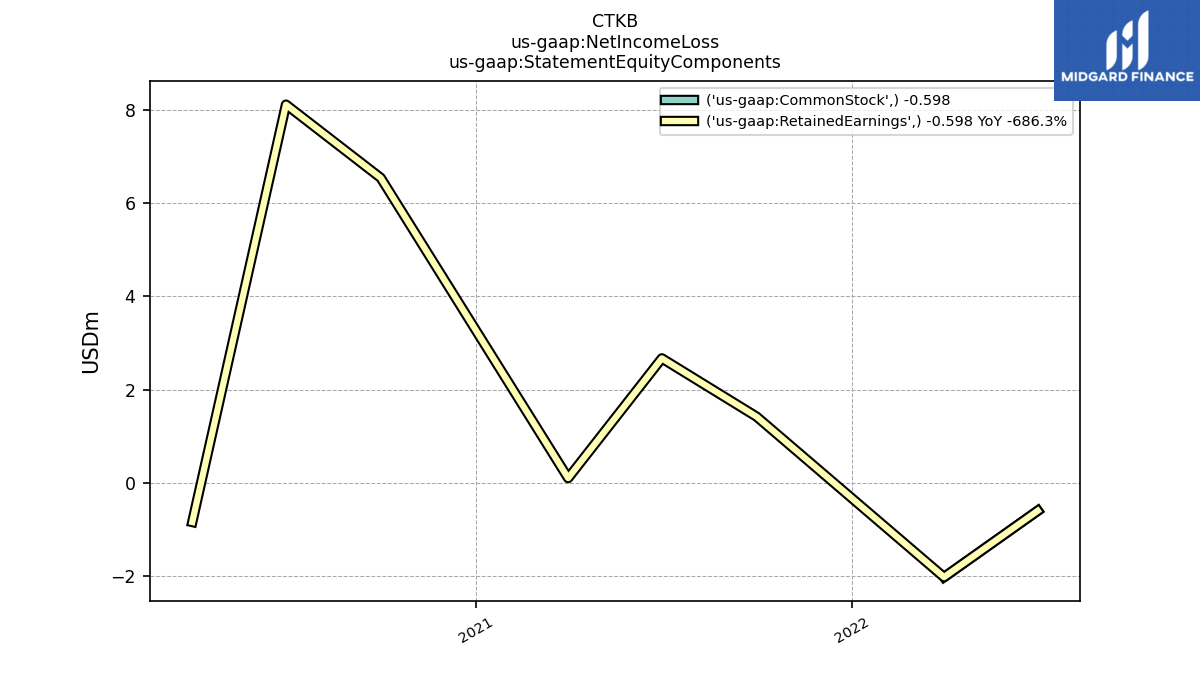
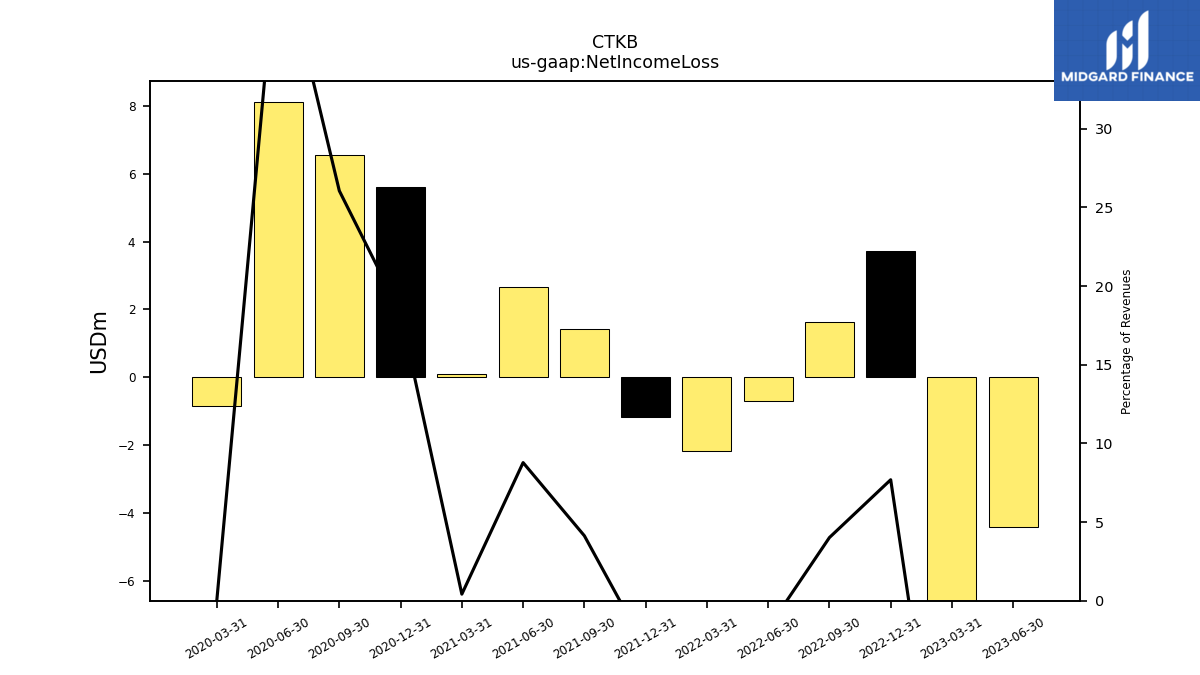
| Net Income Loss | NA | -4.39 | -6.81 | 3.72 | 1.63 | -0.70 | -2.16 | -1.17 | 1.42 | 2.67 | 0.10 | 5.60 | 6.54 | 8.11 | |
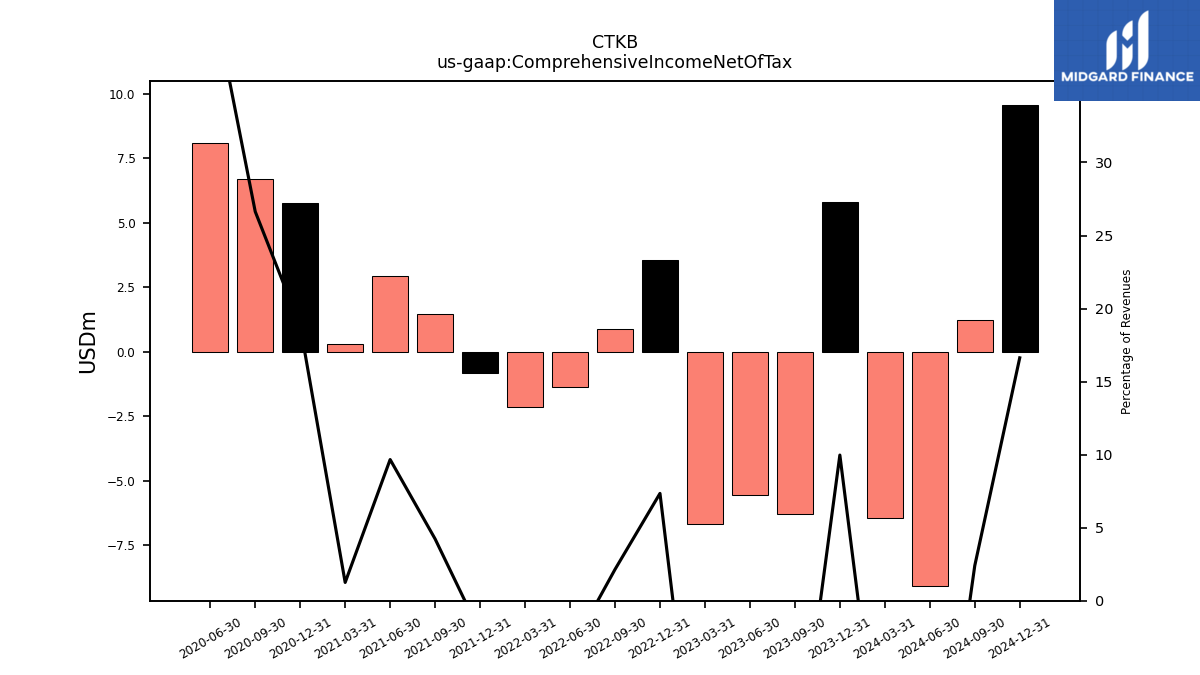
| Comprehensive Income Net Of Tax | -6.28 | -5.56 | -6.70 | 3.55 | 0.87 | -1.39 | -2.14 | -0.84 | 1.45 | 2.94 | 0.30 | 5.76 | 6.68 | 8.09 | |
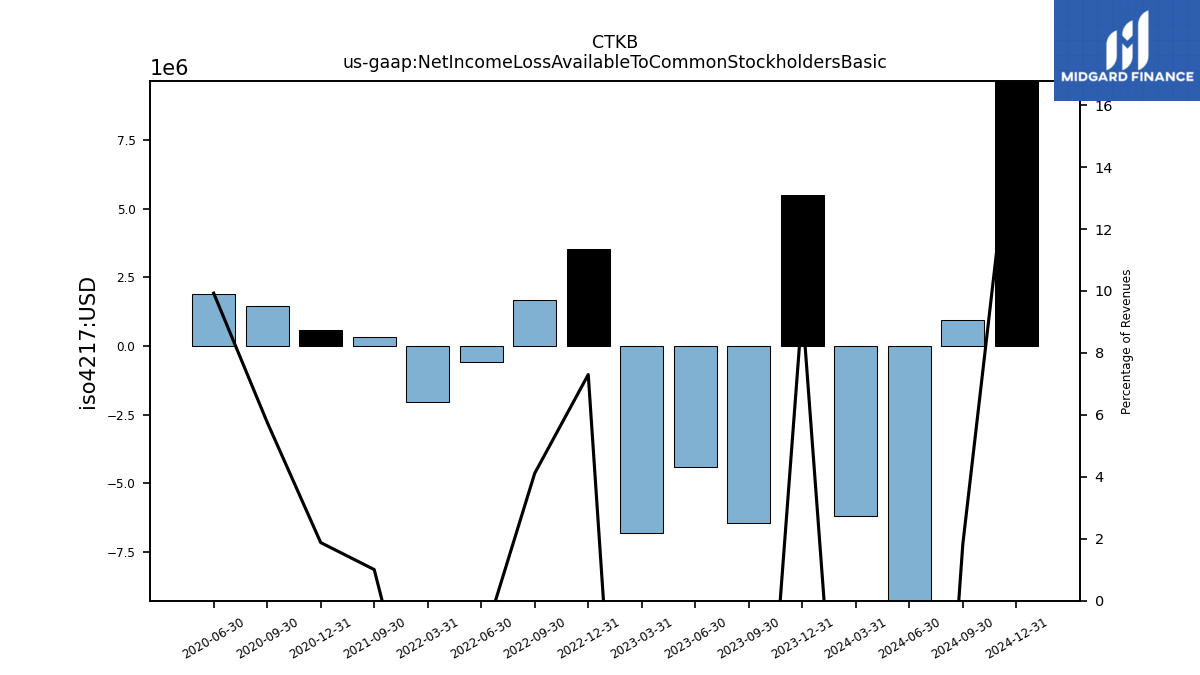
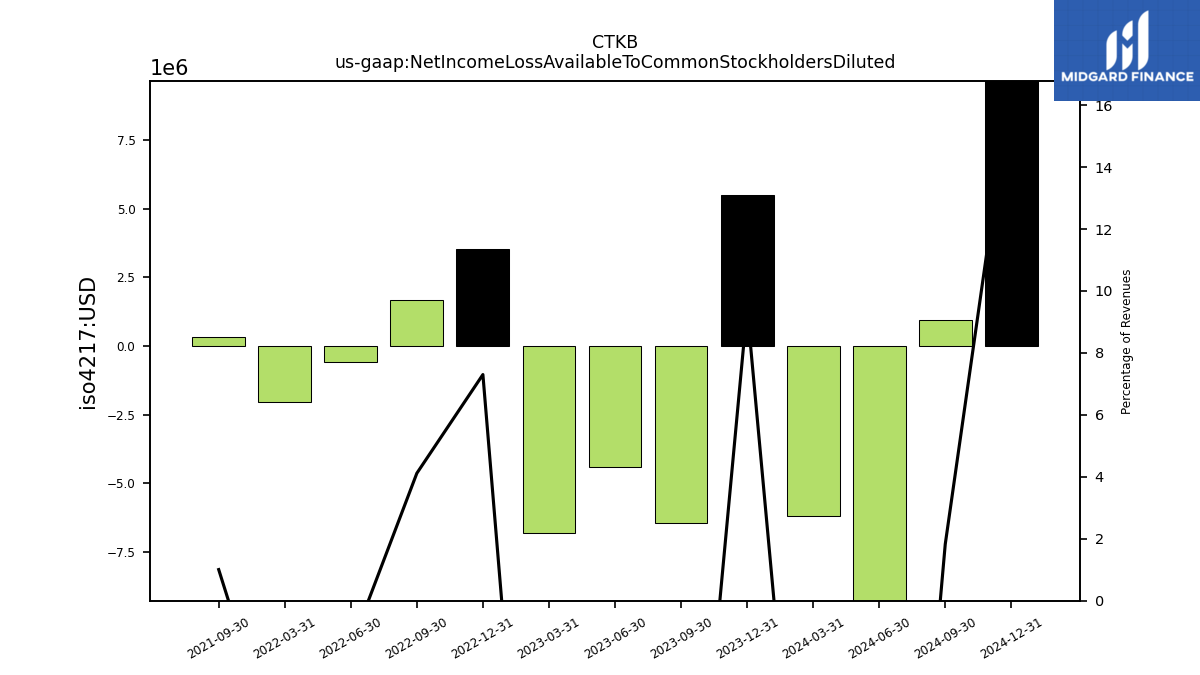
| Net Income Loss Available To Common Stockholders Basic | -6.46 | -4.39 | -6.81 | 3.53 | 1.67 | -0.60 | -2.02 | NA | 0.35 | NA | NA | 0.57 | 1.45 | 1.90 | |
| Net Income Loss Available To Common Stockholders Diluted | -6.46 | -4.39 | -6.81 | 3.53 | 1.67 | -0.60 | -2.02 | NA | 0.35 | NA | NA | NA | NA | NA |
| 2023-09-30 | 2023-06-30 | 2023-03-31 | 2022-12-31 | 2022-09-30 | 2022-06-30 | 2022-03-31 | 2021-12-31 | 2021-09-30 | 2021-06-30 | 2021-03-31 | 2020-12-31 | 2020-09-30 | 2020-06-30 | ||
|---|---|---|---|---|---|---|---|---|---|---|---|---|---|---|---|
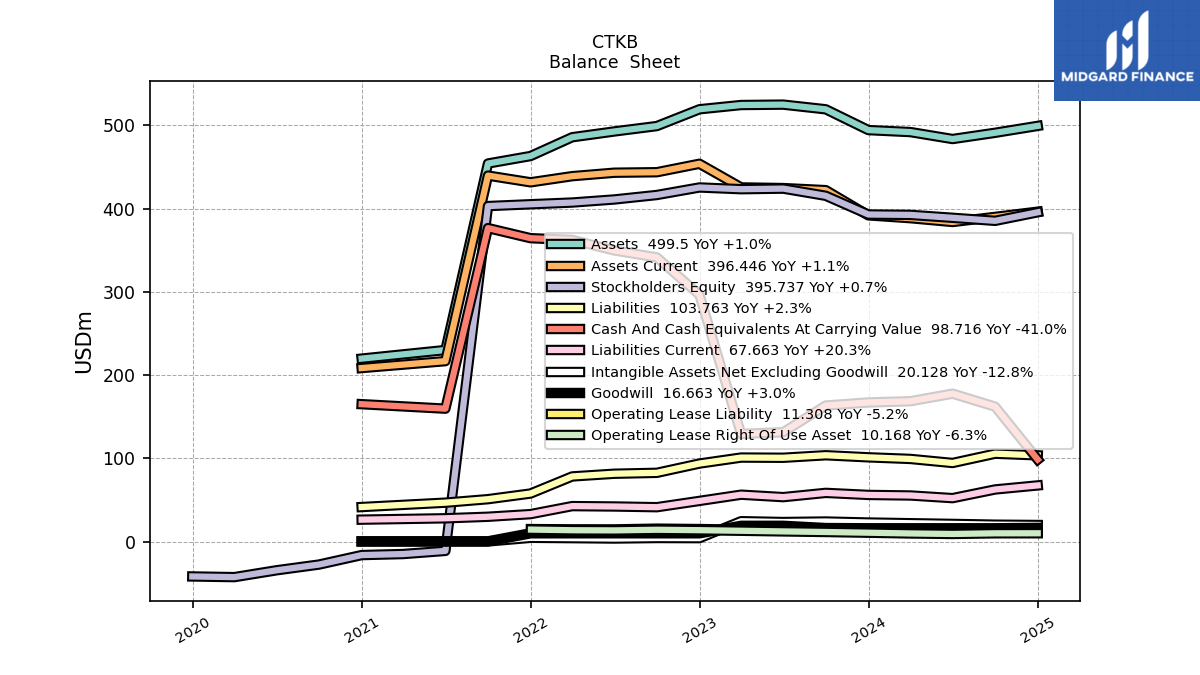
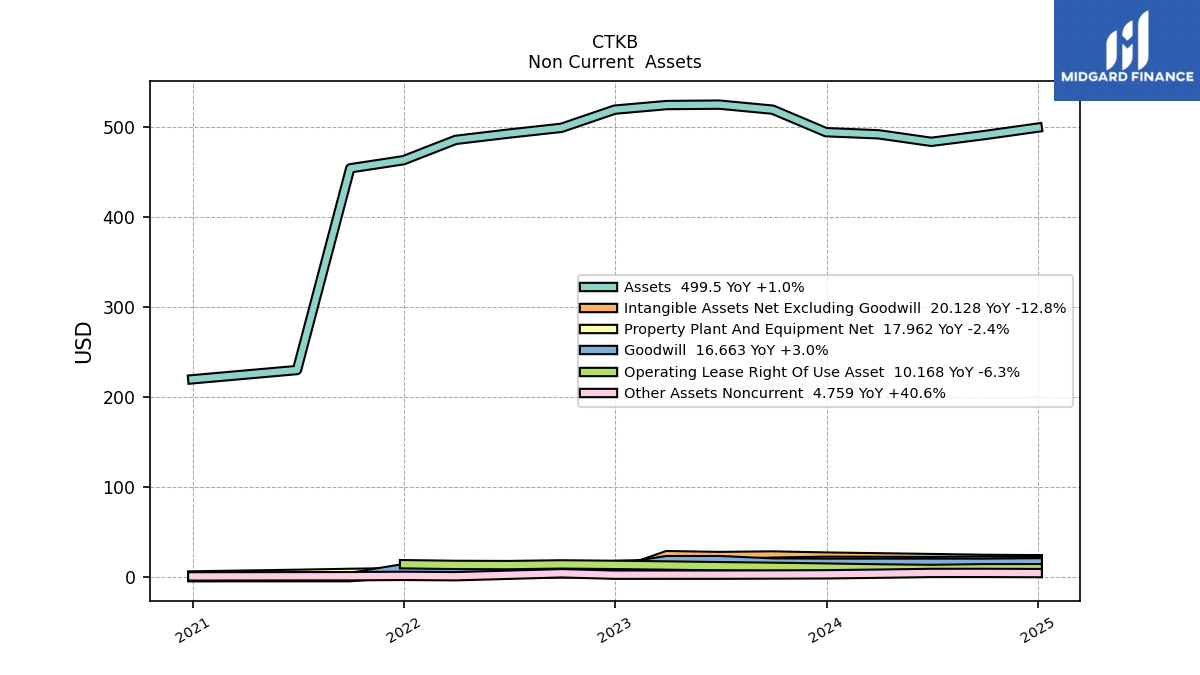
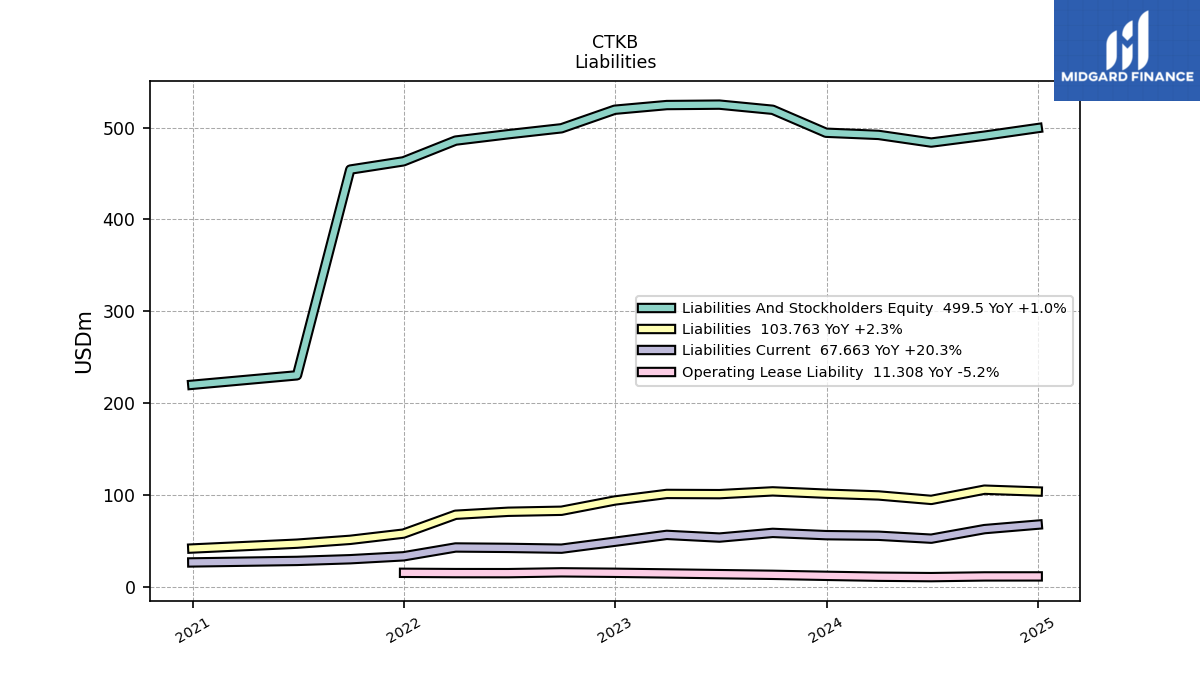
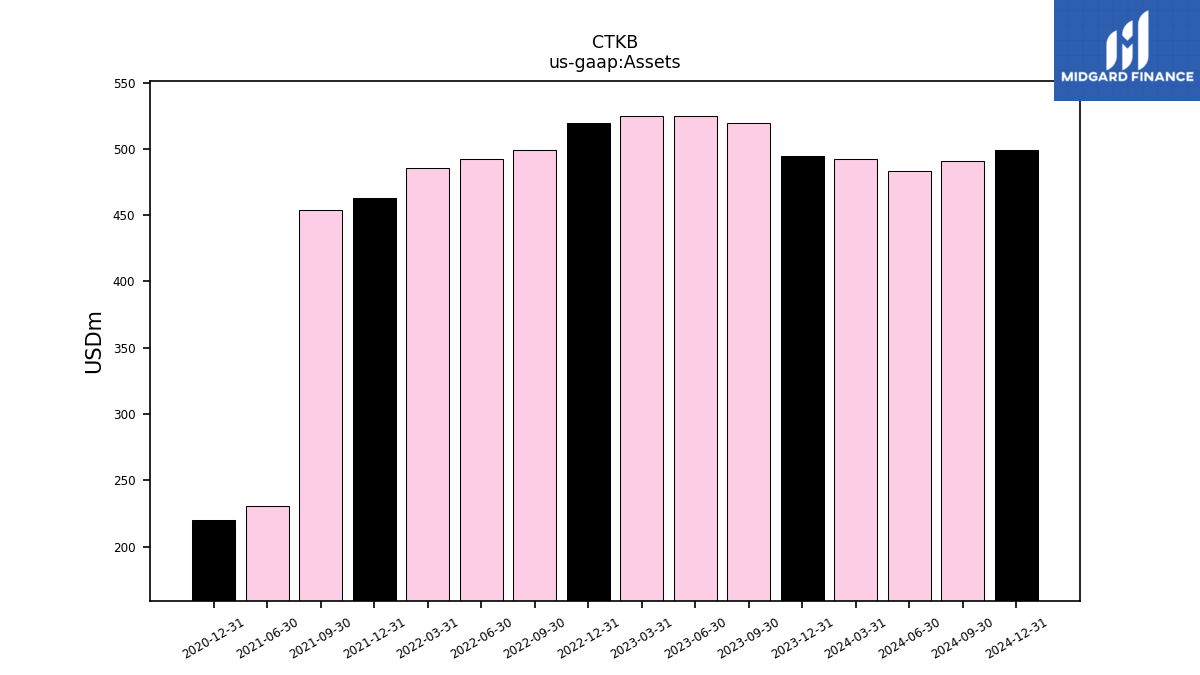
| Assets | 519.43 | 525.05 | 524.58 | 519.48 | 499.30 | 492.82 | 485.88 | 463.31 | 454.32 | 230.28 | NA | 219.98 | NA | NA | |
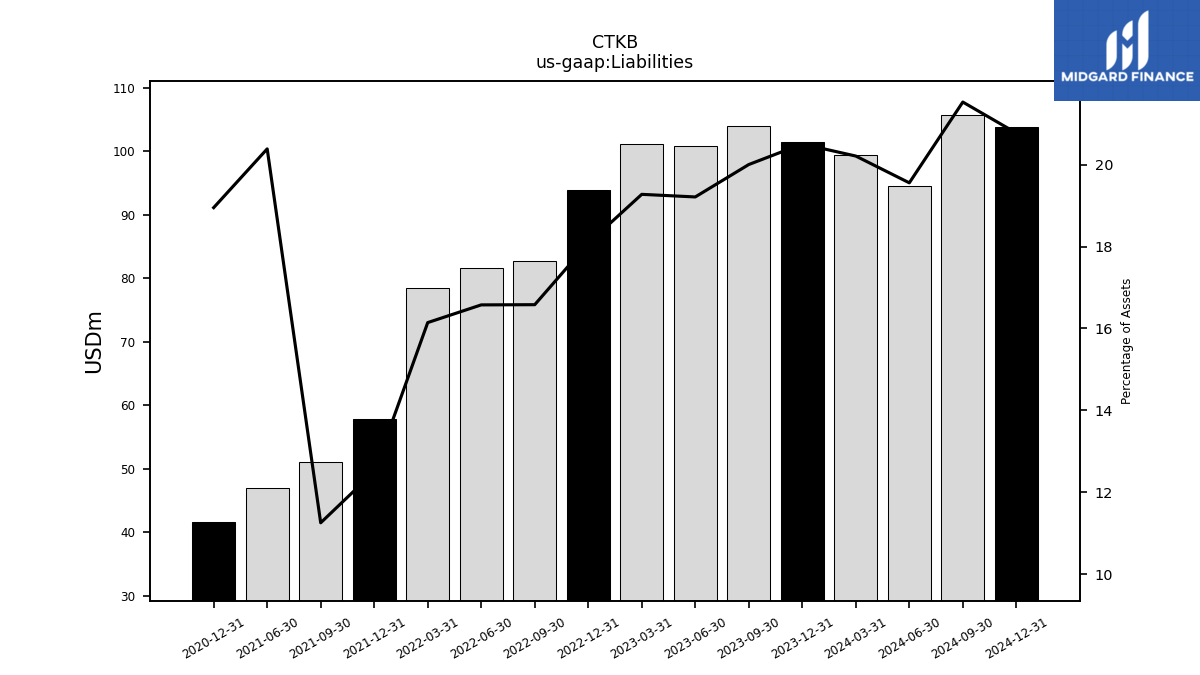
| Liabilities | 103.91 | 100.88 | 101.11 | 93.93 | 82.79 | 81.69 | 78.44 | 57.92 | 51.12 | 46.95 | NA | 41.69 | NA | NA | |
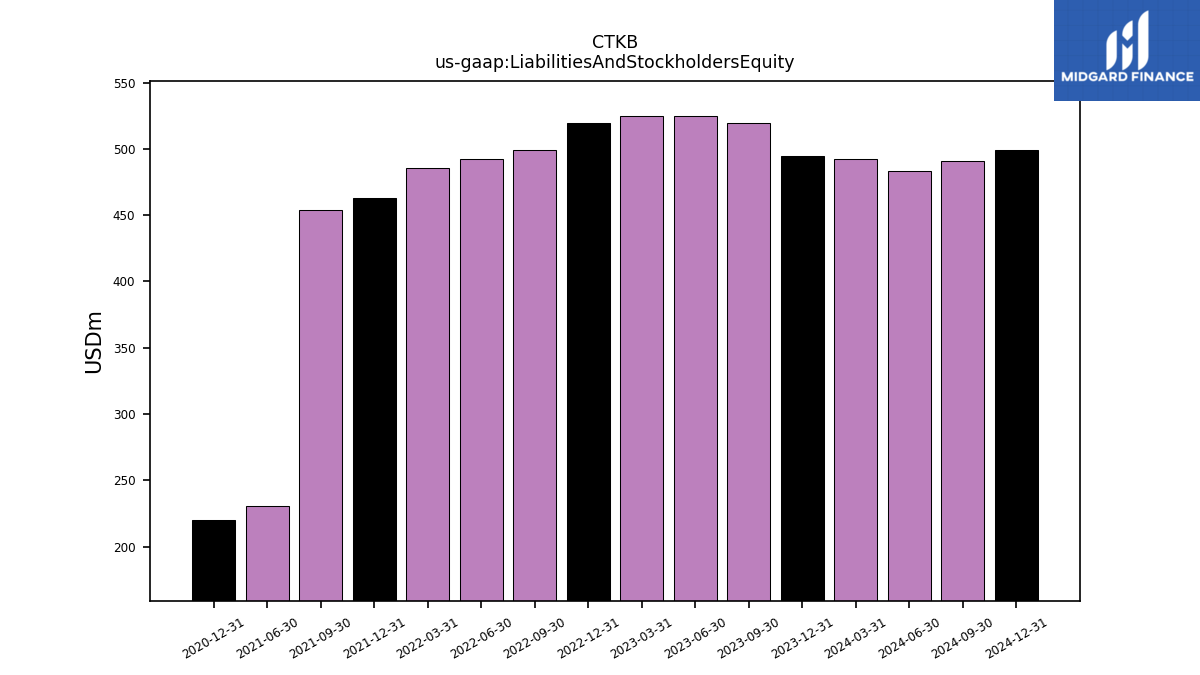
| Liabilities And Stockholders Equity | 519.43 | 525.05 | 524.58 | 519.48 | 499.30 | 492.82 | 485.88 | 463.31 | 454.32 | 230.28 | NA | 219.98 | NA | NA | |
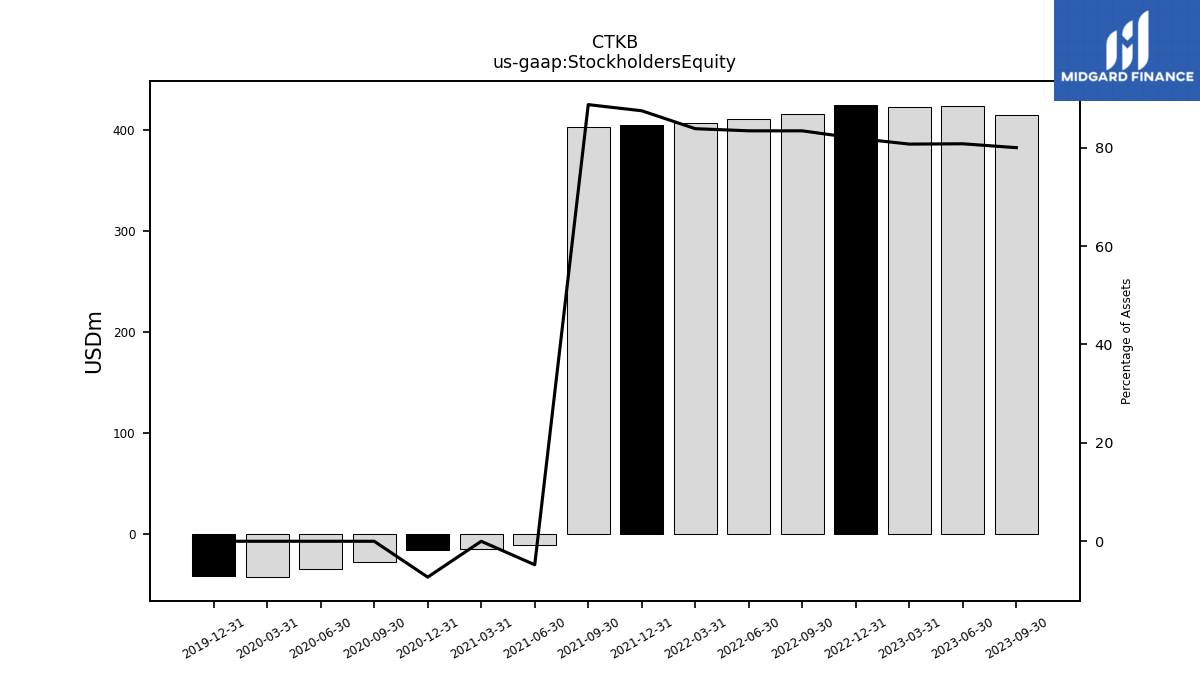
| Stockholders Equity | 415.52 | 424.18 | 423.46 | 425.55 | 416.51 | 411.13 | 407.44 | 405.38 | 403.19 | -10.98 | -14.76 | -16.03 | -27.39 | -34.30 |
| 2023-09-30 | 2023-06-30 | 2023-03-31 | 2022-12-31 | 2022-09-30 | 2022-06-30 | 2022-03-31 | 2021-12-31 | 2021-09-30 | 2021-06-30 | 2021-03-31 | 2020-12-31 | 2020-09-30 | 2020-06-30 | ||
|---|---|---|---|---|---|---|---|---|---|---|---|---|---|---|---|
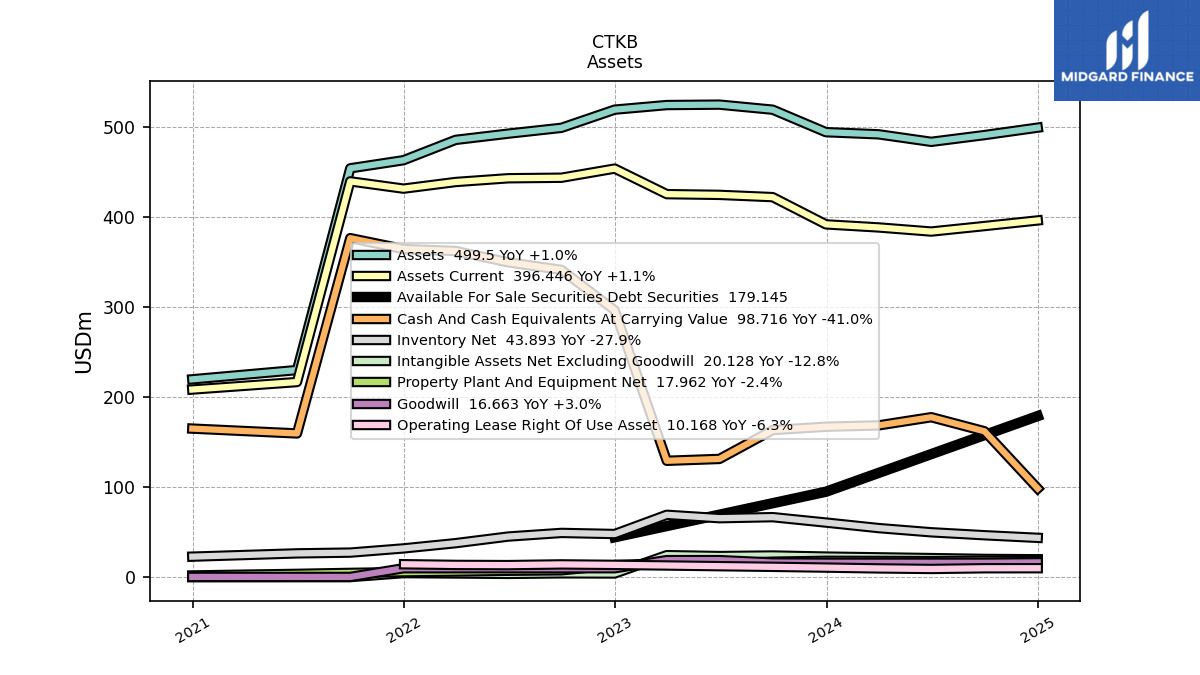
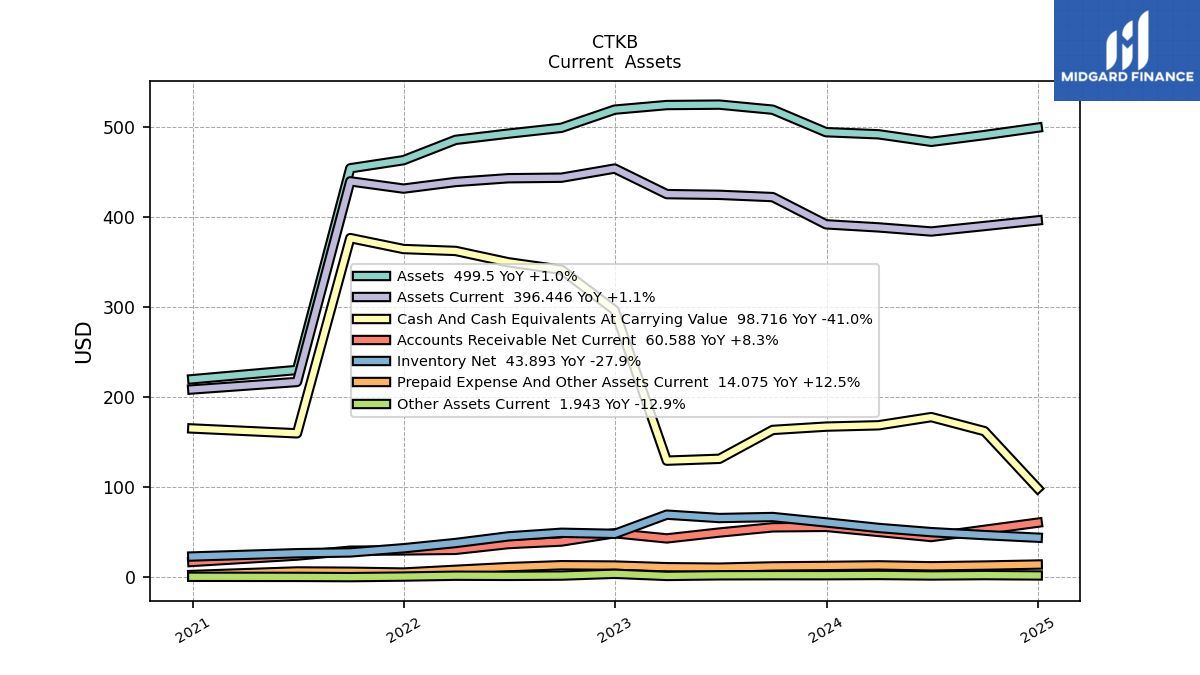
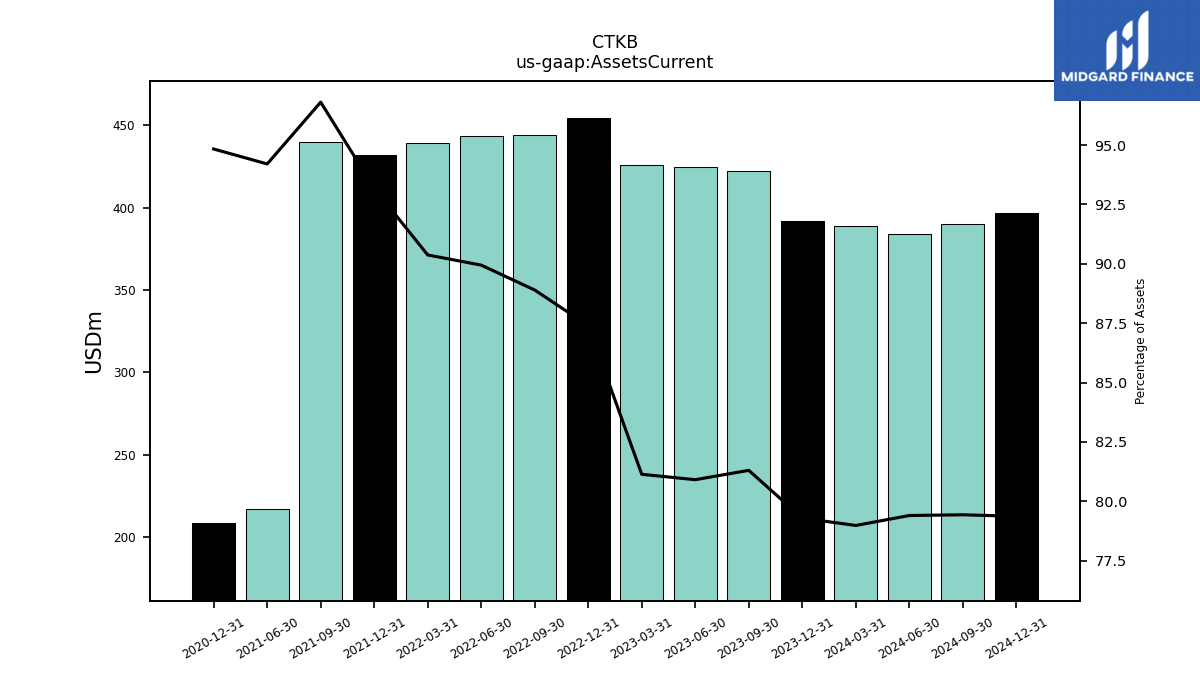
| Assets Current | 422.31 | 424.82 | 425.62 | 454.02 | 443.86 | 443.27 | 439.11 | 431.73 | 439.83 | 216.94 | NA | 208.62 | NA | NA | |
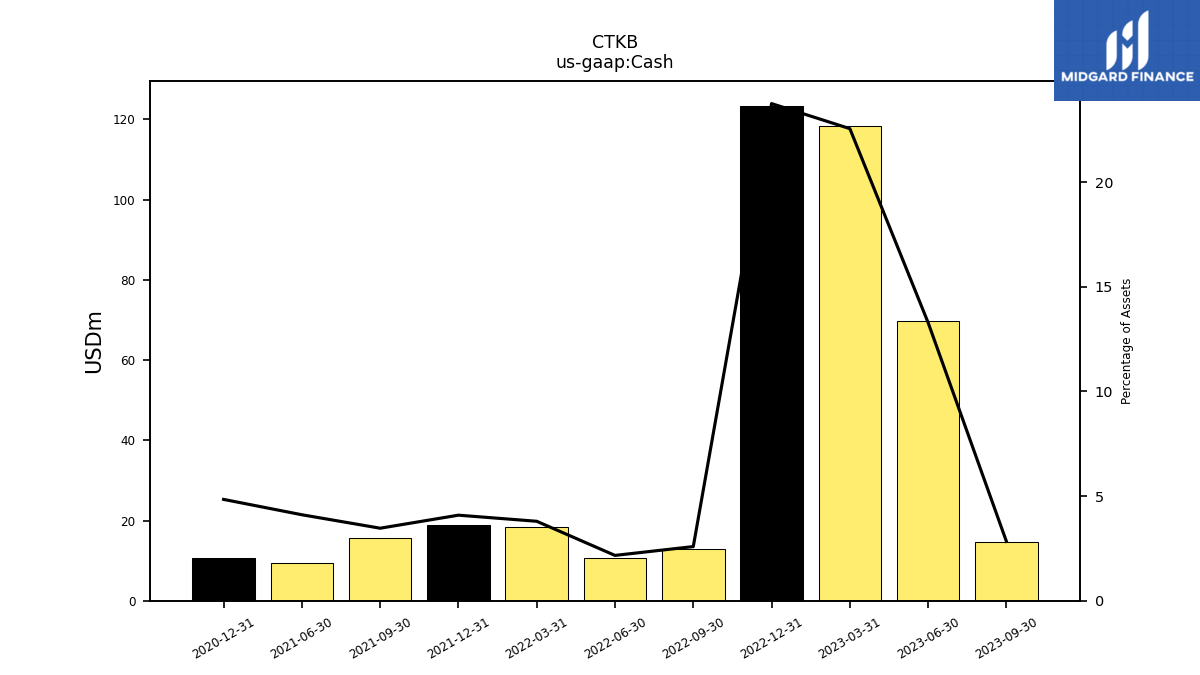
| Cash | 14.72 | 69.75 | 118.31 | 123.37 | 12.92 | 10.67 | 18.45 | 18.94 | 15.74 | 9.46 | NA | 10.65 | NA | NA | |
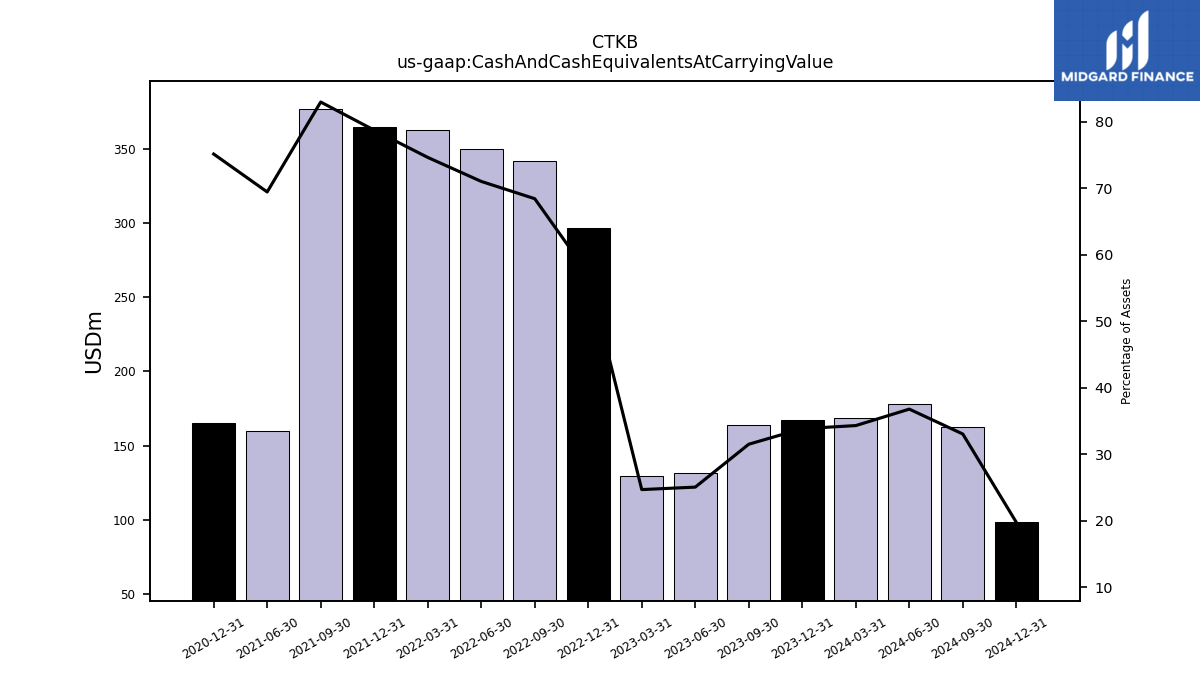
| Cash And Cash Equivalents At Carrying Value | 163.63 | 131.54 | 129.48 | 296.60 | 341.52 | 349.89 | 362.51 | 364.62 | 376.77 | 159.85 | NA | 165.23 | NA | NA | |
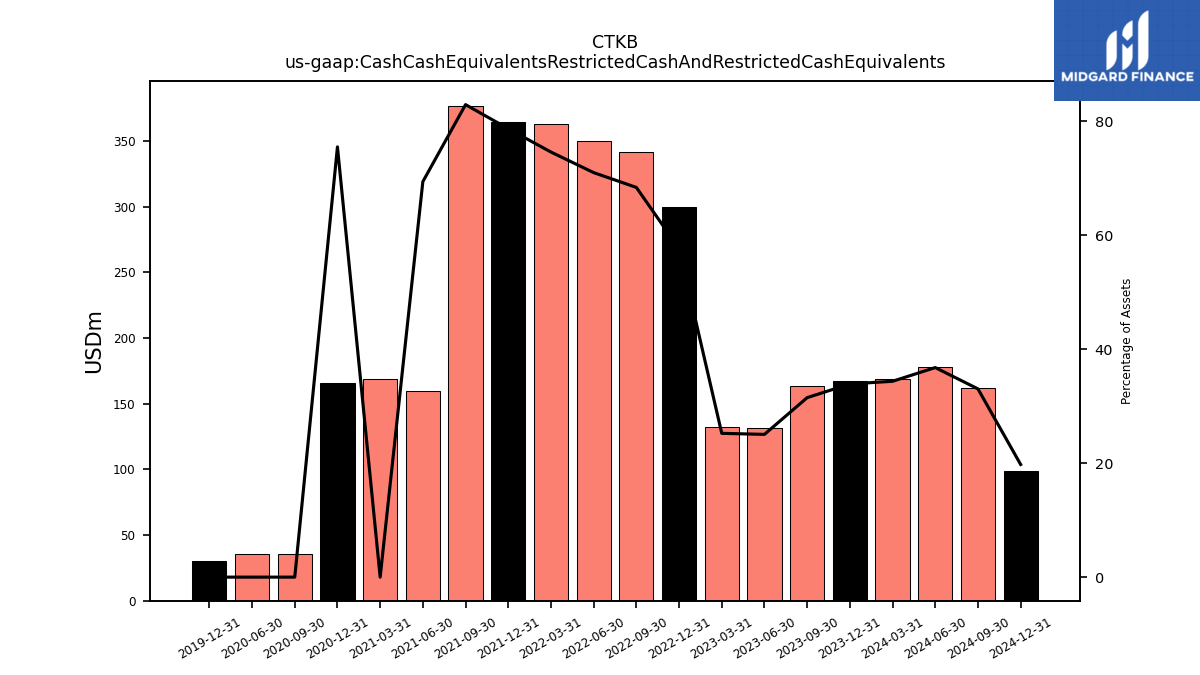
| Cash Cash Equivalents Restricted Cash And Restricted Cash Equivalents | 163.63 | 131.54 | 132.39 | 299.50 | 341.52 | 349.89 | 362.51 | 364.62 | 376.77 | 159.85 | 168.58 | 166.12 | 35.53 | 35.32 | |
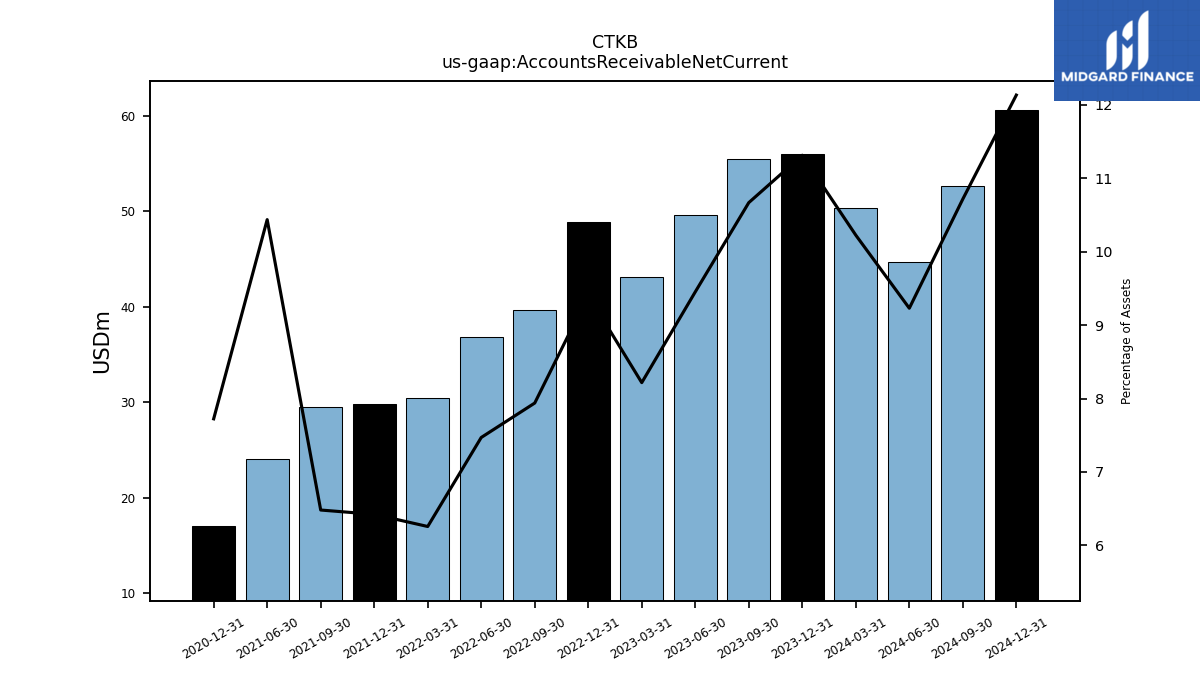
| Accounts Receivable Net Current | 55.40 | 49.62 | 43.10 | 48.86 | 39.64 | 36.81 | 30.41 | 29.76 | 29.45 | 24.03 | NA | 16.99 | NA | NA | |
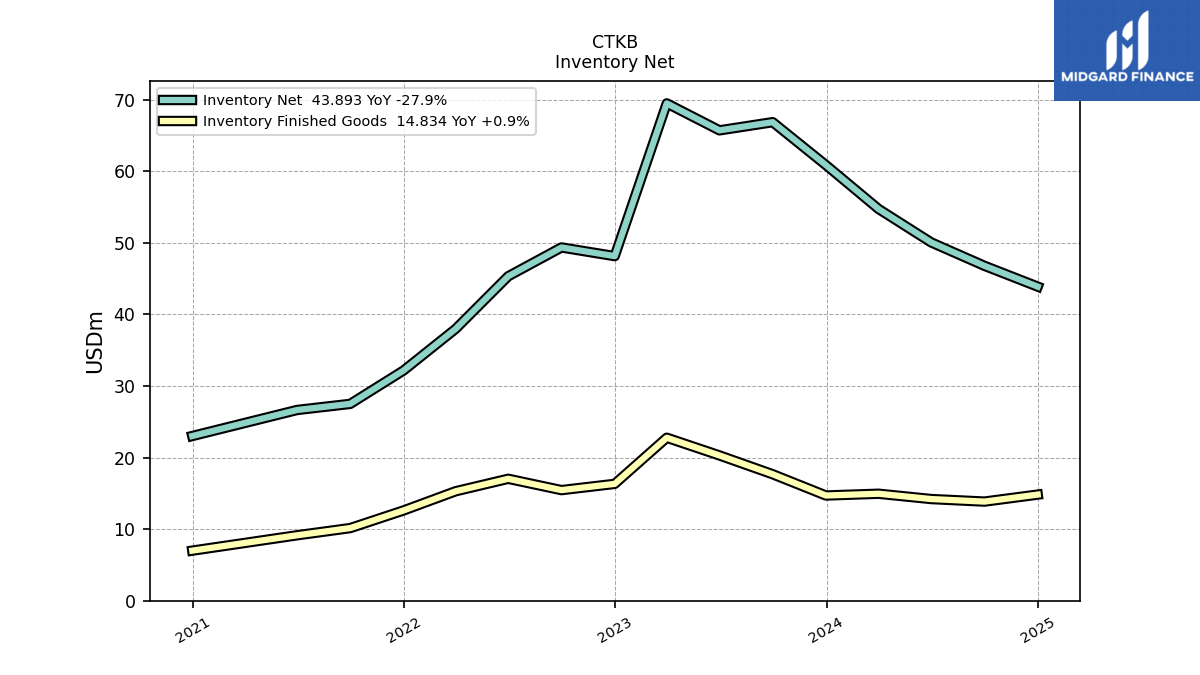
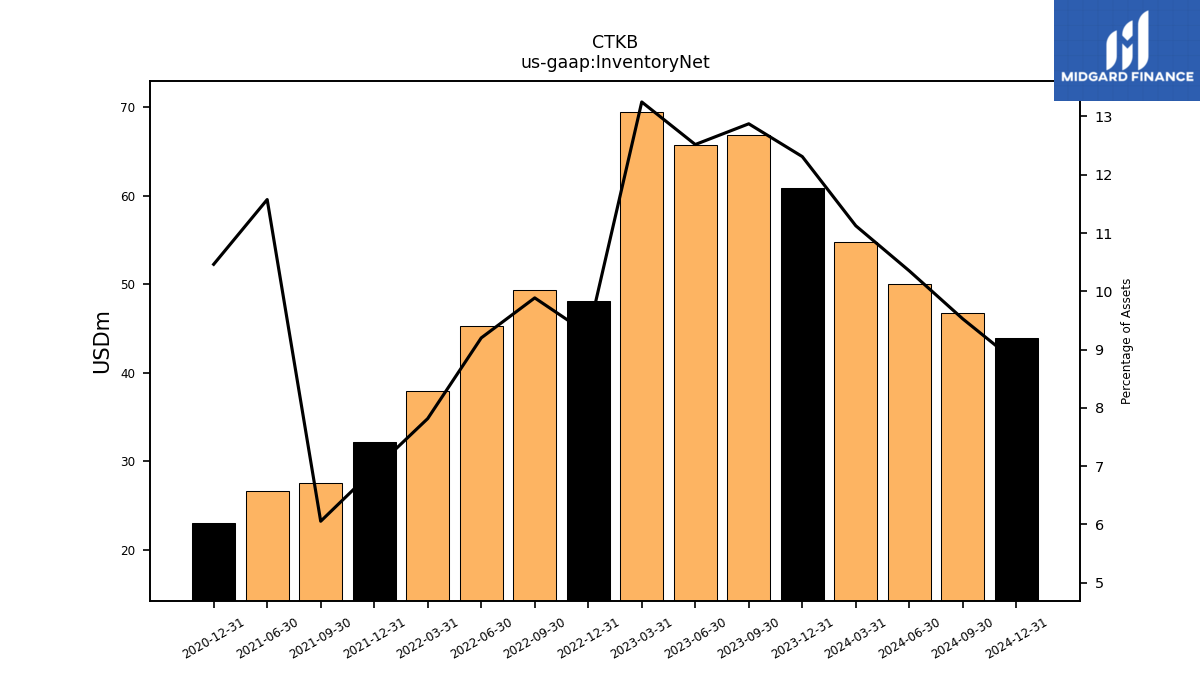
| Inventory Net | 66.88 | 65.73 | 69.50 | 48.15 | 49.37 | 45.34 | 37.98 | 32.17 | 27.51 | 26.66 | NA | 23.02 | NA | NA | |
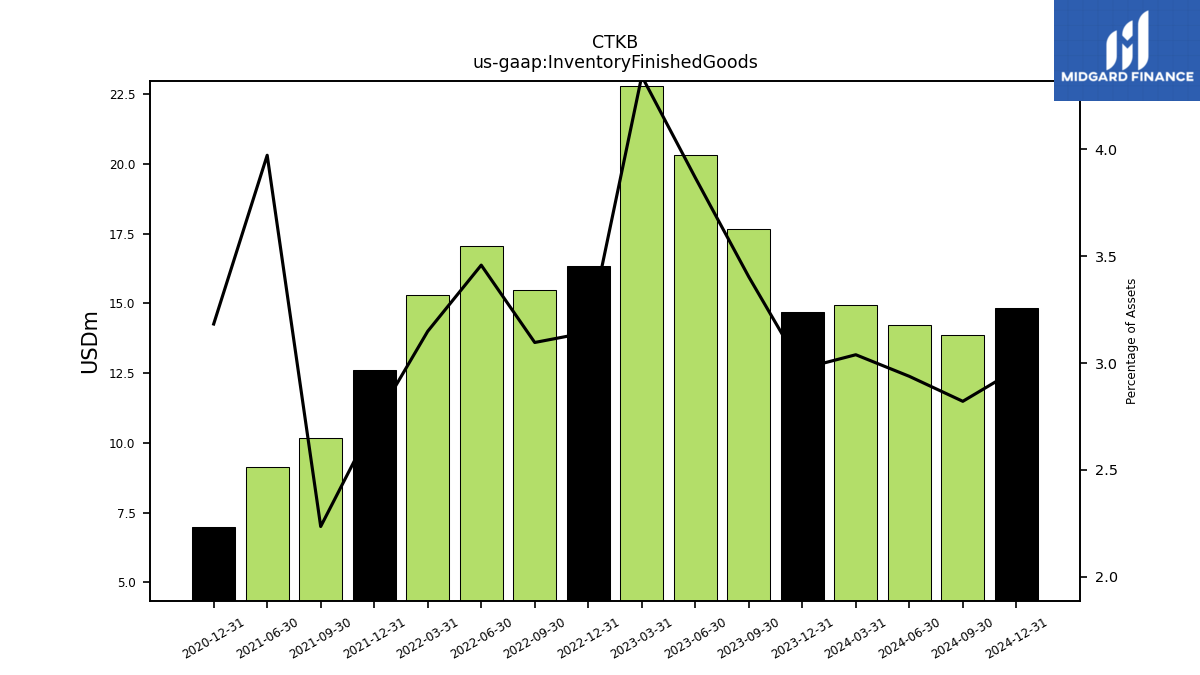
| Inventory Finished Goods | 17.68 | 20.31 | 22.78 | 16.33 | 15.46 | 17.04 | 15.30 | 12.61 | 10.15 | 9.15 | NA | 7.00 | NA | NA | |
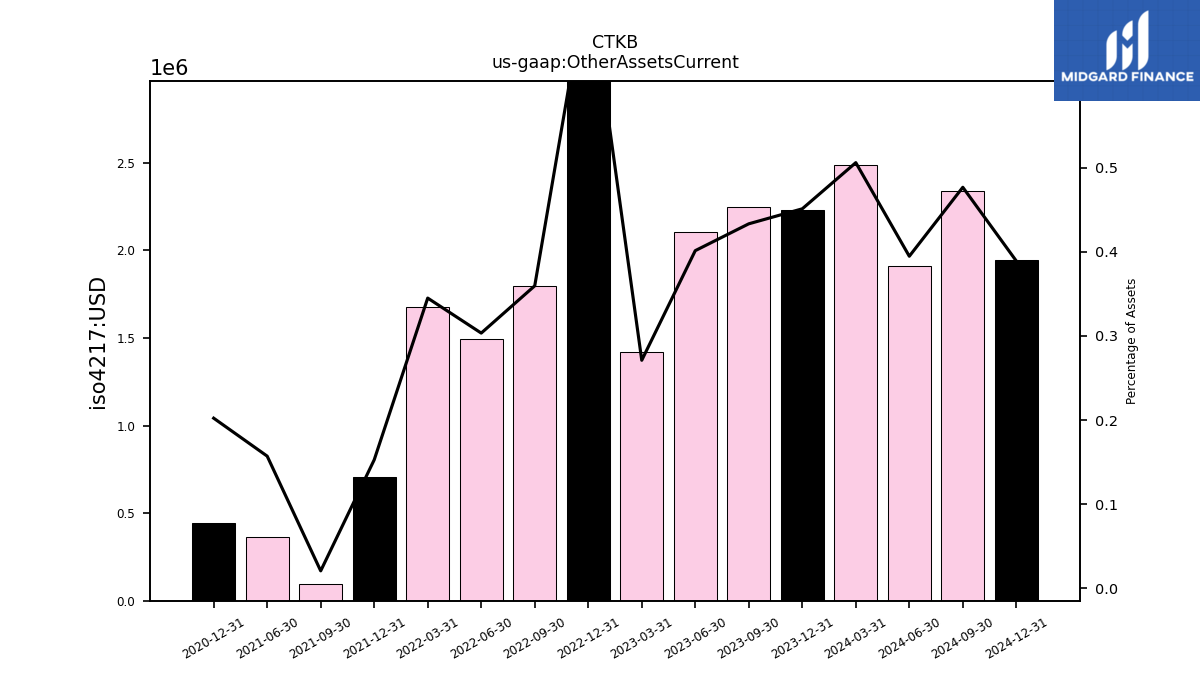
| Other Assets Current | 2.25 | 2.11 | 1.42 | 3.80 | 1.79 | 1.50 | 1.68 | 0.71 | 0.10 | 0.36 | NA | 0.45 | NA | NA | |
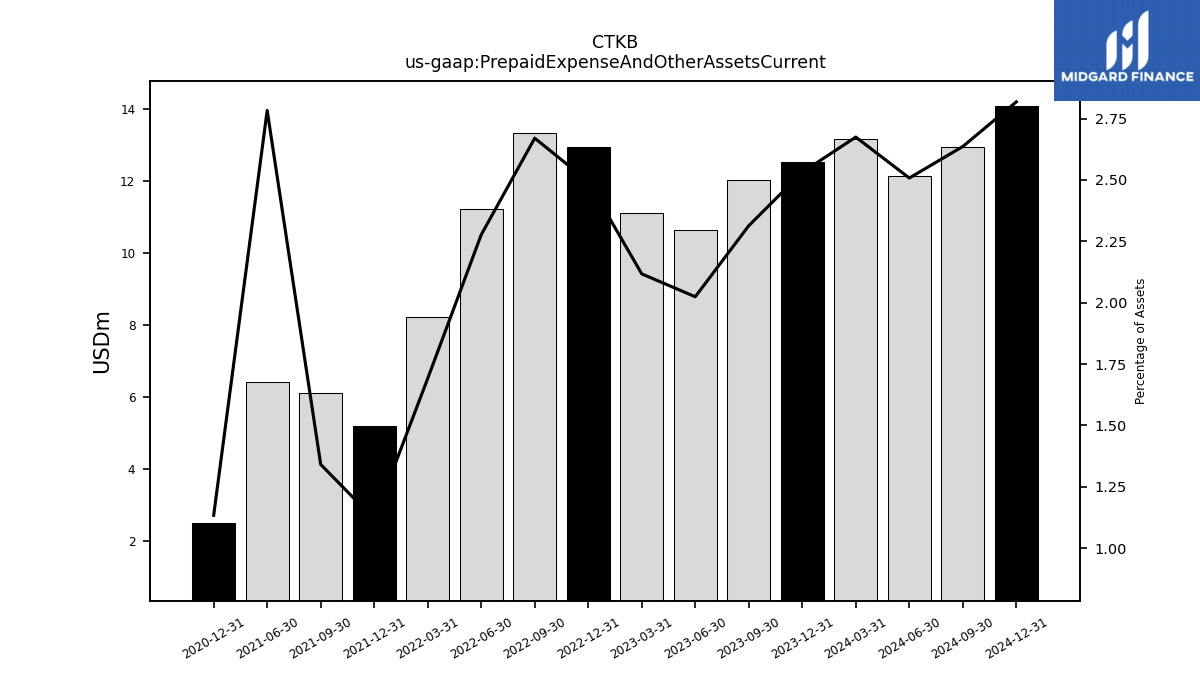
| Prepaid Expense And Other Assets Current | 12.02 | 10.63 | 11.11 | 12.95 | 13.33 | 11.22 | 8.22 | 5.18 | 6.09 | 6.41 | NA | 2.50 | NA | NA |
| 2023-09-30 | 2023-06-30 | 2023-03-31 | 2022-12-31 | 2022-09-30 | 2022-06-30 | 2022-03-31 | 2021-12-31 | 2021-09-30 | 2021-06-30 | 2021-03-31 | 2020-12-31 | 2020-09-30 | 2020-06-30 | ||
|---|---|---|---|---|---|---|---|---|---|---|---|---|---|---|---|
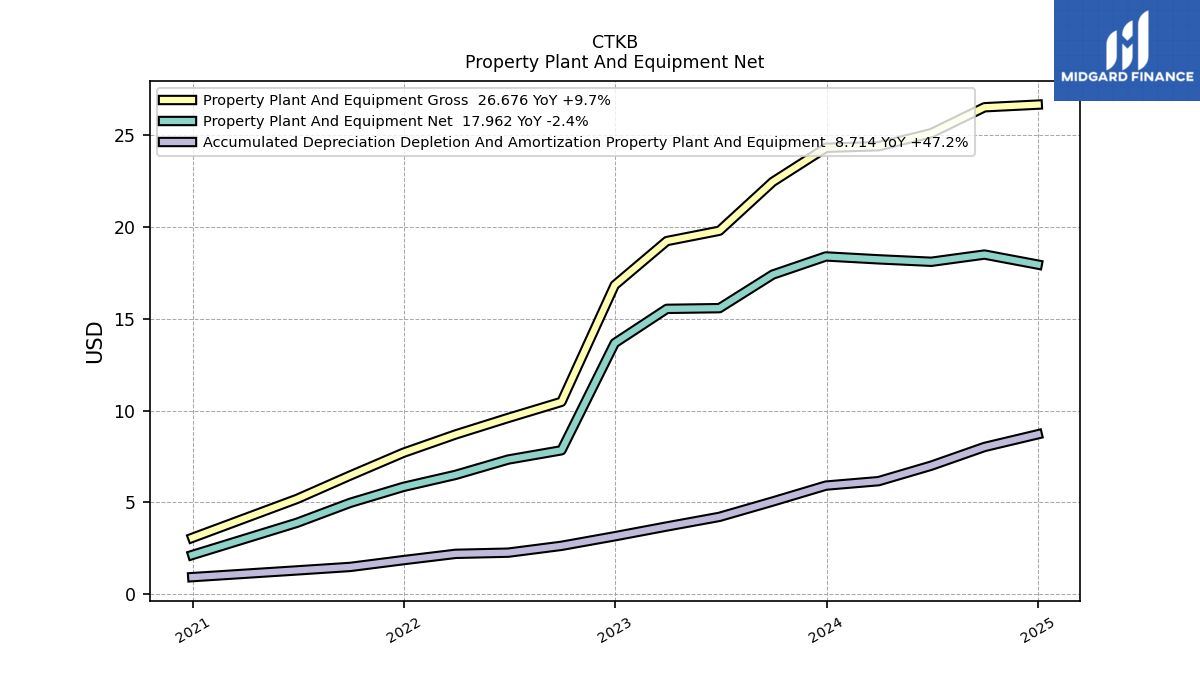
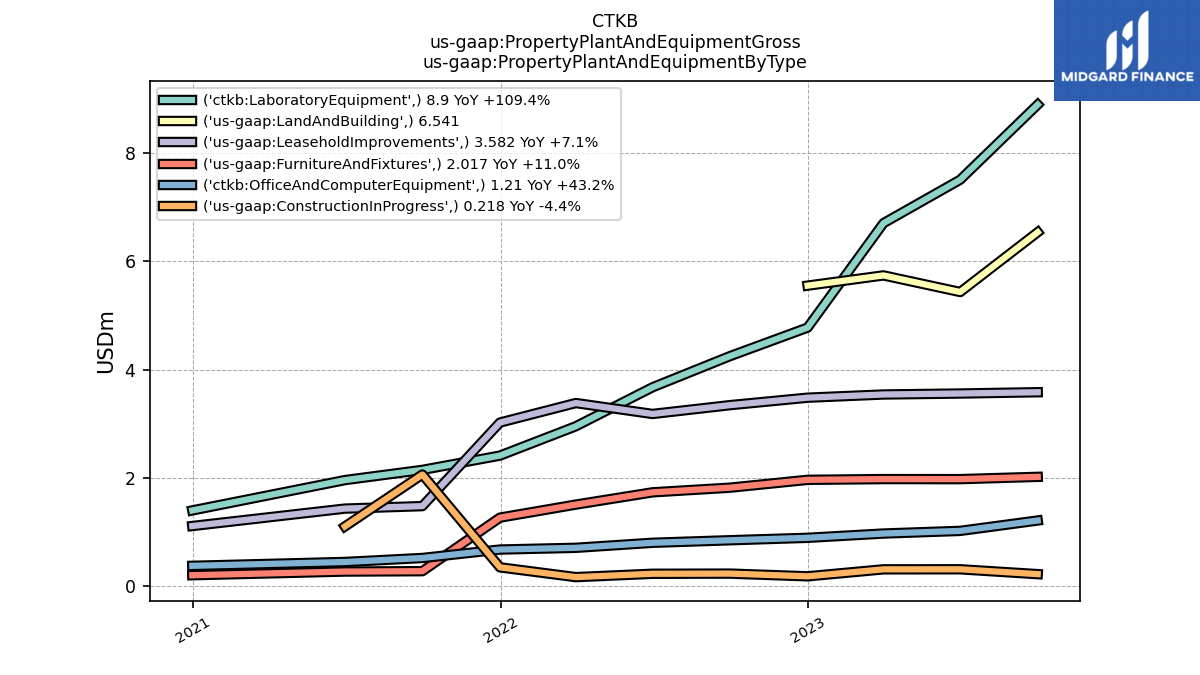
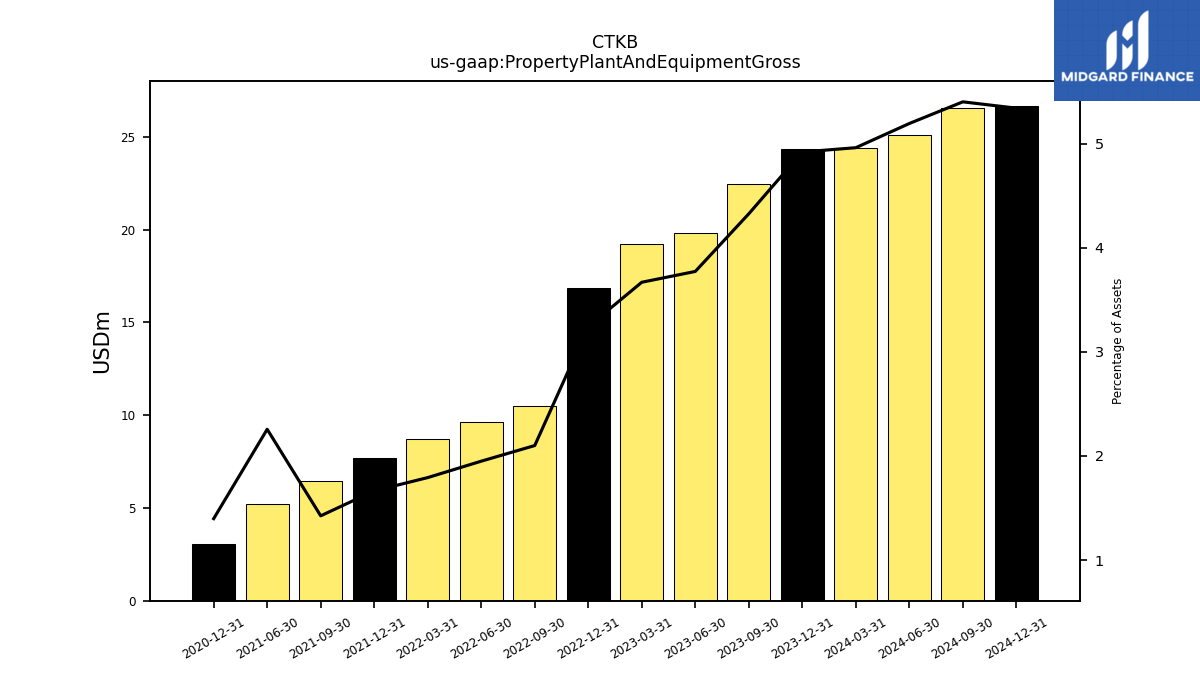
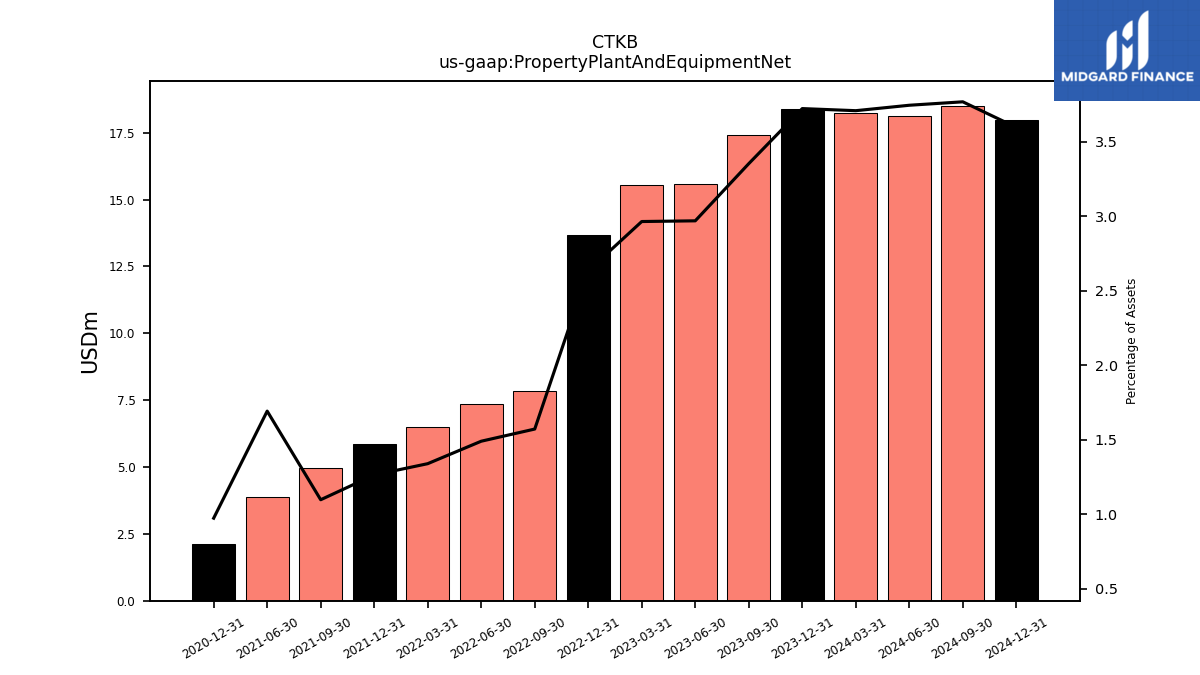
| Property Plant And Equipment Gross | 22.47 | 19.80 | 19.24 | 16.84 | 10.48 | 9.61 | 8.71 | 7.71 | 6.47 | 5.20 | NA | 3.07 | NA | NA | |
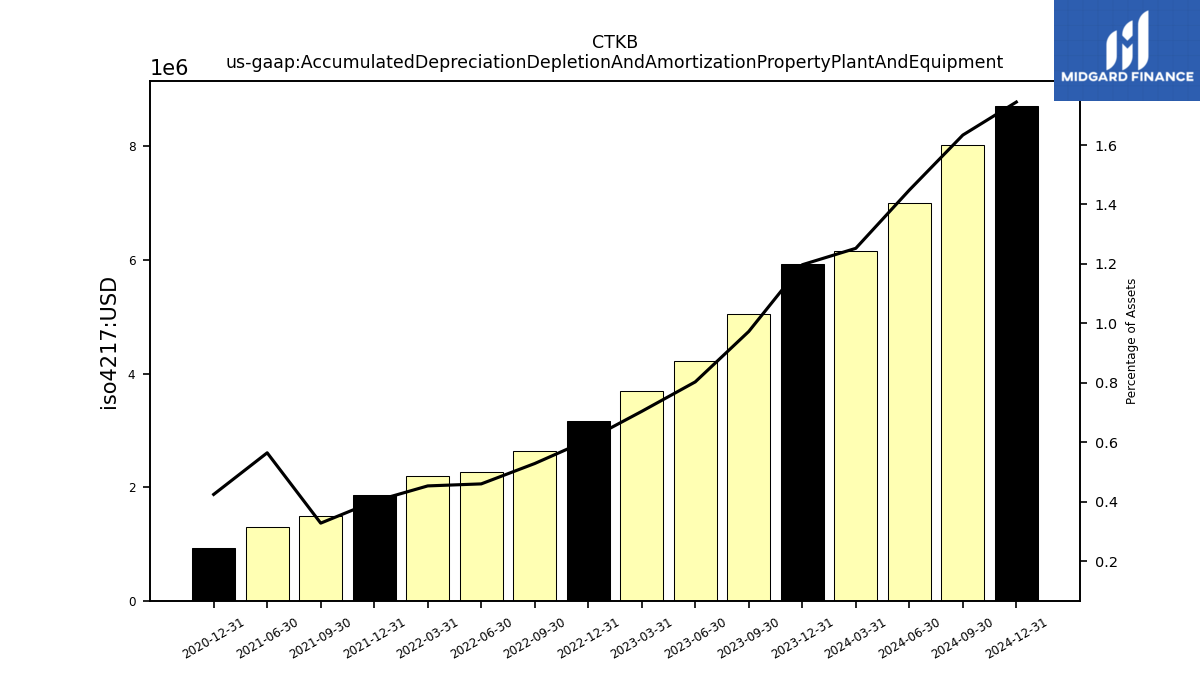
| Accumulated Depreciation Depletion And Amortization Property Plant And Equipment | 5.05 | 4.22 | 3.69 | 3.16 | 2.64 | 2.27 | 2.20 | 1.86 | 1.49 | 1.30 | NA | 0.93 | NA | NA | |
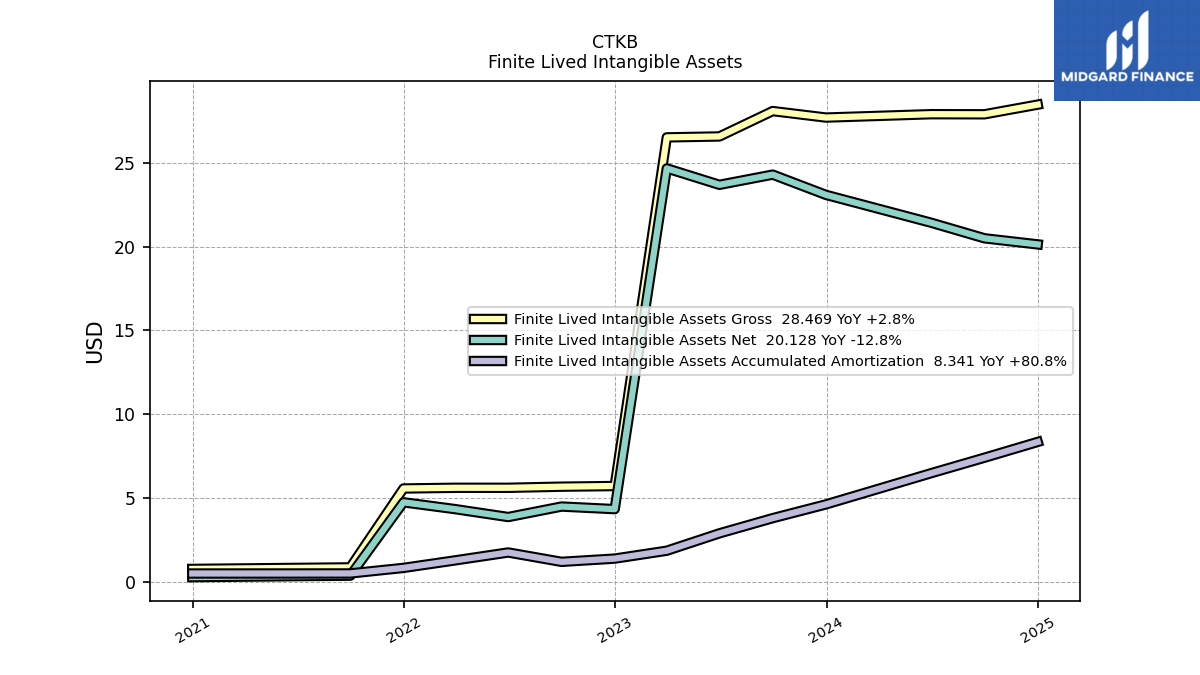
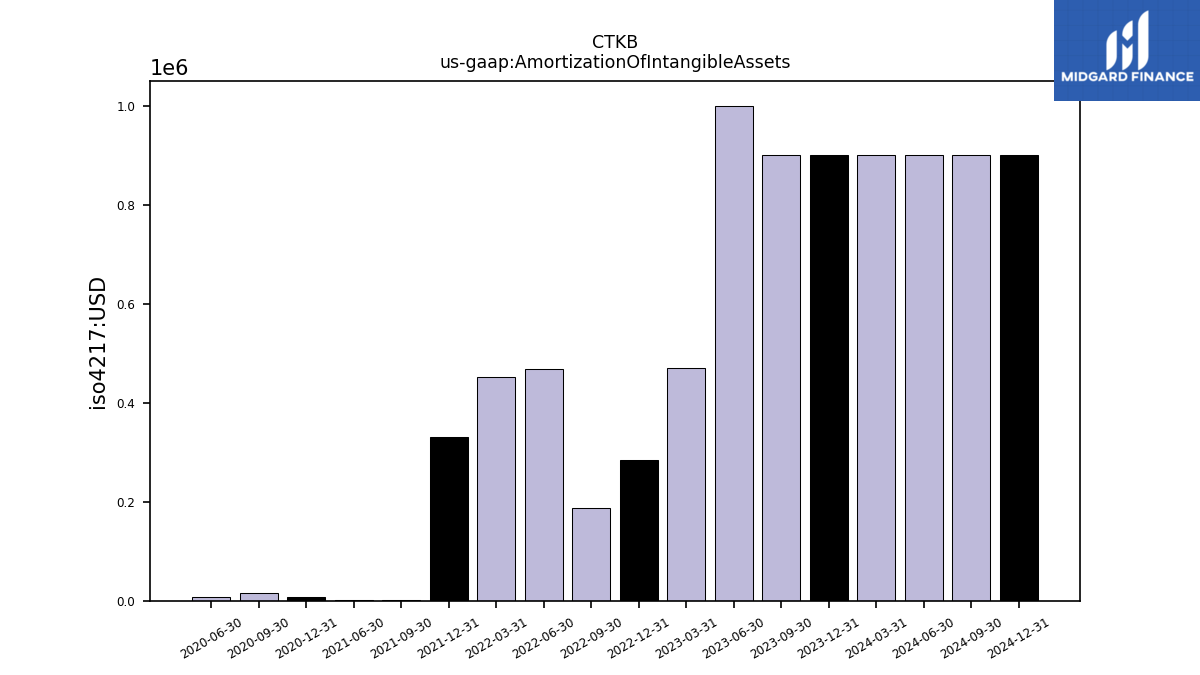
| Amortization Of Intangible Assets | 0.90 | 1.00 | 0.47 | 0.28 | 0.19 | 0.47 | 0.45 | 0.33 | 0.00 | 0.00 | NA | 0.01 | 0.02 | 0.01 | |
| Property Plant And Equipment Net | 17.41 | 15.59 | 15.55 | 13.68 | 7.84 | 7.34 | 6.50 | 5.85 | 4.98 | 3.90 | NA | 2.14 | NA | NA | |
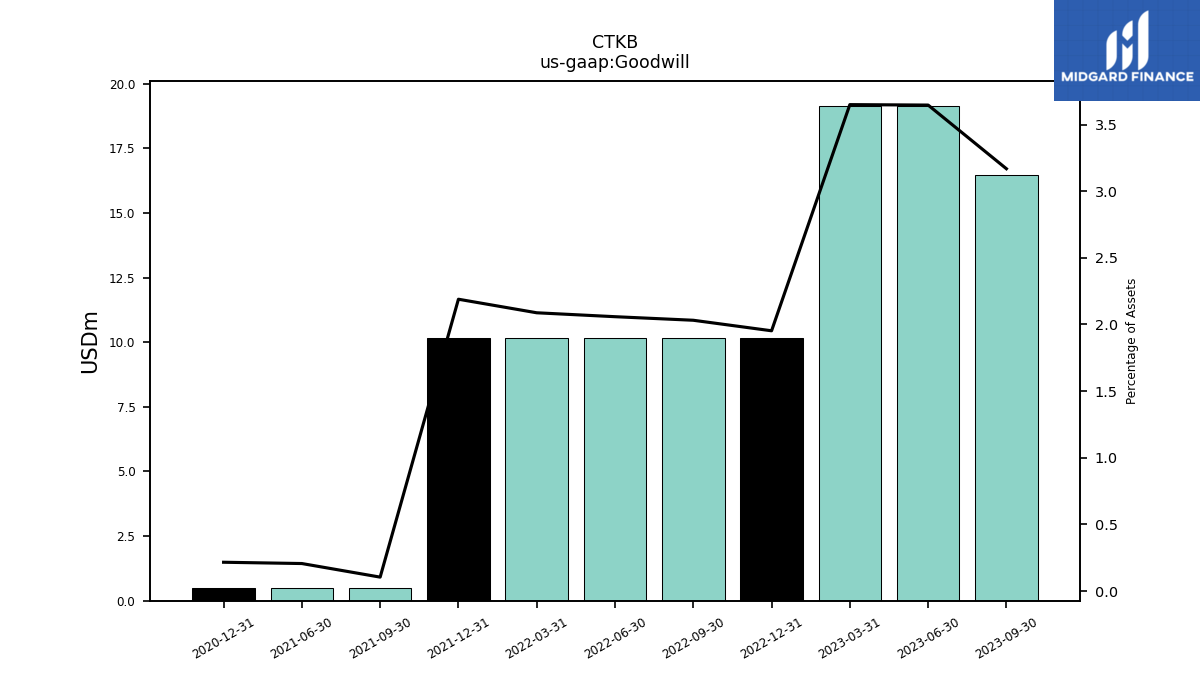
| Goodwill | 16.46 | 19.14 | 19.14 | 10.14 | 10.14 | 10.14 | 10.14 | 10.14 | 0.48 | 0.48 | NA | 0.48 | NA | NA | |
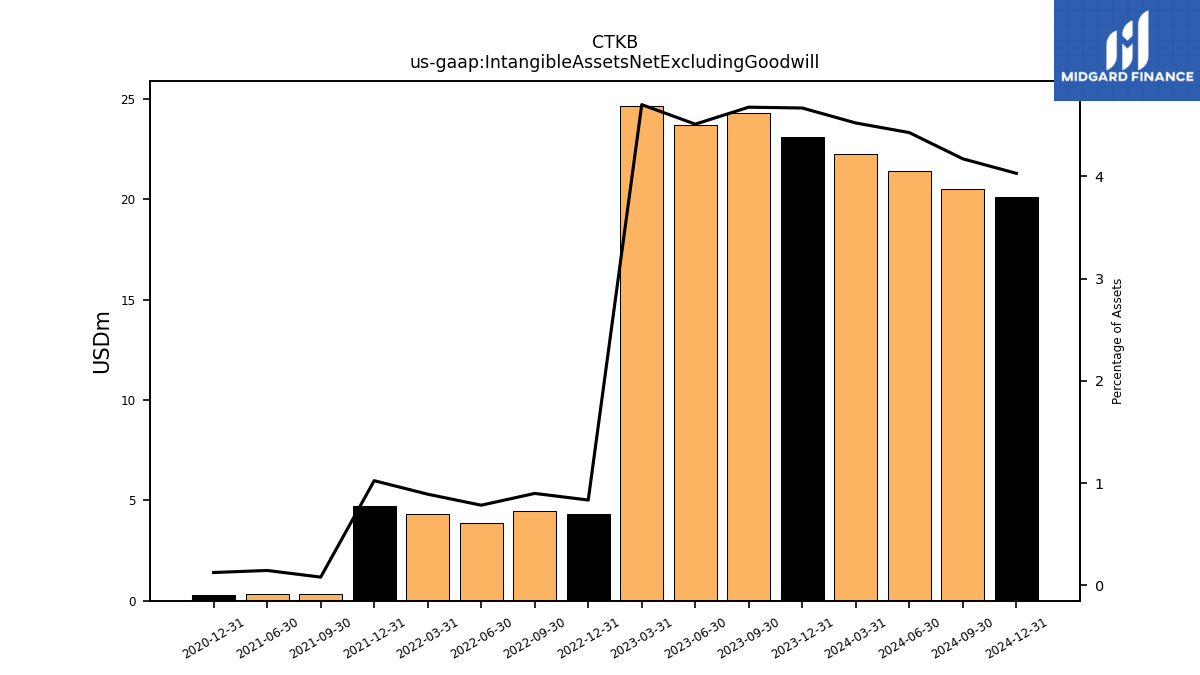
| Intangible Assets Net Excluding Goodwill | 24.29 | 23.68 | 24.66 | 4.33 | 4.49 | 3.86 | 4.33 | 4.74 | 0.36 | 0.33 | NA | 0.27 | NA | NA | |
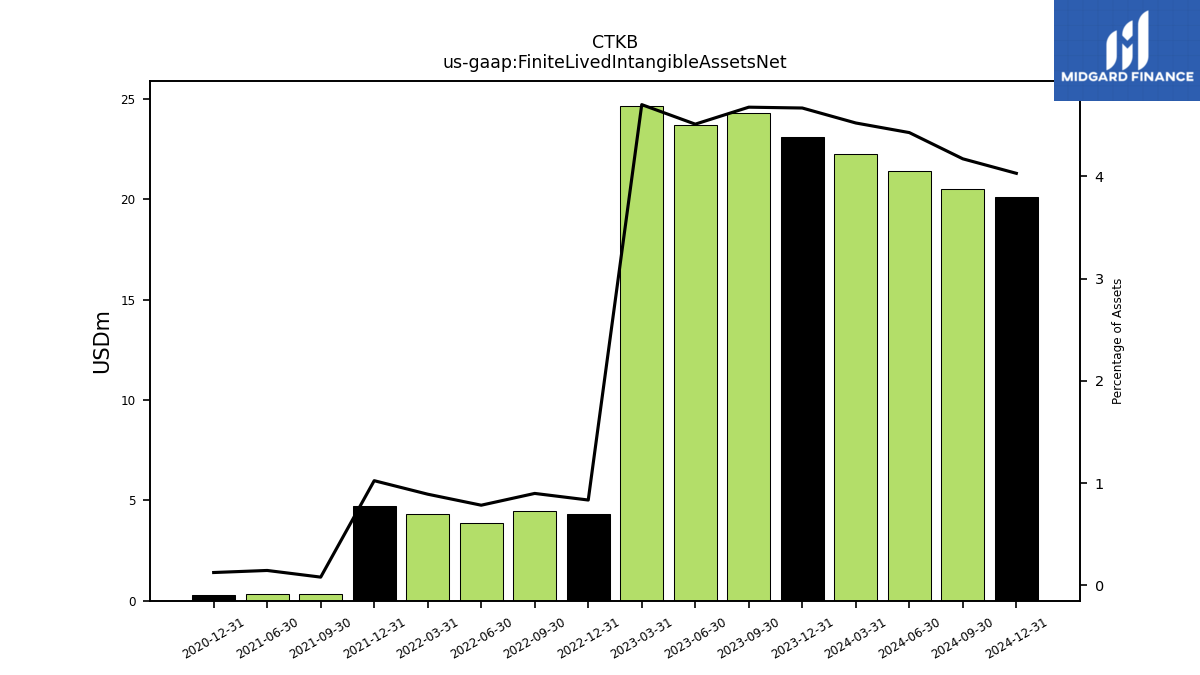
| Finite Lived Intangible Assets Net | 24.29 | 23.68 | 24.66 | 4.33 | 4.49 | 3.86 | 4.33 | 4.74 | 0.36 | 0.33 | NA | 0.27 | NA | NA | |
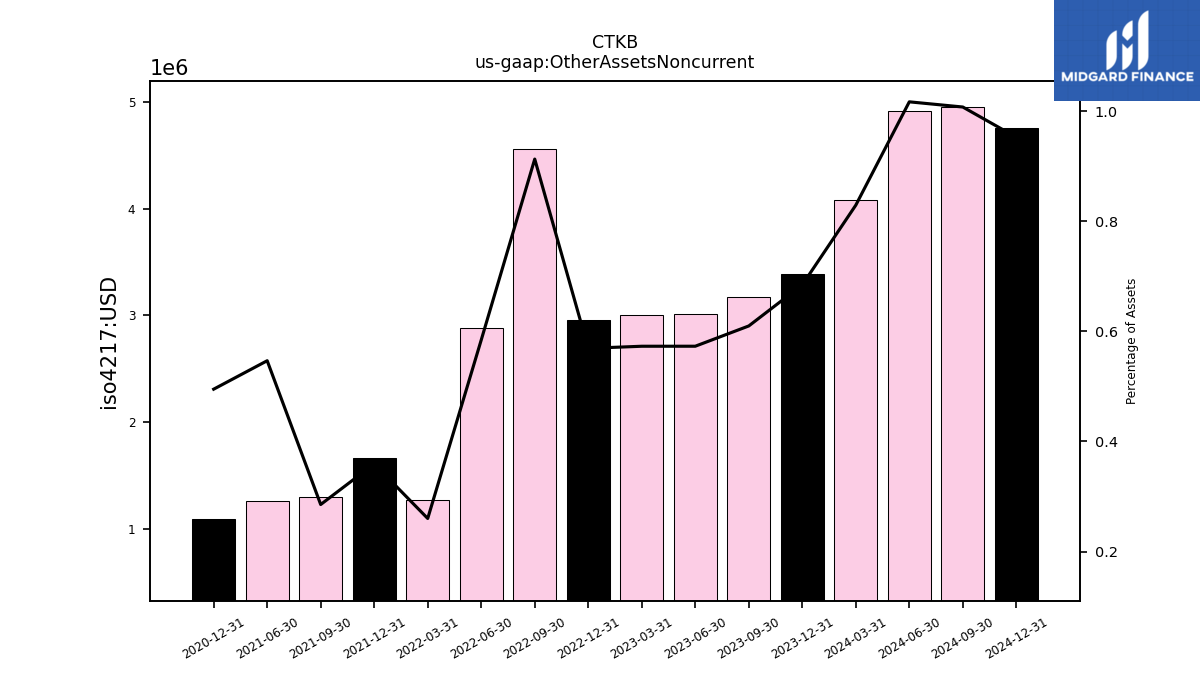
| Other Assets Noncurrent | 3.17 | 3.01 | 3.01 | 2.96 | 4.56 | 2.88 | 1.26 | 1.67 | 1.30 | 1.26 | NA | 1.09 | NA | NA |
| 2023-09-30 | 2023-06-30 | 2023-03-31 | 2022-12-31 | 2022-09-30 | 2022-06-30 | 2022-03-31 | 2021-12-31 | 2021-09-30 | 2021-06-30 | 2021-03-31 | 2020-12-31 | 2020-09-30 | 2020-06-30 | ||
|---|---|---|---|---|---|---|---|---|---|---|---|---|---|---|---|
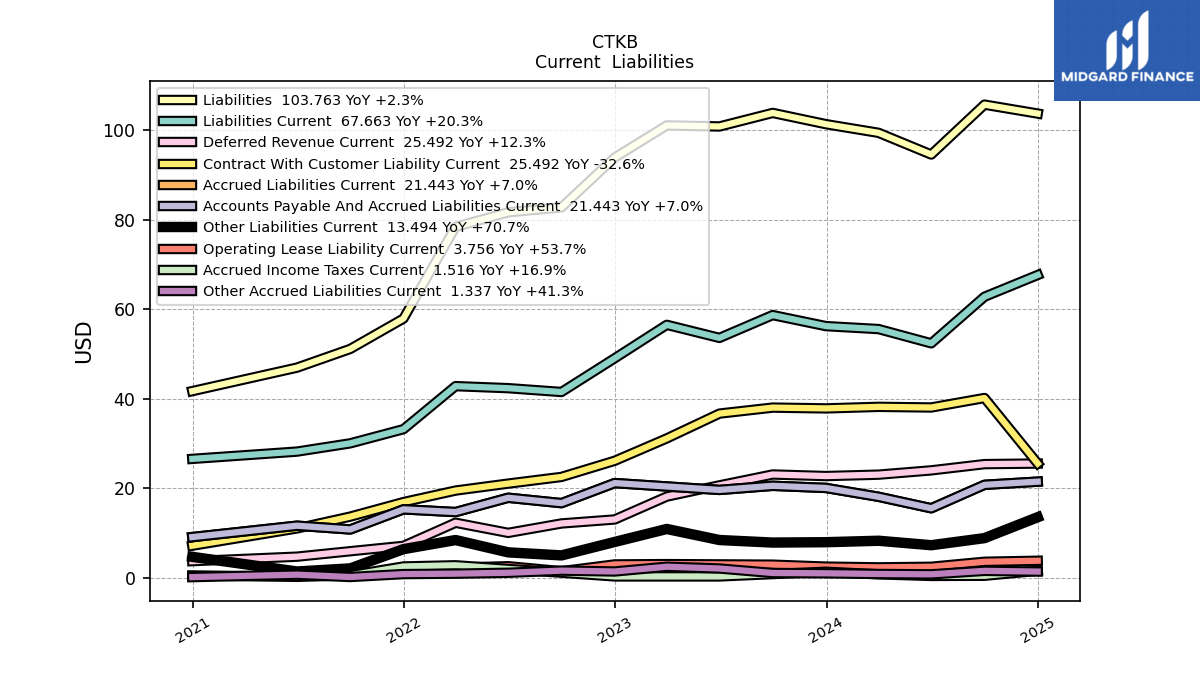
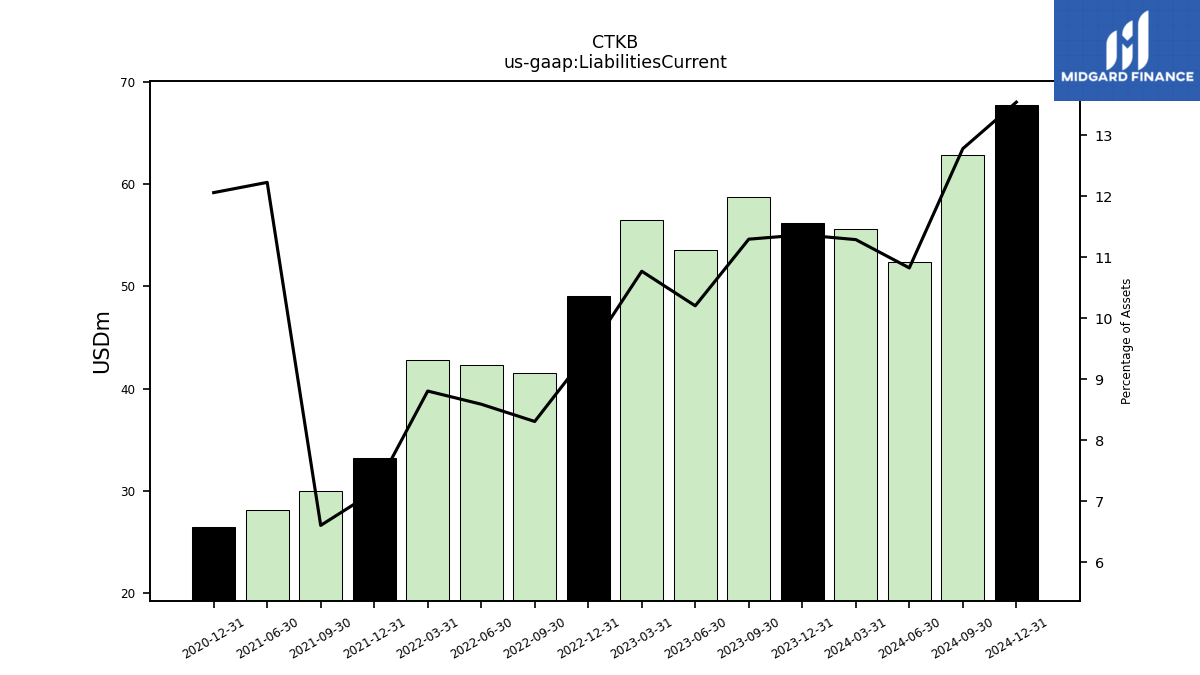
| Liabilities Current | 58.69 | 53.59 | 56.52 | 49.04 | 41.49 | 42.35 | 42.80 | 33.18 | 30.01 | 28.16 | NA | 26.54 | NA | NA | |
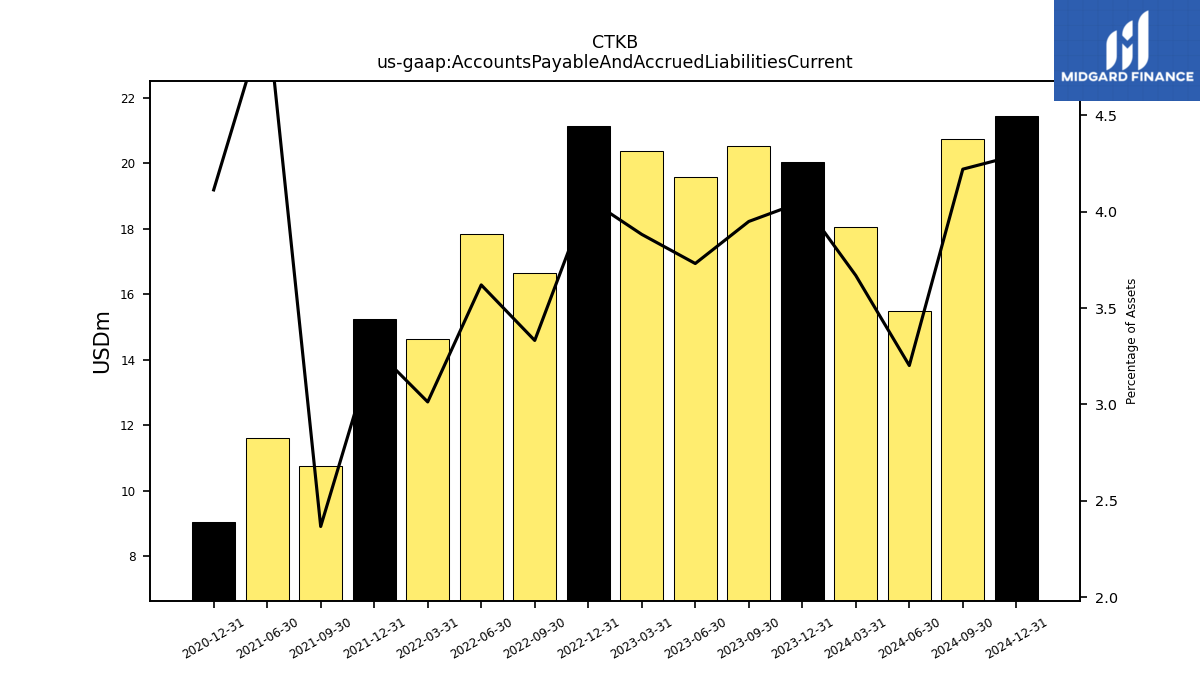
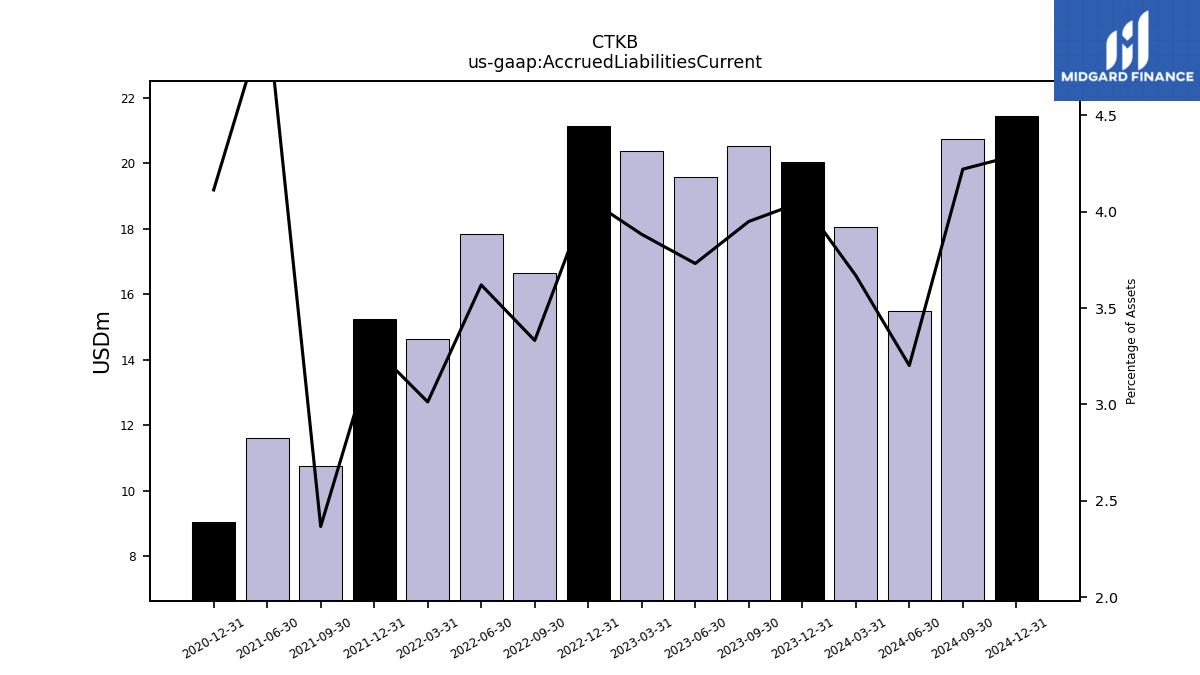
| Accounts Payable And Accrued Liabilities Current | 20.51 | 19.59 | 20.37 | 21.13 | 16.64 | 17.84 | 14.64 | 15.25 | 10.75 | 11.59 | NA | 9.05 | NA | NA | |
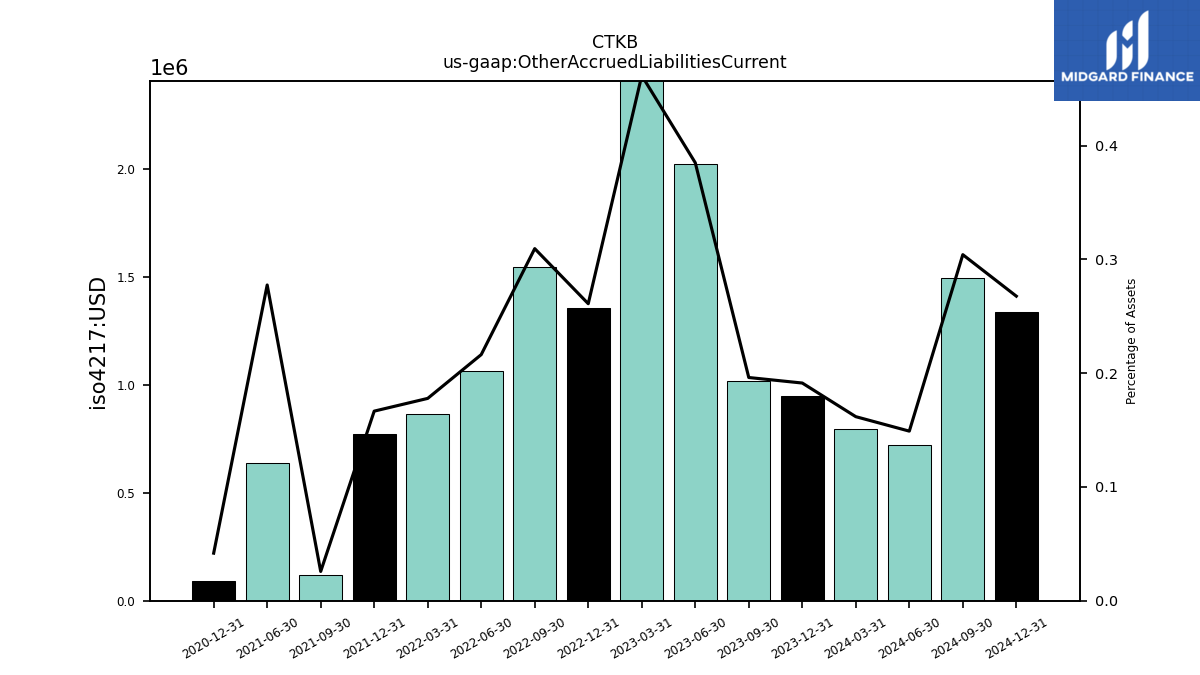
| Other Accrued Liabilities Current | 1.02 | 2.02 | 2.42 | 1.36 | 1.54 | 1.07 | 0.86 | 0.77 | 0.12 | 0.64 | NA | 0.09 | NA | NA | |
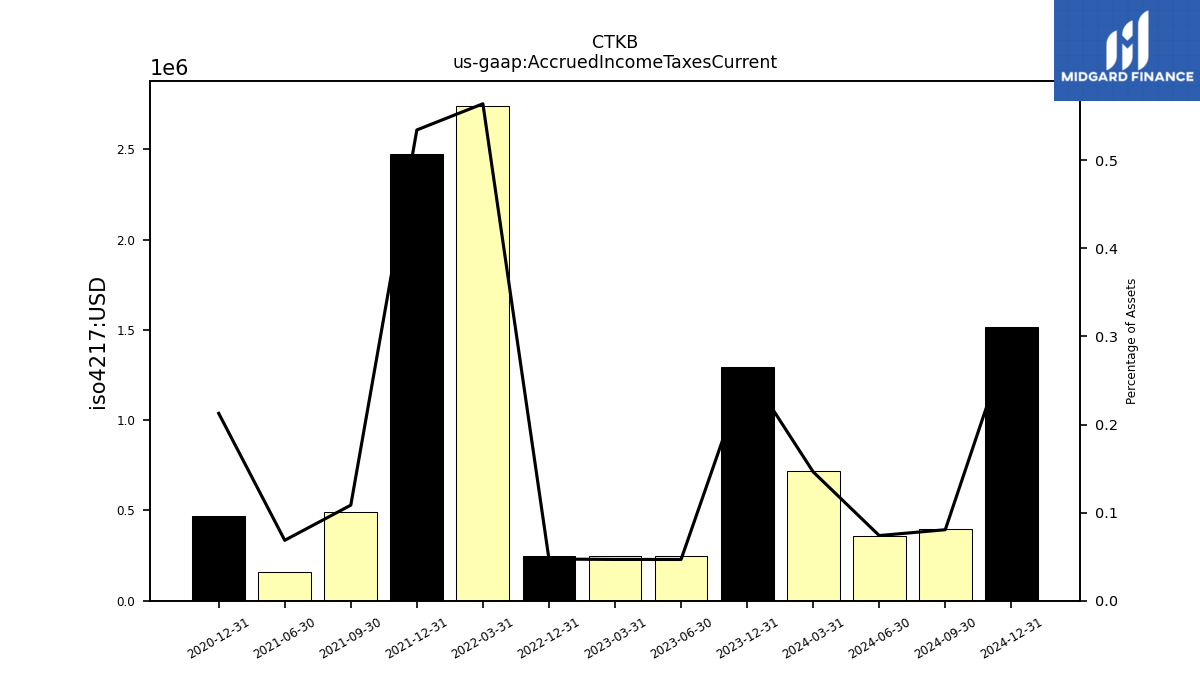
| Accrued Income Taxes Current | NA | 0.25 | 0.25 | 0.25 | NA | NA | 2.74 | 2.48 | 0.49 | 0.16 | NA | 0.47 | NA | NA | |
| Accrued Liabilities Current | 20.51 | 19.59 | 20.37 | 21.13 | 16.64 | 17.84 | 14.64 | 15.25 | 10.75 | 11.59 | NA | 9.05 | NA | NA | |
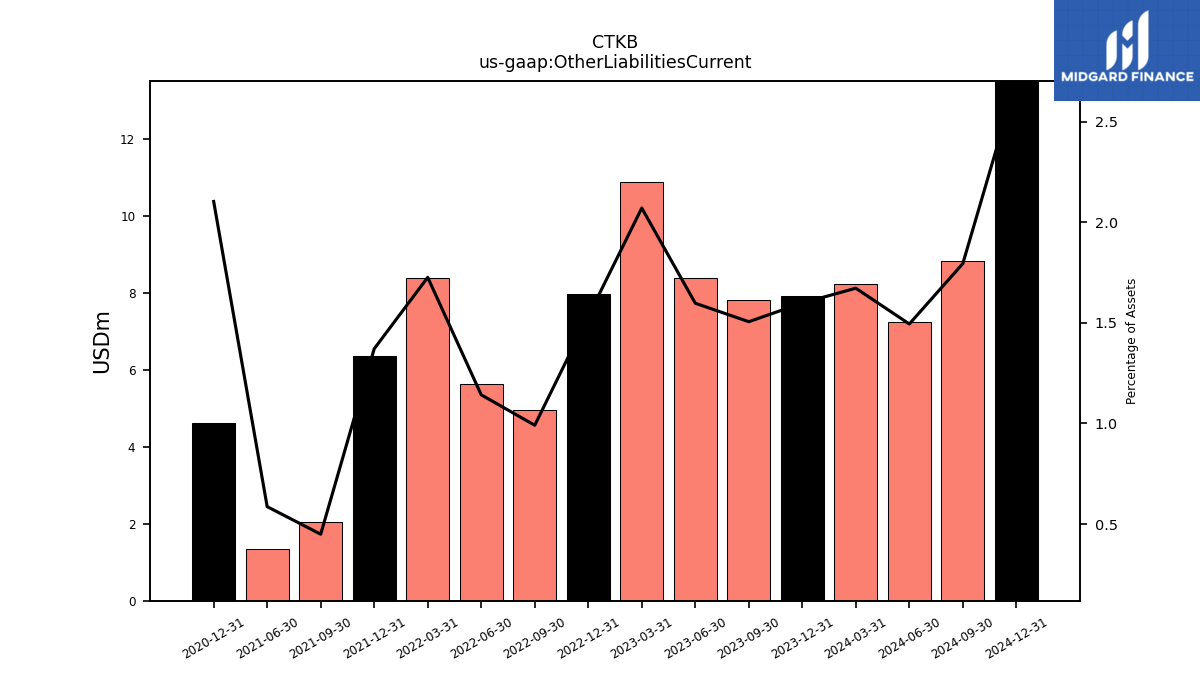
| Other Liabilities Current | 7.82 | 8.39 | 10.86 | 7.96 | 4.95 | 5.63 | 8.39 | 6.35 | 2.04 | 1.35 | NA | 4.63 | NA | NA | |
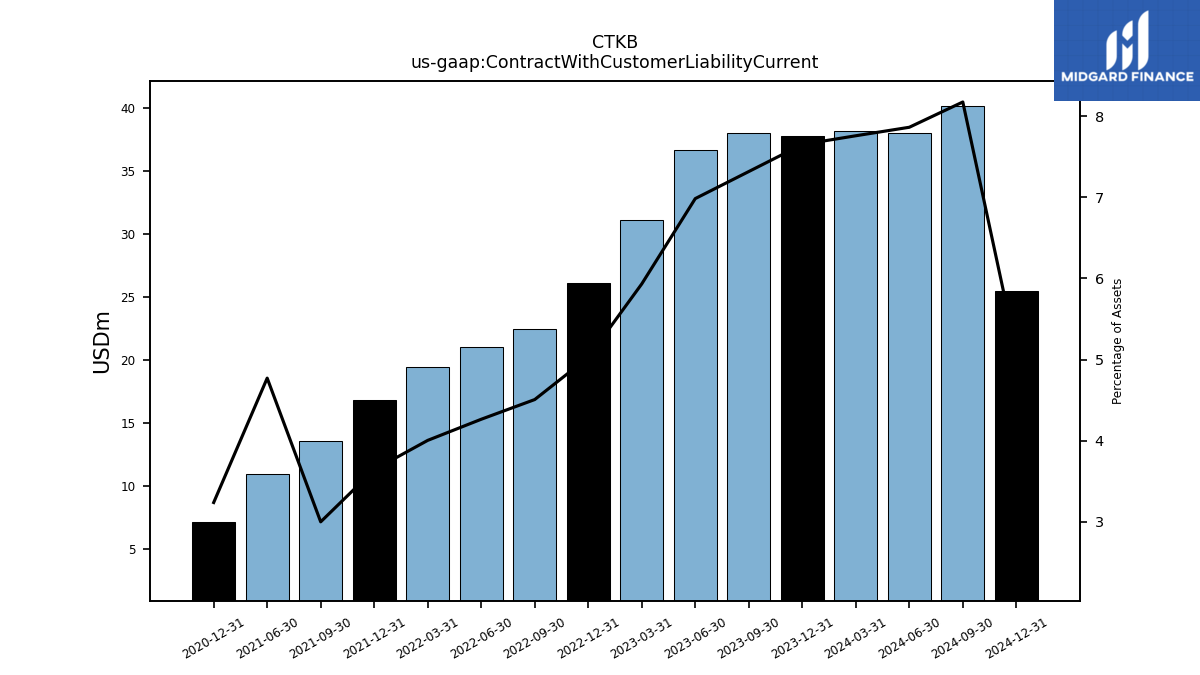
| Contract With Customer Liability Current | 38.01 | 36.67 | 31.12 | 26.11 | 22.50 | 21.01 | 19.45 | 16.87 | 13.63 | 10.98 | NA | 7.12 | NA | NA |
| 2023-09-30 | 2023-06-30 | 2023-03-31 | 2022-12-31 | 2022-09-30 | 2022-06-30 | 2022-03-31 | 2021-12-31 | 2021-09-30 | 2021-06-30 | 2021-03-31 | 2020-12-31 | 2020-09-30 | 2020-06-30 | ||
|---|---|---|---|---|---|---|---|---|---|---|---|---|---|---|---|
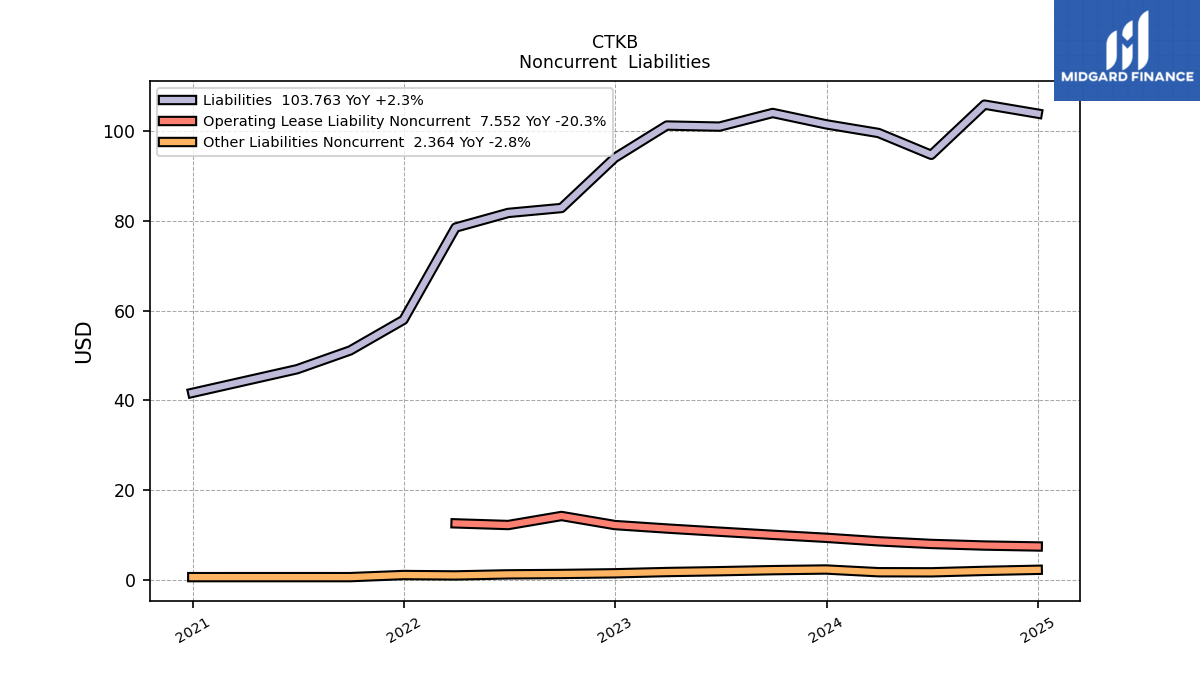
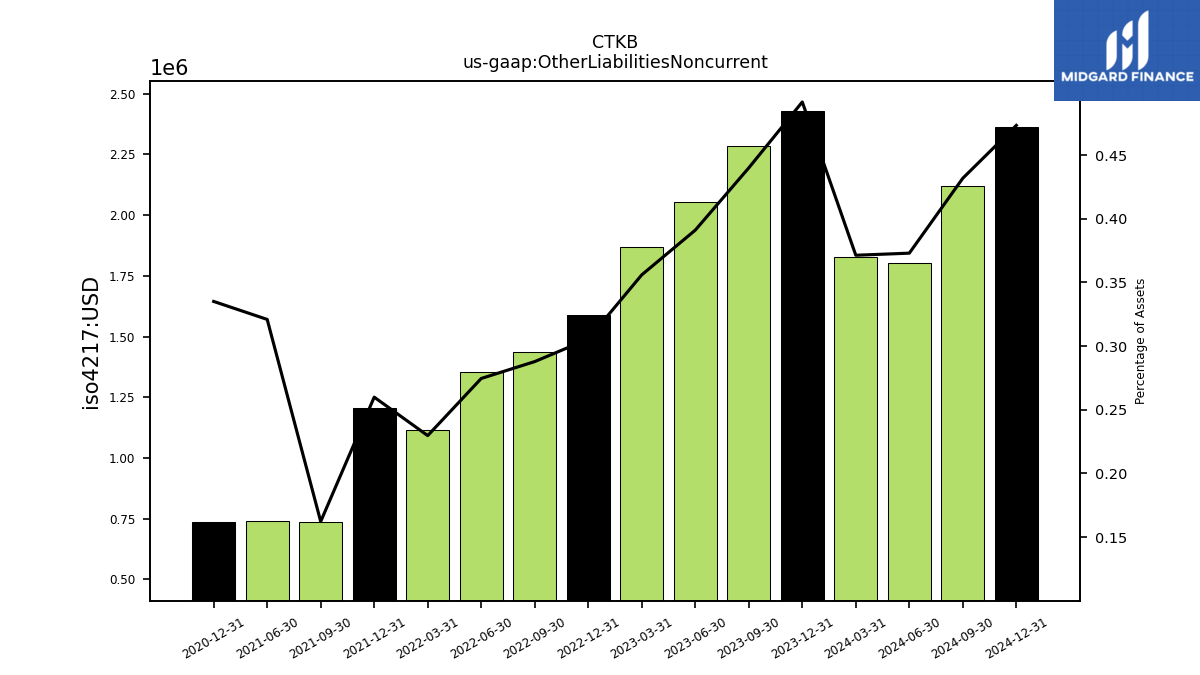
| Other Liabilities Noncurrent | 2.29 | 2.05 | 1.87 | 1.59 | 1.44 | 1.35 | 1.12 | 1.20 | 0.74 | 0.74 | NA | 0.74 | NA | NA | |
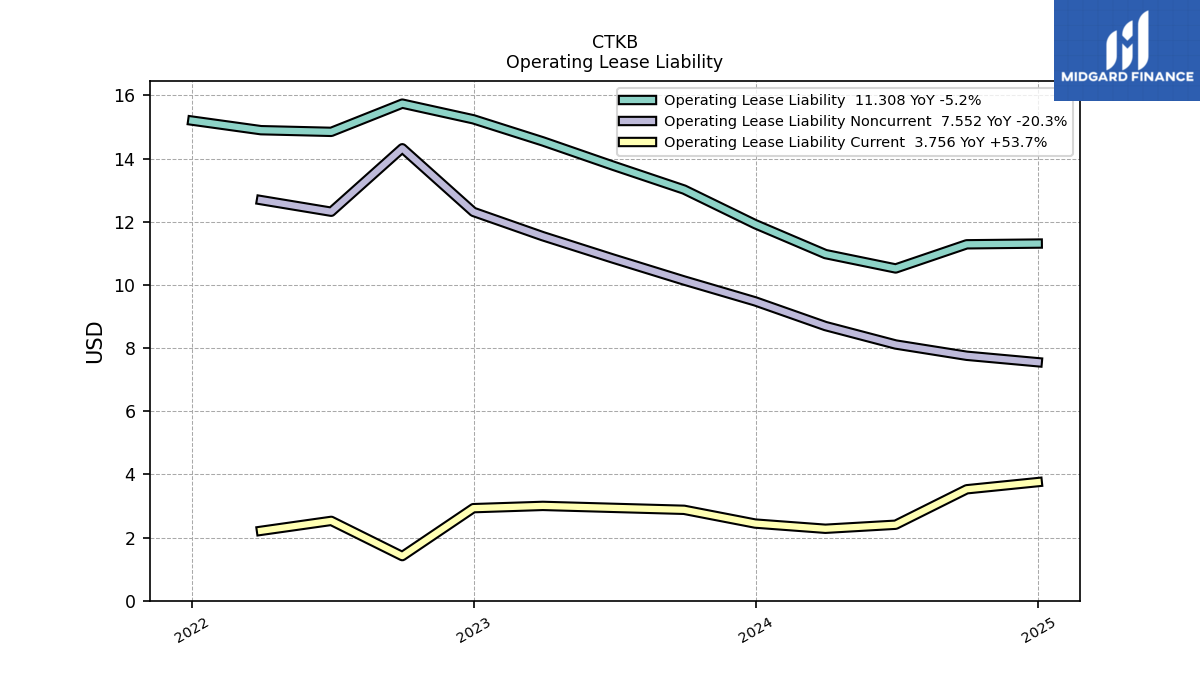
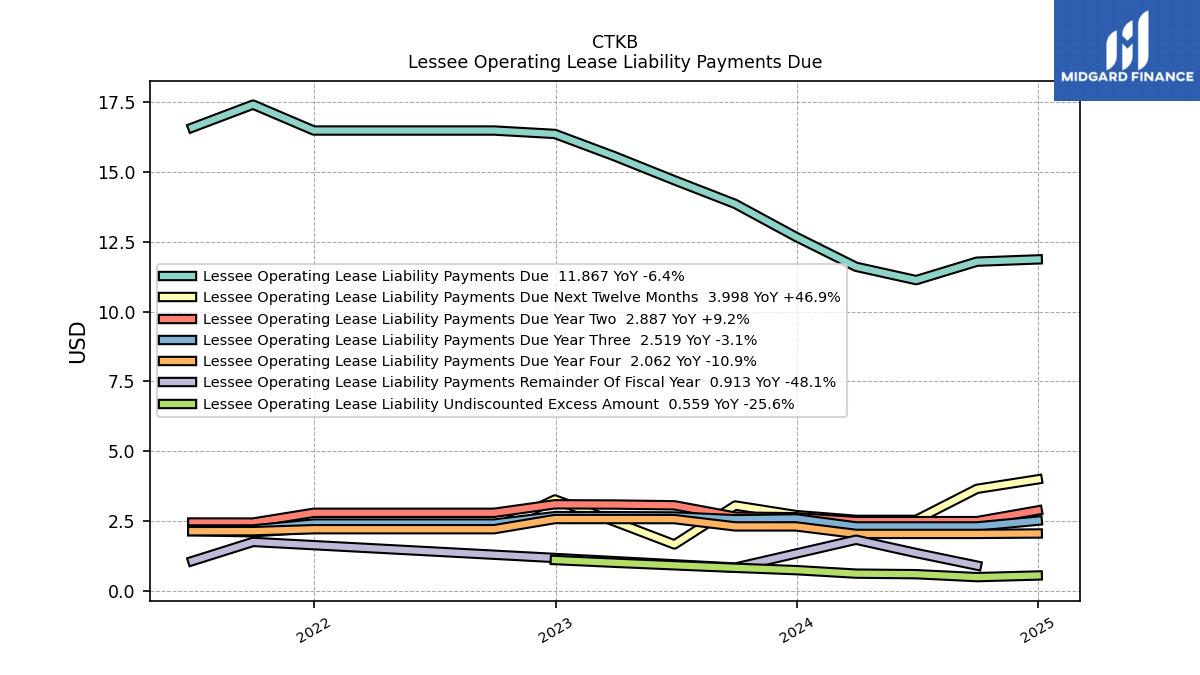
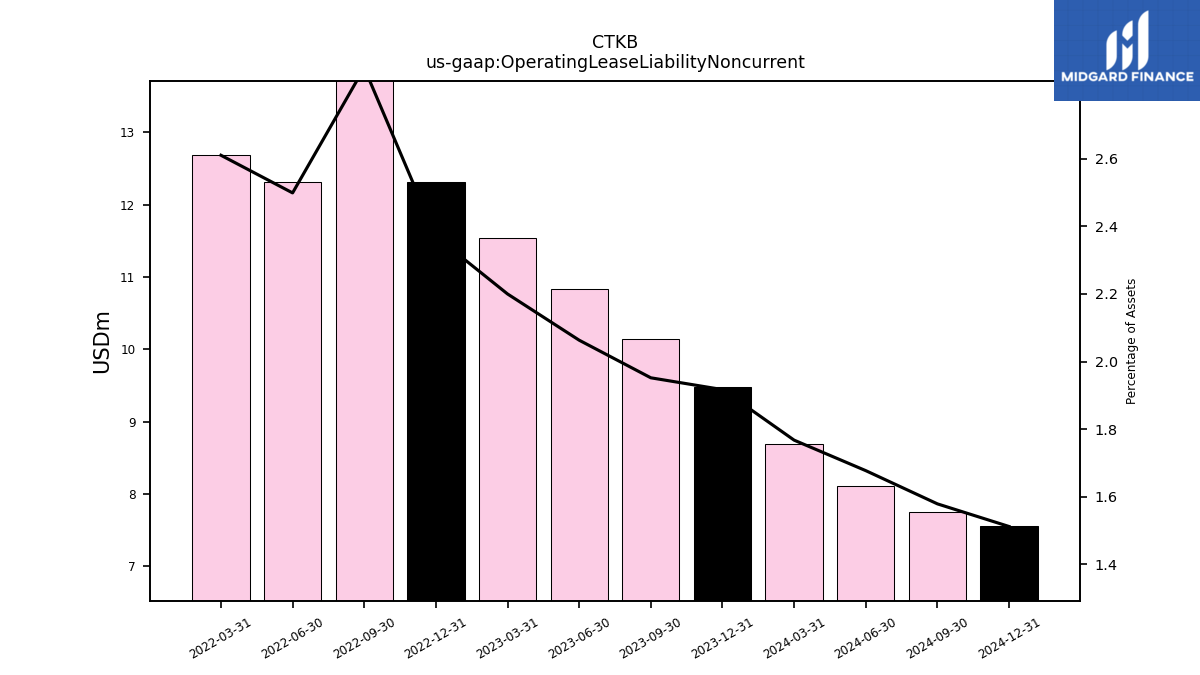
| Operating Lease Liability Noncurrent | 10.14 | 10.83 | 11.54 | 12.31 | 14.33 | 12.32 | 12.68 | NA | NA | NA | NA | NA | NA | NA |
| 2023-09-30 | 2023-06-30 | 2023-03-31 | 2022-12-31 | 2022-09-30 | 2022-06-30 | 2022-03-31 | 2021-12-31 | 2021-09-30 | 2021-06-30 | 2021-03-31 | 2020-12-31 | 2020-09-30 | 2020-06-30 | ||
|---|---|---|---|---|---|---|---|---|---|---|---|---|---|---|---|
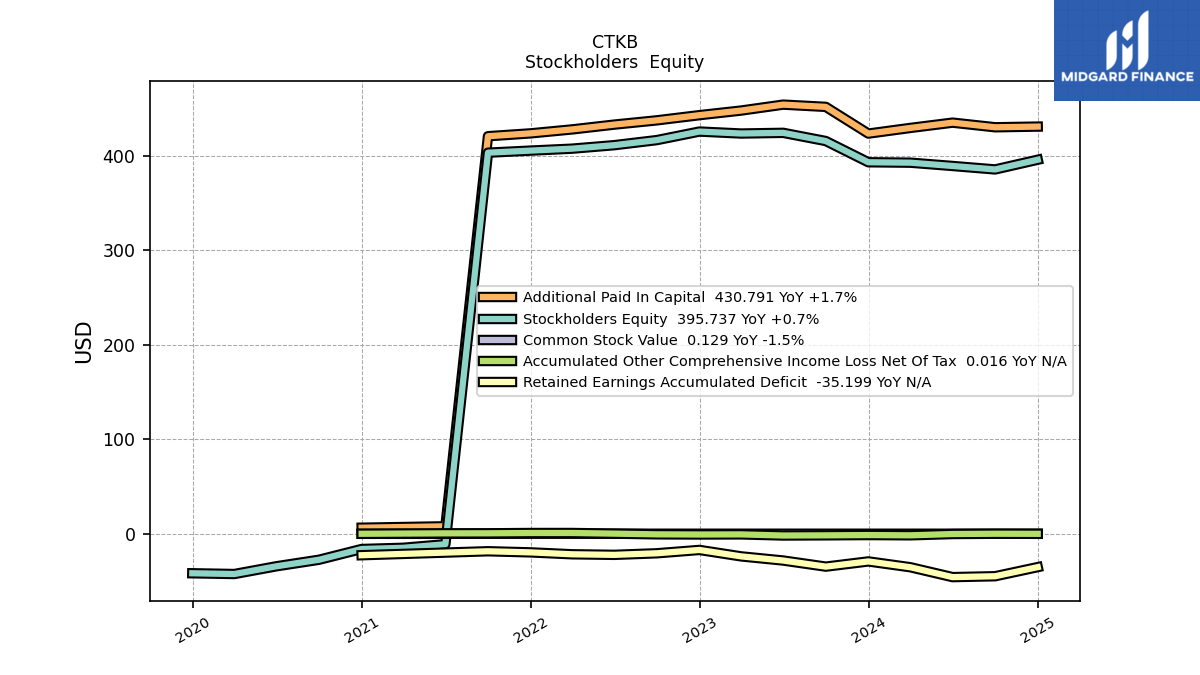
| Stockholders Equity | 415.52 | 424.18 | 423.46 | 425.55 | 416.51 | 411.13 | 407.44 | 405.38 | 403.19 | -10.98 | -14.76 | -16.03 | -27.39 | -34.30 | |
| Common Stock Value | 0.14 | 0.14 | 0.14 | 0.14 | 0.14 | 0.14 | 0.13 | 0.13 | 0.12 | 0.02 | NA | 0.02 | NA | NA | |
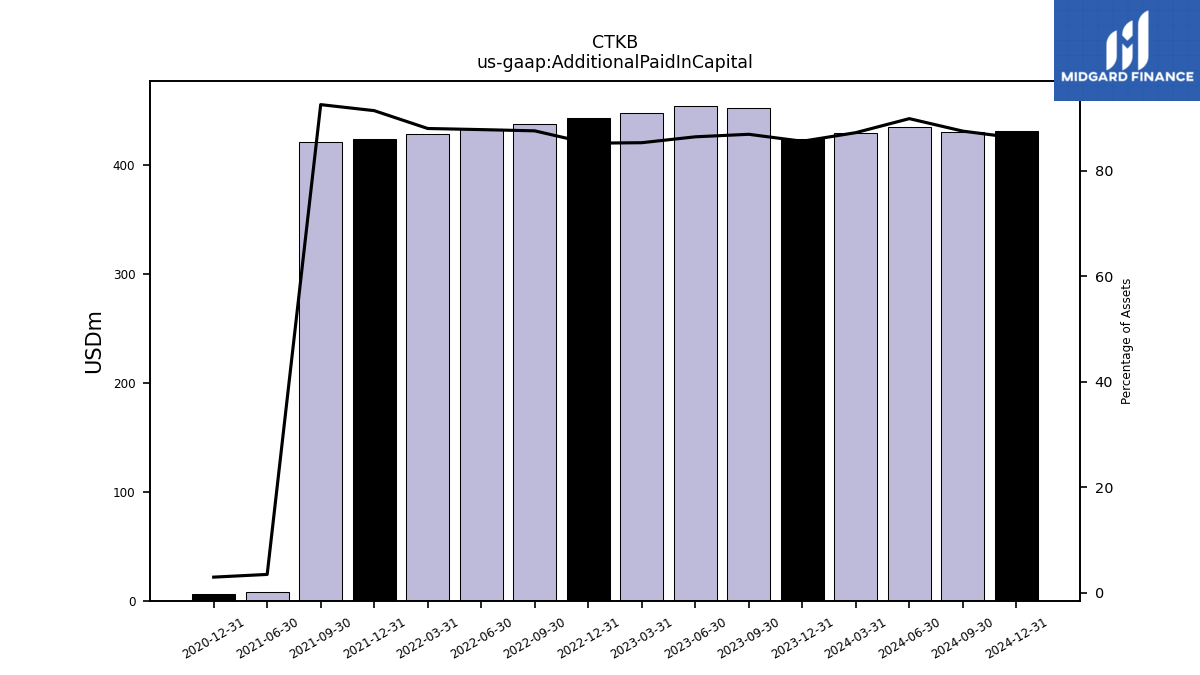
| Additional Paid In Capital | 451.65 | 454.03 | 447.75 | 442.89 | 437.40 | 432.89 | 427.82 | 423.62 | 420.60 | 7.97 | NA | 6.49 | NA | NA | |
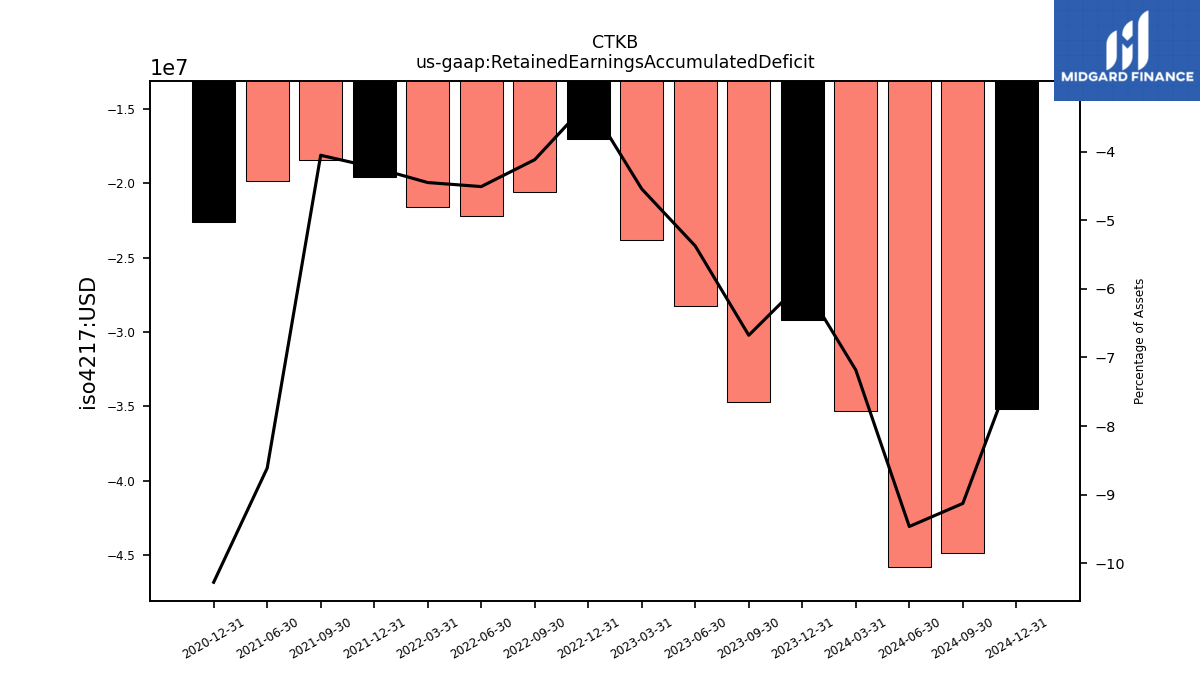
| Retained Earnings Accumulated Deficit | -34.68 | -28.23 | -23.84 | -17.03 | -20.56 | -22.23 | -21.63 | -19.61 | -18.41 | -19.84 | NA | -22.61 | NA | NA | |
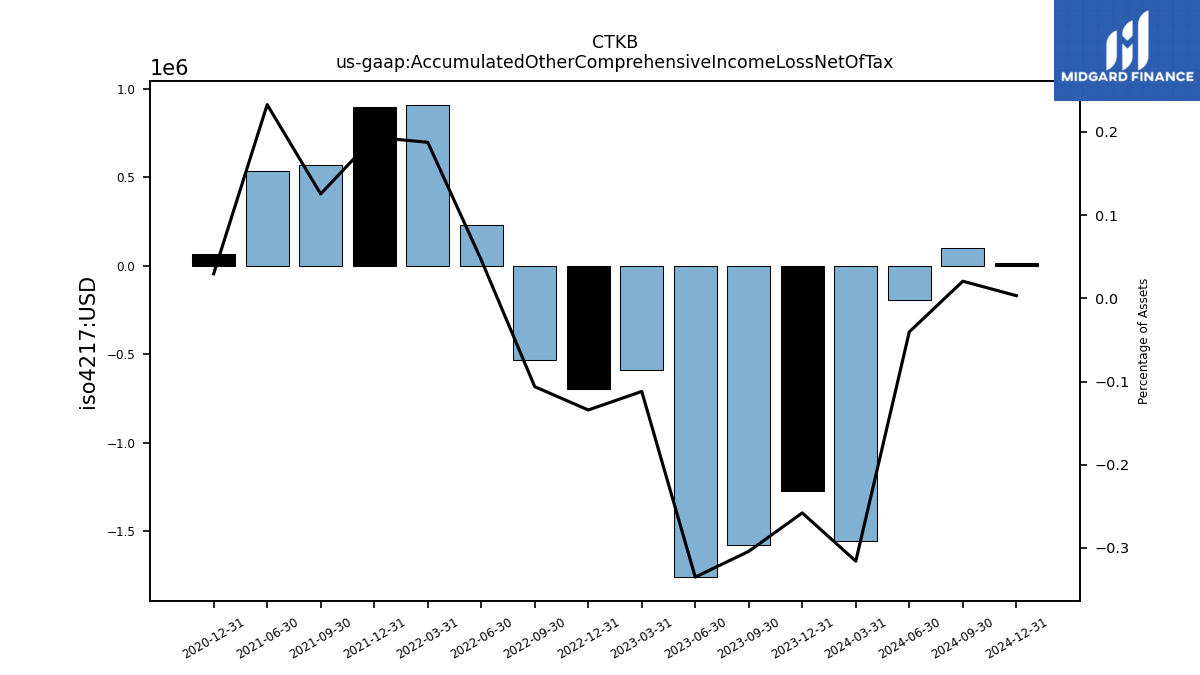
| Accumulated Other Comprehensive Income Loss Net Of Tax | -1.58 | -1.76 | -0.59 | -0.70 | -0.53 | 0.23 | 0.91 | 0.90 | 0.57 | 0.54 | NA | 0.07 | NA | NA | |
| Adjustments To Additional Paid In Capital Sharebased Compensation Requisite Service Period Recognition Value | 5.76 | 5.92 | 4.70 | NA | 4.36 | 3.93 | 3.84 | NA | 2.46 | 0.67 | 0.46 | NA | 0.13 | 0.11 |
| 2023-09-30 | 2023-06-30 | 2023-03-31 | 2022-12-31 | 2022-09-30 | 2022-06-30 | 2022-03-31 | 2021-12-31 | 2021-09-30 | 2021-06-30 | 2021-03-31 | 2020-12-31 | 2020-09-30 | 2020-06-30 | ||
|---|---|---|---|---|---|---|---|---|---|---|---|---|---|---|---|
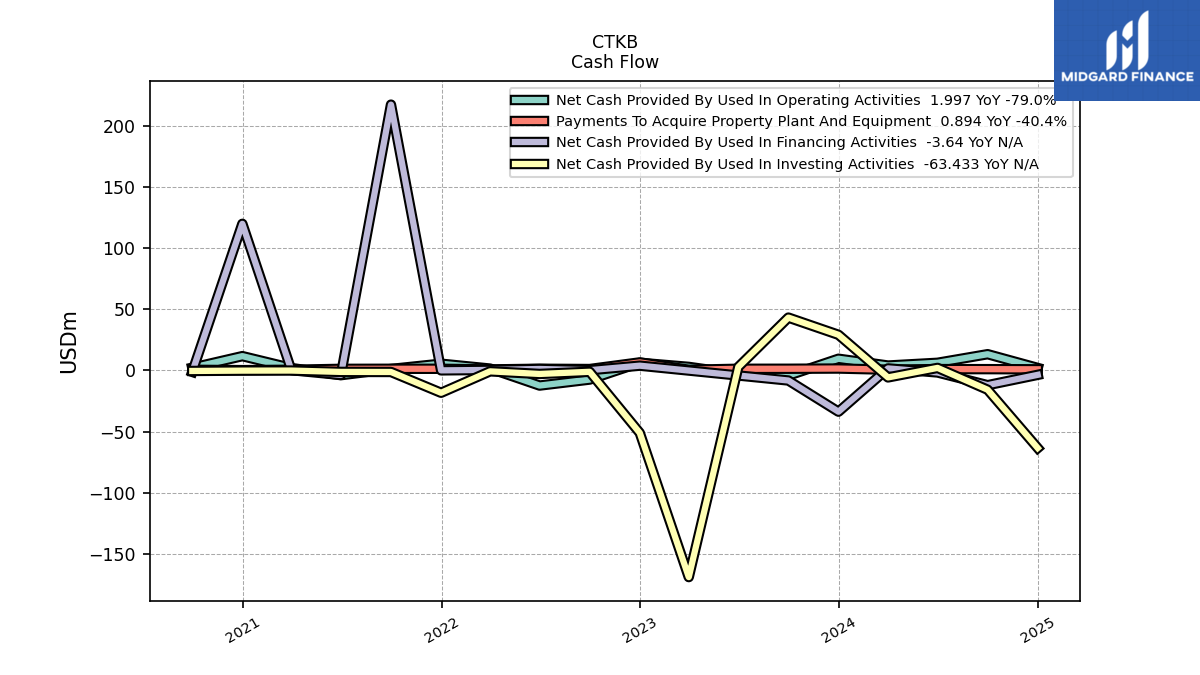
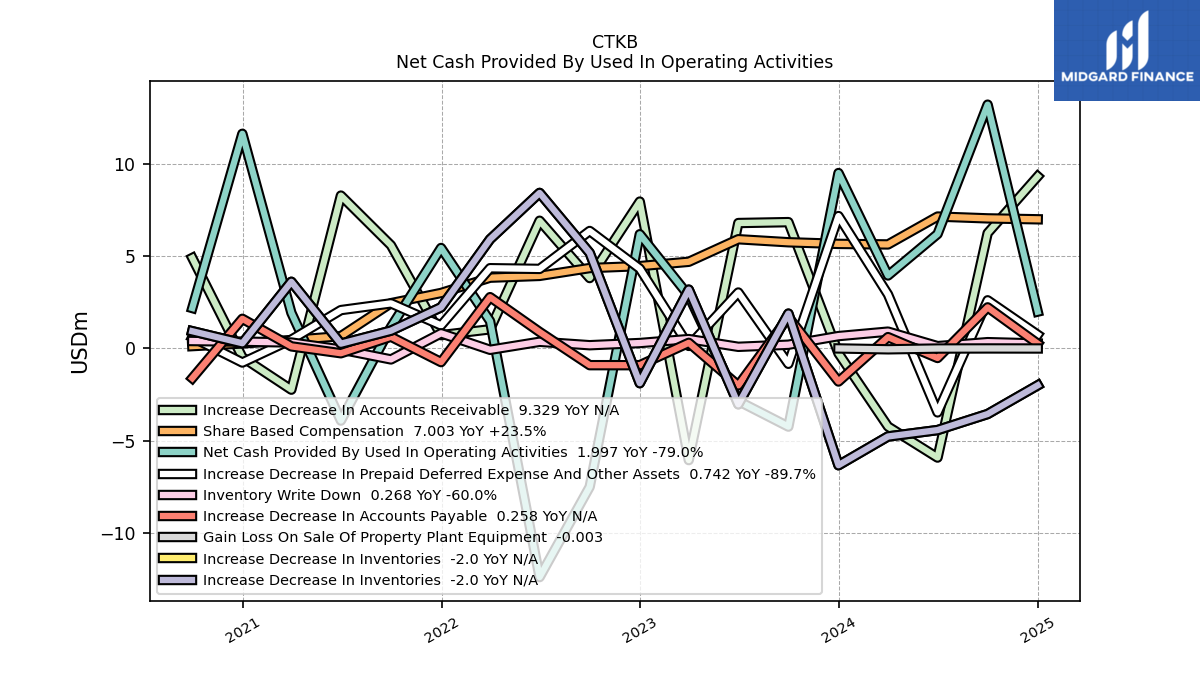
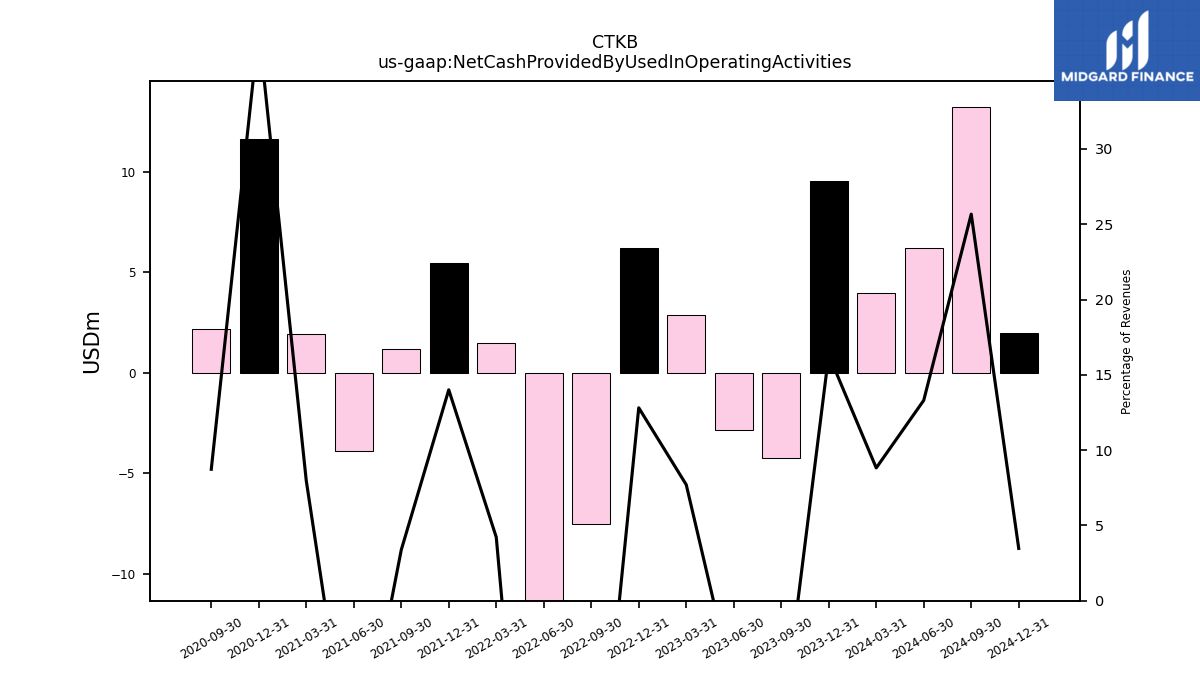
| Net Cash Provided By Used In Operating Activities | -4.24 | -2.85 | 2.86 | 6.19 | -7.50 | -12.40 | 1.48 | 5.45 | 1.16 | -3.91 | 1.94 | 11.64 | 2.19 | NA | |
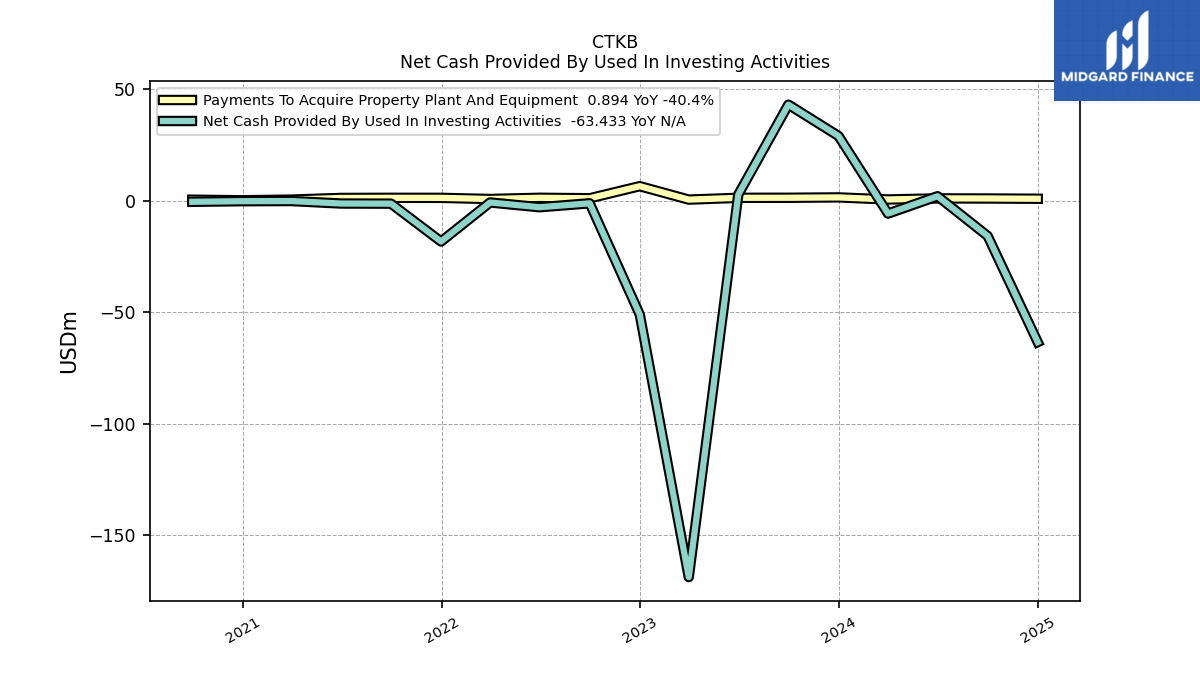
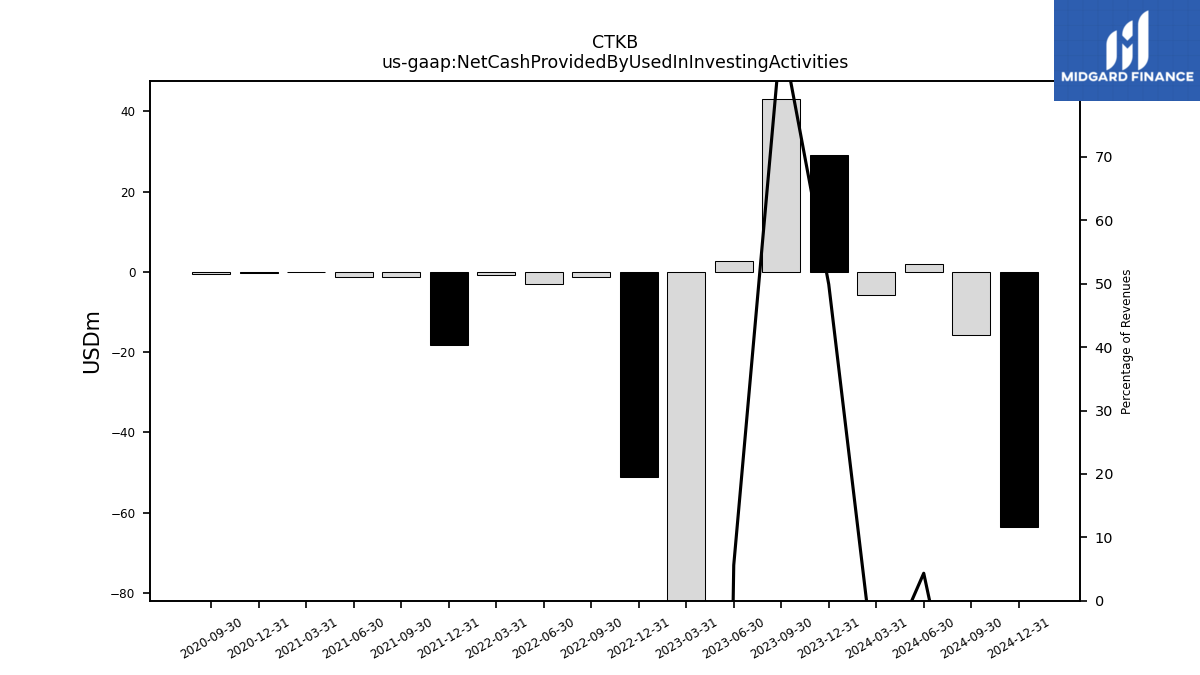
| Net Cash Provided By Used In Investing Activities | 43.12 | 2.79 | -168.87 | -51.06 | -1.15 | -2.92 | -0.78 | -18.30 | -1.31 | -1.25 | -0.14 | -0.20 | -0.47 | NA | |
| Net Cash Provided By Used In Financing Activities | -8.27 | NA | NA | 3.85 | 0.15 | 1.14 | 0.36 | 0.02 | 217.08 | -3.72 | 0.19 | 119.73 | -1.22 | NA |
| 2023-09-30 | 2023-06-30 | 2023-03-31 | 2022-12-31 | 2022-09-30 | 2022-06-30 | 2022-03-31 | 2021-12-31 | 2021-09-30 | 2021-06-30 | 2021-03-31 | 2020-12-31 | 2020-09-30 | 2020-06-30 | ||
|---|---|---|---|---|---|---|---|---|---|---|---|---|---|---|---|
| Net Cash Provided By Used In Operating Activities | -4.24 | -2.85 | 2.86 | 6.19 | -7.50 | -12.40 | 1.48 | 5.45 | 1.16 | -3.91 | 1.94 | 11.64 | 2.19 | NA | |
| Net Income Loss | NA | -4.39 | -6.81 | 3.72 | 1.63 | -0.70 | -2.16 | -1.17 | 1.42 | 2.67 | 0.10 | 5.60 | 6.54 | 8.11 | |
| Profit Loss | -6.46 | -4.39 | -6.81 | 3.72 | 1.63 | -0.70 | -2.16 | -1.17 | 1.42 | 2.67 | 0.10 | 5.60 | 6.54 | NA | |
| Depreciation Depletion And Amortization | 1.77 | 1.65 | 1.00 | 0.76 | 0.07 | 0.86 | 0.79 | 0.69 | 0.19 | 0.20 | 0.17 | 0.16 | 0.18 | NA | |
| Increase Decrease In Accounts Receivable | 6.85 | 6.80 | -6.05 | 7.96 | 3.82 | 6.93 | 1.04 | 0.72 | 5.59 | 8.29 | -2.24 | -0.48 | 4.91 | NA | |
| Increase Decrease In Inventories | 1.89 | -3.03 | 3.19 | -1.88 | 5.18 | 8.43 | 5.92 | 2.23 | 0.96 | 0.26 | 3.61 | 0.28 | 0.94 | NA | |
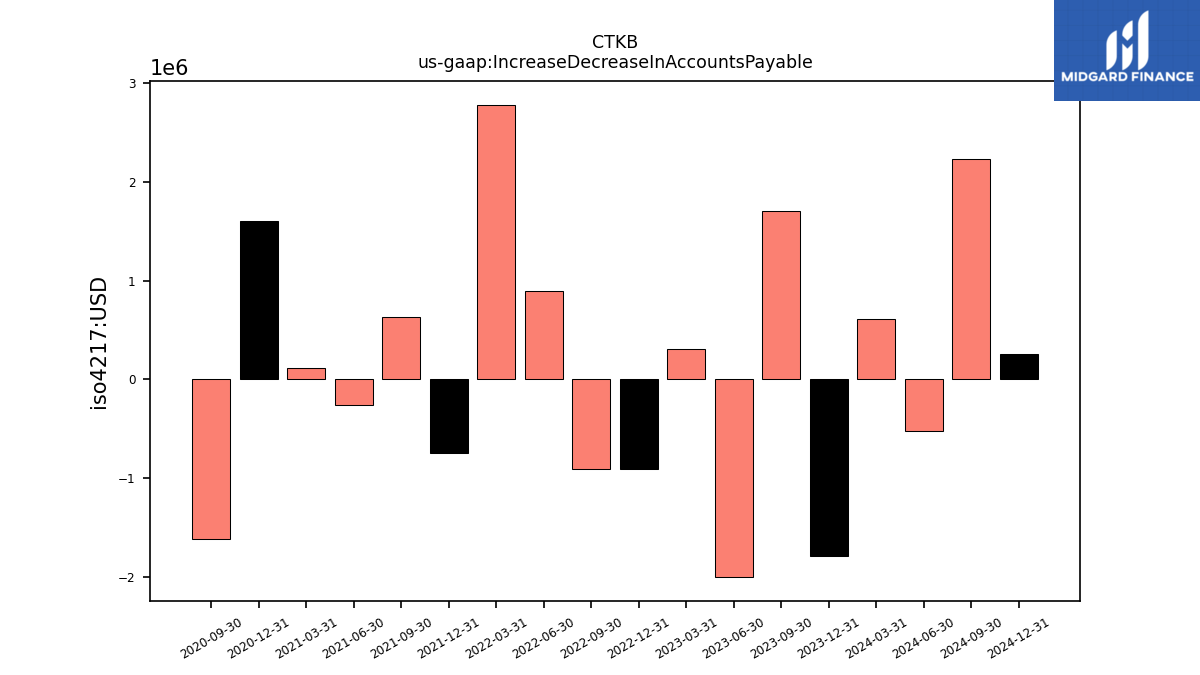
| Increase Decrease In Accounts Payable | 1.71 | -2.00 | 0.30 | -0.91 | -0.91 | 0.90 | 2.78 | -0.74 | 0.64 | -0.26 | 0.11 | 1.61 | -1.61 | NA | |
| Share Based Compensation | 5.76 | 5.92 | 4.70 | 4.46 | 4.36 | 3.93 | 3.84 | 3.01 | 2.46 | 0.67 | 0.46 | 0.27 | 0.13 | NA |
| 2023-09-30 | 2023-06-30 | 2023-03-31 | 2022-12-31 | 2022-09-30 | 2022-06-30 | 2022-03-31 | 2021-12-31 | 2021-09-30 | 2021-06-30 | 2021-03-31 | 2020-12-31 | 2020-09-30 | 2020-06-30 | ||
|---|---|---|---|---|---|---|---|---|---|---|---|---|---|---|---|
| Net Cash Provided By Used In Investing Activities | 43.12 | 2.79 | -168.87 | -51.06 | -1.15 | -2.92 | -0.78 | -18.30 | -1.31 | -1.25 | -0.14 | -0.20 | -0.47 | NA | |
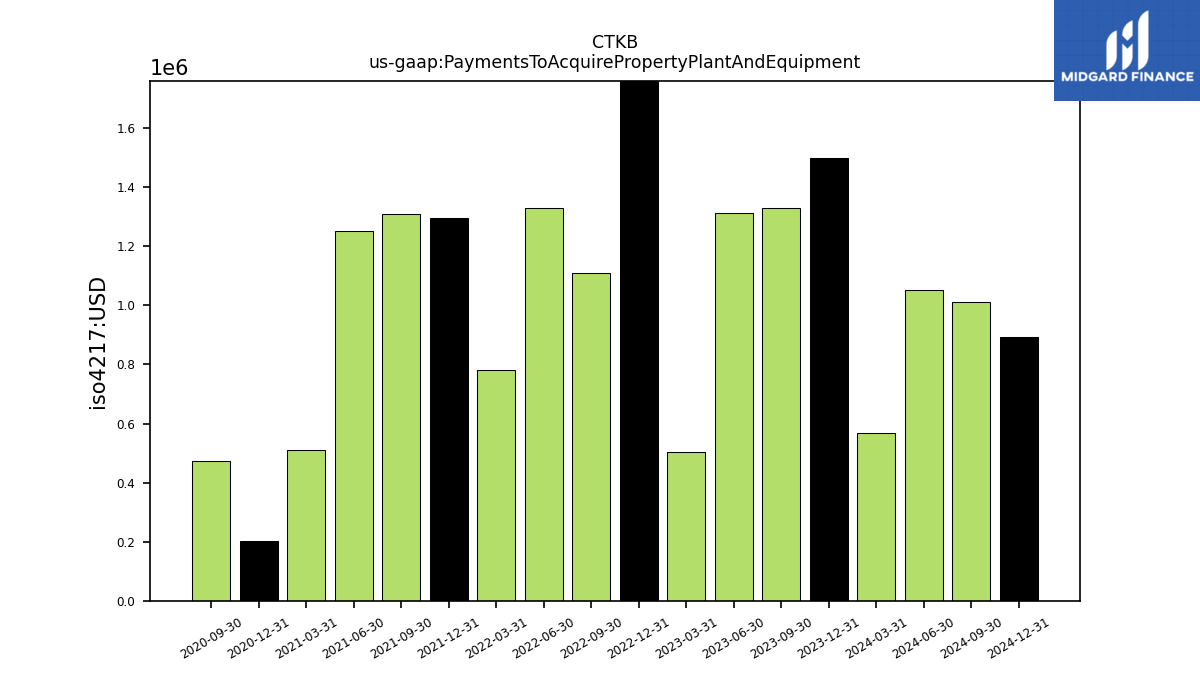
| Payments To Acquire Property Plant And Equipment | 1.33 | 1.31 | 0.51 | 6.53 | 1.11 | 1.33 | 0.78 | 1.30 | 1.31 | 1.25 | 0.51 | 0.20 | 0.47 | NA |
| 2023-09-30 | 2023-06-30 | 2023-03-31 | 2022-12-31 | 2022-09-30 | 2022-06-30 | 2022-03-31 | 2021-12-31 | 2021-09-30 | 2021-06-30 | 2021-03-31 | 2020-12-31 | 2020-09-30 | 2020-06-30 | ||
|---|---|---|---|---|---|---|---|---|---|---|---|---|---|---|---|
| Net Cash Provided By Used In Financing Activities | -8.27 | NA | NA | 3.85 | 0.15 | 1.14 | 0.36 | 0.02 | 217.08 | -3.72 | 0.19 | 119.73 | -1.22 | NA |
| 2023-09-30 | 2023-06-30 | 2023-03-31 | 2022-12-31 | 2022-09-30 | 2022-06-30 | 2022-03-31 | 2021-12-31 | 2021-09-30 | 2021-06-30 | 2021-03-31 | 2020-12-31 | 2020-09-30 | 2020-06-30 | ||
|---|---|---|---|---|---|---|---|---|---|---|---|---|---|---|---|
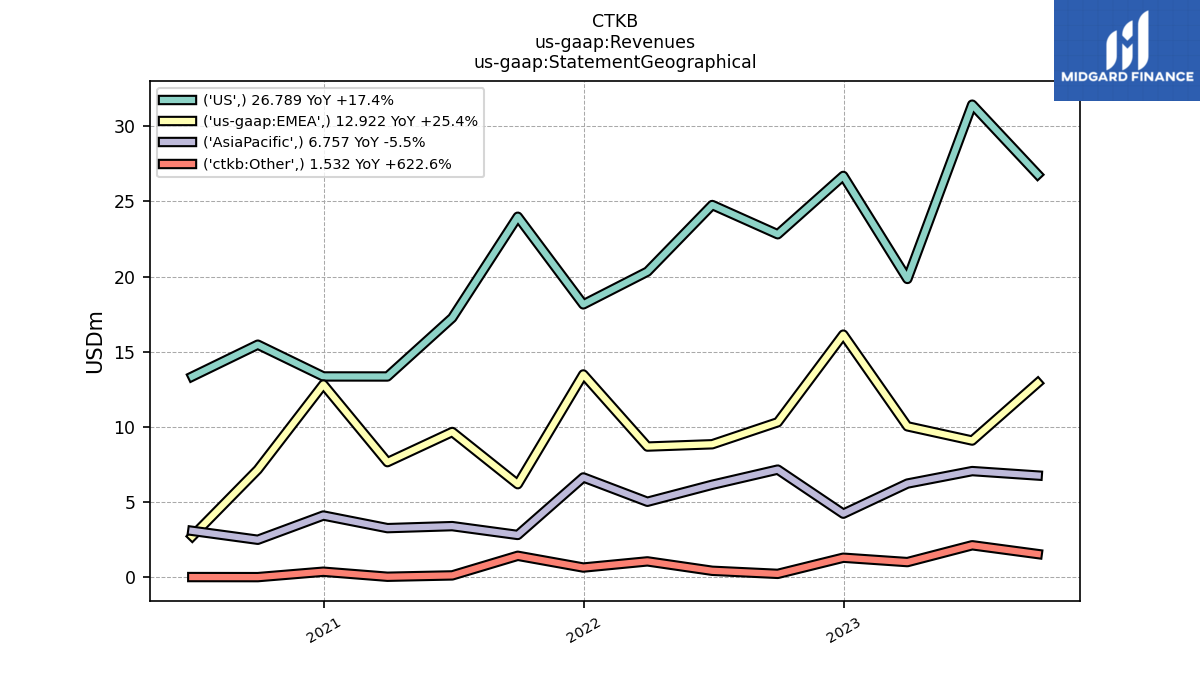
| Revenues | 48.00 | 49.69 | 37.09 | 48.34 | 40.48 | 40.16 | 35.06 | 38.89 | 34.38 | 30.41 | 24.27 | 30.62 | 25.10 | 19.14 | |
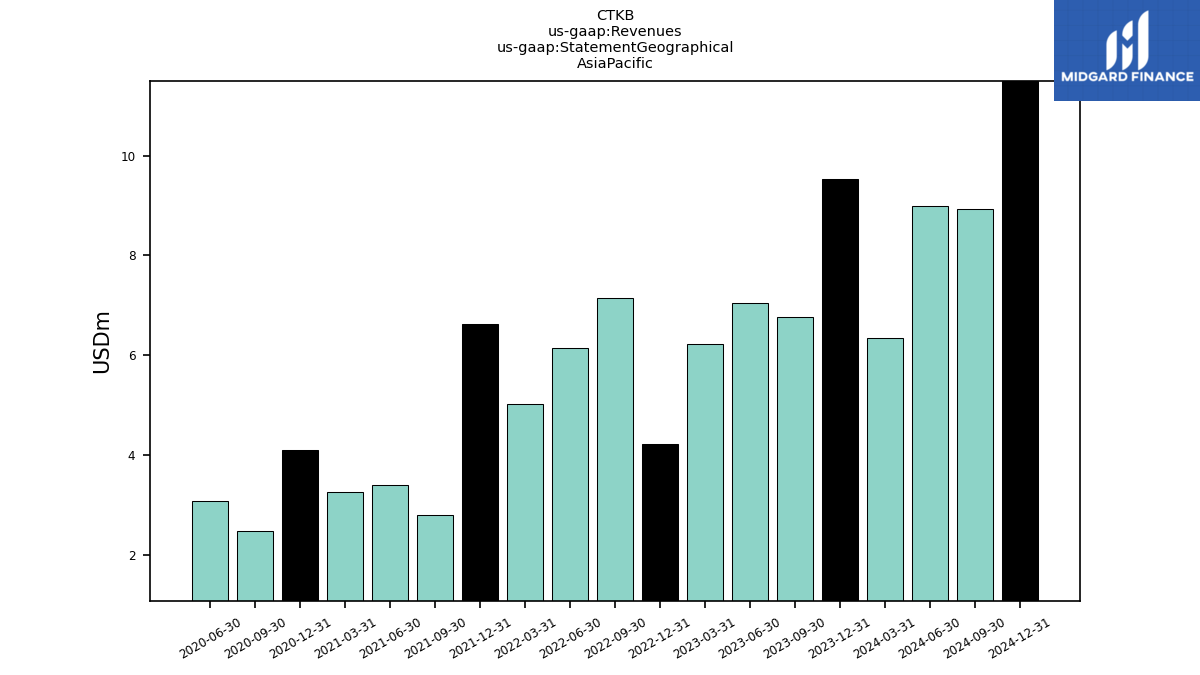
| 6.76 | 7.05 | 6.22 | 4.22 | 7.15 | 6.14 | 5.01 | 6.63 | 2.80 | 3.39 | 3.26 | 4.10 | 2.48 | 3.08 | ||
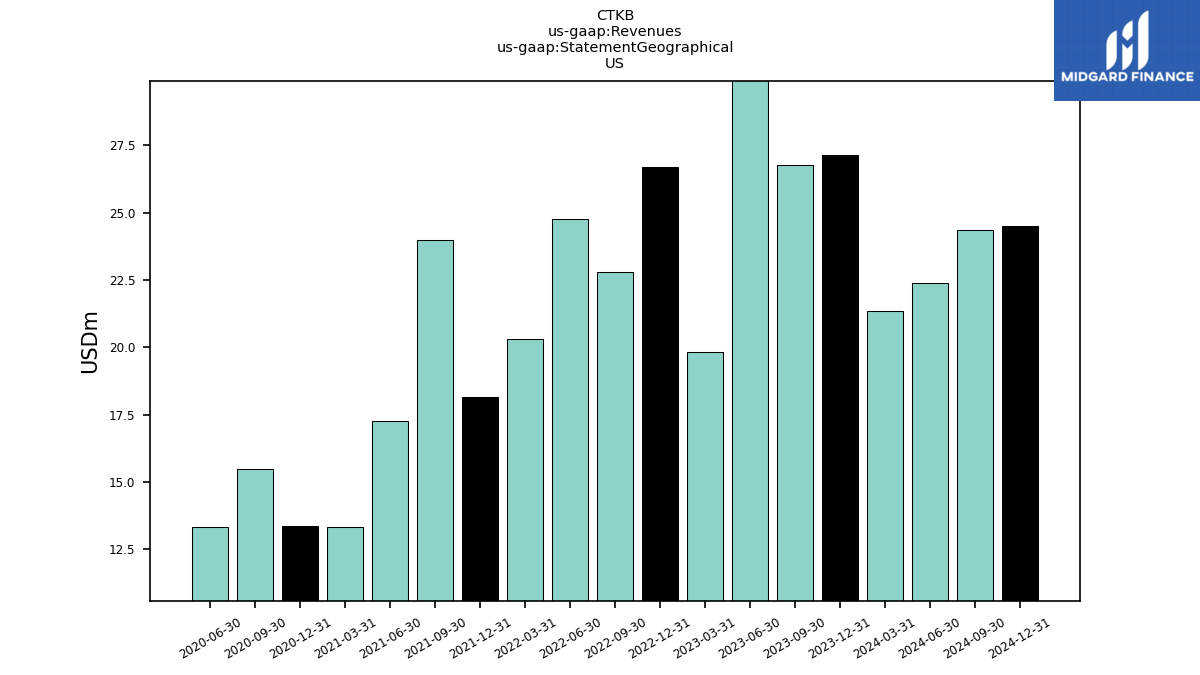
| US | 26.79 | 31.44 | 19.84 | 26.70 | 22.81 | 24.76 | 20.32 | 18.14 | 23.98 | 17.25 | 13.35 | 13.35 | 15.47 | 13.35 | |
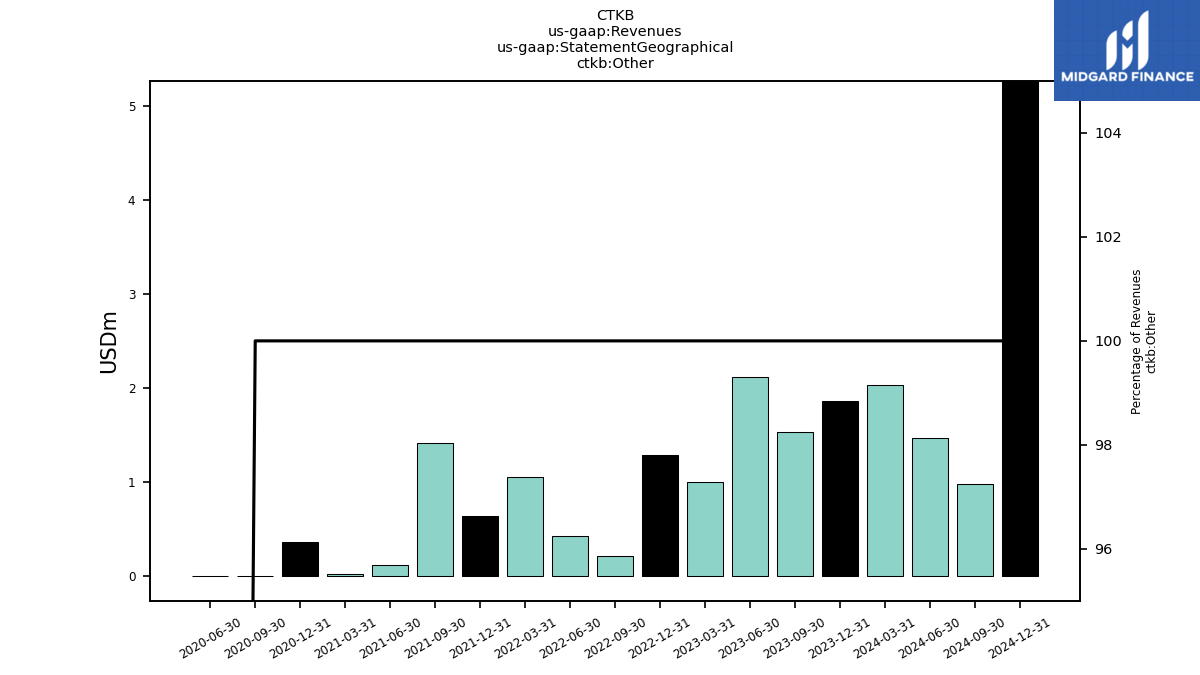
| Other | 1.53 | 2.12 | 1.00 | 1.29 | 0.21 | 0.42 | 1.04 | 0.63 | 1.42 | 0.11 | 0.02 | 0.36 | -0.00 | 0.00 | |
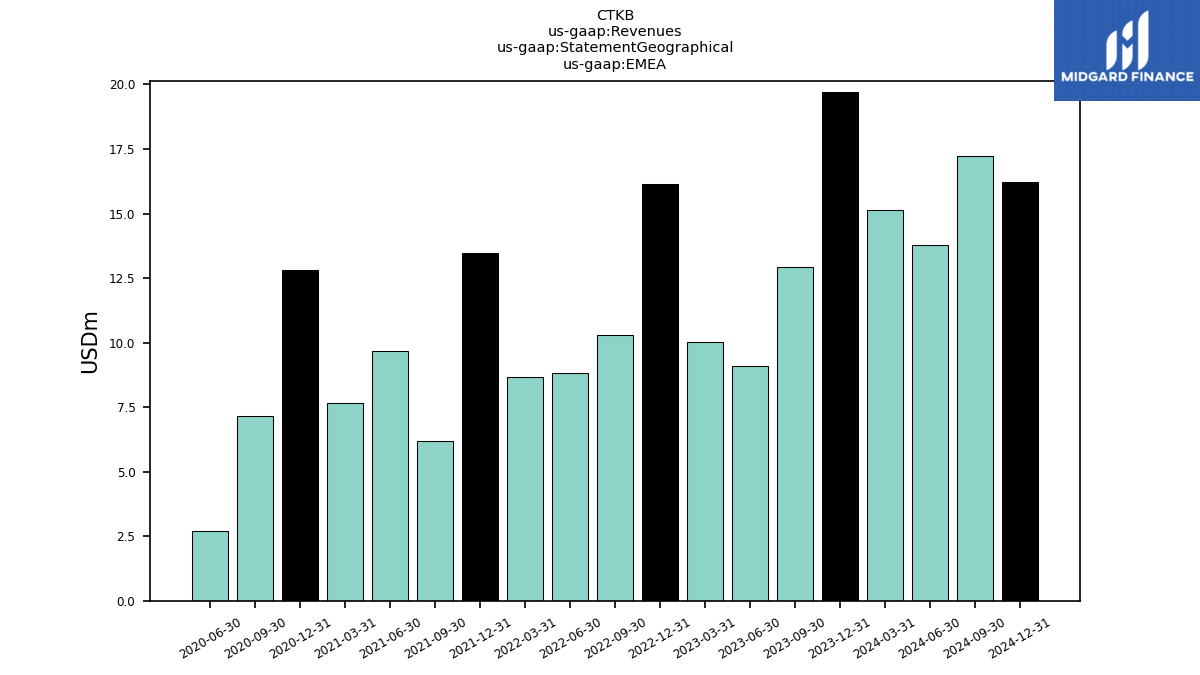
| EMEA | 12.92 | 9.08 | 10.03 | 16.14 | 10.30 | 8.84 | 8.68 | 13.48 | 6.18 | 9.66 | 7.65 | 12.81 | 7.15 | 2.71 | |
| Revenue From Contract With Customer Excluding Assessed Tax | 48.00 | 49.69 | 37.09 | 48.34 | 40.48 | 40.16 | 35.06 | 38.89 | 34.38 | 30.41 | 24.27 | 30.62 | 25.10 | 19.14 | |
| Customer Mix | NA | 49.69 | 37.09 | 48.34 | 40.48 | 40.16 | 35.06 | 38.89 | 34.38 | 30.41 | NA | NA | NA | NA | |
| Sales Channel Mix | NA | 49.69 | 37.09 | 48.34 | 40.48 | 40.16 | 35.06 | 38.89 | 34.38 | 30.41 | NA | NA | NA | NA | |
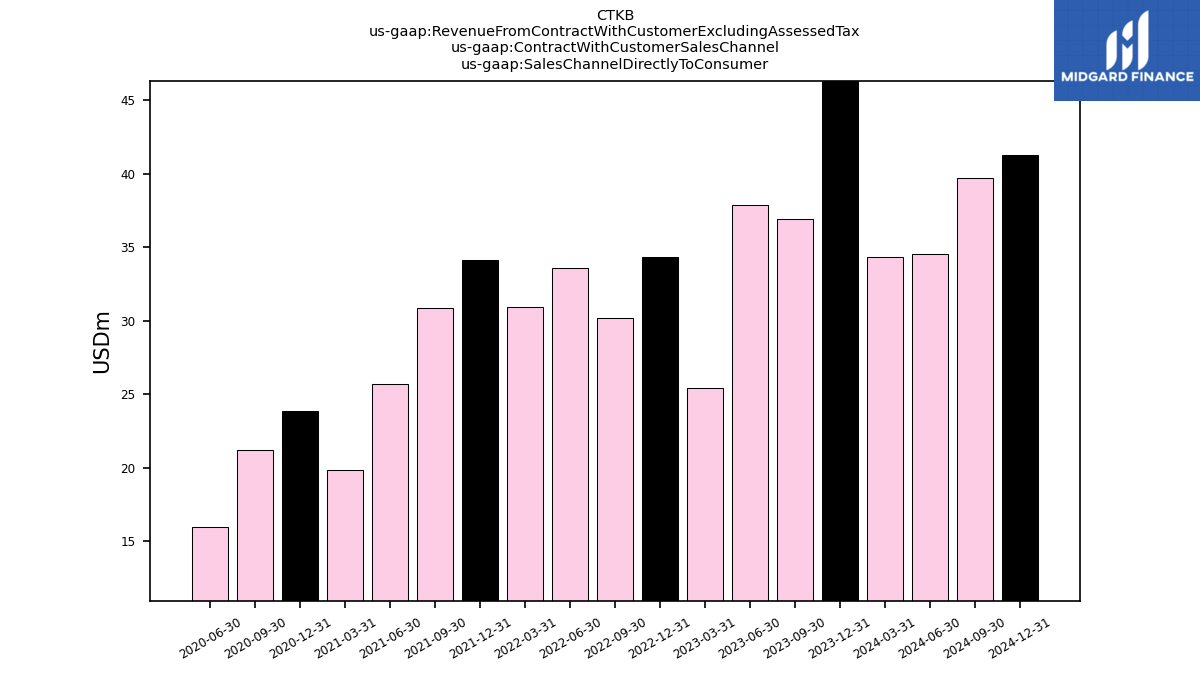
| Sales Channel Directly To Consumer | 36.92 | 37.85 | 25.45 | 34.37 | 30.20 | 33.60 | 30.92 | 34.11 | 30.84 | 25.70 | 19.86 | 23.87 | 21.20 | 16.01 | |
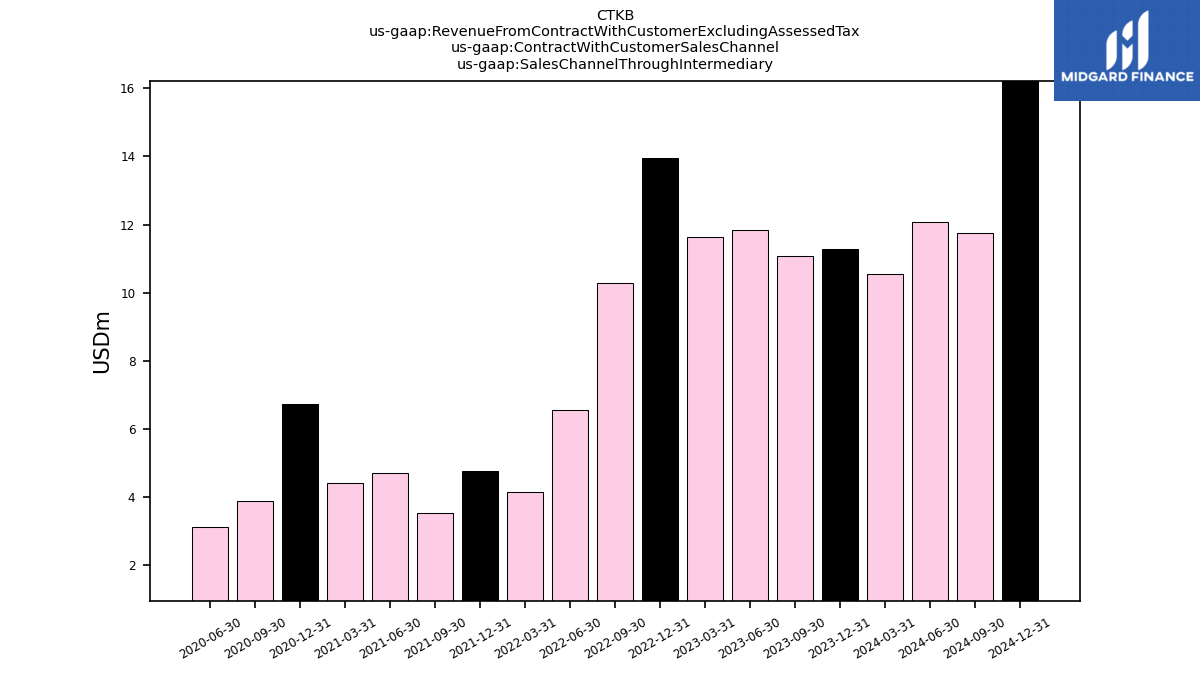
| Sales Channel Through Intermediary | 11.08 | 11.84 | 11.63 | 13.96 | 10.27 | 6.56 | 4.14 | 4.78 | 3.54 | 4.71 | 4.41 | 6.75 | 3.90 | 3.13 | |
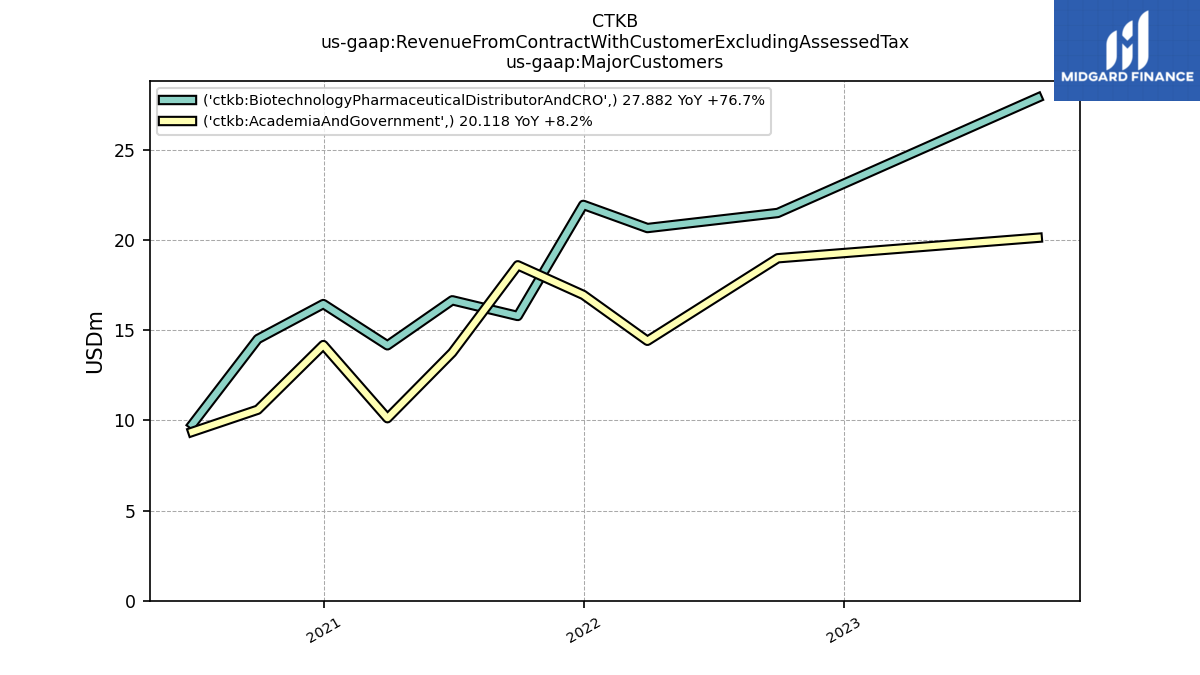
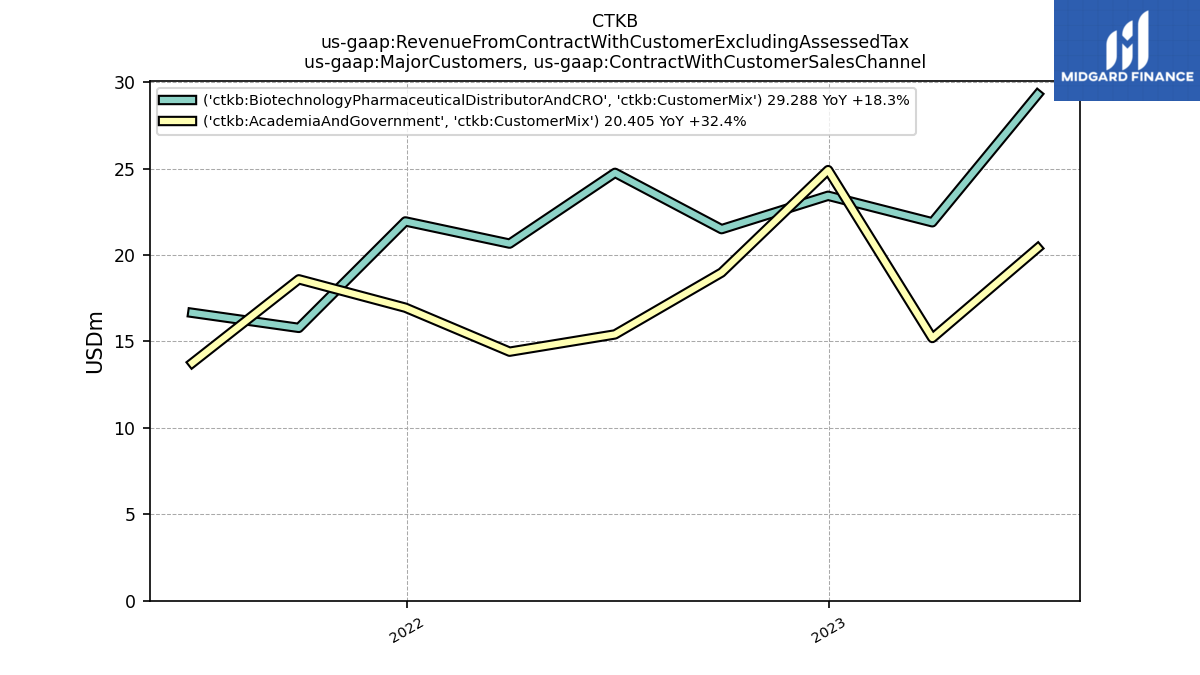
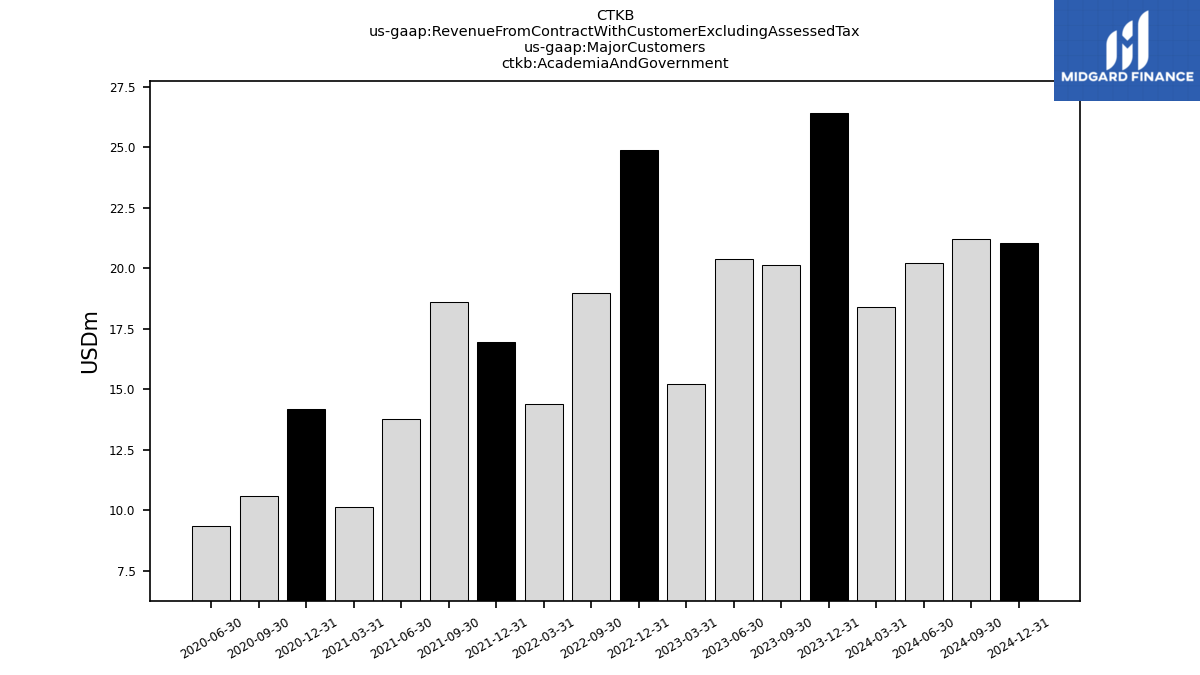
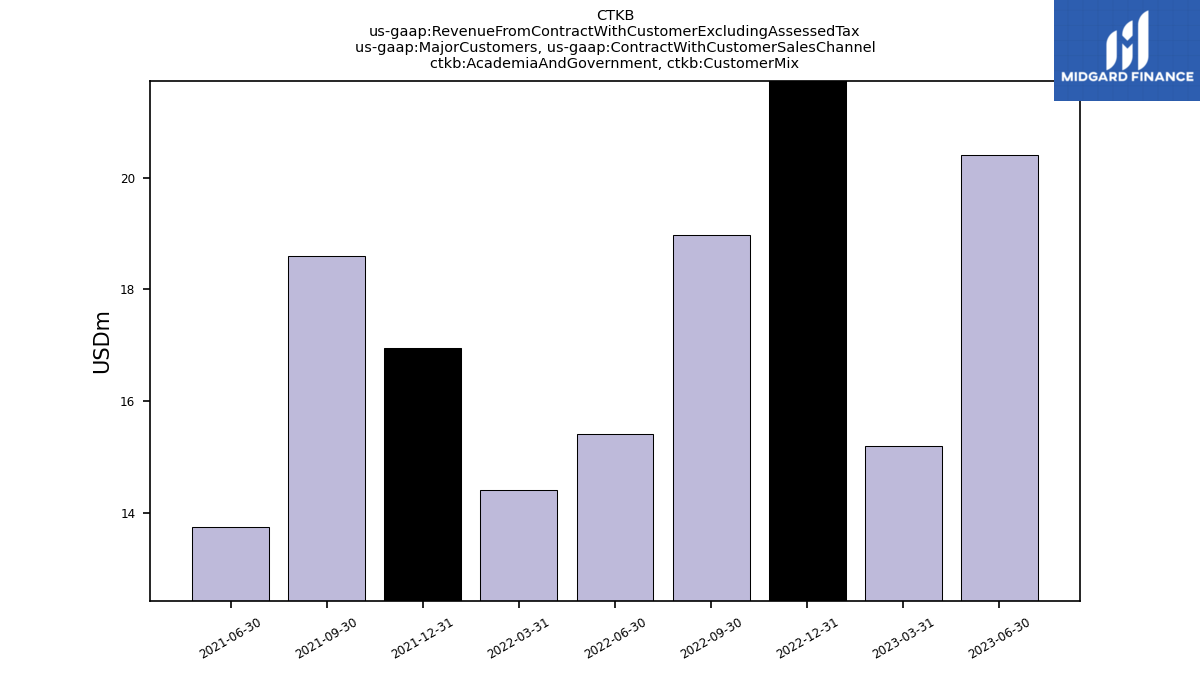
| Academia And Government | 20.12 | NA | NA | NA | 18.98 | NA | 14.41 | 16.95 | 18.59 | 13.75 | 10.12 | 14.17 | 10.59 | 9.36 | |
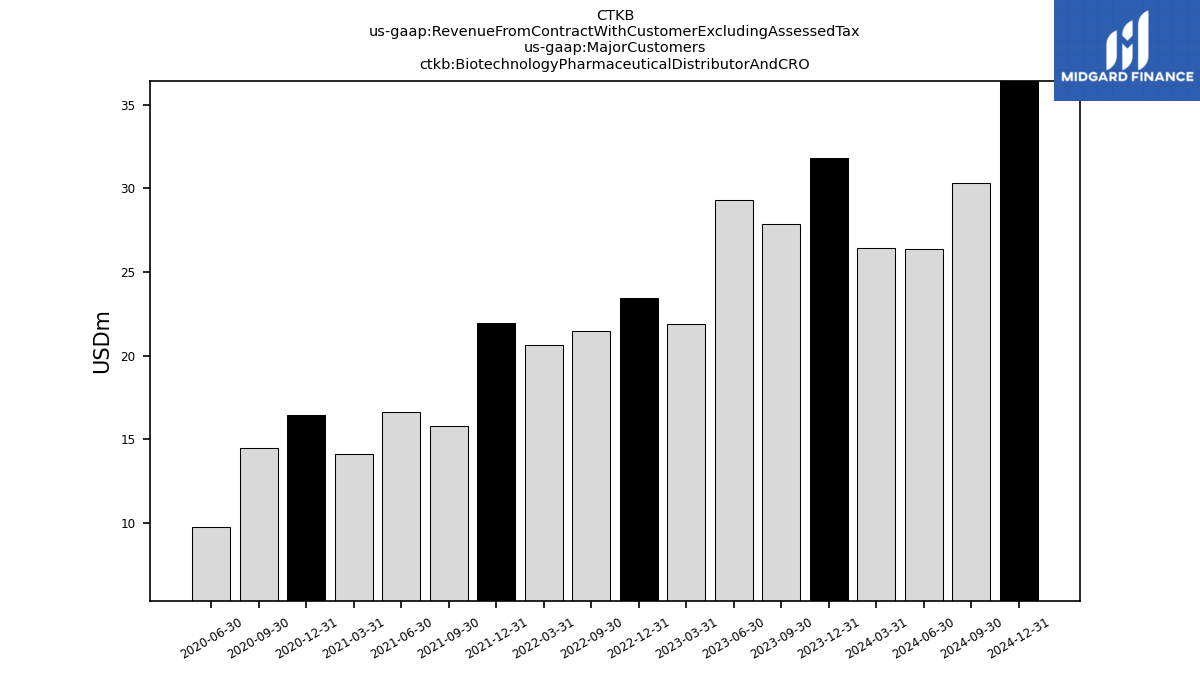
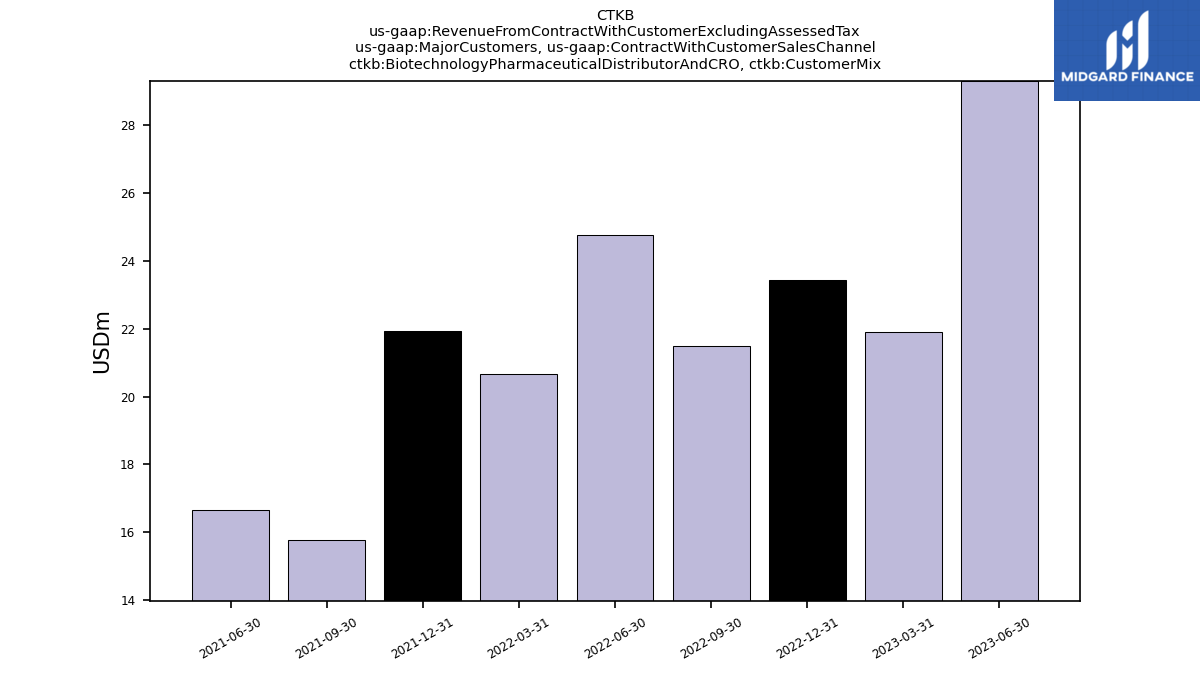
| Biotechnology Pharmaceutical Distributor And C R O | 27.88 | NA | NA | NA | 21.49 | NA | 20.66 | 21.94 | 15.78 | 16.65 | 14.16 | 16.45 | 14.51 | 9.77 | |
| Academia And Government, Customer Mix | NA | 20.41 | 15.20 | 24.91 | 18.98 | 15.41 | 14.41 | 16.95 | 18.59 | 13.75 | NA | NA | NA | NA | |
| Biotechnology Pharmaceutical Distributor And C R O, Customer Mix | NA | 29.29 | 21.89 | 23.43 | 21.49 | 24.75 | 20.66 | 21.94 | 15.78 | 16.65 | NA | NA | NA | NA | |
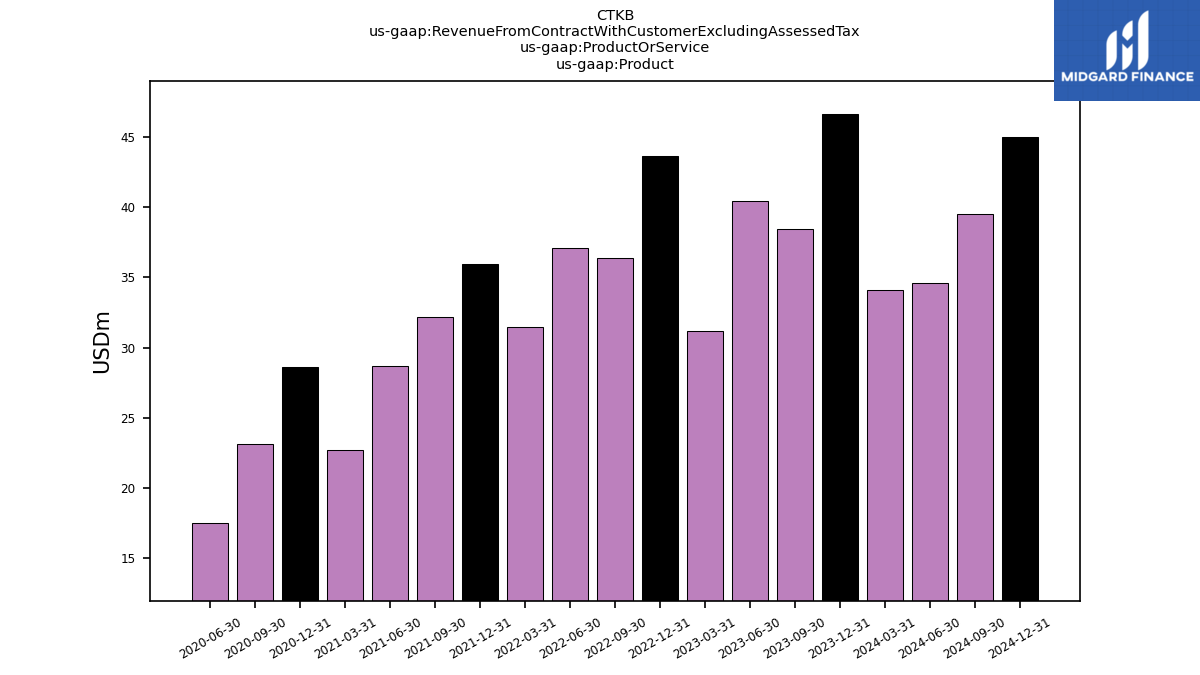
| Product | 38.44 | 40.45 | 31.17 | 43.64 | 36.39 | 37.09 | 31.48 | 35.95 | 32.19 | 28.68 | 22.70 | 28.59 | 23.15 | 17.47 | |
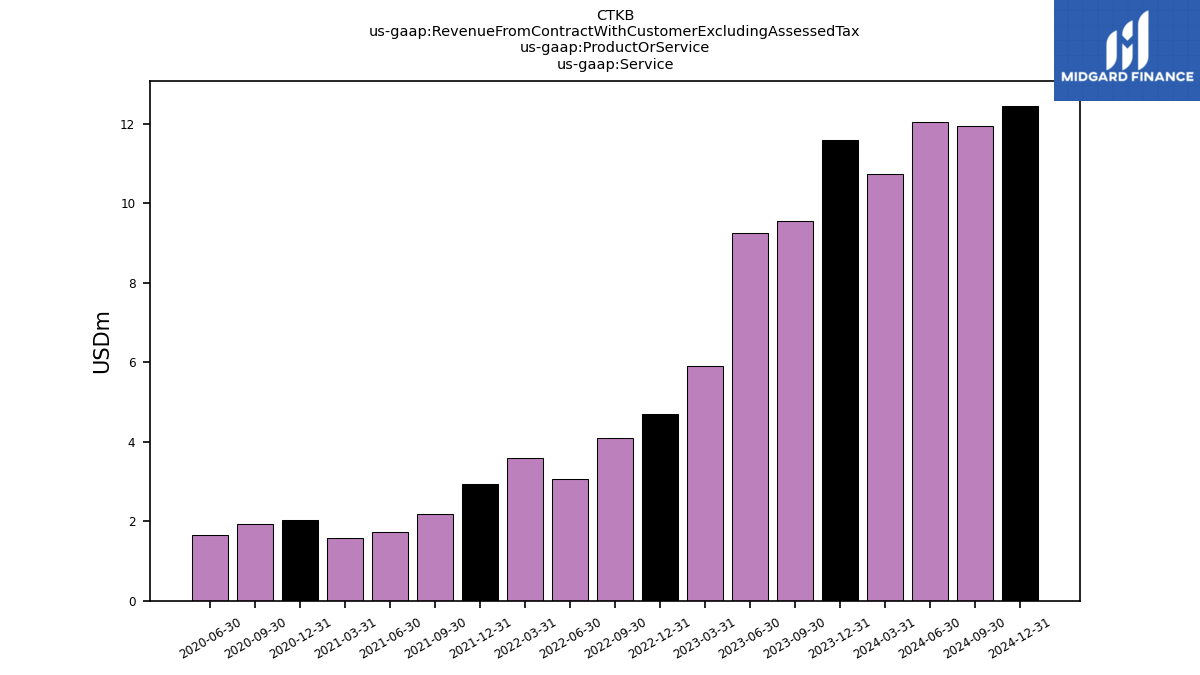
| Service | 9.56 | 9.24 | 5.92 | 4.70 | 4.09 | 3.07 | 3.58 | 2.94 | 2.19 | 1.73 | 1.57 | 2.02 | 1.94 | 1.67 | |
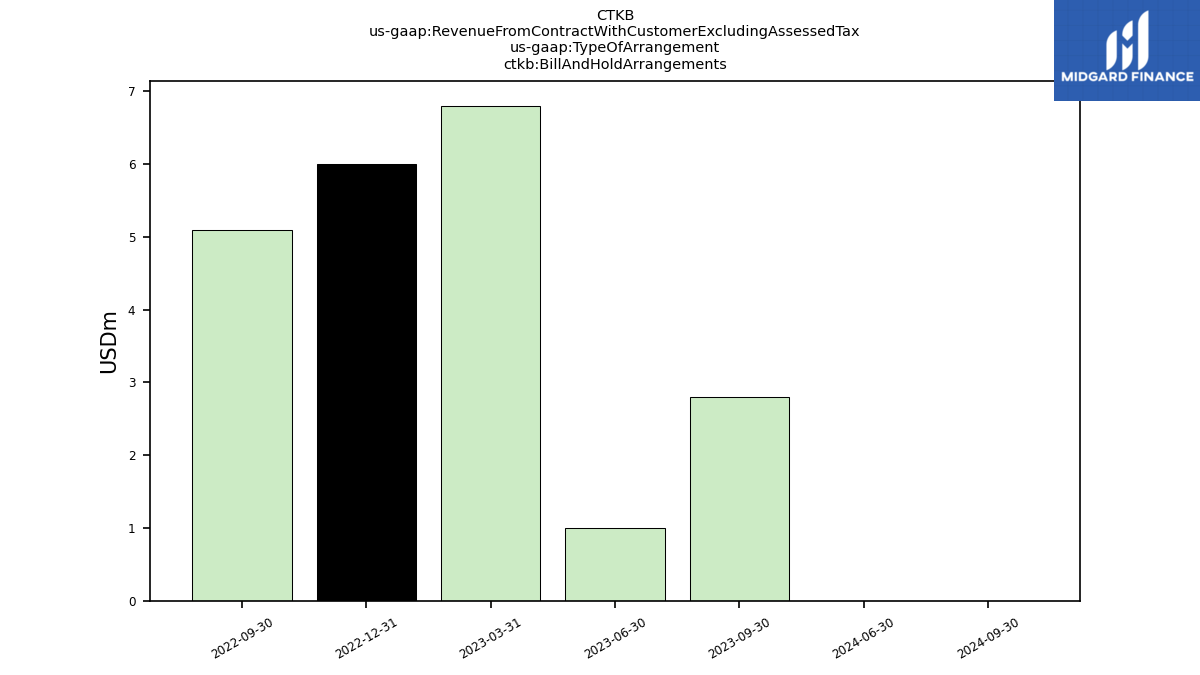
| Bill And Hold Arrangements | NA | NA | NA | 6.00 | 5.10 | NA | NA | NA | NA | NA | NA | NA | NA | NA |

