
| 2023-12-31 | 2023-09-30 | 2023-06-30 | 2023-03-31 | 2022-12-31 | 2022-09-30 | 2022-06-30 | 2022-03-31 | 2021-12-31 | 2021-09-30 | 2021-06-30 | 2021-03-31 | 2020-12-31 | 2020-09-30 | 2020-06-30 | 2020-03-31 | 2019-12-31 | 2019-09-30 | 2019-06-30 | 2019-03-31 | 2018-12-31 | 2018-09-30 | 2018-06-30 | 2018-03-31 | 2017-12-31 | 2017-09-30 | 2017-06-30 | 2017-03-31 | 2016-12-31 | 2016-09-30 | 2016-06-30 | 2016-03-31 | ||
|---|---|---|---|---|---|---|---|---|---|---|---|---|---|---|---|---|---|---|---|---|---|---|---|---|---|---|---|---|---|---|---|---|---|
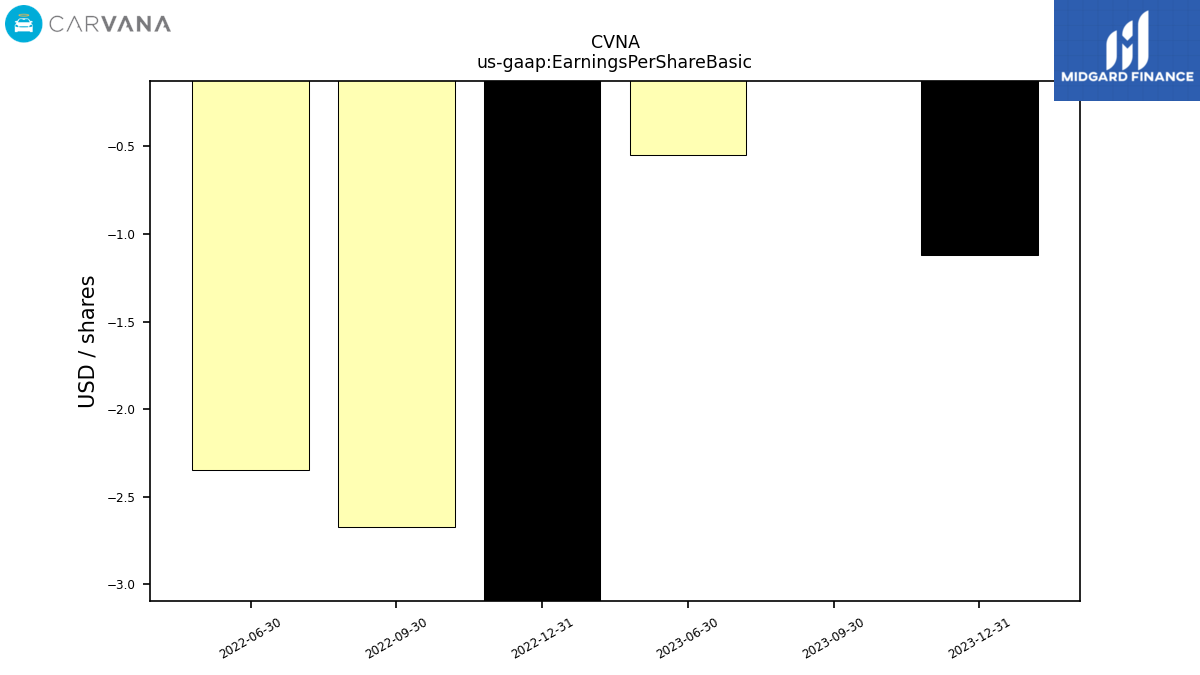
| Earnings Per Share Basic | -1.12 | 7.05 | -0.55 | NA | -7.86 | -2.67 | -2.35 | NA | NA | NA | NA | NA | NA | NA | NA | NA | NA | NA | NA | NA | NA | NA | NA | NA | NA | NA | NA | NA | NA | NA | NA | NA | |
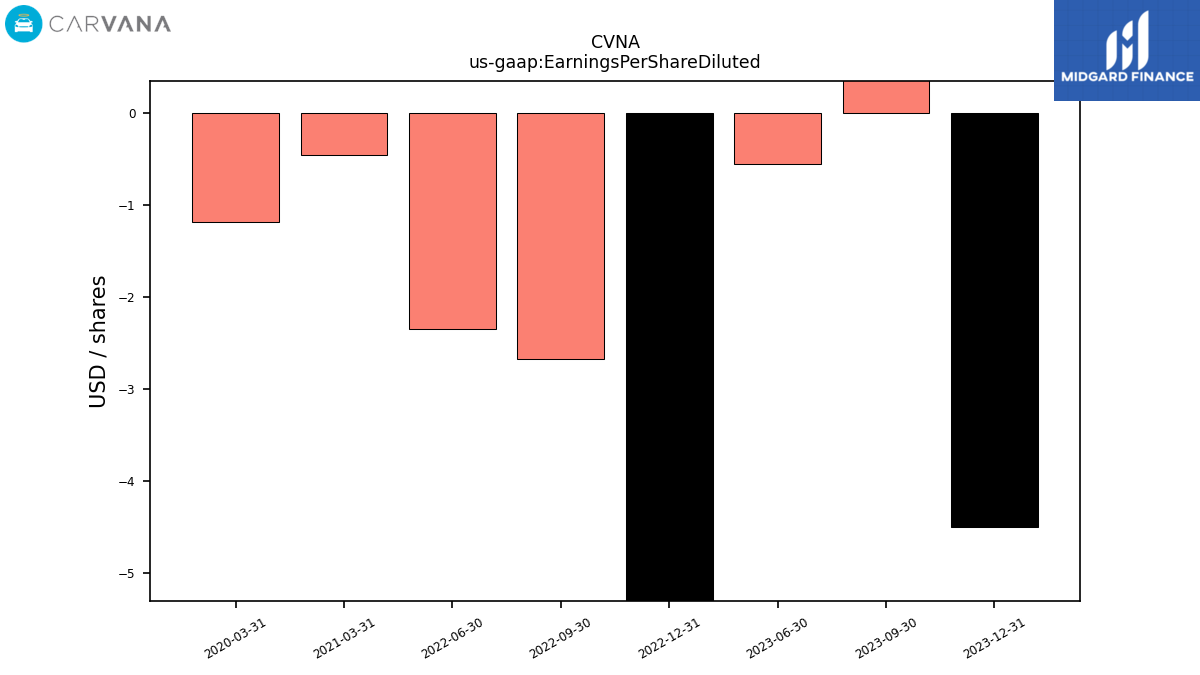
| Earnings Per Share Diluted | -4.49 | 7.05 | -0.55 | NA | -7.86 | -2.67 | -2.35 | NA | NA | NA | NA | -0.46 | NA | NA | NA | -1.19 | NA | NA | NA | NA | NA | NA | NA | NA | NA | NA | NA | NA | NA | NA | NA | NA |
| 2023-12-31 | 2023-09-30 | 2023-06-30 | 2023-03-31 | 2022-12-31 | 2022-09-30 | 2022-06-30 | 2022-03-31 | 2021-12-31 | 2021-09-30 | 2021-06-30 | 2021-03-31 | 2020-12-31 | 2020-09-30 | 2020-06-30 | 2020-03-31 | 2019-12-31 | 2019-09-30 | 2019-06-30 | 2019-03-31 | 2018-12-31 | 2018-09-30 | 2018-06-30 | 2018-03-31 | 2017-12-31 | 2017-09-30 | 2017-06-30 | 2017-03-31 | 2016-12-31 | 2016-09-30 | 2016-06-30 | 2016-03-31 | ||
|---|---|---|---|---|---|---|---|---|---|---|---|---|---|---|---|---|---|---|---|---|---|---|---|---|---|---|---|---|---|---|---|---|---|
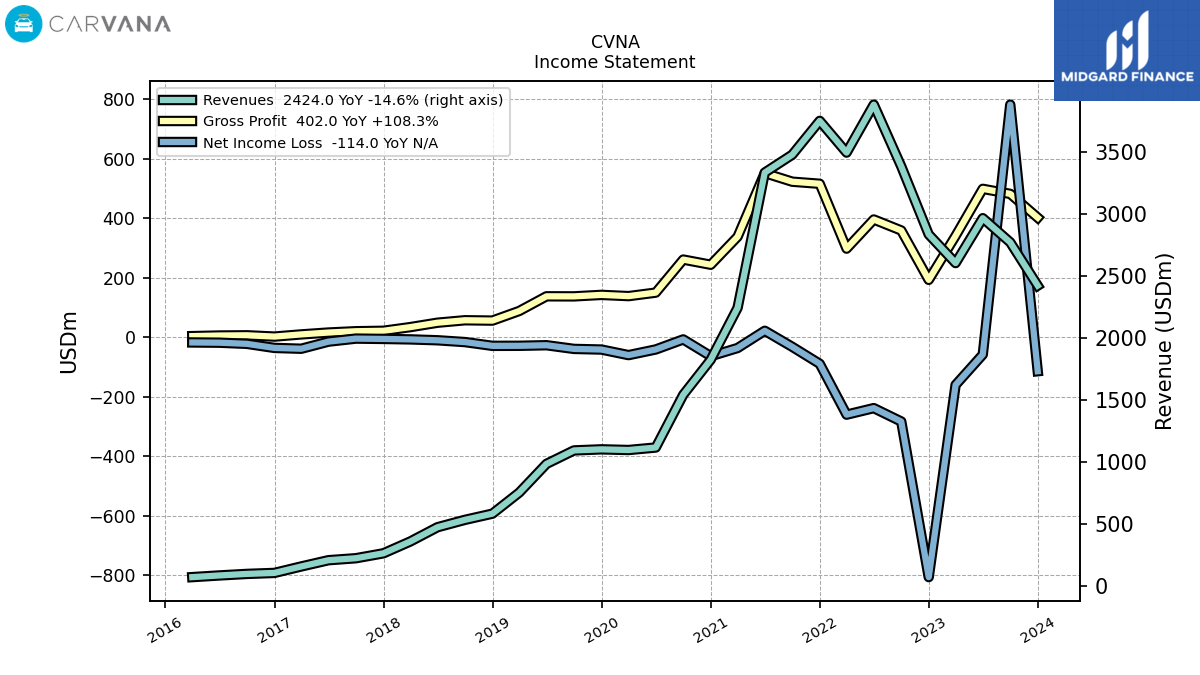
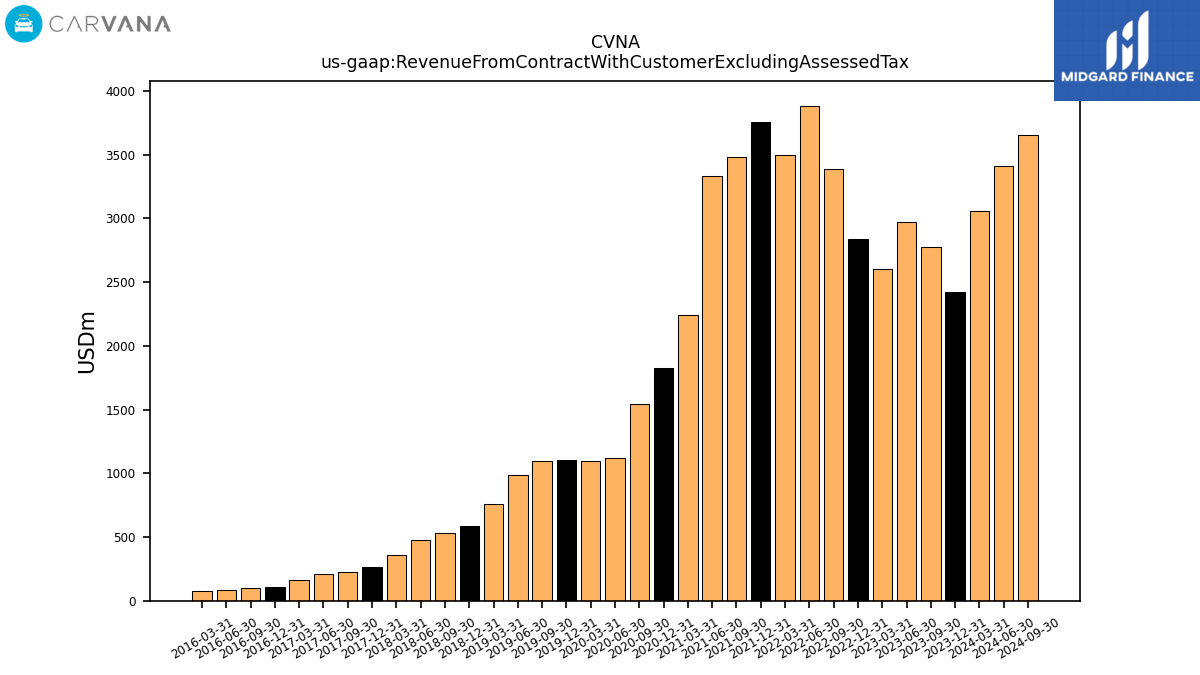
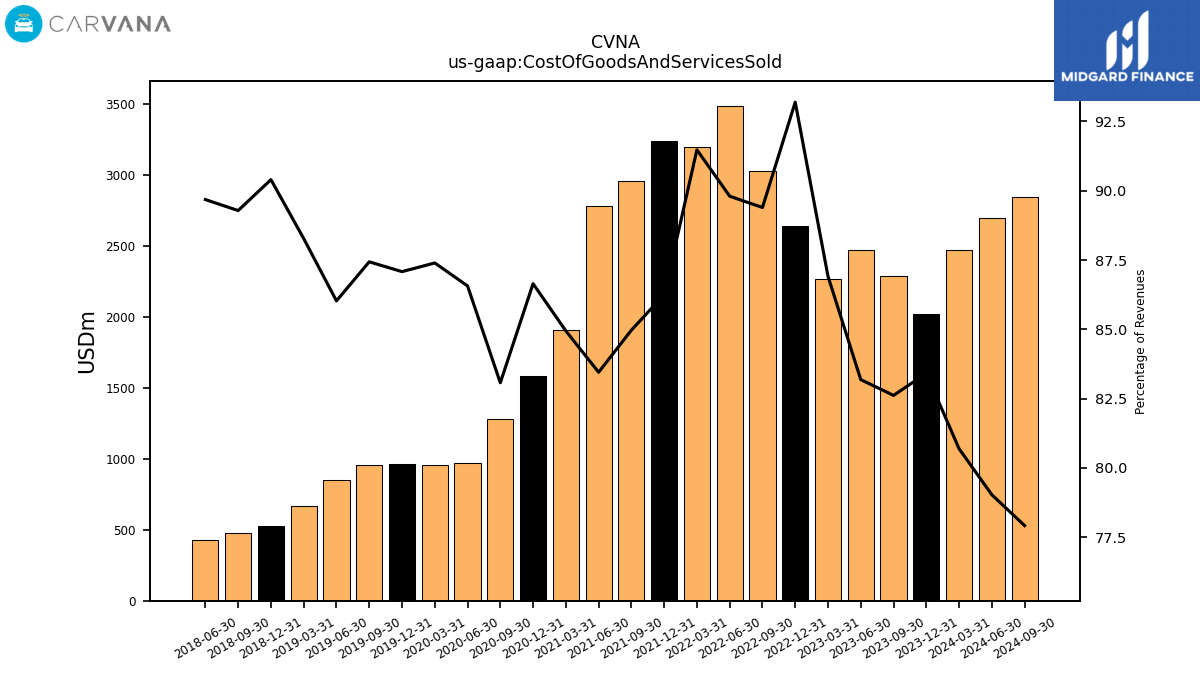
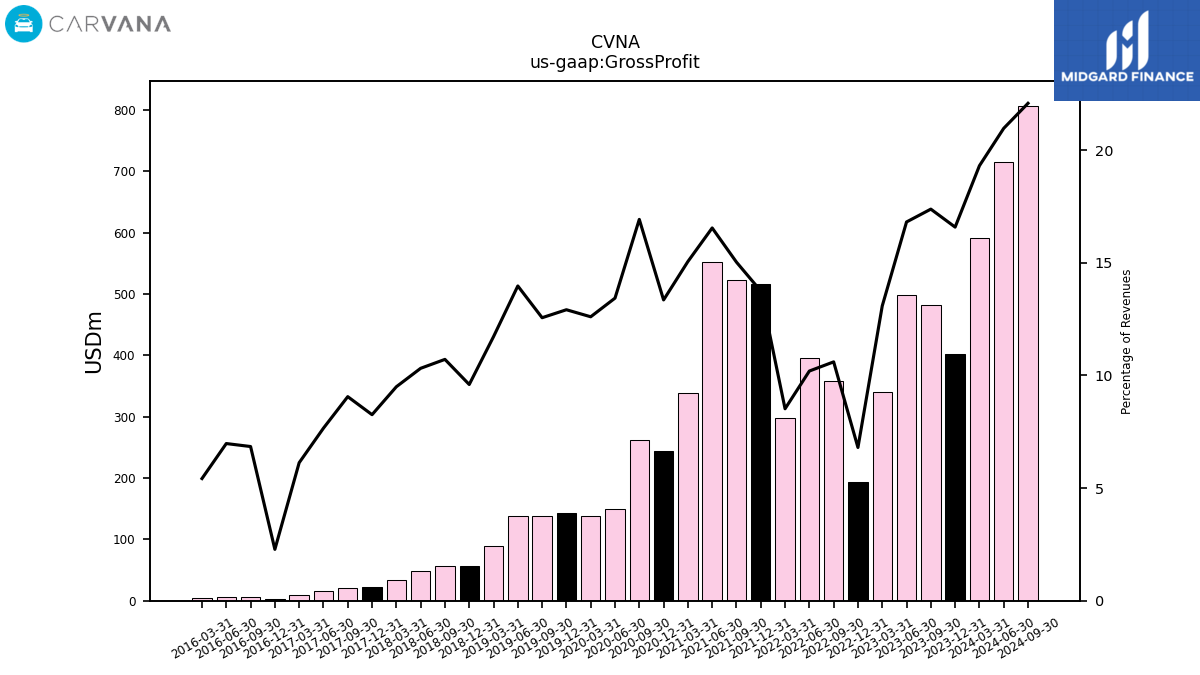
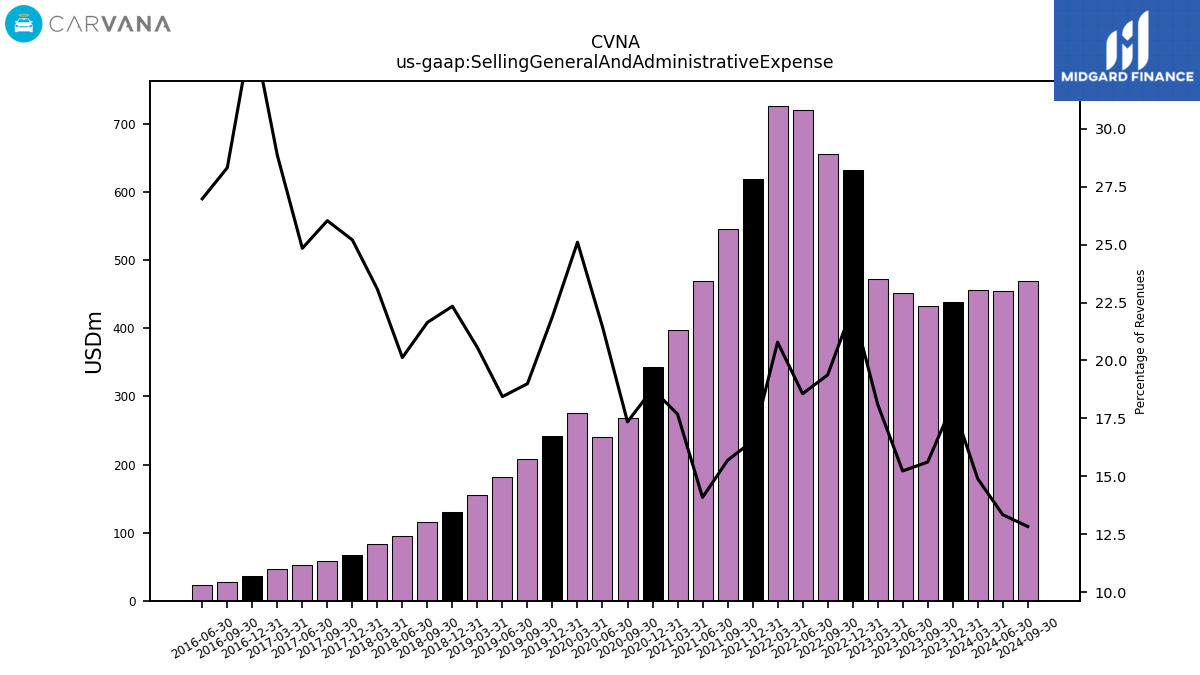
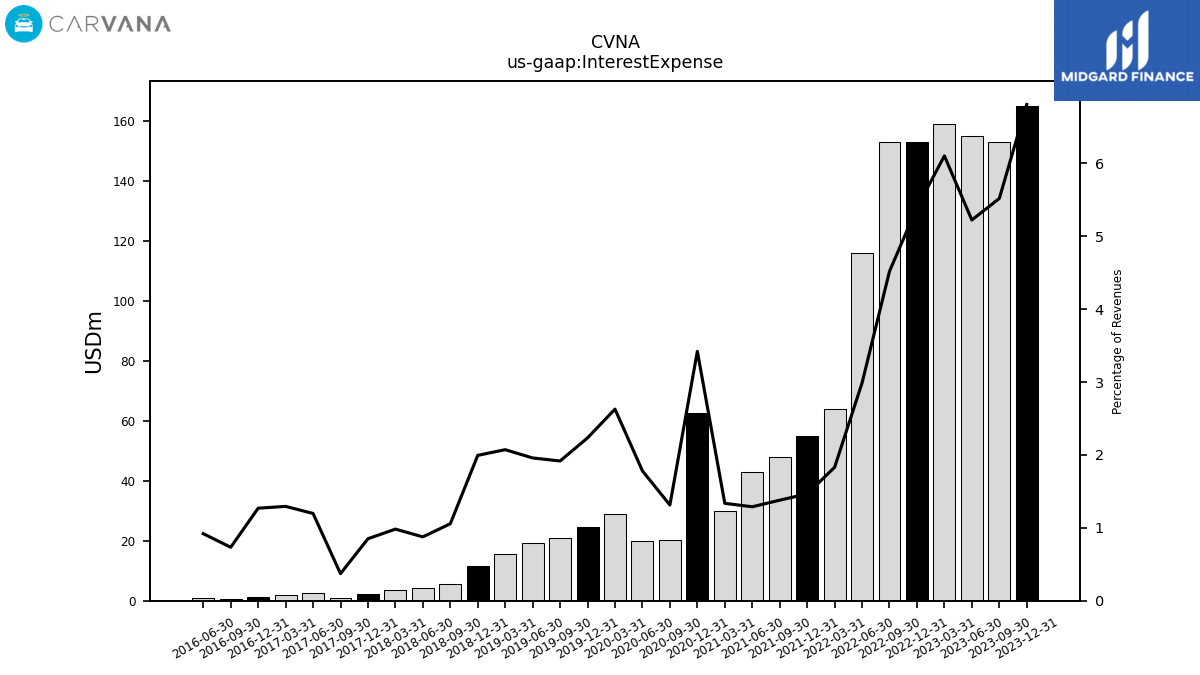
| Revenue From Contract With Customer Excluding Assessed Tax | 2424.00 | 2773.00 | 2968.00 | 2606.00 | 2837.00 | 3386.00 | 3884.00 | 3497.00 | 3753.00 | 3480.00 | 3336.00 | 2245.00 | 1826.41 | 1543.61 | 1118.33 | 1098.22 | 1103.59 | 1094.85 | 986.22 | 755.23 | 584.84 | 534.92 | 475.29 | 360.42 | 265.05 | 225.38 | 209.37 | 159.07 | 106.83 | 98.84 | 86.53 | 72.95 | |
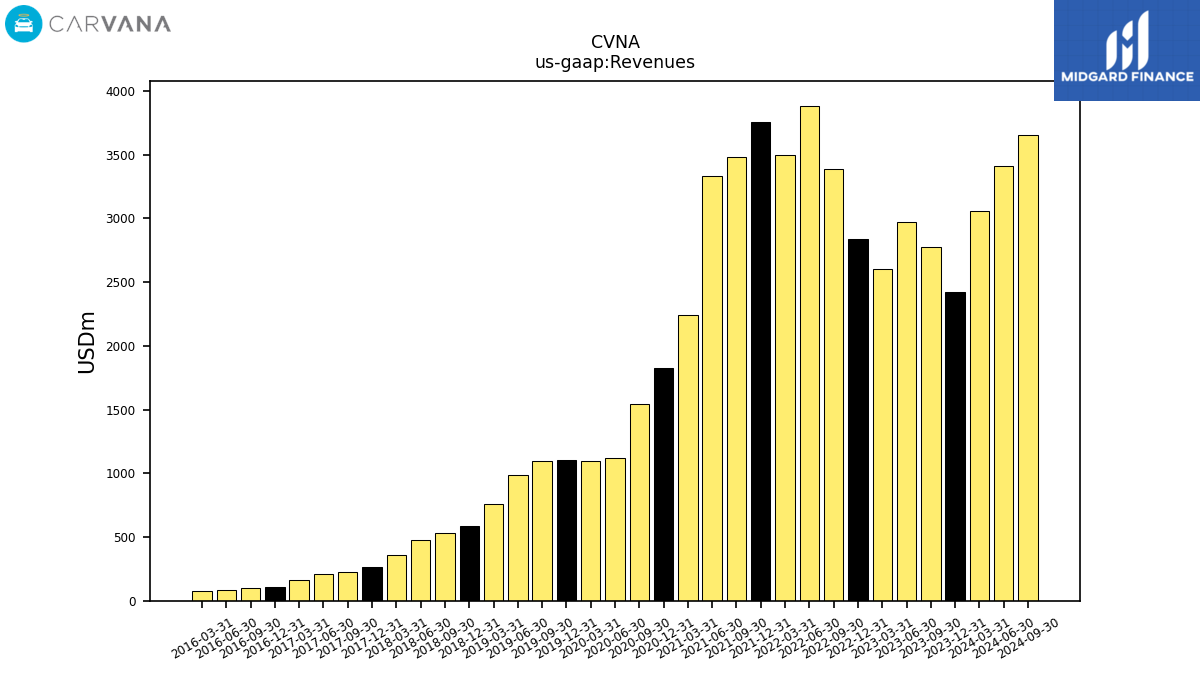
| Revenues | 2424.00 | 2773.00 | 2968.00 | 2606.00 | 2837.00 | 3386.00 | 3884.00 | 3497.00 | 3753.00 | 3480.00 | 3336.00 | 2245.00 | 1826.41 | 1543.61 | 1118.33 | 1098.22 | 1103.59 | 1094.85 | 986.22 | 755.23 | 584.84 | 534.92 | 475.29 | 360.42 | 265.05 | 225.38 | 209.37 | 159.07 | 106.83 | 98.84 | 86.53 | 72.95 | |
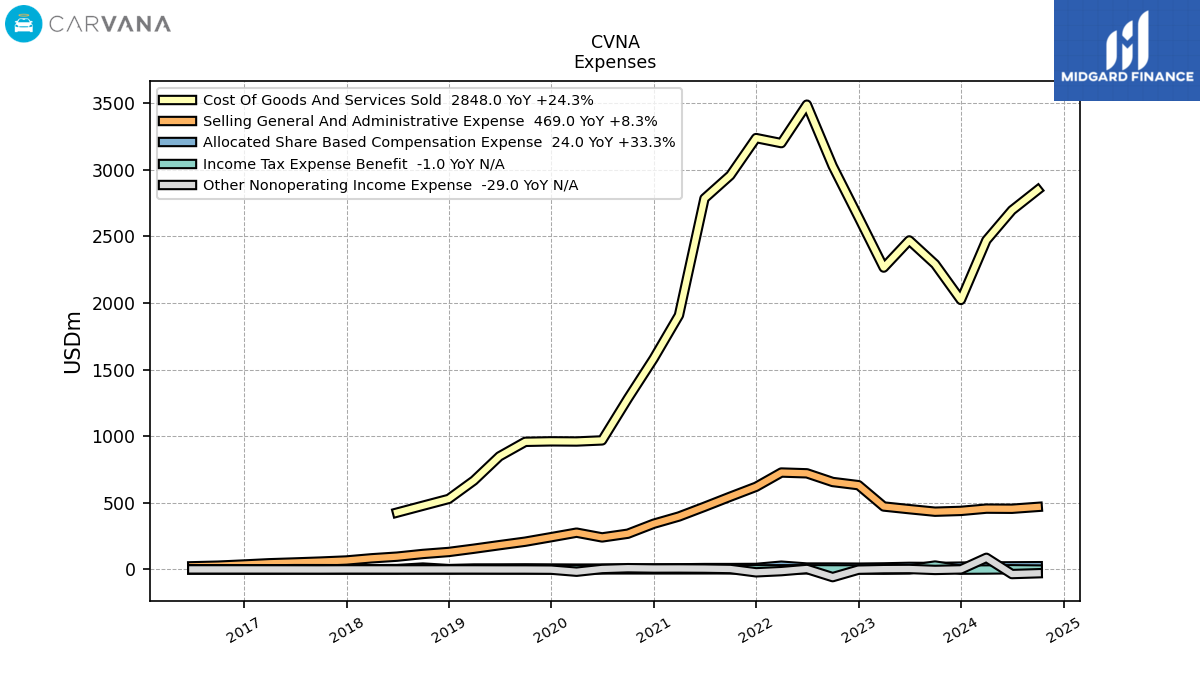
| Cost Of Goods And Services Sold | 2022.00 | 2291.00 | 2469.00 | 2265.00 | 2644.00 | 3027.00 | 3488.00 | 3199.00 | 3237.00 | 2957.00 | 2784.00 | 1907.00 | 1582.54 | 1282.34 | 968.13 | 959.79 | 961.04 | 957.31 | 848.43 | 666.70 | 528.70 | 477.62 | 426.25 | NA | NA | NA | NA | NA | NA | NA | NA | NA | |
| Gross Profit | 402.00 | 482.00 | 499.00 | 341.00 | 193.00 | 359.00 | 396.00 | 298.00 | 516.00 | 523.00 | 552.00 | 338.00 | 243.86 | 261.27 | 150.21 | 138.42 | 142.55 | 137.54 | 137.79 | 88.53 | 56.13 | 57.31 | 49.03 | 34.23 | 21.89 | 20.42 | 16.04 | 9.75 | 2.44 | 6.77 | 6.04 | 3.96 | |
| Selling General And Administrative Expense | 439.00 | 433.00 | 452.00 | 472.00 | 632.00 | 656.00 | 721.00 | 727.00 | 620.00 | 546.00 | 470.00 | 397.00 | 342.67 | 267.84 | 239.93 | 275.71 | 241.66 | 207.97 | 181.84 | 155.24 | 130.65 | 115.77 | 95.65 | 83.19 | 66.81 | 58.68 | 52.01 | 45.91 | 36.70 | 28.00 | 23.34 | NA | |
| Interest Expense | 165.00 | 153.00 | 155.00 | 159.00 | 153.00 | 153.00 | 116.00 | 64.00 | 55.00 | 48.00 | 43.00 | 30.00 | 62.48 | 20.28 | 19.91 | 28.86 | 24.65 | 20.99 | 19.32 | 15.65 | 11.66 | 5.65 | 4.17 | 3.54 | 2.25 | 0.84 | 2.51 | 2.06 | 1.36 | 0.72 | 0.80 | NA | |
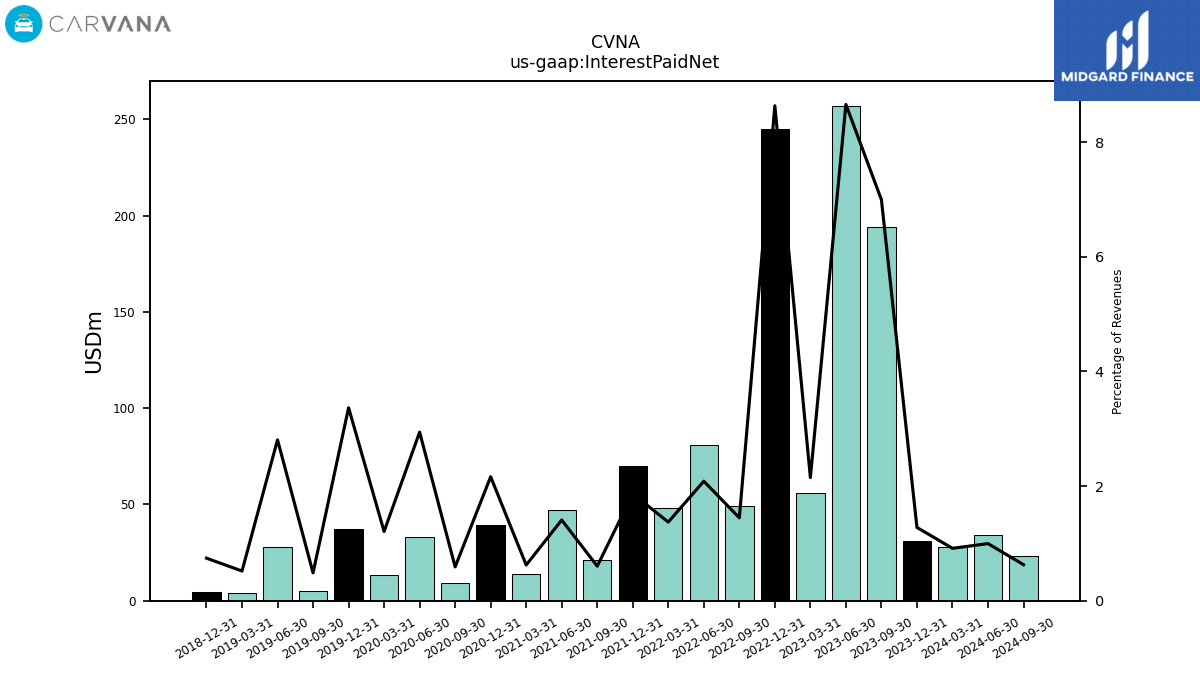
| Interest Paid Net | 31.00 | 194.00 | 257.00 | 56.00 | 245.00 | 49.00 | 81.00 | 48.00 | 70.00 | 21.00 | 47.00 | 14.00 | 39.52 | 9.12 | 32.90 | 13.27 | 37.15 | 5.32 | 27.69 | 3.92 | 4.35 | NA | NA | NA | NA | NA | NA | NA | NA | NA | NA | NA | |
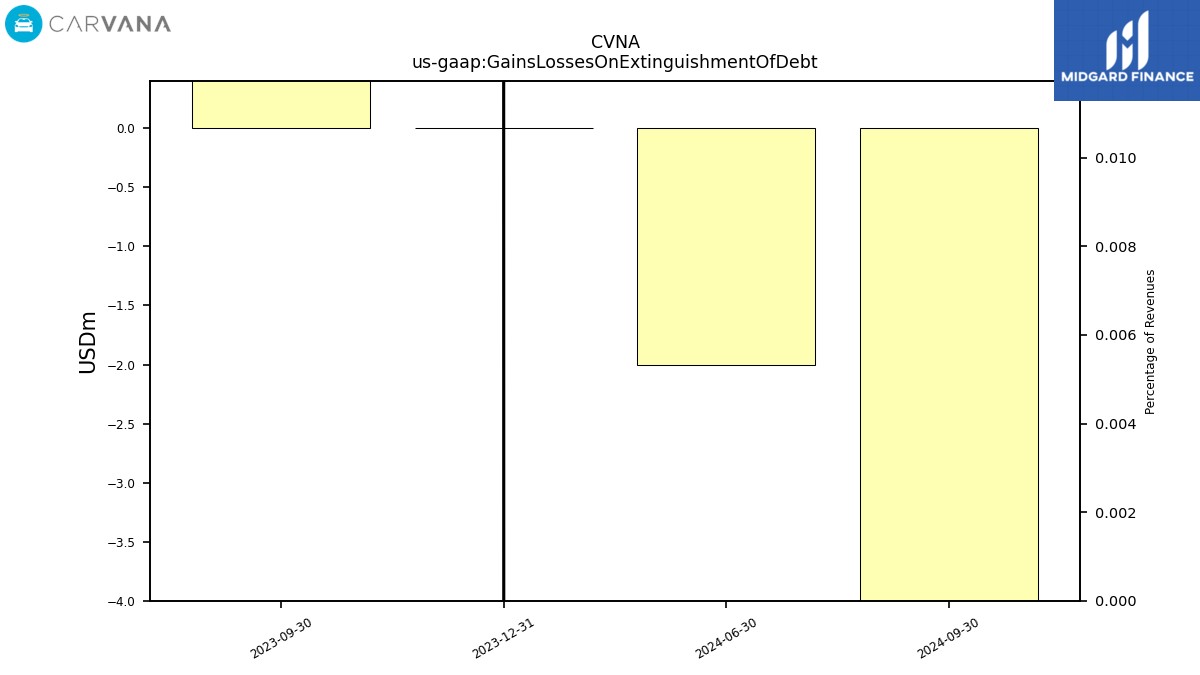
| Gains Losses On Extinguishment Of Debt | 0.00 | 878.00 | NA | NA | NA | NA | NA | NA | NA | NA | NA | NA | NA | NA | NA | NA | NA | NA | NA | NA | NA | NA | NA | NA | NA | NA | NA | NA | NA | NA | NA | NA | |
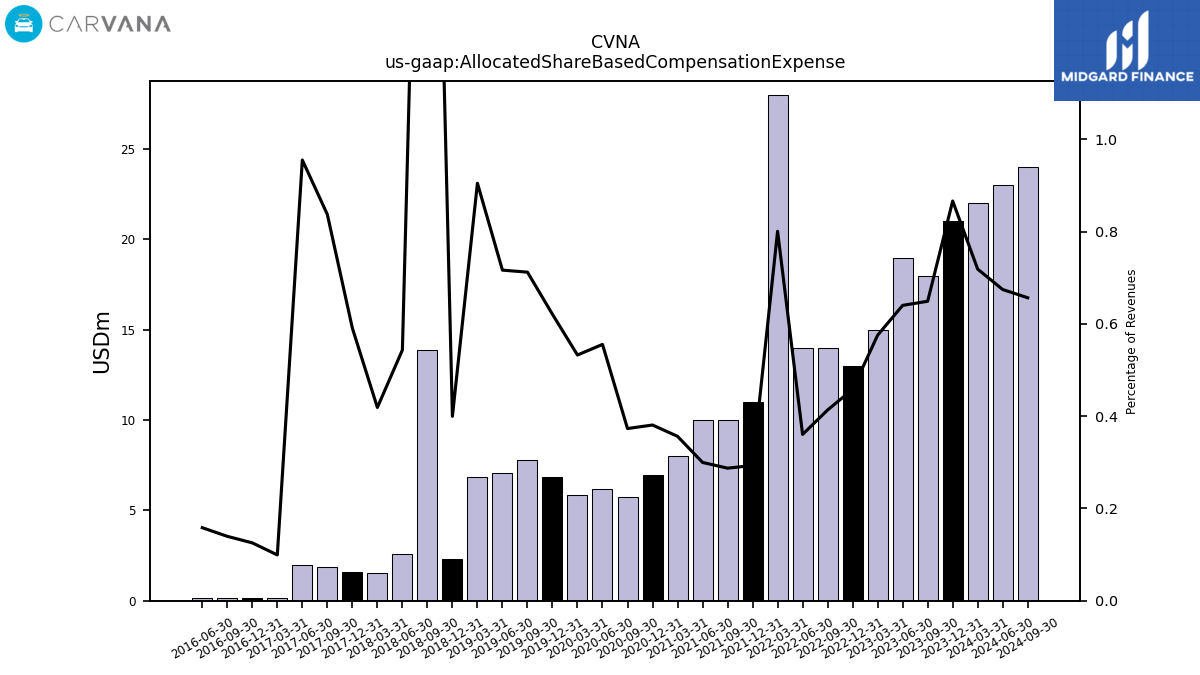
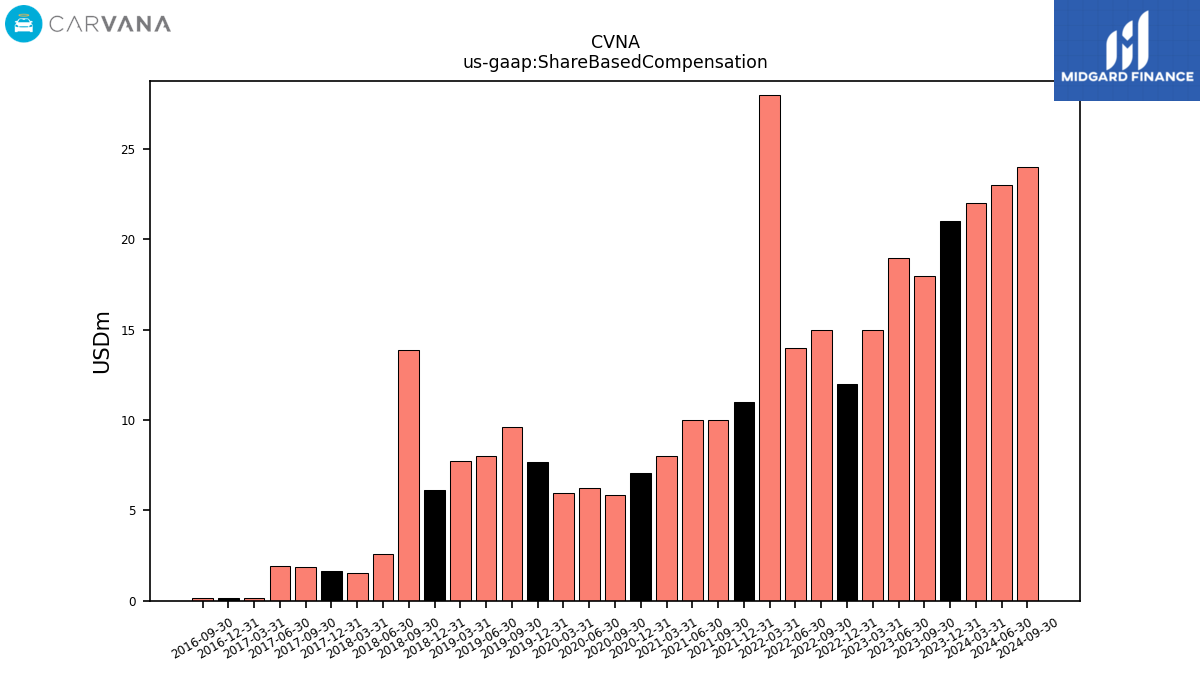
| Allocated Share Based Compensation Expense | 21.00 | 18.00 | 19.00 | 15.00 | 13.00 | 14.00 | 14.00 | 28.00 | 11.00 | 10.00 | 10.00 | 8.00 | 6.96 | 5.76 | 6.21 | 5.85 | 6.85 | 7.80 | 7.07 | 6.83 | 2.34 | 13.89 | 2.58 | 1.51 | 1.57 | 1.89 | 2.00 | 0.16 | 0.13 | 0.14 | 0.14 | NA | |
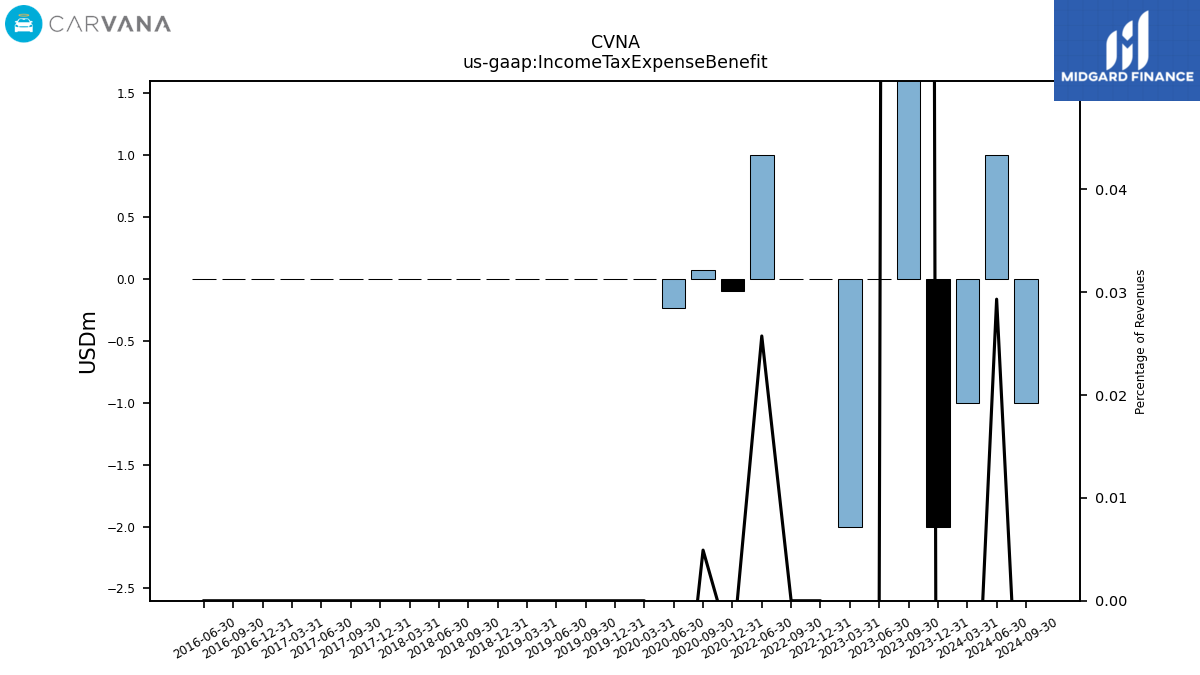
| Income Tax Expense Benefit | -2.00 | 29.00 | 0.00 | -2.00 | 0.00 | 0.00 | 1.00 | NA | NA | NA | NA | NA | -0.09 | 0.08 | -0.24 | 0.00 | 0.00 | 0.00 | 0.00 | 0.00 | 0.00 | 0.00 | 0.00 | 0.00 | 0.00 | 0.00 | 0.00 | 0.00 | 0.00 | 0.00 | 0.00 | NA | |
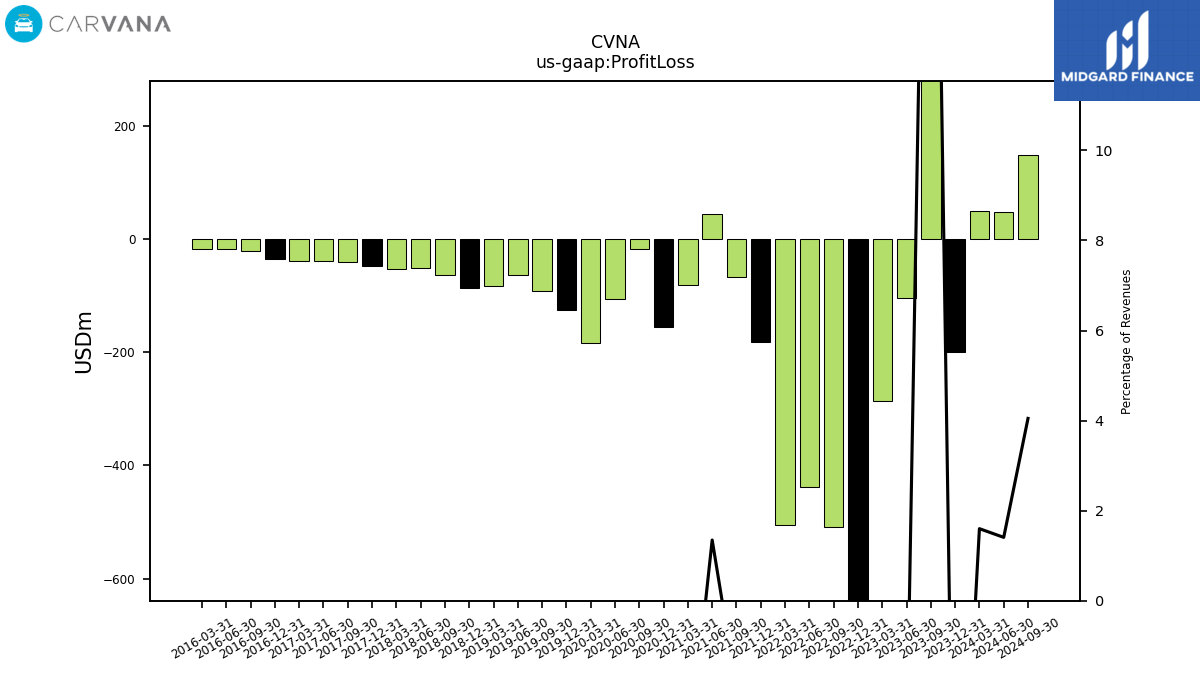
| Profit Loss | -200.00 | 741.00 | -105.00 | -286.00 | -1441.00 | -508.00 | -439.00 | -506.00 | -182.00 | -68.00 | 45.00 | -82.00 | -154.62 | -17.72 | -106.33 | -183.56 | -125.74 | -92.24 | -64.06 | -82.60 | -86.40 | -64.42 | -51.25 | -52.67 | -47.24 | -39.77 | -38.87 | -38.44 | -35.69 | -21.98 | -18.11 | -17.32 | |
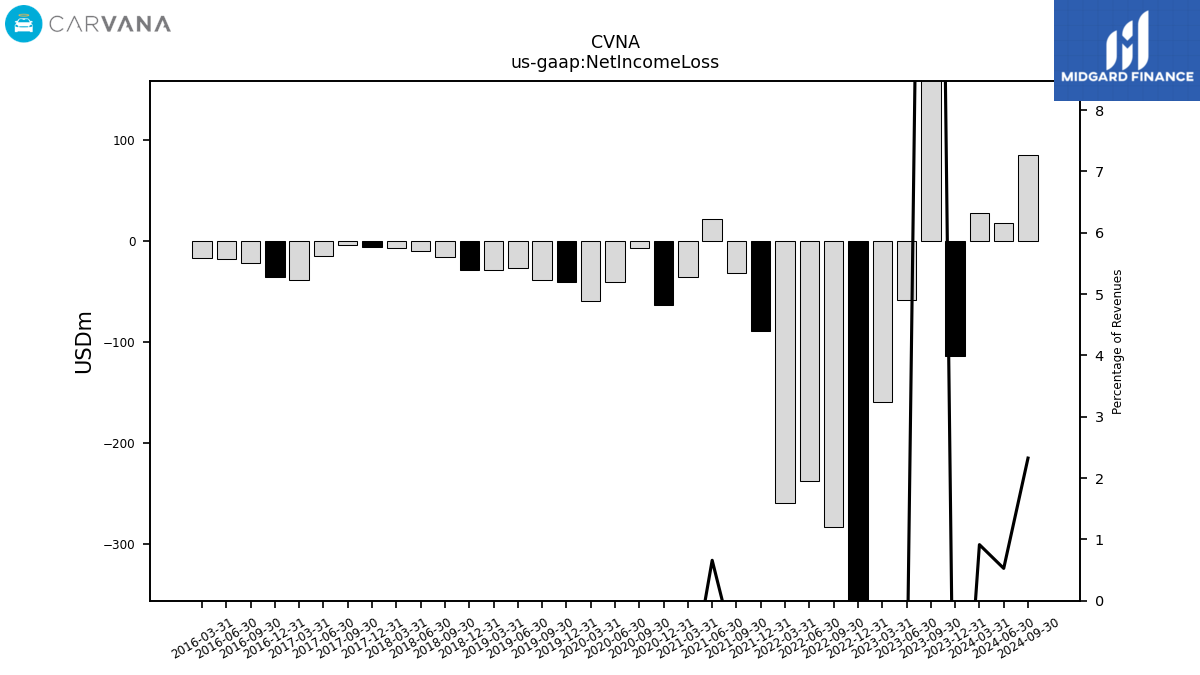
| Net Income Loss | -114.00 | 782.00 | -58.00 | -160.00 | -806.00 | -283.00 | -238.00 | -260.00 | -89.00 | -32.00 | 22.00 | -36.00 | -63.34 | -7.08 | -40.83 | -59.89 | -41.13 | -39.02 | -26.61 | -28.55 | -28.70 | -16.04 | -9.96 | -7.04 | -5.48 | -4.38 | -14.54 | -38.44 | -35.69 | -21.98 | -18.11 | -17.32 | |
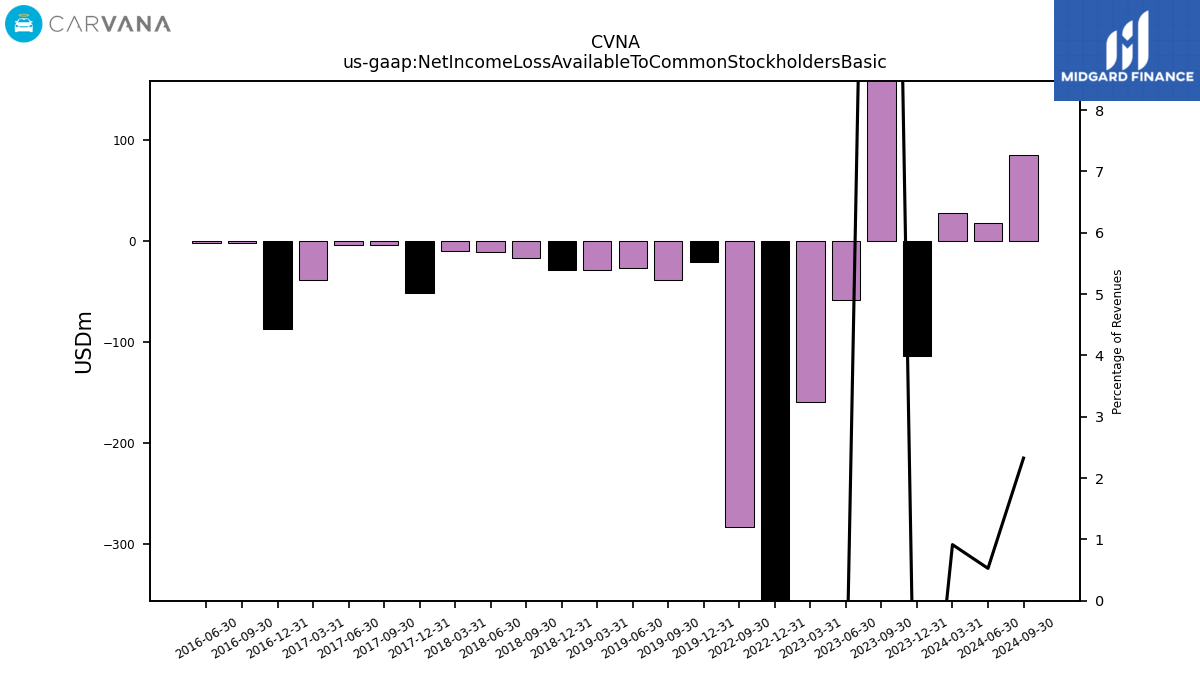
| Net Income Loss Available To Common Stockholders Basic | -114.00 | 782.00 | NA | NA | -806.00 | -283.00 | NA | NA | NA | NA | NA | NA | NA | NA | NA | NA | -20.48 | -39.02 | -26.61 | -28.55 | -28.96 | -17.27 | -11.34 | -9.77 | -51.65 | -4.38 | -4.28 | -38.44 | -86.85 | -2.40 | -1.97 | NA |
| 2023-12-31 | 2023-09-30 | 2023-06-30 | 2023-03-31 | 2022-12-31 | 2022-09-30 | 2022-06-30 | 2022-03-31 | 2021-12-31 | 2021-09-30 | 2021-06-30 | 2021-03-31 | 2020-12-31 | 2020-09-30 | 2020-06-30 | 2020-03-31 | 2019-12-31 | 2019-09-30 | 2019-06-30 | 2019-03-31 | 2018-12-31 | 2018-09-30 | 2018-06-30 | 2018-03-31 | 2017-12-31 | 2017-09-30 | 2017-06-30 | 2017-03-31 | 2016-12-31 | 2016-09-30 | 2016-06-30 | 2016-03-31 | ||
|---|---|---|---|---|---|---|---|---|---|---|---|---|---|---|---|---|---|---|---|---|---|---|---|---|---|---|---|---|---|---|---|---|---|
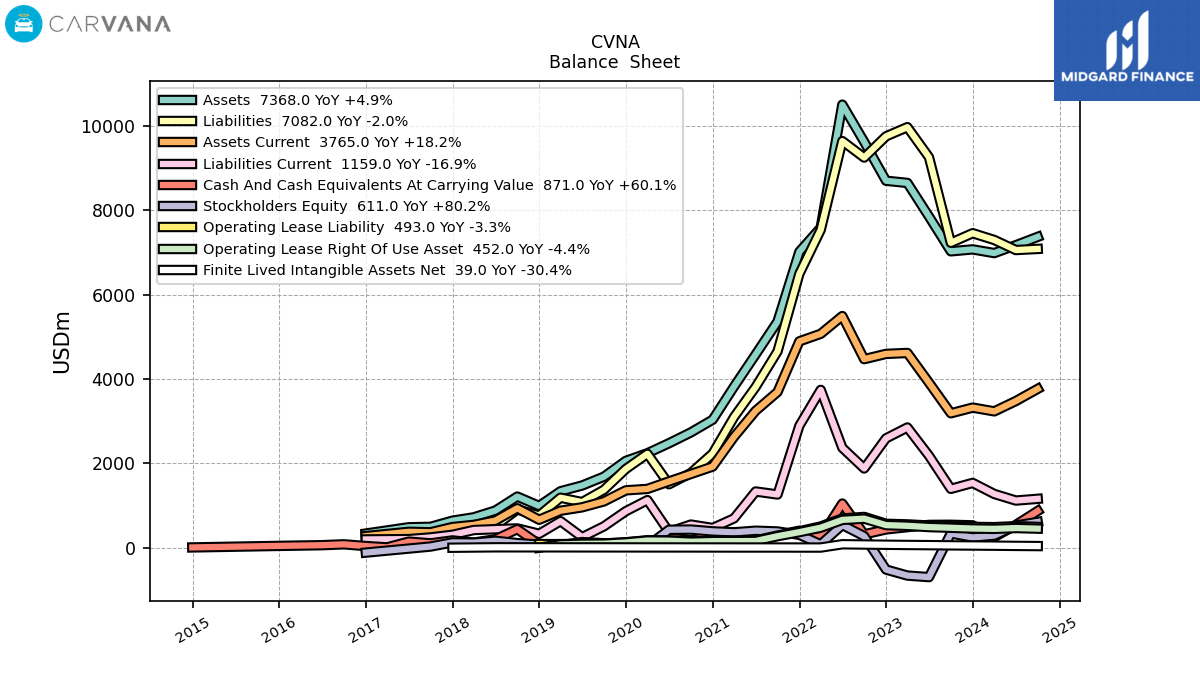
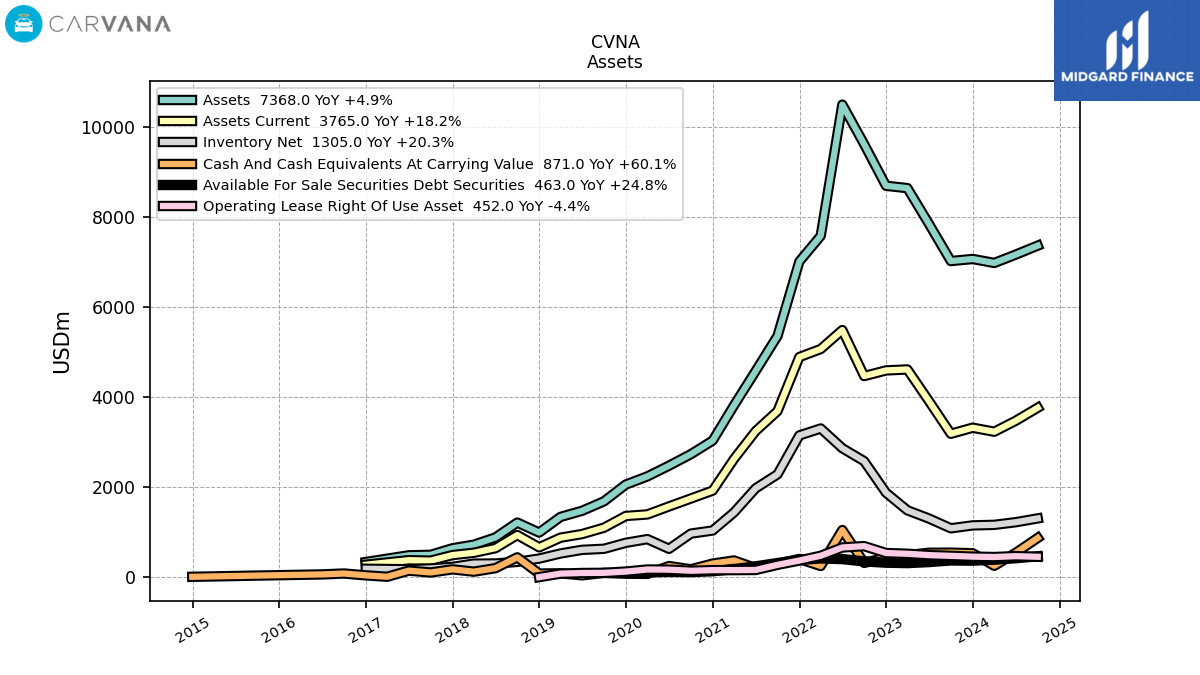
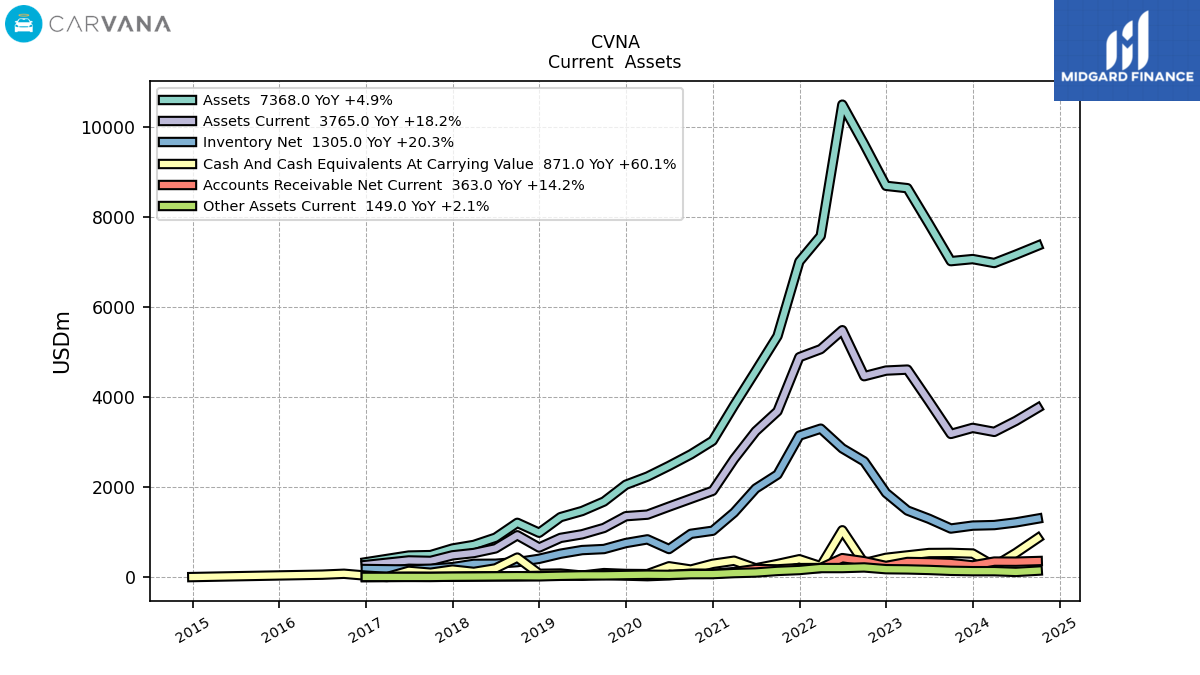
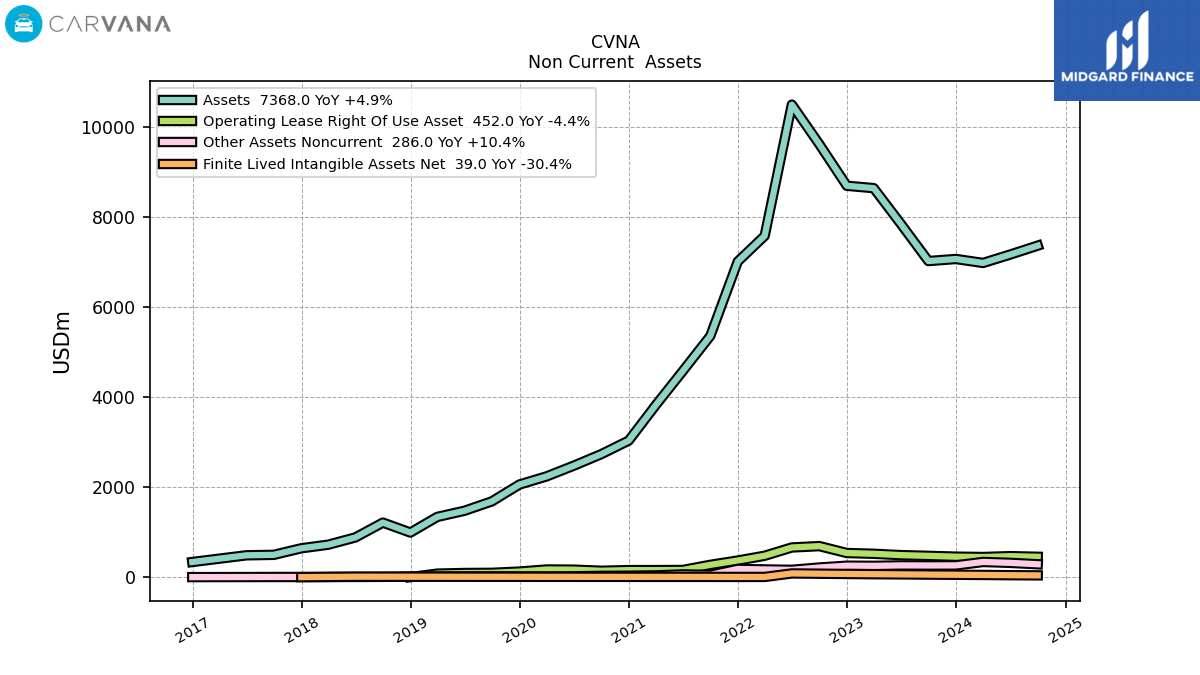
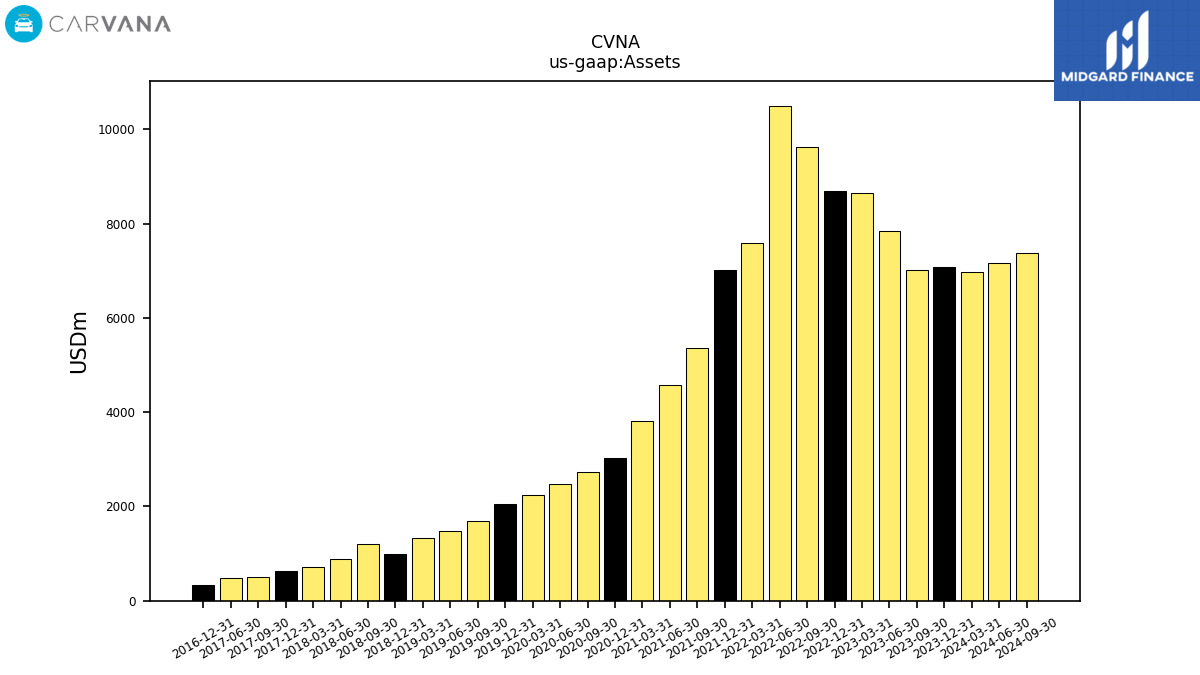
| Assets | 7071.00 | 7025.00 | 7849.00 | 8646.00 | 8698.00 | 9621.00 | 10502.00 | 7585.00 | 7015.00 | 5360.00 | 4581.00 | 3819.00 | 3034.53 | 2732.80 | 2476.81 | 2239.22 | 2057.75 | 1684.32 | 1474.40 | 1338.40 | 991.01 | 1212.10 | 881.76 | 720.73 | 641.14 | 495.17 | 484.88 | NA | 335.83 | NA | NA | NA | |
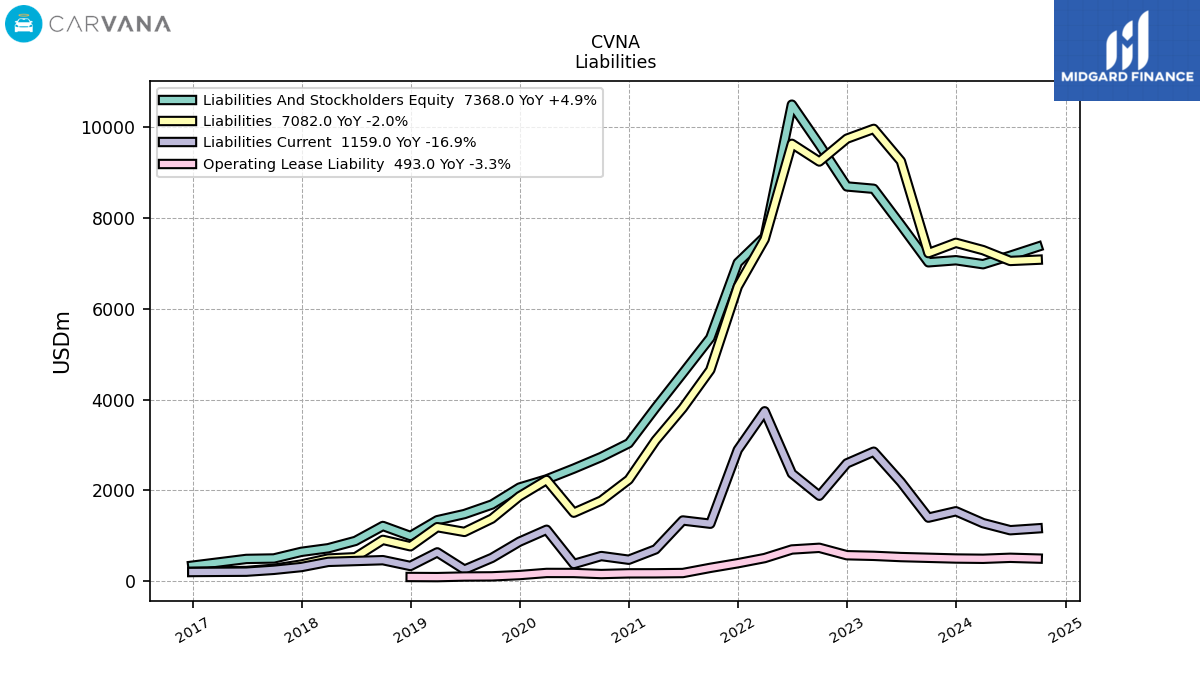
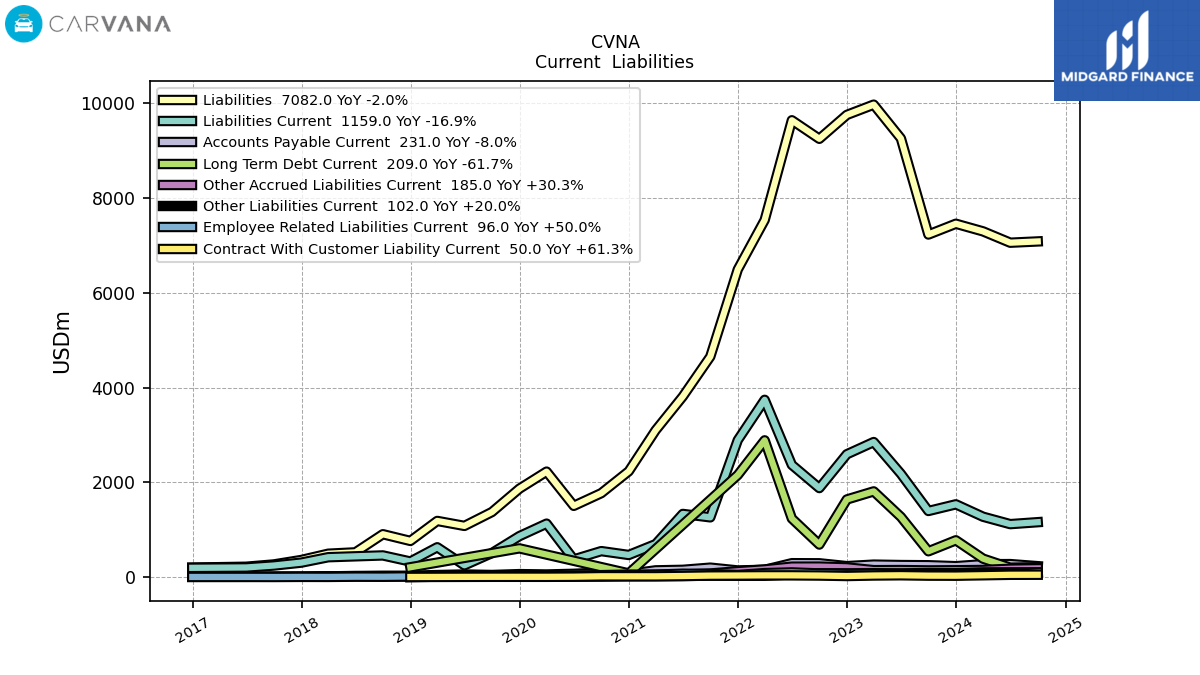
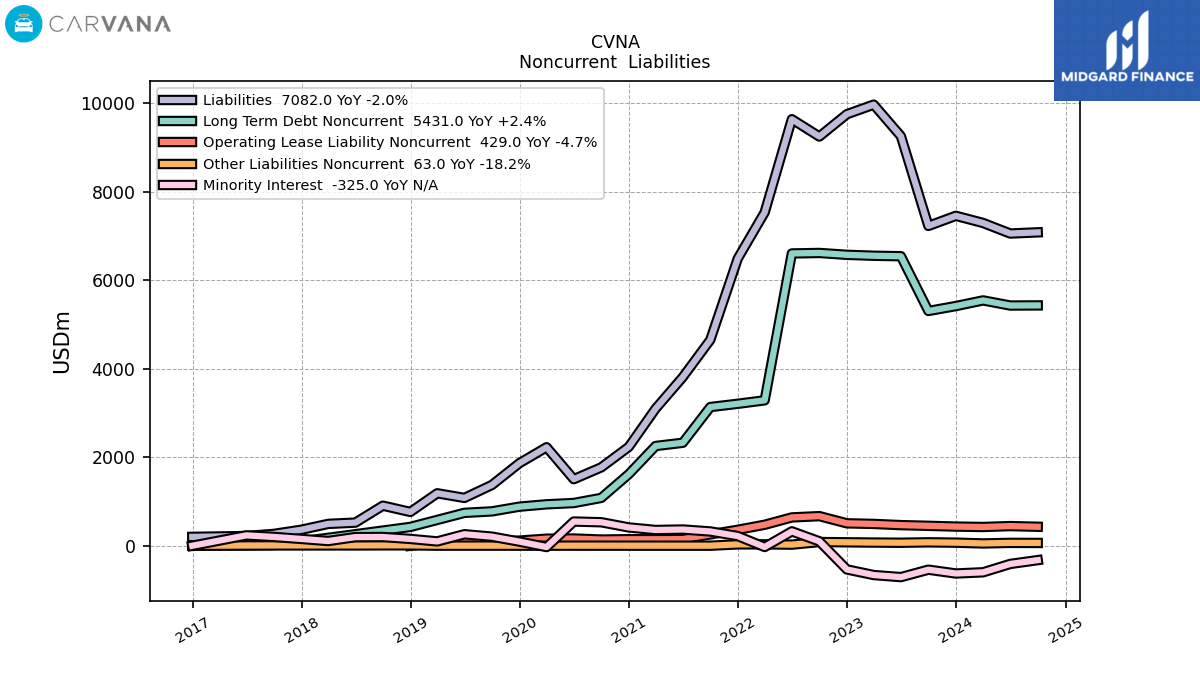
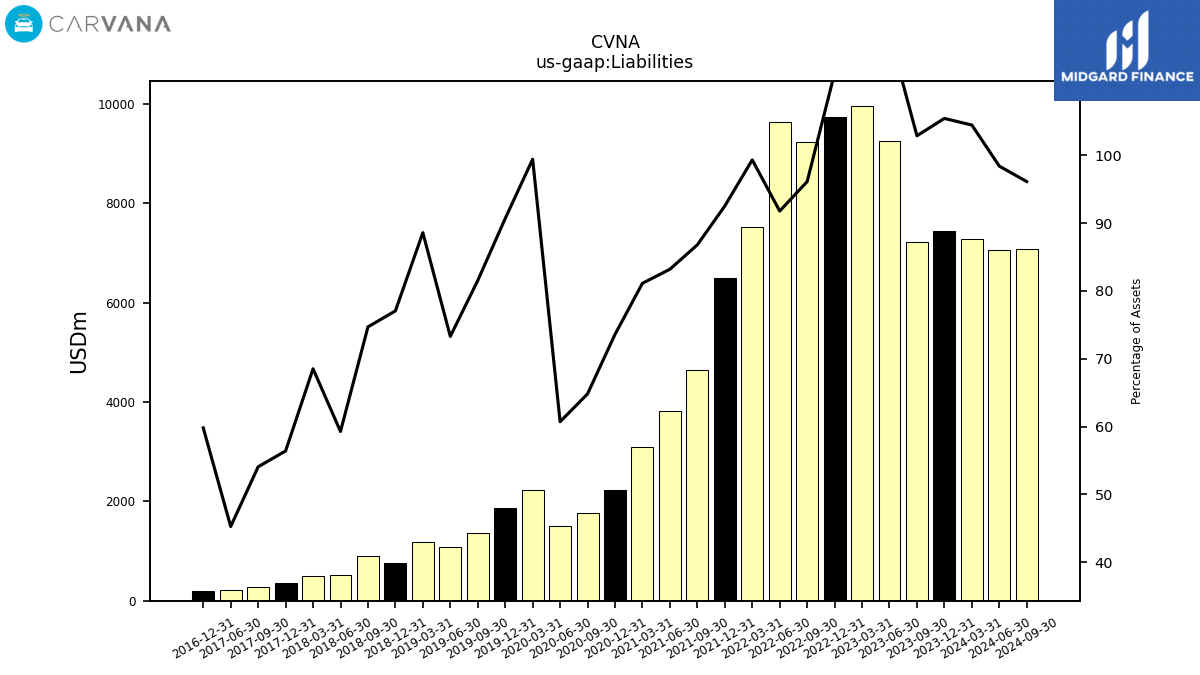
| Liabilities | 7455.00 | 7227.00 | 9255.00 | 9968.00 | 9751.00 | 9247.00 | 9638.00 | 7533.00 | 6490.00 | 4652.00 | 3811.00 | 3098.00 | 2233.03 | 1771.22 | 1503.72 | 2225.99 | 1865.81 | 1373.14 | 1080.59 | 1185.55 | 763.59 | 905.34 | 522.65 | 493.79 | 361.59 | 267.70 | 219.45 | NA | 200.82 | NA | NA | NA | |
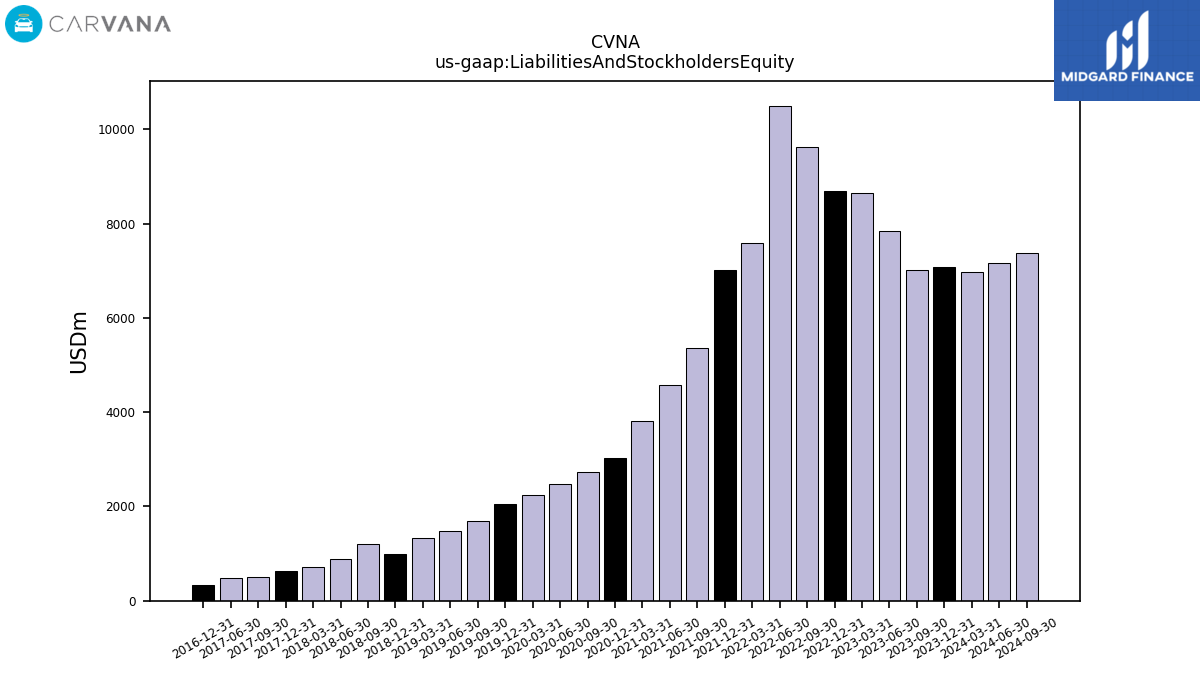
| Liabilities And Stockholders Equity | 7071.00 | 7025.00 | 7849.00 | 8646.00 | 8698.00 | 9621.00 | 10502.00 | 7585.00 | 7015.00 | 5360.00 | 4581.00 | 3819.00 | 3034.53 | 2732.80 | 2476.81 | 2239.22 | 2057.75 | 1684.32 | 1474.40 | 1338.40 | 991.01 | 1212.10 | 881.76 | 720.73 | 641.14 | 495.17 | 484.88 | NA | 335.83 | NA | NA | NA | |
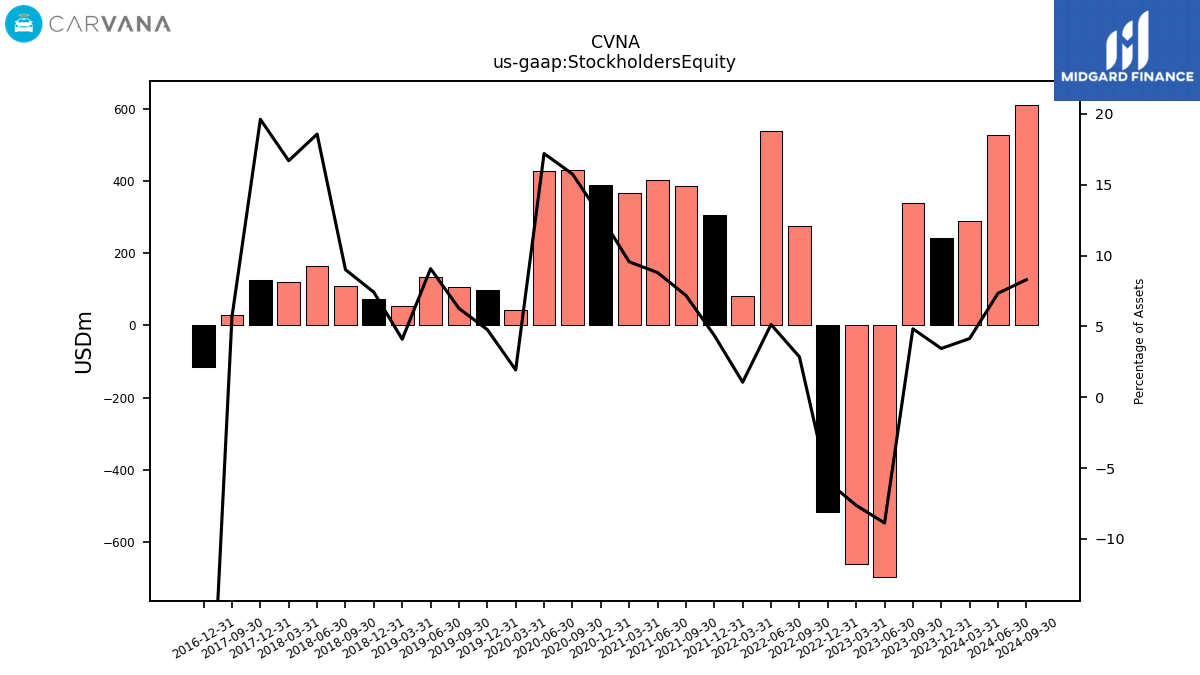
| Stockholders Equity | 243.00 | 339.00 | -697.00 | -660.00 | -518.00 | 274.00 | 539.00 | 80.00 | 306.00 | 385.00 | 403.00 | 365.00 | 387.60 | 430.51 | 425.95 | 43.10 | 98.11 | 105.53 | 133.75 | 54.77 | 73.41 | 109.11 | 163.75 | 120.30 | 125.74 | 28.16 | NA | NA | -115.96 | NA | NA | NA |
| 2023-12-31 | 2023-09-30 | 2023-06-30 | 2023-03-31 | 2022-12-31 | 2022-09-30 | 2022-06-30 | 2022-03-31 | 2021-12-31 | 2021-09-30 | 2021-06-30 | 2021-03-31 | 2020-12-31 | 2020-09-30 | 2020-06-30 | 2020-03-31 | 2019-12-31 | 2019-09-30 | 2019-06-30 | 2019-03-31 | 2018-12-31 | 2018-09-30 | 2018-06-30 | 2018-03-31 | 2017-12-31 | 2017-09-30 | 2017-06-30 | 2017-03-31 | 2016-12-31 | 2016-09-30 | 2016-06-30 | 2016-03-31 | ||
|---|---|---|---|---|---|---|---|---|---|---|---|---|---|---|---|---|---|---|---|---|---|---|---|---|---|---|---|---|---|---|---|---|---|
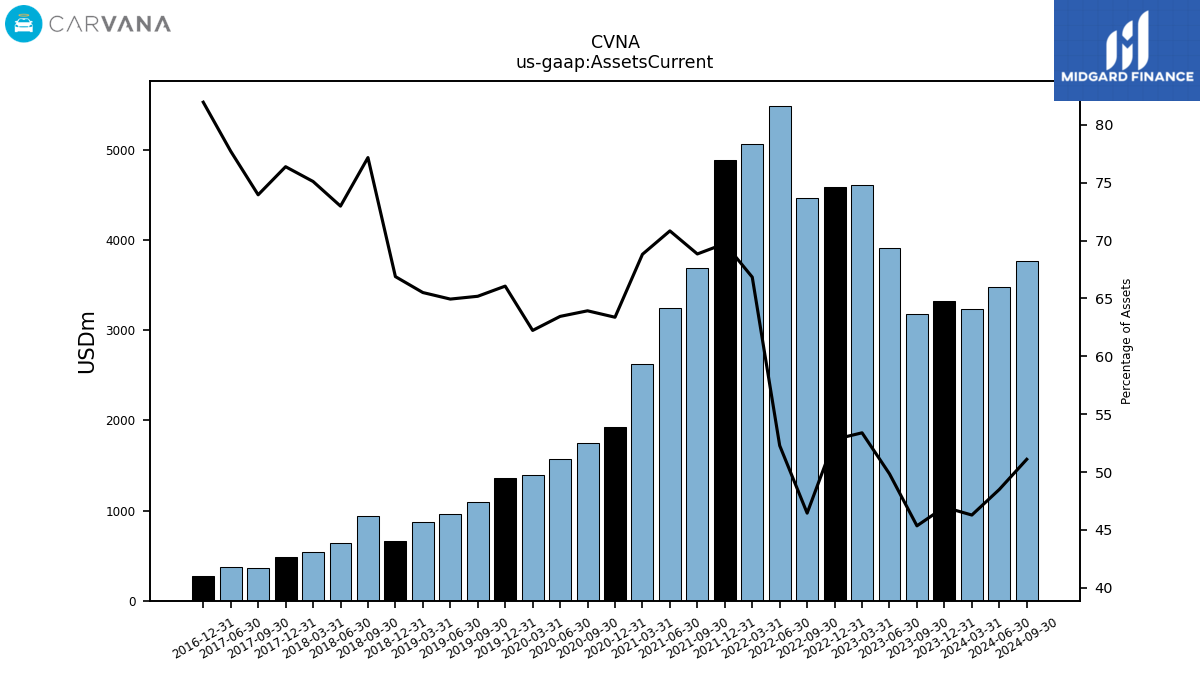
| Assets Current | 3321.00 | 3186.00 | 3912.00 | 4616.00 | 4594.00 | 4469.00 | 5491.00 | 5070.00 | 4892.00 | 3690.00 | 3245.00 | 2628.00 | 1923.15 | 1747.10 | 1571.49 | 1393.58 | 1359.42 | 1097.96 | 957.54 | 876.79 | 662.85 | 935.37 | 643.49 | 541.32 | 489.72 | 366.21 | 376.86 | NA | 275.24 | NA | NA | NA | |
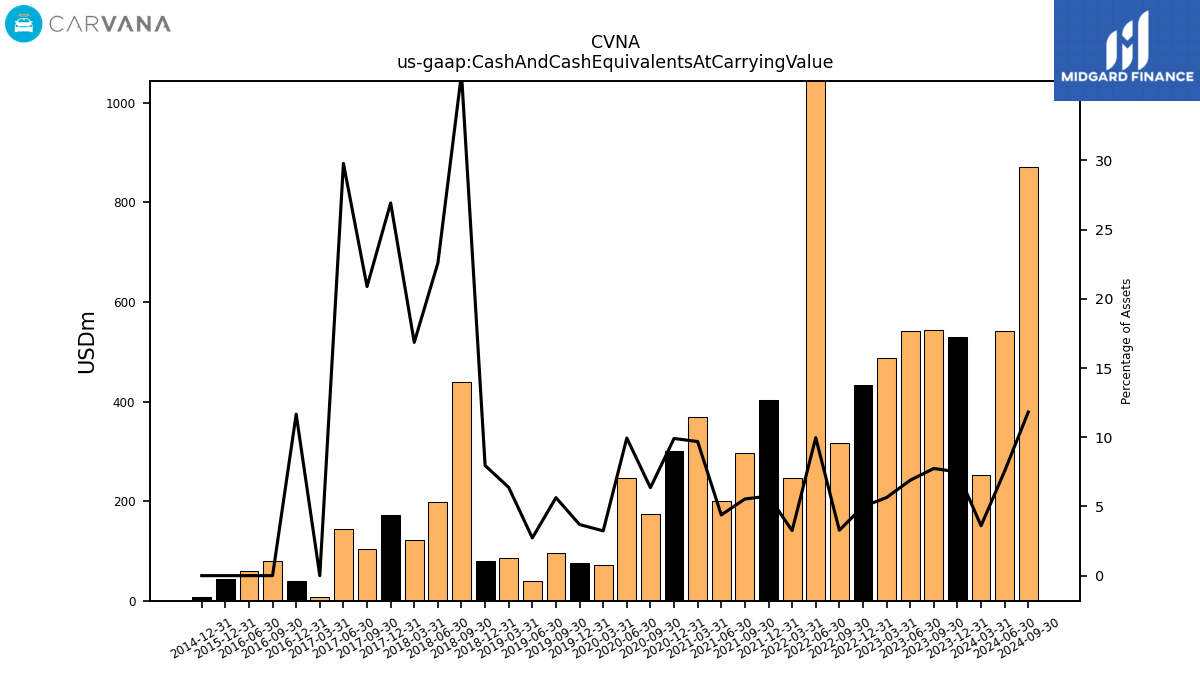
| Cash And Cash Equivalents At Carrying Value | 530.00 | 544.00 | 541.00 | 488.00 | 434.00 | 316.00 | 1047.00 | 247.00 | 403.00 | 297.00 | 201.00 | 370.00 | 300.81 | 173.70 | 246.30 | 72.44 | 76.02 | 94.94 | 40.20 | 85.32 | 78.86 | 439.79 | 199.19 | 121.50 | 172.68 | 103.45 | 144.43 | 8.31 | 39.18 | 80.35 | 60.09 | NA | |
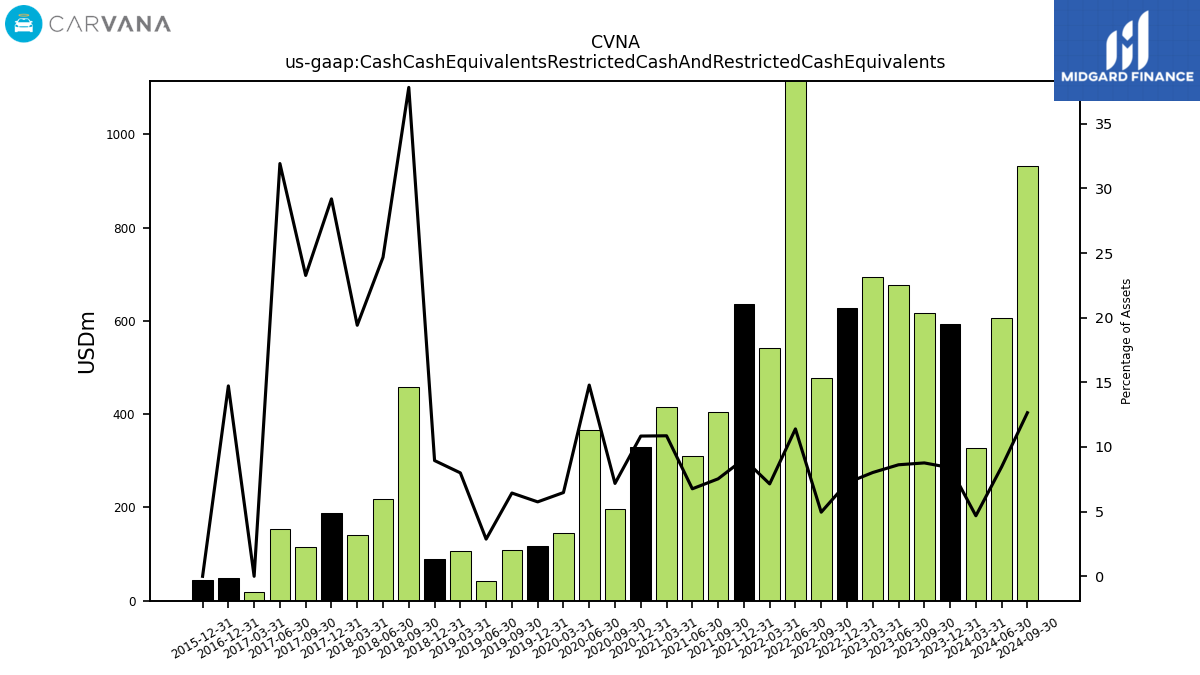
| Cash Cash Equivalents Restricted Cash And Restricted Cash Equivalents | 594.00 | 616.00 | 677.00 | 694.00 | 628.00 | 477.00 | 1197.00 | 542.00 | 636.00 | 404.00 | 310.00 | 415.00 | 329.11 | 196.32 | 366.29 | 145.03 | 118.46 | 108.47 | 42.40 | 107.06 | 88.71 | 458.26 | 217.55 | 139.93 | 187.12 | 115.21 | 154.77 | 19.80 | 49.45 | NA | NA | NA | |
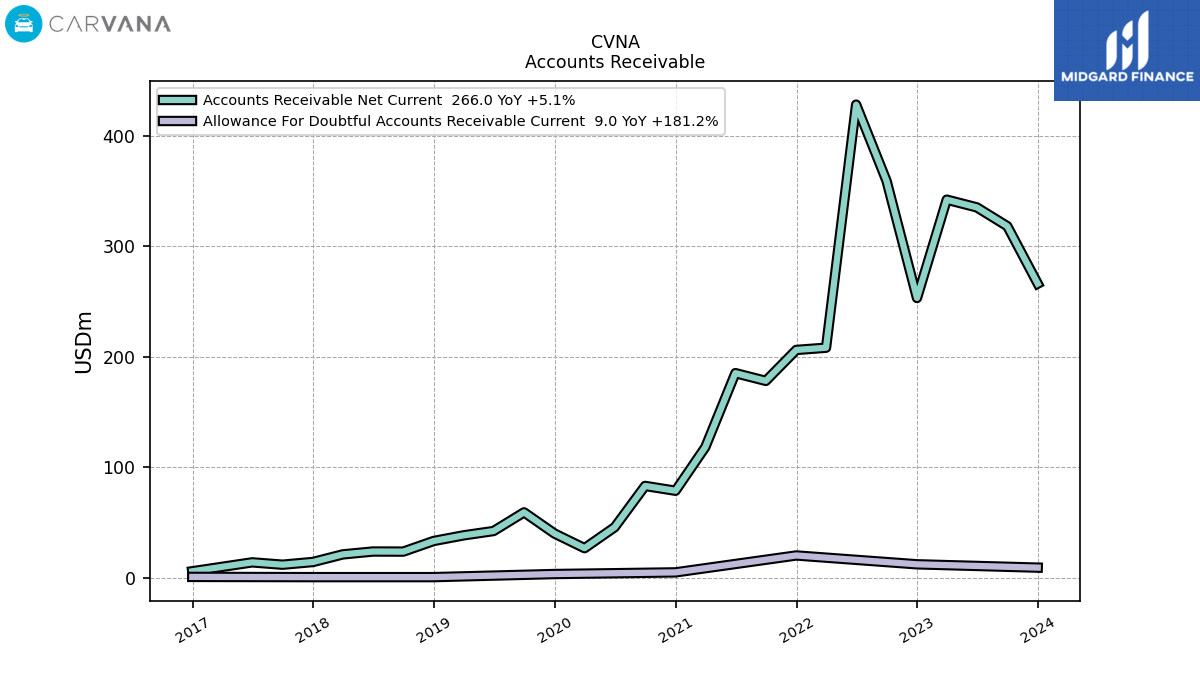
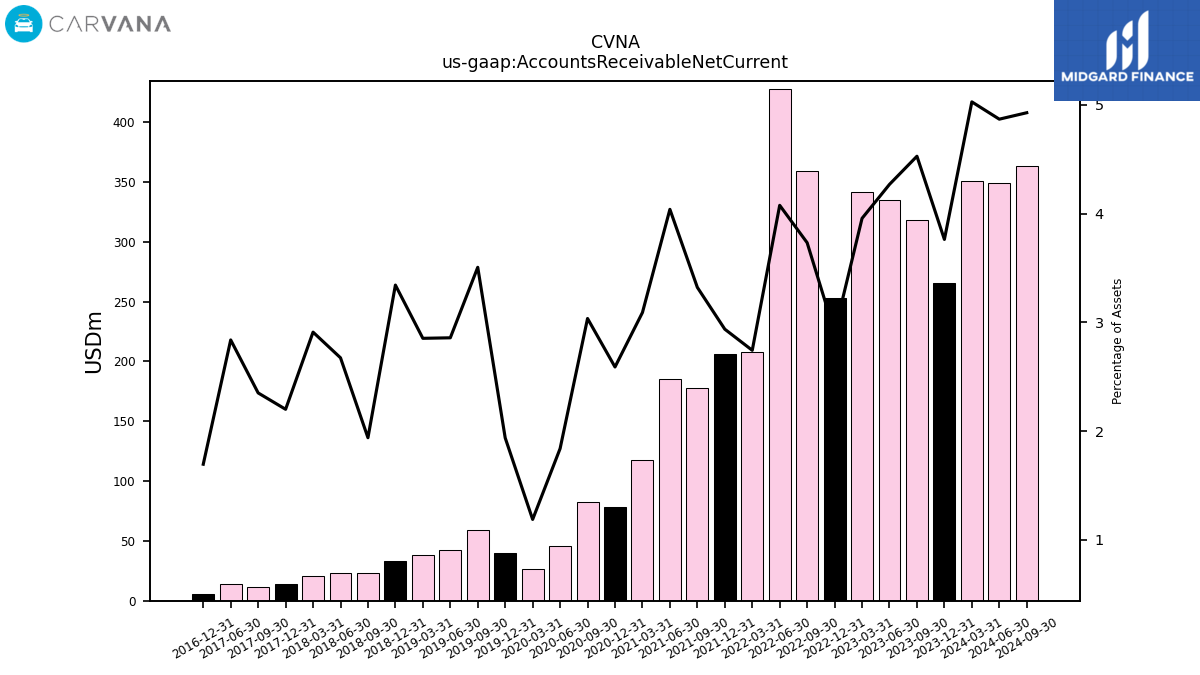
| Accounts Receivable Net Current | 266.00 | 318.00 | 335.00 | 342.00 | 253.00 | 359.00 | 428.00 | 208.00 | 206.00 | 178.00 | 185.00 | 118.00 | 78.56 | 82.93 | 45.54 | 26.59 | 39.86 | 59.04 | 42.13 | 38.18 | 33.12 | 23.50 | 23.57 | 20.97 | 14.11 | 11.64 | 13.76 | NA | 5.69 | NA | NA | NA | |
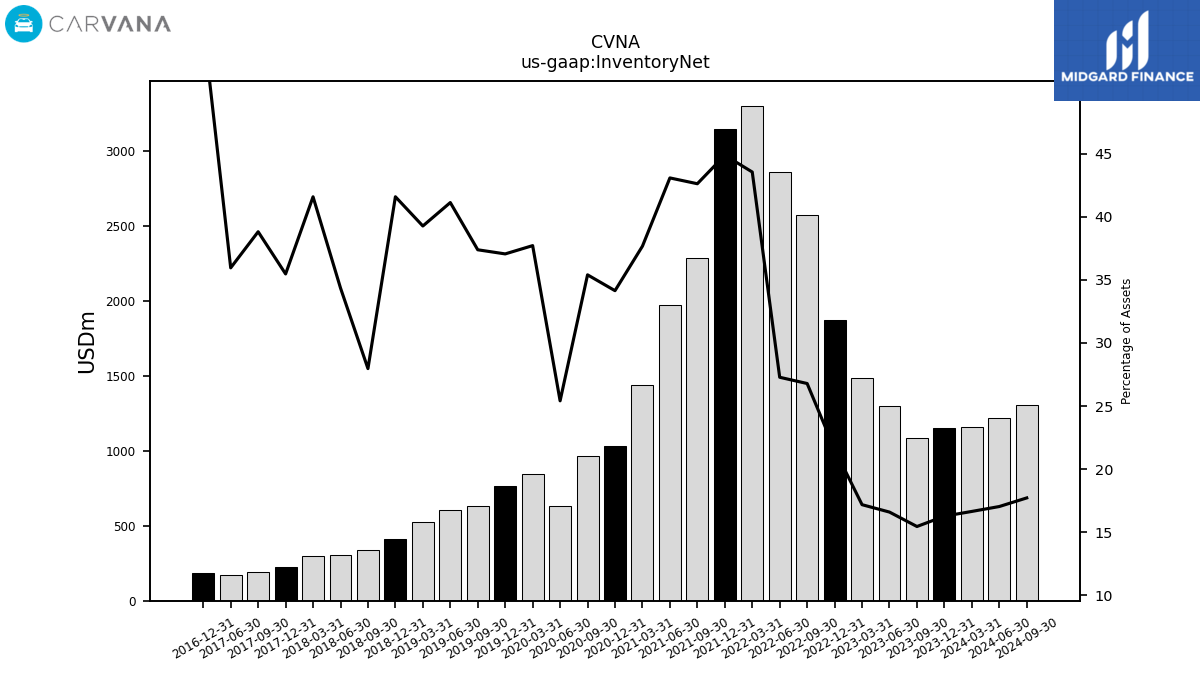
| Inventory Net | 1150.00 | 1085.00 | 1302.00 | 1485.00 | 1876.00 | 2577.00 | 2865.00 | 3304.00 | 3149.00 | 2285.00 | 1974.00 | 1439.00 | 1036.23 | 967.55 | 629.40 | 844.68 | 762.70 | 629.80 | 606.53 | 525.69 | 412.24 | 339.00 | 302.99 | 299.78 | 227.45 | 192.24 | 174.37 | NA | 185.51 | NA | NA | NA | |
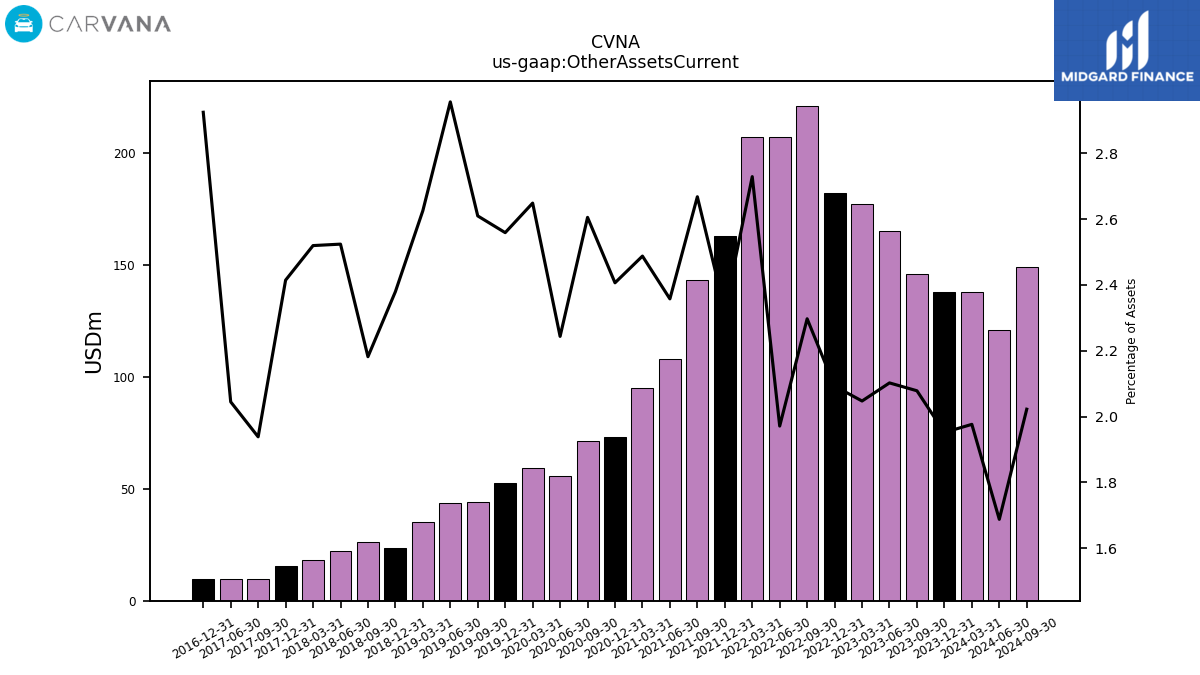
| Other Assets Current | 138.00 | 146.00 | 165.00 | 177.00 | 182.00 | 221.00 | 207.00 | 207.00 | 163.00 | 143.00 | 108.00 | 95.00 | 73.02 | 71.20 | 55.57 | 59.31 | 52.65 | 43.95 | 43.59 | 35.14 | 23.58 | 26.45 | 22.25 | 18.16 | 15.48 | 9.60 | 9.91 | NA | 9.82 | NA | NA | NA | |
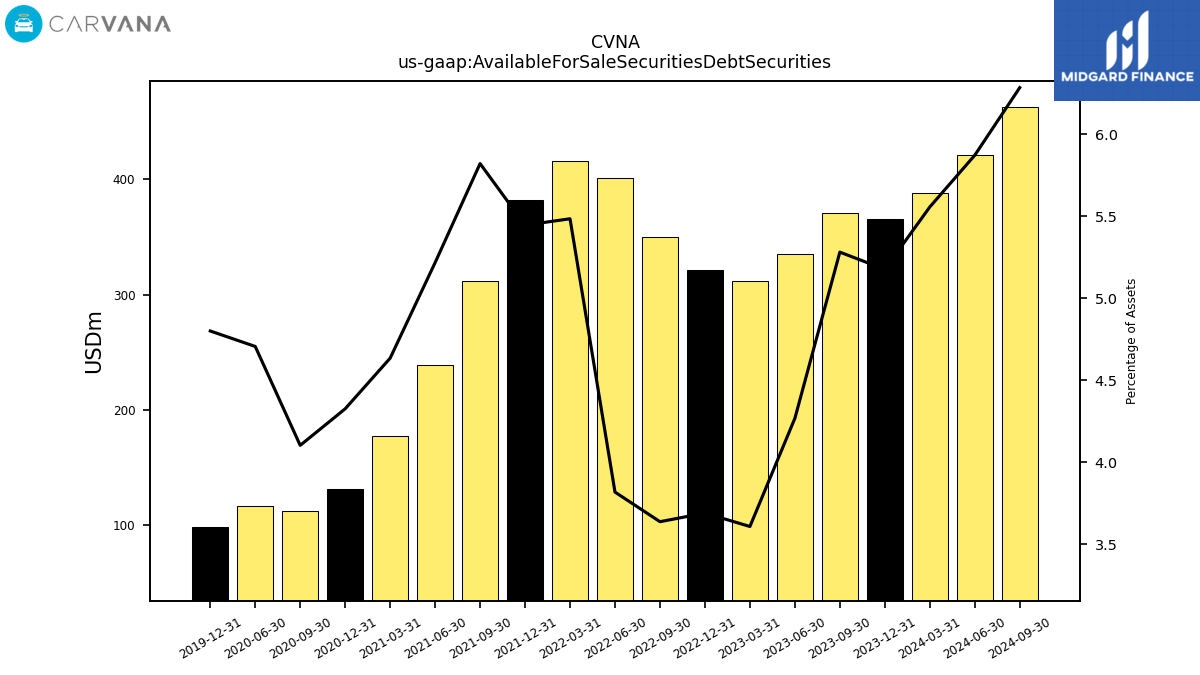
| Available For Sale Securities Debt Securities | 366.00 | 371.00 | 335.00 | 312.00 | 321.00 | 350.00 | 401.00 | 416.00 | 382.00 | 312.00 | 239.00 | 177.00 | 131.27 | 112.13 | 116.56 | NA | 98.78 | NA | NA | NA | NA | NA | NA | NA | NA | NA | NA | NA | NA | NA | NA | NA |
| 2023-12-31 | 2023-09-30 | 2023-06-30 | 2023-03-31 | 2022-12-31 | 2022-09-30 | 2022-06-30 | 2022-03-31 | 2021-12-31 | 2021-09-30 | 2021-06-30 | 2021-03-31 | 2020-12-31 | 2020-09-30 | 2020-06-30 | 2020-03-31 | 2019-12-31 | 2019-09-30 | 2019-06-30 | 2019-03-31 | 2018-12-31 | 2018-09-30 | 2018-06-30 | 2018-03-31 | 2017-12-31 | 2017-09-30 | 2017-06-30 | 2017-03-31 | 2016-12-31 | 2016-09-30 | 2016-06-30 | 2016-03-31 | ||
|---|---|---|---|---|---|---|---|---|---|---|---|---|---|---|---|---|---|---|---|---|---|---|---|---|---|---|---|---|---|---|---|---|---|
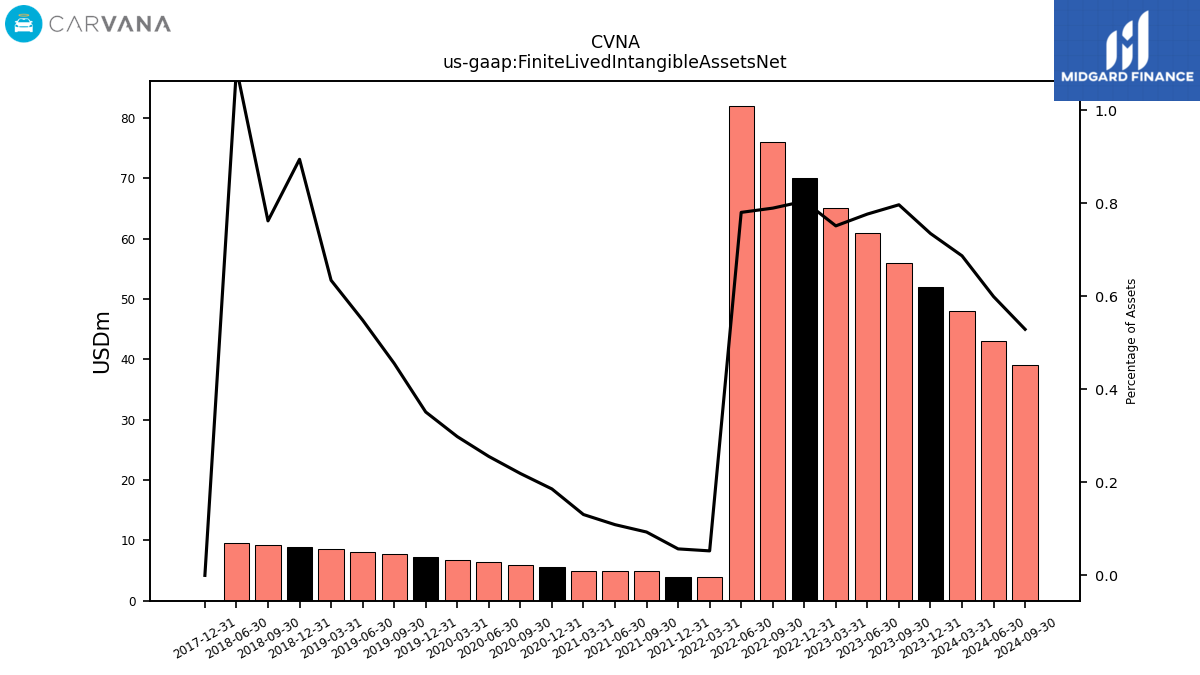
| Finite Lived Intangible Assets Net | 52.00 | 56.00 | 61.00 | 65.00 | 70.00 | 76.00 | 82.00 | 4.00 | 4.00 | 5.00 | 5.00 | 5.00 | 5.64 | 5.99 | 6.34 | 6.68 | 7.23 | 7.68 | 8.10 | 8.50 | 8.87 | 9.24 | 9.62 | NA | 0.00 | NA | NA | NA | NA | NA | NA | NA | |
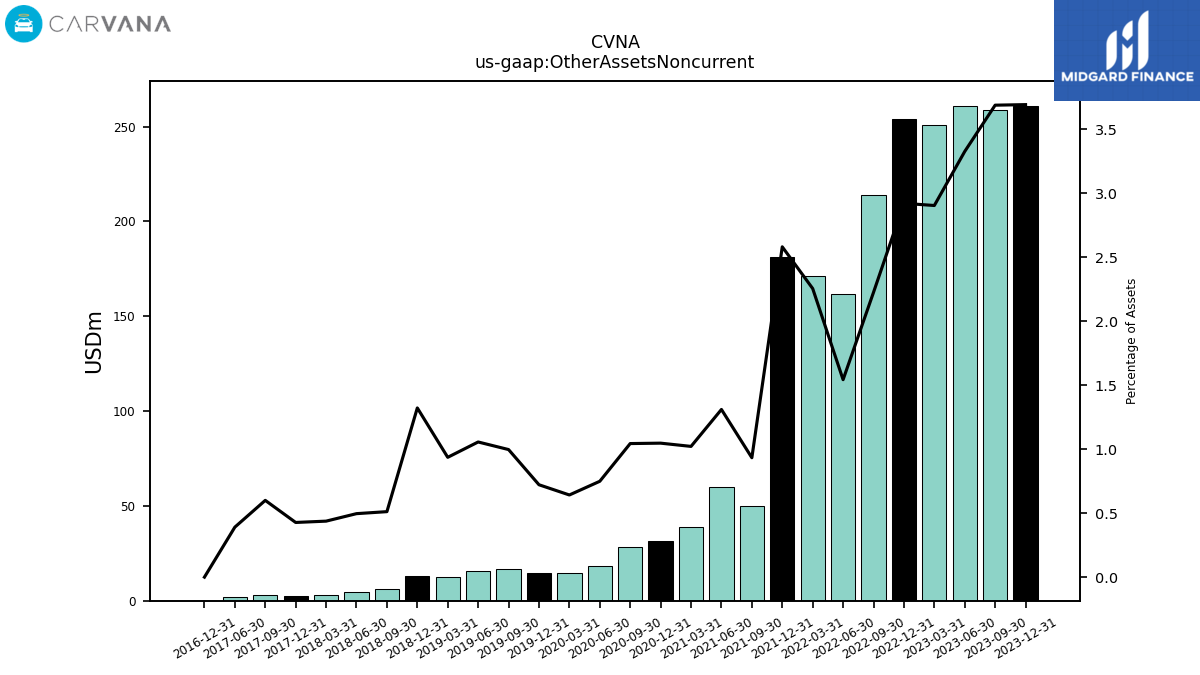
| Other Assets Noncurrent | 261.00 | 259.00 | 261.00 | 251.00 | 254.00 | 214.00 | 162.00 | 171.00 | 181.00 | 50.00 | 60.00 | 39.00 | 31.76 | 28.51 | 18.55 | 14.37 | 14.85 | 16.79 | 15.57 | 12.53 | 13.10 | 6.20 | 4.37 | 3.15 | 2.74 | 2.97 | 1.89 | NA | 0.00 | NA | NA | NA |
| 2023-12-31 | 2023-09-30 | 2023-06-30 | 2023-03-31 | 2022-12-31 | 2022-09-30 | 2022-06-30 | 2022-03-31 | 2021-12-31 | 2021-09-30 | 2021-06-30 | 2021-03-31 | 2020-12-31 | 2020-09-30 | 2020-06-30 | 2020-03-31 | 2019-12-31 | 2019-09-30 | 2019-06-30 | 2019-03-31 | 2018-12-31 | 2018-09-30 | 2018-06-30 | 2018-03-31 | 2017-12-31 | 2017-09-30 | 2017-06-30 | 2017-03-31 | 2016-12-31 | 2016-09-30 | 2016-06-30 | 2016-03-31 | ||
|---|---|---|---|---|---|---|---|---|---|---|---|---|---|---|---|---|---|---|---|---|---|---|---|---|---|---|---|---|---|---|---|---|---|
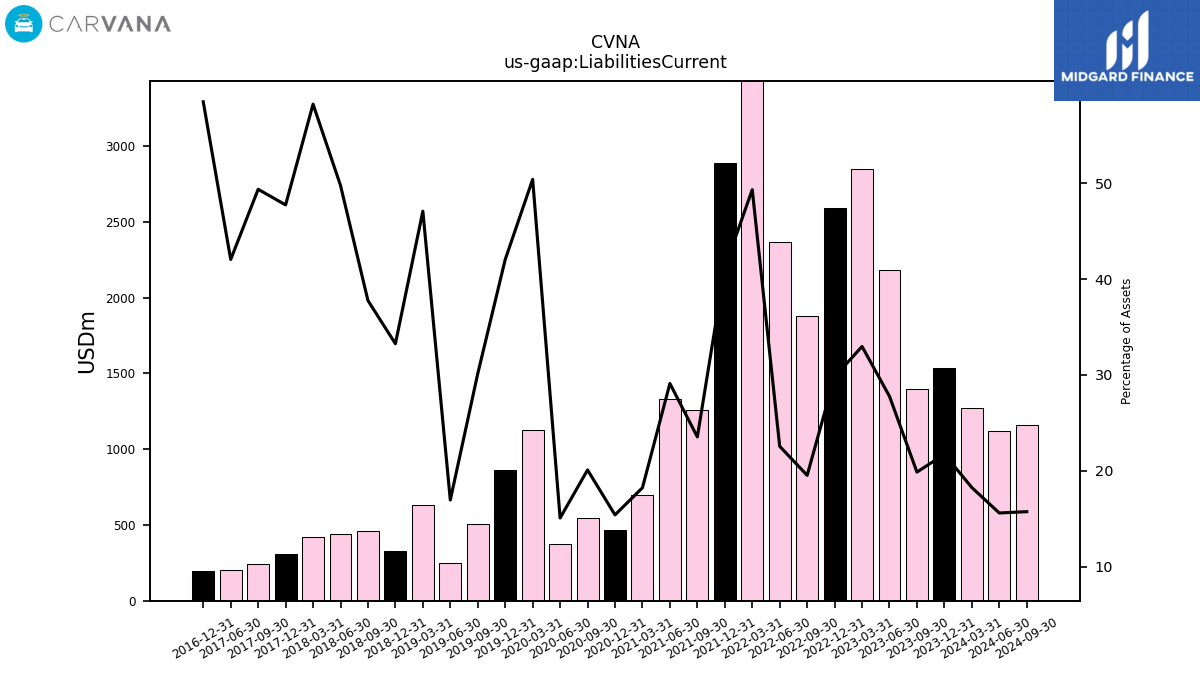
| Liabilities Current | 1536.00 | 1395.00 | 2179.00 | 2850.00 | 2592.00 | 1878.00 | 2368.00 | 3741.00 | 2890.00 | 1261.00 | 1333.00 | 696.00 | 467.14 | 548.79 | 373.26 | 1128.42 | 864.87 | 507.45 | 249.84 | 630.03 | 329.51 | 457.60 | 438.82 | 419.76 | 306.03 | 244.41 | 203.84 | NA | 196.42 | NA | NA | NA | |
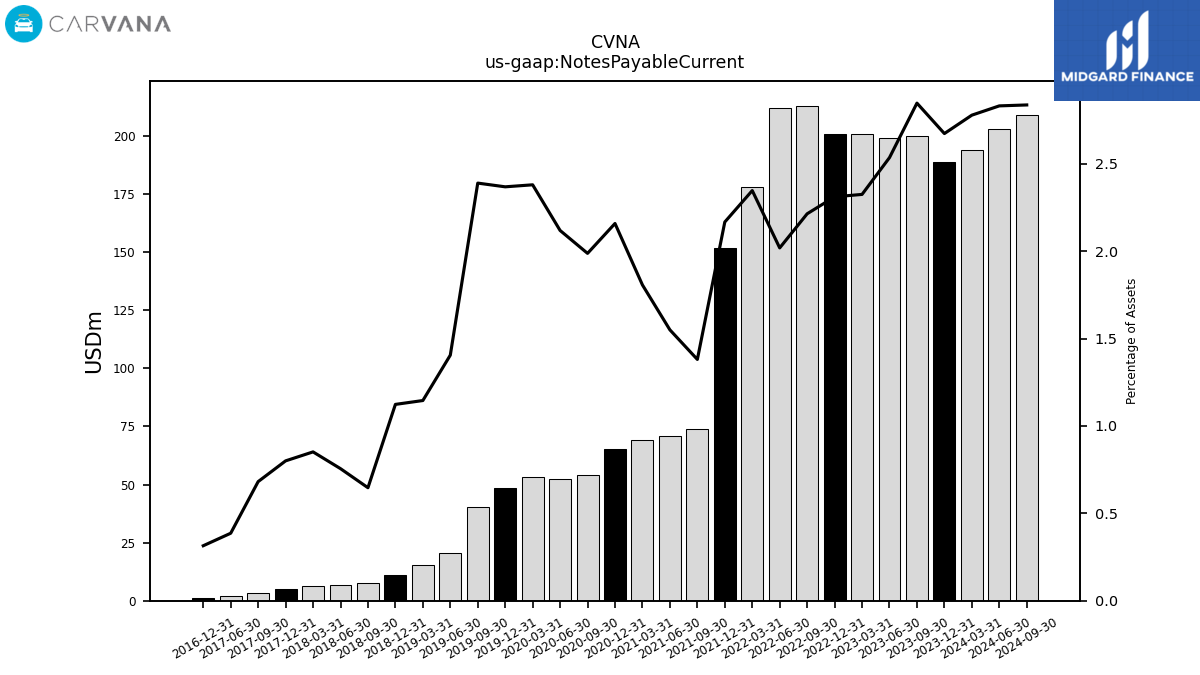
| Notes Payable Current | 189.00 | 200.00 | 199.00 | 201.00 | 201.00 | 213.00 | 212.00 | 178.00 | 152.00 | 74.00 | 71.00 | 69.00 | 65.50 | 54.31 | 52.47 | 53.29 | 48.73 | 40.25 | 20.72 | 15.33 | 11.13 | 7.84 | 6.66 | 6.14 | 5.13 | 3.38 | 1.87 | NA | 1.06 | NA | NA | NA | |
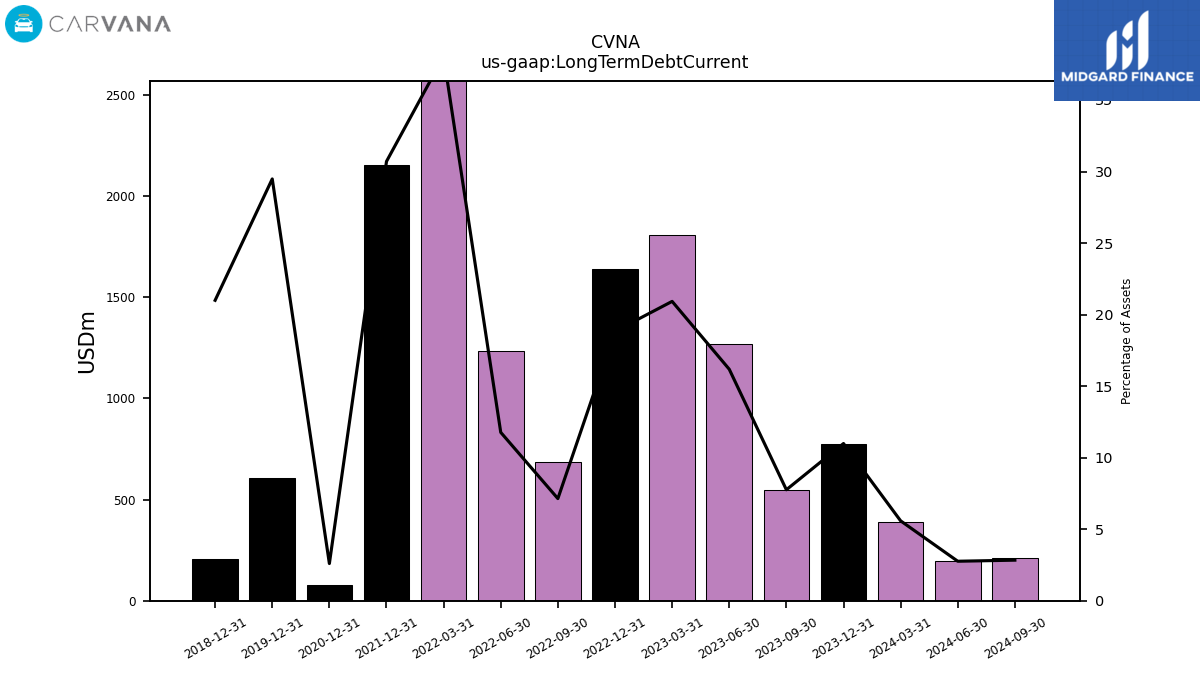
| Long Term Debt Current | 777.00 | 545.00 | 1270.00 | 1809.00 | 1638.00 | 687.00 | 1236.00 | 2886.00 | 2154.00 | NA | NA | NA | 78.91 | NA | NA | NA | 606.64 | NA | NA | NA | 208.10 | NA | NA | NA | NA | NA | NA | NA | NA | NA | NA | NA | |
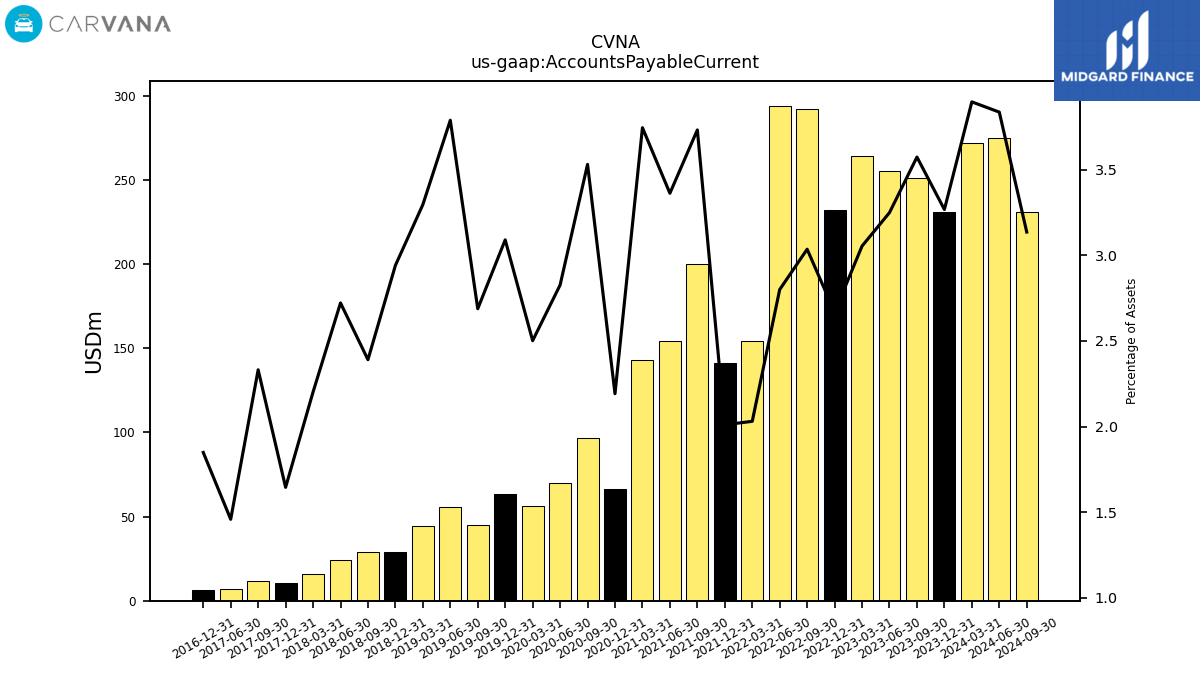
| Accounts Payable Current | 231.00 | 251.00 | 255.00 | 264.00 | 232.00 | 292.00 | 294.00 | 154.00 | 141.00 | 200.00 | 154.00 | 143.00 | 66.50 | 96.48 | 70.00 | 56.01 | 63.58 | 45.27 | 55.85 | 44.11 | 29.14 | 28.97 | 24.00 | 15.87 | 10.55 | 11.54 | 7.07 | NA | 6.21 | NA | NA | NA | |
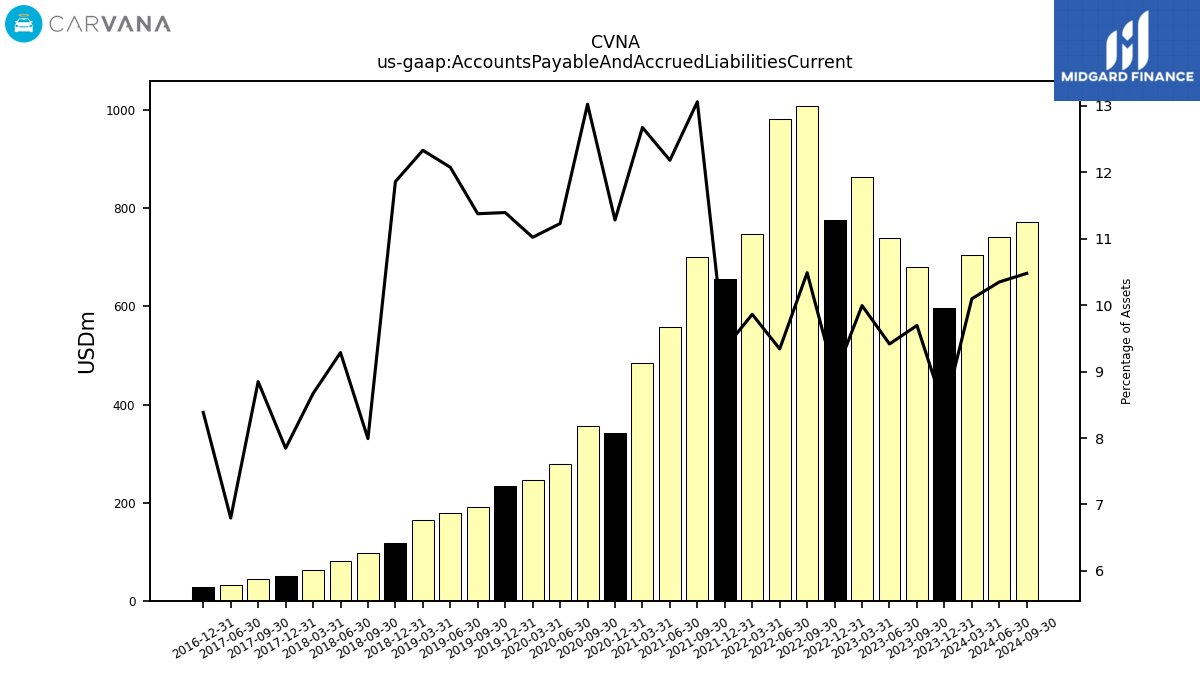
| Accounts Payable And Accrued Liabilities Current | 596.00 | 681.00 | 739.00 | 864.00 | 777.00 | 1009.00 | 981.00 | 748.00 | 656.00 | 700.00 | 558.00 | 484.00 | 342.31 | 355.88 | 278.08 | 246.78 | 234.44 | 191.60 | 178.03 | 165.02 | 117.52 | 96.86 | 81.88 | 62.48 | 50.31 | 43.81 | 32.95 | NA | 28.16 | NA | NA | NA | |
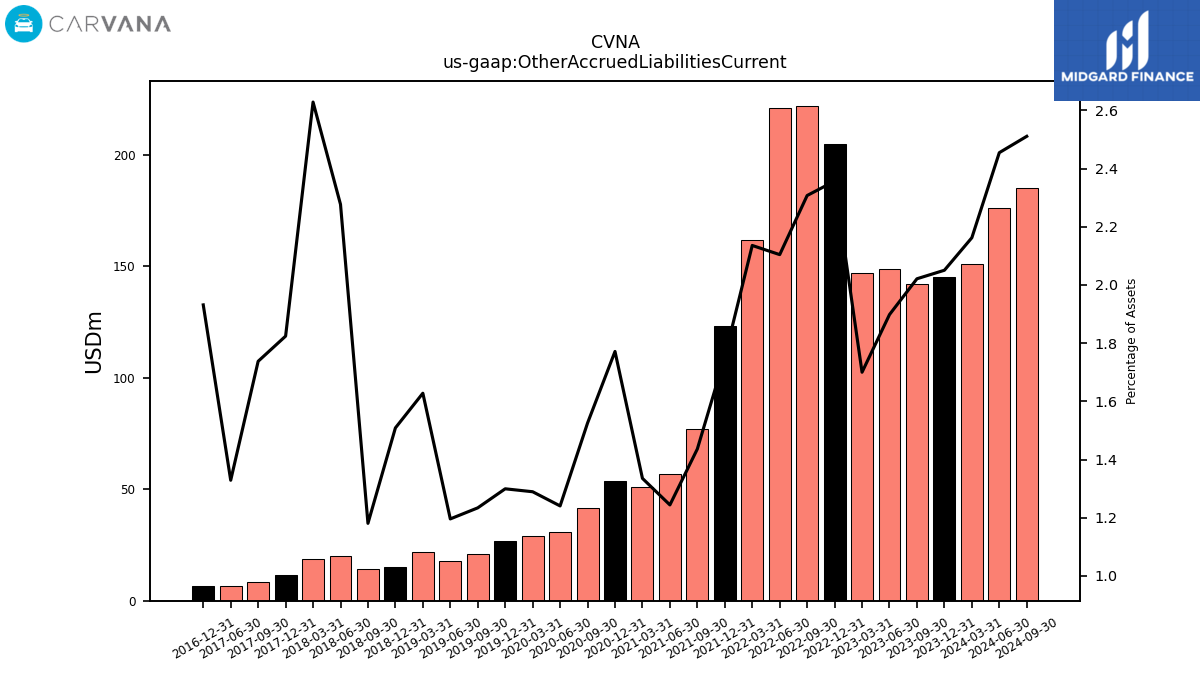
| Other Accrued Liabilities Current | 145.00 | 142.00 | 149.00 | 147.00 | 205.00 | 222.00 | 221.00 | 162.00 | 123.00 | 77.00 | 57.00 | 51.00 | 53.76 | 41.69 | 30.73 | 28.88 | 26.74 | 20.79 | 17.64 | 21.79 | 14.95 | 14.31 | 20.08 | 18.95 | 11.70 | 8.61 | 6.44 | NA | 6.49 | NA | NA | NA | |
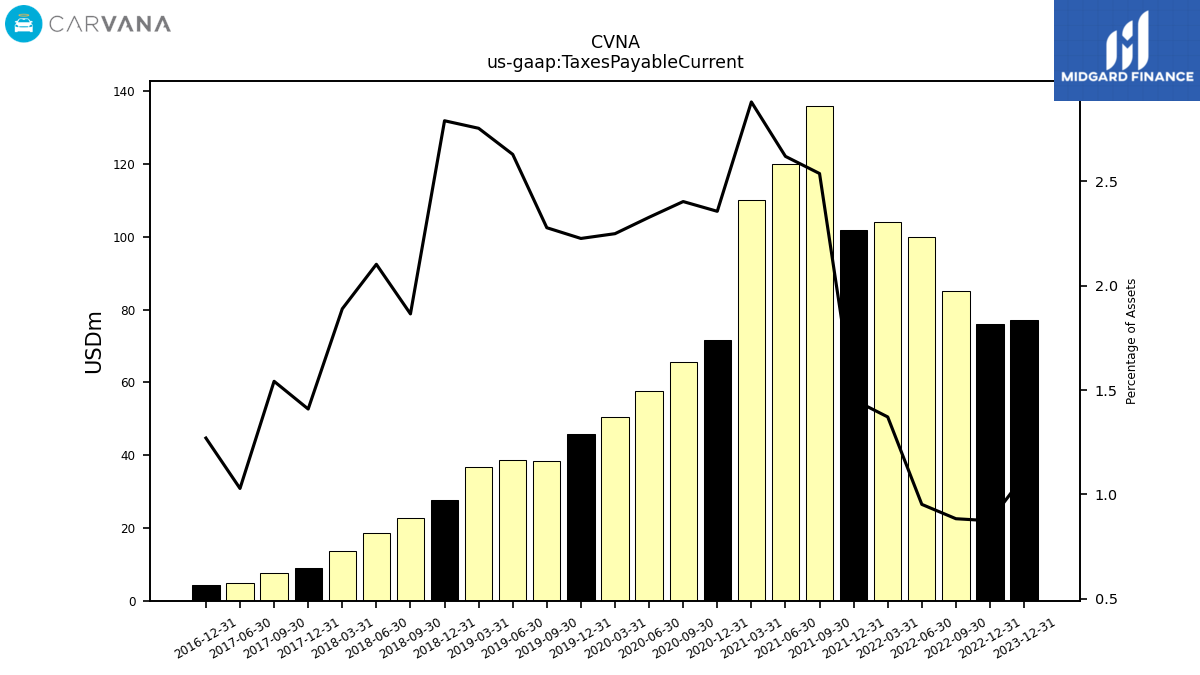
| Taxes Payable Current | 77.00 | NA | NA | NA | 76.00 | 85.00 | 100.00 | 104.00 | 102.00 | 136.00 | 120.00 | 110.00 | 71.50 | 65.67 | 57.65 | 50.36 | 45.81 | 38.36 | 38.76 | 36.86 | 27.65 | 22.60 | 18.54 | 13.62 | 9.03 | 7.63 | 4.99 | NA | 4.26 | NA | NA | NA | |
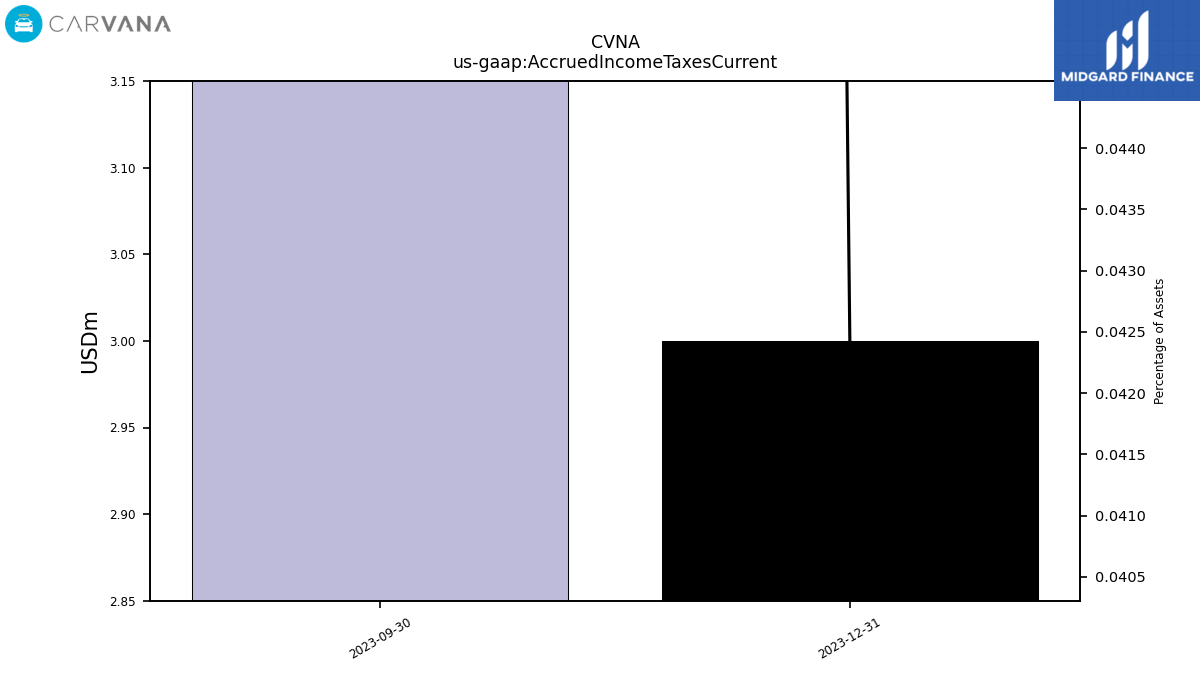
| Accrued Income Taxes Current | 3.00 | 27.00 | NA | NA | NA | NA | NA | NA | NA | NA | NA | NA | NA | NA | NA | NA | NA | NA | NA | NA | NA | NA | NA | NA | NA | NA | NA | NA | NA | NA | NA | NA | |
| Other Liabilities Current | 83.00 | 85.00 | 80.00 | 82.00 | 80.00 | 81.00 | 57.00 | 29.00 | 29.00 | 32.00 | 24.00 | 21.00 | 19.51 | 11.62 | 11.71 | 16.14 | 12.86 | 13.42 | 11.39 | 9.16 | 0.00 | NA | NA | NA | NA | NA | NA | NA | NA | NA | NA | NA | |
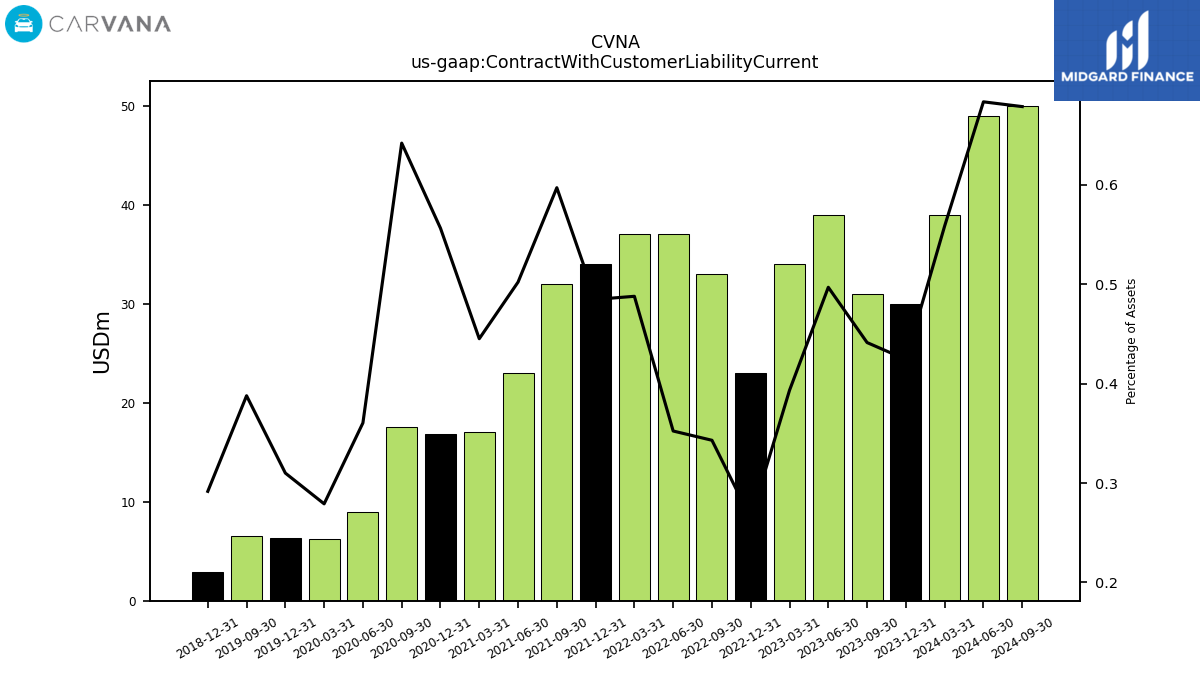
| Contract With Customer Liability Current | 30.00 | 31.00 | 39.00 | 34.00 | 23.00 | 33.00 | 37.00 | 37.00 | 34.00 | 32.00 | 23.00 | 17.00 | 16.88 | 17.54 | 8.93 | 6.25 | 6.38 | 6.53 | NA | NA | 2.89 | NA | NA | NA | NA | NA | NA | NA | NA | NA | NA | NA |
| 2023-12-31 | 2023-09-30 | 2023-06-30 | 2023-03-31 | 2022-12-31 | 2022-09-30 | 2022-06-30 | 2022-03-31 | 2021-12-31 | 2021-09-30 | 2021-06-30 | 2021-03-31 | 2020-12-31 | 2020-09-30 | 2020-06-30 | 2020-03-31 | 2019-12-31 | 2019-09-30 | 2019-06-30 | 2019-03-31 | 2018-12-31 | 2018-09-30 | 2018-06-30 | 2018-03-31 | 2017-12-31 | 2017-09-30 | 2017-06-30 | 2017-03-31 | 2016-12-31 | 2016-09-30 | 2016-06-30 | 2016-03-31 | ||
|---|---|---|---|---|---|---|---|---|---|---|---|---|---|---|---|---|---|---|---|---|---|---|---|---|---|---|---|---|---|---|---|---|---|
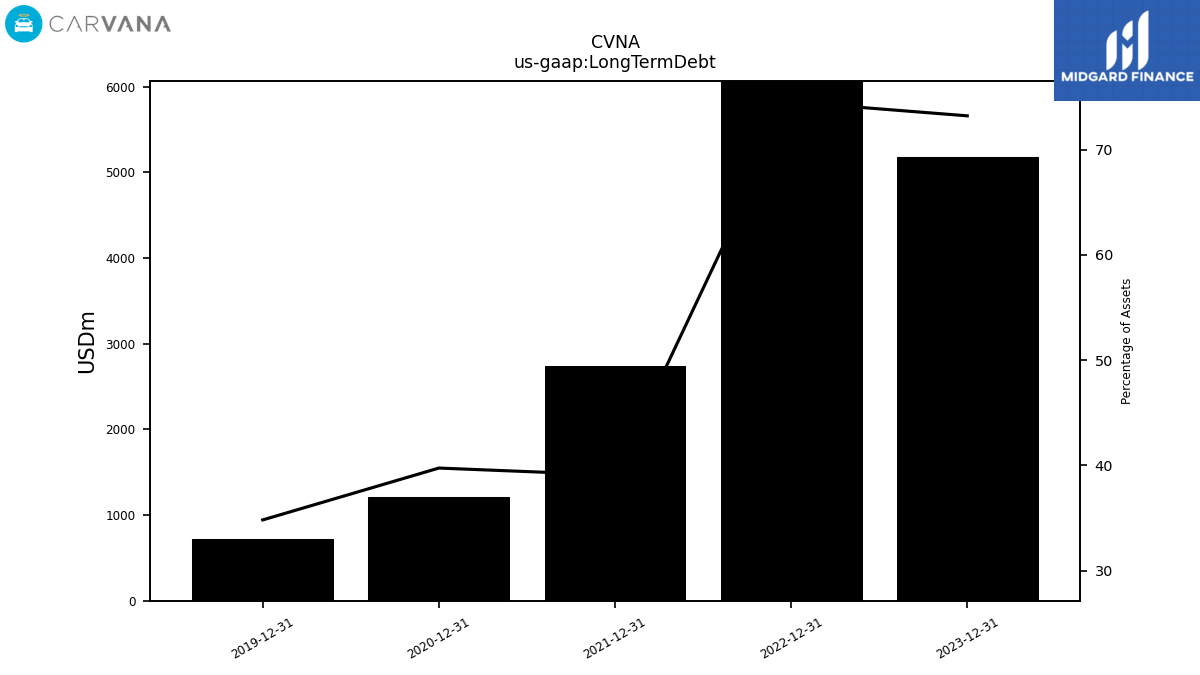
| Long Term Debt | 5176.00 | NA | NA | NA | 6482.00 | NA | NA | NA | 2742.00 | NA | NA | NA | 1206.43 | NA | NA | NA | 716.74 | NA | NA | NA | NA | NA | NA | NA | NA | NA | NA | NA | NA | NA | NA | NA | |
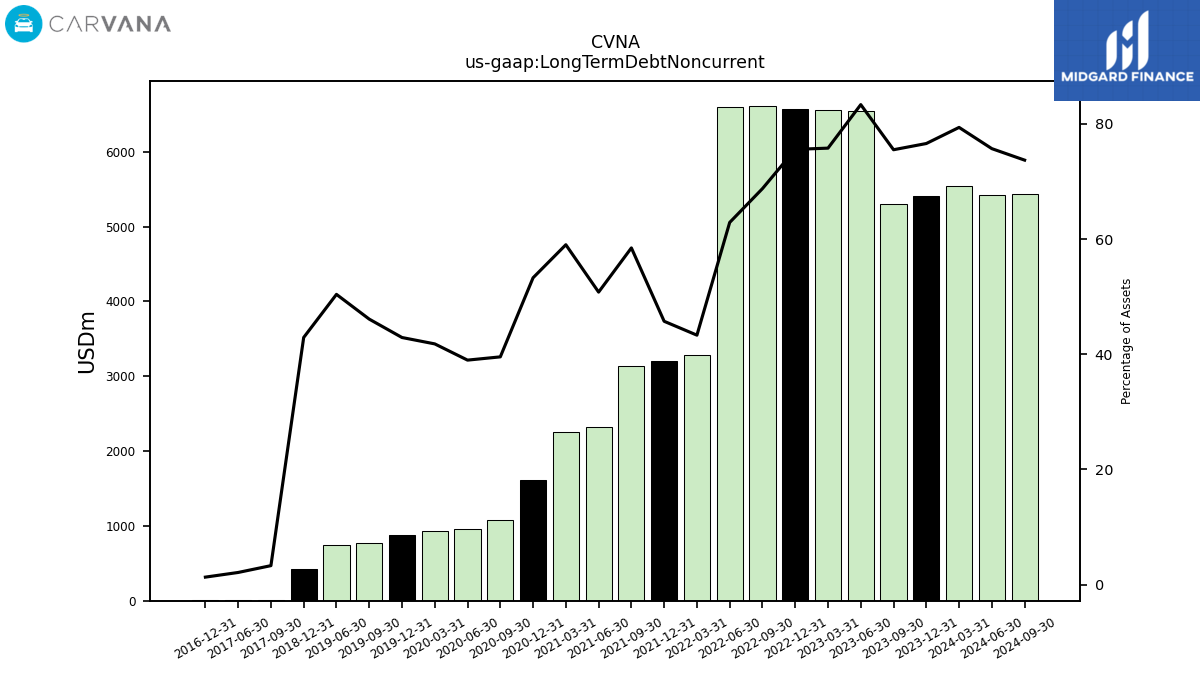
| Long Term Debt Noncurrent | 5416.00 | 5305.00 | 6542.00 | 6553.00 | 6574.00 | 6616.00 | 6605.00 | 3286.00 | 3208.00 | 3134.00 | 2327.00 | 2254.00 | 1617.00 | 1080.93 | 965.67 | 936.12 | 883.06 | 776.58 | 743.13 | NA | 425.35 | NA | NA | NA | NA | 16.36 | 10.28 | NA | 4.40 | NA | NA | NA | |
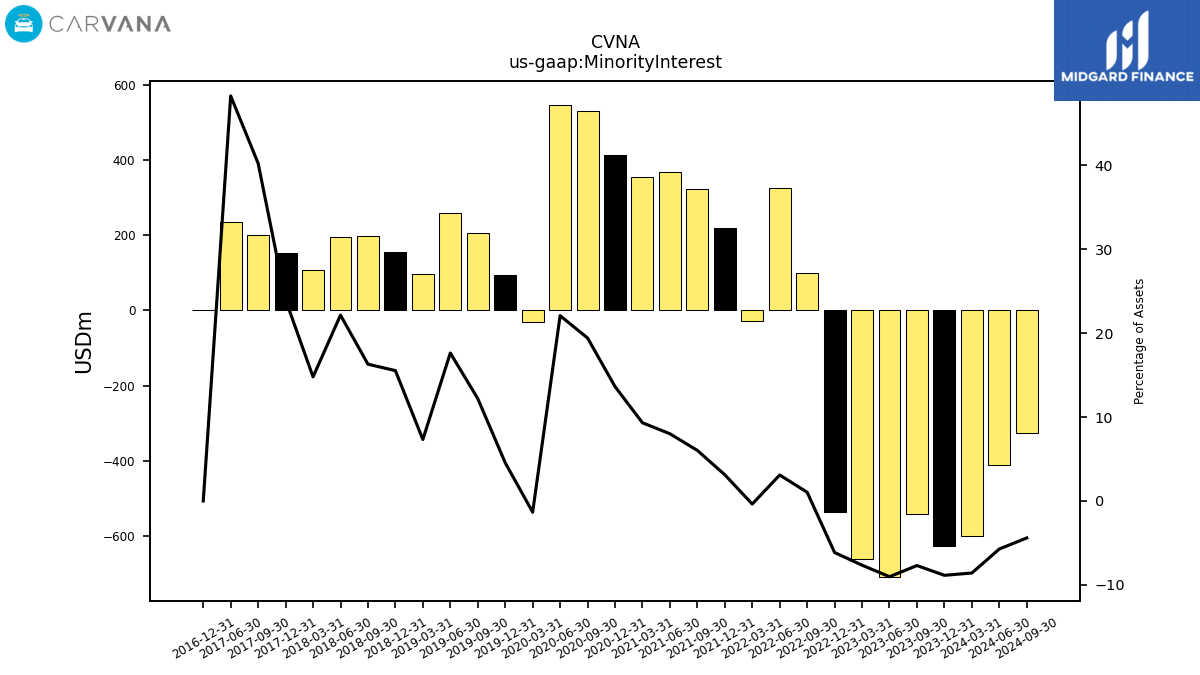
| Minority Interest | -627.00 | -541.00 | -709.00 | -662.00 | -535.00 | 100.00 | 325.00 | -28.00 | 219.00 | 323.00 | 367.00 | 356.00 | 413.90 | 531.07 | 547.13 | -29.88 | 93.83 | 205.65 | 260.07 | 98.07 | 154.02 | 197.66 | 195.36 | 106.64 | 153.81 | 199.31 | 234.19 | NA | 0.00 | NA | NA | NA | |
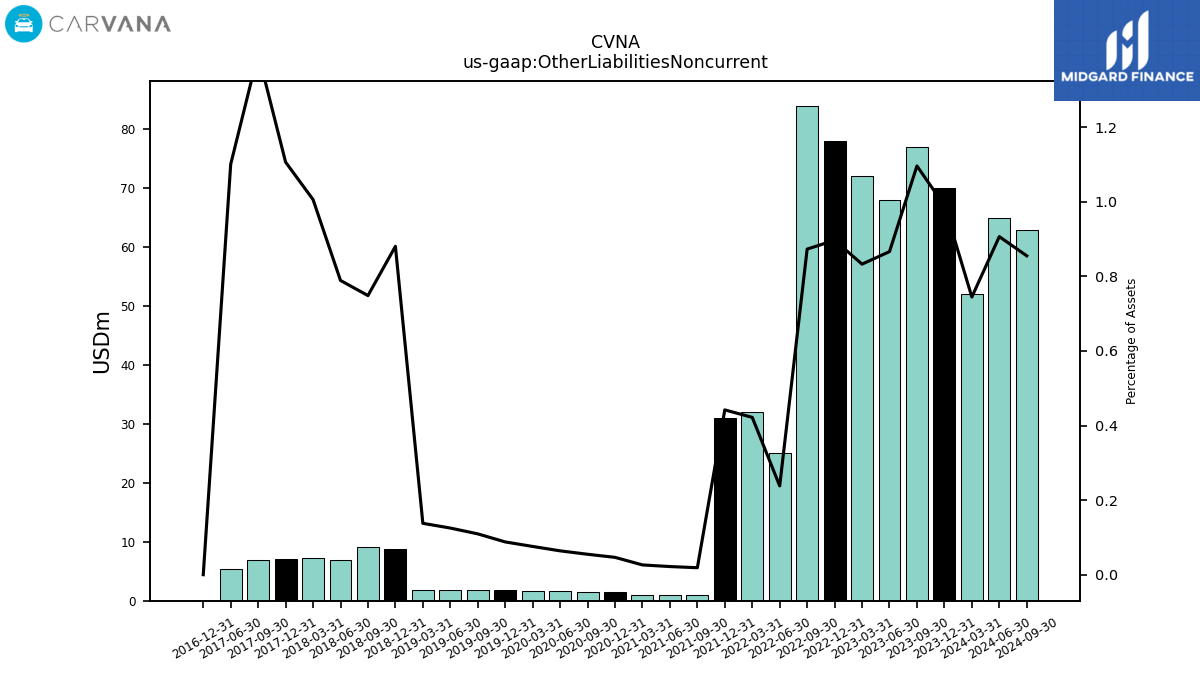
| Other Liabilities Noncurrent | 70.00 | 77.00 | 68.00 | 72.00 | 78.00 | 84.00 | 25.00 | 32.00 | 31.00 | 1.00 | 1.00 | 1.00 | 1.41 | 1.50 | 1.58 | 1.70 | 1.81 | 1.84 | 1.84 | 1.84 | 8.72 | 9.07 | 6.96 | 7.25 | 7.09 | 6.92 | 5.34 | NA | 0.00 | NA | NA | NA | |
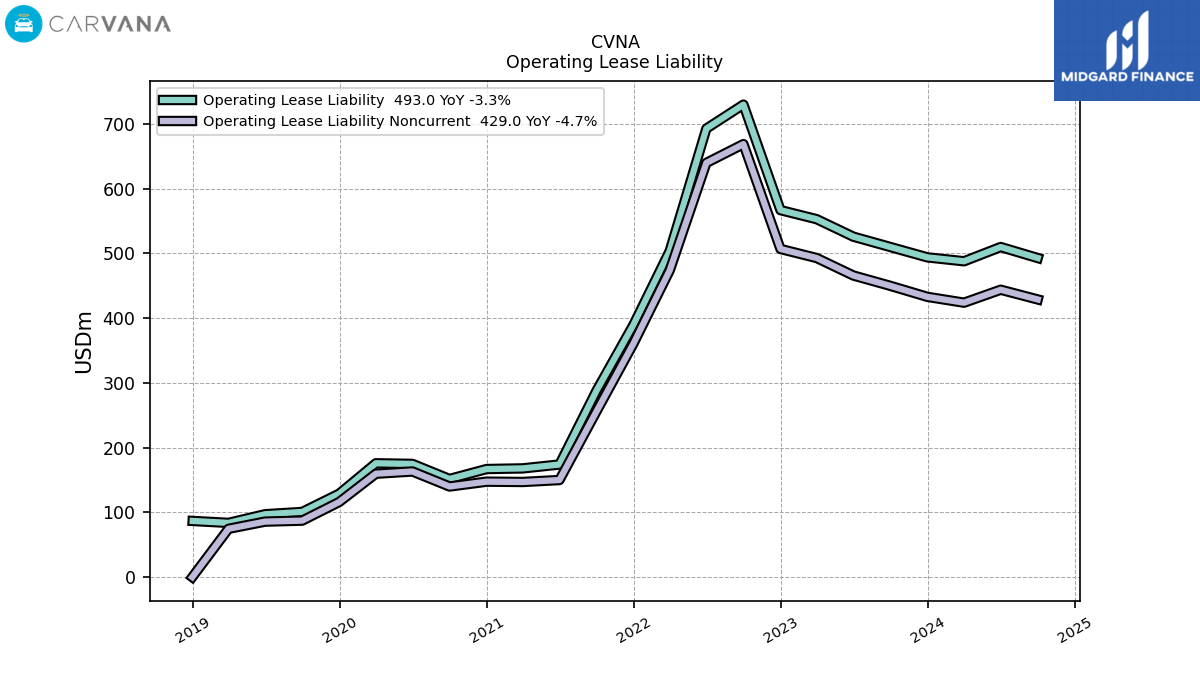
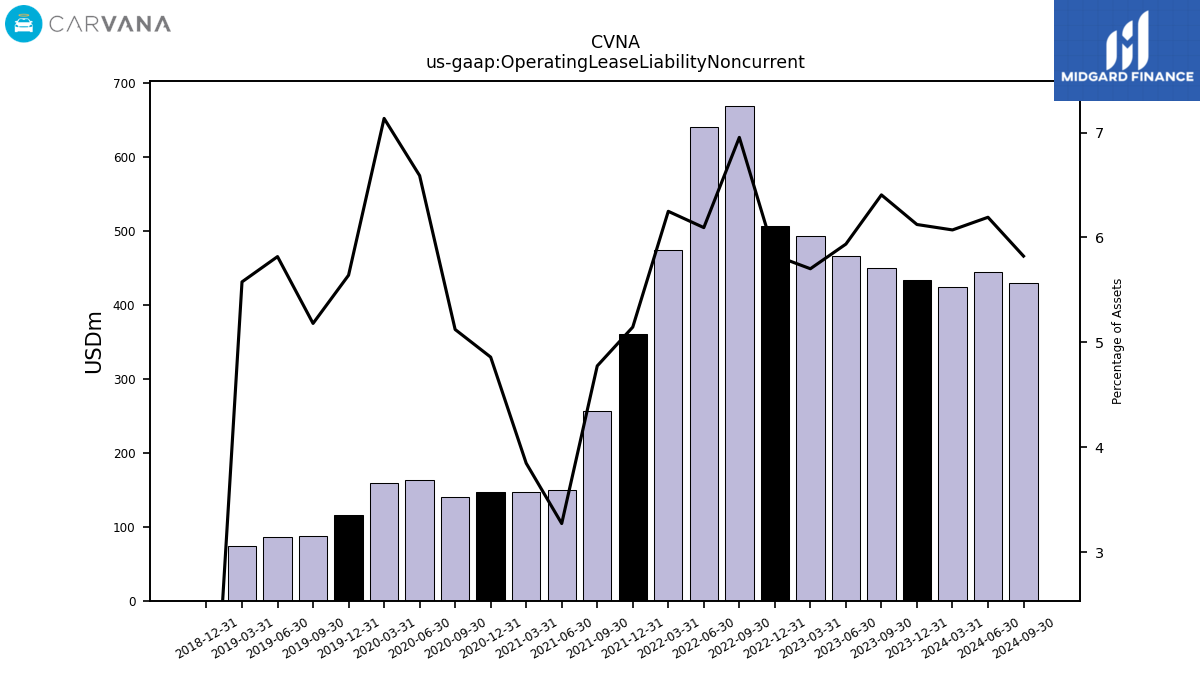
| Operating Lease Liability Noncurrent | 433.00 | 450.00 | 466.00 | 493.00 | 507.00 | 669.00 | 640.00 | 474.00 | 361.00 | 256.00 | 150.00 | 147.00 | 147.48 | 140.01 | 163.21 | 159.75 | 116.07 | 87.27 | 85.78 | 74.64 | 0.00 | NA | NA | NA | NA | NA | NA | NA | NA | NA | NA | NA |
| 2023-12-31 | 2023-09-30 | 2023-06-30 | 2023-03-31 | 2022-12-31 | 2022-09-30 | 2022-06-30 | 2022-03-31 | 2021-12-31 | 2021-09-30 | 2021-06-30 | 2021-03-31 | 2020-12-31 | 2020-09-30 | 2020-06-30 | 2020-03-31 | 2019-12-31 | 2019-09-30 | 2019-06-30 | 2019-03-31 | 2018-12-31 | 2018-09-30 | 2018-06-30 | 2018-03-31 | 2017-12-31 | 2017-09-30 | 2017-06-30 | 2017-03-31 | 2016-12-31 | 2016-09-30 | 2016-06-30 | 2016-03-31 | ||
|---|---|---|---|---|---|---|---|---|---|---|---|---|---|---|---|---|---|---|---|---|---|---|---|---|---|---|---|---|---|---|---|---|---|
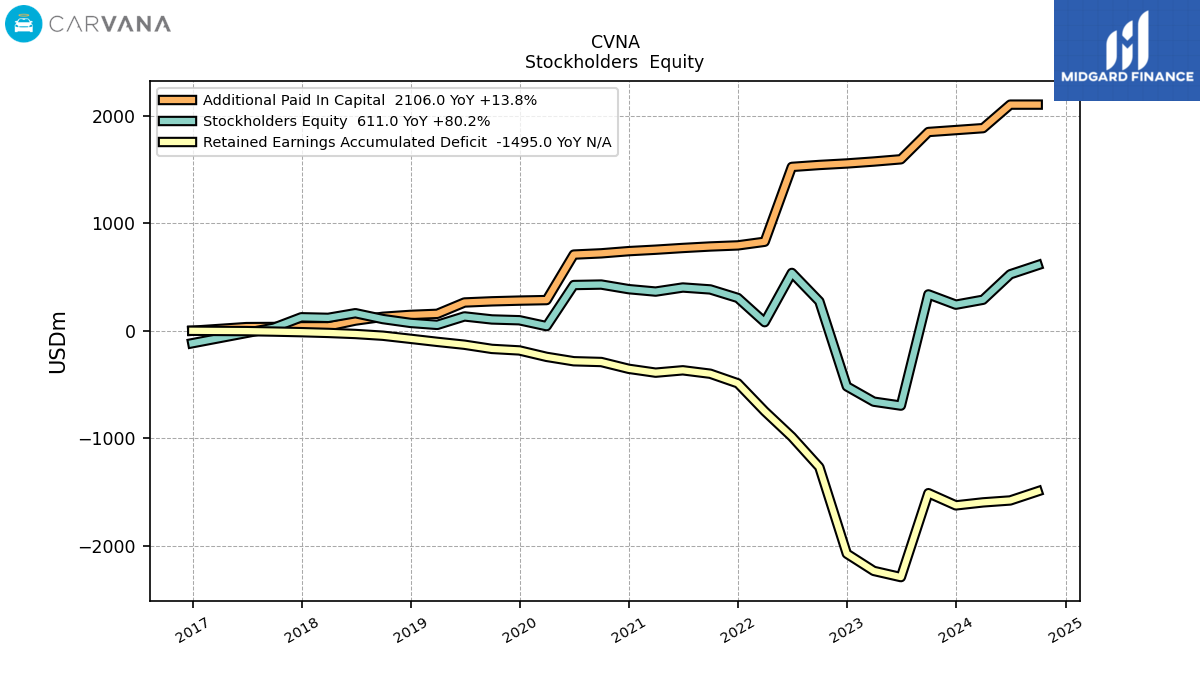
| Stockholders Equity | 243.00 | 339.00 | -697.00 | -660.00 | -518.00 | 274.00 | 539.00 | 80.00 | 306.00 | 385.00 | 403.00 | 365.00 | 387.60 | 430.51 | 425.95 | 43.10 | 98.11 | 105.53 | 133.75 | 54.77 | 73.41 | 109.11 | 163.75 | 120.30 | 125.74 | 28.16 | NA | NA | -115.96 | NA | NA | NA | |
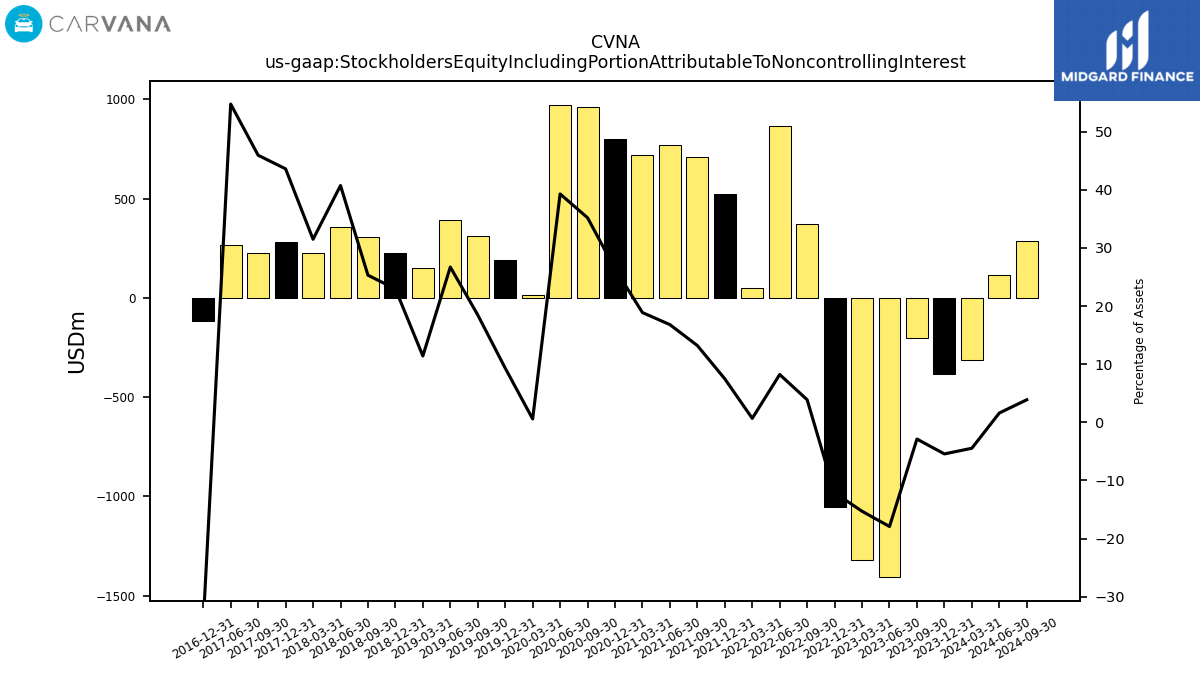
| Stockholders Equity Including Portion Attributable To Noncontrolling Interest | -384.00 | -202.00 | -1406.00 | -1322.00 | -1053.00 | 374.00 | 864.00 | 52.00 | 525.00 | 708.00 | 770.00 | 721.00 | 801.50 | 961.58 | 973.08 | 13.23 | 191.94 | 311.18 | 393.82 | 152.85 | 227.43 | 306.77 | 359.11 | 226.94 | 279.54 | 227.48 | 265.43 | NA | -115.96 | NA | NA | NA | |
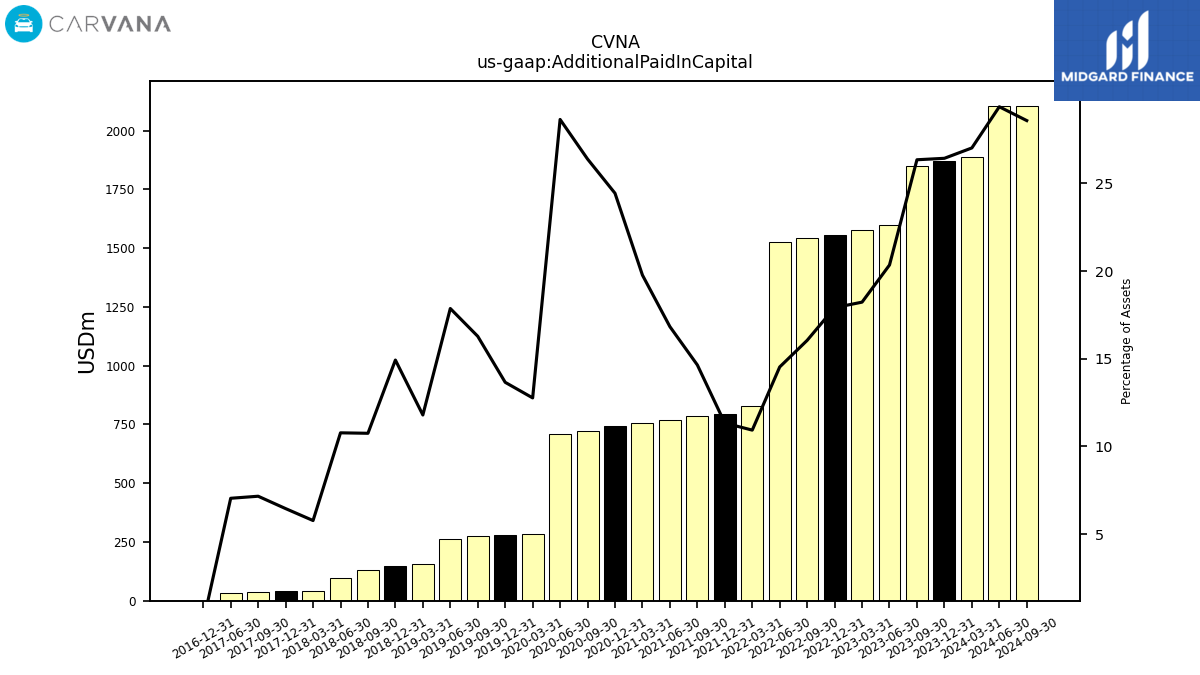
| Additional Paid In Capital | 1869.00 | 1851.00 | 1597.00 | 1576.00 | 1558.00 | 1544.00 | 1526.00 | 829.00 | 795.00 | 785.00 | 771.00 | 755.00 | 741.60 | 721.17 | 709.54 | 285.87 | 280.99 | 274.21 | 263.41 | 157.83 | 147.92 | 130.28 | 95.01 | 41.60 | 41.38 | 35.45 | 34.15 | NA | 0.00 | NA | NA | NA | |
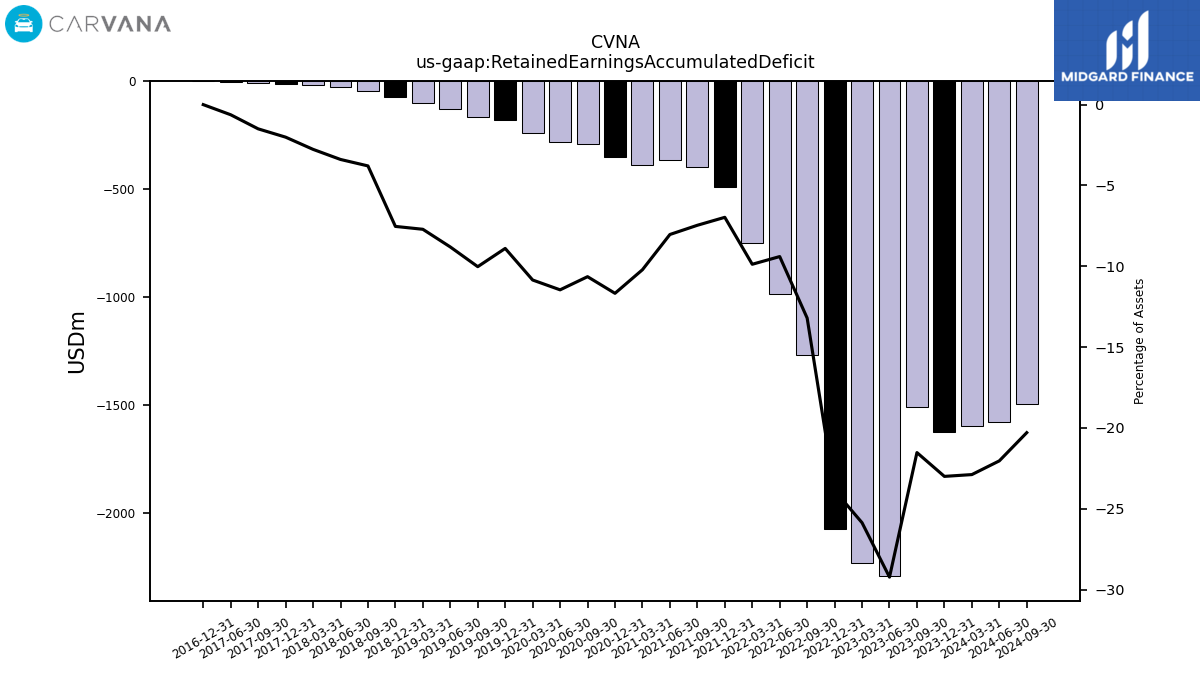
| Retained Earnings Accumulated Deficit | -1626.00 | -1512.00 | -2294.00 | -2236.00 | -2076.00 | -1270.00 | -987.00 | -749.00 | -489.00 | -400.00 | -368.00 | -390.00 | -354.17 | -290.84 | -283.75 | -242.92 | -183.03 | -168.83 | -129.81 | -103.20 | -74.65 | -45.95 | -29.91 | -19.94 | -12.90 | -7.42 | -3.04 | NA | 0.00 | NA | NA | NA | |
| Minority Interest | -627.00 | -541.00 | -709.00 | -662.00 | -535.00 | 100.00 | 325.00 | -28.00 | 219.00 | 323.00 | 367.00 | 356.00 | 413.90 | 531.07 | 547.13 | -29.88 | 93.83 | 205.65 | 260.07 | 98.07 | 154.02 | 197.66 | 195.36 | 106.64 | 153.81 | 199.31 | 234.19 | NA | 0.00 | NA | NA | NA |
| 2023-12-31 | 2023-09-30 | 2023-06-30 | 2023-03-31 | 2022-12-31 | 2022-09-30 | 2022-06-30 | 2022-03-31 | 2021-12-31 | 2021-09-30 | 2021-06-30 | 2021-03-31 | 2020-12-31 | 2020-09-30 | 2020-06-30 | 2020-03-31 | 2019-12-31 | 2019-09-30 | 2019-06-30 | 2019-03-31 | 2018-12-31 | 2018-09-30 | 2018-06-30 | 2018-03-31 | 2017-12-31 | 2017-09-30 | 2017-06-30 | 2017-03-31 | 2016-12-31 | 2016-09-30 | 2016-06-30 | 2016-03-31 | ||
|---|---|---|---|---|---|---|---|---|---|---|---|---|---|---|---|---|---|---|---|---|---|---|---|---|---|---|---|---|---|---|---|---|---|
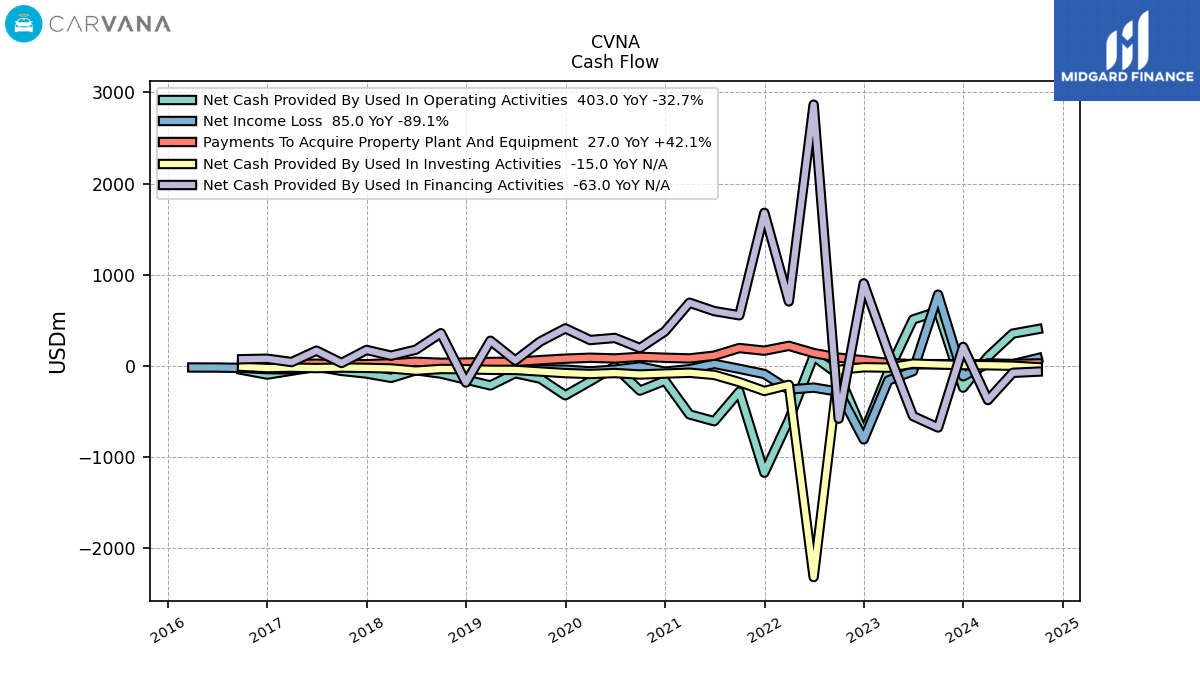
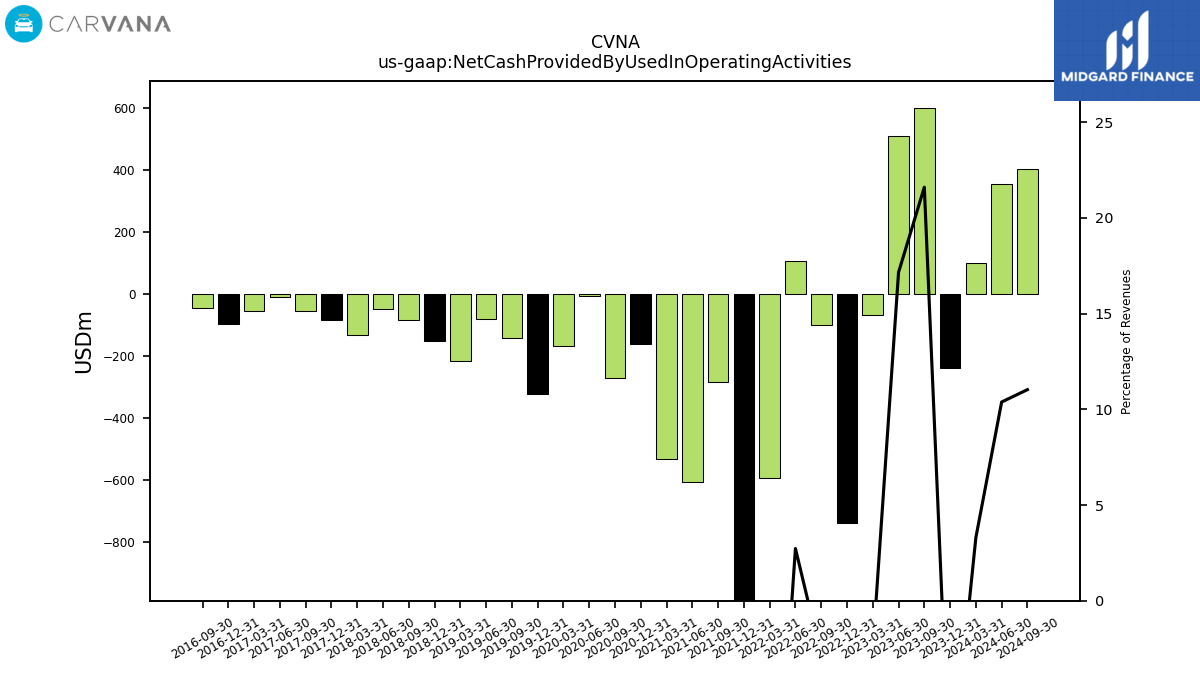
| Net Cash Provided By Used In Operating Activities | -239.00 | 599.00 | 509.00 | -66.00 | -739.00 | -98.00 | 106.00 | -593.00 | -1172.00 | -283.00 | -607.00 | -532.00 | -161.71 | -271.28 | -6.96 | -168.46 | -322.46 | -139.84 | -80.33 | -214.51 | -150.47 | -84.39 | -48.04 | -131.45 | -83.91 | -54.72 | -8.40 | -52.89 | -95.45 | -44.19 | NA | NA | |
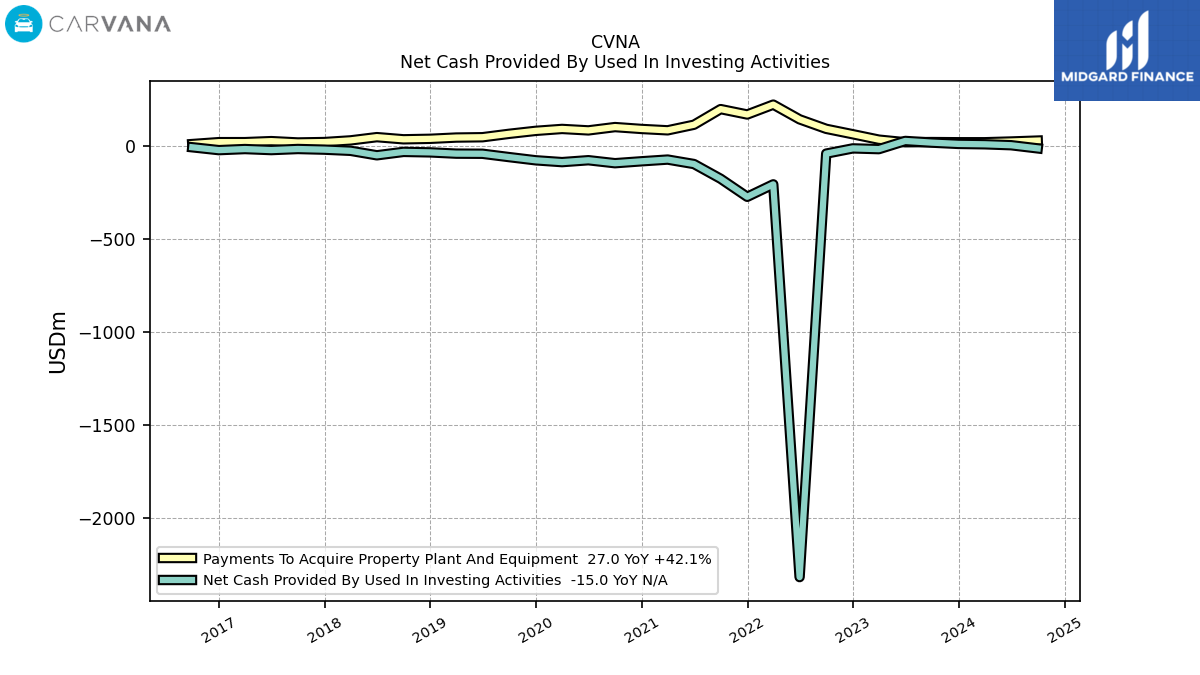
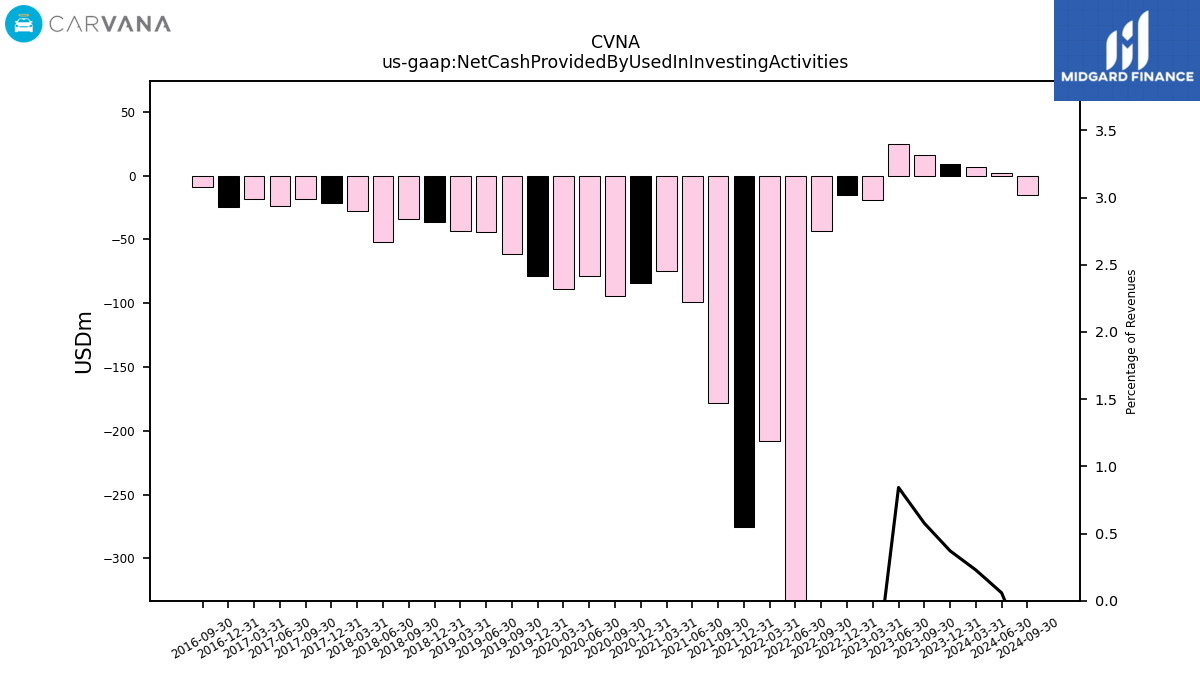
| Net Cash Provided By Used In Investing Activities | 9.00 | 16.00 | 25.00 | -19.00 | -15.00 | -43.00 | -2317.00 | -208.00 | -275.00 | -178.00 | -99.00 | -75.00 | -84.22 | -94.52 | -78.48 | -88.71 | -78.94 | -61.77 | -43.83 | -43.20 | -36.44 | -33.80 | -52.08 | -28.01 | -21.77 | -18.25 | -24.09 | -18.56 | -24.37 | -8.99 | NA | NA | |
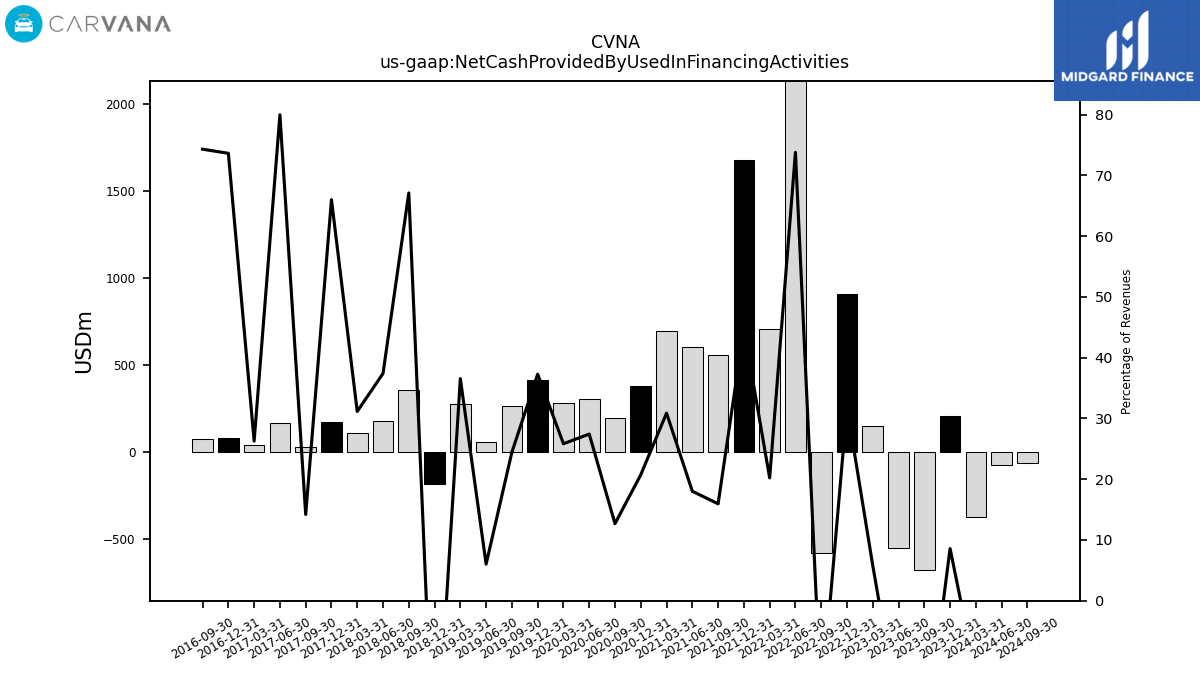
| Net Cash Provided By Used In Financing Activities | 208.00 | -676.00 | -551.00 | 151.00 | 905.00 | -579.00 | 2866.00 | 707.00 | 1679.00 | 555.00 | 601.00 | 693.00 | 378.72 | 195.84 | 306.69 | 283.74 | 411.38 | 267.69 | 59.50 | 276.05 | -182.65 | 358.91 | 177.74 | 112.26 | 174.91 | 31.99 | 167.40 | 41.79 | 78.65 | 73.44 | NA | NA |
| 2023-12-31 | 2023-09-30 | 2023-06-30 | 2023-03-31 | 2022-12-31 | 2022-09-30 | 2022-06-30 | 2022-03-31 | 2021-12-31 | 2021-09-30 | 2021-06-30 | 2021-03-31 | 2020-12-31 | 2020-09-30 | 2020-06-30 | 2020-03-31 | 2019-12-31 | 2019-09-30 | 2019-06-30 | 2019-03-31 | 2018-12-31 | 2018-09-30 | 2018-06-30 | 2018-03-31 | 2017-12-31 | 2017-09-30 | 2017-06-30 | 2017-03-31 | 2016-12-31 | 2016-09-30 | 2016-06-30 | 2016-03-31 | ||
|---|---|---|---|---|---|---|---|---|---|---|---|---|---|---|---|---|---|---|---|---|---|---|---|---|---|---|---|---|---|---|---|---|---|
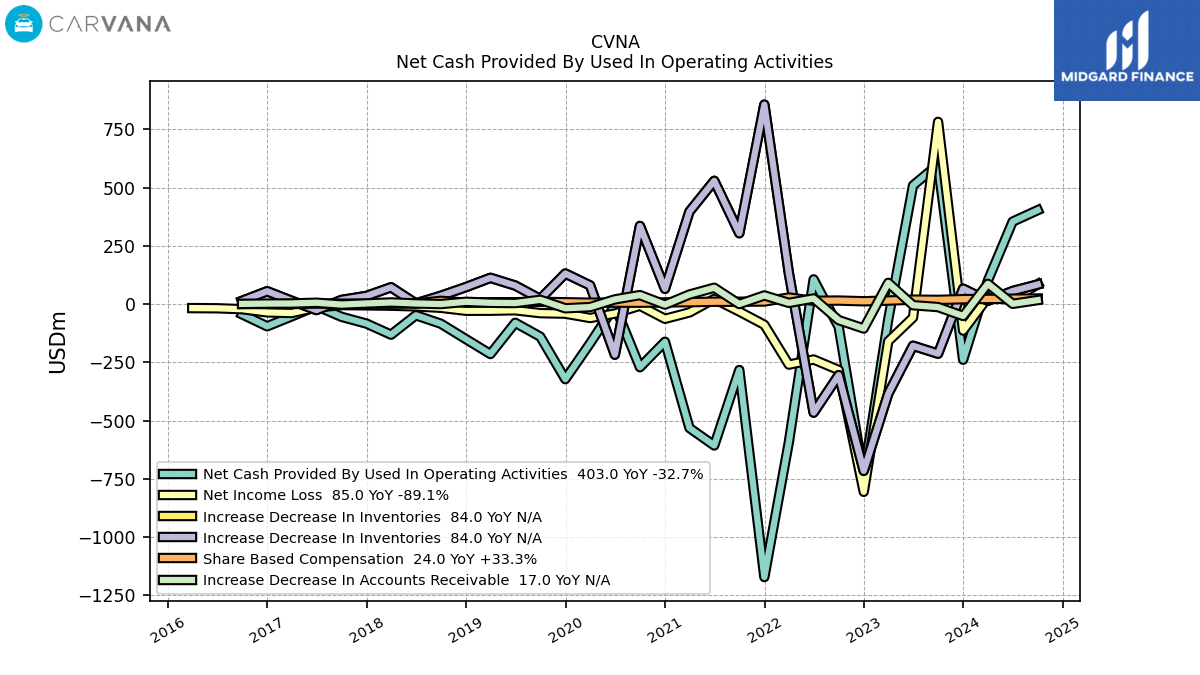
| Net Cash Provided By Used In Operating Activities | -239.00 | 599.00 | 509.00 | -66.00 | -739.00 | -98.00 | 106.00 | -593.00 | -1172.00 | -283.00 | -607.00 | -532.00 | -161.71 | -271.28 | -6.96 | -168.46 | -322.46 | -139.84 | -80.33 | -214.51 | -150.47 | -84.39 | -48.04 | -131.45 | -83.91 | -54.72 | -8.40 | -52.89 | -95.45 | -44.19 | NA | NA | |
| Net Income Loss | -114.00 | 782.00 | -58.00 | -160.00 | -806.00 | -283.00 | -238.00 | -260.00 | -89.00 | -32.00 | 22.00 | -36.00 | -63.34 | -7.08 | -40.83 | -59.89 | -41.13 | -39.02 | -26.61 | -28.55 | -28.70 | -16.04 | -9.96 | -7.04 | -5.48 | -4.38 | -14.54 | -38.44 | -35.69 | -21.98 | -18.11 | -17.32 | |
| Profit Loss | -200.00 | 741.00 | -105.00 | -286.00 | -1441.00 | -508.00 | -439.00 | -506.00 | -182.00 | -68.00 | 45.00 | -82.00 | -154.62 | -17.72 | -106.33 | -183.56 | -125.74 | -92.24 | -64.06 | -82.60 | -86.40 | -64.42 | -51.25 | -52.67 | -47.24 | -39.77 | -38.87 | -38.44 | -35.69 | -21.98 | -18.11 | -17.32 | |
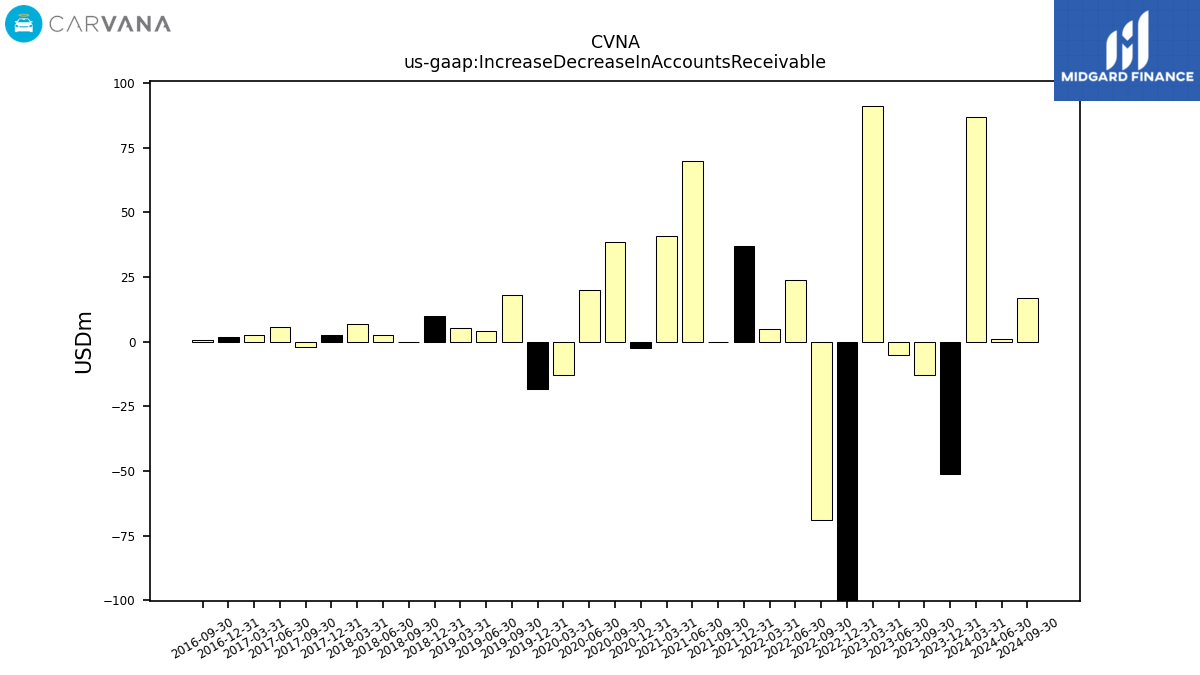
| Increase Decrease In Accounts Receivable | -51.00 | -13.00 | -5.00 | 91.00 | -105.00 | -69.00 | 24.00 | 5.00 | 37.00 | 0.00 | 70.00 | 41.00 | -2.58 | 38.53 | 20.04 | -12.99 | -18.17 | 18.16 | 4.31 | 5.43 | 9.78 | -0.07 | 2.53 | 6.97 | 2.56 | -2.13 | 5.82 | 2.47 | 1.98 | 0.64 | NA | NA | |
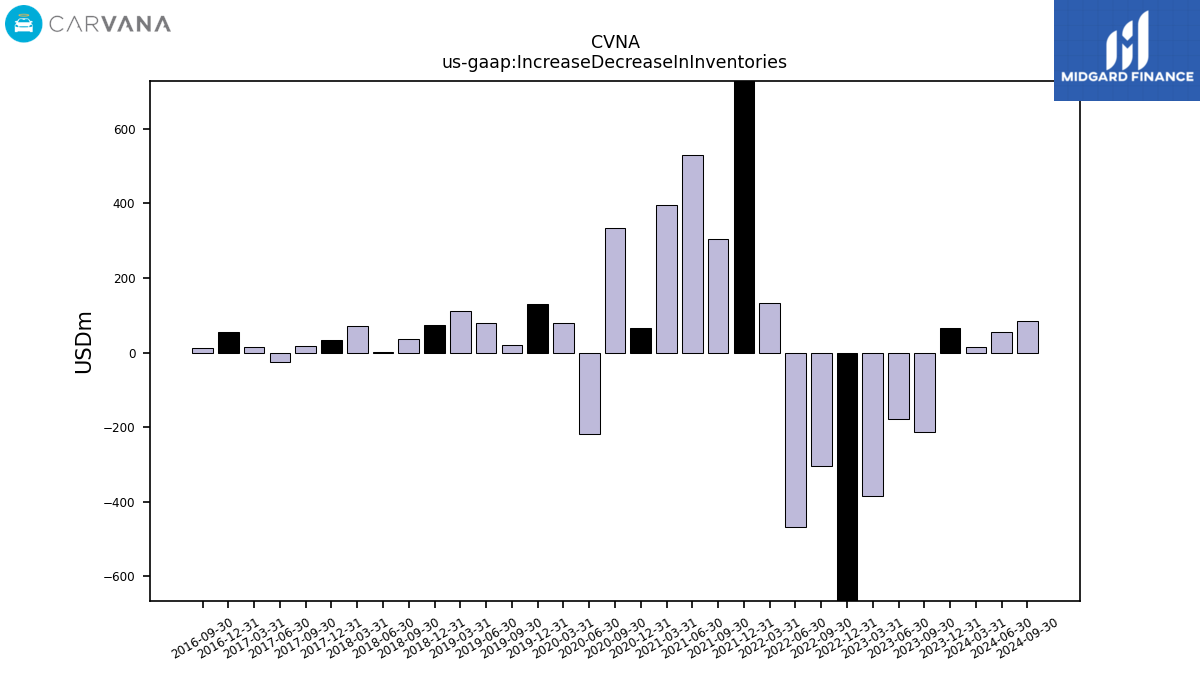
| Increase Decrease In Inventories | 66.00 | -213.00 | -179.00 | -385.00 | -716.00 | -305.00 | -466.00 | 133.00 | 856.00 | 304.00 | 529.00 | 397.00 | 65.36 | 335.19 | -217.24 | 80.01 | 131.10 | 21.77 | 79.45 | 112.54 | 72.76 | 35.49 | 2.79 | 72.03 | 34.88 | 17.63 | -25.71 | 14.04 | 55.13 | 13.73 | NA | NA | |
| Share Based Compensation | 21.00 | 18.00 | 19.00 | 15.00 | 12.00 | 15.00 | 14.00 | 28.00 | 11.00 | 10.00 | 10.00 | 8.00 | 7.08 | 5.85 | 6.22 | 5.94 | 7.70 | 9.62 | 8.03 | 7.71 | 6.11 | 13.89 | 2.58 | 1.51 | 1.62 | 1.89 | 1.94 | 0.16 | 0.13 | 0.14 | NA | NA |
| 2023-12-31 | 2023-09-30 | 2023-06-30 | 2023-03-31 | 2022-12-31 | 2022-09-30 | 2022-06-30 | 2022-03-31 | 2021-12-31 | 2021-09-30 | 2021-06-30 | 2021-03-31 | 2020-12-31 | 2020-09-30 | 2020-06-30 | 2020-03-31 | 2019-12-31 | 2019-09-30 | 2019-06-30 | 2019-03-31 | 2018-12-31 | 2018-09-30 | 2018-06-30 | 2018-03-31 | 2017-12-31 | 2017-09-30 | 2017-06-30 | 2017-03-31 | 2016-12-31 | 2016-09-30 | 2016-06-30 | 2016-03-31 | ||
|---|---|---|---|---|---|---|---|---|---|---|---|---|---|---|---|---|---|---|---|---|---|---|---|---|---|---|---|---|---|---|---|---|---|
| Net Cash Provided By Used In Investing Activities | 9.00 | 16.00 | 25.00 | -19.00 | -15.00 | -43.00 | -2317.00 | -208.00 | -275.00 | -178.00 | -99.00 | -75.00 | -84.22 | -94.52 | -78.48 | -88.71 | -78.94 | -61.77 | -43.83 | -43.20 | -36.44 | -33.80 | -52.08 | -28.01 | -21.77 | -18.25 | -24.09 | -18.56 | -24.37 | -8.99 | NA | NA | |
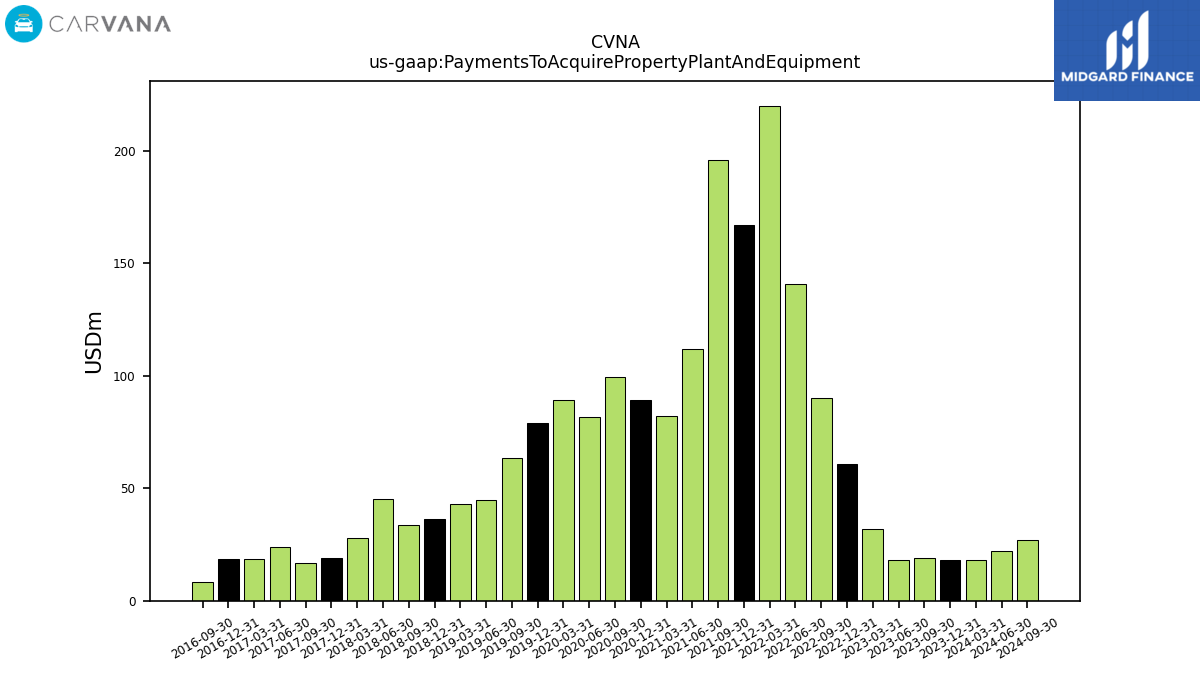
| Payments To Acquire Property Plant And Equipment | 18.00 | 19.00 | 18.00 | 32.00 | 61.00 | 90.00 | 141.00 | 220.00 | 167.00 | 196.00 | 112.00 | 82.00 | 89.31 | 99.43 | 81.62 | 89.43 | 79.16 | 63.24 | 44.94 | 43.20 | 36.44 | 33.80 | 45.41 | 28.01 | 19.08 | 16.83 | 24.02 | 18.56 | 18.52 | 8.33 | NA | NA |
| 2023-12-31 | 2023-09-30 | 2023-06-30 | 2023-03-31 | 2022-12-31 | 2022-09-30 | 2022-06-30 | 2022-03-31 | 2021-12-31 | 2021-09-30 | 2021-06-30 | 2021-03-31 | 2020-12-31 | 2020-09-30 | 2020-06-30 | 2020-03-31 | 2019-12-31 | 2019-09-30 | 2019-06-30 | 2019-03-31 | 2018-12-31 | 2018-09-30 | 2018-06-30 | 2018-03-31 | 2017-12-31 | 2017-09-30 | 2017-06-30 | 2017-03-31 | 2016-12-31 | 2016-09-30 | 2016-06-30 | 2016-03-31 | ||
|---|---|---|---|---|---|---|---|---|---|---|---|---|---|---|---|---|---|---|---|---|---|---|---|---|---|---|---|---|---|---|---|---|---|
| Net Cash Provided By Used In Financing Activities | 208.00 | -676.00 | -551.00 | 151.00 | 905.00 | -579.00 | 2866.00 | 707.00 | 1679.00 | 555.00 | 601.00 | 693.00 | 378.72 | 195.84 | 306.69 | 283.74 | 411.38 | 267.69 | 59.50 | 276.05 | -182.65 | 358.91 | 177.74 | 112.26 | 174.91 | 31.99 | 167.40 | 41.79 | 78.65 | 73.44 | NA | NA |
| 2023-12-31 | 2023-09-30 | 2023-06-30 | 2023-03-31 | 2022-12-31 | 2022-09-30 | 2022-06-30 | 2022-03-31 | 2021-12-31 | 2021-09-30 | 2021-06-30 | 2021-03-31 | 2020-12-31 | 2020-09-30 | 2020-06-30 | 2020-03-31 | 2019-12-31 | 2019-09-30 | 2019-06-30 | 2019-03-31 | 2018-12-31 | 2018-09-30 | 2018-06-30 | 2018-03-31 | 2017-12-31 | 2017-09-30 | 2017-06-30 | 2017-03-31 | 2016-12-31 | 2016-09-30 | 2016-06-30 | 2016-03-31 | ||
|---|---|---|---|---|---|---|---|---|---|---|---|---|---|---|---|---|---|---|---|---|---|---|---|---|---|---|---|---|---|---|---|---|---|
| Revenues | 2424.00 | 2773.00 | 2968.00 | 2606.00 | 2837.00 | 3386.00 | 3884.00 | 3497.00 | 3753.00 | 3480.00 | 3336.00 | 2245.00 | 1826.41 | 1543.61 | 1118.33 | 1098.22 | 1103.59 | 1094.85 | 986.22 | 755.23 | 584.84 | 534.92 | 475.29 | 360.42 | 265.05 | 225.38 | 209.37 | 159.07 | 106.83 | 98.84 | 86.53 | 72.95 | |
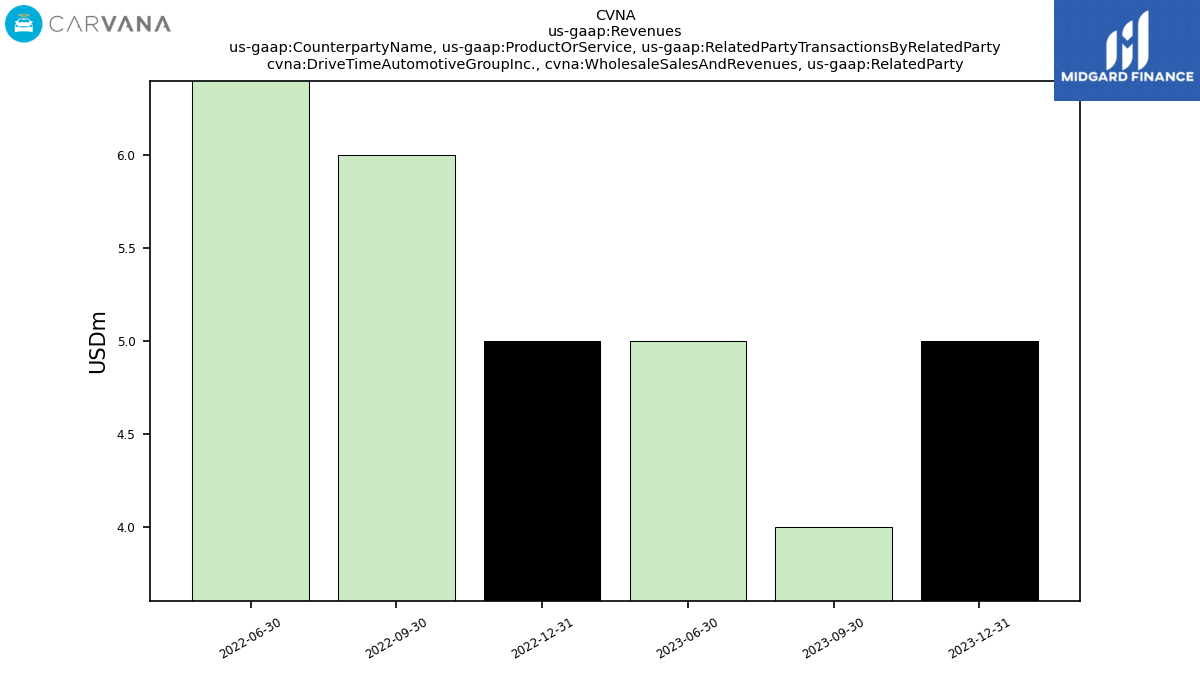
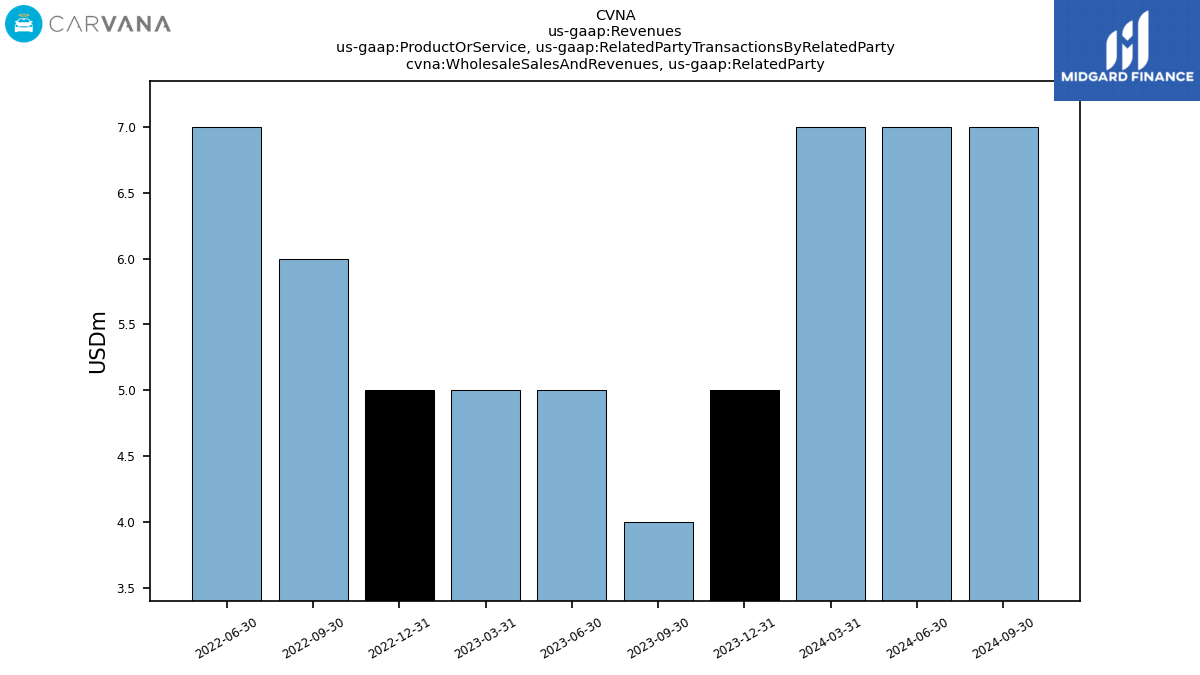
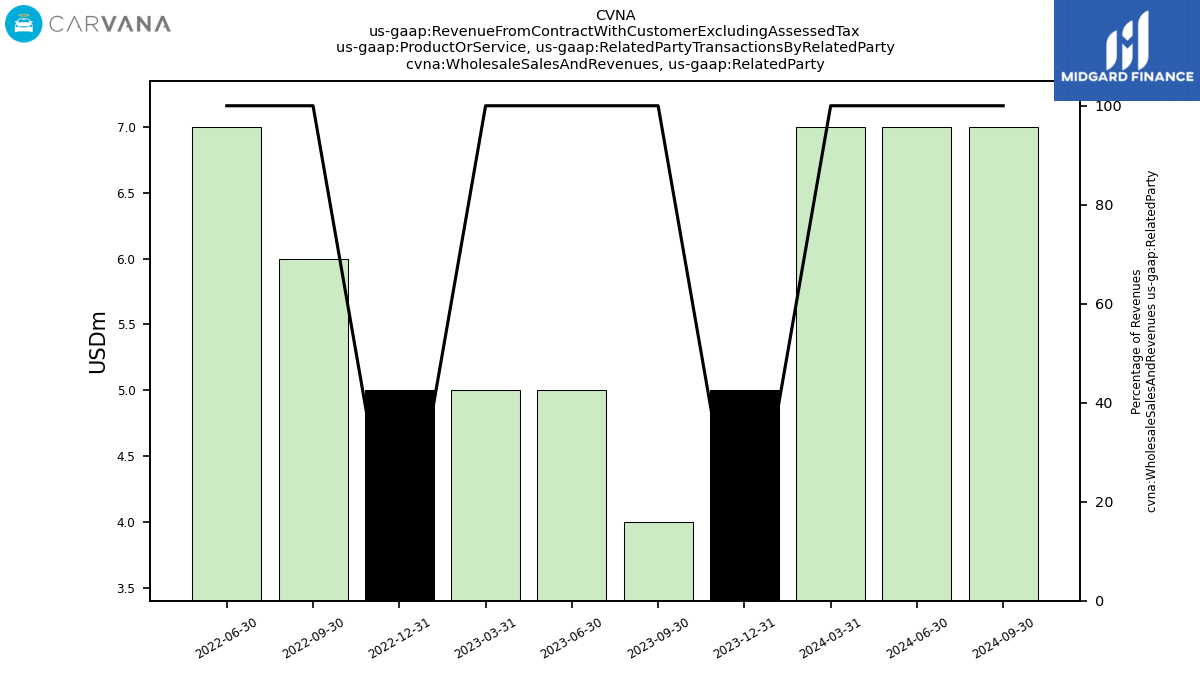
| Drive Time Automotive Group Inc., Wholesale Sales And Revenues, Related Party | 5.00 | 4.00 | 5.00 | NA | 5.00 | 6.00 | 7.00 | NA | NA | NA | NA | NA | NA | NA | NA | NA | NA | NA | NA | NA | NA | NA | NA | NA | NA | NA | NA | NA | NA | NA | NA | NA | |
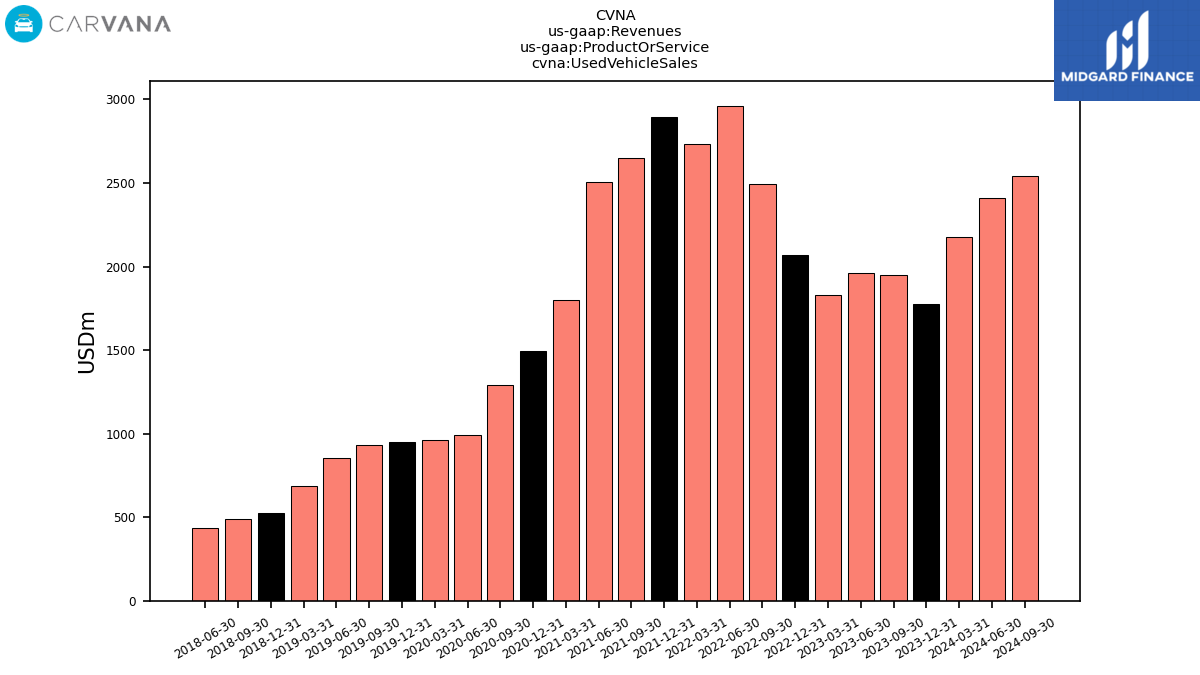
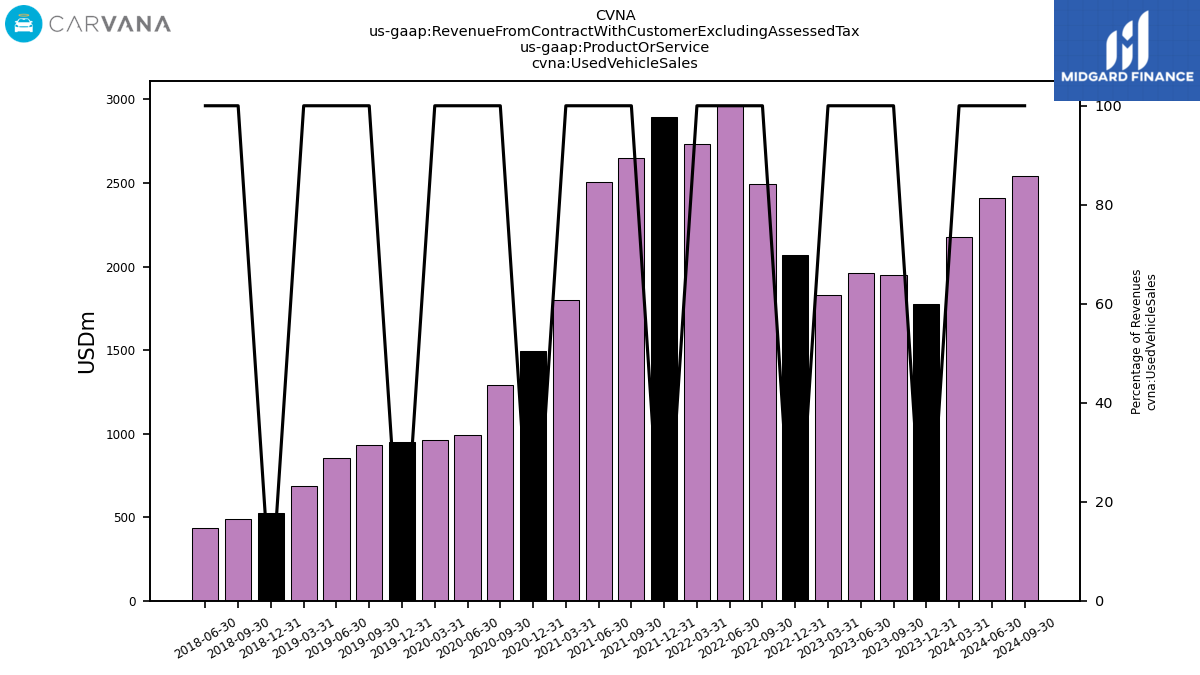
| Used Vehicle Sales | 1777.00 | 1949.00 | 1961.00 | 1827.00 | 2068.00 | 2492.00 | 2962.00 | 2732.00 | 2897.00 | 2650.00 | 2504.00 | 1800.00 | 1495.39 | 1289.13 | 991.80 | 964.28 | 949.97 | 931.02 | 855.78 | 683.83 | 526.80 | 486.27 | 437.92 | NA | NA | NA | NA | NA | NA | NA | NA | NA | |
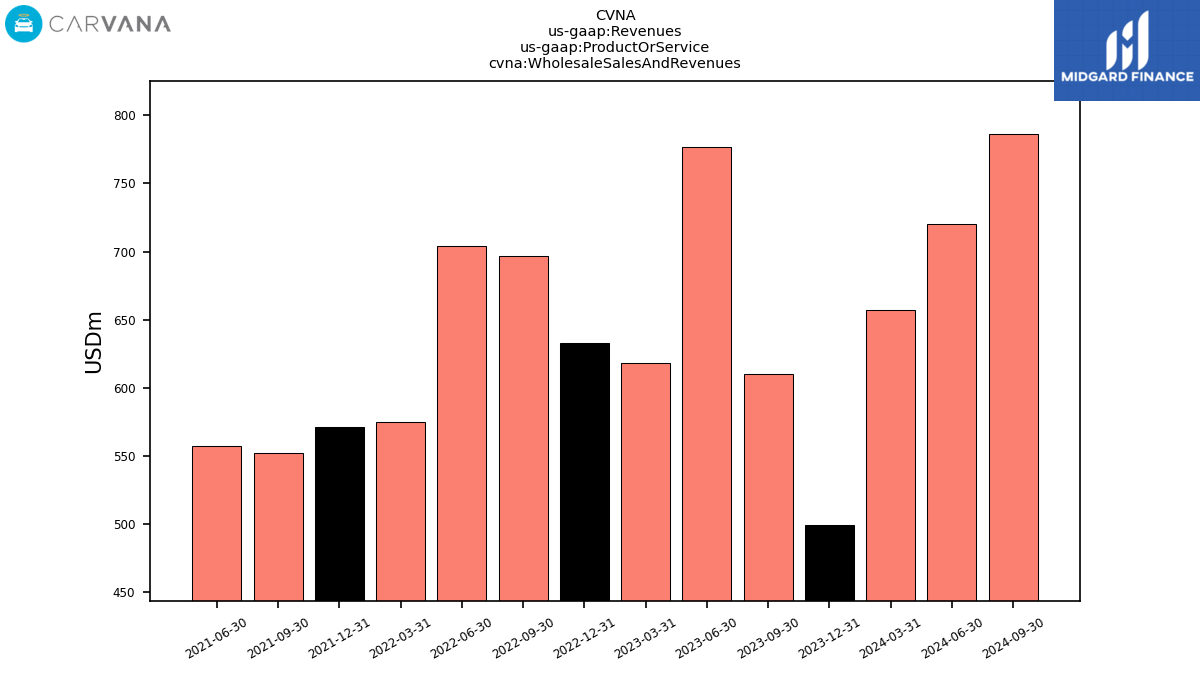
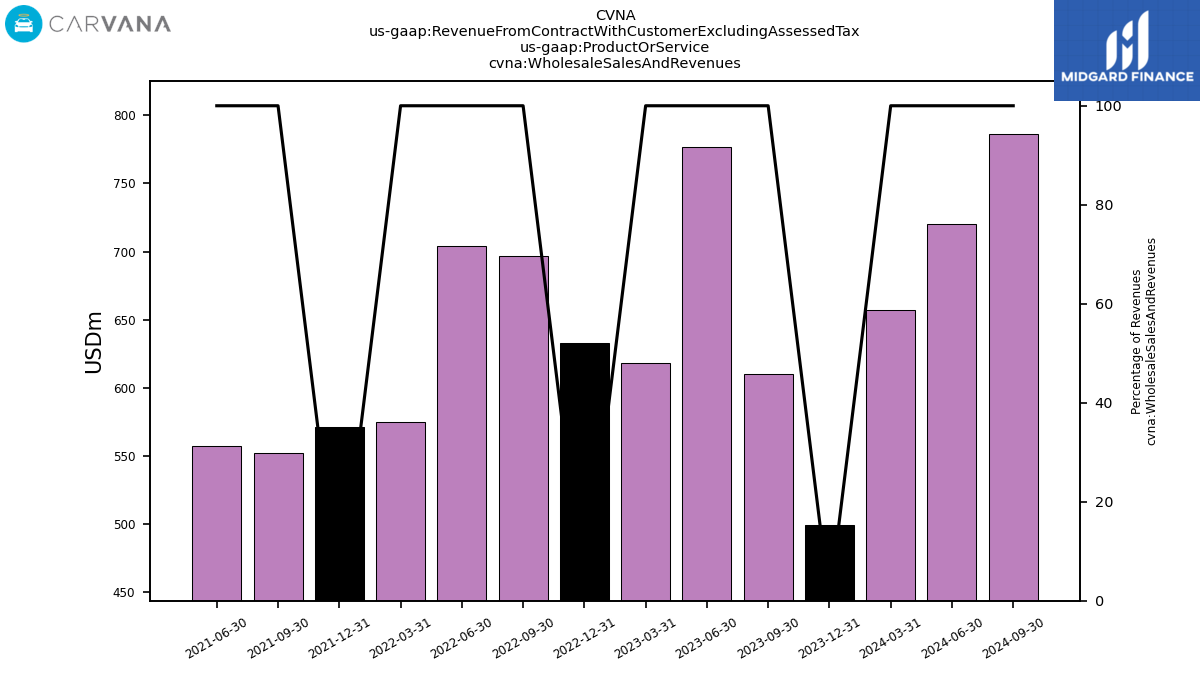
| Wholesale Sales And Revenues | 499.00 | 610.00 | 777.00 | 618.00 | 633.00 | 697.00 | 704.00 | 575.00 | 571.00 | 552.00 | 557.00 | NA | NA | NA | NA | NA | NA | NA | NA | NA | NA | NA | NA | NA | NA | NA | NA | NA | NA | NA | NA | NA | |
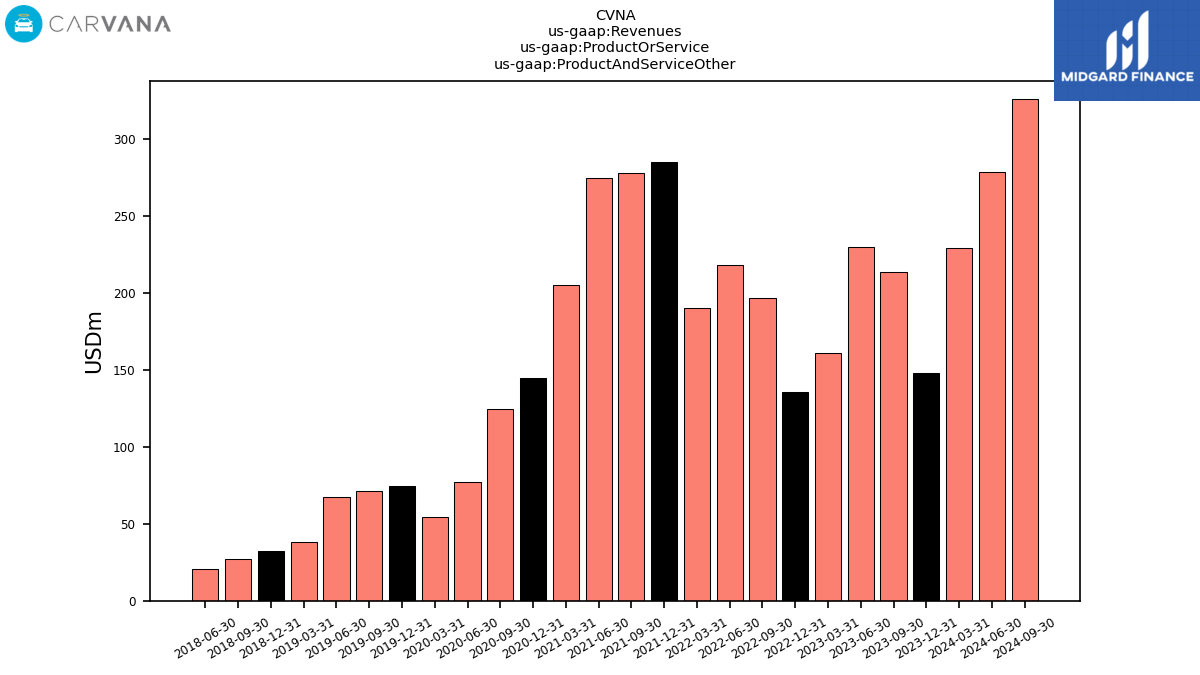
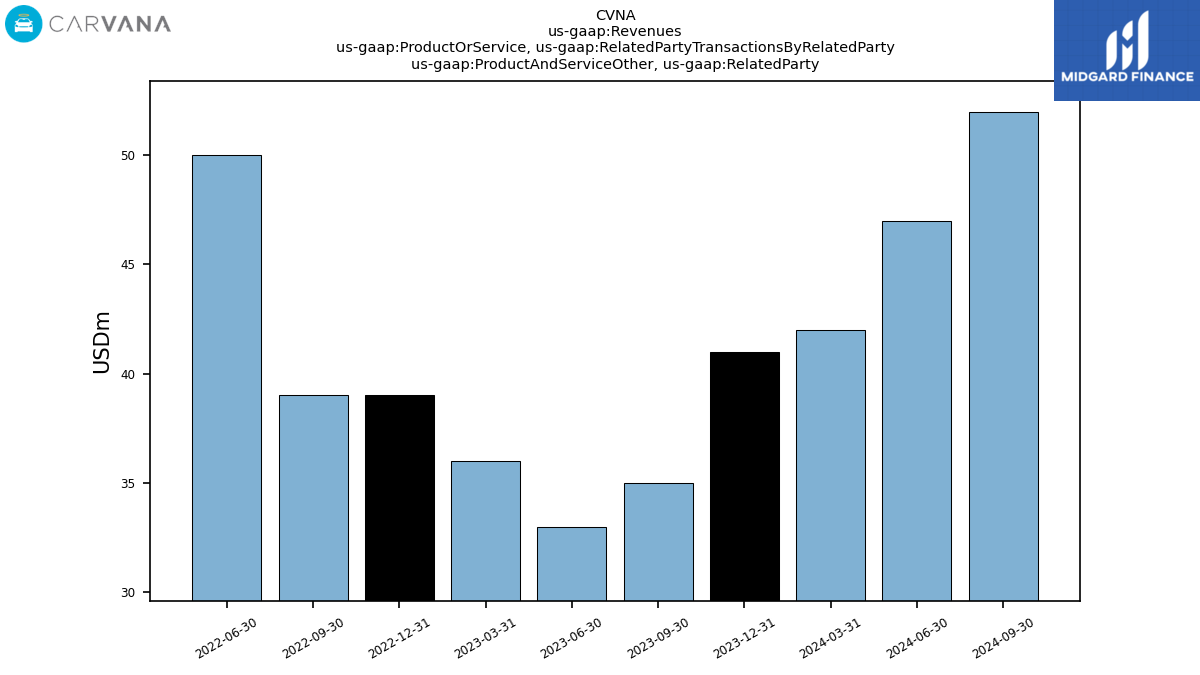
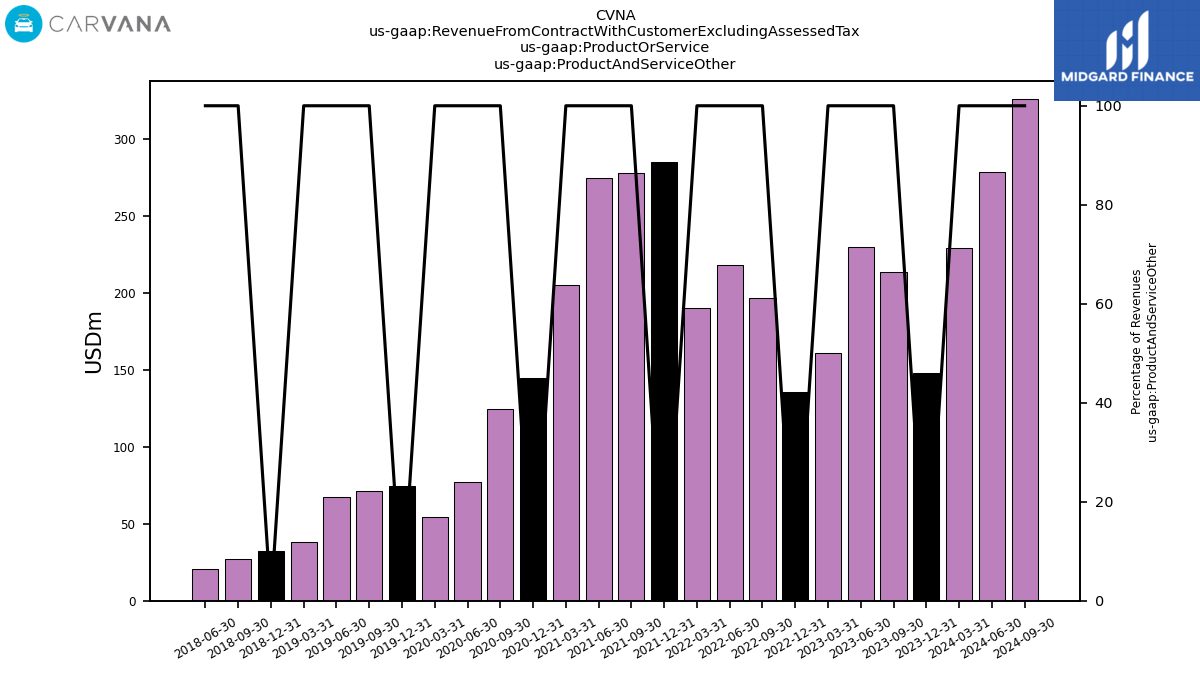
| Product And Service Other | 148.00 | 214.00 | 230.00 | 161.00 | 136.00 | 197.00 | 218.00 | 190.00 | 285.00 | 278.00 | 275.00 | 205.00 | 144.75 | 124.56 | 77.10 | 54.33 | 74.50 | 71.41 | 67.42 | 38.38 | 32.65 | 27.21 | 20.74 | NA | NA | NA | NA | NA | NA | NA | NA | NA | |
| Wholesale Sales And Revenues, Related Party | 5.00 | 4.00 | 5.00 | NA | 5.00 | 6.00 | 7.00 | NA | NA | NA | NA | NA | NA | NA | NA | NA | NA | NA | NA | NA | NA | NA | NA | NA | NA | NA | NA | NA | NA | NA | NA | NA | |
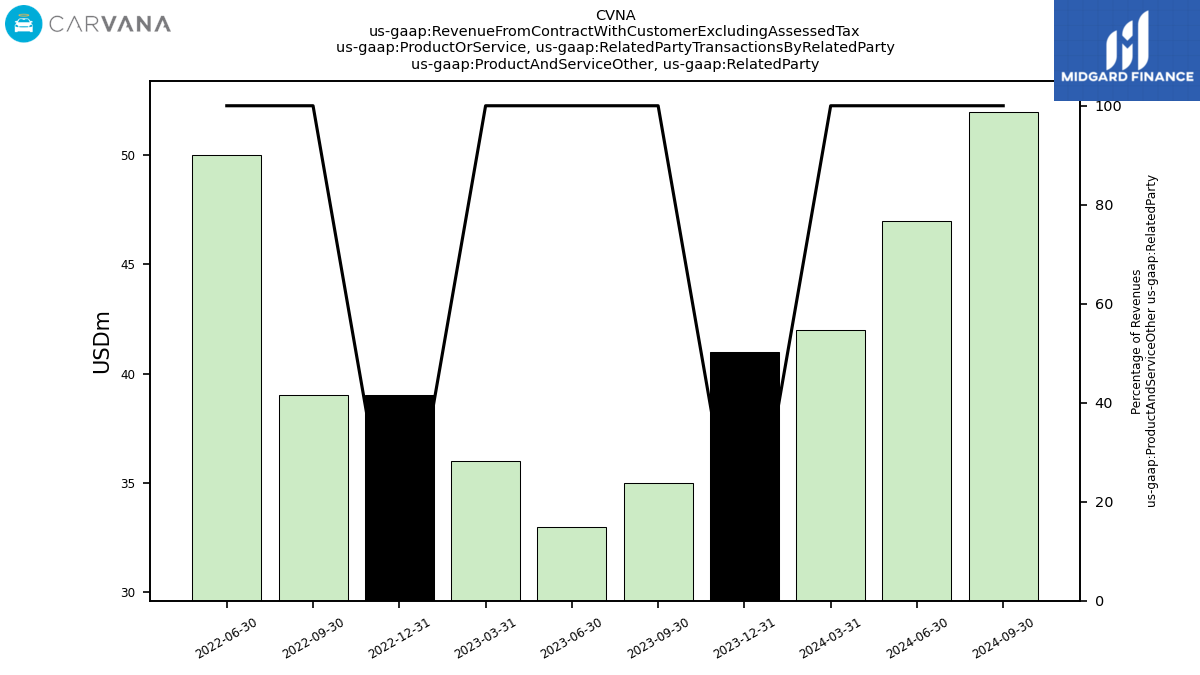
| Product And Service Other, Related Party | 41.00 | 35.00 | 33.00 | NA | 39.00 | 39.00 | 50.00 | NA | NA | NA | NA | NA | NA | NA | NA | NA | NA | NA | NA | NA | NA | NA | NA | NA | NA | NA | NA | NA | NA | NA | NA | NA | |
| Revenue From Contract With Customer Excluding Assessed Tax | 2424.00 | 2773.00 | 2968.00 | 2606.00 | 2837.00 | 3386.00 | 3884.00 | 3497.00 | 3753.00 | 3480.00 | 3336.00 | 2245.00 | 1826.41 | 1543.61 | 1118.33 | 1098.22 | 1103.59 | 1094.85 | 986.22 | 755.23 | 584.84 | 534.92 | 475.29 | 360.42 | 265.05 | 225.38 | 209.37 | 159.07 | 106.83 | 98.84 | 86.53 | 72.95 | |
| Drive Time Automotive Group Inc., Wholesale Sales And Revenues, Related Party | 5.00 | 4.00 | 5.00 | NA | 5.00 | 6.00 | 7.00 | NA | NA | NA | NA | NA | NA | NA | NA | NA | NA | NA | NA | NA | NA | NA | NA | NA | NA | NA | NA | NA | NA | NA | NA | NA | |
| Used Vehicle Sales | 1777.00 | 1949.00 | 1961.00 | 1827.00 | 2068.00 | 2492.00 | 2962.00 | 2732.00 | 2897.00 | 2650.00 | 2504.00 | 1800.00 | 1495.39 | 1289.13 | 991.80 | 964.28 | 949.97 | 931.02 | 855.78 | 683.83 | 526.80 | 486.27 | 437.92 | NA | NA | NA | NA | NA | NA | NA | NA | NA | |
| Wholesale Sales And Revenues | 499.00 | 610.00 | 777.00 | 618.00 | 633.00 | 697.00 | 704.00 | 575.00 | 571.00 | 552.00 | 557.00 | NA | NA | NA | NA | NA | NA | NA | NA | NA | NA | NA | NA | NA | NA | NA | NA | NA | NA | NA | NA | NA | |
| Product And Service Other | 148.00 | 214.00 | 230.00 | 161.00 | 136.00 | 197.00 | 218.00 | 190.00 | 285.00 | 278.00 | 275.00 | 205.00 | 144.75 | 124.56 | 77.10 | 54.33 | 74.50 | 71.41 | 67.42 | 38.38 | 32.65 | 27.21 | 20.74 | NA | NA | NA | NA | NA | NA | NA | NA | NA | |
| Wholesale Sales And Revenues, Related Party | 5.00 | 4.00 | 5.00 | NA | 5.00 | 6.00 | 7.00 | NA | NA | NA | NA | NA | NA | NA | NA | NA | NA | NA | NA | NA | NA | NA | NA | NA | NA | NA | NA | NA | NA | NA | NA | NA | |
| Product And Service Other, Related Party | 41.00 | 35.00 | 33.00 | NA | 39.00 | 39.00 | 50.00 | NA | NA | NA | NA | NA | NA | NA | NA | NA | NA | NA | NA | NA | NA | NA | NA | NA | NA | NA | NA | NA | NA | NA | NA | NA |