
| 2023-12-31 | 2023-09-30 | 2023-06-30 | 2023-03-31 | 2022-12-31 | 2022-09-30 | 2022-06-30 | 2022-03-31 | 2021-12-31 | 2021-09-30 | 2021-06-30 | 2021-03-31 | 2020-12-31 | 2020-09-30 | 2020-06-30 | 2020-03-31 | 2019-12-31 | 2019-09-30 | 2019-06-30 | 2019-03-31 | 2018-12-31 | 2018-09-30 | 2018-06-30 | 2018-03-31 | 2017-12-31 | 2017-09-30 | 2017-06-30 | 2017-03-31 | ||
|---|---|---|---|---|---|---|---|---|---|---|---|---|---|---|---|---|---|---|---|---|---|---|---|---|---|---|---|---|---|
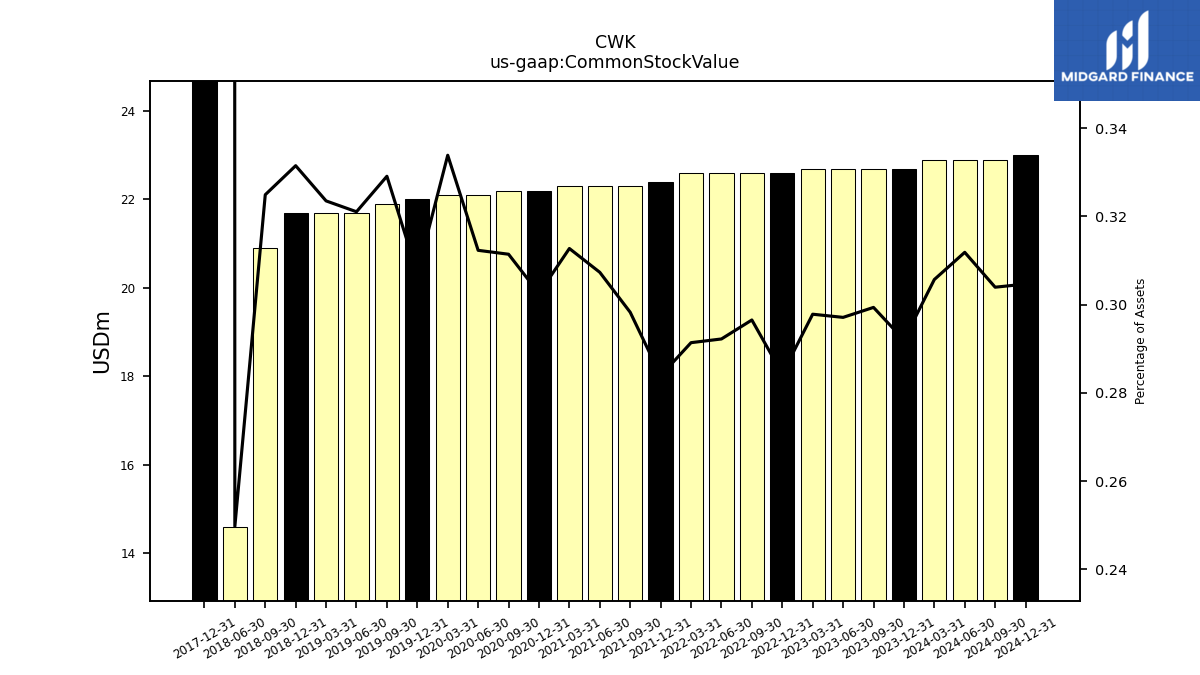
| Common Stock Value | 22.70 | 22.70 | 22.70 | 22.70 | 22.60 | 22.60 | 22.60 | 22.60 | 22.40 | 22.30 | 22.30 | 22.30 | 22.20 | 22.20 | 22.10 | 22.10 | 22.00 | 21.90 | 21.70 | 21.70 | 21.70 | 20.90 | 14.60 | NA | 1451.30 | NA | NA | NA | |
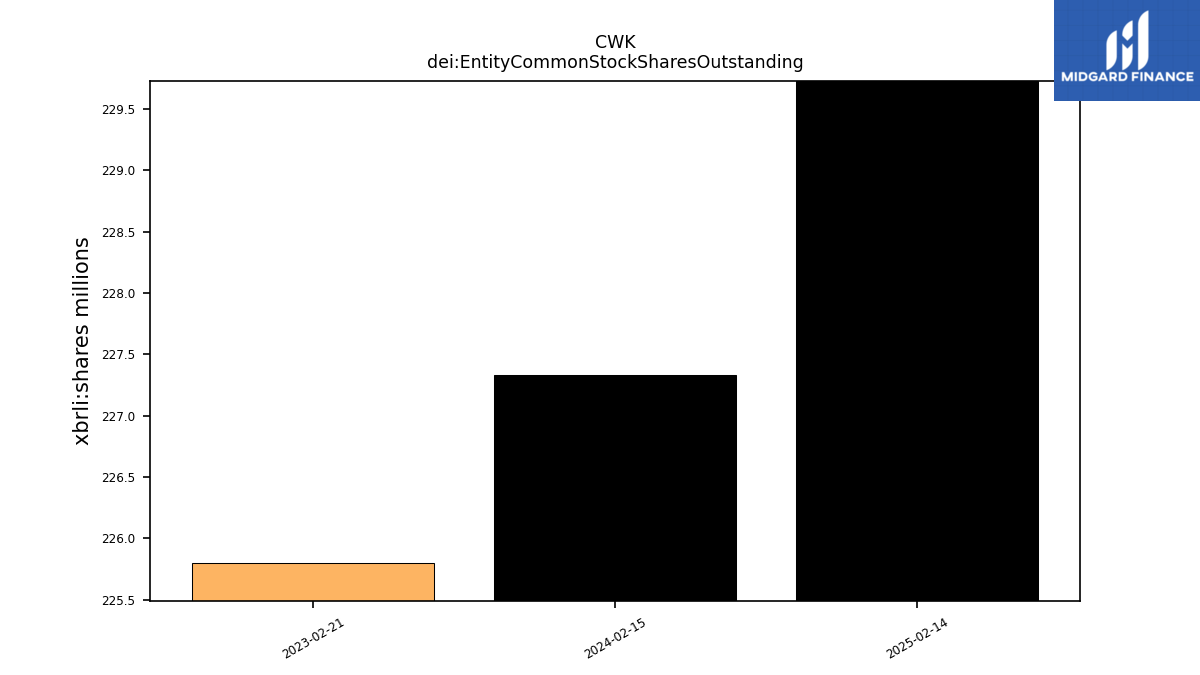
| dei: Entity Common Stock Shares Outstanding | NA | NA | NA | NA | NA | NA | NA | NA | NA | NA | NA | NA | NA | NA | NA | NA | NA | NA | NA | NA | NA | NA | NA | NA | NA | NA | NA | NA | |
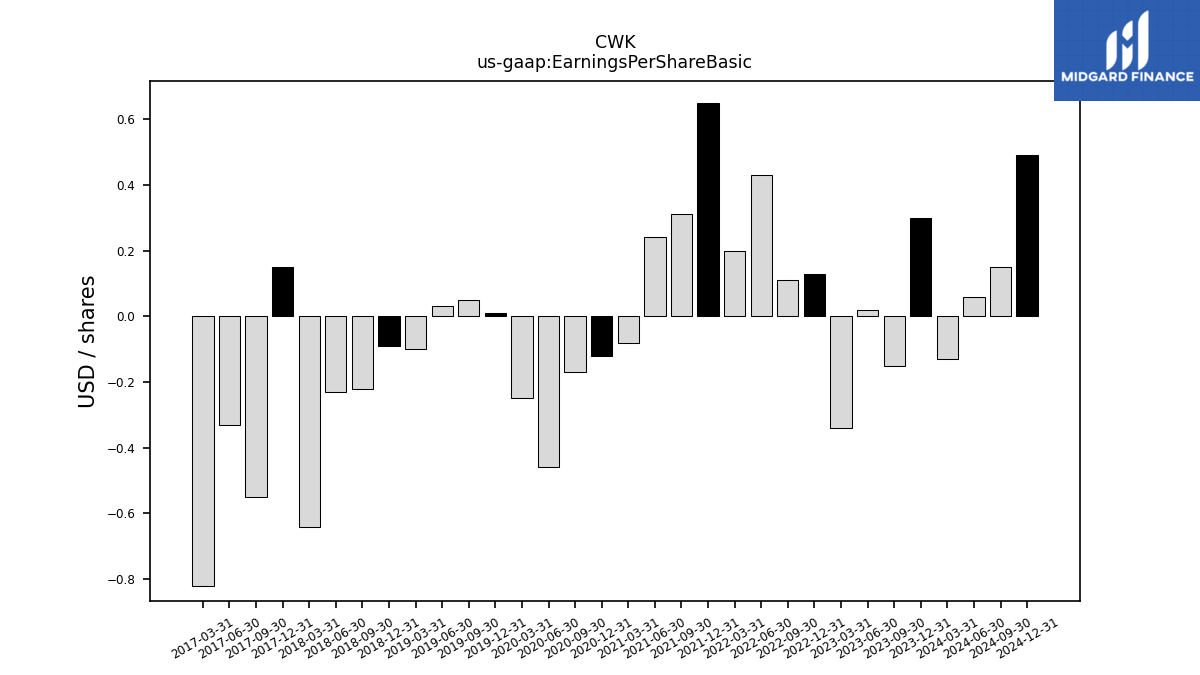
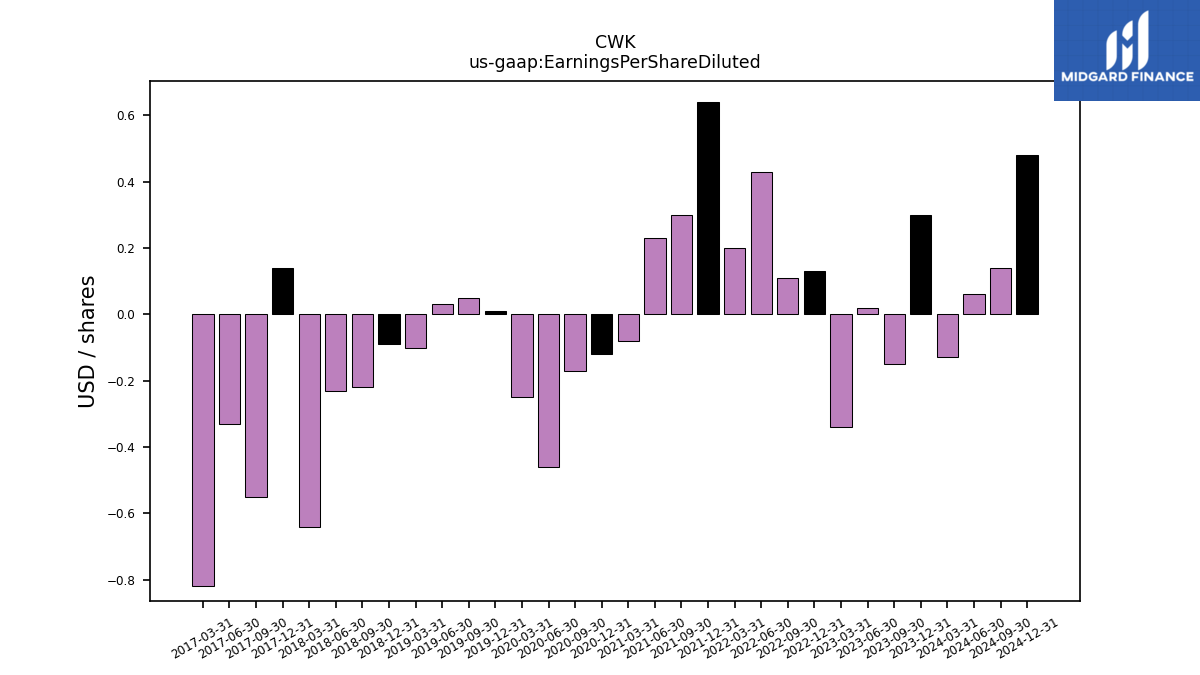
| Earnings Per Share Basic | 0.30 | -0.15 | 0.02 | -0.34 | 0.13 | 0.11 | 0.43 | 0.20 | 0.65 | 0.31 | 0.24 | -0.08 | -0.12 | -0.17 | -0.46 | -0.25 | 0.01 | 0.05 | 0.03 | -0.10 | -0.09 | -0.22 | -0.23 | -0.64 | 0.15 | -0.55 | -0.33 | -0.82 | |
| Earnings Per Share Diluted | 0.30 | -0.15 | 0.02 | -0.34 | 0.13 | 0.11 | 0.43 | 0.20 | 0.64 | 0.30 | 0.23 | -0.08 | -0.12 | -0.17 | -0.46 | -0.25 | 0.01 | 0.05 | 0.03 | -0.10 | -0.09 | -0.22 | -0.23 | -0.64 | 0.14 | -0.55 | -0.33 | -0.82 |
| 2023-12-31 | 2023-09-30 | 2023-06-30 | 2023-03-31 | 2022-12-31 | 2022-09-30 | 2022-06-30 | 2022-03-31 | 2021-12-31 | 2021-09-30 | 2021-06-30 | 2021-03-31 | 2020-12-31 | 2020-09-30 | 2020-06-30 | 2020-03-31 | 2019-12-31 | 2019-09-30 | 2019-06-30 | 2019-03-31 | 2018-12-31 | 2018-09-30 | 2018-06-30 | 2018-03-31 | 2017-12-31 | 2017-09-30 | 2017-06-30 | 2017-03-31 | ||
|---|---|---|---|---|---|---|---|---|---|---|---|---|---|---|---|---|---|---|---|---|---|---|---|---|---|---|---|---|---|
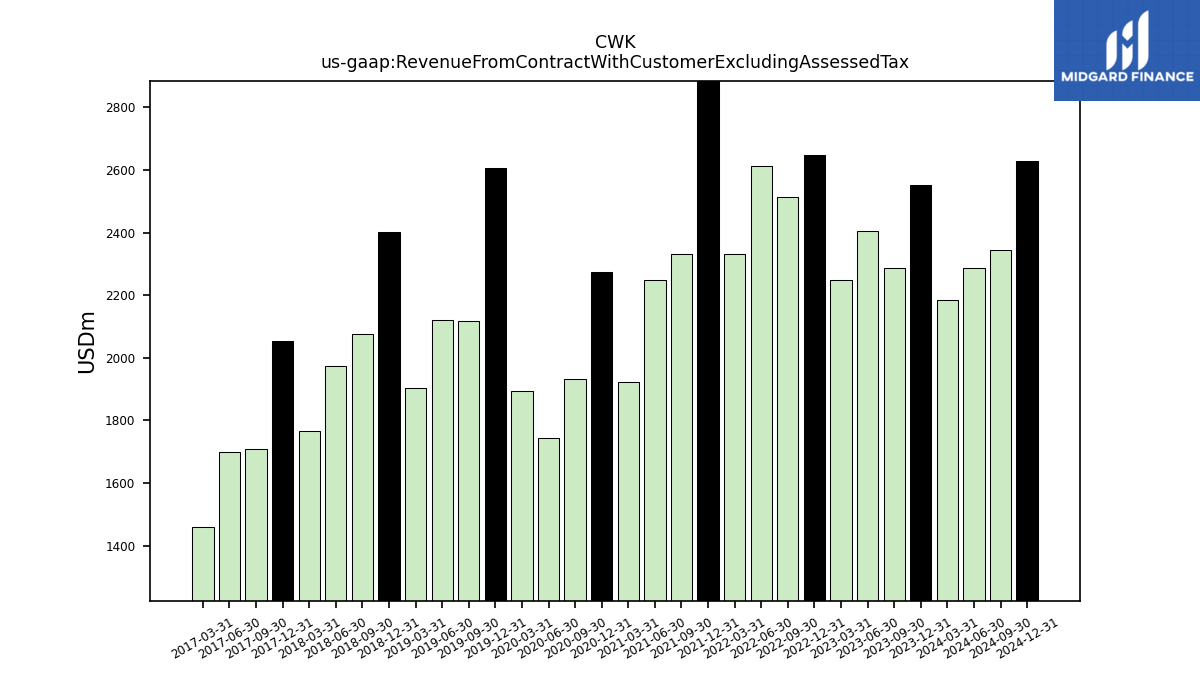
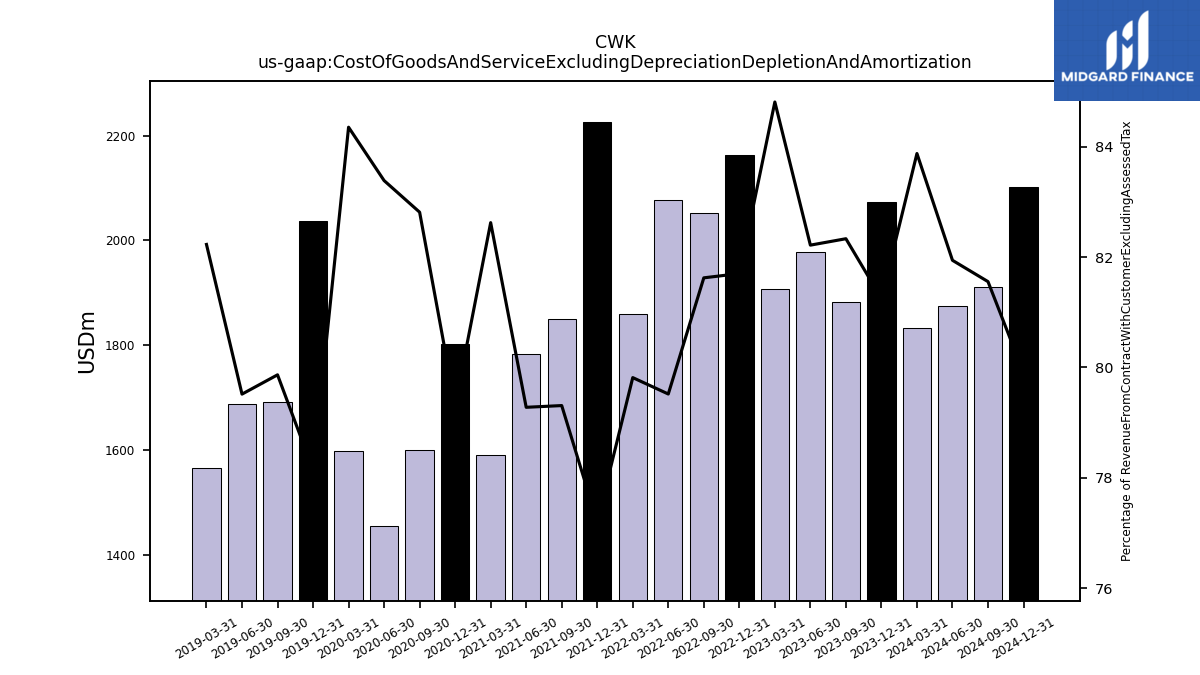
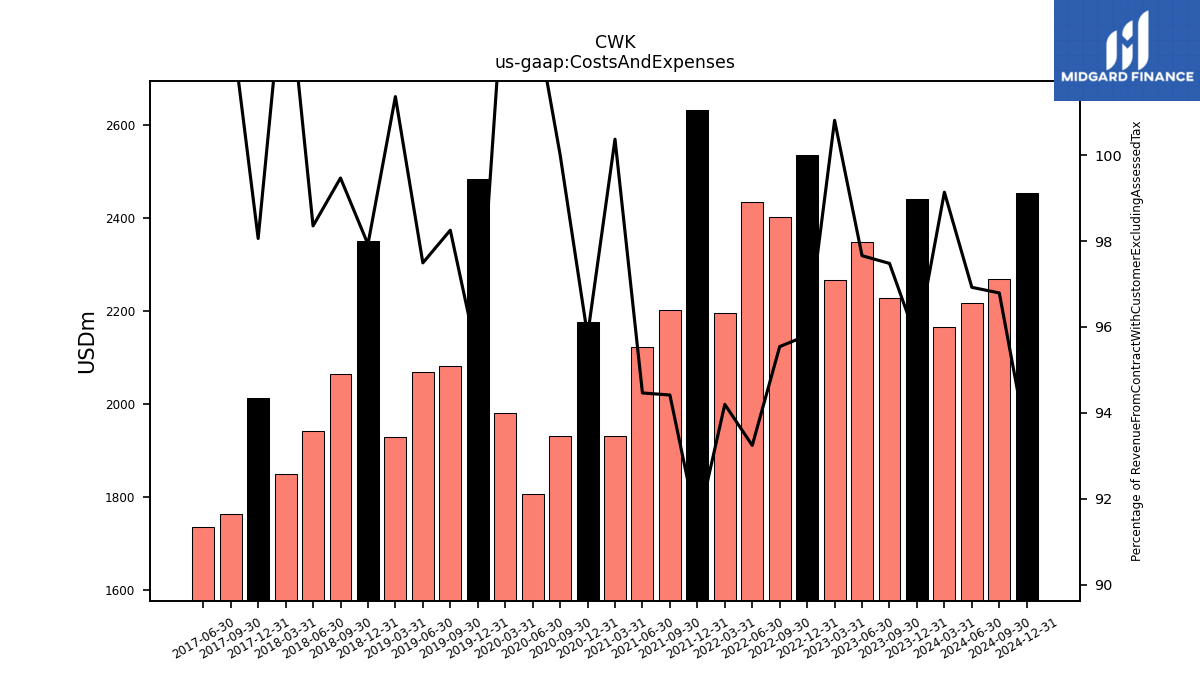
| Revenue From Contract With Customer Excluding Assessed Tax | 2552.40 | 2286.00 | 2406.00 | 2249.30 | 2647.00 | 2515.10 | 2612.60 | 2331.00 | 2883.70 | 2332.90 | 2248.30 | 1923.80 | 2273.10 | 1931.60 | 1743.60 | 1895.40 | 2607.50 | 2118.80 | 2121.70 | 1903.00 | 2401.90 | 2076.00 | 1974.30 | 1767.70 | 2052.70 | 1709.30 | 1700.60 | 1461.30 | |
| Cost Of Goods And Service Excluding Depreciation Depletion And Amortization | 2073.80 | 1882.10 | 1978.10 | 1907.60 | 2162.60 | 2052.90 | 2077.50 | 1860.50 | 2226.30 | 1850.20 | 1782.40 | 1589.50 | 1803.00 | 1599.60 | 1453.90 | 1598.80 | 2037.60 | 1692.20 | 1687.10 | 1564.80 | NA | NA | NA | NA | NA | NA | NA | NA | |
| Costs And Expenses | 2442.40 | 2228.40 | 2349.70 | 2267.60 | 2535.90 | 2403.00 | 2436.00 | 2195.70 | 2634.30 | 2202.60 | 2123.80 | 1931.00 | 2177.60 | 1931.90 | 1806.40 | 1980.90 | 2484.40 | 2081.80 | 2068.50 | 1929.00 | 2352.10 | 2065.00 | 1941.80 | 1849.60 | 2012.90 | 1763.90 | 1736.70 | NA | |
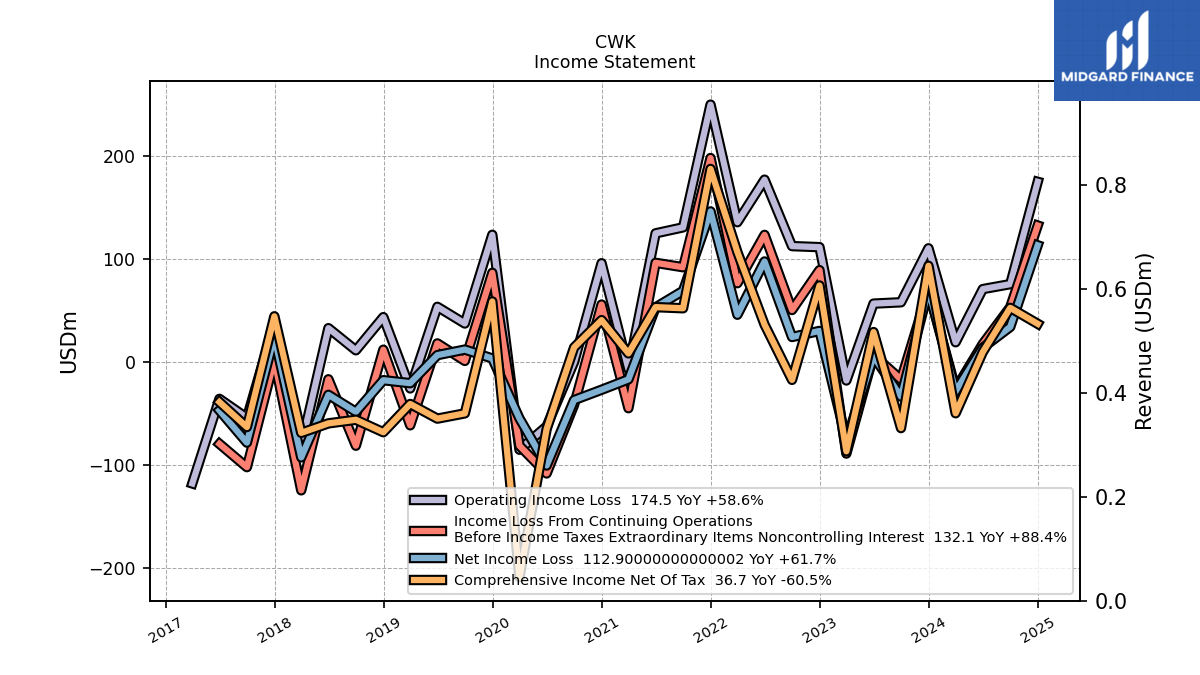
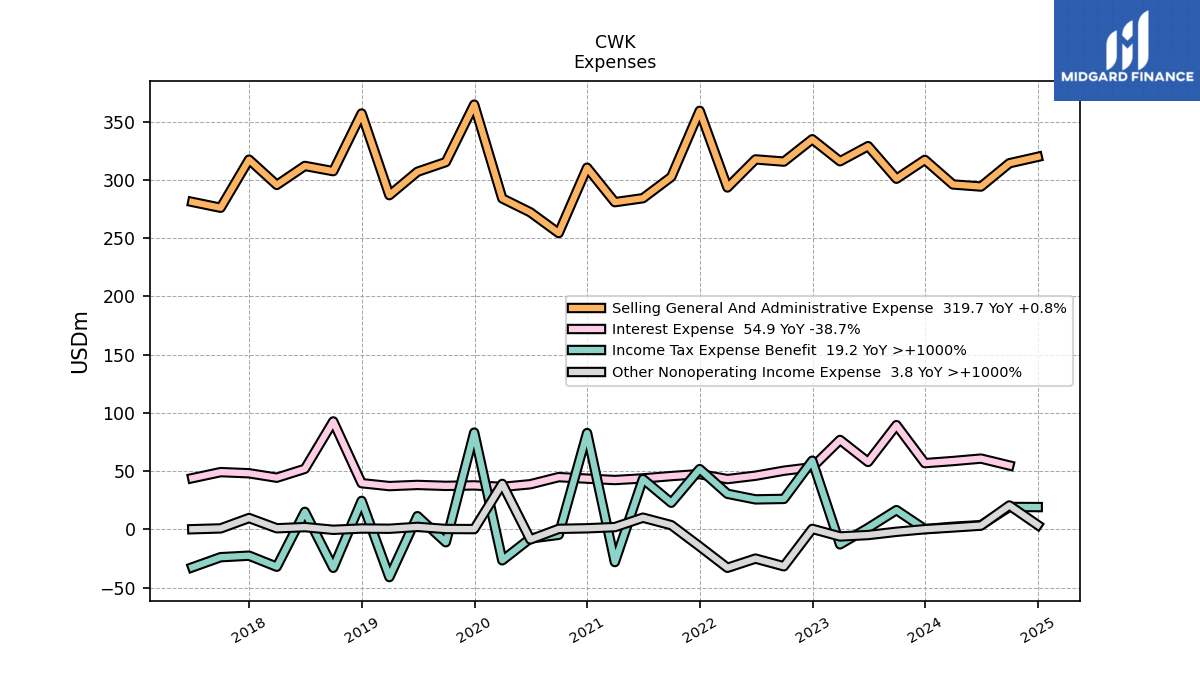
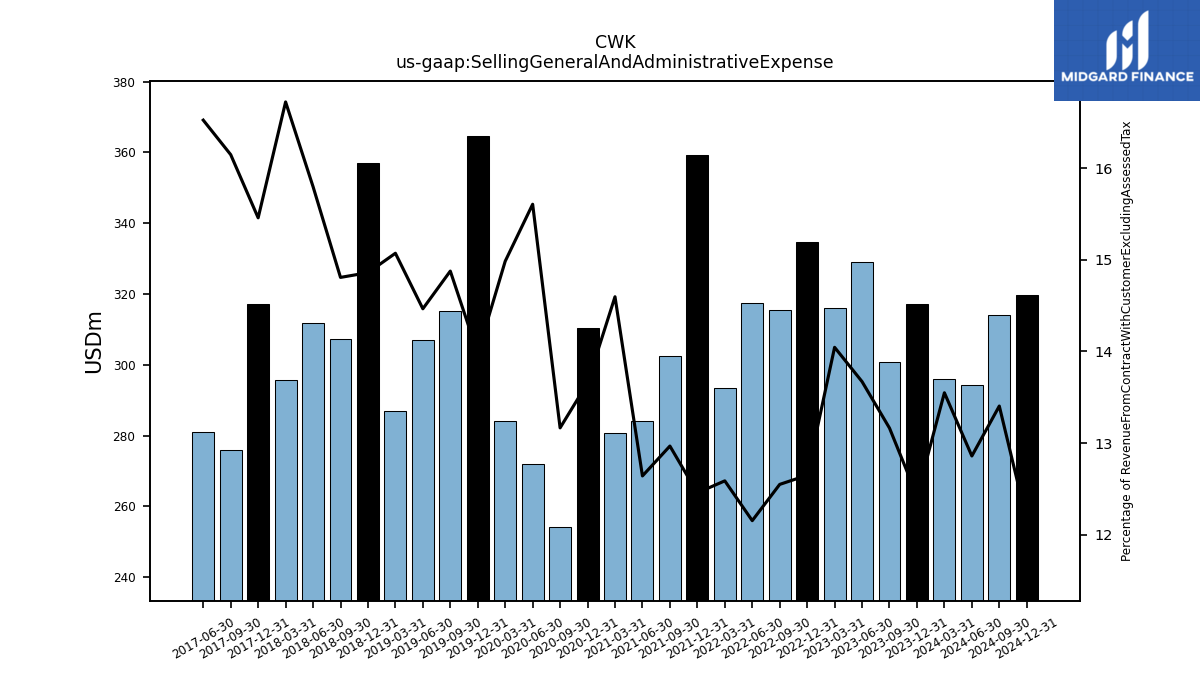
| Selling General And Administrative Expense | 317.10 | 300.90 | 328.90 | 315.90 | 334.80 | 315.60 | 317.50 | 293.40 | 359.20 | 302.50 | 284.20 | 280.80 | 310.40 | 254.30 | 272.10 | 284.00 | 364.50 | 315.20 | 306.90 | 286.80 | 356.90 | 307.40 | 311.90 | 295.60 | 317.30 | 276.00 | 281.00 | NA | |
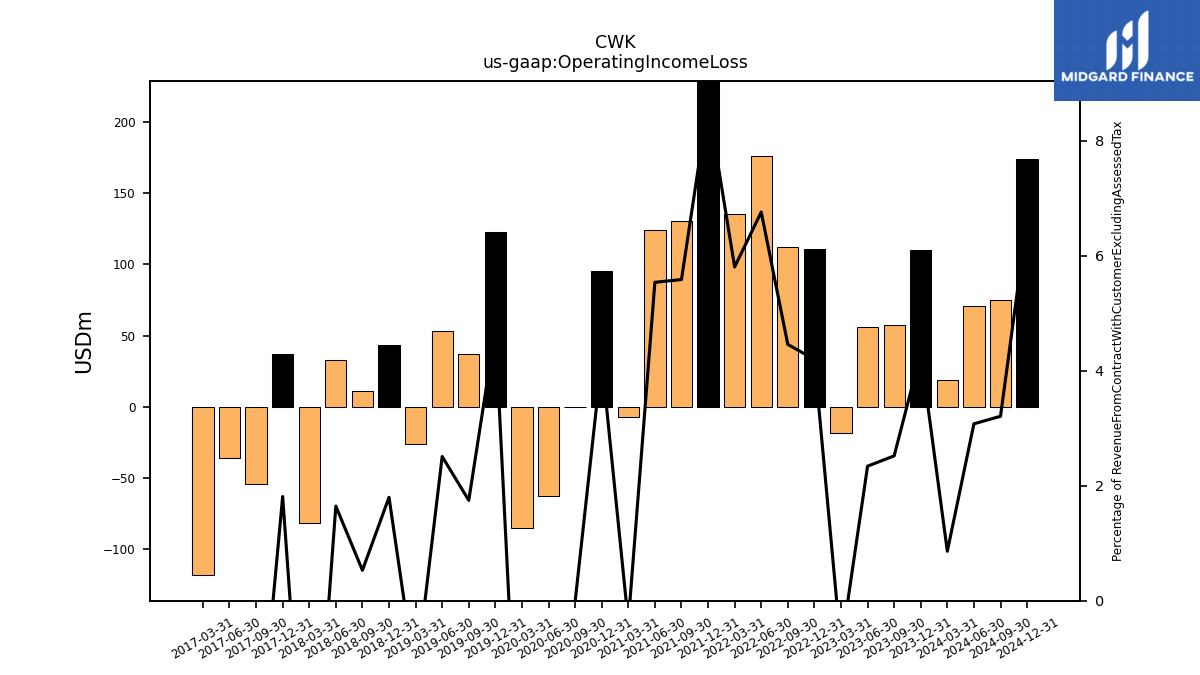
| Operating Income Loss | 110.00 | 57.60 | 56.30 | -18.30 | 111.10 | 112.10 | 176.60 | 135.30 | 249.40 | 130.30 | 124.50 | -7.20 | 95.50 | -0.30 | -62.80 | -85.50 | 123.10 | 37.00 | 53.20 | -26.00 | 43.20 | 11.00 | 32.50 | -81.90 | 37.20 | -54.60 | -36.10 | -118.20 | |
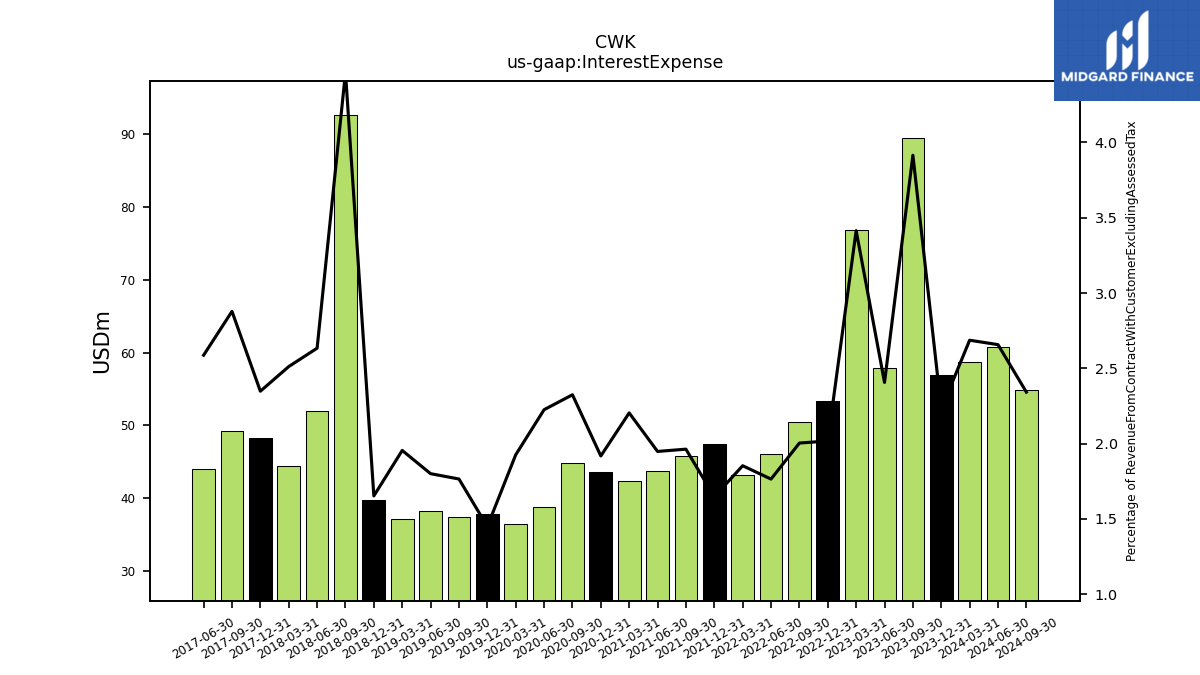
| Interest Expense | 56.90 | 89.50 | 57.90 | 76.80 | 53.40 | 50.40 | 46.10 | 43.20 | 47.50 | 45.80 | 43.80 | 42.40 | 43.60 | 44.90 | 38.80 | 36.50 | 37.80 | 37.40 | 38.20 | 37.20 | 39.70 | 92.70 | 52.00 | 44.40 | 48.20 | 49.20 | 44.00 | NA | |
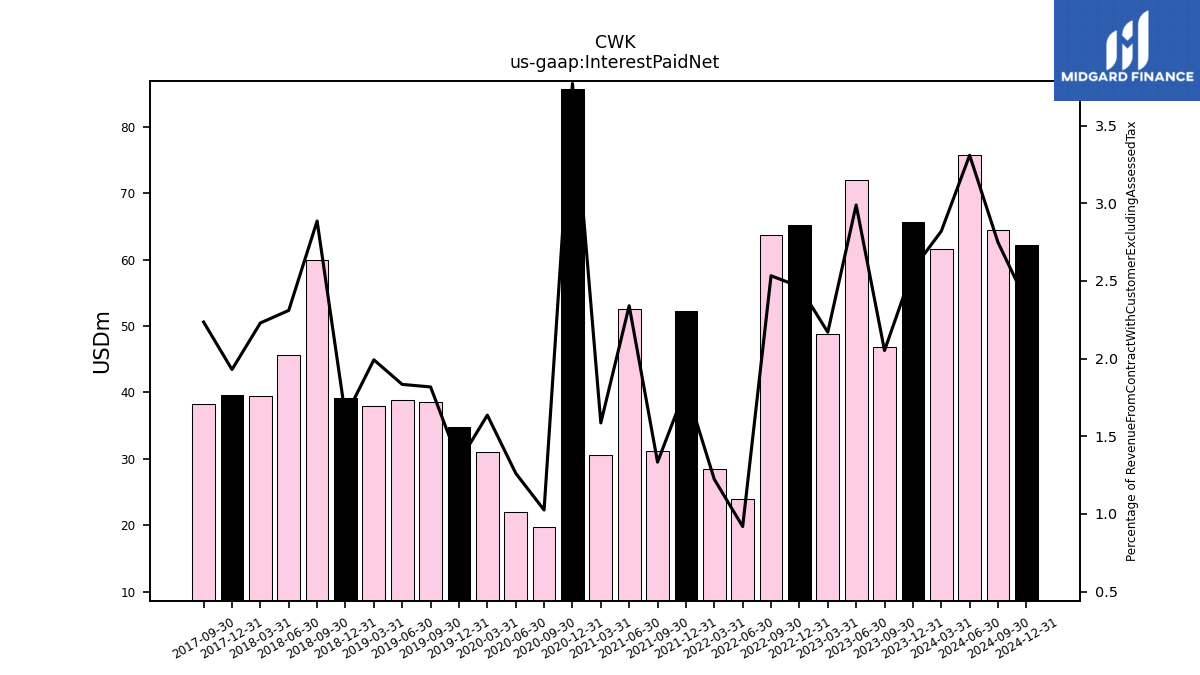
| Interest Paid Net | 65.70 | 46.90 | 71.90 | 48.80 | 65.20 | 63.70 | 24.00 | 28.50 | 52.20 | 31.10 | 52.60 | 30.50 | 85.70 | 19.80 | 22.00 | 31.00 | 34.80 | 38.50 | 38.90 | 37.90 | 39.10 | 59.90 | 45.60 | 39.40 | 39.60 | 38.20 | NA | NA | |
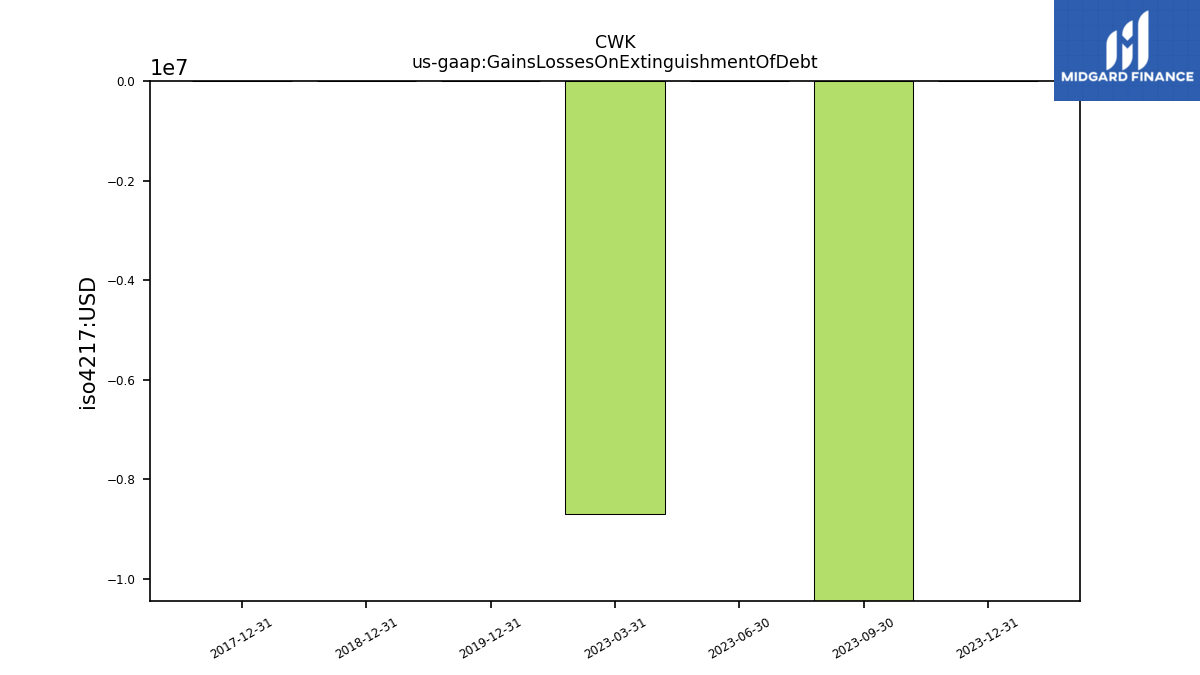
| Gains Losses On Extinguishment Of Debt | 0.00 | -10.60 | 0.00 | -8.70 | NA | NA | NA | NA | NA | NA | NA | NA | NA | NA | NA | NA | 0.00 | NA | NA | NA | 0.00 | NA | NA | NA | 0.00 | NA | NA | NA | |
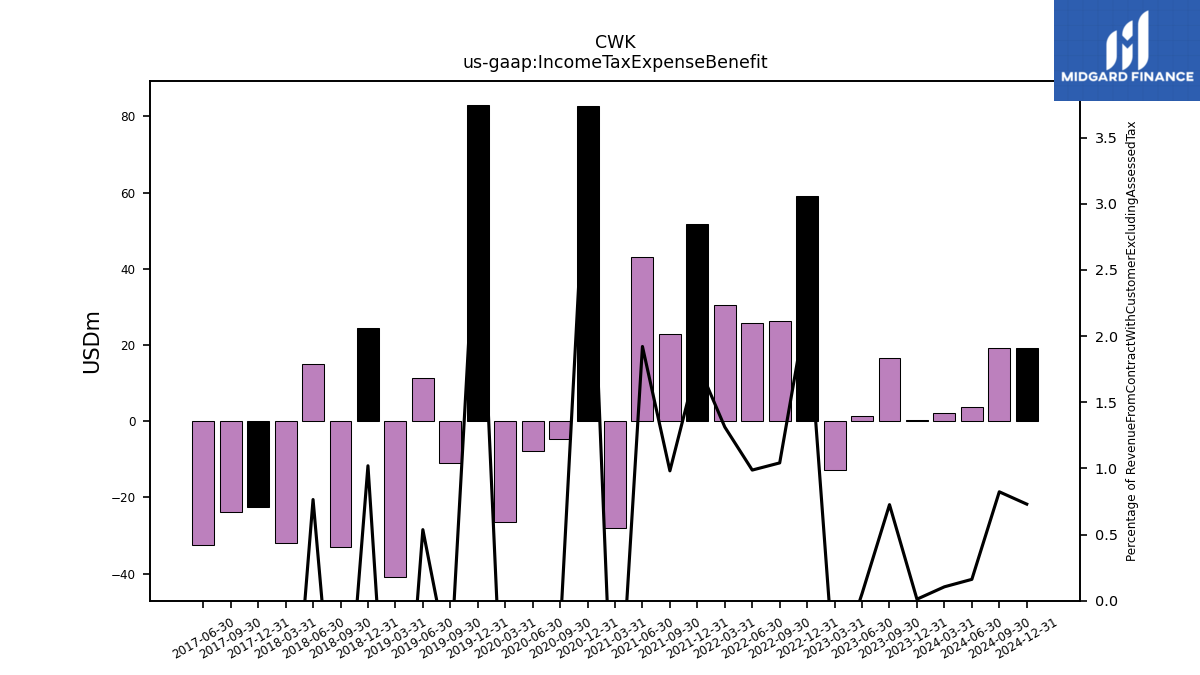
| Income Tax Expense Benefit | 0.30 | 16.60 | 1.30 | -12.80 | 59.00 | 26.20 | 25.80 | 30.60 | 51.80 | 22.90 | 43.20 | -28.00 | 82.70 | -4.60 | -7.70 | -26.50 | 83.10 | -11.00 | 11.40 | -40.90 | 24.50 | -32.90 | 15.10 | -32.00 | -22.50 | -23.80 | -32.50 | NA | |
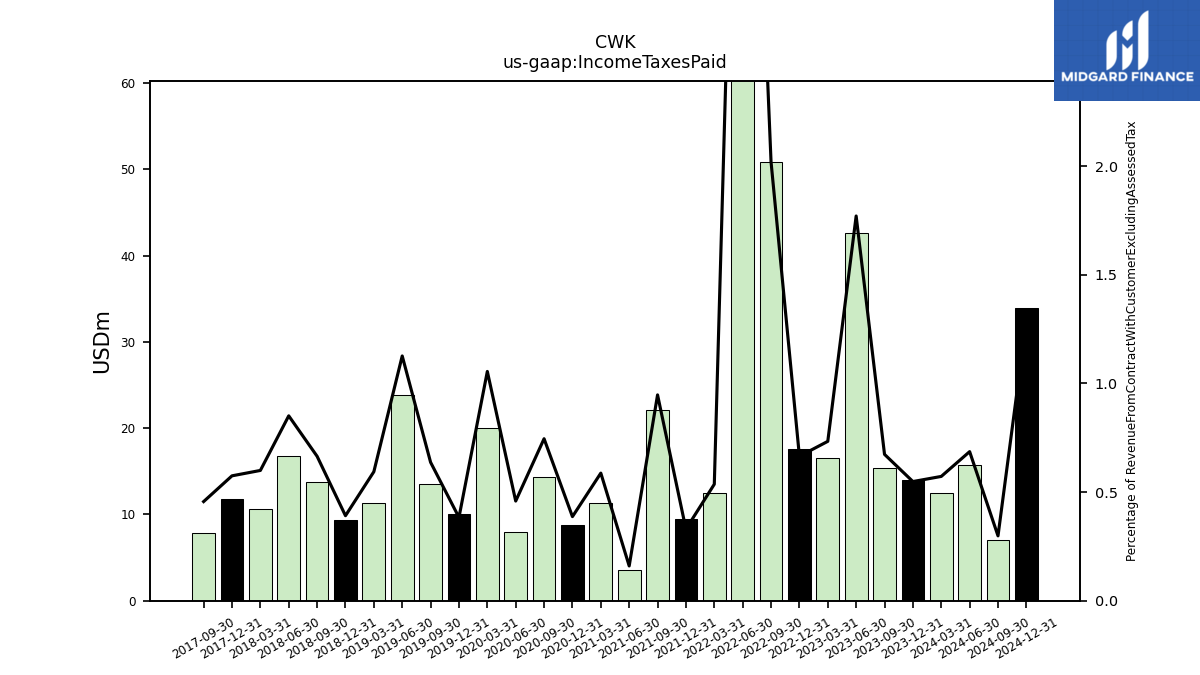
| Income Taxes Paid | 14.00 | 15.40 | 42.60 | 16.50 | 17.60 | 50.80 | 134.50 | 12.50 | 9.50 | 22.10 | 3.60 | 11.30 | 8.80 | 14.40 | 8.00 | 20.00 | 10.00 | 13.50 | 23.90 | 11.30 | 9.40 | 13.80 | 16.80 | 10.60 | 11.80 | 7.80 | NA | NA | |
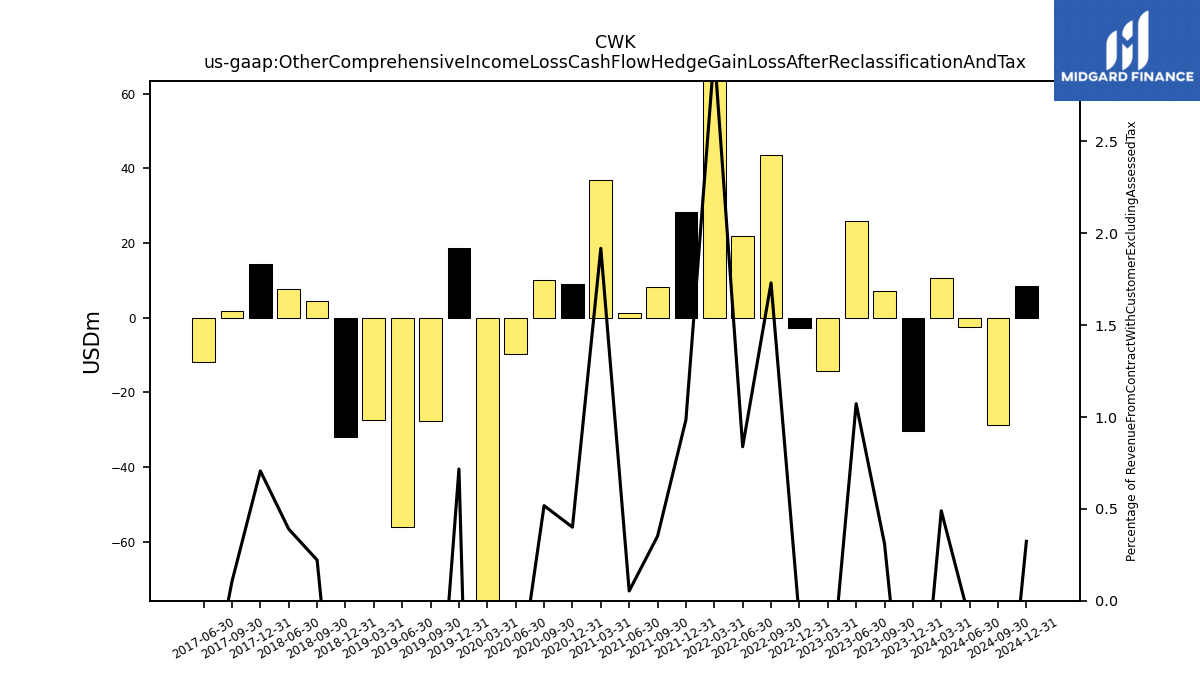
| Other Comprehensive Income Loss Cash Flow Hedge Gain Loss After Reclassification And Tax | -30.40 | 7.10 | 25.80 | -14.20 | -2.70 | 43.50 | 21.90 | 69.60 | 28.40 | 8.20 | 1.20 | 36.90 | 9.10 | 10.00 | -9.70 | -89.30 | 18.70 | -27.70 | -55.90 | -27.40 | -31.90 | 4.60 | 7.70 | NA | 14.50 | 1.80 | -11.80 | NA | |
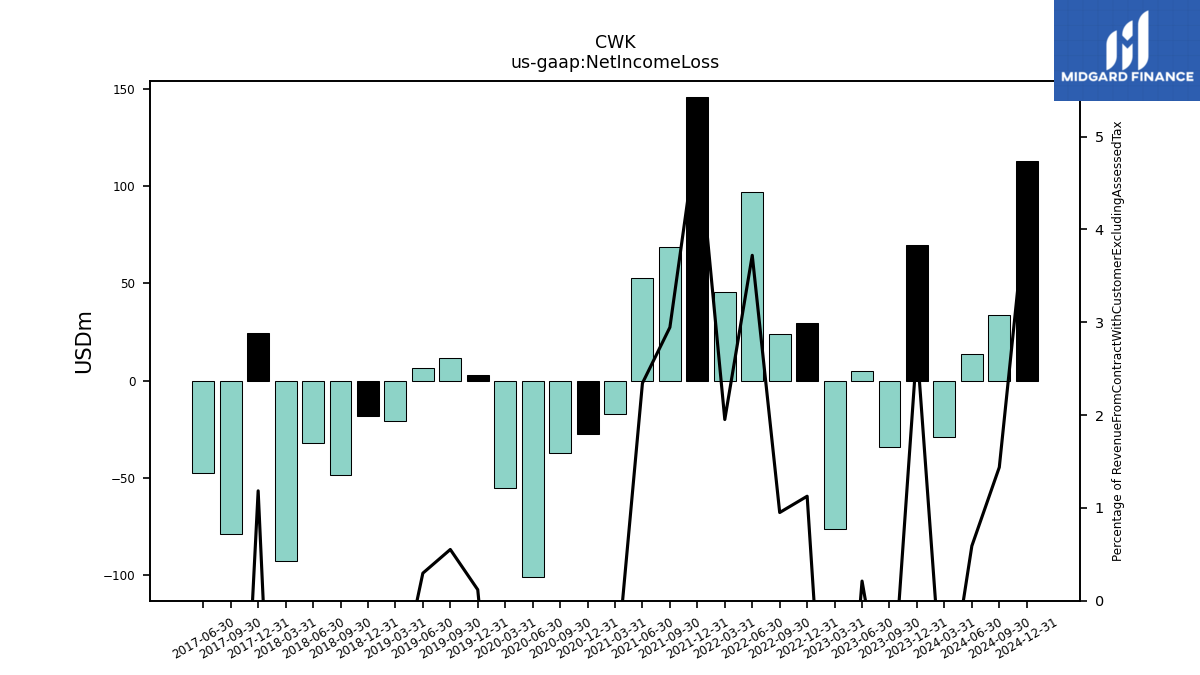
| Net Income Loss | 69.80 | -33.90 | 5.10 | -76.40 | 29.80 | 23.90 | 97.20 | 45.50 | 145.80 | 68.70 | 52.70 | -17.20 | -27.30 | -37.30 | -100.80 | -55.10 | 3.10 | 11.70 | 6.30 | -20.90 | -18.00 | -48.70 | -32.20 | -92.90 | 24.30 | -78.60 | -47.30 | NA | |
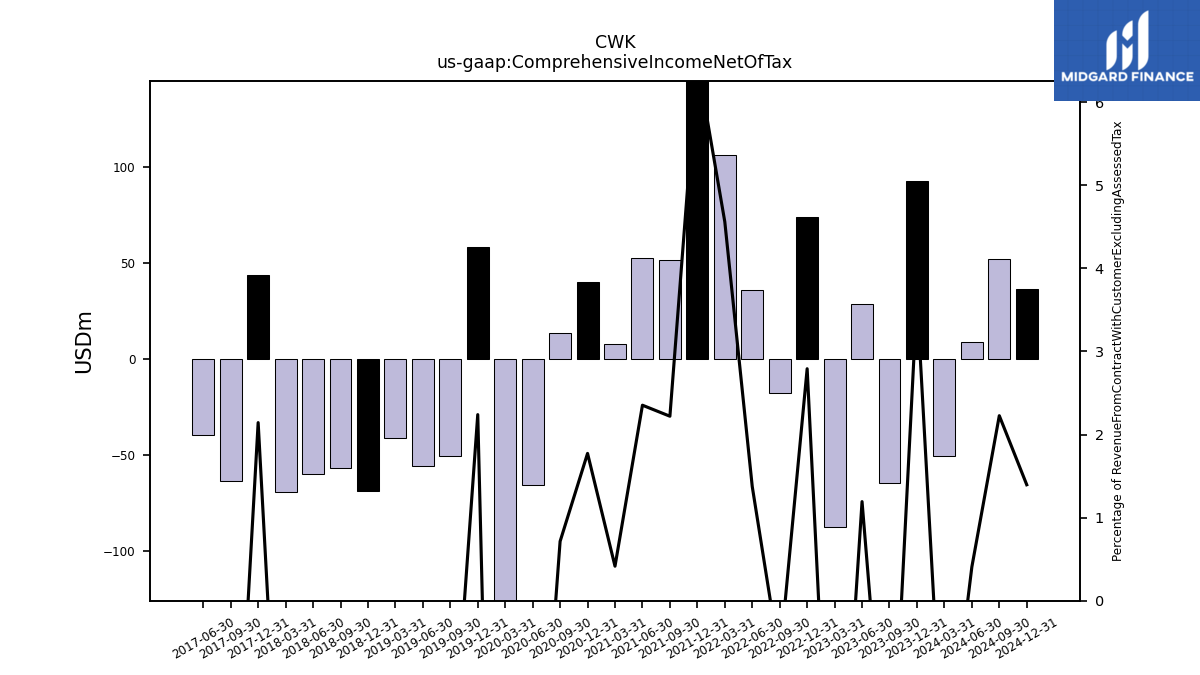
| Comprehensive Income Net Of Tax | 93.00 | -64.50 | 28.70 | -87.00 | 73.90 | -17.70 | 35.90 | 106.30 | 187.00 | 51.80 | 52.90 | 8.00 | 40.30 | 13.80 | -65.40 | -209.10 | 58.40 | -50.20 | -55.30 | -41.10 | -68.50 | -56.40 | -59.90 | -69.10 | 44.00 | -63.50 | -39.20 | NA |
| 2023-12-31 | 2023-09-30 | 2023-06-30 | 2023-03-31 | 2022-12-31 | 2022-09-30 | 2022-06-30 | 2022-03-31 | 2021-12-31 | 2021-09-30 | 2021-06-30 | 2021-03-31 | 2020-12-31 | 2020-09-30 | 2020-06-30 | 2020-03-31 | 2019-12-31 | 2019-09-30 | 2019-06-30 | 2019-03-31 | 2018-12-31 | 2018-09-30 | 2018-06-30 | 2018-03-31 | 2017-12-31 | 2017-09-30 | 2017-06-30 | 2017-03-31 | ||
|---|---|---|---|---|---|---|---|---|---|---|---|---|---|---|---|---|---|---|---|---|---|---|---|---|---|---|---|---|---|
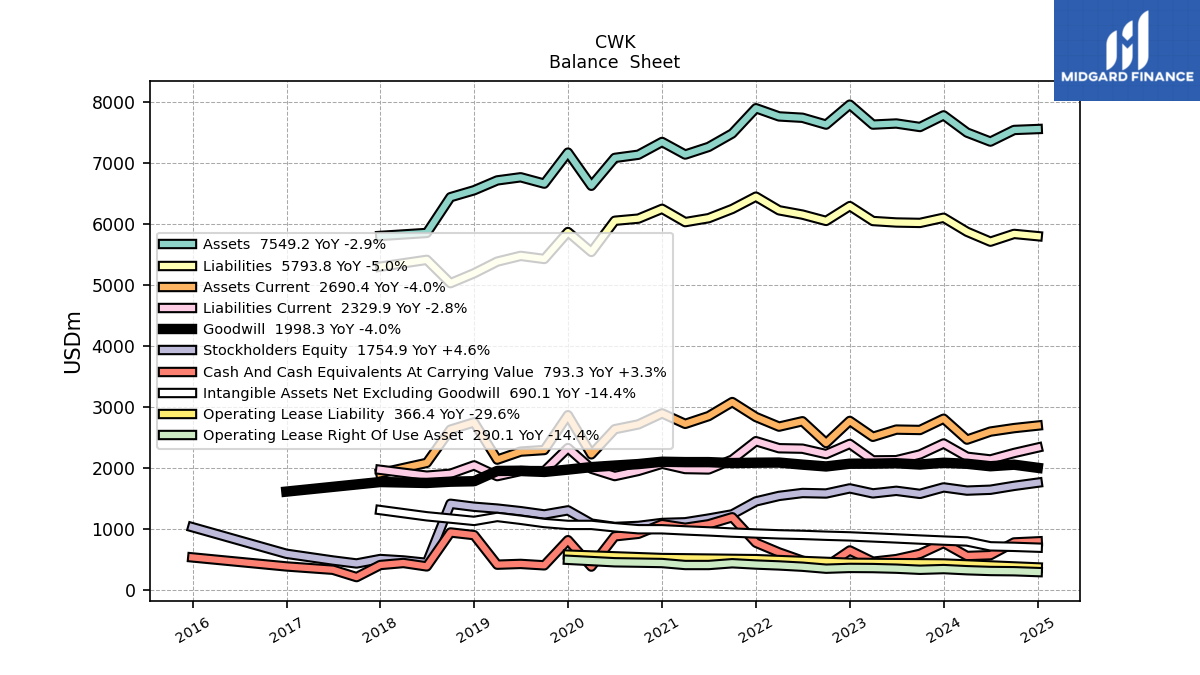
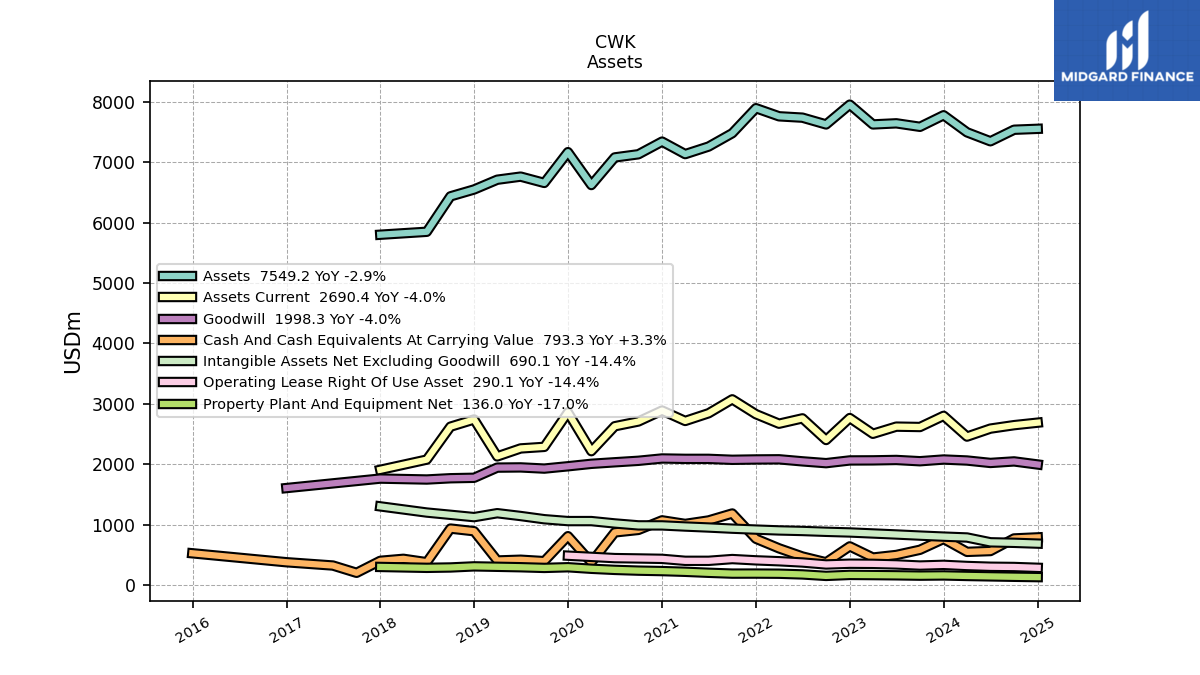
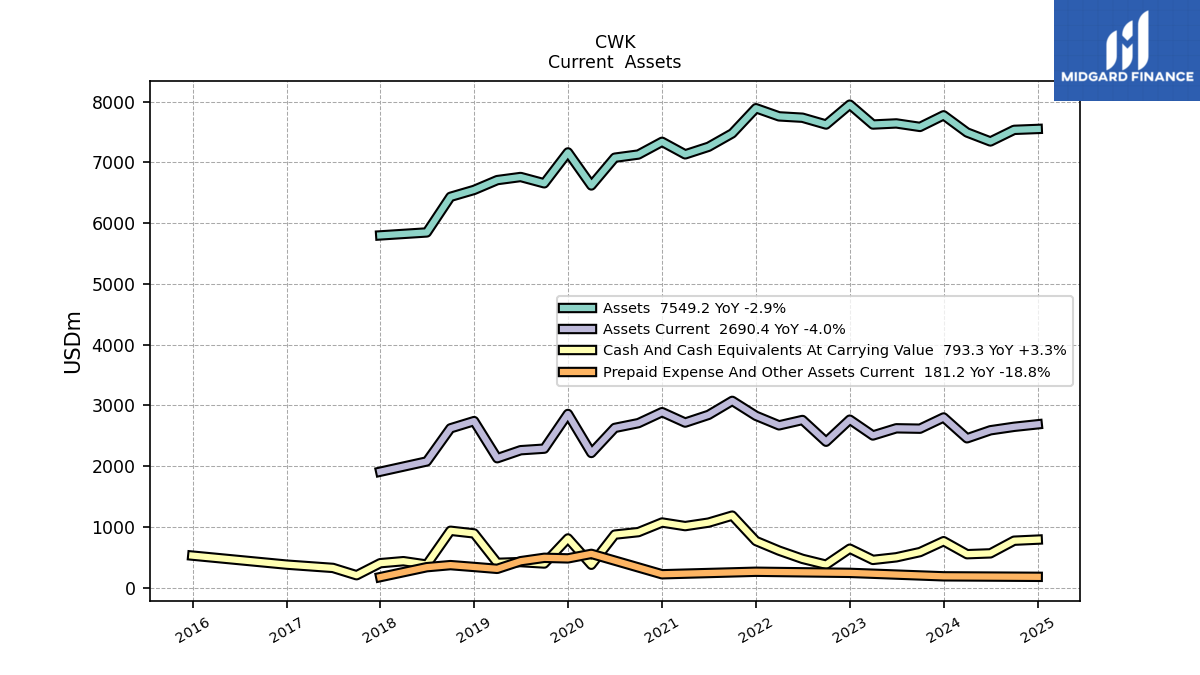
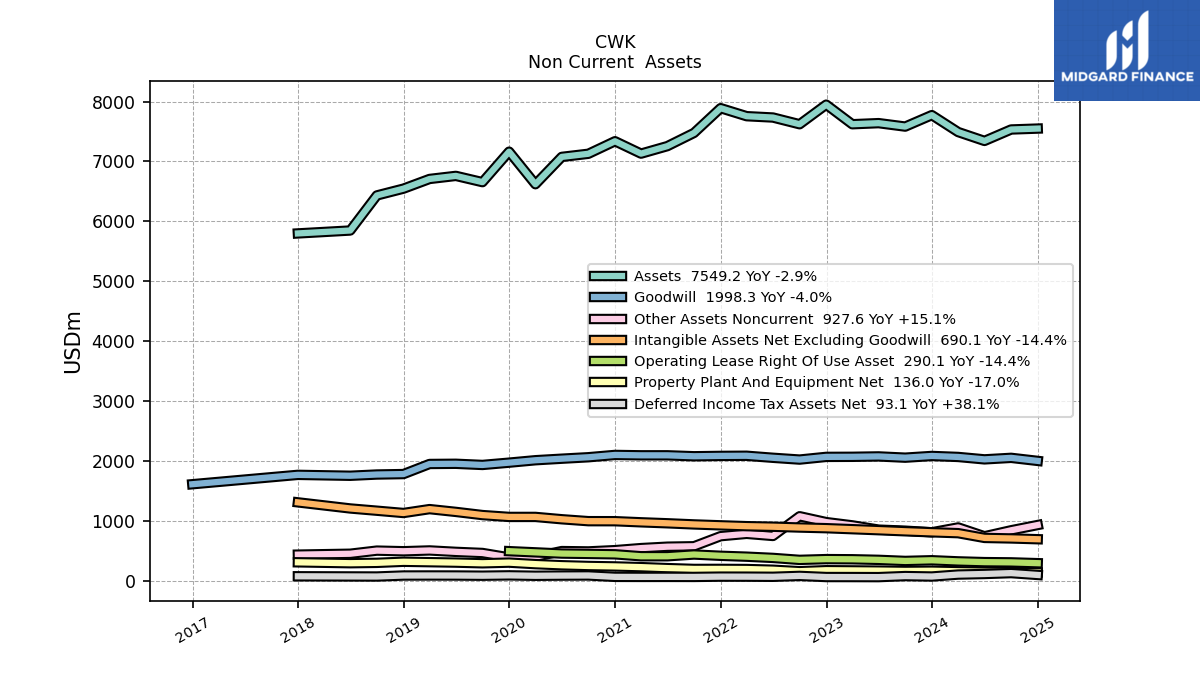
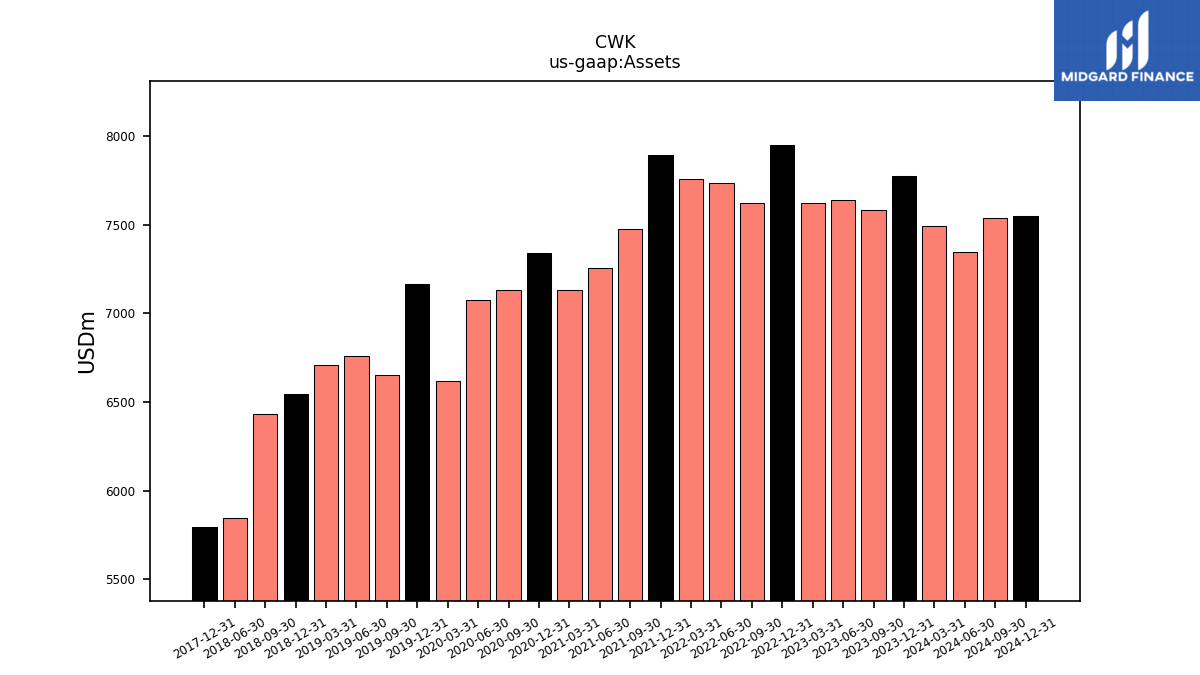
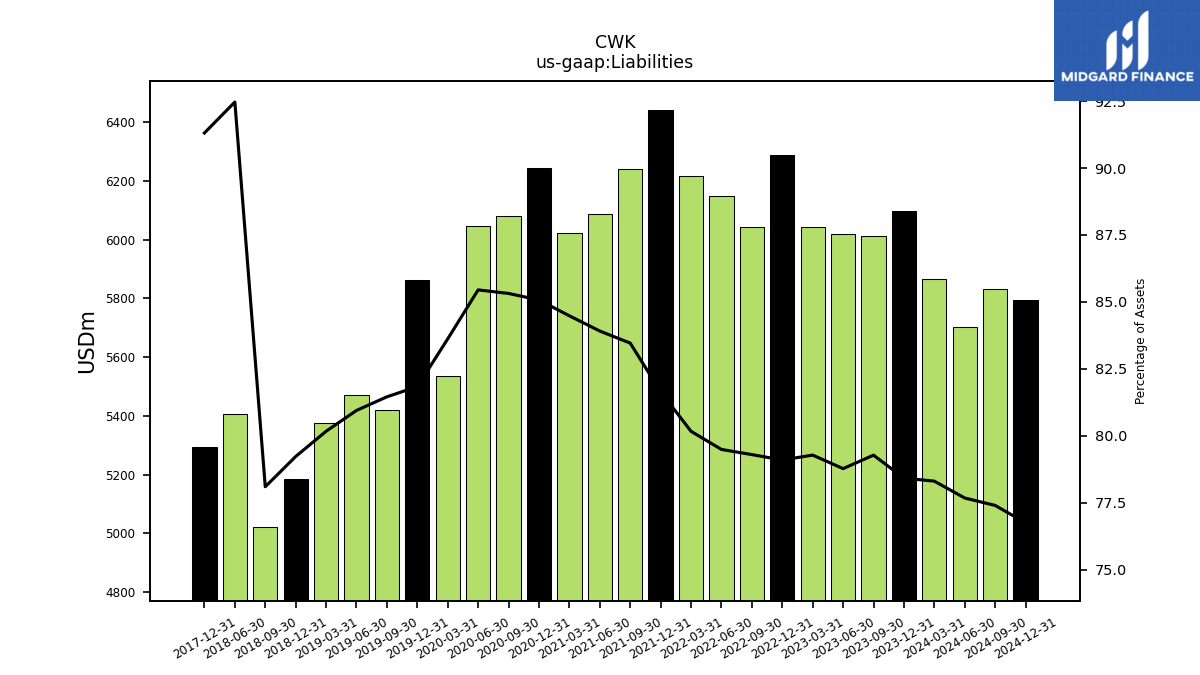
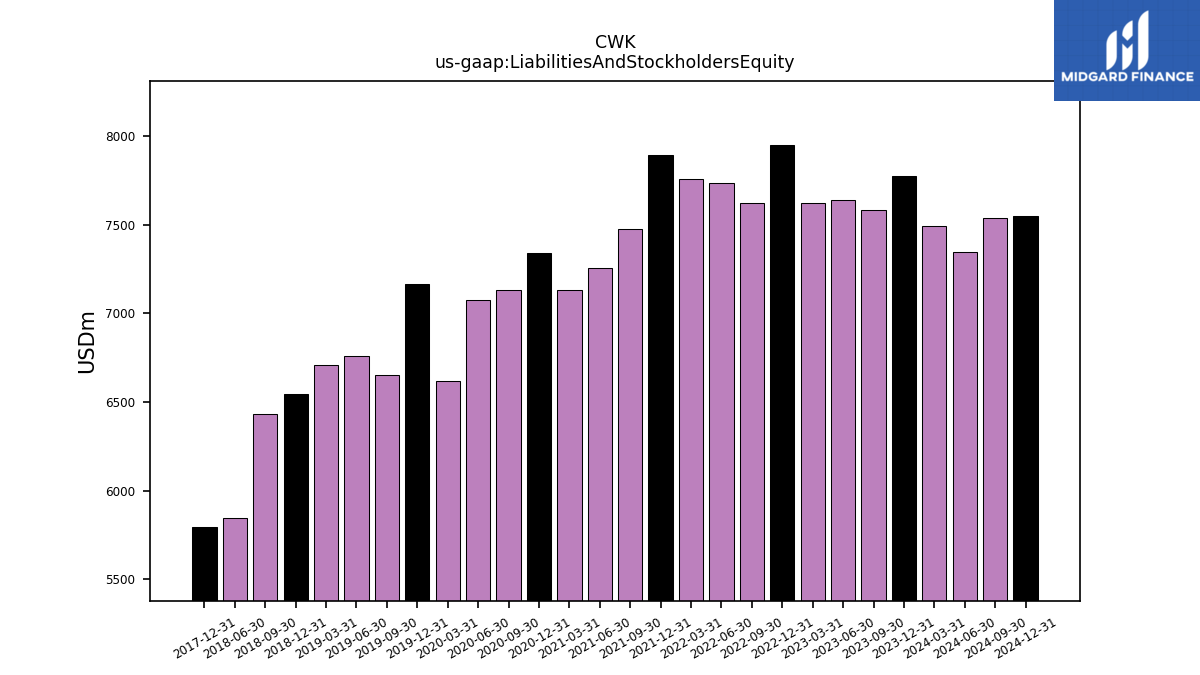
| Assets | 7774.00 | 7582.40 | 7640.10 | 7621.70 | 7949.30 | 7621.60 | 7733.80 | 7756.10 | 7890.40 | 7476.30 | 7256.00 | 7130.80 | 7337.90 | 7128.40 | 7076.20 | 6619.40 | 7163.40 | 6654.40 | 6758.90 | 6707.50 | 6546.00 | 6432.40 | 5846.70 | NA | 5797.90 | NA | NA | NA | |
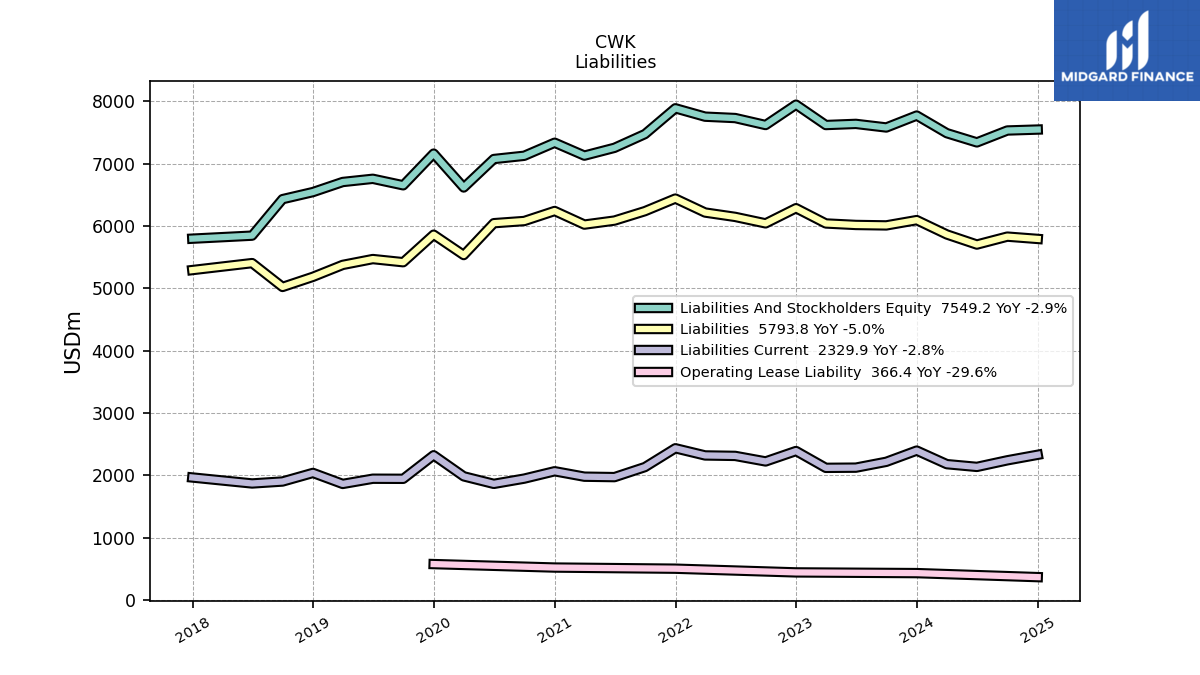
| Liabilities | 6096.00 | 6010.90 | 6018.10 | 6042.20 | 6287.20 | 6043.50 | 6147.40 | 6217.60 | 6441.80 | 6239.70 | 6088.50 | 6024.00 | 6242.30 | 6081.50 | 6046.40 | 5535.00 | 5862.10 | 5420.20 | 5470.90 | 5377.10 | 5185.90 | 5023.30 | 5406.10 | NA | 5294.00 | NA | NA | NA | |
| Liabilities And Stockholders Equity | 7774.00 | 7582.40 | 7640.10 | 7621.70 | 7949.30 | 7621.60 | 7733.80 | 7756.10 | 7890.40 | 7476.30 | 7256.00 | 7130.80 | 7337.90 | 7128.40 | 7076.20 | 6619.40 | 7163.40 | 6654.40 | 6758.90 | 6707.50 | 6546.00 | 6432.40 | 5846.70 | NA | 5797.90 | NA | NA | NA | |
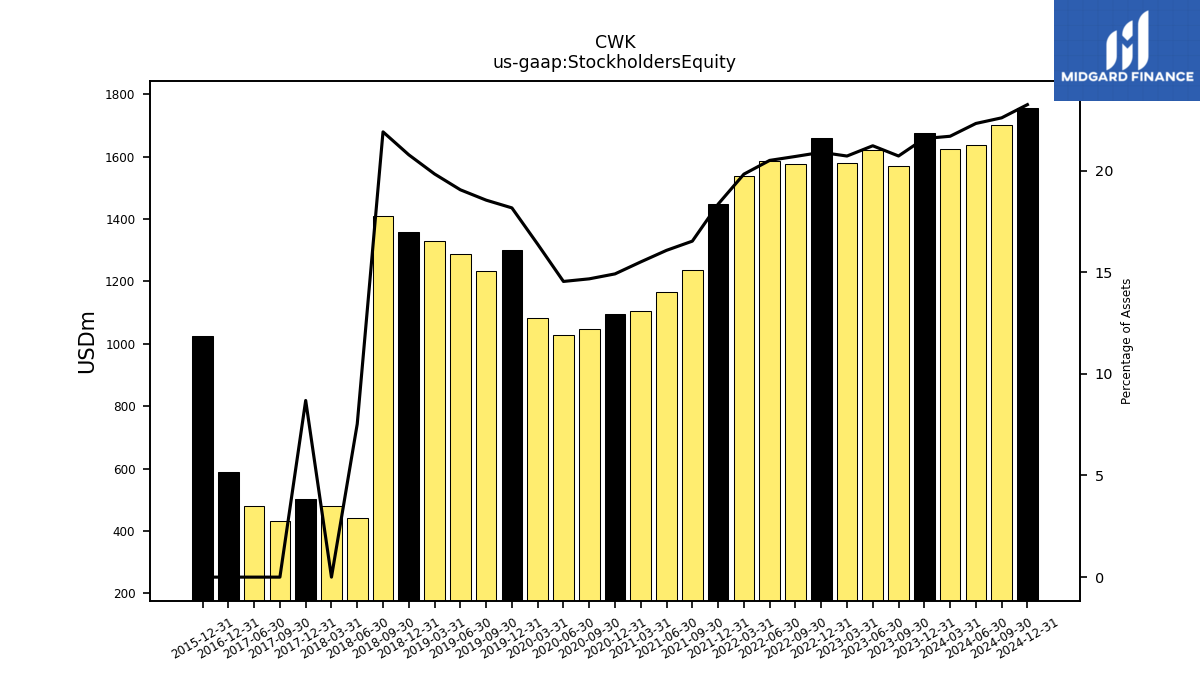
| Stockholders Equity | 1677.40 | 1571.00 | 1621.40 | 1579.00 | 1661.30 | 1577.40 | 1585.60 | 1537.70 | 1447.80 | 1235.80 | 1166.60 | 1105.90 | 1094.70 | 1046.10 | 1029.40 | 1084.20 | 1301.30 | 1234.20 | 1288.00 | 1330.40 | 1360.10 | 1409.10 | 440.60 | 480.50 | 503.90 | 430.90 | 479.60 | NA |
| 2023-12-31 | 2023-09-30 | 2023-06-30 | 2023-03-31 | 2022-12-31 | 2022-09-30 | 2022-06-30 | 2022-03-31 | 2021-12-31 | 2021-09-30 | 2021-06-30 | 2021-03-31 | 2020-12-31 | 2020-09-30 | 2020-06-30 | 2020-03-31 | 2019-12-31 | 2019-09-30 | 2019-06-30 | 2019-03-31 | 2018-12-31 | 2018-09-30 | 2018-06-30 | 2018-03-31 | 2017-12-31 | 2017-09-30 | 2017-06-30 | 2017-03-31 | ||
|---|---|---|---|---|---|---|---|---|---|---|---|---|---|---|---|---|---|---|---|---|---|---|---|---|---|---|---|---|---|
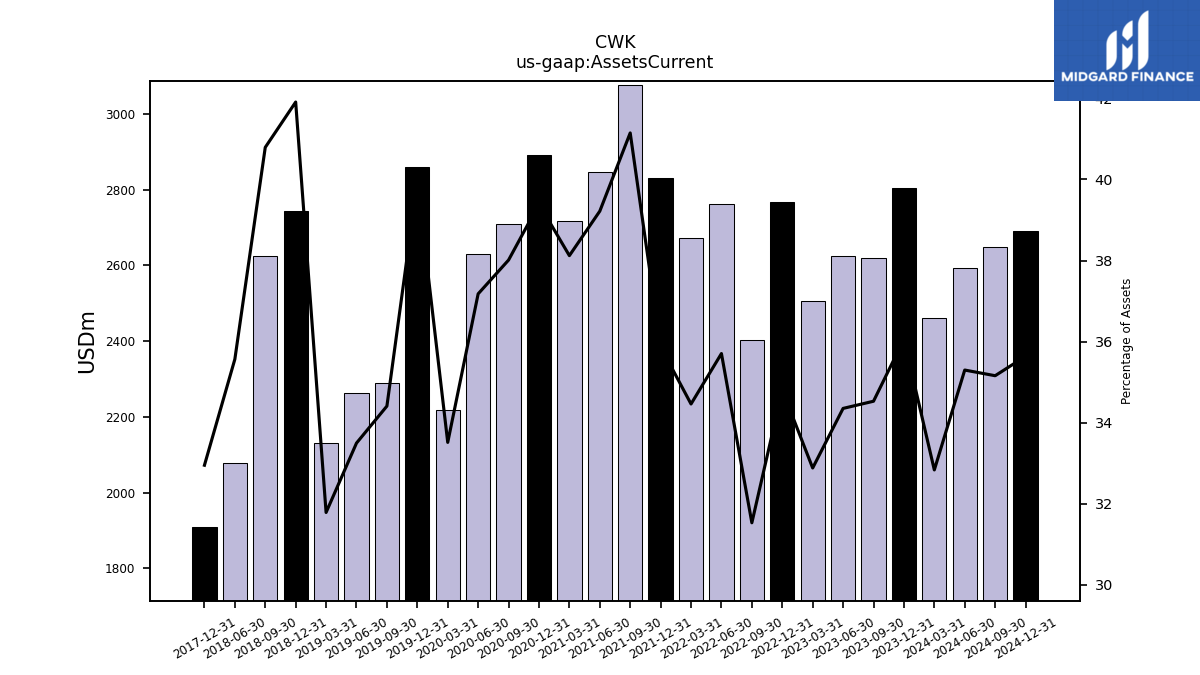
| Assets Current | 2803.20 | 2618.20 | 2624.60 | 2506.30 | 2766.80 | 2403.30 | 2761.40 | 2672.90 | 2830.30 | 3076.20 | 2845.60 | 2718.30 | 2890.70 | 2709.60 | 2630.80 | 2218.50 | 2860.80 | 2289.80 | 2264.10 | 2132.10 | 2743.30 | 2623.80 | 2079.40 | NA | 1910.50 | NA | NA | NA | |
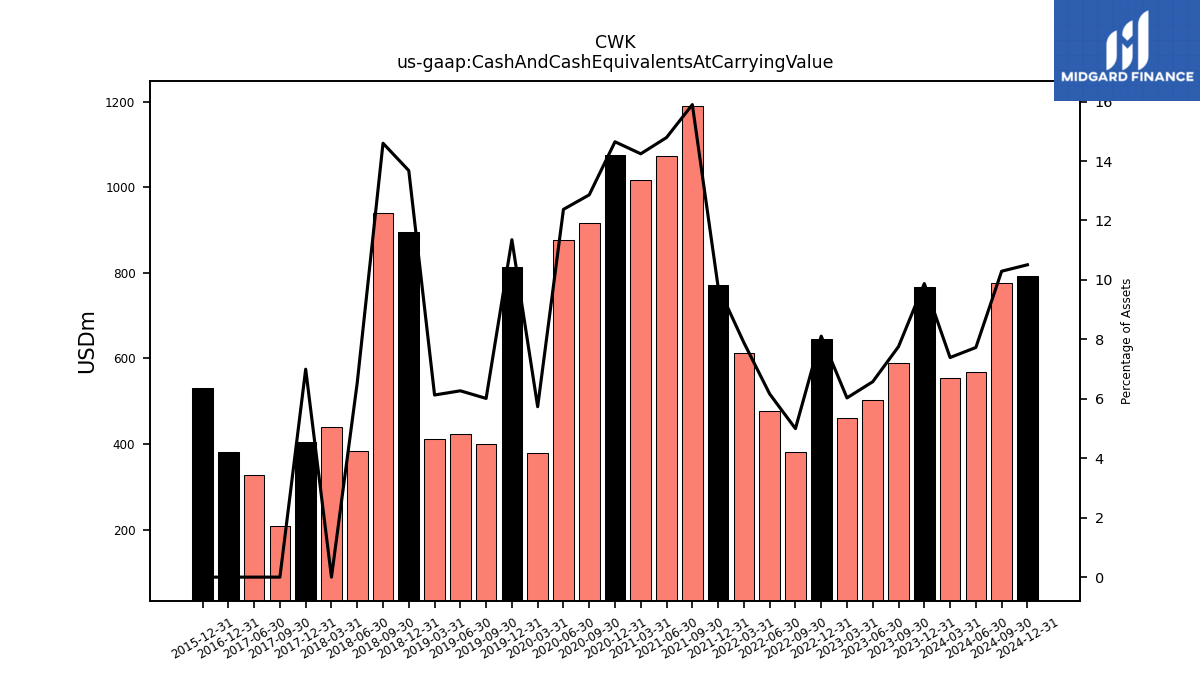
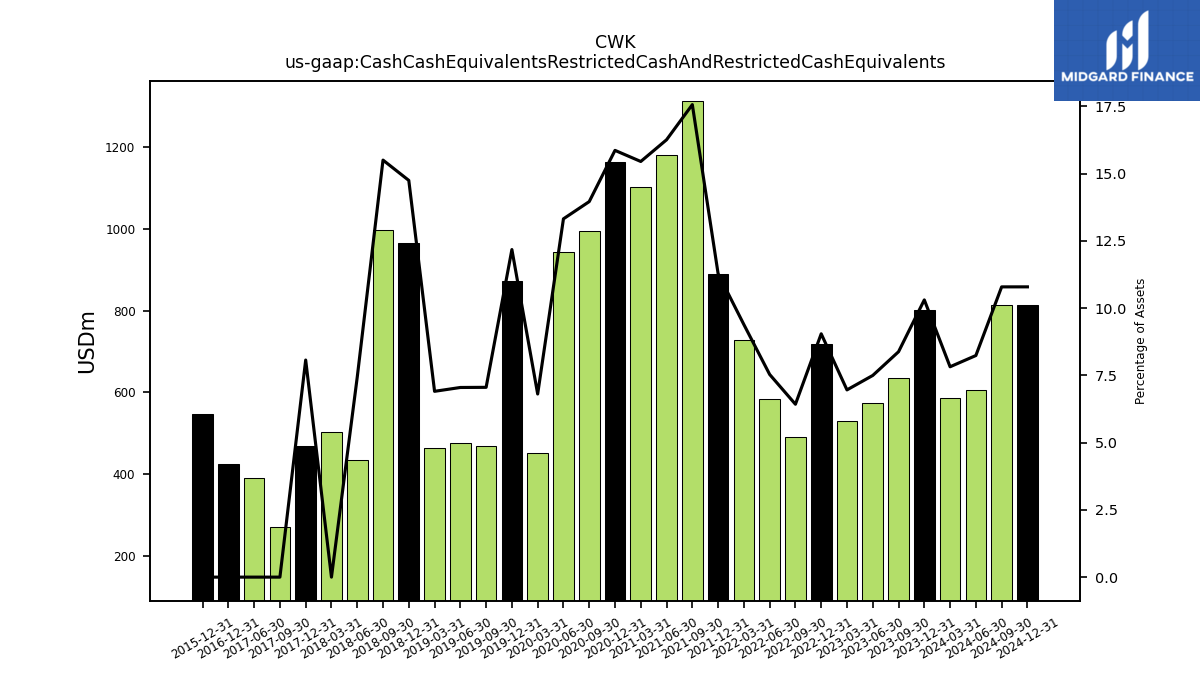
| Cash And Cash Equivalents At Carrying Value | 767.70 | 588.20 | 502.30 | 459.60 | 644.50 | 380.80 | 476.70 | 611.90 | 770.70 | 1188.50 | 1073.20 | 1015.60 | 1074.80 | 916.80 | 875.50 | 379.50 | 813.20 | 400.10 | 423.70 | 411.00 | 895.30 | 939.00 | 382.40 | 438.70 | 405.60 | 207.20 | 327.70 | NA | |
| Cash Cash Equivalents Restricted Cash And Restricted Cash Equivalents | 801.20 | 635.30 | 572.80 | 530.50 | 719.00 | 489.80 | 582.70 | 728.20 | 890.30 | 1313.20 | 1179.70 | 1101.80 | 1164.10 | 995.10 | 942.50 | 450.60 | 872.30 | 469.50 | 476.50 | 463.30 | 965.40 | 997.20 | 434.60 | 503.30 | 467.90 | 271.80 | 391.20 | NA | |
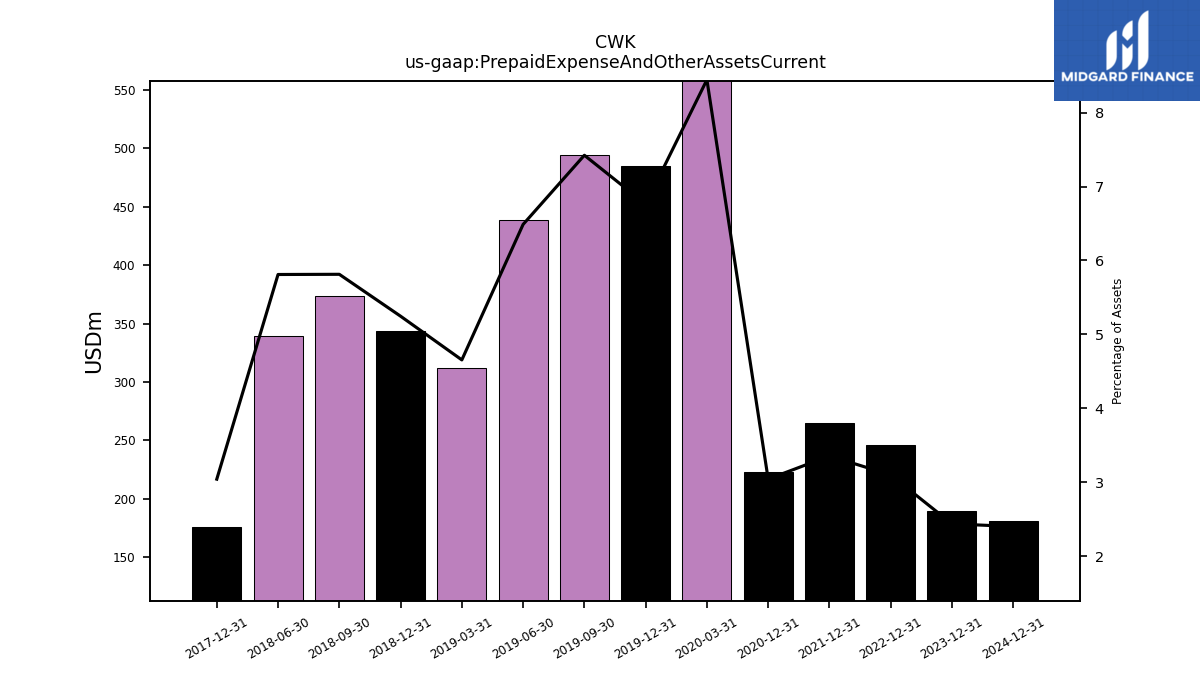
| Prepaid Expense And Other Assets Current | 189.40 | NA | NA | NA | 246.30 | NA | NA | NA | 264.70 | NA | NA | NA | 223.20 | NA | NA | 559.00 | 484.40 | 494.00 | 438.50 | 312.20 | 343.40 | 373.90 | 339.70 | NA | 176.30 | NA | NA | NA |
| 2023-12-31 | 2023-09-30 | 2023-06-30 | 2023-03-31 | 2022-12-31 | 2022-09-30 | 2022-06-30 | 2022-03-31 | 2021-12-31 | 2021-09-30 | 2021-06-30 | 2021-03-31 | 2020-12-31 | 2020-09-30 | 2020-06-30 | 2020-03-31 | 2019-12-31 | 2019-09-30 | 2019-06-30 | 2019-03-31 | 2018-12-31 | 2018-09-30 | 2018-06-30 | 2018-03-31 | 2017-12-31 | 2017-09-30 | 2017-06-30 | 2017-03-31 | ||
|---|---|---|---|---|---|---|---|---|---|---|---|---|---|---|---|---|---|---|---|---|---|---|---|---|---|---|---|---|---|
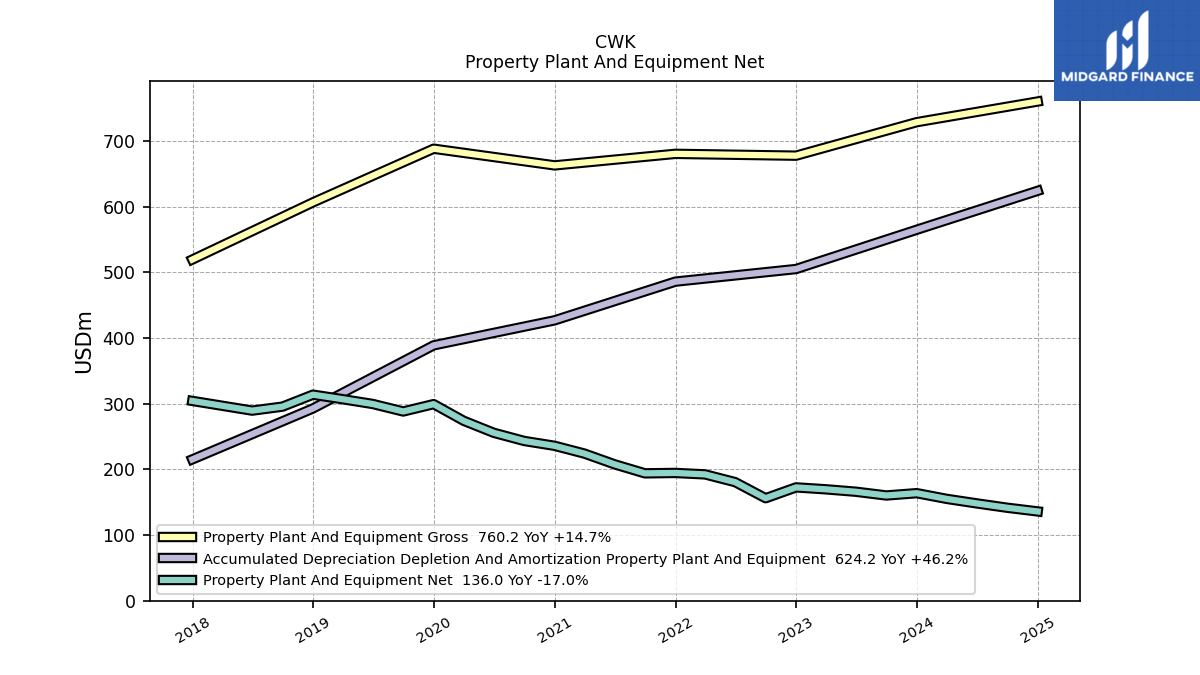
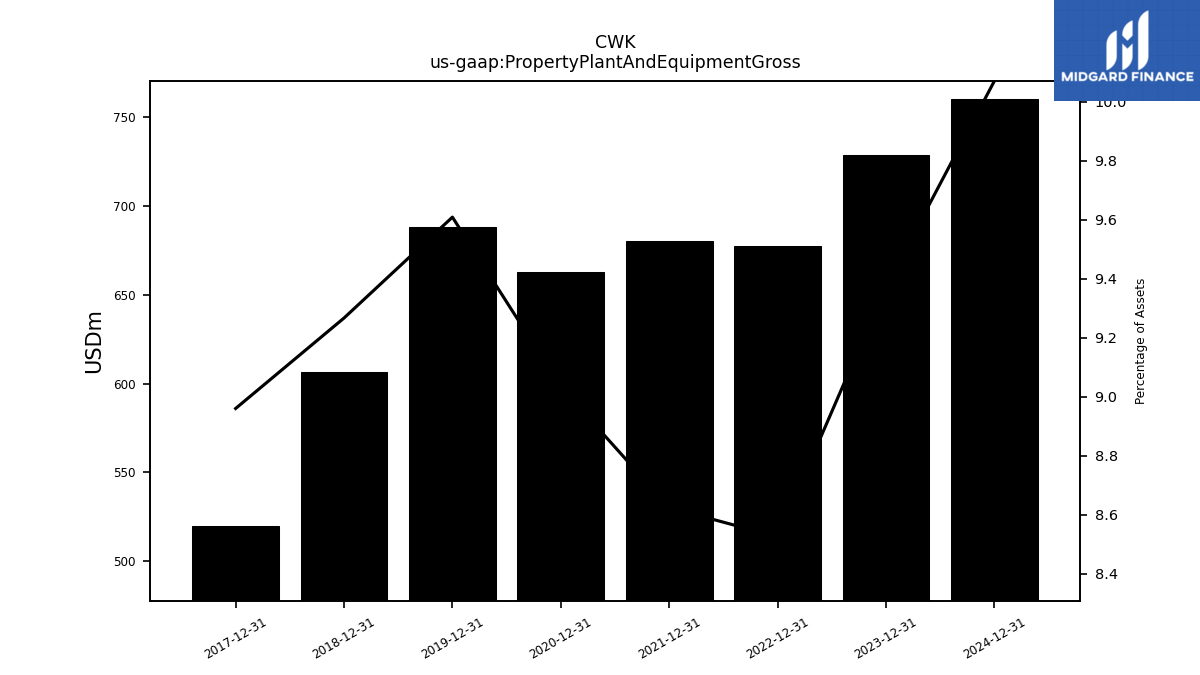
| Property Plant And Equipment Gross | 728.70 | NA | NA | NA | 677.70 | NA | NA | NA | 680.50 | NA | NA | NA | 662.90 | NA | NA | NA | 688.30 | NA | NA | NA | 606.60 | NA | NA | NA | 519.50 | NA | NA | NA | |
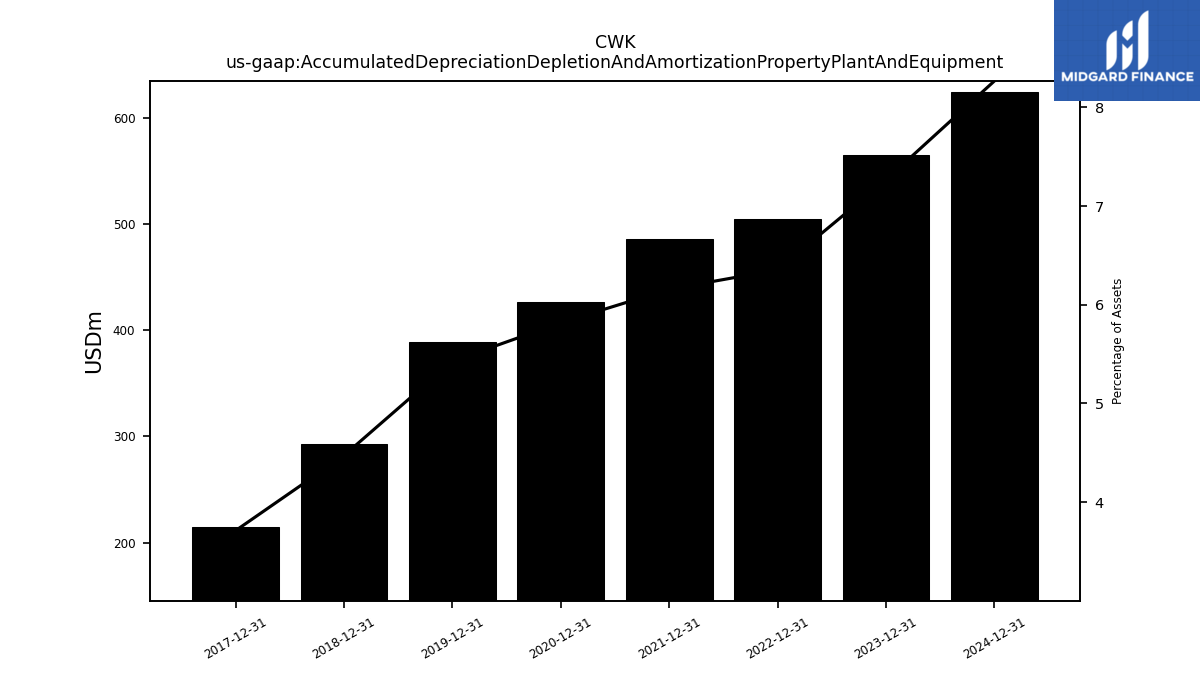
| Accumulated Depreciation Depletion And Amortization Property Plant And Equipment | 564.90 | NA | NA | NA | 505.10 | NA | NA | NA | 485.90 | NA | NA | NA | 427.00 | NA | NA | NA | 388.90 | NA | NA | NA | 292.80 | NA | NA | NA | 215.20 | NA | NA | NA | |
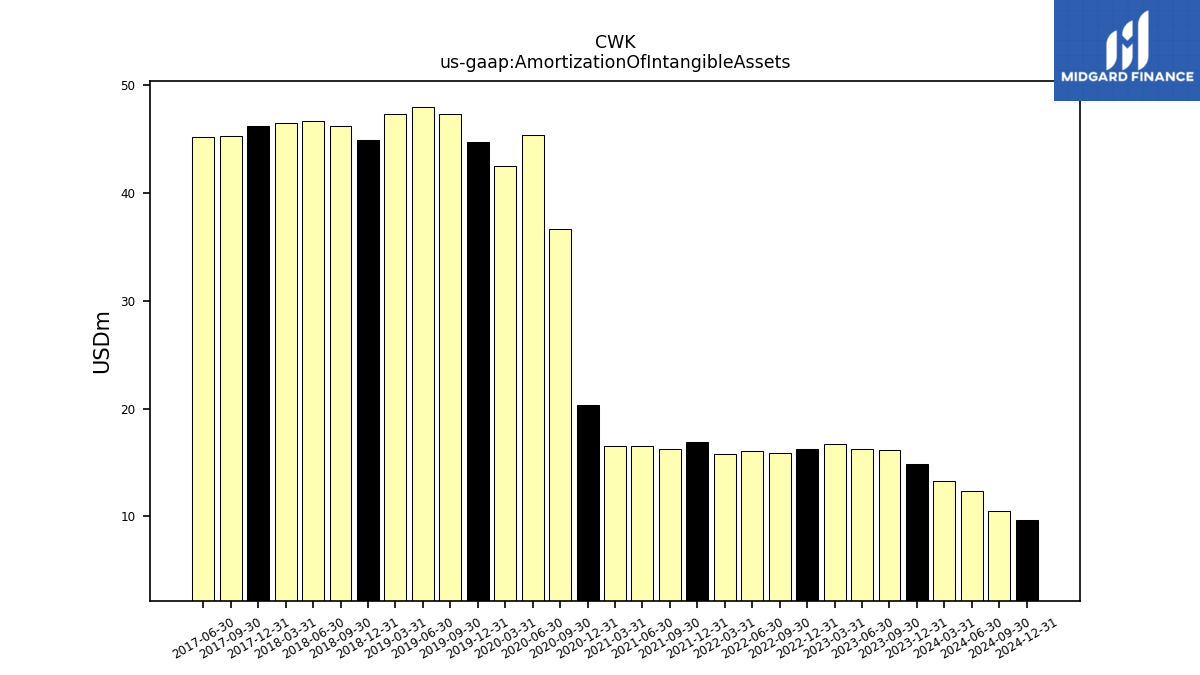
| Amortization Of Intangible Assets | 14.90 | 16.20 | 16.30 | 16.70 | 16.30 | 15.90 | 16.10 | 15.80 | 16.90 | 16.30 | 16.50 | 16.50 | 20.30 | 36.70 | 45.40 | 42.50 | 44.70 | 47.30 | 48.00 | 47.30 | 44.90 | 46.20 | 46.70 | 46.50 | 46.20 | 45.30 | 45.20 | NA | |
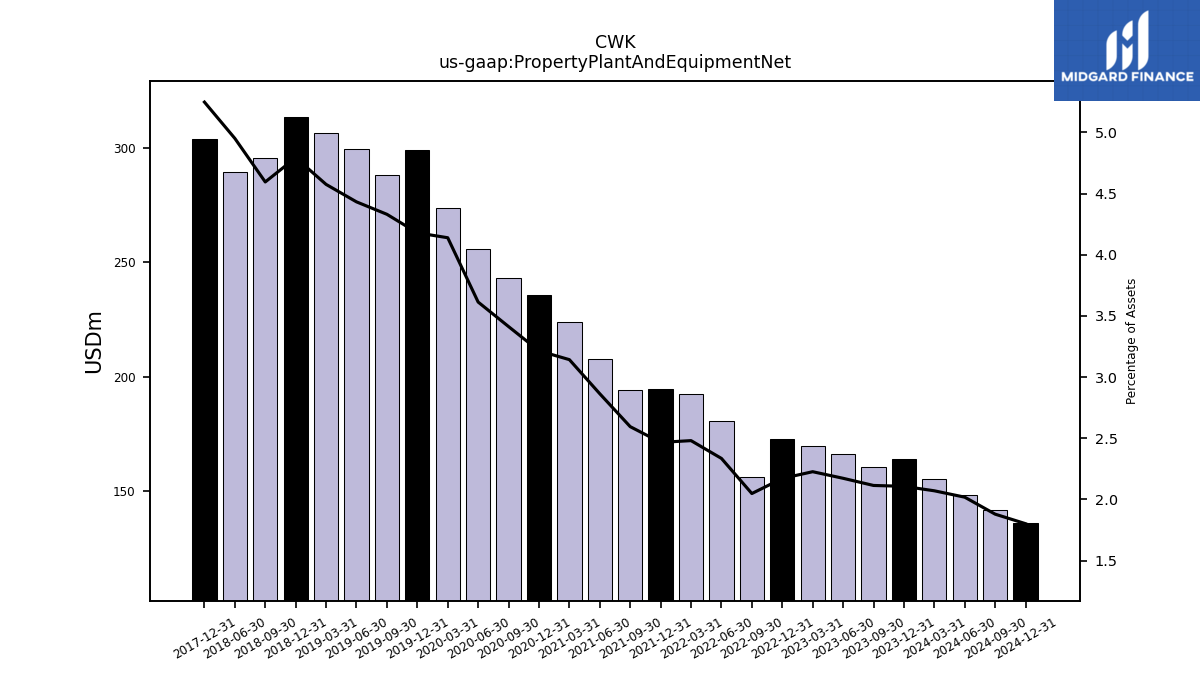
| Property Plant And Equipment Net | 163.80 | 160.30 | 166.00 | 169.70 | 172.60 | 156.10 | 180.60 | 192.40 | 194.60 | 194.00 | 207.80 | 224.10 | 235.90 | 243.30 | 255.70 | 274.00 | 299.40 | 288.20 | 299.60 | 306.90 | 313.80 | 295.60 | 289.50 | NA | 304.30 | NA | NA | NA | |
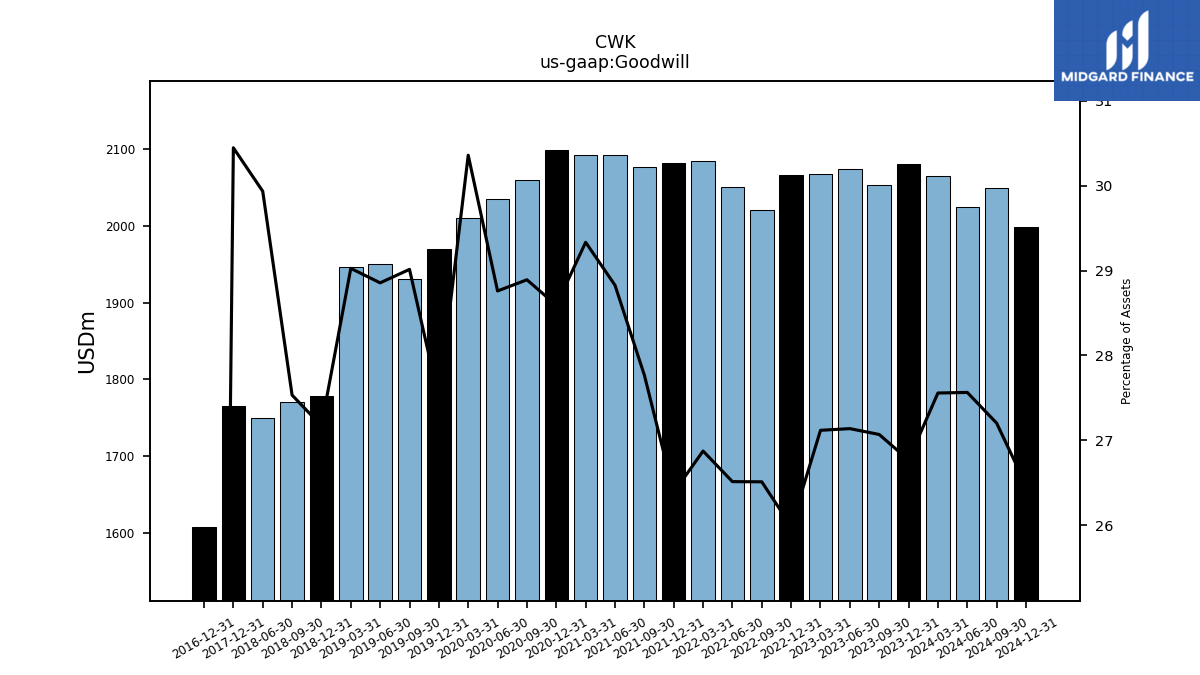
| Goodwill | 2080.90 | 2052.40 | 2073.30 | 2066.80 | 2065.50 | 2020.50 | 2050.40 | 2084.30 | 2081.90 | 2076.00 | 2091.70 | 2091.70 | 2098.00 | 2059.50 | 2035.10 | 2009.60 | 1969.10 | 1930.70 | 1950.30 | 1946.90 | 1778.50 | 1771.00 | 1750.20 | NA | 1765.30 | NA | NA | NA | |
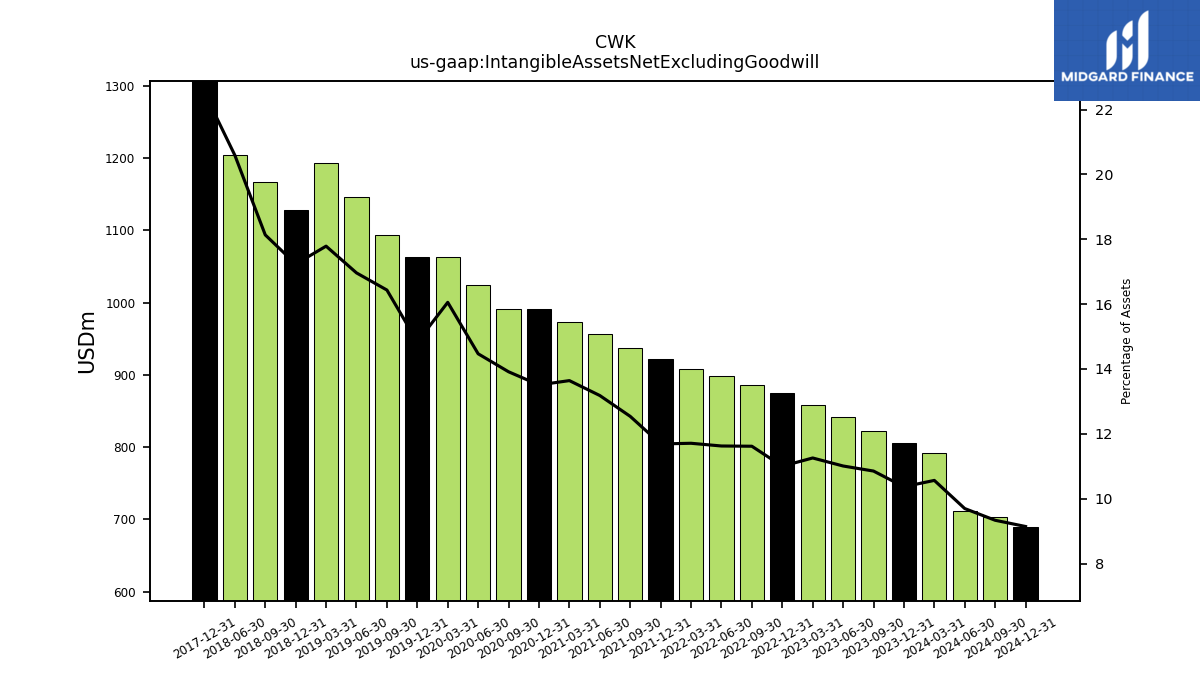
| Intangible Assets Net Excluding Goodwill | 805.90 | 822.80 | 841.00 | 857.80 | 874.50 | 885.40 | 899.00 | 908.10 | 922.20 | 937.40 | 956.40 | 972.70 | 991.20 | 991.80 | 1023.80 | 1062.70 | 1062.60 | 1093.60 | 1146.50 | 1193.10 | 1128.20 | 1166.50 | 1203.90 | NA | 1306.00 | NA | NA | NA | |
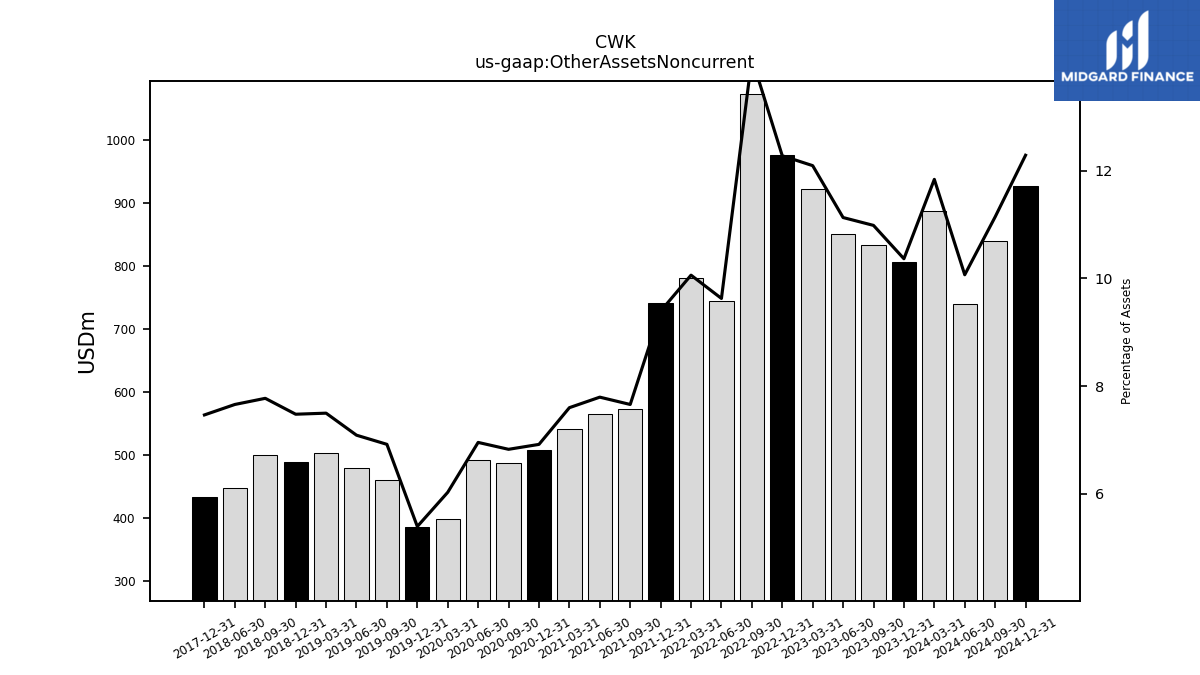
| Other Assets Noncurrent | 805.80 | 832.90 | 850.40 | 921.80 | 976.00 | 1074.00 | 744.60 | 780.30 | 741.10 | 572.60 | 565.60 | 541.90 | 507.60 | 486.60 | 492.10 | 399.00 | 386.30 | 460.40 | 479.10 | 502.90 | 489.50 | 500.00 | 447.80 | NA | 432.80 | NA | NA | NA |
| 2023-12-31 | 2023-09-30 | 2023-06-30 | 2023-03-31 | 2022-12-31 | 2022-09-30 | 2022-06-30 | 2022-03-31 | 2021-12-31 | 2021-09-30 | 2021-06-30 | 2021-03-31 | 2020-12-31 | 2020-09-30 | 2020-06-30 | 2020-03-31 | 2019-12-31 | 2019-09-30 | 2019-06-30 | 2019-03-31 | 2018-12-31 | 2018-09-30 | 2018-06-30 | 2018-03-31 | 2017-12-31 | 2017-09-30 | 2017-06-30 | 2017-03-31 | ||
|---|---|---|---|---|---|---|---|---|---|---|---|---|---|---|---|---|---|---|---|---|---|---|---|---|---|---|---|---|---|
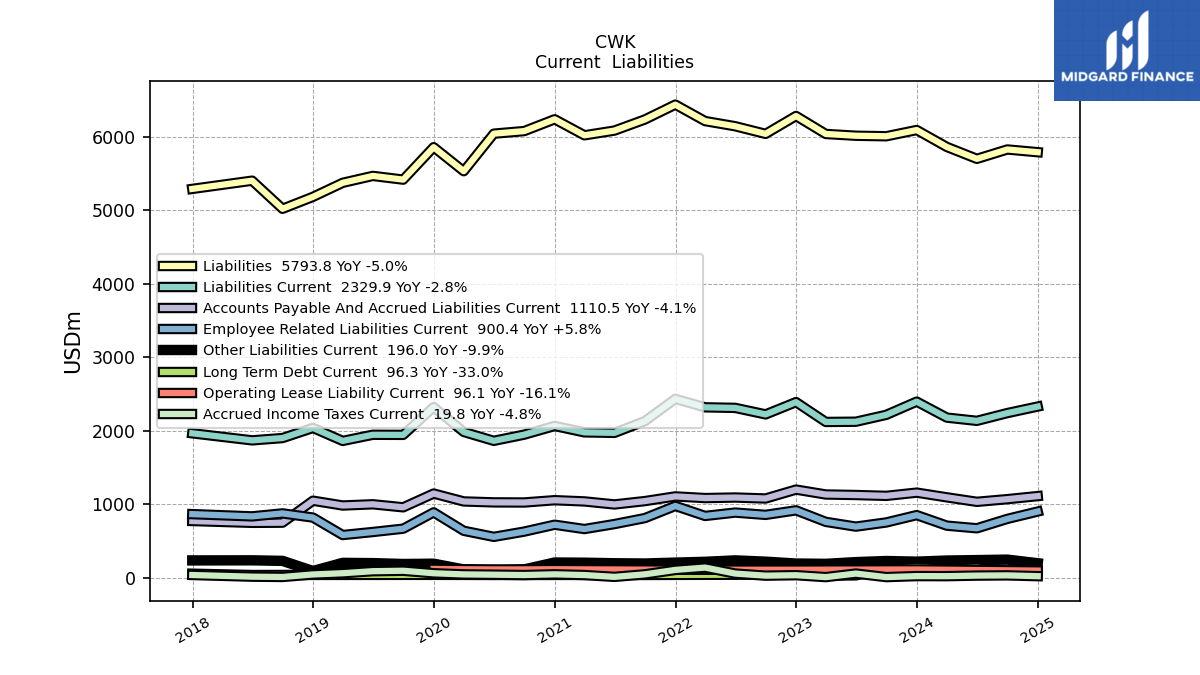
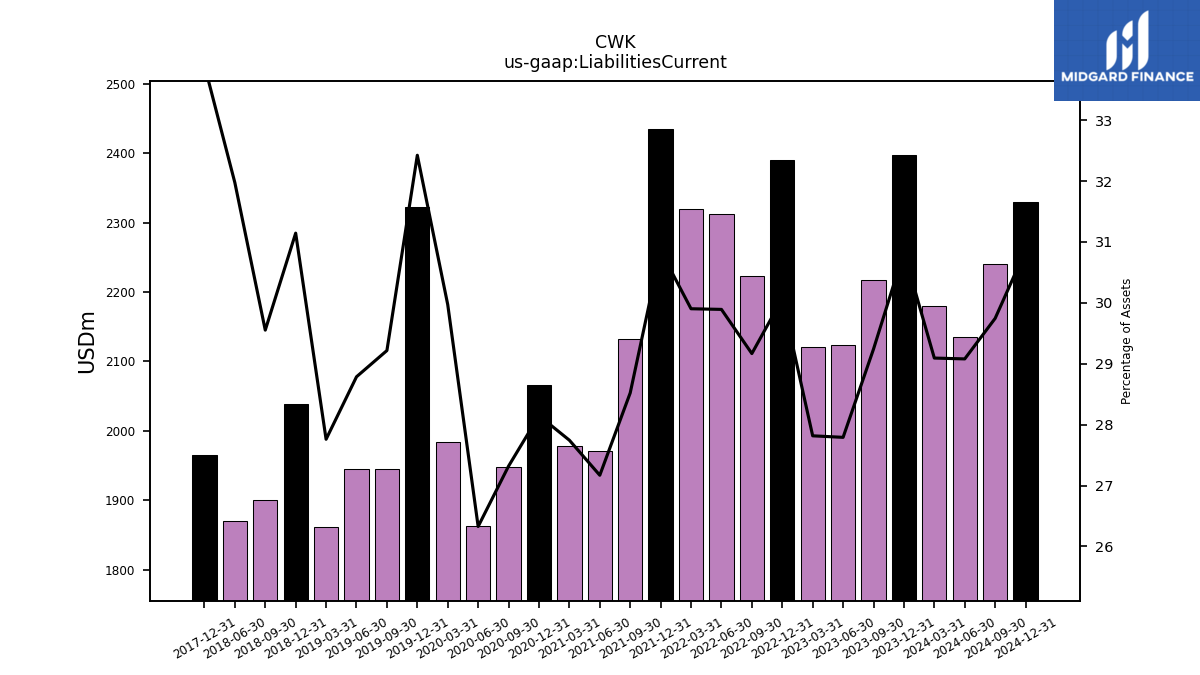
| Liabilities Current | 2397.20 | 2217.10 | 2123.30 | 2120.10 | 2390.40 | 2223.00 | 2311.80 | 2319.30 | 2434.50 | 2132.30 | 1971.40 | 1978.40 | 2065.50 | 1947.40 | 1863.00 | 1983.90 | 2322.60 | 1944.20 | 1945.60 | 1862.00 | 2038.70 | 1900.90 | 1869.40 | NA | 1965.60 | NA | NA | NA | |
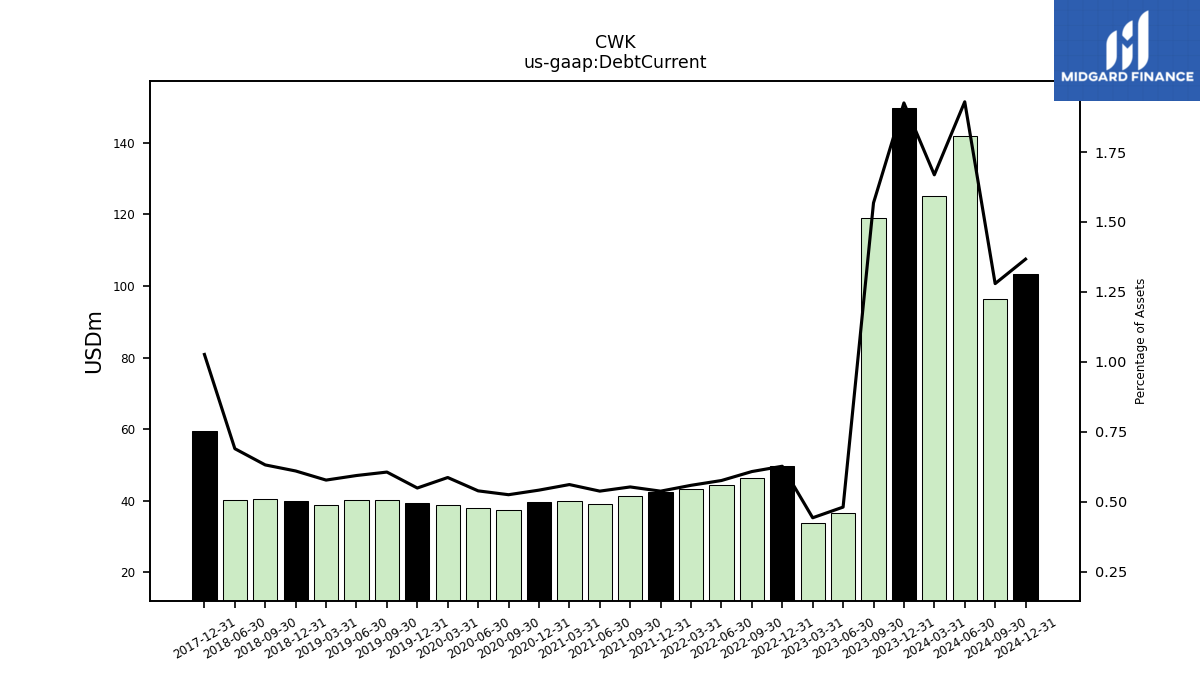
| Debt Current | 149.70 | 118.90 | 36.70 | 33.70 | 49.80 | 46.30 | 44.50 | 43.30 | 42.40 | 41.30 | 39.00 | 40.00 | 39.70 | 37.40 | 38.10 | 38.80 | 39.30 | 40.30 | 40.10 | 38.70 | 39.90 | 40.60 | 40.30 | NA | 59.50 | NA | NA | NA | |
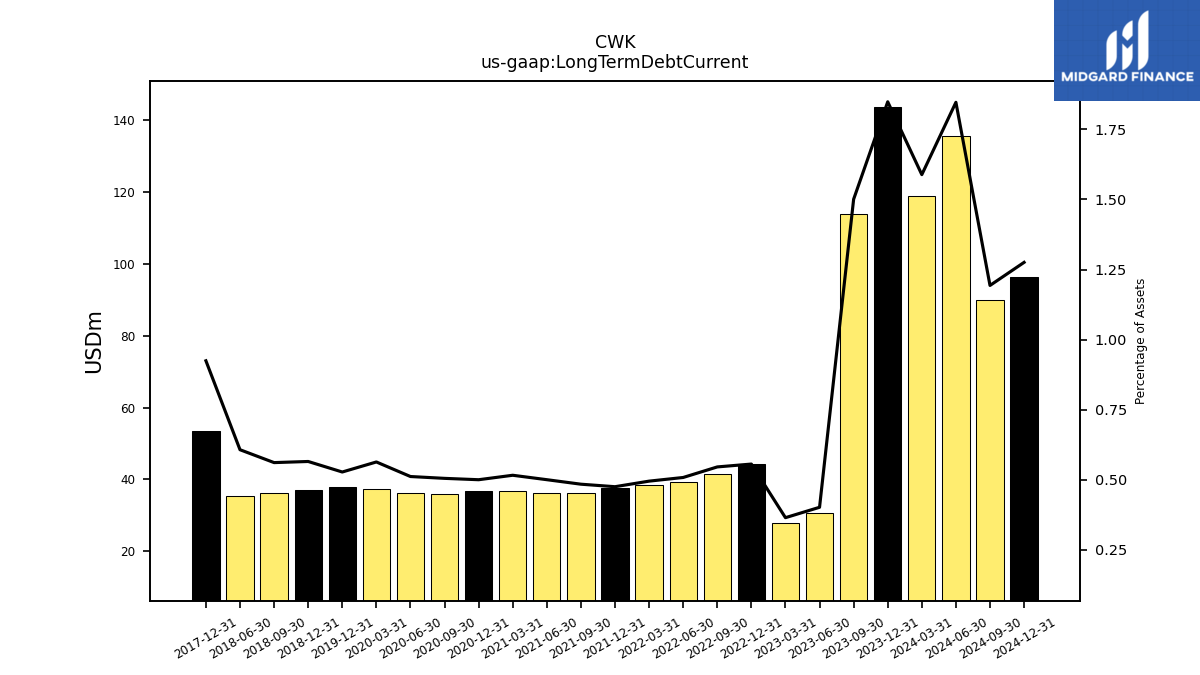
| Long Term Debt Current | 143.70 | 113.80 | 30.70 | 27.80 | 44.20 | 41.60 | 39.30 | 38.40 | 37.50 | 36.20 | 36.30 | 36.80 | 36.70 | 36.00 | 36.20 | 37.30 | 37.80 | NA | NA | NA | 37.00 | 36.10 | 35.50 | NA | 53.60 | NA | NA | NA | |
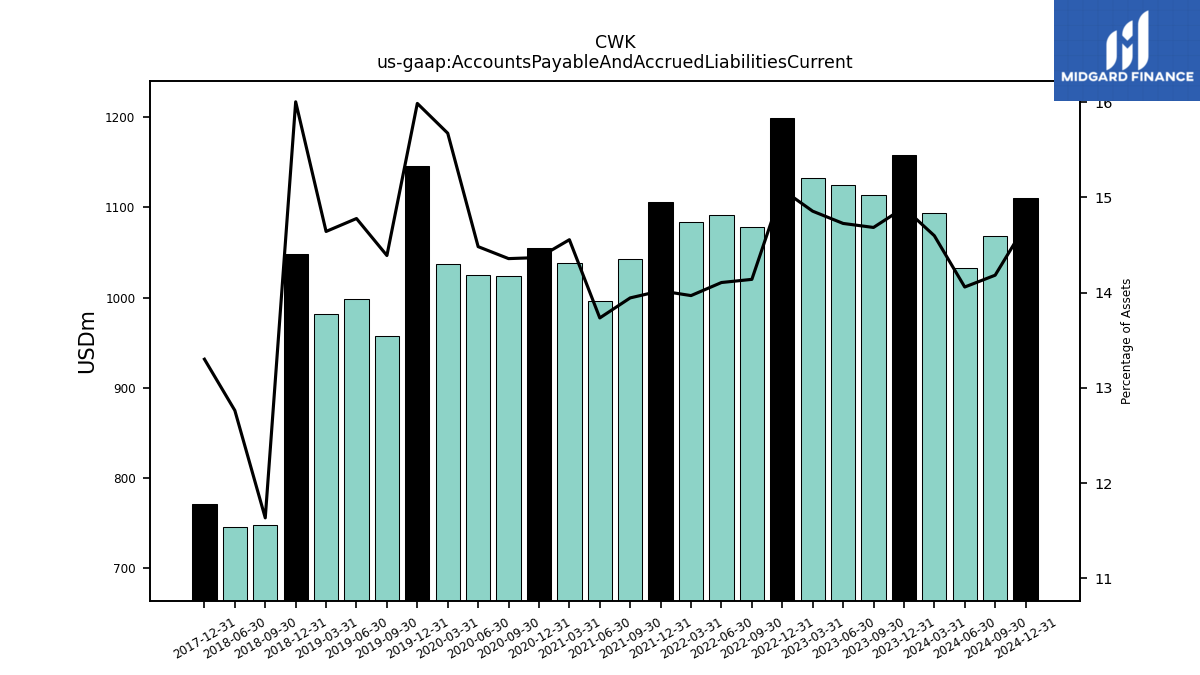
| Accounts Payable And Accrued Liabilities Current | 1157.70 | 1113.50 | 1125.20 | 1132.30 | 1199.00 | 1077.70 | 1091.00 | 1083.50 | 1106.20 | 1042.60 | 996.60 | 1038.00 | 1054.40 | 1023.50 | 1024.90 | 1037.60 | 1145.30 | 957.60 | 998.90 | 982.20 | 1047.70 | 748.40 | 746.20 | NA | 771.20 | NA | NA | NA | |
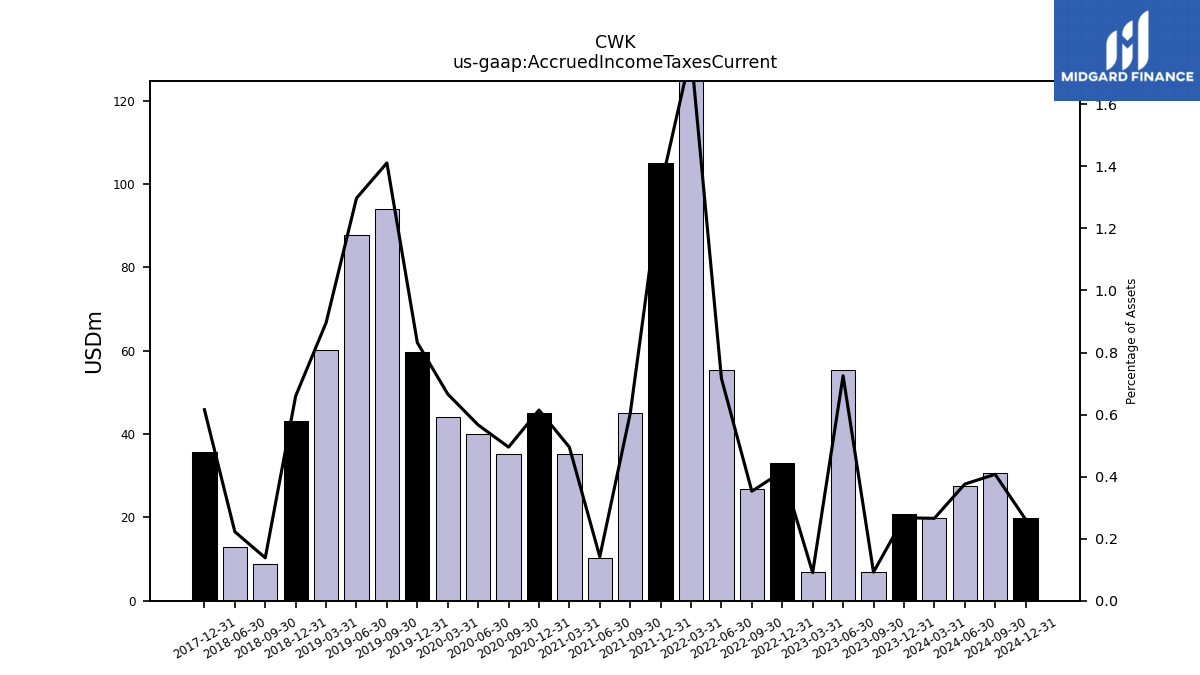
| Accrued Income Taxes Current | 20.80 | 7.00 | 55.40 | 6.90 | 33.10 | 26.90 | 55.40 | 136.90 | 105.10 | 45.10 | 10.30 | 35.30 | 45.10 | 35.30 | 40.10 | 44.10 | 59.60 | 93.90 | 87.70 | 60.10 | 43.20 | 8.90 | 13.00 | NA | 35.70 | NA | NA | NA | |
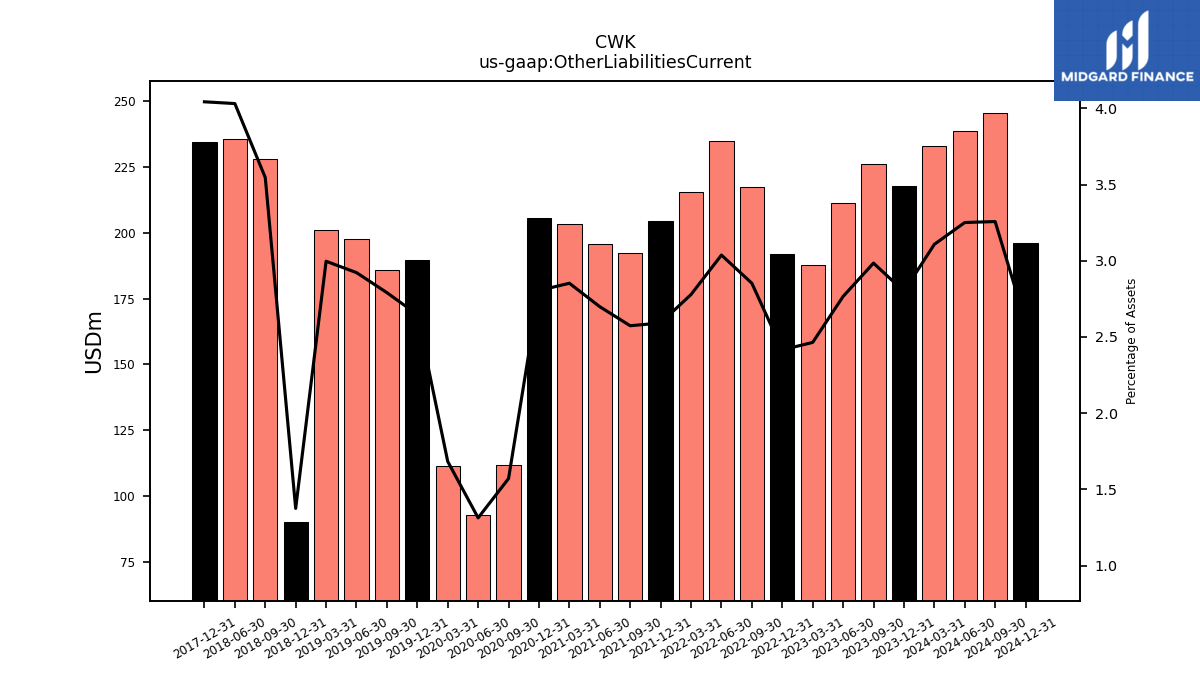
| Other Liabilities Current | 217.60 | 226.30 | 211.30 | 187.80 | 192.00 | 217.40 | 234.90 | 215.50 | 204.50 | 192.40 | 195.80 | 203.40 | 205.80 | 112.00 | 92.90 | 111.40 | 189.60 | 185.70 | 197.50 | 201.00 | 90.00 | 228.10 | 235.70 | NA | 234.40 | NA | NA | NA |
| 2023-12-31 | 2023-09-30 | 2023-06-30 | 2023-03-31 | 2022-12-31 | 2022-09-30 | 2022-06-30 | 2022-03-31 | 2021-12-31 | 2021-09-30 | 2021-06-30 | 2021-03-31 | 2020-12-31 | 2020-09-30 | 2020-06-30 | 2020-03-31 | 2019-12-31 | 2019-09-30 | 2019-06-30 | 2019-03-31 | 2018-12-31 | 2018-09-30 | 2018-06-30 | 2018-03-31 | 2017-12-31 | 2017-09-30 | 2017-06-30 | 2017-03-31 | ||
|---|---|---|---|---|---|---|---|---|---|---|---|---|---|---|---|---|---|---|---|---|---|---|---|---|---|---|---|---|---|
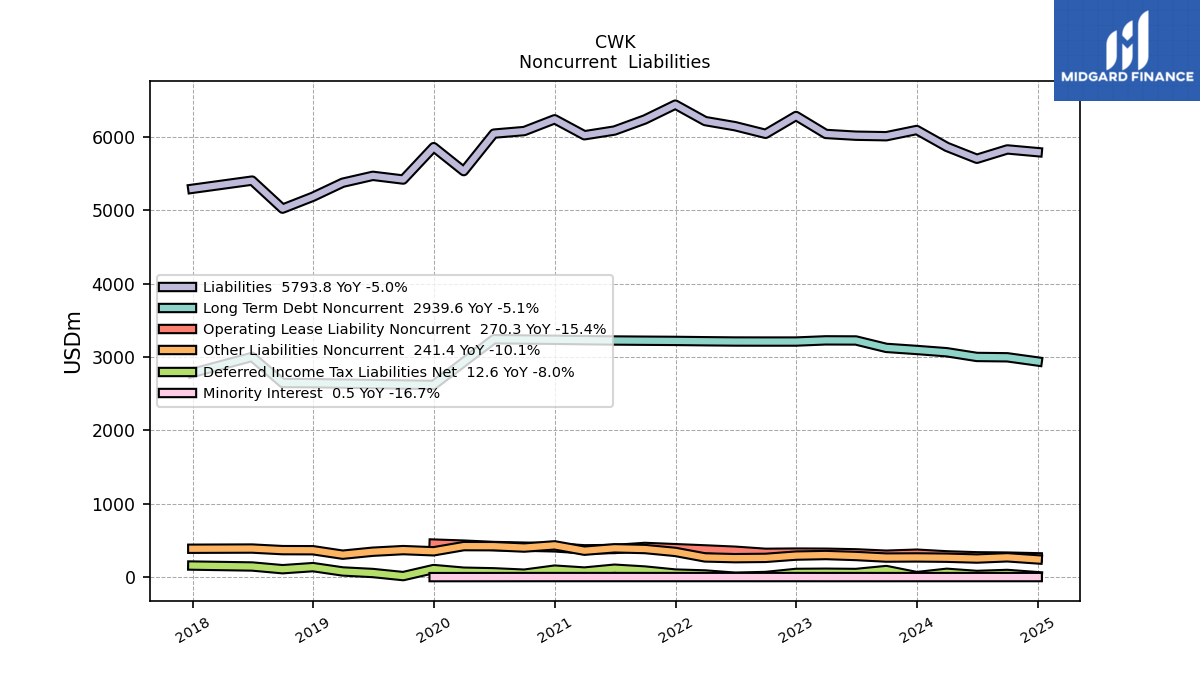
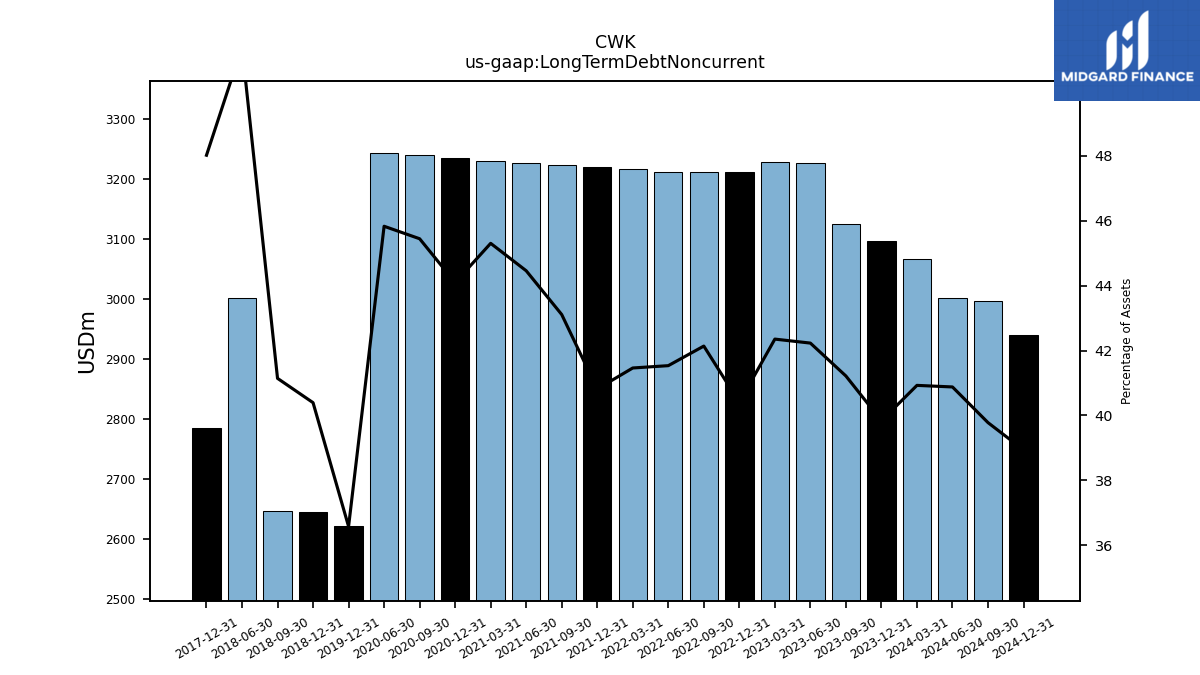
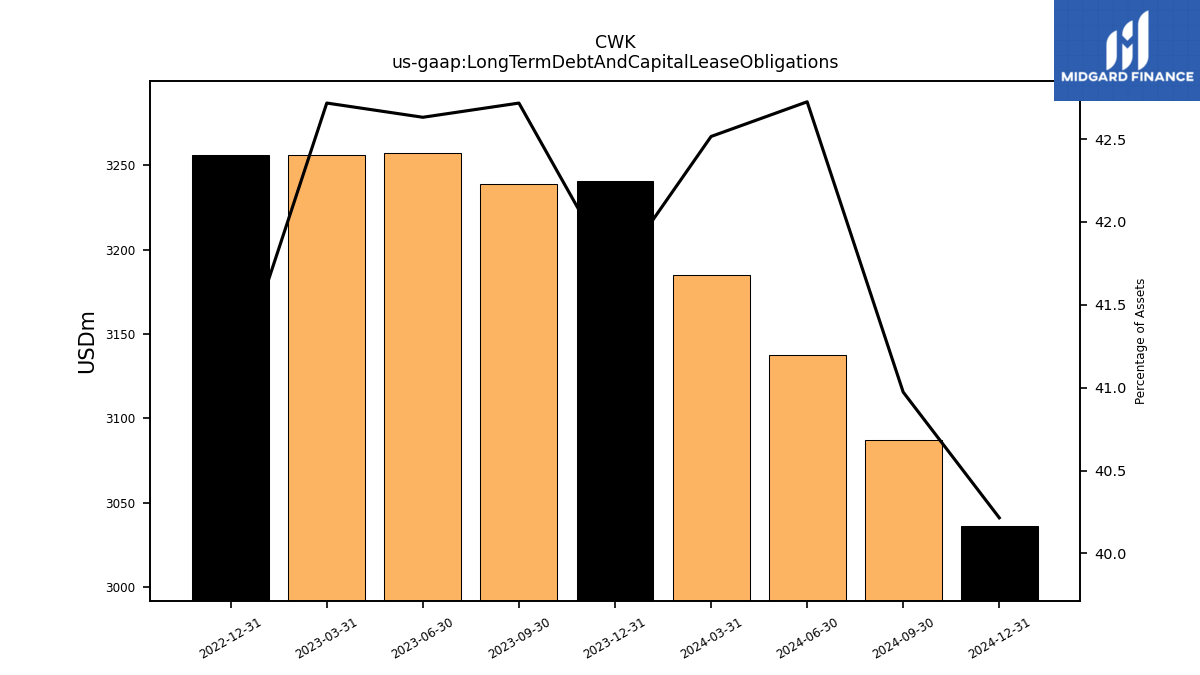
| Long Term Debt Noncurrent | 3096.90 | 3125.20 | 3226.40 | 3228.00 | 3211.70 | 3211.60 | 3212.20 | 3215.90 | 3220.50 | 3223.00 | 3225.90 | 3230.50 | 3235.70 | 3239.50 | 3243.00 | NA | 2620.30 | NA | NA | NA | 2644.20 | 2646.50 | 3002.20 | NA | 2784.00 | NA | NA | NA | |
| Long Term Debt And Capital Lease Obligations | 3240.60 | 3239.00 | 3257.10 | 3255.80 | 3255.90 | NA | NA | NA | NA | NA | NA | NA | NA | NA | NA | NA | NA | NA | NA | NA | NA | NA | NA | NA | NA | NA | NA | NA | |
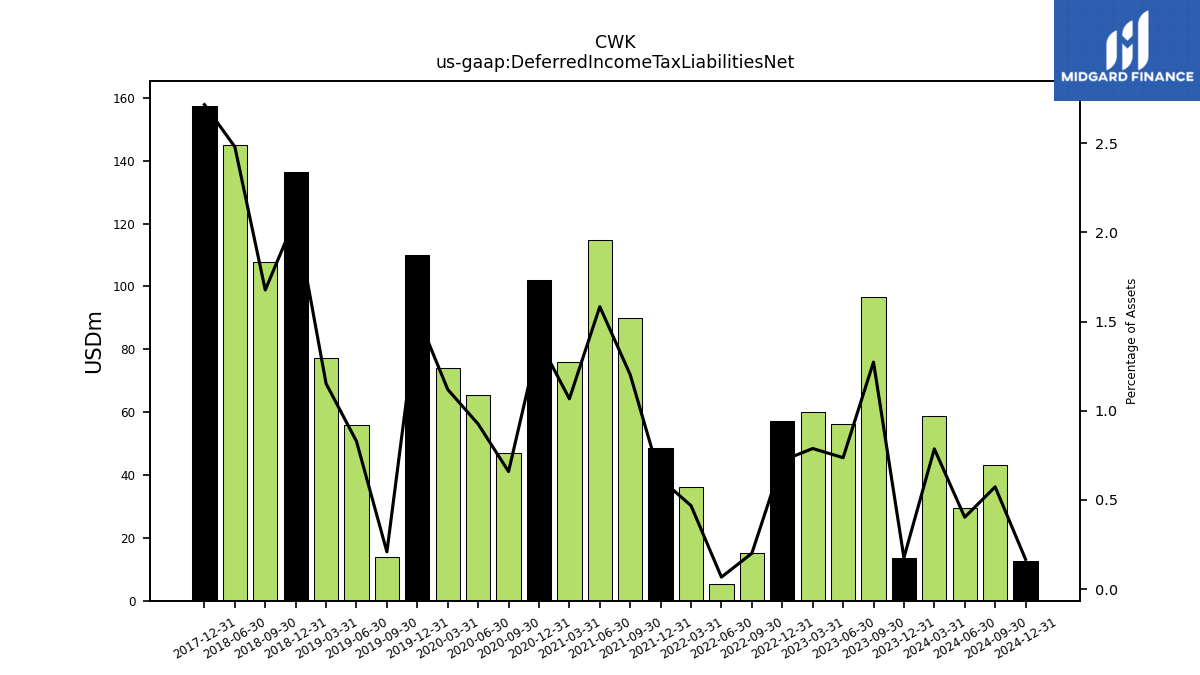
| Deferred Income Tax Liabilities Net | 13.70 | 96.50 | 56.30 | 60.10 | 57.20 | 15.30 | 5.20 | 36.30 | 48.70 | 89.90 | 114.90 | 76.10 | 102.20 | 47.00 | 65.50 | 74.10 | 110.00 | 13.90 | 56.00 | 77.30 | 136.40 | 107.90 | 145.00 | NA | 157.50 | NA | NA | NA | |
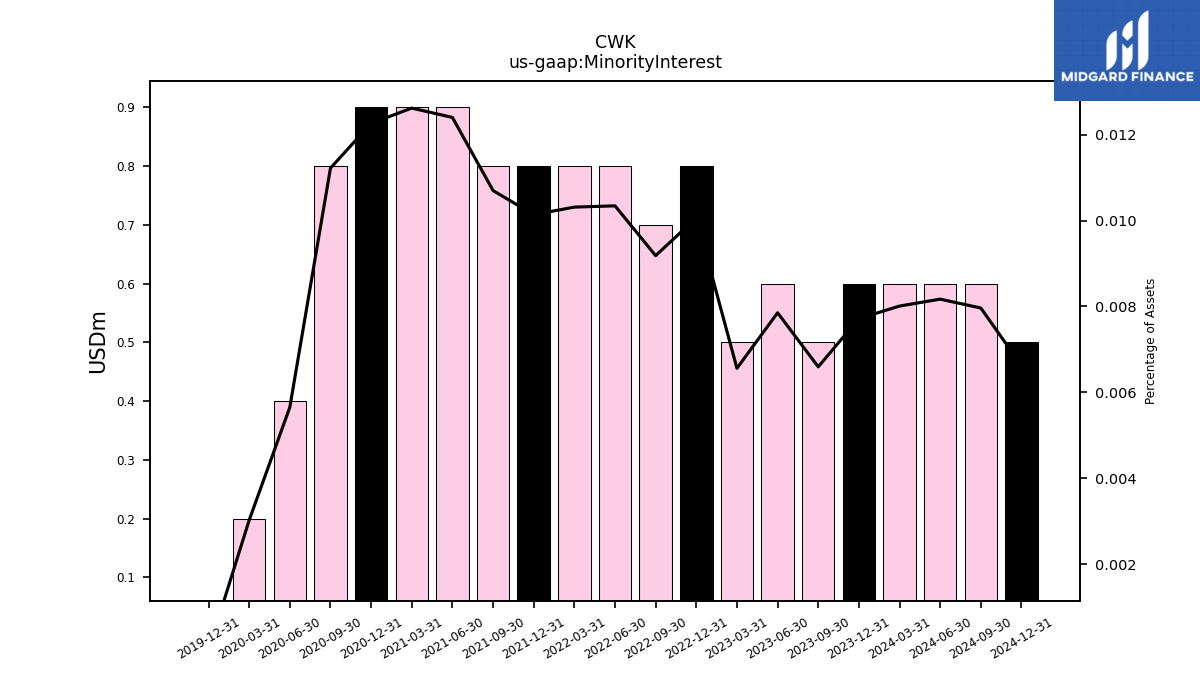
| Minority Interest | 0.60 | 0.50 | 0.60 | 0.50 | 0.80 | 0.70 | 0.80 | 0.80 | 0.80 | 0.80 | 0.90 | 0.90 | 0.90 | 0.80 | 0.40 | 0.20 | 0.00 | NA | NA | NA | NA | NA | NA | NA | NA | NA | NA | NA | |
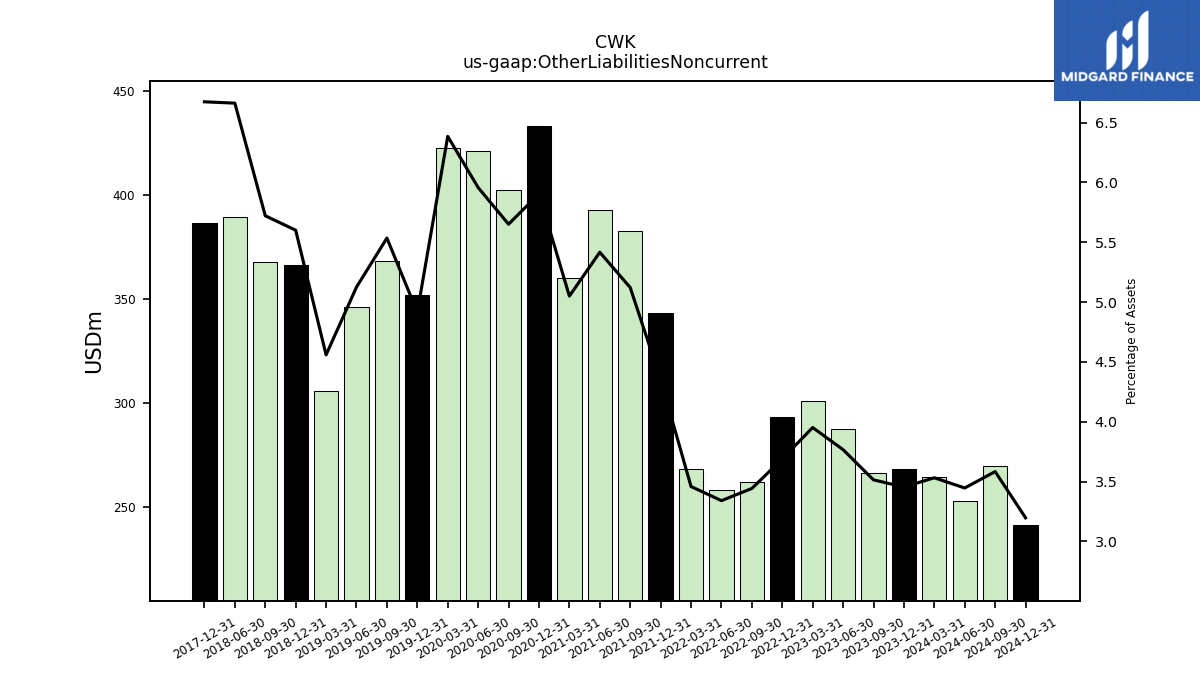
| Other Liabilities Noncurrent | 268.60 | 266.50 | 287.80 | 301.20 | 293.30 | 262.40 | 258.40 | 268.30 | 343.50 | 382.90 | 393.00 | 360.10 | 433.30 | 402.80 | 421.50 | 422.60 | 352.10 | 368.30 | 346.40 | 305.80 | 366.60 | 368.00 | 389.50 | NA | 386.90 | NA | NA | NA | |
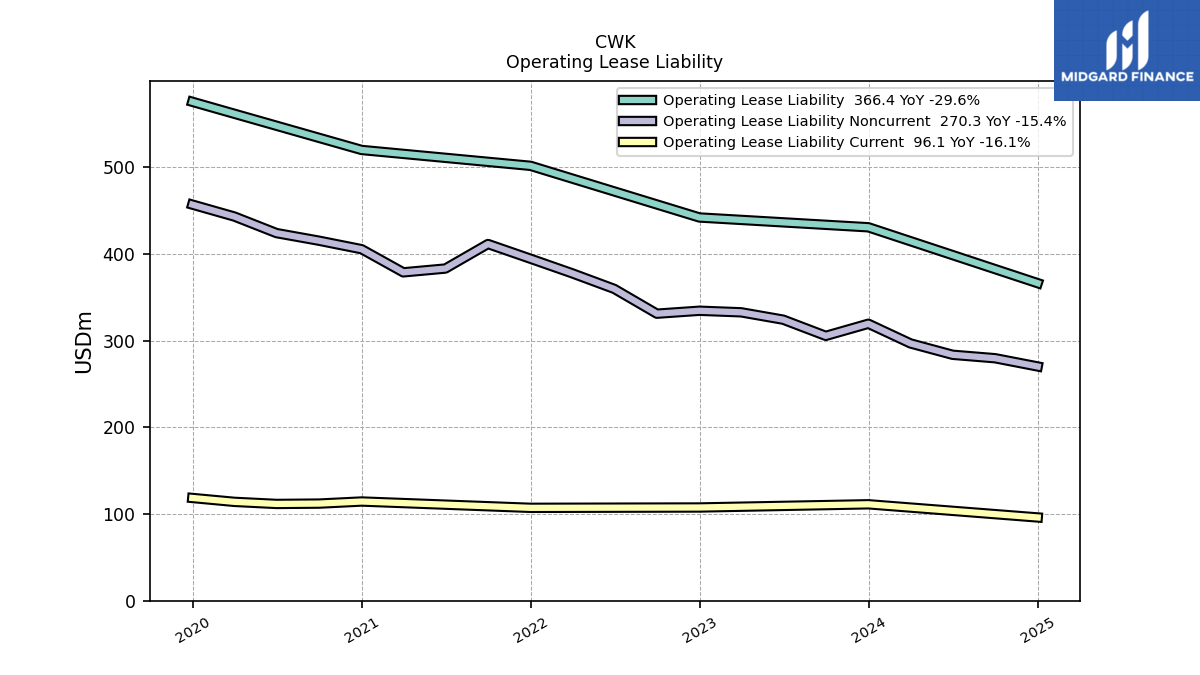
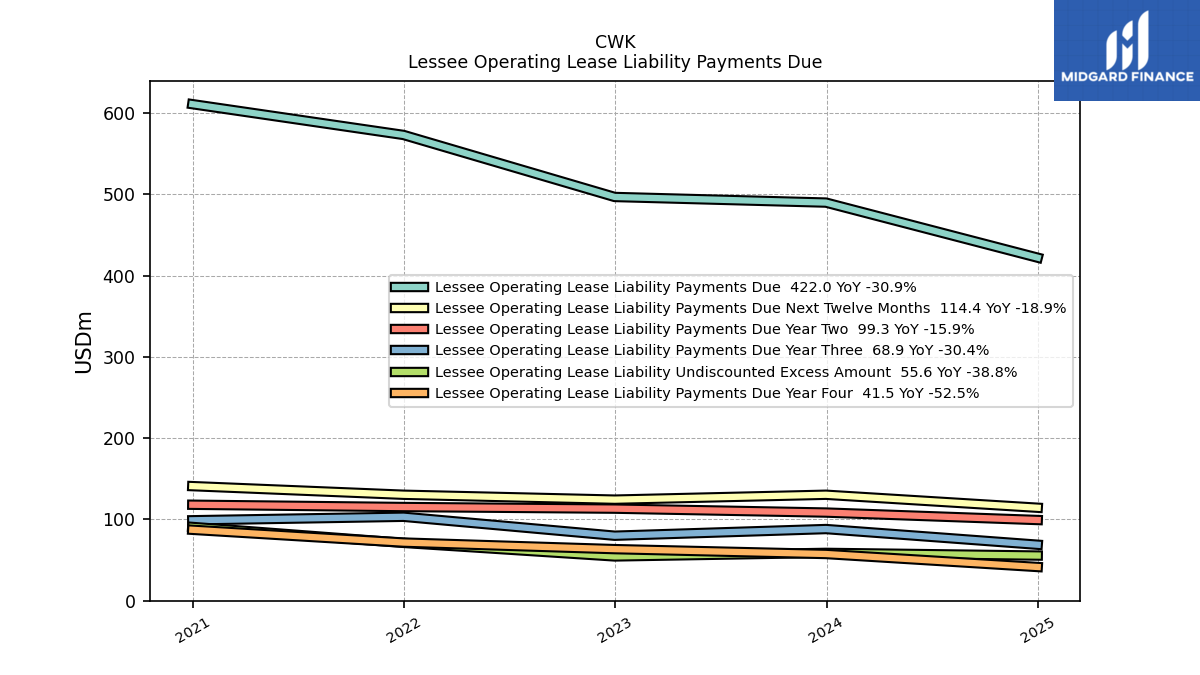
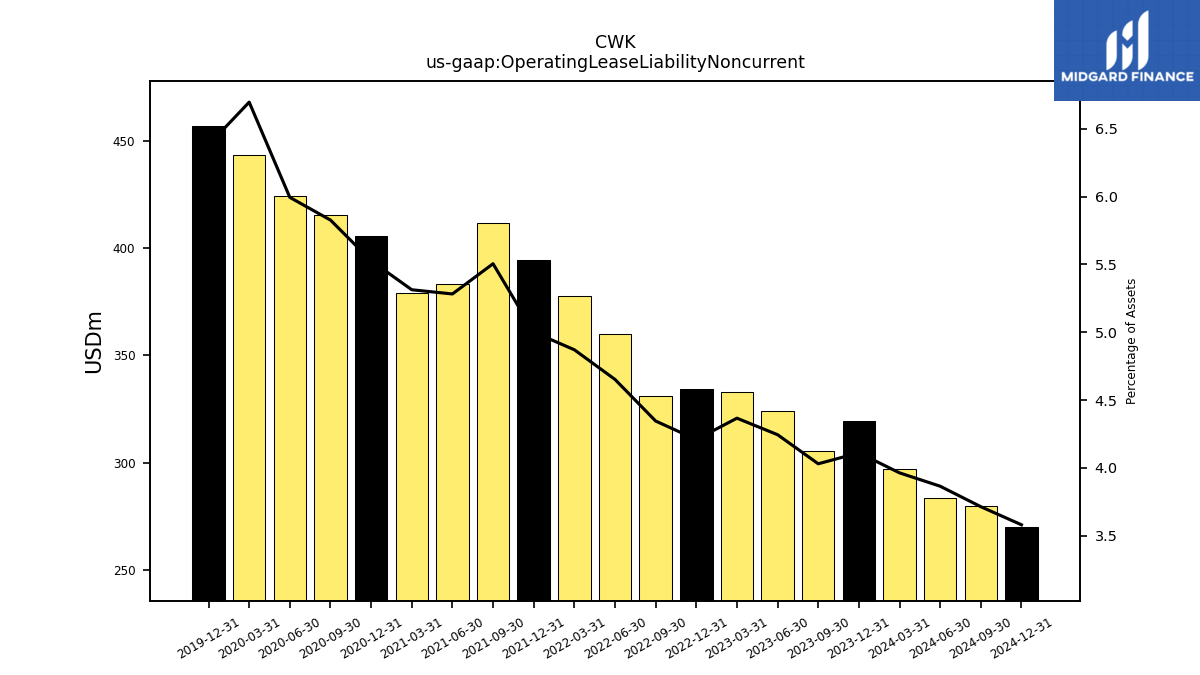
| Operating Lease Liability Noncurrent | 319.60 | 305.60 | 324.30 | 332.80 | 334.60 | 331.20 | 359.80 | 377.80 | 394.60 | 411.60 | 383.30 | 378.90 | 405.60 | 415.40 | 424.20 | 443.30 | 457.10 | NA | NA | NA | NA | NA | NA | NA | NA | NA | NA | NA |
| 2023-12-31 | 2023-09-30 | 2023-06-30 | 2023-03-31 | 2022-12-31 | 2022-09-30 | 2022-06-30 | 2022-03-31 | 2021-12-31 | 2021-09-30 | 2021-06-30 | 2021-03-31 | 2020-12-31 | 2020-09-30 | 2020-06-30 | 2020-03-31 | 2019-12-31 | 2019-09-30 | 2019-06-30 | 2019-03-31 | 2018-12-31 | 2018-09-30 | 2018-06-30 | 2018-03-31 | 2017-12-31 | 2017-09-30 | 2017-06-30 | 2017-03-31 | ||
|---|---|---|---|---|---|---|---|---|---|---|---|---|---|---|---|---|---|---|---|---|---|---|---|---|---|---|---|---|---|
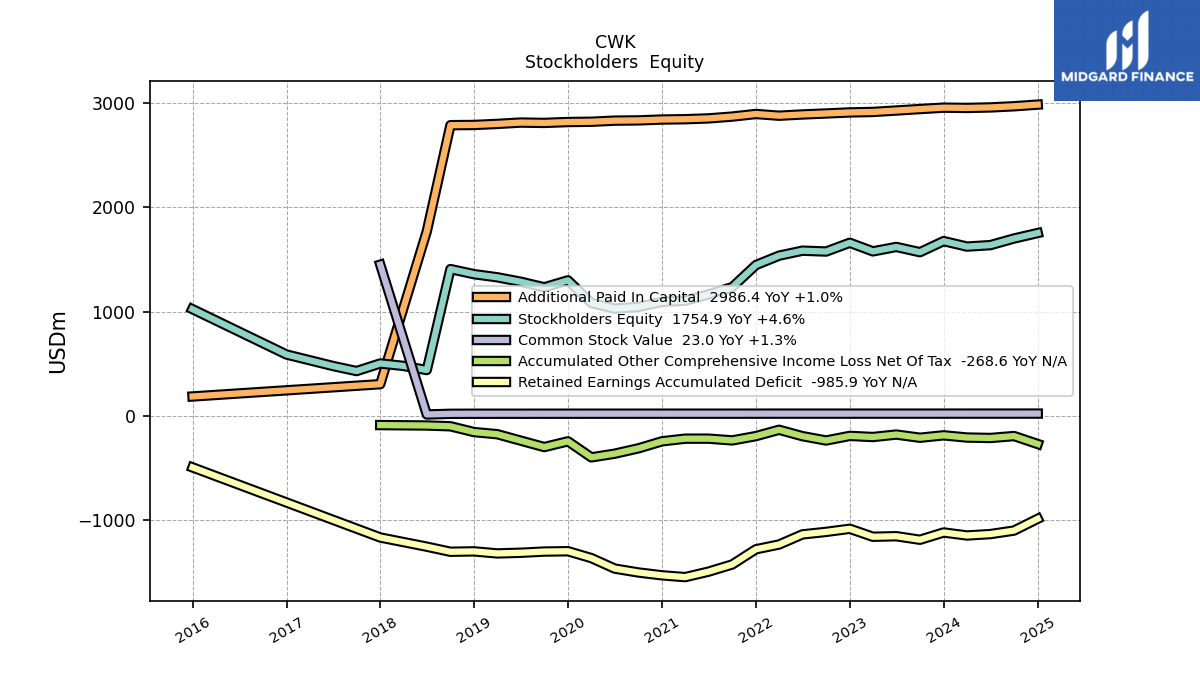
| Stockholders Equity | 1677.40 | 1571.00 | 1621.40 | 1579.00 | 1661.30 | 1577.40 | 1585.60 | 1537.70 | 1447.80 | 1235.80 | 1166.60 | 1105.90 | 1094.70 | 1046.10 | 1029.40 | 1084.20 | 1301.30 | 1234.20 | 1288.00 | 1330.40 | 1360.10 | 1409.10 | 440.60 | 480.50 | 503.90 | 430.90 | 479.60 | NA | |
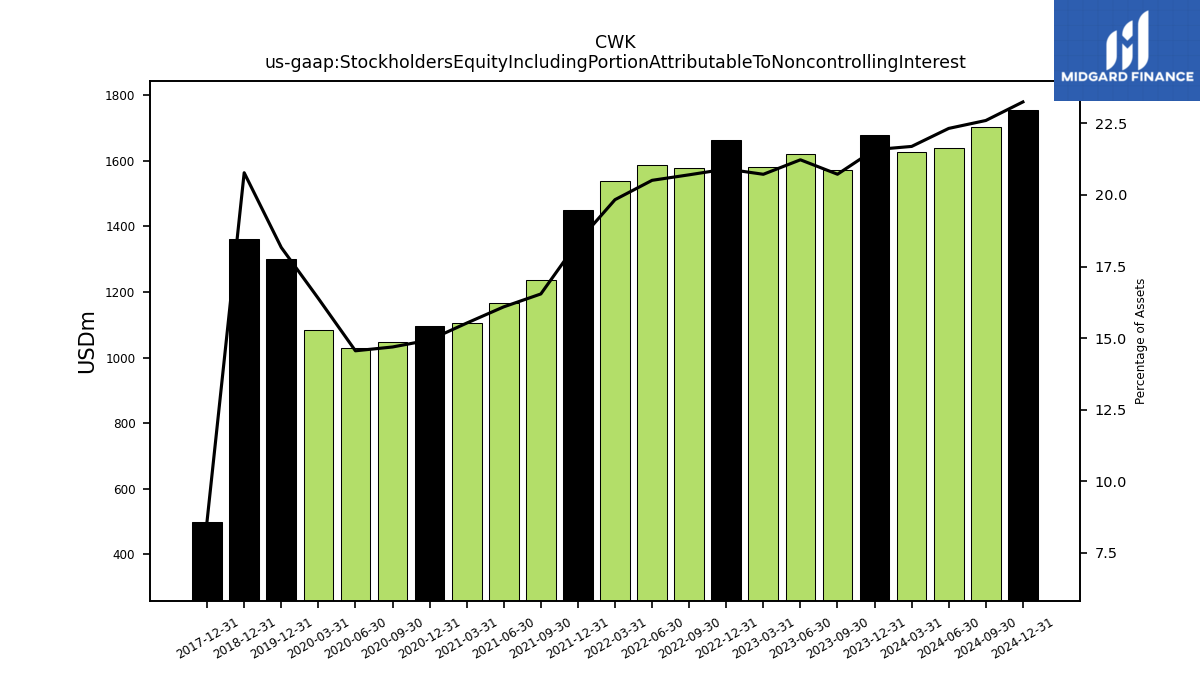
| Stockholders Equity Including Portion Attributable To Noncontrolling Interest | 1678.00 | 1571.50 | 1622.00 | 1579.50 | 1662.10 | 1578.10 | 1586.40 | 1538.50 | 1448.60 | 1236.60 | 1167.50 | 1106.80 | 1095.60 | 1046.90 | 1029.80 | 1084.40 | 1301.30 | NA | NA | NA | 1360.10 | NA | NA | NA | 499.40 | NA | NA | NA | |
| Common Stock Value | 22.70 | 22.70 | 22.70 | 22.70 | 22.60 | 22.60 | 22.60 | 22.60 | 22.40 | 22.30 | 22.30 | 22.30 | 22.20 | 22.20 | 22.10 | 22.10 | 22.00 | 21.90 | 21.70 | 21.70 | 21.70 | 20.90 | 14.60 | NA | 1451.30 | NA | NA | NA | |
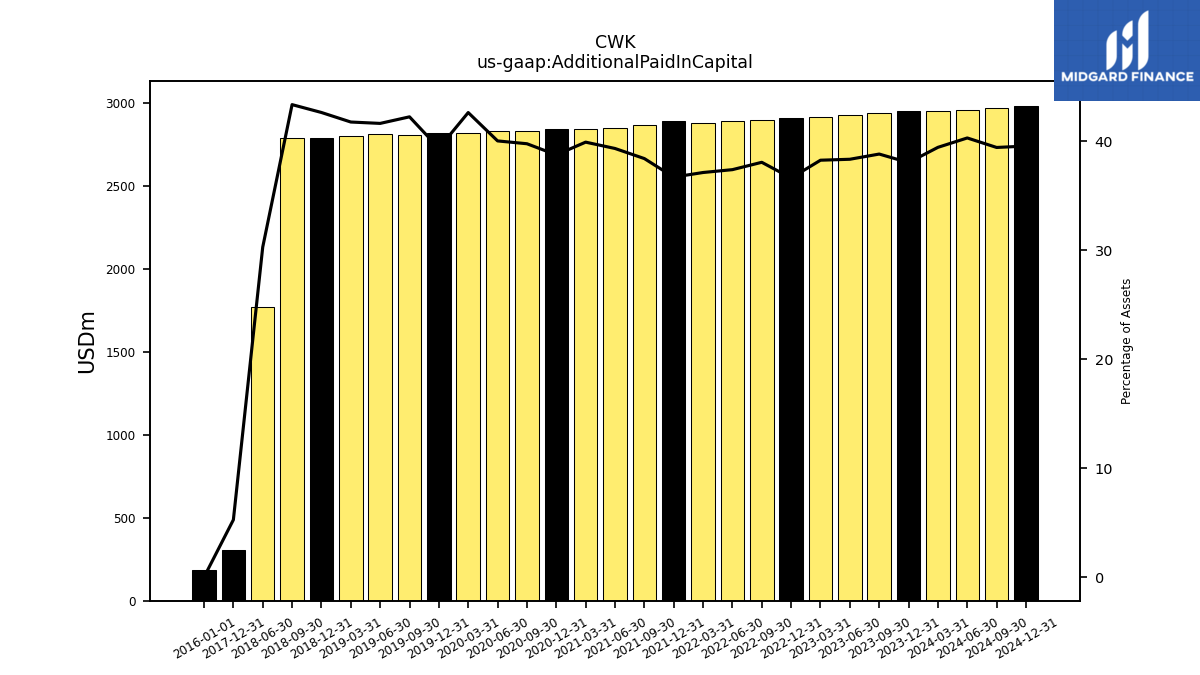
| Additional Paid In Capital | 2957.30 | 2943.90 | 2929.80 | 2916.10 | 2911.50 | 2901.50 | 2892.00 | 2880.00 | 2896.60 | 2871.70 | 2854.30 | 2846.50 | 2843.40 | 2835.10 | 2832.70 | 2822.10 | 2819.50 | 2810.90 | 2814.30 | 2801.40 | 2791.20 | 2789.20 | 1770.60 | NA | 305.00 | NA | NA | NA | |
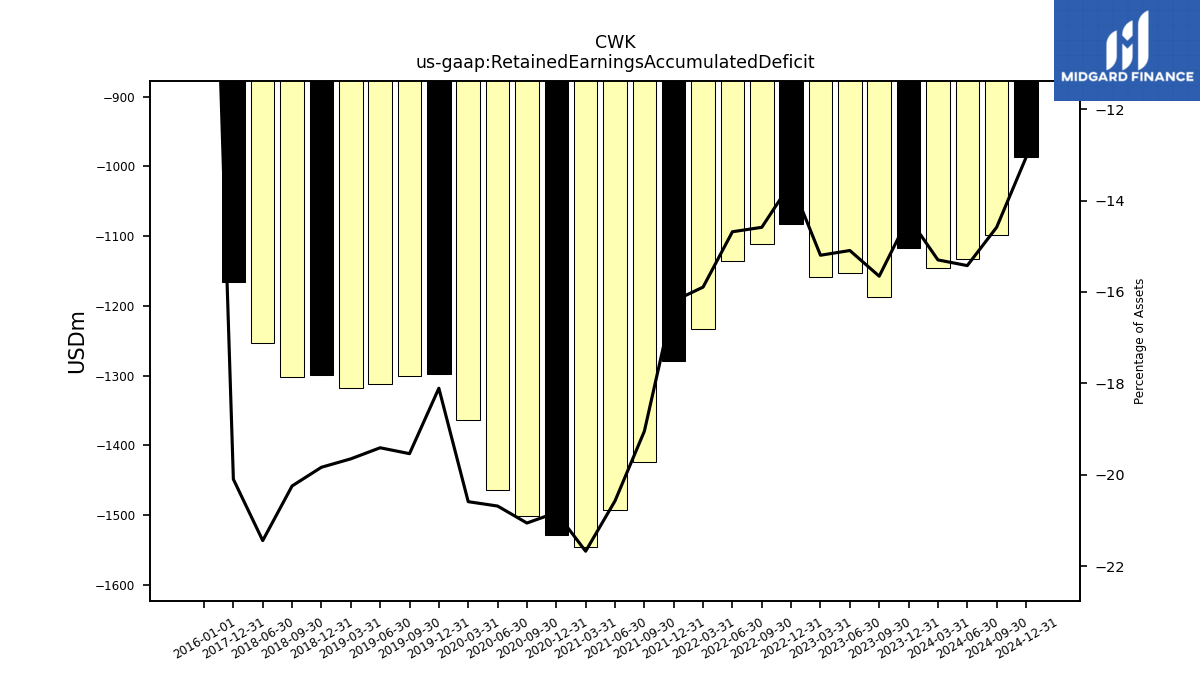
| Retained Earnings Accumulated Deficit | -1117.20 | -1187.00 | -1153.10 | -1158.20 | -1081.80 | -1111.60 | -1135.50 | -1232.70 | -1278.20 | -1424.00 | -1492.70 | -1545.40 | -1528.20 | -1500.90 | -1463.60 | -1362.80 | -1297.00 | -1300.10 | -1311.80 | -1318.10 | -1298.40 | -1302.20 | -1253.50 | NA | -1165.20 | NA | NA | NA | |
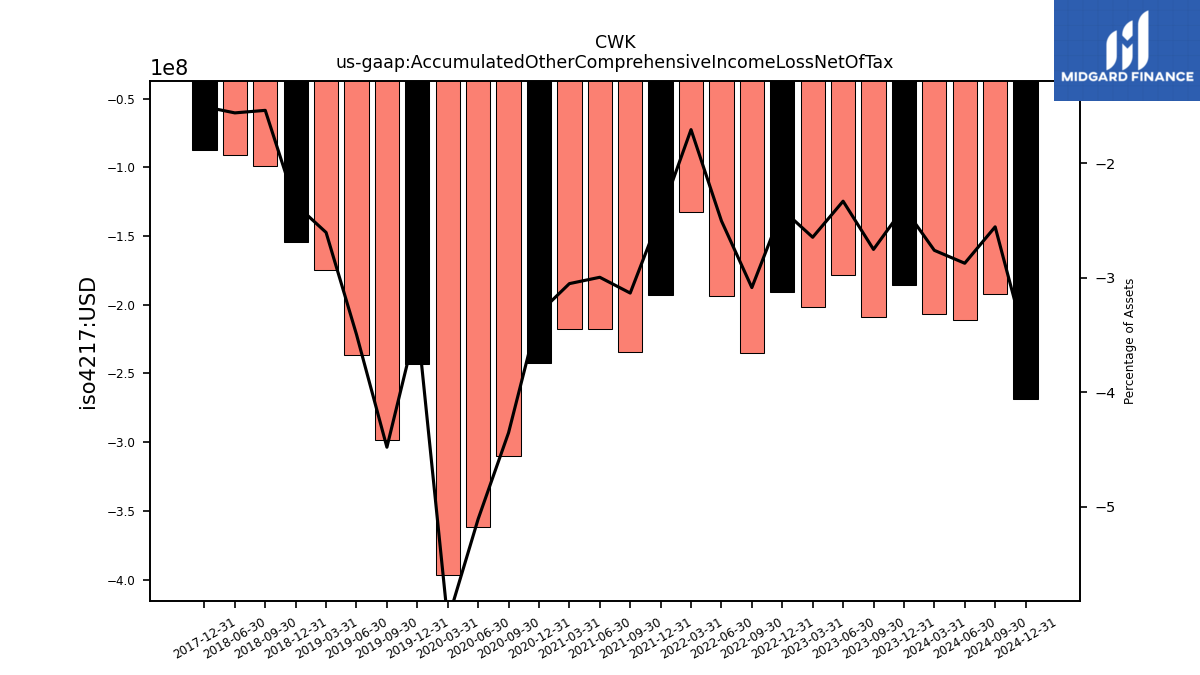
| Accumulated Other Comprehensive Income Loss Net Of Tax | -185.40 | -208.60 | -178.00 | -201.60 | -191.00 | -235.10 | -193.50 | -132.20 | -193.00 | -234.20 | -217.30 | -217.50 | -242.70 | -310.30 | -361.40 | -396.80 | -242.80 | -298.10 | -236.20 | -174.60 | -154.40 | -98.80 | -91.10 | NA | -87.20 | NA | NA | NA | |
| Minority Interest | 0.60 | 0.50 | 0.60 | 0.50 | 0.80 | 0.70 | 0.80 | 0.80 | 0.80 | 0.80 | 0.90 | 0.90 | 0.90 | 0.80 | 0.40 | 0.20 | 0.00 | NA | NA | NA | NA | NA | NA | NA | NA | NA | NA | NA | |
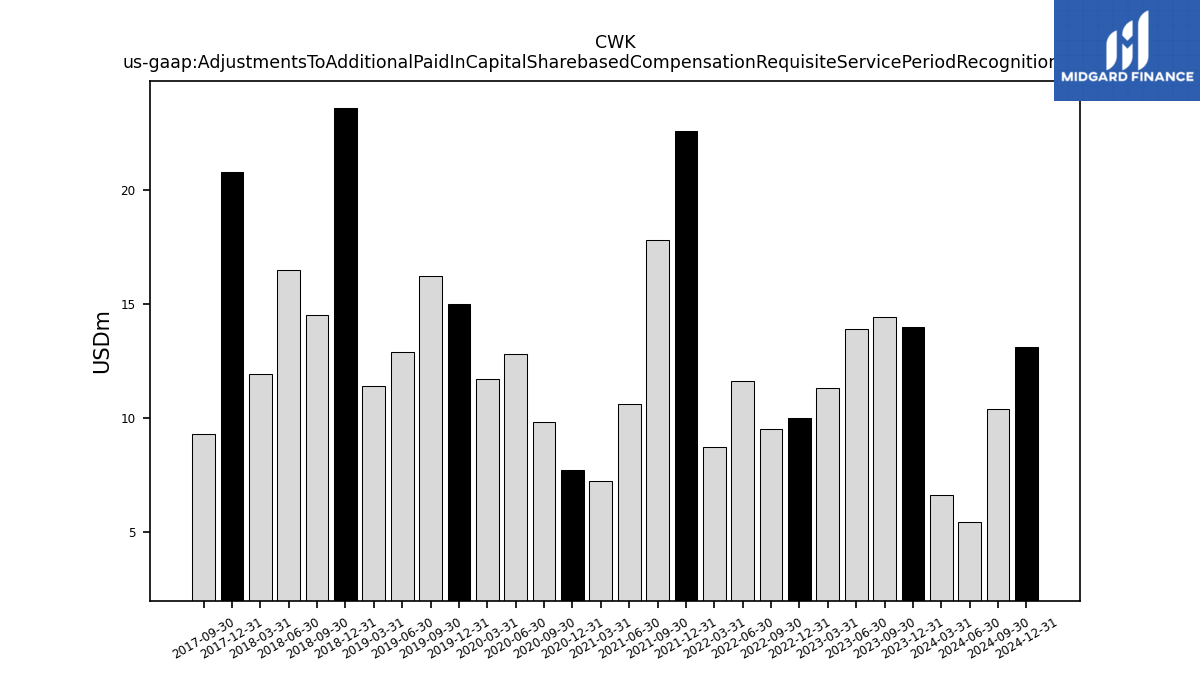
| Adjustments To Additional Paid In Capital Sharebased Compensation Requisite Service Period Recognition Value | 14.00 | 14.40 | 13.90 | 11.30 | 10.00 | 9.50 | 11.60 | 8.70 | 22.60 | 17.80 | 10.60 | 7.20 | 7.70 | 9.80 | 12.80 | 11.70 | 15.00 | 16.20 | 12.90 | 11.40 | 23.60 | 14.50 | 16.50 | 11.90 | 20.80 | 9.30 | NA | NA | |
| Minority Interest Decrease From Distributions To Noncontrolling Interest Holders | 0.00 | 0.00 | 0.00 | 0.20 | NA | NA | NA | NA | NA | NA | NA | NA | NA | NA | NA | NA | NA | NA | NA | NA | NA | NA | NA | NA | NA | NA | NA | NA |
| 2023-12-31 | 2023-09-30 | 2023-06-30 | 2023-03-31 | 2022-12-31 | 2022-09-30 | 2022-06-30 | 2022-03-31 | 2021-12-31 | 2021-09-30 | 2021-06-30 | 2021-03-31 | 2020-12-31 | 2020-09-30 | 2020-06-30 | 2020-03-31 | 2019-12-31 | 2019-09-30 | 2019-06-30 | 2019-03-31 | 2018-12-31 | 2018-09-30 | 2018-06-30 | 2018-03-31 | 2017-12-31 | 2017-09-30 | 2017-06-30 | 2017-03-31 | ||
|---|---|---|---|---|---|---|---|---|---|---|---|---|---|---|---|---|---|---|---|---|---|---|---|---|---|---|---|---|---|
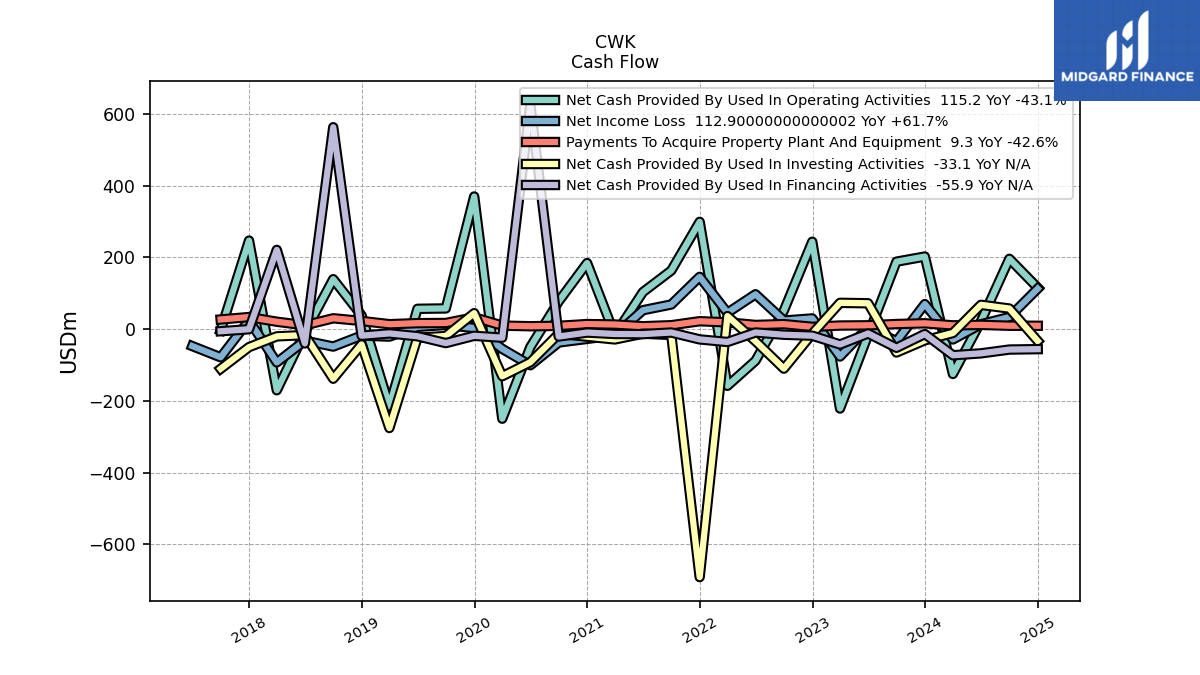
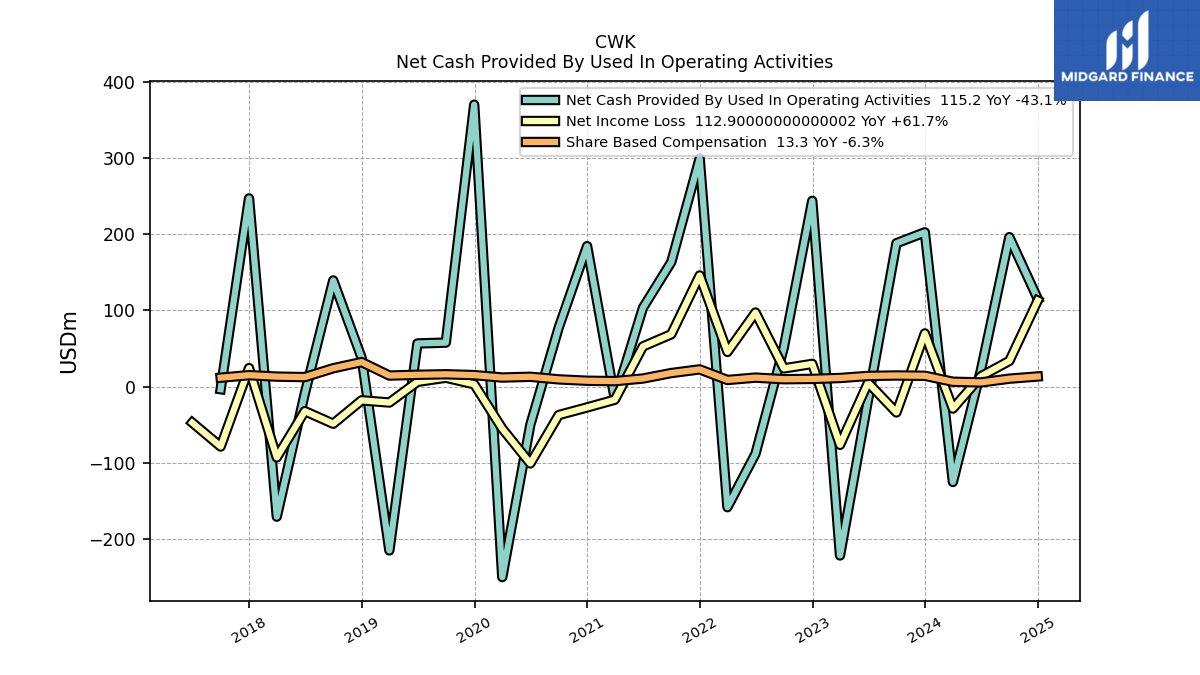
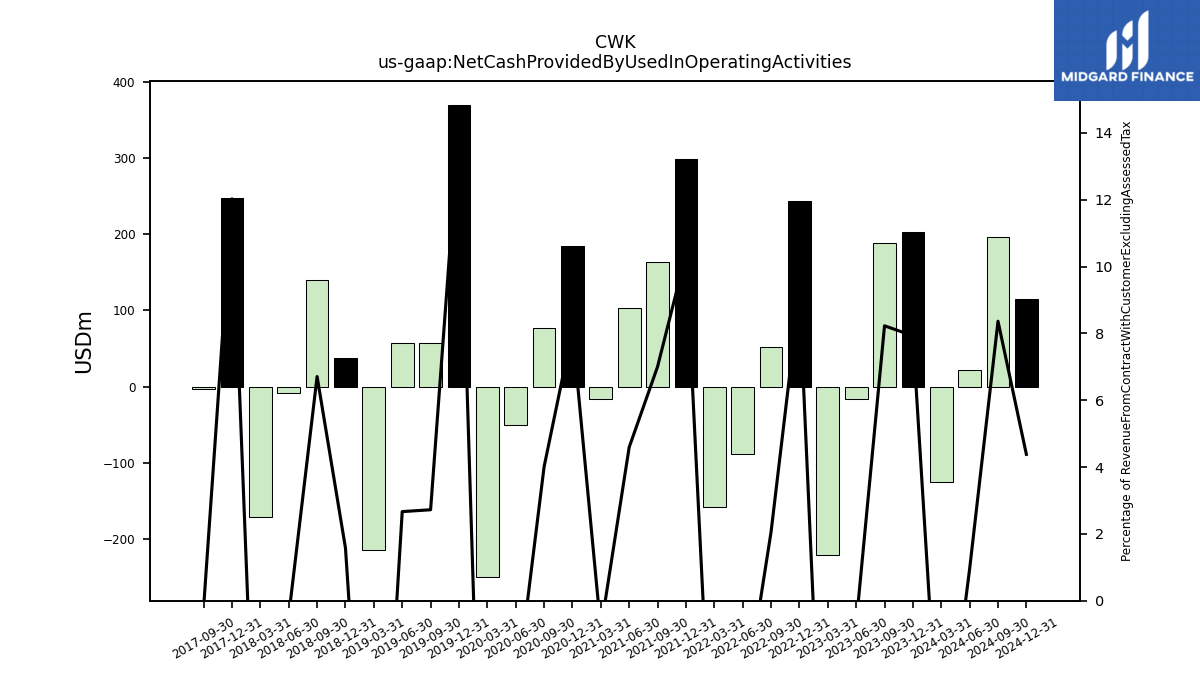
| Net Cash Provided By Used In Operating Activities | 202.40 | 188.10 | -16.80 | -221.50 | 243.70 | 51.70 | -88.10 | -158.20 | 299.20 | 163.40 | 103.30 | -16.40 | 184.30 | 77.40 | -50.00 | -249.90 | 369.90 | 57.70 | 56.60 | -214.90 | 37.90 | 139.30 | -8.80 | -170.60 | 246.90 | -3.40 | NA | NA | |
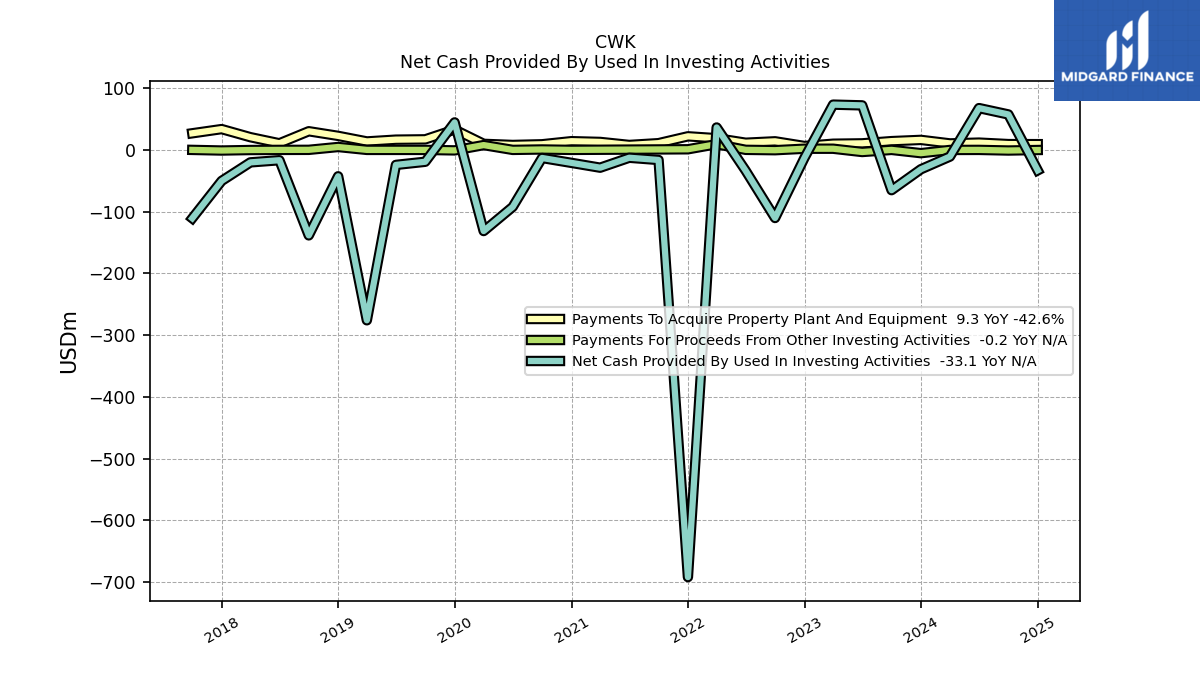
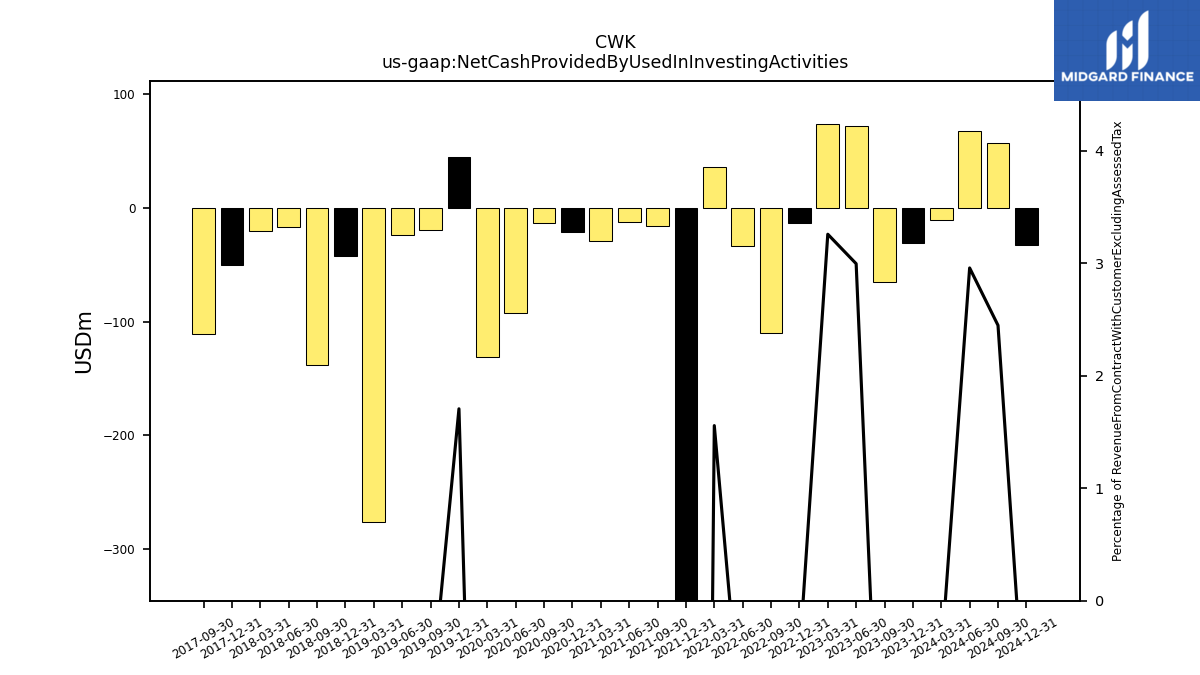
| Net Cash Provided By Used In Investing Activities | -31.30 | -65.20 | 72.10 | 73.30 | -13.00 | -110.30 | -33.70 | 36.30 | -691.70 | -16.30 | -12.70 | -28.80 | -21.00 | -13.10 | -92.30 | -131.40 | 44.50 | -19.20 | -24.30 | -275.90 | -42.70 | -138.40 | -16.70 | -20.20 | -50.20 | -110.70 | NA | NA | |
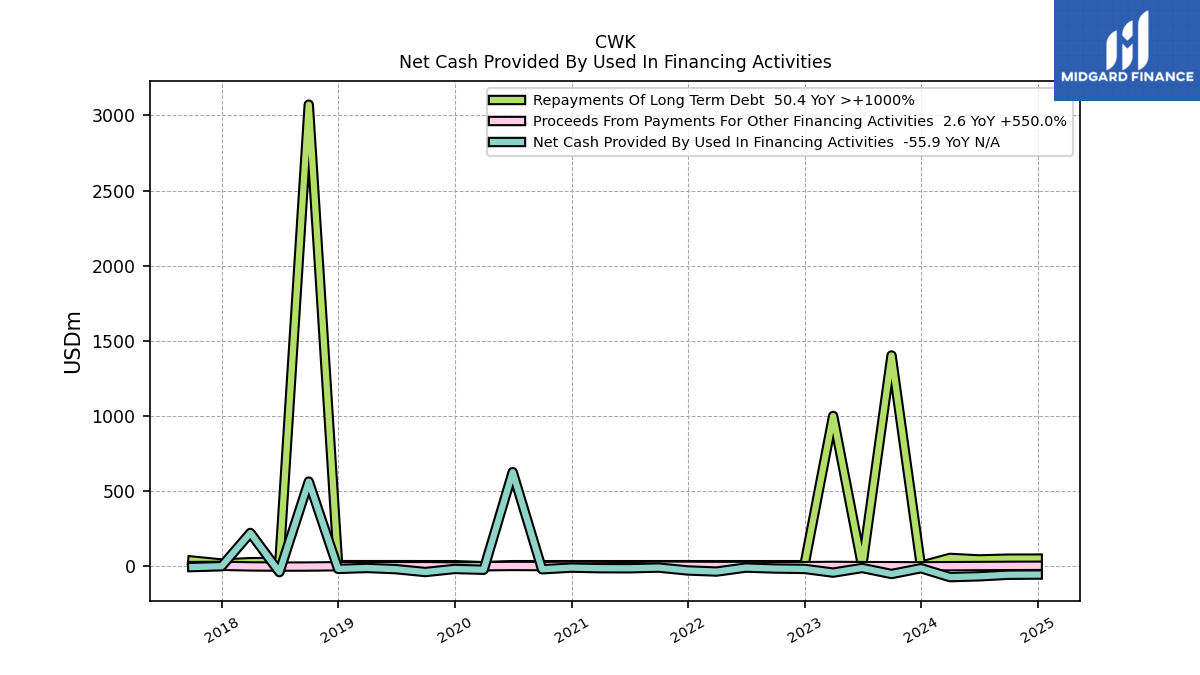
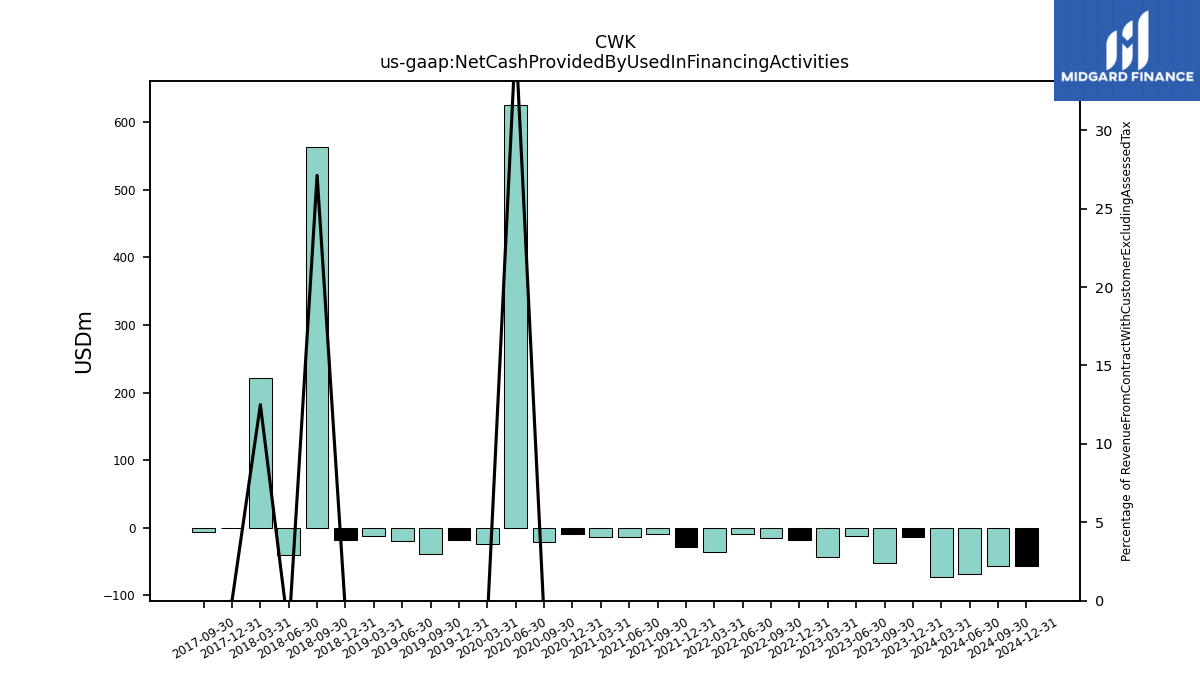
| Net Cash Provided By Used In Financing Activities | -13.70 | -52.10 | -12.20 | -42.80 | -18.30 | -15.70 | -9.40 | -35.90 | -28.70 | -9.50 | -14.00 | -13.60 | -9.60 | -20.70 | 626.10 | -23.90 | -18.70 | -39.00 | -19.90 | -12.00 | -18.30 | 563.10 | -39.90 | 221.00 | -0.30 | -5.90 | NA | NA |
| 2023-12-31 | 2023-09-30 | 2023-06-30 | 2023-03-31 | 2022-12-31 | 2022-09-30 | 2022-06-30 | 2022-03-31 | 2021-12-31 | 2021-09-30 | 2021-06-30 | 2021-03-31 | 2020-12-31 | 2020-09-30 | 2020-06-30 | 2020-03-31 | 2019-12-31 | 2019-09-30 | 2019-06-30 | 2019-03-31 | 2018-12-31 | 2018-09-30 | 2018-06-30 | 2018-03-31 | 2017-12-31 | 2017-09-30 | 2017-06-30 | 2017-03-31 | ||
|---|---|---|---|---|---|---|---|---|---|---|---|---|---|---|---|---|---|---|---|---|---|---|---|---|---|---|---|---|---|
| Net Cash Provided By Used In Operating Activities | 202.40 | 188.10 | -16.80 | -221.50 | 243.70 | 51.70 | -88.10 | -158.20 | 299.20 | 163.40 | 103.30 | -16.40 | 184.30 | 77.40 | -50.00 | -249.90 | 369.90 | 57.70 | 56.60 | -214.90 | 37.90 | 139.30 | -8.80 | -170.60 | 246.90 | -3.40 | NA | NA | |
| Net Income Loss | 69.80 | -33.90 | 5.10 | -76.40 | 29.80 | 23.90 | 97.20 | 45.50 | 145.80 | 68.70 | 52.70 | -17.20 | -27.30 | -37.30 | -100.80 | -55.10 | 3.10 | 11.70 | 6.30 | -20.90 | -18.00 | -48.70 | -32.20 | -92.90 | 24.30 | -78.60 | -47.30 | NA | |
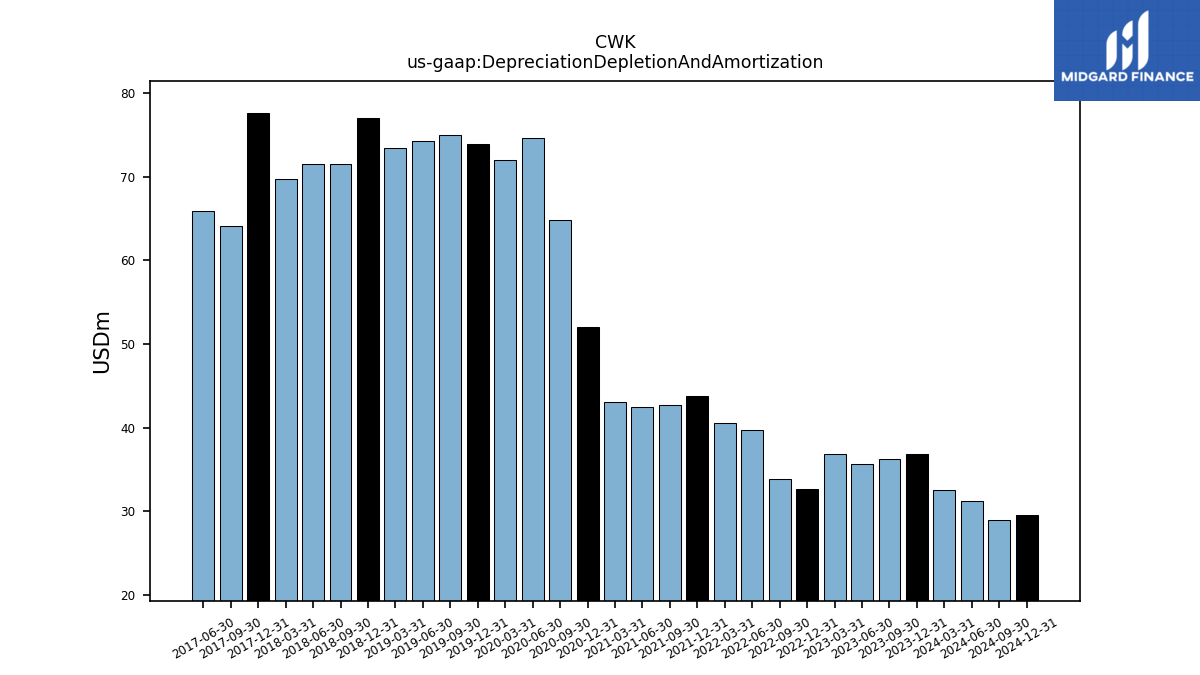
| Depreciation Depletion And Amortization | 36.80 | 36.20 | 35.70 | 36.90 | 32.70 | 33.90 | 39.70 | 40.60 | 43.80 | 42.70 | 42.50 | 43.10 | 52.10 | 64.90 | 74.60 | 72.00 | 73.90 | 75.00 | 74.30 | 73.50 | 77.00 | 71.60 | 71.60 | 69.80 | 77.60 | 64.10 | 65.90 | NA | |
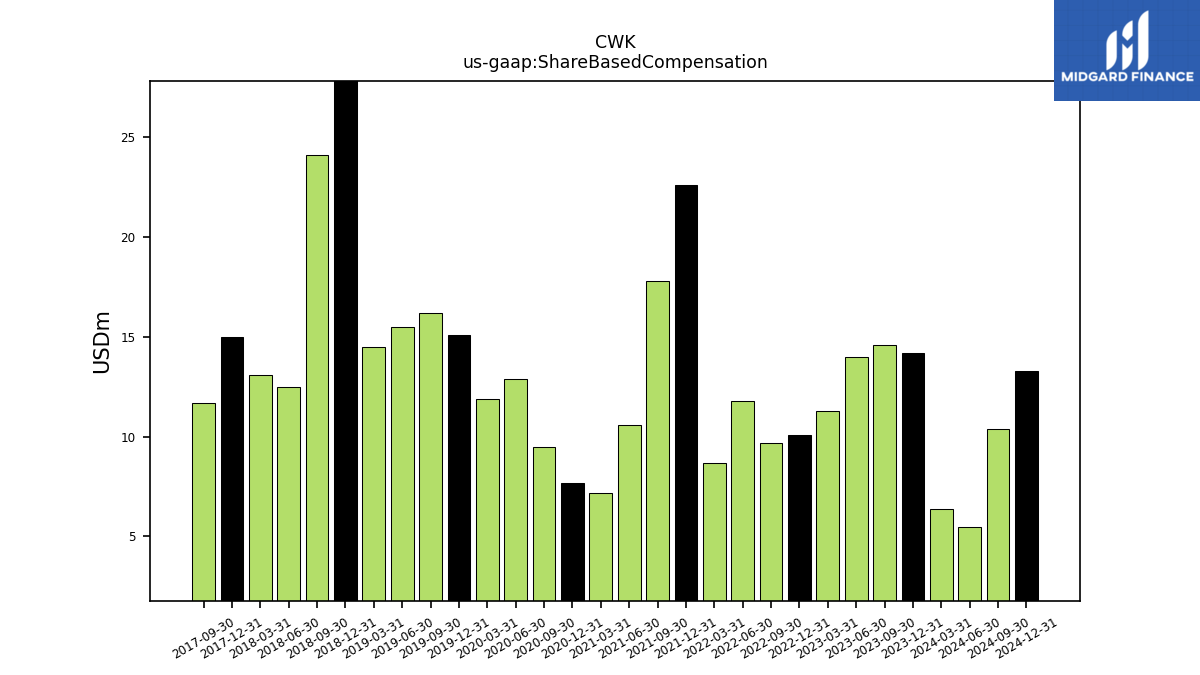
| Share Based Compensation | 14.20 | 14.60 | 14.00 | 11.30 | 10.10 | 9.70 | 11.80 | 8.70 | 22.60 | 17.80 | 10.60 | 7.20 | 7.70 | 9.50 | 12.90 | 11.90 | 15.10 | 16.20 | 15.50 | 14.50 | 32.20 | 24.10 | 12.50 | 13.10 | 15.00 | 11.70 | NA | NA | |
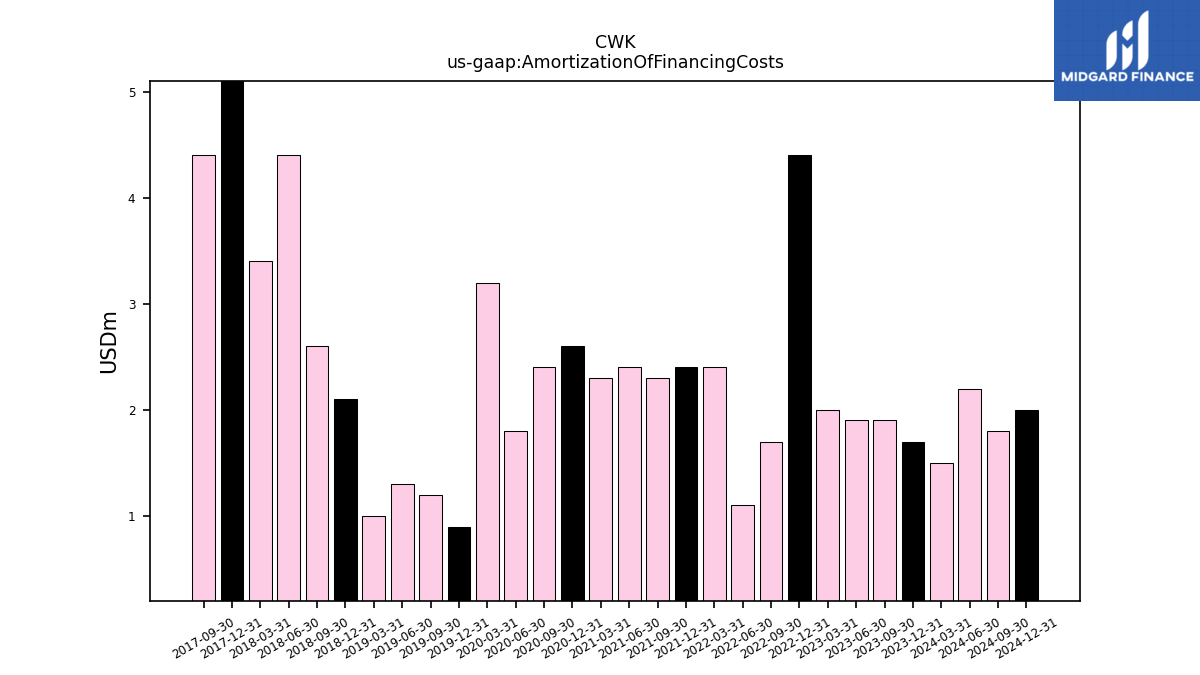
| Amortization Of Financing Costs | 1.70 | 1.90 | 1.90 | 2.00 | 4.40 | 1.70 | 1.10 | 2.40 | 2.40 | 2.30 | 2.40 | 2.30 | 2.60 | 2.40 | 1.80 | 3.20 | 0.90 | 1.20 | 1.30 | 1.00 | 2.10 | 2.60 | 4.40 | 3.40 | 5.30 | 4.40 | NA | NA |
| 2023-12-31 | 2023-09-30 | 2023-06-30 | 2023-03-31 | 2022-12-31 | 2022-09-30 | 2022-06-30 | 2022-03-31 | 2021-12-31 | 2021-09-30 | 2021-06-30 | 2021-03-31 | 2020-12-31 | 2020-09-30 | 2020-06-30 | 2020-03-31 | 2019-12-31 | 2019-09-30 | 2019-06-30 | 2019-03-31 | 2018-12-31 | 2018-09-30 | 2018-06-30 | 2018-03-31 | 2017-12-31 | 2017-09-30 | 2017-06-30 | 2017-03-31 | ||
|---|---|---|---|---|---|---|---|---|---|---|---|---|---|---|---|---|---|---|---|---|---|---|---|---|---|---|---|---|---|
| Net Cash Provided By Used In Investing Activities | -31.30 | -65.20 | 72.10 | 73.30 | -13.00 | -110.30 | -33.70 | 36.30 | -691.70 | -16.30 | -12.70 | -28.80 | -21.00 | -13.10 | -92.30 | -131.40 | 44.50 | -19.20 | -24.30 | -275.90 | -42.70 | -138.40 | -16.70 | -20.20 | -50.20 | -110.70 | NA | NA | |
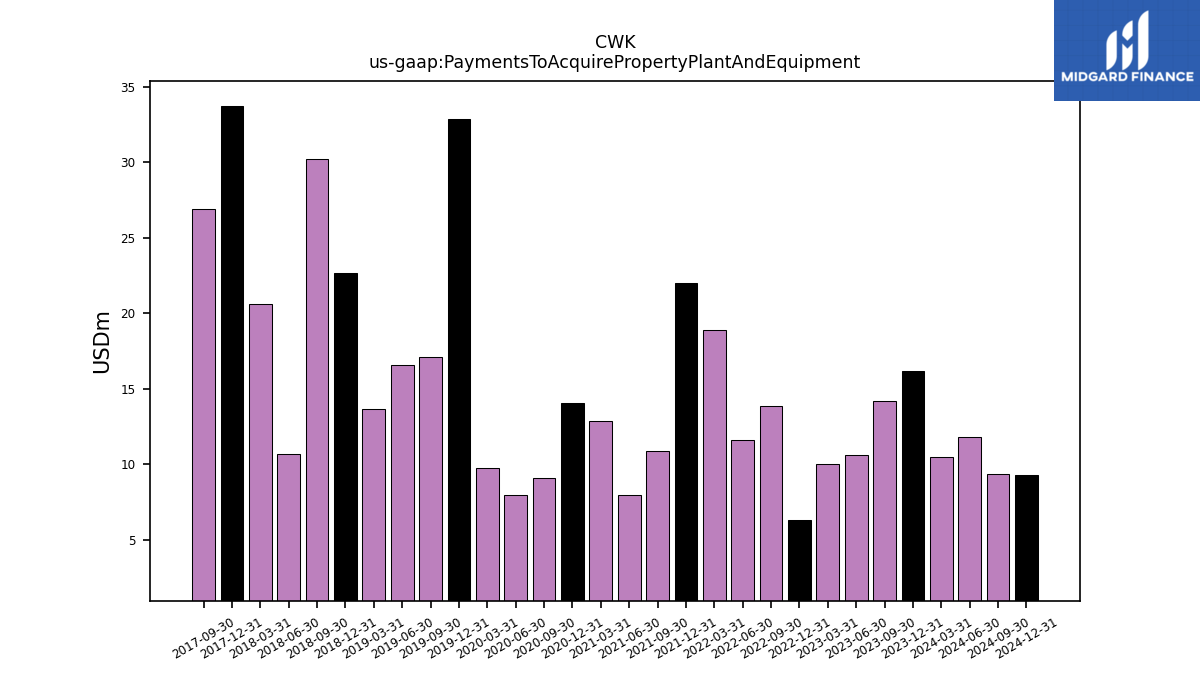
| Payments To Acquire Property Plant And Equipment | 16.20 | 14.20 | 10.60 | 10.00 | 6.30 | 13.90 | 11.60 | 18.90 | 22.00 | 10.90 | 8.00 | 12.90 | 14.10 | 9.10 | 8.00 | 9.80 | 32.90 | 17.10 | 16.60 | 13.70 | 22.70 | 30.20 | 10.70 | 20.60 | 33.70 | 26.90 | NA | NA |
| 2023-12-31 | 2023-09-30 | 2023-06-30 | 2023-03-31 | 2022-12-31 | 2022-09-30 | 2022-06-30 | 2022-03-31 | 2021-12-31 | 2021-09-30 | 2021-06-30 | 2021-03-31 | 2020-12-31 | 2020-09-30 | 2020-06-30 | 2020-03-31 | 2019-12-31 | 2019-09-30 | 2019-06-30 | 2019-03-31 | 2018-12-31 | 2018-09-30 | 2018-06-30 | 2018-03-31 | 2017-12-31 | 2017-09-30 | 2017-06-30 | 2017-03-31 | ||
|---|---|---|---|---|---|---|---|---|---|---|---|---|---|---|---|---|---|---|---|---|---|---|---|---|---|---|---|---|---|
| Net Cash Provided By Used In Financing Activities | -13.70 | -52.10 | -12.20 | -42.80 | -18.30 | -15.70 | -9.40 | -35.90 | -28.70 | -9.50 | -14.00 | -13.60 | -9.60 | -20.70 | 626.10 | -23.90 | -18.70 | -39.00 | -19.90 | -12.00 | -18.30 | 563.10 | -39.90 | 221.00 | -0.30 | -5.90 | NA | NA |
| 2023-12-31 | 2023-09-30 | 2023-06-30 | 2023-03-31 | 2022-12-31 | 2022-09-30 | 2022-06-30 | 2022-03-31 | 2021-12-31 | 2021-09-30 | 2021-06-30 | 2021-03-31 | 2020-12-31 | 2020-09-30 | 2020-06-30 | 2020-03-31 | 2019-12-31 | 2019-09-30 | 2019-06-30 | 2019-03-31 | 2018-12-31 | 2018-09-30 | 2018-06-30 | 2018-03-31 | 2017-12-31 | 2017-09-30 | 2017-06-30 | 2017-03-31 | ||
|---|---|---|---|---|---|---|---|---|---|---|---|---|---|---|---|---|---|---|---|---|---|---|---|---|---|---|---|---|---|
| Revenue From Contract With Customer Excluding Assessed Tax | 2552.40 | 2286.00 | 2406.00 | 2249.30 | 2647.00 | 2515.10 | 2612.60 | 2331.00 | 2883.70 | 2332.90 | 2248.30 | 1923.80 | 2273.10 | 1931.60 | 1743.60 | 1895.40 | 2607.50 | 2118.80 | 2121.70 | 1903.00 | 2401.90 | 2076.00 | 1974.30 | 1767.70 | 2052.70 | 1709.30 | 1700.60 | 1461.30 | |
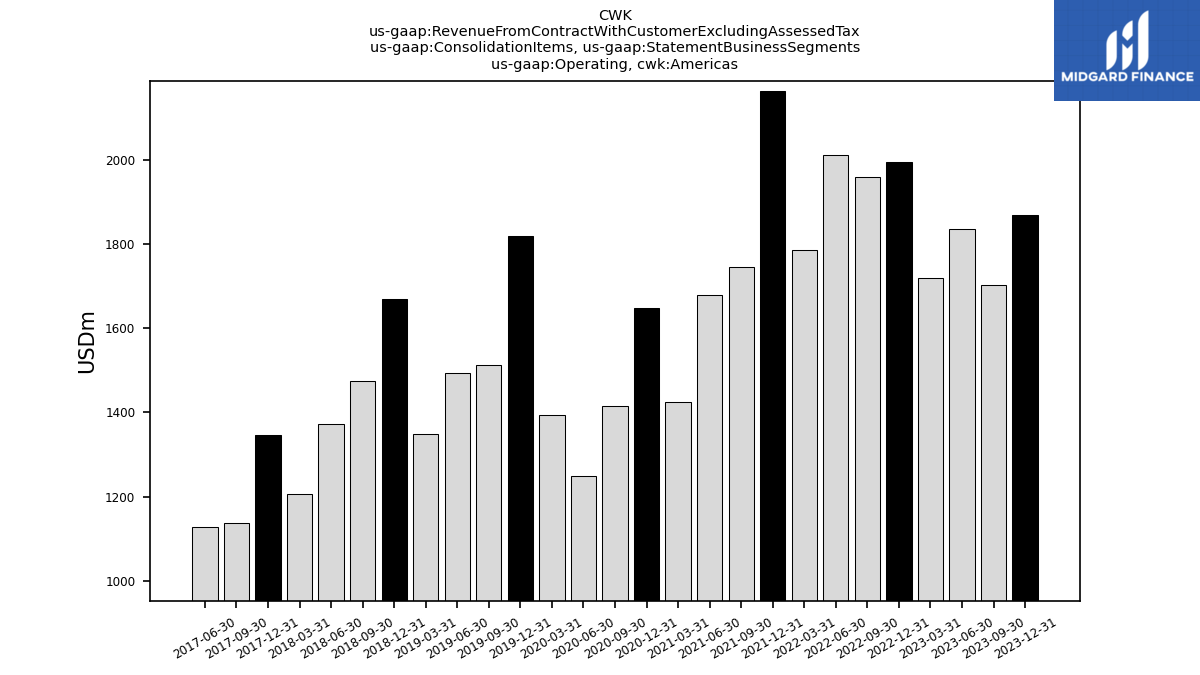
| Operating, Americas | 1870.00 | 1701.90 | 1836.50 | 1720.00 | 1994.80 | 1959.50 | 2011.40 | 1785.30 | 2163.70 | 1746.50 | 1680.20 | 1424.90 | 1647.70 | 1416.10 | 1248.50 | 1394.80 | 1818.80 | 1512.80 | 1492.90 | 1347.60 | 1670.80 | 1475.60 | 1372.10 | 1206.20 | 1346.90 | 1137.40 | 1128.70 | NA | |
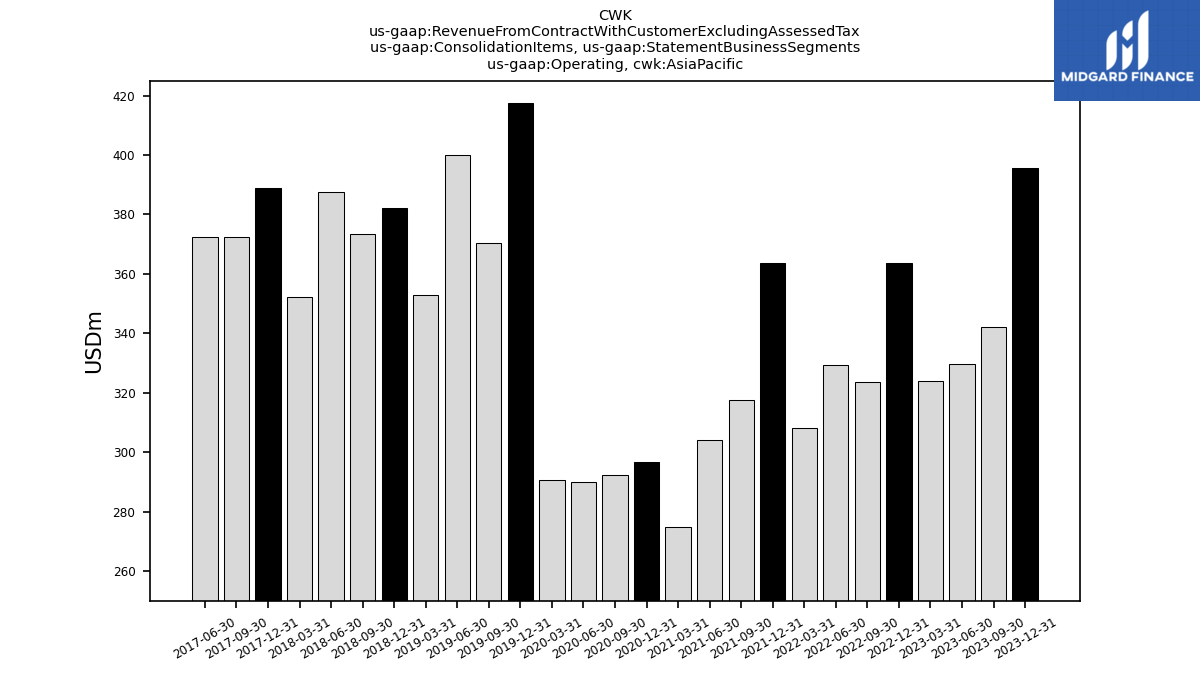
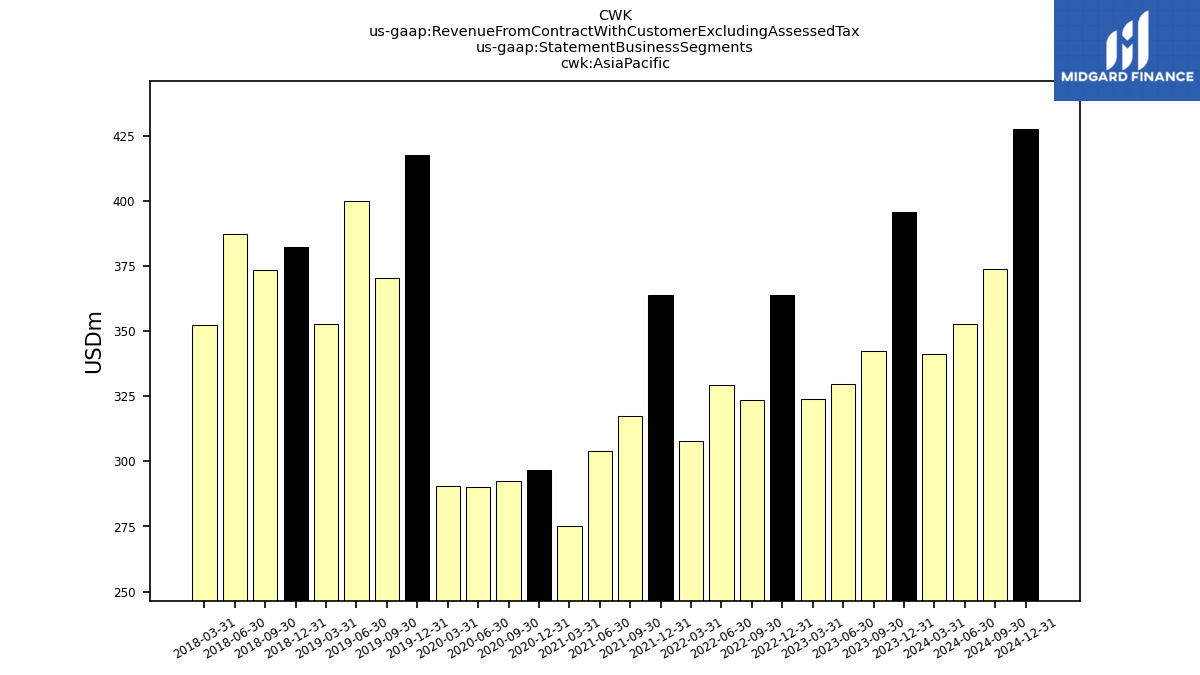
| Operating, Asia Pacific | 395.70 | 342.20 | 329.60 | 324.10 | 363.70 | 323.60 | 329.30 | 308.00 | 363.70 | 317.60 | 304.00 | 275.00 | 296.80 | 292.30 | 290.00 | 290.60 | 417.50 | 370.50 | 399.90 | 352.80 | 382.20 | 373.50 | 387.40 | 352.30 | 388.90 | 372.30 | 372.40 | NA | |
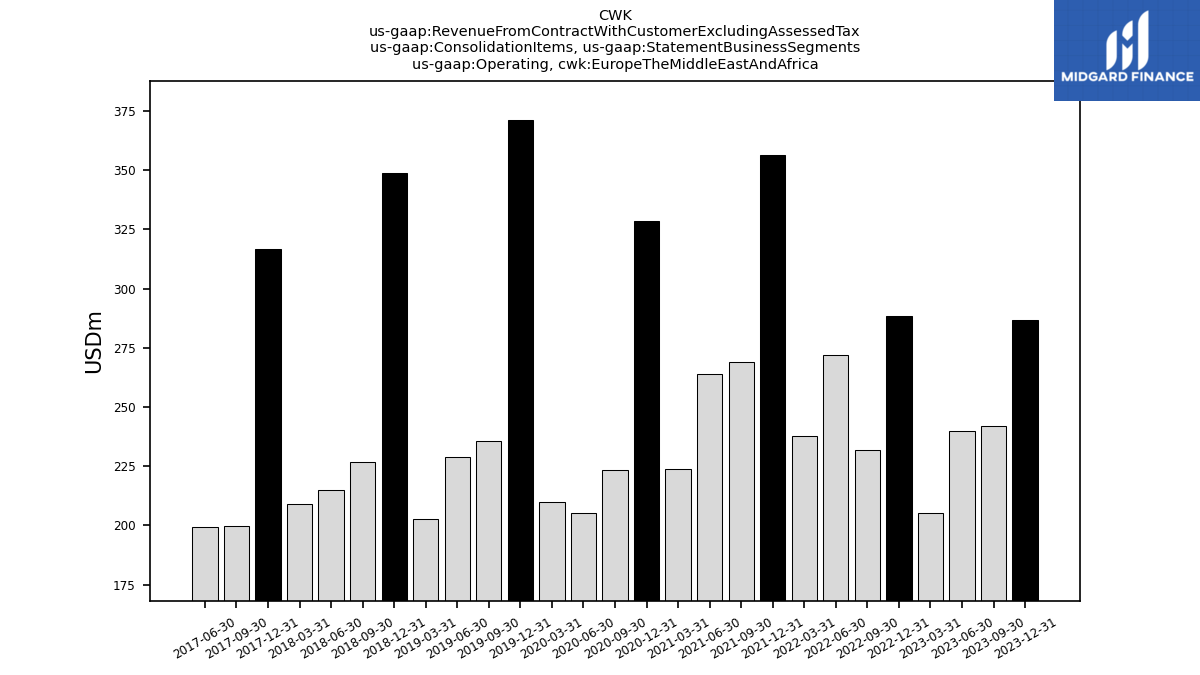
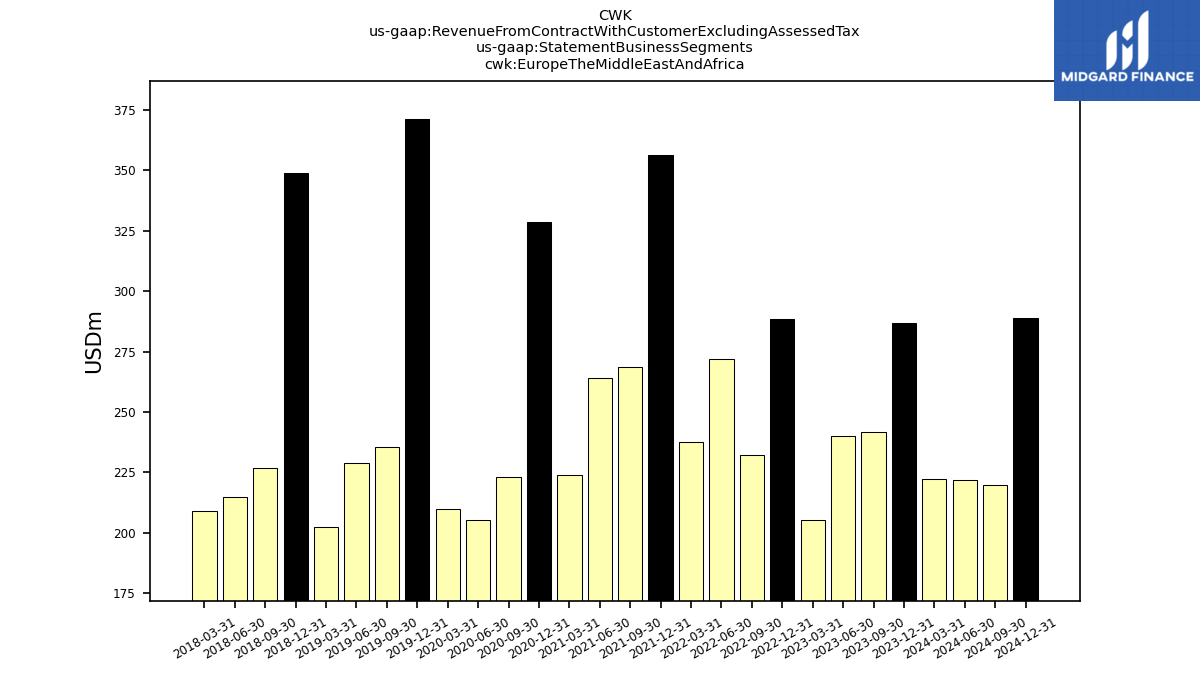
| Operating, Europe The Middle East And Africa | 286.70 | 241.90 | 239.90 | 205.20 | 288.50 | 232.00 | 271.90 | 237.70 | 356.30 | 268.80 | 264.10 | 223.90 | 328.60 | 223.20 | 205.10 | 210.00 | 371.20 | 235.50 | 228.90 | 202.60 | 348.90 | 226.90 | 214.80 | 209.20 | 316.90 | 199.60 | 199.50 | NA | |
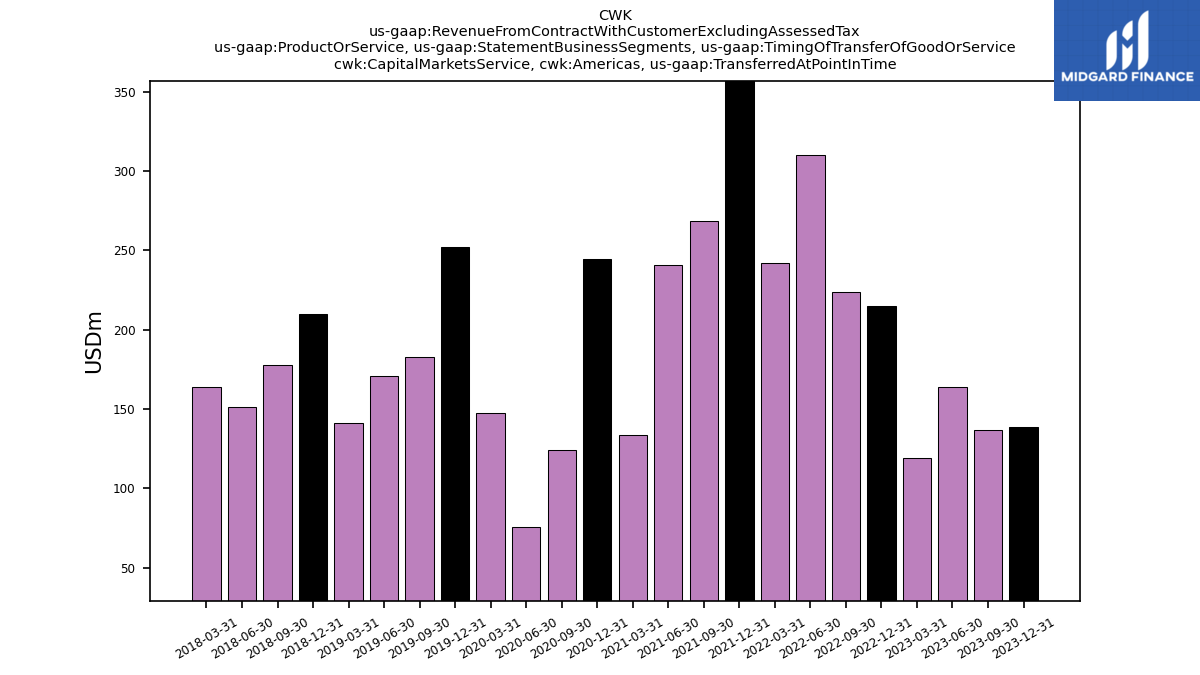
| Capital Markets Service, Americas, Transferred At Point In Time | 138.80 | 136.70 | 164.10 | 119.30 | 214.80 | 223.60 | 309.90 | 242.10 | 471.30 | 268.60 | 240.50 | 133.80 | 244.60 | 124.20 | 75.90 | 147.30 | 252.10 | 182.80 | 170.90 | 141.10 | 209.60 | 177.80 | 151.40 | 163.60 | NA | NA | NA | NA | |
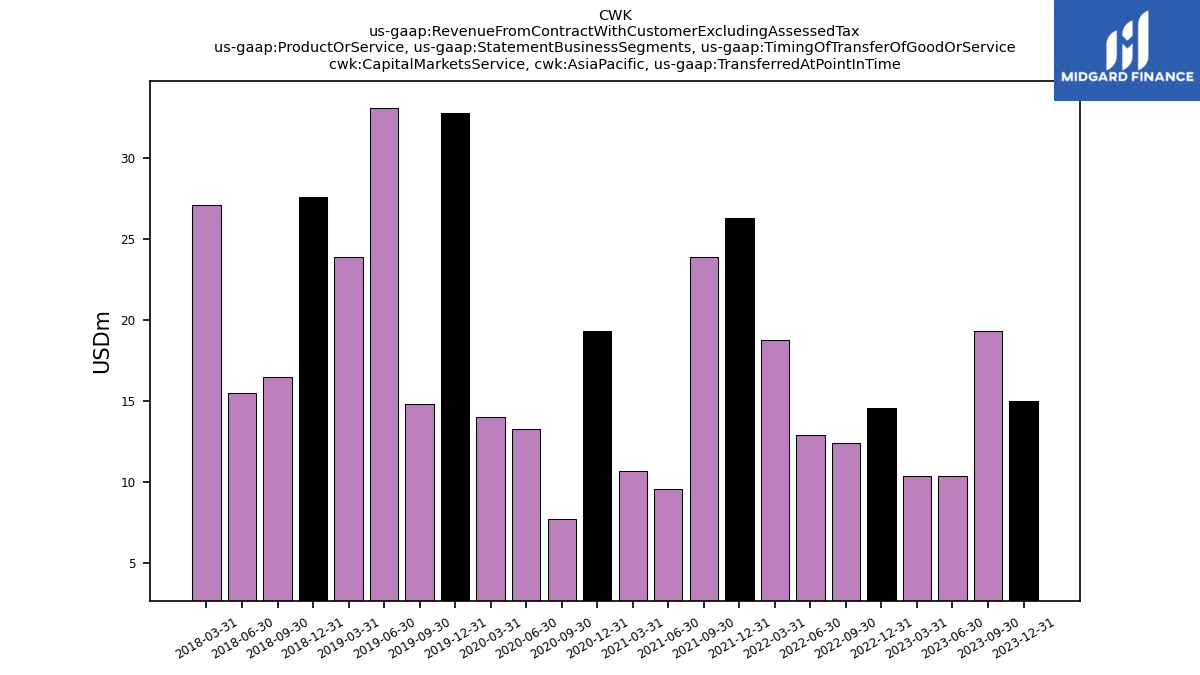
| Capital Markets Service, Asia Pacific, Transferred At Point In Time | 15.00 | 19.30 | 10.40 | 10.40 | 14.60 | 12.40 | 12.90 | 18.80 | 26.30 | 23.90 | 9.60 | 10.70 | 19.30 | 7.70 | 13.30 | 14.00 | 32.80 | 14.80 | 33.10 | 23.90 | 27.60 | 16.50 | 15.50 | 27.10 | NA | NA | NA | NA | |
| Capital Markets Service, Europe The Middle East And Africa, Transferred At Point In Time | 31.10 | 20.90 | 18.00 | 13.60 | 39.80 | 28.10 | 45.50 | 28.90 | 75.10 | 38.50 | 33.00 | 22.30 | 55.80 | 24.00 | 24.00 | 21.60 | 80.90 | 41.70 | 33.20 | 26.40 | 75.10 | 40.00 | 34.60 | 23.90 | NA | NA | NA | NA | |
| Leasing Service, Americas, Transferred At Point In Time | 444.90 | 346.80 | 351.50 | 302.10 | 436.30 | 430.30 | 451.70 | 372.90 | 481.30 | 359.70 | 344.70 | 222.80 | 273.80 | 245.60 | 193.40 | 242.10 | 454.30 | 375.60 | 389.00 | 300.10 | 452.90 | 413.10 | 374.20 | 247.30 | NA | NA | NA | NA | |
| Leasing Service, Asia Pacific, Transferred At Point In Time | 66.90 | 40.60 | 42.30 | 26.80 | 59.20 | 41.20 | 42.50 | 37.20 | 77.00 | 44.90 | 52.80 | 29.40 | 50.20 | 33.90 | 32.30 | 22.80 | 65.20 | 42.60 | 45.70 | 26.80 | 63.70 | 41.40 | 43.00 | 26.00 | NA | NA | NA | NA | |
| Leasing Service, Europe The Middle East And Africa, Transferred At Point In Time | 81.40 | 54.10 | 54.10 | 40.60 | 68.50 | 52.60 | 64.40 | 49.70 | 86.50 | 58.40 | 60.20 | 42.60 | 67.90 | 44.00 | 41.50 | 40.80 | 89.60 | 56.00 | 57.00 | 48.90 | 91.60 | 67.50 | 59.00 | 48.00 | NA | NA | NA | NA | |
| Property Facilities And Project Management, Americas, Transferred Over Time | 1240.70 | 1186.20 | 1281.40 | 1264.40 | 1292.70 | 1257.10 | 1196.20 | 1122.70 | 1145.60 | 1071.50 | 1050.10 | 1030.90 | 1073.50 | 1007.70 | 945.80 | 966.30 | 1055.30 | 906.10 | 892.50 | 869.30 | 957.60 | 849.30 | 804.50 | 758.20 | NA | NA | NA | NA | |
| Property Facilities And Project Management, Asia Pacific, Transferred Over Time | 285.40 | 255.30 | 246.70 | 260.00 | 259.70 | 240.90 | 242.90 | 222.70 | 226.80 | 218.40 | 207.50 | 205.30 | 198.00 | 222.30 | 214.30 | 228.30 | 289.40 | 283.40 | 292.50 | 275.70 | 267.20 | 292.20 | 301.70 | 275.80 | NA | NA | NA | NA | |
| Property Facilities And Project Management, Europe The Middle East And Africa, Transferred Over Time | 123.40 | 127.10 | 124.80 | 108.40 | 129.10 | 111.40 | 117.90 | 114.80 | 135.70 | 128.60 | 125.10 | 114.00 | 148.30 | 117.10 | 102.50 | 106.60 | 132.50 | 96.60 | 95.80 | 87.90 | 118.50 | 75.00 | 77.70 | 99.90 | NA | NA | NA | NA | |
| Valuation And Other Service, Americas, Transferred At Point In Time Or Over Time | 45.60 | 32.20 | 39.50 | 34.20 | 51.00 | 48.50 | 53.60 | 47.60 | 65.50 | 46.70 | 44.90 | 37.40 | 55.80 | 38.60 | 33.40 | 39.10 | 57.10 | 48.30 | 40.50 | 37.10 | 50.70 | 35.40 | 42.00 | 37.10 | NA | NA | NA | NA | |
| Valuation And Other Service, Asia Pacific, Transferred At Point In Time Or Over Time | 28.40 | 27.00 | 30.20 | 26.90 | 30.20 | 29.10 | 31.00 | 29.30 | 33.60 | 30.40 | 34.10 | 29.60 | 29.30 | 28.40 | 30.10 | 25.50 | 30.10 | 29.70 | 28.60 | 26.40 | 23.70 | 23.40 | 27.20 | 23.40 | NA | NA | NA | NA | |
| Valuation And Other Service, Europe The Middle East And Africa, Transferred At Point In Time Or Over Time | 50.80 | 39.80 | 43.00 | 42.60 | 51.10 | 39.90 | 44.10 | 44.30 | 59.00 | 43.30 | 45.80 | 45.00 | 56.60 | 38.10 | 37.10 | 41.00 | 68.20 | 41.20 | 42.90 | 39.40 | 63.70 | 44.40 | 43.50 | 37.40 | NA | NA | NA | NA | |
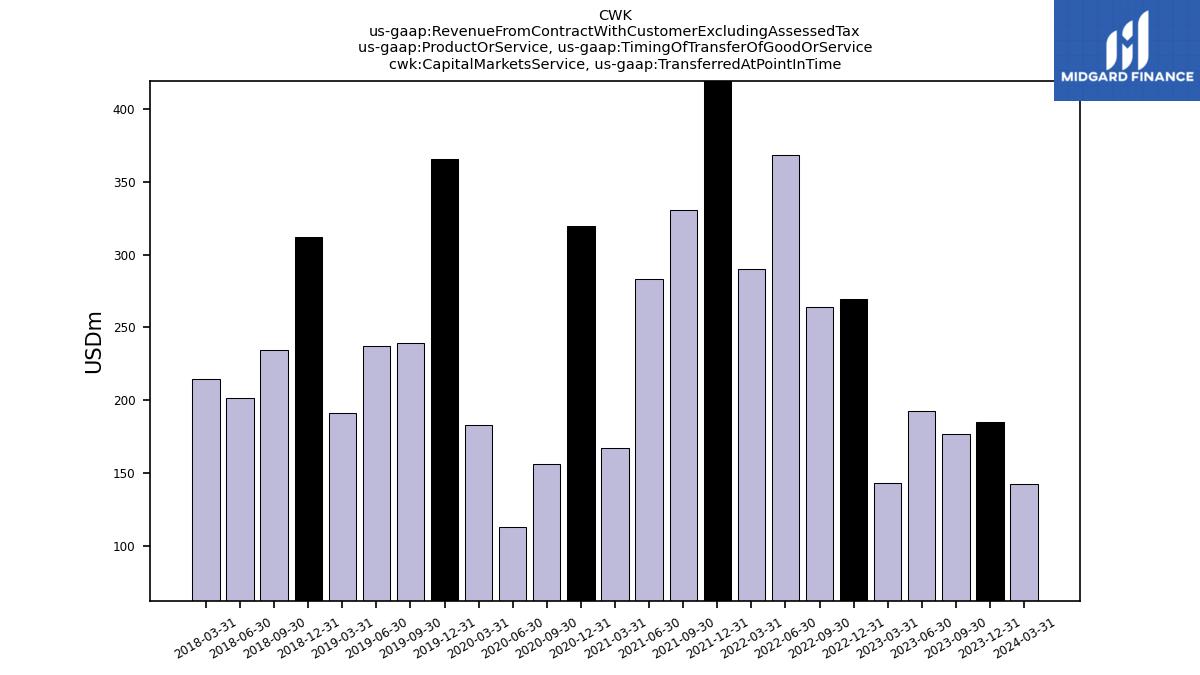
| Capital Markets Service, Transferred At Point In Time | 184.90 | 176.90 | 192.50 | 143.30 | 269.20 | 264.10 | 368.30 | 289.80 | 572.70 | 331.00 | 283.10 | 166.80 | 319.70 | 155.90 | 113.20 | 182.90 | 365.80 | 239.30 | 237.20 | 191.40 | 312.30 | 234.30 | 201.50 | 214.60 | NA | NA | NA | NA | |
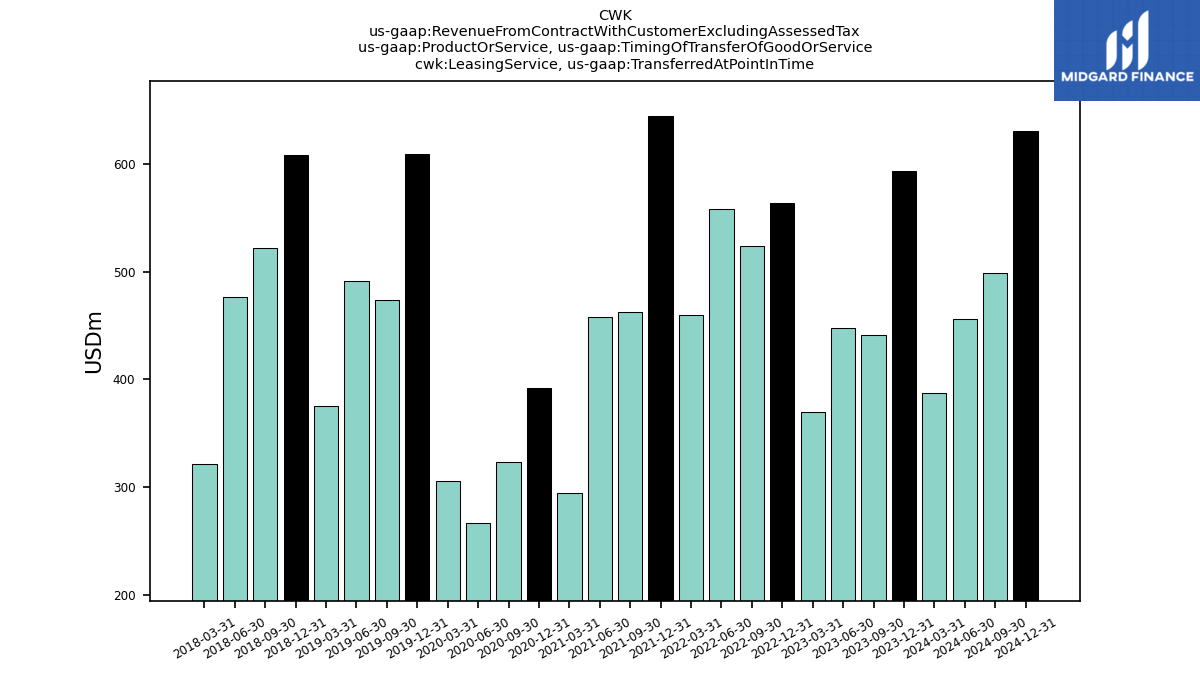
| Leasing Service, Transferred At Point In Time | 593.20 | 441.50 | 447.90 | 369.50 | 564.00 | 524.10 | 558.60 | 459.80 | 644.80 | 463.00 | 457.70 | 294.80 | 391.90 | 323.50 | 267.20 | 305.70 | 609.10 | 474.20 | 491.70 | 375.80 | 608.20 | 522.00 | 476.20 | 321.30 | NA | NA | NA | NA | |
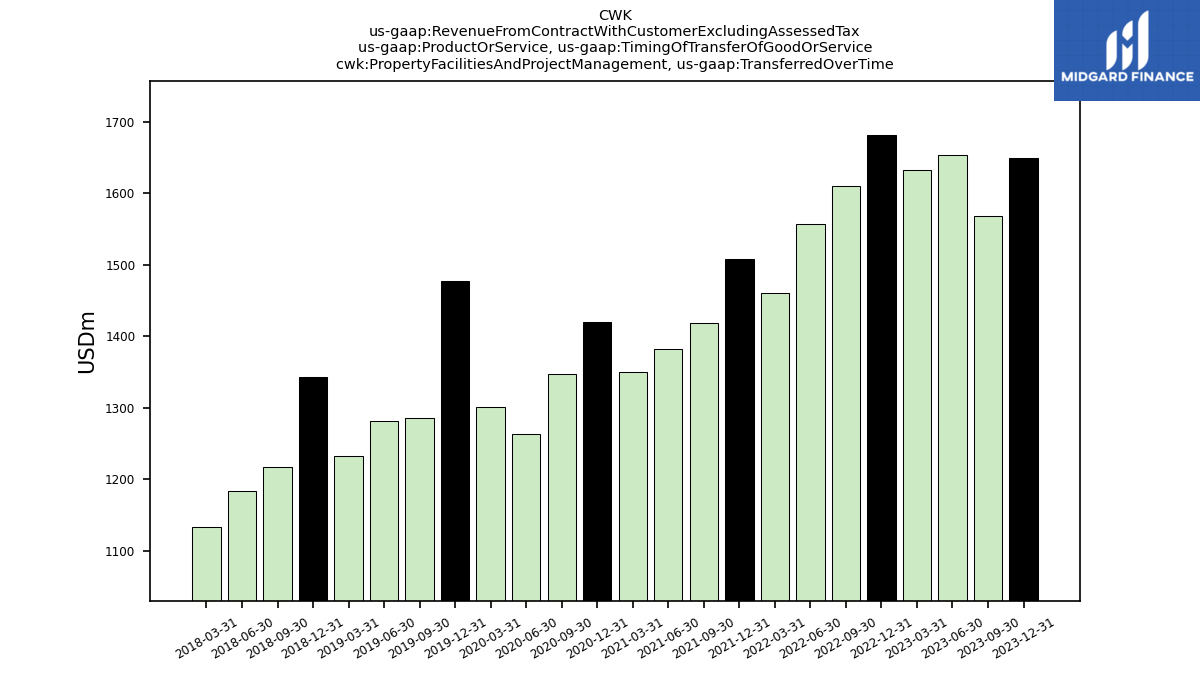
| Property Facilities And Project Management, Transferred Over Time | 1649.50 | 1568.60 | 1652.90 | 1632.80 | 1681.50 | 1609.40 | 1557.00 | 1460.20 | 1508.10 | 1418.50 | 1382.70 | 1350.20 | 1419.80 | 1347.10 | 1262.60 | 1301.20 | 1477.20 | 1286.10 | 1280.80 | 1232.90 | 1343.30 | 1216.50 | 1183.90 | 1133.90 | NA | NA | NA | NA | |
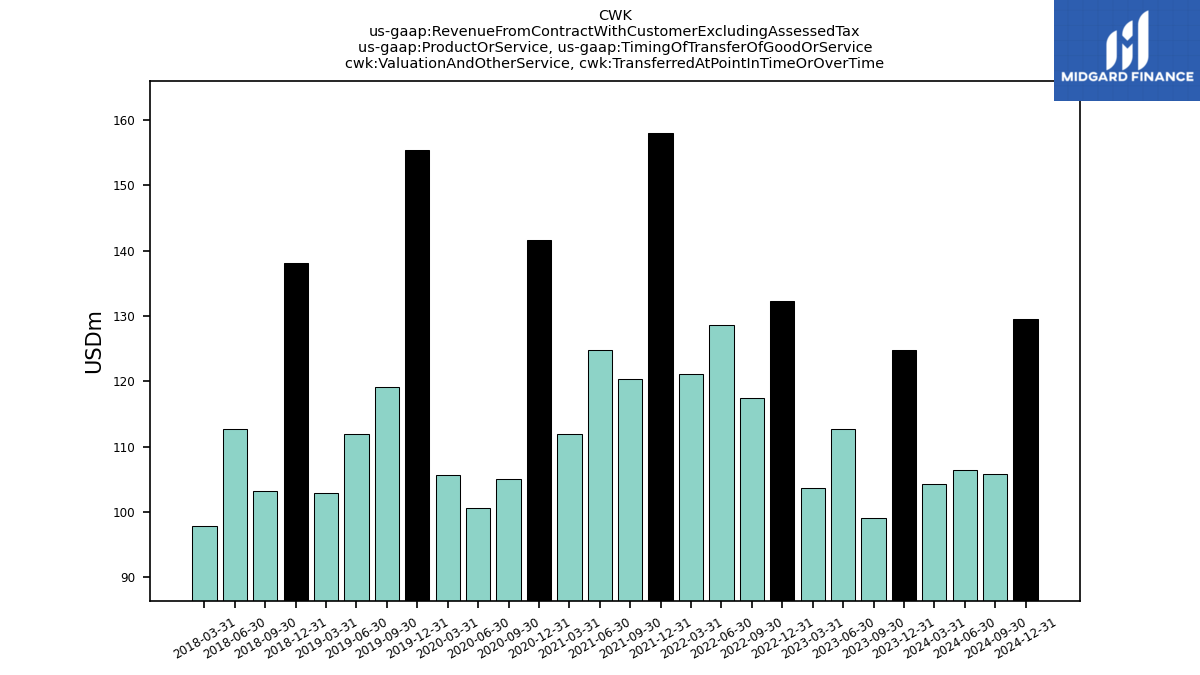
| Valuation And Other Service, Transferred At Point In Time Or Over Time | 124.80 | 99.00 | 112.70 | 103.70 | 132.30 | 117.50 | 128.70 | 121.20 | 158.10 | 120.40 | 124.80 | 112.00 | 141.70 | 105.10 | 100.60 | 105.60 | 155.40 | 119.20 | 112.00 | 102.90 | 138.10 | 103.20 | 112.70 | 97.90 | NA | NA | NA | NA | |
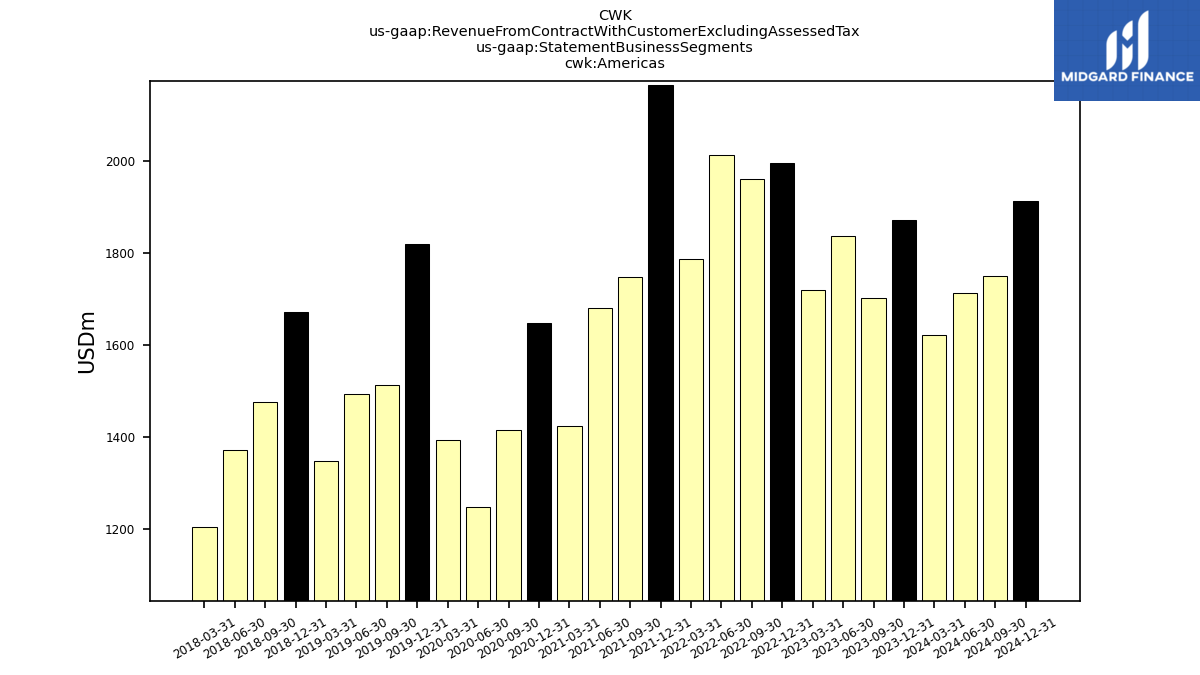
| Americas | 1870.00 | 1701.90 | 1836.50 | 1720.00 | 1994.80 | 1959.50 | 2011.40 | 1785.30 | 2163.70 | 1746.50 | 1680.20 | 1424.90 | 1647.70 | 1416.10 | 1248.50 | 1394.80 | 1818.80 | 1512.80 | 1492.90 | 1347.60 | 1670.80 | 1475.60 | 1372.10 | 1206.20 | NA | NA | NA | NA | |
| Asia Pacific | 395.70 | 342.20 | 329.60 | 324.10 | 363.70 | 323.60 | 329.30 | 308.00 | 363.70 | 317.60 | 304.00 | 275.00 | 296.80 | 292.30 | 290.00 | 290.60 | 417.50 | 370.50 | 399.90 | 352.80 | 382.20 | 373.50 | 387.40 | 352.30 | NA | NA | NA | NA | |
| Europe The Middle East And Africa | 286.70 | 241.90 | 239.90 | 205.20 | 288.50 | 232.00 | 271.90 | 237.70 | 356.30 | 268.80 | 264.10 | 223.90 | 328.60 | 223.20 | 205.10 | 210.00 | 371.20 | 235.50 | 228.90 | 202.60 | 348.90 | 226.90 | 214.80 | 209.20 | NA | NA | NA | NA |