
| 2023-12-31 | 2023-09-30 | 2023-06-30 | 2023-03-31 | 2022-12-31 | 2022-09-30 | 2022-06-30 | 2022-03-31 | 2021-12-31 | 2021-09-30 | 2021-06-30 | 2021-03-31 | 2020-12-31 | 2020-09-30 | 2020-06-30 | 2020-03-31 | 2019-12-31 | 2019-09-30 | 2019-06-30 | 2019-03-31 | 2018-12-31 | 2018-09-30 | 2018-06-30 | 2018-03-31 | 2017-12-31 | 2017-09-30 | 2017-06-30 | 2017-03-31 | 2016-12-31 | 2016-09-30 | 2016-06-30 | 2016-03-31 | 2015-12-31 | 2015-09-30 | 2015-06-30 | 2015-03-31 | 2014-12-31 | 2014-09-30 | 2014-06-30 | 2014-03-31 | 2013-12-31 | 2013-09-30 | 2013-06-30 | 2013-03-31 | 2012-12-31 | 2012-09-30 | 2012-06-30 | 2012-03-31 | 2011-12-31 | 2011-09-30 | 2011-06-30 | 2011-03-31 | 2010-12-31 | 2010-09-30 | 2010-06-30 | 2010-03-31 | ||
|---|---|---|---|---|---|---|---|---|---|---|---|---|---|---|---|---|---|---|---|---|---|---|---|---|---|---|---|---|---|---|---|---|---|---|---|---|---|---|---|---|---|---|---|---|---|---|---|---|---|---|---|---|---|---|---|---|---|
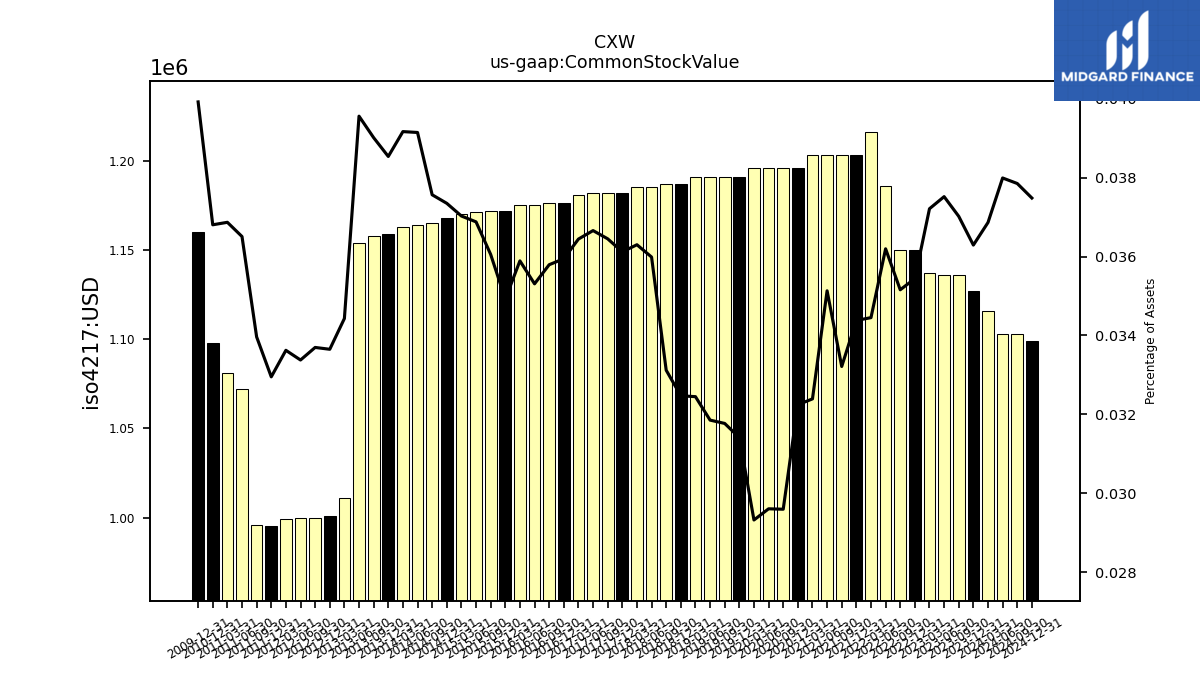
| Common Stock Value | 1.13 | 1.14 | 1.14 | 1.14 | 1.15 | 1.15 | 1.19 | 1.22 | 1.20 | 1.20 | 1.20 | 1.20 | 1.20 | 1.20 | 1.20 | 1.20 | 1.19 | 1.19 | 1.19 | 1.19 | 1.19 | 1.19 | 1.19 | 1.19 | 1.18 | 1.18 | 1.18 | 1.18 | 1.18 | 1.18 | 1.18 | 1.18 | 1.17 | 1.17 | 1.17 | 1.17 | 1.17 | 1.17 | 1.16 | 1.16 | 1.16 | 1.16 | 1.15 | 1.01 | 1.00 | 1.00 | 1.00 | 1.00 | 0.99 | 1.00 | 1.07 | 1.08 | 1.10 | NA | NA | NA | |
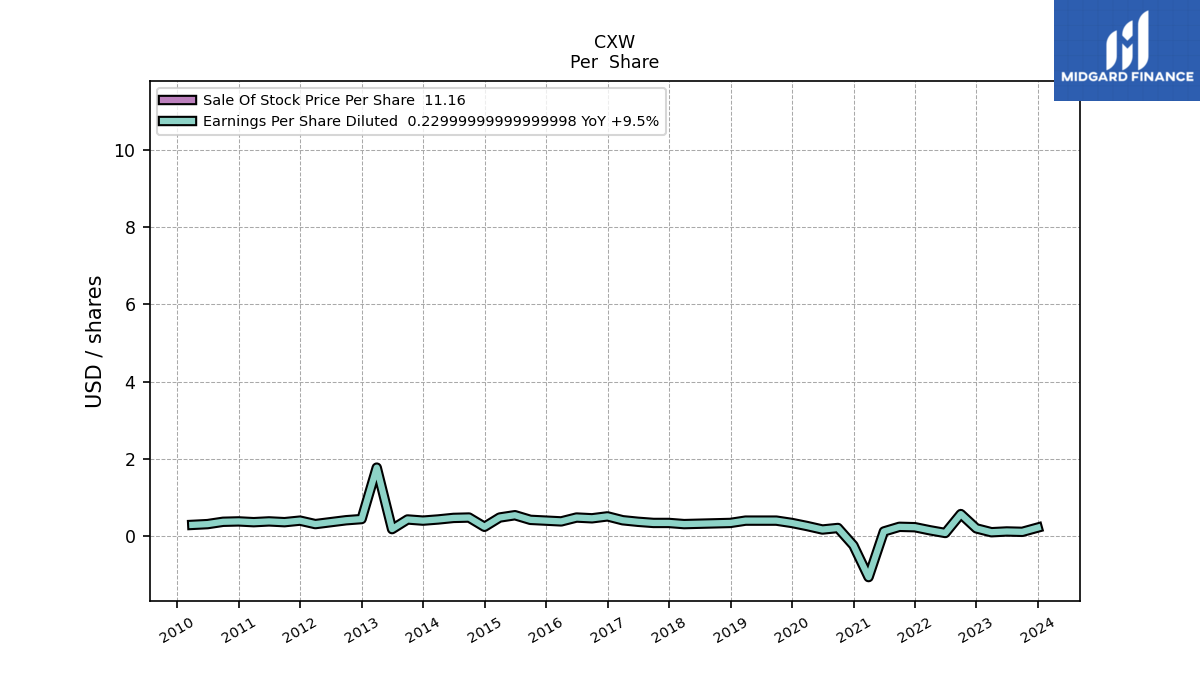
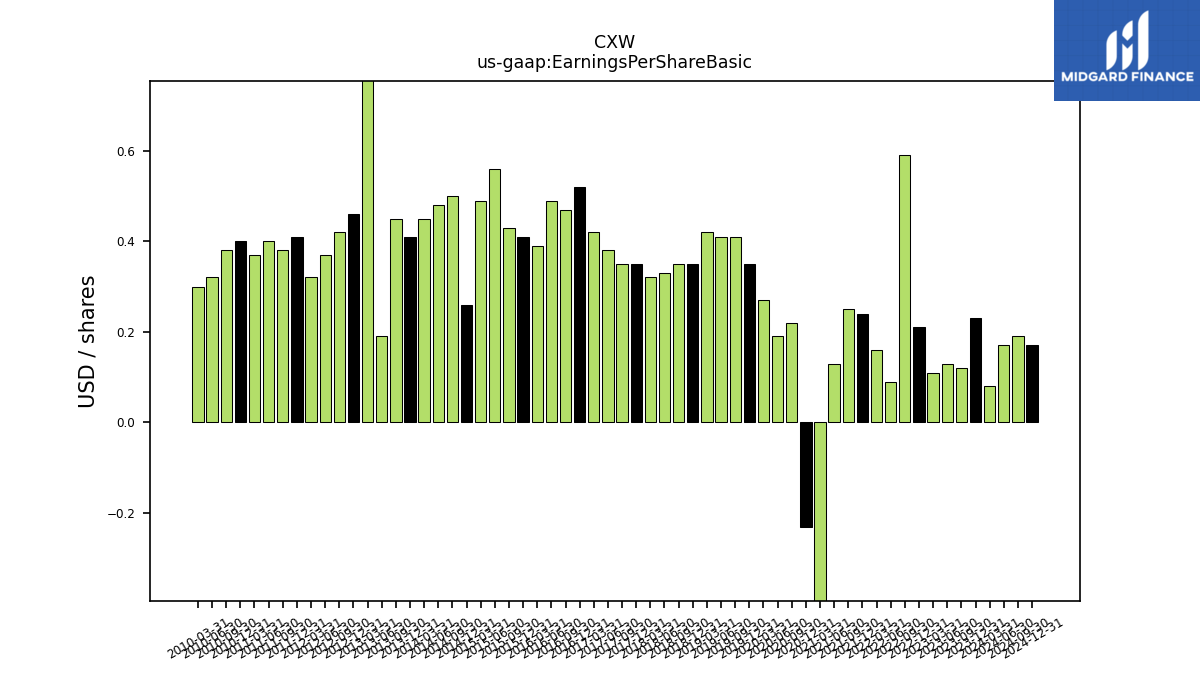
| Earnings Per Share Basic | 0.23 | 0.12 | 0.13 | 0.11 | 0.21 | 0.59 | 0.09 | 0.16 | 0.24 | 0.25 | 0.13 | -1.05 | -0.23 | 0.22 | 0.19 | 0.27 | 0.35 | 0.41 | 0.41 | 0.42 | 0.35 | 0.35 | 0.33 | 0.32 | 0.35 | 0.35 | 0.38 | 0.42 | 0.52 | 0.47 | 0.49 | 0.39 | 0.41 | 0.43 | 0.56 | 0.49 | 0.26 | 0.50 | 0.48 | 0.45 | 0.41 | 0.45 | 0.19 | 1.81 | 0.46 | 0.42 | 0.37 | 0.32 | 0.41 | 0.38 | 0.40 | 0.37 | 0.40 | 0.38 | 0.32 | 0.30 | |
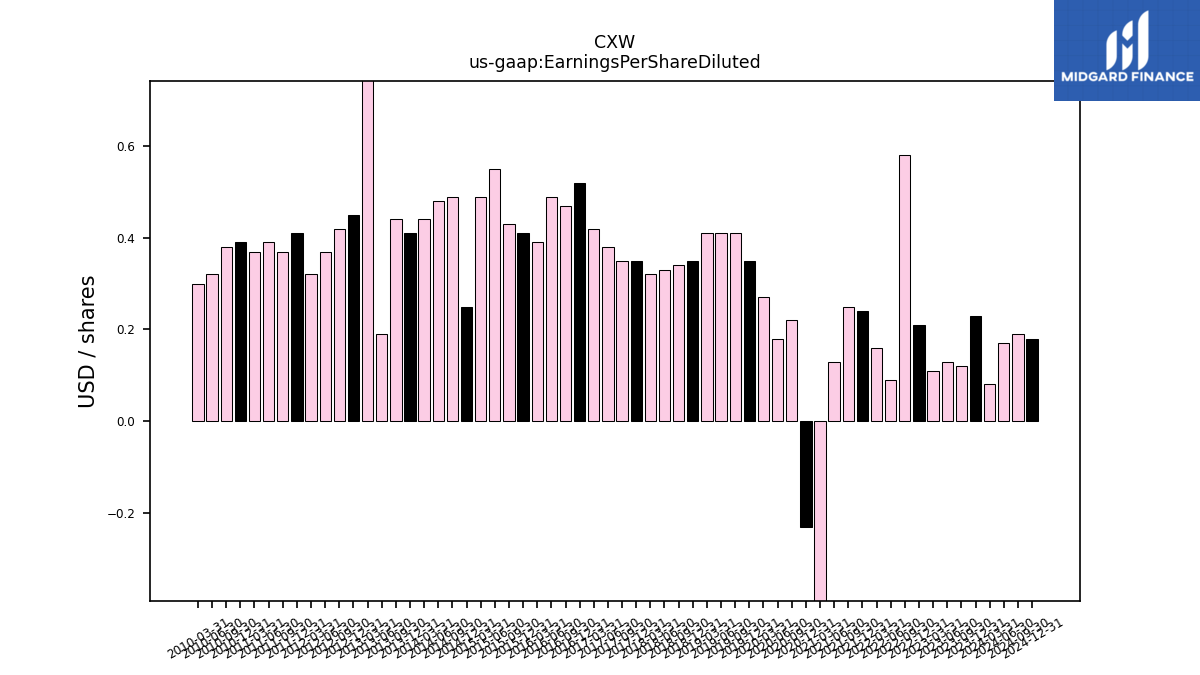
| Earnings Per Share Diluted | 0.23 | 0.12 | 0.13 | 0.11 | 0.21 | 0.58 | 0.09 | 0.16 | 0.24 | 0.25 | 0.13 | -1.05 | -0.23 | 0.22 | 0.18 | 0.27 | 0.35 | 0.41 | 0.41 | 0.41 | 0.35 | 0.34 | 0.33 | 0.32 | 0.35 | 0.35 | 0.38 | 0.42 | 0.52 | 0.47 | 0.49 | 0.39 | 0.41 | 0.43 | 0.55 | 0.49 | 0.25 | 0.49 | 0.48 | 0.44 | 0.41 | 0.44 | 0.19 | 1.78 | 0.45 | 0.42 | 0.37 | 0.32 | 0.41 | 0.37 | 0.39 | 0.37 | 0.39 | 0.38 | 0.32 | 0.30 |
| 2023-12-31 | 2023-09-30 | 2023-06-30 | 2023-03-31 | 2022-12-31 | 2022-09-30 | 2022-06-30 | 2022-03-31 | 2021-12-31 | 2021-09-30 | 2021-06-30 | 2021-03-31 | 2020-12-31 | 2020-09-30 | 2020-06-30 | 2020-03-31 | 2019-12-31 | 2019-09-30 | 2019-06-30 | 2019-03-31 | 2018-12-31 | 2018-09-30 | 2018-06-30 | 2018-03-31 | 2017-12-31 | 2017-09-30 | 2017-06-30 | 2017-03-31 | 2016-12-31 | 2016-09-30 | 2016-06-30 | 2016-03-31 | 2015-12-31 | 2015-09-30 | 2015-06-30 | 2015-03-31 | 2014-12-31 | 2014-09-30 | 2014-06-30 | 2014-03-31 | 2013-12-31 | 2013-09-30 | 2013-06-30 | 2013-03-31 | 2012-12-31 | 2012-09-30 | 2012-06-30 | 2012-03-31 | 2011-12-31 | 2011-09-30 | 2011-06-30 | 2011-03-31 | 2010-12-31 | 2010-09-30 | 2010-06-30 | 2010-03-31 | ||
|---|---|---|---|---|---|---|---|---|---|---|---|---|---|---|---|---|---|---|---|---|---|---|---|---|---|---|---|---|---|---|---|---|---|---|---|---|---|---|---|---|---|---|---|---|---|---|---|---|---|---|---|---|---|---|---|---|---|
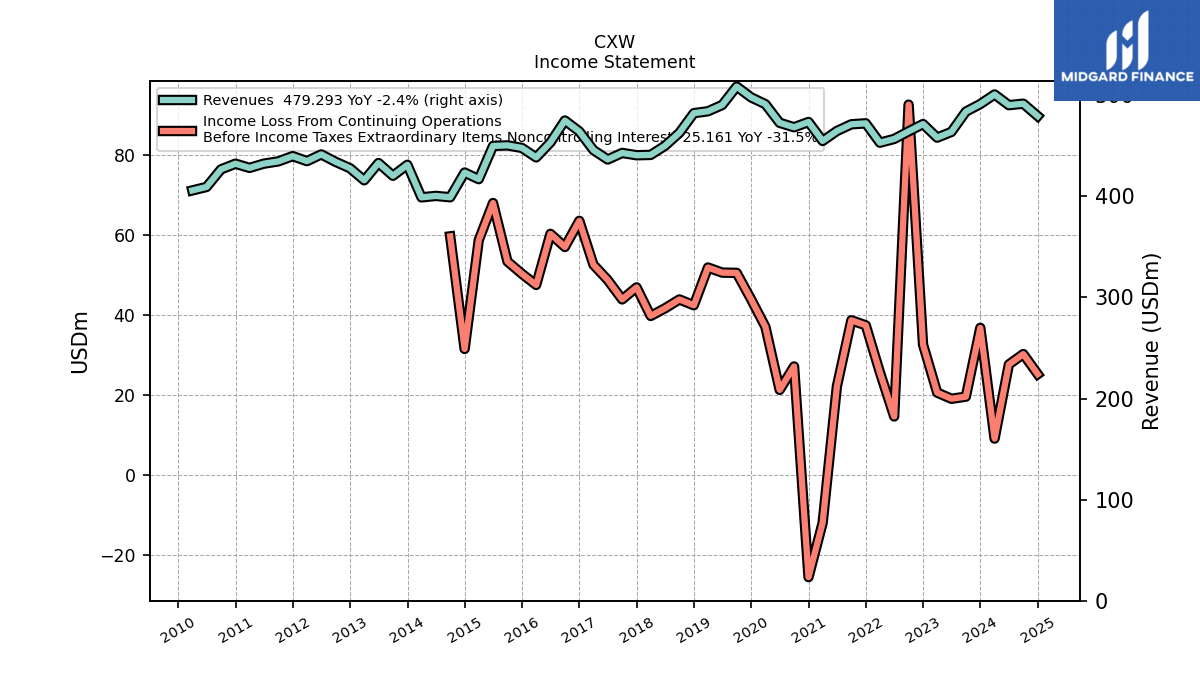
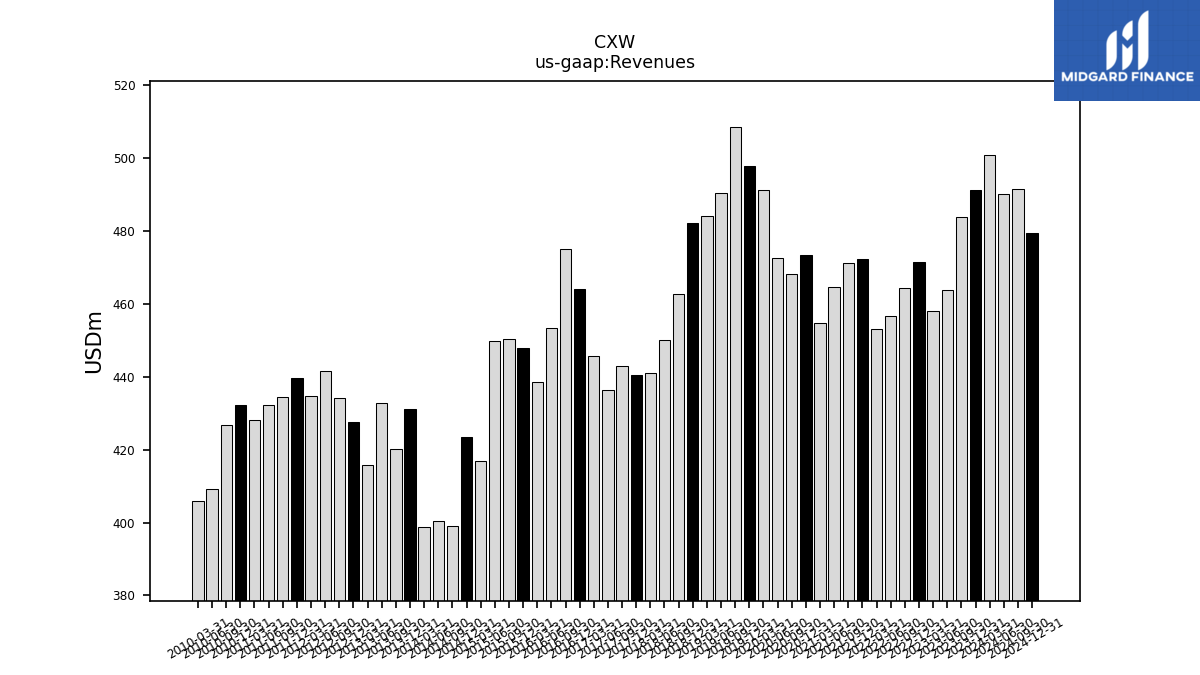
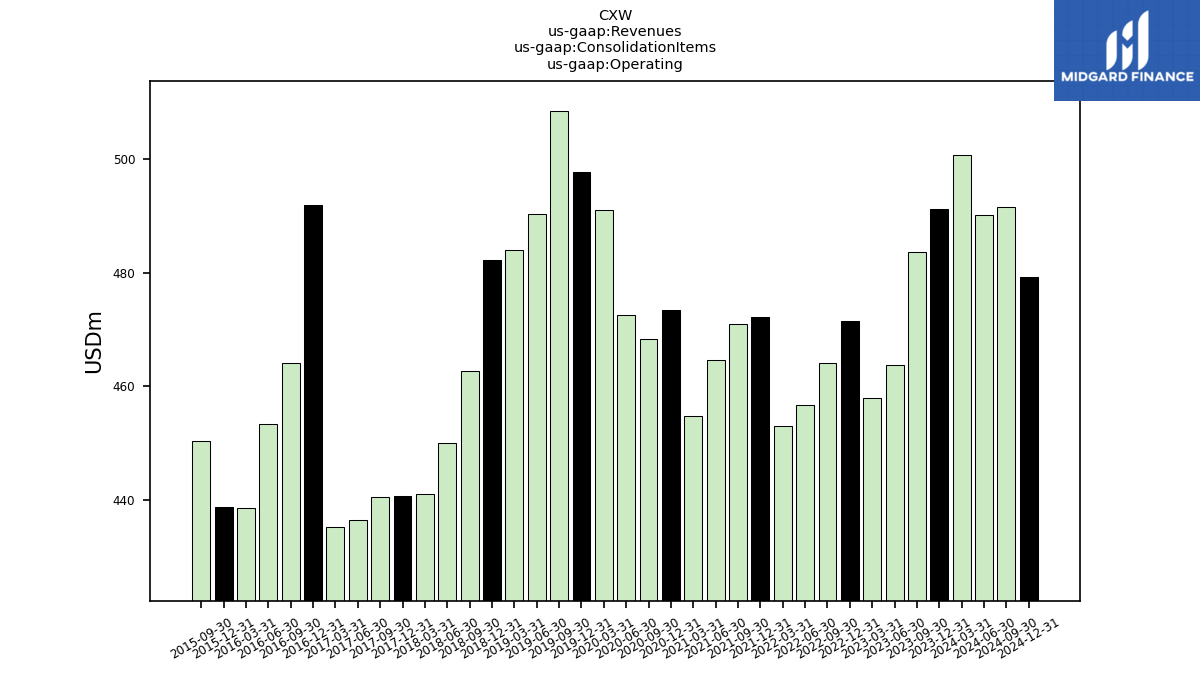
| Revenues | 491.25 | 483.70 | 463.68 | 458.00 | 471.43 | 464.21 | 456.70 | 452.99 | 472.13 | 471.19 | 464.57 | 454.72 | 473.48 | 468.27 | 472.64 | 491.10 | 497.81 | 508.52 | 490.29 | 484.06 | 482.19 | 462.73 | 449.93 | 440.92 | 440.58 | 442.85 | 436.39 | 445.68 | 464.13 | 474.94 | 453.28 | 438.45 | 447.83 | 450.34 | 449.77 | 416.91 | 423.48 | 399.02 | 400.35 | 398.92 | 431.10 | 420.28 | 432.89 | 415.81 | 427.68 | 434.02 | 441.41 | 434.75 | 439.69 | 434.49 | 432.25 | 428.07 | 432.20 | 426.63 | 409.21 | 405.78 | |
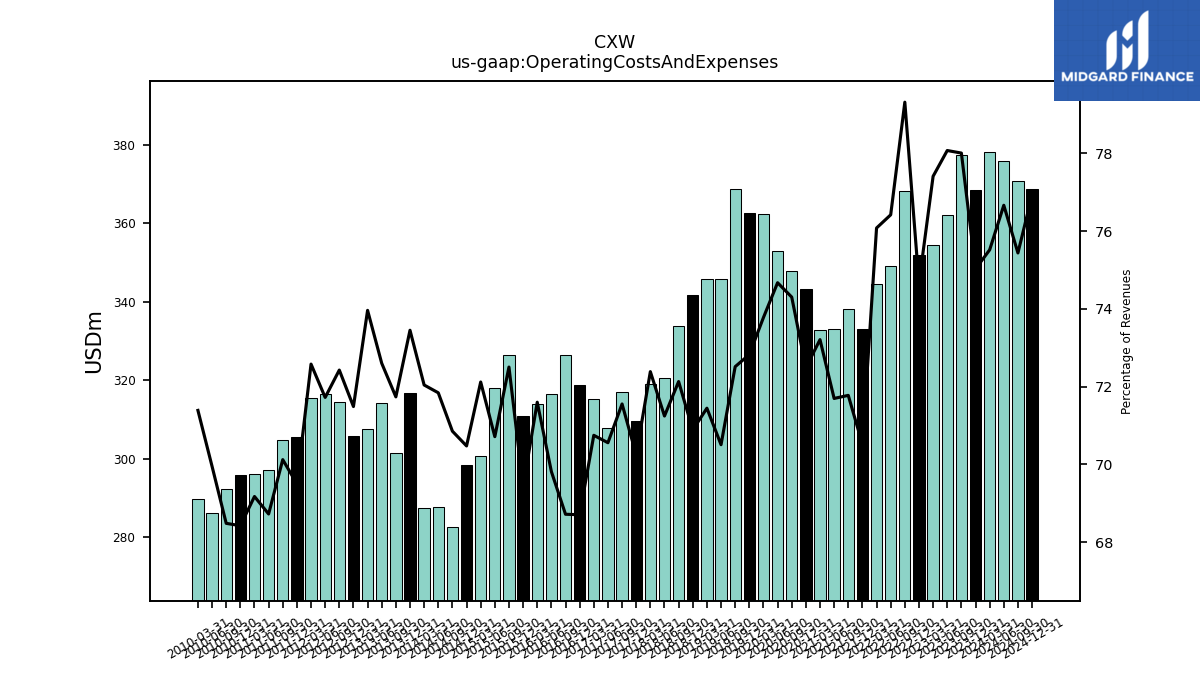
| Operating Costs And Expenses | 368.56 | 377.32 | 362.01 | 354.54 | 351.97 | 368.19 | 349.00 | 344.63 | 332.92 | 338.19 | 333.07 | 332.88 | 343.21 | 347.93 | 352.93 | 362.31 | 362.52 | 368.74 | 345.68 | 345.83 | 341.80 | 333.76 | 320.54 | 319.15 | 309.47 | 316.87 | 307.90 | 315.30 | 318.87 | 326.35 | 316.45 | 313.92 | 310.93 | 326.50 | 318.04 | 300.66 | 298.43 | 282.71 | 287.61 | 287.38 | 316.64 | 301.49 | 314.28 | 307.53 | 305.73 | 314.34 | 316.58 | 315.53 | 305.58 | 304.66 | 297.05 | 296.11 | 295.71 | 292.16 | 286.23 | 289.67 | |
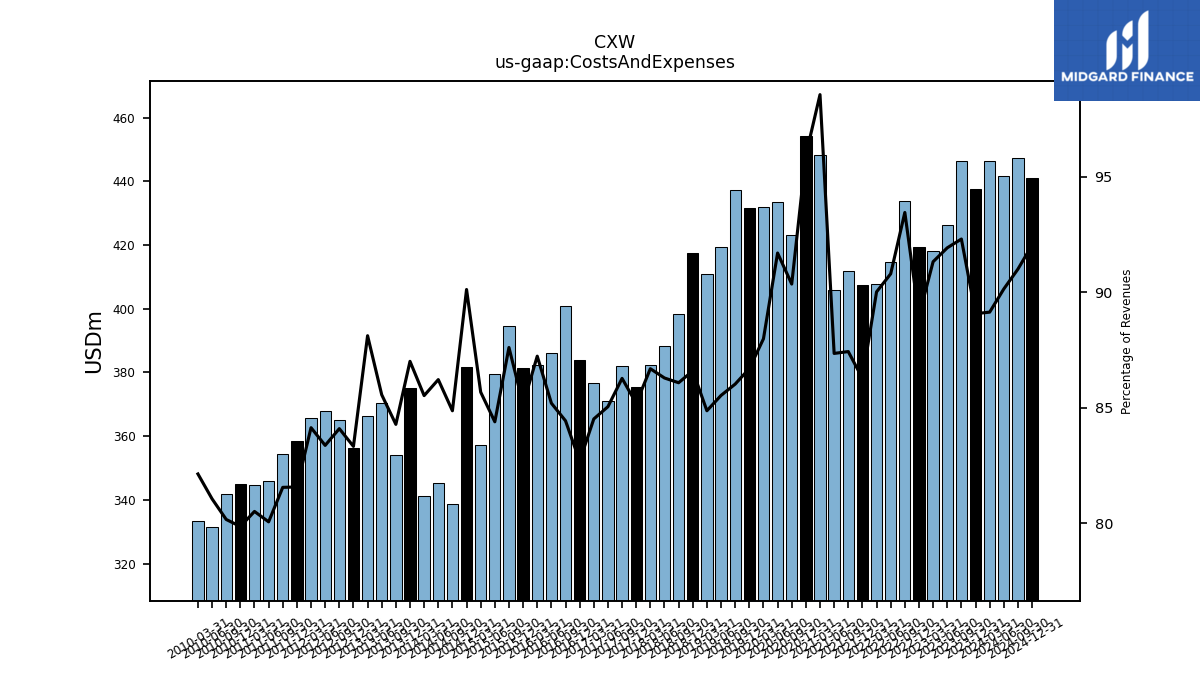
| Costs And Expenses | 437.56 | 446.49 | 426.24 | 418.26 | 419.43 | 433.83 | 414.67 | 407.76 | 407.31 | 411.96 | 405.80 | 448.18 | 454.23 | 423.10 | 433.41 | 432.08 | 431.56 | 437.43 | 419.34 | 410.80 | 417.54 | 398.31 | 388.22 | 382.21 | 375.31 | 382.03 | 371.11 | 376.64 | 383.77 | 400.98 | 386.15 | 382.46 | 381.30 | 394.52 | 379.54 | 357.17 | 381.63 | 338.62 | 345.16 | 341.16 | 375.08 | 354.19 | 370.37 | 366.39 | 356.35 | 364.96 | 367.98 | 365.76 | 358.62 | 354.31 | 346.02 | 344.61 | 345.11 | 341.96 | 331.65 | 333.25 | |
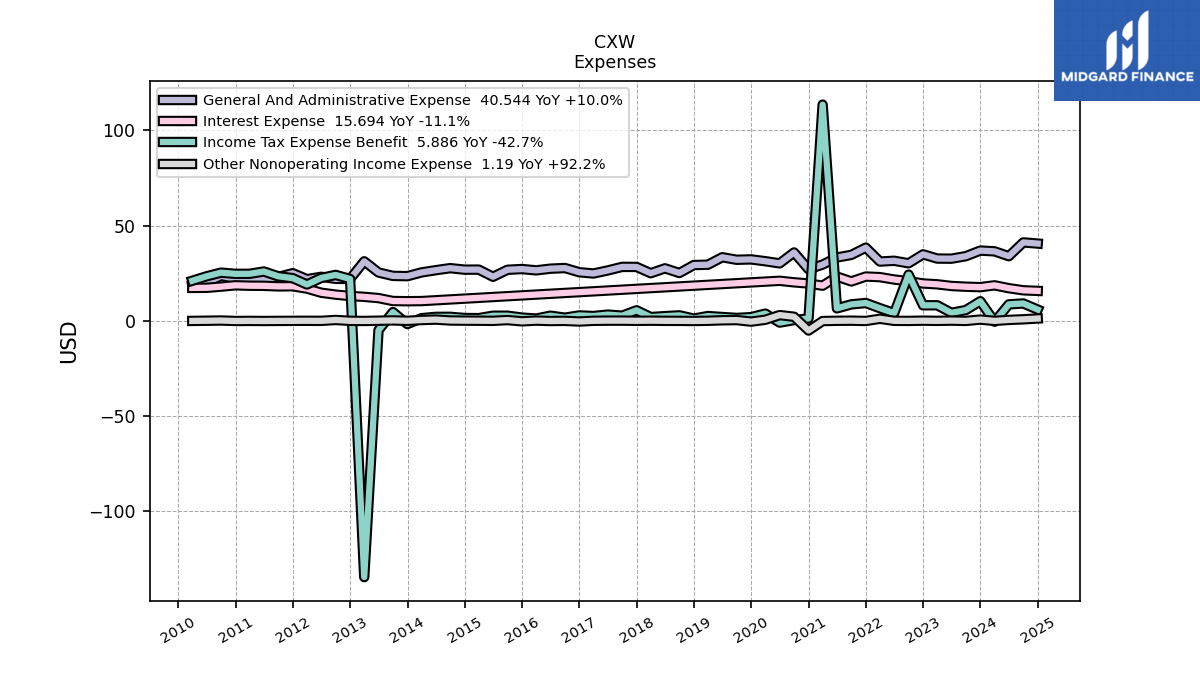
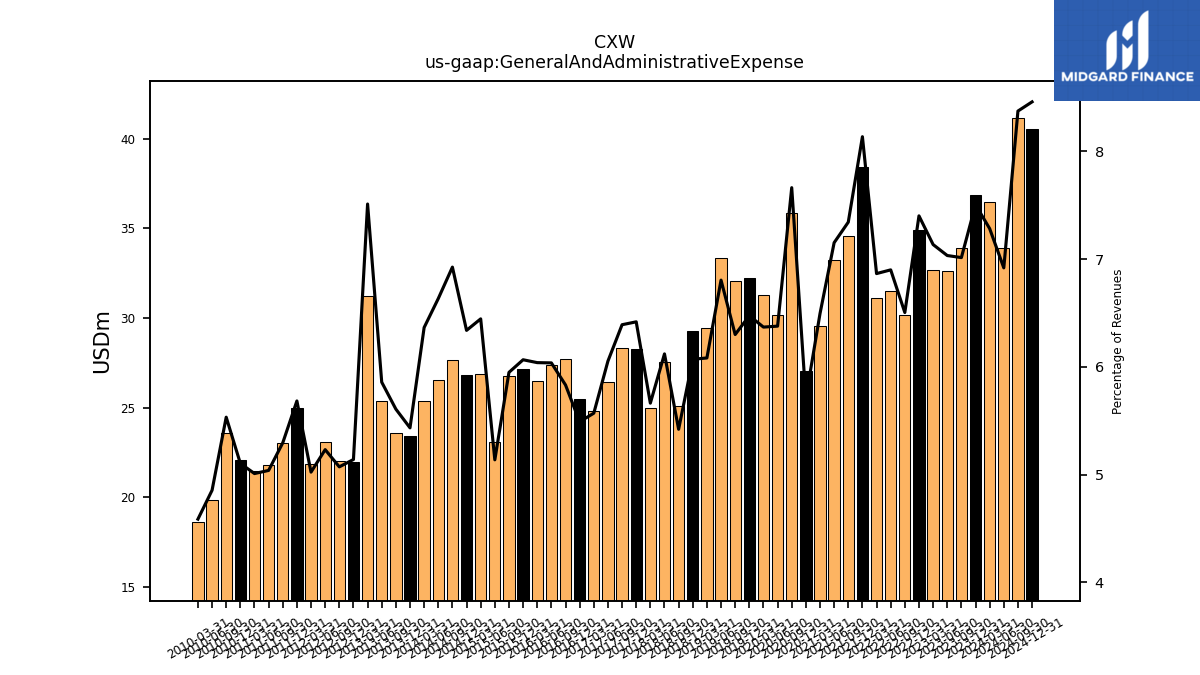
| General And Administrative Expense | 36.87 | 33.93 | 32.61 | 32.68 | 34.89 | 30.19 | 31.51 | 31.10 | 38.41 | 34.60 | 33.23 | 29.53 | 27.03 | 35.88 | 30.14 | 31.28 | 32.23 | 32.04 | 33.36 | 29.45 | 29.27 | 25.09 | 27.54 | 24.97 | 28.28 | 28.30 | 26.42 | 24.83 | 25.48 | 27.70 | 27.36 | 26.48 | 27.17 | 26.79 | 23.11 | 26.87 | 26.84 | 27.64 | 26.56 | 25.39 | 23.43 | 23.57 | 25.36 | 31.23 | 21.98 | 22.02 | 23.09 | 21.84 | 24.99 | 23.01 | 21.78 | 21.45 | 22.06 | 23.61 | 19.87 | 18.61 | |
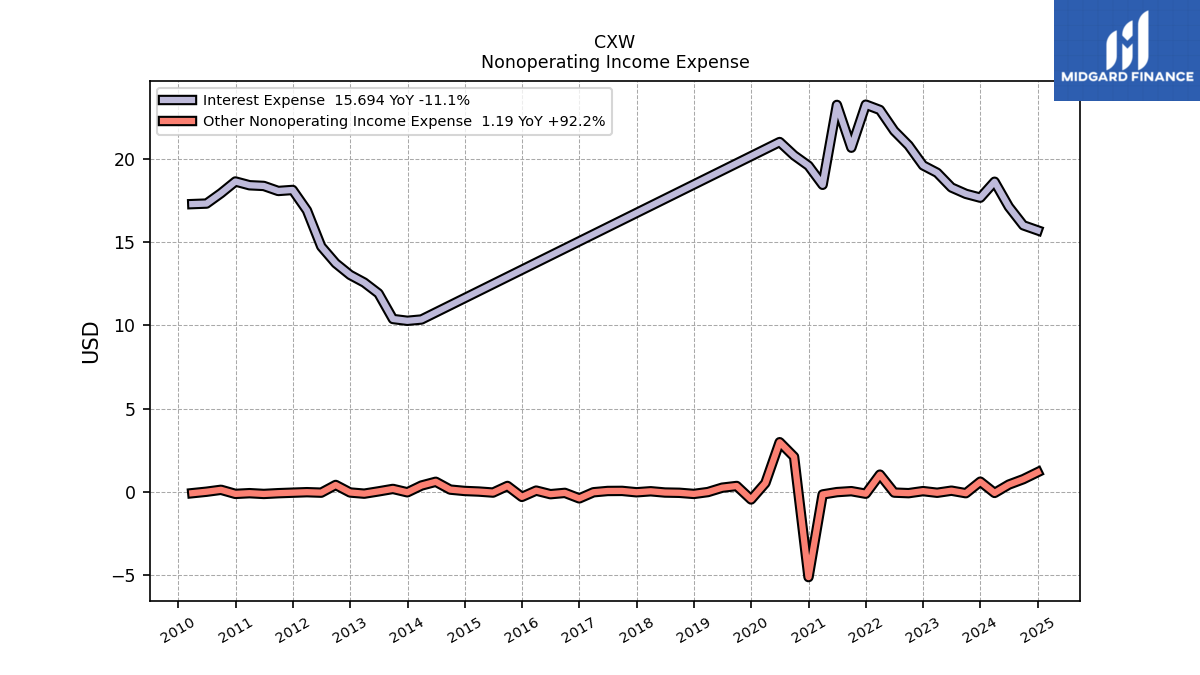
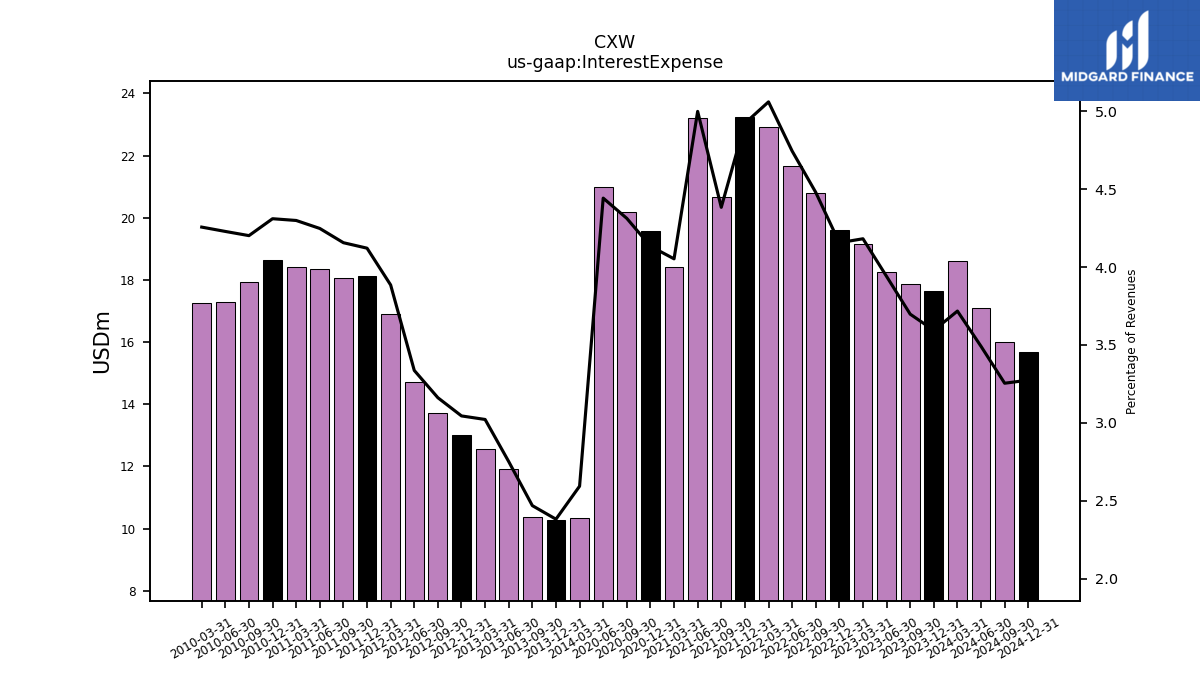
| Interest Expense | 17.66 | 17.89 | 18.27 | 19.15 | 19.59 | 20.79 | 21.67 | 22.92 | 23.24 | 20.65 | 23.22 | 18.43 | 19.57 | 20.19 | 21.00 | NA | NA | NA | NA | NA | NA | NA | NA | NA | NA | NA | NA | NA | NA | NA | NA | NA | NA | NA | NA | NA | NA | NA | NA | 10.35 | 10.27 | 10.38 | 11.91 | 12.57 | 13.02 | 13.72 | 14.73 | 16.89 | 18.12 | 18.06 | 18.36 | 18.40 | 18.63 | 17.93 | 17.30 | 17.27 | |
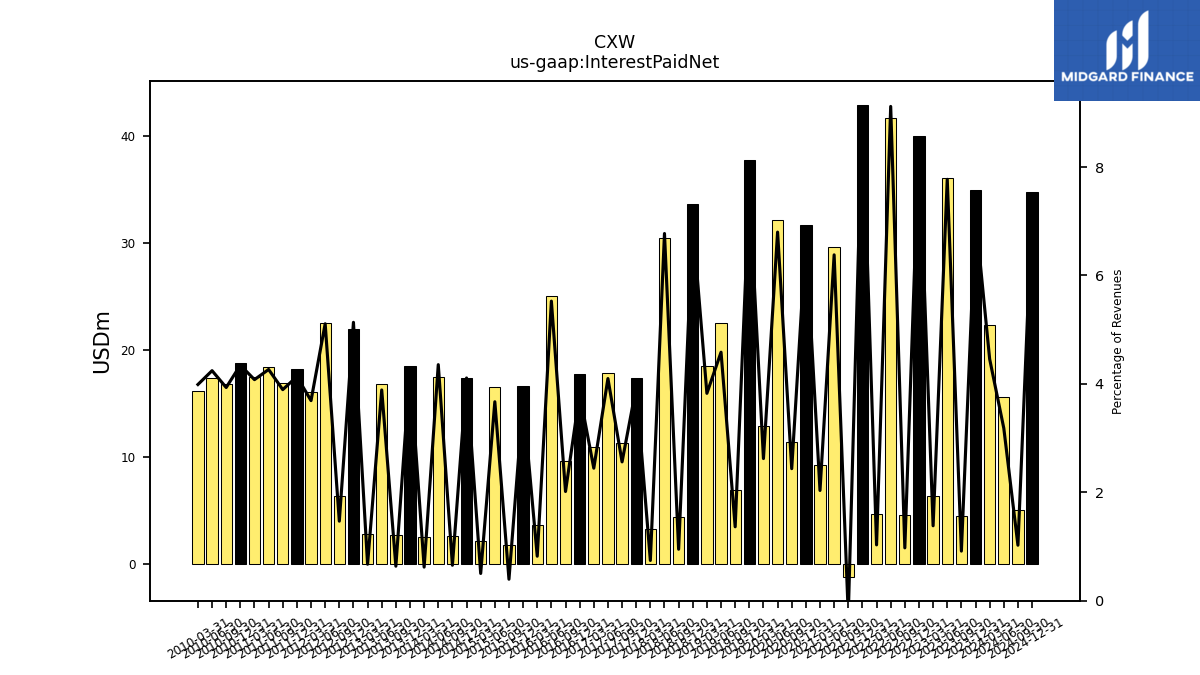
| Interest Paid Net | 34.96 | 4.43 | 36.05 | 6.33 | 39.98 | 4.53 | 41.64 | 4.67 | 42.94 | -1.24 | 29.64 | 9.25 | 31.70 | 11.41 | 32.14 | 12.88 | 37.76 | 6.94 | 22.48 | 18.52 | 33.63 | 4.40 | 30.48 | 3.28 | 17.36 | 11.34 | 17.89 | 10.90 | 17.74 | 9.57 | 25.05 | 3.60 | 16.59 | 1.79 | 16.51 | 2.10 | 17.40 | 2.61 | 17.44 | 2.48 | 18.46 | 2.68 | 16.83 | 2.80 | 21.96 | 6.37 | 22.55 | 16.05 | 18.18 | 16.92 | 18.44 | 17.46 | 18.78 | 16.78 | 17.37 | 16.19 | |
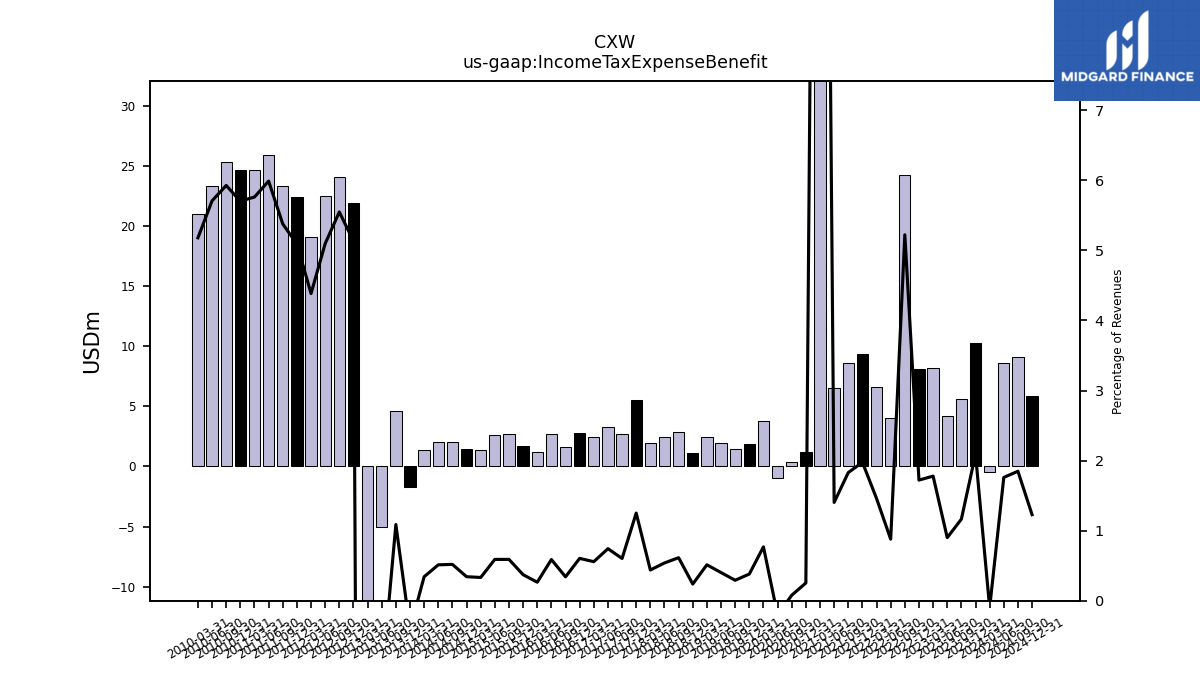
| Income Tax Expense Benefit | 10.28 | 5.63 | 4.18 | 8.15 | 8.12 | 24.24 | 4.01 | 6.61 | 9.33 | 8.62 | 6.52 | 113.53 | 1.20 | 0.37 | -0.96 | 3.78 | 1.90 | 1.49 | 1.97 | 2.48 | 1.15 | 2.84 | 2.43 | 1.94 | 5.51 | 2.67 | 3.24 | 2.48 | 2.81 | 1.62 | 2.67 | 1.16 | 1.67 | 2.66 | 2.65 | 1.39 | 1.45 | 2.07 | 2.05 | 1.37 | -1.74 | 4.57 | -5.00 | -134.65 | 21.95 | 24.08 | 22.49 | 19.06 | 22.39 | 23.36 | 25.89 | 24.66 | 24.64 | 25.28 | 23.35 | 21.02 | |
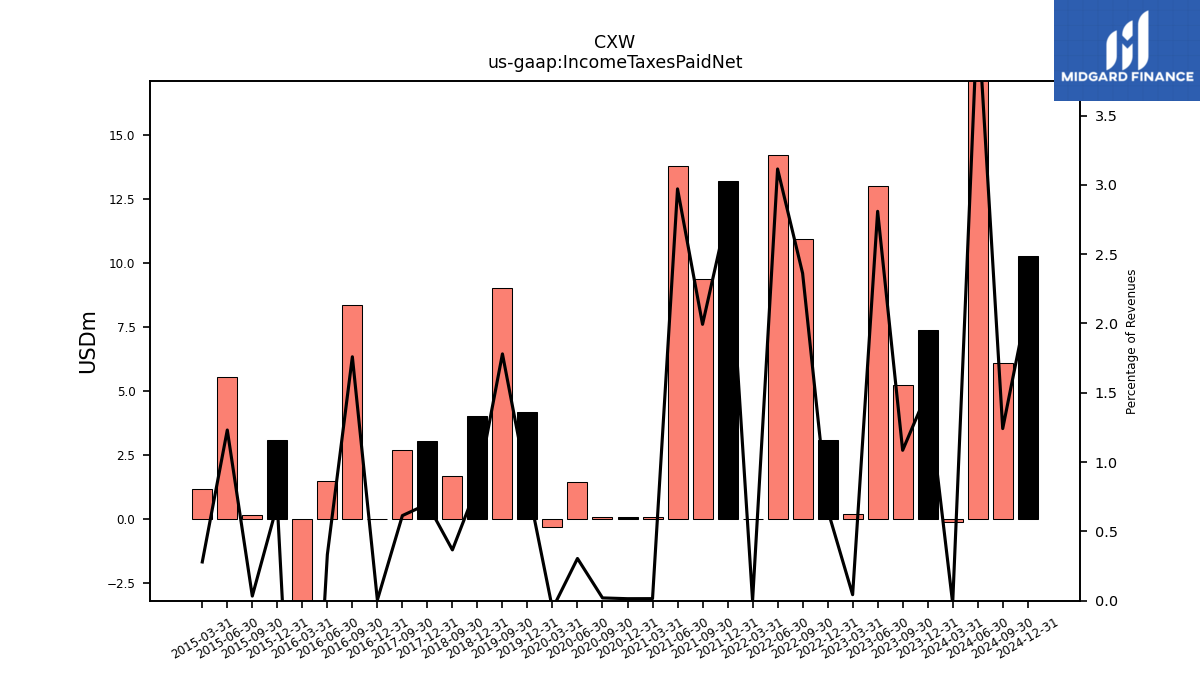
| Income Taxes Paid Net | 7.41 | 5.25 | 13.03 | 0.20 | 3.10 | 10.97 | 14.22 | 0.00 | 13.21 | 9.39 | 13.80 | 0.07 | 0.07 | 0.10 | 1.44 | -0.28 | 4.18 | 9.05 | NA | NA | 4.01 | 1.70 | NA | NA | 3.07 | 2.72 | NA | NA | 0.03 | 8.36 | 1.51 | -12.03 | 3.11 | 0.15 | 5.54 | 1.17 | NA | NA | NA | NA | NA | NA | NA | NA | NA | NA | NA | NA | NA | NA | NA | NA | NA | NA | NA | NA | |
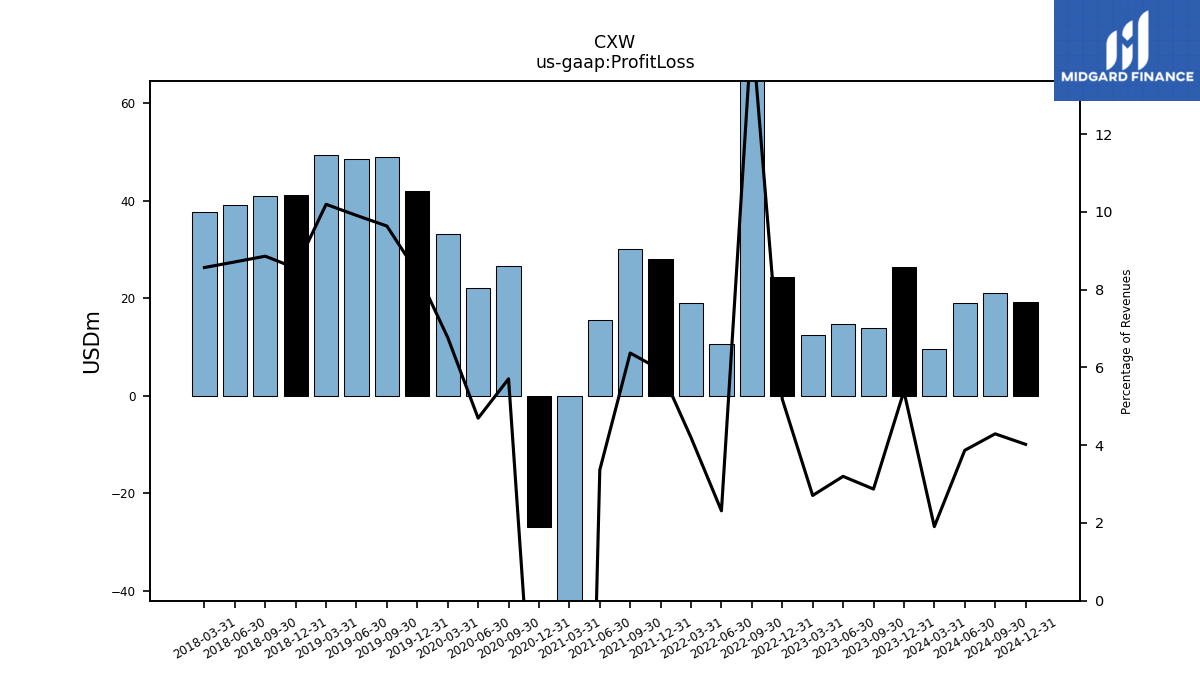
| Profit Loss | 26.47 | 13.89 | 14.83 | 12.40 | 24.44 | 68.32 | 10.56 | 19.00 | 28.04 | 30.01 | 15.62 | -125.57 | -26.80 | 26.72 | 22.19 | 33.24 | 41.97 | 48.99 | 48.58 | 49.34 | 41.24 | 40.99 | 39.20 | 37.78 | NA | NA | NA | NA | NA | NA | NA | NA | NA | NA | NA | NA | NA | NA | NA | NA | NA | NA | NA | NA | NA | NA | NA | NA | NA | NA | NA | NA | NA | NA | NA | NA | |
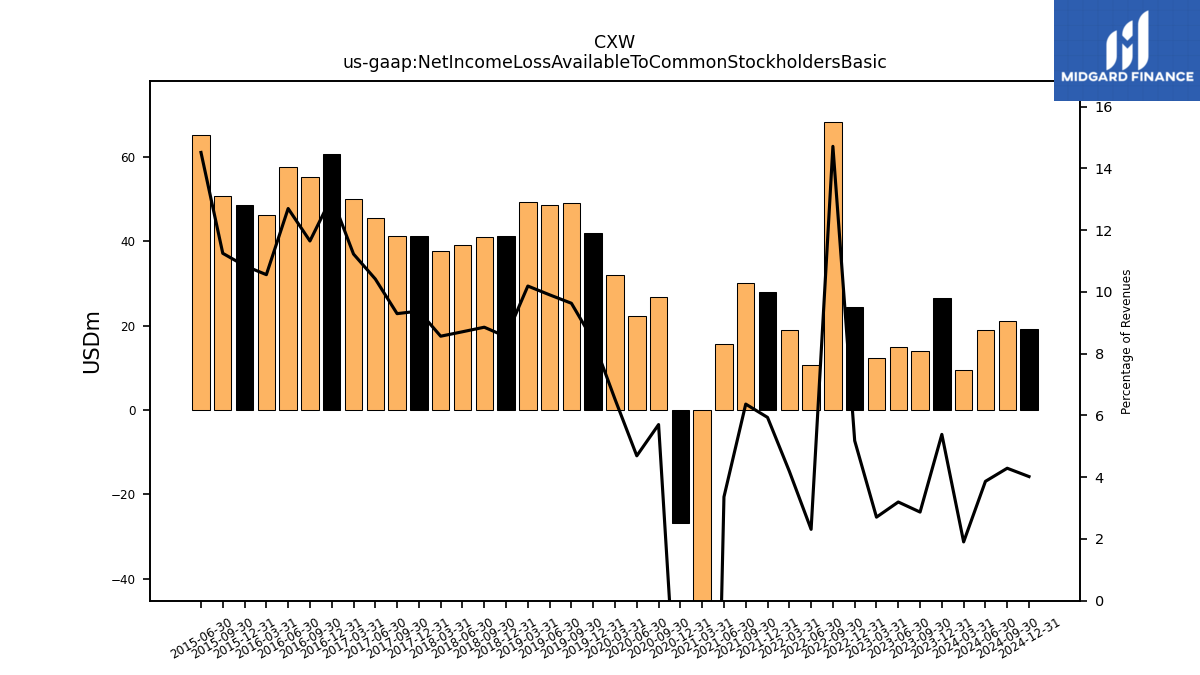
| Net Income Loss Available To Common Stockholders Basic | 26.47 | 13.89 | 14.83 | 12.40 | 24.44 | 68.32 | 10.56 | 19.00 | 28.04 | 30.01 | 15.62 | -125.57 | -26.80 | 26.72 | 22.19 | 32.06 | 41.97 | 48.99 | 48.58 | 49.34 | 41.24 | 40.99 | 39.20 | 37.78 | 41.34 | 41.18 | 45.48 | 50.05 | 60.69 | 55.34 | 57.58 | 46.31 | 48.60 | 50.68 | 65.30 | NA | NA | NA | NA | NA | NA | NA | NA | NA | NA | NA | NA | NA | NA | NA | NA | NA | NA | NA | NA | NA | |
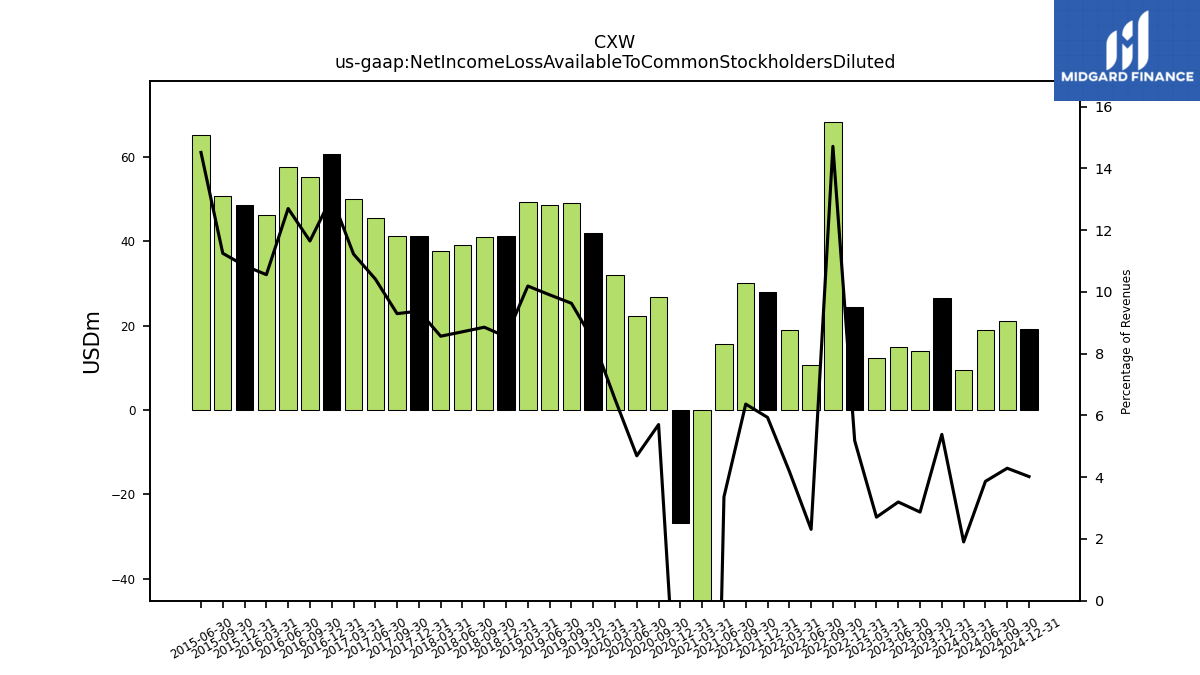
| Net Income Loss Available To Common Stockholders Diluted | 26.47 | 13.89 | 14.83 | 12.40 | 24.44 | 68.32 | 10.56 | 19.00 | 28.04 | 30.01 | 15.62 | -125.57 | -26.80 | 26.72 | 22.19 | 32.06 | 41.97 | 48.99 | 48.58 | 49.34 | 41.24 | 40.99 | 39.20 | 37.78 | 41.34 | 41.18 | 45.48 | 50.05 | 60.69 | 55.34 | 57.58 | 46.31 | 48.60 | 50.68 | 65.30 | NA | NA | NA | NA | NA | NA | NA | NA | NA | NA | NA | NA | NA | NA | NA | NA | NA | NA | NA | NA | NA |
| 2023-12-31 | 2023-09-30 | 2023-06-30 | 2023-03-31 | 2022-12-31 | 2022-09-30 | 2022-06-30 | 2022-03-31 | 2021-12-31 | 2021-09-30 | 2021-06-30 | 2021-03-31 | 2020-12-31 | 2020-09-30 | 2020-06-30 | 2020-03-31 | 2019-12-31 | 2019-09-30 | 2019-06-30 | 2019-03-31 | 2018-12-31 | 2018-09-30 | 2018-06-30 | 2018-03-31 | 2017-12-31 | 2017-09-30 | 2017-06-30 | 2017-03-31 | 2016-12-31 | 2016-09-30 | 2016-06-30 | 2016-03-31 | 2015-12-31 | 2015-09-30 | 2015-06-30 | 2015-03-31 | 2014-12-31 | 2014-09-30 | 2014-06-30 | 2014-03-31 | 2013-12-31 | 2013-09-30 | 2013-06-30 | 2013-03-31 | 2012-12-31 | 2012-09-30 | 2012-06-30 | 2012-03-31 | 2011-12-31 | 2011-09-30 | 2011-06-30 | 2011-03-31 | 2010-12-31 | 2010-09-30 | 2010-06-30 | 2010-03-31 | ||
|---|---|---|---|---|---|---|---|---|---|---|---|---|---|---|---|---|---|---|---|---|---|---|---|---|---|---|---|---|---|---|---|---|---|---|---|---|---|---|---|---|---|---|---|---|---|---|---|---|---|---|---|---|---|---|---|---|---|
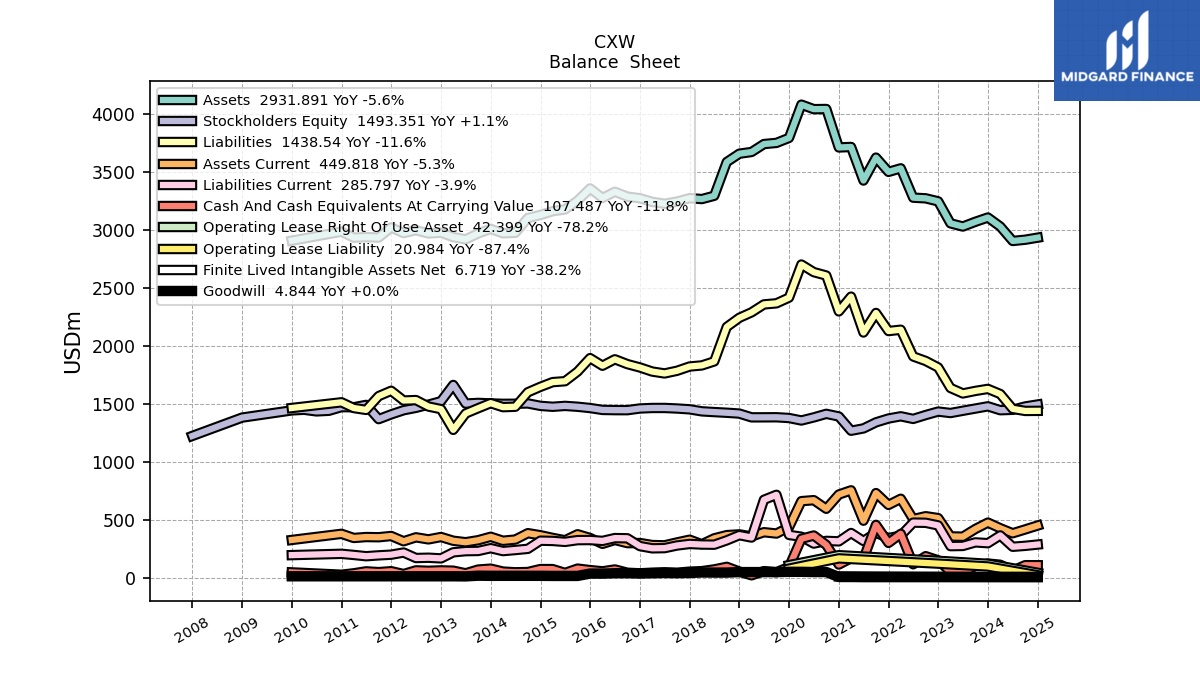
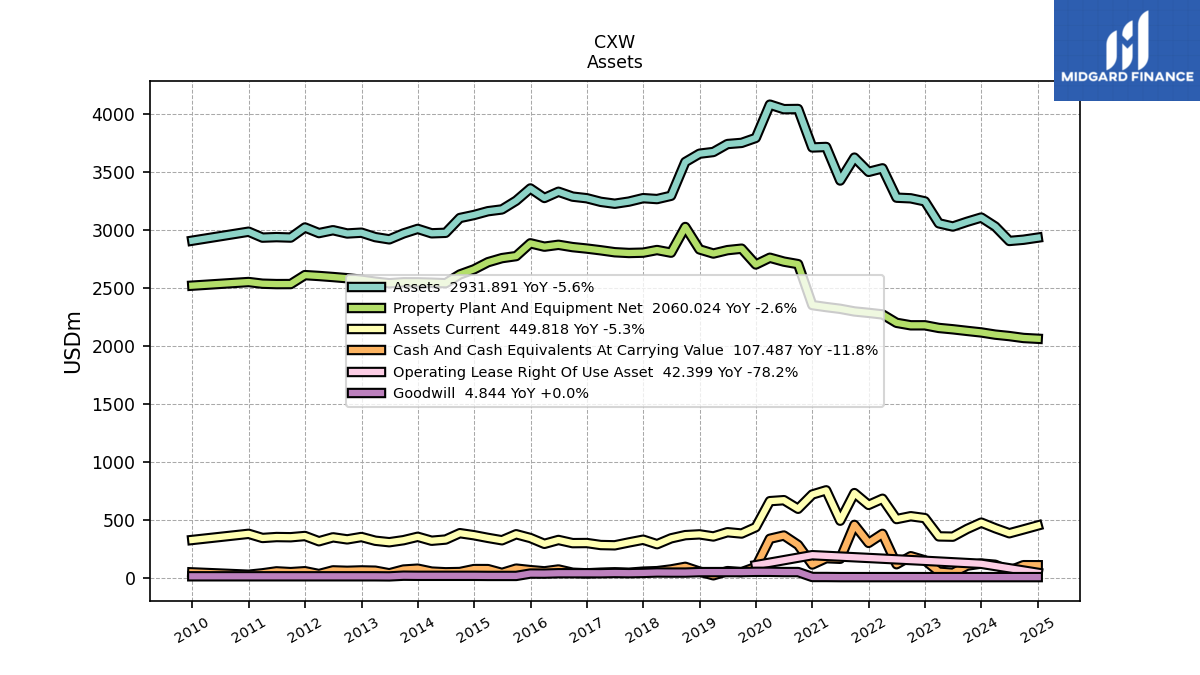
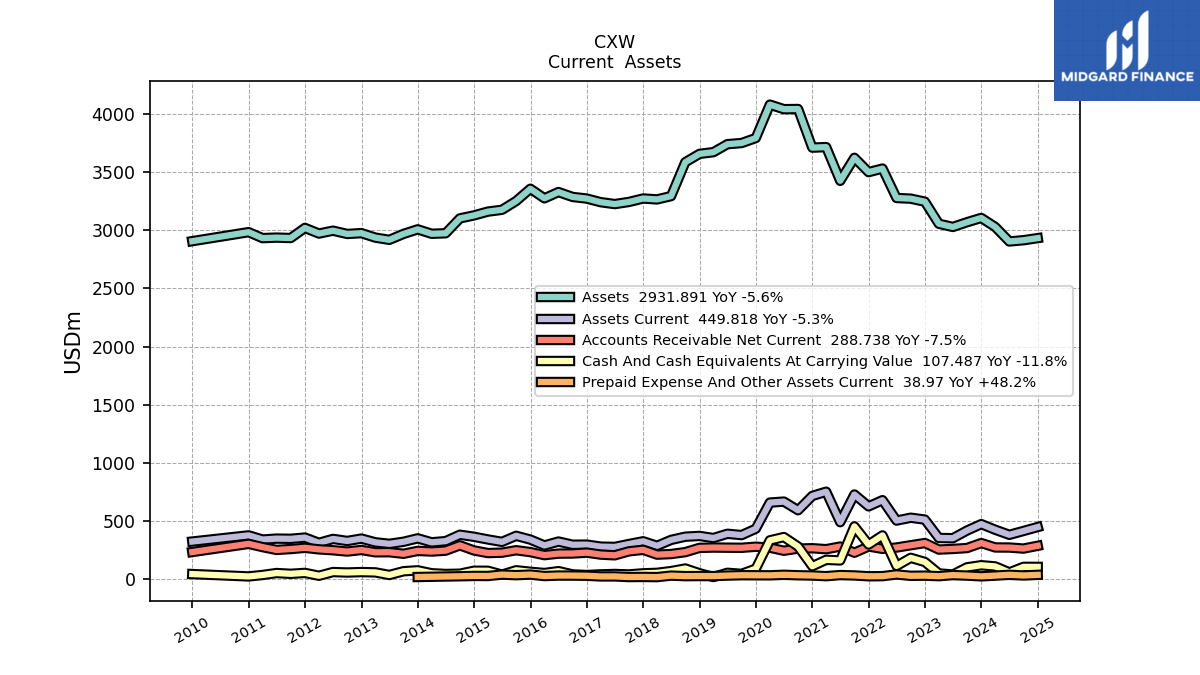
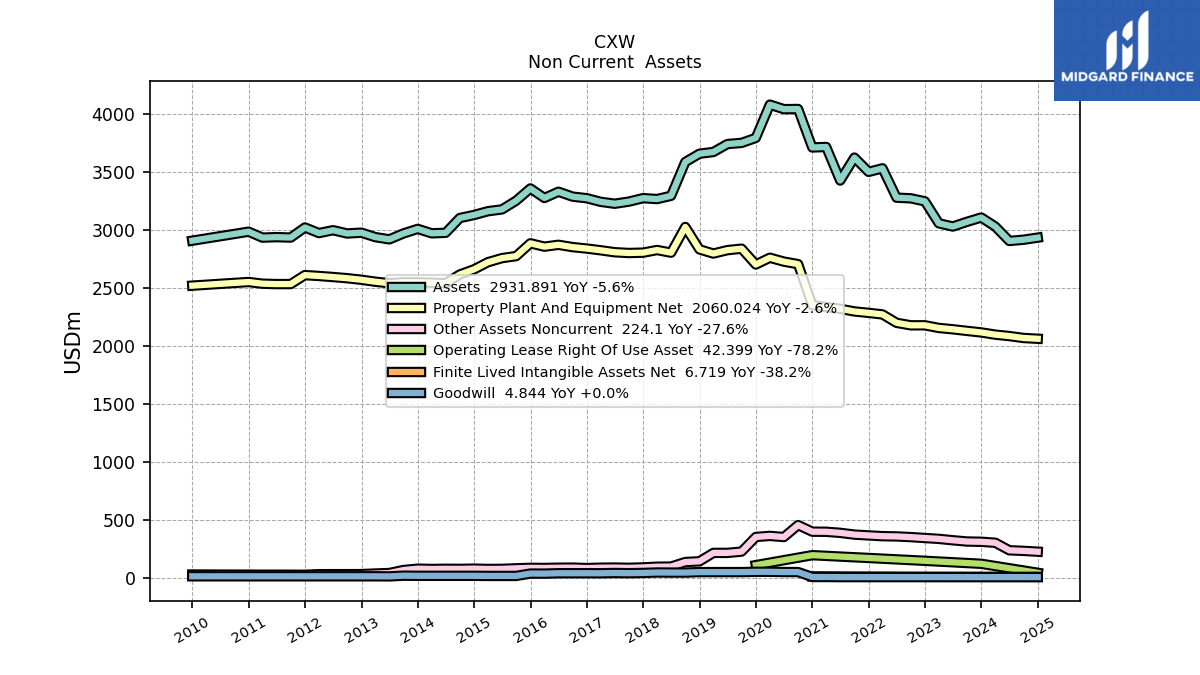
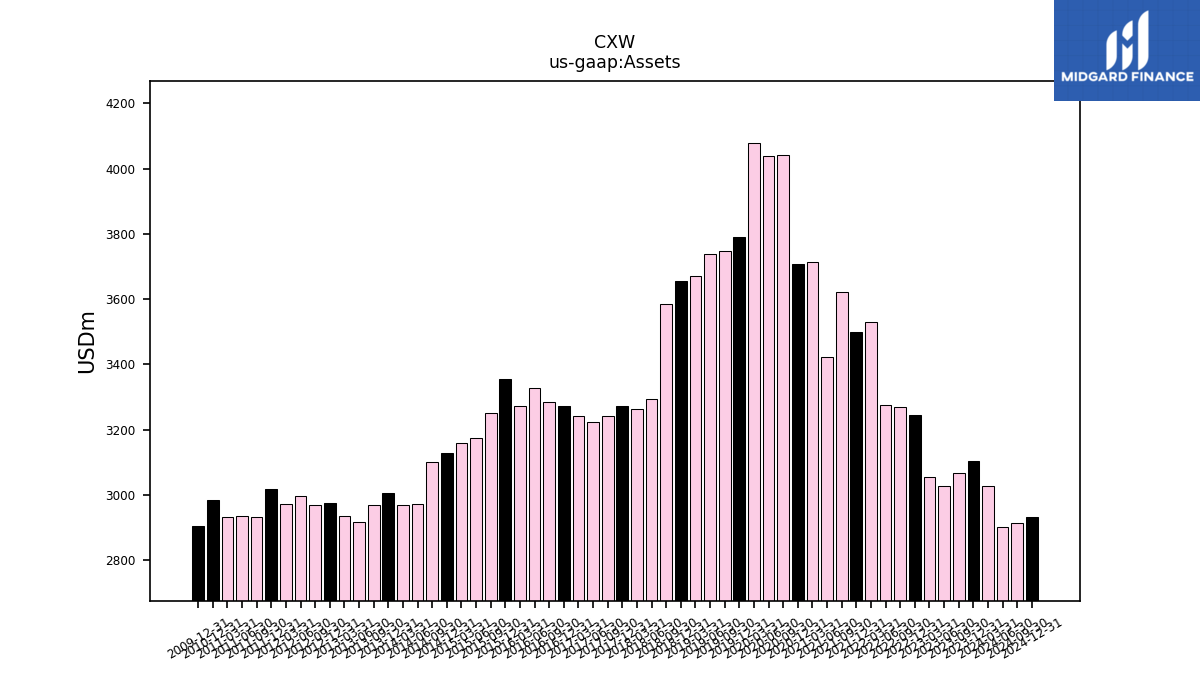
| Assets | 3105.40 | 3068.61 | 3027.78 | 3055.40 | 3244.77 | 3270.93 | 3276.53 | 3529.55 | 3498.94 | 3621.98 | 3424.20 | 3713.80 | 3709.32 | 4041.20 | 4039.74 | 4078.80 | 3791.63 | 3748.84 | 3738.89 | 3670.38 | 3655.66 | 3584.03 | 3292.78 | 3264.45 | 3272.40 | 3242.77 | 3224.32 | 3240.62 | 3271.60 | 3285.51 | 3327.75 | 3273.80 | 3356.02 | 3250.63 | 3175.17 | 3159.77 | 3127.19 | 3101.15 | 2973.49 | 2969.26 | 3007.43 | 2968.18 | 2917.16 | 2936.38 | 2974.74 | 2967.68 | 2996.00 | 2971.13 | 3019.63 | 2932.55 | 2936.35 | 2932.03 | 2983.23 | NA | NA | NA | |
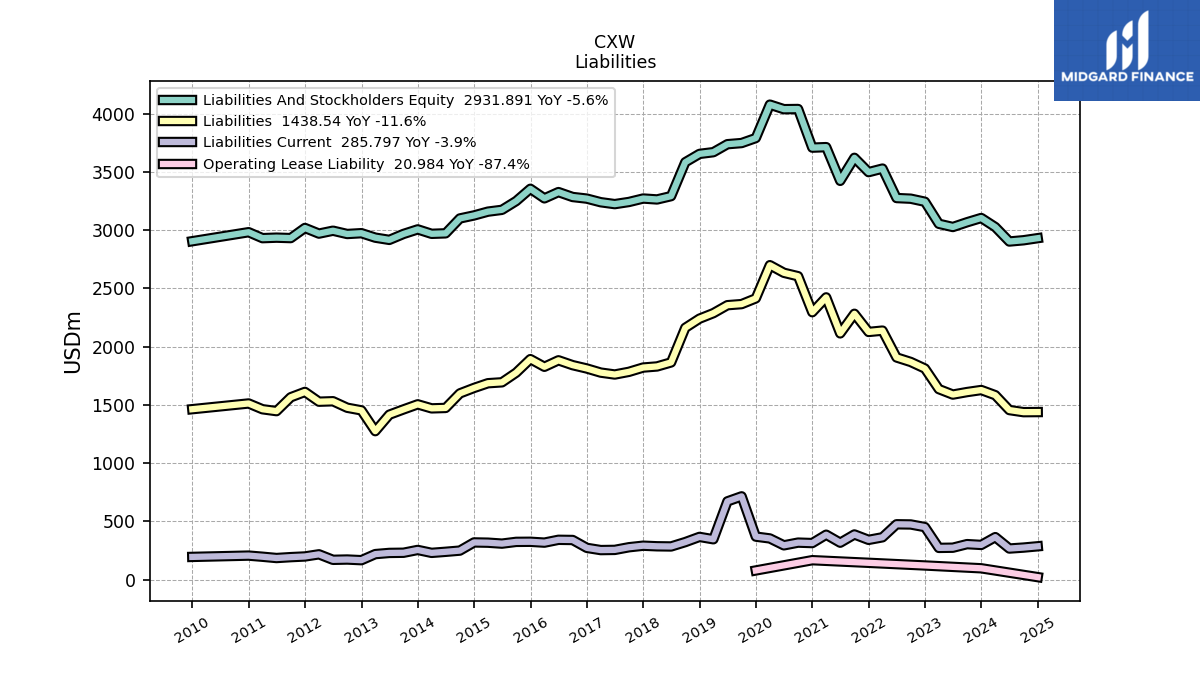
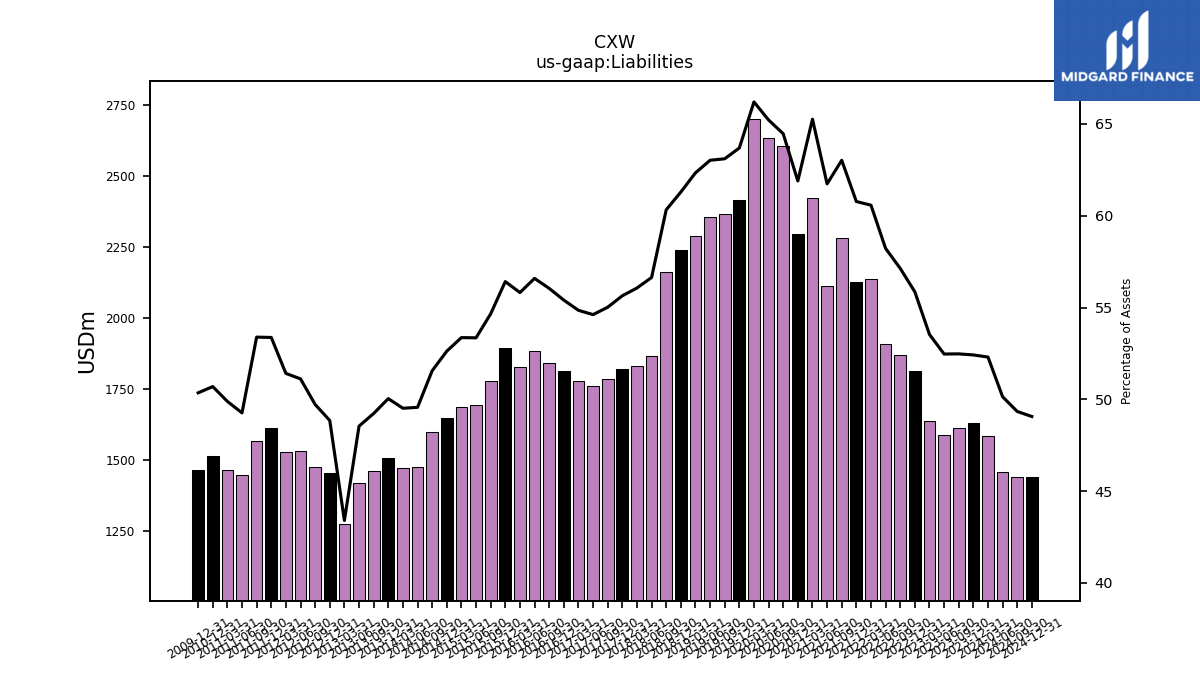
| Liabilities | 1627.83 | 1610.31 | 1588.64 | 1635.67 | 1812.36 | 1868.75 | 1907.59 | 2138.03 | 2126.47 | 2282.62 | 2113.97 | 2423.57 | 2295.87 | 2605.21 | 2634.56 | 2700.12 | 2414.88 | 2365.64 | 2356.30 | 2287.97 | 2240.60 | 2161.96 | 1864.86 | 1830.24 | 1820.79 | 1784.09 | 1760.97 | 1777.46 | 1812.64 | 1841.32 | 1883.12 | 1827.35 | 1893.27 | 1776.75 | 1694.01 | 1686.15 | 1645.69 | 1598.86 | 1473.86 | 1470.24 | 1504.92 | 1461.23 | 1415.97 | 1274.47 | 1453.12 | 1475.60 | 1531.43 | 1527.56 | 1611.61 | 1565.68 | 1446.53 | 1462.74 | 1512.36 | NA | NA | NA | |
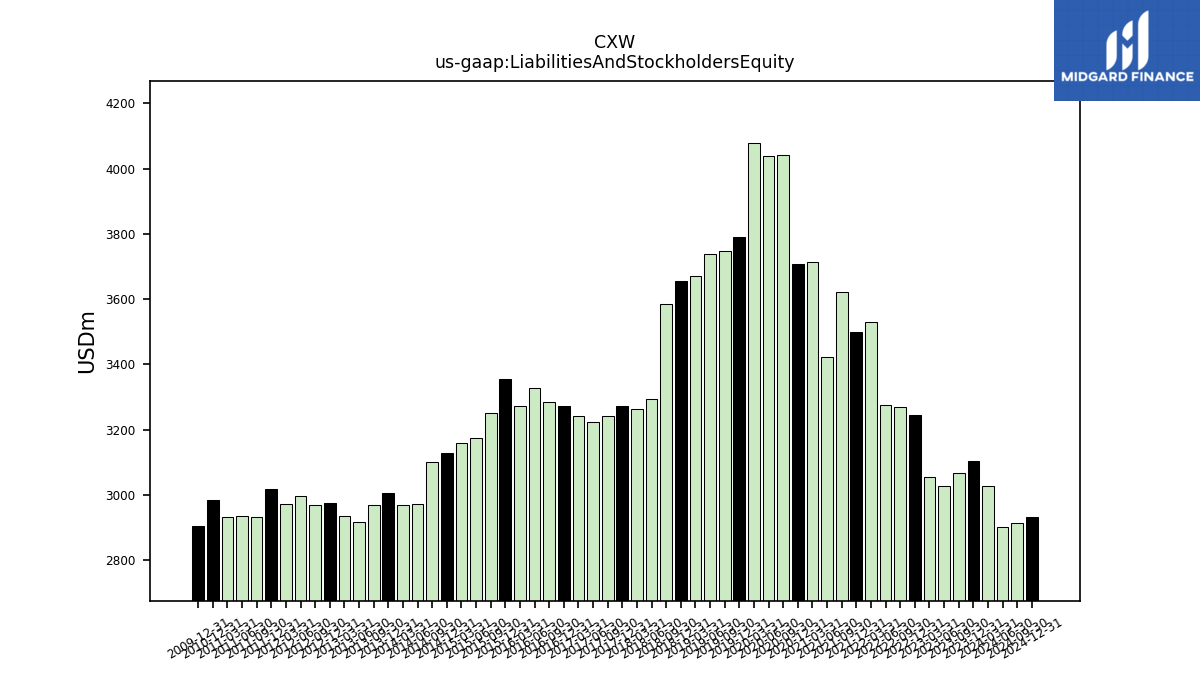
| Liabilities And Stockholders Equity | 3105.40 | 3068.61 | 3027.78 | 3055.40 | 3244.77 | 3270.93 | 3276.53 | 3529.55 | 3498.94 | 3621.98 | 3424.20 | 3713.80 | 3709.32 | 4041.20 | 4039.74 | 4078.80 | 3791.63 | 3748.84 | 3738.89 | 3670.38 | 3655.66 | 3584.03 | 3292.78 | 3264.45 | 3272.40 | 3242.77 | 3224.32 | 3240.62 | 3271.60 | 3285.51 | 3327.75 | 3273.80 | 3356.02 | 3250.63 | 3175.17 | 3159.77 | 3127.19 | 3101.15 | 2973.49 | 2969.26 | 3007.43 | 2968.18 | 2917.16 | 2936.38 | 2974.74 | 2967.68 | 2996.00 | 2971.13 | 3019.63 | 2932.55 | 2936.35 | 2932.03 | 2983.23 | NA | NA | NA | |
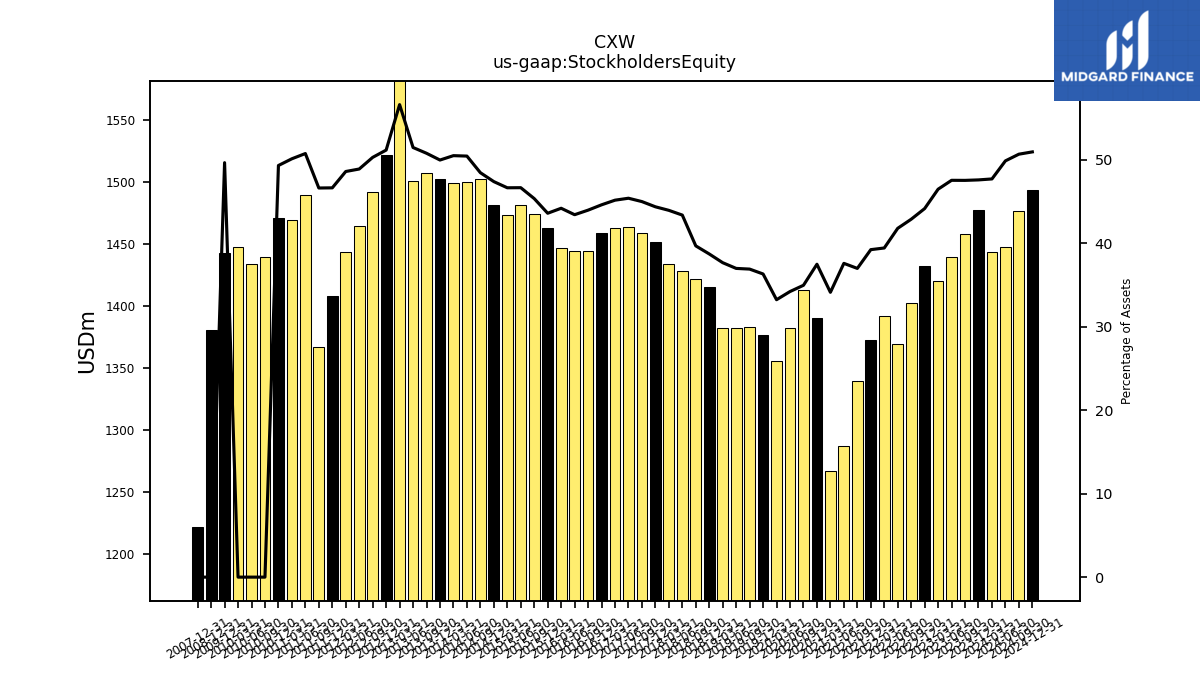
| Stockholders Equity | 1477.57 | 1458.30 | 1439.14 | 1419.73 | 1432.41 | 1402.17 | 1368.94 | 1391.52 | 1372.47 | 1339.36 | 1286.96 | 1266.96 | 1390.17 | 1412.72 | 1381.91 | 1355.40 | 1376.75 | 1383.20 | 1382.59 | 1382.41 | 1415.06 | 1422.08 | 1427.92 | 1434.21 | 1451.61 | 1458.68 | 1463.34 | 1463.16 | 1458.96 | 1444.19 | 1444.63 | 1446.46 | 1462.75 | 1473.88 | 1481.16 | 1473.62 | 1481.50 | 1502.29 | 1499.63 | 1499.02 | 1502.51 | 1506.95 | 1501.19 | 1661.90 | 1521.62 | 1492.08 | 1464.57 | 1443.57 | 1408.02 | 1366.87 | 1489.82 | 1469.29 | 1470.87 | 1439.17 | 1433.93 | 1447.89 |
| 2023-12-31 | 2023-09-30 | 2023-06-30 | 2023-03-31 | 2022-12-31 | 2022-09-30 | 2022-06-30 | 2022-03-31 | 2021-12-31 | 2021-09-30 | 2021-06-30 | 2021-03-31 | 2020-12-31 | 2020-09-30 | 2020-06-30 | 2020-03-31 | 2019-12-31 | 2019-09-30 | 2019-06-30 | 2019-03-31 | 2018-12-31 | 2018-09-30 | 2018-06-30 | 2018-03-31 | 2017-12-31 | 2017-09-30 | 2017-06-30 | 2017-03-31 | 2016-12-31 | 2016-09-30 | 2016-06-30 | 2016-03-31 | 2015-12-31 | 2015-09-30 | 2015-06-30 | 2015-03-31 | 2014-12-31 | 2014-09-30 | 2014-06-30 | 2014-03-31 | 2013-12-31 | 2013-09-30 | 2013-06-30 | 2013-03-31 | 2012-12-31 | 2012-09-30 | 2012-06-30 | 2012-03-31 | 2011-12-31 | 2011-09-30 | 2011-06-30 | 2011-03-31 | 2010-12-31 | 2010-09-30 | 2010-06-30 | 2010-03-31 | ||
|---|---|---|---|---|---|---|---|---|---|---|---|---|---|---|---|---|---|---|---|---|---|---|---|---|---|---|---|---|---|---|---|---|---|---|---|---|---|---|---|---|---|---|---|---|---|---|---|---|---|---|---|---|---|---|---|---|---|
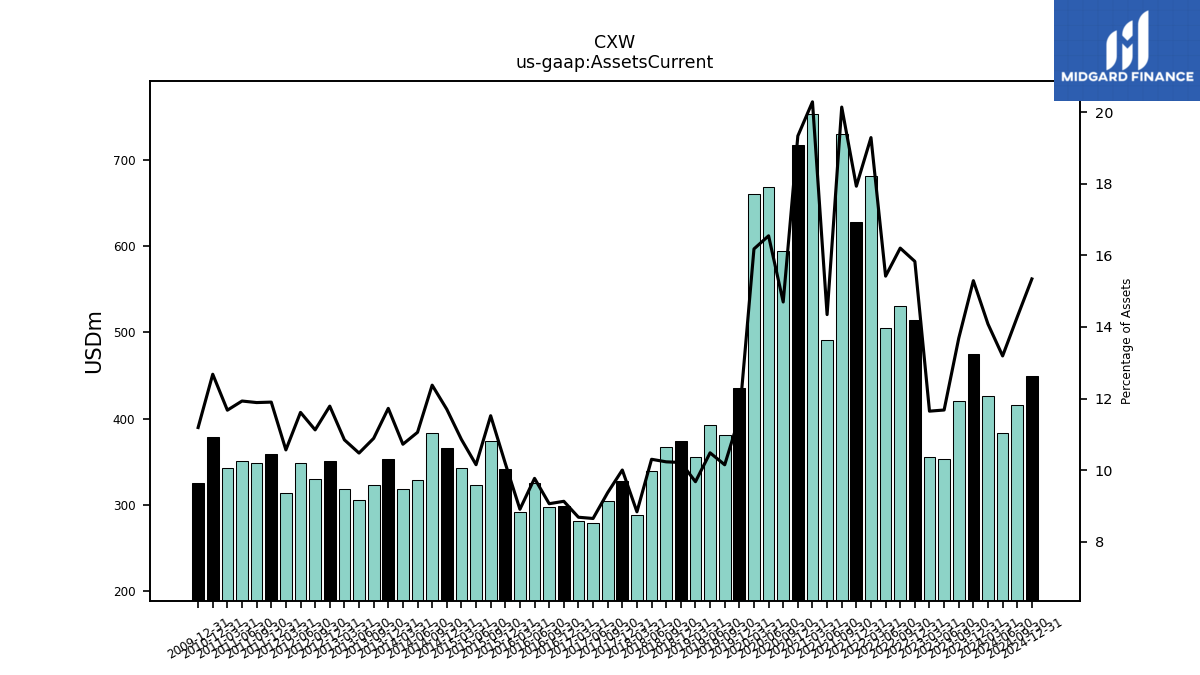
| Assets Current | 474.91 | 419.96 | 353.72 | 355.97 | 513.67 | 529.96 | 505.24 | 680.76 | 627.38 | 729.44 | 491.25 | 753.38 | 717.12 | 593.99 | 668.41 | 659.90 | 435.38 | 380.64 | 392.11 | 355.33 | 373.52 | 366.86 | 339.39 | 288.60 | 327.49 | 304.06 | 279.05 | 281.58 | 298.82 | 297.89 | 325.26 | 291.76 | 342.06 | 374.57 | 322.48 | 343.18 | 365.99 | 383.81 | 328.87 | 318.52 | 352.73 | 323.28 | 305.73 | 318.60 | 350.74 | 330.24 | 348.01 | 314.03 | 359.43 | 348.69 | 350.40 | 342.40 | 378.29 | NA | NA | NA | |
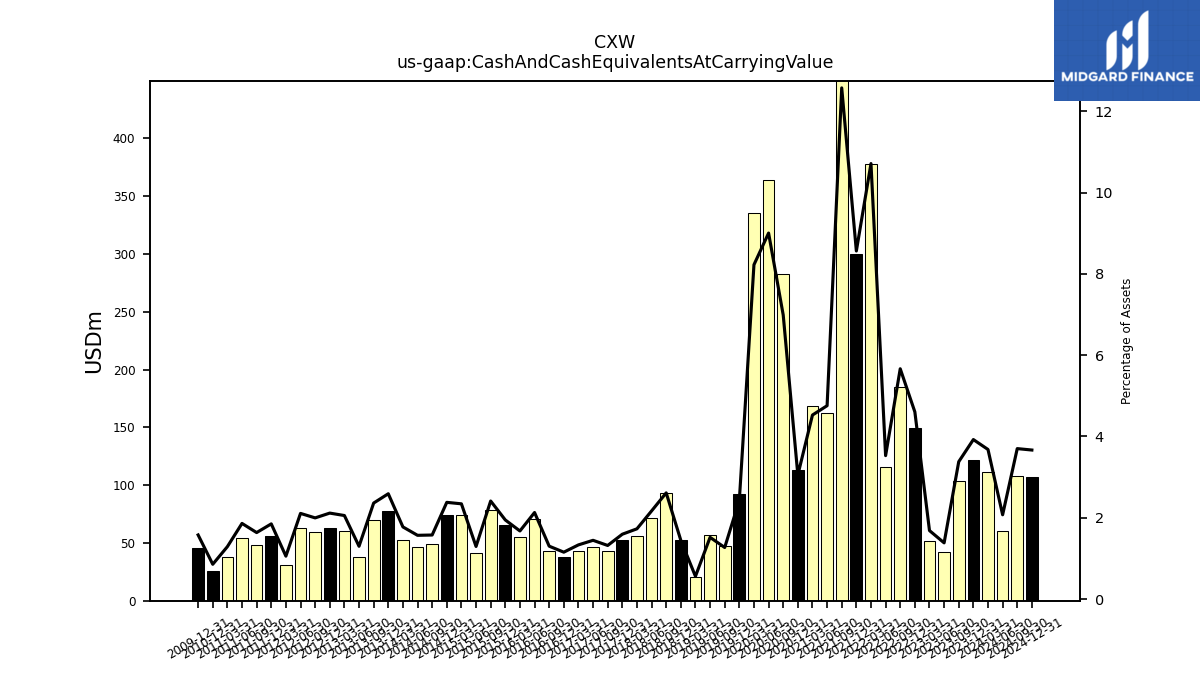
| Cash And Cash Equivalents At Carrying Value | 121.84 | 103.70 | 41.84 | 51.46 | 149.40 | 185.33 | 115.61 | 378.20 | 299.64 | 455.54 | 162.89 | 168.14 | 113.22 | 282.46 | 363.77 | 335.49 | 92.12 | 47.54 | 56.74 | 20.50 | 52.80 | 93.62 | 71.37 | 56.40 | 52.18 | 42.73 | 46.58 | 43.16 | 37.71 | 42.73 | 70.84 | 54.82 | 65.29 | 78.40 | 41.07 | 74.02 | 74.39 | 48.85 | 46.62 | 52.68 | 77.91 | 70.09 | 37.88 | 60.33 | 62.90 | 59.24 | 63.13 | 31.35 | 55.83 | 47.96 | 54.62 | 37.79 | 25.50 | NA | NA | NA | |
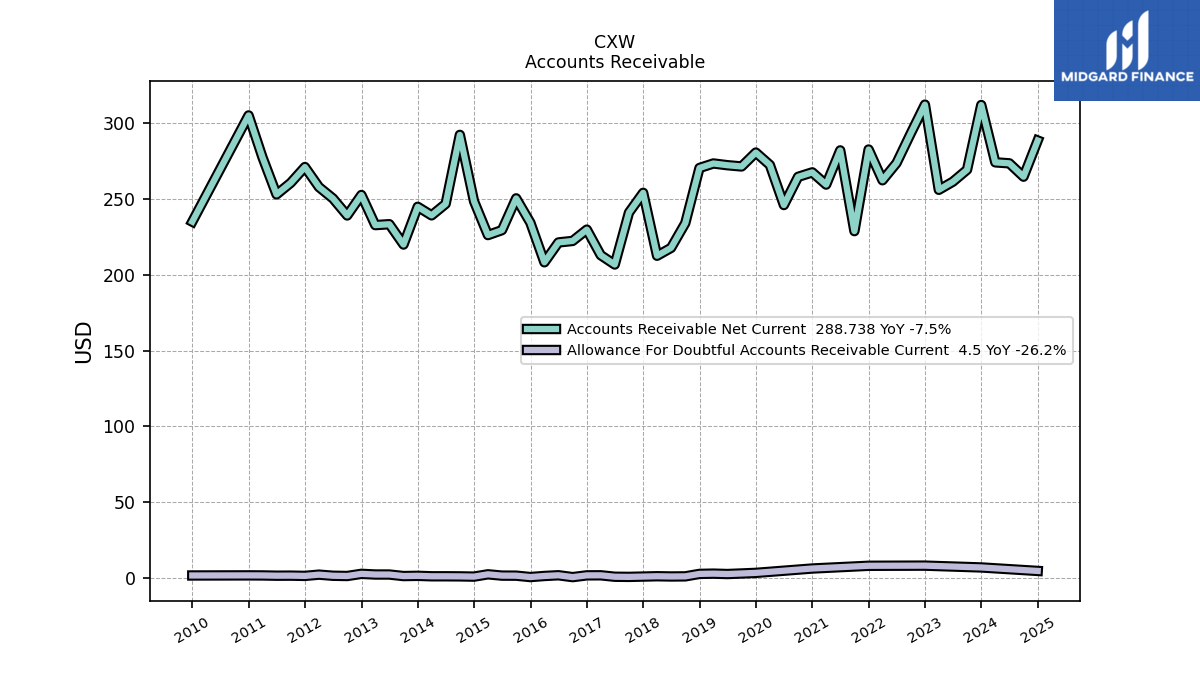
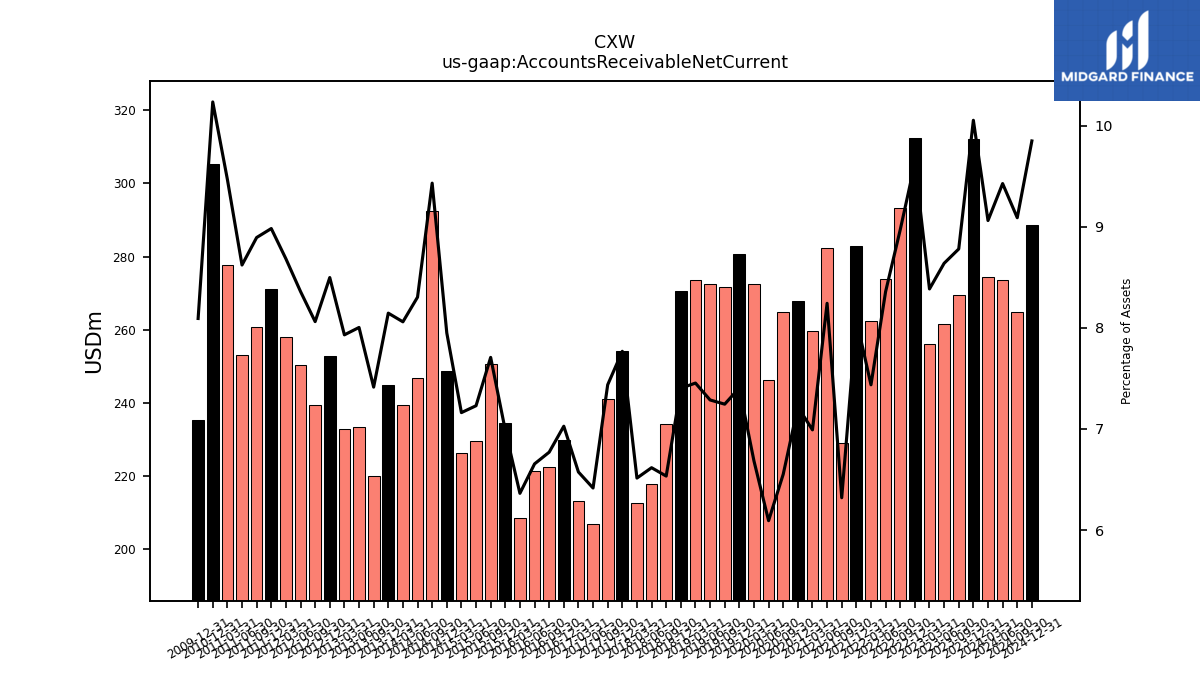
| Accounts Receivable Net Current | 312.17 | 269.42 | 261.54 | 256.18 | 312.44 | 293.39 | 273.84 | 262.47 | 282.81 | 228.89 | 282.23 | 259.62 | 267.70 | 264.75 | 246.11 | 272.60 | 280.79 | 271.59 | 272.42 | 273.57 | 270.60 | 234.16 | 217.86 | 212.63 | 254.19 | 241.14 | 206.85 | 213.03 | 229.88 | 222.42 | 221.43 | 208.30 | 234.46 | 250.54 | 229.54 | 226.28 | 248.59 | 292.47 | 246.89 | 239.30 | 244.96 | 220.04 | 233.47 | 232.86 | 252.76 | 239.23 | 250.44 | 257.98 | 271.22 | 260.79 | 253.14 | 277.62 | 305.31 | NA | NA | NA | |
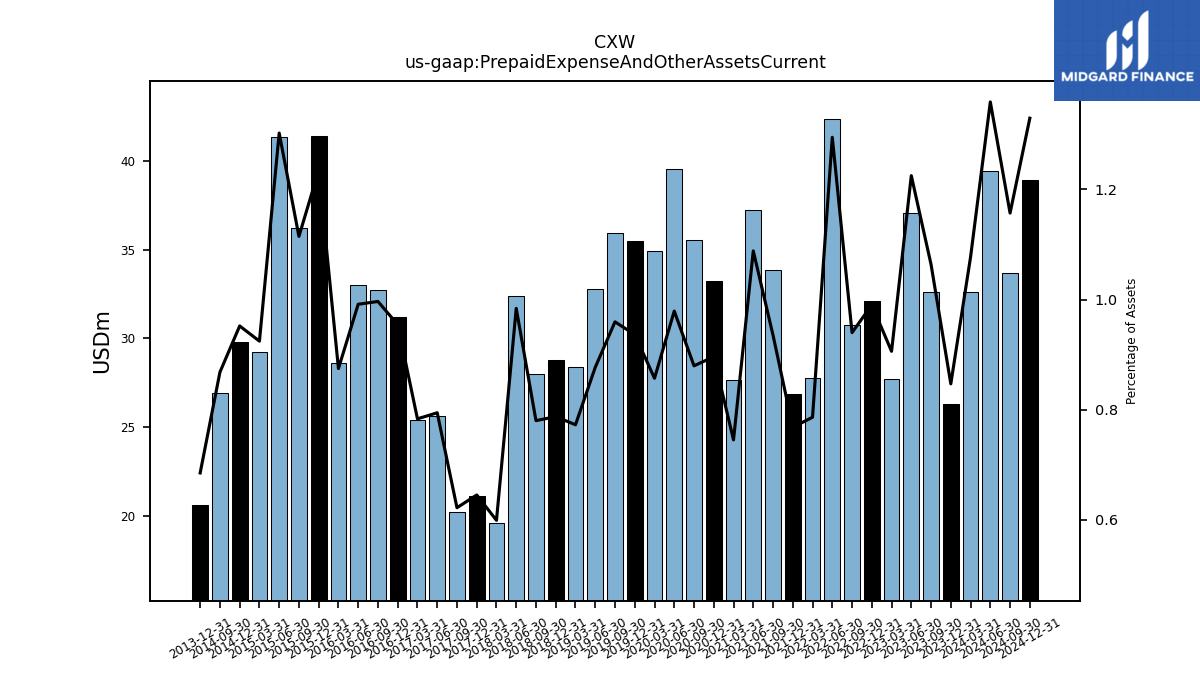
| Prepaid Expense And Other Assets Current | 26.30 | 32.64 | 37.09 | 27.68 | 32.13 | 30.75 | 42.41 | 27.76 | 26.87 | 33.88 | 37.27 | 27.68 | 33.24 | 35.55 | 39.55 | 34.96 | 35.51 | 35.97 | 32.79 | 28.36 | 28.79 | 27.96 | 32.40 | 19.57 | 21.12 | 20.18 | 25.62 | 25.39 | 31.23 | 32.74 | 32.99 | 28.64 | 41.43 | 36.23 | 41.35 | 29.21 | 29.77 | 26.93 | NA | NA | 20.61 | NA | NA | NA | NA | NA | NA | NA | NA | NA | NA | NA | NA | NA | NA | NA |
| 2023-12-31 | 2023-09-30 | 2023-06-30 | 2023-03-31 | 2022-12-31 | 2022-09-30 | 2022-06-30 | 2022-03-31 | 2021-12-31 | 2021-09-30 | 2021-06-30 | 2021-03-31 | 2020-12-31 | 2020-09-30 | 2020-06-30 | 2020-03-31 | 2019-12-31 | 2019-09-30 | 2019-06-30 | 2019-03-31 | 2018-12-31 | 2018-09-30 | 2018-06-30 | 2018-03-31 | 2017-12-31 | 2017-09-30 | 2017-06-30 | 2017-03-31 | 2016-12-31 | 2016-09-30 | 2016-06-30 | 2016-03-31 | 2015-12-31 | 2015-09-30 | 2015-06-30 | 2015-03-31 | 2014-12-31 | 2014-09-30 | 2014-06-30 | 2014-03-31 | 2013-12-31 | 2013-09-30 | 2013-06-30 | 2013-03-31 | 2012-12-31 | 2012-09-30 | 2012-06-30 | 2012-03-31 | 2011-12-31 | 2011-09-30 | 2011-06-30 | 2011-03-31 | 2010-12-31 | 2010-09-30 | 2010-06-30 | 2010-03-31 | ||
|---|---|---|---|---|---|---|---|---|---|---|---|---|---|---|---|---|---|---|---|---|---|---|---|---|---|---|---|---|---|---|---|---|---|---|---|---|---|---|---|---|---|---|---|---|---|---|---|---|---|---|---|---|---|---|---|---|---|
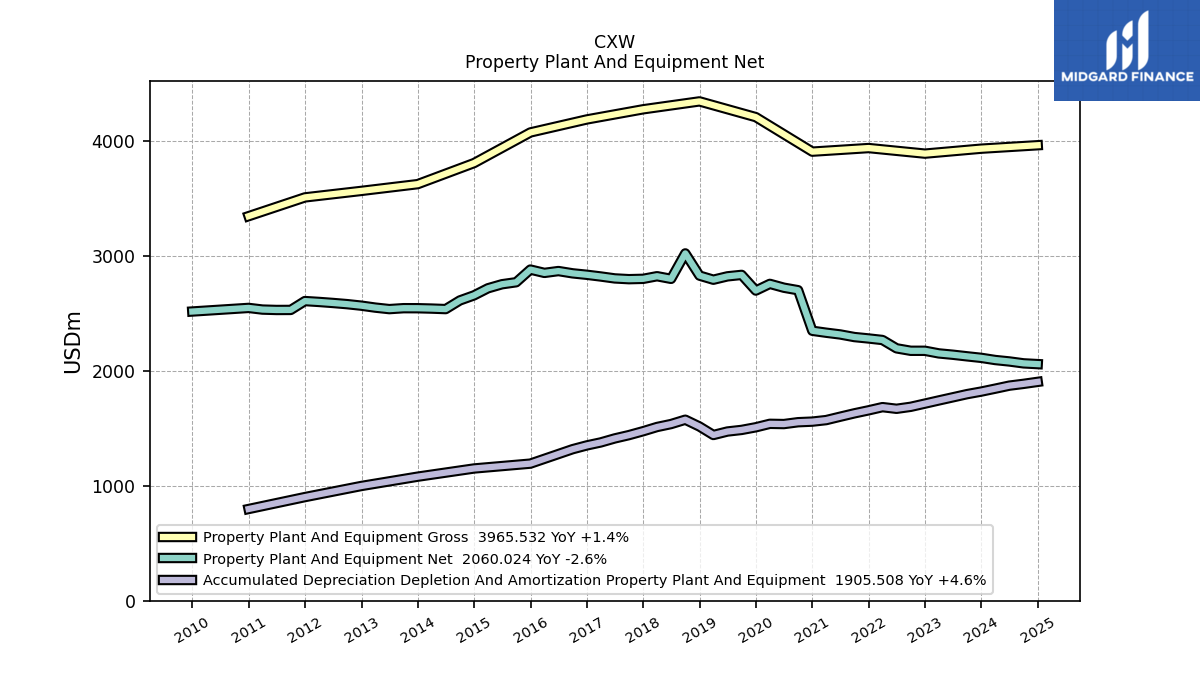
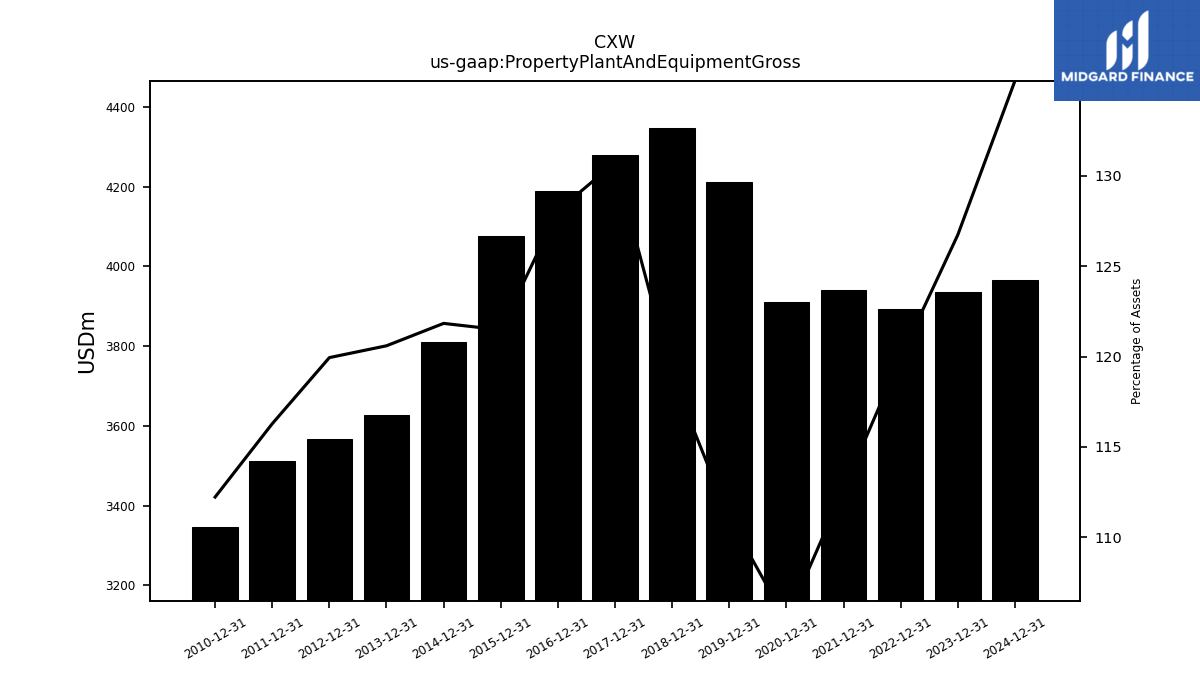
| Property Plant And Equipment Gross | 3935.54 | NA | NA | NA | 3892.38 | NA | NA | NA | 3940.97 | NA | NA | NA | 3909.66 | NA | NA | NA | 4210.22 | NA | NA | NA | 4347.25 | NA | NA | NA | 4278.40 | NA | NA | NA | 4189.98 | NA | NA | NA | 4076.78 | NA | NA | NA | 3810.05 | NA | NA | NA | 3626.85 | NA | NA | NA | 3567.97 | NA | NA | NA | 3511.30 | NA | NA | NA | 3347.86 | NA | NA | NA | |
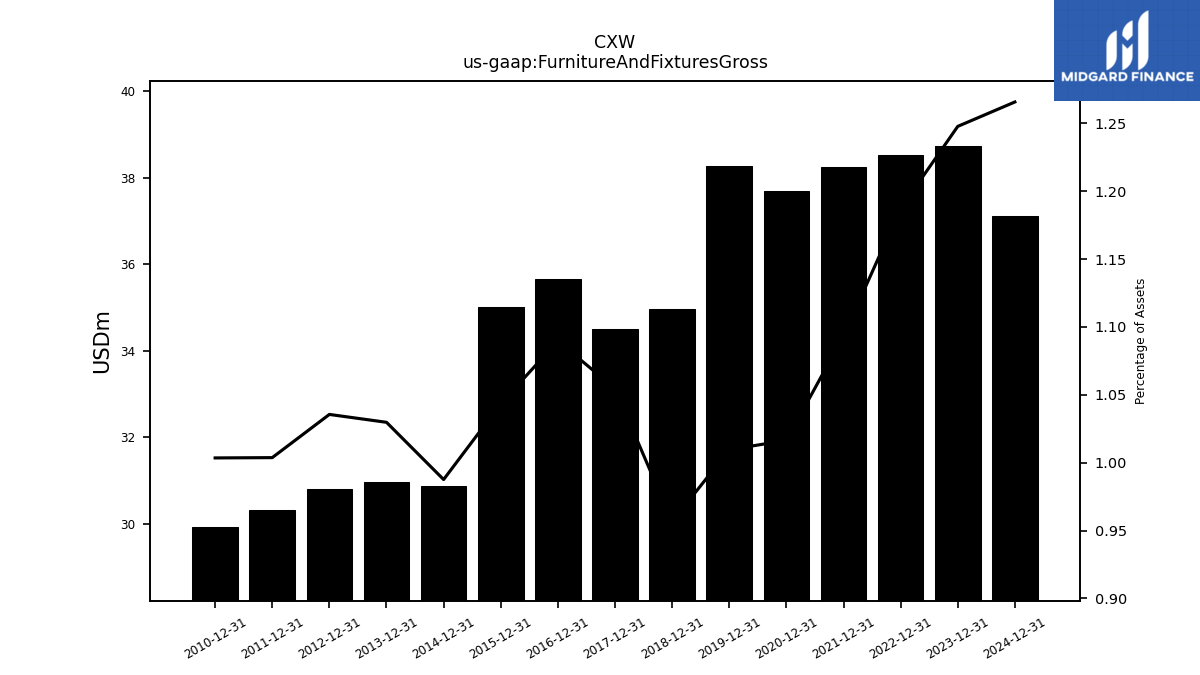
| Furniture And Fixtures Gross | 38.75 | NA | NA | NA | 38.52 | NA | NA | NA | 38.26 | NA | NA | NA | 37.70 | NA | NA | NA | 38.28 | NA | NA | NA | 34.97 | NA | NA | NA | 34.51 | NA | NA | NA | 35.65 | NA | NA | NA | 35.02 | NA | NA | NA | 30.88 | NA | NA | NA | 30.97 | NA | NA | NA | 30.80 | NA | NA | NA | 30.31 | NA | NA | NA | 29.94 | NA | NA | NA | |
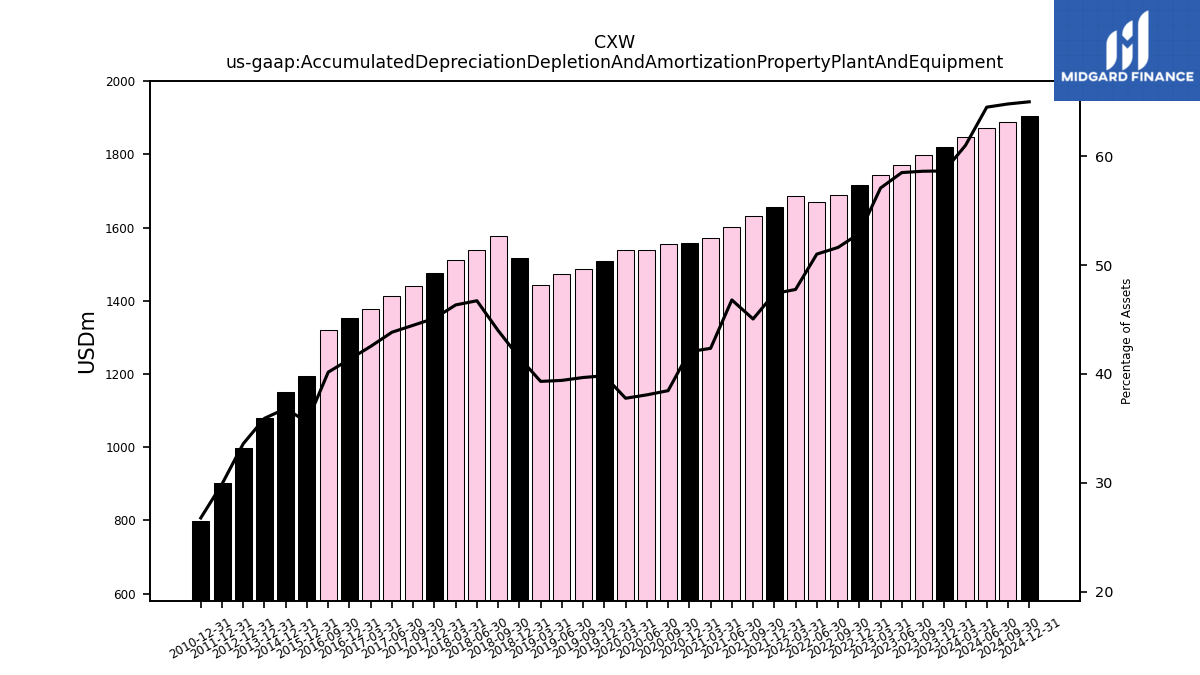
| Accumulated Depreciation Depletion And Amortization Property Plant And Equipment | 1821.02 | 1798.67 | 1771.01 | 1743.78 | 1716.28 | 1688.39 | 1671.09 | 1685.56 | 1657.71 | 1631.52 | 1602.28 | 1572.71 | 1559.39 | 1554.23 | 1538.15 | 1540.25 | 1510.12 | 1487.13 | 1473.26 | 1442.84 | 1516.66 | 1576.13 | 1538.35 | 1512.57 | 1475.95 | 1441.95 | 1413.14 | 1378.22 | 1352.32 | 1319.45 | NA | NA | 1193.72 | NA | NA | NA | 1151.42 | NA | NA | NA | 1080.23 | NA | NA | NA | 999.18 | NA | NA | NA | 902.38 | NA | NA | NA | 798.56 | NA | NA | NA | |
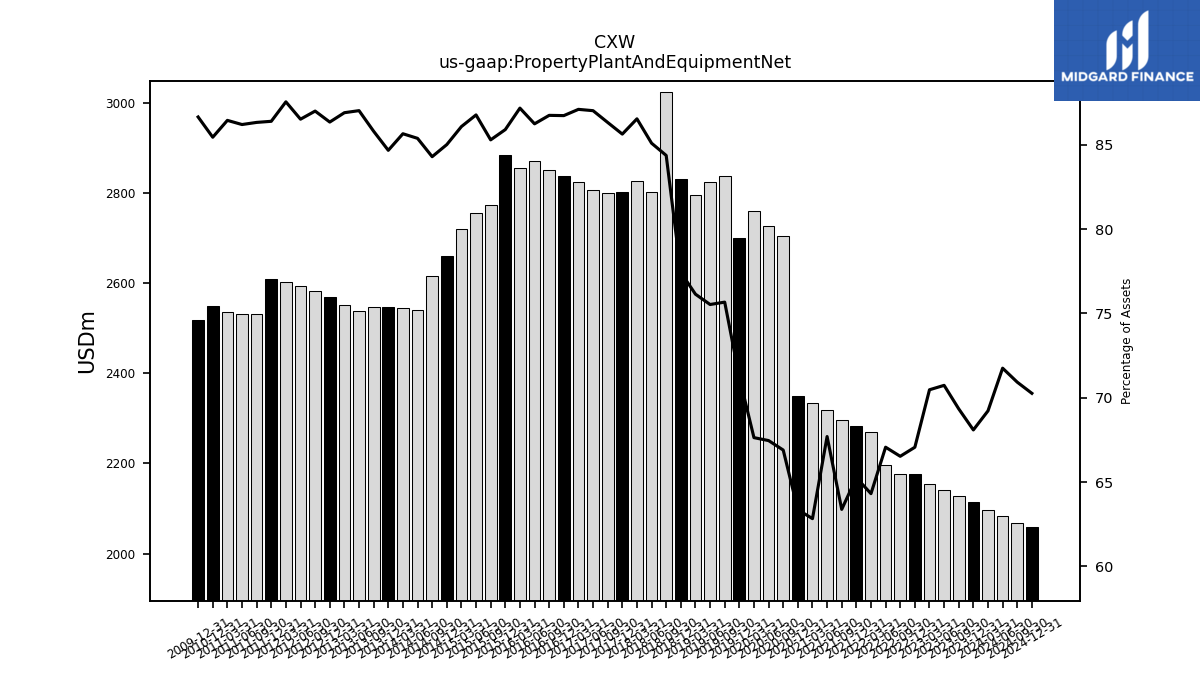
| Property Plant And Equipment Net | 2114.52 | 2127.80 | 2141.71 | 2153.25 | 2176.10 | 2176.05 | 2197.46 | 2269.91 | 2283.26 | 2295.57 | 2318.16 | 2333.34 | 2350.27 | 2703.47 | 2725.18 | 2758.68 | 2700.11 | 2836.84 | 2824.03 | 2794.77 | 2830.59 | 3023.96 | 2802.15 | 2825.20 | 2802.45 | 2799.48 | 2806.08 | 2822.80 | 2837.66 | 2850.22 | 2870.15 | 2854.11 | 2883.06 | 2772.74 | 2755.29 | 2720.08 | 2658.63 | 2614.26 | 2539.00 | 2543.47 | 2546.61 | 2546.90 | 2538.82 | 2551.96 | 2568.79 | 2582.02 | 2592.25 | 2601.30 | 2608.92 | 2531.75 | 2531.33 | 2534.84 | 2549.30 | NA | NA | NA | |
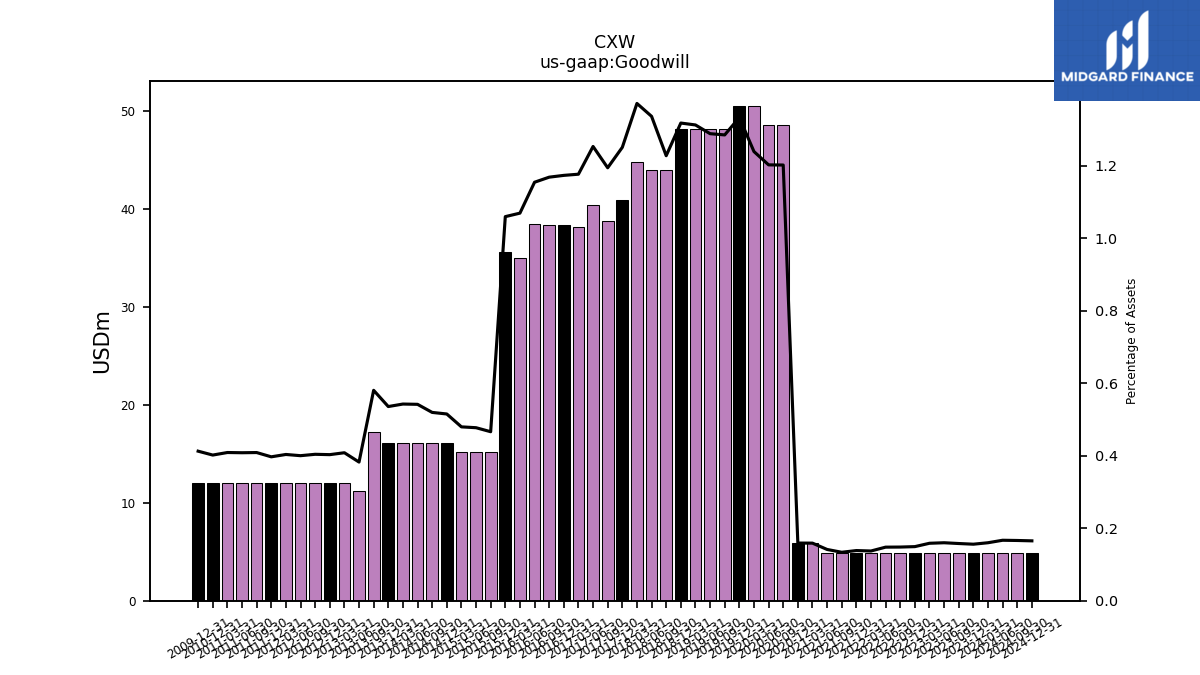
| Goodwill | 4.84 | 4.84 | 4.84 | 4.84 | 4.84 | 4.84 | 4.84 | 4.84 | 4.84 | 4.84 | 4.84 | 5.90 | 5.90 | 48.57 | 48.57 | 50.54 | 50.54 | 48.17 | 48.17 | 48.17 | 48.17 | 44.00 | 44.00 | 44.78 | 40.93 | 38.73 | 40.40 | 38.13 | 38.39 | 38.39 | 38.41 | 35.00 | 35.56 | 15.15 | 15.15 | 15.15 | 16.11 | 16.11 | 16.11 | 16.11 | 16.11 | 17.23 | 11.16 | 11.99 | 11.99 | 11.99 | 11.99 | 11.99 | 11.99 | 11.99 | 11.99 | 11.99 | 11.99 | NA | NA | NA | |
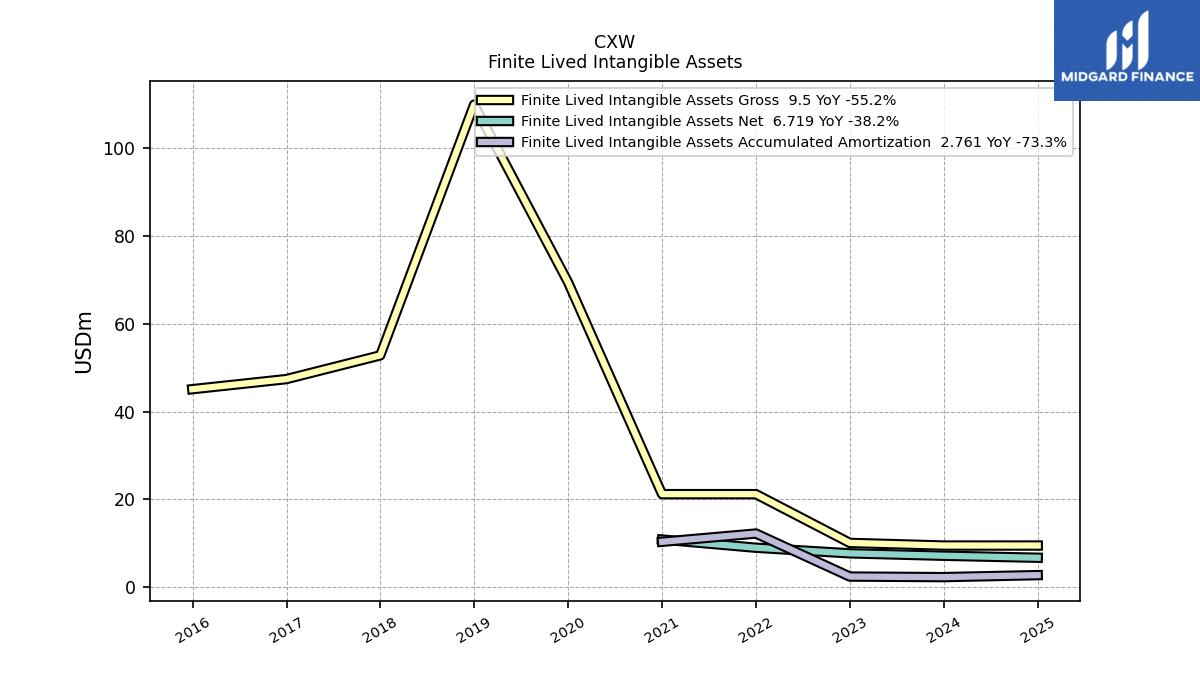
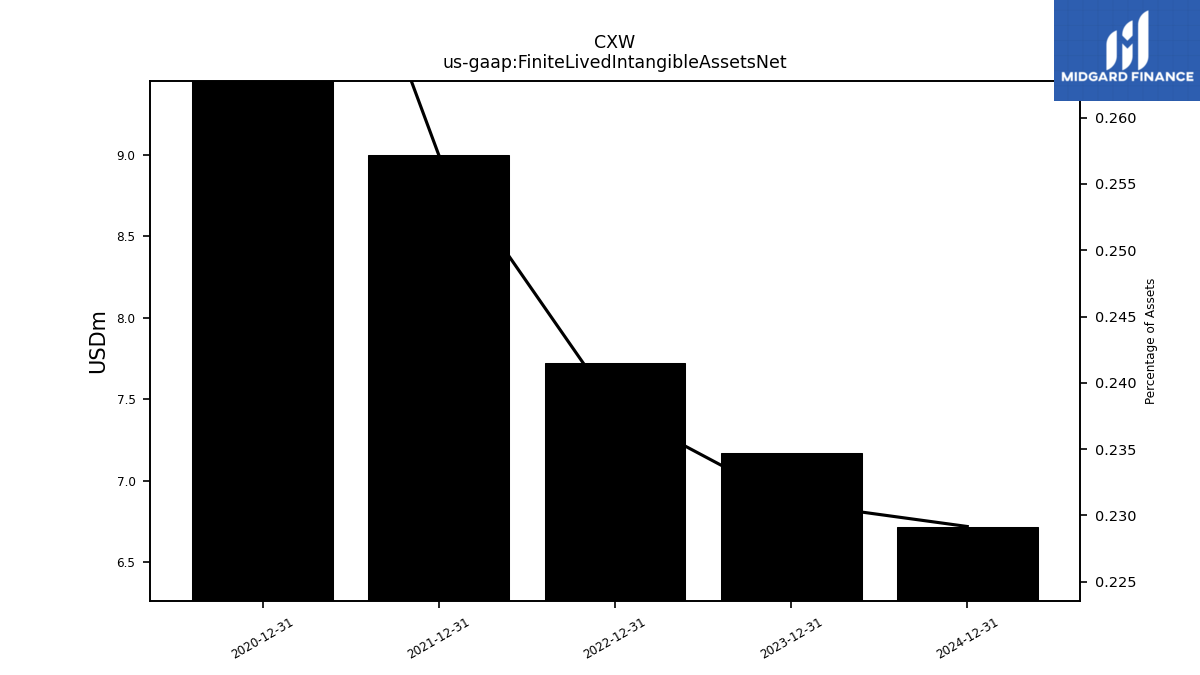
| Finite Lived Intangible Assets Net | 7.17 | NA | NA | NA | 7.72 | NA | NA | NA | 9.00 | NA | NA | NA | 10.87 | NA | NA | NA | NA | NA | NA | NA | NA | NA | NA | NA | NA | NA | NA | NA | NA | NA | NA | NA | NA | NA | NA | NA | NA | NA | NA | NA | NA | NA | NA | NA | NA | NA | NA | NA | NA | NA | NA | NA | NA | NA | NA | NA | |
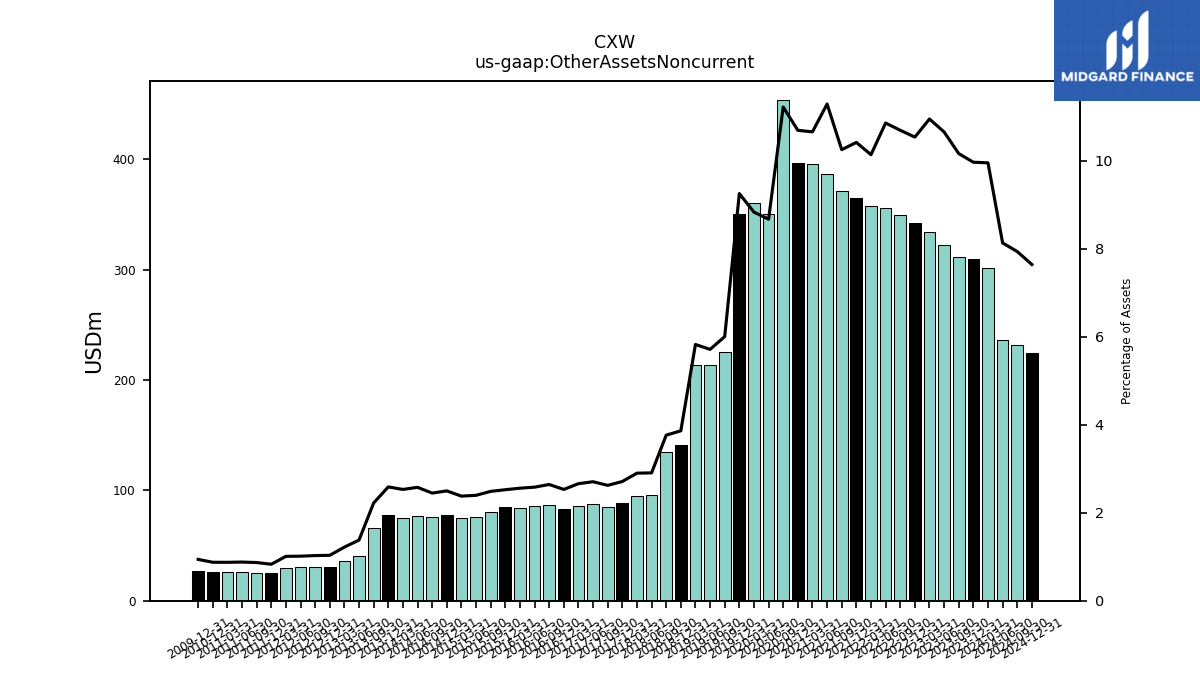
| Other Assets Noncurrent | 309.56 | 311.90 | 322.65 | 334.60 | 341.98 | 349.83 | 355.81 | 357.87 | 364.54 | 371.39 | 386.65 | 395.84 | 396.66 | 453.52 | 350.36 | 360.32 | 350.91 | 225.09 | 213.65 | 213.83 | 141.21 | 134.91 | 95.72 | 94.67 | 88.72 | 85.05 | 87.25 | 86.24 | 82.78 | 86.82 | 85.93 | 83.77 | 84.70 | 80.82 | 76.10 | 75.16 | 78.09 | 75.91 | 76.66 | 75.13 | 77.83 | 65.96 | 40.24 | 35.81 | 30.73 | 30.48 | 30.36 | 29.98 | 25.05 | 25.47 | 25.82 | 25.62 | 26.09 | NA | NA | NA |
| 2023-12-31 | 2023-09-30 | 2023-06-30 | 2023-03-31 | 2022-12-31 | 2022-09-30 | 2022-06-30 | 2022-03-31 | 2021-12-31 | 2021-09-30 | 2021-06-30 | 2021-03-31 | 2020-12-31 | 2020-09-30 | 2020-06-30 | 2020-03-31 | 2019-12-31 | 2019-09-30 | 2019-06-30 | 2019-03-31 | 2018-12-31 | 2018-09-30 | 2018-06-30 | 2018-03-31 | 2017-12-31 | 2017-09-30 | 2017-06-30 | 2017-03-31 | 2016-12-31 | 2016-09-30 | 2016-06-30 | 2016-03-31 | 2015-12-31 | 2015-09-30 | 2015-06-30 | 2015-03-31 | 2014-12-31 | 2014-09-30 | 2014-06-30 | 2014-03-31 | 2013-12-31 | 2013-09-30 | 2013-06-30 | 2013-03-31 | 2012-12-31 | 2012-09-30 | 2012-06-30 | 2012-03-31 | 2011-12-31 | 2011-09-30 | 2011-06-30 | 2011-03-31 | 2010-12-31 | 2010-09-30 | 2010-06-30 | 2010-03-31 | ||
|---|---|---|---|---|---|---|---|---|---|---|---|---|---|---|---|---|---|---|---|---|---|---|---|---|---|---|---|---|---|---|---|---|---|---|---|---|---|---|---|---|---|---|---|---|---|---|---|---|---|---|---|---|---|---|---|---|---|
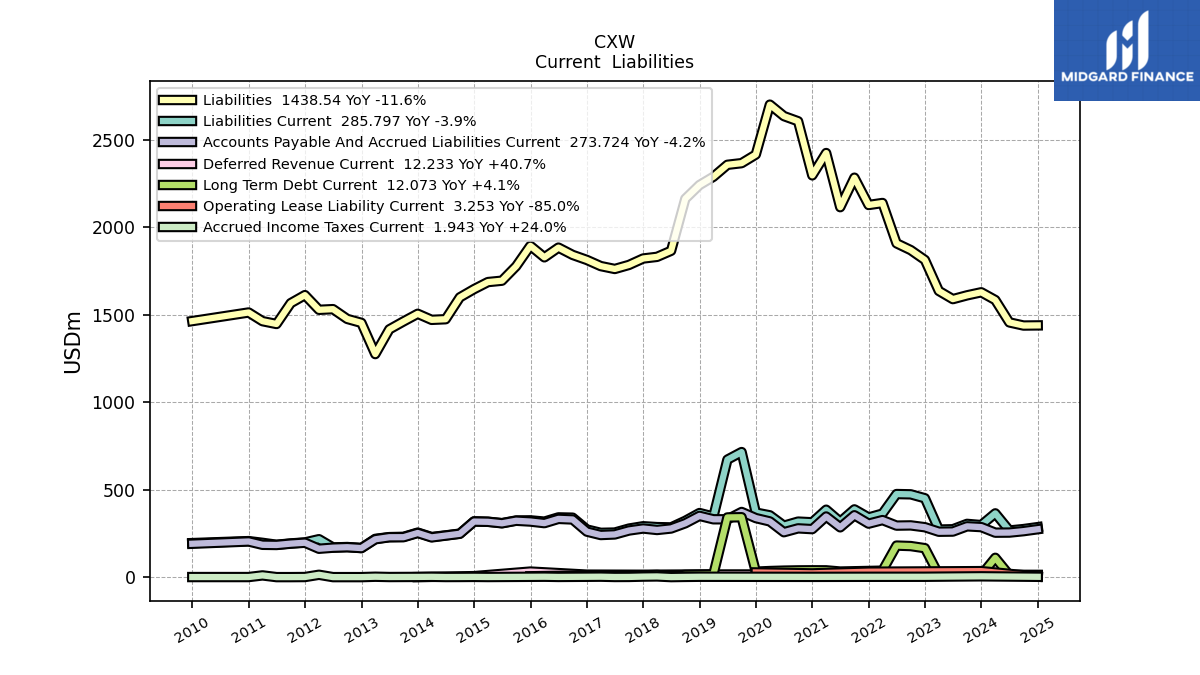
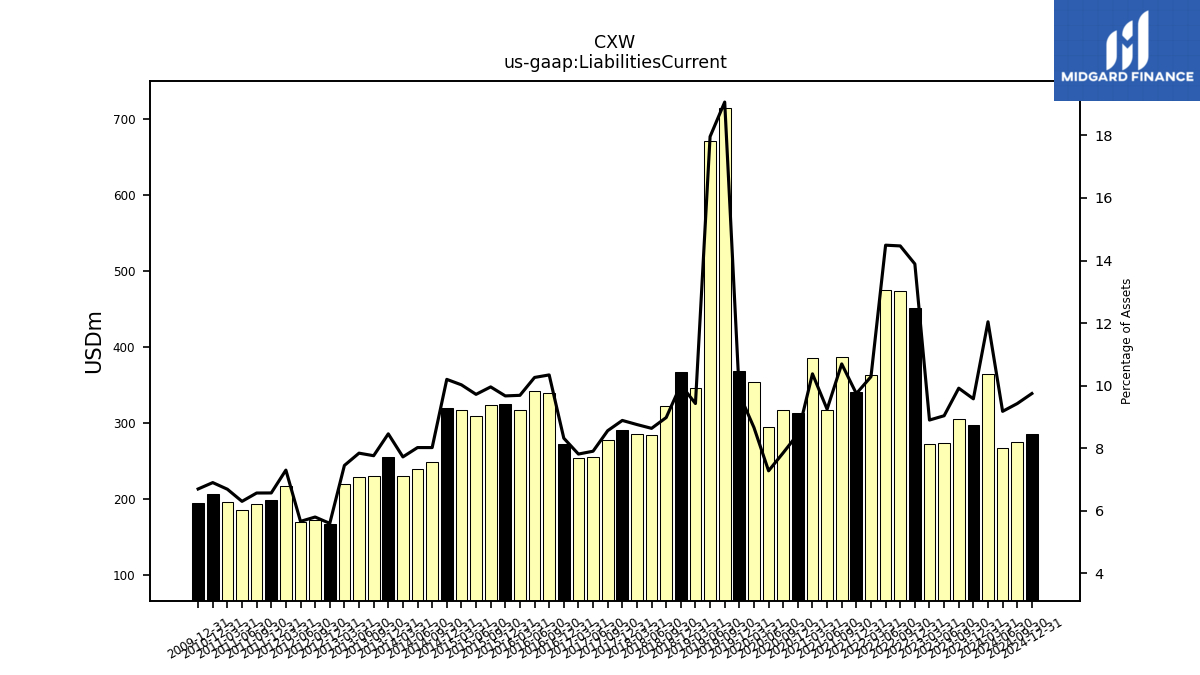
| Liabilities Current | 297.45 | 304.37 | 273.64 | 271.94 | 450.75 | 473.23 | 474.81 | 363.07 | 340.97 | 387.36 | 316.60 | 385.41 | 313.40 | 317.38 | 293.95 | 353.26 | 368.81 | 714.80 | 671.60 | 346.06 | 366.40 | 321.86 | 284.32 | 285.84 | 290.84 | 277.57 | 254.83 | 253.19 | 272.19 | 339.82 | 341.50 | 317.25 | 324.60 | 323.75 | 308.68 | 316.81 | 318.99 | 248.70 | 238.48 | 229.29 | 254.41 | 230.33 | 228.75 | 218.71 | 166.46 | 172.11 | 169.57 | 216.88 | 198.36 | 192.58 | 184.99 | 196.09 | 205.85 | NA | NA | NA | |
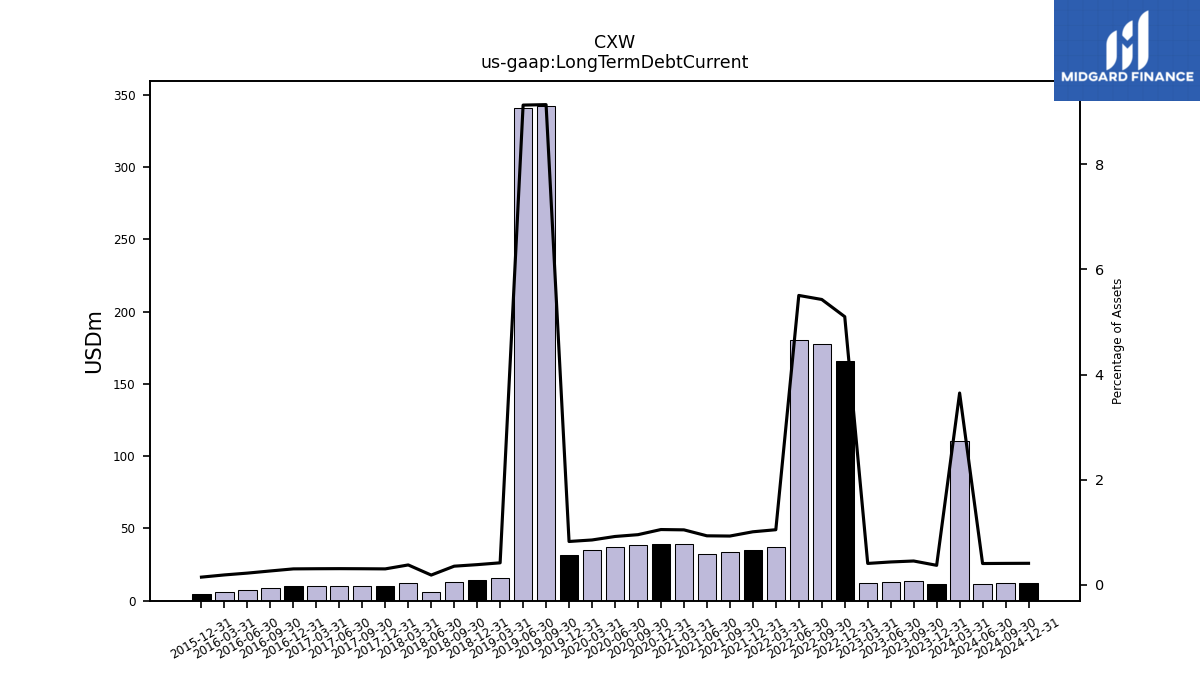
| Long Term Debt Current | 11.60 | 13.98 | 13.24 | 12.51 | 165.53 | 177.56 | 180.38 | 37.07 | 35.38 | 33.69 | 32.00 | 38.91 | 39.09 | 38.64 | 37.24 | 34.89 | 31.35 | 342.39 | 341.15 | 15.45 | 14.12 | 12.79 | 6.19 | 12.43 | 10.00 | 10.00 | 10.00 | 10.00 | 10.00 | 8.75 | 7.50 | 6.25 | 5.00 | NA | NA | NA | NA | NA | NA | NA | NA | NA | NA | NA | NA | NA | NA | NA | NA | NA | NA | NA | NA | NA | NA | NA | |
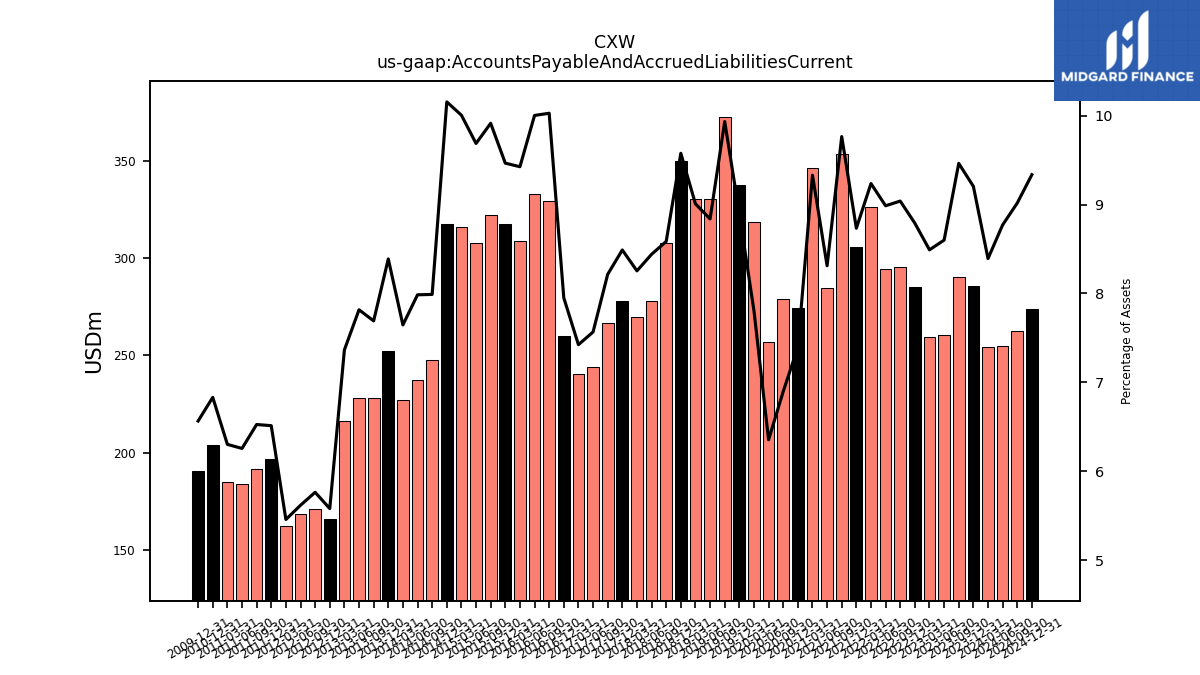
| Accounts Payable And Accrued Liabilities Current | 285.86 | 290.38 | 260.39 | 259.43 | 285.23 | 295.67 | 294.44 | 326.00 | 305.59 | 353.68 | 284.60 | 346.49 | 274.32 | 278.73 | 256.71 | 318.37 | 337.46 | 372.41 | 330.45 | 330.62 | 350.09 | 307.69 | 277.93 | 269.46 | 277.80 | 266.40 | 243.97 | 240.59 | 260.11 | 329.45 | 332.86 | 308.58 | 317.68 | 322.27 | 307.59 | 316.15 | 317.57 | 247.76 | 237.44 | 227.04 | 252.28 | 228.30 | 228.02 | 216.28 | 166.00 | 171.05 | 168.31 | 162.15 | 196.67 | 191.38 | 183.72 | 184.80 | 203.80 | NA | NA | NA | |
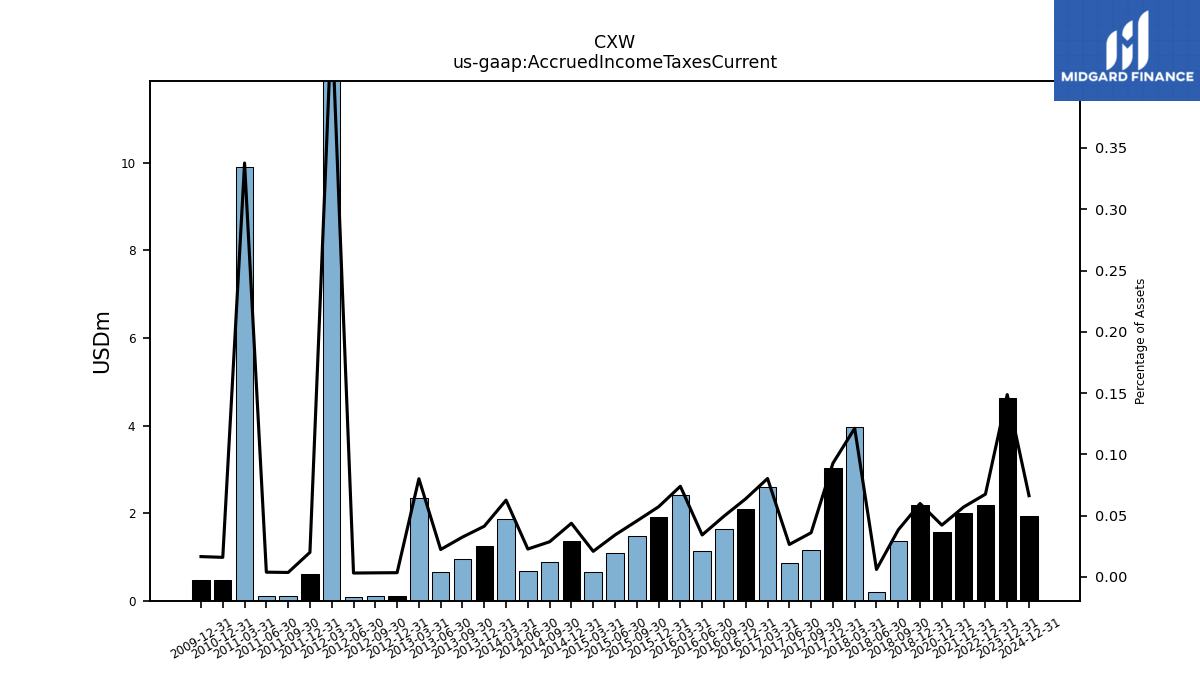
| Accrued Income Taxes Current | 4.62 | NA | NA | NA | 2.19 | NA | NA | NA | 2.00 | NA | NA | NA | 1.57 | NA | NA | NA | NA | NA | NA | NA | 2.19 | 1.38 | 0.20 | 3.96 | 3.03 | 1.17 | 0.85 | 2.60 | 2.09 | 1.63 | 1.14 | 2.42 | 1.92 | 1.48 | 1.09 | 0.66 | 1.37 | 0.89 | 0.68 | 1.86 | 1.24 | 0.96 | 0.65 | 2.35 | 0.10 | 0.10 | 0.09 | 13.53 | 0.60 | 0.11 | 0.11 | 9.90 | 0.48 | NA | NA | NA | |
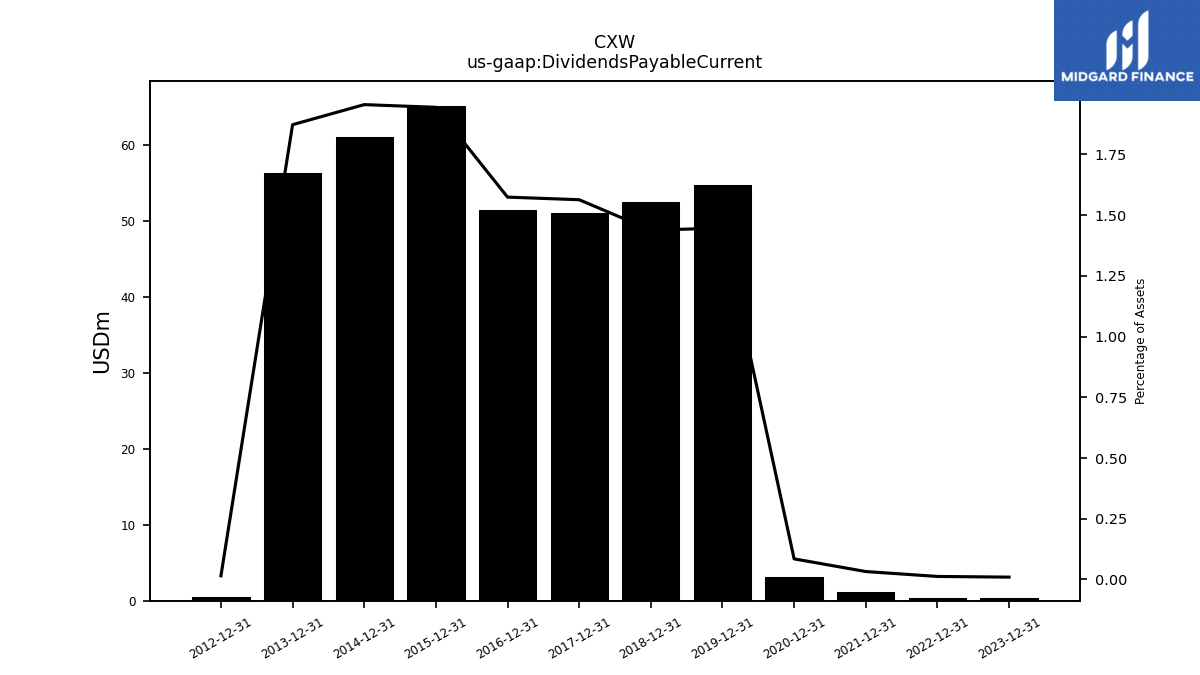
| Dividends Payable Current | 0.30 | NA | NA | NA | 0.41 | NA | NA | NA | 1.14 | NA | NA | NA | 3.15 | NA | NA | NA | 54.84 | NA | NA | NA | 52.57 | NA | NA | NA | 51.16 | NA | NA | NA | 51.50 | NA | NA | NA | 65.23 | NA | NA | NA | 61.13 | NA | NA | NA | 56.31 | NA | NA | NA | 0.45 | NA | NA | NA | NA | NA | NA | NA | NA | NA | NA | NA |
| 2023-12-31 | 2023-09-30 | 2023-06-30 | 2023-03-31 | 2022-12-31 | 2022-09-30 | 2022-06-30 | 2022-03-31 | 2021-12-31 | 2021-09-30 | 2021-06-30 | 2021-03-31 | 2020-12-31 | 2020-09-30 | 2020-06-30 | 2020-03-31 | 2019-12-31 | 2019-09-30 | 2019-06-30 | 2019-03-31 | 2018-12-31 | 2018-09-30 | 2018-06-30 | 2018-03-31 | 2017-12-31 | 2017-09-30 | 2017-06-30 | 2017-03-31 | 2016-12-31 | 2016-09-30 | 2016-06-30 | 2016-03-31 | 2015-12-31 | 2015-09-30 | 2015-06-30 | 2015-03-31 | 2014-12-31 | 2014-09-30 | 2014-06-30 | 2014-03-31 | 2013-12-31 | 2013-09-30 | 2013-06-30 | 2013-03-31 | 2012-12-31 | 2012-09-30 | 2012-06-30 | 2012-03-31 | 2011-12-31 | 2011-09-30 | 2011-06-30 | 2011-03-31 | 2010-12-31 | 2010-09-30 | 2010-06-30 | 2010-03-31 | ||
|---|---|---|---|---|---|---|---|---|---|---|---|---|---|---|---|---|---|---|---|---|---|---|---|---|---|---|---|---|---|---|---|---|---|---|---|---|---|---|---|---|---|---|---|---|---|---|---|---|---|---|---|---|---|---|---|---|---|
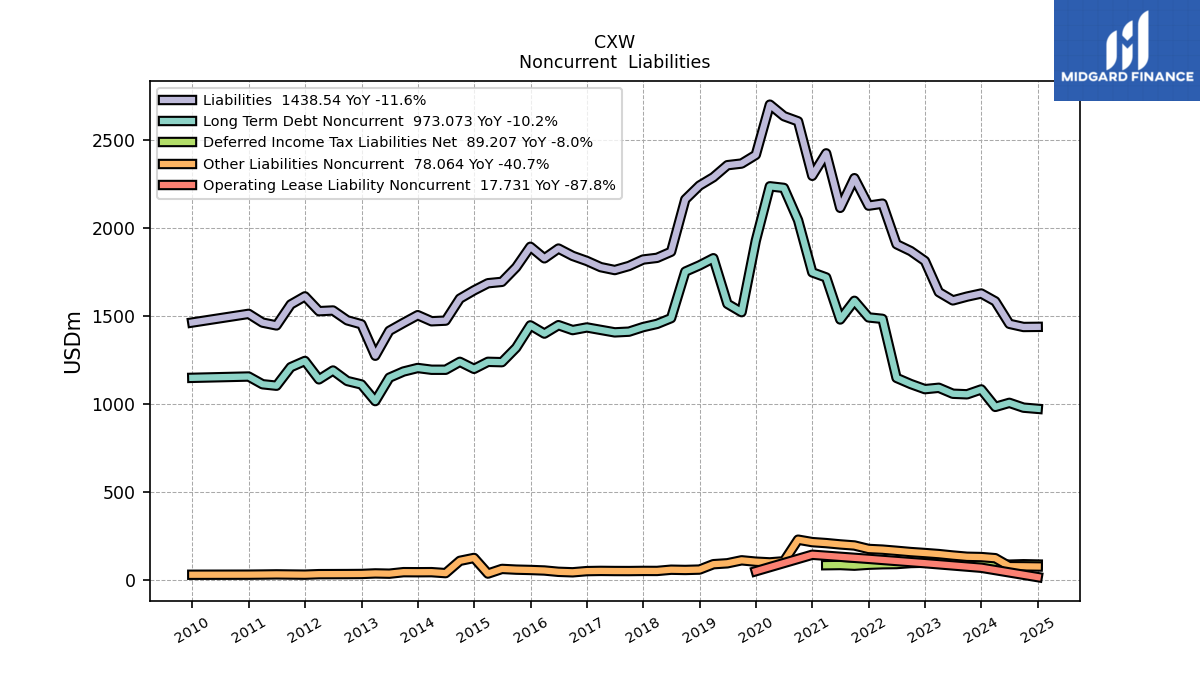
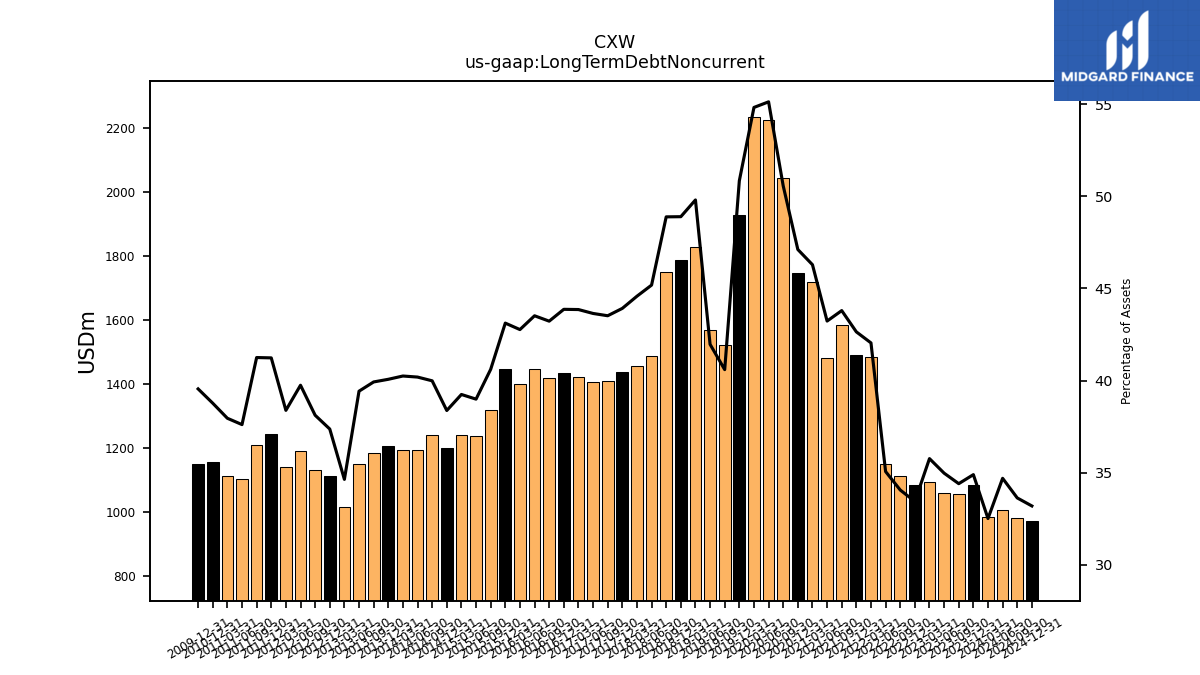
| Long Term Debt Noncurrent | 1083.48 | 1055.59 | 1058.82 | 1092.62 | 1084.86 | 1113.94 | 1148.68 | 1483.95 | 1492.05 | 1586.36 | 1480.29 | 1719.12 | 1747.66 | 2043.69 | 2227.32 | 2236.43 | 1928.02 | 1521.79 | 1569.12 | 1828.11 | 1787.56 | 1752.18 | 1487.78 | 1455.27 | 1437.19 | 1411.21 | 1407.20 | 1421.18 | 1435.17 | 1420.15 | 1448.14 | 1400.13 | 1447.08 | 1320.00 | 1238.00 | 1240.00 | 1200.00 | 1240.00 | 1195.00 | 1195.00 | 1205.00 | 1185.00 | 1150.00 | 1016.95 | 1111.55 | 1131.15 | 1190.76 | 1140.39 | 1245.01 | 1209.65 | 1104.29 | 1112.74 | 1156.57 | NA | NA | NA | |
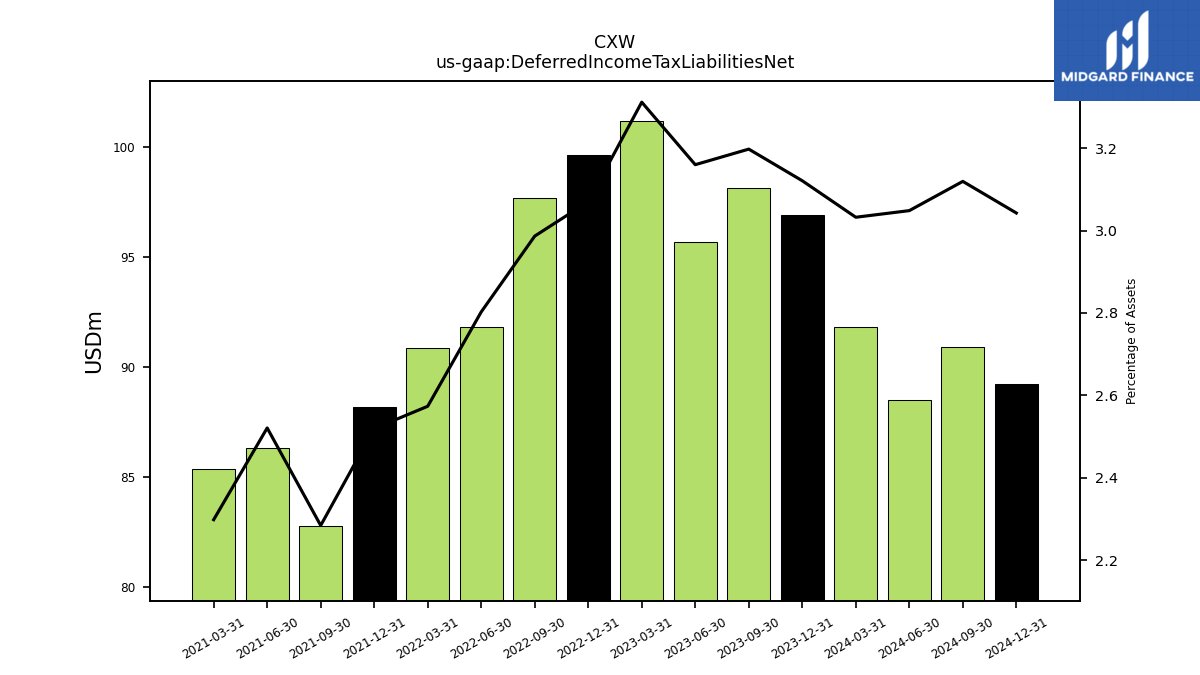
| Deferred Income Tax Liabilities Net | 96.92 | 98.12 | 95.67 | 101.18 | 99.62 | 97.69 | 91.83 | 90.84 | 88.16 | 82.74 | 86.32 | 85.36 | NA | NA | NA | NA | NA | NA | NA | NA | NA | NA | NA | NA | NA | NA | NA | NA | NA | NA | NA | NA | NA | NA | NA | NA | NA | NA | NA | NA | NA | NA | NA | NA | NA | NA | NA | NA | NA | NA | NA | NA | NA | NA | NA | NA | |
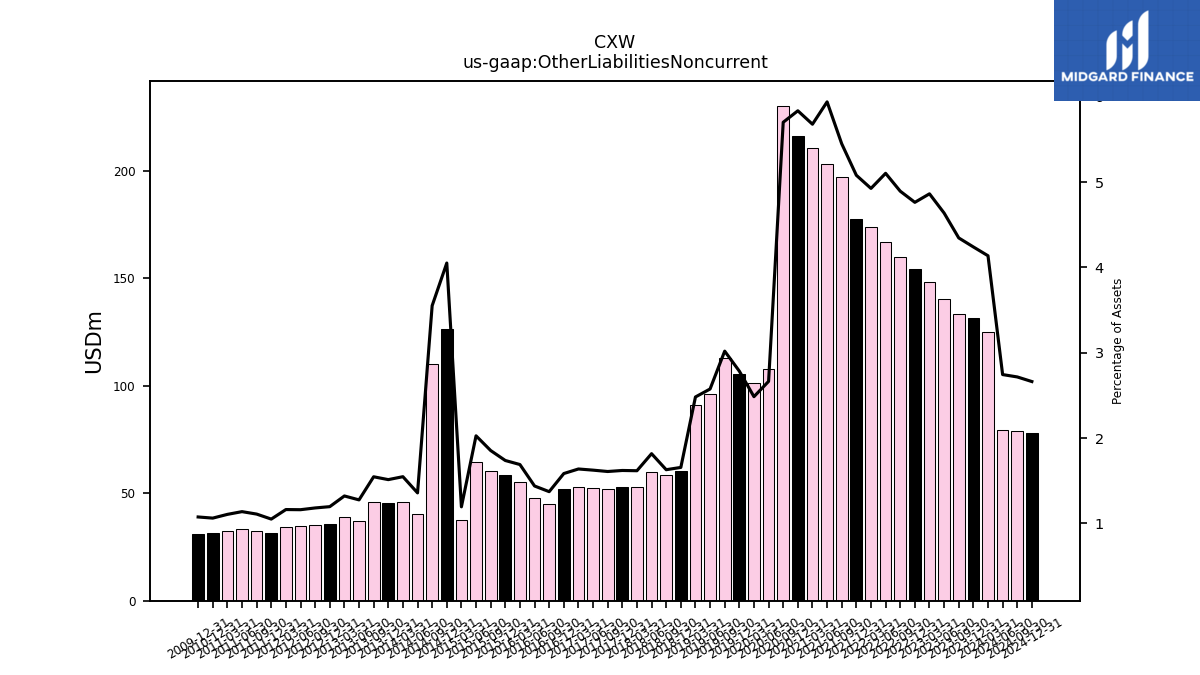
| Other Liabilities Noncurrent | 131.67 | 133.36 | 140.41 | 148.58 | 154.54 | 160.07 | 167.20 | 173.87 | 177.75 | 197.36 | 203.41 | 210.89 | 216.47 | 230.40 | 107.64 | 101.38 | 105.58 | 113.18 | 96.30 | 91.09 | 60.55 | 58.40 | 59.84 | 52.80 | 53.03 | 52.16 | 52.37 | 53.08 | 51.84 | 45.08 | 47.88 | 55.33 | 58.31 | 60.27 | 64.35 | 37.74 | 126.70 | 110.15 | 40.38 | 45.95 | 45.51 | 45.91 | 37.22 | 38.81 | 35.59 | 35.06 | 34.78 | 34.54 | 31.73 | 32.54 | 33.42 | 32.43 | 31.69 | NA | NA | NA | |
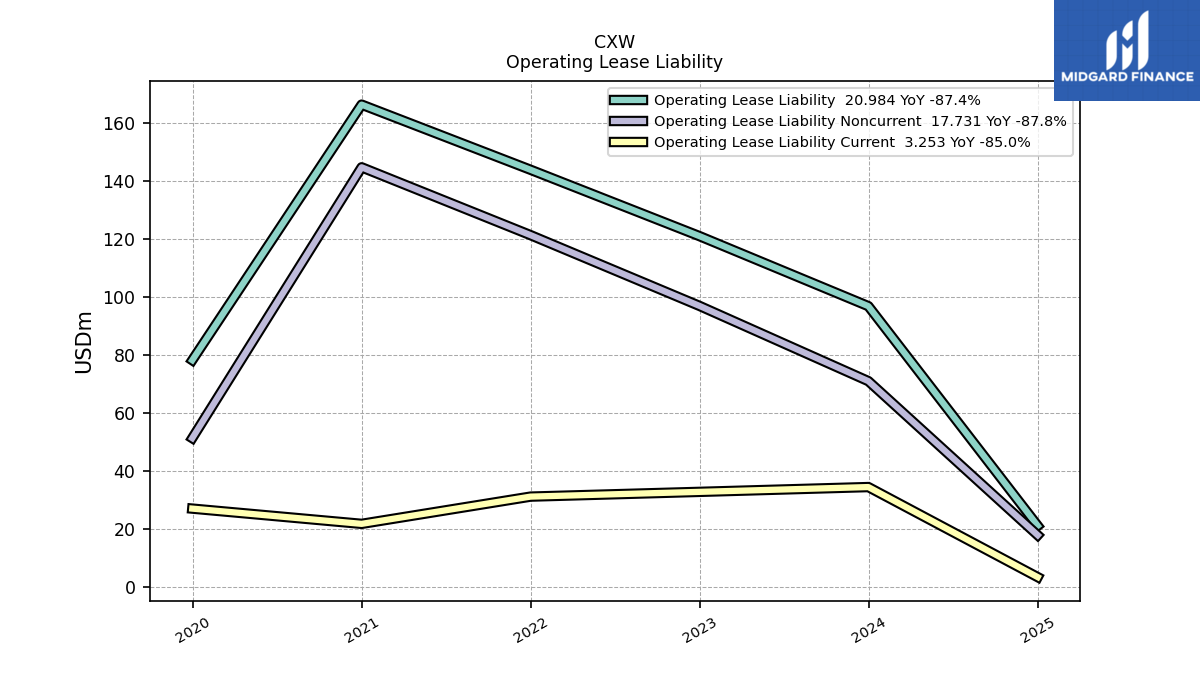
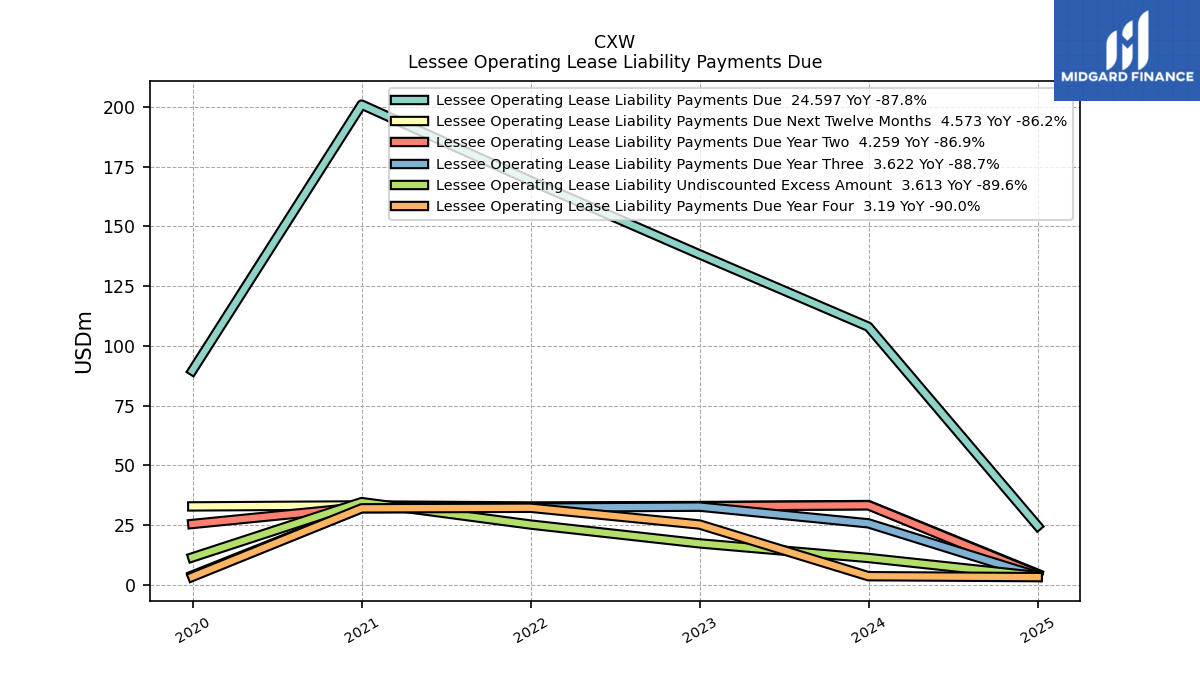
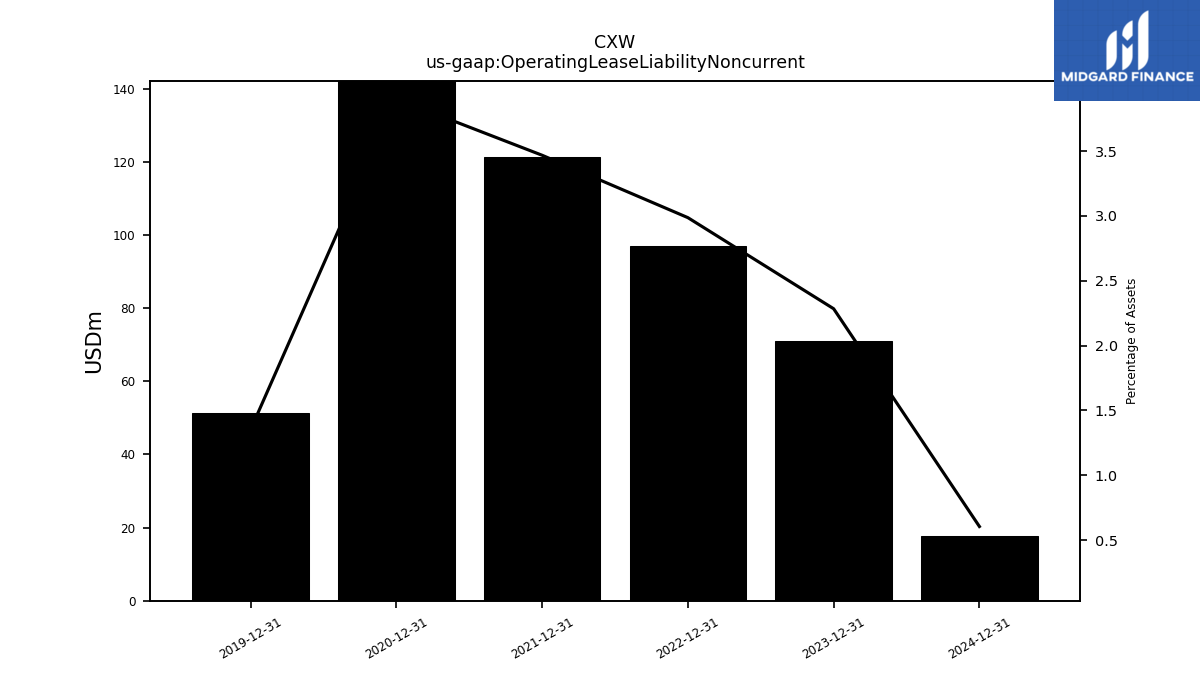
| Operating Lease Liability Noncurrent | 70.94 | NA | NA | NA | 96.92 | NA | NA | NA | 121.35 | NA | NA | NA | 144.77 | NA | NA | NA | 51.25 | NA | NA | NA | NA | NA | NA | NA | NA | NA | NA | NA | NA | NA | NA | NA | NA | NA | NA | NA | NA | NA | NA | NA | NA | NA | NA | NA | NA | NA | NA | NA | NA | NA | NA | NA | NA | NA | NA | NA |
| 2023-12-31 | 2023-09-30 | 2023-06-30 | 2023-03-31 | 2022-12-31 | 2022-09-30 | 2022-06-30 | 2022-03-31 | 2021-12-31 | 2021-09-30 | 2021-06-30 | 2021-03-31 | 2020-12-31 | 2020-09-30 | 2020-06-30 | 2020-03-31 | 2019-12-31 | 2019-09-30 | 2019-06-30 | 2019-03-31 | 2018-12-31 | 2018-09-30 | 2018-06-30 | 2018-03-31 | 2017-12-31 | 2017-09-30 | 2017-06-30 | 2017-03-31 | 2016-12-31 | 2016-09-30 | 2016-06-30 | 2016-03-31 | 2015-12-31 | 2015-09-30 | 2015-06-30 | 2015-03-31 | 2014-12-31 | 2014-09-30 | 2014-06-30 | 2014-03-31 | 2013-12-31 | 2013-09-30 | 2013-06-30 | 2013-03-31 | 2012-12-31 | 2012-09-30 | 2012-06-30 | 2012-03-31 | 2011-12-31 | 2011-09-30 | 2011-06-30 | 2011-03-31 | 2010-12-31 | 2010-09-30 | 2010-06-30 | 2010-03-31 | ||
|---|---|---|---|---|---|---|---|---|---|---|---|---|---|---|---|---|---|---|---|---|---|---|---|---|---|---|---|---|---|---|---|---|---|---|---|---|---|---|---|---|---|---|---|---|---|---|---|---|---|---|---|---|---|---|---|---|---|
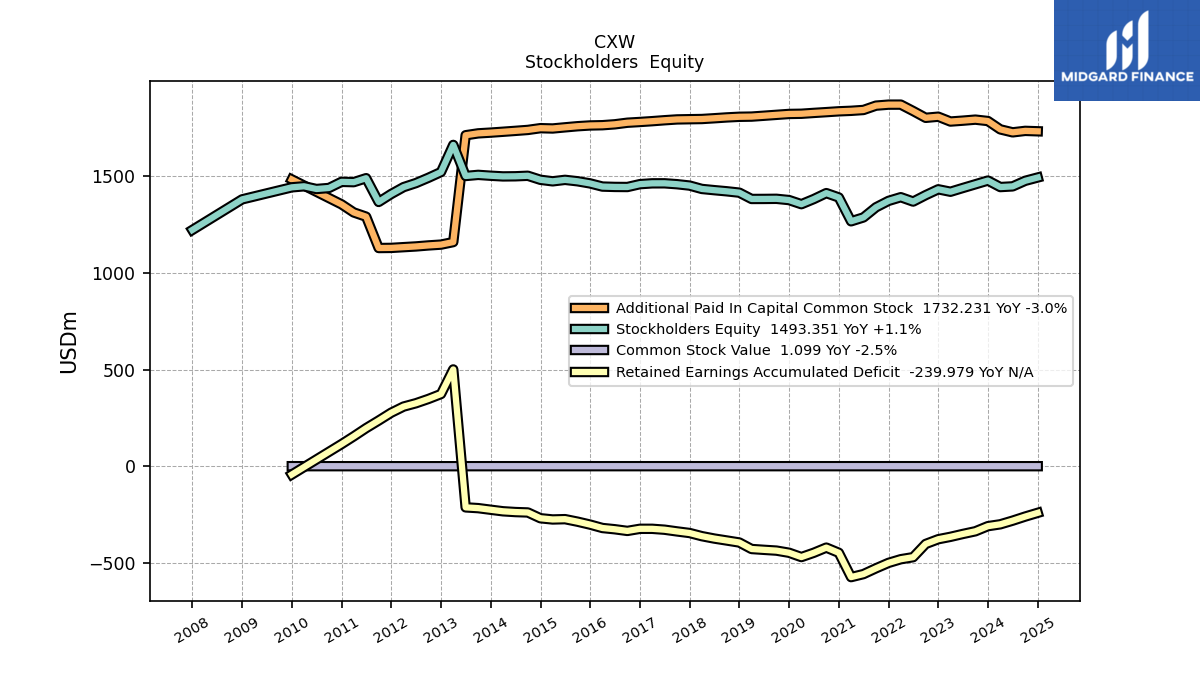
| Stockholders Equity | 1477.57 | 1458.30 | 1439.14 | 1419.73 | 1432.41 | 1402.17 | 1368.94 | 1391.52 | 1372.47 | 1339.36 | 1286.96 | 1266.96 | 1390.17 | 1412.72 | 1381.91 | 1355.40 | 1376.75 | 1383.20 | 1382.59 | 1382.41 | 1415.06 | 1422.08 | 1427.92 | 1434.21 | 1451.61 | 1458.68 | 1463.34 | 1463.16 | 1458.96 | 1444.19 | 1444.63 | 1446.46 | 1462.75 | 1473.88 | 1481.16 | 1473.62 | 1481.50 | 1502.29 | 1499.63 | 1499.02 | 1502.51 | 1506.95 | 1501.19 | 1661.90 | 1521.62 | 1492.08 | 1464.57 | 1443.57 | 1408.02 | 1366.87 | 1489.82 | 1469.29 | 1470.87 | 1439.17 | 1433.93 | 1447.89 | |
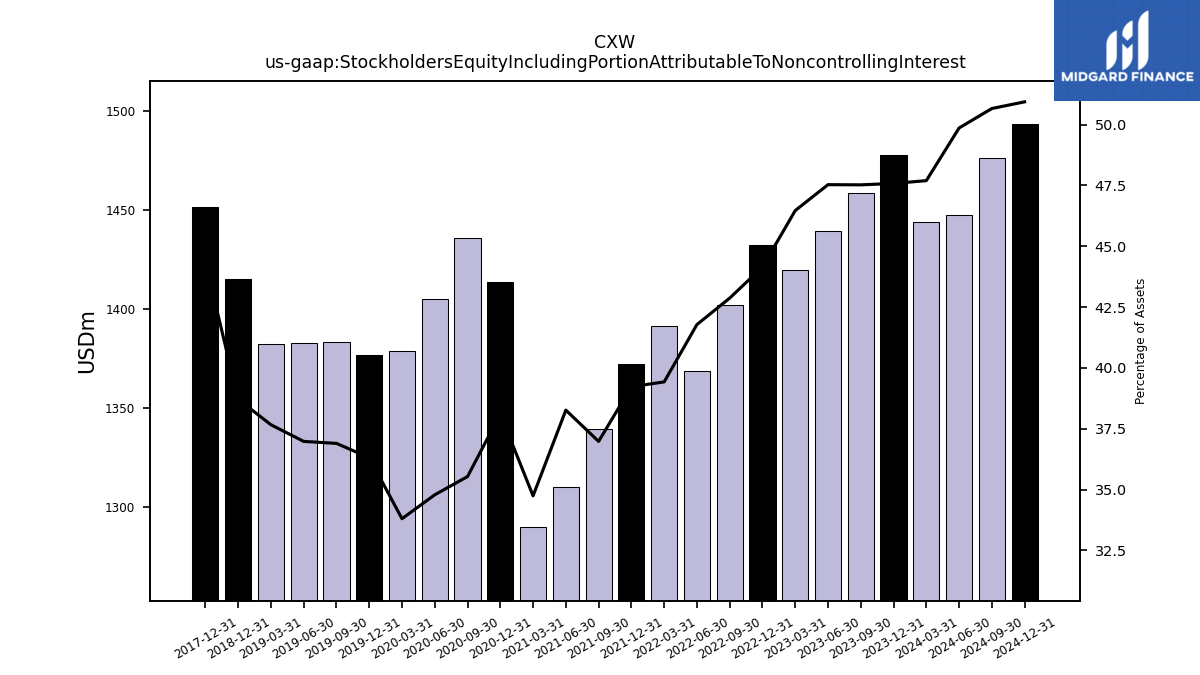
| Stockholders Equity Including Portion Attributable To Noncontrolling Interest | 1477.57 | 1458.30 | 1439.14 | 1419.73 | 1432.41 | 1402.17 | 1368.94 | 1391.52 | 1372.47 | 1339.36 | 1310.23 | 1290.23 | 1413.44 | 1435.99 | 1405.18 | 1378.68 | 1376.75 | 1383.20 | 1382.59 | 1382.41 | 1415.06 | NA | NA | NA | 1451.61 | NA | NA | NA | NA | NA | NA | NA | NA | NA | NA | NA | NA | NA | NA | NA | NA | NA | NA | NA | NA | NA | NA | NA | NA | NA | NA | NA | NA | NA | NA | NA | |
| Common Stock Value | 1.13 | 1.14 | 1.14 | 1.14 | 1.15 | 1.15 | 1.19 | 1.22 | 1.20 | 1.20 | 1.20 | 1.20 | 1.20 | 1.20 | 1.20 | 1.20 | 1.19 | 1.19 | 1.19 | 1.19 | 1.19 | 1.19 | 1.19 | 1.19 | 1.18 | 1.18 | 1.18 | 1.18 | 1.18 | 1.18 | 1.18 | 1.18 | 1.17 | 1.17 | 1.17 | 1.17 | 1.17 | 1.17 | 1.16 | 1.16 | 1.16 | 1.16 | 1.15 | 1.01 | 1.00 | 1.00 | 1.00 | 1.00 | 0.99 | 1.00 | 1.07 | 1.08 | 1.10 | NA | NA | NA | |
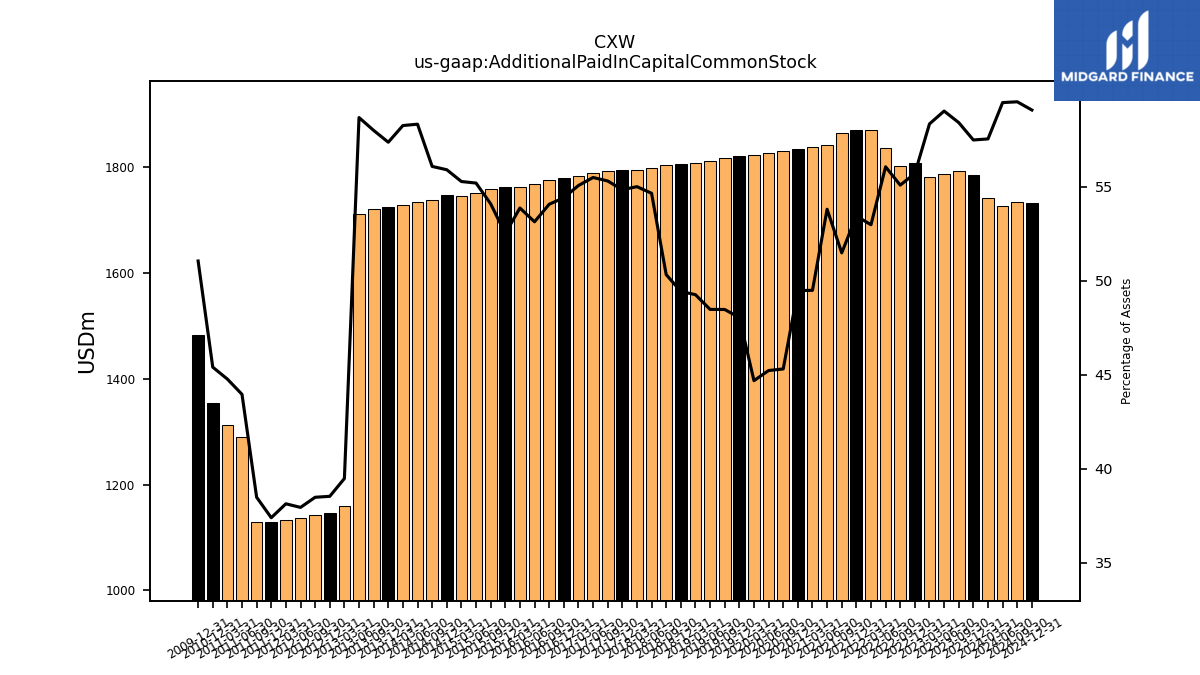
| Additional Paid In Capital Common Stock | 1785.29 | 1792.48 | 1787.21 | 1782.63 | 1807.69 | 1801.87 | 1836.95 | 1870.07 | 1869.95 | 1864.86 | 1842.39 | 1838.07 | 1835.49 | 1831.24 | 1827.17 | 1822.86 | 1821.81 | 1817.26 | 1812.61 | 1808.15 | 1807.20 | 1803.90 | 1799.63 | 1795.67 | 1794.71 | 1793.57 | 1789.34 | 1784.53 | 1780.35 | 1776.50 | 1768.32 | 1763.68 | 1762.39 | 1758.39 | 1752.65 | 1746.73 | 1748.30 | 1739.24 | 1734.40 | 1729.81 | 1725.36 | 1721.50 | 1711.82 | 1159.51 | 1146.49 | 1142.27 | 1137.02 | 1133.30 | 1129.43 | 1128.81 | 1290.92 | 1312.80 | 1354.69 | NA | NA | NA | |
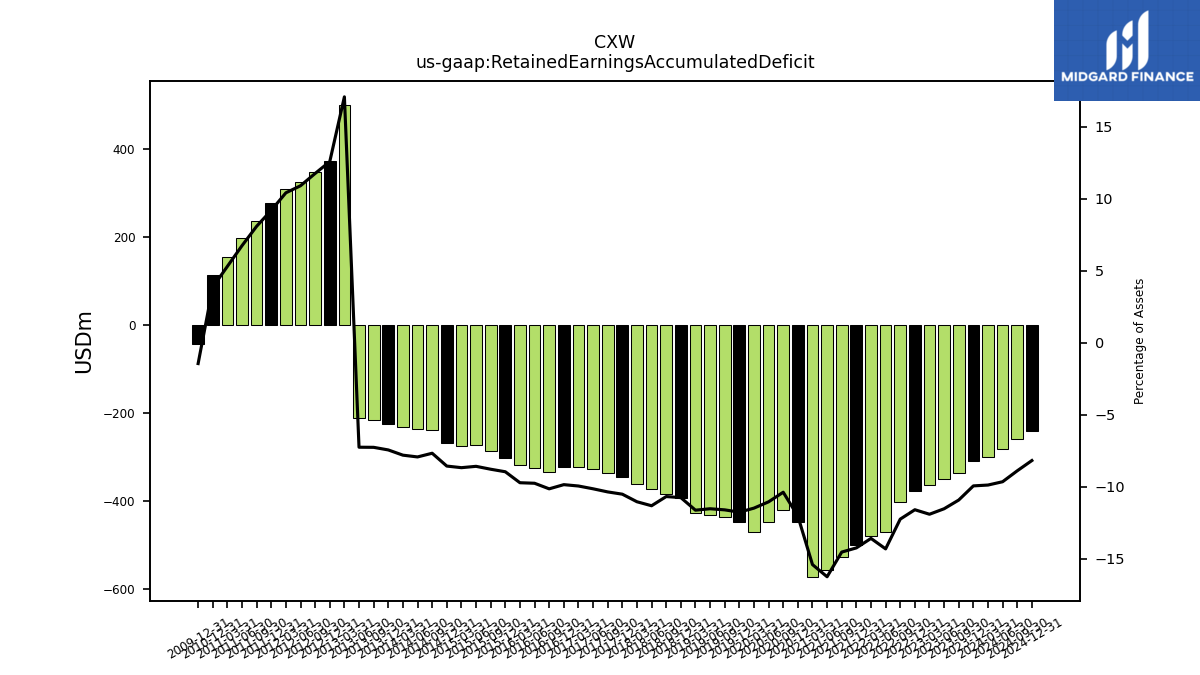
| Retained Earnings Accumulated Deficit | -308.85 | -335.31 | -349.21 | -364.04 | -376.43 | -400.84 | -469.19 | -479.76 | -498.69 | -526.71 | -556.64 | -572.30 | -446.52 | -419.72 | -446.46 | -468.65 | -446.25 | -435.25 | -431.21 | -426.92 | -393.33 | -383.01 | -372.90 | -360.62 | -344.29 | -336.07 | -327.18 | -322.55 | -322.56 | -333.49 | -324.87 | -318.40 | -300.82 | -285.68 | -272.66 | -274.28 | -267.97 | -238.11 | -235.94 | -231.95 | -224.01 | -215.71 | -211.79 | 501.38 | 374.13 | 348.81 | 326.55 | 309.27 | 277.59 | 237.07 | 197.83 | 155.41 | 115.08 | NA | NA | NA |
| 2023-12-31 | 2023-09-30 | 2023-06-30 | 2023-03-31 | 2022-12-31 | 2022-09-30 | 2022-06-30 | 2022-03-31 | 2021-12-31 | 2021-09-30 | 2021-06-30 | 2021-03-31 | 2020-12-31 | 2020-09-30 | 2020-06-30 | 2020-03-31 | 2019-12-31 | 2019-09-30 | 2019-06-30 | 2019-03-31 | 2018-12-31 | 2018-09-30 | 2018-06-30 | 2018-03-31 | 2017-12-31 | 2017-09-30 | 2017-06-30 | 2017-03-31 | 2016-12-31 | 2016-09-30 | 2016-06-30 | 2016-03-31 | 2015-12-31 | 2015-09-30 | 2015-06-30 | 2015-03-31 | 2014-12-31 | 2014-09-30 | 2014-06-30 | 2014-03-31 | 2013-12-31 | 2013-09-30 | 2013-06-30 | 2013-03-31 | 2012-12-31 | 2012-09-30 | 2012-06-30 | 2012-03-31 | 2011-12-31 | 2011-09-30 | 2011-06-30 | 2011-03-31 | 2010-12-31 | 2010-09-30 | 2010-06-30 | 2010-03-31 | ||
|---|---|---|---|---|---|---|---|---|---|---|---|---|---|---|---|---|---|---|---|---|---|---|---|---|---|---|---|---|---|---|---|---|---|---|---|---|---|---|---|---|---|---|---|---|---|---|---|---|---|---|---|---|---|---|---|---|---|
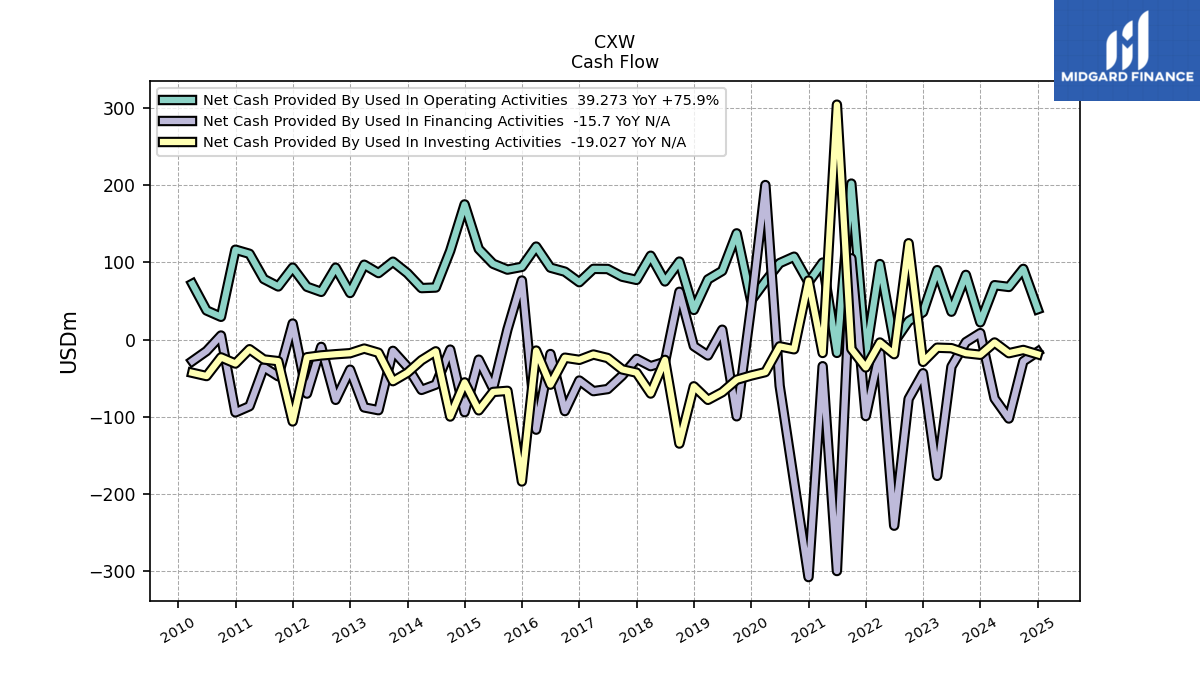
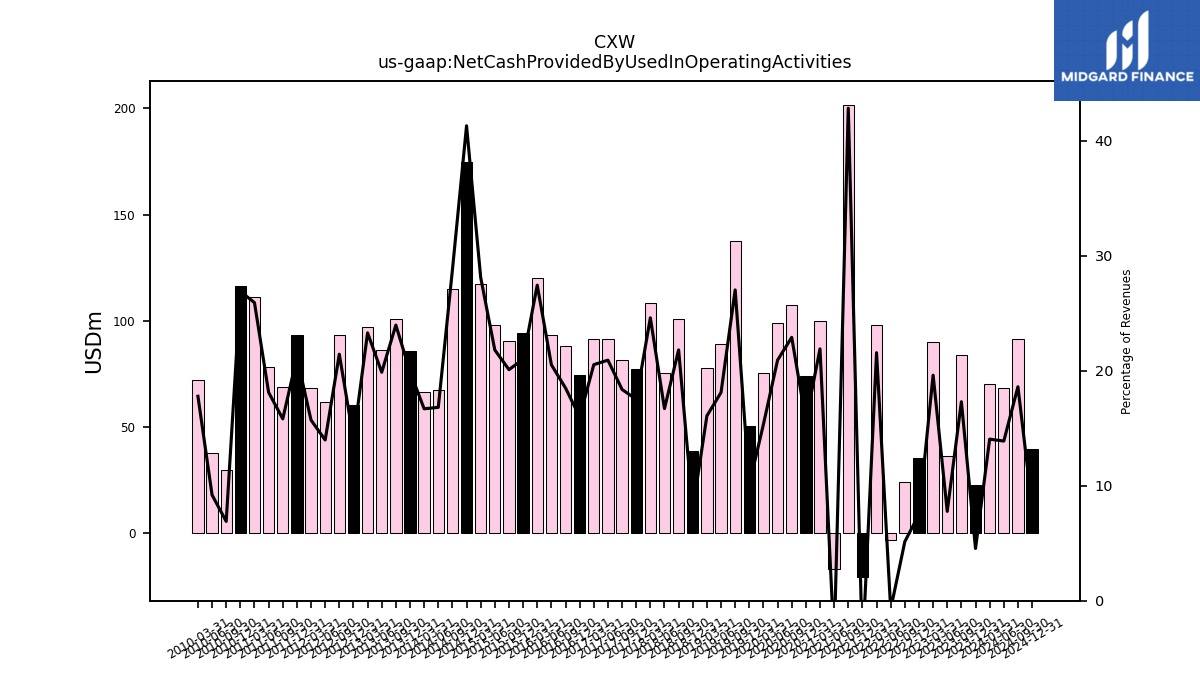
| Net Cash Provided By Used In Operating Activities | 22.32 | 83.71 | 36.04 | 89.83 | 35.39 | 23.88 | -3.39 | 97.71 | -20.91 | 201.81 | -17.27 | 99.60 | 74.02 | 107.24 | 98.90 | 75.38 | 50.31 | 137.45 | 88.80 | 77.82 | 38.31 | 100.92 | 75.17 | 108.48 | 77.19 | 81.35 | 91.29 | 91.49 | 74.19 | 87.86 | 93.02 | 120.31 | 94.06 | 90.49 | 98.06 | 117.19 | 174.89 | 114.78 | 67.32 | 66.58 | 85.90 | 100.75 | 86.00 | 96.86 | 60.20 | 93.04 | 61.70 | 68.31 | 93.08 | 68.72 | 78.33 | 110.95 | 116.28 | 29.44 | 37.65 | 72.14 | |
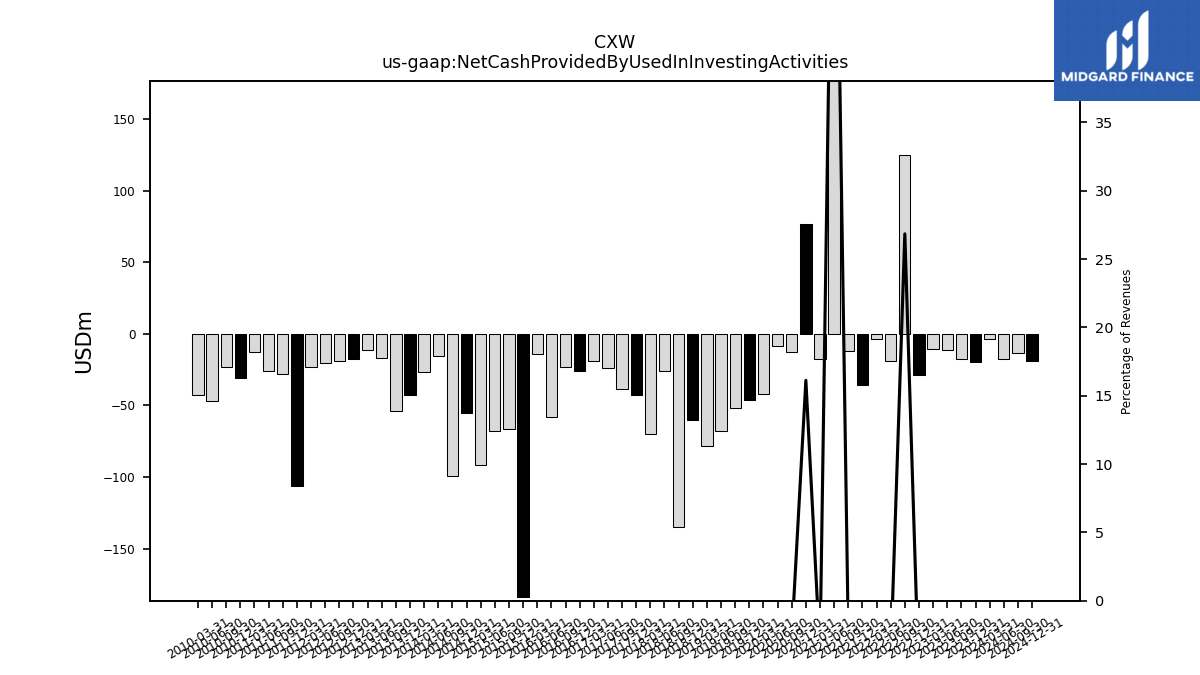
| Net Cash Provided By Used In Investing Activities | -19.66 | -17.59 | -11.12 | -10.51 | -28.85 | 124.63 | -18.93 | -3.81 | -36.10 | -12.05 | 303.93 | -17.36 | 76.36 | -12.57 | -8.75 | -42.07 | -46.53 | -51.98 | -68.08 | -78.00 | -60.42 | -134.54 | -26.24 | -69.85 | -42.80 | -38.57 | -23.86 | -19.33 | -26.23 | -23.42 | -58.33 | -14.22 | -183.60 | -66.32 | -67.78 | -91.58 | -55.39 | -99.59 | -15.18 | -26.73 | -42.94 | -53.83 | -17.08 | -11.65 | -17.62 | -18.95 | -20.48 | -22.88 | -105.96 | -27.92 | -25.71 | -12.46 | -31.03 | -23.01 | -47.21 | -42.97 | |
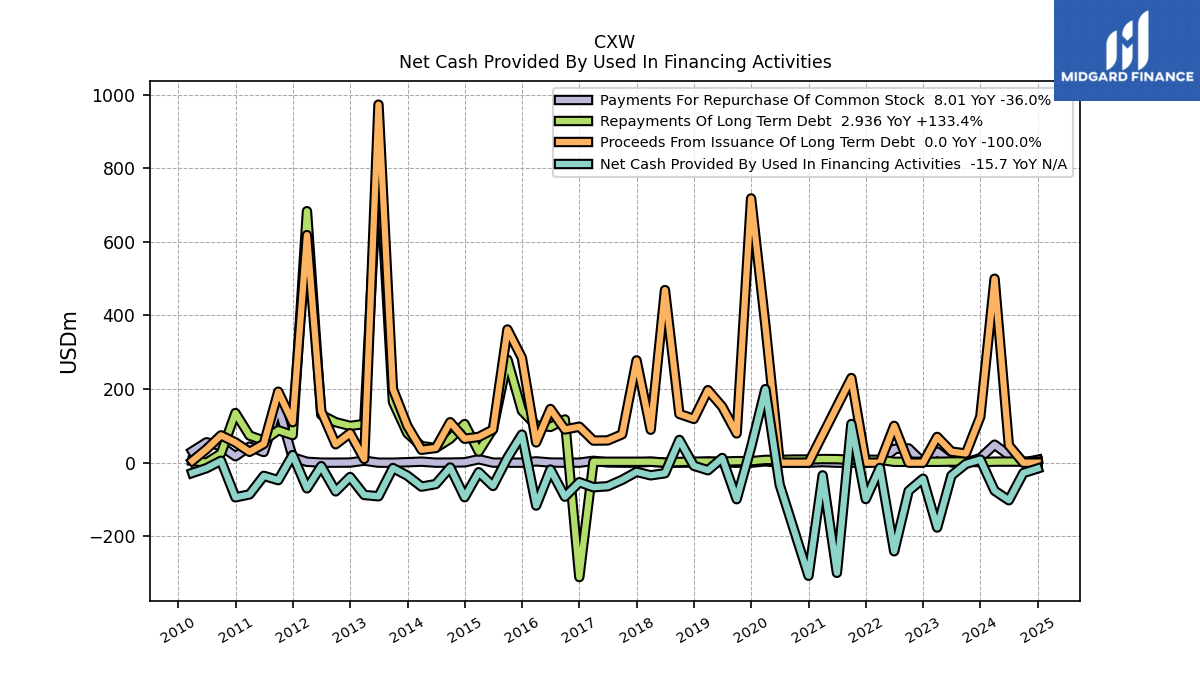
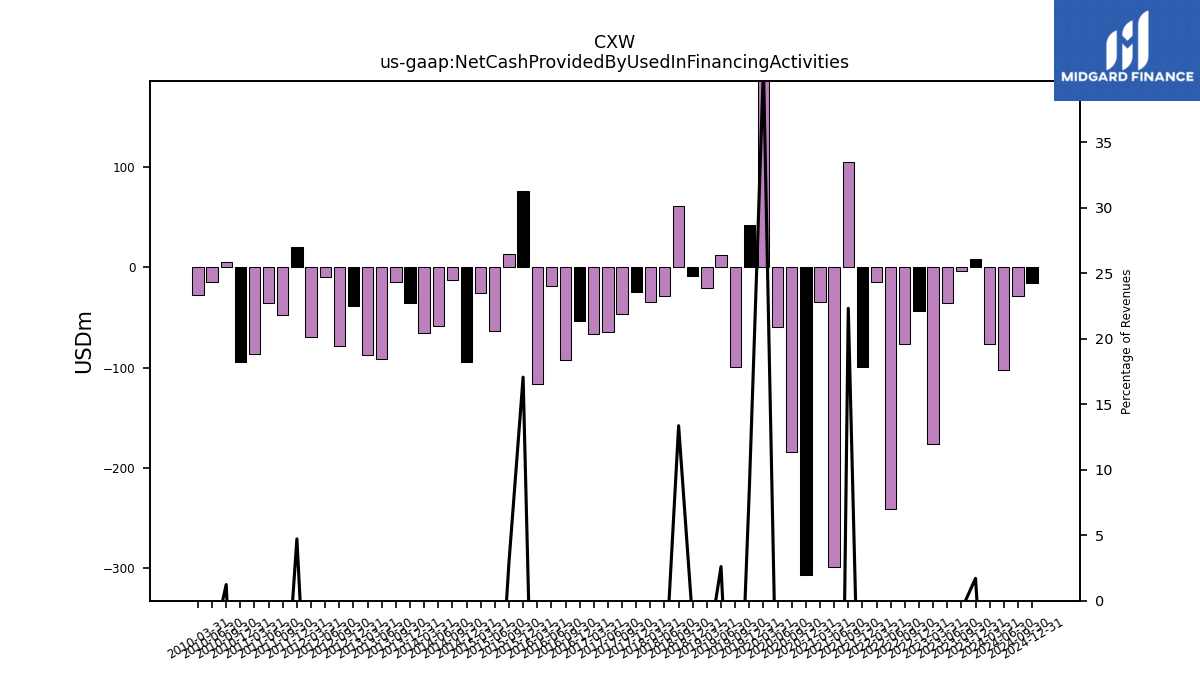
| Net Cash Provided By Used In Financing Activities | 8.38 | -3.31 | -35.00 | -176.31 | -43.54 | -76.75 | -240.80 | -14.07 | -98.96 | 105.16 | -299.46 | -34.45 | -307.30 | -183.72 | -59.75 | 199.94 | 42.24 | -99.29 | 12.77 | -20.56 | -8.48 | 61.82 | -28.80 | -34.41 | -24.94 | -46.63 | -64.01 | -66.71 | -52.98 | -92.55 | -18.66 | -116.57 | 76.43 | 13.16 | -63.24 | -25.98 | -93.95 | -12.96 | -58.21 | -65.09 | -35.26 | -14.57 | -91.38 | -87.77 | -38.93 | -77.98 | -9.45 | -69.91 | 20.75 | -47.47 | -35.79 | -86.21 | -94.19 | 5.27 | -14.87 | -27.91 |
| 2023-12-31 | 2023-09-30 | 2023-06-30 | 2023-03-31 | 2022-12-31 | 2022-09-30 | 2022-06-30 | 2022-03-31 | 2021-12-31 | 2021-09-30 | 2021-06-30 | 2021-03-31 | 2020-12-31 | 2020-09-30 | 2020-06-30 | 2020-03-31 | 2019-12-31 | 2019-09-30 | 2019-06-30 | 2019-03-31 | 2018-12-31 | 2018-09-30 | 2018-06-30 | 2018-03-31 | 2017-12-31 | 2017-09-30 | 2017-06-30 | 2017-03-31 | 2016-12-31 | 2016-09-30 | 2016-06-30 | 2016-03-31 | 2015-12-31 | 2015-09-30 | 2015-06-30 | 2015-03-31 | 2014-12-31 | 2014-09-30 | 2014-06-30 | 2014-03-31 | 2013-12-31 | 2013-09-30 | 2013-06-30 | 2013-03-31 | 2012-12-31 | 2012-09-30 | 2012-06-30 | 2012-03-31 | 2011-12-31 | 2011-09-30 | 2011-06-30 | 2011-03-31 | 2010-12-31 | 2010-09-30 | 2010-06-30 | 2010-03-31 | ||
|---|---|---|---|---|---|---|---|---|---|---|---|---|---|---|---|---|---|---|---|---|---|---|---|---|---|---|---|---|---|---|---|---|---|---|---|---|---|---|---|---|---|---|---|---|---|---|---|---|---|---|---|---|---|---|---|---|---|
| Net Cash Provided By Used In Operating Activities | 22.32 | 83.71 | 36.04 | 89.83 | 35.39 | 23.88 | -3.39 | 97.71 | -20.91 | 201.81 | -17.27 | 99.60 | 74.02 | 107.24 | 98.90 | 75.38 | 50.31 | 137.45 | 88.80 | 77.82 | 38.31 | 100.92 | 75.17 | 108.48 | 77.19 | 81.35 | 91.29 | 91.49 | 74.19 | 87.86 | 93.02 | 120.31 | 94.06 | 90.49 | 98.06 | 117.19 | 174.89 | 114.78 | 67.32 | 66.58 | 85.90 | 100.75 | 86.00 | 96.86 | 60.20 | 93.04 | 61.70 | 68.31 | 93.08 | 68.72 | 78.33 | 110.95 | 116.28 | 29.44 | 37.65 | 72.14 | |
| Profit Loss | 26.47 | 13.89 | 14.83 | 12.40 | 24.44 | 68.32 | 10.56 | 19.00 | 28.04 | 30.01 | 15.62 | -125.57 | -26.80 | 26.72 | 22.19 | 33.24 | 41.97 | 48.99 | 48.58 | 49.34 | 41.24 | 40.99 | 39.20 | 37.78 | NA | NA | NA | NA | NA | NA | NA | NA | NA | NA | NA | NA | NA | NA | NA | NA | NA | NA | NA | NA | NA | NA | NA | NA | NA | NA | NA | NA | NA | NA | NA | NA | |
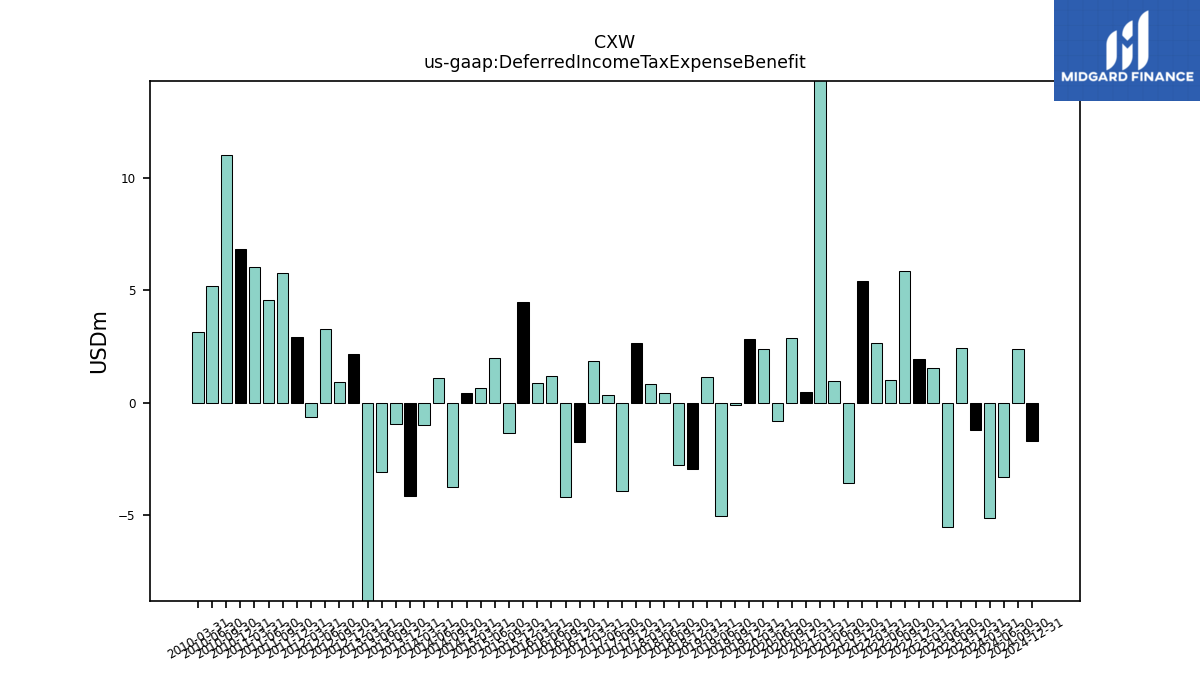
| Deferred Income Tax Expense Benefit | -1.21 | 2.45 | -5.51 | 1.56 | 1.93 | 5.86 | 0.99 | 2.68 | 5.42 | -3.59 | 0.97 | 96.47 | 0.47 | 2.89 | -0.81 | 2.40 | 2.84 | -0.09 | -5.05 | 1.14 | -2.94 | -2.78 | 0.45 | 0.84 | 2.65 | -3.92 | 0.33 | 1.87 | -1.76 | -4.20 | 1.18 | 0.88 | 4.46 | -1.37 | 1.97 | 0.64 | 0.44 | -3.74 | 1.09 | -0.99 | -4.16 | -0.93 | -3.09 | -142.86 | 2.18 | 0.92 | 3.28 | -0.61 | 2.93 | 5.78 | 4.56 | 6.05 | 6.83 | 11.02 | 5.21 | 3.14 | |
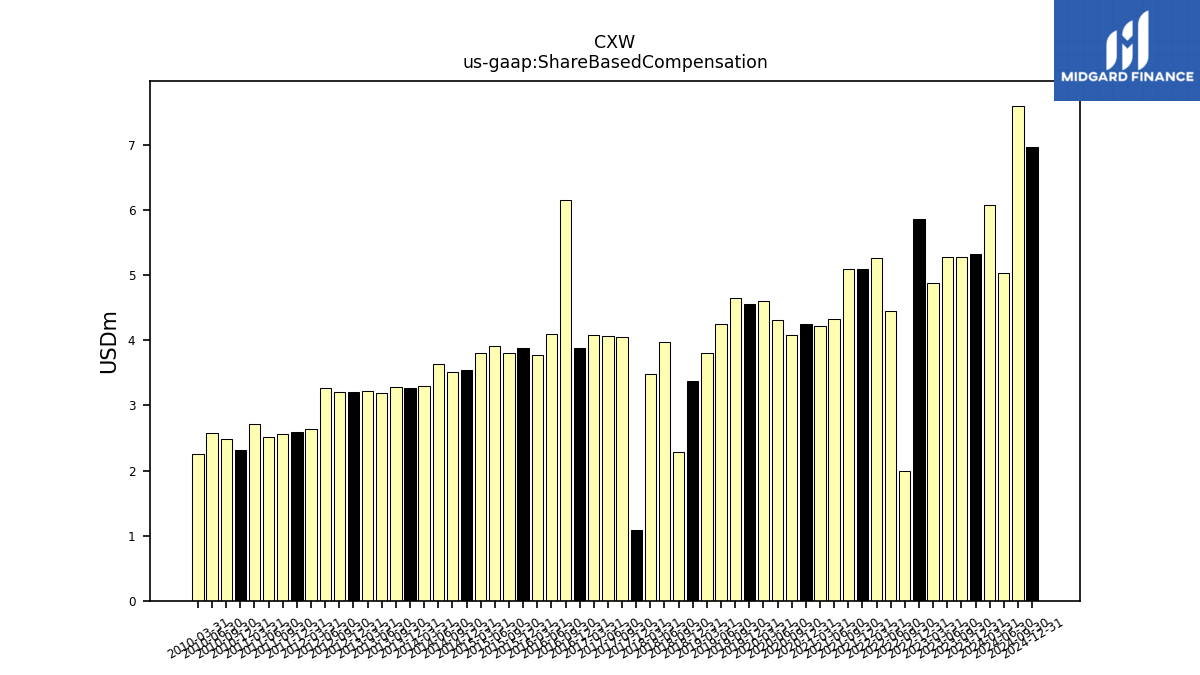
| Share Based Compensation | 5.32 | 5.29 | 5.27 | 4.88 | 5.86 | 1.99 | 4.45 | 5.27 | 5.09 | 5.10 | 4.33 | 4.21 | 4.25 | 4.08 | 4.32 | 4.61 | 4.55 | 4.65 | 4.26 | 3.81 | 3.37 | 2.29 | 3.98 | 3.49 | 1.08 | 4.06 | 4.06 | 4.09 | 3.87 | 6.16 | 4.09 | 3.78 | 3.88 | 3.81 | 3.91 | 3.80 | 3.54 | 3.51 | 3.63 | 3.29 | 3.27 | 3.28 | 3.20 | 3.21 | 3.21 | 3.21 | 3.26 | 2.64 | 2.60 | 2.56 | 2.52 | 2.71 | 2.32 | 2.48 | 2.58 | 2.26 |
| 2023-12-31 | 2023-09-30 | 2023-06-30 | 2023-03-31 | 2022-12-31 | 2022-09-30 | 2022-06-30 | 2022-03-31 | 2021-12-31 | 2021-09-30 | 2021-06-30 | 2021-03-31 | 2020-12-31 | 2020-09-30 | 2020-06-30 | 2020-03-31 | 2019-12-31 | 2019-09-30 | 2019-06-30 | 2019-03-31 | 2018-12-31 | 2018-09-30 | 2018-06-30 | 2018-03-31 | 2017-12-31 | 2017-09-30 | 2017-06-30 | 2017-03-31 | 2016-12-31 | 2016-09-30 | 2016-06-30 | 2016-03-31 | 2015-12-31 | 2015-09-30 | 2015-06-30 | 2015-03-31 | 2014-12-31 | 2014-09-30 | 2014-06-30 | 2014-03-31 | 2013-12-31 | 2013-09-30 | 2013-06-30 | 2013-03-31 | 2012-12-31 | 2012-09-30 | 2012-06-30 | 2012-03-31 | 2011-12-31 | 2011-09-30 | 2011-06-30 | 2011-03-31 | 2010-12-31 | 2010-09-30 | 2010-06-30 | 2010-03-31 | ||
|---|---|---|---|---|---|---|---|---|---|---|---|---|---|---|---|---|---|---|---|---|---|---|---|---|---|---|---|---|---|---|---|---|---|---|---|---|---|---|---|---|---|---|---|---|---|---|---|---|---|---|---|---|---|---|---|---|---|
| Net Cash Provided By Used In Investing Activities | -19.66 | -17.59 | -11.12 | -10.51 | -28.85 | 124.63 | -18.93 | -3.81 | -36.10 | -12.05 | 303.93 | -17.36 | 76.36 | -12.57 | -8.75 | -42.07 | -46.53 | -51.98 | -68.08 | -78.00 | -60.42 | -134.54 | -26.24 | -69.85 | -42.80 | -38.57 | -23.86 | -19.33 | -26.23 | -23.42 | -58.33 | -14.22 | -183.60 | -66.32 | -67.78 | -91.58 | -55.39 | -99.59 | -15.18 | -26.73 | -42.94 | -53.83 | -17.08 | -11.65 | -17.62 | -18.95 | -20.48 | -22.88 | -105.96 | -27.92 | -25.71 | -12.46 | -31.03 | -23.01 | -47.21 | -42.97 | |
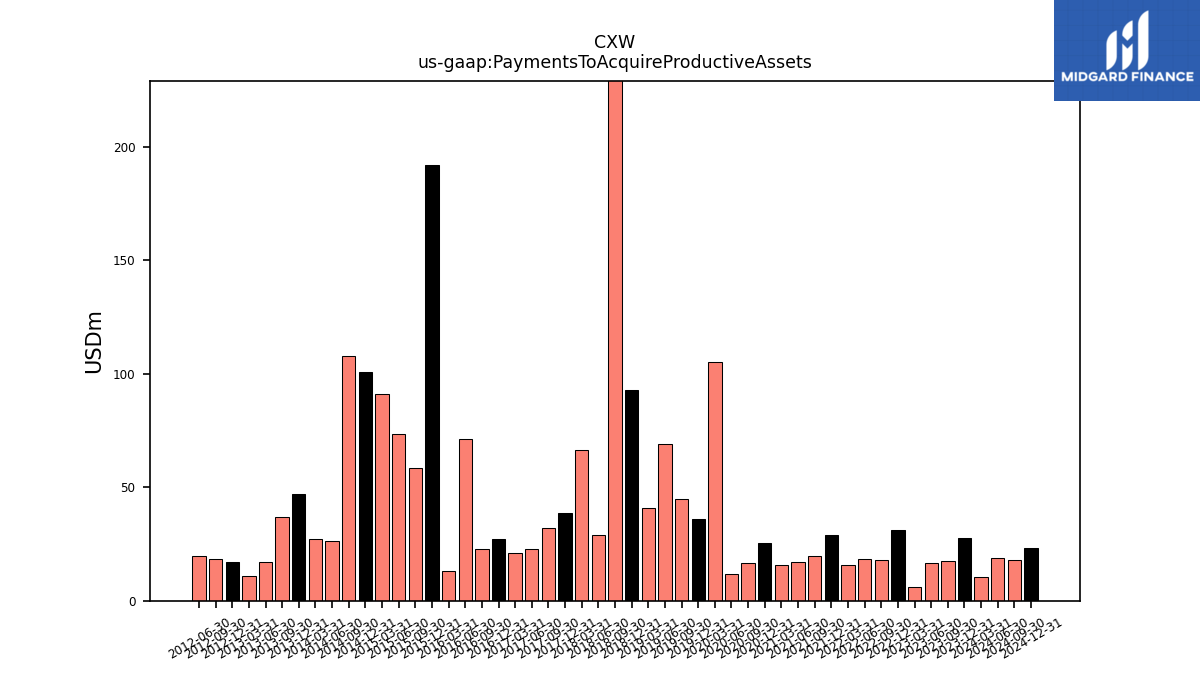
| Payments To Acquire Productive Assets | 27.51 | 17.57 | 16.45 | 6.22 | 31.30 | 18.05 | 18.48 | 15.62 | 28.77 | 19.86 | 17.21 | 15.65 | 25.37 | 16.79 | 11.99 | 105.34 | 35.97 | 44.86 | 69.12 | 40.79 | 92.81 | 298.90 | 29.17 | 66.25 | 38.77 | 32.14 | 22.63 | 21.21 | 27.25 | 23.00 | 71.35 | 12.93 | 191.92 | 58.66 | 73.68 | 91.18 | 101.03 | 107.79 | 26.46 | 27.28 | 47.11 | 36.80 | 16.91 | 10.80 | 17.13 | 18.44 | 19.91 | NA | NA | NA | NA | NA | NA | NA | NA | NA |
| 2023-12-31 | 2023-09-30 | 2023-06-30 | 2023-03-31 | 2022-12-31 | 2022-09-30 | 2022-06-30 | 2022-03-31 | 2021-12-31 | 2021-09-30 | 2021-06-30 | 2021-03-31 | 2020-12-31 | 2020-09-30 | 2020-06-30 | 2020-03-31 | 2019-12-31 | 2019-09-30 | 2019-06-30 | 2019-03-31 | 2018-12-31 | 2018-09-30 | 2018-06-30 | 2018-03-31 | 2017-12-31 | 2017-09-30 | 2017-06-30 | 2017-03-31 | 2016-12-31 | 2016-09-30 | 2016-06-30 | 2016-03-31 | 2015-12-31 | 2015-09-30 | 2015-06-30 | 2015-03-31 | 2014-12-31 | 2014-09-30 | 2014-06-30 | 2014-03-31 | 2013-12-31 | 2013-09-30 | 2013-06-30 | 2013-03-31 | 2012-12-31 | 2012-09-30 | 2012-06-30 | 2012-03-31 | 2011-12-31 | 2011-09-30 | 2011-06-30 | 2011-03-31 | 2010-12-31 | 2010-09-30 | 2010-06-30 | 2010-03-31 | ||
|---|---|---|---|---|---|---|---|---|---|---|---|---|---|---|---|---|---|---|---|---|---|---|---|---|---|---|---|---|---|---|---|---|---|---|---|---|---|---|---|---|---|---|---|---|---|---|---|---|---|---|---|---|---|---|---|---|---|
| Net Cash Provided By Used In Financing Activities | 8.38 | -3.31 | -35.00 | -176.31 | -43.54 | -76.75 | -240.80 | -14.07 | -98.96 | 105.16 | -299.46 | -34.45 | -307.30 | -183.72 | -59.75 | 199.94 | 42.24 | -99.29 | 12.77 | -20.56 | -8.48 | 61.82 | -28.80 | -34.41 | -24.94 | -46.63 | -64.01 | -66.71 | -52.98 | -92.55 | -18.66 | -116.57 | 76.43 | 13.16 | -63.24 | -25.98 | -93.95 | -12.96 | -58.21 | -65.09 | -35.26 | -14.57 | -91.38 | -87.77 | -38.93 | -77.98 | -9.45 | -69.91 | 20.75 | -47.47 | -35.79 | -86.21 | -94.19 | 5.27 | -14.87 | -27.91 | |
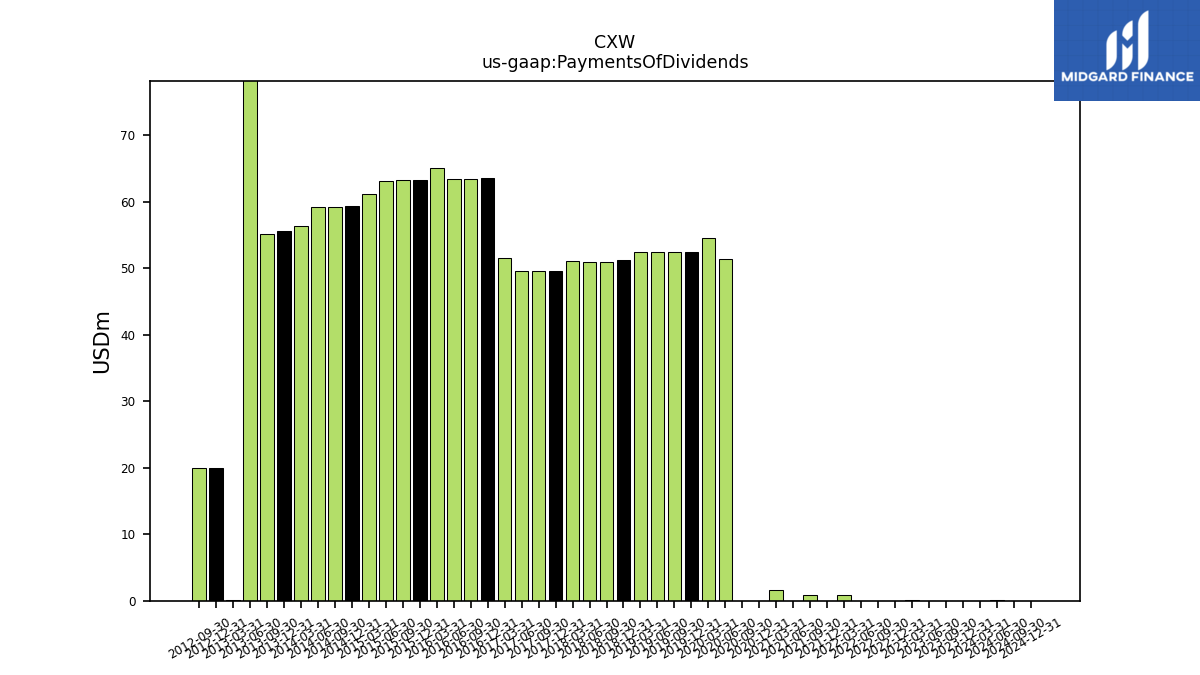
| Payments Of Dividends | 0.00 | 0.00 | 0.00 | 0.13 | 0.00 | 0.00 | 0.02 | 0.87 | 0.00 | 0.90 | 0.00 | 1.61 | 0.01 | 0.01 | 51.44 | 54.53 | 52.39 | 52.39 | 52.38 | 52.37 | 51.18 | 50.95 | 50.96 | 51.11 | 49.63 | 49.63 | 49.60 | 51.46 | 63.48 | 63.47 | 63.44 | 65.11 | 63.24 | 63.19 | 63.12 | 61.14 | 59.36 | 59.22 | 59.20 | 56.27 | 55.65 | 55.17 | 188.44 | 0.17 | 19.93 | 19.93 | NA | NA | NA | NA | NA | NA | NA | NA | NA | NA | |
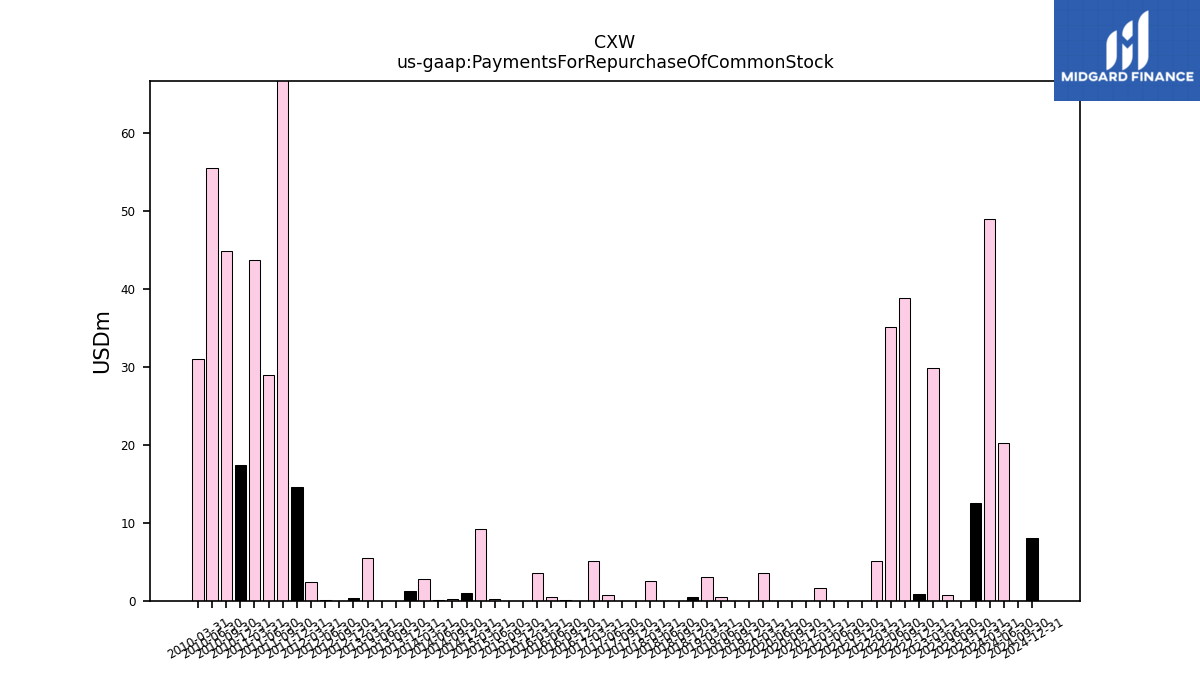
| Payments For Repurchase Of Common Stock | 12.52 | 0.00 | 0.70 | 29.83 | 0.81 | 38.84 | 35.09 | 5.14 | 0.00 | 0.01 | 0.00 | 1.63 | 0.00 | 0.01 | 0.00 | 3.56 | 0.00 | 0.00 | 0.46 | 3.07 | 0.46 | 0.00 | 0.02 | 2.52 | 0.03 | 0.00 | 0.73 | 5.09 | 0.01 | 0.04 | 0.42 | 3.53 | 0.00 | 0.02 | 0.17 | 9.26 | 0.98 | 0.25 | 0.04 | 2.77 | 1.24 | 0.00 | 0.02 | 5.43 | 0.33 | 0.00 | 0.09 | 2.39 | 14.55 | 152.71 | 28.91 | 43.68 | 17.42 | 44.83 | 55.54 | 31.04 |
| 2023-12-31 | 2023-09-30 | 2023-06-30 | 2023-03-31 | 2022-12-31 | 2022-09-30 | 2022-06-30 | 2022-03-31 | 2021-12-31 | 2021-09-30 | 2021-06-30 | 2021-03-31 | 2020-12-31 | 2020-09-30 | 2020-06-30 | 2020-03-31 | 2019-12-31 | 2019-09-30 | 2019-06-30 | 2019-03-31 | 2018-12-31 | 2018-09-30 | 2018-06-30 | 2018-03-31 | 2017-12-31 | 2017-09-30 | 2017-06-30 | 2017-03-31 | 2016-12-31 | 2016-09-30 | 2016-06-30 | 2016-03-31 | 2015-12-31 | 2015-09-30 | 2015-06-30 | 2015-03-31 | 2014-12-31 | 2014-09-30 | 2014-06-30 | 2014-03-31 | 2013-12-31 | 2013-09-30 | 2013-06-30 | 2013-03-31 | 2012-12-31 | 2012-09-30 | 2012-06-30 | 2012-03-31 | 2011-12-31 | 2011-09-30 | 2011-06-30 | 2011-03-31 | 2010-12-31 | 2010-09-30 | 2010-06-30 | 2010-03-31 | ||
|---|---|---|---|---|---|---|---|---|---|---|---|---|---|---|---|---|---|---|---|---|---|---|---|---|---|---|---|---|---|---|---|---|---|---|---|---|---|---|---|---|---|---|---|---|---|---|---|---|---|---|---|---|---|---|---|---|---|
| Revenues | 491.25 | 483.70 | 463.68 | 458.00 | 471.43 | 464.21 | 456.70 | 452.99 | 472.13 | 471.19 | 464.57 | 454.72 | 473.48 | 468.27 | 472.64 | 491.10 | 497.81 | 508.52 | 490.29 | 484.06 | 482.19 | 462.73 | 449.93 | 440.92 | 440.58 | 442.85 | 436.39 | 445.68 | 464.13 | 474.94 | 453.28 | 438.45 | 447.83 | 450.34 | 449.77 | 416.91 | 423.48 | 399.02 | 400.35 | 398.92 | 431.10 | 420.28 | 432.89 | 415.81 | 427.68 | 434.02 | 441.41 | 434.75 | 439.69 | 434.49 | 432.25 | 428.07 | 432.20 | 426.63 | 409.21 | 405.78 | |
| Operating | 491.19 | 483.59 | 463.68 | 457.90 | 471.41 | 464.15 | 456.65 | 452.95 | 472.11 | 471.01 | 464.54 | 454.68 | 473.44 | 468.23 | 472.60 | 491.04 | 497.78 | 508.49 | 490.26 | 484.00 | 482.17 | 462.73 | 449.93 | 440.91 | 440.56 | 440.38 | 436.38 | 435.26 | 491.85 | 464.05 | 453.28 | 438.45 | 438.73 | 450.34 | NA | NA | NA | NA | NA | NA | NA | NA | NA | NA | NA | NA | NA | NA | NA | NA | NA | NA | NA | NA | NA | NA | |
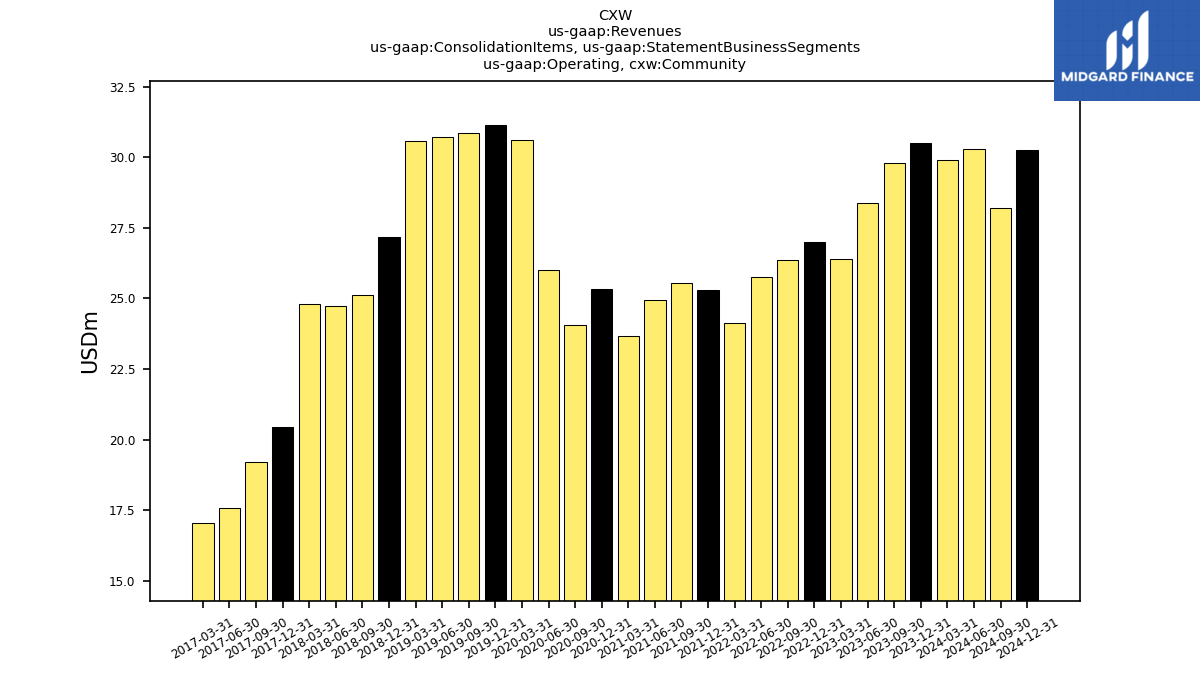
| Operating, Community | 30.50 | 29.79 | 28.36 | 26.41 | 26.99 | 26.38 | 25.77 | 24.11 | 25.31 | 25.54 | 24.93 | 23.66 | 25.32 | 24.07 | 26.00 | 30.60 | 31.14 | 30.85 | 30.71 | 30.57 | 27.19 | 25.13 | 24.72 | 24.80 | 20.43 | 19.20 | 17.58 | 17.05 | NA | NA | NA | NA | NA | NA | NA | NA | NA | NA | NA | NA | NA | NA | NA | NA | NA | NA | NA | NA | NA | NA | NA | NA | NA | NA | NA | NA | |
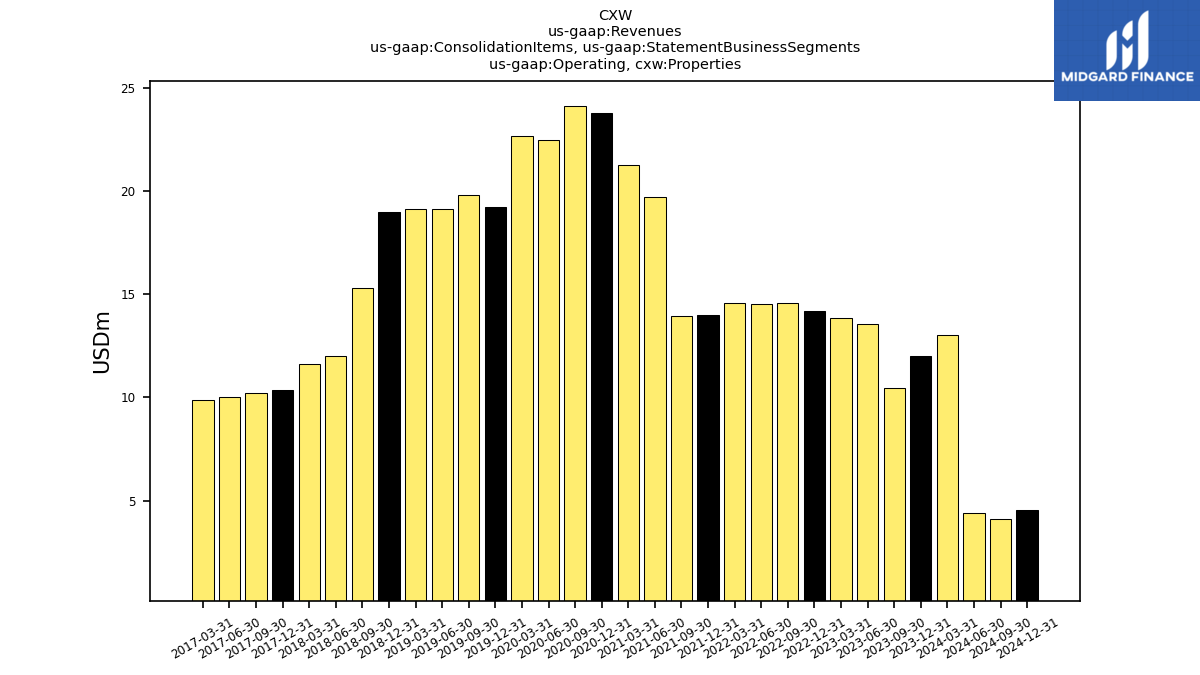
| Operating, Properties | 11.99 | 10.48 | 13.57 | 13.84 | 14.17 | 14.59 | 14.53 | 14.59 | 14.01 | 13.94 | 19.73 | 21.25 | 23.80 | 24.13 | 22.48 | 22.68 | 19.22 | 19.83 | 19.14 | 19.11 | 19.00 | 15.28 | 12.00 | 11.62 | 10.35 | 10.21 | 10.02 | 9.87 | NA | NA | NA | NA | NA | NA | NA | NA | NA | NA | NA | NA | NA | NA | NA | NA | NA | NA | NA | NA | NA | NA | NA | NA | NA | NA | NA | NA | |
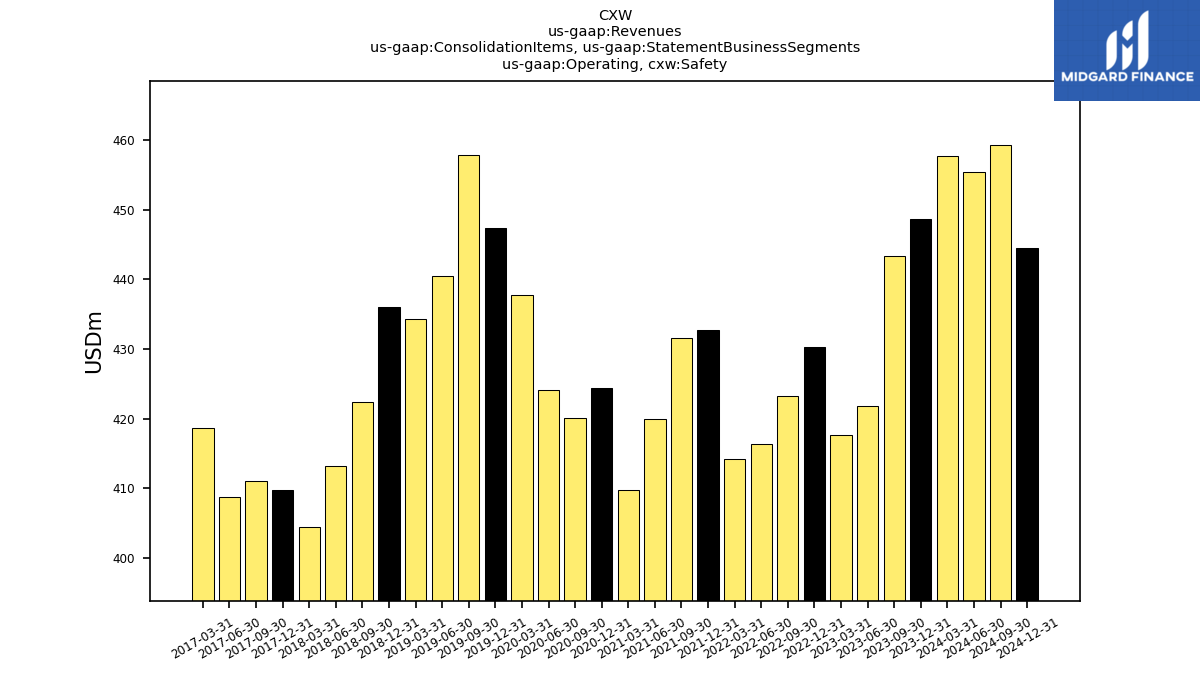
| Operating, Safety | 448.70 | 443.32 | 421.74 | 417.65 | 430.25 | 423.19 | 416.35 | 414.25 | 432.79 | 431.53 | 419.88 | 409.77 | 424.32 | 420.03 | 424.12 | 437.76 | 447.41 | 457.82 | 440.41 | 434.32 | 435.98 | 422.31 | 413.21 | 404.50 | 409.79 | 410.98 | 408.78 | 418.68 | NA | NA | NA | NA | NA | NA | NA | NA | NA | NA | NA | NA | NA | NA | NA | NA | NA | NA | NA | NA | NA | NA | NA | NA | NA | NA | NA | NA |
