
| 2023-12-31 | 2023-09-30 | 2023-06-30 | 2023-03-31 | 2022-12-31 | 2022-09-30 | 2022-06-30 | 2022-03-31 | 2021-12-31 | 2021-09-30 | 2021-06-30 | 2021-03-31 | 2020-12-31 | 2020-09-30 | 2020-06-30 | 2020-03-31 | 2019-12-31 | 2019-09-30 | 2019-06-30 | 2019-03-31 | 2018-12-31 | 2018-09-30 | 2018-06-30 | 2018-03-31 | 2017-12-31 | 2017-09-30 | 2017-06-30 | 2017-03-31 | ||
|---|---|---|---|---|---|---|---|---|---|---|---|---|---|---|---|---|---|---|---|---|---|---|---|---|---|---|---|---|---|
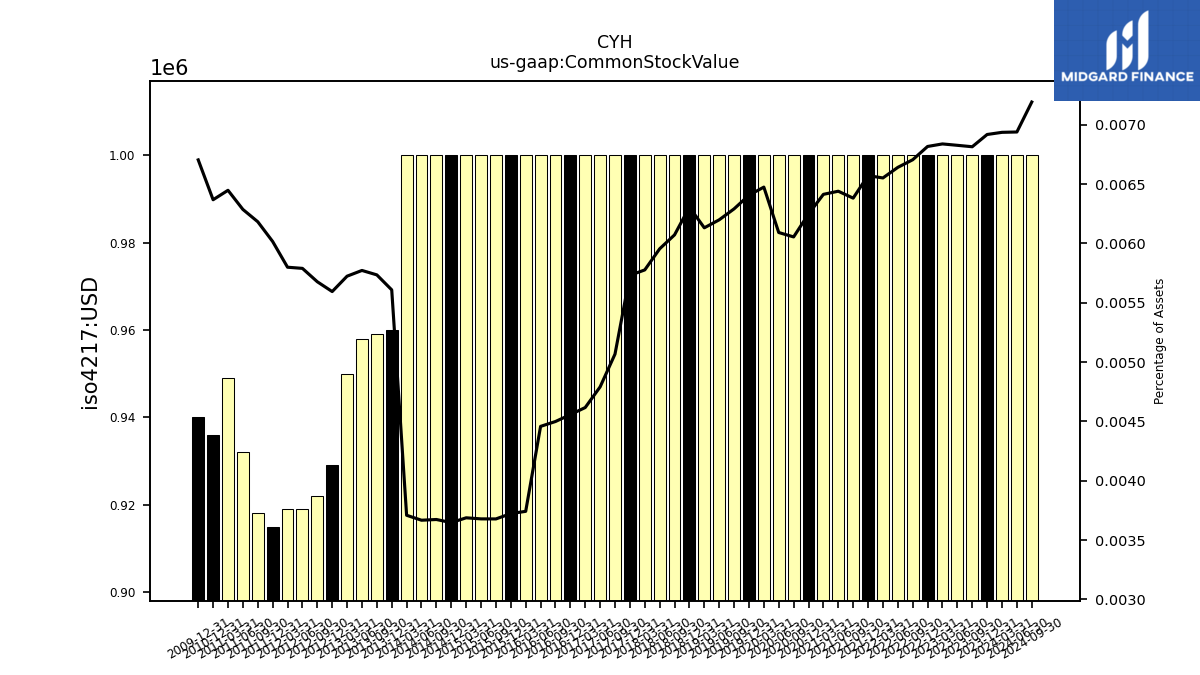
| Common Stock Value | 1.00 | 1.00 | 1.00 | 1.00 | 1.00 | 1.00 | 1.00 | 1.00 | 1.00 | 1.00 | 1.00 | 1.00 | 1.00 | 1.00 | 1.00 | 1.00 | 1.00 | 1.00 | 1.00 | 1.00 | 1.00 | 1.00 | 1.00 | 1.00 | 1.00 | 1.00 | 1.00 | 1.00 | |
| Earnings Per Share Basic | 0.36 | -0.69 | -0.29 | -0.40 | 3.21 | -0.32 | -2.52 | -0.01 | 1.41 | 0.87 | 0.04 | -0.51 | 2.69 | 0.98 | 0.61 | 0.15 | -3.27 | -0.15 | -1.47 | -1.04 | -2.91 | -2.88 | -0.97 | -0.22 | -17.98 | -0.98 | -1.22 | -1.79 | |
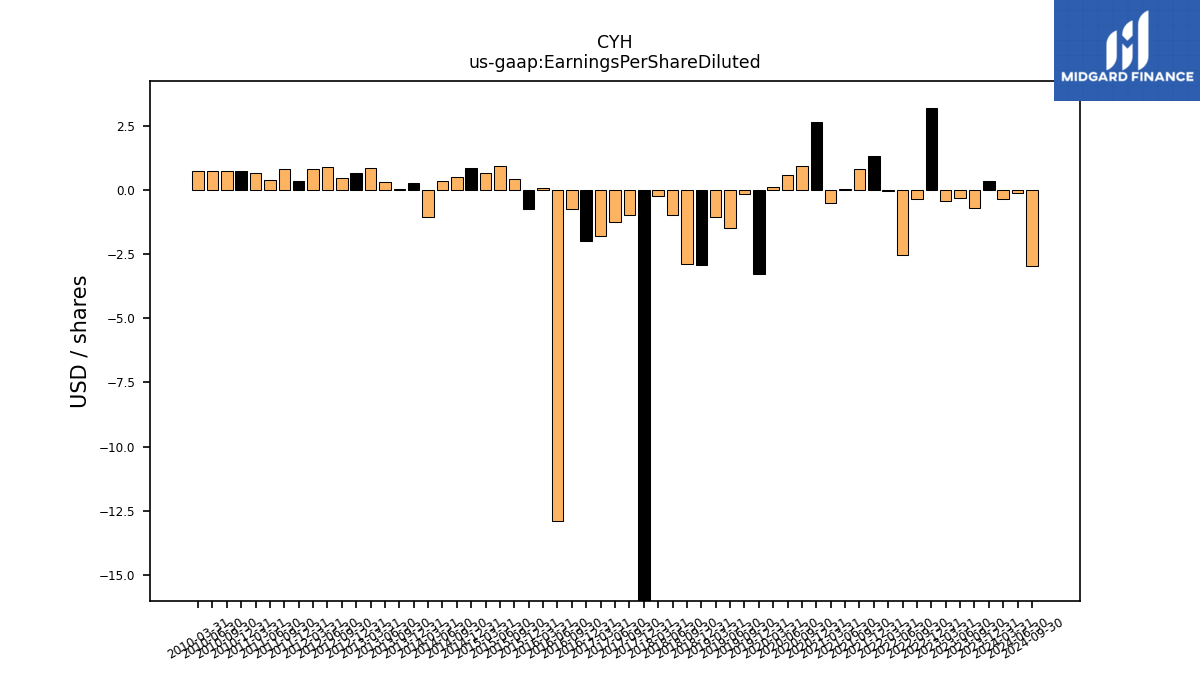
| Earnings Per Share Diluted | 0.36 | -0.69 | -0.29 | -0.40 | 3.21 | -0.32 | -2.52 | -0.01 | 1.36 | 0.85 | 0.04 | -0.51 | 2.65 | 0.97 | 0.61 | 0.15 | -3.27 | -0.15 | -1.47 | -1.04 | -2.91 | -2.88 | -0.97 | -0.22 | -17.98 | -0.98 | -1.22 | -1.79 |
| 2023-12-31 | 2023-09-30 | 2023-06-30 | 2023-03-31 | 2022-12-31 | 2022-09-30 | 2022-06-30 | 2022-03-31 | 2021-12-31 | 2021-09-30 | 2021-06-30 | 2021-03-31 | 2020-12-31 | 2020-09-30 | 2020-06-30 | 2020-03-31 | 2019-12-31 | 2019-09-30 | 2019-06-30 | 2019-03-31 | 2018-12-31 | 2018-09-30 | 2018-06-30 | 2018-03-31 | 2017-12-31 | 2017-09-30 | 2017-06-30 | 2017-03-31 | ||
|---|---|---|---|---|---|---|---|---|---|---|---|---|---|---|---|---|---|---|---|---|---|---|---|---|---|---|---|---|---|
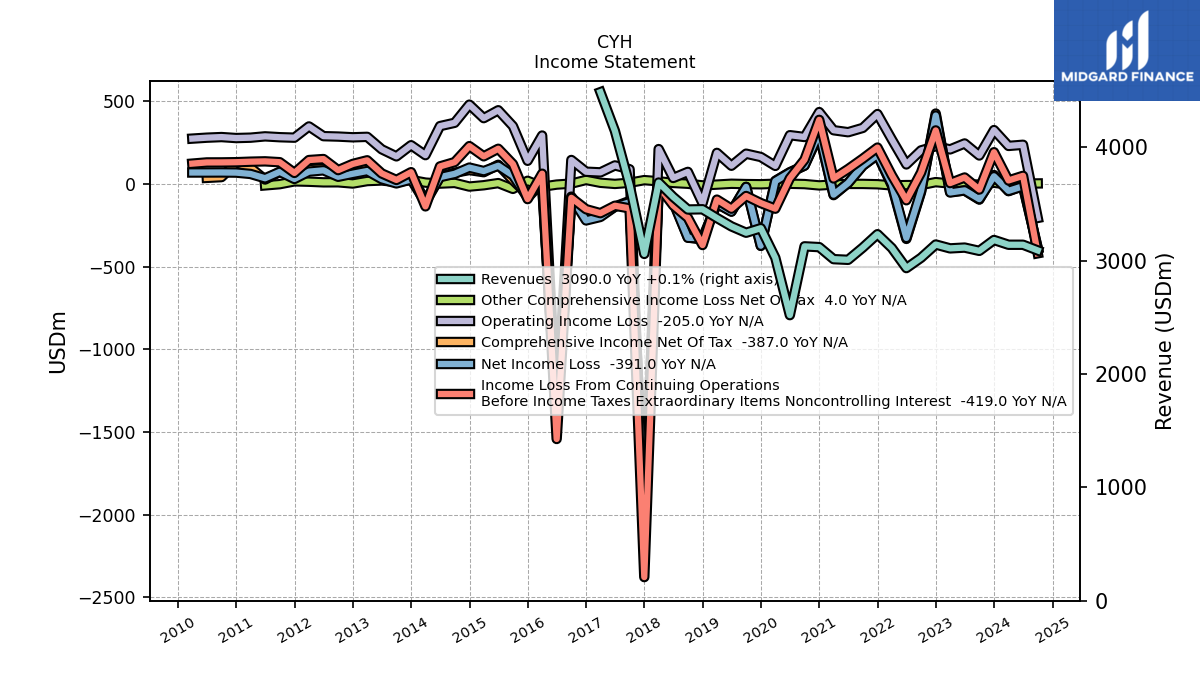
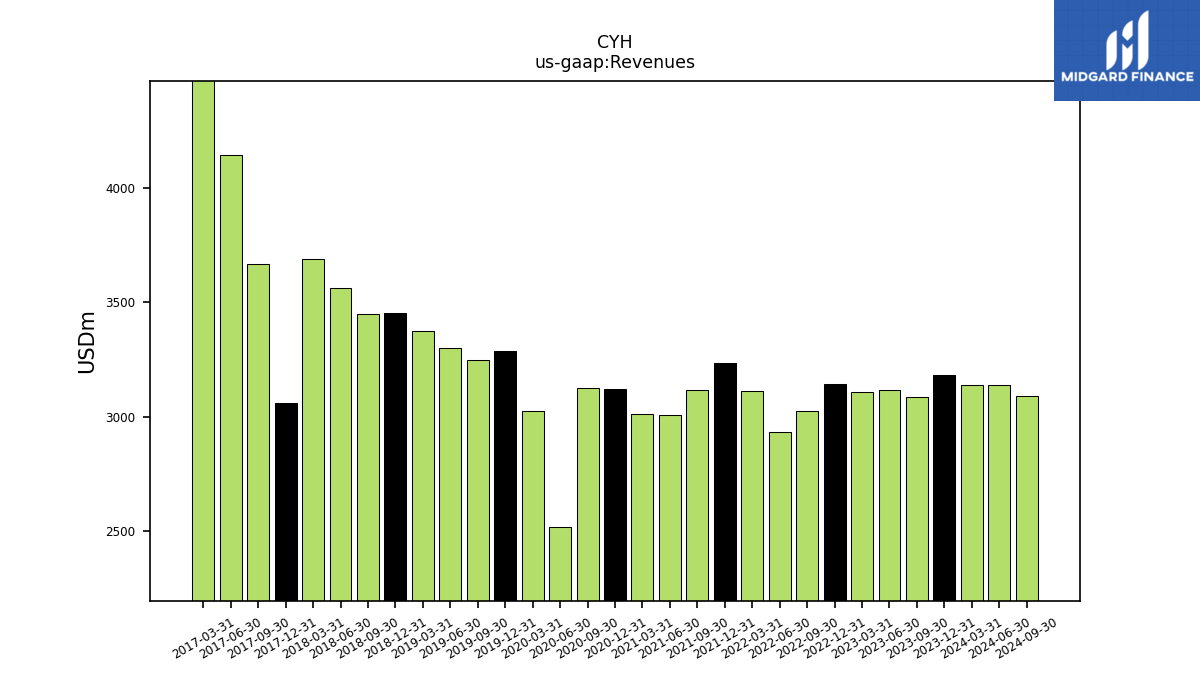
| Revenues | 3182.00 | 3086.00 | 3115.00 | 3108.00 | 3142.00 | 3025.00 | 2934.00 | 3111.00 | 3233.00 | 3115.00 | 3007.00 | 3013.00 | 3119.00 | 3126.00 | 2519.00 | 3025.00 | 3286.00 | 3246.00 | 3302.00 | 3376.00 | 3453.00 | 3451.00 | 3562.00 | 3689.00 | 3059.00 | 3666.00 | 4144.00 | 4486.00 | |
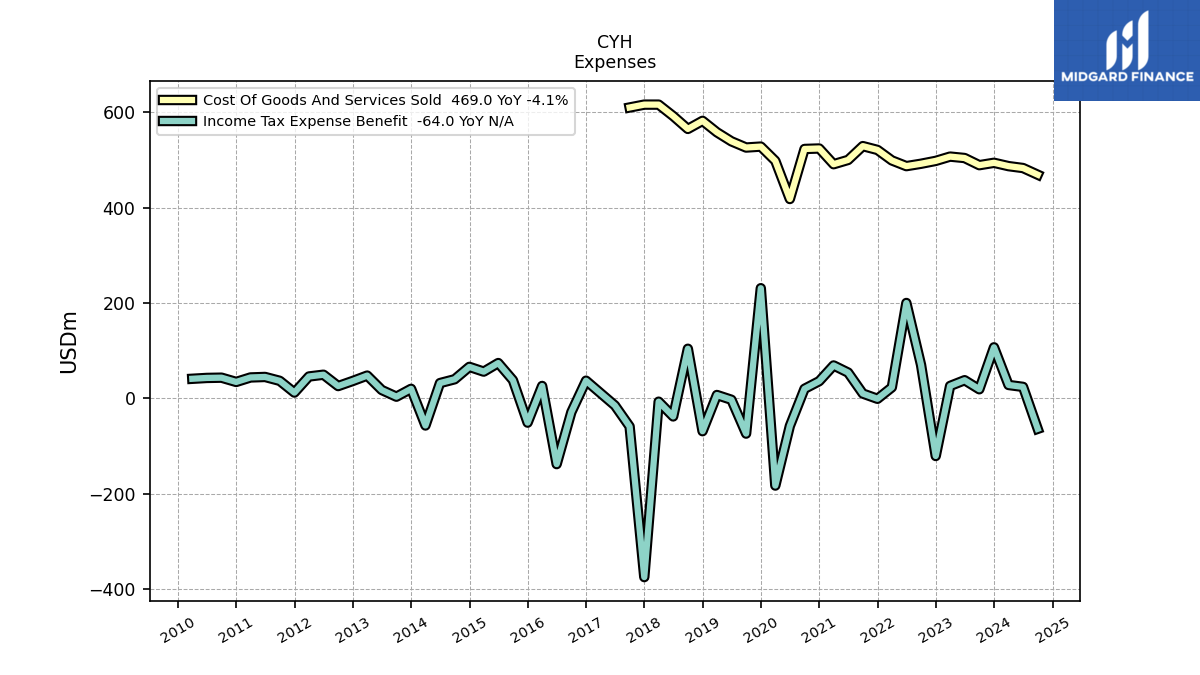
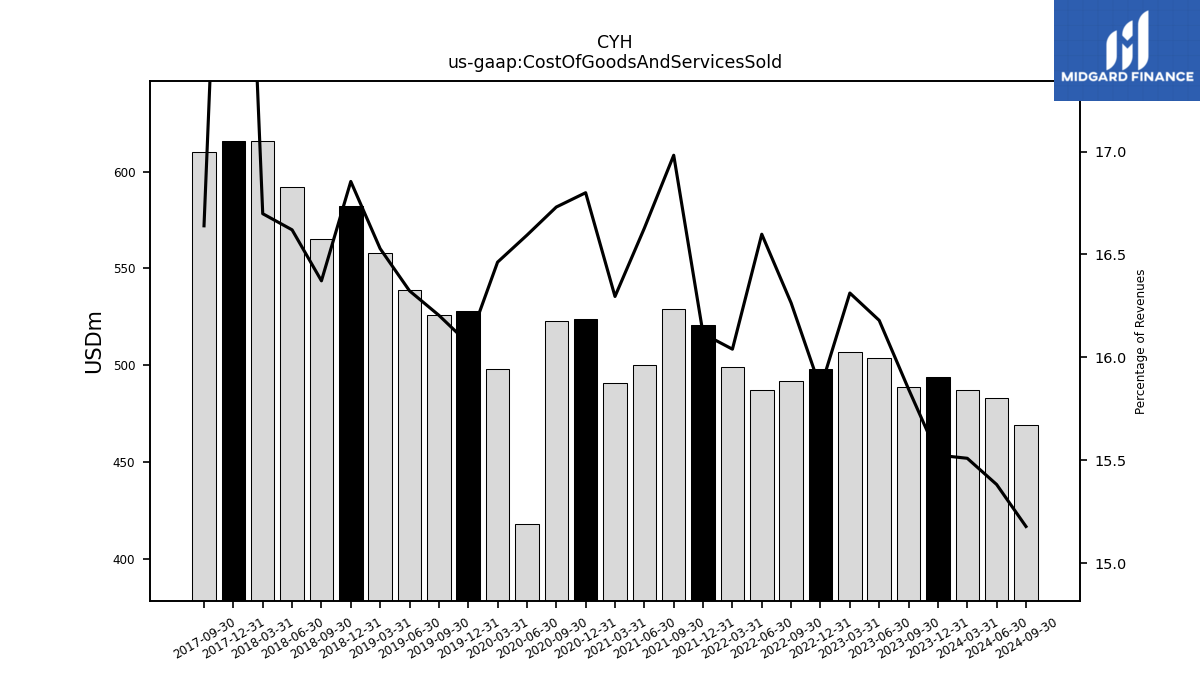
| Cost Of Goods And Services Sold | 494.00 | 489.00 | 504.00 | 507.00 | 498.00 | 492.00 | 487.00 | 499.00 | 521.00 | 529.00 | 500.00 | 491.00 | 524.00 | 523.00 | 418.00 | 498.00 | 528.00 | 526.00 | 539.00 | 558.00 | 582.00 | 565.00 | 592.00 | 616.00 | 616.00 | 610.00 | NA | NA | |
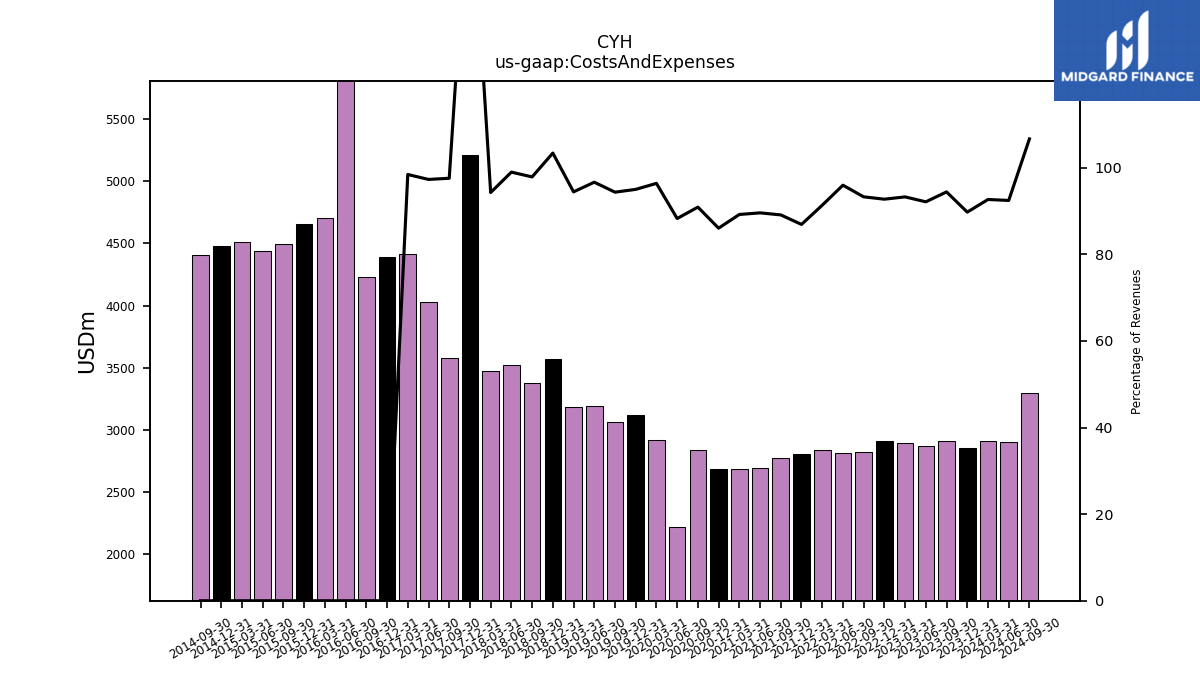
| Costs And Expenses | 2855.00 | 2913.00 | 2869.00 | 2898.00 | 2913.00 | 2821.00 | 2815.00 | 2841.00 | 2809.00 | 2775.00 | 2693.00 | 2687.00 | 2683.00 | 2841.00 | 2223.00 | 2915.00 | 3121.00 | 3062.00 | 3191.00 | 3187.00 | 3569.00 | 3377.00 | 3525.00 | 3477.00 | 5210.00 | 3576.00 | 4031.00 | 4415.00 | |
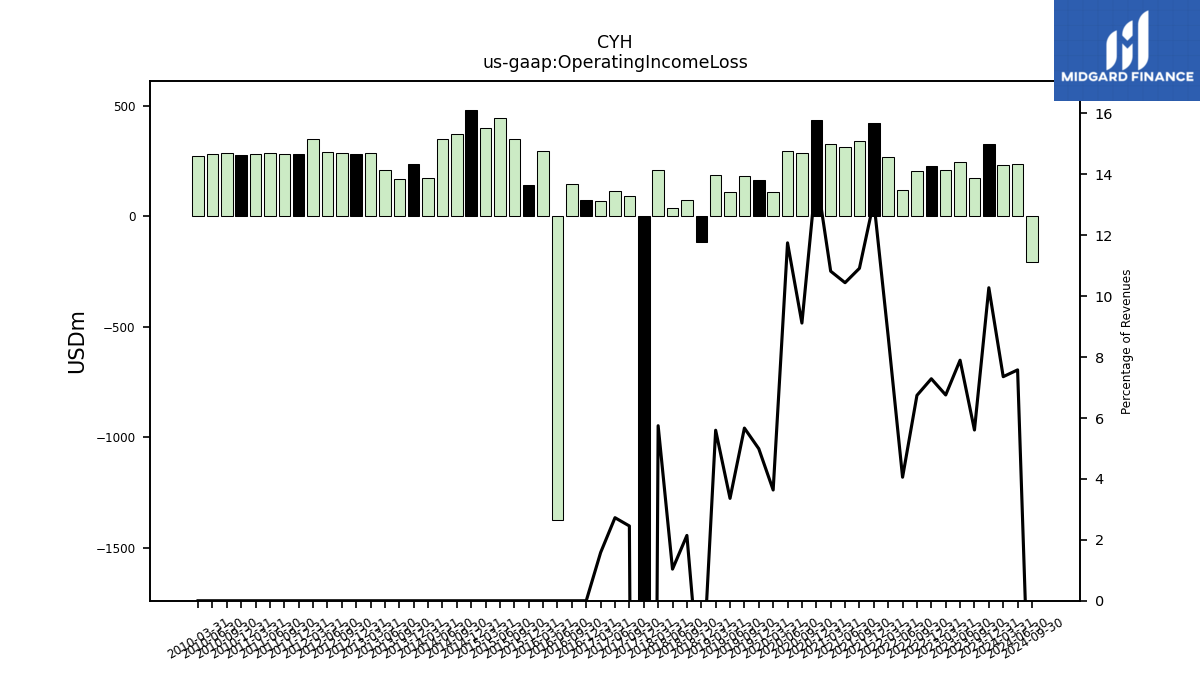
| Operating Income Loss | 327.00 | 173.00 | 246.00 | 210.00 | 229.00 | 204.00 | 119.00 | 270.00 | 424.00 | 340.00 | 314.00 | 326.00 | 436.00 | 285.00 | 296.00 | 110.00 | 164.00 | 184.00 | 111.00 | 189.00 | -116.00 | 74.00 | 37.00 | 212.00 | -2152.00 | 90.00 | 113.00 | 71.00 | |
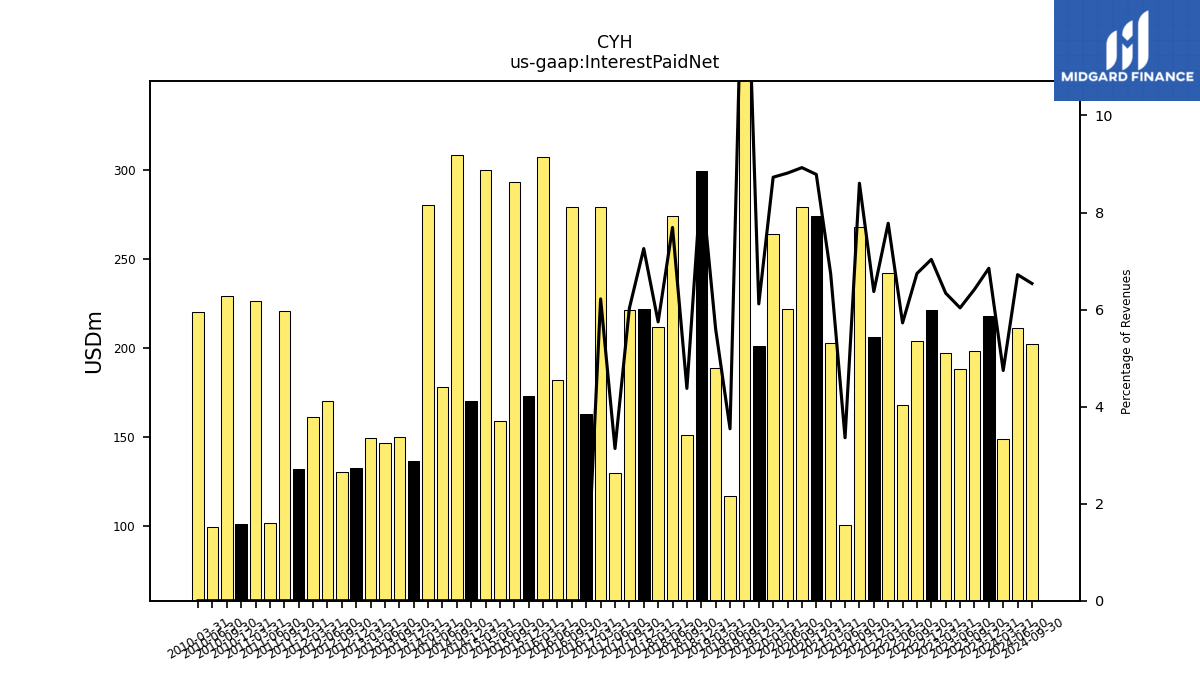
| Interest Paid Net | 218.00 | 198.00 | 188.00 | 197.00 | 221.00 | 204.00 | 168.00 | 242.00 | 206.00 | 268.00 | 101.00 | 203.00 | 274.00 | 279.00 | 222.00 | 264.00 | 201.00 | 492.00 | 117.00 | 189.00 | 299.00 | 151.00 | 274.00 | 212.00 | 222.00 | 221.00 | 130.00 | 279.00 | |
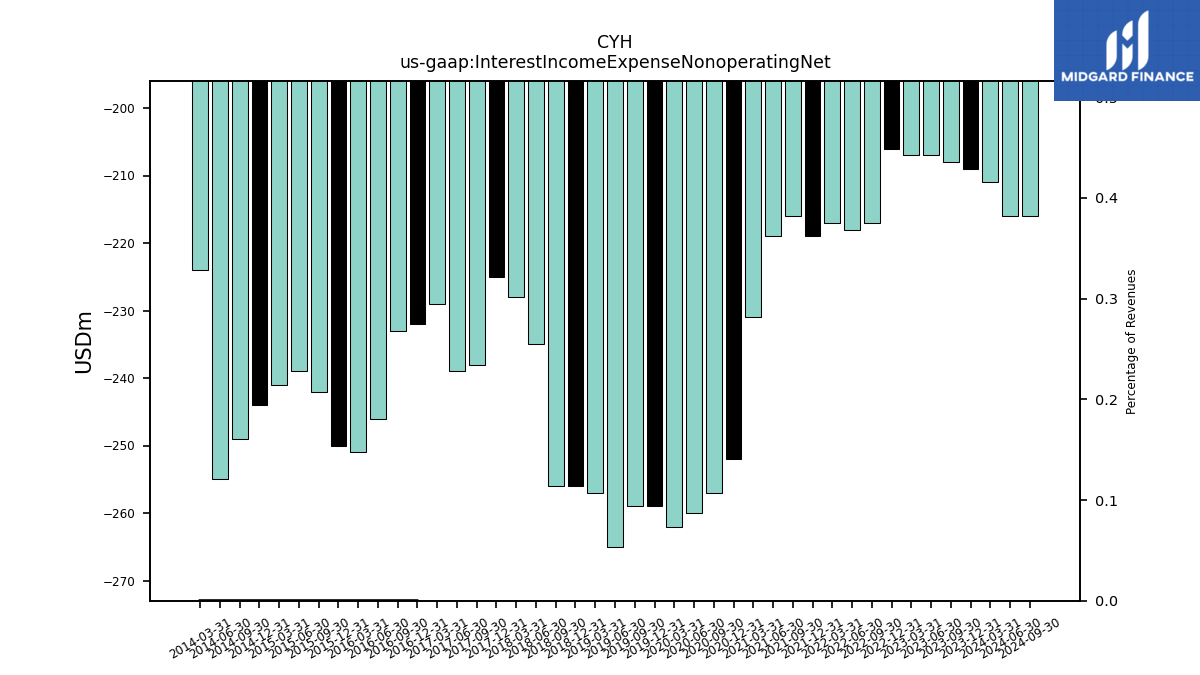
| Interest Income Expense Nonoperating Net | -209.00 | -208.00 | -207.00 | -207.00 | -206.00 | -217.00 | -218.00 | -217.00 | -219.00 | -216.00 | -219.00 | -231.00 | -252.00 | -257.00 | -260.00 | -262.00 | -259.00 | -259.00 | -265.00 | -257.00 | -256.00 | -256.00 | -235.00 | -228.00 | -225.00 | -238.00 | -239.00 | -229.00 | |
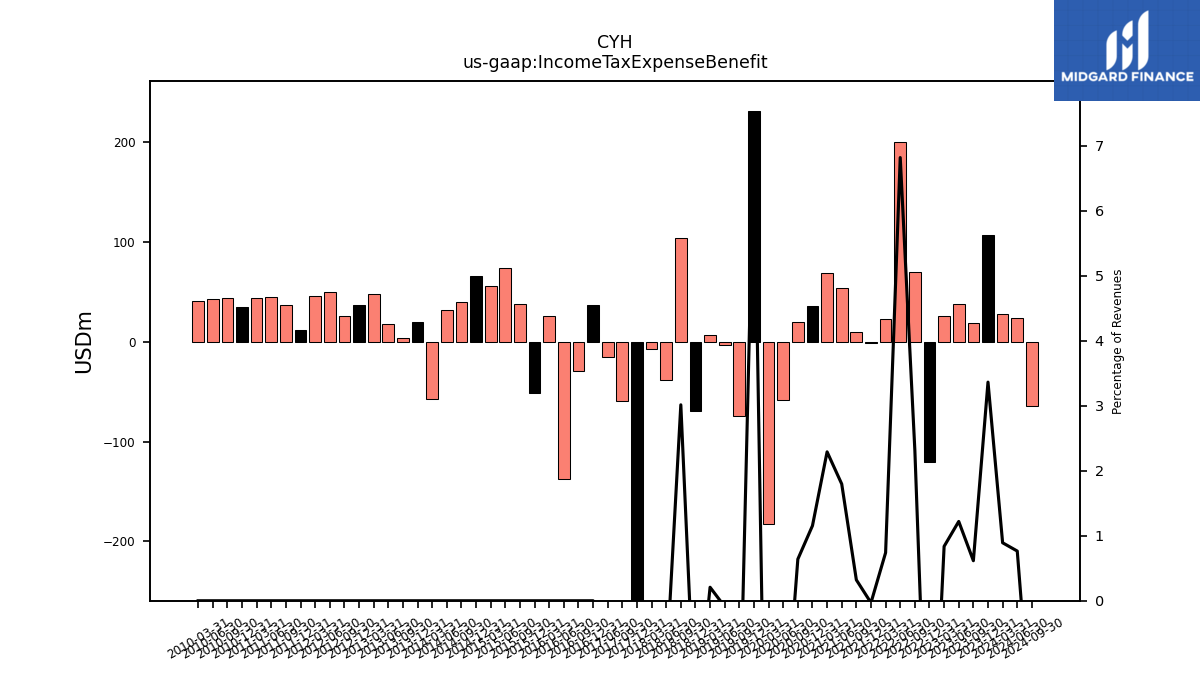
| Income Tax Expense Benefit | 107.00 | 19.00 | 38.00 | 26.00 | -121.00 | 70.00 | 200.00 | 23.00 | -1.00 | 10.00 | 54.00 | 69.00 | 36.00 | 20.00 | -58.00 | -183.00 | 231.00 | -74.00 | -3.00 | 7.00 | -69.00 | 104.00 | -38.00 | -7.00 | -375.00 | -59.00 | -15.00 | NA | |
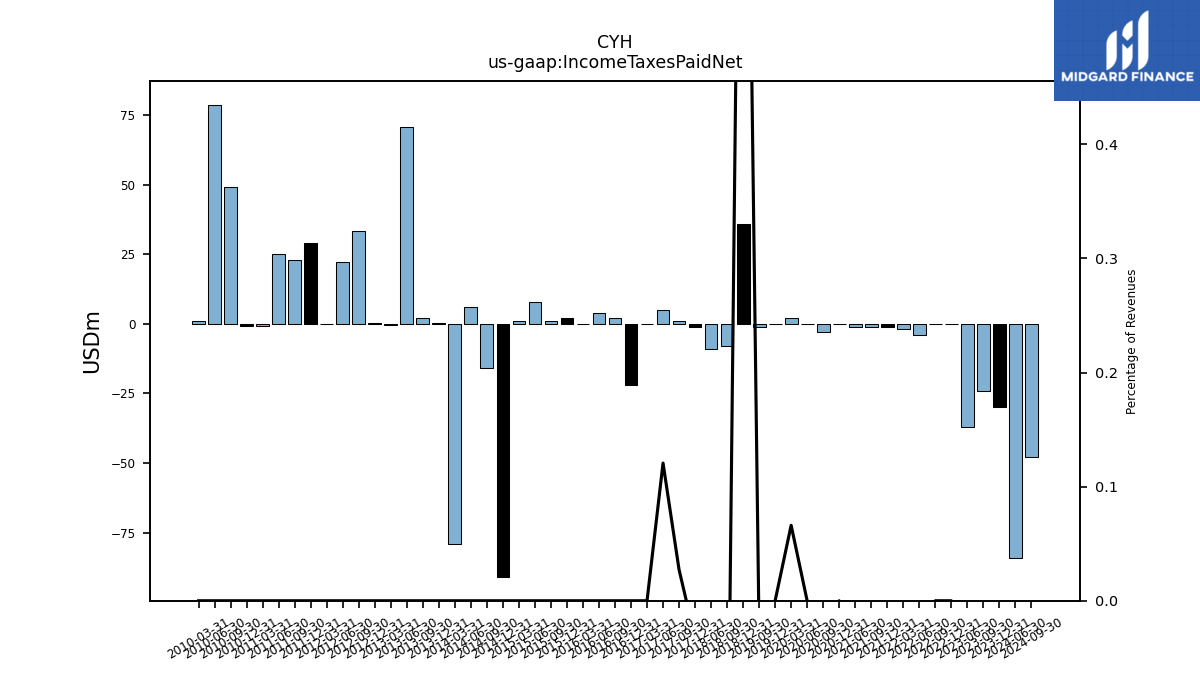
| Income Taxes Paid Net | -30.00 | -24.00 | -37.00 | NA | 0.00 | 0.00 | -4.00 | -2.00 | -1.00 | -1.00 | -1.00 | NA | 0.00 | -3.00 | 0.00 | 2.00 | 0.00 | -1.00 | NA | NA | 36.00 | -8.00 | -9.00 | NA | -1.00 | 1.00 | 5.00 | 0.00 | |
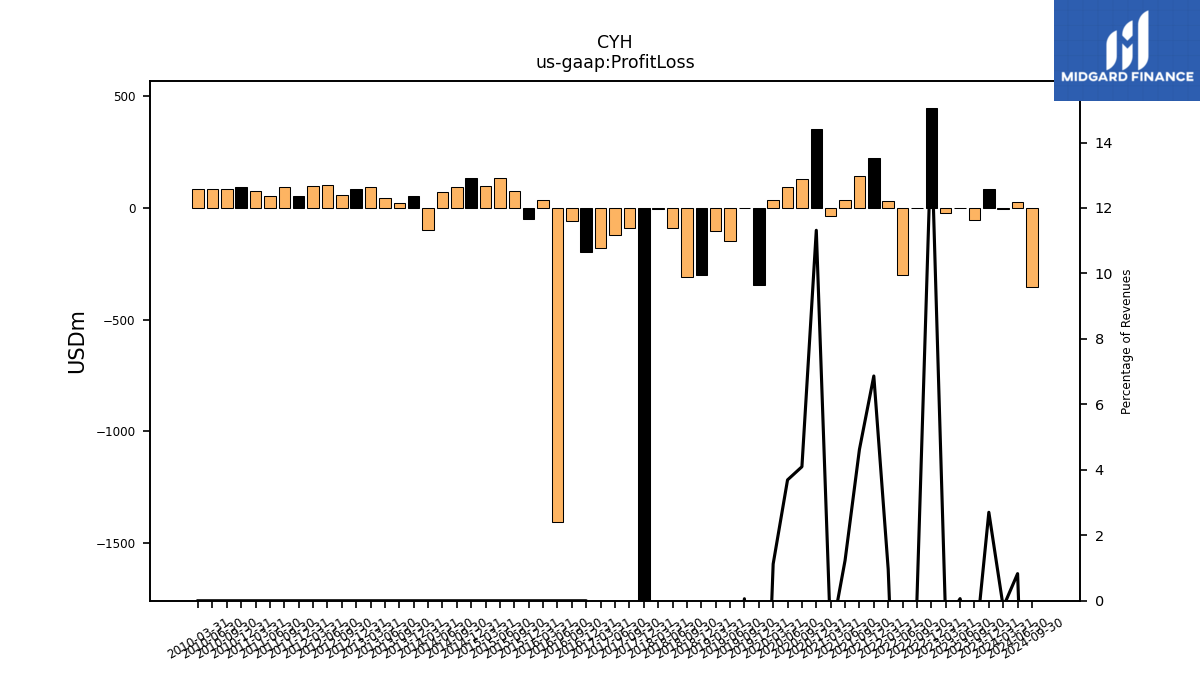
| Profit Loss | 86.00 | -52.00 | 2.00 | -20.00 | 446.00 | 1.00 | -298.00 | 30.00 | 222.00 | 144.00 | 37.00 | -35.00 | 353.00 | 128.00 | 93.00 | 34.00 | -346.00 | 2.00 | -146.00 | -101.00 | -299.00 | -308.00 | -91.00 | -6.00 | -2006.00 | -90.00 | -122.00 | -177.00 | |
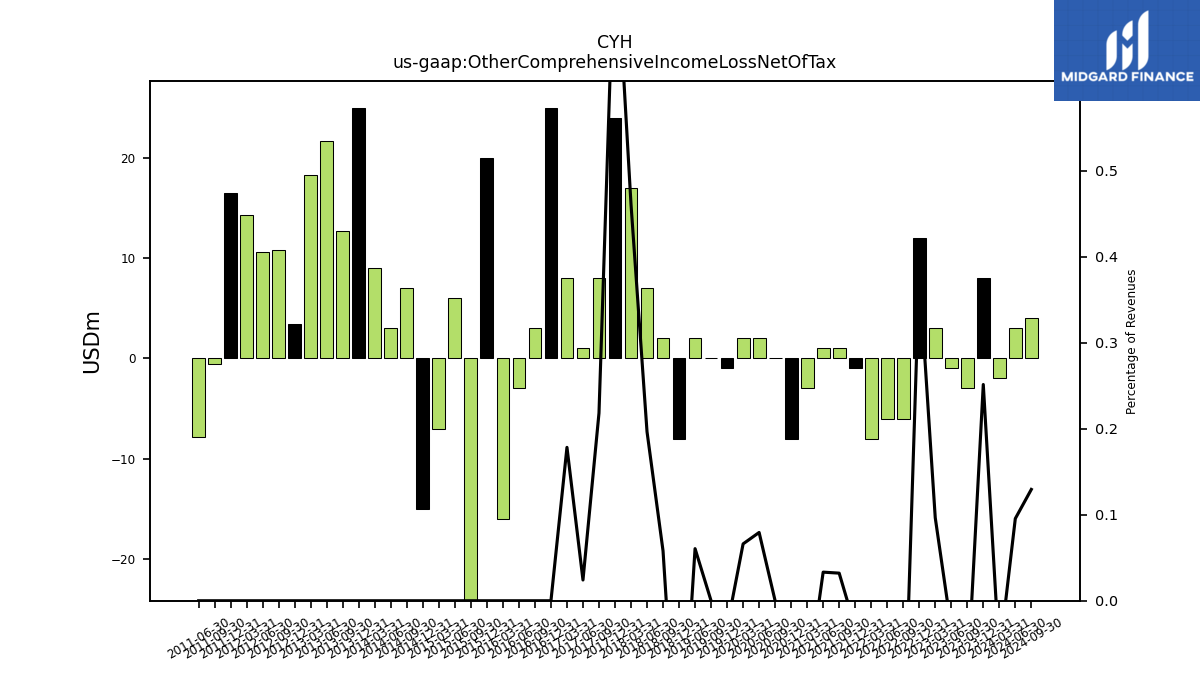
| Other Comprehensive Income Loss Net Of Tax | 8.00 | -3.00 | -1.00 | 3.00 | 12.00 | -6.00 | -6.00 | -8.00 | -1.00 | 1.00 | 1.00 | -3.00 | -8.00 | 0.00 | 2.00 | 2.00 | -1.00 | 0.00 | 2.00 | NA | -8.00 | 2.00 | 7.00 | 17.00 | 24.00 | 8.00 | 1.00 | 8.00 | |
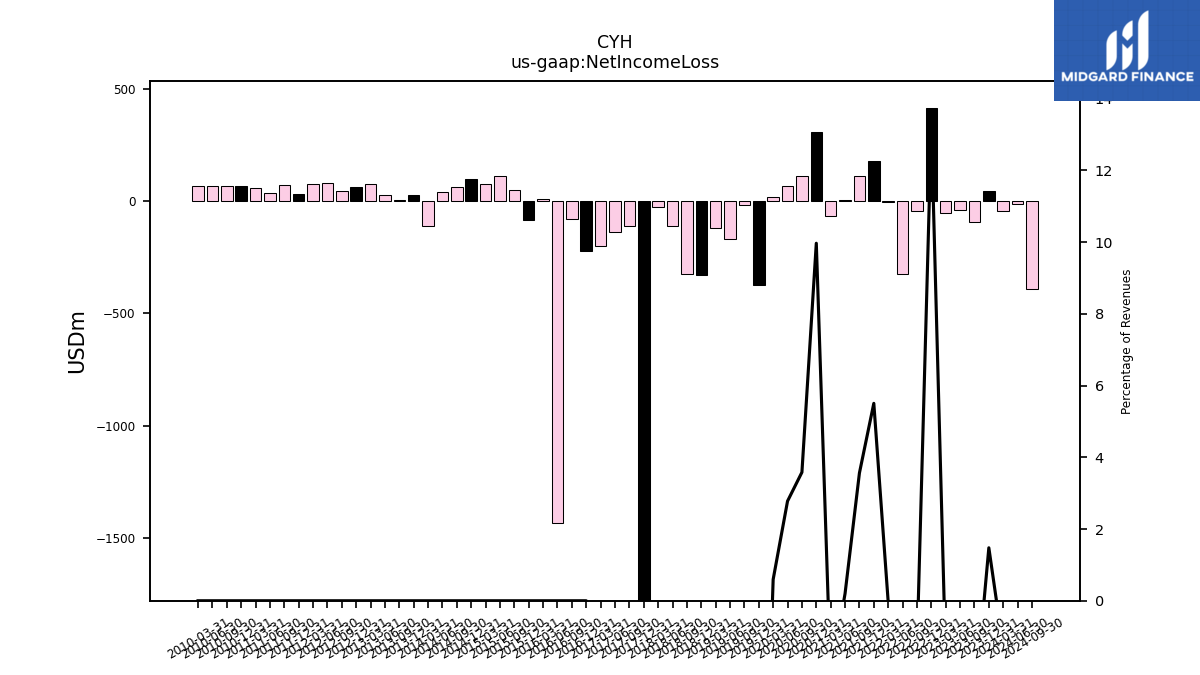
| Net Income Loss | 47.00 | -91.00 | -38.00 | -51.00 | 415.00 | -42.00 | -326.00 | -1.00 | 178.00 | 111.00 | 6.00 | -64.00 | 311.00 | 112.00 | 70.00 | 18.00 | -373.00 | -17.00 | -167.00 | -118.00 | -328.00 | -325.00 | -110.00 | -25.00 | -2013.00 | -110.00 | -137.00 | -199.00 | |
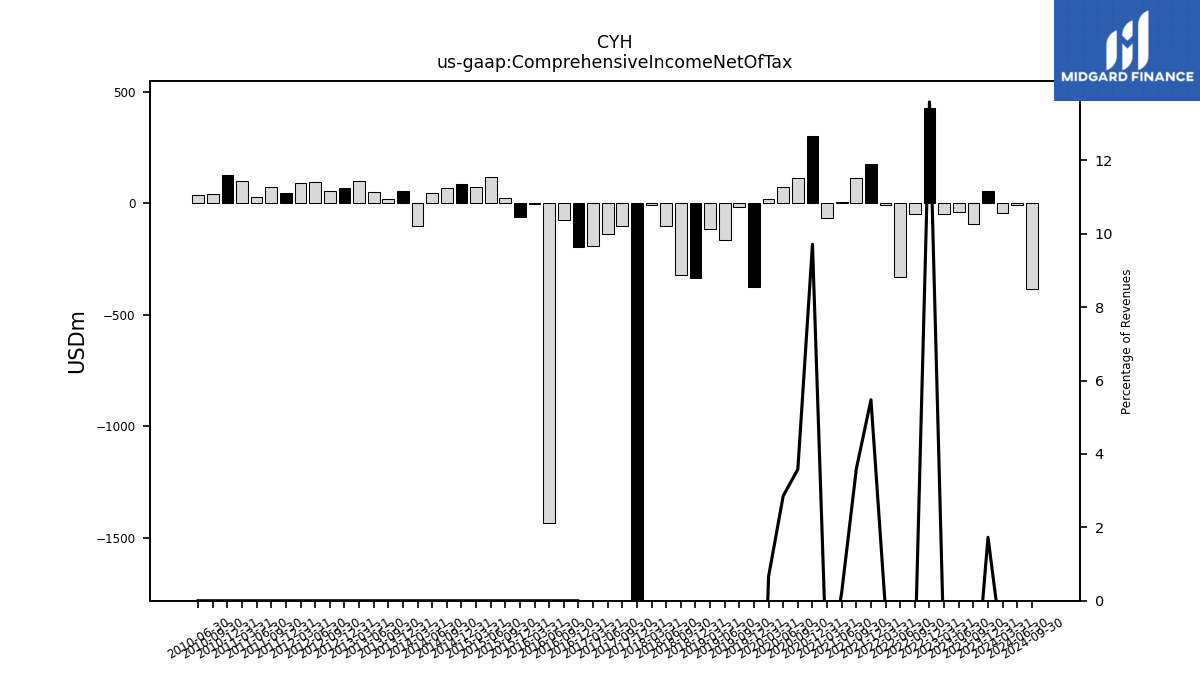
| Comprehensive Income Net Of Tax | 55.00 | -94.00 | -39.00 | -48.00 | 427.00 | -48.00 | -332.00 | -9.00 | 177.00 | 112.00 | 7.00 | -67.00 | 303.00 | 112.00 | 72.00 | 20.00 | -374.00 | -17.00 | -165.00 | -118.00 | -336.00 | -323.00 | -103.00 | -8.00 | -1989.00 | -102.00 | -136.00 | -191.00 |
| 2023-12-31 | 2023-09-30 | 2023-06-30 | 2023-03-31 | 2022-12-31 | 2022-09-30 | 2022-06-30 | 2022-03-31 | 2021-12-31 | 2021-09-30 | 2021-06-30 | 2021-03-31 | 2020-12-31 | 2020-09-30 | 2020-06-30 | 2020-03-31 | 2019-12-31 | 2019-09-30 | 2019-06-30 | 2019-03-31 | 2018-12-31 | 2018-09-30 | 2018-06-30 | 2018-03-31 | 2017-12-31 | 2017-09-30 | 2017-06-30 | 2017-03-31 | ||
|---|---|---|---|---|---|---|---|---|---|---|---|---|---|---|---|---|---|---|---|---|---|---|---|---|---|---|---|---|---|
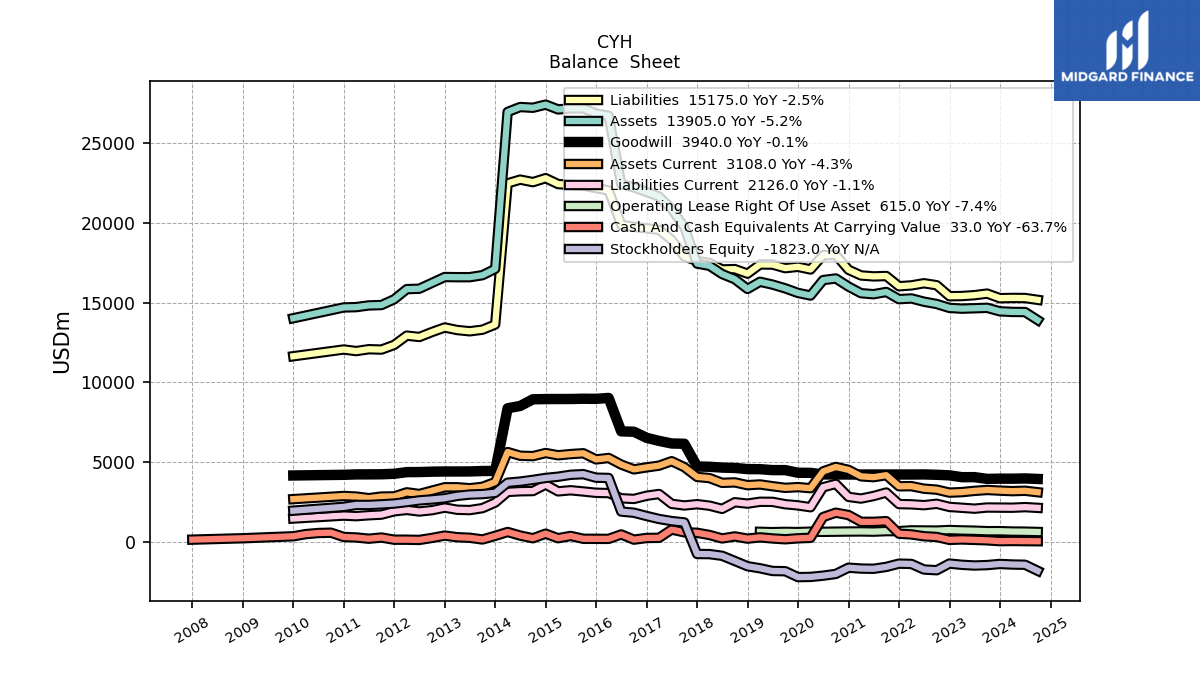
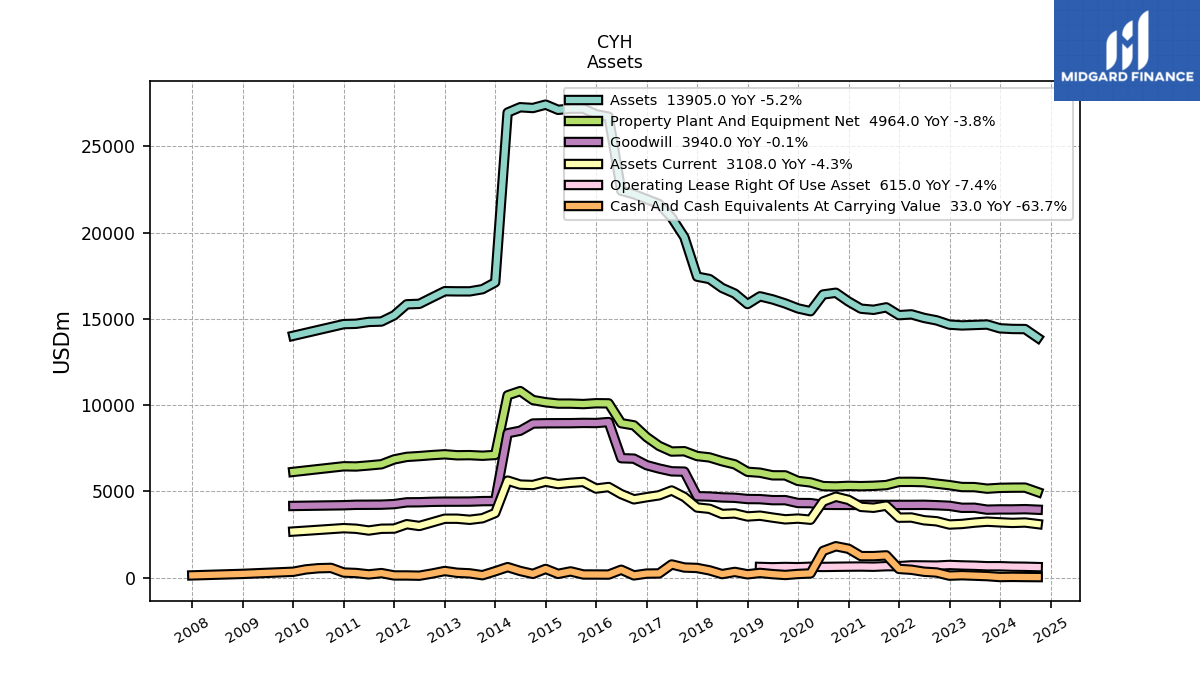
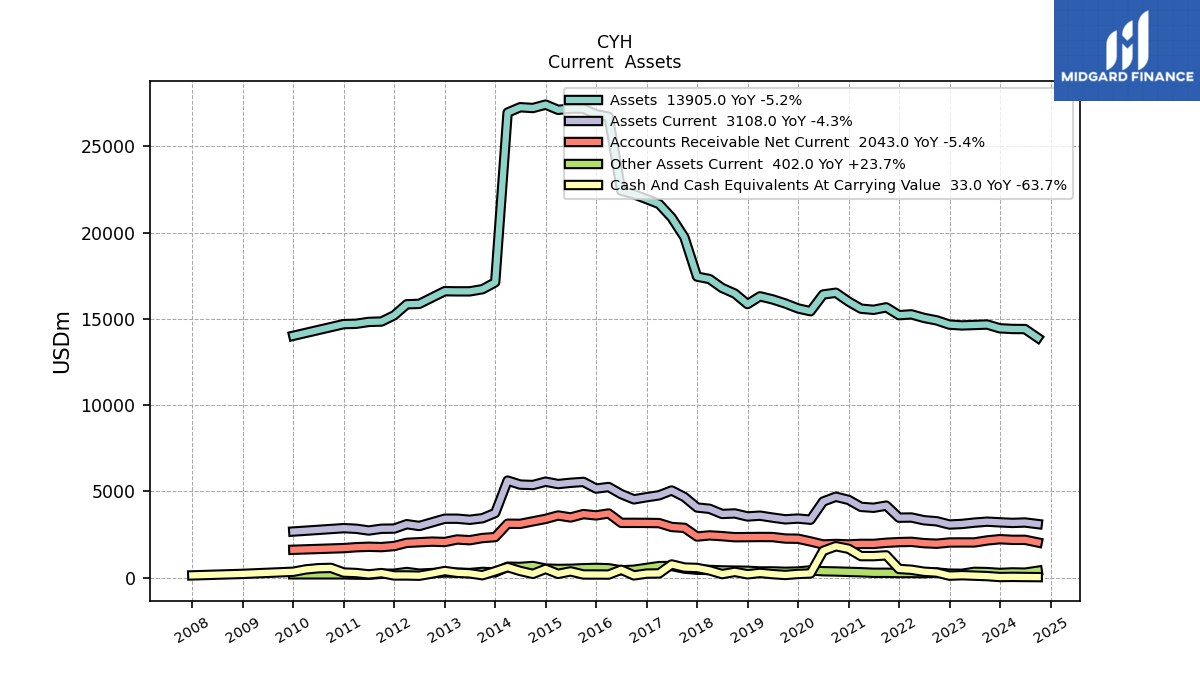
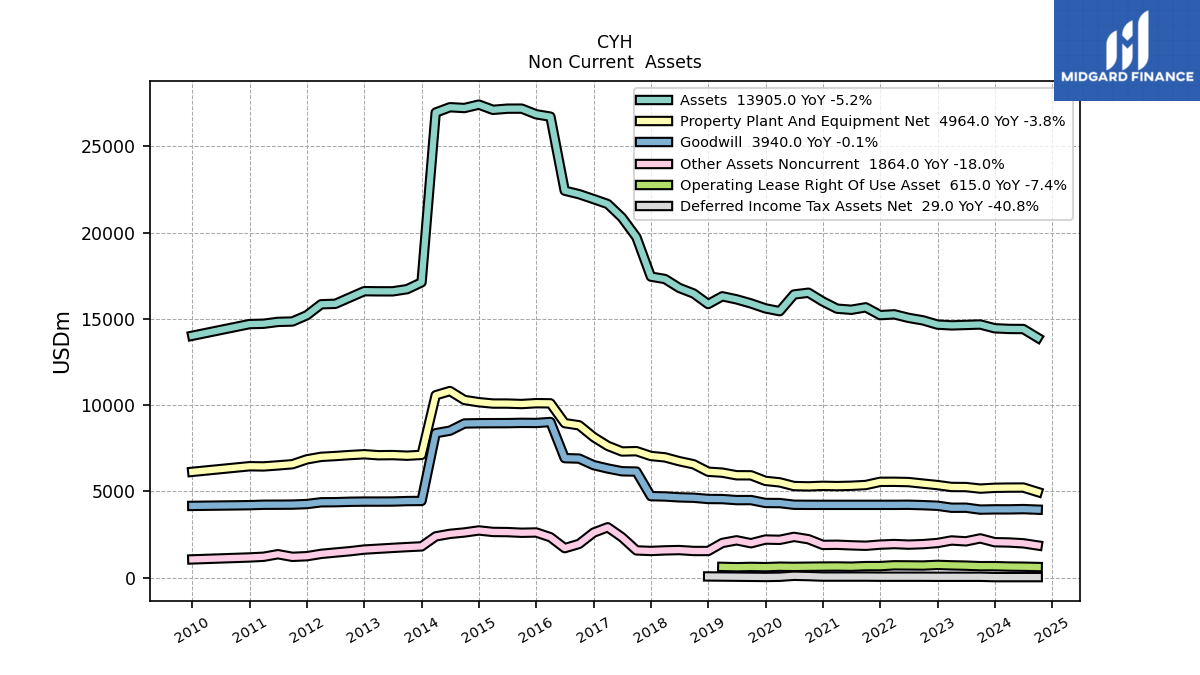
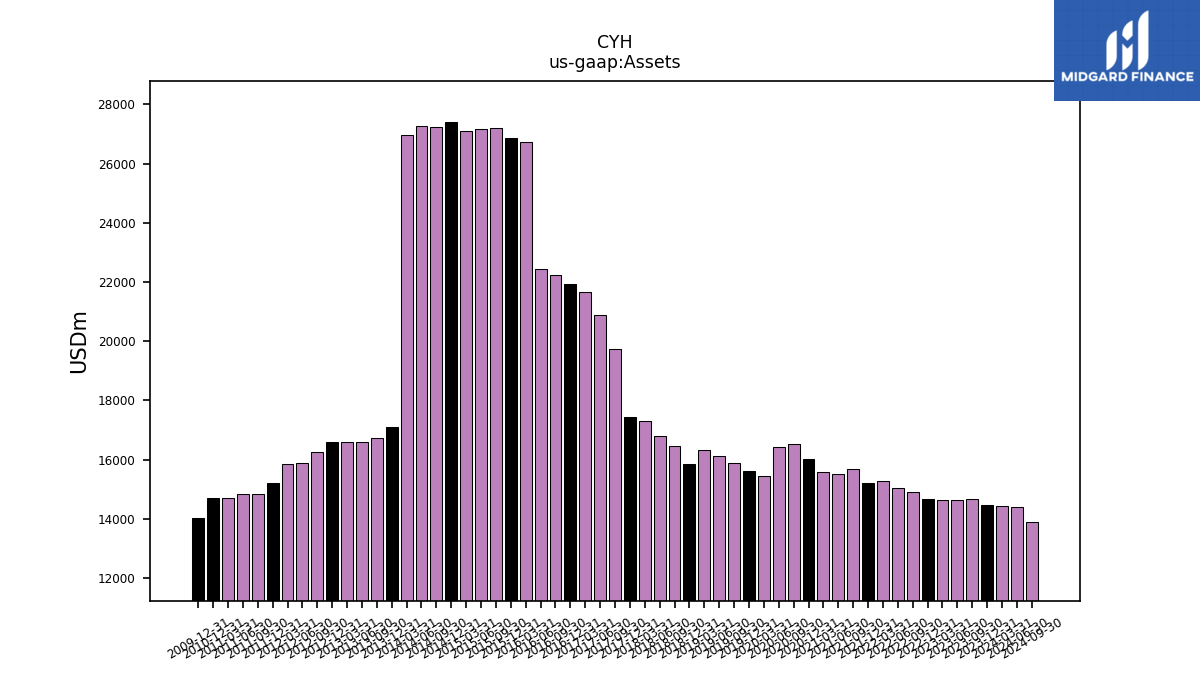
| Assets | 14455.00 | 14674.00 | 14648.00 | 14623.00 | 14669.00 | 14914.00 | 15058.00 | 15263.00 | 15217.00 | 15670.00 | 15528.00 | 15592.00 | 16006.00 | 16516.00 | 16415.00 | 15445.00 | 15609.00 | 15895.00 | 16132.00 | 16309.00 | 15859.00 | 16469.00 | 16794.00 | 17311.00 | 17450.00 | 19735.00 | 20873.00 | 21660.00 | |
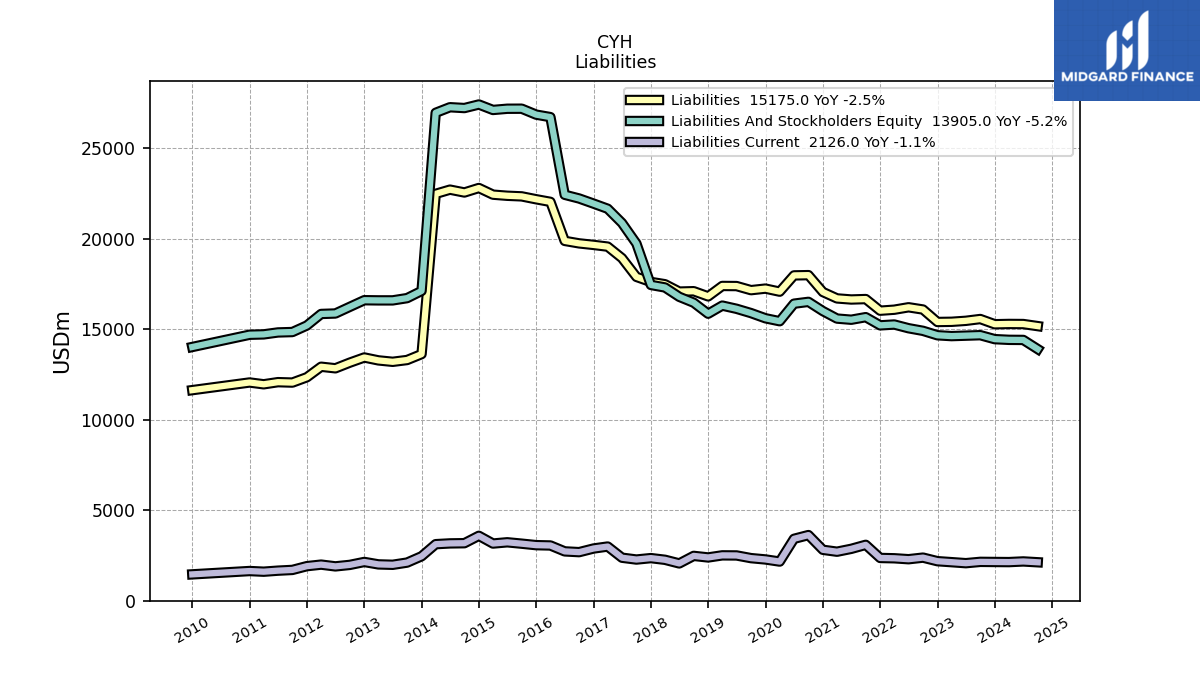
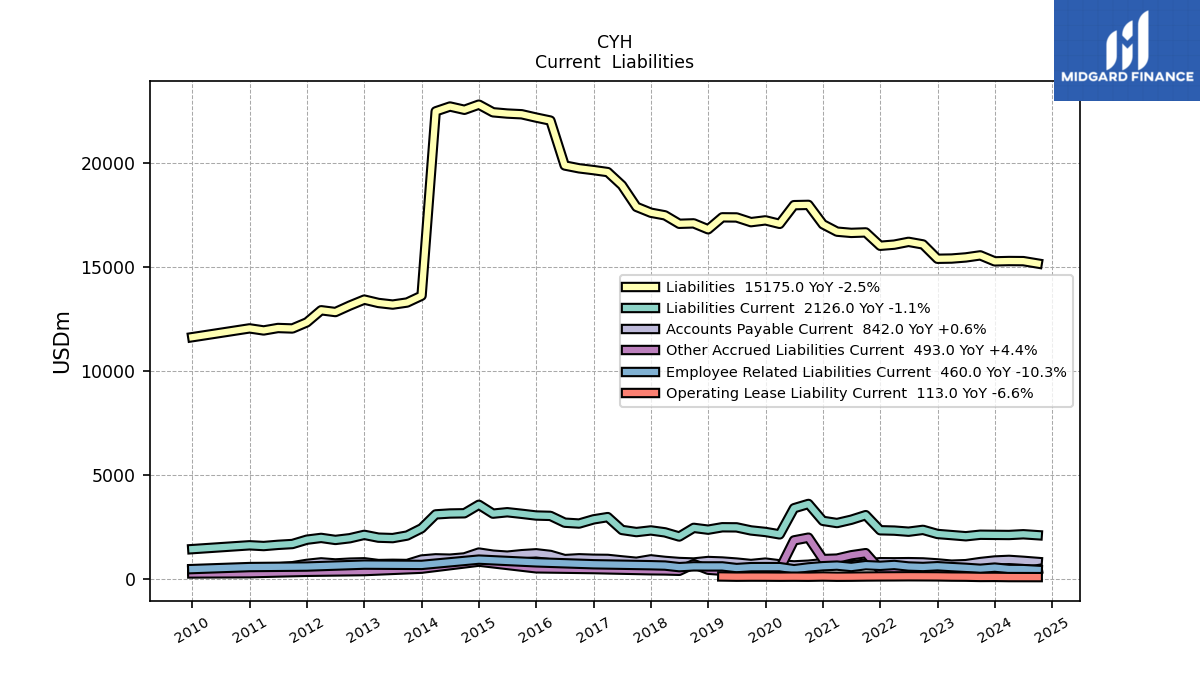
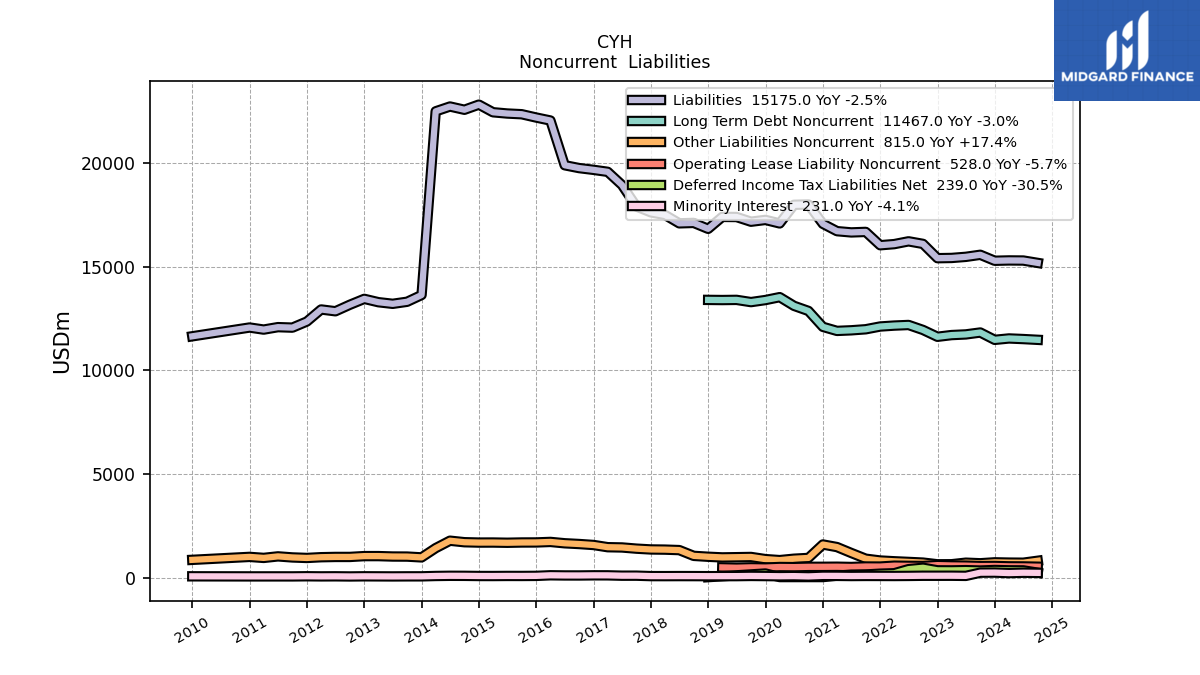
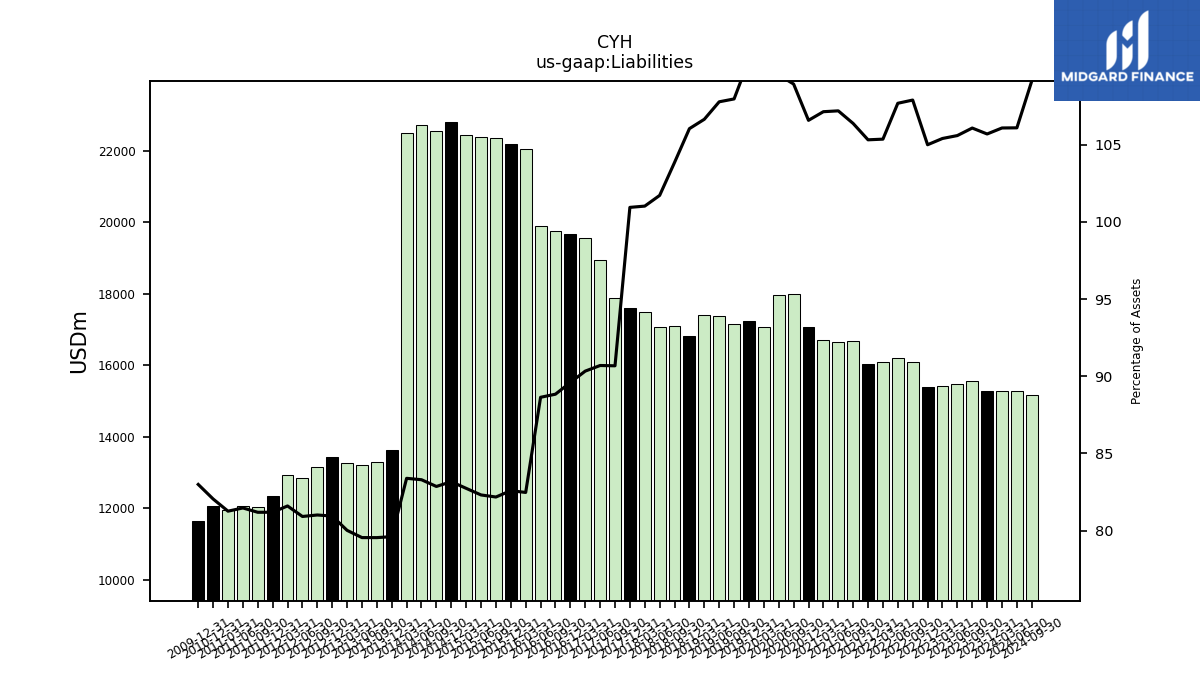
| Liabilities | 15279.00 | 15567.00 | 15468.00 | 15414.00 | 15403.00 | 16092.00 | 16216.00 | 16082.00 | 16027.00 | 16670.00 | 16646.00 | 16706.00 | 17060.00 | 17992.00 | 17978.00 | 17079.00 | 17248.00 | 17162.00 | 17388.00 | 17394.00 | 16818.00 | 17104.00 | 17083.00 | 17489.00 | 17615.00 | 17896.00 | 18932.00 | 19567.00 | |
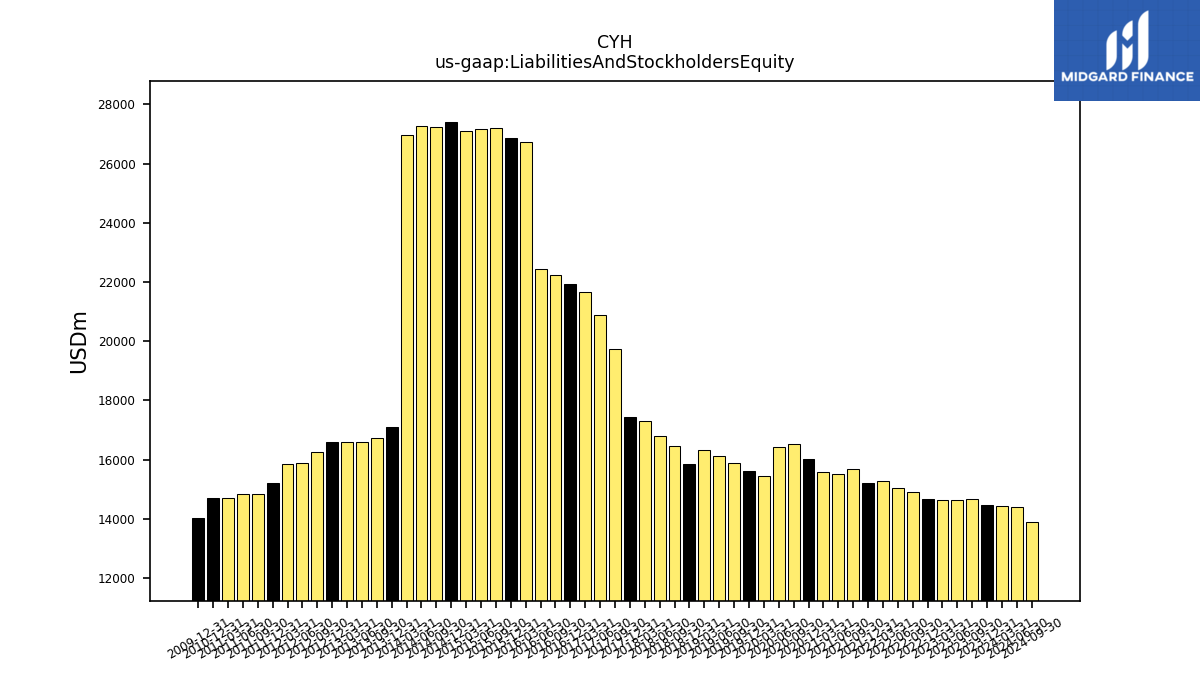
| Liabilities And Stockholders Equity | 14455.00 | 14674.00 | 14648.00 | 14623.00 | 14669.00 | 14914.00 | 15058.00 | 15263.00 | 15217.00 | 15670.00 | 15528.00 | 15592.00 | 16006.00 | 16516.00 | 16415.00 | 15445.00 | 15609.00 | 15895.00 | 16132.00 | 16309.00 | 15859.00 | 16469.00 | 16794.00 | 17311.00 | 17450.00 | 19735.00 | 20873.00 | 21660.00 | |
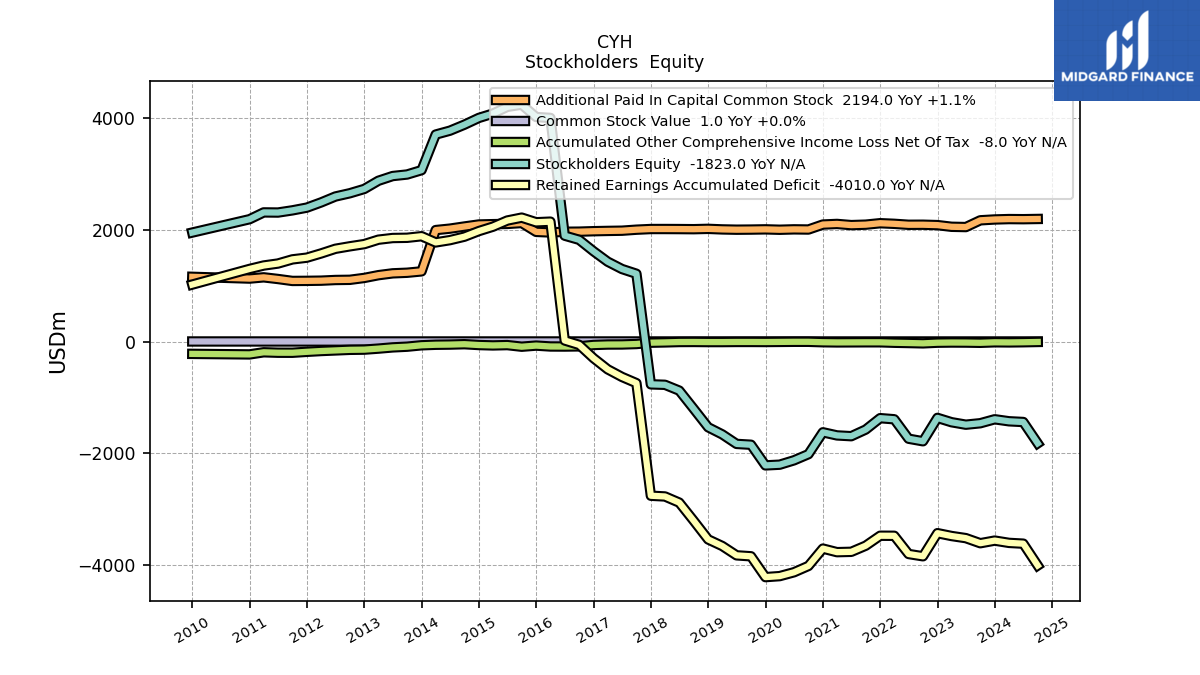
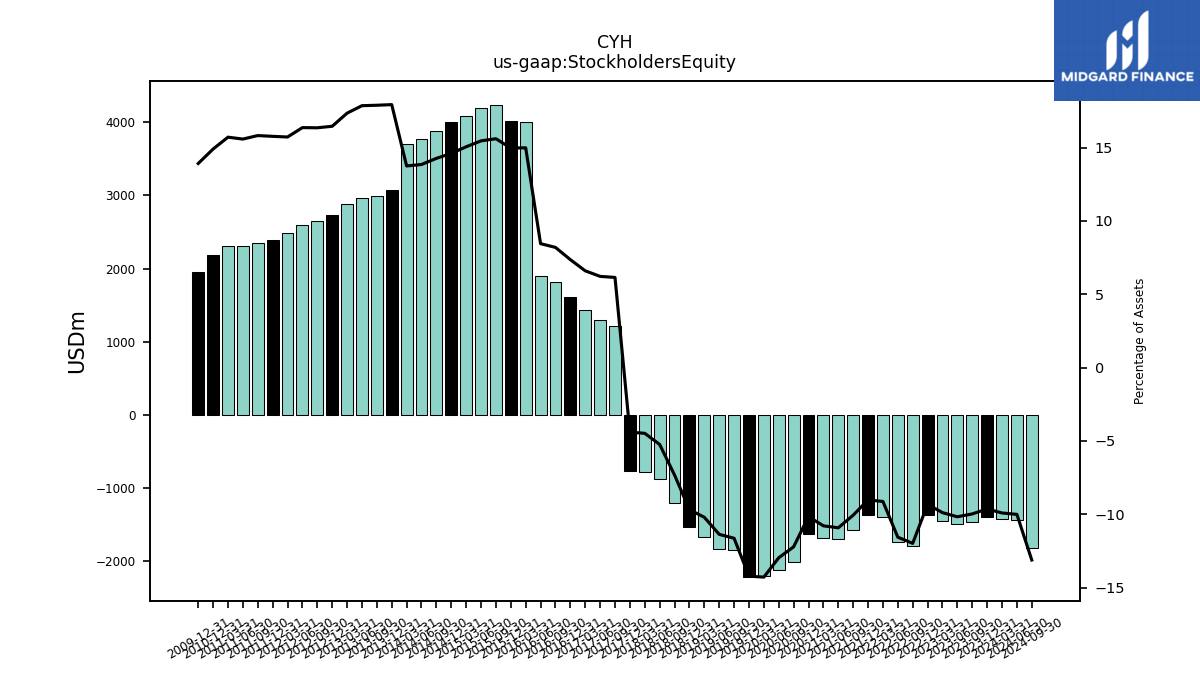
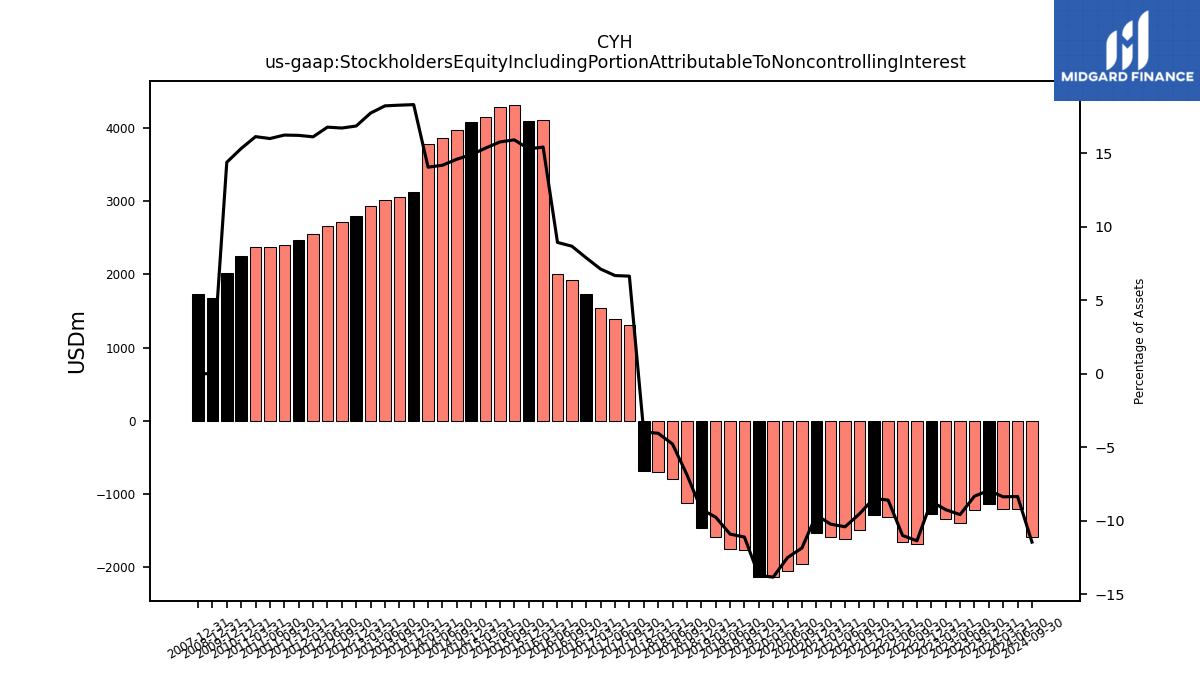
| Stockholders Equity | -1392.00 | -1463.00 | -1489.00 | -1445.00 | -1367.00 | -1786.00 | -1740.00 | -1392.00 | -1372.00 | -1576.00 | -1695.00 | -1681.00 | -1625.00 | -2017.00 | -2127.00 | -2205.00 | -2218.00 | -1848.00 | -1833.00 | -1663.00 | -1535.00 | -1205.00 | -879.00 | -775.00 | -767.00 | 1213.00 | 1298.00 | 1429.00 |
| 2023-12-31 | 2023-09-30 | 2023-06-30 | 2023-03-31 | 2022-12-31 | 2022-09-30 | 2022-06-30 | 2022-03-31 | 2021-12-31 | 2021-09-30 | 2021-06-30 | 2021-03-31 | 2020-12-31 | 2020-09-30 | 2020-06-30 | 2020-03-31 | 2019-12-31 | 2019-09-30 | 2019-06-30 | 2019-03-31 | 2018-12-31 | 2018-09-30 | 2018-06-30 | 2018-03-31 | 2017-12-31 | 2017-09-30 | 2017-06-30 | 2017-03-31 | ||
|---|---|---|---|---|---|---|---|---|---|---|---|---|---|---|---|---|---|---|---|---|---|---|---|---|---|---|---|---|---|
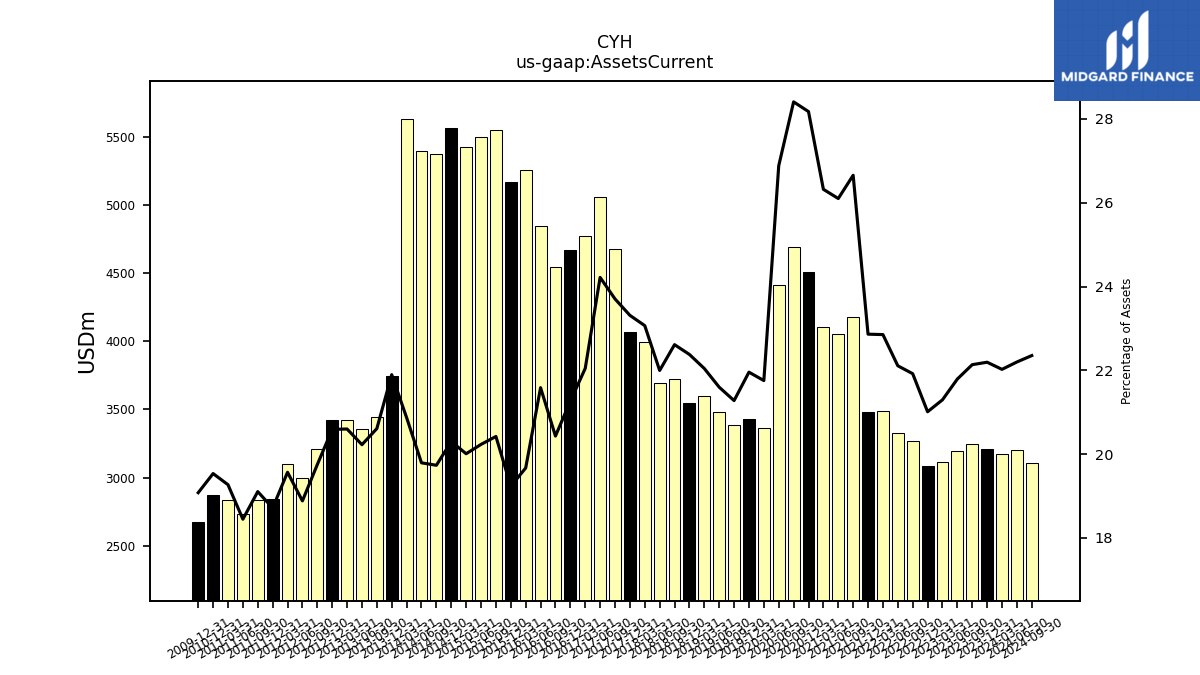
| Assets Current | 3208.00 | 3248.00 | 3192.00 | 3114.00 | 3082.00 | 3269.00 | 3329.00 | 3488.00 | 3479.00 | 4177.00 | 4053.00 | 4104.00 | 4510.00 | 4692.00 | 4413.00 | 3360.00 | 3427.00 | 3382.00 | 3484.00 | 3595.00 | 3549.00 | 3724.00 | 3694.00 | 3993.00 | 4068.00 | 4678.00 | 5055.00 | 4775.00 | |
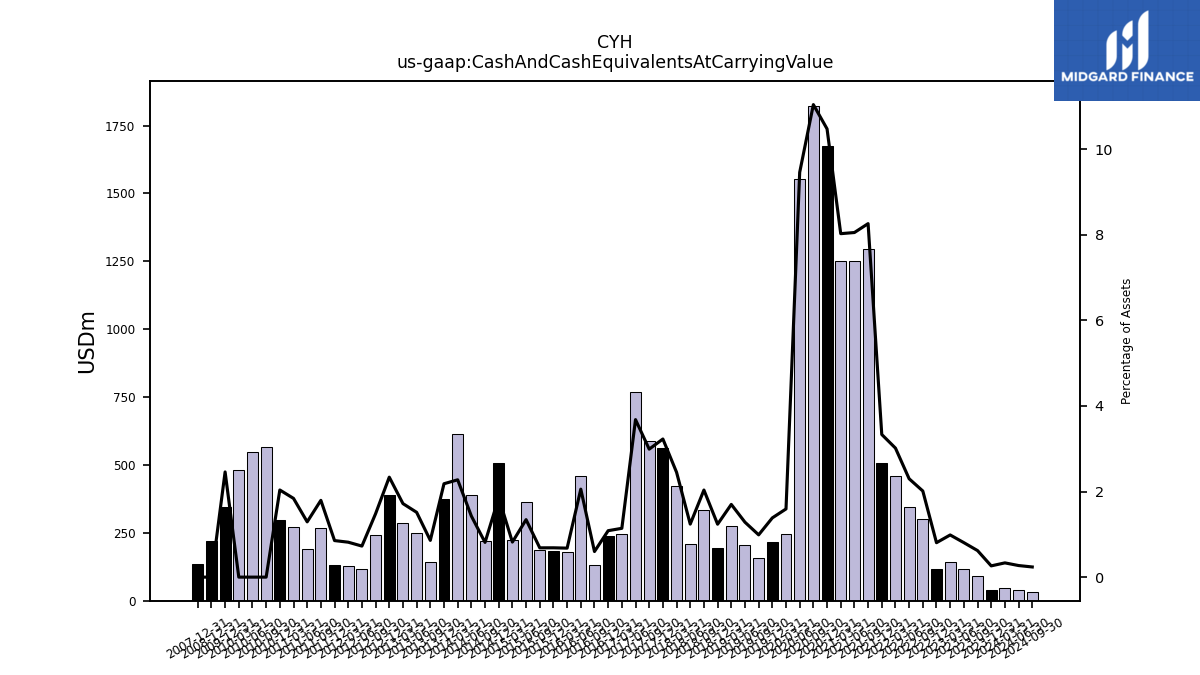
| Cash And Cash Equivalents At Carrying Value | 38.00 | 91.00 | 118.00 | 144.00 | 118.00 | 300.00 | 346.00 | 460.00 | 507.00 | 1294.00 | 1250.00 | 1251.00 | 1676.00 | 1823.00 | 1552.00 | 246.00 | 216.00 | 157.00 | 207.00 | 277.00 | 196.00 | 335.00 | 208.00 | 424.00 | 563.00 | 590.00 | 768.00 | 247.00 | |
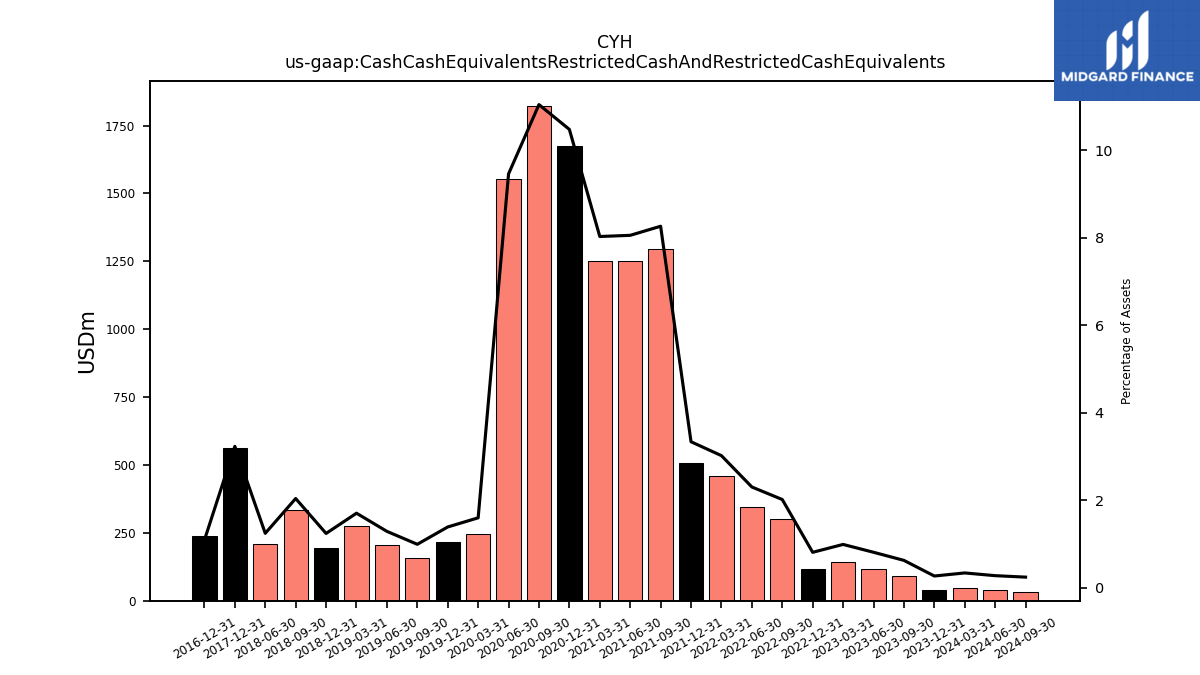
| Cash Cash Equivalents Restricted Cash And Restricted Cash Equivalents | 38.00 | 91.00 | 118.00 | 144.00 | 118.00 | 300.00 | 346.00 | 460.00 | 507.00 | 1294.00 | 1250.00 | 1251.00 | 1676.00 | 1823.00 | 1552.00 | 246.00 | 216.00 | 157.00 | 207.00 | 277.00 | 196.00 | 335.00 | 208.00 | NA | 563.00 | NA | NA | NA | |
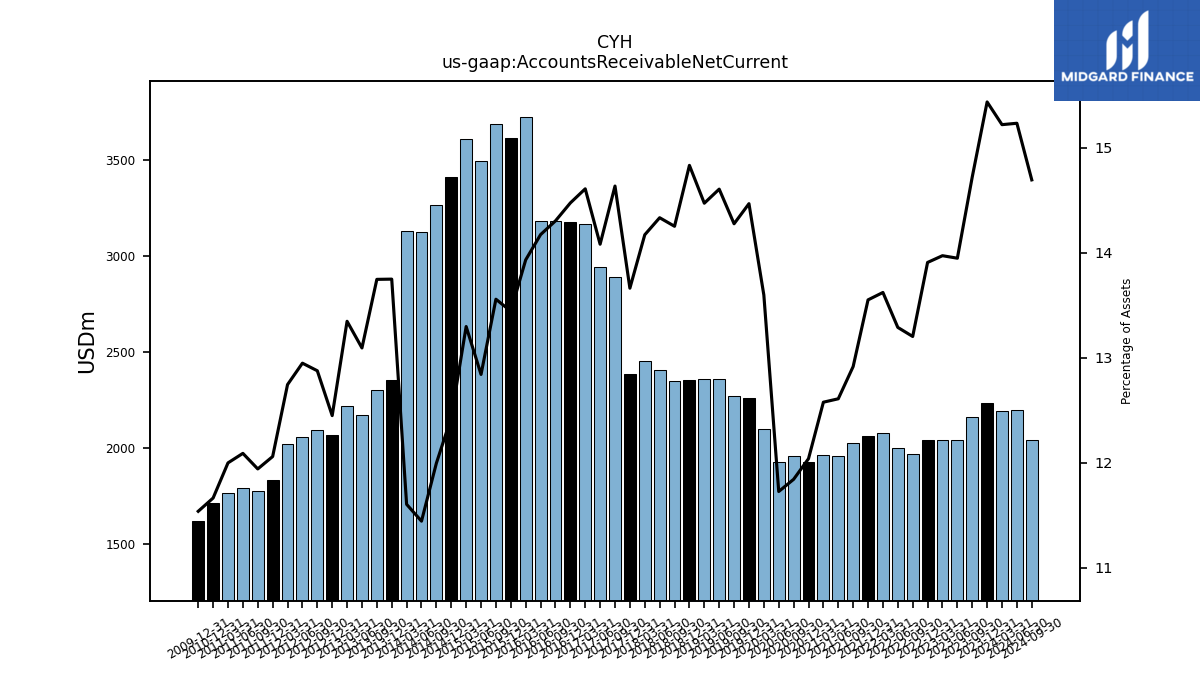
| Accounts Receivable Net Current | 2231.00 | 2160.00 | 2043.00 | 2043.00 | 2040.00 | 1969.00 | 2001.00 | 2079.00 | 2062.00 | 2024.00 | 1958.00 | 1961.00 | 1927.00 | 1956.00 | 1925.00 | 2100.00 | 2258.00 | 2269.00 | 2356.00 | 2360.00 | 2352.00 | 2347.00 | 2407.00 | 2453.00 | 2384.00 | 2888.00 | 2939.00 | 3164.00 | |
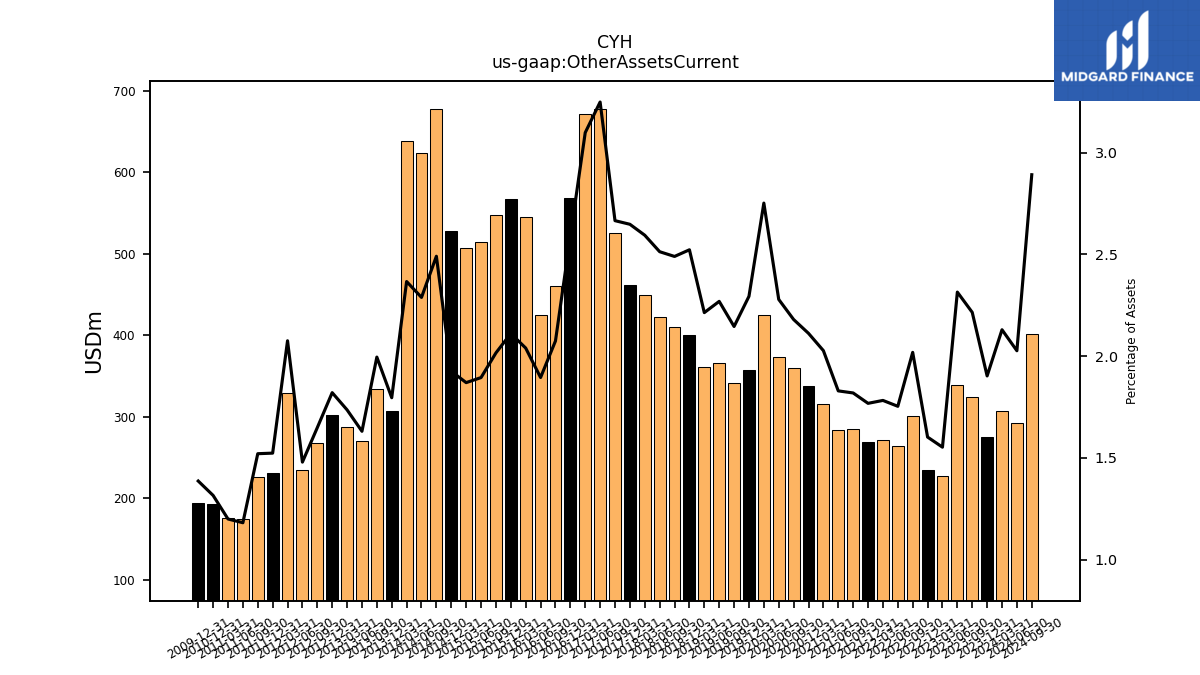
| Other Assets Current | 275.00 | 325.00 | 339.00 | 227.00 | 235.00 | 301.00 | 264.00 | 272.00 | 269.00 | 285.00 | 284.00 | 316.00 | 338.00 | 360.00 | 374.00 | 425.00 | 358.00 | 341.00 | 366.00 | 361.00 | 400.00 | 410.00 | 422.00 | 449.00 | 462.00 | 526.00 | 678.00 | 671.00 | |
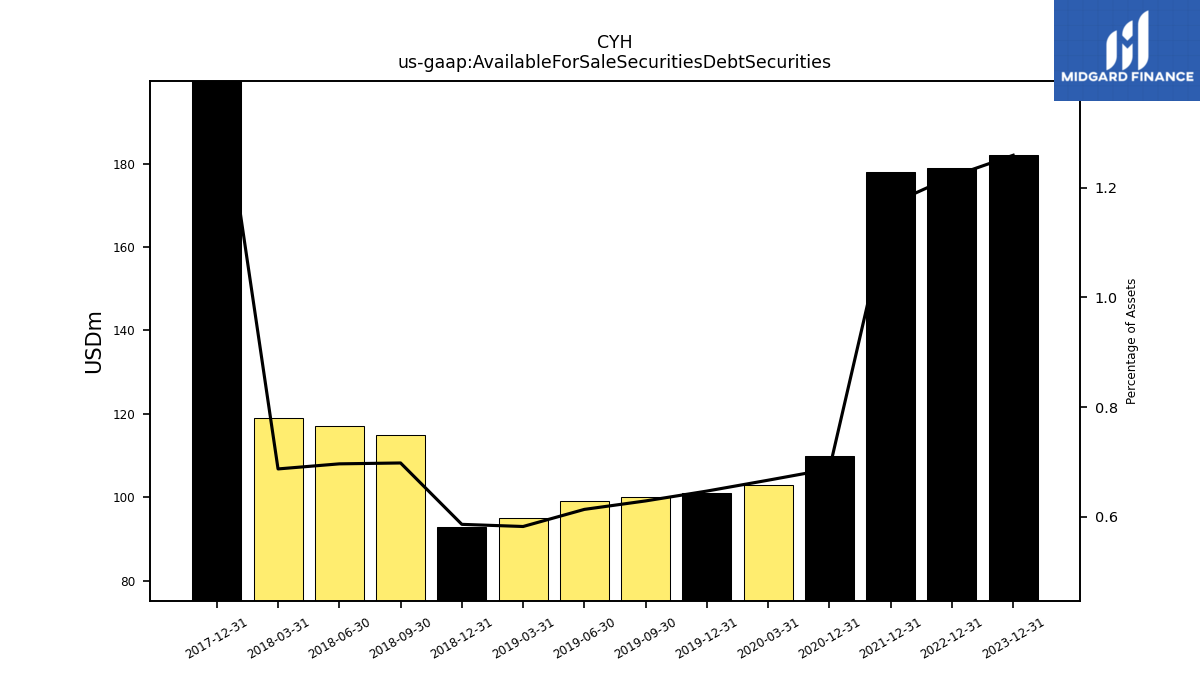
| Available For Sale Securities Debt Securities | 182.00 | NA | NA | NA | 179.00 | NA | NA | NA | 178.00 | NA | NA | NA | 110.00 | NA | NA | 103.00 | 101.00 | 100.00 | 99.00 | 95.00 | 93.00 | 115.00 | 117.00 | 119.00 | 252.00 | NA | NA | NA |
| 2023-12-31 | 2023-09-30 | 2023-06-30 | 2023-03-31 | 2022-12-31 | 2022-09-30 | 2022-06-30 | 2022-03-31 | 2021-12-31 | 2021-09-30 | 2021-06-30 | 2021-03-31 | 2020-12-31 | 2020-09-30 | 2020-06-30 | 2020-03-31 | 2019-12-31 | 2019-09-30 | 2019-06-30 | 2019-03-31 | 2018-12-31 | 2018-09-30 | 2018-06-30 | 2018-03-31 | 2017-12-31 | 2017-09-30 | 2017-06-30 | 2017-03-31 | ||
|---|---|---|---|---|---|---|---|---|---|---|---|---|---|---|---|---|---|---|---|---|---|---|---|---|---|---|---|---|---|
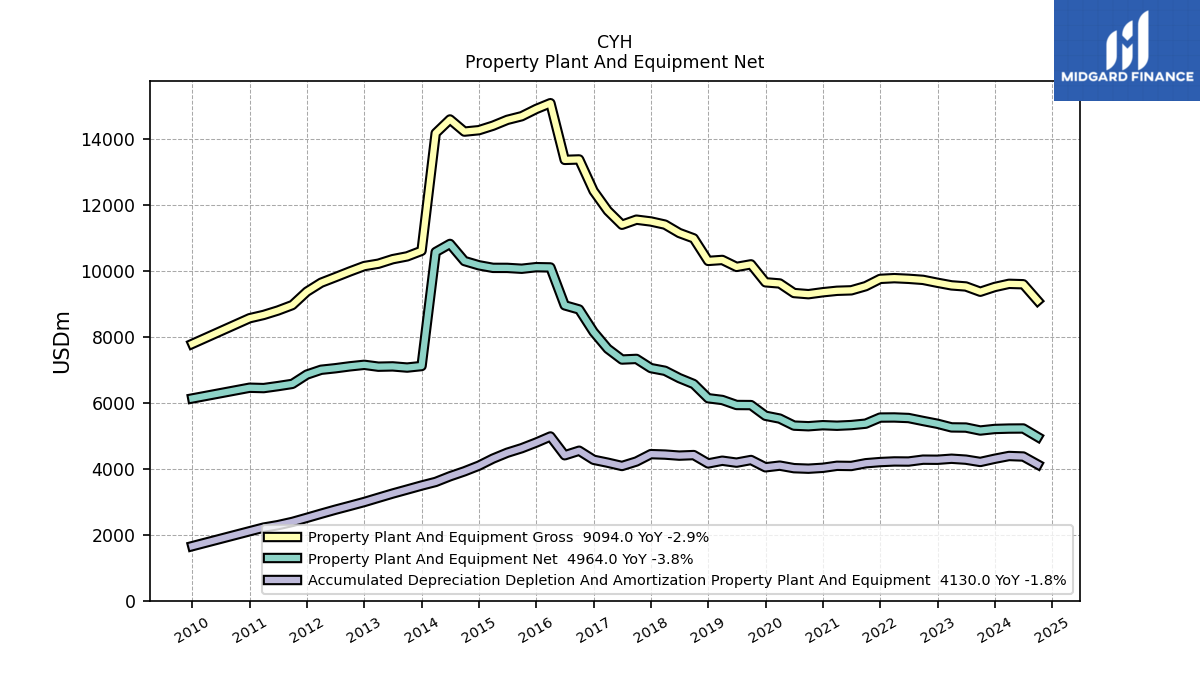
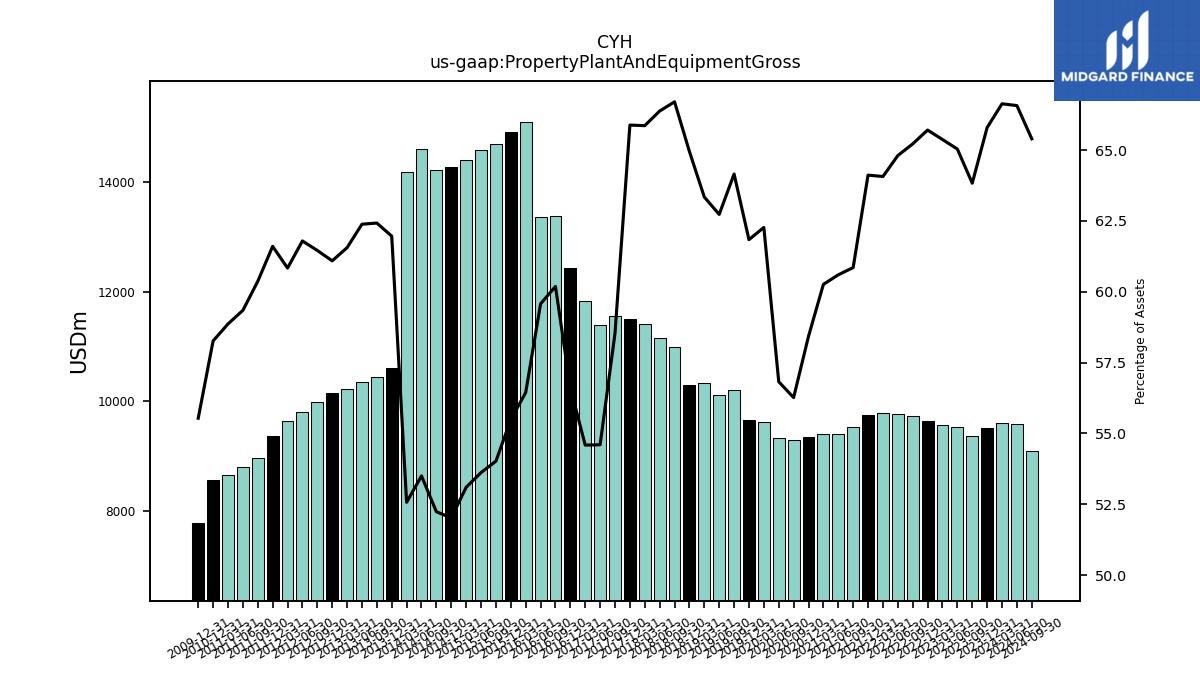
| Property Plant And Equipment Gross | 9511.00 | 9367.00 | 9527.00 | 9560.00 | 9639.00 | 9727.00 | 9759.00 | 9779.00 | 9757.00 | 9536.00 | 9410.00 | 9396.00 | 9352.00 | 9293.00 | 9328.00 | 9618.00 | 9653.00 | 10198.00 | 10120.00 | 10331.00 | 10301.00 | 10986.00 | 11148.00 | 11402.00 | 11497.00 | 11552.00 | 11397.00 | 11824.00 | |
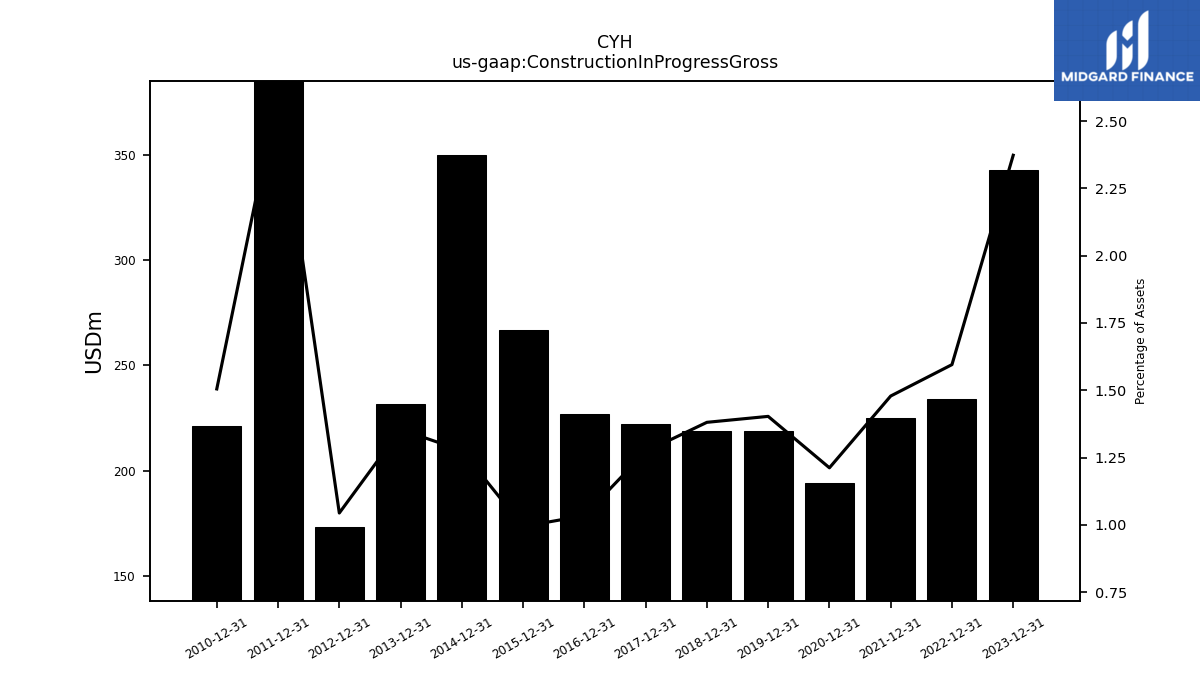
| Construction In Progress Gross | 343.00 | NA | NA | NA | 234.00 | NA | NA | NA | 225.00 | NA | NA | NA | 194.00 | NA | NA | NA | 219.00 | NA | NA | NA | 219.00 | NA | NA | NA | 222.00 | NA | NA | NA | |
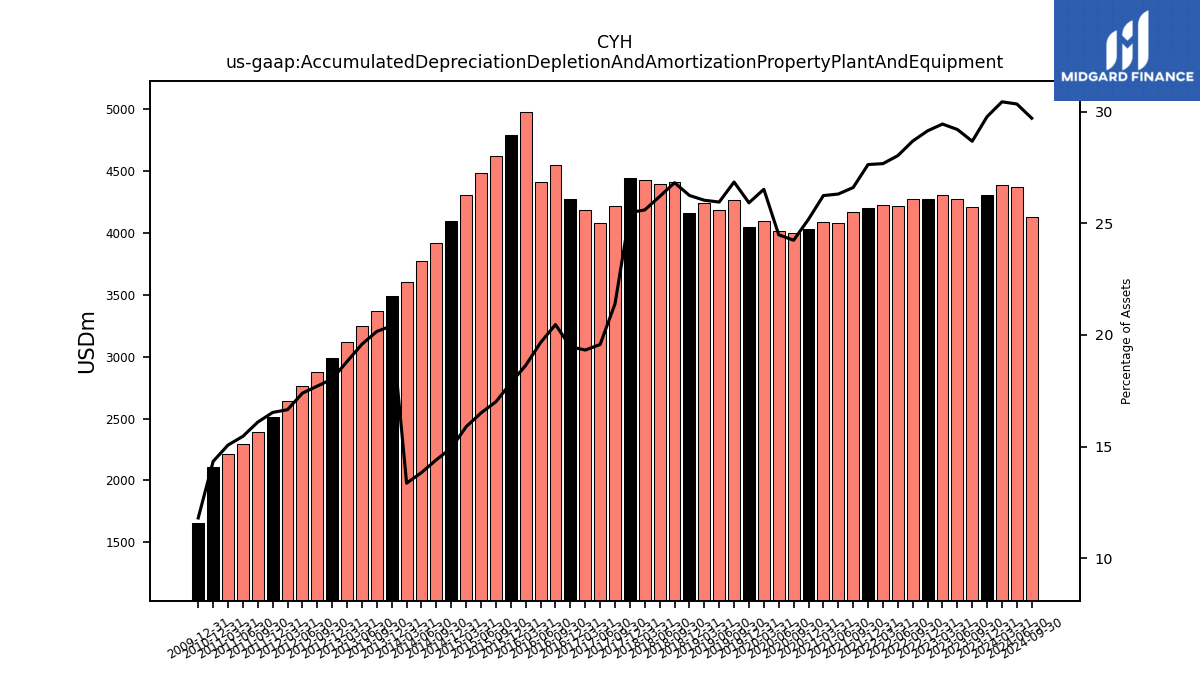
| Accumulated Depreciation Depletion And Amortization Property Plant And Equipment | 4304.00 | 4207.00 | 4277.00 | 4305.00 | 4274.00 | 4277.00 | 4220.00 | 4223.00 | 4204.00 | 4168.00 | 4085.00 | 4091.00 | 4030.00 | 4003.00 | 4019.00 | 4096.00 | 4045.00 | 4267.00 | 4186.00 | 4245.00 | 4162.00 | 4416.00 | 4399.00 | 4431.00 | 4445.00 | 4221.00 | 4085.00 | 4185.00 | |
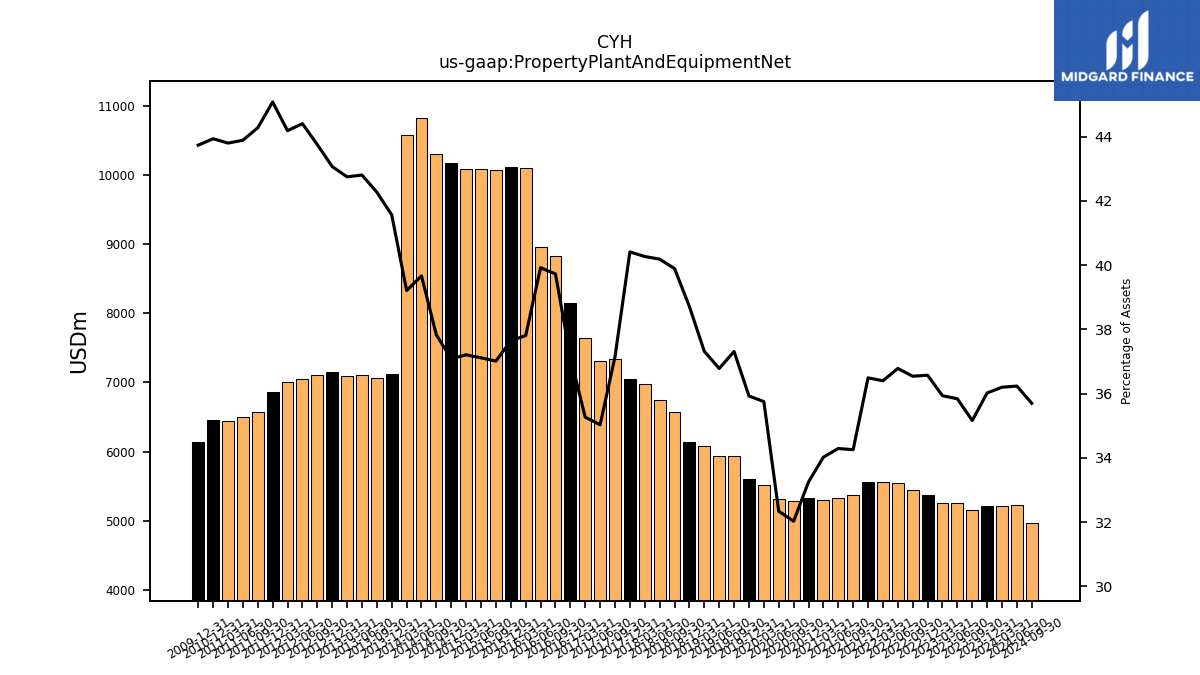
| Property Plant And Equipment Net | 5207.00 | 5160.00 | 5250.00 | 5255.00 | 5365.00 | 5450.00 | 5539.00 | 5556.00 | 5553.00 | 5368.00 | 5325.00 | 5305.00 | 5322.00 | 5290.00 | 5309.00 | 5522.00 | 5608.00 | 5931.00 | 5934.00 | 6086.00 | 6139.00 | 6570.00 | 6749.00 | 6971.00 | 7052.00 | 7331.00 | 7312.00 | 7639.00 | |
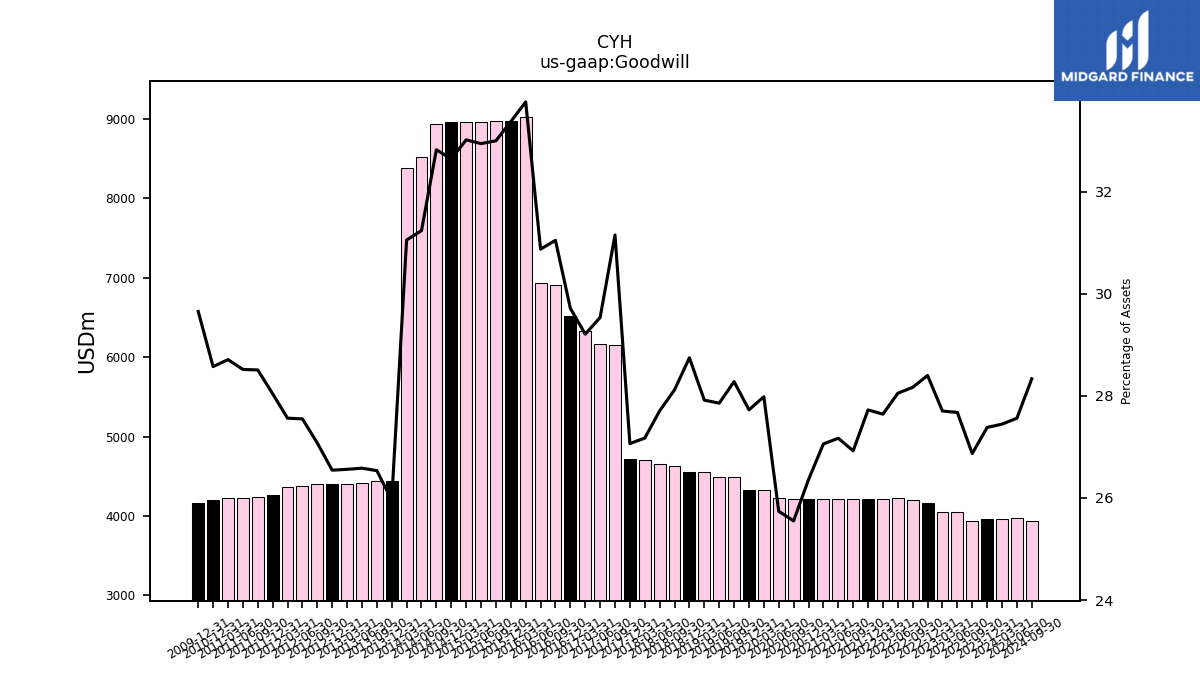
| Goodwill | 3958.00 | 3943.00 | 4054.00 | 4051.00 | 4166.00 | 4201.00 | 4224.00 | 4219.00 | 4219.00 | 4219.00 | 4219.00 | 4219.00 | 4219.00 | 4220.00 | 4225.00 | 4322.00 | 4328.00 | 4495.00 | 4494.00 | 4553.00 | 4559.00 | 4631.00 | 4653.00 | 4704.00 | 4723.00 | 6148.00 | 6165.00 | 6327.00 | |
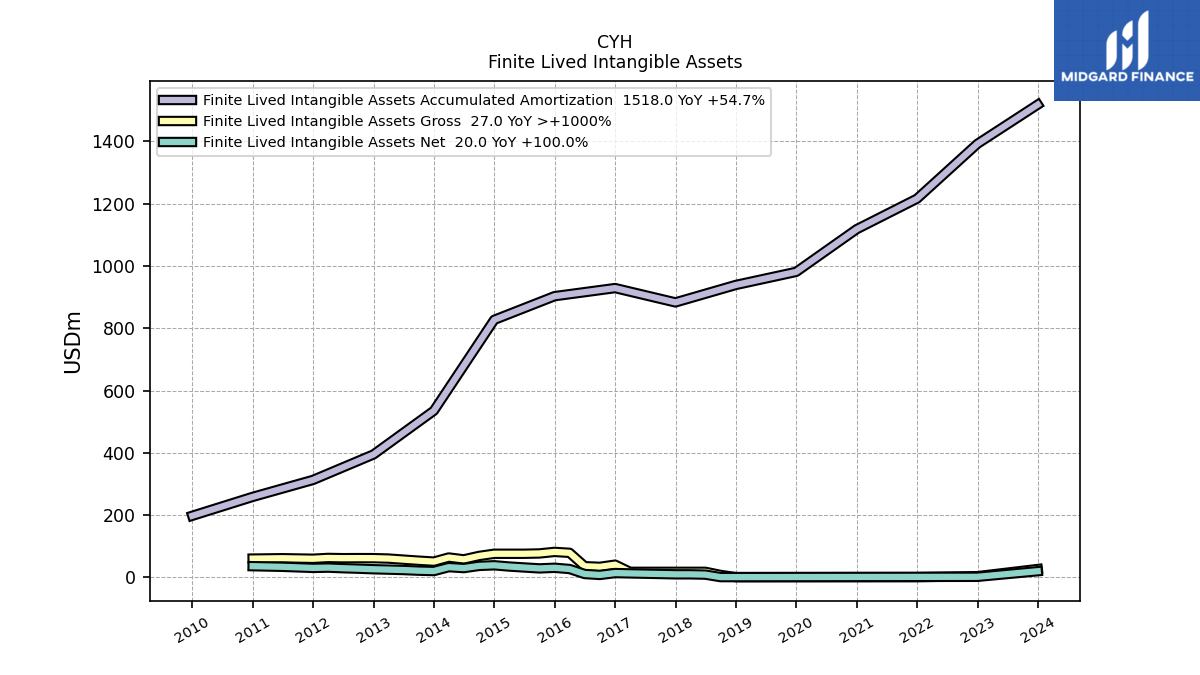
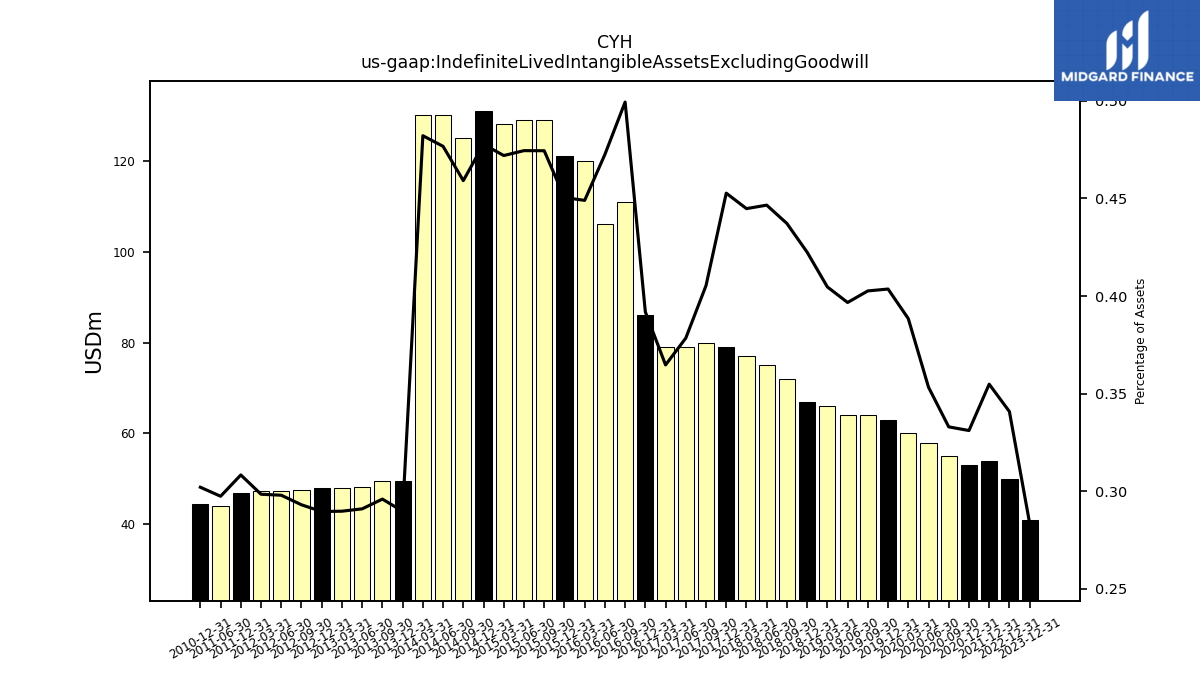
| Indefinite Lived Intangible Assets Excluding Goodwill | 41.00 | NA | NA | NA | 50.00 | NA | NA | NA | 54.00 | NA | NA | NA | 53.00 | 55.00 | 58.00 | 60.00 | 63.00 | 64.00 | 64.00 | 66.00 | 67.00 | 72.00 | 75.00 | 77.00 | 79.00 | 80.00 | 79.00 | 79.00 | |
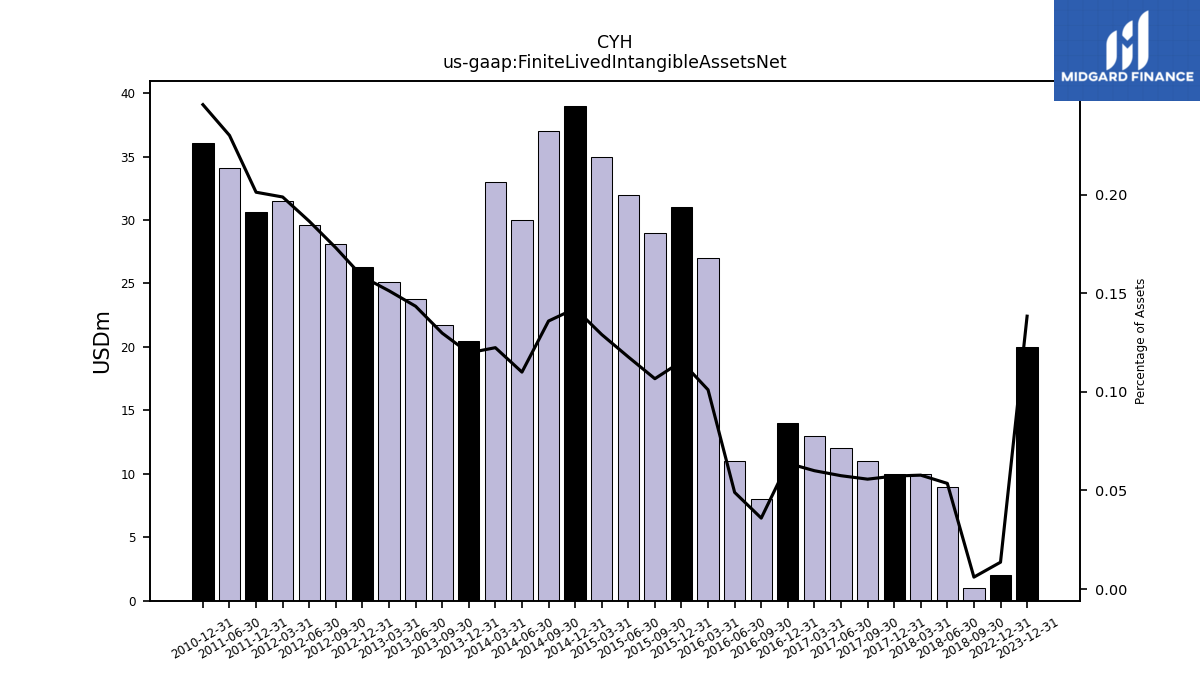
| Finite Lived Intangible Assets Net | 20.00 | NA | NA | NA | 2.00 | NA | NA | NA | NA | NA | NA | NA | NA | NA | NA | NA | NA | NA | NA | NA | NA | 1.00 | 9.00 | 10.00 | 10.00 | 11.00 | 12.00 | 13.00 | |
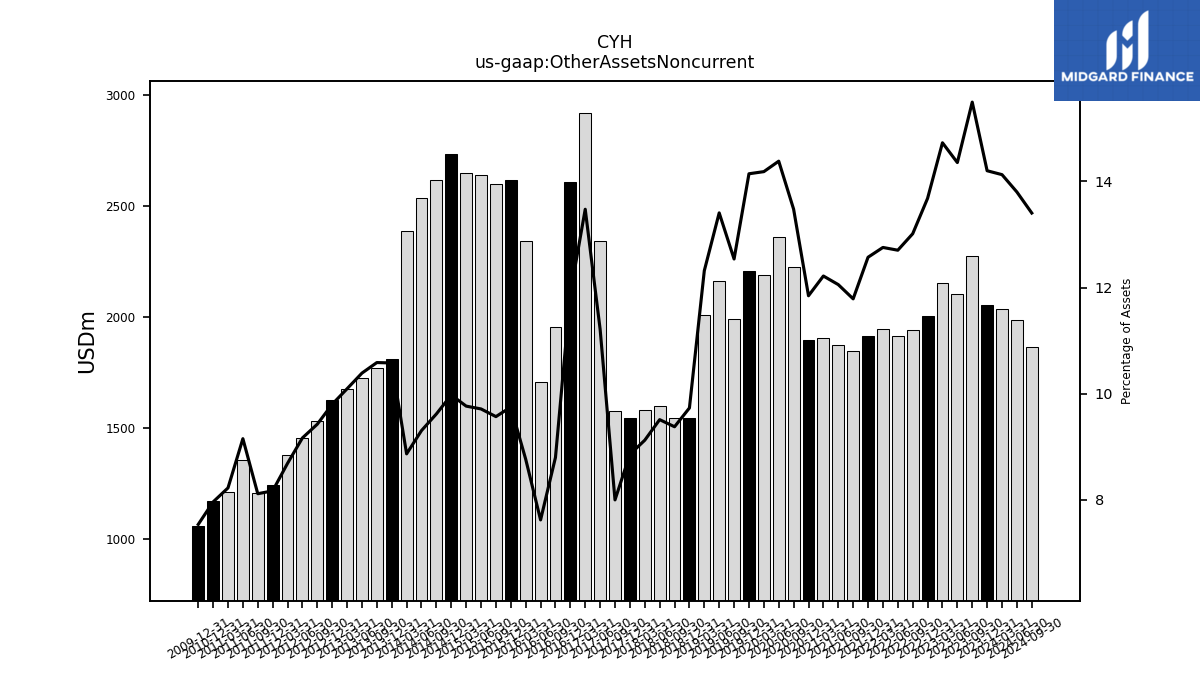
| Other Assets Noncurrent | 2053.00 | 2274.00 | 2103.00 | 2154.00 | 2007.00 | 1941.00 | 1913.00 | 1947.00 | 1913.00 | 1847.00 | 1872.00 | 1905.00 | 1896.00 | 2226.00 | 2361.00 | 2191.00 | 2208.00 | 1993.00 | 2163.00 | 2009.00 | 1543.00 | 1544.00 | 1597.00 | 1579.00 | 1545.00 | 1578.00 | 2341.00 | 2919.00 | |
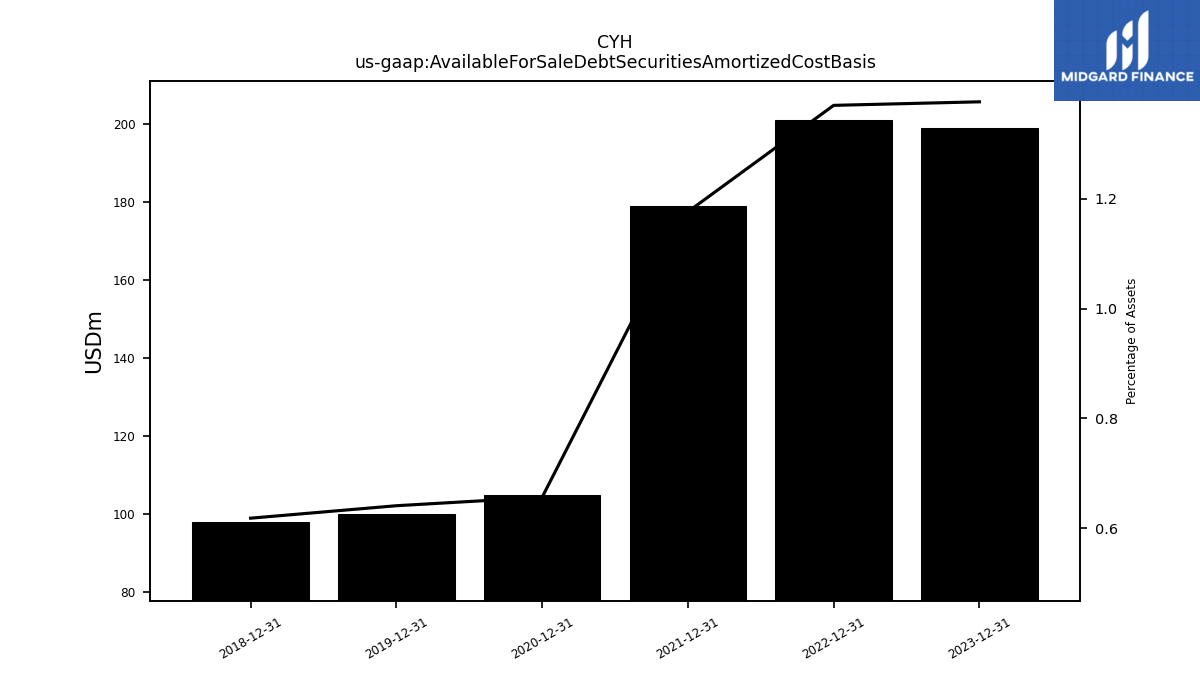
| Available For Sale Debt Securities Amortized Cost Basis | 199.00 | NA | NA | NA | 201.00 | NA | NA | NA | 179.00 | NA | NA | NA | 105.00 | NA | NA | NA | 100.00 | NA | NA | NA | 98.00 | NA | NA | NA | NA | NA | NA | NA |
| 2023-12-31 | 2023-09-30 | 2023-06-30 | 2023-03-31 | 2022-12-31 | 2022-09-30 | 2022-06-30 | 2022-03-31 | 2021-12-31 | 2021-09-30 | 2021-06-30 | 2021-03-31 | 2020-12-31 | 2020-09-30 | 2020-06-30 | 2020-03-31 | 2019-12-31 | 2019-09-30 | 2019-06-30 | 2019-03-31 | 2018-12-31 | 2018-09-30 | 2018-06-30 | 2018-03-31 | 2017-12-31 | 2017-09-30 | 2017-06-30 | 2017-03-31 | ||
|---|---|---|---|---|---|---|---|---|---|---|---|---|---|---|---|---|---|---|---|---|---|---|---|---|---|---|---|---|---|
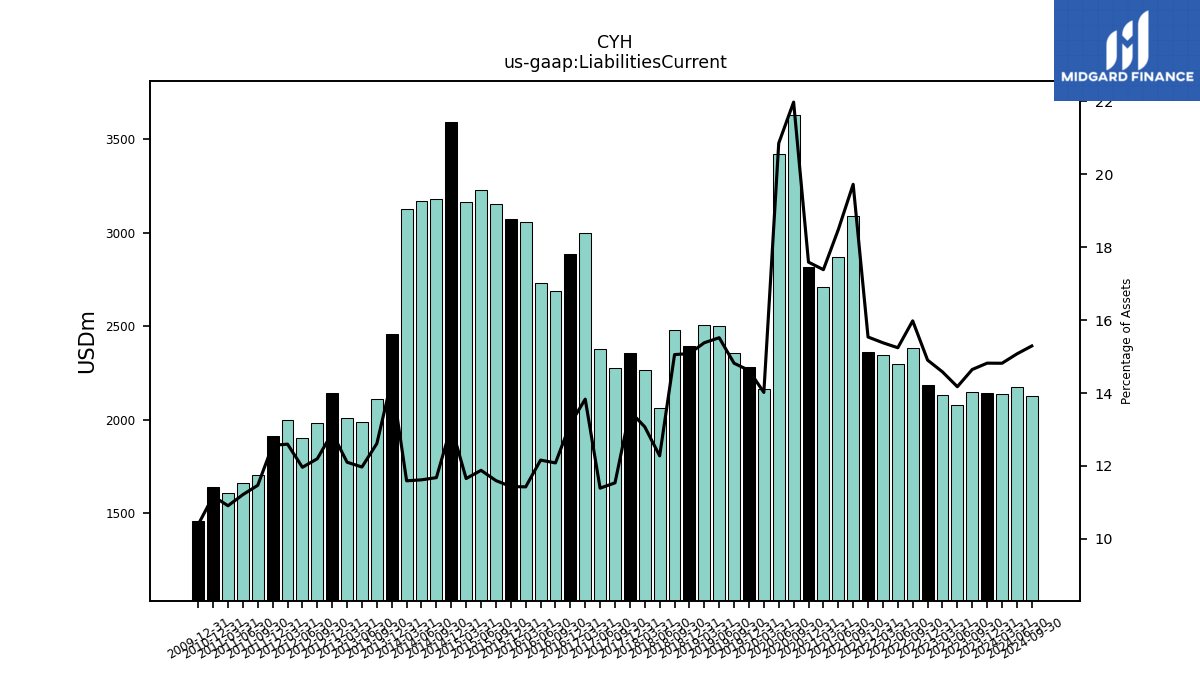
| Liabilities Current | 2142.00 | 2149.00 | 2076.00 | 2132.00 | 2186.00 | 2383.00 | 2295.00 | 2347.00 | 2364.00 | 3090.00 | 2869.00 | 2710.00 | 2815.00 | 3629.00 | 3422.00 | 2165.00 | 2282.00 | 2355.00 | 2503.00 | 2508.00 | 2392.00 | 2479.00 | 2062.00 | 2263.00 | 2356.00 | 2277.00 | 2378.00 | 2996.00 | |
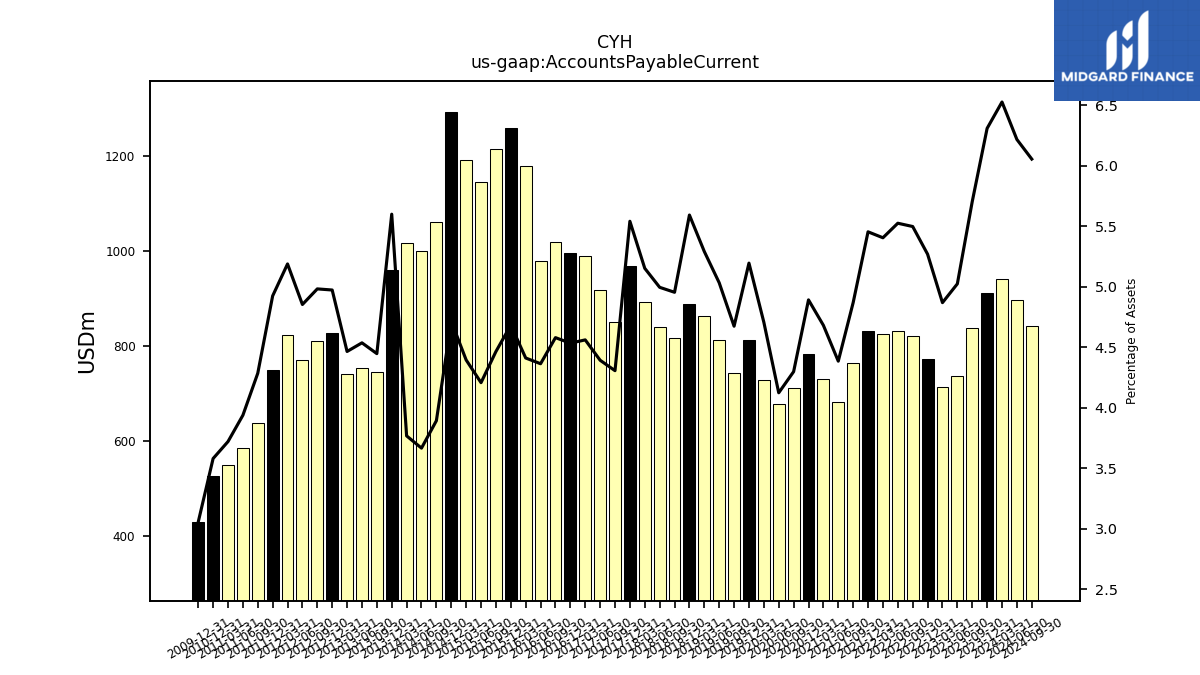
| Accounts Payable Current | 912.00 | 837.00 | 736.00 | 712.00 | 773.00 | 820.00 | 832.00 | 825.00 | 830.00 | 763.00 | 681.00 | 730.00 | 783.00 | 710.00 | 677.00 | 727.00 | 811.00 | 743.00 | 812.00 | 863.00 | 887.00 | 816.00 | 839.00 | 892.00 | 967.00 | 850.00 | 917.00 | 988.00 | |
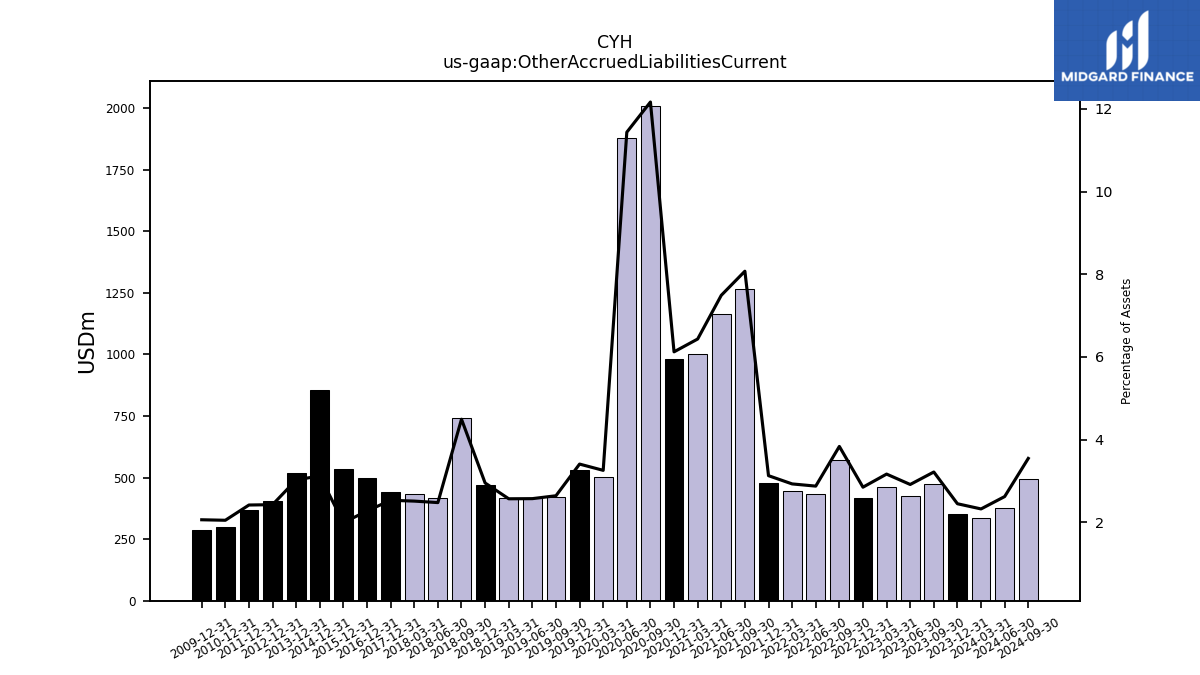
| Other Accrued Liabilities Current | 354.00 | 472.00 | 427.00 | 463.00 | 418.00 | 572.00 | 433.00 | 447.00 | 476.00 | 1265.00 | 1163.00 | 1003.00 | 980.00 | 2009.00 | 1877.00 | 503.00 | 532.00 | 420.00 | 415.00 | 419.00 | 468.00 | 740.00 | 416.00 | 435.00 | 442.00 | NA | NA | NA |
| 2023-12-31 | 2023-09-30 | 2023-06-30 | 2023-03-31 | 2022-12-31 | 2022-09-30 | 2022-06-30 | 2022-03-31 | 2021-12-31 | 2021-09-30 | 2021-06-30 | 2021-03-31 | 2020-12-31 | 2020-09-30 | 2020-06-30 | 2020-03-31 | 2019-12-31 | 2019-09-30 | 2019-06-30 | 2019-03-31 | 2018-12-31 | 2018-09-30 | 2018-06-30 | 2018-03-31 | 2017-12-31 | 2017-09-30 | 2017-06-30 | 2017-03-31 | ||
|---|---|---|---|---|---|---|---|---|---|---|---|---|---|---|---|---|---|---|---|---|---|---|---|---|---|---|---|---|---|
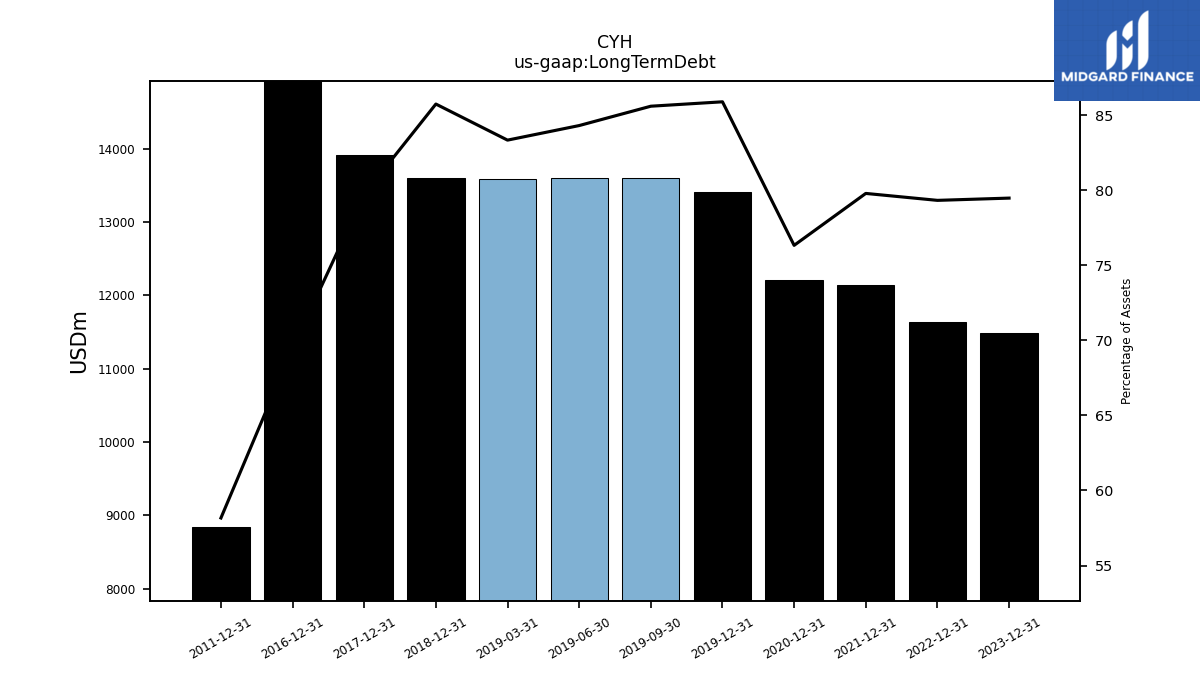
| Long Term Debt | 11487.00 | NA | NA | NA | 11635.00 | NA | NA | NA | 12140.00 | NA | NA | NA | 12216.00 | NA | NA | NA | 13405.00 | 13604.00 | 13599.00 | 13590.00 | 13596.00 | NA | NA | NA | 13913.00 | NA | NA | NA | |
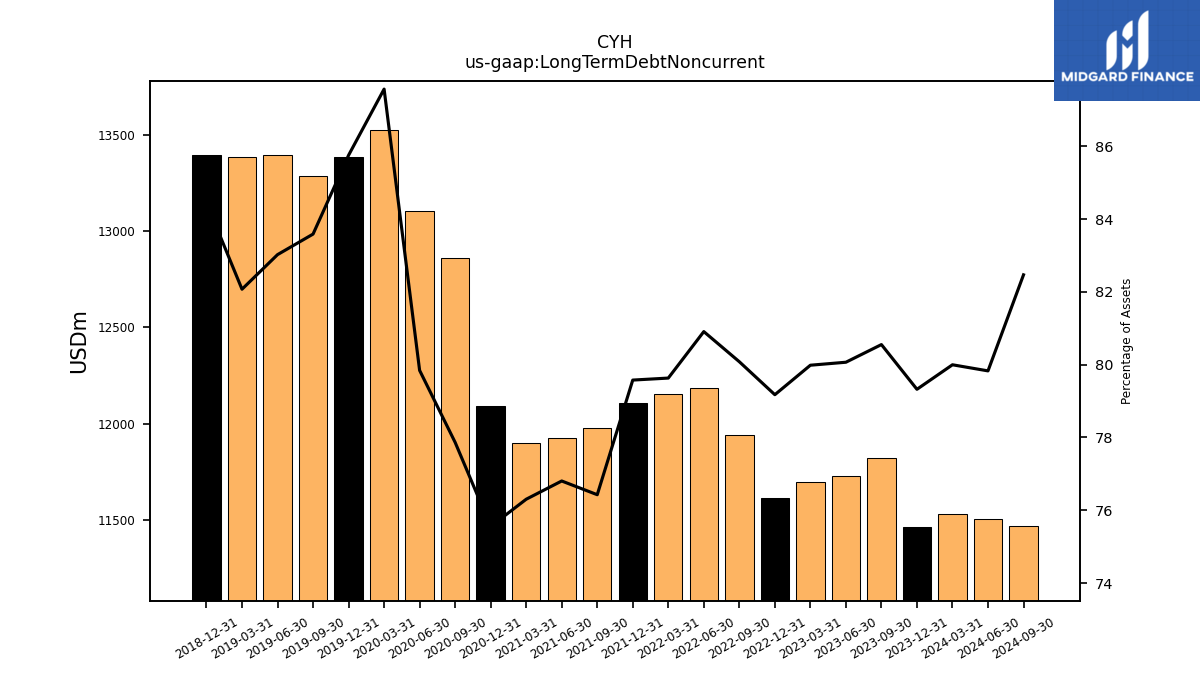
| Long Term Debt Noncurrent | 11466.00 | 11820.00 | 11728.00 | 11696.00 | 11614.00 | 11943.00 | 12183.00 | 12154.00 | 12109.00 | 11976.00 | 11926.00 | 11897.00 | 12093.00 | 12860.00 | 13106.00 | 13525.00 | 13385.00 | 13286.00 | 13393.00 | 13385.00 | 13392.00 | NA | NA | NA | NA | NA | NA | NA | |
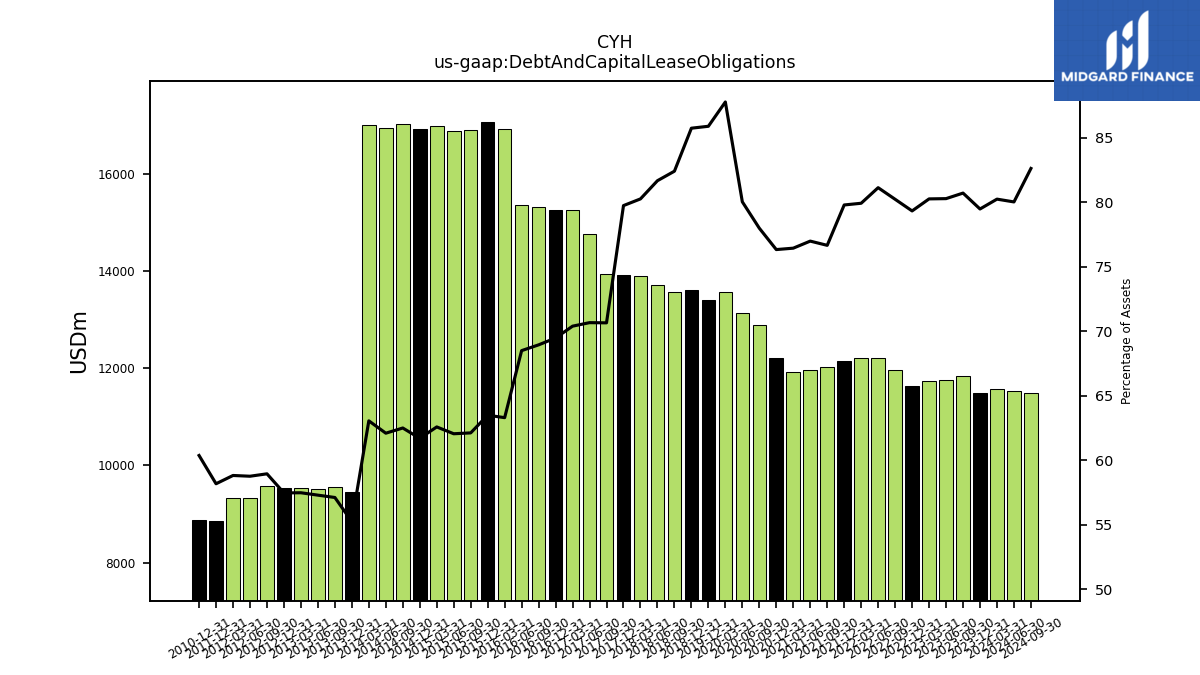
| Debt And Capital Lease Obligations | 11487.00 | 11842.00 | 11758.00 | 11735.00 | 11635.00 | 11964.00 | 12215.00 | 12197.00 | 12140.00 | 12011.00 | 11953.00 | 11917.00 | 12216.00 | 12879.00 | 13136.00 | 13555.00 | 13405.00 | NA | NA | NA | 13596.00 | 13570.00 | 13714.00 | 13892.00 | 13913.00 | 13941.00 | 14748.00 | 15245.00 | |
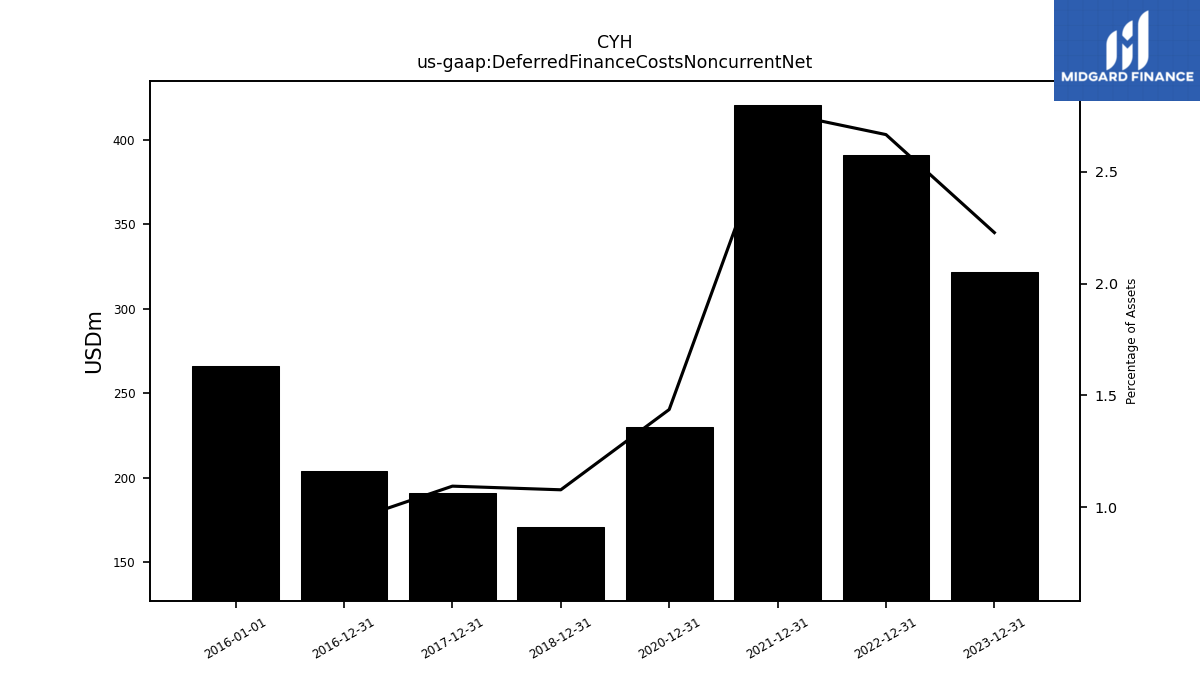
| Deferred Finance Costs Noncurrent Net | 322.00 | NA | NA | NA | 391.00 | NA | NA | NA | 421.00 | NA | NA | NA | 230.00 | NA | NA | NA | NA | NA | NA | NA | 171.00 | NA | NA | NA | 191.00 | NA | NA | NA | |
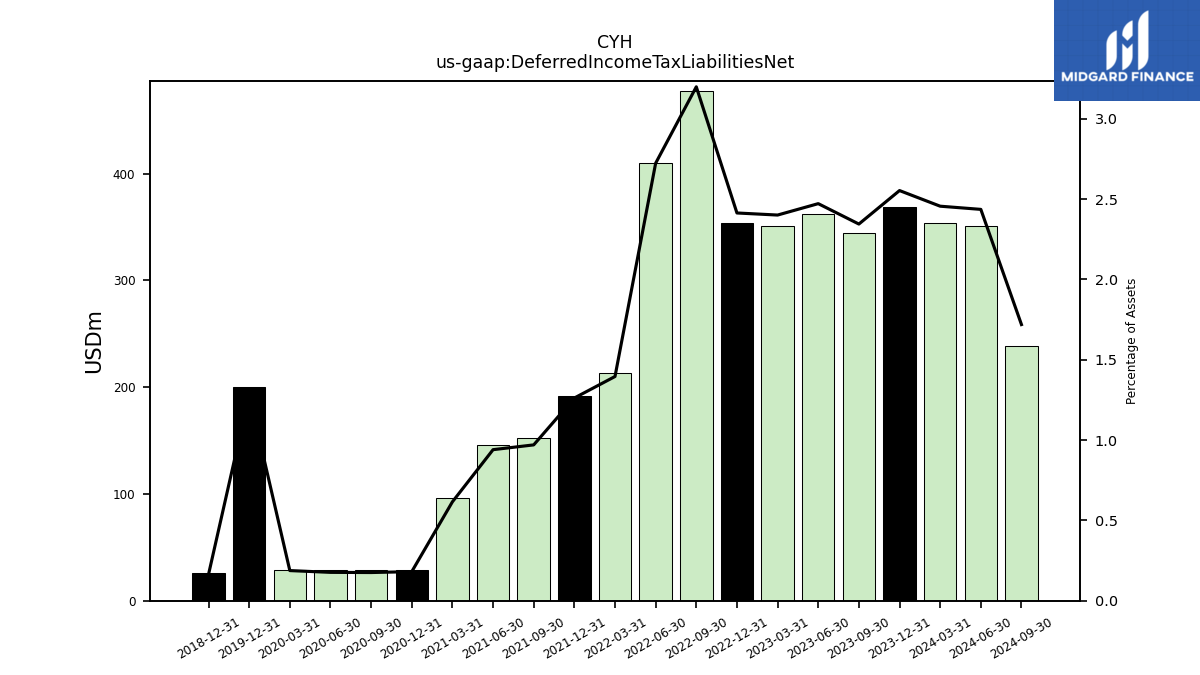
| Deferred Income Tax Liabilities Net | 369.00 | 344.00 | 362.00 | 351.00 | 354.00 | 477.00 | 410.00 | 213.00 | 192.00 | 152.00 | 146.00 | 96.00 | 29.00 | 29.00 | 29.00 | 29.00 | 200.00 | NA | NA | NA | 26.00 | NA | NA | NA | NA | NA | NA | NA | |
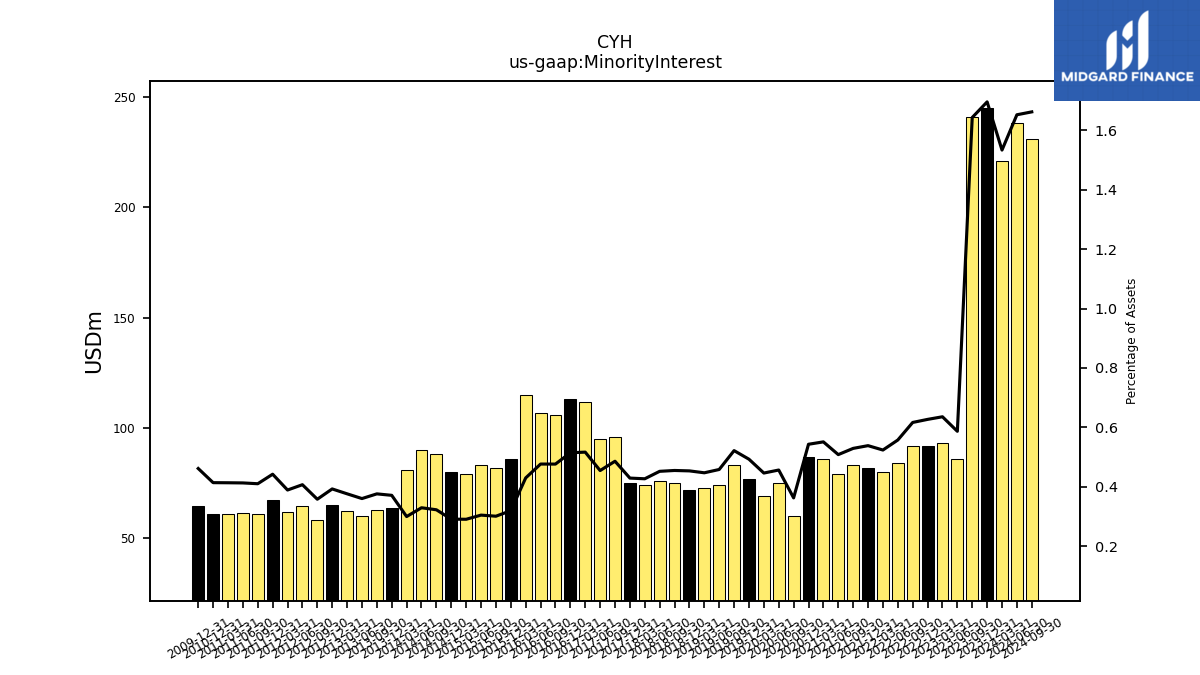
| Minority Interest | 245.00 | 241.00 | 86.00 | 93.00 | 92.00 | 92.00 | 84.00 | 80.00 | 82.00 | 83.00 | 79.00 | 86.00 | 87.00 | 60.00 | 75.00 | 69.00 | 77.00 | 83.00 | 74.00 | 73.00 | 72.00 | 75.00 | 76.00 | 74.00 | 75.00 | 96.00 | 95.00 | 112.00 | |
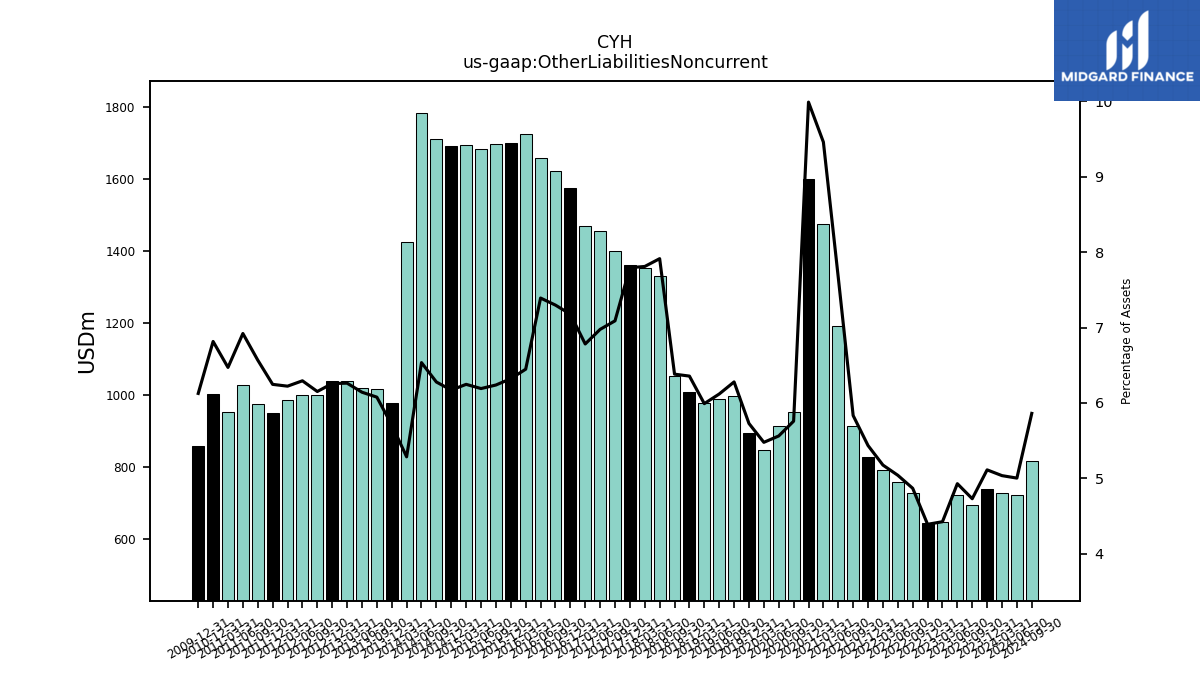
| Other Liabilities Noncurrent | 739.00 | 694.00 | 722.00 | 647.00 | 644.00 | 726.00 | 759.00 | 790.00 | 827.00 | 914.00 | 1190.00 | 1475.00 | 1599.00 | 951.00 | 913.00 | 846.00 | 894.00 | 998.00 | 987.00 | 977.00 | 1008.00 | 1051.00 | 1329.00 | 1352.00 | 1360.00 | 1399.00 | 1456.00 | 1469.00 | |
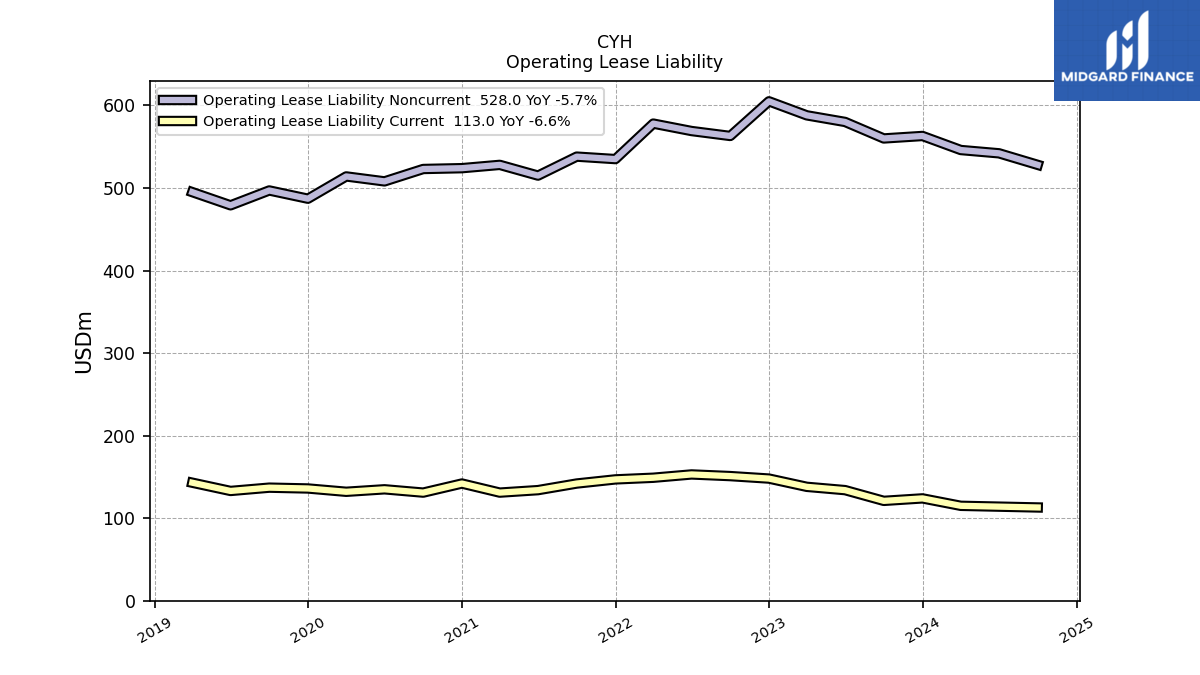
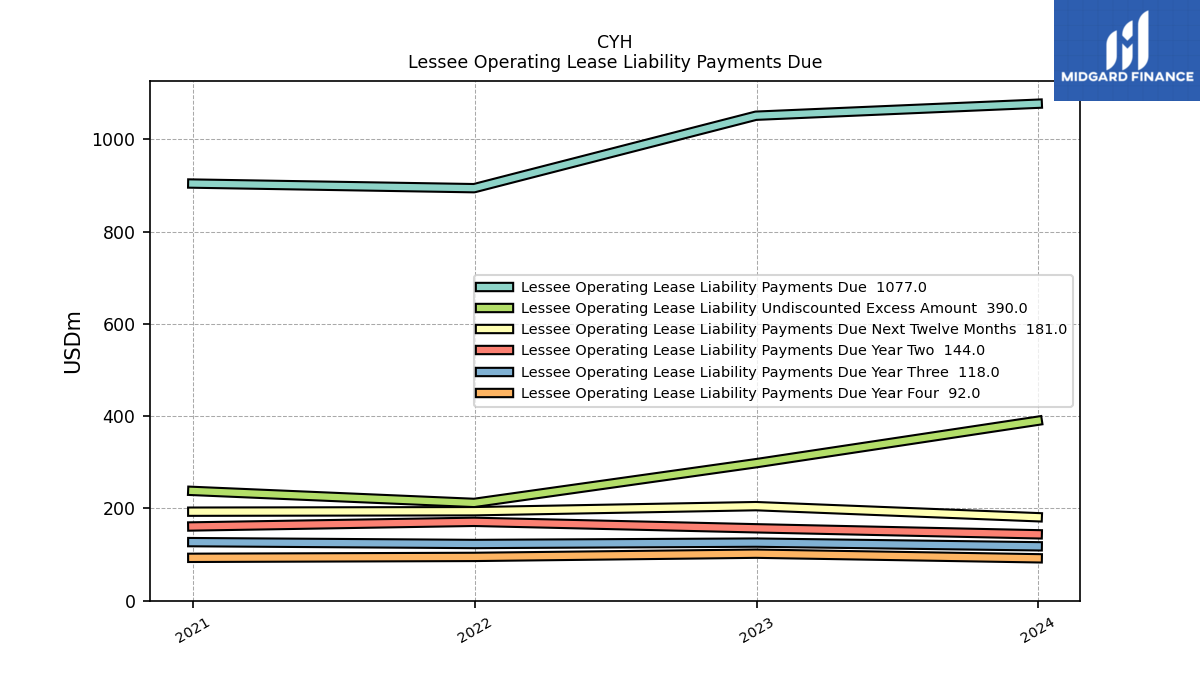
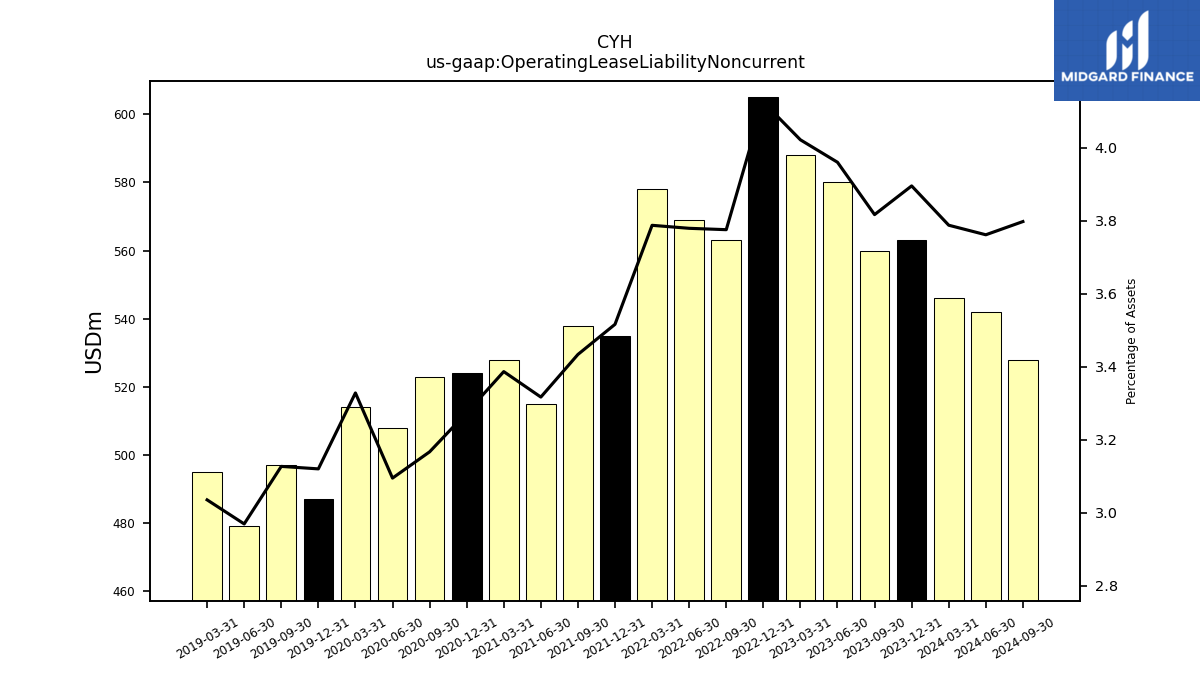
| Operating Lease Liability Noncurrent | 563.00 | 560.00 | 580.00 | 588.00 | 605.00 | 563.00 | 569.00 | 578.00 | 535.00 | 538.00 | 515.00 | 528.00 | 524.00 | 523.00 | 508.00 | 514.00 | 487.00 | 497.00 | 479.00 | 495.00 | NA | NA | NA | NA | NA | NA | NA | NA |
| 2023-12-31 | 2023-09-30 | 2023-06-30 | 2023-03-31 | 2022-12-31 | 2022-09-30 | 2022-06-30 | 2022-03-31 | 2021-12-31 | 2021-09-30 | 2021-06-30 | 2021-03-31 | 2020-12-31 | 2020-09-30 | 2020-06-30 | 2020-03-31 | 2019-12-31 | 2019-09-30 | 2019-06-30 | 2019-03-31 | 2018-12-31 | 2018-09-30 | 2018-06-30 | 2018-03-31 | 2017-12-31 | 2017-09-30 | 2017-06-30 | 2017-03-31 | ||
|---|---|---|---|---|---|---|---|---|---|---|---|---|---|---|---|---|---|---|---|---|---|---|---|---|---|---|---|---|---|
| Stockholders Equity | -1392.00 | -1463.00 | -1489.00 | -1445.00 | -1367.00 | -1786.00 | -1740.00 | -1392.00 | -1372.00 | -1576.00 | -1695.00 | -1681.00 | -1625.00 | -2017.00 | -2127.00 | -2205.00 | -2218.00 | -1848.00 | -1833.00 | -1663.00 | -1535.00 | -1205.00 | -879.00 | -775.00 | -767.00 | 1213.00 | 1298.00 | 1429.00 | |
| Stockholders Equity Including Portion Attributable To Noncontrolling Interest | -1147.00 | -1222.00 | -1403.00 | -1352.00 | -1275.00 | -1694.00 | -1656.00 | -1312.00 | -1290.00 | -1493.00 | -1616.00 | -1595.00 | -1538.00 | -1957.00 | -2052.00 | -2136.00 | -2141.00 | -1765.00 | -1759.00 | -1590.00 | -1463.00 | -1130.00 | -803.00 | -701.00 | -692.00 | 1309.00 | 1393.00 | 1541.00 | |
| Common Stock Value | 1.00 | 1.00 | 1.00 | 1.00 | 1.00 | 1.00 | 1.00 | 1.00 | 1.00 | 1.00 | 1.00 | 1.00 | 1.00 | 1.00 | 1.00 | 1.00 | 1.00 | 1.00 | 1.00 | 1.00 | 1.00 | 1.00 | 1.00 | 1.00 | 1.00 | 1.00 | 1.00 | 1.00 | |
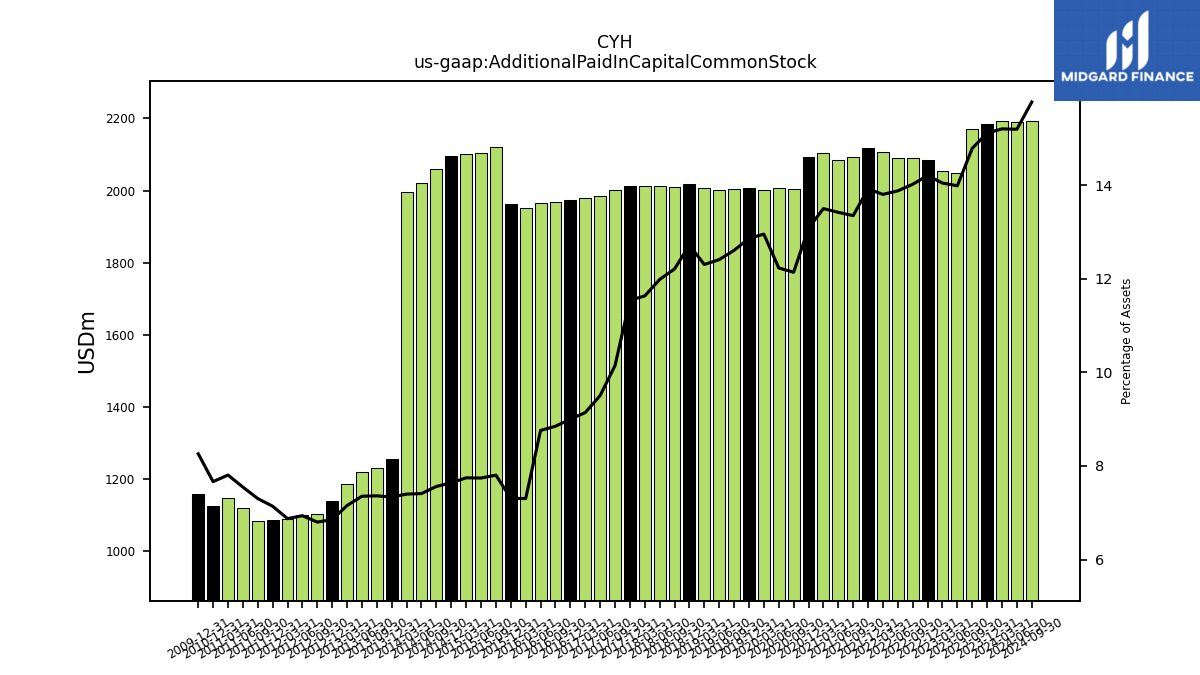
| Additional Paid In Capital Common Stock | 2185.00 | 2170.00 | 2049.00 | 2054.00 | 2084.00 | 2091.00 | 2090.00 | 2107.00 | 2118.00 | 2092.00 | 2084.00 | 2105.00 | 2094.00 | 2005.00 | 2008.00 | 2001.00 | 2008.00 | 2004.00 | 2002.00 | 2007.00 | 2017.00 | 2011.00 | 2013.00 | 2014.00 | 2014.00 | 2002.00 | 1984.00 | 1980.00 | |
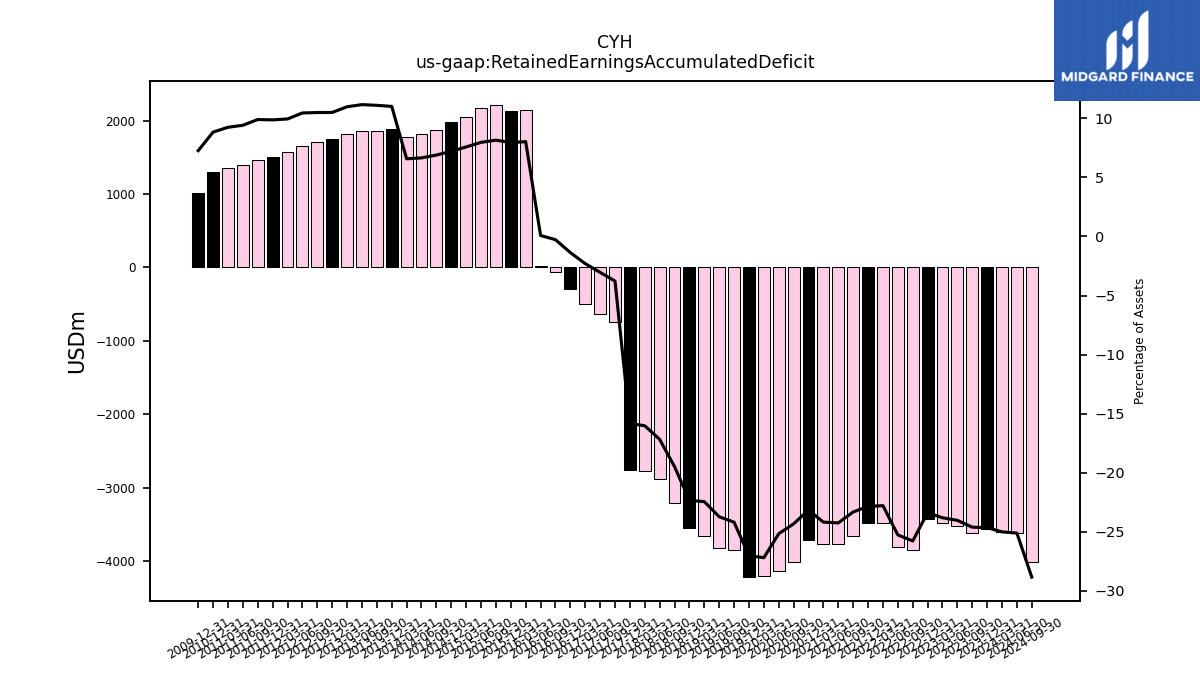
| Retained Earnings Accumulated Deficit | -3564.00 | -3611.00 | -3520.00 | -3482.00 | -3431.00 | -3845.00 | -3804.00 | -3478.00 | -3477.00 | -3655.00 | -3765.00 | -3771.00 | -3707.00 | -4018.00 | -4131.00 | -4200.00 | -4218.00 | -3845.00 | -3828.00 | -3661.00 | -3543.00 | -3209.00 | -2884.00 | -2774.00 | -2761.00 | -745.00 | -634.00 | -498.00 | |
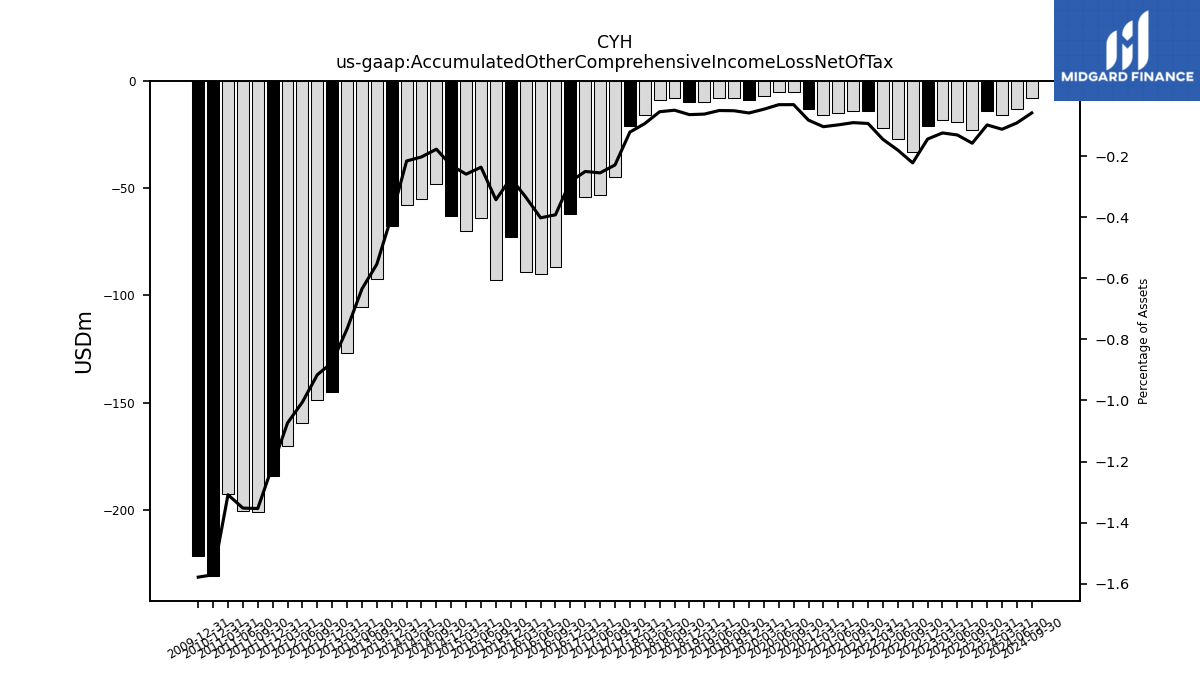
| Accumulated Other Comprehensive Income Loss Net Of Tax | -14.00 | -23.00 | -19.00 | -18.00 | -21.00 | -33.00 | -27.00 | -22.00 | -14.00 | -14.00 | -15.00 | -16.00 | -13.00 | -5.00 | -5.00 | -7.00 | -9.00 | -8.00 | -8.00 | -10.00 | -10.00 | -8.00 | -9.00 | -16.00 | -21.00 | -45.00 | -53.00 | -54.00 | |
| Minority Interest | 245.00 | 241.00 | 86.00 | 93.00 | 92.00 | 92.00 | 84.00 | 80.00 | 82.00 | 83.00 | 79.00 | 86.00 | 87.00 | 60.00 | 75.00 | 69.00 | 77.00 | 83.00 | 74.00 | 73.00 | 72.00 | 75.00 | 76.00 | 74.00 | 75.00 | 96.00 | 95.00 | 112.00 |
| 2023-12-31 | 2023-09-30 | 2023-06-30 | 2023-03-31 | 2022-12-31 | 2022-09-30 | 2022-06-30 | 2022-03-31 | 2021-12-31 | 2021-09-30 | 2021-06-30 | 2021-03-31 | 2020-12-31 | 2020-09-30 | 2020-06-30 | 2020-03-31 | 2019-12-31 | 2019-09-30 | 2019-06-30 | 2019-03-31 | 2018-12-31 | 2018-09-30 | 2018-06-30 | 2018-03-31 | 2017-12-31 | 2017-09-30 | 2017-06-30 | 2017-03-31 | ||
|---|---|---|---|---|---|---|---|---|---|---|---|---|---|---|---|---|---|---|---|---|---|---|---|---|---|---|---|---|---|
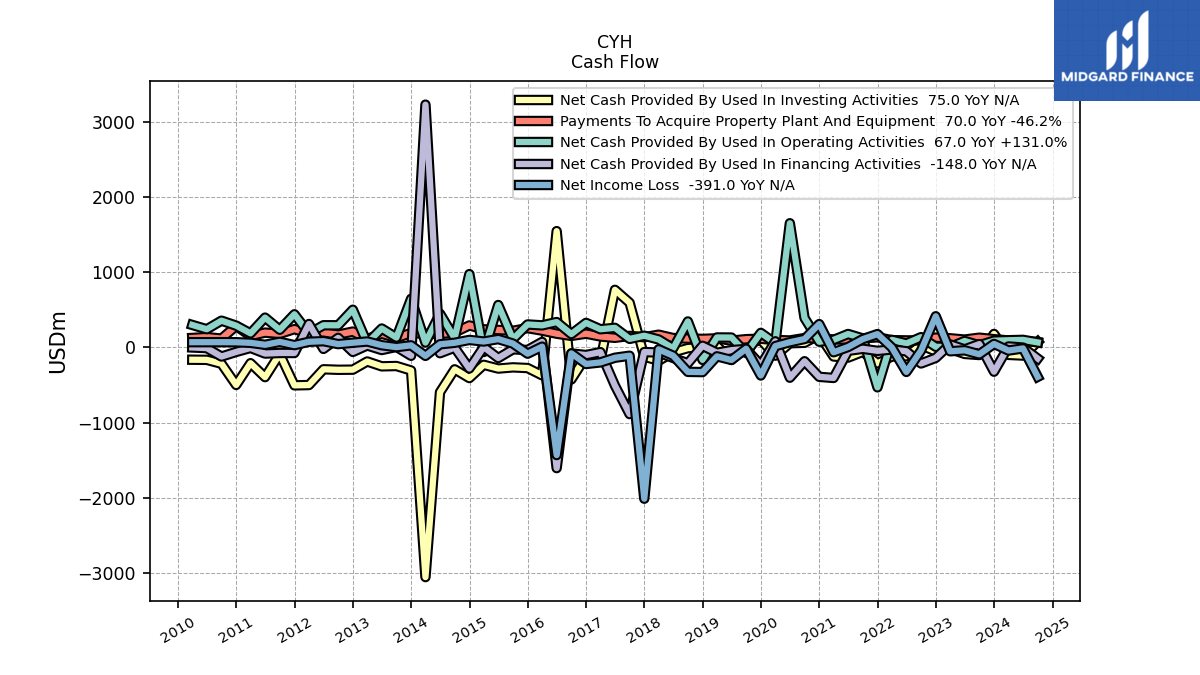
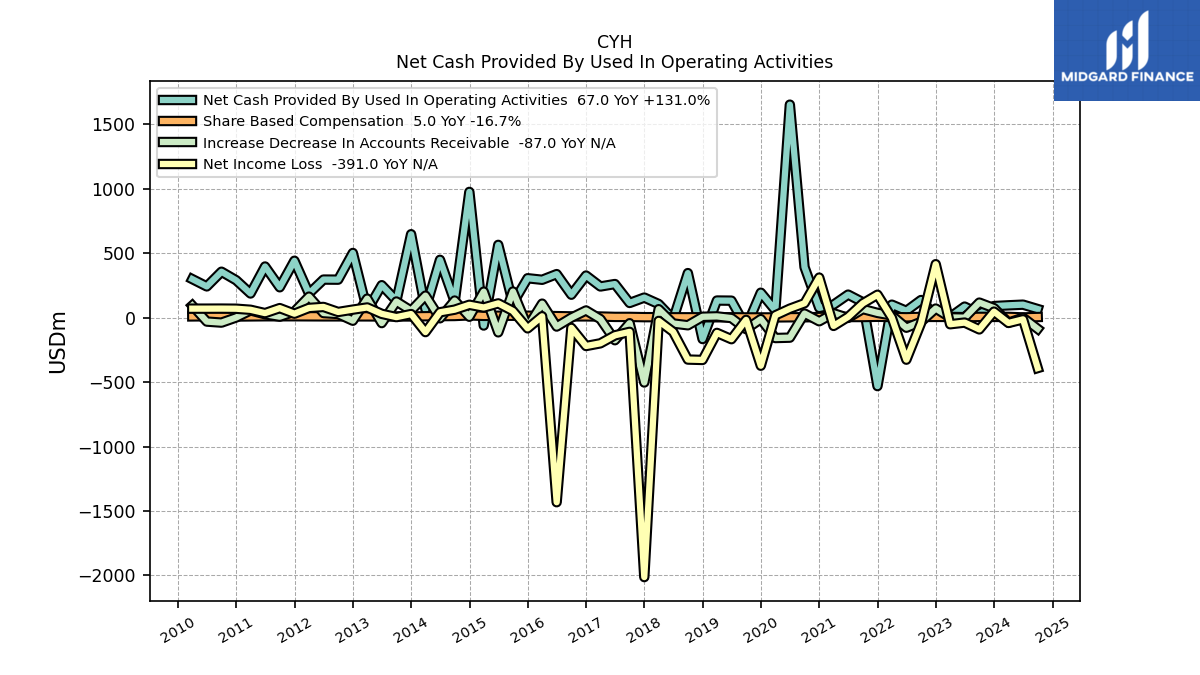
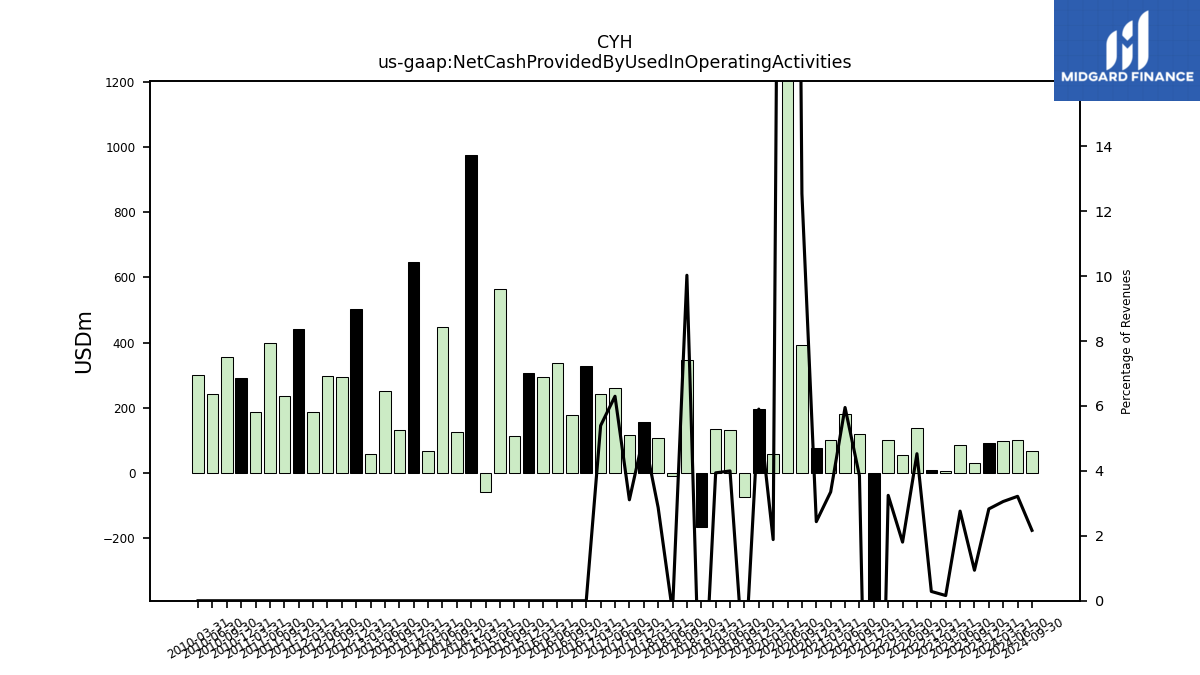
| Net Cash Provided By Used In Operating Activities | 90.00 | 29.00 | 86.00 | 5.00 | 9.00 | 137.00 | 53.00 | 101.00 | -531.00 | 120.00 | 179.00 | 101.00 | 76.00 | 392.00 | 1653.00 | 57.00 | 194.00 | -74.00 | 132.00 | 133.00 | -166.00 | 346.00 | -12.00 | 106.00 | 156.00 | 114.00 | 261.00 | 242.00 | |
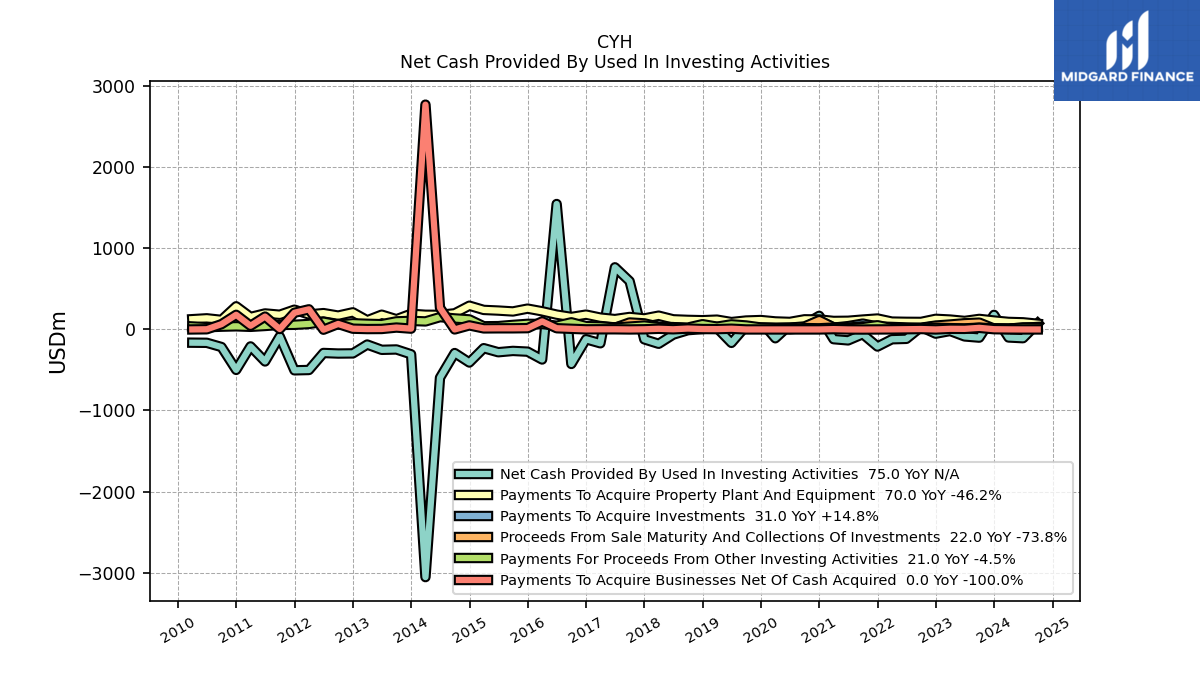
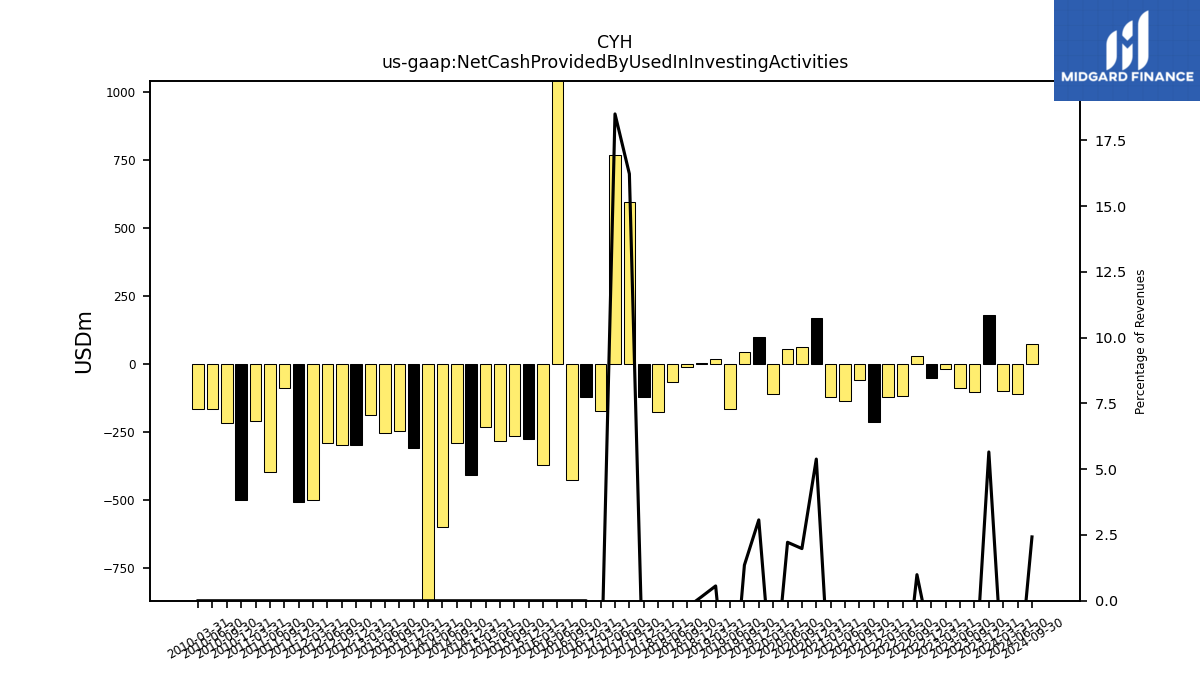
| Net Cash Provided By Used In Investing Activities | 180.00 | -101.00 | -86.00 | -19.00 | -52.00 | 30.00 | -116.00 | -121.00 | -211.00 | -58.00 | -135.00 | -120.00 | 168.00 | 62.00 | 56.00 | -109.00 | 101.00 | 44.00 | -166.00 | 19.00 | 5.00 | -9.00 | -64.00 | -177.00 | -122.00 | 595.00 | 767.00 | -171.00 | |
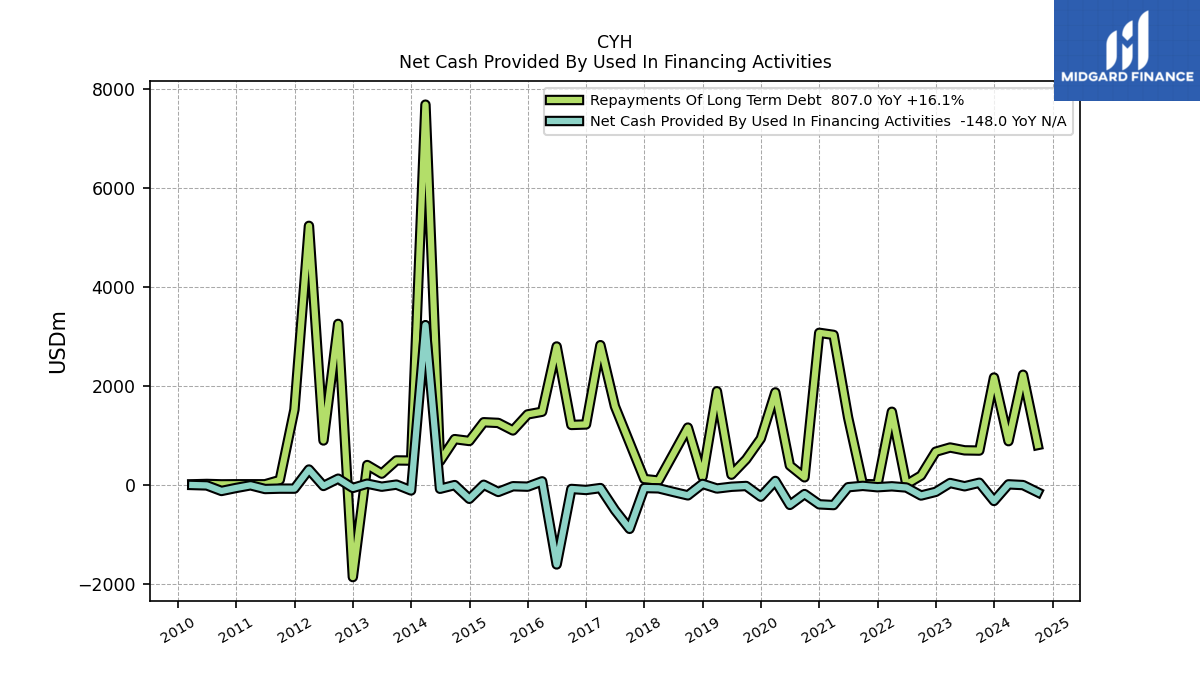
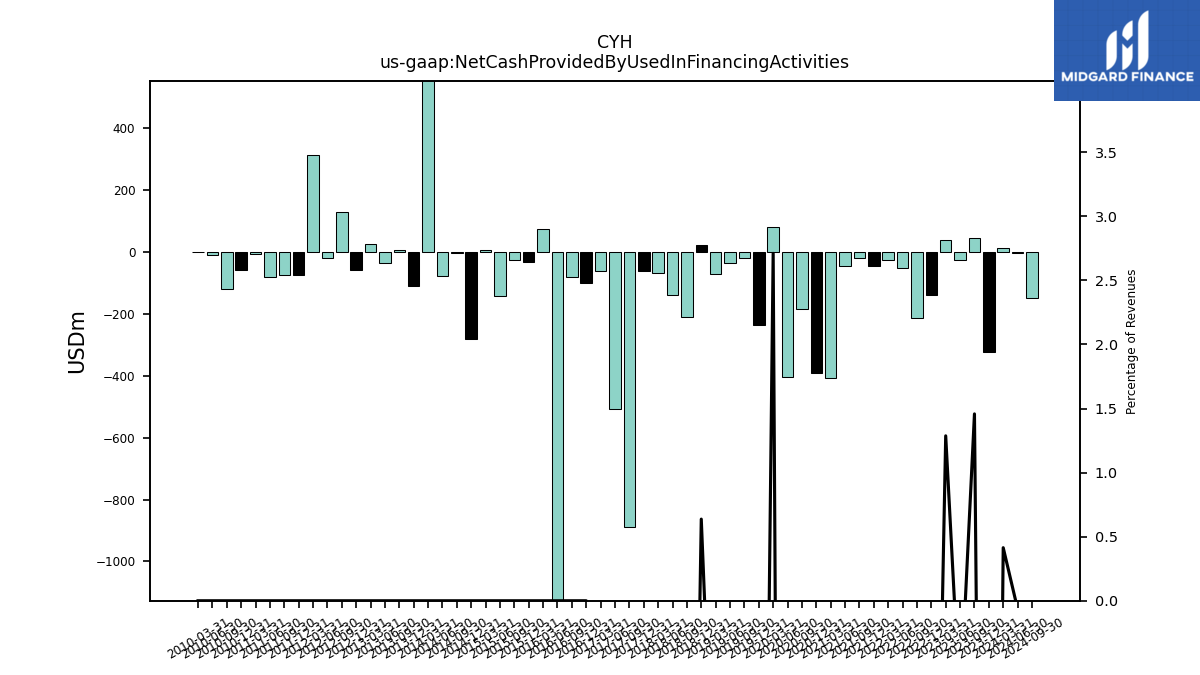
| Net Cash Provided By Used In Financing Activities | -323.00 | 45.00 | -26.00 | 40.00 | -139.00 | -213.00 | -51.00 | -27.00 | -45.00 | -18.00 | -45.00 | -406.00 | -391.00 | -183.00 | -403.00 | 82.00 | -236.00 | -20.00 | -36.00 | -71.00 | 22.00 | -210.00 | -140.00 | -68.00 | -61.00 | -887.00 | -507.00 | -62.00 |
| 2023-12-31 | 2023-09-30 | 2023-06-30 | 2023-03-31 | 2022-12-31 | 2022-09-30 | 2022-06-30 | 2022-03-31 | 2021-12-31 | 2021-09-30 | 2021-06-30 | 2021-03-31 | 2020-12-31 | 2020-09-30 | 2020-06-30 | 2020-03-31 | 2019-12-31 | 2019-09-30 | 2019-06-30 | 2019-03-31 | 2018-12-31 | 2018-09-30 | 2018-06-30 | 2018-03-31 | 2017-12-31 | 2017-09-30 | 2017-06-30 | 2017-03-31 | ||
|---|---|---|---|---|---|---|---|---|---|---|---|---|---|---|---|---|---|---|---|---|---|---|---|---|---|---|---|---|---|
| Net Cash Provided By Used In Operating Activities | 90.00 | 29.00 | 86.00 | 5.00 | 9.00 | 137.00 | 53.00 | 101.00 | -531.00 | 120.00 | 179.00 | 101.00 | 76.00 | 392.00 | 1653.00 | 57.00 | 194.00 | -74.00 | 132.00 | 133.00 | -166.00 | 346.00 | -12.00 | 106.00 | 156.00 | 114.00 | 261.00 | 242.00 | |
| Net Income Loss | 47.00 | -91.00 | -38.00 | -51.00 | 415.00 | -42.00 | -326.00 | -1.00 | 178.00 | 111.00 | 6.00 | -64.00 | 311.00 | 112.00 | 70.00 | 18.00 | -373.00 | -17.00 | -167.00 | -118.00 | -328.00 | -325.00 | -110.00 | -25.00 | -2013.00 | -110.00 | -137.00 | -199.00 | |
| Profit Loss | 86.00 | -52.00 | 2.00 | -20.00 | 446.00 | 1.00 | -298.00 | 30.00 | 222.00 | 144.00 | 37.00 | -35.00 | 353.00 | 128.00 | 93.00 | 34.00 | -346.00 | 2.00 | -146.00 | -101.00 | -299.00 | -308.00 | -91.00 | -6.00 | -2006.00 | -90.00 | -122.00 | -177.00 | |
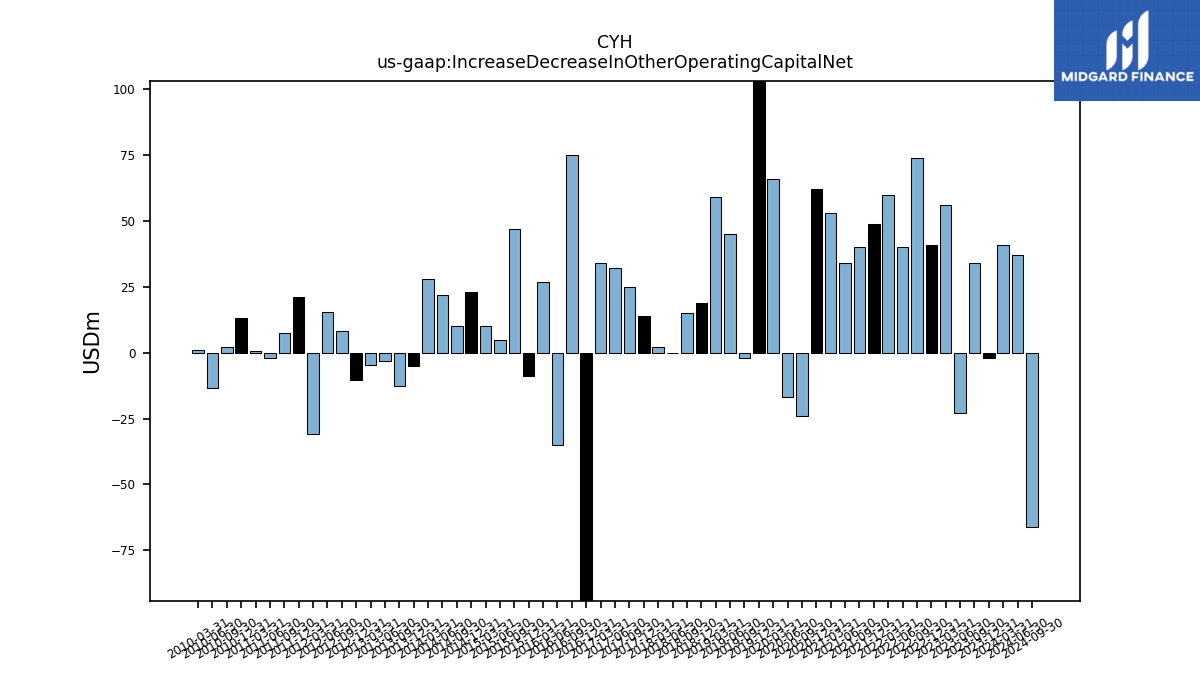
| Increase Decrease In Other Operating Capital Net | -2.00 | 34.00 | -23.00 | 56.00 | 41.00 | 74.00 | 40.00 | 60.00 | 49.00 | 40.00 | 34.00 | 53.00 | 62.00 | -24.00 | -17.00 | 66.00 | 143.00 | -2.00 | 45.00 | 59.00 | 19.00 | 15.00 | 0.00 | 2.00 | 14.00 | 25.00 | 32.00 | 34.00 | |
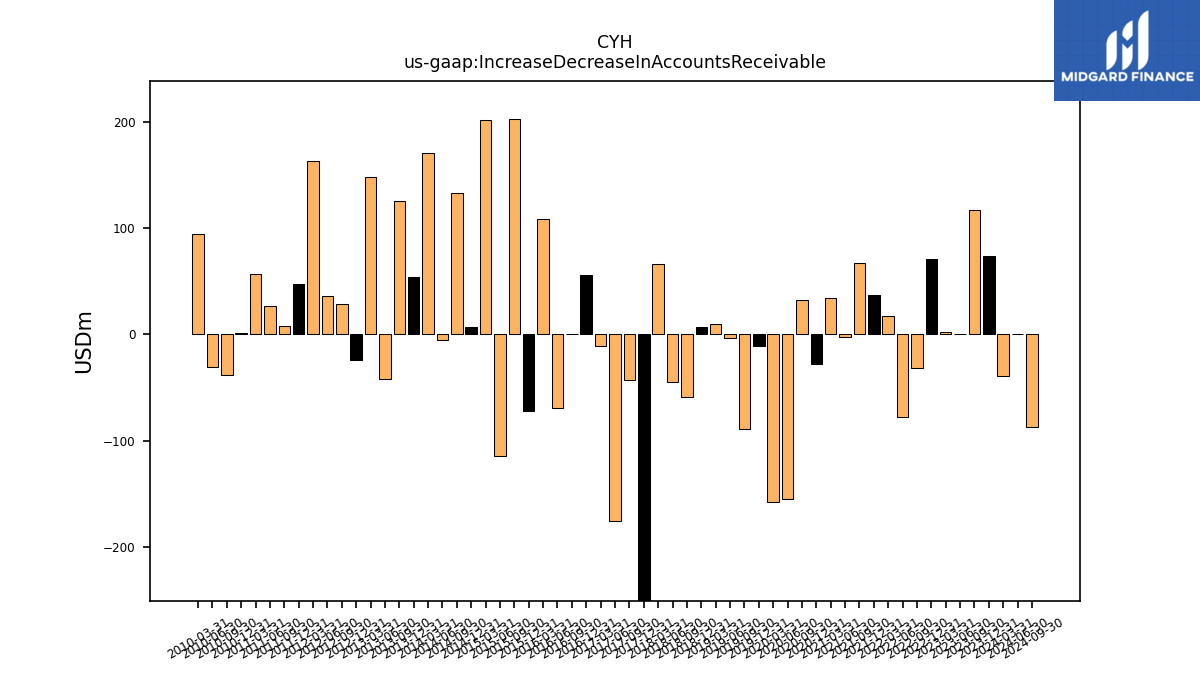
| Increase Decrease In Accounts Receivable | 74.00 | 117.00 | 0.00 | 2.00 | 71.00 | -32.00 | -78.00 | 17.00 | 37.00 | 67.00 | -2.00 | 34.00 | -28.00 | 32.00 | -155.00 | -158.00 | -11.00 | -89.00 | -3.00 | 10.00 | 7.00 | -59.00 | -45.00 | 66.00 | -503.00 | -43.00 | -175.00 | -11.00 | |
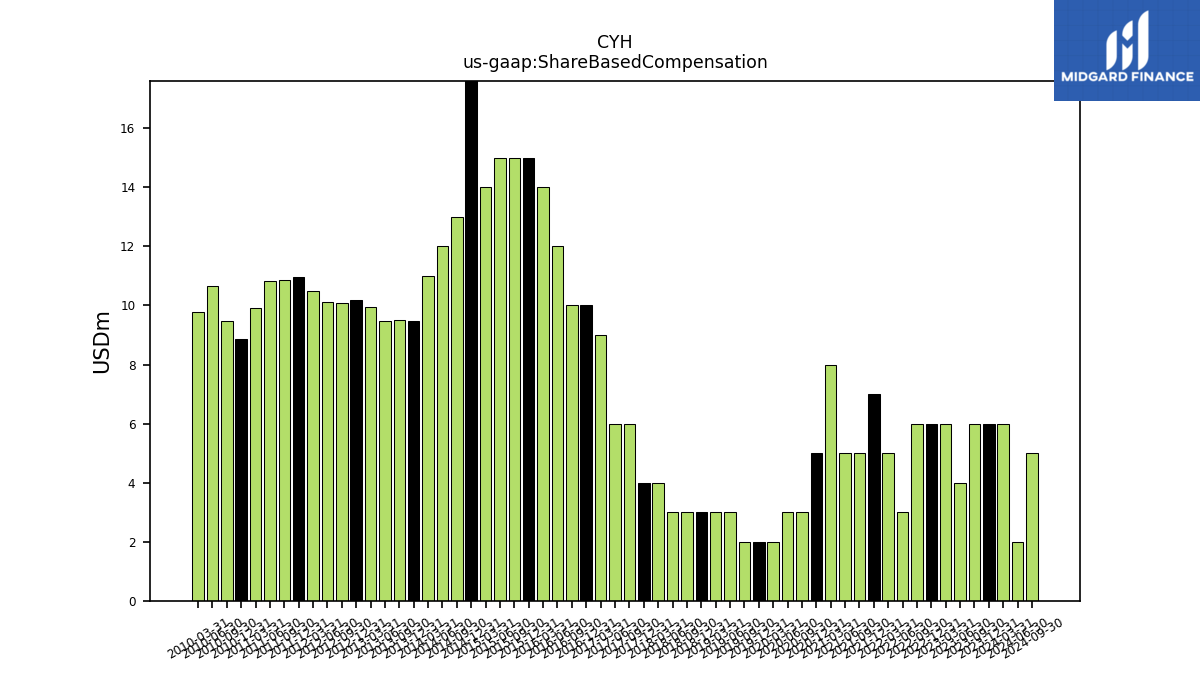
| Share Based Compensation | 6.00 | 6.00 | 4.00 | 6.00 | 6.00 | 6.00 | 3.00 | 5.00 | 7.00 | 5.00 | 5.00 | 8.00 | 5.00 | 3.00 | 3.00 | 2.00 | 2.00 | 2.00 | 3.00 | 3.00 | 3.00 | 3.00 | 3.00 | 4.00 | 4.00 | 6.00 | 6.00 | 9.00 |
| 2023-12-31 | 2023-09-30 | 2023-06-30 | 2023-03-31 | 2022-12-31 | 2022-09-30 | 2022-06-30 | 2022-03-31 | 2021-12-31 | 2021-09-30 | 2021-06-30 | 2021-03-31 | 2020-12-31 | 2020-09-30 | 2020-06-30 | 2020-03-31 | 2019-12-31 | 2019-09-30 | 2019-06-30 | 2019-03-31 | 2018-12-31 | 2018-09-30 | 2018-06-30 | 2018-03-31 | 2017-12-31 | 2017-09-30 | 2017-06-30 | 2017-03-31 | ||
|---|---|---|---|---|---|---|---|---|---|---|---|---|---|---|---|---|---|---|---|---|---|---|---|---|---|---|---|---|---|
| Net Cash Provided By Used In Investing Activities | 180.00 | -101.00 | -86.00 | -19.00 | -52.00 | 30.00 | -116.00 | -121.00 | -211.00 | -58.00 | -135.00 | -120.00 | 168.00 | 62.00 | 56.00 | -109.00 | 101.00 | 44.00 | -166.00 | 19.00 | 5.00 | -9.00 | -64.00 | -177.00 | -122.00 | 595.00 | 767.00 | -171.00 | |
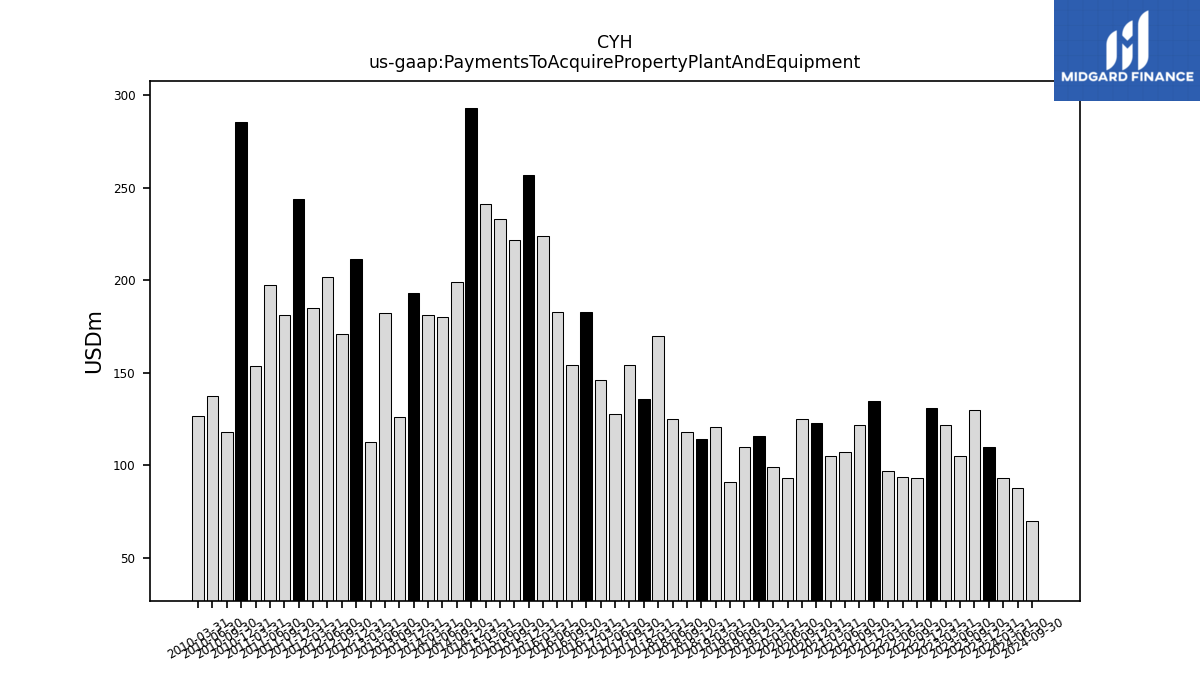
| Payments To Acquire Property Plant And Equipment | 110.00 | 130.00 | 105.00 | 122.00 | 131.00 | 93.00 | 94.00 | 97.00 | 135.00 | 122.00 | 107.00 | 105.00 | 123.00 | 125.00 | 93.00 | 99.00 | 116.00 | 110.00 | 91.00 | 121.00 | 114.00 | 118.00 | 125.00 | 170.00 | 136.00 | 154.00 | 128.00 | 146.00 | |
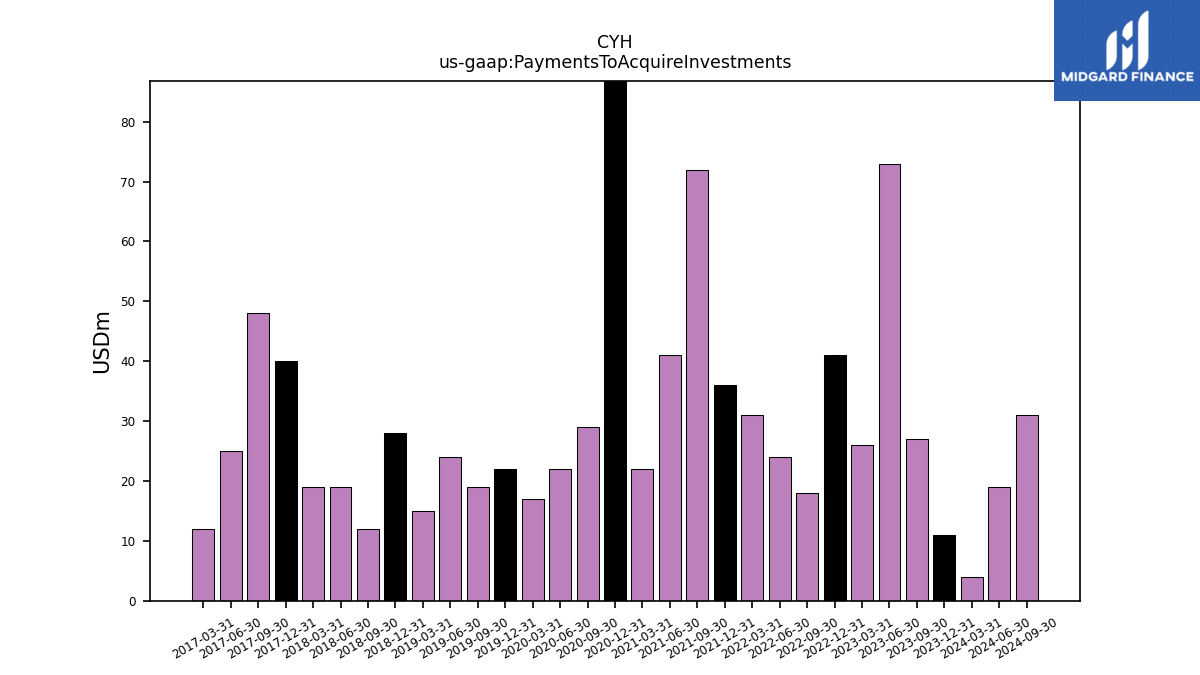
| Payments To Acquire Investments | 11.00 | 27.00 | 73.00 | 26.00 | 41.00 | 18.00 | 24.00 | 31.00 | 36.00 | 72.00 | 41.00 | 22.00 | 110.00 | 29.00 | 22.00 | 17.00 | 22.00 | 19.00 | 24.00 | 15.00 | 28.00 | 12.00 | 19.00 | 19.00 | 40.00 | 48.00 | 25.00 | 12.00 |
| 2023-12-31 | 2023-09-30 | 2023-06-30 | 2023-03-31 | 2022-12-31 | 2022-09-30 | 2022-06-30 | 2022-03-31 | 2021-12-31 | 2021-09-30 | 2021-06-30 | 2021-03-31 | 2020-12-31 | 2020-09-30 | 2020-06-30 | 2020-03-31 | 2019-12-31 | 2019-09-30 | 2019-06-30 | 2019-03-31 | 2018-12-31 | 2018-09-30 | 2018-06-30 | 2018-03-31 | 2017-12-31 | 2017-09-30 | 2017-06-30 | 2017-03-31 | ||
|---|---|---|---|---|---|---|---|---|---|---|---|---|---|---|---|---|---|---|---|---|---|---|---|---|---|---|---|---|---|
| Net Cash Provided By Used In Financing Activities | -323.00 | 45.00 | -26.00 | 40.00 | -139.00 | -213.00 | -51.00 | -27.00 | -45.00 | -18.00 | -45.00 | -406.00 | -391.00 | -183.00 | -403.00 | 82.00 | -236.00 | -20.00 | -36.00 | -71.00 | 22.00 | -210.00 | -140.00 | -68.00 | -61.00 | -887.00 | -507.00 | -62.00 |
| 2023-12-31 | 2023-09-30 | 2023-06-30 | 2023-03-31 | 2022-12-31 | 2022-09-30 | 2022-06-30 | 2022-03-31 | 2021-12-31 | 2021-09-30 | 2021-06-30 | 2021-03-31 | 2020-12-31 | 2020-09-30 | 2020-06-30 | 2020-03-31 | 2019-12-31 | 2019-09-30 | 2019-06-30 | 2019-03-31 | 2018-12-31 | 2018-09-30 | 2018-06-30 | 2018-03-31 | 2017-12-31 | 2017-09-30 | 2017-06-30 | 2017-03-31 | ||
|---|---|---|---|---|---|---|---|---|---|---|---|---|---|---|---|---|---|---|---|---|---|---|---|---|---|---|---|---|---|
| Revenues | 3182.00 | 3086.00 | 3115.00 | 3108.00 | 3142.00 | 3025.00 | 2934.00 | 3111.00 | 3233.00 | 3115.00 | 3007.00 | 3013.00 | 3119.00 | 3126.00 | 2519.00 | 3025.00 | 3286.00 | 3246.00 | 3302.00 | 3376.00 | 3453.00 | 3451.00 | 3562.00 | 3689.00 | 3059.00 | 3666.00 | 4144.00 | 4486.00 | |
| Managed Care And Other Third Party Payors | 1537.00 | 1479.00 | 1492.00 | 1469.00 | 87.00 | 1925.00 | 1862.00 | 1933.00 | 2092.00 | 2010.00 | 1919.00 | 1915.00 | 1975.00 | 1967.00 | 1626.00 | 1832.00 | 2023.00 | 1971.00 | 1993.00 | 2025.00 | 2057.00 | 2065.00 | 2110.00 | 2117.00 | NA | 2171.00 | 2412.00 | 2528.00 | |
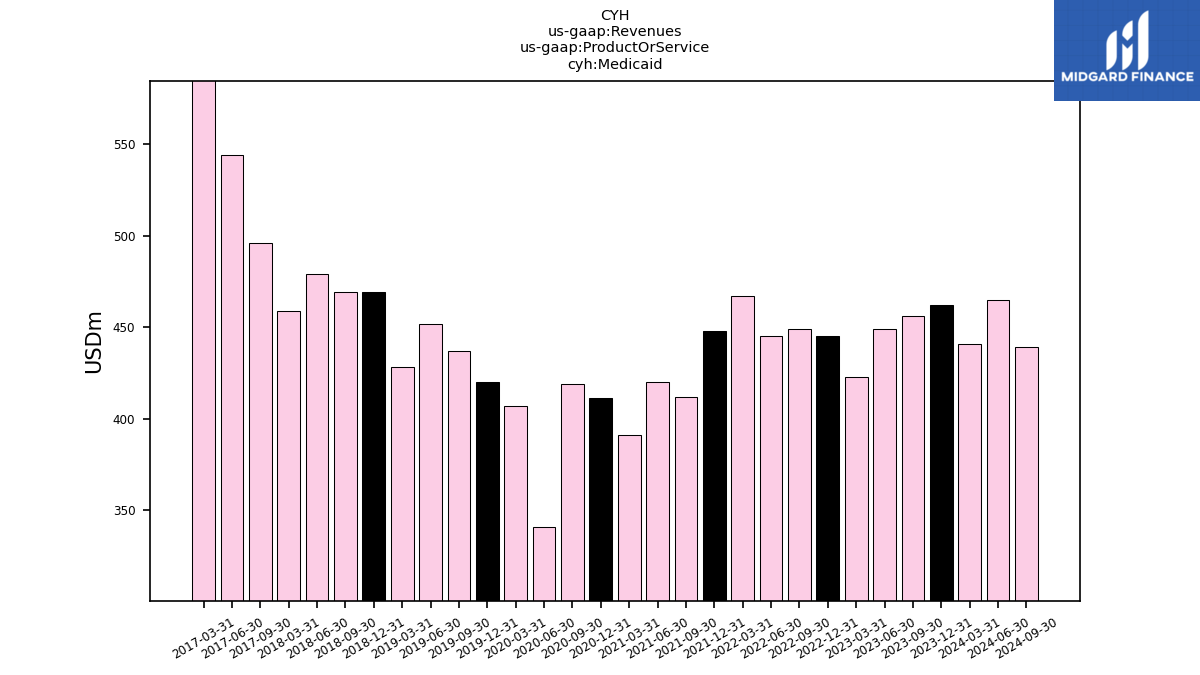
| Medicaid | 462.00 | 456.00 | 449.00 | 423.00 | 445.00 | 449.00 | 445.00 | 467.00 | 448.00 | 412.00 | 420.00 | 391.00 | 411.00 | 419.00 | 341.00 | 407.00 | 420.00 | 437.00 | 452.00 | 428.00 | 469.00 | 469.00 | 479.00 | 459.00 | NA | 496.00 | 544.00 | 587.00 | |
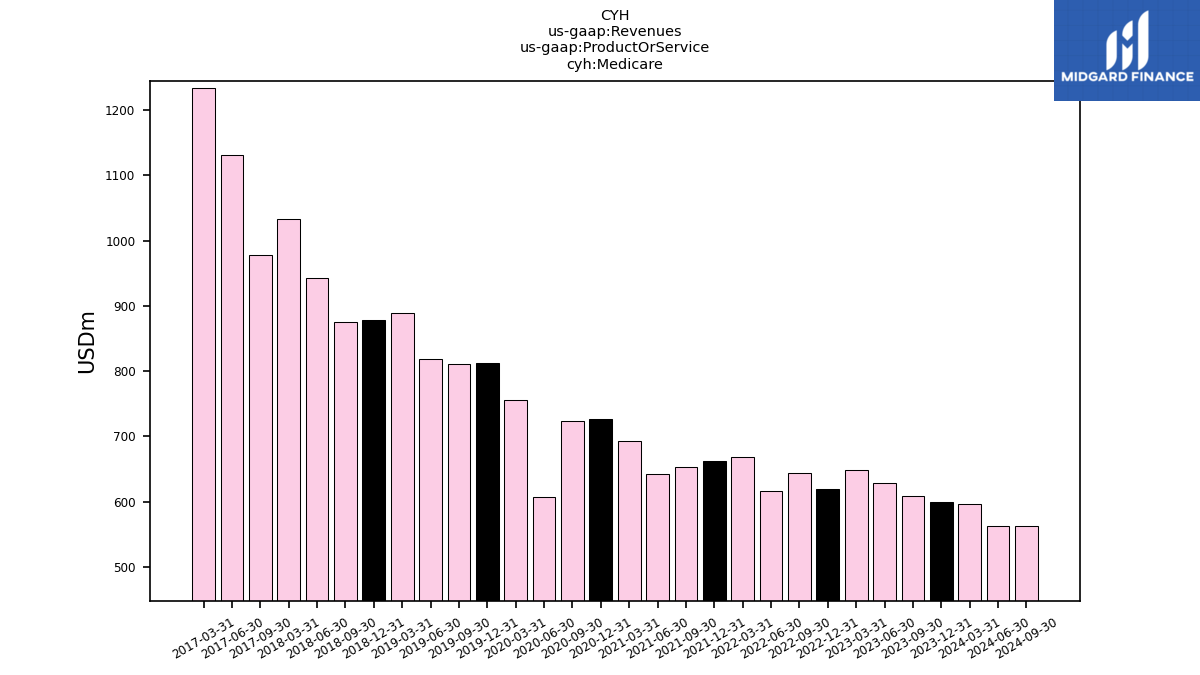
| Medicare | 600.00 | 608.00 | 628.00 | 649.00 | 619.00 | 644.00 | 616.00 | 668.00 | 662.00 | 653.00 | 642.00 | 693.00 | 727.00 | 723.00 | 607.00 | 756.00 | 812.00 | 811.00 | 819.00 | 889.00 | 878.00 | 875.00 | 943.00 | 1033.00 | NA | 978.00 | 1131.00 | 1234.00 | |
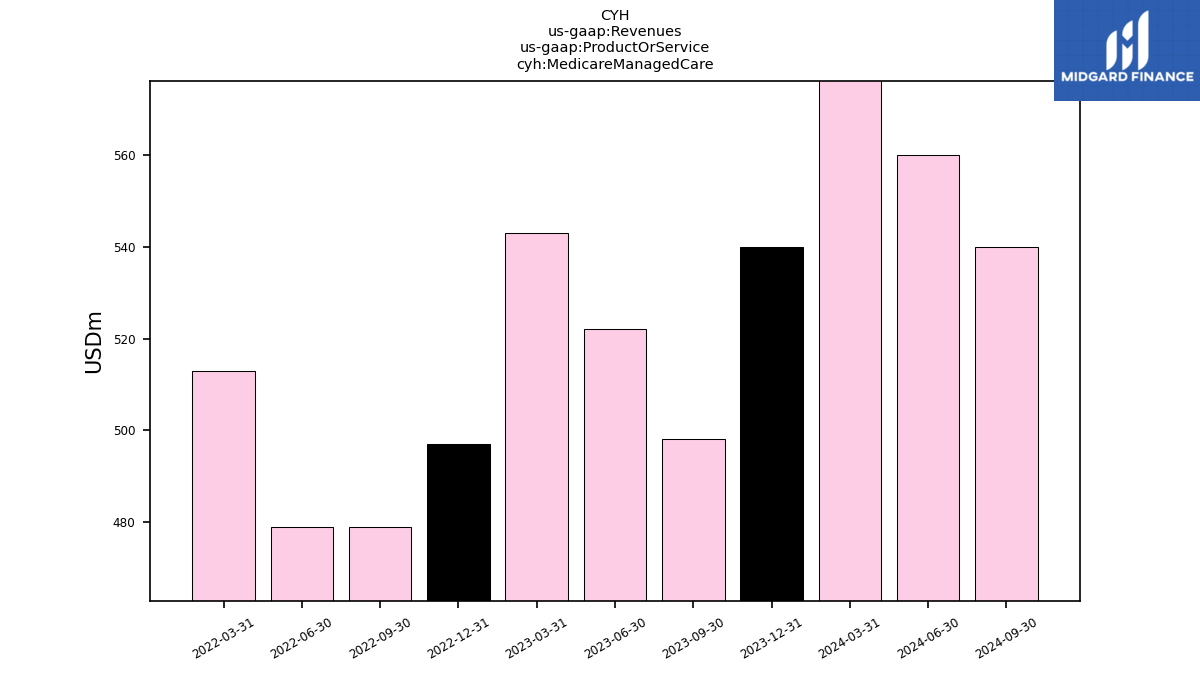
| Medicare Managed Care | 540.00 | 498.00 | 522.00 | 543.00 | 497.00 | 479.00 | 479.00 | 513.00 | NA | NA | NA | NA | NA | NA | NA | NA | NA | NA | NA | NA | NA | NA | NA | NA | NA | NA | NA | NA | |
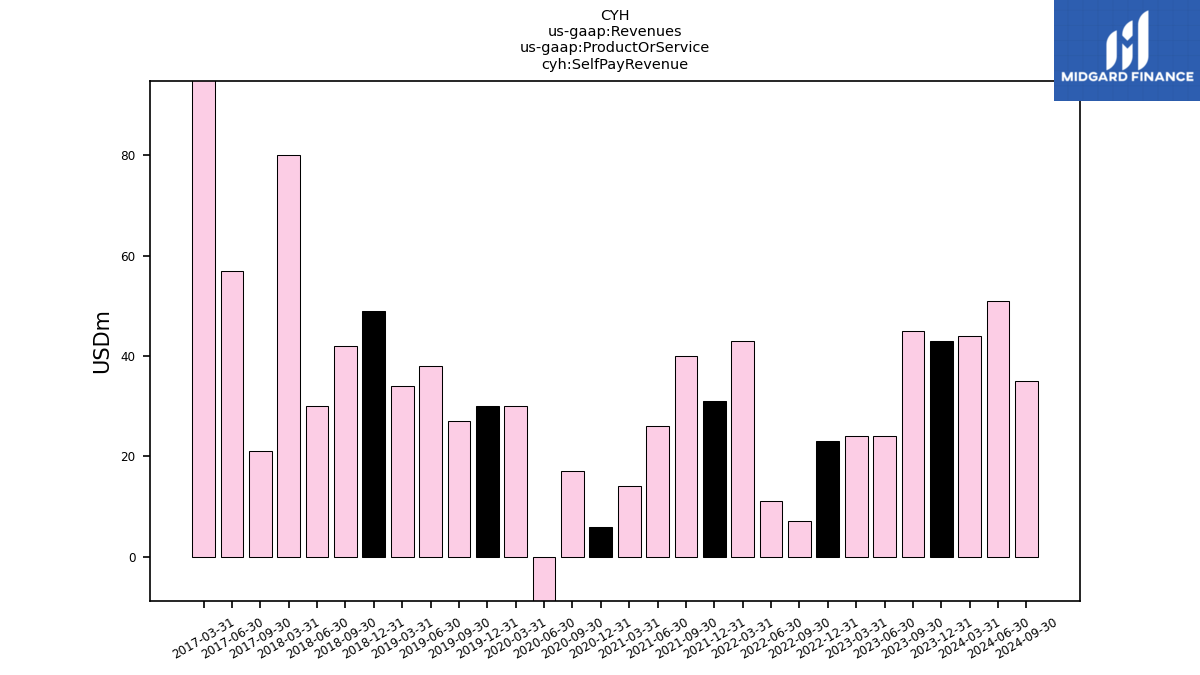
| Self Pay Revenue | 43.00 | 45.00 | 24.00 | 24.00 | 23.00 | 7.00 | 11.00 | 43.00 | 31.00 | 40.00 | 26.00 | 14.00 | 6.00 | 17.00 | -55.00 | 30.00 | 30.00 | 27.00 | 38.00 | 34.00 | 49.00 | 42.00 | 30.00 | 80.00 | NA | 21.00 | 57.00 | 137.00 |