
| 2023-12-31 | 2023-09-30 | 2023-06-30 | 2023-03-31 | 2022-12-31 | 2022-09-30 | 2022-06-30 | 2022-03-31 | 2021-12-31 | 2021-09-30 | 2021-06-30 | 2021-03-31 | 2020-12-31 | 2020-09-30 | 2020-06-30 | 2020-03-31 | 2019-12-31 | 2019-09-30 | 2019-06-30 | 2019-03-31 | 2018-12-31 | 2018-09-30 | 2018-06-30 | 2018-03-31 | 2017-12-31 | 2017-09-30 | 2017-06-30 | 2017-03-31 | 2016-12-31 | 2016-09-30 | 2016-06-30 | 2016-03-31 | ||
|---|---|---|---|---|---|---|---|---|---|---|---|---|---|---|---|---|---|---|---|---|---|---|---|---|---|---|---|---|---|---|---|---|---|
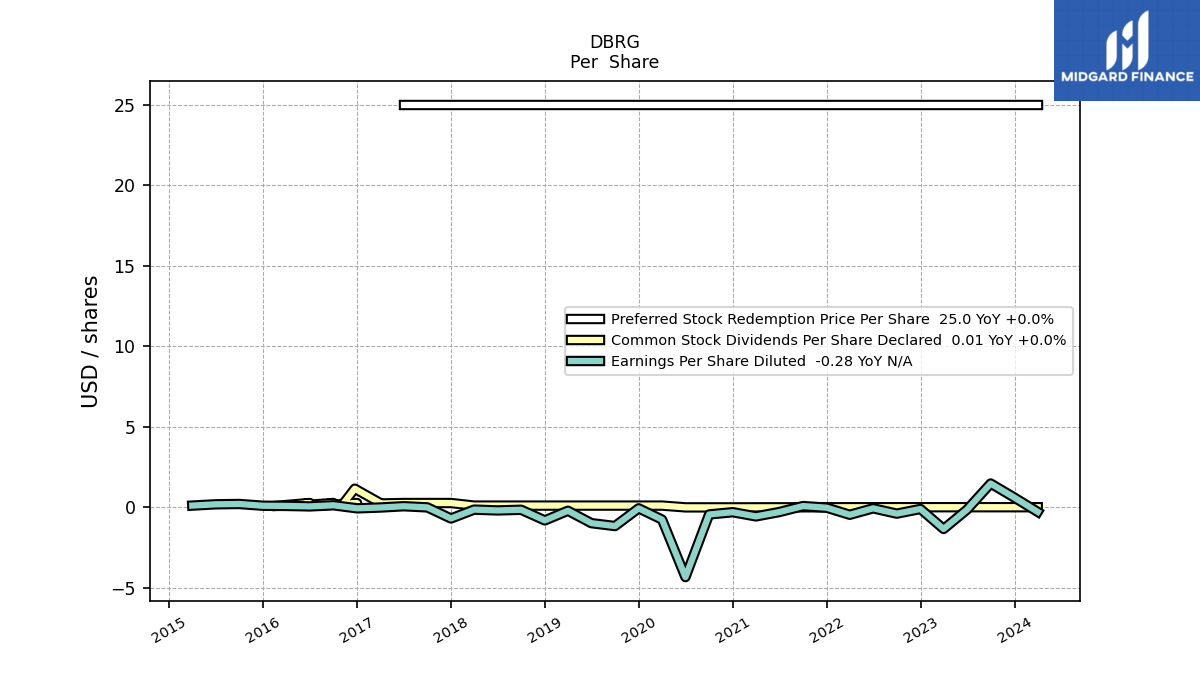
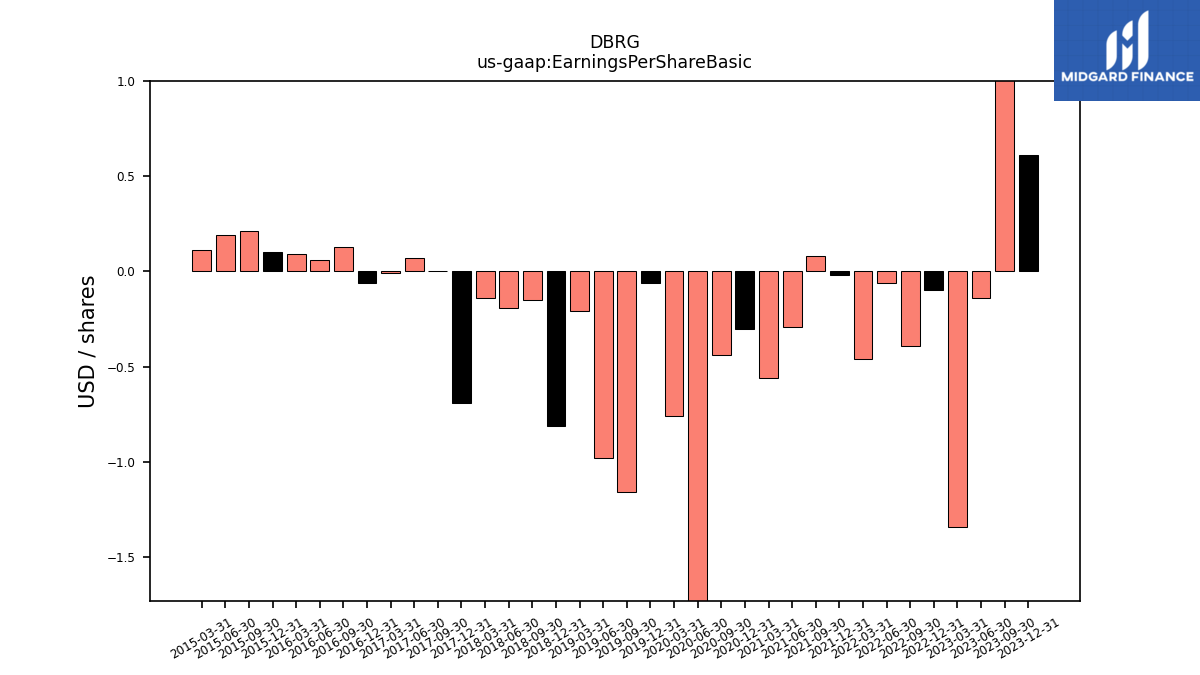
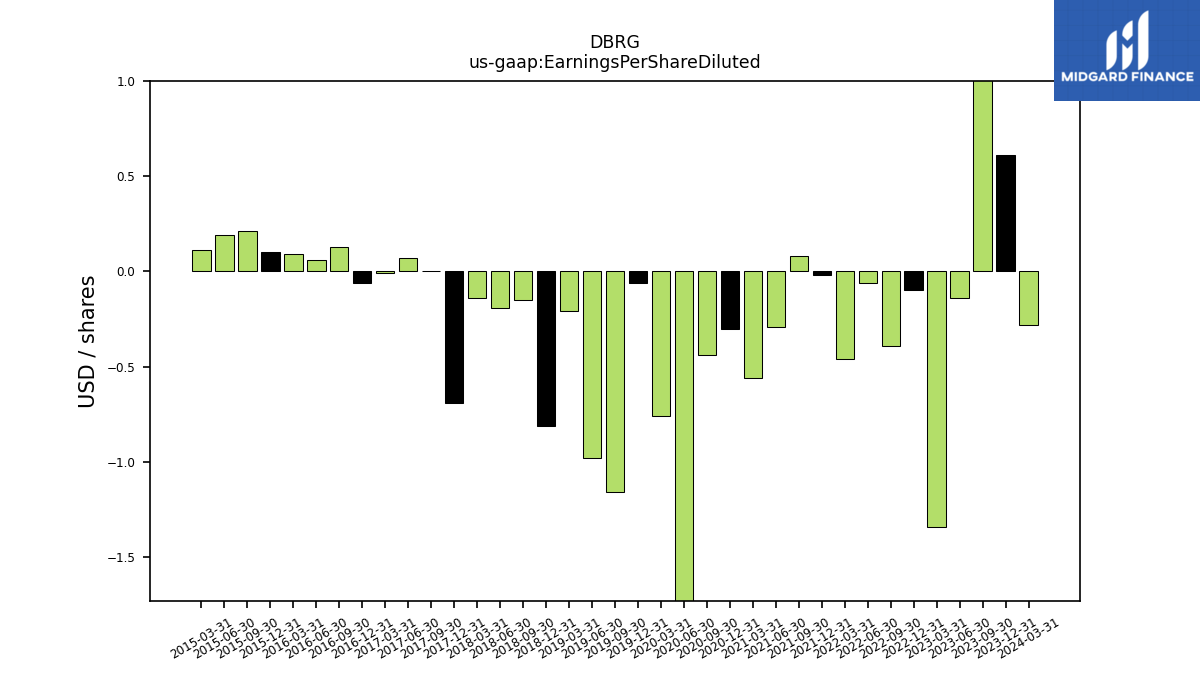
| Earnings Per Share Basic | 0.61 | 1.60 | -0.14 | -1.34 | -0.10 | -0.39 | -0.06 | -0.46 | -0.02 | 0.08 | -0.29 | -0.56 | -0.30 | -0.44 | -4.33 | -0.76 | -0.06 | -1.16 | -0.98 | -0.21 | -0.81 | -0.15 | -0.19 | -0.14 | -0.69 | 0.00 | 0.07 | -0.01 | -0.06 | 0.13 | 0.06 | 0.09 | |
| Earnings Per Share Diluted | 0.61 | 1.48 | -0.14 | -1.34 | -0.10 | -0.39 | -0.06 | -0.46 | -0.02 | 0.08 | -0.29 | -0.56 | -0.30 | -0.44 | -4.33 | -0.76 | -0.06 | -1.16 | -0.98 | -0.21 | -0.81 | -0.15 | -0.19 | -0.14 | -0.69 | 0.00 | 0.07 | -0.01 | -0.06 | 0.13 | 0.06 | 0.09 | |
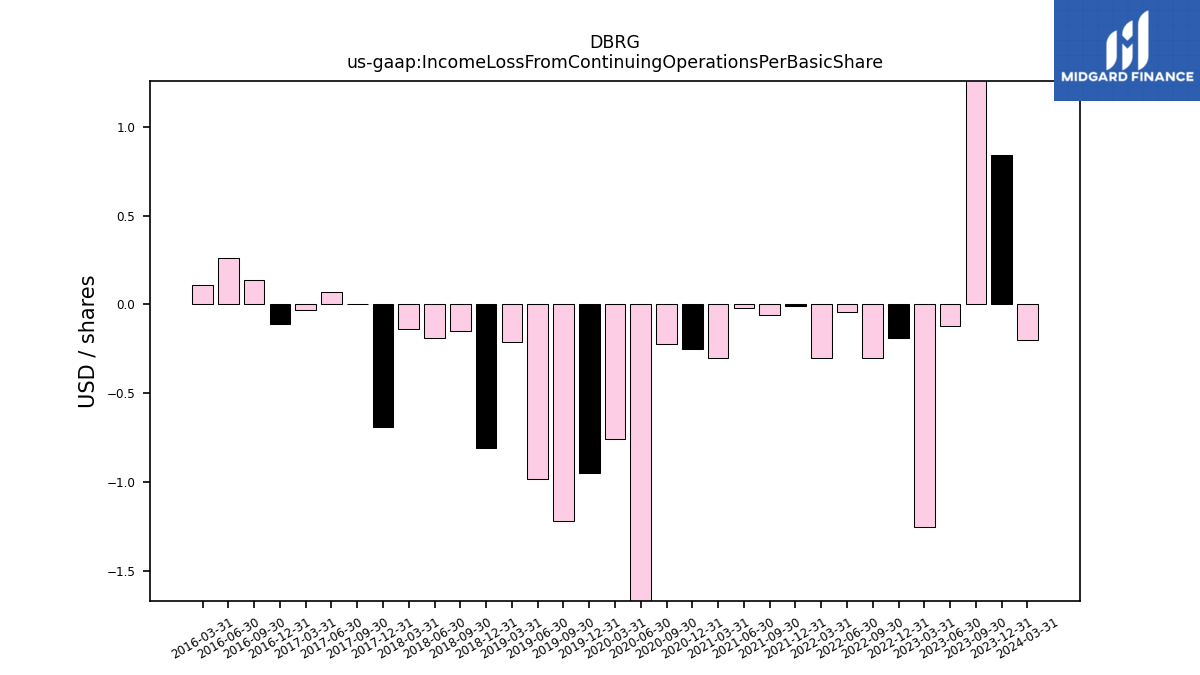
| Income Loss From Continuing Operations Per Basic Share | 0.00 | 0.00 | -0.00 | -0.00 | -0.00 | -0.00 | -0.00 | -0.00 | -0.00 | -0.00 | -0.00 | -0.00 | -0.00 | -0.00 | -0.00 | -0.00 | -0.00 | -0.00 | -0.00 | -0.00 | -0.00 | -0.00 | -0.00 | -0.00 | -0.00 | 0.00 | 0.00 | -0.00 | -0.00 | 0.00 | 0.00 | 0.00 | |
| Income Loss From Continuing Operations Per Diluted Share | 0.00 | 0.00 | -0.00 | -0.00 | -0.00 | -0.00 | -0.00 | -0.00 | -0.00 | -0.00 | -0.00 | -0.00 | -0.00 | -0.00 | -0.00 | -0.00 | -0.00 | -0.00 | -0.00 | -0.00 | -0.00 | -0.00 | -0.00 | -0.00 | -0.00 | 0.00 | 0.00 | -0.00 | -0.00 | 0.00 | 0.00 | 0.00 |
| 2023-12-31 | 2023-09-30 | 2023-06-30 | 2023-03-31 | 2022-12-31 | 2022-09-30 | 2022-06-30 | 2022-03-31 | 2021-12-31 | 2021-09-30 | 2021-06-30 | 2021-03-31 | 2020-12-31 | 2020-09-30 | 2020-06-30 | 2020-03-31 | 2019-12-31 | 2019-09-30 | 2019-06-30 | 2019-03-31 | 2018-12-31 | 2018-09-30 | 2018-06-30 | 2018-03-31 | 2017-12-31 | 2017-09-30 | 2017-06-30 | 2017-03-31 | 2016-12-31 | 2016-09-30 | 2016-06-30 | 2016-03-31 | ||
|---|---|---|---|---|---|---|---|---|---|---|---|---|---|---|---|---|---|---|---|---|---|---|---|---|---|---|---|---|---|---|---|---|---|
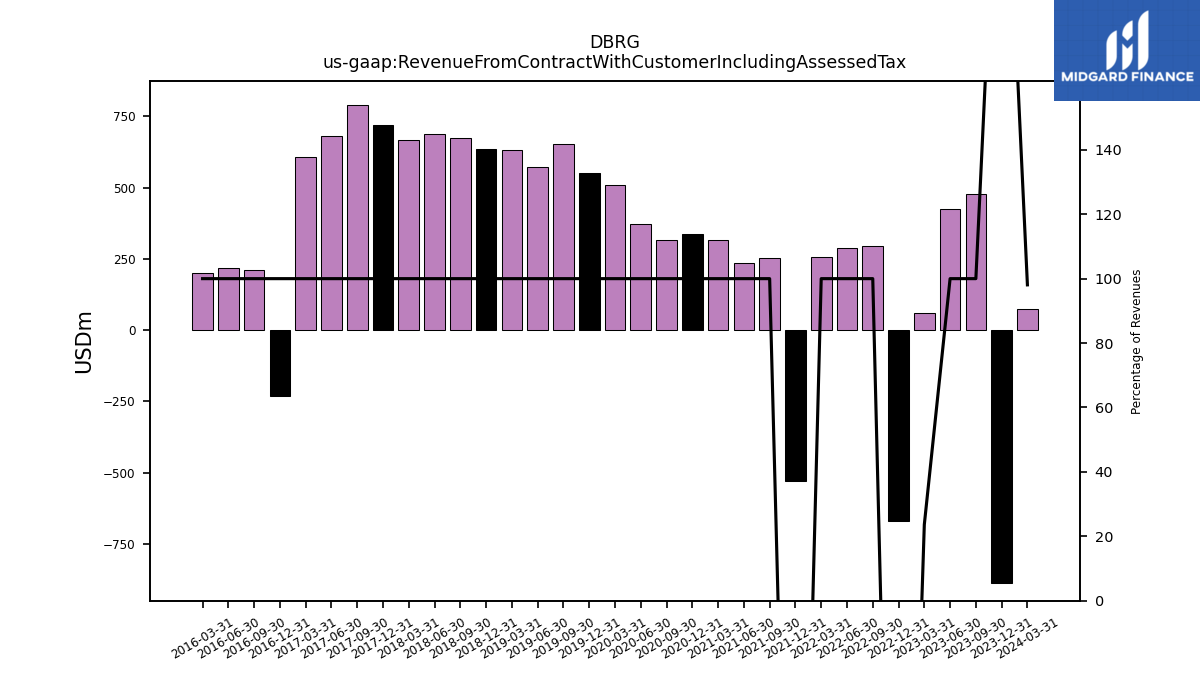
| Revenue From Contract With Customer Including Assessed Tax | -888.06 | 477.08 | 424.93 | 250.16 | -670.82 | 296.62 | 289.41 | 257.46 | -529.12 | 252.17 | 237.19 | 315.70 | 338.84 | 316.68 | 372.37 | 507.51 | 552.36 | 652.50 | 573.44 | 632.90 | 634.24 | 674.77 | 689.60 | 666.66 | 720.34 | 789.85 | 679.37 | 607.16 | -231.84 | 212.07 | 217.53 | 200.79 | |
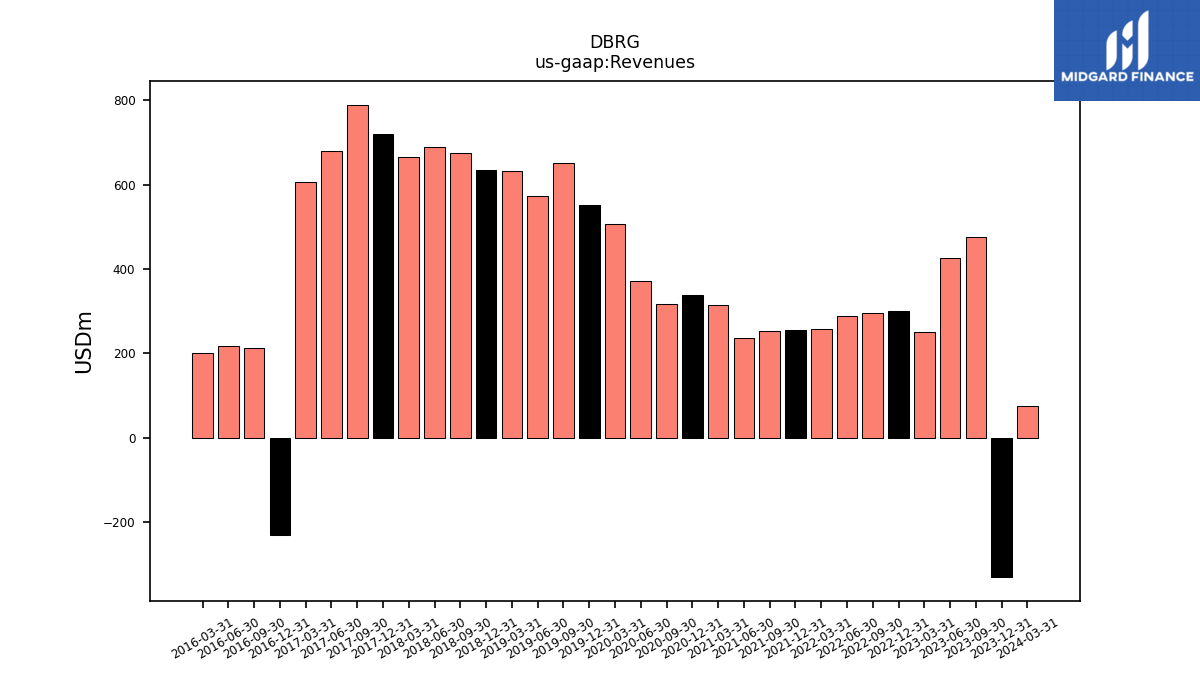
| Revenues | -330.79 | 477.08 | 424.93 | 250.16 | 301.08 | 296.62 | 289.41 | 257.46 | 255.86 | 252.17 | 237.19 | 315.70 | 338.84 | 316.68 | 372.37 | 507.51 | 552.36 | 652.50 | 573.44 | 632.90 | 634.24 | 674.77 | 689.60 | 666.66 | 720.34 | 789.85 | 679.37 | 607.16 | -231.84 | 212.07 | 217.53 | 200.79 | |
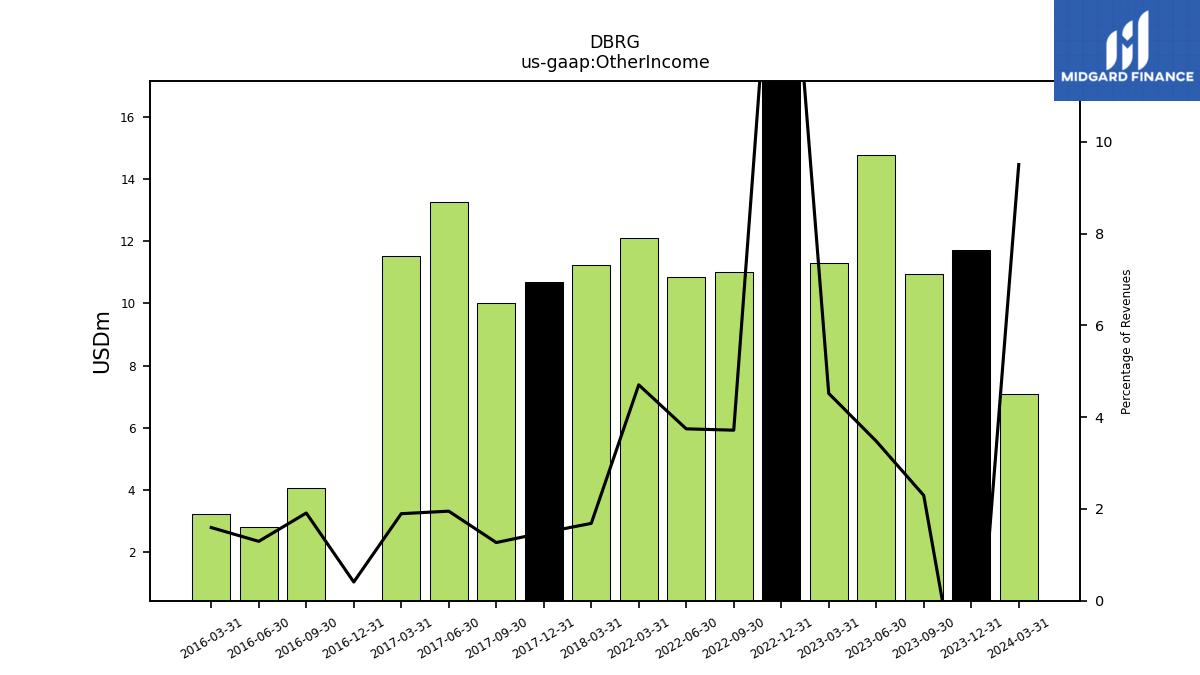
| Other Income | 11.72 | 10.95 | 14.78 | 11.30 | 53.05 | 11.02 | 10.84 | 12.11 | NA | NA | NA | NA | NA | NA | NA | NA | NA | NA | NA | NA | NA | NA | NA | 11.24 | 10.69 | 10.02 | 13.26 | 11.52 | -0.95 | 4.05 | 2.81 | 3.20 | |
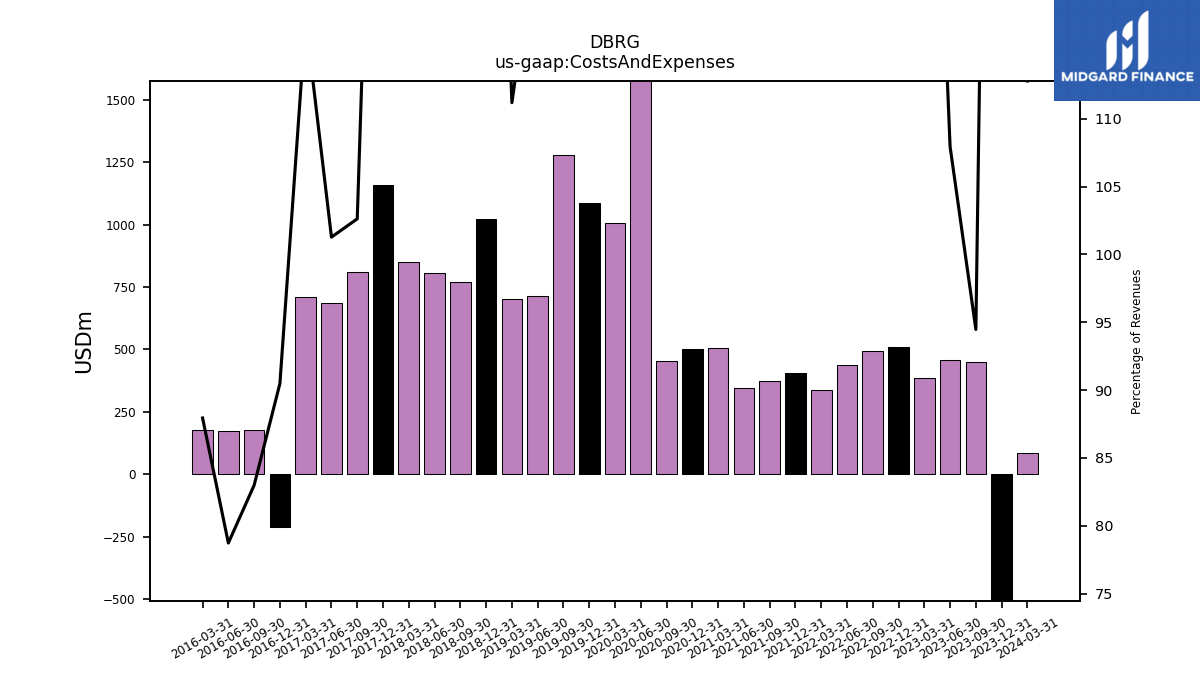
| Costs And Expenses | -741.96 | 450.67 | 458.67 | 384.50 | 508.72 | 494.29 | 437.19 | 339.40 | 405.78 | 374.11 | 344.21 | 504.08 | 500.09 | 454.18 | 2532.12 | 1005.47 | 1088.52 | 1278.68 | 714.12 | 703.66 | 1023.51 | 769.08 | 805.19 | 851.85 | 1159.32 | 810.52 | 688.00 | 712.17 | -209.76 | 175.98 | 171.24 | 176.57 | |
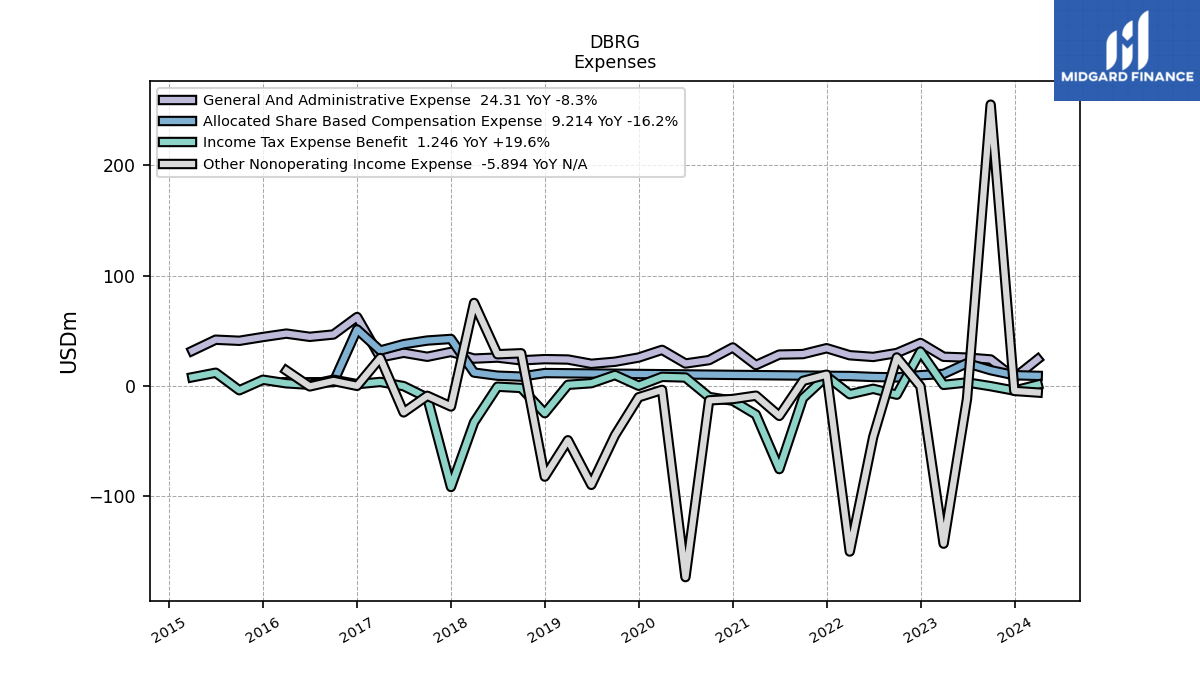
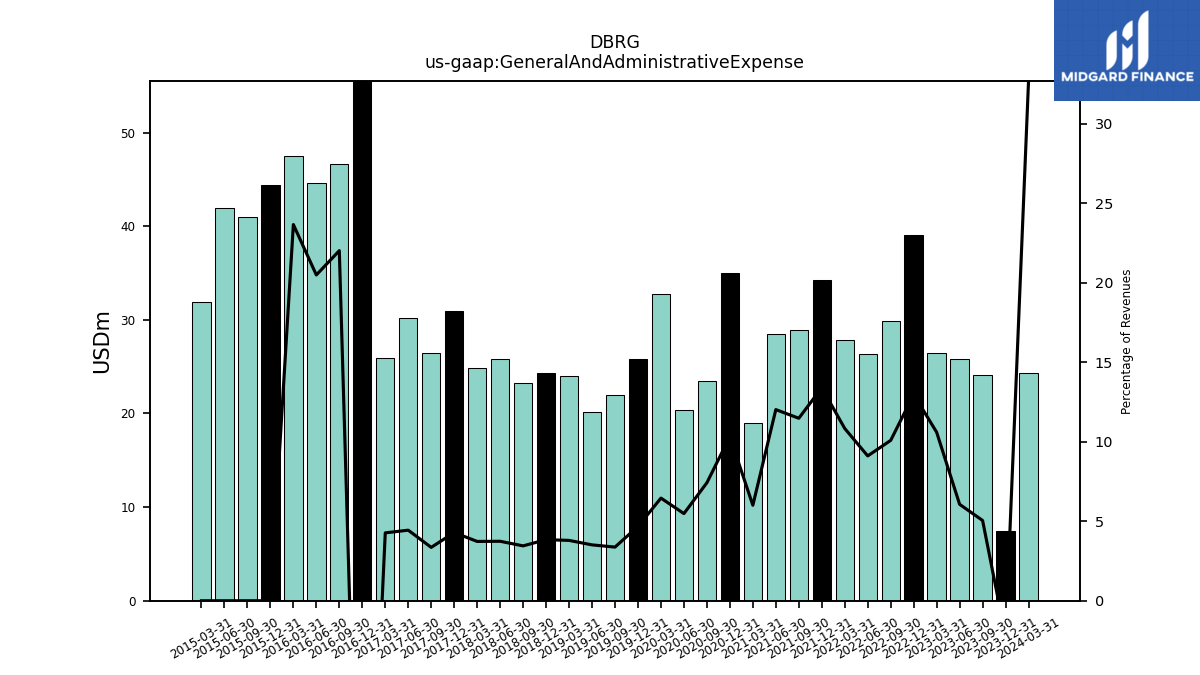
| General And Administrative Expense | 7.44 | 24.08 | 25.76 | 26.51 | 39.04 | 29.91 | 26.35 | 27.89 | 34.26 | 28.93 | 28.50 | 18.96 | 34.96 | 23.50 | 20.41 | 32.76 | 25.81 | 22.01 | 20.15 | 24.01 | 24.36 | 23.28 | 25.79 | 24.86 | 30.89 | 26.50 | 30.14 | 25.91 | 62.50 | 46.68 | 44.56 | 47.49 | |
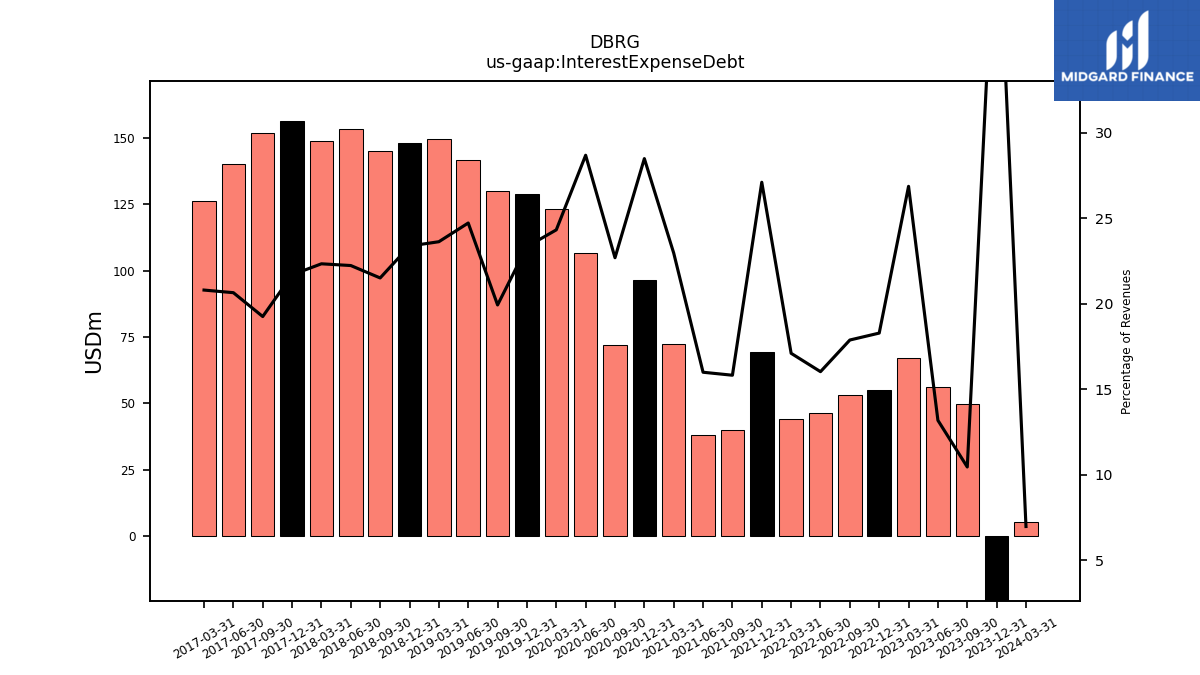
| Interest Expense Debt | -148.57 | 49.89 | 56.02 | 67.20 | 55.05 | 53.03 | 46.39 | 44.03 | 69.34 | 39.90 | 37.94 | 72.48 | 96.51 | 71.85 | 106.79 | 123.41 | 128.88 | 130.03 | 141.74 | 149.52 | 148.24 | 145.12 | 153.31 | 148.89 | 156.23 | 152.05 | 140.26 | 126.28 | NA | NA | NA | NA | |
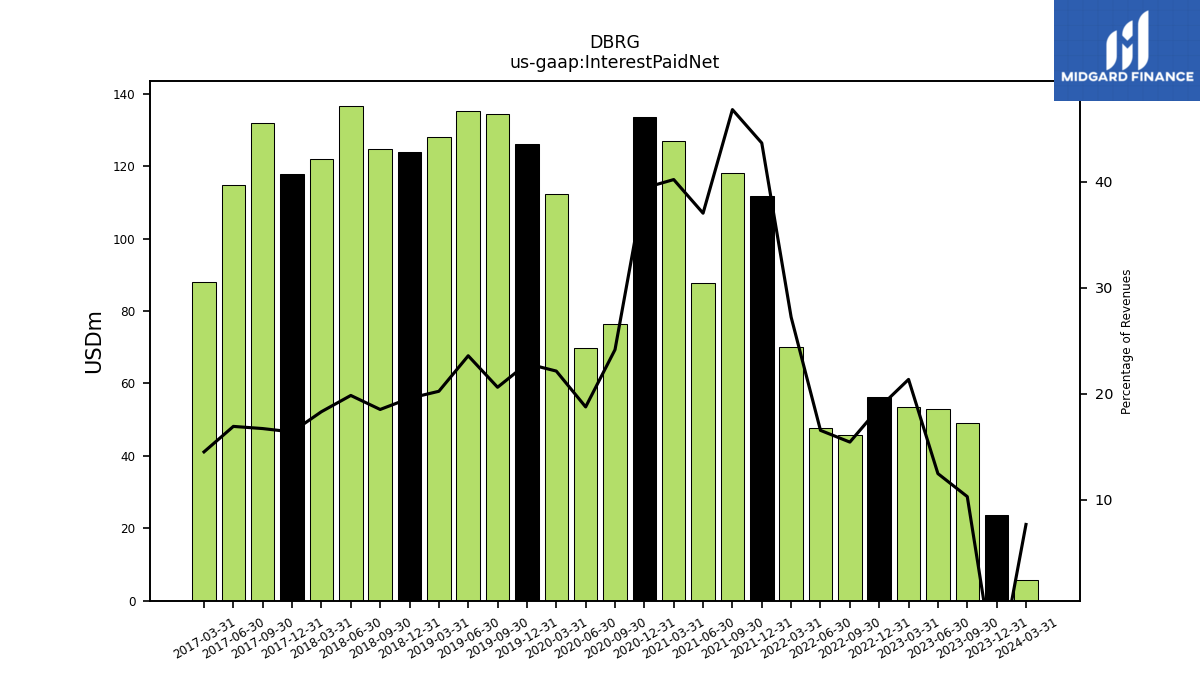
| Interest Paid Net | 23.77 | 49.03 | 52.89 | 53.38 | 56.20 | 45.74 | 47.84 | 70.06 | 111.66 | 118.00 | 87.81 | 126.89 | 133.50 | 76.45 | 69.78 | 112.28 | 126.06 | 134.38 | 135.15 | 127.95 | 124.03 | 124.84 | 136.69 | 121.93 | 117.98 | 131.89 | 114.83 | 88.03 | NA | NA | NA | NA | |
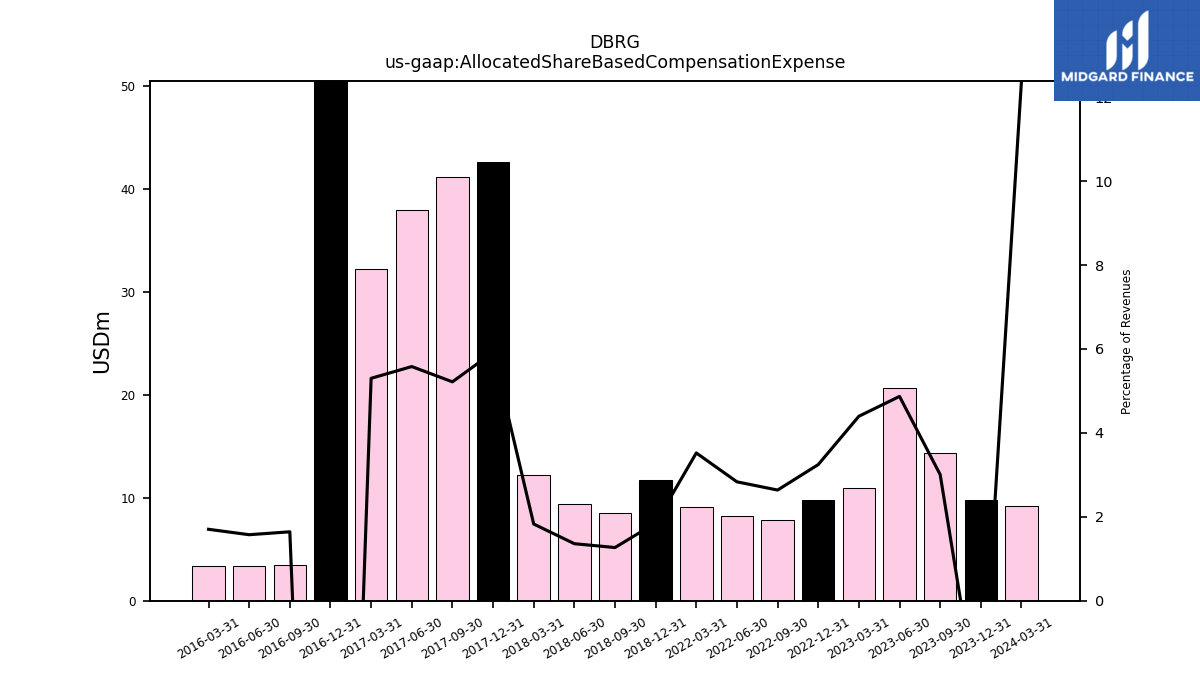
| Allocated Share Based Compensation Expense | 9.80 | 14.34 | 20.69 | 11.00 | 9.77 | 7.82 | 8.20 | 9.07 | NA | NA | NA | NA | NA | NA | NA | NA | NA | NA | NA | NA | 11.75 | 8.56 | 9.38 | 12.19 | 42.65 | 41.21 | 37.91 | 32.18 | 51.25 | 3.48 | 3.42 | 3.42 | |
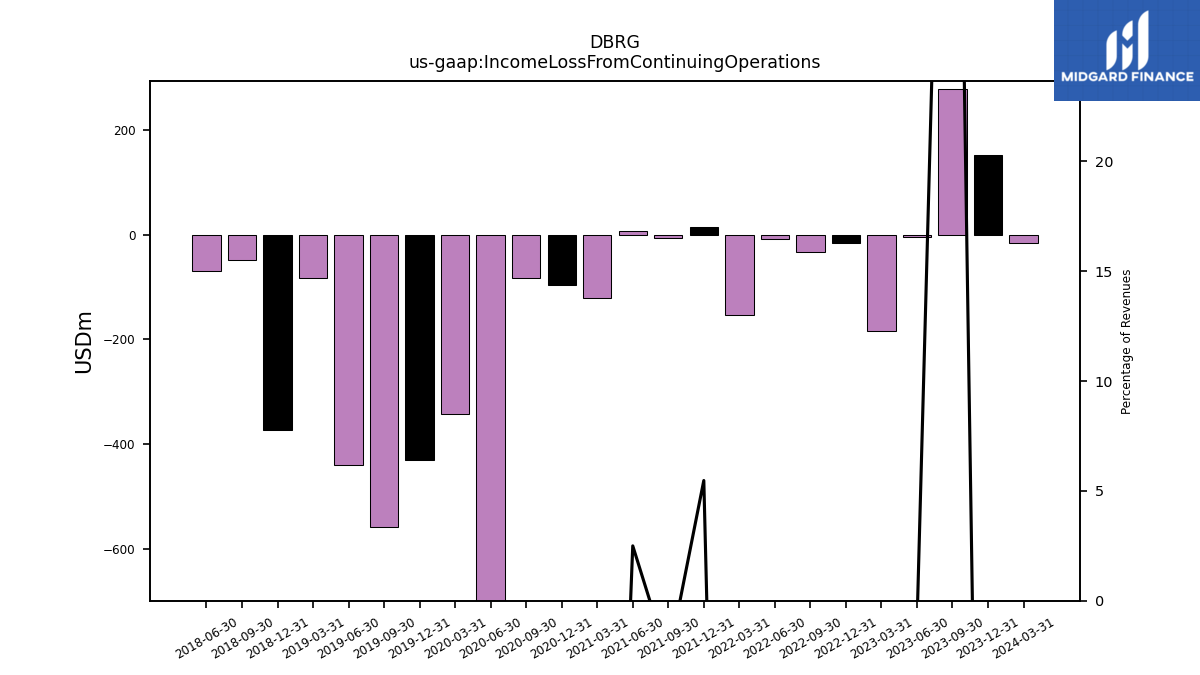
| Income Loss From Continuing Operations | 151.57 | 278.84 | -5.00 | -184.14 | -16.61 | -34.08 | -7.55 | -153.47 | 14.00 | -6.78 | 5.93 | -121.08 | -95.87 | -82.63 | -2022.74 | -342.43 | -430.23 | -557.57 | -440.64 | -83.42 | -373.99 | -48.43 | -69.24 | NA | NA | NA | NA | NA | NA | NA | NA | NA | |
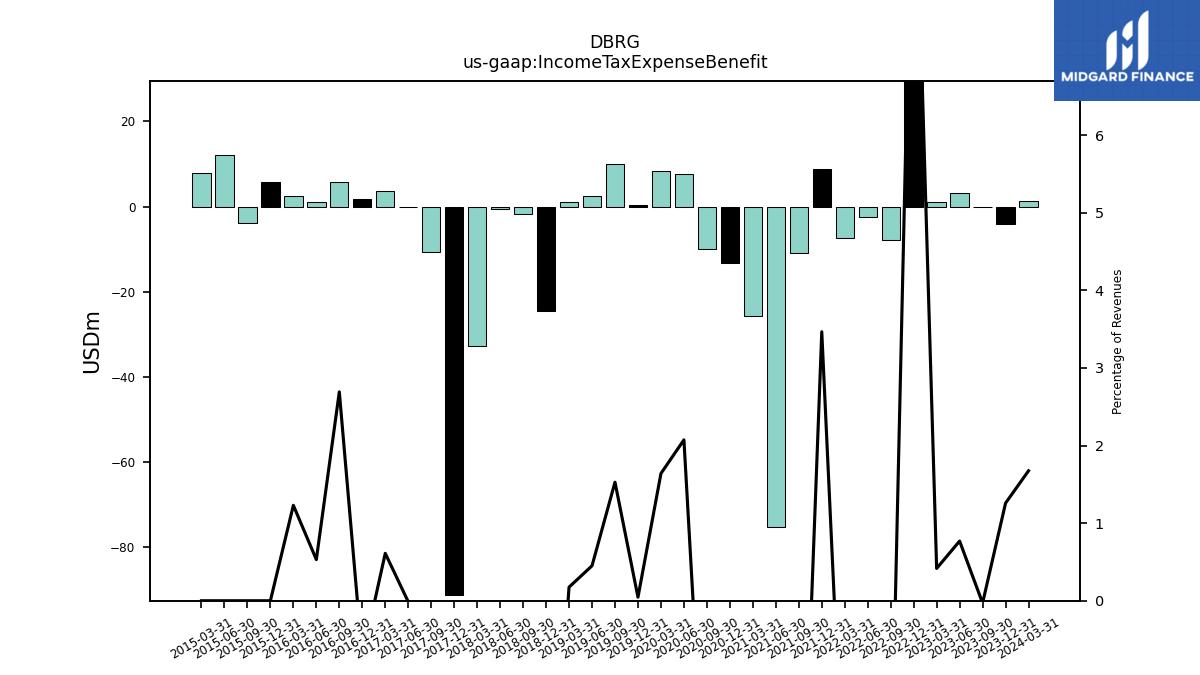
| Income Tax Expense Benefit | -4.16 | -0.14 | 3.27 | 1.04 | 31.24 | -7.84 | -2.52 | -7.41 | 8.87 | -10.97 | -75.24 | -25.82 | -13.29 | -9.92 | 7.72 | 8.32 | 0.25 | 9.97 | 2.58 | 1.11 | -24.62 | -1.77 | -0.58 | -32.81 | -91.41 | -10.61 | -0.09 | 3.71 | 1.69 | 5.71 | 1.15 | 2.47 | |
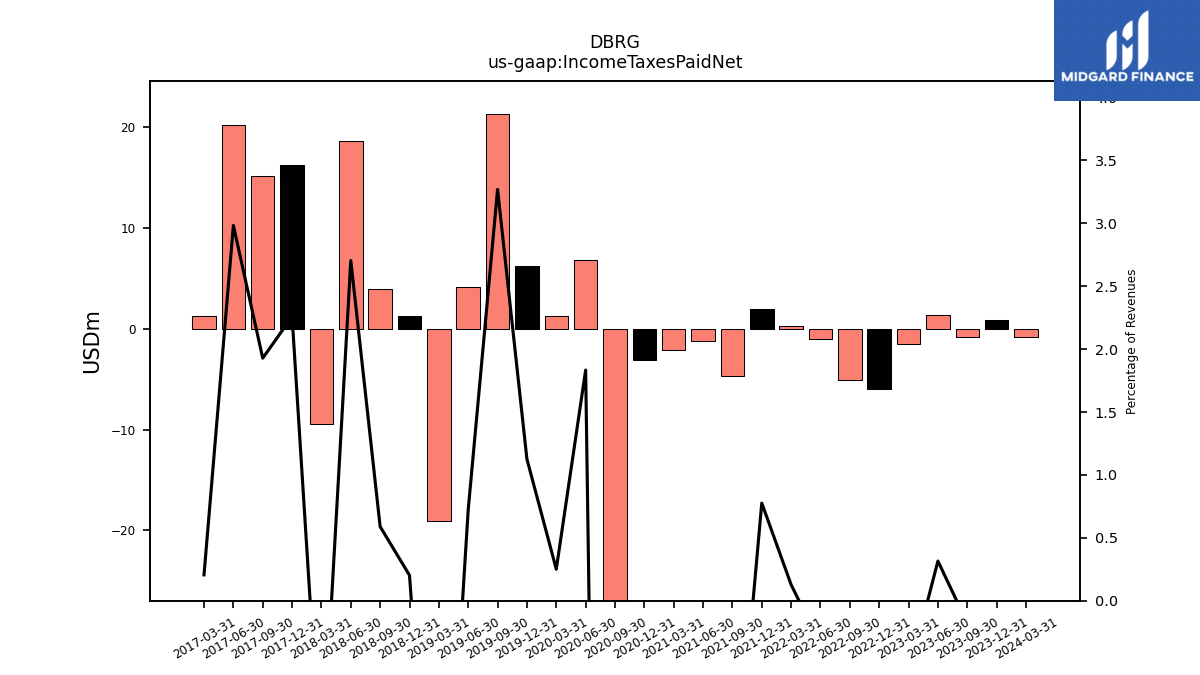
| Income Taxes Paid Net | 0.91 | -0.85 | 1.34 | -1.46 | -5.96 | -5.11 | -1.00 | 0.33 | 1.99 | -4.63 | -1.16 | -2.12 | -3.05 | -44.20 | 6.83 | 1.27 | 6.22 | 21.34 | 4.15 | -19.11 | 1.28 | 3.98 | 18.65 | -9.43 | 16.27 | 15.23 | 20.27 | 1.25 | NA | NA | NA | NA | |
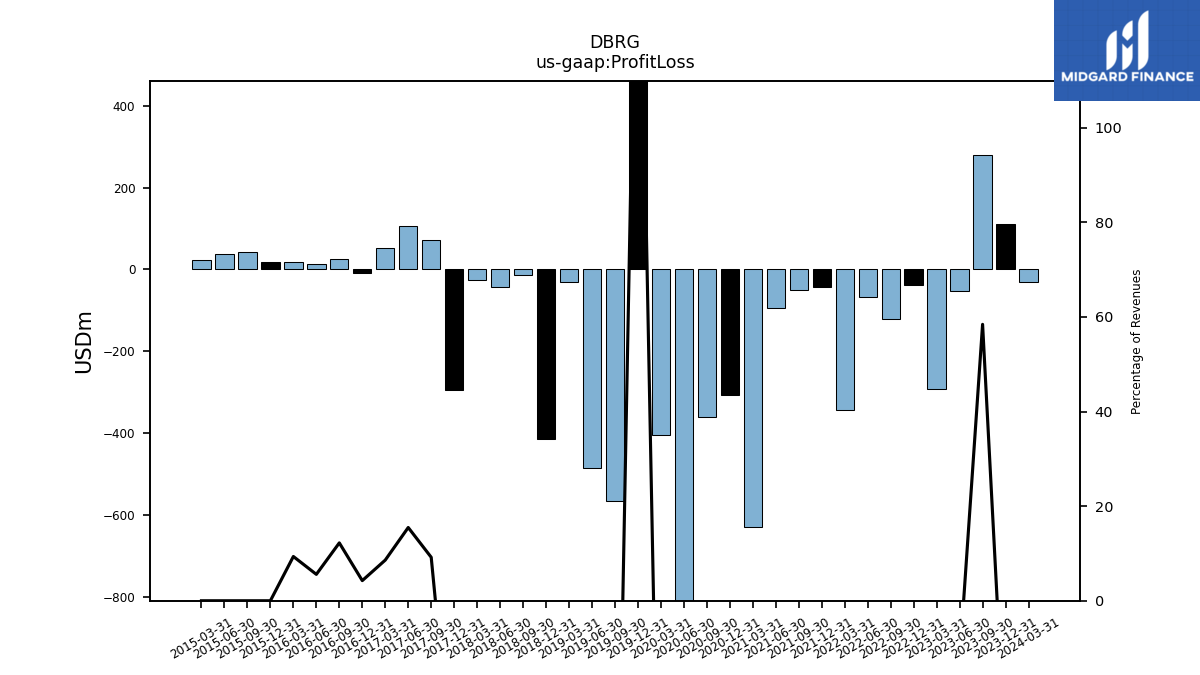
| Profit Loss | 111.25 | 278.78 | -52.52 | -292.34 | -37.24 | -120.99 | -68.08 | -343.68 | -42.87 | -51.36 | -95.08 | -627.60 | -306.13 | -361.23 | -2718.99 | -404.06 | 931.73 | -565.84 | -484.65 | -30.16 | -413.08 | -13.95 | -41.85 | -26.30 | -294.58 | 72.59 | 105.19 | 52.19 | -9.87 | 25.94 | 12.14 | 18.78 | |
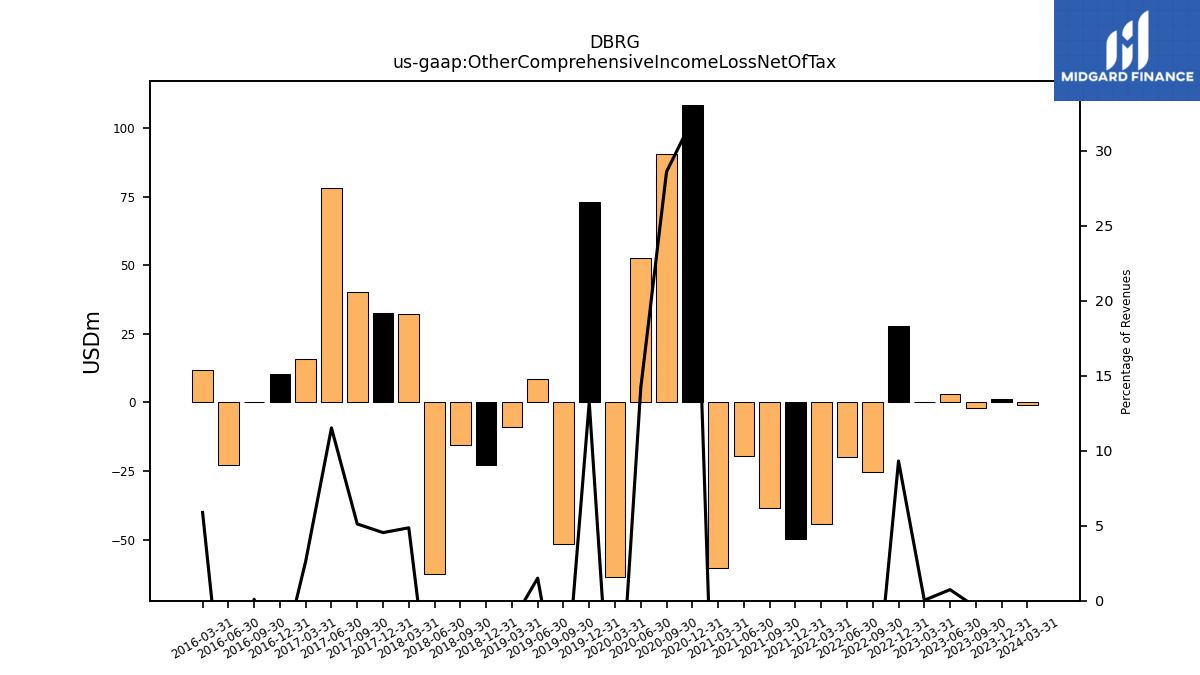
| Other Comprehensive Income Loss Net Of Tax | 1.41 | -2.05 | 3.14 | 0.09 | 28.04 | -25.52 | -20.04 | -44.31 | -49.70 | -38.52 | -19.50 | -60.23 | 108.64 | 90.54 | 52.84 | -63.71 | 73.07 | -51.68 | 8.64 | -9.07 | -22.77 | -15.48 | -62.48 | 32.40 | 32.72 | 40.41 | 78.26 | 15.98 | 10.41 | 0.20 | -22.72 | 11.82 | |
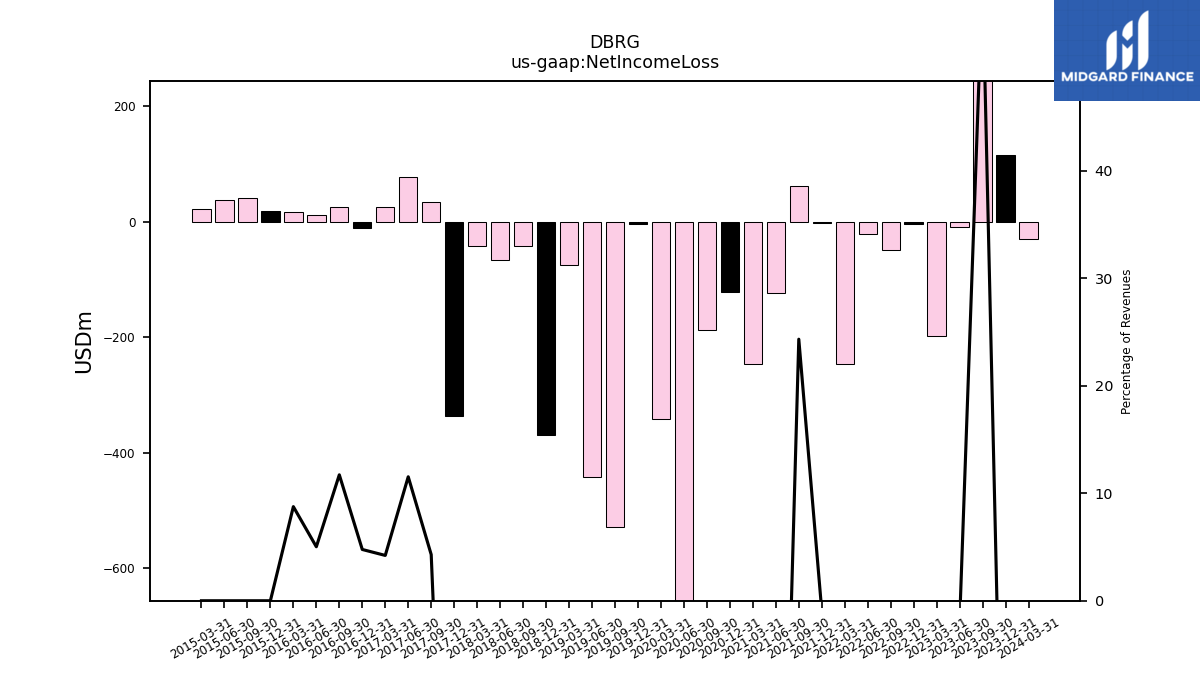
| Net Income Loss | 115.27 | 276.47 | -8.66 | -197.80 | -4.59 | -49.09 | -21.56 | -246.56 | -2.42 | 61.36 | -122.74 | -246.29 | -122.06 | -187.27 | -2024.27 | -342.16 | -4.26 | -527.82 | -441.75 | -74.98 | -370.08 | -42.79 | -65.41 | -41.33 | -335.74 | 33.91 | 78.34 | 25.60 | -11.06 | 24.84 | 10.92 | 17.57 | |
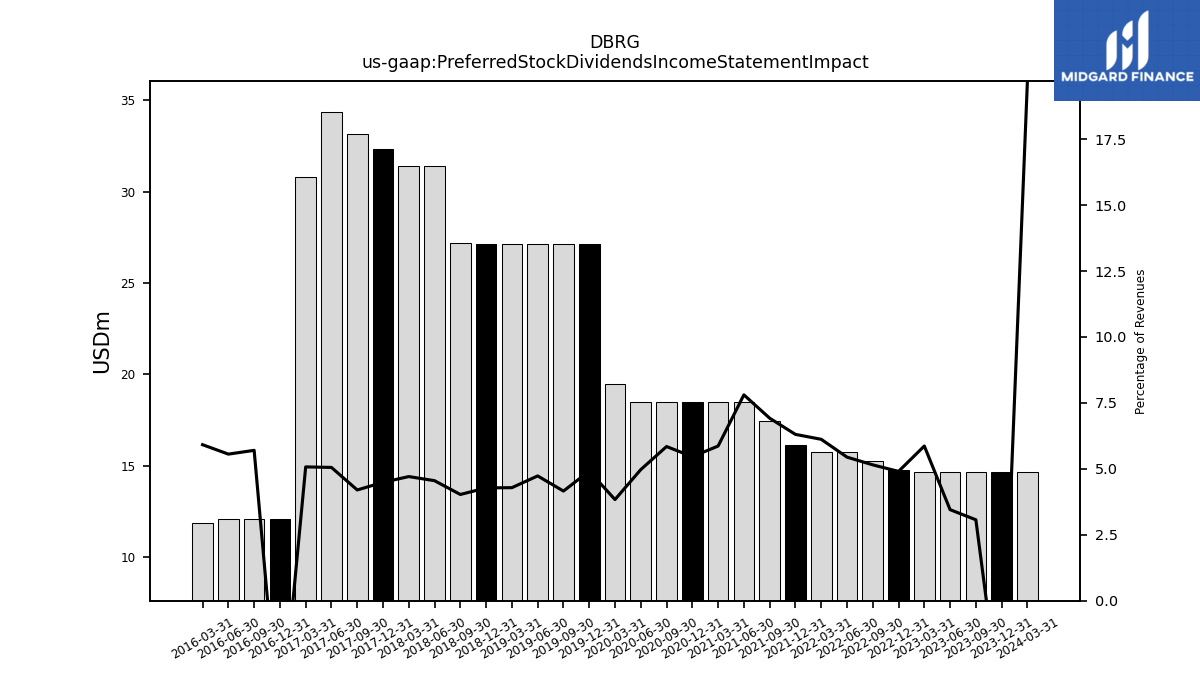
| Preferred Stock Dividends Income Statement Impact | 14.66 | 14.64 | 14.68 | 14.68 | 14.77 | 15.28 | 15.76 | 15.76 | 16.14 | 17.46 | 18.52 | 18.52 | 18.52 | 18.52 | 18.52 | 19.47 | 27.14 | 27.14 | 27.14 | 27.14 | 27.14 | 27.18 | 31.39 | 31.39 | 32.34 | 33.18 | 34.34 | 30.81 | 12.09 | 12.09 | 12.09 | 11.88 | |
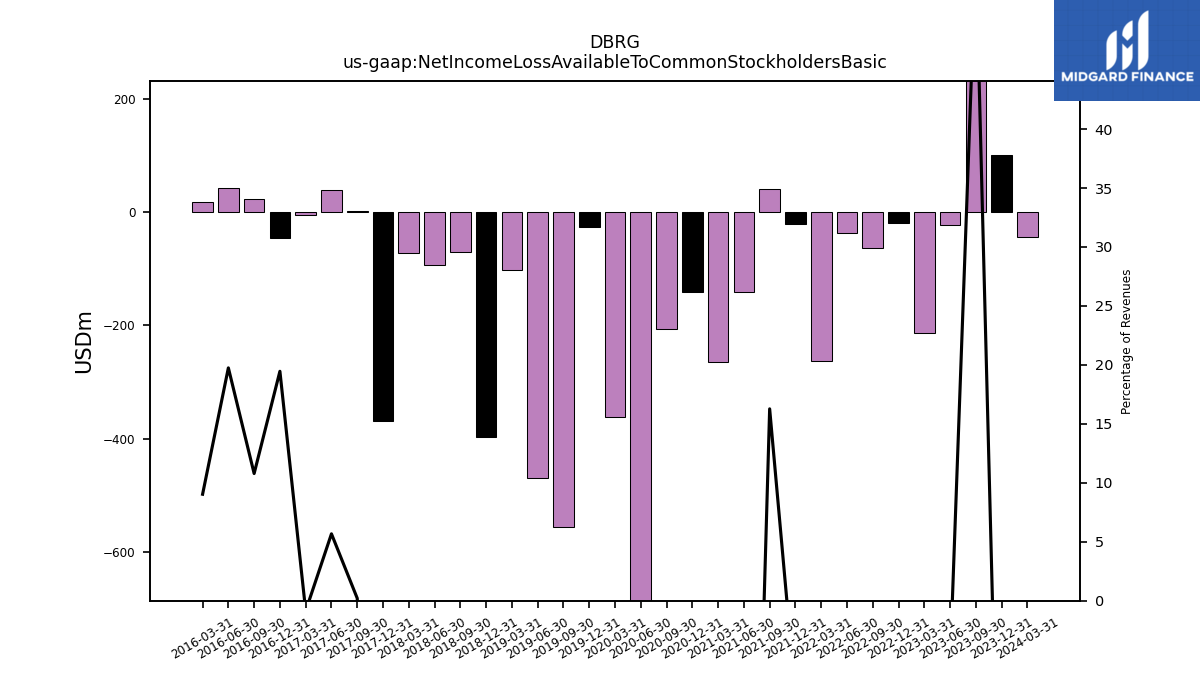
| Net Income Loss Available To Common Stockholders Basic | 100.61 | 261.83 | -22.41 | -212.47 | -19.36 | -63.27 | -37.32 | -262.32 | -20.69 | 41.04 | -141.26 | -264.81 | -140.57 | -205.78 | -2042.79 | -361.63 | -26.25 | -554.95 | -468.89 | -102.11 | -397.21 | -69.97 | -92.81 | -72.71 | -368.08 | 1.65 | 38.55 | -5.22 | -45.11 | 22.88 | 42.96 | 18.14 | |
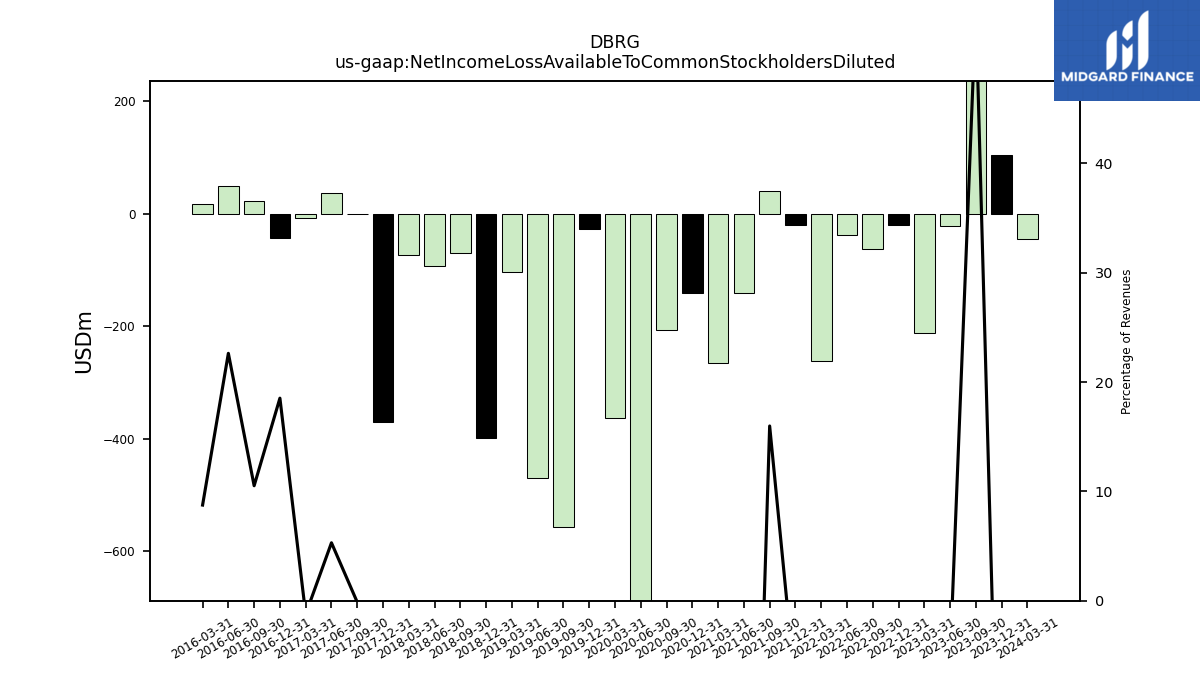
| Net Income Loss Available To Common Stockholders Diluted | 103.94 | 258.29 | -22.44 | -212.50 | -19.37 | -63.29 | -37.32 | -262.32 | -20.69 | 40.30 | -141.26 | -264.81 | -140.57 | -205.78 | -2042.79 | -362.88 | -27.12 | -555.90 | -469.84 | -102.83 | -397.81 | -70.61 | -93.45 | -73.34 | -369.79 | -1.03 | 36.01 | -7.45 | -42.95 | 22.30 | 49.21 | 17.57 |
| 2023-12-31 | 2023-09-30 | 2023-06-30 | 2023-03-31 | 2022-12-31 | 2022-09-30 | 2022-06-30 | 2022-03-31 | 2021-12-31 | 2021-09-30 | 2021-06-30 | 2021-03-31 | 2020-12-31 | 2020-09-30 | 2020-06-30 | 2020-03-31 | 2019-12-31 | 2019-09-30 | 2019-06-30 | 2019-03-31 | 2018-12-31 | 2018-09-30 | 2018-06-30 | 2018-03-31 | 2017-12-31 | 2017-09-30 | 2017-06-30 | 2017-03-31 | 2016-12-31 | 2016-09-30 | 2016-06-30 | 2016-03-31 | ||
|---|---|---|---|---|---|---|---|---|---|---|---|---|---|---|---|---|---|---|---|---|---|---|---|---|---|---|---|---|---|---|---|---|---|
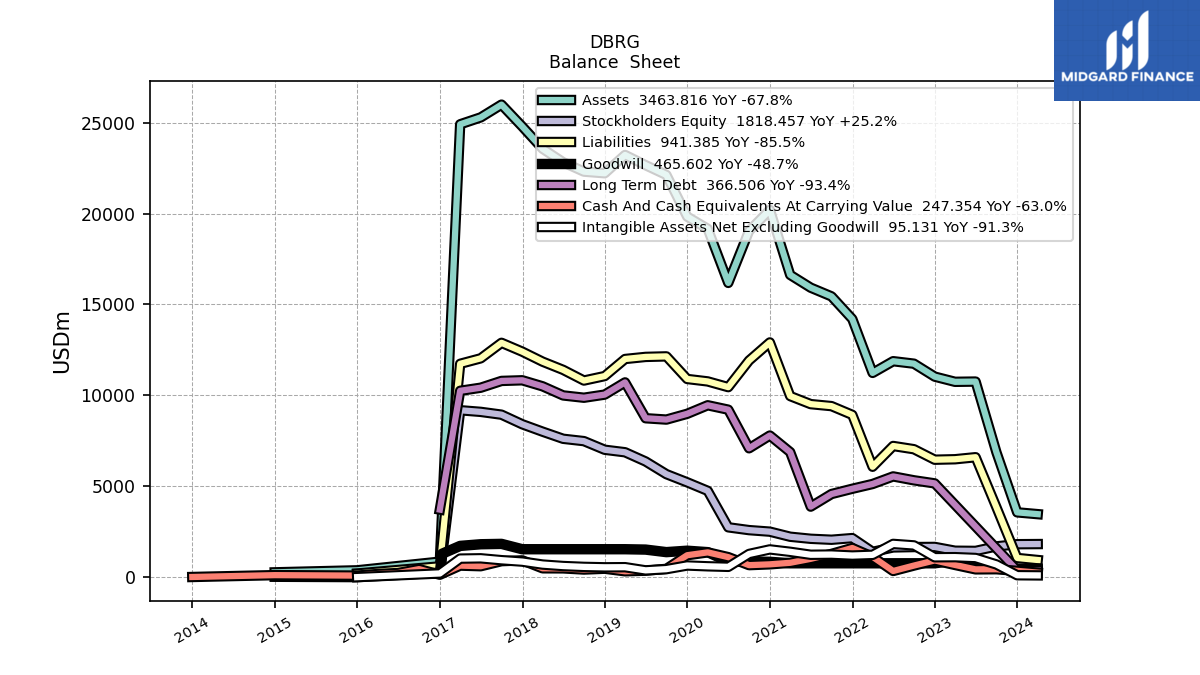
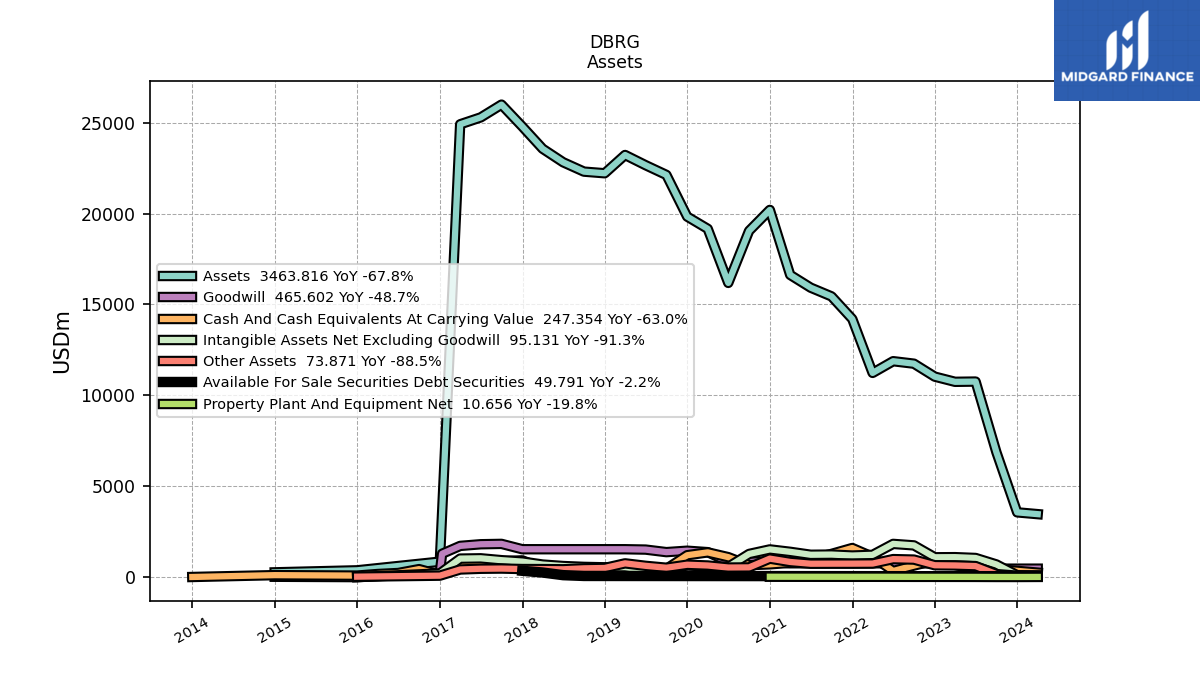
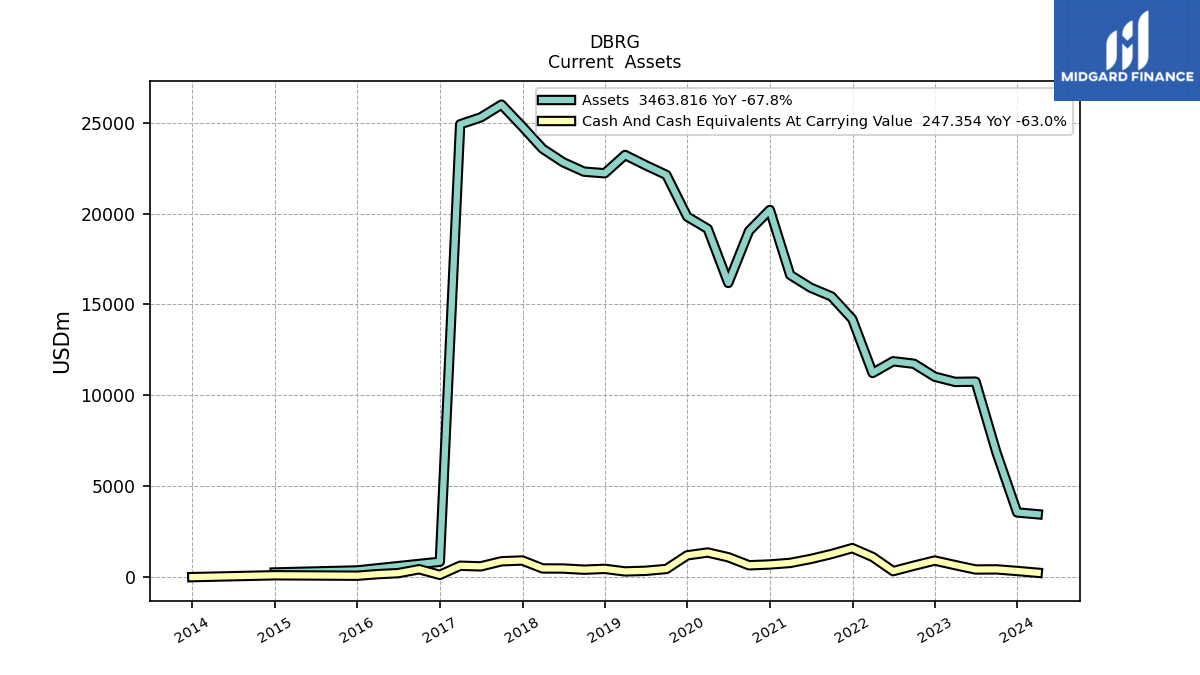
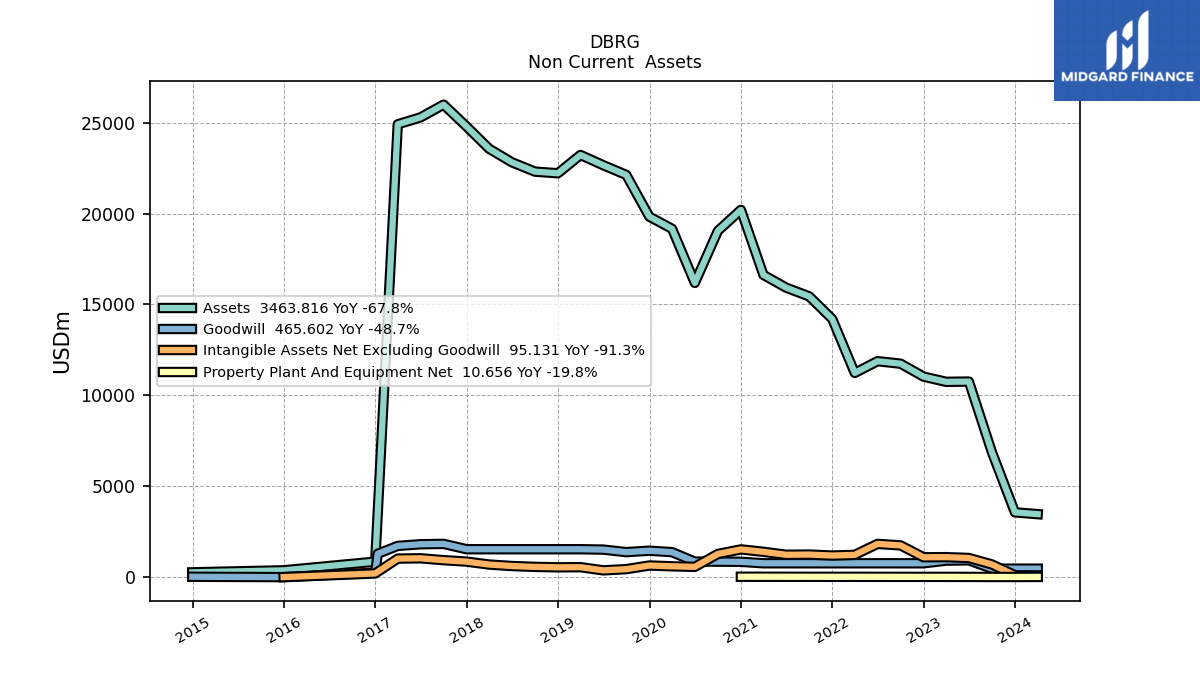
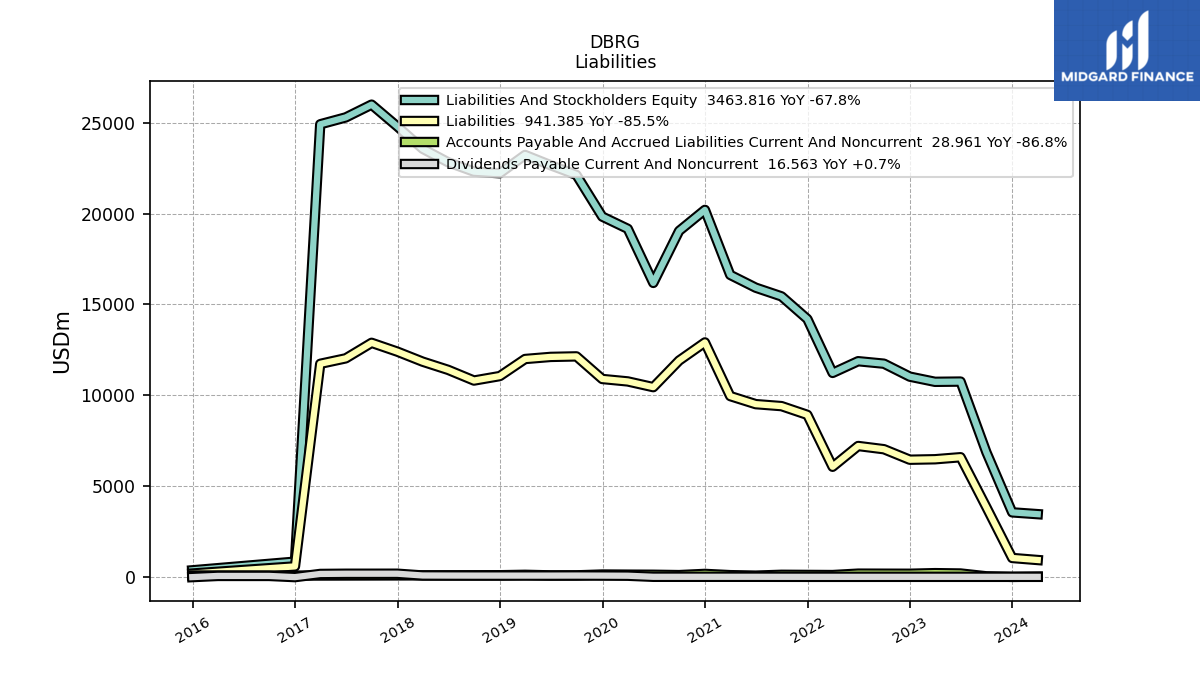
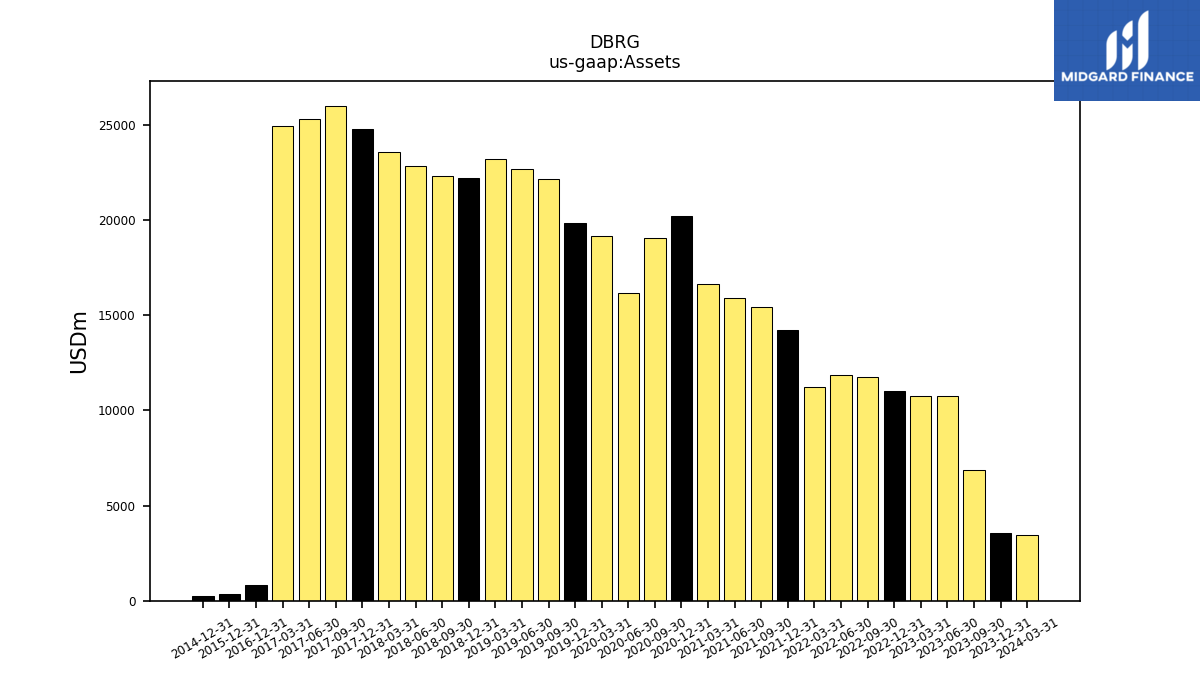
| Assets | 3562.55 | 6872.09 | 10757.07 | 10743.43 | 11028.50 | 11740.83 | 11877.29 | 11232.16 | 14197.82 | 15442.98 | 15921.35 | 16625.25 | 20200.56 | 19043.05 | 16183.53 | 19160.06 | 19832.18 | 22123.99 | 22658.54 | 23221.03 | 22215.25 | 22305.28 | 22819.72 | 23564.49 | 24785.65 | 25990.76 | 25288.33 | 24909.73 | 850.63 | NA | NA | NA | |
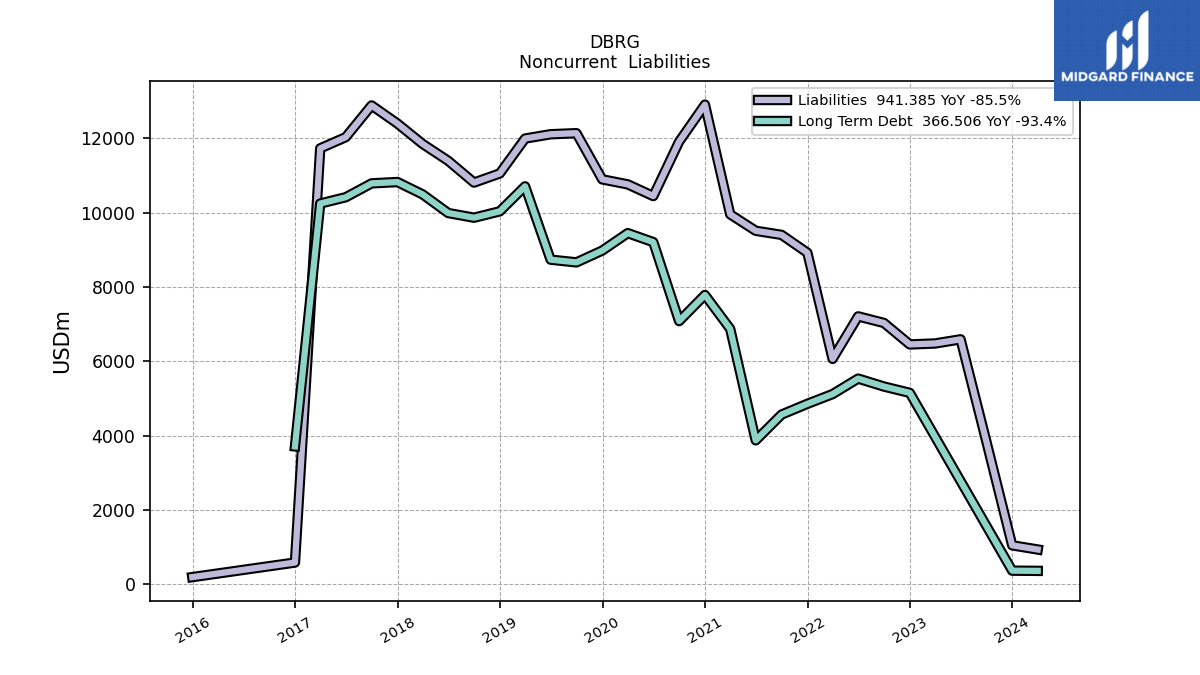
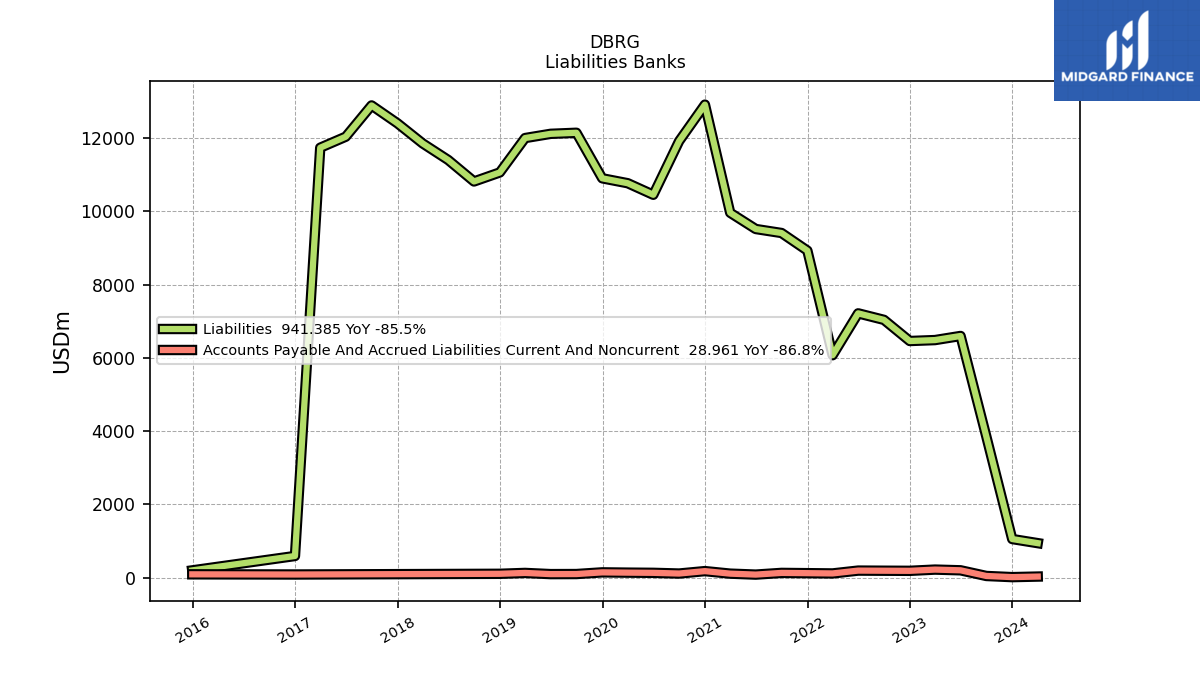
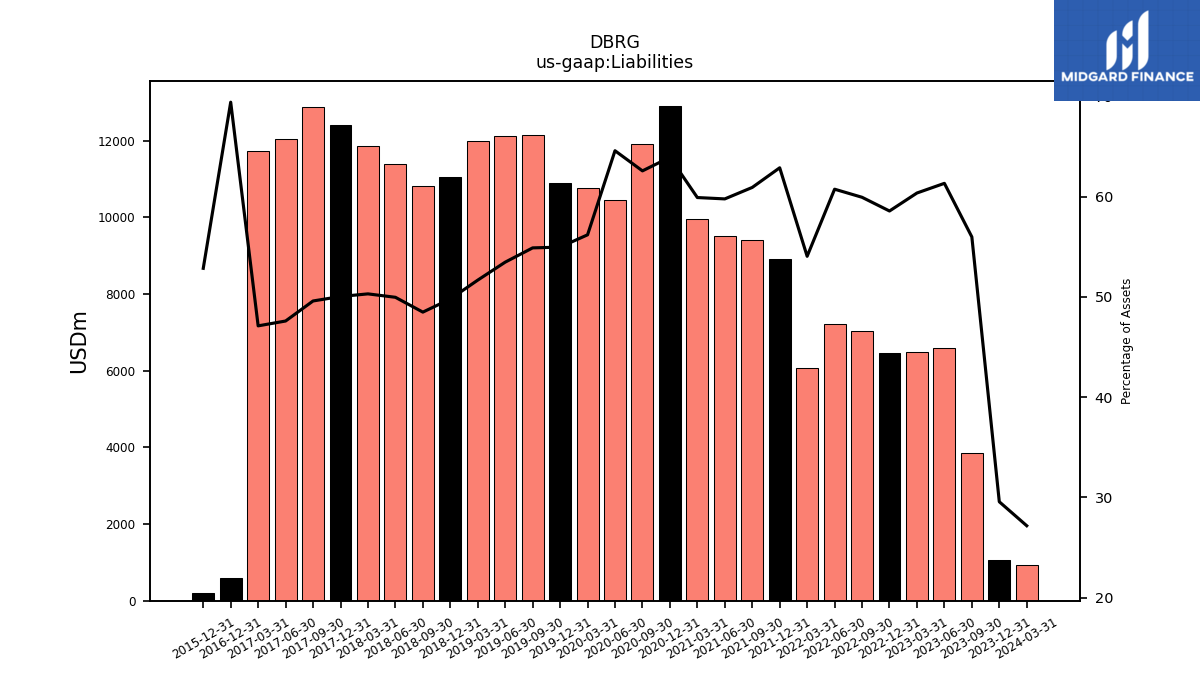
| Liabilities | 1053.39 | 3846.75 | 6596.13 | 6484.20 | 6458.44 | 7036.11 | 7213.76 | 6070.48 | 8926.20 | 9406.54 | 9515.81 | 9958.99 | 12910.69 | 11913.75 | 10449.90 | 10765.18 | 10899.66 | 12142.56 | 12113.50 | 11998.13 | 11059.49 | 10813.38 | 11399.99 | 11852.41 | 12402.11 | 12888.73 | 12035.18 | 11734.72 | 590.44 | NA | NA | NA | |
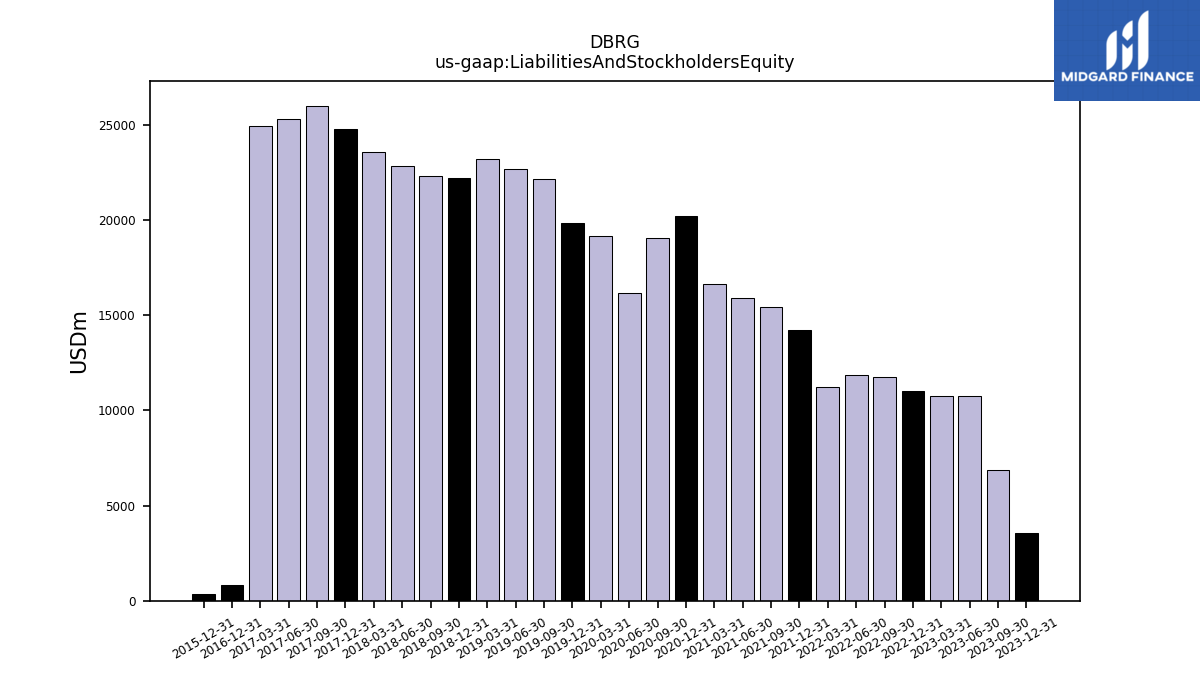
| Liabilities And Stockholders Equity | 3562.55 | 6872.09 | 10757.07 | 10743.43 | 11028.50 | 11740.83 | 11877.29 | 11232.16 | 14197.82 | 15442.98 | 15921.35 | 16625.25 | 20200.56 | 19043.05 | 16183.53 | 19160.06 | 19832.18 | 22123.99 | 22658.54 | 23221.03 | 22215.25 | 22305.28 | 22819.72 | 23564.49 | 24785.65 | 25990.76 | 25288.33 | 24909.73 | 850.63 | NA | NA | NA | |
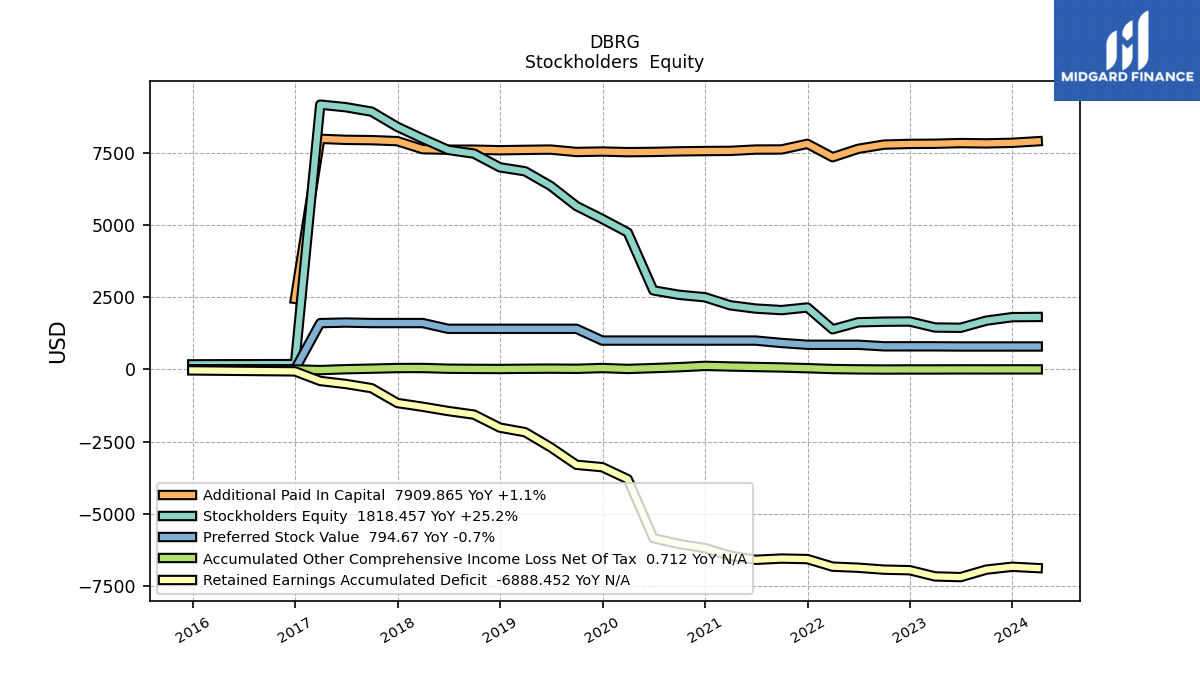
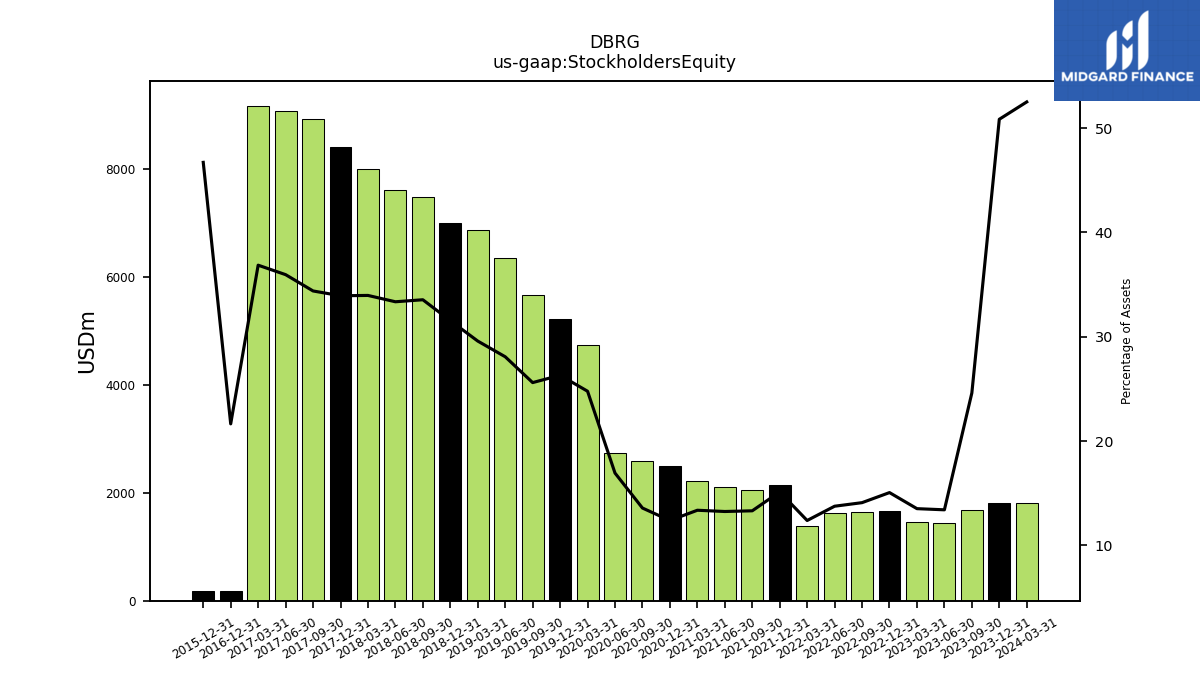
| Stockholders Equity | 1811.06 | 1690.77 | 1442.21 | 1452.32 | 1660.70 | 1654.66 | 1633.29 | 1390.83 | 2146.93 | 2055.86 | 2108.95 | 2222.03 | 2501.47 | 2585.59 | 2739.78 | 4746.43 | 5216.04 | 5663.73 | 6361.72 | 6868.70 | 7006.05 | 7480.99 | 7609.53 | 8000.97 | 8407.92 | 8936.17 | 9090.17 | 9179.87 | 184.11 | NA | NA | NA |
| 2023-12-31 | 2023-09-30 | 2023-06-30 | 2023-03-31 | 2022-12-31 | 2022-09-30 | 2022-06-30 | 2022-03-31 | 2021-12-31 | 2021-09-30 | 2021-06-30 | 2021-03-31 | 2020-12-31 | 2020-09-30 | 2020-06-30 | 2020-03-31 | 2019-12-31 | 2019-09-30 | 2019-06-30 | 2019-03-31 | 2018-12-31 | 2018-09-30 | 2018-06-30 | 2018-03-31 | 2017-12-31 | 2017-09-30 | 2017-06-30 | 2017-03-31 | 2016-12-31 | 2016-09-30 | 2016-06-30 | 2016-03-31 | ||
|---|---|---|---|---|---|---|---|---|---|---|---|---|---|---|---|---|---|---|---|---|---|---|---|---|---|---|---|---|---|---|---|---|---|
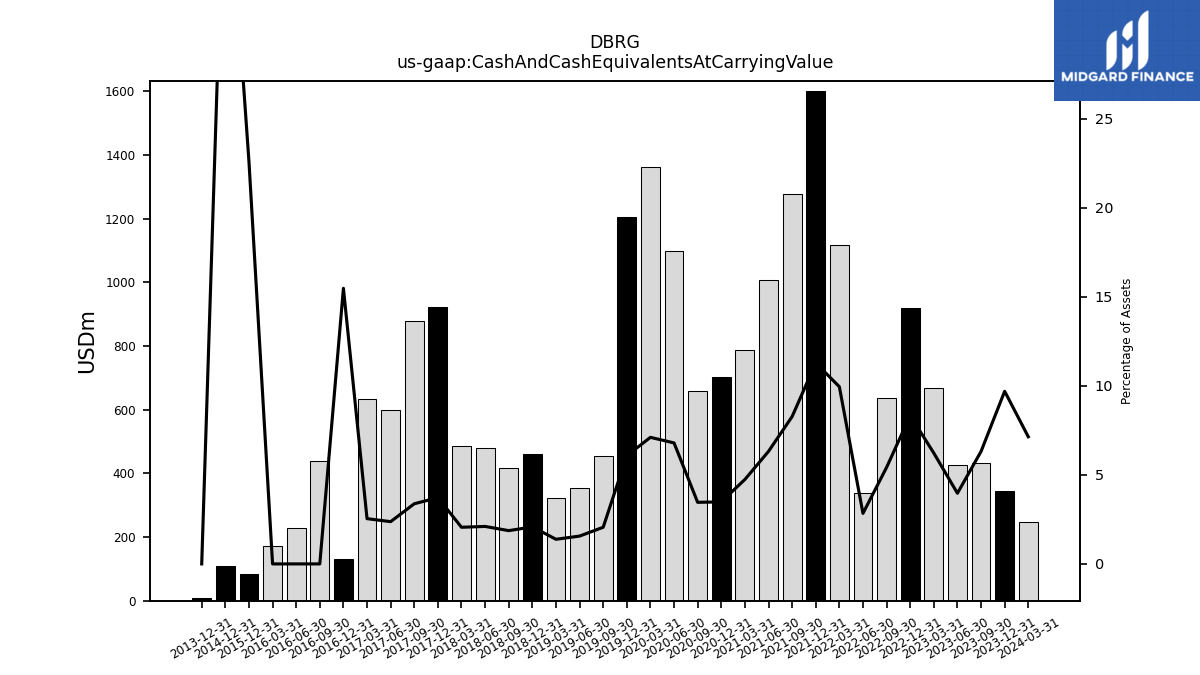
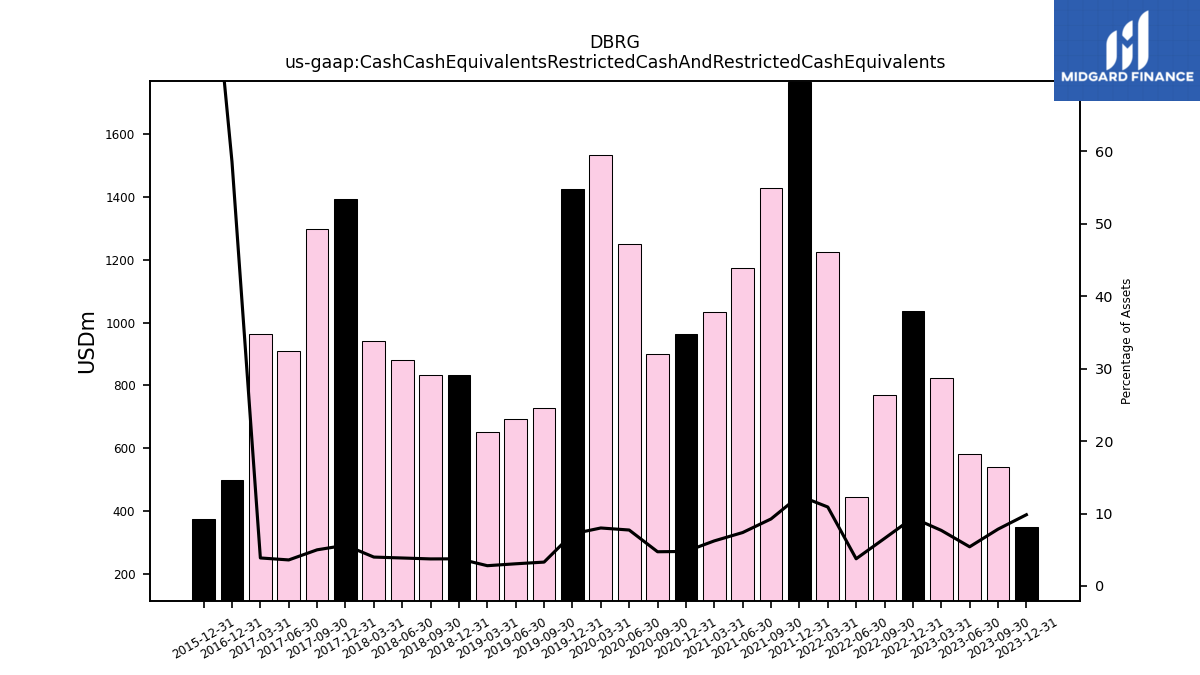
| Cash And Cash Equivalents At Carrying Value | 345.33 | 434.04 | 426.88 | 668.52 | 918.25 | 636.37 | 337.15 | 1117.69 | 1602.10 | 1277.73 | 1006.20 | 788.36 | 703.54 | 658.45 | 1099.47 | 1361.77 | 1205.19 | 455.33 | 353.98 | 321.20 | 461.91 | 416.80 | 480.23 | 484.83 | 921.82 | 877.93 | 599.92 | 633.21 | 131.67 | 440.17 | 227.20 | 171.30 | |
| Cash Cash Equivalents Restricted Cash And Restricted Cash Equivalents | 350.25 | 538.67 | 581.57 | 824.21 | 1036.74 | 770.39 | 445.84 | 1224.02 | 1766.24 | 1428.93 | 1174.12 | 1034.39 | 963.01 | 899.39 | 1249.62 | 1533.18 | 1424.70 | 729.08 | 693.79 | 649.89 | 832.73 | 833.04 | 881.26 | 939.73 | 1393.92 | 1296.63 | 909.04 | 963.31 | 497.89 | NA | NA | NA |
| 2023-12-31 | 2023-09-30 | 2023-06-30 | 2023-03-31 | 2022-12-31 | 2022-09-30 | 2022-06-30 | 2022-03-31 | 2021-12-31 | 2021-09-30 | 2021-06-30 | 2021-03-31 | 2020-12-31 | 2020-09-30 | 2020-06-30 | 2020-03-31 | 2019-12-31 | 2019-09-30 | 2019-06-30 | 2019-03-31 | 2018-12-31 | 2018-09-30 | 2018-06-30 | 2018-03-31 | 2017-12-31 | 2017-09-30 | 2017-06-30 | 2017-03-31 | 2016-12-31 | 2016-09-30 | 2016-06-30 | 2016-03-31 | ||
|---|---|---|---|---|---|---|---|---|---|---|---|---|---|---|---|---|---|---|---|---|---|---|---|---|---|---|---|---|---|---|---|---|---|
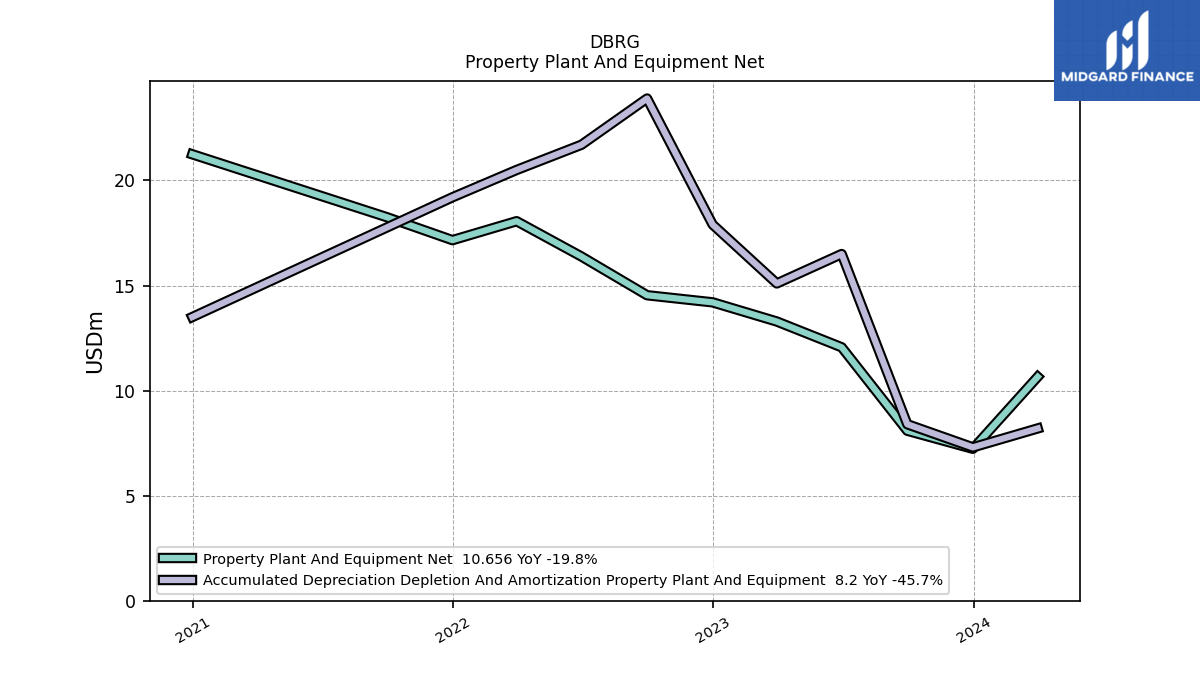
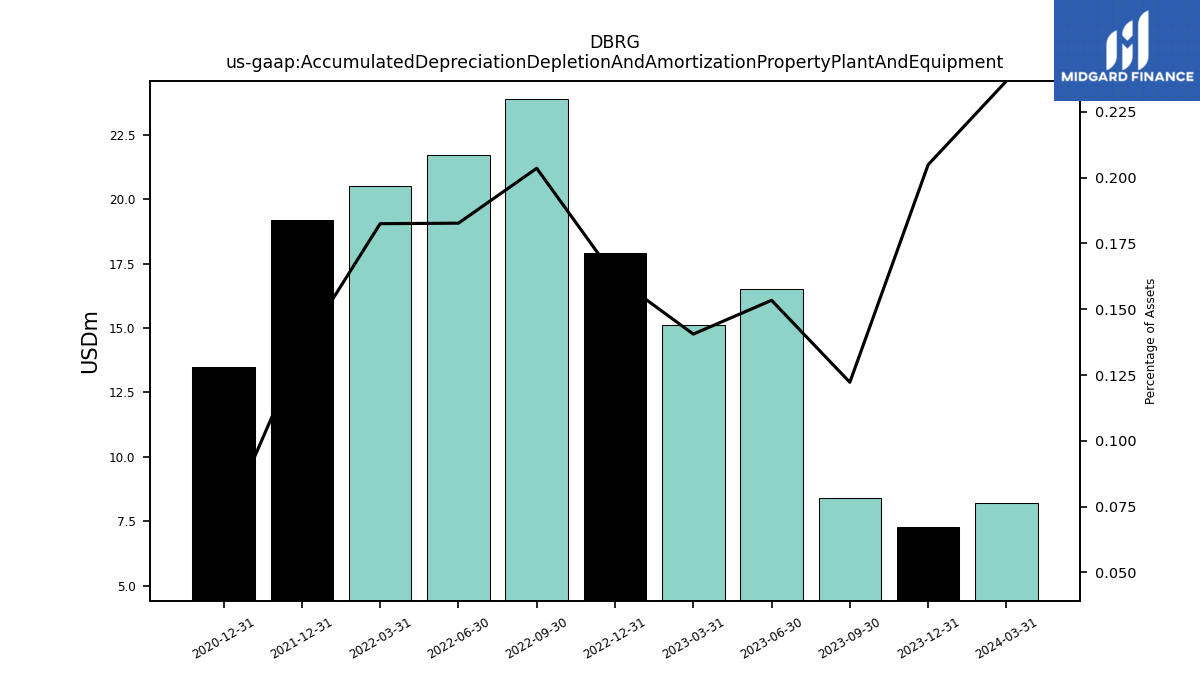
| Accumulated Depreciation Depletion And Amortization Property Plant And Equipment | 7.30 | 8.40 | 16.50 | 15.10 | 17.90 | 23.90 | 21.70 | 20.50 | 19.20 | NA | NA | NA | 13.50 | NA | NA | NA | NA | NA | NA | NA | NA | NA | NA | NA | NA | NA | NA | NA | NA | NA | NA | NA | |
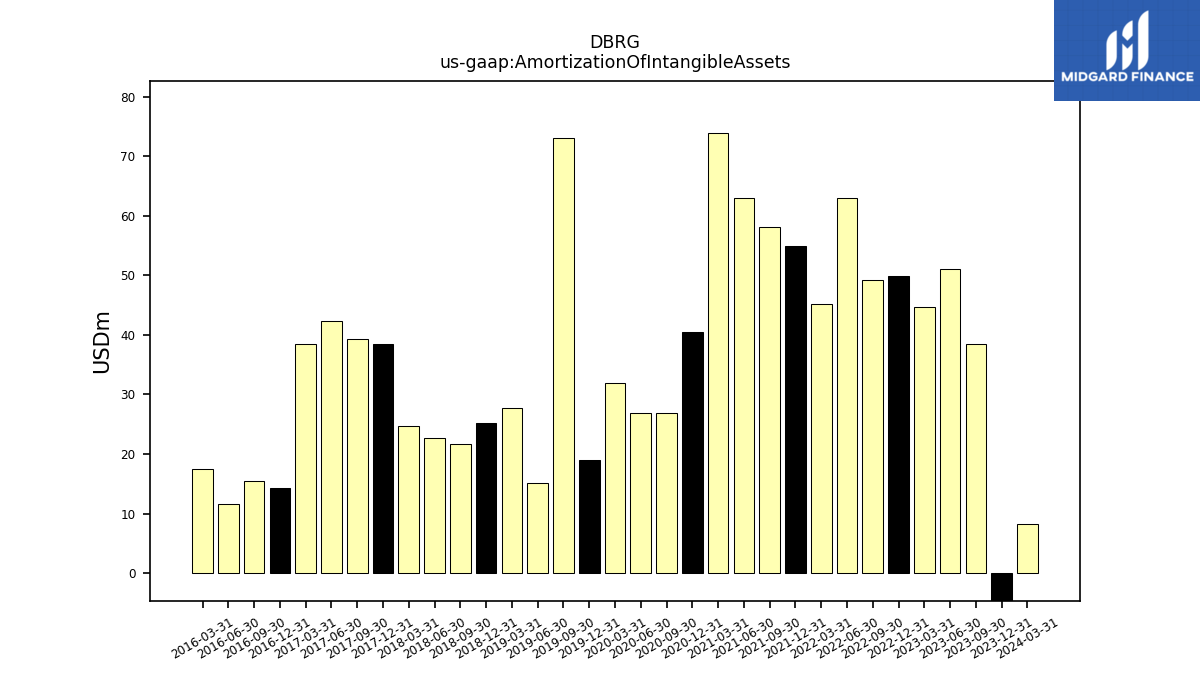
| Amortization Of Intangible Assets | -99.73 | 38.50 | 51.04 | 44.76 | 49.91 | 49.23 | 62.92 | 45.25 | 55.01 | 58.10 | 62.98 | 73.96 | 40.51 | 26.93 | 26.93 | 31.97 | 18.97 | 73.02 | 15.19 | 27.71 | 25.25 | 21.67 | 22.70 | 24.73 | 38.53 | 39.35 | 42.30 | 38.47 | 14.27 | 15.39 | 11.59 | 17.51 | |
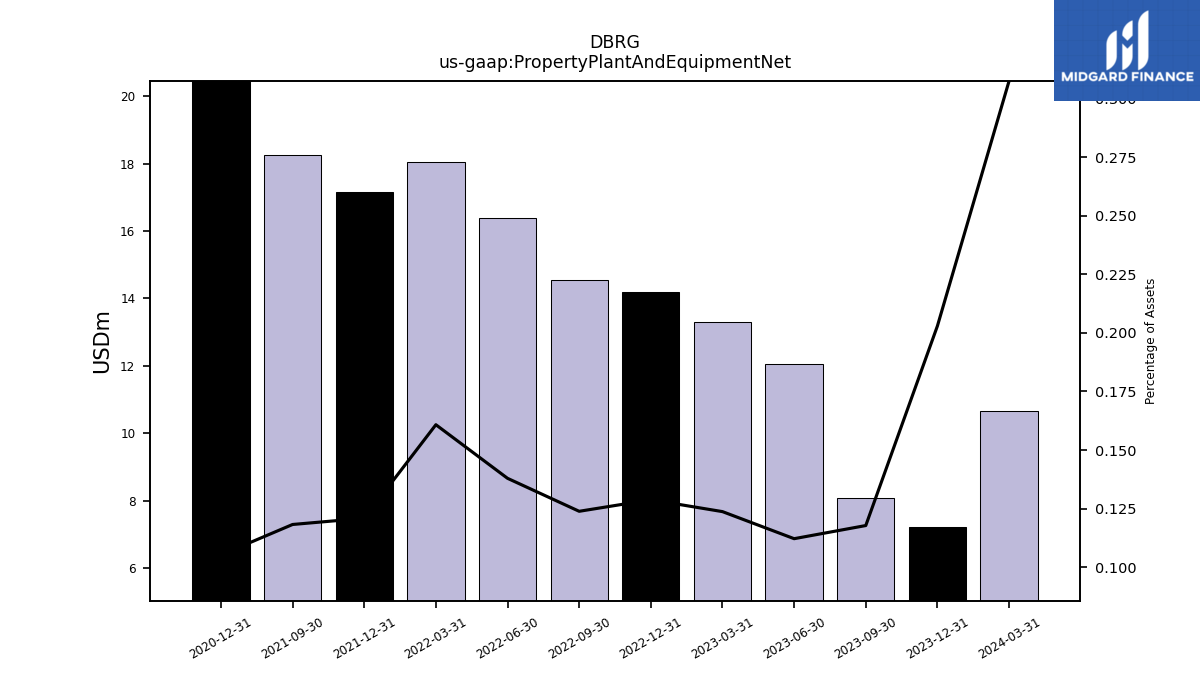
| Property Plant And Equipment Net | 7.23 | 8.09 | 12.06 | 13.29 | 14.20 | 14.54 | 16.38 | 18.06 | 17.16 | 18.25 | NA | NA | 21.25 | NA | NA | NA | NA | NA | NA | NA | NA | NA | NA | NA | NA | NA | NA | NA | NA | NA | NA | NA | |
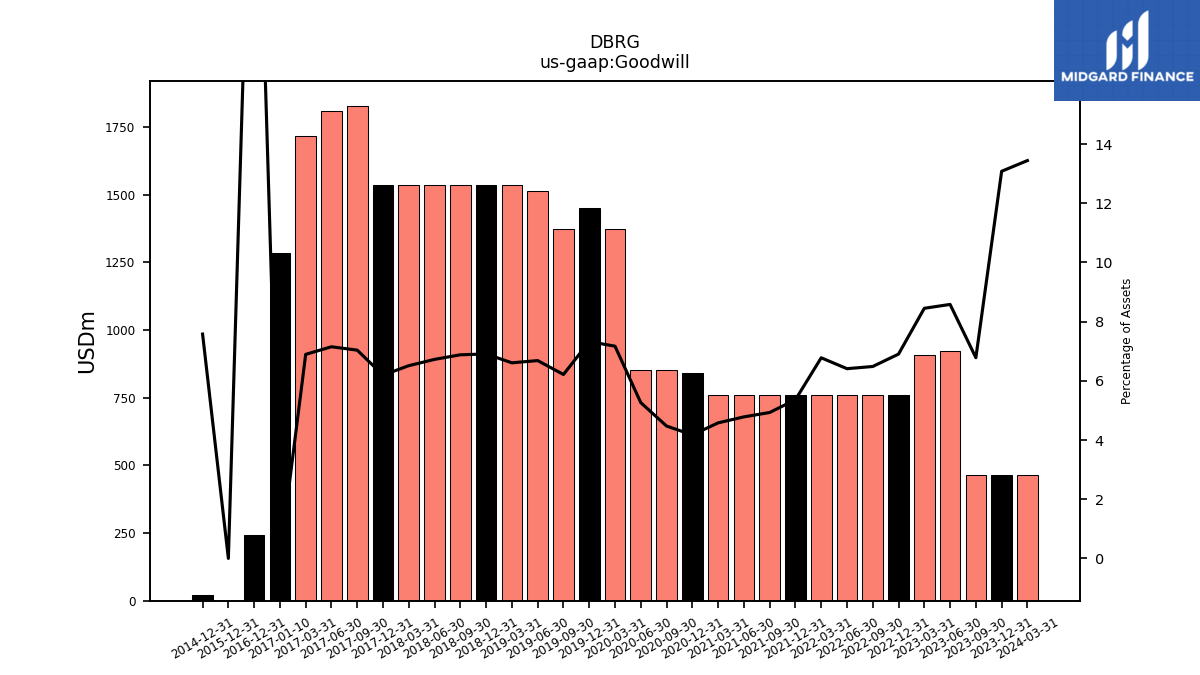
| Goodwill | 465.99 | 466.09 | 923.11 | 907.94 | 761.37 | 761.37 | 761.37 | 761.37 | 761.37 | 761.37 | 761.37 | 761.37 | 842.93 | 851.76 | 851.76 | 1373.89 | 1452.89 | 1374.81 | 1514.56 | 1534.56 | 1534.56 | 1534.56 | 1534.56 | 1534.56 | 1534.56 | 1828.82 | 1808.39 | 1717.37 | 243.33 | NA | NA | NA | |
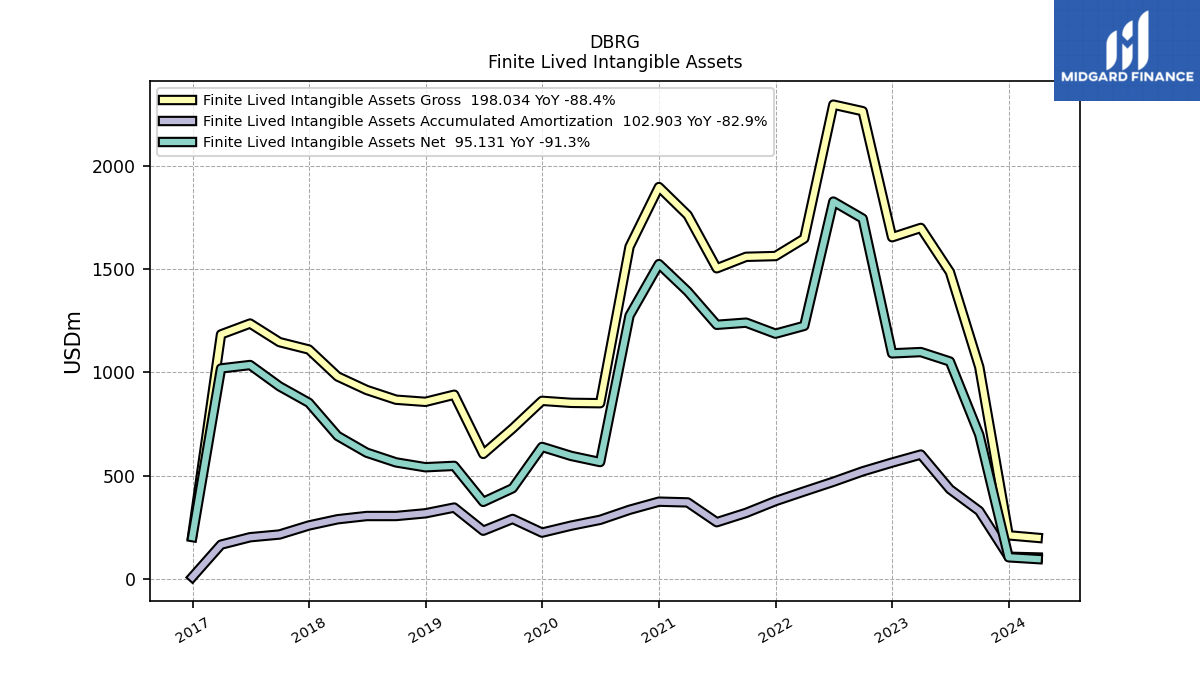
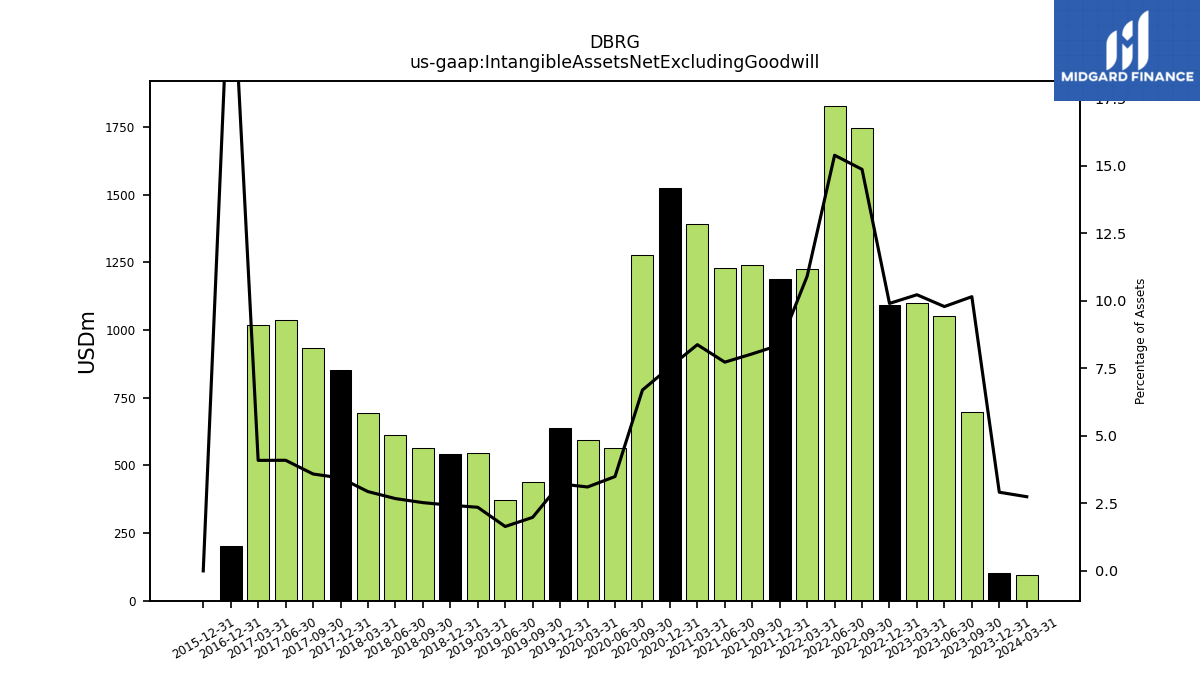
| Intangible Assets Net Excluding Goodwill | 103.75 | 697.75 | 1052.82 | 1098.52 | 1092.17 | 1745.56 | 1827.96 | 1225.49 | 1187.63 | 1241.04 | 1230.62 | 1392.53 | 1524.97 | 1275.04 | 565.22 | 595.25 | 638.85 | 438.37 | 372.35 | 546.90 | 540.26 | 563.71 | 610.85 | 691.90 | 852.87 | 932.50 | 1035.77 | 1019.20 | 201.63 | NA | NA | NA | |
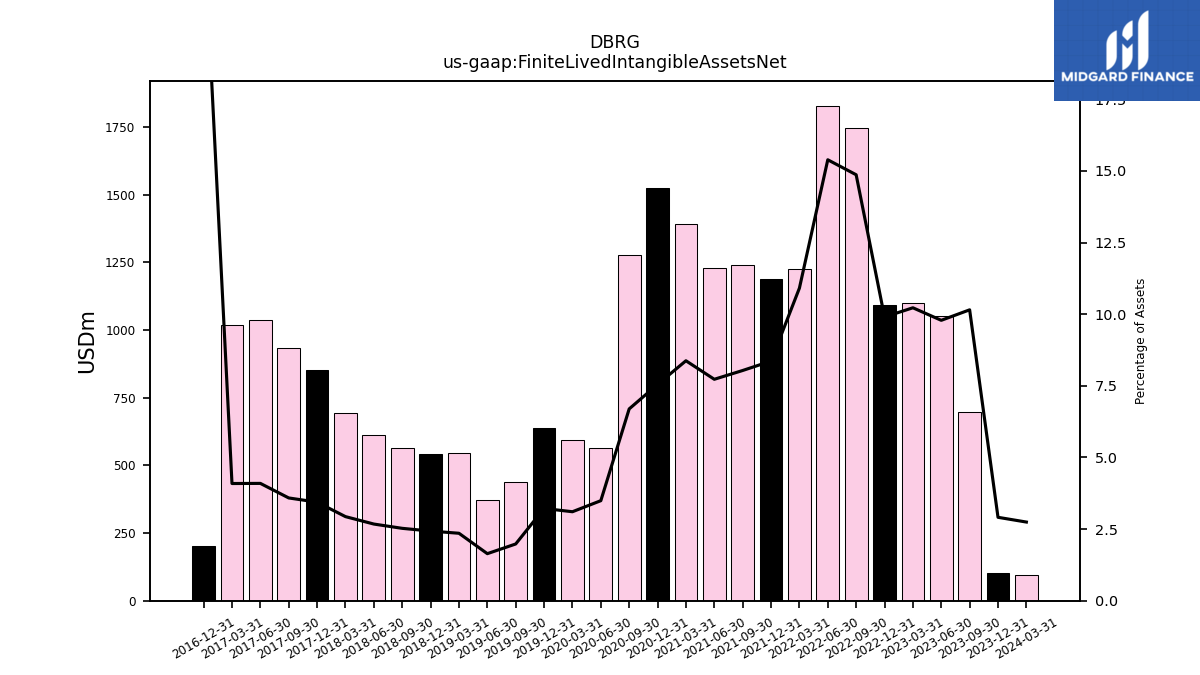
| Finite Lived Intangible Assets Net | 103.75 | 697.75 | 1052.82 | 1098.52 | 1092.17 | 1745.56 | 1827.96 | 1225.49 | 1187.63 | 1241.04 | 1230.62 | 1392.53 | 1524.97 | 1275.04 | 565.22 | 595.25 | 638.85 | 438.37 | 372.35 | 546.90 | 540.26 | 563.71 | 610.85 | 691.90 | 852.87 | 932.50 | 1035.77 | 1019.20 | 201.63 | NA | NA | NA |
| 2023-12-31 | 2023-09-30 | 2023-06-30 | 2023-03-31 | 2022-12-31 | 2022-09-30 | 2022-06-30 | 2022-03-31 | 2021-12-31 | 2021-09-30 | 2021-06-30 | 2021-03-31 | 2020-12-31 | 2020-09-30 | 2020-06-30 | 2020-03-31 | 2019-12-31 | 2019-09-30 | 2019-06-30 | 2019-03-31 | 2018-12-31 | 2018-09-30 | 2018-06-30 | 2018-03-31 | 2017-12-31 | 2017-09-30 | 2017-06-30 | 2017-03-31 | 2016-12-31 | 2016-09-30 | 2016-06-30 | 2016-03-31 | ||
|---|---|---|---|---|---|---|---|---|---|---|---|---|---|---|---|---|---|---|---|---|---|---|---|---|---|---|---|---|---|---|---|---|---|
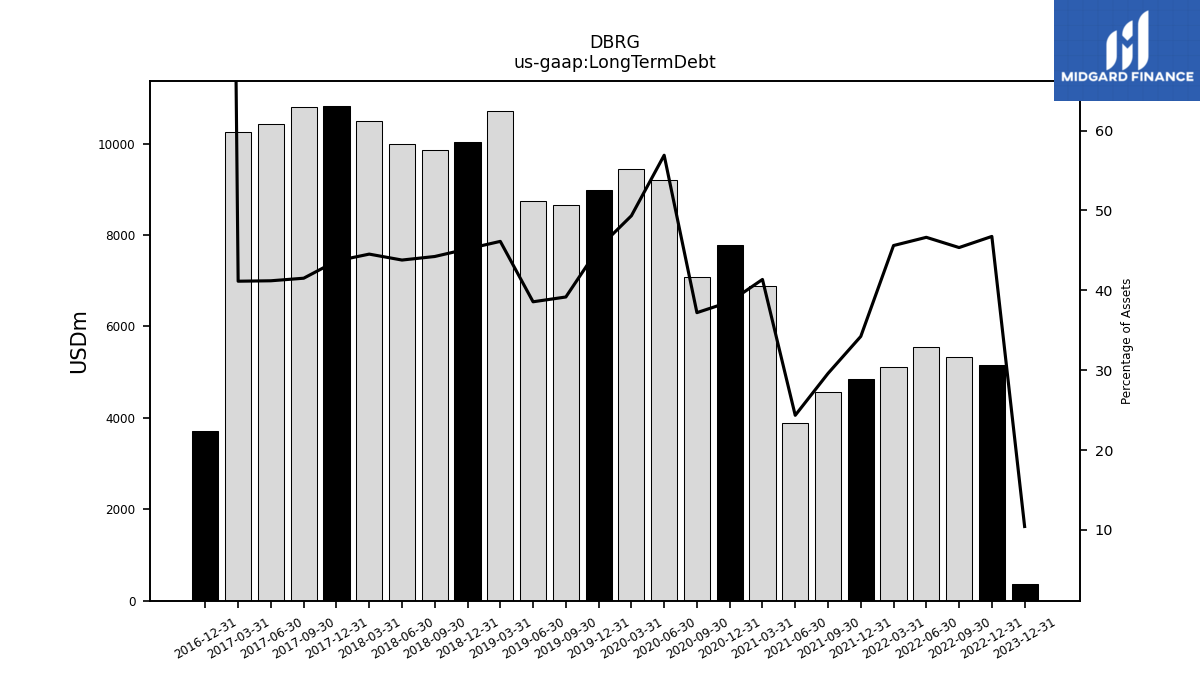
| Long Term Debt | 371.78 | NA | NA | NA | 5156.14 | 5325.61 | 5539.73 | 5123.25 | 4860.40 | 4571.21 | 3877.66 | 6877.29 | 7789.74 | 7085.99 | 9211.11 | 9453.34 | 8983.91 | 8666.11 | 8739.67 | 10712.79 | 10039.96 | 9867.98 | 9994.11 | 10495.43 | 10827.81 | 10791.98 | 10418.98 | 10249.55 | 3715.62 | NA | NA | NA |
| 2023-12-31 | 2023-09-30 | 2023-06-30 | 2023-03-31 | 2022-12-31 | 2022-09-30 | 2022-06-30 | 2022-03-31 | 2021-12-31 | 2021-09-30 | 2021-06-30 | 2021-03-31 | 2020-12-31 | 2020-09-30 | 2020-06-30 | 2020-03-31 | 2019-12-31 | 2019-09-30 | 2019-06-30 | 2019-03-31 | 2018-12-31 | 2018-09-30 | 2018-06-30 | 2018-03-31 | 2017-12-31 | 2017-09-30 | 2017-06-30 | 2017-03-31 | 2016-12-31 | 2016-09-30 | 2016-06-30 | 2016-03-31 | ||
|---|---|---|---|---|---|---|---|---|---|---|---|---|---|---|---|---|---|---|---|---|---|---|---|---|---|---|---|---|---|---|---|---|---|
| Stockholders Equity | 1811.06 | 1690.77 | 1442.21 | 1452.32 | 1660.70 | 1654.66 | 1633.29 | 1390.83 | 2146.93 | 2055.86 | 2108.95 | 2222.03 | 2501.47 | 2585.59 | 2739.78 | 4746.43 | 5216.04 | 5663.73 | 6361.72 | 6868.70 | 7006.05 | 7480.99 | 7609.53 | 8000.97 | 8407.92 | 8936.17 | 9090.17 | 9179.87 | 184.11 | NA | NA | NA | |
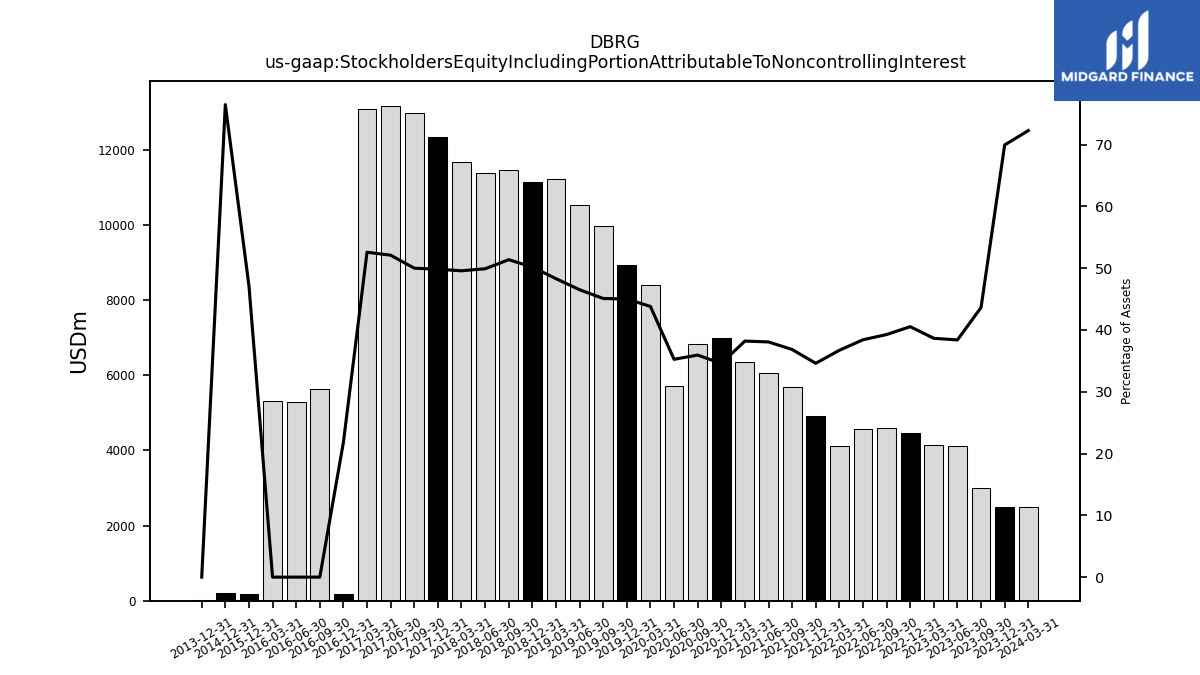
| Stockholders Equity Including Portion Attributable To Noncontrolling Interest | 2491.30 | 2998.16 | 4129.01 | 4151.81 | 4469.49 | 4608.69 | 4561.52 | 4122.94 | 4912.39 | 5688.27 | 6059.03 | 6350.34 | 6984.59 | 6842.07 | 5704.57 | 8391.72 | 8926.42 | 9975.45 | 10537.10 | 11215.44 | 11146.37 | 11457.51 | 11386.20 | 11680.44 | 12349.39 | 12993.04 | 13173.65 | 13095.54 | 185.66 | 5642.87 | 5280.17 | 5313.41 | |
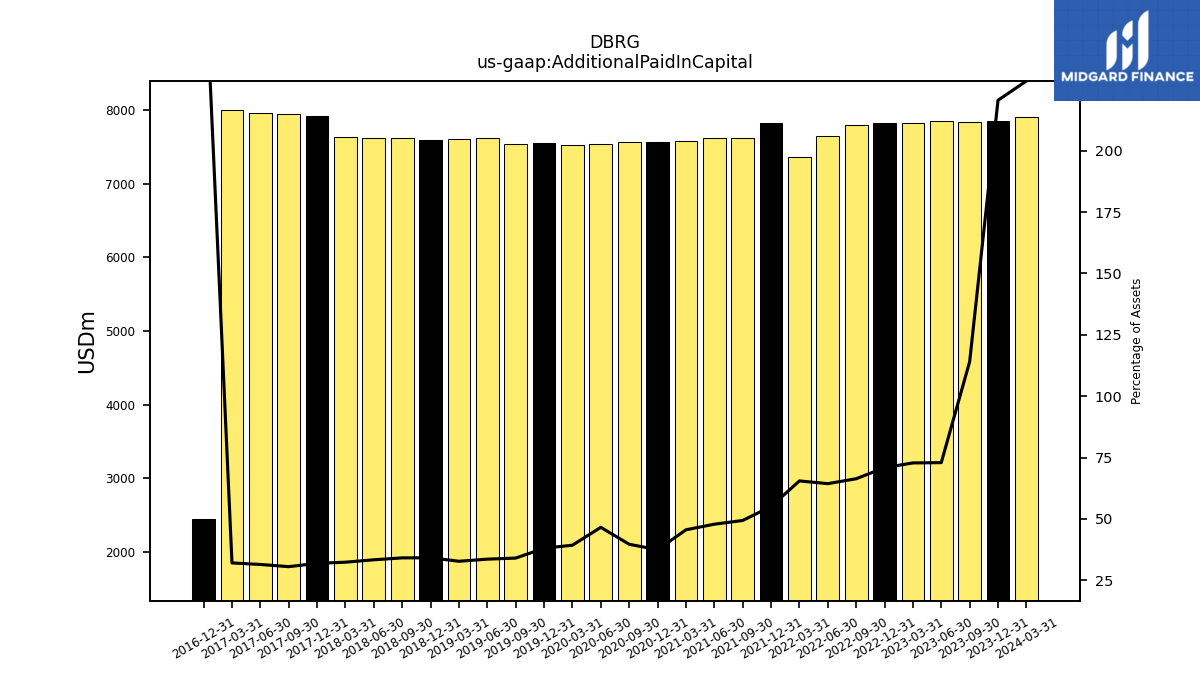
| Additional Paid In Capital | 7855.84 | 7835.83 | 7846.44 | 7823.72 | 7818.07 | 7793.49 | 7646.85 | 7356.36 | 7820.81 | 7625.55 | 7622.38 | 7576.87 | 7570.47 | 7559.55 | 7540.20 | 7532.21 | 7553.60 | 7538.36 | 7621.65 | 7610.95 | 7598.02 | 7618.52 | 7616.92 | 7634.95 | 7913.62 | 7947.99 | 7958.87 | 7994.46 | 2443.10 | NA | NA | NA | |
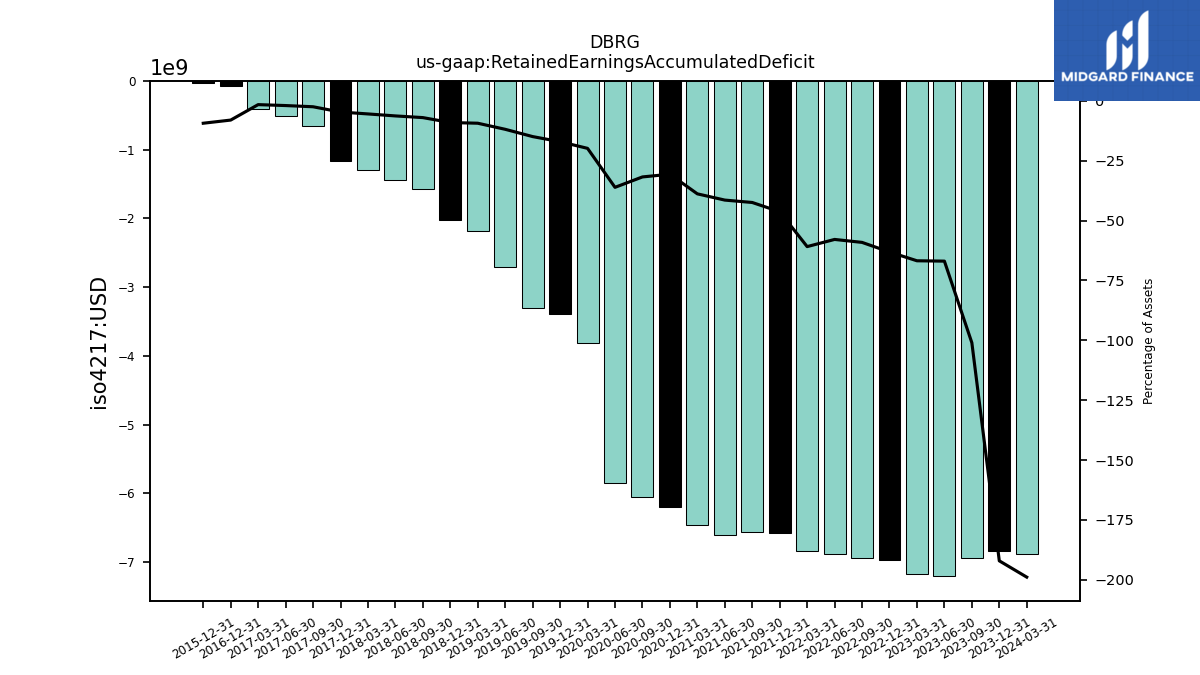
| Retained Earnings Accumulated Deficit | -6842.50 | -6941.47 | -7201.65 | -7176.71 | -6962.61 | -6941.66 | -6875.82 | -6838.50 | -6576.18 | -6557.62 | -6601.52 | -6460.26 | -6195.46 | -6054.88 | -5849.10 | -3806.31 | -3389.59 | -3307.89 | -2699.28 | -2176.73 | -2018.30 | -1567.66 | -1443.72 | -1295.00 | -1165.41 | -650.13 | -505.55 | -401.07 | -68.54 | NA | NA | NA | |
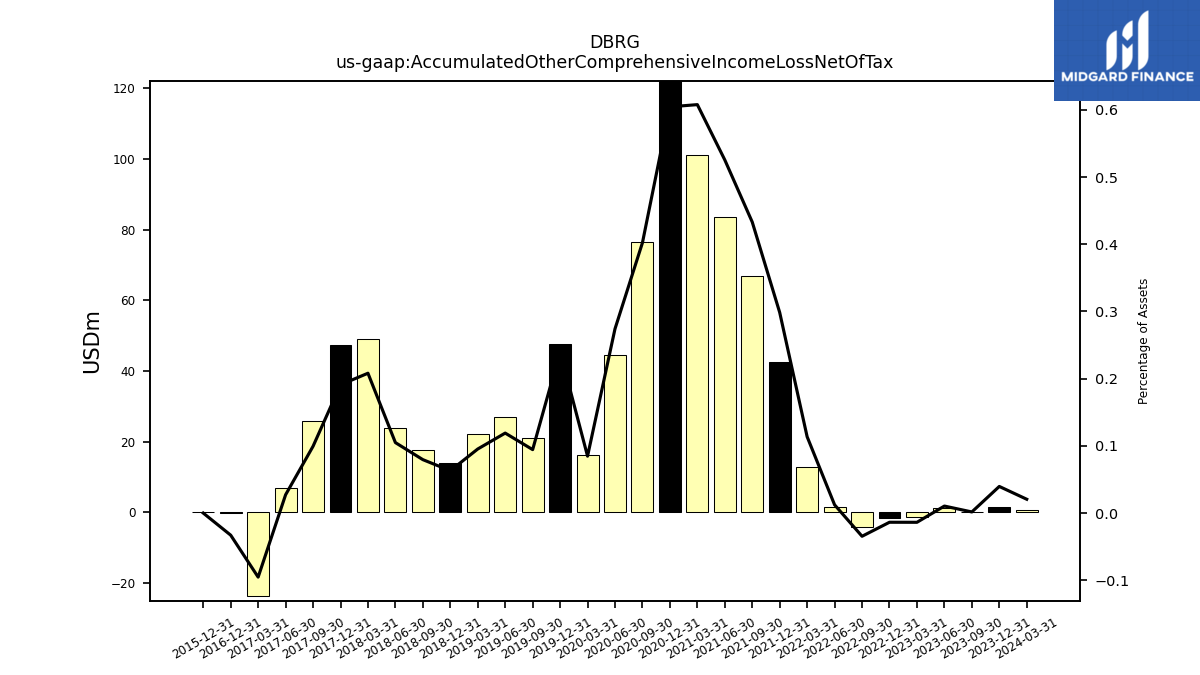
| Accumulated Other Comprehensive Income Loss Net Of Tax | 1.41 | 0.11 | 1.12 | -1.48 | -1.51 | -4.06 | 1.46 | 12.75 | 42.38 | 66.88 | 83.67 | 101.06 | 122.12 | 76.61 | 44.37 | 16.22 | 47.67 | 20.89 | 26.97 | 22.14 | 14.00 | 17.73 | 23.93 | 49.04 | 47.32 | 25.83 | 6.88 | -23.75 | -0.28 | NA | NA | NA |
| 2023-12-31 | 2023-09-30 | 2023-06-30 | 2023-03-31 | 2022-12-31 | 2022-09-30 | 2022-06-30 | 2022-03-31 | 2021-12-31 | 2021-09-30 | 2021-06-30 | 2021-03-31 | 2020-12-31 | 2020-09-30 | 2020-06-30 | 2020-03-31 | 2019-12-31 | 2019-09-30 | 2019-06-30 | 2019-03-31 | 2018-12-31 | 2018-09-30 | 2018-06-30 | 2018-03-31 | 2017-12-31 | 2017-09-30 | 2017-06-30 | 2017-03-31 | 2016-12-31 | 2016-09-30 | 2016-06-30 | 2016-03-31 | ||
|---|---|---|---|---|---|---|---|---|---|---|---|---|---|---|---|---|---|---|---|---|---|---|---|---|---|---|---|---|---|---|---|---|---|
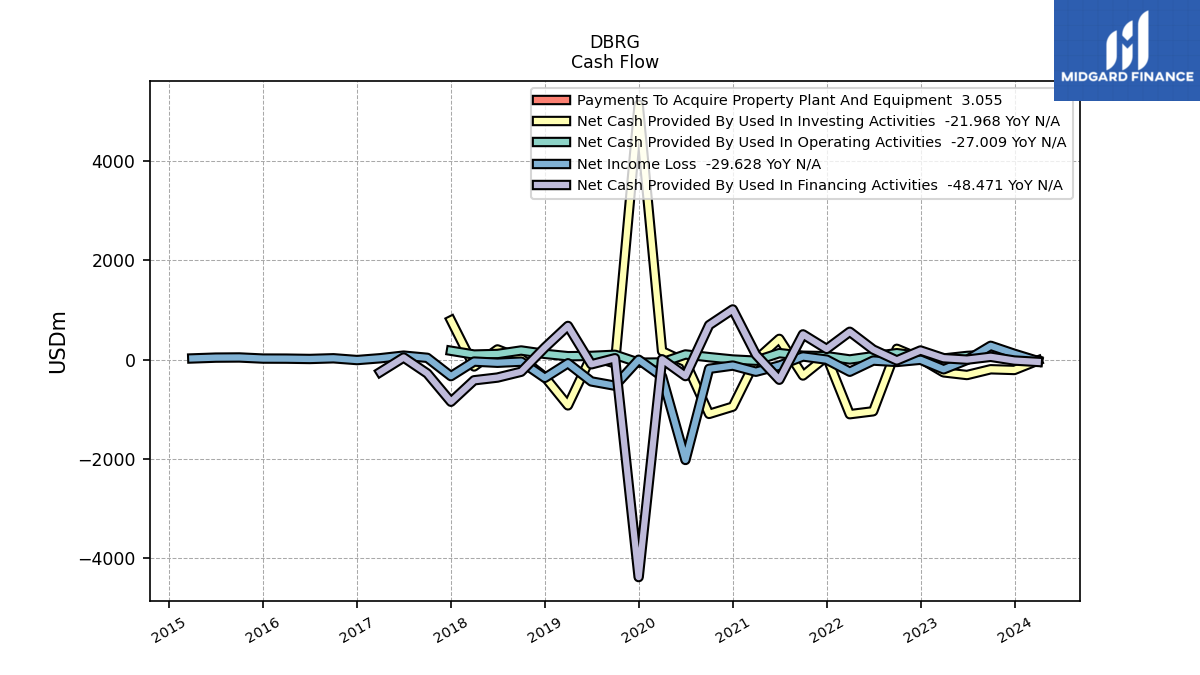
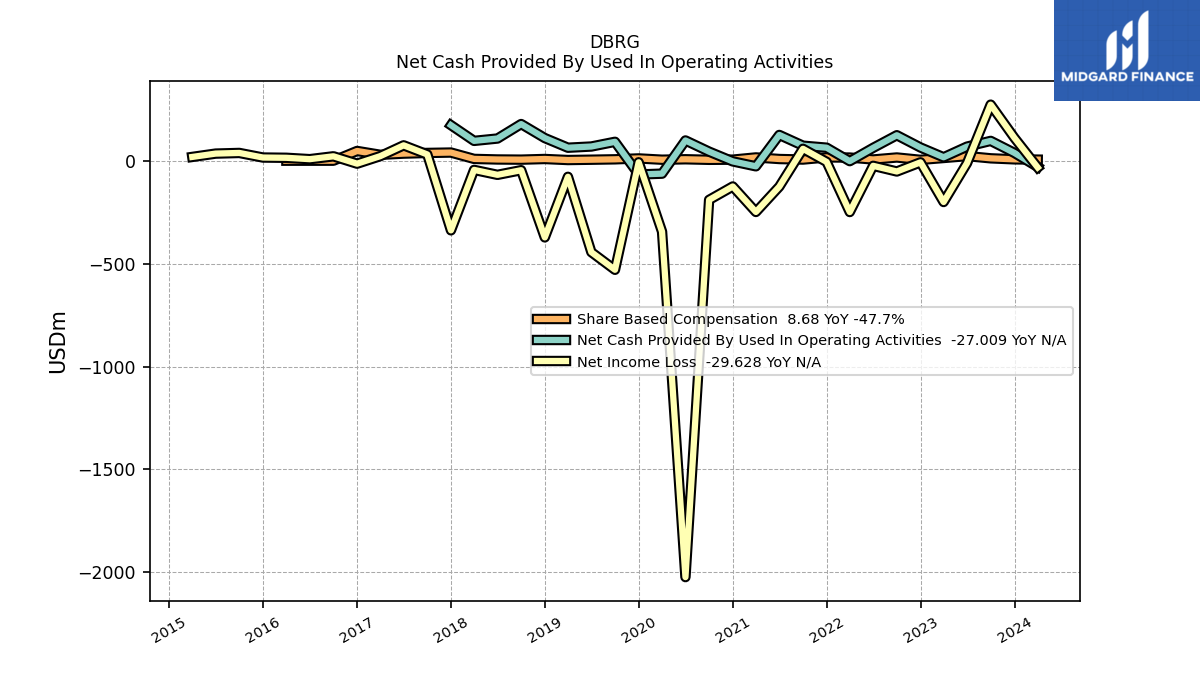
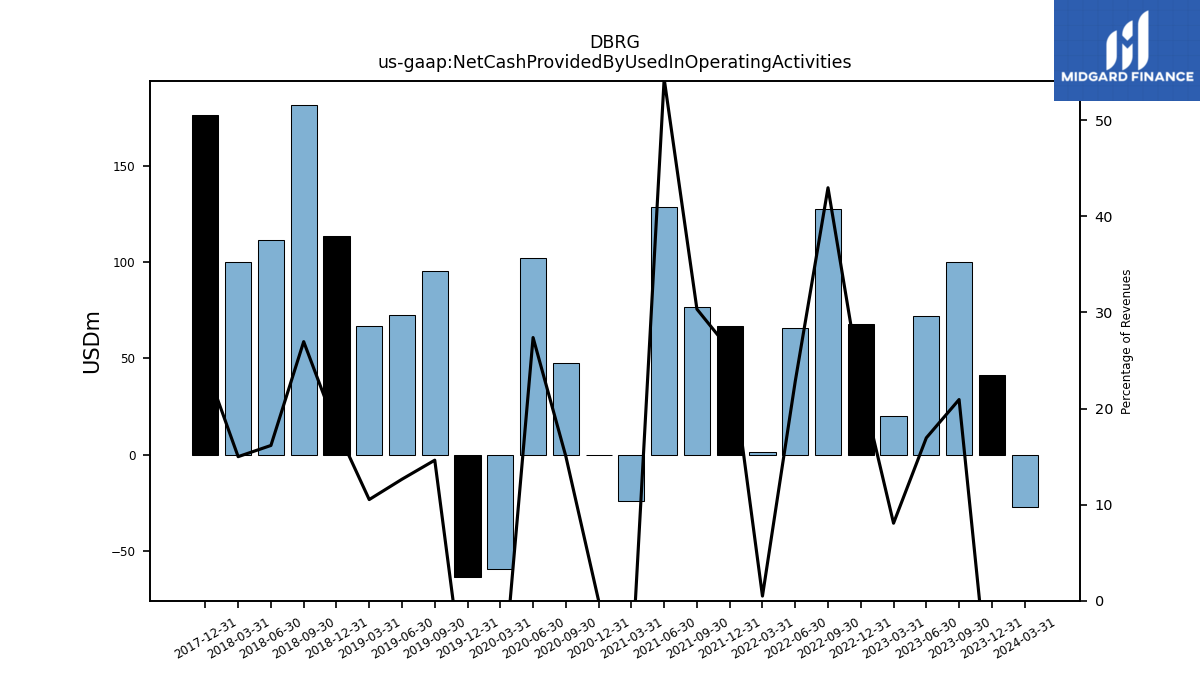
| Net Cash Provided By Used In Operating Activities | 41.56 | 99.88 | 72.02 | 20.18 | 67.81 | 127.47 | 66.05 | 1.26 | 66.83 | 76.52 | 128.83 | -23.94 | 0.01 | 47.57 | 101.98 | -59.67 | -63.72 | 95.44 | 72.52 | 66.64 | 113.67 | 181.92 | 111.43 | 99.95 | 176.47 | NA | NA | NA | NA | NA | NA | NA | |
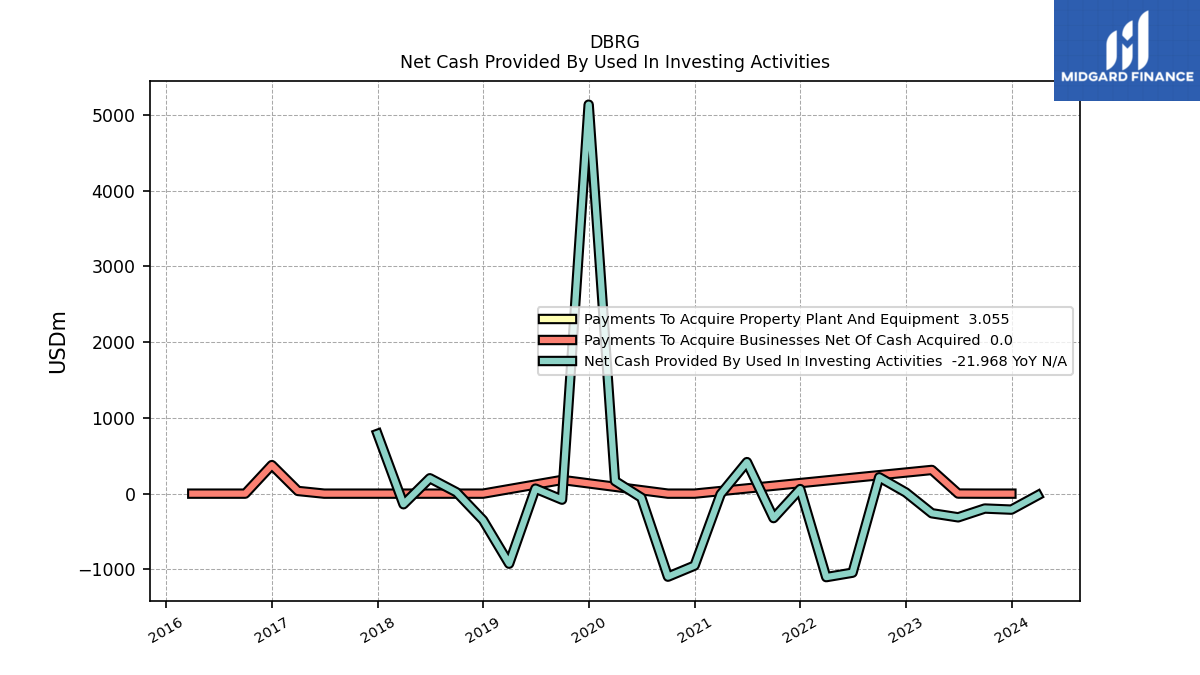
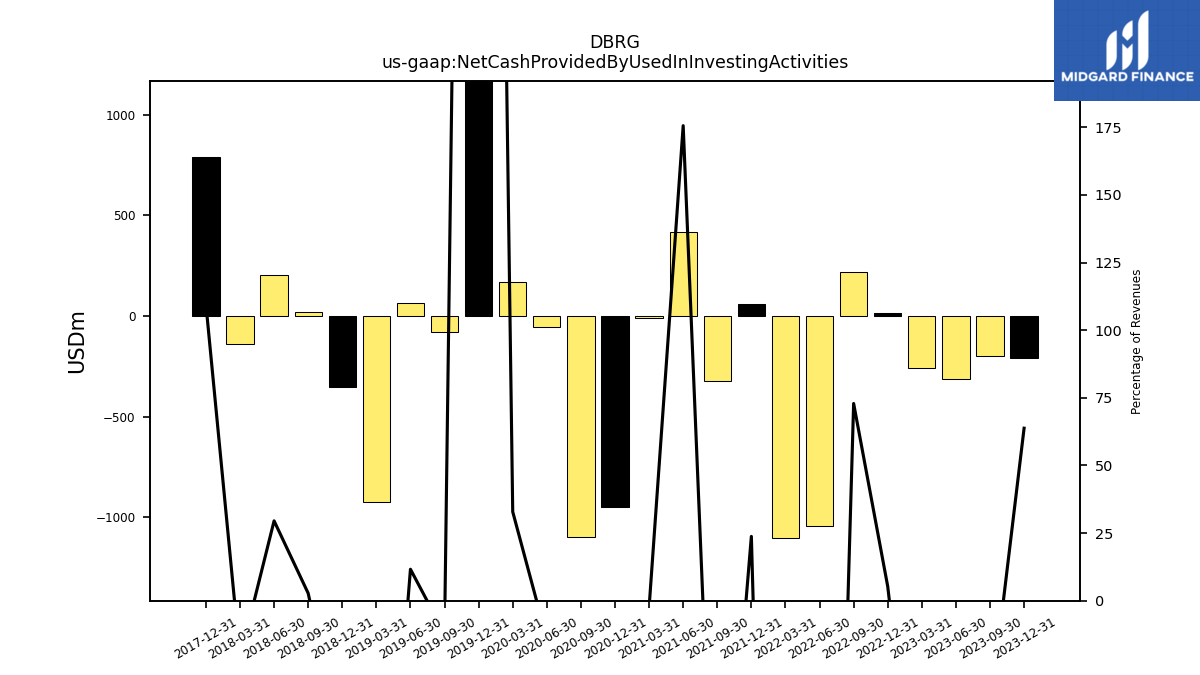
| Net Cash Provided By Used In Investing Activities | -210.97 | -196.52 | -312.68 | -258.87 | 15.95 | 216.28 | -1043.49 | -1102.15 | 60.87 | -322.90 | 416.50 | -7.90 | -950.06 | -1096.49 | -52.36 | 166.92 | 5136.60 | -79.48 | 66.76 | -924.95 | -350.19 | 18.62 | 203.60 | -140.24 | 789.72 | NA | NA | NA | NA | NA | NA | NA | |
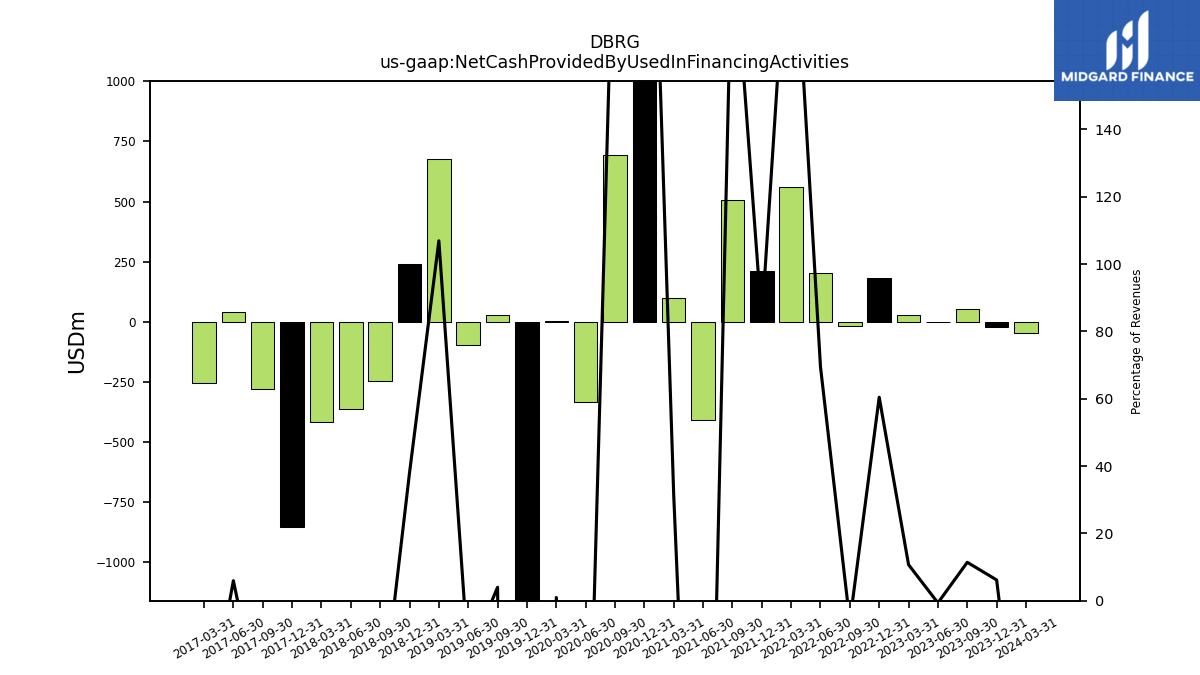
| Net Cash Provided By Used In Financing Activities | -20.44 | 54.49 | -2.68 | 26.79 | 182.01 | -18.57 | 201.03 | 559.32 | 213.04 | 506.90 | -407.85 | 99.17 | 1009.80 | 692.72 | -334.37 | 4.88 | -4385.46 | 26.14 | -96.94 | 676.67 | 240.86 | -246.79 | -363.74 | -418.74 | -851.91 | -281.57 | 40.49 | -253.51 | NA | NA | NA | NA |
| 2023-12-31 | 2023-09-30 | 2023-06-30 | 2023-03-31 | 2022-12-31 | 2022-09-30 | 2022-06-30 | 2022-03-31 | 2021-12-31 | 2021-09-30 | 2021-06-30 | 2021-03-31 | 2020-12-31 | 2020-09-30 | 2020-06-30 | 2020-03-31 | 2019-12-31 | 2019-09-30 | 2019-06-30 | 2019-03-31 | 2018-12-31 | 2018-09-30 | 2018-06-30 | 2018-03-31 | 2017-12-31 | 2017-09-30 | 2017-06-30 | 2017-03-31 | 2016-12-31 | 2016-09-30 | 2016-06-30 | 2016-03-31 | ||
|---|---|---|---|---|---|---|---|---|---|---|---|---|---|---|---|---|---|---|---|---|---|---|---|---|---|---|---|---|---|---|---|---|---|
| Net Cash Provided By Used In Operating Activities | 41.56 | 99.88 | 72.02 | 20.18 | 67.81 | 127.47 | 66.05 | 1.26 | 66.83 | 76.52 | 128.83 | -23.94 | 0.01 | 47.57 | 101.98 | -59.67 | -63.72 | 95.44 | 72.52 | 66.64 | 113.67 | 181.92 | 111.43 | 99.95 | 176.47 | NA | NA | NA | NA | NA | NA | NA | |
| Net Income Loss | 115.27 | 276.47 | -8.66 | -197.80 | -4.59 | -49.09 | -21.56 | -246.56 | -2.42 | 61.36 | -122.74 | -246.29 | -122.06 | -187.27 | -2024.27 | -342.16 | -4.26 | -527.82 | -441.75 | -74.98 | -370.08 | -42.79 | -65.41 | -41.33 | -335.74 | 33.91 | 78.34 | 25.60 | -11.06 | 24.84 | 10.92 | 17.57 | |
| Profit Loss | 111.25 | 278.78 | -52.52 | -292.34 | -37.24 | -120.99 | -68.08 | -343.68 | -42.87 | -51.36 | -95.08 | -627.60 | -306.13 | -361.23 | -2718.99 | -404.06 | 931.73 | -565.84 | -484.65 | -30.16 | -413.08 | -13.95 | -41.85 | -26.30 | -294.58 | 72.59 | 105.19 | 52.19 | -9.87 | 25.94 | 12.14 | 18.78 | |
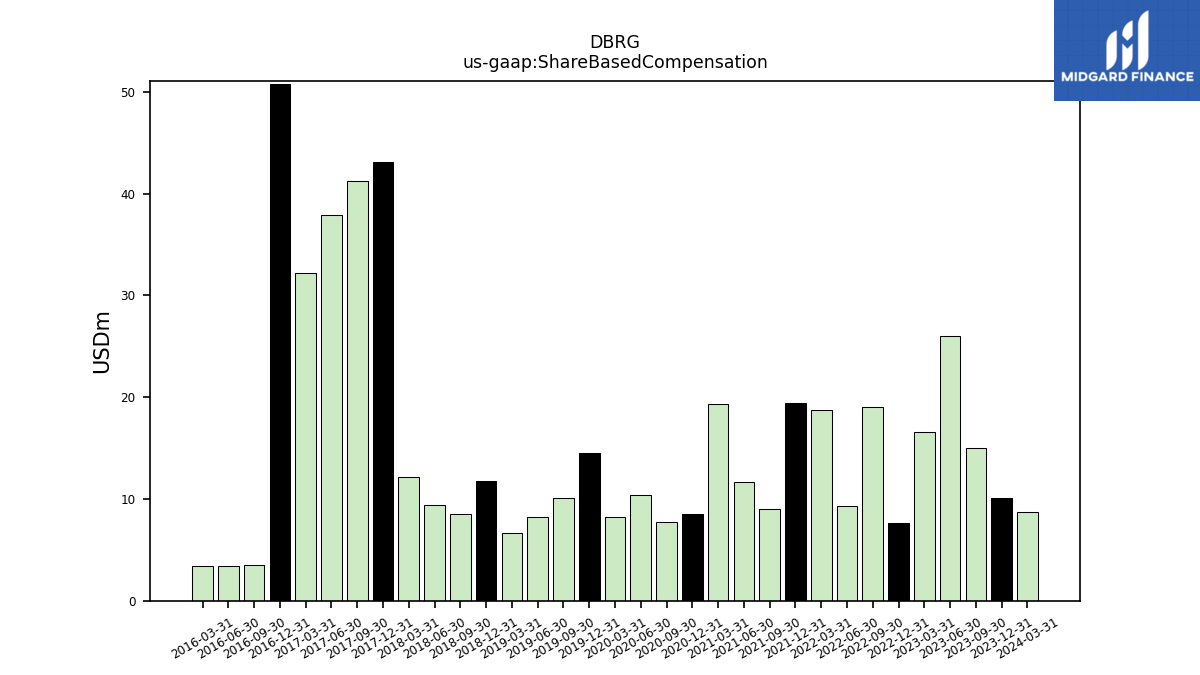
| Share Based Compensation | 10.05 | 15.01 | 25.96 | 16.61 | 7.59 | 19.05 | 9.35 | 18.72 | 19.41 | 9.04 | 11.64 | 19.32 | 8.54 | 7.74 | 10.42 | 8.25 | 14.52 | 10.12 | 8.27 | 6.66 | 11.75 | 8.56 | 9.40 | 12.17 | 43.12 | 41.21 | 37.91 | 32.18 | 50.82 | 3.48 | 3.42 | 3.42 | |
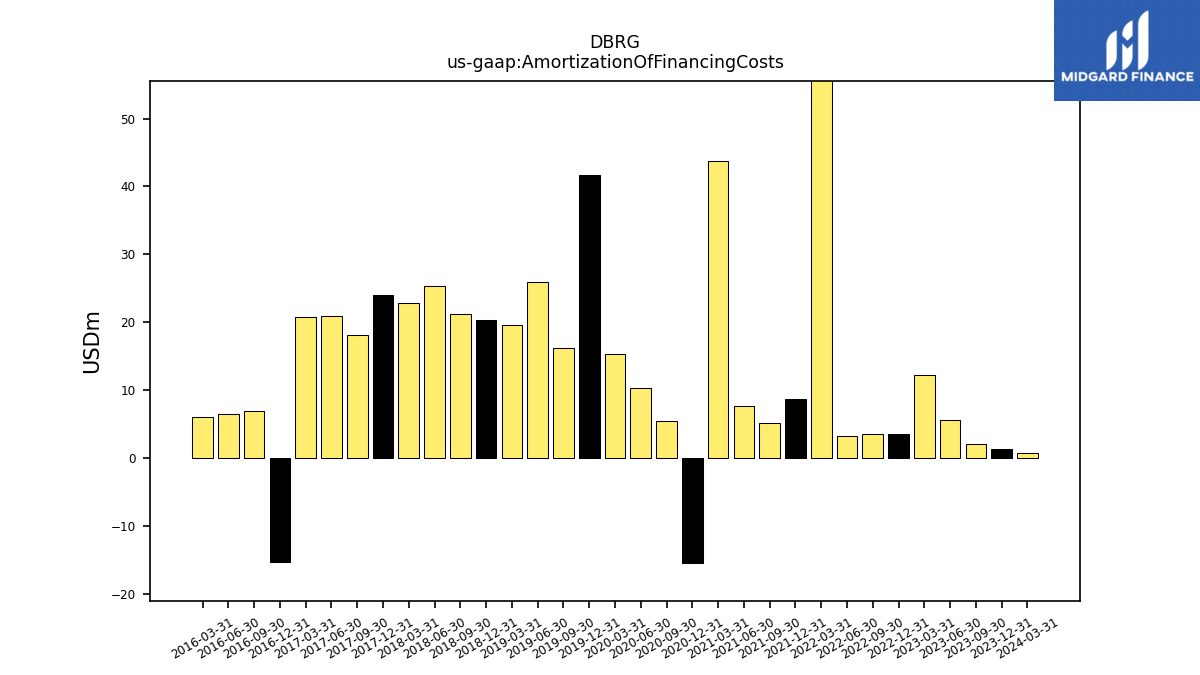
| Amortization Of Financing Costs | 1.36 | 2.04 | 5.54 | 12.18 | 3.47 | 3.50 | 3.17 | 96.28 | 8.63 | 5.12 | 7.64 | 43.73 | -15.46 | 5.43 | 10.37 | 15.26 | 41.76 | 16.20 | 25.98 | 19.59 | 20.32 | 21.22 | 25.29 | 22.80 | 23.95 | 18.17 | 20.87 | 20.74 | -15.35 | 6.90 | 6.44 | 5.96 |
| 2023-12-31 | 2023-09-30 | 2023-06-30 | 2023-03-31 | 2022-12-31 | 2022-09-30 | 2022-06-30 | 2022-03-31 | 2021-12-31 | 2021-09-30 | 2021-06-30 | 2021-03-31 | 2020-12-31 | 2020-09-30 | 2020-06-30 | 2020-03-31 | 2019-12-31 | 2019-09-30 | 2019-06-30 | 2019-03-31 | 2018-12-31 | 2018-09-30 | 2018-06-30 | 2018-03-31 | 2017-12-31 | 2017-09-30 | 2017-06-30 | 2017-03-31 | 2016-12-31 | 2016-09-30 | 2016-06-30 | 2016-03-31 | ||
|---|---|---|---|---|---|---|---|---|---|---|---|---|---|---|---|---|---|---|---|---|---|---|---|---|---|---|---|---|---|---|---|---|---|
| Net Cash Provided By Used In Investing Activities | -210.97 | -196.52 | -312.68 | -258.87 | 15.95 | 216.28 | -1043.49 | -1102.15 | 60.87 | -322.90 | 416.50 | -7.90 | -950.06 | -1096.49 | -52.36 | 166.92 | 5136.60 | -79.48 | 66.76 | -924.95 | -350.19 | 18.62 | 203.60 | -140.24 | 789.72 | NA | NA | NA | NA | NA | NA | NA |
| 2023-12-31 | 2023-09-30 | 2023-06-30 | 2023-03-31 | 2022-12-31 | 2022-09-30 | 2022-06-30 | 2022-03-31 | 2021-12-31 | 2021-09-30 | 2021-06-30 | 2021-03-31 | 2020-12-31 | 2020-09-30 | 2020-06-30 | 2020-03-31 | 2019-12-31 | 2019-09-30 | 2019-06-30 | 2019-03-31 | 2018-12-31 | 2018-09-30 | 2018-06-30 | 2018-03-31 | 2017-12-31 | 2017-09-30 | 2017-06-30 | 2017-03-31 | 2016-12-31 | 2016-09-30 | 2016-06-30 | 2016-03-31 | ||
|---|---|---|---|---|---|---|---|---|---|---|---|---|---|---|---|---|---|---|---|---|---|---|---|---|---|---|---|---|---|---|---|---|---|
| Net Cash Provided By Used In Financing Activities | -20.44 | 54.49 | -2.68 | 26.79 | 182.01 | -18.57 | 201.03 | 559.32 | 213.04 | 506.90 | -407.85 | 99.17 | 1009.80 | 692.72 | -334.37 | 4.88 | -4385.46 | 26.14 | -96.94 | 676.67 | 240.86 | -246.79 | -363.74 | -418.74 | -851.91 | -281.57 | 40.49 | -253.51 | NA | NA | NA | NA | |
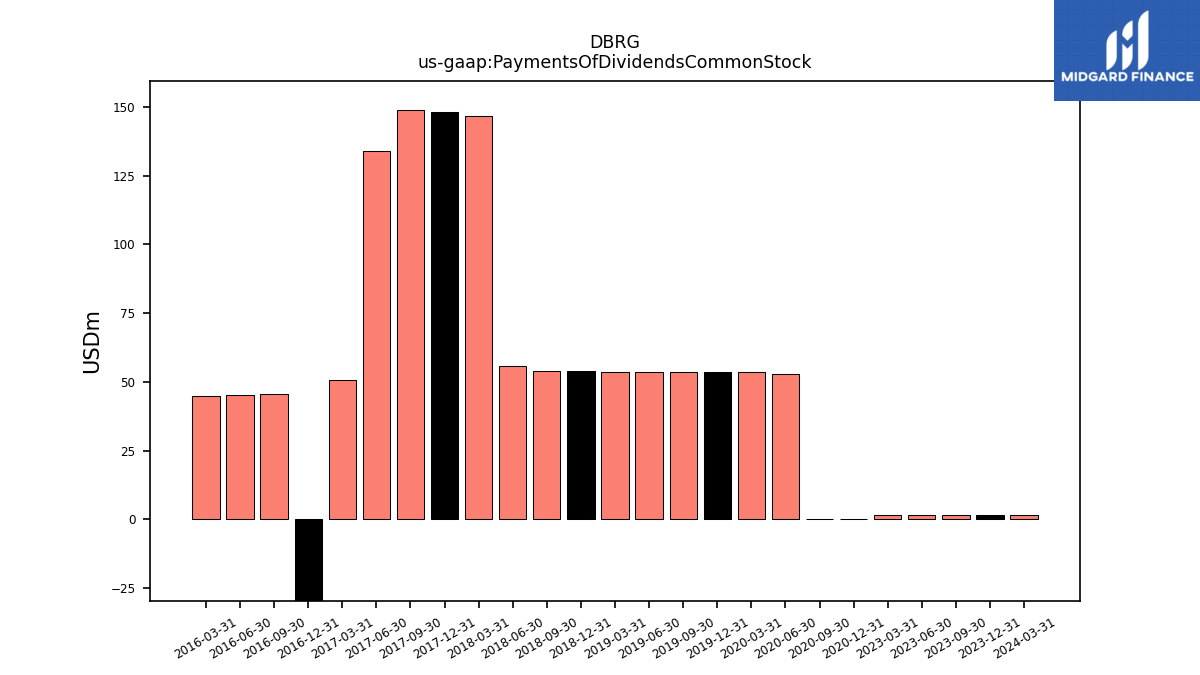
| Payments Of Dividends Common Stock | 1.64 | 1.62 | 1.61 | 1.60 | NA | NA | NA | NA | NA | NA | NA | NA | 0.00 | 0.00 | 52.85 | 53.66 | 53.66 | 53.65 | 53.41 | 53.43 | 54.02 | 53.95 | 55.85 | 146.70 | 148.26 | 149.02 | 134.15 | 50.72 | -59.72 | 45.52 | 45.24 | 44.90 |
| 2023-12-31 | 2023-09-30 | 2023-06-30 | 2023-03-31 | 2022-12-31 | 2022-09-30 | 2022-06-30 | 2022-03-31 | 2021-12-31 | 2021-09-30 | 2021-06-30 | 2021-03-31 | 2020-12-31 | 2020-09-30 | 2020-06-30 | 2020-03-31 | 2019-12-31 | 2019-09-30 | 2019-06-30 | 2019-03-31 | 2018-12-31 | 2018-09-30 | 2018-06-30 | 2018-03-31 | 2017-12-31 | 2017-09-30 | 2017-06-30 | 2017-03-31 | 2016-12-31 | 2016-09-30 | 2016-06-30 | 2016-03-31 | ||
|---|---|---|---|---|---|---|---|---|---|---|---|---|---|---|---|---|---|---|---|---|---|---|---|---|---|---|---|---|---|---|---|---|---|
| Revenues | -330.79 | 477.08 | 424.93 | 250.16 | 301.08 | 296.62 | 289.41 | 257.46 | 255.86 | 252.17 | 237.19 | 315.70 | 338.84 | 316.68 | 372.37 | 507.51 | 552.36 | 652.50 | 573.44 | 632.90 | 634.24 | 674.77 | 689.60 | 666.66 | 720.34 | 789.85 | 679.37 | 607.16 | -231.84 | 212.07 | 217.53 | 200.79 | |
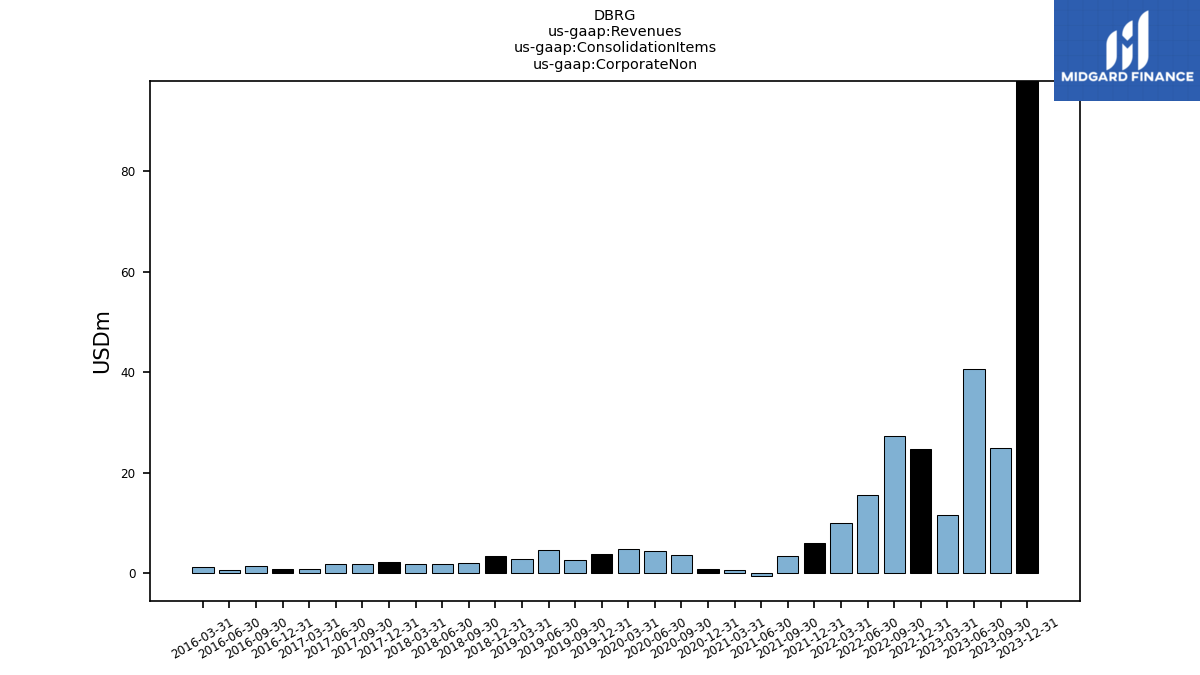
| Corporate Non | 98.00 | 25.05 | 40.78 | 11.67 | 24.72 | 27.28 | 15.61 | 10.04 | 6.03 | 3.41 | -0.50 | 0.74 | 0.87 | 3.76 | 4.50 | 4.88 | 3.98 | 2.69 | 4.59 | 2.98 | 3.38 | 2.16 | 1.84 | 1.86 | 2.27 | 1.85 | 1.86 | 0.87 | 0.95 | 1.47 | 0.68 | 1.28 | |
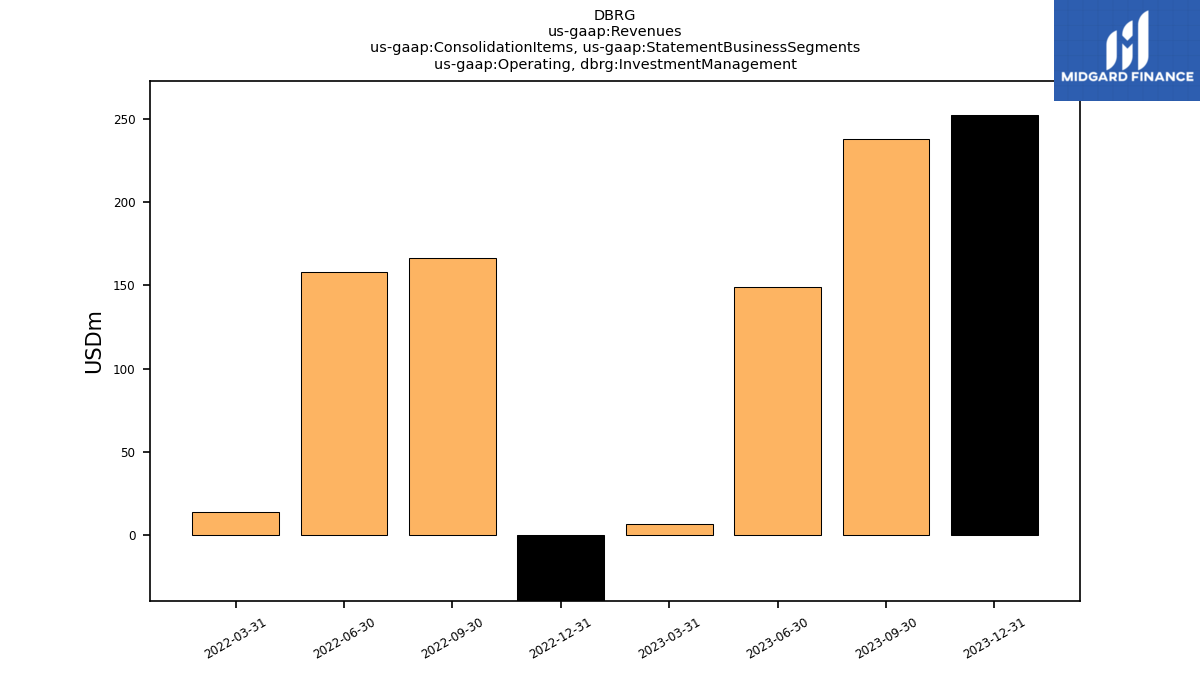
| Operating, Investment Management | 252.31 | 237.66 | 149.09 | 6.83 | -156.36 | 166.67 | 157.91 | 13.83 | NA | NA | NA | NA | NA | NA | NA | NA | NA | NA | NA | NA | NA | NA | NA | NA | NA | NA | NA | NA | NA | NA | NA | NA | |
| Revenue From Contract With Customer Including Assessed Tax | -888.06 | 477.08 | 424.93 | 250.16 | -670.82 | 296.62 | 289.41 | 257.46 | -529.12 | 252.17 | 237.19 | 315.70 | 338.84 | 316.68 | 372.37 | 507.51 | 552.36 | 652.50 | 573.44 | 632.90 | 634.24 | 674.77 | 689.60 | 666.66 | 720.34 | 789.85 | 679.37 | 607.16 | -231.84 | 212.07 | 217.53 | 200.79 | |
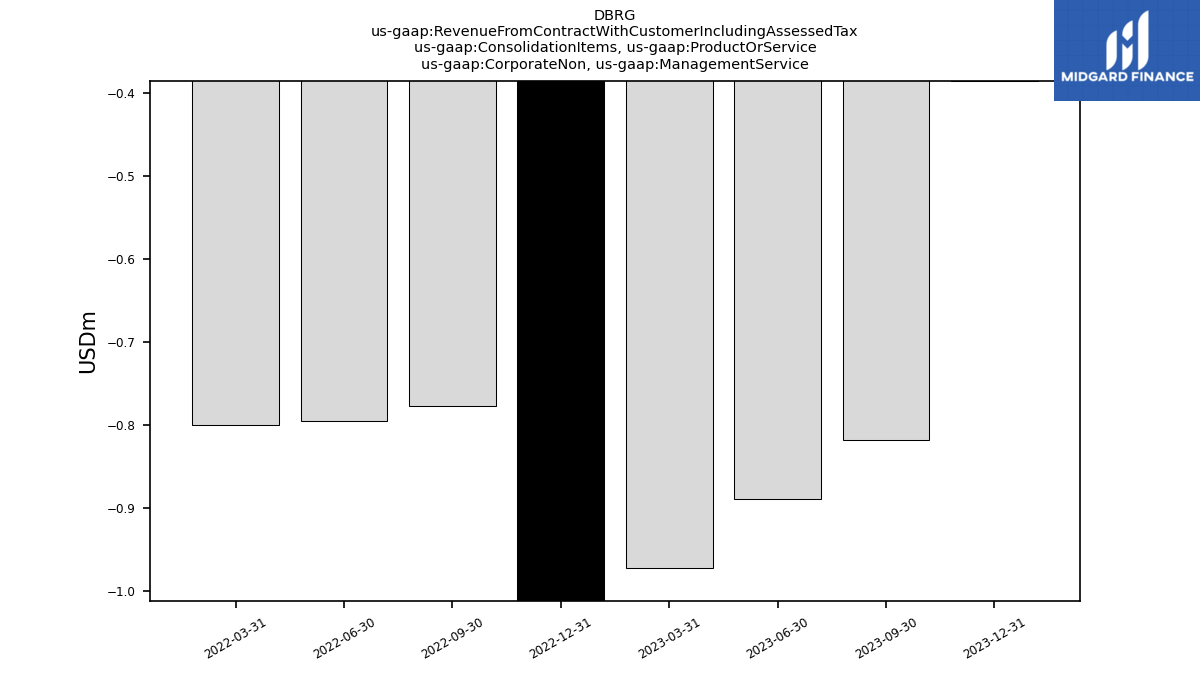
| Corporate Non, Management Service | -0.39 | -0.82 | -0.89 | -0.97 | -1.02 | -0.78 | -0.80 | -0.80 | NA | NA | NA | NA | NA | NA | NA | NA | NA | NA | NA | NA | NA | NA | NA | NA | NA | NA | NA | NA | NA | NA | NA | NA | |
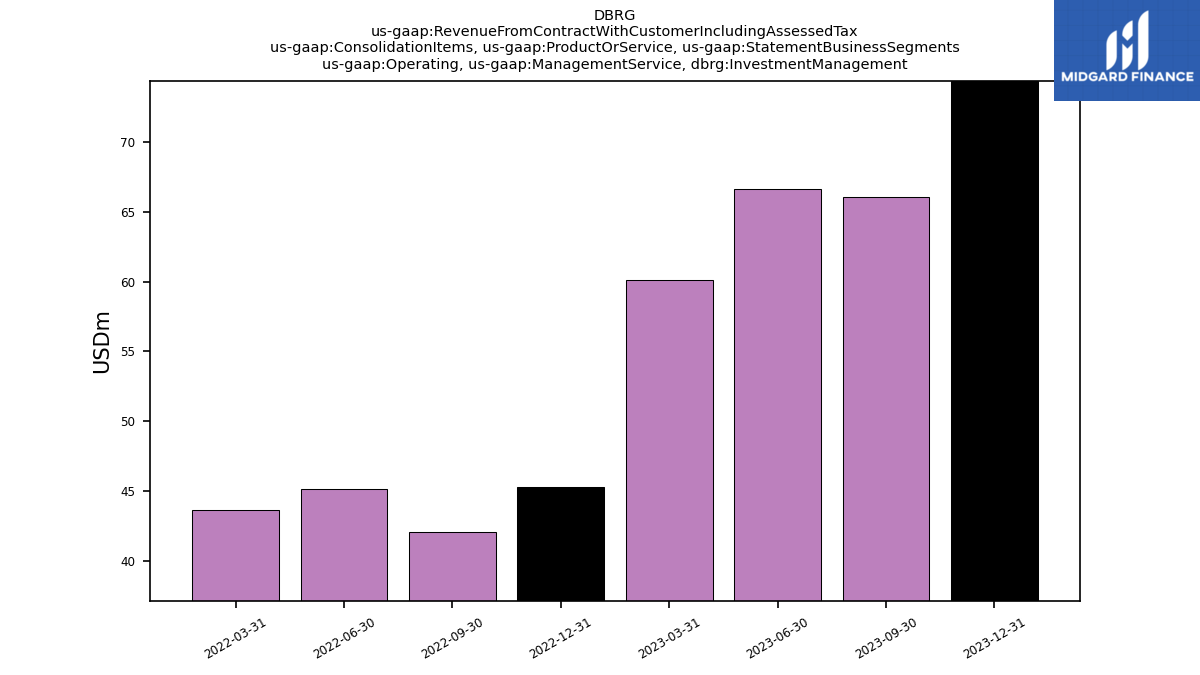
| Operating, Management Service, Investment Management | 74.39 | 66.06 | 66.63 | 60.10 | 45.27 | 42.04 | 45.11 | 43.64 | NA | NA | NA | NA | NA | NA | NA | NA | NA | NA | NA | NA | NA | NA | NA | NA | NA | NA | NA | NA | NA | NA | NA | NA | |
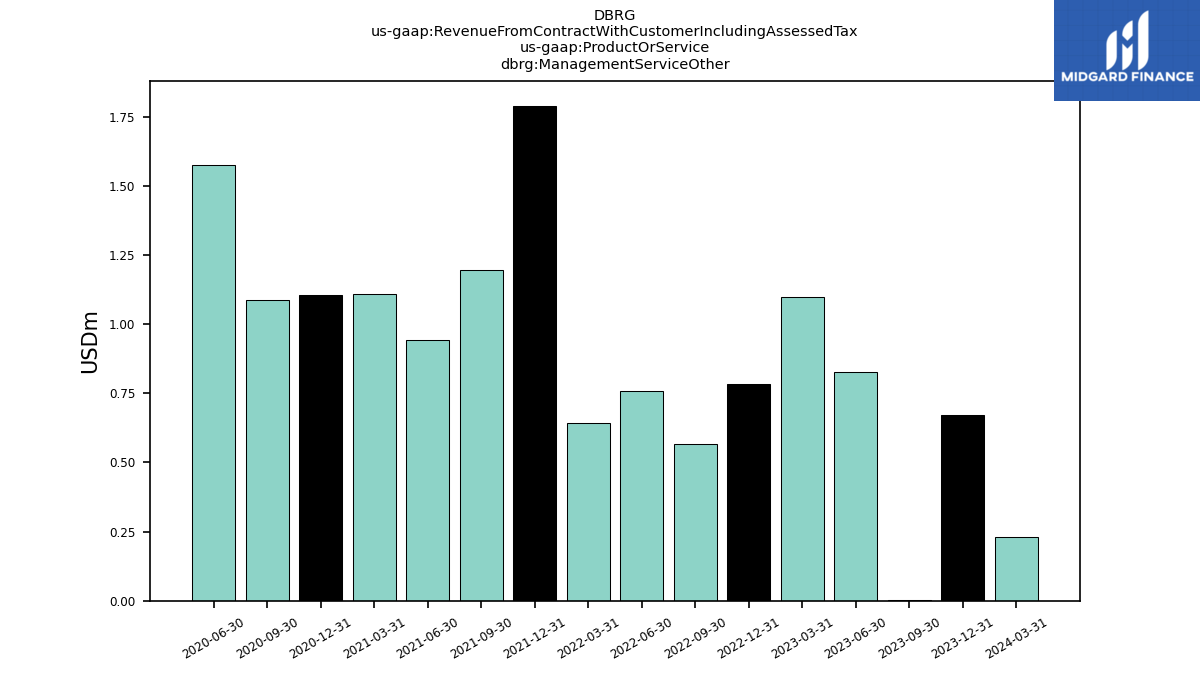
| Management Service Other | 0.67 | 0.00 | 0.83 | 1.10 | 0.78 | 0.57 | 0.76 | 0.64 | 1.79 | 1.19 | 0.94 | 1.11 | 1.10 | 1.09 | 1.57 | NA | NA | NA | NA | NA | NA | NA | NA | NA | NA | NA | NA | NA | NA | NA | NA | NA | |
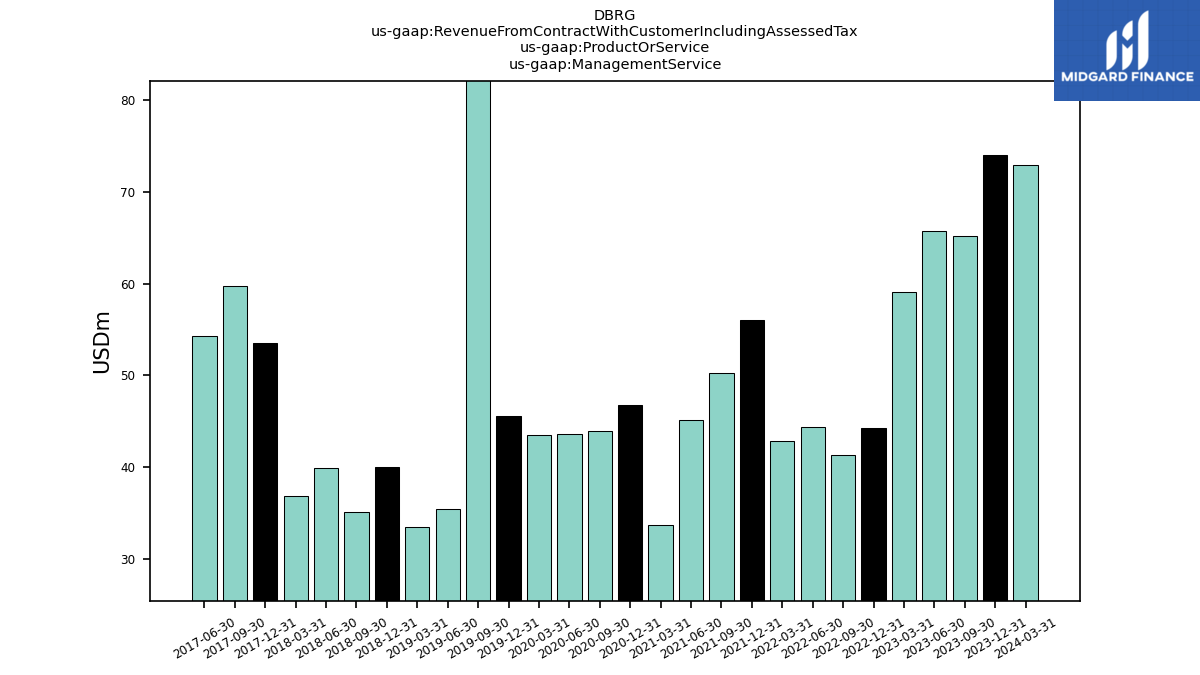
| Management Service | 74.01 | 65.24 | 65.74 | 59.13 | 44.26 | 41.26 | 44.32 | 42.84 | 56.00 | 50.23 | 45.16 | 33.68 | 46.79 | 43.92 | 43.54 | 43.51 | 45.60 | 111.85 | 35.43 | 33.50 | 40.00 | 35.05 | 39.92 | 36.84 | 53.53 | 59.69 | 54.32 | NA | NA | NA | NA | NA | |
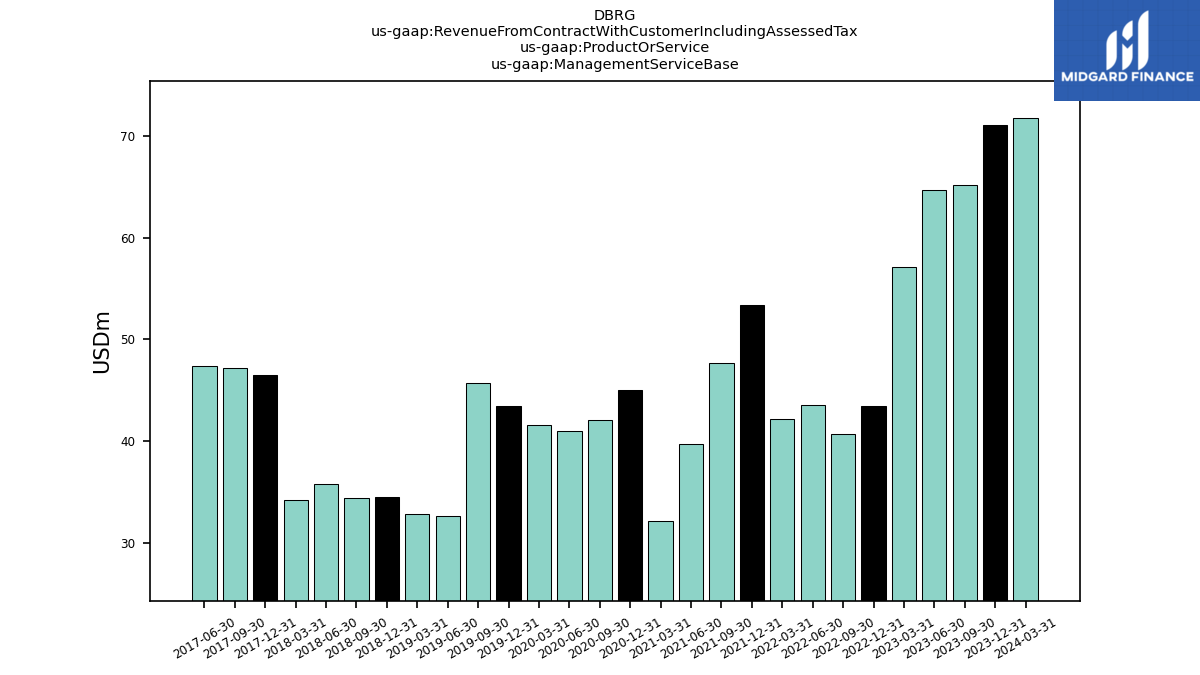
| Management Service Base | 71.15 | 65.24 | 64.74 | 57.16 | 43.48 | 40.70 | 43.56 | 42.19 | 53.43 | 47.72 | 39.73 | 32.10 | 45.07 | 42.09 | 41.04 | 41.62 | 43.45 | 45.76 | 32.61 | 32.84 | 34.45 | 34.41 | 35.75 | 34.18 | 46.50 | 47.22 | 47.34 | NA | NA | NA | NA | NA | |
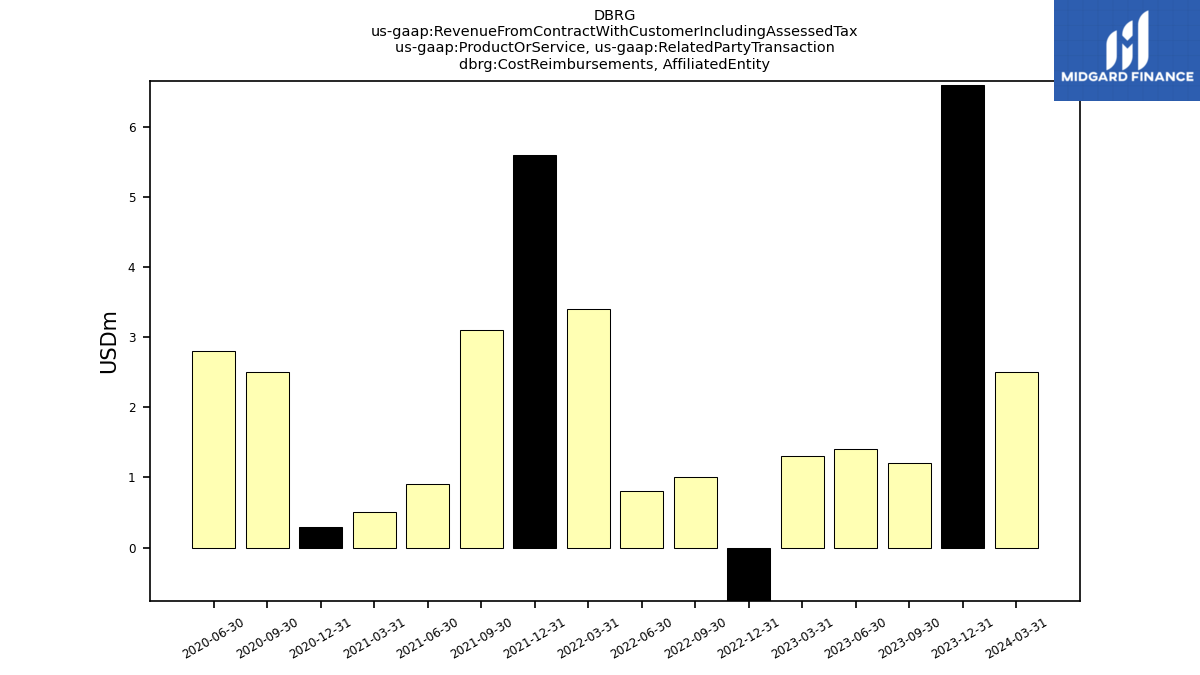
| Cost Reimbursements, | 6.60 | 1.20 | 1.40 | 1.30 | -1.40 | 1.00 | 0.80 | 3.40 | 5.60 | 3.10 | 0.90 | 0.50 | 0.30 | 2.50 | 2.80 | NA | NA | NA | NA | NA | NA | NA | NA | NA | NA | NA | NA | NA | NA | NA | NA | NA | |
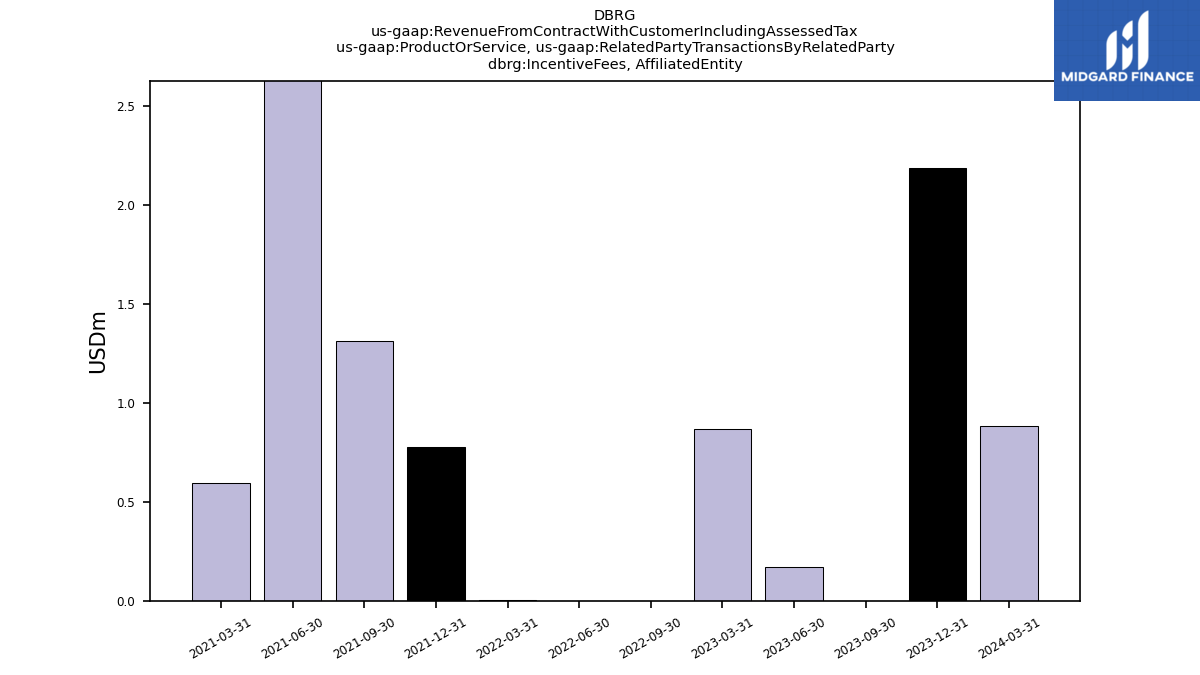
| Incentive Fees, | 2.19 | 0.00 | 0.17 | 0.87 | NA | 0.00 | 0.00 | 0.00 | 0.78 | 1.31 | 4.49 | 0.59 | NA | NA | NA | NA | NA | NA | NA | NA | NA | NA | NA | NA | NA | NA | NA | NA | NA | NA | NA | NA | |
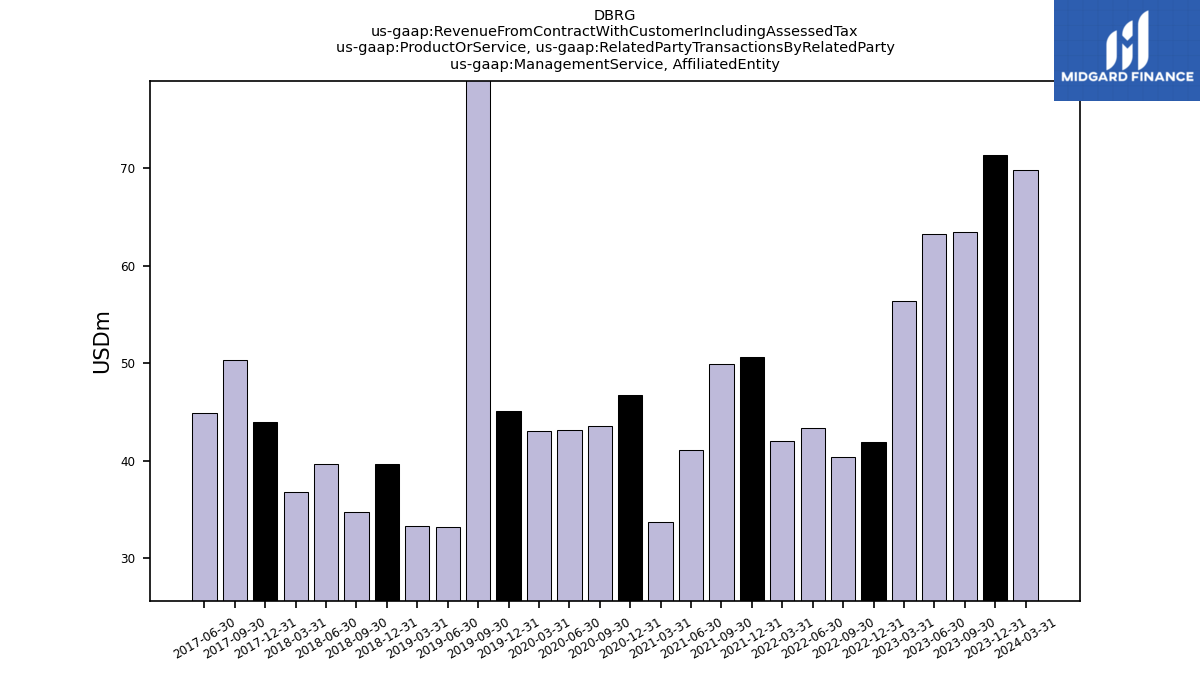
| Management Service, | 71.32 | 63.50 | 63.23 | 56.39 | 41.98 | 40.35 | 43.40 | 42.00 | 50.60 | 49.93 | 41.14 | 33.68 | 46.76 | 43.53 | 43.14 | 43.10 | 45.11 | 111.36 | 33.27 | 33.32 | 39.63 | 34.73 | 39.63 | 36.77 | 43.93 | 50.30 | 44.90 | NA | NA | NA | NA | NA | |
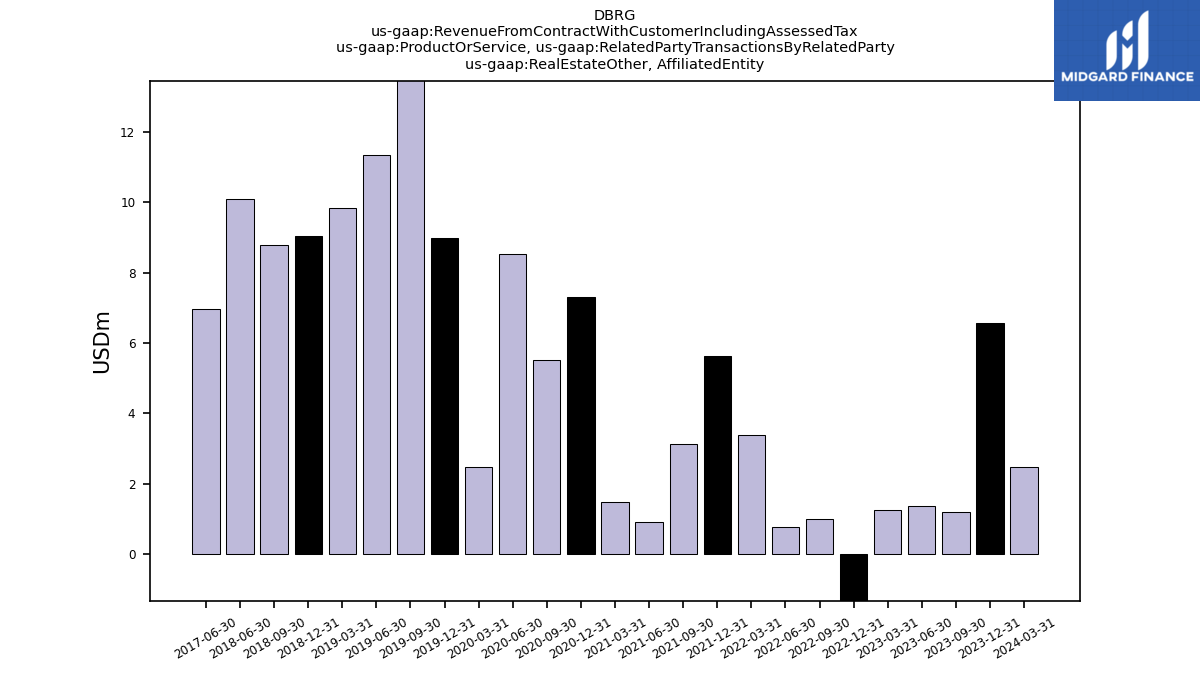
| Real Estate Other, | 6.56 | 1.21 | 1.38 | 1.25 | -1.36 | 0.99 | 0.79 | 3.38 | 5.63 | 3.12 | 0.91 | 1.49 | 7.32 | 5.53 | 8.52 | 2.49 | 8.98 | 34.06 | 11.34 | 9.85 | 9.03 | 8.78 | 10.09 | NA | NA | NA | 6.97 | NA | NA | NA | NA | NA |
