
| 2023-12-31 | 2023-09-30 | 2023-06-30 | 2023-03-31 | 2022-12-31 | 2022-09-30 | 2022-06-30 | 2022-03-31 | 2021-12-31 | 2021-09-30 | 2021-06-30 | 2021-03-31 | 2020-12-31 | 2020-09-30 | 2020-06-30 | 2020-03-31 | 2019-12-31 | 2019-09-30 | 2019-06-30 | 2019-03-31 | 2018-12-31 | 2018-09-30 | 2018-06-30 | 2018-03-31 | 2017-12-31 | 2017-09-30 | 2017-06-30 | ||
|---|---|---|---|---|---|---|---|---|---|---|---|---|---|---|---|---|---|---|---|---|---|---|---|---|---|---|---|---|
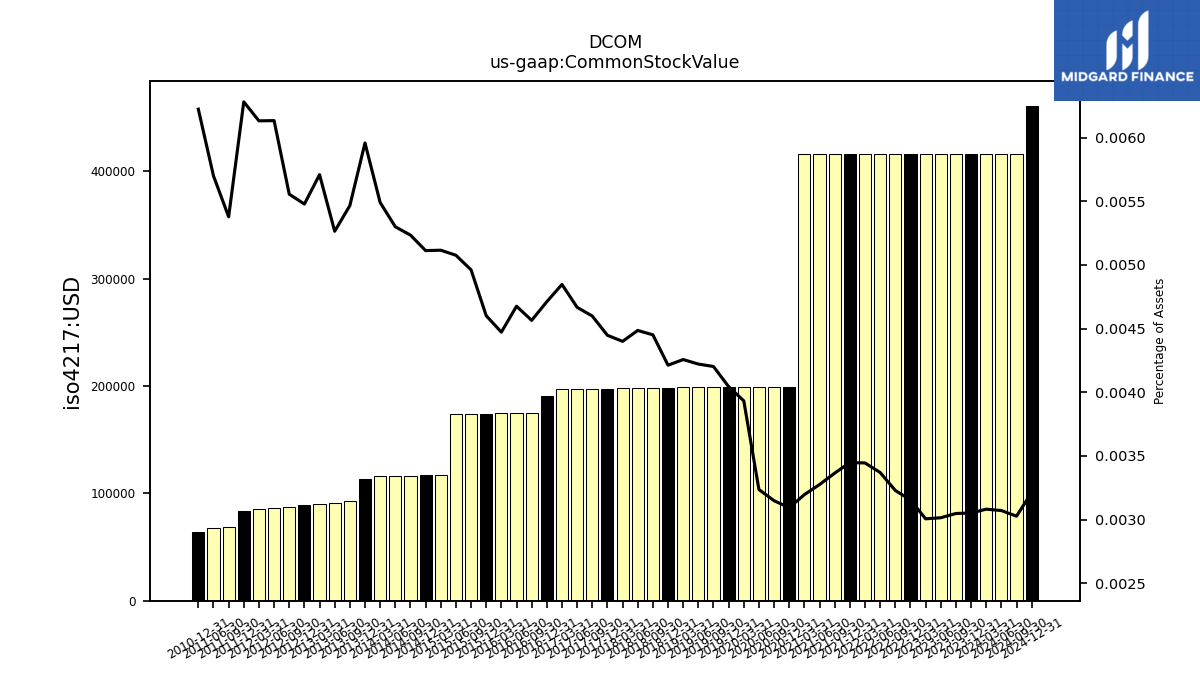
| Common Stock Value | 0.42 | 0.42 | 0.42 | 0.42 | 0.42 | 0.42 | 0.42 | 0.42 | 0.42 | 0.42 | 0.42 | 0.42 | 0.20 | 0.20 | 0.20 | 0.20 | 0.20 | 0.20 | 0.20 | 0.20 | 0.20 | 0.20 | 0.20 | 0.20 | 0.20 | 0.20 | 0.20 | |
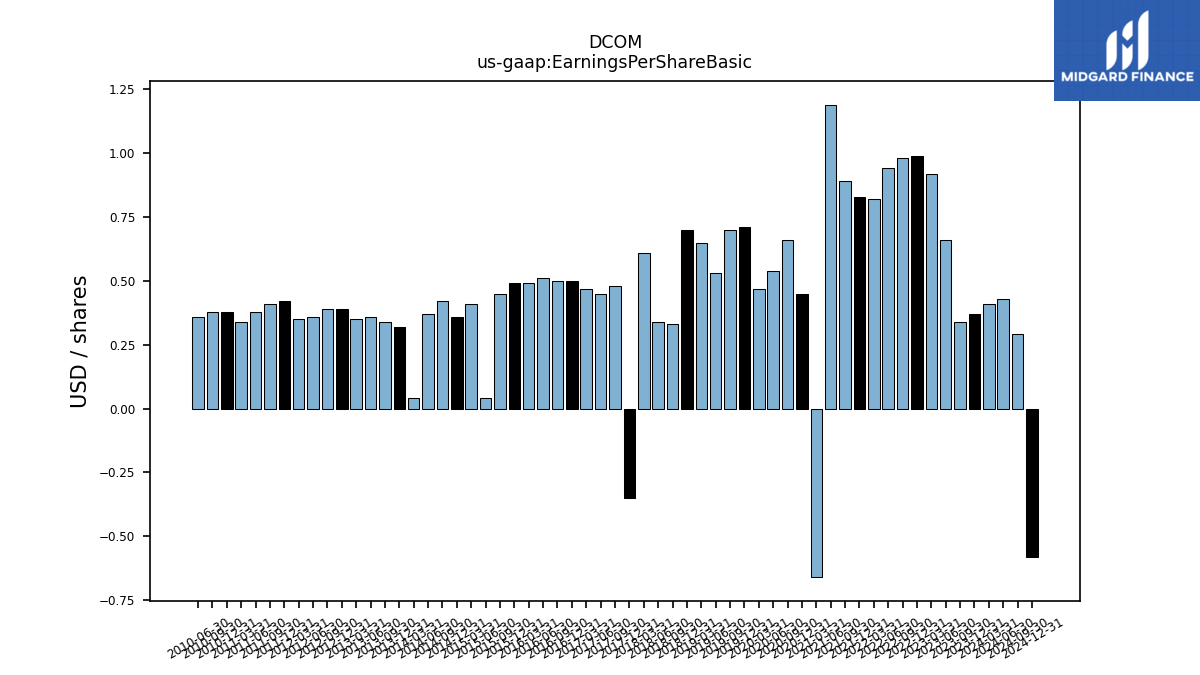
| Earnings Per Share Basic | 0.37 | 0.34 | 0.66 | 0.92 | 0.99 | 0.98 | 0.94 | 0.82 | 0.83 | 0.89 | 1.19 | -0.66 | 0.45 | 0.66 | 0.54 | 0.47 | 0.71 | 0.70 | 0.53 | 0.65 | 0.70 | 0.33 | 0.34 | 0.61 | -0.35 | 0.48 | 0.45 | |
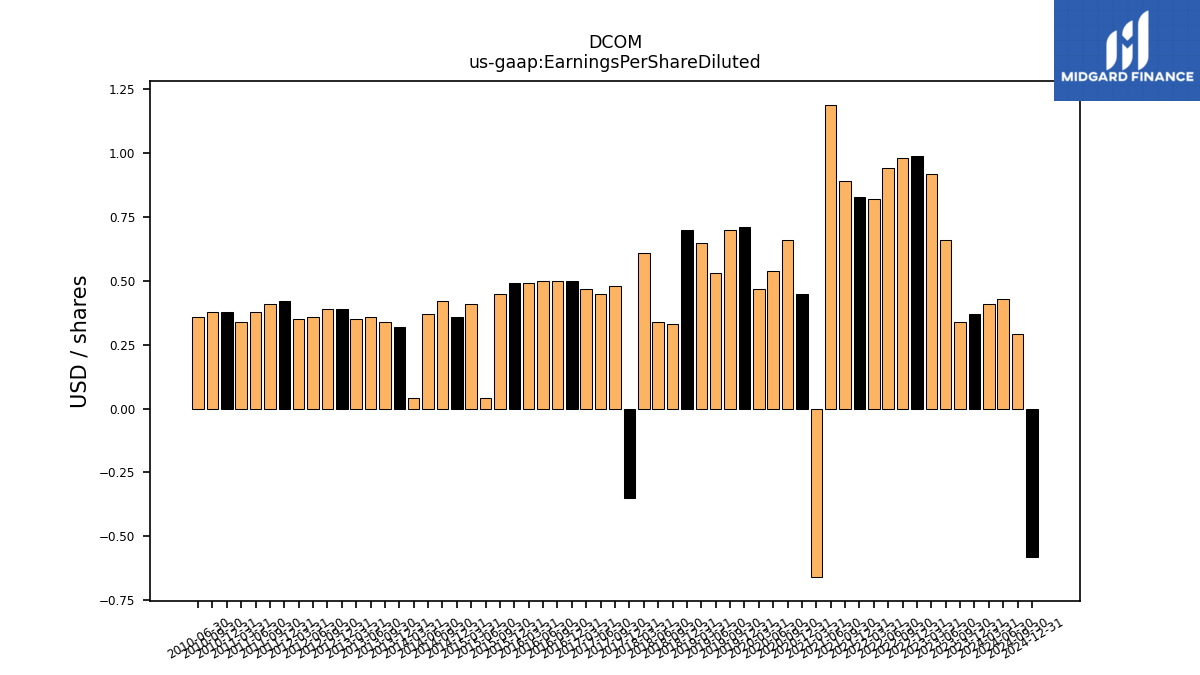
| Earnings Per Share Diluted | 0.37 | 0.34 | 0.66 | 0.92 | 0.99 | 0.98 | 0.94 | 0.82 | 0.83 | 0.89 | 1.19 | -0.66 | 0.45 | 0.66 | 0.54 | 0.47 | 0.71 | 0.70 | 0.53 | 0.65 | 0.70 | 0.33 | 0.34 | 0.61 | -0.35 | 0.48 | 0.45 | |
| Tier One Risk Based Capital To Risk Weighted Assets | 0.00 | NA | NA | NA | 0.00 | NA | NA | NA | 0.00 | NA | NA | NA | 0.00 | NA | NA | NA | 0.00 | NA | NA | NA | 0.00 | NA | NA | NA | NA | NA | NA | |
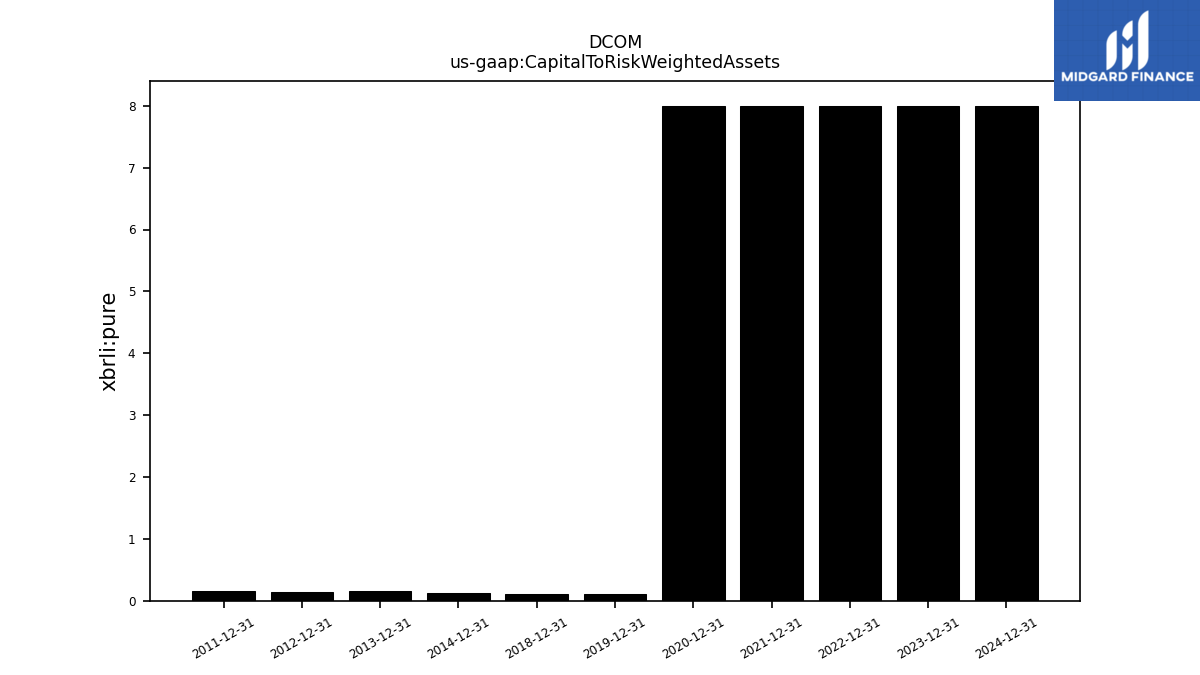
| Capital To Risk Weighted Assets | 0.00 | NA | NA | NA | 0.00 | NA | NA | NA | 0.00 | NA | NA | NA | 0.00 | NA | NA | NA | 0.00 | NA | NA | NA | 0.00 | NA | NA | NA | NA | NA | NA |
| 2023-12-31 | 2023-09-30 | 2023-06-30 | 2023-03-31 | 2022-12-31 | 2022-09-30 | 2022-06-30 | 2022-03-31 | 2021-12-31 | 2021-09-30 | 2021-06-30 | 2021-03-31 | 2020-12-31 | 2020-09-30 | 2020-06-30 | 2020-03-31 | 2019-12-31 | 2019-09-30 | 2019-06-30 | 2019-03-31 | 2018-12-31 | 2018-09-30 | 2018-06-30 | 2018-03-31 | 2017-12-31 | 2017-09-30 | 2017-06-30 | ||
|---|---|---|---|---|---|---|---|---|---|---|---|---|---|---|---|---|---|---|---|---|---|---|---|---|---|---|---|---|
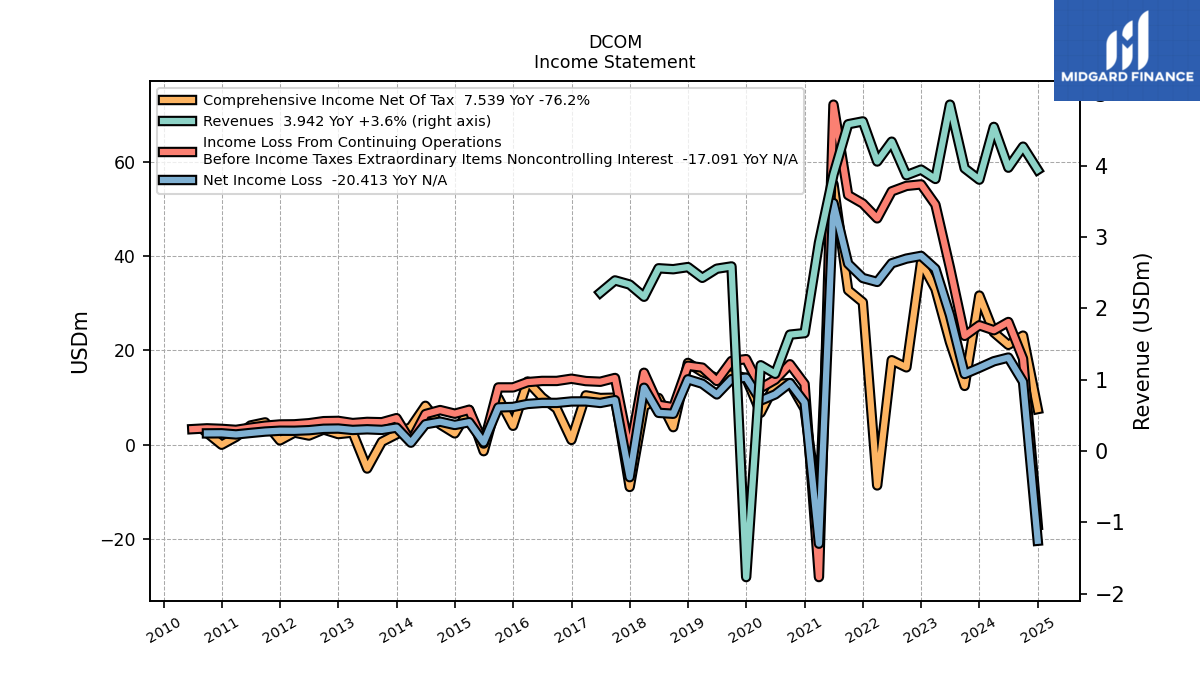
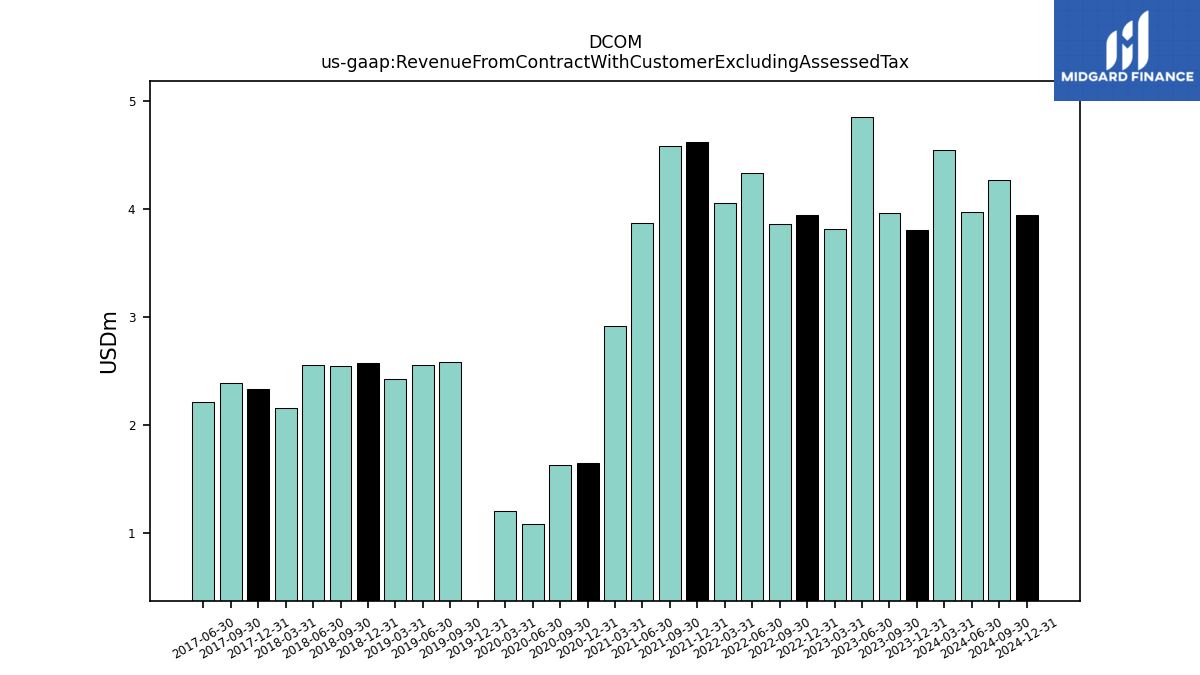
| Revenue From Contract With Customer Excluding Assessed Tax | 3.80 | 3.96 | 4.86 | 3.81 | 3.94 | 3.87 | 4.34 | 4.06 | 4.62 | 4.58 | 3.88 | 2.92 | 1.65 | 1.63 | 1.08 | 1.20 | -1.77 | 2.59 | 2.56 | 2.43 | 2.58 | 2.55 | 2.56 | 2.16 | 2.33 | 2.39 | 2.22 | |
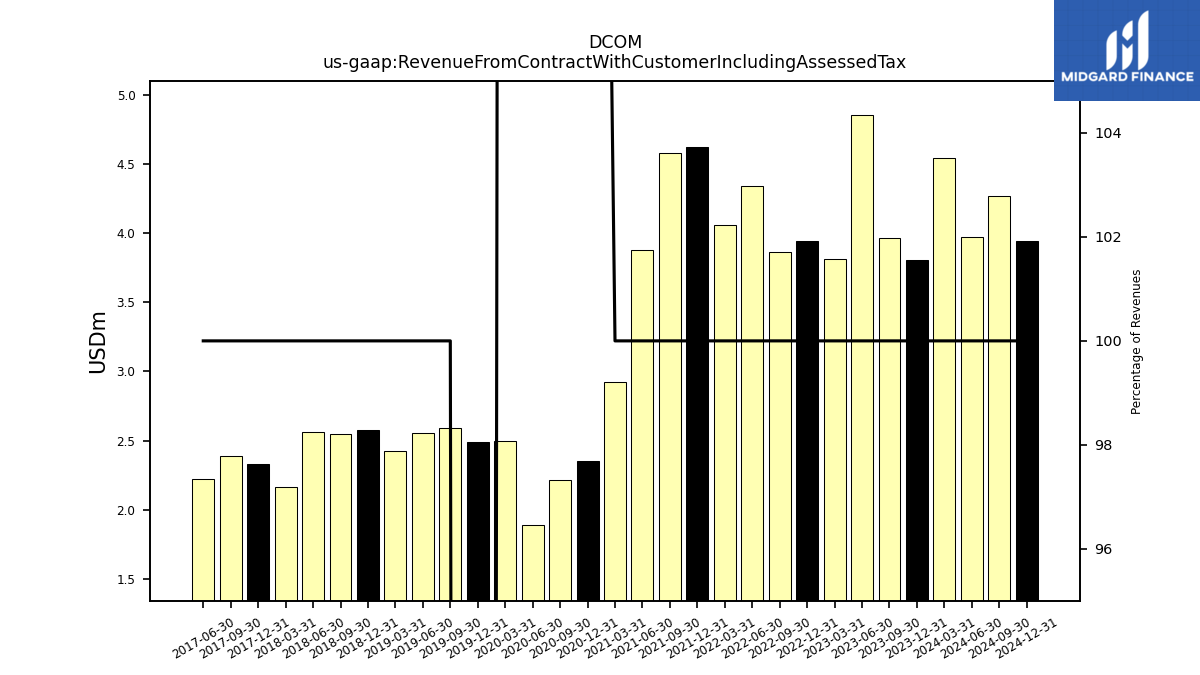
| Revenue From Contract With Customer Including Assessed Tax | 3.80 | 3.96 | 4.86 | 3.81 | 3.94 | 3.87 | 4.34 | 4.06 | 4.62 | 4.58 | 3.88 | 2.92 | 2.35 | 2.21 | 1.89 | 2.50 | 2.49 | 2.59 | 2.56 | 2.43 | 2.58 | 2.55 | 2.56 | 2.16 | 2.33 | 2.39 | 2.22 | |
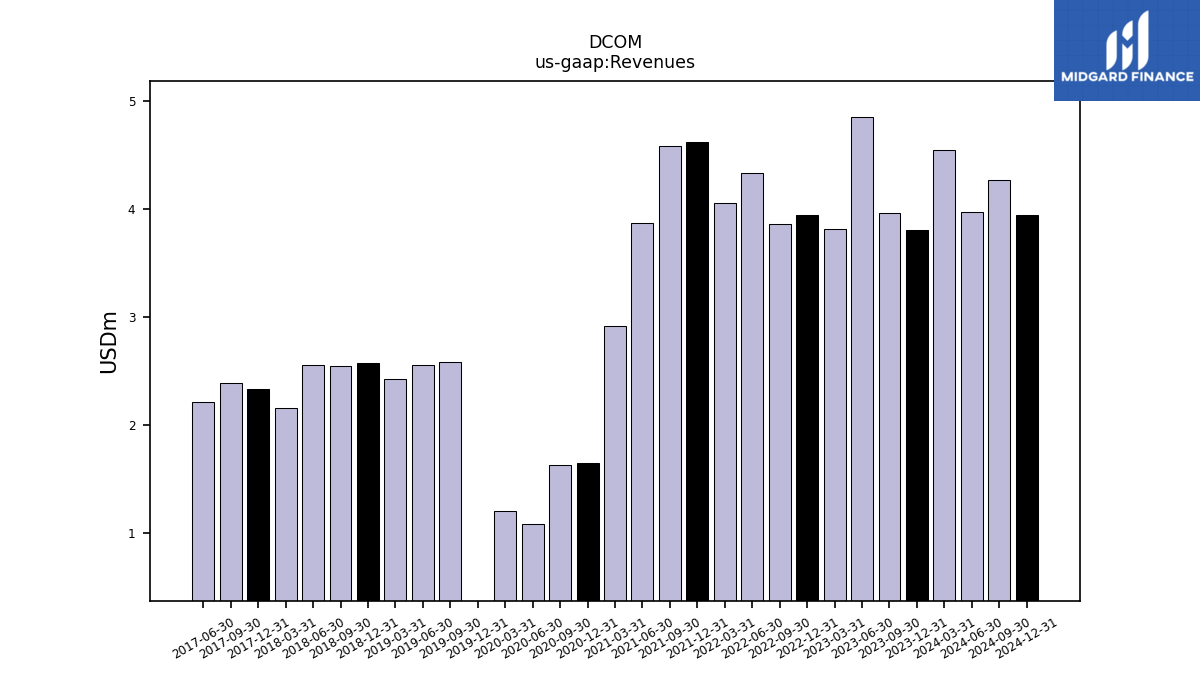
| Revenues | 3.80 | 3.96 | 4.86 | 3.81 | 3.94 | 3.87 | 4.34 | 4.06 | 4.62 | 4.58 | 3.88 | 2.92 | 1.65 | 1.63 | 1.08 | 1.20 | -1.77 | 2.59 | 2.56 | 2.43 | 2.58 | 2.55 | 2.56 | 2.16 | 2.33 | 2.39 | 2.22 | |
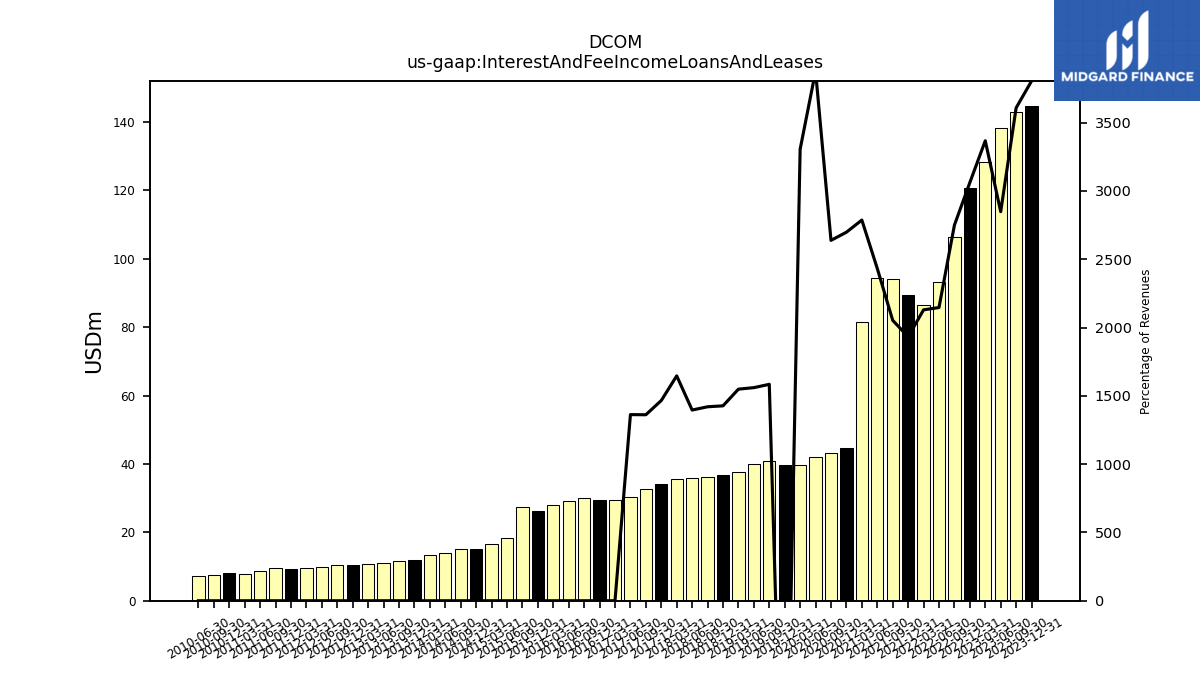
| Interest And Fee Income Loans And Leases | 144.74 | 143.00 | 138.31 | 128.44 | 120.77 | 106.31 | 93.10 | 86.42 | 89.30 | 94.05 | 94.29 | 81.38 | 44.60 | 43.06 | 41.99 | 39.76 | 39.73 | 41.01 | 39.88 | 37.61 | 36.80 | 36.20 | 35.77 | 35.61 | 34.21 | 32.57 | 30.25 | |
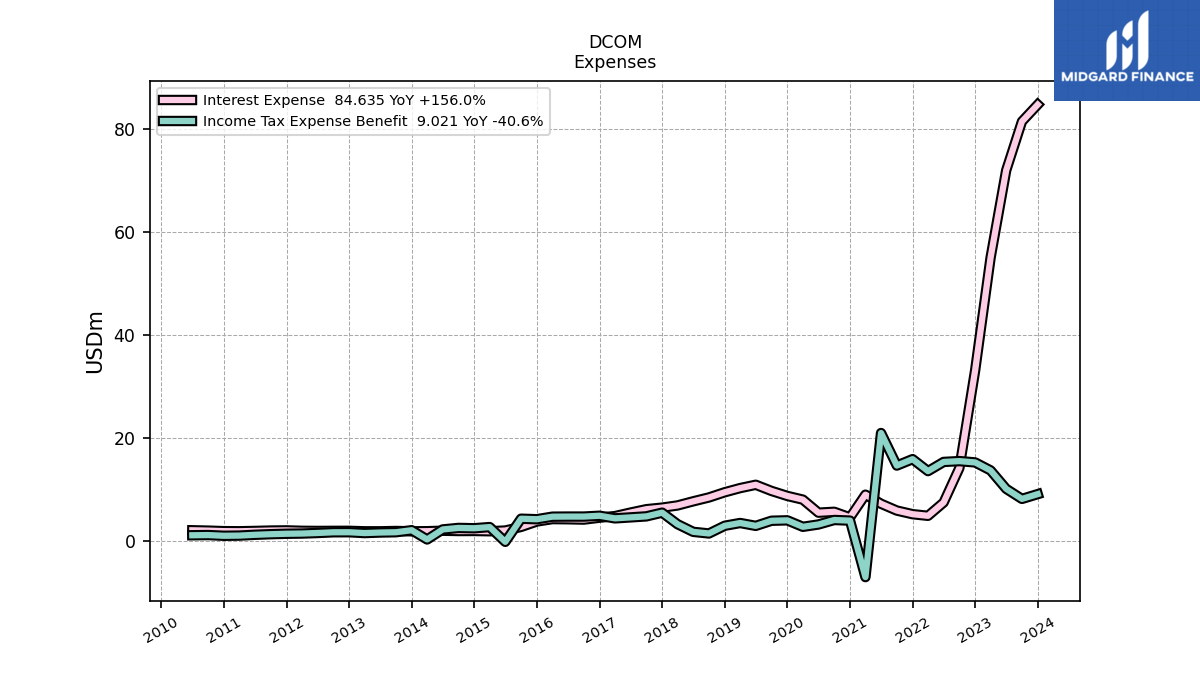
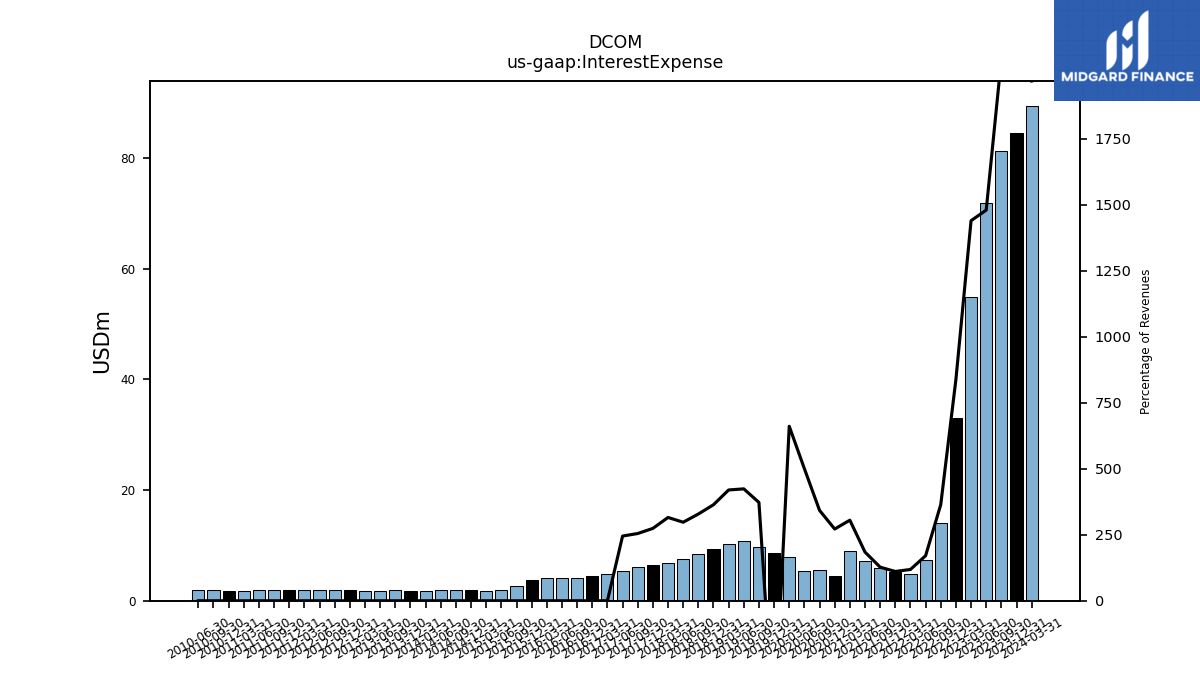
| Interest Expense | 84.64 | 81.36 | 71.87 | 54.92 | 33.06 | 14.09 | 7.40 | 4.81 | 5.13 | 5.83 | 7.15 | 8.91 | 4.49 | 5.59 | 5.42 | 7.95 | 8.67 | 9.64 | 10.84 | 10.19 | 9.38 | 8.38 | 7.62 | 6.83 | 6.40 | 6.09 | 5.44 | |
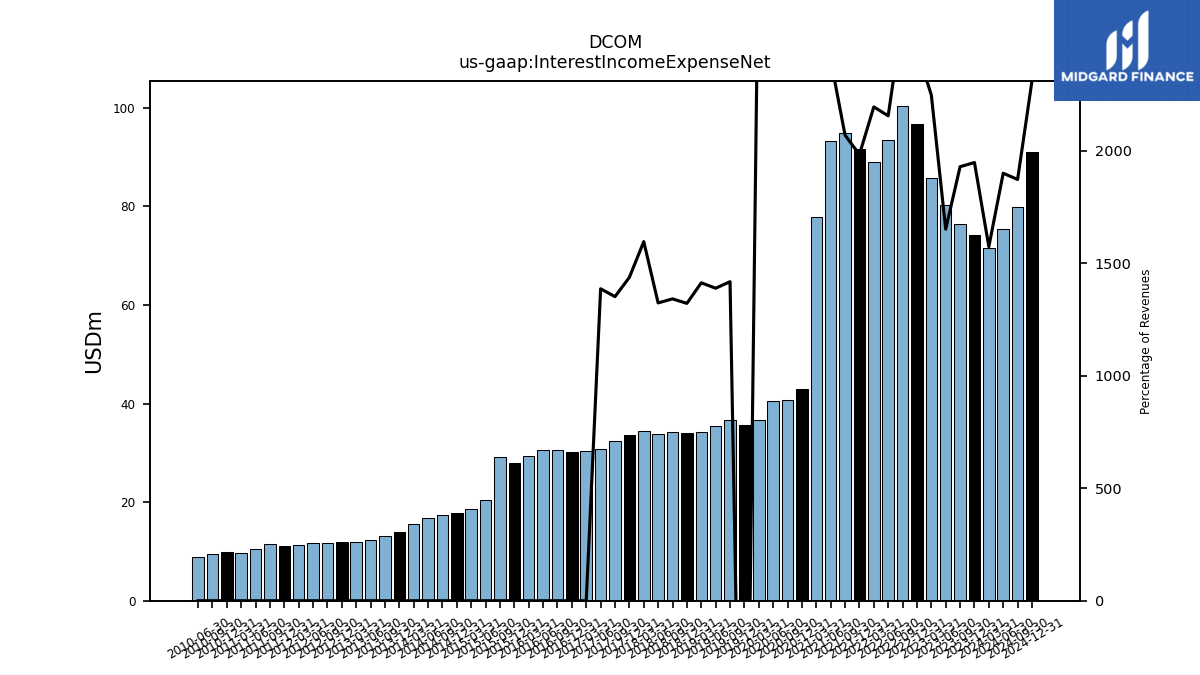
| Interest Income Expense Net | 74.12 | 76.48 | 80.22 | 85.75 | 96.80 | 100.44 | 93.51 | 89.11 | 91.69 | 94.83 | 93.25 | 77.84 | 42.99 | 40.71 | 40.43 | 36.65 | 35.65 | 36.72 | 35.52 | 34.32 | 34.10 | 34.21 | 33.93 | 34.54 | 33.56 | 32.34 | 30.79 | |
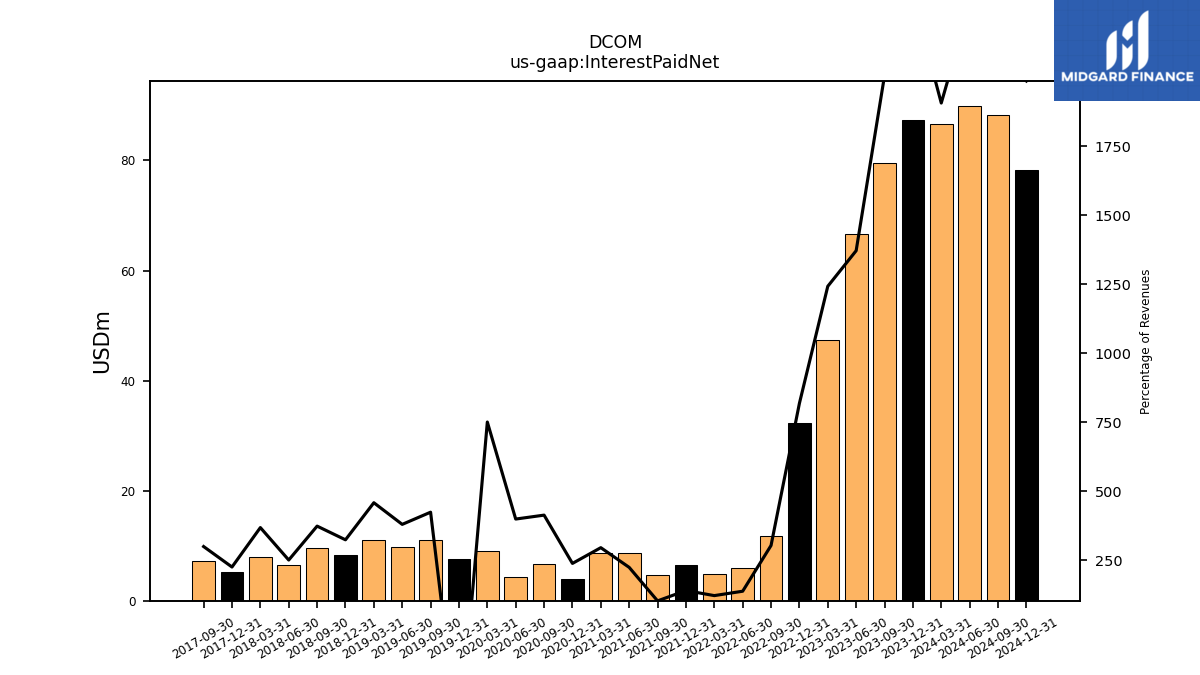
| Interest Paid Net | 87.29 | 79.51 | 66.62 | 47.40 | 32.29 | 11.72 | 5.96 | 4.93 | 6.46 | 4.69 | 8.68 | 8.62 | 3.94 | 6.75 | 4.32 | 9.03 | 7.59 | 10.97 | 9.71 | 11.13 | 8.35 | 9.52 | 6.42 | 7.96 | 5.26 | 7.16 | NA | |
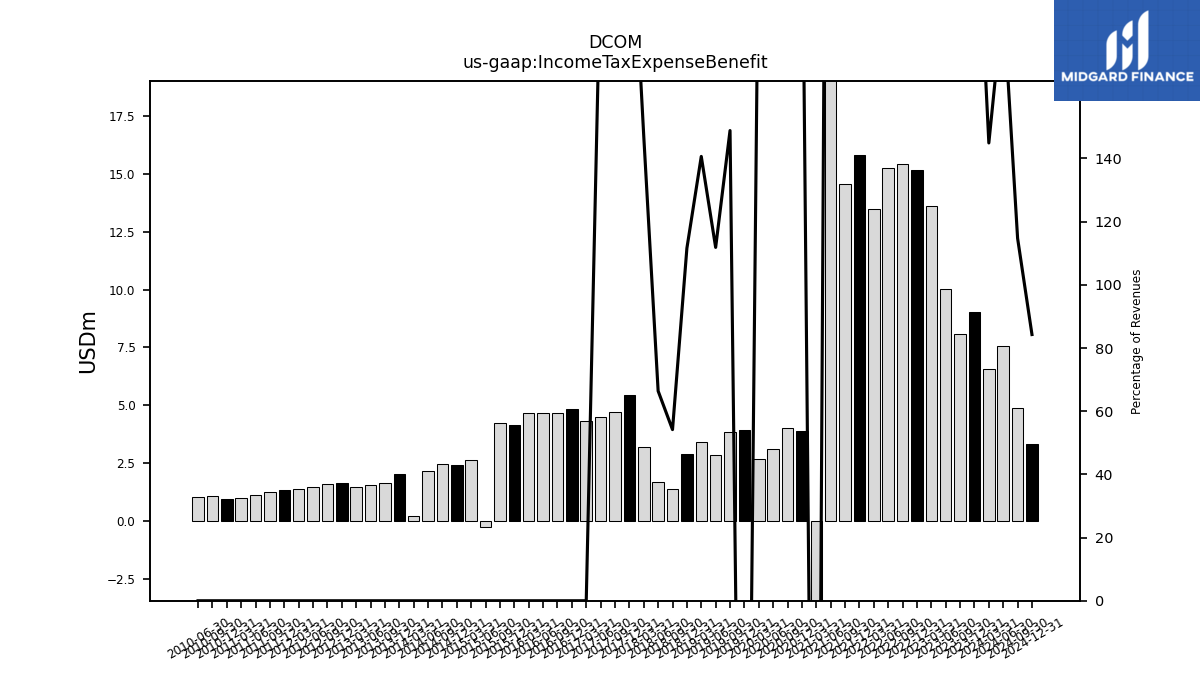
| Income Tax Expense Benefit | 9.02 | 8.09 | 10.05 | 13.62 | 15.18 | 15.43 | 15.27 | 13.48 | 15.81 | 14.56 | 20.89 | -7.09 | 3.88 | 4.00 | 3.13 | 2.68 | 3.93 | 3.85 | 2.86 | 3.42 | 2.88 | 1.38 | 1.70 | 3.18 | 5.42 | 4.70 | 4.50 | |
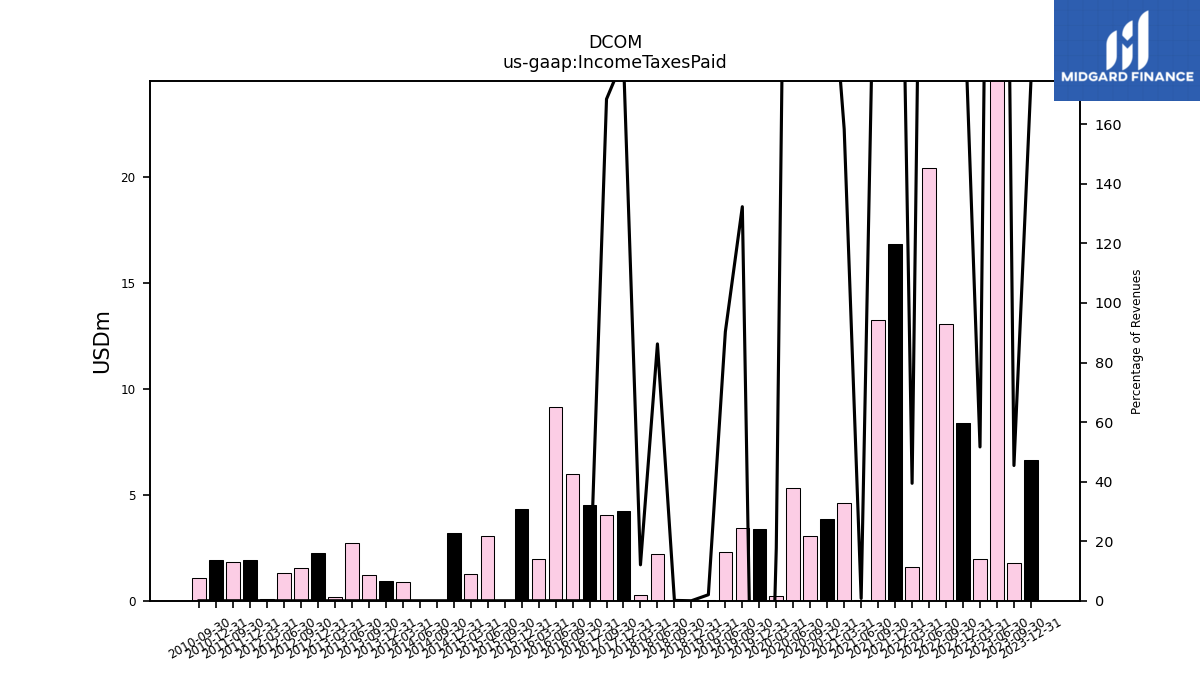
| Income Taxes Paid | 6.64 | 1.80 | 27.50 | 1.97 | 8.39 | 13.07 | 20.46 | 1.60 | 16.84 | 13.28 | 0.03 | 4.62 | 3.84 | 3.08 | 5.33 | 0.21 | 3.38 | 3.42 | 2.31 | 0.05 | 0.00 | 0.00 | 2.21 | 0.26 | 4.25 | 4.03 | NA | |
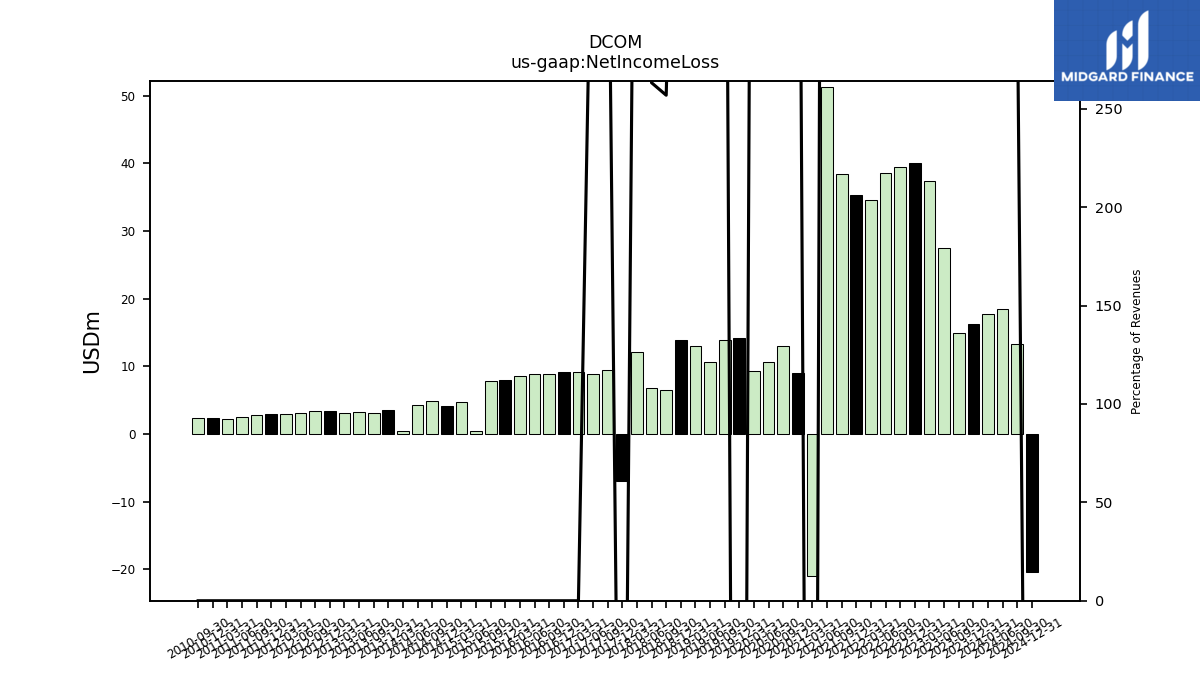
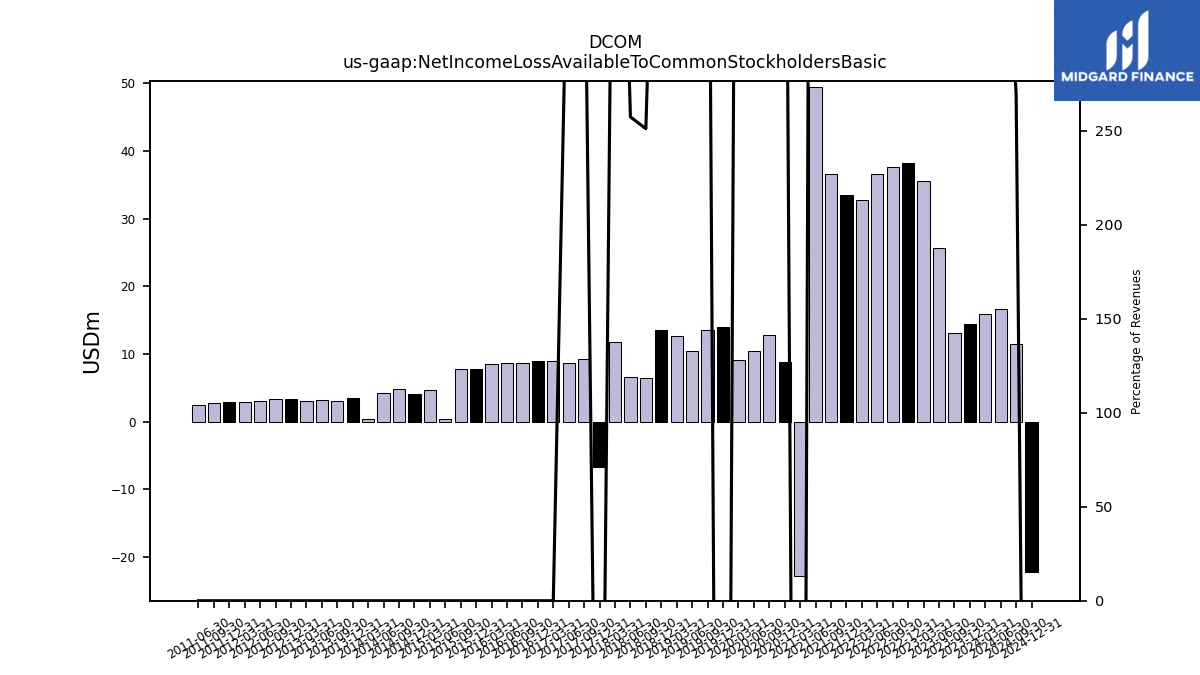
| Net Income Loss | 16.31 | 14.98 | 27.50 | 37.30 | 40.06 | 39.48 | 38.48 | 34.53 | 35.36 | 38.40 | 51.28 | -21.03 | 8.98 | 13.06 | 10.66 | 9.35 | 14.21 | 13.90 | 10.65 | 12.93 | 13.86 | 6.55 | 6.74 | 12.07 | -6.92 | 9.44 | 8.84 | |
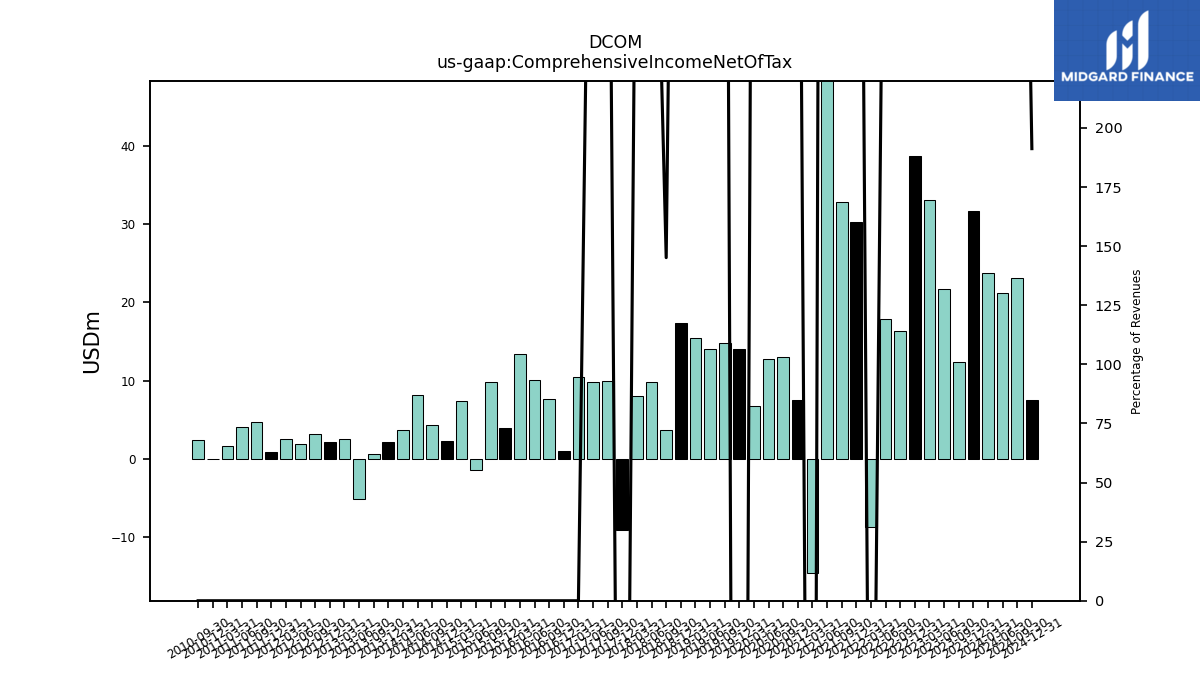
| Comprehensive Income Net Of Tax | 31.64 | 12.46 | 21.75 | 33.04 | 38.72 | 16.39 | 17.91 | -8.67 | 30.22 | 32.78 | 55.32 | -14.58 | 7.60 | 13.07 | 12.82 | 6.76 | 14.10 | 14.87 | 14.09 | 15.41 | 17.34 | 3.70 | 9.91 | 8.10 | -8.99 | 9.96 | 9.89 | |
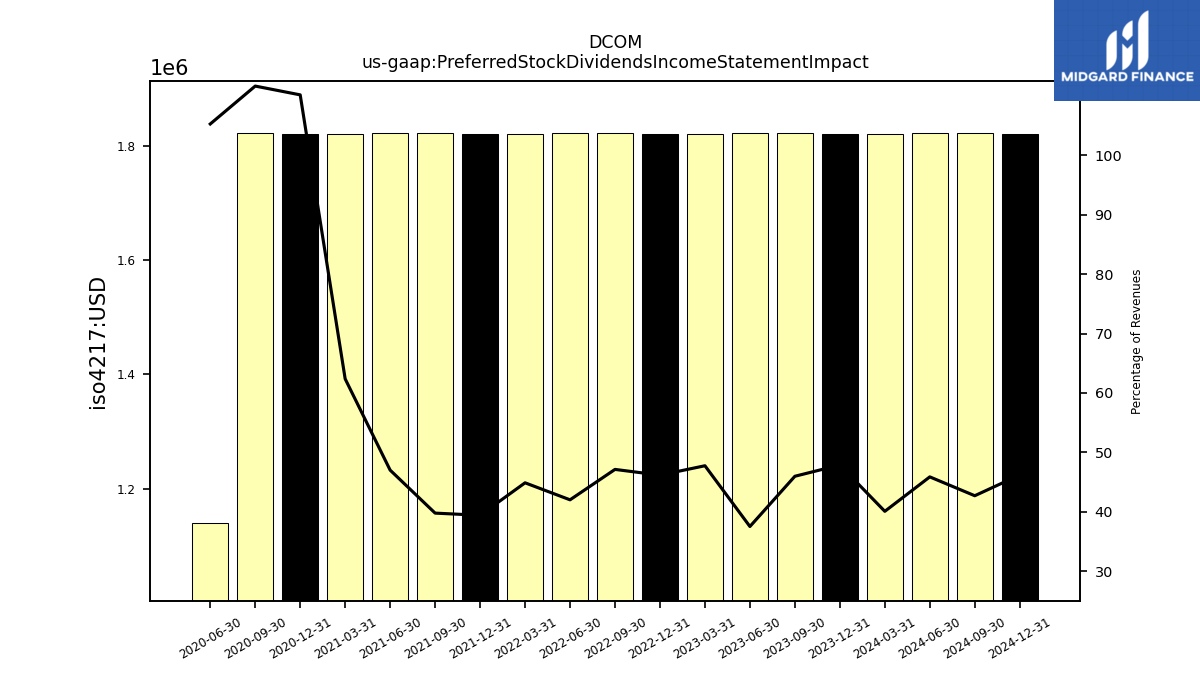
| Preferred Stock Dividends Income Statement Impact | 1.82 | 1.82 | 1.82 | 1.82 | 1.82 | 1.82 | 1.82 | 1.82 | 1.82 | 1.82 | 1.82 | 1.82 | 1.82 | 1.82 | 1.14 | NA | NA | NA | NA | NA | NA | NA | NA | NA | NA | NA | NA | |
| Net Income Loss Available To Common Stockholders Basic | 14.49 | 13.16 | 25.68 | 35.48 | 38.24 | 37.66 | 36.66 | 32.71 | 33.54 | 36.57 | 49.46 | -22.86 | 8.79 | 12.79 | 10.44 | 9.15 | 13.91 | 13.61 | 10.43 | 12.65 | 13.56 | 6.40 | 6.59 | 11.82 | -6.77 | 9.25 | 8.66 | |
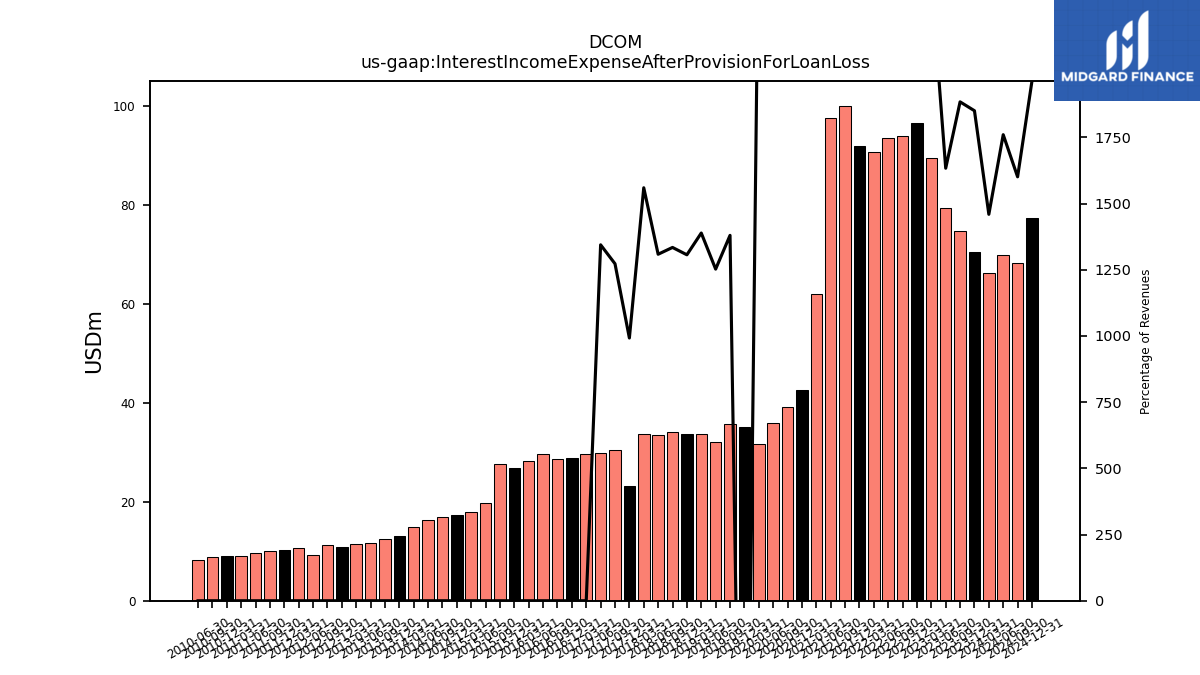
| Interest Income Expense After Provision For Loan Loss | 70.40 | 74.67 | 79.33 | 89.40 | 96.47 | 93.85 | 93.47 | 90.70 | 91.82 | 100.02 | 97.50 | 62.06 | 42.49 | 39.21 | 35.93 | 31.65 | 35.05 | 35.72 | 32.02 | 33.72 | 33.70 | 34.01 | 33.53 | 33.74 | 23.16 | 30.45 | 29.84 | |
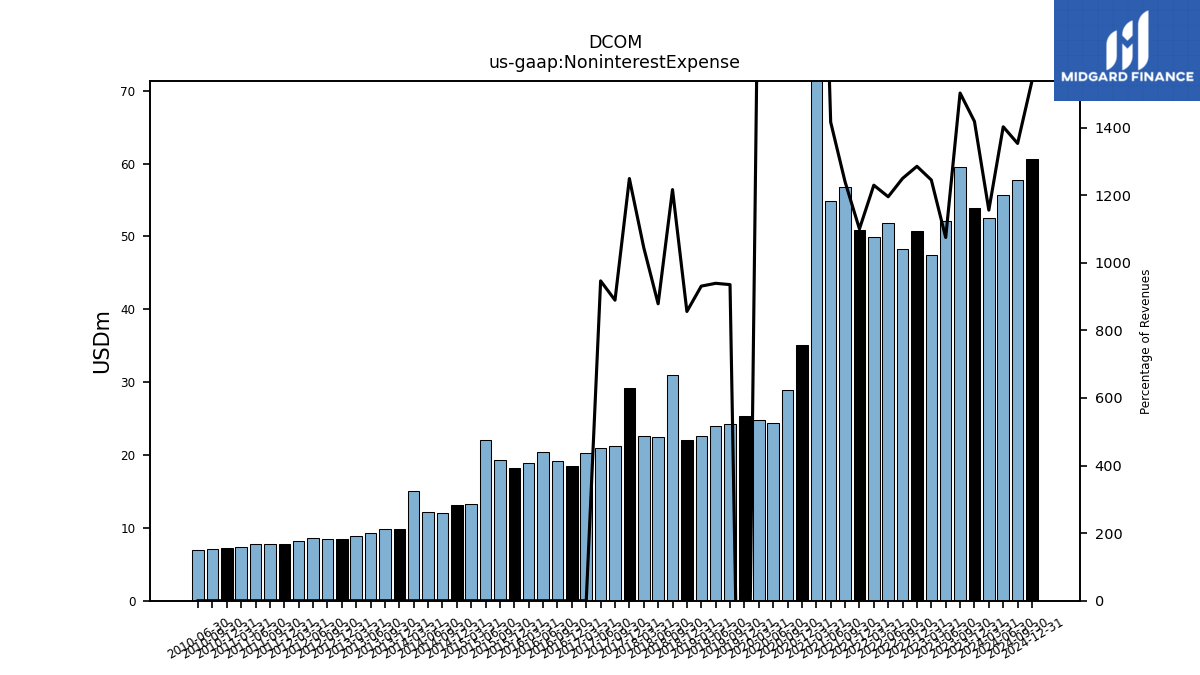
| Noninterest Expense | 53.94 | 59.52 | 52.19 | 47.48 | 50.70 | 48.30 | 51.84 | 49.89 | 50.83 | 56.78 | 54.88 | 82.81 | 35.08 | 28.94 | 24.40 | 24.84 | 25.33 | 24.20 | 24.00 | 22.60 | 22.07 | 31.00 | 22.51 | 22.60 | 29.15 | 21.27 | 21.01 | |
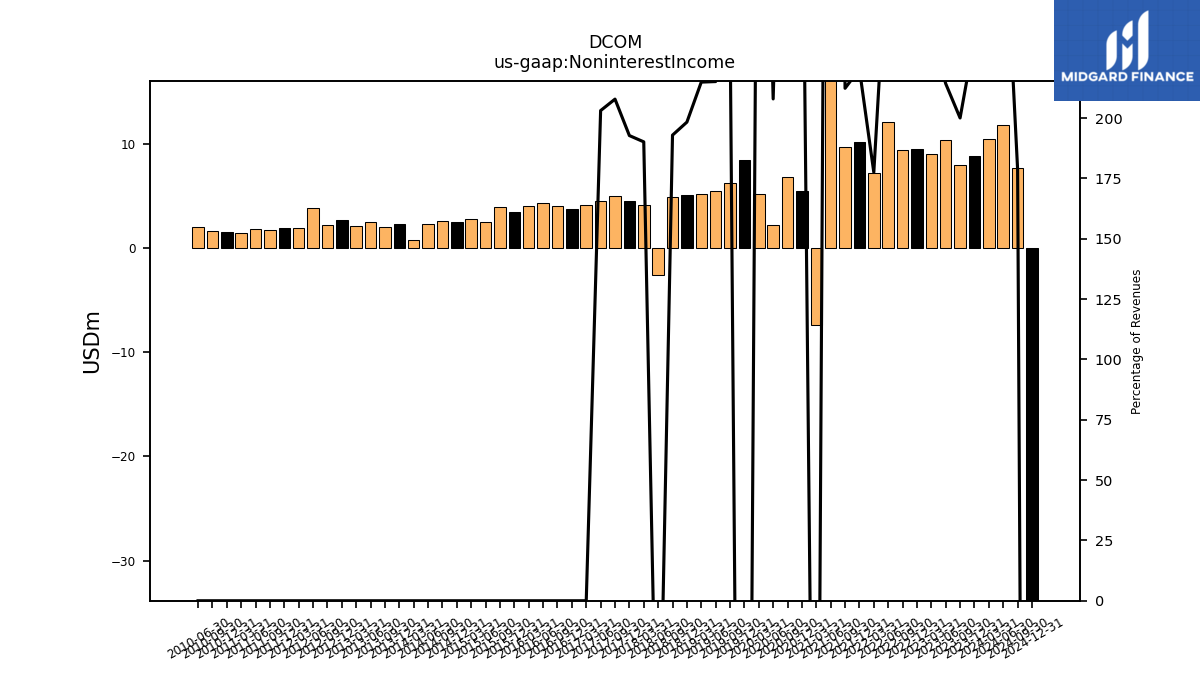
| Noninterest Income | 8.87 | 7.93 | 10.40 | 9.00 | 9.47 | 9.36 | 12.12 | 7.20 | 10.18 | 9.73 | 29.54 | -7.38 | 5.44 | 6.79 | 2.25 | 5.22 | 8.43 | 6.24 | 5.50 | 5.22 | 5.12 | 4.92 | -2.58 | 4.11 | 4.50 | 4.97 | 4.51 |
| 2023-12-31 | 2023-09-30 | 2023-06-30 | 2023-03-31 | 2022-12-31 | 2022-09-30 | 2022-06-30 | 2022-03-31 | 2021-12-31 | 2021-09-30 | 2021-06-30 | 2021-03-31 | 2020-12-31 | 2020-09-30 | 2020-06-30 | 2020-03-31 | 2019-12-31 | 2019-09-30 | 2019-06-30 | 2019-03-31 | 2018-12-31 | 2018-09-30 | 2018-06-30 | 2018-03-31 | 2017-12-31 | 2017-09-30 | 2017-06-30 | ||
|---|---|---|---|---|---|---|---|---|---|---|---|---|---|---|---|---|---|---|---|---|---|---|---|---|---|---|---|---|
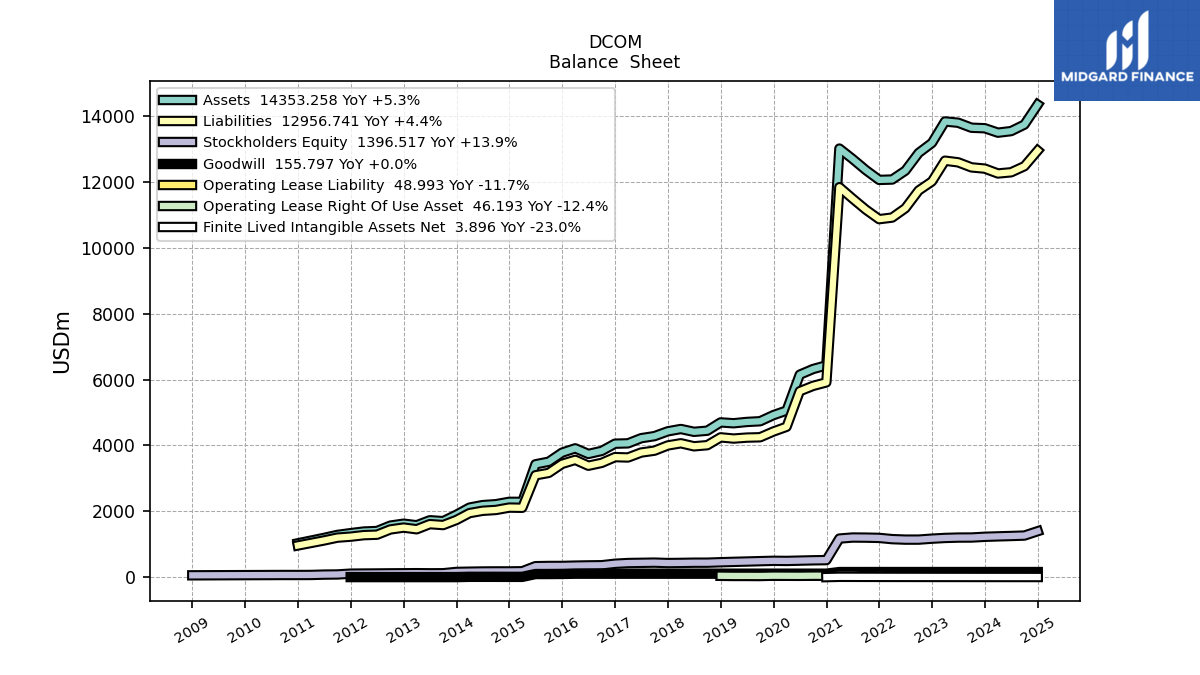
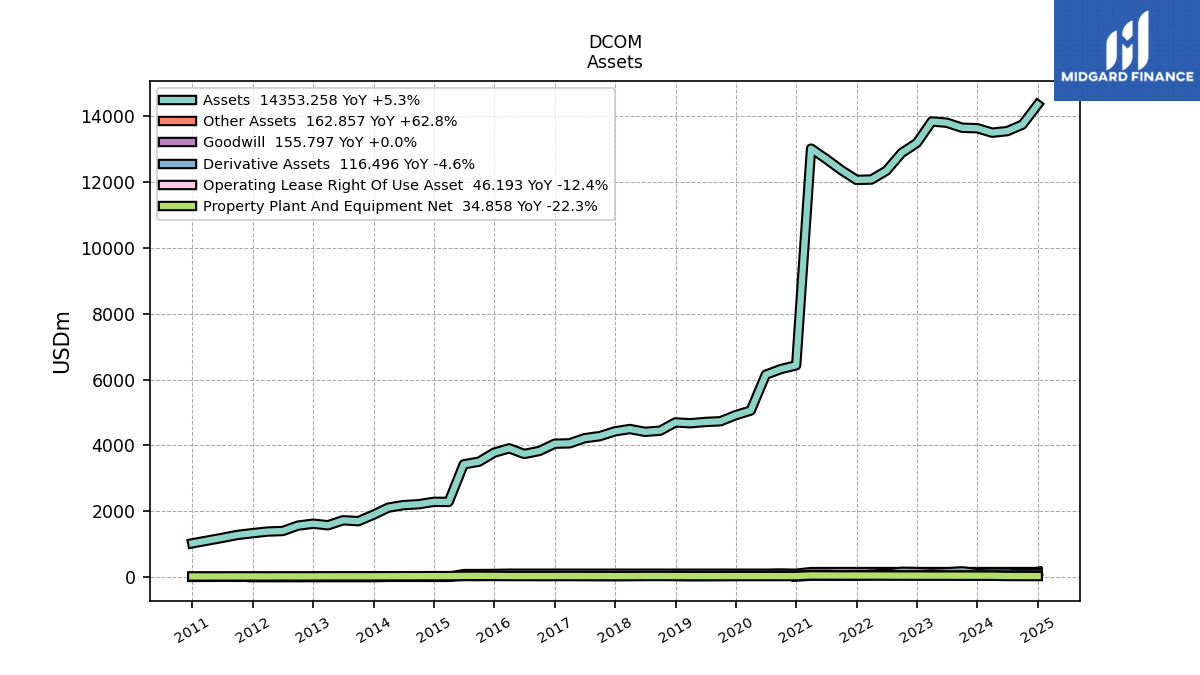
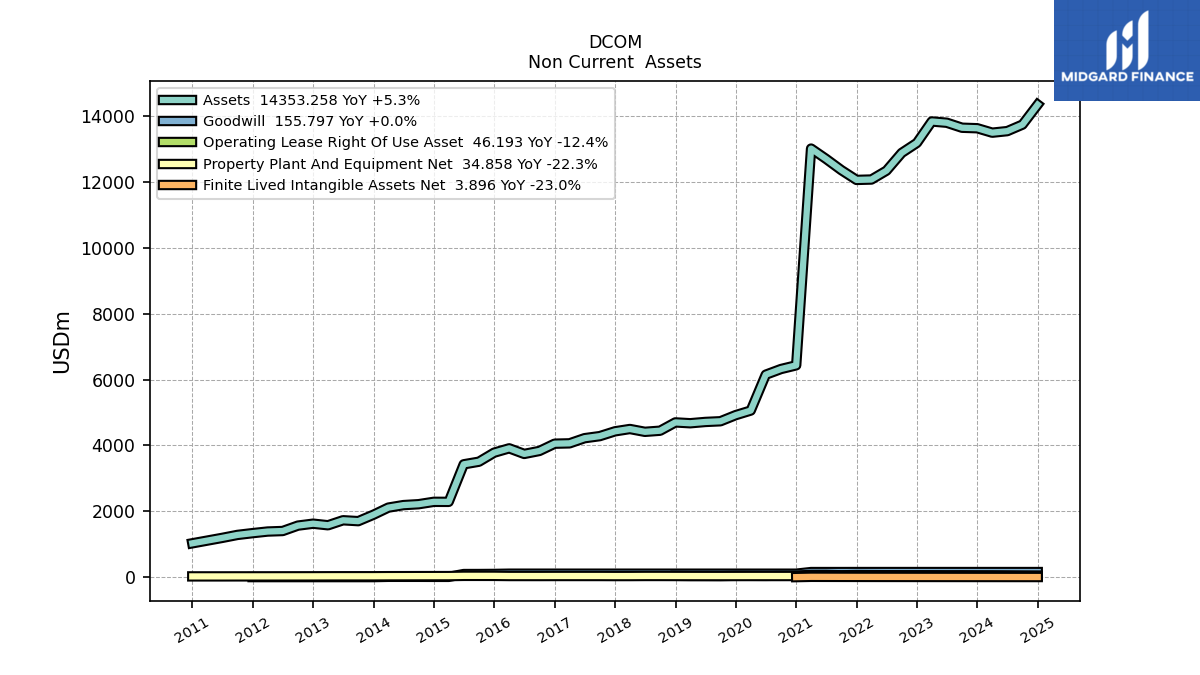
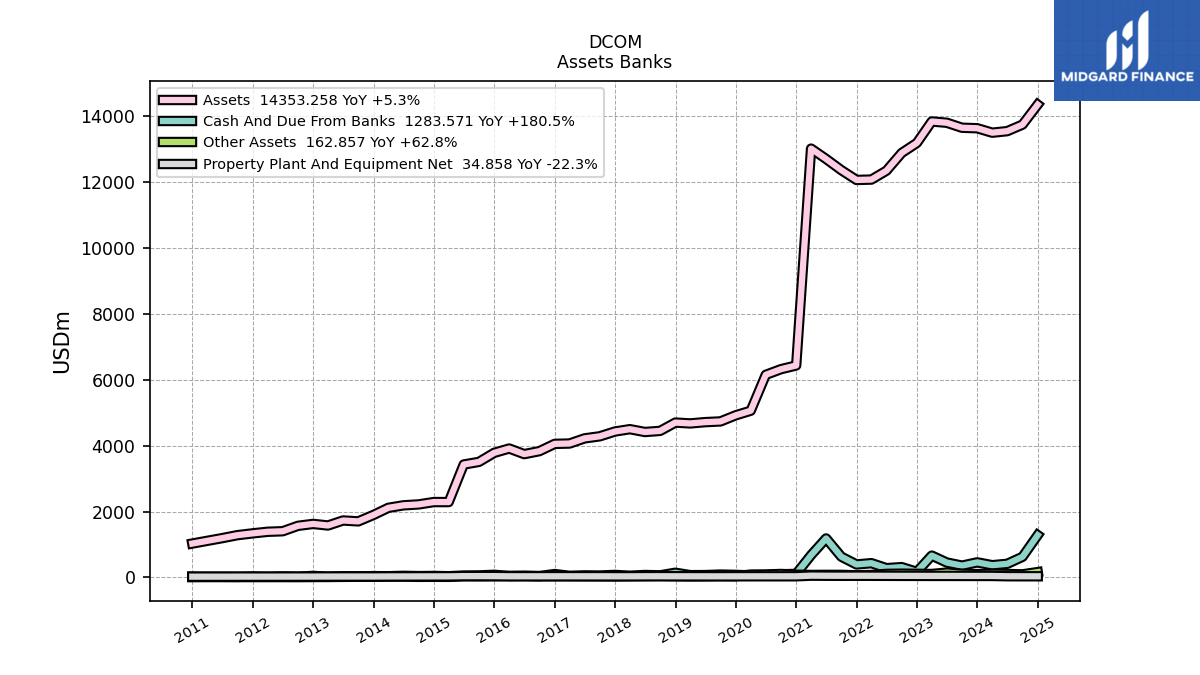
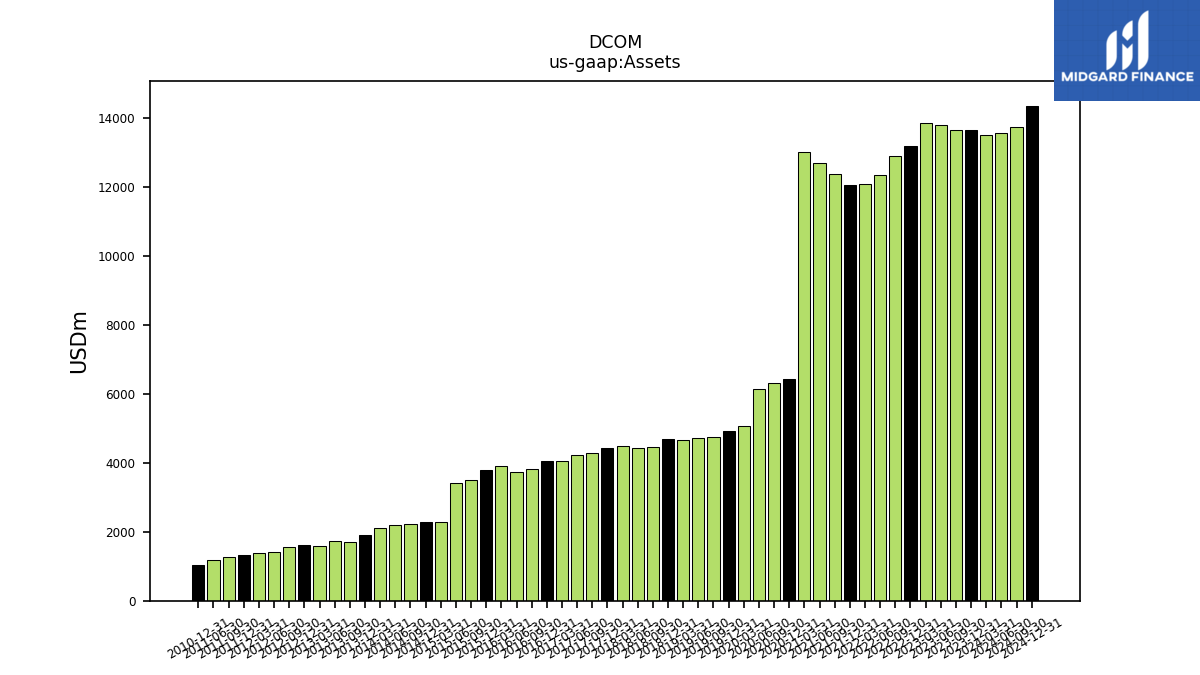
| Assets | 13636.00 | 13651.41 | 13802.86 | 13841.72 | 13189.92 | 12885.90 | 12347.08 | 12078.25 | 12066.36 | 12364.38 | 12703.68 | 13018.63 | 6434.30 | 6322.38 | 6150.66 | 5060.87 | 4921.52 | 4736.02 | 4714.53 | 4675.21 | 4700.74 | 4448.76 | 4414.78 | 4500.62 | 4430.00 | 4284.28 | 4221.45 | |
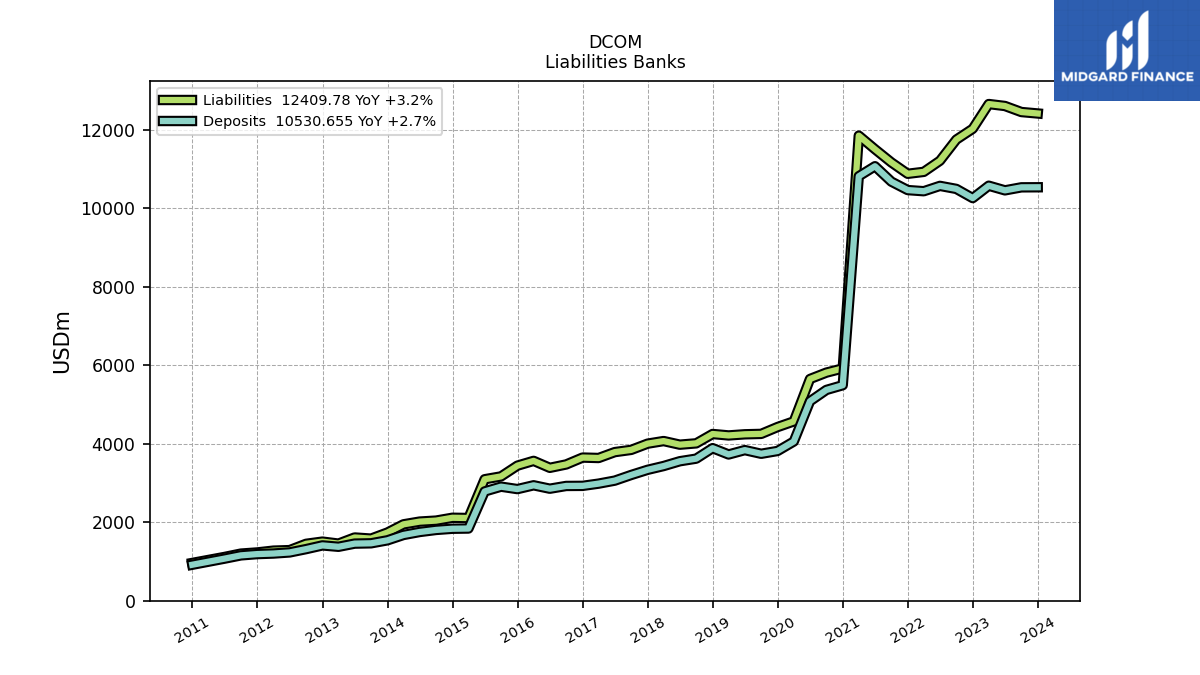
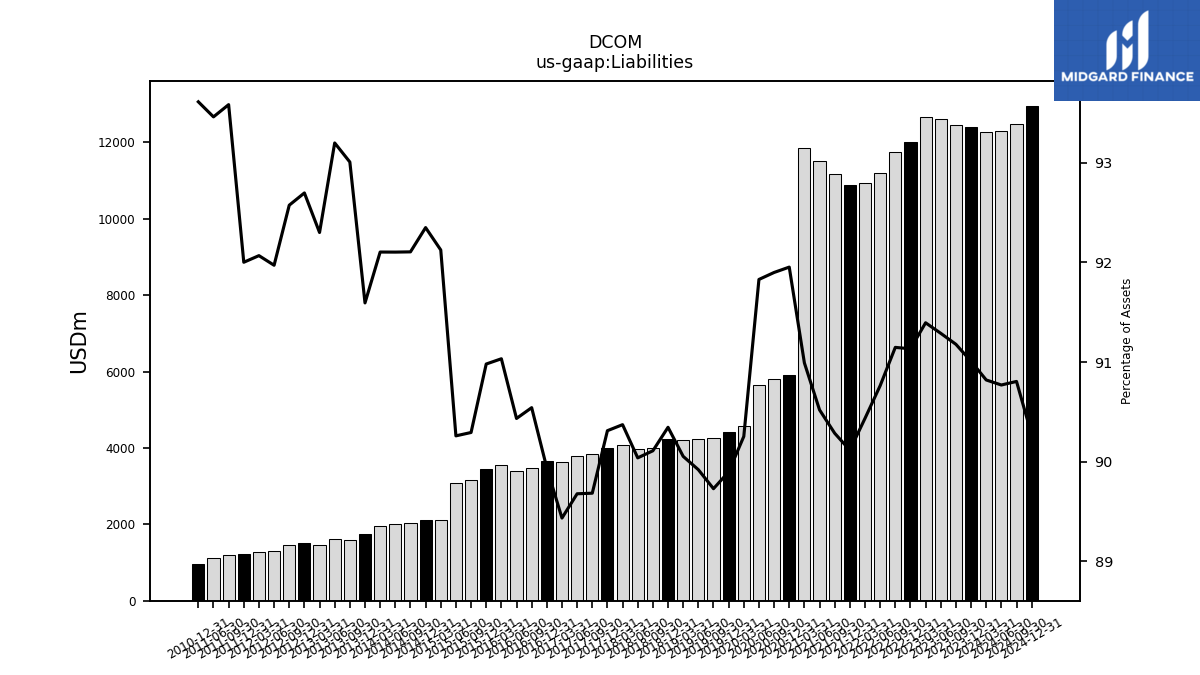
| Liabilities | 12409.78 | 12447.06 | 12600.36 | 12650.47 | 12020.34 | 11745.11 | 11206.56 | 10922.96 | 10873.74 | 11163.26 | 11499.41 | 11845.80 | 5916.47 | 5810.16 | 5648.04 | 4567.62 | 4424.37 | 4249.62 | 4239.33 | 4210.21 | 4246.91 | 4008.77 | 3975.03 | 4067.30 | 4000.80 | 3842.34 | 3785.75 | |
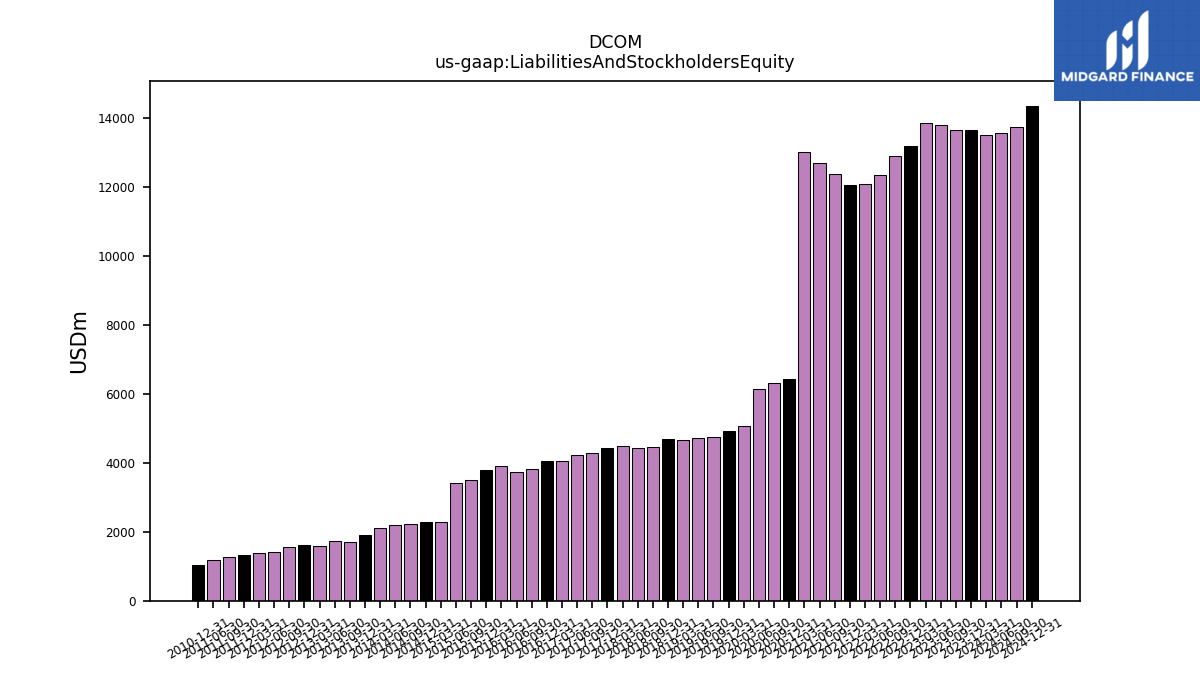
| Liabilities And Stockholders Equity | 13636.00 | 13651.41 | 13802.86 | 13841.72 | 13189.92 | 12885.90 | 12347.08 | 12078.25 | 12066.36 | 12364.38 | 12703.68 | 13018.63 | 6434.30 | 6322.38 | 6150.66 | 5060.87 | 4921.52 | 4736.02 | 4714.53 | 4675.21 | 4700.74 | 4448.76 | 4414.78 | 4500.62 | 4430.00 | 4284.28 | 4221.45 | |
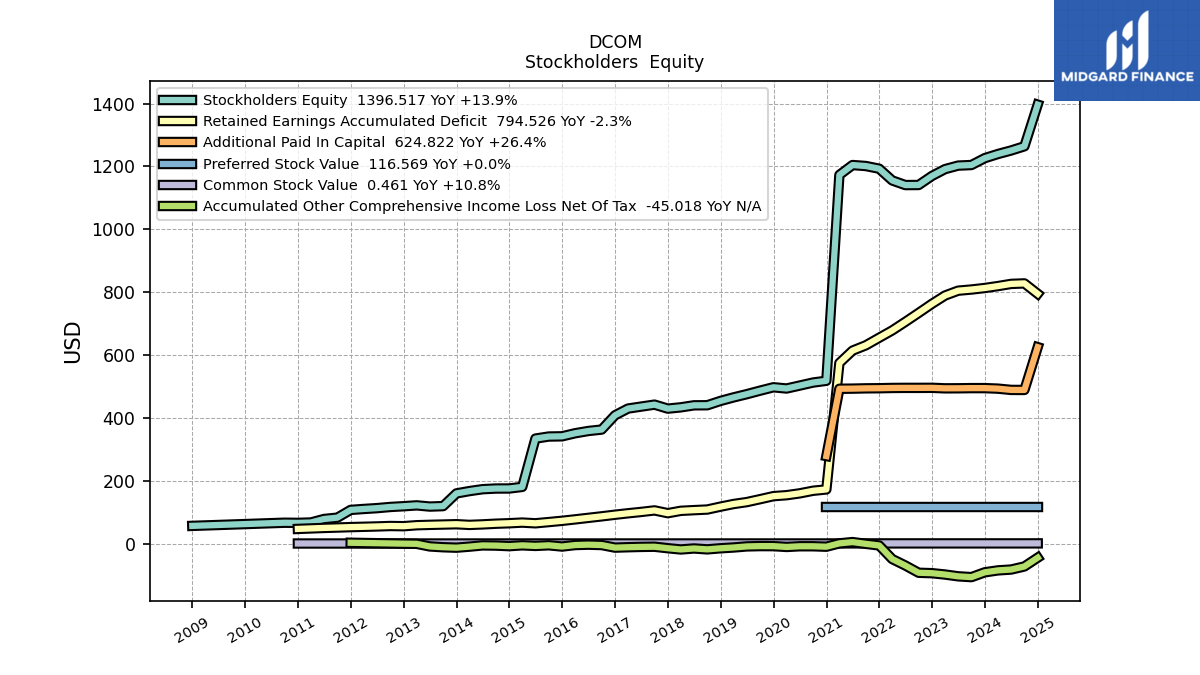
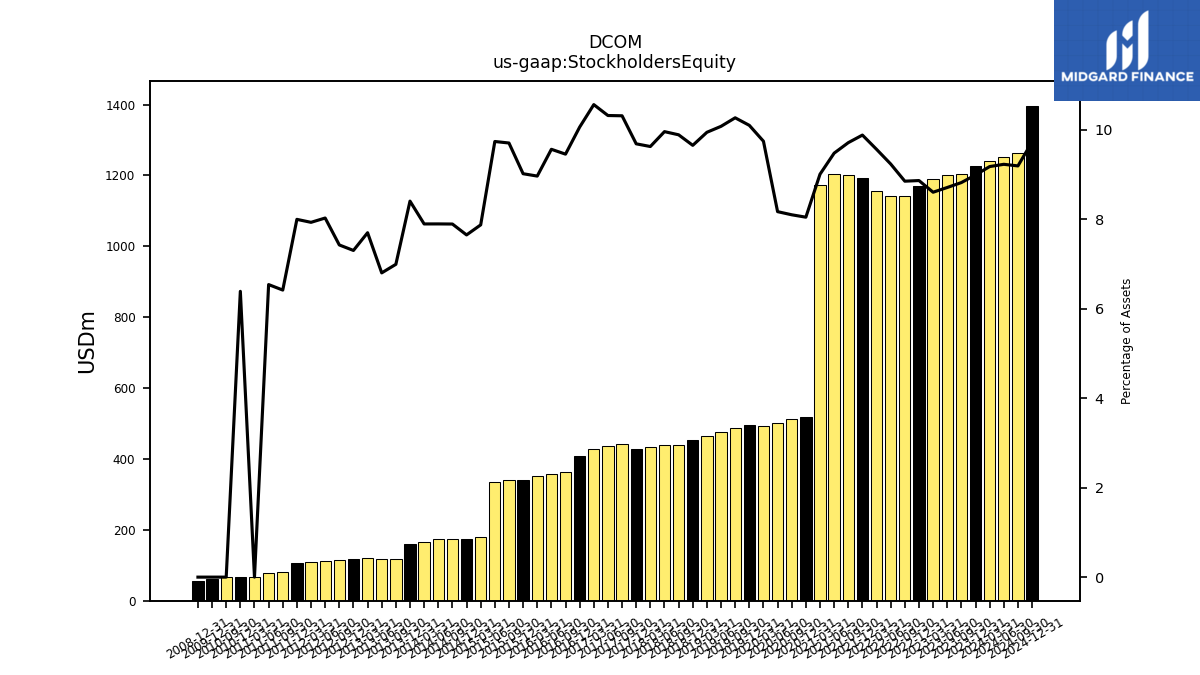
| Stockholders Equity | 1226.22 | 1204.34 | 1202.50 | 1191.25 | 1169.58 | 1140.79 | 1140.52 | 1155.29 | 1192.62 | 1201.12 | 1204.28 | 1172.82 | 517.83 | 512.22 | 502.62 | 493.25 | 497.15 | 486.40 | 475.20 | 465.00 | 453.83 | 439.99 | 439.75 | 433.32 | 429.20 | 441.94 | 435.71 |
| 2023-12-31 | 2023-09-30 | 2023-06-30 | 2023-03-31 | 2022-12-31 | 2022-09-30 | 2022-06-30 | 2022-03-31 | 2021-12-31 | 2021-09-30 | 2021-06-30 | 2021-03-31 | 2020-12-31 | 2020-09-30 | 2020-06-30 | 2020-03-31 | 2019-12-31 | 2019-09-30 | 2019-06-30 | 2019-03-31 | 2018-12-31 | 2018-09-30 | 2018-06-30 | 2018-03-31 | 2017-12-31 | 2017-09-30 | 2017-06-30 | ||
|---|---|---|---|---|---|---|---|---|---|---|---|---|---|---|---|---|---|---|---|---|---|---|---|---|---|---|---|---|
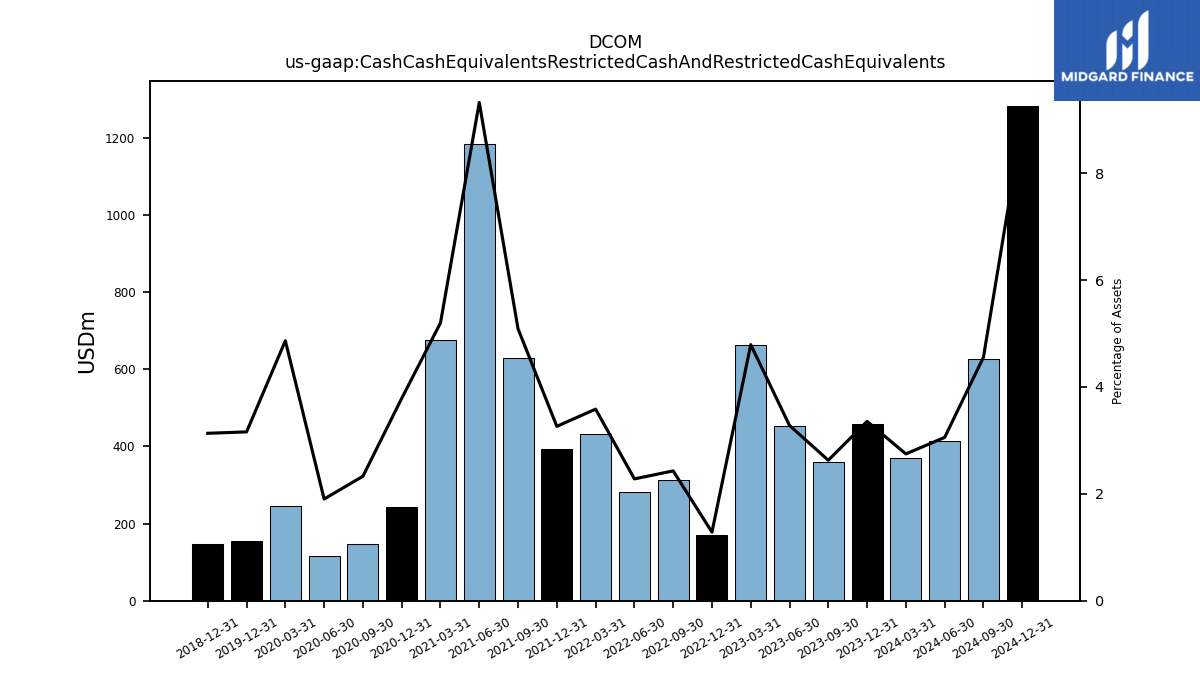
| Cash Cash Equivalents Restricted Cash And Restricted Cash Equivalents | 457.55 | 358.82 | 452.50 | 663.13 | 169.30 | 313.00 | 281.49 | 432.99 | 393.72 | 629.01 | 1184.18 | 676.72 | 243.60 | 147.28 | 117.01 | 246.15 | 155.49 | NA | NA | NA | 147.26 | NA | NA | NA | NA | NA | NA |
| 2023-12-31 | 2023-09-30 | 2023-06-30 | 2023-03-31 | 2022-12-31 | 2022-09-30 | 2022-06-30 | 2022-03-31 | 2021-12-31 | 2021-09-30 | 2021-06-30 | 2021-03-31 | 2020-12-31 | 2020-09-30 | 2020-06-30 | 2020-03-31 | 2019-12-31 | 2019-09-30 | 2019-06-30 | 2019-03-31 | 2018-12-31 | 2018-09-30 | 2018-06-30 | 2018-03-31 | 2017-12-31 | 2017-09-30 | 2017-06-30 | ||
|---|---|---|---|---|---|---|---|---|---|---|---|---|---|---|---|---|---|---|---|---|---|---|---|---|---|---|---|---|
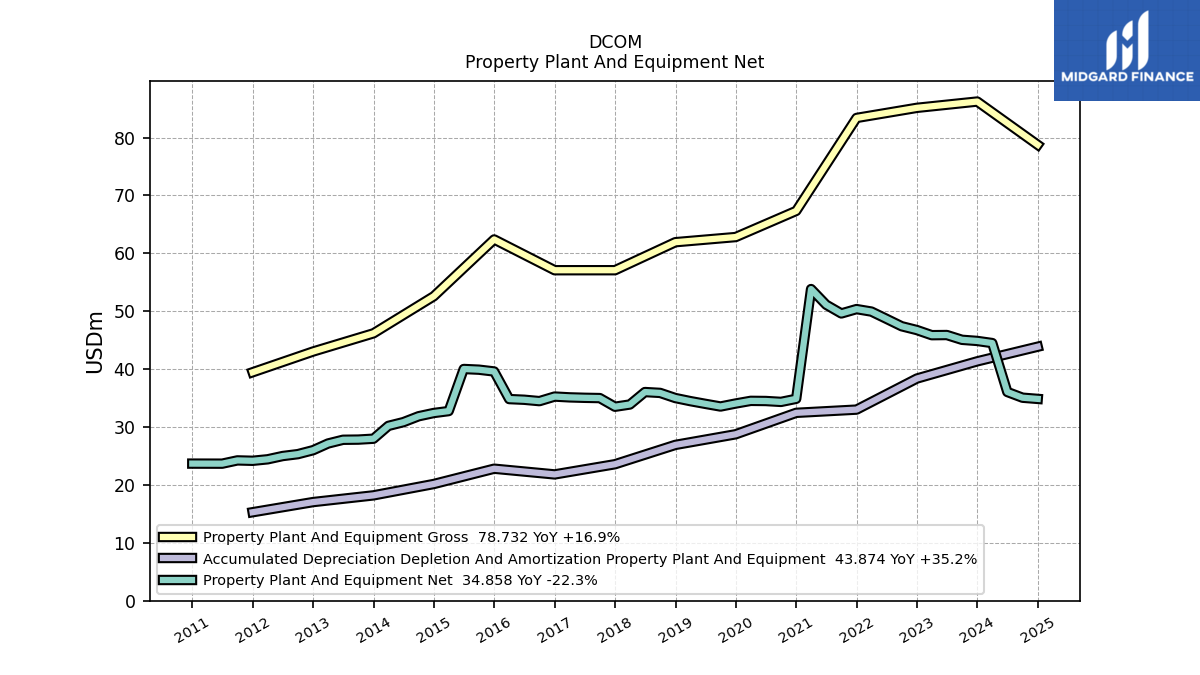
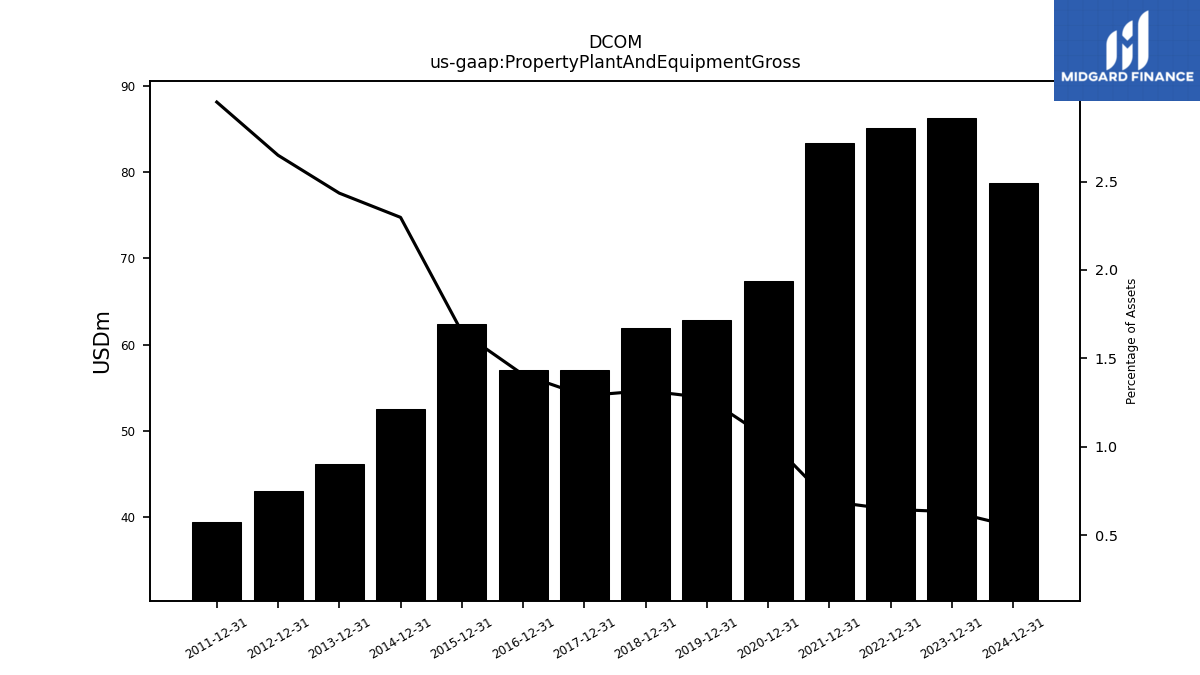
| Property Plant And Equipment Gross | 86.21 | NA | NA | NA | 85.12 | NA | NA | NA | 83.38 | NA | NA | NA | 67.32 | NA | NA | NA | 62.81 | NA | NA | NA | 61.92 | NA | NA | NA | 57.08 | NA | NA | |
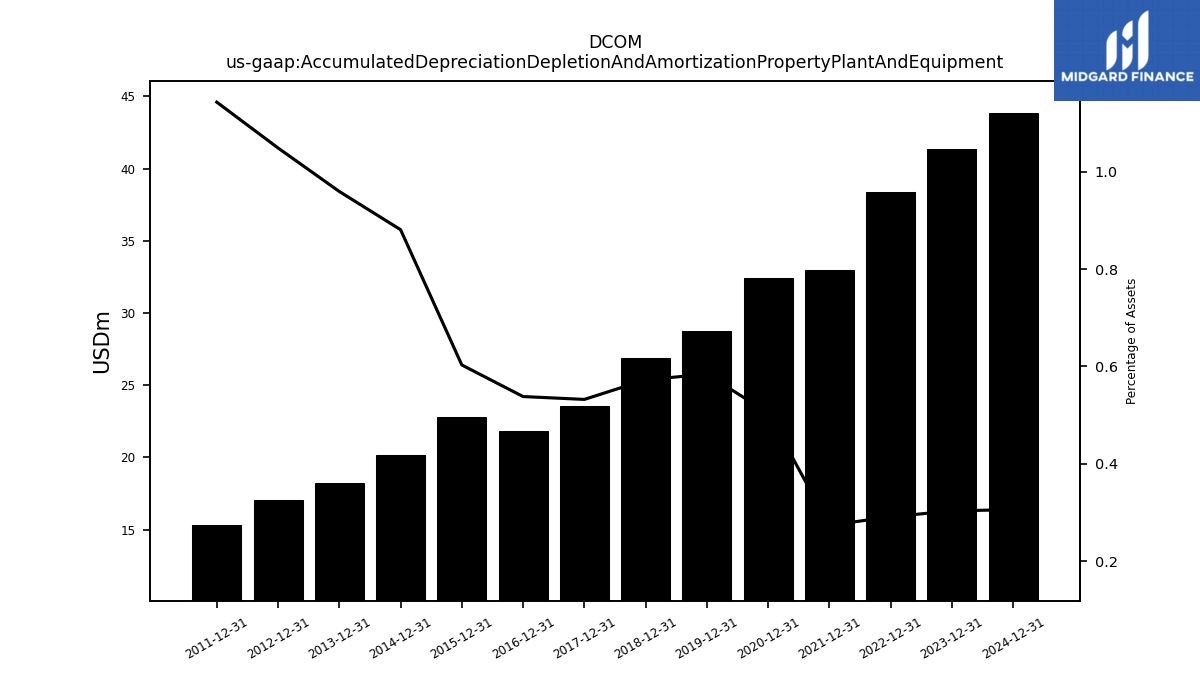
| Accumulated Depreciation Depletion And Amortization Property Plant And Equipment | 41.34 | NA | NA | NA | 38.38 | NA | NA | NA | 33.01 | NA | NA | NA | 32.45 | NA | NA | NA | 28.75 | NA | NA | NA | 26.91 | NA | NA | NA | 23.58 | NA | NA | |
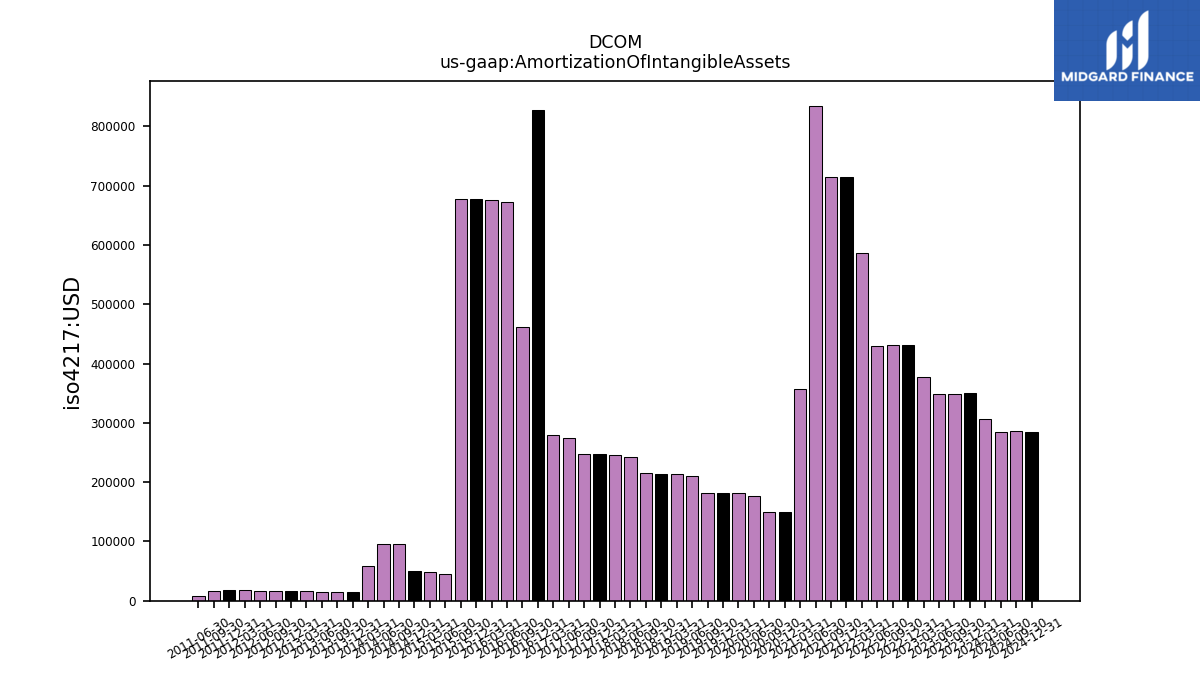
| Amortization Of Intangible Assets | 0.35 | 0.35 | 0.35 | 0.38 | 0.43 | 0.43 | 0.43 | 0.59 | 0.71 | 0.71 | 0.83 | 0.36 | 0.15 | 0.15 | 0.18 | 0.18 | 0.18 | 0.18 | 0.21 | 0.21 | 0.21 | 0.21 | 0.24 | 0.25 | 0.25 | 0.25 | 0.27 | |
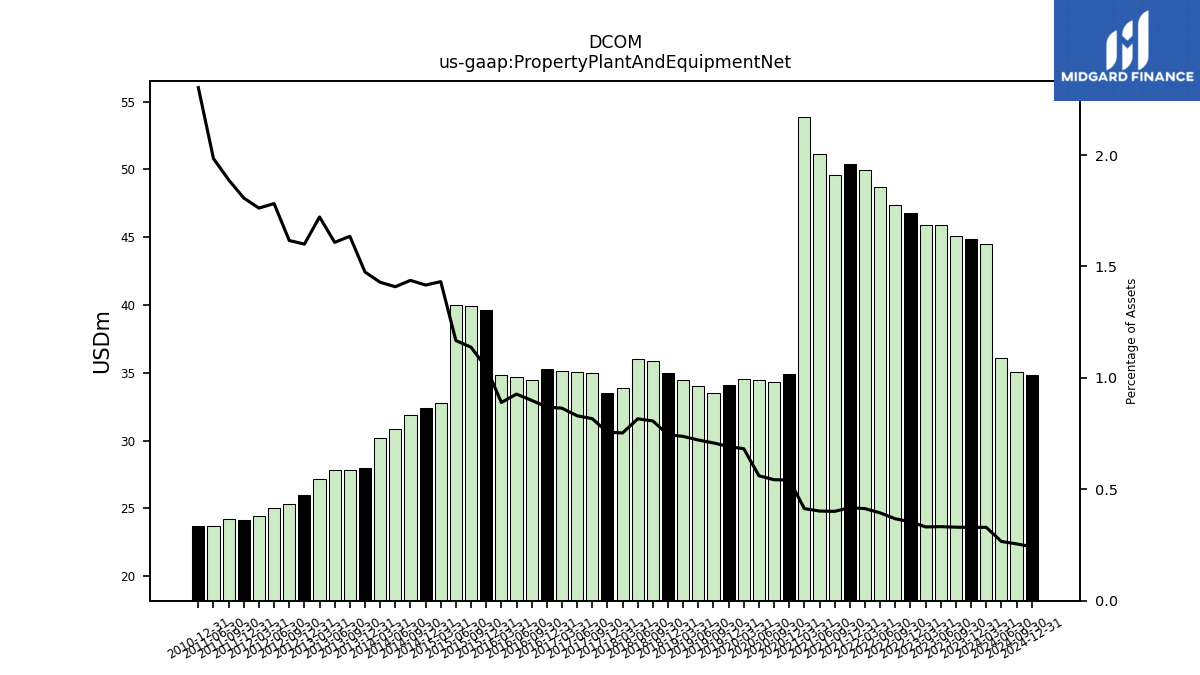
| Property Plant And Equipment Net | 44.87 | 45.06 | 45.89 | 45.86 | 46.75 | 47.41 | 48.69 | 49.94 | 50.37 | 49.62 | 51.13 | 53.83 | 34.87 | 34.34 | 34.49 | 34.52 | 34.06 | 33.54 | 34.01 | 34.48 | 35.01 | 35.89 | 36.04 | 33.89 | 33.51 | 35.00 | 35.05 | |
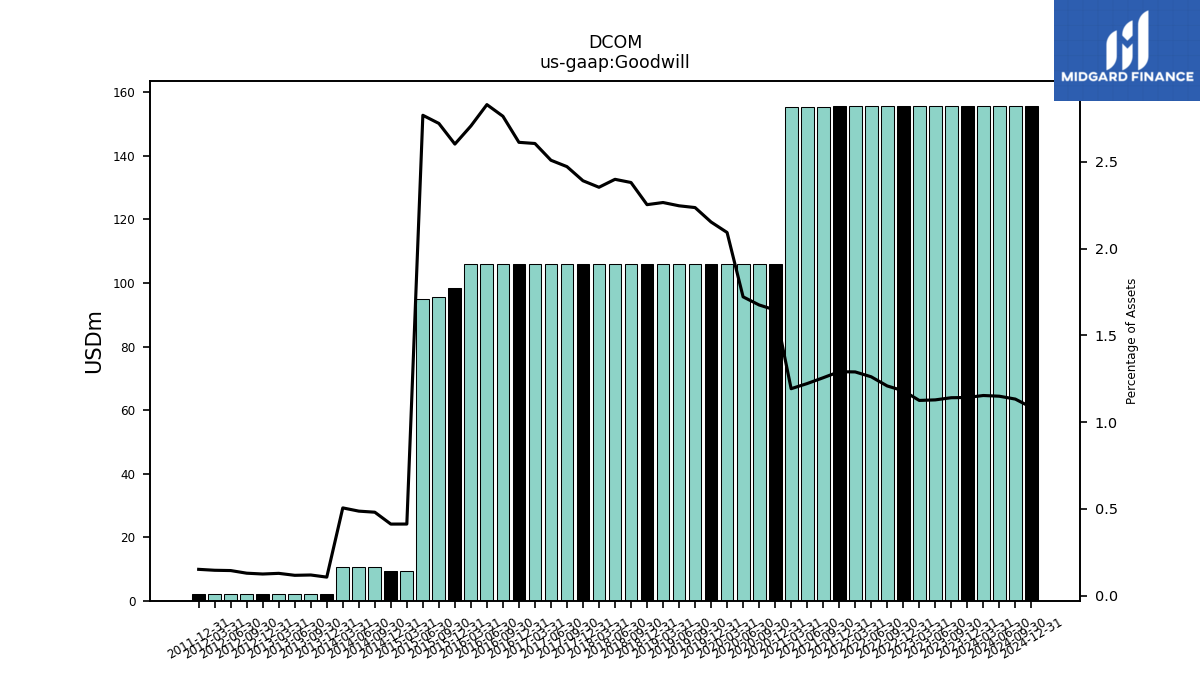
| Goodwill | 155.80 | 155.80 | 155.80 | 155.80 | 155.80 | 155.80 | 155.80 | 155.80 | 155.80 | 155.34 | 155.34 | 155.34 | 105.95 | 105.95 | 105.95 | 105.95 | 106.00 | 105.95 | 105.95 | 105.95 | 105.95 | 105.95 | 105.95 | 105.95 | 105.95 | 105.95 | 105.95 | |
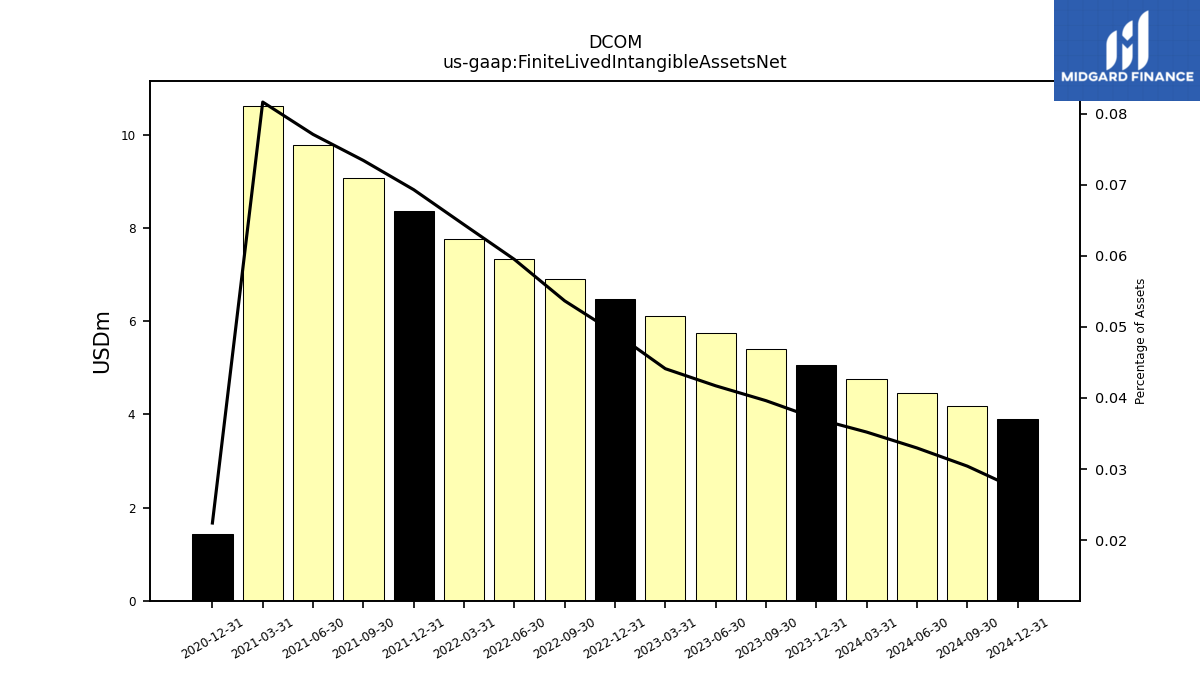
| Finite Lived Intangible Assets Net | 5.06 | 5.41 | 5.76 | 6.11 | 6.48 | 6.92 | 7.35 | 7.78 | 8.36 | 9.08 | 9.79 | 10.63 | 1.44 | NA | NA | NA | NA | NA | NA | NA | NA | NA | NA | NA | NA | NA | NA | |
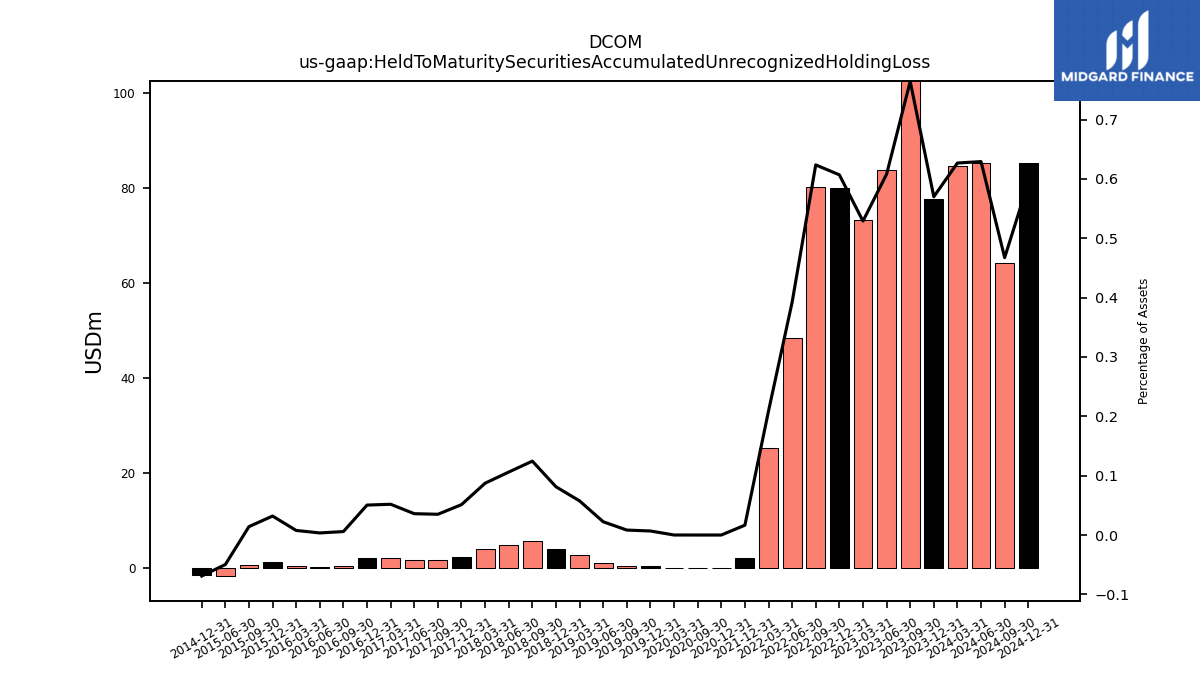
| Held To Maturity Securities Accumulated Unrecognized Holding Loss | 77.72 | 104.31 | 83.89 | 73.21 | 80.04 | 80.35 | 48.42 | 25.23 | 2.01 | NA | NA | NA | 0.01 | 0.01 | NA | 0.01 | 0.34 | 0.40 | 1.06 | 2.69 | 3.83 | 5.54 | 4.69 | 3.94 | 2.27 | 1.50 | 1.52 | |
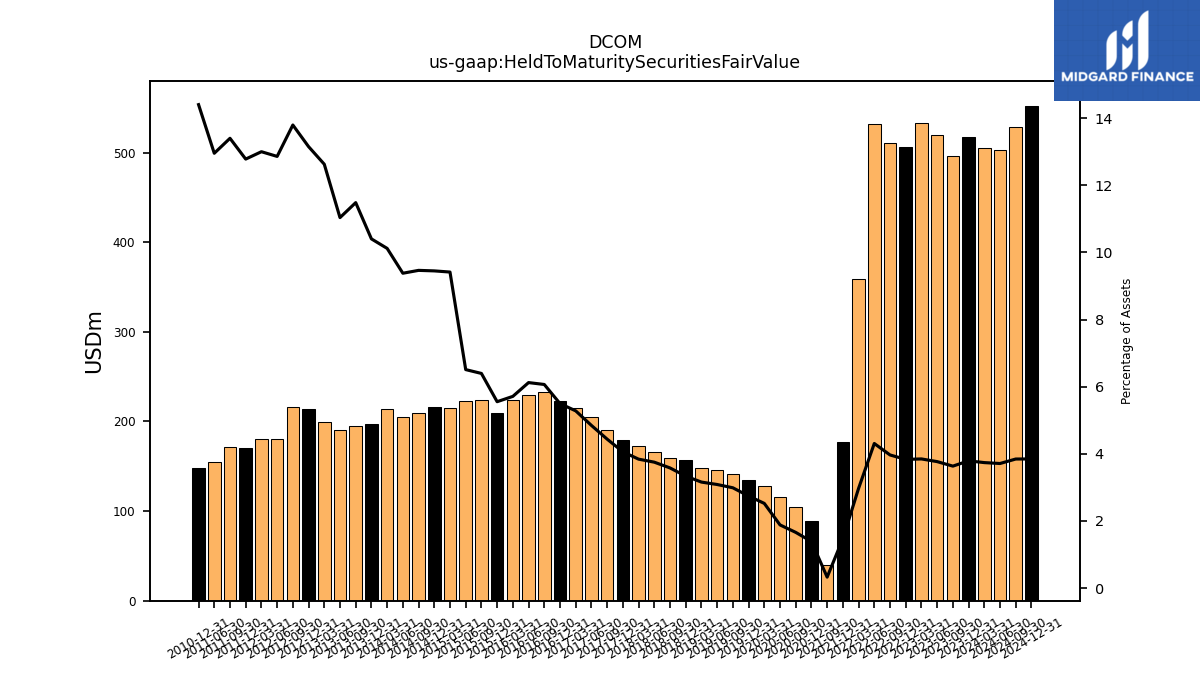
| Held To Maturity Securities Fair Value | 516.93 | 495.99 | 520.07 | 532.57 | 505.76 | 511.05 | 531.87 | 358.69 | 177.35 | 40.30 | NA | NA | 89.33 | 104.91 | 115.75 | 127.65 | 135.03 | 141.50 | 145.48 | 147.63 | 156.79 | 159.24 | 165.61 | 172.88 | 179.88 | 190.10 | 204.58 | |
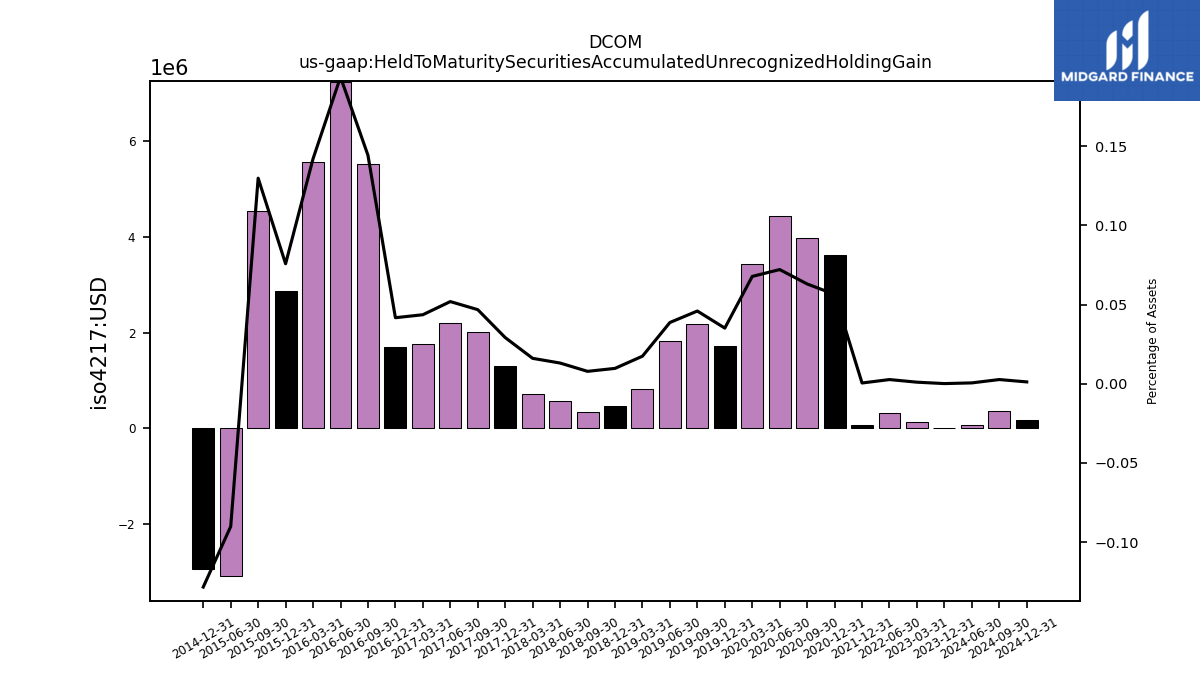
| Held To Maturity Securities Accumulated Unrecognized Holding Gain | 0.02 | NA | NA | 0.14 | NA | NA | 0.33 | NA | 0.06 | NA | NA | NA | 3.63 | 3.99 | 4.44 | 3.43 | 1.73 | 2.18 | 1.82 | 0.81 | 0.46 | 0.35 | 0.58 | 0.72 | 1.29 | 2.01 | 2.19 | |
| Held To Maturity Securities Accumulated Unrecognized Holding Loss | 77.72 | 104.31 | 83.89 | 73.21 | 80.04 | 80.35 | 48.42 | 25.23 | 2.01 | NA | NA | NA | 0.01 | 0.01 | NA | 0.01 | 0.34 | 0.40 | 1.06 | 2.69 | 3.83 | 5.54 | 4.69 | 3.94 | 2.27 | 1.50 | 1.52 | |
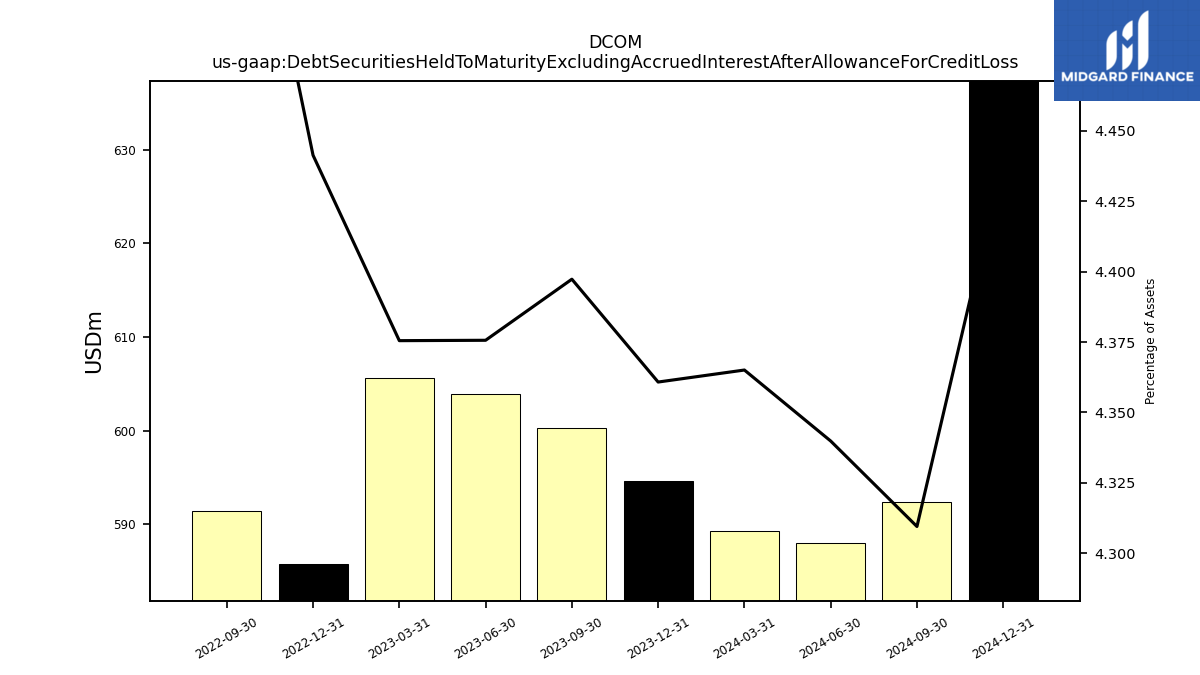
| Debt Securities Held To Maturity Excluding Accrued Interest After Allowance For Credit Loss | 594.64 | 600.29 | 603.96 | 605.64 | 585.80 | 591.40 | NA | NA | NA | NA | NA | NA | NA | NA | NA | NA | NA | NA | NA | NA | NA | NA | NA | NA | NA | NA | NA | |
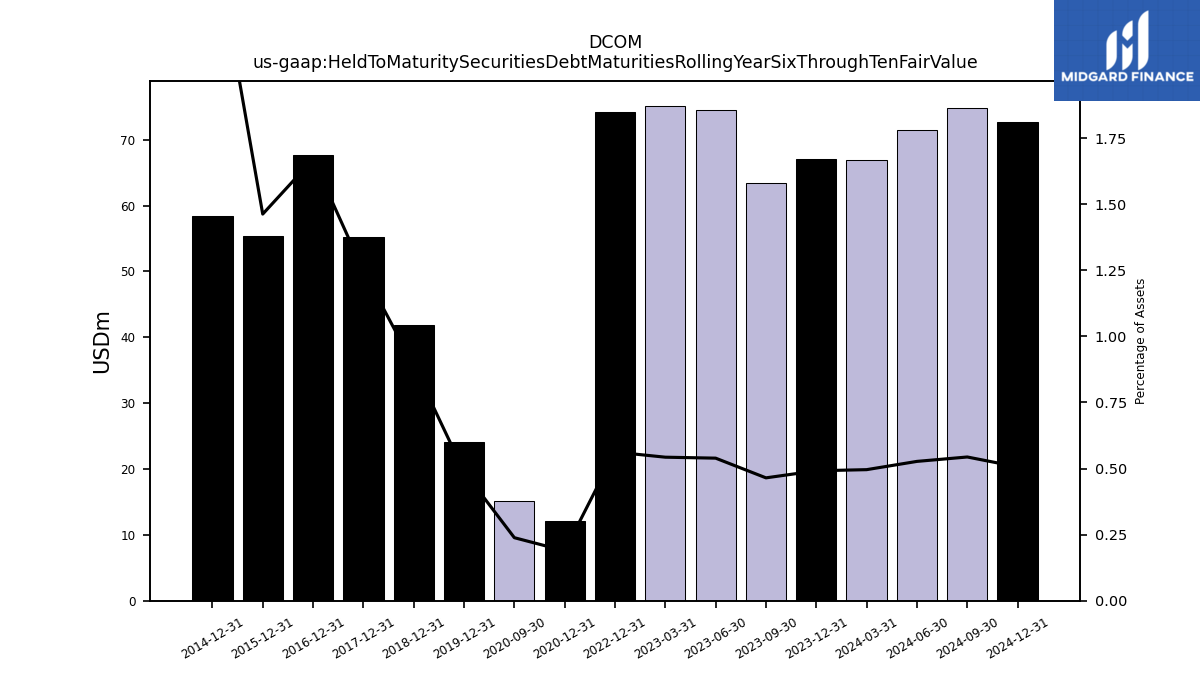
| Held To Maturity Securities Debt Maturities Rolling Year Six Through Ten Fair Value | 67.04 | 63.47 | 74.46 | 75.17 | 74.19 | NA | NA | NA | NA | NA | NA | NA | 12.14 | 15.08 | NA | NA | 24.06 | NA | NA | NA | 41.85 | NA | NA | NA | 55.30 | NA | NA | |
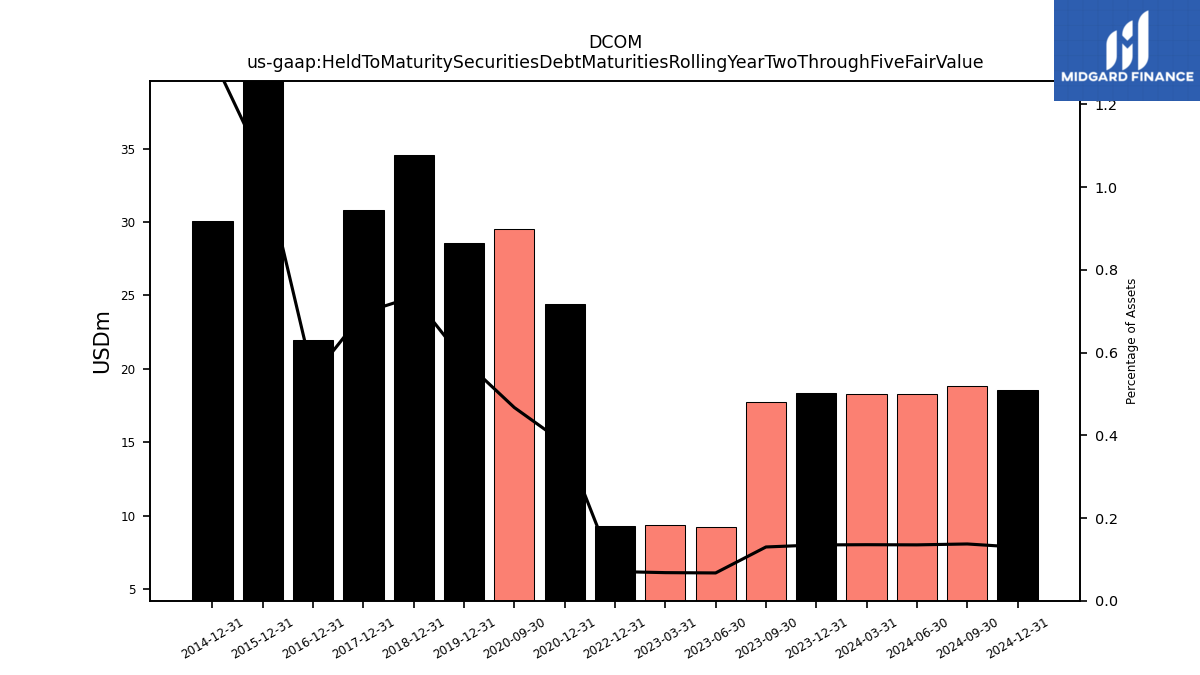
| Held To Maturity Securities Debt Maturities Rolling Year Two Through Five Fair Value | 18.40 | 17.74 | 9.28 | 9.41 | 9.31 | NA | NA | NA | NA | NA | NA | NA | 24.45 | 29.52 | NA | NA | 28.59 | NA | NA | NA | 34.54 | NA | NA | NA | 30.83 | NA | NA |
| 2023-12-31 | 2023-09-30 | 2023-06-30 | 2023-03-31 | 2022-12-31 | 2022-09-30 | 2022-06-30 | 2022-03-31 | 2021-12-31 | 2021-09-30 | 2021-06-30 | 2021-03-31 | 2020-12-31 | 2020-09-30 | 2020-06-30 | 2020-03-31 | 2019-12-31 | 2019-09-30 | 2019-06-30 | 2019-03-31 | 2018-12-31 | 2018-09-30 | 2018-06-30 | 2018-03-31 | 2017-12-31 | 2017-09-30 | 2017-06-30 | ||
|---|---|---|---|---|---|---|---|---|---|---|---|---|---|---|---|---|---|---|---|---|---|---|---|---|---|---|---|---|
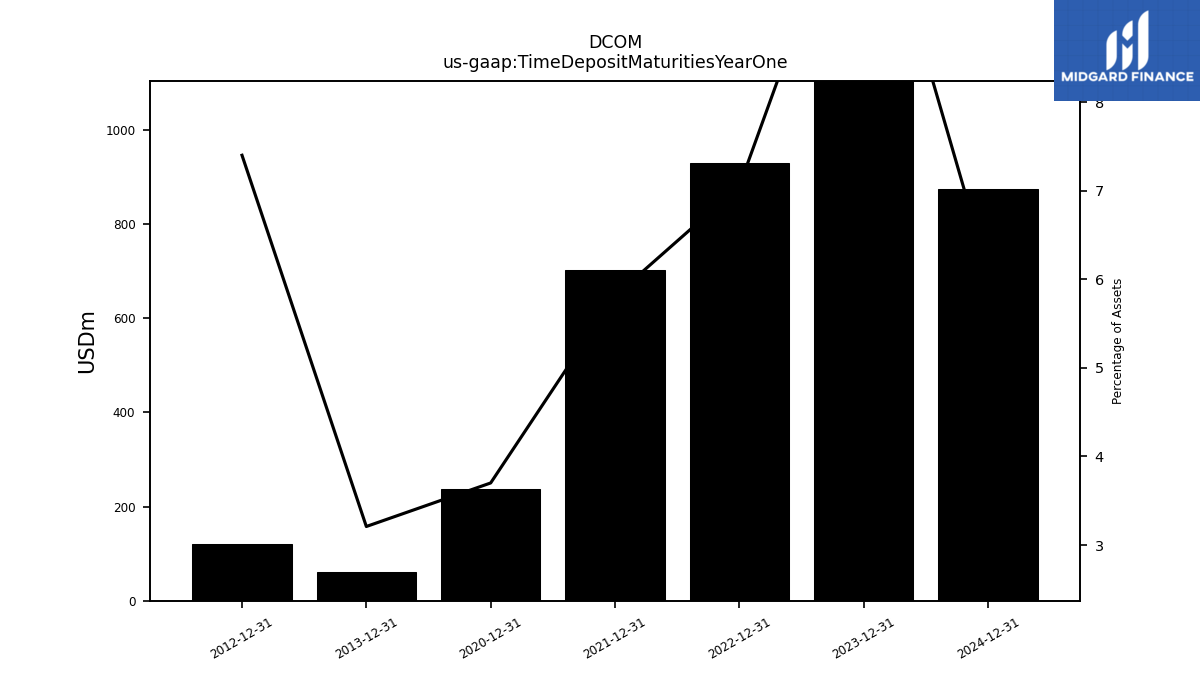
| Time Deposit Maturities Year One | 1489.73 | NA | NA | NA | 929.79 | NA | NA | NA | 701.26 | NA | NA | NA | 238.12 | NA | NA | NA | NA | NA | NA | NA | NA | NA | NA | NA | NA | NA | NA | |
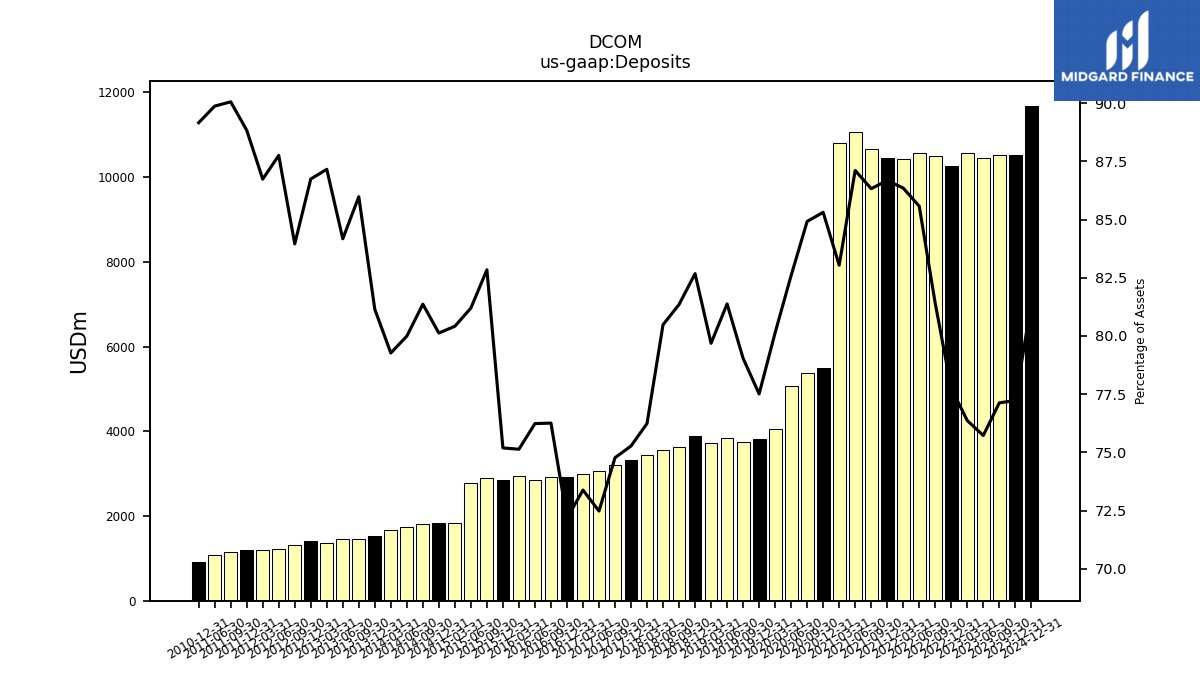
| Deposits | 10530.66 | 10528.78 | 10452.06 | 10570.24 | 10254.41 | 10488.67 | 10566.00 | 10430.10 | 10458.97 | 10674.04 | 11066.19 | 10810.81 | 5489.25 | 5369.07 | 5080.42 | 4055.74 | 3814.65 | 3743.28 | 3836.58 | 3725.46 | 3886.39 | 3619.14 | 3553.20 | 3431.24 | 3334.54 | 3203.31 | 3059.62 |
| 2023-12-31 | 2023-09-30 | 2023-06-30 | 2023-03-31 | 2022-12-31 | 2022-09-30 | 2022-06-30 | 2022-03-31 | 2021-12-31 | 2021-09-30 | 2021-06-30 | 2021-03-31 | 2020-12-31 | 2020-09-30 | 2020-06-30 | 2020-03-31 | 2019-12-31 | 2019-09-30 | 2019-06-30 | 2019-03-31 | 2018-12-31 | 2018-09-30 | 2018-06-30 | 2018-03-31 | 2017-12-31 | 2017-09-30 | 2017-06-30 | ||
|---|---|---|---|---|---|---|---|---|---|---|---|---|---|---|---|---|---|---|---|---|---|---|---|---|---|---|---|---|
| Stockholders Equity | 1226.22 | 1204.34 | 1202.50 | 1191.25 | 1169.58 | 1140.79 | 1140.52 | 1155.29 | 1192.62 | 1201.12 | 1204.28 | 1172.82 | 517.83 | 512.22 | 502.62 | 493.25 | 497.15 | 486.40 | 475.20 | 465.00 | 453.83 | 439.99 | 439.75 | 433.32 | 429.20 | 441.94 | 435.71 | |
| Common Stock Value | 0.42 | 0.42 | 0.42 | 0.42 | 0.42 | 0.42 | 0.42 | 0.42 | 0.42 | 0.42 | 0.42 | 0.42 | 0.20 | 0.20 | 0.20 | 0.20 | 0.20 | 0.20 | 0.20 | 0.20 | 0.20 | 0.20 | 0.20 | 0.20 | 0.20 | 0.20 | 0.20 | |
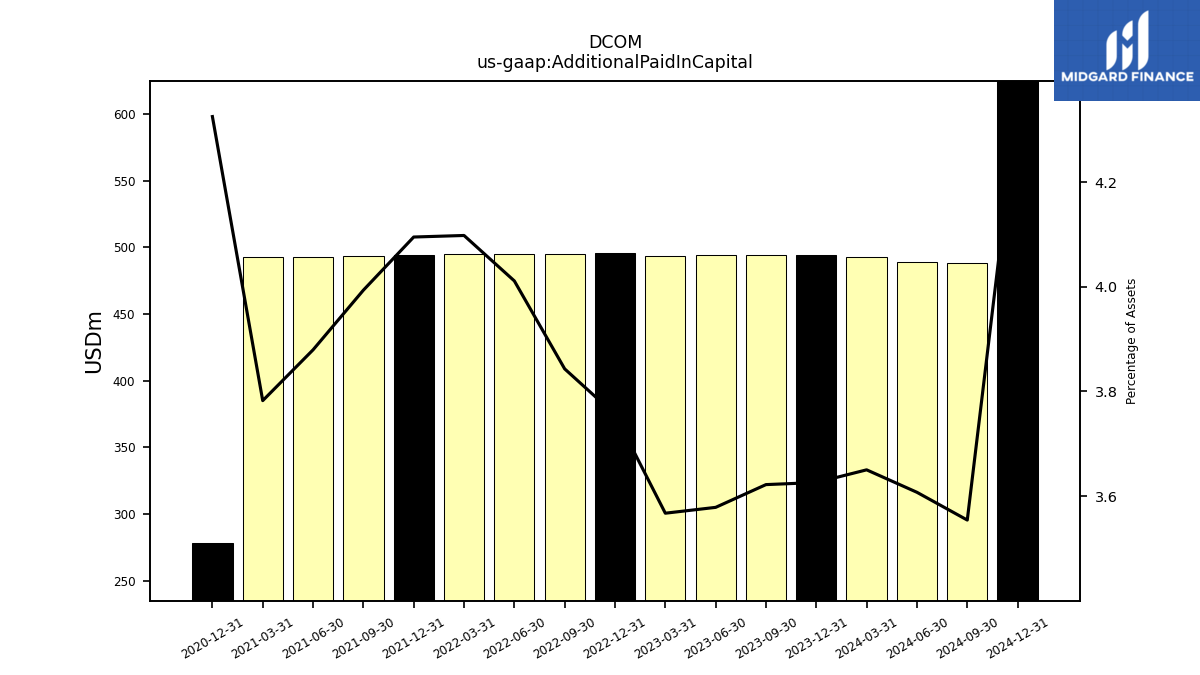
| Additional Paid In Capital | 494.45 | 494.47 | 493.95 | 493.80 | 495.41 | 495.23 | 495.27 | 494.97 | 494.12 | 493.77 | 492.85 | 492.43 | 278.30 | NA | NA | NA | NA | NA | NA | NA | NA | NA | NA | NA | NA | NA | NA | |
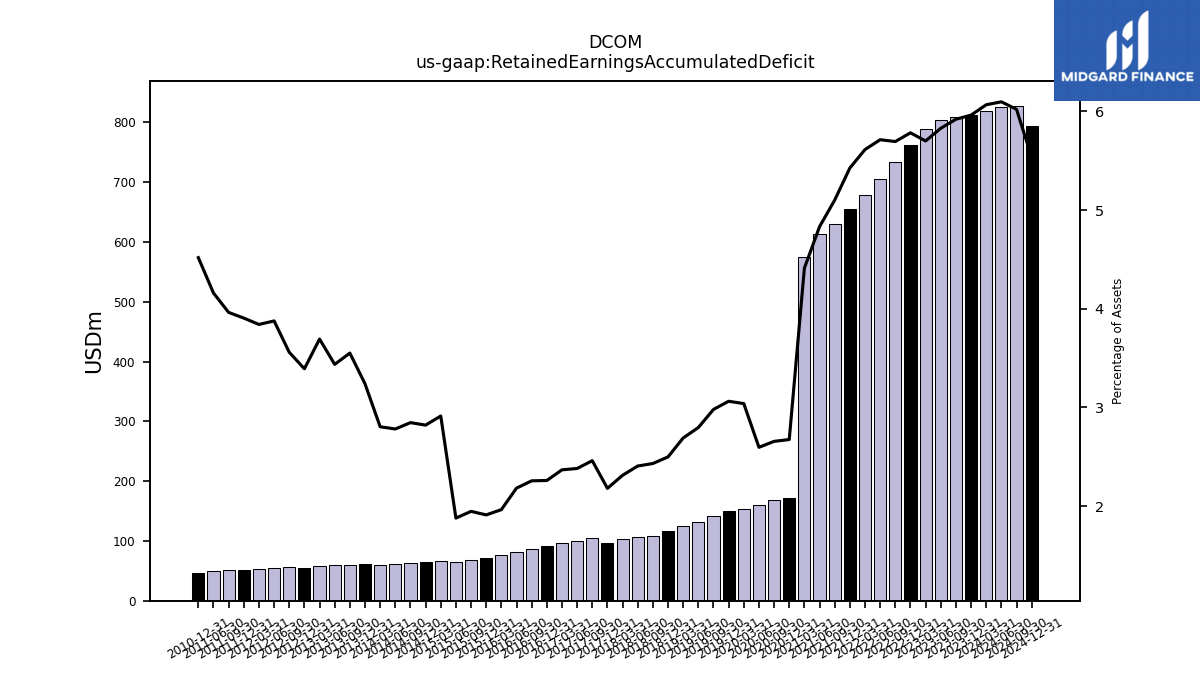
| Retained Earnings Accumulated Deficit | 813.01 | 808.24 | 804.53 | 789.01 | 762.76 | 733.78 | 705.37 | 677.99 | 654.73 | 630.74 | 613.79 | 574.30 | 172.07 | 167.90 | 159.63 | 153.77 | 150.70 | 141.10 | 131.81 | 125.77 | 117.43 | 108.16 | 106.21 | 104.05 | 96.55 | 105.38 | 100.50 | |
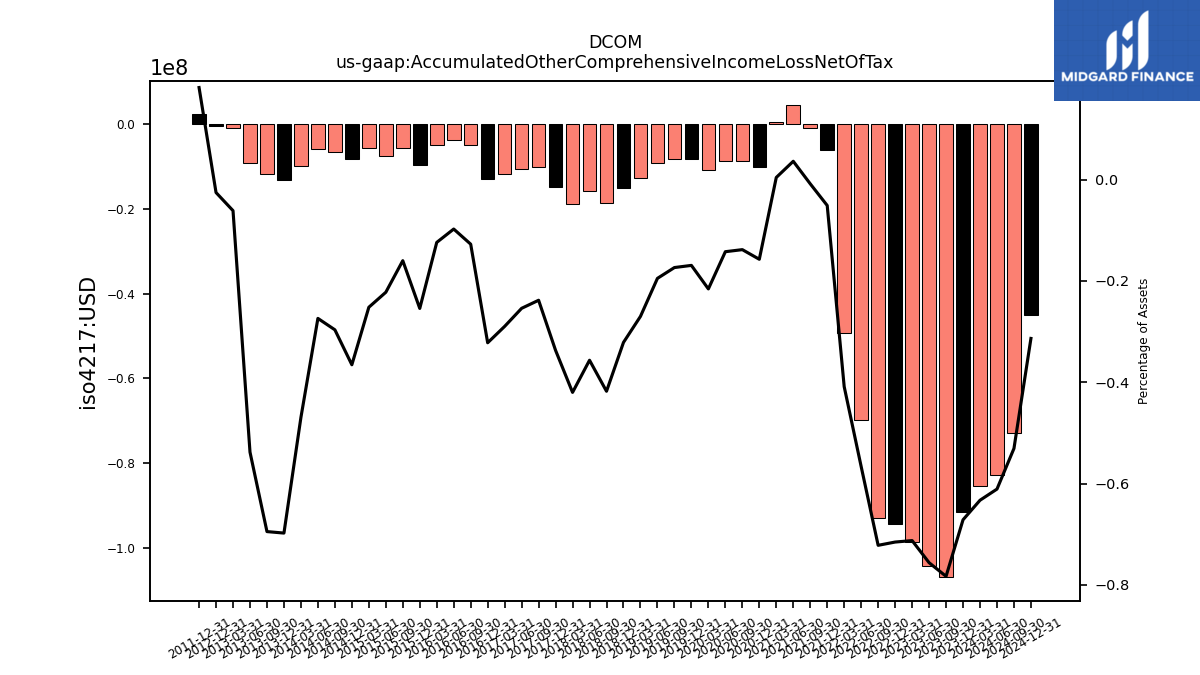
| Accumulated Other Comprehensive Income Loss Net Of Tax | -91.58 | -106.91 | -104.39 | -98.64 | -94.38 | -93.04 | -69.95 | -49.38 | -6.18 | -1.04 | 4.58 | 0.53 | -10.13 | -8.75 | -8.76 | -10.93 | -8.34 | -8.23 | -9.20 | -12.63 | -15.11 | -18.59 | -15.75 | -18.91 | -14.94 | -10.21 | -10.73 |
| 2023-12-31 | 2023-09-30 | 2023-06-30 | 2023-03-31 | 2022-12-31 | 2022-09-30 | 2022-06-30 | 2022-03-31 | 2021-12-31 | 2021-09-30 | 2021-06-30 | 2021-03-31 | 2020-12-31 | 2020-09-30 | 2020-06-30 | 2020-03-31 | 2019-12-31 | 2019-09-30 | 2019-06-30 | 2019-03-31 | 2018-12-31 | 2018-09-30 | 2018-06-30 | 2018-03-31 | 2017-12-31 | 2017-09-30 | 2017-06-30 | ||
|---|---|---|---|---|---|---|---|---|---|---|---|---|---|---|---|---|---|---|---|---|---|---|---|---|---|---|---|---|
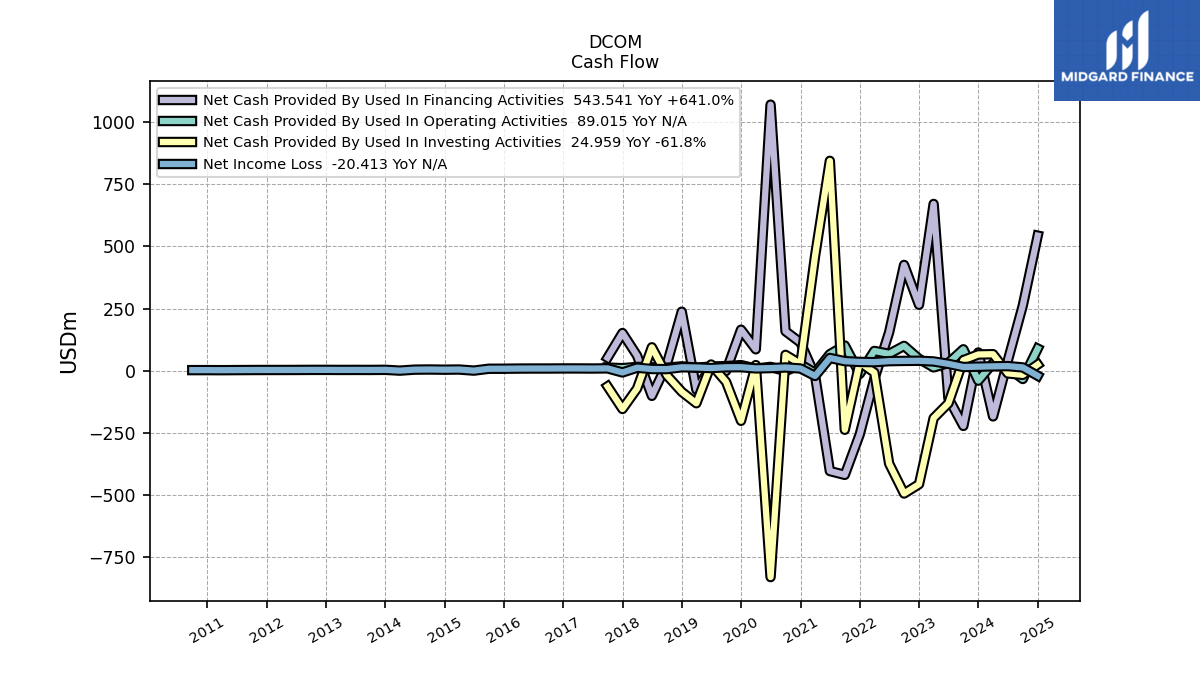
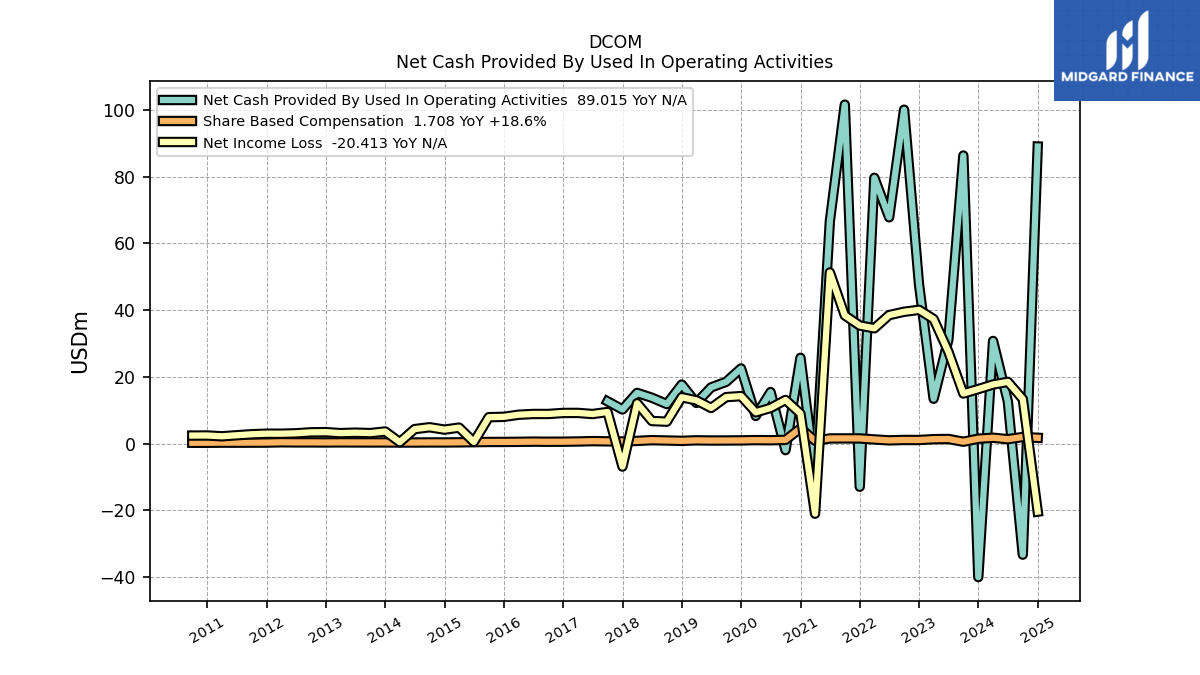
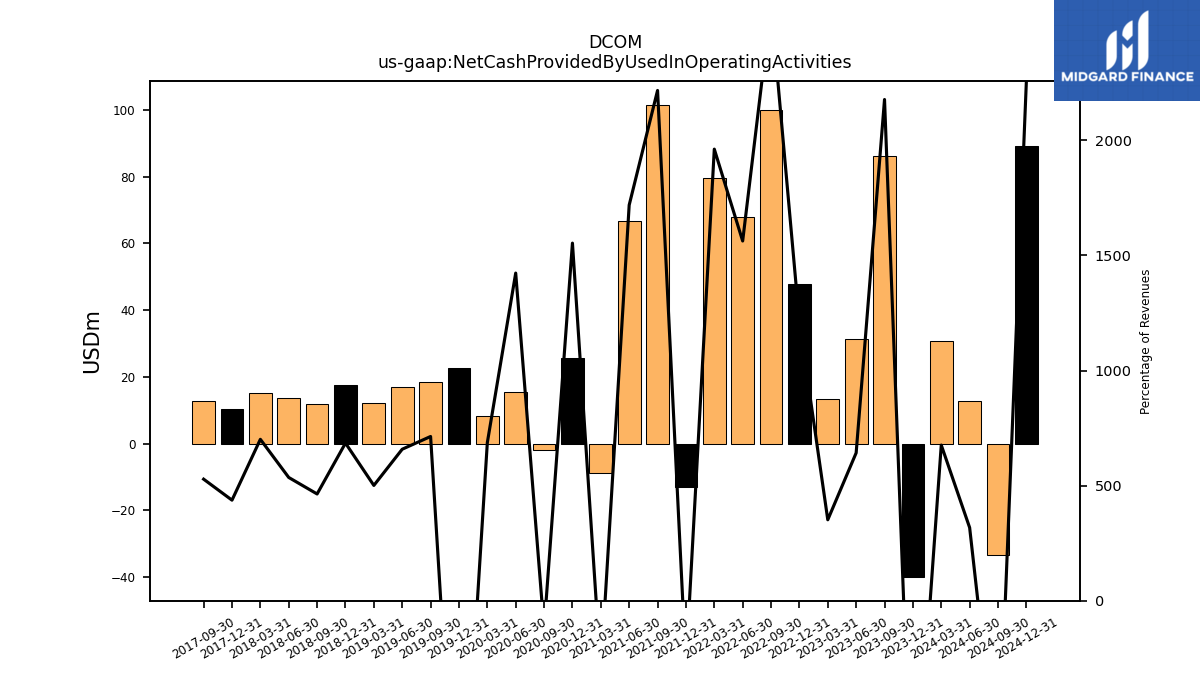
| Net Cash Provided By Used In Operating Activities | -40.04 | 86.30 | 31.20 | 13.42 | 47.72 | 100.04 | 67.79 | 79.62 | -12.96 | 101.56 | 66.64 | -8.92 | 25.68 | -1.98 | 15.42 | 8.27 | 22.50 | 18.47 | 16.83 | 12.16 | 17.66 | 11.82 | 13.72 | 15.17 | 10.20 | 12.64 | NA | |
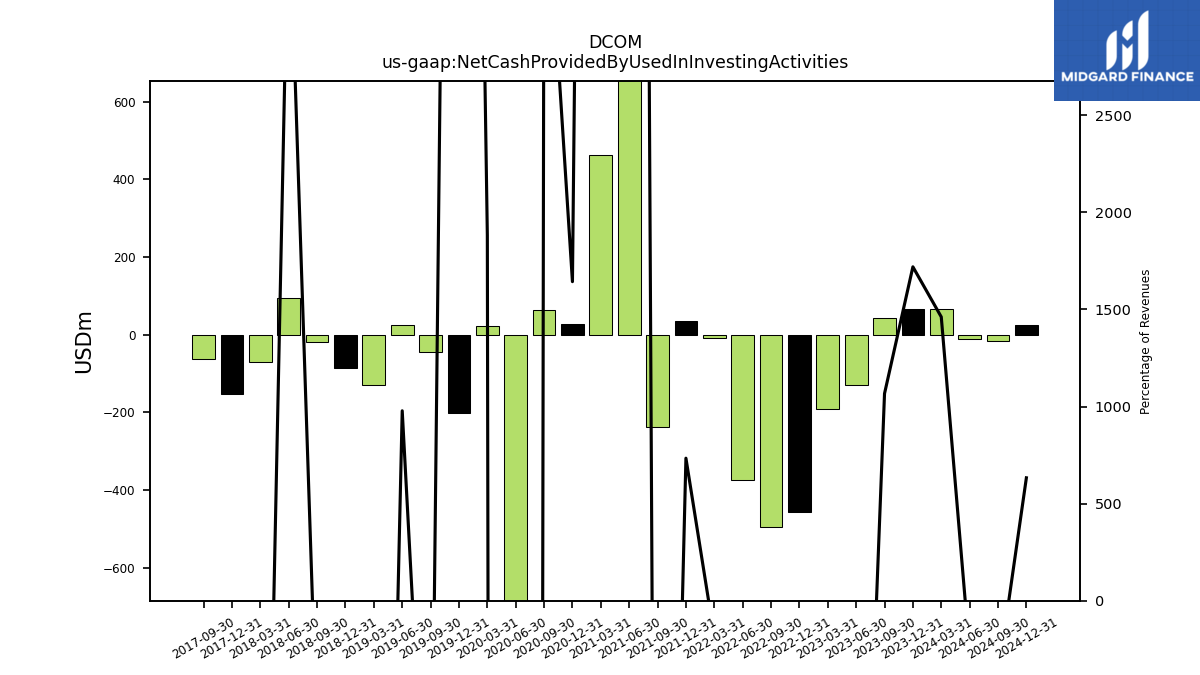
| Net Cash Provided By Used In Investing Activities | 65.42 | 42.29 | -131.07 | -190.68 | -456.69 | -494.21 | -373.82 | -7.48 | 33.93 | -237.65 | 844.61 | 461.93 | 27.16 | 63.89 | -830.54 | 22.65 | -201.65 | -45.03 | 25.00 | -130.93 | -84.87 | -18.36 | 94.32 | -71.64 | -154.12 | -63.06 | NA | |
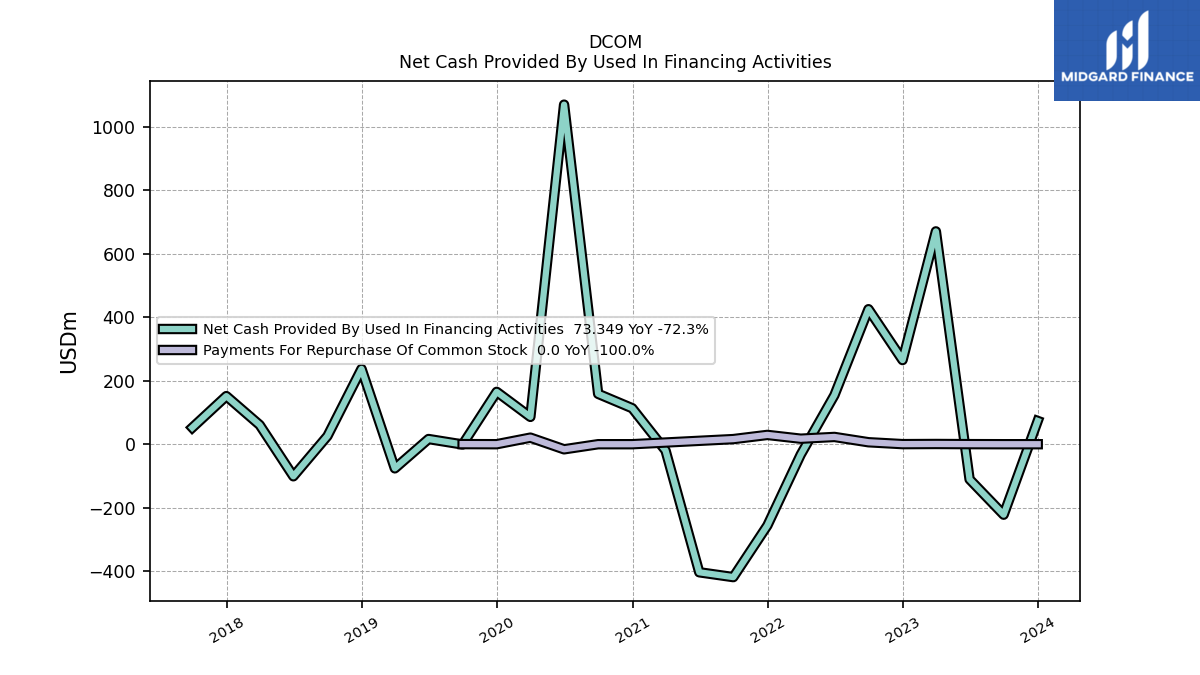
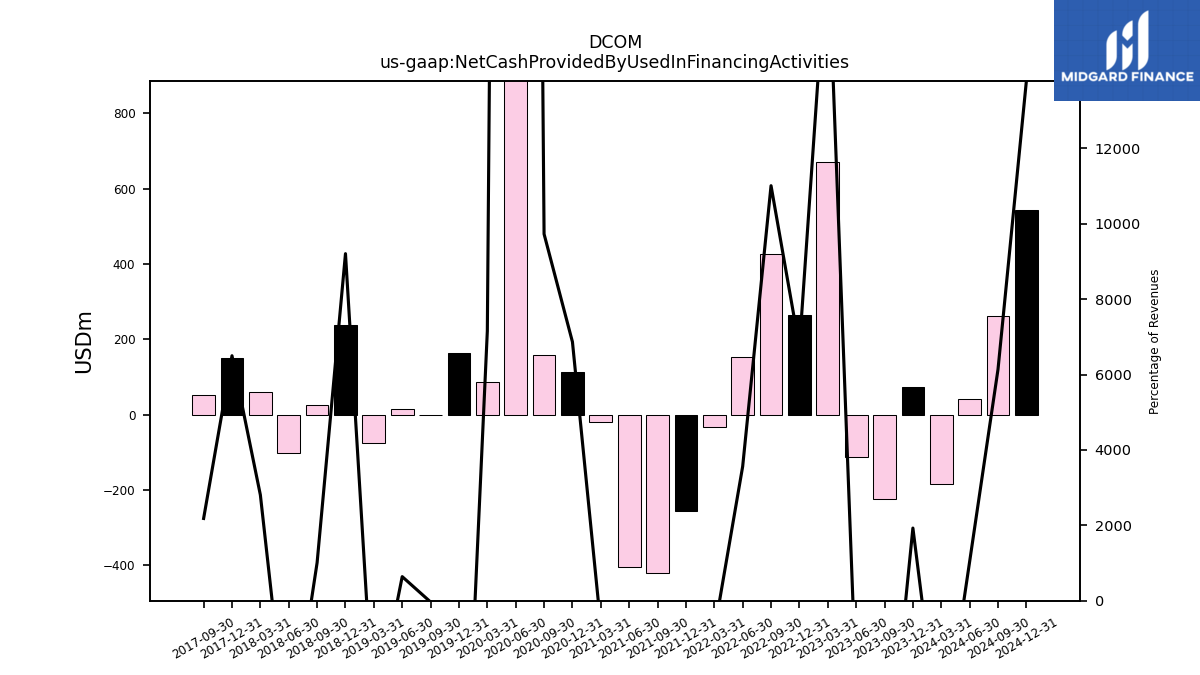
| Net Cash Provided By Used In Financing Activities | 73.35 | -222.27 | -110.75 | 671.10 | 265.26 | 425.68 | 154.52 | -32.88 | -256.26 | -419.08 | -403.79 | -19.90 | 113.51 | 158.78 | 1070.72 | 86.07 | 165.13 | -0.86 | 16.35 | -76.15 | 237.47 | 25.75 | -101.16 | 60.73 | 151.71 | 52.22 | NA |
| 2023-12-31 | 2023-09-30 | 2023-06-30 | 2023-03-31 | 2022-12-31 | 2022-09-30 | 2022-06-30 | 2022-03-31 | 2021-12-31 | 2021-09-30 | 2021-06-30 | 2021-03-31 | 2020-12-31 | 2020-09-30 | 2020-06-30 | 2020-03-31 | 2019-12-31 | 2019-09-30 | 2019-06-30 | 2019-03-31 | 2018-12-31 | 2018-09-30 | 2018-06-30 | 2018-03-31 | 2017-12-31 | 2017-09-30 | 2017-06-30 | ||
|---|---|---|---|---|---|---|---|---|---|---|---|---|---|---|---|---|---|---|---|---|---|---|---|---|---|---|---|---|
| Net Cash Provided By Used In Operating Activities | -40.04 | 86.30 | 31.20 | 13.42 | 47.72 | 100.04 | 67.79 | 79.62 | -12.96 | 101.56 | 66.64 | -8.92 | 25.68 | -1.98 | 15.42 | 8.27 | 22.50 | 18.47 | 16.83 | 12.16 | 17.66 | 11.82 | 13.72 | 15.17 | 10.20 | 12.64 | NA | |
| Net Income Loss | 16.31 | 14.98 | 27.50 | 37.30 | 40.06 | 39.48 | 38.48 | 34.53 | 35.36 | 38.40 | 51.28 | -21.03 | 8.98 | 13.06 | 10.66 | 9.35 | 14.21 | 13.90 | 10.65 | 12.93 | 13.86 | 6.55 | 6.74 | 12.07 | -6.92 | 9.44 | 8.84 | |
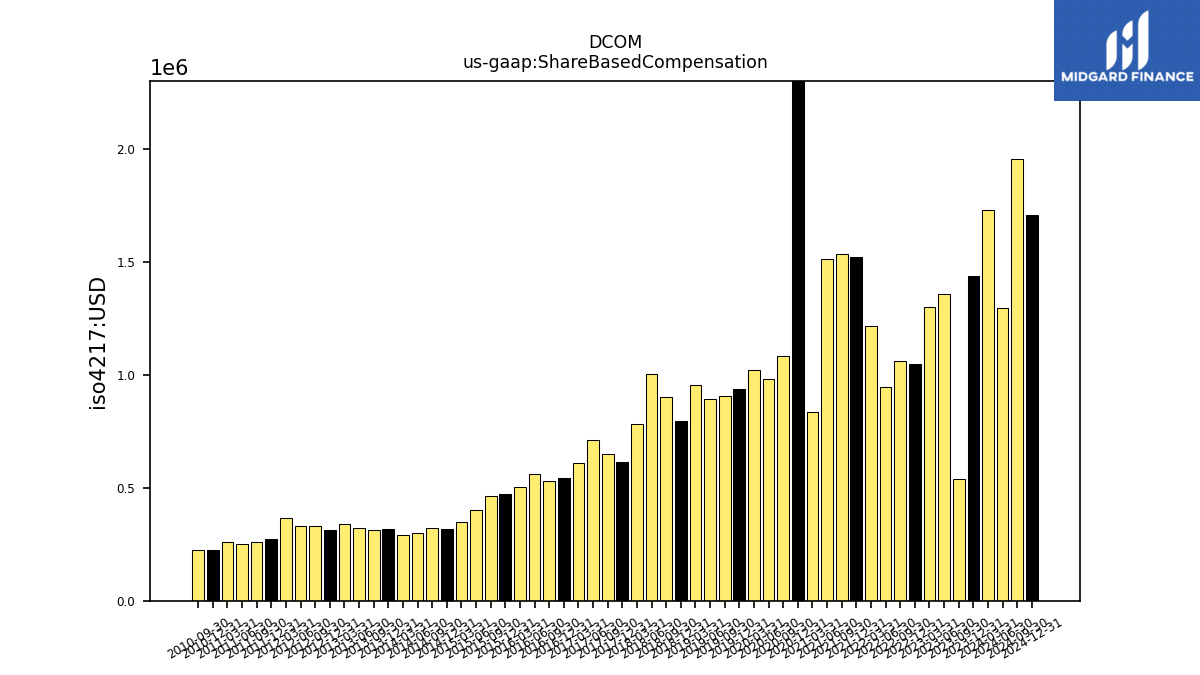
| Share Based Compensation | 1.44 | 0.54 | 1.36 | 1.30 | 1.05 | 1.06 | 0.95 | 1.22 | 1.52 | 1.53 | 1.51 | 0.84 | 4.55 | 1.08 | 0.98 | 1.02 | 0.94 | 0.91 | 0.89 | 0.95 | 0.80 | 0.90 | 1.00 | 0.78 | 0.61 | 0.65 | 0.71 |
| 2023-12-31 | 2023-09-30 | 2023-06-30 | 2023-03-31 | 2022-12-31 | 2022-09-30 | 2022-06-30 | 2022-03-31 | 2021-12-31 | 2021-09-30 | 2021-06-30 | 2021-03-31 | 2020-12-31 | 2020-09-30 | 2020-06-30 | 2020-03-31 | 2019-12-31 | 2019-09-30 | 2019-06-30 | 2019-03-31 | 2018-12-31 | 2018-09-30 | 2018-06-30 | 2018-03-31 | 2017-12-31 | 2017-09-30 | 2017-06-30 | ||
|---|---|---|---|---|---|---|---|---|---|---|---|---|---|---|---|---|---|---|---|---|---|---|---|---|---|---|---|---|
| Net Cash Provided By Used In Investing Activities | 65.42 | 42.29 | -131.07 | -190.68 | -456.69 | -494.21 | -373.82 | -7.48 | 33.93 | -237.65 | 844.61 | 461.93 | 27.16 | 63.89 | -830.54 | 22.65 | -201.65 | -45.03 | 25.00 | -130.93 | -84.87 | -18.36 | 94.32 | -71.64 | -154.12 | -63.06 | NA |
| 2023-12-31 | 2023-09-30 | 2023-06-30 | 2023-03-31 | 2022-12-31 | 2022-09-30 | 2022-06-30 | 2022-03-31 | 2021-12-31 | 2021-09-30 | 2021-06-30 | 2021-03-31 | 2020-12-31 | 2020-09-30 | 2020-06-30 | 2020-03-31 | 2019-12-31 | 2019-09-30 | 2019-06-30 | 2019-03-31 | 2018-12-31 | 2018-09-30 | 2018-06-30 | 2018-03-31 | 2017-12-31 | 2017-09-30 | 2017-06-30 | ||
|---|---|---|---|---|---|---|---|---|---|---|---|---|---|---|---|---|---|---|---|---|---|---|---|---|---|---|---|---|
| Net Cash Provided By Used In Financing Activities | 73.35 | -222.27 | -110.75 | 671.10 | 265.26 | 425.68 | 154.52 | -32.88 | -256.26 | -419.08 | -403.79 | -19.90 | 113.51 | 158.78 | 1070.72 | 86.07 | 165.13 | -0.86 | 16.35 | -76.15 | 237.47 | 25.75 | -101.16 | 60.73 | 151.71 | 52.22 | NA | |
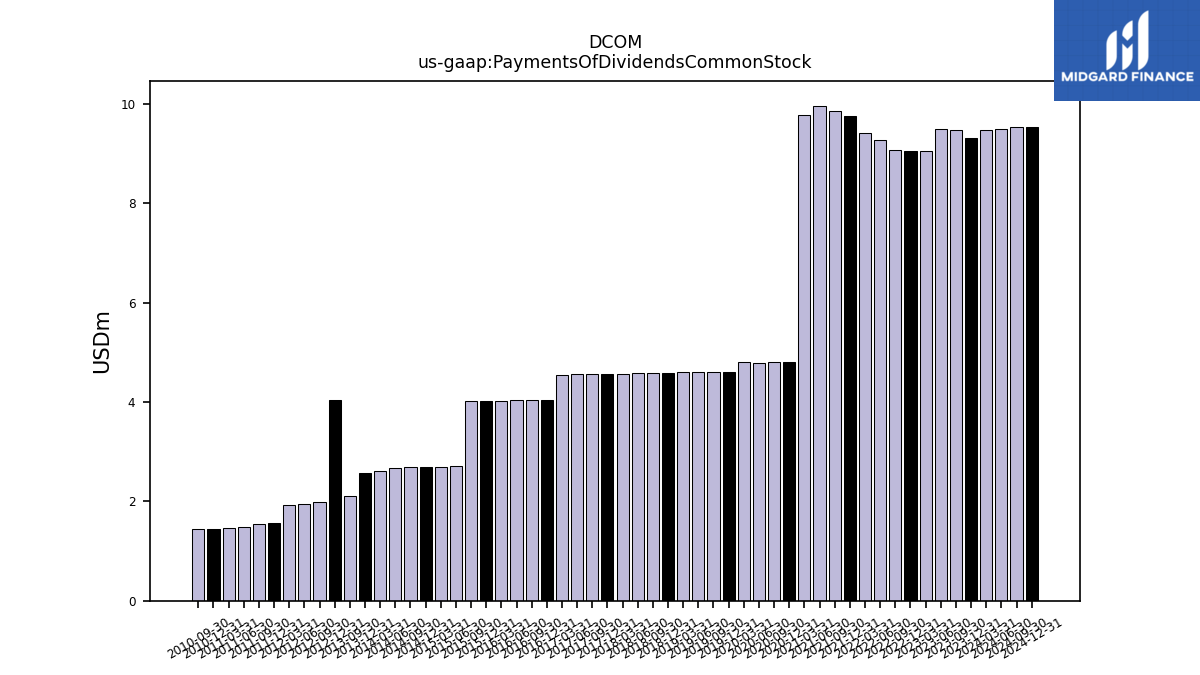
| Payments Of Dividends Common Stock | 9.30 | 9.46 | 9.48 | 9.05 | 9.05 | 9.07 | 9.26 | 9.41 | 9.75 | 9.86 | 9.96 | 9.78 | 4.80 | 4.80 | 4.79 | 4.81 | 4.61 | 4.61 | 4.61 | 4.59 | 4.59 | 4.59 | 4.59 | 4.57 | 4.57 | 4.57 | 4.56 | |
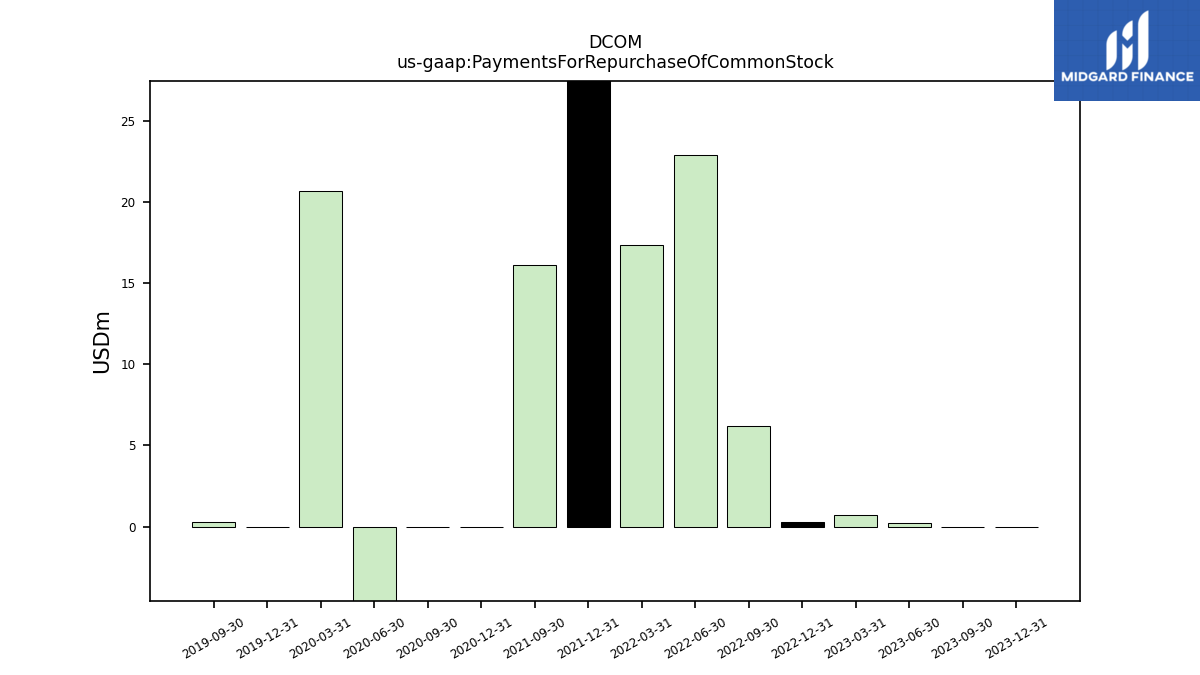
| Payments For Repurchase Of Common Stock | 0.00 | 0.00 | 0.23 | 0.71 | 0.26 | 6.21 | 22.90 | 17.39 | 29.31 | 16.15 | NA | NA | 0.00 | 0.00 | -16.08 | 20.71 | 0.00 | 0.30 | NA | NA | NA | NA | NA | NA | NA | NA | NA |
| 2023-12-31 | 2023-09-30 | 2023-06-30 | 2023-03-31 | 2022-12-31 | 2022-09-30 | 2022-06-30 | 2022-03-31 | 2021-12-31 | 2021-09-30 | 2021-06-30 | 2021-03-31 | 2020-12-31 | 2020-09-30 | 2020-06-30 | 2020-03-31 | 2019-12-31 | 2019-09-30 | 2019-06-30 | 2019-03-31 | 2018-12-31 | 2018-09-30 | 2018-06-30 | 2018-03-31 | 2017-12-31 | 2017-09-30 | 2017-06-30 | ||
|---|---|---|---|---|---|---|---|---|---|---|---|---|---|---|---|---|---|---|---|---|---|---|---|---|---|---|---|---|
| Revenues | 3.80 | 3.96 | 4.86 | 3.81 | 3.94 | 3.87 | 4.34 | 4.06 | 4.62 | 4.58 | 3.88 | 2.92 | 1.65 | 1.63 | 1.08 | 1.20 | -1.77 | 2.59 | 2.56 | 2.43 | 2.58 | 2.55 | 2.56 | 2.16 | 2.33 | 2.39 | 2.22 | |
| Revenue From Contract With Customer Excluding Assessed Tax | 3.80 | 3.96 | 4.86 | 3.81 | 3.94 | 3.87 | 4.34 | 4.06 | 4.62 | 4.58 | 3.88 | 2.92 | 1.65 | 1.63 | 1.08 | 1.20 | -1.77 | 2.59 | 2.56 | 2.43 | 2.58 | 2.55 | 2.56 | 2.16 | 2.33 | 2.39 | 2.22 | |
| Revenue From Contract With Customer Including Assessed Tax | 3.80 | 3.96 | 4.86 | 3.81 | 3.94 | 3.87 | 4.34 | 4.06 | 4.62 | 4.58 | 3.88 | 2.92 | 2.35 | 2.21 | 1.89 | 2.50 | 2.49 | 2.59 | 2.56 | 2.43 | 2.58 | 2.55 | 2.56 | 2.16 | 2.33 | 2.39 | 2.22 |
