
| 2023-10-28 | 2023-07-29 | 2023-04-29 | 2023-01-28 | 2022-10-29 | 2022-07-30 | 2022-04-30 | 2022-01-29 | 2021-10-30 | 2021-07-31 | 2021-05-01 | 2021-01-30 | 2020-10-31 | 2020-08-01 | 2020-05-02 | 2020-02-01 | 2019-11-02 | 2019-08-03 | 2019-05-04 | 2019-02-02 | 2018-11-03 | 2018-08-04 | 2018-05-05 | 2017-10-28 | 2017-07-29 | 2017-04-29 | 2017-01-28 | 2016-10-29 | 2016-07-30 | 2016-04-30 | 2016-01-30 | 2015-10-31 | 2015-08-01 | 2015-05-02 | 2015-01-31 | 2014-11-01 | 2014-08-02 | 2014-05-03 | 2014-02-01 | 2013-11-02 | 2013-08-03 | 2013-05-04 | 2012-10-27 | 2012-07-28 | 2012-04-28 | 2012-01-28 | 2011-10-29 | 2011-07-30 | 2011-04-30 | 2011-01-29 | 2010-10-30 | 2010-07-31 | 2010-05-01 | ||
|---|---|---|---|---|---|---|---|---|---|---|---|---|---|---|---|---|---|---|---|---|---|---|---|---|---|---|---|---|---|---|---|---|---|---|---|---|---|---|---|---|---|---|---|---|---|---|---|---|---|---|---|---|---|---|
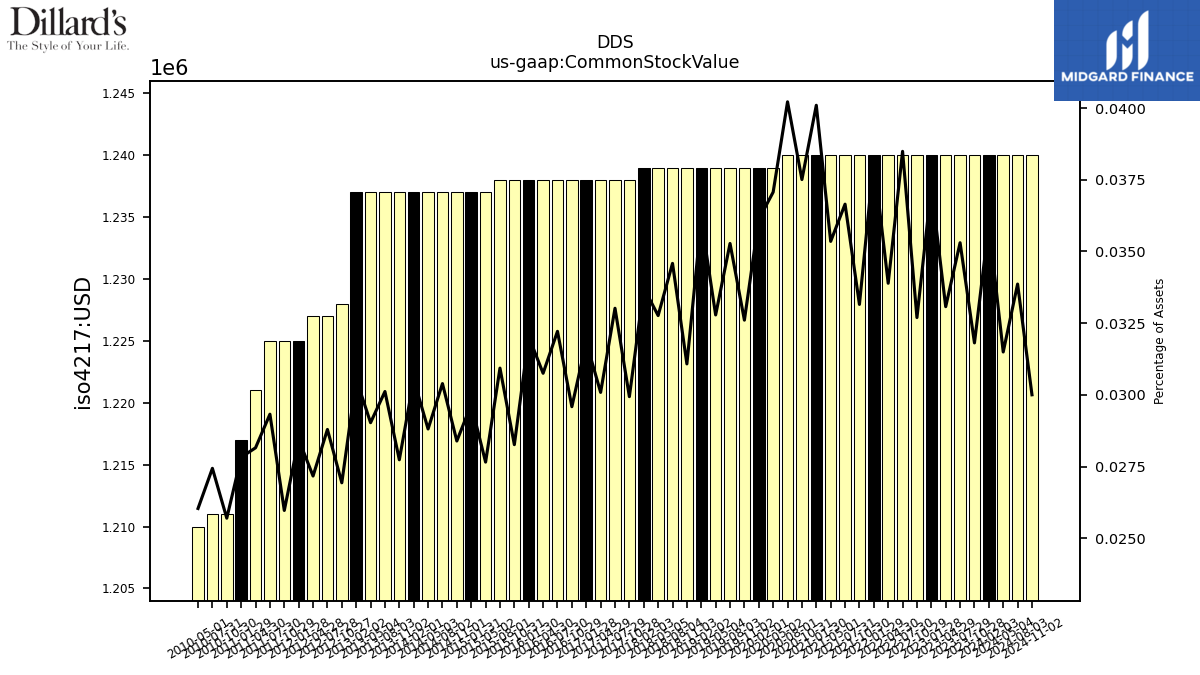
| Common Stock Value | 1.24 | 1.24 | 1.24 | 1.24 | 1.24 | 1.24 | 1.24 | 1.24 | 1.24 | 1.24 | 1.24 | 1.24 | 1.24 | 1.24 | 1.24 | 1.24 | 1.24 | 1.24 | 1.24 | 1.24 | 1.24 | 1.24 | 1.24 | 1.24 | 1.24 | 1.24 | 1.24 | 1.24 | 1.24 | 1.24 | 1.24 | 1.24 | 1.24 | 1.24 | 1.24 | 1.24 | 1.24 | 1.24 | 1.24 | 1.24 | 1.24 | 1.24 | 1.23 | 1.23 | 1.23 | 1.23 | 1.23 | 1.23 | 1.22 | 1.22 | 1.21 | 1.21 | 1.21 | |
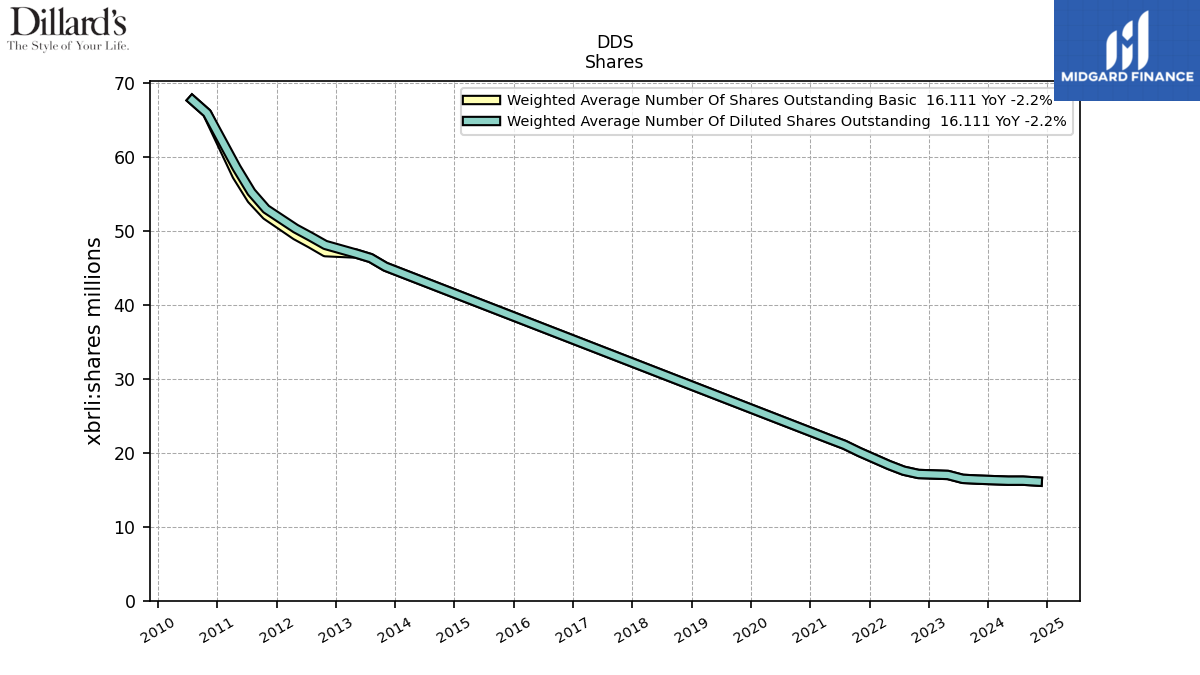
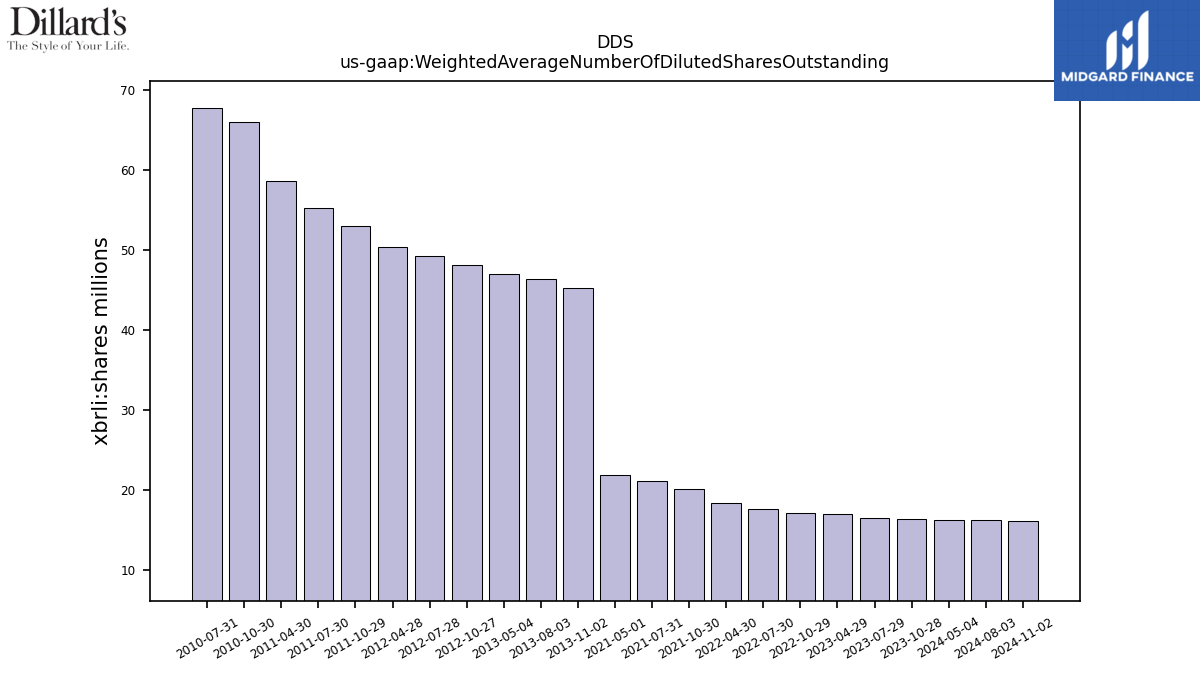
| Weighted Average Number Of Diluted Shares Outstanding | 16.38 | 16.48 | 17.00 | NA | 17.14 | 17.58 | 18.35 | NA | 20.11 | 21.08 | 21.84 | NA | NA | NA | NA | NA | NA | NA | NA | NA | NA | NA | NA | NA | NA | NA | NA | NA | NA | NA | NA | NA | NA | NA | NA | NA | NA | NA | NA | 45.16 | 46.33 | 46.94 | 48.10 | 49.23 | 50.31 | NA | 52.95 | 55.24 | 58.53 | NA | 65.92 | 67.69 | NA | |
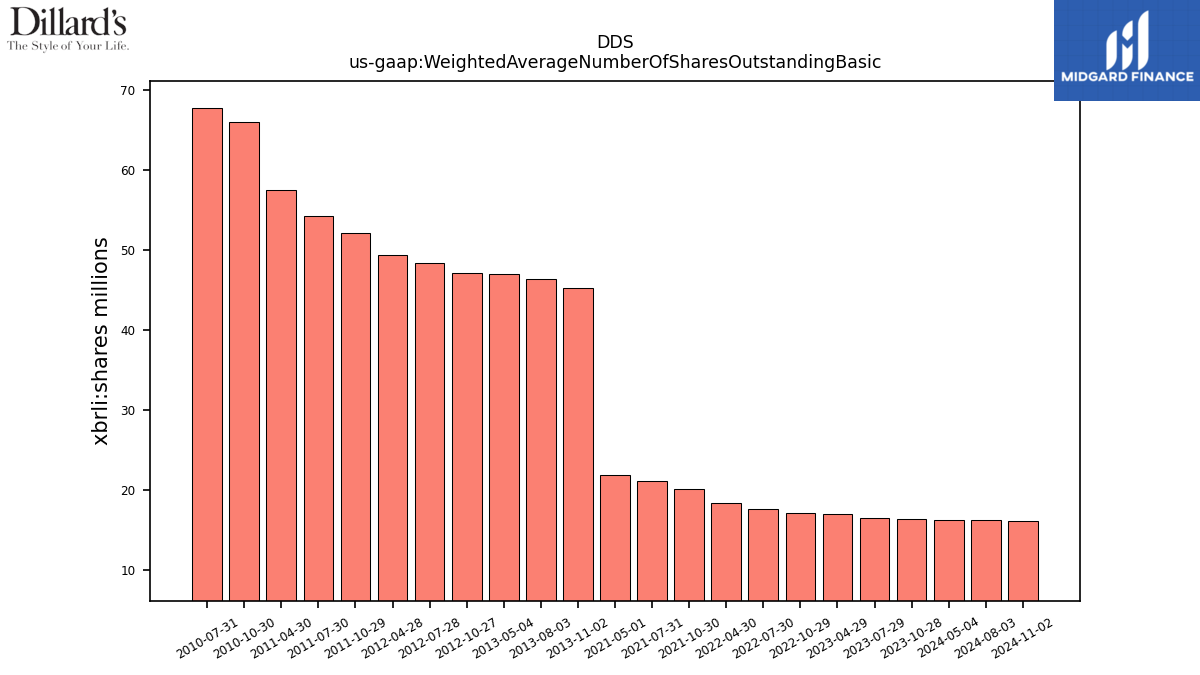
| Weighted Average Number Of Shares Outstanding Basic | 16.38 | 16.48 | 17.00 | NA | 17.14 | 17.58 | 18.35 | NA | 20.11 | 21.08 | 21.84 | NA | NA | NA | NA | NA | NA | NA | NA | NA | NA | NA | NA | NA | NA | NA | NA | NA | NA | NA | NA | NA | NA | NA | NA | NA | NA | NA | NA | 45.16 | 46.33 | 46.94 | 47.13 | 48.29 | 49.38 | NA | 52.11 | 54.26 | 57.46 | NA | 65.92 | 67.69 | NA | |
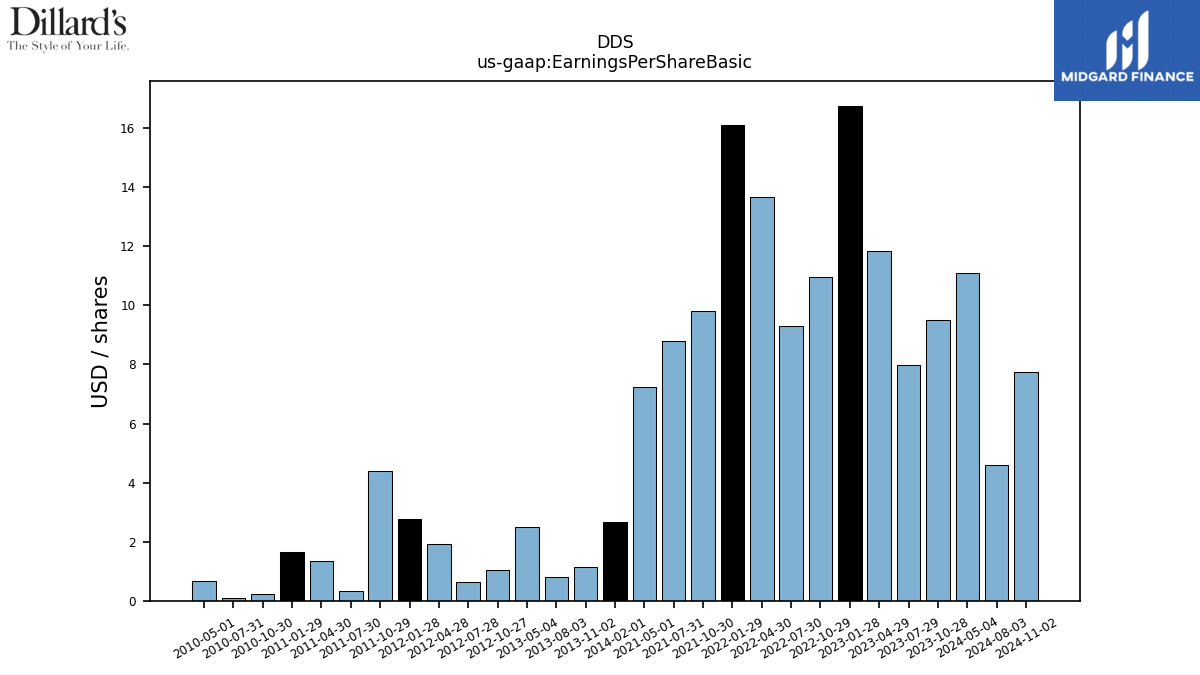
| Earnings Per Share Basic | 9.49 | 7.98 | 11.85 | 16.76 | 10.96 | 9.30 | 13.68 | 16.12 | 9.81 | 8.81 | 7.25 | NA | NA | NA | NA | NA | NA | NA | NA | NA | NA | NA | NA | NA | NA | NA | NA | NA | NA | NA | NA | NA | NA | NA | NA | NA | NA | NA | 2.67 | 1.13 | 0.79 | 2.50 | 1.03 | 0.64 | 1.92 | 2.77 | 4.38 | 0.32 | 1.33 | 1.66 | 0.22 | 0.10 | 0.68 | |
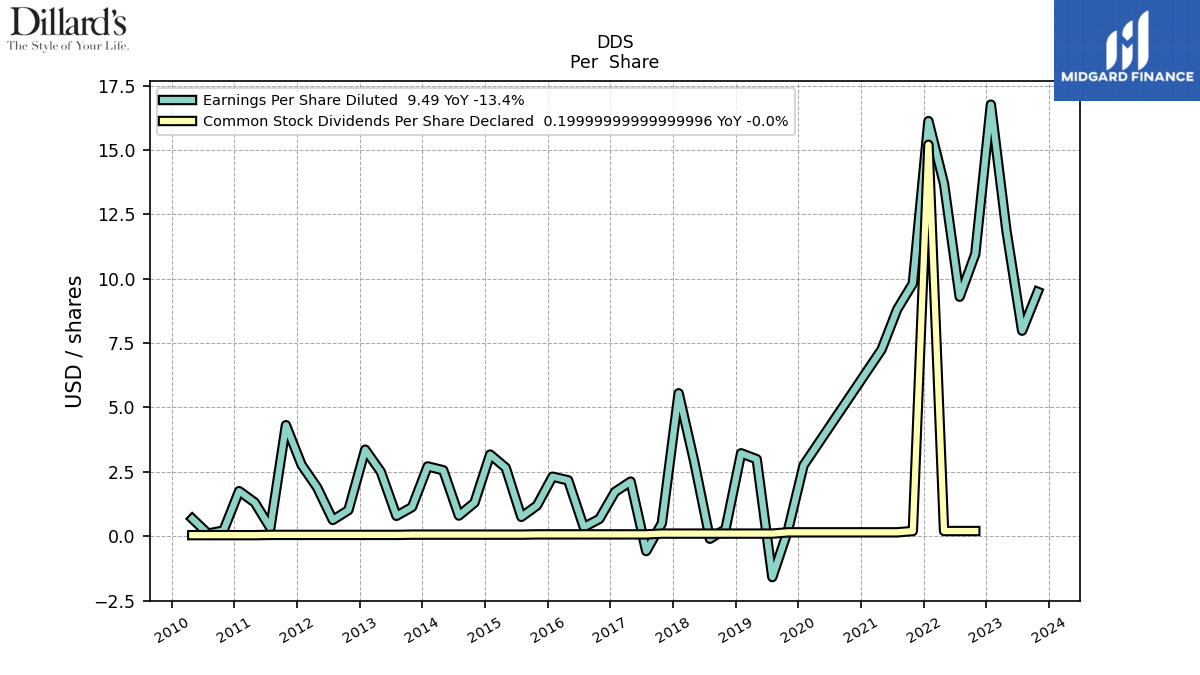
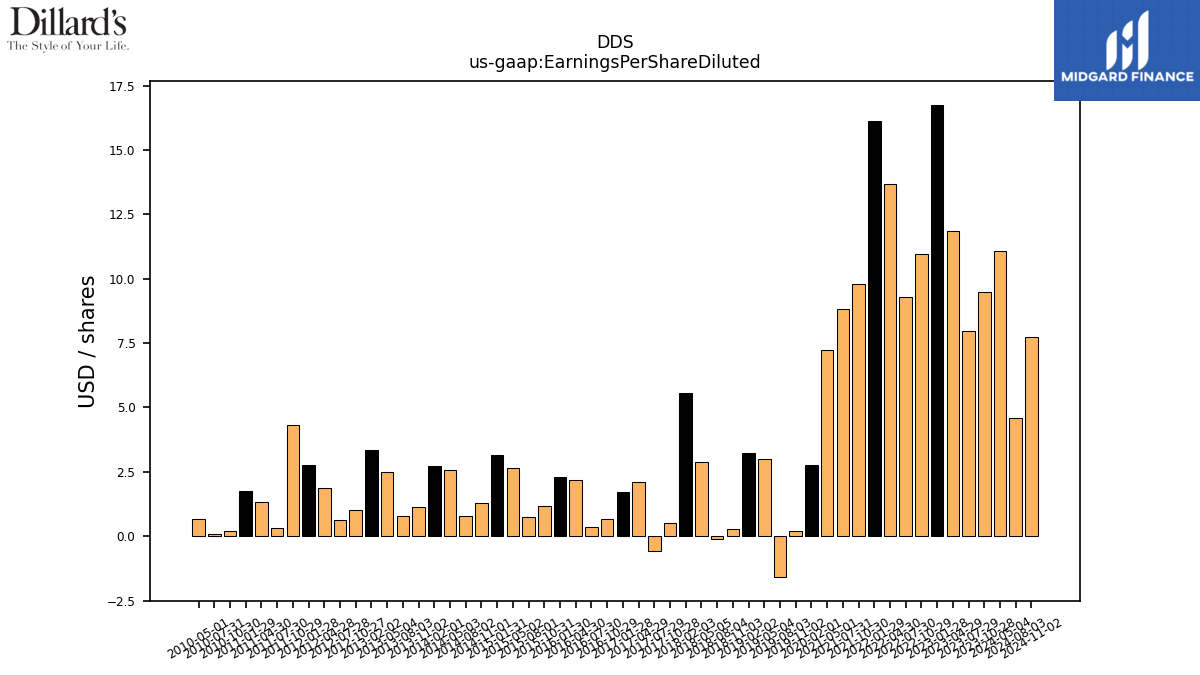
| Earnings Per Share Diluted | 9.49 | 7.98 | 11.85 | 16.76 | 10.96 | 9.30 | 13.68 | 16.12 | 9.81 | 8.81 | 7.25 | NA | NA | NA | NA | 2.75 | 0.22 | -1.59 | 2.99 | 3.22 | 0.27 | -0.10 | 2.89 | 0.50 | -0.58 | 2.12 | 1.72 | 0.67 | 0.35 | 2.17 | 2.31 | 1.19 | 0.75 | 2.66 | 3.17 | 1.30 | 0.80 | 2.56 | 2.71 | 1.13 | 0.79 | 2.50 | 1.01 | 0.63 | 1.89 | 2.77 | 4.31 | 0.32 | 1.31 | 1.75 | 0.22 | 0.10 | 0.68 |
| 2023-10-28 | 2023-07-29 | 2023-04-29 | 2023-01-28 | 2022-10-29 | 2022-07-30 | 2022-04-30 | 2022-01-29 | 2021-10-30 | 2021-07-31 | 2021-05-01 | 2021-01-30 | 2020-10-31 | 2020-08-01 | 2020-05-02 | 2020-02-01 | 2019-11-02 | 2019-08-03 | 2019-05-04 | 2019-02-02 | 2018-11-03 | 2018-08-04 | 2018-05-05 | 2017-10-28 | 2017-07-29 | 2017-04-29 | 2017-01-28 | 2016-10-29 | 2016-07-30 | 2016-04-30 | 2016-01-30 | 2015-10-31 | 2015-08-01 | 2015-05-02 | 2015-01-31 | 2014-11-01 | 2014-08-02 | 2014-05-03 | 2014-02-01 | 2013-11-02 | 2013-08-03 | 2013-05-04 | 2012-10-27 | 2012-07-28 | 2012-04-28 | 2012-01-28 | 2011-10-29 | 2011-07-30 | 2011-04-30 | 2011-01-29 | 2010-10-30 | 2010-07-31 | 2010-05-01 | ||
|---|---|---|---|---|---|---|---|---|---|---|---|---|---|---|---|---|---|---|---|---|---|---|---|---|---|---|---|---|---|---|---|---|---|---|---|---|---|---|---|---|---|---|---|---|---|---|---|---|---|---|---|---|---|---|
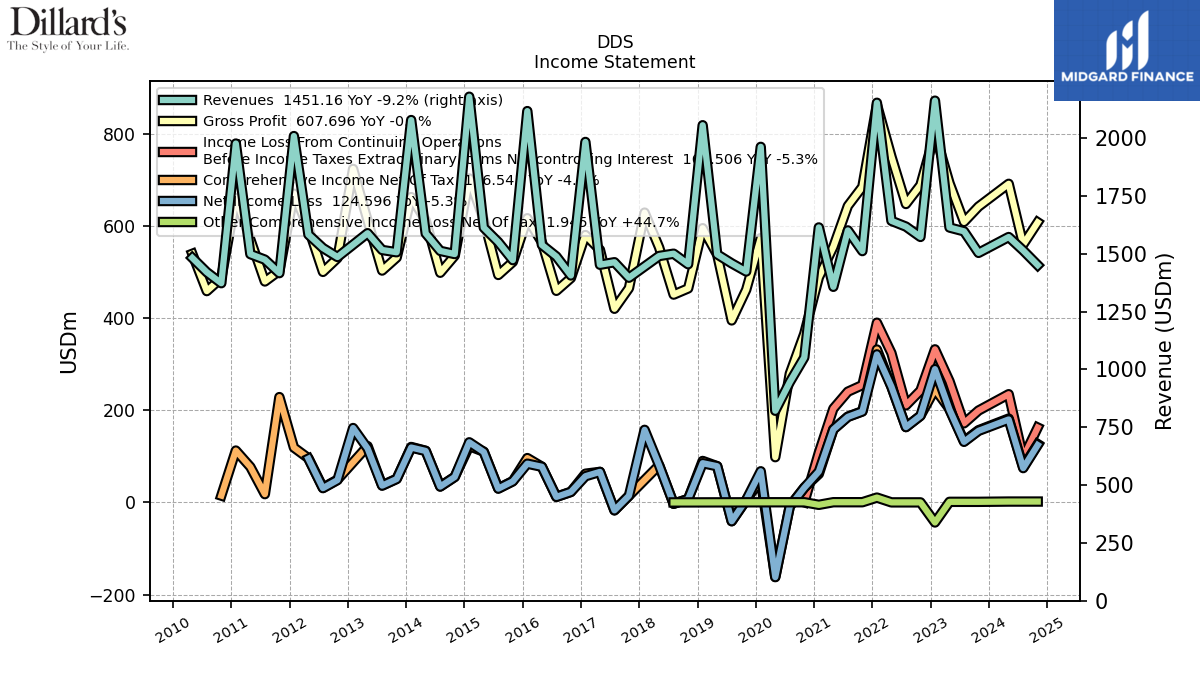
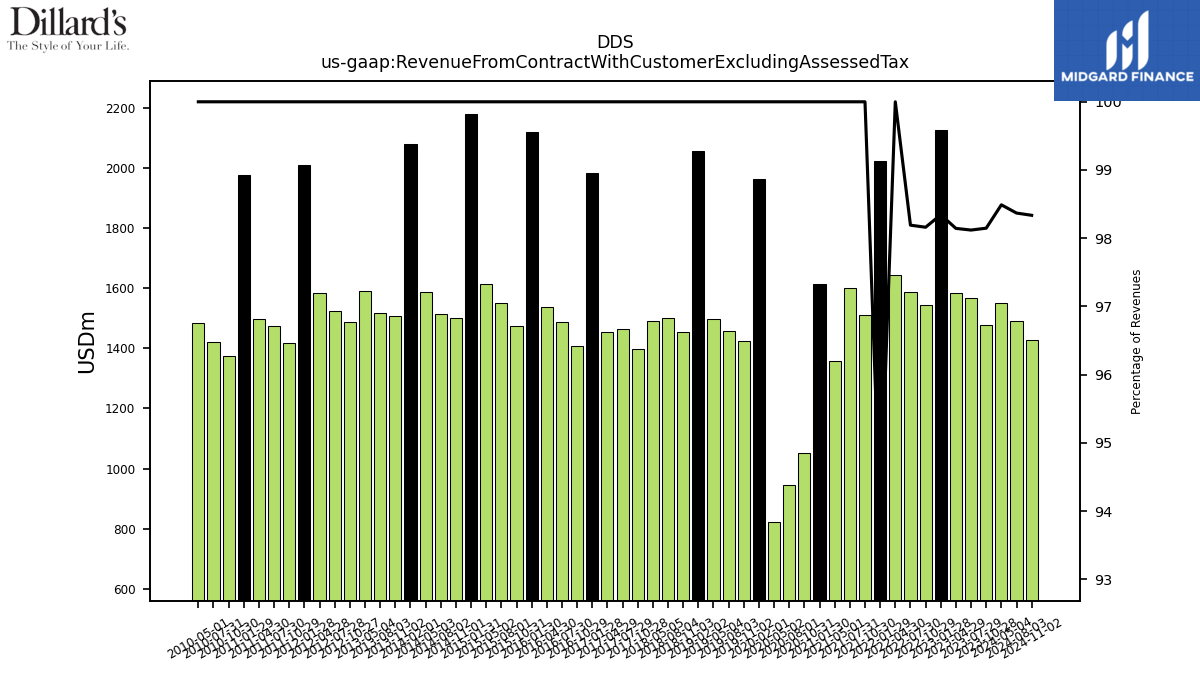
| Revenue From Contract With Customer Excluding Assessed Tax | 1476.36 | 1567.38 | 1613.91 | 2251.78 | 1544.14 | 1588.62 | 1642.78 | 2153.39 | 1511.91 | 1601.43 | 1357.54 | 1614.31 | 1052.11 | 945.18 | 821.58 | 1962.77 | 1423.66 | 1458.85 | 1497.93 | 2056.26 | 1454.96 | 1500.71 | 1490.72 | 1396.82 | 1463.81 | 1452.87 | 1983.97 | 1406.49 | 1488.75 | 1538.80 | 2117.43 | 1472.85 | 1550.84 | 1613.42 | 2179.56 | 1499.14 | 1512.89 | 1588.54 | 2078.68 | 1506.92 | 1516.80 | 1589.38 | 1486.35 | 1525.18 | 1583.23 | 2009.42 | 1416.54 | 1475.05 | 1498.76 | 1977.05 | 1373.04 | 1420.79 | 1482.66 | |
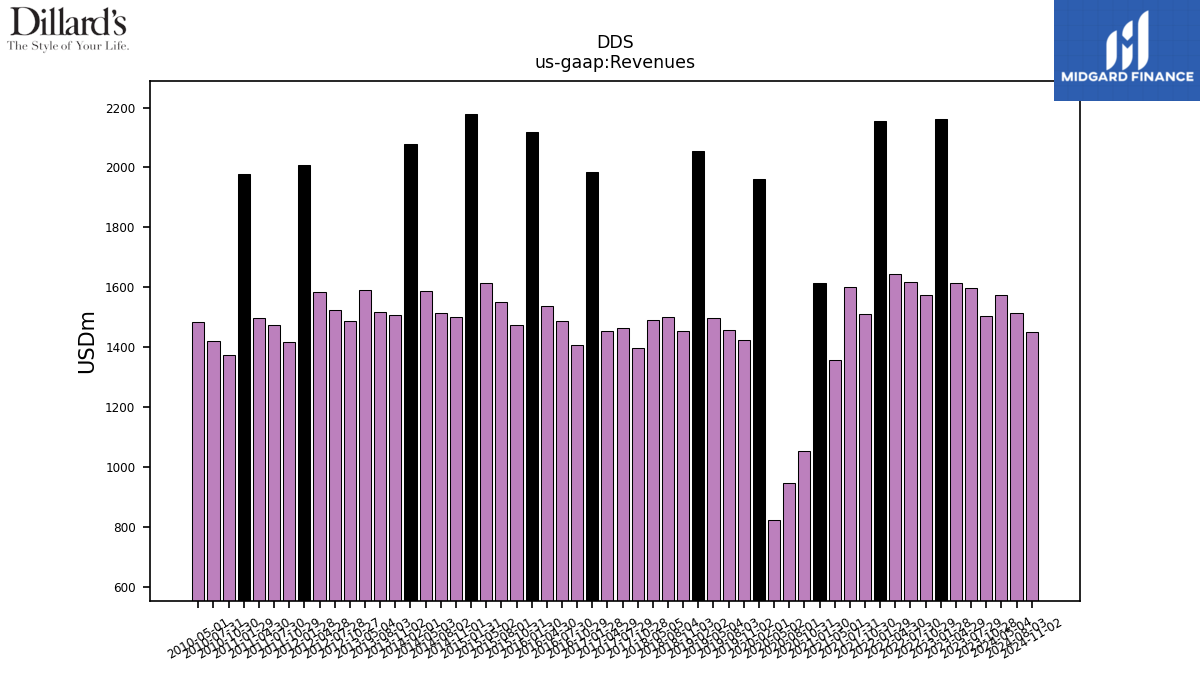
| Revenues | 1504.23 | 1597.42 | 1613.91 | 2162.47 | 1573.07 | 1617.89 | 1642.78 | 2153.39 | 1511.91 | 1601.43 | 1357.54 | 1614.31 | 1052.11 | 945.18 | 821.58 | 1962.77 | 1423.66 | 1458.85 | 1497.93 | 2056.26 | 1454.96 | 1500.71 | 1490.72 | 1396.82 | 1463.81 | 1452.87 | 1983.97 | 1406.49 | 1488.75 | 1538.80 | 2117.43 | 1472.85 | 1550.84 | 1613.42 | 2179.56 | 1499.14 | 1512.89 | 1588.54 | 2078.68 | 1506.92 | 1516.80 | 1589.38 | 1486.35 | 1525.18 | 1583.23 | 2009.42 | 1416.54 | 1475.05 | 1498.76 | 1977.05 | 1373.04 | 1420.79 | 1482.66 | |
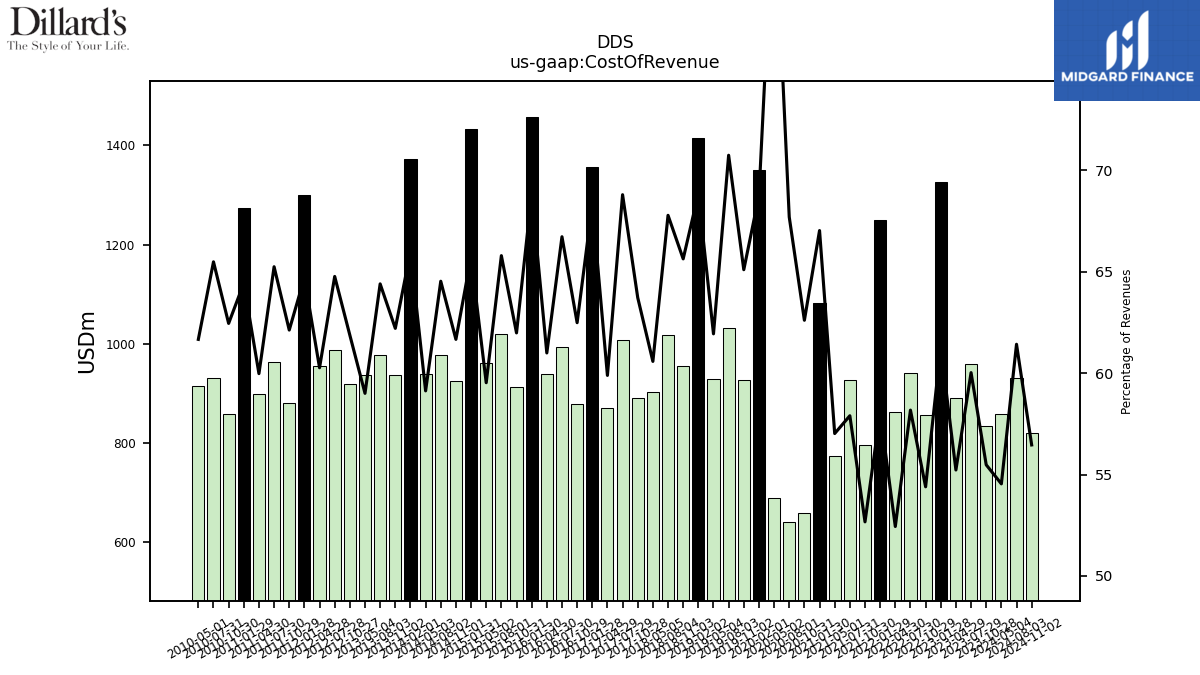
| Cost Of Revenue | 834.54 | 958.84 | 891.26 | 1325.27 | 855.68 | 941.22 | 861.44 | 1250.09 | 796.28 | 927.21 | 774.09 | 1082.06 | 658.68 | 639.85 | 688.47 | 1349.41 | 926.78 | 1032.01 | 927.77 | 1415.66 | 954.94 | 1017.18 | 903.05 | 890.08 | 1007.05 | 870.09 | 1355.61 | 878.87 | 993.36 | 938.58 | 1457.13 | 912.92 | 1020.33 | 960.42 | 1432.67 | 924.44 | 976.27 | 939.22 | 1371.70 | 937.41 | 976.82 | 937.78 | 919.62 | 987.80 | 954.13 | 1300.27 | 880.00 | 962.40 | 898.89 | 1273.89 | 857.47 | 930.44 | 914.26 | |
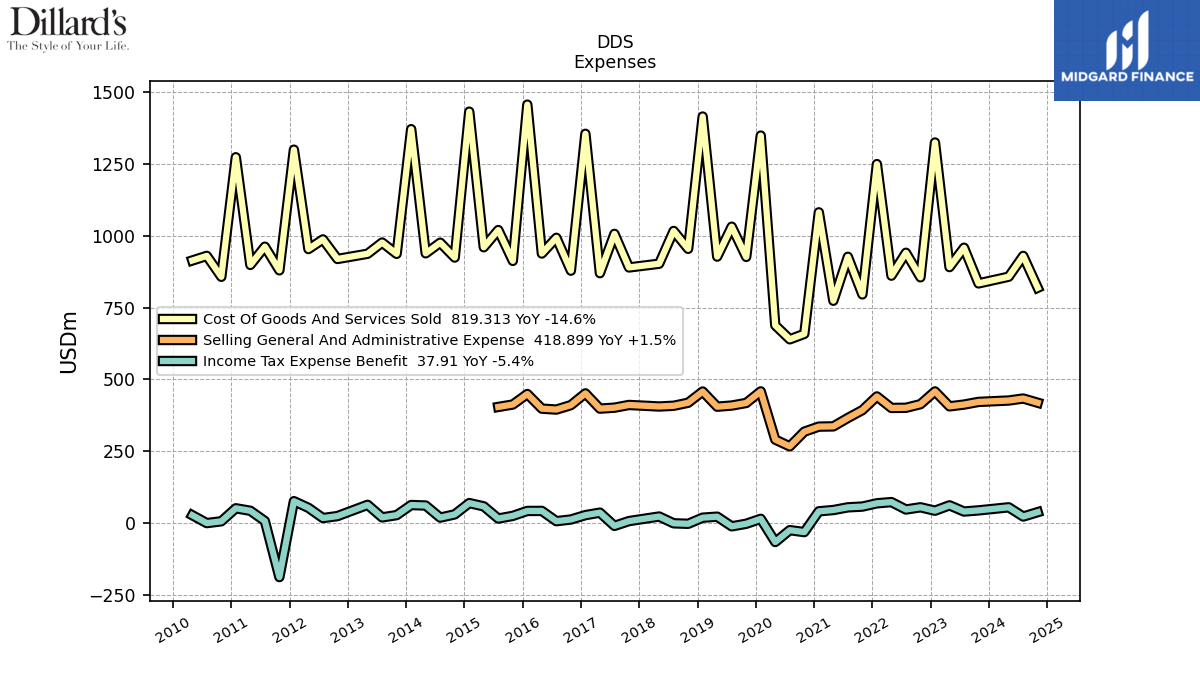
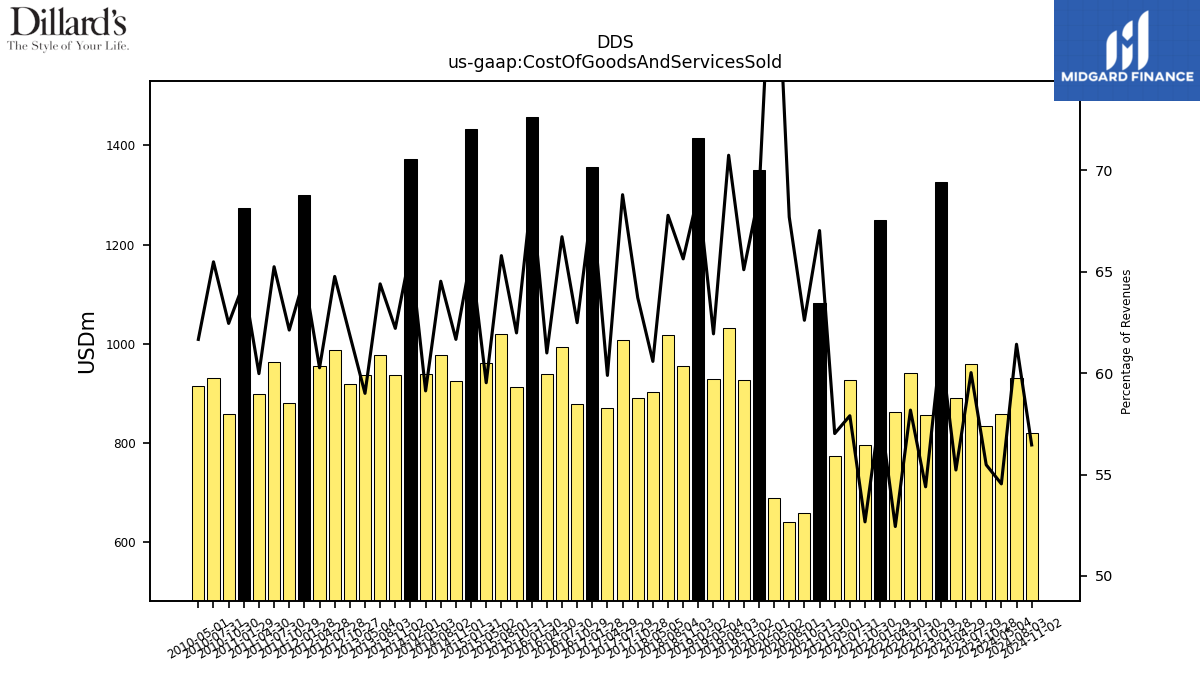
| Cost Of Goods And Services Sold | 834.54 | 958.84 | 891.26 | 1325.27 | 855.68 | 941.22 | 861.44 | 1250.09 | 796.28 | 927.21 | 774.09 | 1082.06 | 658.68 | 639.85 | 688.47 | 1349.41 | 926.78 | 1032.01 | 927.77 | 1415.66 | 954.94 | 1017.18 | 903.05 | 890.08 | 1007.05 | 870.09 | 1355.61 | 878.87 | 993.36 | 938.58 | 1457.13 | 912.92 | 1020.33 | 960.42 | 1432.67 | 924.44 | 976.27 | 939.22 | 1371.70 | 937.41 | 976.82 | 937.78 | 919.62 | 987.80 | 954.13 | 1300.27 | 880.00 | 962.40 | 898.89 | 1273.89 | 857.47 | 930.44 | 914.26 | |
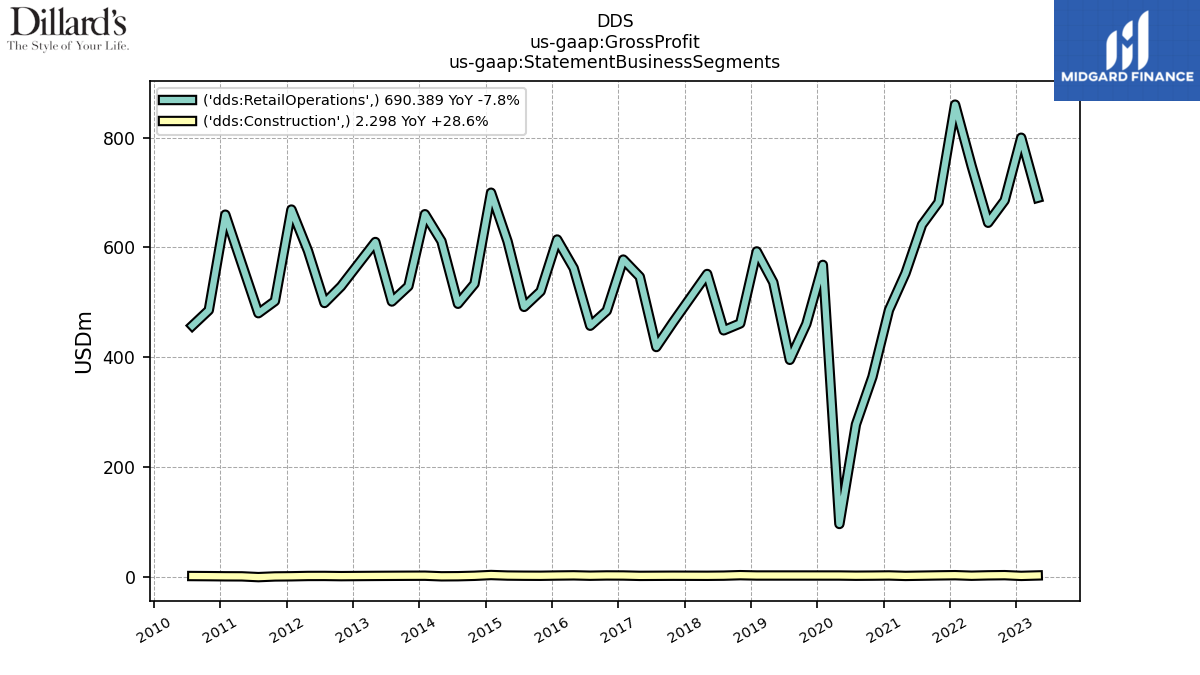
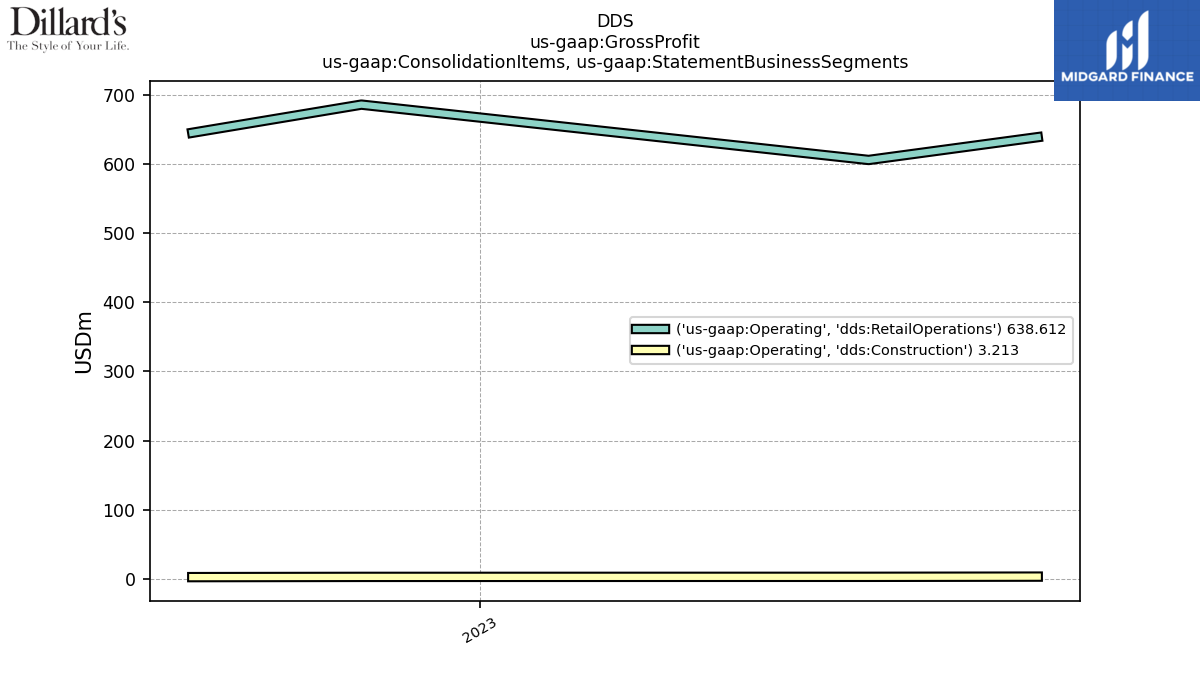
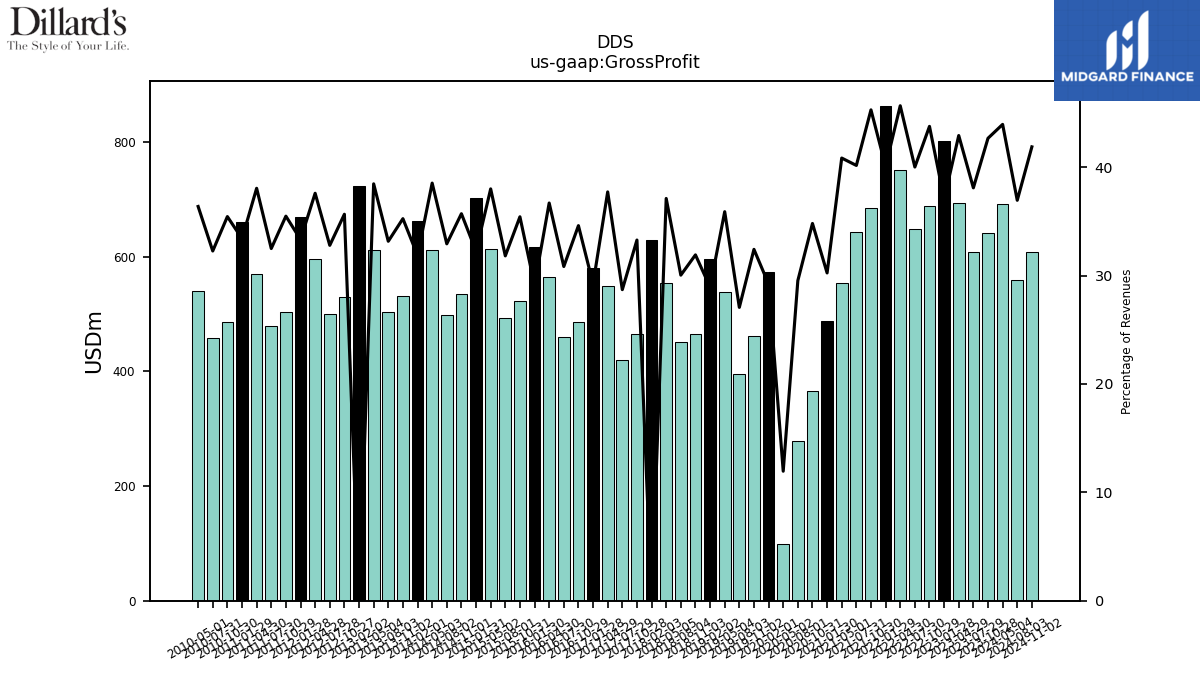
| Gross Profit | 641.83 | 608.54 | 692.69 | 801.38 | 688.47 | 647.40 | 750.23 | 862.98 | 684.72 | 643.17 | 554.45 | 488.23 | 366.21 | 279.20 | 98.19 | 573.49 | 461.53 | 394.85 | 537.67 | 594.95 | 464.28 | 450.85 | 553.28 | 464.84 | 420.16 | 548.03 | 580.07 | 486.74 | 459.09 | 564.66 | 616.57 | 521.73 | 493.45 | 613.07 | 702.81 | 535.34 | 498.21 | 612.09 | 662.35 | 531.21 | 503.03 | 611.35 | 530.00 | 500.12 | 595.19 | 669.77 | 502.62 | 479.35 | 570.31 | 660.45 | 486.64 | 458.47 | 539.34 | |
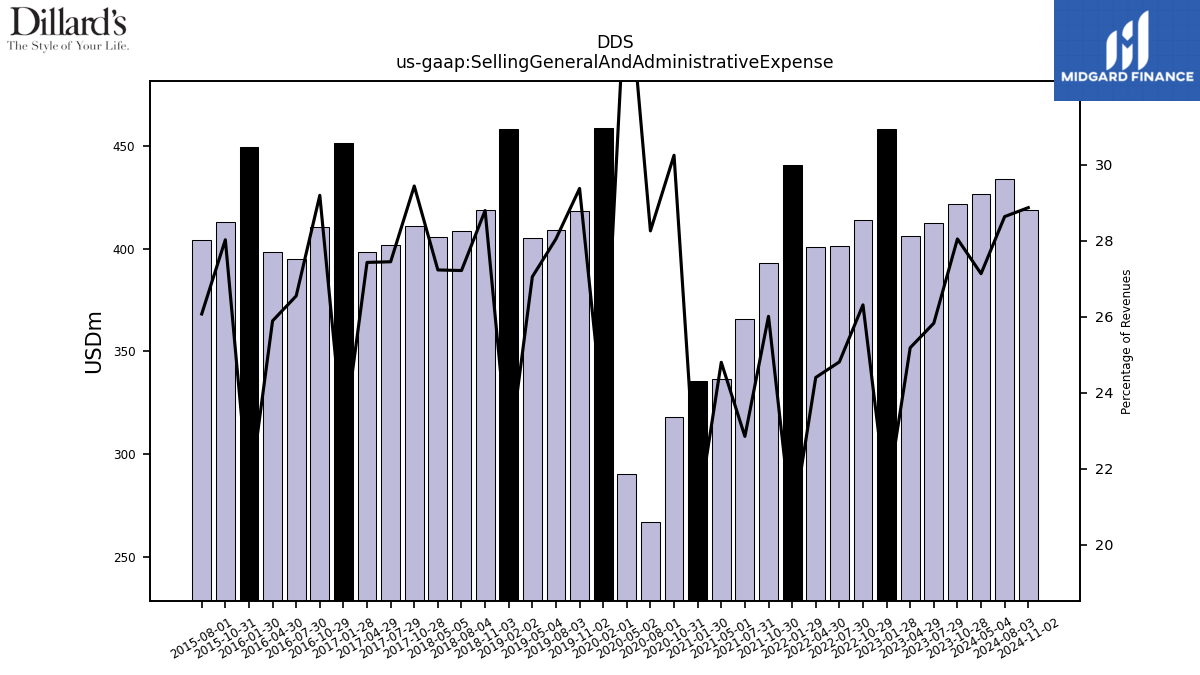
| Selling General And Administrative Expense | 421.82 | 412.54 | 406.38 | 458.37 | 413.84 | 401.33 | 400.77 | 440.88 | 393.19 | 365.87 | 336.61 | 335.76 | 318.22 | 267.06 | 290.45 | 458.58 | 418.15 | 409.12 | 405.16 | 458.05 | 418.90 | 408.36 | 405.87 | 411.16 | 401.70 | 398.45 | 451.61 | 410.56 | 395.14 | 398.34 | 449.36 | 412.71 | 404.28 | NA | NA | NA | NA | NA | NA | NA | NA | NA | NA | NA | NA | NA | NA | NA | NA | NA | NA | NA | NA | |
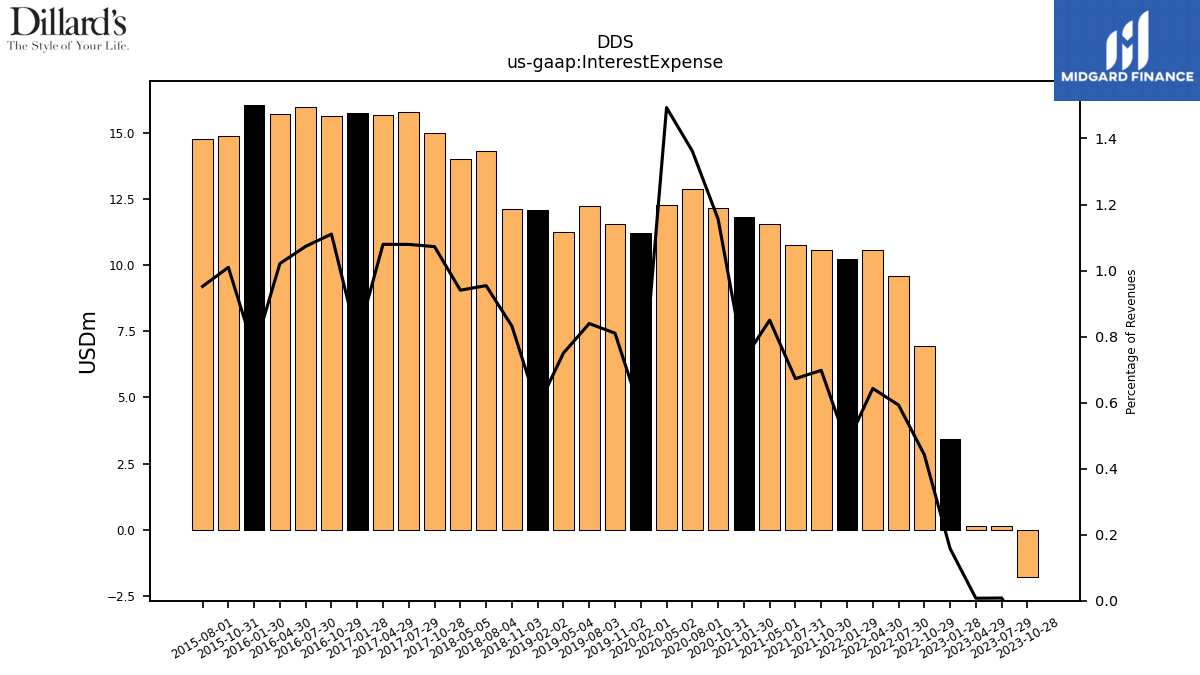
| Interest Expense | -1.79 | 0.13 | 0.12 | 3.42 | 6.96 | 9.59 | 10.56 | 10.24 | 10.55 | 10.77 | 11.54 | 11.80 | 12.16 | 12.87 | 12.27 | 11.21 | 11.54 | 12.25 | 11.24 | 12.07 | 12.10 | 14.32 | 14.02 | 14.98 | 15.80 | 15.68 | 15.75 | 15.62 | 15.98 | 15.71 | 16.06 | 14.87 | 14.77 | NA | NA | NA | NA | NA | NA | NA | NA | NA | NA | NA | NA | NA | NA | NA | NA | NA | NA | NA | NA | |
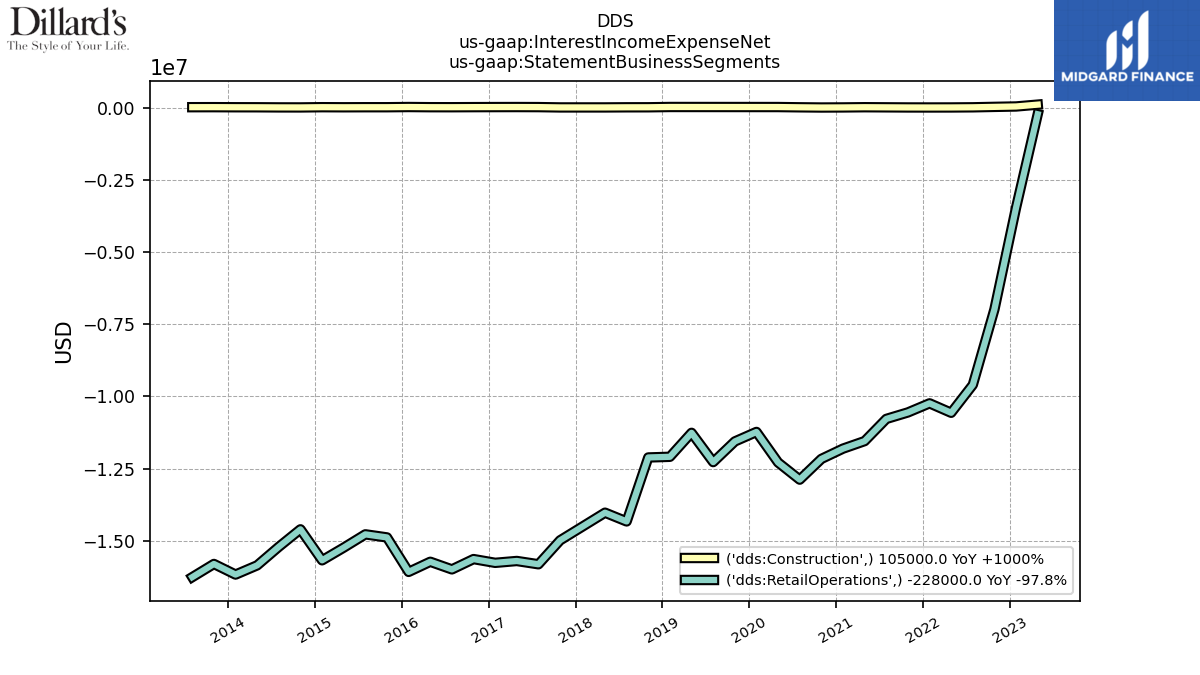
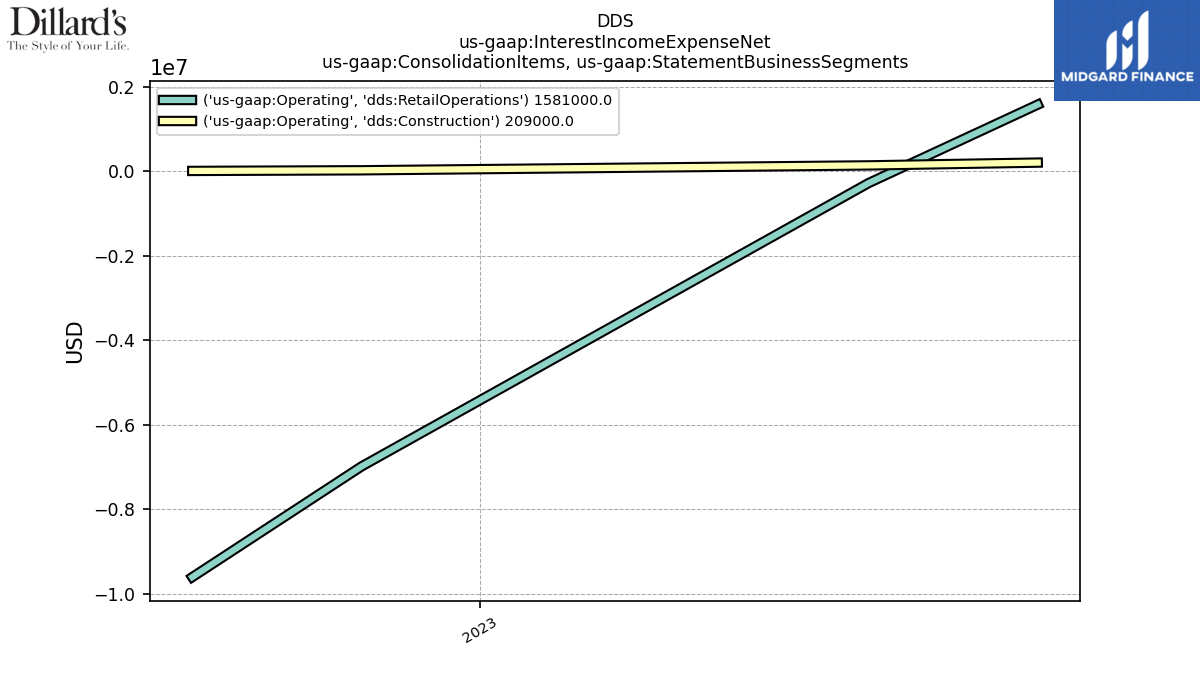
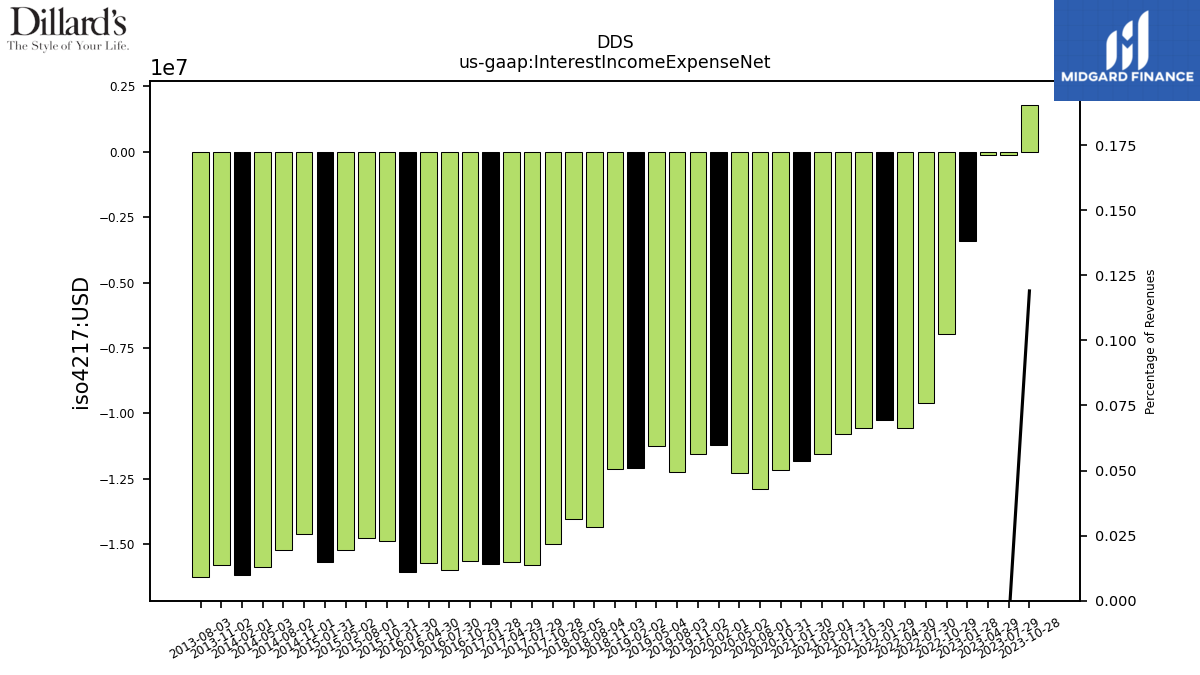
| Interest Income Expense Net | 1.79 | -0.13 | -0.12 | -3.42 | -6.96 | -9.59 | -10.56 | -10.24 | -10.55 | -10.77 | -11.54 | -11.80 | -12.16 | -12.87 | -12.27 | -11.21 | -11.54 | -12.25 | -11.24 | -12.07 | -12.10 | -14.32 | -14.02 | -14.98 | -15.80 | -15.68 | -15.75 | -15.62 | -15.98 | -15.71 | -16.06 | -14.87 | -14.77 | -15.23 | -15.66 | -14.60 | -15.20 | -15.84 | -16.16 | -15.79 | -16.25 | NA | NA | NA | NA | NA | NA | NA | NA | NA | NA | NA | NA | |
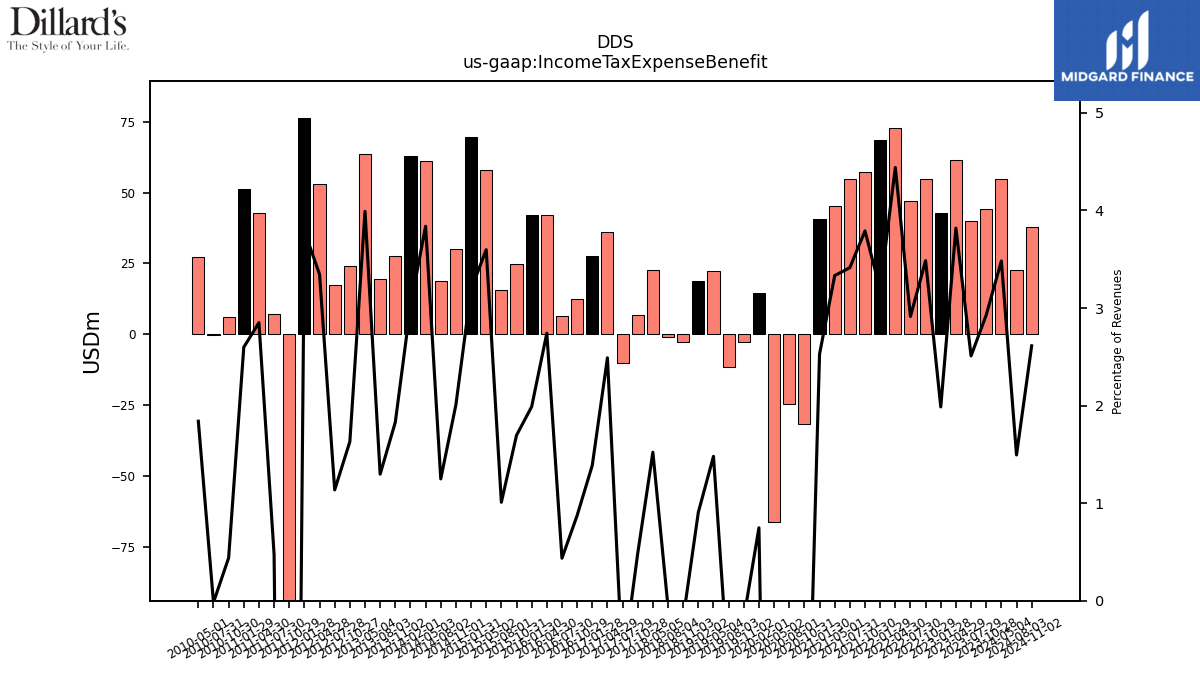
| Income Tax Expense Benefit | 44.04 | 40.08 | 61.62 | 42.95 | 54.82 | 47.13 | 72.93 | 68.69 | 57.30 | 54.66 | 45.24 | 40.80 | -31.62 | -24.76 | -66.17 | 14.68 | -2.56 | -11.48 | 22.17 | 18.65 | -2.65 | -0.96 | 22.69 | 6.79 | -9.95 | 36.17 | 27.52 | 12.29 | 6.49 | 42.20 | 42.11 | 24.97 | 15.65 | 58.04 | 69.52 | 30.11 | 18.89 | 60.96 | 62.73 | 27.57 | 19.68 | 63.42 | 24.23 | 17.33 | 52.97 | 76.12 | -188.36 | 7.01 | 42.71 | 51.38 | 6.04 | -0.24 | 27.28 | |
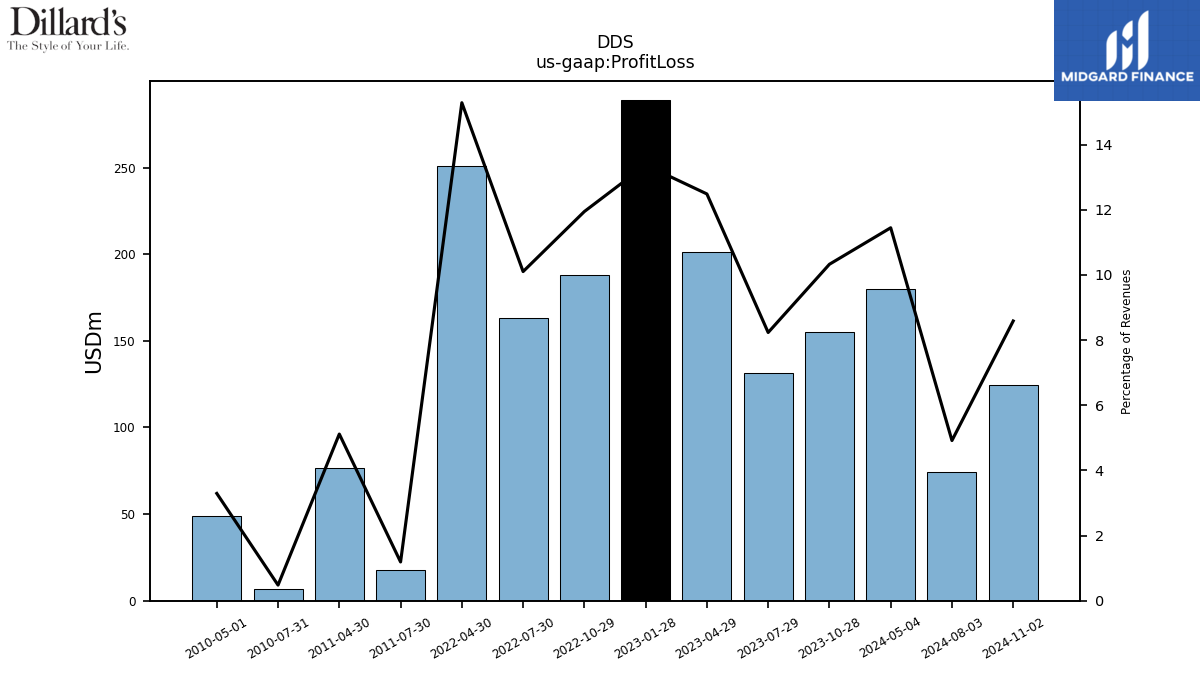
| Profit Loss | 155.34 | 131.51 | 201.50 | 289.19 | 187.91 | 163.45 | 251.09 | NA | NA | NA | NA | NA | NA | NA | NA | NA | NA | NA | NA | NA | NA | NA | NA | NA | NA | NA | NA | NA | NA | NA | NA | NA | NA | NA | NA | NA | NA | NA | NA | NA | NA | NA | NA | NA | NA | NA | NA | 17.57 | 76.68 | NA | NA | 6.83 | 48.83 | |
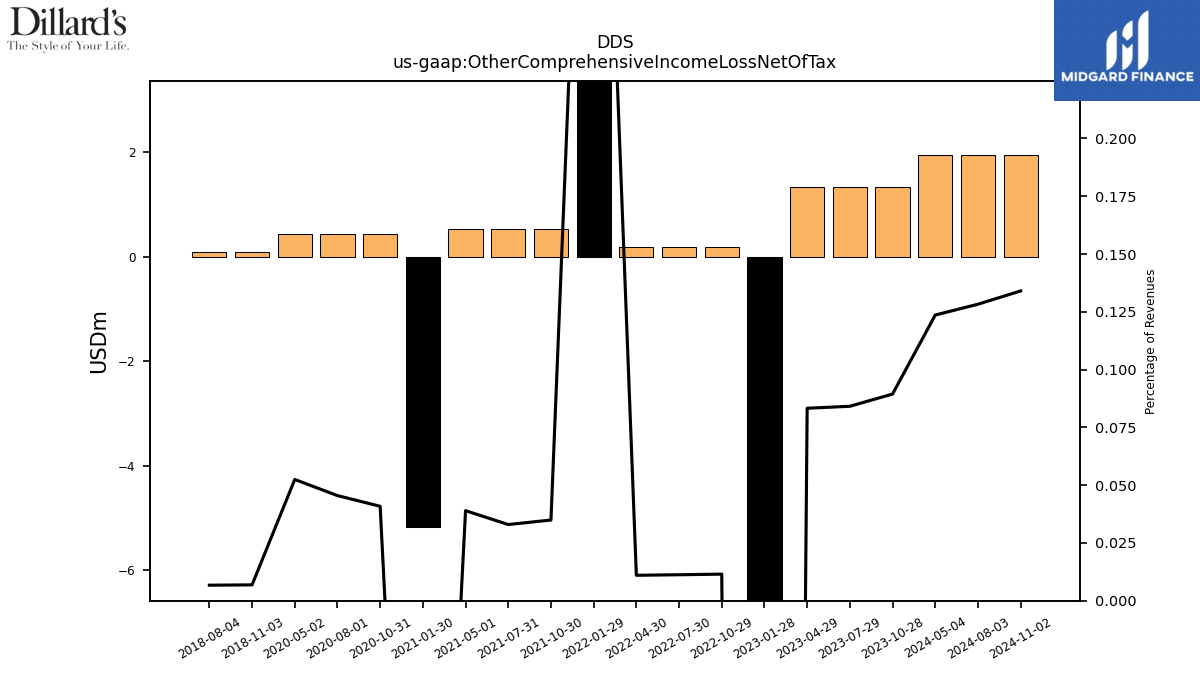
| Other Comprehensive Income Loss Net Of Tax | 1.34 | 1.34 | 1.34 | -43.47 | 0.18 | 0.18 | 0.18 | 10.55 | 0.53 | 0.53 | 0.53 | -5.17 | 0.43 | 0.43 | 0.43 | NA | NA | NA | NA | NA | 0.10 | 0.10 | NA | NA | NA | NA | NA | NA | NA | NA | NA | NA | NA | NA | NA | NA | NA | NA | NA | NA | NA | NA | NA | NA | NA | NA | NA | NA | NA | NA | NA | NA | NA | |
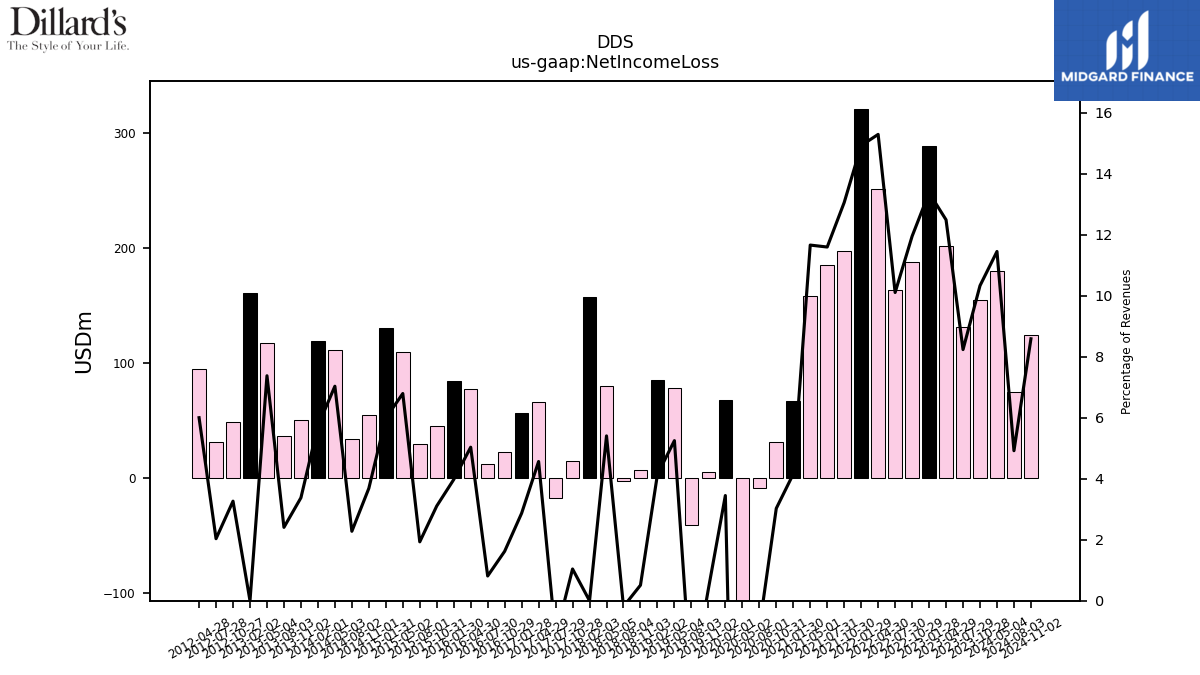
| Net Income Loss | 155.34 | 131.51 | 201.50 | 289.19 | 187.91 | 163.45 | 251.09 | 321.24 | 197.33 | 185.66 | 158.25 | 67.04 | 31.85 | -8.57 | -161.97 | 67.69 | 5.46 | -40.67 | 78.60 | 85.16 | 7.42 | -2.87 | 80.55 | 14.54 | -17.08 | 66.30 | 56.91 | 22.80 | 12.08 | 77.43 | 84.11 | 45.74 | 29.95 | 109.57 | 130.49 | 55.23 | 34.45 | 111.68 | 119.10 | 50.87 | 36.49 | 117.21 | 48.51 | 31.02 | 94.98 | NA | NA | NA | NA | NA | NA | NA | NA | |
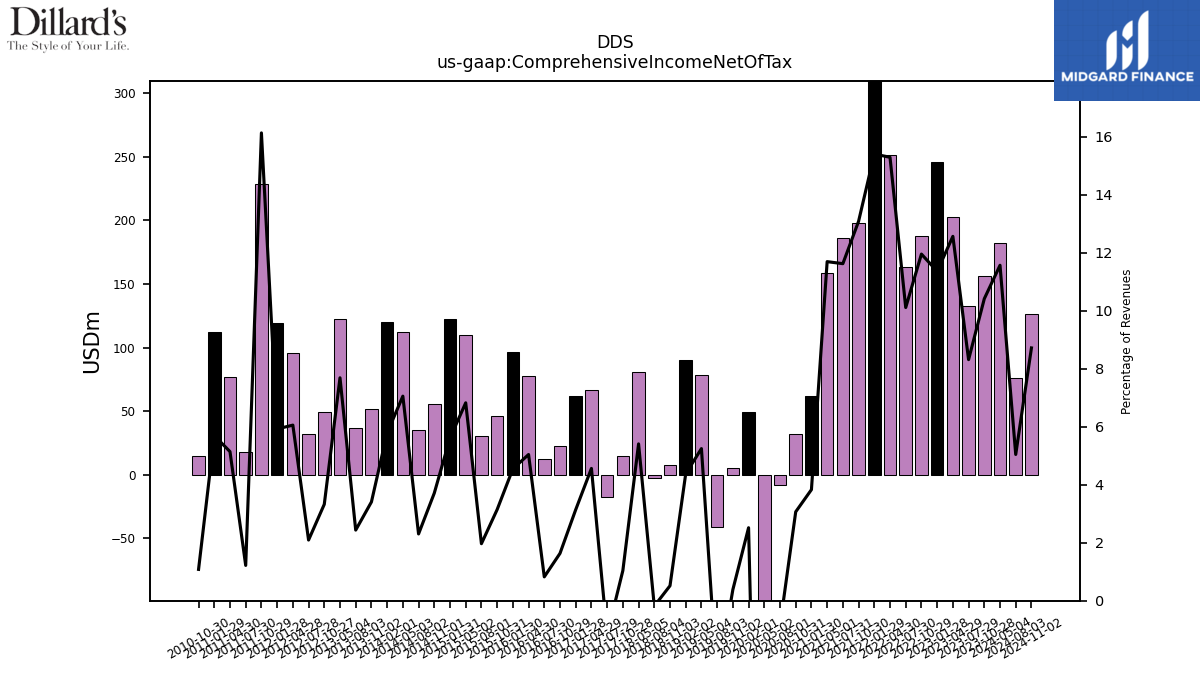
| Comprehensive Income Net Of Tax | 156.68 | 132.85 | 202.84 | 245.72 | 188.09 | 163.63 | 251.27 | 331.79 | 197.86 | 186.18 | 158.78 | 61.87 | 32.28 | -8.14 | -161.54 | 49.44 | 5.46 | -40.67 | 78.60 | 90.03 | 7.53 | -2.77 | 80.65 | 14.54 | -17.08 | 66.30 | 62.33 | 22.98 | 12.27 | 77.62 | 96.30 | 46.32 | 30.52 | 110.14 | 122.30 | 55.64 | 34.86 | 112.09 | 120.33 | 51.35 | 36.97 | 122.22 | 49.43 | 31.94 | 95.90 | 119.06 | 228.58 | 17.98 | 77.09 | 112.62 | 14.86 | NA | NA | |
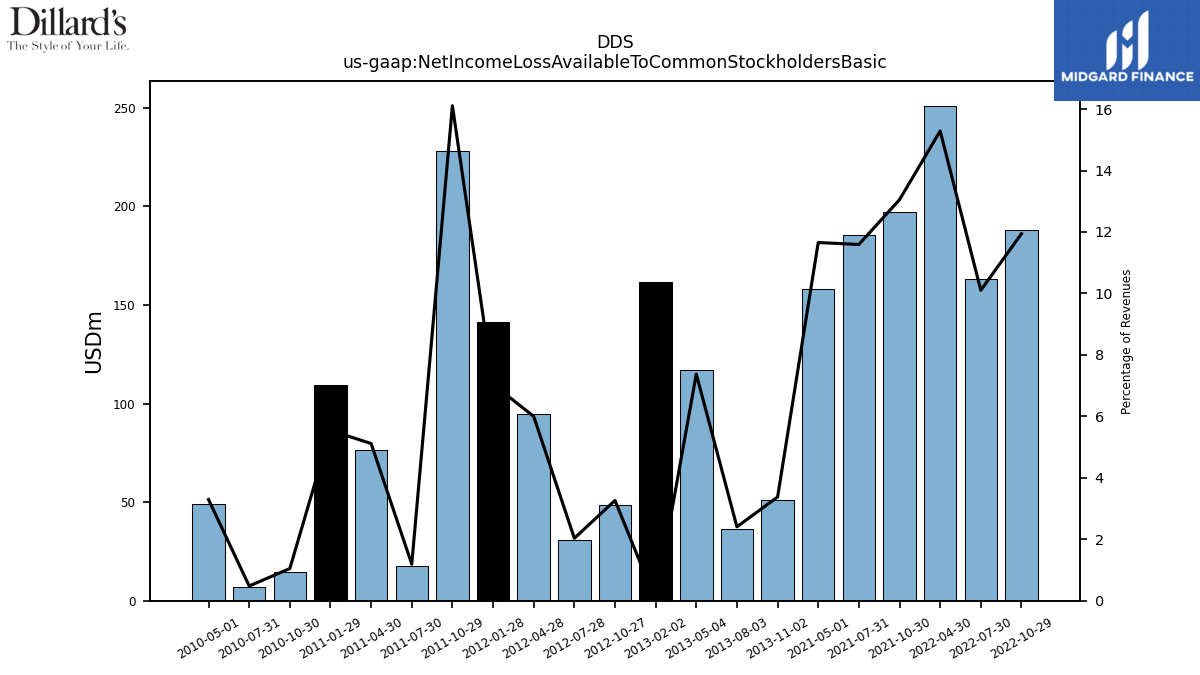
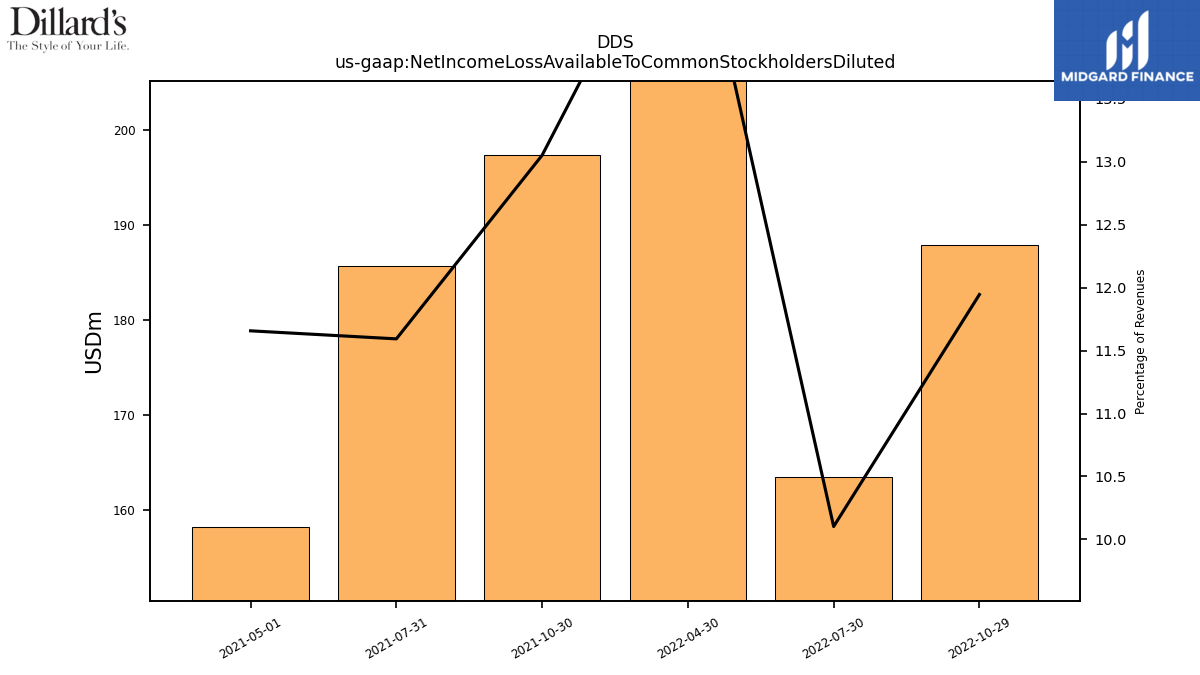
| Net Income Loss Available To Common Stockholders Basic | NA | NA | NA | NA | 187.91 | 163.45 | 251.09 | NA | 197.33 | 185.66 | 158.25 | NA | NA | NA | NA | NA | NA | NA | NA | NA | NA | NA | NA | NA | NA | NA | NA | NA | NA | NA | NA | NA | NA | NA | NA | NA | NA | NA | NA | 50.87 | 36.49 | 117.21 | 48.51 | 31.02 | 94.98 | 141.50 | 228.17 | 17.57 | 76.68 | 109.58 | 14.38 | 6.83 | 48.83 | |
| Net Income Loss Available To Common Stockholders Diluted | NA | NA | NA | NA | 187.91 | 163.45 | 251.09 | NA | 197.33 | 185.66 | 158.25 | NA | NA | NA | NA | NA | NA | NA | NA | NA | NA | NA | NA | NA | NA | NA | NA | NA | NA | NA | NA | NA | NA | NA | NA | NA | NA | NA | NA | NA | NA | NA | NA | NA | NA | NA | NA | NA | NA | NA | NA | NA | NA |
| 2023-10-28 | 2023-07-29 | 2023-04-29 | 2023-01-28 | 2022-10-29 | 2022-07-30 | 2022-04-30 | 2022-01-29 | 2021-10-30 | 2021-07-31 | 2021-05-01 | 2021-01-30 | 2020-10-31 | 2020-08-01 | 2020-05-02 | 2020-02-01 | 2019-11-02 | 2019-08-03 | 2019-05-04 | 2019-02-02 | 2018-11-03 | 2018-08-04 | 2018-05-05 | 2017-10-28 | 2017-07-29 | 2017-04-29 | 2017-01-28 | 2016-10-29 | 2016-07-30 | 2016-04-30 | 2016-01-30 | 2015-10-31 | 2015-08-01 | 2015-05-02 | 2015-01-31 | 2014-11-01 | 2014-08-02 | 2014-05-03 | 2014-02-01 | 2013-11-02 | 2013-08-03 | 2013-05-04 | 2012-10-27 | 2012-07-28 | 2012-04-28 | 2012-01-28 | 2011-10-29 | 2011-07-30 | 2011-04-30 | 2011-01-29 | 2010-10-30 | 2010-07-31 | 2010-05-01 | ||
|---|---|---|---|---|---|---|---|---|---|---|---|---|---|---|---|---|---|---|---|---|---|---|---|---|---|---|---|---|---|---|---|---|---|---|---|---|---|---|---|---|---|---|---|---|---|---|---|---|---|---|---|---|---|---|
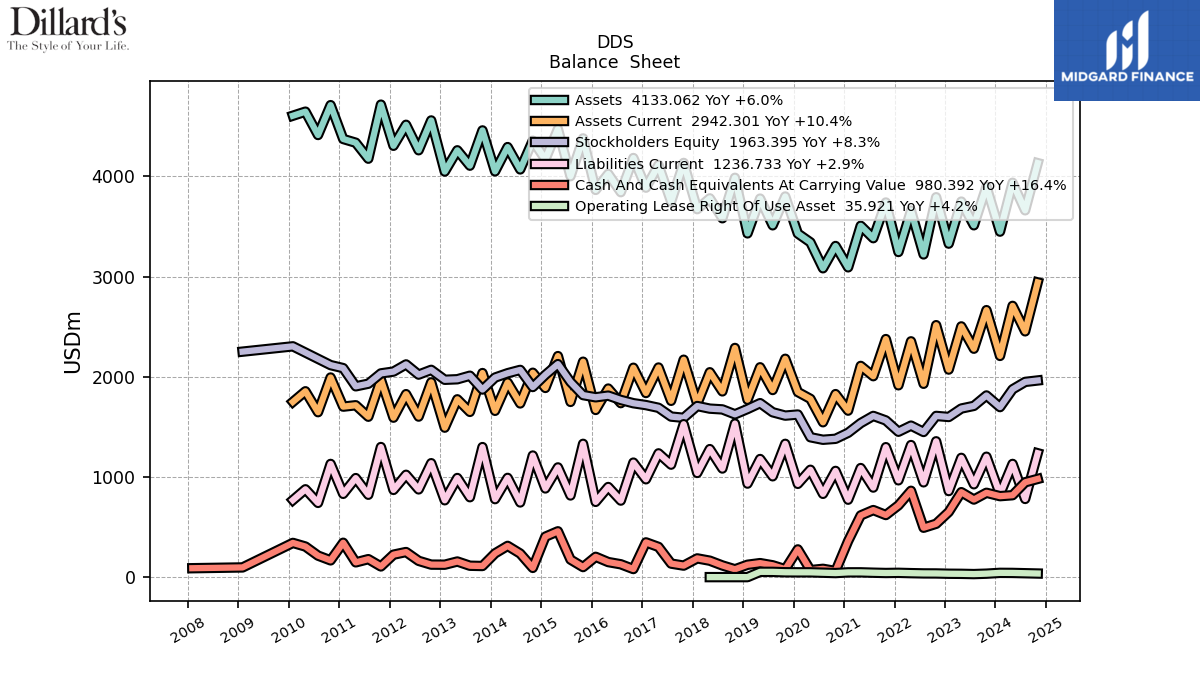
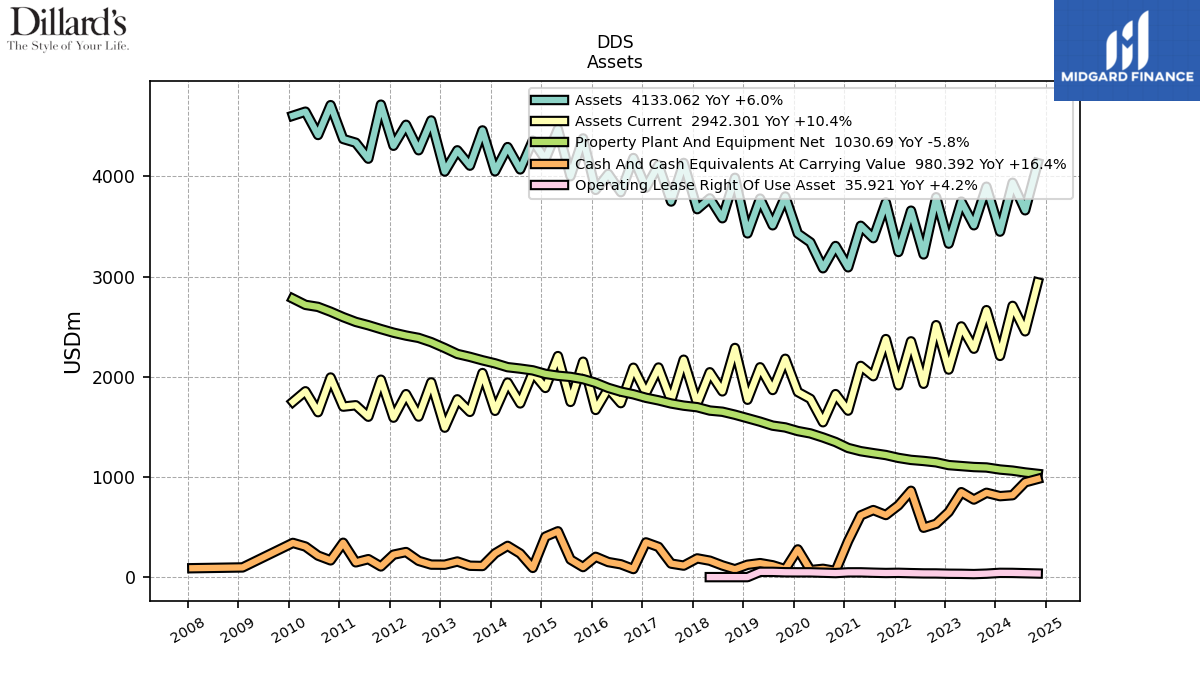
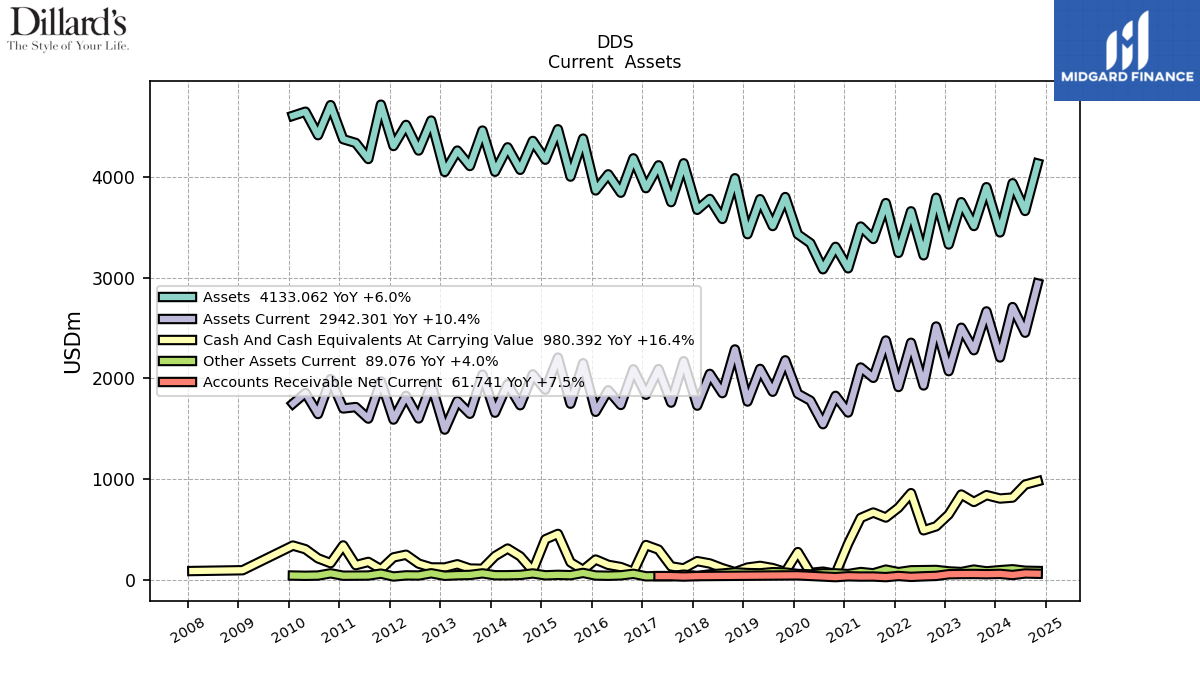
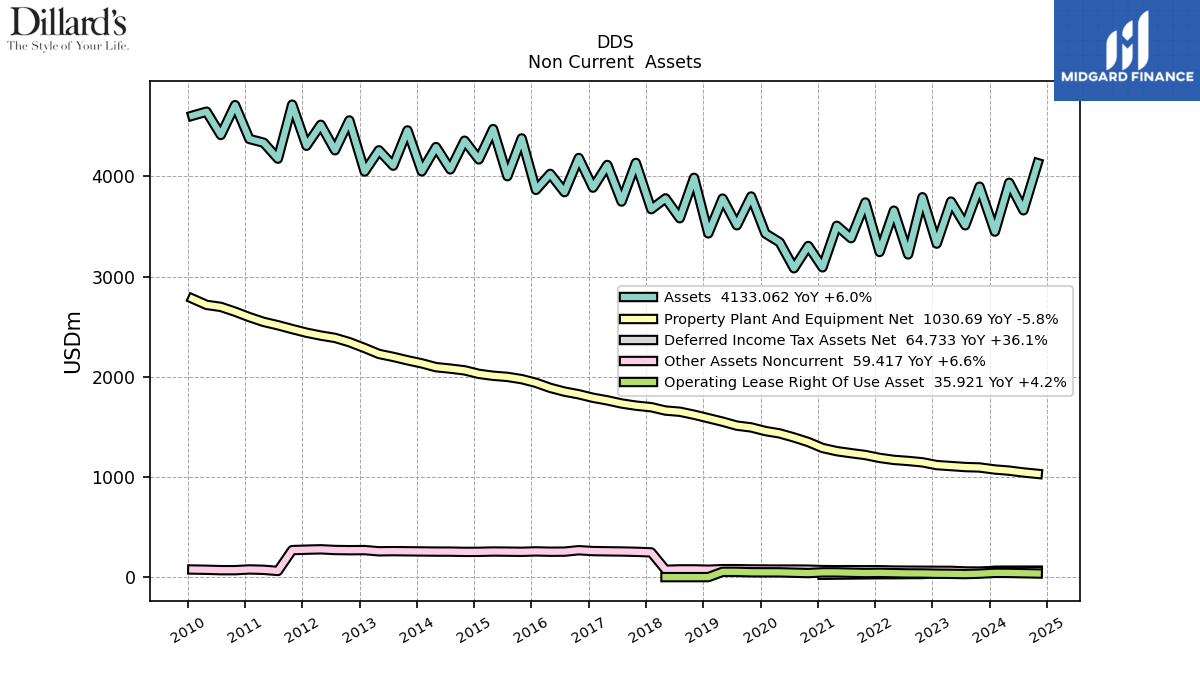
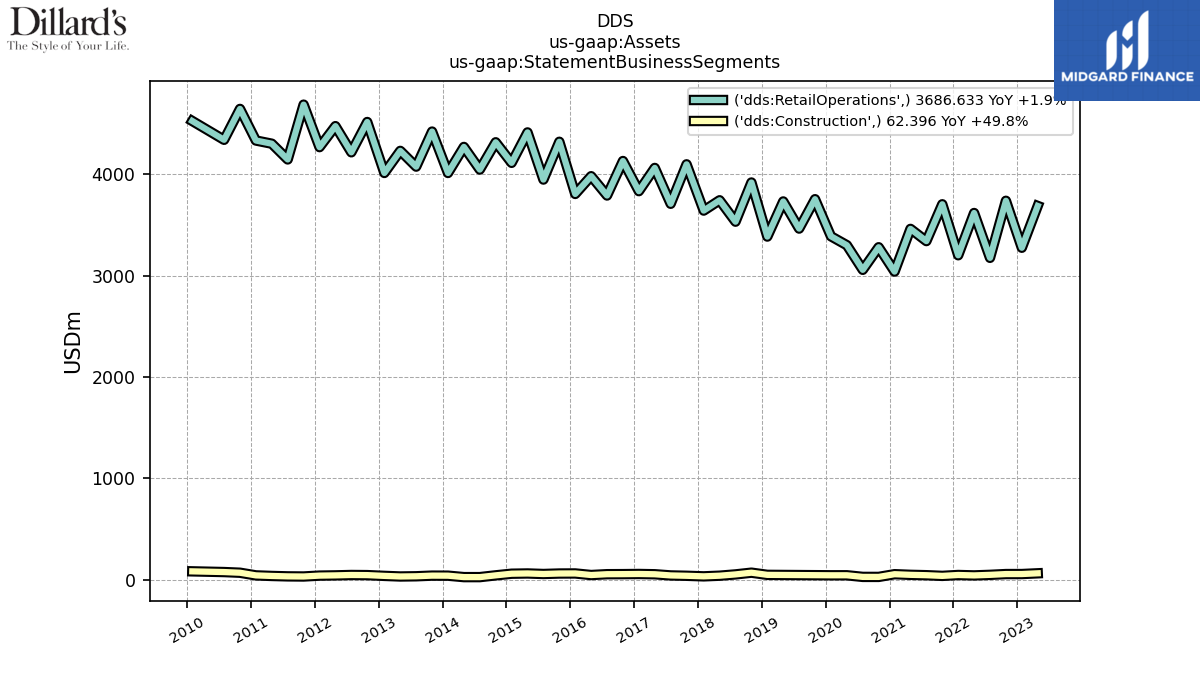
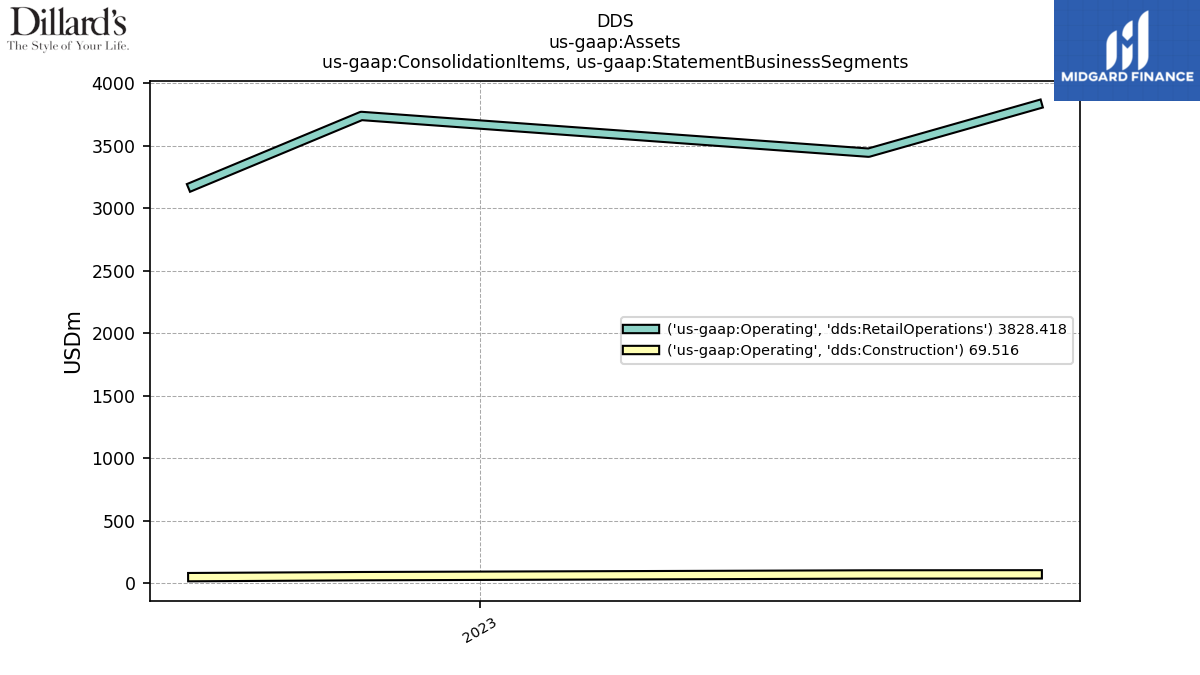
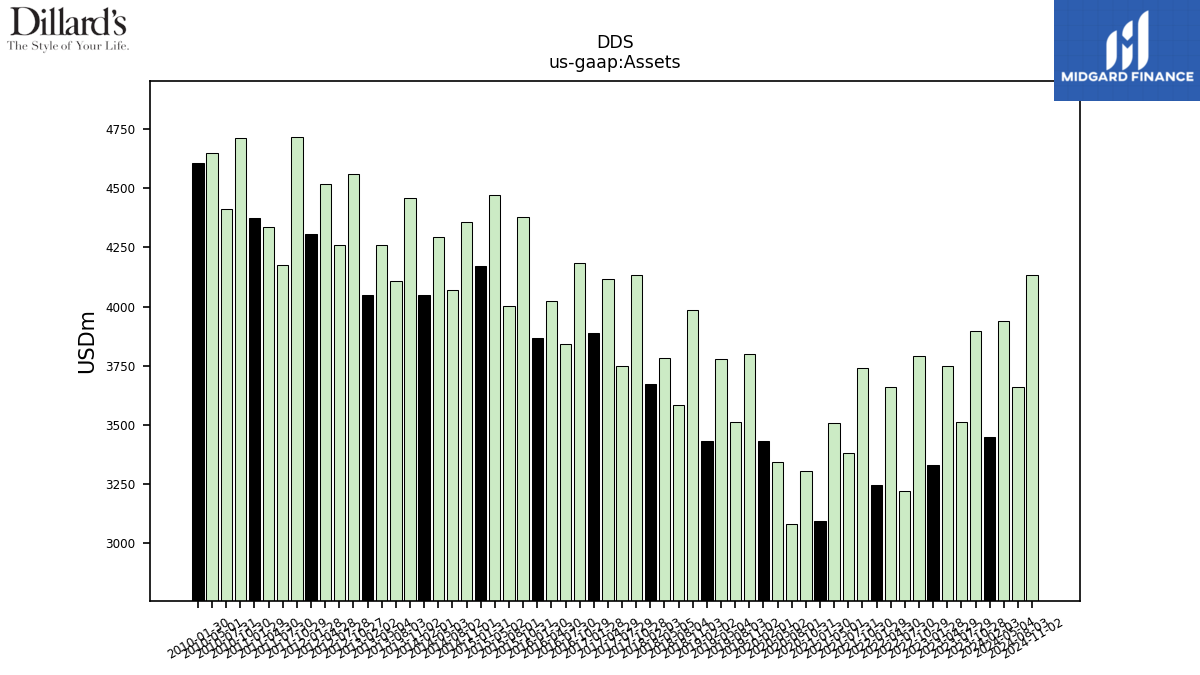
| Assets | 3897.93 | 3512.36 | 3749.03 | 3329.15 | 3792.63 | 3221.60 | 3658.81 | 3245.56 | 3740.20 | 3383.51 | 3507.66 | 3092.51 | 3305.99 | 3083.24 | 3342.34 | 3430.26 | 3800.06 | 3512.08 | 3778.99 | 3431.37 | 3986.60 | 3582.63 | 3781.46 | 4135.33 | 3749.34 | 4114.90 | 3888.14 | 4184.23 | 3843.01 | 4025.65 | 3865.62 | 4380.19 | 4002.33 | 4472.96 | 4170.07 | 4357.07 | 4070.13 | 4293.62 | 4050.74 | 4459.91 | 4107.46 | 4261.16 | 4559.37 | 4261.46 | 4516.03 | 4306.14 | 4717.13 | 4177.34 | 4336.88 | 4374.17 | 4712.09 | 4413.68 | 4647.04 | |
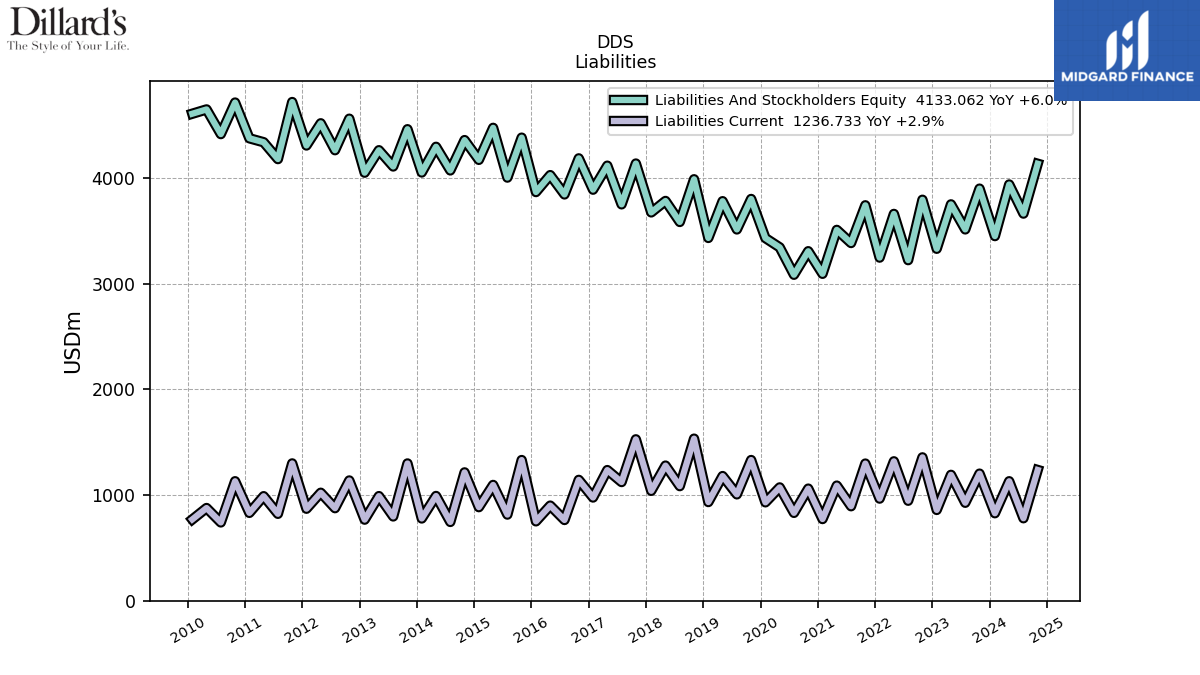
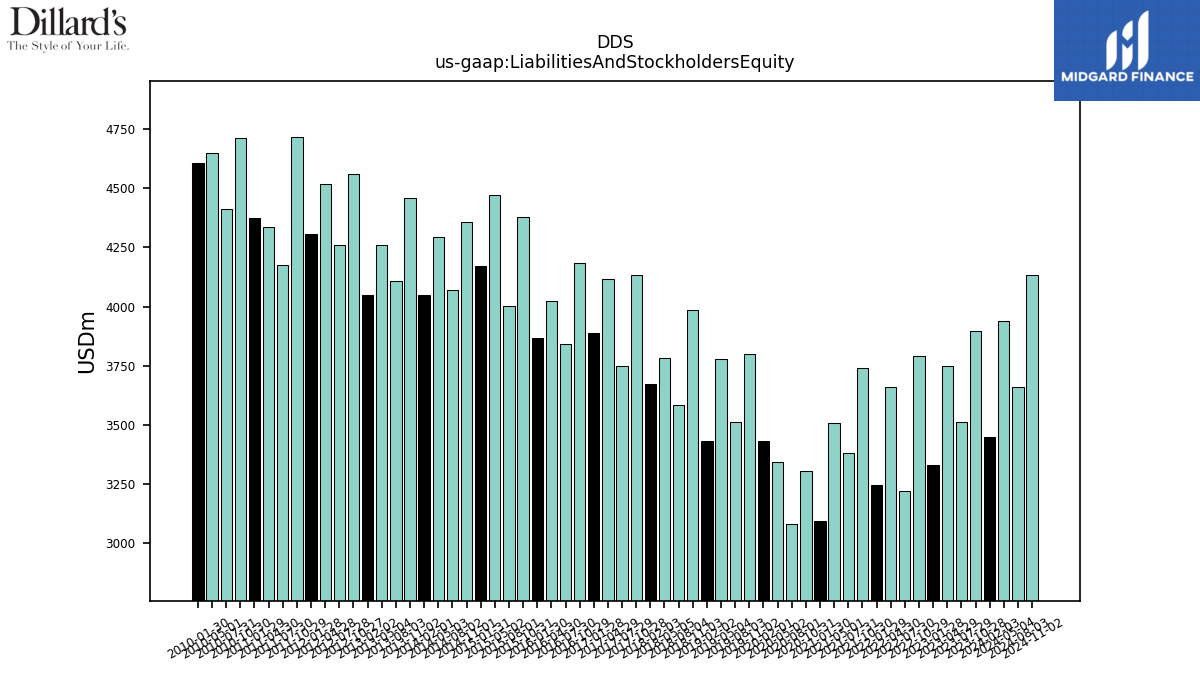
| Liabilities And Stockholders Equity | 3897.93 | 3512.36 | 3749.03 | 3329.15 | 3792.63 | 3221.60 | 3658.81 | 3245.56 | 3740.20 | 3383.51 | 3507.66 | 3092.51 | 3305.99 | 3083.24 | 3342.34 | 3430.26 | 3800.06 | 3512.08 | 3778.99 | 3431.37 | 3986.60 | 3582.63 | 3781.46 | 4135.33 | 3749.34 | 4114.90 | 3888.14 | 4184.23 | 3843.01 | 4025.65 | 3865.62 | 4380.19 | 4002.33 | 4472.96 | 4170.07 | 4357.07 | 4070.13 | 4293.62 | 4050.74 | 4459.91 | 4107.46 | 4261.16 | 4559.37 | 4261.46 | 4516.03 | 4306.14 | 4717.13 | 4177.34 | 4336.88 | 4374.17 | 4712.09 | 4413.68 | 4647.04 | |
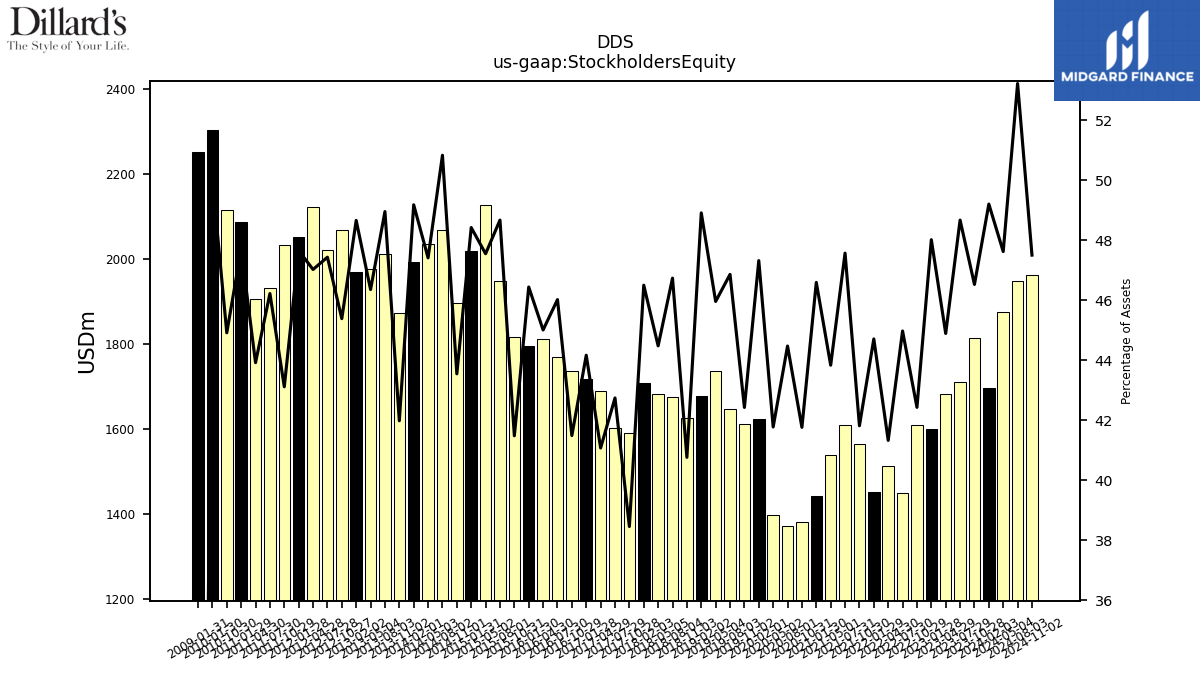
| Stockholders Equity | 1813.64 | 1709.52 | 1683.13 | 1598.64 | 1609.35 | 1449.00 | 1512.33 | 1451.22 | 1564.20 | 1609.58 | 1537.70 | 1441.01 | 1380.83 | 1371.31 | 1396.41 | 1623.26 | 1612.38 | 1645.84 | 1736.91 | 1678.38 | 1625.28 | 1674.47 | 1682.09 | 1590.65 | 1602.72 | 1690.41 | 1717.42 | 1736.20 | 1768.70 | 1812.01 | 1795.31 | 1817.15 | 1948.06 | 2126.94 | 2019.27 | 1897.55 | 2068.92 | 2035.76 | 1992.20 | 1872.57 | 2010.84 | 1975.41 | 2069.41 | 2021.48 | 2123.76 | 2052.02 | 2033.96 | 1930.96 | 1904.86 | 2086.72 | 2116.57 | NA | NA |
| 2023-10-28 | 2023-07-29 | 2023-04-29 | 2023-01-28 | 2022-10-29 | 2022-07-30 | 2022-04-30 | 2022-01-29 | 2021-10-30 | 2021-07-31 | 2021-05-01 | 2021-01-30 | 2020-10-31 | 2020-08-01 | 2020-05-02 | 2020-02-01 | 2019-11-02 | 2019-08-03 | 2019-05-04 | 2019-02-02 | 2018-11-03 | 2018-08-04 | 2018-05-05 | 2017-10-28 | 2017-07-29 | 2017-04-29 | 2017-01-28 | 2016-10-29 | 2016-07-30 | 2016-04-30 | 2016-01-30 | 2015-10-31 | 2015-08-01 | 2015-05-02 | 2015-01-31 | 2014-11-01 | 2014-08-02 | 2014-05-03 | 2014-02-01 | 2013-11-02 | 2013-08-03 | 2013-05-04 | 2012-10-27 | 2012-07-28 | 2012-04-28 | 2012-01-28 | 2011-10-29 | 2011-07-30 | 2011-04-30 | 2011-01-29 | 2010-10-30 | 2010-07-31 | 2010-05-01 | ||
|---|---|---|---|---|---|---|---|---|---|---|---|---|---|---|---|---|---|---|---|---|---|---|---|---|---|---|---|---|---|---|---|---|---|---|---|---|---|---|---|---|---|---|---|---|---|---|---|---|---|---|---|---|---|---|
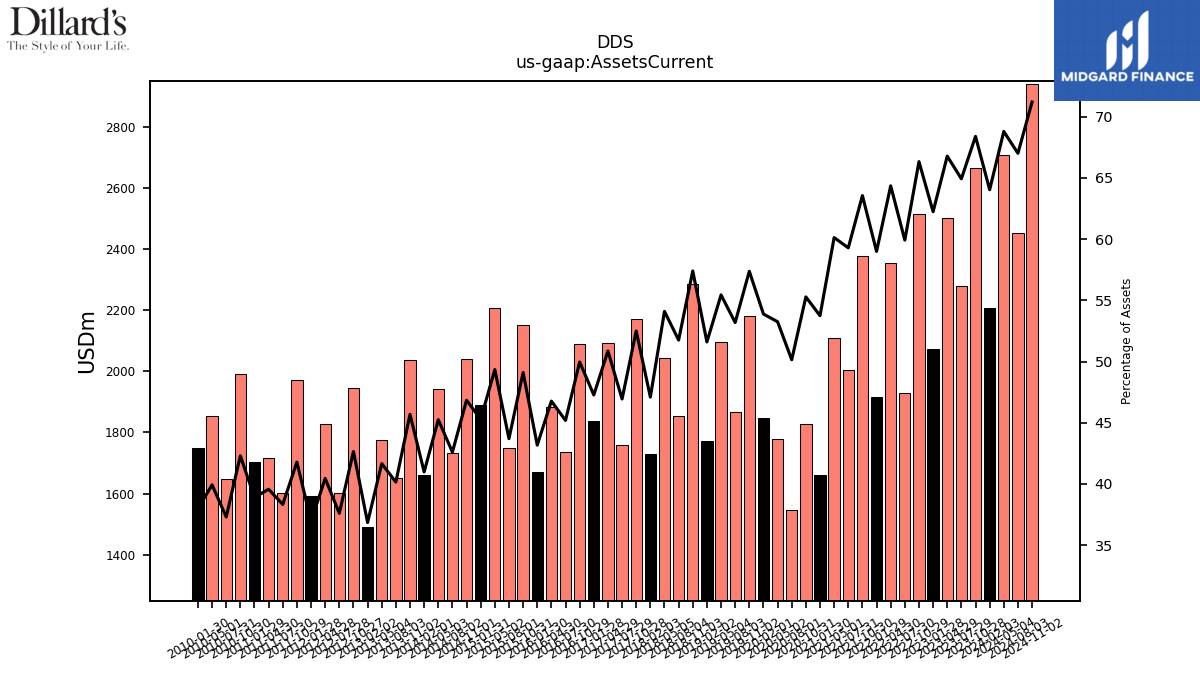
| Assets Current | 2665.56 | 2280.23 | 2503.20 | 2071.85 | 2515.42 | 1930.14 | 2354.26 | 1914.65 | 2376.80 | 2005.82 | 2108.83 | 1661.94 | 1827.40 | 1546.06 | 1779.67 | 1848.08 | 2179.98 | 1867.88 | 2094.94 | 1770.53 | 2287.98 | 1854.18 | 2045.38 | 2170.77 | 1759.87 | 2092.74 | 1837.92 | 2090.47 | 1736.63 | 1882.69 | 1668.88 | 2150.87 | 1748.99 | 2206.94 | 1888.44 | 2040.71 | 1733.93 | 1942.73 | 1660.16 | 2037.54 | 1649.33 | 1775.31 | 1944.59 | 1602.55 | 1826.92 | 1591.73 | 1971.14 | 1601.15 | 1715.97 | 1701.93 | 1993.11 | 1646.58 | 1855.58 | |
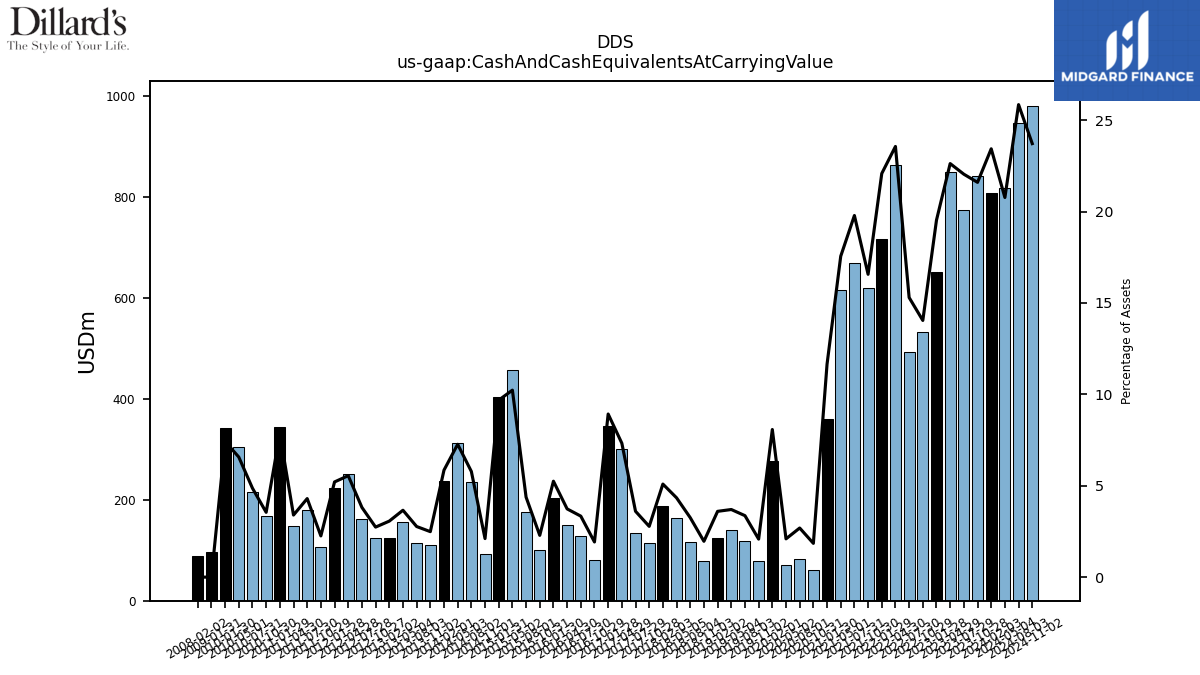
| Cash And Cash Equivalents At Carrying Value | 842.00 | 774.34 | 848.32 | 650.34 | 532.71 | 492.86 | 862.17 | 716.76 | 619.72 | 669.47 | 615.92 | 360.34 | 61.12 | 82.87 | 69.99 | 277.08 | 79.06 | 118.11 | 139.80 | 123.51 | 78.16 | 116.55 | 164.08 | 114.86 | 135.09 | 301.48 | 346.99 | 80.48 | 128.25 | 150.31 | 202.87 | 100.11 | 175.14 | 457.62 | 403.75 | 91.90 | 235.33 | 312.08 | 237.13 | 110.97 | 113.73 | 155.96 | 124.79 | 162.53 | 250.69 | 224.27 | 106.38 | 179.53 | 147.27 | 343.29 | 167.12 | 214.71 | 305.30 | |
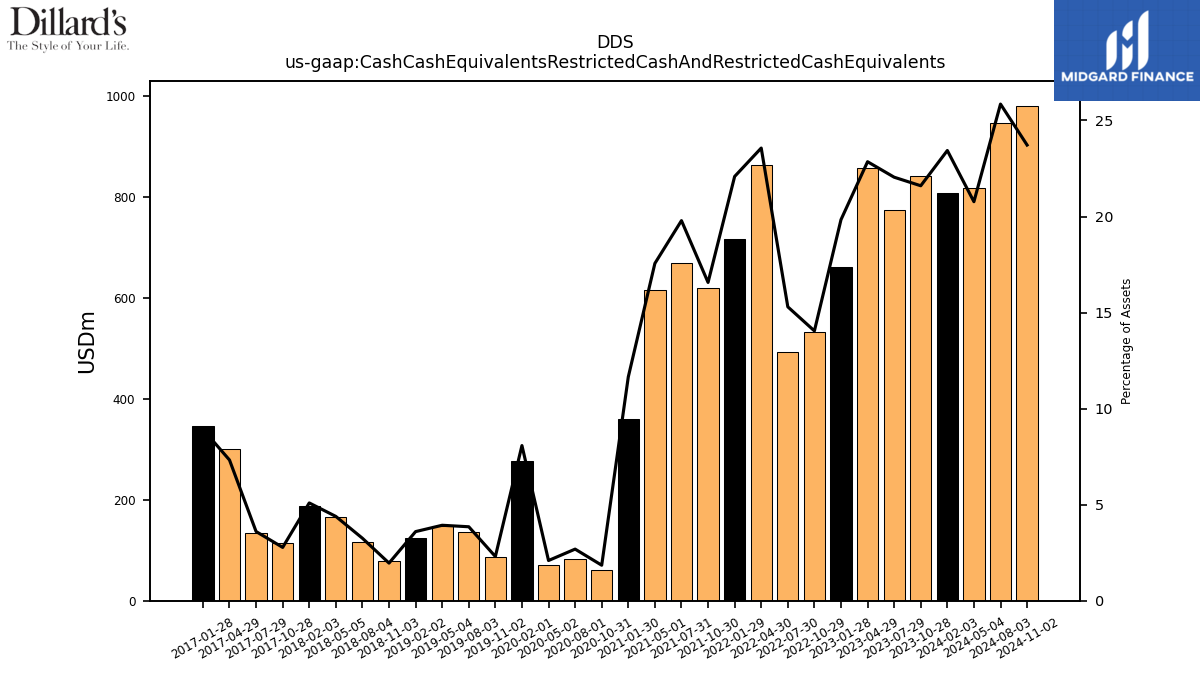
| Cash Cash Equivalents Restricted Cash And Restricted Cash Equivalents | 842.00 | 774.34 | 856.73 | 660.33 | 532.71 | 492.86 | 862.17 | 716.76 | 619.72 | 669.47 | 615.92 | 360.34 | 61.12 | 82.87 | 69.99 | 277.08 | 87.53 | 135.26 | 148.49 | 123.51 | 78.16 | 116.55 | 165.99 | 114.86 | 135.09 | 301.48 | 346.99 | NA | NA | NA | NA | NA | NA | NA | NA | NA | NA | NA | NA | NA | NA | NA | NA | NA | NA | NA | NA | NA | NA | NA | NA | NA | NA | |
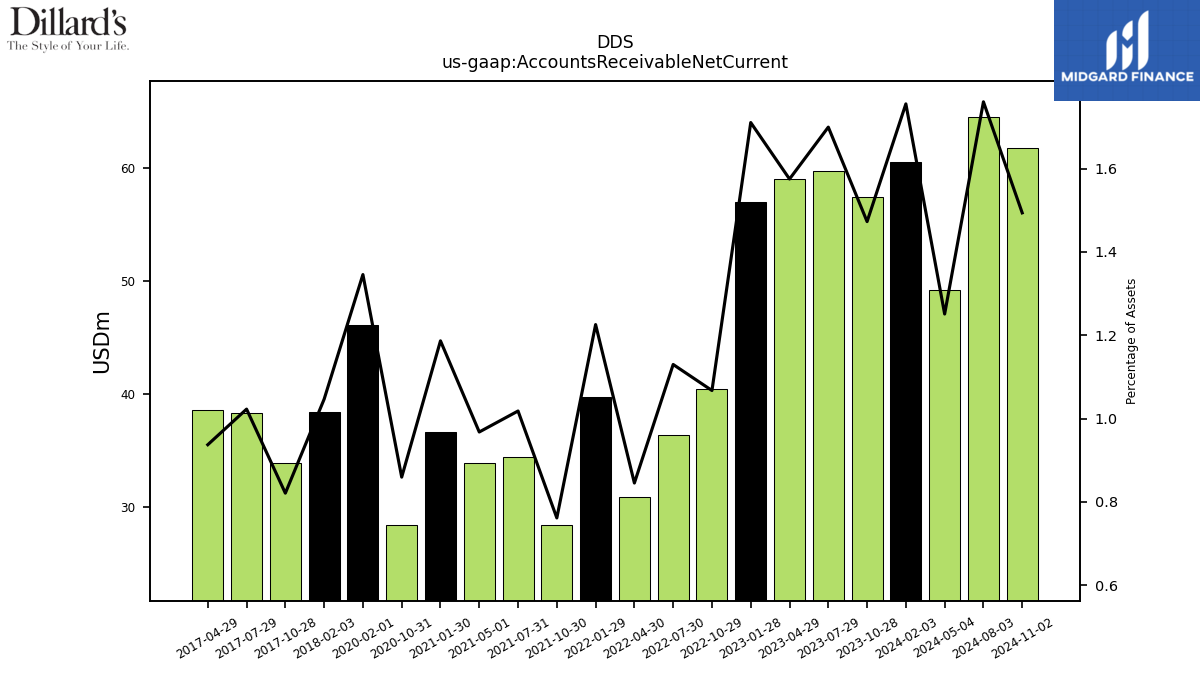
| Accounts Receivable Net Current | 57.41 | 59.70 | 59.05 | 56.95 | 40.48 | 36.40 | 30.92 | 39.78 | 28.47 | 34.45 | 33.94 | 36.69 | 28.41 | NA | NA | 46.16 | NA | NA | NA | NA | NA | NA | NA | 33.94 | 38.34 | 38.56 | NA | NA | NA | NA | NA | NA | NA | NA | NA | NA | NA | NA | NA | NA | NA | NA | NA | NA | NA | NA | NA | NA | NA | NA | NA | NA | NA | |
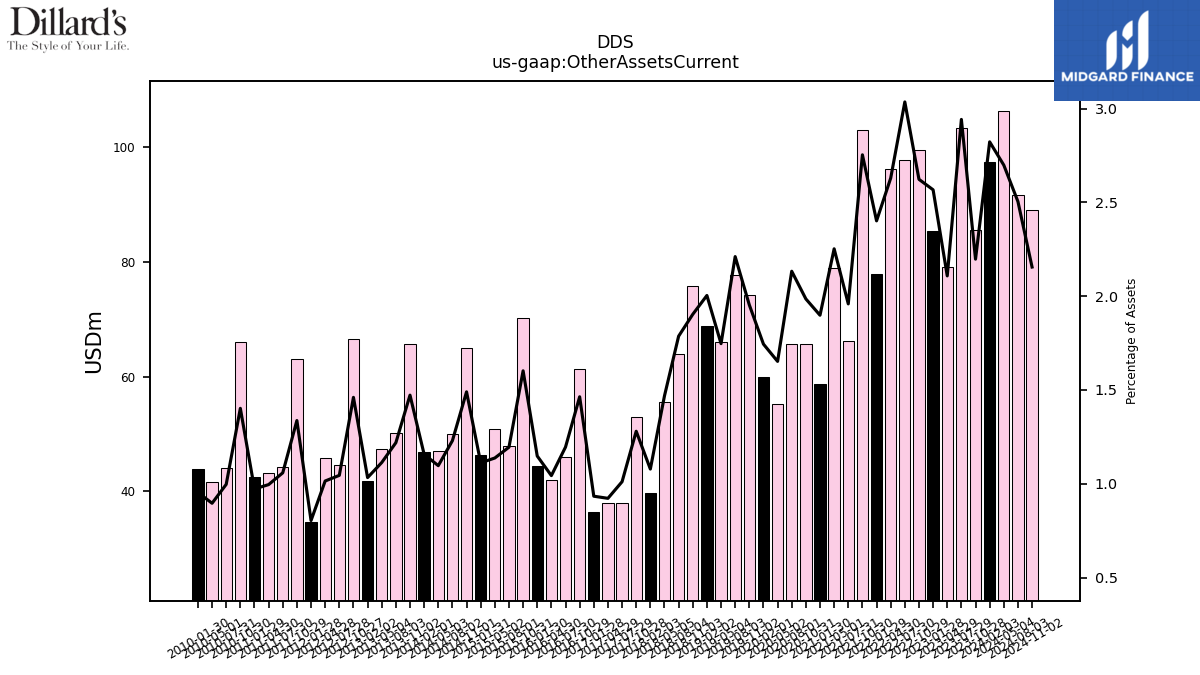
| Other Assets Current | 85.65 | 103.33 | 79.03 | 85.45 | 99.47 | 97.78 | 96.19 | 77.94 | 102.98 | 66.28 | 79.00 | 58.71 | 65.63 | 65.76 | 55.22 | 59.84 | 74.23 | 77.65 | 66.02 | 68.75 | 75.87 | 64.01 | 55.54 | 52.93 | 37.91 | 37.96 | 36.30 | 61.24 | 45.95 | 42.01 | 44.37 | 70.17 | 47.83 | 50.87 | 46.35 | 64.92 | 50.05 | 47.08 | 46.86 | 65.66 | 50.07 | 47.43 | 66.59 | 44.52 | 45.83 | 34.62 | 63.07 | 44.21 | 43.18 | 42.54 | 66.06 | 44.00 | 41.65 | |
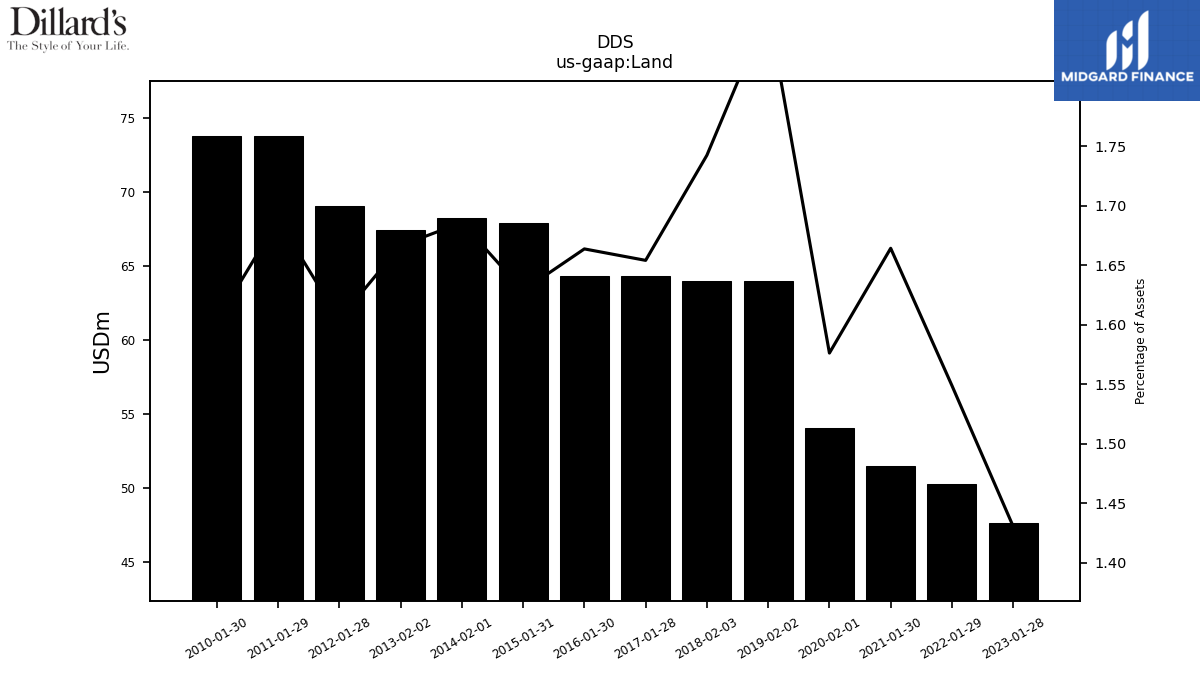
| Land | NA | NA | NA | 47.62 | NA | NA | NA | 50.27 | NA | NA | NA | 51.47 | NA | NA | NA | 54.07 | NA | NA | NA | 64.00 | NA | NA | NA | NA | NA | NA | 64.31 | NA | NA | NA | 64.31 | NA | NA | NA | 67.92 | NA | NA | NA | 68.29 | NA | NA | NA | NA | NA | NA | 69.09 | NA | NA | NA | 73.84 | NA | NA | NA |
| 2023-10-28 | 2023-07-29 | 2023-04-29 | 2023-01-28 | 2022-10-29 | 2022-07-30 | 2022-04-30 | 2022-01-29 | 2021-10-30 | 2021-07-31 | 2021-05-01 | 2021-01-30 | 2020-10-31 | 2020-08-01 | 2020-05-02 | 2020-02-01 | 2019-11-02 | 2019-08-03 | 2019-05-04 | 2019-02-02 | 2018-11-03 | 2018-08-04 | 2018-05-05 | 2017-10-28 | 2017-07-29 | 2017-04-29 | 2017-01-28 | 2016-10-29 | 2016-07-30 | 2016-04-30 | 2016-01-30 | 2015-10-31 | 2015-08-01 | 2015-05-02 | 2015-01-31 | 2014-11-01 | 2014-08-02 | 2014-05-03 | 2014-02-01 | 2013-11-02 | 2013-08-03 | 2013-05-04 | 2012-10-27 | 2012-07-28 | 2012-04-28 | 2012-01-28 | 2011-10-29 | 2011-07-30 | 2011-04-30 | 2011-01-29 | 2010-10-30 | 2010-07-31 | 2010-05-01 | ||
|---|---|---|---|---|---|---|---|---|---|---|---|---|---|---|---|---|---|---|---|---|---|---|---|---|---|---|---|---|---|---|---|---|---|---|---|---|---|---|---|---|---|---|---|---|---|---|---|---|---|---|---|---|---|---|
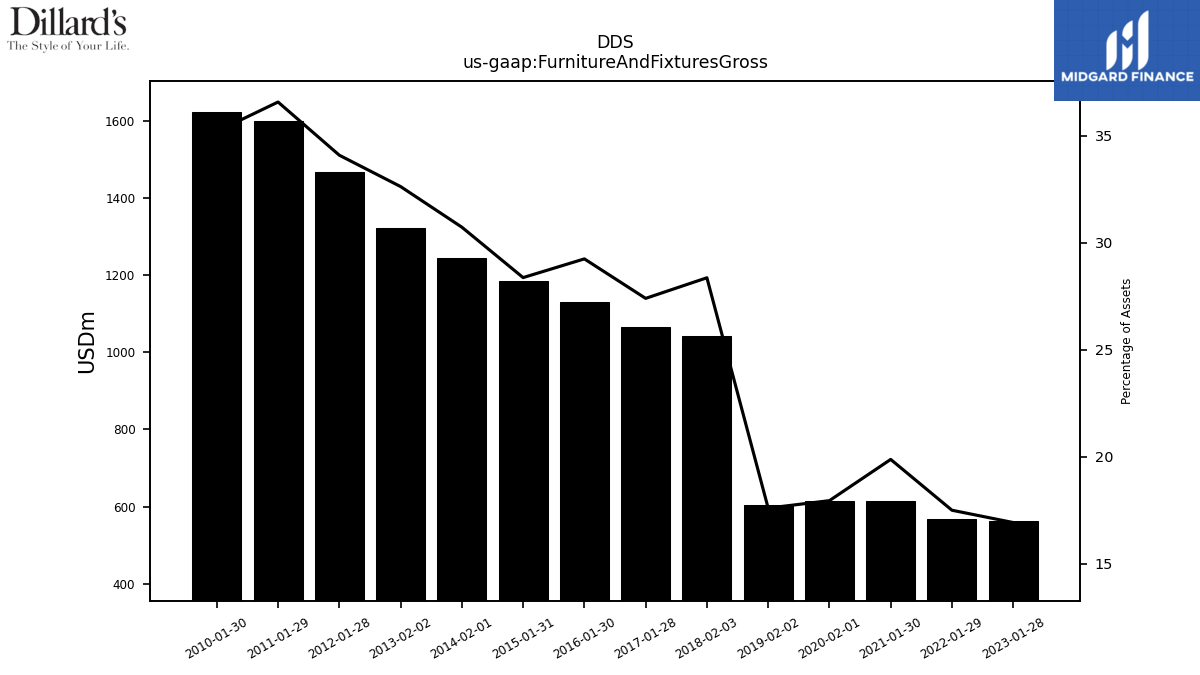
| Furniture And Fixtures Gross | NA | NA | NA | 563.26 | NA | NA | NA | 567.80 | NA | NA | NA | 614.50 | NA | NA | NA | 615.49 | NA | NA | NA | 603.70 | NA | NA | NA | NA | NA | NA | 1065.29 | NA | NA | NA | 1130.47 | NA | NA | NA | 1183.05 | NA | NA | NA | 1244.67 | NA | NA | NA | NA | NA | NA | 1468.01 | NA | NA | NA | 1599.95 | NA | NA | NA | |
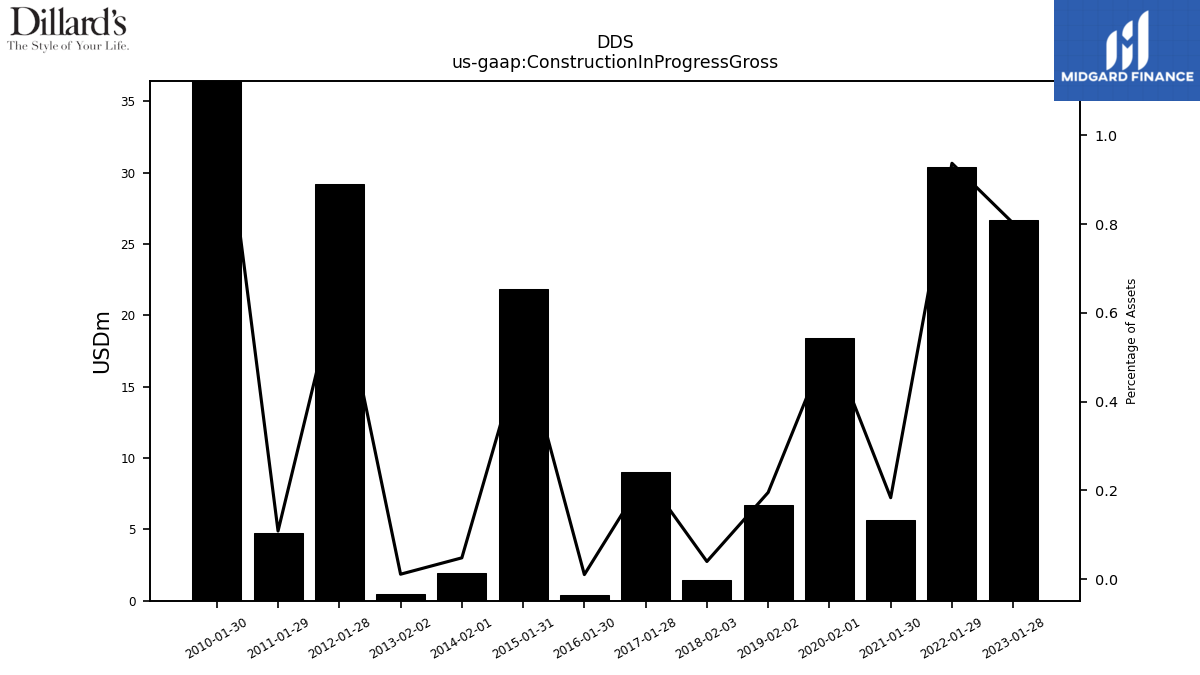
| Construction In Progress Gross | NA | NA | NA | 26.70 | NA | NA | NA | 30.42 | NA | NA | NA | 5.68 | NA | NA | NA | 18.39 | NA | NA | NA | 6.71 | NA | NA | NA | NA | NA | NA | 9.02 | NA | NA | NA | 0.40 | NA | NA | NA | 21.87 | NA | NA | NA | 1.95 | NA | NA | NA | NA | NA | NA | 29.19 | NA | NA | NA | 4.75 | NA | NA | NA | |
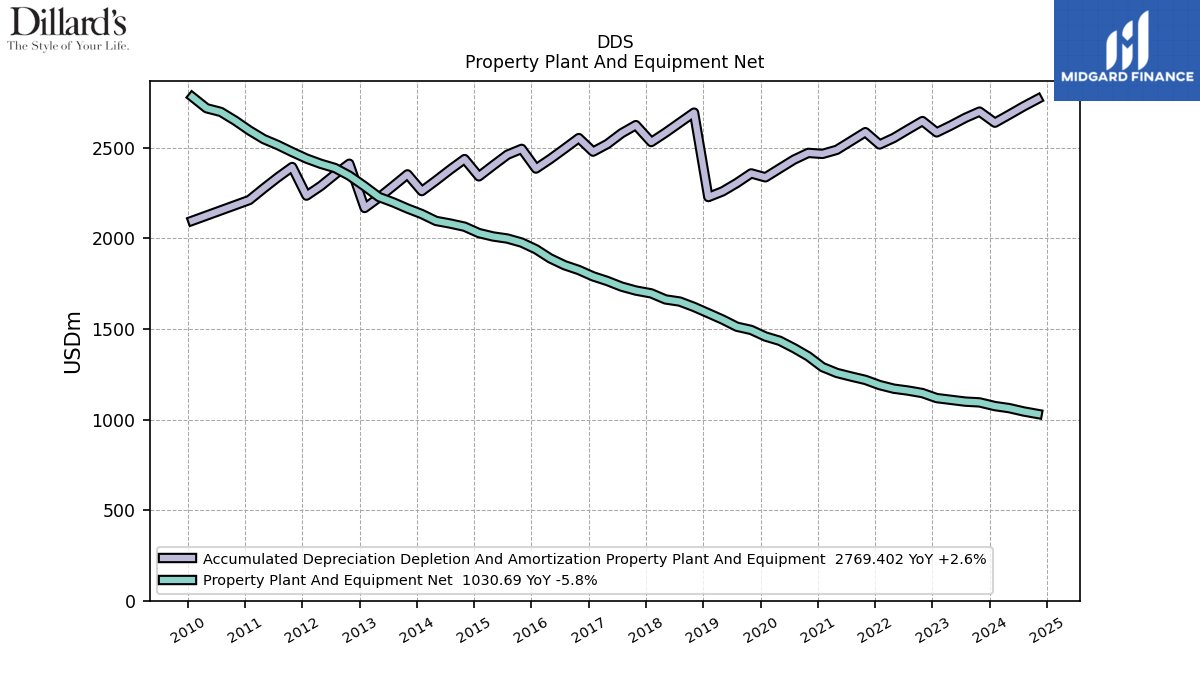
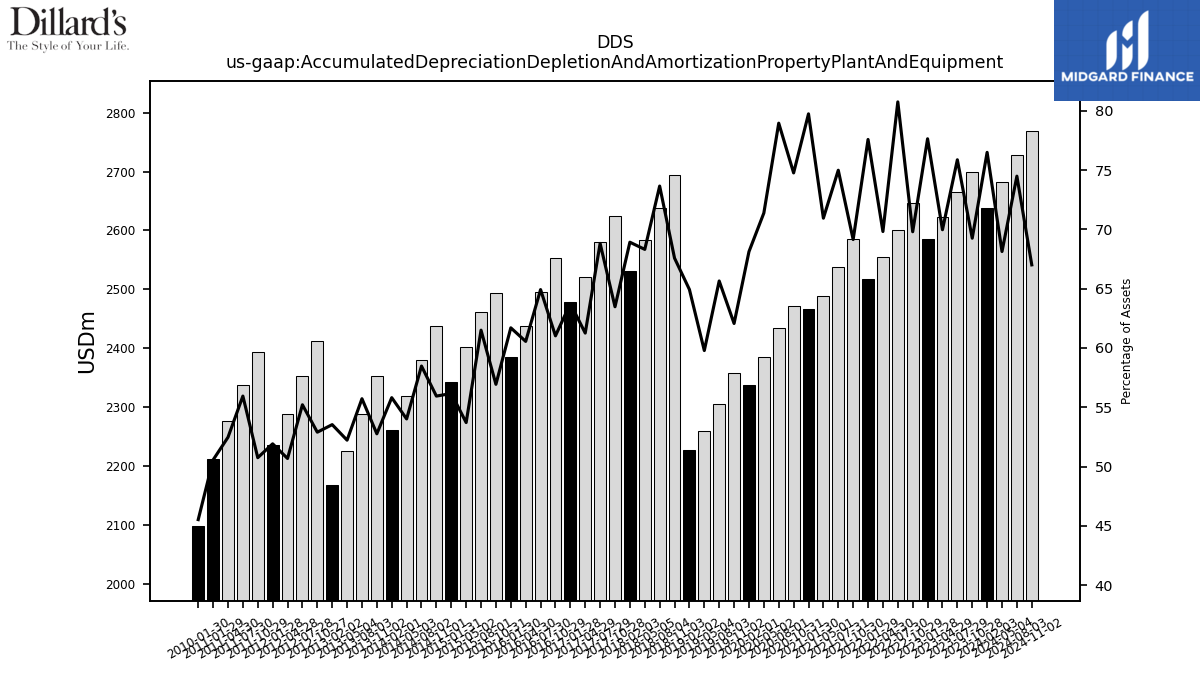
| Accumulated Depreciation Depletion And Amortization Property Plant And Equipment | 2699.52 | 2664.74 | 2623.18 | 2584.71 | 2647.23 | 2601.42 | 2554.49 | 2517.91 | 2586.06 | 2537.14 | 2488.45 | 2466.00 | 2471.57 | 2434.36 | 2385.69 | 2336.73 | 2358.47 | 2305.59 | 2259.14 | 2227.86 | 2693.92 | 2638.66 | 2583.20 | 2624.88 | 2580.08 | 2520.55 | 2478.49 | 2553.32 | 2494.91 | 2437.66 | 2385.01 | 2493.82 | 2461.42 | 2402.42 | 2341.95 | 2437.36 | 2379.92 | 2319.16 | 2260.68 | 2353.19 | 2288.60 | 2225.36 | 2411.76 | 2352.66 | 2288.70 | 2235.61 | 2393.78 | 2336.88 | 2275.51 | 2211.60 | NA | NA | NA | |
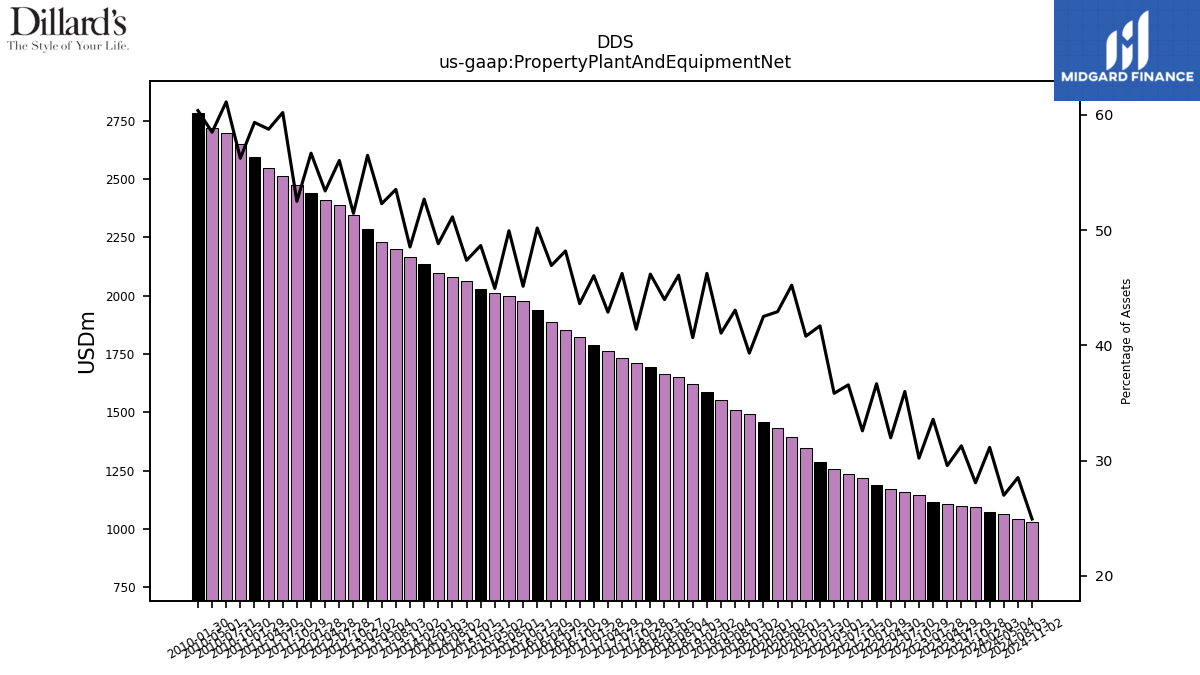
| Property Plant And Equipment Net | 1094.59 | 1098.95 | 1108.69 | 1118.38 | 1146.06 | 1159.74 | 1170.27 | 1190.15 | 1218.84 | 1237.43 | 1257.25 | 1289.30 | 1348.80 | 1394.24 | 1434.60 | 1458.18 | 1494.45 | 1512.26 | 1551.84 | 1586.73 | 1621.33 | 1651.15 | 1662.85 | 1711.86 | 1733.56 | 1764.52 | 1790.27 | 1825.22 | 1851.83 | 1889.32 | 1939.83 | 1976.61 | 1998.88 | 2010.28 | 2029.17 | 2064.30 | 2081.58 | 2096.01 | 2134.20 | 2164.55 | 2198.69 | 2228.09 | 2345.91 | 2388.11 | 2411.40 | 2440.27 | 2476.36 | 2514.54 | 2547.92 | 2595.51 | 2649.72 | 2697.69 | 2717.98 | |
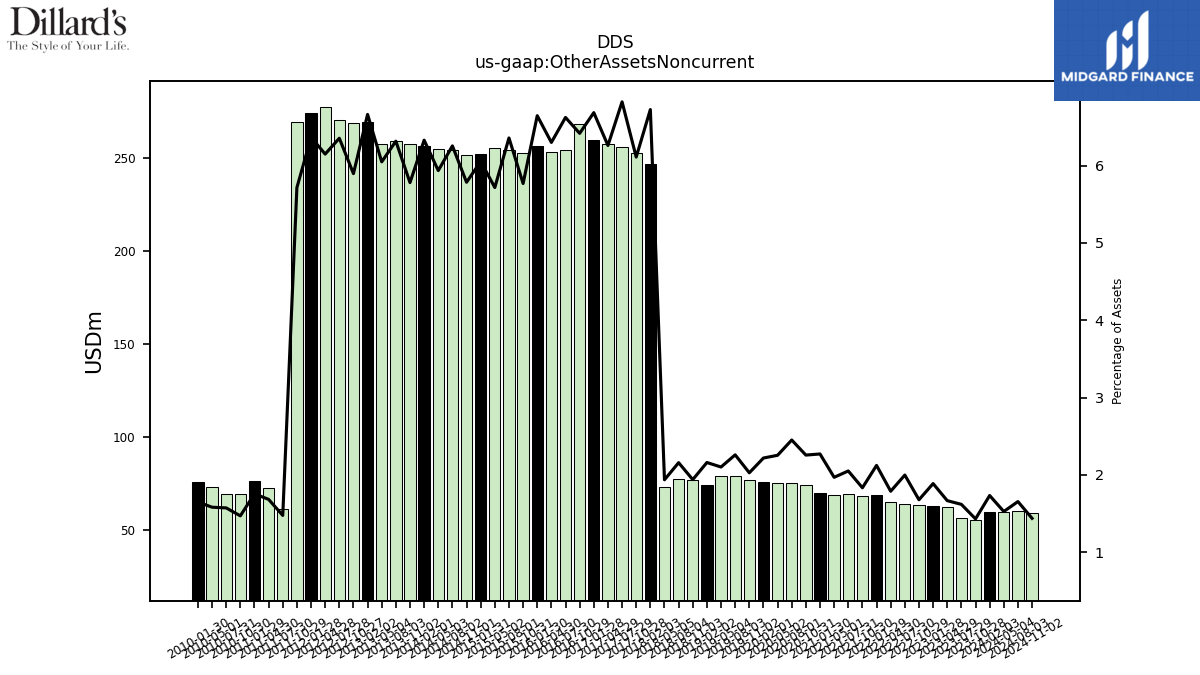
| Other Assets Noncurrent | 55.76 | 56.84 | 62.47 | 62.83 | 63.65 | 64.36 | 65.42 | 68.88 | 68.56 | 69.38 | 69.04 | 70.21 | 74.58 | 75.56 | 75.31 | 76.08 | 77.03 | 79.33 | 79.42 | 74.10 | 77.28 | 77.30 | 73.23 | 252.70 | 255.90 | 257.64 | 259.95 | 268.54 | 254.54 | 253.63 | 256.91 | 252.70 | 254.47 | 255.74 | 252.46 | 252.06 | 254.62 | 254.88 | 256.38 | 257.83 | 259.44 | 257.75 | 268.87 | 270.81 | 277.72 | 274.14 | 269.63 | 61.64 | 72.98 | 76.73 | 69.26 | 69.41 | 73.48 |
| 2023-10-28 | 2023-07-29 | 2023-04-29 | 2023-01-28 | 2022-10-29 | 2022-07-30 | 2022-04-30 | 2022-01-29 | 2021-10-30 | 2021-07-31 | 2021-05-01 | 2021-01-30 | 2020-10-31 | 2020-08-01 | 2020-05-02 | 2020-02-01 | 2019-11-02 | 2019-08-03 | 2019-05-04 | 2019-02-02 | 2018-11-03 | 2018-08-04 | 2018-05-05 | 2017-10-28 | 2017-07-29 | 2017-04-29 | 2017-01-28 | 2016-10-29 | 2016-07-30 | 2016-04-30 | 2016-01-30 | 2015-10-31 | 2015-08-01 | 2015-05-02 | 2015-01-31 | 2014-11-01 | 2014-08-02 | 2014-05-03 | 2014-02-01 | 2013-11-02 | 2013-08-03 | 2013-05-04 | 2012-10-27 | 2012-07-28 | 2012-04-28 | 2012-01-28 | 2011-10-29 | 2011-07-30 | 2011-04-30 | 2011-01-29 | 2010-10-30 | 2010-07-31 | 2010-05-01 | ||
|---|---|---|---|---|---|---|---|---|---|---|---|---|---|---|---|---|---|---|---|---|---|---|---|---|---|---|---|---|---|---|---|---|---|---|---|---|---|---|---|---|---|---|---|---|---|---|---|---|---|---|---|---|---|---|
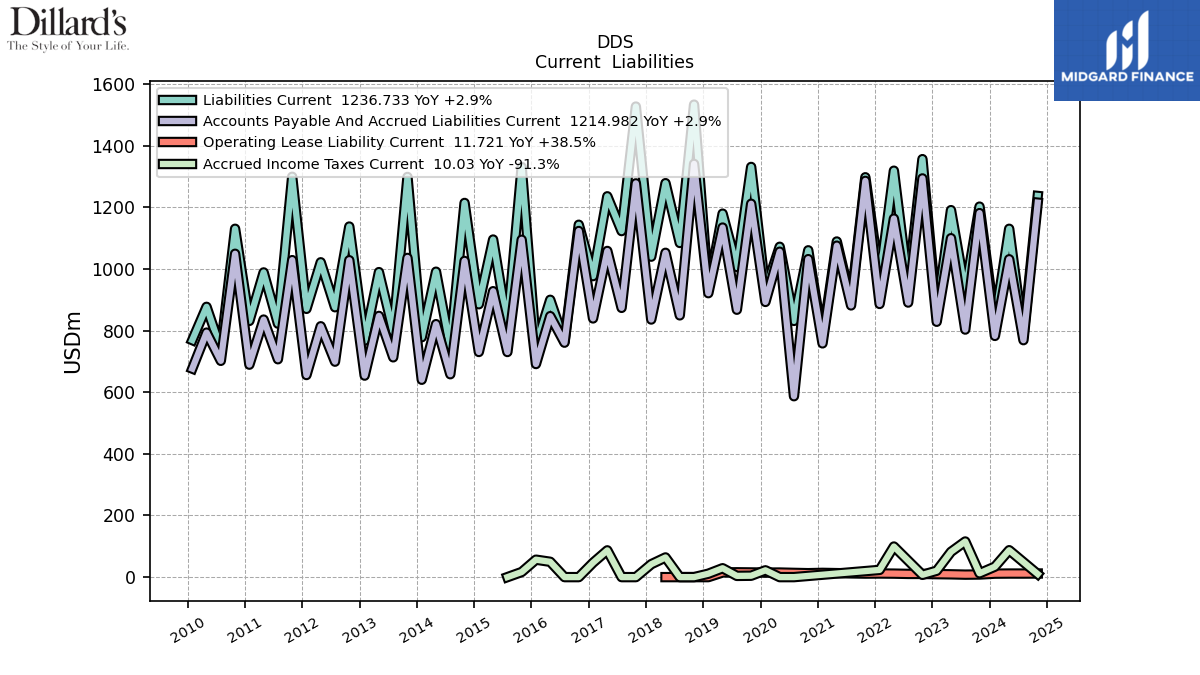
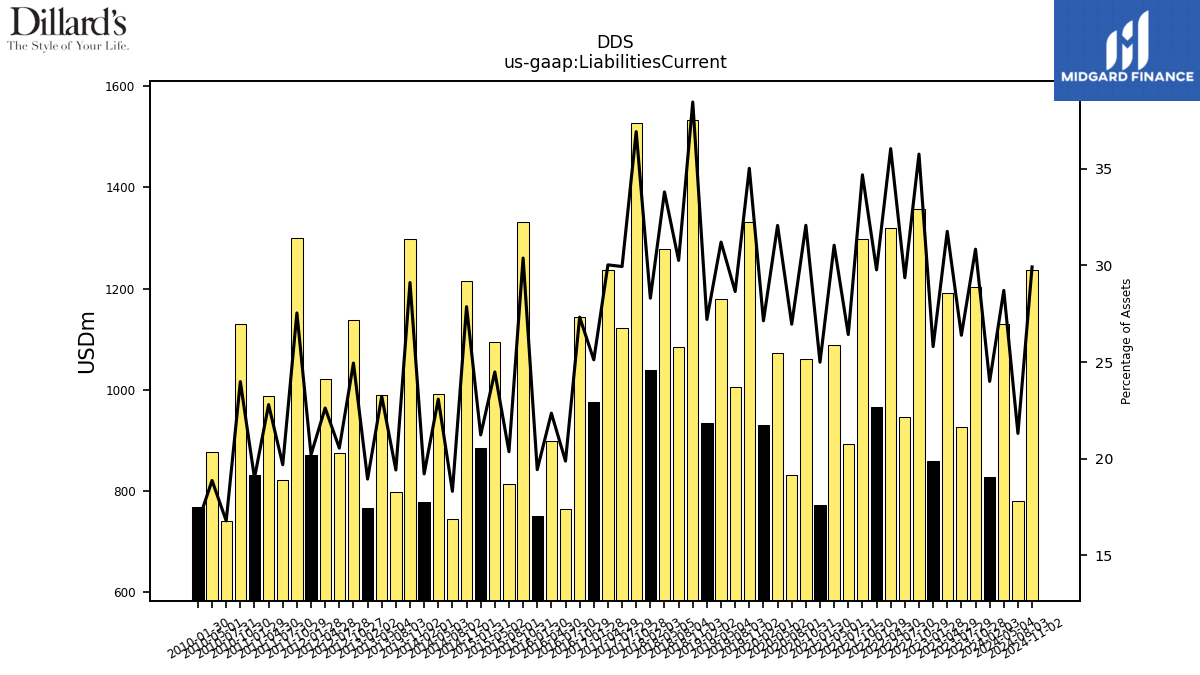
| Liabilities Current | 1202.16 | 926.82 | 1190.79 | 858.96 | 1356.25 | 946.01 | 1318.72 | 966.19 | 1297.40 | 894.01 | 1089.02 | 772.88 | 1060.43 | 831.21 | 1071.88 | 930.82 | 1330.95 | 1006.23 | 1179.35 | 933.53 | 1533.05 | 1084.18 | 1278.29 | 1526.84 | 1122.68 | 1235.70 | 976.52 | 1143.35 | 763.86 | 899.89 | 751.22 | 1330.80 | 815.02 | 1095.38 | 885.32 | 1214.13 | 745.36 | 991.00 | 778.31 | 1298.44 | 797.53 | 989.71 | 1137.51 | 875.59 | 1021.61 | 870.36 | 1299.05 | 822.38 | 988.73 | 831.21 | 1130.32 | 740.78 | 877.02 | |
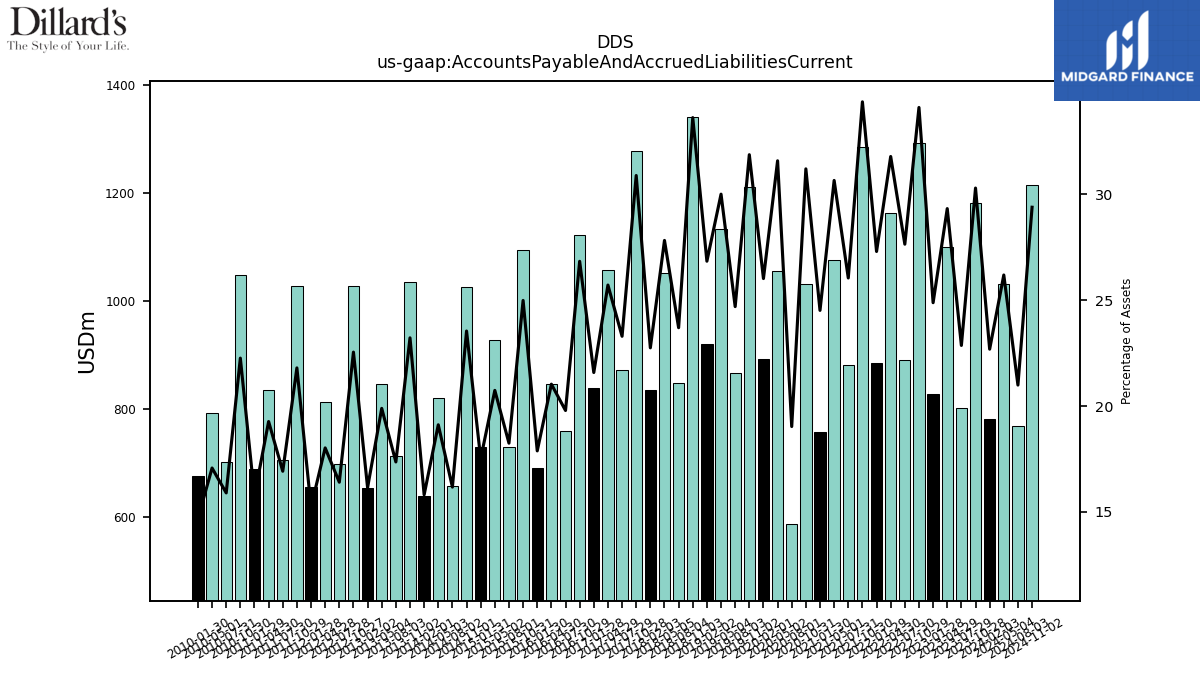
| Accounts Payable And Accrued Liabilities Current | 1181.20 | 803.14 | 1099.67 | 828.48 | 1293.70 | 890.78 | 1163.29 | 886.23 | 1285.79 | 881.54 | 1075.53 | 758.36 | 1031.81 | 586.87 | 1055.89 | 892.79 | 1211.45 | 867.53 | 1134.26 | 921.21 | 1340.77 | 849.22 | 1052.31 | 1277.66 | 873.55 | 1058.33 | 839.30 | 1123.09 | 760.62 | 846.82 | 691.31 | 1094.72 | 730.34 | 927.75 | 730.42 | 1025.97 | 658.24 | 820.78 | 640.34 | 1035.83 | 713.10 | 847.62 | 1028.16 | 699.03 | 813.95 | 655.65 | 1028.56 | 706.87 | 835.70 | 689.28 | 1049.23 | 701.70 | 793.39 | |
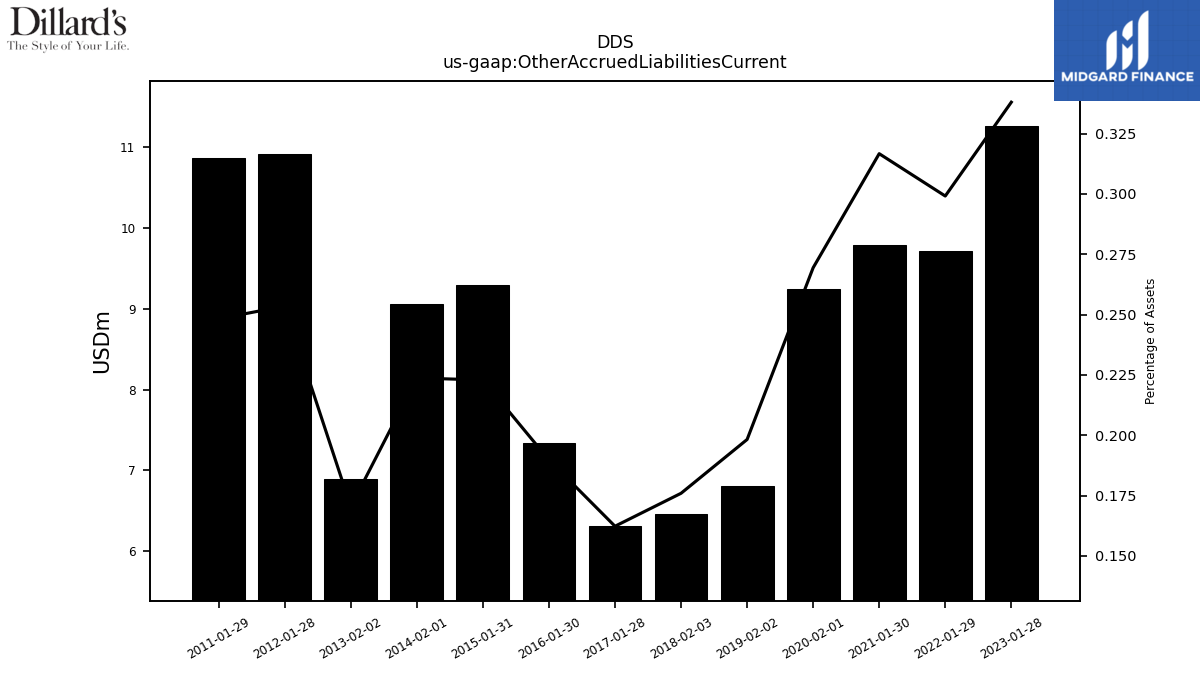
| Other Accrued Liabilities Current | NA | NA | NA | 11.25 | NA | NA | NA | 9.71 | NA | NA | NA | 9.79 | NA | NA | NA | 9.24 | NA | NA | NA | 6.80 | NA | NA | NA | NA | NA | NA | 6.31 | NA | NA | NA | 7.33 | NA | NA | NA | 9.29 | NA | NA | NA | 9.06 | NA | NA | NA | NA | NA | NA | 10.92 | NA | NA | NA | 10.86 | NA | NA | NA | |
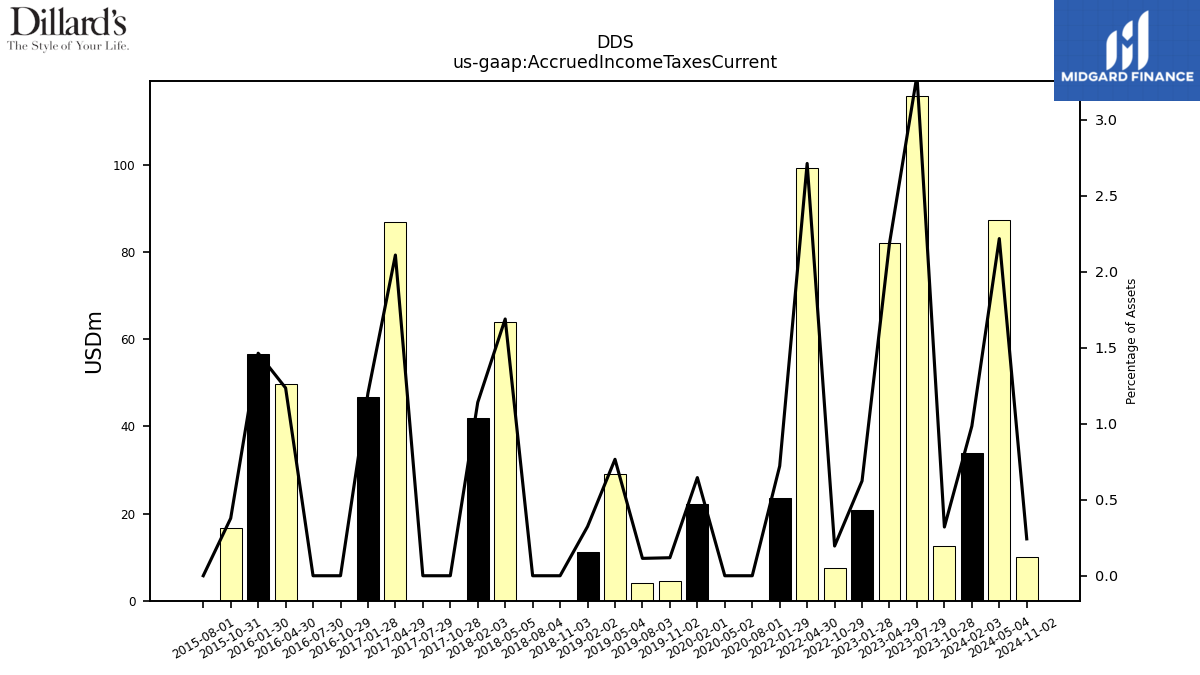
| Accrued Income Taxes Current | 12.50 | 115.63 | 82.03 | 20.77 | 7.42 | NA | 99.29 | 23.44 | NA | NA | NA | NA | NA | 0.00 | 0.00 | 22.16 | 4.50 | 4.01 | 28.96 | 11.12 | 0.00 | 0.00 | 63.91 | 0.00 | 0.00 | 86.86 | 46.73 | 0.00 | 0.00 | 49.76 | 56.62 | 16.57 | 0.00 | NA | NA | NA | NA | NA | NA | NA | NA | NA | NA | NA | NA | NA | NA | NA | NA | NA | NA | NA | NA | |
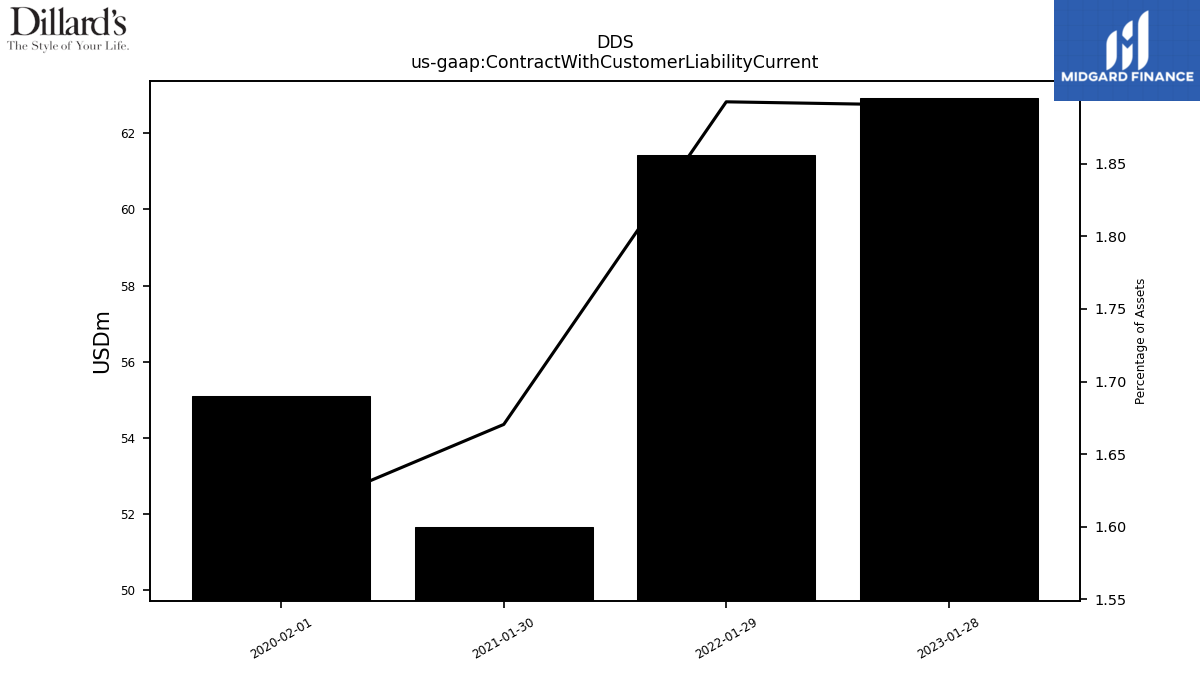
| Contract With Customer Liability Current | NA | NA | NA | 62.92 | NA | NA | NA | 61.43 | NA | NA | NA | 51.66 | NA | NA | NA | 55.09 | NA | NA | NA | NA | NA | NA | NA | NA | NA | NA | NA | NA | NA | NA | NA | NA | NA | NA | NA | NA | NA | NA | NA | NA | NA | NA | NA | NA | NA | NA | NA | NA | NA | NA | NA | NA | NA |
| 2023-10-28 | 2023-07-29 | 2023-04-29 | 2023-01-28 | 2022-10-29 | 2022-07-30 | 2022-04-30 | 2022-01-29 | 2021-10-30 | 2021-07-31 | 2021-05-01 | 2021-01-30 | 2020-10-31 | 2020-08-01 | 2020-05-02 | 2020-02-01 | 2019-11-02 | 2019-08-03 | 2019-05-04 | 2019-02-02 | 2018-11-03 | 2018-08-04 | 2018-05-05 | 2017-10-28 | 2017-07-29 | 2017-04-29 | 2017-01-28 | 2016-10-29 | 2016-07-30 | 2016-04-30 | 2016-01-30 | 2015-10-31 | 2015-08-01 | 2015-05-02 | 2015-01-31 | 2014-11-01 | 2014-08-02 | 2014-05-03 | 2014-02-01 | 2013-11-02 | 2013-08-03 | 2013-05-04 | 2012-10-27 | 2012-07-28 | 2012-04-28 | 2012-01-28 | 2011-10-29 | 2011-07-30 | 2011-04-30 | 2011-01-29 | 2010-10-30 | 2010-07-31 | 2010-05-01 | ||
|---|---|---|---|---|---|---|---|---|---|---|---|---|---|---|---|---|---|---|---|---|---|---|---|---|---|---|---|---|---|---|---|---|---|---|---|---|---|---|---|---|---|---|---|---|---|---|---|---|---|---|---|---|---|---|
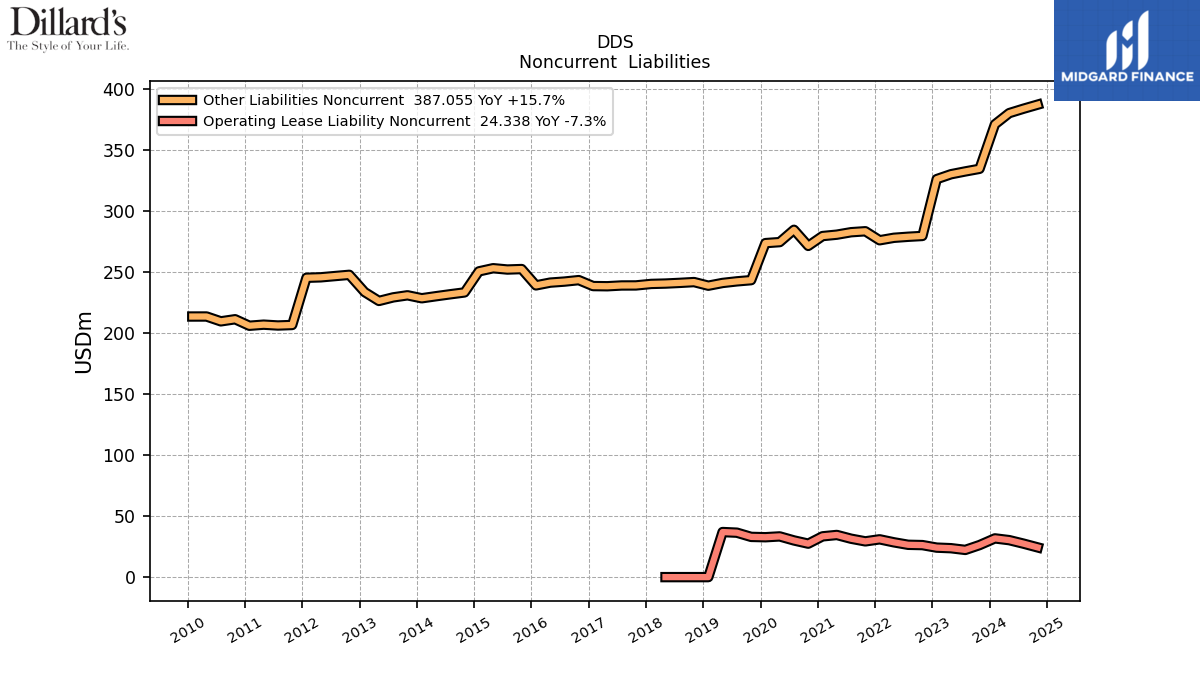
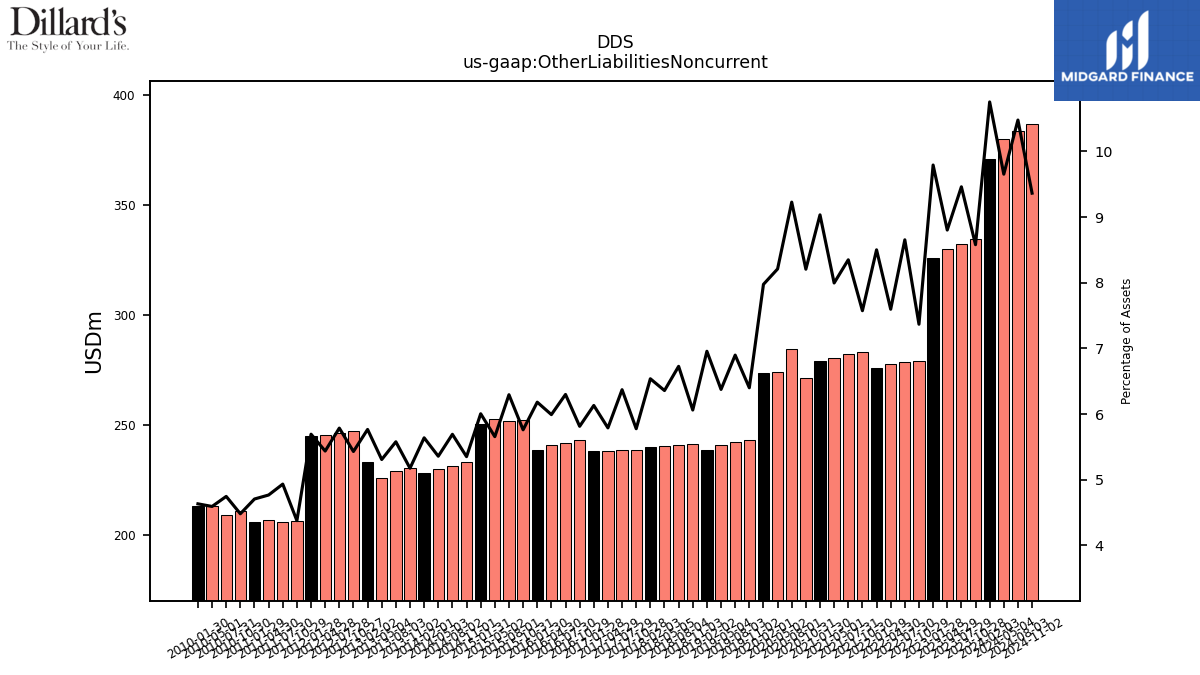
| Other Liabilities Noncurrent | 334.46 | 332.33 | 330.04 | 326.03 | 279.47 | 278.81 | 277.96 | 275.94 | 283.32 | 282.53 | 280.52 | 279.39 | 271.32 | 284.53 | 274.44 | 273.60 | 243.26 | 242.28 | 240.97 | 238.73 | 241.69 | 241.04 | 240.48 | 238.94 | 238.91 | 238.28 | 238.42 | 243.30 | 242.10 | 241.25 | 238.98 | 252.36 | 251.97 | 253.04 | 250.46 | 233.21 | 231.71 | 230.11 | 228.44 | 230.86 | 229.16 | 226.23 | 247.63 | 246.62 | 245.58 | 245.22 | 206.53 | 206.13 | 206.81 | 205.92 | 211.25 | 209.53 | 213.49 | |
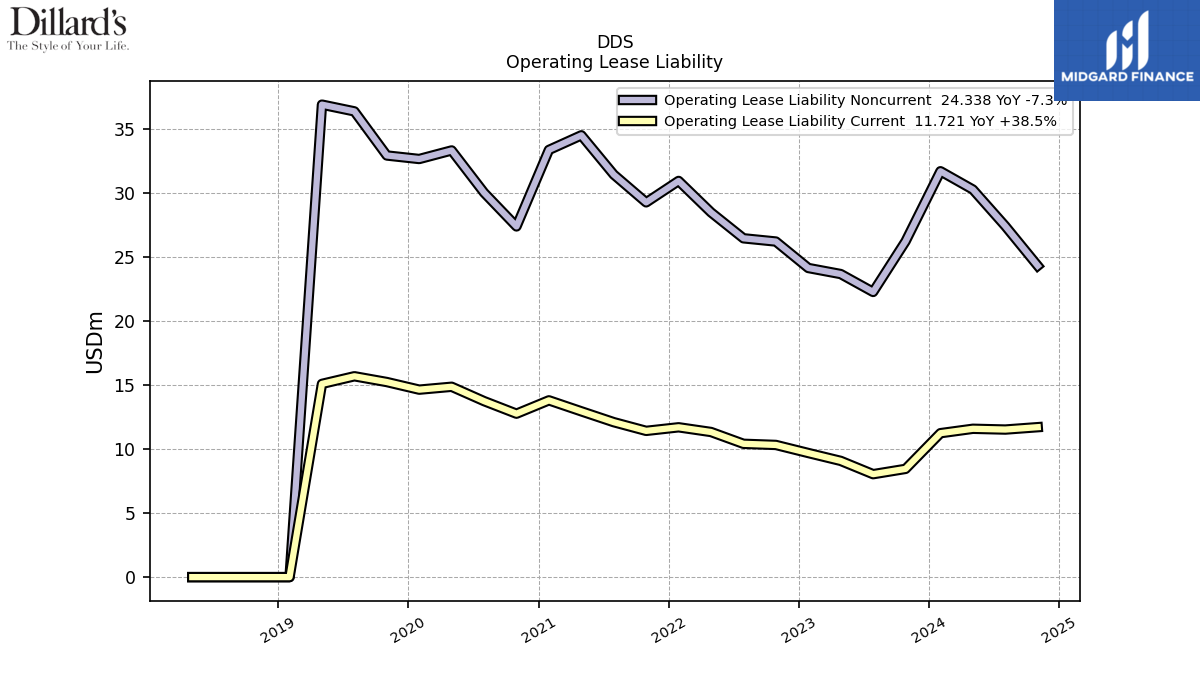
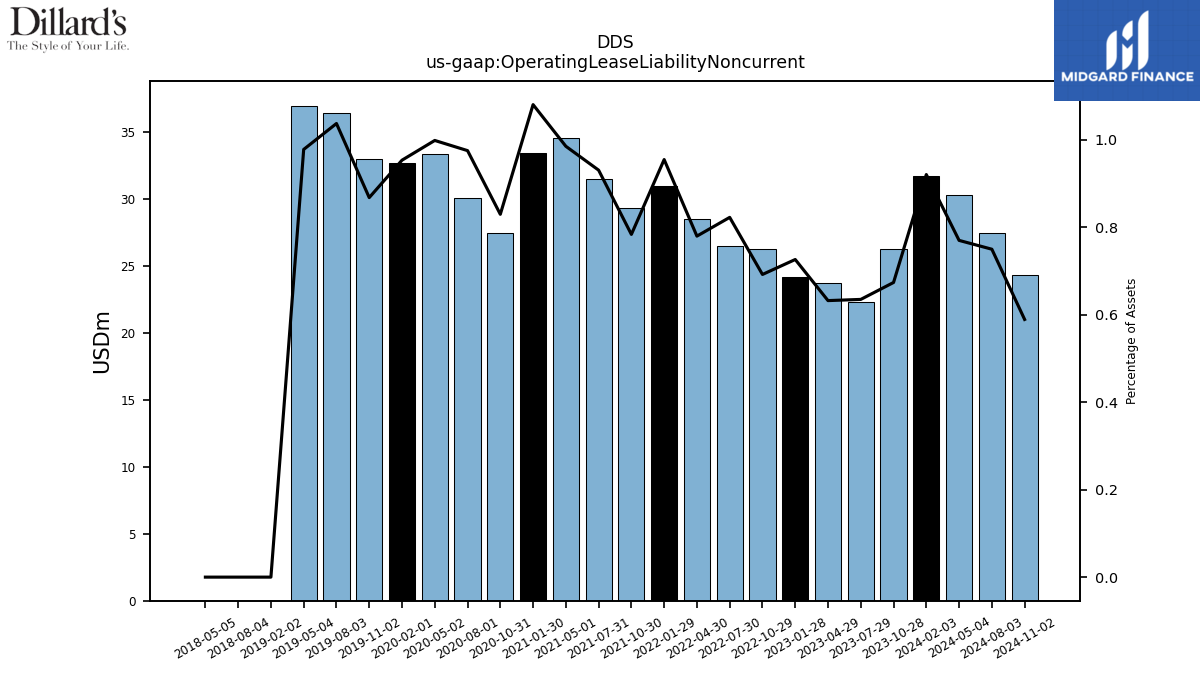
| Operating Lease Liability Noncurrent | 26.25 | 22.29 | 23.69 | 24.16 | 26.23 | 26.48 | 28.51 | 30.97 | 29.29 | 31.47 | 34.54 | 33.39 | 27.41 | 30.05 | 33.35 | 32.68 | 32.96 | 36.41 | 36.93 | 0.00 | NA | 0.00 | 0.00 | NA | NA | NA | NA | NA | NA | NA | NA | NA | NA | NA | NA | NA | NA | NA | NA | NA | NA | NA | NA | NA | NA | NA | NA | NA | NA | NA | NA | NA | NA |
| 2023-10-28 | 2023-07-29 | 2023-04-29 | 2023-01-28 | 2022-10-29 | 2022-07-30 | 2022-04-30 | 2022-01-29 | 2021-10-30 | 2021-07-31 | 2021-05-01 | 2021-01-30 | 2020-10-31 | 2020-08-01 | 2020-05-02 | 2020-02-01 | 2019-11-02 | 2019-08-03 | 2019-05-04 | 2019-02-02 | 2018-11-03 | 2018-08-04 | 2018-05-05 | 2017-10-28 | 2017-07-29 | 2017-04-29 | 2017-01-28 | 2016-10-29 | 2016-07-30 | 2016-04-30 | 2016-01-30 | 2015-10-31 | 2015-08-01 | 2015-05-02 | 2015-01-31 | 2014-11-01 | 2014-08-02 | 2014-05-03 | 2014-02-01 | 2013-11-02 | 2013-08-03 | 2013-05-04 | 2012-10-27 | 2012-07-28 | 2012-04-28 | 2012-01-28 | 2011-10-29 | 2011-07-30 | 2011-04-30 | 2011-01-29 | 2010-10-30 | 2010-07-31 | 2010-05-01 | ||
|---|---|---|---|---|---|---|---|---|---|---|---|---|---|---|---|---|---|---|---|---|---|---|---|---|---|---|---|---|---|---|---|---|---|---|---|---|---|---|---|---|---|---|---|---|---|---|---|---|---|---|---|---|---|---|
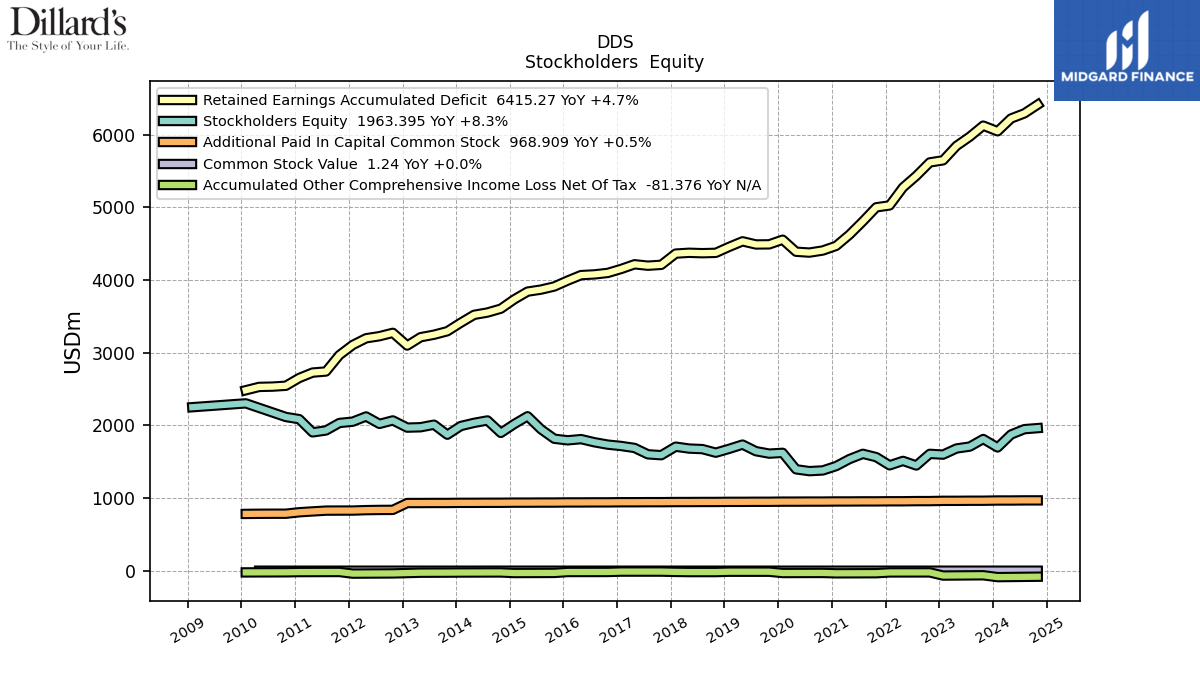
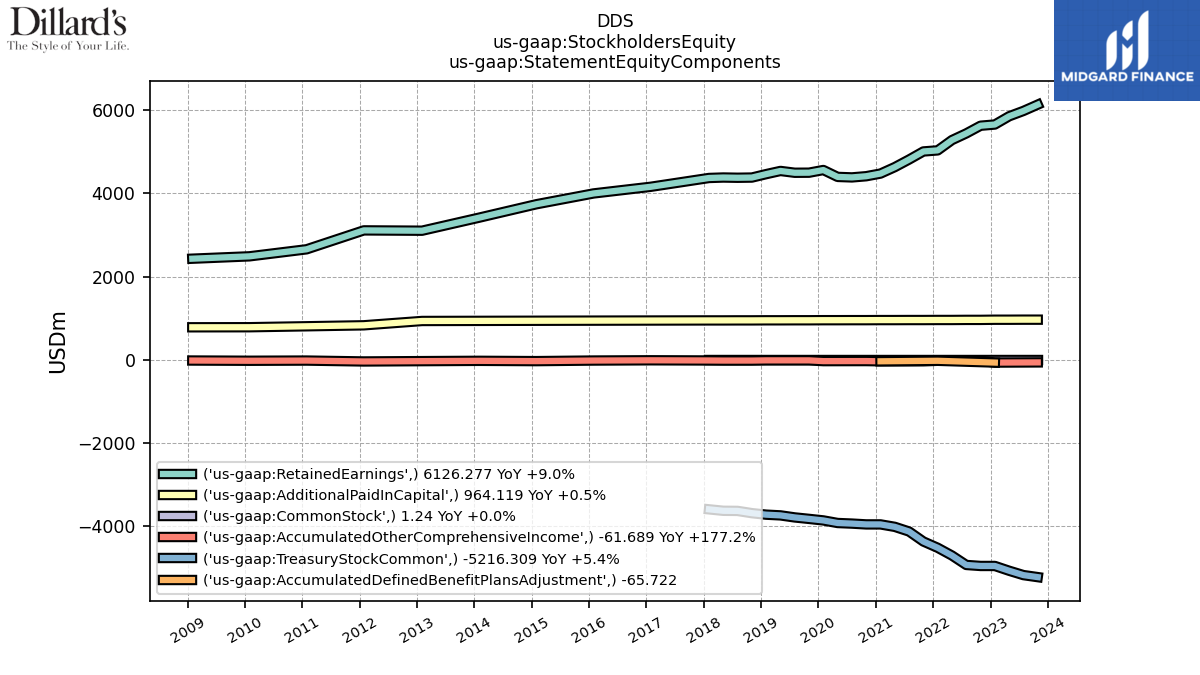
| Stockholders Equity | 1813.64 | 1709.52 | 1683.13 | 1598.64 | 1609.35 | 1449.00 | 1512.33 | 1451.22 | 1564.20 | 1609.58 | 1537.70 | 1441.01 | 1380.83 | 1371.31 | 1396.41 | 1623.26 | 1612.38 | 1645.84 | 1736.91 | 1678.38 | 1625.28 | 1674.47 | 1682.09 | 1590.65 | 1602.72 | 1690.41 | 1717.42 | 1736.20 | 1768.70 | 1812.01 | 1795.31 | 1817.15 | 1948.06 | 2126.94 | 2019.27 | 1897.55 | 2068.92 | 2035.76 | 1992.20 | 1872.57 | 2010.84 | 1975.41 | 2069.41 | 2021.48 | 2123.76 | 2052.02 | 2033.96 | 1930.96 | 1904.86 | 2086.72 | 2116.57 | NA | NA | |
| Common Stock Value | 1.24 | 1.24 | 1.24 | 1.24 | 1.24 | 1.24 | 1.24 | 1.24 | 1.24 | 1.24 | 1.24 | 1.24 | 1.24 | 1.24 | 1.24 | 1.24 | 1.24 | 1.24 | 1.24 | 1.24 | 1.24 | 1.24 | 1.24 | 1.24 | 1.24 | 1.24 | 1.24 | 1.24 | 1.24 | 1.24 | 1.24 | 1.24 | 1.24 | 1.24 | 1.24 | 1.24 | 1.24 | 1.24 | 1.24 | 1.24 | 1.24 | 1.24 | 1.23 | 1.23 | 1.23 | 1.23 | 1.23 | 1.23 | 1.22 | 1.22 | 1.21 | 1.21 | 1.21 | |
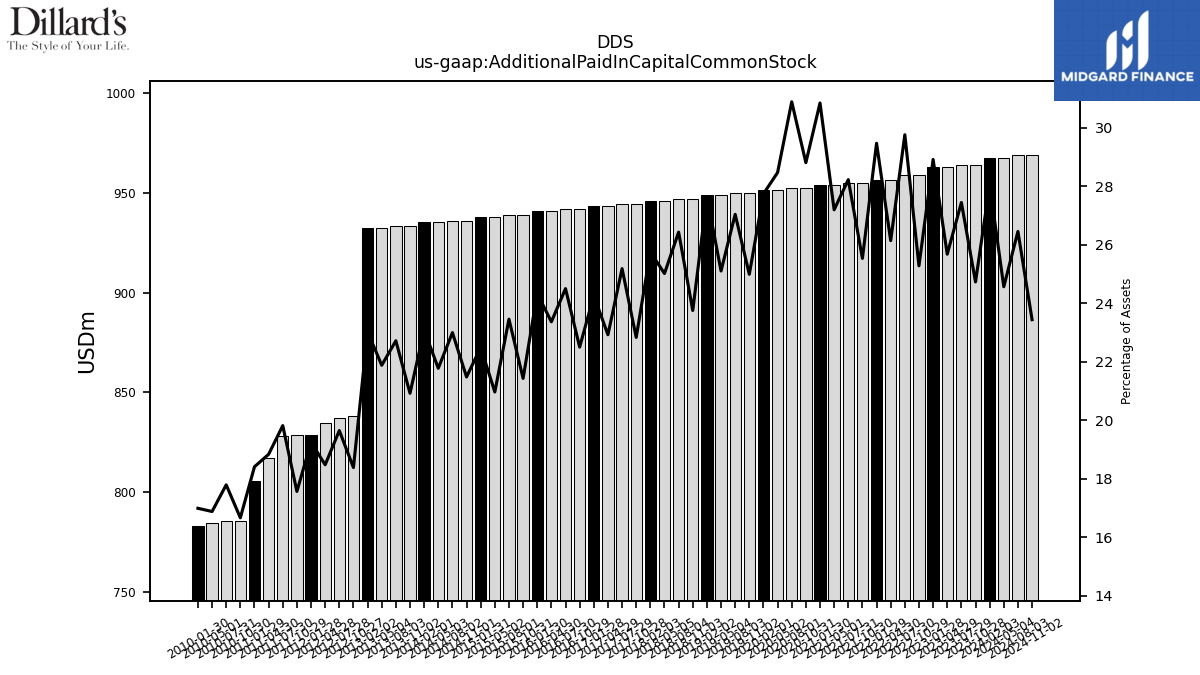
| Additional Paid In Capital Common Stock | 964.12 | 964.12 | 962.84 | 962.84 | 958.97 | 958.97 | 956.65 | 956.65 | 955.20 | 955.20 | 954.13 | 954.13 | 952.52 | 952.52 | 951.73 | 951.73 | 949.85 | 949.85 | 948.84 | 948.84 | 947.12 | 947.12 | 946.15 | 944.40 | 944.40 | 943.47 | 943.47 | 941.71 | 941.71 | 940.80 | 940.80 | 938.92 | 938.92 | 937.99 | 937.99 | 936.11 | 936.11 | 935.21 | 935.21 | 933.26 | 933.26 | 932.50 | 838.26 | 837.40 | 834.62 | 828.80 | 828.80 | 827.94 | 817.01 | 805.42 | 785.41 | 785.40 | 784.56 | |
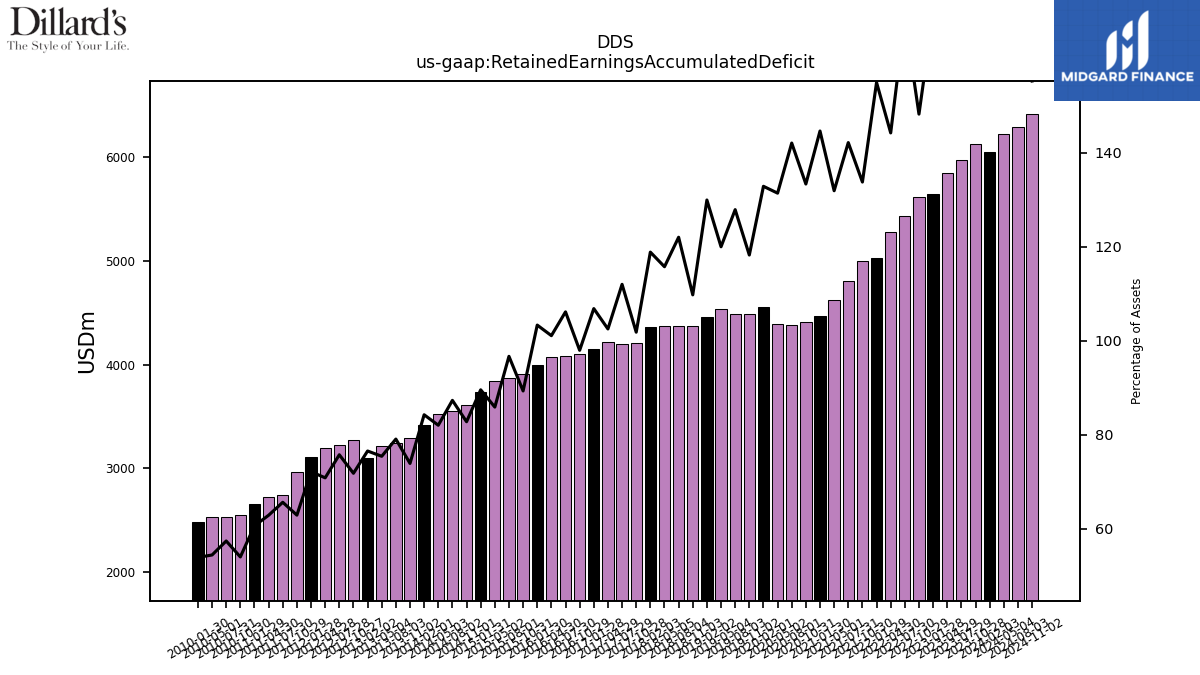
| Retained Earnings Accumulated Deficit | 6126.28 | 5975.03 | 5846.80 | 5648.70 | 5619.81 | 5435.33 | 5275.37 | 5027.92 | 5002.07 | 4808.74 | 4626.24 | 4471.27 | 4407.53 | 4378.99 | 4391.04 | 4556.49 | 4492.51 | 4490.76 | 4533.97 | 4458.01 | 4375.48 | 4370.78 | 4376.41 | 4210.51 | 4198.85 | 4217.97 | 4153.84 | 4099.26 | 4078.82 | 4069.15 | 3994.21 | 3912.63 | 3869.55 | 3841.99 | 3734.89 | 3606.87 | 3554.17 | 3522.31 | 3413.24 | 3296.79 | 3248.62 | 3214.45 | 3274.63 | 3228.47 | 3199.85 | 3107.34 | 2968.08 | 2742.62 | 2727.88 | 2653.44 | 2546.34 | 2534.59 | 2530.43 | |
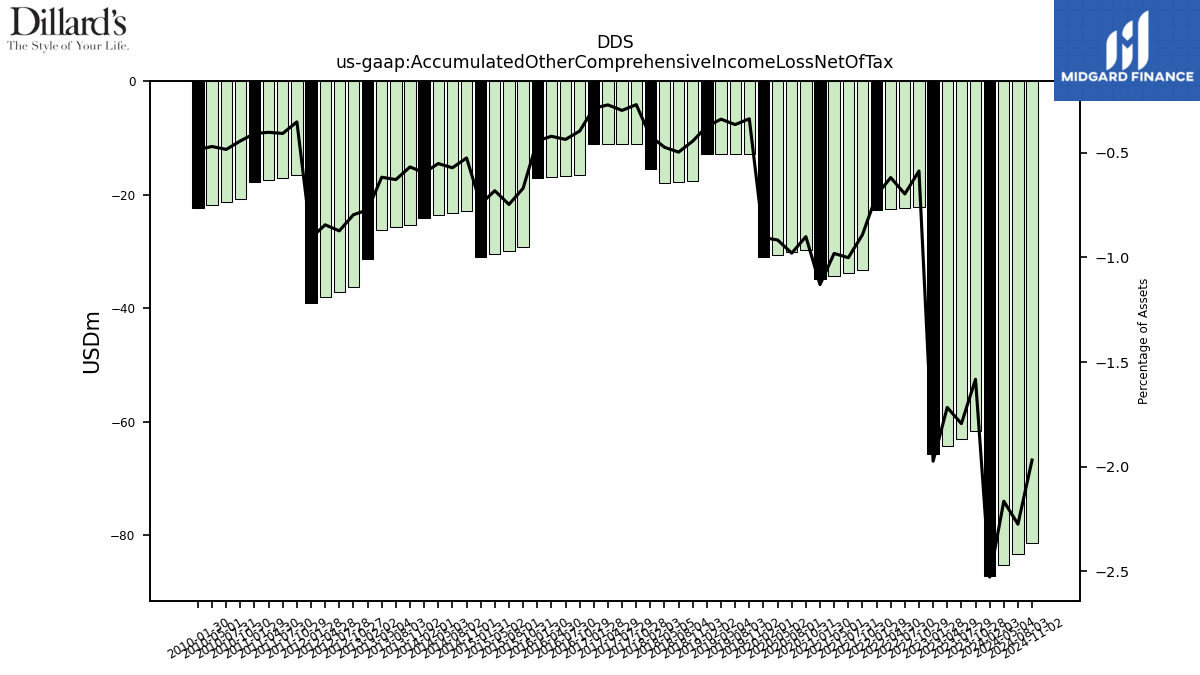
| Accumulated Other Comprehensive Income Loss Net Of Tax | -61.69 | -63.03 | -64.38 | -65.72 | -22.25 | -22.43 | -22.62 | -22.80 | -33.35 | -33.88 | -34.41 | -34.94 | -29.77 | -30.20 | -30.63 | -31.06 | -12.81 | -12.81 | -12.81 | -12.81 | -17.68 | -17.79 | -17.89 | -11.14 | -11.14 | -11.14 | -11.14 | -16.56 | -16.75 | -16.93 | -17.12 | -29.31 | -29.89 | -30.46 | -31.03 | -22.84 | -23.25 | -23.66 | -24.07 | -25.30 | -25.79 | -26.27 | -36.28 | -37.20 | -38.12 | -39.03 | -16.60 | -17.01 | -17.42 | -17.83 | -20.87 | -21.35 | -21.82 | |
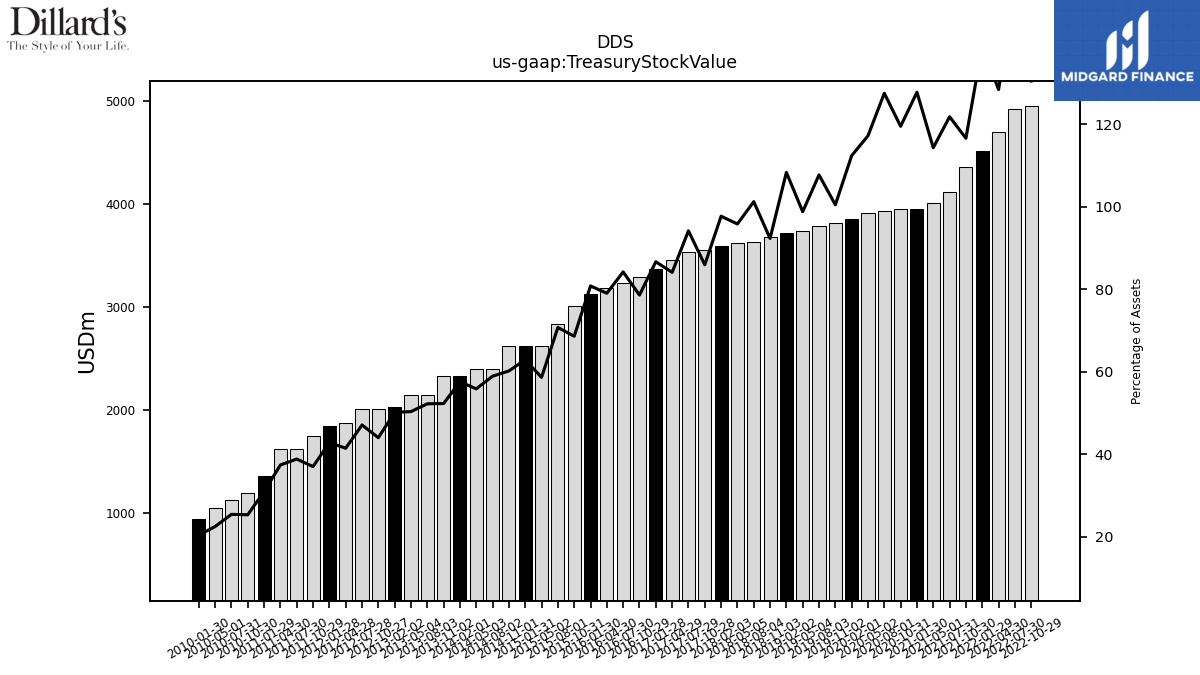
| Treasury Stock Value | NA | NA | NA | NA | 4948.42 | 4924.11 | 4698.31 | 4511.80 | 4360.96 | 4121.72 | 4009.51 | 3950.70 | 3950.70 | 3931.24 | 3916.97 | 3855.14 | 3818.40 | 3783.19 | 3734.33 | 3716.89 | 3680.88 | 3626.89 | 3623.82 | 3554.36 | 3530.64 | 3461.13 | 3369.99 | 3289.44 | 3236.33 | 3182.24 | 3123.82 | 3006.32 | 2831.77 | 2623.82 | 2623.82 | 2623.82 | 2399.34 | 2399.34 | 2333.41 | 2333.41 | 2146.50 | 2146.50 | 2008.43 | 2008.43 | 1873.82 | 1846.31 | 1747.54 | 1623.82 | 1623.82 | 1355.53 | 1195.53 | 1124.20 | 1046.63 |
| 2023-10-28 | 2023-07-29 | 2023-04-29 | 2023-01-28 | 2022-10-29 | 2022-07-30 | 2022-04-30 | 2022-01-29 | 2021-10-30 | 2021-07-31 | 2021-05-01 | 2021-01-30 | 2020-10-31 | 2020-08-01 | 2020-05-02 | 2020-02-01 | 2019-11-02 | 2019-08-03 | 2019-05-04 | 2019-02-02 | 2018-11-03 | 2018-08-04 | 2018-05-05 | 2017-10-28 | 2017-07-29 | 2017-04-29 | 2017-01-28 | 2016-10-29 | 2016-07-30 | 2016-04-30 | 2016-01-30 | 2015-10-31 | 2015-08-01 | 2015-05-02 | 2015-01-31 | 2014-11-01 | 2014-08-02 | 2014-05-03 | 2014-02-01 | 2013-11-02 | 2013-08-03 | 2013-05-04 | 2012-10-27 | 2012-07-28 | 2012-04-28 | 2012-01-28 | 2011-10-29 | 2011-07-30 | 2011-04-30 | 2011-01-29 | 2010-10-30 | 2010-07-31 | 2010-05-01 | ||
|---|---|---|---|---|---|---|---|---|---|---|---|---|---|---|---|---|---|---|---|---|---|---|---|---|---|---|---|---|---|---|---|---|---|---|---|---|---|---|---|---|---|---|---|---|---|---|---|---|---|---|---|---|---|---|
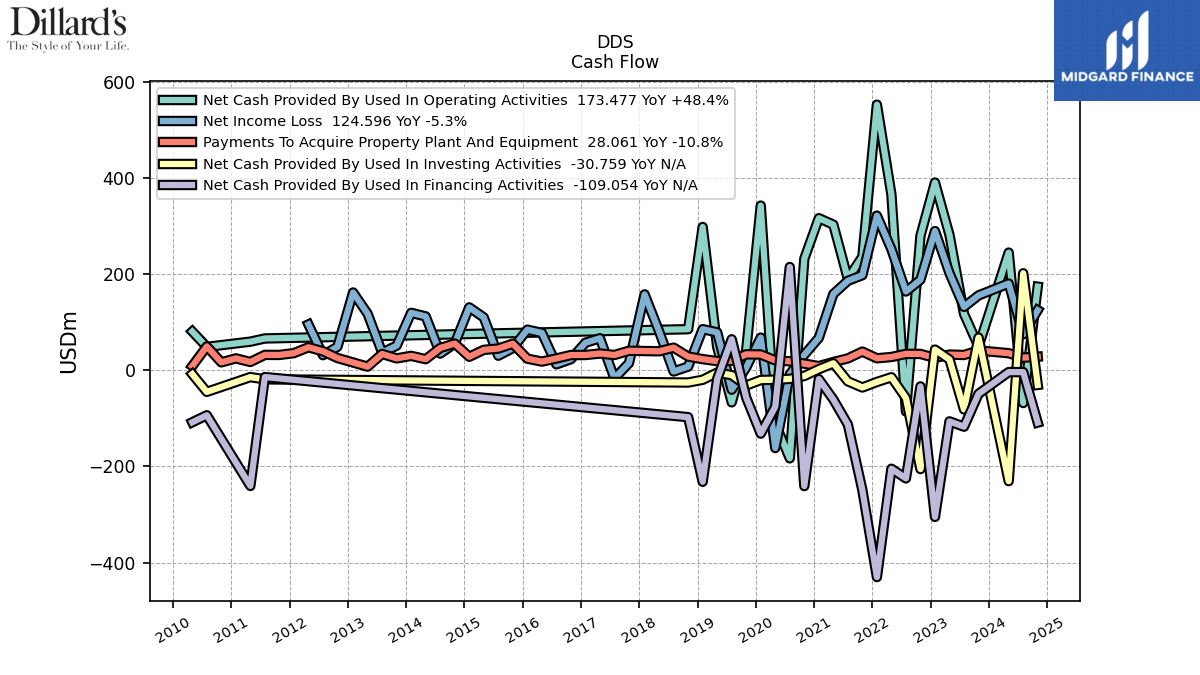
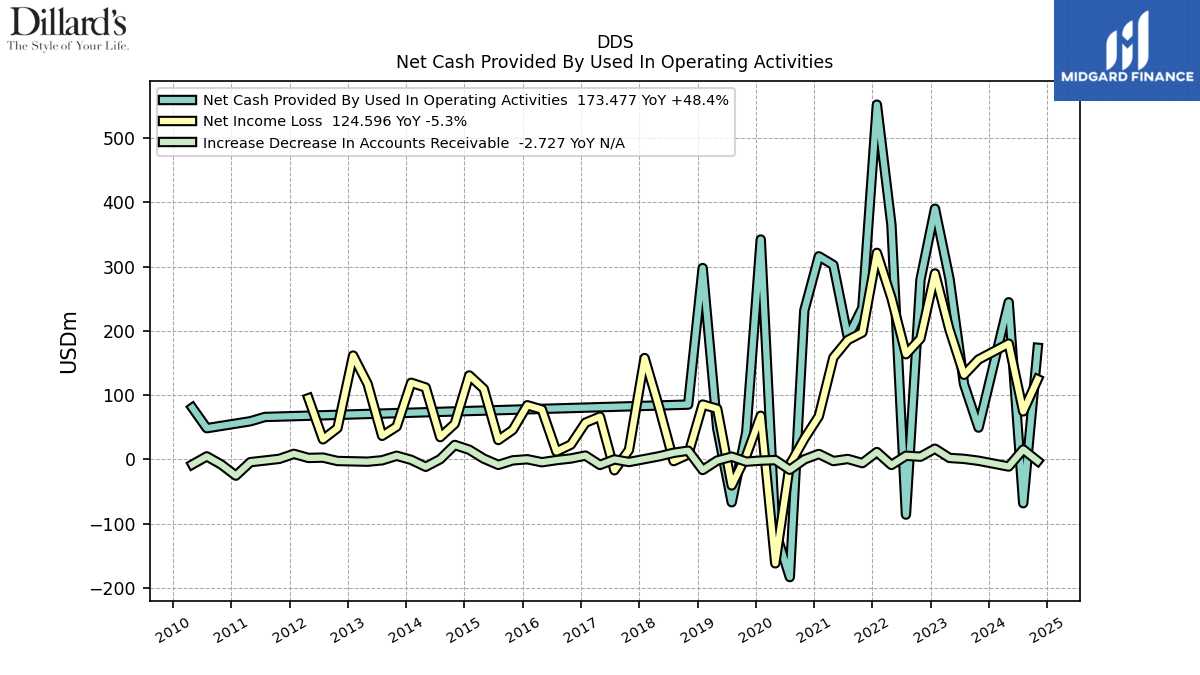
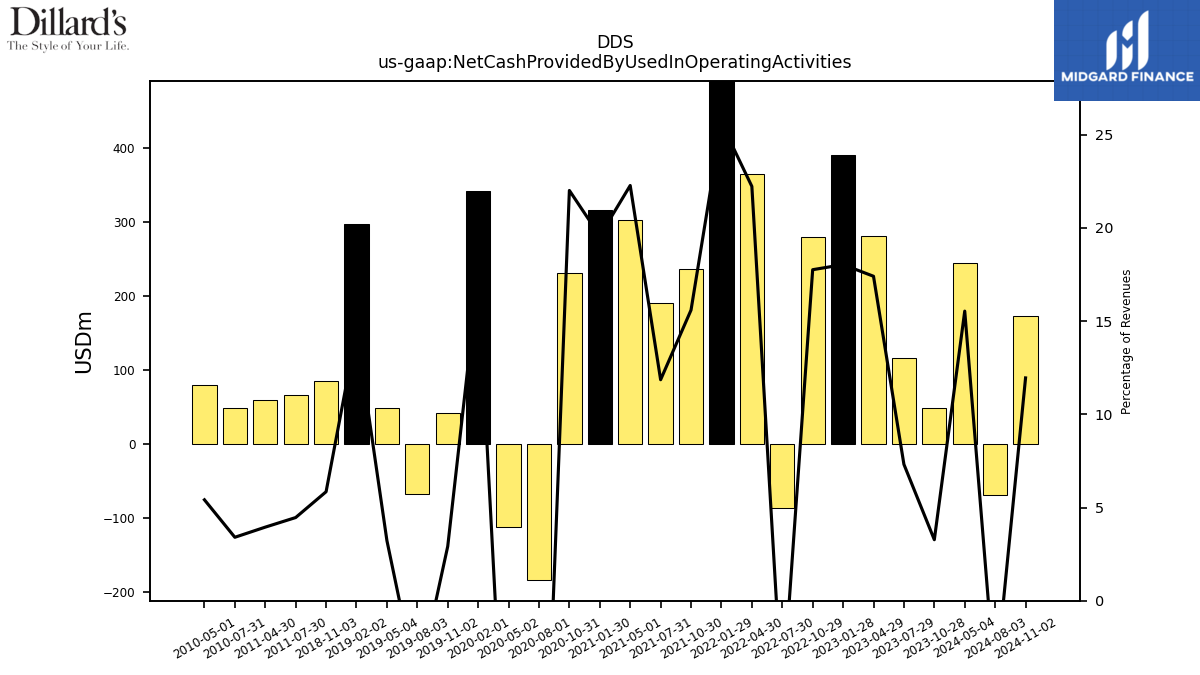
| Net Cash Provided By Used In Operating Activities | 49.26 | 116.90 | 280.95 | 389.97 | 279.37 | -86.13 | 365.18 | 551.94 | 235.78 | 189.89 | 302.41 | 315.88 | 231.57 | -183.38 | -111.12 | 342.09 | 41.56 | -66.94 | 48.36 | 297.63 | 85.09 | NA | NA | NA | NA | NA | NA | NA | NA | NA | NA | NA | NA | NA | NA | NA | NA | NA | NA | NA | NA | NA | NA | NA | NA | NA | NA | 65.84 | 59.19 | NA | NA | 48.38 | 80.29 | |
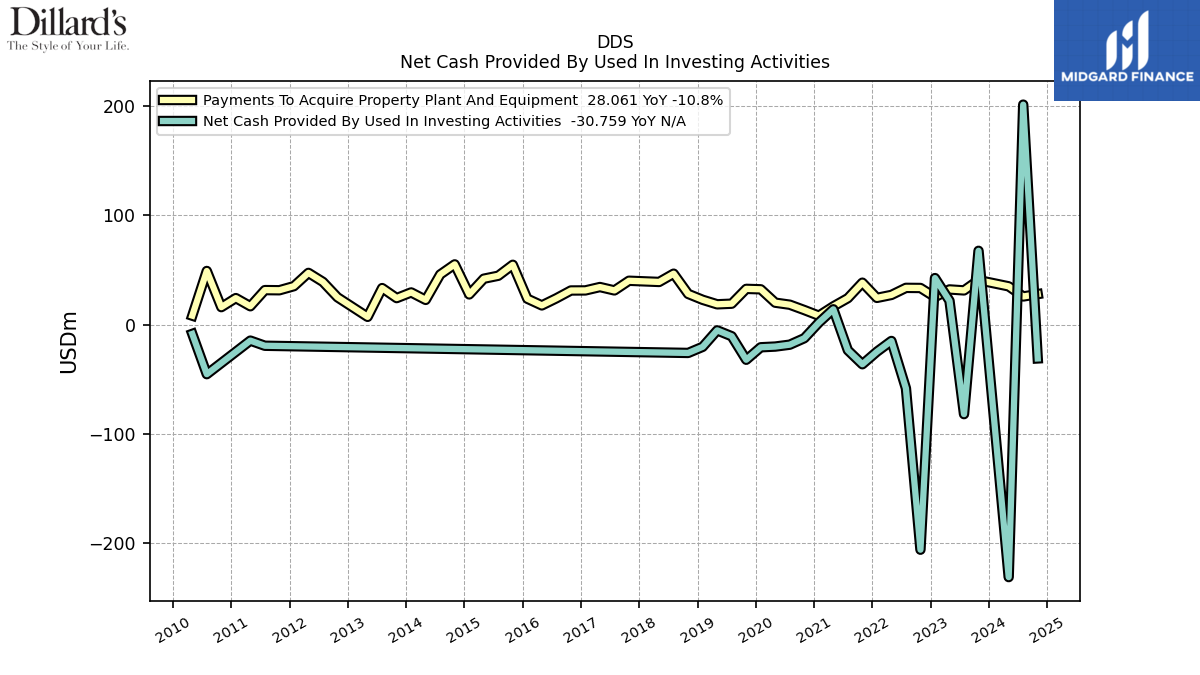
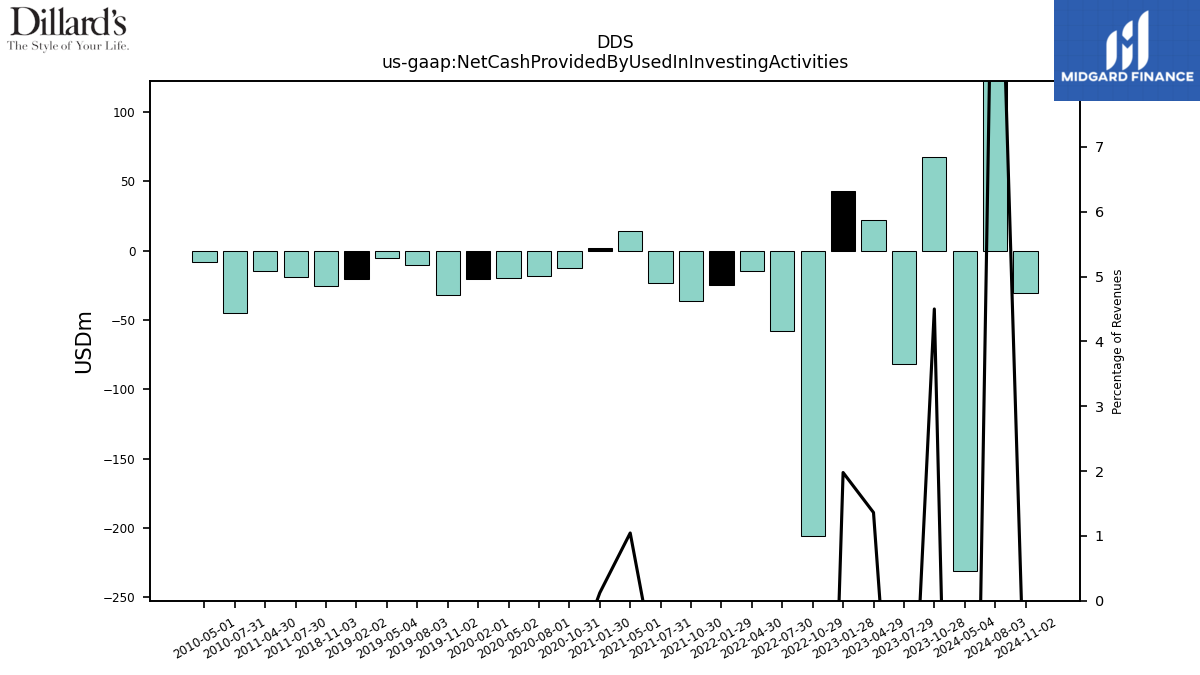
| Net Cash Provided By Used In Investing Activities | 67.68 | -81.72 | 21.96 | 42.75 | -205.72 | -58.10 | -14.78 | -24.61 | -36.08 | -23.28 | 14.18 | 1.97 | -12.27 | -18.18 | -19.90 | -20.56 | -31.99 | -10.46 | -5.09 | -20.16 | -25.74 | NA | NA | NA | NA | NA | NA | NA | NA | NA | NA | NA | NA | NA | NA | NA | NA | NA | NA | NA | NA | NA | NA | NA | NA | NA | NA | -19.16 | -14.46 | NA | NA | -45.16 | -8.31 | |
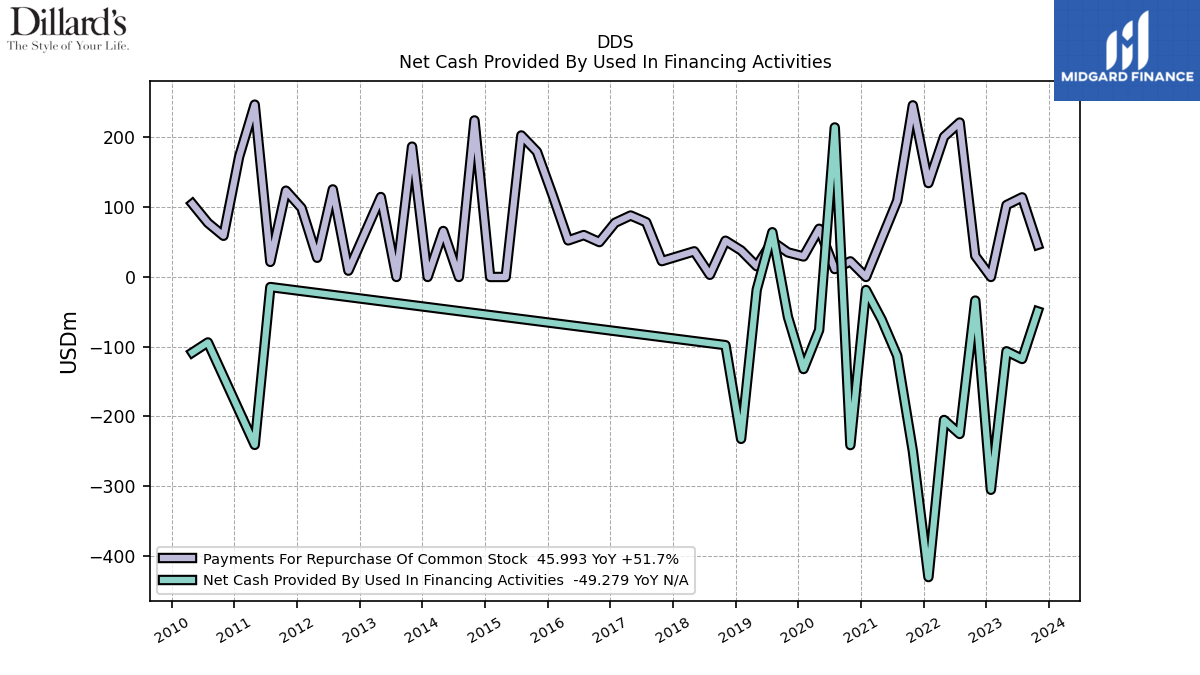
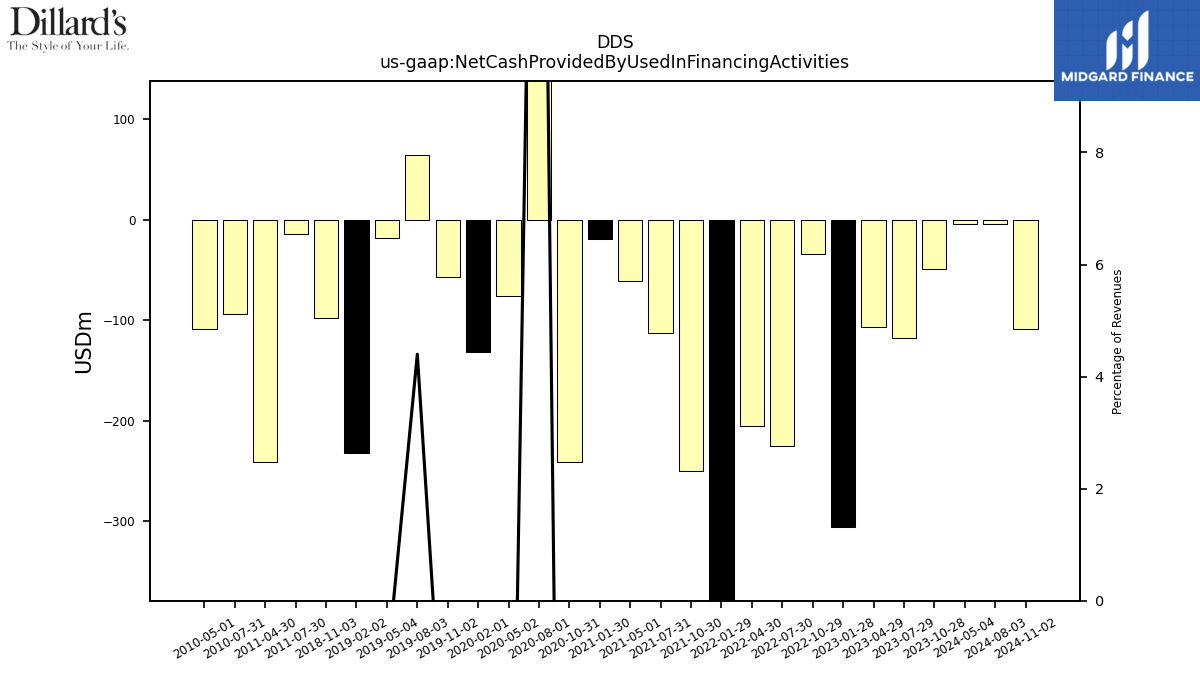
| Net Cash Provided By Used In Financing Activities | -49.28 | -117.57 | -106.50 | -305.10 | -33.80 | -225.08 | -204.98 | -430.29 | -249.46 | -113.05 | -61.02 | -18.64 | -241.05 | 214.44 | -76.05 | -131.99 | -57.30 | 64.17 | -18.29 | -232.12 | -97.74 | NA | NA | NA | NA | NA | NA | NA | NA | NA | NA | NA | NA | NA | NA | NA | NA | NA | NA | NA | NA | NA | NA | NA | NA | NA | NA | -14.43 | -240.75 | NA | NA | -93.80 | -108.38 |
| 2023-10-28 | 2023-07-29 | 2023-04-29 | 2023-01-28 | 2022-10-29 | 2022-07-30 | 2022-04-30 | 2022-01-29 | 2021-10-30 | 2021-07-31 | 2021-05-01 | 2021-01-30 | 2020-10-31 | 2020-08-01 | 2020-05-02 | 2020-02-01 | 2019-11-02 | 2019-08-03 | 2019-05-04 | 2019-02-02 | 2018-11-03 | 2018-08-04 | 2018-05-05 | 2017-10-28 | 2017-07-29 | 2017-04-29 | 2017-01-28 | 2016-10-29 | 2016-07-30 | 2016-04-30 | 2016-01-30 | 2015-10-31 | 2015-08-01 | 2015-05-02 | 2015-01-31 | 2014-11-01 | 2014-08-02 | 2014-05-03 | 2014-02-01 | 2013-11-02 | 2013-08-03 | 2013-05-04 | 2012-10-27 | 2012-07-28 | 2012-04-28 | 2012-01-28 | 2011-10-29 | 2011-07-30 | 2011-04-30 | 2011-01-29 | 2010-10-30 | 2010-07-31 | 2010-05-01 | ||
|---|---|---|---|---|---|---|---|---|---|---|---|---|---|---|---|---|---|---|---|---|---|---|---|---|---|---|---|---|---|---|---|---|---|---|---|---|---|---|---|---|---|---|---|---|---|---|---|---|---|---|---|---|---|---|
| Net Cash Provided By Used In Operating Activities | 49.26 | 116.90 | 280.95 | 389.97 | 279.37 | -86.13 | 365.18 | 551.94 | 235.78 | 189.89 | 302.41 | 315.88 | 231.57 | -183.38 | -111.12 | 342.09 | 41.56 | -66.94 | 48.36 | 297.63 | 85.09 | NA | NA | NA | NA | NA | NA | NA | NA | NA | NA | NA | NA | NA | NA | NA | NA | NA | NA | NA | NA | NA | NA | NA | NA | NA | NA | 65.84 | 59.19 | NA | NA | 48.38 | 80.29 | |
| Net Income Loss | 155.34 | 131.51 | 201.50 | 289.19 | 187.91 | 163.45 | 251.09 | 321.24 | 197.33 | 185.66 | 158.25 | 67.04 | 31.85 | -8.57 | -161.97 | 67.69 | 5.46 | -40.67 | 78.60 | 85.16 | 7.42 | -2.87 | 80.55 | 14.54 | -17.08 | 66.30 | 56.91 | 22.80 | 12.08 | 77.43 | 84.11 | 45.74 | 29.95 | 109.57 | 130.49 | 55.23 | 34.45 | 111.68 | 119.10 | 50.87 | 36.49 | 117.21 | 48.51 | 31.02 | 94.98 | NA | NA | NA | NA | NA | NA | NA | NA | |
| Profit Loss | 155.34 | 131.51 | 201.50 | 289.19 | 187.91 | 163.45 | 251.09 | NA | NA | NA | NA | NA | NA | NA | NA | NA | NA | NA | NA | NA | NA | NA | NA | NA | NA | NA | NA | NA | NA | NA | NA | NA | NA | NA | NA | NA | NA | NA | NA | NA | NA | NA | NA | NA | NA | NA | NA | 17.57 | 76.68 | NA | NA | 6.83 | 48.83 | |
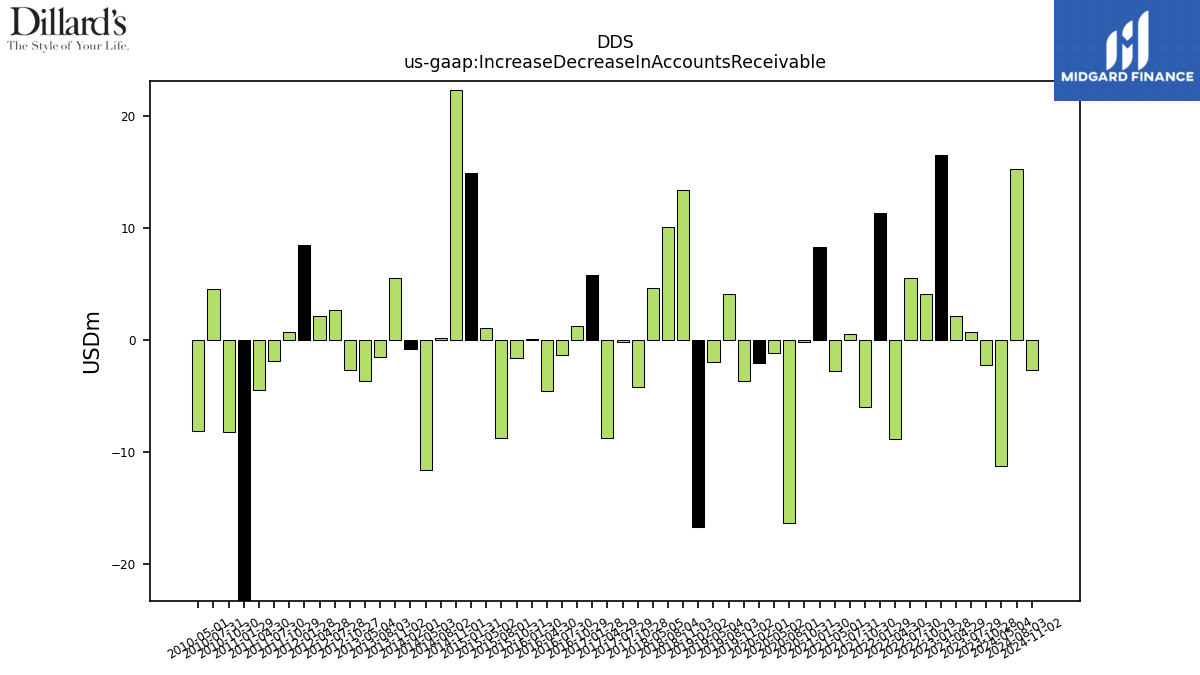
| Increase Decrease In Accounts Receivable | -2.29 | 0.65 | 2.10 | 16.48 | 4.08 | 5.48 | -8.86 | 11.30 | -5.97 | 0.50 | -2.75 | 8.29 | -0.23 | -16.33 | -1.20 | -2.08 | -3.71 | 4.08 | -1.99 | -16.68 | 13.39 | 10.08 | 4.63 | -4.24 | -0.23 | -8.81 | 5.76 | 1.26 | -1.32 | -4.61 | 0.02 | -1.67 | -8.74 | 1.01 | 14.85 | 22.33 | 0.15 | -11.66 | -0.87 | 5.47 | -1.57 | -3.71 | -2.66 | 2.61 | 2.09 | 8.45 | 0.69 | -1.92 | -4.46 | -25.47 | -8.22 | 4.56 | -8.13 |
| 2023-10-28 | 2023-07-29 | 2023-04-29 | 2023-01-28 | 2022-10-29 | 2022-07-30 | 2022-04-30 | 2022-01-29 | 2021-10-30 | 2021-07-31 | 2021-05-01 | 2021-01-30 | 2020-10-31 | 2020-08-01 | 2020-05-02 | 2020-02-01 | 2019-11-02 | 2019-08-03 | 2019-05-04 | 2019-02-02 | 2018-11-03 | 2018-08-04 | 2018-05-05 | 2017-10-28 | 2017-07-29 | 2017-04-29 | 2017-01-28 | 2016-10-29 | 2016-07-30 | 2016-04-30 | 2016-01-30 | 2015-10-31 | 2015-08-01 | 2015-05-02 | 2015-01-31 | 2014-11-01 | 2014-08-02 | 2014-05-03 | 2014-02-01 | 2013-11-02 | 2013-08-03 | 2013-05-04 | 2012-10-27 | 2012-07-28 | 2012-04-28 | 2012-01-28 | 2011-10-29 | 2011-07-30 | 2011-04-30 | 2011-01-29 | 2010-10-30 | 2010-07-31 | 2010-05-01 | ||
|---|---|---|---|---|---|---|---|---|---|---|---|---|---|---|---|---|---|---|---|---|---|---|---|---|---|---|---|---|---|---|---|---|---|---|---|---|---|---|---|---|---|---|---|---|---|---|---|---|---|---|---|---|---|---|
| Net Cash Provided By Used In Investing Activities | 67.68 | -81.72 | 21.96 | 42.75 | -205.72 | -58.10 | -14.78 | -24.61 | -36.08 | -23.28 | 14.18 | 1.97 | -12.27 | -18.18 | -19.90 | -20.56 | -31.99 | -10.46 | -5.09 | -20.16 | -25.74 | NA | NA | NA | NA | NA | NA | NA | NA | NA | NA | NA | NA | NA | NA | NA | NA | NA | NA | NA | NA | NA | NA | NA | NA | NA | NA | -19.16 | -14.46 | NA | NA | -45.16 | -8.31 | |
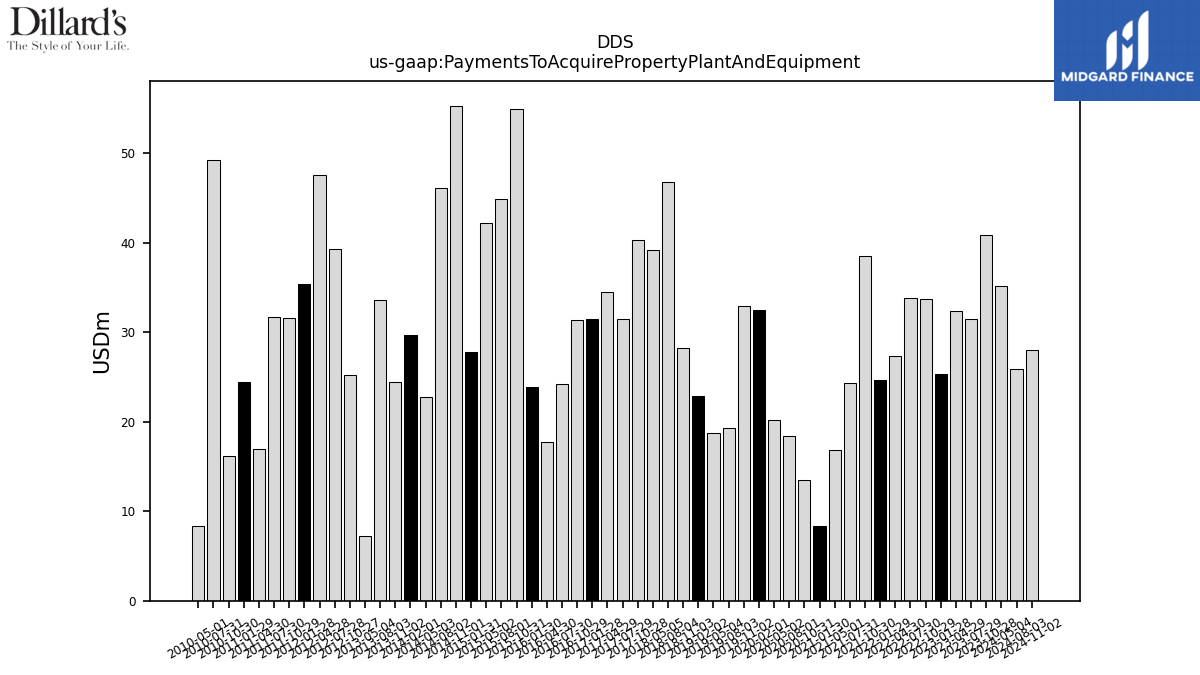
| Payments To Acquire Property Plant And Equipment | 40.87 | 31.46 | 32.35 | 25.33 | 33.68 | 33.78 | 27.31 | 24.61 | 38.54 | 24.36 | 16.85 | 8.35 | 13.49 | 18.38 | 20.23 | 32.47 | 32.87 | 19.31 | 18.74 | 22.86 | 28.25 | 46.76 | 39.19 | 40.29 | 31.44 | 34.54 | 31.45 | 31.38 | 24.25 | 17.74 | 23.86 | 54.90 | 44.87 | 42.16 | 27.79 | 55.28 | 46.04 | 22.77 | 29.63 | 24.43 | 33.60 | 7.26 | 25.17 | 39.24 | 47.50 | 35.35 | 31.60 | 31.74 | 16.96 | 24.43 | 16.15 | 49.24 | 8.36 |
| 2023-10-28 | 2023-07-29 | 2023-04-29 | 2023-01-28 | 2022-10-29 | 2022-07-30 | 2022-04-30 | 2022-01-29 | 2021-10-30 | 2021-07-31 | 2021-05-01 | 2021-01-30 | 2020-10-31 | 2020-08-01 | 2020-05-02 | 2020-02-01 | 2019-11-02 | 2019-08-03 | 2019-05-04 | 2019-02-02 | 2018-11-03 | 2018-08-04 | 2018-05-05 | 2017-10-28 | 2017-07-29 | 2017-04-29 | 2017-01-28 | 2016-10-29 | 2016-07-30 | 2016-04-30 | 2016-01-30 | 2015-10-31 | 2015-08-01 | 2015-05-02 | 2015-01-31 | 2014-11-01 | 2014-08-02 | 2014-05-03 | 2014-02-01 | 2013-11-02 | 2013-08-03 | 2013-05-04 | 2012-10-27 | 2012-07-28 | 2012-04-28 | 2012-01-28 | 2011-10-29 | 2011-07-30 | 2011-04-30 | 2011-01-29 | 2010-10-30 | 2010-07-31 | 2010-05-01 | ||
|---|---|---|---|---|---|---|---|---|---|---|---|---|---|---|---|---|---|---|---|---|---|---|---|---|---|---|---|---|---|---|---|---|---|---|---|---|---|---|---|---|---|---|---|---|---|---|---|---|---|---|---|---|---|---|
| Net Cash Provided By Used In Financing Activities | -49.28 | -117.57 | -106.50 | -305.10 | -33.80 | -225.08 | -204.98 | -430.29 | -249.46 | -113.05 | -61.02 | -18.64 | -241.05 | 214.44 | -76.05 | -131.99 | -57.30 | 64.17 | -18.29 | -232.12 | -97.74 | NA | NA | NA | NA | NA | NA | NA | NA | NA | NA | NA | NA | NA | NA | NA | NA | NA | NA | NA | NA | NA | NA | NA | NA | NA | NA | -14.43 | -240.75 | NA | NA | -93.80 | -108.38 | |
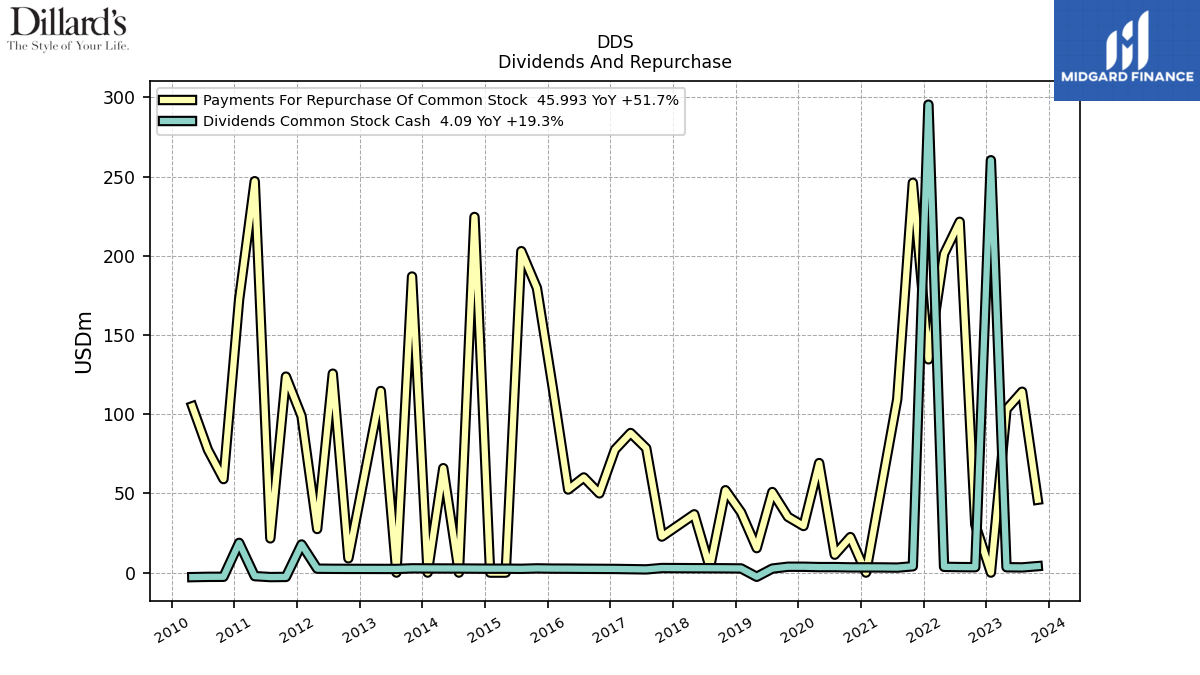
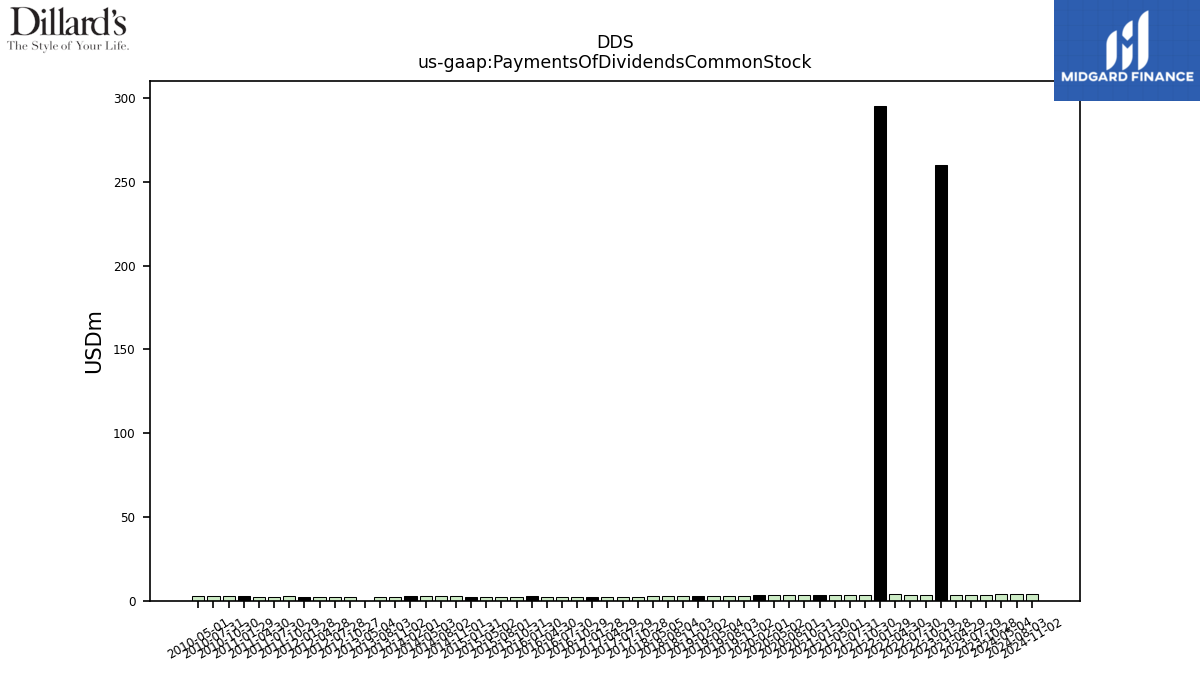
| Payments Of Dividends Common Stock | 3.29 | 3.39 | 3.42 | 260.30 | 3.49 | 3.65 | 3.88 | 295.51 | 3.16 | 3.27 | 3.30 | 3.31 | 3.48 | 3.48 | 3.71 | 3.71 | 2.54 | 2.63 | 2.63 | 2.73 | 2.76 | 2.79 | 2.84 | 2.04 | 2.17 | 2.31 | 2.37 | 2.40 | 2.50 | 2.51 | 2.67 | 2.38 | 2.48 | 2.47 | 2.53 | 2.59 | 2.61 | 2.64 | 2.71 | 2.32 | 2.33 | 0.00 | 2.38 | 2.49 | 2.50 | 2.47 | 2.82 | 2.25 | 2.46 | 2.64 | 2.67 | 2.85 | 2.95 | |
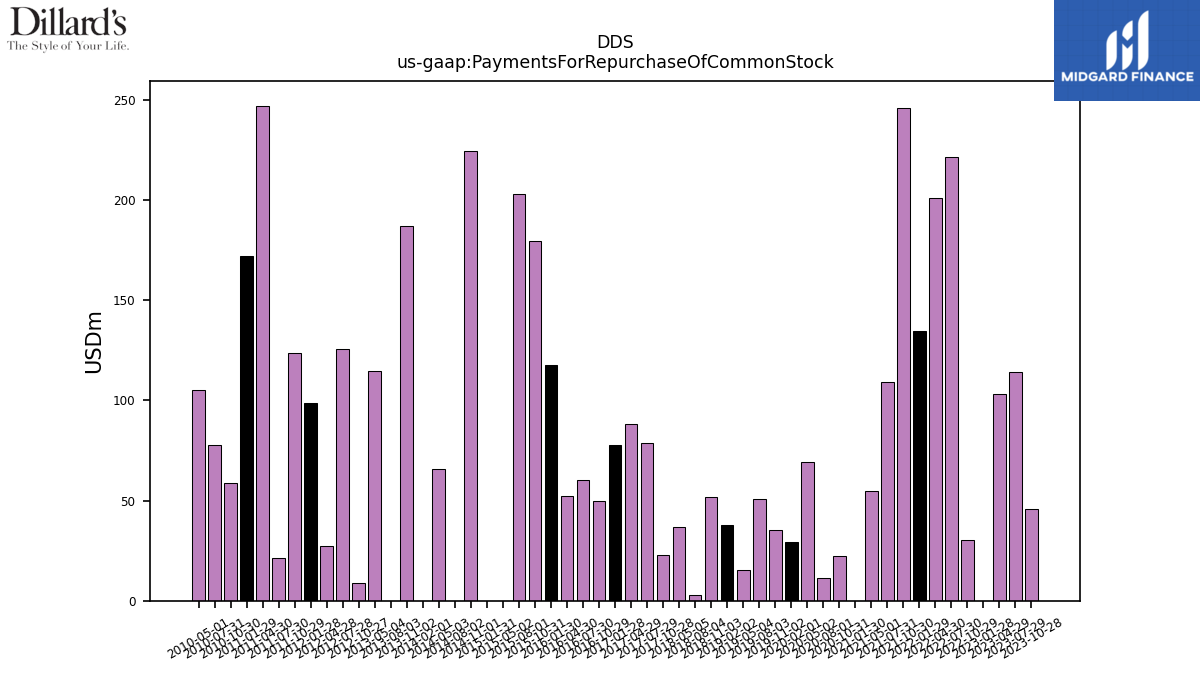
| Payments For Repurchase Of Common Stock | 45.99 | 114.18 | 103.08 | 0.00 | 30.31 | 221.44 | 201.10 | 134.60 | 246.08 | 109.37 | 54.81 | 0.00 | 22.42 | 11.31 | 69.15 | 29.41 | 35.21 | 50.86 | 15.44 | 38.01 | 52.00 | 3.06 | 36.82 | 22.73 | 78.51 | 88.14 | 77.66 | 50.00 | 60.08 | 52.43 | 117.51 | 179.58 | 202.91 | 0.00 | 0.00 | 224.49 | 0.00 | 65.92 | 0.00 | 186.92 | 0.00 | 114.65 | 9.02 | 125.59 | 27.51 | 98.77 | 123.72 | 21.59 | 247.08 | 172.31 | 59.02 | 77.56 | 105.00 |
| 2023-10-28 | 2023-07-29 | 2023-04-29 | 2023-01-28 | 2022-10-29 | 2022-07-30 | 2022-04-30 | 2022-01-29 | 2021-10-30 | 2021-07-31 | 2021-05-01 | 2021-01-30 | 2020-10-31 | 2020-08-01 | 2020-05-02 | 2020-02-01 | 2019-11-02 | 2019-08-03 | 2019-05-04 | 2019-02-02 | 2018-11-03 | 2018-08-04 | 2018-05-05 | 2017-10-28 | 2017-07-29 | 2017-04-29 | 2017-01-28 | 2016-10-29 | 2016-07-30 | 2016-04-30 | 2016-01-30 | 2015-10-31 | 2015-08-01 | 2015-05-02 | 2015-01-31 | 2014-11-01 | 2014-08-02 | 2014-05-03 | 2014-02-01 | 2013-11-02 | 2013-08-03 | 2013-05-04 | 2012-10-27 | 2012-07-28 | 2012-04-28 | 2012-01-28 | 2011-10-29 | 2011-07-30 | 2011-04-30 | 2011-01-29 | 2010-10-30 | 2010-07-31 | 2010-05-01 | ||
|---|---|---|---|---|---|---|---|---|---|---|---|---|---|---|---|---|---|---|---|---|---|---|---|---|---|---|---|---|---|---|---|---|---|---|---|---|---|---|---|---|---|---|---|---|---|---|---|---|---|---|---|---|---|---|
| Revenues | 1504.23 | 1597.42 | 1613.91 | 2162.47 | 1573.07 | 1617.89 | 1642.78 | 2153.39 | 1511.91 | 1601.43 | 1357.54 | 1614.31 | 1052.11 | 945.18 | 821.58 | 1962.77 | 1423.66 | 1458.85 | 1497.93 | 2056.26 | 1454.96 | 1500.71 | 1490.72 | 1396.82 | 1463.81 | 1452.87 | 1983.97 | 1406.49 | 1488.75 | 1538.80 | 2117.43 | 1472.85 | 1550.84 | 1613.42 | 2179.56 | 1499.14 | 1512.89 | 1588.54 | 2078.68 | 1506.92 | 1516.80 | 1589.38 | 1486.35 | 1525.18 | 1583.23 | 2009.42 | 1416.54 | 1475.05 | 1498.76 | 1977.05 | 1373.04 | 1420.79 | 1482.66 | |
| Revenue From Contract With Customer Excluding Assessed Tax | 1476.36 | 1567.38 | 1613.91 | 2251.78 | 1544.14 | 1588.62 | 1642.78 | 2153.39 | 1511.91 | 1601.43 | 1357.54 | 1614.31 | 1052.11 | 945.18 | 821.58 | 1962.77 | 1423.66 | 1458.85 | 1497.93 | 2056.26 | 1454.96 | 1500.71 | 1490.72 | 1396.82 | 1463.81 | 1452.87 | 1983.97 | 1406.49 | 1488.75 | 1538.80 | 2117.43 | 1472.85 | 1550.84 | 1613.42 | 2179.56 | 1499.14 | 1512.89 | 1588.54 | 2078.68 | 1506.92 | 1516.80 | 1589.38 | 1486.35 | 1525.18 | 1583.23 | 2009.42 | 1416.54 | 1475.05 | 1498.76 | 1977.05 | 1373.04 | 1420.79 | 1482.66 | |
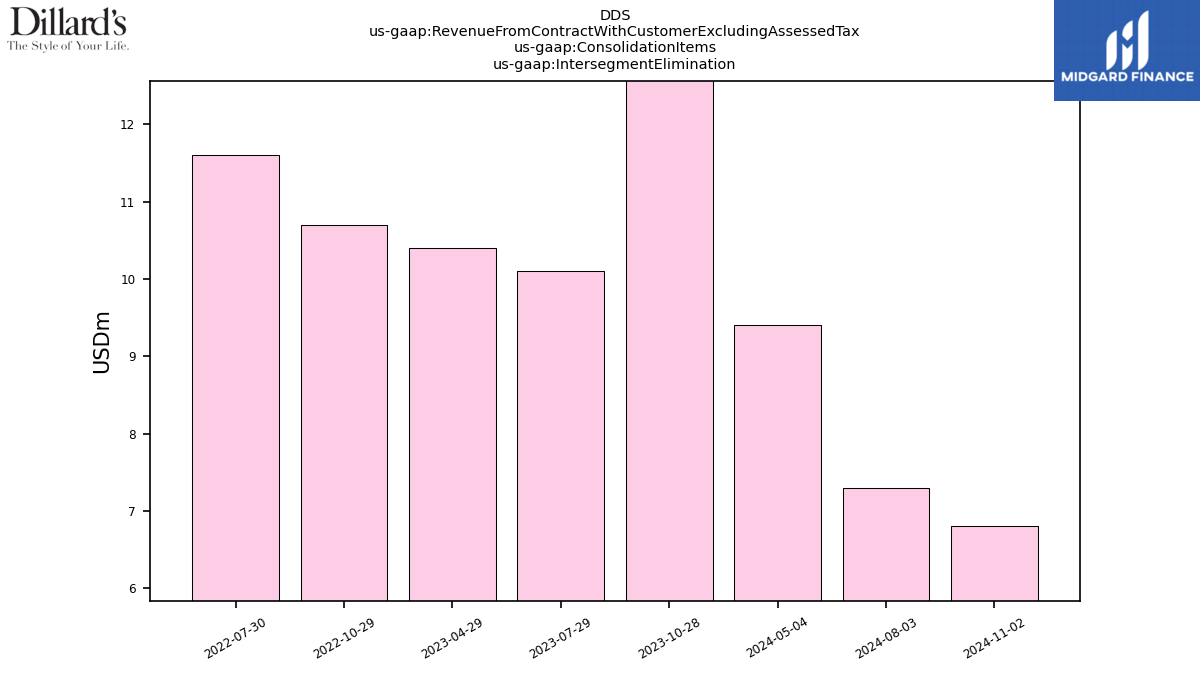
| Intersegment Elimination | 14.40 | 10.10 | NA | NA | 10.70 | 11.60 | NA | NA | NA | NA | NA | NA | NA | NA | NA | NA | NA | NA | NA | NA | NA | NA | NA | NA | NA | NA | NA | NA | NA | NA | NA | NA | NA | NA | NA | NA | NA | NA | NA | NA | NA | NA | NA | NA | NA | NA | NA | NA | NA | NA | NA | NA | NA | |
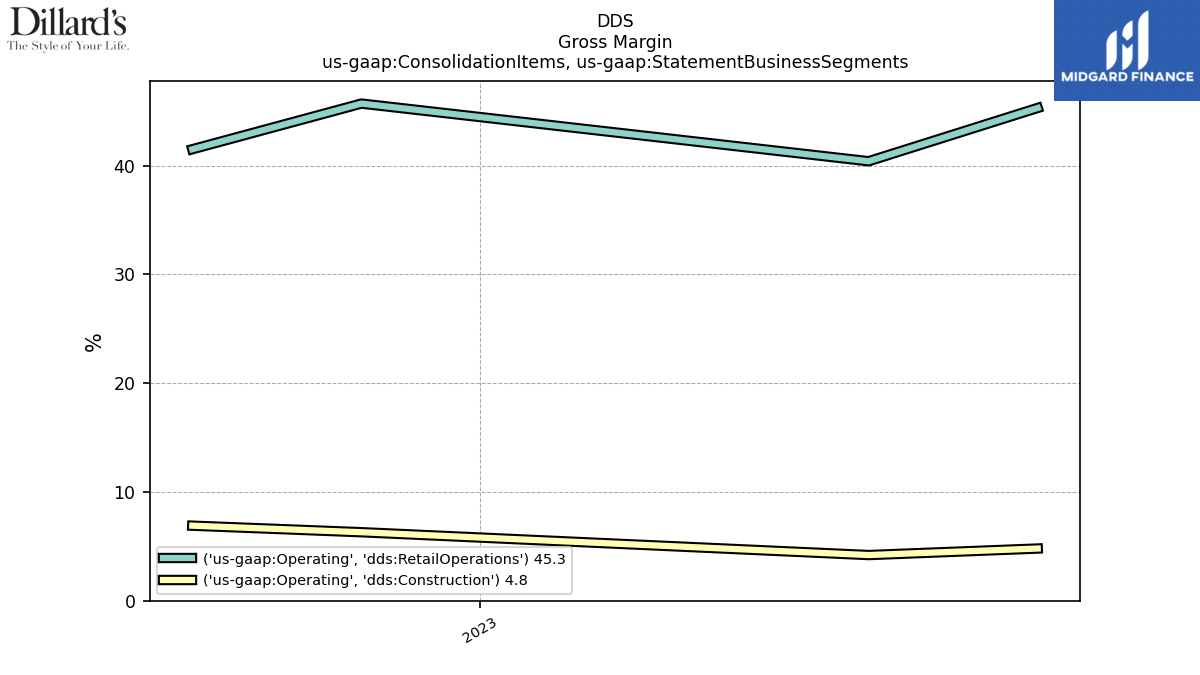
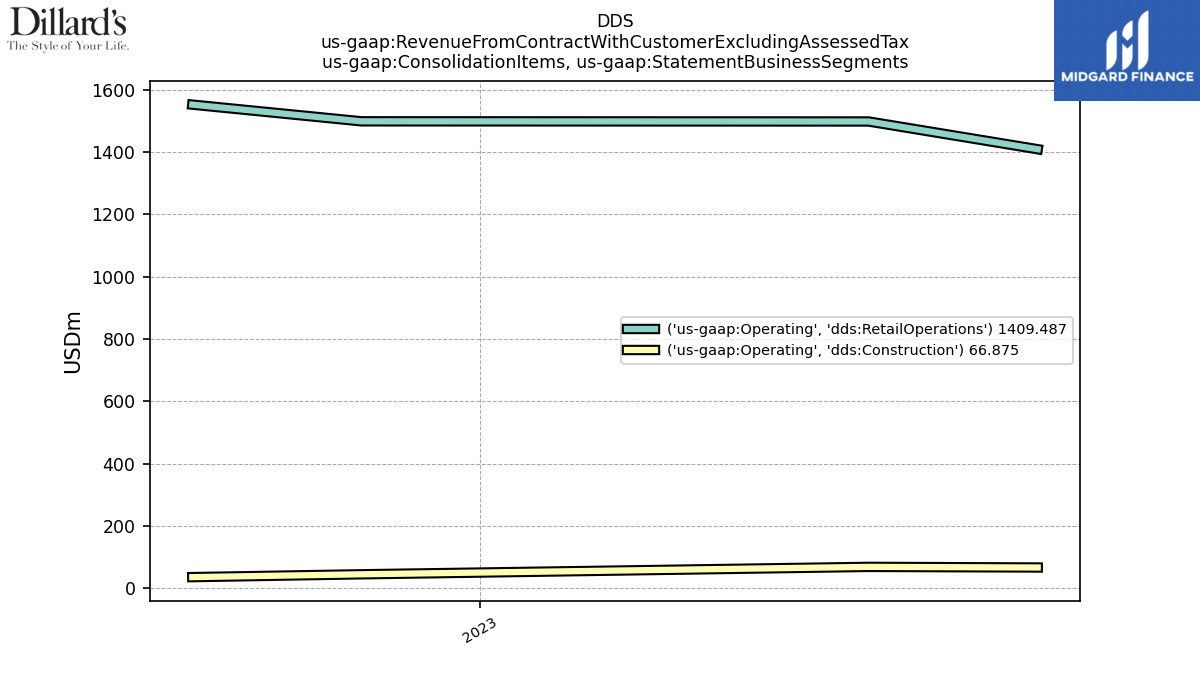
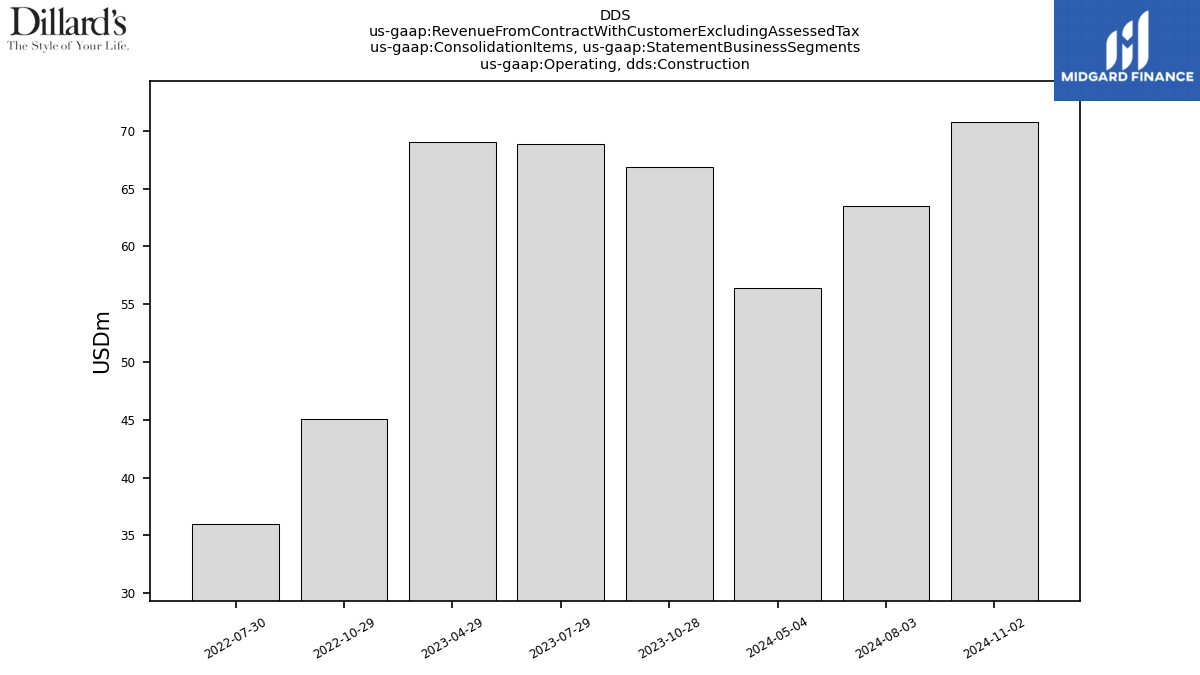
| Operating, Construction | 66.88 | 68.84 | NA | NA | 45.07 | 35.96 | NA | NA | NA | NA | NA | NA | NA | NA | NA | NA | NA | NA | NA | NA | NA | NA | NA | NA | NA | NA | NA | NA | NA | NA | NA | NA | NA | NA | NA | NA | NA | NA | NA | NA | NA | NA | NA | NA | NA | NA | NA | NA | NA | NA | NA | NA | NA | |
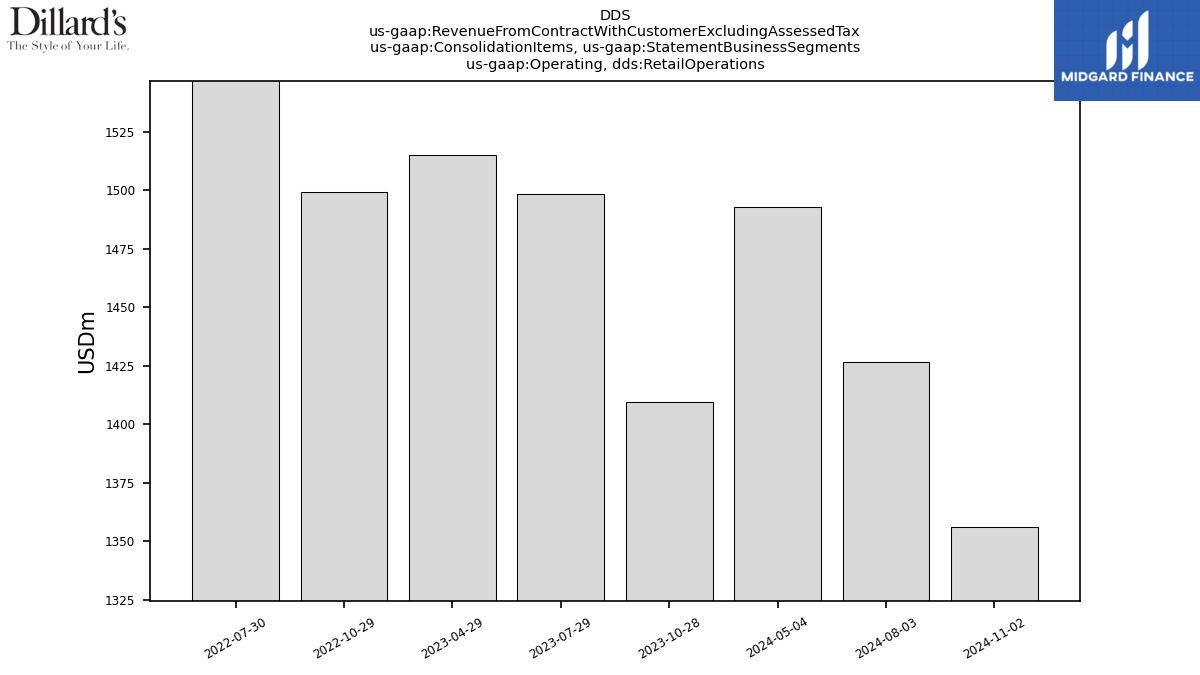
| Operating, Retail Operations | 1409.49 | 1498.53 | NA | NA | 1499.07 | 1552.66 | NA | NA | NA | NA | NA | NA | NA | NA | NA | NA | NA | NA | NA | NA | NA | NA | NA | NA | NA | NA | NA | NA | NA | NA | NA | NA | NA | NA | NA | NA | NA | NA | NA | NA | NA | NA | NA | NA | NA | NA | NA | NA | NA | NA | NA | NA | NA |