
| 2023-12-31 | 2023-09-30 | 2023-06-30 | 2023-03-31 | 2022-12-31 | 2022-09-30 | 2022-06-30 | 2022-03-31 | 2021-12-31 | 2021-09-30 | 2021-06-30 | 2021-03-31 | 2020-12-31 | 2020-09-30 | 2020-06-30 | 2020-03-31 | 2019-12-31 | 2019-09-30 | 2019-06-30 | 2019-03-31 | 2018-12-31 | 2018-09-30 | 2018-06-30 | 2018-03-31 | 2017-12-31 | 2017-09-30 | 2017-06-30 | 2017-03-31 | 2016-12-31 | 2016-09-30 | 2016-06-30 | 2016-03-31 | 2015-12-31 | 2015-09-30 | 2015-06-30 | 2015-03-31 | 2014-12-31 | 2014-09-30 | 2014-06-30 | 2014-03-31 | 2013-12-31 | 2013-09-30 | 2013-06-30 | 2013-03-31 | 2012-12-31 | 2012-09-30 | 2012-06-30 | 2012-03-31 | 2011-12-31 | 2011-09-30 | 2011-06-30 | 2011-03-31 | 2010-12-31 | 2010-09-30 | 2010-06-30 | 2010-03-31 | ||
|---|---|---|---|---|---|---|---|---|---|---|---|---|---|---|---|---|---|---|---|---|---|---|---|---|---|---|---|---|---|---|---|---|---|---|---|---|---|---|---|---|---|---|---|---|---|---|---|---|---|---|---|---|---|---|---|---|---|
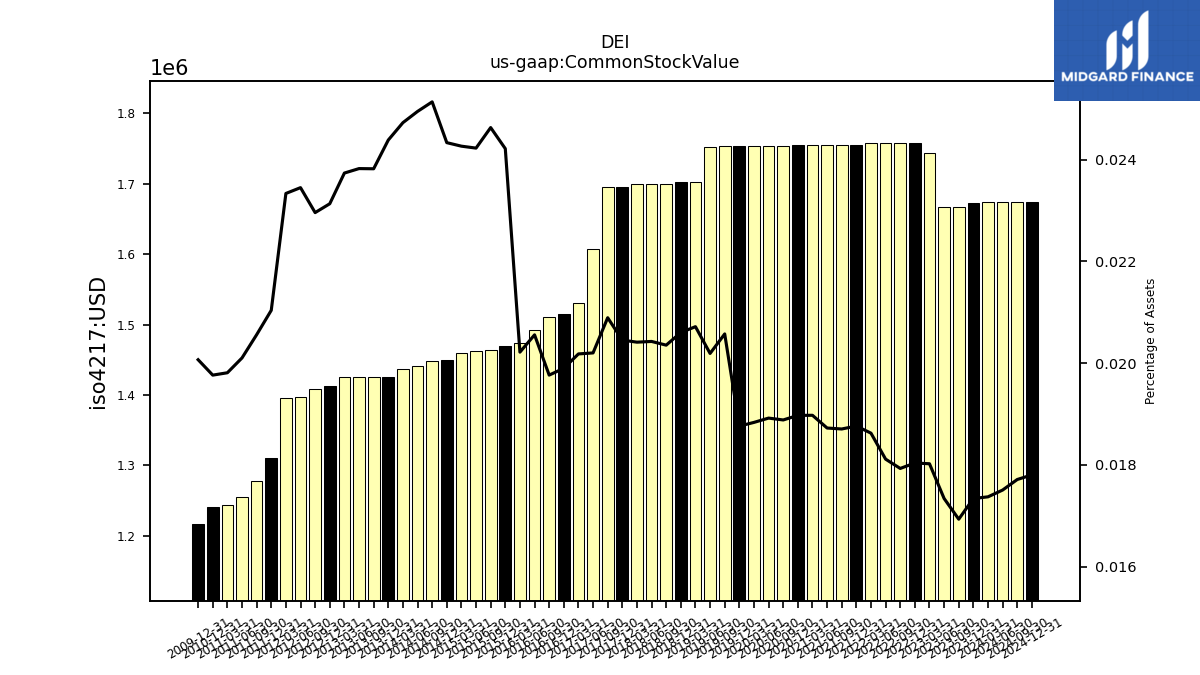
| Common Stock Value | 1.67 | 1.67 | 1.67 | 1.74 | 1.76 | 1.76 | 1.76 | 1.76 | 1.75 | 1.75 | 1.75 | 1.75 | 1.75 | 1.75 | 1.75 | 1.75 | 1.75 | 1.75 | 1.75 | 1.70 | 1.70 | 1.70 | 1.70 | 1.70 | 1.70 | 1.70 | 1.61 | 1.53 | 1.51 | 1.51 | 1.49 | 1.47 | 1.47 | 1.46 | 1.46 | 1.46 | 1.45 | 1.45 | 1.44 | 1.44 | 1.43 | 1.43 | 1.43 | 1.43 | 1.41 | 1.41 | 1.40 | 1.40 | 1.31 | 1.28 | 1.25 | 1.24 | 1.24 | NA | NA | NA | |
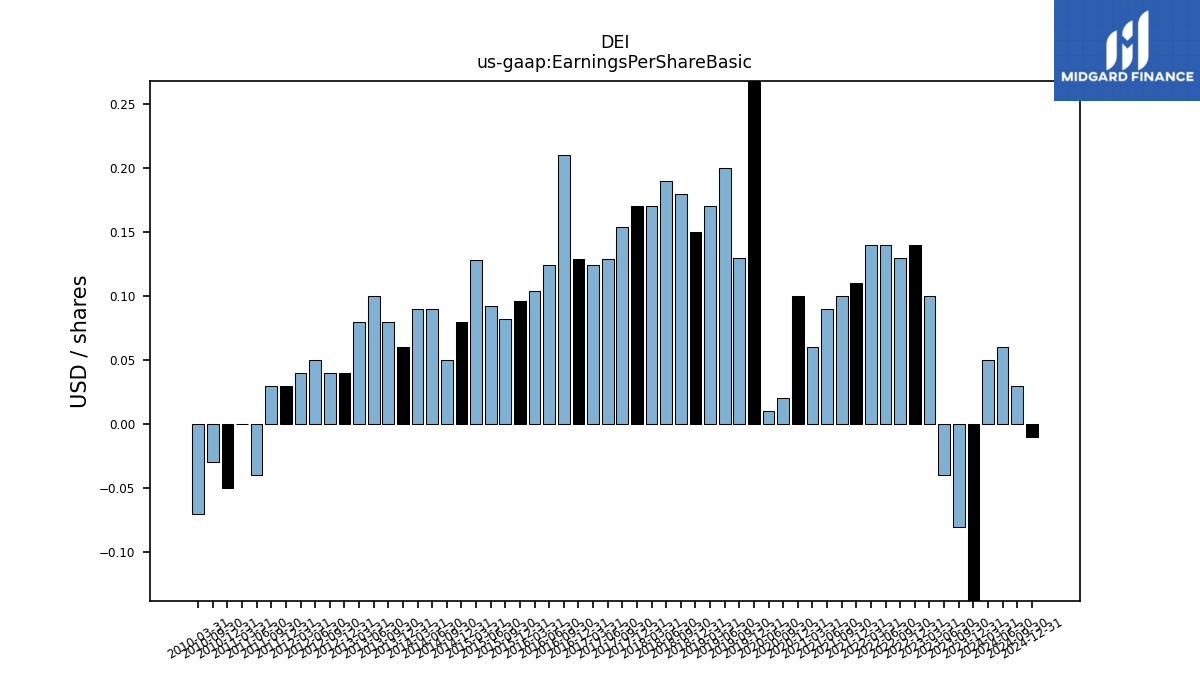
| Earnings Per Share Basic | -0.24 | -0.08 | -0.04 | 0.10 | 0.14 | 0.13 | 0.14 | 0.14 | 0.11 | 0.10 | 0.09 | 0.06 | 0.10 | 0.02 | 0.01 | NA | 1.58 | 0.13 | 0.20 | 0.17 | 0.15 | 0.18 | 0.19 | 0.17 | 0.17 | 0.15 | 0.13 | 0.12 | 0.13 | 0.21 | 0.12 | 0.10 | 0.10 | 0.08 | 0.09 | 0.13 | 0.08 | 0.05 | 0.09 | 0.09 | 0.06 | 0.08 | 0.10 | 0.08 | 0.04 | 0.04 | 0.05 | 0.04 | 0.03 | 0.03 | -0.04 | 0.00 | -0.05 | -0.03 | NA | -0.07 | |
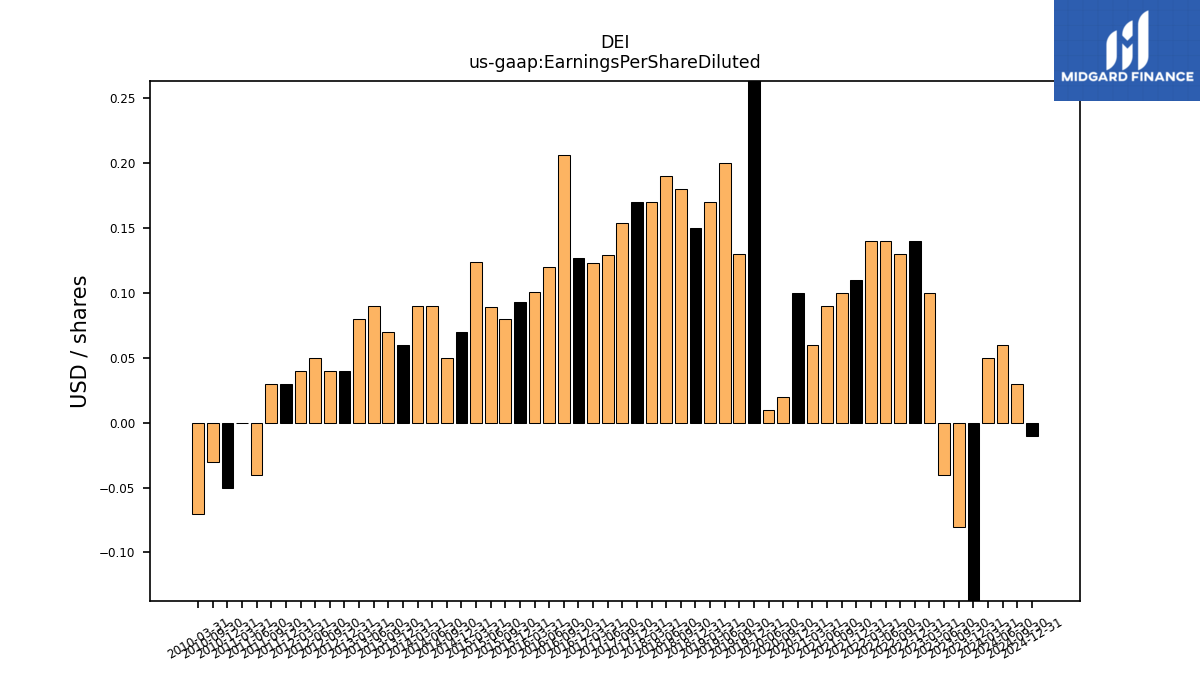
| Earnings Per Share Diluted | -0.24 | -0.08 | -0.04 | 0.10 | 0.14 | 0.13 | 0.14 | 0.14 | 0.11 | 0.10 | 0.09 | 0.06 | 0.10 | 0.02 | 0.01 | NA | 1.58 | 0.13 | 0.20 | 0.17 | 0.15 | 0.18 | 0.19 | 0.17 | 0.17 | 0.15 | 0.13 | 0.12 | 0.13 | 0.21 | 0.12 | 0.10 | 0.09 | 0.08 | 0.09 | 0.12 | 0.07 | 0.05 | 0.09 | 0.09 | 0.06 | 0.07 | 0.09 | 0.08 | 0.04 | 0.04 | 0.05 | 0.04 | 0.03 | 0.03 | -0.04 | 0.00 | -0.05 | -0.03 | NA | -0.07 |
| 2023-12-31 | 2023-09-30 | 2023-06-30 | 2023-03-31 | 2022-12-31 | 2022-09-30 | 2022-06-30 | 2022-03-31 | 2021-12-31 | 2021-09-30 | 2021-06-30 | 2021-03-31 | 2020-12-31 | 2020-09-30 | 2020-06-30 | 2020-03-31 | 2019-12-31 | 2019-09-30 | 2019-06-30 | 2019-03-31 | 2018-12-31 | 2018-09-30 | 2018-06-30 | 2018-03-31 | 2017-12-31 | 2017-09-30 | 2017-06-30 | 2017-03-31 | 2016-12-31 | 2016-09-30 | 2016-06-30 | 2016-03-31 | 2015-12-31 | 2015-09-30 | 2015-06-30 | 2015-03-31 | 2014-12-31 | 2014-09-30 | 2014-06-30 | 2014-03-31 | 2013-12-31 | 2013-09-30 | 2013-06-30 | 2013-03-31 | 2012-12-31 | 2012-09-30 | 2012-06-30 | 2012-03-31 | 2011-12-31 | 2011-09-30 | 2011-06-30 | 2011-03-31 | 2010-12-31 | 2010-09-30 | 2010-06-30 | 2010-03-31 | ||
|---|---|---|---|---|---|---|---|---|---|---|---|---|---|---|---|---|---|---|---|---|---|---|---|---|---|---|---|---|---|---|---|---|---|---|---|---|---|---|---|---|---|---|---|---|---|---|---|---|---|---|---|---|---|---|---|---|---|
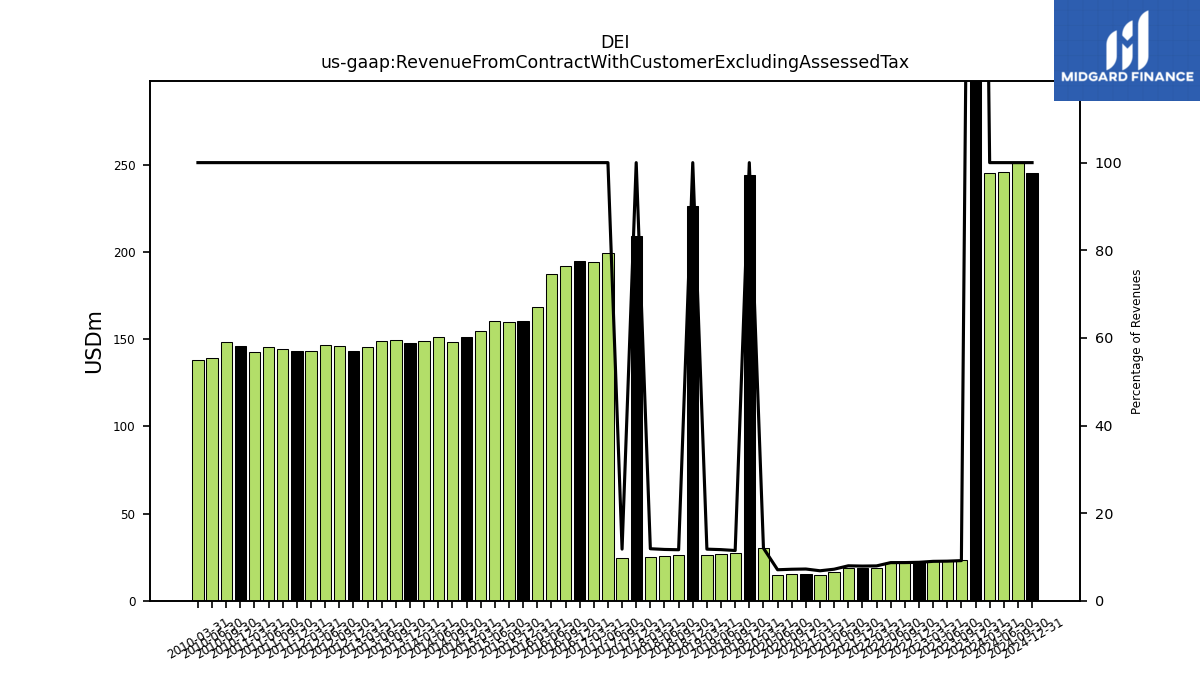
| Revenue From Contract With Customer Excluding Assessed Tax | 951.39 | 23.40 | 22.90 | 22.70 | 22.30 | 22.10 | 21.50 | 19.00 | 18.90 | 19.00 | 16.20 | 14.80 | 15.60 | 15.60 | 14.70 | 30.20 | 243.89 | 27.30 | 26.90 | 26.40 | 226.29 | 26.00 | 25.70 | 25.20 | 209.19 | 24.60 | 199.63 | 194.48 | 194.64 | 192.12 | 187.22 | 168.57 | 160.43 | 160.08 | 160.46 | 154.81 | 151.09 | 148.15 | 151.43 | 148.88 | 147.68 | 149.69 | 148.72 | 145.46 | 143.15 | 145.99 | 146.47 | 143.39 | 143.28 | 144.06 | 145.41 | 142.59 | 145.78 | 148.07 | 139.21 | 137.79 | |
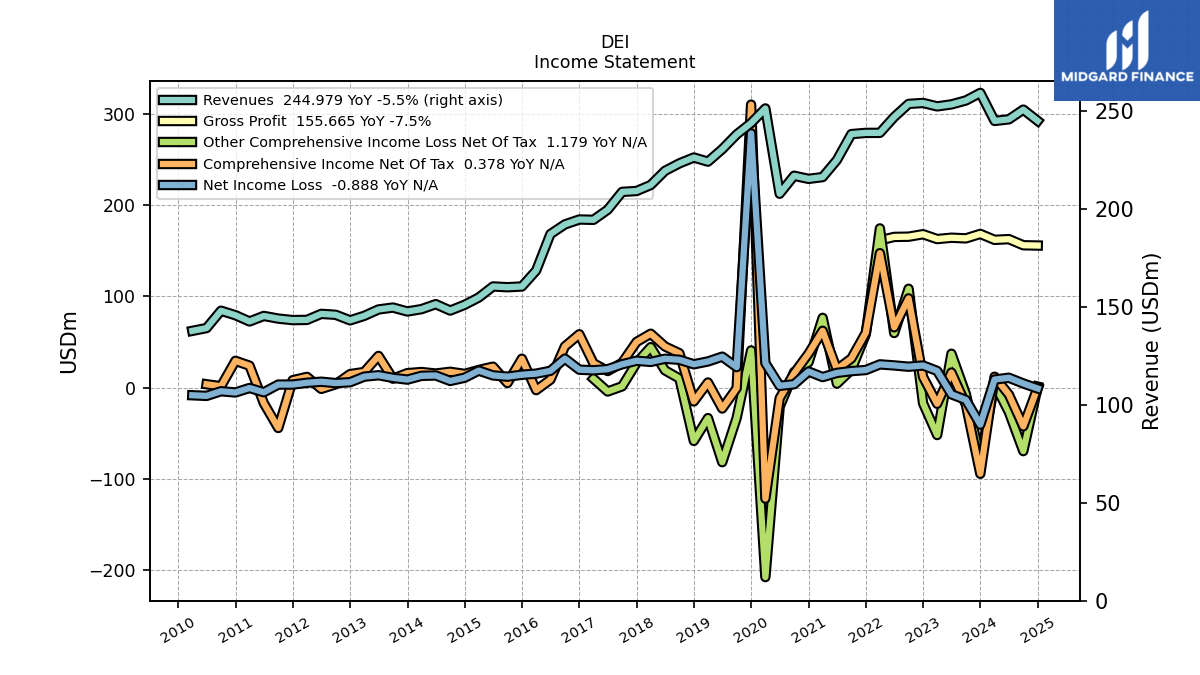
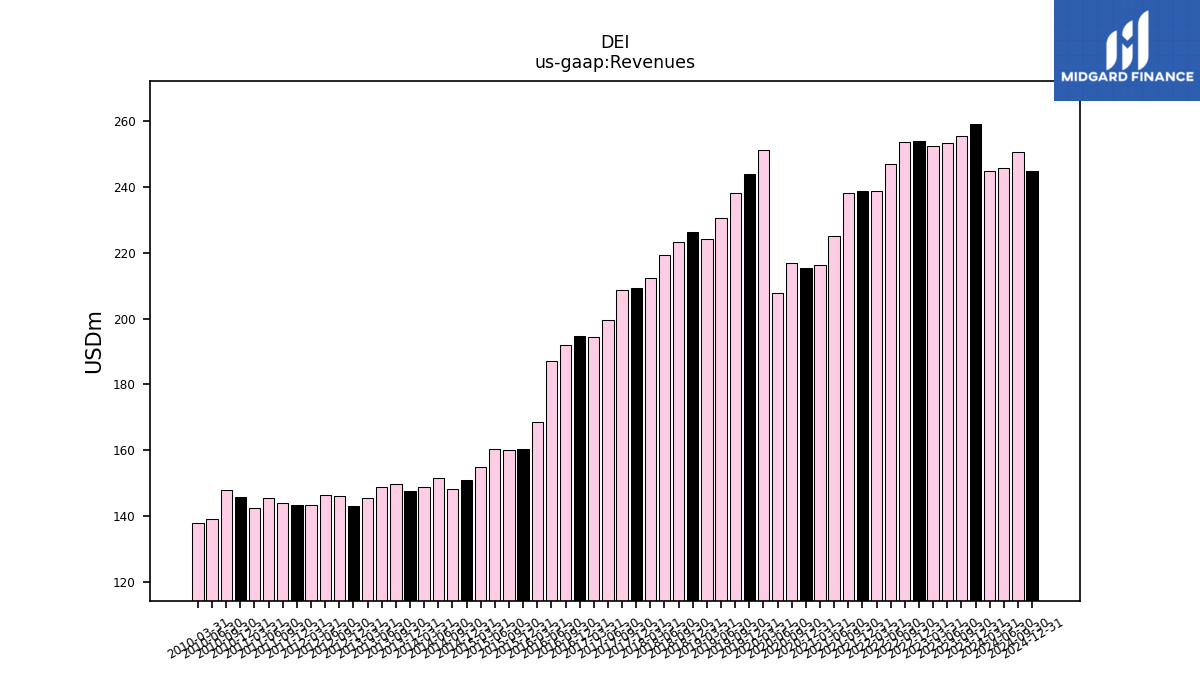
| Revenues | 259.28 | 255.41 | 253.41 | 252.39 | 254.14 | 253.66 | 246.97 | 238.88 | 238.85 | 238.24 | 225.01 | 216.29 | 215.39 | 216.99 | 207.80 | 251.35 | 243.89 | 238.07 | 230.53 | 224.19 | 226.29 | 223.31 | 219.47 | 212.25 | 209.19 | 208.75 | 199.63 | 194.48 | 194.64 | 192.12 | 187.22 | 168.57 | 160.43 | 160.08 | 160.46 | 154.81 | 151.09 | 148.15 | 151.43 | 148.88 | 147.68 | 149.69 | 148.72 | 145.46 | 143.15 | 145.99 | 146.47 | 143.39 | 143.28 | 144.06 | 145.41 | 142.59 | 145.78 | 148.07 | 139.21 | 137.79 | |
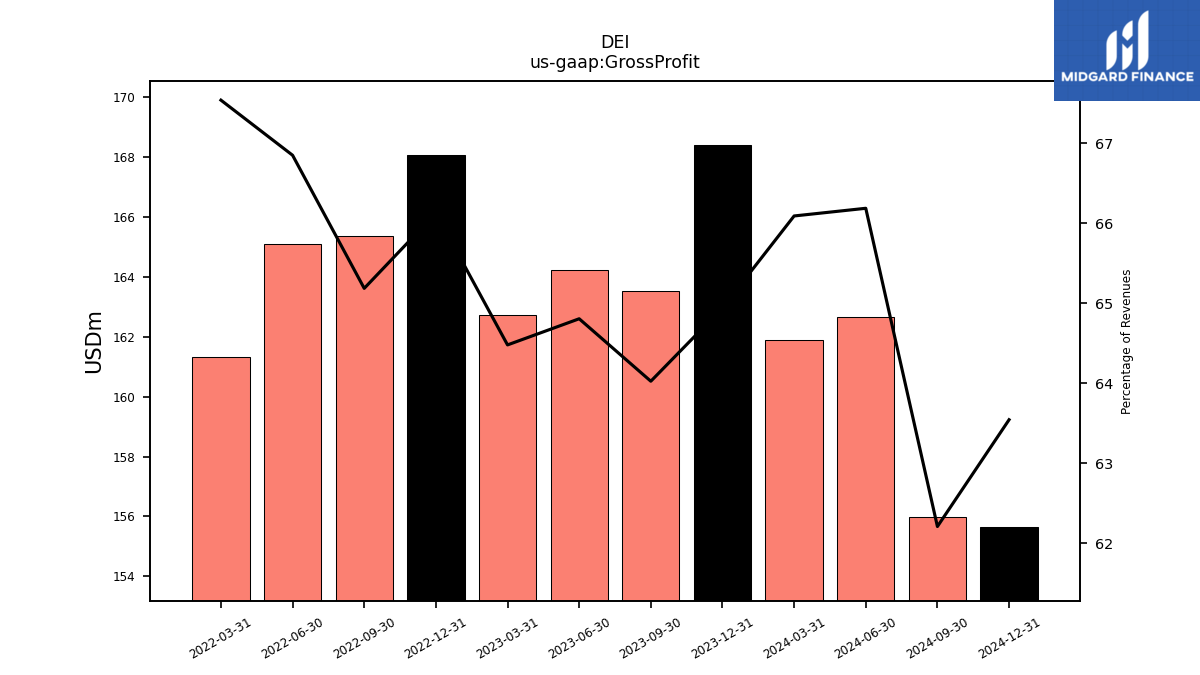
| Gross Profit | 168.38 | 163.52 | 164.22 | 162.74 | 168.05 | 165.35 | 165.10 | 161.34 | NA | NA | NA | NA | NA | NA | NA | NA | NA | NA | NA | NA | NA | NA | NA | NA | NA | NA | NA | NA | NA | NA | NA | NA | NA | NA | NA | NA | NA | NA | NA | NA | NA | NA | NA | NA | NA | NA | NA | NA | NA | NA | NA | NA | NA | NA | NA | NA | |
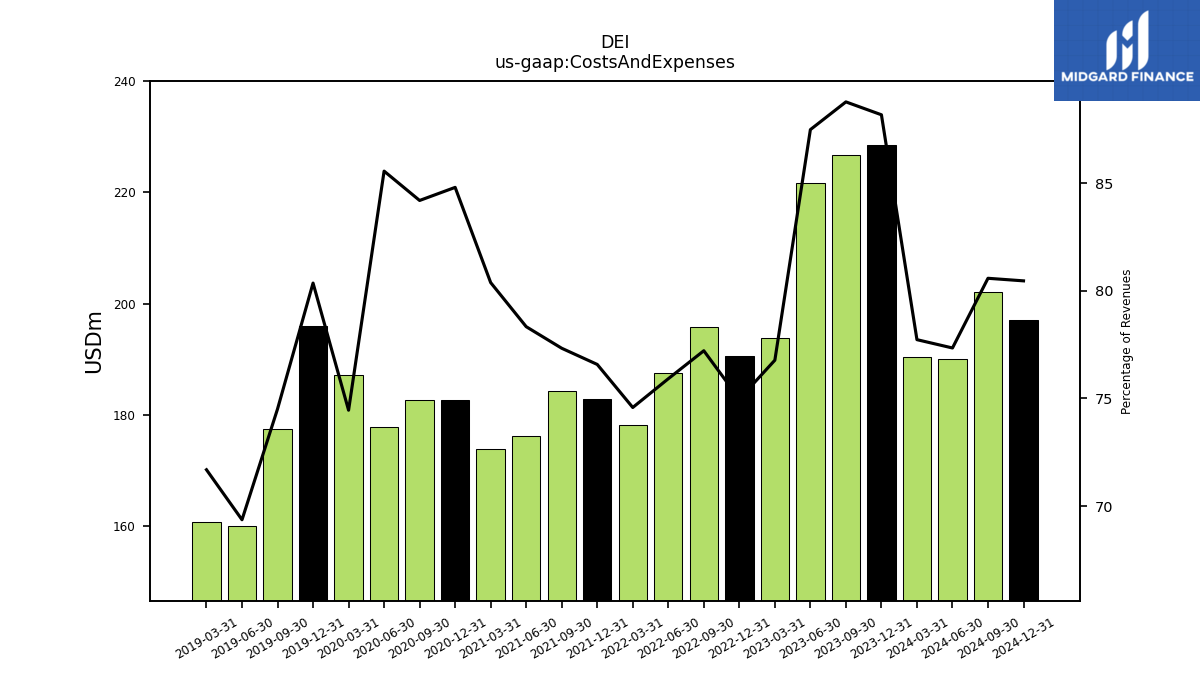
| Costs And Expenses | 228.62 | 226.74 | 221.69 | 193.77 | 190.53 | 195.86 | 187.48 | 178.15 | 182.91 | 184.23 | 176.25 | 173.86 | 182.66 | 182.69 | 177.78 | 187.13 | 195.98 | 177.38 | 159.90 | 160.71 | NA | NA | NA | NA | NA | NA | NA | NA | NA | NA | NA | NA | NA | NA | NA | NA | NA | NA | NA | NA | NA | NA | NA | NA | NA | NA | NA | NA | NA | NA | NA | NA | NA | NA | NA | NA | |
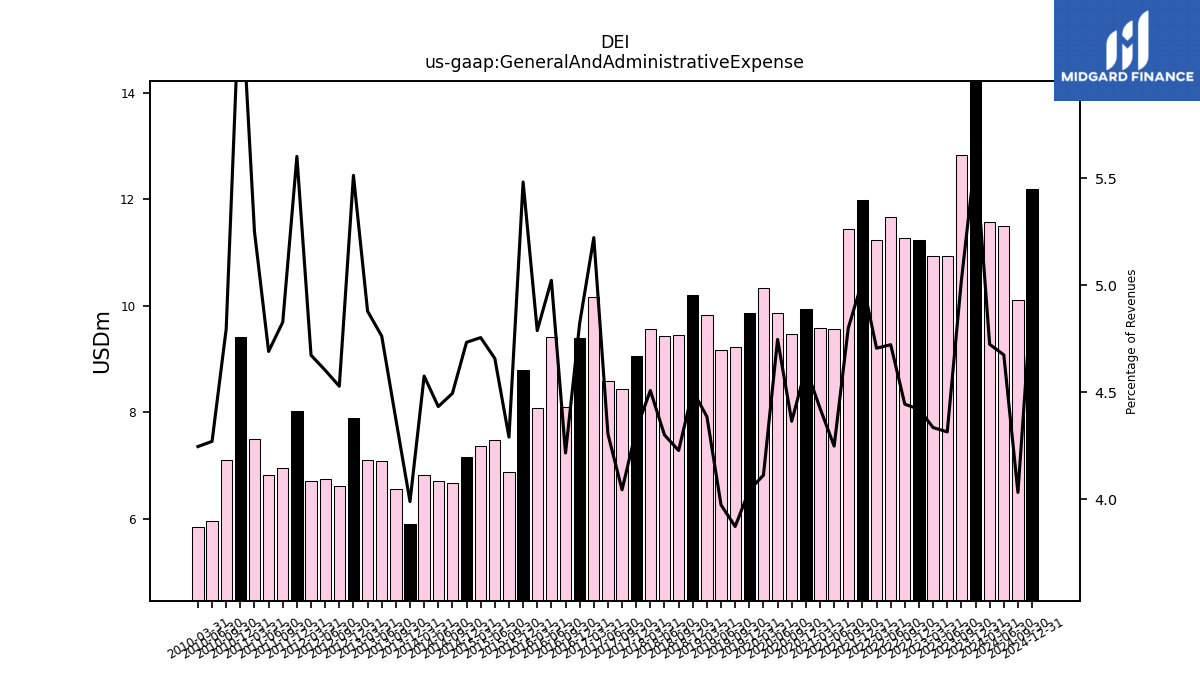
| General And Administrative Expense | 14.54 | 12.83 | 10.93 | 10.94 | 11.23 | 11.27 | 11.66 | 11.24 | 11.99 | 11.44 | 9.56 | 9.57 | 9.93 | 9.47 | 9.86 | 10.34 | 9.86 | 9.22 | 9.16 | 9.83 | 10.20 | 9.44 | 9.44 | 9.57 | 9.04 | 8.44 | 8.59 | 10.16 | 9.38 | 8.10 | 9.40 | 8.07 | 8.79 | 6.87 | 7.47 | 7.36 | 7.15 | 6.66 | 6.71 | 6.81 | 5.89 | 6.55 | 7.08 | 7.10 | 7.89 | 6.61 | 6.74 | 6.70 | 8.03 | 6.95 | 6.82 | 7.49 | 9.41 | 7.10 | 5.94 | 5.85 | |
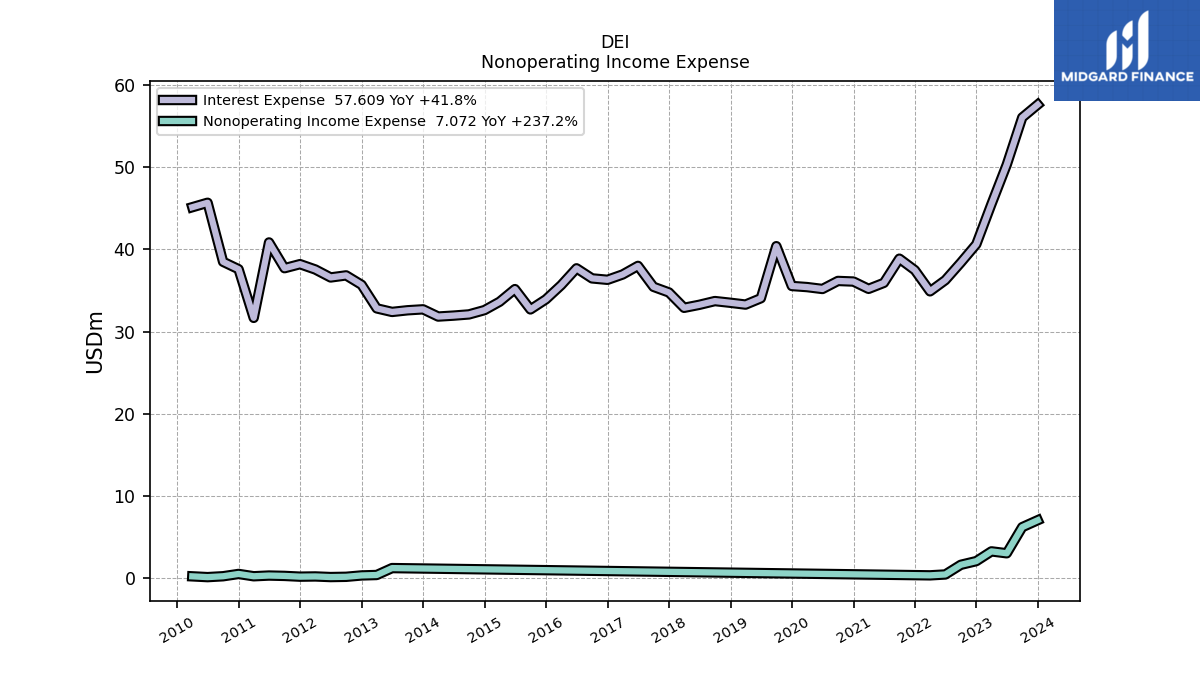
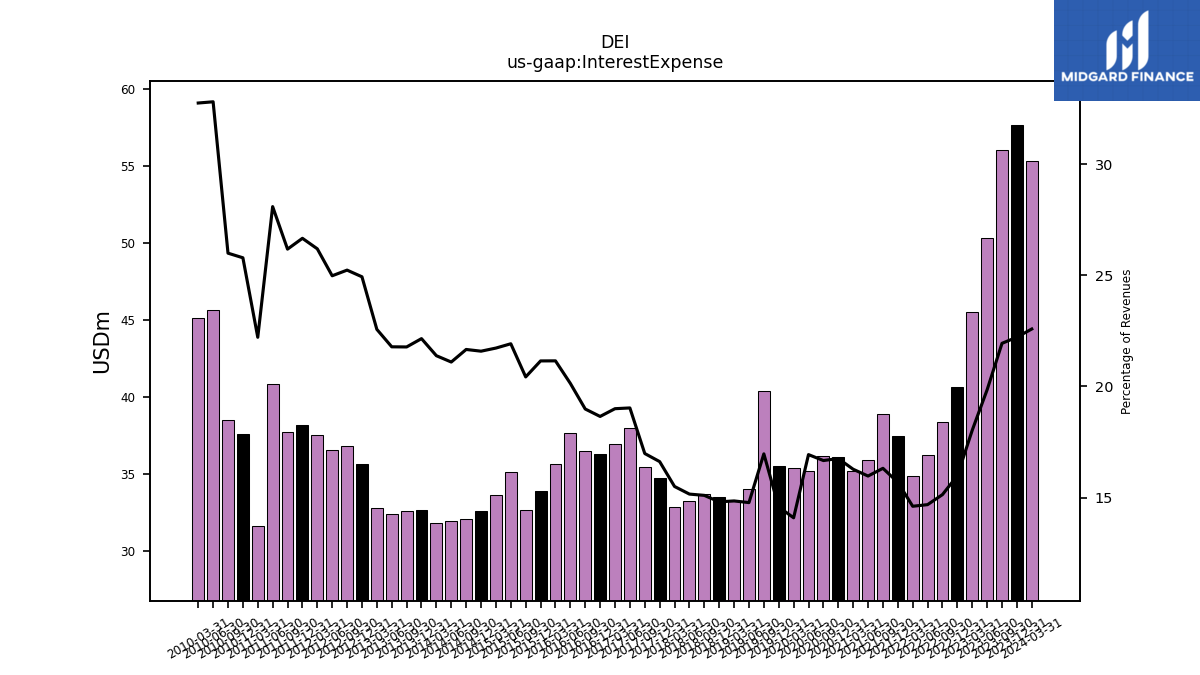
| Interest Expense | 57.61 | 56.04 | 50.30 | 45.51 | 40.62 | 38.39 | 36.26 | 34.90 | 37.48 | 38.88 | 35.94 | 35.20 | 36.09 | 36.17 | 35.19 | 35.42 | 35.55 | 40.40 | 34.06 | 33.29 | 33.51 | 33.72 | 33.27 | 32.90 | 34.77 | 35.45 | 38.00 | 36.95 | 36.31 | 36.48 | 37.70 | 35.66 | 33.93 | 32.70 | 35.18 | 33.64 | 32.62 | 32.10 | 31.95 | 31.84 | 32.72 | 32.60 | 32.40 | 32.83 | 35.70 | 36.84 | 36.59 | 37.56 | 38.21 | 37.72 | 40.85 | 31.68 | 37.60 | 38.50 | 45.68 | 45.13 | |
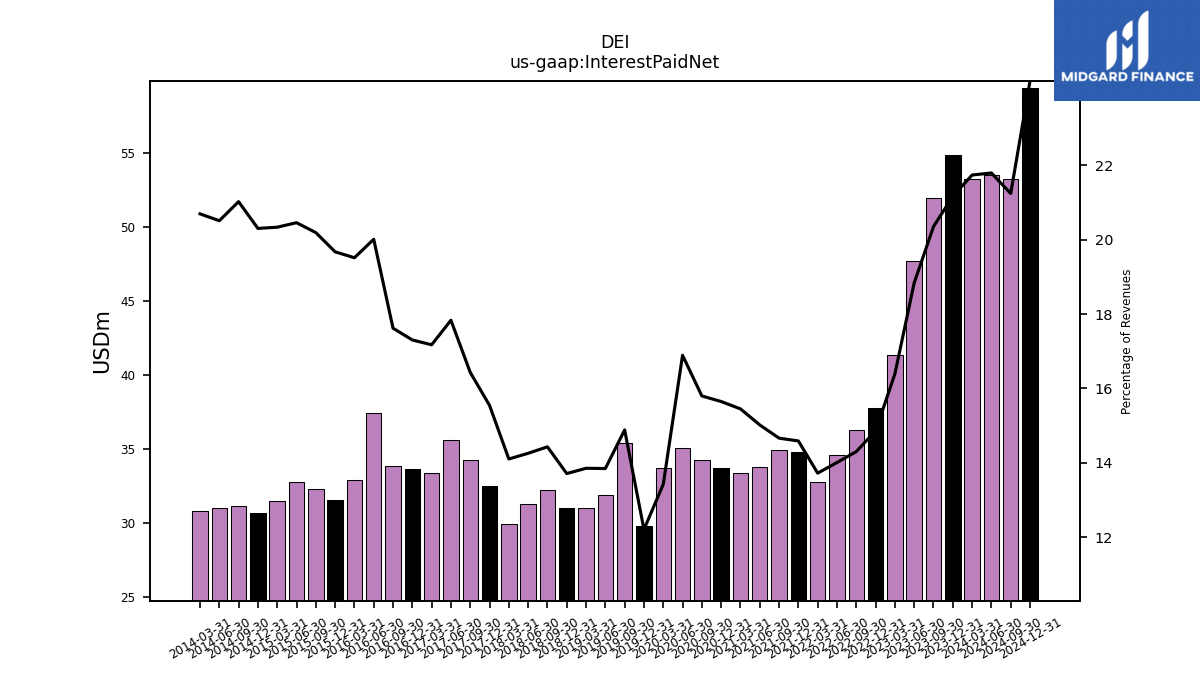
| Interest Paid Net | 54.87 | 51.98 | 47.73 | 41.37 | 37.76 | 36.28 | 34.60 | 32.78 | 34.85 | 34.94 | 33.80 | 33.42 | 33.71 | 34.28 | 35.10 | 33.74 | 29.78 | 35.44 | 31.93 | 31.06 | 31.03 | 32.23 | 31.29 | 29.94 | 32.52 | 34.30 | 35.60 | 33.40 | 33.68 | 33.85 | 37.46 | 32.89 | 31.56 | 32.32 | 32.82 | 31.48 | 30.67 | 31.14 | 31.05 | 30.81 | NA | NA | NA | NA | NA | NA | NA | NA | NA | NA | NA | NA | NA | NA | NA | NA | |
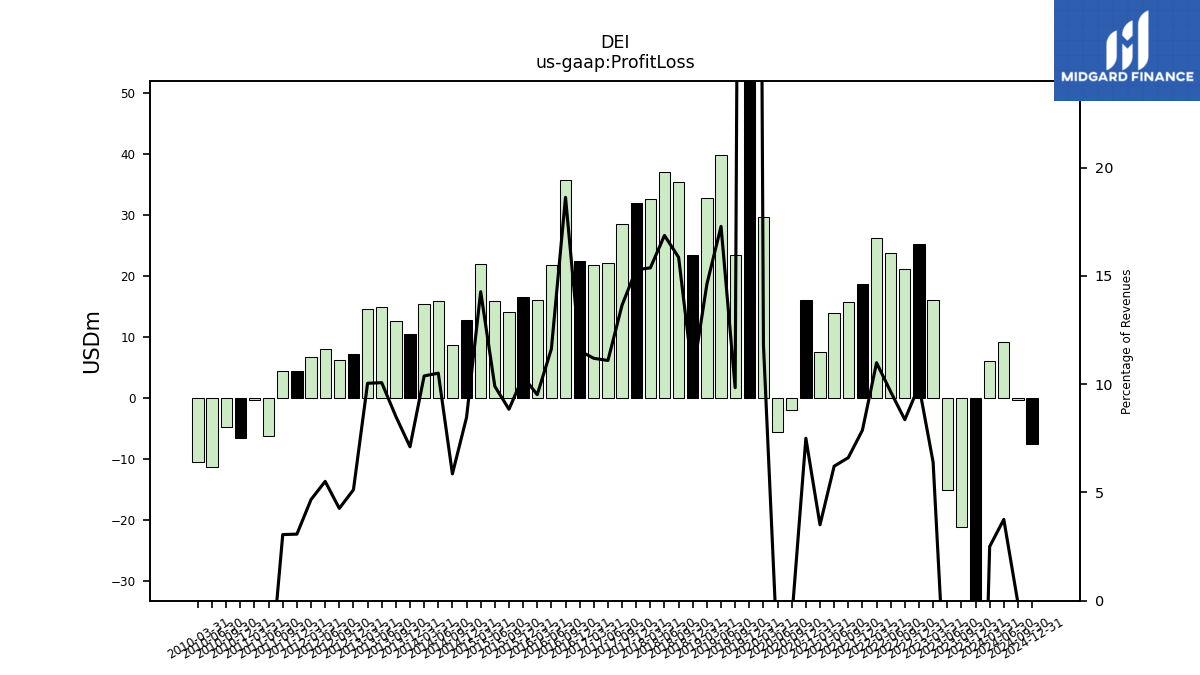
| Profit Loss | -55.91 | -21.02 | -15.07 | 16.16 | 25.23 | 21.21 | 23.84 | 26.26 | 18.82 | 15.75 | 13.98 | 7.59 | 16.17 | -1.86 | -5.47 | 29.71 | 322.63 | 23.42 | 39.86 | 32.79 | 23.53 | 35.42 | 37.03 | 32.63 | 31.99 | 28.51 | 22.15 | 21.78 | 22.47 | 35.80 | 21.78 | 16.05 | 16.61 | 14.16 | 15.89 | 22.10 | 12.80 | 8.68 | 15.92 | 15.46 | 10.50 | 12.74 | 14.98 | 14.61 | 7.34 | 6.23 | 8.07 | 6.70 | 4.41 | 4.40 | -6.21 | -0.34 | -6.44 | -4.74 | -11.30 | -10.47 | |
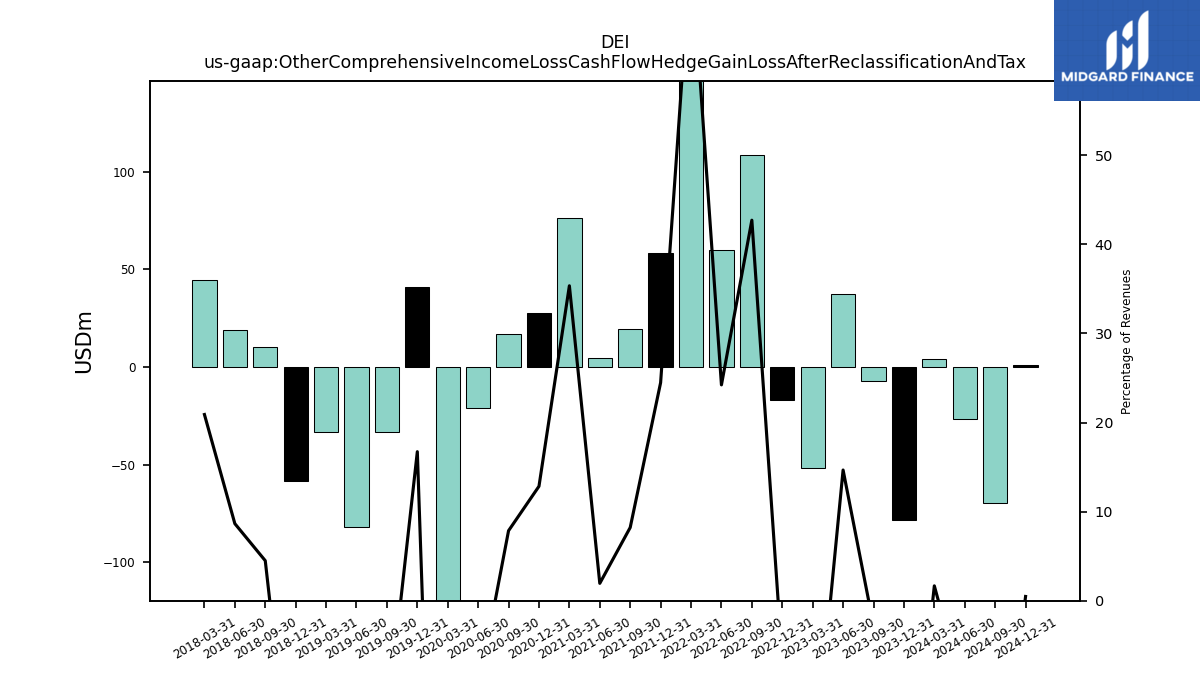
| Other Comprehensive Income Loss Cash Flow Hedge Gain Loss After Reclassification And Tax | -78.27 | -7.04 | 37.19 | -51.90 | -17.08 | 108.35 | 59.84 | 174.43 | 58.47 | 19.59 | 4.40 | 76.47 | 27.67 | 17.06 | -20.80 | -207.46 | 40.81 | -33.18 | -81.61 | -33.31 | -58.34 | 10.04 | 18.99 | 44.37 | NA | NA | NA | NA | NA | NA | NA | NA | NA | NA | NA | NA | NA | NA | NA | NA | NA | NA | NA | NA | NA | NA | NA | NA | NA | NA | NA | NA | NA | NA | NA | NA | |
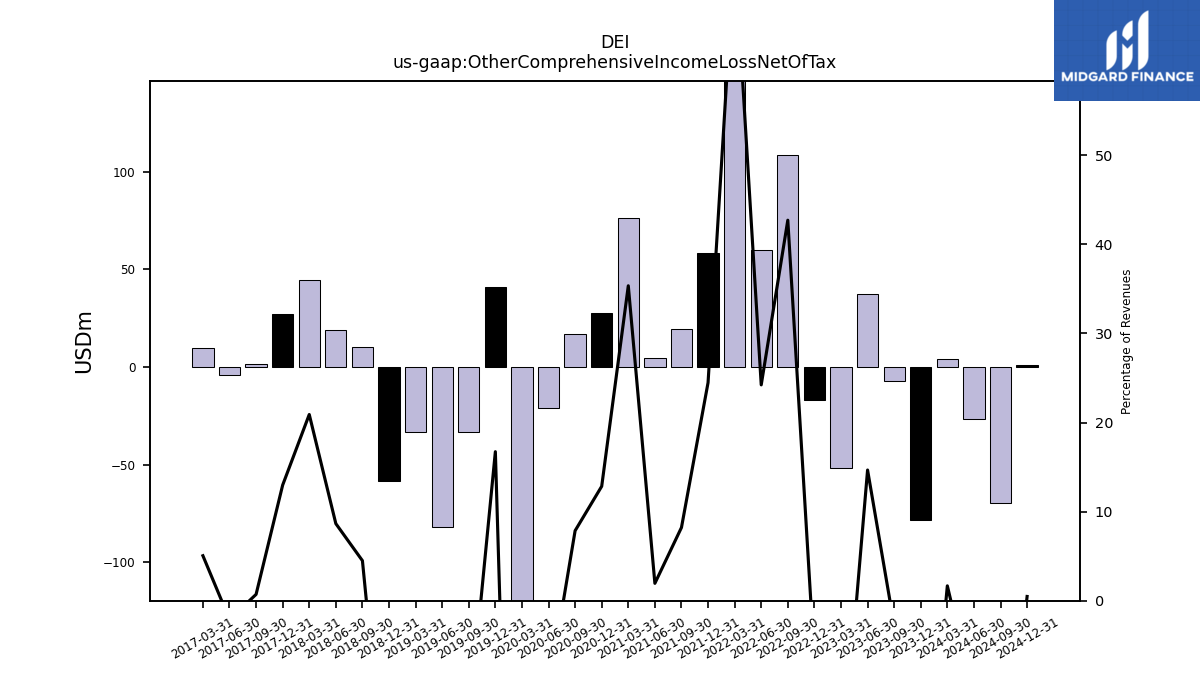
| Other Comprehensive Income Loss Net Of Tax | -78.27 | -7.04 | 37.19 | -51.90 | -17.08 | 108.35 | 59.84 | 174.43 | 58.47 | 19.59 | 4.40 | 76.47 | 27.67 | 17.06 | -20.80 | -207.46 | 40.81 | -33.18 | -81.61 | -33.31 | -58.34 | 10.04 | 18.99 | 44.37 | 27.16 | 1.49 | -4.19 | 9.83 | NA | NA | NA | NA | NA | NA | NA | NA | NA | NA | NA | NA | NA | NA | NA | NA | NA | NA | NA | NA | NA | NA | NA | NA | NA | NA | NA | NA | |
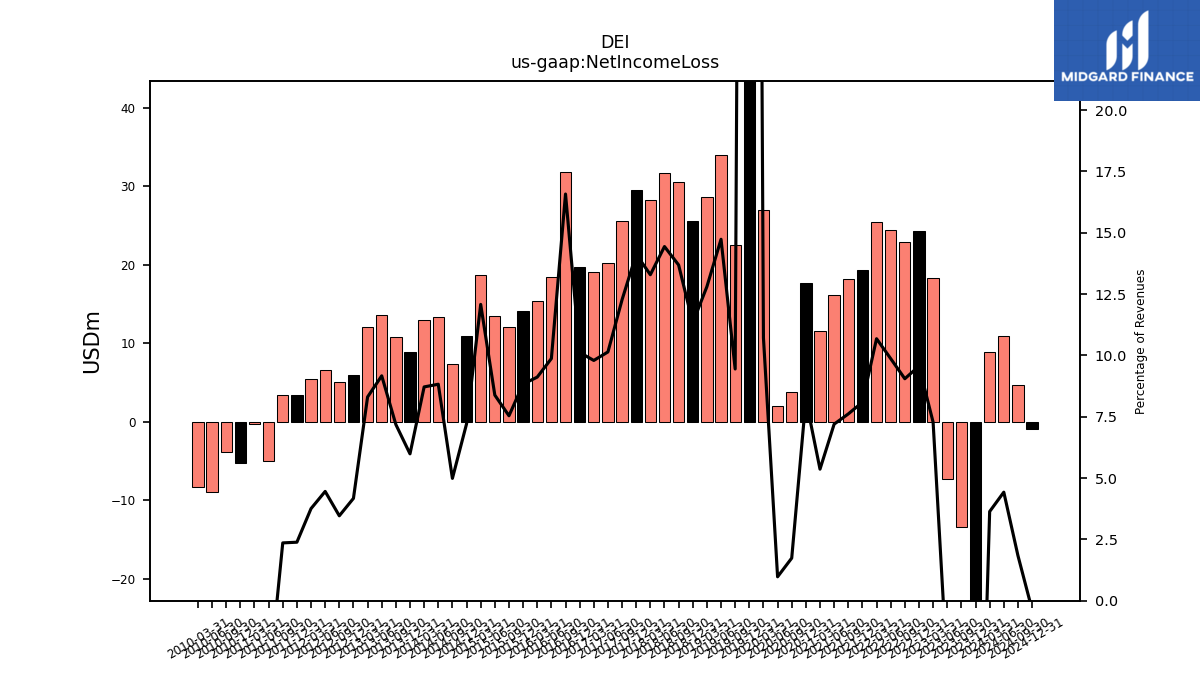
| Net Income Loss | -40.45 | -13.36 | -7.26 | 18.37 | 24.30 | 22.95 | 24.37 | 25.51 | 19.33 | 18.14 | 16.20 | 11.60 | 17.70 | 3.77 | 2.03 | 26.92 | 278.56 | 22.49 | 33.97 | 28.70 | 25.64 | 30.56 | 31.68 | 28.21 | 29.54 | 25.61 | 20.24 | 19.05 | 19.70 | 31.85 | 18.48 | 15.37 | 14.17 | 12.07 | 13.45 | 18.70 | 10.89 | 7.39 | 13.36 | 12.98 | 8.84 | 10.75 | 13.63 | 12.08 | 5.97 | 5.05 | 6.53 | 5.39 | 3.42 | 3.40 | -5.02 | -0.35 | -5.25 | -3.90 | -8.99 | -8.29 | |
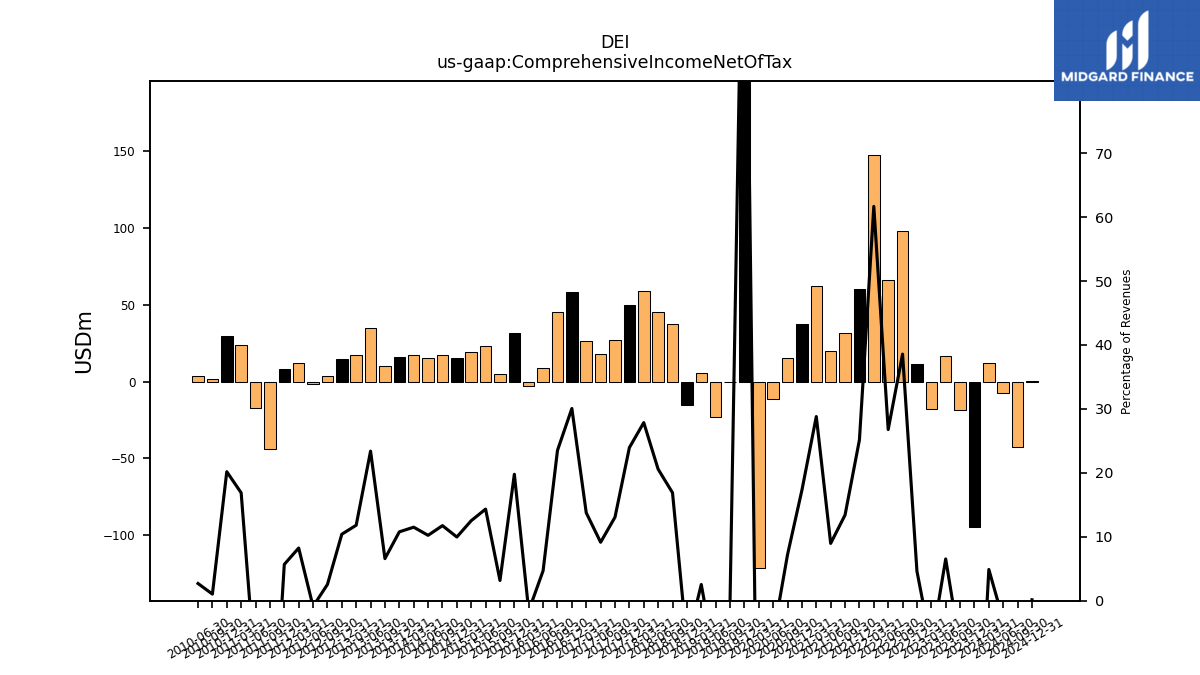
| Comprehensive Income Net Of Tax | -94.30 | -18.50 | 16.56 | -17.61 | 11.72 | 97.83 | 66.11 | 147.32 | 60.09 | 31.95 | 20.18 | 62.30 | 37.25 | 15.65 | -11.57 | -121.49 | 309.97 | -0.54 | -22.83 | 5.70 | -15.06 | 37.72 | 45.15 | 59.13 | 50.10 | 27.28 | 18.26 | 26.75 | 58.52 | 45.18 | 8.80 | -2.66 | 31.73 | 5.08 | 22.99 | 19.38 | 15.06 | 17.40 | 15.49 | 17.13 | 15.91 | 9.87 | 34.80 | 17.18 | 14.89 | 3.72 | -1.30 | 11.82 | 8.15 | -44.18 | -17.00 | 24.07 | 29.41 | 1.54 | 3.75 | NA | |
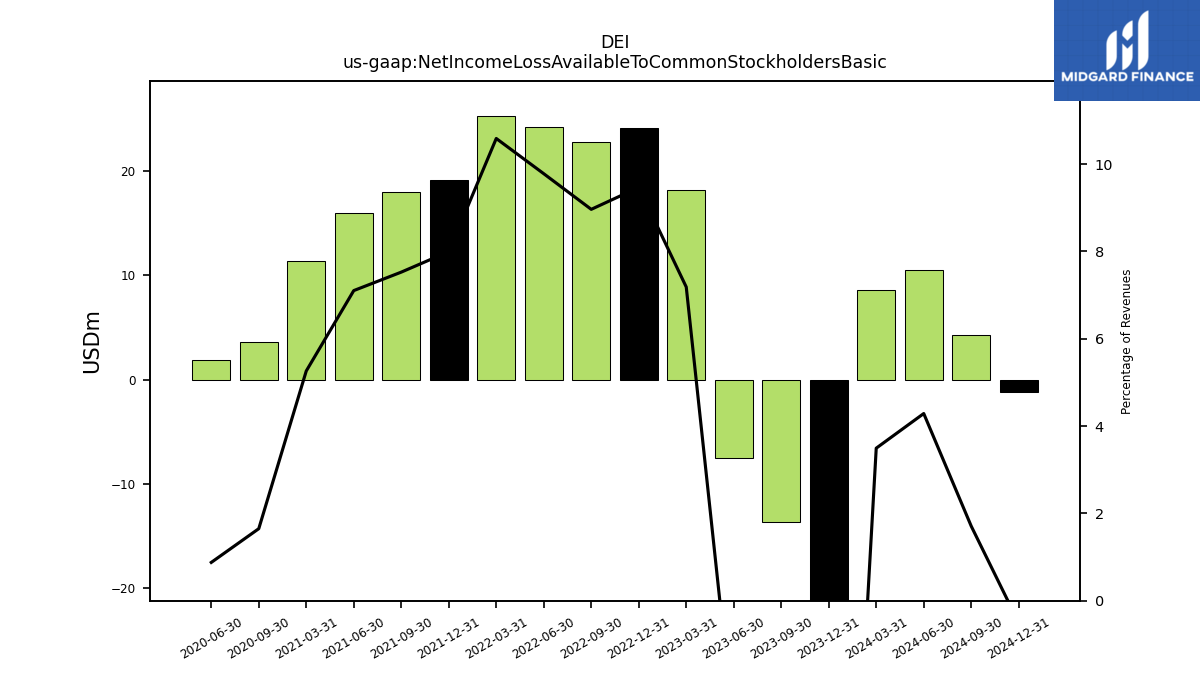
| Net Income Loss Available To Common Stockholders Basic | -40.81 | -13.63 | NA | NA | 24.06 | 22.74 | 24.15 | 25.29 | 19.10 | 17.93 | 15.98 | 11.38 | NA | 3.58 | 1.82 | NA | NA | NA | NA | NA | NA | NA | NA | NA | NA | NA | NA | NA | NA | NA | NA | NA | NA | NA | NA | NA | NA | NA | NA | NA | NA | NA | NA | NA | NA | NA | NA | NA | NA | NA | NA | NA | NA | NA | NA | NA | |
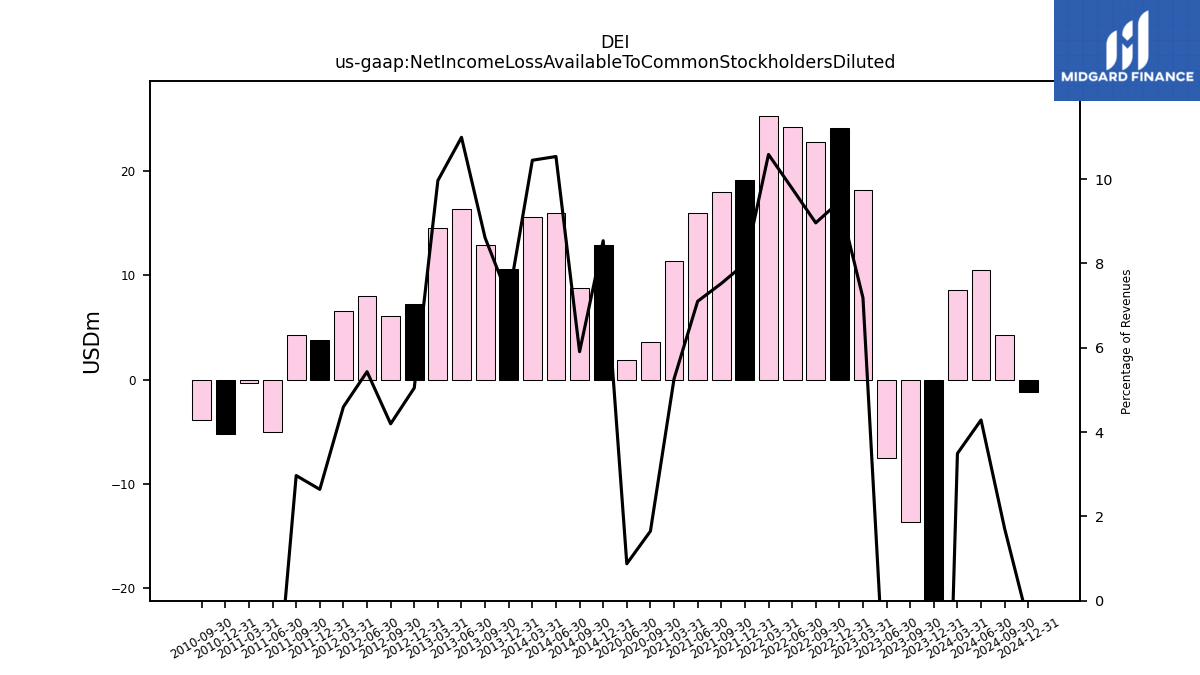
| Net Income Loss Available To Common Stockholders Diluted | -40.81 | -13.63 | NA | NA | 24.06 | 22.74 | 24.15 | 25.29 | 19.10 | 17.93 | 15.98 | 11.38 | NA | 3.58 | 1.82 | NA | NA | NA | NA | NA | NA | NA | NA | NA | NA | NA | NA | NA | NA | NA | NA | NA | NA | NA | NA | NA | 12.90 | 8.75 | 15.96 | 15.55 | 10.60 | 12.88 | 16.35 | 14.50 | 7.23 | 6.13 | 7.96 | 6.60 | 3.79 | 4.28 | -5.02 | -0.35 | -5.25 | -3.90 | NA | NA |
| 2023-12-31 | 2023-09-30 | 2023-06-30 | 2023-03-31 | 2022-12-31 | 2022-09-30 | 2022-06-30 | 2022-03-31 | 2021-12-31 | 2021-09-30 | 2021-06-30 | 2021-03-31 | 2020-12-31 | 2020-09-30 | 2020-06-30 | 2020-03-31 | 2019-12-31 | 2019-09-30 | 2019-06-30 | 2019-03-31 | 2018-12-31 | 2018-09-30 | 2018-06-30 | 2018-03-31 | 2017-12-31 | 2017-09-30 | 2017-06-30 | 2017-03-31 | 2016-12-31 | 2016-09-30 | 2016-06-30 | 2016-03-31 | 2015-12-31 | 2015-09-30 | 2015-06-30 | 2015-03-31 | 2014-12-31 | 2014-09-30 | 2014-06-30 | 2014-03-31 | 2013-12-31 | 2013-09-30 | 2013-06-30 | 2013-03-31 | 2012-12-31 | 2012-09-30 | 2012-06-30 | 2012-03-31 | 2011-12-31 | 2011-09-30 | 2011-06-30 | 2011-03-31 | 2010-12-31 | 2010-09-30 | 2010-06-30 | 2010-03-31 | ||
|---|---|---|---|---|---|---|---|---|---|---|---|---|---|---|---|---|---|---|---|---|---|---|---|---|---|---|---|---|---|---|---|---|---|---|---|---|---|---|---|---|---|---|---|---|---|---|---|---|---|---|---|---|---|---|---|---|---|
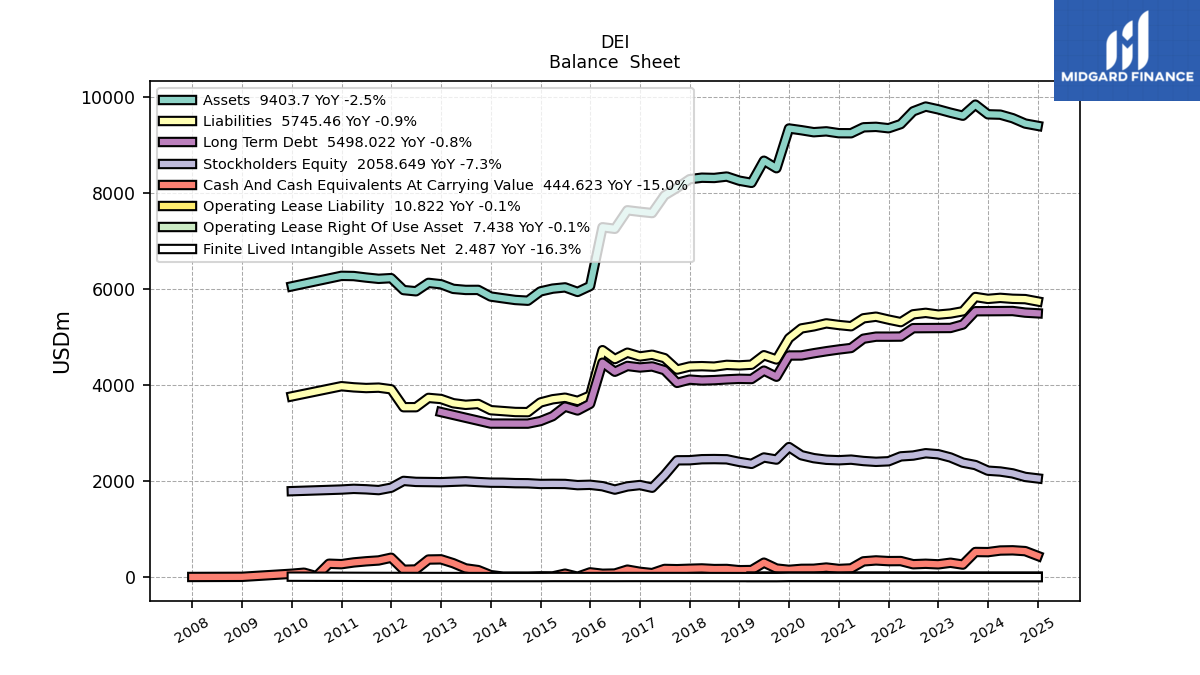
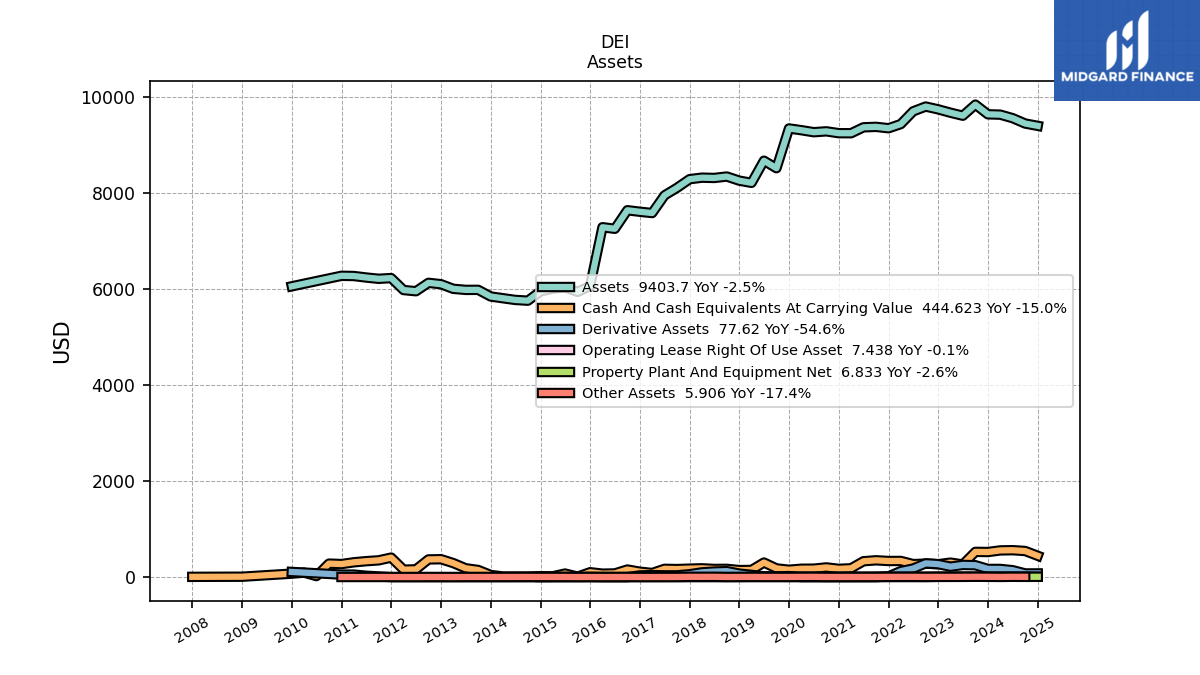
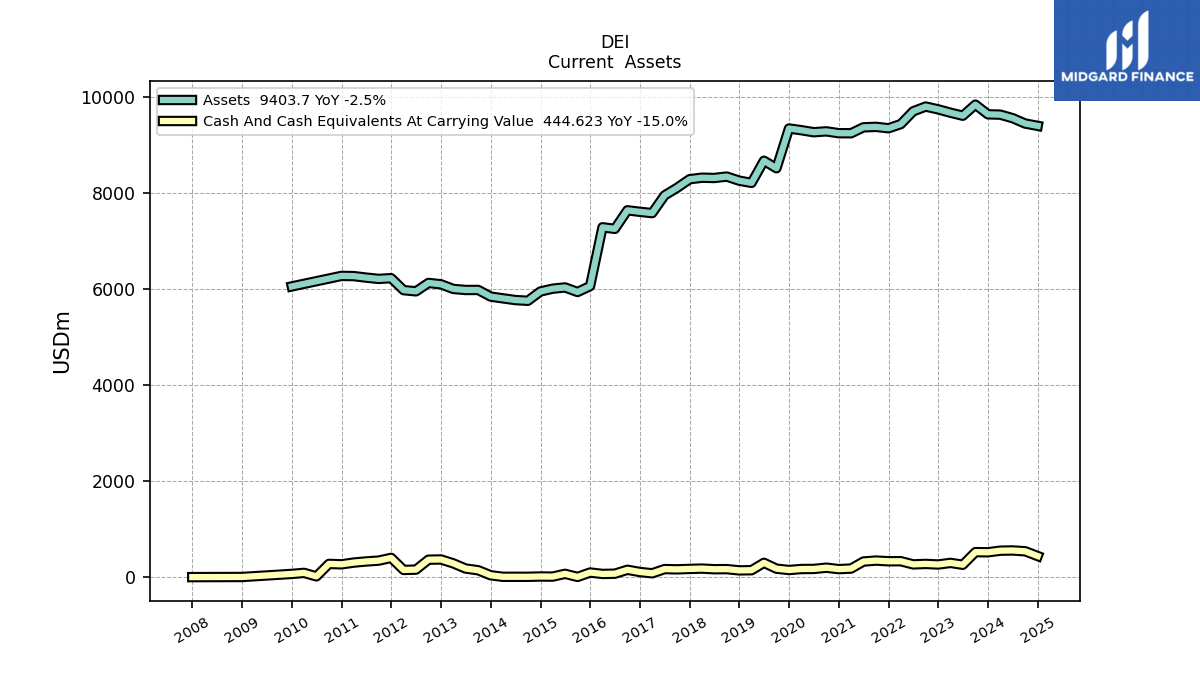
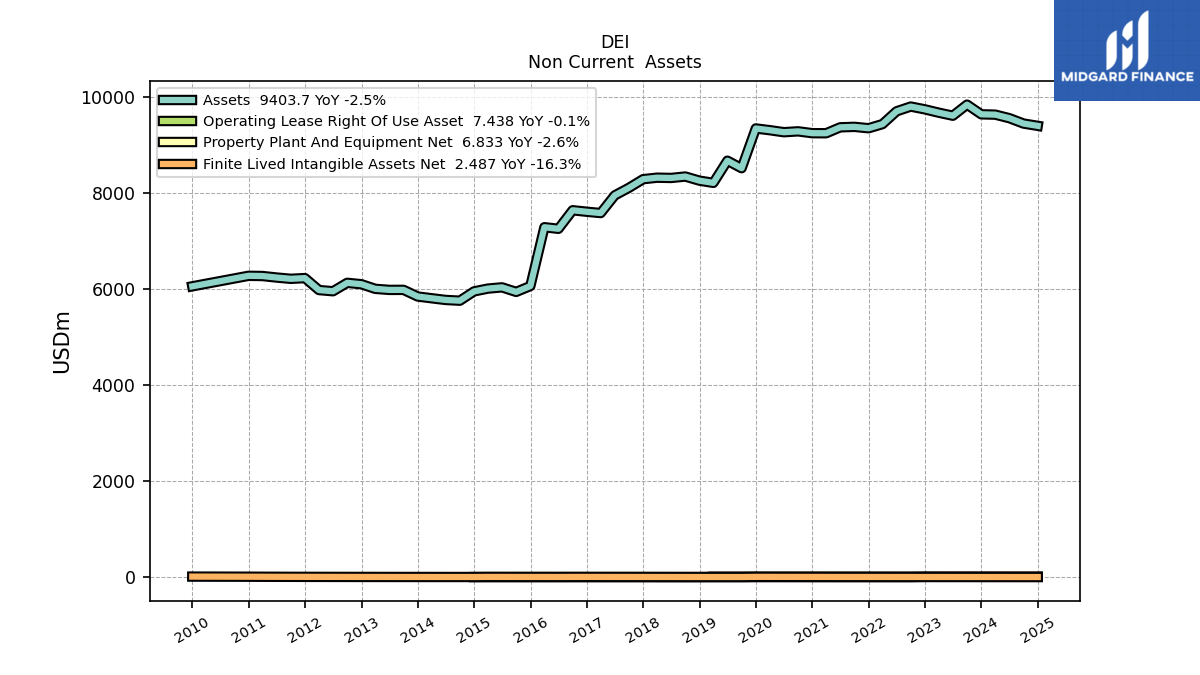
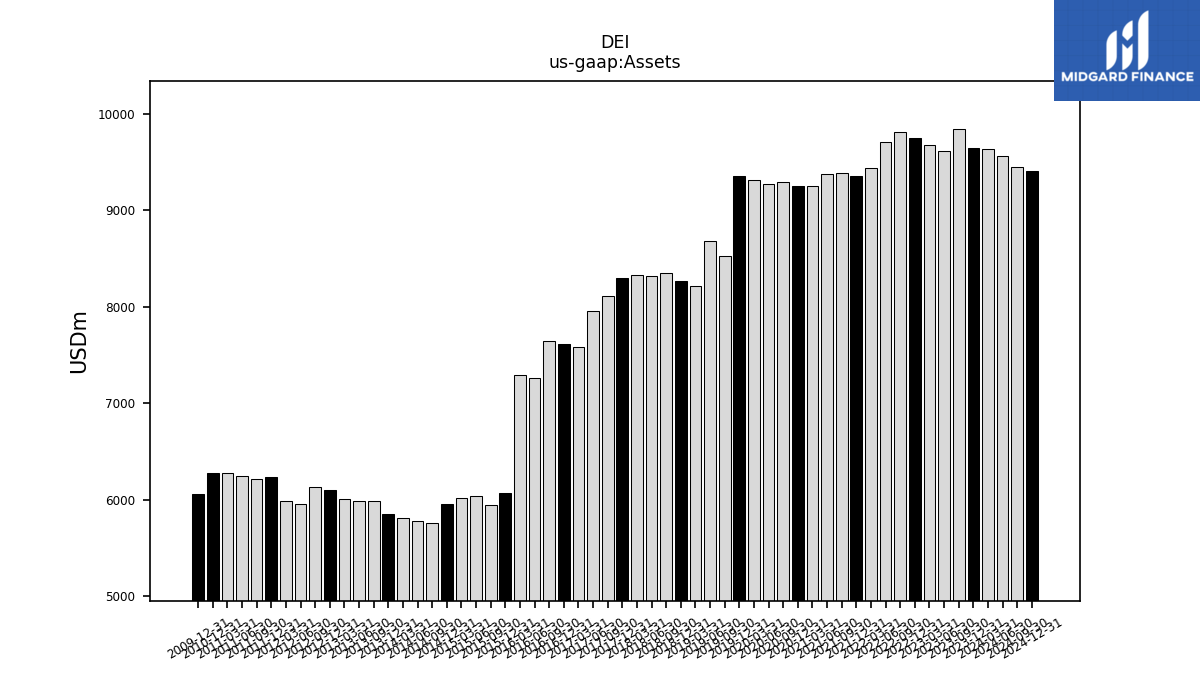
| Assets | 9644.22 | 9846.08 | 9614.86 | 9677.71 | 9747.45 | 9805.74 | 9706.56 | 9440.31 | 9354.03 | 9382.89 | 9373.35 | 9249.74 | 9250.83 | 9289.37 | 9271.38 | 9313.05 | 9349.30 | 8520.90 | 8677.71 | 8215.91 | 8261.71 | 8347.78 | 8317.98 | 8323.90 | 8292.64 | 8113.17 | 7955.39 | 7586.70 | 7613.70 | 7645.27 | 7258.50 | 7291.42 | 6066.16 | 5943.86 | 6038.73 | 6012.81 | 5954.60 | 5760.65 | 5776.05 | 5811.46 | 5847.79 | 5986.41 | 5985.51 | 6007.68 | 6103.81 | 6132.74 | 5957.46 | 5982.38 | 6231.60 | 6216.68 | 6243.36 | 6274.65 | 6279.29 | NA | NA | NA | |
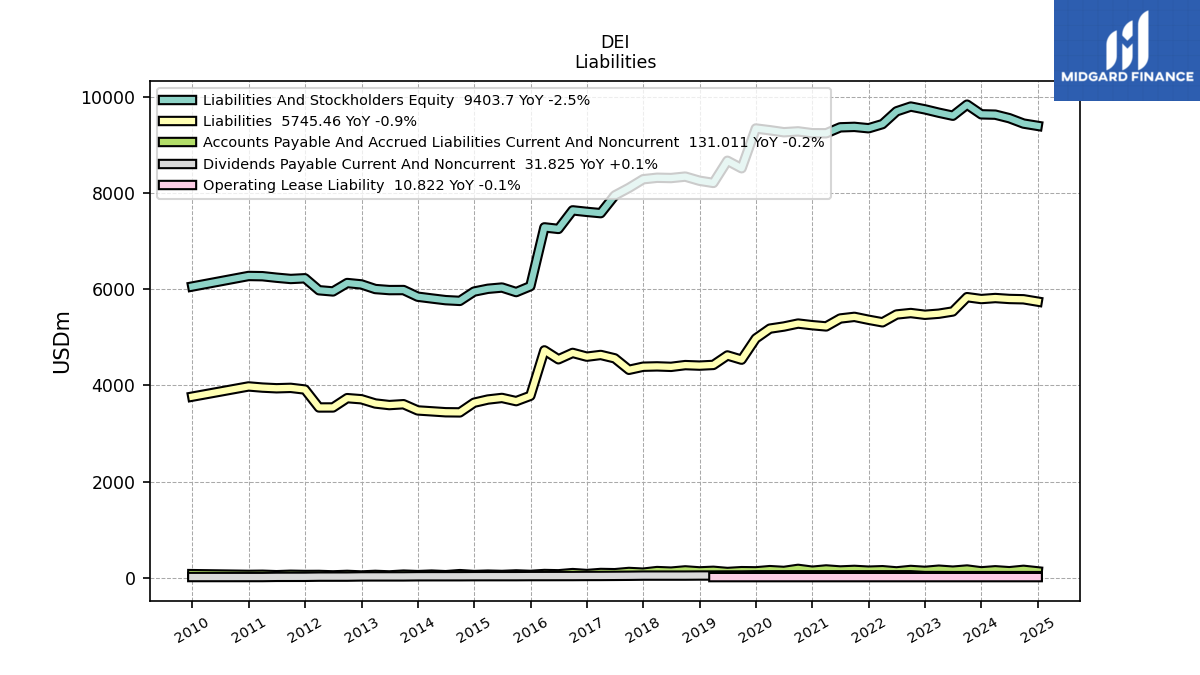
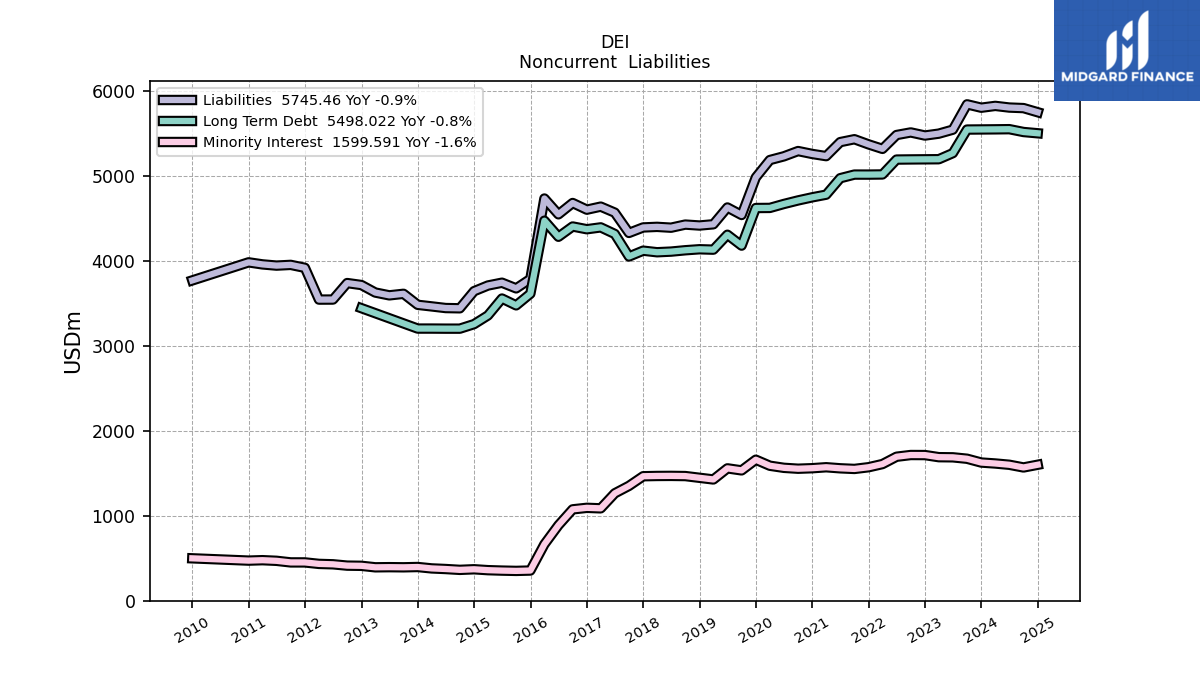
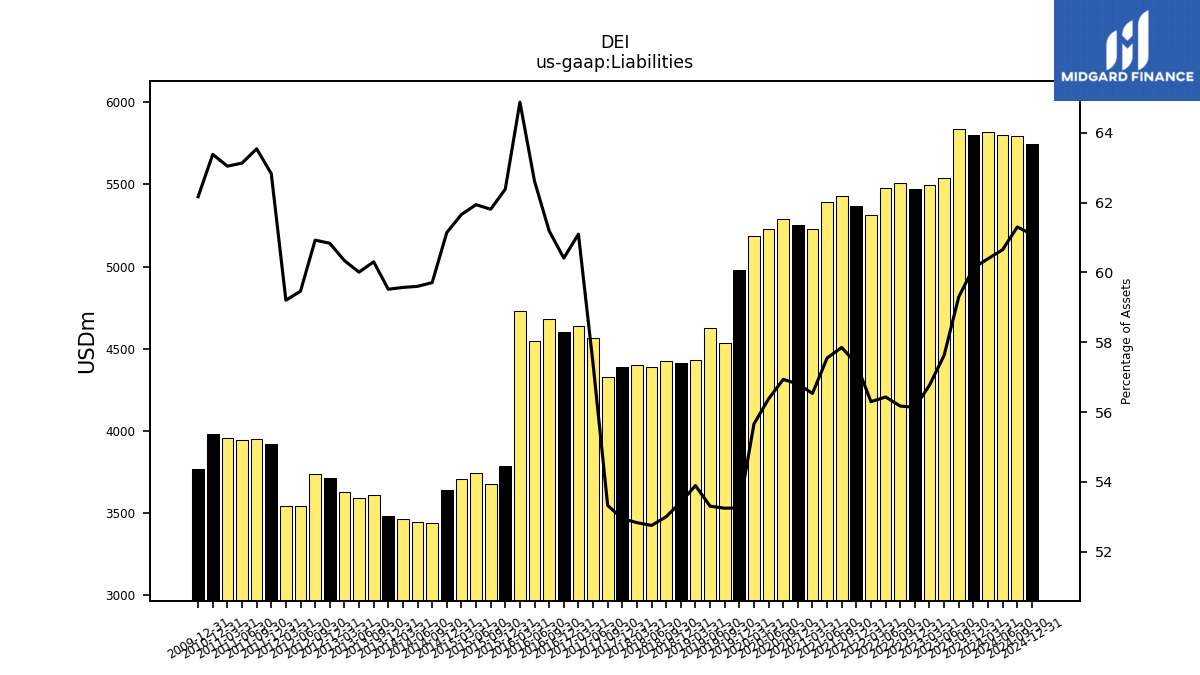
| Liabilities | 5798.82 | 5838.62 | 5540.55 | 5493.90 | 5471.66 | 5508.00 | 5477.61 | 5314.62 | 5367.48 | 5428.19 | 5394.22 | 5229.21 | 5254.81 | 5289.01 | 5227.04 | 5183.35 | 4978.37 | 4536.83 | 4625.35 | 4427.73 | 4413.28 | 4424.24 | 4387.70 | 4397.43 | 4390.59 | 4326.10 | 4564.86 | 4635.39 | 4599.63 | 4678.23 | 4544.78 | 4730.81 | 3784.61 | 3674.05 | 3740.62 | 3707.61 | 3640.87 | 3439.64 | 3442.67 | 3461.97 | 3480.58 | 3610.15 | 3591.90 | 3625.07 | 3713.35 | 3736.51 | 3542.51 | 3541.98 | 3915.65 | 3950.31 | 3941.78 | 3956.01 | 3980.12 | NA | NA | NA | |
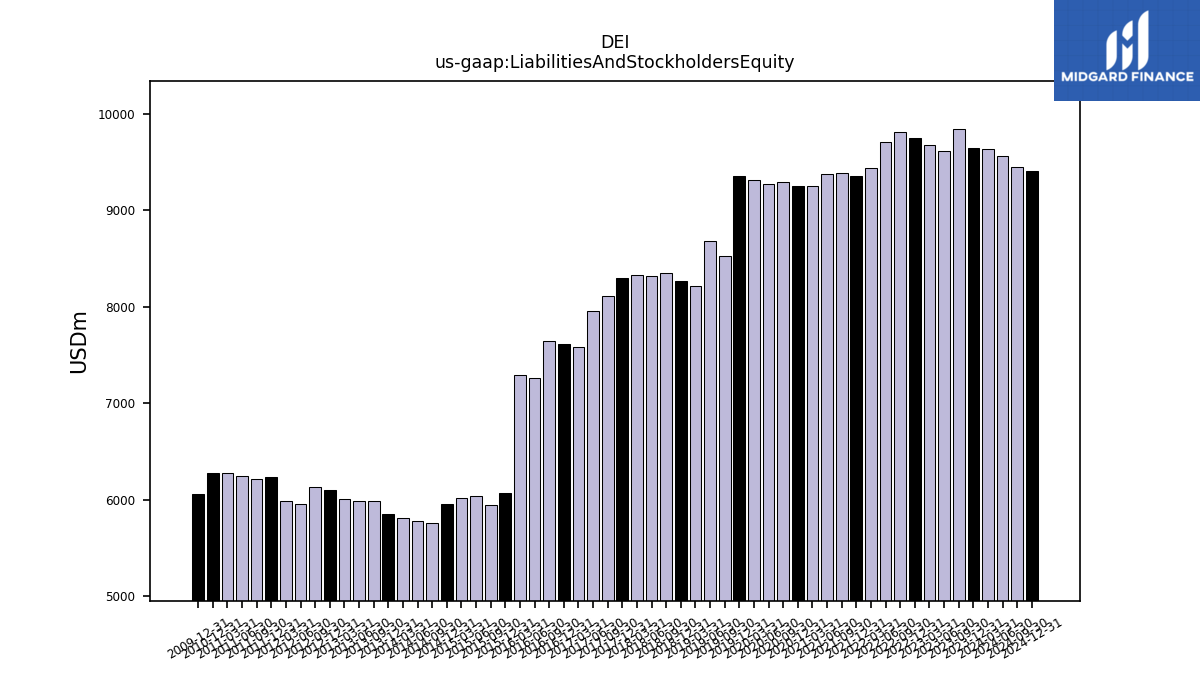
| Liabilities And Stockholders Equity | 9644.22 | 9846.08 | 9614.86 | 9677.71 | 9747.45 | 9805.74 | 9706.56 | 9440.31 | 9354.03 | 9382.89 | 9373.35 | 9249.74 | 9250.83 | 9289.37 | 9271.38 | 9313.05 | 9349.30 | 8520.90 | 8677.71 | 8215.91 | 8261.71 | 8347.78 | 8317.98 | 8323.90 | 8292.64 | 8113.17 | 7955.39 | 7586.70 | 7613.70 | 7645.27 | 7258.50 | 7291.42 | 6066.16 | 5943.86 | 6038.73 | 6012.81 | 5954.60 | 5760.65 | 5776.05 | 5811.46 | 5847.79 | 5986.41 | 5985.51 | 6007.68 | 6103.81 | 6132.74 | 5957.46 | 5982.38 | 6231.60 | 6216.68 | 6243.36 | 6274.65 | 6279.29 | NA | NA | NA | |
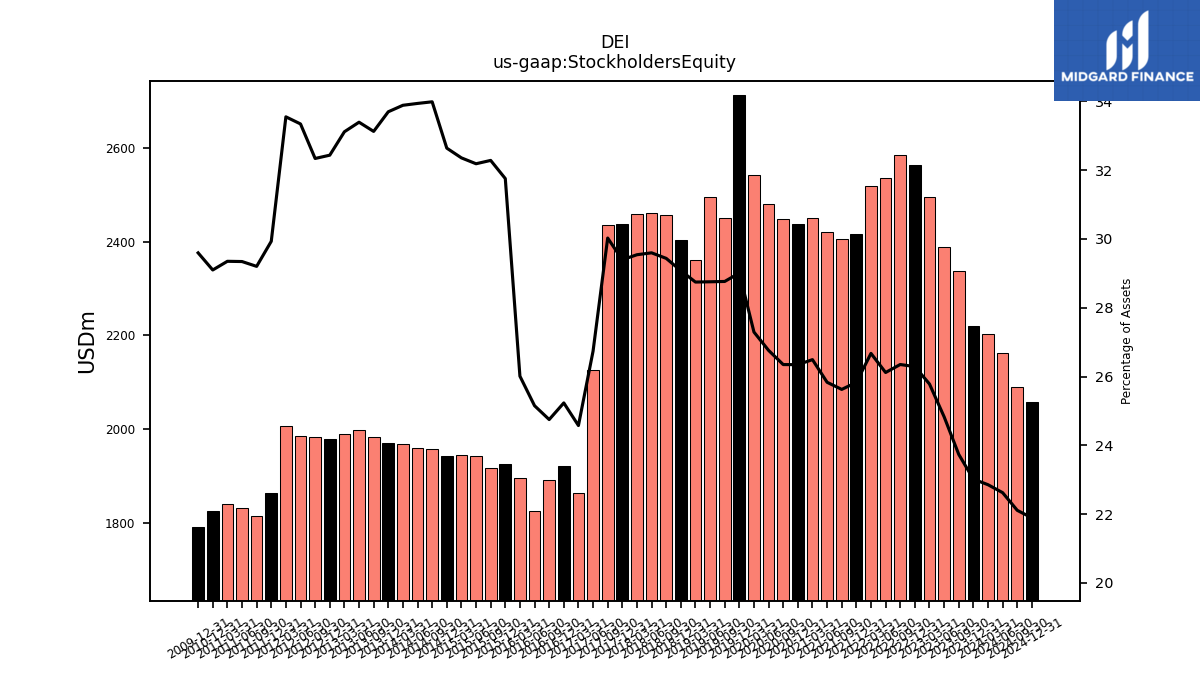
| Stockholders Equity | 2219.86 | 2337.26 | 2387.42 | 2495.16 | 2562.41 | 2583.74 | 2535.05 | 2517.95 | 2416.07 | 2404.43 | 2421.38 | 2450.32 | 2437.09 | 2447.53 | 2480.98 | 2541.76 | 2712.07 | 2450.87 | 2495.15 | 2361.70 | 2402.33 | 2457.08 | 2461.74 | 2458.85 | 2437.52 | 2435.92 | 2127.07 | 1864.49 | 1921.14 | 1892.18 | 1825.61 | 1896.53 | 1926.21 | 1918.75 | 1943.51 | 1945.44 | 1943.46 | 1957.74 | 1960.23 | 1969.12 | 1970.40 | 1982.95 | 1998.65 | 1989.36 | 1979.66 | 1983.17 | 1986.28 | 2006.96 | 1865.11 | 1815.37 | 1831.92 | 1841.54 | 1827.06 | NA | NA | NA |
| 2023-12-31 | 2023-09-30 | 2023-06-30 | 2023-03-31 | 2022-12-31 | 2022-09-30 | 2022-06-30 | 2022-03-31 | 2021-12-31 | 2021-09-30 | 2021-06-30 | 2021-03-31 | 2020-12-31 | 2020-09-30 | 2020-06-30 | 2020-03-31 | 2019-12-31 | 2019-09-30 | 2019-06-30 | 2019-03-31 | 2018-12-31 | 2018-09-30 | 2018-06-30 | 2018-03-31 | 2017-12-31 | 2017-09-30 | 2017-06-30 | 2017-03-31 | 2016-12-31 | 2016-09-30 | 2016-06-30 | 2016-03-31 | 2015-12-31 | 2015-09-30 | 2015-06-30 | 2015-03-31 | 2014-12-31 | 2014-09-30 | 2014-06-30 | 2014-03-31 | 2013-12-31 | 2013-09-30 | 2013-06-30 | 2013-03-31 | 2012-12-31 | 2012-09-30 | 2012-06-30 | 2012-03-31 | 2011-12-31 | 2011-09-30 | 2011-06-30 | 2011-03-31 | 2010-12-31 | 2010-09-30 | 2010-06-30 | 2010-03-31 | ||
|---|---|---|---|---|---|---|---|---|---|---|---|---|---|---|---|---|---|---|---|---|---|---|---|---|---|---|---|---|---|---|---|---|---|---|---|---|---|---|---|---|---|---|---|---|---|---|---|---|---|---|---|---|---|---|---|---|---|
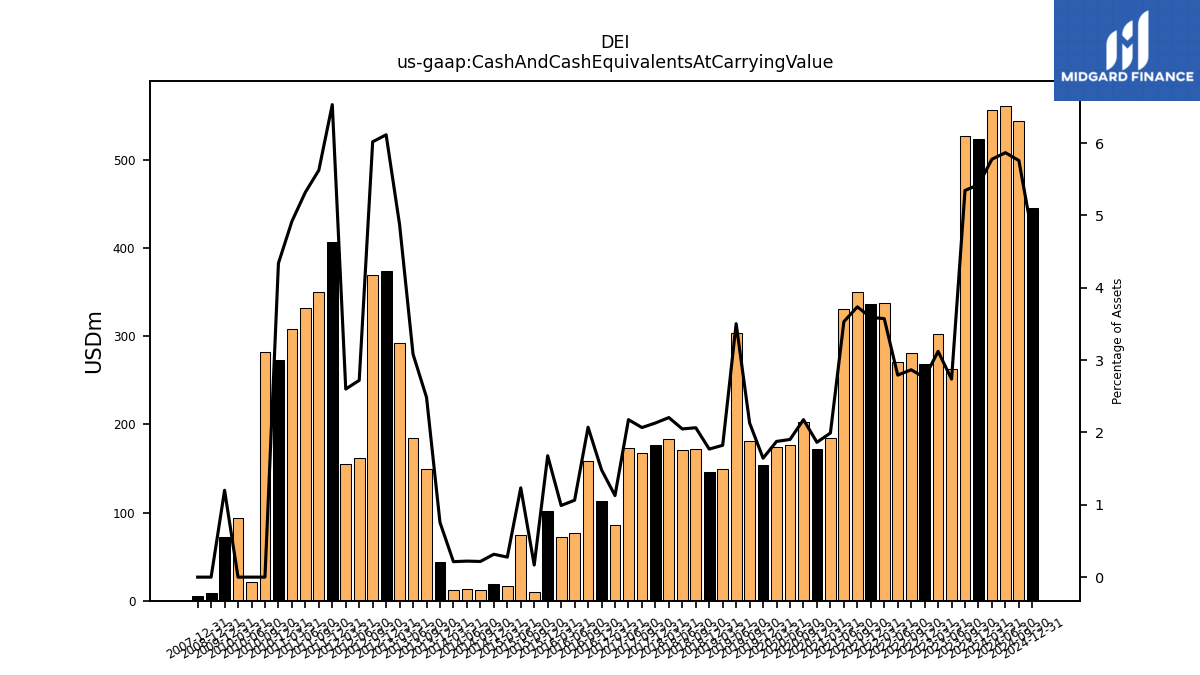
| Cash And Cash Equivalents At Carrying Value | 523.08 | 526.23 | 263.18 | 301.98 | 268.84 | 281.01 | 271.04 | 337.27 | 335.90 | 350.49 | 330.93 | 184.27 | 172.38 | 202.17 | 176.39 | 174.70 | 153.68 | 181.51 | 303.96 | 149.72 | 146.23 | 172.36 | 170.39 | 183.56 | 176.65 | 167.74 | 173.15 | 85.53 | 112.93 | 158.41 | 77.17 | 72.19 | 101.80 | 9.93 | 74.53 | 16.64 | 18.82 | 12.47 | 12.79 | 12.42 | 44.21 | 148.81 | 184.41 | 292.63 | 373.20 | 369.02 | 162.03 | 155.53 | 406.98 | 349.61 | 332.14 | 308.54 | 272.42 | 281.68 | 21.25 | 94.30 | |
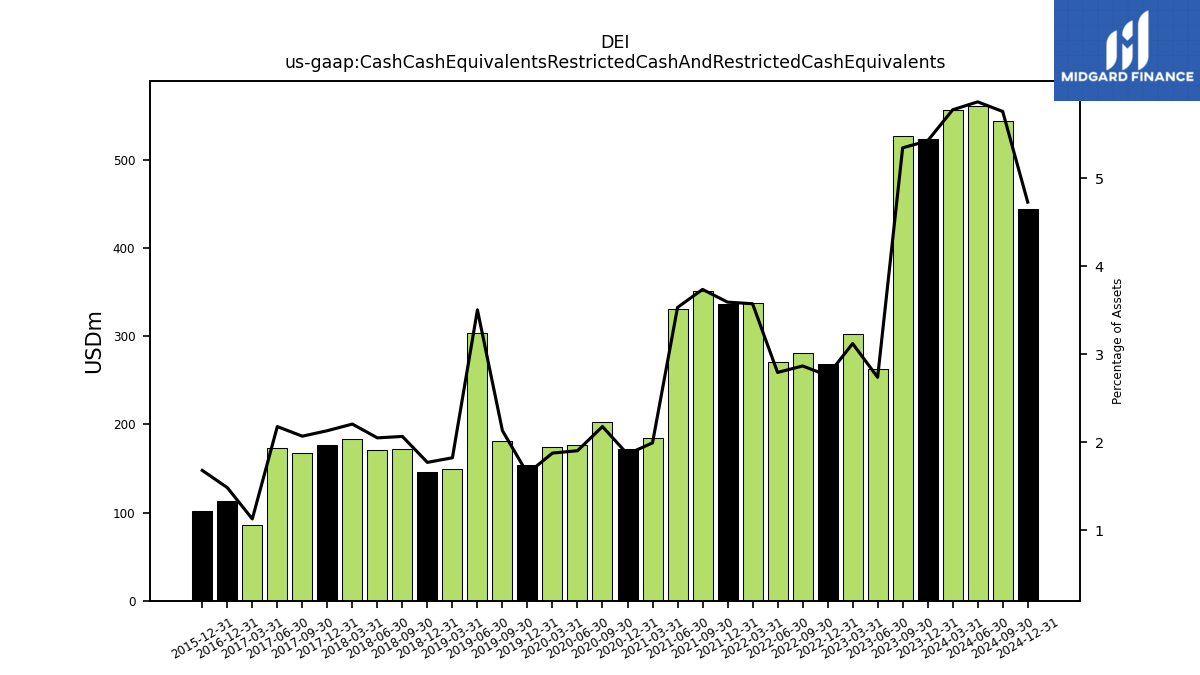
| Cash Cash Equivalents Restricted Cash And Restricted Cash Equivalents | 523.18 | 526.33 | 263.29 | 302.08 | 268.94 | 281.11 | 271.14 | 337.38 | 336.01 | 350.60 | 331.07 | 184.41 | 172.52 | 202.36 | 176.51 | 174.82 | 153.80 | 181.63 | 304.08 | 149.84 | 146.35 | 172.48 | 170.51 | 183.68 | 176.77 | 167.86 | 173.27 | 85.65 | 113.05 | NA | NA | NA | 101.92 | NA | NA | NA | NA | NA | NA | NA | NA | NA | NA | NA | NA | NA | NA | NA | NA | NA | NA | NA | NA | NA | NA | NA | |
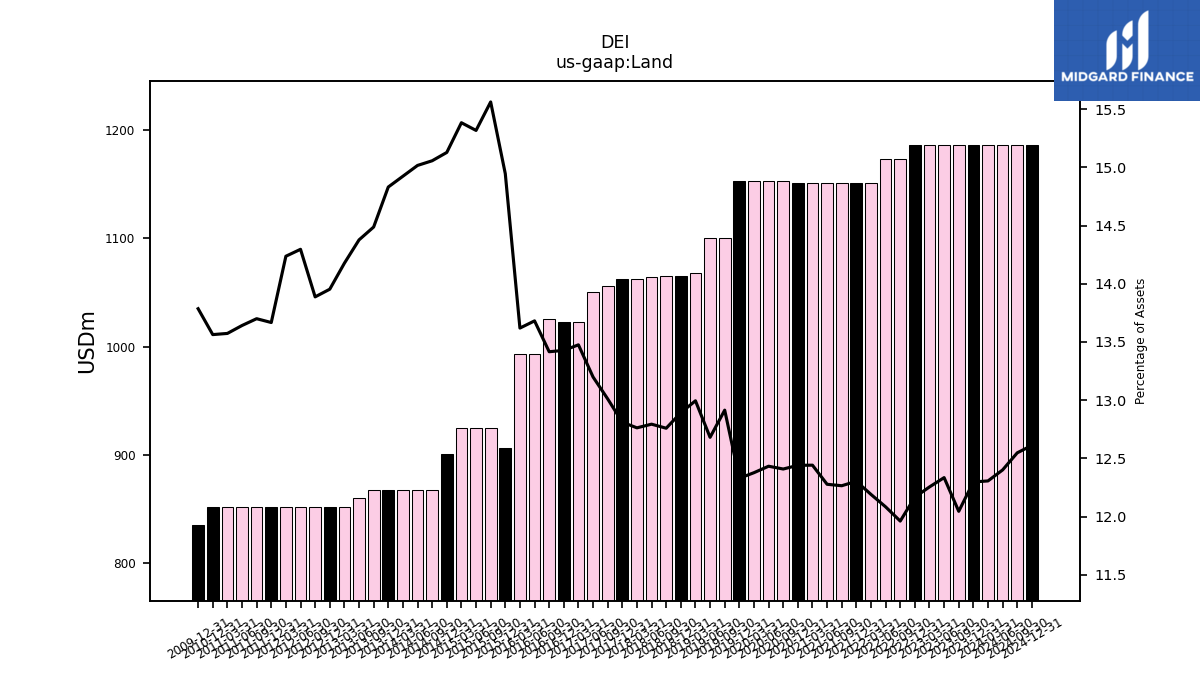
| Land | 1185.98 | 1185.98 | 1185.98 | 1185.98 | 1185.98 | 1172.91 | 1172.91 | 1150.82 | 1150.82 | 1150.82 | 1150.82 | 1150.82 | 1150.82 | 1152.68 | 1152.68 | 1152.68 | 1152.68 | 1100.41 | 1100.41 | 1067.64 | 1065.10 | 1065.10 | 1064.19 | 1062.33 | 1062.35 | 1055.60 | 1050.04 | 1022.34 | 1022.34 | 1025.70 | 993.05 | 993.04 | 906.60 | 924.97 | 924.97 | 924.97 | 900.81 | 867.36 | 867.36 | 867.28 | 867.28 | 867.28 | 860.53 | 851.68 | 851.68 | 851.68 | 851.68 | 851.68 | 851.68 | 851.68 | 851.68 | 851.68 | 851.68 | NA | NA | NA |
| 2023-12-31 | 2023-09-30 | 2023-06-30 | 2023-03-31 | 2022-12-31 | 2022-09-30 | 2022-06-30 | 2022-03-31 | 2021-12-31 | 2021-09-30 | 2021-06-30 | 2021-03-31 | 2020-12-31 | 2020-09-30 | 2020-06-30 | 2020-03-31 | 2019-12-31 | 2019-09-30 | 2019-06-30 | 2019-03-31 | 2018-12-31 | 2018-09-30 | 2018-06-30 | 2018-03-31 | 2017-12-31 | 2017-09-30 | 2017-06-30 | 2017-03-31 | 2016-12-31 | 2016-09-30 | 2016-06-30 | 2016-03-31 | 2015-12-31 | 2015-09-30 | 2015-06-30 | 2015-03-31 | 2014-12-31 | 2014-09-30 | 2014-06-30 | 2014-03-31 | 2013-12-31 | 2013-09-30 | 2013-06-30 | 2013-03-31 | 2012-12-31 | 2012-09-30 | 2012-06-30 | 2012-03-31 | 2011-12-31 | 2011-09-30 | 2011-06-30 | 2011-03-31 | 2010-12-31 | 2010-09-30 | 2010-06-30 | 2010-03-31 | ||
|---|---|---|---|---|---|---|---|---|---|---|---|---|---|---|---|---|---|---|---|---|---|---|---|---|---|---|---|---|---|---|---|---|---|---|---|---|---|---|---|---|---|---|---|---|---|---|---|---|---|---|---|---|---|---|---|---|---|
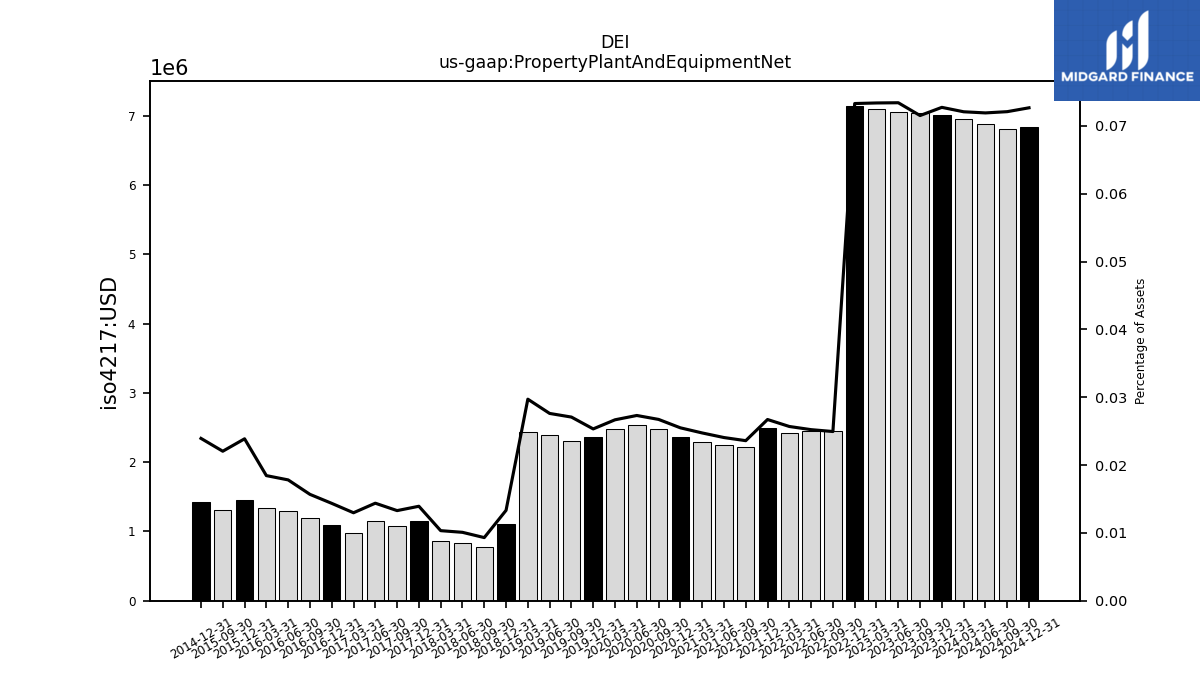
| Property Plant And Equipment Net | 7.01 | 7.04 | 7.06 | 7.10 | 7.14 | 2.45 | 2.45 | 2.42 | 2.50 | 2.21 | 2.25 | 2.29 | 2.36 | 2.48 | 2.53 | 2.48 | 2.37 | 2.31 | 2.40 | 2.44 | 1.10 | 0.78 | 0.84 | 0.86 | 1.16 | 1.08 | 1.14 | 0.98 | 1.09 | 1.20 | 1.29 | 1.34 | 1.45 | 1.31 | NA | NA | 1.43 | NA | NA | NA | NA | NA | NA | NA | NA | NA | NA | NA | NA | NA | NA | NA | NA | NA | NA | NA | |
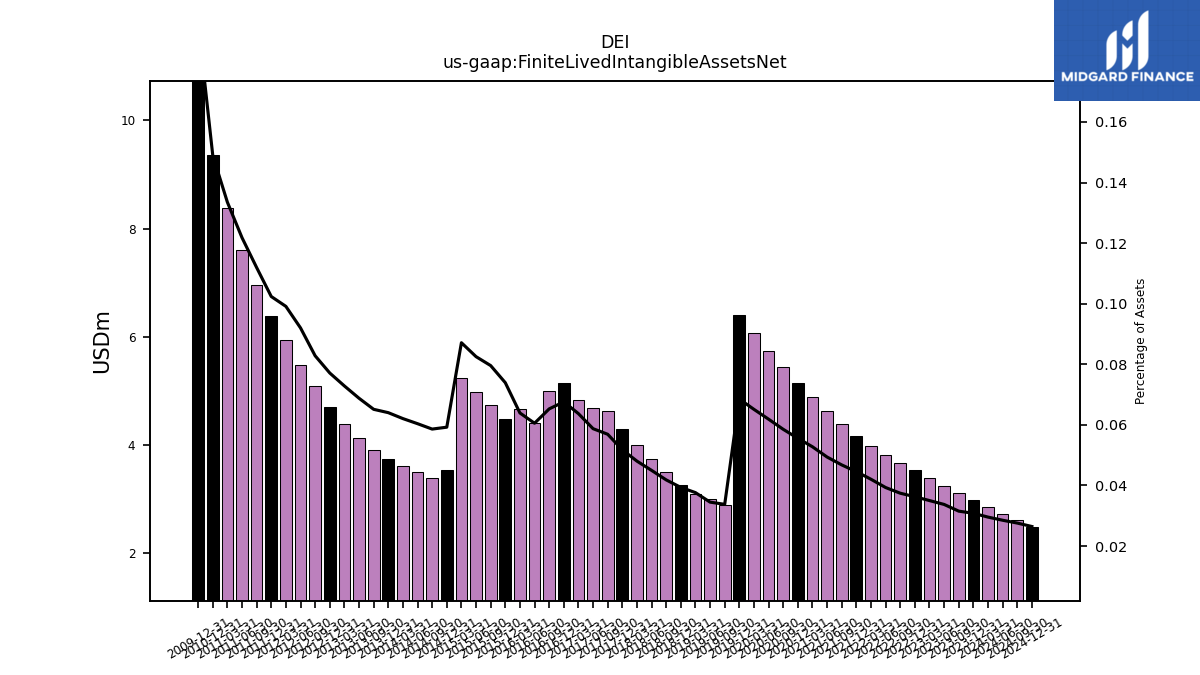
| Finite Lived Intangible Assets Net | 2.97 | 3.10 | 3.24 | 3.39 | 3.54 | 3.67 | 3.82 | 3.97 | 4.17 | 4.39 | 4.63 | 4.88 | 5.14 | 5.44 | 5.74 | 6.06 | 6.41 | 2.88 | 2.99 | 3.09 | 3.25 | 3.49 | 3.74 | 4.00 | 4.29 | 4.62 | 4.67 | 4.83 | 5.15 | 4.99 | 4.39 | 4.66 | 4.48 | 4.73 | 4.98 | 5.24 | 3.53 | 3.38 | 3.49 | 3.61 | 3.74 | 3.90 | 4.12 | 4.38 | 4.71 | 5.08 | 5.48 | 5.93 | 6.38 | 6.96 | 7.60 | 8.38 | 9.36 | NA | NA | NA |
| 2023-12-31 | 2023-09-30 | 2023-06-30 | 2023-03-31 | 2022-12-31 | 2022-09-30 | 2022-06-30 | 2022-03-31 | 2021-12-31 | 2021-09-30 | 2021-06-30 | 2021-03-31 | 2020-12-31 | 2020-09-30 | 2020-06-30 | 2020-03-31 | 2019-12-31 | 2019-09-30 | 2019-06-30 | 2019-03-31 | 2018-12-31 | 2018-09-30 | 2018-06-30 | 2018-03-31 | 2017-12-31 | 2017-09-30 | 2017-06-30 | 2017-03-31 | 2016-12-31 | 2016-09-30 | 2016-06-30 | 2016-03-31 | 2015-12-31 | 2015-09-30 | 2015-06-30 | 2015-03-31 | 2014-12-31 | 2014-09-30 | 2014-06-30 | 2014-03-31 | 2013-12-31 | 2013-09-30 | 2013-06-30 | 2013-03-31 | 2012-12-31 | 2012-09-30 | 2012-06-30 | 2012-03-31 | 2011-12-31 | 2011-09-30 | 2011-06-30 | 2011-03-31 | 2010-12-31 | 2010-09-30 | 2010-06-30 | 2010-03-31 | ||
|---|---|---|---|---|---|---|---|---|---|---|---|---|---|---|---|---|---|---|---|---|---|---|---|---|---|---|---|---|---|---|---|---|---|---|---|---|---|---|---|---|---|---|---|---|---|---|---|---|---|---|---|---|---|---|---|---|---|
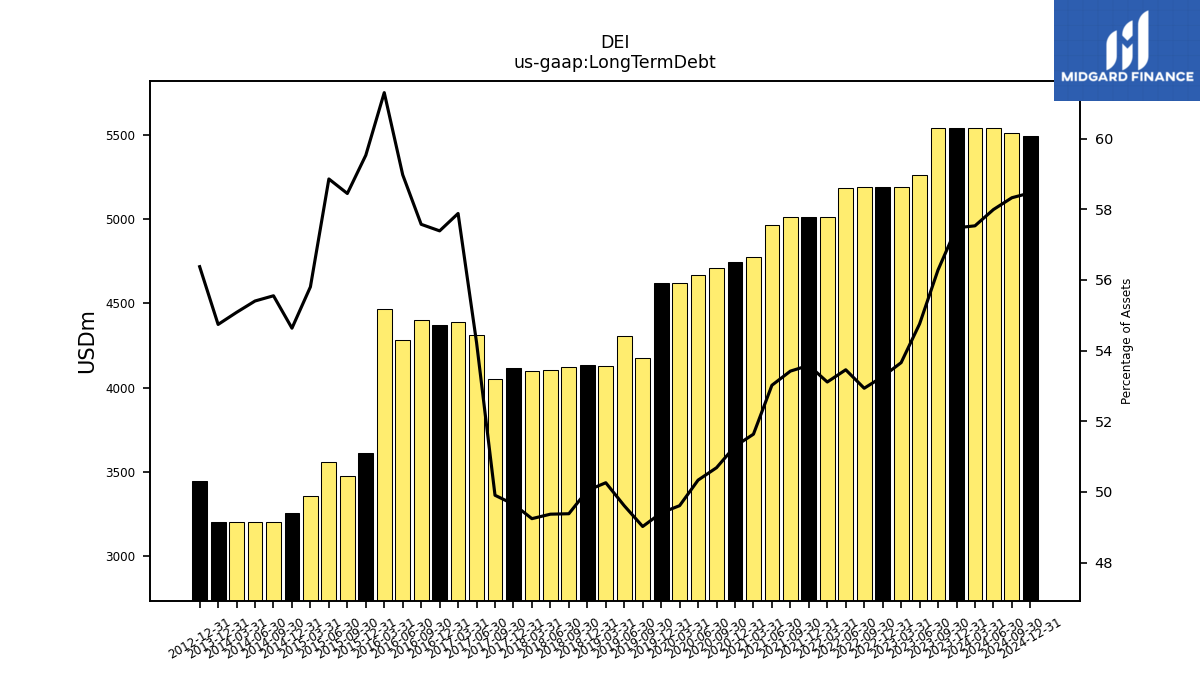
| Long Term Debt | 5543.17 | 5541.85 | 5264.65 | 5193.01 | 5191.89 | 5190.60 | 5188.90 | 5013.88 | 5012.08 | 5012.29 | 4969.66 | 4775.99 | 4744.97 | 4708.31 | 4666.60 | 4620.22 | 4619.06 | 4176.97 | 4304.91 | 4129.27 | 4134.03 | 4122.28 | 4106.49 | 4098.90 | 4117.39 | 4048.83 | 4314.14 | 4391.41 | 4369.54 | 4401.85 | 4280.93 | 4469.96 | 3611.28 | 3474.11 | 3554.41 | 3355.47 | 3253.29 | 3200.21 | 3200.21 | 3201.14 | 3201.14 | NA | NA | NA | 3441.14 | NA | NA | NA | NA | NA | NA | NA | NA | NA | NA | NA | |
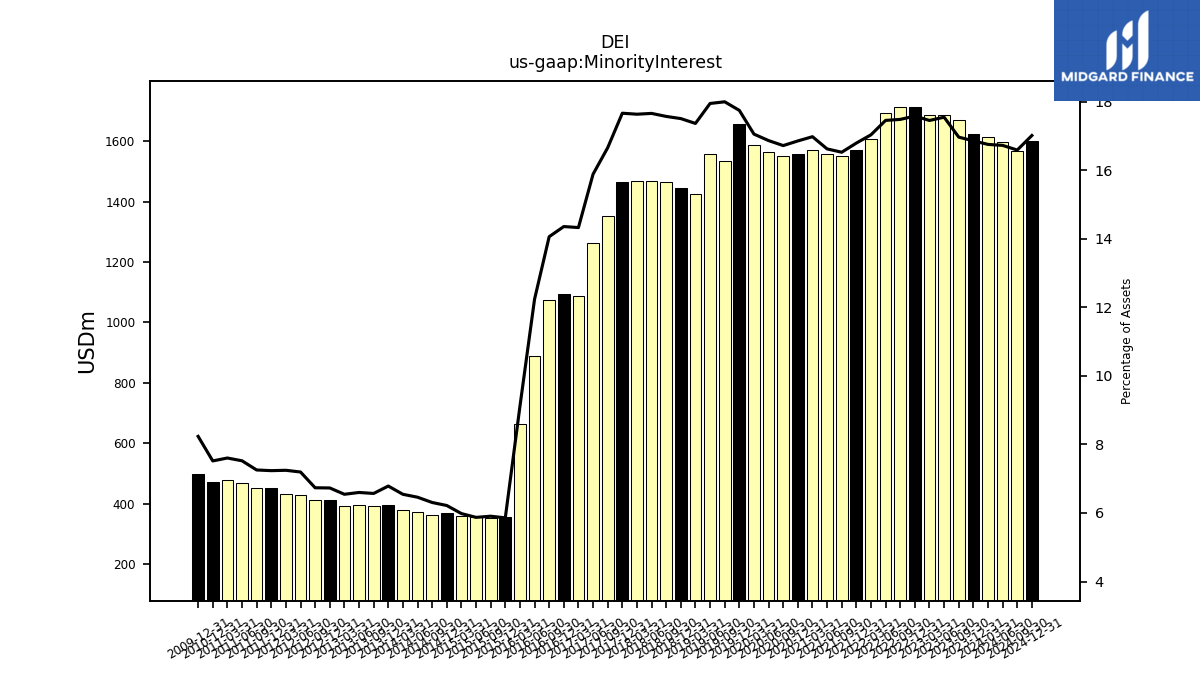
| Minority Interest | 1625.54 | 1670.20 | 1686.89 | 1688.65 | 1713.37 | 1713.99 | 1693.90 | 1607.75 | 1570.48 | 1550.27 | 1557.75 | 1570.20 | 1558.93 | 1552.84 | 1563.36 | 1587.94 | 1658.86 | 1533.19 | 1557.21 | 1426.48 | 1446.10 | 1466.46 | 1468.54 | 1467.62 | 1464.53 | 1351.15 | 1263.46 | 1086.82 | 1092.93 | 1074.86 | 888.11 | 664.09 | 355.34 | 351.06 | 354.60 | 359.75 | 370.27 | 363.28 | 373.14 | 380.37 | 396.81 | 393.31 | 394.96 | 393.25 | 410.80 | 413.07 | 428.67 | 433.44 | 450.85 | 451.00 | 469.66 | 477.10 | 472.11 | NA | NA | NA |
| 2023-12-31 | 2023-09-30 | 2023-06-30 | 2023-03-31 | 2022-12-31 | 2022-09-30 | 2022-06-30 | 2022-03-31 | 2021-12-31 | 2021-09-30 | 2021-06-30 | 2021-03-31 | 2020-12-31 | 2020-09-30 | 2020-06-30 | 2020-03-31 | 2019-12-31 | 2019-09-30 | 2019-06-30 | 2019-03-31 | 2018-12-31 | 2018-09-30 | 2018-06-30 | 2018-03-31 | 2017-12-31 | 2017-09-30 | 2017-06-30 | 2017-03-31 | 2016-12-31 | 2016-09-30 | 2016-06-30 | 2016-03-31 | 2015-12-31 | 2015-09-30 | 2015-06-30 | 2015-03-31 | 2014-12-31 | 2014-09-30 | 2014-06-30 | 2014-03-31 | 2013-12-31 | 2013-09-30 | 2013-06-30 | 2013-03-31 | 2012-12-31 | 2012-09-30 | 2012-06-30 | 2012-03-31 | 2011-12-31 | 2011-09-30 | 2011-06-30 | 2011-03-31 | 2010-12-31 | 2010-09-30 | 2010-06-30 | 2010-03-31 | ||
|---|---|---|---|---|---|---|---|---|---|---|---|---|---|---|---|---|---|---|---|---|---|---|---|---|---|---|---|---|---|---|---|---|---|---|---|---|---|---|---|---|---|---|---|---|---|---|---|---|---|---|---|---|---|---|---|---|---|
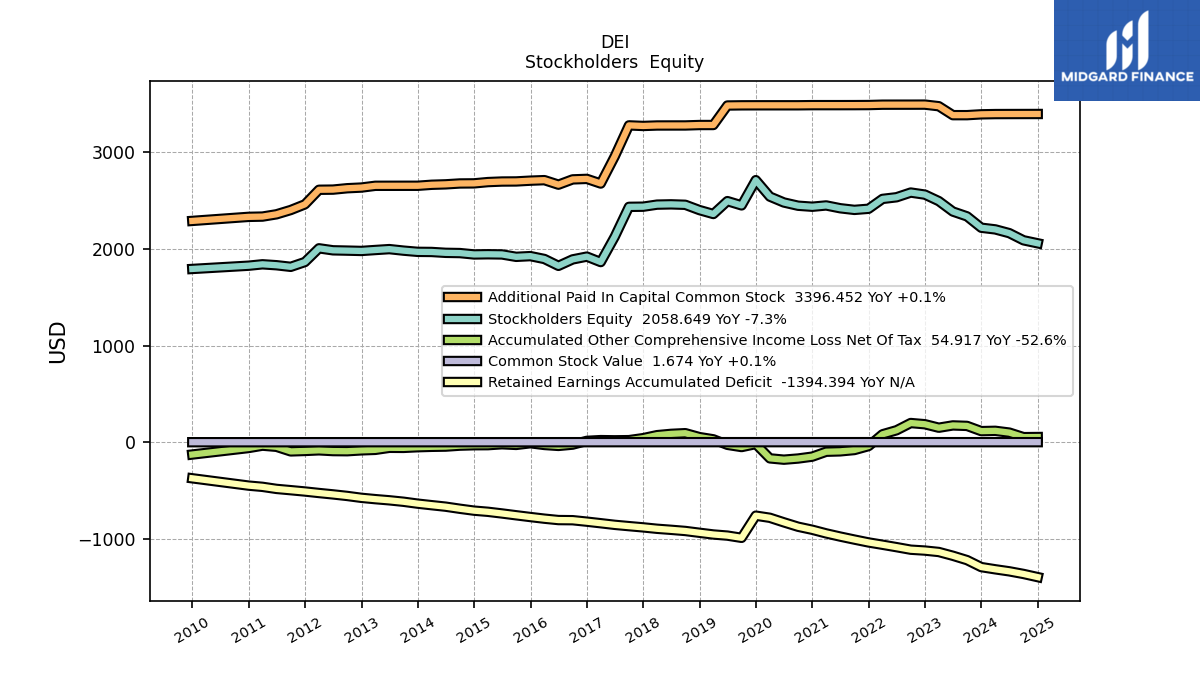
| Stockholders Equity | 2219.86 | 2337.26 | 2387.42 | 2495.16 | 2562.41 | 2583.74 | 2535.05 | 2517.95 | 2416.07 | 2404.43 | 2421.38 | 2450.32 | 2437.09 | 2447.53 | 2480.98 | 2541.76 | 2712.07 | 2450.87 | 2495.15 | 2361.70 | 2402.33 | 2457.08 | 2461.74 | 2458.85 | 2437.52 | 2435.92 | 2127.07 | 1864.49 | 1921.14 | 1892.18 | 1825.61 | 1896.53 | 1926.21 | 1918.75 | 1943.51 | 1945.44 | 1943.46 | 1957.74 | 1960.23 | 1969.12 | 1970.40 | 1982.95 | 1998.65 | 1989.36 | 1979.66 | 1983.17 | 1986.28 | 2006.96 | 1865.11 | 1815.37 | 1831.92 | 1841.54 | 1827.06 | NA | NA | NA | |
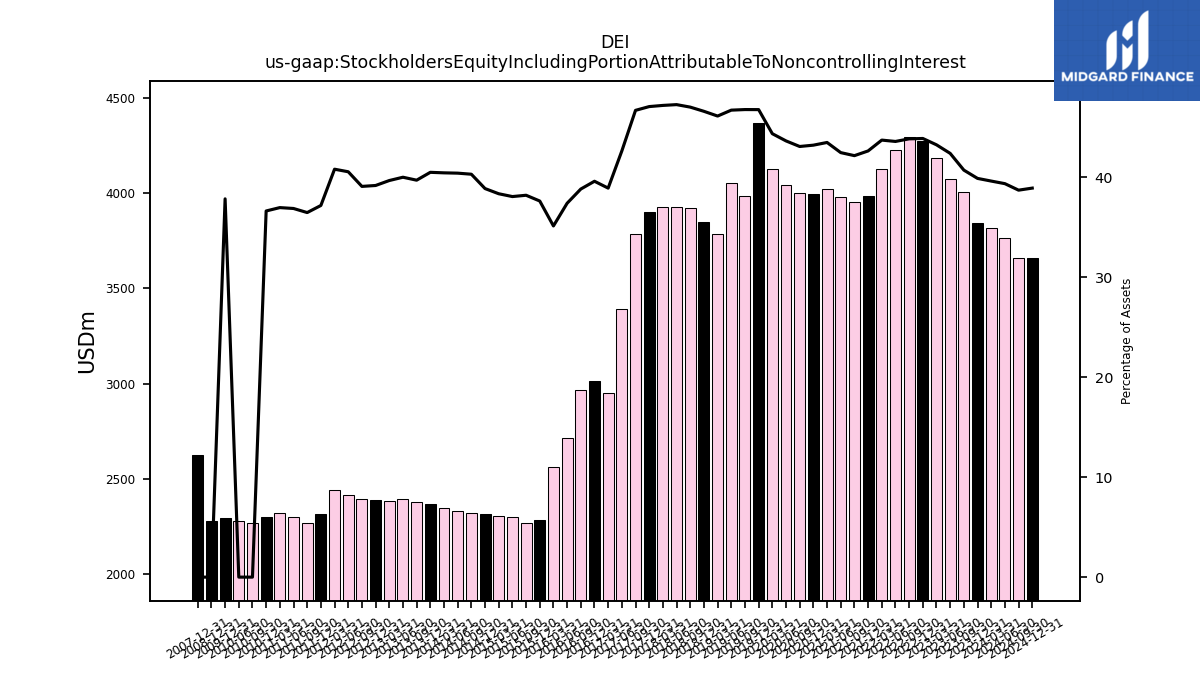
| Stockholders Equity Including Portion Attributable To Noncontrolling Interest | 3845.40 | 4007.46 | 4074.32 | 4183.81 | 4275.78 | 4297.73 | 4228.95 | 4125.70 | 3986.55 | 3954.69 | 3979.13 | 4020.53 | 3996.02 | 4000.37 | 4044.34 | 4129.71 | 4370.93 | 3984.06 | 4052.36 | 3788.18 | 3848.43 | 3923.54 | 3930.29 | 3926.47 | 3902.05 | 3787.08 | 3390.53 | 2951.31 | 3014.07 | 2967.04 | 2713.72 | 2560.61 | 2281.55 | 2269.81 | 2298.11 | 2305.19 | 2313.72 | 2321.02 | 2333.37 | 2349.49 | 2367.21 | 2376.26 | 2393.61 | 2382.61 | 2390.46 | 2396.24 | 2414.95 | 2440.40 | 2315.95 | 2266.37 | 2301.58 | 2318.64 | 2299.17 | 2266.51 | 2279.50 | NA | |
| Common Stock Value | 1.67 | 1.67 | 1.67 | 1.74 | 1.76 | 1.76 | 1.76 | 1.76 | 1.75 | 1.75 | 1.75 | 1.75 | 1.75 | 1.75 | 1.75 | 1.75 | 1.75 | 1.75 | 1.75 | 1.70 | 1.70 | 1.70 | 1.70 | 1.70 | 1.70 | 1.70 | 1.61 | 1.53 | 1.51 | 1.51 | 1.49 | 1.47 | 1.47 | 1.46 | 1.46 | 1.46 | 1.45 | 1.45 | 1.44 | 1.44 | 1.43 | 1.43 | 1.43 | 1.43 | 1.41 | 1.41 | 1.40 | 1.40 | 1.31 | 1.28 | 1.25 | 1.24 | 1.24 | NA | NA | NA | |
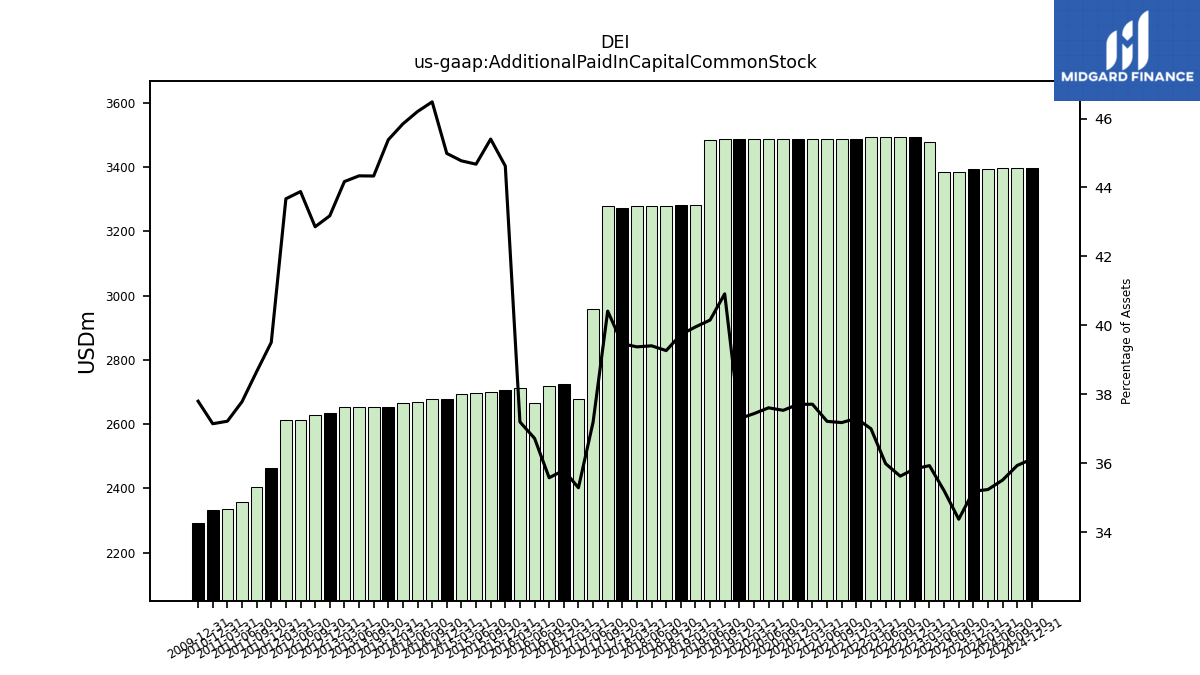
| Additional Paid In Capital Common Stock | 3392.95 | 3384.28 | 3384.27 | 3476.81 | 3493.31 | 3492.94 | 3492.86 | 3492.66 | 3488.89 | 3488.19 | 3487.95 | 3487.95 | 3487.89 | 3486.44 | 3486.44 | 3486.44 | 3486.36 | 3486.03 | 3484.18 | 3282.39 | 3282.32 | 3277.75 | 3277.64 | 3277.42 | 3272.54 | 3278.64 | 2958.18 | 2676.96 | 2725.16 | 2719.86 | 2665.24 | 2712.15 | 2706.75 | 2698.71 | 2697.81 | 2692.02 | 2678.80 | 2677.72 | 2668.66 | 2664.23 | 2653.91 | 2653.85 | 2653.75 | 2653.59 | 2635.41 | 2628.39 | 2614.12 | 2612.54 | 2461.65 | 2403.05 | 2358.83 | 2335.14 | 2332.31 | NA | NA | NA | |
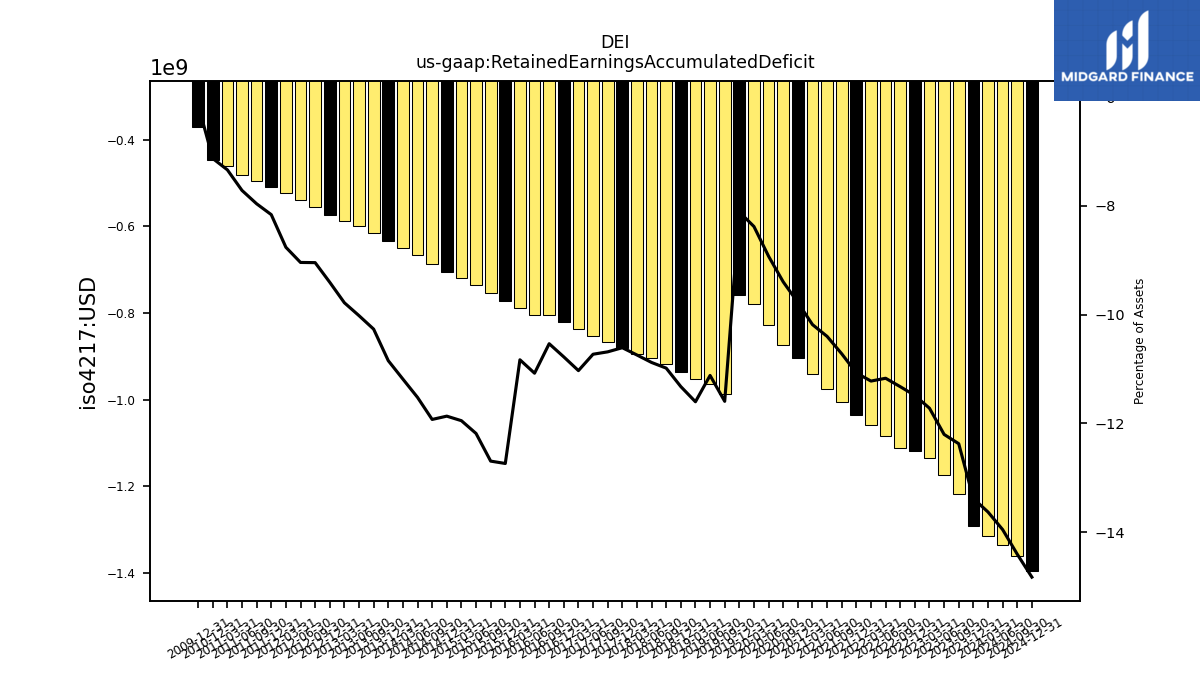
| Retained Earnings Accumulated Deficit | -1290.68 | -1218.46 | -1173.41 | -1134.47 | -1119.71 | -1110.61 | -1084.35 | -1059.50 | -1035.80 | -1005.98 | -974.98 | -942.05 | -904.52 | -873.08 | -827.75 | -780.56 | -758.58 | -988.03 | -964.93 | -953.34 | -935.63 | -917.01 | -905.09 | -894.29 | -879.81 | -866.95 | -853.59 | -836.86 | -820.68 | -805.53 | -804.13 | -789.78 | -772.73 | -754.57 | -735.90 | -718.63 | -706.70 | -687.17 | -665.60 | -650.14 | -634.38 | -614.70 | -599.78 | -587.75 | -574.17 | -554.72 | -538.66 | -524.23 | -508.67 | -495.05 | -481.83 | -460.50 | -447.72 | NA | NA | NA | |
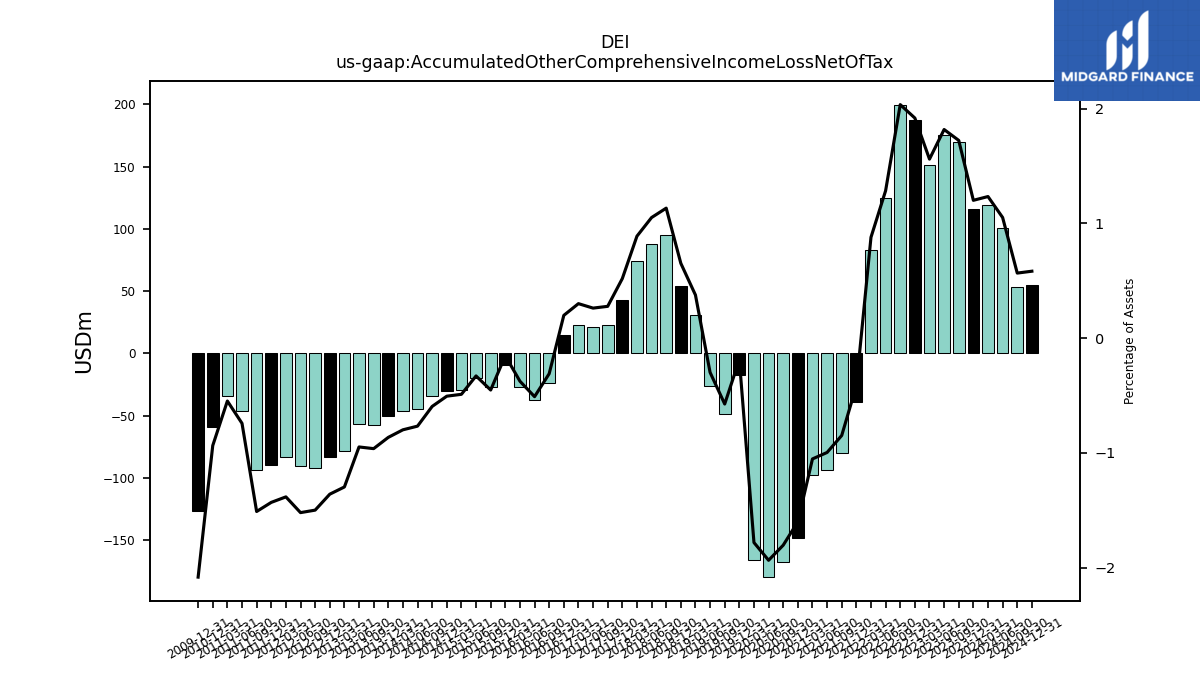
| Accumulated Other Comprehensive Income Loss Net Of Tax | 115.92 | 169.76 | 174.90 | 151.08 | 187.06 | 199.65 | 124.77 | 83.03 | -38.77 | -79.54 | -93.34 | -97.33 | -148.03 | -167.59 | -179.47 | -165.87 | -17.46 | -48.88 | -25.85 | 30.94 | 53.94 | 94.64 | 87.49 | 74.02 | 43.10 | 22.54 | 20.87 | 22.86 | 15.16 | -23.66 | -36.99 | -27.31 | -9.29 | -26.85 | -19.86 | -29.40 | -30.09 | -34.26 | -44.27 | -46.40 | -50.55 | -57.62 | -56.74 | -77.90 | -82.99 | -91.91 | -90.57 | -82.74 | -89.18 | -93.91 | -46.33 | -34.35 | -58.77 | NA | NA | NA | |
| Minority Interest | 1625.54 | 1670.20 | 1686.89 | 1688.65 | 1713.37 | 1713.99 | 1693.90 | 1607.75 | 1570.48 | 1550.27 | 1557.75 | 1570.20 | 1558.93 | 1552.84 | 1563.36 | 1587.94 | 1658.86 | 1533.19 | 1557.21 | 1426.48 | 1446.10 | 1466.46 | 1468.54 | 1467.62 | 1464.53 | 1351.15 | 1263.46 | 1086.82 | 1092.93 | 1074.86 | 888.11 | 664.09 | 355.34 | 351.06 | 354.60 | 359.75 | 370.27 | 363.28 | 373.14 | 380.37 | 396.81 | 393.31 | 394.96 | 393.25 | 410.80 | 413.07 | 428.67 | 433.44 | 450.85 | 451.00 | 469.66 | 477.10 | 472.11 | NA | NA | NA | |
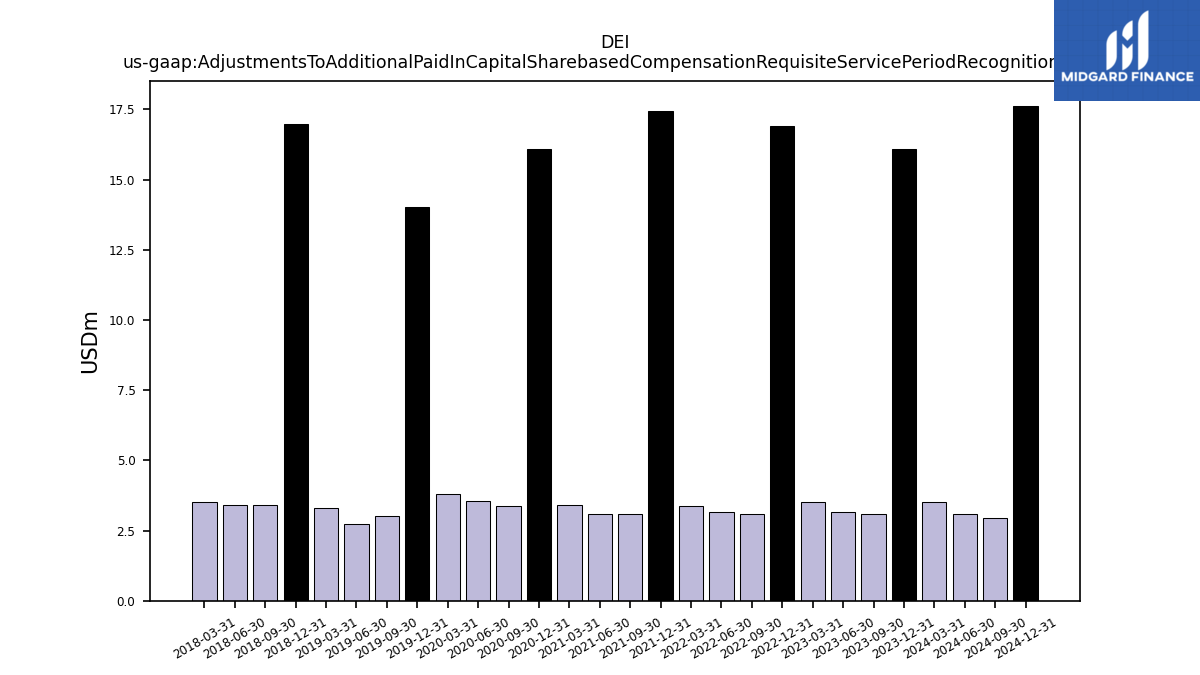
| Adjustments To Additional Paid In Capital Sharebased Compensation Requisite Service Period Recognition Value | 16.09 | 3.08 | 3.18 | 3.51 | 16.90 | 3.09 | 3.15 | 3.37 | 17.46 | 3.10 | 3.11 | 3.41 | 16.09 | 3.36 | 3.56 | 3.80 | 14.03 | 3.00 | 2.72 | 3.30 | 16.97 | 3.43 | 3.41 | 3.50 | NA | NA | NA | NA | NA | NA | NA | NA | NA | NA | NA | NA | NA | NA | NA | NA | NA | NA | NA | NA | NA | NA | NA | NA | NA | NA | NA | NA | NA | NA | NA | NA | |
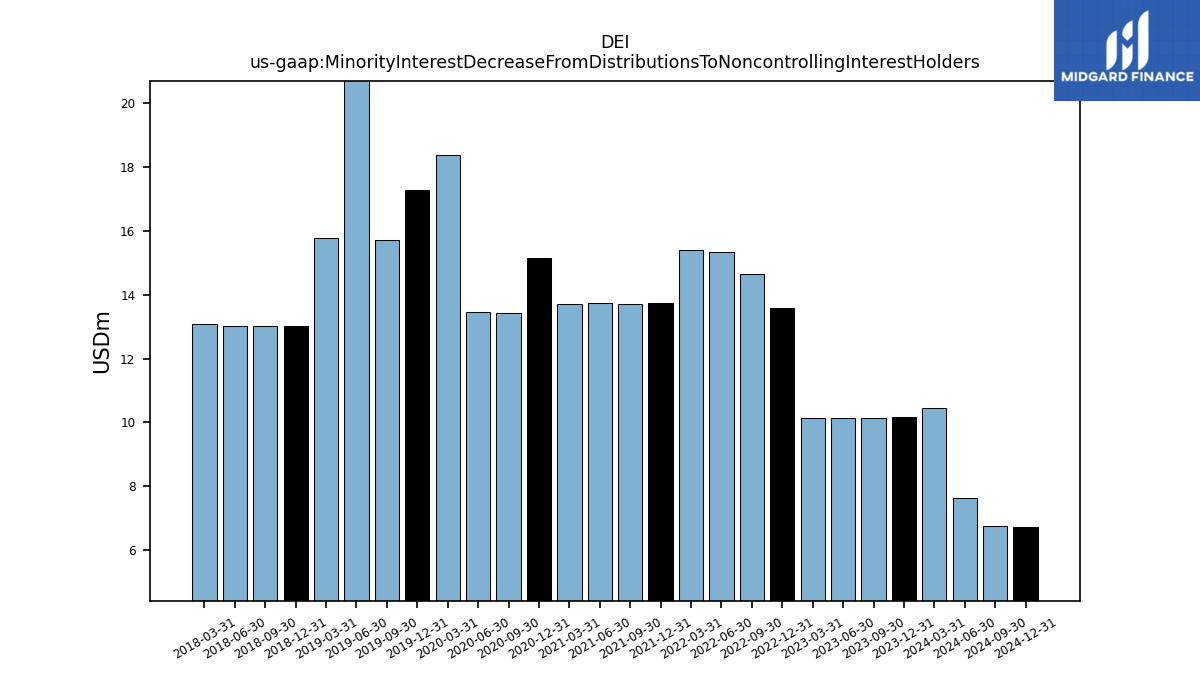
| Minority Interest Decrease From Distributions To Noncontrolling Interest Holders | 10.16 | 10.14 | 10.15 | 10.14 | 13.59 | 14.65 | 15.33 | 15.39 | 13.73 | 13.72 | 13.74 | 13.72 | 15.15 | 13.43 | 13.45 | 18.37 | 17.28 | 15.73 | 28.21 | 15.76 | 13.02 | 13.01 | 13.03 | 13.09 | NA | NA | NA | NA | NA | NA | NA | NA | NA | NA | NA | NA | NA | NA | NA | NA | NA | NA | NA | NA | NA | NA | NA | NA | NA | NA | NA | NA | NA | NA | NA | NA |
| 2023-12-31 | 2023-09-30 | 2023-06-30 | 2023-03-31 | 2022-12-31 | 2022-09-30 | 2022-06-30 | 2022-03-31 | 2021-12-31 | 2021-09-30 | 2021-06-30 | 2021-03-31 | 2020-12-31 | 2020-09-30 | 2020-06-30 | 2020-03-31 | 2019-12-31 | 2019-09-30 | 2019-06-30 | 2019-03-31 | 2018-12-31 | 2018-09-30 | 2018-06-30 | 2018-03-31 | 2017-12-31 | 2017-09-30 | 2017-06-30 | 2017-03-31 | 2016-12-31 | 2016-09-30 | 2016-06-30 | 2016-03-31 | 2015-12-31 | 2015-09-30 | 2015-06-30 | 2015-03-31 | 2014-12-31 | 2014-09-30 | 2014-06-30 | 2014-03-31 | 2013-12-31 | 2013-09-30 | 2013-06-30 | 2013-03-31 | 2012-12-31 | 2012-09-30 | 2012-06-30 | 2012-03-31 | 2011-12-31 | 2011-09-30 | 2011-06-30 | 2011-03-31 | 2010-12-31 | 2010-09-30 | 2010-06-30 | 2010-03-31 | ||
|---|---|---|---|---|---|---|---|---|---|---|---|---|---|---|---|---|---|---|---|---|---|---|---|---|---|---|---|---|---|---|---|---|---|---|---|---|---|---|---|---|---|---|---|---|---|---|---|---|---|---|---|---|---|---|---|---|---|
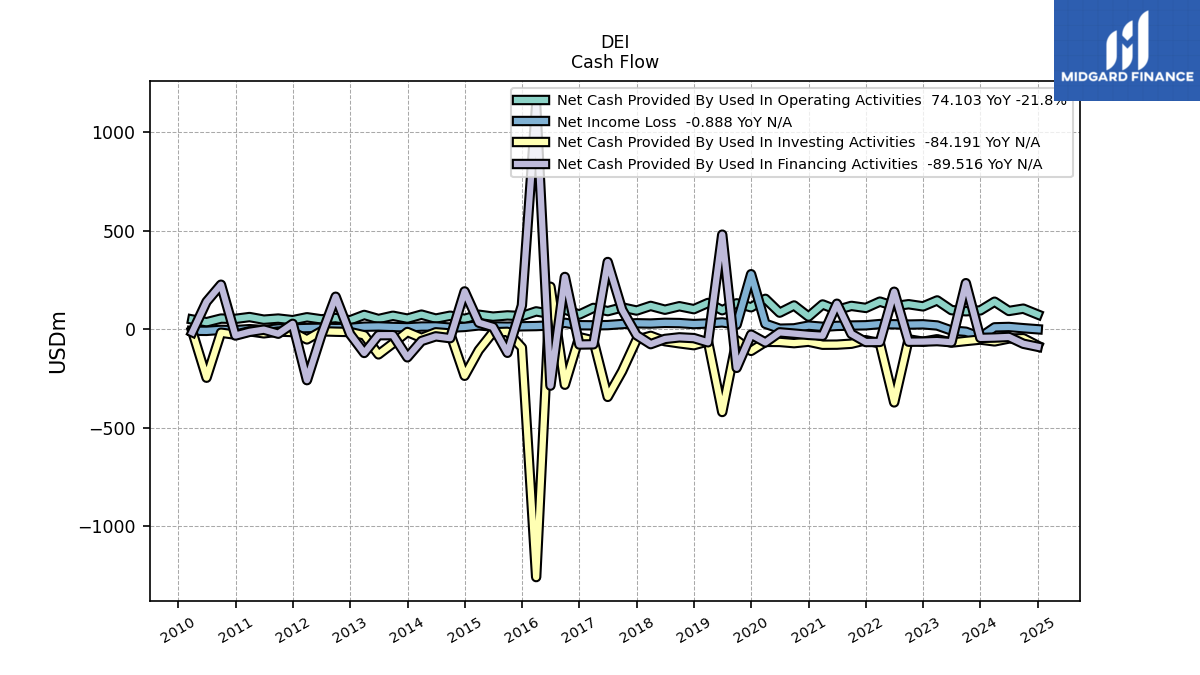
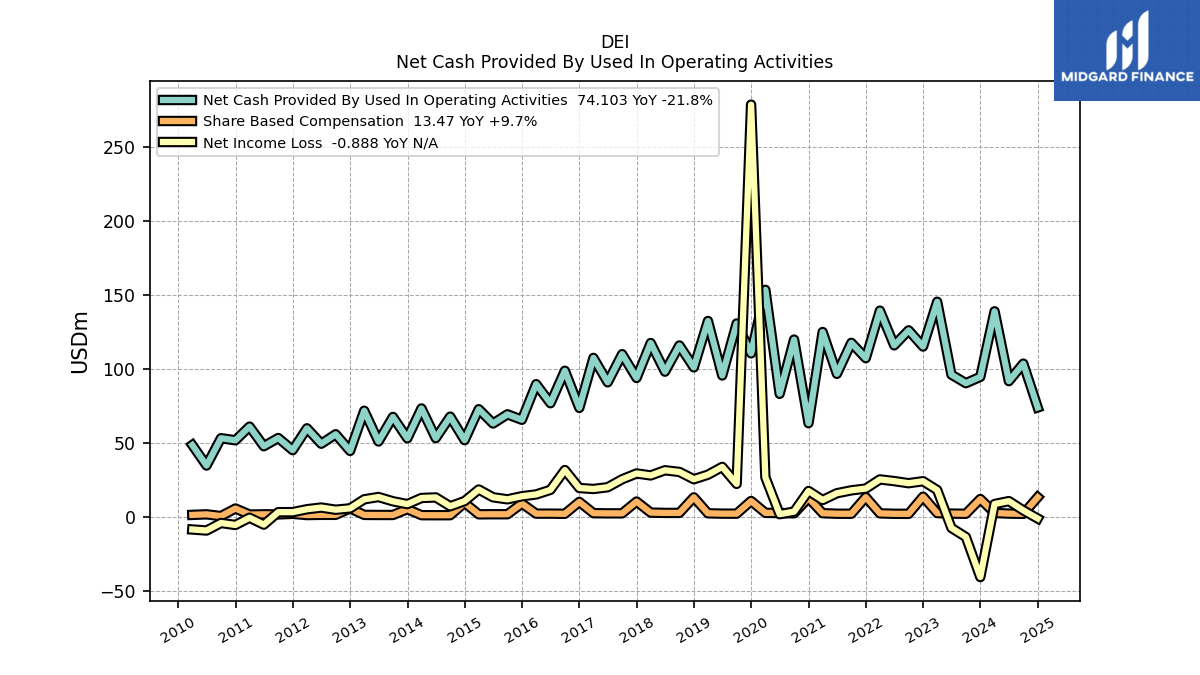
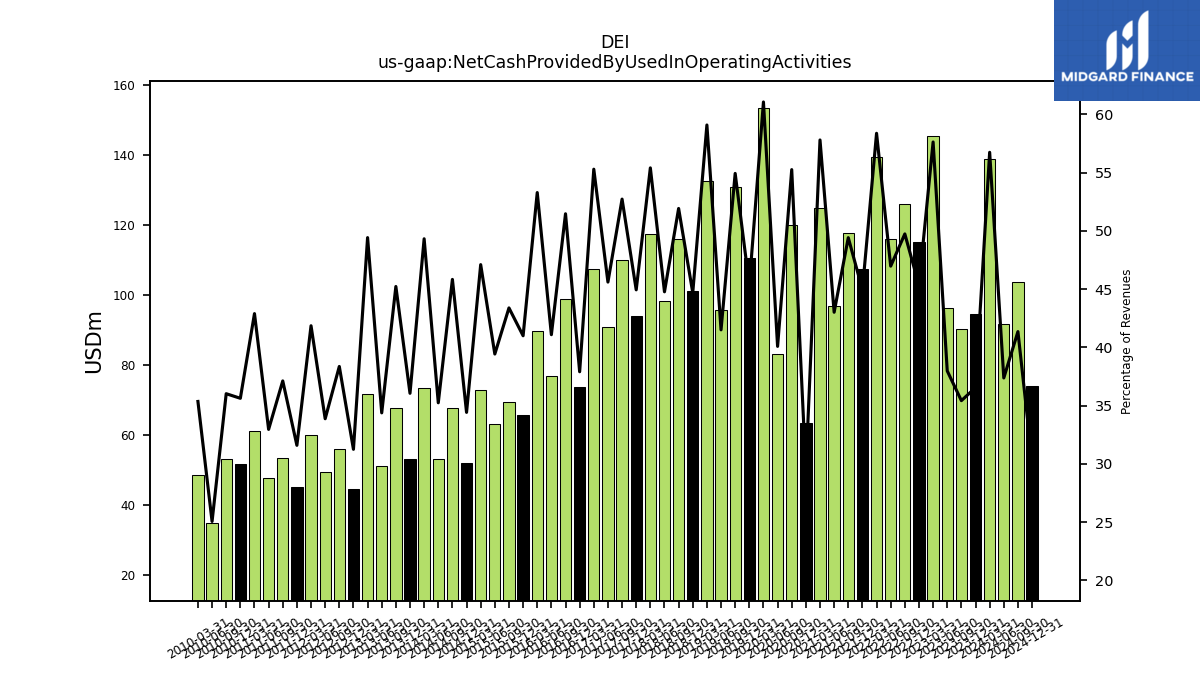
| Net Cash Provided By Used In Operating Activities | 94.75 | 90.49 | 96.25 | 145.47 | 115.22 | 126.18 | 116.02 | 139.47 | 107.37 | 117.74 | 96.79 | 125.04 | 63.49 | 119.92 | 83.30 | 153.51 | 110.62 | 130.79 | 95.69 | 132.49 | 101.14 | 115.96 | 98.26 | 117.62 | 94.02 | 110.08 | 91.05 | 107.55 | 73.79 | 98.89 | 76.93 | 89.84 | 65.78 | 69.46 | 63.27 | 72.93 | 52.01 | 67.91 | 53.37 | 73.44 | 53.25 | 67.70 | 51.13 | 71.89 | 44.73 | 56.01 | 49.61 | 60.02 | 45.26 | 53.48 | 47.92 | 61.17 | 51.94 | 53.34 | 34.88 | 48.72 | |
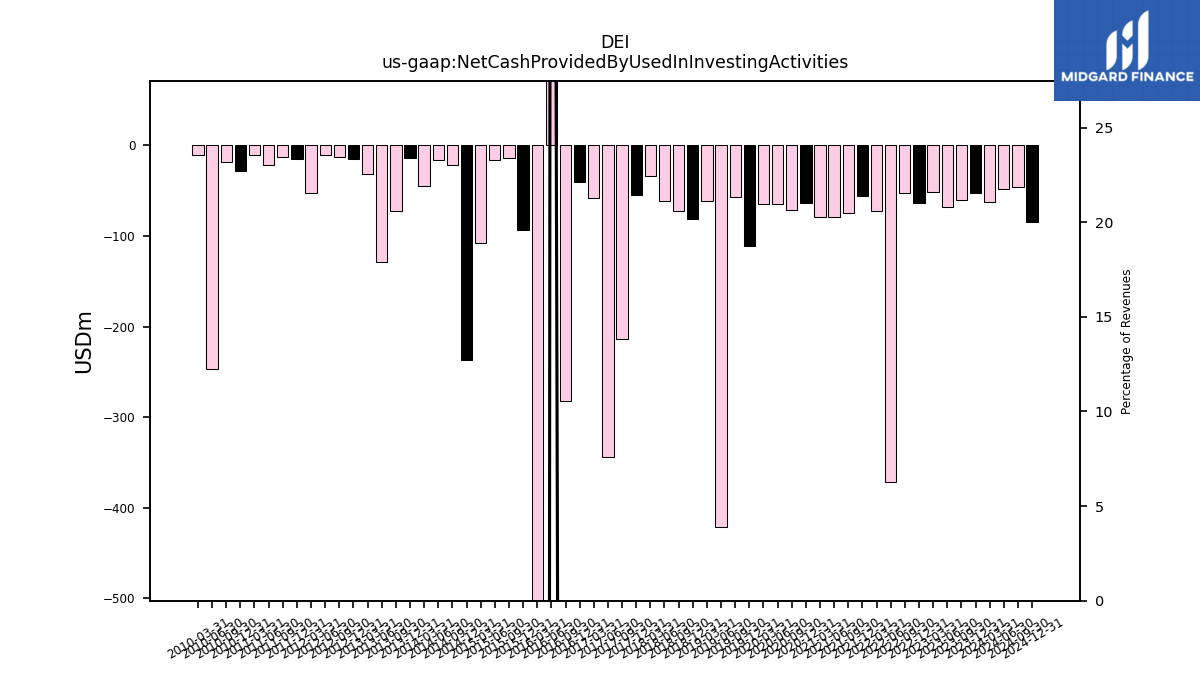
| Net Cash Provided By Used In Investing Activities | -53.22 | -60.44 | -68.53 | -51.40 | -63.95 | -52.19 | -371.87 | -72.94 | -56.31 | -74.23 | -78.84 | -79.32 | -63.88 | -71.33 | -65.17 | -64.78 | -110.60 | -56.62 | -420.61 | -61.84 | -81.57 | -72.16 | -61.50 | -34.32 | -54.42 | -213.53 | -343.87 | -57.78 | -40.94 | -282.22 | 214.94 | -1257.94 | -93.89 | -13.78 | -16.19 | -107.73 | -236.87 | -22.15 | -16.21 | -44.73 | -14.57 | -72.64 | -128.41 | -31.39 | -14.89 | -13.25 | -11.02 | -52.35 | -14.82 | -12.56 | -21.52 | -11.06 | -28.47 | -18.24 | -246.73 | -11.18 | |
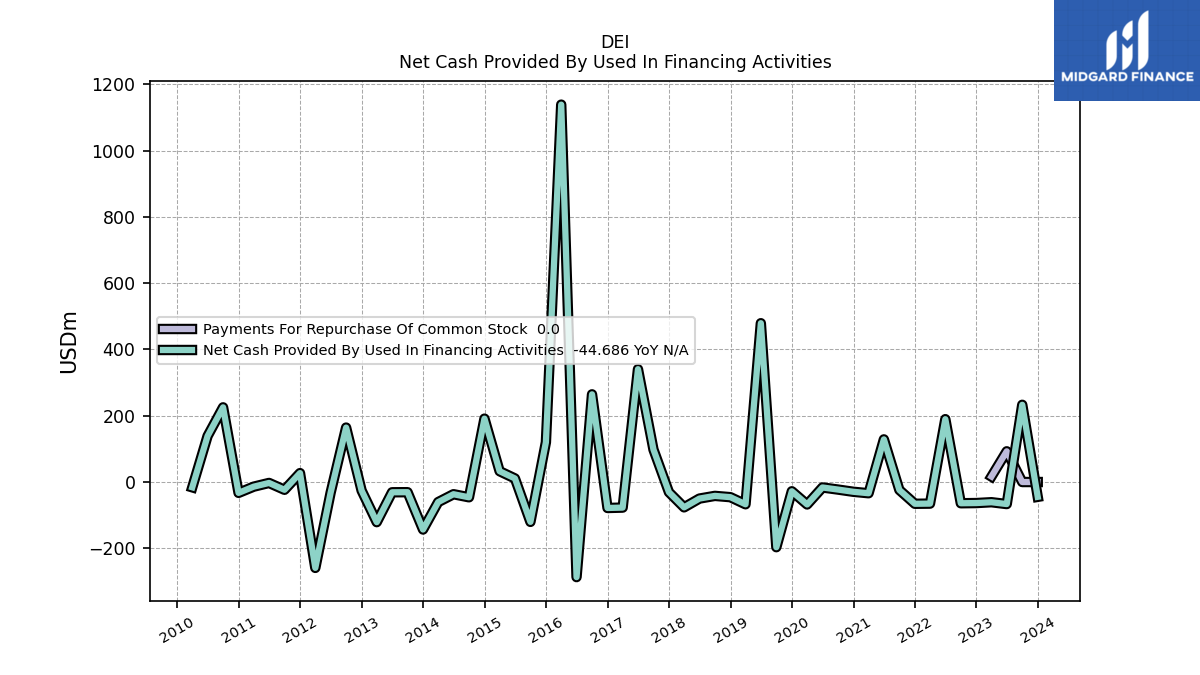
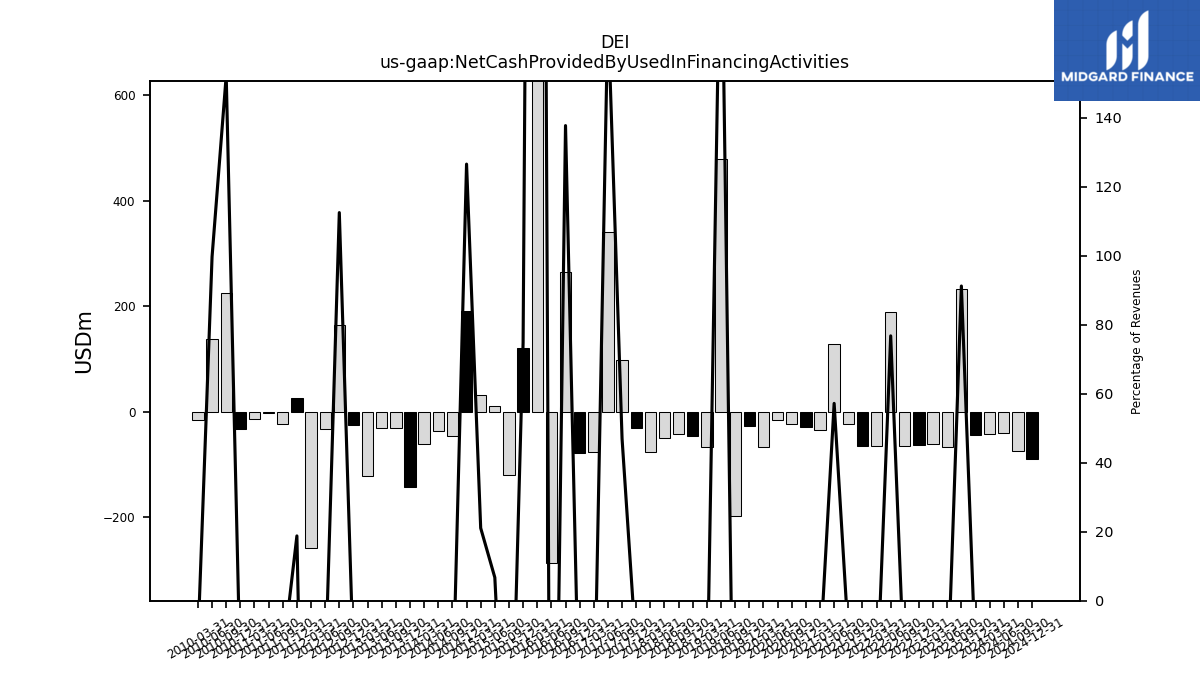
| Net Cash Provided By Used In Financing Activities | -44.69 | 233.00 | -66.51 | -60.93 | -63.44 | -64.03 | 189.62 | -65.16 | -65.64 | -23.98 | 128.71 | -33.84 | -29.45 | -22.74 | -16.43 | -67.71 | -27.84 | -196.62 | 479.16 | -67.16 | -45.71 | -41.84 | -49.92 | -76.38 | -30.69 | 98.04 | 340.44 | -77.17 | -78.33 | 264.58 | -286.89 | 1138.50 | 119.98 | -120.28 | 10.81 | 32.62 | 191.22 | -46.07 | -36.79 | -60.49 | -143.28 | -30.66 | -30.94 | -121.07 | -25.66 | 164.25 | -32.10 | -259.12 | 26.93 | -23.45 | -2.80 | -14.00 | -32.73 | 225.33 | 138.80 | -15.98 |
| 2023-12-31 | 2023-09-30 | 2023-06-30 | 2023-03-31 | 2022-12-31 | 2022-09-30 | 2022-06-30 | 2022-03-31 | 2021-12-31 | 2021-09-30 | 2021-06-30 | 2021-03-31 | 2020-12-31 | 2020-09-30 | 2020-06-30 | 2020-03-31 | 2019-12-31 | 2019-09-30 | 2019-06-30 | 2019-03-31 | 2018-12-31 | 2018-09-30 | 2018-06-30 | 2018-03-31 | 2017-12-31 | 2017-09-30 | 2017-06-30 | 2017-03-31 | 2016-12-31 | 2016-09-30 | 2016-06-30 | 2016-03-31 | 2015-12-31 | 2015-09-30 | 2015-06-30 | 2015-03-31 | 2014-12-31 | 2014-09-30 | 2014-06-30 | 2014-03-31 | 2013-12-31 | 2013-09-30 | 2013-06-30 | 2013-03-31 | 2012-12-31 | 2012-09-30 | 2012-06-30 | 2012-03-31 | 2011-12-31 | 2011-09-30 | 2011-06-30 | 2011-03-31 | 2010-12-31 | 2010-09-30 | 2010-06-30 | 2010-03-31 | ||
|---|---|---|---|---|---|---|---|---|---|---|---|---|---|---|---|---|---|---|---|---|---|---|---|---|---|---|---|---|---|---|---|---|---|---|---|---|---|---|---|---|---|---|---|---|---|---|---|---|---|---|---|---|---|---|---|---|---|
| Net Cash Provided By Used In Operating Activities | 94.75 | 90.49 | 96.25 | 145.47 | 115.22 | 126.18 | 116.02 | 139.47 | 107.37 | 117.74 | 96.79 | 125.04 | 63.49 | 119.92 | 83.30 | 153.51 | 110.62 | 130.79 | 95.69 | 132.49 | 101.14 | 115.96 | 98.26 | 117.62 | 94.02 | 110.08 | 91.05 | 107.55 | 73.79 | 98.89 | 76.93 | 89.84 | 65.78 | 69.46 | 63.27 | 72.93 | 52.01 | 67.91 | 53.37 | 73.44 | 53.25 | 67.70 | 51.13 | 71.89 | 44.73 | 56.01 | 49.61 | 60.02 | 45.26 | 53.48 | 47.92 | 61.17 | 51.94 | 53.34 | 34.88 | 48.72 | |
| Net Income Loss | -40.45 | -13.36 | -7.26 | 18.37 | 24.30 | 22.95 | 24.37 | 25.51 | 19.33 | 18.14 | 16.20 | 11.60 | 17.70 | 3.77 | 2.03 | 26.92 | 278.56 | 22.49 | 33.97 | 28.70 | 25.64 | 30.56 | 31.68 | 28.21 | 29.54 | 25.61 | 20.24 | 19.05 | 19.70 | 31.85 | 18.48 | 15.37 | 14.17 | 12.07 | 13.45 | 18.70 | 10.89 | 7.39 | 13.36 | 12.98 | 8.84 | 10.75 | 13.63 | 12.08 | 5.97 | 5.05 | 6.53 | 5.39 | 3.42 | 3.40 | -5.02 | -0.35 | -5.25 | -3.90 | -8.99 | -8.29 | |
| Profit Loss | -55.91 | -21.02 | -15.07 | 16.16 | 25.23 | 21.21 | 23.84 | 26.26 | 18.82 | 15.75 | 13.98 | 7.59 | 16.17 | -1.86 | -5.47 | 29.71 | 322.63 | 23.42 | 39.86 | 32.79 | 23.53 | 35.42 | 37.03 | 32.63 | 31.99 | 28.51 | 22.15 | 21.78 | 22.47 | 35.80 | 21.78 | 16.05 | 16.61 | 14.16 | 15.89 | 22.10 | 12.80 | 8.68 | 15.92 | 15.46 | 10.50 | 12.74 | 14.98 | 14.61 | 7.34 | 6.23 | 8.07 | 6.70 | 4.41 | 4.40 | -6.21 | -0.34 | -6.44 | -4.74 | -11.30 | -10.47 | |
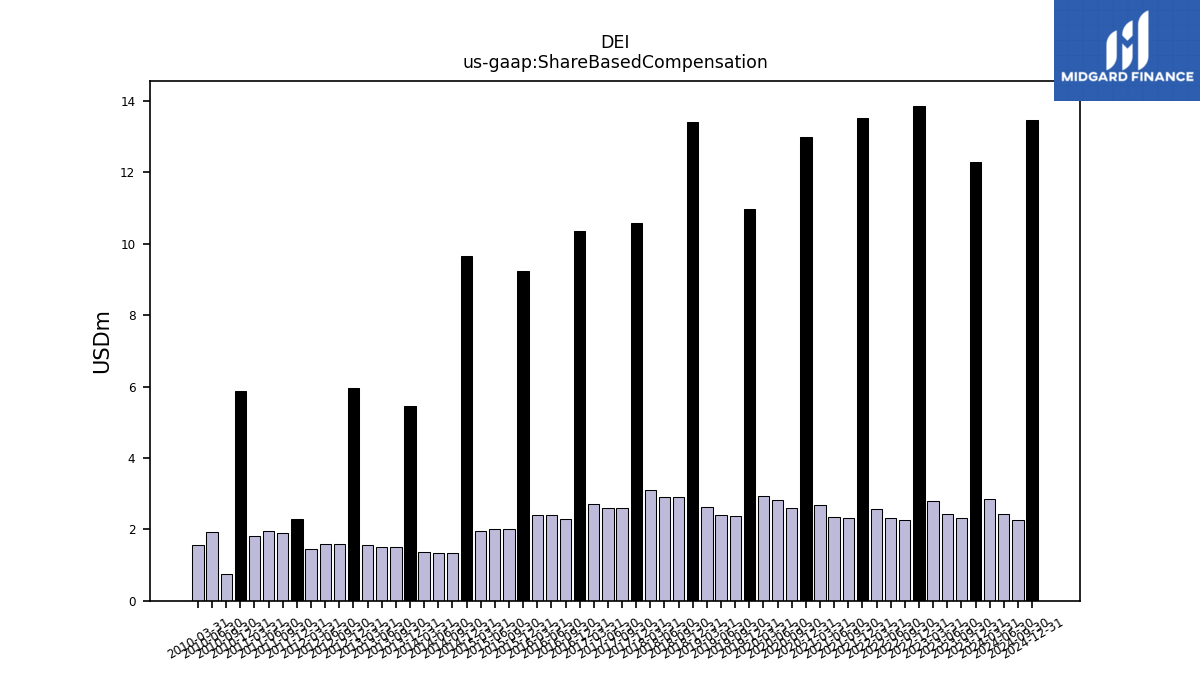
| Share Based Compensation | 12.28 | 2.33 | 2.43 | 2.79 | 13.87 | 2.27 | 2.31 | 2.58 | 13.53 | 2.32 | 2.35 | 2.69 | 13.00 | 2.61 | 2.81 | 2.94 | 10.96 | 2.38 | 2.40 | 2.63 | 13.42 | 2.90 | 2.90 | 3.10 | 10.58 | 2.60 | 2.60 | 2.71 | 10.35 | 2.30 | 2.40 | 2.40 | 9.23 | 2.00 | 2.00 | 1.95 | 9.67 | 1.35 | 1.34 | 1.36 | 5.45 | 1.50 | 1.50 | 1.56 | 5.96 | 1.60 | 1.60 | 1.45 | 2.29 | 1.90 | 1.95 | 1.80 | 5.87 | 0.76 | 1.94 | 1.56 | |
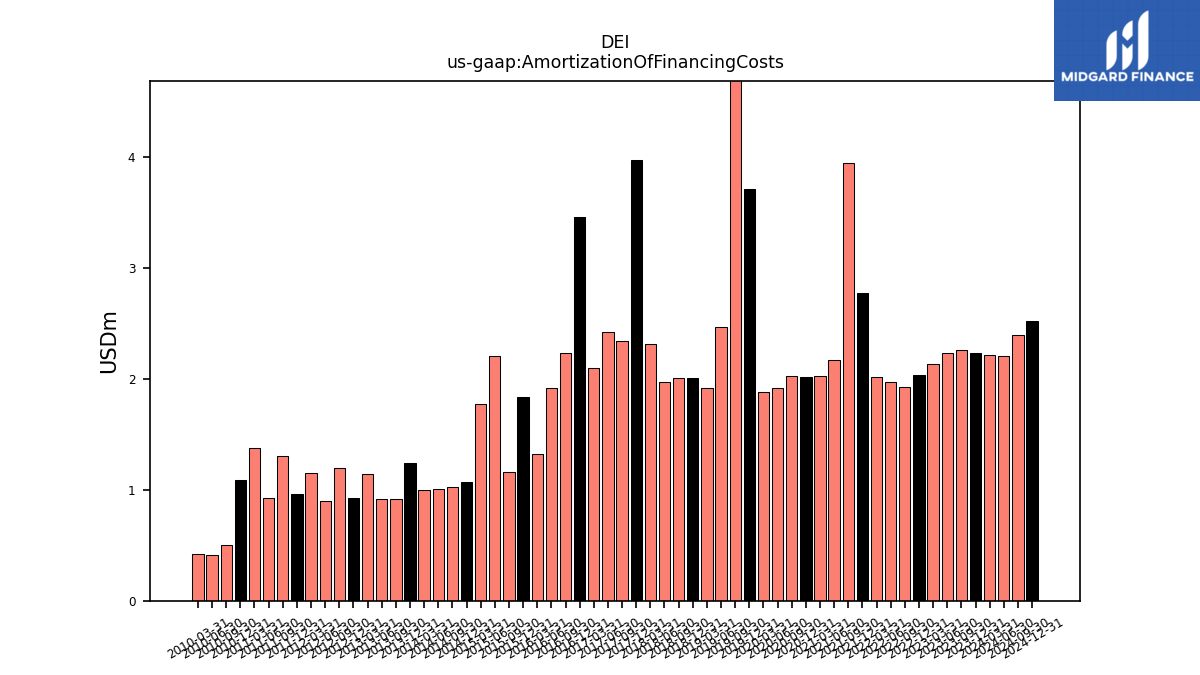
| Amortization Of Financing Costs | 2.23 | 2.26 | 2.23 | 2.13 | 2.04 | 1.93 | 1.97 | 2.01 | 2.77 | 3.94 | 2.17 | 2.02 | 2.02 | 2.02 | 1.92 | 1.88 | 3.71 | 6.22 | 2.46 | 1.92 | 2.01 | 2.01 | 1.97 | 2.31 | 3.97 | 2.34 | 2.42 | 2.10 | 3.46 | 2.23 | 1.92 | 1.32 | 1.83 | 1.16 | 2.20 | 1.77 | 1.07 | 1.02 | 1.00 | 1.00 | 1.24 | 0.91 | 0.91 | 1.15 | 0.92 | 1.20 | 0.90 | 1.16 | 0.96 | 1.30 | 0.93 | 1.38 | 1.09 | 0.51 | 0.41 | 0.42 |
| 2023-12-31 | 2023-09-30 | 2023-06-30 | 2023-03-31 | 2022-12-31 | 2022-09-30 | 2022-06-30 | 2022-03-31 | 2021-12-31 | 2021-09-30 | 2021-06-30 | 2021-03-31 | 2020-12-31 | 2020-09-30 | 2020-06-30 | 2020-03-31 | 2019-12-31 | 2019-09-30 | 2019-06-30 | 2019-03-31 | 2018-12-31 | 2018-09-30 | 2018-06-30 | 2018-03-31 | 2017-12-31 | 2017-09-30 | 2017-06-30 | 2017-03-31 | 2016-12-31 | 2016-09-30 | 2016-06-30 | 2016-03-31 | 2015-12-31 | 2015-09-30 | 2015-06-30 | 2015-03-31 | 2014-12-31 | 2014-09-30 | 2014-06-30 | 2014-03-31 | 2013-12-31 | 2013-09-30 | 2013-06-30 | 2013-03-31 | 2012-12-31 | 2012-09-30 | 2012-06-30 | 2012-03-31 | 2011-12-31 | 2011-09-30 | 2011-06-30 | 2011-03-31 | 2010-12-31 | 2010-09-30 | 2010-06-30 | 2010-03-31 | ||
|---|---|---|---|---|---|---|---|---|---|---|---|---|---|---|---|---|---|---|---|---|---|---|---|---|---|---|---|---|---|---|---|---|---|---|---|---|---|---|---|---|---|---|---|---|---|---|---|---|---|---|---|---|---|---|---|---|---|
| Net Cash Provided By Used In Investing Activities | -53.22 | -60.44 | -68.53 | -51.40 | -63.95 | -52.19 | -371.87 | -72.94 | -56.31 | -74.23 | -78.84 | -79.32 | -63.88 | -71.33 | -65.17 | -64.78 | -110.60 | -56.62 | -420.61 | -61.84 | -81.57 | -72.16 | -61.50 | -34.32 | -54.42 | -213.53 | -343.87 | -57.78 | -40.94 | -282.22 | 214.94 | -1257.94 | -93.89 | -13.78 | -16.19 | -107.73 | -236.87 | -22.15 | -16.21 | -44.73 | -14.57 | -72.64 | -128.41 | -31.39 | -14.89 | -13.25 | -11.02 | -52.35 | -14.82 | -12.56 | -21.52 | -11.06 | -28.47 | -18.24 | -246.73 | -11.18 |
| 2023-12-31 | 2023-09-30 | 2023-06-30 | 2023-03-31 | 2022-12-31 | 2022-09-30 | 2022-06-30 | 2022-03-31 | 2021-12-31 | 2021-09-30 | 2021-06-30 | 2021-03-31 | 2020-12-31 | 2020-09-30 | 2020-06-30 | 2020-03-31 | 2019-12-31 | 2019-09-30 | 2019-06-30 | 2019-03-31 | 2018-12-31 | 2018-09-30 | 2018-06-30 | 2018-03-31 | 2017-12-31 | 2017-09-30 | 2017-06-30 | 2017-03-31 | 2016-12-31 | 2016-09-30 | 2016-06-30 | 2016-03-31 | 2015-12-31 | 2015-09-30 | 2015-06-30 | 2015-03-31 | 2014-12-31 | 2014-09-30 | 2014-06-30 | 2014-03-31 | 2013-12-31 | 2013-09-30 | 2013-06-30 | 2013-03-31 | 2012-12-31 | 2012-09-30 | 2012-06-30 | 2012-03-31 | 2011-12-31 | 2011-09-30 | 2011-06-30 | 2011-03-31 | 2010-12-31 | 2010-09-30 | 2010-06-30 | 2010-03-31 | ||
|---|---|---|---|---|---|---|---|---|---|---|---|---|---|---|---|---|---|---|---|---|---|---|---|---|---|---|---|---|---|---|---|---|---|---|---|---|---|---|---|---|---|---|---|---|---|---|---|---|---|---|---|---|---|---|---|---|---|
| Net Cash Provided By Used In Financing Activities | -44.69 | 233.00 | -66.51 | -60.93 | -63.44 | -64.03 | 189.62 | -65.16 | -65.64 | -23.98 | 128.71 | -33.84 | -29.45 | -22.74 | -16.43 | -67.71 | -27.84 | -196.62 | 479.16 | -67.16 | -45.71 | -41.84 | -49.92 | -76.38 | -30.69 | 98.04 | 340.44 | -77.17 | -78.33 | 264.58 | -286.89 | 1138.50 | 119.98 | -120.28 | 10.81 | 32.62 | 191.22 | -46.07 | -36.79 | -60.49 | -143.28 | -30.66 | -30.94 | -121.07 | -25.66 | 164.25 | -32.10 | -259.12 | 26.93 | -23.45 | -2.80 | -14.00 | -32.73 | 225.33 | 138.80 | -15.98 | |
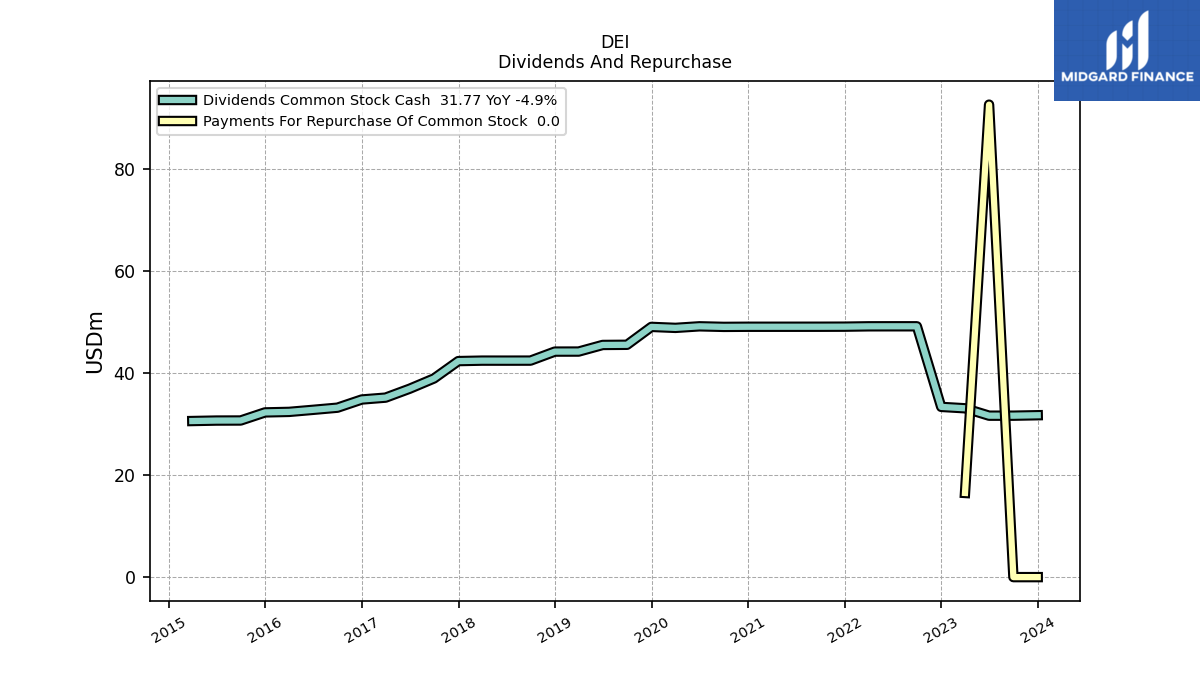
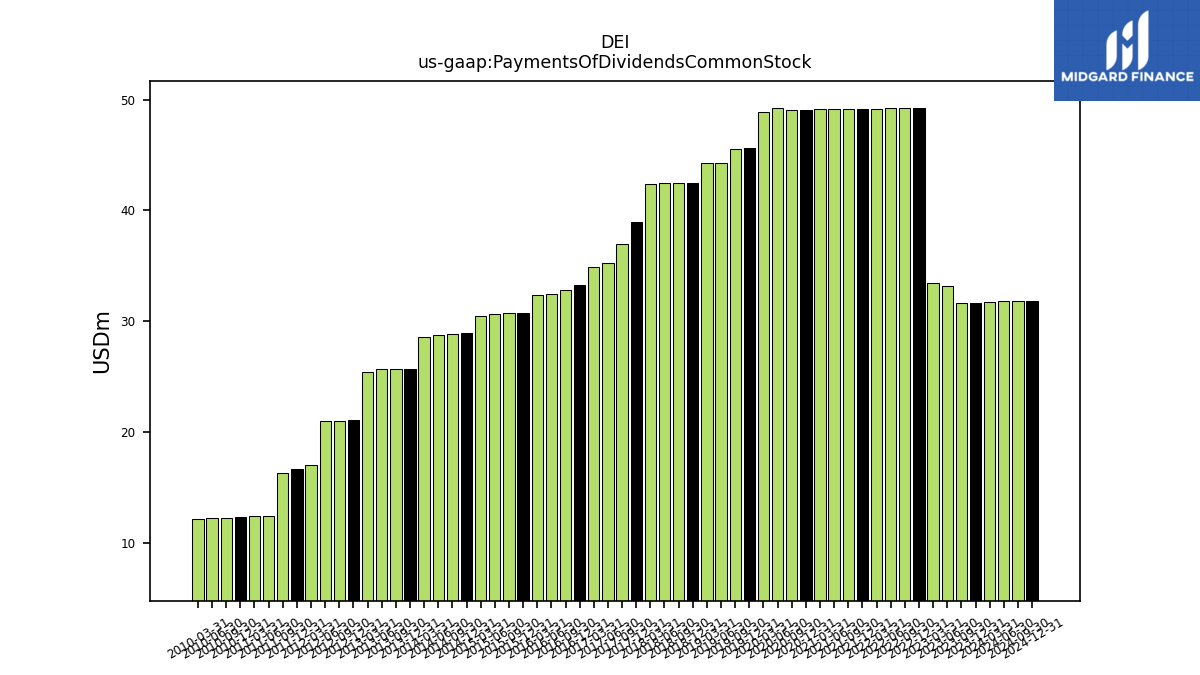
| Payments Of Dividends Common Stock | 31.68 | 31.68 | 33.13 | 33.40 | 49.22 | 49.22 | 49.22 | 49.15 | 49.14 | 49.13 | 49.13 | 49.13 | 49.10 | 49.10 | 49.22 | 48.91 | 45.59 | 45.56 | 44.26 | 44.26 | 42.48 | 42.48 | 42.48 | 42.39 | 38.98 | 36.97 | 35.22 | 34.85 | 33.25 | 32.83 | 32.42 | 32.32 | 30.73 | 30.72 | 30.63 | 30.42 | 28.96 | 28.82 | 28.73 | 28.52 | 25.67 | 25.67 | 25.66 | 25.42 | 21.11 | 20.96 | 20.94 | 17.04 | 16.62 | 16.32 | 12.43 | 12.41 | 12.35 | 12.26 | 12.20 | 12.16 | |
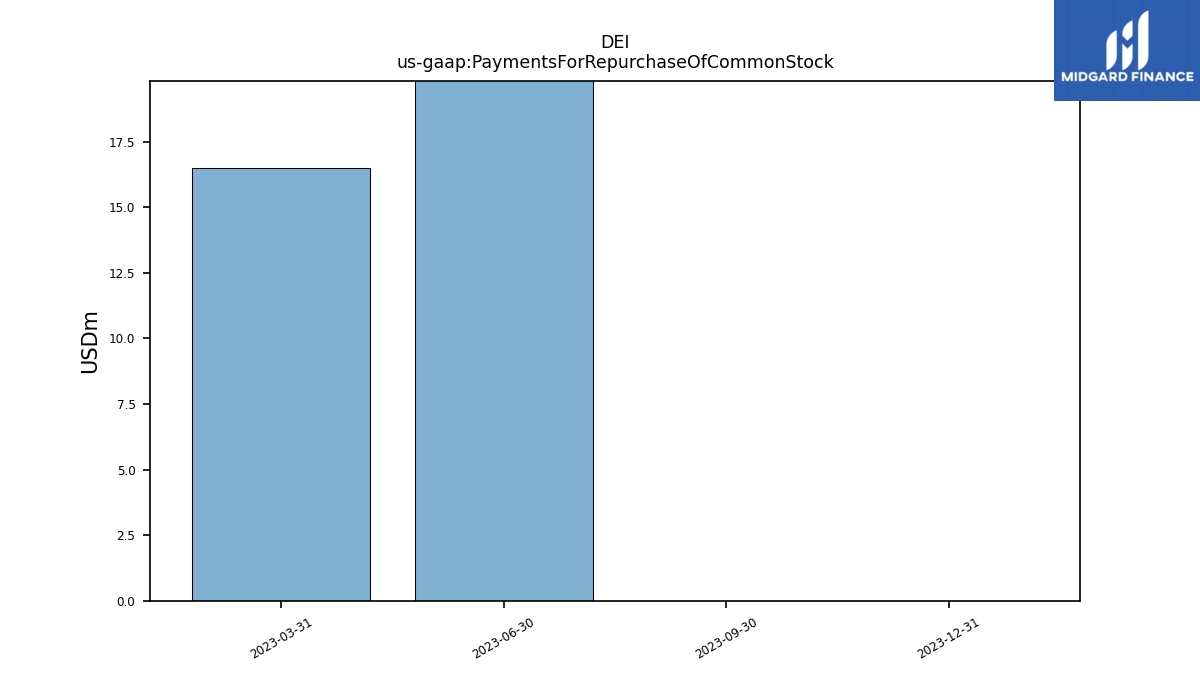
| Payments For Repurchase Of Common Stock | 0.00 | 0.00 | 92.72 | 16.51 | NA | NA | NA | NA | NA | NA | NA | NA | NA | NA | NA | NA | NA | NA | NA | NA | NA | NA | NA | NA | NA | NA | NA | NA | NA | NA | NA | NA | NA | NA | NA | NA | NA | NA | NA | NA | NA | NA | NA | NA | NA | NA | NA | NA | NA | NA | NA | NA | NA | NA | NA | NA |
| 2023-12-31 | 2023-09-30 | 2023-06-30 | 2023-03-31 | 2022-12-31 | 2022-09-30 | 2022-06-30 | 2022-03-31 | 2021-12-31 | 2021-09-30 | 2021-06-30 | 2021-03-31 | 2020-12-31 | 2020-09-30 | 2020-06-30 | 2020-03-31 | 2019-12-31 | 2019-09-30 | 2019-06-30 | 2019-03-31 | 2018-12-31 | 2018-09-30 | 2018-06-30 | 2018-03-31 | 2017-12-31 | 2017-09-30 | 2017-06-30 | 2017-03-31 | 2016-12-31 | 2016-09-30 | 2016-06-30 | 2016-03-31 | 2015-12-31 | 2015-09-30 | 2015-06-30 | 2015-03-31 | 2014-12-31 | 2014-09-30 | 2014-06-30 | 2014-03-31 | 2013-12-31 | 2013-09-30 | 2013-06-30 | 2013-03-31 | 2012-12-31 | 2012-09-30 | 2012-06-30 | 2012-03-31 | 2011-12-31 | 2011-09-30 | 2011-06-30 | 2011-03-31 | 2010-12-31 | 2010-09-30 | 2010-06-30 | 2010-03-31 | ||
|---|---|---|---|---|---|---|---|---|---|---|---|---|---|---|---|---|---|---|---|---|---|---|---|---|---|---|---|---|---|---|---|---|---|---|---|---|---|---|---|---|---|---|---|---|---|---|---|---|---|---|---|---|---|---|---|---|---|
| Revenues | 259.28 | 255.41 | 253.41 | 252.39 | 254.14 | 253.66 | 246.97 | 238.88 | 238.85 | 238.24 | 225.01 | 216.29 | 215.39 | 216.99 | 207.80 | 251.35 | 243.89 | 238.07 | 230.53 | 224.19 | 226.29 | 223.31 | 219.47 | 212.25 | 209.19 | 208.75 | 199.63 | 194.48 | 194.64 | 192.12 | 187.22 | 168.57 | 160.43 | 160.08 | 160.46 | 154.81 | 151.09 | 148.15 | 151.43 | 148.88 | 147.68 | 149.69 | 148.72 | 145.46 | 143.15 | 145.99 | 146.47 | 143.39 | 143.28 | 144.06 | 145.41 | 142.59 | 145.78 | 148.07 | 139.21 | 137.79 | |
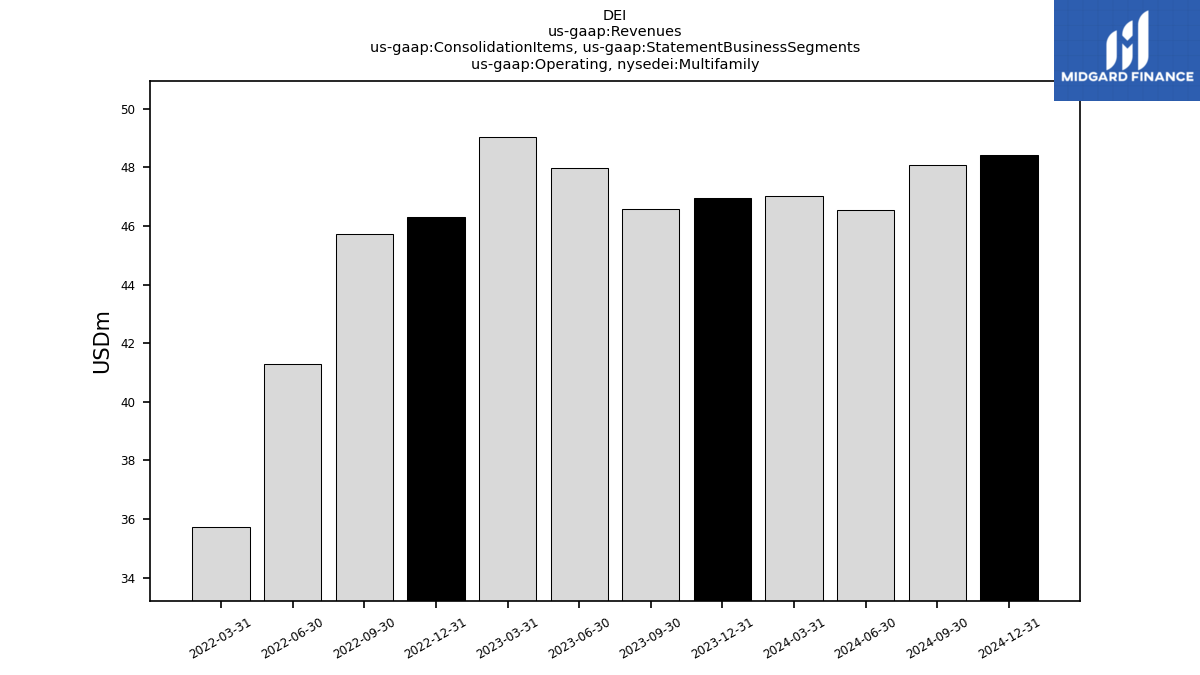
| Operating, Multifamily | 46.95 | 46.59 | 47.97 | 49.03 | 46.31 | 45.74 | 41.29 | 35.74 | NA | NA | NA | NA | NA | NA | NA | NA | NA | NA | NA | NA | NA | NA | NA | NA | NA | NA | NA | NA | NA | NA | NA | NA | NA | NA | NA | NA | NA | NA | NA | NA | NA | NA | NA | NA | NA | NA | NA | NA | NA | NA | NA | NA | NA | NA | NA | NA | |
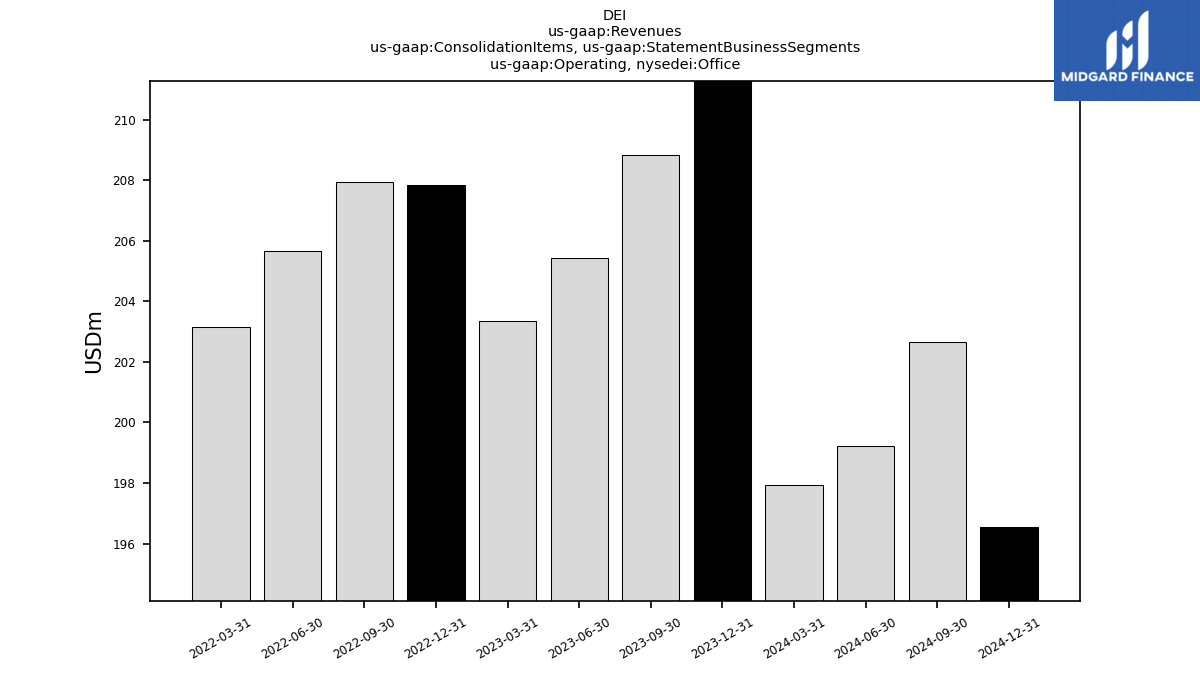
| Operating, Office | 212.33 | 208.82 | 205.43 | 203.36 | 207.83 | 207.93 | 205.68 | 203.14 | NA | NA | NA | NA | NA | NA | NA | NA | NA | NA | NA | NA | NA | NA | NA | NA | NA | NA | NA | NA | NA | NA | NA | NA | NA | NA | NA | NA | NA | NA | NA | NA | NA | NA | NA | NA | NA | NA | NA | NA | NA | NA | NA | NA | NA | NA | NA | NA | |
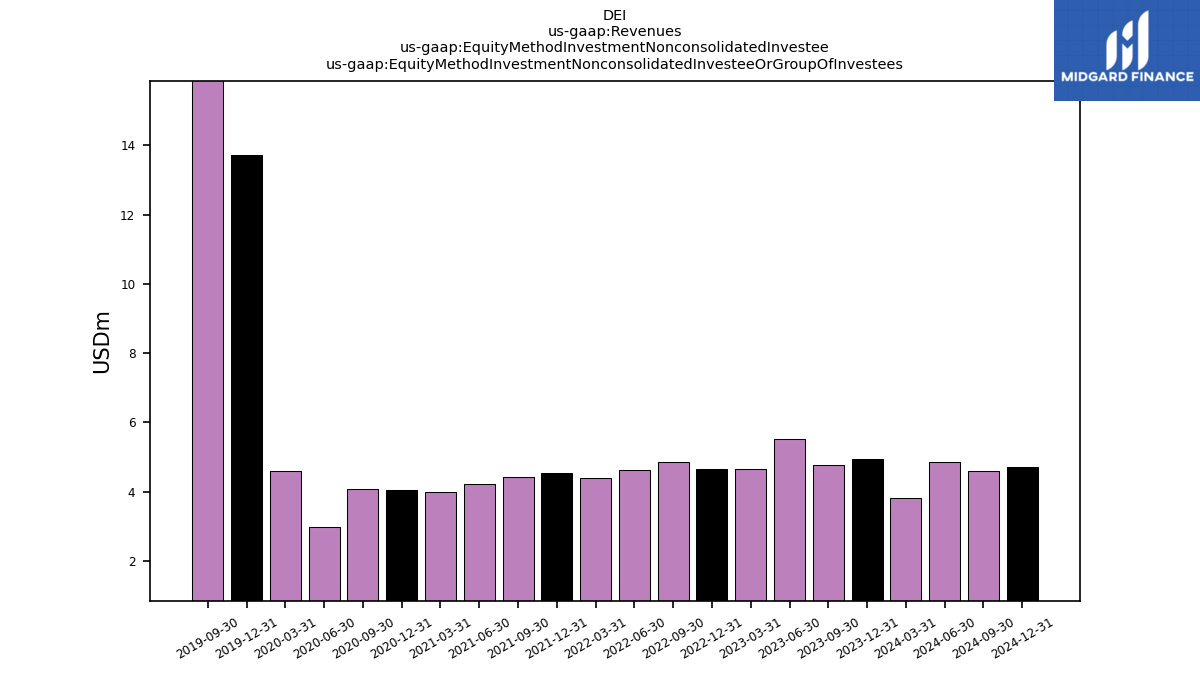
| Equity Method Investment Nonconsolidated Investee Or Group Of Investees | 4.95 | 4.76 | 5.52 | 4.64 | 4.67 | 4.86 | 4.64 | 4.40 | 4.54 | 4.43 | 4.21 | 4.00 | 4.06 | 4.08 | 3.00 | 4.60 | 13.71 | 21.07 | NA | NA | NA | NA | NA | NA | NA | NA | NA | NA | NA | NA | NA | NA | NA | NA | NA | NA | NA | NA | NA | NA | NA | NA | NA | NA | NA | NA | NA | NA | NA | NA | NA | NA | NA | NA | NA | NA | |
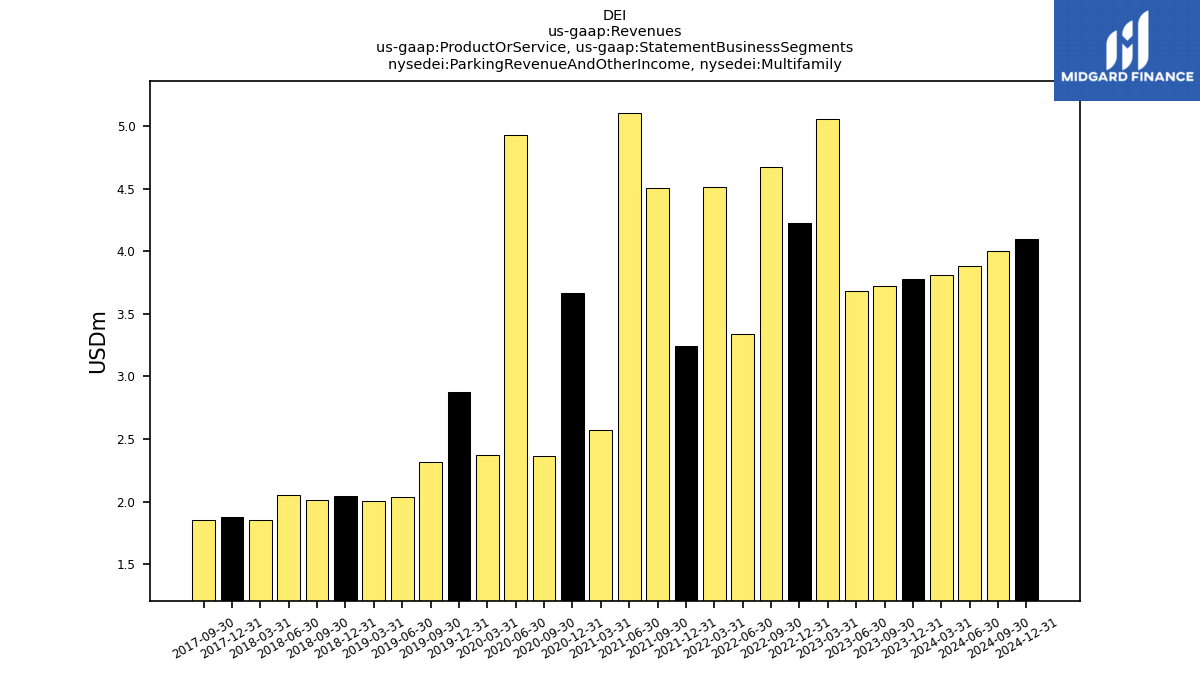
| Parking Revenue And Other Income, Multifamily | 3.78 | 3.72 | 3.69 | 5.06 | 4.23 | 4.68 | 3.34 | 4.51 | 3.25 | 4.51 | 5.11 | 2.57 | 3.67 | 2.37 | 4.93 | 2.38 | 2.88 | 2.31 | 2.04 | 2.00 | 2.04 | 2.01 | 2.05 | 1.85 | 1.87 | 1.85 | NA | NA | NA | NA | NA | NA | NA | NA | NA | NA | NA | NA | NA | NA | NA | NA | NA | NA | NA | NA | NA | NA | NA | NA | NA | NA | NA | NA | NA | NA | |
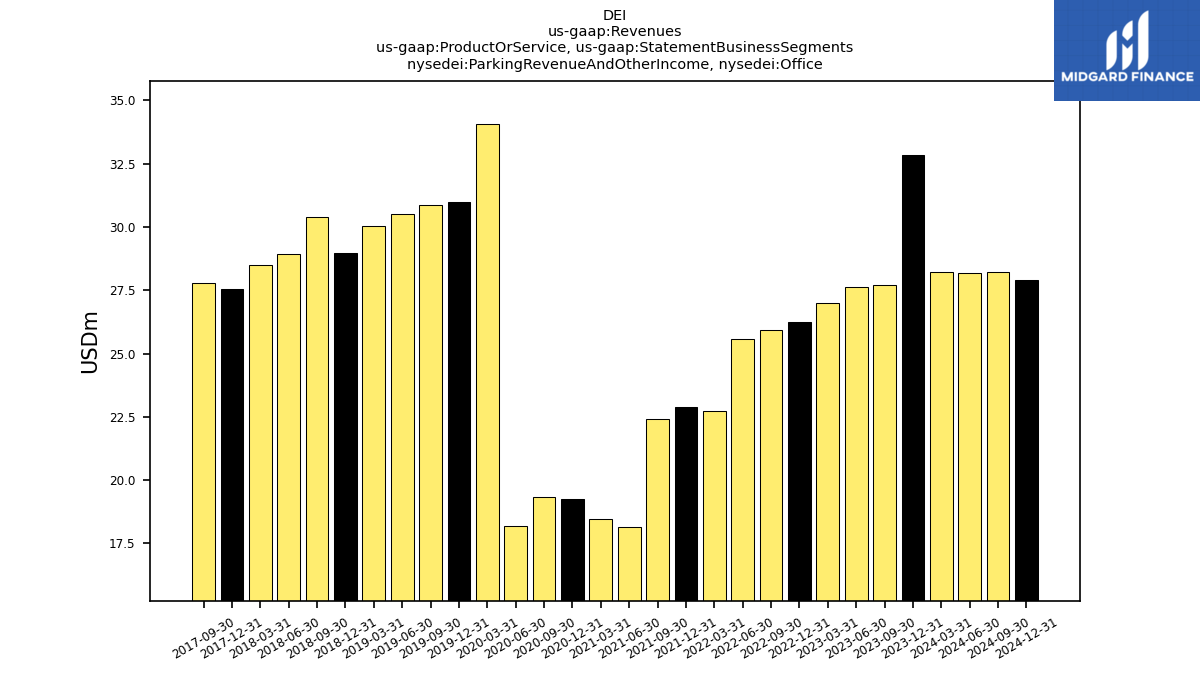
| Parking Revenue And Other Income, Office | 32.83 | 27.72 | 27.64 | 27.01 | 26.23 | 25.92 | 25.58 | 22.71 | 22.89 | 22.40 | 18.17 | 18.46 | 19.25 | 19.32 | 18.18 | 34.06 | 30.99 | 30.88 | 30.52 | 30.05 | 28.95 | 30.37 | 28.95 | 28.51 | 27.57 | 27.77 | NA | NA | NA | NA | NA | NA | NA | NA | NA | NA | NA | NA | NA | NA | NA | NA | NA | NA | NA | NA | NA | NA | NA | NA | NA | NA | NA | NA | NA | NA | |
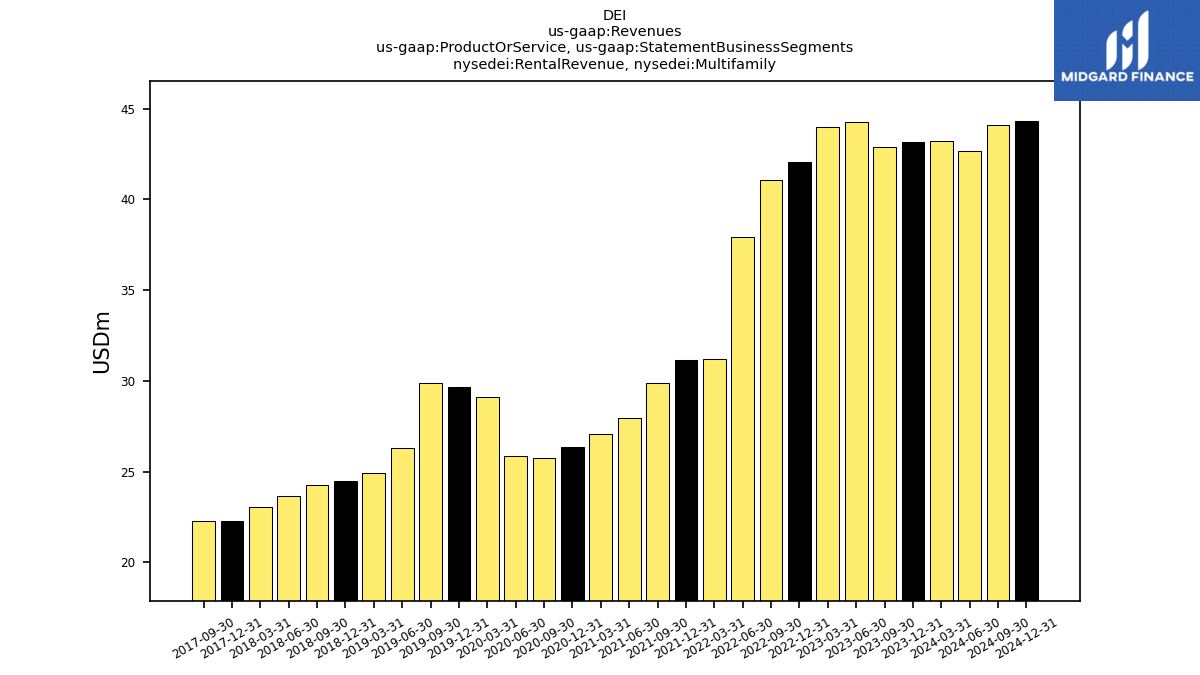
| Rental Revenue, Multifamily | 43.17 | 42.86 | 44.29 | 43.97 | 42.08 | 41.06 | 37.95 | 31.23 | 31.16 | 29.88 | 27.97 | 27.08 | 26.33 | 25.73 | 25.87 | 29.09 | 29.64 | 29.85 | 26.31 | 24.89 | 24.47 | 24.24 | 23.66 | 23.06 | 22.28 | 22.28 | NA | NA | NA | NA | NA | NA | NA | NA | NA | NA | NA | NA | NA | NA | NA | NA | NA | NA | NA | NA | NA | NA | NA | NA | NA | NA | NA | NA | NA | NA | |
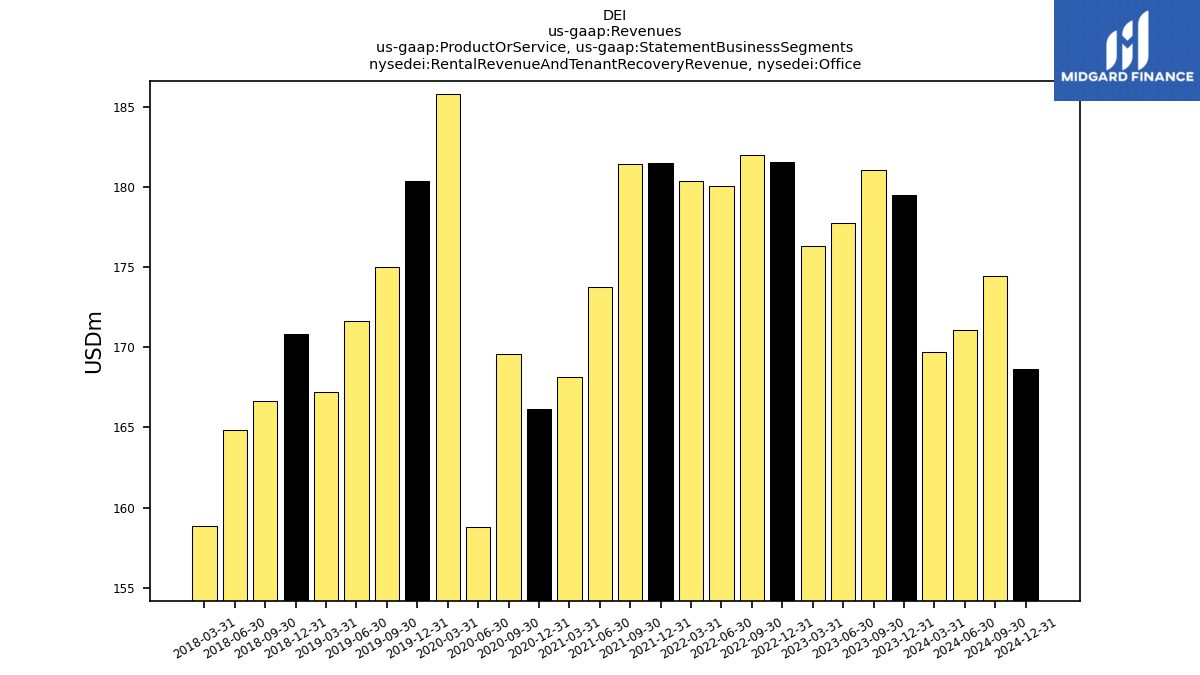
| Rental Revenue And Tenant Recovery Revenue, Office | 179.50 | 181.11 | 177.79 | 176.34 | 181.60 | 182.01 | 180.10 | 180.43 | 181.56 | 181.46 | 173.76 | 168.18 | 166.15 | 169.57 | 158.81 | 185.83 | 180.39 | 175.02 | 171.67 | 167.24 | 170.83 | 166.68 | 164.81 | 158.82 | NA | NA | NA | NA | NA | NA | NA | NA | NA | NA | NA | NA | NA | NA | NA | NA | NA | NA | NA | NA | NA | NA | NA | NA | NA | NA | NA | NA | NA | NA | NA | NA | |
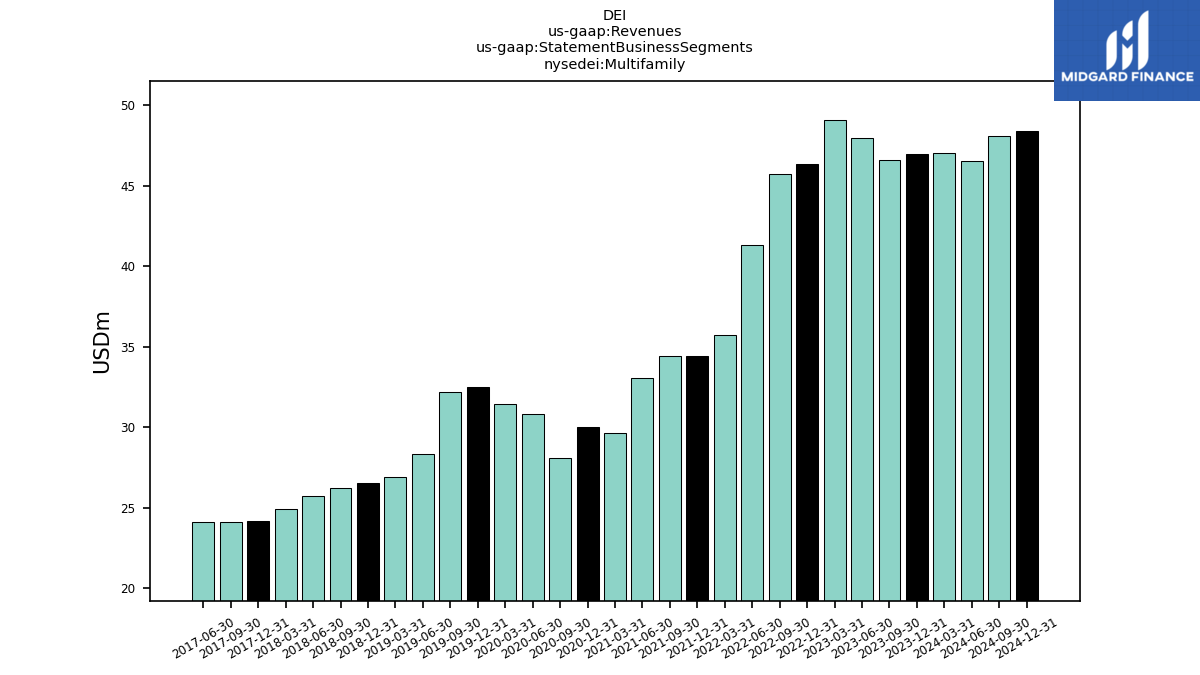
| Multifamily | 46.95 | 46.59 | 47.97 | 49.03 | 46.31 | 45.74 | 41.29 | 35.74 | 34.41 | 34.39 | 33.08 | 29.65 | 29.99 | 28.09 | 30.81 | 31.46 | 32.52 | 32.17 | 28.34 | 26.90 | 26.51 | 26.25 | 25.71 | 24.91 | 24.15 | 24.13 | 24.09 | NA | NA | NA | NA | NA | NA | NA | NA | NA | NA | NA | NA | NA | NA | NA | NA | NA | NA | NA | NA | NA | NA | NA | NA | NA | NA | NA | NA | NA | |
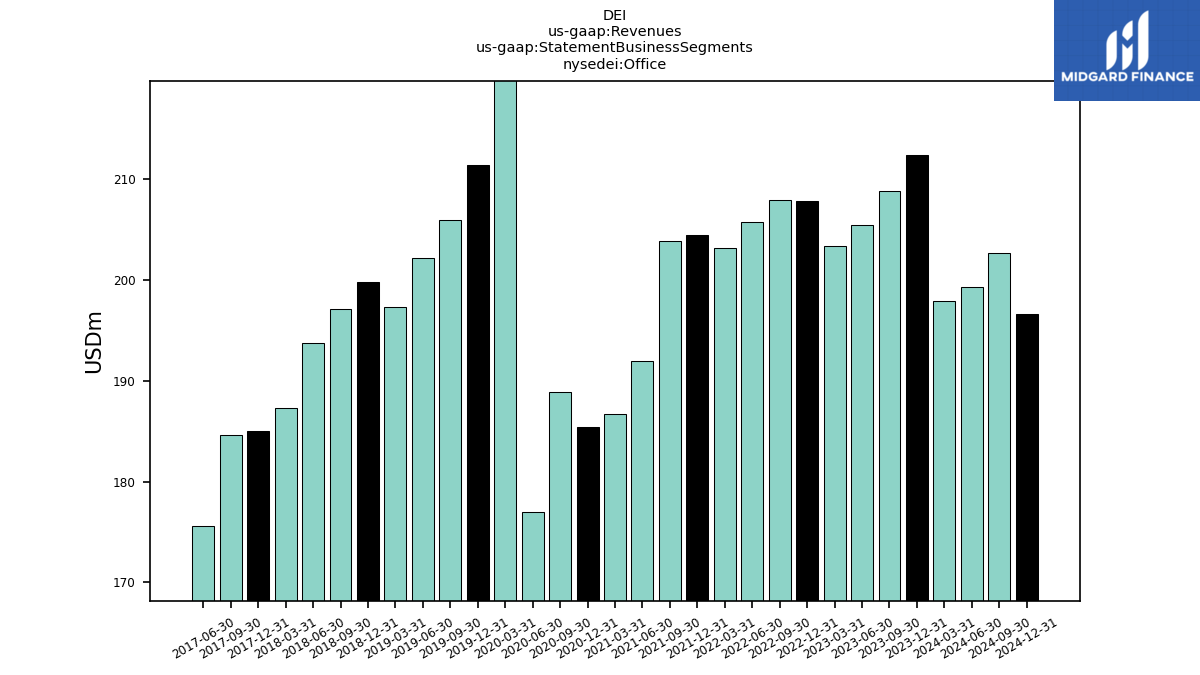
| Office | 212.33 | 208.82 | 205.43 | 203.36 | 207.83 | 207.93 | 205.68 | 203.14 | 204.44 | 203.86 | 191.93 | 186.64 | 185.40 | 188.90 | 176.99 | 219.89 | 211.38 | 205.90 | 202.19 | 197.29 | 199.78 | 197.05 | 193.76 | 187.33 | 185.04 | 184.62 | 175.54 | NA | NA | NA | NA | NA | NA | NA | NA | NA | NA | NA | NA | NA | NA | NA | NA | NA | NA | NA | NA | NA | NA | NA | NA | NA | NA | NA | NA | NA | |
| Revenue From Contract With Customer Excluding Assessed Tax | 951.39 | 23.40 | 22.90 | 22.70 | 22.30 | 22.10 | 21.50 | 19.00 | 18.90 | 19.00 | 16.20 | 14.80 | 15.60 | 15.60 | 14.70 | 30.20 | 243.89 | 27.30 | 26.90 | 26.40 | 226.29 | 26.00 | 25.70 | 25.20 | 209.19 | 24.60 | 199.63 | 194.48 | 194.64 | 192.12 | 187.22 | 168.57 | 160.43 | 160.08 | 160.46 | 154.81 | 151.09 | 148.15 | 151.43 | 148.88 | 147.68 | 149.69 | 148.72 | 145.46 | 143.15 | 145.99 | 146.47 | 143.39 | 143.28 | 144.06 | 145.41 | 142.59 | 145.78 | 148.07 | 139.21 | 137.79 |