
| 2023-09-30 | 2023-06-30 | 2023-03-31 | 2022-12-31 | 2022-09-30 | 2022-06-30 | 2022-03-31 | 2021-12-31 | 2021-09-30 | 2021-06-30 | 2021-03-31 | 2020-12-31 | 2020-09-30 | 2020-09-18 | 2020-06-30 | 2020-03-31 | 2019-12-31 | 2019-09-30 | 2019-06-30 | 2019-03-31 | 2018-12-31 | 2018-09-30 | 2018-06-30 | 2018-03-31 | 2017-12-31 | 2017-09-30 | 2017-06-30 | 2017-03-31 | 2016-12-31 | 2016-09-30 | 2016-06-30 | 2016-03-31 | 2015-12-31 | 2015-09-30 | 2015-06-30 | 2015-03-31 | 2014-12-31 | 2014-09-30 | 2014-06-30 | 2014-03-31 | 2012-12-31 | 2012-09-30 | 2012-06-30 | 2012-03-31 | 2011-09-30 | 2011-06-30 | 2011-03-31 | 2010-12-31 | 2010-09-30 | 2010-06-30 | 2010-03-31 | 2009-12-31 | 2009-09-30 | 2009-06-30 | 2009-03-31 | ||
|---|---|---|---|---|---|---|---|---|---|---|---|---|---|---|---|---|---|---|---|---|---|---|---|---|---|---|---|---|---|---|---|---|---|---|---|---|---|---|---|---|---|---|---|---|---|---|---|---|---|---|---|---|---|---|---|---|
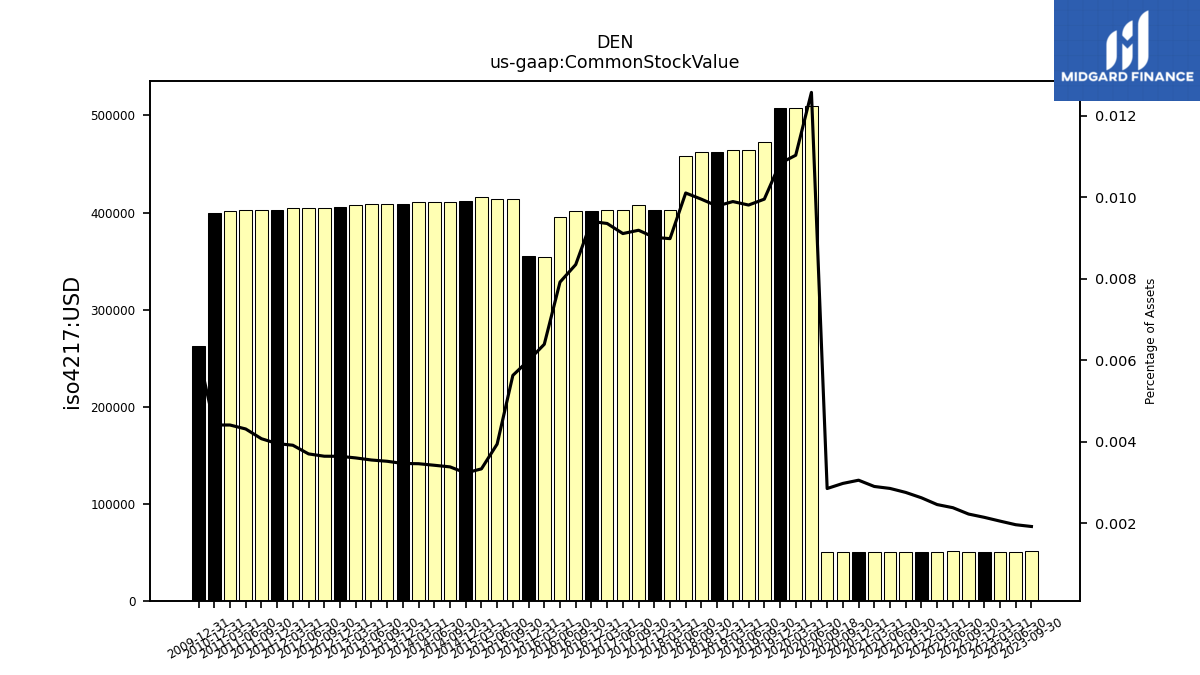
| Common Stock Value | 0.05 | 0.05 | 0.05 | 0.05 | 0.05 | 0.05 | 0.05 | 0.05 | 0.05 | 0.05 | 0.05 | 0.05 | 0.05 | 0.05 | 0.51 | 0.51 | 0.51 | 0.47 | 0.46 | 0.46 | 0.46 | 0.46 | 0.46 | 0.40 | 0.40 | 0.41 | 0.40 | 0.40 | 0.40 | 0.40 | 0.40 | 0.35 | 0.35 | 0.41 | 0.41 | 0.42 | 0.41 | 0.41 | 0.41 | 0.41 | 0.41 | 0.41 | 0.41 | 0.41 | 0.40 | 0.40 | 0.40 | 0.40 | NA | NA | NA | 0.26 | NA | NA | NA | |
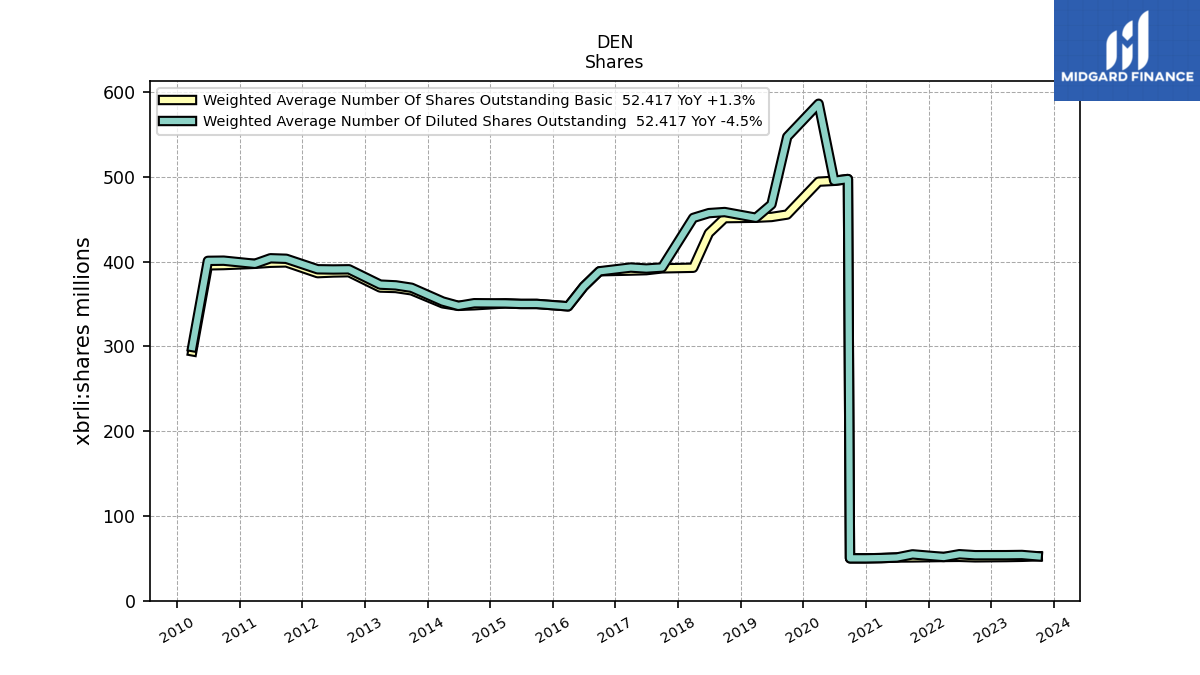
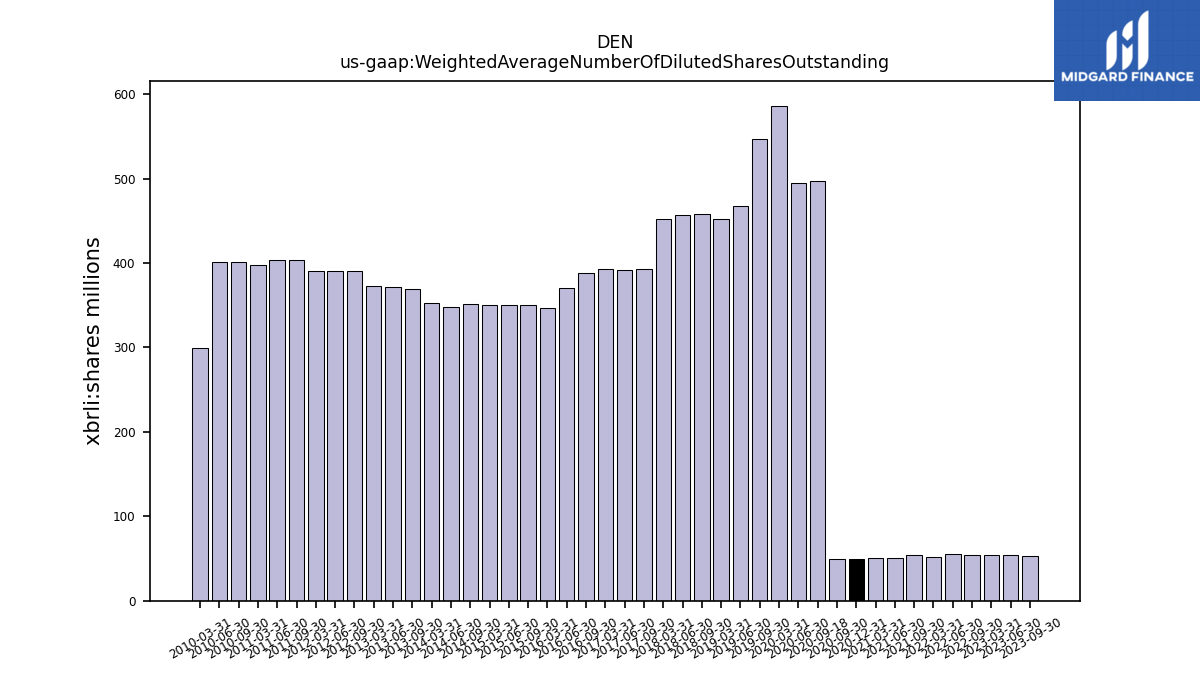
| Weighted Average Number Of Diluted Shares Outstanding | 52.42 | 54.00 | 53.76 | NA | 53.72 | 54.89 | 51.60 | NA | 54.71 | 51.00 | 50.32 | 50.00 | 50.00 | 497.40 | 495.25 | 586.19 | NA | 547.21 | 467.43 | 451.72 | NA | 458.45 | 457.17 | 451.54 | NA | 393.02 | 391.83 | 393.00 | NA | 388.57 | 370.57 | 347.24 | NA | 350.05 | 350.04 | 350.69 | NA | 350.92 | 347.80 | 352.93 | NA | 390.91 | 390.70 | 390.94 | 403.31 | 403.92 | 397.39 | NA | 401.09 | 400.87 | 299.22 | NA | NA | NA | NA | |
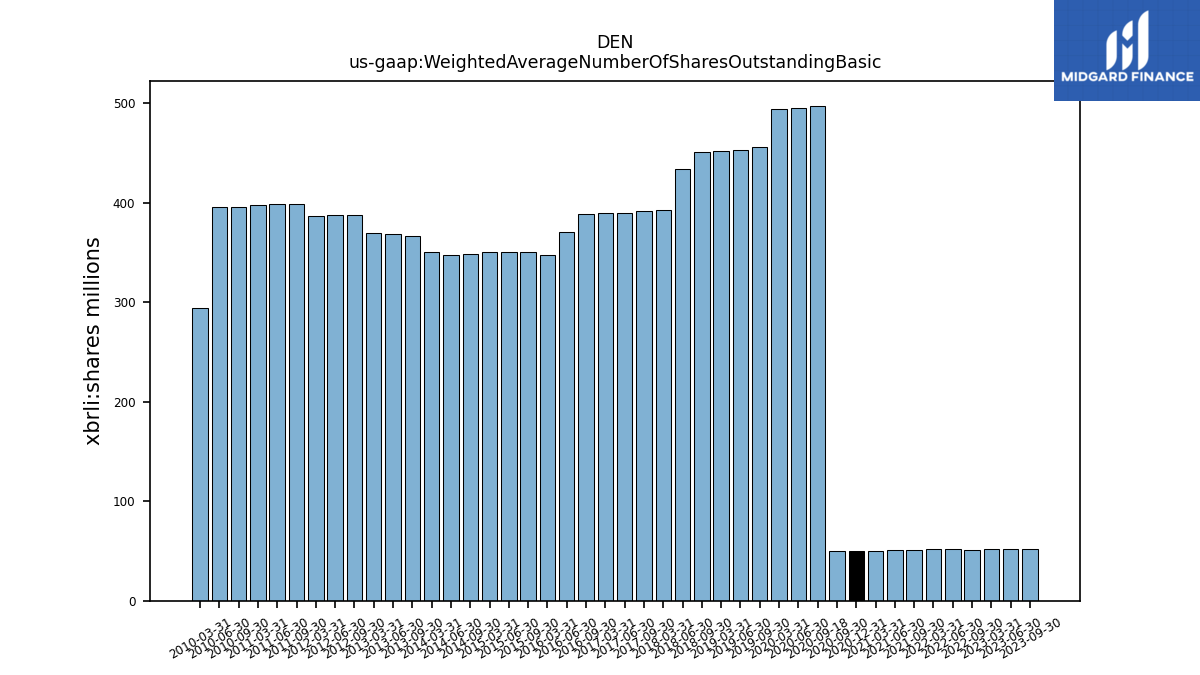
| Weighted Average Number Of Shares Outstanding Basic | 52.42 | 51.82 | 51.50 | NA | 51.18 | 51.76 | 51.60 | NA | 51.09 | 51.00 | 50.32 | 50.00 | 50.00 | 497.40 | 495.25 | 494.26 | NA | 455.49 | 452.61 | 451.72 | NA | 451.26 | 433.47 | 392.74 | NA | 392.01 | 389.90 | 389.40 | NA | 388.57 | 370.57 | 347.24 | NA | 350.05 | 350.04 | 350.69 | NA | 348.45 | 347.80 | 350.75 | NA | 387.51 | 387.16 | 386.37 | 399.04 | 398.63 | 397.39 | NA | 395.91 | 395.55 | 294.14 | NA | NA | NA | NA | |
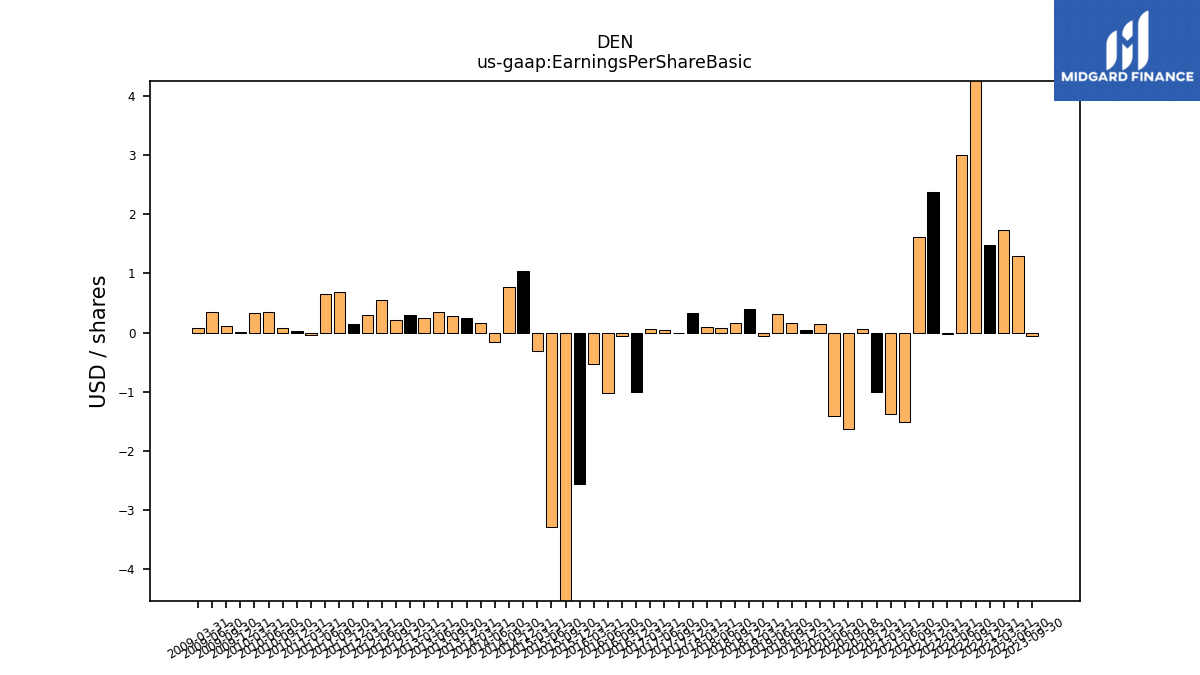
| Earnings Per Share Basic | -0.06 | 1.30 | 1.73 | 1.48 | 4.89 | 3.00 | -0.02 | 2.37 | 1.62 | -1.52 | -1.38 | -1.01 | 0.06 | -1.63 | -1.41 | 0.15 | 0.04 | 0.16 | 0.32 | -0.06 | 0.40 | 0.17 | 0.07 | 0.10 | 0.33 | 0.00 | 0.04 | 0.06 | -1.01 | -0.06 | -1.03 | -0.53 | -2.56 | -6.41 | -3.28 | -0.31 | 1.04 | 0.77 | -0.16 | 0.17 | 0.30 | 0.22 | 0.55 | 0.29 | 0.69 | 0.65 | -0.04 | 0.03 | 0.07 | 0.34 | 0.33 | 0.01 | 0.11 | 0.35 | 0.07 | |
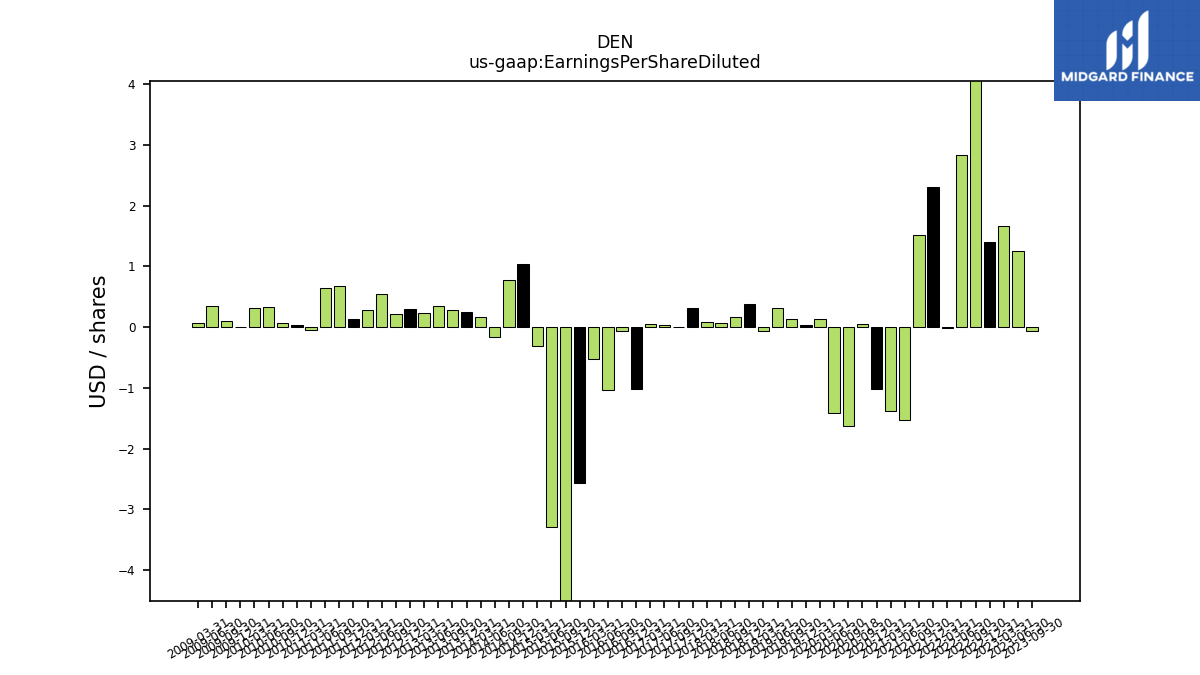
| Earnings Per Share Diluted | -0.06 | 1.25 | 1.66 | 1.40 | 4.66 | 2.83 | -0.02 | 2.31 | 1.51 | -1.52 | -1.38 | -1.01 | 0.06 | -1.63 | -1.41 | 0.14 | 0.04 | 0.14 | 0.32 | -0.06 | 0.38 | 0.17 | 0.07 | 0.09 | 0.32 | 0.00 | 0.04 | 0.05 | -1.01 | -0.06 | -1.03 | -0.53 | -2.56 | -6.41 | -3.28 | -0.31 | 1.04 | 0.77 | -0.16 | 0.17 | 0.30 | 0.22 | 0.54 | 0.29 | 0.68 | 0.64 | -0.04 | 0.03 | 0.07 | 0.34 | 0.32 | 0.01 | 0.11 | 0.35 | 0.07 |
| 2023-09-30 | 2023-06-30 | 2023-03-31 | 2022-12-31 | 2022-09-30 | 2022-06-30 | 2022-03-31 | 2021-12-31 | 2021-09-30 | 2021-06-30 | 2021-03-31 | 2020-12-31 | 2020-09-30 | 2020-09-18 | 2020-06-30 | 2020-03-31 | 2019-12-31 | 2019-09-30 | 2019-06-30 | 2019-03-31 | 2018-12-31 | 2018-09-30 | 2018-06-30 | 2018-03-31 | 2017-12-31 | 2017-09-30 | 2017-06-30 | 2017-03-31 | 2016-12-31 | 2016-09-30 | 2016-06-30 | 2016-03-31 | 2015-12-31 | 2015-09-30 | 2015-06-30 | 2015-03-31 | 2014-12-31 | 2014-09-30 | 2014-06-30 | 2014-03-31 | 2012-12-31 | 2012-09-30 | 2012-06-30 | 2012-03-31 | 2011-09-30 | 2011-06-30 | 2011-03-31 | 2010-12-31 | 2010-09-30 | 2010-06-30 | 2010-03-31 | 2009-12-31 | 2009-09-30 | 2009-06-30 | 2009-03-31 | ||
|---|---|---|---|---|---|---|---|---|---|---|---|---|---|---|---|---|---|---|---|---|---|---|---|---|---|---|---|---|---|---|---|---|---|---|---|---|---|---|---|---|---|---|---|---|---|---|---|---|---|---|---|---|---|---|---|---|
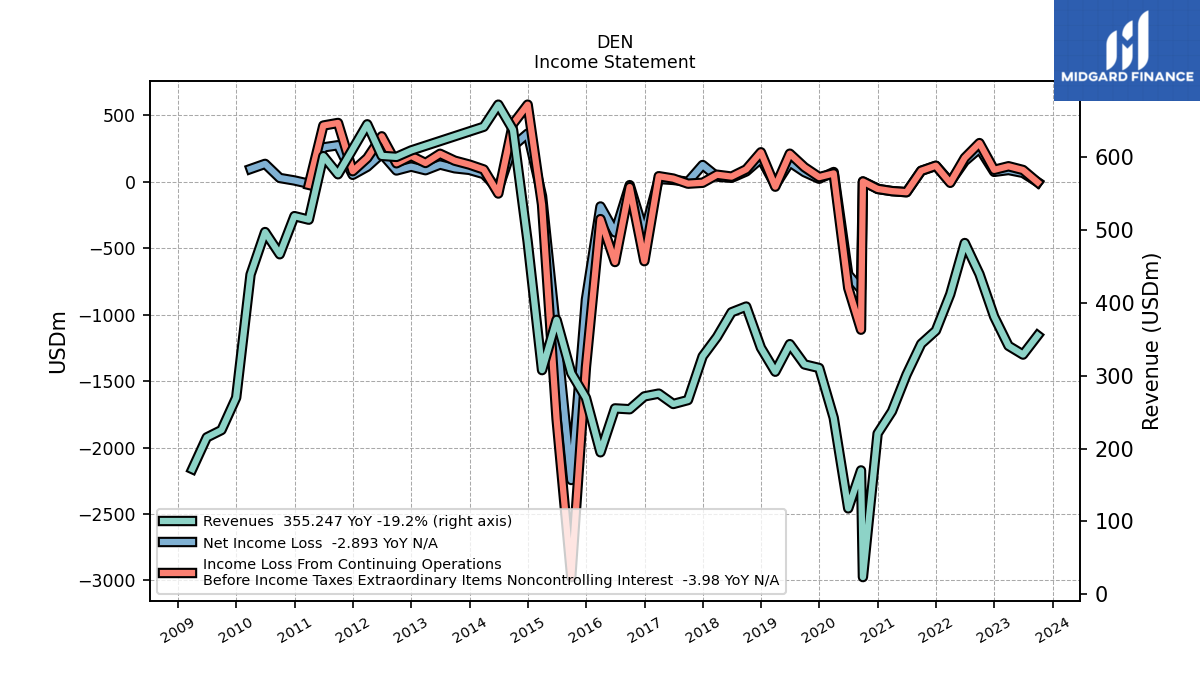
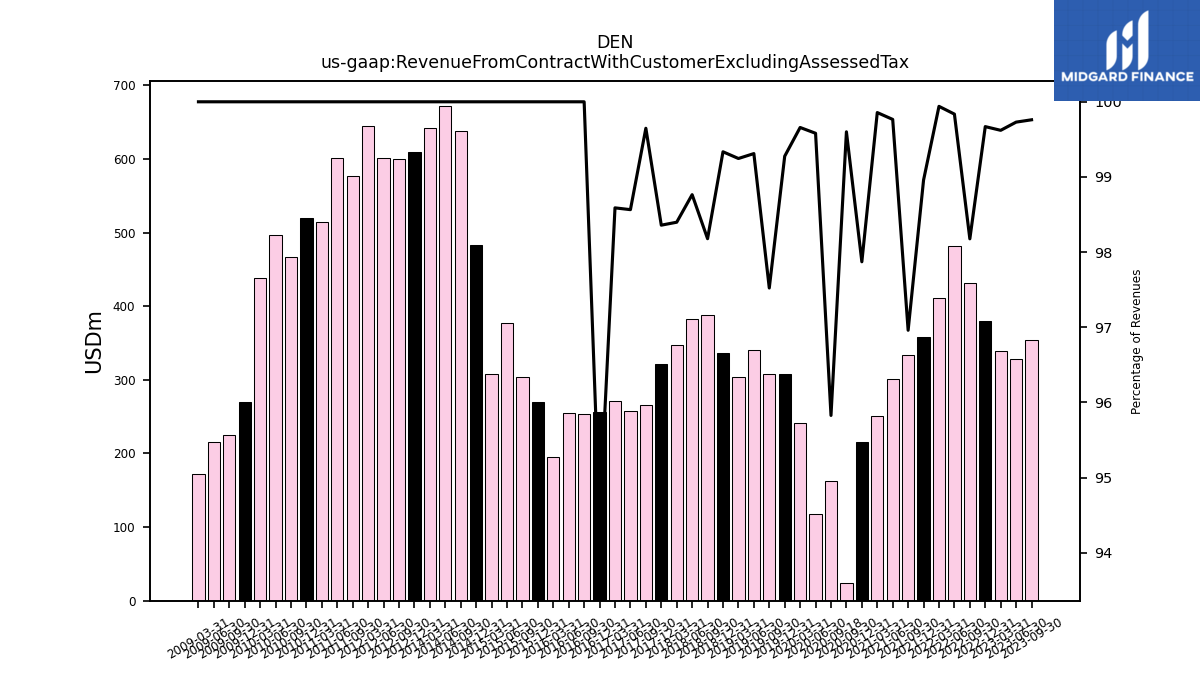
| Revenue From Contract With Customer Excluding Assessed Tax | 354.40 | 328.09 | 339.72 | 379.90 | 431.47 | 481.37 | 411.61 | 358.13 | 333.28 | 300.66 | 250.80 | 215.90 | 23.44 | 162.94 | 117.38 | 241.37 | 308.36 | 307.64 | 341.00 | 303.15 | 336.10 | 387.78 | 382.28 | 347.57 | 321.23 | 265.62 | 257.44 | 271.57 | 256.59 | 253.99 | 255.15 | 194.84 | 269.62 | 303.60 | 376.69 | 307.65 | 483.68 | 637.66 | 672.12 | 641.74 | 609.20 | 600.37 | 601.78 | 645.12 | 576.50 | 601.40 | 514.16 | 519.06 | 466.70 | 497.21 | 438.82 | 269.89 | 225.41 | 215.36 | 171.82 | |
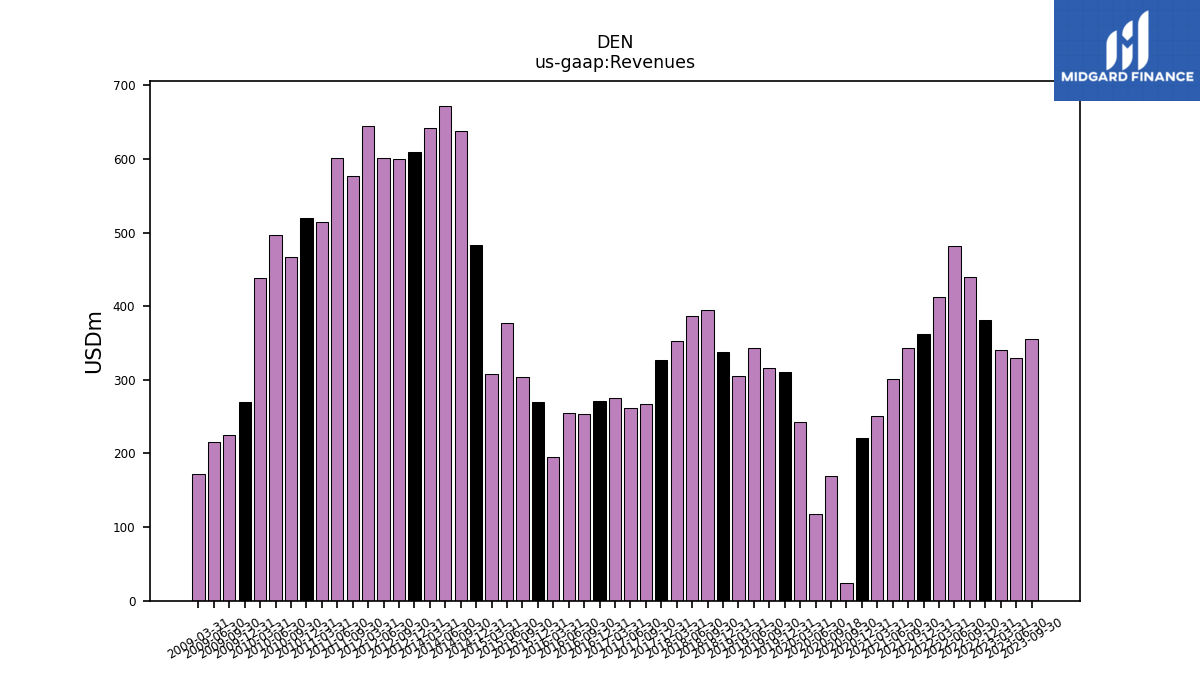
| Revenues | 355.25 | 328.98 | 341.02 | 381.16 | 439.49 | 482.16 | 411.86 | 361.90 | 343.74 | 301.37 | 251.16 | 220.60 | 23.53 | 170.04 | 117.88 | 242.20 | 310.61 | 315.45 | 343.37 | 305.45 | 338.36 | 394.97 | 387.06 | 353.23 | 326.59 | 266.56 | 261.18 | 275.45 | 271.62 | 253.99 | 255.15 | 194.84 | 269.62 | 303.60 | 376.69 | 307.65 | 483.68 | 637.66 | 672.12 | 641.74 | 609.20 | 600.37 | 601.78 | 645.12 | 576.50 | 601.40 | 514.16 | 519.06 | 466.70 | 497.21 | 438.82 | 269.89 | 225.41 | 215.36 | 171.82 | |
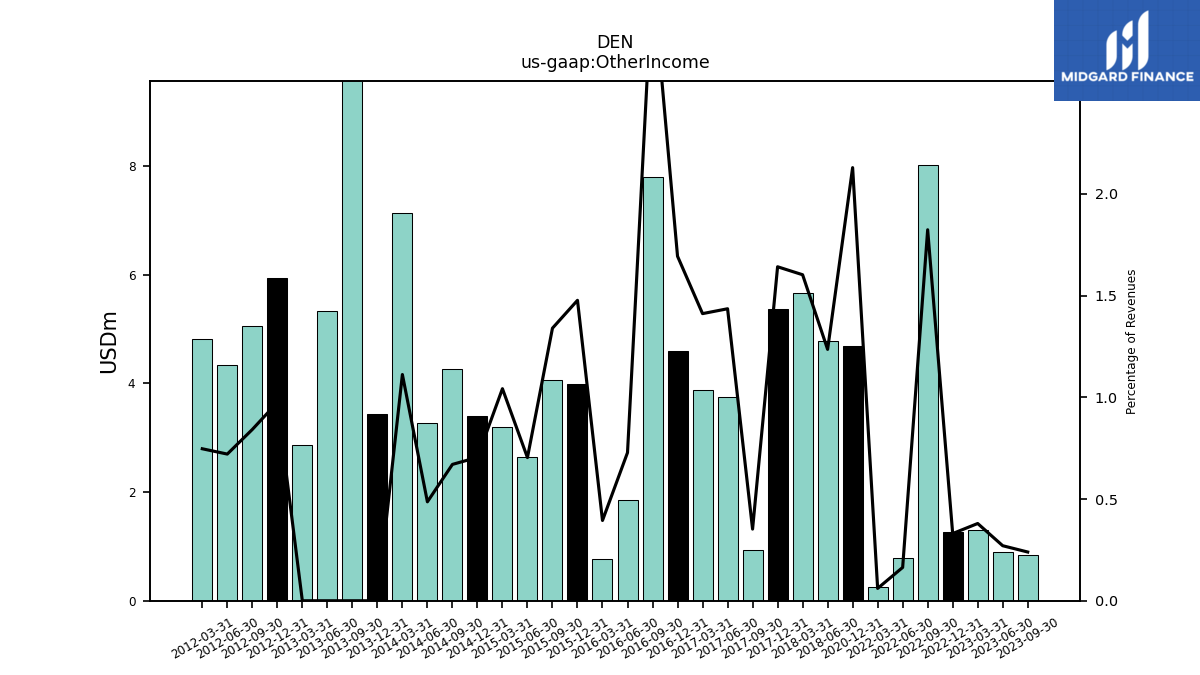
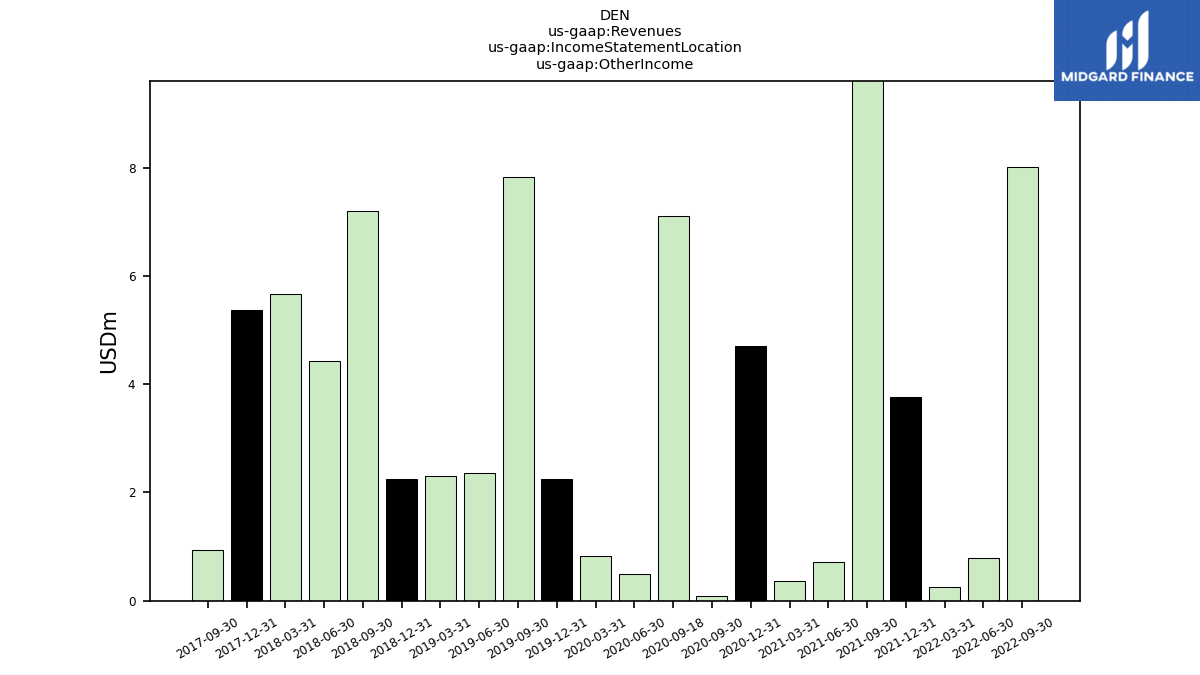
| Other Income | 0.85 | 0.89 | 1.29 | 1.26 | 8.02 | 0.79 | 0.25 | NA | NA | NA | NA | 4.70 | NA | NA | NA | NA | NA | NA | NA | NA | NA | NA | 4.78 | 5.66 | 5.36 | 0.94 | 3.75 | 3.89 | 4.60 | 7.80 | 1.86 | 0.77 | 3.98 | 4.07 | 2.65 | 3.21 | 3.41 | 4.27 | 3.27 | 7.14 | 5.94 | 5.05 | 4.34 | 4.82 | NA | NA | NA | NA | NA | NA | NA | NA | NA | NA | NA | |
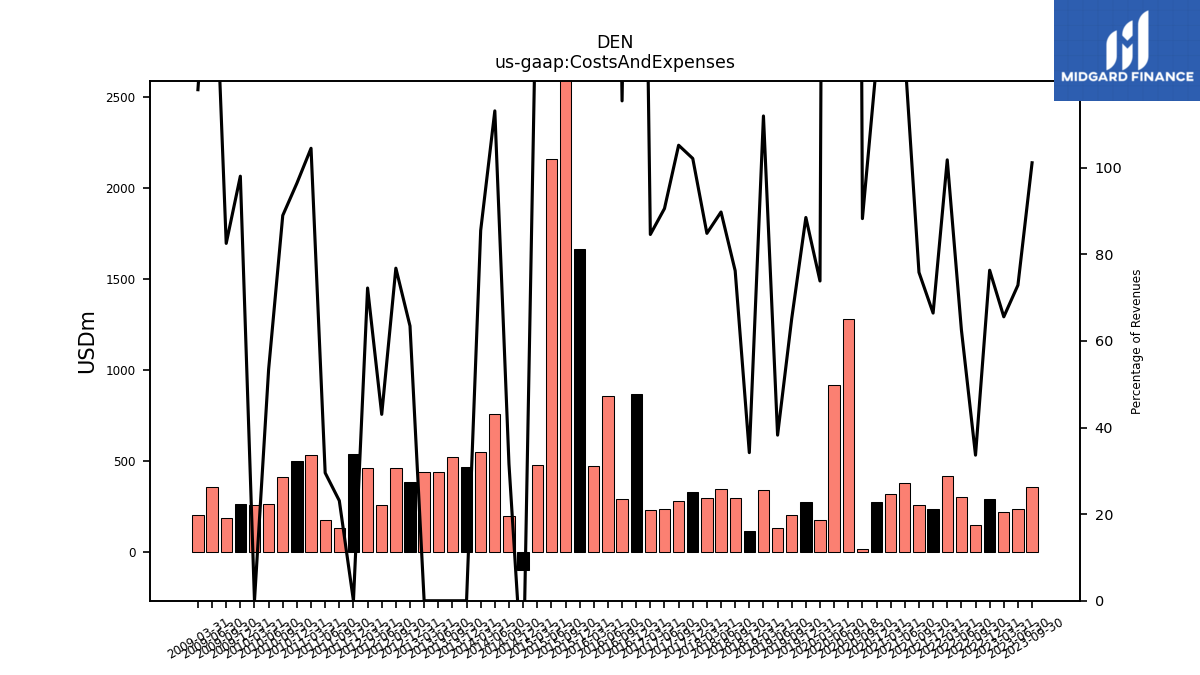
| Costs And Expenses | 359.23 | 239.71 | 223.57 | 290.86 | 147.74 | 301.81 | 419.24 | 240.37 | 260.62 | 379.36 | 321.04 | 273.78 | 20.76 | 1282.96 | 917.05 | 178.80 | 274.85 | 205.54 | 131.30 | 341.88 | 115.71 | 300.94 | 347.41 | 299.64 | 333.48 | 280.35 | 236.51 | 232.95 | 868.89 | 293.14 | 858.76 | 475.16 | 1663.72 | 3278.61 | 2161.36 | 479.86 | -97.52 | 201.34 | 760.18 | 548.64 | 386.47 | 460.99 | 258.98 | 465.80 | 133.19 | 177.59 | 537.11 | 500.36 | 415.17 | 265.52 | 261.68 | 264.56 | 185.99 | 358.06 | 202.73 | |
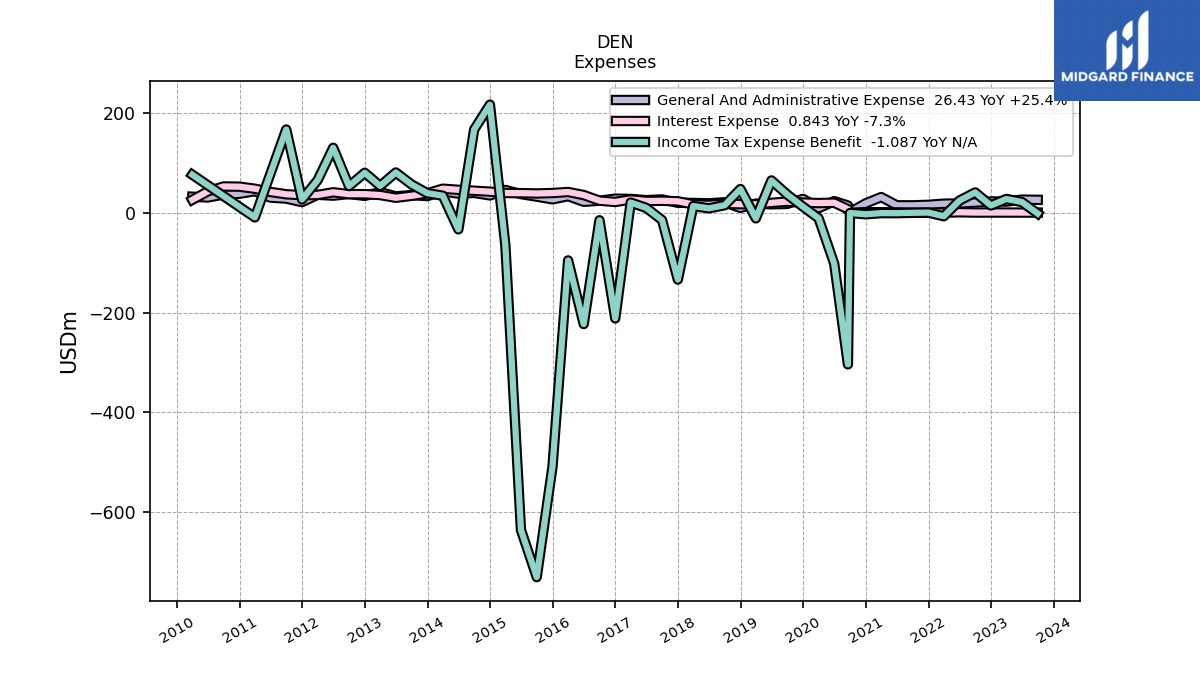
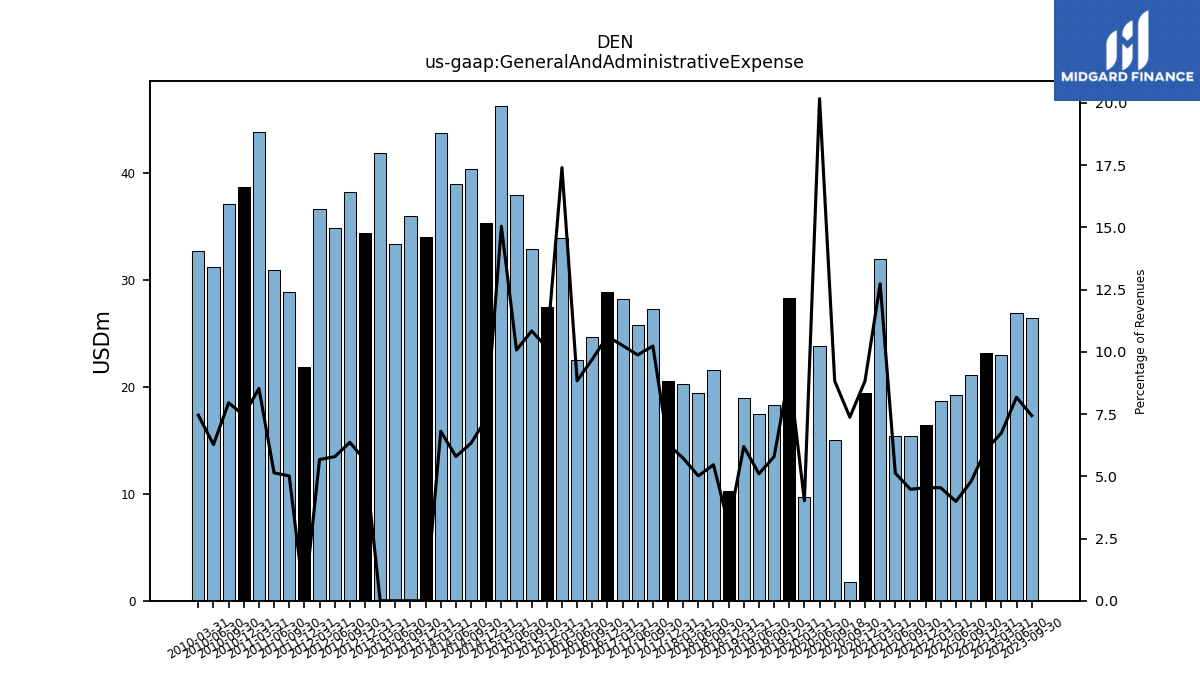
| General And Administrative Expense | 26.43 | 26.89 | 22.98 | 23.18 | 21.07 | 19.23 | 18.69 | 16.44 | 15.39 | 15.45 | 31.98 | 19.47 | 1.74 | 15.01 | 23.78 | 9.73 | 28.33 | 18.27 | 17.51 | 18.93 | 10.27 | 21.58 | 19.41 | 20.23 | 20.50 | 27.27 | 25.79 | 28.24 | 28.84 | 24.64 | 22.55 | 33.90 | 27.43 | 32.91 | 37.95 | 46.28 | 35.33 | 40.37 | 38.95 | 43.69 | 34.39 | 38.20 | 34.83 | 36.61 | 28.91 | 30.90 | 43.85 | 38.67 | 37.12 | 31.19 | 32.71 | NA | NA | NA | NA | |
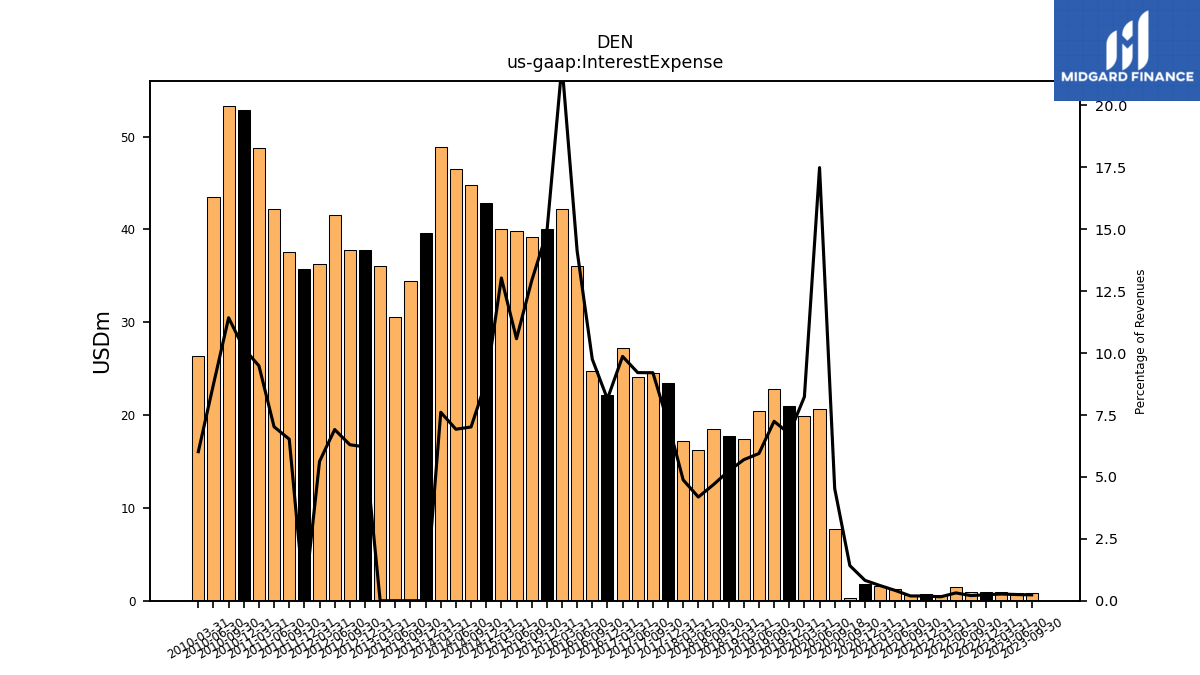
| Interest Expense | 0.84 | 0.82 | 0.93 | 0.93 | 0.91 | 1.53 | 0.66 | 0.69 | 0.67 | 1.25 | 1.54 | 1.81 | 0.33 | 7.70 | 20.62 | 19.95 | 20.96 | 22.86 | 20.42 | 17.40 | 17.71 | 18.53 | 16.21 | 17.24 | 23.48 | 24.55 | 24.06 | 27.18 | 22.14 | 24.78 | 36.06 | 42.17 | 40.08 | 39.23 | 39.86 | 40.10 | 42.87 | 44.75 | 46.55 | 48.83 | 37.84 | 37.83 | 41.60 | 36.31 | 37.62 | 42.25 | 48.78 | 52.88 | 53.33 | 43.48 | 26.42 | NA | NA | NA | NA | |
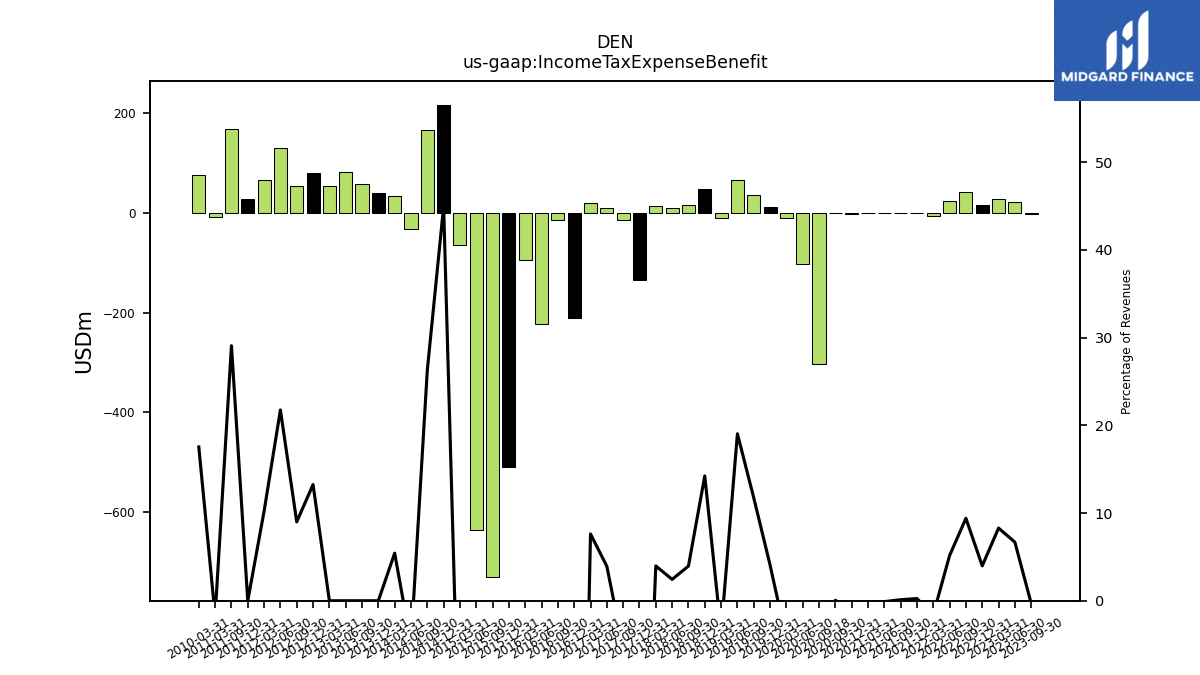
| Income Tax Expense Benefit | -1.09 | 22.00 | 28.25 | 15.18 | 41.32 | 24.85 | -6.50 | 0.90 | 0.40 | -0.30 | -0.24 | -2.53 | 0.01 | -303.81 | -101.71 | -10.62 | 12.68 | 37.05 | 65.38 | -10.76 | 48.17 | 15.62 | 9.43 | 14.02 | -133.67 | -14.23 | 10.27 | 20.97 | -211.54 | -14.56 | -222.94 | -95.12 | -509.02 | -730.88 | -636.17 | -64.46 | 217.57 | 167.57 | -32.86 | 34.79 | 80.70 | 54.01 | 130.94 | 65.84 | 167.65 | NA | -8.76 | NA | NA | NA | 76.94 | NA | NA | NA | NA | |
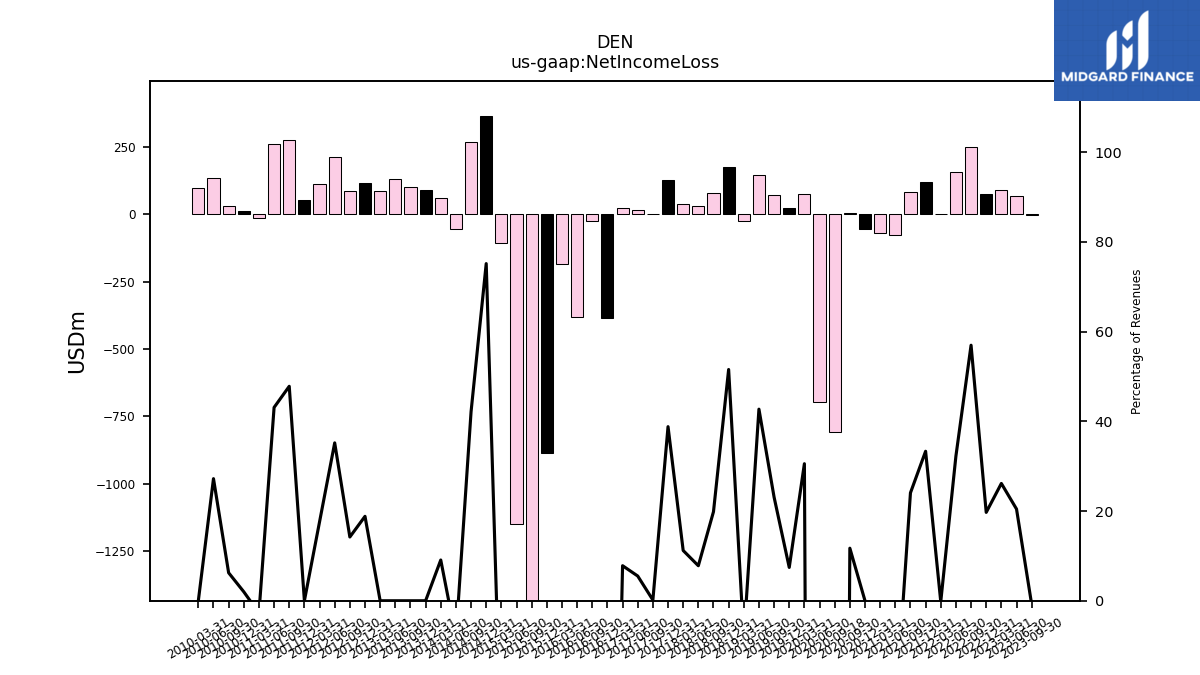
| Net Income Loss | -2.89 | 67.28 | 89.20 | 75.11 | 250.42 | 155.49 | -0.87 | 120.63 | 82.71 | -77.69 | -69.64 | -53.42 | 2.76 | -809.12 | -697.47 | 74.02 | 23.08 | 72.86 | 146.69 | -25.67 | 174.48 | 78.42 | 30.22 | 39.58 | 126.78 | 0.44 | 14.40 | 21.53 | -385.73 | -24.59 | -380.67 | -185.19 | -885.08 | -2244.13 | -1148.50 | -107.75 | 363.63 | 268.75 | -55.20 | 58.31 | 114.66 | 85.37 | 211.87 | 113.47 | 275.67 | 259.25 | -14.19 | 10.36 | 29.10 | 135.37 | 96.89 | NA | NA | NA | NA |
| 2023-09-30 | 2023-06-30 | 2023-03-31 | 2022-12-31 | 2022-09-30 | 2022-06-30 | 2022-03-31 | 2021-12-31 | 2021-09-30 | 2021-06-30 | 2021-03-31 | 2020-12-31 | 2020-09-30 | 2020-09-18 | 2020-06-30 | 2020-03-31 | 2019-12-31 | 2019-09-30 | 2019-06-30 | 2019-03-31 | 2018-12-31 | 2018-09-30 | 2018-06-30 | 2018-03-31 | 2017-12-31 | 2017-09-30 | 2017-06-30 | 2017-03-31 | 2016-12-31 | 2016-09-30 | 2016-06-30 | 2016-03-31 | 2015-12-31 | 2015-09-30 | 2015-06-30 | 2015-03-31 | 2014-12-31 | 2014-09-30 | 2014-06-30 | 2014-03-31 | 2012-12-31 | 2012-09-30 | 2012-06-30 | 2012-03-31 | 2011-09-30 | 2011-06-30 | 2011-03-31 | 2010-12-31 | 2010-09-30 | 2010-06-30 | 2010-03-31 | 2009-12-31 | 2009-09-30 | 2009-06-30 | 2009-03-31 | ||
|---|---|---|---|---|---|---|---|---|---|---|---|---|---|---|---|---|---|---|---|---|---|---|---|---|---|---|---|---|---|---|---|---|---|---|---|---|---|---|---|---|---|---|---|---|---|---|---|---|---|---|---|---|---|---|---|---|
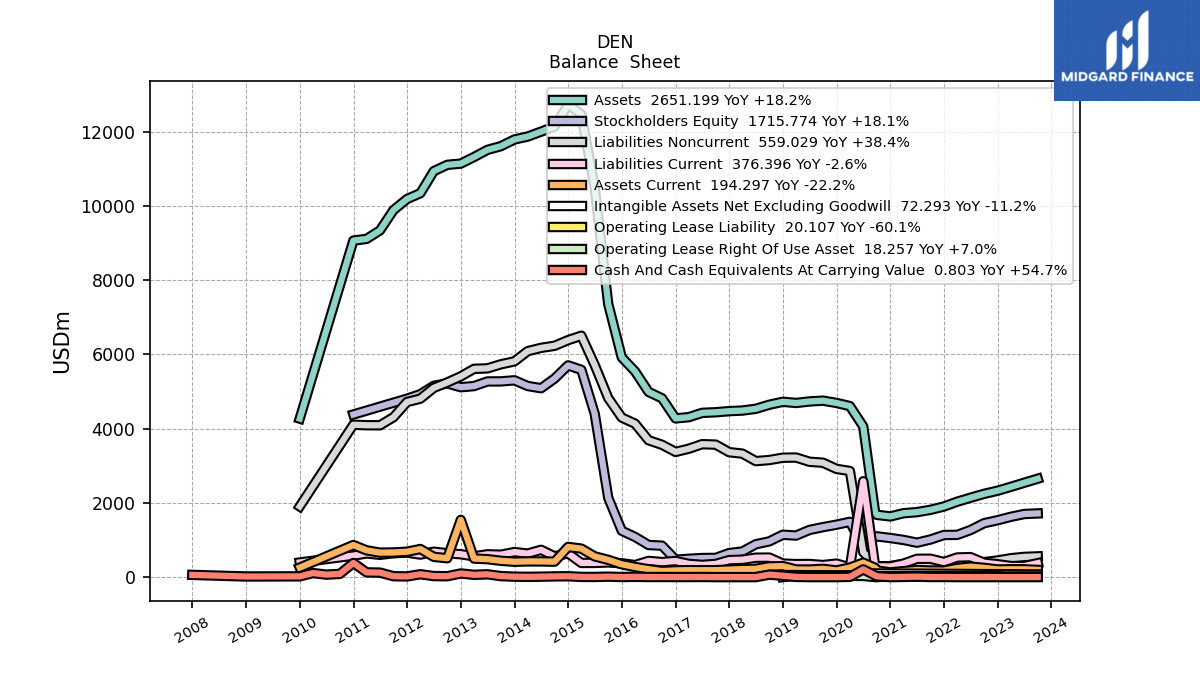
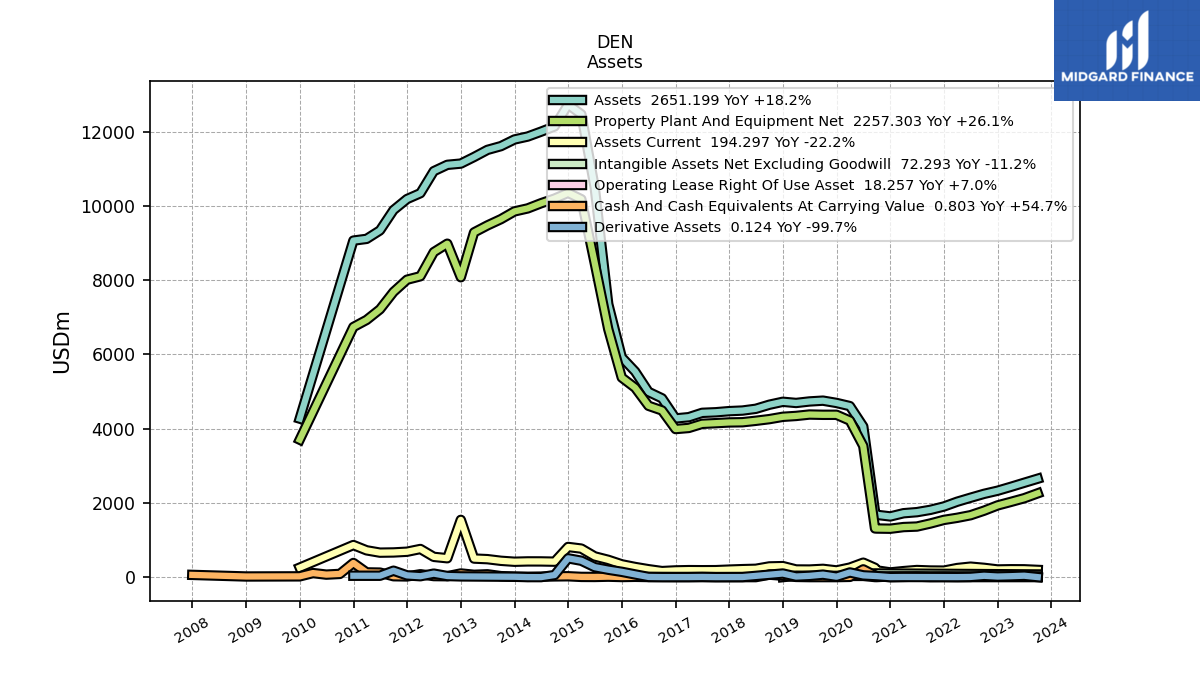
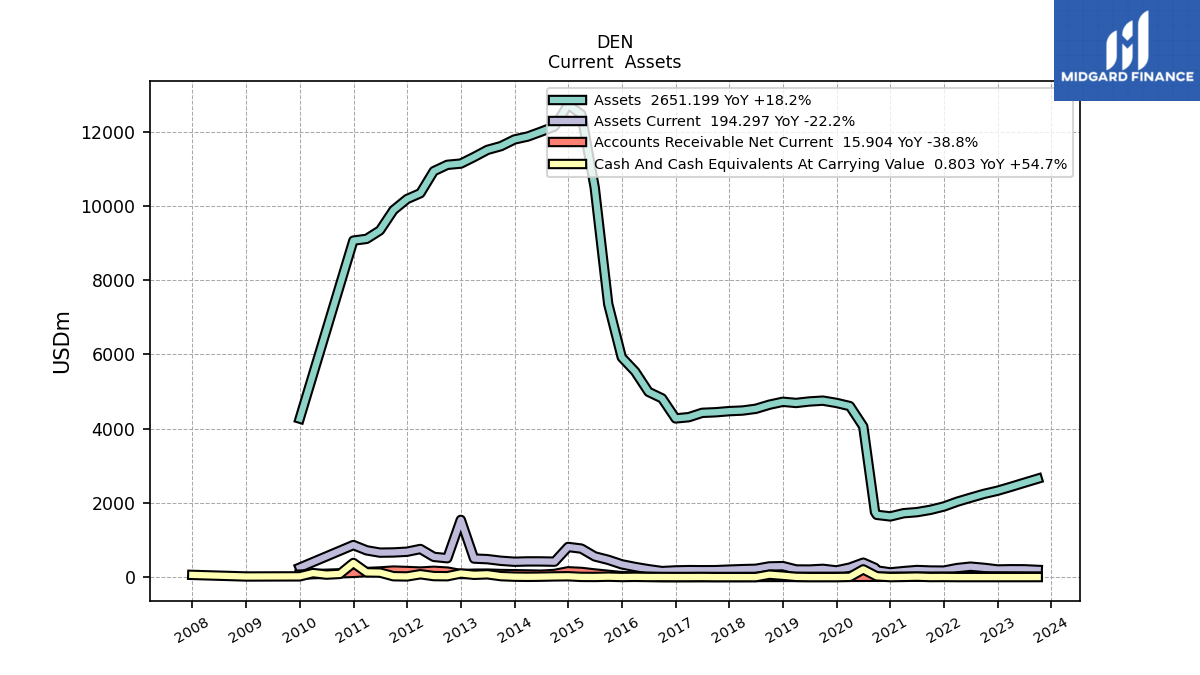
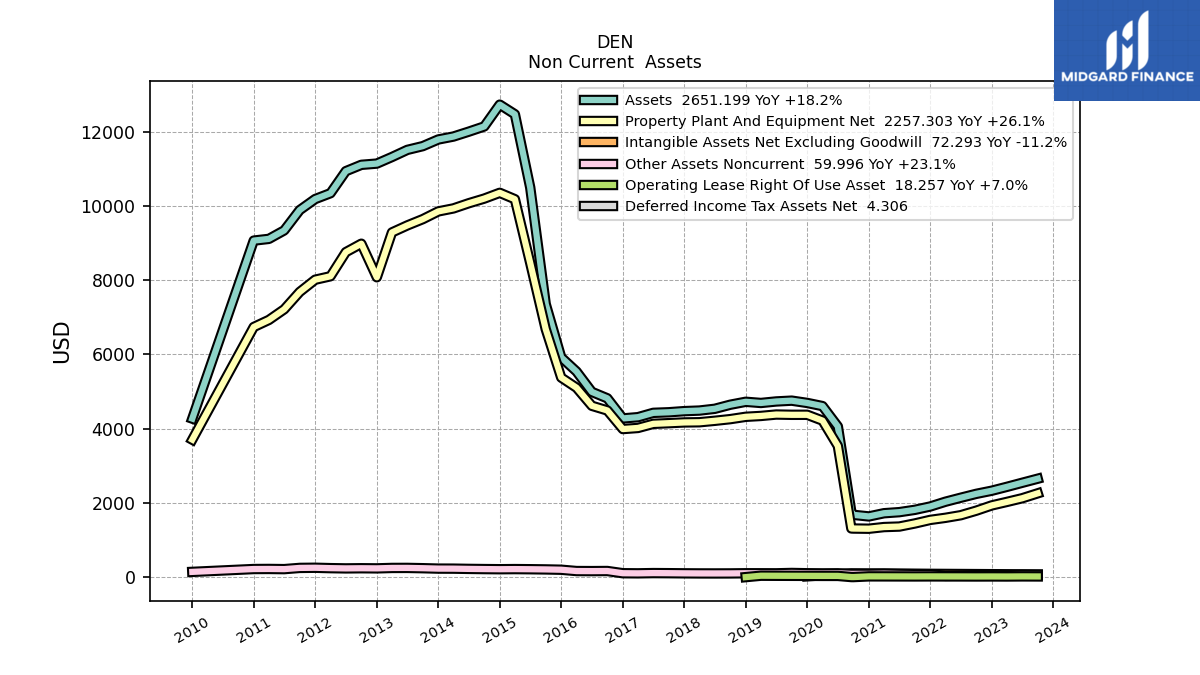
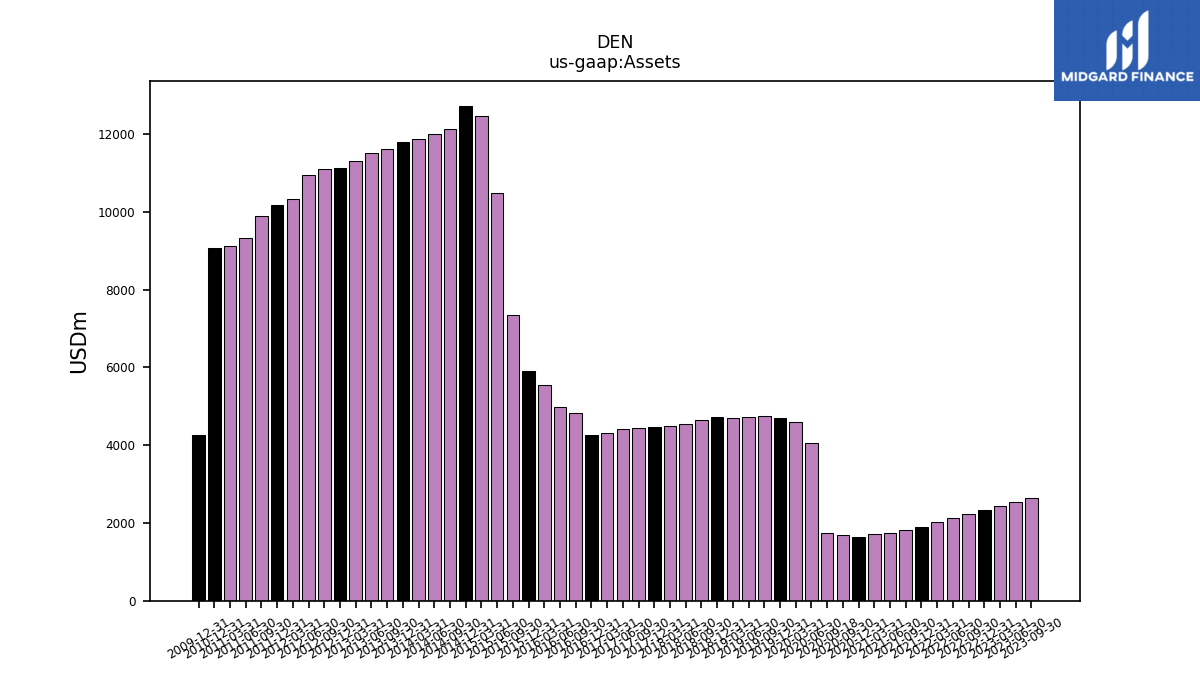
| Assets | 2651.20 | 2541.62 | 2432.06 | 2327.50 | 2243.33 | 2138.68 | 2031.35 | 1902.95 | 1812.27 | 1750.09 | 1721.16 | 1634.76 | 1677.87 | 1751.41 | 4058.03 | 4607.09 | 4691.87 | 4753.71 | 4732.03 | 4691.16 | 4723.22 | 4644.02 | 4534.23 | 4486.78 | 4471.30 | 4440.93 | 4425.34 | 4308.66 | 4274.58 | 4816.80 | 4989.97 | 5538.55 | 5919.82 | 7355.15 | 10495.30 | 12468.06 | 12727.80 | 12140.05 | 11999.68 | 11867.96 | 11139.34 | 11105.95 | 10935.42 | 10342.06 | 9886.93 | 9339.42 | 9111.42 | 9065.06 | NA | NA | NA | 4269.98 | NA | NA | NA | |
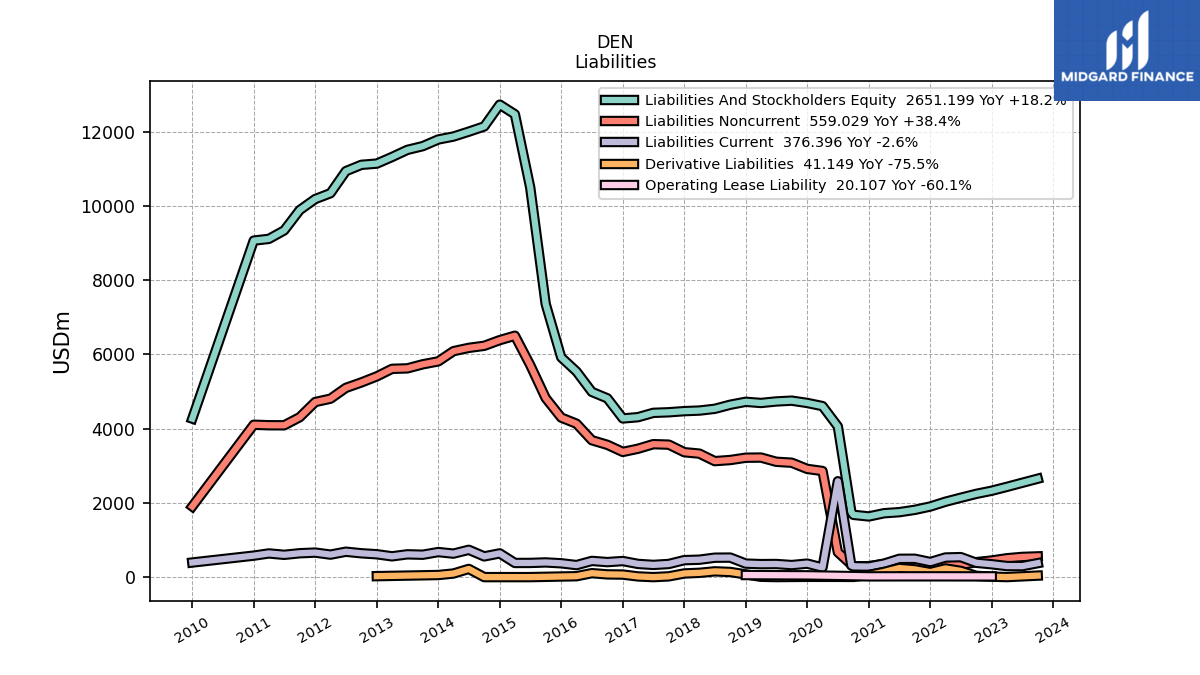
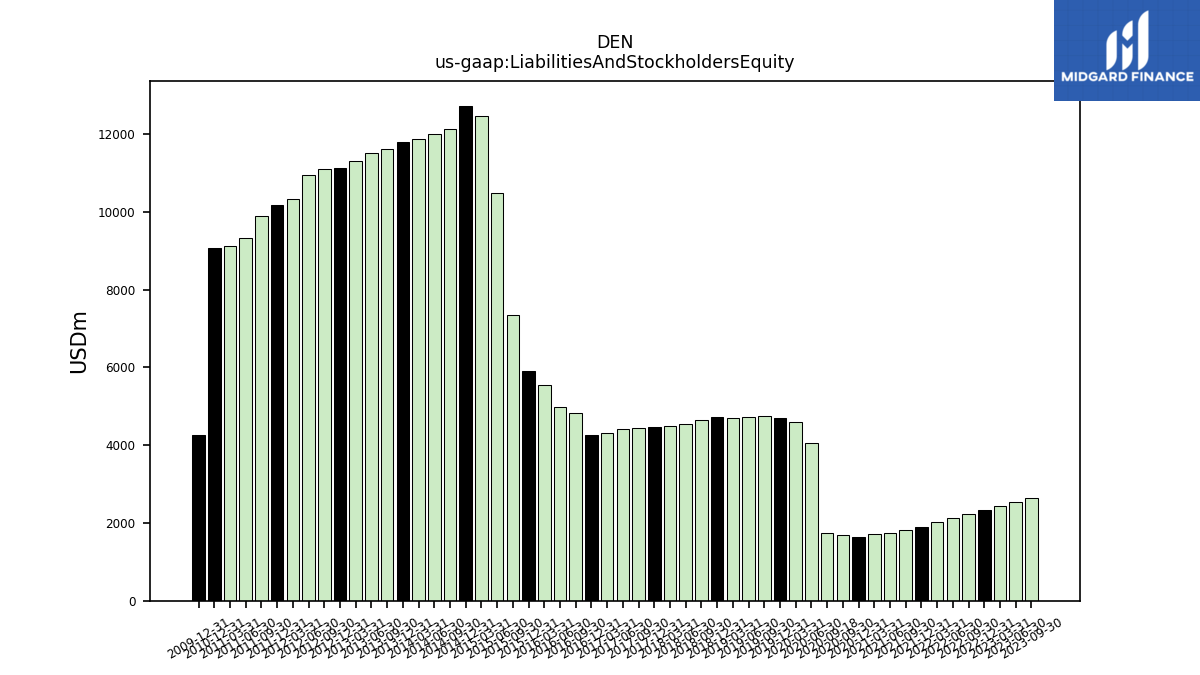
| Liabilities And Stockholders Equity | 2651.20 | 2541.62 | 2432.06 | 2327.50 | 2243.33 | 2138.68 | 2031.35 | 1902.95 | 1812.27 | 1750.09 | 1721.16 | 1634.76 | 1677.87 | 1751.41 | 4058.03 | 4607.09 | 4691.87 | 4753.71 | 4732.03 | 4691.16 | 4723.22 | 4644.02 | 4534.23 | 4486.78 | 4471.30 | 4440.93 | 4425.34 | 4308.66 | 4274.58 | 4816.80 | 4989.97 | 5538.55 | 5919.82 | 7355.15 | 10495.30 | 12468.06 | 12727.80 | 12140.05 | 11999.68 | 11867.96 | 11139.34 | 11105.95 | 10935.42 | 10342.06 | 9886.93 | 9339.42 | 9111.42 | 9065.06 | NA | NA | NA | 4269.98 | NA | NA | NA | |
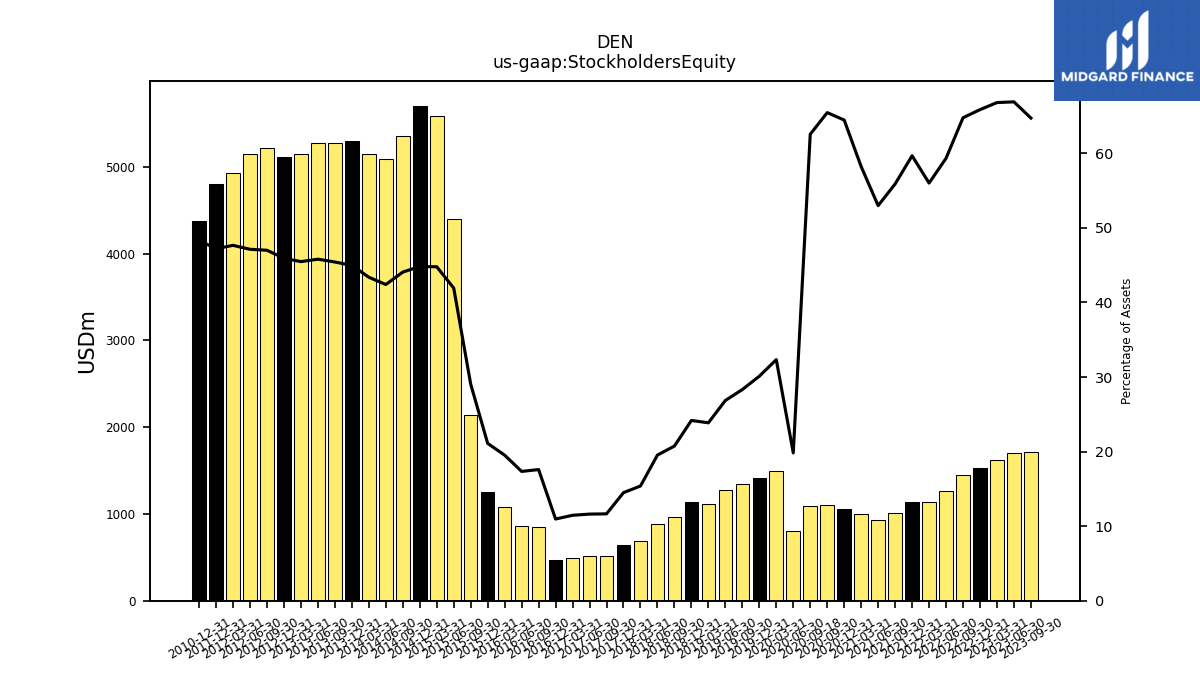
| Stockholders Equity | 1715.77 | 1700.15 | 1624.58 | 1532.62 | 1452.88 | 1268.84 | 1137.65 | 1135.39 | 1012.79 | 927.20 | 1001.93 | 1053.67 | 1098.18 | 1095.42 | 804.42 | 1489.44 | 1412.26 | 1346.12 | 1270.68 | 1119.32 | 1141.78 | 963.18 | 885.64 | 690.22 | 648.16 | 517.45 | 514.20 | 493.76 | 468.45 | 847.34 | 865.30 | 1081.28 | 1248.91 | 2136.33 | 4400.03 | 5583.48 | 5703.86 | 5349.77 | 5087.95 | 5147.91 | 5114.89 | 5219.22 | 5153.20 | 4928.44 | NA | NA | NA | 4380.71 | NA | NA | NA | NA | NA | NA | NA |
| 2023-09-30 | 2023-06-30 | 2023-03-31 | 2022-12-31 | 2022-09-30 | 2022-06-30 | 2022-03-31 | 2021-12-31 | 2021-09-30 | 2021-06-30 | 2021-03-31 | 2020-12-31 | 2020-09-30 | 2020-09-18 | 2020-06-30 | 2020-03-31 | 2019-12-31 | 2019-09-30 | 2019-06-30 | 2019-03-31 | 2018-12-31 | 2018-09-30 | 2018-06-30 | 2018-03-31 | 2017-12-31 | 2017-09-30 | 2017-06-30 | 2017-03-31 | 2016-12-31 | 2016-09-30 | 2016-06-30 | 2016-03-31 | 2015-12-31 | 2015-09-30 | 2015-06-30 | 2015-03-31 | 2014-12-31 | 2014-09-30 | 2014-06-30 | 2014-03-31 | 2012-12-31 | 2012-09-30 | 2012-06-30 | 2012-03-31 | 2011-09-30 | 2011-06-30 | 2011-03-31 | 2010-12-31 | 2010-09-30 | 2010-06-30 | 2010-03-31 | 2009-12-31 | 2009-09-30 | 2009-06-30 | 2009-03-31 | ||
|---|---|---|---|---|---|---|---|---|---|---|---|---|---|---|---|---|---|---|---|---|---|---|---|---|---|---|---|---|---|---|---|---|---|---|---|---|---|---|---|---|---|---|---|---|---|---|---|---|---|---|---|---|---|---|---|---|
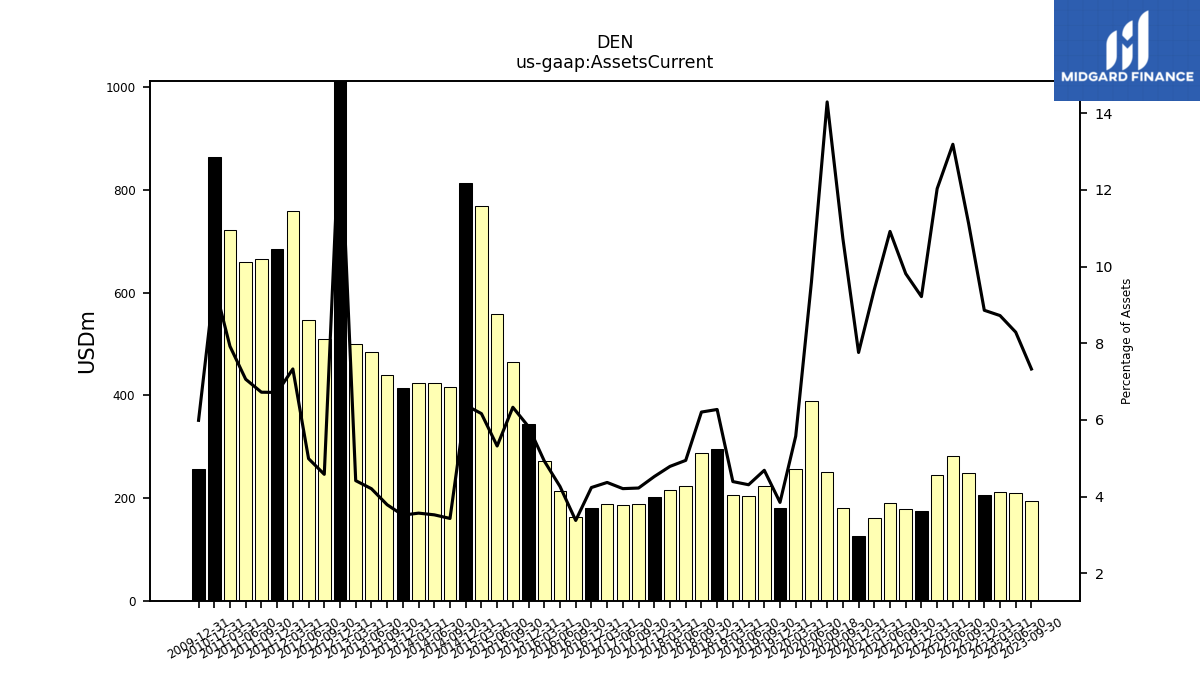
| Assets Current | 194.30 | 210.68 | 212.14 | 206.23 | 249.65 | 282.10 | 244.42 | 175.41 | 177.89 | 191.06 | 161.82 | 126.85 | 180.11 | 250.36 | 389.45 | 256.92 | 180.61 | 222.78 | 203.94 | 206.05 | 296.29 | 288.19 | 224.24 | 214.85 | 202.25 | 187.59 | 186.23 | 188.27 | 181.13 | 162.72 | 212.82 | 272.98 | 344.71 | 465.62 | 558.38 | 768.65 | 812.68 | 416.49 | 422.97 | 423.58 | 1542.75 | 508.77 | 545.76 | 758.03 | 664.71 | 659.48 | 721.66 | 864.32 | NA | NA | NA | 255.76 | NA | NA | NA | |
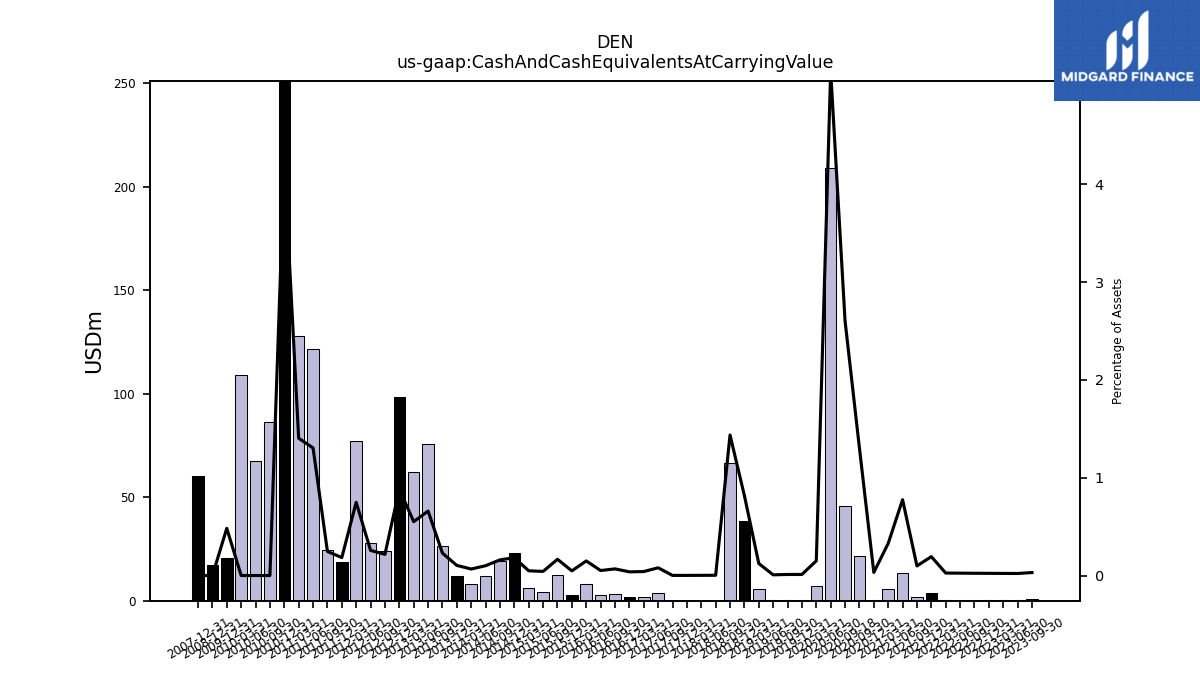
| Cash And Cash Equivalents At Carrying Value | 0.80 | 0.53 | 0.53 | 0.52 | 0.52 | 0.52 | 0.52 | 3.67 | 1.78 | 13.56 | 5.65 | 0.52 | 21.86 | 45.59 | 209.28 | 6.92 | 0.52 | 0.51 | 0.34 | 5.75 | 38.56 | 66.71 | 0.12 | 0.09 | 0.06 | 0.06 | 3.51 | 1.75 | 1.61 | 3.27 | 2.54 | 8.25 | 2.81 | 12.21 | 4.41 | 6.02 | 23.15 | 19.44 | 12.05 | 7.89 | 98.51 | 24.03 | 28.11 | 77.37 | 24.36 | 121.79 | 127.86 | 381.87 | 86.34 | 67.47 | 109.19 | 20.59 | NA | NA | NA | |
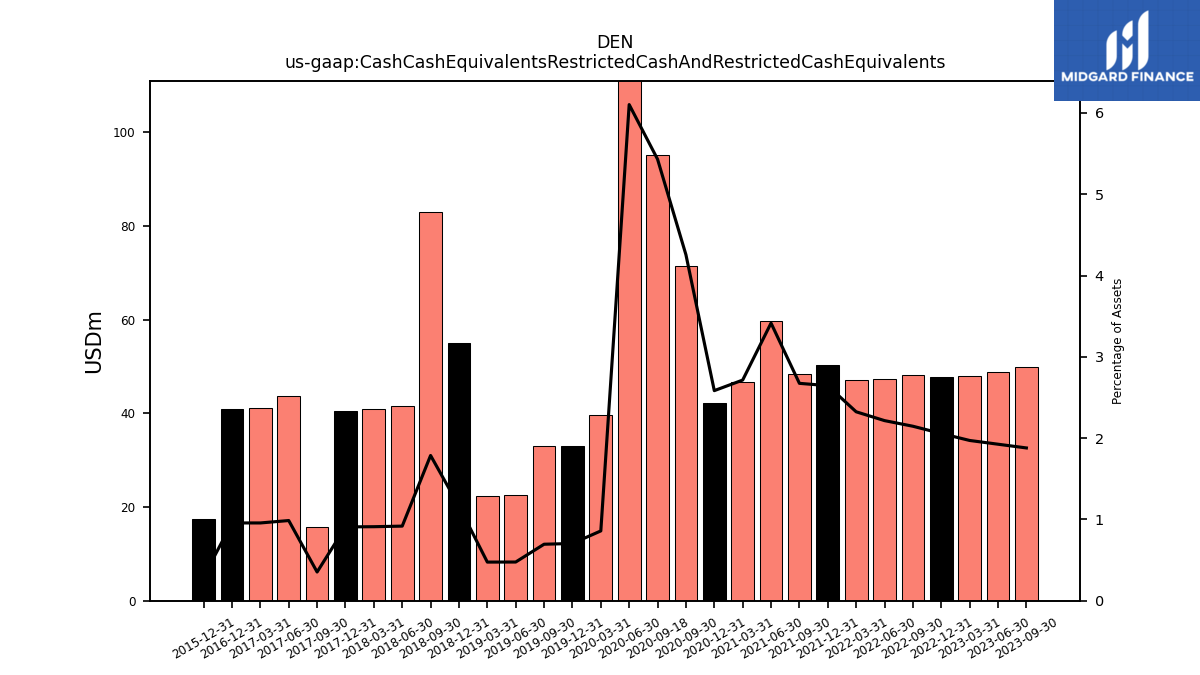
| Cash Cash Equivalents Restricted Cash And Restricted Cash Equivalents | 49.83 | 48.94 | 47.95 | 47.88 | 48.15 | 47.39 | 47.21 | 50.34 | 48.46 | 59.77 | 46.72 | 42.25 | 71.41 | 95.11 | 247.64 | 39.57 | 33.05 | 33.05 | 22.54 | 22.31 | 54.95 | 82.98 | 41.62 | 40.87 | 40.61 | 15.70 | 43.66 | 41.23 | 40.91 | NA | NA | NA | 17.50 | NA | NA | NA | NA | NA | NA | NA | NA | NA | NA | NA | NA | NA | NA | NA | NA | NA | NA | NA | NA | NA | NA | |
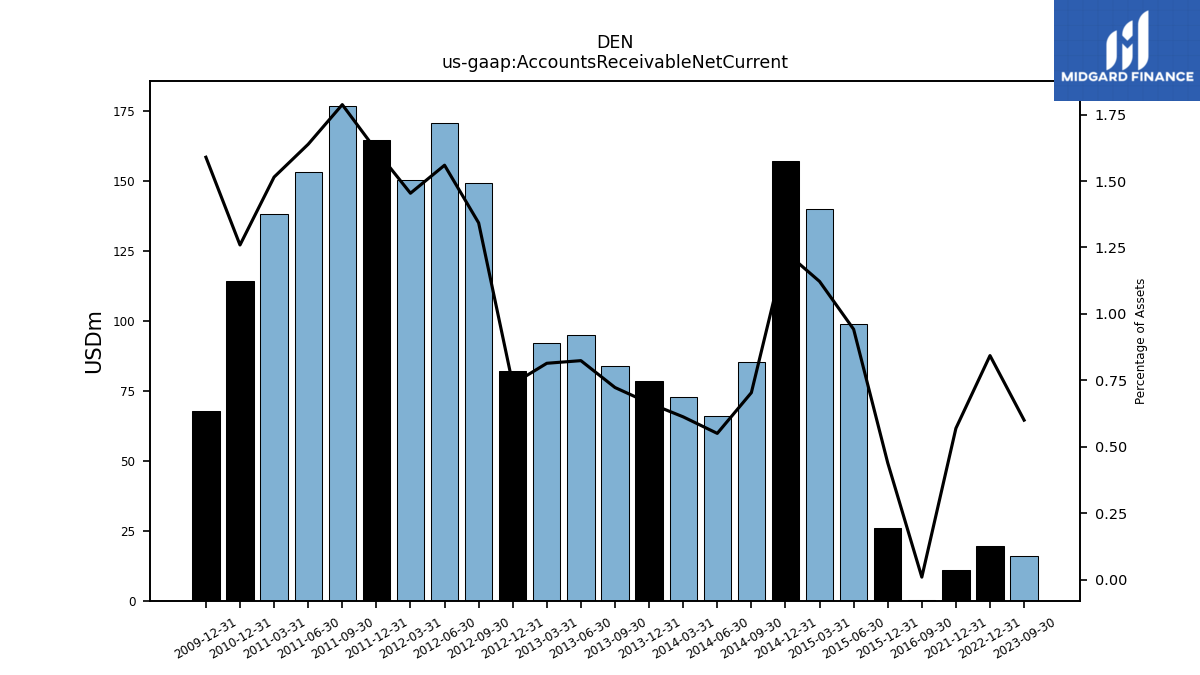
| Accounts Receivable Net Current | 15.90 | NA | NA | 19.62 | NA | NA | NA | 10.83 | NA | NA | NA | NA | NA | NA | NA | NA | NA | NA | NA | NA | NA | NA | NA | NA | NA | NA | NA | NA | NA | 0.43 | NA | NA | 25.99 | NA | 98.86 | 139.90 | 156.96 | 85.39 | 66.00 | 72.66 | 81.97 | 149.10 | 170.54 | 150.38 | 176.73 | 153.02 | 138.03 | 114.15 | NA | NA | NA | 67.87 | NA | NA | NA | |
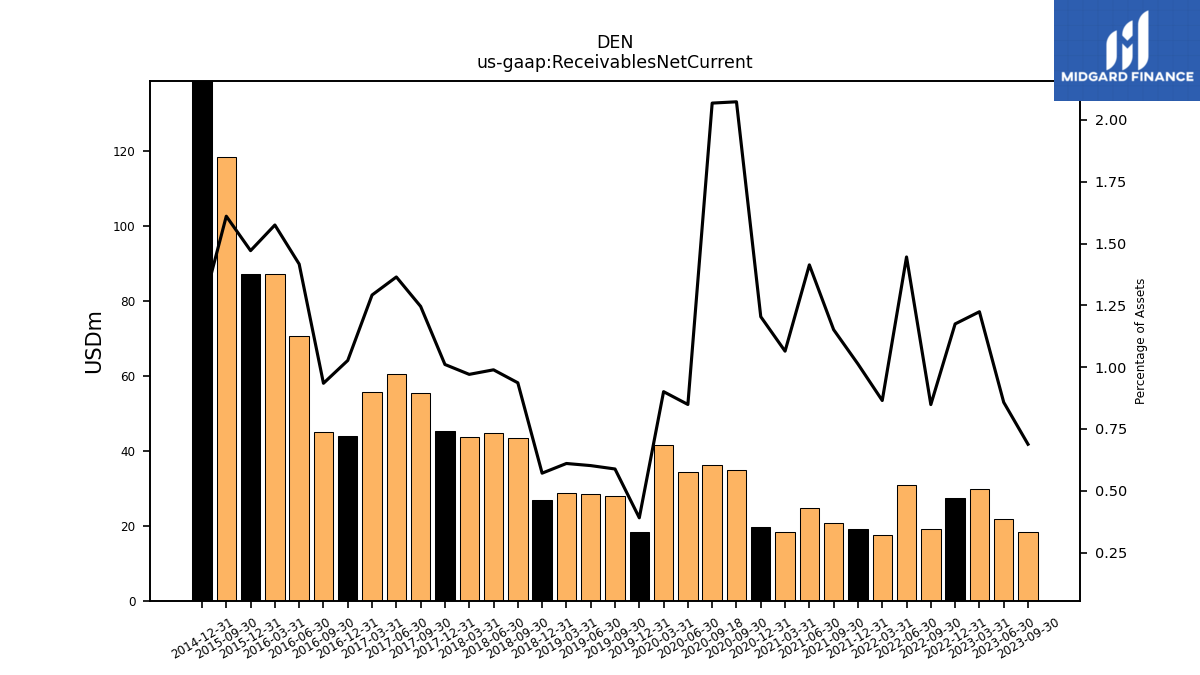
| Receivables Net Current | 18.24 | 21.80 | 29.77 | 27.34 | 19.04 | 30.92 | 17.57 | 19.27 | 20.87 | 24.74 | 18.32 | 19.68 | 34.79 | 36.22 | 34.45 | 41.50 | 18.32 | 27.95 | 28.47 | 28.62 | 26.97 | 43.49 | 44.85 | 43.55 | 45.19 | 55.32 | 60.39 | 55.65 | 43.90 | 45.02 | 70.70 | 87.23 | 87.09 | 118.46 | NA | NA | 156.96 | NA | NA | NA | NA | NA | NA | NA | NA | NA | NA | NA | NA | NA | NA | NA | NA | NA | NA |
| 2023-09-30 | 2023-06-30 | 2023-03-31 | 2022-12-31 | 2022-09-30 | 2022-06-30 | 2022-03-31 | 2021-12-31 | 2021-09-30 | 2021-06-30 | 2021-03-31 | 2020-12-31 | 2020-09-30 | 2020-09-18 | 2020-06-30 | 2020-03-31 | 2019-12-31 | 2019-09-30 | 2019-06-30 | 2019-03-31 | 2018-12-31 | 2018-09-30 | 2018-06-30 | 2018-03-31 | 2017-12-31 | 2017-09-30 | 2017-06-30 | 2017-03-31 | 2016-12-31 | 2016-09-30 | 2016-06-30 | 2016-03-31 | 2015-12-31 | 2015-09-30 | 2015-06-30 | 2015-03-31 | 2014-12-31 | 2014-09-30 | 2014-06-30 | 2014-03-31 | 2012-12-31 | 2012-09-30 | 2012-06-30 | 2012-03-31 | 2011-09-30 | 2011-06-30 | 2011-03-31 | 2010-12-31 | 2010-09-30 | 2010-06-30 | 2010-03-31 | 2009-12-31 | 2009-09-30 | 2009-06-30 | 2009-03-31 | ||
|---|---|---|---|---|---|---|---|---|---|---|---|---|---|---|---|---|---|---|---|---|---|---|---|---|---|---|---|---|---|---|---|---|---|---|---|---|---|---|---|---|---|---|---|---|---|---|---|---|---|---|---|---|---|---|---|---|
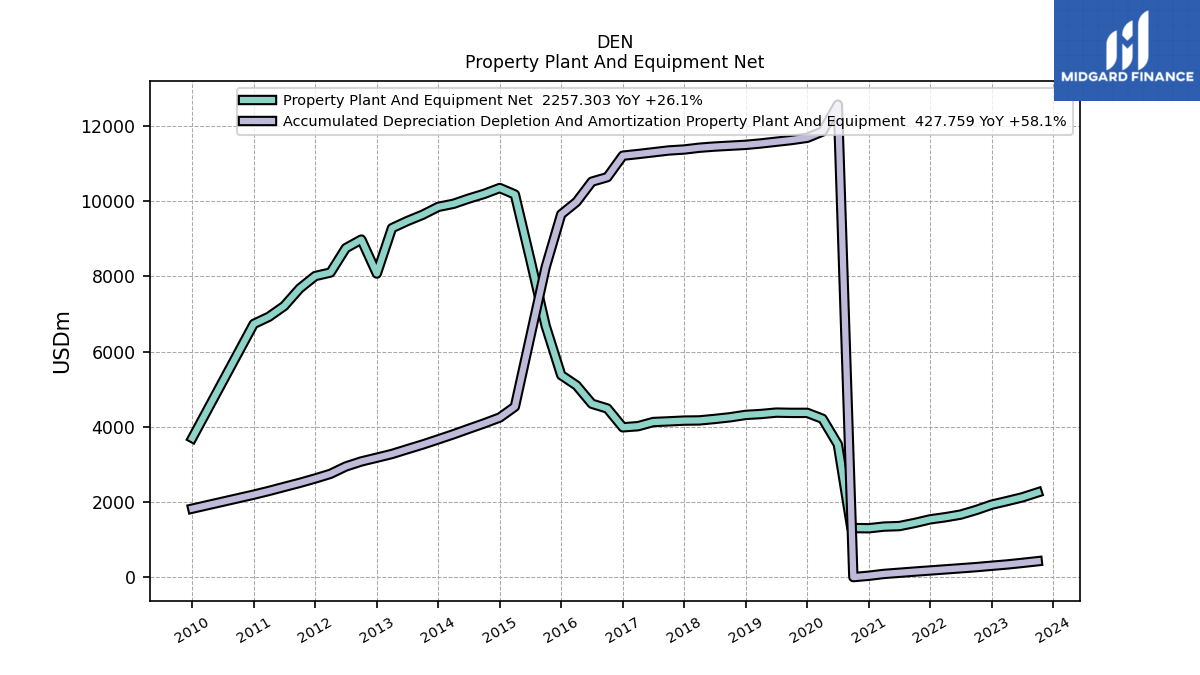
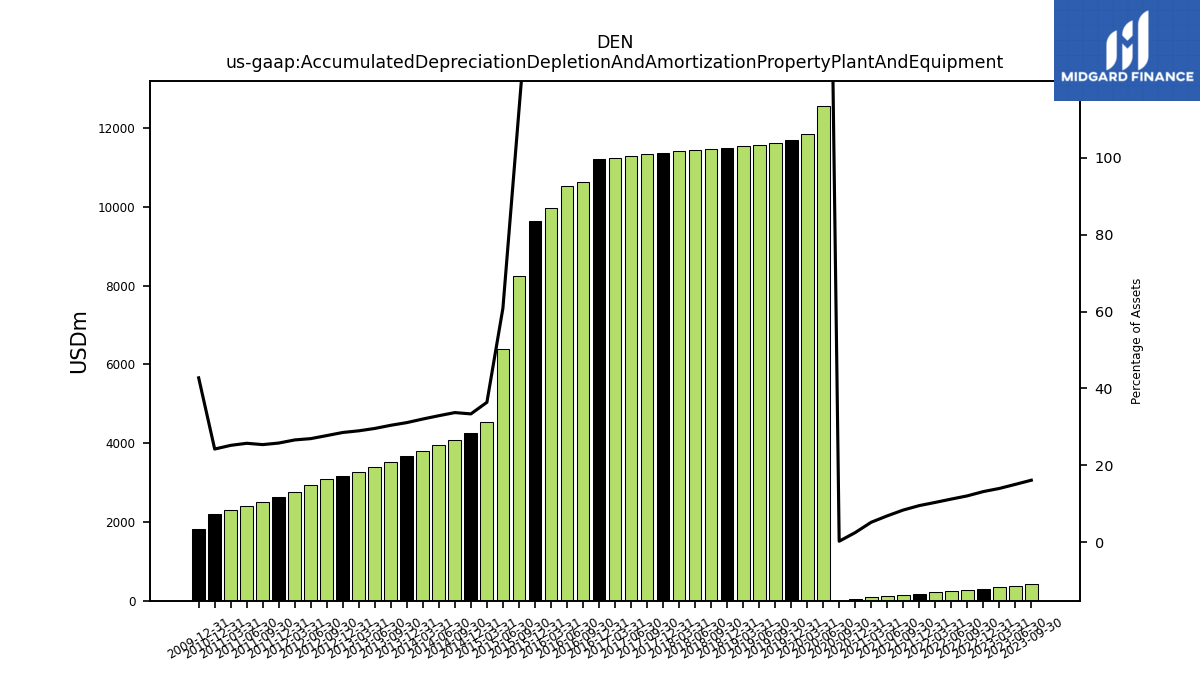
| Accumulated Depreciation Depletion And Amortization Property Plant And Equipment | 427.76 | 382.59 | 340.31 | 306.74 | 270.59 | 240.13 | 210.54 | 181.39 | 151.84 | 120.07 | 89.54 | 41.09 | 4.45 | NA | 12570.06 | 11854.99 | 11688.02 | 11629.25 | 11583.50 | 11537.62 | 11500.19 | 11477.87 | 11455.05 | 11424.17 | 11376.65 | 11350.96 | 11302.66 | 11255.39 | 11212.33 | 10641.30 | 10521.06 | 9982.73 | 9653.20 | 8252.33 | 6388.35 | 4536.89 | 4248.65 | 4093.89 | 3949.28 | 3803.38 | 3180.24 | 3080.96 | 2947.03 | 2752.00 | 2510.72 | 2403.74 | 2295.95 | 2197.52 | NA | NA | NA | 1825.53 | NA | NA | NA | |
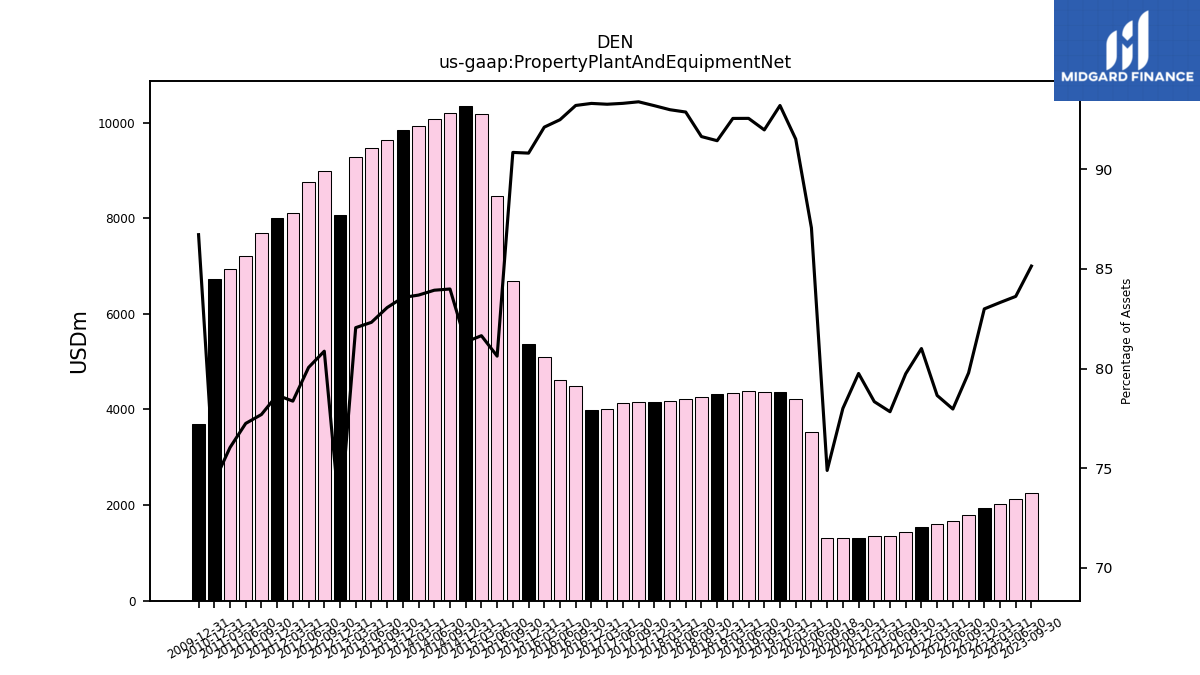
| Property Plant And Equipment Net | 2257.30 | 2125.34 | 2026.25 | 1931.68 | 1789.81 | 1667.53 | 1597.65 | 1541.50 | 1445.14 | 1362.17 | 1348.36 | 1303.80 | 1308.73 | 1311.59 | 3532.88 | 4216.17 | 4372.83 | 4372.28 | 4379.68 | 4341.72 | 4318.61 | 4255.82 | 4211.03 | 4172.15 | 4166.87 | 4147.17 | 4129.18 | 4018.39 | 3988.37 | 4489.34 | 4615.05 | 5101.80 | 5375.81 | 6681.86 | 8461.79 | 10180.07 | 10352.24 | 10196.68 | 10071.42 | 9931.98 | 8077.11 | 8981.65 | 8754.31 | 8104.67 | 7681.64 | 7214.48 | 6928.03 | 6737.36 | NA | NA | NA | 3702.87 | NA | NA | NA | |
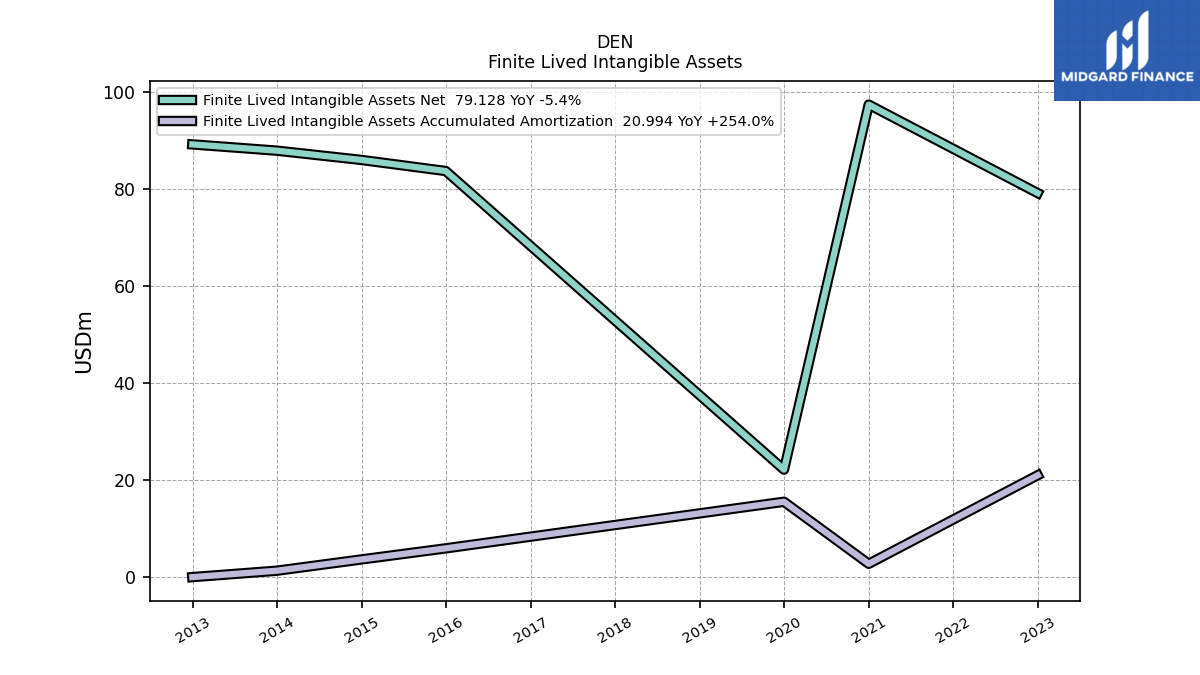
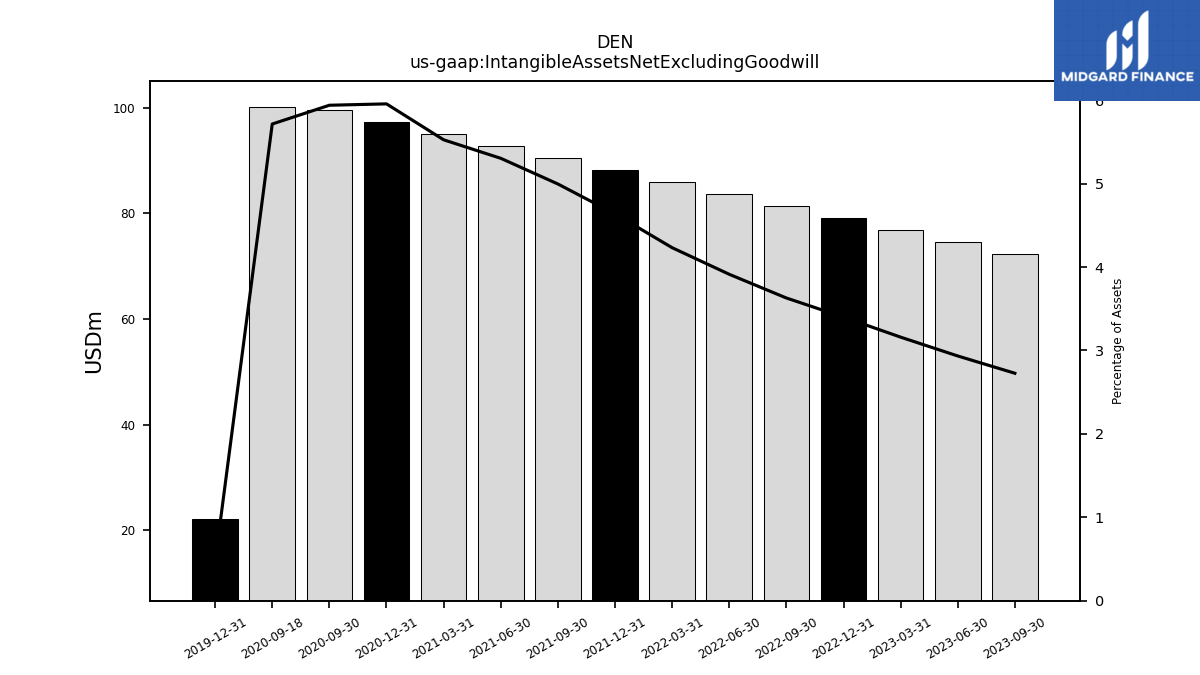
| Intangible Assets Net Excluding Goodwill | 72.29 | 74.57 | 76.85 | 79.13 | 81.41 | 83.69 | 85.97 | 88.25 | 90.53 | 92.81 | 95.10 | 97.36 | 99.66 | 100.08 | NA | NA | 22.14 | NA | NA | NA | NA | NA | NA | NA | NA | NA | NA | NA | NA | NA | NA | NA | NA | NA | NA | NA | NA | NA | NA | NA | NA | NA | NA | NA | NA | NA | NA | NA | NA | NA | NA | NA | NA | NA | NA | |
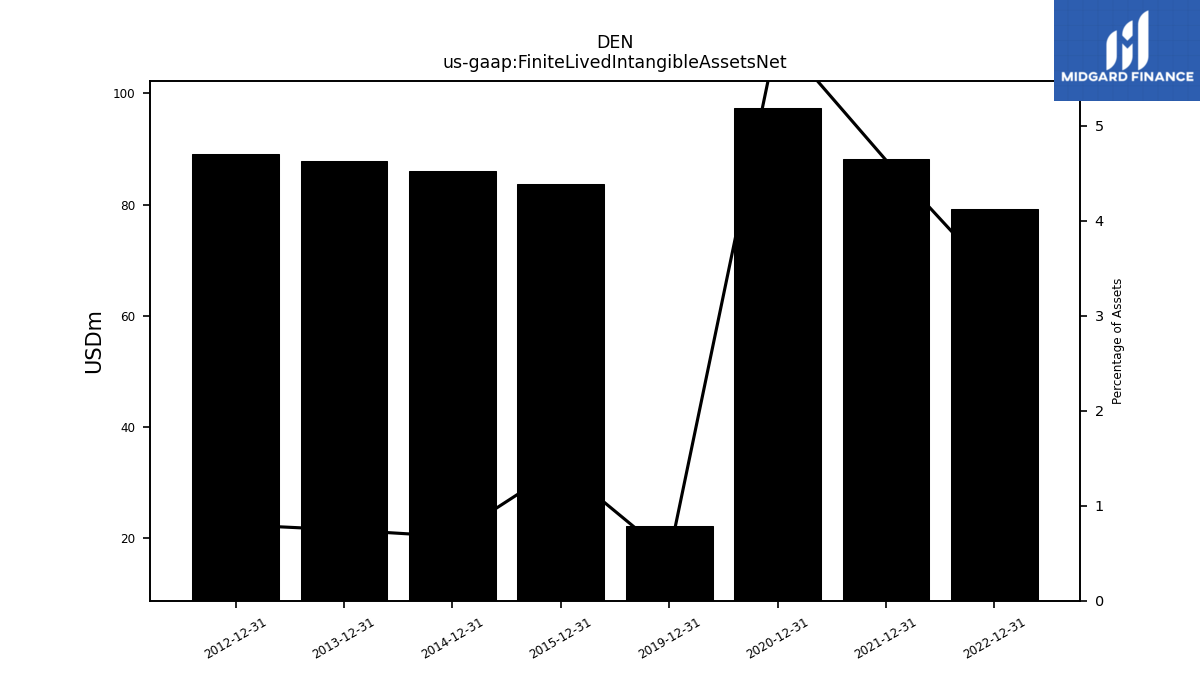
| Finite Lived Intangible Assets Net | NA | NA | NA | 79.13 | NA | NA | NA | 88.25 | NA | NA | NA | 97.36 | NA | NA | NA | NA | 22.14 | NA | NA | NA | NA | NA | NA | NA | NA | NA | NA | NA | NA | NA | NA | NA | 83.68 | NA | NA | NA | 85.97 | NA | NA | NA | 89.17 | NA | NA | NA | NA | NA | NA | NA | NA | NA | NA | NA | NA | NA | NA | |
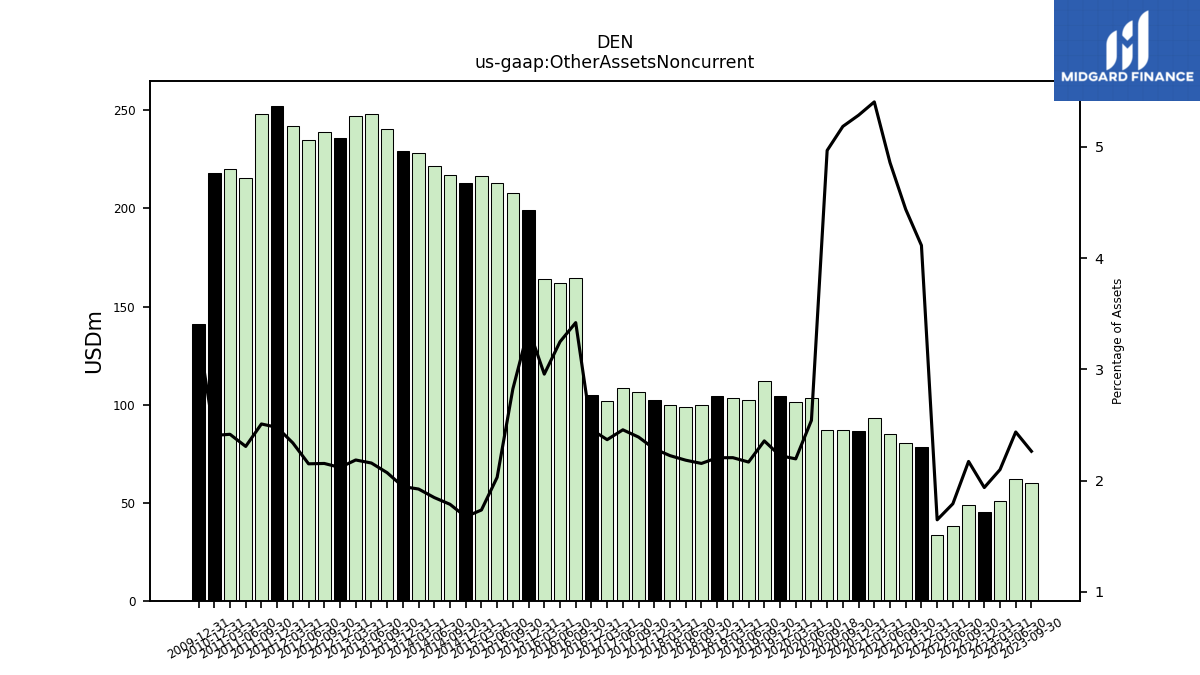
| Other Assets Noncurrent | 60.00 | 61.93 | 51.02 | 45.08 | 48.72 | 38.30 | 33.45 | 78.30 | 80.44 | 85.04 | 93.03 | 86.41 | 87.00 | 87.02 | 103.12 | 101.11 | 104.33 | 112.01 | 102.50 | 103.46 | 104.12 | 100.01 | 98.97 | 99.77 | 102.18 | 106.16 | 108.69 | 102.00 | 105.08 | 164.75 | 162.08 | 163.78 | 199.31 | 207.68 | 212.92 | 216.28 | 213.10 | 216.83 | 221.60 | 228.27 | 235.85 | 239.16 | 235.13 | 241.79 | 248.03 | 215.43 | 220.11 | 218.05 | NA | NA | NA | 141.32 | NA | NA | NA |
| 2023-09-30 | 2023-06-30 | 2023-03-31 | 2022-12-31 | 2022-09-30 | 2022-06-30 | 2022-03-31 | 2021-12-31 | 2021-09-30 | 2021-06-30 | 2021-03-31 | 2020-12-31 | 2020-09-30 | 2020-09-18 | 2020-06-30 | 2020-03-31 | 2019-12-31 | 2019-09-30 | 2019-06-30 | 2019-03-31 | 2018-12-31 | 2018-09-30 | 2018-06-30 | 2018-03-31 | 2017-12-31 | 2017-09-30 | 2017-06-30 | 2017-03-31 | 2016-12-31 | 2016-09-30 | 2016-06-30 | 2016-03-31 | 2015-12-31 | 2015-09-30 | 2015-06-30 | 2015-03-31 | 2014-12-31 | 2014-09-30 | 2014-06-30 | 2014-03-31 | 2012-12-31 | 2012-09-30 | 2012-06-30 | 2012-03-31 | 2011-09-30 | 2011-06-30 | 2011-03-31 | 2010-12-31 | 2010-09-30 | 2010-06-30 | 2010-03-31 | 2009-12-31 | 2009-09-30 | 2009-06-30 | 2009-03-31 | ||
|---|---|---|---|---|---|---|---|---|---|---|---|---|---|---|---|---|---|---|---|---|---|---|---|---|---|---|---|---|---|---|---|---|---|---|---|---|---|---|---|---|---|---|---|---|---|---|---|---|---|---|---|---|---|---|---|---|
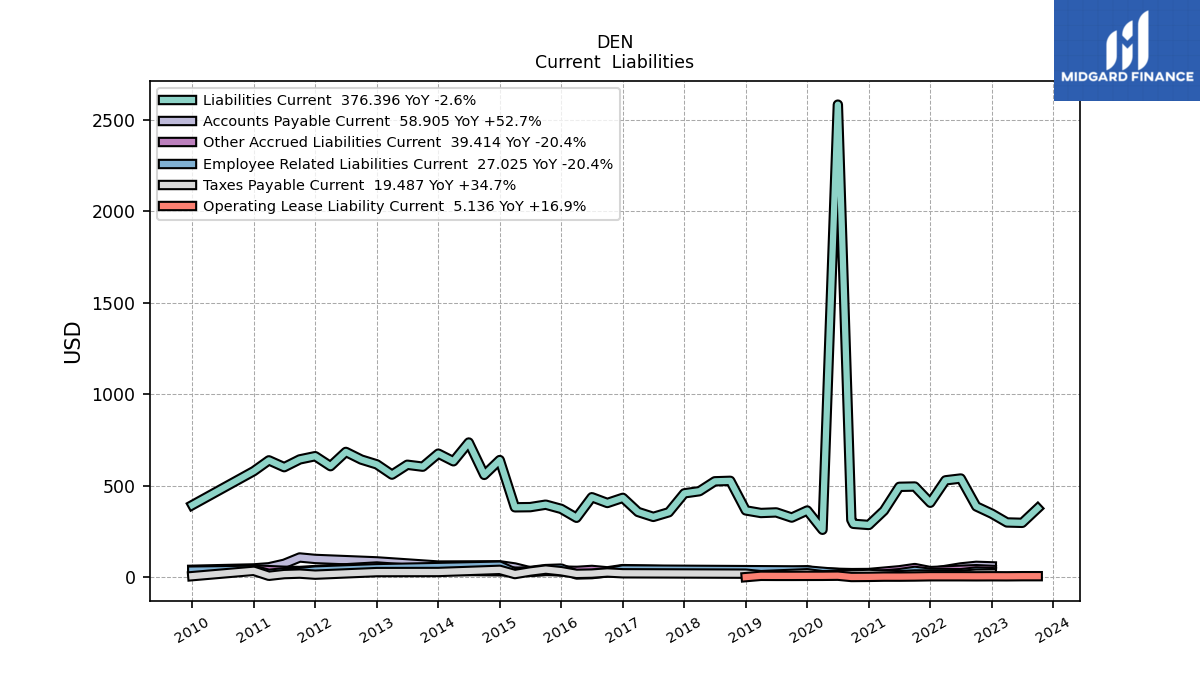
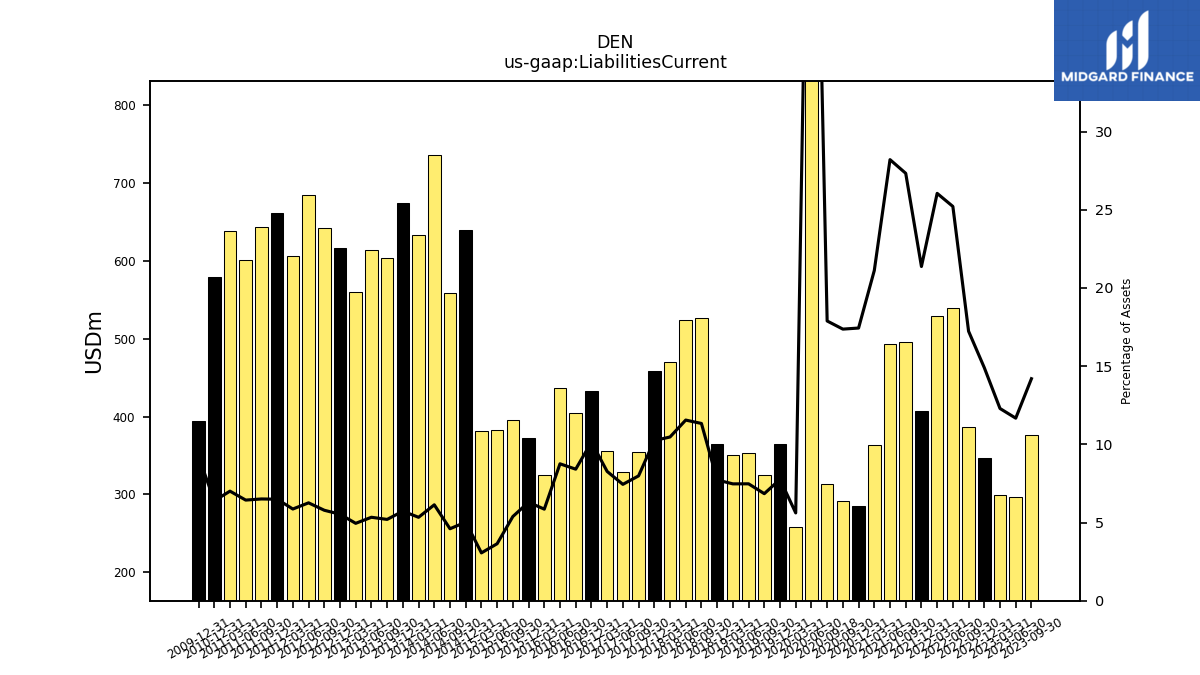
| Liabilities Current | 376.40 | 296.73 | 298.95 | 346.86 | 386.59 | 539.20 | 529.13 | 406.68 | 495.30 | 493.60 | 363.43 | 285.06 | 291.41 | 313.30 | 2583.17 | 258.72 | 364.24 | 325.47 | 353.80 | 350.58 | 364.79 | 526.43 | 523.82 | 469.77 | 458.06 | 354.55 | 329.34 | 356.28 | 433.50 | 405.25 | 436.91 | 324.40 | 373.01 | 396.13 | 382.64 | 381.67 | 640.12 | 558.85 | 736.03 | 633.26 | 616.42 | 642.61 | 684.61 | 606.59 | 643.52 | 601.11 | 638.47 | 579.35 | NA | NA | NA | 393.79 | NA | NA | NA | |
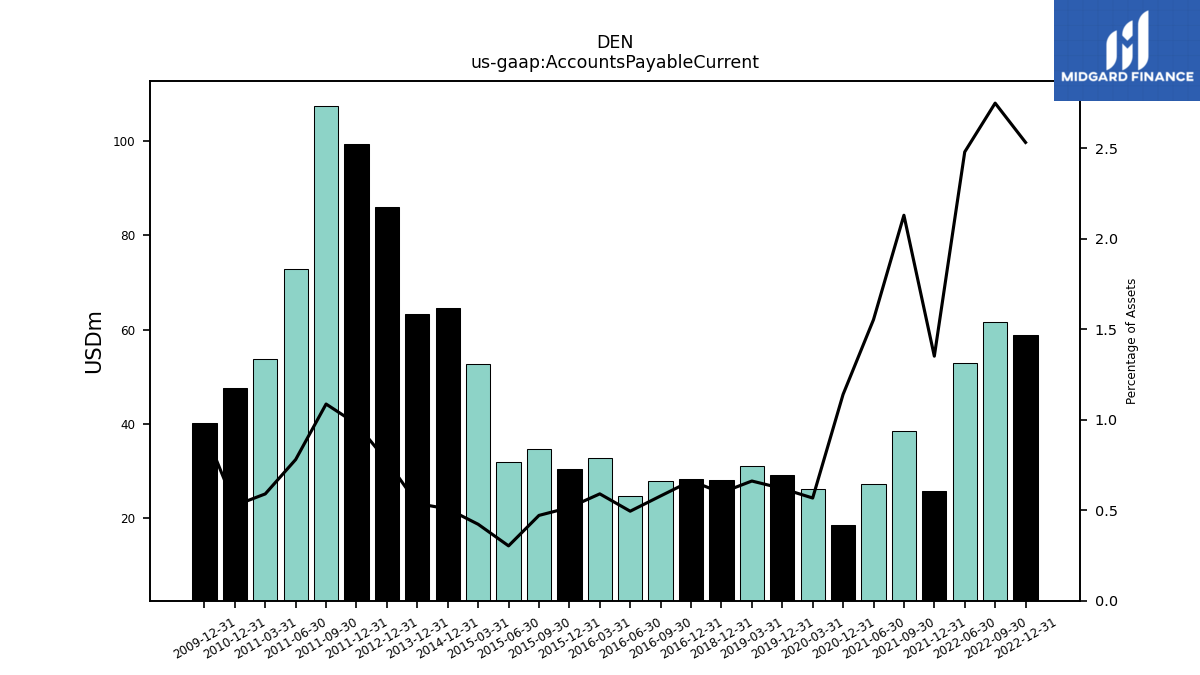
| Accounts Payable Current | NA | NA | NA | 58.91 | 61.64 | 53.01 | NA | 25.70 | 38.58 | 27.17 | NA | 18.63 | NA | NA | NA | 26.13 | 29.08 | NA | NA | 31.01 | 28.18 | NA | NA | NA | NA | NA | NA | NA | 28.30 | 27.88 | 24.68 | 32.69 | 30.48 | 34.66 | 31.80 | 52.66 | 64.60 | NA | NA | NA | 86.05 | NA | NA | NA | 107.39 | 72.83 | 53.75 | 47.66 | NA | NA | NA | 40.14 | NA | NA | NA | |
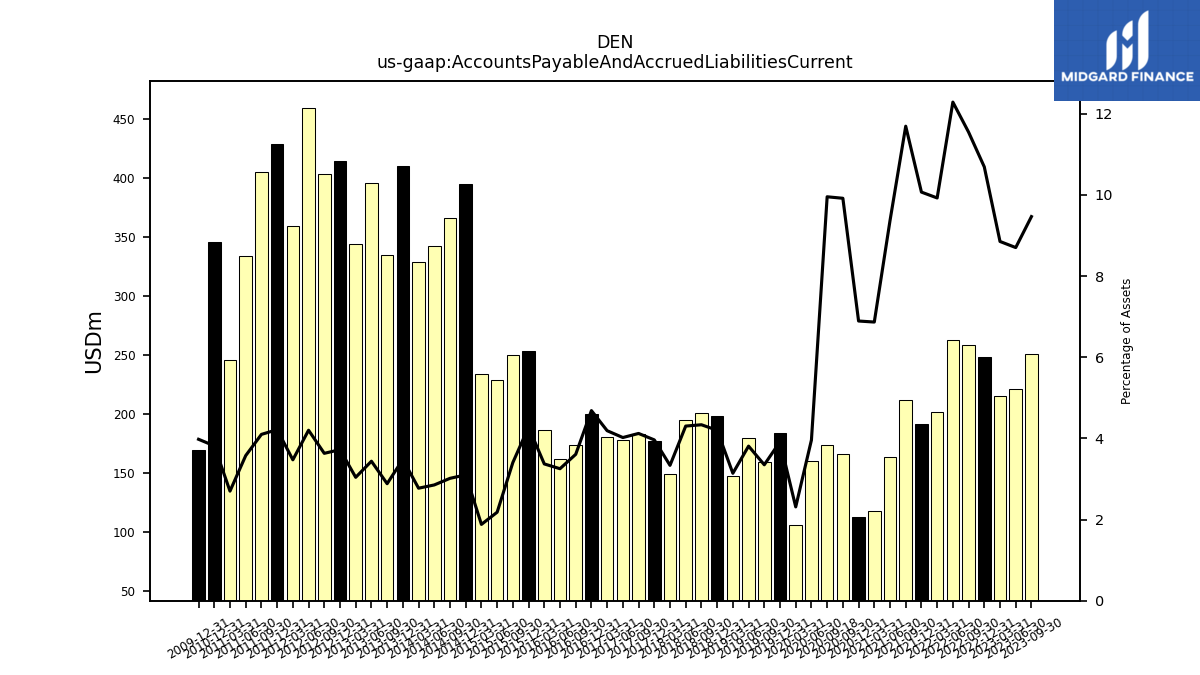
| Accounts Payable And Accrued Liabilities Current | 250.94 | 221.17 | 215.29 | 248.80 | 259.01 | 262.75 | 201.60 | 191.60 | 211.89 | 163.91 | 118.19 | 112.67 | 166.38 | 174.32 | 160.69 | 106.55 | 183.83 | 159.26 | 180.28 | 147.32 | 198.38 | 201.37 | 195.14 | 149.68 | 177.22 | 183.06 | 177.95 | 180.53 | 200.27 | 173.77 | 162.33 | 186.72 | 253.20 | 250.51 | 228.94 | 234.54 | 394.76 | 366.15 | 342.40 | 329.10 | 414.67 | 403.40 | 459.42 | 359.14 | 405.24 | 333.95 | 246.15 | 346.00 | NA | NA | NA | 169.87 | NA | NA | NA | |
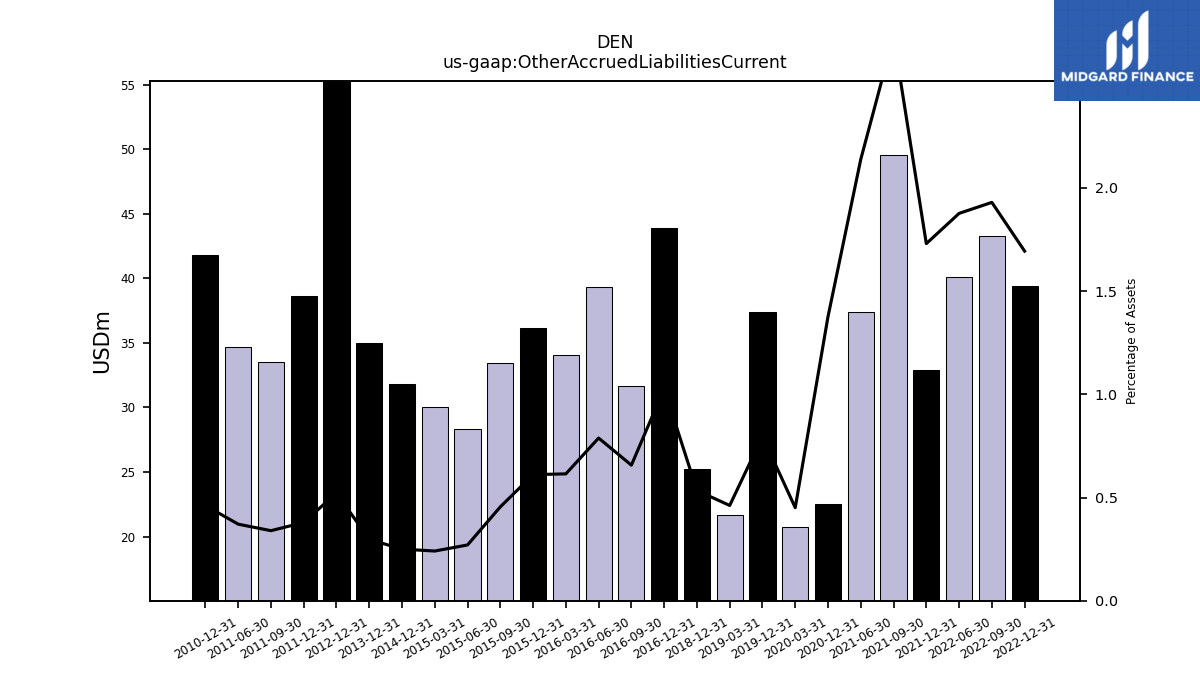
| Other Accrued Liabilities Current | NA | NA | NA | 39.41 | 43.28 | 40.12 | NA | 32.91 | 49.53 | 37.41 | NA | 22.50 | NA | NA | NA | 20.78 | 37.37 | NA | NA | 21.65 | 25.23 | NA | NA | NA | NA | NA | NA | NA | 43.93 | 31.63 | 39.32 | 34.04 | 36.15 | 33.45 | 28.36 | 30.02 | 31.83 | NA | NA | NA | 58.14 | NA | NA | NA | 33.55 | 34.65 | NA | 41.82 | NA | NA | NA | NA | NA | NA | NA | |
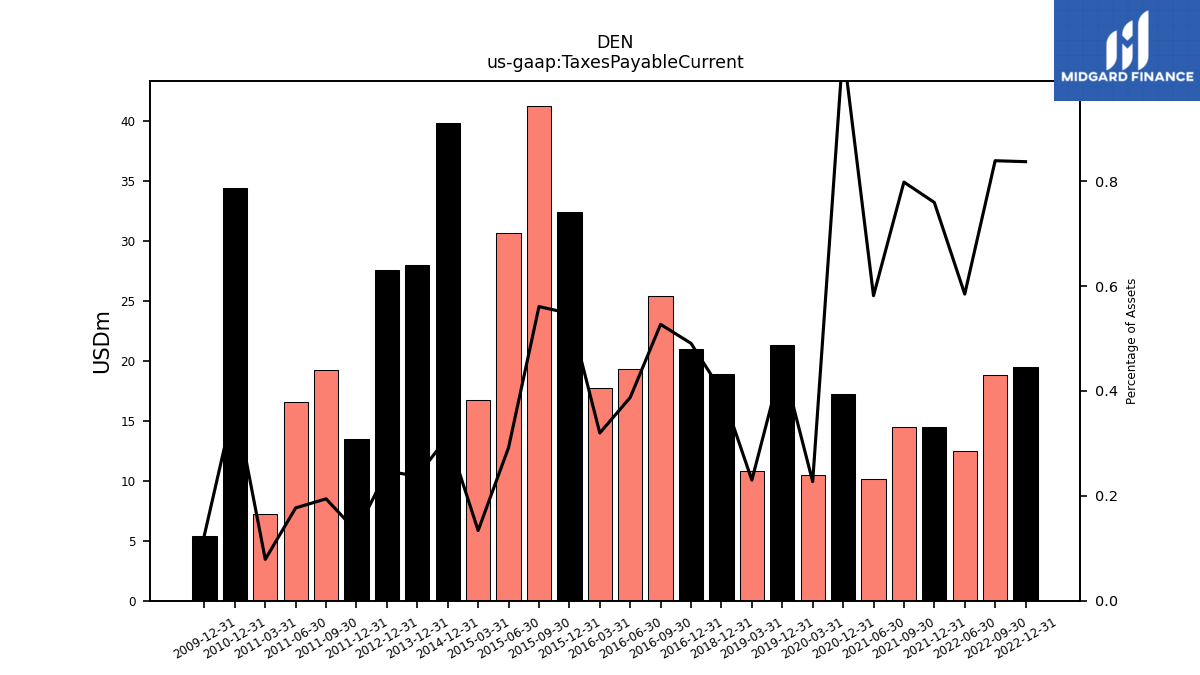
| Taxes Payable Current | NA | NA | NA | 19.49 | 18.82 | 12.51 | NA | 14.45 | 14.47 | 10.18 | NA | 17.22 | NA | NA | NA | 10.46 | 21.27 | NA | NA | 10.79 | 18.90 | NA | NA | NA | NA | NA | NA | NA | 20.98 | 25.39 | 19.34 | 17.72 | 32.44 | 41.25 | 30.65 | 16.70 | 39.82 | NA | NA | NA | 27.52 | NA | NA | NA | 19.21 | 16.54 | 7.20 | 34.37 | NA | NA | NA | 5.36 | NA | NA | NA |
| 2023-09-30 | 2023-06-30 | 2023-03-31 | 2022-12-31 | 2022-09-30 | 2022-06-30 | 2022-03-31 | 2021-12-31 | 2021-09-30 | 2021-06-30 | 2021-03-31 | 2020-12-31 | 2020-09-30 | 2020-09-18 | 2020-06-30 | 2020-03-31 | 2019-12-31 | 2019-09-30 | 2019-06-30 | 2019-03-31 | 2018-12-31 | 2018-09-30 | 2018-06-30 | 2018-03-31 | 2017-12-31 | 2017-09-30 | 2017-06-30 | 2017-03-31 | 2016-12-31 | 2016-09-30 | 2016-06-30 | 2016-03-31 | 2015-12-31 | 2015-09-30 | 2015-06-30 | 2015-03-31 | 2014-12-31 | 2014-09-30 | 2014-06-30 | 2014-03-31 | 2012-12-31 | 2012-09-30 | 2012-06-30 | 2012-03-31 | 2011-09-30 | 2011-06-30 | 2011-03-31 | 2010-12-31 | 2010-09-30 | 2010-06-30 | 2010-03-31 | 2009-12-31 | 2009-09-30 | 2009-06-30 | 2009-03-31 | ||
|---|---|---|---|---|---|---|---|---|---|---|---|---|---|---|---|---|---|---|---|---|---|---|---|---|---|---|---|---|---|---|---|---|---|---|---|---|---|---|---|---|---|---|---|---|---|---|---|---|---|---|---|---|---|---|---|---|
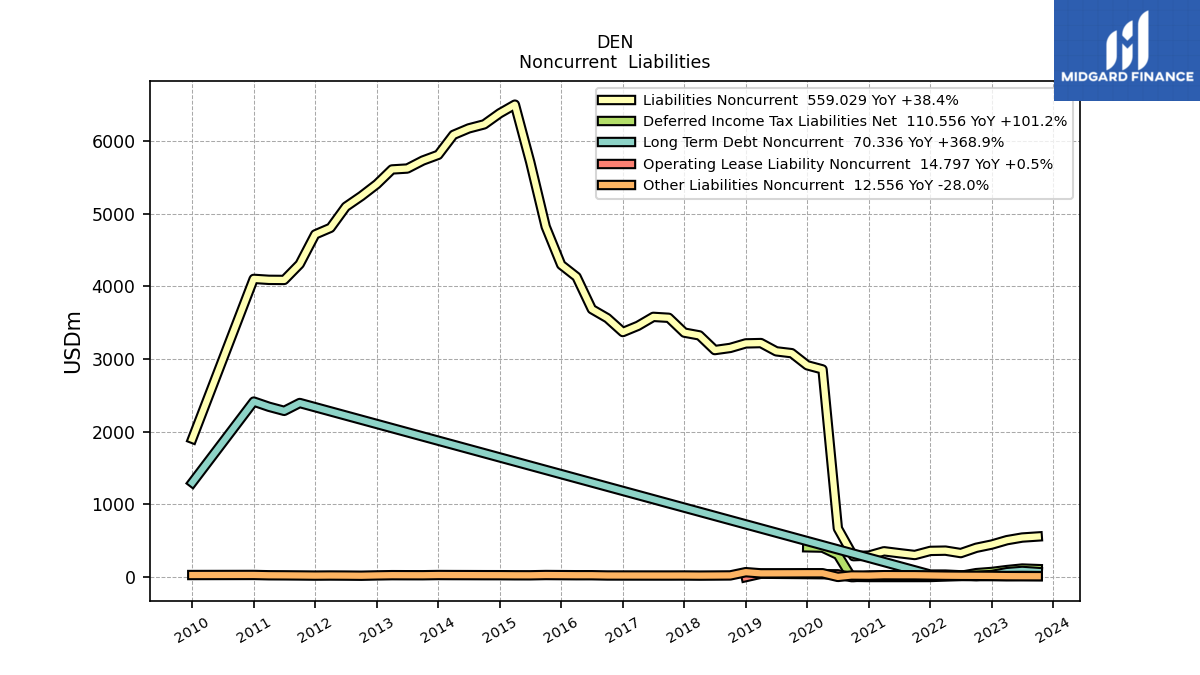
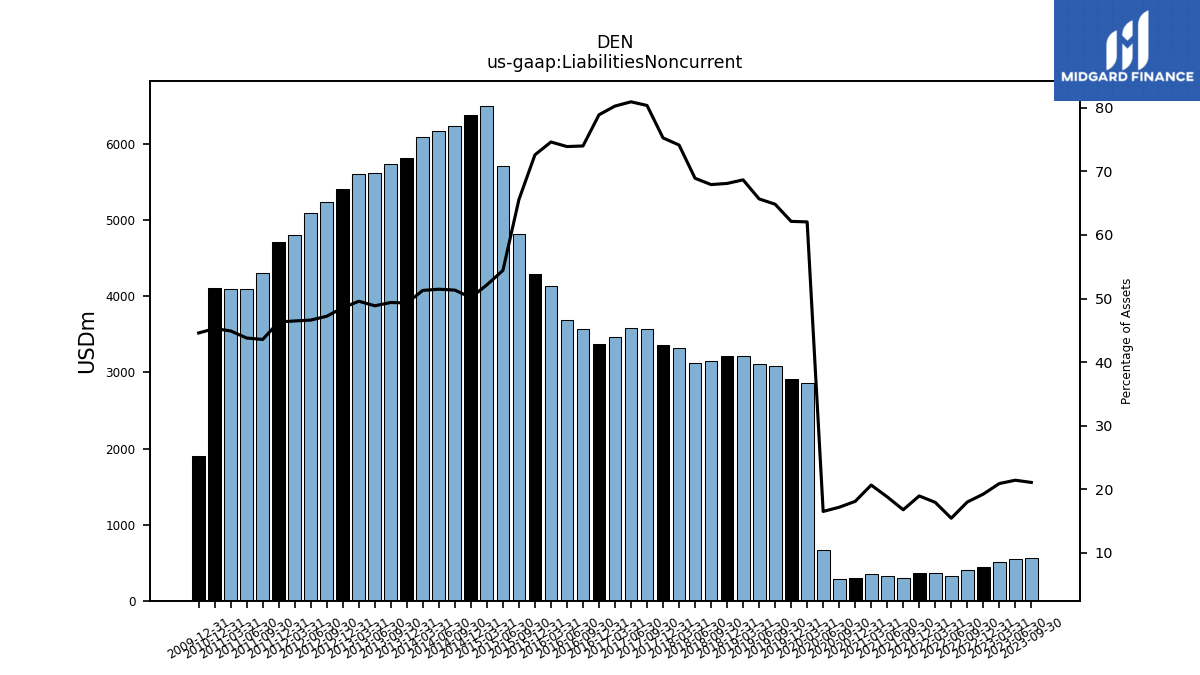
| Liabilities Noncurrent | 559.03 | 544.74 | 508.53 | 448.02 | 403.87 | 330.64 | 364.57 | 360.88 | 304.18 | 329.30 | 355.80 | 296.03 | 288.28 | NA | 670.44 | 2858.92 | 2915.37 | 3082.12 | 3107.56 | 3221.26 | 3216.65 | 3154.40 | 3124.77 | 3326.79 | 3365.08 | 3568.93 | 3581.80 | 3458.62 | 3372.63 | 3564.21 | 3687.76 | 4132.87 | 4297.90 | 4822.69 | 5712.63 | 6502.90 | 6383.82 | 6231.43 | 6175.70 | 6086.79 | 5408.03 | 5244.12 | 5097.61 | 4807.03 | 4307.64 | 4090.00 | 4091.58 | 4105.01 | NA | NA | NA | 1903.95 | NA | NA | NA | |
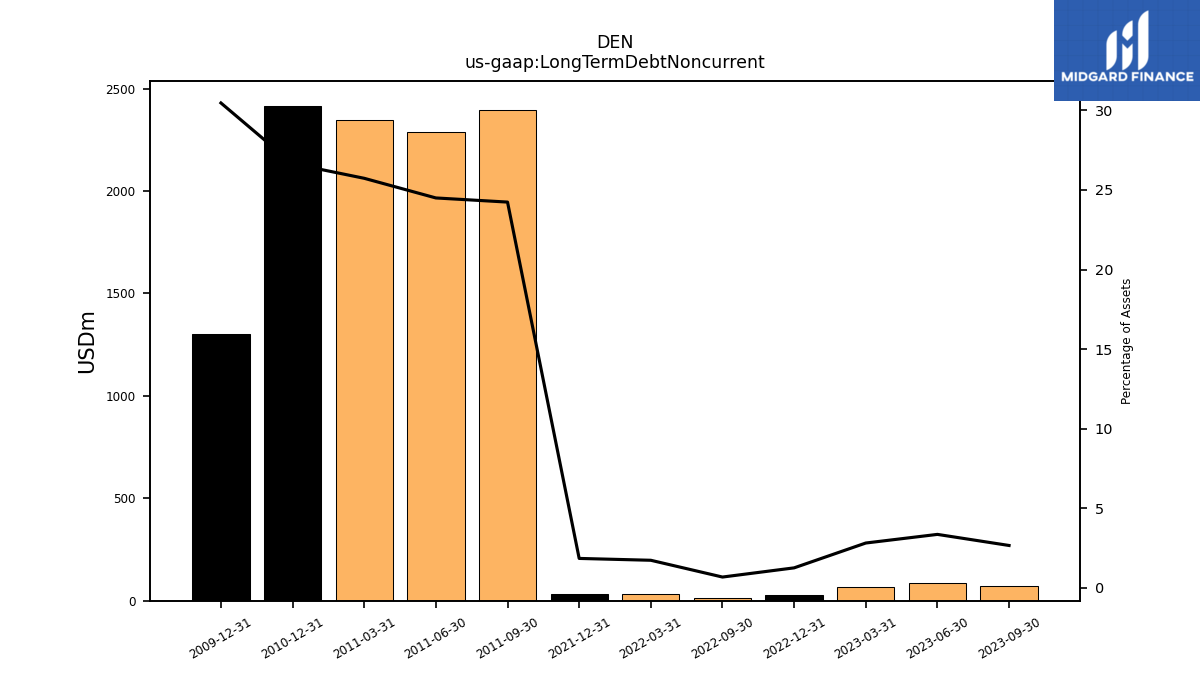
| Long Term Debt Noncurrent | 70.34 | 85.15 | 68.28 | 29.00 | 15.00 | NA | 35.00 | 35.00 | NA | NA | NA | NA | NA | NA | NA | NA | NA | NA | NA | NA | NA | NA | NA | NA | NA | NA | NA | NA | NA | NA | NA | NA | NA | NA | NA | NA | NA | NA | NA | NA | NA | NA | NA | NA | 2396.55 | 2288.11 | 2344.78 | 2416.21 | NA | NA | NA | 1301.07 | NA | NA | NA | |
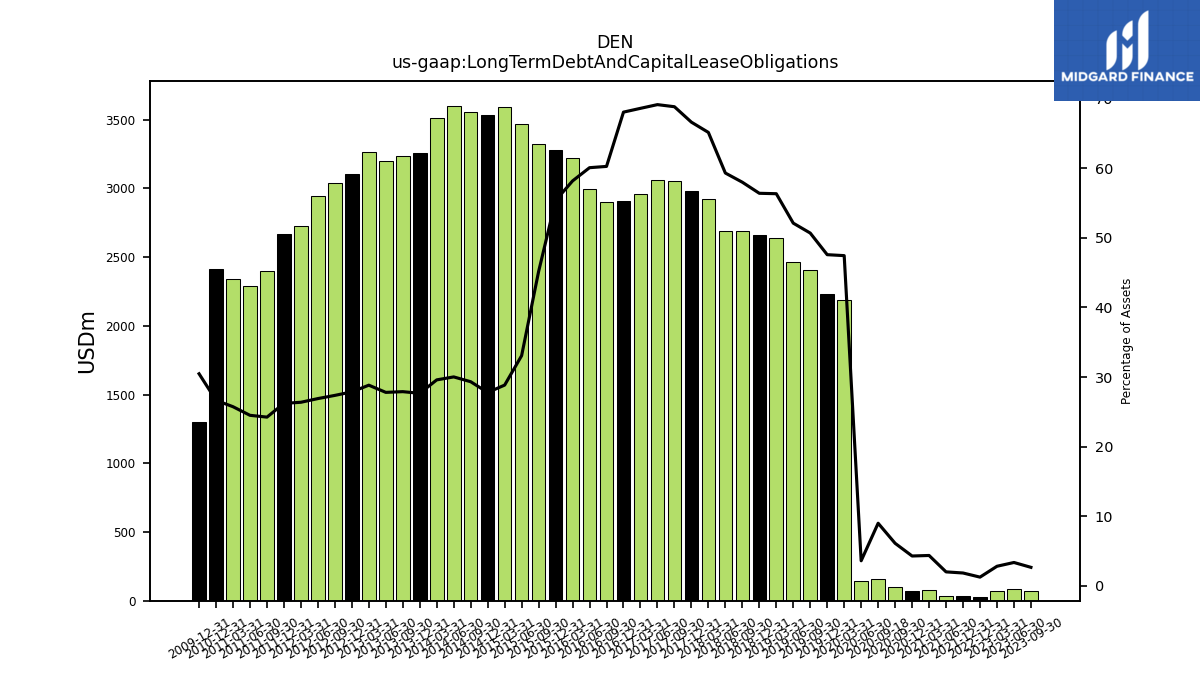
| Long Term Debt And Capital Lease Obligations | 70.34 | 85.15 | 68.28 | 29.00 | NA | NA | NA | 35.00 | NA | 35.00 | 75.00 | 70.00 | 102.46 | 157.46 | 145.92 | 2185.98 | 2232.57 | 2409.68 | 2466.13 | 2643.31 | 2664.21 | 2693.42 | 2689.65 | 2923.38 | 2979.09 | 3057.44 | 3060.05 | 2956.39 | 2909.73 | 2903.05 | 2998.27 | 3222.50 | 3277.87 | 3321.32 | 3471.14 | 3596.09 | 3535.90 | 3560.21 | 3602.16 | 3512.04 | 3104.46 | 3038.86 | 2942.07 | 2727.70 | 2396.55 | 2288.11 | 2344.78 | 2416.21 | NA | NA | NA | 1301.07 | NA | NA | NA | |
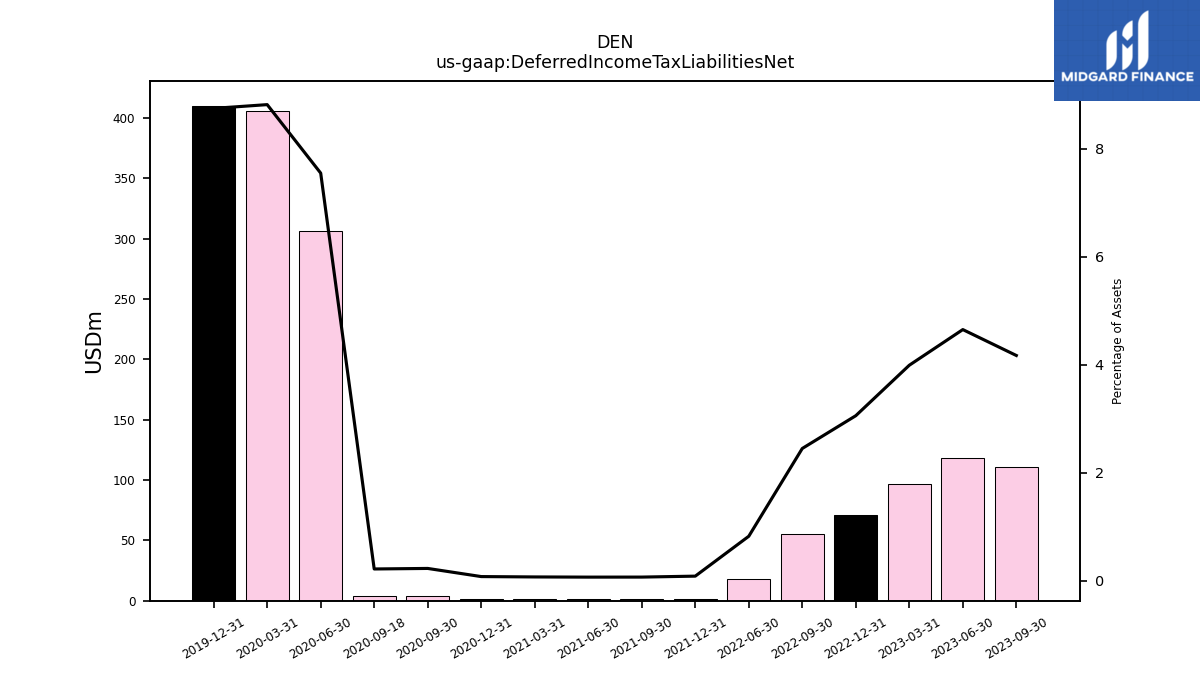
| Deferred Income Tax Liabilities Net | 110.56 | 118.17 | 97.03 | 71.12 | 54.94 | 17.63 | NA | 1.64 | 1.24 | 1.19 | 1.22 | 1.27 | 3.84 | 3.83 | 306.19 | 406.02 | 410.23 | NA | NA | NA | NA | NA | NA | NA | NA | NA | NA | NA | NA | NA | NA | NA | NA | NA | NA | NA | NA | NA | NA | NA | NA | NA | NA | NA | NA | NA | NA | NA | NA | NA | NA | NA | NA | NA | NA | |
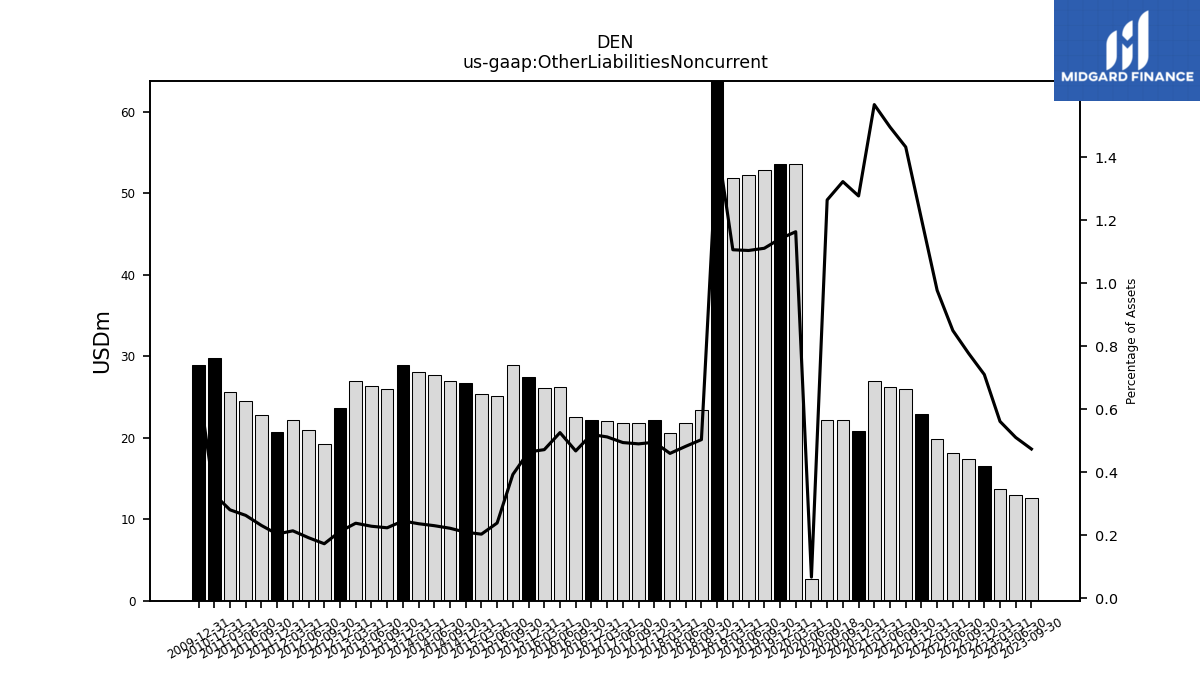
| Other Liabilities Noncurrent | 12.56 | 12.97 | 13.65 | 16.53 | 17.44 | 18.17 | 19.85 | 22.91 | 25.95 | 26.17 | 26.96 | 20.87 | 22.19 | 22.14 | 2.72 | 53.59 | 53.53 | 52.80 | 52.23 | 51.88 | 68.21 | 23.38 | 21.86 | 20.63 | 22.14 | 21.76 | 21.87 | 22.06 | 22.22 | 22.52 | 26.23 | 26.12 | 27.48 | 28.89 | 25.07 | 25.36 | 26.67 | 26.96 | 27.64 | 28.07 | 23.61 | 19.21 | 21.00 | 22.13 | 22.84 | 24.56 | 25.57 | 29.83 | NA | NA | NA | 28.88 | NA | NA | NA | |
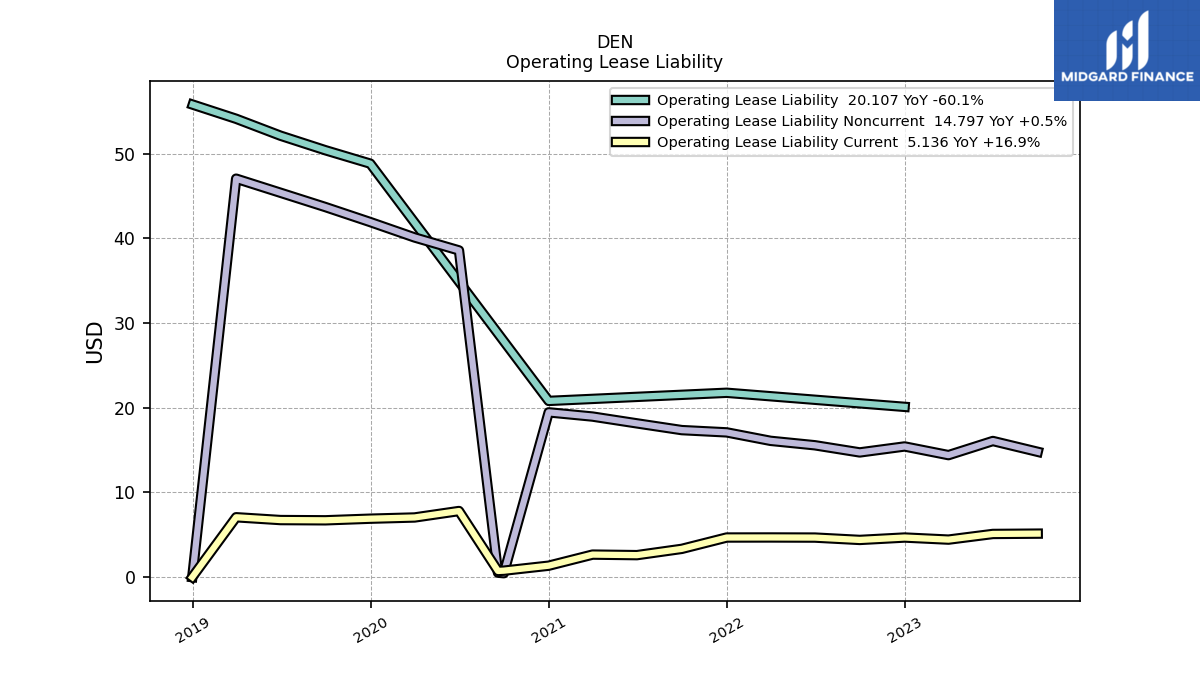
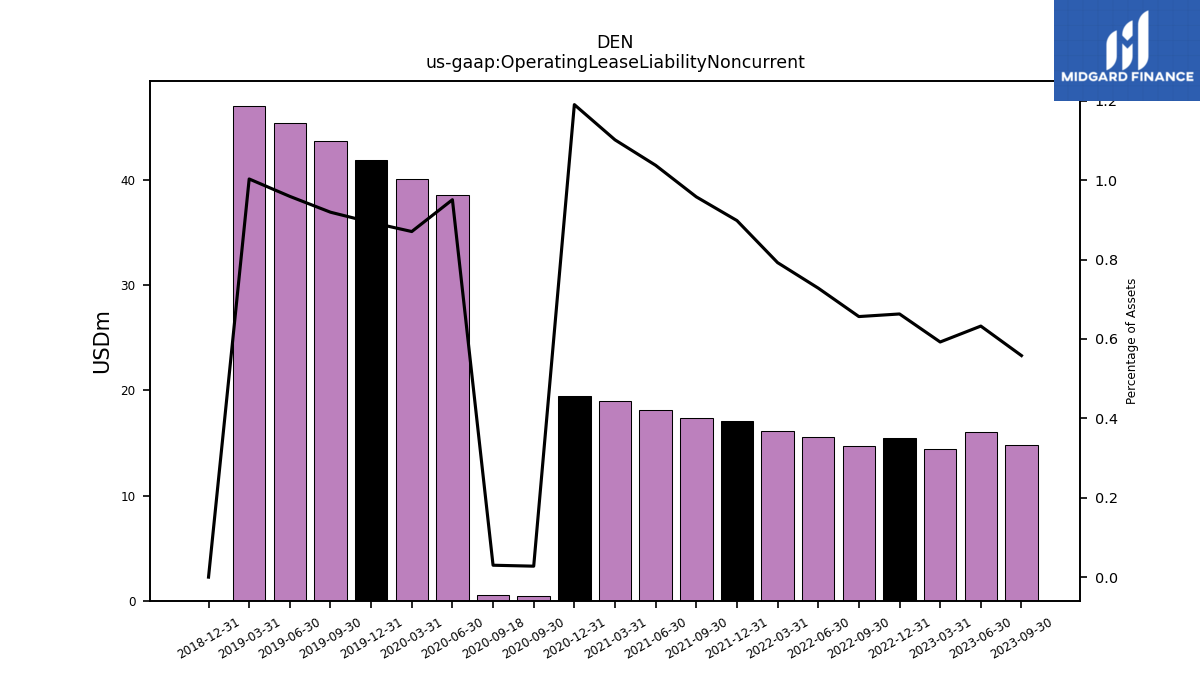
| Operating Lease Liability Noncurrent | 14.80 | 16.07 | 14.41 | 15.43 | 14.73 | 15.57 | 16.09 | 17.09 | 17.36 | 18.16 | 18.96 | 19.46 | 0.46 | 0.53 | 38.58 | 40.11 | 41.93 | 43.70 | 45.39 | 47.06 | 0.00 | NA | NA | NA | NA | NA | NA | NA | NA | NA | NA | NA | NA | NA | NA | NA | NA | NA | NA | NA | NA | NA | NA | NA | NA | NA | NA | NA | NA | NA | NA | NA | NA | NA | NA |
| 2023-09-30 | 2023-06-30 | 2023-03-31 | 2022-12-31 | 2022-09-30 | 2022-06-30 | 2022-03-31 | 2021-12-31 | 2021-09-30 | 2021-06-30 | 2021-03-31 | 2020-12-31 | 2020-09-30 | 2020-09-18 | 2020-06-30 | 2020-03-31 | 2019-12-31 | 2019-09-30 | 2019-06-30 | 2019-03-31 | 2018-12-31 | 2018-09-30 | 2018-06-30 | 2018-03-31 | 2017-12-31 | 2017-09-30 | 2017-06-30 | 2017-03-31 | 2016-12-31 | 2016-09-30 | 2016-06-30 | 2016-03-31 | 2015-12-31 | 2015-09-30 | 2015-06-30 | 2015-03-31 | 2014-12-31 | 2014-09-30 | 2014-06-30 | 2014-03-31 | 2012-12-31 | 2012-09-30 | 2012-06-30 | 2012-03-31 | 2011-09-30 | 2011-06-30 | 2011-03-31 | 2010-12-31 | 2010-09-30 | 2010-06-30 | 2010-03-31 | 2009-12-31 | 2009-09-30 | 2009-06-30 | 2009-03-31 | ||
|---|---|---|---|---|---|---|---|---|---|---|---|---|---|---|---|---|---|---|---|---|---|---|---|---|---|---|---|---|---|---|---|---|---|---|---|---|---|---|---|---|---|---|---|---|---|---|---|---|---|---|---|---|---|---|---|---|
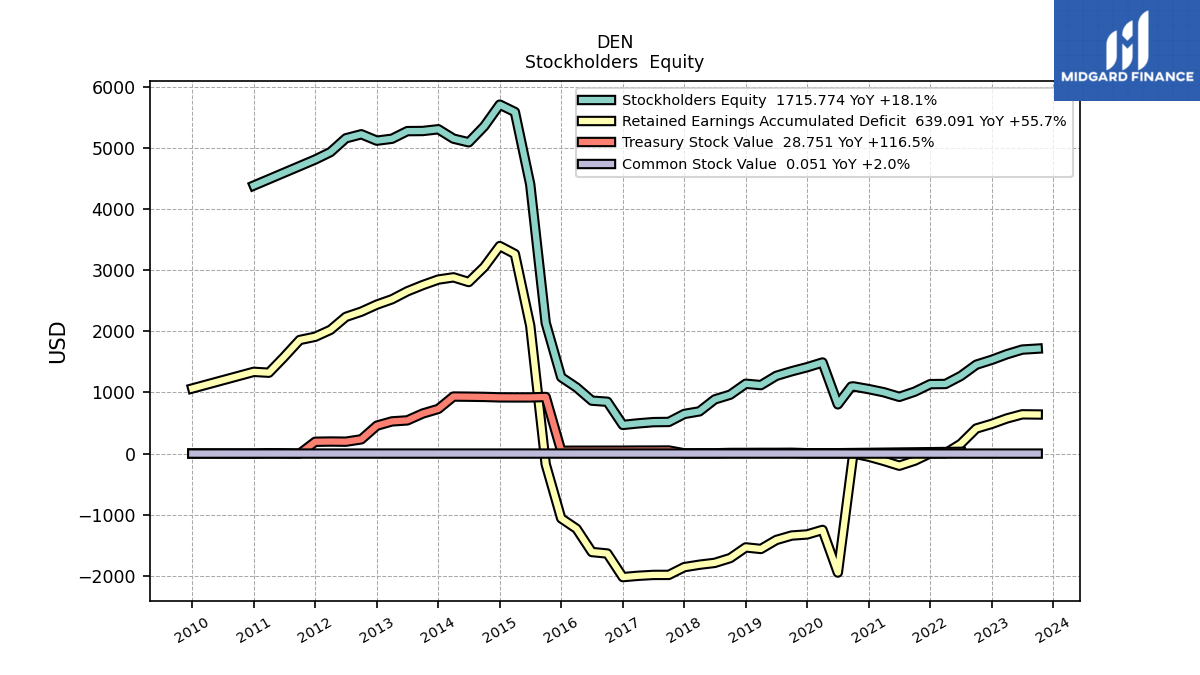
| Stockholders Equity | 1715.77 | 1700.15 | 1624.58 | 1532.62 | 1452.88 | 1268.84 | 1137.65 | 1135.39 | 1012.79 | 927.20 | 1001.93 | 1053.67 | 1098.18 | 1095.42 | 804.42 | 1489.44 | 1412.26 | 1346.12 | 1270.68 | 1119.32 | 1141.78 | 963.18 | 885.64 | 690.22 | 648.16 | 517.45 | 514.20 | 493.76 | 468.45 | 847.34 | 865.30 | 1081.28 | 1248.91 | 2136.33 | 4400.03 | 5583.48 | 5703.86 | 5349.77 | 5087.95 | 5147.91 | 5114.89 | 5219.22 | 5153.20 | 4928.44 | NA | NA | NA | 4380.71 | NA | NA | NA | NA | NA | NA | NA | |
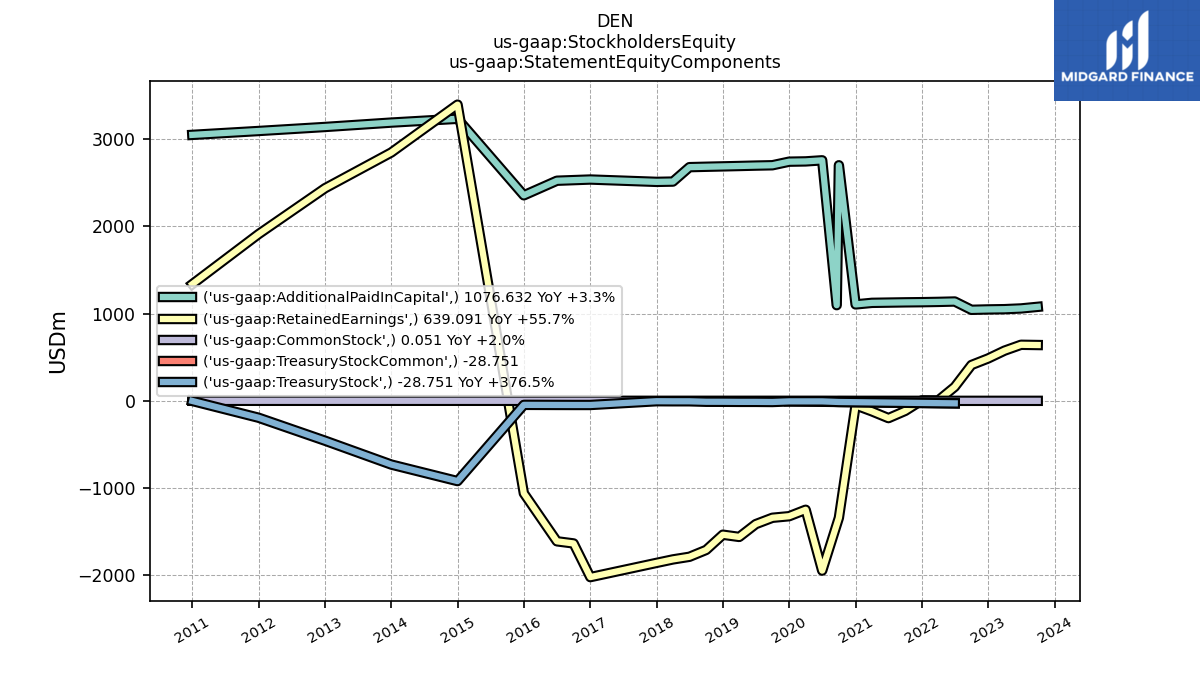
| Common Stock Value | 0.05 | 0.05 | 0.05 | 0.05 | 0.05 | 0.05 | 0.05 | 0.05 | 0.05 | 0.05 | 0.05 | 0.05 | 0.05 | 0.05 | 0.51 | 0.51 | 0.51 | 0.47 | 0.46 | 0.46 | 0.46 | 0.46 | 0.46 | 0.40 | 0.40 | 0.41 | 0.40 | 0.40 | 0.40 | 0.40 | 0.40 | 0.35 | 0.35 | 0.41 | 0.41 | 0.42 | 0.41 | 0.41 | 0.41 | 0.41 | 0.41 | 0.41 | 0.41 | 0.41 | 0.40 | 0.40 | 0.40 | 0.40 | NA | NA | NA | 0.26 | NA | NA | NA | |
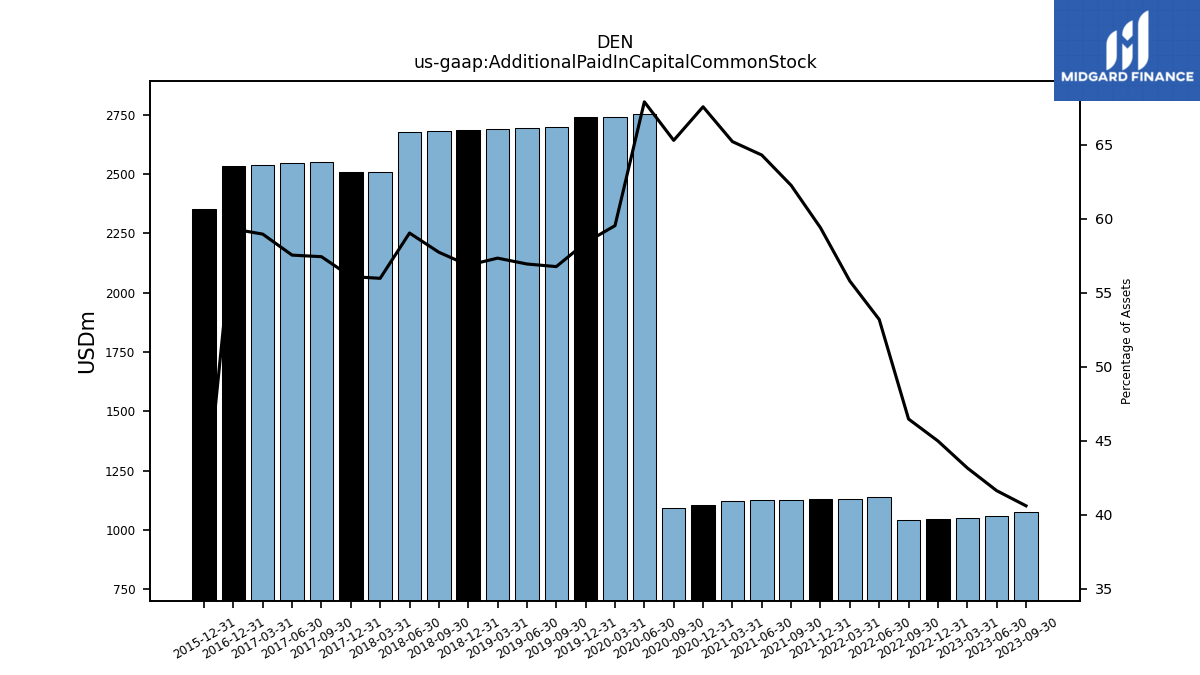
| Additional Paid In Capital Common Stock | 1076.63 | 1058.12 | 1049.83 | 1047.06 | 1042.44 | 1137.58 | 1133.13 | 1130.00 | 1128.03 | 1125.14 | 1122.18 | 1104.28 | 1095.37 | NA | 2754.75 | 2742.30 | 2739.10 | 2698.16 | 2694.18 | 2689.52 | 2685.21 | 2680.90 | 2676.35 | 2511.13 | 2507.83 | 2550.35 | 2546.10 | 2540.06 | 2534.67 | NA | NA | NA | 2353.55 | NA | NA | NA | NA | NA | NA | NA | NA | NA | NA | NA | NA | NA | NA | NA | NA | NA | NA | NA | NA | NA | NA | |
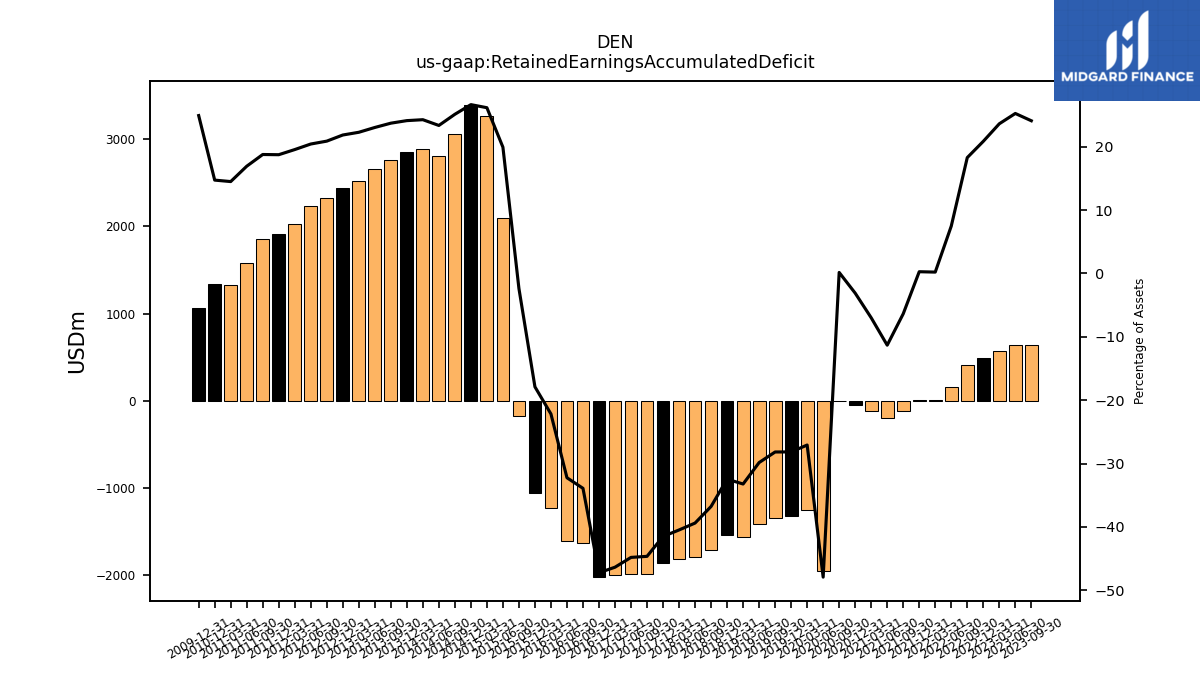
| Retained Earnings Accumulated Deficit | 639.09 | 641.98 | 574.70 | 485.50 | 410.39 | 159.97 | 4.47 | 5.34 | -115.29 | -198.00 | -120.30 | -50.66 | 2.76 | NA | -1944.77 | -1247.30 | -1321.31 | -1339.23 | -1412.09 | -1558.79 | -1533.11 | -1707.59 | -1786.01 | -1816.23 | -1855.81 | -1982.59 | -1983.06 | -1997.45 | -2018.99 | -1633.26 | -1608.70 | -1228.04 | -1058.95 | -173.89 | 2092.35 | 3262.51 | 3392.47 | 3050.74 | 2803.88 | 2880.91 | 2434.84 | 2320.17 | 2234.81 | 2022.94 | 1856.87 | 1581.20 | 1321.95 | 1336.14 | NA | NA | NA | 1064.42 | NA | NA | NA | |
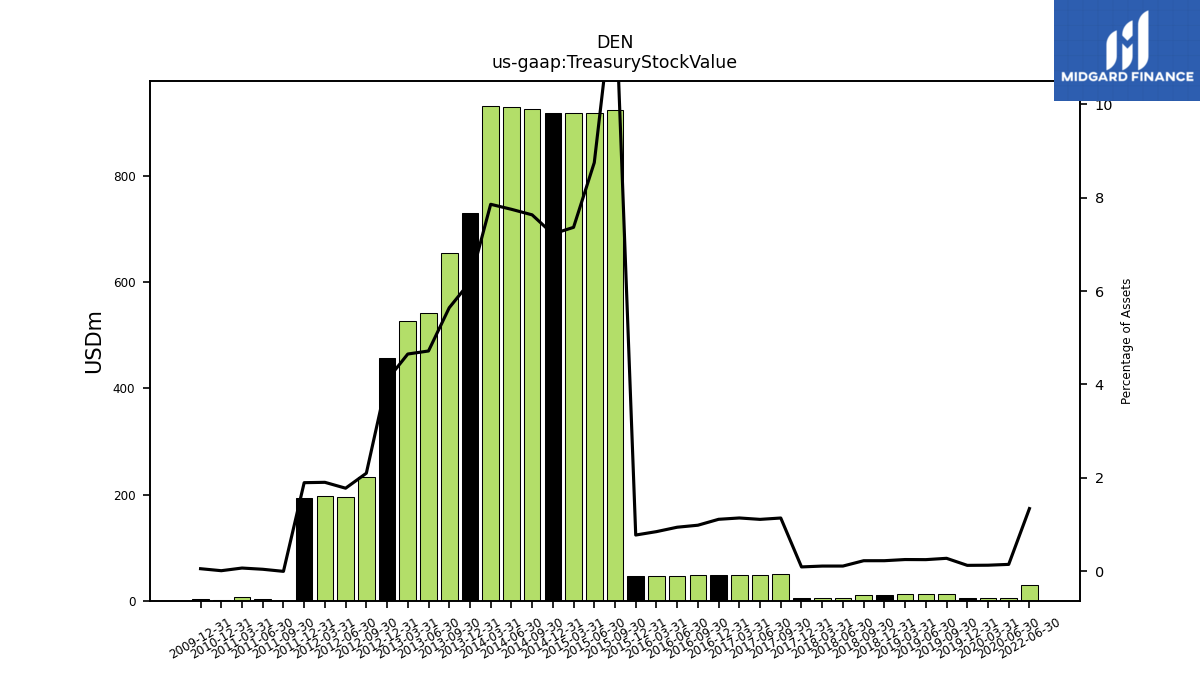
| Treasury Stock Value | NA | NA | NA | NA | NA | 28.75 | NA | NA | NA | NA | NA | NA | NA | NA | 6.07 | 6.07 | 6.03 | 13.28 | 11.88 | 11.88 | 10.78 | 10.59 | 5.16 | 5.08 | 4.26 | 50.72 | 49.25 | 49.25 | 47.63 | 47.58 | 47.15 | 47.11 | 46.04 | 925.30 | 918.28 | 918.16 | 919.23 | 926.48 | 930.02 | 932.53 | 456.46 | 233.34 | 194.67 | 197.12 | 0.00 | 4.19 | 6.47 | 1.28 | NA | NA | NA | 2.43 | NA | NA | NA | |
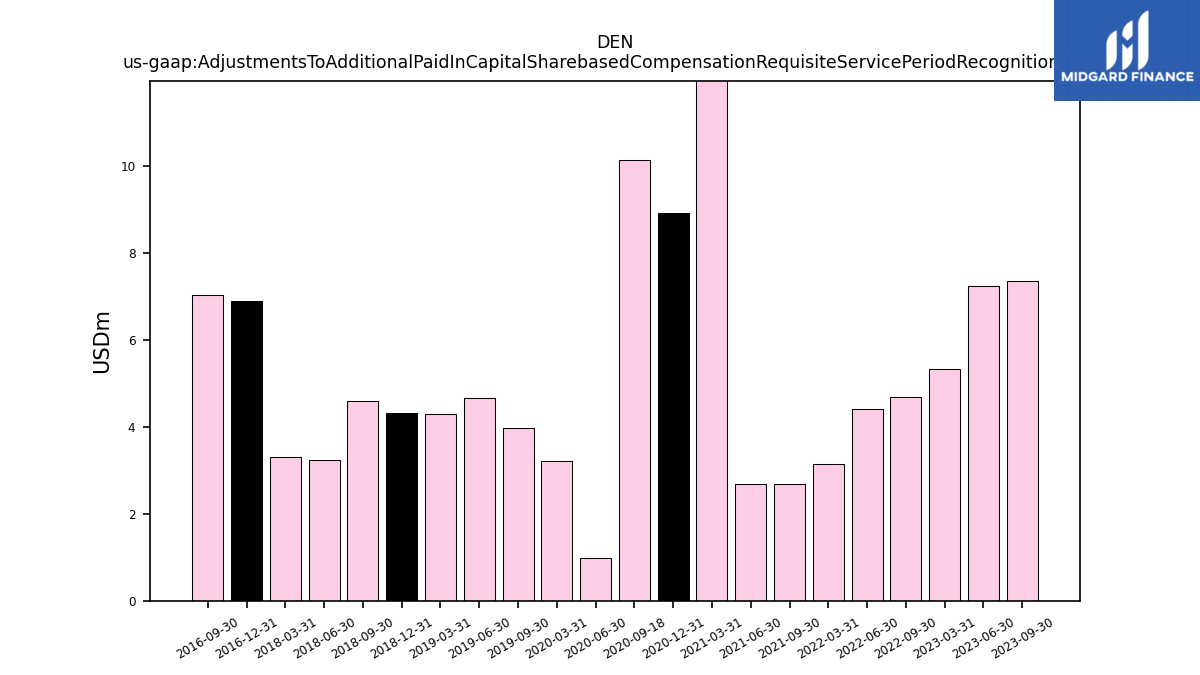
| Adjustments To Additional Paid In Capital Sharebased Compensation Requisite Service Period Recognition Value | 7.36 | 7.25 | 5.32 | NA | 4.69 | 4.40 | 3.14 | NA | 2.69 | 2.68 | 19.17 | 8.91 | NA | 10.13 | 0.99 | 3.20 | NA | 3.98 | 4.67 | 4.31 | 4.31 | 4.60 | 3.23 | 3.30 | NA | NA | NA | NA | 6.88 | 7.03 | NA | NA | NA | NA | NA | NA | NA | NA | NA | NA | NA | NA | NA | NA | NA | NA | NA | NA | NA | NA | NA | NA | NA | NA | NA |
| 2023-09-30 | 2023-06-30 | 2023-03-31 | 2022-12-31 | 2022-09-30 | 2022-06-30 | 2022-03-31 | 2021-12-31 | 2021-09-30 | 2021-06-30 | 2021-03-31 | 2020-12-31 | 2020-09-30 | 2020-09-18 | 2020-06-30 | 2020-03-31 | 2019-12-31 | 2019-09-30 | 2019-06-30 | 2019-03-31 | 2018-12-31 | 2018-09-30 | 2018-06-30 | 2018-03-31 | 2017-12-31 | 2017-09-30 | 2017-06-30 | 2017-03-31 | 2016-12-31 | 2016-09-30 | 2016-06-30 | 2016-03-31 | 2015-12-31 | 2015-09-30 | 2015-06-30 | 2015-03-31 | 2014-12-31 | 2014-09-30 | 2014-06-30 | 2014-03-31 | 2012-12-31 | 2012-09-30 | 2012-06-30 | 2012-03-31 | 2011-09-30 | 2011-06-30 | 2011-03-31 | 2010-12-31 | 2010-09-30 | 2010-06-30 | 2010-03-31 | 2009-12-31 | 2009-09-30 | 2009-06-30 | 2009-03-31 | ||
|---|---|---|---|---|---|---|---|---|---|---|---|---|---|---|---|---|---|---|---|---|---|---|---|---|---|---|---|---|---|---|---|---|---|---|---|---|---|---|---|---|---|---|---|---|---|---|---|---|---|---|---|---|---|---|---|---|
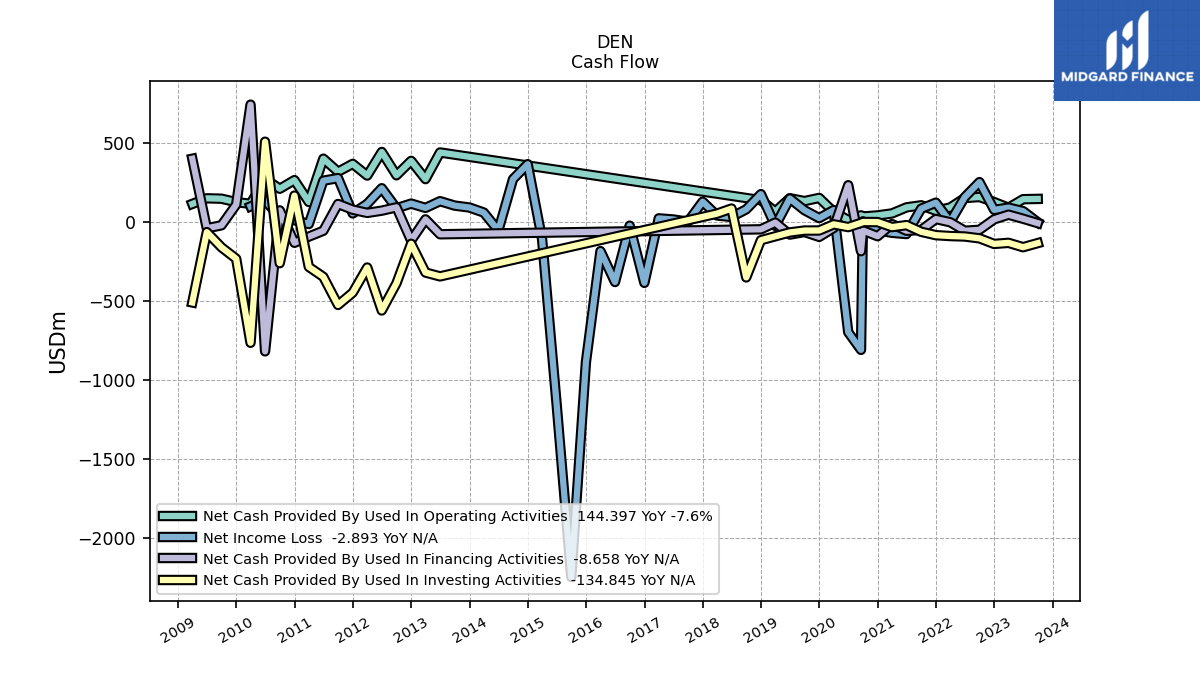
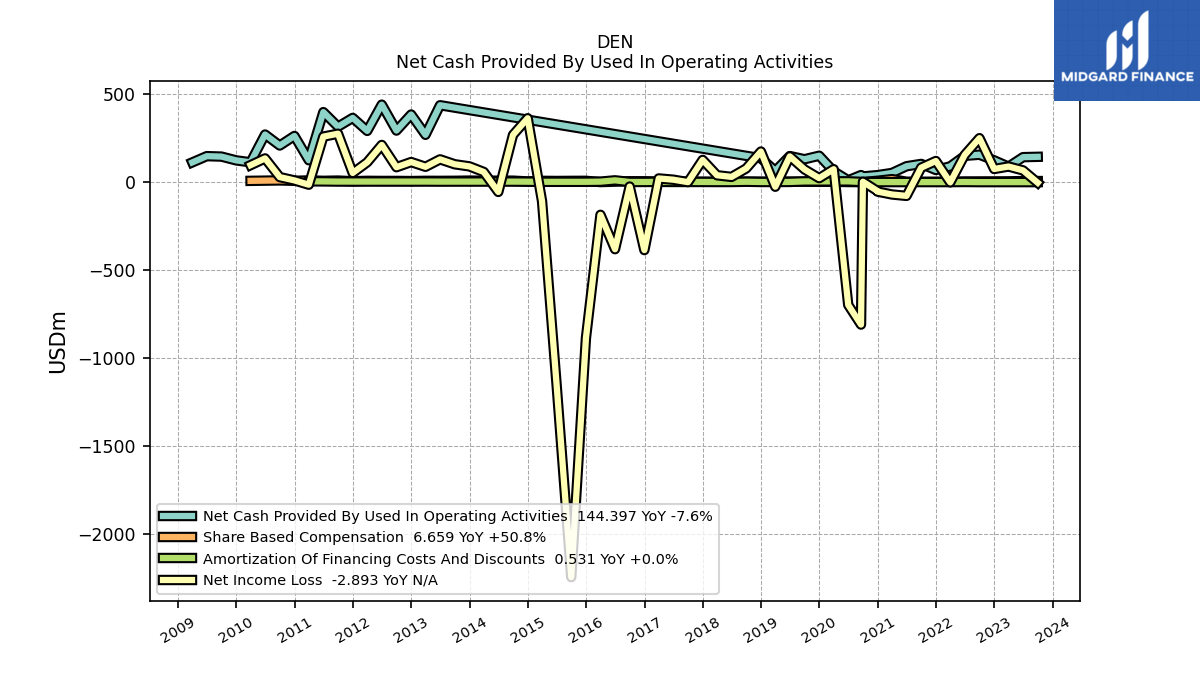
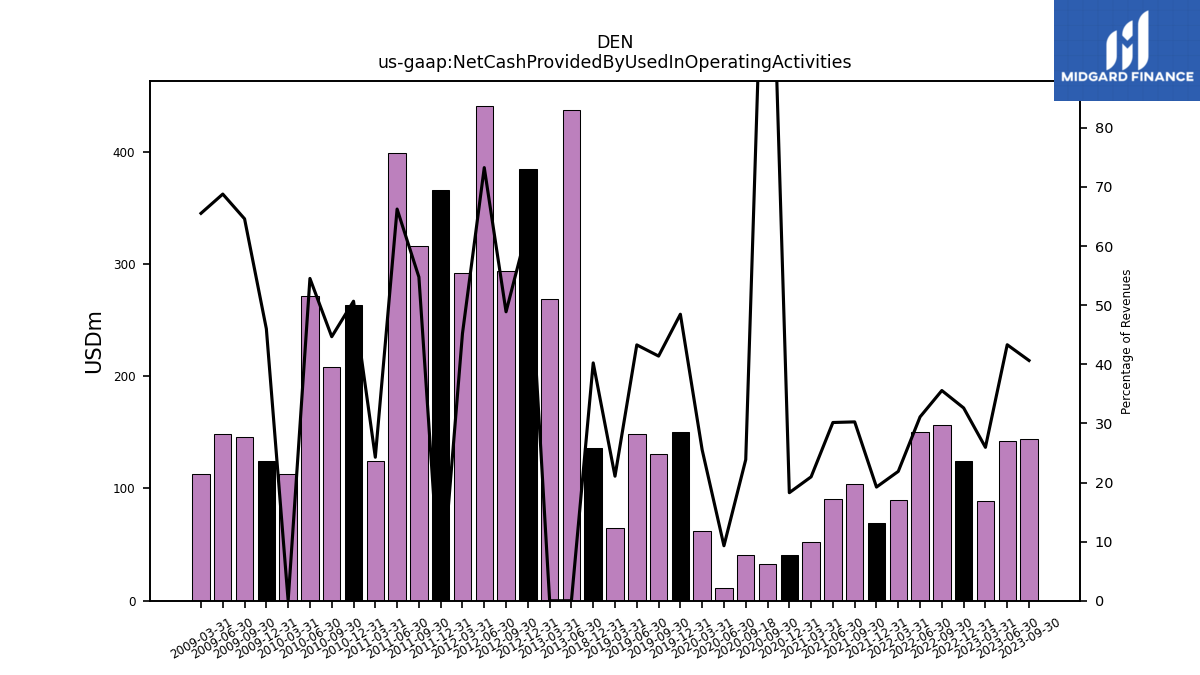
| Net Cash Provided By Used In Operating Activities | 144.40 | 142.49 | 88.52 | 124.34 | 156.30 | 149.97 | 90.14 | 69.60 | 104.02 | 90.88 | 52.66 | 40.33 | 32.91 | 40.60 | 10.97 | 61.84 | 150.56 | 130.58 | 148.63 | 64.37 | 136.16 | NA | NA | NA | NA | NA | NA | NA | NA | NA | NA | NA | NA | NA | NA | NA | NA | NA | NA | NA | 384.76 | 293.51 | 440.97 | 291.65 | 315.74 | 398.52 | 124.83 | 263.04 | 208.48 | 271.12 | 113.17 | 124.17 | 145.65 | 148.17 | 112.62 | |
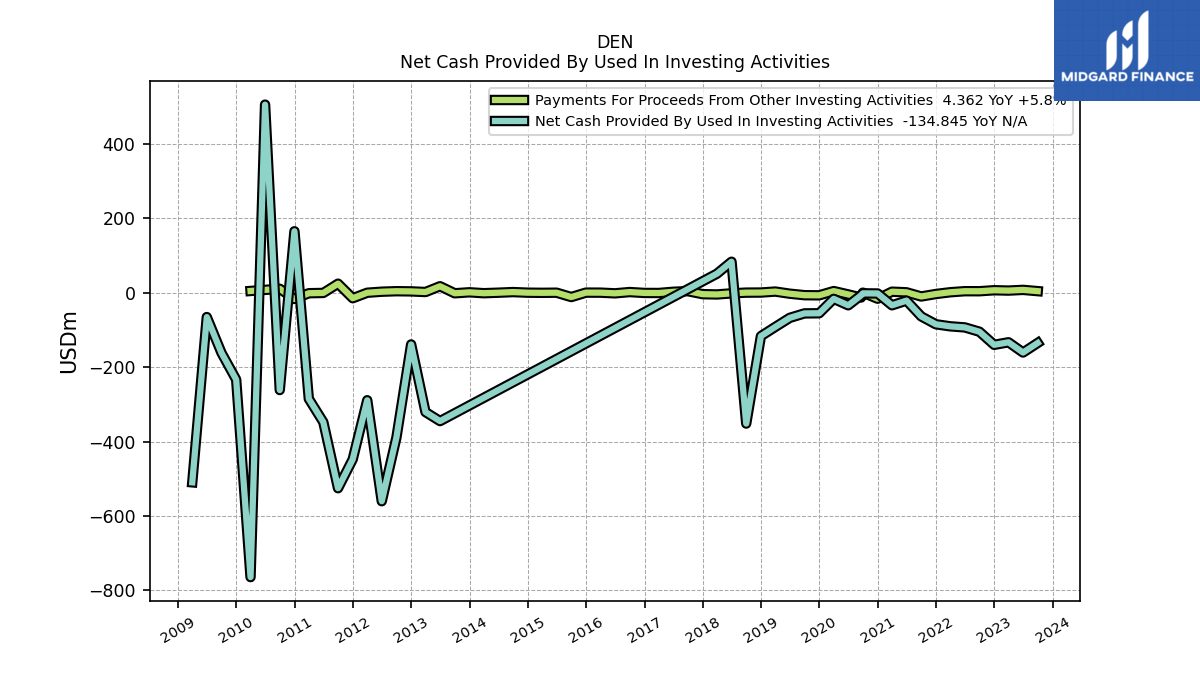
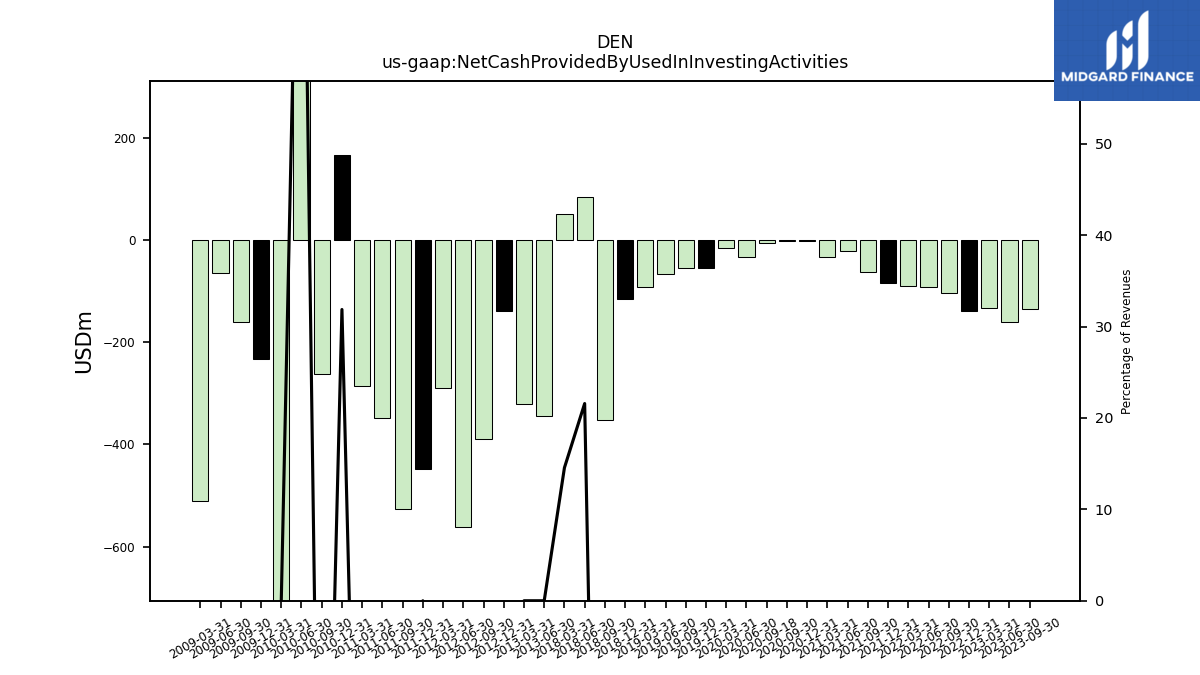
| Net Cash Provided By Used In Investing Activities | -134.84 | -160.63 | -133.07 | -139.94 | -104.69 | -93.10 | -90.21 | -84.69 | -63.47 | -21.11 | -33.66 | -1.88 | -1.56 | -7.12 | -33.70 | -16.29 | -55.11 | -55.44 | -67.34 | -91.80 | -116.54 | -351.63 | 83.50 | 51.40 | NA | NA | NA | NA | NA | NA | NA | NA | NA | NA | NA | NA | NA | NA | NA | NA | -138.87 | -388.75 | -560.34 | -288.88 | -525.41 | -347.80 | -285.04 | 165.37 | -261.54 | 505.71 | -764.33 | -233.32 | -161.55 | -65.30 | -509.54 | |
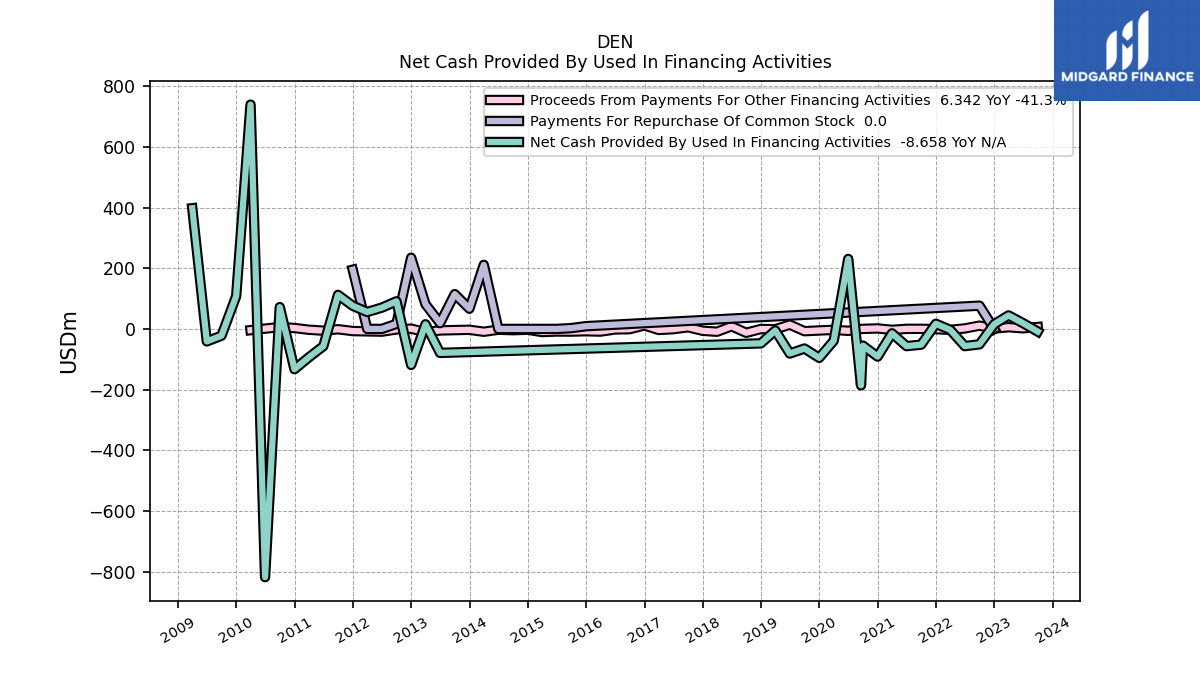
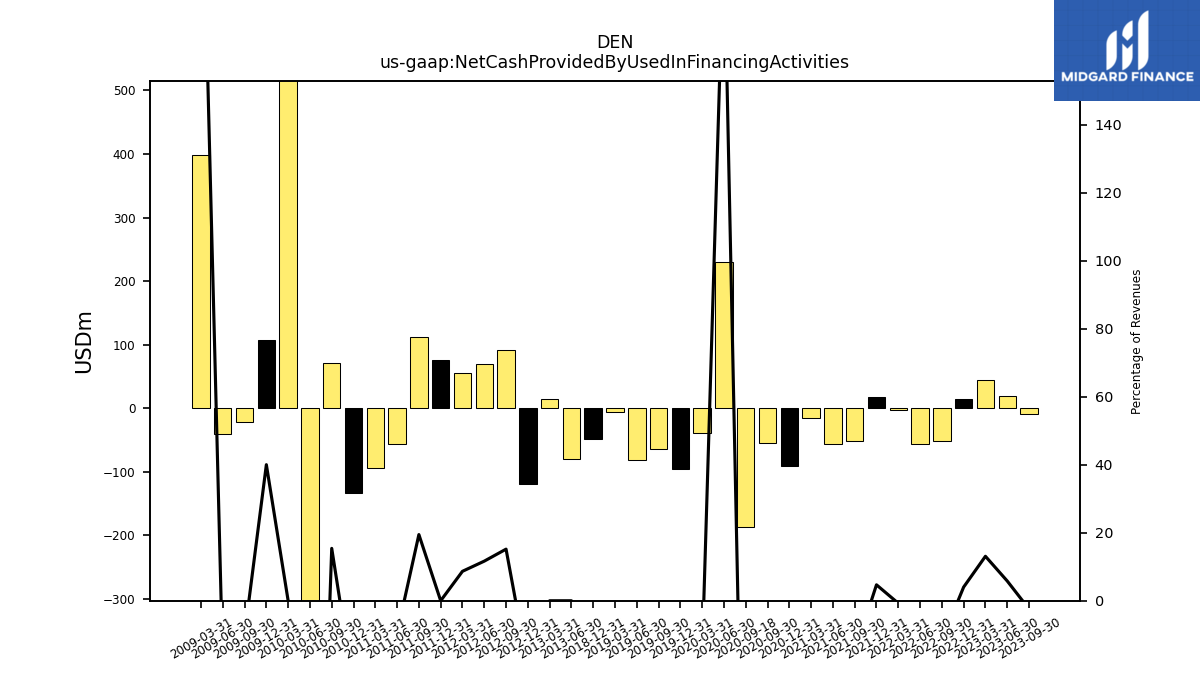
| Net Cash Provided By Used In Financing Activities | -8.66 | 19.13 | 44.62 | 15.33 | -50.84 | -56.69 | -3.07 | 16.97 | -51.86 | -56.72 | -14.52 | -91.31 | -55.05 | -186.00 | 230.80 | -39.02 | -95.45 | -64.63 | -81.06 | -5.21 | -47.65 | NA | NA | NA | NA | NA | NA | NA | NA | NA | NA | NA | NA | NA | NA | NA | NA | NA | NA | NA | -118.68 | 91.16 | 70.12 | 55.90 | 112.24 | -56.79 | -93.80 | -132.88 | 71.93 | -818.55 | 739.75 | 108.06 | -22.36 | -41.12 | 398.06 |
| 2023-09-30 | 2023-06-30 | 2023-03-31 | 2022-12-31 | 2022-09-30 | 2022-06-30 | 2022-03-31 | 2021-12-31 | 2021-09-30 | 2021-06-30 | 2021-03-31 | 2020-12-31 | 2020-09-30 | 2020-09-18 | 2020-06-30 | 2020-03-31 | 2019-12-31 | 2019-09-30 | 2019-06-30 | 2019-03-31 | 2018-12-31 | 2018-09-30 | 2018-06-30 | 2018-03-31 | 2017-12-31 | 2017-09-30 | 2017-06-30 | 2017-03-31 | 2016-12-31 | 2016-09-30 | 2016-06-30 | 2016-03-31 | 2015-12-31 | 2015-09-30 | 2015-06-30 | 2015-03-31 | 2014-12-31 | 2014-09-30 | 2014-06-30 | 2014-03-31 | 2012-12-31 | 2012-09-30 | 2012-06-30 | 2012-03-31 | 2011-09-30 | 2011-06-30 | 2011-03-31 | 2010-12-31 | 2010-09-30 | 2010-06-30 | 2010-03-31 | 2009-12-31 | 2009-09-30 | 2009-06-30 | 2009-03-31 | ||
|---|---|---|---|---|---|---|---|---|---|---|---|---|---|---|---|---|---|---|---|---|---|---|---|---|---|---|---|---|---|---|---|---|---|---|---|---|---|---|---|---|---|---|---|---|---|---|---|---|---|---|---|---|---|---|---|---|
| Net Cash Provided By Used In Operating Activities | 144.40 | 142.49 | 88.52 | 124.34 | 156.30 | 149.97 | 90.14 | 69.60 | 104.02 | 90.88 | 52.66 | 40.33 | 32.91 | 40.60 | 10.97 | 61.84 | 150.56 | 130.58 | 148.63 | 64.37 | 136.16 | NA | NA | NA | NA | NA | NA | NA | NA | NA | NA | NA | NA | NA | NA | NA | NA | NA | NA | NA | 384.76 | 293.51 | 440.97 | 291.65 | 315.74 | 398.52 | 124.83 | 263.04 | 208.48 | 271.12 | 113.17 | 124.17 | 145.65 | 148.17 | 112.62 | |
| Net Income Loss | -2.89 | 67.28 | 89.20 | 75.11 | 250.42 | 155.49 | -0.87 | 120.63 | 82.71 | -77.69 | -69.64 | -53.42 | 2.76 | -809.12 | -697.47 | 74.02 | 23.08 | 72.86 | 146.69 | -25.67 | 174.48 | 78.42 | 30.22 | 39.58 | 126.78 | 0.44 | 14.40 | 21.53 | -385.73 | -24.59 | -380.67 | -185.19 | -885.08 | -2244.13 | -1148.50 | -107.75 | 363.63 | 268.75 | -55.20 | 58.31 | 114.66 | 85.37 | 211.87 | 113.47 | 275.67 | 259.25 | -14.19 | 10.36 | 29.10 | 135.37 | 96.89 | NA | NA | NA | NA | |
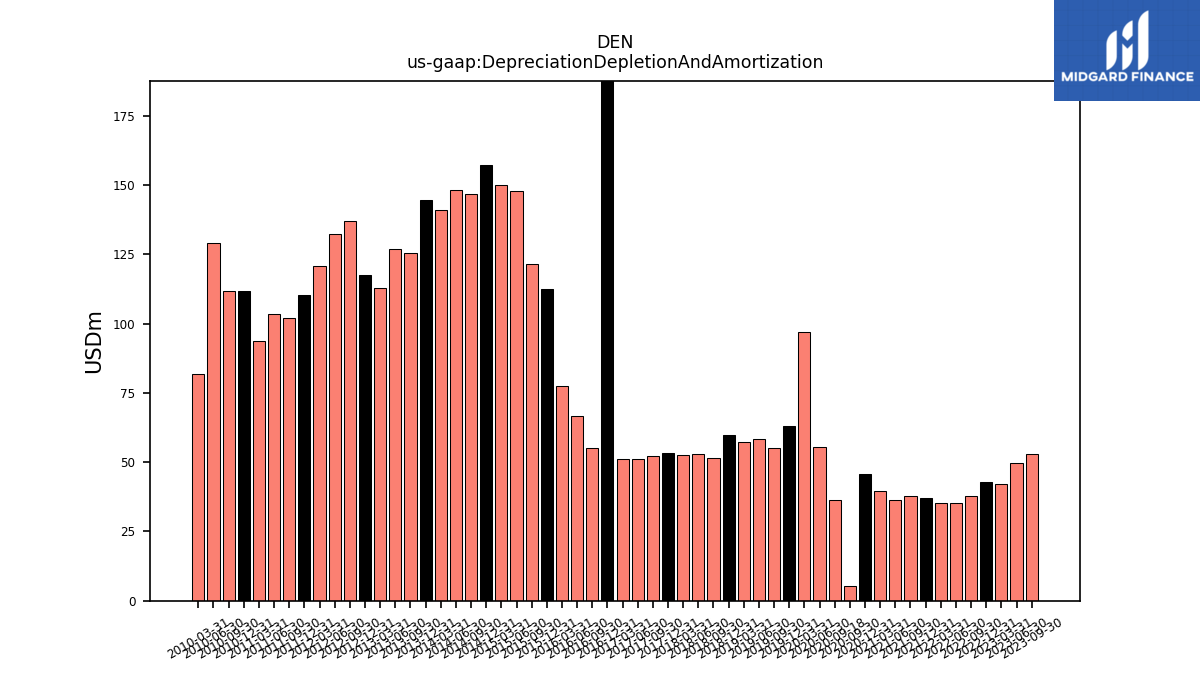
| Depreciation Depletion And Amortization | 52.92 | 49.77 | 42.03 | 43.00 | 37.68 | 35.40 | 35.34 | 37.12 | 37.69 | 36.38 | 39.45 | 45.81 | 5.28 | 36.32 | 55.41 | 96.86 | 63.19 | 55.06 | 58.26 | 57.30 | 59.74 | 51.32 | 52.94 | 52.45 | 53.27 | 52.10 | 51.15 | 51.20 | 647.12 | 55.01 | 66.54 | 77.37 | 112.36 | 121.41 | 147.94 | 149.96 | 157.12 | 146.56 | 148.16 | 141.13 | 117.42 | 136.94 | 132.29 | 120.89 | 101.98 | 103.50 | 93.59 | 111.62 | 111.60 | 129.21 | 81.87 | NA | NA | NA | NA | |
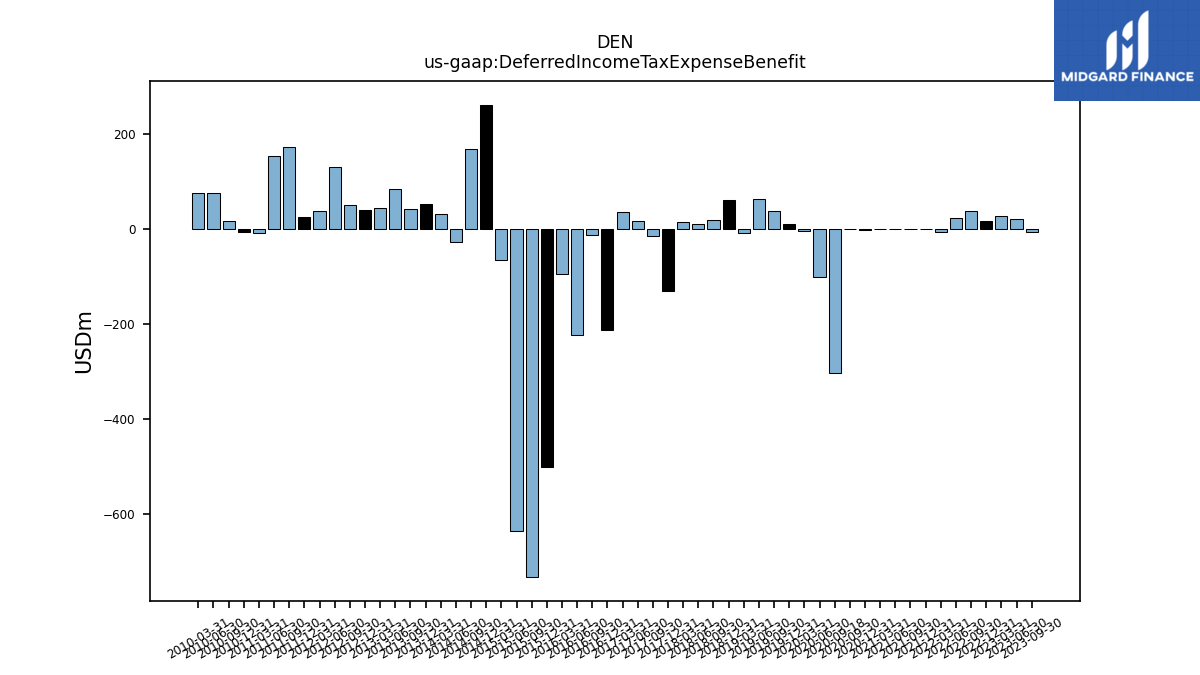
| Deferred Income Tax Expense Benefit | -7.62 | 21.14 | 25.91 | 16.18 | 37.31 | 21.94 | -5.94 | 0.40 | 0.05 | -0.04 | -0.05 | -2.56 | 0.01 | -302.36 | -102.30 | -4.21 | 10.02 | 37.91 | 62.02 | -9.48 | 60.49 | 17.50 | 10.19 | 15.05 | -131.62 | -15.30 | 16.24 | 34.91 | -211.81 | -13.52 | -222.94 | -95.11 | -499.61 | -732.06 | -634.47 | -66.04 | 261.01 | 167.36 | -28.56 | 30.18 | 38.78 | 49.67 | 130.15 | 37.14 | 172.98 | 152.53 | -7.91 | -6.94 | 16.59 | 74.42 | 76.27 | NA | NA | NA | NA | |
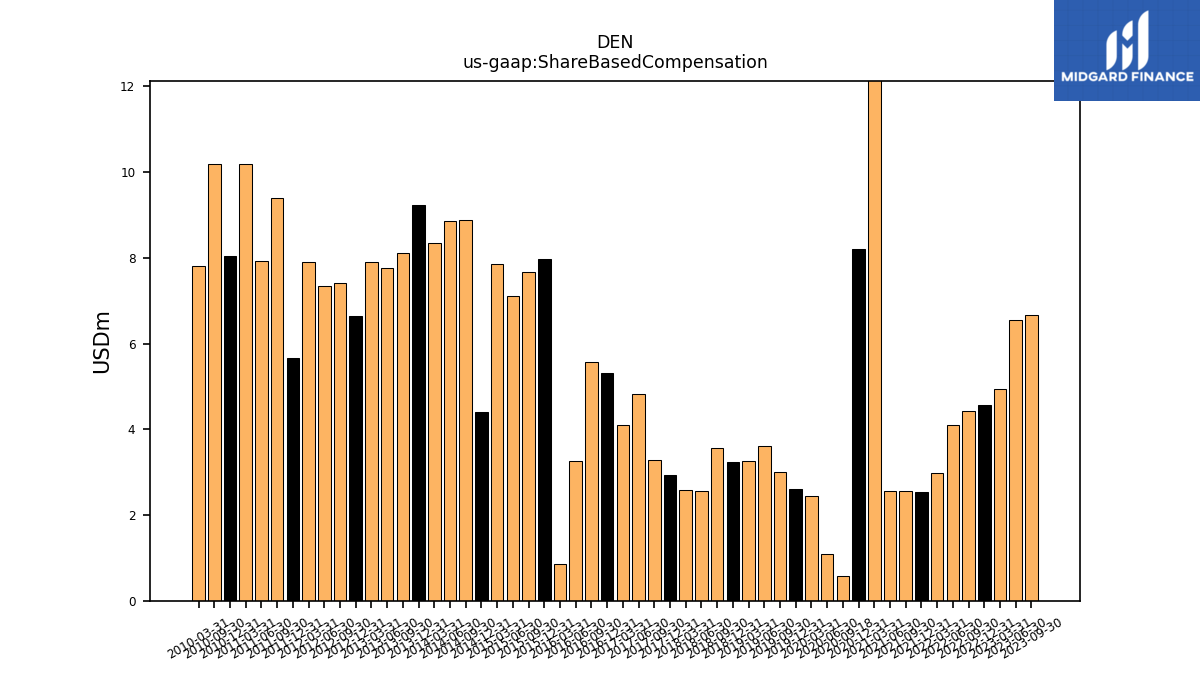
| Share Based Compensation | 6.66 | 6.55 | 4.94 | 4.56 | 4.42 | 4.10 | 2.97 | 2.53 | 2.56 | 2.55 | 17.68 | 8.21 | NA | 0.57 | 1.09 | 2.45 | 2.60 | 3.00 | 3.60 | 3.26 | 3.24 | 3.56 | 2.56 | 2.59 | 2.94 | 3.27 | 4.83 | 4.11 | 5.31 | 5.56 | 3.26 | 0.86 | 7.97 | 7.67 | 7.12 | 7.85 | 4.41 | 8.89 | 8.87 | 8.35 | 6.65 | 7.41 | 7.34 | 7.91 | 9.39 | 7.93 | 10.20 | 8.04 | 10.20 | NA | 7.81 | NA | NA | NA | NA |
| 2023-09-30 | 2023-06-30 | 2023-03-31 | 2022-12-31 | 2022-09-30 | 2022-06-30 | 2022-03-31 | 2021-12-31 | 2021-09-30 | 2021-06-30 | 2021-03-31 | 2020-12-31 | 2020-09-30 | 2020-09-18 | 2020-06-30 | 2020-03-31 | 2019-12-31 | 2019-09-30 | 2019-06-30 | 2019-03-31 | 2018-12-31 | 2018-09-30 | 2018-06-30 | 2018-03-31 | 2017-12-31 | 2017-09-30 | 2017-06-30 | 2017-03-31 | 2016-12-31 | 2016-09-30 | 2016-06-30 | 2016-03-31 | 2015-12-31 | 2015-09-30 | 2015-06-30 | 2015-03-31 | 2014-12-31 | 2014-09-30 | 2014-06-30 | 2014-03-31 | 2012-12-31 | 2012-09-30 | 2012-06-30 | 2012-03-31 | 2011-09-30 | 2011-06-30 | 2011-03-31 | 2010-12-31 | 2010-09-30 | 2010-06-30 | 2010-03-31 | 2009-12-31 | 2009-09-30 | 2009-06-30 | 2009-03-31 | ||
|---|---|---|---|---|---|---|---|---|---|---|---|---|---|---|---|---|---|---|---|---|---|---|---|---|---|---|---|---|---|---|---|---|---|---|---|---|---|---|---|---|---|---|---|---|---|---|---|---|---|---|---|---|---|---|---|---|
| Net Cash Provided By Used In Investing Activities | -134.84 | -160.63 | -133.07 | -139.94 | -104.69 | -93.10 | -90.21 | -84.69 | -63.47 | -21.11 | -33.66 | -1.88 | -1.56 | -7.12 | -33.70 | -16.29 | -55.11 | -55.44 | -67.34 | -91.80 | -116.54 | -351.63 | 83.50 | 51.40 | NA | NA | NA | NA | NA | NA | NA | NA | NA | NA | NA | NA | NA | NA | NA | NA | -138.87 | -388.75 | -560.34 | -288.88 | -525.41 | -347.80 | -285.04 | 165.37 | -261.54 | 505.71 | -764.33 | -233.32 | -161.55 | -65.30 | -509.54 |
| 2023-09-30 | 2023-06-30 | 2023-03-31 | 2022-12-31 | 2022-09-30 | 2022-06-30 | 2022-03-31 | 2021-12-31 | 2021-09-30 | 2021-06-30 | 2021-03-31 | 2020-12-31 | 2020-09-30 | 2020-09-18 | 2020-06-30 | 2020-03-31 | 2019-12-31 | 2019-09-30 | 2019-06-30 | 2019-03-31 | 2018-12-31 | 2018-09-30 | 2018-06-30 | 2018-03-31 | 2017-12-31 | 2017-09-30 | 2017-06-30 | 2017-03-31 | 2016-12-31 | 2016-09-30 | 2016-06-30 | 2016-03-31 | 2015-12-31 | 2015-09-30 | 2015-06-30 | 2015-03-31 | 2014-12-31 | 2014-09-30 | 2014-06-30 | 2014-03-31 | 2012-12-31 | 2012-09-30 | 2012-06-30 | 2012-03-31 | 2011-09-30 | 2011-06-30 | 2011-03-31 | 2010-12-31 | 2010-09-30 | 2010-06-30 | 2010-03-31 | 2009-12-31 | 2009-09-30 | 2009-06-30 | 2009-03-31 | ||
|---|---|---|---|---|---|---|---|---|---|---|---|---|---|---|---|---|---|---|---|---|---|---|---|---|---|---|---|---|---|---|---|---|---|---|---|---|---|---|---|---|---|---|---|---|---|---|---|---|---|---|---|---|---|---|---|---|
| Net Cash Provided By Used In Financing Activities | -8.66 | 19.13 | 44.62 | 15.33 | -50.84 | -56.69 | -3.07 | 16.97 | -51.86 | -56.72 | -14.52 | -91.31 | -55.05 | -186.00 | 230.80 | -39.02 | -95.45 | -64.63 | -81.06 | -5.21 | -47.65 | NA | NA | NA | NA | NA | NA | NA | NA | NA | NA | NA | NA | NA | NA | NA | NA | NA | NA | NA | -118.68 | 91.16 | 70.12 | 55.90 | 112.24 | -56.79 | -93.80 | -132.88 | 71.93 | -818.55 | 739.75 | 108.06 | -22.36 | -41.12 | 398.06 | |
| Payments For Repurchase Of Common Stock | NA | NA | NA | 0.00 | 76.65 | NA | NA | NA | NA | NA | NA | NA | NA | NA | NA | NA | NA | NA | NA | NA | NA | NA | NA | NA | NA | NA | NA | NA | NA | NA | NA | NA | 9.07 | 2.69 | 0.00 | 0.00 | 0.00 | 0.00 | 0.00 | 211.36 | 234.73 | 16.75 | 0.00 | 0.00 | NA | NA | NA | NA | NA | NA | NA | NA | NA | NA | NA |
| 2023-09-30 | 2023-06-30 | 2023-03-31 | 2022-12-31 | 2022-09-30 | 2022-06-30 | 2022-03-31 | 2021-12-31 | 2021-09-30 | 2021-06-30 | 2021-03-31 | 2020-12-31 | 2020-09-30 | 2020-09-18 | 2020-06-30 | 2020-03-31 | 2019-12-31 | 2019-09-30 | 2019-06-30 | 2019-03-31 | 2018-12-31 | 2018-09-30 | 2018-06-30 | 2018-03-31 | 2017-12-31 | 2017-09-30 | 2017-06-30 | 2017-03-31 | 2016-12-31 | 2016-09-30 | 2016-06-30 | 2016-03-31 | 2015-12-31 | 2015-09-30 | 2015-06-30 | 2015-03-31 | 2014-12-31 | 2014-09-30 | 2014-06-30 | 2014-03-31 | 2012-12-31 | 2012-09-30 | 2012-06-30 | 2012-03-31 | 2011-09-30 | 2011-06-30 | 2011-03-31 | 2010-12-31 | 2010-09-30 | 2010-06-30 | 2010-03-31 | 2009-12-31 | 2009-09-30 | 2009-06-30 | 2009-03-31 | ||
|---|---|---|---|---|---|---|---|---|---|---|---|---|---|---|---|---|---|---|---|---|---|---|---|---|---|---|---|---|---|---|---|---|---|---|---|---|---|---|---|---|---|---|---|---|---|---|---|---|---|---|---|---|---|---|---|---|
| Revenues | 355.25 | 328.98 | 341.02 | 381.16 | 439.49 | 482.16 | 411.86 | 361.90 | 343.74 | 301.37 | 251.16 | 220.60 | 23.53 | 170.04 | 117.88 | 242.20 | 310.61 | 315.45 | 343.37 | 305.45 | 338.36 | 394.97 | 387.06 | 353.23 | 326.59 | 266.56 | 261.18 | 275.45 | 271.62 | 253.99 | 255.15 | 194.84 | 269.62 | 303.60 | 376.69 | 307.65 | 483.68 | 637.66 | 672.12 | 641.74 | 609.20 | 600.37 | 601.78 | 645.12 | 576.50 | 601.40 | 514.16 | 519.06 | 466.70 | 497.21 | 438.82 | 269.89 | 225.41 | 215.36 | 171.82 | |
| Other Income | NA | NA | NA | NA | 8.02 | 0.79 | 0.25 | 3.77 | 10.45 | 0.71 | 0.36 | 4.70 | 0.09 | 7.10 | 0.49 | 0.83 | 2.25 | 7.82 | 2.37 | 2.31 | 2.25 | 7.20 | 4.44 | 5.66 | 5.36 | 0.94 | NA | NA | NA | NA | NA | NA | NA | NA | NA | NA | NA | NA | NA | NA | NA | NA | NA | NA | NA | NA | NA | NA | NA | NA | NA | NA | NA | NA | NA | |
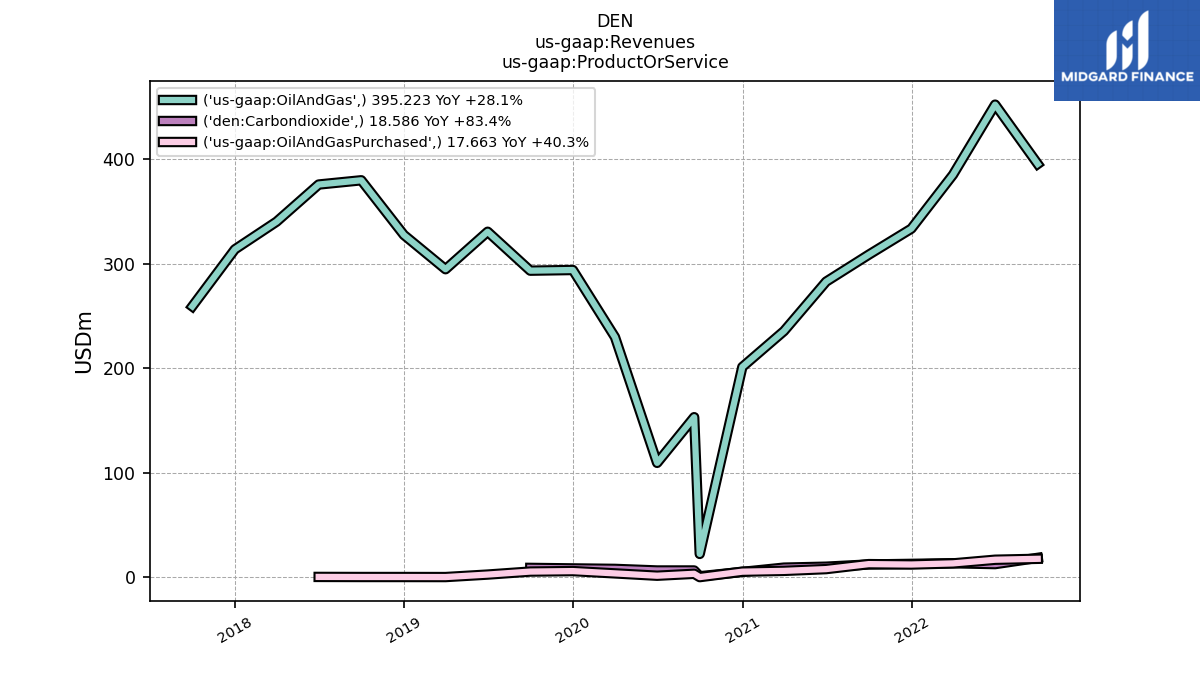
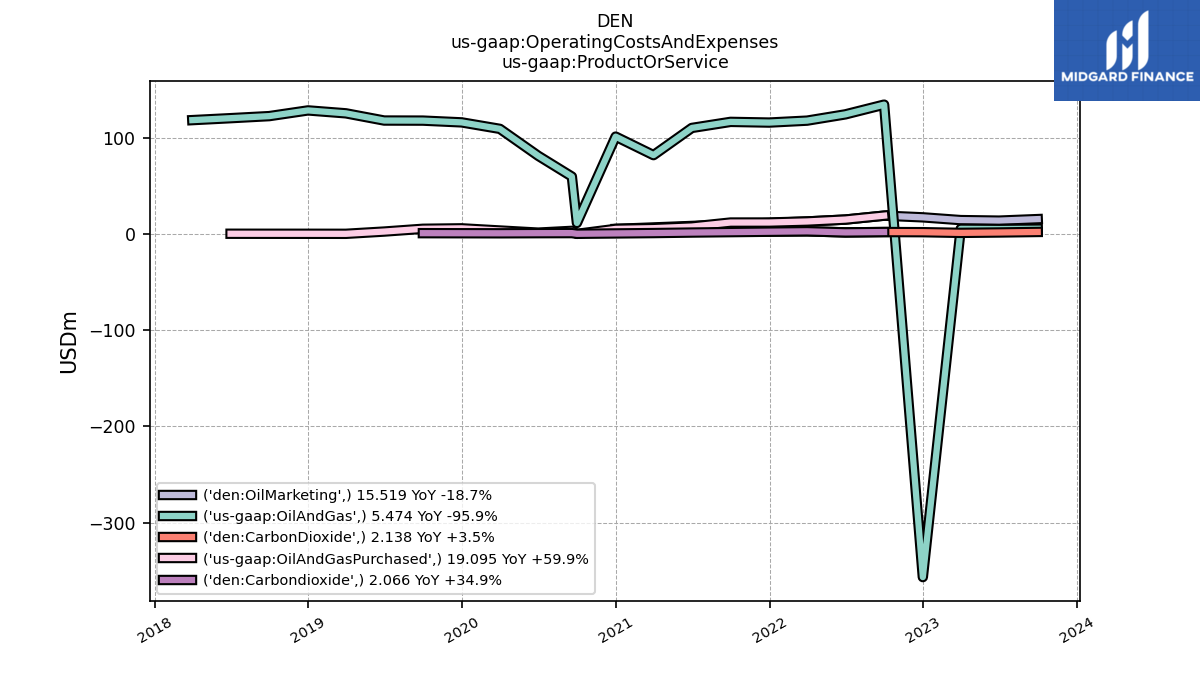
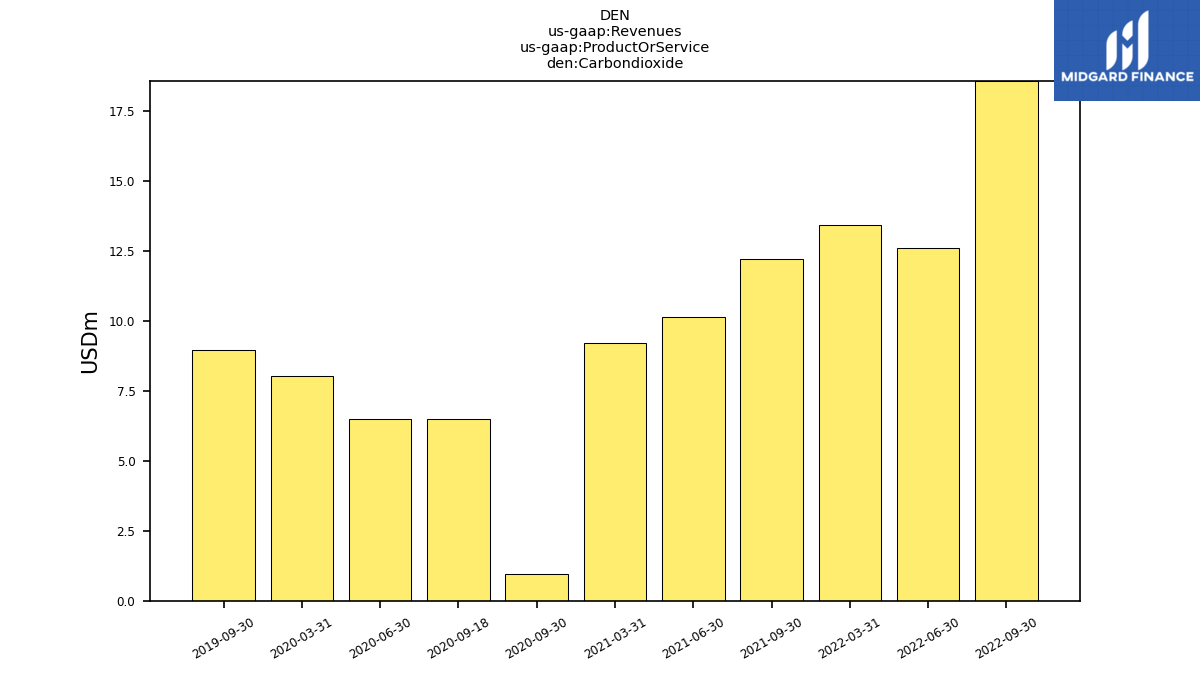
| Carbondioxide | NA | NA | NA | NA | 18.59 | 12.61 | 13.42 | NA | 12.24 | 10.13 | 9.23 | NA | 0.97 | 6.52 | 6.50 | 8.03 | NA | 8.98 | NA | NA | NA | NA | NA | NA | NA | NA | NA | NA | NA | NA | NA | NA | NA | NA | NA | NA | NA | NA | NA | NA | NA | NA | NA | NA | NA | NA | NA | NA | NA | NA | NA | NA | NA | NA | NA | |
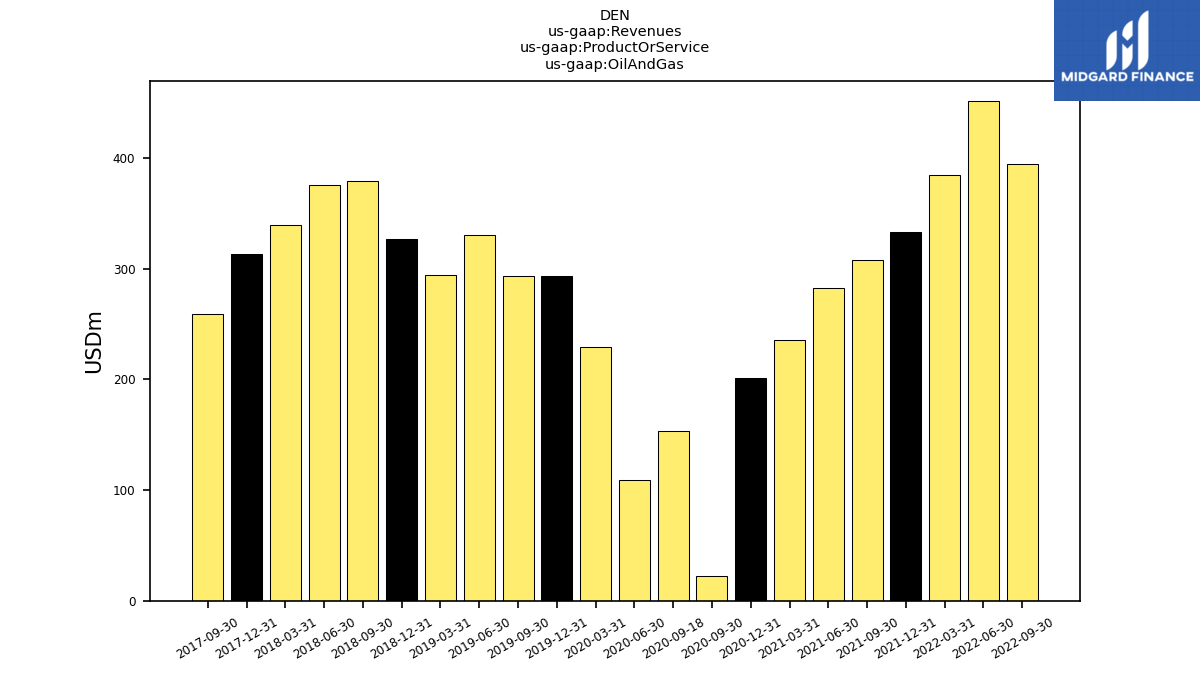
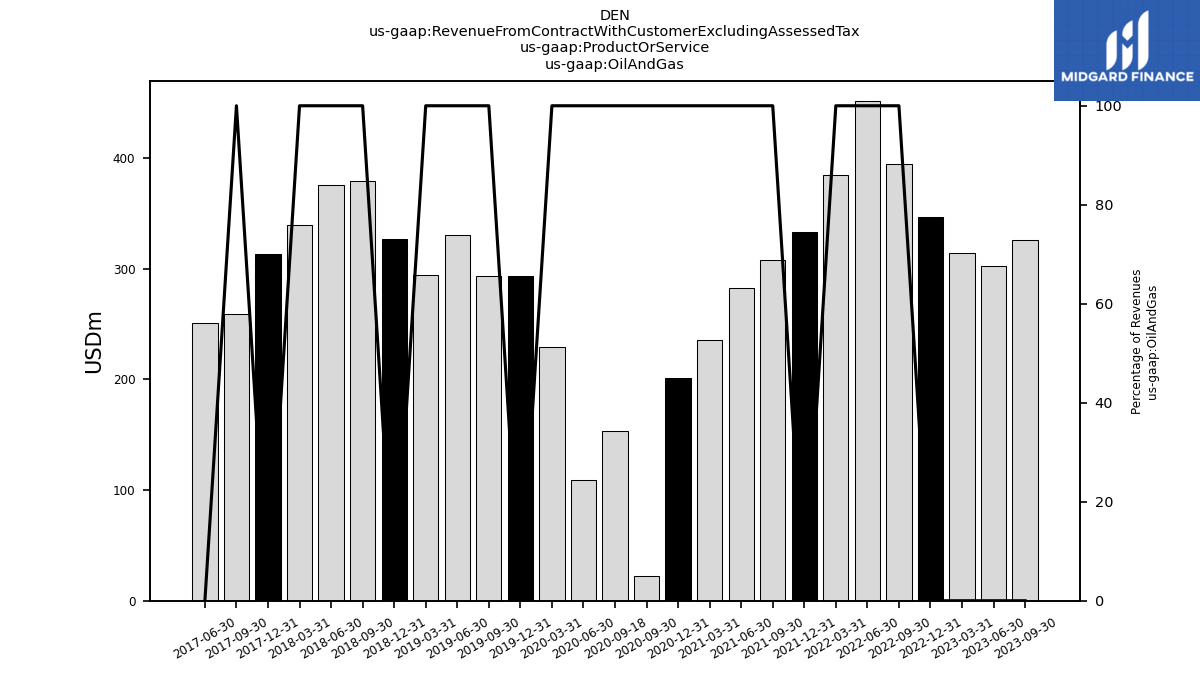
| Oil And Gas | NA | NA | NA | NA | 395.22 | 451.97 | 384.91 | 333.35 | 308.45 | 282.71 | 235.44 | 201.11 | 22.32 | 153.09 | 109.39 | 229.62 | 293.83 | 293.19 | 330.42 | 294.58 | 327.38 | 379.63 | 375.56 | 340.02 | 313.58 | 259.03 | NA | NA | NA | NA | NA | NA | NA | NA | NA | NA | NA | NA | NA | NA | NA | NA | NA | NA | NA | NA | NA | NA | NA | NA | NA | NA | NA | NA | NA | |
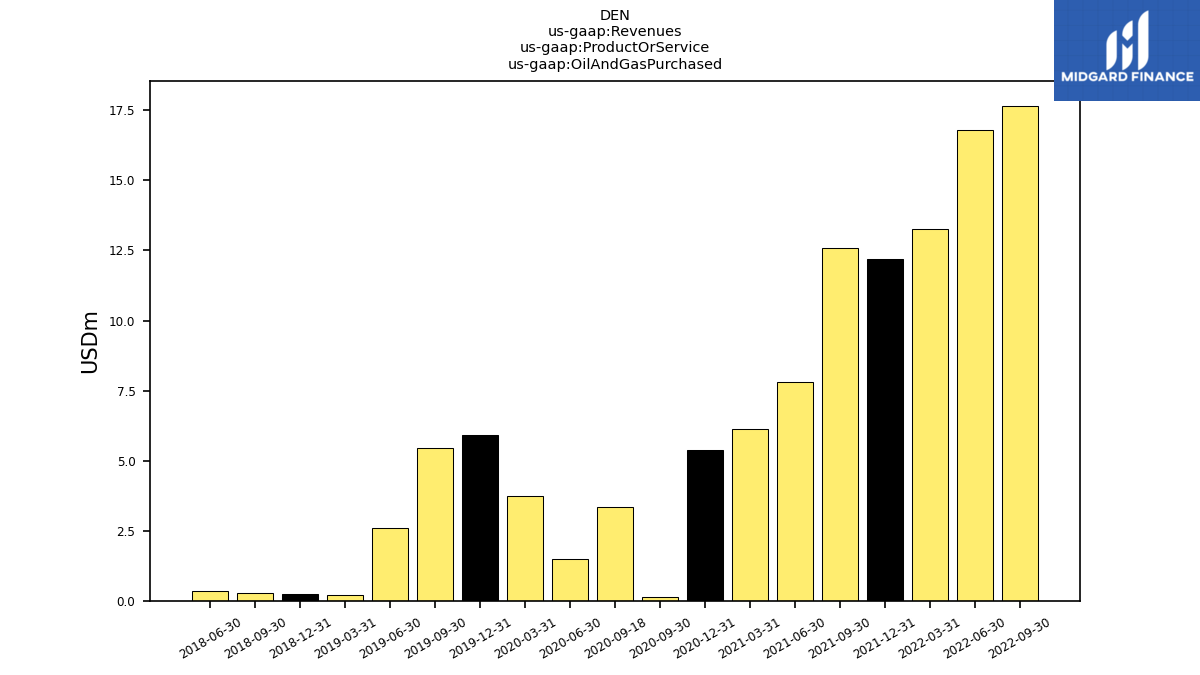
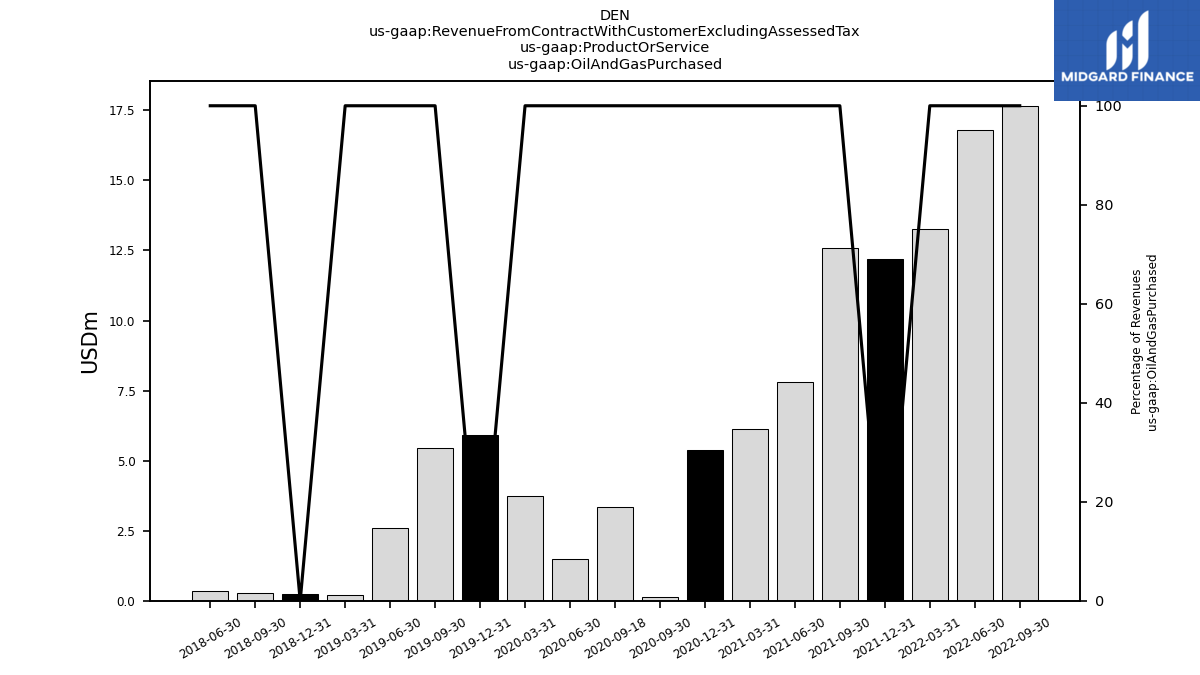
| Oil And Gas Purchased | NA | NA | NA | NA | 17.66 | 16.79 | 13.28 | 12.20 | 12.59 | 7.82 | 6.13 | 5.38 | 0.15 | 3.33 | 1.49 | 3.72 | 5.92 | 5.47 | 2.59 | 0.21 | 0.25 | 0.27 | 0.35 | NA | NA | NA | NA | NA | NA | NA | NA | NA | NA | NA | NA | NA | NA | NA | NA | NA | NA | NA | NA | NA | NA | NA | NA | NA | NA | NA | NA | NA | NA | NA | NA | |
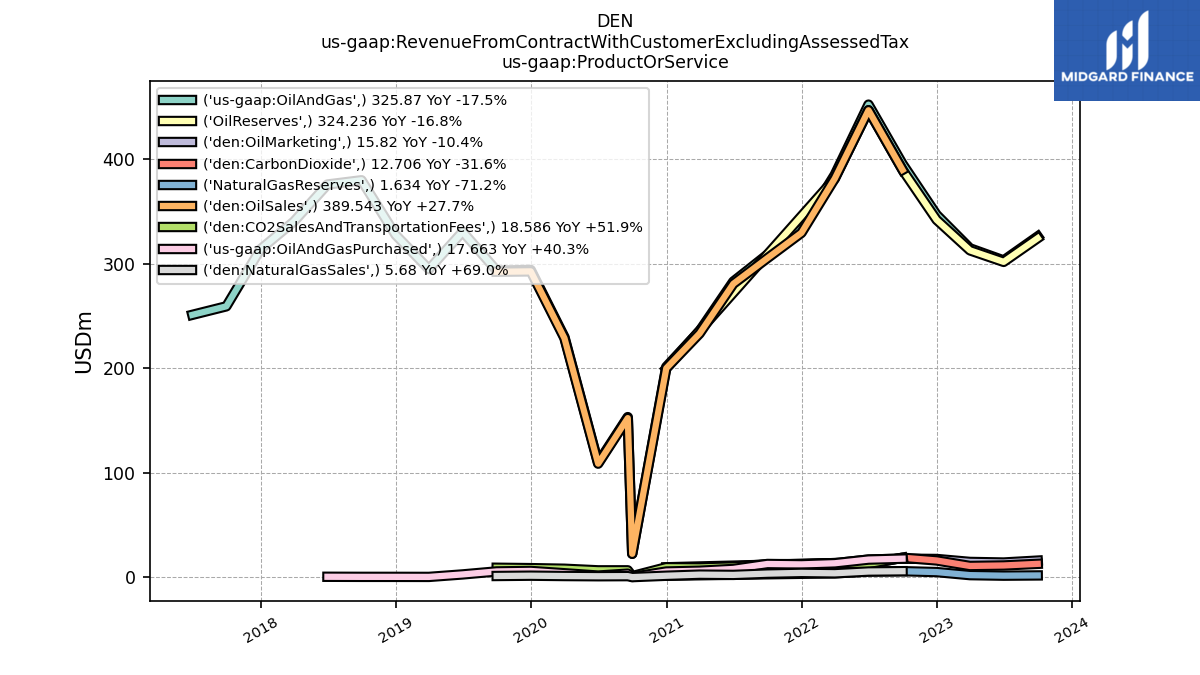
| Revenue From Contract With Customer Excluding Assessed Tax | 354.40 | 328.09 | 339.72 | 379.90 | 431.47 | 481.37 | 411.61 | 358.13 | 333.28 | 300.66 | 250.80 | 215.90 | 23.44 | 162.94 | 117.38 | 241.37 | 308.36 | 307.64 | 341.00 | 303.15 | 336.10 | 387.78 | 382.28 | 347.57 | 321.23 | 265.62 | 257.44 | 271.57 | 256.59 | 253.99 | 255.15 | 194.84 | 269.62 | 303.60 | 376.69 | 307.65 | 483.68 | 637.66 | 672.12 | 641.74 | 609.20 | 600.37 | 601.78 | 645.12 | 576.50 | 601.40 | 514.16 | 519.06 | 466.70 | 497.21 | 438.82 | 269.89 | 225.41 | 215.36 | 171.82 | |
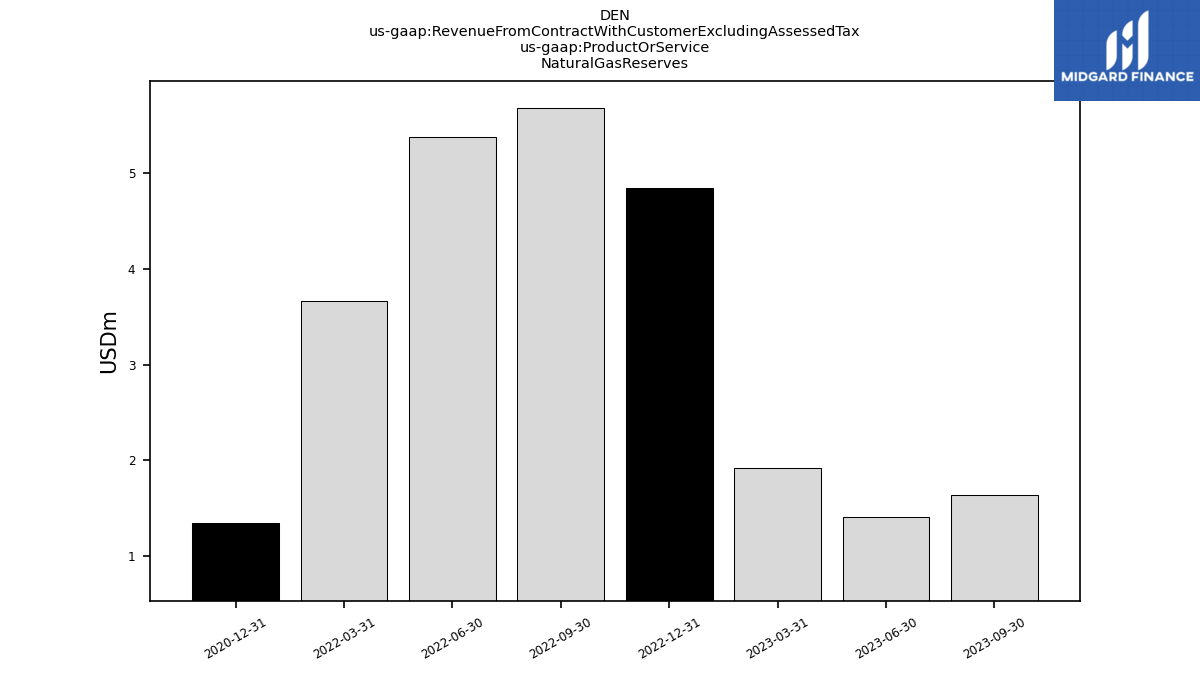
| 1.63 | 1.40 | 1.92 | 4.84 | 5.68 | 5.38 | 3.67 | NA | NA | NA | NA | 1.34 | NA | NA | NA | NA | NA | NA | NA | NA | NA | NA | NA | NA | NA | NA | NA | NA | NA | NA | NA | NA | NA | NA | NA | NA | NA | NA | NA | NA | NA | NA | NA | NA | NA | NA | NA | NA | NA | NA | NA | NA | NA | NA | NA | ||
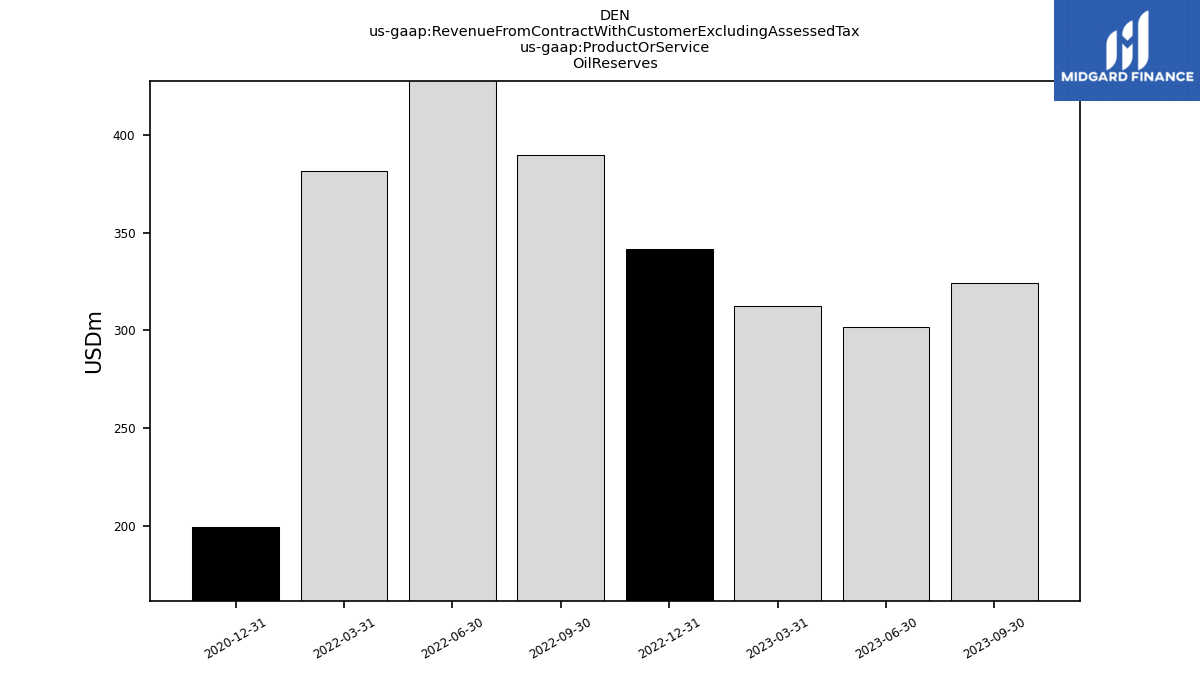
| 324.24 | 301.54 | 312.57 | 341.73 | 389.54 | 446.59 | 381.24 | NA | NA | NA | NA | 199.77 | NA | NA | NA | NA | NA | NA | NA | NA | NA | NA | NA | NA | NA | NA | NA | NA | NA | NA | NA | NA | NA | NA | NA | NA | NA | NA | NA | NA | NA | NA | NA | NA | NA | NA | NA | NA | NA | NA | NA | NA | NA | NA | NA | ||
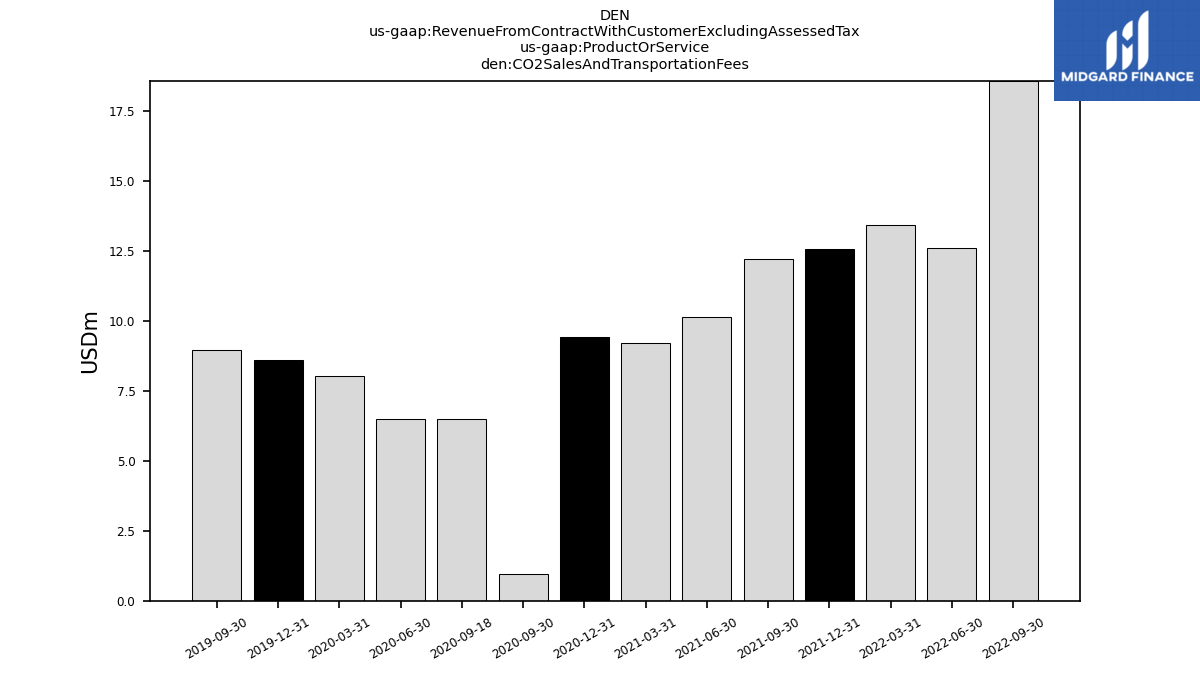
| C O2 Sales And Transportation Fees | NA | NA | NA | NA | 18.59 | 12.61 | 13.42 | 12.58 | 12.24 | 10.13 | 9.23 | 9.42 | 0.97 | 6.52 | 6.50 | 8.03 | 8.61 | 8.98 | NA | NA | NA | NA | NA | NA | NA | NA | NA | NA | NA | NA | NA | NA | NA | NA | NA | NA | NA | NA | NA | NA | NA | NA | NA | NA | NA | NA | NA | NA | NA | NA | NA | NA | NA | NA | NA | |
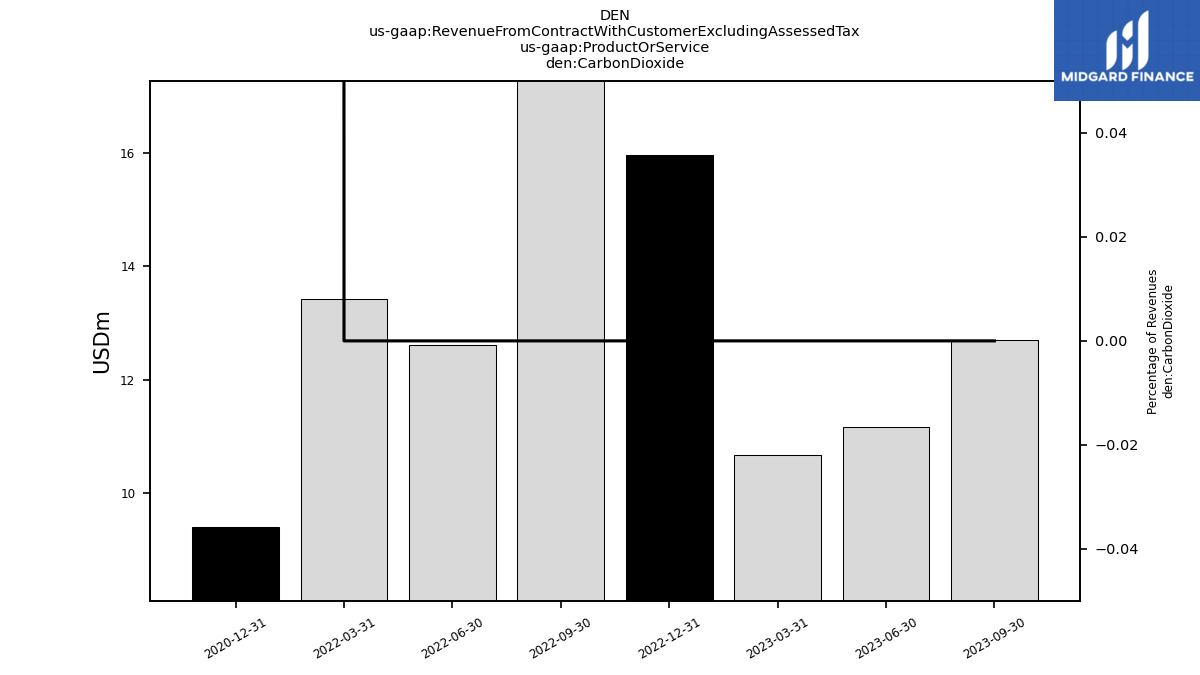
| Carbon Dioxide | 12.71 | 11.16 | 10.69 | 15.95 | 18.59 | 12.61 | 13.42 | NA | NA | NA | NA | 9.42 | NA | NA | NA | NA | NA | NA | NA | NA | NA | NA | NA | NA | NA | NA | NA | NA | NA | NA | NA | NA | NA | NA | NA | NA | NA | NA | NA | NA | NA | NA | NA | NA | NA | NA | NA | NA | NA | NA | NA | NA | NA | NA | NA | |
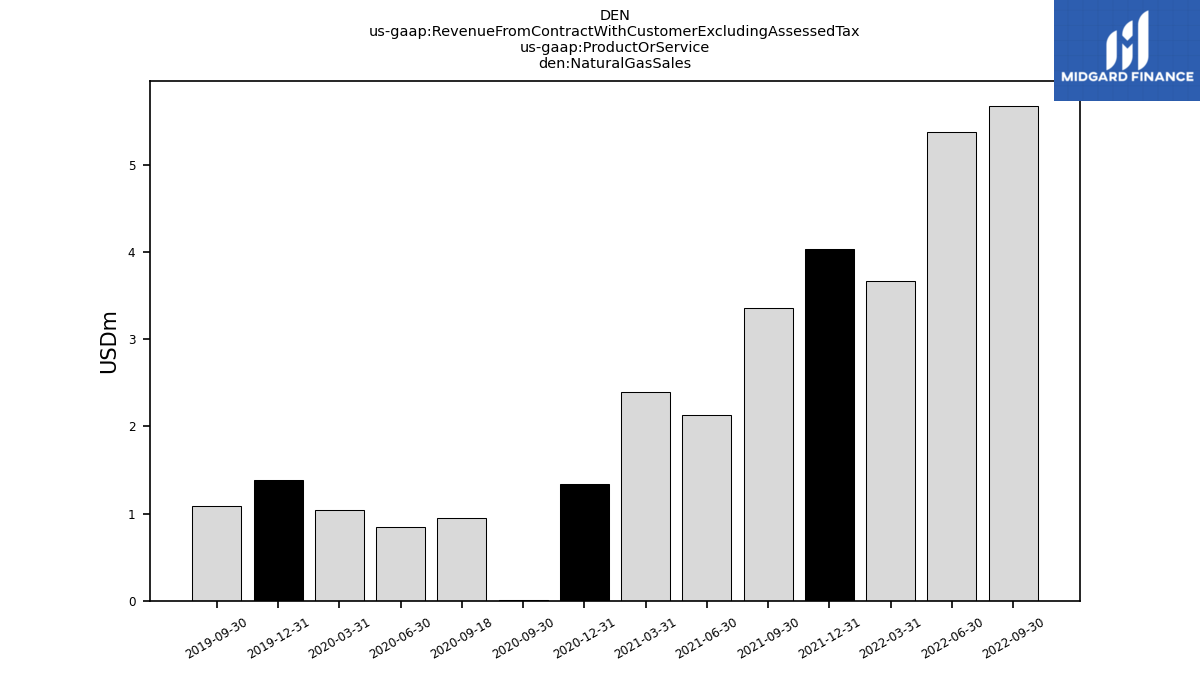
| Natural Gas Sales | NA | NA | NA | NA | 5.68 | 5.38 | 3.67 | 4.04 | 3.36 | 2.13 | 2.40 | 1.34 | 0.01 | 0.95 | 0.85 | 1.05 | 1.38 | 1.09 | NA | NA | NA | NA | NA | NA | NA | NA | NA | NA | NA | NA | NA | NA | NA | NA | NA | NA | NA | NA | NA | NA | NA | NA | NA | NA | NA | NA | NA | NA | NA | NA | NA | NA | NA | NA | NA | |
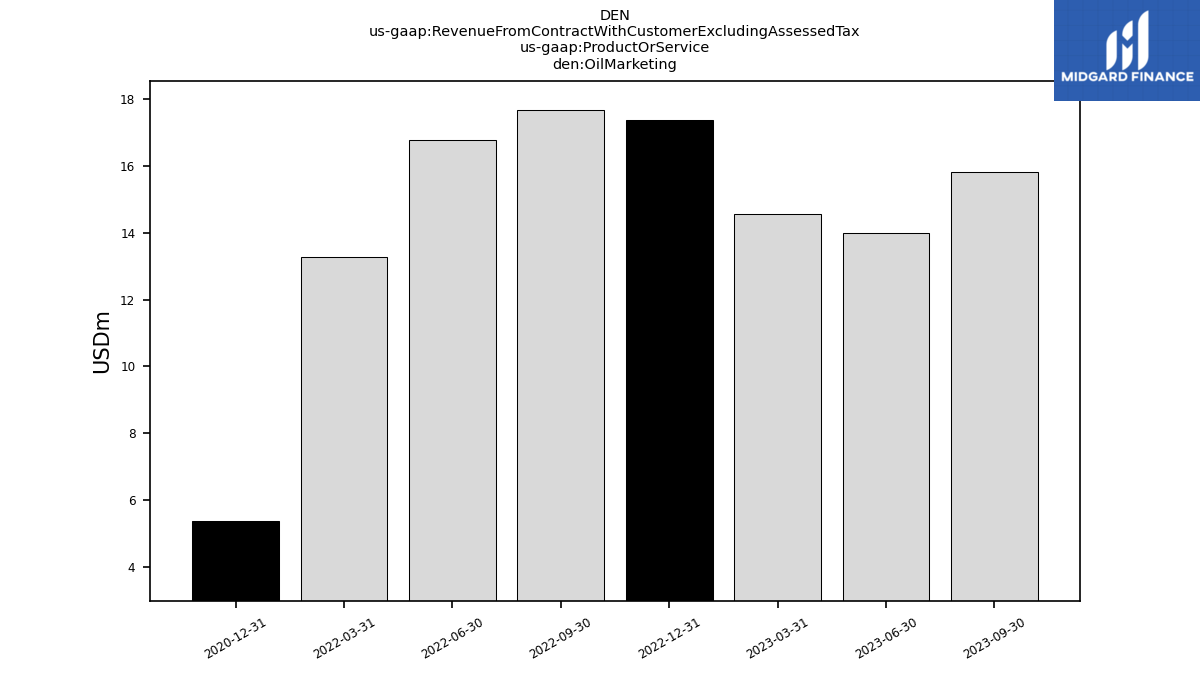
| Oil Marketing | 15.82 | 13.98 | 14.55 | 17.37 | 17.66 | 16.79 | 13.28 | NA | NA | NA | NA | 5.38 | NA | NA | NA | NA | NA | NA | NA | NA | NA | NA | NA | NA | NA | NA | NA | NA | NA | NA | NA | NA | NA | NA | NA | NA | NA | NA | NA | NA | NA | NA | NA | NA | NA | NA | NA | NA | NA | NA | NA | NA | NA | NA | NA | |
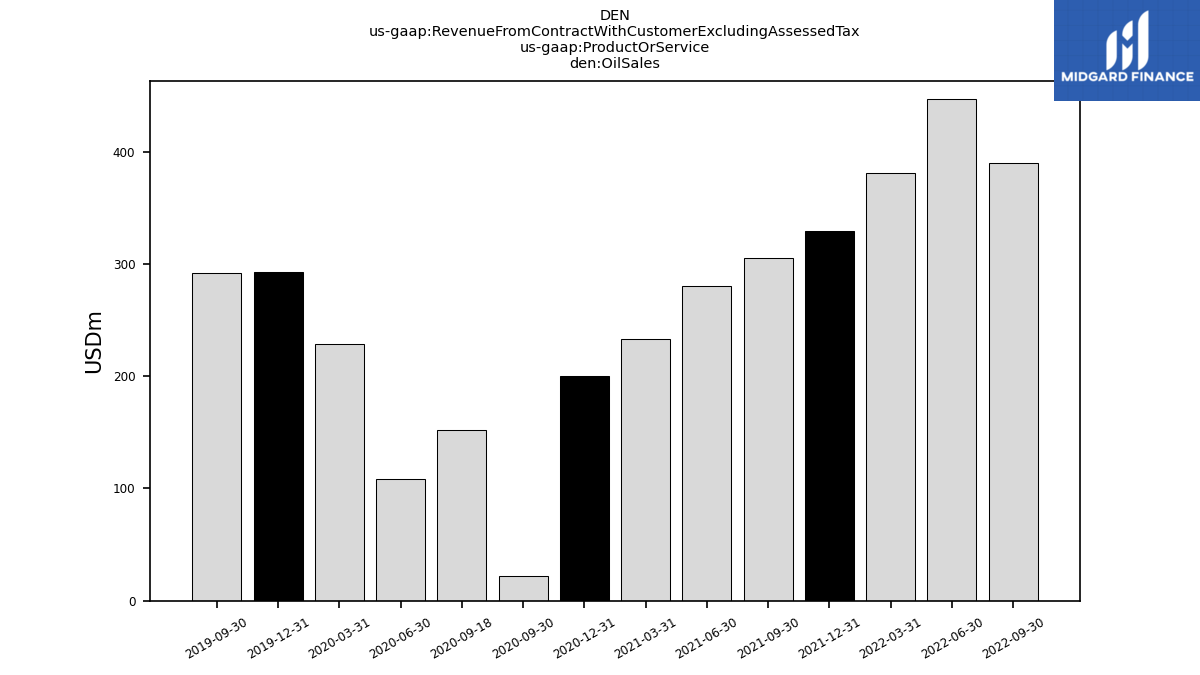
| Oil Sales | NA | NA | NA | NA | 389.54 | 446.59 | 381.24 | 329.31 | 305.09 | 280.58 | 233.04 | 199.77 | 22.31 | 152.14 | 108.54 | 228.58 | 292.45 | 292.10 | NA | NA | NA | NA | NA | NA | NA | NA | NA | NA | NA | NA | NA | NA | NA | NA | NA | NA | NA | NA | NA | NA | NA | NA | NA | NA | NA | NA | NA | NA | NA | NA | NA | NA | NA | NA | NA | |
| Oil And Gas | 325.87 | 302.95 | 314.49 | 346.58 | 395.22 | 451.97 | 384.91 | 333.35 | 308.45 | 282.71 | 235.44 | 201.11 | 22.32 | 153.09 | 109.39 | 229.62 | 293.83 | 293.19 | 330.42 | 294.58 | 327.38 | 379.63 | 375.56 | 340.02 | 313.58 | 259.03 | 250.88 | NA | NA | NA | NA | NA | NA | NA | NA | NA | NA | NA | NA | NA | NA | NA | NA | NA | NA | NA | NA | NA | NA | NA | NA | NA | NA | NA | NA | |
| Oil And Gas Purchased | NA | NA | NA | NA | 17.66 | 16.79 | 13.28 | 12.20 | 12.59 | 7.82 | 6.13 | 5.38 | 0.15 | 3.33 | 1.49 | 3.72 | 5.92 | 5.47 | 2.59 | 0.21 | 0.25 | 0.27 | 0.35 | NA | NA | NA | NA | NA | NA | NA | NA | NA | NA | NA | NA | NA | NA | NA | NA | NA | NA | NA | NA | NA | NA | NA | NA | NA | NA | NA | NA | NA | NA | NA | NA |